Análisis del Lenovo Legion Pro 5 16ARX8: Portátil gaming con RTX 4050 en gran forma
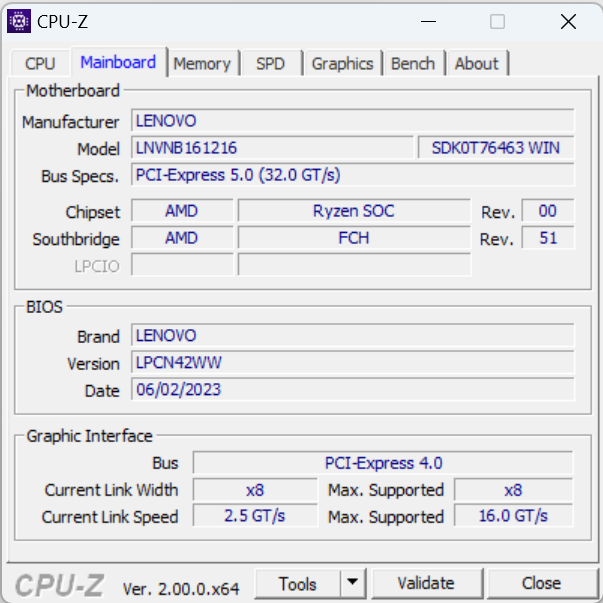
El Lenovo Legion Pro 5 16ARX8 tiene suficiente rendimiento como para situarse entre un portátil básico y uno de gama media-alta. Se puede configurar con un Ryzen 5 7645HX o un Ryzen 7 7745HX así como la Nividia RTX 4050, 4060 o4070. El dispositivo costará entre 1.500 y algo más de 2.000 euros (entre 1.655 y 2.200 dólares), dependiendo de las especificaciones. La pantalla, el SSD y la RAM también se pueden configurar.
Ya hemos analizado otras dos variantes de este portátil Lenovo: elLegion Pro 5 16IRX8 con un procesadorIntel Core i7-13700HXy RTX 4060 así como elPro 5 16ARX8 con unAMD Ryzen 7 7745HXy RTX 4070. Por tanto, aquí sólo cubriremos brevemente el chasis, las características y los dispositivos de entrada. Puedes consultar los dos análisis anteriores para más información.
Ha llegado el momento de poner a prueba la configuración básica del Legion Pro 5. Con el mismo sistema de refrigeración y el mismo chasis que las variantes más potentes, el Pro 5 16ARX8 debería tener algunas ventajas sobre ellas, al menos en lo que respecta a la temperatura. Por supuesto, el Legion Pro 5 de especificación básica también será llevado a sus límites con más facilidad en términos de rendimiento. No obstante, estos límites no son tan bajos como podría sugerir la GPU básica.
El Legion Pro 5 compite con modelos de la talla delAsus TUF Gaming A16con unaAMD Radeon RX 7600Sasí como elMedion Erazer Scout E20que también incluye una RTX 4050.
Posibles contendientes en la comparación
Valoración | Fecha | Modelo | Peso | Altura | Tamaño | Resolución | Precio |
|---|---|---|---|---|---|---|---|
| 89 % v7 (old) | 08/2023 | Lenovo Legion Pro 5 16ARX8 (R5 7645HX, RTX 4050) R5 7645HX, GeForce RTX 4050 Laptop GPU | 2.5 kg | 27.3 mm | 16.00" | 2560x1600 | |
| 87.9 % v7 (old) | 05/2023 | Lenovo Legion Pro 5 16IRX8 i7-13700HX, GeForce RTX 4060 Laptop GPU | 2.5 kg | 26.8 mm | 16.00" | 2560x1600 | |
| 86.3 % v7 (old) | 06/2023 | Asus TUF A15 FA507 R7 7735HS, GeForce RTX 4050 Laptop GPU | 2.2 kg | 24.9 mm | 15.60" | 1920x1080 | |
| 86.2 % v7 (old) | 02/2023 | Asus TUF Gaming A16 FA617 R7 7735HS, Radeon RX 7600S | 2.2 kg | 27 mm | 16.00" | 1920x1200 | |
| 85.5 % v7 (old) | 06/2023 | Acer Nitro 5 AN517-55-5552 i5-12500H, GeForce RTX 4050 Laptop GPU | 3 kg | 28.9 mm | 17.30" | 1920x1080 | |
| 83 % v7 (old) | 05/2023 | Medion Erazer Scout E20 i7-13700H, GeForce RTX 4050 Laptop GPU | 2.8 kg | 29 mm | 17.30" | 1920x1080 |
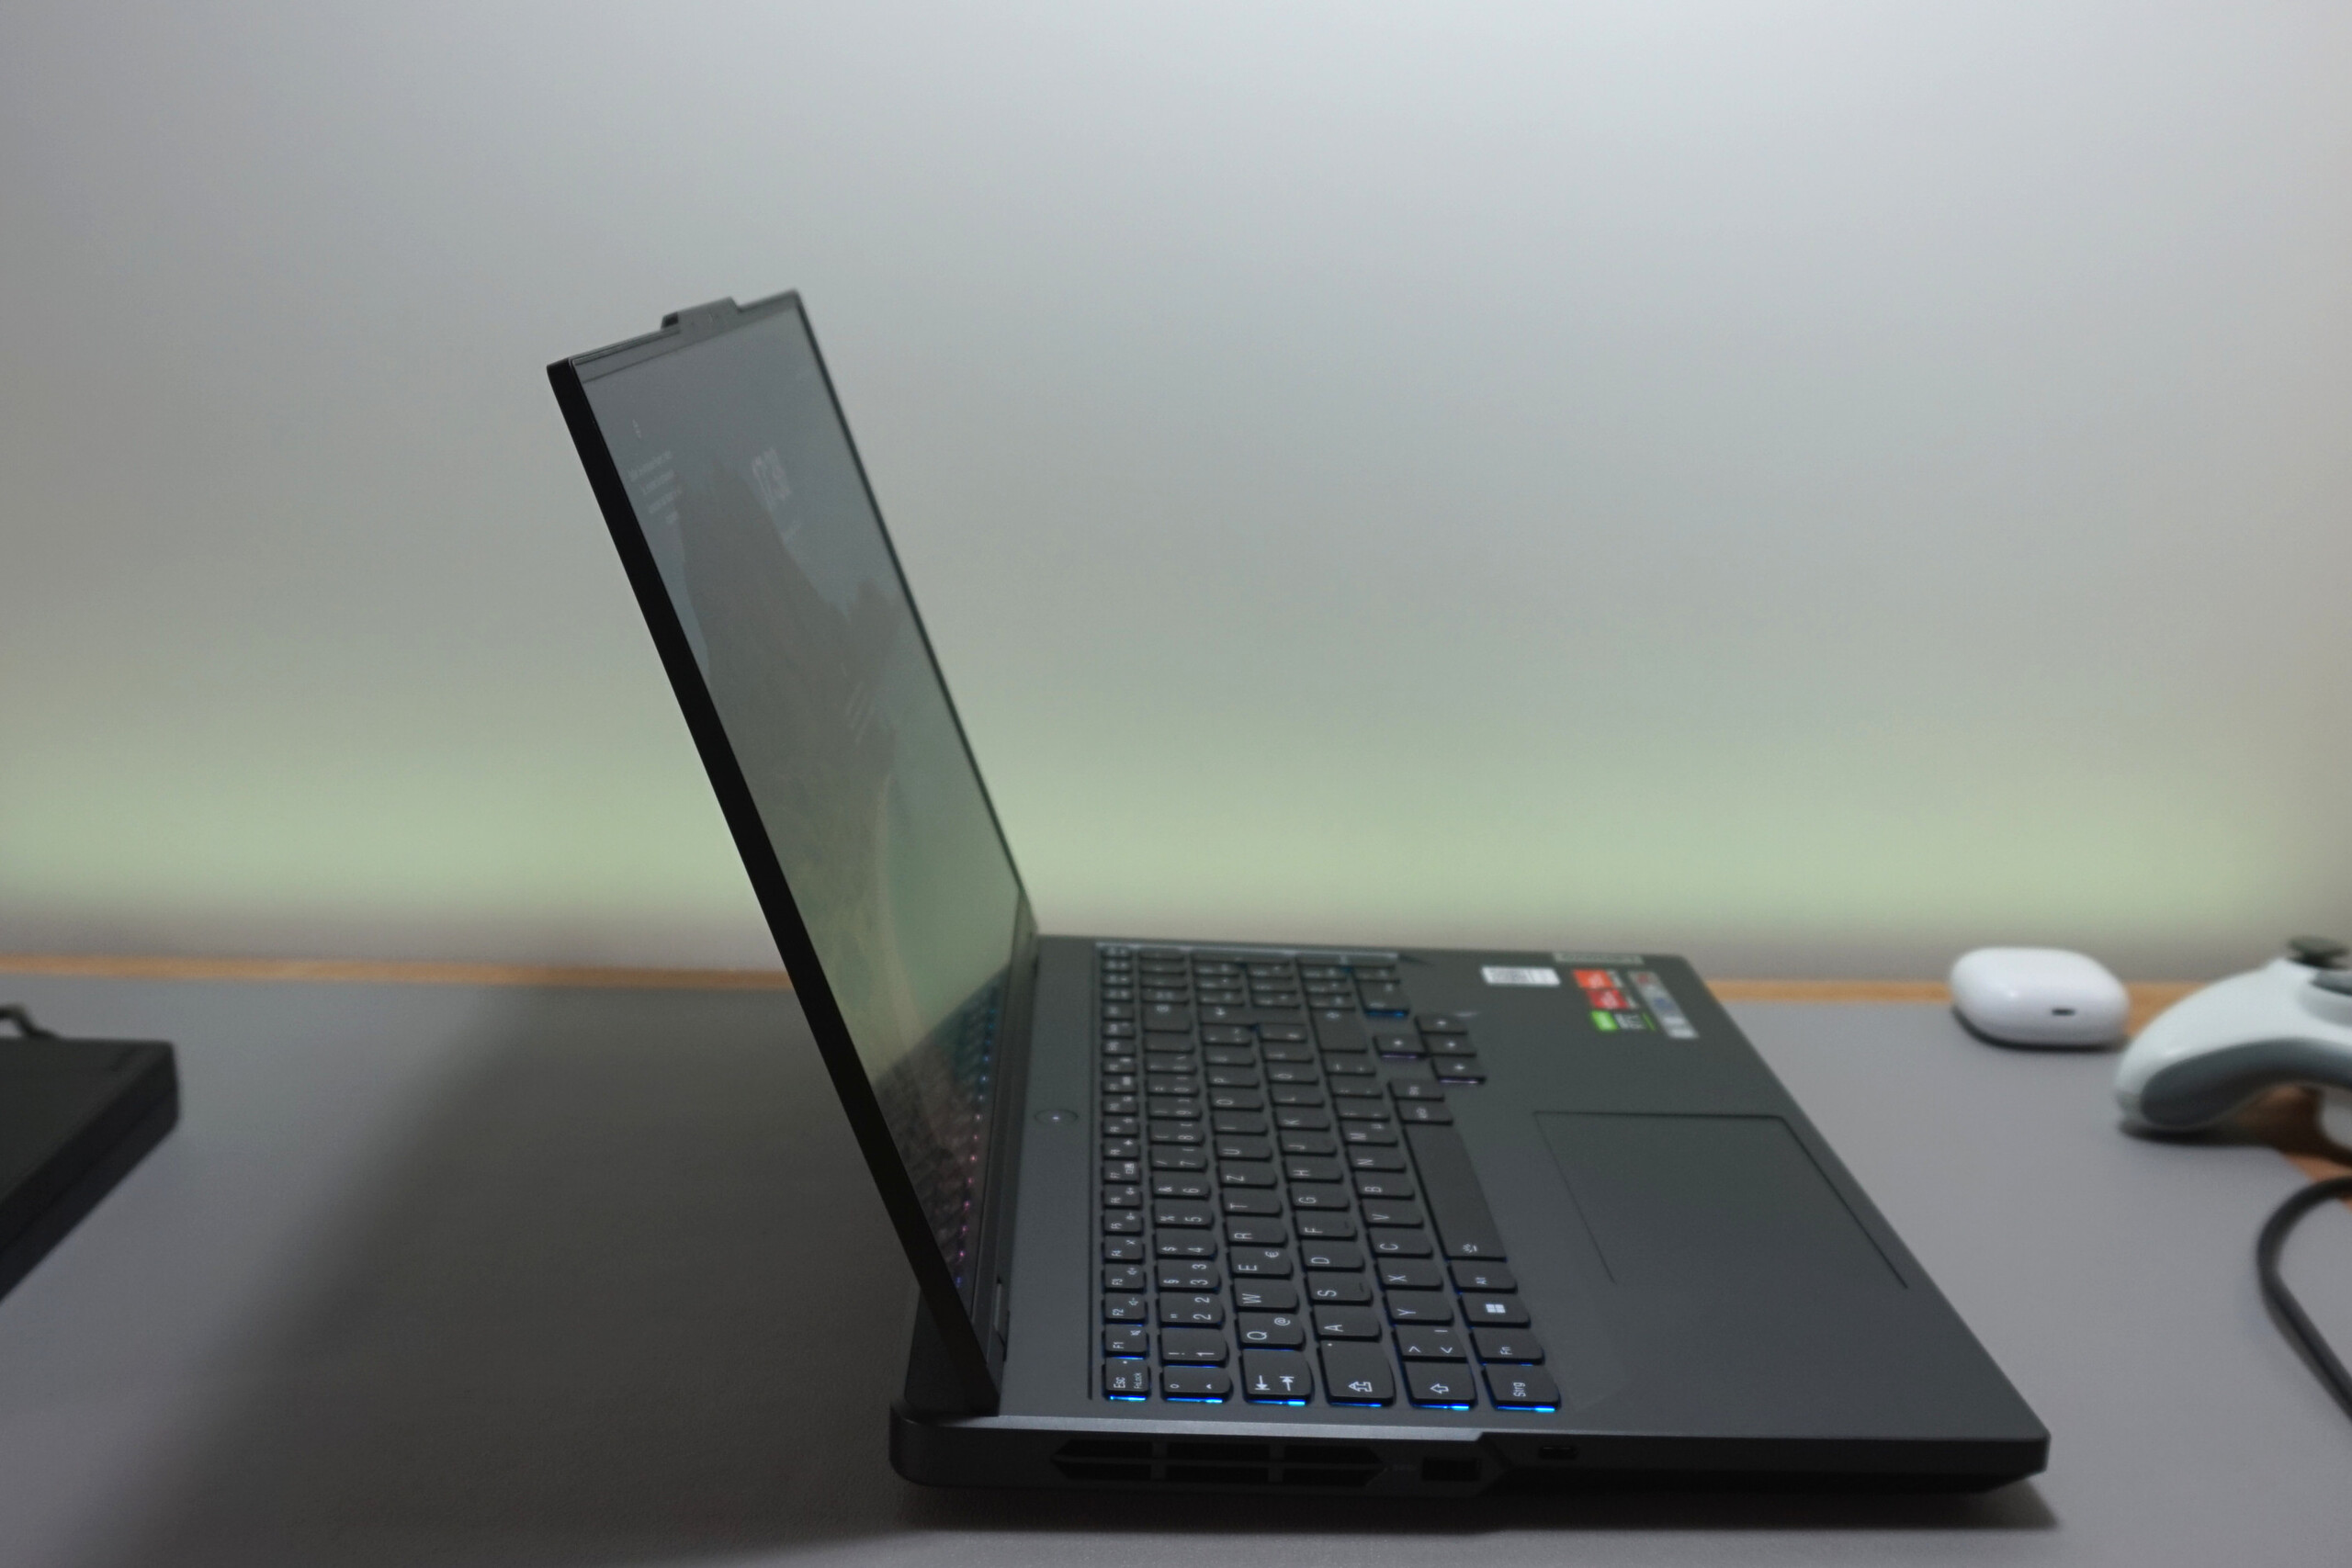
Funda - Compacta Legion con diseño apagado
El chasis negro y limpio renuncia a cualquier salpicadura de color y efectos luminosos. Pero está equipado con bisagras agradablemente rígidas y un bisel metálico excepcionalmente sólido. La sección de la base también es suficientemente robusta.
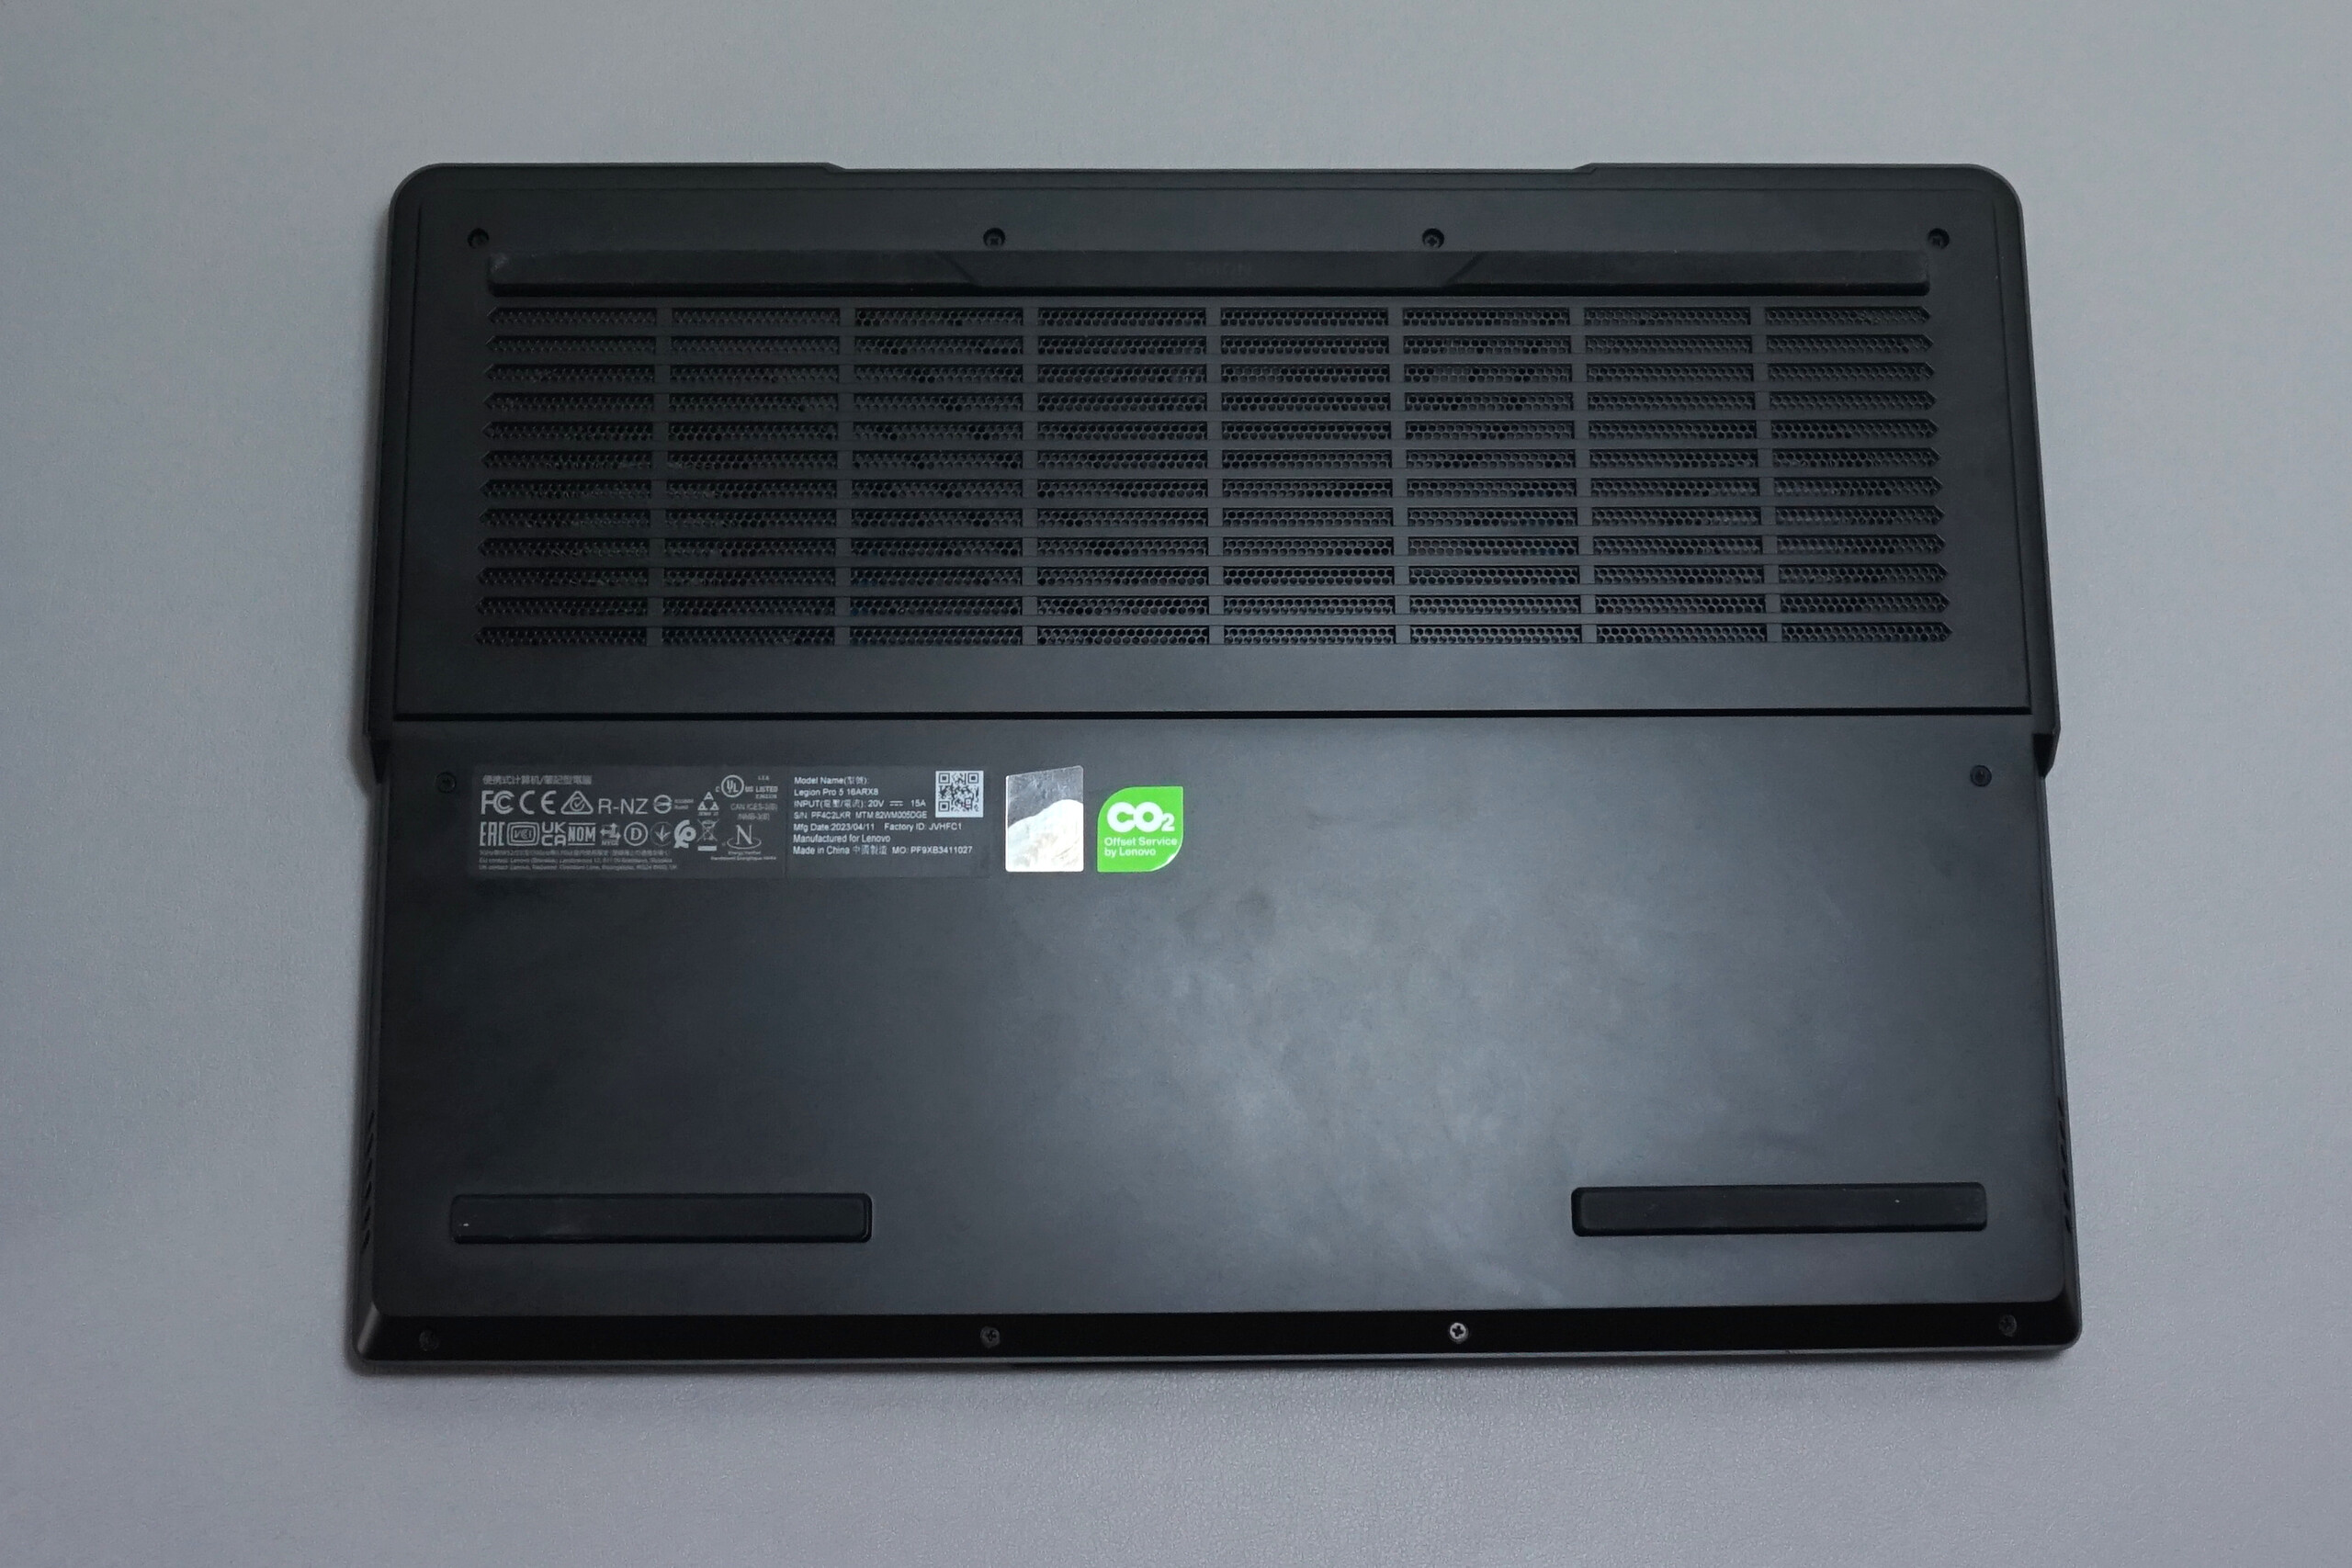
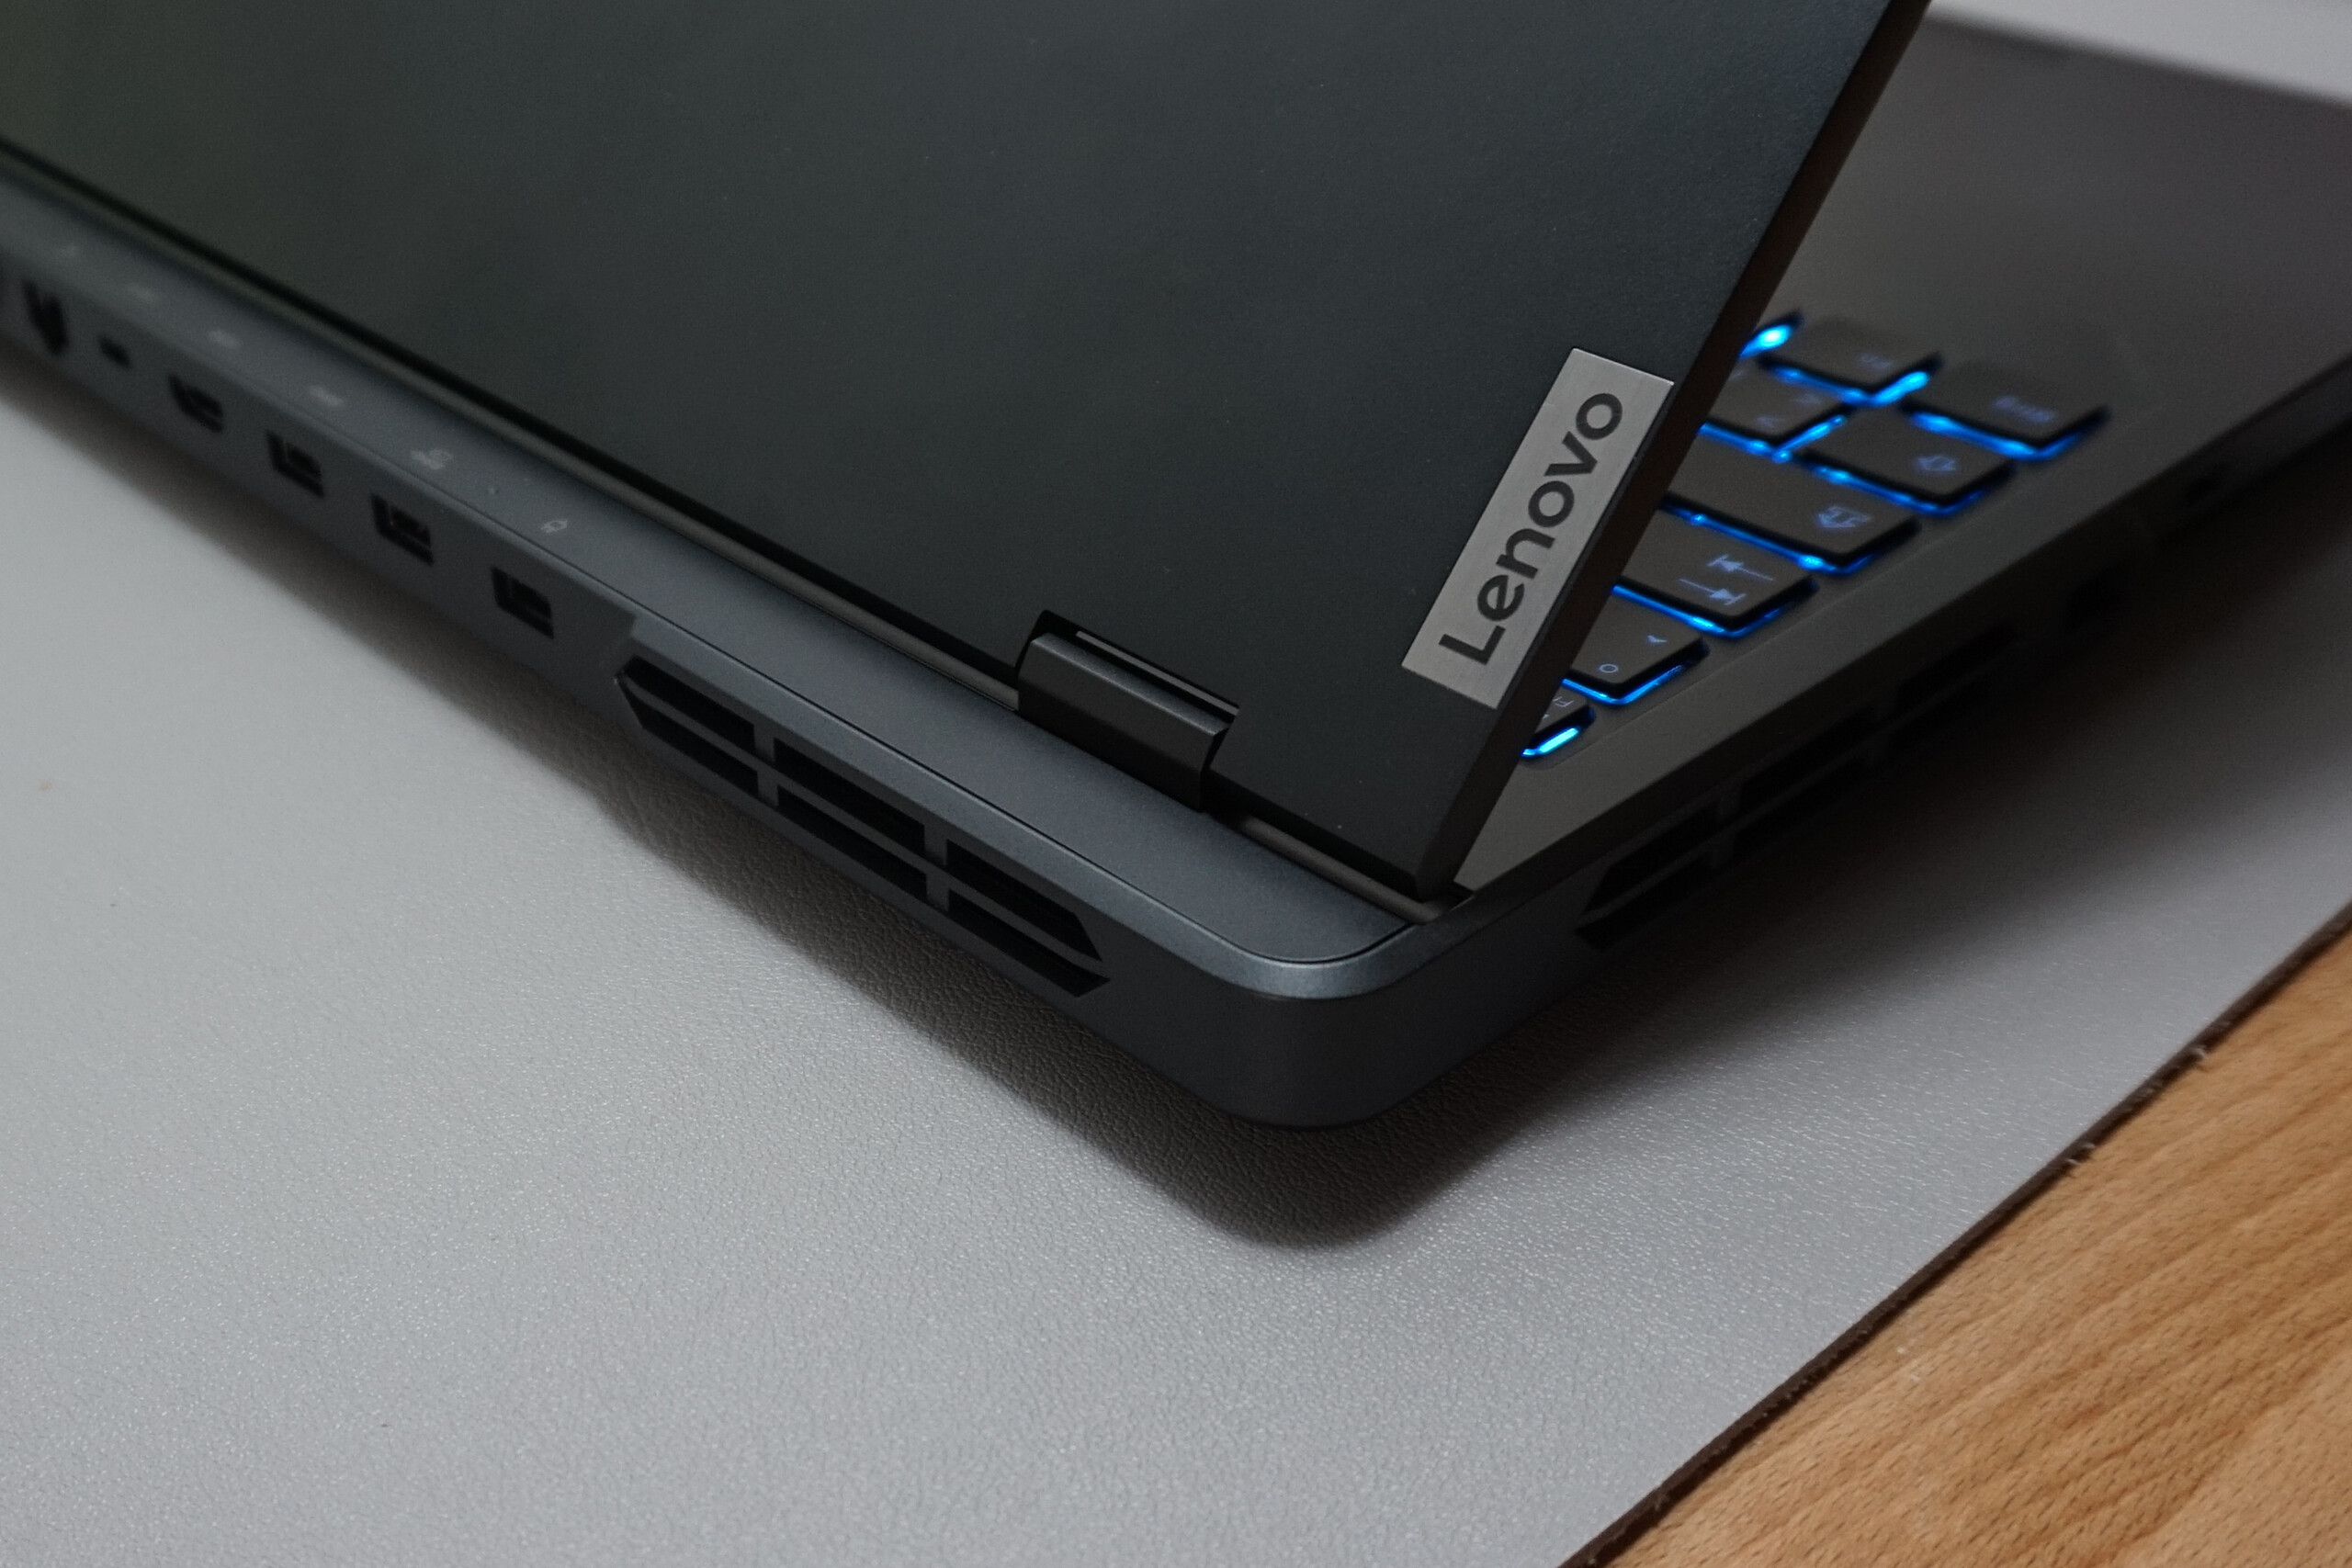
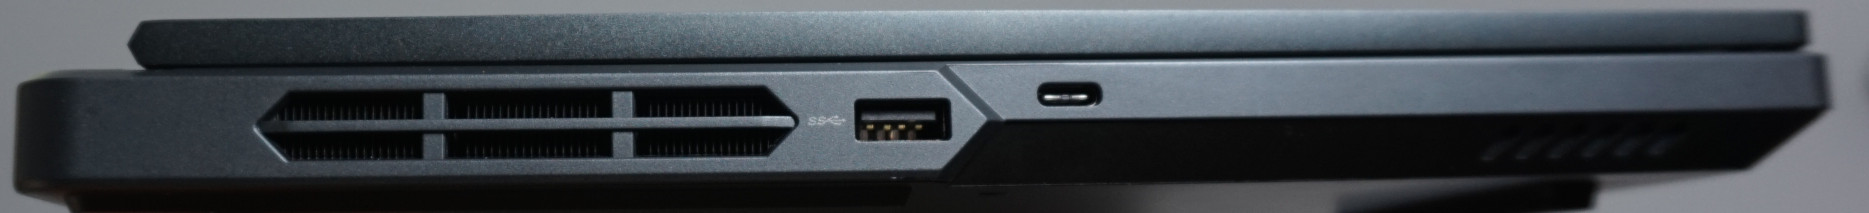
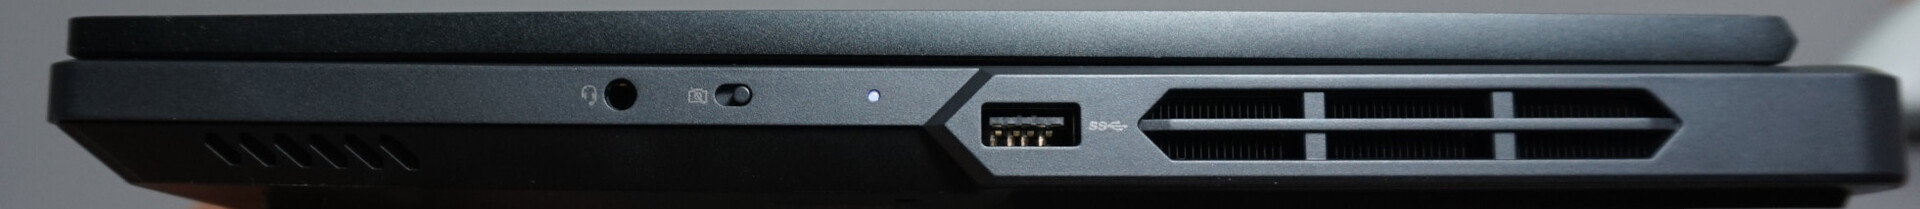
Especificaciones: sólo faltan los puertos rápidos
Como en el Legion Pro 5 16IRX8, no hay puertos Thunderbolt en el portátil. Pero es de esperar de un modelo basado en AMD. Dicho esto, el dispositivo ofrece tres salidas de vídeo y se puede cargar por el puerto USB-C de la trasera, aunque este método de carga no ofrece toda la potencia necesaria para jugar. Aparte de eso, el Legion Pro 5 viene con un buen número y variedad de puertos. No hay lector de tarjetas a bordo.
Otra característica interesante es el interruptor mecánico en el lado derecho que corta la alimentación de la webcam.

Cámara web
La webcam Full HD ofrece una calidad de imagen suficiente para las videollamadas y ajusta bien el brillo a las condiciones de luz cambiantes. El micrófono es menos convincente para un modelo de doble array. Las voces suenan ligeramente metálico, y sólo obtendrá un volumen decente al hablar directamente en el micrófono.

 GeForce RTX 4050 Laptop GPU, R5 7645HX, SK hynix PC801 HFS512GEJ9X115N")
 GeForce RTX 4050 Laptop GPU, R5 7645HX, SK hynix PC801 HFS512GEJ9X115N")
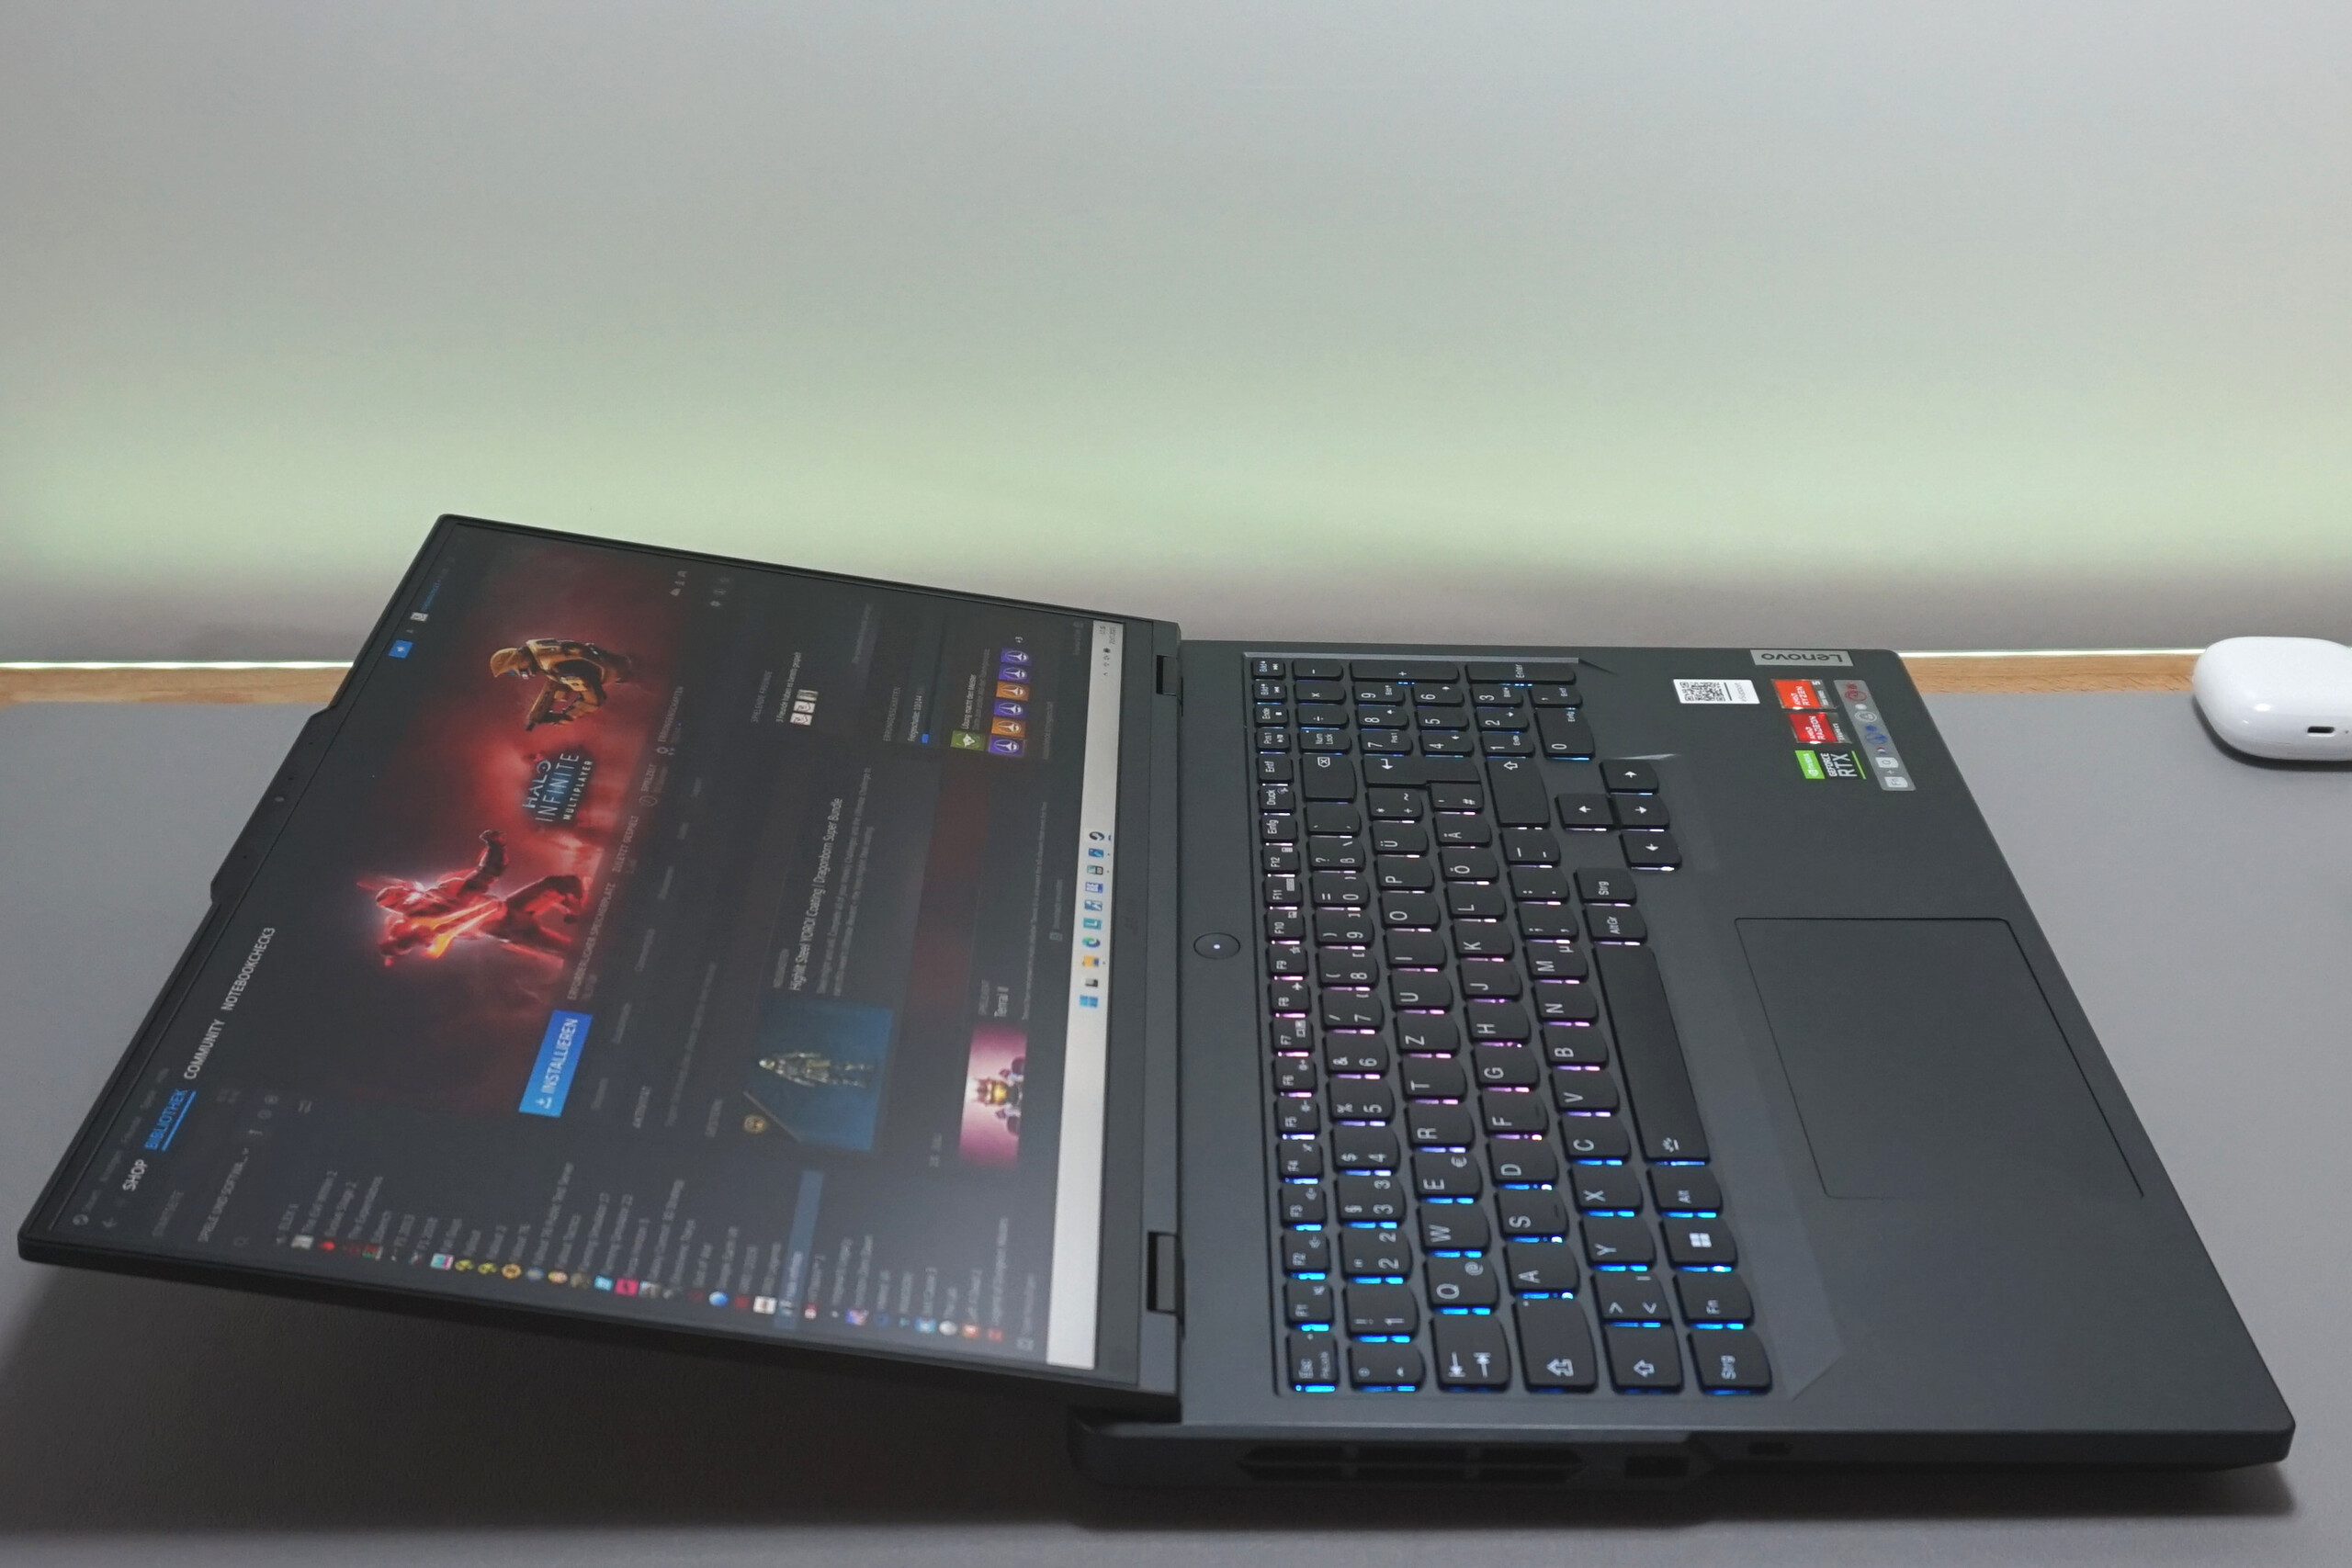
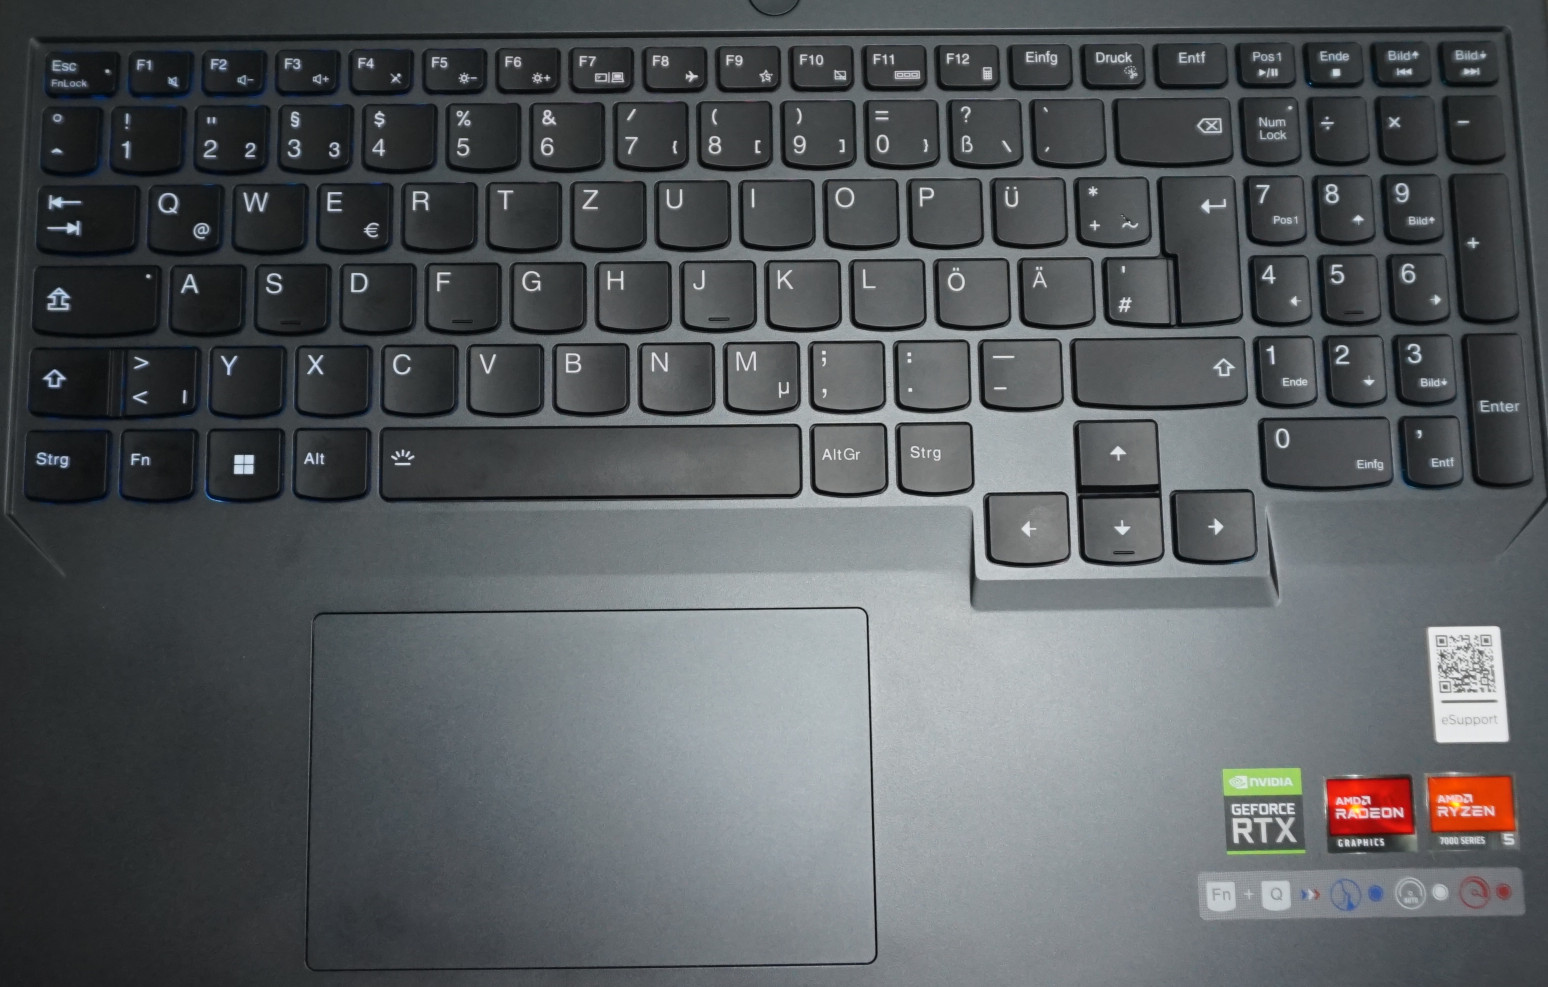
Dispositivos de entrada - Portátil para juegos con teclado cómodo
Aparte del teclado numérico ligeramente más estrecho, el resto del teclado (incluidas las teclas de dirección) es tan grande como un teclado de sobremesa típico. Las teclas podrían tener un poco más de recorrido, pero proporcionan una respuesta agradable. No nos gustó tanto el touchpad. A veces no registra una entrada de clic cuando tocamos en la superficie y sólo lo hace cuando presionamos el botón físicamente.
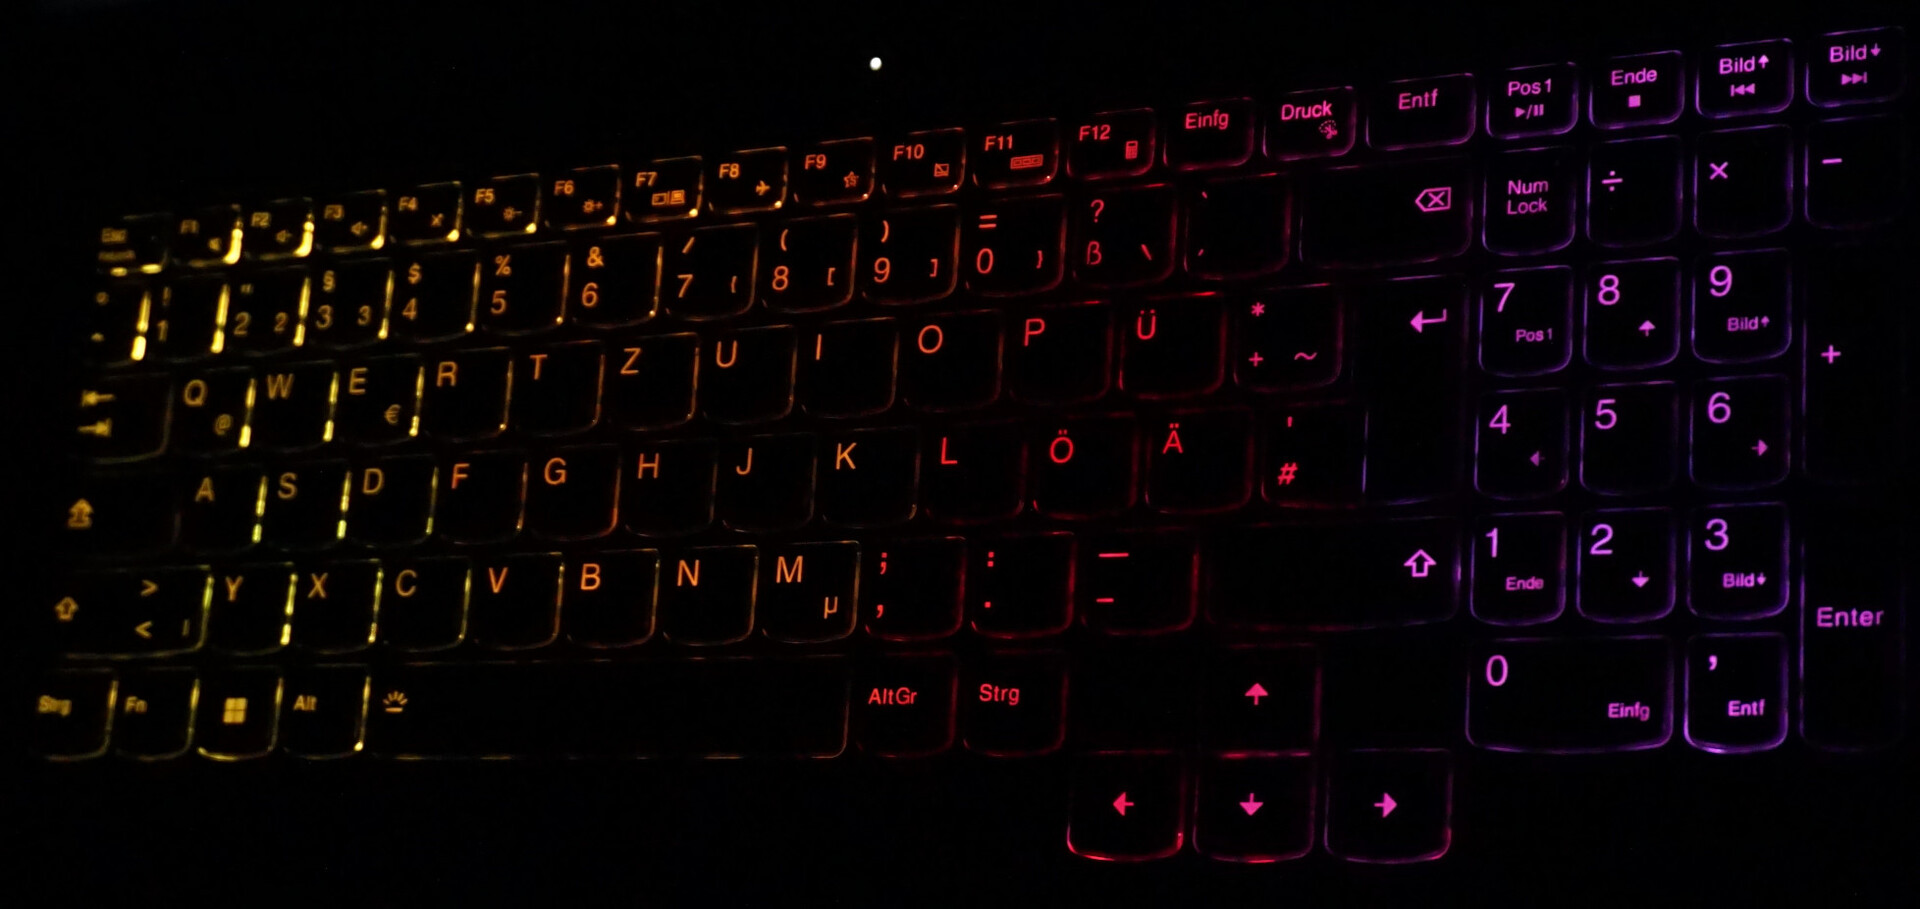
La retroiluminación del teclado ofrece una personalización limitada. Sólo hay cuatro zonas, un puñado de colores y aún menos efectos disponibles.
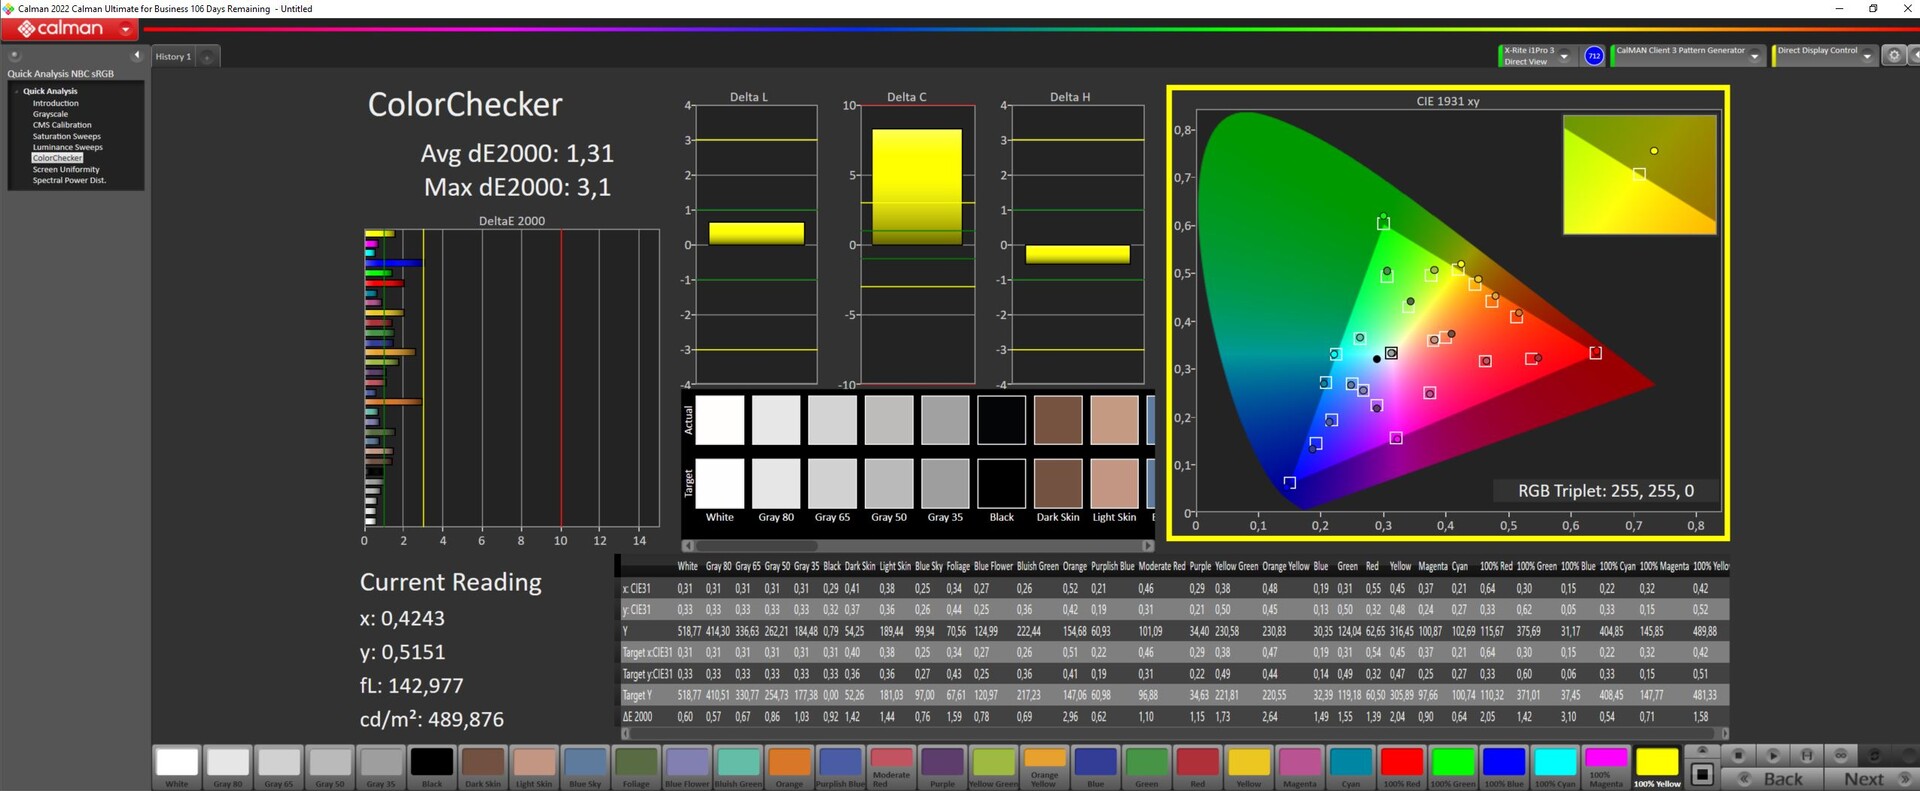
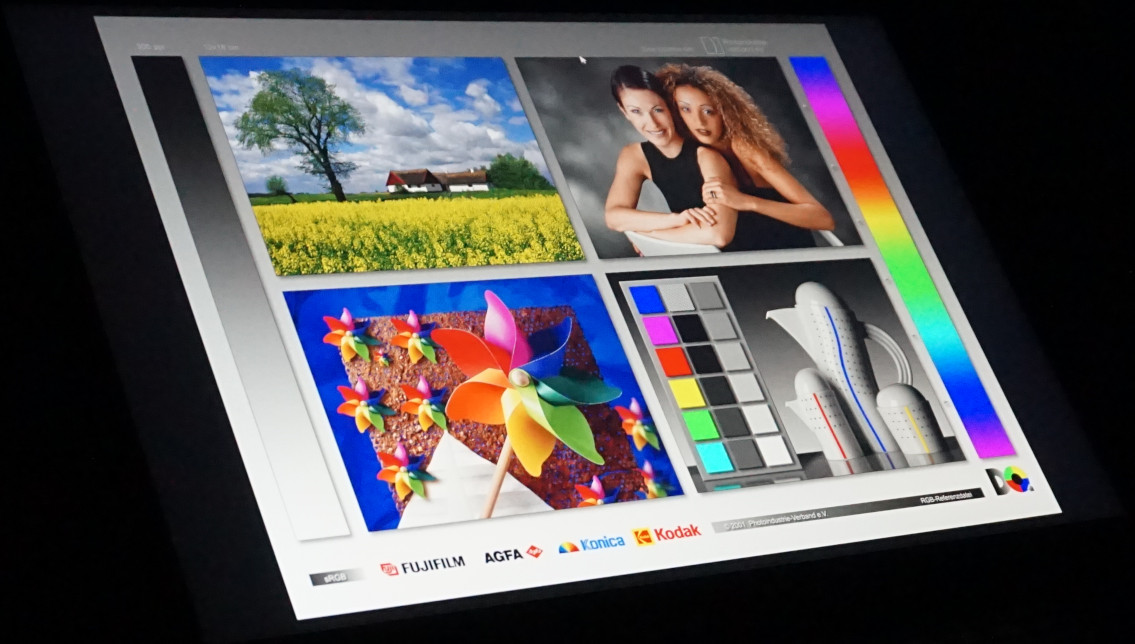
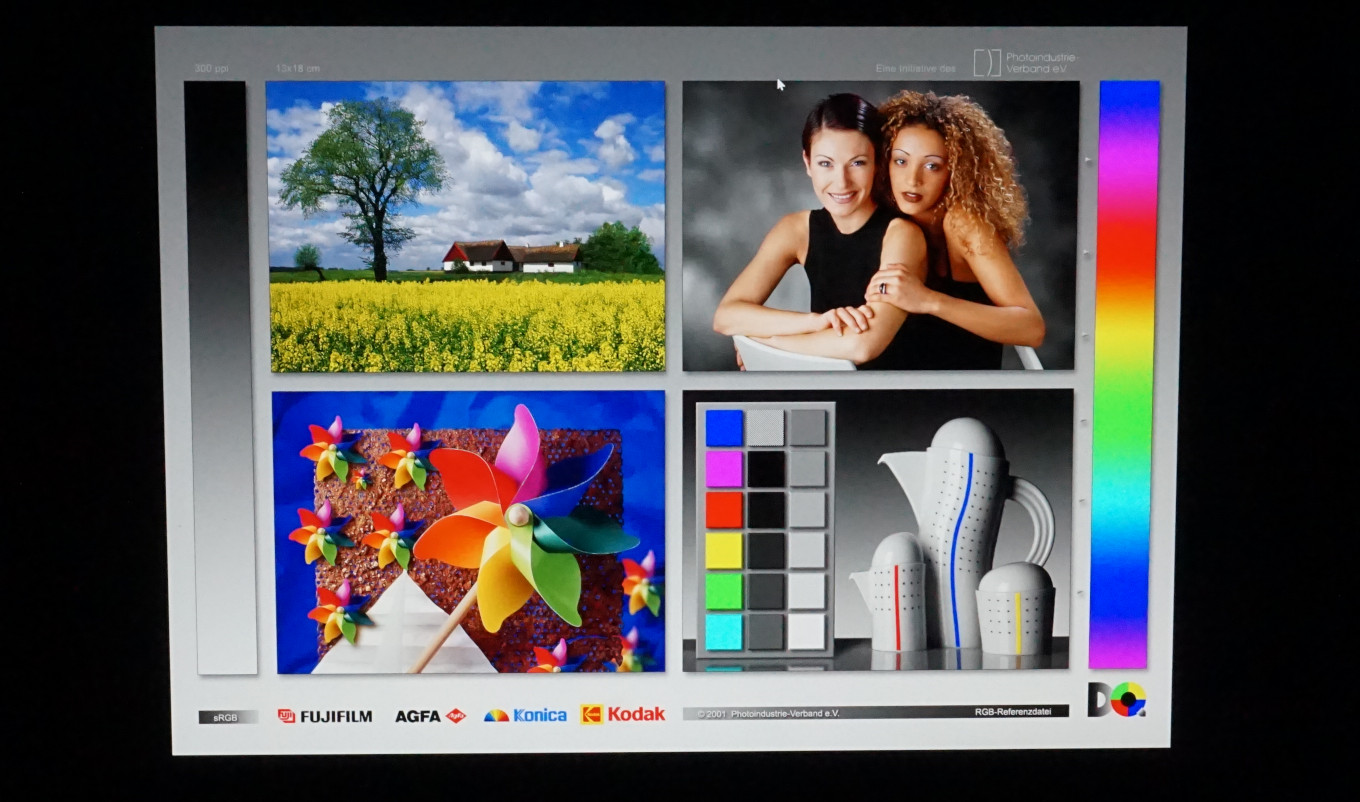
Pantalla - Brillante, precisa, rápida

La pantalla del Legion Pro 5 cumple todos los requisitos esenciales para una pantalla de juegos: frecuencia de refresco de 240 Hz, resolución de 2.560 por 1.600 píxeles y cobertura sRGB completa. El elevado número de píxeles, junto con la relación de aspecto 16:10, también permite editar vídeos e imágenes cómodamente. El Legion Pro 5 tiene potencia de cálculo suficiente para este tipo de aplicaciones. Dicho esto, la frecuencia de actualización y la resolución parecen demasiado ambiciosas para el modelo básico con una RTX 4050, que verás más adelante en la sección "Rendimiento en juegos".
Otra cosa que merece la pena destacar es el alto brillo máximo de más de 500 cd/m². Esto significa que la pantalla puede producir imágenes brillantes y vibrantes que saltan a la vista incluso en entornos luminosos. Durante las sesiones de juego nocturnas, sin embargo, esta cualidad particular tiene menos impacto en cómo se ven las imágenes en la pantalla. En un entorno poco iluminado, el nivel de negro relativamente bajo de la pantalla (que se traduce en una relación de contraste meramente media) no permite obtener negros muy profundos durante las escenas más oscuras. Una pantalla OLED habría sido probablemente más adecuada.
Pero en este rango de precios, y especialmente para los juegos, el panel IPS a bordo parece ser una excelente opción debido a su gran calidad de imagen en general. No detectamos ningún parpadeo PWM y sólo notamos un mínimo sangrado de pantalla.
| |||||||||||||||||||||||||
iluminación: 87 %
Brillo con batería: 534 cd/m²
Contraste: 936:1 (Negro: 0.58 cd/m²)
ΔE ColorChecker Calman: 1.35 | ∀{0.5-29.43 Ø4.71}
calibrated: 1.31
ΔE Greyscale Calman: 1.03 | ∀{0.09-98 Ø4.96}
72.9% AdobeRGB 1998 (Argyll 3D)
99.8% sRGB (Argyll 3D)
71.6% Display P3 (Argyll 3D)
Gamma: 2.38
CCT: 6452 K
| Lenovo Legion Pro 5 16ARX8 (R5 7645HX, RTX 4050) CSOT T3 MNG007DA2-2, IPS, 2560x1600, 16" | Lenovo Legion Pro 5 16IRX8 AU Optronics B160QAN03.1, IPS, 2560x1600, 16" | Acer Nitro 5 AN517-55-5552 BOE0A6F NV173FHM-NX4, IPS, 1920x1080, 17.3" | Asus TUF A15 FA507 N156HMA-GA1, IPS, 1920x1080, 15.6" | Medion Erazer Scout E20 LG Philips LGD0611, IPS, 1920x1080, 17.3" | Asus TUF Gaming A16 FA617 NE160WUM-NX2 (BOE0B33), IPS-Level, 1920x1200, 16" | |
|---|---|---|---|---|---|---|
| Display | -0% | -46% | -7% | -7% | -3% | |
| Display P3 Coverage (%) | 71.6 | 71.2 -1% | 37.6 -47% | 64.9 -9% | 65.1 -9% | 69.4 -3% |
| sRGB Coverage (%) | 99.8 | 98.8 -1% | 56.4 -43% | 96.5 -3% | 96.7 -3% | 97.8 -2% |
| AdobeRGB 1998 Coverage (%) | 72.9 | 73.3 1% | 38.9 -47% | 66.6 -9% | 66.5 -9% | 70.9 -3% |
| Response Times | -61% | -110% | -227% | -62% | -68% | |
| Response Time Grey 50% / Grey 80% * (ms) | 12 ? | 14.5 ? -21% | 18 ? -50% | 30.4 ? -153% | 14.8 ? -23% | 17 ? -42% |
| Response Time Black / White * (ms) | 5.2 ? | 10.4 ? -100% | 14 ? -169% | 20.8 ? -300% | 10.4 ? -100% | 10.1 ? -94% |
| PWM Frequency (Hz) | ||||||
| Screen | -2% | -107% | -12% | -41% | -8% | |
| Brightness middle (cd/m²) | 543 | 405.7 -25% | 285 -48% | 288 -47% | 312 -43% | 308 -43% |
| Brightness (cd/m²) | 516 | 368 -29% | 257 -50% | 271 -47% | 303 -41% | 293 -43% |
| Brightness Distribution (%) | 87 | 87 0% | 81 -7% | 91 5% | 91 5% | 90 3% |
| Black Level * (cd/m²) | 0.58 | 0.38 34% | 0.58 -0% | 0.17 71% | 0.25 57% | 0.23 60% |
| Contrast (:1) | 936 | 1068 14% | 491 -48% | 1694 81% | 1248 33% | 1339 43% |
| Colorchecker dE 2000 * | 1.35 | 1.65 -22% | 4.59 -240% | 1.9 -41% | 2.65 -96% | 1.47 -9% |
| Colorchecker dE 2000 max. * | 3.22 | 4.2 -30% | 6.98 -117% | 3.3 -2% | 6.44 -100% | 2.98 7% |
| Colorchecker dE 2000 calibrated * | 1.31 | 0.53 60% | 4.82 -268% | 0.9 31% | 0.96 27% | 1.02 22% |
| Greyscale dE 2000 * | 1.03 | 1.2 -17% | 2.89 -181% | 2.7 -162% | 3.2 -211% | 2.2 -114% |
| Gamma | 2.38 92% | 2.3 96% | 2.38 92% | 2.32 95% | 2.246 98% | 2.228 99% |
| CCT | 6452 101% | 6453 101% | 7000 93% | 6535 99% | 7258 90% | 6228 104% |
| Media total (Programa/Opciones) | -21% /
-10% | -88% /
-94% | -82% /
-42% | -37% /
-37% | -26% /
-16% |
* ... más pequeño es mejor
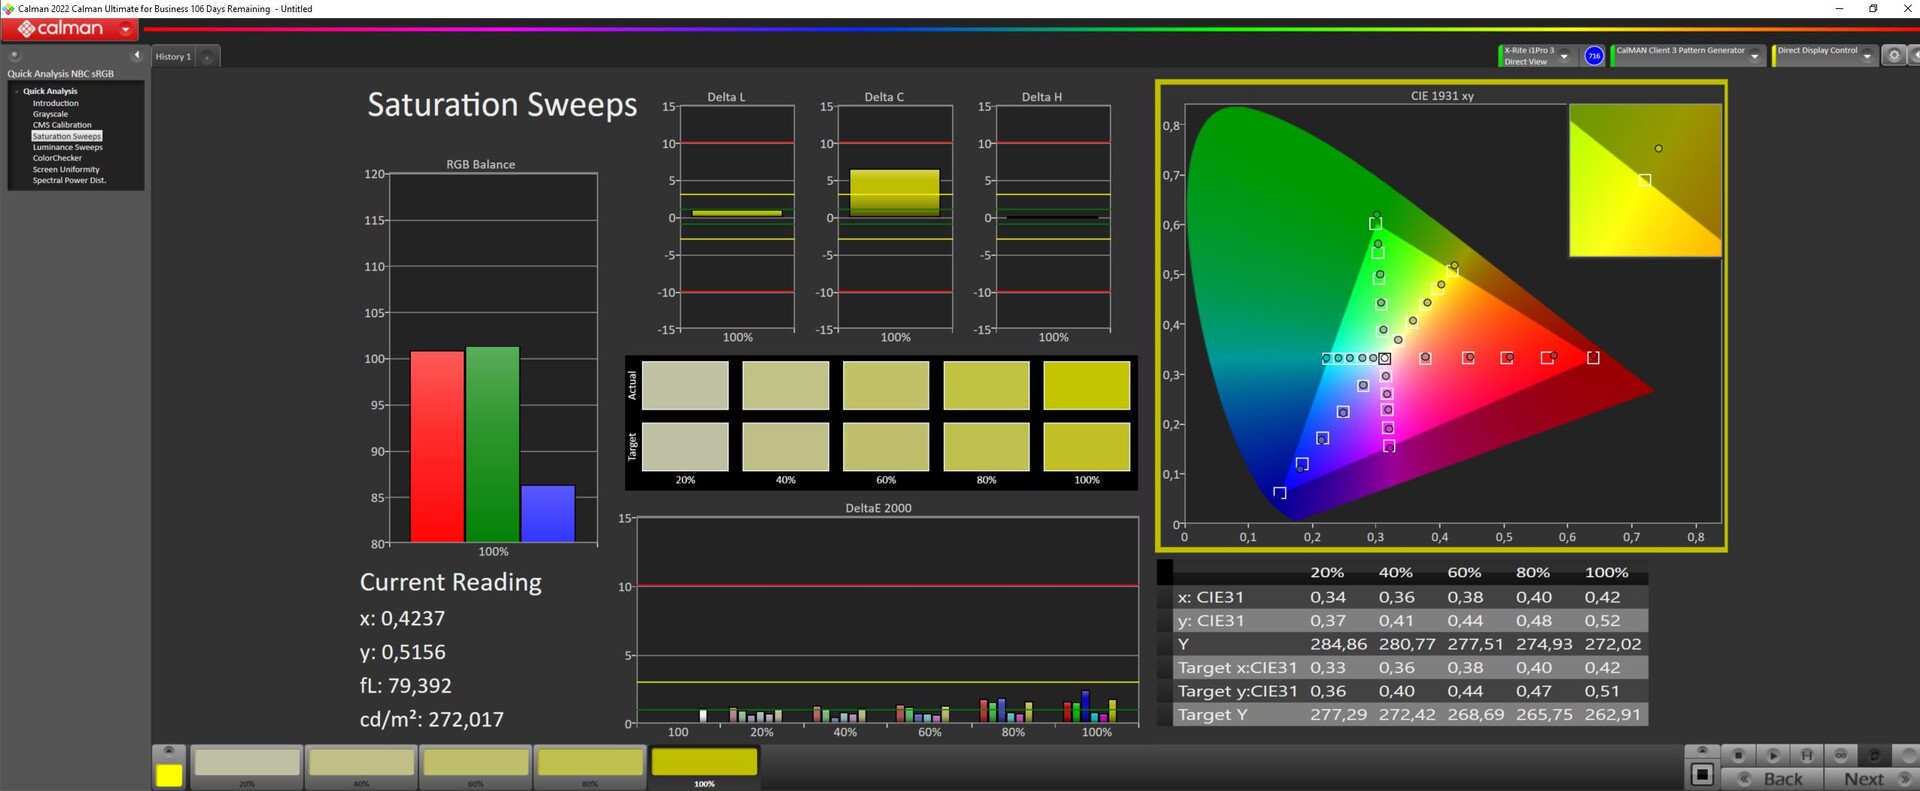
Al igual que las pantallas de los competidores con especificaciones similares, el panel del Legion Pro 5 casi puede reproducir toda la gama sRGB y está a sólo una fracción de la cobertura del 100% según nuestras mediciones. La reproducción completa de AdobeRGB y Display-P3 está más allá de las capacidades de la pantalla. Sin embargo, esto no supone ninguna desventaja en un portátil de juegos. Incluso es posible editar fotos muy bien en el dispositivo, siempre que no esperes que cumpla los estándares profesionales.
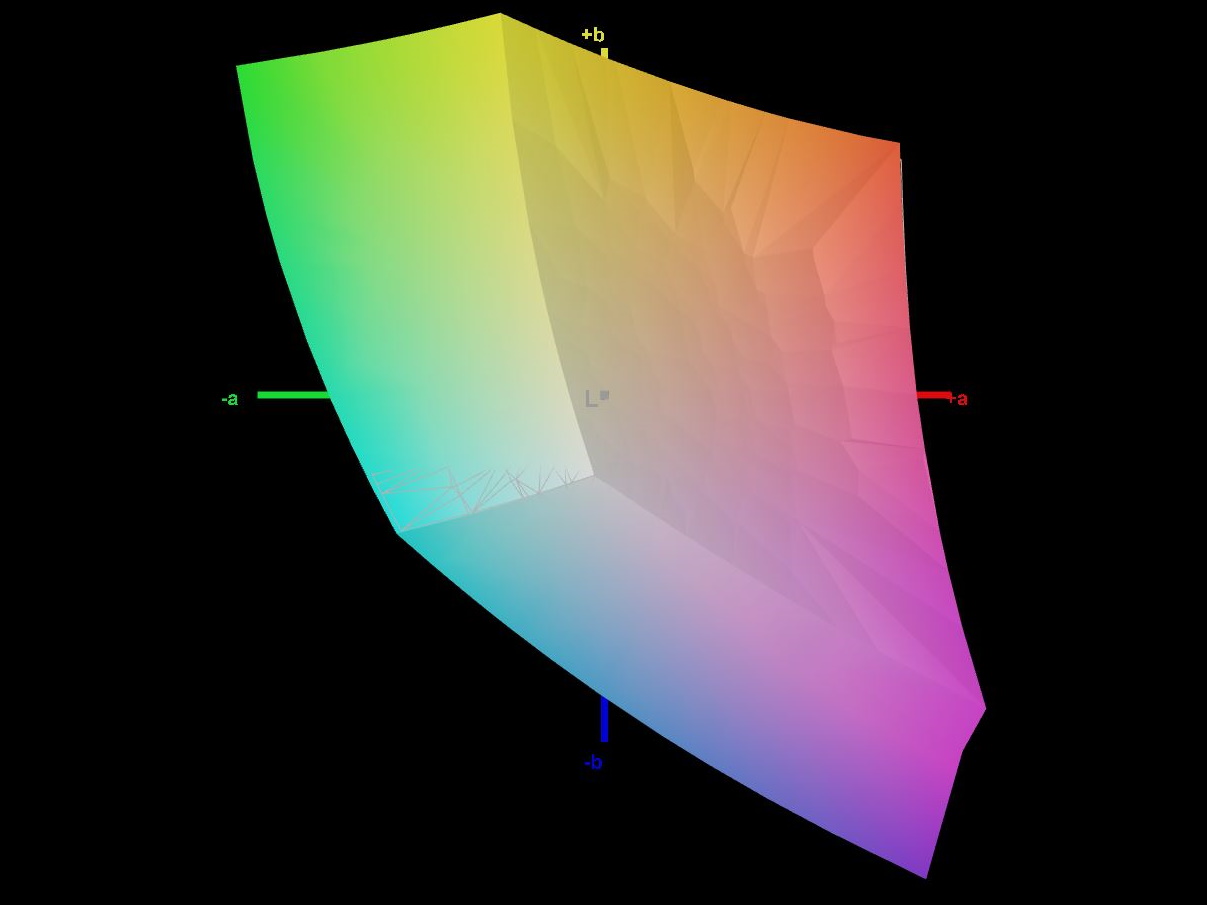
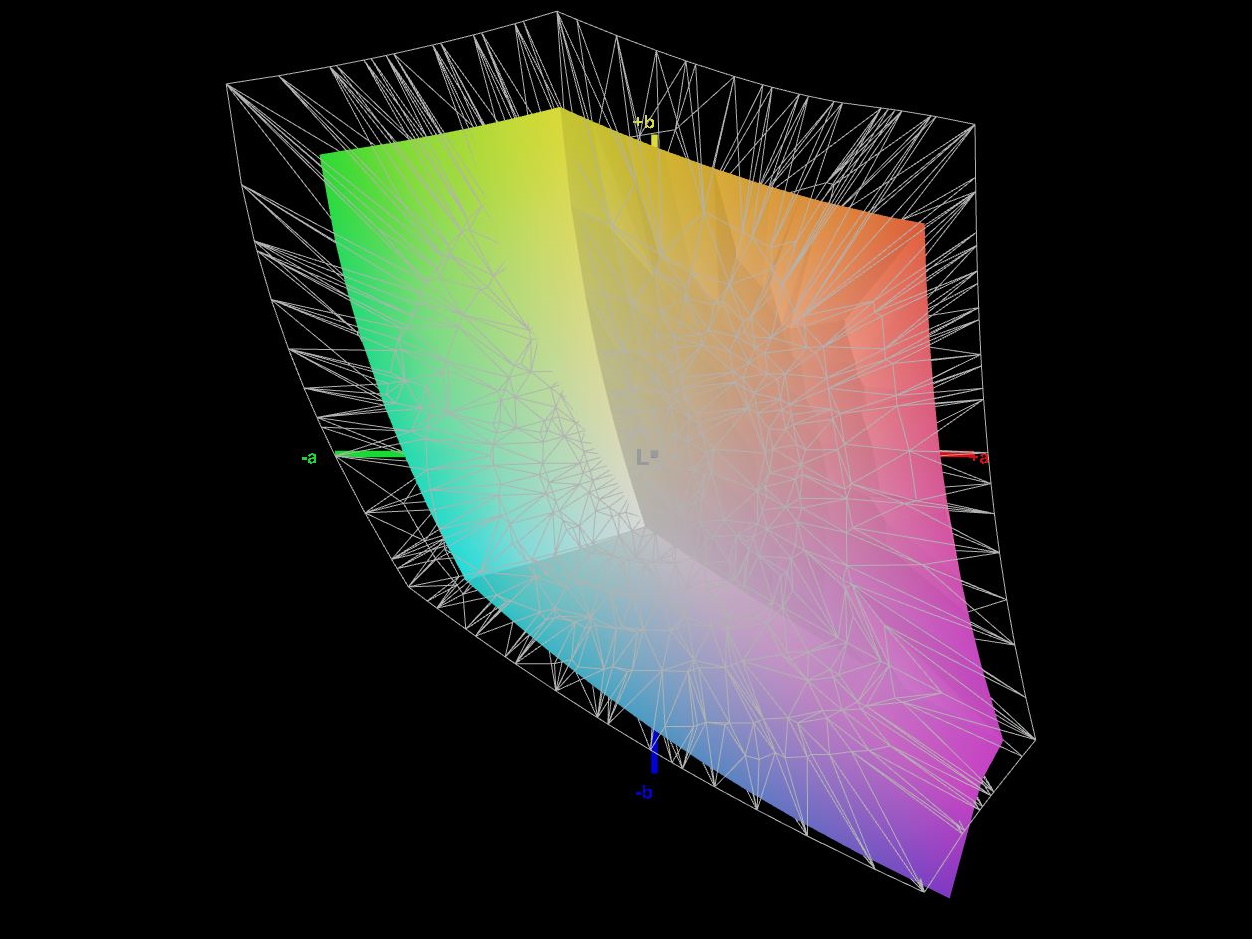
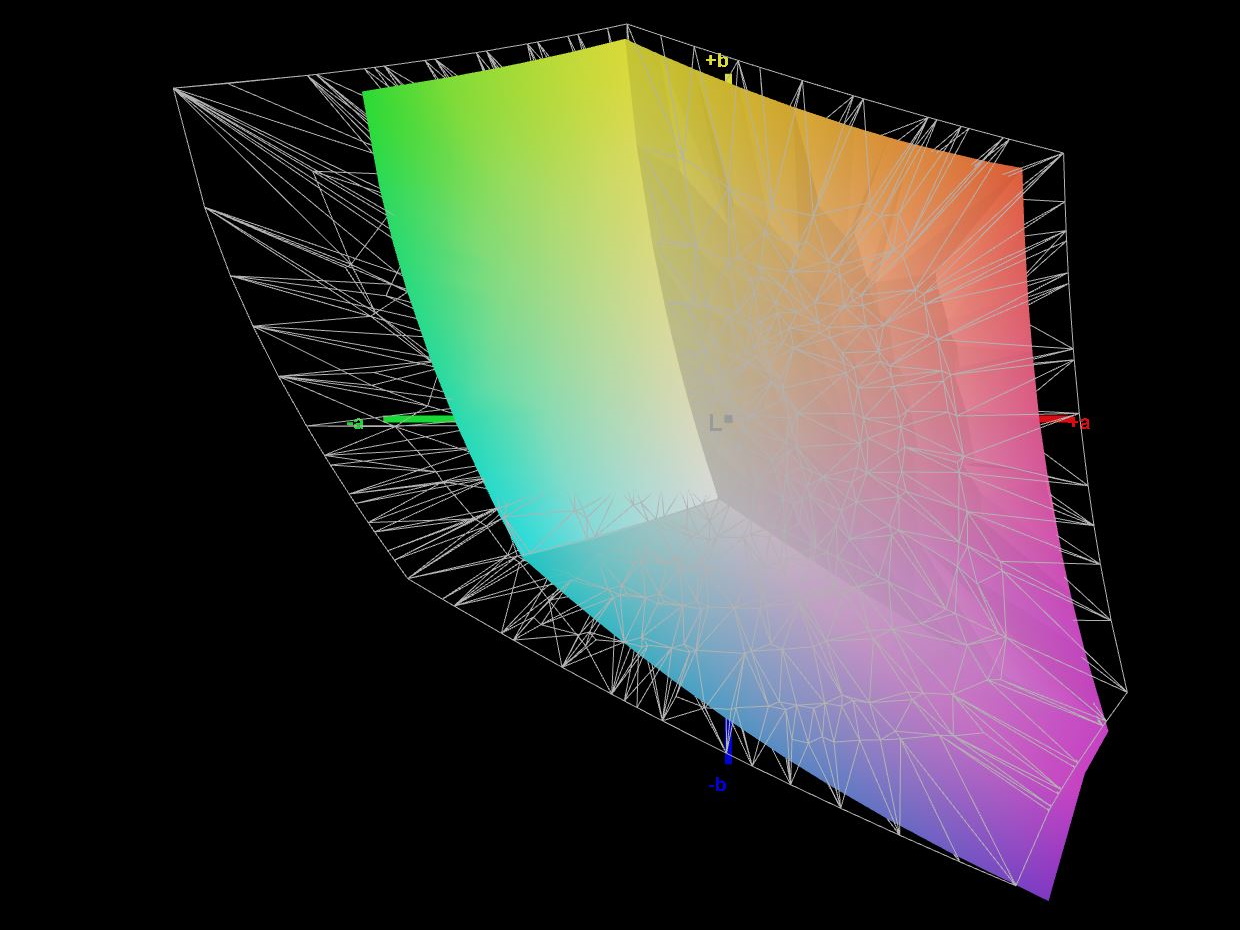
Según nuestras mediciones, el azul tenía el Delta E más alto de todos los colores. Pero aún así, sólo un par de ojos bien entrenados pueden percibir este Delta E máximo. La diferencia de color global es tan baja que ni siquiera los monitores profesionales obtendrían resultados mucho mejores. Como era de esperar, nuestra calibración no produjo ninguna mejora significativa.


Tiempos de respuesta del display
| ↔ Tiempo de respuesta de Negro a Blanco | ||
|---|---|---|
| 5.2 ms ... subida ↗ y bajada ↘ combinada | ↗ 1.8 ms subida | 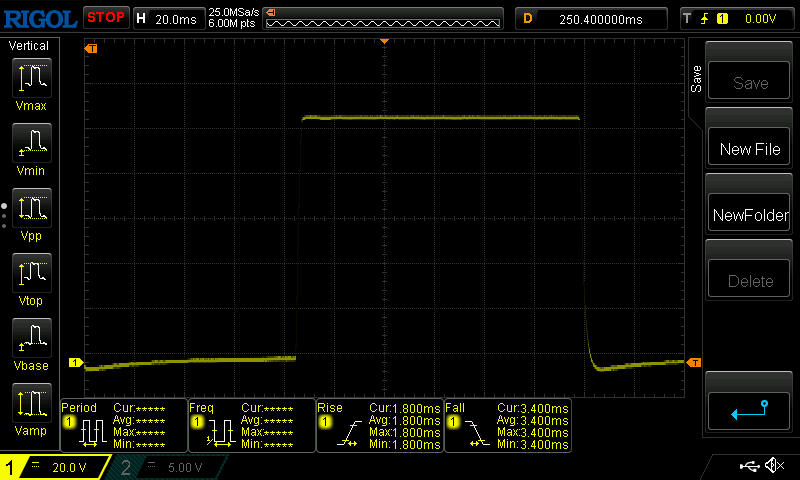 |
| ↘ 3.4 ms bajada | ||
| La pantalla mostró tiempos de respuesta muy rápidos en nuestros tests y debería ser adecuada para juegos frenéticos. En comparación, todos los dispositivos de prueba van de ##min### (mínimo) a 240 (máximo) ms. » 18 % de todos los dispositivos son mejores. Esto quiere decir que el tiempo de respuesta medido es mejor que la media (19.8 ms) de todos los dispositivos testados. | ||
| ↔ Tiempo de respuesta 50% Gris a 80% Gris | ||
| 12 ms ... subida ↗ y bajada ↘ combinada | ↗ 5.4 ms subida | 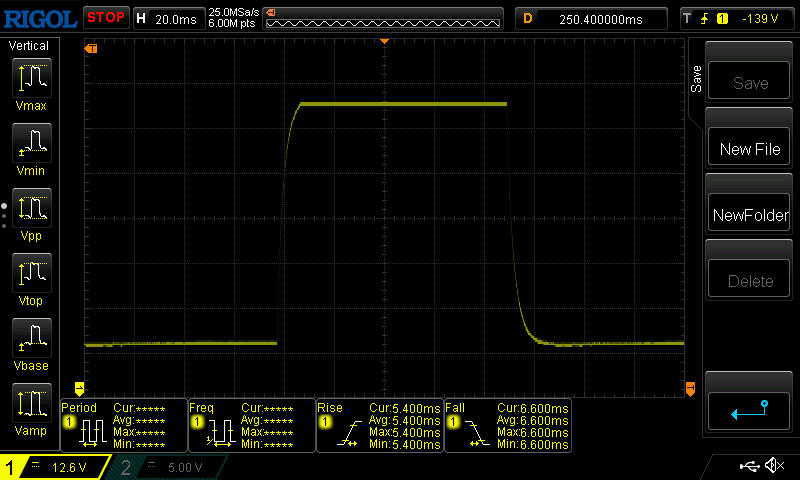 |
| ↘ 6.6 ms bajada | ||
| La pantalla mostró buenos tiempos de respuesta en nuestros tests pero podría ser demasiado lenta para los jugones competitivos. En comparación, todos los dispositivos de prueba van de ##min### (mínimo) a 636 (máximo) ms. » 25 % de todos los dispositivos son mejores. Esto quiere decir que el tiempo de respuesta medido es mejor que la media (31 ms) de todos los dispositivos testados. | ||
Parpadeo de Pantalla / PWM (Pulse-Width Modulation)
| Parpadeo de Pantalla / PWM no detectado | 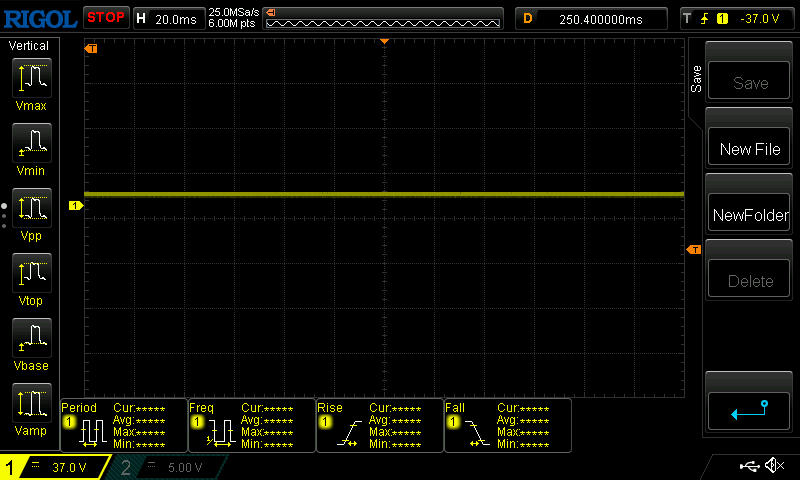 | ||
Comparación: 52 % de todos los dispositivos testados no usaron PWM para atenuar el display. Si se usó, medimos una media de 7757 (mínimo: 5 - máxmo: 343500) Hz. | |||
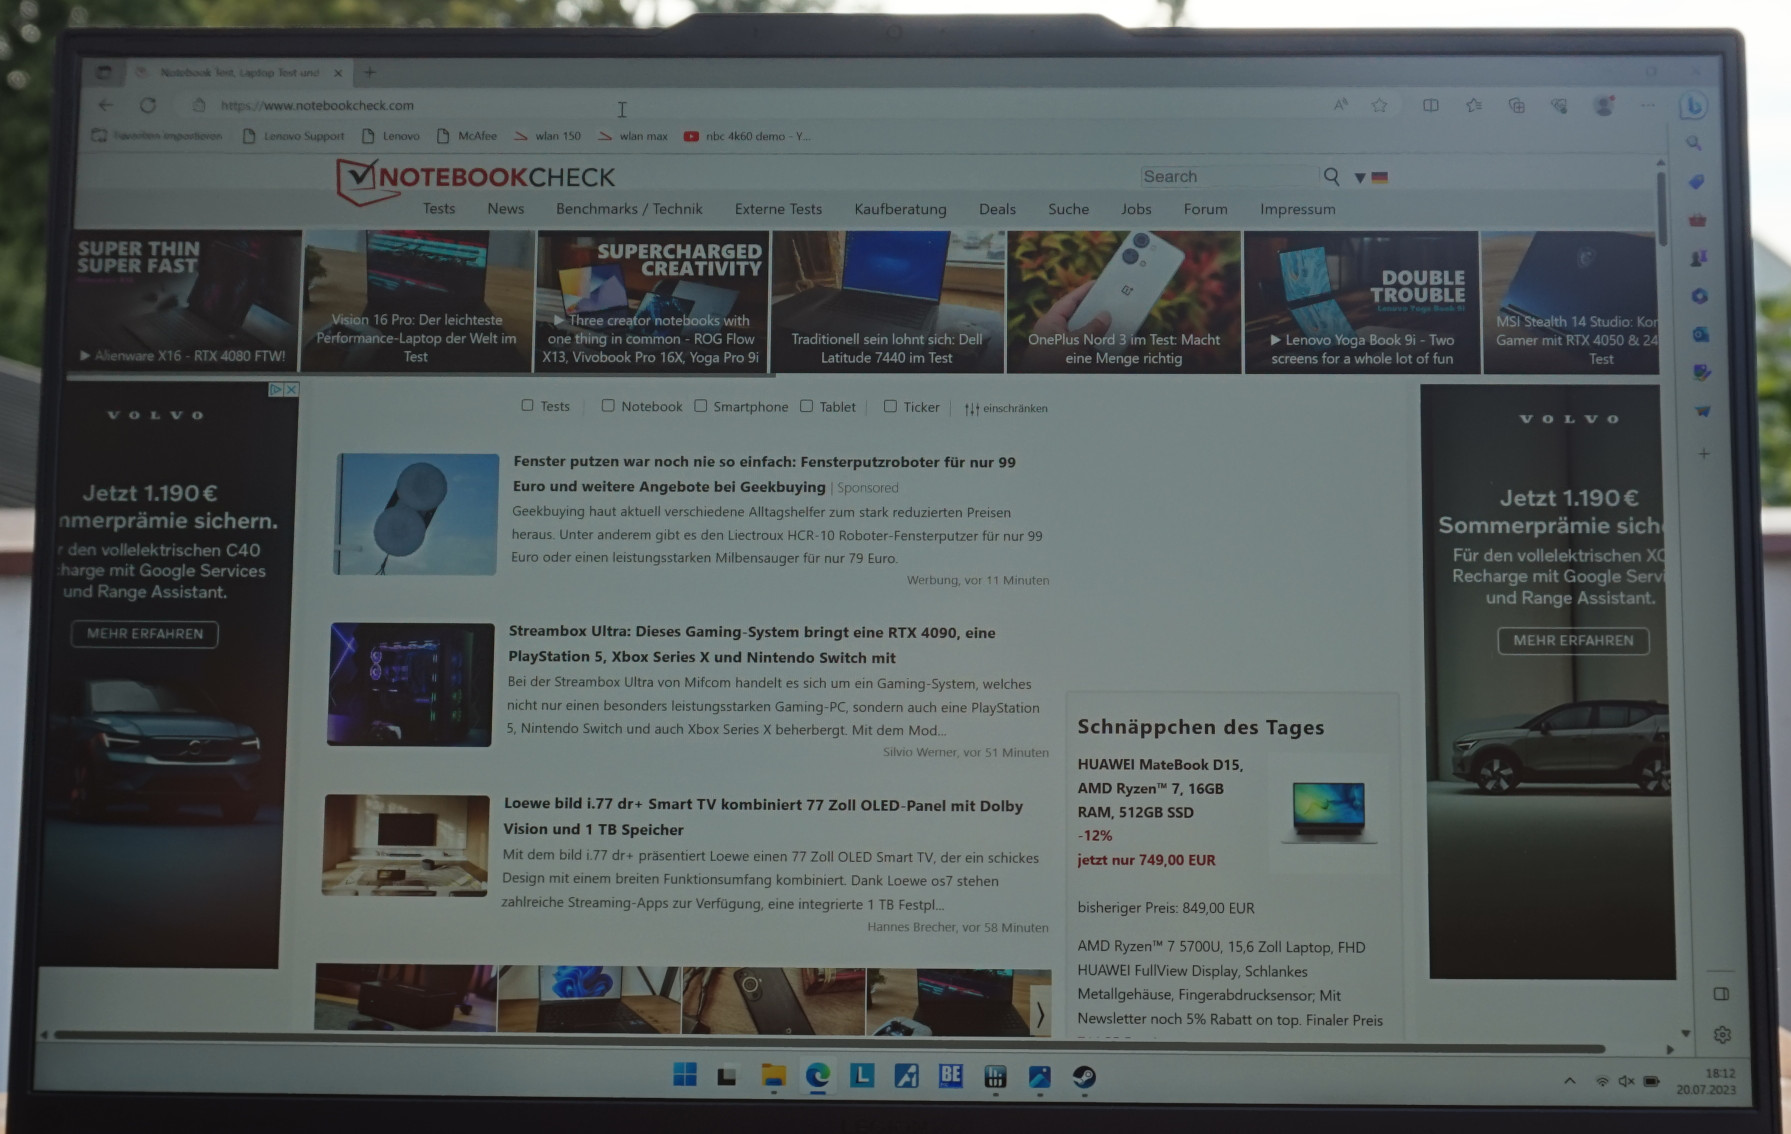
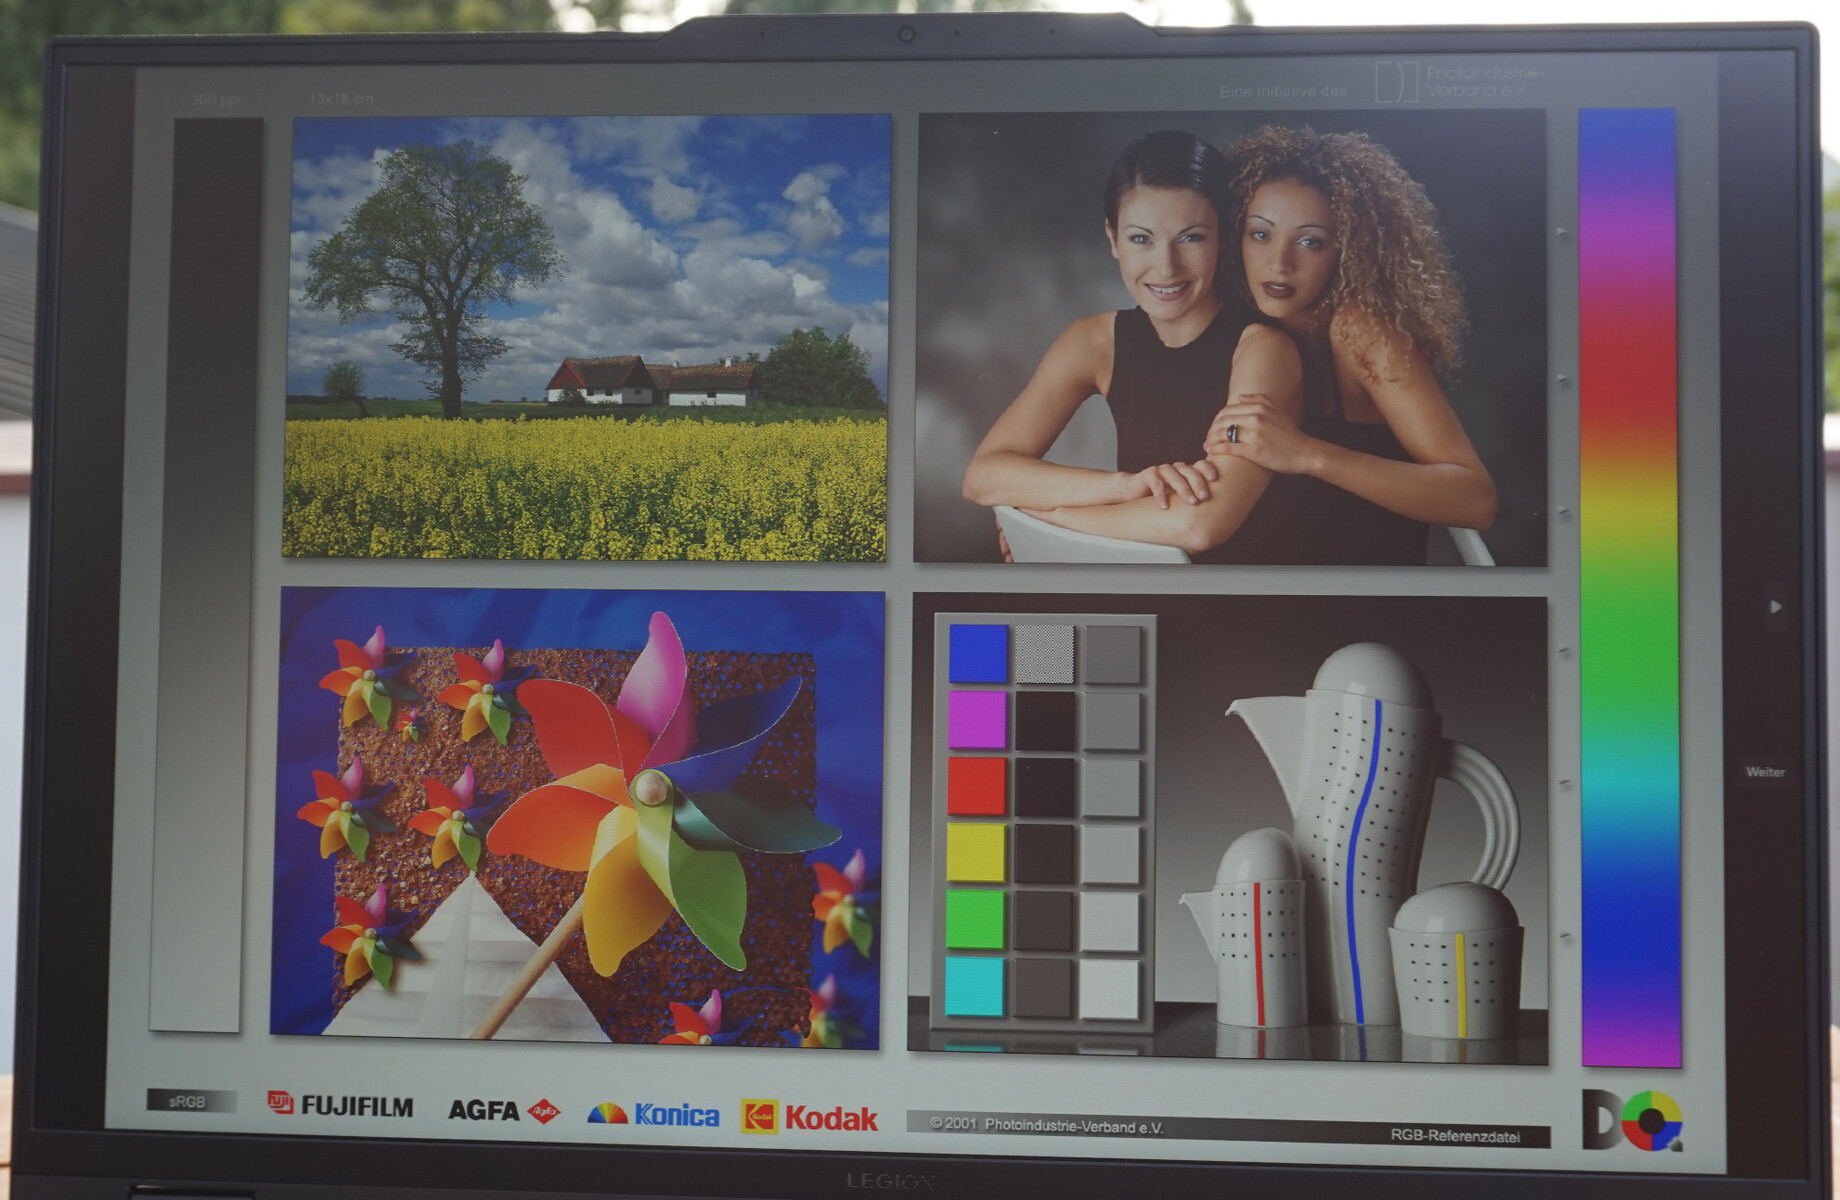
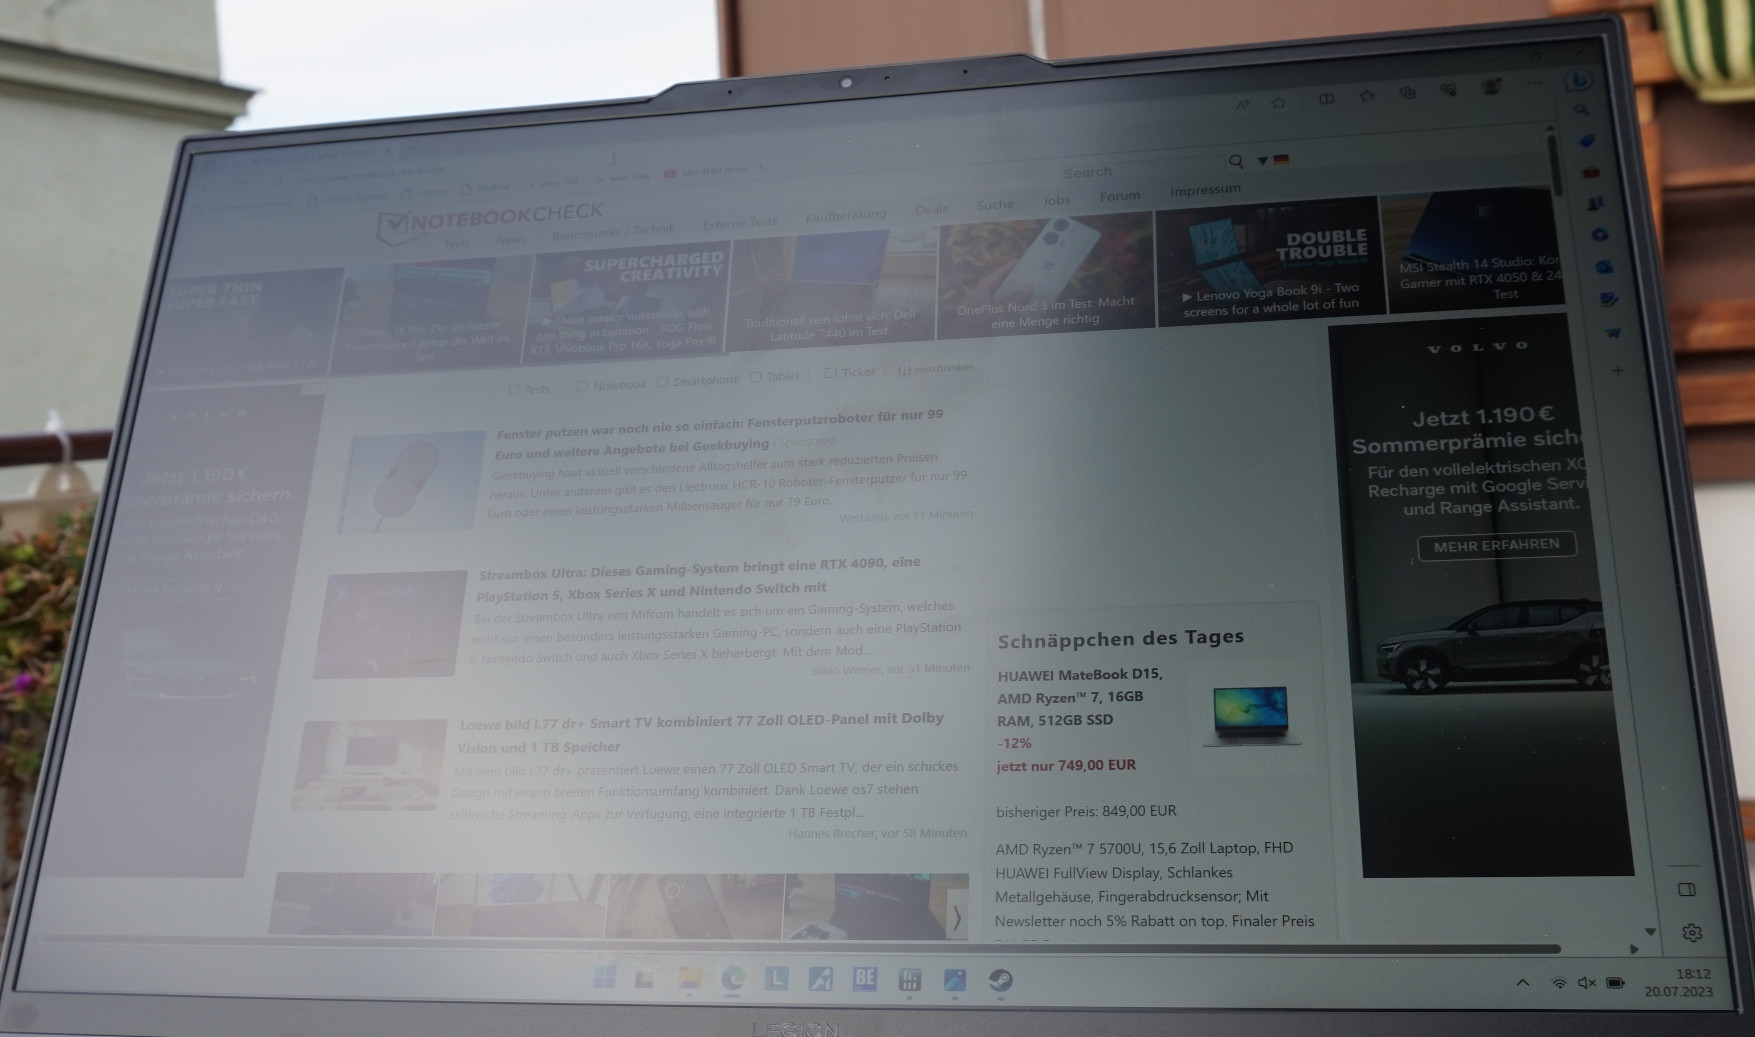
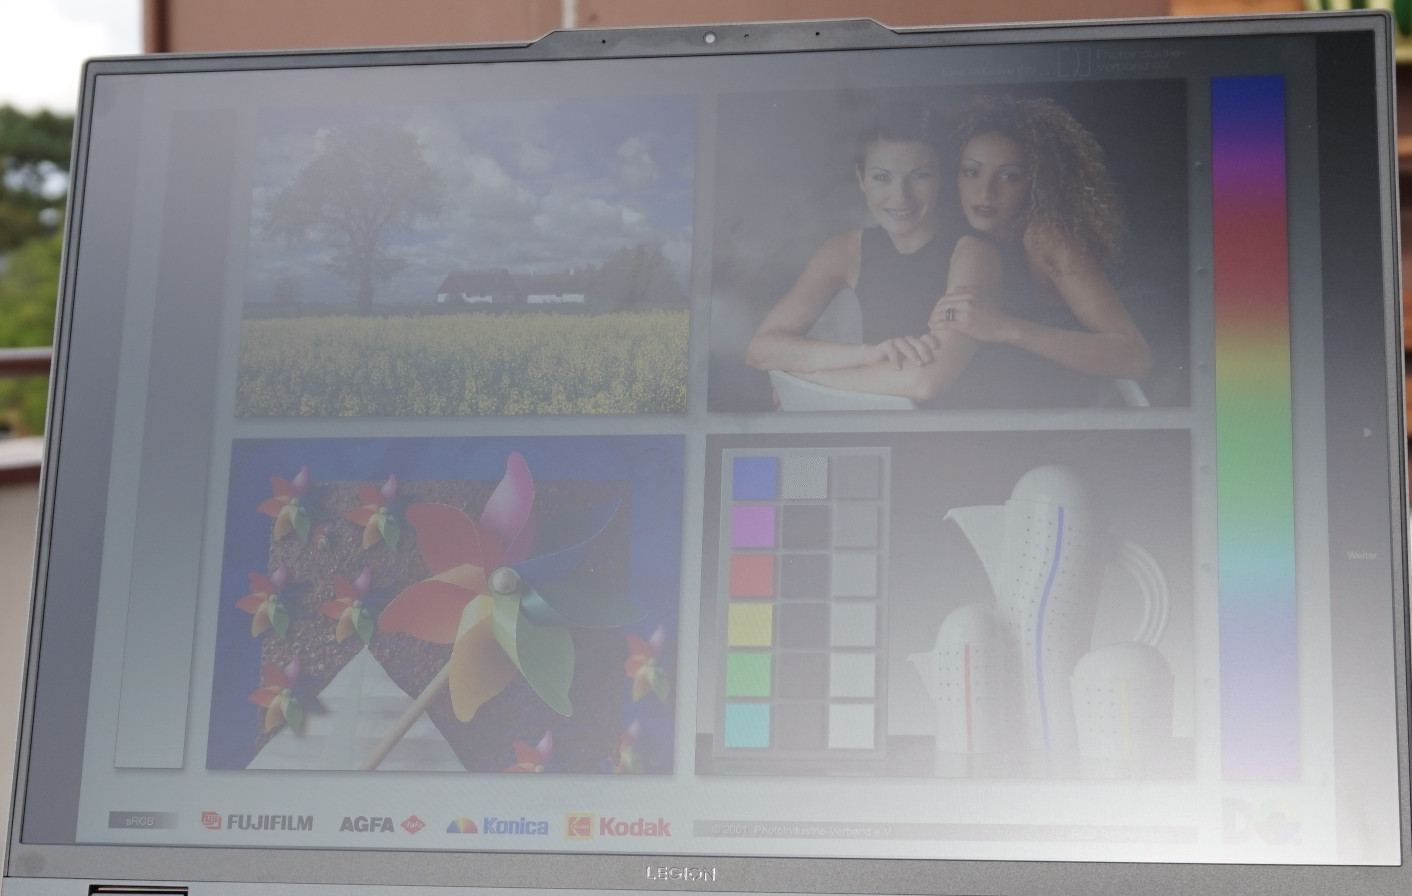
Gracias a la superficie mate de la pantalla y a su alto brillo, los colores y el texto son fácilmente legibles en exteriores, incluso a plena luz del día. Pero los colores se resienten con la luz solar directa. Aparte de eso, no hay nada que te impida usar el portátil en un balcón o un jardín.
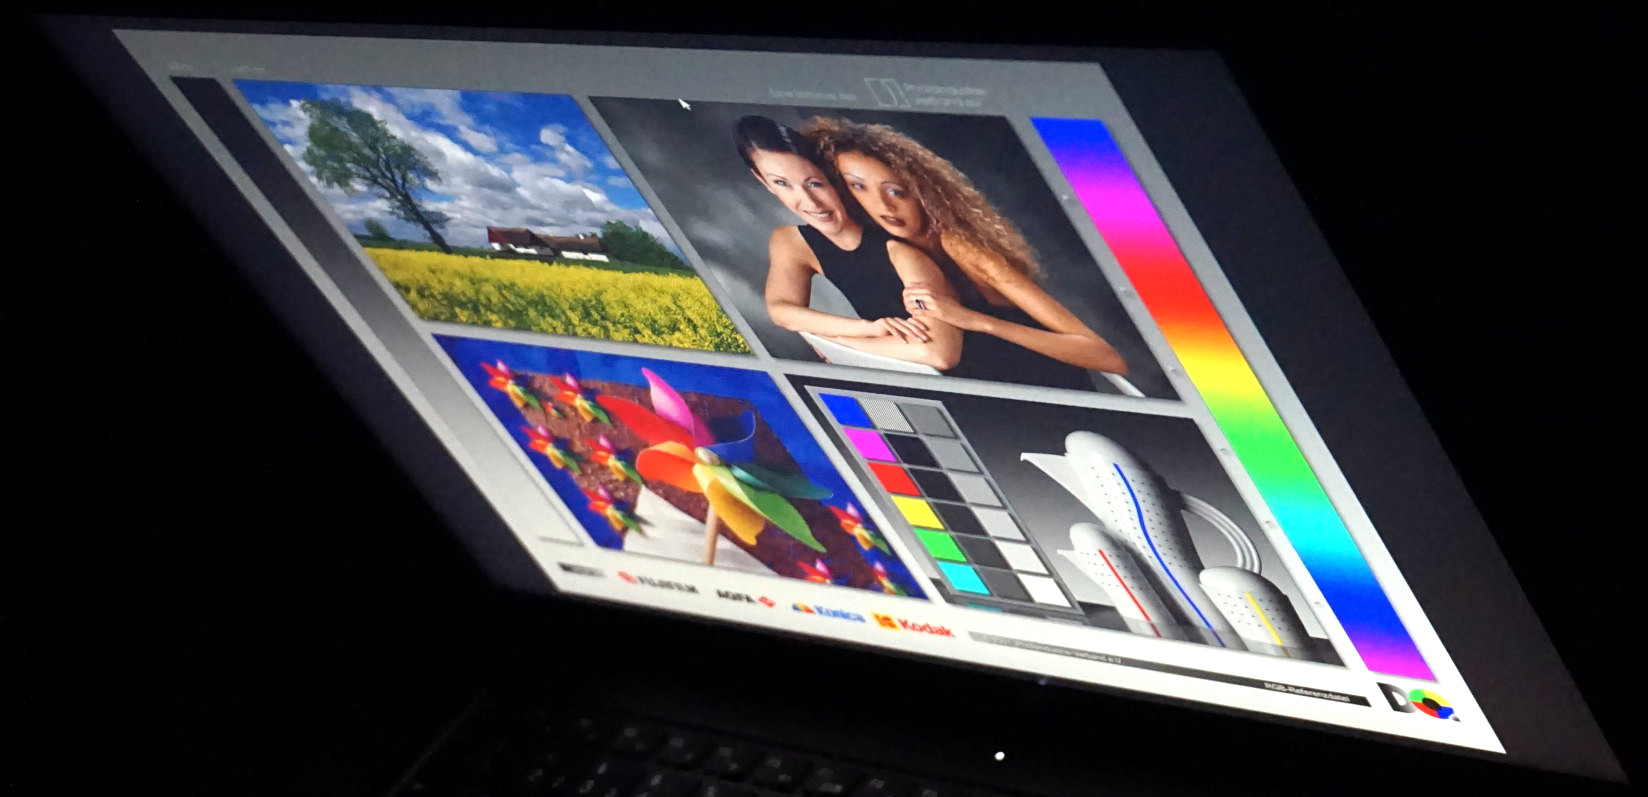
El panel IPS no muestra ningún cambio de color o brillo incluso cuando se mira desde un ángulo muy agudo.
Rendimiento - Muy personalizable Legion
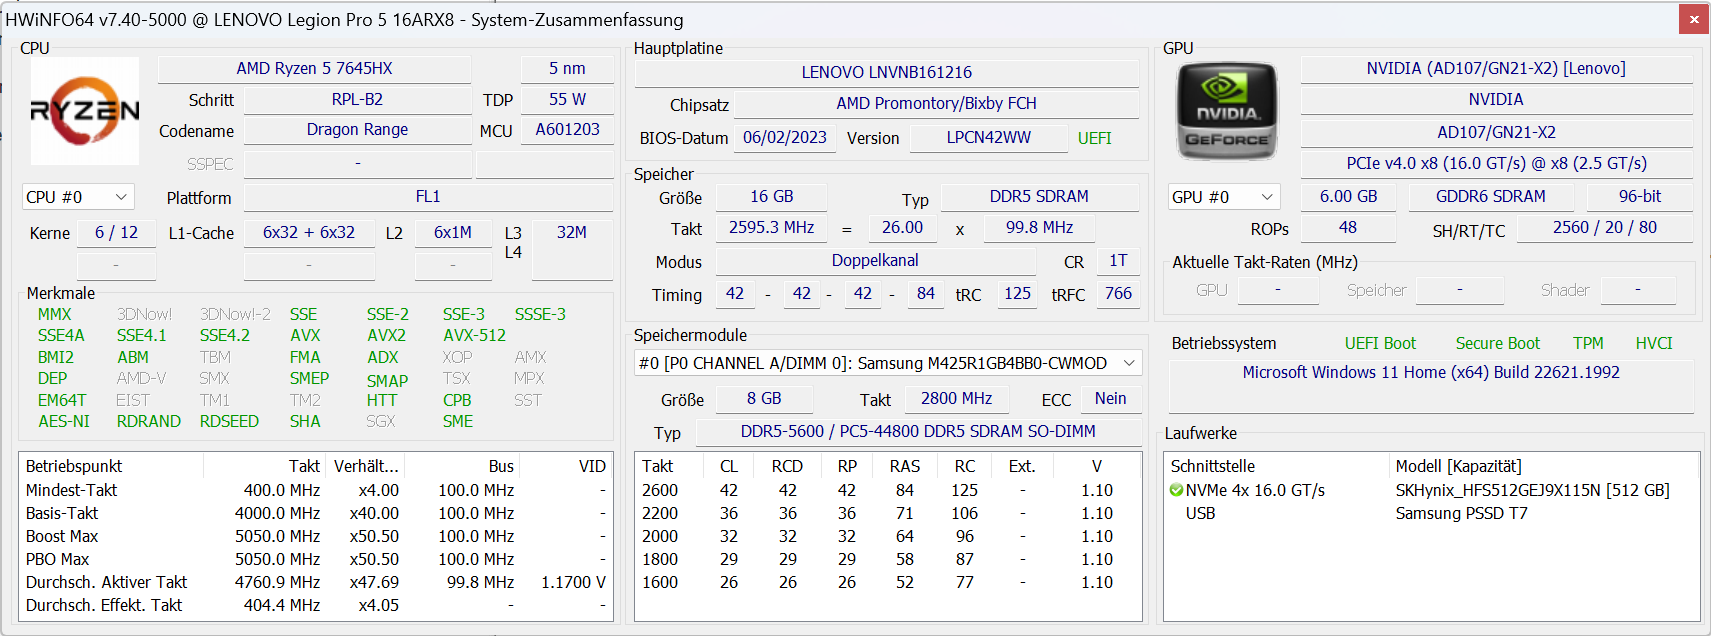
La configuración es la típica de un portátil básico. Equipado con unAMD Ryzen 5 7645HXuna RTX 4050 y 16 GB de RAM, el Legion Pro 5 no es necesariamente capaz de ejecutar juegos modernos con los ajustes al máximo. Pero bajando algunos ajustes de calidad e, idealmente, bajando la resolución a Full HD, casi siempre puedes obtener 100 FPS o más del portátil.
Condiciones de la prueba
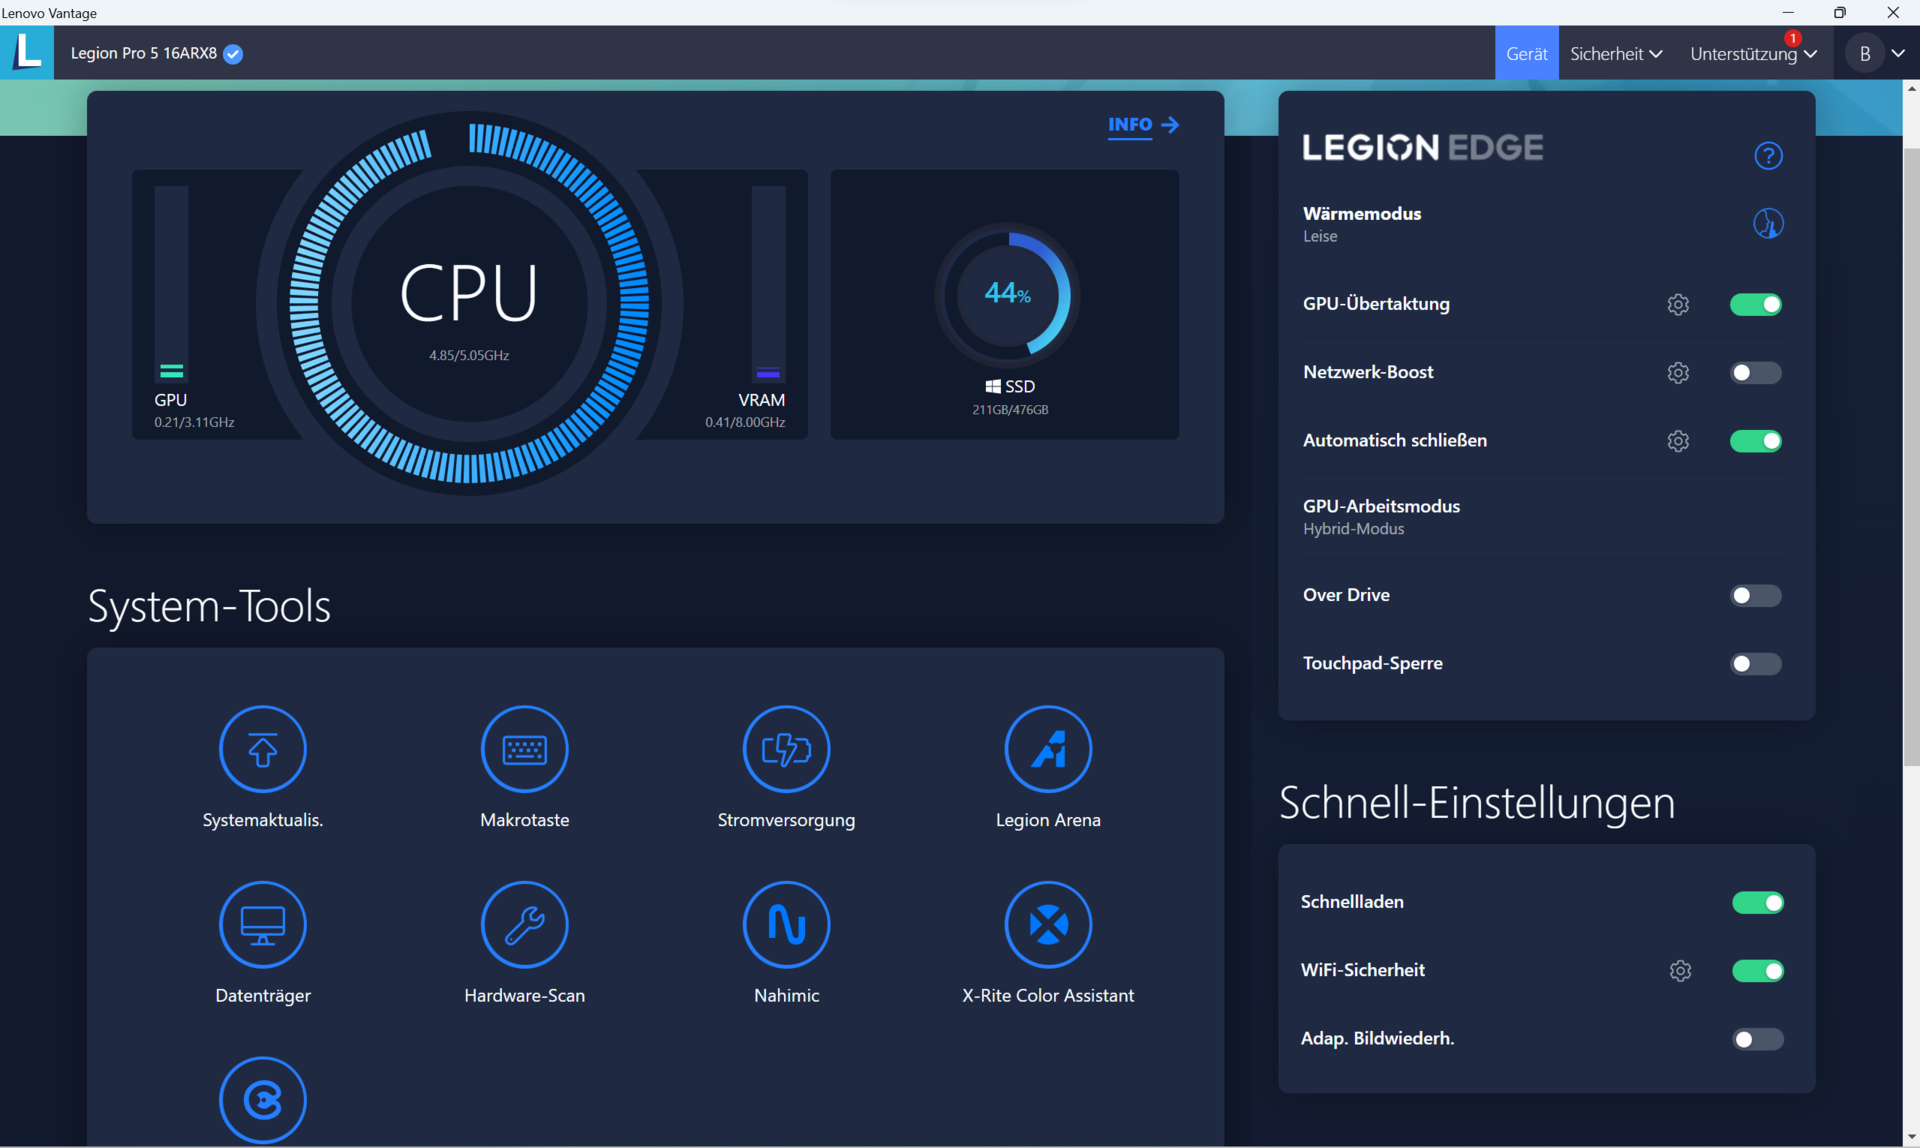
Puedes alternar entre tres modos de rendimiento usando la combinación de teclas Fn+Q que suele encontrarse en los portátiles Lenovo. Usamos el modo "Rendimiento" para nuestras pruebas comparativas y de juegos. También está el modo "Silencioso", que suele reducir los resultados de las pruebas en un 20%, pero también reduce a más de la mitad el ruido del ventilador. El último preajuste es un modo "Equilibrado" inteligente que ajusta automáticamente la configuración según sea necesario. Durante nuestras pruebas, este modo nunca igualó los ajustes del modo "Rendimiento".
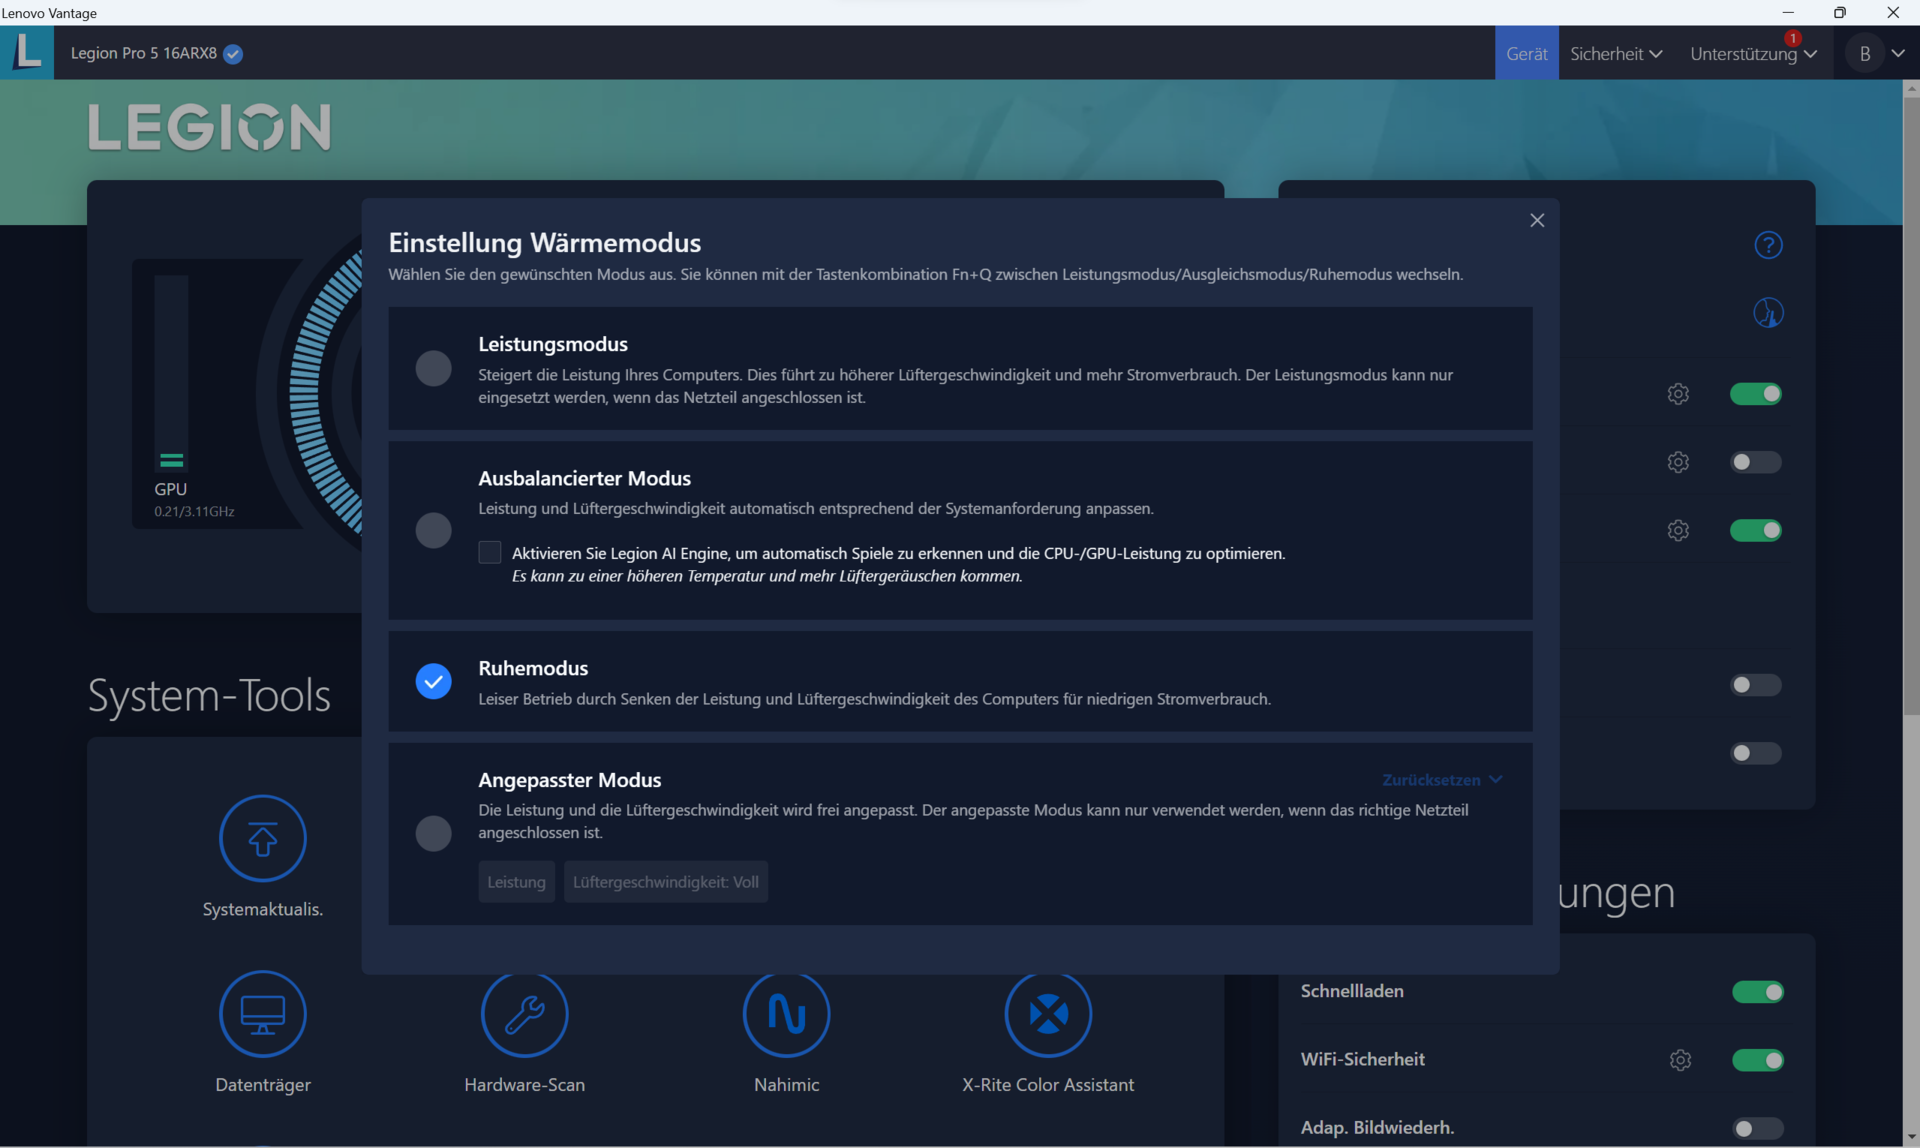
Sin embargo, estos tres modos sólo representan una fracción de las opciones disponibles. Lenovo Vantage permite ajustar manualmente todo tipo de parámetros de la CPU y la GPU junto con un perfil de ventilador personalizado. Por ejemplo, puedes definir manualmente los límites de potencia a corto y largo plazo del procesador, la alimentación máxima de la tarjeta gráfica, el boost dinámico e incluso los límites máximos de temperatura.
Entre la refrigeración pasiva y la asignación personalizada de energía a la GPU y la CPU, hay innumerables opciones que te permiten personalizar el portátil para juegos según tus necesidades. Lo único que tienes que hacer es aceptar la advertencia de Lenovo de que hacerlo puede causar daños a tu dispositivo. Además, no todos los ajustes harán que todas las aplicaciones funcionen de forma estable. Dicho esto, es muy factible obtener buenos resultados si sabes a grandes rasgos lo que hace cada ajuste y ajustas los ventiladores en consecuencia.
| Perfil de potencia | Consumo de CPU (medido) | Consumo de GPU (medido) | Ruido máx. del ventilador |
|---|---|---|---|
| Silencioso | 75/65 vatios | 50 vatios | 33 dB(A) |
| Rendimiento | 90/90 vatios | 55 vatios | 39 dB(A) |
| Batería | 54/45 vatios | 50 vatios | 36 dB(A) |
| Máximo | 145/145 vatios | 140 vatios | 50 dB(A) |
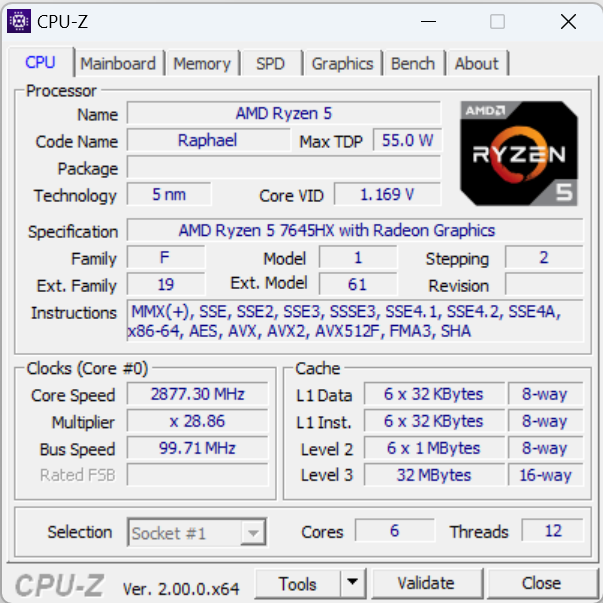
Procesador
Manteniéndose fiel a la línea, la 7ª generación AMD Ryzen 5 7645HX sigue centrándose en características optimizadas para juegos. Contiene seis núcleos y doce subprocesos y presume de unos generosos 32 MB de caché L3. Los núcleos tienen una velocidad de reloj máxima decente de 5,0 GHz.
Por tanto, el procesador no está tan lejos de los de gama altaIntel Core i7-13700H que se encuentra en el Medion Erazer Scout E20. Aunque el Ryzen no puede seguir el ritmo en tareas multinúcleo, brilla y compensa esta carencia en las pruebas mononúcleo. En los distintos benchmarks, su puntuación global se alinea perfectamente con la puntuación media obtenida en todos los portátiles para juegos que hemos probado en los últimos dos años.
Como el procesador no recibe la máxima potencia posible y el sistema de refrigeración es de tamaño suficiente, la puntuación de Cinebench R15 del portátil se mantuvo casi perfectamente constante a lo largo de las 25 ejecuciones. En comparación, el i7-13700H obtuvo una puntuación inferior a la del Ryzen 5 al final de la prueba en bucle. Incluso en modo silencioso (línea rosa), el Legion Pro 5 logró superar al Scout E20 durante un periodo prolongado.
El rendimiento también es soberbio cuando el Legion funciona con batería. Entre otras cosas, la puntuación multinúcleo de Cinebench R23 disminuyó de 14.000 a 12.700, lo que supone menos de un 10% de caída.
Para más información y resultados, puedes consultar nuestra lista de pruebas de CPU en https://www.notebookcheck.net/Mobile-Processors-Benchmark-List.2436.0.html.
Cinebench R15 Multi Sustained load
Cinebench R23: Multi Core | Single Core
Cinebench R20: CPU (Multi Core) | CPU (Single Core)
Cinebench R15: CPU Multi 64Bit | CPU Single 64Bit
Blender: v2.79 BMW27 CPU
7-Zip 18.03: 7z b 4 | 7z b 4 -mmt1
Geekbench 5.5: Multi-Core | Single-Core
HWBOT x265 Benchmark v2.2: 4k Preset
LibreOffice : 20 Documents To PDF
R Benchmark 2.5: Overall mean
| CPU Performance rating | |
| Media de la clase Gaming | |
| Lenovo Legion Pro 5 16IRX8 | |
| Medion Erazer Scout E20 | |
| Lenovo Legion Pro 5 16ARX8 (R5 7645HX, RTX 4050) | |
| Medio AMD Ryzen 5 7645HX | |
| Asus TUF A15 FA507 | |
| Asus TUF Gaming A16 FA617 | |
| Acer Nitro 5 AN517-55-5552 | |
| Cinebench R23 / Multi Core | |
| Media de la clase Gaming (10488 - 42661, n=107, últimos 2 años) | |
| Lenovo Legion Pro 5 16IRX8 | |
| Medion Erazer Scout E20 | |
| Acer Nitro 5 AN517-55-5552 | |
| Asus TUF Gaming A16 FA617 | |
| Lenovo Legion Pro 5 16ARX8 (R5 7645HX, RTX 4050) | |
| Medio AMD Ryzen 5 7645HX (n=1) | |
| Asus TUF A15 FA507 | |
| Cinebench R23 / Single Core | |
| Media de la clase Gaming (1166 - 2415, n=107, últimos 2 años) | |
| Medion Erazer Scout E20 | |
| Lenovo Legion Pro 5 16ARX8 (R5 7645HX, RTX 4050) | |
| Medio AMD Ryzen 5 7645HX (n=1) | |
| Lenovo Legion Pro 5 16IRX8 | |
| Acer Nitro 5 AN517-55-5552 | |
| Asus TUF Gaming A16 FA617 | |
| Asus TUF A15 FA507 | |
| Cinebench R20 / CPU (Multi Core) | |
| Media de la clase Gaming (4029 - 16433, n=106, últimos 2 años) | |
| Lenovo Legion Pro 5 16IRX8 | |
| Medion Erazer Scout E20 | |
| Lenovo Legion Pro 5 16ARX8 (R5 7645HX, RTX 4050) | |
| Medio AMD Ryzen 5 7645HX (n=1) | |
| Asus TUF Gaming A16 FA617 | |
| Asus TUF A15 FA507 | |
| Acer Nitro 5 AN517-55-5552 | |
| Cinebench R20 / CPU (Single Core) | |
| Media de la clase Gaming (442 - 913, n=106, últimos 2 años) | |
| Medion Erazer Scout E20 | |
| Lenovo Legion Pro 5 16ARX8 (R5 7645HX, RTX 4050) | |
| Medio AMD Ryzen 5 7645HX (n=1) | |
| Lenovo Legion Pro 5 16IRX8 | |
| Acer Nitro 5 AN517-55-5552 | |
| Asus TUF Gaming A16 FA617 | |
| Asus TUF A15 FA507 | |
| Cinebench R15 / CPU Multi 64Bit | |
| Media de la clase Gaming (1578 - 6330, n=105, últimos 2 años) | |
| Lenovo Legion Pro 5 16IRX8 | |
| Medion Erazer Scout E20 | |
| Asus TUF Gaming A16 FA617 | |
| Lenovo Legion Pro 5 16ARX8 (R5 7645HX, RTX 4050) | |
| Asus TUF A15 FA507 | |
| Medio AMD Ryzen 5 7645HX (2148 - 2276, n=3) | |
| Acer Nitro 5 AN517-55-5552 | |
| Cinebench R15 / CPU Single 64Bit | |
| Media de la clase Gaming (188.8 - 350, n=106, últimos 2 años) | |
| Lenovo Legion Pro 5 16ARX8 (R5 7645HX, RTX 4050) | |
| Medio AMD Ryzen 5 7645HX (281 - 289, n=3) | |
| Medion Erazer Scout E20 | |
| Lenovo Legion Pro 5 16IRX8 | |
| Asus TUF A15 FA507 | |
| Asus TUF Gaming A16 FA617 | |
| Acer Nitro 5 AN517-55-5552 | |
| Blender / v2.79 BMW27 CPU | |
| Acer Nitro 5 AN517-55-5552 | |
| Asus TUF Gaming A16 FA617 | |
| Lenovo Legion Pro 5 16ARX8 (R5 7645HX, RTX 4050) | |
| Medio AMD Ryzen 5 7645HX (n=1) | |
| Asus TUF A15 FA507 | |
| Medion Erazer Scout E20 | |
| Lenovo Legion Pro 5 16IRX8 | |
| Media de la clase Gaming (79 - 330, n=104, últimos 2 años) | |
| 7-Zip 18.03 / 7z b 4 | |
| Media de la clase Gaming (33491 - 148086, n=105, últimos 2 años) | |
| Lenovo Legion Pro 5 16IRX8 | |
| Medion Erazer Scout E20 | |
| Asus TUF Gaming A16 FA617 | |
| Asus TUF A15 FA507 | |
| Lenovo Legion Pro 5 16ARX8 (R5 7645HX, RTX 4050) | |
| Medio AMD Ryzen 5 7645HX (n=1) | |
| Acer Nitro 5 AN517-55-5552 | |
| 7-Zip 18.03 / 7z b 4 -mmt1 | |
| Lenovo Legion Pro 5 16ARX8 (R5 7645HX, RTX 4050) | |
| Medio AMD Ryzen 5 7645HX (n=1) | |
| Media de la clase Gaming (4199 - 7436, n=105, últimos 2 años) | |
| Medion Erazer Scout E20 | |
| Asus TUF A15 FA507 | |
| Asus TUF Gaming A16 FA617 | |
| Lenovo Legion Pro 5 16IRX8 | |
| Acer Nitro 5 AN517-55-5552 | |
| Geekbench 5.5 / Multi-Core | |
| Media de la clase Gaming (6460 - 28263, n=105, últimos 2 años) | |
| Lenovo Legion Pro 5 16IRX8 | |
| Medion Erazer Scout E20 | |
| Lenovo Legion Pro 5 16ARX8 (R5 7645HX, RTX 4050) | |
| Medio AMD Ryzen 5 7645HX (n=1) | |
| Acer Nitro 5 AN517-55-5552 | |
| Asus TUF Gaming A16 FA617 | |
| Asus TUF A15 FA507 | |
| Geekbench 5.5 / Single-Core | |
| Media de la clase Gaming (986 - 2474, n=105, últimos 2 años) | |
| Lenovo Legion Pro 5 16ARX8 (R5 7645HX, RTX 4050) | |
| Medio AMD Ryzen 5 7645HX (n=1) | |
| Medion Erazer Scout E20 | |
| Lenovo Legion Pro 5 16IRX8 | |
| Asus TUF Gaming A16 FA617 | |
| Acer Nitro 5 AN517-55-5552 | |
| Asus TUF A15 FA507 | |
| HWBOT x265 Benchmark v2.2 / 4k Preset | |
| Media de la clase Gaming (11.5 - 44.4, n=105, últimos 2 años) | |
| Lenovo Legion Pro 5 16IRX8 | |
| Lenovo Legion Pro 5 16ARX8 (R5 7645HX, RTX 4050) | |
| Medio AMD Ryzen 5 7645HX (n=1) | |
| Asus TUF Gaming A16 FA617 | |
| Asus TUF A15 FA507 | |
| Medion Erazer Scout E20 | |
| Acer Nitro 5 AN517-55-5552 | |
| LibreOffice / 20 Documents To PDF | |
| Asus TUF Gaming A16 FA617 | |
| Lenovo Legion Pro 5 16ARX8 (R5 7645HX, RTX 4050) | |
| Medio AMD Ryzen 5 7645HX (n=1) | |
| Acer Nitro 5 AN517-55-5552 | |
| Asus TUF A15 FA507 | |
| Media de la clase Gaming (33.2 - 88.8, n=105, últimos 2 años) | |
| Medion Erazer Scout E20 | |
| Lenovo Legion Pro 5 16IRX8 | |
| R Benchmark 2.5 / Overall mean | |
| Acer Nitro 5 AN517-55-5552 | |
| Asus TUF Gaming A16 FA617 | |
| Asus TUF A15 FA507 | |
| Lenovo Legion Pro 5 16IRX8 | |
| Medion Erazer Scout E20 | |
| Lenovo Legion Pro 5 16ARX8 (R5 7645HX, RTX 4050) | |
| Medio AMD Ryzen 5 7645HX (n=1) | |
| Media de la clase Gaming (0.3439 - 0.759, n=106, últimos 2 años) | |
* ... más pequeño es mejor
AIDA64: FP32 Ray-Trace | FPU Julia | CPU SHA3 | CPU Queen | FPU SinJulia | FPU Mandel | CPU AES | CPU ZLib | FP64 Ray-Trace | CPU PhotoWorxx
| Performance rating | |
| Media de la clase Gaming | |
| Lenovo Legion Pro 5 16IRX8 | |
| Lenovo Legion Pro 5 16ARX8 (R5 7645HX, RTX 4050) | |
| Medio AMD Ryzen 5 7645HX | |
| Asus TUF Gaming A16 FA617 | |
| Asus TUF A15 FA507 | |
| Medion Erazer Scout E20 | |
| Acer Nitro 5 AN517-55-5552 | |
| AIDA64 / FP32 Ray-Trace | |
| Media de la clase Gaming (10227 - 85542, n=105, últimos 2 años) | |
| Lenovo Legion Pro 5 16ARX8 (R5 7645HX, RTX 4050) | |
| Medio AMD Ryzen 5 7645HX (n=1) | |
| Lenovo Legion Pro 5 16IRX8 | |
| Asus TUF Gaming A16 FA617 | |
| Asus TUF A15 FA507 | |
| Medion Erazer Scout E20 | |
| Acer Nitro 5 AN517-55-5552 | |
| AIDA64 / FPU Julia | |
| Media de la clase Gaming (51376 - 238426, n=105, últimos 2 años) | |
| Lenovo Legion Pro 5 16IRX8 | |
| Asus TUF A15 FA507 | |
| Asus TUF Gaming A16 FA617 | |
| Lenovo Legion Pro 5 16ARX8 (R5 7645HX, RTX 4050) | |
| Medio AMD Ryzen 5 7645HX (n=1) | |
| Medion Erazer Scout E20 | |
| Acer Nitro 5 AN517-55-5552 | |
| AIDA64 / CPU SHA3 | |
| Media de la clase Gaming (2180 - 10115, n=105, últimos 2 años) | |
| Lenovo Legion Pro 5 16IRX8 | |
| Lenovo Legion Pro 5 16ARX8 (R5 7645HX, RTX 4050) | |
| Medio AMD Ryzen 5 7645HX (n=1) | |
| Asus TUF Gaming A16 FA617 | |
| Asus TUF A15 FA507 | |
| Medion Erazer Scout E20 | |
| Acer Nitro 5 AN517-55-5552 | |
| AIDA64 / CPU Queen | |
| Media de la clase Gaming (49785 - 173351, n=90, últimos 2 años) | |
| Lenovo Legion Pro 5 16IRX8 | |
| Medion Erazer Scout E20 | |
| Asus TUF Gaming A16 FA617 | |
| Asus TUF A15 FA507 | |
| Lenovo Legion Pro 5 16ARX8 (R5 7645HX, RTX 4050) | |
| Medio AMD Ryzen 5 7645HX (n=1) | |
| Acer Nitro 5 AN517-55-5552 | |
| AIDA64 / FPU SinJulia | |
| Media de la clase Gaming (4424 - 33636, n=105, últimos 2 años) | |
| Lenovo Legion Pro 5 16IRX8 | |
| Asus TUF Gaming A16 FA617 | |
| Asus TUF A15 FA507 | |
| Lenovo Legion Pro 5 16ARX8 (R5 7645HX, RTX 4050) | |
| Medio AMD Ryzen 5 7645HX (n=1) | |
| Medion Erazer Scout E20 | |
| Acer Nitro 5 AN517-55-5552 | |
| AIDA64 / FPU Mandel | |
| Media de la clase Gaming (25115 - 128721, n=105, últimos 2 años) | |
| Asus TUF A15 FA507 | |
| Asus TUF Gaming A16 FA617 | |
| Lenovo Legion Pro 5 16IRX8 | |
| Lenovo Legion Pro 5 16ARX8 (R5 7645HX, RTX 4050) | |
| Medio AMD Ryzen 5 7645HX (n=1) | |
| Medion Erazer Scout E20 | |
| Acer Nitro 5 AN517-55-5552 | |
| AIDA64 / CPU AES | |
| Media de la clase Gaming (39258 - 247074, n=105, últimos 2 años) | |
| Lenovo Legion Pro 5 16IRX8 | |
| Medion Erazer Scout E20 | |
| Asus TUF A15 FA507 | |
| Asus TUF Gaming A16 FA617 | |
| Acer Nitro 5 AN517-55-5552 | |
| Lenovo Legion Pro 5 16ARX8 (R5 7645HX, RTX 4050) | |
| Medio AMD Ryzen 5 7645HX (n=1) | |
| AIDA64 / CPU ZLib | |
| Media de la clase Gaming (574 - 2531, n=105, últimos 2 años) | |
| Lenovo Legion Pro 5 16IRX8 | |
| Medion Erazer Scout E20 | |
| Acer Nitro 5 AN517-55-5552 | |
| Asus TUF Gaming A16 FA617 | |
| Lenovo Legion Pro 5 16ARX8 (R5 7645HX, RTX 4050) | |
| Medio AMD Ryzen 5 7645HX (n=1) | |
| Asus TUF A15 FA507 | |
| AIDA64 / FP64 Ray-Trace | |
| Media de la clase Gaming (5509 - 45446, n=105, últimos 2 años) | |
| Lenovo Legion Pro 5 16ARX8 (R5 7645HX, RTX 4050) | |
| Medio AMD Ryzen 5 7645HX (n=1) | |
| Lenovo Legion Pro 5 16IRX8 | |
| Asus TUF Gaming A16 FA617 | |
| Asus TUF A15 FA507 | |
| Medion Erazer Scout E20 | |
| Acer Nitro 5 AN517-55-5552 | |
| AIDA64 / CPU PhotoWorxx | |
| Media de la clase Gaming (12271 - 89891, n=105, últimos 2 años) | |
| Medion Erazer Scout E20 | |
| Lenovo Legion Pro 5 16IRX8 | |
| Acer Nitro 5 AN517-55-5552 | |
| Lenovo Legion Pro 5 16ARX8 (R5 7645HX, RTX 4050) | |
| Medio AMD Ryzen 5 7645HX (n=1) | |
| Asus TUF A15 FA507 | |
| Asus TUF Gaming A16 FA617 | |
Rendimiento del sistema
El Legion Pro 5 16ARX8 tuvo una actuación fantástica en términos de rendimiento del sistema. En PCMark 10 y CrossMark, obtuvo una puntuación considerablemente superior a la de Legion con un procesador Intel Core, al tiempo que aventajaba a muchos portátiles de juego con especificaciones similares.
Lo notarás fácilmente cuando utilices el Legion Pro 5. La instalación, el inicio y la ejecución de programas son rápidos e inmediatos. En ningún momento el sistema mostró ningún tartamudeo perceptible. Por el contrario, siguió funcionando sin problemas incluso cuando muchos programas se ejecutaban al mismo tiempo.
CrossMark: Overall | Productivity | Creativity | Responsiveness
| PCMark 10 / Score | |
| Media de la clase Gaming (5828 - 12414, n=93, últimos 2 años) | |
| Lenovo Legion Pro 5 16ARX8 (R5 7645HX, RTX 4050) | |
| Medio AMD Ryzen 5 7645HX, NVIDIA GeForce RTX 4050 Laptop GPU (n=1) | |
| Lenovo Legion Pro 5 16IRX8 | |
| Medion Erazer Scout E20 | |
| Asus TUF Gaming A16 FA617 | |
| Asus TUF A15 FA507 | |
| Acer Nitro 5 AN517-55-5552 | |
| PCMark 10 / Essentials | |
| Lenovo Legion Pro 5 16ARX8 (R5 7645HX, RTX 4050) | |
| Medio AMD Ryzen 5 7645HX, NVIDIA GeForce RTX 4050 Laptop GPU (n=1) | |
| Medion Erazer Scout E20 | |
| Lenovo Legion Pro 5 16IRX8 | |
| Media de la clase Gaming (8810 - 11935, n=97, últimos 2 años) | |
| Asus TUF Gaming A16 FA617 | |
| Asus TUF A15 FA507 | |
| Acer Nitro 5 AN517-55-5552 | |
| PCMark 10 / Productivity | |
| Media de la clase Gaming (6845 - 25323, n=95, últimos 2 años) | |
| Lenovo Legion Pro 5 16ARX8 (R5 7645HX, RTX 4050) | |
| Medio AMD Ryzen 5 7645HX, NVIDIA GeForce RTX 4050 Laptop GPU (n=1) | |
| Medion Erazer Scout E20 | |
| Asus TUF Gaming A16 FA617 | |
| Asus TUF A15 FA507 | |
| Lenovo Legion Pro 5 16IRX8 | |
| Acer Nitro 5 AN517-55-5552 | |
| PCMark 10 / Digital Content Creation | |
| Media de la clase Gaming (7602 - 19954, n=95, últimos 2 años) | |
| Lenovo Legion Pro 5 16IRX8 | |
| Lenovo Legion Pro 5 16ARX8 (R5 7645HX, RTX 4050) | |
| Medio AMD Ryzen 5 7645HX, NVIDIA GeForce RTX 4050 Laptop GPU (n=1) | |
| Asus TUF Gaming A16 FA617 | |
| Medion Erazer Scout E20 | |
| Asus TUF A15 FA507 | |
| Acer Nitro 5 AN517-55-5552 | |
| CrossMark / Overall | |
| Media de la clase Gaming (1366 - 2409, n=94, últimos 2 años) | |
| Lenovo Legion Pro 5 16ARX8 (R5 7645HX, RTX 4050) | |
| Medio AMD Ryzen 5 7645HX, NVIDIA GeForce RTX 4050 Laptop GPU (n=1) | |
| Medion Erazer Scout E20 | |
| Acer Nitro 5 AN517-55-5552 | |
| Lenovo Legion Pro 5 16IRX8 | |
| Asus TUF A15 FA507 | |
| CrossMark / Productivity | |
| Lenovo Legion Pro 5 16ARX8 (R5 7645HX, RTX 4050) | |
| Medio AMD Ryzen 5 7645HX, NVIDIA GeForce RTX 4050 Laptop GPU (n=1) | |
| Medion Erazer Scout E20 | |
| Media de la clase Gaming (1386 - 2254, n=94, últimos 2 años) | |
| Acer Nitro 5 AN517-55-5552 | |
| Lenovo Legion Pro 5 16IRX8 | |
| Asus TUF A15 FA507 | |
| CrossMark / Creativity | |
| Media de la clase Gaming (1343 - 2786, n=94, últimos 2 años) | |
| Lenovo Legion Pro 5 16ARX8 (R5 7645HX, RTX 4050) | |
| Medio AMD Ryzen 5 7645HX, NVIDIA GeForce RTX 4050 Laptop GPU (n=1) | |
| Medion Erazer Scout E20 | |
| Acer Nitro 5 AN517-55-5552 | |
| Lenovo Legion Pro 5 16IRX8 | |
| Asus TUF A15 FA507 | |
| CrossMark / Responsiveness | |
| Medion Erazer Scout E20 | |
| Lenovo Legion Pro 5 16ARX8 (R5 7645HX, RTX 4050) | |
| Medio AMD Ryzen 5 7645HX, NVIDIA GeForce RTX 4050 Laptop GPU (n=1) | |
| Acer Nitro 5 AN517-55-5552 | |
| Media de la clase Gaming (1226 - 2334, n=94, últimos 2 años) | |
| Lenovo Legion Pro 5 16IRX8 | |
| Asus TUF A15 FA507 | |
| PCMark 10 Score | 8105 puntos | |
ayuda | ||
| AIDA64 / Memory Copy | |
| Media de la clase Gaming (21750 - 129946, n=105, últimos 2 años) | |
| Medion Erazer Scout E20 | |
| Lenovo Legion Pro 5 16IRX8 | |
| Asus TUF Gaming A16 FA617 | |
| Asus TUF A15 FA507 | |
| Lenovo Legion Pro 5 16ARX8 (R5 7645HX, RTX 4050) | |
| Medio AMD Ryzen 5 7645HX (n=1) | |
| Acer Nitro 5 AN517-55-5552 | |
| AIDA64 / Memory Read | |
| Media de la clase Gaming (22956 - 118858, n=105, últimos 2 años) | |
| Lenovo Legion Pro 5 16IRX8 | |
| Medion Erazer Scout E20 | |
| Acer Nitro 5 AN517-55-5552 | |
| Asus TUF Gaming A16 FA617 | |
| Lenovo Legion Pro 5 16ARX8 (R5 7645HX, RTX 4050) | |
| Medio AMD Ryzen 5 7645HX (n=1) | |
| Asus TUF A15 FA507 | |
| AIDA64 / Memory Write | |
| Media de la clase Gaming (22297 - 135096, n=105, últimos 2 años) | |
| Lenovo Legion Pro 5 16IRX8 | |
| Medion Erazer Scout E20 | |
| Asus TUF Gaming A16 FA617 | |
| Asus TUF A15 FA507 | |
| Lenovo Legion Pro 5 16ARX8 (R5 7645HX, RTX 4050) | |
| Medio AMD Ryzen 5 7645HX (n=1) | |
| Acer Nitro 5 AN517-55-5552 | |
| AIDA64 / Memory Latency | |
| Media de la clase Gaming (75.3 - 259, n=105, últimos 2 años) | |
| Acer Nitro 5 AN517-55-5552 | |
| Medion Erazer Scout E20 | |
| Asus TUF Gaming A16 FA617 | |
| Lenovo Legion Pro 5 16ARX8 (R5 7645HX, RTX 4050) | |
| Medio AMD Ryzen 5 7645HX (n=1) | |
| Asus TUF A15 FA507 | |
| Lenovo Legion Pro 5 16IRX8 | |
* ... más pequeño es mejor
Latencia del CPD
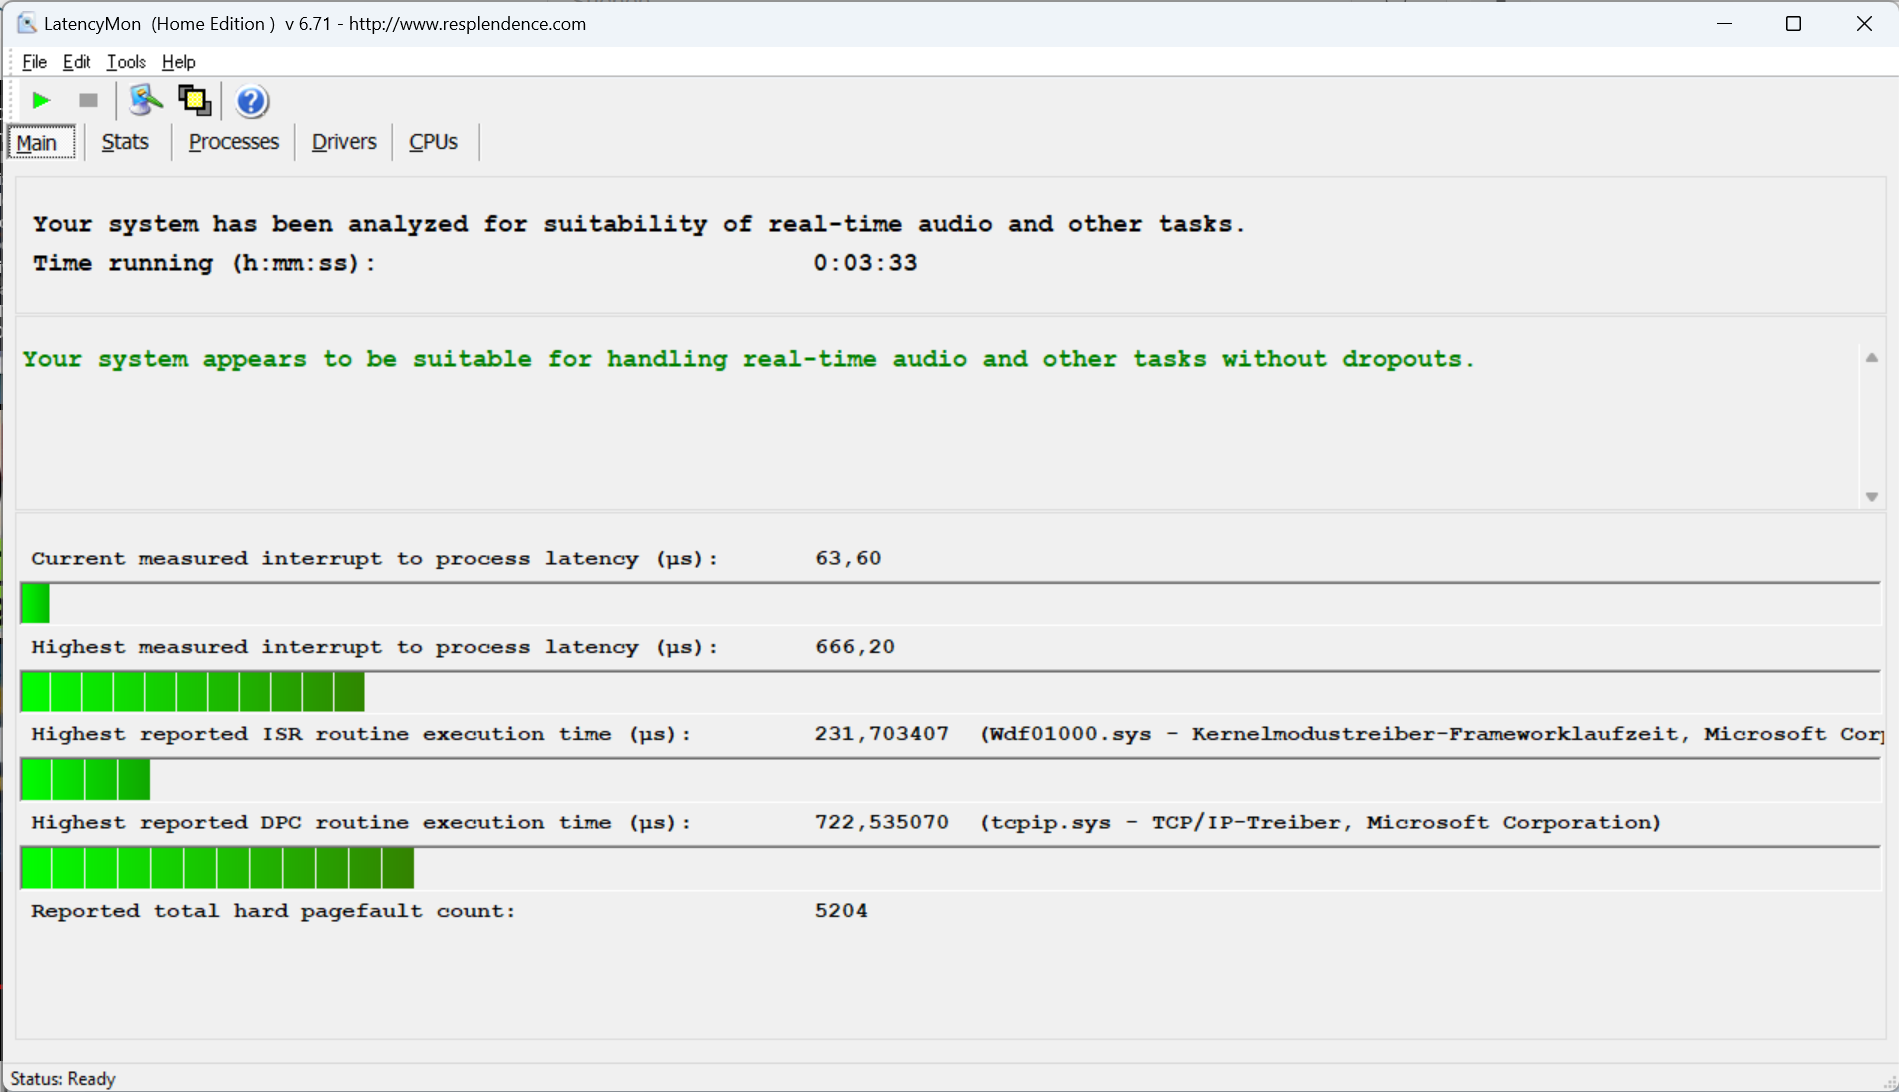
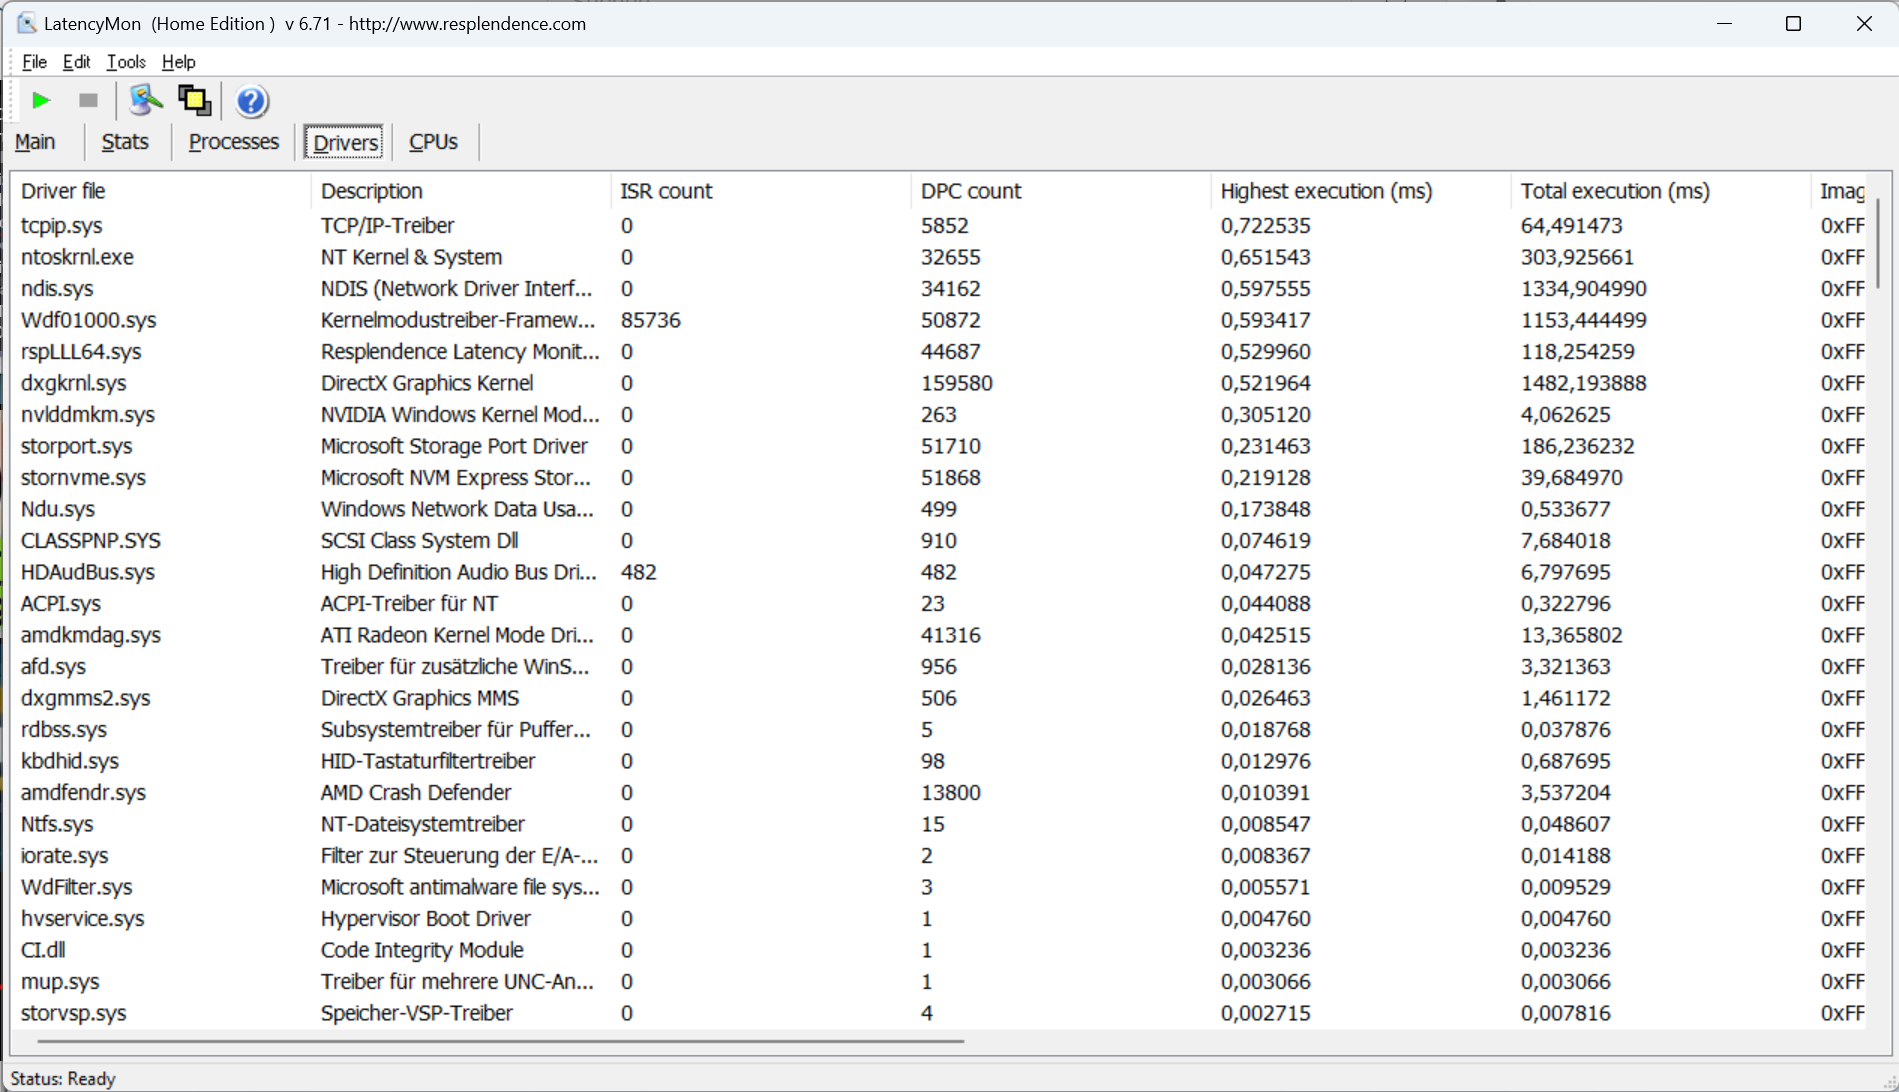
Nuestra impresión general positiva continúa con las latencias del dispositivo. A diferencia de la mayoría de portátiles, el Legion Pro 5 es capaz de manejar tareas de audio en tiempo real según LatencyMon. Aunque probablemente pocas personas tengan planes de realizar procesamiento de audio en tiempo real, esto demuestra que los controladores están bien configurados. Dicho esto, instalar cualquier actualización o software adicional puede cambiar los resultados significativamente.
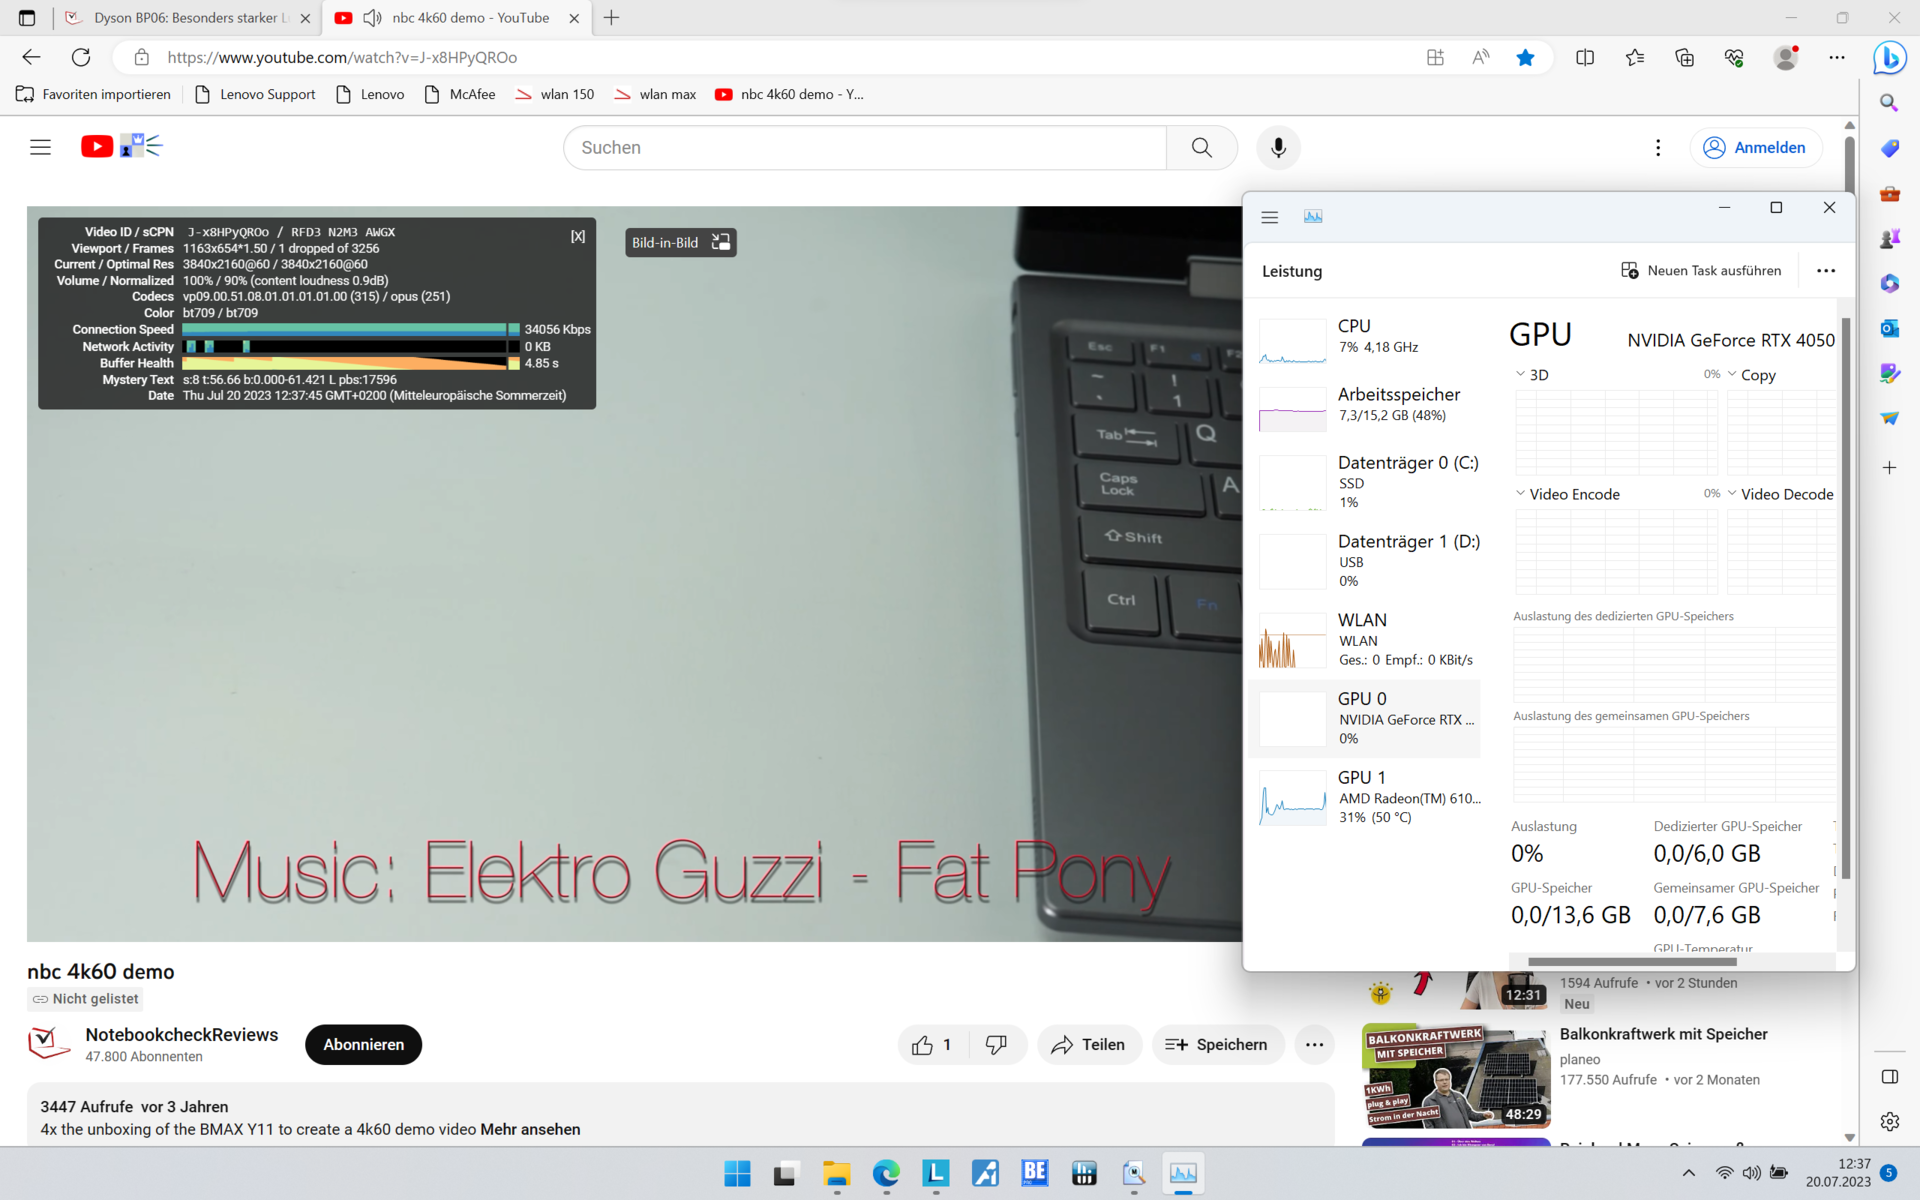
Aunque no es perfecto, las pocas caídas de frames durante el streaming de vídeo 4K son aceptables para un portátil de juegos. La iGPU (hasta el 30% de uso) tuvo, no obstante, mucho que hacer durante la prueba.
| DPC Latencies / LatencyMon - interrupt to process latency (max), Web, Youtube, Prime95 | |
| Medion Erazer Scout E20 | |
| Acer Nitro 5 AN517-55-5552 | |
| Lenovo Legion Pro 5 16IRX8 | |
| Lenovo Legion Pro 5 16ARX8 (R5 7645HX, RTX 4050) | |
| Asus TUF Gaming A16 FA617 | |
* ... más pequeño es mejor
Almacenamiento masivo
El SSD SK Hynix incluido ofreció velocidades de lectura y escritura por encima de la media. La unidad M.2 NVMe es capaz de hacer buen uso de la interfaz PCIe 4.0. El único problema es que la capacidad de 512 GB es bastante escasa. Incluso una pequeña colección de juegos puede requerir rápidamente más almacenamiento que esto. La buena noticia es que el Legion Pro 5 tiene una segunda ranura SSD que te permite ampliar fácilmente la cantidad de almacenamiento del sistema.

* ... más pequeño es mejor
Sustained load Read: DiskSpd Read Loop, Queue Depth 8
Tarjeta gráfica
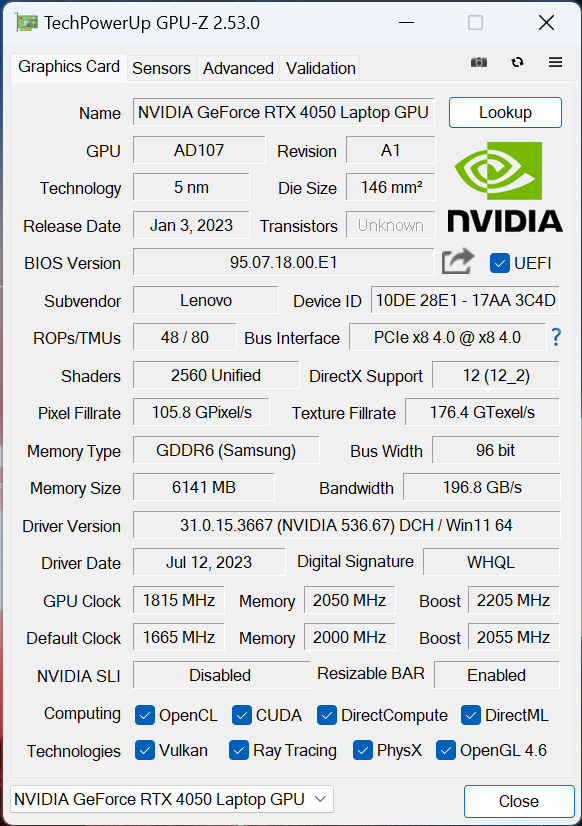
El Nvidia GeForce RTX 4050 es una GPU básica típica que puede compararse con una RTX 3060 en términos de rendimiento. No obstante, con 30 núcleos RT y 80 núcleos Tensor, está significativamente menos equipada en comparación. A pesar de su menor consumo, la GPU es capaz de ejecutar los juegos con fluidez. Aumentar su potencia al máximo permitido tampoco ofrece un aumento sustancial del rendimiento, como hemos demostrado en este artículo.
Una de las principales ventajas de consumir menos es que la GPU produce mucho menos calor, lo que significa que los ventiladores no tienen que trabajar tanto y el portátil puede mantenerse más fresco.
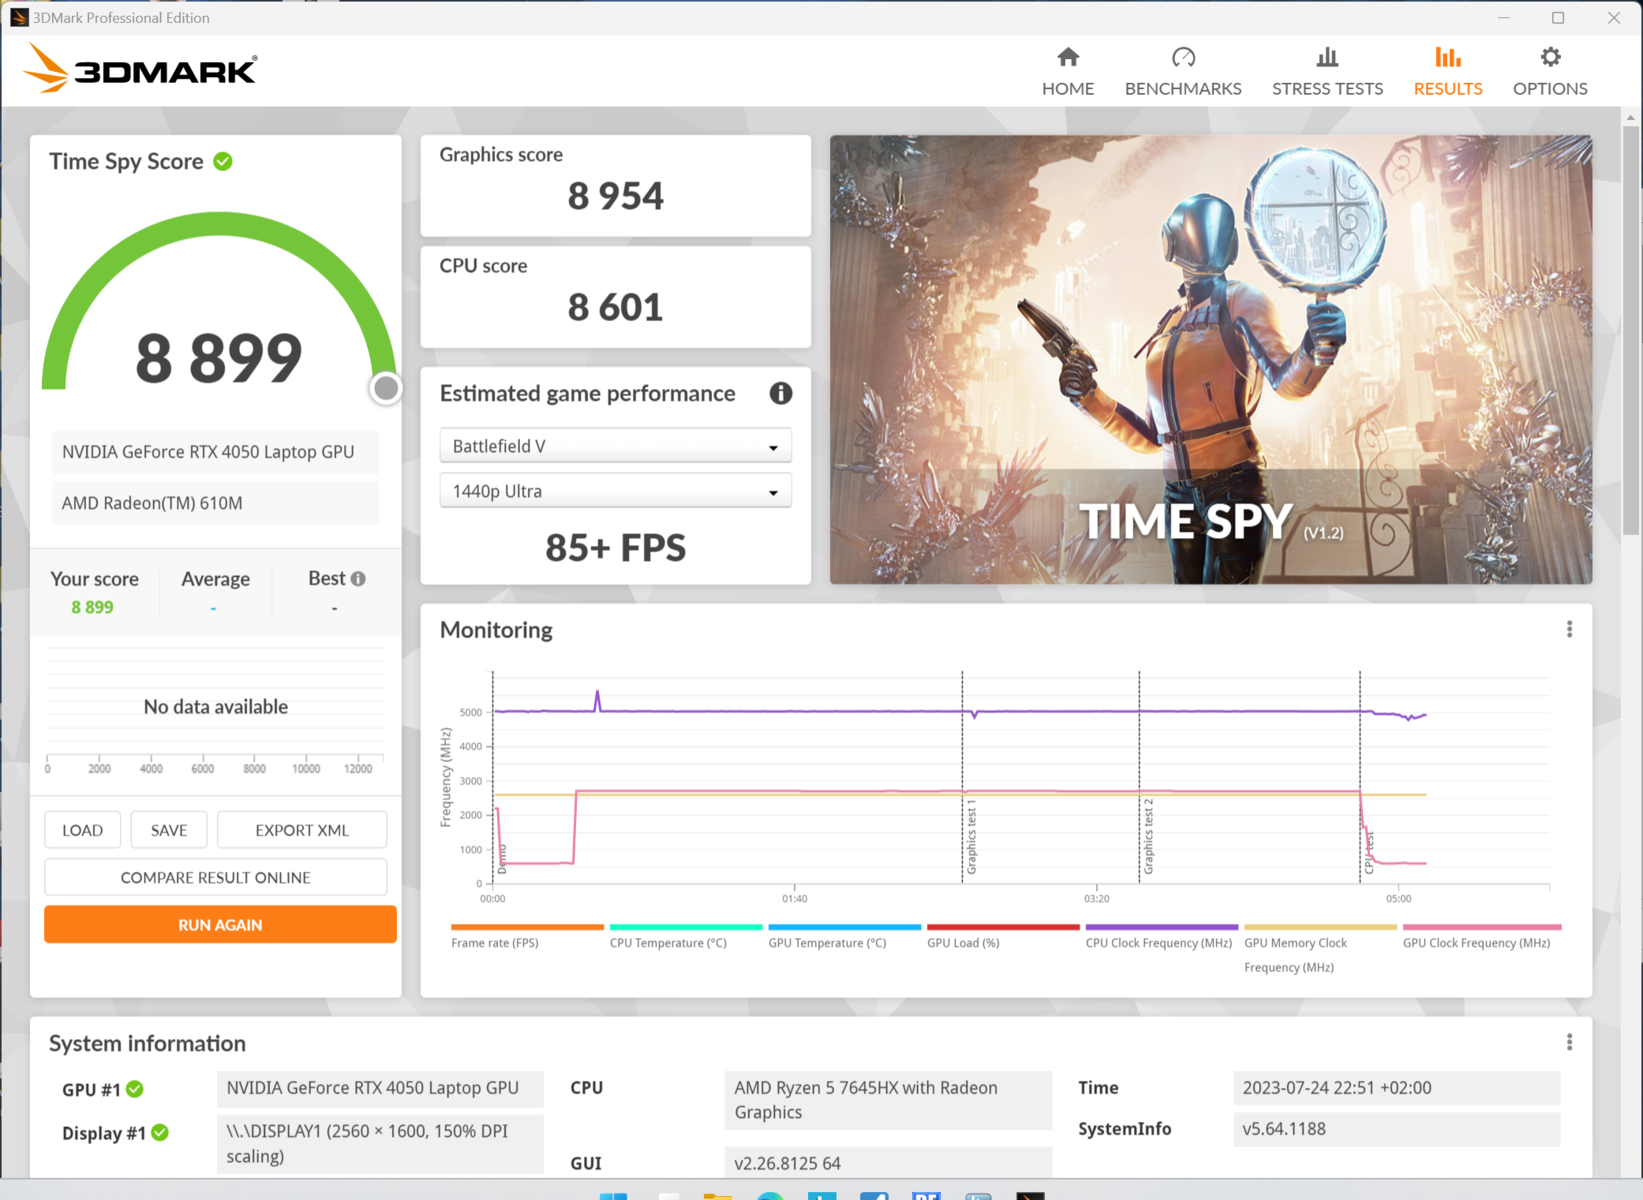
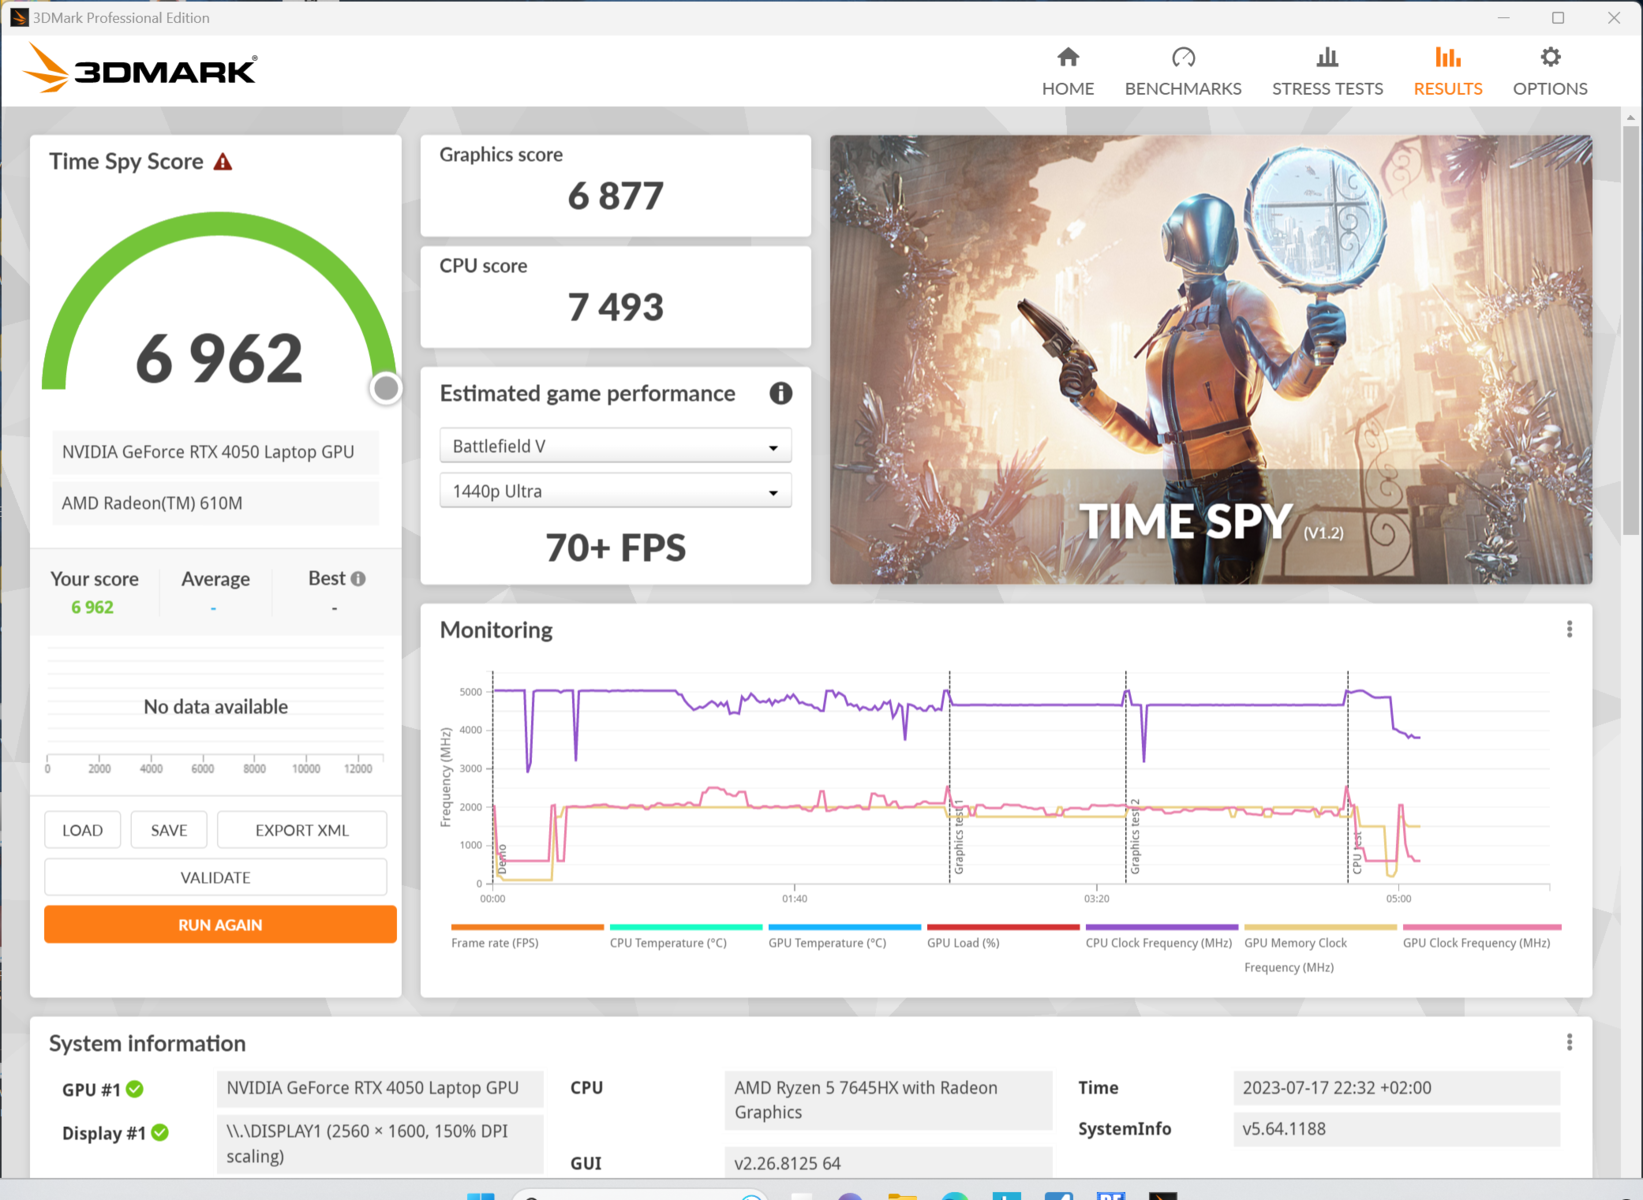
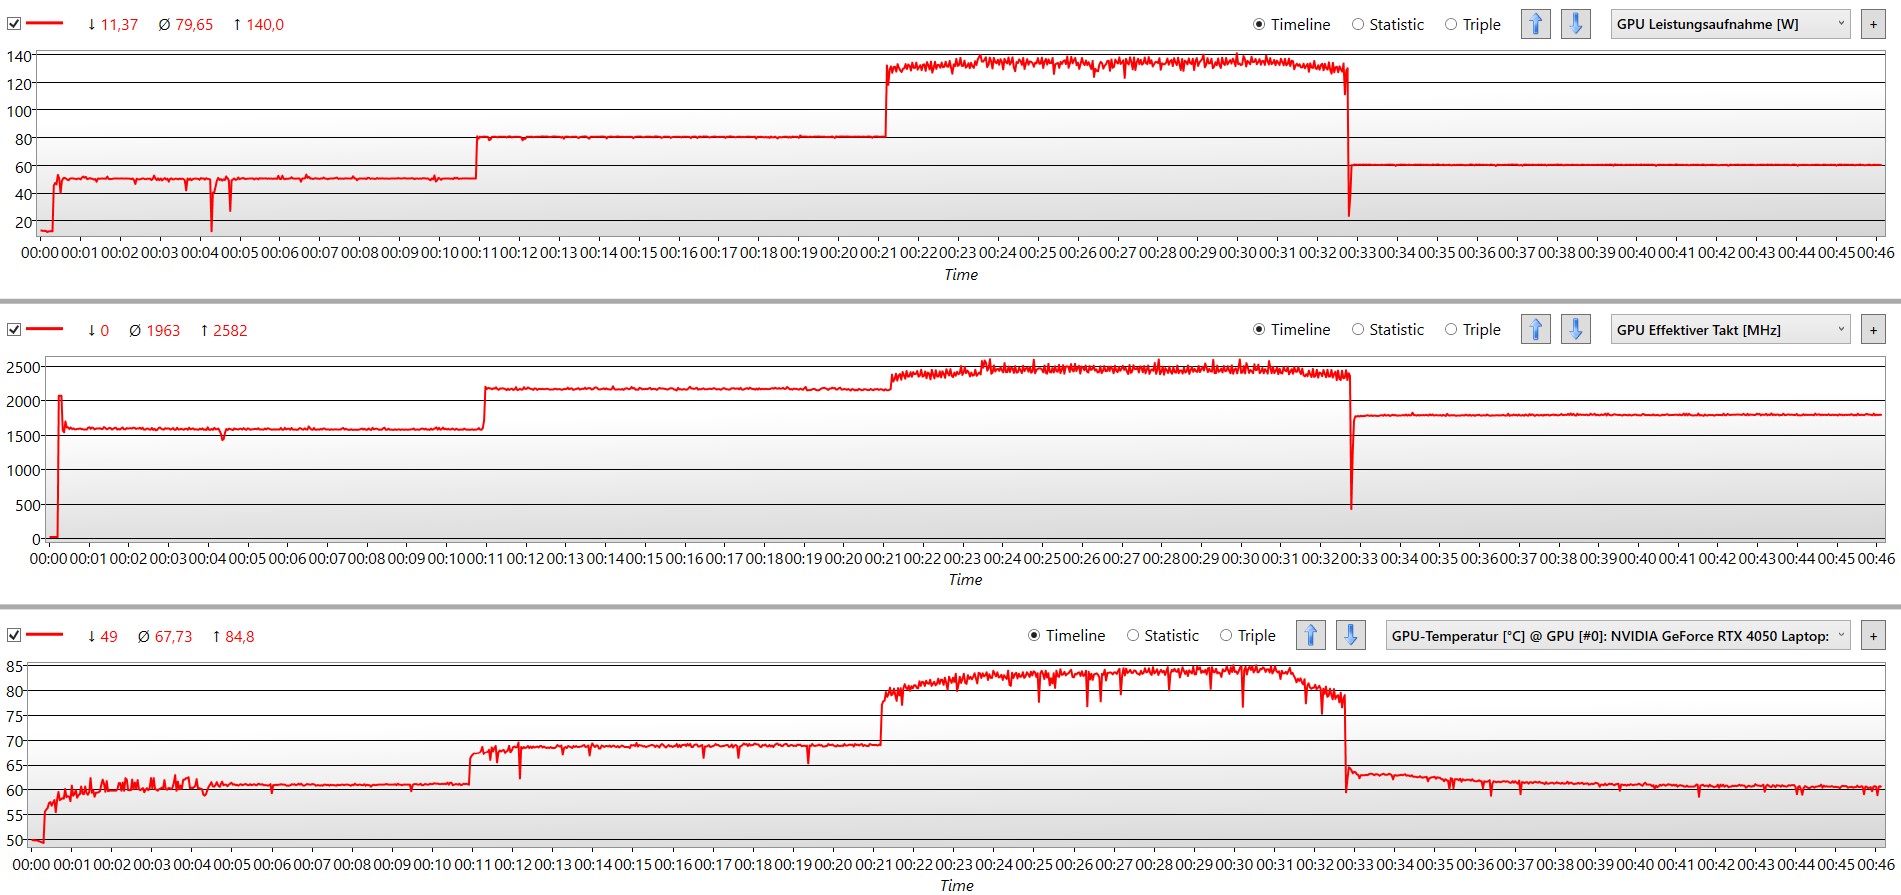
Según nuestras pruebas, el Legion Pro asigna 50 W de potencia a la tarjeta gráfica en modo silencioso; esta cifra es aún mayor con 60 W en batería. HWiNFO indicó que la GPU dispone de casi 130 W en modo Rendimiento. El rendimiento en 3Dmark es excepcional para una RTX 4050. El Lenovo Legion Pro 5 16ARX8 logró superar al Medion Erazer Scout E20 en aproximadamente un 20% en 3Dmark Time Spy - manteniendo el ruido del ventilador a un nivel moderado.
El software Lenovo Vantage permite personalizar aún más el rendimiento. Sin limitar el rendimiento de la GPU, es posible reducir el consumo de energía del procesador para reducir el ruido del ventilador. Tras probar varios ajustes, no pudimos obtener mejores resultados que los que vimos en el modo Rendimiento.

| 3DMark 11 Performance | 27506 puntos | |
| 3DMark Cloud Gate Standard Score | 54487 puntos | |
| 3DMark Fire Strike Score | 21537 puntos | |
| 3DMark Time Spy Score | 8899 puntos | |
ayuda | ||
* ... más pequeño es mejor
Rendimiento de juego
Ejecutar juegos modernos con los ajustes al máximo y resolución nativa lleva al Lenovo Legion Pro 5 a sus límites. Comparado con el Asus TUF A15 o Medion Erazer Scoutambos equipados con la RTX 4050el Legion Pro 5 se mostró mucho mejor en nuestras pruebas de juego. Lenovo ha logrado extraer un 20% más de FPS de la tarjeta gráfica en algunos casos.
Los resultados varían ligeramente en función del juego. Por ejemplo, Star Wars Jedi: Survivor funcionó constantemente a FPS muy altos, pero las frecuencias de cuadro estuvieron por debajo de la media en Hogwarts Legacy. Dicho esto, hay que señalar que estos dos títulos más recientes son muy fluidos y jugables con ajustes altos.
En la tabla siguiente, hemos utilizado los resultados de F1 23 para ilustrar la diferencia entre los modos Rendimiento y Silencio. El modo silencioso disminuye el rendimiento en un 20% aproximadamente y reduce el ruido máximo del ventilador de 50 a 33 decibelios. En otras palabras: el portátil para juegos es alrededor de un 70% más silencioso en modo Silencioso y aún así permite que la mayoría de los juegos se ejecuten con fluidez.
F1 23 en los modos Silencio y Rendimiento
| Alto/FHD | Ultra/FHD | Ultra/QHD | ruido máx. del ventilador | |
|---|---|---|---|---|
| Silencioso | 133 FPS | 39 FPS | 34 FPS | 33 dB(A) |
| Rendimiento | 165 FPS | 51 FPS | 41 FPS | 50 dB(A) |
| The Witcher 3 - 1920x1080 Ultra Graphics & Postprocessing (HBAO+) | |
| Media de la clase Gaming (104.7 - 240, n=7, últimos 2 años) | |
| Lenovo Legion Pro 5 16IRX8 | |
| Acer Nitro 17 AN17-51-71ER | |
| Asus TUF Gaming A16 FA617 | |
| Lenovo Legion Pro 5 16ARX8 (R5 7645HX, RTX 4050) | |
| Acer Nitro 5 AN517-55-5552 | |
| Medion Erazer Scout E20 | |
| Asus TUF A15 FA507 | |
| Hogwarts Legacy | |
| 1920x1080 High Preset AA:High T | |
| Asus TUF A15 FA507 | |
| Acer Nitro 5 AN517-55-5552 | |
| Medio NVIDIA GeForce RTX 4050 Laptop GPU (44.8 - 93.6, n=8) | |
| Lenovo Legion Pro 5 16ARX8 (R5 7645HX, RTX 4050) | |
| 1920x1080 Ultra Preset AA:High T | |
| Media de la clase Gaming (n=1últimos 2 años) | |
| Medio NVIDIA GeForce RTX 4050 Laptop GPU (39 - 77.3, n=8) | |
| Acer Nitro 5 AN517-55-5552 | |
| Lenovo Legion Pro 5 16ARX8 (R5 7645HX, RTX 4050) | |
| Asus TUF A15 FA507 | |
El rendimiento del sistema se mantuvo perfectamente estable durante nuestra prueba de estrés Witcher 3. Las fluctuaciones que se ven fueron causadas por el ciclo día-noche del juego. Como en muchas otras pruebas, el Legion Pro 5 queda marginalmente por delante de sus competidores con la misma GPU.
Witcher 3 FPS chart
| bajo | medio | alto | ultra | QHD | |
|---|---|---|---|---|---|
| GTA V (2015) | 174.6 | 101.7 | 63 | ||
| The Witcher 3 (2015) | 177 | 89 | |||
| Dota 2 Reborn (2015) | 191.8 | 175.6 | |||
| Final Fantasy XV Benchmark (2018) | 86.3 | 62.3 | |||
| X-Plane 11.11 (2018) | 110 | ||||
| Far Cry 5 (2018) | 131 | 119 | 88 | ||
| Strange Brigade (2018) | 174.8 | 152.8 | 100.7 | ||
| Hogwarts Legacy (2023) | 64 | 52 | 35 | ||
| Sons of the Forest (2023) | 76 | 76 | 56 | ||
| Star Wars Jedi Survivor (2023) | 60 | 56 | 35 | ||
| F1 23 (2023) | 165.2 | 50.5 | 40.8 |
Emisiones - Portátil para juegos silencioso y cálido
Emisiones sonoras
El portátil Lenovo es prácticamente inaudible cuando se utiliza para navegar por Internet, transmitir contenidos multimedia y otras tareas menos exigentes. Con sólo 24 dB, el nivel de ruido que medimos es indistinguible de un ruido de fondo muy bajo.
El nivel de ruido aumentó a 44 dB con mucha carga. En el mismo escenario (Witcher 3 en Ultra/FHD), el Medion Erazer Scout E20 era un 50% más ruidoso y ofrecía peores frecuencias de cuadro. En modo silencioso, el Legion Pro no es ni la mitad de ruidoso que el Scout E20 y aún así puede alcanzar casi 80 FPS en Witcher 3. El portátil sólo alcanzó el nivel máximo de ruido de 50 dB durante la prueba de estrés.
Si quieres, el Legion Pro 5 puede ejecutar juegos sin ningún ruido molesto del ventilador; como mucho oirás un zumbido silencioso. Esto se puede conseguir fácilmente jugando con los distintos ajustes disponibles. El portátil tampoco se vuelve más ruidoso que un entorno de trabajo silencioso en modo Silencio.
Ruido
| Ocioso |
| 23 / 23 / 24.42 dB(A) |
| Carga |
| 34.94 / 50 dB(A) |
 | ||
30 dB silencioso 40 dB(A) audible 50 dB(A) ruidosamente alto |
||
min: | ||
| Lenovo Legion Pro 5 16ARX8 (R5 7645HX, RTX 4050) GeForce RTX 4050 Laptop GPU, R5 7645HX, SK hynix PC801 HFS512GEJ9X115N | Lenovo Legion Pro 5 16IRX8 GeForce RTX 4060 Laptop GPU, i7-13700HX, SK hynix PC801 HFS512GEJ9X115N | Asus TUF A15 FA507 GeForce RTX 4050 Laptop GPU, R7 7735HS, Micron 2400 MTFDKBA512QFM | Asus TUF Gaming A16 FA617 Radeon RX 7600S, R7 7735HS, Micron 2400 MTFDKBA1T0QFM | Acer Nitro 5 AN517-55-5552 GeForce RTX 4050 Laptop GPU, i5-12500H, WDC PC SN810 512GB | Medion Erazer Scout E20 GeForce RTX 4050 Laptop GPU, i7-13700H, Phison PS5021-E21 1TB | |
|---|---|---|---|---|---|---|
| Noise | -4% | 5% | -9% | -34% | -23% | |
| apagado / medio ambiente * (dB) | 23 | 23 -0% | 23.3 -1% | 24 -4% | 25.7 -12% | 25 -9% |
| Idle Minimum * (dB) | 23 | 23.1 -0% | 23.3 -1% | 24 -4% | 25.7 -12% | 26 -13% |
| Idle Average * (dB) | 23 | 23.1 -0% | 23.3 -1% | 25 -9% | 31.5 -37% | 27 -17% |
| Idle Maximum * (dB) | 24.42 | 26.6 -9% | 23.3 5% | 28 -15% | 31.2 -28% | 32 -31% |
| Load Average * (dB) | 34.94 | 34.7 1% | 29.6 15% | 42 -20% | 62.9 -80% | 57 -63% |
| Witcher 3 ultra * (dB) | 43.79 | 47.6 -9% | 43 2% | 50 -14% | 50 -14% | |
| Load Maximum * (dB) | 50 | 54.8 -10% | 43 14% | 50 -0% | 67.5 -35% | 57 -14% |
* ... más pequeño es mejor
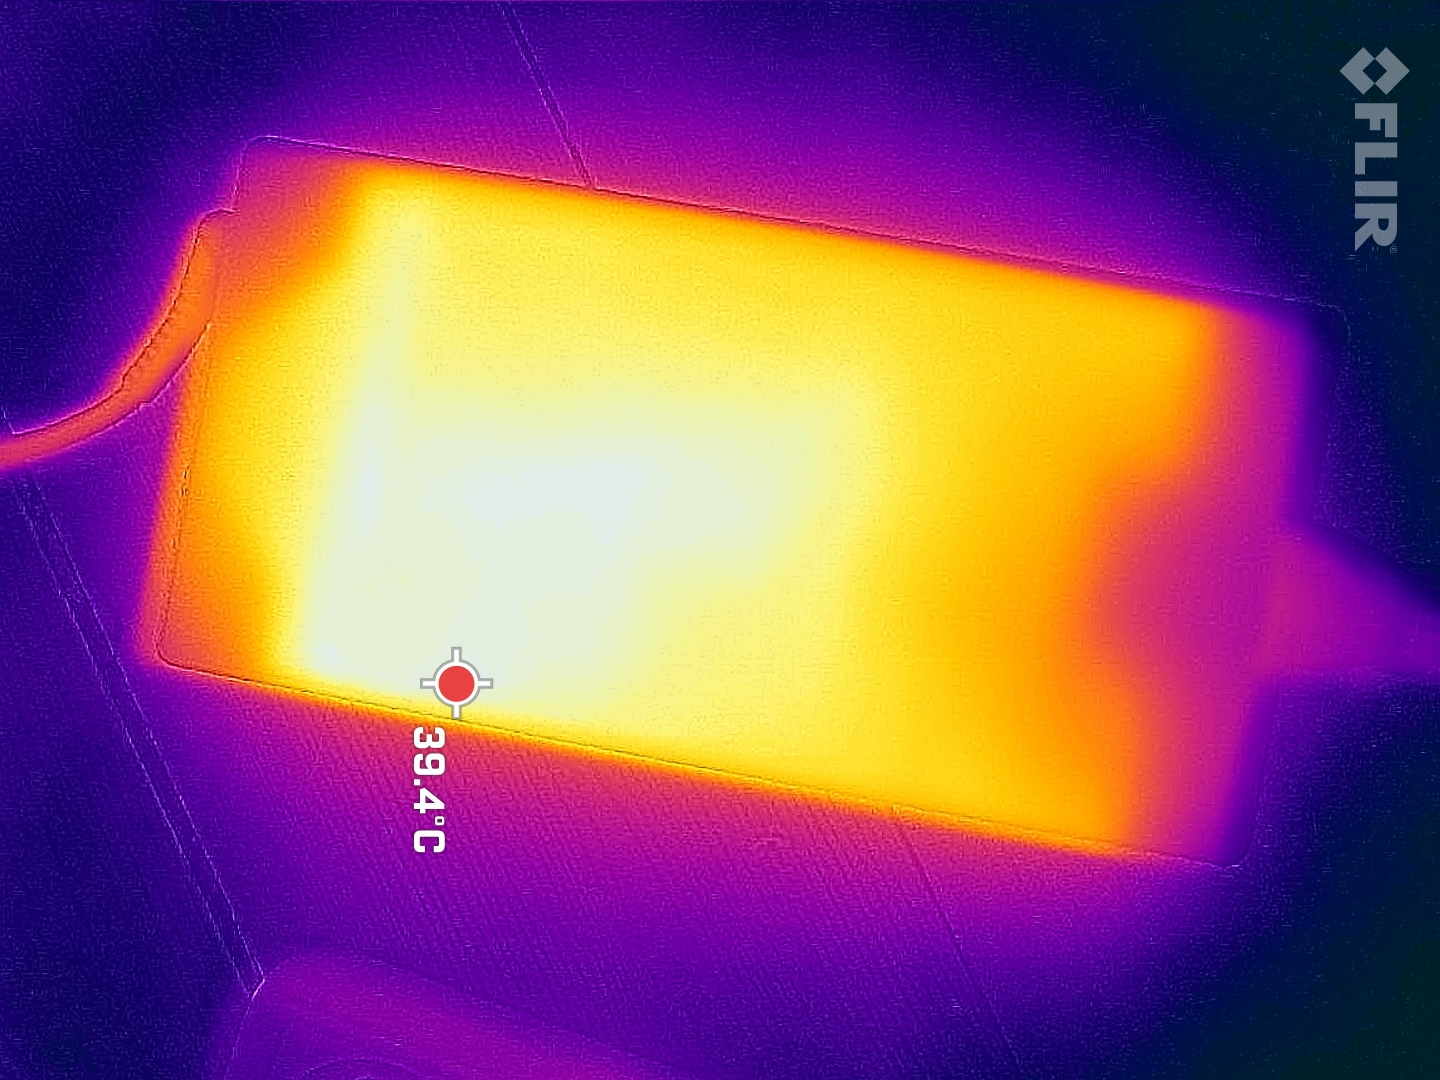
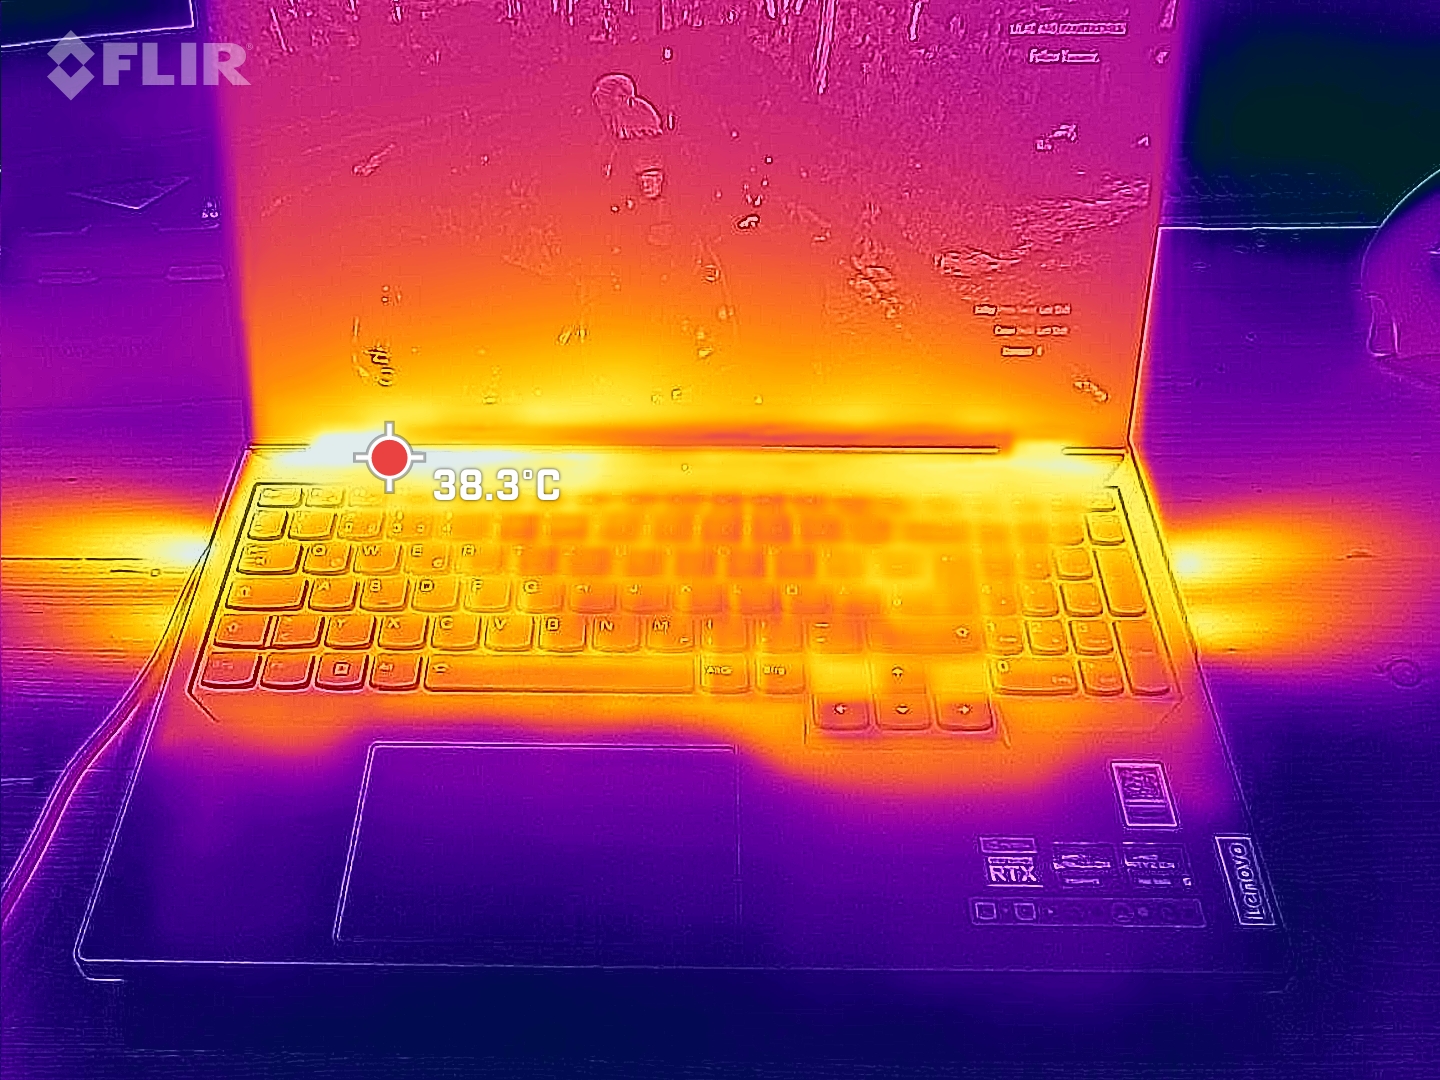
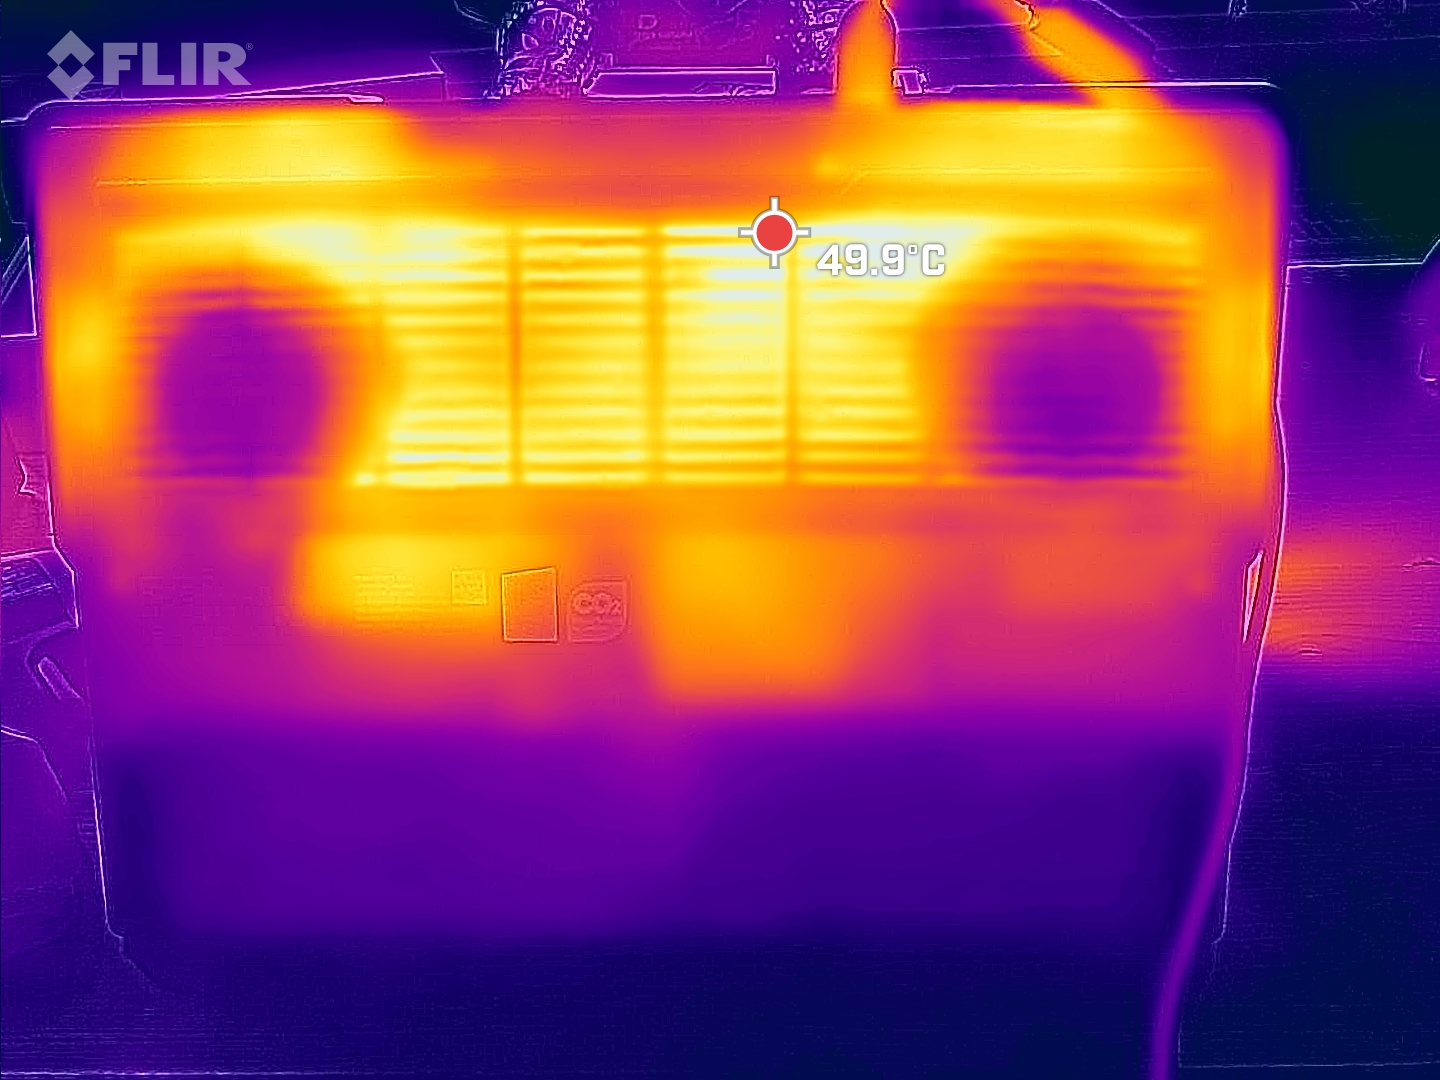
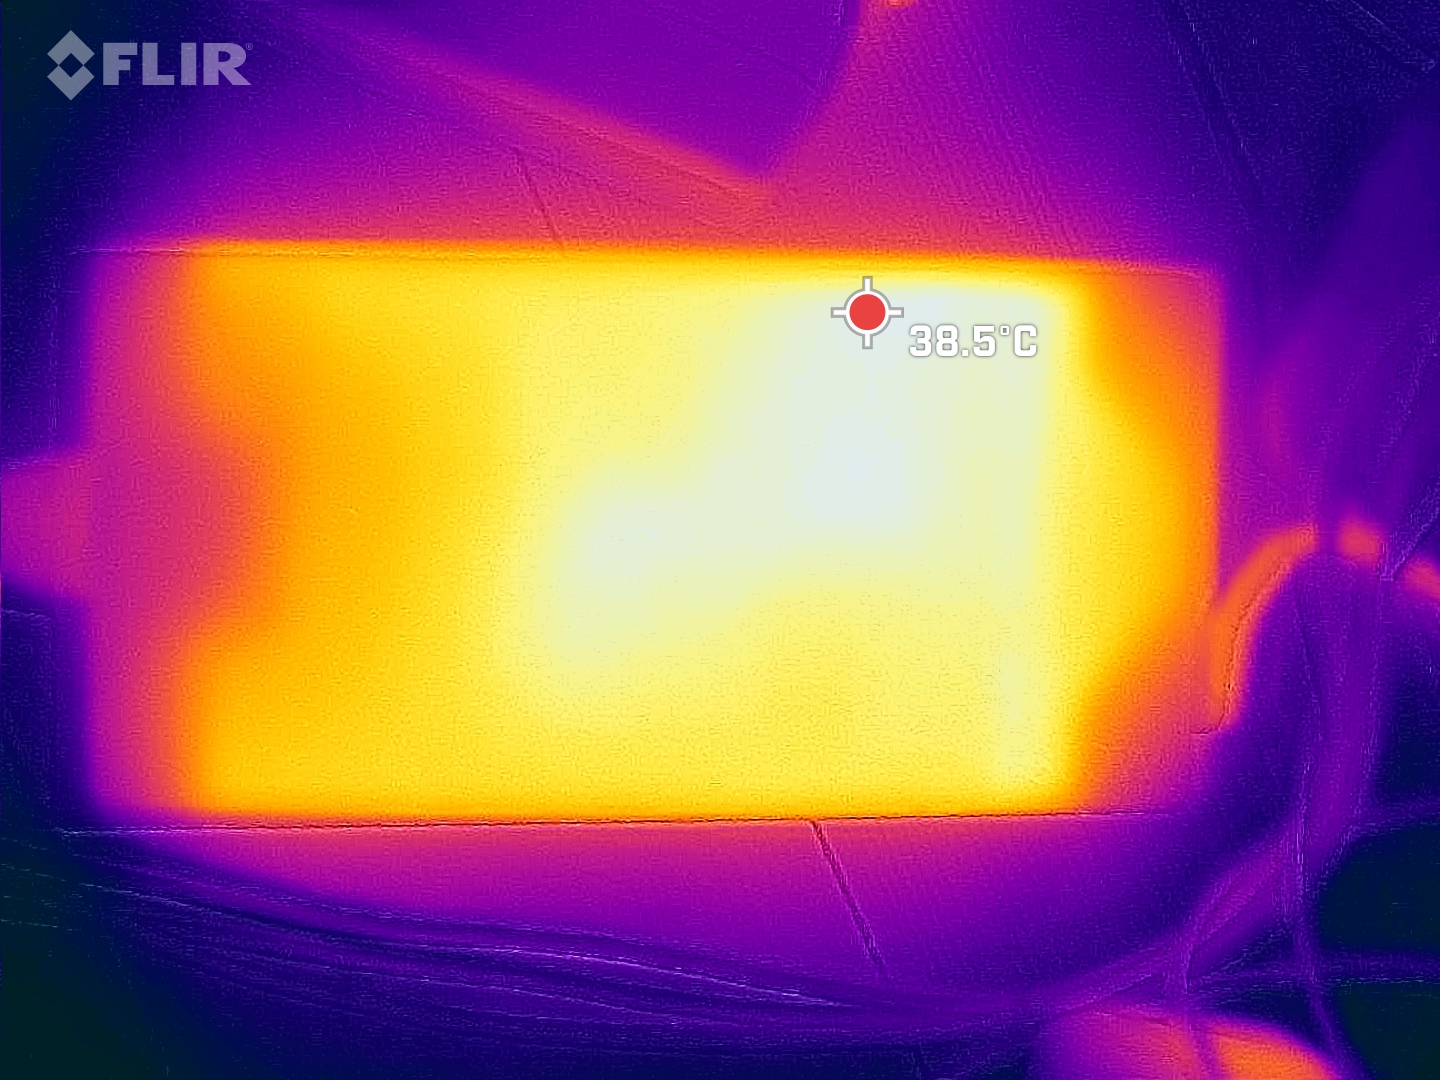
Temperatura
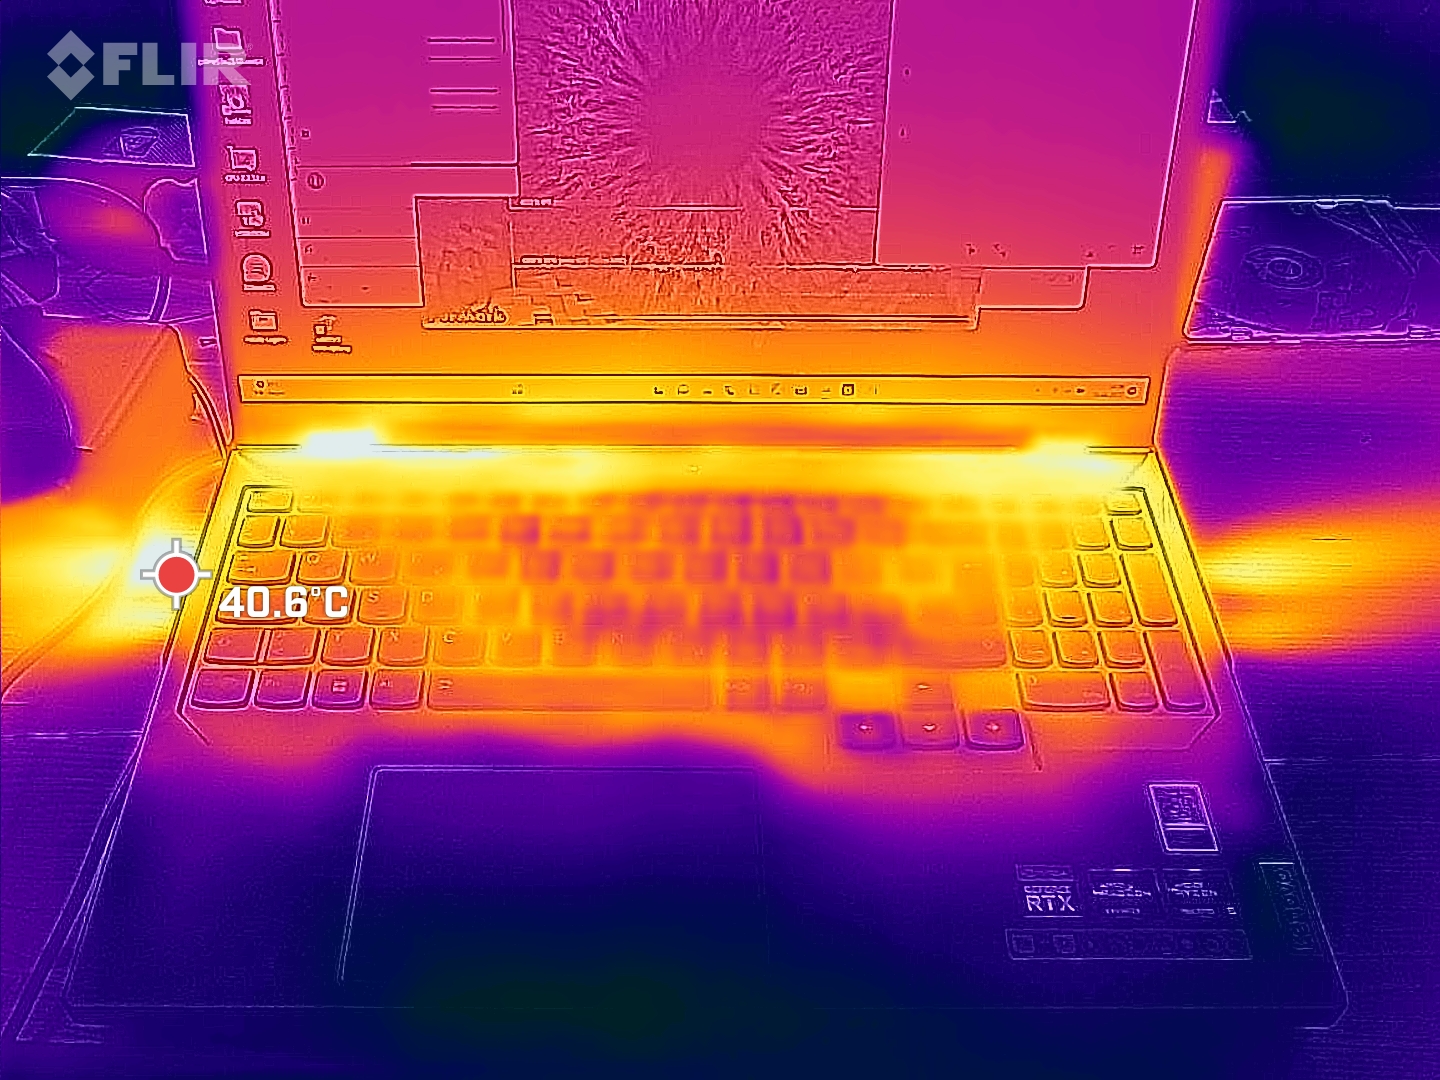
Las cosas son menos agradables cuando se trata de las térmicas. Como los ventiladores son casi inaudibles durante tareas sencillas, el portátil también tiene una disipación de calor débil. En inactivo, medimos temperaturas de hasta 36°C en el teclado - demasiado calor. Lo ideal sería que rondara los 30°C.
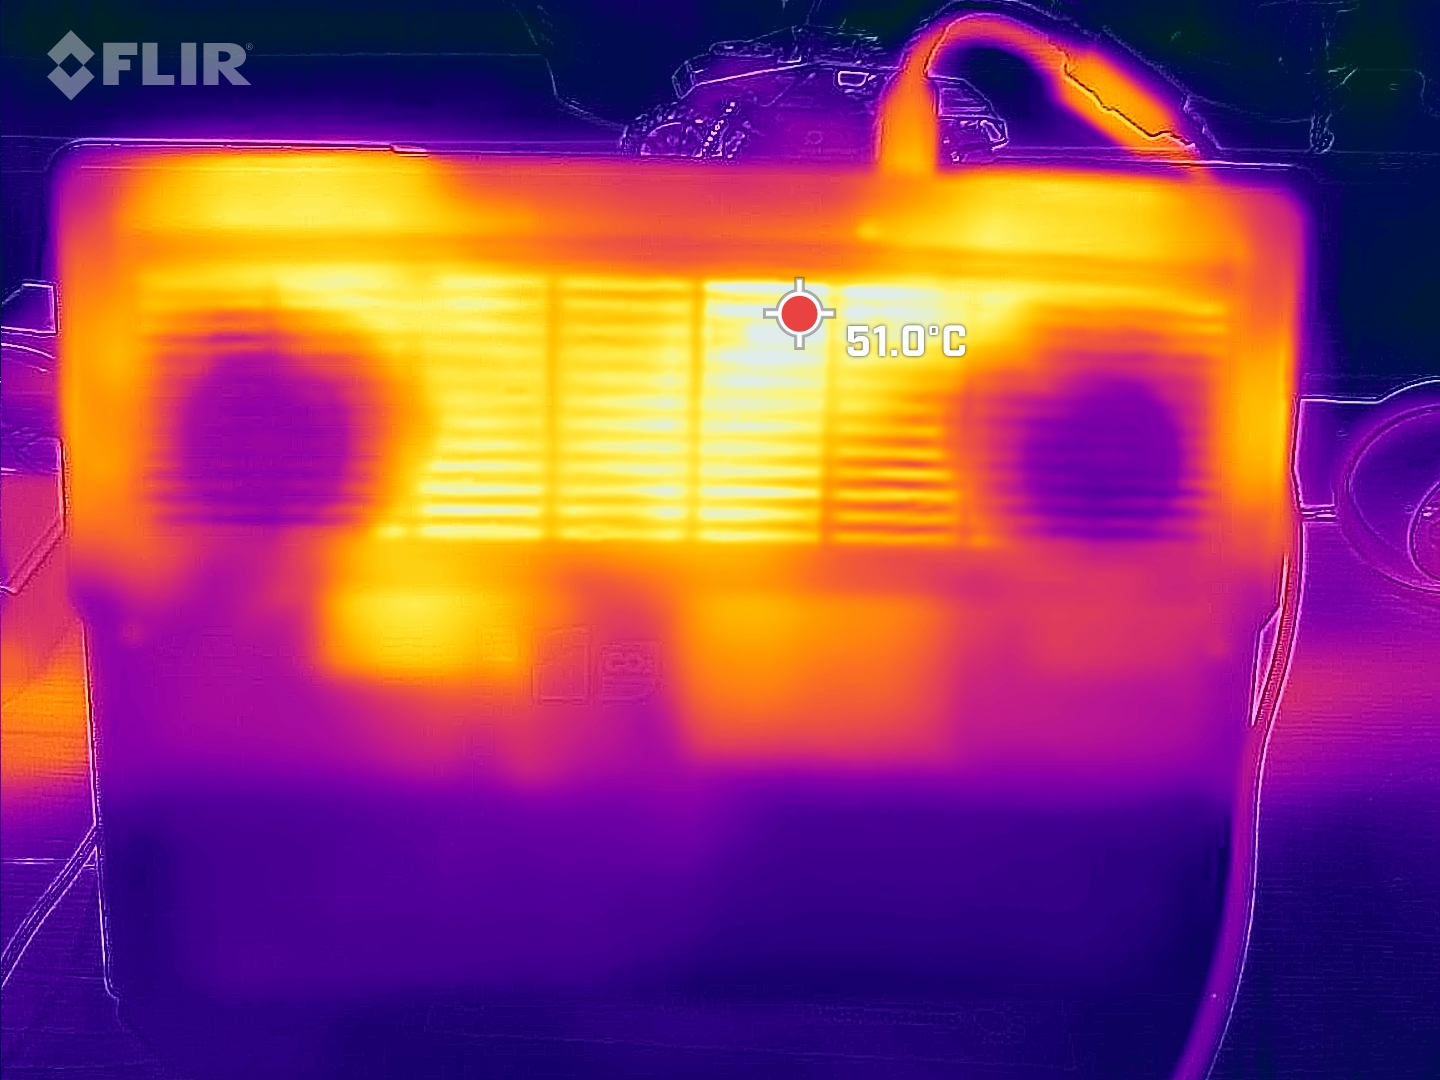
Dicho esto, nos parece aceptable que la parte superior alcance los 45°C con carga máxima. Y los reposamanos se mantuvieron frescos en todo momento. Sólo la parte inferior del portátil se calentó desagradablemente a 54°C.
(±) La temperatura máxima en la parte superior es de 45 °C / 113 F, frente a la media de 40.4 °C / 105 F, que oscila entre 21.2 y 68.8 °C para la clase Gaming.
(-) El fondo se calienta hasta un máximo de 54 °C / 129 F, frente a la media de 43.2 °C / 110 F
(±) En reposo, la temperatura media de la parte superior es de 32.3 °C / 90# F, frente a la media del dispositivo de 33.9 °C / 93 F.
(±) Jugando a The Witcher 3, la temperatura media de la parte superior es de 35.2 °C / 95 F, frente a la media del dispositivo de 33.9 °C / 93 F.
(+) El reposamanos y el panel táctil están a una temperatura inferior a la de la piel, con un máximo de 31 °C / 87.8 F y, por tanto, son fríos al tacto.
(-) La temperatura media de la zona del reposamanos de dispositivos similares fue de 28.8 °C / 83.8 F (-2.2 °C / -4 F).
| Lenovo Legion Pro 5 16ARX8 (R5 7645HX, RTX 4050) AMD Ryzen 5 7645HX, NVIDIA GeForce RTX 4050 Laptop GPU | Lenovo Legion Pro 5 16IRX8 Intel Core i7-13700HX, NVIDIA GeForce RTX 4060 Laptop GPU | Asus TUF A15 FA507 AMD Ryzen 7 7735HS, NVIDIA GeForce RTX 4050 Laptop GPU | Asus TUF Gaming A16 FA617 AMD Ryzen 7 7735HS, AMD Radeon RX 7600S | Acer Nitro 5 AN517-55-5552 Intel Core i5-12500H, NVIDIA GeForce RTX 4050 Laptop GPU | Medion Erazer Scout E20 Intel Core i7-13700H, NVIDIA GeForce RTX 4050 Laptop GPU | |
|---|---|---|---|---|---|---|
| Heat | 10% | 15% | -6% | 11% | 19% | |
| Maximum Upper Side * (°C) | 45 | 42.8 5% | 48.9 -9% | 54 -20% | 42.4 6% | 41 9% |
| Maximum Bottom * (°C) | 54 | 50 7% | 44.6 17% | 47 13% | 48.2 11% | 39 28% |
| Idle Upper Side * (°C) | 36 | 29.6 18% | 27.1 25% | 40 -11% | 31.6 12% | 31 14% |
| Idle Bottom * (°C) | 38 | 34 11% | 27.5 28% | 40 -5% | 33.1 13% | 29 24% |
* ... más pequeño es mejor
Prueba de esfuerzo
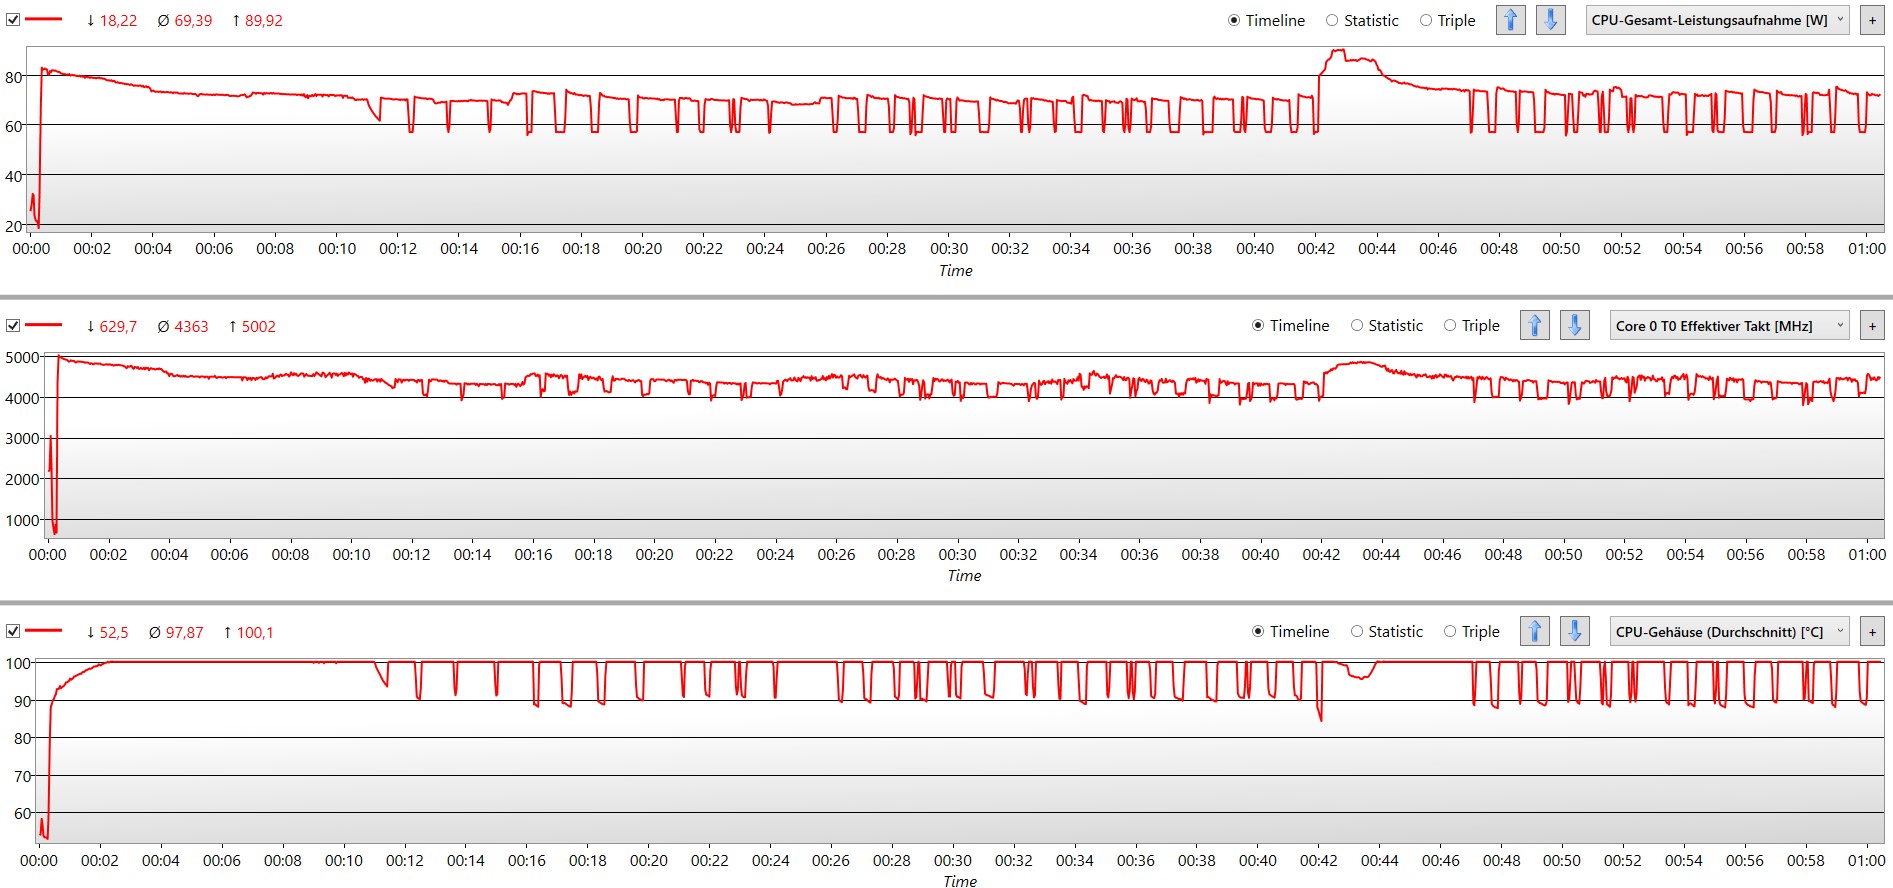
Durante nuestra prueba de estrés, realizada en modo Rendimiento, el rendimiento del portátil se estabilizó en un nivel alto tras caer marginalmente al principio. La CPU incluso fue capaz de alcanzar temporalmente la velocidad de reloj máxima permitida de 5,0 GHz una vez más. También es destacable que el procesador haya conseguido mantenerse por encima de los 4,0 GHz de forma constante.
El Lenovo Pro 5 ha sido configurado de tal manera que el consumo máximo de energía permitido es ligeramente inferior a lo especificado por los fabricantes de hardware. Esto, unido a la impresionante refrigeración general, ayuda al portátil a aprovechar constantemente al máximo los parámetros especificados en el modo Rendimiento.
Altavoces
Los altavoces estéreo son muy potentes. Los graves son incluso un poco más potentes que los de un portátil. En cambio, los graves y los medios son casi inexistentes. Por desgracia, esto hace que la música suene bastante anémica, especialmente el sonido de las guitarras eléctricas o la batería.
Por otro lado, los controladores de los altavoces son capaces de reproducir voces y vocalizaciones bastante bien, aunque no al nivel de calidad de unos buenos altavoces. Pero está bien para jugar.
Lenovo Legion Pro 5 16ARX8 (R5 7645HX, RTX 4050) análisis de audio
(±) | la sonoridad del altavoz es media pero buena (78.06 dB)
Graves 100 - 315 Hz
(-) | casi sin bajos - de media 20.9% inferior a la mediana
(±) | la linealidad de los graves es media (11.7% delta a frecuencia anterior)
Medios 400 - 2000 Hz
(±) | medias más altas - de media 6.8% más altas que la mediana
(+) | los medios son lineales (5.7% delta a la frecuencia anterior)
Altos 2 - 16 kHz
(+) | máximos equilibrados - a sólo 2.8% de la mediana
(±) | la linealidad de los máximos es media (7.5% delta a frecuencia anterior)
Total 100 - 16.000 Hz
(±) | la linealidad del sonido global es media (21.5% de diferencia con la mediana)
En comparación con la misma clase
» 77% de todos los dispositivos probados de esta clase eran mejores, 5% similares, 18% peores
» El mejor tuvo un delta de 6%, la media fue 18%, el peor fue ###max##%
En comparación con todos los dispositivos probados
» 61% de todos los dispositivos probados eran mejores, 7% similares, 32% peores
» El mejor tuvo un delta de 4%, la media fue 23%, el peor fue ###max##%
Apple MacBook Pro 16 2021 M1 Pro análisis de audio
(+) | los altavoces pueden reproducir a un volumen relativamente alto (#84.7 dB)
Graves 100 - 315 Hz
(+) | buen bajo - sólo 3.8% lejos de la mediana
(+) | el bajo es lineal (5.2% delta a la frecuencia anterior)
Medios 400 - 2000 Hz
(+) | medios equilibrados - a sólo 1.3% de la mediana
(+) | los medios son lineales (2.1% delta a la frecuencia anterior)
Altos 2 - 16 kHz
(+) | máximos equilibrados - a sólo 1.9% de la mediana
(+) | los máximos son lineales (2.7% delta a la frecuencia anterior)
Total 100 - 16.000 Hz
(+) | el sonido global es lineal (4.6% de diferencia con la mediana)
En comparación con la misma clase
» 0% de todos los dispositivos probados de esta clase eran mejores, 0% similares, 100% peores
» El mejor tuvo un delta de 5%, la media fue 17%, el peor fue ###max##%
En comparación con todos los dispositivos probados
» 0% de todos los dispositivos probados eran mejores, 0% similares, 100% peores
» El mejor tuvo un delta de 4%, la media fue 23%, el peor fue ###max##%
Gestión de la energía - Eficiente bajo carga
Consumo de energía
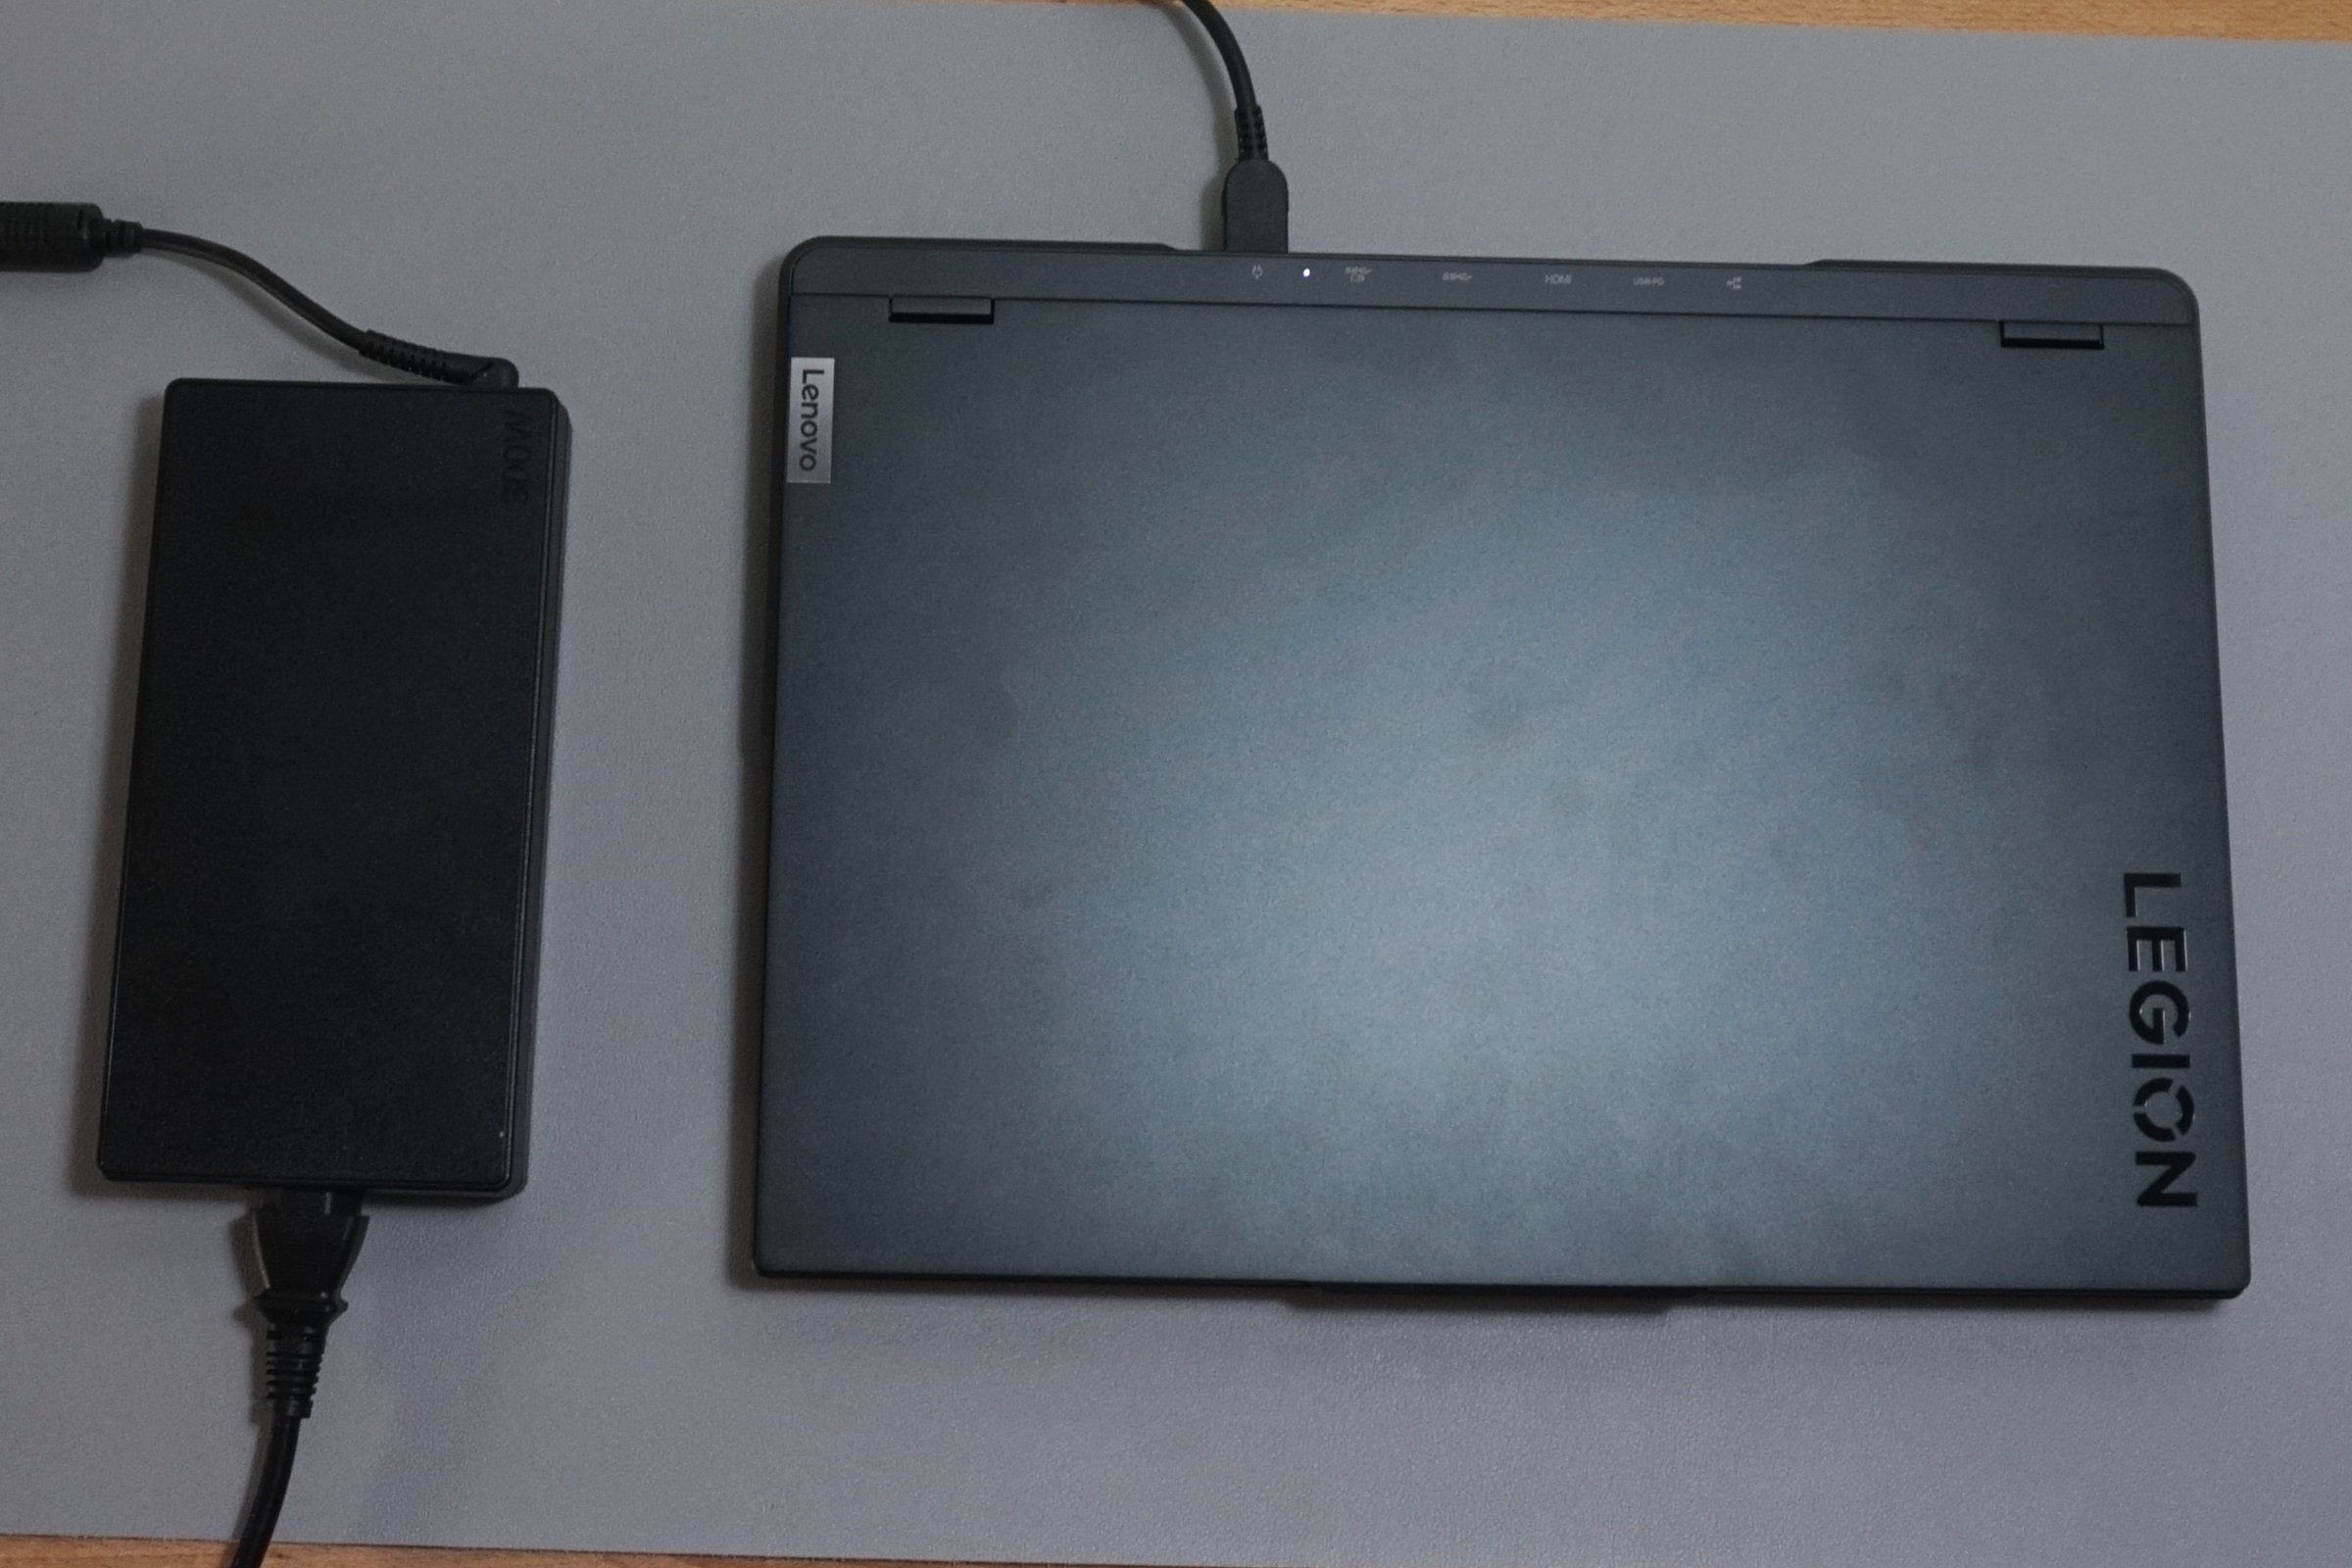
Los procesadores de la serie "HX" de AMD no son capaces de cumplir su promesa de alta eficiencia. Consumir al menos 13 W en reposo es demasiado para un portátil de especificaciones moderadas. El Asus TUF A15 con un Ryzen 7 7735HS sólo consume 8 W en la misma situación, y el igualmente potente Medion Erazer Scout E20consume sólo 5 W. Comparado con estos portátiles de juego de configuración similar, el Legion parece usar demasiada energía en inactivo.
Sin embargo, es capaz de batir a muchos de sus competidores cuando realiza tareas exigentes. Por ejemplo, sólo consumió unos 125 W ejecutando Witcher 3. Durante nuestras pruebas, medimos un consumo máximo de 204 W, lo que significa que el adaptador de 300 W debería ser adecuado para el dispositivo.
Hay que tener en cuenta que el procesador y la tarjeta gráfica por sí solos pueden consumir 145 W y 115 W respectivamente, y de forma simultánea. Aunque los usuarios tienen que activarlo explícitamente y aceptar una advertencia de seguridad, también tiene sentido que Lenovo haya incluido un cargador tan bestia.
| Off / Standby | |
| Ocioso | |
| Carga |
|
Clave:
min: | |
| Lenovo Legion Pro 5 16ARX8 (R5 7645HX, RTX 4050) R5 7645HX, GeForce RTX 4050 Laptop GPU, SK hynix PC801 HFS512GEJ9X115N, IPS, 2560x1600, 16" | Lenovo Legion Pro 5 16IRX8 i7-13700HX, GeForce RTX 4060 Laptop GPU, SK hynix PC801 HFS512GEJ9X115N, IPS, 2560x1600, 16" | Asus TUF A15 FA507 R7 7735HS, GeForce RTX 4050 Laptop GPU, Micron 2400 MTFDKBA512QFM, IPS, 1920x1080, 15.6" | Asus TUF Gaming A16 FA617 R7 7735HS, Radeon RX 7600S, Micron 2400 MTFDKBA1T0QFM, IPS-Level, 1920x1200, 16" | Acer Nitro 5 AN517-55-5552 i5-12500H, GeForce RTX 4050 Laptop GPU, WDC PC SN810 512GB, IPS, 1920x1080, 17.3" | Medion Erazer Scout E20 i7-13700H, GeForce RTX 4050 Laptop GPU, Phison PS5021-E21 1TB, IPS, 1920x1080, 17.3" | Medio NVIDIA GeForce RTX 4050 Laptop GPU | Media de la clase Gaming | |
|---|---|---|---|---|---|---|---|---|
| Power Consumption | -47% | 22% | 15% | 3% | 14% | 13% | -13% | |
| Idle Minimum * (Watt) | 13 | 24.5 -88% | 8 38% | 8 38% | 7.6 42% | 5 62% | 9.95 ? 23% | 13 ? -0% |
| Idle Average * (Watt) | 17.4 | 29.2 -68% | 12.1 30% | 11 37% | 11.3 35% | 11 37% | 15.8 ? 9% | 19 ? -9% |
| Idle Maximum * (Watt) | 21.8 | 34.3 -57% | 12.5 43% | 16 27% | 15.4 29% | 22 -1% | 20.1 ? 8% | 24.6 ? -13% |
| Load Average * (Watt) | 96.4 | 98.7 -2% | 74.9 22% | 97 -1% | 151 -57% | 96 -0% | 88 ? 9% | 110.7 ? -15% |
| Witcher 3 ultra * (Watt) | 125 | 178.6 -43% | 136.6 -9% | 161.5 -29% | 137.8 -10% | 145.2 -16% | ||
| Load Maximum * (Watt) | 204 | 249.6 -22% | 185 9% | 168 18% | 244 -20% | 201 1% | 176.3 ? 14% | 259 ? -27% |
* ... más pequeño es mejor
Power consumption Witcher 3 / Stress test
Power consumption with external monitor
Duración de la batería
La batería de 80 Wh no ofrece una duración espectacular debido al elevado consumo de energía de la CPU. Con el brillo de pantalla bajado a 150 cd/m², el portátil duró unas 6,5 horas tanto en nuestro test de reproducción de vídeo como en el de navegación web Wi-Fi. Aumentar el brillo de la pantalla al máximo redujo la duración de la batería a la mitad.
Aunque 47 minutos de duración de la batería es muy poco en Witcher 3, el rendimiento en juegos está sólo unos puntos porcentuales por debajo de lo que es capaz el Legion cuando está enchufado.
| Lenovo Legion Pro 5 16ARX8 (R5 7645HX, RTX 4050) R5 7645HX, GeForce RTX 4050 Laptop GPU, 80 Wh | Lenovo Legion Pro 5 16IRX8 i7-13700HX, GeForce RTX 4060 Laptop GPU, 80 Wh | Asus TUF A15 FA507 R7 7735HS, GeForce RTX 4050 Laptop GPU, 90 Wh | Asus TUF Gaming A16 FA617 R7 7735HS, Radeon RX 7600S, 90 Wh | Acer Nitro 5 AN517-55-5552 i5-12500H, GeForce RTX 4050 Laptop GPU, 90 Wh | Medion Erazer Scout E20 i7-13700H, GeForce RTX 4050 Laptop GPU, 53.35 Wh | Media de la clase Gaming | |
|---|---|---|---|---|---|---|---|
| Duración de Batería | -39% | 120% | 116% | 53% | -16% | 41% | |
| H.264 (h) | 5.4 | 12.5 131% | 7.4 37% | 4.6 -15% | 8.32 ? 54% | ||
| WiFi v1.3 (h) | 5.6 | 3.4 -39% | 11.7 109% | 12.1 116% | 9.4 68% | 4.7 -16% | 7.11 ? 27% |
| Witcher 3 ultra (h) | 0.8 |
Pro
Contra
Veredicto: silencioso, rápido o ambas cosas

El Lenovo Legion Pro 4 16ARX8 no tiene ningún punto débil grave y ha conseguido sorprendernos con su rendimiento estable en juegos, su pantalla brillante y sus especificaciones decentes. Es cierto que no es lo bastante potente como para ejecutar los juegos más recientes con los ajustes más altos, pero casi siempre es capaz de ofrecer velocidades de fotogramas decentes. Además, el ruido del ventilador se mantiene en un nivel aceptable, por lo que no es necesario usar auriculares para jugar. Parece una combinación atractiva para los jugadores ocasionales.
Además, el software Lenovo Vantage ofrece opciones de personalización adicionales. Con un poco de trabajo, puedes optimizar el rendimiento del portátil para tus juegos favoritos. Gracias al gran rendimiento gráfico del Legion, es concebible tener un modo casi pasivo orientado a la edición de fotos y vídeos. La excelente pantalla también facilita este tipo de trabajos de edición, aunque no a un nivel profesional.
La versatilidad es su punto fuerte: el portátil es silencioso durante los juegos y, sin embargo, con un solo clic, puede plantar cara fácilmente a los mejores portátiles con el mismo hardware
La combinación de una resolución WQXGA (2.560 x 1.600) y una frecuencia de refresco de 240 Hz es un poco exagerada. La GPU no tiene el rendimiento necesario para aprovechar al máximo la pantalla. Otro aspecto decepcionante es la escasa duración de la batería. Tampoco le habría venido mal al portátil un puerto USB4 y un lector de tarjetas. Sin embargo, estos puntos débiles son fáciles de pasar por alto teniendo en cuenta el modesto precio del Legion(se puede obtener un descuento adicional si se presenta una identificación válida de una institución educativa).
El Medion Erazer Scout E20 y Asus TUF Gaming A16 Advantageofrecen un rendimiento similar, pero están unos puntos porcentuales por detrás del Legion Pro 5 en casi todas las áreas. Ambos portátiles también tienen pantallas más pobres y son menos personalizables, más ruidosos bajo carga y, al menos para estudiantes y educadores, más caros. Los competidores aún pueden aprender un par de cosas del portátil para juegos básico de Lenovo.
Precio y disponibilidad
En Alemania, puedes comprar el Lenovo Legion Pro 5 16ARX8 (R5 7645HX, RTX 4050) directamente a Lenovo o en Campuspoint por 1.500 euros (1.640 dólares). Quienes dispongan de un documento de identidad válido pueden conseguirlo a un precio rebajado de 1.200 euros (1.312 dólares). En Estados Unidos, se puede adquirir un modelo similar con 1 TB de almacenamiento por 1.419 dólares en amazon.es.
Lenovo Legion Pro 5 16ARX8 (R5 7645HX, RTX 4050)
- 07/29/2023 v7 (old)
Mario Petzold
Transparencia
La selección de los dispositivos que se van a reseñar corre a cargo de nuestro equipo editorial. La muestra de prueba fue proporcionada al autor en calidad de préstamo por el fabricante o el minorista a los efectos de esta reseña. El prestamista no tuvo ninguna influencia en esta reseña, ni el fabricante recibió una copia de la misma antes de su publicación. No había ninguna obligación de publicar esta reseña. Como empresa de medios independiente, Notebookcheck no está sujeta a la autoridad de fabricantes, minoristas o editores.
Así es como prueba Notebookcheck
Cada año, Notebookcheck revisa de forma independiente cientos de portátiles y smartphones utilizando procedimientos estandarizados para asegurar que todos los resultados son comparables. Hemos desarrollado continuamente nuestros métodos de prueba durante unos 20 años y hemos establecido los estándares de la industria en el proceso. En nuestros laboratorios de pruebas, técnicos y editores experimentados utilizan equipos de medición de alta calidad. Estas pruebas implican un proceso de validación en varias fases. Nuestro complejo sistema de clasificación se basa en cientos de mediciones y puntos de referencia bien fundamentados, lo que mantiene la objetividad.Price comparison

