Notebookcheck Logo
Revisión de Lenovo Legion 9 18 con RTX 5090

Análisis del Lenovo Legion 9 18 con RTX 5090: El portátil para juegos más potente del mercado

Delantero de la cumbre.

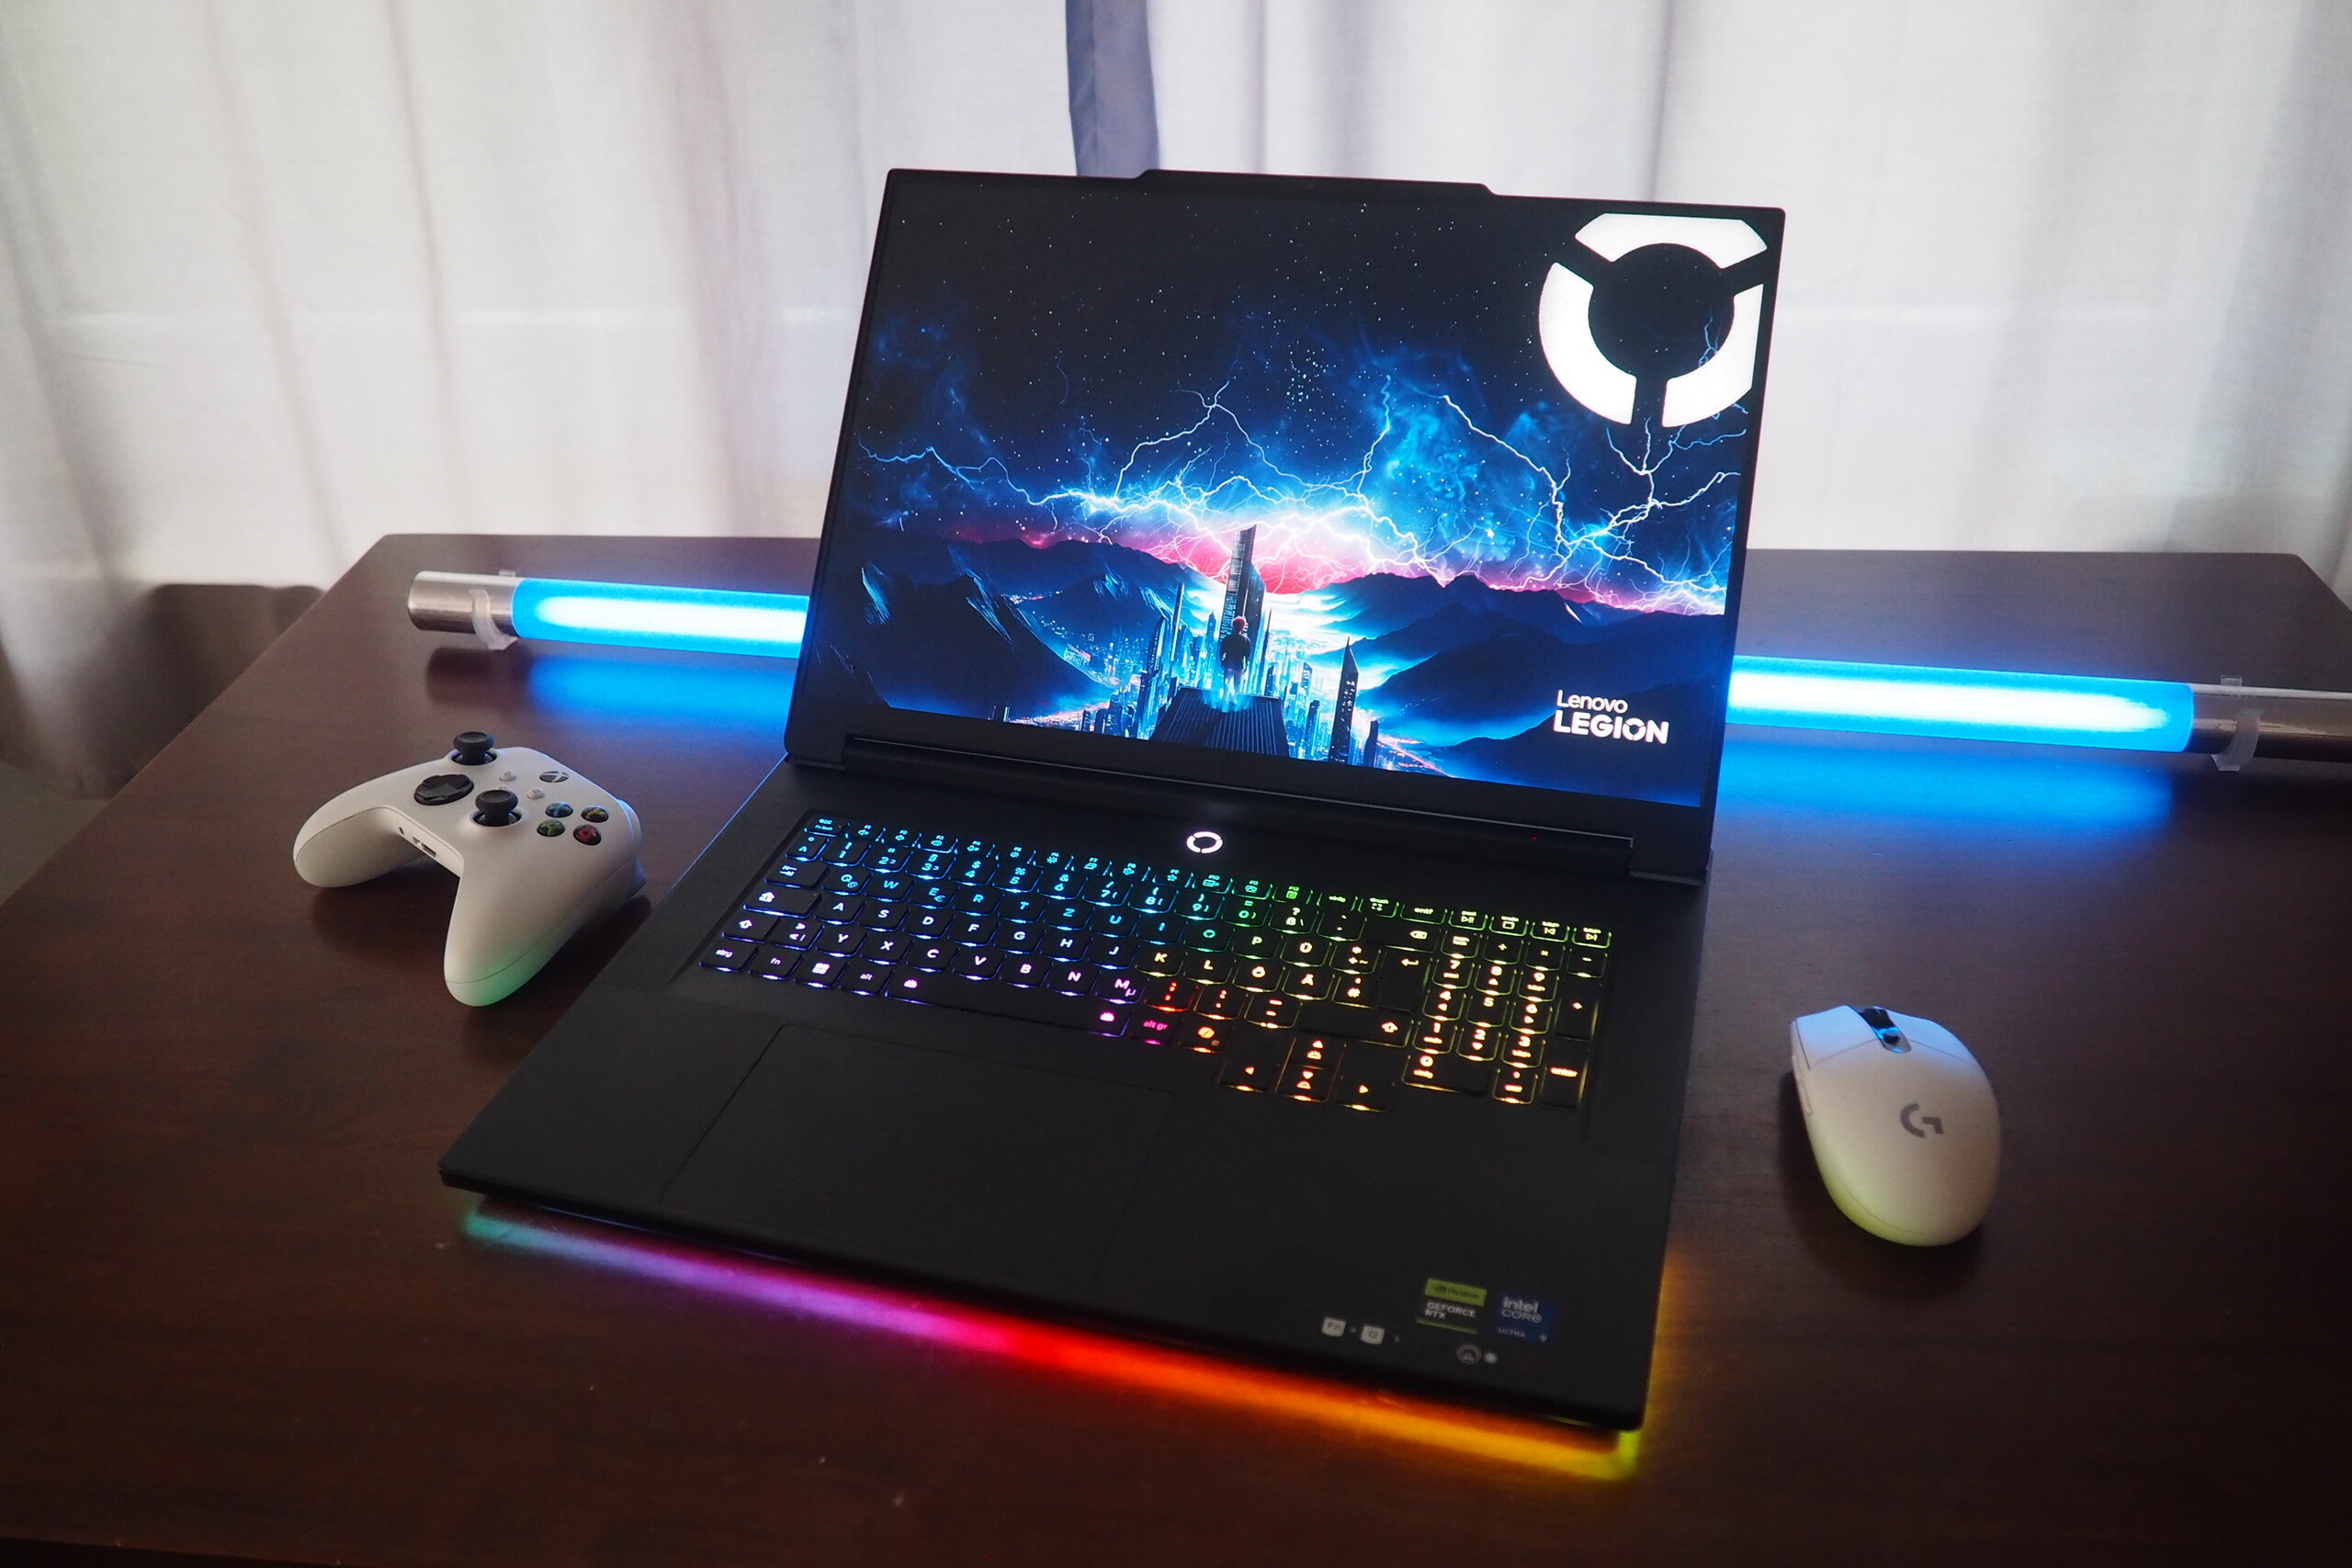
Lenovo ha conquistado sin esfuerzo el segmento de los portátiles para juegos de 18 pulgadas con el Legion 9 18. Tras probar recientemente la versión RTX 5080, ahora echamos un vistazo al modelo superior basado en la RTX 5090. ¿Tendrá que volver a calentar motores la competencia?
Florian Glaser, 👁 Florian Glaser (traducido por DeepL / Ninh Duy) Publicado 🇺🇸 🇩🇪 ...
Laptop / Notebook Gaming Intel Arrow Lake Nvidia Geforce

Veredicto

Como la Variante RTX 5080, la edición RTX 5090 del Lenovo Legion 9 18 -que es absurdamente caro, algo menos de 6.000 euros- también ofrece un rendimiento entre bueno y muy bueno en la mayoría de las categorías.

Uno de los puntos fuertes de este coloso de los juegos es su chasis de alta calidad, que atrae por su diseño elegante y sus numerosos elementos de iluminación. La conectividad tampoco está nada mal, con la inclusión de dos puertos Thunderbolt 5.

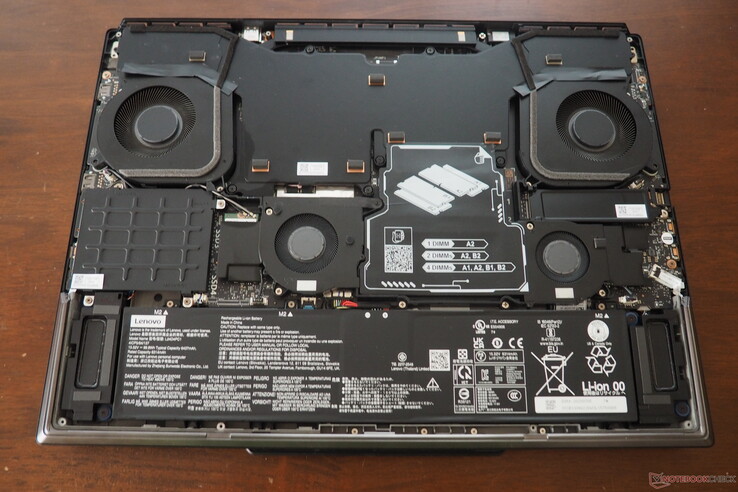
Bajo el capó, las cosas son bastante fastuosas si tenemos en cuenta los cuatro ventiladores, los cuatro bancos de RAM y las cuatro ranuras para SSD. La calidad del sonido también está a la altura del enorme precio de venta.

El rendimiento del Legion 9 18 es irreprochable. No en vano, gracias al overclocking de la GPU, el Legion 9 18 está a la cabeza de todos los portátiles con la GPU RTX 5090 para portátiles probados hasta la fecha.

Sin embargo, este chico tan delgado también tiene algunas desventajas. Por ejemplo, la fuente de alimentación de 400 W incluida es extremadamente voluminosa y pesada.

El portátil requiere mucha energía y sólo ofrece una escasa duración de la batería con altos niveles de ruido mientras se juega.

El homólogo RTX 5080 del Legion 9 18 se comporta ligeramente mejor en estos aspectos a pesar de su menor rendimiento.

Pro

+ carcasa estable y de alta calidad
+ overclocking de GPU opcional
+ cuatro ranuras SO-DIMM y M.2 cada una
+ dispositivos de entrada de éxito
+ iluminación elegante
+ conexiones modernas
+ sonido potente

Contra

- fuente de alimentación voluminosa y pesada
- consumo de energía elevado
- Pantalla muy reflectante
- ralentización parcial de la SSD
- escasa duración de la batería
- ruidoso bajo carga
- extremadamente caro

Precio y disponibilidad

El Lenovo Legion 9 18IAX10 con Core Ultra 9 275HX y GeForce RTX 5090 está disponible por algo menos de 6.000 euros en Amazon DE.

El portátil aún no aparece oficialmente en el sitio web de Lenovo en EE.UU., pero las variantes con Core Ultra 9 275HX y RTX 5080 pueden adquirirse a partir de 3.299,99 dólares a través de Lenovo.com.

Amazon Logo
$3,549.00
Lenovo Legion Pro 7i Gen 10 16" Gaming Laptop (2025 Model) Intel Core Ultra 9 275HX 24C, NVIDIA GeForce RTX 5090 24GB, 64GB RAM, 2TB (1TB+1TB) NVMe SSD, 16" WQXGA OLED 500 nits 240Hz, Windows 11 Home
  • $3,549.00
    Lenovo Legion Pro 7i Gen 10 16" Gaming Laptop (2025 Model) Intel Core Ultra 9 275HX 24C, NVIDIA GeForce RTX 5090 24GB, 64GB RAM, 2TB (1TB+1TB) NVMe SSD, 16.0" WQXGA OLED 500 nits 240Hz, Windows 11 Pro
  • $3,269.99
    Lenovo Legion Pro 7i Gen 10 (2025 Model) RTX 5090 Gaming Laptop, 16" OLED 2.5K WQXGA 240Hz, Intel Core Ultra 9 275HX, NVIDIA GeForce RTX 5090, 32GB DDR5, 1TB SSD, Wi-Fi 7, Per-Key RGB, Eclipse Black

La competencia del Legion 9 18 incluye otros portátiles para juegos de 18 pulgadas con la Portátil RTX 5090 como el Alienware 18 Area-51el Asus Strix Scar 18 G835y el Razer Blade 18 2025, que aparecen todos en las tablas como dispositivos de comparación.

Especificaciones

Lenovo Legion 9 18IAX10 RTX 5090 (Legion 9 18 Serie)
Procesador
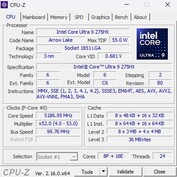
Intel Core Ultra 9 275HX 24 x 2.1 - 5.4 GHz, 205 W PL2 / Short Burst, 171 W PL1 / Sustained, Arrow Lake-HX
Adaptador gráfico
Nvidia GeForce RTX 5090 Laptop - 24 GB VRAM, Núcleo: 1747 MHz, Memoría: 1788 MHz, 175 W TDP, GDDR7, ForceWare 581.42, Optimus
Memoría
64 GB 
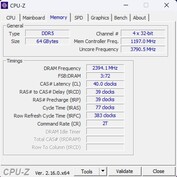
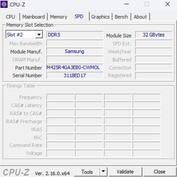
, 2x 32 GB DDR5-5600, four SO-DIMM slots (two empty)
pantalla
18.00 pulgadas 16:10, 3840 x 2400 pixels 252 PPI, BOEhydis NE180QAM-NZ2 (BOE0D5B), IPS, WQUXGA, lustroso: si, HDR, 240 Hz, Adaptive Sync
Placa base
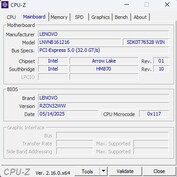
Intel HM870 (Arrow Lake-HX PCH)
Disco duro
Samsung PM9E1 MZVLC2T0HBLD, 2000 GB 
, NVMe-SSD, four M.2 2280 slots (three empty)
Tarjeta de sonido
Intel Arrow Point PCH - Audio Context Engine
Conexiones
4 USB 3.1 Gen2, 2 Thunderbolt 5, USB-C Power Delivery (PD), 1 HDMI, 2 DisplayPort, Audio Conexiones: Line-In/Out, Card Reader: SD
Equipamento de red
Killer 2.5 Gigabit Ethernet Controller (10/100/1000/2500MBit/s), Intel Killer Wi-Fi 7 BE1750W 320 MHz (BE200NGW) (b/g/n = Wi-Fi 4/ac = Wi-Fi 5/ax = Wi-Fi 6/ Wi-Fi 6E 6 GHz be = Wi-Fi 7), Bluetooth 5.4
Tamaño
Alto x ancho x profundidad (en mm): 28 x 403 x 297
Battería
99.9 Wh Litio-Polimero
Sistema Operativo
Microsoft Windows 11 Pro
Cámara
Webcam: E-shutter
Cámara principal: 5 MPix
Características adicionales
Altavoces: 4x 2W (woofers) + 2x 2W (tweeters), Teclado: Chiclet RGB, Luz de Teclado: si, 400 W Power Supply, Lenovo Vantage + Legion Software, 24 Meses Garantía
Peso
3.52 kg, Suministro de Electricidad: 1.24 kg
Precio
5900 EUR
Nota: El fabricante puede utilizar componentes de diferentes proveedores, incluidos paneles de visualización, unidades o lápices de memoria con especificaciones similares.


Chasis

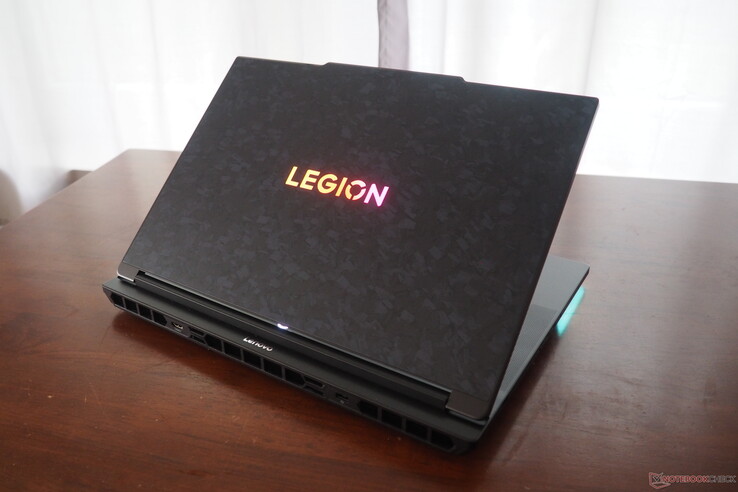
El chasis no sólo impresiona por su tapa texturizada, sino también por su buena estabilidad y su fabricación limpia. 3.5 kg es bastante peso para un portátil, superando incluso al Strix Scar 18 o al Blade 18 (3,2-3,3 kg). Pero, como demuestra el Alienware 18 Area-51 (4,2 kg), las cosas pueden ser aún más pesadas.

La altura de 2,8 cm (sin pies) está en línea con el Blade 18. Nos gustó especialmente el generoso ángulo de apertura de 180°.

Lenovo Legion 9 18
Lenovo Legion 9 18
Lenovo Legion 9 18
Lenovo Legion 9 18

Comparación de tamaños

410 mm 320 mm 24.32 mm 4.2 kg403 mm 297 mm 28 mm 3.5 kg399 mm 298 mm 32 mm 3.3 kg403 mm 296.9 mm 27.95 mm 3.5 kg400 mm 275.4 mm 27.9 mm 3.2 kg297 mm 210 mm 1 mm 5.7 g

Conectividad

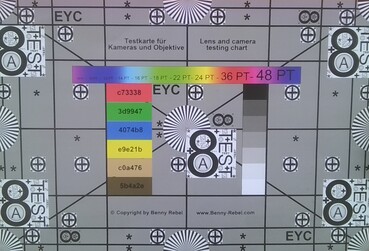
El número y la variedad de conexiones no dejan nada que desear, sobre todo porque Lenovo ha instalado interfaces modernas (véase más abajo). Curiosamente, el lector de tarjetas es más lento que en la versión RTX 5080, mientras que el módulo inalámbrico ofrece resultados significativamente mejores. La cámara web de 5 MP, que ofrece un obturador electrónico, produce imágenes decentes.

La apertura de la carcasa podría ser más cómoda para el mantenimiento. Aunque los 11 tornillos Phillips se pueden quitar con bastante facilidad, la cubierta inferior es increíblemente difícil de desprender.

Izquierda: USB-A 3.2 Gen2, 2,5 GbE RJ-45, 2x Thunderbolt 5 (incl. PD y DP 2.1), salida de audio de 3,5 mm
Trasera: HDMI 2.1, entrada de CC
Derecha: Obturador de la webcam, USB-C 3.2 Gen2, Lector de tarjetas, 2x USB-A 3.2 Gen2

Lector de tarjetas SD

SD Card Reader - average JPG Copy Test (av. of 3 runs)
Lenovo Legion 9 18IAX10
Intel Core Ultra 9 275HX (Toshiba Exceria Pro SDXC 64 GB UHS-II)
210.3 MB/s +153%
Razer Blade 18 2025 RTX 5090 Laptop
Intel Core Ultra 9 275HX (Angelbird AV Pro V60)
207 MB/s +149%
Alienware 18 Area-51
Intel Core Ultra 9 275HX (Toshiba Exceria Pro SDXC 64 GB UHS-II)
202.7 MB/s +144%
Media de la clase Gaming
  (20 - 210, n=67, últimos 2 años)
116.8 MB/s +41%
Lenovo Legion 9 18IAX10 RTX 5090
Intel Core Ultra 9 275HX (AV PRO microSD 128 GB V60)
83 MB/s

Comunicación

Networking
iperf3 transmit AXE11000
Asus Strix Scar 18 G835LX
Intel Wi-Fi 7 BE200 320MHz
1660 (1544min, 1548.64P1 - 1812max) MBit/s +31%
Razer Blade 18 2025 RTX 5090 Laptop
Intel Wi-Fi 7 BE202
1524 (1324min, 1335.89P1 - 1661max) MBit/s +20%
Alienware 18 Area-51
Intel Killer Wi-Fi 7 BE1750W 320 MHz (BE200NGW)
1472 (1259min - 1593max) MBit/s +16%
Lenovo Legion 9 18IAX10 RTX 5090
Intel Killer Wi-Fi 7 BE1750W 320 MHz (BE200NGW)
1272 (970min - 1472max) MBit/s
Media de la clase Gaming
  (469 - 1862, n=119, últimos 2 años)
1229 MBit/s -3%
Medio Intel Killer Wi-Fi 7 BE1750W 320 MHz (BE200NGW)
  (662 - 1609, n=8)
1224 MBit/s -4%
Lenovo Legion 9 18IAX10
Intel Killer Wi-Fi 7 BE1750x BE200NGW
658 (433min - 746max) MBit/s -48%
iperf3 receive AXE11000
Asus Strix Scar 18 G835LX
Intel Wi-Fi 7 BE200 320MHz
1588 (1563min, 1565.32P1 - 1610max) MBit/s +1%
Lenovo Legion 9 18IAX10 RTX 5090
Intel Killer Wi-Fi 7 BE1750W 320 MHz (BE200NGW)
1574 (1530min - 1596max) MBit/s
Razer Blade 18 2025 RTX 5090 Laptop
Intel Wi-Fi 7 BE202
1491 (1392min, 1398.09P1 - 1518max) MBit/s -5%
Media de la clase Gaming
  (680 - 1745, n=119, últimos 2 años)
1428 MBit/s -9%
Medio Intel Killer Wi-Fi 7 BE1750W 320 MHz (BE200NGW)
  (824 - 1644, n=8)
1410 MBit/s -10%
Alienware 18 Area-51
Intel Killer Wi-Fi 7 BE1750W 320 MHz (BE200NGW)
1393 (1267min - 1440max) MBit/s -11%
Lenovo Legion 9 18IAX10
Intel Killer Wi-Fi 7 BE1750x BE200NGW
798 (627min - 834max) MBit/s -49%
05010015020025030035040045050055060065070075080085090095010001050110011501200125013001350140014501500155016001650170017501800Tooltip
Lenovo Legion 9 18IAX10 RTX 5090 Intel Killer Wi-Fi 7 BE1750W 320 MHz (BE200NGW); iperf3 transmit AXE11000; iperf 3.1.3: Ø1272 (970-1472)
Alienware 18 Area-51 Intel Killer Wi-Fi 7 BE1750W 320 MHz (BE200NGW); iperf3 transmit AXE11000; iperf 3.1.3: Ø1472 (1259-1593)
Asus Strix Scar 18 G835LX Intel Wi-Fi 7 BE200 320MHz; iperf3 transmit AXE11000: Ø1660 (1544-1812)
Razer Blade 18 2025 RTX 5090 Laptop Intel Wi-Fi 7 BE202; iperf3 transmit AXE11000: Ø1524 (1324-1661)
Lenovo Legion 9 18IAX10 Intel Killer Wi-Fi 7 BE1750x BE200NGW; iperf3 transmit AXE11000; iperf 3.1.3: Ø658 (433-746)
Lenovo Legion 9 18IAX10 RTX 5090 Intel Killer Wi-Fi 7 BE1750W 320 MHz (BE200NGW); iperf3 receive AXE11000; iperf 3.1.3: Ø1573 (1530-1596)
Alienware 18 Area-51 Intel Killer Wi-Fi 7 BE1750W 320 MHz (BE200NGW); iperf3 receive AXE11000; iperf 3.1.3: Ø1392 (1267-1440)
Asus Strix Scar 18 G835LX Intel Wi-Fi 7 BE200 320MHz; iperf3 receive AXE11000: Ø1588 (1563-1610)
Razer Blade 18 2025 RTX 5090 Laptop Intel Wi-Fi 7 BE202; iperf3 receive AXE11000: Ø1491 (1392-1518)
Lenovo Legion 9 18IAX10 Intel Killer Wi-Fi 7 BE1750x BE200NGW; iperf3 receive AXE11000; iperf 3.1.3: Ø798 (627-834)

Cámara web

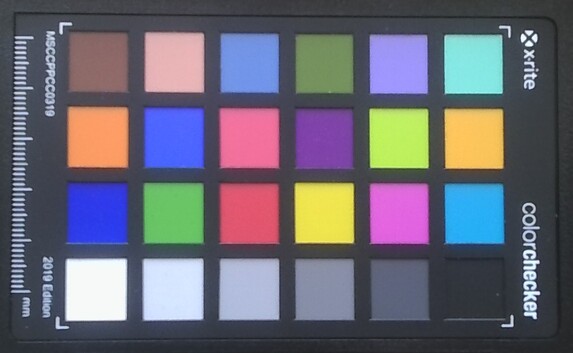
ColorChecker
11.4 ∆E
13.3 ∆E
11.8 ∆E
14.2 ∆E
13.3 ∆E
12.2 ∆E
11.4 ∆E
12.6 ∆E
14.9 ∆E
12.5 ∆E
12.2 ∆E
8.5 ∆E
11.1 ∆E
14.5 ∆E
16.3 ∆E
8.2 ∆E
14.6 ∆E
18.1 ∆E
1.9 ∆E
12.5 ∆E
15.1 ∆E
14.8 ∆E
12.6 ∆E
5.3 ∆E
ColorChecker Lenovo Legion 9 18IAX10 RTX 5090: 12.21 ∆E min: 1.87 - max: 18.05 ∆E

Mantenimiento

Lenovo Legion 9 18
Lenovo Legion 9 18
Lenovo Legion 9 18
Lenovo Legion 9 18

Dispositivos de entrada

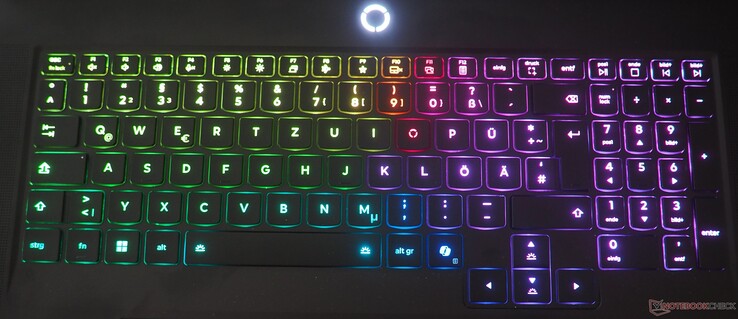
Aunque Lenovo no utiliza un teclado mecánico, la experiencia de introducción de datos con el teclado es impresionante. Entre otras cosas, el teclado deleita con una intensa iluminación RGB, una disposición muy utilizable y un tamaño de teclas agradable, especialmente para las teclas de dirección.

También hay un touchpad de precisión, que tiene un respetable tamaño de 15 x 9,5 cm y ofrece unas propiedades de deslizamiento bastante buenas.

Lenovo Legion 9 18

Mostrar

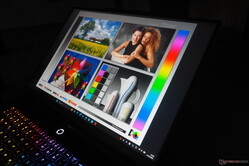
La decisión de Lenovo sobre la pantalla es un tanto incomprensible. Al igual que en la versión RTX 5080, en la SKU RTX 5090 se utiliza un panel IPS brillante, que puede ser muy reflectante dependiendo del entorno.

Para evitar estos reflejos, los modelos IPS suelen instalarse en versión mate, mientras que los paneles OLED son (algunos dirían que por desgracia) casi exclusivamente modelos brillantes.

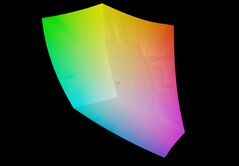
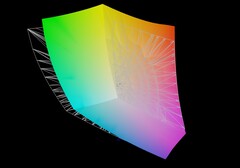
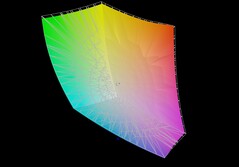
La ventaja de la versión brillante son los colores vivos, y este panel de 240 Hz ofrece una gran cobertura de la gama de colores. Además de Display P3, Adobe RGB también está cubierto casi por completo.

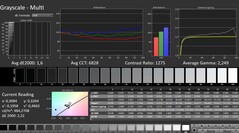
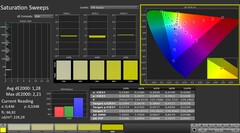
La pantalla se precalibra en el momento de la entrega, lo que se traduce en una gran precisión del color. Los valores también son buenos para los estándares IPS, sin ser superados por la competencia.

Un brillo medio de 440 cd/m² y un valor de negro de 0,27 cd/m² garantizan un sólido contraste de algo menos de 1.600:1. Tampoco hay sorpresas en cuanto a la estabilidad del ángulo de visión y los tiempos de respuesta.

Gracias a la elevada resolución de 3.840 x 2.400 (formato 16:10), la imagen se ve bastante nítida.

448
cd/m²
480
cd/m²
459
cd/m²
432
cd/m²
439
cd/m²
442
cd/m²
405
cd/m²
430
cd/m²
425
cd/m²
Temperatura del cuarto
BOEhydis NE180QAM-NZ2 (BOE0D5B) tested with X-Rite i1Pro 3
Máximo: 480 cd/m² (Nits) Médio: 440 cd/m² Minimum: 4 cd/m²
iluminación: 84 %
Brillo con batería: 439 cd/m²
Contraste: 1626:1 (Negro: 0.27 cd/m²)
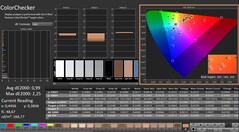
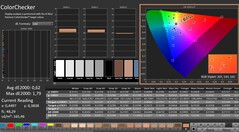
ΔE ColorChecker Calman: 0.99 | ∀{0.5-29.43 Ø4.79}
calibrated: 0.62
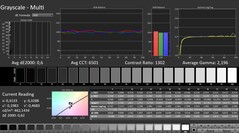
ΔE Greyscale Calman: 1.6 | ∀{0.09-98 Ø5}
88.9% AdobeRGB 1998 (Argyll 3D)
100% sRGB (Argyll 3D)
96.8% Display P3 (Argyll 3D)
Gamma: 2.249
CCT: 6828 K
Lenovo Legion 9 18IAX10 RTX 5090
BOEhydis NE180QAM-NZ2 (BOE0D5B), IPS, 3840x2400, 18", 240 Hz
Alienware 18 Area-51
AU Optronics B180QAN, IPS, 2560x1600, 18", 300 Hz
Asus Strix Scar 18 G835LX
N180QDM-NM2, Mini-LED, 2560x1600, 18", 240 Hz
Razer Blade 18 2025 RTX 5090 Laptop
NE180QAM-NZ1, IPS, 3840x2400, 18", 240 Hz
Lenovo Legion 9 18IAX10
BOE NE180QAM-NZ2, IPS, 3840x2400, 18", 240 Hz
Display
0%
0%
0%
-0%
Display P3 Coverage (%)
96.8
96.1
-1%
99
2%
97
0%
96
-1%
sRGB Coverage (%)
100
100
0%
100
0%
100
0%
100
0%
AdobeRGB 1998 Coverage (%)
88.9
89.7
1%
87.2
-2%
89
0%
88.8
0%
Response Times
-12%
-1%
48%
8%
Response Time Grey 50% / Grey 80% * (ms)
12.7 ?(6.2, 6.5)
13 ?(5.8, 7.2)
-2%
7.4 ?(2.4, 5)
42%
5.1 ?(2.3, 2.8)
60%
9.7 ?(4.6, 5.1)
24%
Response Time Black / White * (ms)
7.2 ?(3.3, 3.9)
8.7 ?(4.4, 4.3)
-21%
10.4 ?(0.6, 9.8)
-44%
4.6 ?(1.5, 3.1)
36%
7.8 ?(4.1, 3.7)
-8%
PWM Frequency (Hz)
20610 ?(100)
PWM Amplitude * (%)
100
Screen
-80%
69%
-56%
-67%
Brightness middle (cd/m²)
439
512.5
17%
764
74%
545
24%
479.7
9%
Brightness (cd/m²)
440
496
13%
747
70%
510
16%
465
6%
Brightness Distribution (%)
84
94
12%
93
11%
86
2%
86
2%
Black Level * (cd/m²)
0.27
0.41
-52%
0.1
63%
0.41
-52%
0.27
-0%
Contrast (:1)
1626
1250
-23%
7640
370%
1329
-18%
1777
9%
Colorchecker dE 2000 *
0.99
3.24
-227%
1.2
-21%
2.2
-122%
3.14
-217%
Colorchecker dE 2000 max. *
2.25
8.4
-273%
2.8
-24%
5.8
-158%
6.48
-188%
Colorchecker dE 2000 calibrated *
0.62
0.47
24%
1.1
-77%
1.17
-89%
Greyscale dE 2000 *
1.6
5
-213%
1.5
6%
3.5
-119%
3.8
-138%
Gamma
2.249 98%
2.37 93%
2.17 101%
2.18 101%
2.18 101%
CCT
6828 95%
6417 101%
6556 99%
7027 93%
7301 89%
Media total (Programa/Opciones)
-31% / -53%
23% / 42%
-3% / -29%
-20% / -42%

* ... más pequeño es mejor

Calman: Escala de grises
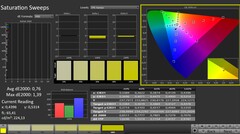
Calman: Saturación de color
Calman: ColorChecker
Calman: Escala de grises (calibrada)
Calman: Saturación del color (calibrado)
Calman: ColorChecker (calibrado)
Lenovo Legion 9 18 vs sRGB
Lenovo Legion 9 18 vs AdobeRGB
Lenovo Legion 9 18 vs Pantalla P3
Visión diurna
Visión diurna
Matriz de subpíxeles
Gran ángulo de visión

Tiempos de respuesta del display

Los tiempos de respuesta del display muestran lo rápido que puede cambiar la pantalla de un color al siguiente. Tiempos lentos de respuesta pueden llevar a imágenes persistentes alrededor de objetos en movimiento o a displays borrosos. Particularmente los aficionados a los juegos 3D frenéticos deberían usar una pantalla con tiempos de respuesta rápidos.
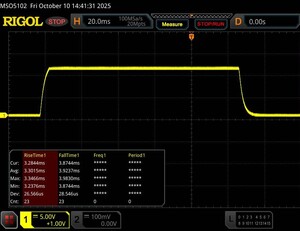
       Tiempo de respuesta de Negro a Blanco
7.2 ms ... subida ↗ y bajada ↘ combinada↗ 3.3 ms subida
↘ 3.9 ms bajada
La pantalla mostró tiempos de respuesta muy rápidos en nuestros tests y debería ser adecuada para juegos frenéticos.
En comparación, todos los dispositivos de prueba van de ##min### (mínimo) a 240 (máximo) ms. » 20 % de todos los dispositivos son mejores.
Esto quiere decir que el tiempo de respuesta medido es mejor que la media (20.3 ms) de todos los dispositivos testados.
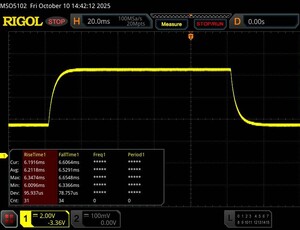
       Tiempo de respuesta 50% Gris a 80% Gris
12.7 ms ... subida ↗ y bajada ↘ combinada↗ 6.2 ms subida
↘ 6.5 ms bajada
La pantalla mostró buenos tiempos de respuesta en nuestros tests pero podría ser demasiado lenta para los jugones competitivos.
En comparación, todos los dispositivos de prueba van de ##min### (mínimo) a 636 (máximo) ms. » 25 % de todos los dispositivos son mejores.
Esto quiere decir que el tiempo de respuesta medido es mejor que la media (31.7 ms) de todos los dispositivos testados.

Parpadeo de Pantalla / PWM (Pulse-Width Modulation)

Para atenuar el brillo de pantalla algunos portátiles están encendiendo y apagando la retroiluminación muy rápidamente. Esto se hace a una frecuencia que no debiera detectarse a simple vista. Si la frecuencia es demasiado lenta, la gente sensible podría experimentar problemas visuales, dolores de cabeza e incluso ver parpadeos.
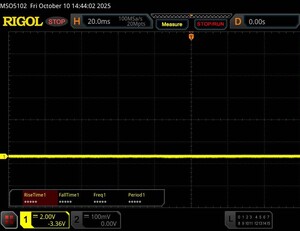
Parpadeo de Pantalla / PWM no detectado

Comparación: 53 % de todos los dispositivos testados no usaron PWM para atenuar el display. Si se usó, medimos una media de 8167 (mínimo: 5 - máxmo: 343500) Hz.

0% de luminosidad
0% de luminosidad
25% de luminosidad
25% de luminosidad
50% de luminosidad
50% de luminosidad
75% de luminosidad
75% de luminosidad
100% de luminosidad
100% de luminosidad

Rendimiento

En términos de hardware, en particular la CPU y la GPU, el Legion 9 18IAX10 pertenece al segmento de gama alta absoluta.

los 64 GB de RAM tampoco deberían alcanzar rápidamente sus límites para la mayoría de los usuarios, pero la unidad SSD de 2 TB incorporada podría haber sido mayor teniendo en cuenta el precio de la configuración de prueba.

CPU-Z
CPU-Z
CPU-Z
CPU-Z
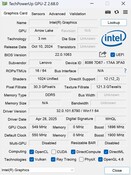
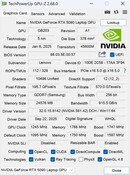
GPU-Z
GPU-Z
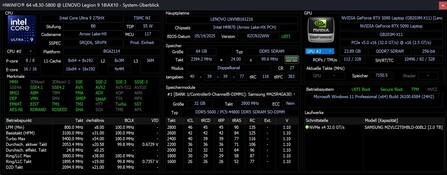
HWiNFO
 

Condiciones de la prueba

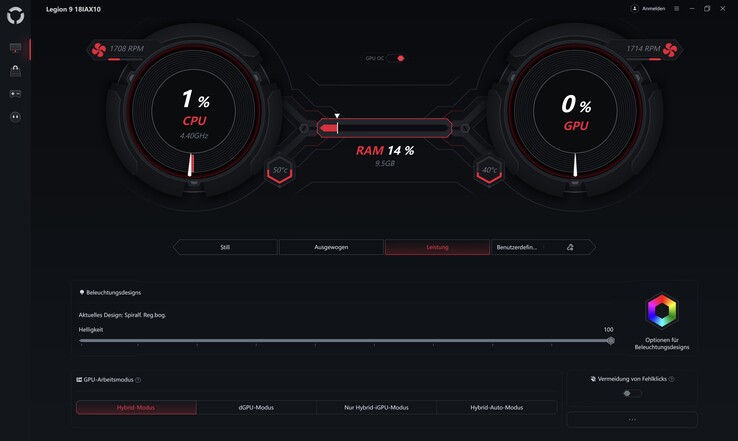
El modo de funcionamiento puede cambiarse a través del software Legion o cómodamente mediante la combinación de teclas Fn + Q. A menos que se indique lo contrario, nuestras mediciones se realizaron en el perfil Rendimiento con el overclocking de la GPU activado.

Legion Software
Modo Silencioso Equilibrado + GPUOC Rendimiento + GPU OC
Cyberpunk 2077 Ruido 41 dB(A) 49 dB(A) 56 dB(A)
Rendimiento de Cyberpunk 2077 (FHD/Ultra) 114 fps 136 fps 170 fps
Consumo de energía de la GPU de Cyberpunk 2077 ~75 W ~95 W ~165 W
Cinebench R15 Multi Score 4124 Puntos 5040 Puntos 6013 Puntos
CPU PL1 56 W 91 W 171 W
CPU PL2 65 W 125 W 205 W

Procesador

Los altos niveles PL1 y PL2 del Intel Core Ultra 9 275HX garantizan un rendimiento excelente en las pruebas comparativas de CPU, aunque esto también es aplicable a la competencia de la Legion 9 18, todas ellas equipadas también con un 275HX.

Los resultados en el bucle multinúcleo Cinebench R15 también fueron muy estables, lo que habla en favor de una buena refrigeración.

Cinebench R15 Bucle multinúcleo

03056109151220152518302135244027453050335536603965427045754880518554905795Tooltip
Lenovo Legion 9 18IAX10 RTX 5090 Intel Core Ultra 9 275HX: Ø5963 (5903.19-6039.56)
Alienware 18 Area-51 Intel Core Ultra 9 275HX: Ø5784 (5592.06-5827.51)
Asus Strix Scar 18 G835LX Intel Core Ultra 9 275HX: Ø5942 (5879.76-6059.69)
Razer Blade 18 2025 RTX 5090 Laptop Intel Core Ultra 9 275HX: Ø5669 (5617.98-5714.29)
Lenovo Legion 9 18IAX10 Intel Core Ultra 9 275HX: Ø5891 (5622.72-5979.97)
CPU Performance rating - Percent
Asus Strix Scar 18 G835LX
Intel Core Ultra 9 275HX
85.1 pt
Lenovo Legion 9 18IAX10
Intel Core Ultra 9 275HX
83.7 pt
Lenovo Legion 9 18IAX10 RTX 5090
Intel Core Ultra 9 275HX
82.7 pt
Alienware 18 Area-51
Intel Core Ultra 9 275HX
82.3 pt
Razer Blade 18 2025 RTX 5090 Laptop
Intel Core Ultra 9 275HX
81.5 pt
Medio Intel Core Ultra 9 275HX
 
79.3 pt
Media de la clase Gaming
 
62.2 pt
Cinebench R23
Multi Core
Lenovo Legion 9 18IAX10
Intel Core Ultra 9 275HX
39751 (37212.9min - 39751.3max) Points 0%
Lenovo Legion 9 18IAX10 RTX 5090
Intel Core Ultra 9 275HX
39723 Points
Asus Strix Scar 18 G835LX
Intel Core Ultra 9 275HX
39001 Points -2%
Alienware 18 Area-51
Intel Core Ultra 9 275HX
38431 (37240.9min - 38430.9max) Points -3%
Razer Blade 18 2025 RTX 5090 Laptop
Intel Core Ultra 9 275HX
37062 Points -7%
Medio Intel Core Ultra 9 275HX
  (30712 - 40970, n=25)
36028 Points -9%
Media de la clase Gaming
  (5668 - 40970, n=144, últimos 2 años)
25187 Points -37%
Single Core
Asus Strix Scar 18 G835LX
Intel Core Ultra 9 275HX
2252 Points +9%
Lenovo Legion 9 18IAX10
Intel Core Ultra 9 275HX
2211 Points +7%
Razer Blade 18 2025 RTX 5090 Laptop
Intel Core Ultra 9 275HX
2194 Points +6%
Alienware 18 Area-51
Intel Core Ultra 9 275HX
2192 Points +6%
Medio Intel Core Ultra 9 275HX
  (2009 - 2267, n=25)
2184 Points +6%
Lenovo Legion 9 18IAX10 RTX 5090
Intel Core Ultra 9 275HX
2061 Points
Media de la clase Gaming
  (1136 - 2267, n=144, últimos 2 años)
1979 Points -4%
Cinebench R20
CPU (Multi Core)
Lenovo Legion 9 18IAX10
Intel Core Ultra 9 275HX
15616 Points +1%
Lenovo Legion 9 18IAX10 RTX 5090
Intel Core Ultra 9 275HX
15528 Points
Asus Strix Scar 18 G835LX
Intel Core Ultra 9 275HX
15517 Points 0%
Alienware 18 Area-51
Intel Core Ultra 9 275HX
15149 Points -2%
Razer Blade 18 2025 RTX 5090 Laptop
Intel Core Ultra 9 275HX
14483 Points -7%
Medio Intel Core Ultra 9 275HX
  (12026 - 16108, n=24)
14115 Points -9%
Media de la clase Gaming
  (2179 - 16108, n=143, últimos 2 años)
9700 Points -38%
CPU (Single Core)
Asus Strix Scar 18 G835LX
Intel Core Ultra 9 275HX
866 Points +1%
Lenovo Legion 9 18IAX10 RTX 5090
Intel Core Ultra 9 275HX
859 Points
Lenovo Legion 9 18IAX10
Intel Core Ultra 9 275HX
855 Points 0%
Medio Intel Core Ultra 9 275HX
  (774 - 870, n=24)
843 Points -2%
Alienware 18 Area-51
Intel Core Ultra 9 275HX
842 Points -2%
Razer Blade 18 2025 RTX 5090 Laptop
Intel Core Ultra 9 275HX
838 Points -2%
Media de la clase Gaming
  (439 - 870, n=143, últimos 2 años)
764 Points -11%
Cinebench R15
CPU Multi 64Bit
Asus Strix Scar 18 G835LX
Intel Core Ultra 9 275HX
6060 (5879.76min - 6059.69max) Points 0%
Lenovo Legion 9 18IAX10 RTX 5090
Intel Core Ultra 9 275HX
6040 (5903.19min - 6039.56max) Points
Lenovo Legion 9 18IAX10
Intel Core Ultra 9 275HX
5980 (5622.72min - 5979.97max) Points -1%
Alienware 18 Area-51
Intel Core Ultra 9 275HX
5828 (5592.06min - 5827.51max) Points -4%
Razer Blade 18 2025 RTX 5090 Laptop
Intel Core Ultra 9 275HX
5714 (5617.98min - 5714.29max) Points -5%
Medio Intel Core Ultra 9 275HX
  (4756 - 6271, n=24)
5616 Points -7%
Media de la clase Gaming
  (1537 - 6271, n=143, últimos 2 años)
3898 Points -35%
CPU Single 64Bit
Asus Strix Scar 18 G835LX
Intel Core Ultra 9 275HX
343 Points +1%
Lenovo Legion 9 18IAX10 RTX 5090
Intel Core Ultra 9 275HX
340 Points
Lenovo Legion 9 18IAX10
Intel Core Ultra 9 275HX
334 Points -2%
Alienware 18 Area-51
Intel Core Ultra 9 275HX
331 Points -3%
Medio Intel Core Ultra 9 275HX
  (306 - 343, n=25)
331 Points -3%
Razer Blade 18 2025 RTX 5090 Laptop
Intel Core Ultra 9 275HX
327 Points -4%
Media de la clase Gaming
  (188.8 - 343, n=142, últimos 2 años)
293 Points -14%
Blender - v2.79 BMW27 CPU
Media de la clase Gaming
  (80 - 517, n=139, últimos 2 años)
154.1 Seconds * -81%
Medio Intel Core Ultra 9 275HX
  (82 - 116, n=23)
94.7 Seconds * -11%
Razer Blade 18 2025 RTX 5090 Laptop
Intel Core Ultra 9 275HX
89 Seconds * -5%
Alienware 18 Area-51
Intel Core Ultra 9 275HX
88 Seconds * -4%
Asus Strix Scar 18 G835LX
Intel Core Ultra 9 275HX
87 Seconds * -2%
Lenovo Legion 9 18IAX10 RTX 5090
Intel Core Ultra 9 275HX
85 Seconds *
Lenovo Legion 9 18IAX10
Intel Core Ultra 9 275HX
84 Seconds * +1%
7-Zip 18.03
7z b 4
Asus Strix Scar 18 G835LX
Intel Core Ultra 9 275HX
122818 MIPS +1%
Alienware 18 Area-51
Intel Core Ultra 9 275HX
121759 MIPS +1%
Lenovo Legion 9 18IAX10 RTX 5090
Intel Core Ultra 9 275HX
121015 MIPS
Razer Blade 18 2025 RTX 5090 Laptop
Intel Core Ultra 9 275HX
120234 MIPS -1%
Lenovo Legion 9 18IAX10
Intel Core Ultra 9 275HX
117865 MIPS -3%
Medio Intel Core Ultra 9 275HX
  (98236 - 124155, n=24)
113779 MIPS -6%
Media de la clase Gaming
  (23795 - 148086, n=141, últimos 2 años)
91277 MIPS -25%
7z b 4 -mmt1
Asus Strix Scar 18 G835LX
Intel Core Ultra 9 275HX
7027 MIPS +1%
Lenovo Legion 9 18IAX10 RTX 5090
Intel Core Ultra 9 275HX
6965 MIPS
Lenovo Legion 9 18IAX10
Intel Core Ultra 9 275HX
6710 MIPS -4%
Medio Intel Core Ultra 9 275HX
  (6026 - 7149, n=24)
6675 MIPS -4%
Razer Blade 18 2025 RTX 5090 Laptop
Intel Core Ultra 9 275HX
6588 MIPS -5%
Alienware 18 Area-51
Intel Core Ultra 9 275HX
6585 MIPS -5%
Media de la clase Gaming
  (4199 - 7508, n=141, últimos 2 años)
6395 MIPS -8%
Geekbench 6.5
Multi-Core
Asus Strix Scar 18 G835LX
Intel Core Ultra 9 275HX
21668 Points +7%
Razer Blade 18 2025 RTX 5090 Laptop
Intel Core Ultra 9 275HX
20819 Points +2%
Lenovo Legion 9 18IAX10
Intel Core Ultra 9 275HX
20352 Points 0%
Lenovo Legion 9 18IAX10 RTX 5090
Intel Core Ultra 9 275HX
20324 Points
Alienware 18 Area-51
Intel Core Ultra 9 275HX
19869 Points -2%
Medio Intel Core Ultra 9 275HX
  (16033 - 21668, n=26)
19387 Points -5%
Media de la clase Gaming
  (5340 - 22104, n=141, últimos 2 años)
15604 Points -23%
Single-Core
Asus Strix Scar 18 G835LX
Intel Core Ultra 9 275HX
3158 Points +2%
Lenovo Legion 9 18IAX10 RTX 5090
Intel Core Ultra 9 275HX
3095 Points
Lenovo Legion 9 18IAX10
Intel Core Ultra 9 275HX
3062 Points -1%
Alienware 18 Area-51
Intel Core Ultra 9 275HX
3057 Points -1%
Medio Intel Core Ultra 9 275HX
  (2843 - 3160, n=26)
3030 Points -2%
Razer Blade 18 2025 RTX 5090 Laptop
Intel Core Ultra 9 275HX
2986 Points -4%
Media de la clase Gaming
  (1490 - 3253, n=141, últimos 2 años)
2779 Points -10%
Geekbench 5.5
Multi-Core
Asus Strix Scar 18 G835LX
Intel Core Ultra 9 275HX
25855 Points +5%
Razer Blade 18 2025 RTX 5090 Laptop
Intel Core Ultra 9 275HX
25068 Points +2%
Lenovo Legion 9 18IAX10 RTX 5090
Intel Core Ultra 9 275HX
24600 Points
Lenovo Legion 9 18IAX10
Intel Core Ultra 9 275HX
24203 Points -2%
Alienware 18 Area-51
Intel Core Ultra 9 275HX
23447 Points -5%
Medio Intel Core Ultra 9 275HX
  (19105 - 25855, n=25)
22878 Points -7%
Media de la clase Gaming
  (4557 - 27010, n=140, últimos 2 años)
16739 Points -32%
Single-Core
Asus Strix Scar 18 G835LX
Intel Core Ultra 9 275HX
2292 Points +2%
Lenovo Legion 9 18IAX10 RTX 5090
Intel Core Ultra 9 275HX
2254 Points
Lenovo Legion 9 18IAX10
Intel Core Ultra 9 275HX
2239 Points -1%
Alienware 18 Area-51
Intel Core Ultra 9 275HX
2233 Points -1%
Razer Blade 18 2025 RTX 5090 Laptop
Intel Core Ultra 9 275HX
2217 Points -2%
Medio Intel Core Ultra 9 275HX
  (2033 - 2292, n=25)
2198 Points -2%
Media de la clase Gaming
  (986 - 2423, n=140, últimos 2 años)
2002 Points -11%
HWBOT x265 Benchmark v2.2 - 4k Preset
Lenovo Legion 9 18IAX10
Intel Core Ultra 9 275HX
41.3 fps 0%
Asus Strix Scar 18 G835LX
Intel Core Ultra 9 275HX
41.2 fps 0%
Lenovo Legion 9 18IAX10 RTX 5090
Intel Core Ultra 9 275HX
41.1 fps
Alienware 18 Area-51
Intel Core Ultra 9 275HX
40.5 fps -1%
Razer Blade 18 2025 RTX 5090 Laptop
Intel Core Ultra 9 275HX
39.7 fps -3%
Medio Intel Core Ultra 9 275HX
  (30.7 - 43.8, n=24)
38.2 fps -7%
Media de la clase Gaming
  (7.7 - 44.3, n=141, últimos 2 años)
27.2 fps -34%
LibreOffice - 20 Documents To PDF
Media de la clase Gaming
  (19 - 88.8, n=140, últimos 2 años)
47.6 s * -2%
Lenovo Legion 9 18IAX10 RTX 5090
Intel Core Ultra 9 275HX
46.6 s *
Medio Intel Core Ultra 9 275HX
  (33.2 - 62.1, n=24)
41.5 s * +11%
Asus Strix Scar 18 G835LX
Intel Core Ultra 9 275HX
41.3 s * +11%
Razer Blade 18 2025 RTX 5090 Laptop
Intel Core Ultra 9 275HX
39.5 s * +15%
Alienware 18 Area-51
Intel Core Ultra 9 275HX
37.4 s * +20%
Lenovo Legion 9 18IAX10
Intel Core Ultra 9 275HX
36.8 s * +21%
R Benchmark 2.5 - Overall mean
Media de la clase Gaming
  (0.3551 - 0.759, n=142, últimos 2 años)
0.428 sec * -6%
Razer Blade 18 2025 RTX 5090 Laptop
Intel Core Ultra 9 275HX
0.4174 sec * -3%
Medio Intel Core Ultra 9 275HX
  (0.3943 - 0.4568, n=24)
0.4172 sec * -3%
Alienware 18 Area-51
Intel Core Ultra 9 275HX
0.4088 sec * -1%
Lenovo Legion 9 18IAX10
Intel Core Ultra 9 275HX
0.4079 sec * -1%
Lenovo Legion 9 18IAX10 RTX 5090
Intel Core Ultra 9 275HX
0.4043 sec *
Asus Strix Scar 18 G835LX
Intel Core Ultra 9 275HX
0.3943 sec * +2%

* ... más pequeño es mejor

Cinebench R15 CPU Multi 64Bit
6040 Points
Cinebench R15 OpenGL 64Bit
325 fps
Cinebench R15 Ref. Match 64Bit
99.6 %
Cinebench R15 CPU Single 64Bit
340 Points
Cinebench R20 CPU (Single Core)
859 Points
Cinebench R20 CPU (Multi Core)
15528 Points
Cinebench R23 Multi Core
39723 Points
Cinebench R23 Single Core
2061 Points
Cinebench 2024 CPU Single Core
136 Points
Cinebench 2024 CPU Multi Core
2199 Points
ayuda
Performance rating
Lenovo Legion 9 18IAX10
Intel Core Ultra 9 275HX, GeForce RTX 5080 Laptop
97.6 pt
Alienware 18 Area-51
Intel Core Ultra 9 275HX, GeForce RTX 5090 Laptop
94.3 pt
Asus Strix Scar 18 G835LX
Intel Core Ultra 9 275HX, GeForce RTX 5090 Laptop
93.1 pt
Lenovo Legion 9 18IAX10 RTX 5090
Intel Core Ultra 9 275HX, GeForce RTX 5090 Laptop
91.9 pt
Razer Blade 18 2025 RTX 5090 Laptop
Intel Core Ultra 9 275HX, GeForce RTX 5090 Laptop
88.4 pt
Medio Intel Core Ultra 9 275HX
 
86.1 pt
Media de la clase Gaming
 
69.2 pt
AIDA64 / FP32 Ray-Trace
Lenovo Legion 9 18IAX10
Intel Core Ultra 9 275HX, GeForce RTX 5080 Laptop
39730 KRay/s +1%
Asus Strix Scar 18 G835LX
Intel Core Ultra 9 275HX, GeForce RTX 5090 Laptop
39458 KRay/s +1%
Lenovo Legion 9 18IAX10 RTX 5090
Intel Core Ultra 9 275HX, GeForce RTX 5090 Laptop
39159 KRay/s
Alienware 18 Area-51
Intel Core Ultra 9 275HX, GeForce RTX 5090 Laptop
39149 KRay/s 0%
Medio Intel Core Ultra 9 275HX
  (28067 - 39895, n=24)
35827 KRay/s -9%
Razer Blade 18 2025 RTX 5090 Laptop
Intel Core Ultra 9 275HX, GeForce RTX 5090 Laptop
35004 KRay/s -11%
Media de la clase Gaming
  (7192 - 85542, n=139, últimos 2 años)
28248 KRay/s -28%
AIDA64 / FPU Julia
Alienware 18 Area-51
Intel Core Ultra 9 275HX, GeForce RTX 5090 Laptop
200744 Points +1%
Lenovo Legion 9 18IAX10
Intel Core Ultra 9 275HX, GeForce RTX 5080 Laptop
199786 Points +1%
Lenovo Legion 9 18IAX10 RTX 5090
Intel Core Ultra 9 275HX, GeForce RTX 5090 Laptop
198115 Points
Asus Strix Scar 18 G835LX
Intel Core Ultra 9 275HX, GeForce RTX 5090 Laptop
194867 Points -2%
Razer Blade 18 2025 RTX 5090 Laptop
Intel Core Ultra 9 275HX, GeForce RTX 5090 Laptop
192982 Points -3%
Medio Intel Core Ultra 9 275HX
  (140254 - 200744, n=24)
180870 Points -9%
Media de la clase Gaming
  (35040 - 252486, n=139, últimos 2 años)
127486 Points -36%
AIDA64 / CPU SHA3
Lenovo Legion 9 18IAX10
Intel Core Ultra 9 275HX, GeForce RTX 5080 Laptop
9817 MB/s +5%
Asus Strix Scar 18 G835LX
Intel Core Ultra 9 275HX, GeForce RTX 5090 Laptop
9482 MB/s +2%
Alienware 18 Area-51
Intel Core Ultra 9 275HX, GeForce RTX 5090 Laptop
9479 MB/s +2%
Lenovo Legion 9 18IAX10 RTX 5090
Intel Core Ultra 9 275HX, GeForce RTX 5090 Laptop
9330 MB/s
Razer Blade 18 2025 RTX 5090 Laptop
Intel Core Ultra 9 275HX, GeForce RTX 5090 Laptop
8964 MB/s -4%
Medio Intel Core Ultra 9 275HX
  (6766 - 9817, n=24)
8688 MB/s -7%
Media de la clase Gaming
  (1728 - 10389, n=139, últimos 2 años)
5861 MB/s -37%
AIDA64 / CPU Queen
Alienware 18 Area-51
Intel Core Ultra 9 275HX, GeForce RTX 5090 Laptop
140937 Points +1%
Lenovo Legion 9 18IAX10
Intel Core Ultra 9 275HX, GeForce RTX 5080 Laptop
139875 Points +1%
Asus Strix Scar 18 G835LX
Intel Core Ultra 9 275HX, GeForce RTX 5090 Laptop
139608 Points 0%
Lenovo Legion 9 18IAX10 RTX 5090
Intel Core Ultra 9 275HX, GeForce RTX 5090 Laptop
139080 Points
Razer Blade 18 2025 RTX 5090 Laptop
Intel Core Ultra 9 275HX, GeForce RTX 5090 Laptop
135851 Points -2%
Medio Intel Core Ultra 9 275HX
  (113887 - 140937, n=24)
134000 Points -4%
Media de la clase Gaming
  (50699 - 200651, n=139, últimos 2 años)
119750 Points -14%
AIDA64 / FPU SinJulia
Lenovo Legion 9 18IAX10
Intel Core Ultra 9 275HX, GeForce RTX 5080 Laptop
14425 Points +2%
Media de la clase Gaming
  (5020 - 33636, n=139, últimos 2 años)
14420 Points +2%
Lenovo Legion 9 18IAX10 RTX 5090
Intel Core Ultra 9 275HX, GeForce RTX 5090 Laptop
14126 Points
Asus Strix Scar 18 G835LX
Intel Core Ultra 9 275HX, GeForce RTX 5090 Laptop
14112 Points 0%
Alienware 18 Area-51
Intel Core Ultra 9 275HX, GeForce RTX 5090 Laptop
13997 Points -1%
Razer Blade 18 2025 RTX 5090 Laptop
Intel Core Ultra 9 275HX, GeForce RTX 5090 Laptop
13643 Points -3%
Medio Intel Core Ultra 9 275HX
  (11172 - 14425, n=24)
13513 Points -4%
AIDA64 / FPU Mandel
Lenovo Legion 9 18IAX10
Intel Core Ultra 9 275HX, GeForce RTX 5080 Laptop
104508 Points +1%
Alienware 18 Area-51
Intel Core Ultra 9 275HX, GeForce RTX 5090 Laptop
104217 Points 0%
Asus Strix Scar 18 G835LX
Intel Core Ultra 9 275HX, GeForce RTX 5090 Laptop
104057 Points 0%
Lenovo Legion 9 18IAX10 RTX 5090
Intel Core Ultra 9 275HX, GeForce RTX 5090 Laptop
103702 Points
Razer Blade 18 2025 RTX 5090 Laptop
Intel Core Ultra 9 275HX, GeForce RTX 5090 Laptop
96990 Points -6%
Medio Intel Core Ultra 9 275HX
  (72596 - 104508, n=24)
94298 Points -9%
Media de la clase Gaming
  (17585 - 134044, n=139, últimos 2 años)
65718 Points -37%
AIDA64 / CPU AES
Lenovo Legion 9 18IAX10
Intel Core Ultra 9 275HX, GeForce RTX 5080 Laptop
247074 MB/s +82%
Lenovo Legion 9 18IAX10 RTX 5090
Intel Core Ultra 9 275HX, GeForce RTX 5090 Laptop
135576 MB/s
Asus Strix Scar 18 G835LX
Intel Core Ultra 9 275HX, GeForce RTX 5090 Laptop
134920 MB/s 0%
Alienware 18 Area-51
Intel Core Ultra 9 275HX, GeForce RTX 5090 Laptop
134887 MB/s -1%
Medio Intel Core Ultra 9 275HX
  (107195 - 247074, n=24)
132597 MB/s -2%
Razer Blade 18 2025 RTX 5090 Laptop
Intel Core Ultra 9 275HX, GeForce RTX 5090 Laptop
131331 MB/s -3%
Media de la clase Gaming
  (19065 - 247074, n=139, últimos 2 años)
109553 MB/s -19%
AIDA64 / CPU ZLib
Lenovo Legion 9 18IAX10 RTX 5090
Intel Core Ultra 9 275HX, GeForce RTX 5090 Laptop
2236 MB/s
Lenovo Legion 9 18IAX10
Intel Core Ultra 9 275HX, GeForce RTX 5080 Laptop
2226 MB/s 0%
Asus Strix Scar 18 G835LX
Intel Core Ultra 9 275HX, GeForce RTX 5090 Laptop
2220 MB/s -1%
Alienware 18 Area-51
Intel Core Ultra 9 275HX, GeForce RTX 5090 Laptop
2188 MB/s -2%
Razer Blade 18 2025 RTX 5090 Laptop
Intel Core Ultra 9 275HX, GeForce RTX 5090 Laptop
2109 MB/s -6%
Medio Intel Core Ultra 9 275HX
  (1599 - 2263, n=24)
2050 MB/s -8%
Media de la clase Gaming
  (373 - 2531, n=139, últimos 2 años)
1533 MB/s -31%
AIDA64 / FP64 Ray-Trace
Lenovo Legion 9 18IAX10
Intel Core Ultra 9 275HX, GeForce RTX 5080 Laptop
21854 KRay/s +2%
Alienware 18 Area-51
Intel Core Ultra 9 275HX, GeForce RTX 5090 Laptop
21542 KRay/s +1%
Lenovo Legion 9 18IAX10 RTX 5090
Intel Core Ultra 9 275HX, GeForce RTX 5090 Laptop
21381 KRay/s
Asus Strix Scar 18 G835LX
Intel Core Ultra 9 275HX, GeForce RTX 5090 Laptop
21372 KRay/s 0%
Medio Intel Core Ultra 9 275HX
  (14847 - 21854, n=24)
19331 KRay/s -10%
Razer Blade 18 2025 RTX 5090 Laptop
Intel Core Ultra 9 275HX, GeForce RTX 5090 Laptop
19038 KRay/s -11%
Media de la clase Gaming
  (3856 - 45446, n=139, últimos 2 años)
15118 KRay/s -29%
AIDA64 / CPU PhotoWorxx
Alienware 18 Area-51
Intel Core Ultra 9 275HX, GeForce RTX 5090 Laptop
62916 MPixel/s +29%
Razer Blade 18 2025 RTX 5090 Laptop
Intel Core Ultra 9 275HX, GeForce RTX 5090 Laptop
56818 MPixel/s +16%
Asus Strix Scar 18 G835LX
Intel Core Ultra 9 275HX, GeForce RTX 5090 Laptop
56601 MPixel/s +16%
Medio Intel Core Ultra 9 275HX
  (37482 - 62916, n=24)
50180 MPixel/s +3%
Lenovo Legion 9 18IAX10 RTX 5090
Intel Core Ultra 9 275HX, GeForce RTX 5090 Laptop
48862 MPixel/s
Lenovo Legion 9 18IAX10
Intel Core Ultra 9 275HX, GeForce RTX 5080 Laptop
48730 MPixel/s 0%
Media de la clase Gaming
  (10805 - 62916, n=139, últimos 2 años)
42851 MPixel/s -12%

Rendimiento del sistema

En términos de rendimiento del sistema, la Legion 9 18 y sus rivales también están muy cerca entre sí, lo que significa que cualquier diferencia en las tareas de productividad diarias apenas se nota en la práctica.

Performance rating: Percent
PCMark 10: Essentials
CrossMark: Overall | Productivity | Creativity | Responsiveness
WebXPRT 3: Overall
WebXPRT 4: Overall
Mozilla Kraken 1.1: Total
Performance rating
Alienware 18 Area-51
GeForce RTX 5090 Laptop, Ultra 9 275HX
87.8 pt
Lenovo Legion 9 18IAX10
GeForce RTX 5080 Laptop, Ultra 9 275HX, Samsung PM9E1 MZVLC2T0HBLD
85 pt
Razer Blade 18 2025 RTX 5090 Laptop
GeForce RTX 5090 Laptop, Ultra 9 275HX, Lexar NM790 2TB
83.6 pt
Asus Strix Scar 18 G835LX
GeForce RTX 5090 Laptop, Ultra 9 275HX, WD PC SN8000S 2TB
83.2 pt
Lenovo Legion 9 18IAX10 RTX 5090
GeForce RTX 5090 Laptop, Ultra 9 275HX, Samsung PM9E1 MZVLC2T0HBLD
82.8 pt
Medio Intel Core Ultra 9 275HX, Nvidia GeForce RTX 5090 Laptop
 
82.8 pt
Media de la clase Gaming
 
74 pt
PCMark 10 / Essentials
Lenovo Legion 9 18IAX10
GeForce RTX 5080 Laptop, Ultra 9 275HX, Samsung PM9E1 MZVLC2T0HBLD
11472 Points +8%
Alienware 18 Area-51
GeForce RTX 5090 Laptop, Ultra 9 275HX
11062 Points +4%
Asus Strix Scar 18 G835LX
GeForce RTX 5090 Laptop, Ultra 9 275HX, WD PC SN8000S 2TB
10966 Points +3%
Medio Intel Core Ultra 9 275HX, Nvidia GeForce RTX 5090 Laptop
  (9994 - 11369, n=11)
10890 Points +2%
Media de la clase Gaming
  (8840 - 12600, n=122, últimos 2 años)
10758 Points +1%
Razer Blade 18 2025 RTX 5090 Laptop
GeForce RTX 5090 Laptop, Ultra 9 275HX, Lexar NM790 2TB
10688 Points 0%
Lenovo Legion 9 18IAX10 RTX 5090
GeForce RTX 5090 Laptop, Ultra 9 275HX, Samsung PM9E1 MZVLC2T0HBLD
10656 Points
CrossMark / Overall
Alienware 18 Area-51
GeForce RTX 5090 Laptop, Ultra 9 275HX
2339 Points +7%
Razer Blade 18 2025 RTX 5090 Laptop
GeForce RTX 5090 Laptop, Ultra 9 275HX, Lexar NM790 2TB
2269 Points +3%
Asus Strix Scar 18 G835LX
GeForce RTX 5090 Laptop, Ultra 9 275HX, WD PC SN8000S 2TB
2221 Points +1%
Lenovo Legion 9 18IAX10
GeForce RTX 5080 Laptop, Ultra 9 275HX, Samsung PM9E1 MZVLC2T0HBLD
2221 Points +1%
Medio Intel Core Ultra 9 275HX, Nvidia GeForce RTX 5090 Laptop
  (1995 - 2339, n=11)
2202 Points 0%
Lenovo Legion 9 18IAX10 RTX 5090
GeForce RTX 5090 Laptop, Ultra 9 275HX, Samsung PM9E1 MZVLC2T0HBLD
2195 Points
Media de la clase Gaming
  (1247 - 2344, n=113, últimos 2 años)
1985 Points -10%
CrossMark / Productivity
Alienware 18 Area-51
GeForce RTX 5090 Laptop, Ultra 9 275HX
2211 Points +10%
Razer Blade 18 2025 RTX 5090 Laptop
GeForce RTX 5090 Laptop, Ultra 9 275HX, Lexar NM790 2TB
2069 Points +3%
Lenovo Legion 9 18IAX10
GeForce RTX 5080 Laptop, Ultra 9 275HX, Samsung PM9E1 MZVLC2T0HBLD
2055 Points +2%
Medio Intel Core Ultra 9 275HX, Nvidia GeForce RTX 5090 Laptop
  (1847 - 2211, n=11)
2041 Points +1%
Asus Strix Scar 18 G835LX
GeForce RTX 5090 Laptop, Ultra 9 275HX, WD PC SN8000S 2TB
2025 Points +1%
Lenovo Legion 9 18IAX10 RTX 5090
GeForce RTX 5090 Laptop, Ultra 9 275HX, Samsung PM9E1 MZVLC2T0HBLD
2012 Points
Media de la clase Gaming
  (1299 - 2211, n=113, últimos 2 años)
1864 Points -7%
CrossMark / Creativity
Razer Blade 18 2025 RTX 5090 Laptop
GeForce RTX 5090 Laptop, Ultra 9 275HX, Lexar NM790 2TB
2642 Points +3%
Asus Strix Scar 18 G835LX
GeForce RTX 5090 Laptop, Ultra 9 275HX, WD PC SN8000S 2TB
2606 Points +2%
Lenovo Legion 9 18IAX10 RTX 5090
GeForce RTX 5090 Laptop, Ultra 9 275HX, Samsung PM9E1 MZVLC2T0HBLD
2559 Points
Alienware 18 Area-51
GeForce RTX 5090 Laptop, Ultra 9 275HX
2519 Points -2%
Lenovo Legion 9 18IAX10
GeForce RTX 5080 Laptop, Ultra 9 275HX, Samsung PM9E1 MZVLC2T0HBLD
2498 Points -2%
Medio Intel Core Ultra 9 275HX, Nvidia GeForce RTX 5090 Laptop
  (2170 - 2642, n=11)
2497 Points -2%
Media de la clase Gaming
  (1275 - 2729, n=113, últimos 2 años)
2216 Points -13%
CrossMark / Responsiveness
Alienware 18 Area-51
GeForce RTX 5090 Laptop, Ultra 9 275HX
2217 Points +23%
Lenovo Legion 9 18IAX10
GeForce RTX 5080 Laptop, Ultra 9 275HX, Samsung PM9E1 MZVLC2T0HBLD
1973 Points +10%
Medio Intel Core Ultra 9 275HX, Nvidia GeForce RTX 5090 Laptop
  (1673 - 2217, n=11)
1906 Points +6%
Razer Blade 18 2025 RTX 5090 Laptop
GeForce RTX 5090 Laptop, Ultra 9 275HX, Lexar NM790 2TB
1897 Points +5%
Asus Strix Scar 18 G835LX
GeForce RTX 5090 Laptop, Ultra 9 275HX, WD PC SN8000S 2TB
1813 Points +1%
Lenovo Legion 9 18IAX10 RTX 5090
GeForce RTX 5090 Laptop, Ultra 9 275HX, Samsung PM9E1 MZVLC2T0HBLD
1800 Points
Media de la clase Gaming
  (1030 - 2330, n=113, últimos 2 años)
1737 Points -3%
WebXPRT 3 / Overall
Lenovo Legion 9 18IAX10
GeForce RTX 5080 Laptop, Ultra 9 275HX, Samsung PM9E1 MZVLC2T0HBLD
378 Points +2%
Lenovo Legion 9 18IAX10 RTX 5090
GeForce RTX 5090 Laptop, Ultra 9 275HX, Samsung PM9E1 MZVLC2T0HBLD
372 Points
Alienware 18 Area-51
GeForce RTX 5090 Laptop, Ultra 9 275HX
362 Points -3%
Razer Blade 18 2025 RTX 5090 Laptop
GeForce RTX 5090 Laptop, Ultra 9 275HX, Lexar NM790 2TB
351 Points -6%
Medio Intel Core Ultra 9 275HX, Nvidia GeForce RTX 5090 Laptop
  (315 - 372, n=11)
347 Points -7%
Asus Strix Scar 18 G835LX
GeForce RTX 5090 Laptop, Ultra 9 275HX, WD PC SN8000S 2TB
346 Points -7%
Media de la clase Gaming
  (237 - 532, n=116, últimos 2 años)
316 Points -15%
WebXPRT 4 / Overall
Alienware 18 Area-51
GeForce RTX 5090 Laptop, Ultra 9 275HX
341 Points +4%
Asus Strix Scar 18 G835LX
GeForce RTX 5090 Laptop, Ultra 9 275HX, WD PC SN8000S 2TB
335 Points +2%
Lenovo Legion 9 18IAX10
GeForce RTX 5080 Laptop, Ultra 9 275HX, Samsung PM9E1 MZVLC2T0HBLD
333 Points +2%
Medio Intel Core Ultra 9 275HX, Nvidia GeForce RTX 5090 Laptop
  (313 - 341, n=10)
329 Points +1%
Lenovo Legion 9 18IAX10 RTX 5090
GeForce RTX 5090 Laptop, Ultra 9 275HX, Samsung PM9E1 MZVLC2T0HBLD
327 Points
Razer Blade 18 2025 RTX 5090 Laptop
GeForce RTX 5090 Laptop, Ultra 9 275HX, Lexar NM790 2TB
319 Points -2%
Media de la clase Gaming
  (176.4 - 345, n=112, últimos 2 años)
284 Points -13%
Mozilla Kraken 1.1 / Total
Media de la clase Gaming
  (397 - 674, n=126, últimos 2 años)
472 ms * -14%
Lenovo Legion 9 18IAX10
GeForce RTX 5080 Laptop, Ultra 9 275HX, Samsung PM9E1 MZVLC2T0HBLD
421 ms * -1%
Lenovo Legion 9 18IAX10 RTX 5090
GeForce RTX 5090 Laptop, Ultra 9 275HX, Samsung PM9E1 MZVLC2T0HBLD
415 ms *
Medio Intel Core Ultra 9 275HX, Nvidia GeForce RTX 5090 Laptop
  (402 - 424, n=11)
413 ms * -0%
Razer Blade 18 2025 RTX 5090 Laptop
GeForce RTX 5090 Laptop, Ultra 9 275HX, Lexar NM790 2TB
411 ms * +1%
Asus Strix Scar 18 G835LX
GeForce RTX 5090 Laptop, Ultra 9 275HX, WD PC SN8000S 2TB
409 ms * +1%
Alienware 18 Area-51
GeForce RTX 5090 Laptop, Ultra 9 275HX
402 ms * +3%

* ... más pequeño es mejor

AIDA64 / Memory Copy
Alienware 18 Area-51
Intel Core Ultra 9 275HX, GeForce RTX 5090 Laptop
94460 MB/s +29%
Asus Strix Scar 18 G835LX
Intel Core Ultra 9 275HX, GeForce RTX 5090 Laptop
84432 MB/s +16%
Razer Blade 18 2025 RTX 5090 Laptop
Intel Core Ultra 9 275HX, GeForce RTX 5090 Laptop
84391 MB/s +16%
Lenovo Legion 9 18IAX10
Intel Core Ultra 9 275HX, GeForce RTX 5080 Laptop
80101 MB/s +10%
Medio Intel Core Ultra 9 275HX
  (56003 - 94460, n=24)
79435 MB/s +9%
Lenovo Legion 9 18IAX10 RTX 5090
Intel Core Ultra 9 275HX, GeForce RTX 5090 Laptop
72954 MB/s
Media de la clase Gaming
  (21750 - 104987, n=139, últimos 2 años)
70734 MB/s -3%
AIDA64 / Memory Read
Alienware 18 Area-51
Intel Core Ultra 9 275HX, GeForce RTX 5090 Laptop
96990 MB/s +30%
Asus Strix Scar 18 G835LX
Intel Core Ultra 9 275HX, GeForce RTX 5090 Laptop
86194 MB/s +16%
Razer Blade 18 2025 RTX 5090 Laptop
Intel Core Ultra 9 275HX, GeForce RTX 5090 Laptop
84719 MB/s +14%
Medio Intel Core Ultra 9 275HX
  (55795 - 97151, n=24)
84051 MB/s +13%
Lenovo Legion 9 18IAX10
Intel Core Ultra 9 275HX, GeForce RTX 5080 Laptop
74725 MB/s 0%
Lenovo Legion 9 18IAX10 RTX 5090
Intel Core Ultra 9 275HX, GeForce RTX 5090 Laptop
74579 MB/s
Media de la clase Gaming
  (22956 - 104349, n=139, últimos 2 años)
73621 MB/s -1%
AIDA64 / Memory Write
Razer Blade 18 2025 RTX 5090 Laptop
Intel Core Ultra 9 275HX, GeForce RTX 5090 Laptop
105456 MB/s +48%
Lenovo Legion 9 18IAX10
Intel Core Ultra 9 275HX, GeForce RTX 5080 Laptop
92365 MB/s +29%
Alienware 18 Area-51
Intel Core Ultra 9 275HX, GeForce RTX 5090 Laptop
90726 MB/s +27%
Asus Strix Scar 18 G835LX
Intel Core Ultra 9 275HX, GeForce RTX 5090 Laptop
82198 MB/s +15%
Medio Intel Core Ultra 9 275HX
  (55663 - 106063, n=24)
79946 MB/s +12%
Media de la clase Gaming
  (22297 - 133486, n=139, últimos 2 años)
72169 MB/s +1%
Lenovo Legion 9 18IAX10 RTX 5090
Intel Core Ultra 9 275HX, GeForce RTX 5090 Laptop
71380 MB/s
AIDA64 / Memory Latency
Lenovo Legion 9 18IAX10
Intel Core Ultra 9 275HX, GeForce RTX 5080 Laptop
120.5 ns * -4%
Medio Intel Core Ultra 9 275HX
  (105.8 - 161.6, n=24)
118.4 ns * -2%
Razer Blade 18 2025 RTX 5090 Laptop
Intel Core Ultra 9 275HX, GeForce RTX 5090 Laptop
116.8 ns * -1%
Lenovo Legion 9 18IAX10 RTX 5090
Intel Core Ultra 9 275HX, GeForce RTX 5090 Laptop
116.1 ns *
Alienware 18 Area-51
Intel Core Ultra 9 275HX, GeForce RTX 5090 Laptop
114.2 ns * +2%
Asus Strix Scar 18 G835LX
Intel Core Ultra 9 275HX, GeForce RTX 5090 Laptop
108.9 ns * +6%
Media de la clase Gaming
  (59.5 - 259, n=139, últimos 2 años)
101.7 ns * +12%

* ... más pequeño es mejor

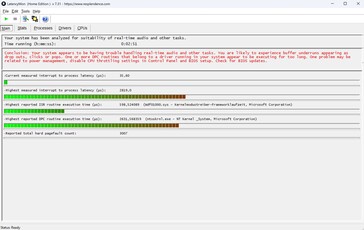
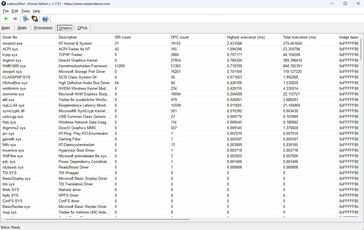
Latencia del CPD

Las desviaciones son significativamente mayores cuando se trata de la latencia del CPD. Como suele ocurrir, los valores determinados no son los ideales.

LatencyMon
LatencyMon
DPC Latencies / LatencyMon - interrupt to process latency (max), Web, Youtube, Prime95
Alienware 18 Area-51
GeForce RTX 5090 Laptop, Ultra 9 275HX
4449.9 μs * -58%
Lenovo Legion 9 18IAX10 RTX 5090
GeForce RTX 5090 Laptop, Ultra 9 275HX, Samsung PM9E1 MZVLC2T0HBLD
2819 μs *
Lenovo Legion 9 18IAX10
GeForce RTX 5080 Laptop, Ultra 9 275HX, Samsung PM9E1 MZVLC2T0HBLD
2449.5 μs * +13%
Razer Blade 18 2025 RTX 5090 Laptop
GeForce RTX 5090 Laptop, Ultra 9 275HX, Lexar NM790 2TB
908.7 μs * +68%
Asus Strix Scar 18 G835LX
GeForce RTX 5090 Laptop, Ultra 9 275HX, WD PC SN8000S 2TB
810 μs * +71%

* ... más pequeño es mejor

Dispositivos de almacenamiento

La unidad de 2 TB incluida nos deja con sentimientos encontrados. Aunque la unidad SSD NVMe de Samsung tiene en general un gran rendimiento e idealmente supera la marca de los 10.000 MB/s, se produjo una ralentización al cabo de un rato en nuestra prueba en bucle, lo que no ocurrió con la competencia ni con la versión RTX 5080 de la Legion 9 18.

Samsung PM9E1 MZVLC2T0HBLD
CDM 5/6 Read Seq Q32T1: 9340 MB/s
CDM 5/6 Write Seq Q32T1: 12664 MB/s
CDM 5/6 Read 4K Q32T1: 539.9 MB/s
CDM 5/6 Write 4K Q32T1: 774.9 MB/s
CDM 5 Read Seq: 5822 MB/s
CDM 5 Write Seq: 4413 MB/s
CDM 5/6 Read 4K: 79.53 MB/s
CDM 5/6 Write 4K: 161.5 MB/s
Drive Performance rating - Percent
Alienware 18 Area-51
 
87 pt
Lenovo Legion 9 18IAX10
Samsung PM9E1 MZVLC2T0HBLD
76.7 pt
Lenovo Legion 9 18IAX10 RTX 5090
Samsung PM9E1 MZVLC2T0HBLD
74.6 pt
Medio Samsung PM9E1 MZVLC2T0HBLD
 
74.6 pt
Razer Blade 18 2025 RTX 5090 Laptop
Lexar NM790 2TB
56.3 pt
Media de la clase Gaming
 
49.8 pt
Asus Strix Scar 18 G835LX
WD PC SN8000S 2TB
44.8 pt
DiskSpd
seq read
Alienware 18 Area-51
 
8300 (7871.23min - 8300.49max) MB/s +127%
Medio Samsung PM9E1 MZVLC2T0HBLD
  (3661 - 7663, n=3)
5571 MB/s +52%
Lenovo Legion 9 18IAX10
Samsung PM9E1 MZVLC2T0HBLD
5390 (5173.6min - 5389.89max) MB/s +47%
Razer Blade 18 2025 RTX 5090 Laptop
Lexar NM790 2TB
4102 (3686.13min - 4101.79max) MB/s +12%
Asus Strix Scar 18 G835LX
WD PC SN8000S 2TB
3799 (23.02min - 3799.36max) MB/s +4%
Lenovo Legion 9 18IAX10 RTX 5090
Samsung PM9E1 MZVLC2T0HBLD
3661 (3483.53min - 3661.21max) MB/s
Media de la clase Gaming
  (281 - 8300, n=124, últimos 2 años)
3494 MB/s -5%
seq write
Alienware 18 Area-51
 
9699 (9652.56min - 9698.6max) MB/s +117%
Medio Samsung PM9E1 MZVLC2T0HBLD
  (4468 - 9101, n=3)
6013 MB/s +35%
Razer Blade 18 2025 RTX 5090 Laptop
Lexar NM790 2TB
4576 (4478.11min - 4575.64max) MB/s +2%
Lenovo Legion 9 18IAX10
Samsung PM9E1 MZVLC2T0HBLD
4469 (3758.1min - 4469.32max) MB/s 0%
Lenovo Legion 9 18IAX10 RTX 5090
Samsung PM9E1 MZVLC2T0HBLD
4468 (3787.01min - 4467.85max) MB/s
Asus Strix Scar 18 G835LX
WD PC SN8000S 2TB
4437 (4373.88min - 4437.36max) MB/s -1%
Media de la clase Gaming
  (1247 - 9699, n=124, últimos 2 años)
3985 MB/s -11%
seq q8 t1 read
Alienware 18 Area-51
 
13801 (12080.4min - 13801.4max) MB/s +14%
Medio Samsung PM9E1 MZVLC2T0HBLD
  (12077 - 14373, n=3)
12909 MB/s +7%
Asus Strix Scar 18 G835LX
WD PC SN8000S 2TB
12470 (11207.2min - 12469.7max) MB/s +3%
Lenovo Legion 9 18IAX10
Samsung PM9E1 MZVLC2T0HBLD
12276 (9957.29min - 12275.7max) MB/s +2%
Lenovo Legion 9 18IAX10 RTX 5090
Samsung PM9E1 MZVLC2T0HBLD
12077 (9499.68min - 12077.2max) MB/s
Razer Blade 18 2025 RTX 5090 Laptop
Lexar NM790 2TB
6942 (5111.86min - 6941.99max) MB/s -43%
Media de la clase Gaming
  (2644 - 15056, n=124, últimos 2 años)
6913 MB/s -43%
seq q8 t1 write
Medio Samsung PM9E1 MZVLC2T0HBLD
  (13215 - 13519, n=3)
13347 MB/s +1%
Lenovo Legion 9 18IAX10
Samsung PM9E1 MZVLC2T0HBLD
13306 (13278.5min - 13306max) MB/s +1%
Lenovo Legion 9 18IAX10 RTX 5090
Samsung PM9E1 MZVLC2T0HBLD
13215 (13080.4min - 13214.6max) MB/s
Alienware 18 Area-51
 
12495 (12375.7min - 12494.8max) MB/s -5%
Asus Strix Scar 18 G835LX
WD PC SN8000S 2TB
8696 (8611.54min - 8696.26max) MB/s -34%
Razer Blade 18 2025 RTX 5090 Laptop
Lexar NM790 2TB
5639 (5290.9min - 5638.82max) MB/s -57%
Media de la clase Gaming
  (1281 - 13519, n=124, últimos 2 años)
5556 MB/s -58%
4k q1 t1 read
Alienware 18 Area-51
 
110.2 (96.01min - 110.18max) MB/s +45%
Lenovo Legion 9 18IAX10
Samsung PM9E1 MZVLC2T0HBLD
79.9 (46.3min - 79.9max) MB/s +5%
Medio Samsung PM9E1 MZVLC2T0HBLD
  (74 - 79.9, n=3)
76.6 MB/s +1%
Lenovo Legion 9 18IAX10 RTX 5090
Samsung PM9E1 MZVLC2T0HBLD
75.8 (74.95min - 75.76max) MB/s
Razer Blade 18 2025 RTX 5090 Laptop
Lexar NM790 2TB
70.7 (69.52min - 70.73max) MB/s -7%
Media de la clase Gaming
  (32.2 - 110.2, n=124, últimos 2 años)
69.1 MB/s -9%
Asus Strix Scar 18 G835LX
WD PC SN8000S 2TB
63.4 (62.2min - 63.4max) MB/s -16%
4k q1 t1 write
Alienware 18 Area-51
 
324 (313.38min - 324.26max) MB/s +144%
Media de la clase Gaming
  (78 - 397, n=124, últimos 2 años)
211 MB/s +59%
Razer Blade 18 2025 RTX 5090 Laptop
Lexar NM790 2TB
208 (195.06min - 207.75max) MB/s +57%
Lenovo Legion 9 18IAX10
Samsung PM9E1 MZVLC2T0HBLD
169.3 (163.19min - 169.33max) MB/s +28%
Medio Samsung PM9E1 MZVLC2T0HBLD
  (132.7 - 173.9, n=3)
158.6 MB/s +20%
Asus Strix Scar 18 G835LX
WD PC SN8000S 2TB
136.4 (134.95min - 136.4max) MB/s +3%
Lenovo Legion 9 18IAX10 RTX 5090
Samsung PM9E1 MZVLC2T0HBLD
132.7 (108.03min - 132.68max) MB/s
4k q32 t16 read
Alienware 18 Area-51
 
8067 (7938.61min - 8067.38max) MB/s +55%
Lenovo Legion 9 18IAX10 RTX 5090
Samsung PM9E1 MZVLC2T0HBLD
5193 (5143.71min - 5193.1max) MB/s
Medio Samsung PM9E1 MZVLC2T0HBLD
  (3136 - 6152, n=3)
4827 MB/s -7%
Razer Blade 18 2025 RTX 5090 Laptop
Lexar NM790 2TB
3980 (3931.74min - 3980.4max) MB/s -23%
Lenovo Legion 9 18IAX10
Samsung PM9E1 MZVLC2T0HBLD
3136 (3096.72min - 3135.56max) MB/s -40%
Media de la clase Gaming
  (417 - 8067, n=124, últimos 2 años)
2583 MB/s -50%
Asus Strix Scar 18 G835LX
WD PC SN8000S 2TB
746 (519.37min - 746.01max) MB/s -86%
4k q32 t16 write
Alienware 18 Area-51
 
5653 (5471.48min - 5652.63max) MB/s +21%
Lenovo Legion 9 18IAX10 RTX 5090
Samsung PM9E1 MZVLC2T0HBLD
4667 (4622.59min - 4666.55max) MB/s
Lenovo Legion 9 18IAX10
Samsung PM9E1 MZVLC2T0HBLD
4541 (4149.44min - 4540.62max) MB/s -3%
Medio Samsung PM9E1 MZVLC2T0HBLD
  (3772 - 4667, n=3)
4327 MB/s -7%
Media de la clase Gaming
  (162.3 - 5653, n=124, últimos 2 años)
2153 MB/s -54%
Razer Blade 18 2025 RTX 5090 Laptop
Lexar NM790 2TB
802 (759.72min - 801.55max) MB/s -83%
Asus Strix Scar 18 G835LX
WD PC SN8000S 2TB
284 (254.39min - 283.58max) MB/s -94%
AS SSD
Score Total
Lenovo Legion 9 18IAX10
Samsung PM9E1 MZVLC2T0HBLD
12538 Points +6%
Lenovo Legion 9 18IAX10 RTX 5090
Samsung PM9E1 MZVLC2T0HBLD
11782 Points
Alienware 18 Area-51
 
11094 Points -6%
Medio Samsung PM9E1 MZVLC2T0HBLD
  (8564 - 12538, n=3)
10961 Points -7%
Razer Blade 18 2025 RTX 5090 Laptop
Lexar NM790 2TB
8733 Points -26%
Media de la clase Gaming
  (2858 - 13854, n=122, últimos 2 años)
6912 Points -41%
Asus Strix Scar 18 G835LX
WD PC SN8000S 2TB
4764 Points -60%
Score Read
Lenovo Legion 9 18IAX10
Samsung PM9E1 MZVLC2T0HBLD
4418 Points +5%
Lenovo Legion 9 18IAX10 RTX 5090
Samsung PM9E1 MZVLC2T0HBLD
4226 Points
Alienware 18 Area-51
 
3886 Points -8%
Medio Samsung PM9E1 MZVLC2T0HBLD
  (2056 - 4418, n=3)
3567 Points -16%
Razer Blade 18 2025 RTX 5090 Laptop
Lexar NM790 2TB
3198 Points -24%
Media de la clase Gaming
  (953 - 4418, n=122, últimos 2 años)
2375 Points -44%
Asus Strix Scar 18 G835LX
WD PC SN8000S 2TB
1653 Points -61%
Score Write
Lenovo Legion 9 18IAX10
Samsung PM9E1 MZVLC2T0HBLD
6099 Points +9%
Medio Samsung PM9E1 MZVLC2T0HBLD
  (5594 - 6099, n=3)
5768 Points +3%
Lenovo Legion 9 18IAX10 RTX 5090
Samsung PM9E1 MZVLC2T0HBLD
5594 Points
Alienware 18 Area-51
 
5208 Points -7%
Razer Blade 18 2025 RTX 5090 Laptop
Lexar NM790 2TB
3919 Points -30%
Media de la clase Gaming
  (1375 - 7208, n=122, últimos 2 años)
3382 Points -40%
Asus Strix Scar 18 G835LX
WD PC SN8000S 2TB
2267 Points -59%
Seq Read
Alienware 18 Area-51
 
9820.79 MB/s +7%
Medio Samsung PM9E1 MZVLC2T0HBLD
  (9220 - 9890, n=3)
9530 MB/s +3%
Lenovo Legion 9 18IAX10
Samsung PM9E1 MZVLC2T0HBLD
9481.05 MB/s +3%
Lenovo Legion 9 18IAX10 RTX 5090
Samsung PM9E1 MZVLC2T0HBLD
9219.98 MB/s
Razer Blade 18 2025 RTX 5090 Laptop
Lexar NM790 2TB
5795 MB/s -37%
Asus Strix Scar 18 G835LX
WD PC SN8000S 2TB
5595 MB/s -39%
Media de la clase Gaming
  (2272 - 9890, n=122, últimos 2 años)
5272 MB/s -43%
Seq Write
Alienware 18 Area-51
 
9926.3 MB/s +82%
Medio Samsung PM9E1 MZVLC2T0HBLD
  (4929 - 6649, n=3)
5674 MB/s +4%
Razer Blade 18 2025 RTX 5090 Laptop
Lexar NM790 2TB
5456 MB/s 0%
Lenovo Legion 9 18IAX10 RTX 5090
Samsung PM9E1 MZVLC2T0HBLD
5443.59 MB/s
Asus Strix Scar 18 G835LX
WD PC SN8000S 2TB
5305 MB/s -3%
Lenovo Legion 9 18IAX10
Samsung PM9E1 MZVLC2T0HBLD
4929.36 MB/s -9%
Media de la clase Gaming
  (114.5 - 9926, n=122, últimos 2 años)
3943 MB/s -28%
4K Read
Alienware 18 Area-51
 
102.16 MB/s +37%
Lenovo Legion 9 18IAX10
Samsung PM9E1 MZVLC2T0HBLD
80.82 MB/s +9%
Lenovo Legion 9 18IAX10 RTX 5090
Samsung PM9E1 MZVLC2T0HBLD
74.48 MB/s
Medio Samsung PM9E1 MZVLC2T0HBLD
  (62.2 - 80.8, n=3)
72.5 MB/s -3%
Media de la clase Gaming
  (27.8 - 108.4, n=122, últimos 2 años)
68.2 MB/s -8%
Razer Blade 18 2025 RTX 5090 Laptop
Lexar NM790 2TB
67.3 MB/s -10%
Asus Strix Scar 18 G835LX
WD PC SN8000S 2TB
65.1 MB/s -13%
4K Write
Alienware 18 Area-51
 
297.02 MB/s +34%
Lenovo Legion 9 18IAX10
Samsung PM9E1 MZVLC2T0HBLD
249.69 MB/s +12%
Lenovo Legion 9 18IAX10 RTX 5090
Samsung PM9E1 MZVLC2T0HBLD
222.16 MB/s
Media de la clase Gaming
  (75.6 - 512, n=122, últimos 2 años)
218 MB/s -2%
Medio Samsung PM9E1 MZVLC2T0HBLD
  (154.7 - 250, n=3)
209 MB/s -6%
Razer Blade 18 2025 RTX 5090 Laptop
Lexar NM790 2TB
198.5 MB/s -11%
Asus Strix Scar 18 G835LX
WD PC SN8000S 2TB
189.8 MB/s -15%
4K-64 Read
Lenovo Legion 9 18IAX10
Samsung PM9E1 MZVLC2T0HBLD
3389.06 MB/s +5%
Lenovo Legion 9 18IAX10 RTX 5090
Samsung PM9E1 MZVLC2T0HBLD
3229.33 MB/s
Alienware 18 Area-51
 
2801.97 MB/s -13%
Razer Blade 18 2025 RTX 5090 Laptop
Lexar NM790 2TB
2551 MB/s -21%
Medio Samsung PM9E1 MZVLC2T0HBLD
  (1005 - 3389, n=3)
2541 MB/s -21%
Media de la clase Gaming
  (517 - 3630, n=122, últimos 2 años)
1781 MB/s -45%
Asus Strix Scar 18 G835LX
WD PC SN8000S 2TB
1029 MB/s -68%
4K-64 Write
Lenovo Legion 9 18IAX10
Samsung PM9E1 MZVLC2T0HBLD
5355.89 MB/s +11%
Medio Samsung PM9E1 MZVLC2T0HBLD
  (4792 - 5356, n=3)
4992 MB/s +3%
Lenovo Legion 9 18IAX10 RTX 5090
Samsung PM9E1 MZVLC2T0HBLD
4827.85 MB/s
Alienware 18 Area-51
 
3918.24 MB/s -19%
Razer Blade 18 2025 RTX 5090 Laptop
Lexar NM790 2TB
3175 MB/s -34%
Media de la clase Gaming
  (991 - 5909, n=122, últimos 2 años)
2773 MB/s -43%
Asus Strix Scar 18 G835LX
WD PC SN8000S 2TB
1546 MB/s -68%
Access Time Read
Asus Strix Scar 18 G835LX
WD PC SN8000S 2TB
0.067 ms * -63%
Media de la clase Gaming
  (0.016 - 0.379, n=122, últimos 2 años)
0.0577 ms * -41%
Lenovo Legion 9 18IAX10 RTX 5090
Samsung PM9E1 MZVLC2T0HBLD
0.041 ms *
Alienware 18 Area-51
 
0.039 ms * +5%
Medio Samsung PM9E1 MZVLC2T0HBLD
  (0.034 - 0.041, n=3)
0.03733 ms * +9%
Lenovo Legion 9 18IAX10
Samsung PM9E1 MZVLC2T0HBLD
0.034 ms * +17%
Razer Blade 18 2025 RTX 5090 Laptop
Lexar NM790 2TB
0.024 ms * +41%
Access Time Write
Alienware 18 Area-51
 
0.096 ms * -433%
Razer Blade 18 2025 RTX 5090 Laptop
Lexar NM790 2TB
0.061 ms * -239%
Lenovo Legion 9 18IAX10
Samsung PM9E1 MZVLC2T0HBLD
0.044 ms * -144%
Media de la clase Gaming
  (0.012 - 0.277, n=122, últimos 2 años)
0.04052 ms * -125%
Medio Samsung PM9E1 MZVLC2T0HBLD
  (0.018 - 0.044, n=3)
0.02933 ms * -63%
Asus Strix Scar 18 G835LX
WD PC SN8000S 2TB
0.019 ms * -6%
Lenovo Legion 9 18IAX10 RTX 5090
Samsung PM9E1 MZVLC2T0HBLD
0.018 ms *

* ... más pequeño es mejor

Rendimiento continuo de lectura: Bucle de lectura DiskSpd, profundidad de cola 8

069513902085278034754170486555606255695076458340903597301042511120118151251013205Tooltip
Lenovo Legion 9 18IAX10 RTX 5090 Samsung PM9E1 MZVLC2T0HBLD; diskspd 2.0.17 f: Ø10706 (5844.82-12205.76)
Alienware 18 Area-51  ; diskspd 2.0.17 f: Ø13767 (11976.21-13820.48)
Asus Strix Scar 18 G835LX WD PC SN8000S 2TB; diskspd 2.0.17 f: Ø12242 (10589.57-12452.94)
Razer Blade 18 2025 RTX 5090 Laptop Lexar NM790 2TB; diskspd 2.0.17 f: Ø6926 (6006.45-6951.01)
Lenovo Legion 9 18IAX10 Samsung PM9E1 MZVLC2T0HBLD; diskspd 2.0.17 f: Ø12203 (9655.06-12265.19)

Rendimiento de la GPU

La GPU RTX 5090 del portátil Legion 9 18 resulta ser lo más destacado. En las pruebas globales de 3DMark, el Legion 9 supera a todos los demás portátiles RTX 5090, aunque su hermano RTX 5080 le queda a la zaga por menos de un 10%.

Sin embargo, la RTX 5090 ofrece una mayor garantía de futuro teniendo en cuenta sus 24 GB de VRAM GDDR7.

3DMark Performance rating - Percent
Lenovo Legion 9 18IAX10 RTX 5090
Nvidia GeForce RTX 5090 Laptop
98 pt
Razer Blade 18 2025 RTX 5090 Laptop
Nvidia GeForce RTX 5090 Laptop
93.2 pt
Alienware 18 Area-51
Nvidia GeForce RTX 5090 Laptop
91.1 pt
Medio Nvidia GeForce RTX 5090 Laptop
 
90.7 pt
Asus Strix Scar 18 G835LX
Nvidia GeForce RTX 5090 Laptop
89.9 pt
Lenovo Legion 9 18IAX10 -1!
Nvidia GeForce RTX 5080 Laptop
89.8 pt
Media de la clase Gaming
 
61.1 pt
3DMark 11 - 1280x720 Performance GPU
Lenovo Legion 9 18IAX10 RTX 5090
Nvidia GeForce RTX 5090 Laptop
80022 Points
Medio Nvidia GeForce RTX 5090 Laptop
  (48548 - 80022, n=18)
67438 Points -16%
Razer Blade 18 2025 RTX 5090 Laptop
Nvidia GeForce RTX 5090 Laptop
66617 Points -17%
Asus Strix Scar 18 G835LX
Nvidia GeForce RTX 5090 Laptop
66337 Points -17%
Lenovo Legion 9 18IAX10
Nvidia GeForce RTX 5080 Laptop
63968 Points -20%
Alienware 18 Area-51
Nvidia GeForce RTX 5090 Laptop
58943 Points -26%
Media de la clase Gaming
  (13523 - 80022, n=135, últimos 2 años)
48490 Points -39%
3DMark
1920x1080 Fire Strike Graphics
Lenovo Legion 9 18IAX10
Nvidia GeForce RTX 5080 Laptop
55515 Points +4%
Lenovo Legion 9 18IAX10 RTX 5090
Nvidia GeForce RTX 5090 Laptop
53491 Points
Razer Blade 18 2025 RTX 5090 Laptop
Nvidia GeForce RTX 5090 Laptop
53282 Points 0%
Medio Nvidia GeForce RTX 5090 Laptop
  (42175 - 62849, n=21)
51762 Points -3%
Alienware 18 Area-51
Nvidia GeForce RTX 5090 Laptop
50772 Points -5%
Asus Strix Scar 18 G835LX
Nvidia GeForce RTX 5090 Laptop
48863 Points -9%
Media de la clase Gaming
  (2913 - 62849, n=151, últimos 2 años)
35701 Points -33%
2560x1440 Time Spy Graphics
Lenovo Legion 9 18IAX10 RTX 5090
Nvidia GeForce RTX 5090 Laptop
25984 Points
Alienware 18 Area-51
Nvidia GeForce RTX 5090 Laptop
25763 Points -1%
Razer Blade 18 2025 RTX 5090 Laptop
Nvidia GeForce RTX 5090 Laptop
25198 Points -3%
Asus Strix Scar 18 G835LX
Nvidia GeForce RTX 5090 Laptop
24599 Points -5%
Medio Nvidia GeForce RTX 5090 Laptop
  (19216 - 25984, n=20)
23746 Points -9%
Lenovo Legion 9 18IAX10
Nvidia GeForce RTX 5080 Laptop
23269 Points -10%
Media de la clase Gaming
  (2295 - 25984, n=146, últimos 2 años)
14963 Points -42%
2560x1440 Port Royal Graphics
Alienware 18 Area-51
Nvidia GeForce RTX 5090 Laptop
16978 Points +4%
Razer Blade 18 2025 RTX 5090 Laptop
Nvidia GeForce RTX 5090 Laptop
16407 Points +1%
Lenovo Legion 9 18IAX10 RTX 5090
Nvidia GeForce RTX 5090 Laptop
16262 Points
Medio Nvidia GeForce RTX 5090 Laptop
  (12749 - 17063, n=15)
15951 Points -2%
Asus Strix Scar 18 G835LX
Nvidia GeForce RTX 5090 Laptop
15946 Points -2%
Media de la clase Gaming
  (984 - 16978, n=80, últimos 2 años)
10518 Points -35%
3DMark 11 Performance
54833 puntos
3DMark Cloud Gate Standard Score
74154 puntos
3DMark Fire Strike Score
41019 puntos
3DMark Time Spy Score
23942 puntos
ayuda
Blender
v3.3 Classroom OPTIX/RTX
Media de la clase Gaming
  (9 - 95, n=138, últimos 2 años)
19.2 Seconds * -75%
Asus Strix Scar 18 G835LX
Nvidia GeForce RTX 5090 Laptop, Intel Core Ultra 9 275HX
15 Seconds * -36%
Asus Strix Scar 18 G835LX
Nvidia GeForce RTX 5090 Laptop, Intel Core Ultra 9 275HX
10 Seconds * +9%
Lenovo Legion 9 18IAX10
Nvidia GeForce RTX 5080 Laptop, Intel Core Ultra 9 275HX
12 Seconds * -9%
Medio Nvidia GeForce RTX 5090 Laptop
  (9 - 18, n=18)
11.9 Seconds * -8%
Razer Blade 18 2025 RTX 5090 Laptop
Nvidia GeForce RTX 5090 Laptop, Intel Core Ultra 9 275HX
11 Seconds * -0%
Lenovo Legion 9 18IAX10 RTX 5090
Nvidia GeForce RTX 5090 Laptop, Intel Core Ultra 9 275HX
11 Seconds *
Alienware 18 Area-51
Nvidia GeForce RTX 5090 Laptop, Intel Core Ultra 9 275HX
10 Seconds * +9%
v3.3 Classroom CUDA
Media de la clase Gaming
  (15 - 110, n=139, últimos 2 años)
31.9 Seconds * -113%
Lenovo Legion 9 18IAX10
Nvidia GeForce RTX 5080 Laptop, Intel Core Ultra 9 275HX
19 Seconds * -27%
Medio Nvidia GeForce RTX 5090 Laptop
  (15 - 37, n=16)
17.8 Seconds * -19%
Asus Strix Scar 18 G835LX
Nvidia GeForce RTX 5090 Laptop, Intel Core Ultra 9 275HX
16 Seconds * -7%
Alienware 18 Area-51
Nvidia GeForce RTX 5090 Laptop, Intel Core Ultra 9 275HX
15 Seconds * -0%
Razer Blade 18 2025 RTX 5090 Laptop
Nvidia GeForce RTX 5090 Laptop, Intel Core Ultra 9 275HX
15 Seconds * -0%
Lenovo Legion 9 18IAX10 RTX 5090
Nvidia GeForce RTX 5090 Laptop, Intel Core Ultra 9 275HX
15 Seconds *

* ... más pequeño es mejor

Rendimiento en juegos

La RTX 5090 es actualmente más o menos la única GPU para portátiles que se adapta bien a las pantallas UHD en términos de rendimiento bruto. Con la excepción de juegos mal optimizados como Borderlands 4 y Oblivion Remasterizado casi todos los títulos actuales se ejecutan sin problemas con el máximo de detalles en la resolución nativa de 3.840 x 2.160.

Si las cosas se ponen difíciles, el reescalado ayuda como de costumbre. Por ejemplo, la velocidad de fotogramas en Borderlands 4 con la inclusión de DLSS4 sube de 20 a 38 fps en el preajuste UHD Badass.

Si además se añade la generación de fotogramas múltiples 4x, llega incluso a 118 fps. Sin embargo, la experiencia subjetiva de juego no es perfecta en este caso, por decirlo suavemente, debido a la fluctuación de los tiempos de fotogramas.

Performance rating - Percent
Alienware 18 Area-51 -1!
GeForce RTX 5090 Laptop, Ultra 9 275HX
98 pt
Lenovo Legion 9 18IAX10 -1!
GeForce RTX 5080 Laptop, Ultra 9 275HX
96.8 pt
Lenovo Legion 9 18IAX10 RTX 5090
GeForce RTX 5090 Laptop, Ultra 9 275HX
96.7 pt
Razer Blade 18 2025 RTX 5090 Laptop
GeForce RTX 5090 Laptop, Ultra 9 275HX
95.5 pt
Asus Strix Scar 18 G835LX
GeForce RTX 5090 Laptop, Ultra 9 275HX
91.4 pt
Medio Nvidia GeForce RTX 5090 Laptop
 
87.7 pt
Media de la clase Gaming
 
67.2 pt
Cyberpunk 2077 2.2 Phantom Liberty - 1920x1080 Ultra Preset (FSR off)
Lenovo Legion 9 18IAX10 RTX 5090
GeForce RTX 5090 Laptop, Ultra 9 275HX
169.9 (129min) fps
Lenovo Legion 9 18IAX10
GeForce RTX 5080 Laptop, Ultra 9 275HX
168 (133min, 119P1) fps -1%
Alienware 18 Area-51
GeForce RTX 5090 Laptop, Ultra 9 275HX
166.5 (132.2min, 120P1) fps -2%
Razer Blade 18 2025 RTX 5090 Laptop
GeForce RTX 5090 Laptop, Ultra 9 275HX
163.4 fps -4%
Asus Strix Scar 18 G835LX
GeForce RTX 5090 Laptop, Ultra 9 275HX
154.9 (126.3min) fps -9%
Medio Nvidia GeForce RTX 5090 Laptop
  (91.4 - 169.9, n=20)
146.5 fps -14%
Media de la clase Gaming
  (6.76 - 169.9, n=141, últimos 2 años)
100.1 fps -41%
Baldur's Gate 3 - 1920x1080 Ultra Preset AA:T
Alienware 18 Area-51
GeForce RTX 5090 Laptop, Ultra 9 275HX
236.5 fps +13%
Lenovo Legion 9 18IAX10
GeForce RTX 5080 Laptop, Ultra 9 275HX
225.1 fps +8%
Razer Blade 18 2025 RTX 5090 Laptop
GeForce RTX 5090 Laptop, Ultra 9 275HX
213 fps +2%
Lenovo Legion 9 18IAX10 RTX 5090
GeForce RTX 5090 Laptop, Ultra 9 275HX
209 (119.6min, 138.4P0.1, 174.5P1) fps
Asus Strix Scar 18 G835LX
GeForce RTX 5090 Laptop, Ultra 9 275HX
193.7 fps -7%
Medio Nvidia GeForce RTX 5090 Laptop
  (118.8 - 237, n=19)
193.2 fps -8%
Media de la clase Gaming
  (34.5 - 246, n=106, últimos 2 años)
134.5 fps -36%
GTA V - 1920x1080 Highest Settings possible AA:4xMSAA + FX AF:16x
Lenovo Legion 9 18IAX10 RTX 5090
GeForce RTX 5090 Laptop, Ultra 9 275HX
183.9 (2.08min, 125P1) fps
Razer Blade 18 2025 RTX 5090 Laptop
GeForce RTX 5090 Laptop, Ultra 9 275HX
166.2 (3min, 111.1P1) fps -10%
Asus Strix Scar 18 G835LX
GeForce RTX 5090 Laptop, Ultra 9 275HX
161.9 (2.78min, 111.1P1) fps -12%
Medio Nvidia GeForce RTX 5090 Laptop
  (120.5 - 186.9, n=14)
154.4 fps -16%
Media de la clase Gaming
  (12.1 - 186.9, n=128, últimos 2 años)
124.3 fps -32%
Final Fantasy XV Benchmark - 1920x1080 High Quality
Razer Blade 18 2025 RTX 5090 Laptop
GeForce RTX 5090 Laptop, Ultra 9 275HX
215 fps +3%
Alienware 18 Area-51
GeForce RTX 5090 Laptop, Ultra 9 275HX
212 fps +1%
Lenovo Legion 9 18IAX10 RTX 5090
GeForce RTX 5090 Laptop, Ultra 9 275HX
209 fps
Lenovo Legion 9 18IAX10
GeForce RTX 5080 Laptop, Ultra 9 275HX
204 fps -2%
Asus Strix Scar 18 G835LX
GeForce RTX 5090 Laptop, Ultra 9 275HX
199.3 fps -5%
Medio Nvidia GeForce RTX 5090 Laptop
  (144.4 - 215, n=18)
194.1 fps -7%
Media de la clase Gaming
  (19.2 - 215, n=139, últimos 2 años)
136.1 fps -35%
Strange Brigade - 1920x1080 ultra AA:ultra AF:16
Alienware 18 Area-51
GeForce RTX 5090 Laptop, Ultra 9 275HX
456 (177min, 324P1) fps +3%
Razer Blade 18 2025 RTX 5090 Laptop
GeForce RTX 5090 Laptop, Ultra 9 275HX
453 (129.8min, 324P1) fps +2%
Lenovo Legion 9 18IAX10 RTX 5090
GeForce RTX 5090 Laptop, Ultra 9 275HX
443 (75.3min, 312P1) fps
Lenovo Legion 9 18IAX10
GeForce RTX 5080 Laptop, Ultra 9 275HX
421 (63.1min, 302P1) fps -5%
Asus Strix Scar 18 G835LX
GeForce RTX 5090 Laptop, Ultra 9 275HX
401 (103.4min, 236P1) fps -9%
Medio Nvidia GeForce RTX 5090 Laptop
  (303 - 464, n=16)
401 fps -9%
Media de la clase Gaming
  (38.9 - 456, n=127, últimos 2 años)
261 fps -41%
Dota 2 Reborn - 1920x1080 ultra (3/3) best looking
Asus Strix Scar 18 G835LX
GeForce RTX 5090 Laptop, Ultra 9 275HX
186.6 (157.4min) fps +1%
Lenovo Legion 9 18IAX10
GeForce RTX 5080 Laptop, Ultra 9 275HX
185.2 (156.4min) fps 0%
Lenovo Legion 9 18IAX10 RTX 5090
GeForce RTX 5090 Laptop, Ultra 9 275HX
184.8 (155.3min) fps
Razer Blade 18 2025 RTX 5090 Laptop
GeForce RTX 5090 Laptop, Ultra 9 275HX
175.5 (149.3min) fps -5%
Medio Nvidia GeForce RTX 5090 Laptop
  (132.4 - 248, n=18)
172.3 fps -7%
Alienware 18 Area-51
GeForce RTX 5090 Laptop, Ultra 9 275HX
171.5 (139.4min) fps -7%
Media de la clase Gaming
  (65.1 - 248, n=142, últimos 2 años)
154.3 fps -17%
X-Plane 11.11 - 1920x1080 high (fps_test=3)
Lenovo Legion 9 18IAX10
GeForce RTX 5080 Laptop, Ultra 9 275HX
123.8 fps +4%
Alienware 18 Area-51
GeForce RTX 5090 Laptop, Ultra 9 275HX
122.9 fps +4%
Razer Blade 18 2025 RTX 5090 Laptop
GeForce RTX 5090 Laptop, Ultra 9 275HX
122.1 fps +3%
Asus Strix Scar 18 G835LX
GeForce RTX 5090 Laptop, Ultra 9 275HX
121.7 fps +3%
Lenovo Legion 9 18IAX10 RTX 5090
GeForce RTX 5090 Laptop, Ultra 9 275HX
118.7 fps
Lenovo Legion 9 18IAX10 RTX 5090
GeForce RTX 5090 Laptop, Ultra 9 275HX
117.6 fps -1%
Medio Nvidia GeForce RTX 5090 Laptop
  (79.9 - 133.6, n=19)
113.2 fps -5%
Media de la clase Gaming
  (33.4 - 150.2, n=145, últimos 2 años)
103.9 fps -12%
bajomedioaltoultraQHD DLSSQHD4K DLSS4K
GTA V (2015) 184.3 183.9 164.5 163.8
Dota 2 Reborn (2015) 201 184.8 180.1
Final Fantasy XV Benchmark (2018) 209 176.7 111.8
X-Plane 11.11 (2018) 118.7 97.1
Strange Brigade (2018) 479 443 333 182.2
Baldur's Gate 3 (2023) 209 209 158.3 88.5
Cyberpunk 2077 2.2 Phantom Liberty (2023) 185 169.9 122.8 55.1
Horizon Forbidden West (2024) 140.7 140.3 100.9 81 59.5
Ghost of Tsushima (2024) 115.1 108.1 100.3 94.4 62
Senua's Saga Hellblade 2 (2024) 86.1 63.1 61.8 37.5
Space Marine 2 (2024) 108.5 108 107.4 94.7 69.6
Until Dawn (2024) 116.6 104 76.6 63.2 45.4
Stalker 2 (2024) 167.8 147.6 110.7 92.7 65.4
The Elder Scrolls IV Oblivion Remastered (2025) 111.8 61.9 45.9 41.6 27.3
Doom: The Dark Ages (2025) 133.2 128.9 92.2 75.6 52.2
Borderlands 4 (2025) 76.6 54 37.1 117.5 20.2
Battlefield 6 (2025) 181.4 169.4 159.9 145.8 136.7 108.5 82.5 59.7
Borderlands 4
3840x2160 Badass Preset AA:FX
Lenovo Legion 9 18IAX10 RTX 5090
GeForce RTX 5090 Laptop, Ultra 9 275HX
20.2 (18.3min, 18.3P0.1, 18.7P1) fps
Media de la clase Gaming
  (n=1últimos 2 años)
20.2 fps 0%
3840x2160 Badass Preset + Quality DLSS + Max. FG
Lenovo Legion 9 18IAX10 RTX 5090
GeForce RTX 5090 Laptop, Ultra 9 275HX
117.5 (11min, 18.2P0.1, 29.7P1) fps
Media de la clase Gaming
  (n=1últimos 2 años)
117.5 fps 0%
Doom: The Dark Ages
3840x2160 Ultra Nightmare AA:T
Lenovo Legion 9 18IAX10 RTX 5090
GeForce RTX 5090 Laptop, Ultra 9 275HX
52.2 (38.8min, 39.4P0.1, 40.4P1) fps
Media de la clase Gaming
  (32.2 - 52.2, n=4, últimos 2 años)
41.1 fps -21%
3840x2160 Ultra Nightmare - DLSS Quality
Lenovo Legion 9 18IAX10 RTX 5090
GeForce RTX 5090 Laptop, Ultra 9 275HX
75.6 (58.6min, 59.2P0.1, 60.6P1) fps
Media de la clase Gaming
  (33.2 - 75.6, n=5, últimos 2 años)
55 fps -27%
The Elder Scrolls IV Oblivion Remastered
3840x2160 Ultra Preset AA:T
Lenovo Legion 9 18IAX10 RTX 5090
GeForce RTX 5090 Laptop, Ultra 9 275HX
27.3 (19.1min, 19.4P0.1, 23.3P1) fps
Media de la clase Gaming
  (17.9 - 27.3, n=2, últimos 2 años)
22.6 fps -17%
3840x2160 Ultra Preset + Quality DLSS
Lenovo Legion 9 18IAX10 RTX 5090
GeForce RTX 5090 Laptop, Ultra 9 275HX
41.6 (22.9min, 25.1P0.1, 35P1) fps
Media de la clase Gaming
  (31.2 - 41.6, n=2, últimos 2 años)
36.4 fps -12%
Stalker 2
3840x2160 Epic Preset
Lenovo Legion 9 18IAX10 RTX 5090
GeForce RTX 5090 Laptop, Ultra 9 275HX
65.4 (40min, 40.9P0.1, 47.5P1) fps
Media de la clase Gaming
  (28.2 - 65.4, n=2, últimos 2 años)
46.8 fps -28%
3840x2160 Epic Preset + Quality DLSS + FG
Lenovo Legion 9 18IAX10 RTX 5090
GeForce RTX 5090 Laptop, Ultra 9 275HX
92.7 (35.4min, 46.7P0.1, 65P1) fps
Media de la clase Gaming
  (55.6 - 92.7, n=2, últimos 2 años)
74.2 fps -20%
Until Dawn
3840x2160 Ultra Preset
Lenovo Legion 9 18IAX10 RTX 5090
GeForce RTX 5090 Laptop, Ultra 9 275HX
45.4 (23min, 24.5P0.1, 41.8P1) fps
Media de la clase Gaming
  (n=1últimos 2 años)
45.4 fps 0%
3840x2160 Ultra Preset + Quality DLSS + Ray Tracing
Lenovo Legion 9 18IAX10 RTX 5090
GeForce RTX 5090 Laptop, Ultra 9 275HX
63.2 (15.8min, 20.5P0.1, 56.3P1) fps
Media de la clase Gaming
  (n=1últimos 2 años)
63.2 fps 0%
Space Marine 2
3840x2160 Ultra Preset AA:T
Lenovo Legion 9 18IAX10 RTX 5090
GeForce RTX 5090 Laptop, Ultra 9 275HX
69.6 (61.2min, 63.3P0.1, 64.9P1) fps
Media de la clase Gaming
  (n=1últimos 2 años)
69.6 fps 0%
3840x2160 Ultra Preset + Quality DLSS
Lenovo Legion 9 18IAX10 RTX 5090
GeForce RTX 5090 Laptop, Ultra 9 275HX
94.7 (60.5min, 77.3P0.1, 87.5P1) fps
Media de la clase Gaming
  (n=1últimos 2 años)
94.7 fps 0%
Senua's Saga Hellblade 2
3840x2160 High Preset
Lenovo Legion 9 18IAX10 RTX 5090
GeForce RTX 5090 Laptop, Ultra 9 275HX
37.5 (35.2min, 35.4P0.1, 36P1) fps
Media de la clase Gaming
  (n=1últimos 2 años)
37.5 fps 0%
3840x2160 High Preset + Quality DLSS
Lenovo Legion 9 18IAX10 RTX 5090
GeForce RTX 5090 Laptop, Ultra 9 275HX
61.8 (55.4min, 58P0.1, 59P1) fps
Media de la clase Gaming
  (n=1últimos 2 años)
61.8 fps 0%
Ghost of Tsushima
3840x2160 Very High Preset AA:T
Lenovo Legion 9 18IAX10 RTX 5090
GeForce RTX 5090 Laptop, Ultra 9 275HX
62 (44.9min, 52.4P0.1, 53.8P1) fps
Media de la clase Gaming
  (n=1últimos 2 años)
62 fps 0%
3840x2160 Very High Preset + Quality DLSS
Lenovo Legion 9 18IAX10 RTX 5090
GeForce RTX 5090 Laptop, Ultra 9 275HX
94.4 (47min, 62.5P0.1, 77.6P1) fps
Media de la clase Gaming
  (n=1últimos 2 años)
94.4 fps 0%
Horizon Forbidden West
3840x2160 Very High Preset AA:T
Lenovo Legion 9 18IAX10 RTX 5090
GeForce RTX 5090 Laptop, Ultra 9 275HX
59.5 (54min, 54.4P0.1, 55P1) fps
Media de la clase Gaming
  (13.7 - 59.5, n=3, últimos 2 años)
38.6 fps -35%
3840x2160 Very High Preset + Quality DLSS
Lenovo Legion 9 18IAX10 RTX 5090
GeForce RTX 5090 Laptop, Ultra 9 275HX
81 (67.3min, 70P0.1, 74.1P1) fps
Media de la clase Gaming
  (n=1últimos 2 años)
81 fps 0%

Hemos analizado cómo se comporta el rendimiento 3D durante un período de tiempo más largo utilizando Cyberpunk 2077. Los valores de fps fueron relativamente constantes, aparte de pequeñas fluctuaciones.

Cyberpunk 2077 Gráfico de fps en ultra

0102030405060708090100110120130140150160Tooltip
Lenovo Legion 9 18IAX10 RTX 5090 Ultra 9 275HX, GeForce RTX 5090 Laptop: Ø165.1 (150.2-169.2)
Alienware 18 Area-51 Ultra 9 275HX, GeForce RTX 5090 Laptop: Ø154.3 (146-157.5)
Asus Strix Scar 18 G835LX Ultra 9 275HX, GeForce RTX 5090 Laptop: Ø144.2 (124.3-147.1)
Razer Blade 18 2025 RTX 5090 Laptop Ultra 9 275HX, GeForce RTX 5090 Laptop: Ø157 (138.6-159.4)
Lenovo Legion 9 18IAX10 Ultra 9 275HX, GeForce RTX 5080 Laptop: Ø153.9 (146.1-156)

Emisiones

Emisiones sonoras

El rendimiento superior a la media se cobra su peaje en forma de un nivel de ruido superior a la media. 56 dB(A) mientras juega a Cyberpunk 2077 es uno de los valores más altos que hemos observado.

Sin embargo, la competencia también es bastante ruidosa con 48 a 54 dB(A), por lo que es mejor utilizar auriculares cuando se juega.

En reposo, los ventiladores del Legion 9 18 permanecen mucho más silenciosos y a veces se apagan por completo.

Ruido

Ocioso
24 / 30 / 32 dB(A)
Carga
46 / 56 dB(A)
  red to green bar
 
 
30 dB
silencioso
40 dB(A)
audible
50 dB(A)
ruidosamente alto
 
min: dark, med: mid, max: light   Earthworks M23R, Arta (15 cm de distancia)   ruido ambiental: 24 dB(A)
dB(A) 0102030405060708090Deep BassMiddle BassHigh BassLower RangeMidsHigher MidsLower HighsMid HighsUpper HighsSuper Highs2054.540.9424241.9402540.639.237.934.838.337.8314645.445.540.648.645.94041.934.33228.737.432.65047.326.425.426.427.537.76331.223.823.327.123.636.78029.417.319.416.516.331.110033.416.920.316.214.931.312529.417.620.814.513.532.216030.619.421.316.815.134.120034.224.823.420.819.137.225031.921.621.917.216.138.131531.319.621.713.514.538.740033.120.722.31213.140.350035.522.324.911.211.642.763033.620.725.911.111.241.980034.219.121.410.110.941.810003519.221.210.711.243.3125035.618.721.61110.944.6160034.317.421.511.311.343.420003417.120.411.411.742.8250035.520.620.511.81244.9315034.815.919.312.312.545.7400034.514.618.612.512.746.2500035.214.91512.81345.463003113.613.71313.142.7800027.413.313.61313.140.31000024.812.812.912.712.7391250023.113.213.212.61335.71600020.812.212.112.11232SPL463032.524.324.655.8N5.71.31.70.60.610.9median 33.6median 17.6median 20.8median 12.5median 12.7median 41.8Delta3.53.42.91.61.43.4hearing rangehide median Fan NoiseLenovo Legion 9 18IAX10 RTX 5090
Lenovo Legion 9 18IAX10 RTX 5090
Ultra 9 275HX, GeForce RTX 5090 Laptop
Alienware 18 Area-51
Ultra 9 275HX, GeForce RTX 5090 Laptop
Asus Strix Scar 18 G835LX
Ultra 9 275HX, GeForce RTX 5090 Laptop
Razer Blade 18 2025 RTX 5090 Laptop
Ultra 9 275HX, GeForce RTX 5090 Laptop
Lenovo Legion 9 18IAX10
Ultra 9 275HX, GeForce RTX 5080 Laptop
Noise
1%
0%
12%
8%
apagado / medio ambiente * (dB)
24
23.4
2%
23.3
3%
23.4
2%
23.3
3%
Idle Minimum * (dB)
24
30.2
-26%
29.8
-24%
23.4
2%
23.3
3%
Idle Average * (dB)
30
30.6
-2%
29.8
1%
23.4
22%
23.3
22%
Idle Maximum * (dB)
32
30.6
4%
29.8
7%
23.4
27%
29.1
9%
Load Average * (dB)
46
38
17%
42.9
7%
40.4
12%
46.8
-2%
Cyberpunk 2077 ultra * (dB)
56
48.9
13%
53.7
4%
48.2
14%
49.6
11%
Load Maximum * (dB)
56
55.9
-0%
53.7
4%
53.5
4%
49.6
11%

* ... más pequeño es mejor

Temperatura

Al igual que con el modelo RTX 5080, la evolución de la temperatura es un tanto curiosa. Mientras que la Legion 9 18 ya se calienta relativamente en modo inactivo, las superficies del chasis apenas se calientan bajo carga, pero a veces alcanzan valores similares.

 40 °C41 °C40 °C 
 39 °C40 °C38 °C 
 28 °C31 °C29 °C 
Máximo: 41 °C
Médio: 36.2 °C
39 °C39 °C37 °C
31 °C33 °C30 °C
27 °C27 °C27 °C
Máximo: 39 °C
Médio: 32.2 °C
Conector de corriente  51 °C | Temperatura del cuarto 20 °C | Fluke t3000FC (calibrated), Voltcraft IR-900
(±) La temperatura media de la parte superior bajo carga máxima es de 36.2 °C / 97 F, en comparación con la media de 33.9 °C / 93 F de los dispositivos de la clase Gaming.
(±) La temperatura máxima en la parte superior es de 41 °C / 106 F, frente a la media de 40.5 °C / 105 F, que oscila entre 21.2 y 68.8 °C para la clase Gaming.
(+) El fondo se calienta hasta un máximo de 39 °C / 102 F, frente a la media de 43.2 °C / 110 F
(±) En reposo, la temperatura media de la parte superior es de 34.7 °C / 94# F, frente a la media del dispositivo de 33.9 °C / 93 F.
(±) 3: The average temperature for the upper side is 33.1 °C / 92 F, compared to the average of 33.9 °C / 93 F for the class Gaming.
(+) Los reposamanos y el panel táctil alcanzan como máximo la temperatura de la piel (33 °C / 91.4 F) y, por tanto, no están calientes.
(-) La temperatura media de la zona del reposamanos de dispositivos similares fue de 28.9 °C / 84 F (-4.1 °C / -7.4 F).
Lenovo Legion 9 18IAX10 RTX 5090
Ultra 9 275HX, GeForce RTX 5090 Laptop
Alienware 18 Area-51
Ultra 9 275HX, GeForce RTX 5090 Laptop
Asus Strix Scar 18 G835LX
Ultra 9 275HX, GeForce RTX 5090 Laptop
Razer Blade 18 2025 RTX 5090 Laptop
Ultra 9 275HX, GeForce RTX 5090 Laptop
Lenovo Legion 9 18IAX10
Ultra 9 275HX, GeForce RTX 5080 Laptop
Heat
13%
4%
9%
-1%
Maximum Upper Side * (°C)
41
36.8
10%
45.6
-11%
44.3
-8%
43
-5%
Maximum Bottom * (°C)
39
35.8
8%
46
-18%
42
-8%
41.8
-7%
Idle Upper Side * (°C)
38
30.6
19%
28.9
24%
27.2
28%
37
3%
Idle Bottom * (°C)
36
30.8
14%
29.2
19%
27.5
24%
34.2
5%

* ... más pequeño es mejor

Prueba de esfuerzo

En la prueba de estrés con FurMark y Prime95, la Core Ultra 9 275HX se estabilizó en torno a los 87 °C, frente a los moderados 71 °C de la RTX 5090.

FurMark y Prime95
FurMark y Prime95
FurMark y Prime95
FurMark y Prime95
FurMark y Prime95
FurMark y Prime95
Cyberpunk 2077
Cyberpunk 2077
Cyberpunk 2077
Cyberpunk 2077
Cyberpunk 2077
Cyberpunk 2077

Altavoz

Por el contrario, la calidad del sonido no tiene por qué esconderse detrás de la competencia. El sistema de sonido del Legion 9 18 está entre los mejores en el espacio de los portátiles y tampoco defrauda cuando se trata de la respuesta de los graves.

dB(A) 0102030405060708090Deep BassMiddle BassHigh BassLower RangeMidsHigher MidsLower HighsMid HighsUpper HighsSuper Highs204040.12537.537.5314645.94029.430.55026.329.86319.648.48016.658.910016.365.212517.173.216020.172.920024.574.525017.772.631513.469.240011.969.750011.575.763011.47780010.571.8100010.769.1125010.968.8160010.869.8200011.264250011.860.6315012.259.5400012.357.8500012.758.1630012.858.9800012.962.71000012.863.21250012.5601600011.954SPL24.680.7N0.653.1median 12.3median 68.8Delta1.76.535.532.835.524.922.624.923.325.423.324.821.224.831.522.331.526.622.226.627.422.727.431.921.331.940.719.640.758.122.158.163.721.563.767.223.367.270.223.470.272.924.272.972.622.872.677.520.677.577.921.277.975.421.375.477.919.677.976.819.876.87618767717.6777615.27677.614.477.67613.17671.912.671.971.112.371.170.612.170.664.311.964.363.310.963.387.930.687.978.61.478.6median 72.9median 19.6median 72.96.34.16.3hearing rangehide median Pink NoiseLenovo Legion 9 18IAX10 RTX 5090Alienware 18 Area-51
Diagrama de frecuencia en comparación (¡las casillas de verificación se pueden marcar y desmarcar!)
Lenovo Legion 9 18IAX10 RTX 5090 análisis de audio

(±) | la sonoridad del altavoz es media pero buena (81 dB)
Graves 100 - 315 Hz
(+) | buen bajo - sólo 3.6% lejos de la mediana
(+) | el bajo es lineal (6.4% delta a la frecuencia anterior)
Medios 400 - 2000 Hz
(+) | medios equilibrados - a sólo 3.1% de la mediana
(+) | los medios son lineales (5% delta a la frecuencia anterior)
Altos 2 - 16 kHz
(±) | máximos reducidos - de media 8.7% inferior a la mediana
(+) | los máximos son lineales (3% delta a la frecuencia anterior)
Total 100 - 16.000 Hz
(+) | el sonido global es lineal (11.2% de diferencia con la mediana)
En comparación con la misma clase
» 8% de todos los dispositivos probados de esta clase eran mejores, 4% similares, 88% peores
» El mejor tuvo un delta de 6%, la media fue 18%, el peor fue ###max##%
En comparación con todos los dispositivos probados
» 6% de todos los dispositivos probados eran mejores, 2% similares, 92% peores
» El mejor tuvo un delta de 4%, la media fue 24%, el peor fue ###max##%

Alienware 18 Area-51 análisis de audio

(+) | los altavoces pueden reproducir a un volumen relativamente alto (#87.9 dB)
Graves 100 - 315 Hz
(-) | casi sin bajos - de media 17.5% inferior a la mediana
(±) | la linealidad de los graves es media (13.4% delta a frecuencia anterior)
Medios 400 - 2000 Hz
(+) | medios equilibrados - a sólo 3.1% de la mediana
(+) | los medios son lineales (3.6% delta a la frecuencia anterior)
Altos 2 - 16 kHz
(+) | máximos equilibrados - a sólo 2.9% de la mediana
(+) | los máximos son lineales (2.9% delta a la frecuencia anterior)
Total 100 - 16.000 Hz
(+) | el sonido global es lineal (14.2% de diferencia con la mediana)
En comparación con la misma clase
» 25% de todos los dispositivos probados de esta clase eran mejores, 7% similares, 68% peores
» El mejor tuvo un delta de 6%, la media fue 18%, el peor fue ###max##%
En comparación con todos los dispositivos probados
» 16% de todos los dispositivos probados eran mejores, 4% similares, 80% peores
» El mejor tuvo un delta de 4%, la media fue 24%, el peor fue ###max##%

Gestión de la energía

consumo de energía

En modo 3D, el consumo de 343 W (valor medio de 3DMark 06) a 393 W (valor máximo de la prueba de estrés) está más o menos en línea con el modelo RTX 5080, que también consume mucha energía para un portátil. Mientras la conmutación gráfica está activa, el portátil sólo consume de 31 a 42 W en modo inactivo.

Consumo de corriente
Off / Standbydarklight 0.1 / 0.5 Watt
Ociosodarkmidlight 30.9 / 32.6 / 42.1 Watt
Carga midlight 150 / 393 Watt
 color bar
Clave: min: dark, med: mid, max: light        Metrahit Energy
Lenovo Legion 9 18IAX10 RTX 5090
Ultra 9 275HX, GeForce RTX 5090 Laptop
Alienware 18 Area-51
Ultra 9 275HX, GeForce RTX 5090 Laptop
Asus Strix Scar 18 G835LX
Ultra 9 275HX, GeForce RTX 5090 Laptop
Razer Blade 18 2025 RTX 5090 Laptop
Ultra 9 275HX, GeForce RTX 5090 Laptop
Lenovo Legion 9 18IAX10
Ultra 9 275HX, GeForce RTX 5080 Laptop
Media de la clase Gaming
 
Power Consumption
-17%
8%
18%
-10%
37%
Idle Minimum * (Watt)
30.9
38.4
-24%
11.4
63%
18.1
41%
34.5
-12%
Idle Average * (Watt)
32.6
45.6
-40%
39.2
-20%
27.9
14%
44.1
-35%
Idle Maximum * (Watt)
42.1
57.5
-37%
40.2
5%
28.7
32%
53.3
-27%
Load Average * (Watt)
150
190.1
-27%
161.2
-7%
108.3
28%
140.9
6%
Cyberpunk 2077 ultra external monitor * (Watt)
343
333
3%
295
14%
331
3%
353
-3%
Cyberpunk 2077 ultra * (Watt)
348
340
2%
303
13%
338
3%
360
-3%
Load Maximum * (Watt)
393
373.2
5%
430.9
-10%
366.7
7%
367.5
6%

* ... más pequeño es mejor

Consumo de energía: Cyberpunk 2077 / Prueba de estrés

020406080100120140160180200220240260280300320340360380Tooltip
Lenovo Legion 9 18IAX10 RTX 5090; 1280x720 Prime95 28.10 and Furmark 1.25: Ø382 (331-393)
Lenovo Legion 9 18IAX10 RTX 5090; Idle 150cd/m2: Ø32.6 (30.9-42.1)
Lenovo Legion 9 18IAX10 RTX 5090; Cyberpunk 2077 FHD ultra no FSR 150cd: Ø348 (326-356)

Consumo de energía: Monitor externo

020406080100120140160180200220240260280300320340Tooltip
Lenovo Legion 9 18IAX10 RTX 5090; Prime95 V2810 Stress (external Monitor): Ø260 (235-278)
Lenovo Legion 9 18IAX10 RTX 5090; Cinebench R23 Multi (external Monitor): Ø261 (257-267)
Lenovo Legion 9 18IAX10 RTX 5090; 1280x720 FurMark 1.19 GPU Stress Test (external Monitor): Ø225 (222-234)
Lenovo Legion 9 18IAX10 RTX 5090; Idle 1min (external Monitor): Ø40.3 (37-56.8)
Lenovo Legion 9 18IAX10 RTX 5090; Cyberpunk 2077 FHD ultra no FSR (external Monitor): Ø343 (328-350)

Duración de las pilas

En modo batería, el consumo de energía es superior al del Legion 9 más barato.

Con algo menos de 3 horas en la prueba Wi-Fi (perfil Equilibrado en lugar de Rendimiento), el Legion 9 18 dura más que el Alienware 18 con sus escasas 2 horas, pero el valor medido sigue siendo bastante decepcionante, sobre todo teniendo en cuenta la potente batería de 99 Wh.

Tiempo de Ejecución de la Batería
WiFi Websurfing
2h 56min
Lenovo Legion 9 18IAX10 RTX 5090
Ultra 9 275HX, GeForce RTX 5090 Laptop, 99.9 Wh
Alienware 18 Area-51
Ultra 9 275HX, GeForce RTX 5090 Laptop, 96 Wh
Asus Strix Scar 18 G835LX
Ultra 9 275HX, GeForce RTX 5090 Laptop, 90 Wh
Razer Blade 18 2025 RTX 5090 Laptop
Ultra 9 275HX, GeForce RTX 5090 Laptop, 99.99 Wh
Lenovo Legion 9 18IAX10
Ultra 9 275HX, GeForce RTX 5080 Laptop, 99.9 Wh
Media de la clase Gaming
 
Duración de Batería
-31%
90%
169%
93%
126%
WiFi v1.3 (h)
2.9
2
-31%
5.5
90%
7.8
169%
5.6
93%
H.264 (h)
5.8
Cyberpunk 2077 ultra 150cd (h)
0.7
Load (h)
1.2

Impresiones generales de Notebookcheck sobre el Lenovo Legion 9 18IAX10

Lenovo vende un sustituto de sobremesa extremadamente caro pero también de gran calidad e increíblemente rápido con la Legion 9 18IAX10, cuya RTX 5090 se lleva a menudo la corona del rendimiento.

Lenovo Legion 9 18IAX10 RTX 5090 - 10/10/2025 v8
Florian Glaser

Acabado
91 / 98 → 93%
Teclado
90%
Ratón
86%
Conectividad
75 / 80 → 94%
Peso
53 / 10-68 → 74%
Battería
52 / 95 → 54%
Pantalla
82%
Rendimiento de juegos
96%
Rendimiento de la Aplicación
94%
AI Performance
90%
Temperatura
88 / 95 → 93%
Ruido
58 / 90 → 65%
Audio
84%
Cámara
43 / 75 → 57%
Médio
66%
87%
Gaming - media ponderada
CO2 Emissions
No Data
Materials
0%
Packaging
100%
Power Use
79.8%
Repairability
50%
Software Updates
22.3%
Recycle Logo Total Sustainability Score: 42%

Posibles alternativas en comparación

Imagen
Modelo
Precio
Peso
Altura
Pantalla
1.
87.1%
Lenovo Legion 9 18IAX10 RTX 5090
Intel Core Ultra 9 275HX ⎘
Nvidia GeForce RTX 5090 Laptop ⎘
64 GB Memoría, 2000 GB SSD
Amazon:
1. $3,549.00
Lenovo Legion Pro 7i Gen 10 ...
2. $3,549.00
Lenovo Legion Pro 7i Gen 10 ...
3. $3,269.99
Lenovo Legion Pro 7i Gen 10 ...
Precio de catálogo: 5900 EUR
3.5 kg28 mm18.00"
3840x2400
252 PPI
IPS
2.
86.2%
Alienware 18 Area-51
Intel Core Ultra 9 275HX ⎘
Nvidia GeForce RTX 5090 Laptop ⎘
64 GB Memoría
Amazon: $3,432.01
Precio de catálogo: 4400 USD
4.2 kg24.32 mm18.00"
2560x1600
168 PPI
IPS
3.
88%
Asus Strix Scar 18 G835LX
Intel Core Ultra 9 275HX ⎘
Nvidia GeForce RTX 5090 Laptop ⎘
64 GB Memoría, 2048 GB SSD
Amazon:
1. $4,249.00
ASUS ROG Strix SCAR 18 (2025...
2. $5,639.00
EXCaliberPC [2025] ASUS ROG ...
3. $3,129.99
ASUS ROG Strix SCAR 18 (2025...
Precio de catálogo: 5799€
3.3 kg32 mm18.00"
2560x1600
168 PPI
Mini-LED
4.
89.5%
Razer Blade 18 2025 RTX 5090 Laptop
Intel Core Ultra 9 275HX ⎘
Nvidia GeForce RTX 5090 Laptop ⎘
64 GB Memoría, 2048 GB SSD
Amazon:
1. $5,495.00
Razer Blade 18 Gaming Laptop...
2. $4,399.99
Razer Blade 18 Gaming Laptop...
3. $5,698.00
Razer Blade 17 Gaming Laptop...
Precio de catálogo: 5299€
3.2 kg27.9 mm18.00"
3840x2400
252 PPI
IPS
5.
89.1%
Lenovo Legion 9 18IAX10
Intel Core Ultra 9 275HX ⎘
Nvidia GeForce RTX 5080 Laptop ⎘
64 GB Memoría, 2000 GB SSD
Amazon: $2,749.95
Precio de catálogo: 3800 USD
3.5 kg27.95 mm18.00"
3840x2400
252 PPI
IPS

Transparencia

La selección de los dispositivos que se van a reseñar corre a cargo de nuestro equipo editorial. La muestra de prueba fue proporcionada al autor en calidad de préstamo por el fabricante o el minorista a los efectos de esta reseña. El prestamista no tuvo ninguna influencia en esta reseña, ni el fabricante recibió una copia de la misma antes de su publicación. No había ninguna obligación de publicar esta reseña. Como empresa de medios independiente, Notebookcheck no está sujeta a la autoridad de fabricantes, minoristas o editores.

Así es como prueba Notebookcheck

Cada año, Notebookcheck revisa de forma independiente cientos de portátiles y smartphones utilizando procedimientos estandarizados para asegurar que todos los resultados son comparables. Hemos desarrollado continuamente nuestros métodos de prueba durante unos 20 años y hemos establecido los estándares de la industria en el proceso. En nuestros laboratorios de pruebas, técnicos y editores experimentados utilizan equipos de medición de alta calidad. Estas pruebas implican un proceso de validación en varias fases. Nuestro complejo sistema de clasificación se basa en cientos de mediciones y puntos de referencia bien fundamentados, lo que mantiene la objetividad.
Please share our article, every link counts!
Mail Logo
> Análisis y pruebas de ordenadores portátiles y móviles teléfonos > Análisis > Análisis del Lenovo Legion 9 18 con RTX 5090: El portátil para juegos más potente del mercado
Florian Glaser, 2025-10-24 (Update: 2025-10-24)