Análisis del Lenovo ThinkPad E16 G1 Intel: El Core i5 está codo con codo con el AMD Ryzen 7

La serie ThinkPad E se compone de modelos asequibles para usuarios empresariales, en contraste con la serie ThinkPad T, más lujosa, o la serie ThinkPad X, más elegante. Este año marca la introducción de la familia ThinkPad E16 de 16 pulgadas para complementar las opciones existentes de 14 pulgadas ThinkPad E14 y 15 pulgadas ThinkPad E15. Dos versiones del ThinkPad E16 están disponibles en el momento del lanzamiento con procesadores Intel o AMD. Hace poco analizamos la versión ThinkPad E16 AMD Ryzen 7, por lo que ahora es el momento de echar un vistazo a la versión ThinkPad E16 Intel Core i5 para ver cómo se comparan sus diferencias.
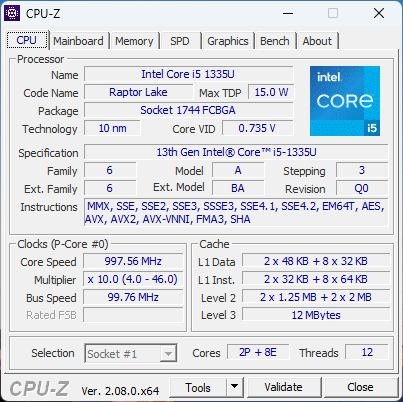
Nuestra unidad de revisión Intel específica es una configuración de gama baja con el Core i5-1335U y pantalla táctil 1200p por aproximadamente $800 a $900 USD al por menor. Otras configuraciones pueden llegar hasta el Core i7-1365U, el Core i7-1360P o incluso el Core i7-13700H con gráficos discretos GeForce MX550 y una pantalla de 1600p de mayor resolución por precios mucho más elevados. Estas opciones aún no están disponibles en el momento de la publicación.
Entre las alternativas al ThinkPad E16 se incluyen otros portátiles multimedia o de negocios de 16 pulgadas como el Acer TravelMate P4, Samsung Galaxy Book3 Pro 16, o LG Gram 16. Recomendamos consultar nuestro análisis existente sobre el ThinkPad E16 G1 versión AMD ya que nuestra versión Intel comparte el mismo diseño de chasis y características físicas.
Más reseñas de Lenovo:
Posibles contendientes en la comparación
Valoración | Fecha | Modelo | Peso | Altura | Tamaño | Resolución | Precio |
|---|---|---|---|---|---|---|---|
| 85.5 % v7 (old) | 11/2023 | Lenovo ThinkPad E16 G1 Core i5-1335U i5-1335U, Iris Xe G7 80EUs | 1.8 kg | 19.85 mm | 16.00" | 1920x1200 | |
| 88.1 % v7 (old) | 09/2023 | Lenovo ThinkPad E16 G1-21JUS08X00 R7 7730U, Vega 8 | 1.8 kg | 19.85 mm | 16.00" | 2560x1600 | |
| 84.6 % v7 (old) | 07/2023 | Dell Inspiron 16 7635 2-in-1 R5 7530U, Vega 7 | 2 kg | 18.99 mm | 16.00" | 1920x1200 | |
| 86 % v7 (old) | 04/2023 | Acer TravelMate P4 TMP416-51-55KN i5-1240P, Iris Xe G7 80EUs | 1.6 kg | 18.5 mm | 16.00" | 1920x1200 | |
| 85.6 % v7 (old) | 05/2023 | Samsung Galaxy Book3 Pro 16 i5-1340P, Iris Xe G7 80EUs | 1.6 kg | 12.5 mm | 16.00" | 2880x1800 | |
| 86.6 % v7 (old) | 01/2023 | LG Gram 16Z90Q i7-1260P, Iris Xe G7 96EUs | 1.2 kg | 16.8 mm | 16.00" | 2560x1600 |
Caso
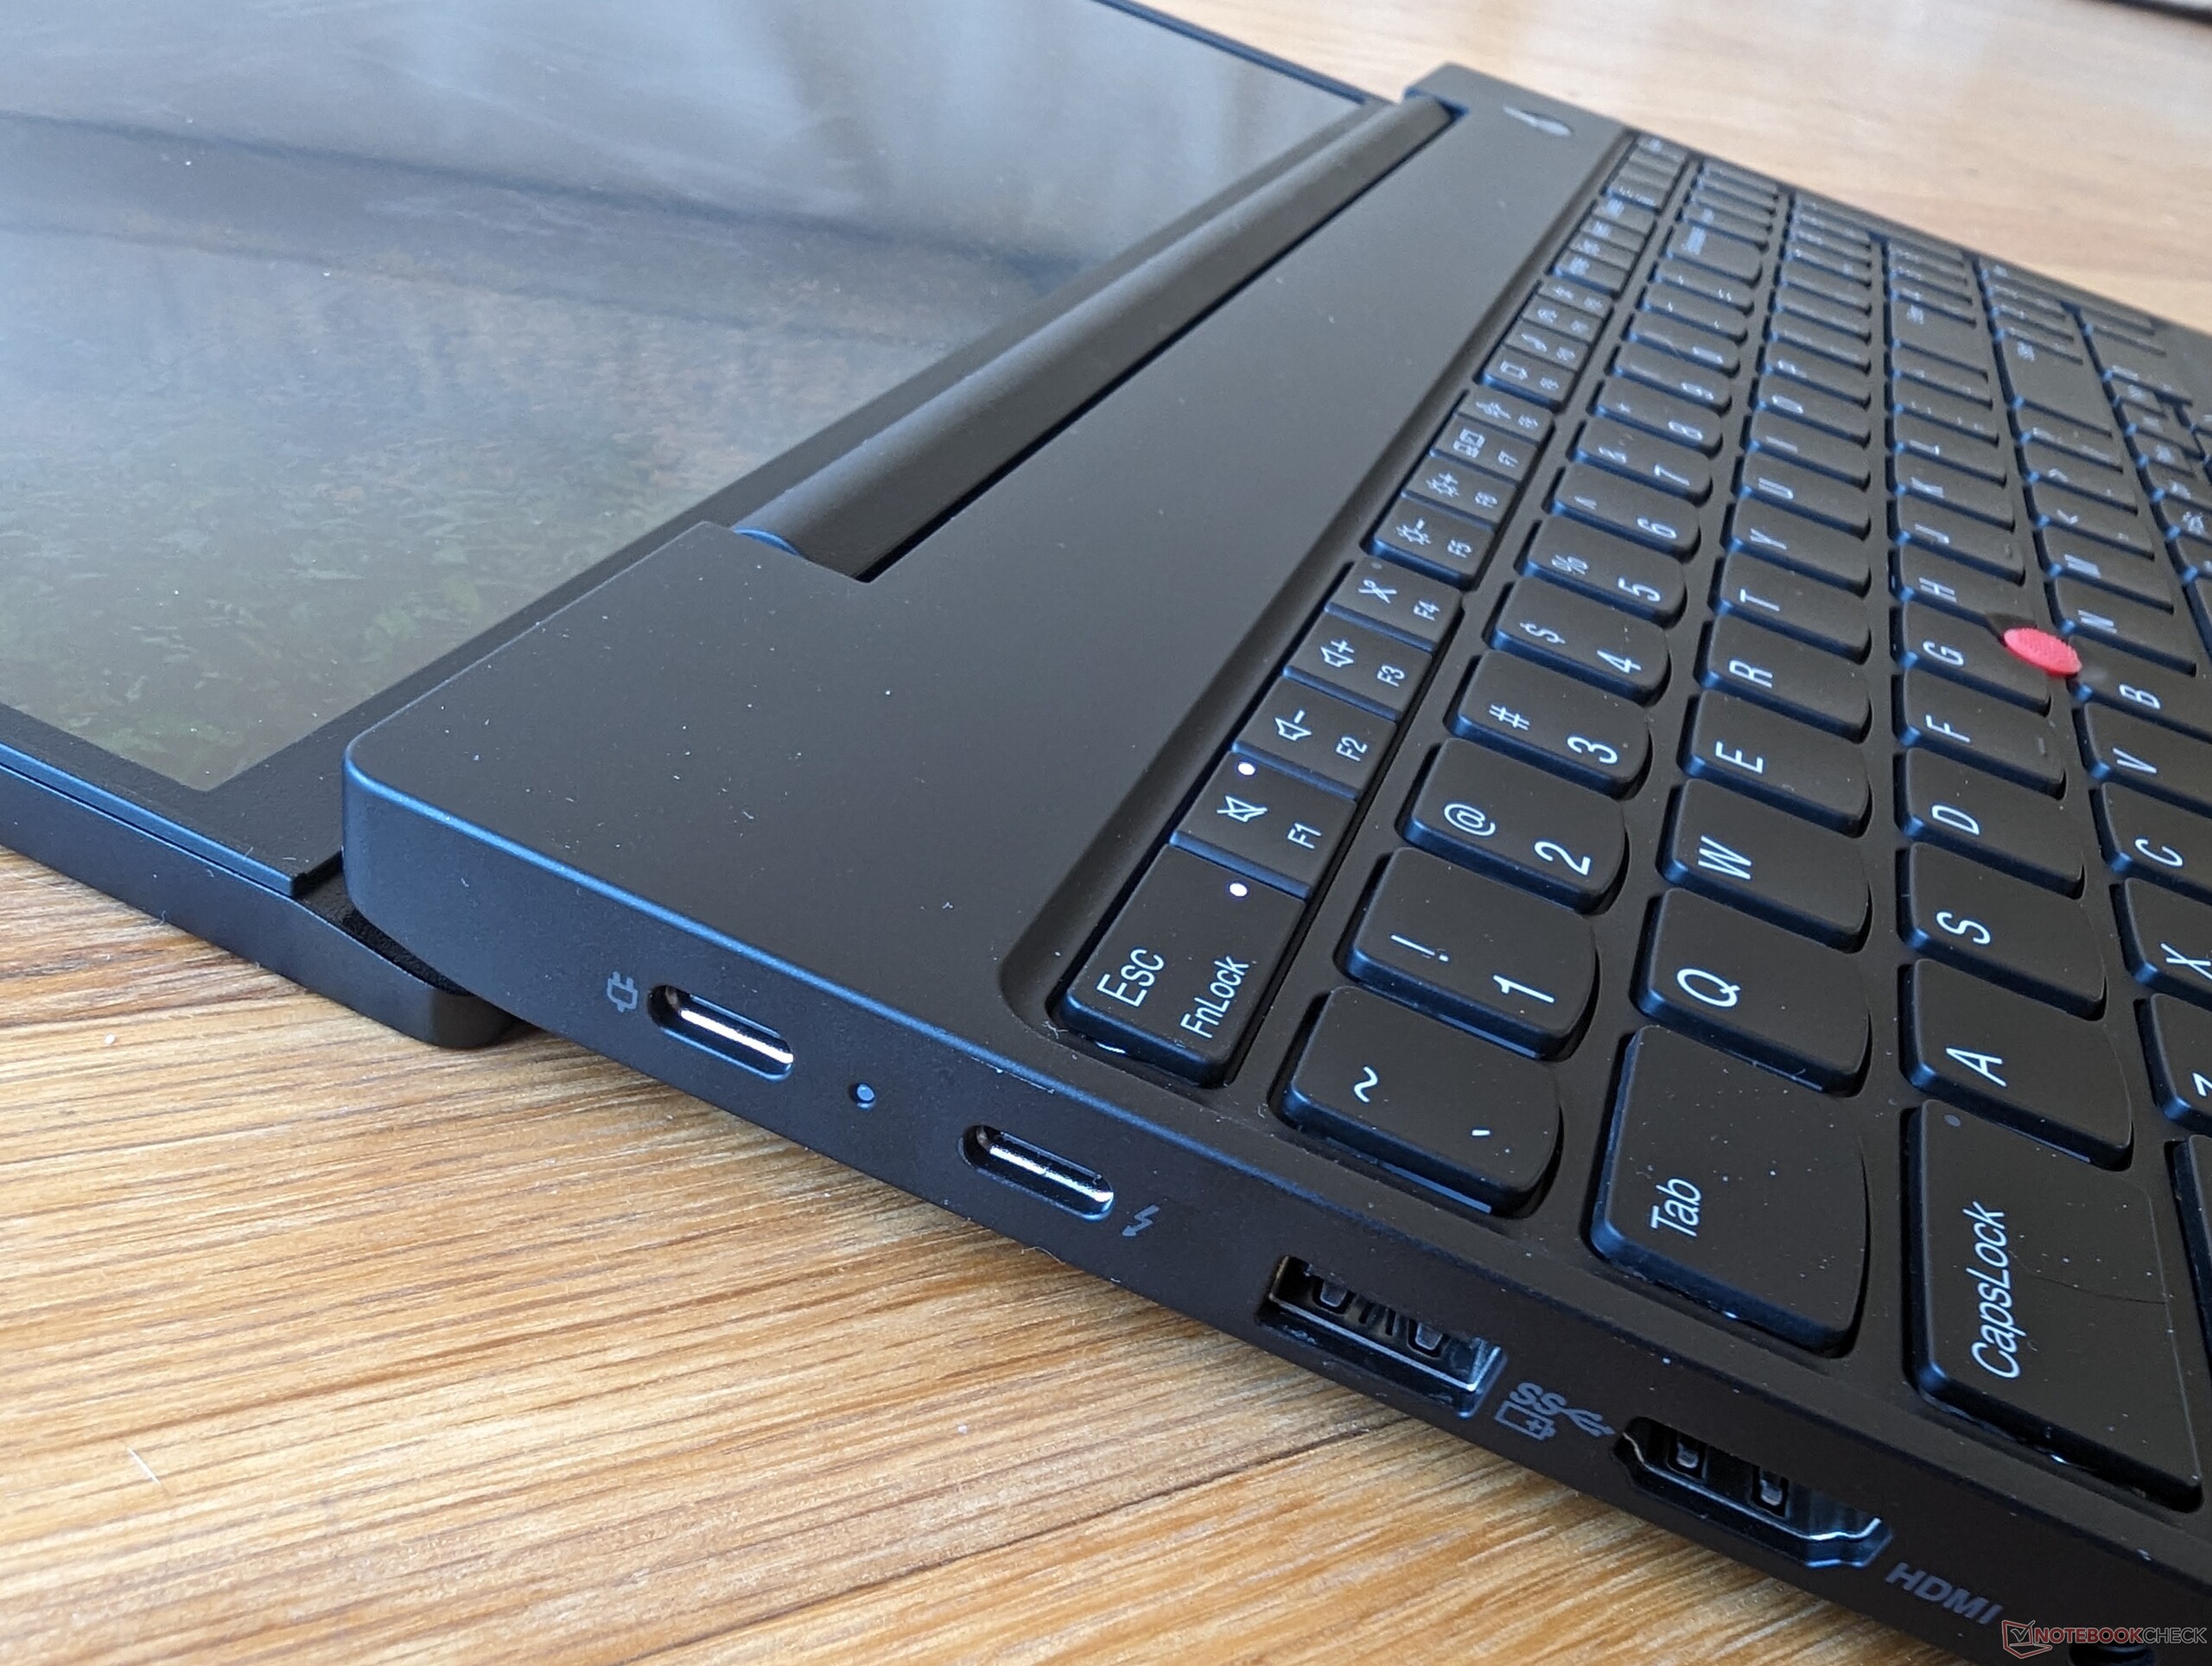
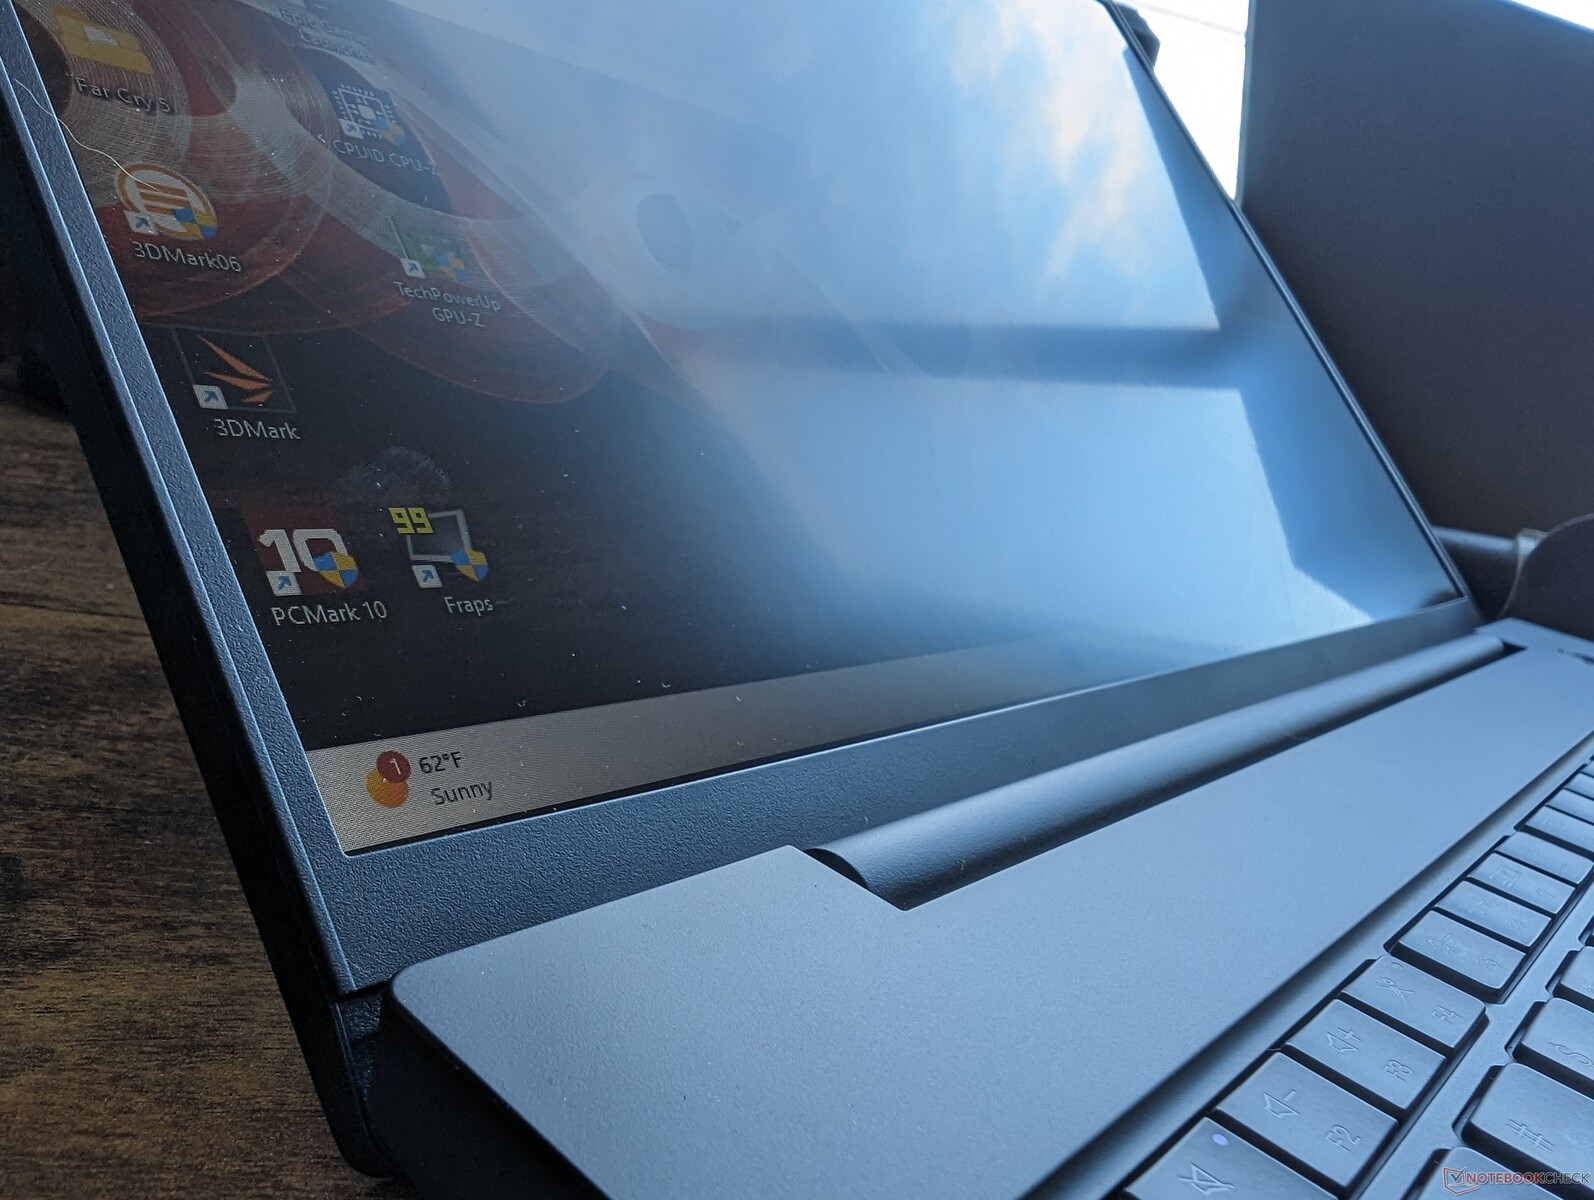
La forma más fácil de identificar una versión Intel de una versión AMD es buscar el logotipo Thunderbolt en el borde izquierdo. Thunderbolt sólo es compatible con las versiones Intel, ya que las versiones AMD actuales no se suministran con USB4.
Comunicación
Cámara web


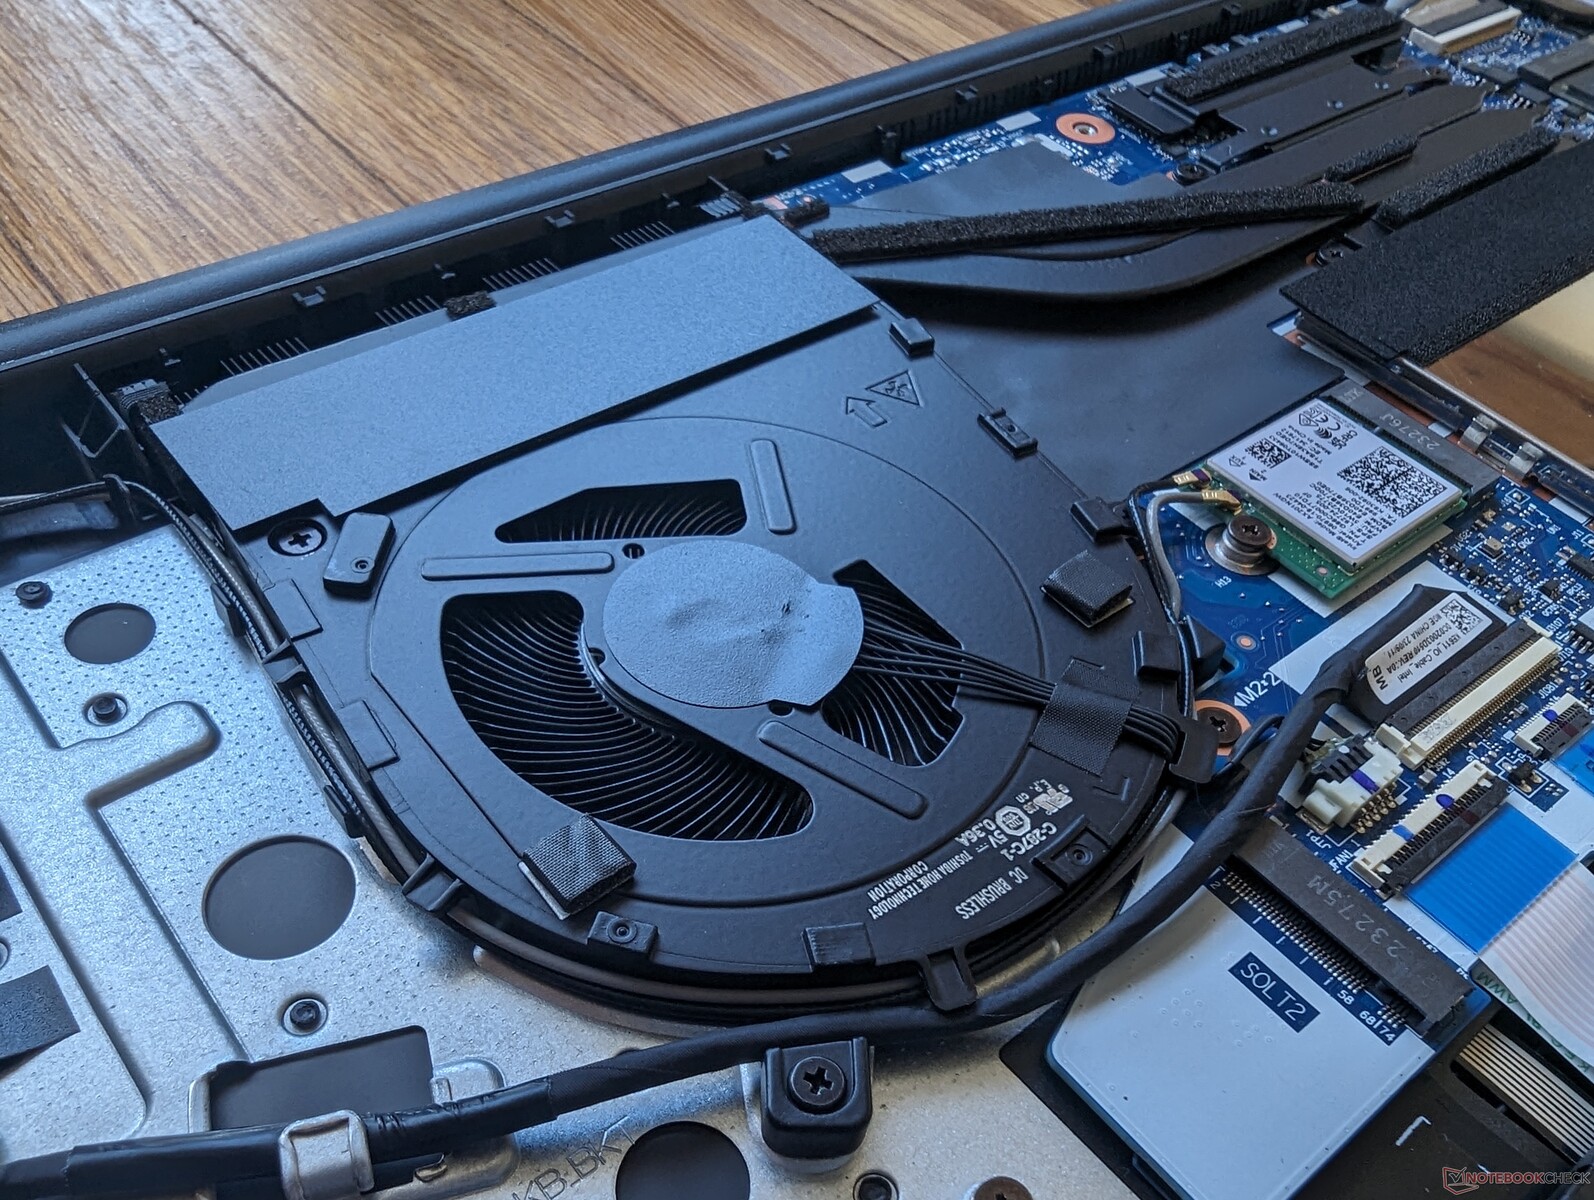
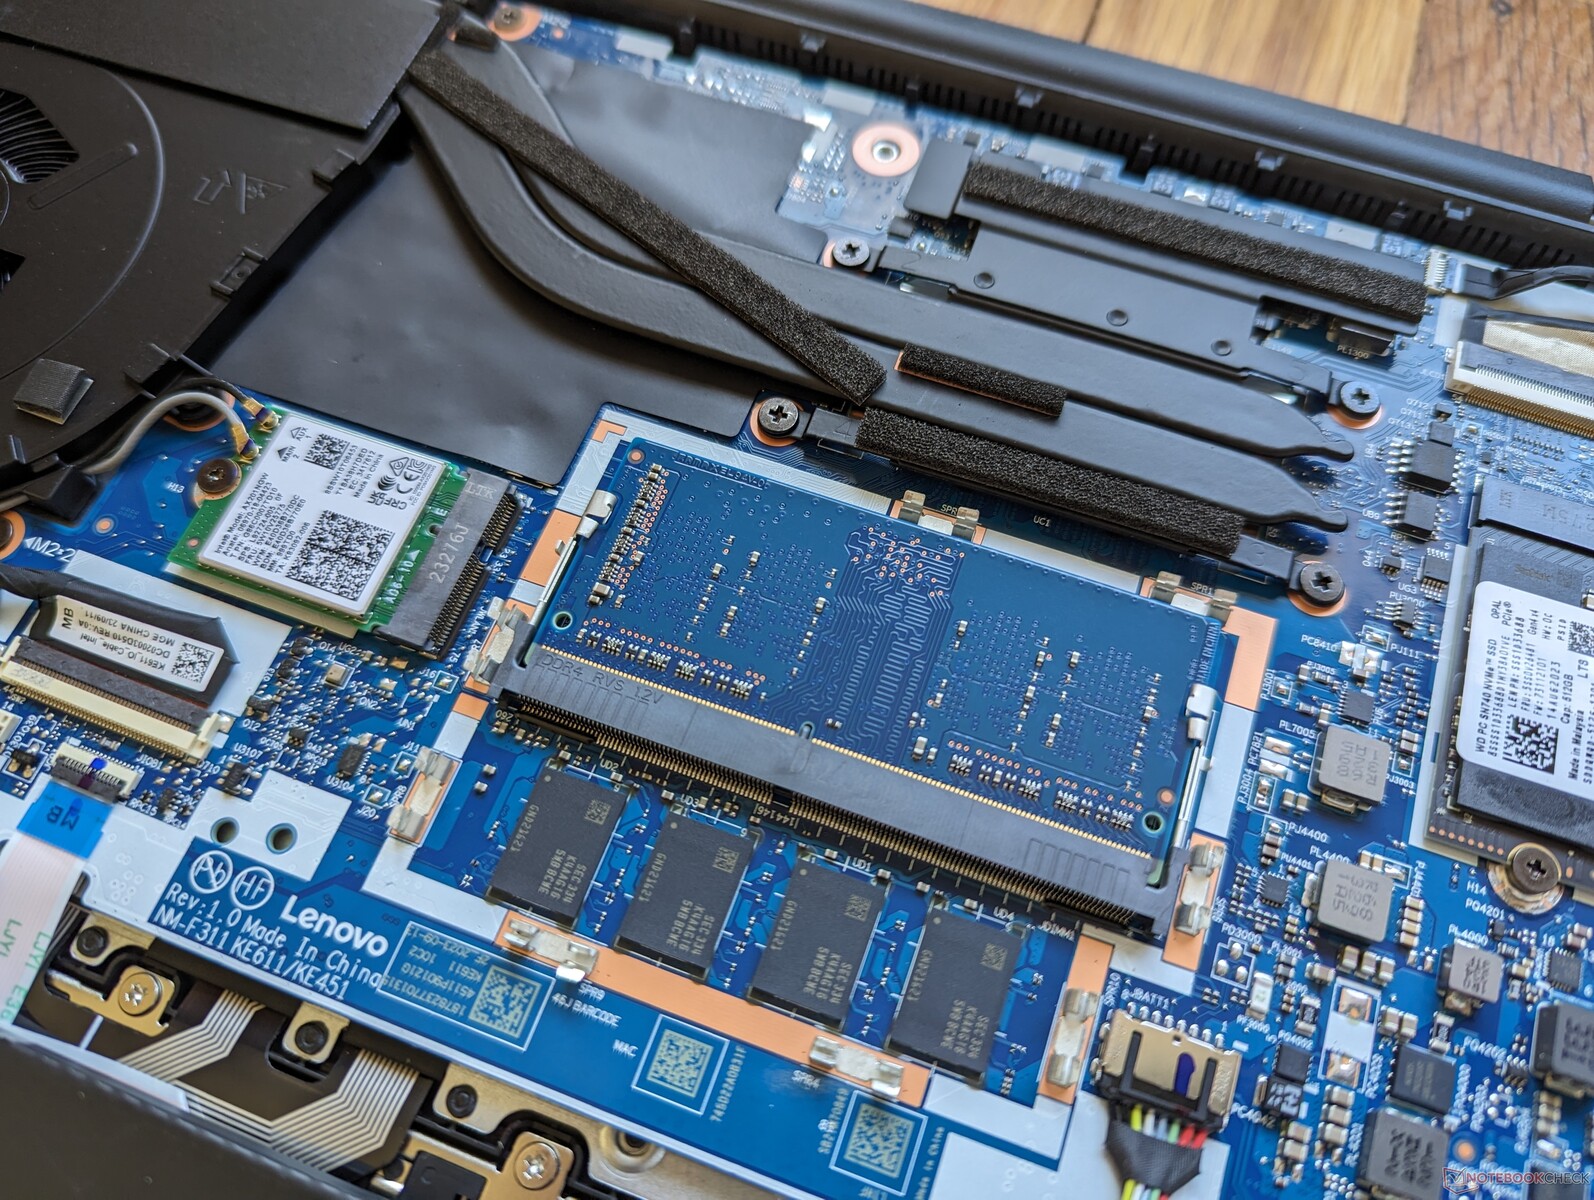
Mantenimiento
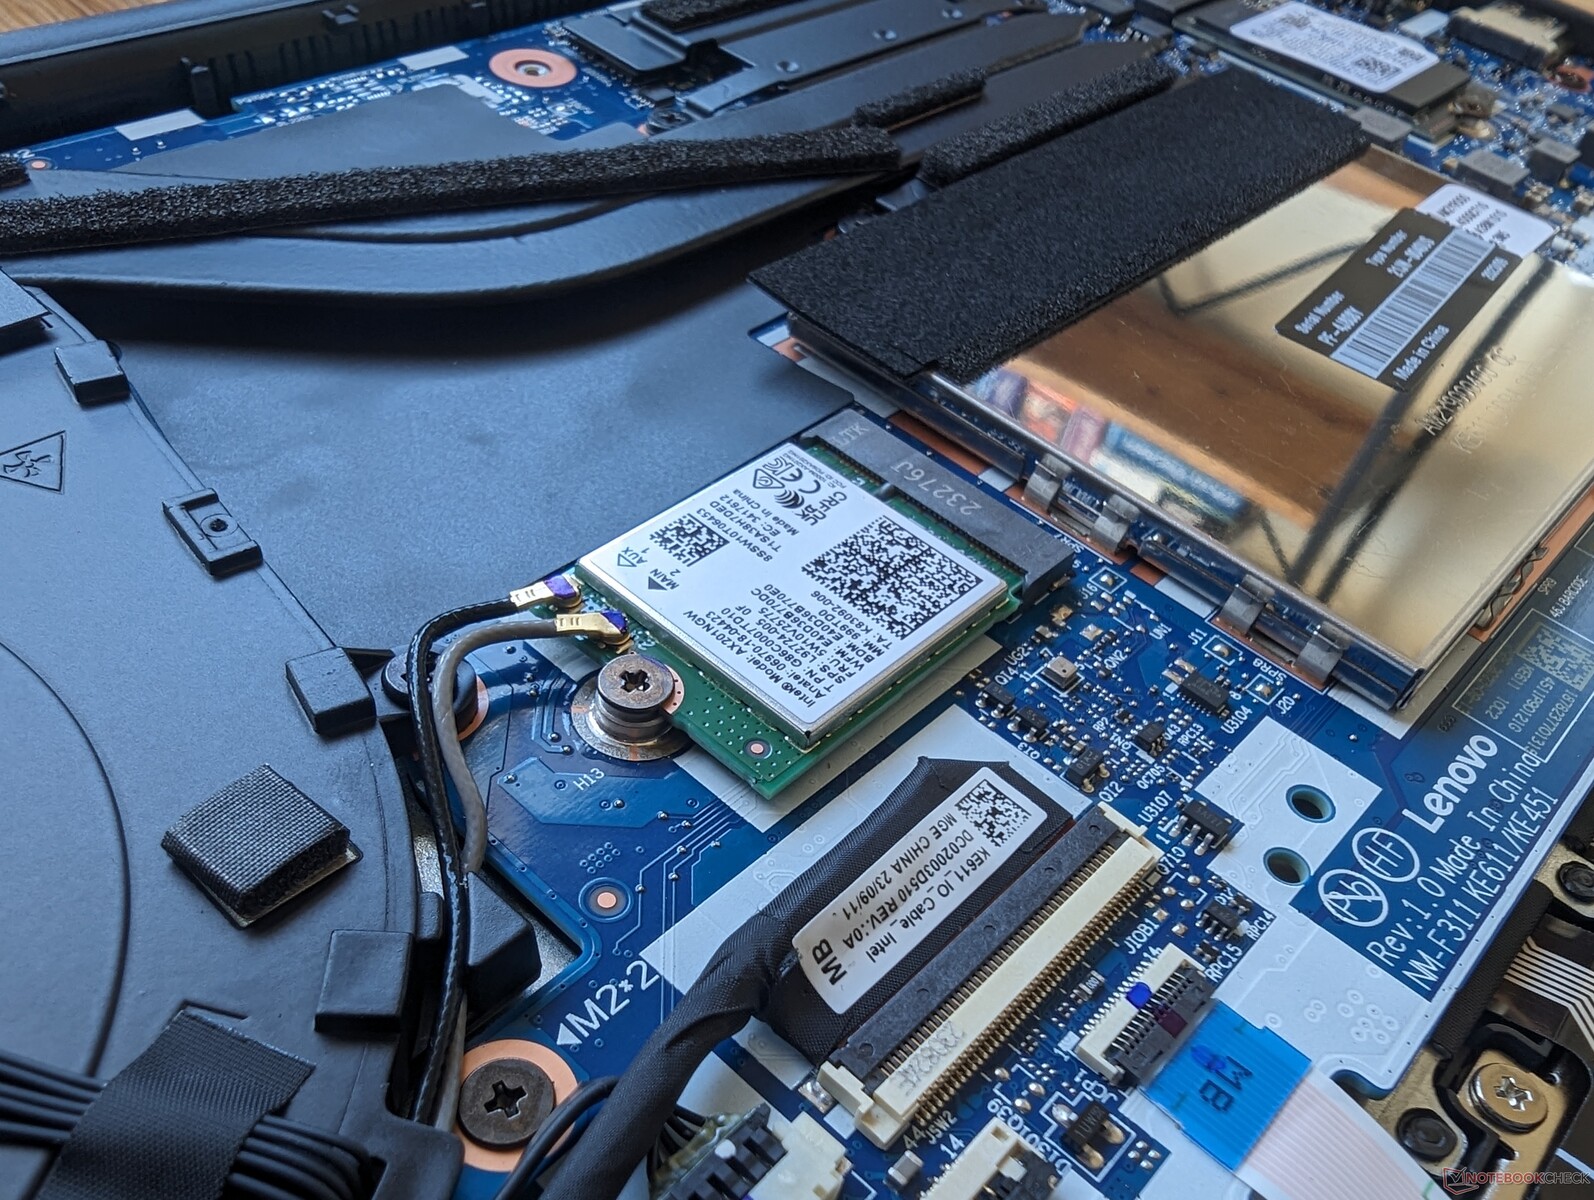
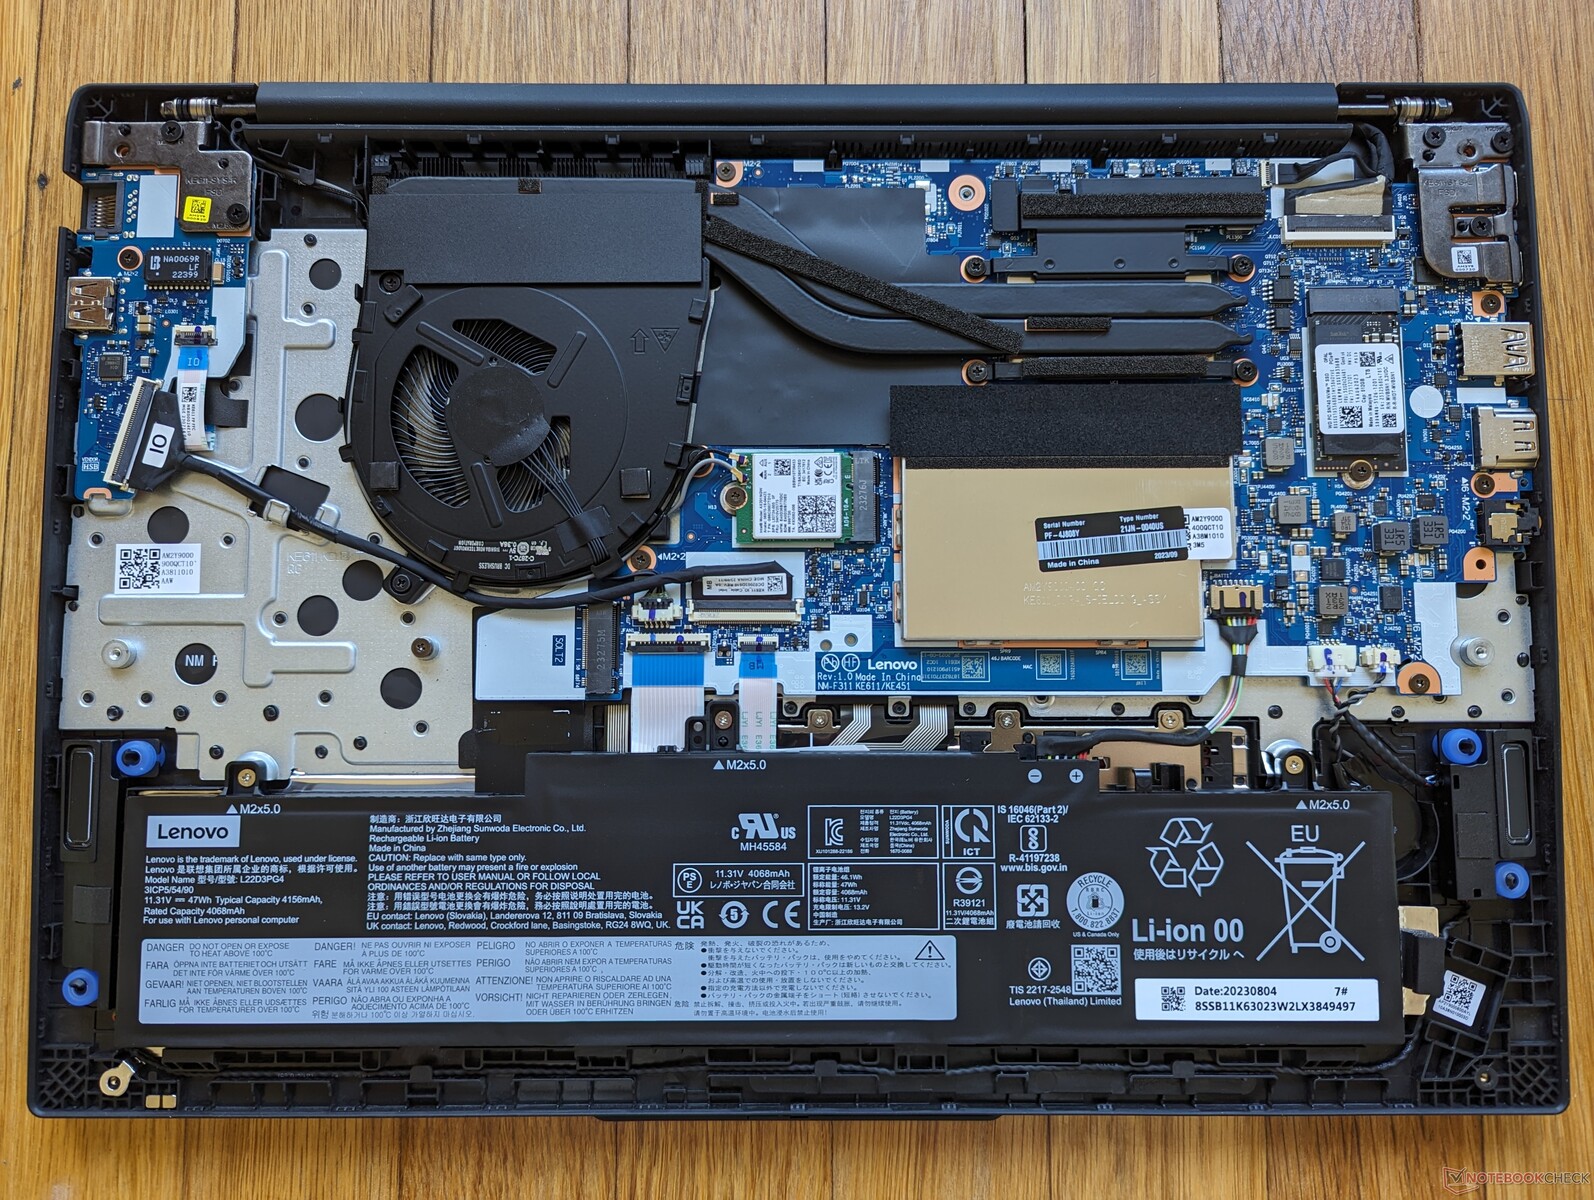
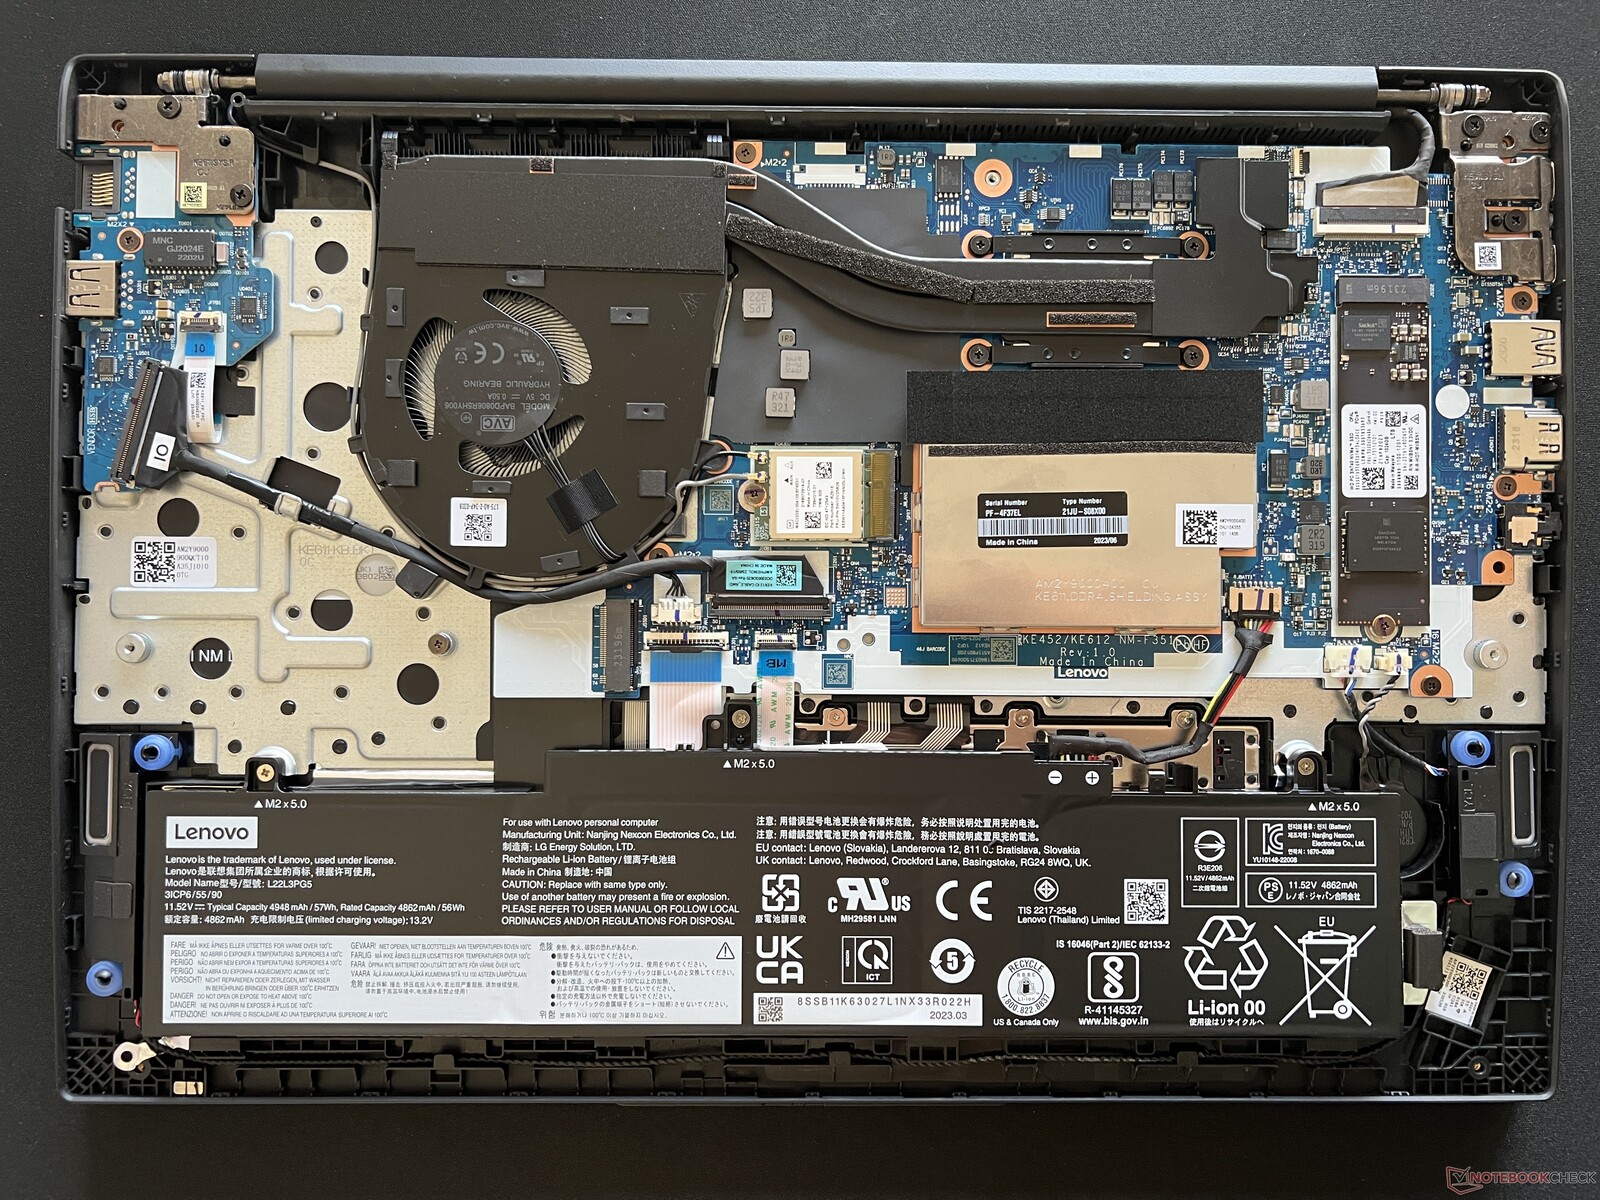
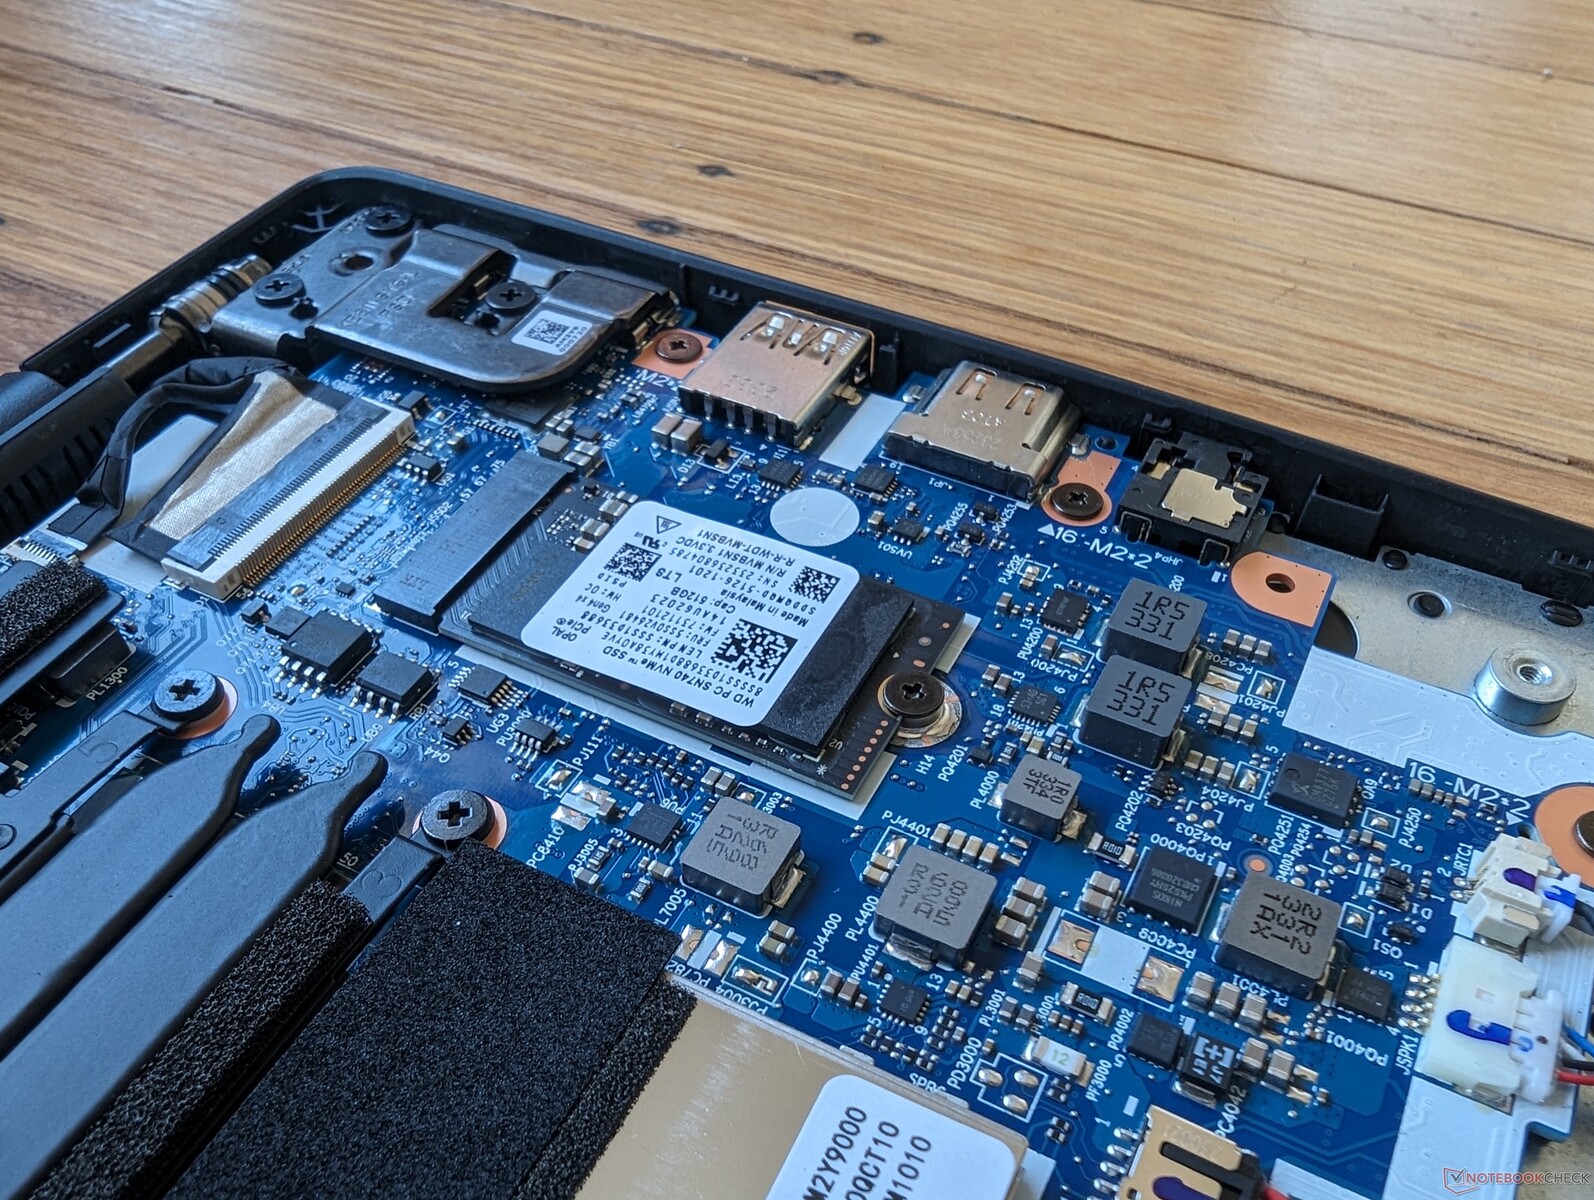
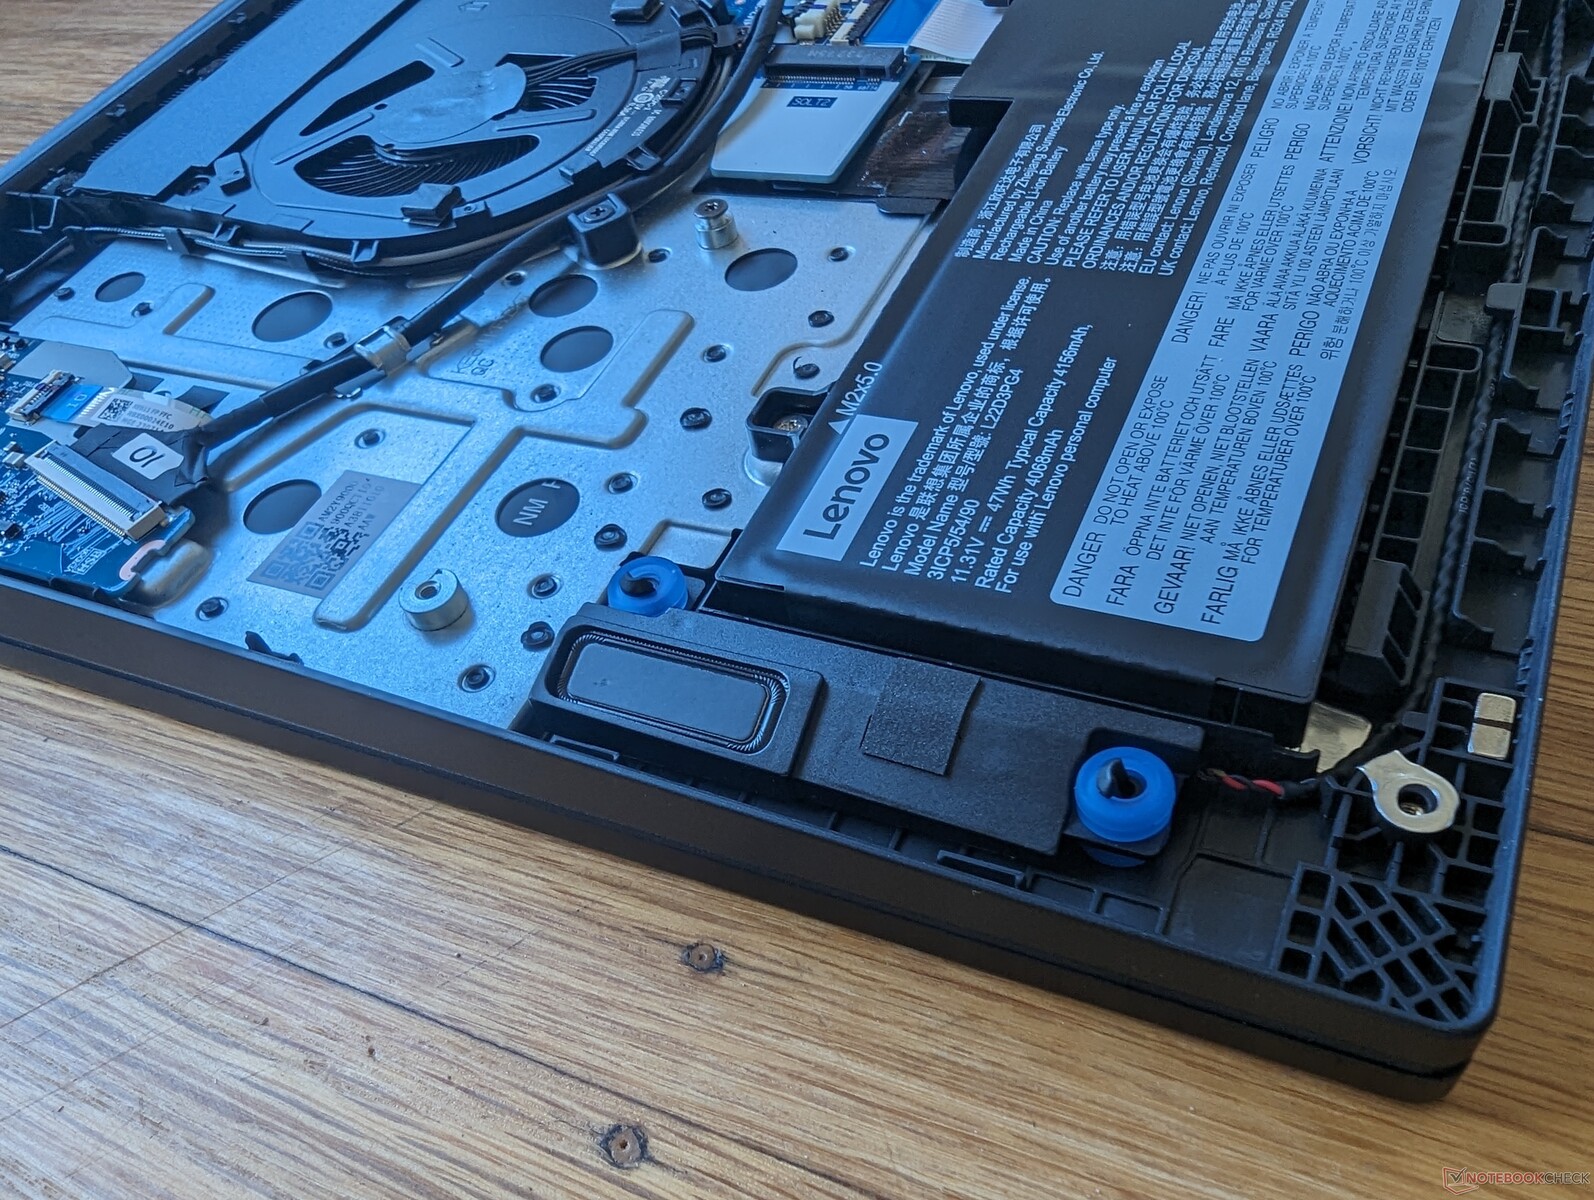
Tanto la versión de Intel como la de AMD admiten hasta dos unidades SSD M.2 cada una. Sin embargo, la versión Intel sólo admite unidades de hasta 42 mm de longitud, mientras que la versión AMD puede admitir una unidad de hasta 80 mm. Esto es similar a lo que observamos entre el pequeño 14 pulgadas ThinkPad E14 G5 Versiones Intel y AMD.
Garantía
Se aplica una garantía limitada del fabricante de un año si se adquiere en EE.UU. En comparación, los modelos ThinkPad de gama más alta de las series T o X suelen incluir garantías de tres años de serie.
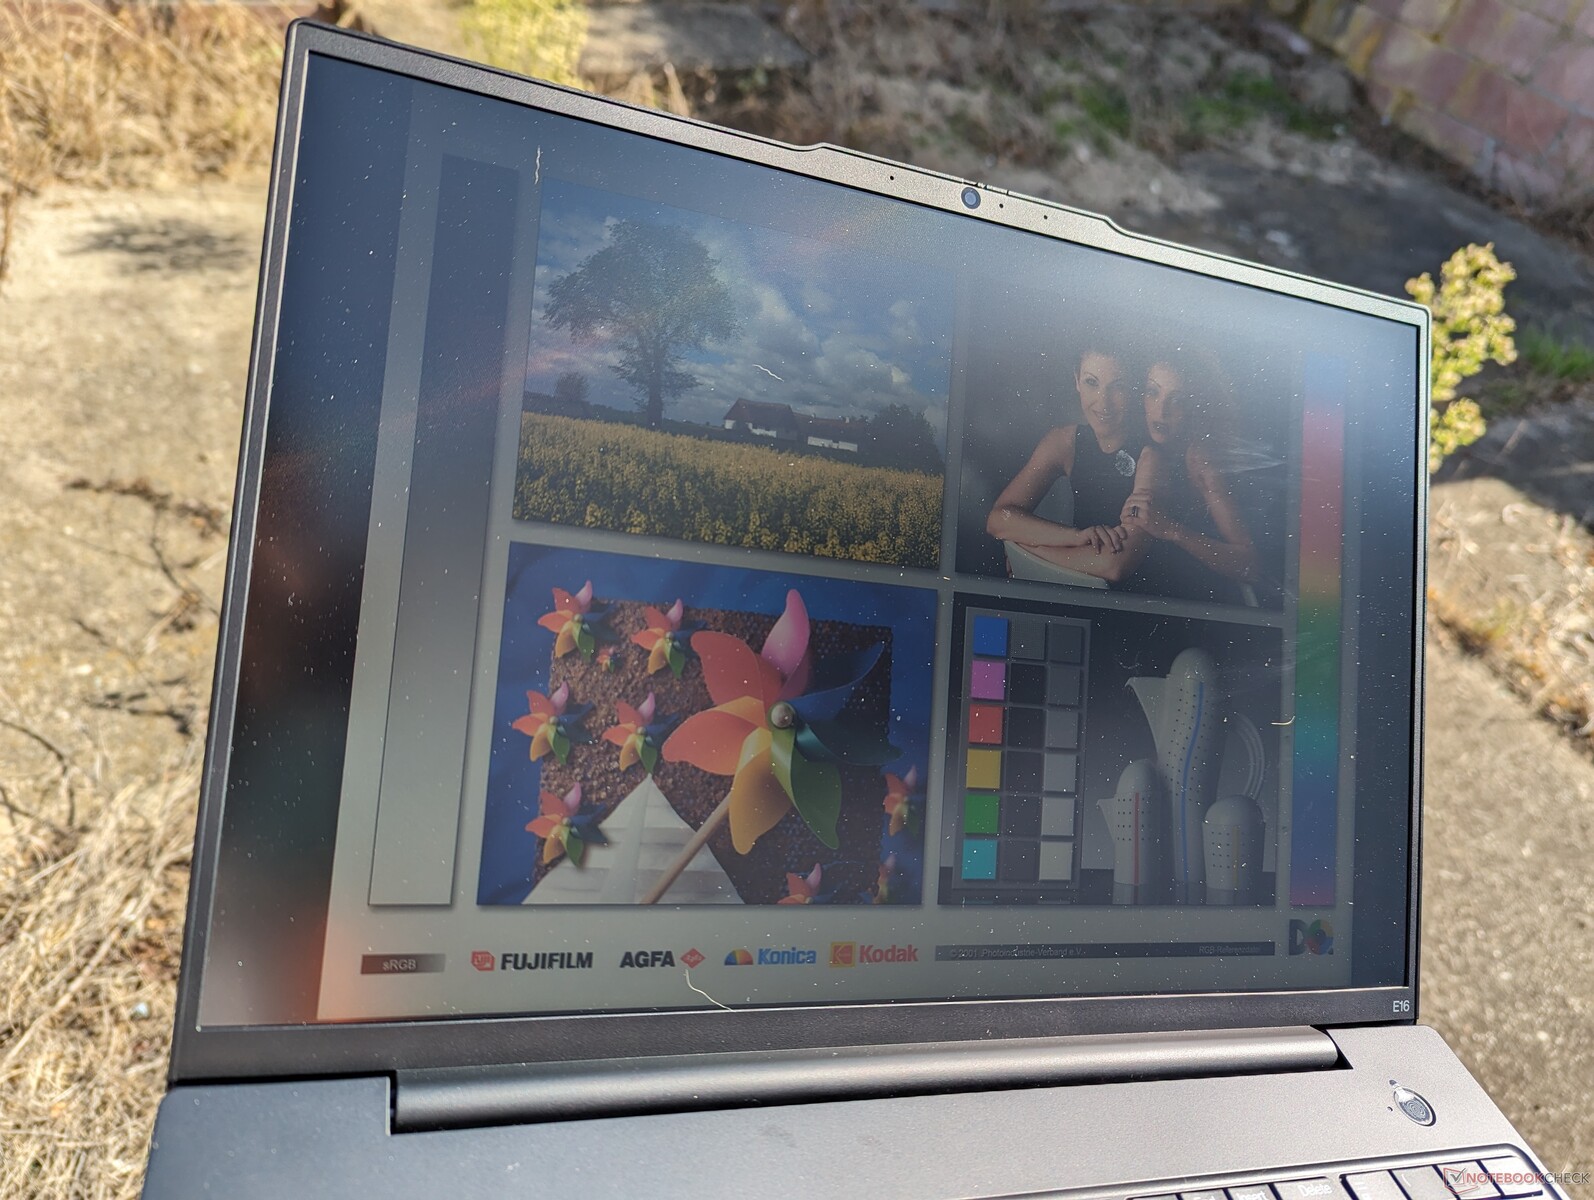
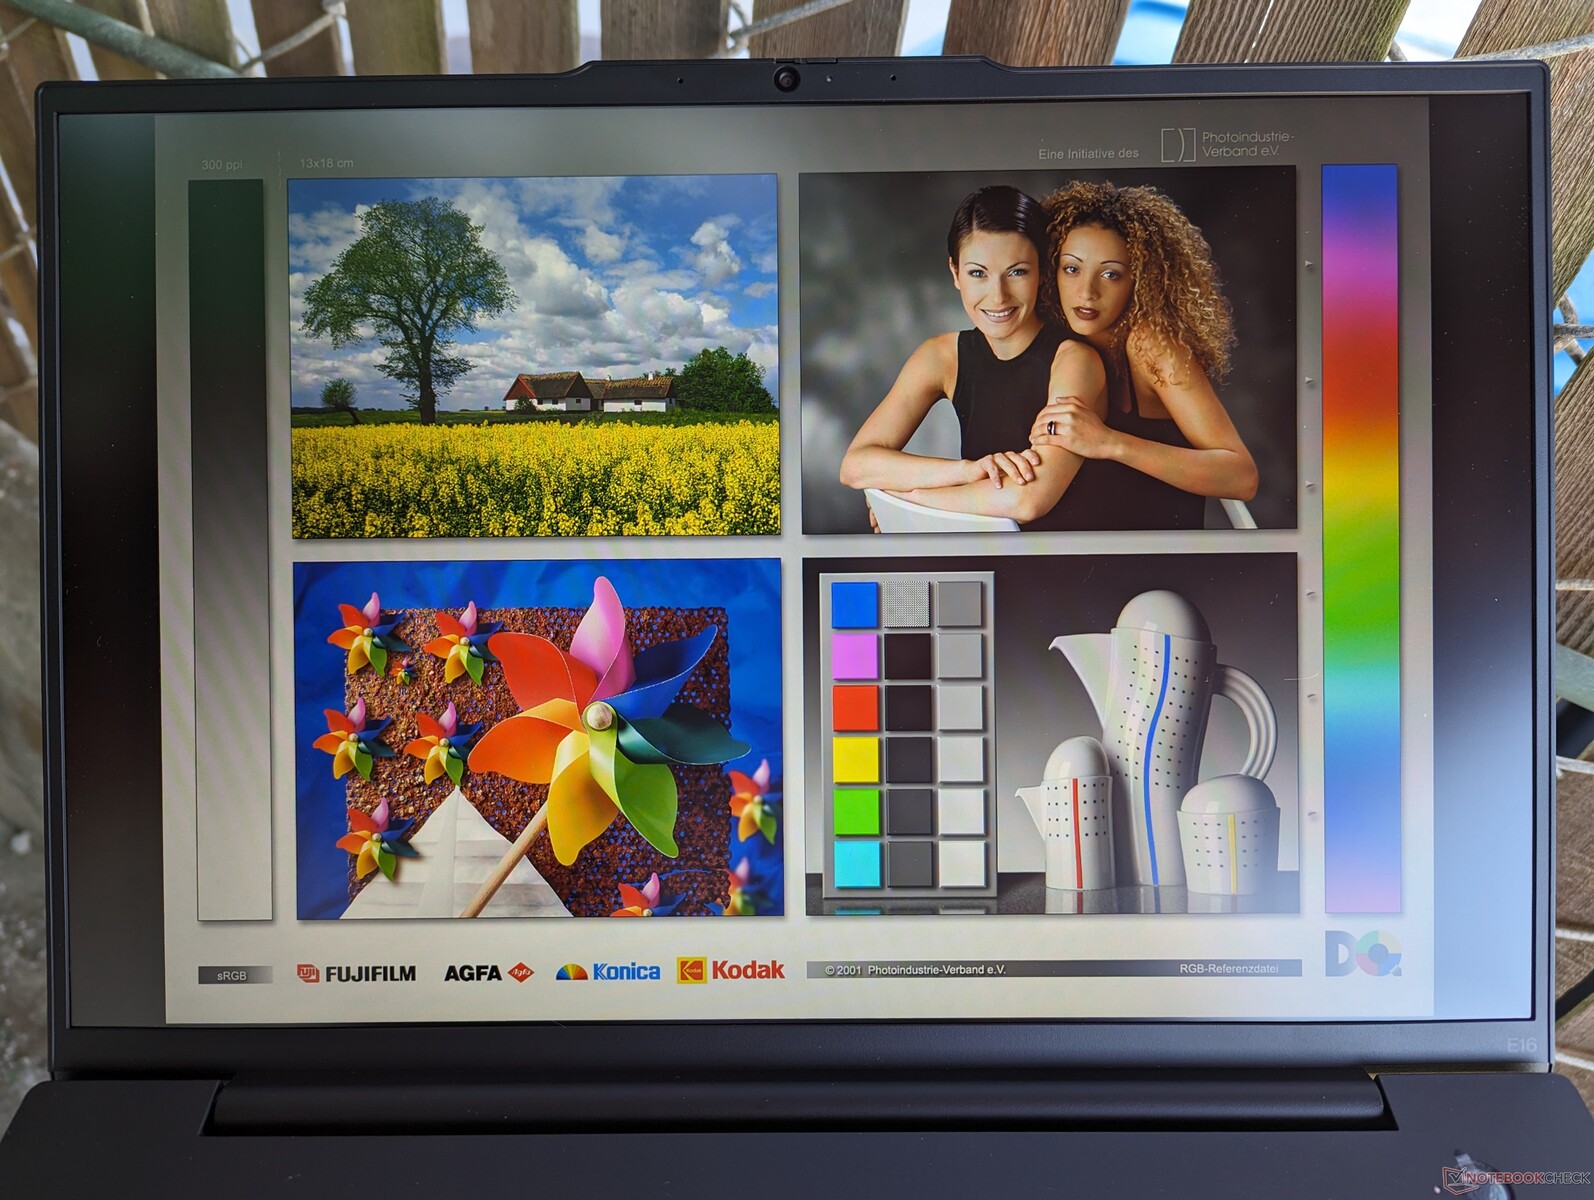
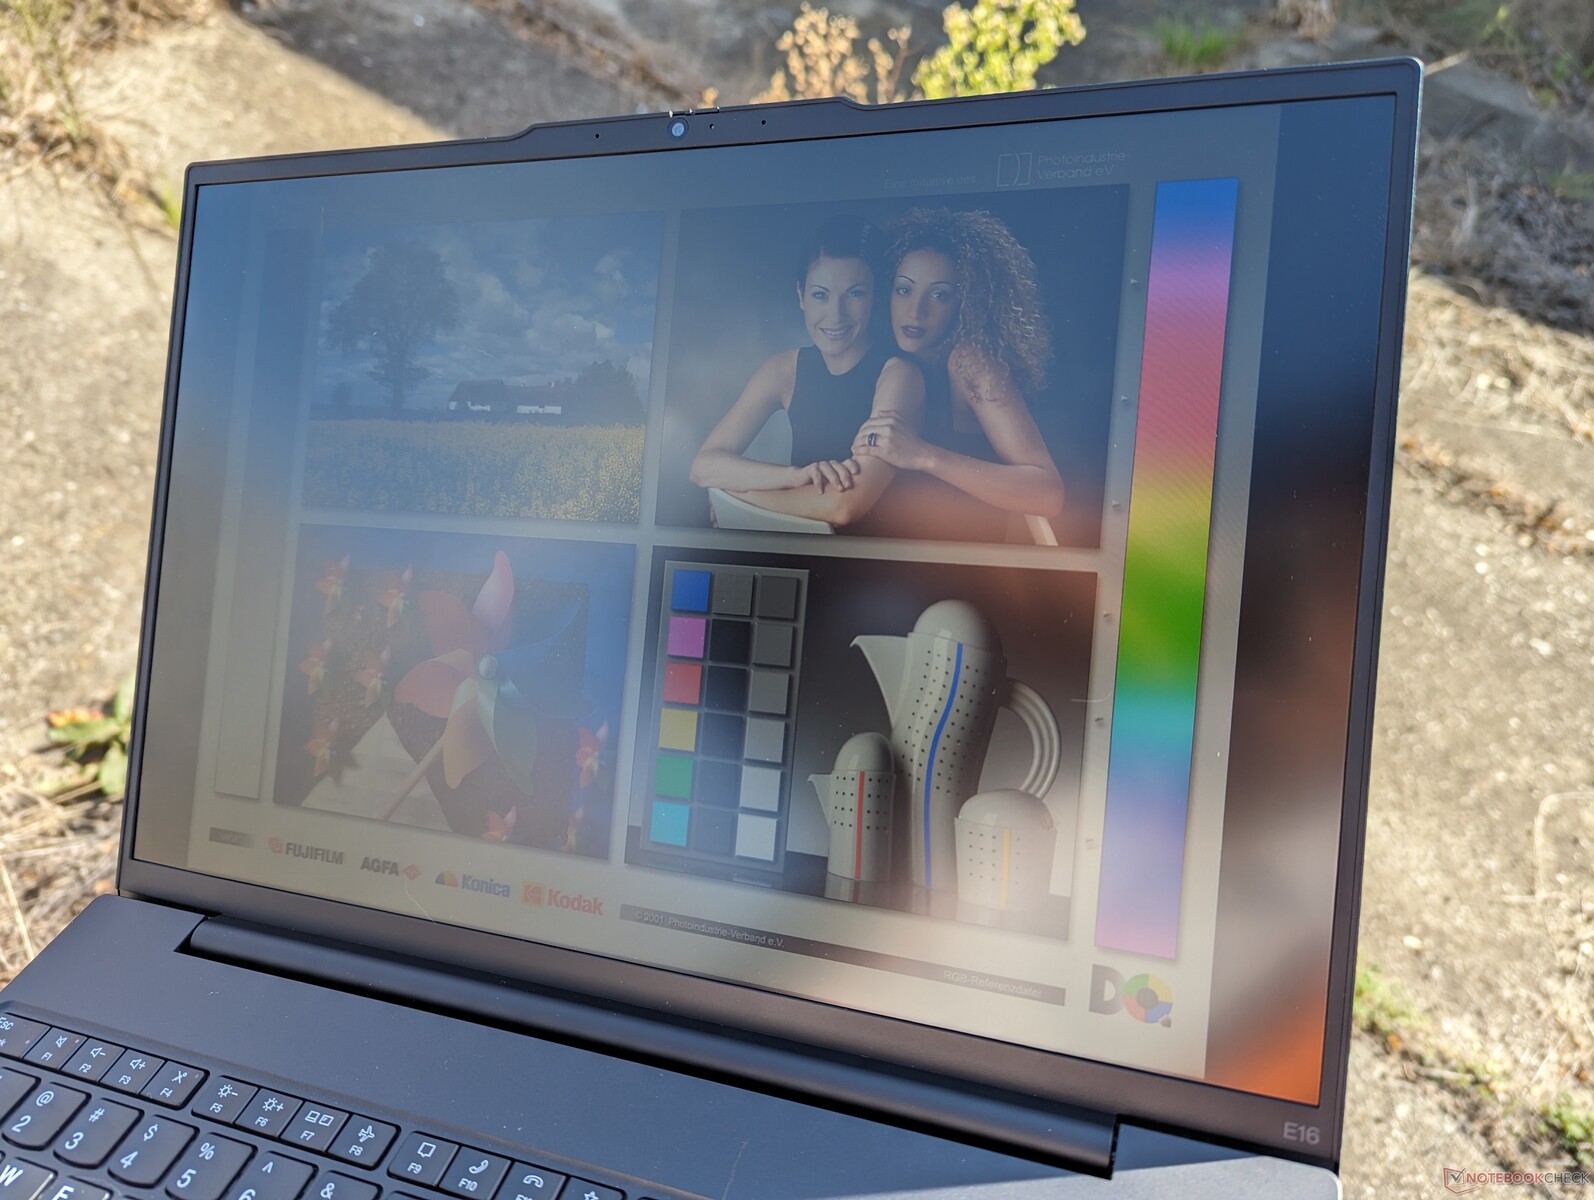
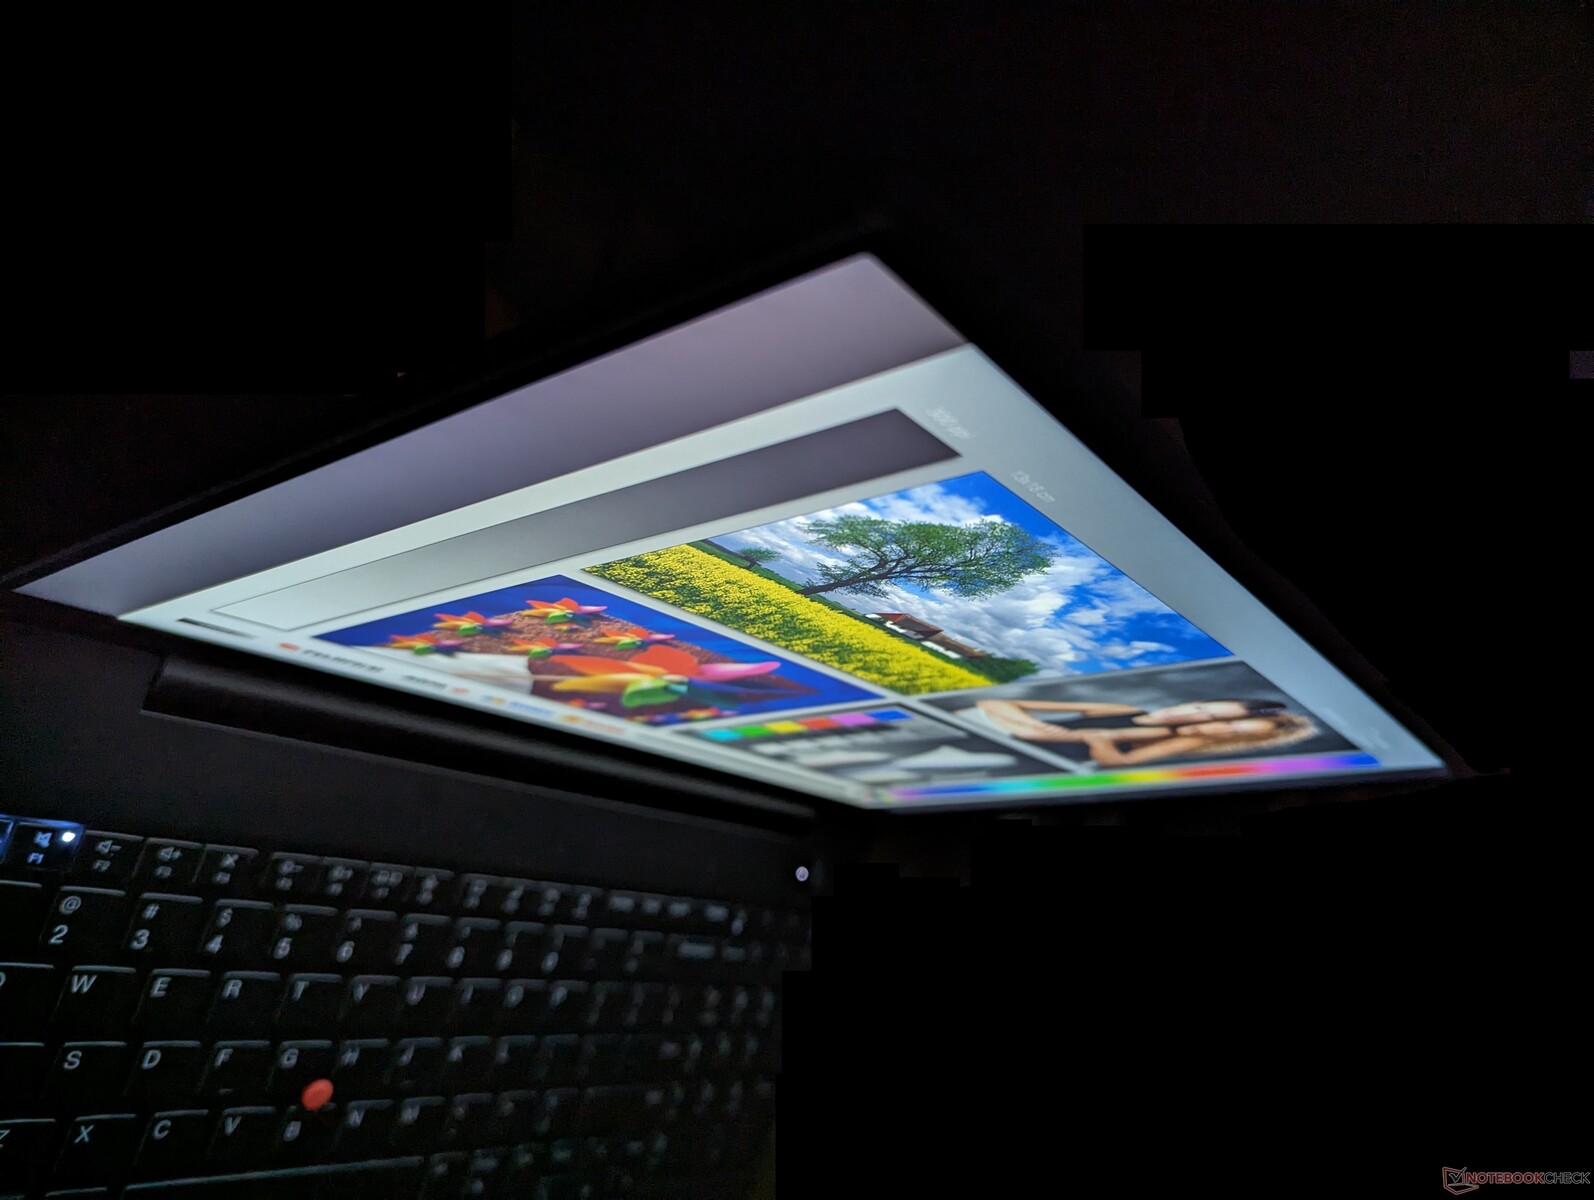
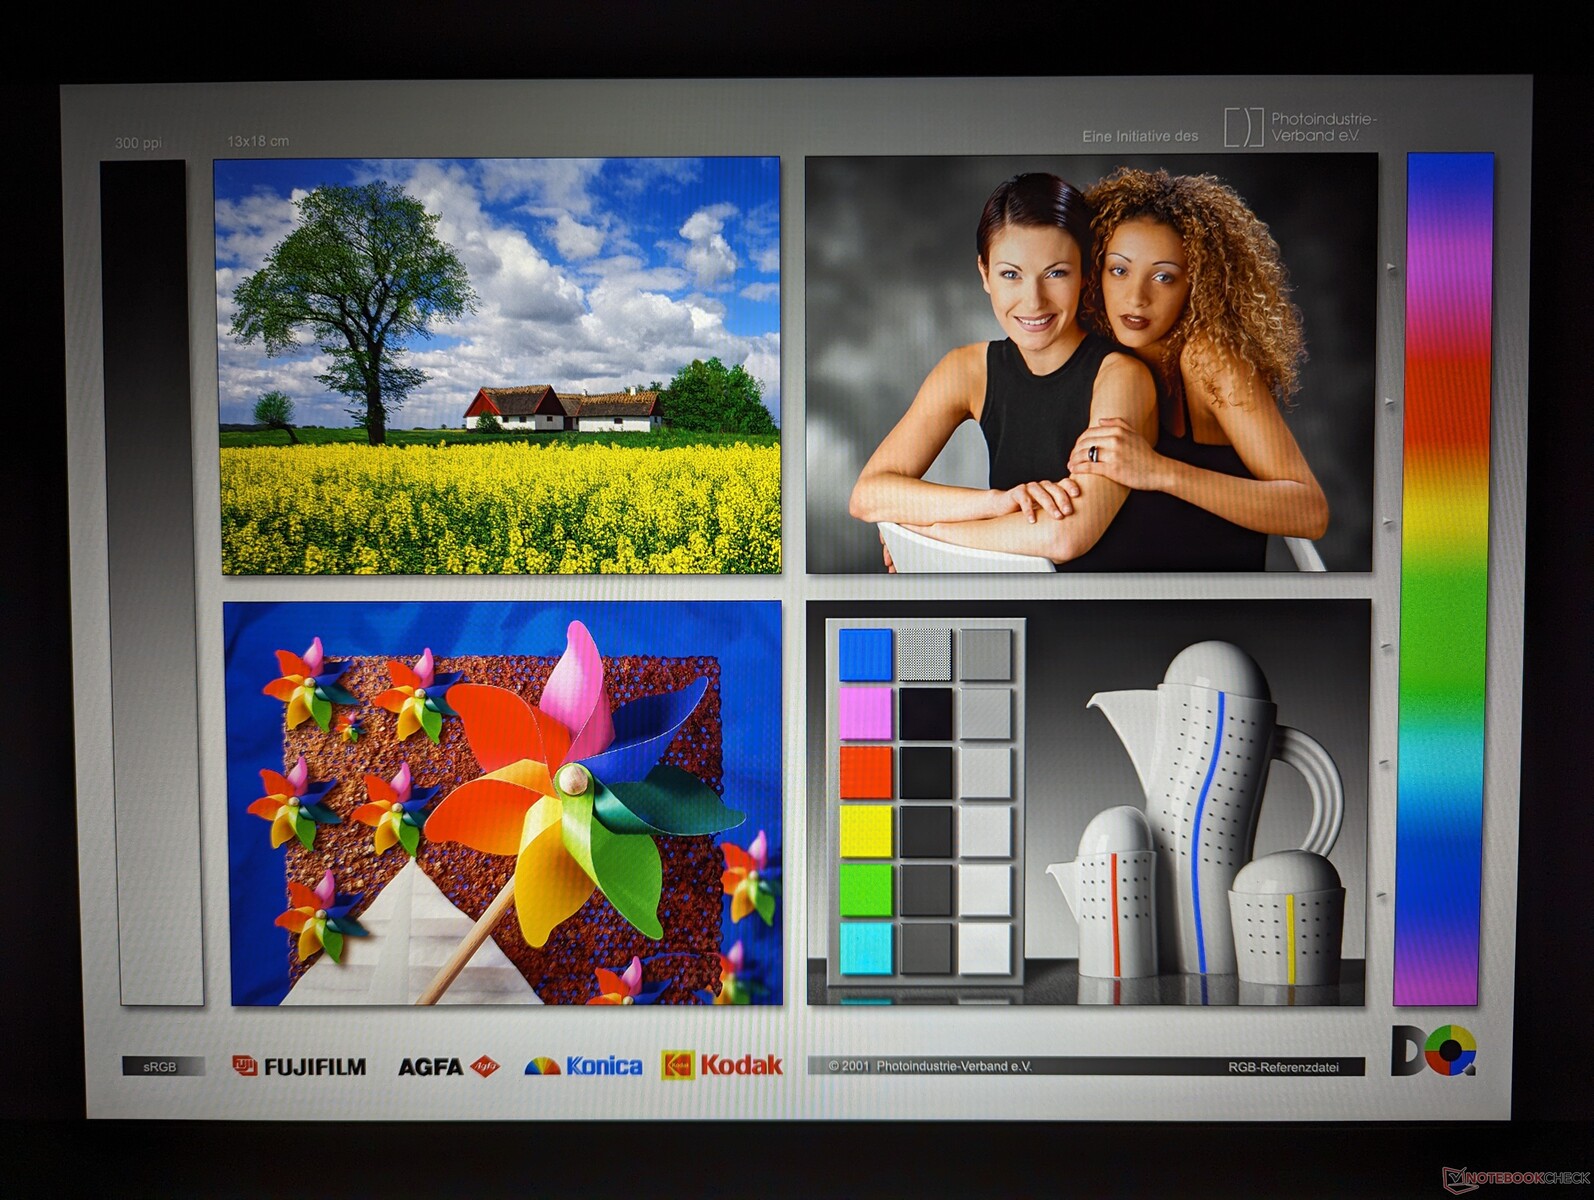
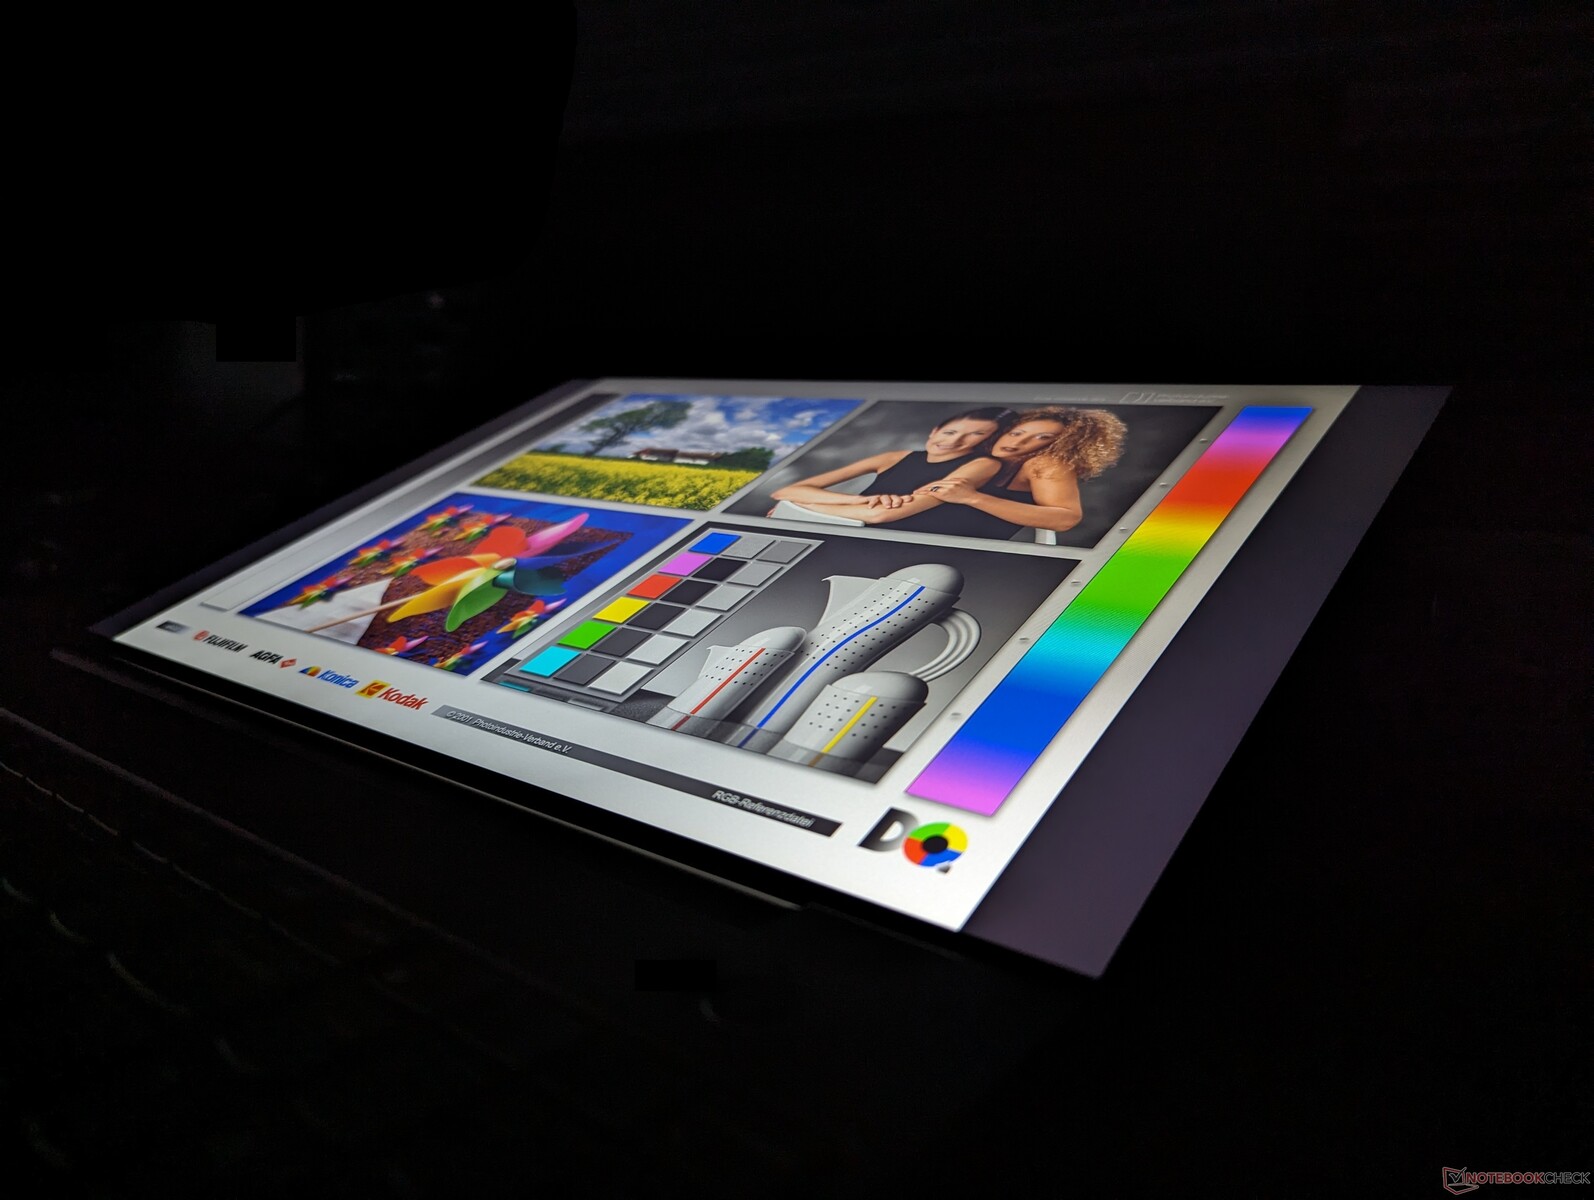
Mostrar
Hay disponibles cuatro opciones de IPS mate:
- 1200p, 60% sRGB, 300 nits, 60 Hz, no táctil
- 1200p, 60% sRGB, 300 nits, 60 Hz, táctil
- 1200p, 100% sRGB, 300 nits, 60 Hz, no táctil
- 1600p, 100% sRGB, 400 nits, 60 Hz, no táctil
Nuestra unidad de análisis Intel específica viene con la opción en negrita de arriba mientras que nuestra unidad AMD viene con la opción 1600p. La calidad de imagen es como la noche y el día entre nuestras unidades Intel y AMD, ya que esta última parece más nítida, más vibrante y con tiempos de respuesta más rápidos para una experiencia de visualización notablemente mejor. Recomendamos evitar nuestra opción de panel específico a menos que la funcionalidad de pantalla táctil sea imprescindible.

| |||||||||||||||||||||||||
iluminación: 91 %
Brillo con batería: 318.6 cd/m²
Contraste: 1099:1 (Negro: 0.29 cd/m²)
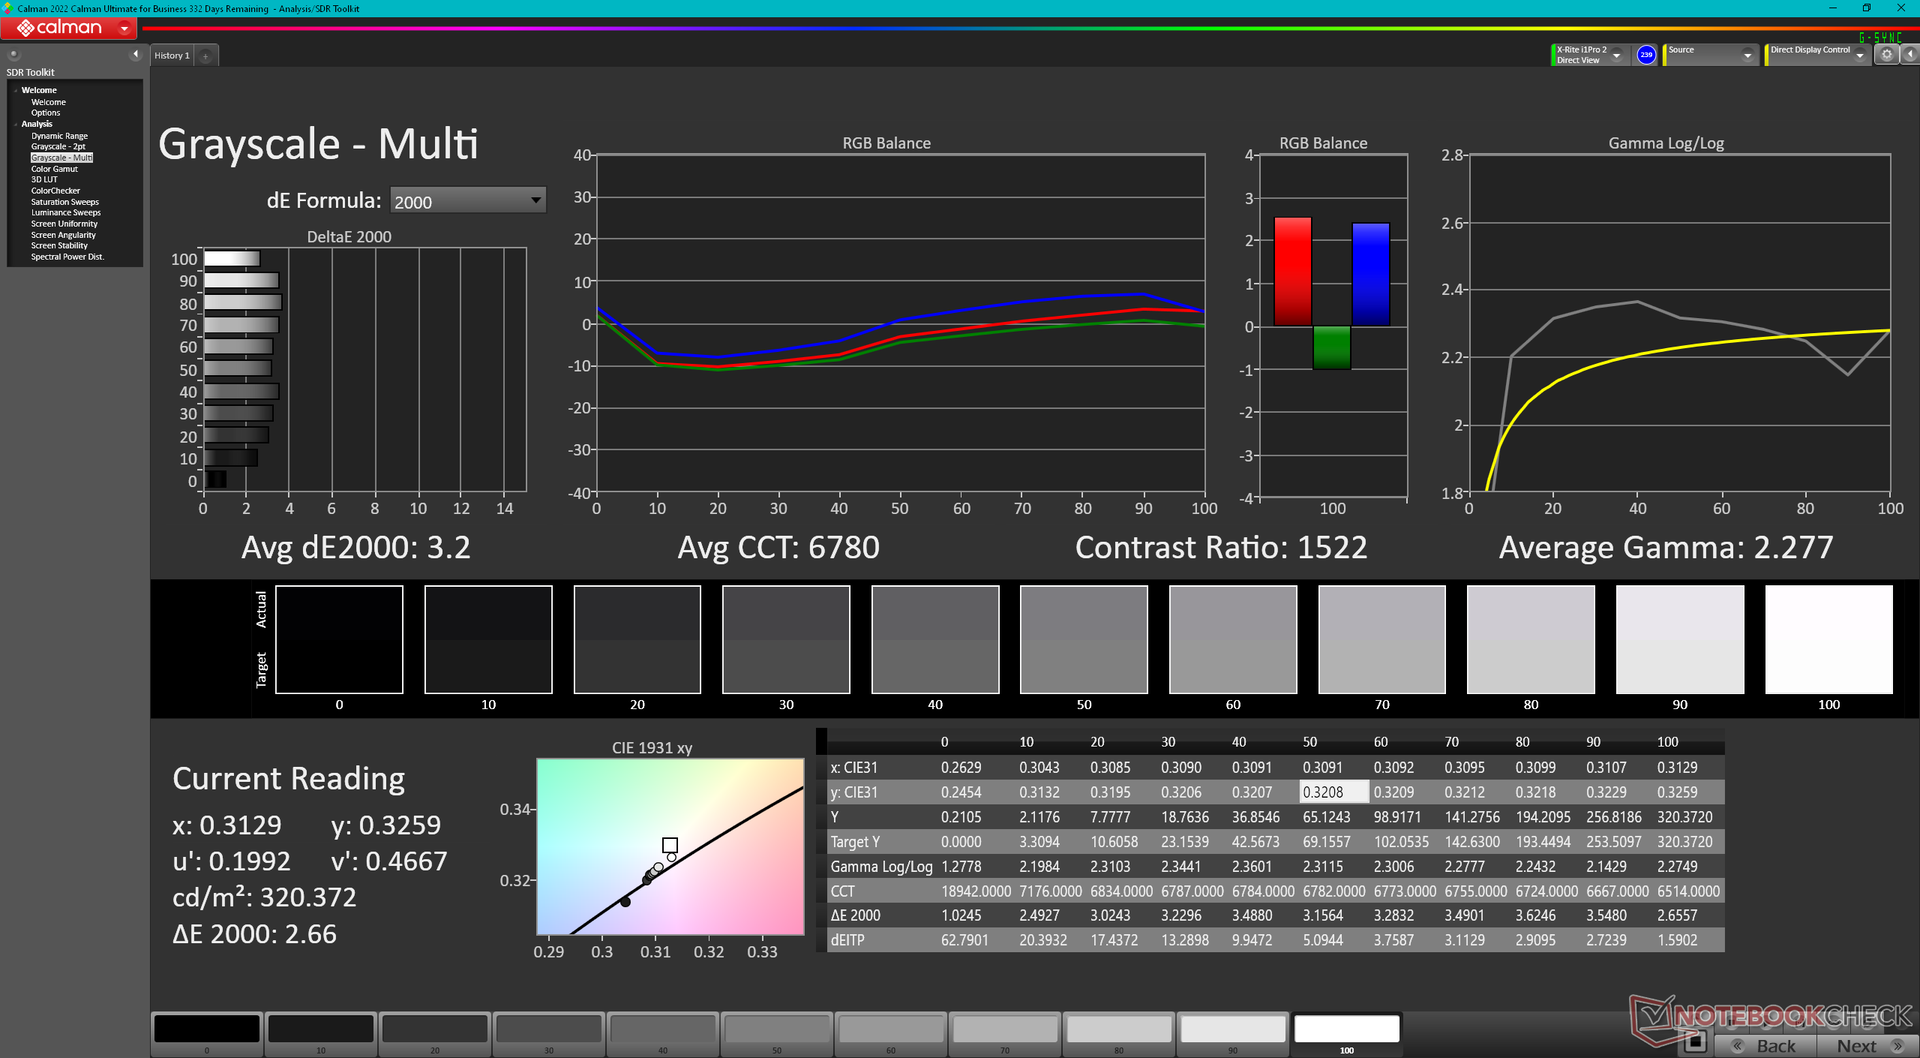
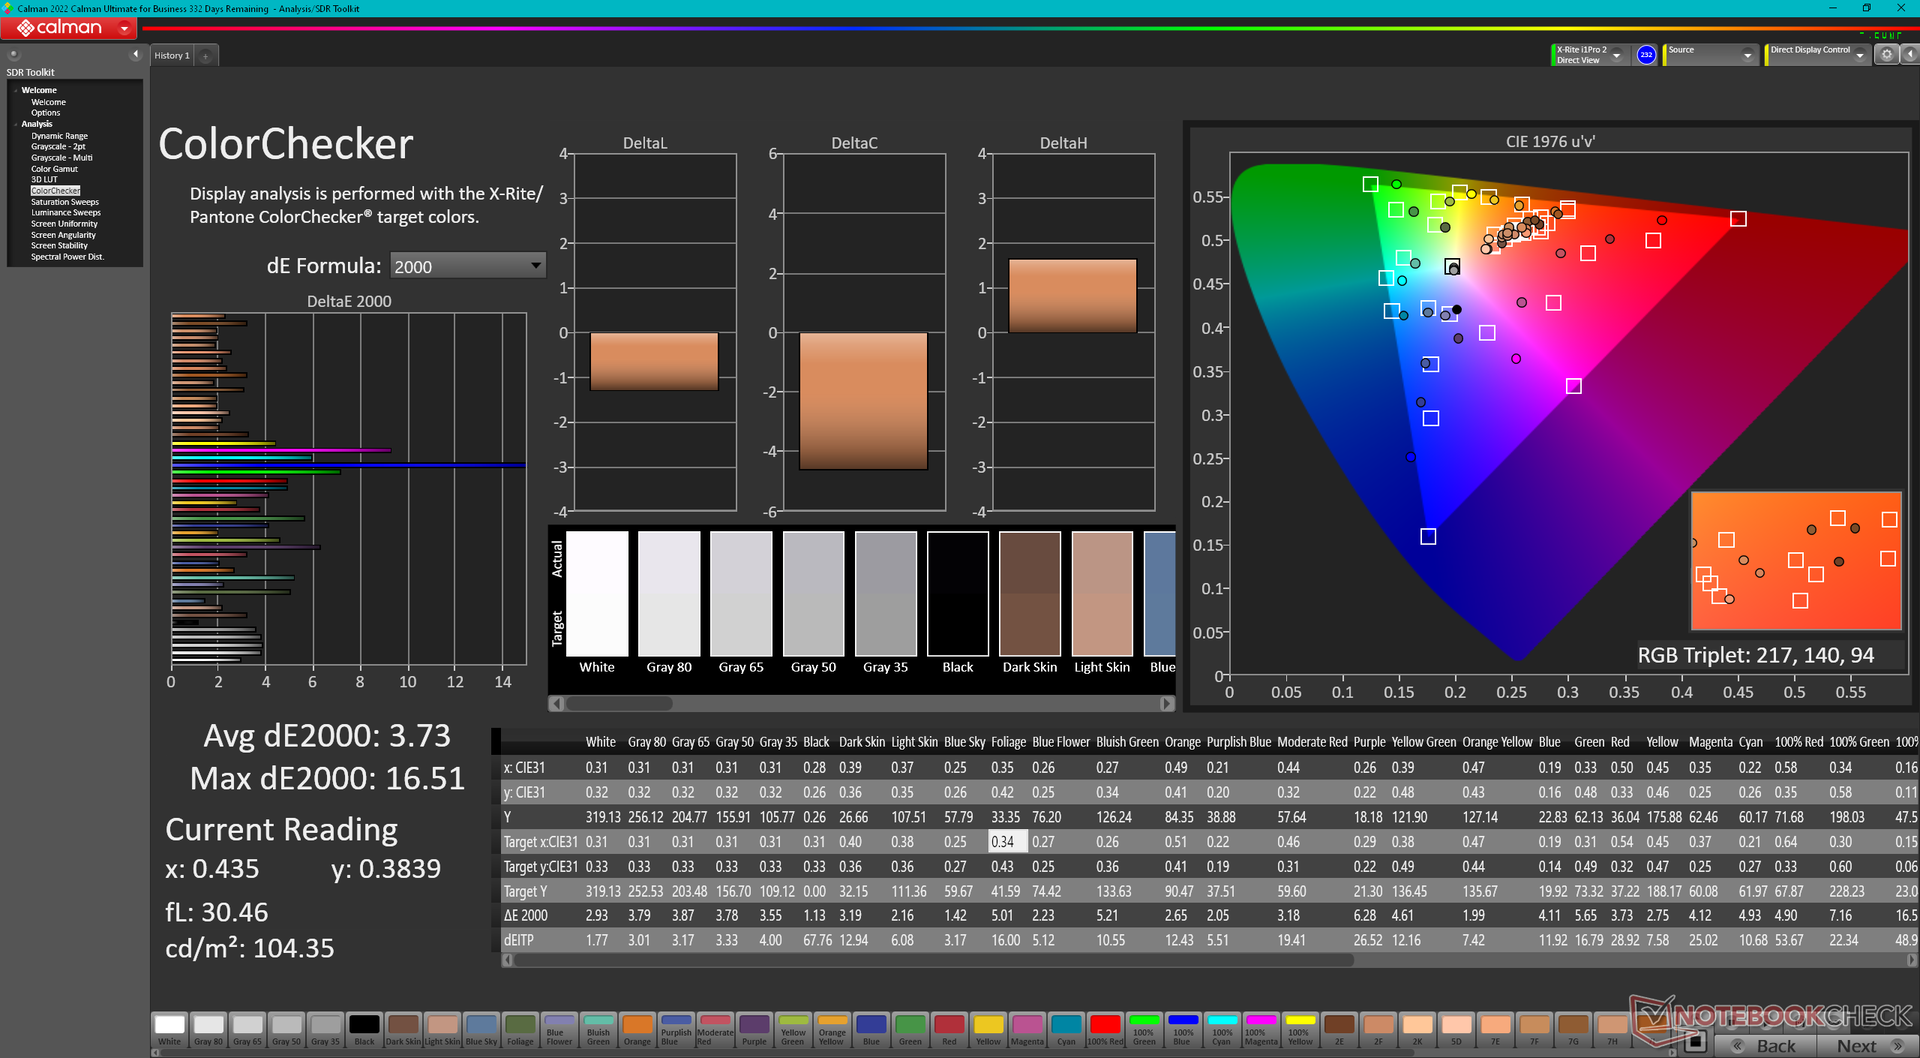
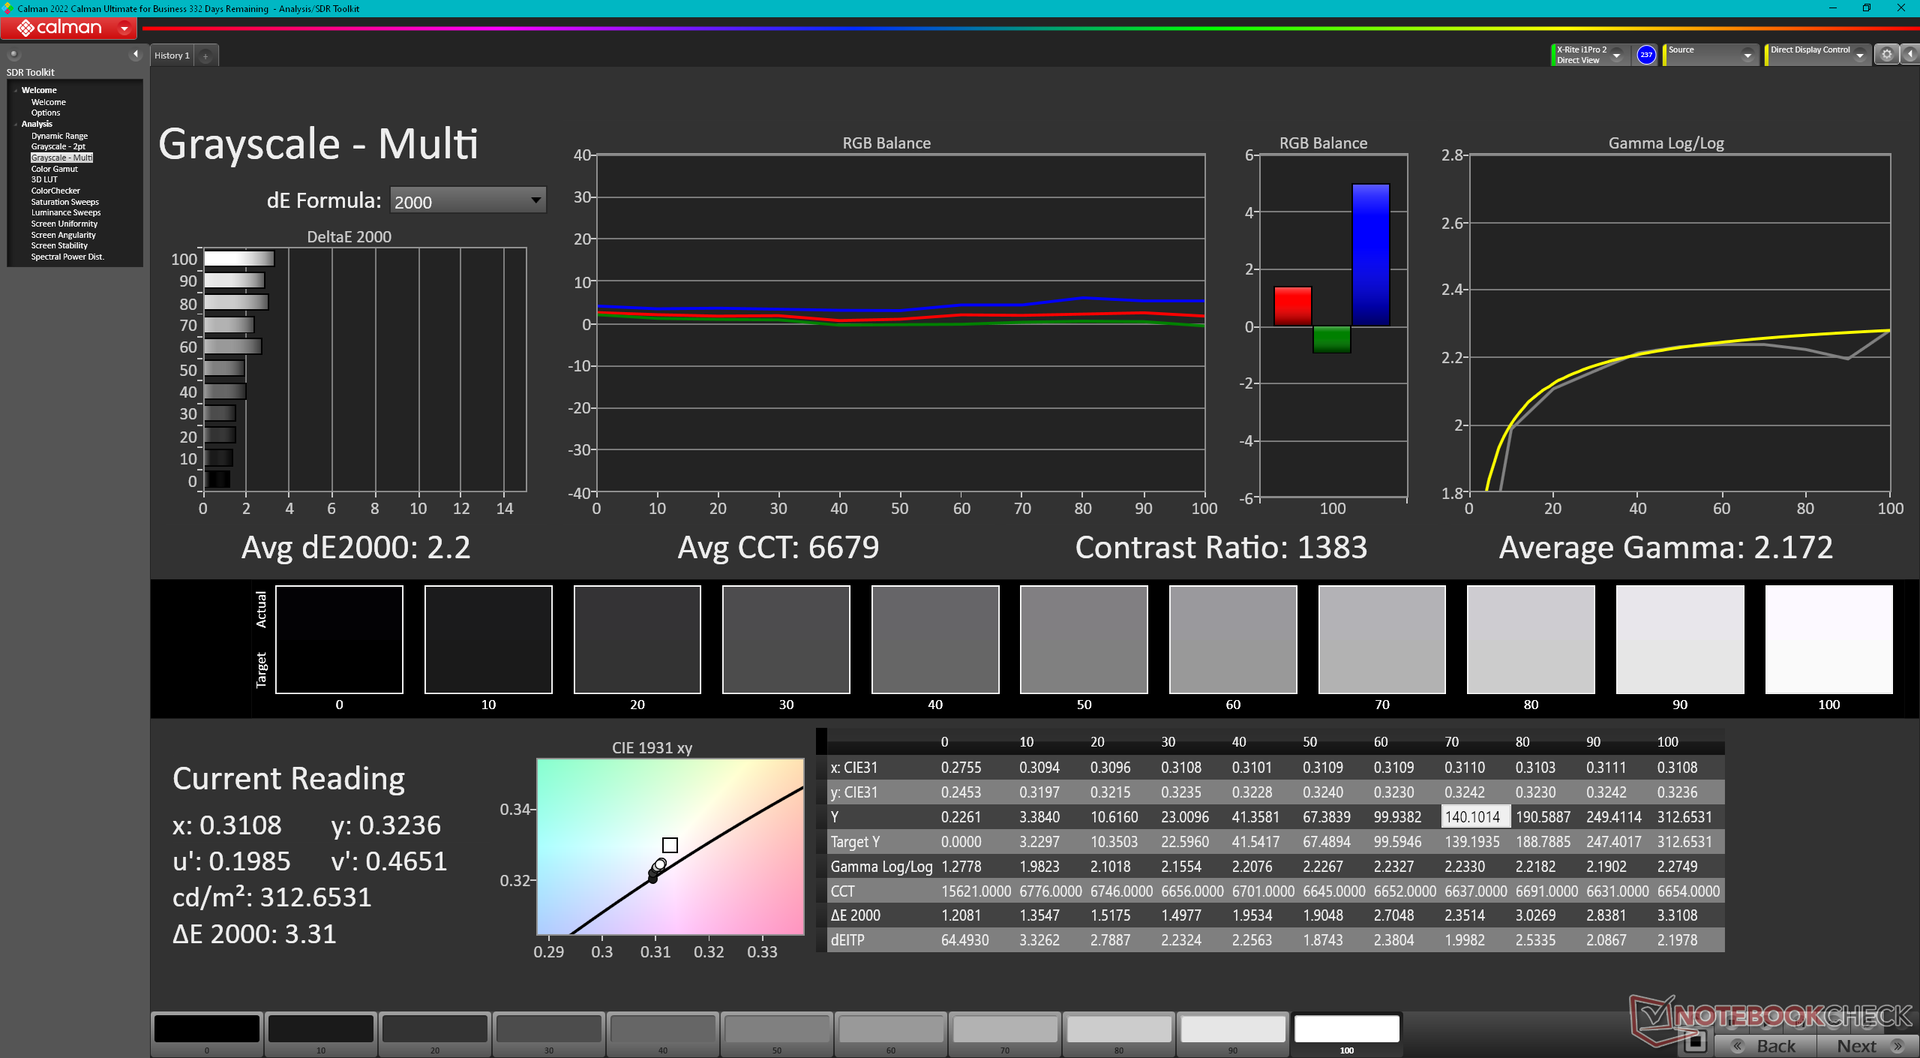
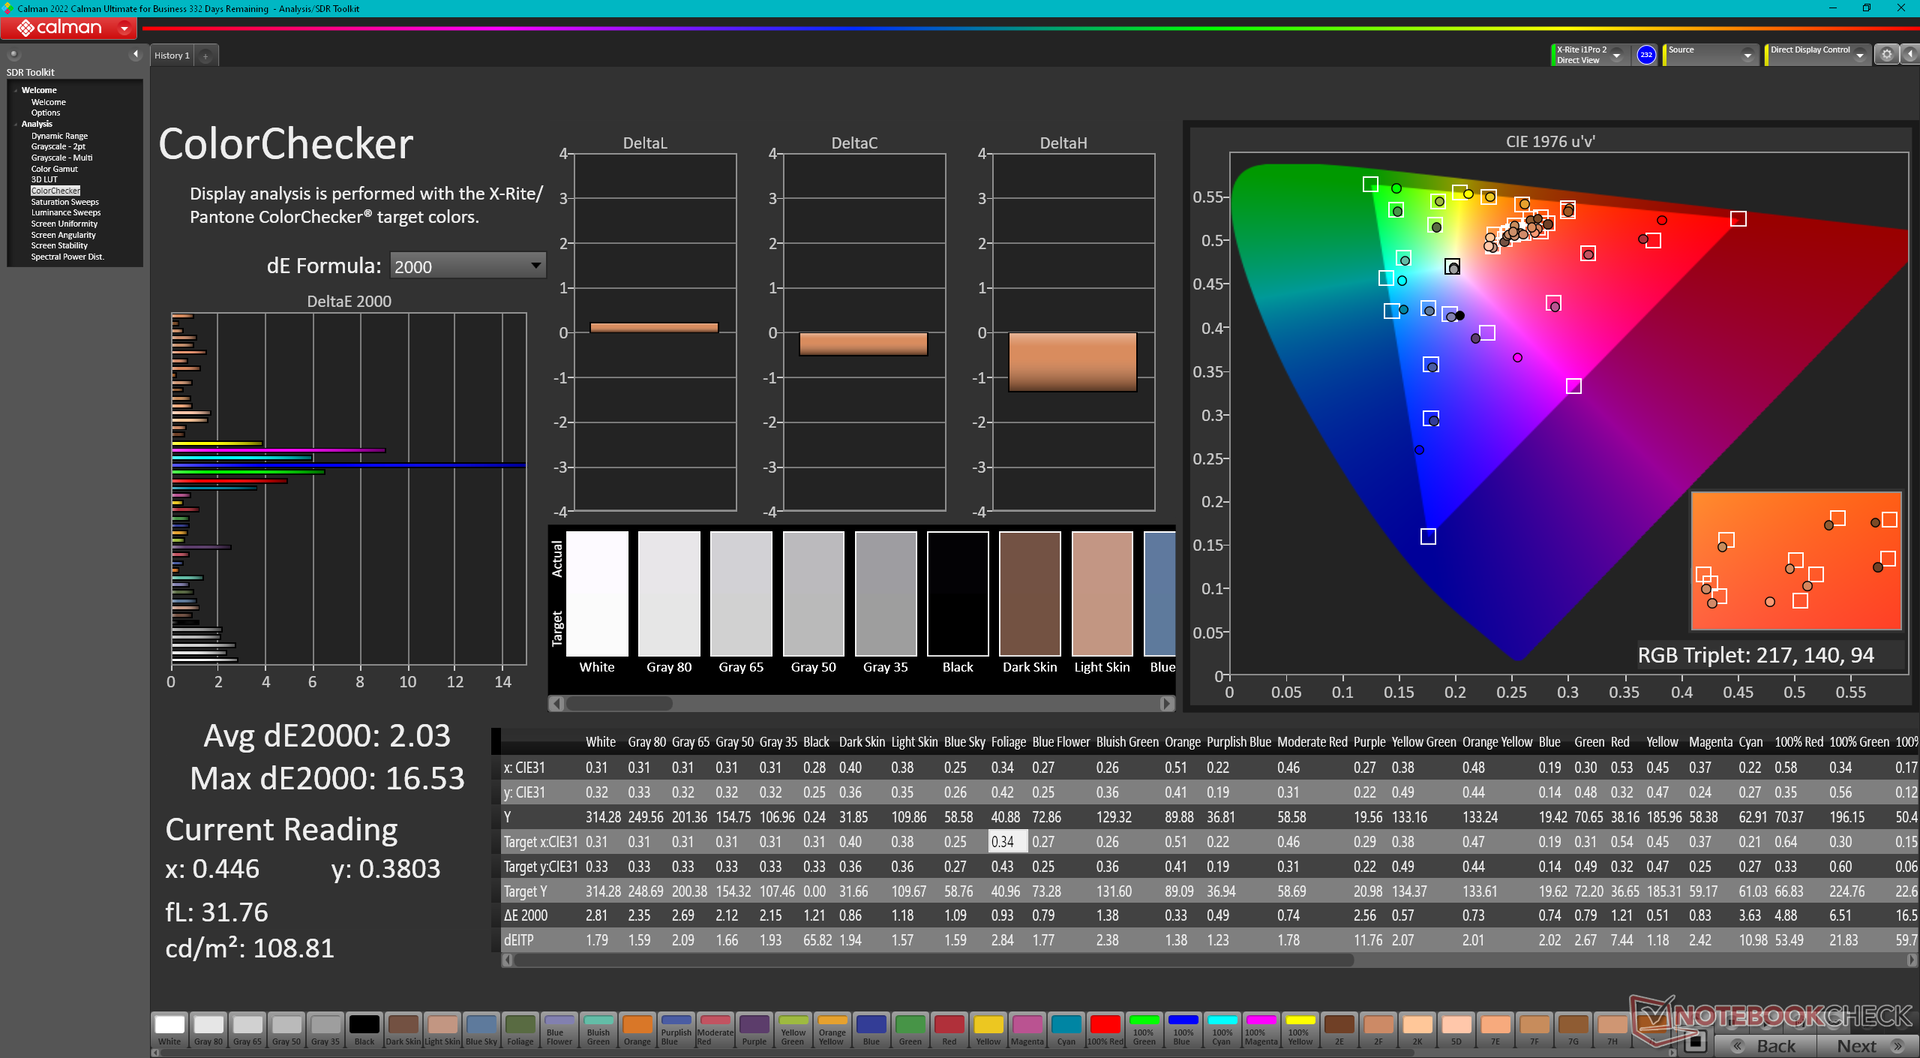
ΔE ColorChecker Calman: 3.73 | ∀{0.5-29.43 Ø4.71}
calibrated: 2.03
ΔE Greyscale Calman: 3.2 | ∀{0.09-98 Ø4.96}
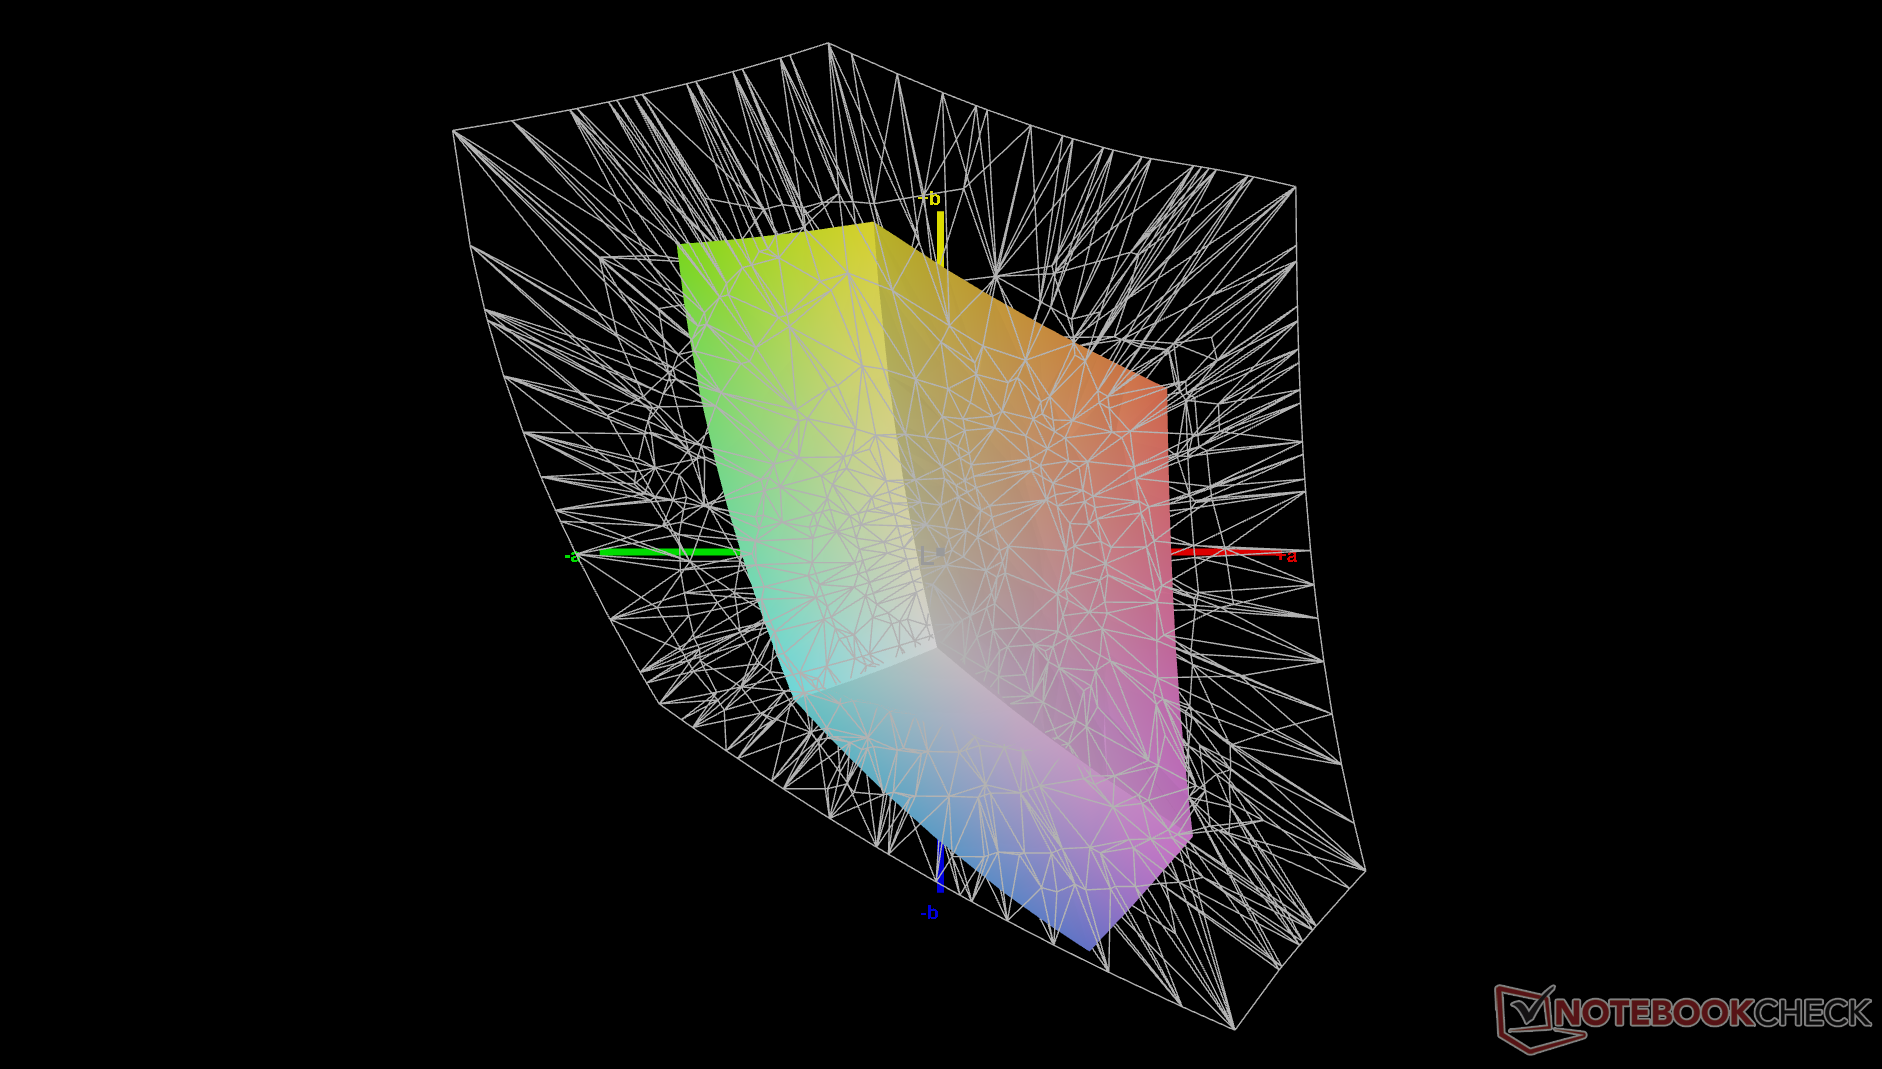
43.3% AdobeRGB 1998 (Argyll 3D)
62.6% sRGB (Argyll 3D)
42% Display P3 (Argyll 3D)
Gamma: 2.28
CCT: 6780 K
| Lenovo ThinkPad E16 G1 Core i5-1335U R160NW41 R2, IPS, 1920x1200, 16" | Lenovo ThinkPad E16 G1-21JUS08X00 MNG007DA1-C, IPS, 2560x1600, 16" | Dell Inspiron 16 7635 2-in-1 Chi Mei 160JCA, IPS, 1920x1200, 16" | Acer TravelMate P4 TMP416-51-55KN BOE BOE0A32, IPS, 1920x1200, 16" | Samsung Galaxy Book3 Pro 16 Samsung ATNA60CL03-0, AMOLED, 2880x1800, 16" | LG Gram 16Z90Q LG LP160WQ1-SPB2 (LGD06EB), IPS, 2560x1600, 16" | |
|---|---|---|---|---|---|---|
| Display | 58% | 59% | -7% | 107% | 95% | |
| Display P3 Coverage (%) | 42 | 67.6 61% | 67.4 60% | 38.9 -7% | 99.7 137% | 96.8 130% |
| sRGB Coverage (%) | 62.6 | 95.3 52% | 98.2 57% | 58.1 -7% | 100 60% | 99.9 60% |
| AdobeRGB 1998 Coverage (%) | 43.3 | 70 62% | 69.5 61% | 40.2 -7% | 97 124% | 84.6 95% |
| Response Times | 30% | 38% | 62% | 95% | 16% | |
| Response Time Grey 50% / Grey 80% * (ms) | 46.4 ? | 32.4 ? 30% | 27.6 ? 41% | 20 ? 57% | 2 ? 96% | 45.7 ? 2% |
| Response Time Black / White * (ms) | 27.6 ? | 19.6 ? 29% | 18.2 ? 34% | 9 ? 67% | 2 ? 93% | 19.7 ? 29% |
| PWM Frequency (Hz) | ||||||
| Screen | 30% | 12% | -20% | 295% | 13% | |
| Brightness middle (cd/m²) | 318.6 | 404 27% | 301.3 -5% | 269 -16% | 412 29% | 366 15% |
| Brightness (cd/m²) | 302 | 389 29% | 269 -11% | 265 -12% | 412 36% | 347 15% |
| Brightness Distribution (%) | 91 | 91 0% | 79 -13% | 94 3% | 98 8% | 89 -2% |
| Black Level * (cd/m²) | 0.29 | 0.24 17% | 0.28 3% | 0.305 -5% | 0.015 95% | 0.32 -10% |
| Contrast (:1) | 1099 | 1683 53% | 1076 -2% | 882 -20% | 27467 2399% | 1144 4% |
| Colorchecker dE 2000 * | 3.73 | 2.1 44% | 3.1 17% | 4.89 -31% | 2.34 37% | 2.82 24% |
| Colorchecker dE 2000 max. * | 16.51 | 4.2 75% | 5.5 67% | 8.81 47% | 3.34 80% | 4.65 72% |
| Colorchecker dE 2000 calibrated * | 2.03 | 1.4 31% | 0.49 76% | 5.12 -152% | 2.95 -45% | 2.69 -33% |
| Greyscale dE 2000 * | 3.2 | 3.3 -3% | 3.9 -22% | 2.91 9% | 2.78 13% | 2.3 28% |
| Gamma | 2.28 96% | 2.24 98% | 2.19 100% | 2.28 96% | 2.5 88% | 1.971 112% |
| CCT | 6780 96% | 7038 92% | 6186 105% | 6920 94% | 6879 94% | 6796 96% |
| Media total (Programa/Opciones) | 39% /
36% | 36% /
26% | 12% /
-5% | 166% /
226% | 41% /
31% |
* ... más pequeño es mejor
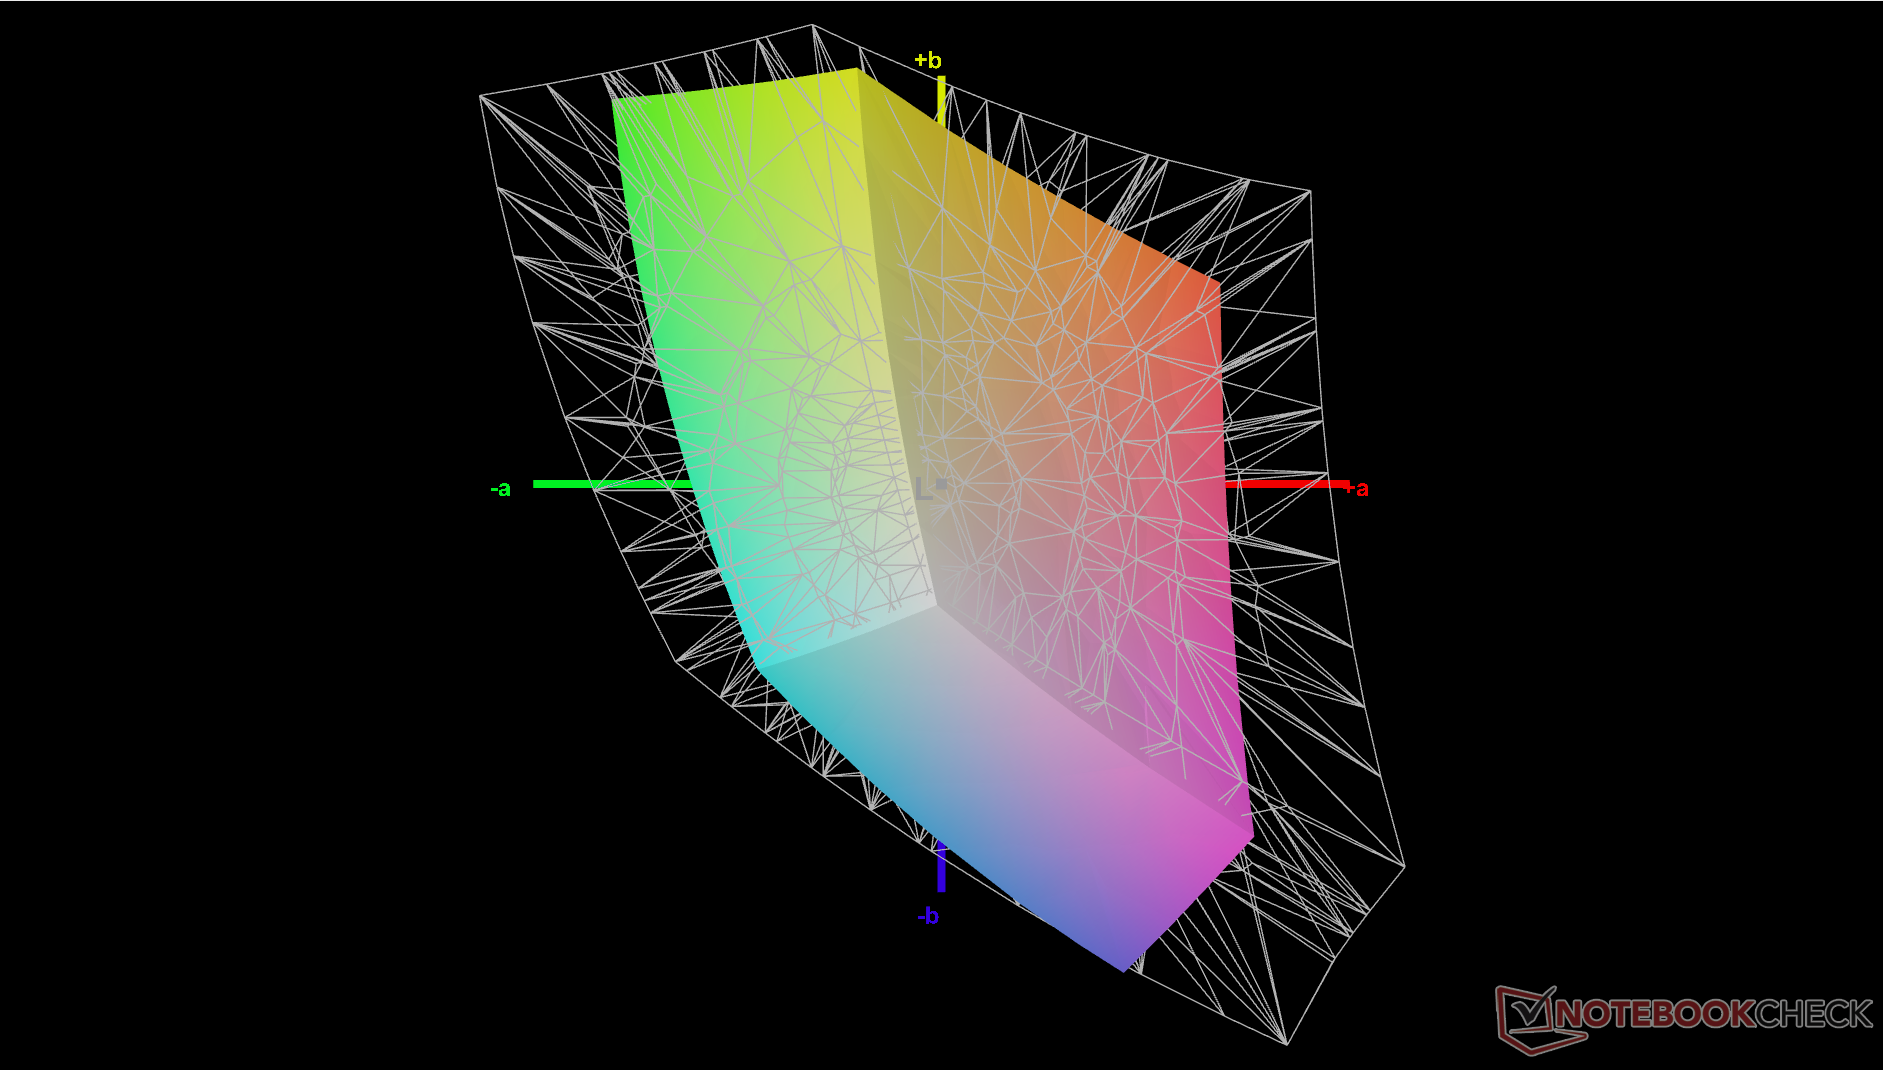
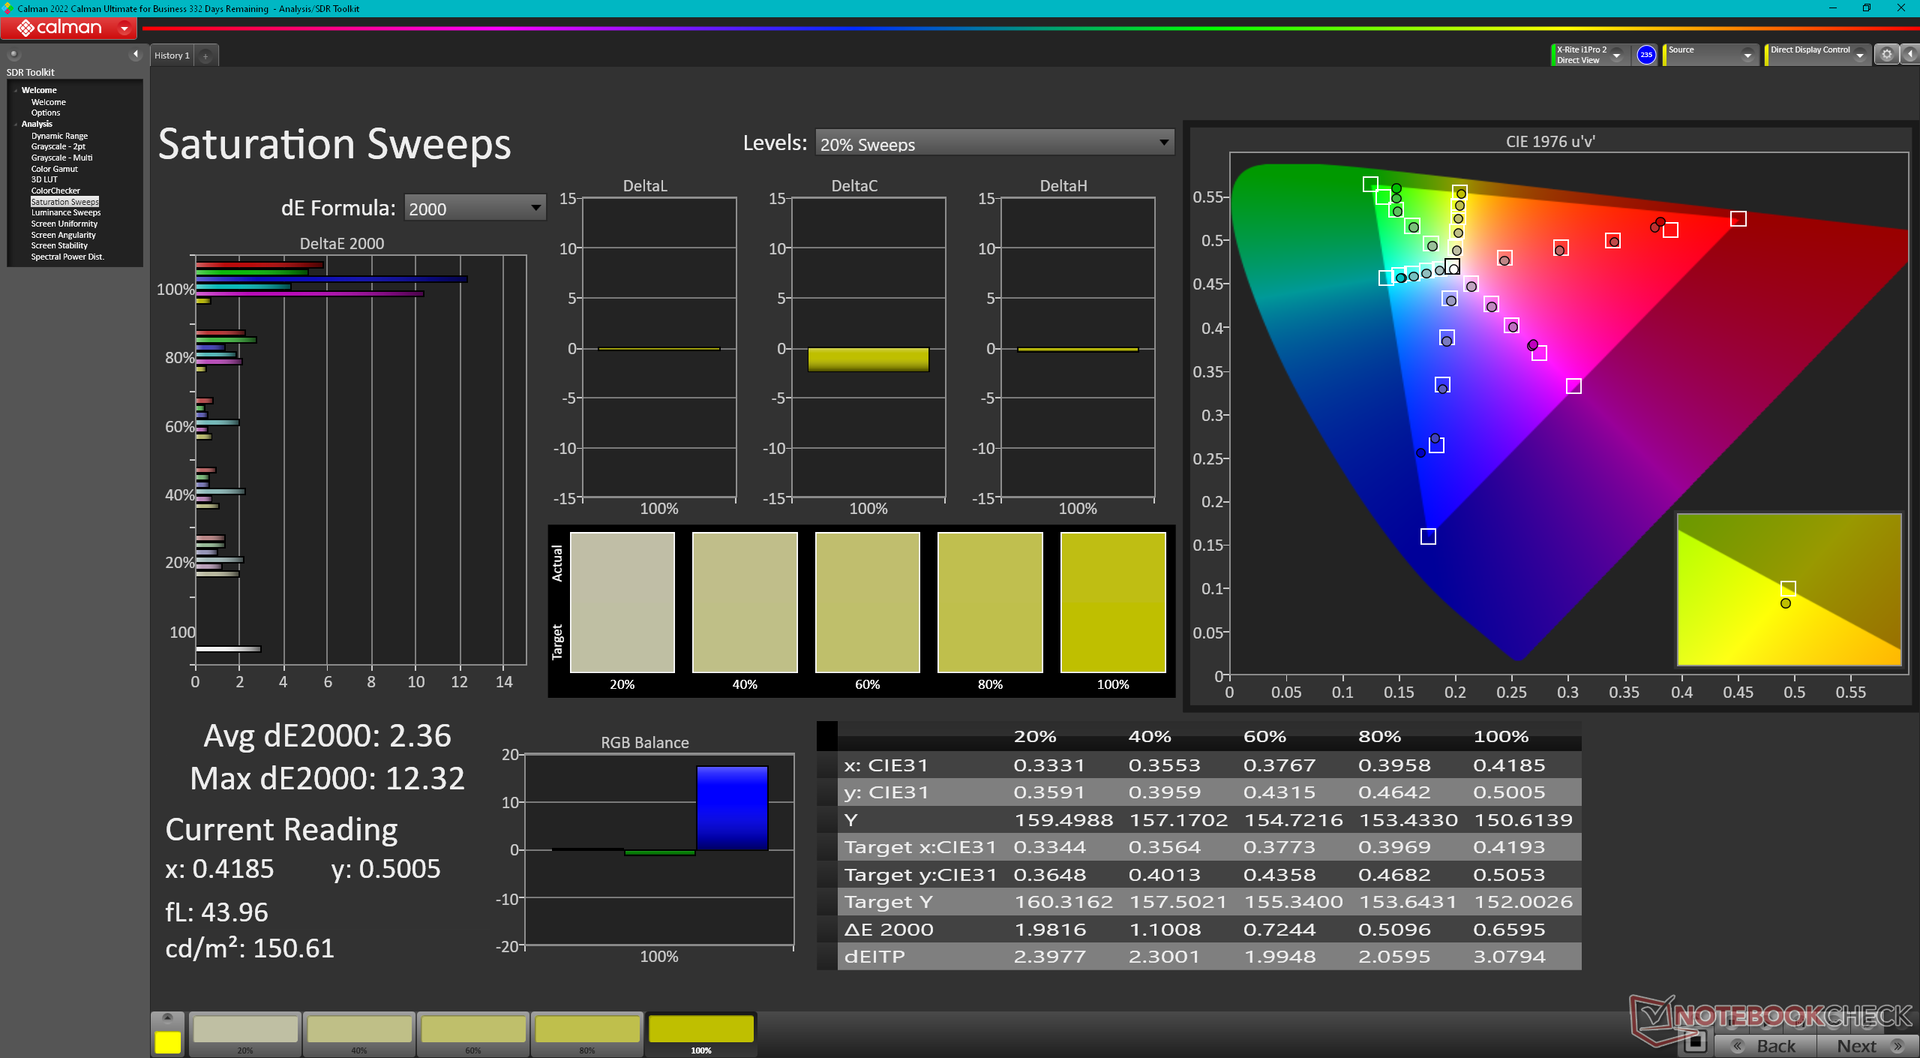
Calibrar la pantalla con un colorímetro X-Rite mejoraría ligeramente los valores deltaE medios de la escala de grises y del color de 3,2 y 3,73 a 2,2 y 2,03, respectivamente. Sin embargo, los colores siguen siendo cada vez más imprecisos en los niveles de saturación más altos, pase lo que pase, debido a la estrecha cobertura de color sRGB mencionada anteriormente.
Tiempos de respuesta del display
| ↔ Tiempo de respuesta de Negro a Blanco | ||
|---|---|---|
| 27.6 ms ... subida ↗ y bajada ↘ combinada | ↗ 12.9 ms subida | 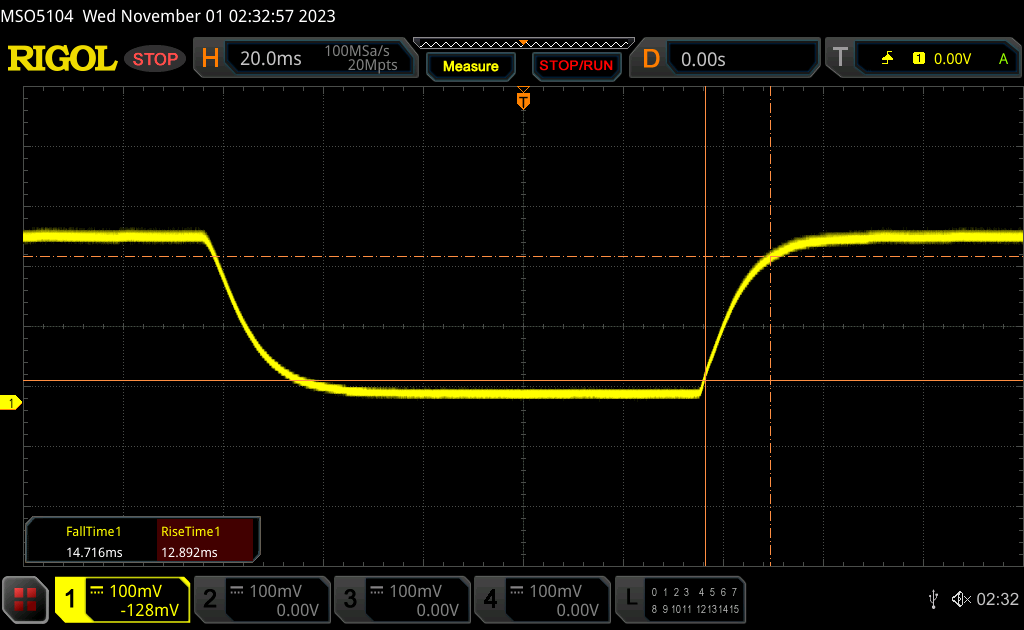 |
| ↘ 14.7 ms bajada | ||
| La pantalla mostró tiempos de respuesta relativamente lentos en nuestros tests pero podría ser demasiado lenta para los jugones. En comparación, todos los dispositivos de prueba van de ##min### (mínimo) a 240 (máximo) ms. » 70 % de todos los dispositivos son mejores. Eso quiere decir que el tiempo de respuesta es peor que la media (19.8 ms) de todos los dispositivos testados. | ||
| ↔ Tiempo de respuesta 50% Gris a 80% Gris | ||
| 46.4 ms ... subida ↗ y bajada ↘ combinada | ↗ 19.5 ms subida | 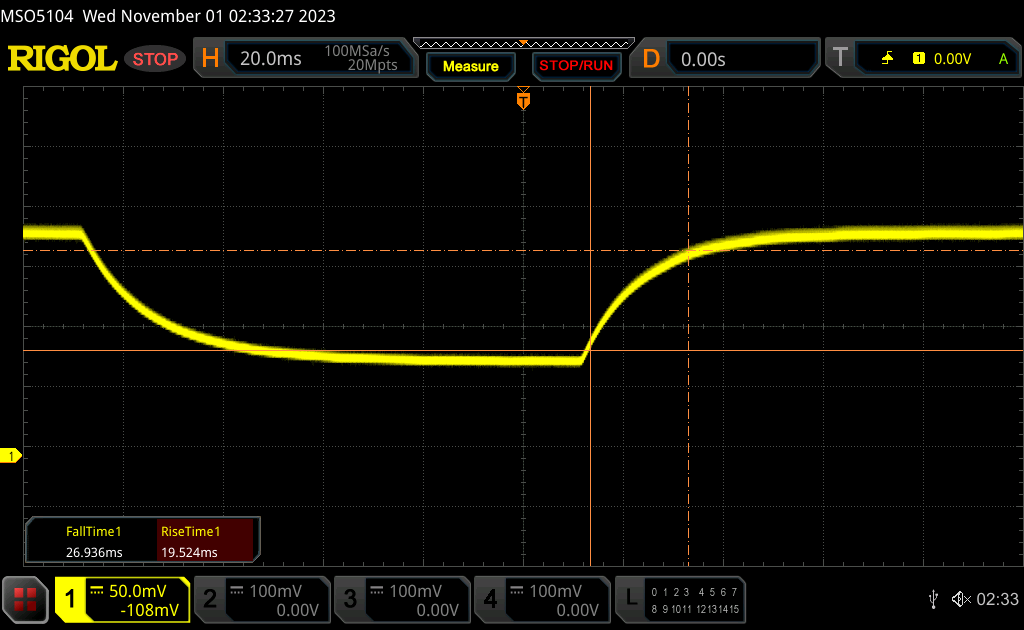 |
| ↘ 26.9 ms bajada | ||
| La pantalla mostró tiempos de respuesta lentos en nuestros tests y podría ser demasiado lenta para los jugones. En comparación, todos los dispositivos de prueba van de ##min### (mínimo) a 636 (máximo) ms. » 80 % de todos los dispositivos son mejores. Eso quiere decir que el tiempo de respuesta es peor que la media (31 ms) de todos los dispositivos testados. | ||
Parpadeo de Pantalla / PWM (Pulse-Width Modulation)
| Parpadeo de Pantalla / PWM no detectado | 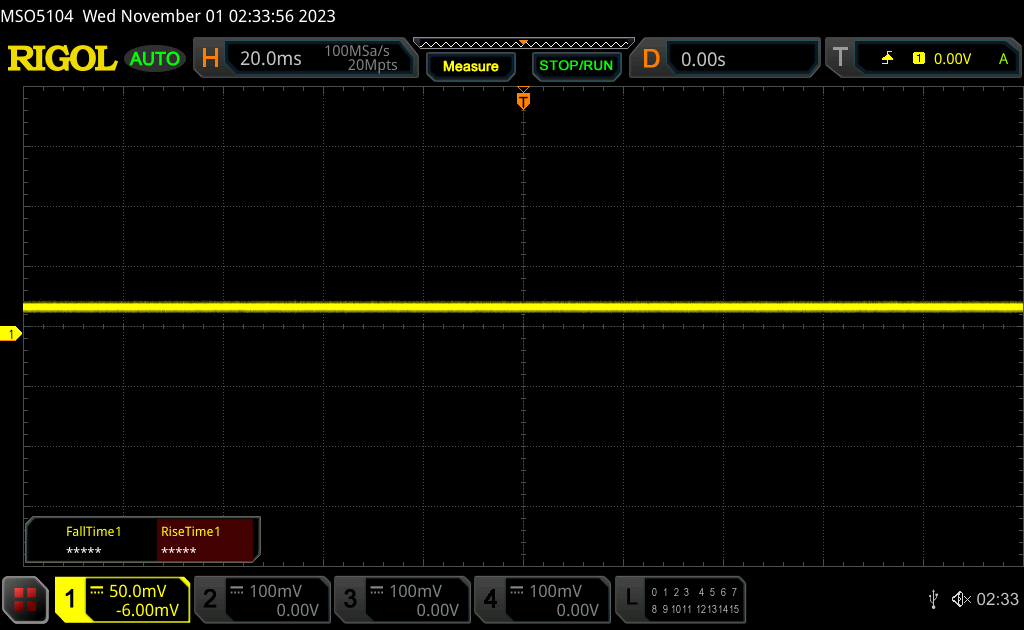 | ||
Comparación: 52 % de todos los dispositivos testados no usaron PWM para atenuar el display. Si se usó, medimos una media de 7754 (mínimo: 5 - máxmo: 343500) Hz. | |||
Rendimiento
Condiciones de prueba
Pusimos Windows en modo Rendimiento antes de ejecutar los puntos de referencia que aparecen a continuación. Los usuarios deberían familiarizarse con el software Vantage integrado, ya que es el eje central para las funciones específicas de Lenovo y las actualizaciones de la BIOS.


Procesador
A diferencia de la mayoría de las demás CPU Core i5 y Core i7, el Core i5-1335U rinde mucho más cerca del más caro Core i7-1355U de lo que cabría esperar inicialmente. Los puntos de referencia clasifican nuestro Core i5-1335U sólo entre un 5 y un 10 por ciento más lento que el Core i7-1355U, lo que significa que puede ahorrarse varios cientos de dólares optando por la configuración Core i5 si no le importa el pequeño déficit de rendimiento de la CPU. La mayor razón para seleccionar la opción Core i7 está en cambio relacionada con sus gráficos integrados, como se demuestra en la sección Rendimiento de la GPU más abajo.
Cuando se compara con el Ryzen 7 7730U nuestra versión Intel Core i5 es entre un 10 y un 15 por ciento más lenta en el rendimiento multihilo, mientras que ocurre lo contrario en lo que respecta al rendimiento monohilo.
Cinebench R15 Multi Loop
Cinebench R23: Multi Core | Single Core
Cinebench R20: CPU (Multi Core) | CPU (Single Core)
Cinebench R15: CPU Multi 64Bit | CPU Single 64Bit
Blender: v2.79 BMW27 CPU
7-Zip 18.03: 7z b 4 | 7z b 4 -mmt1
Geekbench 5.5: Multi-Core | Single-Core
HWBOT x265 Benchmark v2.2: 4k Preset
LibreOffice : 20 Documents To PDF
R Benchmark 2.5: Overall mean
* ... más pequeño es mejor
AIDA64: FP32 Ray-Trace | FPU Julia | CPU SHA3 | CPU Queen | FPU SinJulia | FPU Mandel | CPU AES | CPU ZLib | FP64 Ray-Trace | CPU PhotoWorxx
| Performance rating | |
| Lenovo ThinkPad E16 G1-21JUS08X00 | |
| Samsung Galaxy Book3 Pro 16 | |
| Dell Inspiron 16 7635 2-in-1 | |
| Acer TravelMate P4 TMP416-51-55KN | |
| Lenovo ThinkPad E16 G1 Core i5-1335U | |
| Medio Intel Core i5-1335U | |
| LG Gram 16Z90Q | |
| AIDA64 / FP32 Ray-Trace | |
| Lenovo ThinkPad E16 G1-21JUS08X00 | |
| Dell Inspiron 16 7635 2-in-1 | |
| Acer TravelMate P4 TMP416-51-55KN | |
| Samsung Galaxy Book3 Pro 16 | |
| Lenovo ThinkPad E16 G1 Core i5-1335U | |
| Medio Intel Core i5-1335U (5661 - 7809, n=11) | |
| LG Gram 16Z90Q | |
| AIDA64 / FPU SinJulia | |
| Lenovo ThinkPad E16 G1-21JUS08X00 | |
| Dell Inspiron 16 7635 2-in-1 | |
| Samsung Galaxy Book3 Pro 16 | |
| Acer TravelMate P4 TMP416-51-55KN | |
| Lenovo ThinkPad E16 G1 Core i5-1335U | |
| LG Gram 16Z90Q | |
| Medio Intel Core i5-1335U (3873 - 5008, n=11) | |
| AIDA64 / FPU Mandel | |
| Lenovo ThinkPad E16 G1-21JUS08X00 | |
| Dell Inspiron 16 7635 2-in-1 | |
| Samsung Galaxy Book3 Pro 16 | |
| Acer TravelMate P4 TMP416-51-55KN | |
| Lenovo ThinkPad E16 G1 Core i5-1335U | |
| Medio Intel Core i5-1335U (14376 - 20553, n=11) | |
| LG Gram 16Z90Q | |
| AIDA64 / FP64 Ray-Trace | |
| Lenovo ThinkPad E16 G1-21JUS08X00 | |
| Dell Inspiron 16 7635 2-in-1 | |
| Acer TravelMate P4 TMP416-51-55KN | |
| Samsung Galaxy Book3 Pro 16 | |
| Lenovo ThinkPad E16 G1 Core i5-1335U | |
| LG Gram 16Z90Q | |
| Medio Intel Core i5-1335U (2878 - 4214, n=11) | |
| AIDA64 / CPU PhotoWorxx | |
| Samsung Galaxy Book3 Pro 16 | |
| LG Gram 16Z90Q | |
| Medio Intel Core i5-1335U (13584 - 41123, n=11) | |
| Acer TravelMate P4 TMP416-51-55KN | |
| Lenovo ThinkPad E16 G1 Core i5-1335U | |
| Dell Inspiron 16 7635 2-in-1 | |
| Lenovo ThinkPad E16 G1-21JUS08X00 | |
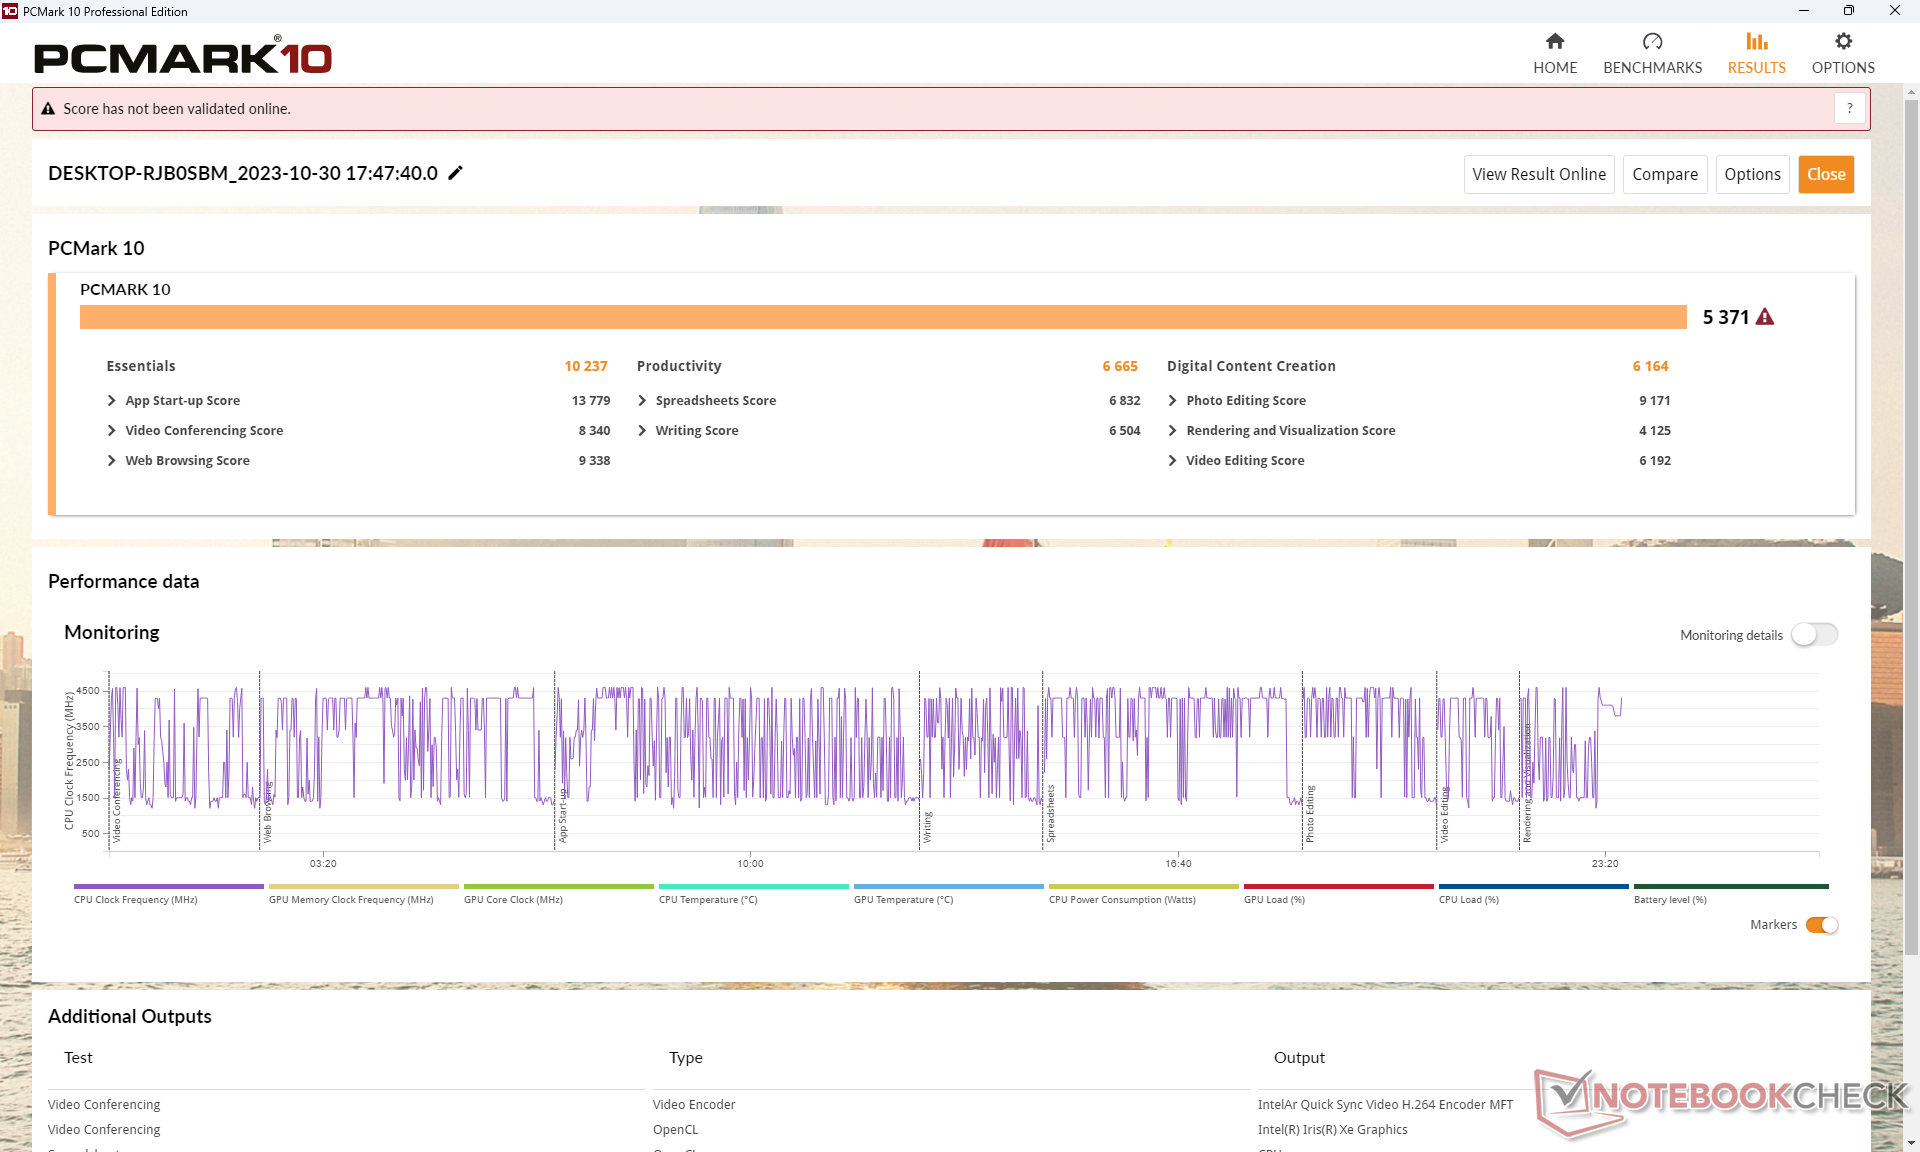
Rendimiento del sistema
Los resultados de PCMark están codo con codo con la alternativa AMD Ryzen 7 excepto en la subprueba de Productividad debido al superior rendimiento multihilo del Ryzen 7 7730U sobre nuestro Core i5-1335U.
CrossMark: Overall | Productivity | Creativity | Responsiveness
| PCMark 10 / Score | |
| Dell Inspiron 16 7635 2-in-1 | |
| Lenovo ThinkPad E16 G1-21JUS08X00 | |
| Samsung Galaxy Book3 Pro 16 | |
| Lenovo ThinkPad E16 G1 Core i5-1335U | |
| Medio Intel Core i5-1335U, Intel Iris Xe Graphics G7 80EUs (5068 - 5600, n=11) | |
| Acer TravelMate P4 TMP416-51-55KN | |
| LG Gram 16Z90Q | |
| PCMark 10 / Essentials | |
| Dell Inspiron 16 7635 2-in-1 | |
| Samsung Galaxy Book3 Pro 16 | |
| Lenovo ThinkPad E16 G1-21JUS08X00 | |
| Medio Intel Core i5-1335U, Intel Iris Xe Graphics G7 80EUs (9828 - 11912, n=11) | |
| Lenovo ThinkPad E16 G1 Core i5-1335U | |
| LG Gram 16Z90Q | |
| Acer TravelMate P4 TMP416-51-55KN | |
| PCMark 10 / Productivity | |
| Dell Inspiron 16 7635 2-in-1 | |
| Lenovo ThinkPad E16 G1-21JUS08X00 | |
| Medio Intel Core i5-1335U, Intel Iris Xe Graphics G7 80EUs (6196 - 7261, n=11) | |
| Acer TravelMate P4 TMP416-51-55KN | |
| Samsung Galaxy Book3 Pro 16 | |
| Lenovo ThinkPad E16 G1 Core i5-1335U | |
| LG Gram 16Z90Q | |
| PCMark 10 / Digital Content Creation | |
| Samsung Galaxy Book3 Pro 16 | |
| Acer TravelMate P4 TMP416-51-55KN | |
| Lenovo ThinkPad E16 G1 Core i5-1335U | |
| Lenovo ThinkPad E16 G1-21JUS08X00 | |
| LG Gram 16Z90Q | |
| Dell Inspiron 16 7635 2-in-1 | |
| Medio Intel Core i5-1335U, Intel Iris Xe Graphics G7 80EUs (5361 - 6164, n=11) | |
| CrossMark / Overall | |
| Samsung Galaxy Book3 Pro 16 | |
| Acer TravelMate P4 TMP416-51-55KN | |
| Medio Intel Core i5-1335U, Intel Iris Xe Graphics G7 80EUs (1339 - 1599, n=11) | |
| Lenovo ThinkPad E16 G1 Core i5-1335U | |
| Lenovo ThinkPad E16 G1-21JUS08X00 | |
| Dell Inspiron 16 7635 2-in-1 | |
| CrossMark / Productivity | |
| Samsung Galaxy Book3 Pro 16 | |
| Acer TravelMate P4 TMP416-51-55KN | |
| Medio Intel Core i5-1335U, Intel Iris Xe Graphics G7 80EUs (1337 - 1638, n=11) | |
| Lenovo ThinkPad E16 G1 Core i5-1335U | |
| Lenovo ThinkPad E16 G1-21JUS08X00 | |
| Dell Inspiron 16 7635 2-in-1 | |
| CrossMark / Creativity | |
| Samsung Galaxy Book3 Pro 16 | |
| Acer TravelMate P4 TMP416-51-55KN | |
| Medio Intel Core i5-1335U, Intel Iris Xe Graphics G7 80EUs (1315 - 1620, n=11) | |
| Lenovo ThinkPad E16 G1 Core i5-1335U | |
| Lenovo ThinkPad E16 G1-21JUS08X00 | |
| Dell Inspiron 16 7635 2-in-1 | |
| CrossMark / Responsiveness | |
| Acer TravelMate P4 TMP416-51-55KN | |
| Samsung Galaxy Book3 Pro 16 | |
| Medio Intel Core i5-1335U, Intel Iris Xe Graphics G7 80EUs (1023 - 1868, n=11) | |
| Lenovo ThinkPad E16 G1 Core i5-1335U | |
| Lenovo ThinkPad E16 G1-21JUS08X00 | |
| Dell Inspiron 16 7635 2-in-1 | |
| PCMark 10 Score | 5371 puntos | |
ayuda | ||
| AIDA64 / Memory Copy | |
| LG Gram 16Z90Q | |
| Samsung Galaxy Book3 Pro 16 | |
| Medio Intel Core i5-1335U (22417 - 60884, n=11) | |
| Acer TravelMate P4 TMP416-51-55KN | |
| Dell Inspiron 16 7635 2-in-1 | |
| Lenovo ThinkPad E16 G1 Core i5-1335U | |
| Lenovo ThinkPad E16 G1-21JUS08X00 | |
| AIDA64 / Memory Read | |
| LG Gram 16Z90Q | |
| Samsung Galaxy Book3 Pro 16 | |
| Acer TravelMate P4 TMP416-51-55KN | |
| Medio Intel Core i5-1335U (23104 - 61555, n=11) | |
| Dell Inspiron 16 7635 2-in-1 | |
| Lenovo ThinkPad E16 G1-21JUS08X00 | |
| Lenovo ThinkPad E16 G1 Core i5-1335U | |
| AIDA64 / Memory Write | |
| Samsung Galaxy Book3 Pro 16 | |
| LG Gram 16Z90Q | |
| Medio Intel Core i5-1335U (22936 - 72584, n=11) | |
| Acer TravelMate P4 TMP416-51-55KN | |
| Lenovo ThinkPad E16 G1 Core i5-1335U | |
| Dell Inspiron 16 7635 2-in-1 | |
| Lenovo ThinkPad E16 G1-21JUS08X00 | |
| AIDA64 / Memory Latency | |
| Dell Inspiron 16 7635 2-in-1 | |
| LG Gram 16Z90Q | |
| Medio Intel Core i5-1335U (78.6 - 112.8, n=11) | |
| Samsung Galaxy Book3 Pro 16 | |
| Lenovo ThinkPad E16 G1-21JUS08X00 | |
| Lenovo ThinkPad E16 G1 Core i5-1335U | |
| Acer TravelMate P4 TMP416-51-55KN | |
* ... más pequeño es mejor
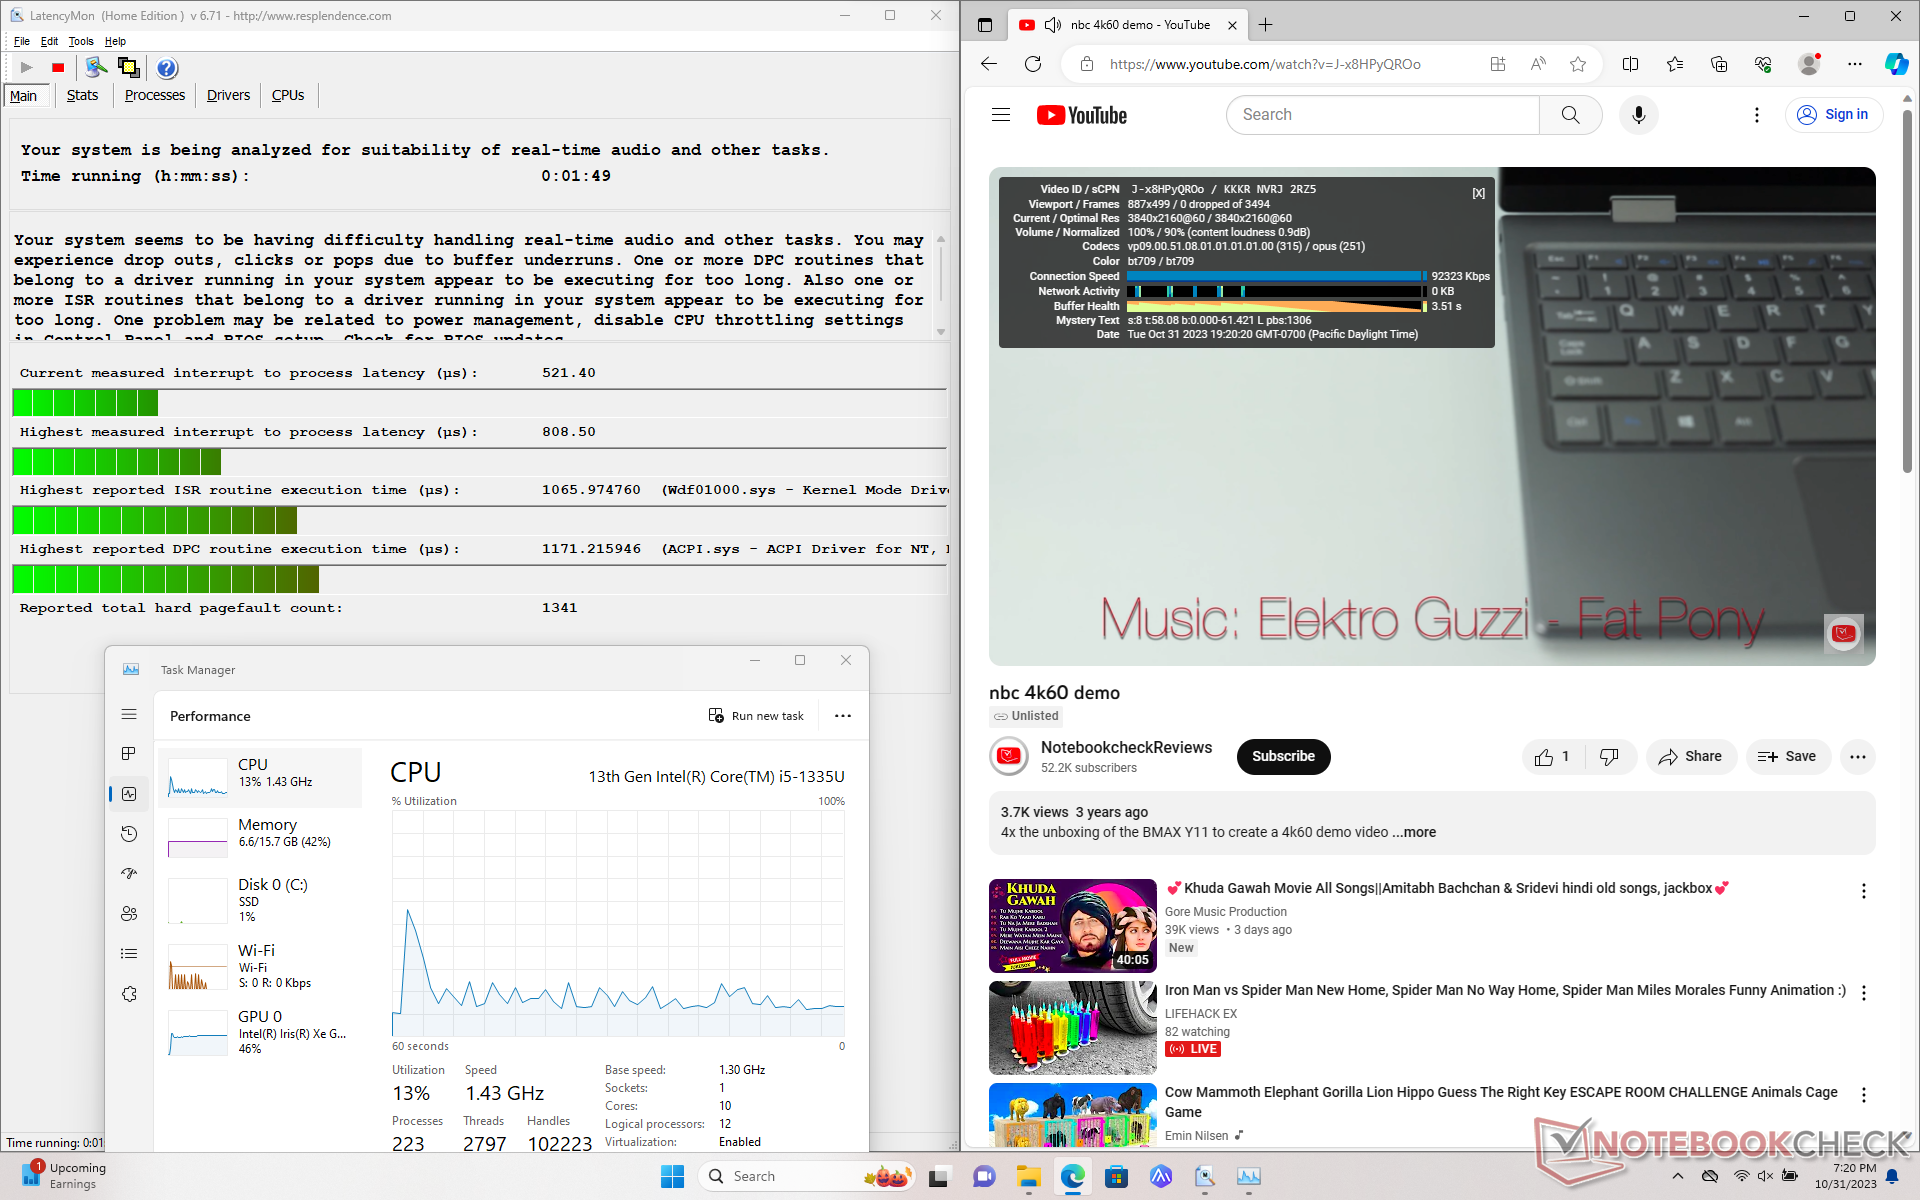
Latencia del CPD
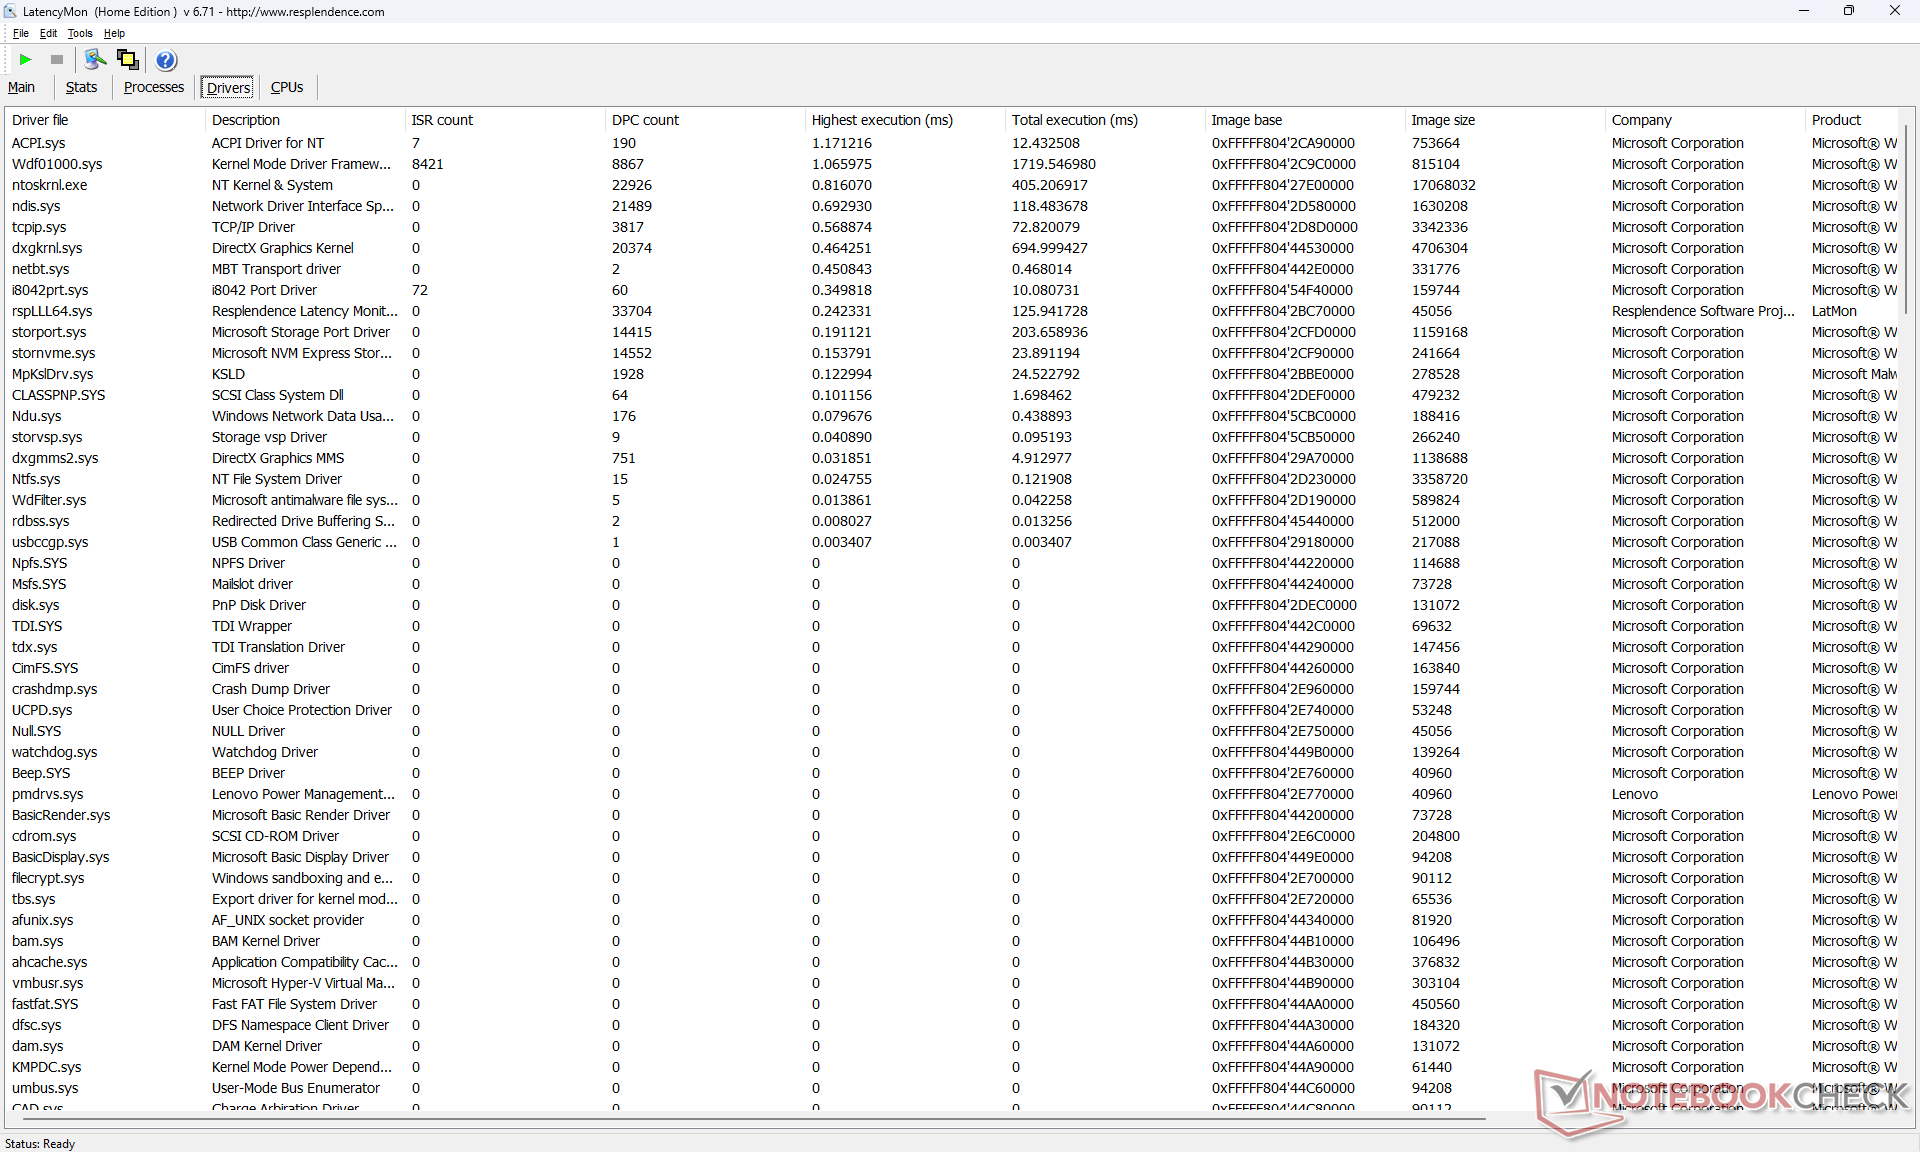
LatencyMon sólo revela problemas menores de CPD al abrir varias pestañas del navegador de nuestra página principal. la reproducción de vídeo 4K a 60 FPS es, por lo demás, perfectamente fluida sin que se registren caídas de fotogramas.
| DPC Latencies / LatencyMon - interrupt to process latency (max), Web, Youtube, Prime95 | |
| Acer TravelMate P4 TMP416-51-55KN | |
| LG Gram 16Z90Q | |
| Lenovo ThinkPad E16 G1-21JUS08X00 | |
| Lenovo ThinkPad E16 G1 Core i5-1335U | |
| Dell Inspiron 16 7635 2-in-1 | |
| Samsung Galaxy Book3 Pro 16 | |
* ... más pequeño es mejor
Dispositivos de almacenamiento
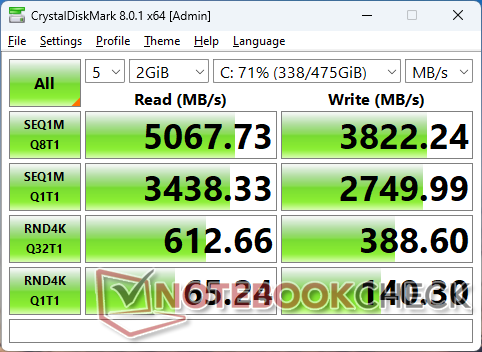
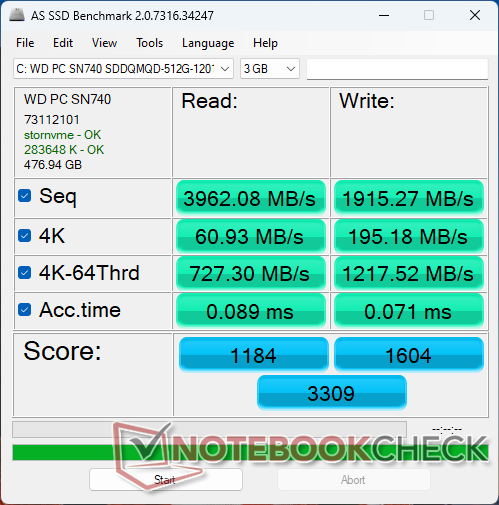
Nuestra unidad de prueba incluye el Western Digital SN740 que es una unidad SSD NVMe PCIe4 x4 de gama media que ofrece velocidades de lectura y escritura secuenciales en el mundo real de hasta 5100 MB/s y 3900 MB/s, respectivamente. La unidad 2242 no mostraría problemas para mantener estas velocidades máximas a pesar de la falta de almohadillas térmicas o ayudas de refrigeración.

* ... más pequeño es mejor
Disk Throttling: DiskSpd Read Loop, Queue Depth 8
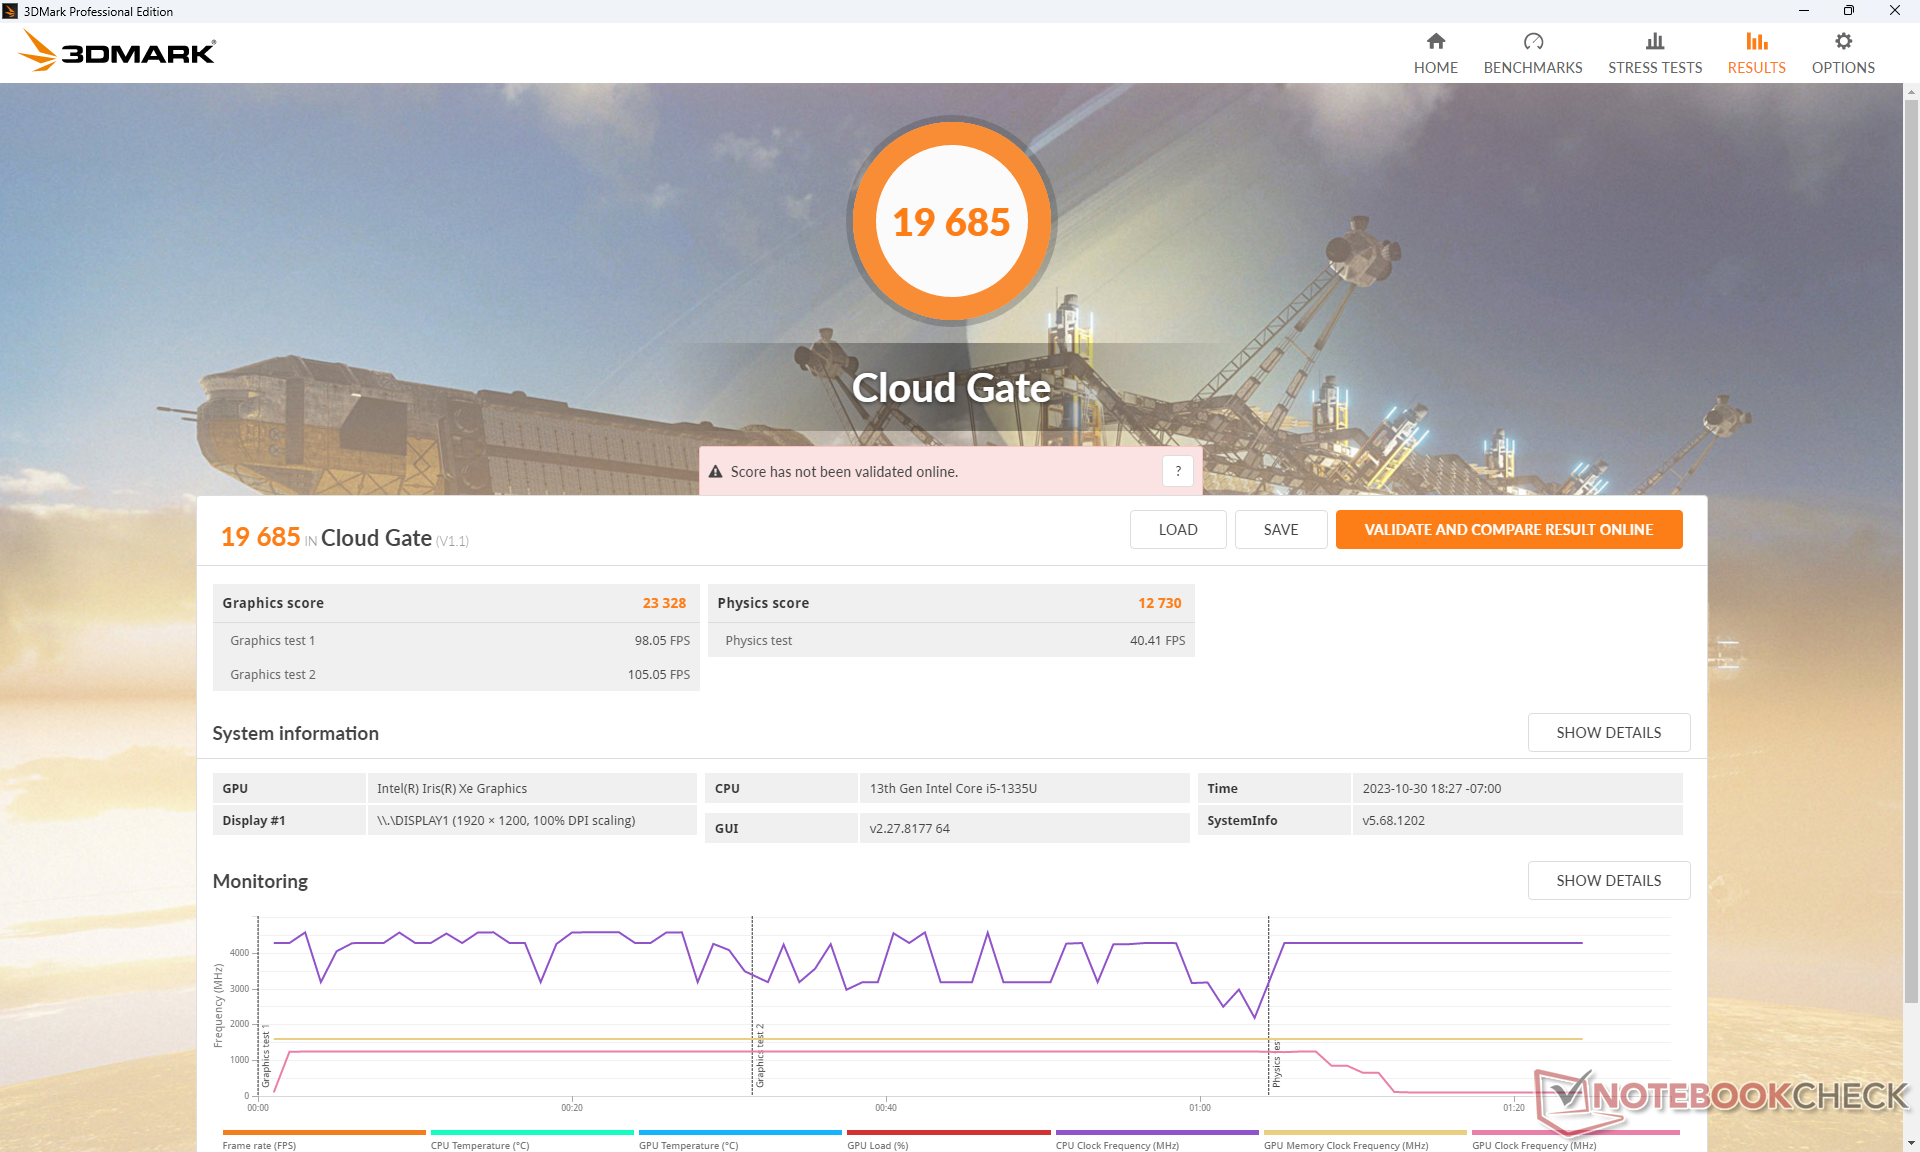
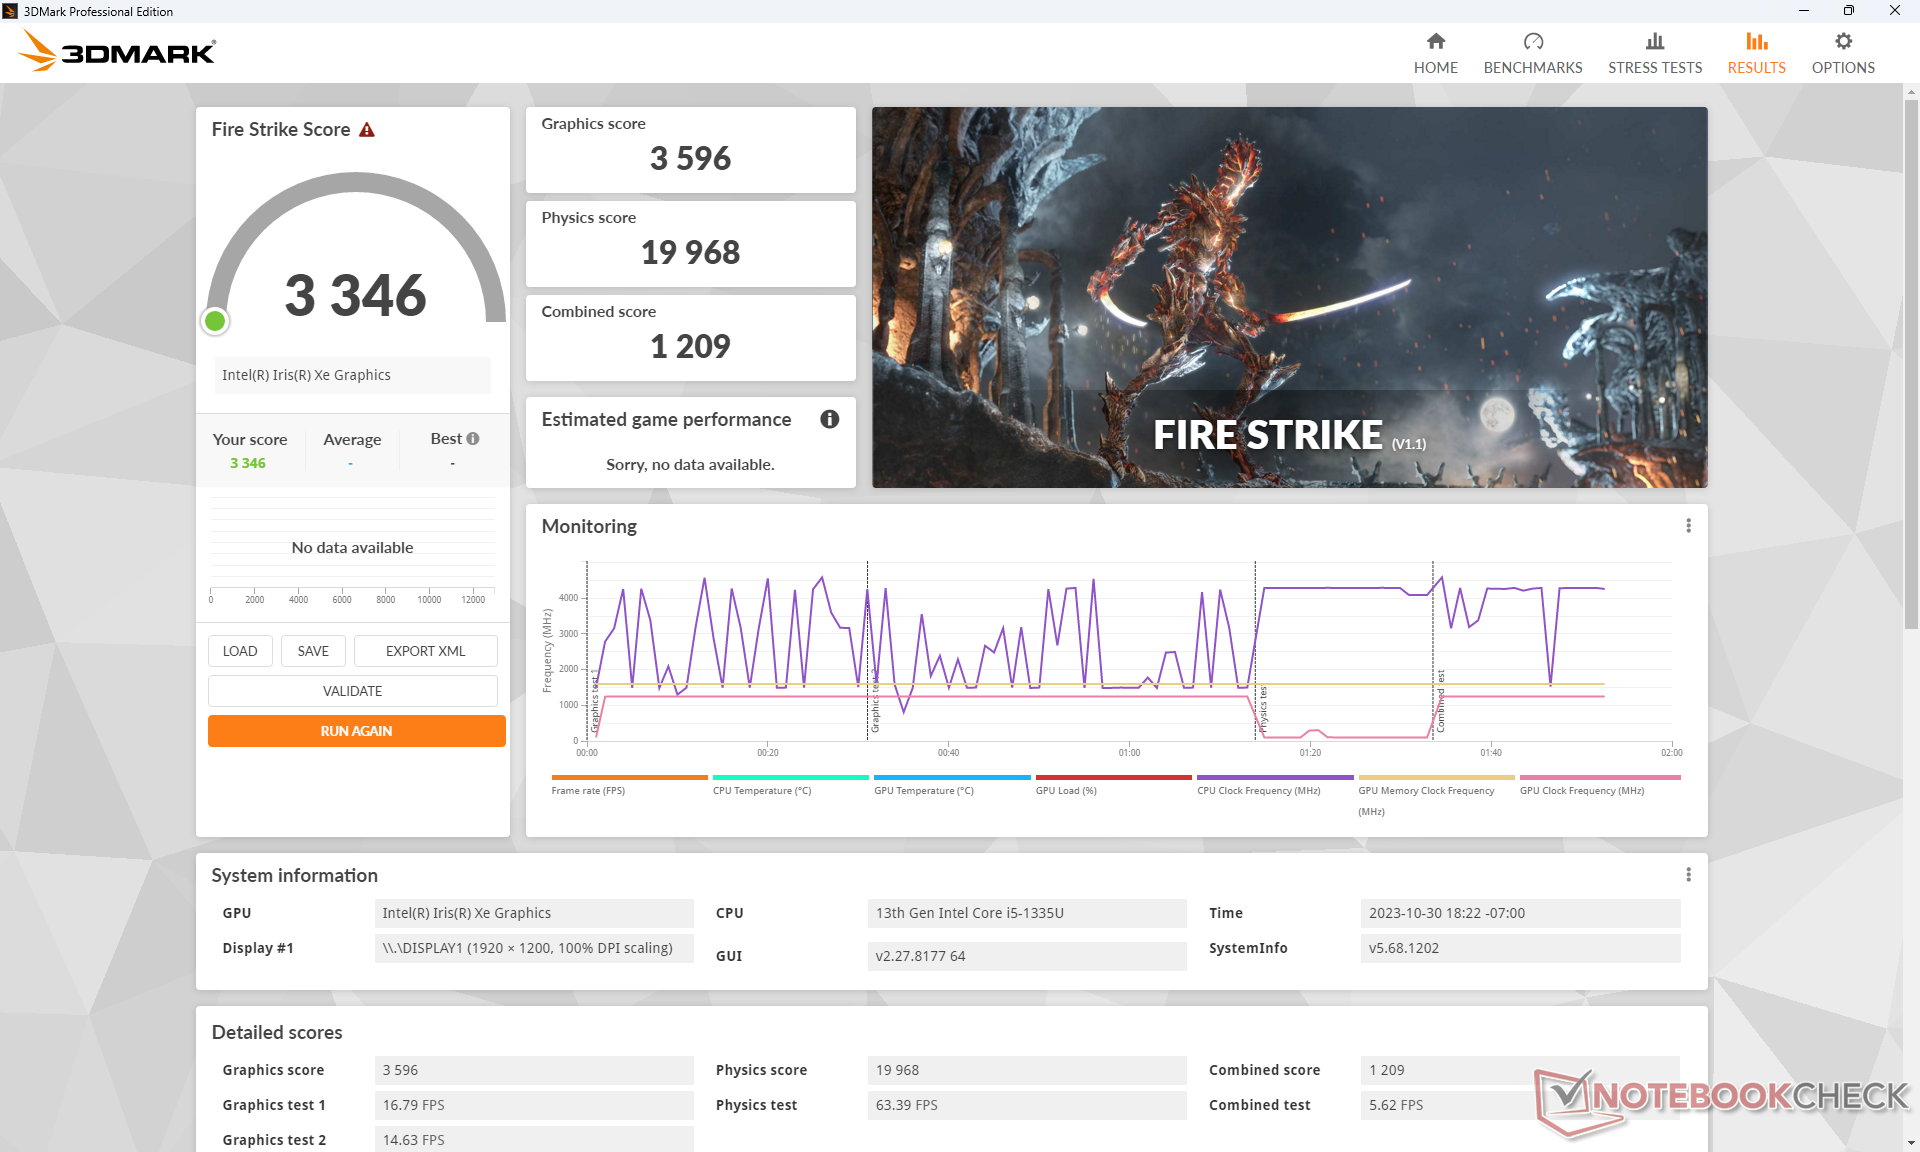
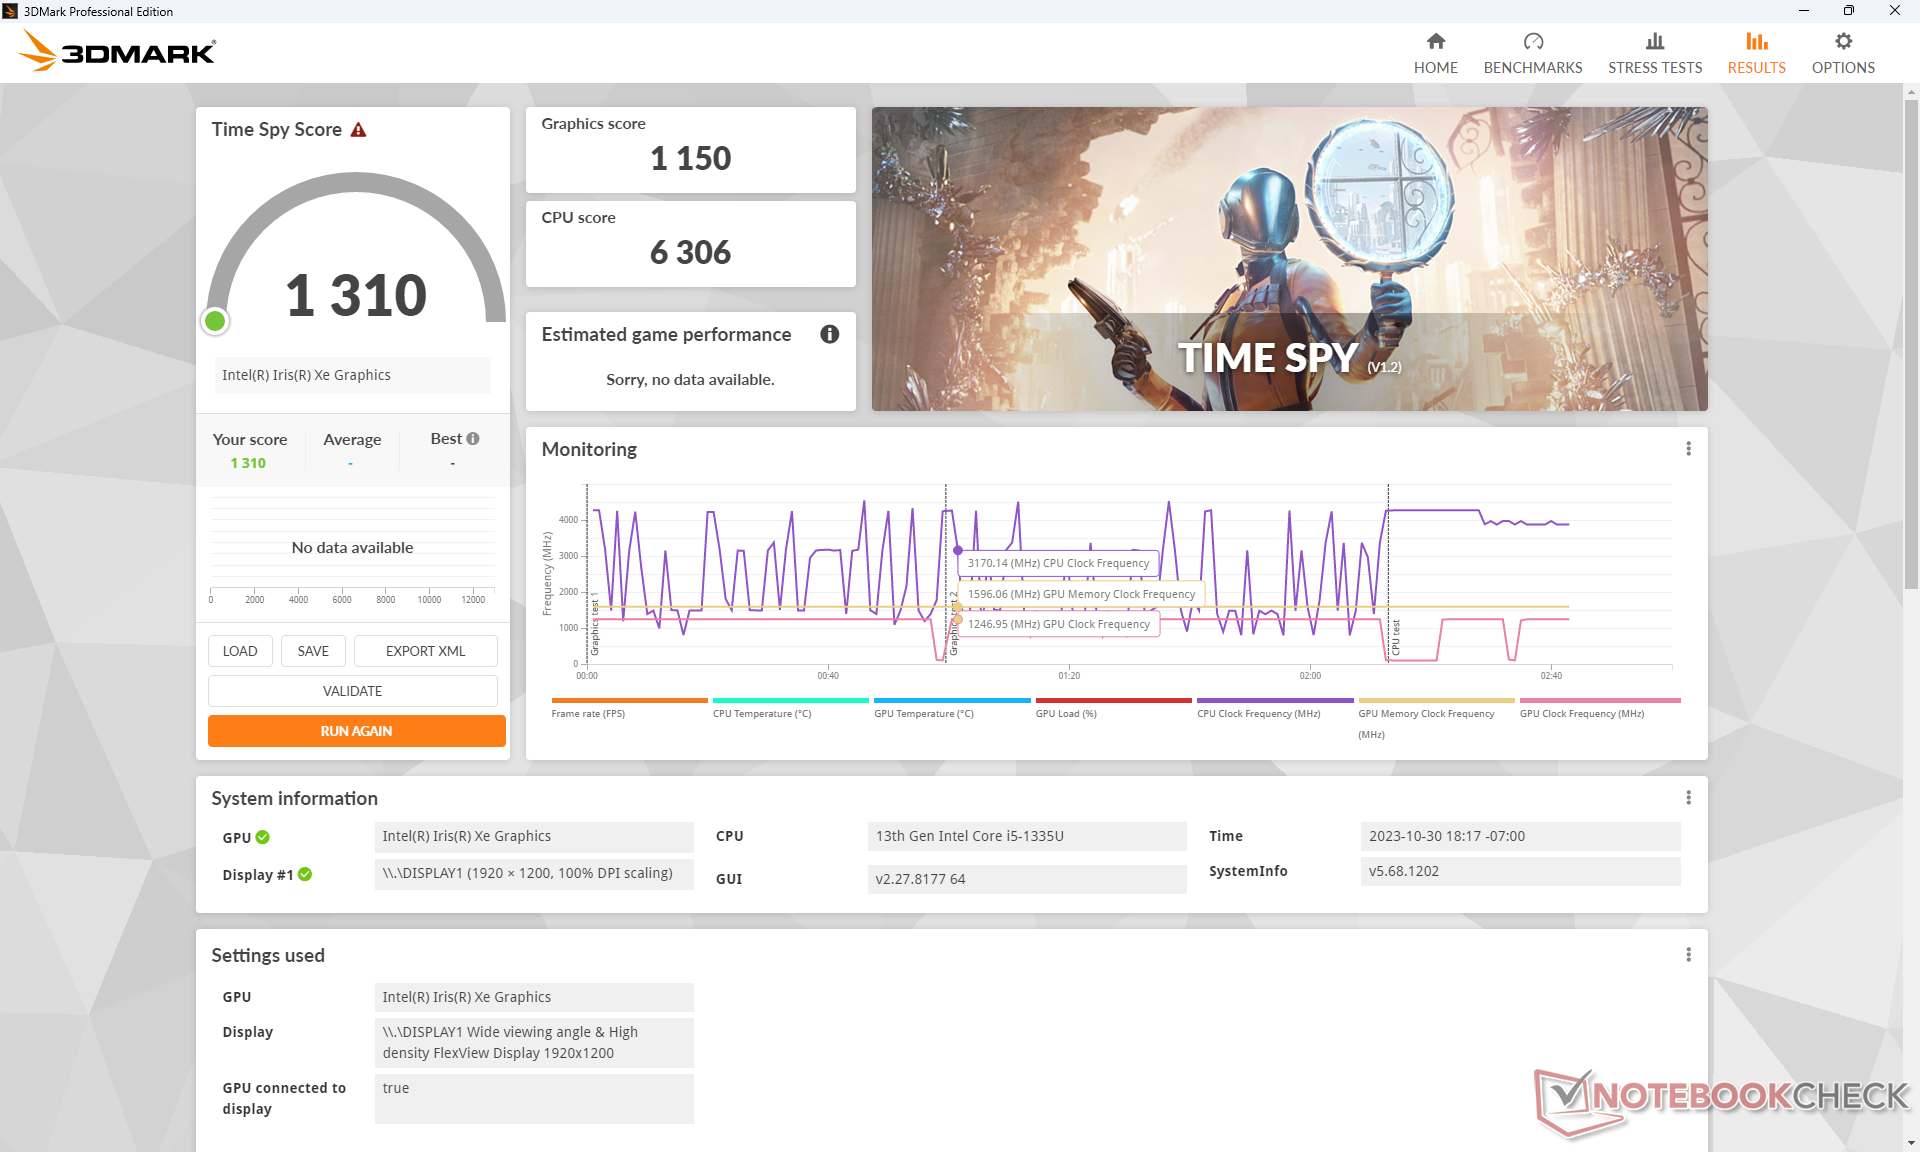
Rendimiento de la GPU
Nuestros Iris Xe 80 UE está rindiendo donde esperamos que lo haga en relación con otros portátiles con la misma GPU, si no ligeramente más lenta. La actualización a la configuración Core i7 con Iris Xe 96 EUs o GeForce MX550 aumentaría el rendimiento entre un 25 y un 30 por ciento o entre un 70 y un 100 por ciento, respectivamente.
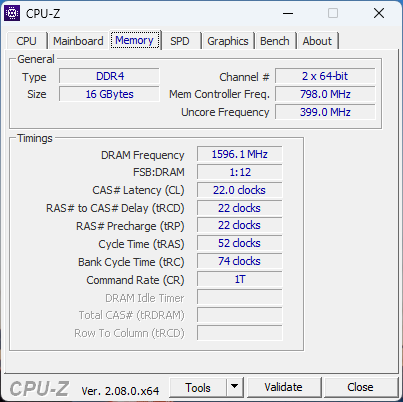
Asegúrese de configurarlo con RAM de doble canal o, de lo contrario, el rendimiento de la iGPU se resentirá considerablemente.
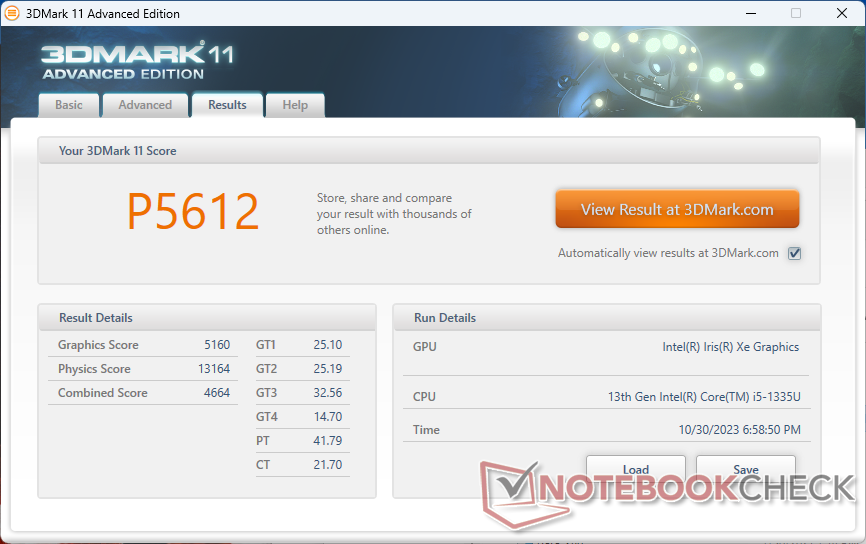
| 3DMark 11 Performance | 5612 puntos | |
| 3DMark Cloud Gate Standard Score | 19685 puntos | |
| 3DMark Fire Strike Score | 3346 puntos | |
| 3DMark Time Spy Score | 1310 puntos | |
ayuda | ||
* ... más pequeño es mejor
Las velocidades de fotogramas en ralentí en Witcher 3 caían bastante durante el inicio de la prueba, lo que sugería alguna actividad de fondo que interrumpía. Afortunadamente, esto no volvería a ocurrir durante el resto de la prueba.
Witcher 3 FPS Chart
| bajo | medio | alto | ultra | |
|---|---|---|---|---|
| GTA V (2015) | 84.5 | 68.8 | 13.2 | 5.41 |
| The Witcher 3 (2015) | 73.6 | 45.1 | 22.1 | 11.1 |
| Dota 2 Reborn (2015) | 100.7 | 75.2 | 49.2 | 45 |
| Final Fantasy XV Benchmark (2018) | 31 | 16.9 | 12.1 | |
| X-Plane 11.11 (2018) | 28.6 | 22.5 | 21 | |
| Far Cry 5 (2018) | 40 | 19 | 18 | 17 |
| Strange Brigade (2018) | 70.3 | 27.3 | 22.4 | 18.3 |
| Cyberpunk 2077 1.6 (2022) | 14.1 | |||
| Tiny Tina's Wonderlands (2022) | 20.6 | 15.3 | 10.4 | 8.1 |
| F1 22 (2022) | 32.8 | 29.1 | 21.3 | 16.5 |
Emisiones
Ruido del sistema
El ruido del ventilador es en general más fuerte que el que experimentamos en la versión Ryzen 7, probablemente debido a la mayor demanda de energía de nuestra versión Intel. La versión AMD es capaz de permanecer más silenciosa durante períodos más largos cuando se introduce estrés. Al ejecutar 3DMark 06, por ejemplo, el ruido del ventilador se mantendría relativamente silencioso con algo menos de 25 dB(A) en comparación con los casi 33 dB(A) de nuestra versión Intel.
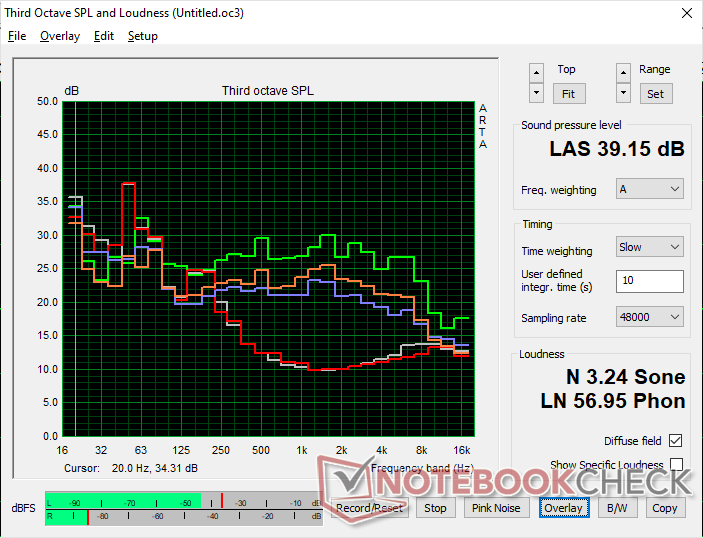
Ruido
| Ocioso |
| 24.6 / 24.6 / 24.6 dB(A) |
| Carga |
| 32.7 / 39.2 dB(A) |
 | ||
30 dB silencioso 40 dB(A) audible 50 dB(A) ruidosamente alto |
||
min: | ||
| Lenovo ThinkPad E16 G1 Core i5-1335U Iris Xe G7 80EUs, i5-1335U | Lenovo ThinkPad E16 G1-21JUS08X00 Vega 8, R7 7730U, WD PC SN740 SDDPNQD-1T00 | Dell Inspiron 16 7635 2-in-1 Vega 7, R5 7530U, Kioxia BG5 KBG50ZNS512G | Acer TravelMate P4 TMP416-51-55KN Iris Xe G7 80EUs, i5-1240P, Micron 2450 512GB MTFDKBA512TFK | Samsung Galaxy Book3 Pro 16 Iris Xe G7 80EUs, i5-1340P, WD PC SN740 256GB SDDPNQD-256G | LG Gram 16Z90Q Iris Xe G7 96EUs, i7-1260P, Samsung PM9A1 MZVL21T0HCLR | |
|---|---|---|---|---|---|---|
| Noise | 11% | -7% | -10% | -14% | -7% | |
| apagado / medio ambiente * (dB) | 24.6 | 22.4 9% | 23.6 4% | 25.4 -3% | 25.2 -2% | 25 -2% |
| Idle Minimum * (dB) | 24.6 | 22.4 9% | 23.6 4% | 25.4 -3% | 25.2 -2% | 26 -6% |
| Idle Average * (dB) | 24.6 | 22.4 9% | 23.6 4% | 25.4 -3% | 25.2 -2% | 27 -10% |
| Idle Maximum * (dB) | 24.6 | 23.7 4% | 23.6 4% | 25.4 -3% | 29.3 -19% | 28 -14% |
| Load Average * (dB) | 32.7 | 24.8 24% | 40.3 -23% | 43.9 -34% | 46.4 -42% | 38 -16% |
| Witcher 3 ultra * (dB) | 34.7 | 29.8 14% | 44.2 -27% | 37 -7% | ||
| Load Maximum * (dB) | 39.2 | 36.1 8% | 44.2 -13% | 43.7 -11% | 46.4 -18% | 38 3% |
* ... más pequeño es mejor
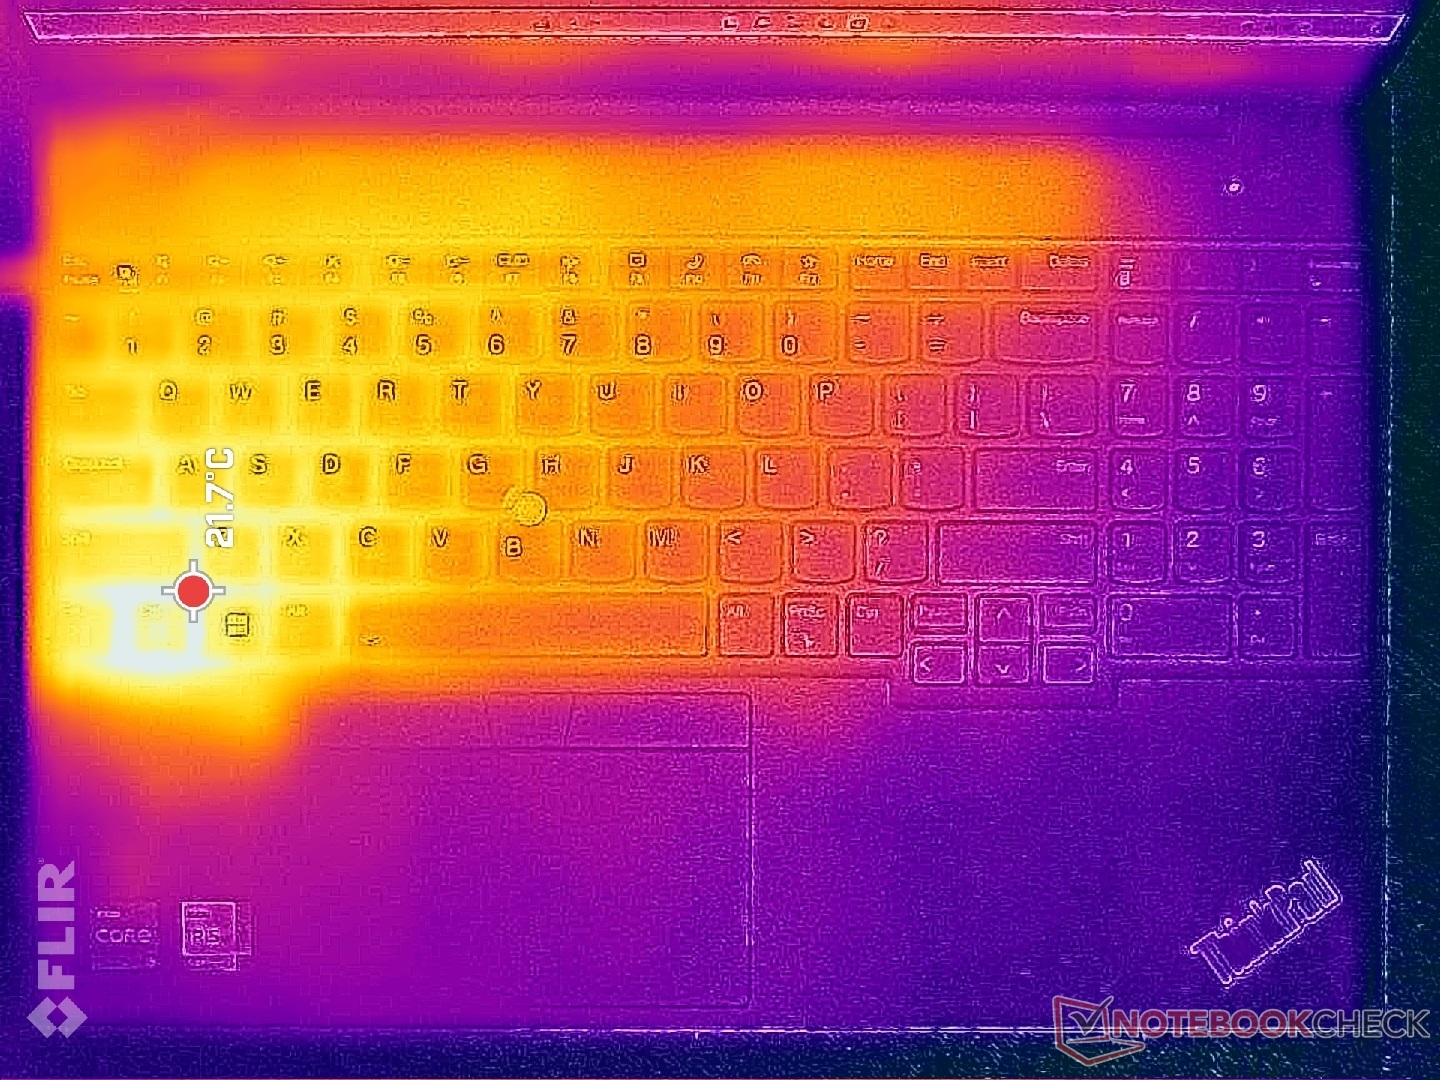
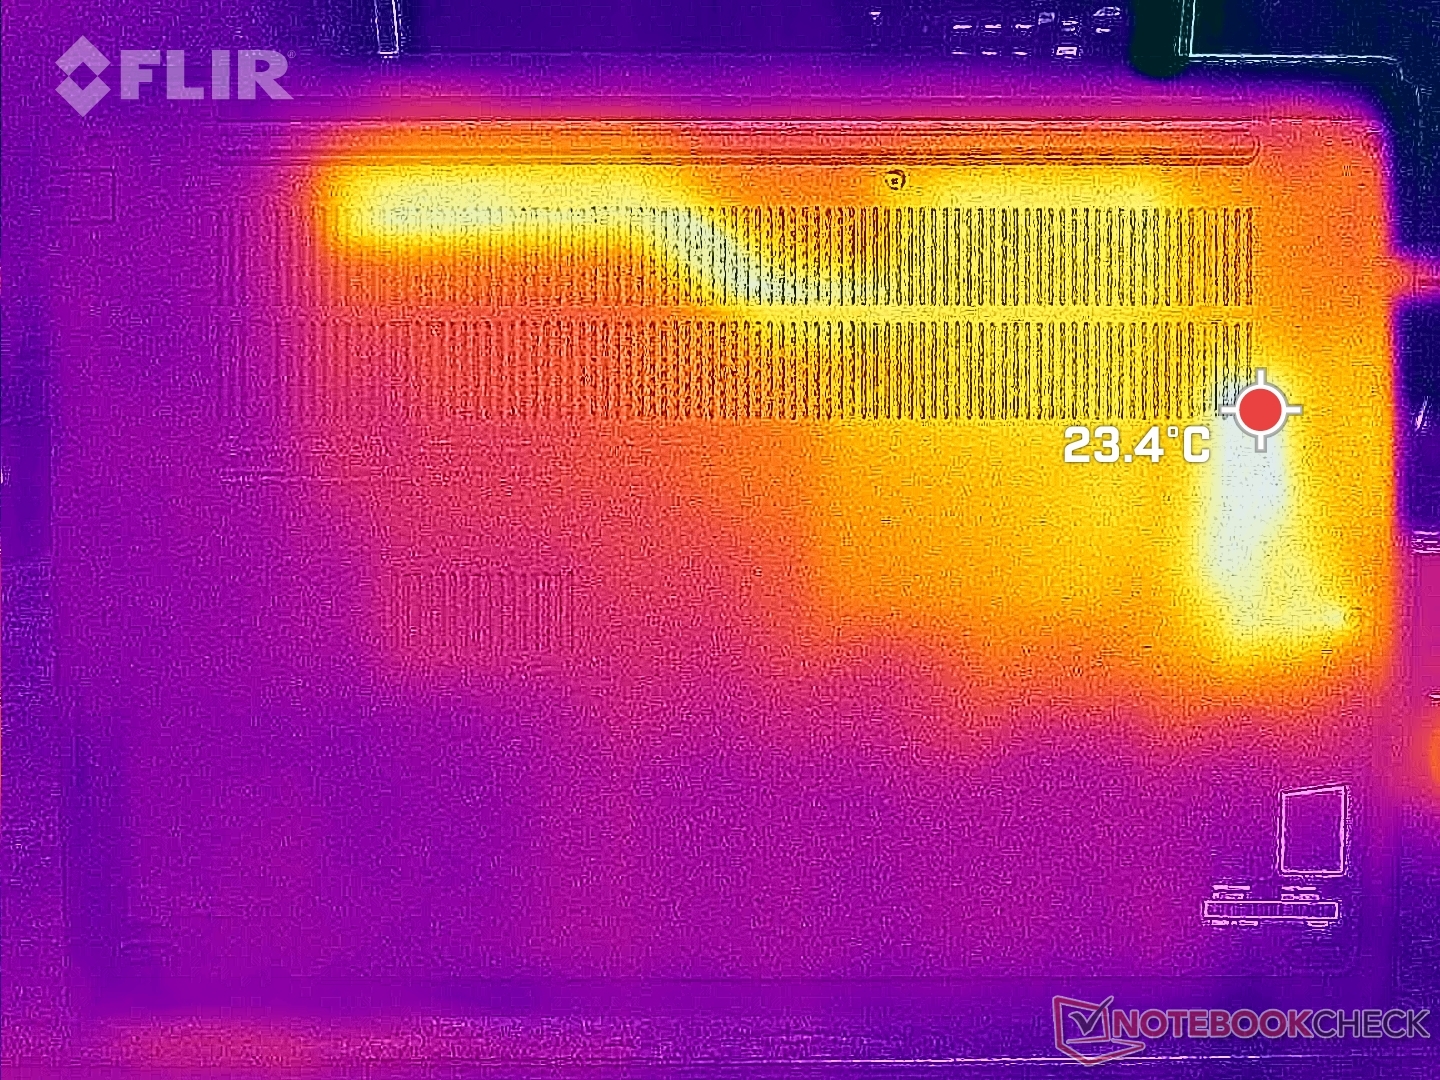
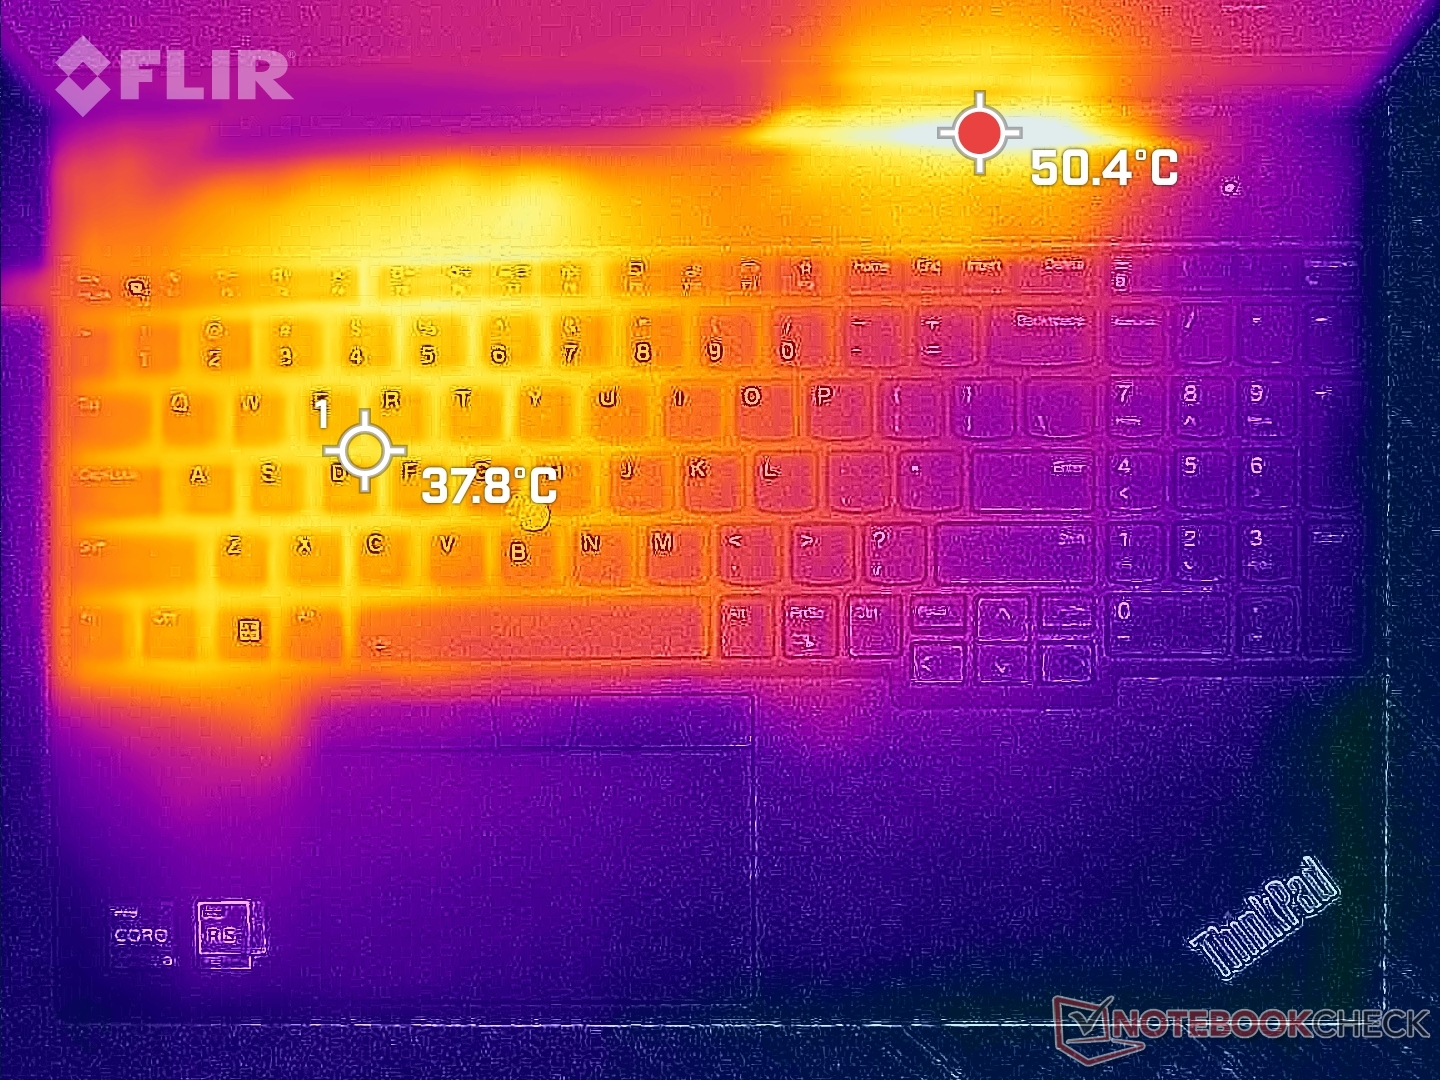
Temperatura
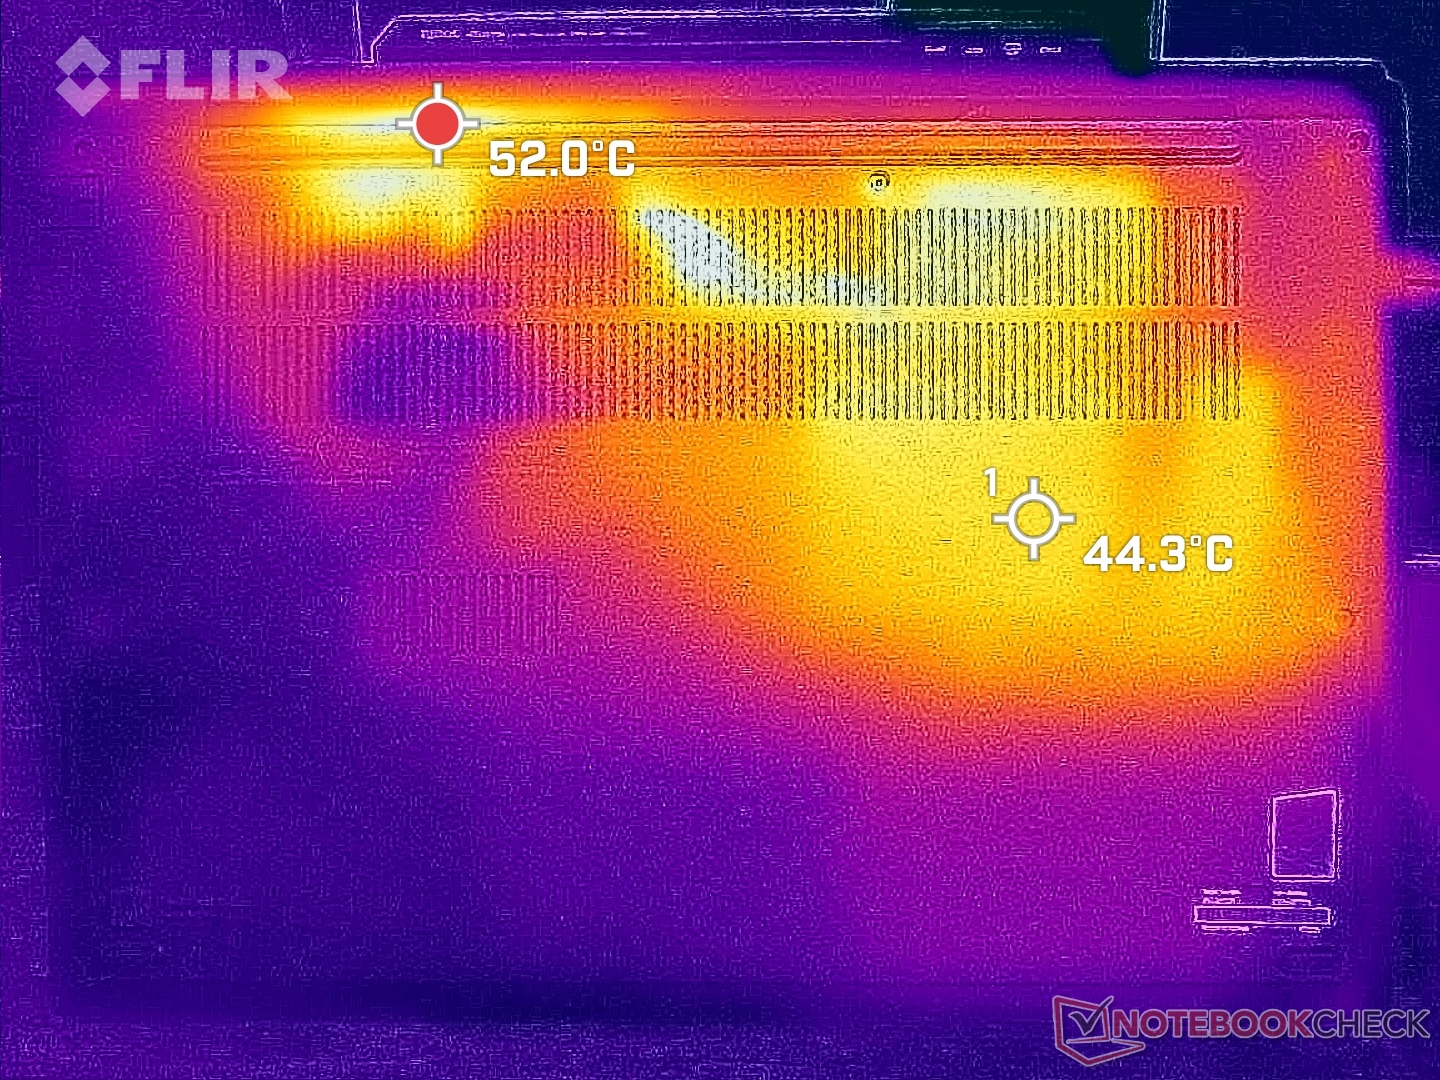
Las temperaturas superficiales son más cálidas en la mitad izquierda del portátil que en la derecha, simplemente debido a la colocación del procesador y la solución de refrigeración en el interior. Los puntos calientes cuando se ejecutan cargas exigentes pueden alcanzar hasta 38 C y 45 C en los lados superior e inferior, respectivamente, como muestran los mapas de temperatura a continuación. Los resultados son en realidad unos grados C más fríos que los que registramos en la configuración AMD, quizá debido al ventilador más ruidoso mencionado anteriormente. Aunque las diferencias de temperatura entre los cuadrantes más cálidos y más fríos son perceptibles al tacto, no resultan incómodas ni distraen durante el uso.
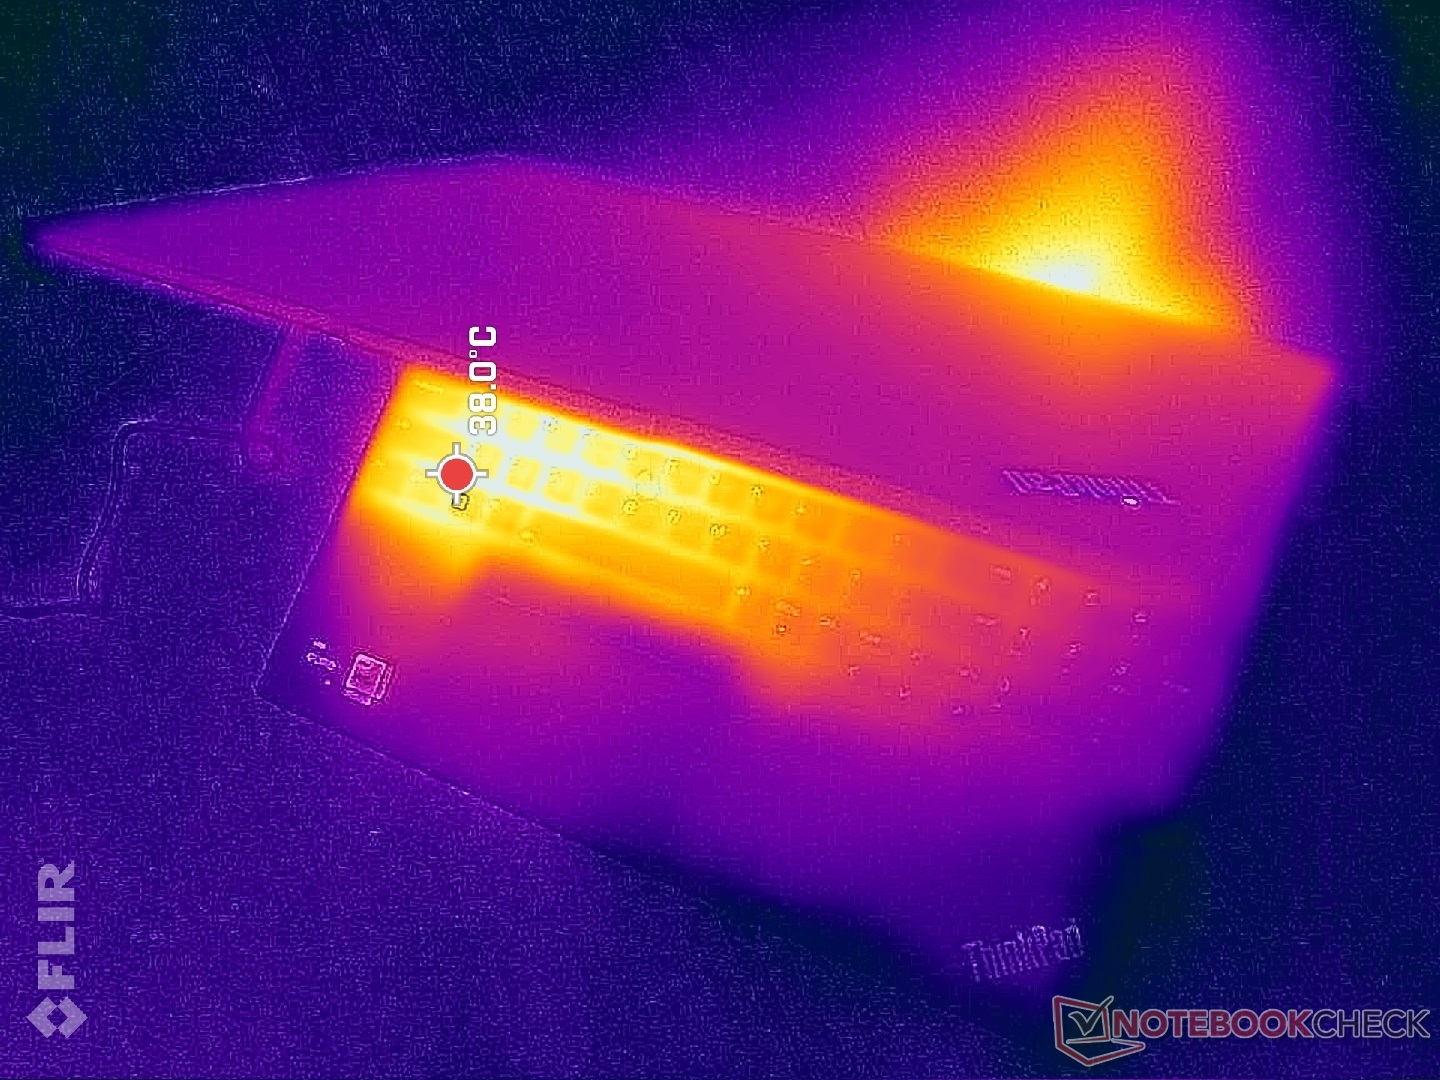
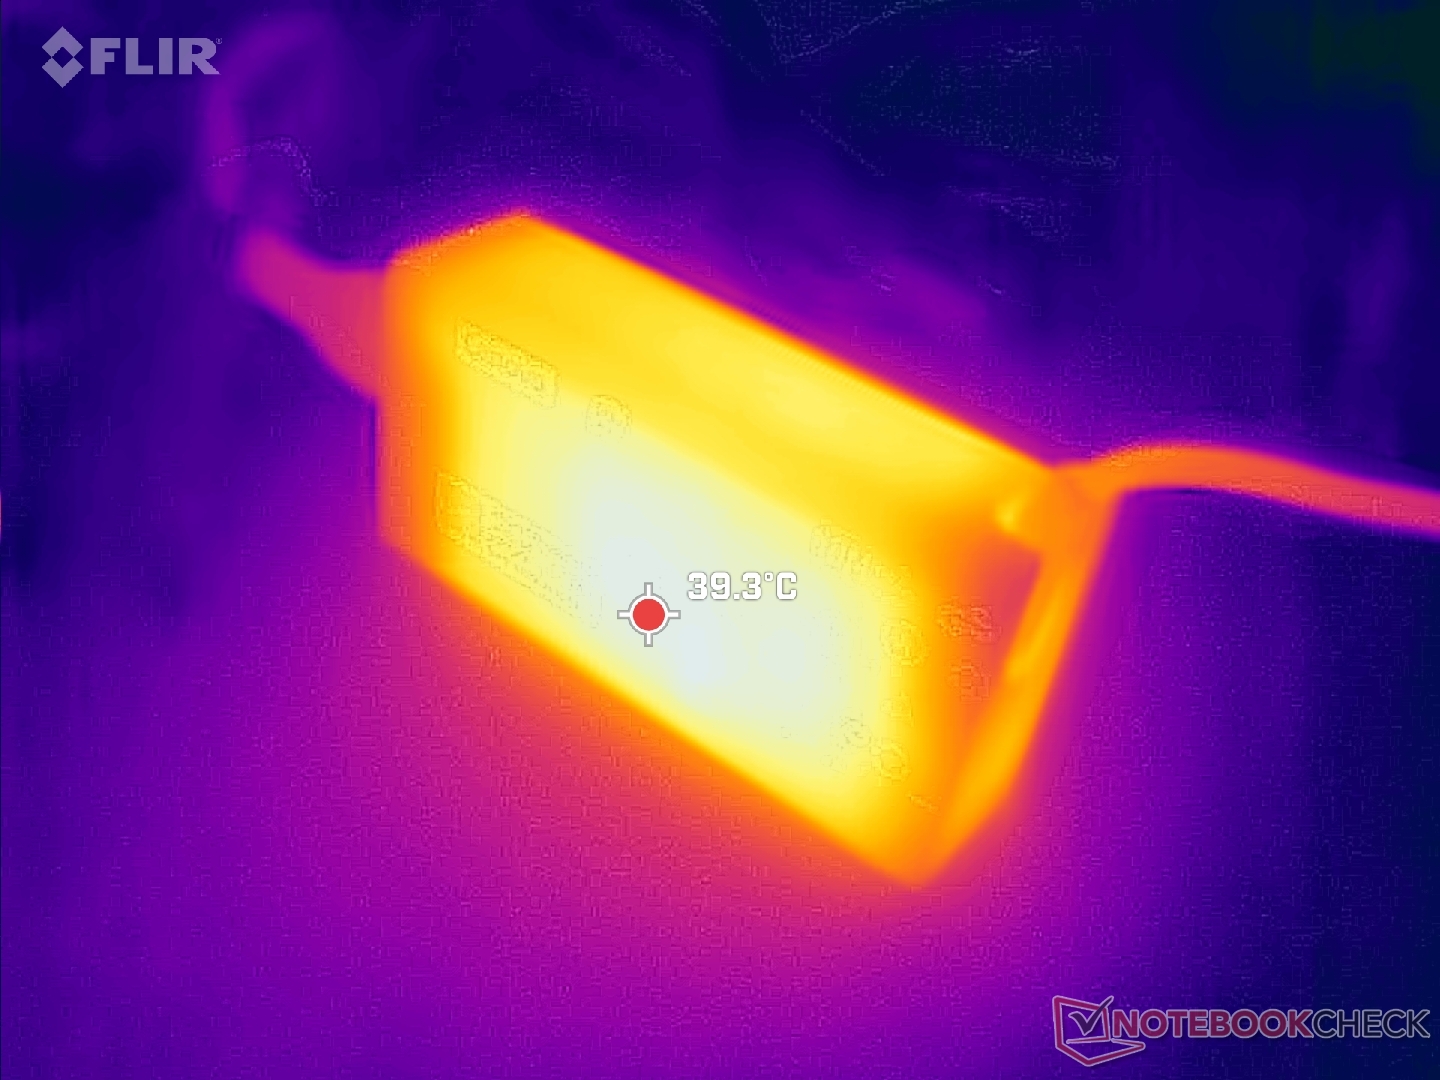
(±) La temperatura máxima en la parte superior es de 44 °C / 111 F, frente a la media de 34.3 °C / 94 F, que oscila entre 21.2 y 62.5 °C para la clase Office.
(-) El fondo se calienta hasta un máximo de 50.4 °C / 123 F, frente a la media de 36.8 °C / 98 F
(+) En reposo, la temperatura media de la parte superior es de 24.3 °C / 76# F, frente a la media del dispositivo de 29.5 °C / 85 F.
(+) El reposamanos y el panel táctil están a una temperatura inferior a la de la piel, con un máximo de 27 °C / 80.6 F y, por tanto, son fríos al tacto.
(±) La temperatura media de la zona del reposamanos de dispositivos similares fue de 27.5 °C / 81.5 F (+0.5 °C / 0.9 F).
| Lenovo ThinkPad E16 G1 Core i5-1335U Intel Core i5-1335U, Intel Iris Xe Graphics G7 80EUs | Lenovo ThinkPad E16 G1-21JUS08X00 AMD Ryzen 7 7730U, AMD Radeon RX Vega 8 (Ryzen 4000/5000) | Dell Inspiron 16 7635 2-in-1 AMD Ryzen 5 7530U, AMD Radeon RX Vega 7 | Acer TravelMate P4 TMP416-51-55KN Intel Core i5-1240P, Intel Iris Xe Graphics G7 80EUs | Samsung Galaxy Book3 Pro 16 Intel Core i5-1340P, Intel Iris Xe Graphics G7 80EUs | LG Gram 16Z90Q Intel Core i7-1260P, Intel Iris Xe Graphics G7 96EUs | |
|---|---|---|---|---|---|---|
| Heat | 0% | 4% | -1% | -5% | 6% | |
| Maximum Upper Side * (°C) | 44 | 46.1 -5% | 41.6 5% | 38.6 12% | 41.6 5% | 45 -2% |
| Maximum Bottom * (°C) | 50.4 | 52.2 -4% | 39 23% | 44.4 12% | 45 11% | 43 15% |
| Idle Upper Side * (°C) | 27.2 | 25.7 6% | 29.4 -8% | 28.9 -6% | 31 -14% | 26 4% |
| Idle Bottom * (°C) | 27.8 | 26.7 4% | 28.6 -3% | 34 -22% | 33.6 -21% | 26 6% |
* ... más pequeño es mejor
Prueba de estrés
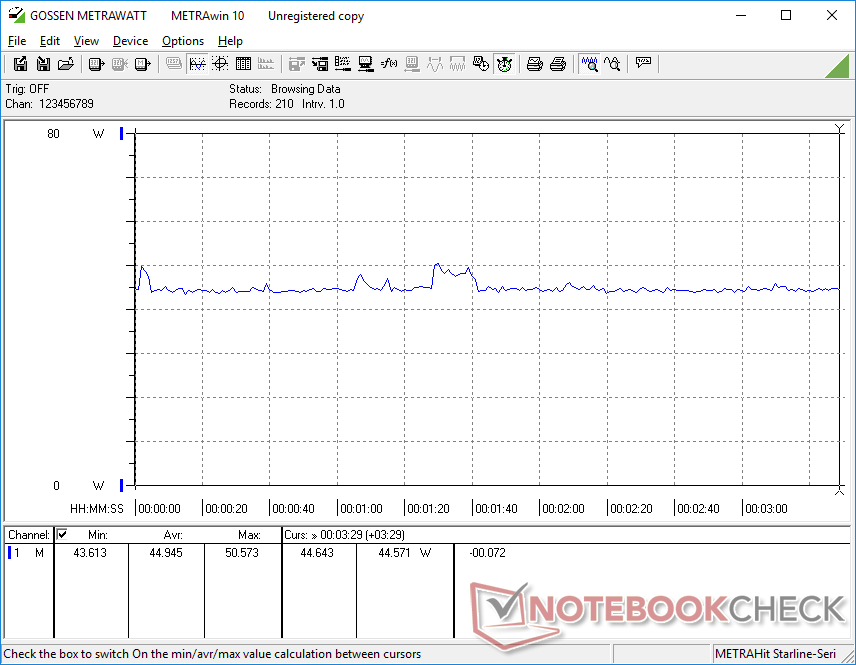
Al ejecutar Prime95, la CPU alcanzaba picos de 4 GHz, 50 W y 94 C sólo durante los primeros segundos, antes de descender de forma constante y estabilizarse en 2,4 GHz, 86 C y 28 W, ya que el pico de Turbo Boost es insostenible. El rango alto de 80 C es bastante cálido para un portátil Core serie U de 16 pulgadas. Ejecutando esta misma prueba en elAcer Swift Edge 16 con el Ryzen 7 7840U, por ejemplo, haría que la CPU se estabilizara en sólo 64 C en comparación.
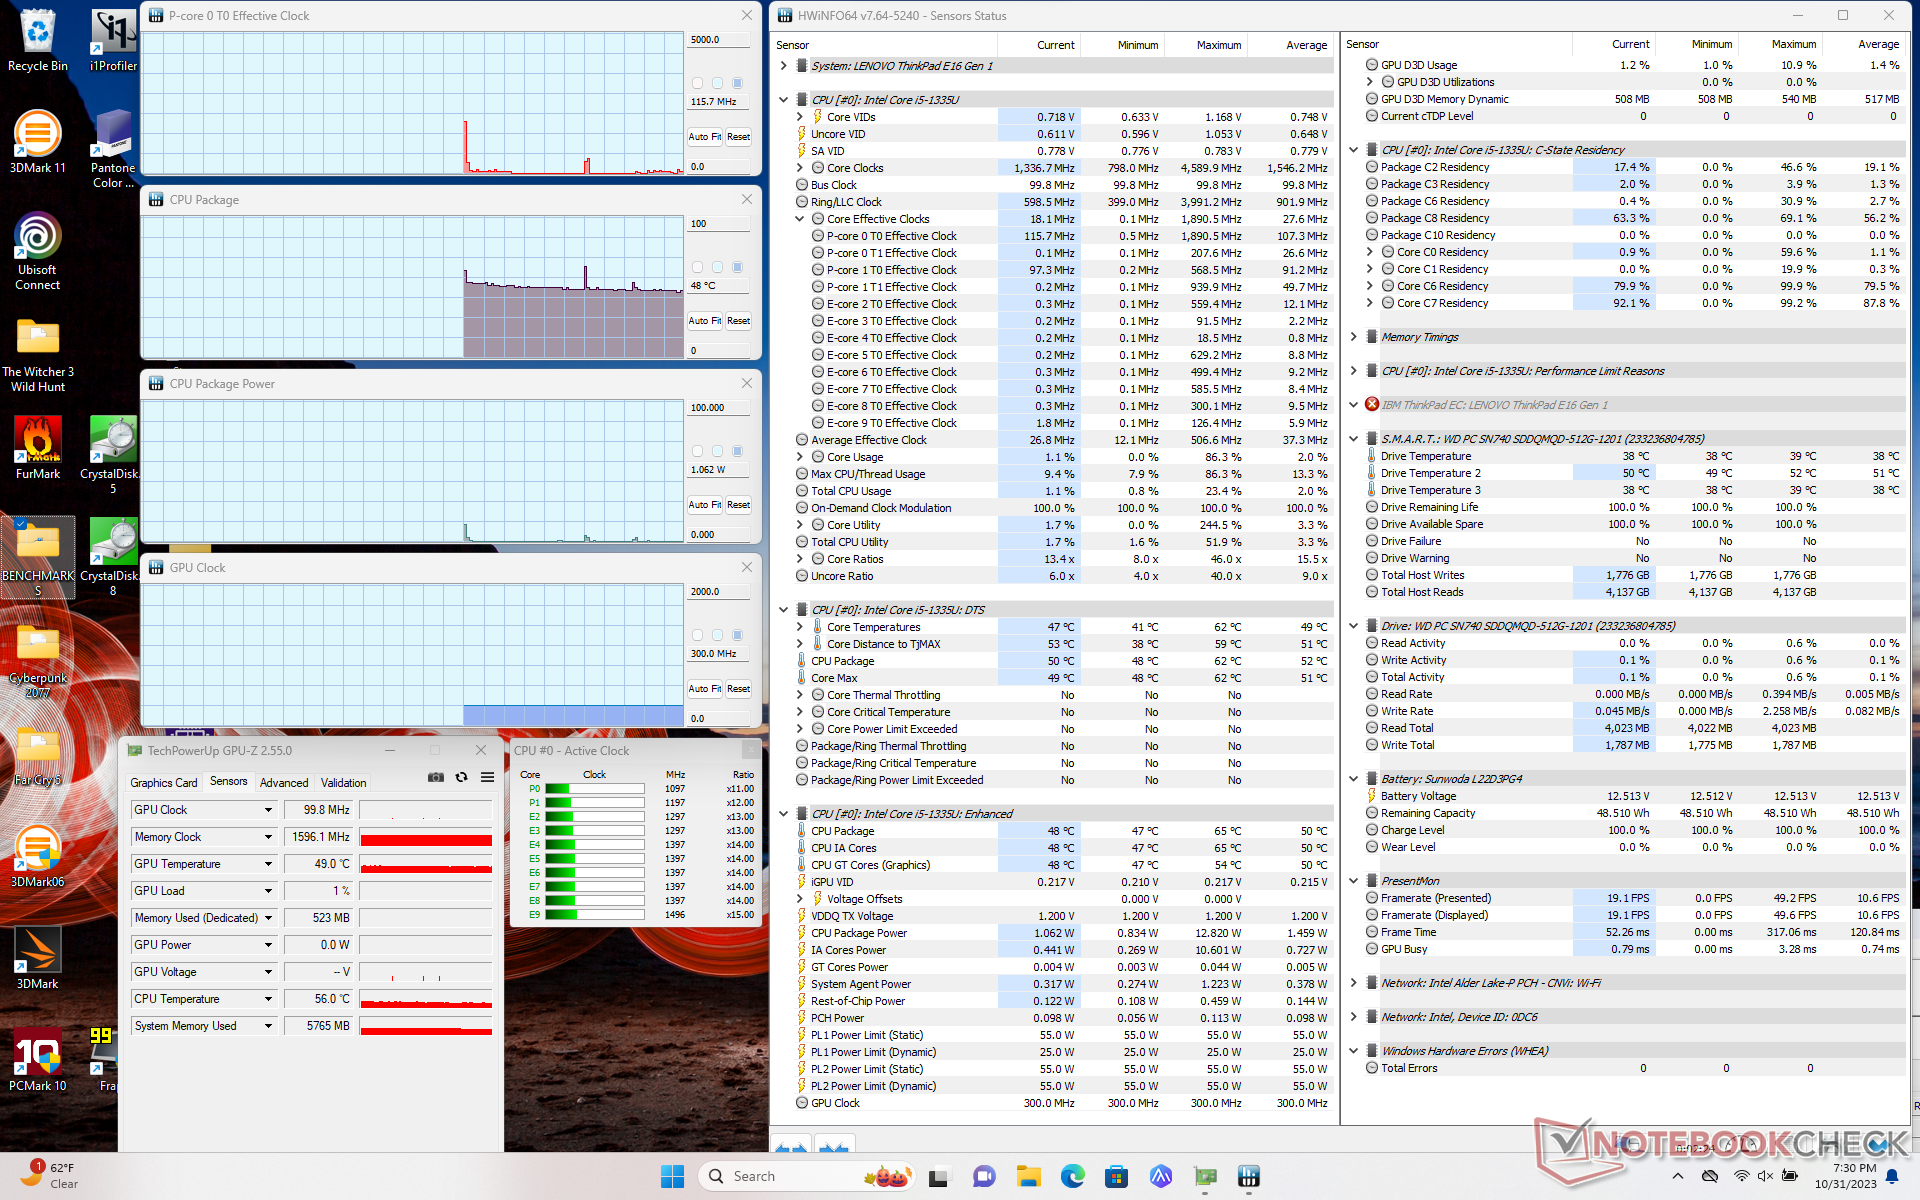
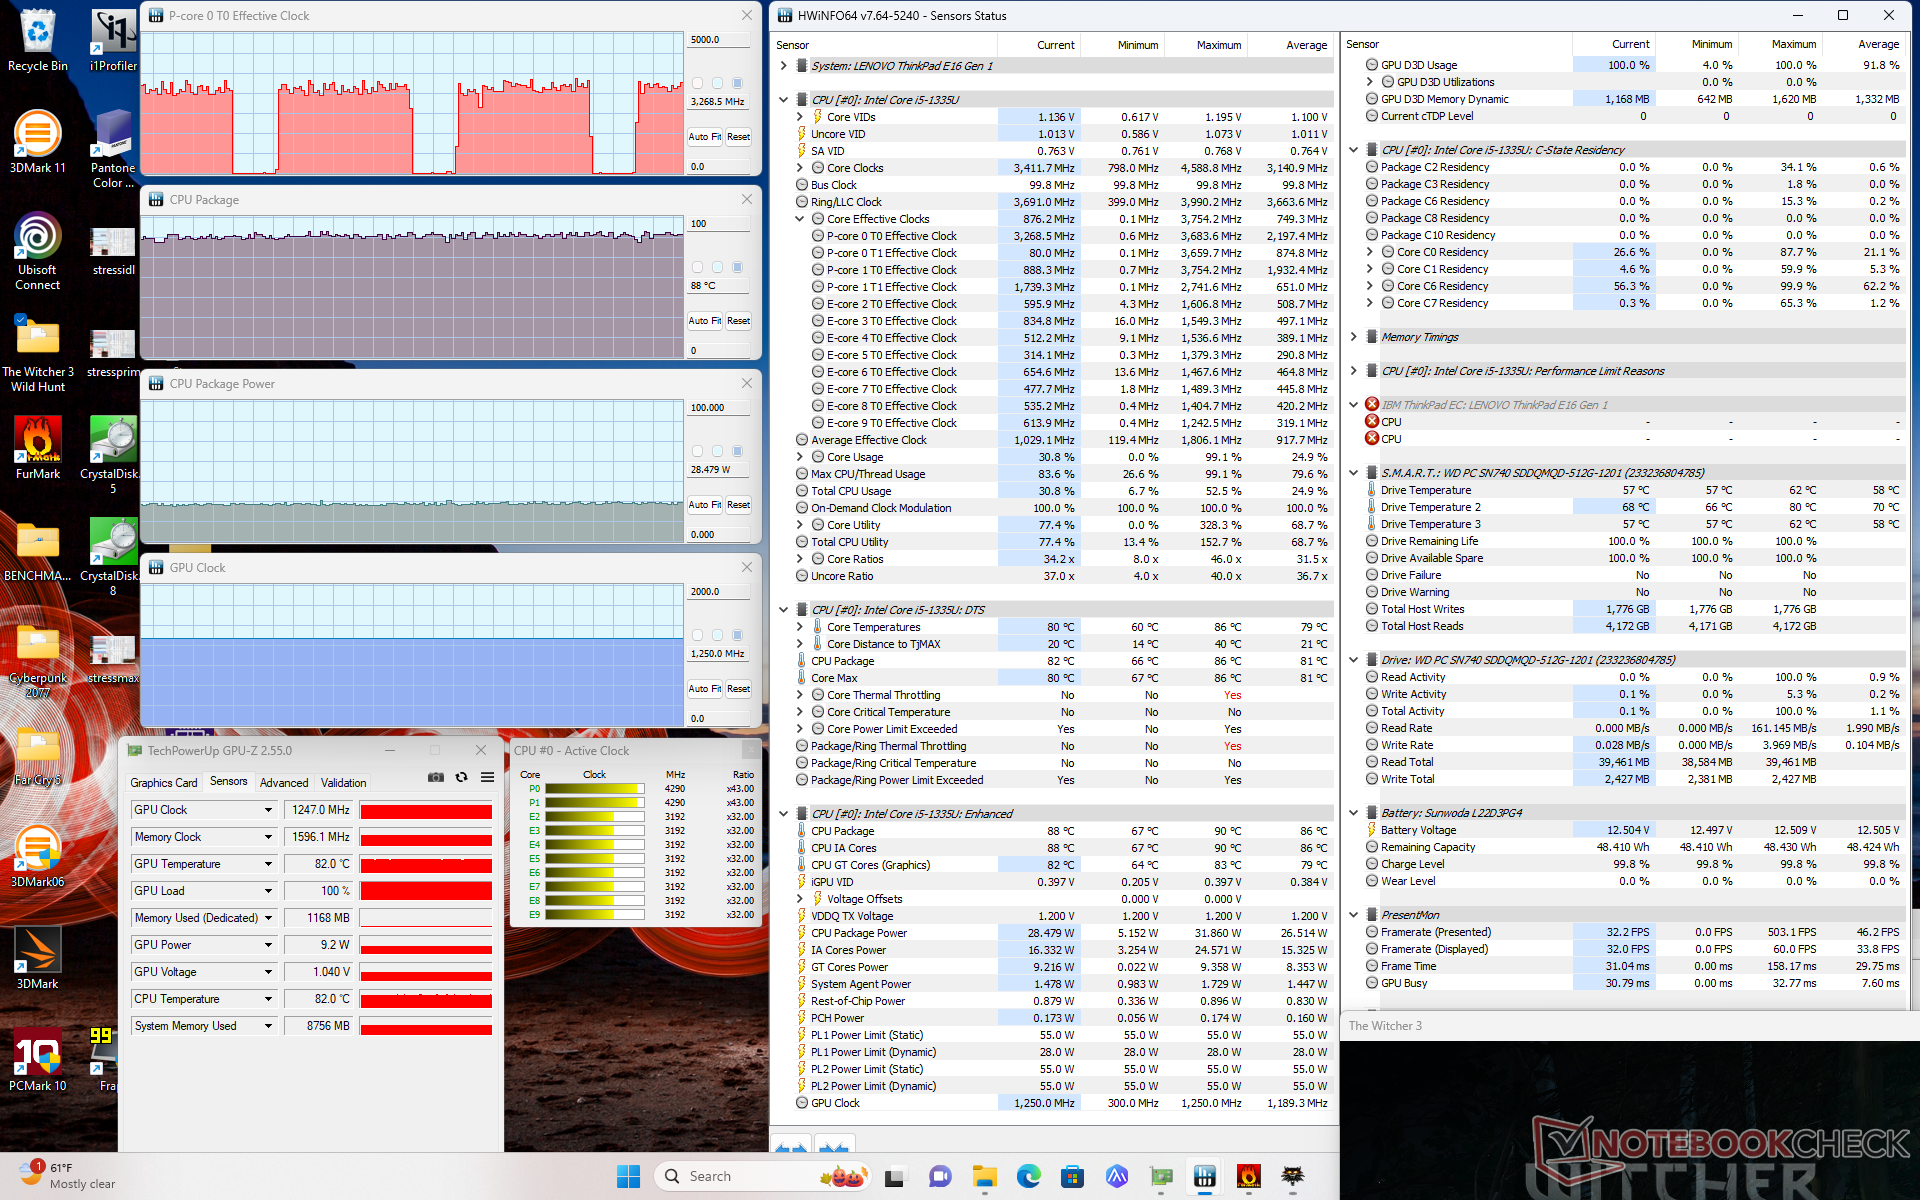
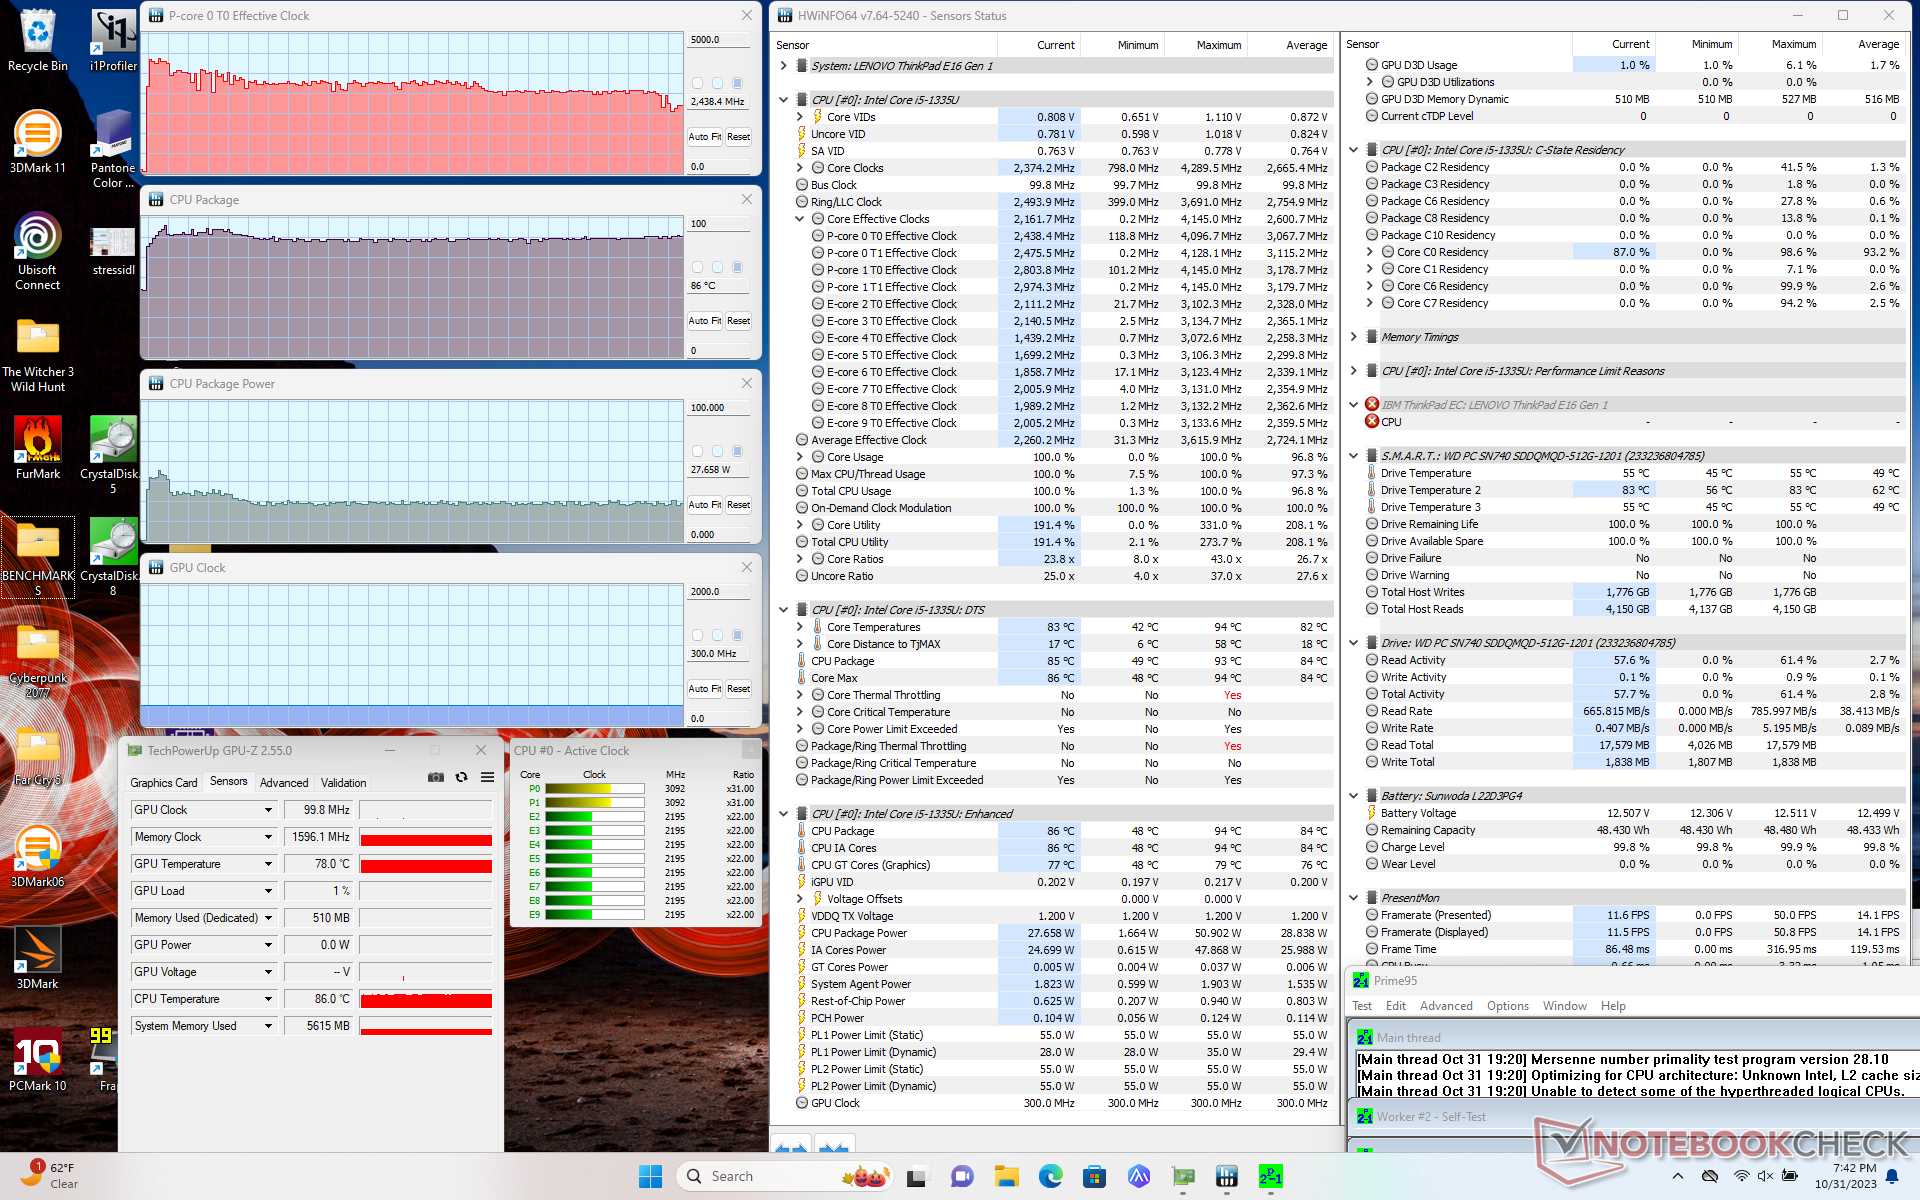
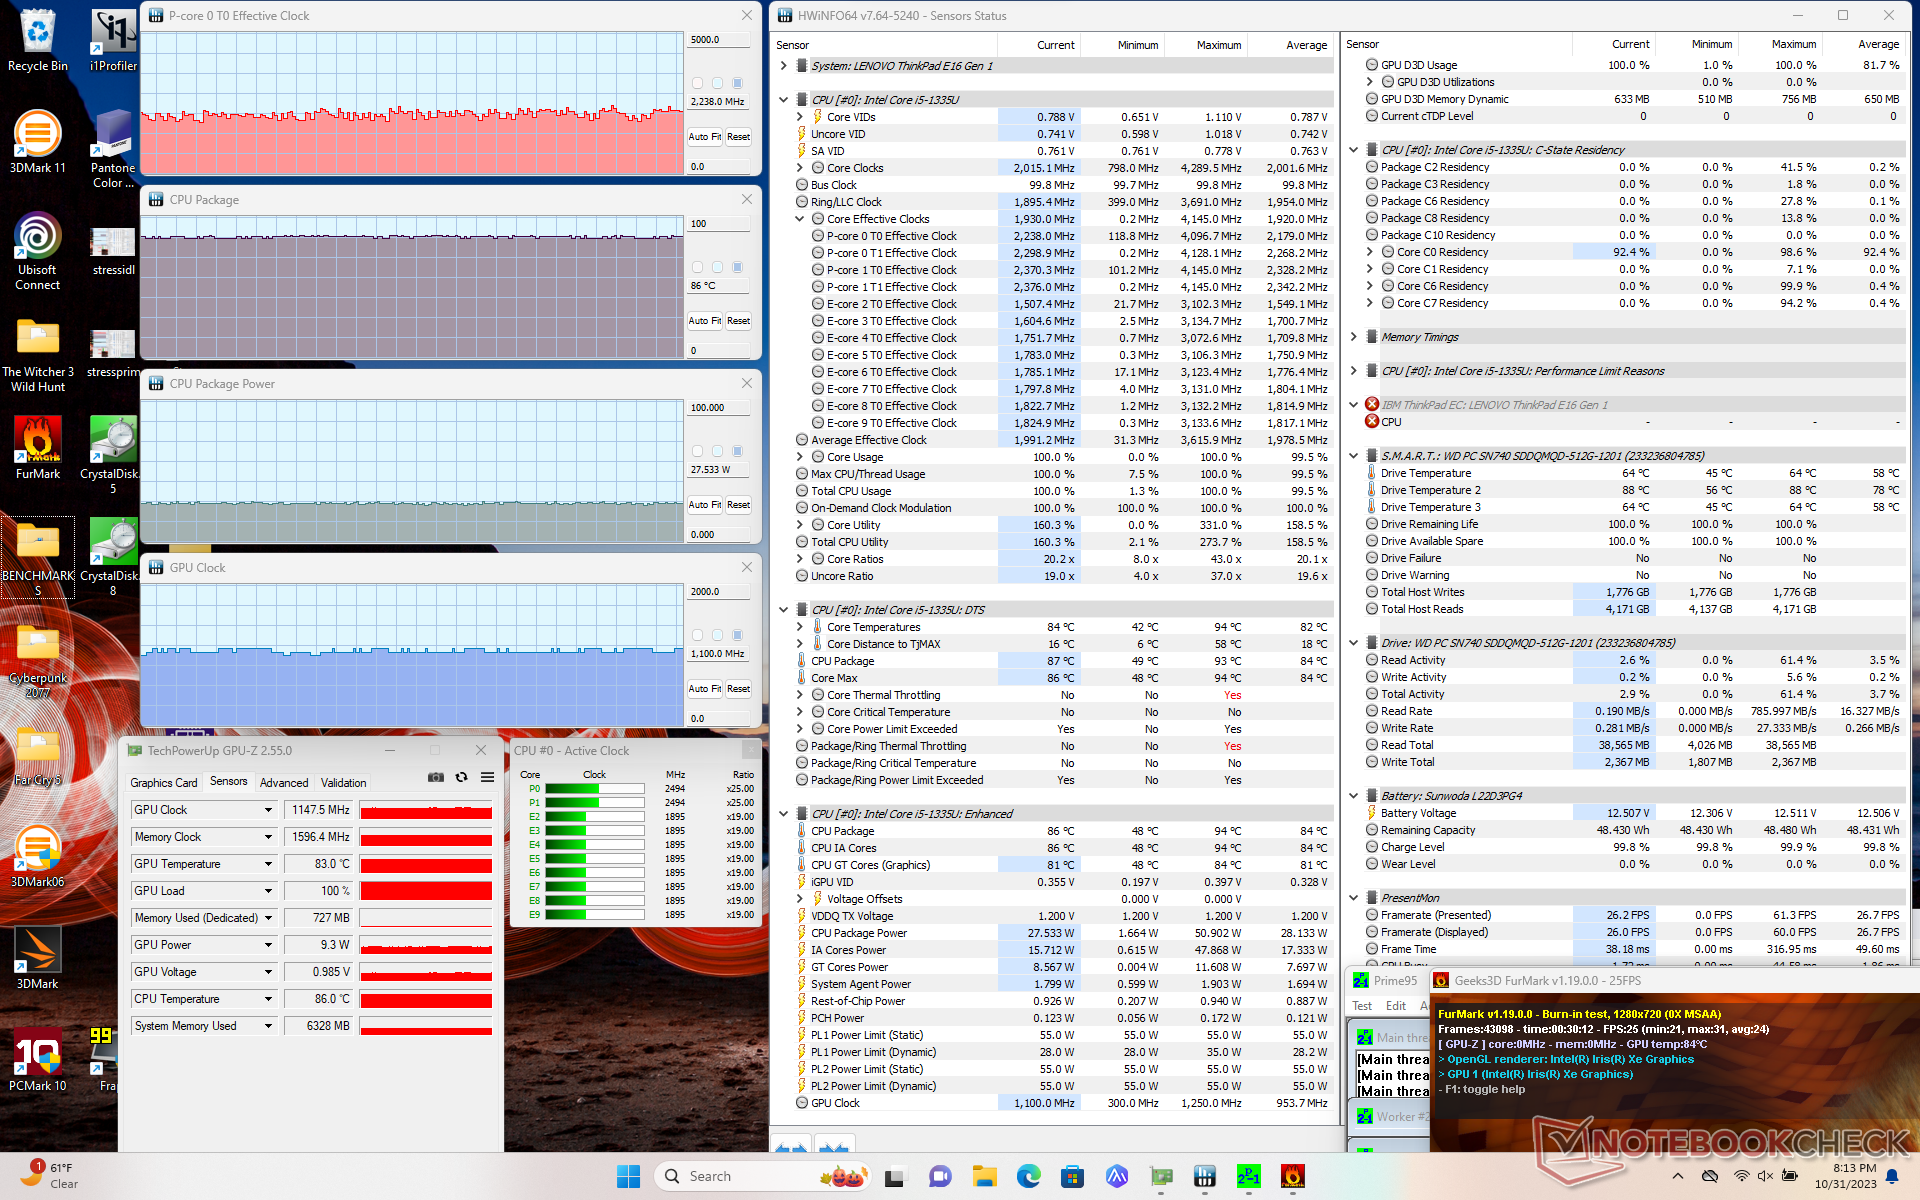
| Reloj dela CPU (GHz) | Reloj de la GPU (MHz) | Temperatura media de la CPU (°C) | |
| Sistema en reposo | -- | -- | 48 |
| Prime95 Stress | 2.4 | -- | 86 |
| Estrés Prime95+ FurMark | ~2,2 | 1100 | 86 |
| Witcher 3 Estrés | ~3,2 | 1250 | 88 |
Altavoces
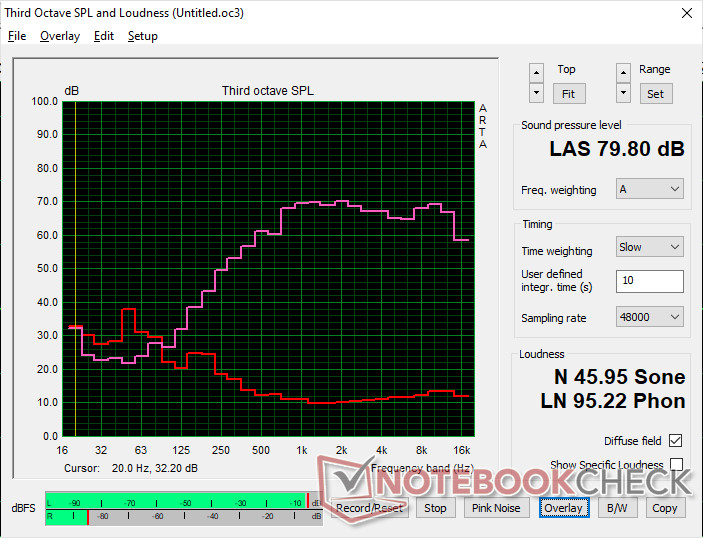
Lenovo ThinkPad E16 G1 Core i5-1335U análisis de audio
(±) | la sonoridad del altavoz es media pero buena (79.8 dB)
Graves 100 - 315 Hz
(-) | casi sin bajos - de media 24.7% inferior a la mediana
(±) | la linealidad de los graves es media (8.8% delta a frecuencia anterior)
Medios 400 - 2000 Hz
(+) | medios equilibrados - a sólo 4.8% de la mediana
(+) | los medios son lineales (4.8% delta a la frecuencia anterior)
Altos 2 - 16 kHz
(+) | máximos equilibrados - a sólo 2.1% de la mediana
(+) | los máximos son lineales (2.7% delta a la frecuencia anterior)
Total 100 - 16.000 Hz
(±) | la linealidad del sonido global es media (18.4% de diferencia con la mediana)
En comparación con la misma clase
» 33% de todos los dispositivos probados de esta clase eran mejores, 7% similares, 59% peores
» El mejor tuvo un delta de 7%, la media fue 21%, el peor fue ###max##%
En comparación con todos los dispositivos probados
» 41% de todos los dispositivos probados eran mejores, 8% similares, 51% peores
» El mejor tuvo un delta de 4%, la media fue 23%, el peor fue ###max##%
Apple MacBook Pro 16 2021 M1 Pro análisis de audio
(+) | los altavoces pueden reproducir a un volumen relativamente alto (#84.7 dB)
Graves 100 - 315 Hz
(+) | buen bajo - sólo 3.8% lejos de la mediana
(+) | el bajo es lineal (5.2% delta a la frecuencia anterior)
Medios 400 - 2000 Hz
(+) | medios equilibrados - a sólo 1.3% de la mediana
(+) | los medios son lineales (2.1% delta a la frecuencia anterior)
Altos 2 - 16 kHz
(+) | máximos equilibrados - a sólo 1.9% de la mediana
(+) | los máximos son lineales (2.7% delta a la frecuencia anterior)
Total 100 - 16.000 Hz
(+) | el sonido global es lineal (4.6% de diferencia con la mediana)
En comparación con la misma clase
» 0% de todos los dispositivos probados de esta clase eran mejores, 0% similares, 100% peores
» El mejor tuvo un delta de 5%, la media fue 17%, el peor fue ###max##%
En comparación con todos los dispositivos probados
» 0% de todos los dispositivos probados eran mejores, 0% similares, 100% peores
» El mejor tuvo un delta de 4%, la media fue 23%, el peor fue ###max##%
Gestión de la energía
Consumo de energía
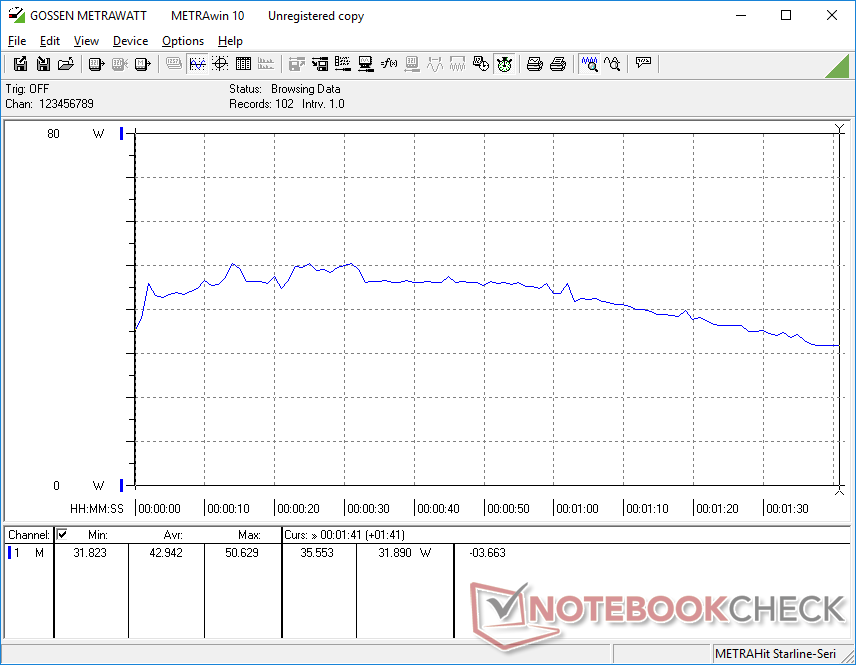
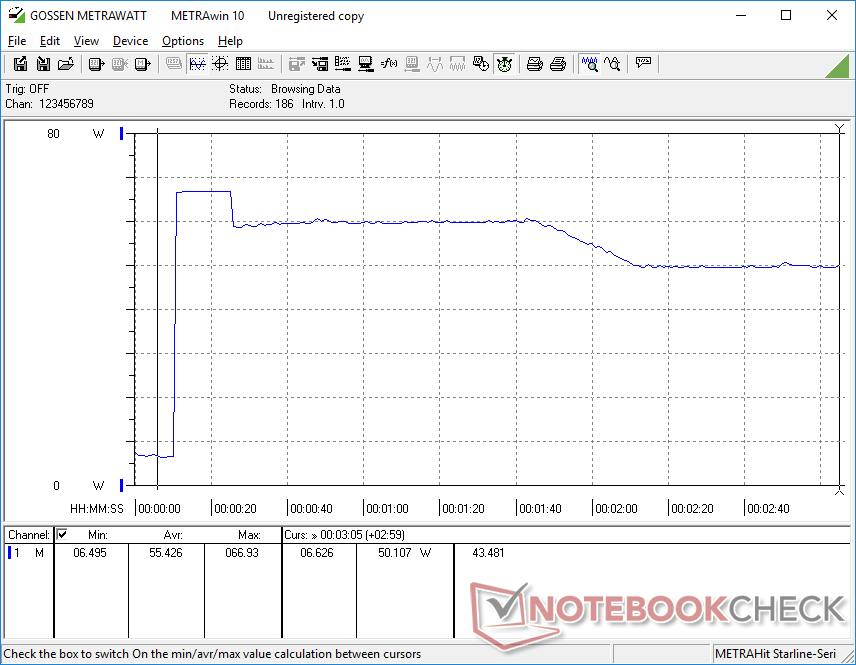
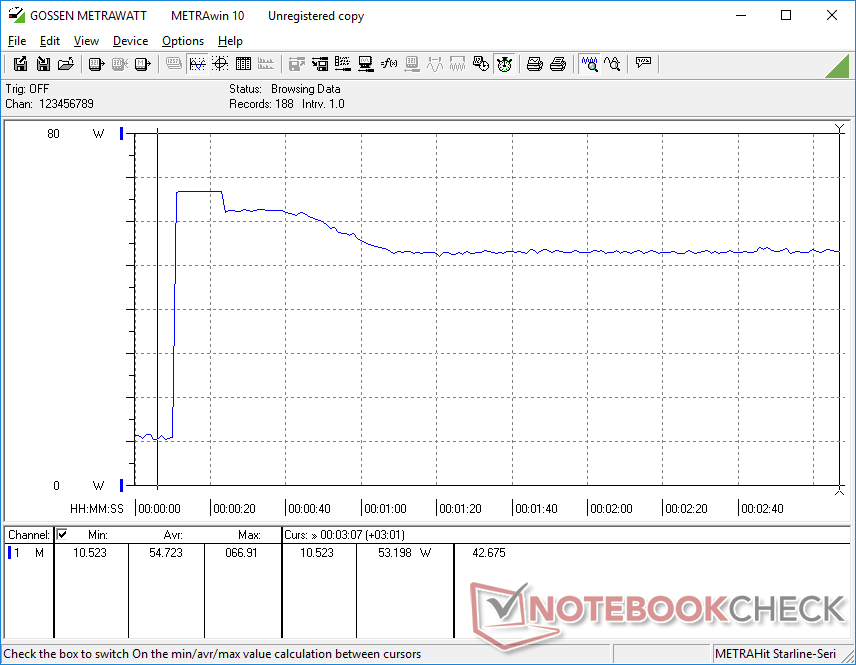
En general, el sistema Intel es más exigente que la versión AMD cuando se ejecutan tareas intensivas de la CPU, aunque el procesador AMD suele ser más rápido que el Intel cuando se trata de cargas multihilo. Al iniciar CineBench R15 xT, por ejemplo, el consumo podía llegar a 68 W en nuestra unidad Intel frente a sólo 45 W en la unidad AMD. También se observan resultados similares al ejecutar Prime95. El consumo general en reposo en el escritorio o cuando se ejecutan tareas intensivas de la GPU como Witcher 3 es por lo demás prácticamente el mismo entre las versiones Intel y AMD.
| Off / Standby | |
| Ocioso | |
| Carga |
|
Clave:
min: | |
| Lenovo ThinkPad E16 G1 Core i5-1335U i5-1335U, Iris Xe G7 80EUs, , IPS, 1920x1200, 16" | Lenovo ThinkPad E16 G1-21JUS08X00 R7 7730U, Vega 8, WD PC SN740 SDDPNQD-1T00, IPS, 2560x1600, 16" | Dell Inspiron 16 7635 2-in-1 R5 7530U, Vega 7, Kioxia BG5 KBG50ZNS512G, IPS, 1920x1200, 16" | Acer TravelMate P4 TMP416-51-55KN i5-1240P, Iris Xe G7 80EUs, Micron 2450 512GB MTFDKBA512TFK, IPS, 1920x1200, 16" | Samsung Galaxy Book3 Pro 16 i5-1340P, Iris Xe G7 80EUs, WD PC SN740 256GB SDDPNQD-256G, AMOLED, 2880x1800, 16" | LG Gram 16Z90Q i7-1260P, Iris Xe G7 96EUs, Samsung PM9A1 MZVL21T0HCLR, IPS, 2560x1600, 16" | |
|---|---|---|---|---|---|---|
| Power Consumption | -3% | 2% | 1% | 9% | -7% | |
| Idle Minimum * (Watt) | 4.9 | 4.1 16% | 4.8 2% | 5.2 -6% | 3.9 20% | 5 -2% |
| Idle Average * (Watt) | 8.3 | 9.6 -16% | 7.6 8% | 7.1 14% | 4.8 42% | 8 4% |
| Idle Maximum * (Watt) | 8.6 | 10.2 -19% | 8.7 -1% | 9.6 -12% | 10 -16% | 14 -63% |
| Load Average * (Watt) | 42.9 | 47.3 -10% | 47.1 -10% | 47 -10% | 44 -3% | 47 -10% |
| Witcher 3 ultra * (Watt) | 44.9 | 46.7 -4% | 46.6 -4% | 43.3 4% | 42.3 6% | 37.8 16% |
| Load Maximum * (Watt) | 67 | 55.7 17% | 56.4 16% | 56 16% | 63 6% | 56 16% |
* ... más pequeño es mejor
Power Consumption Witcher 3 / Stresstest
Power Consumption external Monitor
Duración de las pilas
El modelo viene con dos opciones de capacidad de batería: 47 Wh y 57 Wh. Nuestra unidad Intel viene con la opción menor mientras que nuestra unidad AMD viene con la mayor. La duración de la batería es sólo la mitad que en nuestra unidad AMD para un uso real de navegación de sólo 5 horas. Para un portátil de 16 pulgadas, la opción de 47 Wh es mucho menor de lo esperado y un recorte definitivo.
La carga desde vacío a plena capacidad es, afortunadamente, bastante rápida con poco más de una hora.
| Lenovo ThinkPad E16 G1 Core i5-1335U i5-1335U, Iris Xe G7 80EUs, 47 Wh | Lenovo ThinkPad E16 G1-21JUS08X00 R7 7730U, Vega 8, 57 Wh | Dell Inspiron 16 7635 2-in-1 R5 7530U, Vega 7, 64 Wh | Acer TravelMate P4 TMP416-51-55KN i5-1240P, Iris Xe G7 80EUs, 56 Wh | Samsung Galaxy Book3 Pro 16 i5-1340P, Iris Xe G7 80EUs, 76 Wh | LG Gram 16Z90Q i7-1260P, Iris Xe G7 96EUs, 80 Wh | |
|---|---|---|---|---|---|---|
| Duración de Batería | 117% | 179% | 81% | 96% | 94% | |
| WiFi v1.3 (h) | 5.2 | 11.3 117% | 14.5 179% | 9.4 81% | 10.2 96% | 10.1 94% |
| H.264 (h) | 11.7 | 14.4 | ||||
| Load (h) | 1.3 | 1.9 | 2 | 2.6 | ||
| Reader / Idle (h) | 26 | 30.4 | 18.1 |
Pro
Contra
Veredicto - AMD gana en duración de batería
Optar por el Intel ThinkPad E16 G1 en lugar de AMD le proporcionará compatibilidad con Thunderbolt, un rendimiento más rápido de un solo subproceso y un rendimiento gráfico integrado más rápido, suponiendo que seleccione el Core i7-1355U. Sin embargo, estos beneficios palidecen en comparación con lo que la Versión AMD ofrece: una duración de la batería notablemente superior, mayor rendimiento por vatio, rendimiento multihilo más rápido y compatibilidad con unidades SSD M.2 2280. Por tanto, tendrá que valorar realmente las superiores capacidades de conexión de la versión Intel si decide saltarse las opciones AMD.
Si no tiene previsto conectar monitores Thunderbolt o eGPU a su ThinkPad E16 G1, entonces las versiones AMD pueden ofrecer tanto una mayor duración de la batería como un rendimiento multihilo más rápido que las opciones Intel por aproximadamente el mismo precio.
Independientemente de la preferencia de versión, los usuarios aún querrán tener cuidado con la pantalla y el tamaño de la batería antes de comprar. Por desgracia, no todos los minoristas enumeran la cobertura de color o la capacidad de la batería, por lo que es fácil comprar accidentalmente una configuración con la pantalla de gama más baja o un paquete de baterías más pequeño de 47 Wh. Recomendamos aspirar a la cobertura sRGB completa y al paquete de baterías más grande de 57 Wh si es posible, ya que son saltos significativos sobre la configuración base.
Precio y disponibilidad
Lenovo ya está distribuyendo el ThinkPad E16 G1 a partir de 638 USD para la configuración Core i3 o 724 USD para la configuración Core i5.
Lenovo ThinkPad E16 G1 Core i5-1335U
- 11/02/2023 v7 (old)
Allen Ngo
Transparencia
La selección de los dispositivos que se van a reseñar corre a cargo de nuestro equipo editorial. La muestra de prueba fue proporcionada al autor en calidad de préstamo por el fabricante o el minorista a los efectos de esta reseña. El prestamista no tuvo ninguna influencia en esta reseña, ni el fabricante recibió una copia de la misma antes de su publicación. No había ninguna obligación de publicar esta reseña. Como empresa de medios independiente, Notebookcheck no está sujeta a la autoridad de fabricantes, minoristas o editores.
Así es como prueba Notebookcheck
Cada año, Notebookcheck revisa de forma independiente cientos de portátiles y smartphones utilizando procedimientos estandarizados para asegurar que todos los resultados son comparables. Hemos desarrollado continuamente nuestros métodos de prueba durante unos 20 años y hemos establecido los estándares de la industria en el proceso. En nuestros laboratorios de pruebas, técnicos y editores experimentados utilizan equipos de medición de alta calidad. Estas pruebas implican un proceso de validación en varias fases. Nuestro complejo sistema de clasificación se basa en cientos de mediciones y puntos de referencia bien fundamentados, lo que mantiene la objetividad.Price comparison

