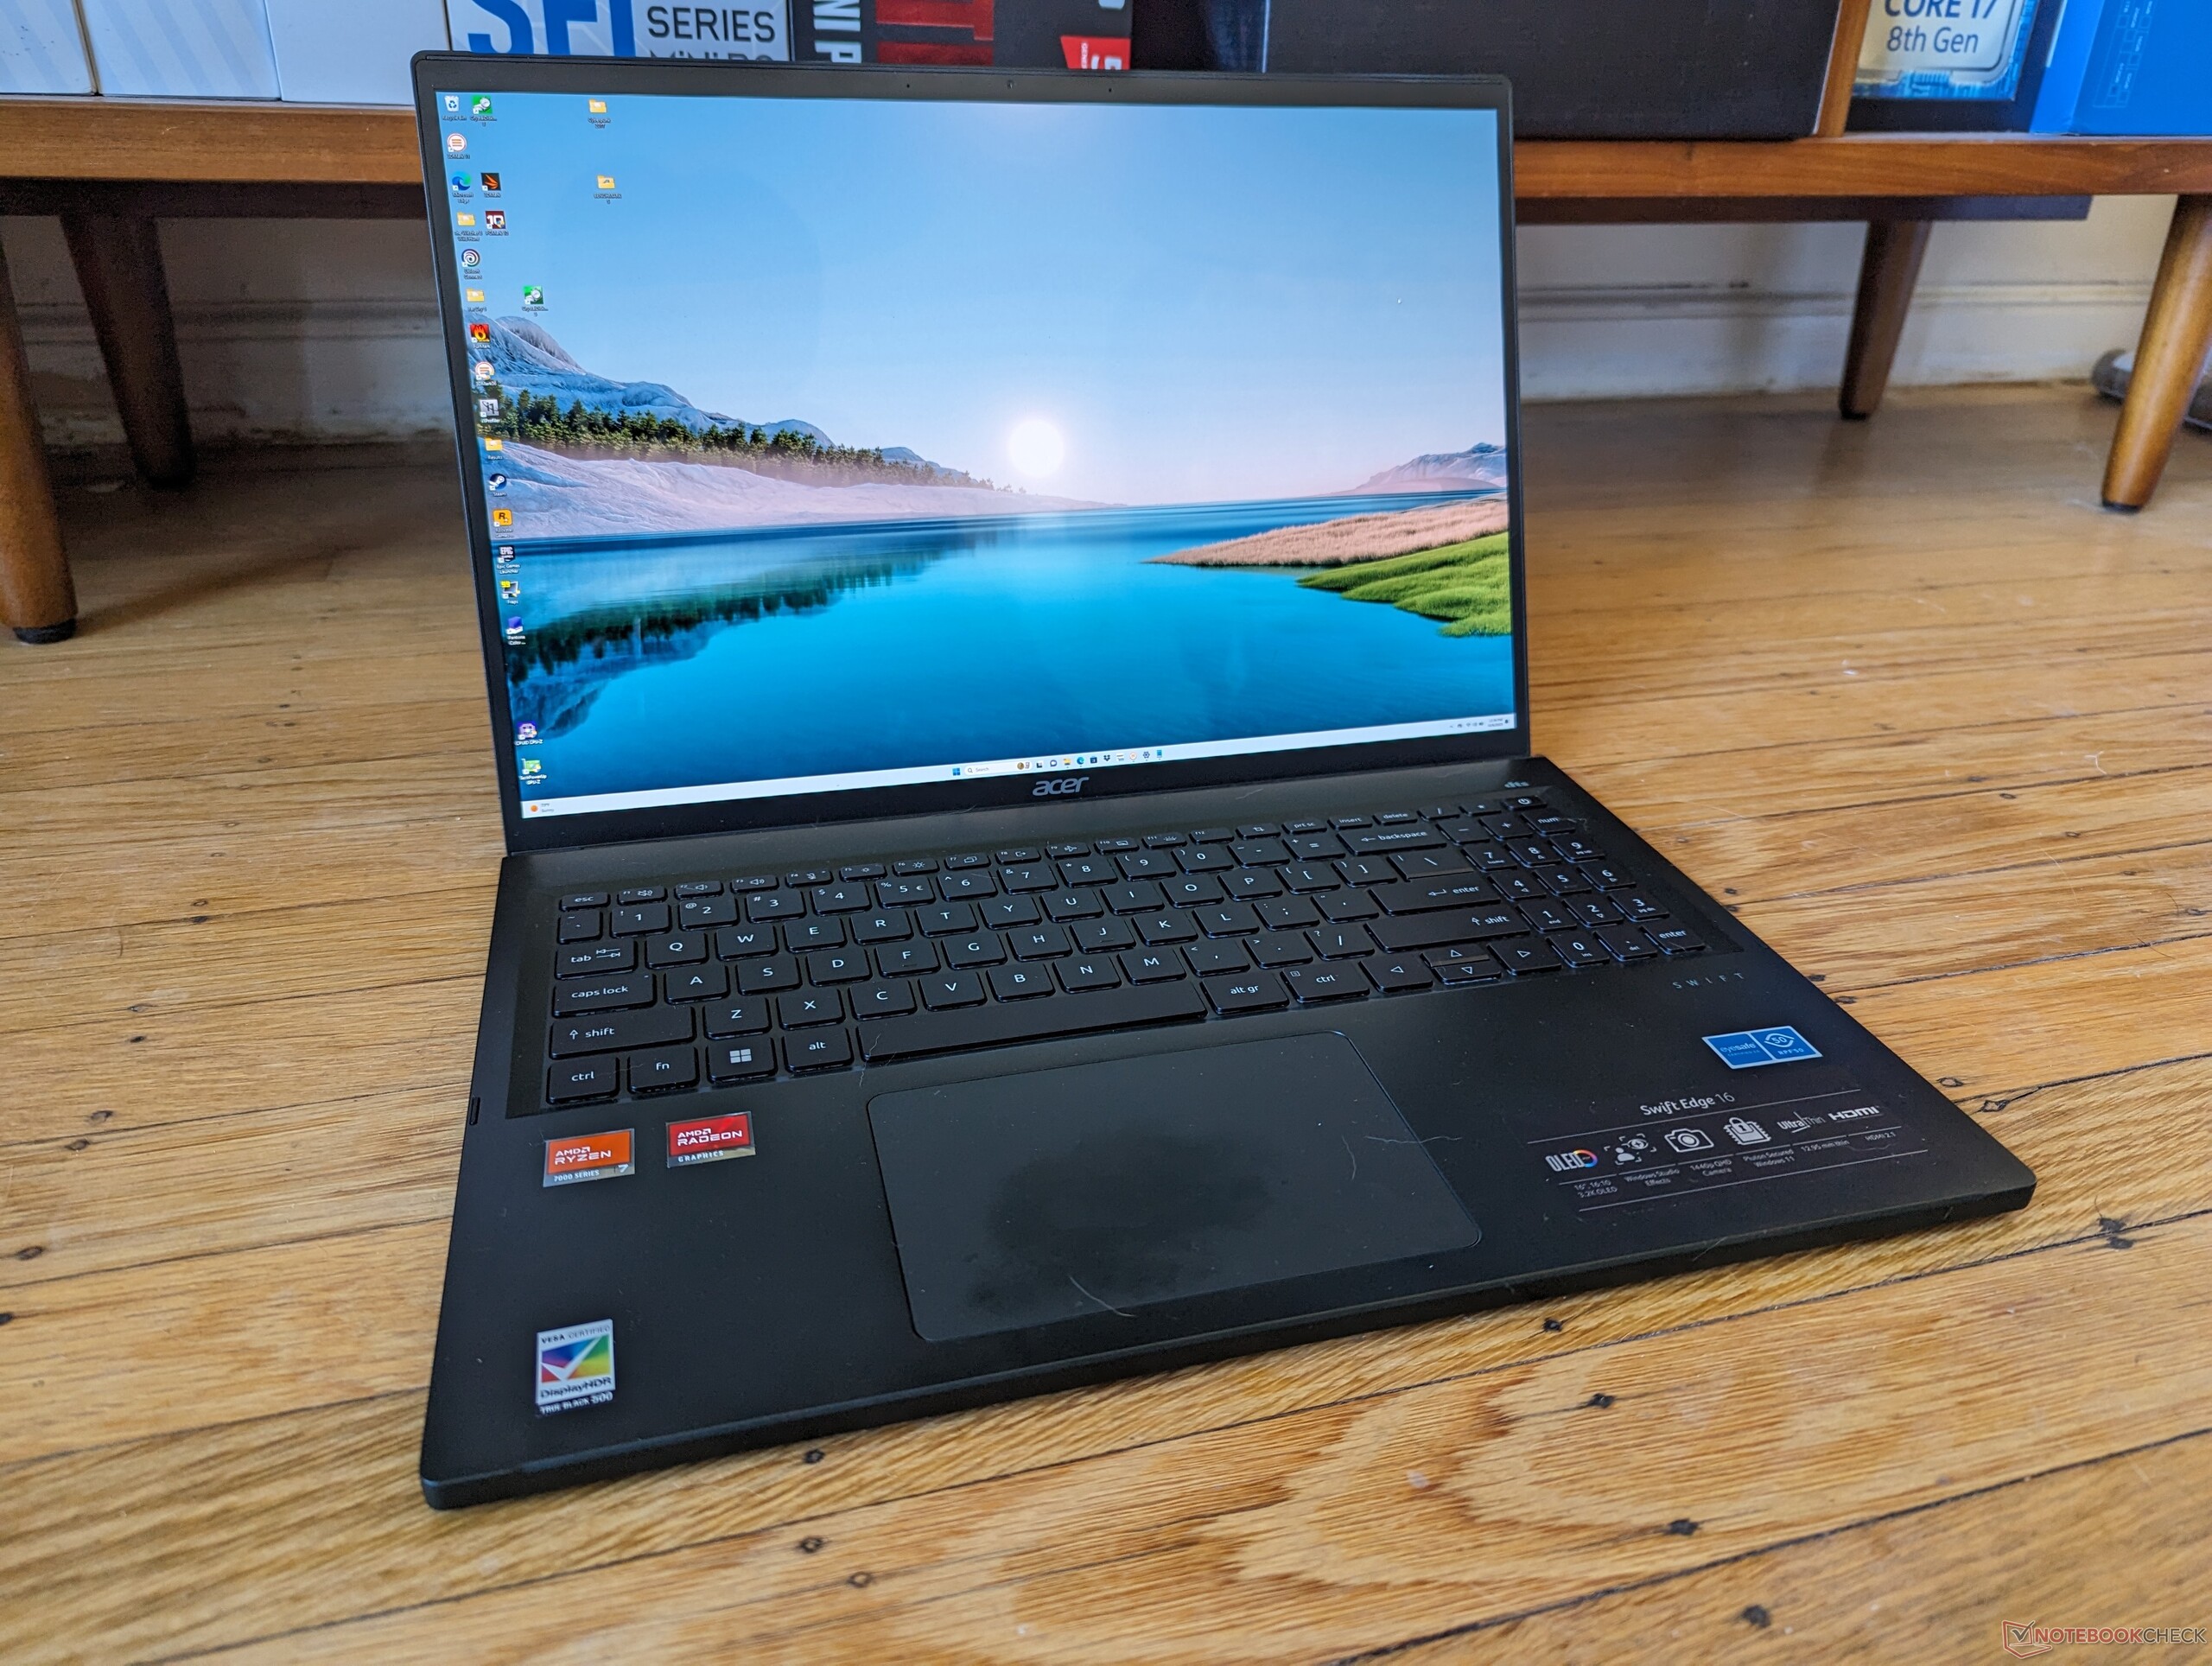
Análisis del portátil Acer Swift Edge 16 Ryzen 7 7840U: CPU Zen 4 y pantalla OLED de 3,2K a 120 Hz

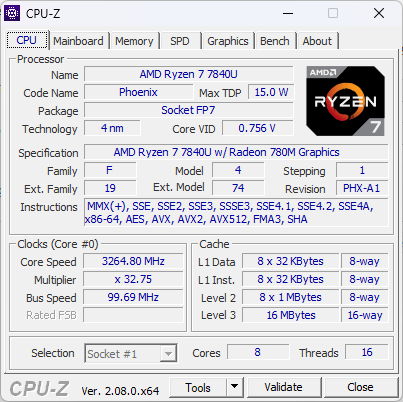
El Acer Swift Edge SFE16 se ha renovado esta temporada para soportar la nueva CPU Zen 4 Ryzen 7 7840U frente a la Zen 3+ Ryzen 7 7735U lanzada apenas unos meses antes. El modelo actualizado también incorpora un nuevo panel OLED Samsung 3.2K de 120 Hz en lugar del 4K de 60 Hz de la configuración Zen 3+.
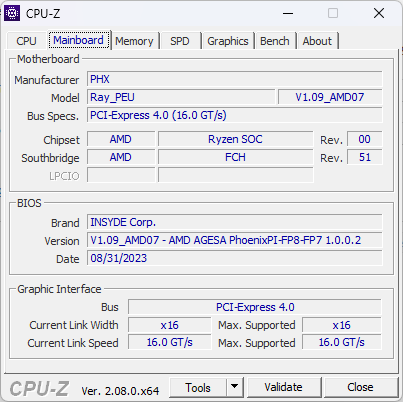
Aparte de las diferencias de CPU y GPU mencionadas anteriormente, tanto el Swift Edge SFE16 Zen 4 como el Swift Edge SFE16 Zen 3+ utilizan diseños de chasis similares con algunas diferencias que señalaremos en este análisis. Internamente, sin embargo, muchos aspectos de la placa base han cambiado. Recomendamos consultar nuestro análisis de la Swift Edge SFE16 Zen 3+ para saber más sobre las características físicas del modelo.
Entre las alternativas al Swift Edge se incluyen otros Ultrabooks ligeros de 16 pulgadas como el LG Gram 16, Samsung Galaxy Book3 Pro 16,Asus VivoBook 16o elHuawei MateBook 16s.
El Swift Edge 16 no debe confundirse con el Swift X 16 que es un portátil más grueso con CPUs de la serie H más rápidas y gráficos dedicados GeForce RTX.
Más análisis de Acer:
Posibles contendientes en la comparación
Valoración | Fecha | Modelo | Peso | Altura | Tamaño | Resolución | Precio |
|---|---|---|---|---|---|---|---|
| 88.6 % v7 (old) | 10/2023 | Acer Swift Edge SFE16 Ryzen 7 7840U R7 7840U, Radeon 780M | 1.2 kg | 13 mm | 16.00" | 3200x2000 | |
| 87.5 % v7 (old) | 06/2023 | Acer Swift Edge SFE16-42-R1GM R7 7735U, Radeon 680M | 1.2 kg | 13.95 mm | 16.00" | 3840x2400 | |
| 88 % v7 (old) | 08/2023 | Lenovo Slim Pro 9i 16IRP8 i9-13905H, GeForce RTX 4050 Laptop GPU | 2.2 kg | 18.2 mm | 16.00" | 3200x2000 | |
| 86.3 % v7 (old) | 05/2023 | Asus VivoBook Pro 16 i7-12700H, GeForce RTX 3050 Ti Laptop GPU | 1.9 kg | 20 mm | 16.00" | 2560x1600 | |
| 89.4 % v7 (old) | 04/2023 | Samsung Galaxy Book3 Ultra 16 i7-13700H, GeForce RTX 4050 Laptop GPU | 1.8 kg | 16.5 mm | 16.00" | 2880x1800 | |
| 86.4 % v7 (old) | 07/2022 | Huawei MateBook 16s i7 i7-12700H, Iris Xe G7 96EUs | 2 kg | 17.8 mm | 16.00" | 2520x1680 |
Caso
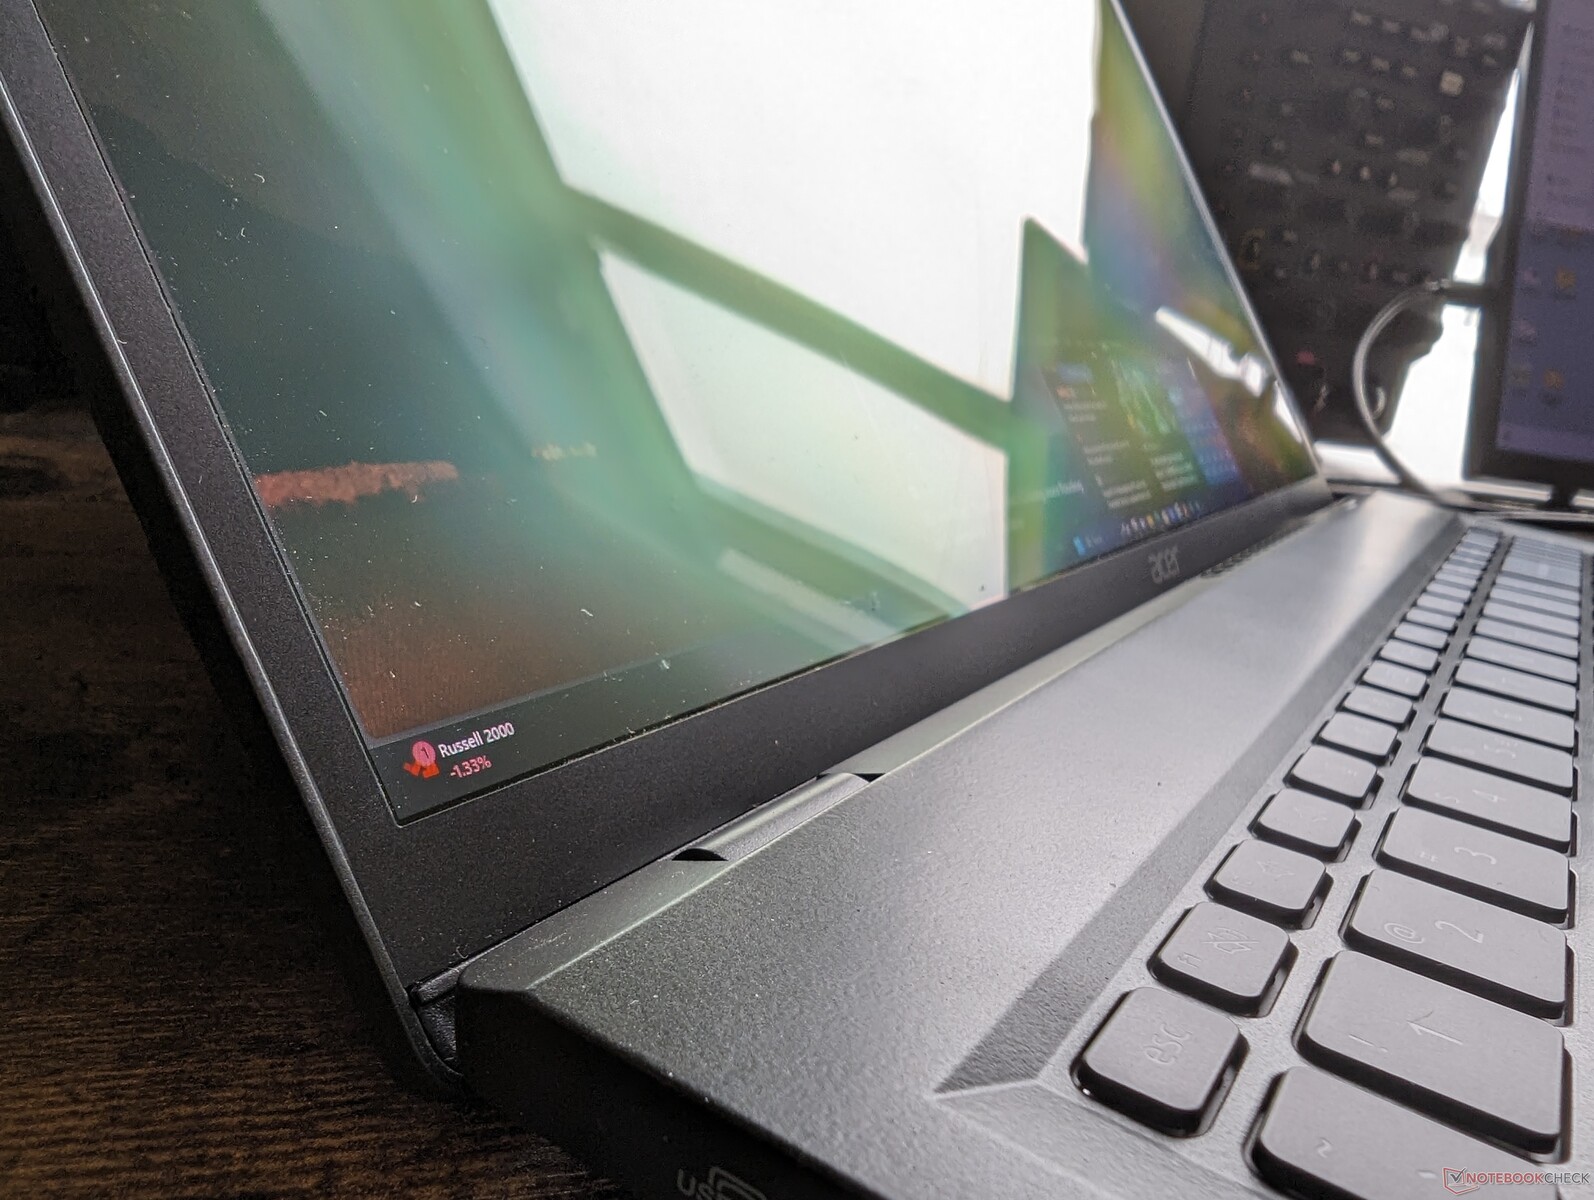
El Swift Edge 16 Zen 4 puede parecer idéntico al Swift Edge 16 Zen 3+ a primera vista, pero los cambios exteriores se notan al mirarlo más de cerca. En primer lugar, la versión más reciente integra un teclado numérico, mientras que la versión Zen 3+ carecía de él. En segundo lugar, las rejillas de ventilación sobre la primera fila de teclas del teclado han desaparecido y el borde frontal es ahora continuo, sin cortes. Este último es un cambio extraño, ya que dificulta la apertura de la tapa.
Aparte de eso, el modelo utiliza los mismos materiales lisos de chasis de magnesio y aluminio, los mismos puertos y posicionamiento, y el mismo tamaño de clickpad que antes. Las dimensiones son ligeramente más anchas e incluso más delgadas esta vez, pero las diferencias son difíciles de notar en la práctica.
Lector de tarjetas SD
Acer ha añadido un lector MicroSD mientras que la característica faltaba en la configuración Ryzen 7 7735U. Sin embargo, las tasas de transferencia son unas 3 veces más lentas que los lectores de tarjetas SD de modelos de la competencia como elAsus VivoBook Pro 16 o el Samsung Galaxy Book3 Ultra 16.
| SD Card Reader | |
| average JPG Copy Test (av. of 3 runs) | |
| Lenovo Slim Pro 9i 16IRP8 (PNY EliteX-Pro60 V60 256 GB) | |
| Samsung Galaxy Book3 Ultra 16 (AV PRO microSD 128 GB V60) | |
| Asus VivoBook Pro 16 (AV Pro SD microSD 128 GB V60) | |
| Acer Swift Edge SFE16 Ryzen 7 7840U (AV Pro V60) | |
| maximum AS SSD Seq Read Test (1GB) | |
| Lenovo Slim Pro 9i 16IRP8 (PNY EliteX-Pro60 V60 256 GB) | |
| Samsung Galaxy Book3 Ultra 16 (AV PRO microSD 128 GB V60) | |
| Asus VivoBook Pro 16 (AV Pro SD microSD 128 GB V60) | |
| Acer Swift Edge SFE16 Ryzen 7 7840U (AV Pro V60) | |
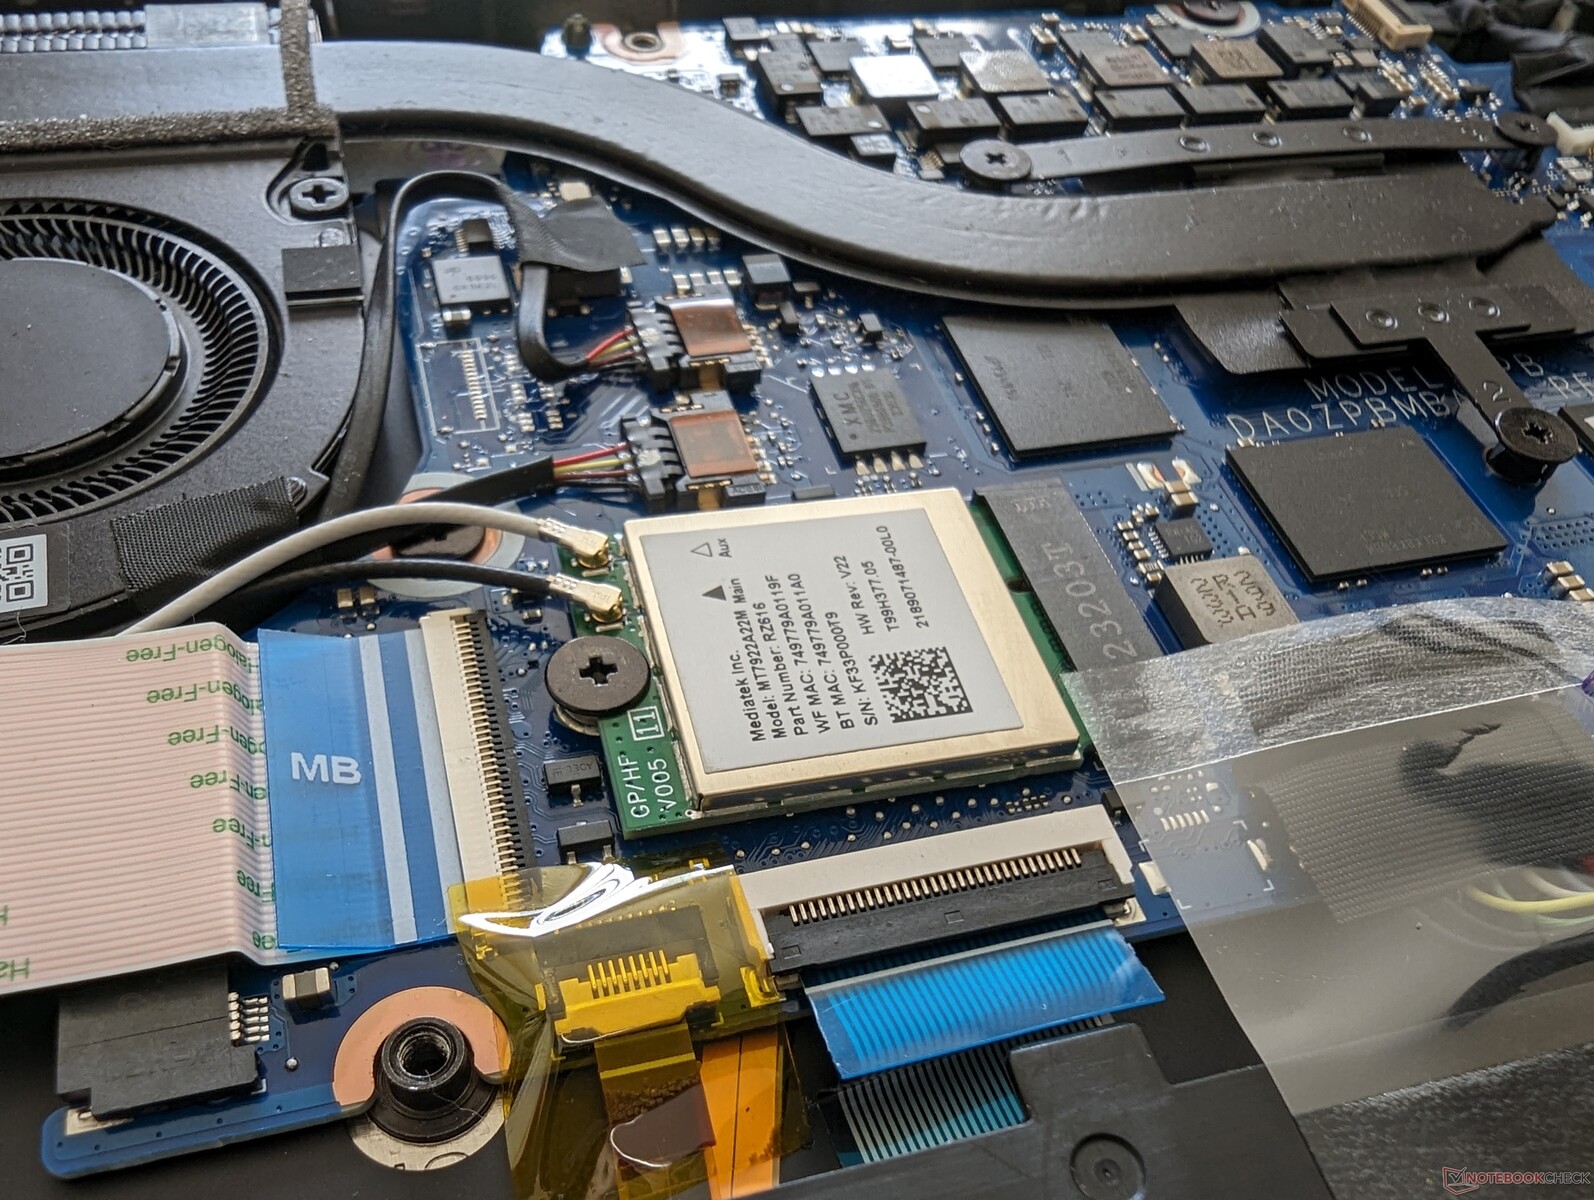
Comunicación
El módulo MediaTek tiene velocidades de transmisión inusualmente lentas en Wi-Fi 6 similares a las que observamos en la configuración Zen 3+. Por lo demás, las velocidades Wi-Fi 6E son excelentes cuando se empareja con nuestra red Asus AXE11000 de 6 GHz.
Cámara web
La webcam es de 3,7 MP efectivos con grabación de hasta 1440p30 frente a los 2,1 MP y 1080p30 de la configuración Zen 3+ para una imagen ligeramente más nítida.
Sigue sin incorporar obturador de privacidad ni soporte IR.


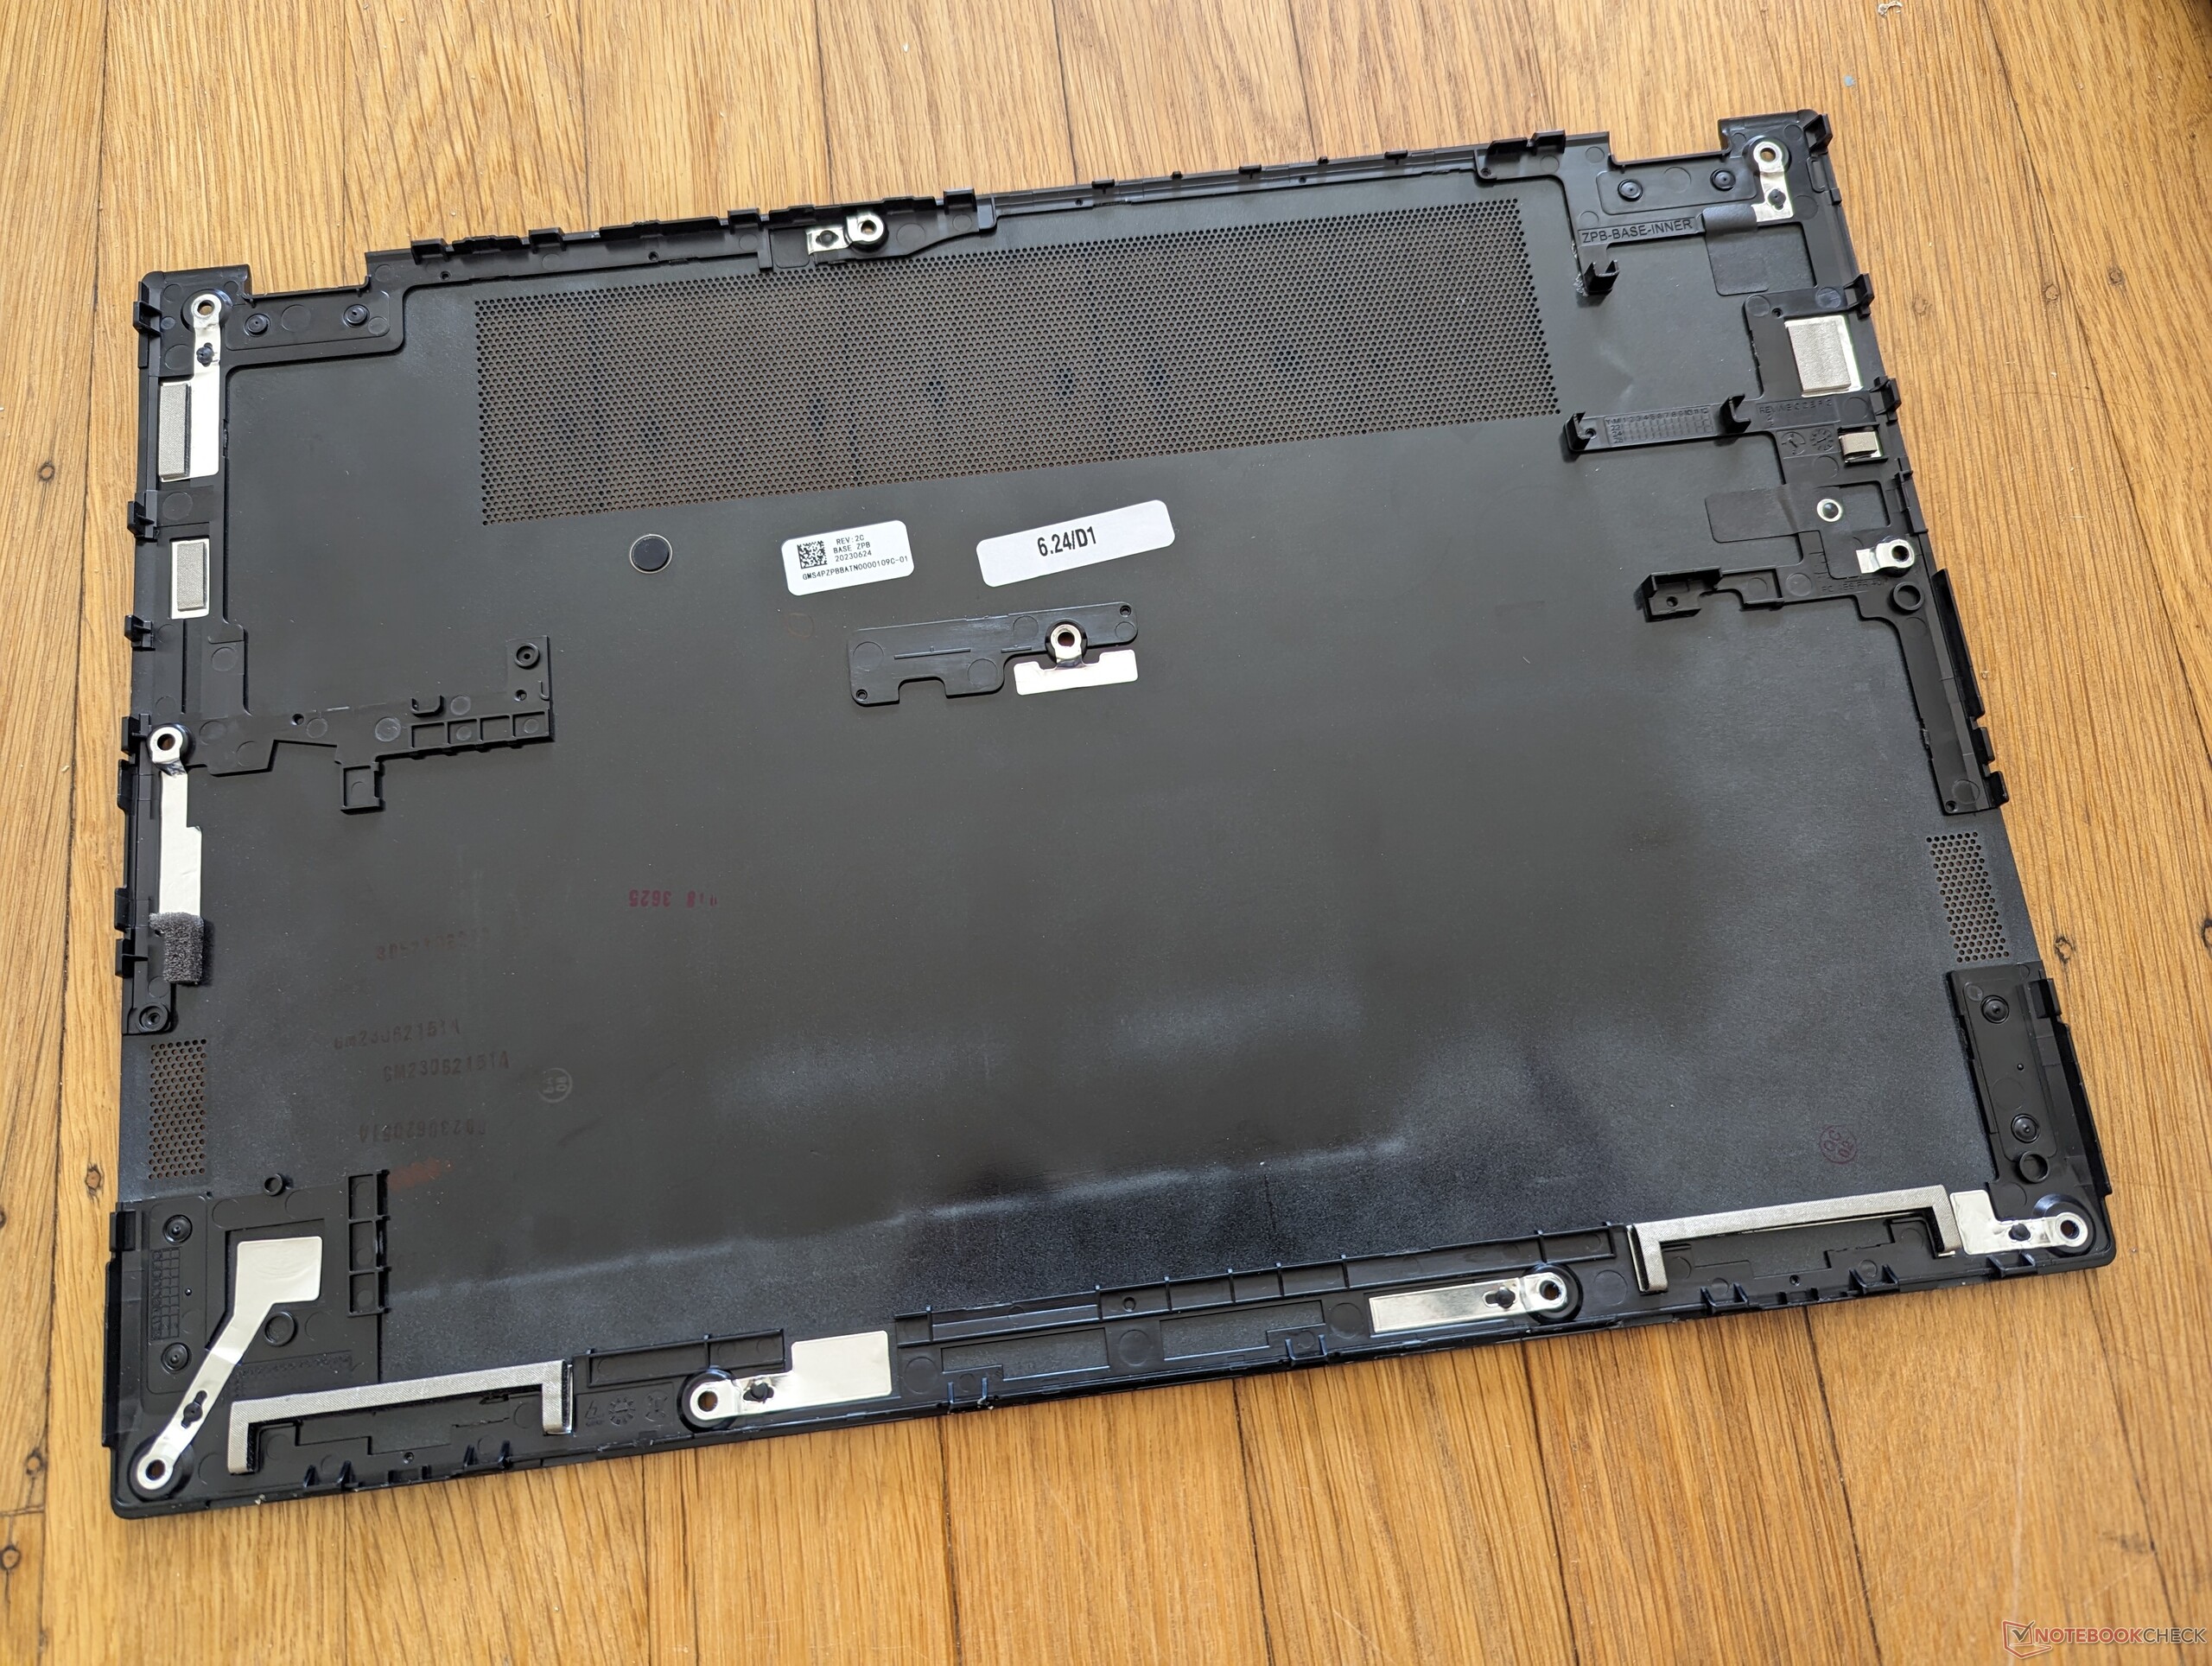
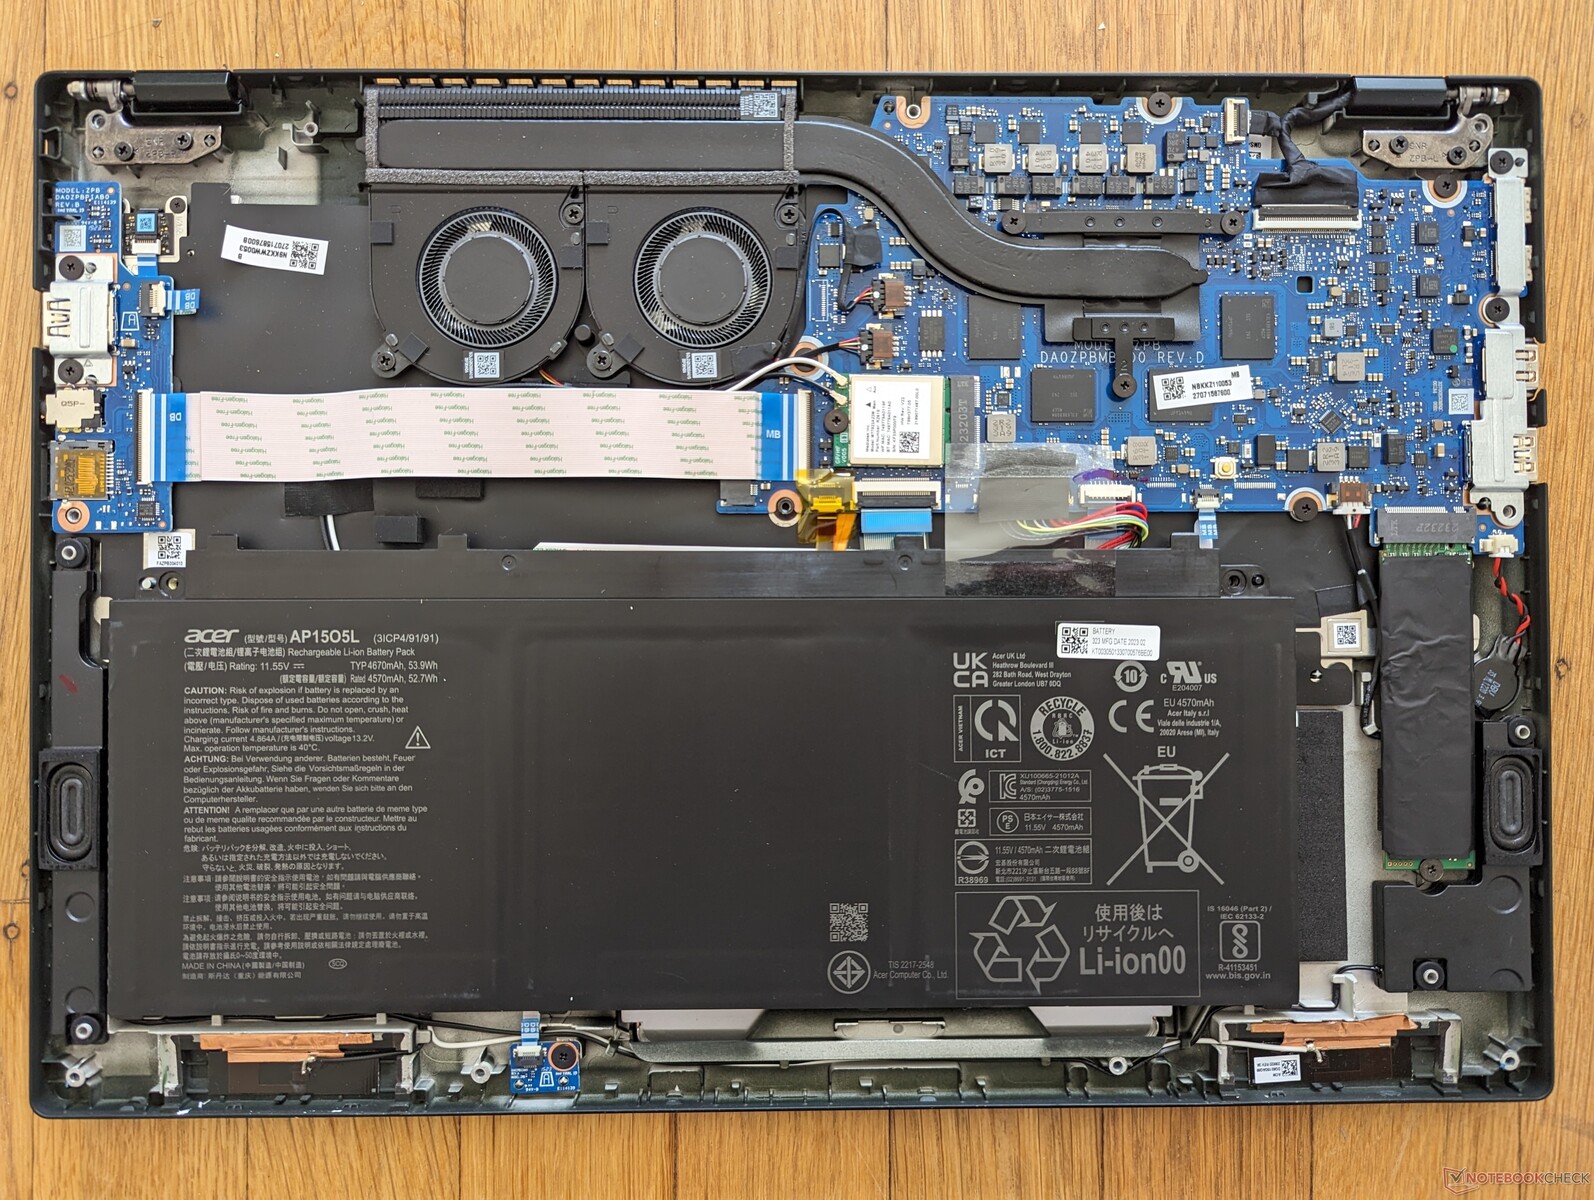
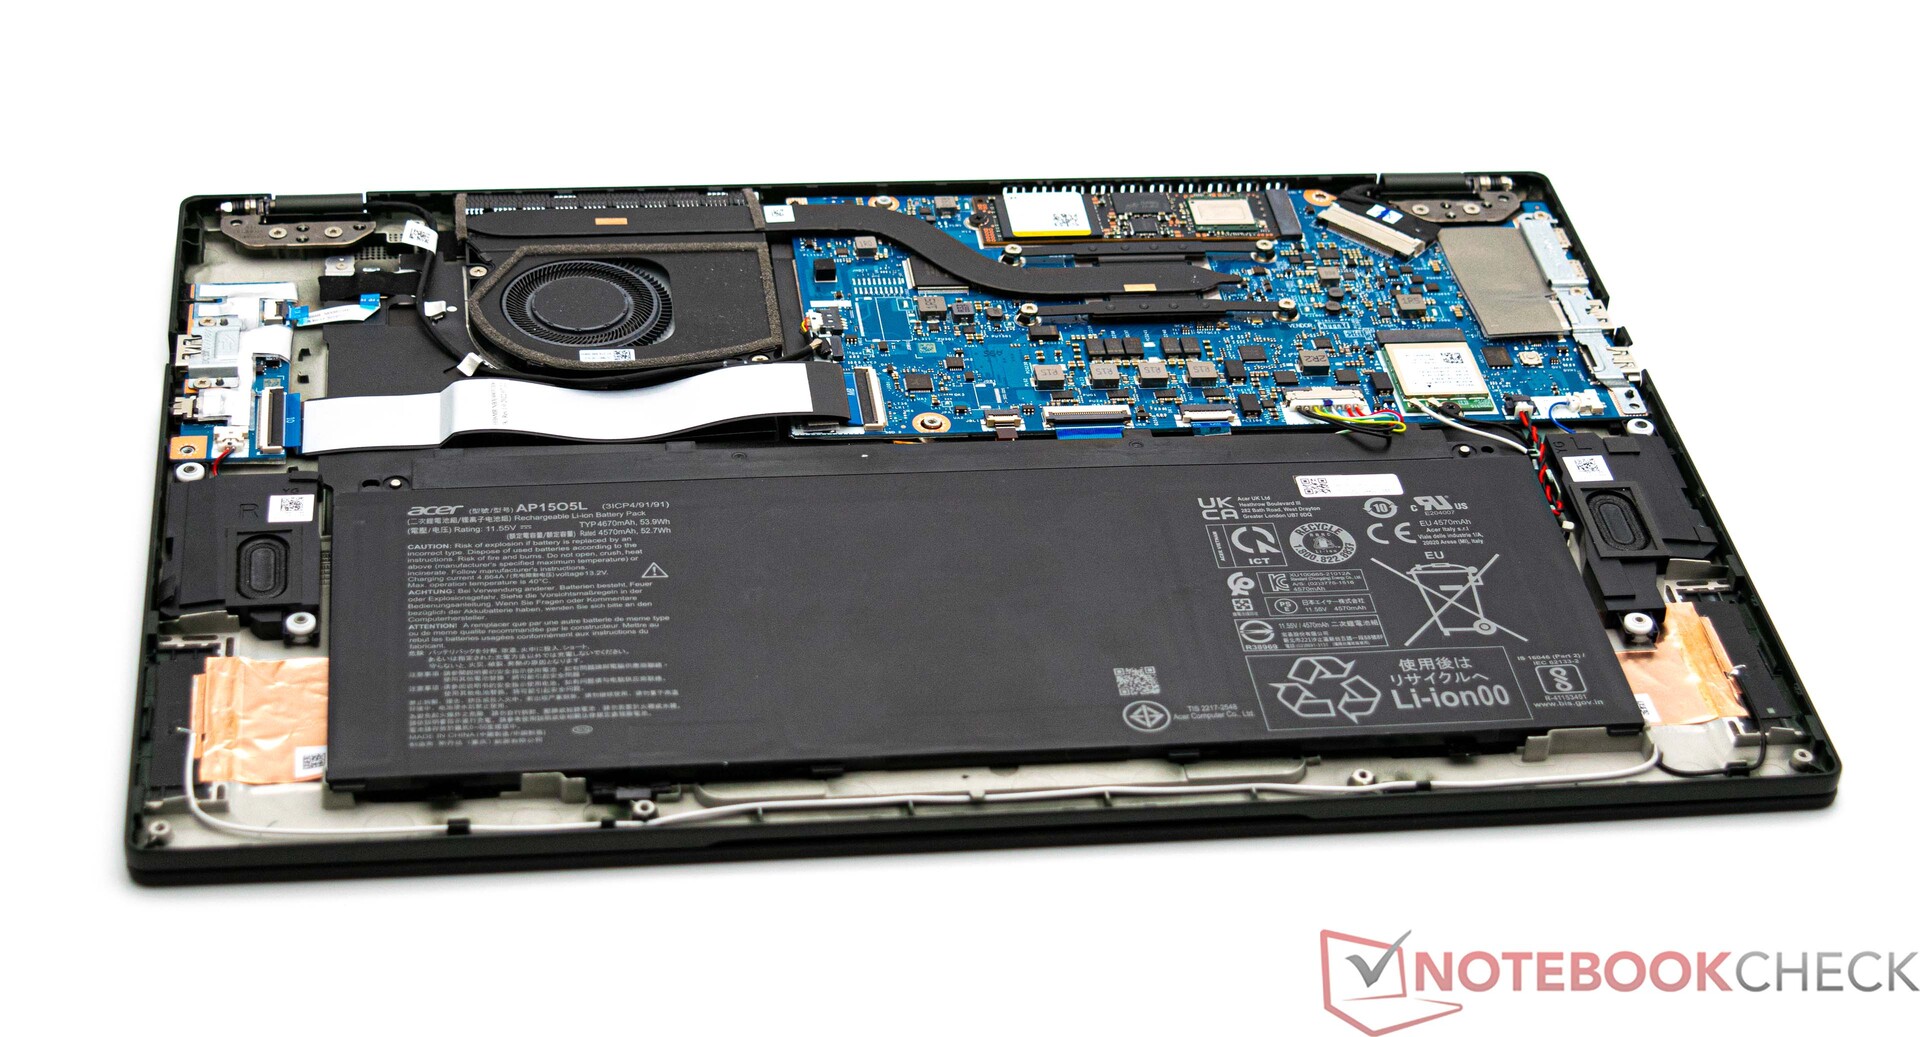
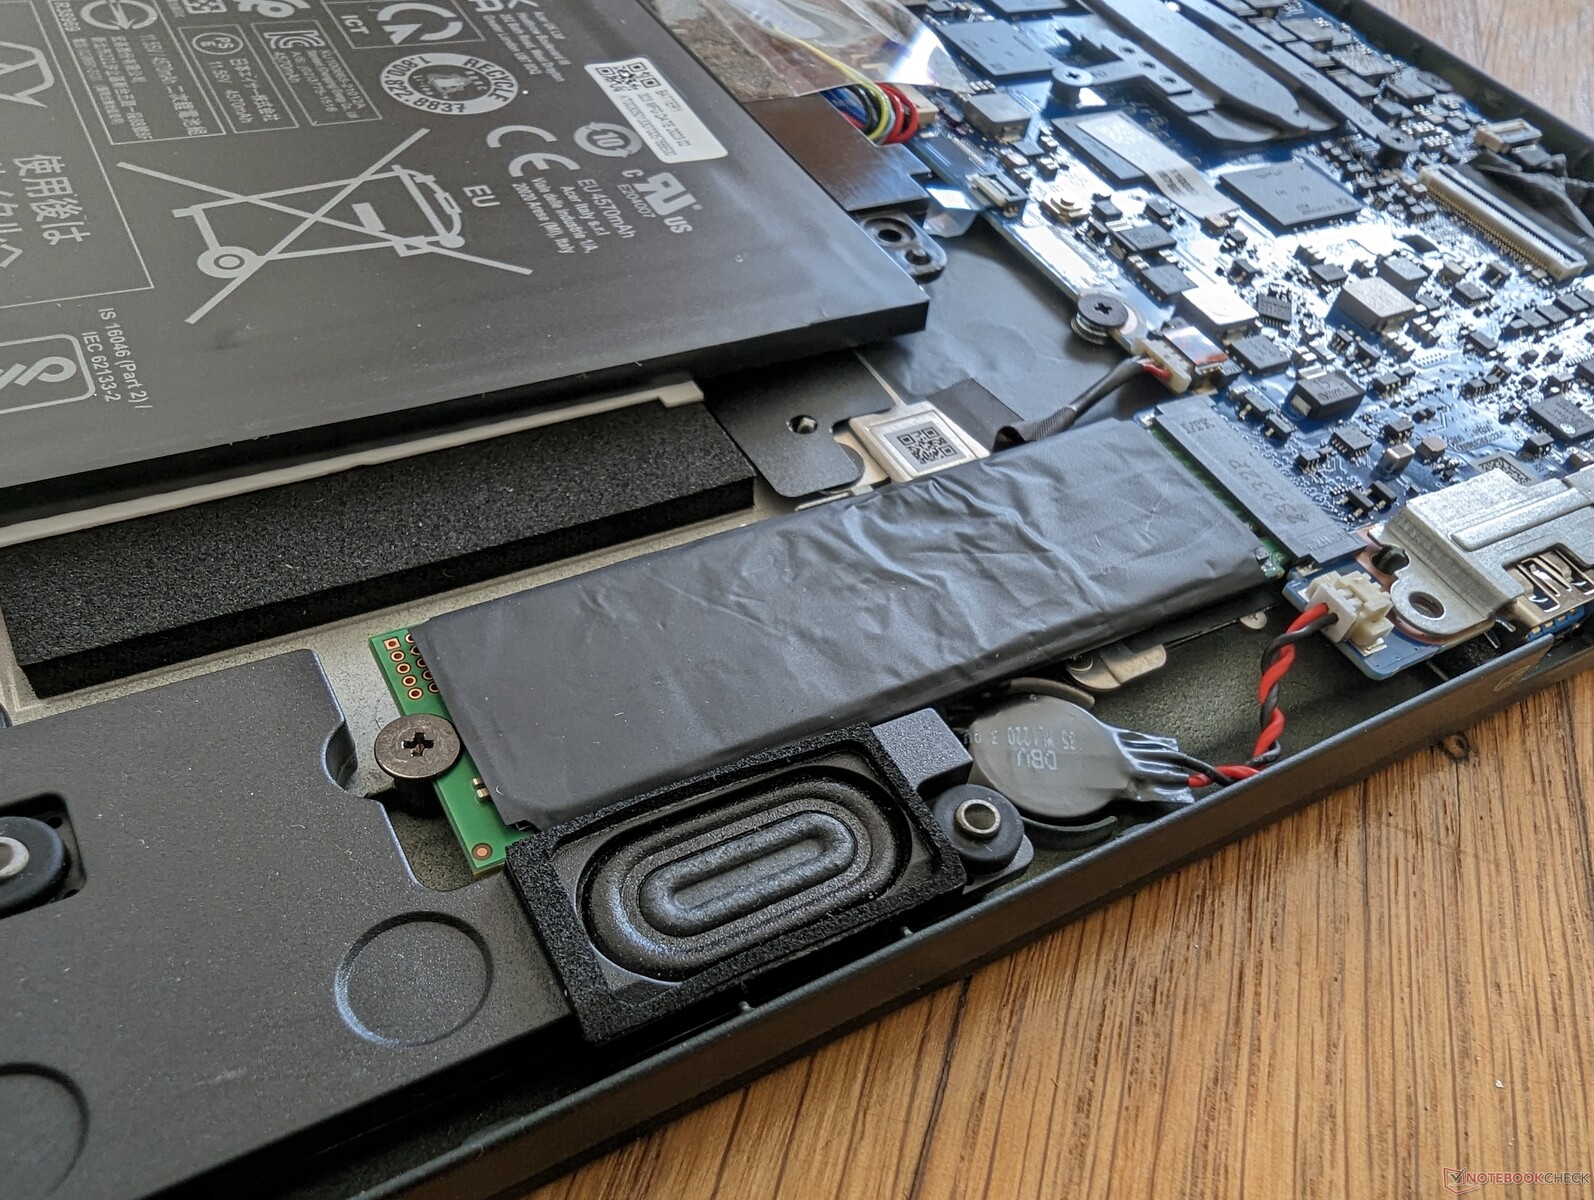
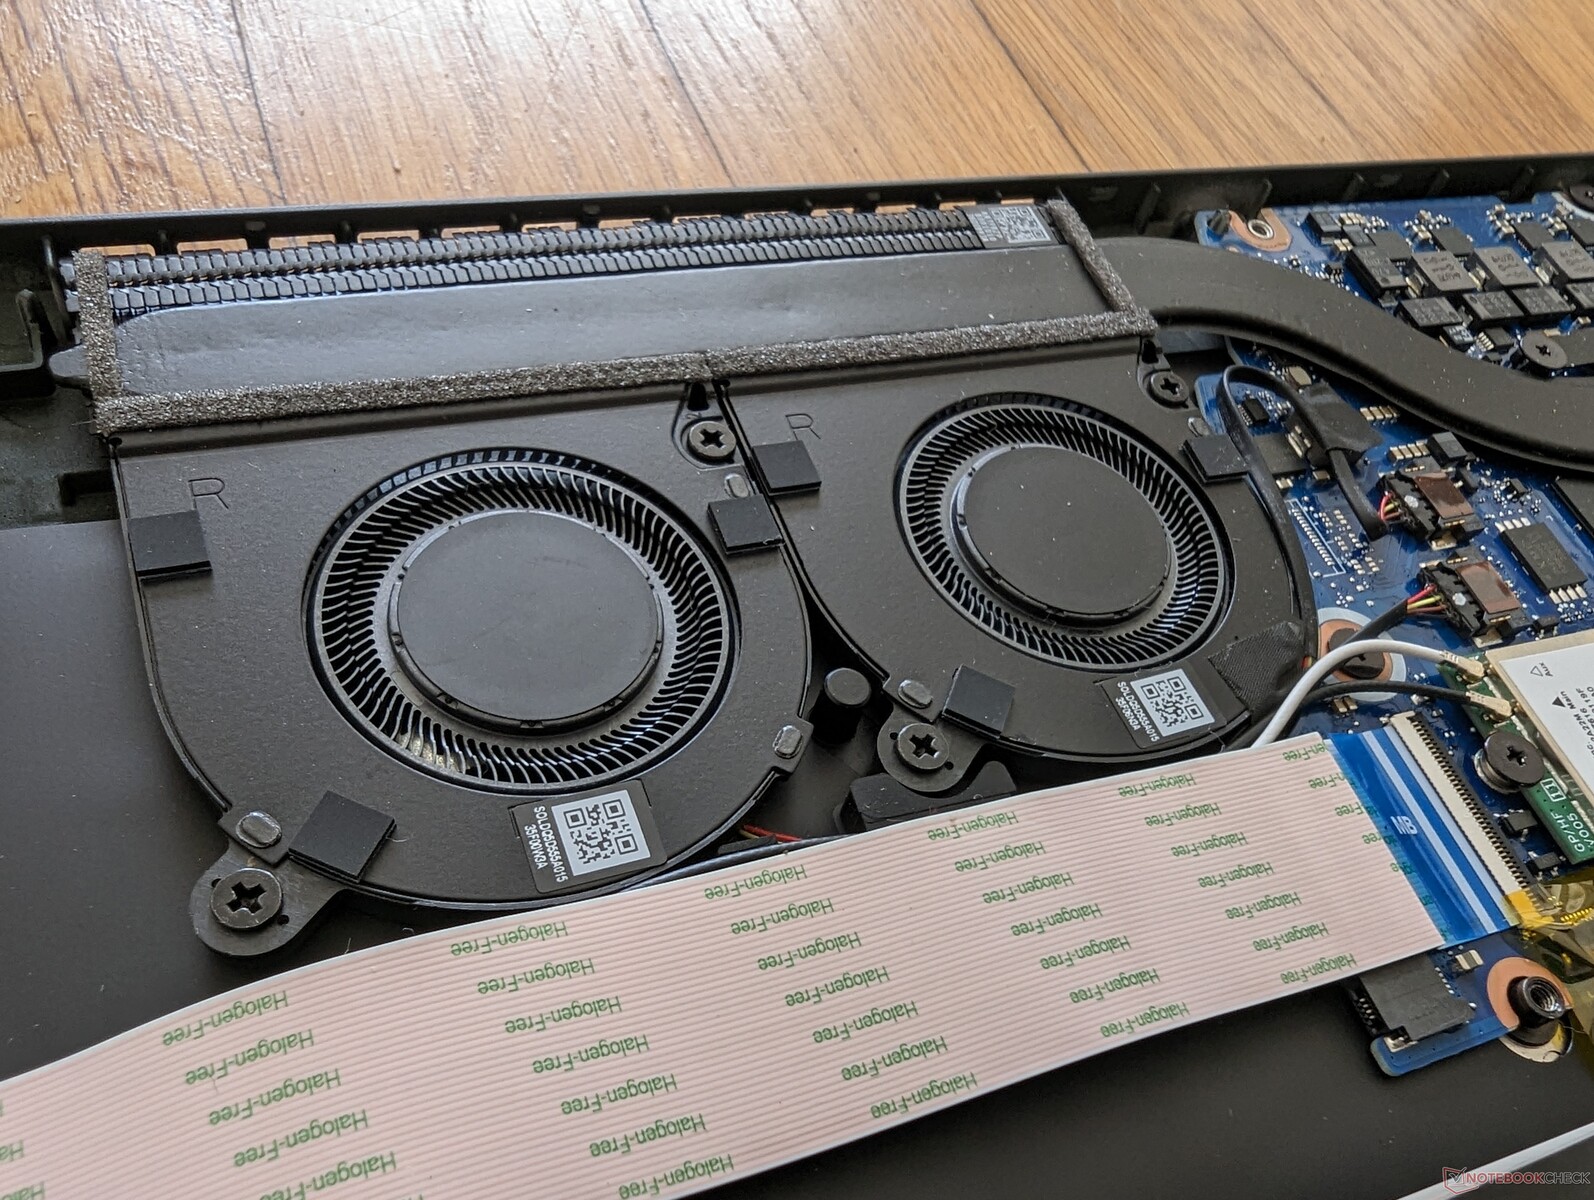
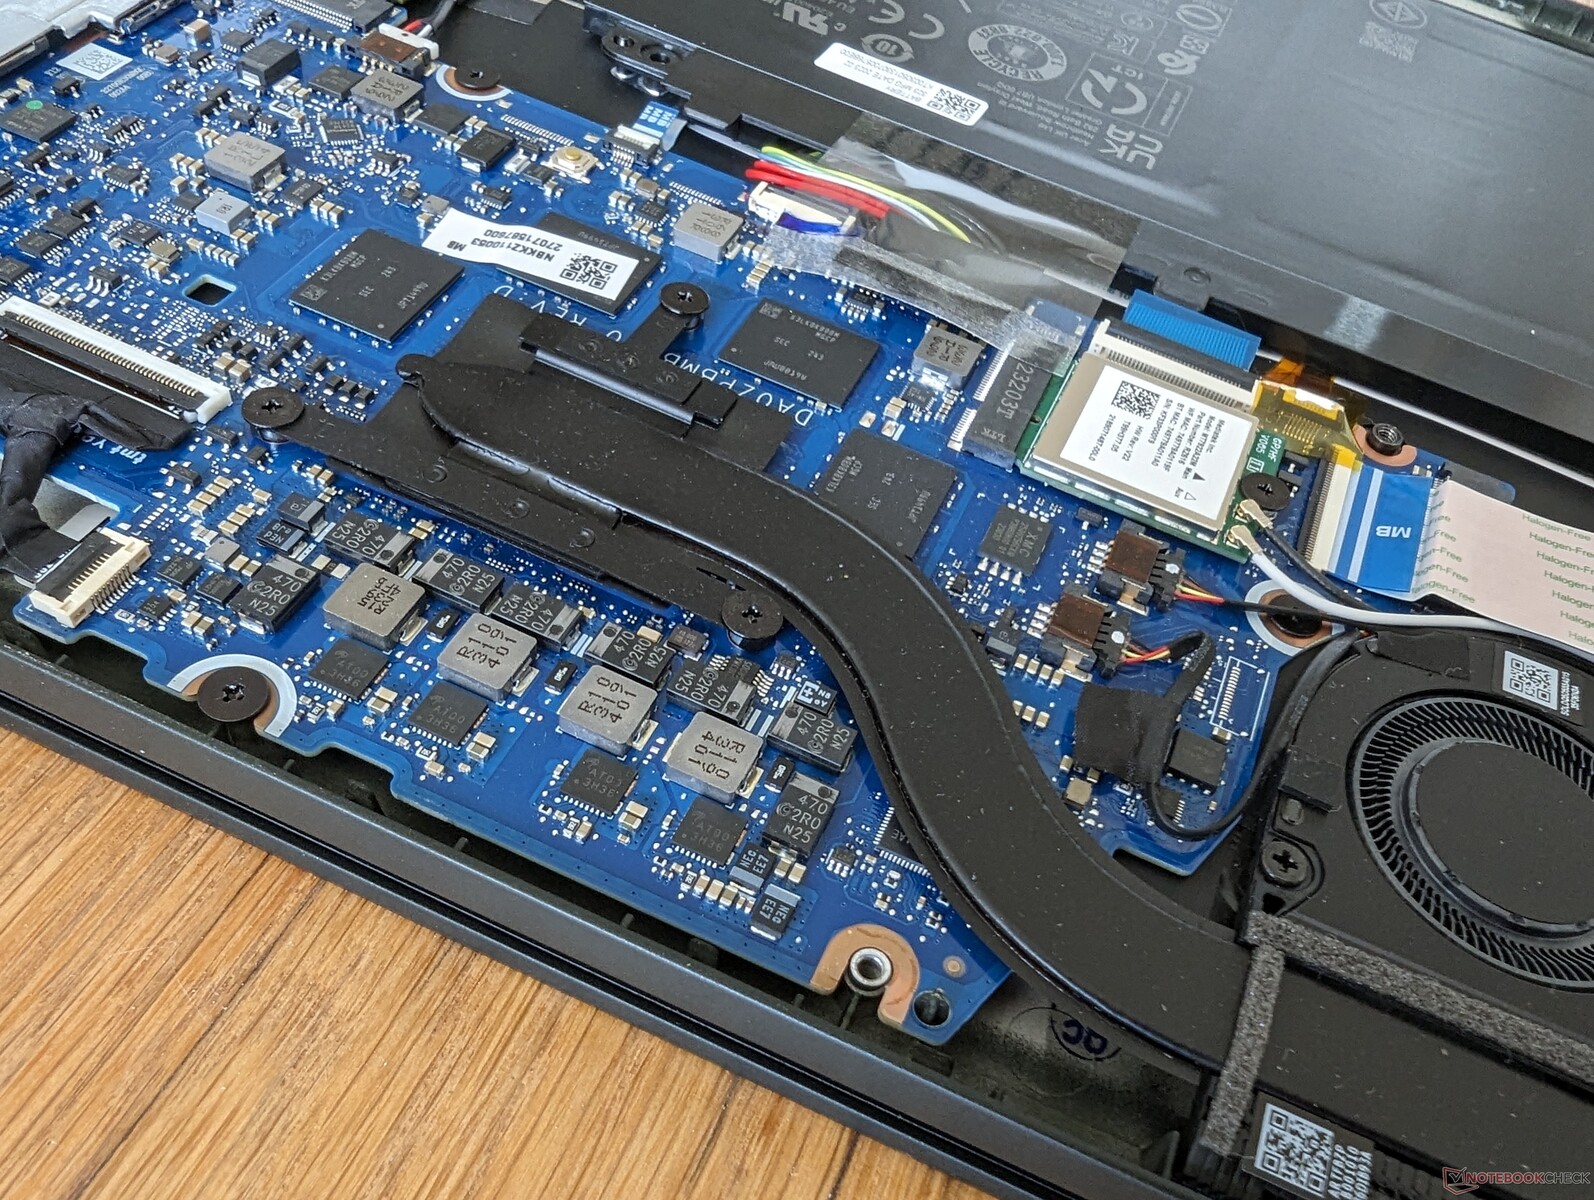
Mantenimiento
El panel inferior es fácil de abrir con una llave Torx. Los ventiladores y la placa base han cambiado bastante entre los modelos Zen 3+ y Zen 4, como muestran las imágenes de abajo. El SSD, por ejemplo, ahora está junto a la batería.
Accesorios y garantía
No hay más extras en la caja que la documentación y el adaptador de CA. Se aplica una garantía limitada del fabricante de un año si se compra en EE.UU.
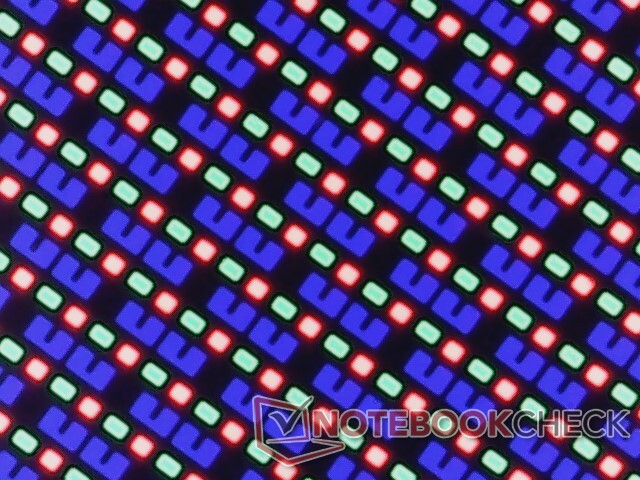
Mostrar
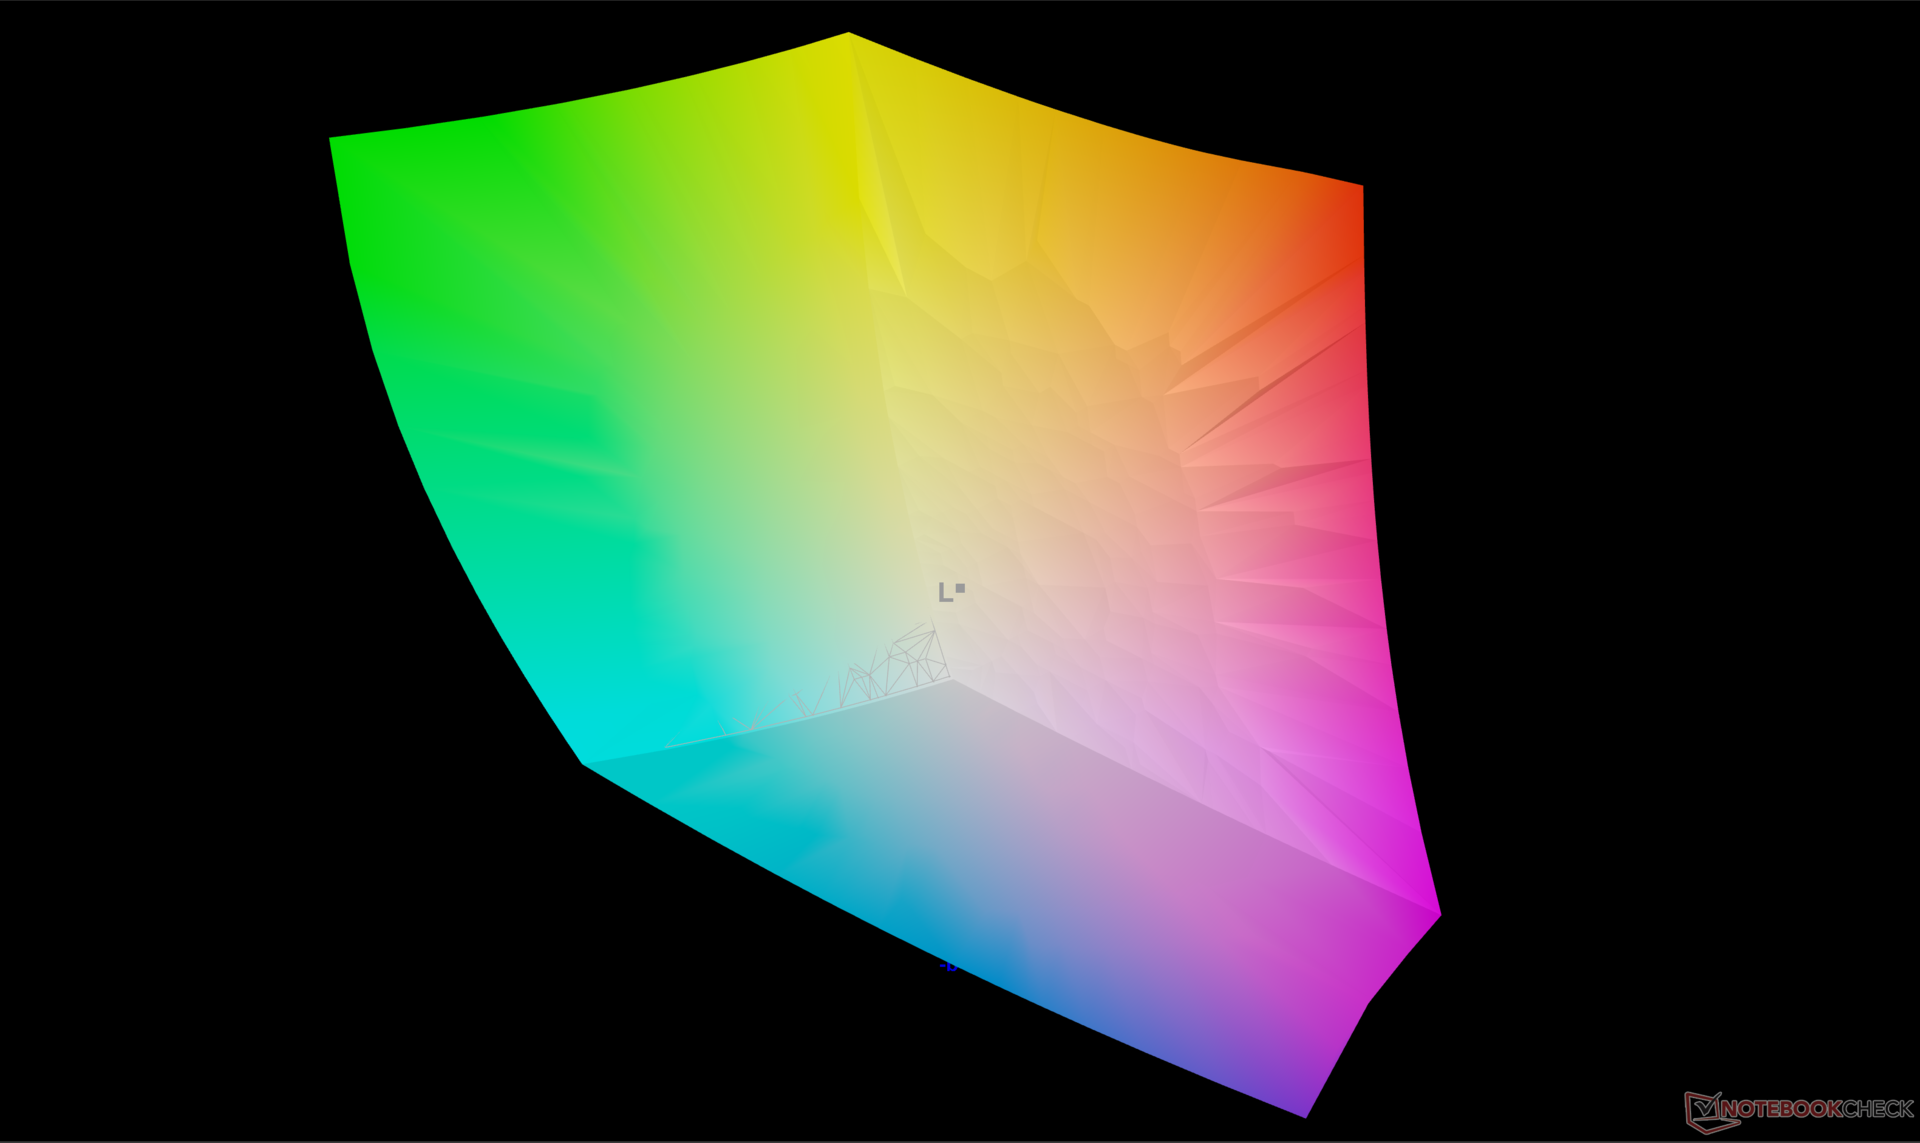
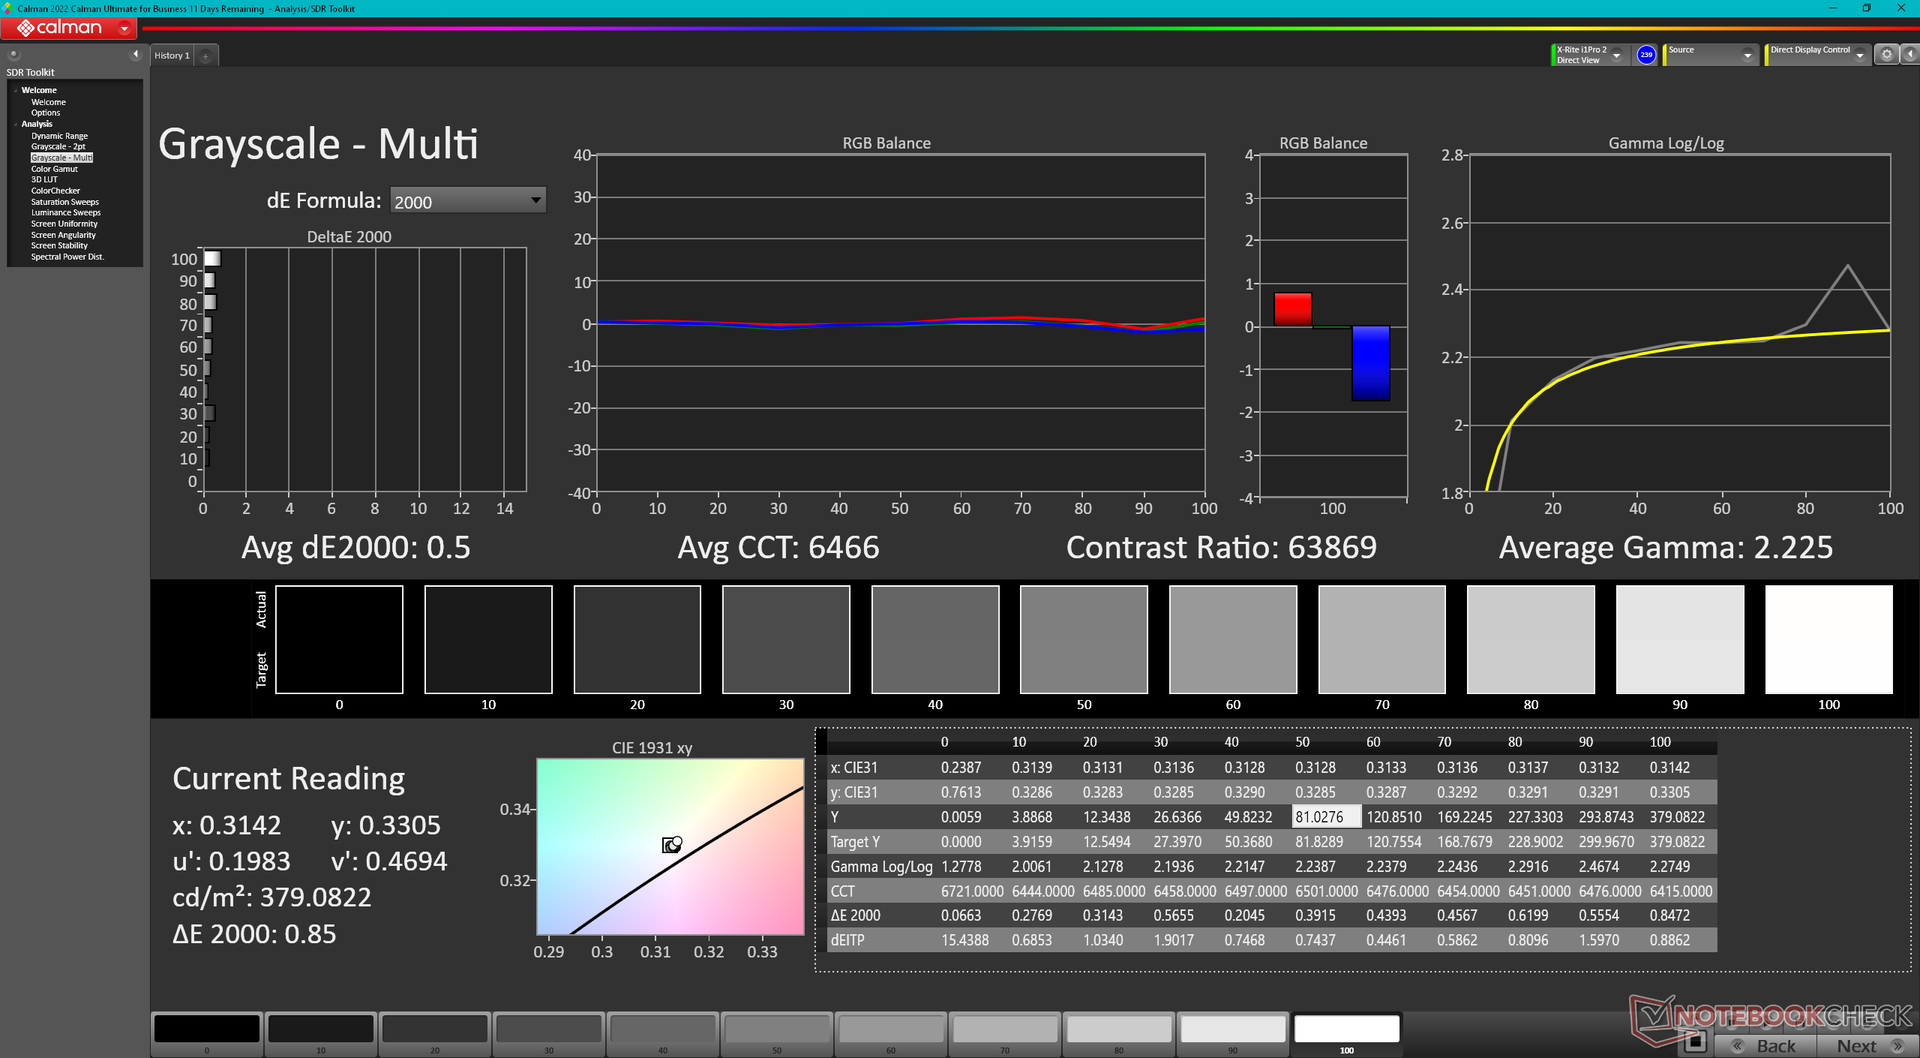
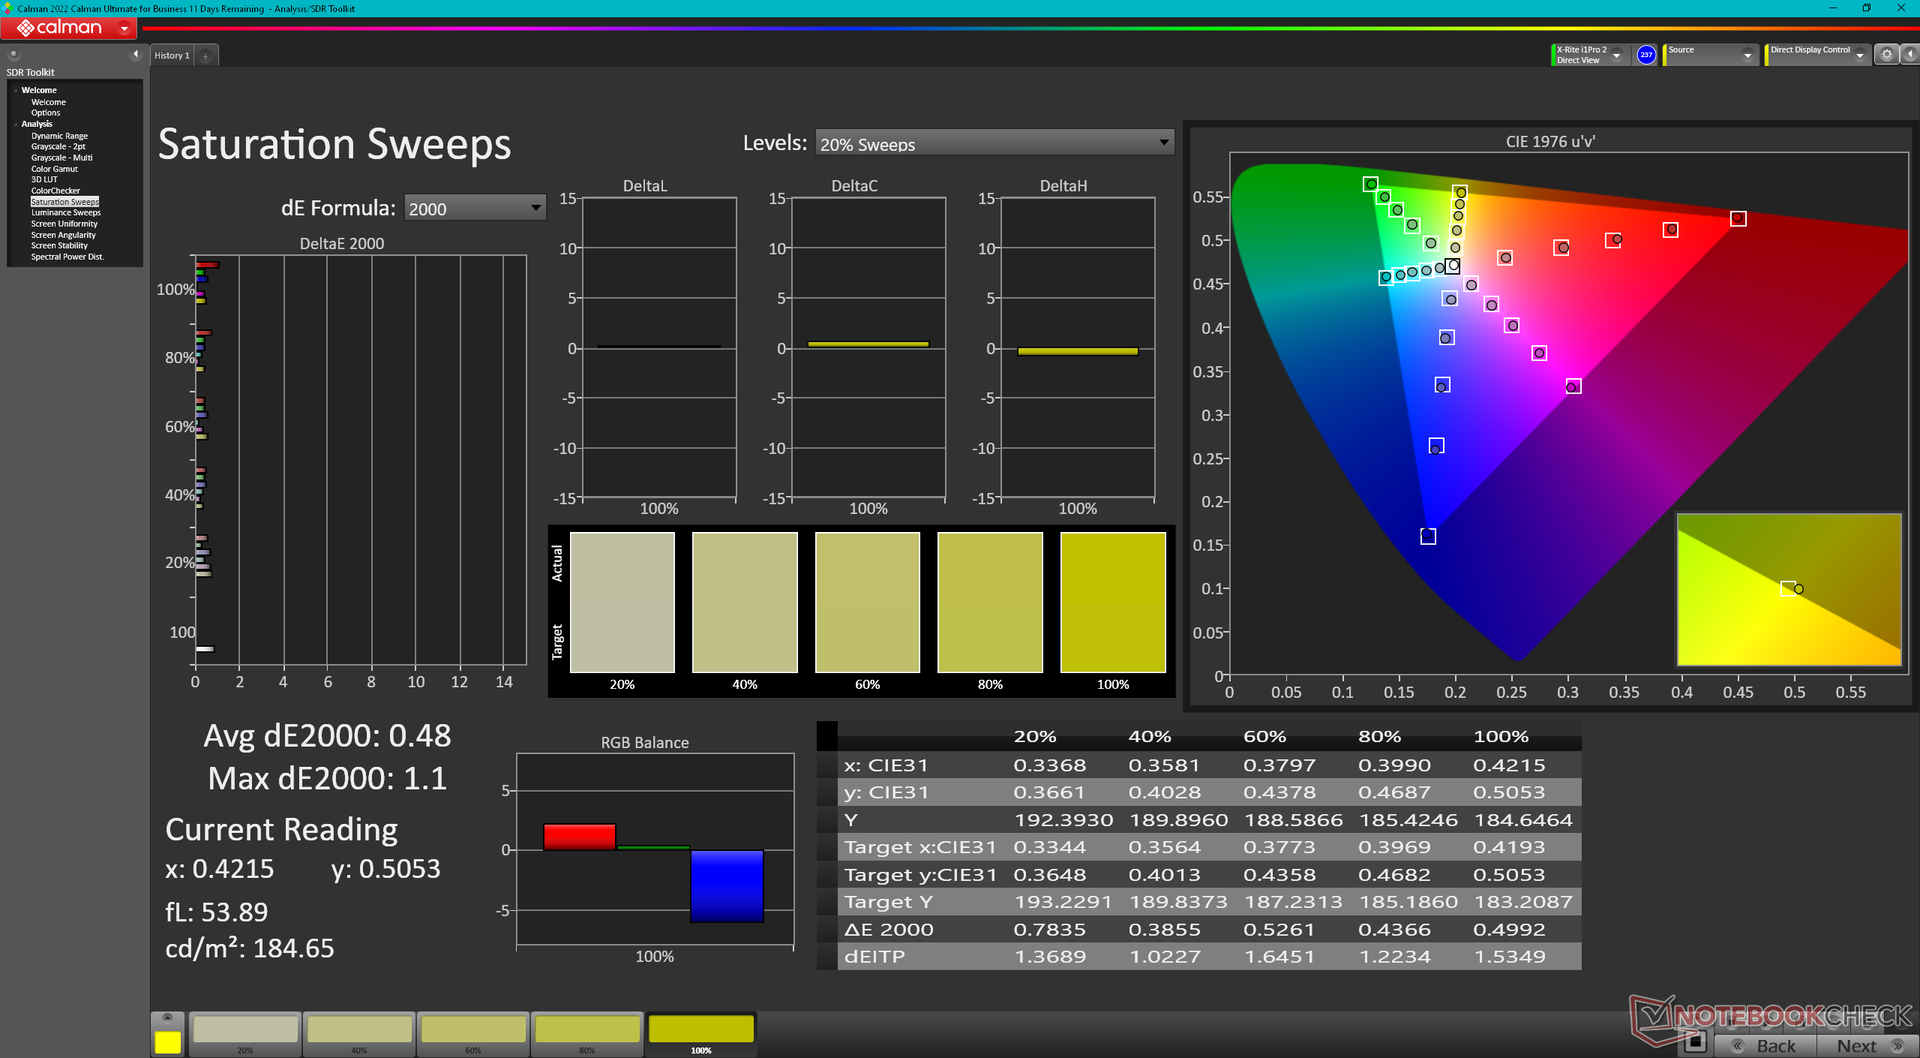
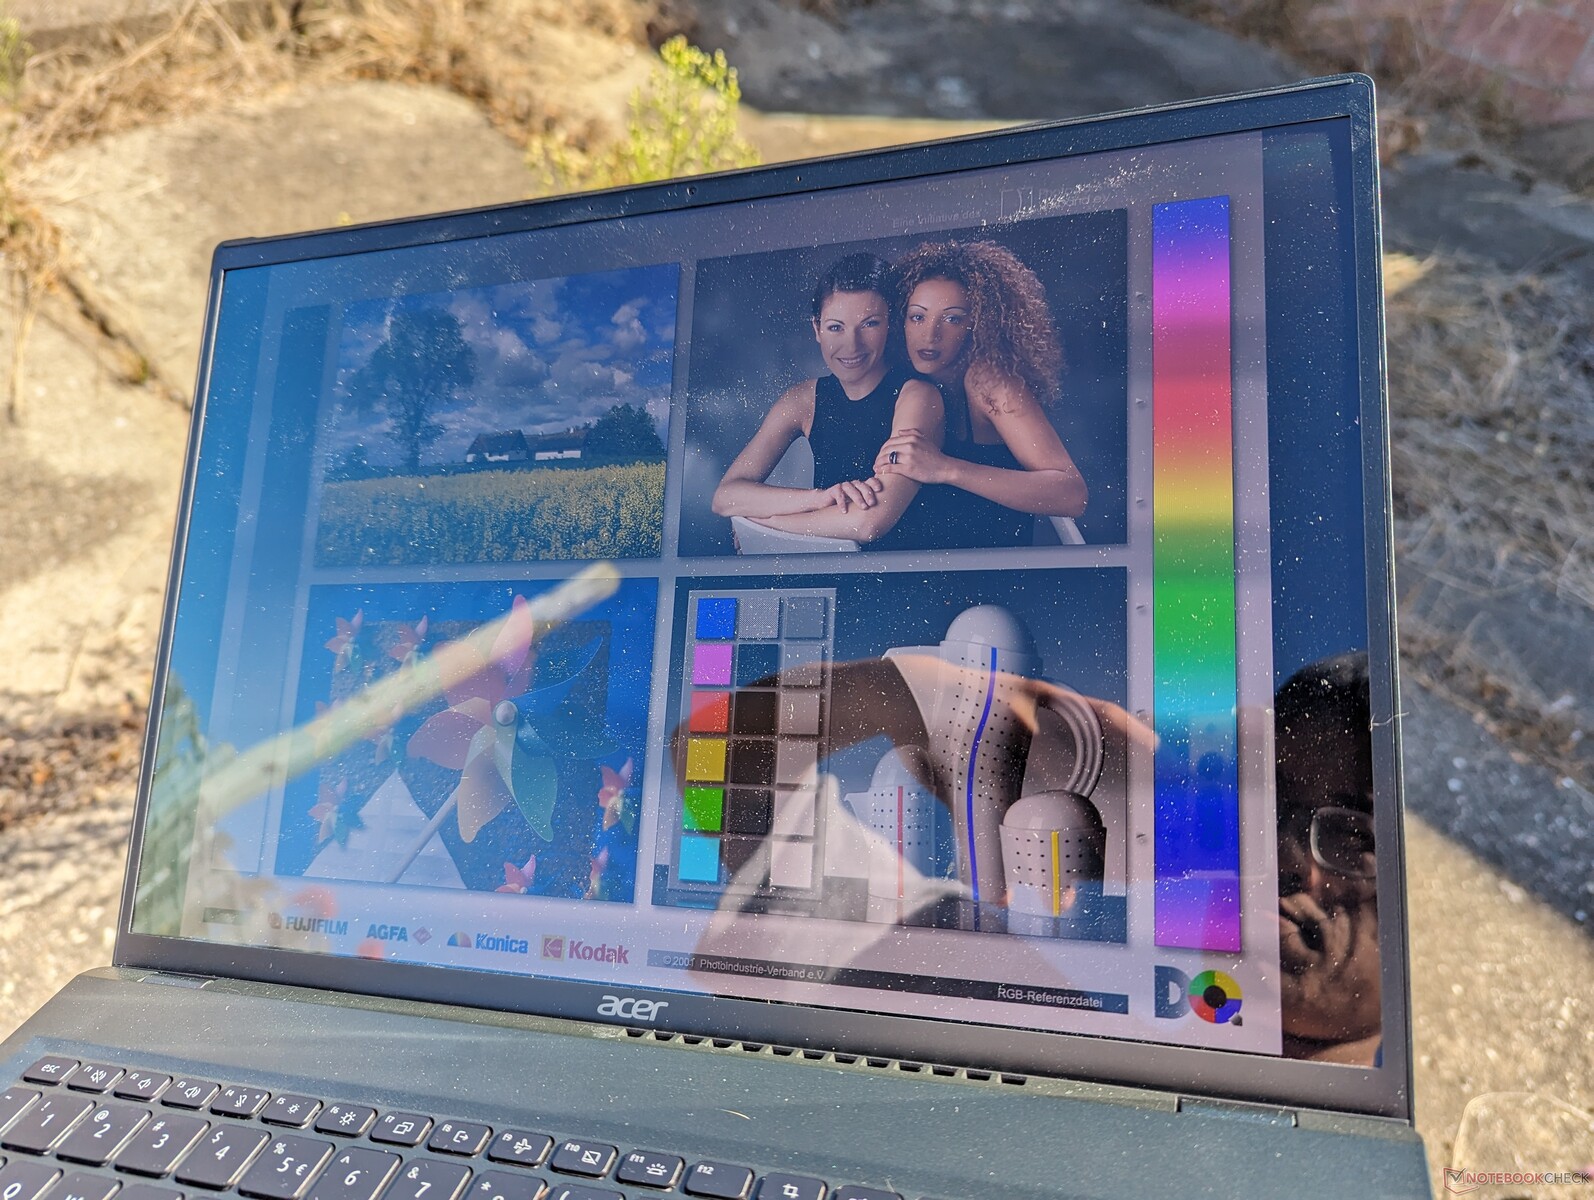
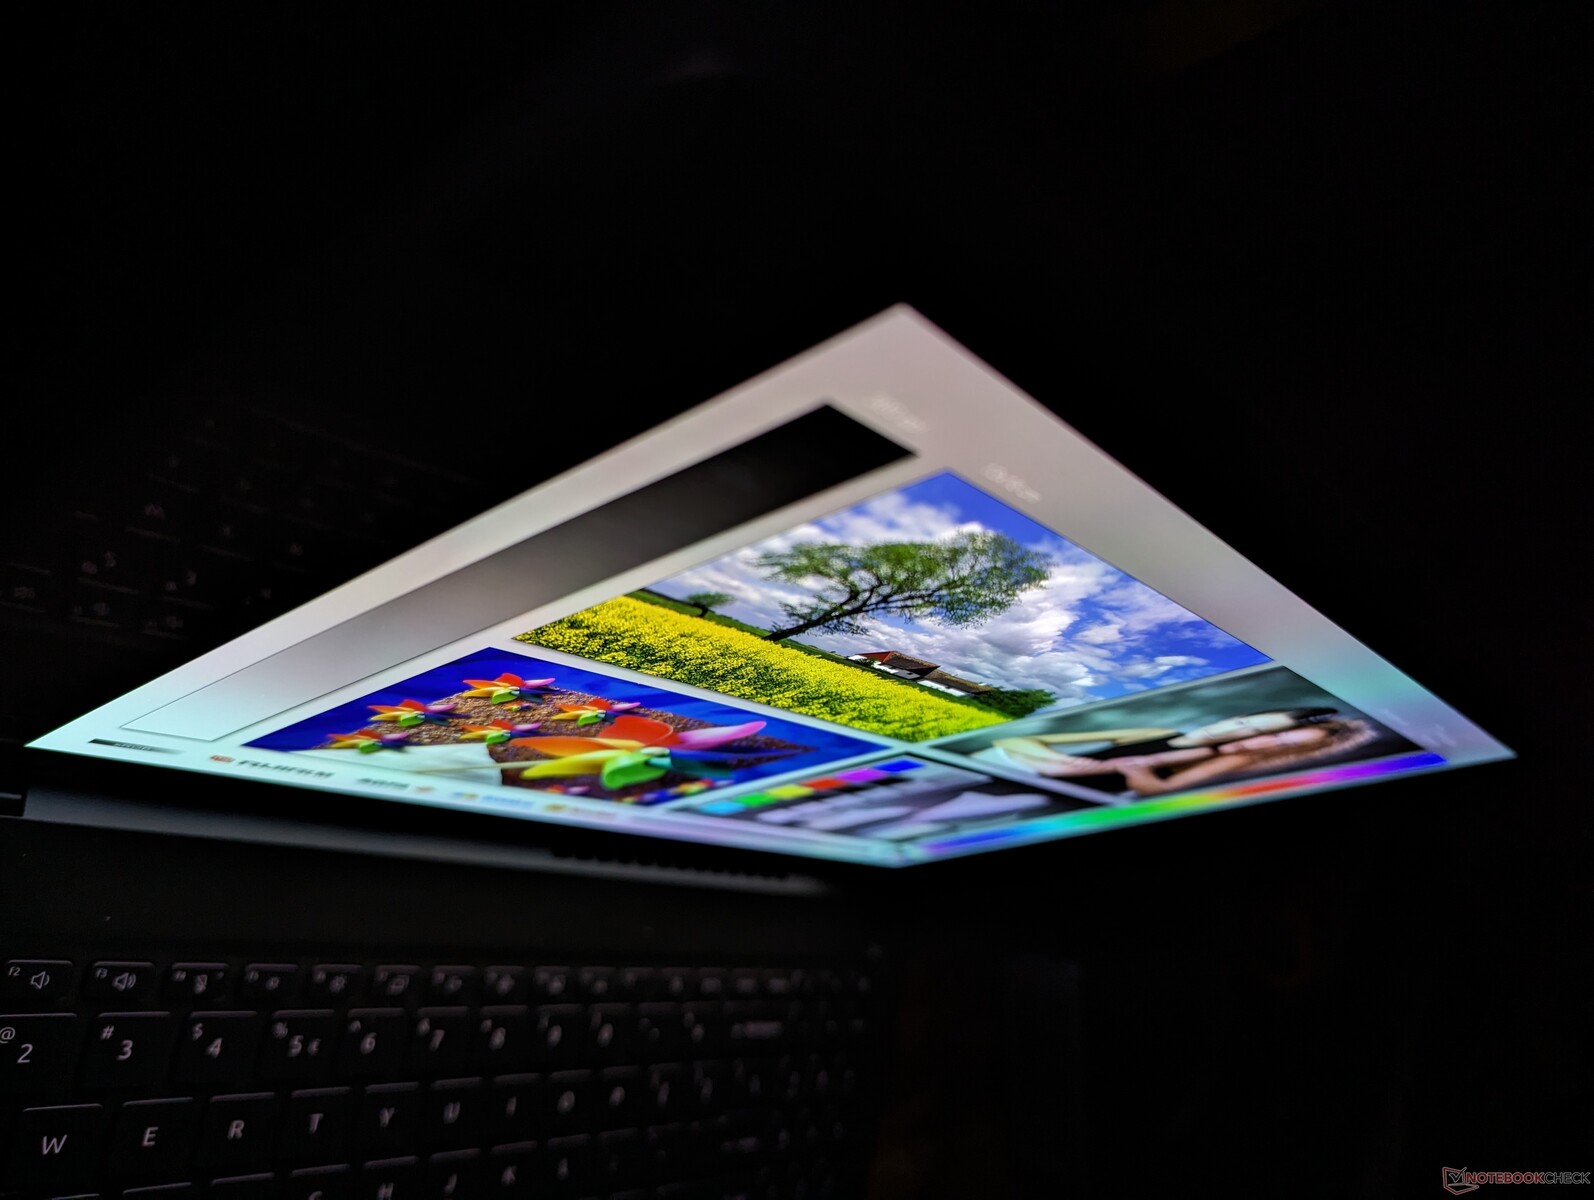
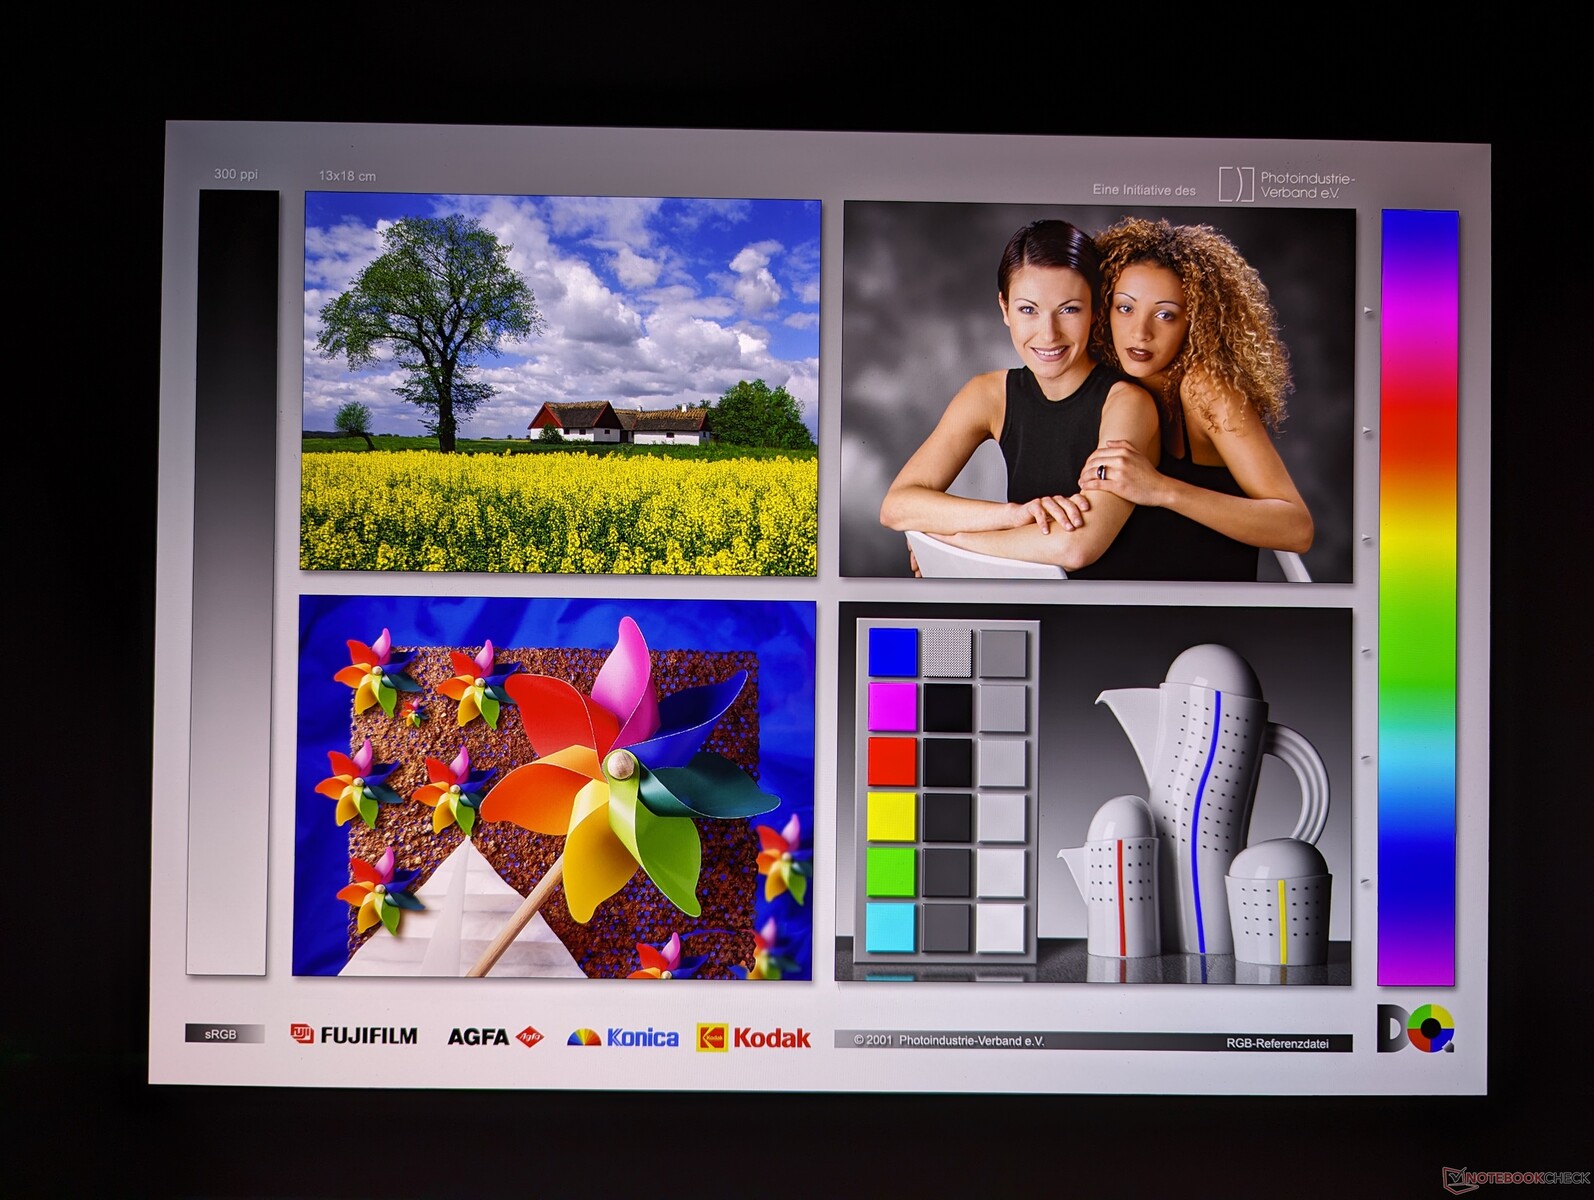
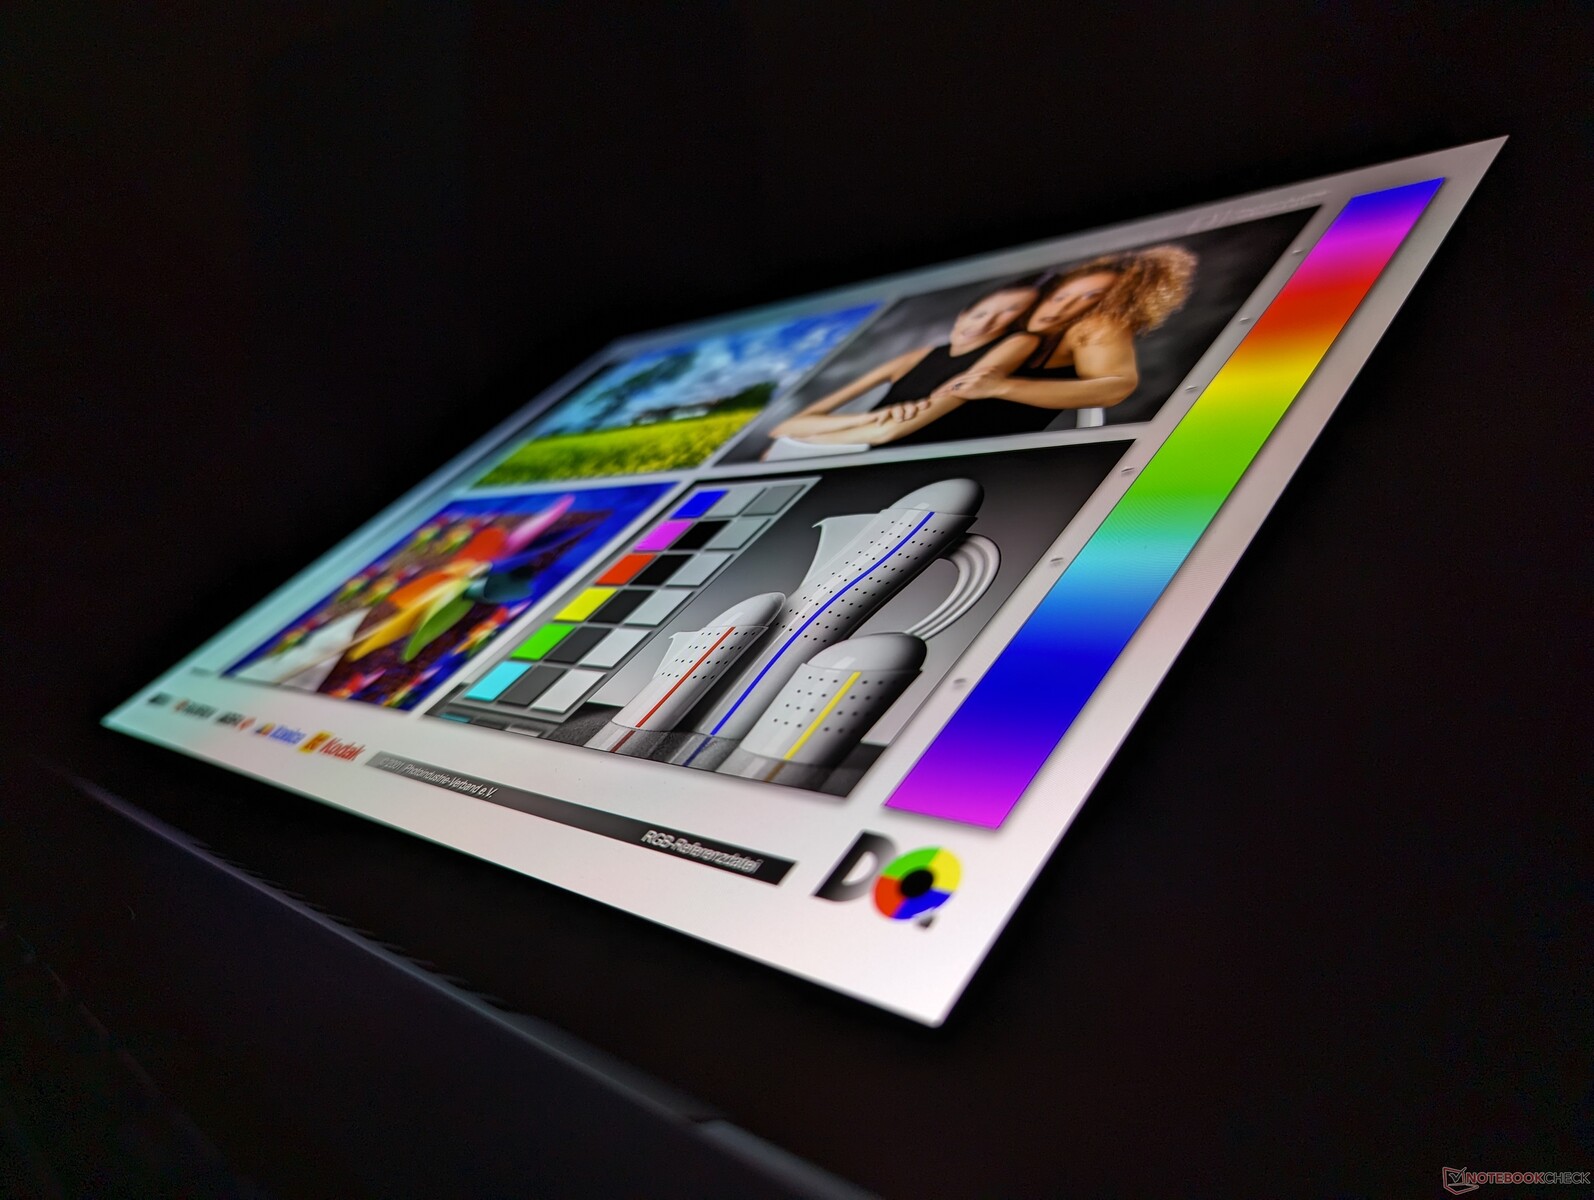
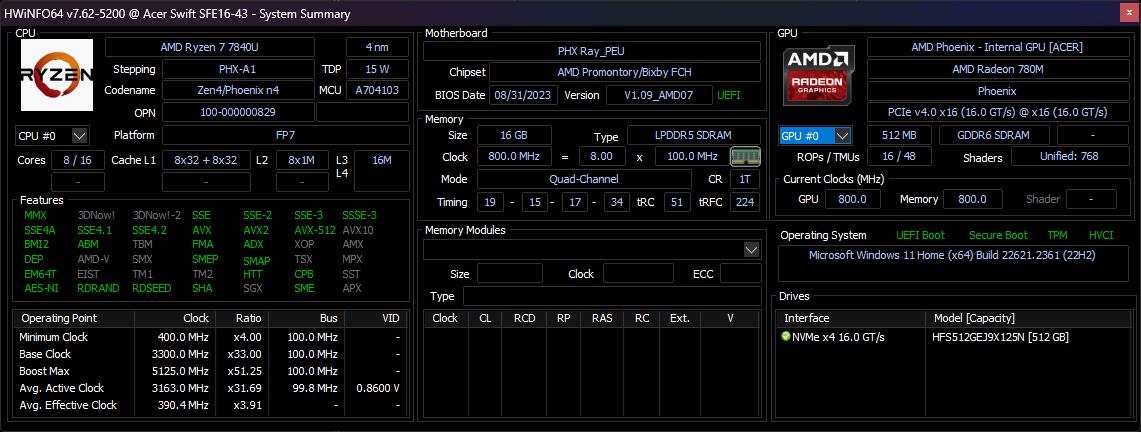
Nuestra unidad viene con una pantalla OLED de 3200 x 2000 120 Hz en lugar de la pantalla OLED de 3840 x 2400 60 Hz de nuestro anterior Zen 3+ Swift Edge 16 de análisis. Por lo demás, los dos paneles Samsung ofrecen coberturas de color, niveles de brillo, niveles de negro y tiempos de respuesta muy rápidos similares. La opción de mayor resolución puede ser más útil para ciertas aplicaciones como Excel o ventanas multitarea en paralelo, pero es difícil volver a 60 Hz una vez te acostumbras a la frecuencia de refresco de 120 Hz de nuestra opción 3.2K de menor resolución. Para los juegos, la pantalla de 120 Hz permite alcanzar los 40 FPS en lugar de los 30 FPS sin tener que preocuparse por las roturas de pantalla.
| |||||||||||||||||||||||||
iluminación: 98 %
Brillo con batería: 379.8 cd/m²
Contraste: ∞:1 (Negro: 0 cd/m²)
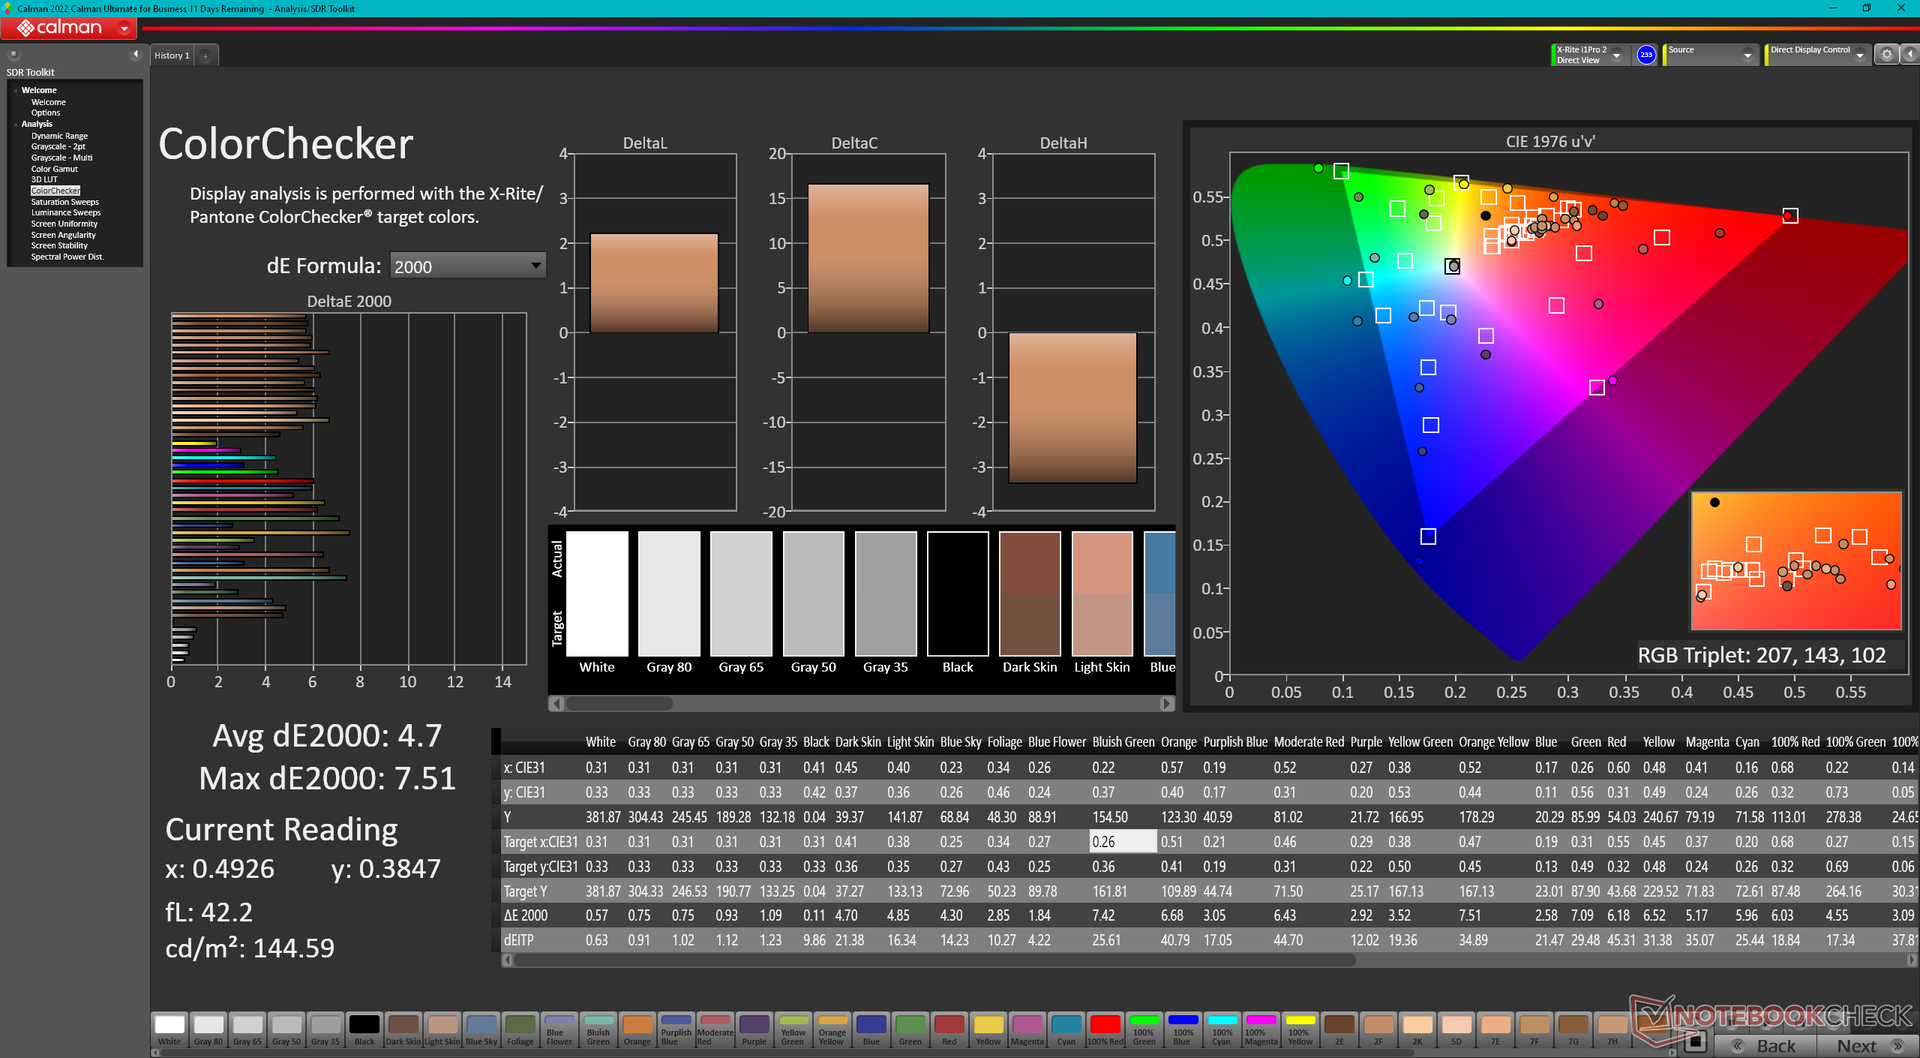
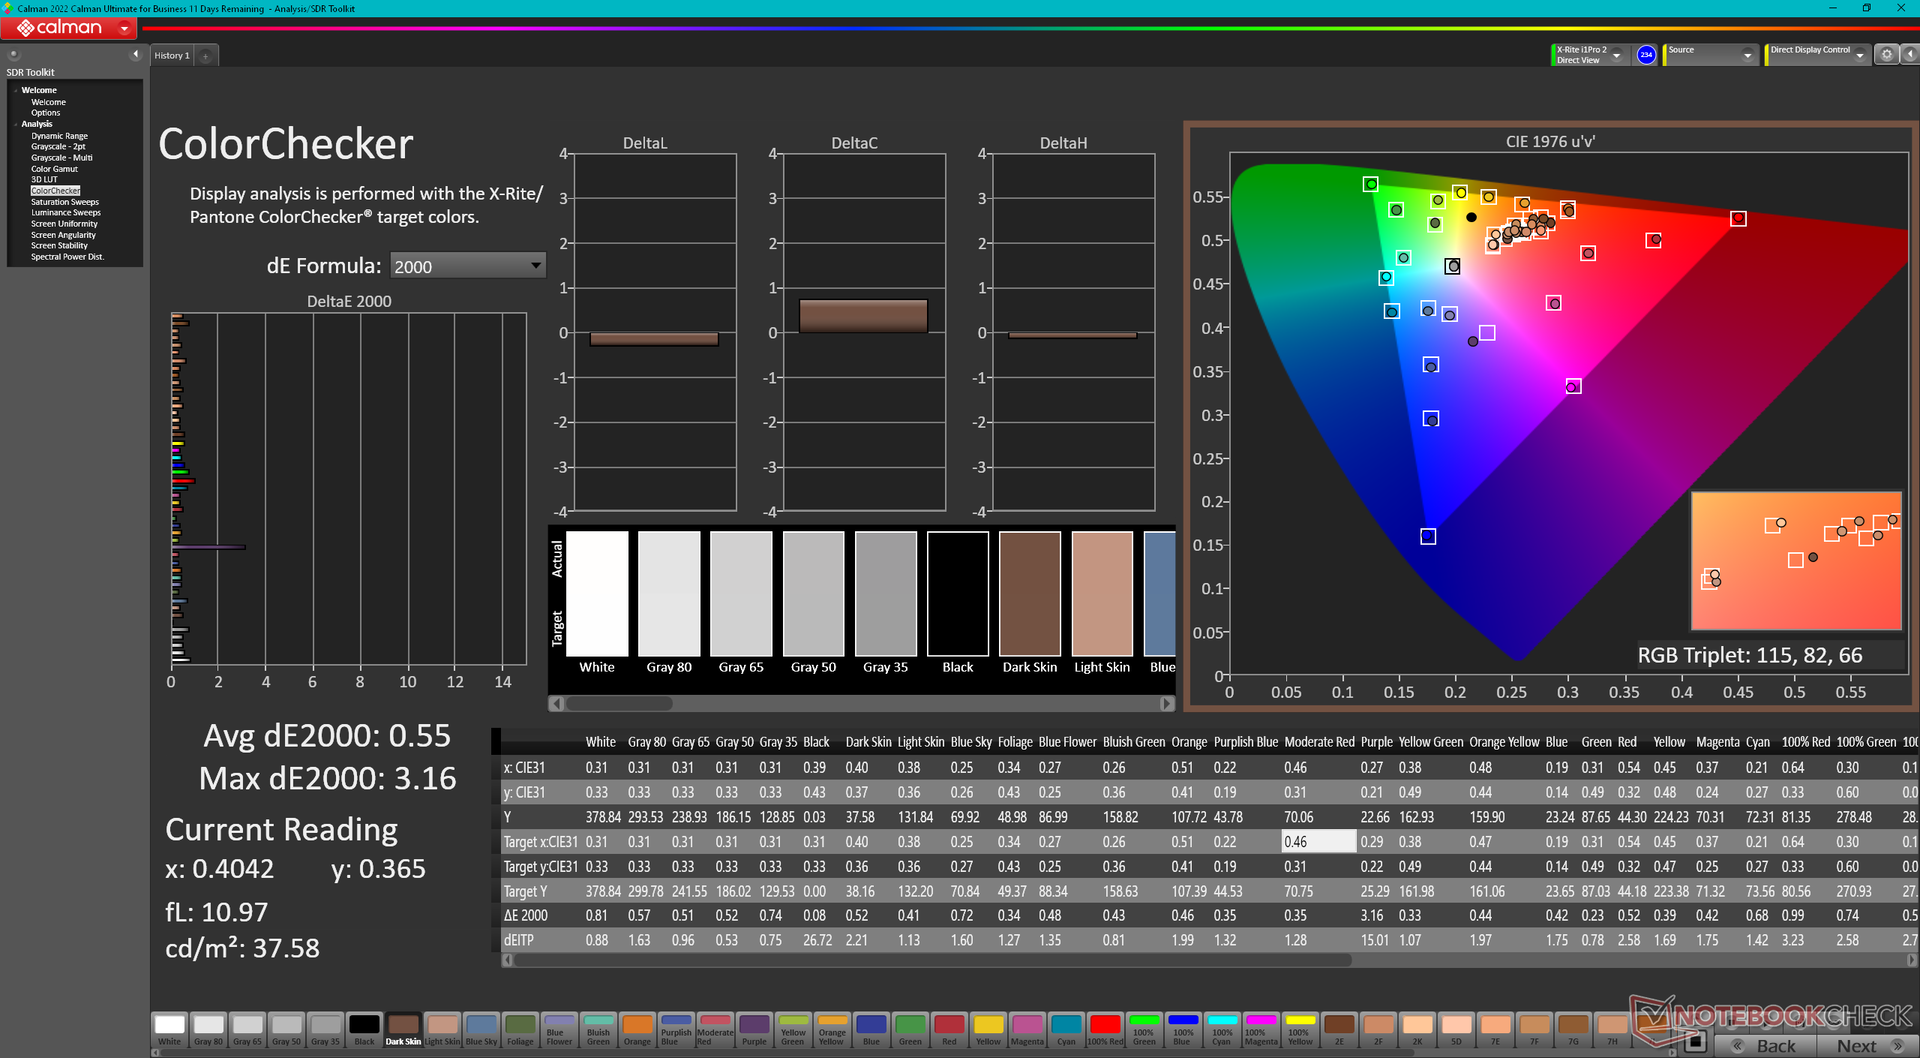
ΔE ColorChecker Calman: 4.7 | ∀{0.5-29.43 Ø4.71}
calibrated: 0.55
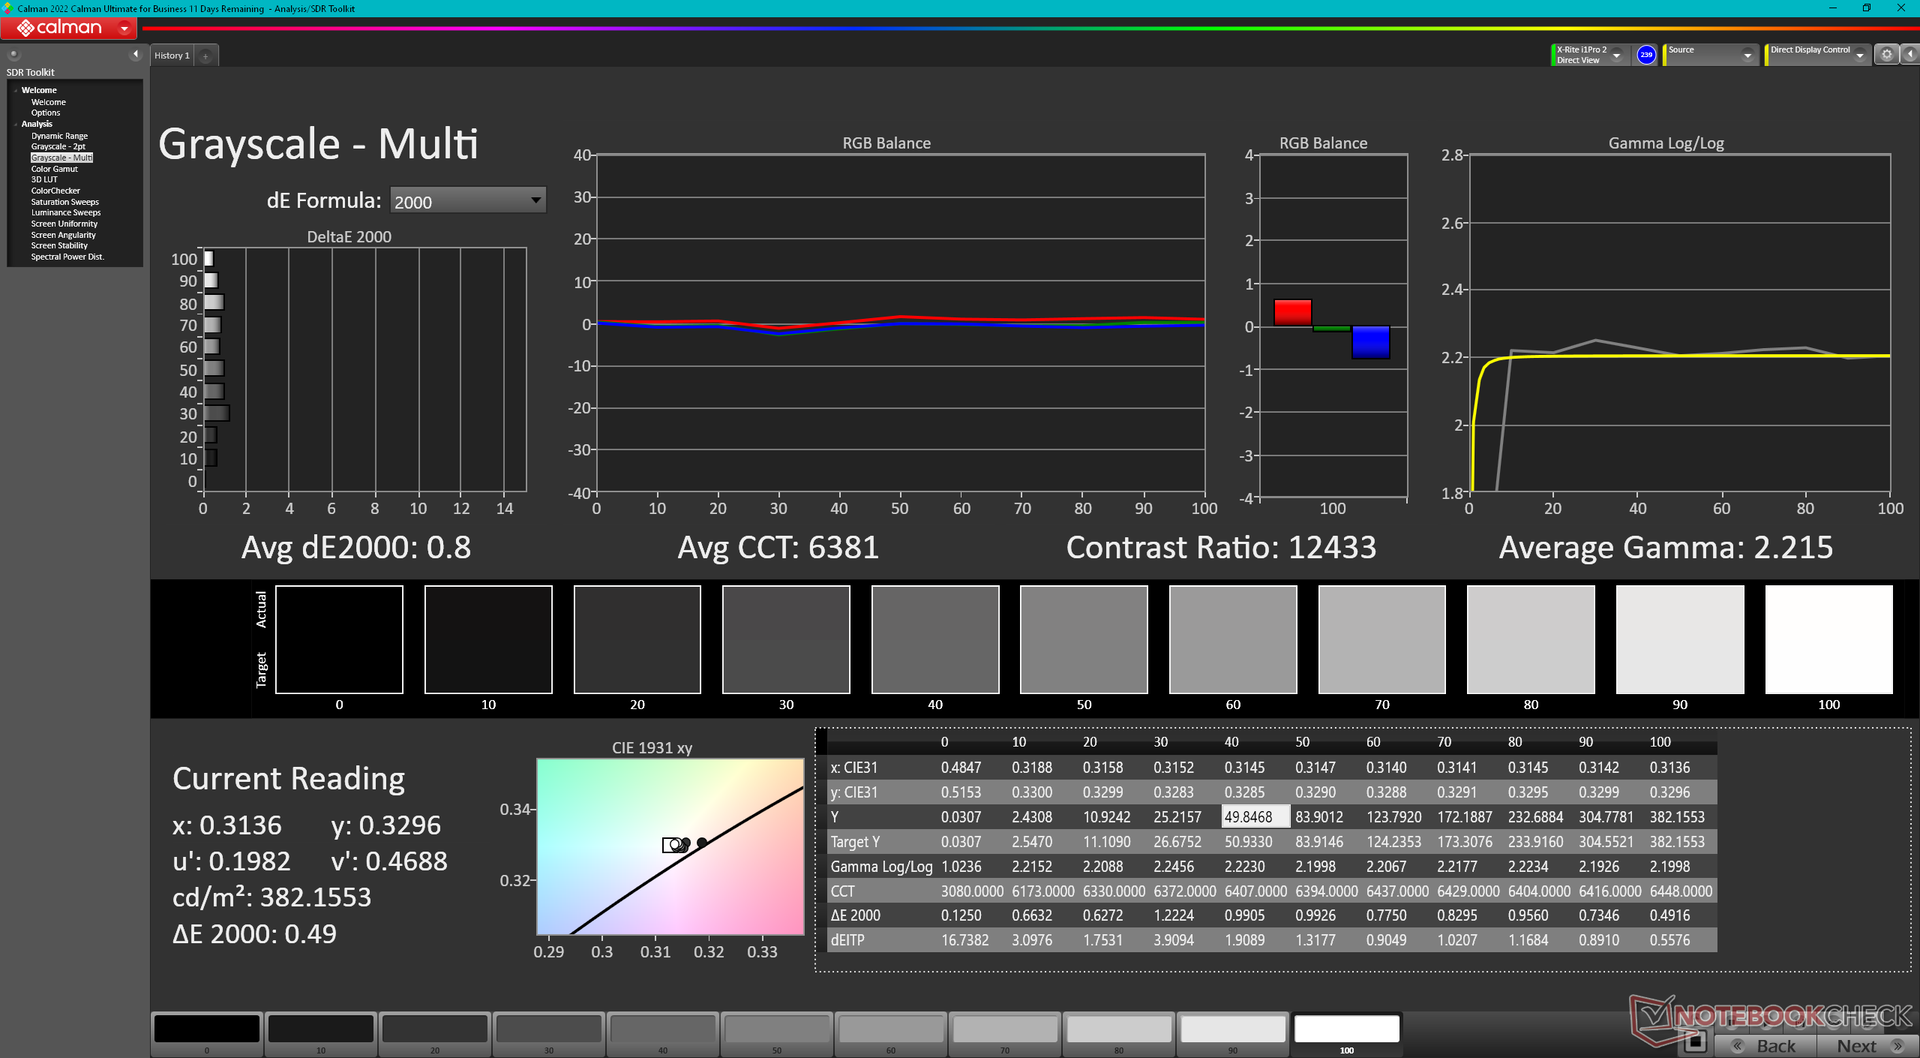
ΔE Greyscale Calman: 0.8 | ∀{0.09-98 Ø4.96}
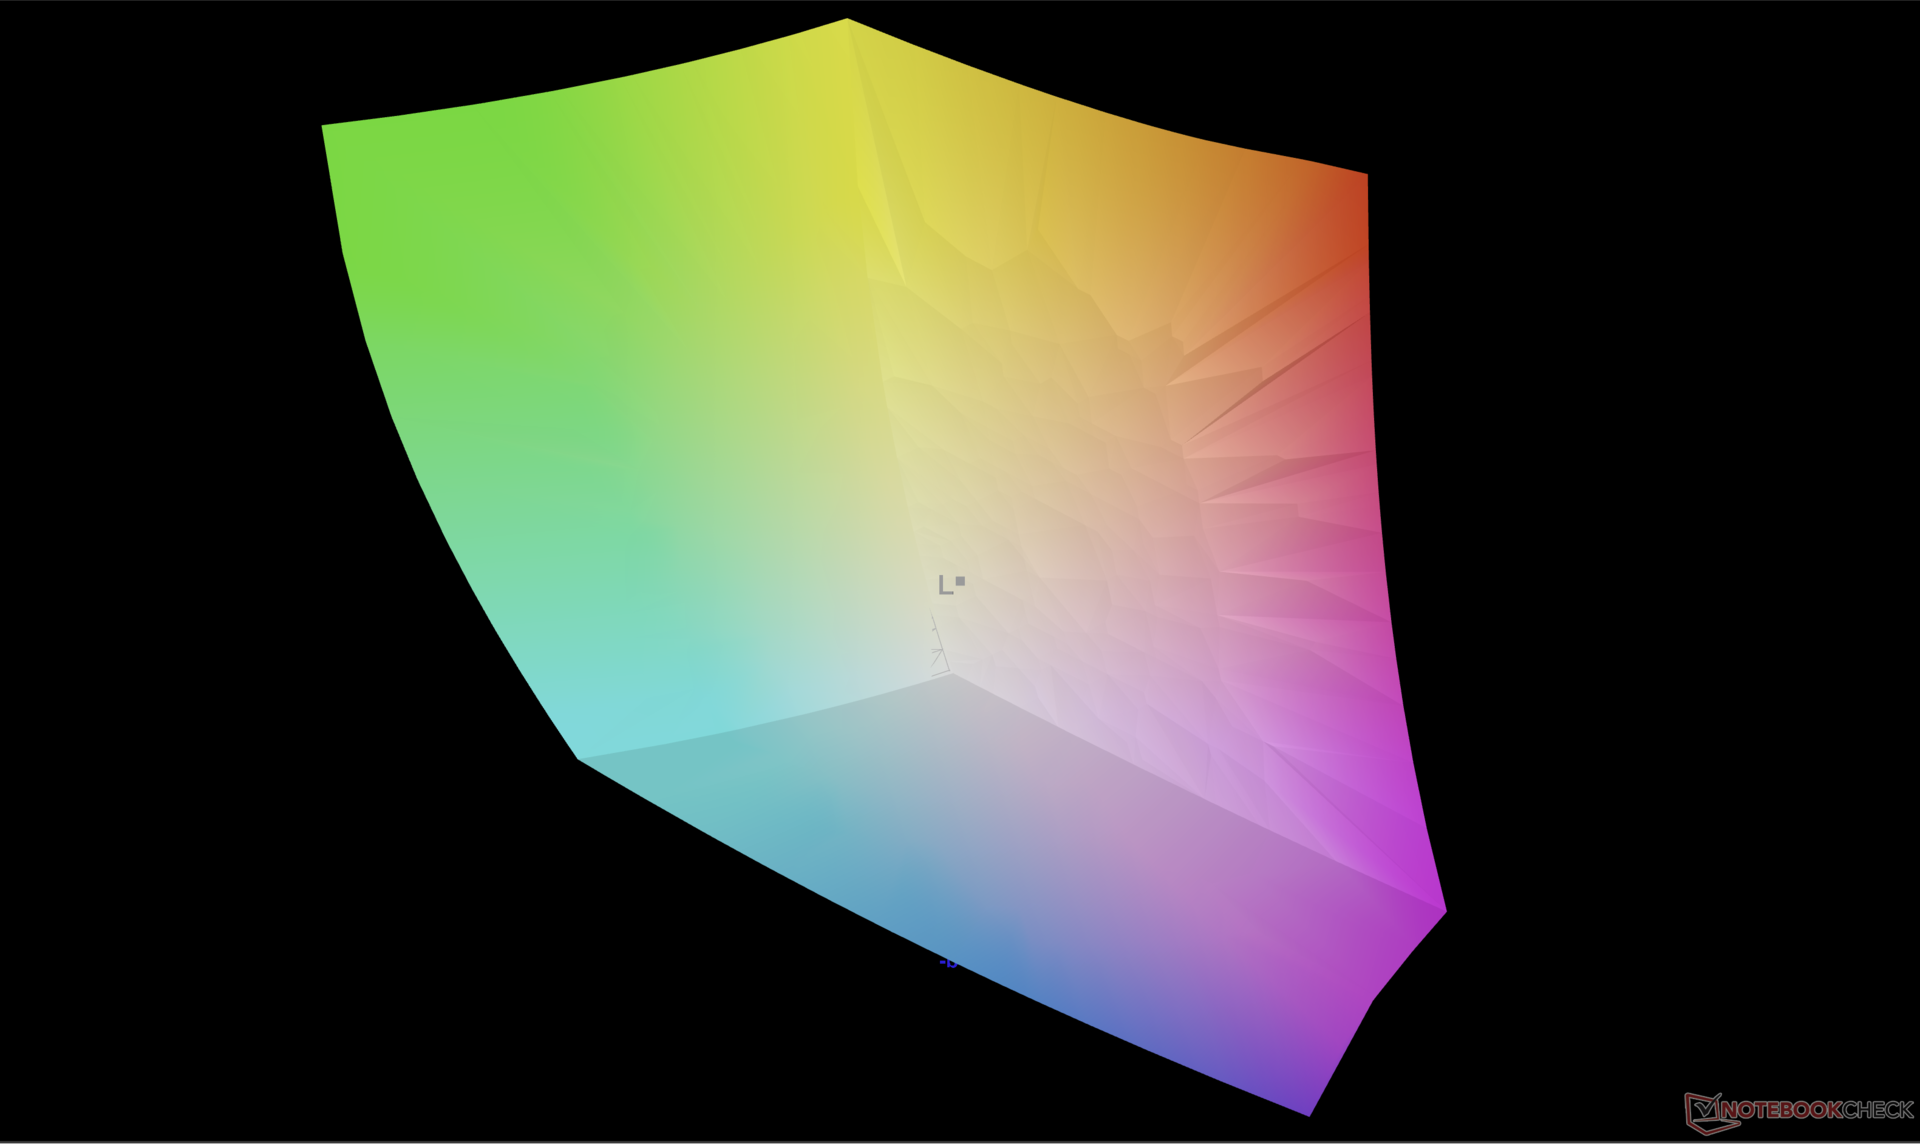
100% AdobeRGB 1998 (Argyll 3D)
100% sRGB (Argyll 3D)
99.9% Display P3 (Argyll 3D)
Gamma: 2.22
CCT: 6381 K
| Acer Swift Edge SFE16 Ryzen 7 7840U Samsung ATNA60BX03-0, OLED, 3200x2000, 16" | Acer Swift Edge SFE16-42-R1GM Samsung SDC4168, OLED, 3840x2400, 16" | Lenovo Slim Pro 9i 16IRP8 LEN160-3.2K, Mini-LED, 3200x2000, 16" | Asus VivoBook Pro 16 Au Optronics B160QAN02.L, IPS, 2560x1600, 16" | Samsung Galaxy Book3 Ultra 16 Samsung ATNA60CL03-0, AMOLED, 2880x1800, 16" | Huawei MateBook 16s i7 BOE XS TV160DKT-NH0, IPS, 2520x1680, 16" | |
|---|---|---|---|---|---|---|
| Display | -1% | -7% | -5% | -1% | -24% | |
| Display P3 Coverage (%) | 99.9 | 99.7 0% | 95.1 -5% | 98.5 -1% | 99.9 0% | 64.5 -35% |
| sRGB Coverage (%) | 100 | 100 0% | 99.9 0% | 99.9 0% | 100 0% | 96.7 -3% |
| AdobeRGB 1998 Coverage (%) | 100 | 97.2 -3% | 84.6 -15% | 86.1 -14% | 96.3 -4% | 66.6 -33% |
| Response Times | -226% | -1588% | -476% | 25% | -4192% | |
| Response Time Grey 50% / Grey 80% * (ms) | 0.57 ? | 2 ? -251% | 14 ? -2356% | 2 ? -251% | 0.49 ? 14% | 35.7 ? -6163% |
| Response Time Black / White * (ms) | 1 ? | 3 ? -200% | 9.2 ? -820% | 8 ? -700% | 0.65 ? 35% | 23.2 ? -2220% |
| PWM Frequency (Hz) | 238.8 | 239 ? | 5784 ? | 240 ? | ||
| Screen | -66% | -198% | -42% | -49% | -3% | |
| Brightness middle (cd/m²) | 379.8 | 369 -3% | 627.4 65% | 504 33% | 400 5% | 311 -18% |
| Brightness (cd/m²) | 383 | 371 -3% | 618 61% | 465 21% | 399 4% | 319 -17% |
| Brightness Distribution (%) | 98 | 97 -1% | 95 -3% | 87 -11% | 93 -5% | 91 -7% |
| Black Level * (cd/m²) | 0.19 | 0.35 | 0.03 | 0.17 | ||
| Colorchecker dE 2000 * | 4.7 | 2.3 51% | 5.84 -24% | 1.83 61% | 2.3 51% | 1 79% |
| Colorchecker dE 2000 max. * | 7.51 | 4.37 42% | 10.22 -36% | 5.51 27% | 4.15 45% | 1.7 77% |
| Colorchecker dE 2000 calibrated * | 0.55 | 2.87 -422% | 4.45 -709% | 1.34 -144% | 1.66 -202% | 0.8 -45% |
| Greyscale dE 2000 * | 0.8 | 1.83 -129% | 6.7 -738% | 3.02 -278% | 2.7 -238% | 1.5 -88% |
| Gamma | 2.22 99% | 2.39 92% | 2.77 79% | 2.39 92% | 2.266 97% | 2.15 102% |
| CCT | 6381 102% | 6392 102% | 5795 112% | 6688 97% | 7047 92% | 6432 101% |
| Contrast (:1) | 3302 | 1440 | 13333 | 1829 | ||
| Media total (Programa/Opciones) | -98% /
-77% | -598% /
-382% | -174% /
-105% | -8% /
-25% | -1406% /
-706% |
* ... más pequeño es mejor
Tiempos de respuesta del display
| ↔ Tiempo de respuesta de Negro a Blanco | ||
|---|---|---|
| 1 ms ... subida ↗ y bajada ↘ combinada | ↗ 0.55 ms subida | 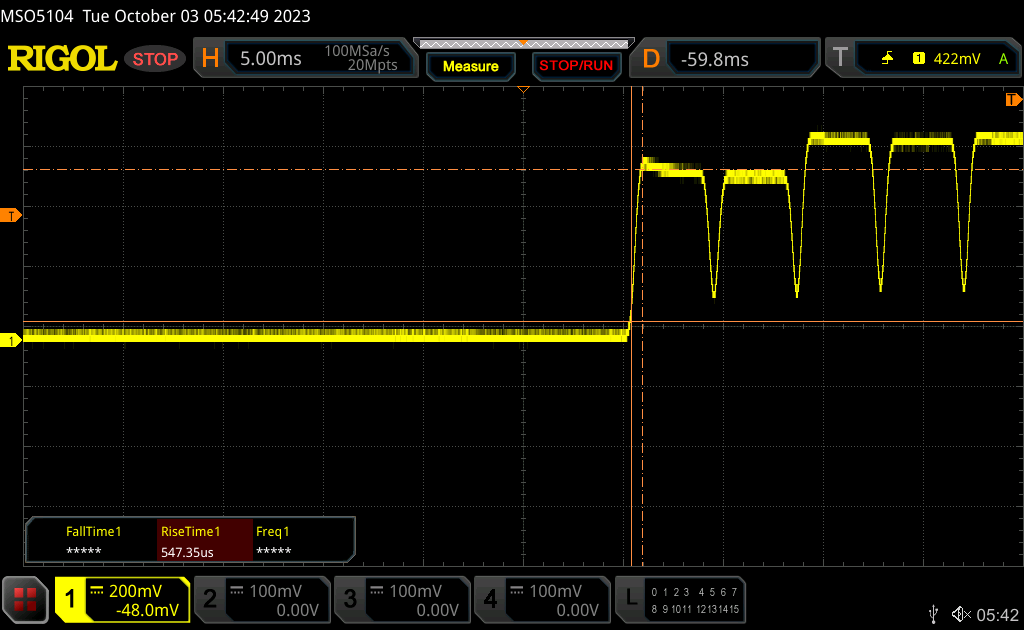 |
| ↘ 0.45 ms bajada | ||
| La pantalla mostró tiempos de respuesta muy rápidos en nuestros tests y debería ser adecuada para juegos frenéticos. En comparación, todos los dispositivos de prueba van de ##min### (mínimo) a 240 (máximo) ms. » 4 % de todos los dispositivos son mejores. Esto quiere decir que el tiempo de respuesta medido es mejor que la media (19.8 ms) de todos los dispositivos testados. | ||
| ↔ Tiempo de respuesta 50% Gris a 80% Gris | ||
| 0.57 ms ... subida ↗ y bajada ↘ combinada | ↗ 0.28 ms subida | 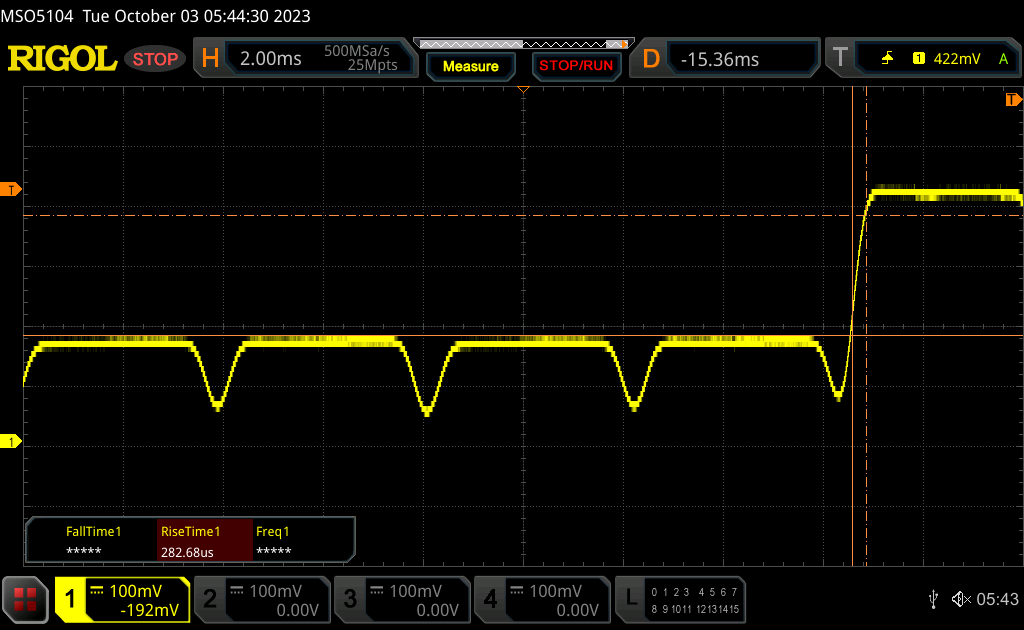 |
| ↘ 0.29 ms bajada | ||
| La pantalla mostró tiempos de respuesta muy rápidos en nuestros tests y debería ser adecuada para juegos frenéticos. En comparación, todos los dispositivos de prueba van de ##min### (mínimo) a 636 (máximo) ms. » 1 % de todos los dispositivos son mejores. Esto quiere decir que el tiempo de respuesta medido es mejor que la media (31 ms) de todos los dispositivos testados. | ||
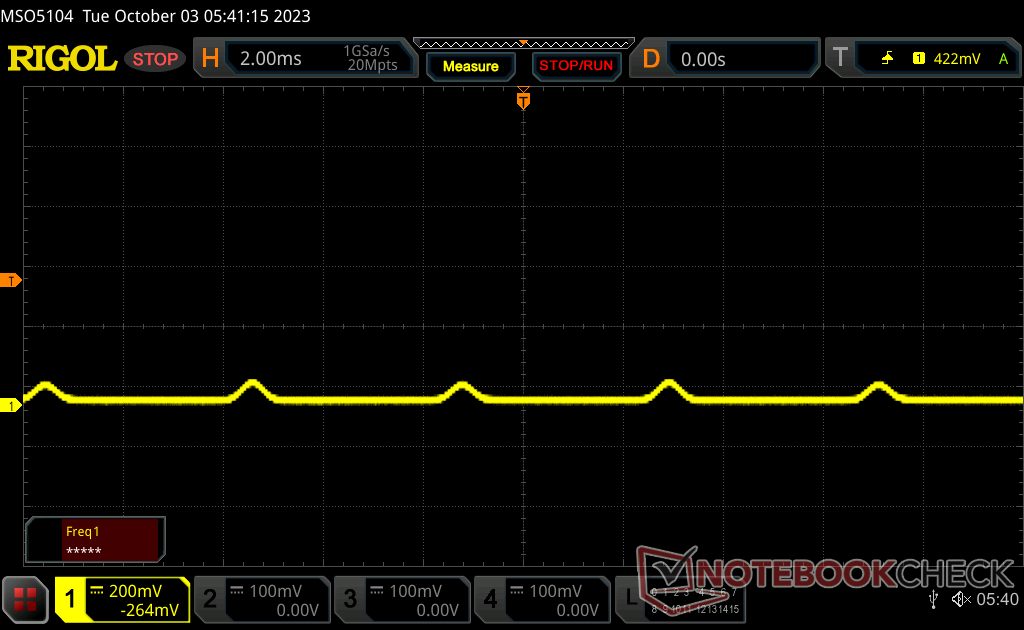
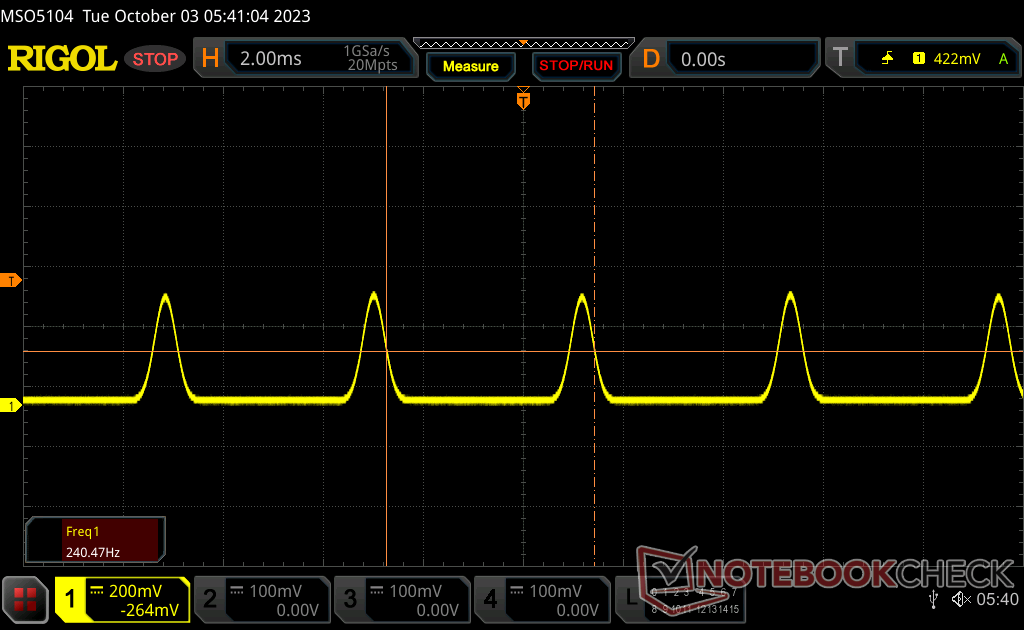
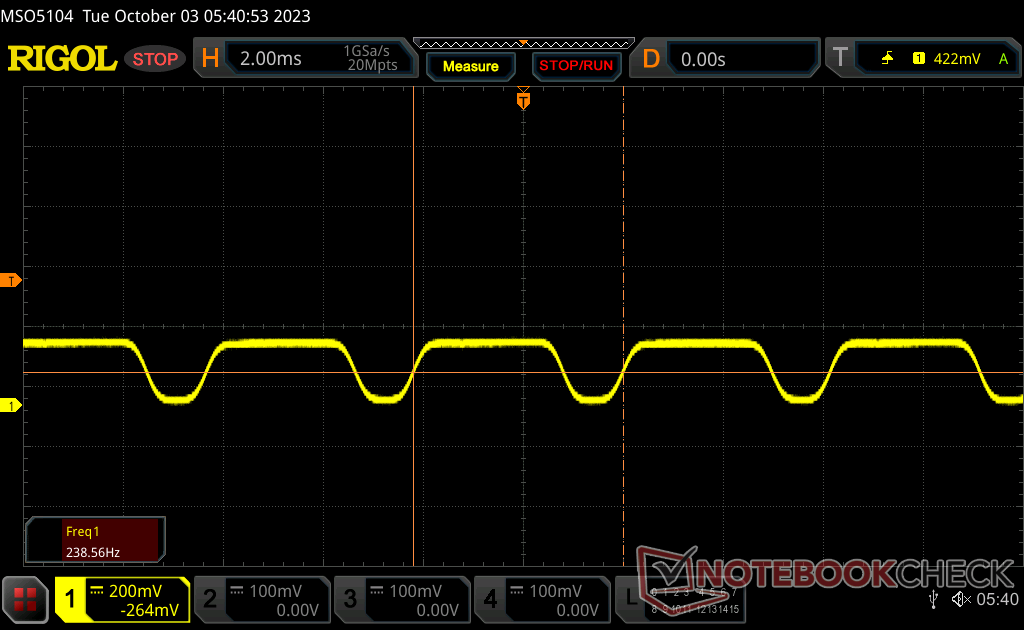
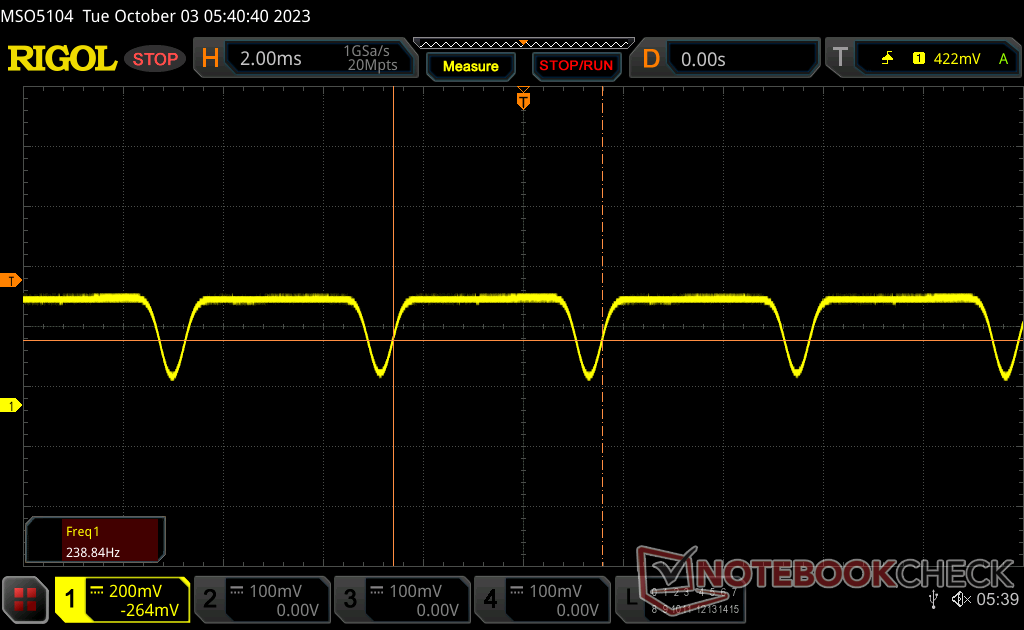
Parpadeo de Pantalla / PWM (Pulse-Width Modulation)
| Parpadeo de Pantalla / PWM detectado | 238.8 Hz | 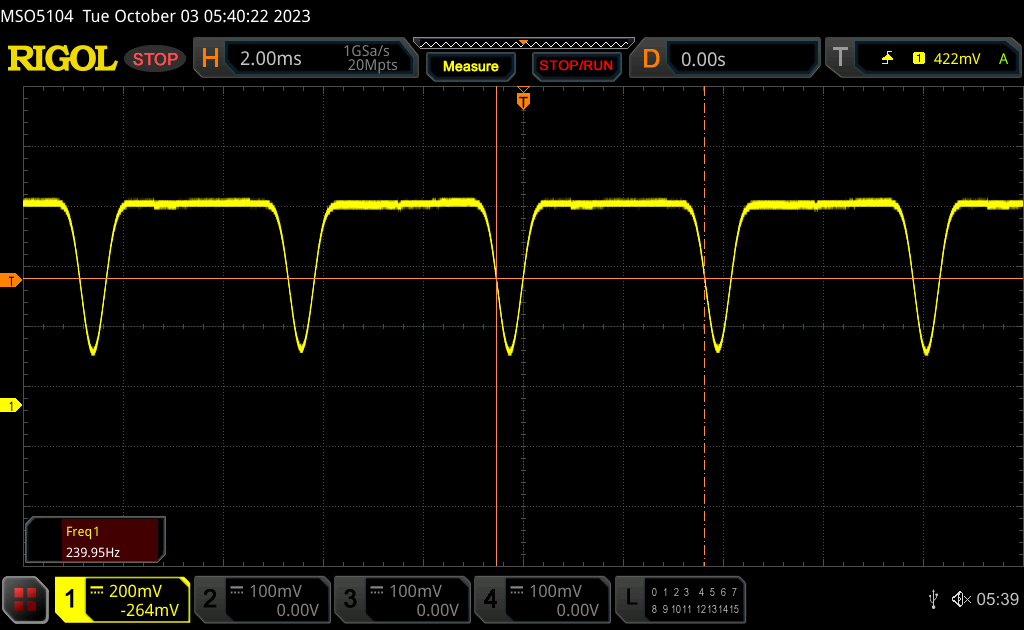 | |
La retroiluminación del display parpadea a 238.8 Hz (seguramente usa PWM - Pulse-Width Modulation) . La frecuencia de 238.8 Hz es relativamente baja, por lo que la gente sensible debería ver parpadeos y padecer fatiga visual por la pantalla (usado al brillo indicado a continuación). Comparación: 52 % de todos los dispositivos testados no usaron PWM para atenuar el display. Si se usó, medimos una media de 7754 (mínimo: 5 - máxmo: 343500) Hz. | |||
En todos los niveles de brillo, incluido el máximo, se produce una modulación constante del ancho de pulso de 238 Hz. Este comportamiento es habitual en las pantallas OLED de smartphones y portátiles.
Rendimiento
Condiciones de ensayo
Pusimos Windows en modo Rendimiento antes de ejecutar las pruebas. Acer no incluye software especializado para ajustes de rendimiento o display, a diferencia de la serie Asus VivoBook.
FreeSync no está soportado en el display interno.
Procesador
El rendimiento multihilo está ligera pero consistentemente por detrás de la mayoría de portátiles con el mismo Ryzen 7 7840U. El reciente AMD Framework Laptop 13.5por ejemplo, funcionaría un 15 por ciento más rápido. La discrepancia se debe al potencial Turbo Core más débil de la CPU en el Acer derivado de su pequeña solución de refrigeración en relación con el gran tamaño de la pantalla de 16 pulgadas. Las puntuaciones de CineBench R15 xT caerían hasta un 21 por ciento con el tiempo, como muestra nuestro gráfico comparativo a continuación.
El rendimiento general sigue siendo más rápido que el Zen 3+ Ryzen 7 7735U en el antiguo Acer Swift Edge SFE16-42-R1GM en un 15 por ciento en cargas monohilo y multihilo a pesar de la ralentización.
Cinebench R15 Multi Loop
Cinebench R23: Multi Core | Single Core
Cinebench R20: CPU (Multi Core) | CPU (Single Core)
Cinebench R15: CPU Multi 64Bit | CPU Single 64Bit
Blender: v2.79 BMW27 CPU
7-Zip 18.03: 7z b 4 | 7z b 4 -mmt1
Geekbench 5.5: Multi-Core | Single-Core
HWBOT x265 Benchmark v2.2: 4k Preset
LibreOffice : 20 Documents To PDF
R Benchmark 2.5: Overall mean
* ... más pequeño es mejor
AIDA64: FP32 Ray-Trace | FPU Julia | CPU SHA3 | CPU Queen | FPU SinJulia | FPU Mandel | CPU AES | CPU ZLib | FP64 Ray-Trace | CPU PhotoWorxx
| Performance rating | |
| Lenovo Slim Pro 9i 16IRP8 | |
| Medio AMD Ryzen 7 7840U | |
| Acer Swift Edge SFE16 Ryzen 7 7840U | |
| Samsung Galaxy Book3 Ultra 16 | |
| Asus VivoBook Pro 16 | |
| Acer Swift Edge SFE16-42-R1GM | |
| Huawei MateBook 16s i7 | |
| AIDA64 / FP32 Ray-Trace | |
| Medio AMD Ryzen 7 7840U (17924 - 25901, n=11) | |
| Lenovo Slim Pro 9i 16IRP8 | |
| Acer Swift Edge SFE16 Ryzen 7 7840U | |
| Asus VivoBook Pro 16 | |
| Samsung Galaxy Book3 Ultra 16 | |
| Acer Swift Edge SFE16-42-R1GM | |
| Huawei MateBook 16s i7 | |
| AIDA64 / FPU Julia | |
| Lenovo Slim Pro 9i 16IRP8 | |
| Medio AMD Ryzen 7 7840U (78360 - 109745, n=11) | |
| Acer Swift Edge SFE16 Ryzen 7 7840U | |
| Asus VivoBook Pro 16 | |
| Acer Swift Edge SFE16-42-R1GM | |
| Samsung Galaxy Book3 Ultra 16 | |
| Huawei MateBook 16s i7 | |
| AIDA64 / CPU Queen | |
| Lenovo Slim Pro 9i 16IRP8 | |
| Asus VivoBook Pro 16 | |
| Samsung Galaxy Book3 Ultra 16 | |
| Medio AMD Ryzen 7 7840U (83206 - 114294, n=10) | |
| Acer Swift Edge SFE16 Ryzen 7 7840U | |
| Huawei MateBook 16s i7 | |
| Acer Swift Edge SFE16-42-R1GM | |
| AIDA64 / FPU SinJulia | |
| Medio AMD Ryzen 7 7840U (11969 - 14822, n=11) | |
| Acer Swift Edge SFE16 Ryzen 7 7840U | |
| Lenovo Slim Pro 9i 16IRP8 | |
| Acer Swift Edge SFE16-42-R1GM | |
| Samsung Galaxy Book3 Ultra 16 | |
| Asus VivoBook Pro 16 | |
| Huawei MateBook 16s i7 | |
| AIDA64 / FPU Mandel | |
| Medio AMD Ryzen 7 7840U (40720 - 58482, n=11) | |
| Lenovo Slim Pro 9i 16IRP8 | |
| Acer Swift Edge SFE16 Ryzen 7 7840U | |
| Acer Swift Edge SFE16-42-R1GM | |
| Asus VivoBook Pro 16 | |
| Samsung Galaxy Book3 Ultra 16 | |
| Huawei MateBook 16s i7 | |
| AIDA64 / CPU ZLib | |
| Lenovo Slim Pro 9i 16IRP8 | |
| Samsung Galaxy Book3 Ultra 16 | |
| Asus VivoBook Pro 16 | |
| Medio AMD Ryzen 7 7840U (801 - 1047, n=11) | |
| Acer Swift Edge SFE16 Ryzen 7 7840U | |
| Huawei MateBook 16s i7 | |
| Acer Swift Edge SFE16-42-R1GM | |
| AIDA64 / FP64 Ray-Trace | |
| Medio AMD Ryzen 7 7840U (9347 - 13846, n=11) | |
| Lenovo Slim Pro 9i 16IRP8 | |
| Acer Swift Edge SFE16 Ryzen 7 7840U | |
| Asus VivoBook Pro 16 | |
| Samsung Galaxy Book3 Ultra 16 | |
| Acer Swift Edge SFE16-42-R1GM | |
| Huawei MateBook 16s i7 | |
| AIDA64 / CPU PhotoWorxx | |
| Lenovo Slim Pro 9i 16IRP8 | |
| Samsung Galaxy Book3 Ultra 16 | |
| Huawei MateBook 16s i7 | |
| Medio AMD Ryzen 7 7840U (26206 - 38173, n=11) | |
| Acer Swift Edge SFE16 Ryzen 7 7840U | |
| Acer Swift Edge SFE16-42-R1GM | |
| Asus VivoBook Pro 16 | |
Rendimiento del sistema
CrossMark: Overall | Productivity | Creativity | Responsiveness
| PCMark 10 / Score | |
| Lenovo Slim Pro 9i 16IRP8 | |
| Acer Swift Edge SFE16 Ryzen 7 7840U | |
| Samsung Galaxy Book3 Ultra 16 | |
| Asus VivoBook Pro 16 | |
| Medio AMD Ryzen 7 7840U, AMD Radeon 780M (5866 - 7157, n=10) | |
| Huawei MateBook 16s i7 | |
| Acer Swift Edge SFE16-42-R1GM | |
| PCMark 10 / Essentials | |
| Huawei MateBook 16s i7 | |
| Lenovo Slim Pro 9i 16IRP8 | |
| Acer Swift Edge SFE16 Ryzen 7 7840U | |
| Samsung Galaxy Book3 Ultra 16 | |
| Medio AMD Ryzen 7 7840U, AMD Radeon 780M (9068 - 11081, n=10) | |
| Asus VivoBook Pro 16 | |
| Acer Swift Edge SFE16-42-R1GM | |
| PCMark 10 / Productivity | |
| Acer Swift Edge SFE16 Ryzen 7 7840U | |
| Lenovo Slim Pro 9i 16IRP8 | |
| Acer Swift Edge SFE16-42-R1GM | |
| Asus VivoBook Pro 16 | |
| Medio AMD Ryzen 7 7840U, AMD Radeon 780M (7323 - 10099, n=10) | |
| Samsung Galaxy Book3 Ultra 16 | |
| Huawei MateBook 16s i7 | |
| PCMark 10 / Digital Content Creation | |
| Lenovo Slim Pro 9i 16IRP8 | |
| Samsung Galaxy Book3 Ultra 16 | |
| Asus VivoBook Pro 16 | |
| Acer Swift Edge SFE16 Ryzen 7 7840U | |
| Medio AMD Ryzen 7 7840U, AMD Radeon 780M (7204 - 8987, n=10) | |
| Acer Swift Edge SFE16-42-R1GM | |
| Huawei MateBook 16s i7 | |
| CrossMark / Overall | |
| Huawei MateBook 16s i7 | |
| Acer Swift Edge SFE16 Ryzen 7 7840U | |
| Lenovo Slim Pro 9i 16IRP8 | |
| Asus VivoBook Pro 16 | |
| Samsung Galaxy Book3 Ultra 16 | |
| Medio AMD Ryzen 7 7840U, AMD Radeon 780M (1256 - 1804, n=10) | |
| Acer Swift Edge SFE16-42-R1GM | |
| CrossMark / Productivity | |
| Huawei MateBook 16s i7 | |
| Acer Swift Edge SFE16 Ryzen 7 7840U | |
| Asus VivoBook Pro 16 | |
| Lenovo Slim Pro 9i 16IRP8 | |
| Medio AMD Ryzen 7 7840U, AMD Radeon 780M (1261 - 1798, n=10) | |
| Samsung Galaxy Book3 Ultra 16 | |
| Acer Swift Edge SFE16-42-R1GM | |
| CrossMark / Creativity | |
| Lenovo Slim Pro 9i 16IRP8 | |
| Huawei MateBook 16s i7 | |
| Acer Swift Edge SFE16 Ryzen 7 7840U | |
| Asus VivoBook Pro 16 | |
| Samsung Galaxy Book3 Ultra 16 | |
| Medio AMD Ryzen 7 7840U, AMD Radeon 780M (1251 - 1835, n=10) | |
| Acer Swift Edge SFE16-42-R1GM | |
| CrossMark / Responsiveness | |
| Huawei MateBook 16s i7 | |
| Acer Swift Edge SFE16 Ryzen 7 7840U | |
| Asus VivoBook Pro 16 | |
| Samsung Galaxy Book3 Ultra 16 | |
| Lenovo Slim Pro 9i 16IRP8 | |
| Medio AMD Ryzen 7 7840U, AMD Radeon 780M (1082 - 1775, n=10) | |
| Acer Swift Edge SFE16-42-R1GM | |
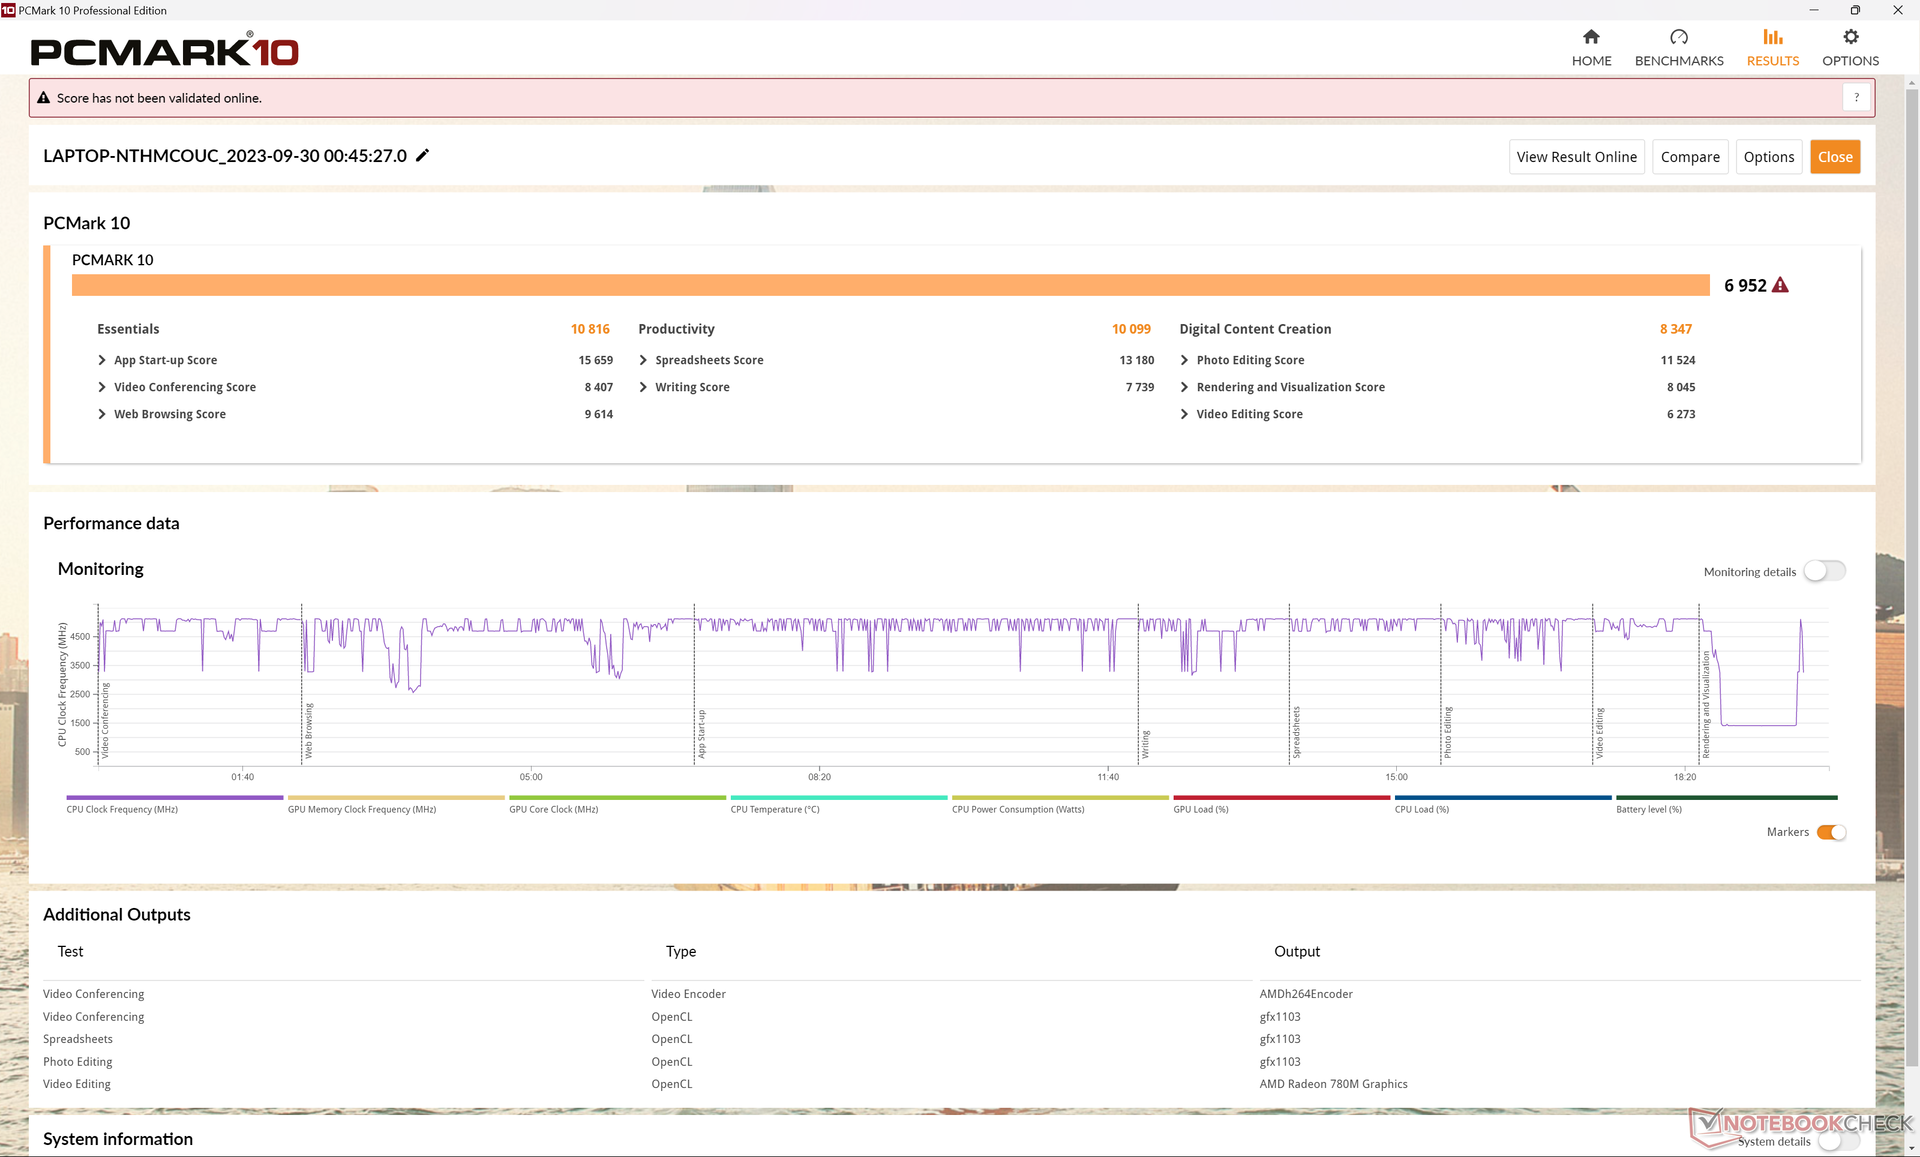
| PCMark 10 Score | 6952 puntos | |
ayuda | ||
| AIDA64 / Memory Copy | |
| Lenovo Slim Pro 9i 16IRP8 | |
| Samsung Galaxy Book3 Ultra 16 | |
| Huawei MateBook 16s i7 | |
| Acer Swift Edge SFE16 Ryzen 7 7840U | |
| Medio AMD Ryzen 7 7840U (43255 - 70532, n=12) | |
| Acer Swift Edge SFE16-42-R1GM | |
| Asus VivoBook Pro 16 | |
| AIDA64 / Memory Read | |
| Lenovo Slim Pro 9i 16IRP8 | |
| Samsung Galaxy Book3 Ultra 16 | |
| Huawei MateBook 16s i7 | |
| Acer Swift Edge SFE16 Ryzen 7 7840U | |
| Medio AMD Ryzen 7 7840U (37399 - 61602, n=11) | |
| Acer Swift Edge SFE16-42-R1GM | |
| Asus VivoBook Pro 16 | |
| AIDA64 / Memory Write | |
| Acer Swift Edge SFE16 Ryzen 7 7840U | |
| Lenovo Slim Pro 9i 16IRP8 | |
| Samsung Galaxy Book3 Ultra 16 | |
| Medio AMD Ryzen 7 7840U (46797 - 92289, n=13) | |
| Huawei MateBook 16s i7 | |
| Acer Swift Edge SFE16-42-R1GM | |
| Asus VivoBook Pro 16 | |
| AIDA64 / Memory Latency | |
| Medio AMD Ryzen 7 7840U (90 - 137.2, n=12) | |
| Acer Swift Edge SFE16 Ryzen 7 7840U | |
| Huawei MateBook 16s i7 | |
| Lenovo Slim Pro 9i 16IRP8 | |
| Acer Swift Edge SFE16-42-R1GM | |
| Samsung Galaxy Book3 Ultra 16 | |
| Asus VivoBook Pro 16 | |
* ... más pequeño es mejor
Latencia del CPD
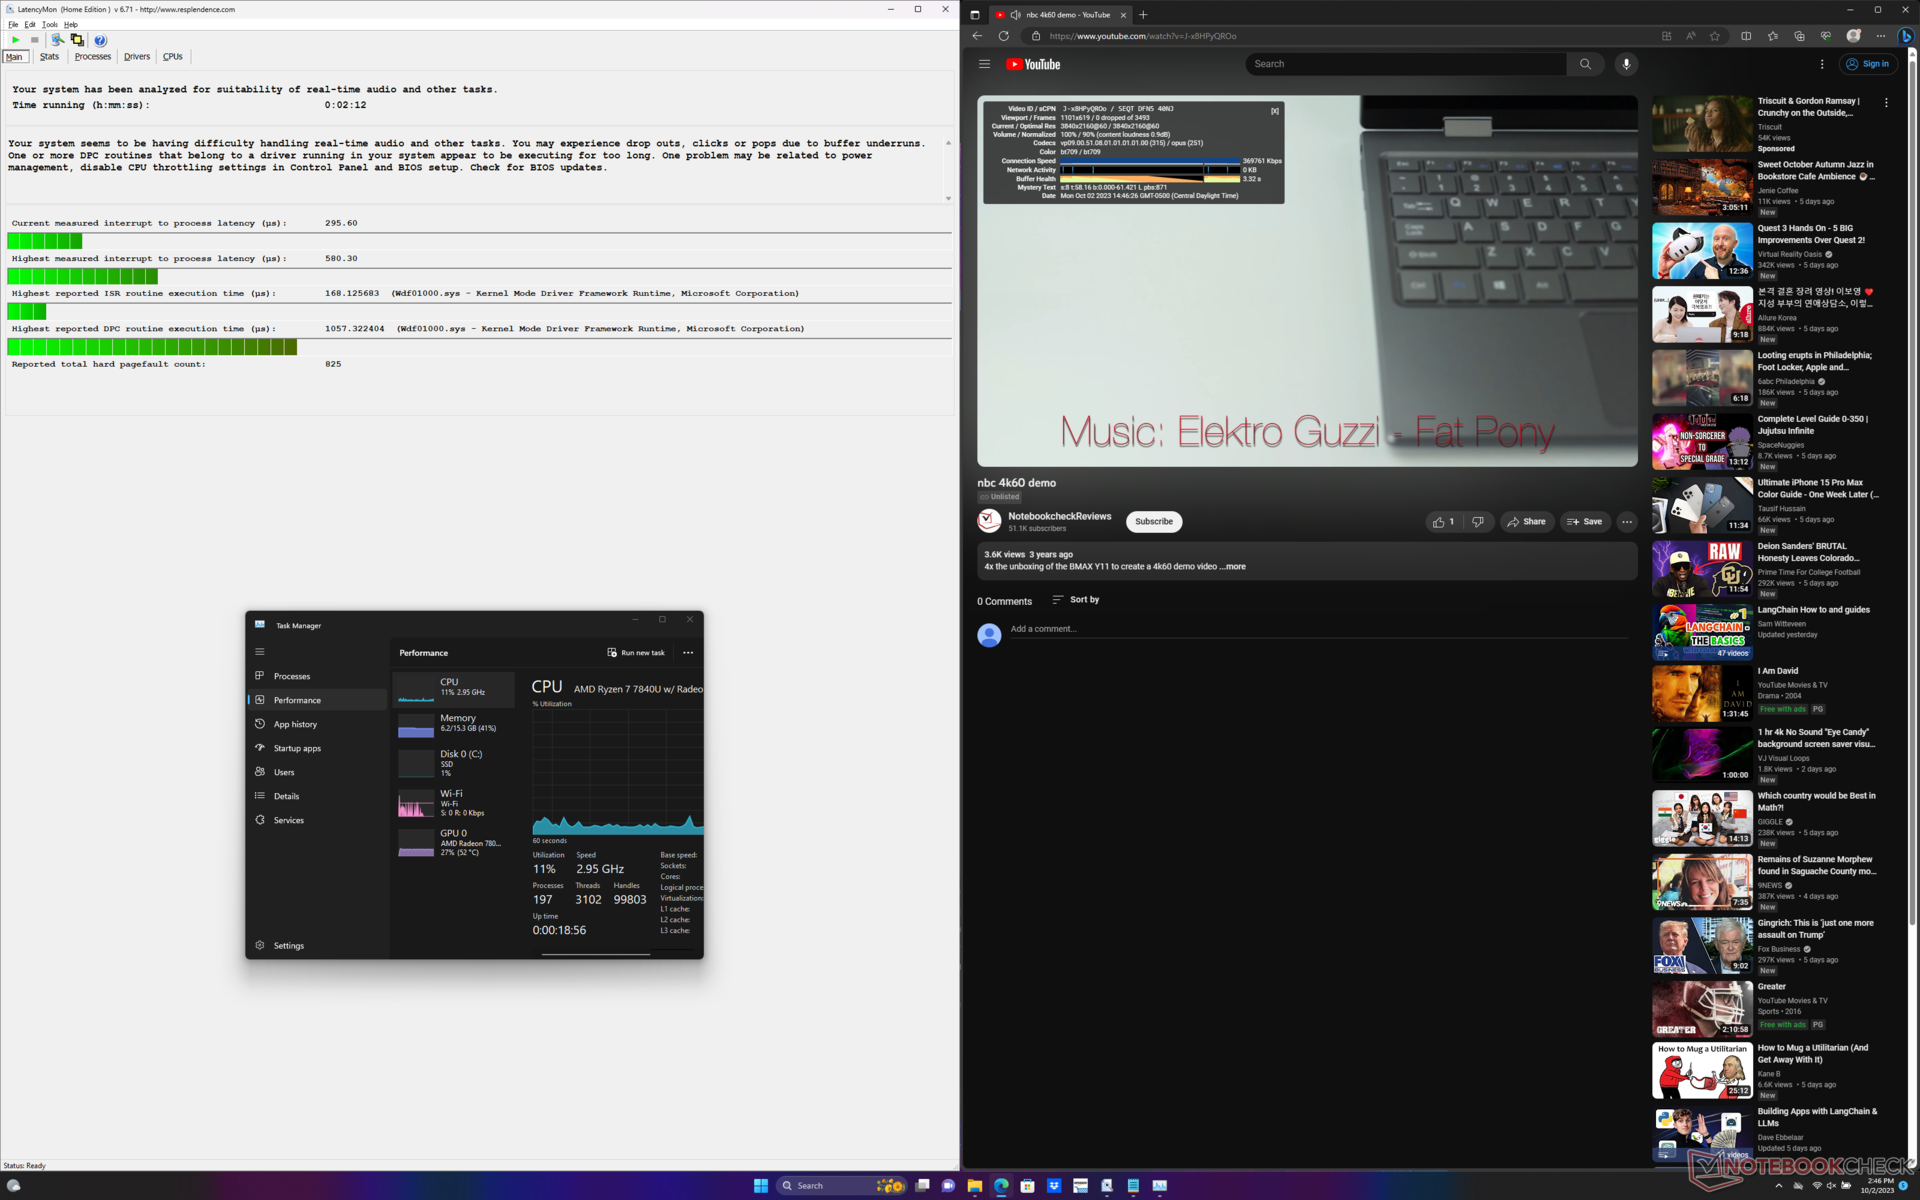
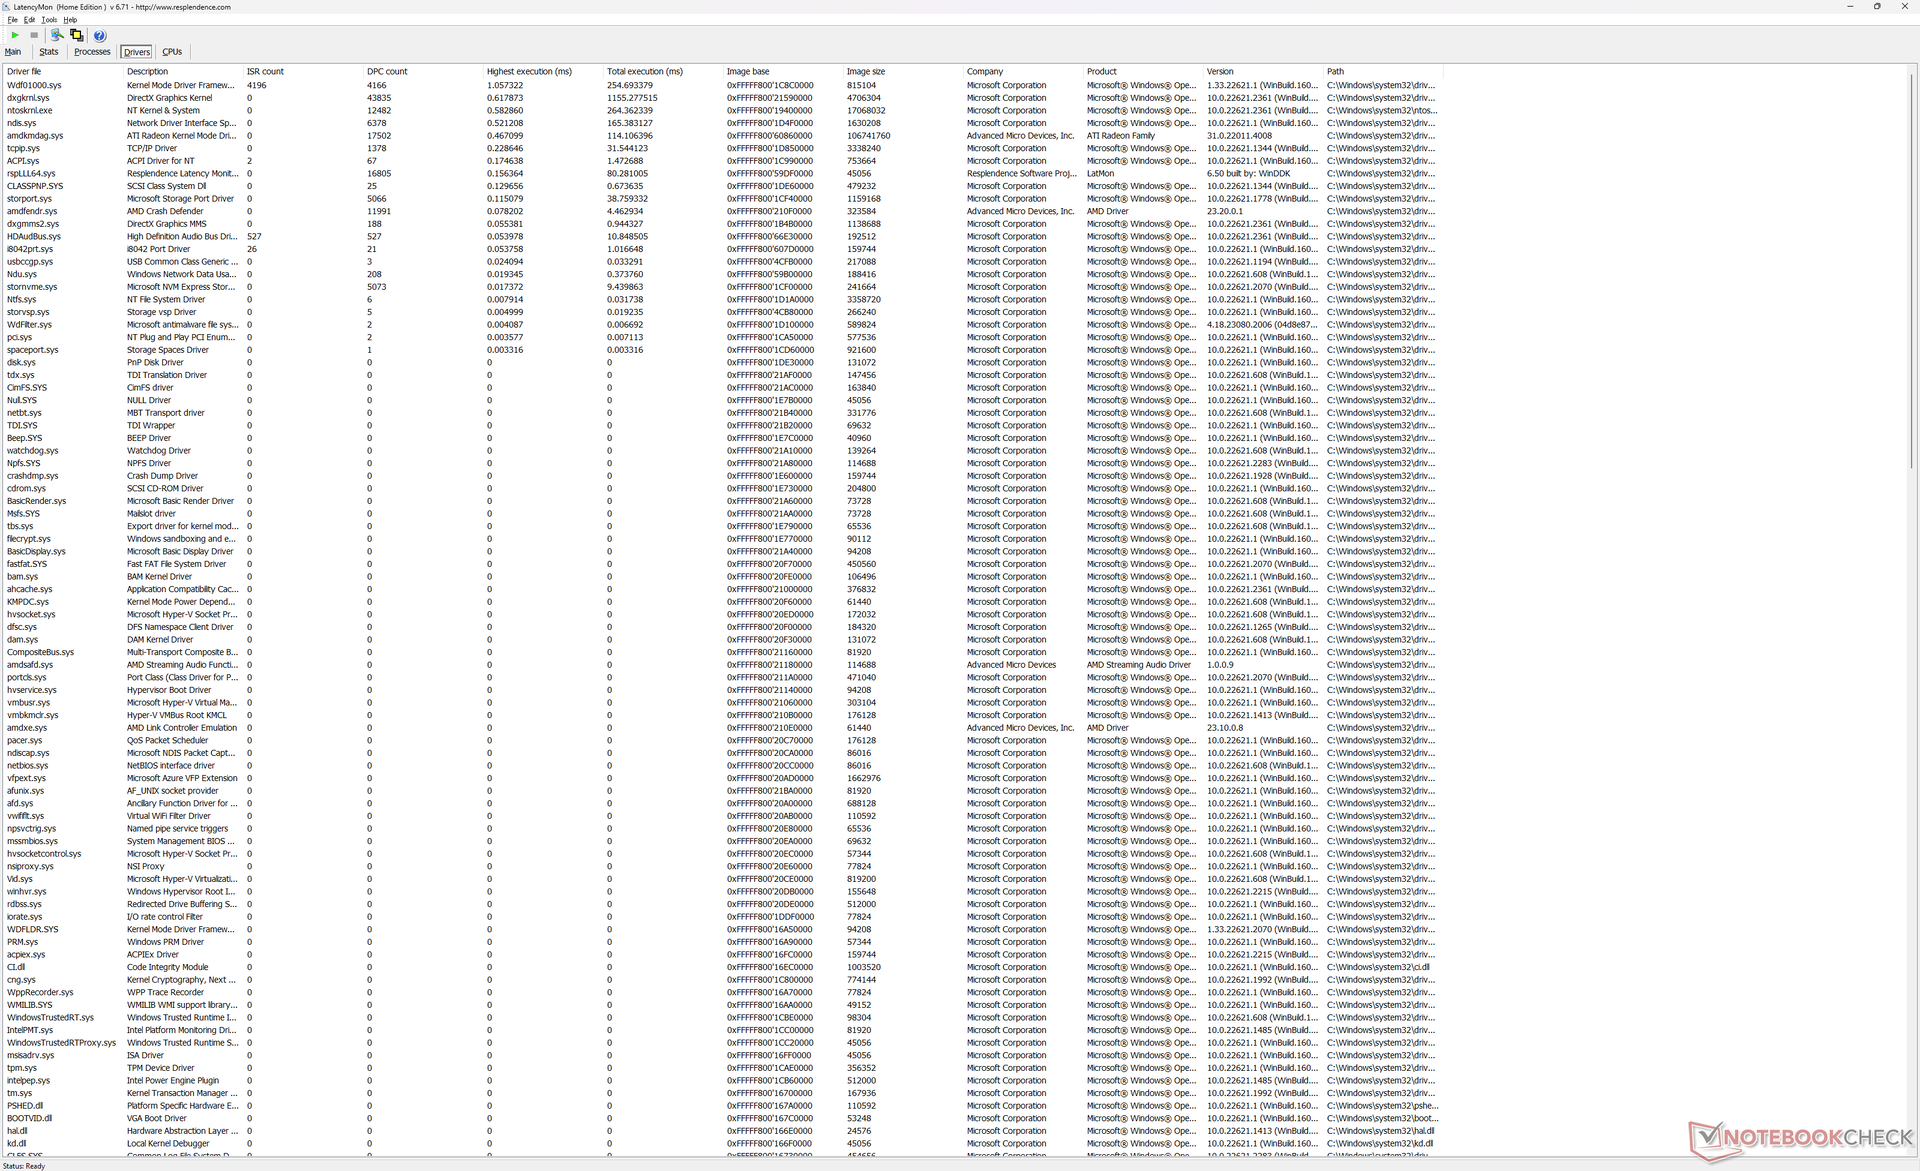
LatencyMon no revela problemas importantes de CPD al abrir varias pestañas de nuestra página de inicio. la reproducción de vídeo 4K a 60 FPS también es perfecta y no se registran caídas de fotogramas.
| DPC Latencies / LatencyMon - interrupt to process latency (max), Web, Youtube, Prime95 | |
| Samsung Galaxy Book3 Ultra 16 | |
| Acer Swift Edge SFE16-42-R1GM | |
| Asus VivoBook Pro 16 | |
| Lenovo Slim Pro 9i 16IRP8 | |
| Acer Swift Edge SFE16 Ryzen 7 7840U | |
* ... más pequeño es mejor
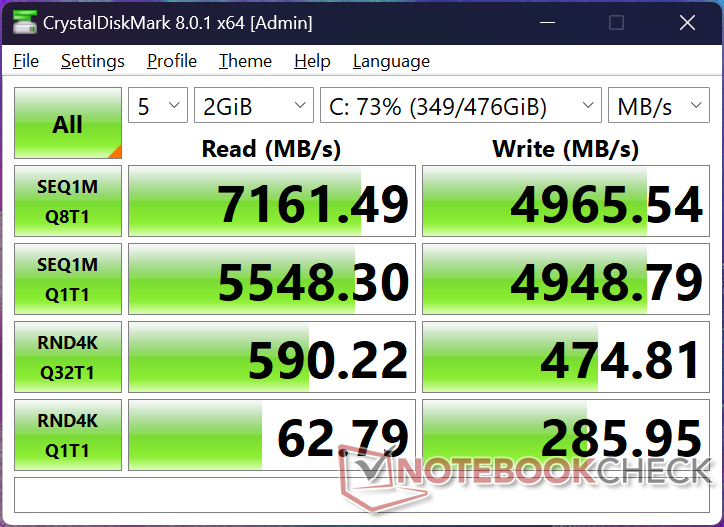
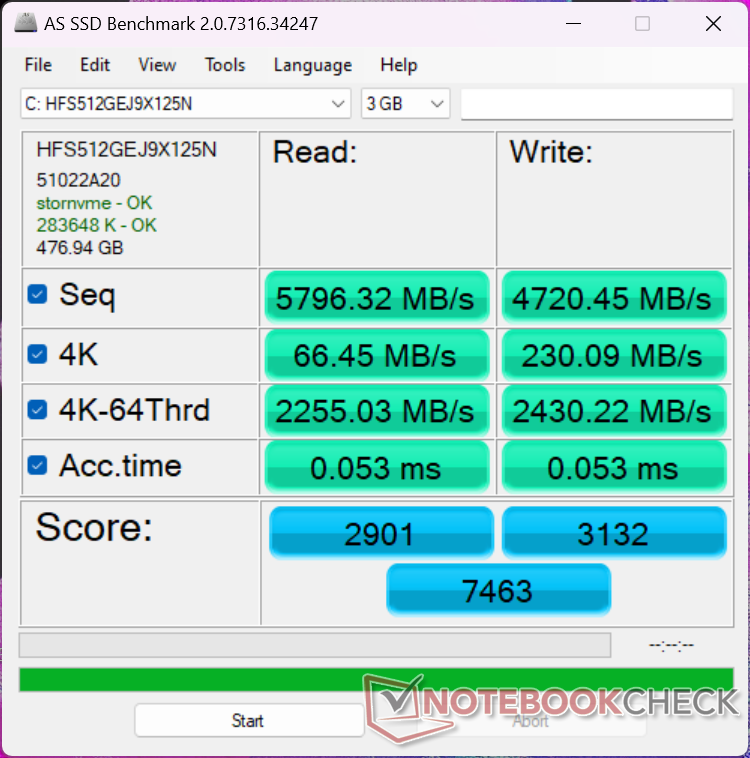
Dispositivos de almacenamiento
Nuestra unidad de prueba se suministra con un SK hynix HFS512GEJ9X125N que, sobre el papel, rivaliza con la Samsung PM9A1. En realidad, sin embargo, la unidad en nuestra unidad de aceleración a tan bajo como 3500 MB / s después de sólo un par de minutos de estrés como se muestra en el gráfico siguiente. Este comportamiento también se observó en nuestro antiguo Swift Edge 16, lo que sugiere que las unidades sufren de una refrigeración o disipación de calor inadecuadas.

| Drive Performance rating - Percent | |
| Acer Swift Edge SFE16 Ryzen 7 7840U | |
| Samsung Galaxy Book3 Ultra 16 | |
| Acer Swift Edge SFE16-42-R1GM | |
| Lenovo Slim Pro 9i 16IRP8 | |
| Huawei MateBook 16s i7 | |
| Asus VivoBook Pro 16 | |
* ... más pequeño es mejor
Disk Throttling: DiskSpd Read Loop, Queue Depth 8
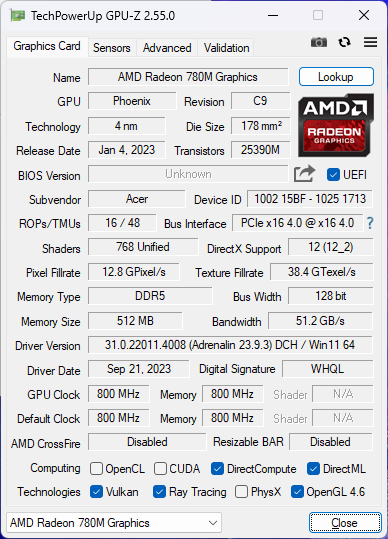
Rendimiento de la GPU
La 2022 Radeon 680M ya suponía una enorme mejora con respecto a la anterior serie RX Vega, por lo que la 2023 Radeon 780M es más bien una actualización menor con mejoras marginales. En este caso, la Radeon 780M de nuestro Acer es unos pocos puntos porcentuales más rápida que la 680M en la configuración Zen 3+.
Configurar el sistema en modo Equilibrado en lugar de en modo Rendimiento o utilizar la batería afectará al rendimiento general, como se muestra en la tabla de resultados de Fire Strike que aparece a continuación.
| Perfil de energía | Puntuación gráfica | Puntuación física | Puntuación combinada |
| Modo Rendimiento | 7156 | 20127 | 2511 |
| Modo equilibrado | 4682 (-37%) | 15022 (-25%) | 1726 (-31%) |
| Batería | 4982 (-33%) | 14856 (-26%) | 1734 (-31%) |
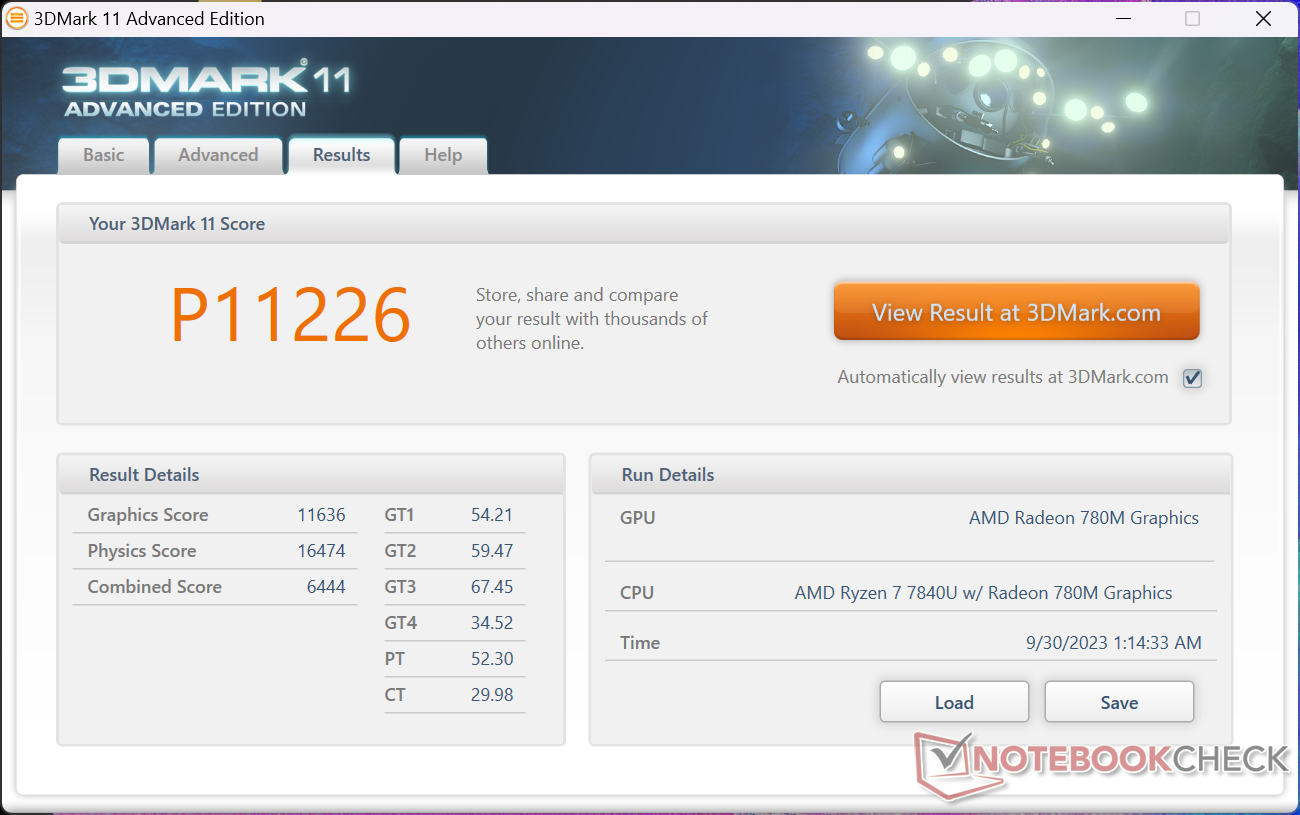
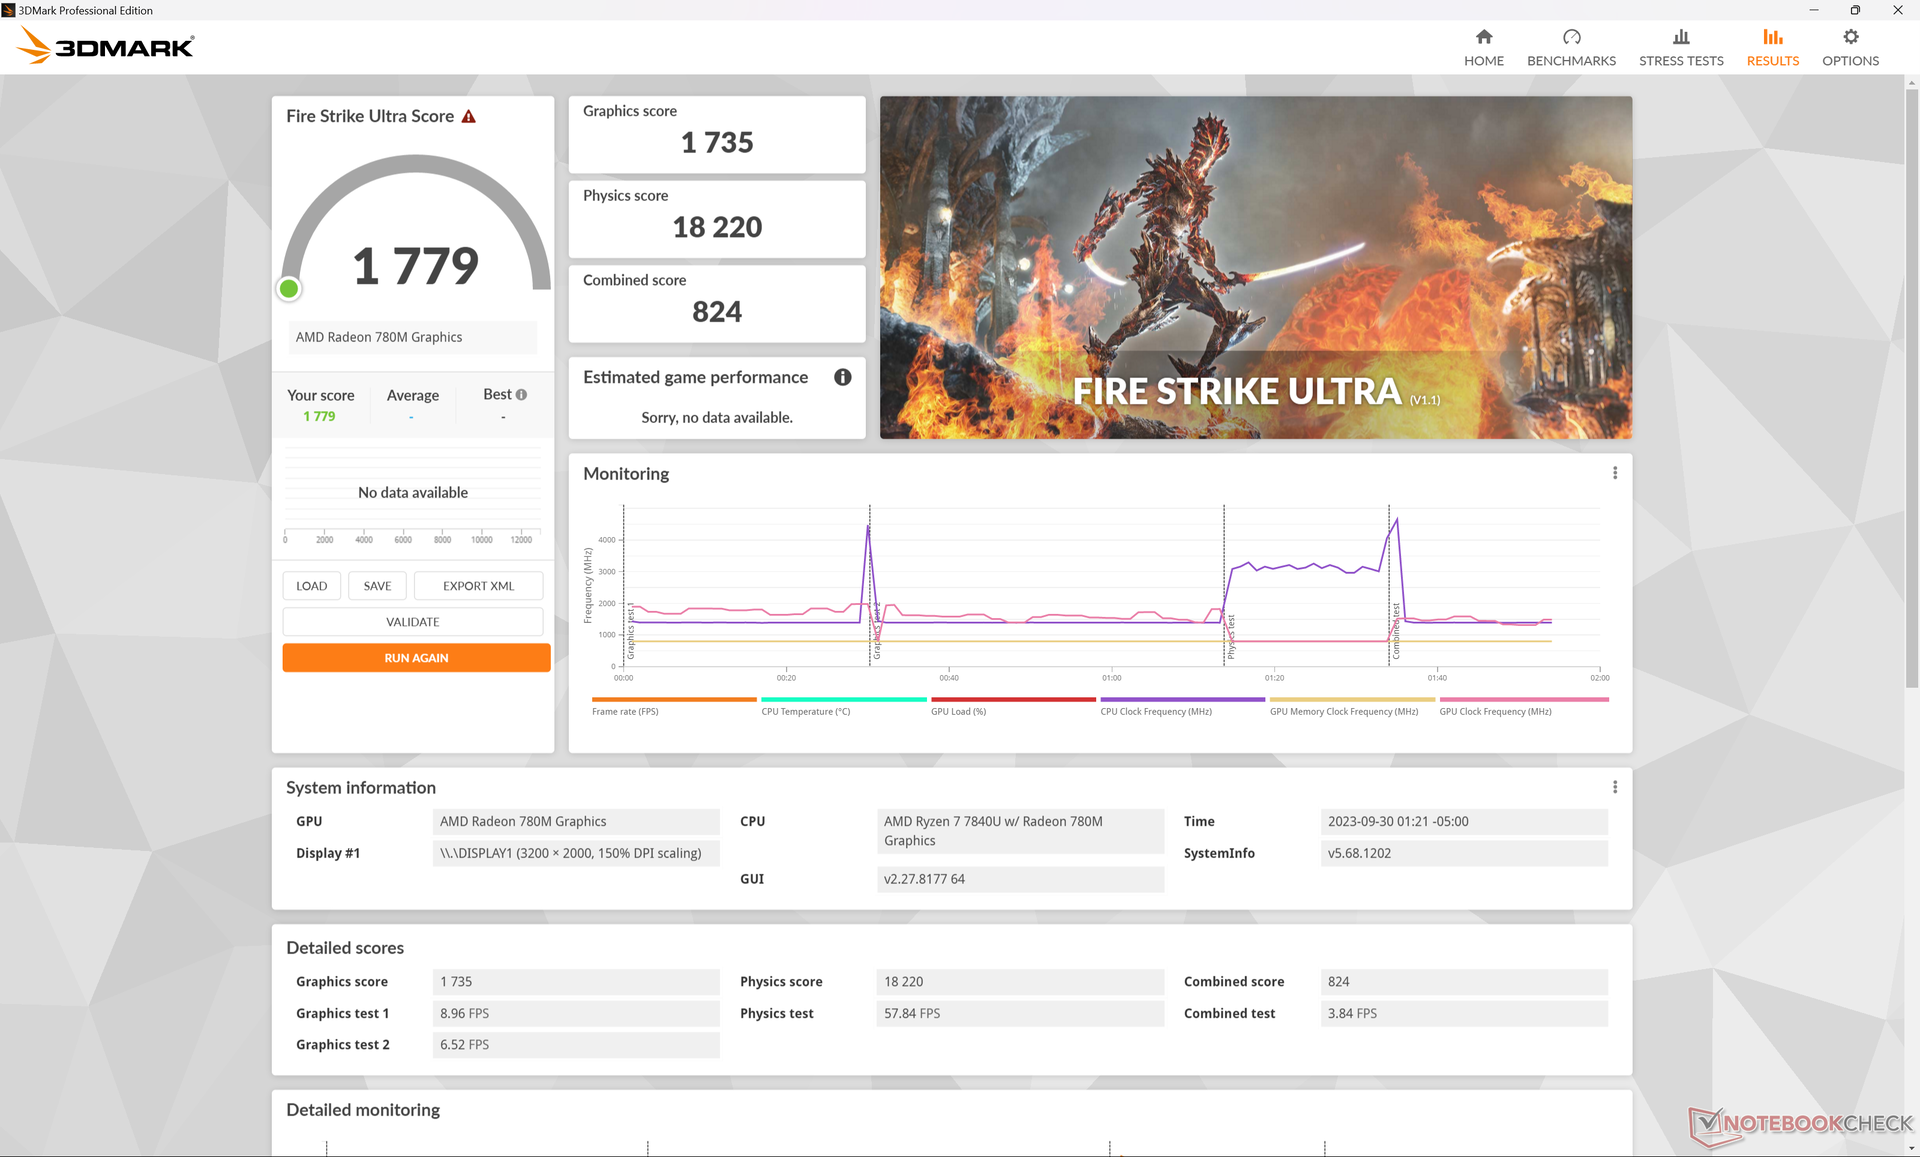
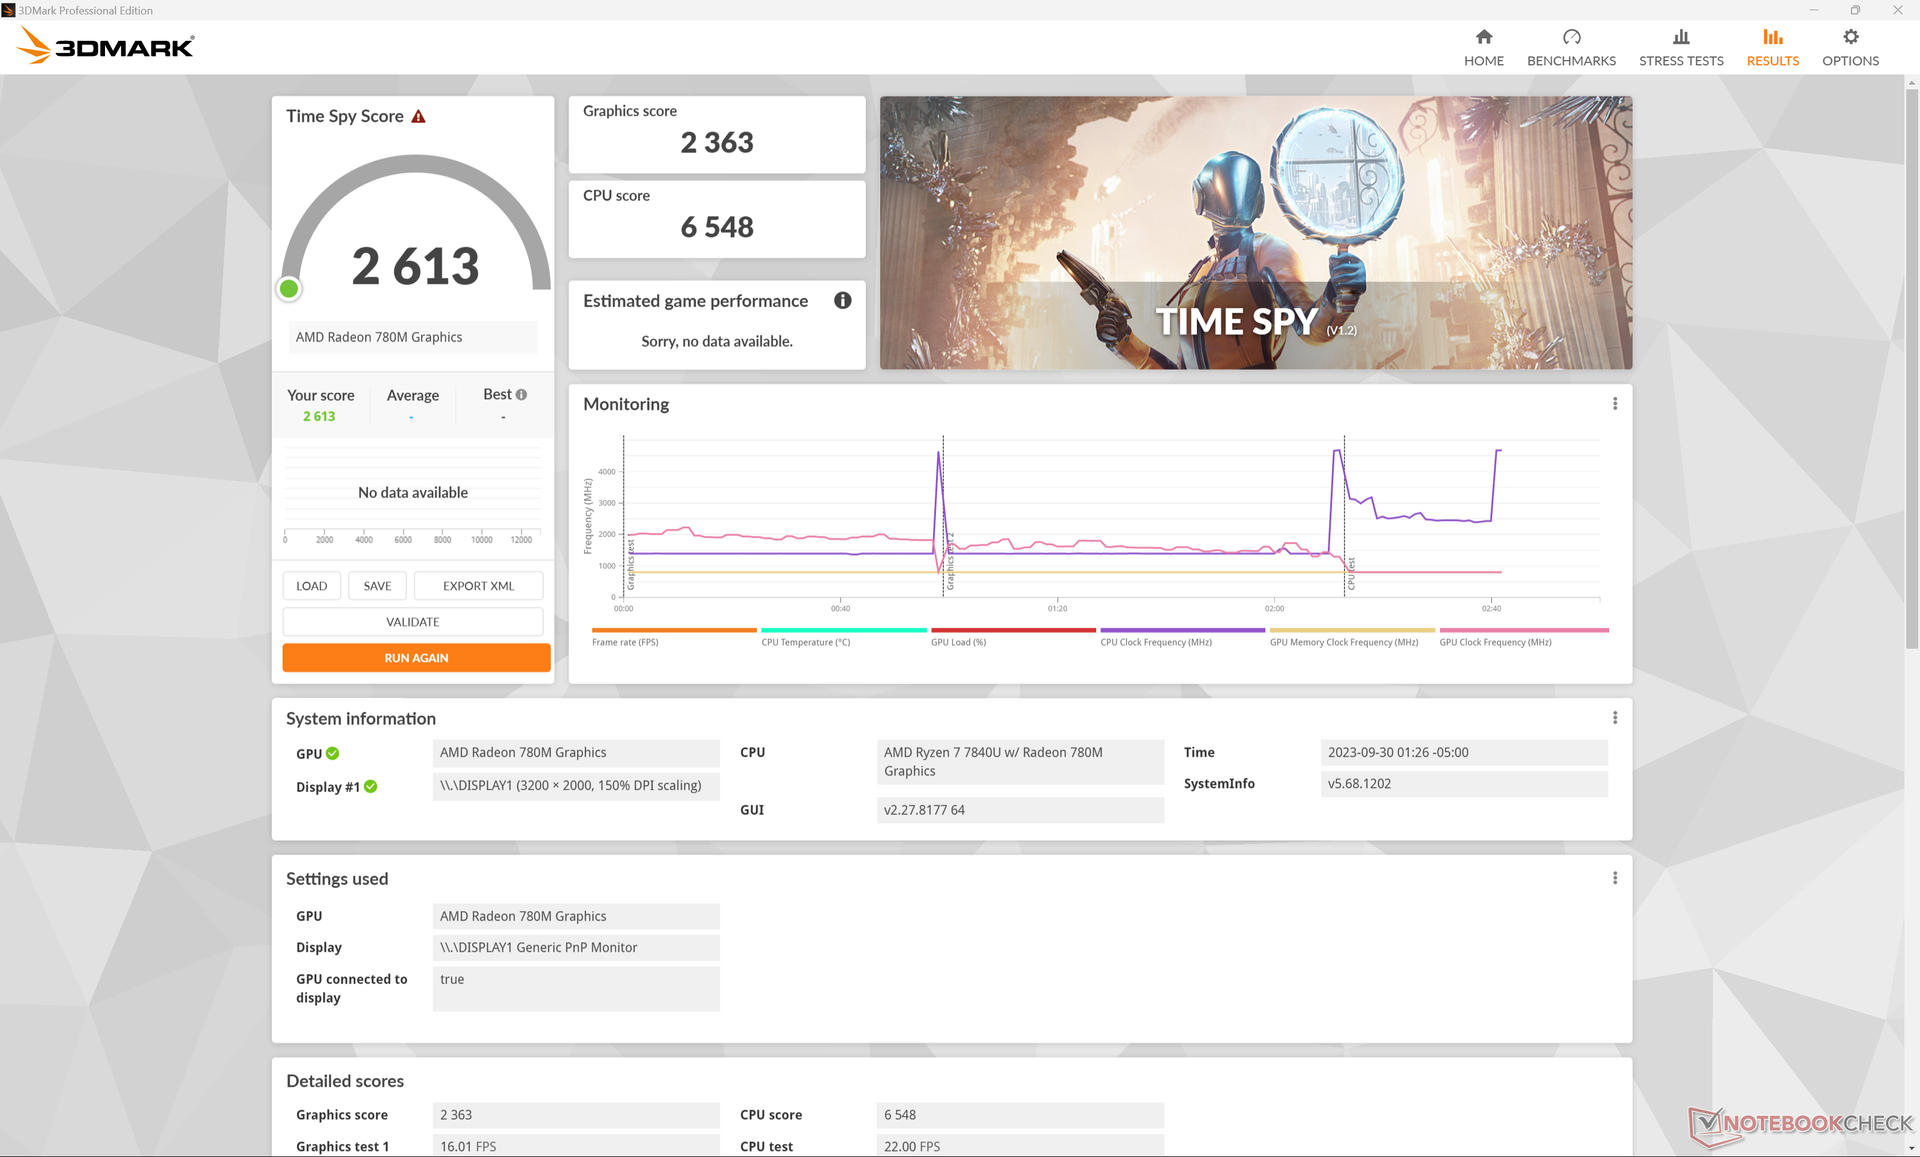
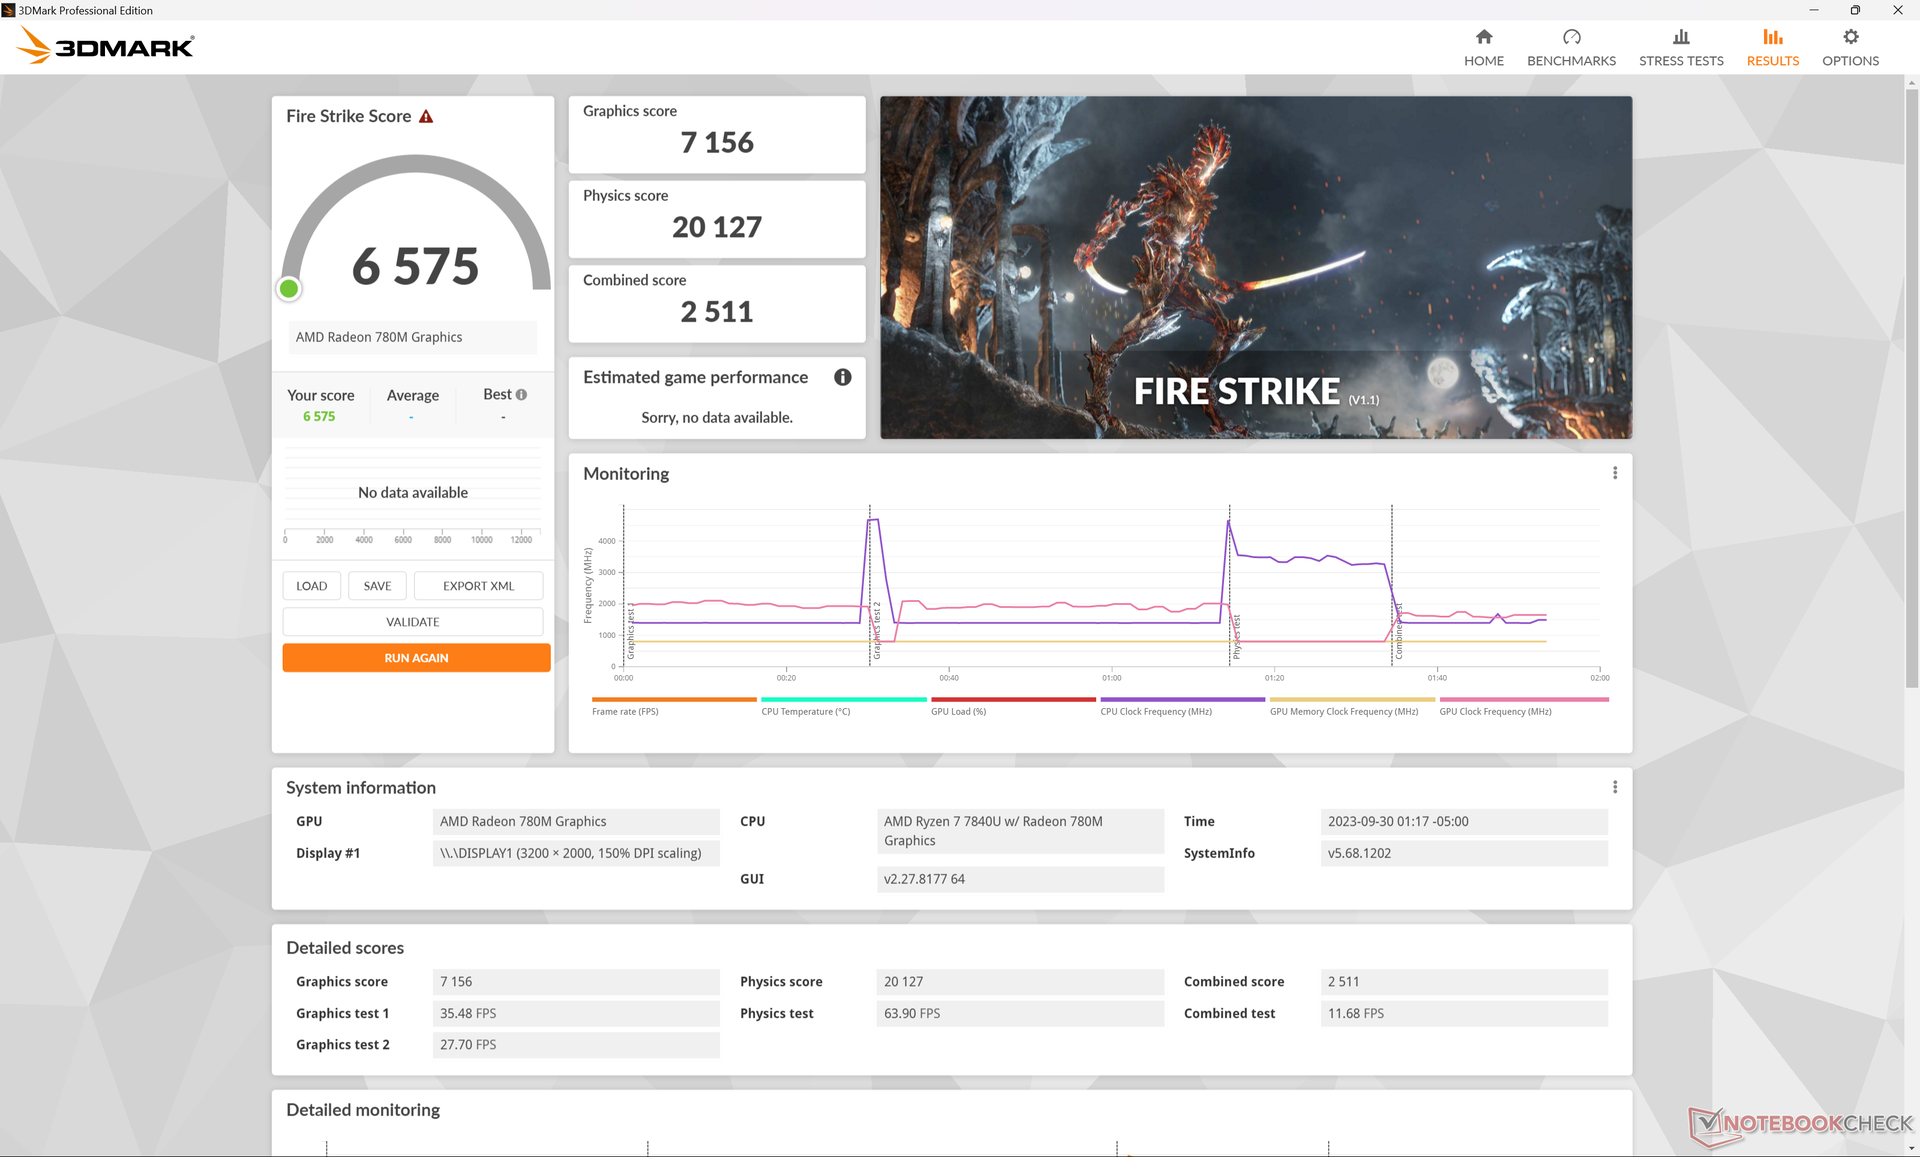
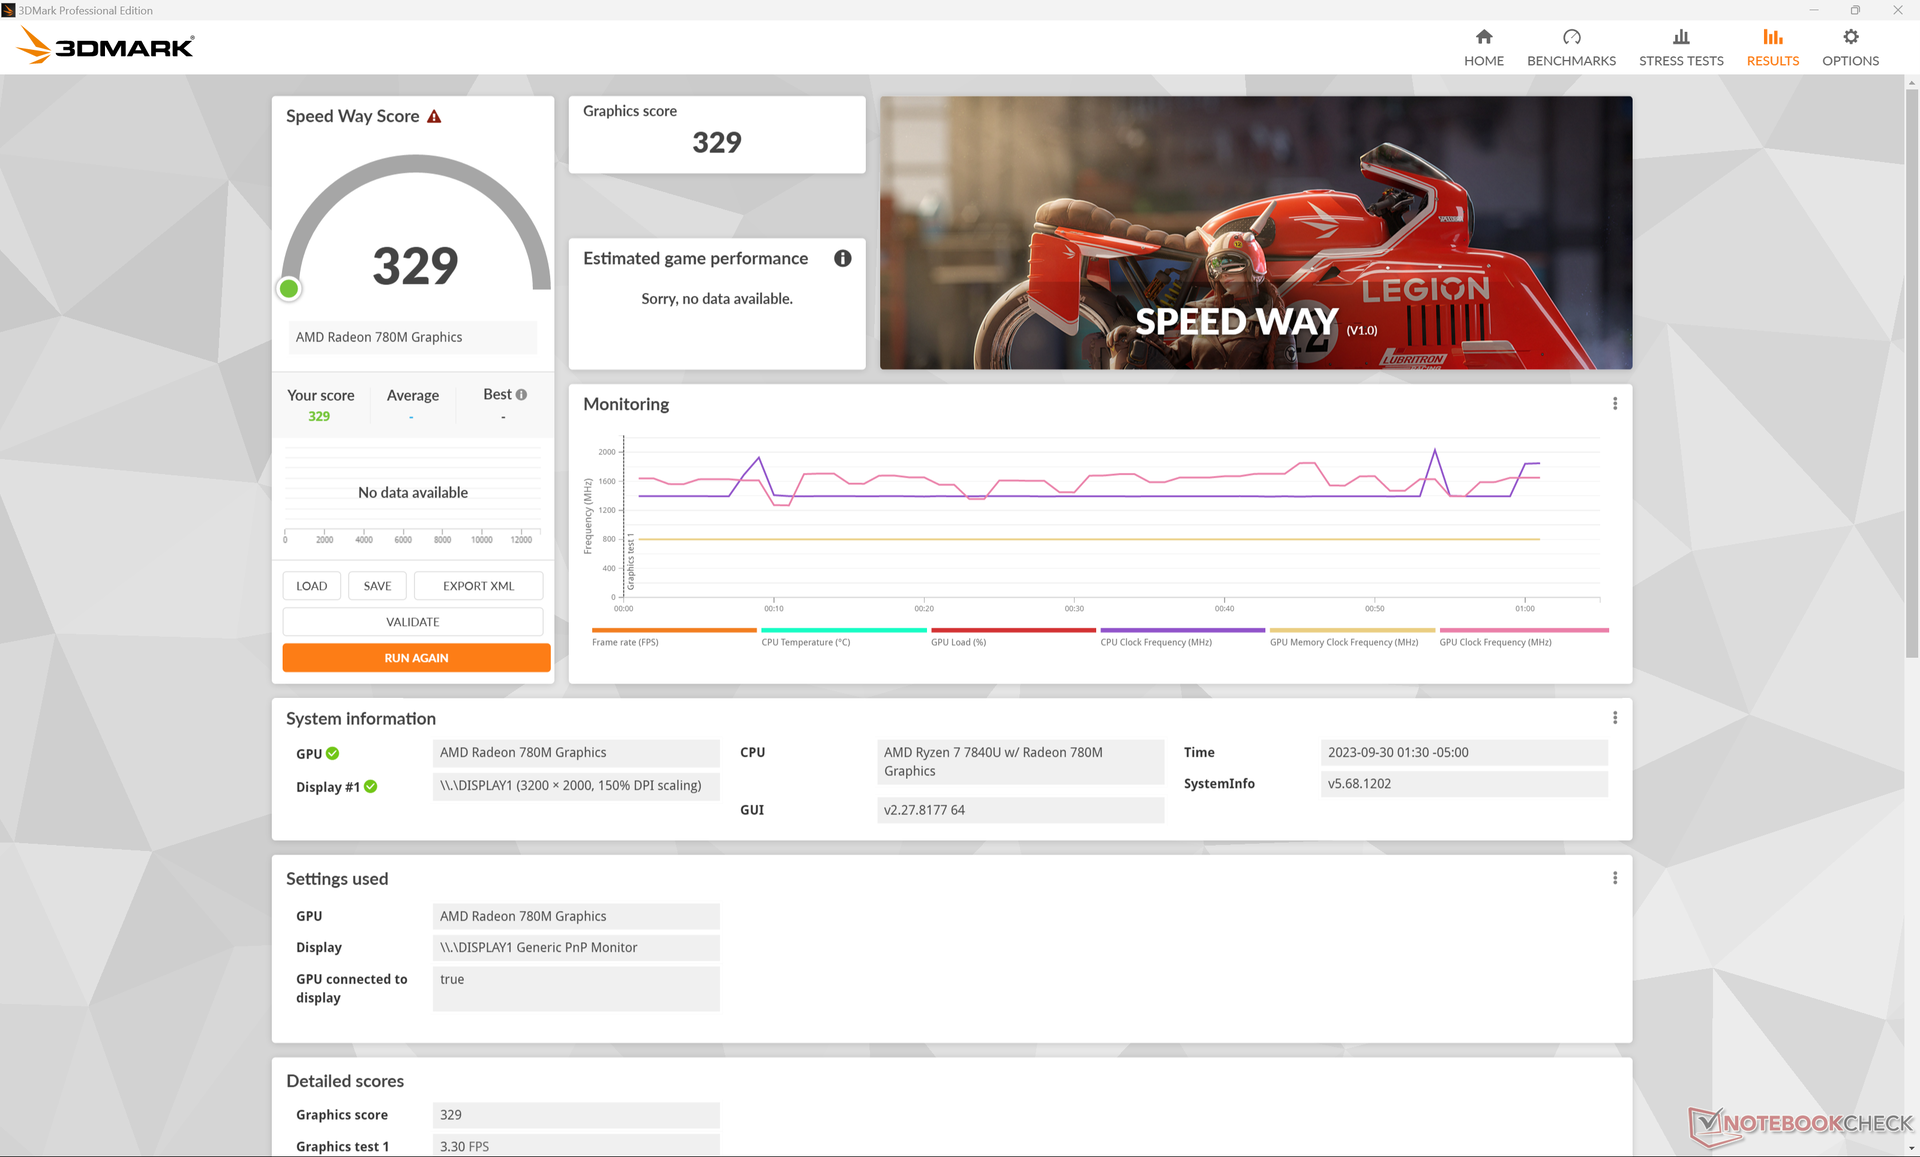
| 3DMark 11 Performance | 11226 puntos | |
| 3DMark Fire Strike Score | 6575 puntos | |
| 3DMark Time Spy Score | 2613 puntos | |
ayuda | ||
* ... más pequeño es mejor
El rendimiento de la GPU también se ralentiza con el tiempo, de forma similar a lo que observamos al ejecutar la prueba en bucle CineBench R15 xT. Por ejemplo, en ralentí con Witcher 3por ejemplo, las frecuencias de cuadro empezaban en 45 FPS antes de ralentizarse y estabilizarse por debajo de los 30 FPS.
Witcher 3 FPS Chart
| bajo | medio | alto | ultra | |
|---|---|---|---|---|
| GTA V (2015) | 139.3 | 53.9 | 21 | |
| The Witcher 3 (2015) | 109.8 | 36.1 | 20.4 | |
| Dota 2 Reborn (2015) | 128.1 | 101.5 | 66.8 | 61.4 |
| Final Fantasy XV Benchmark (2018) | 50.5 | 27.4 | 21.2 | |
| X-Plane 11.11 (2018) | 49.1 | 37 | 30.3 | |
| Far Cry 5 (2018) | 53 | 28 | 26 | 24 |
| Strange Brigade (2018) | 139.8 | 60.6 | 49.5 | 41.3 |
| Cyberpunk 2077 1.6 (2022) | 26.7 | 20.8 | 17.3 | 15.9 |
| Tiny Tina's Wonderlands (2022) | 34.3 | 28.4 | 18.6 | 16.5 |
| F1 22 (2022) | 65.4 | 62.1 | 42.6 | 9.92 |
Emisiones
Ruido del sistema
El ruido del ventilador no ha cambiado realmente con respecto a la configuración del Zen 3+ a pesar de que el número de ventiladores ha cambiado. Esto es desafortunado ya que el ventilador de nuestra unidad de pruebas Zen 3+ pulsaba frecuente y ruidosamente en cuanto se introducían cargas más pesadas y nuestra unidad Zen 4 no sería diferente. El ruido del ventilador ronda regularmente los 28 dB(A) contra un fondo silencioso de 24 dB(A) cuando se navega por internet o se hace streaming mientras que las cargas más pesadas se estabilizan en 41 dB(A) como antes.
Ruido
| Ocioso |
| 24.1 / 24.3 / 28 dB(A) |
| Carga |
| 41 / 40.9 dB(A) |
 | ||
30 dB silencioso 40 dB(A) audible 50 dB(A) ruidosamente alto |
||
min: | ||
| Acer Swift Edge SFE16 Ryzen 7 7840U Radeon 780M, R7 7840U, SK hynix HFS512GEJ9X125N | Acer Swift Edge SFE16-42-R1GM Radeon 680M, R7 7735U, Micron 3400 1TB MTFDKBA1T0TFH | Lenovo Slim Pro 9i 16IRP8 GeForce RTX 4050 Laptop GPU, i9-13905H, Samsung PM9A1 MZVL21T0HCLR | Asus VivoBook Pro 16 GeForce RTX 3050 Ti Laptop GPU, i7-12700H, Intel SSD 670p SSDPEKNU010TZ | Samsung Galaxy Book3 Ultra 16 GeForce RTX 4050 Laptop GPU, i7-13700H, Samsung PM9A1 MZVL2512HCJQ | Huawei MateBook 16s i7 Iris Xe G7 96EUs, i7-12700H, Silicon Motion PCIe-8 SSD | |
|---|---|---|---|---|---|---|
| Noise | -7% | -1% | -15% | -3% | 4% | |
| apagado / medio ambiente * (dB) | 23.4 | 25.7 -10% | 22.7 3% | 25.2 -8% | 25 -7% | 24 -3% |
| Idle Minimum * (dB) | 24.1 | 25.7 -7% | 22.7 6% | 25.2 -5% | 26 -8% | 24 -0% |
| Idle Average * (dB) | 24.3 | 27 -11% | 22.7 7% | 25.2 -4% | 27 -11% | 25.2 -4% |
| Idle Maximum * (dB) | 28 | 29.3 -5% | 27.5 2% | 25.2 10% | 28 -0% | 27.2 3% |
| Load Average * (dB) | 41 | 42.3 -3% | 28.9 30% | 55.1 -34% | 40 2% | 34.8 15% |
| Witcher 3 ultra * (dB) | 40.9 | 52.6 -29% | 39 5% | 34.8 15% | ||
| Load Maximum * (dB) | 40.9 | 42.7 -4% | 52.5 -28% | 61.5 -50% | 41 -0% | 39 5% |
* ... más pequeño es mejor
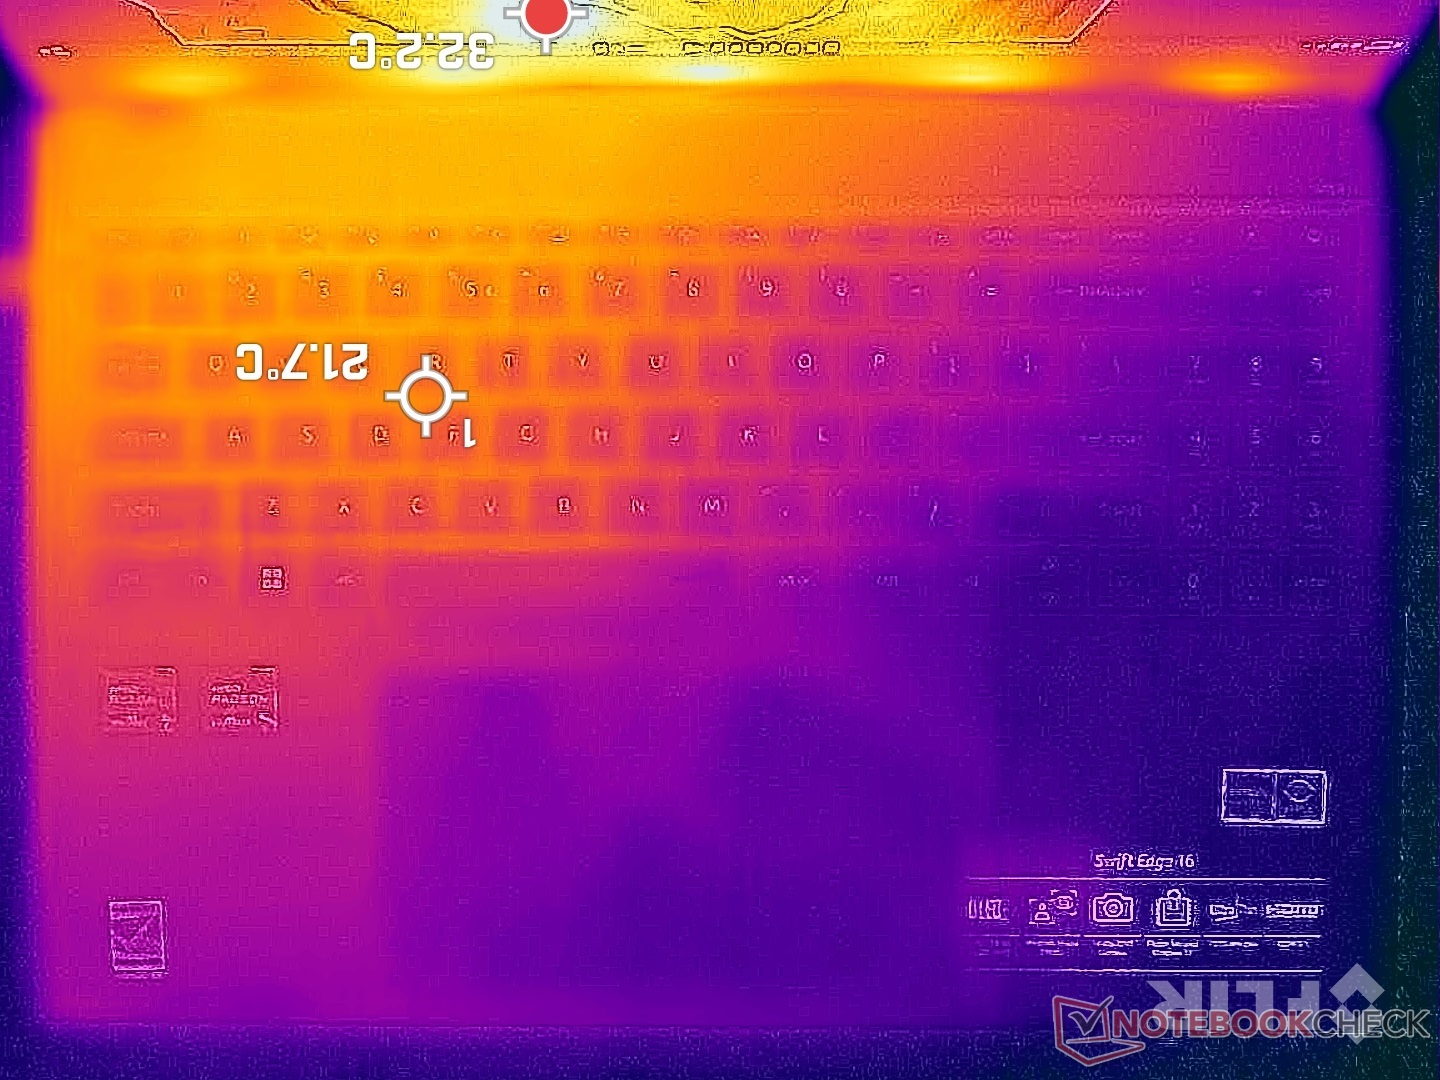
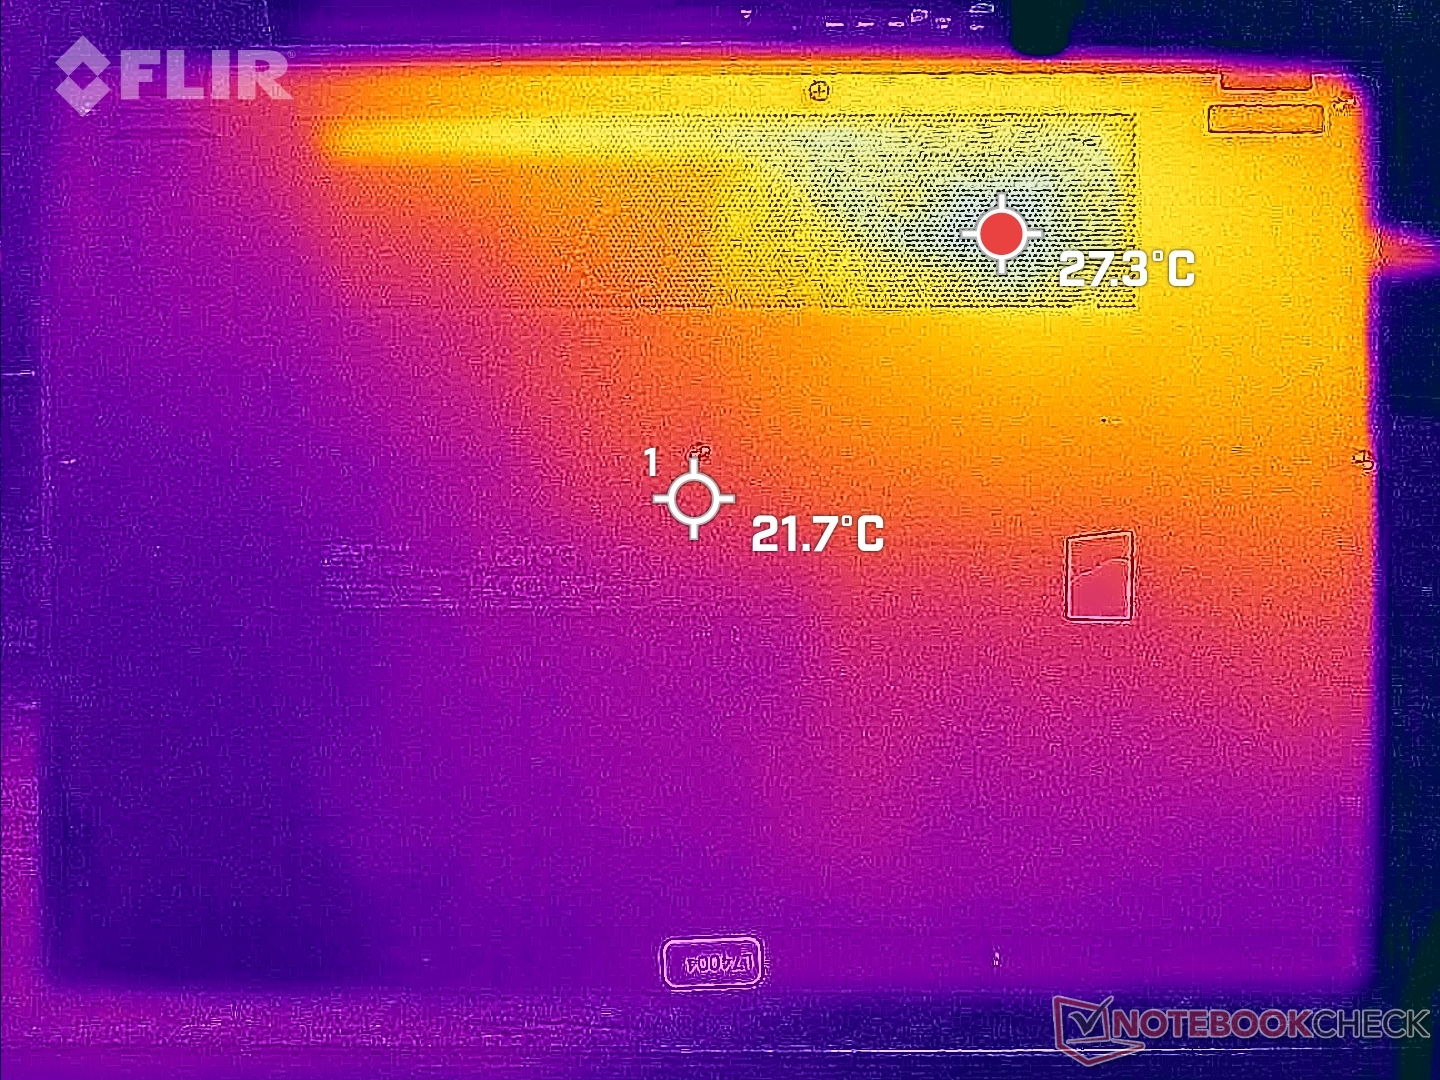
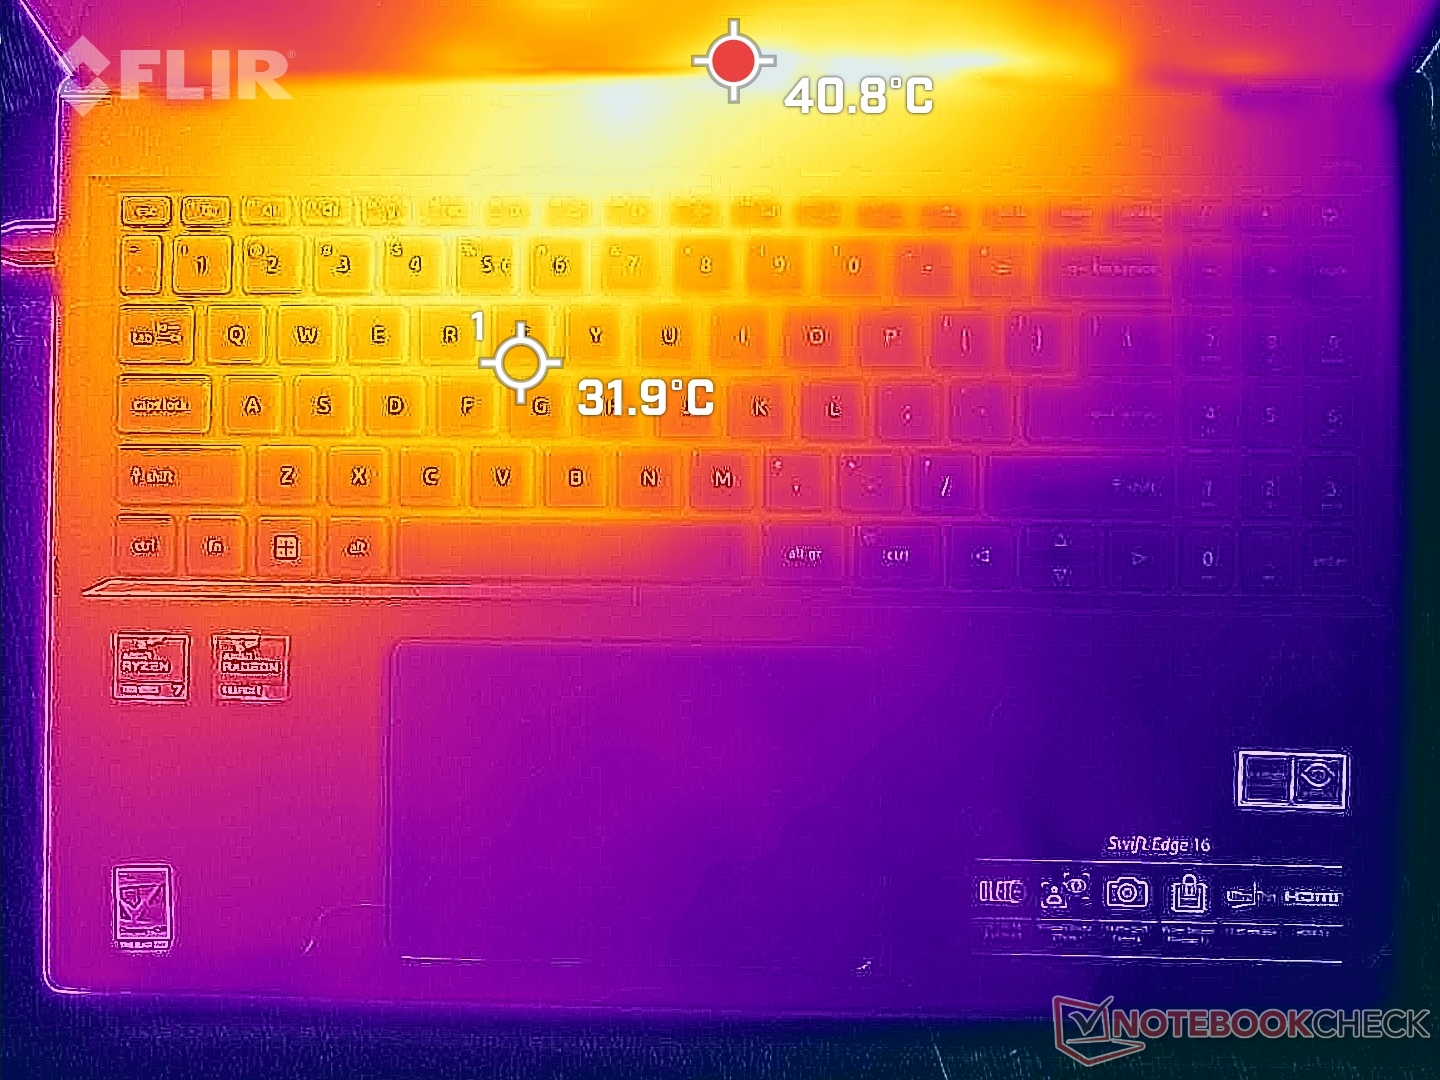
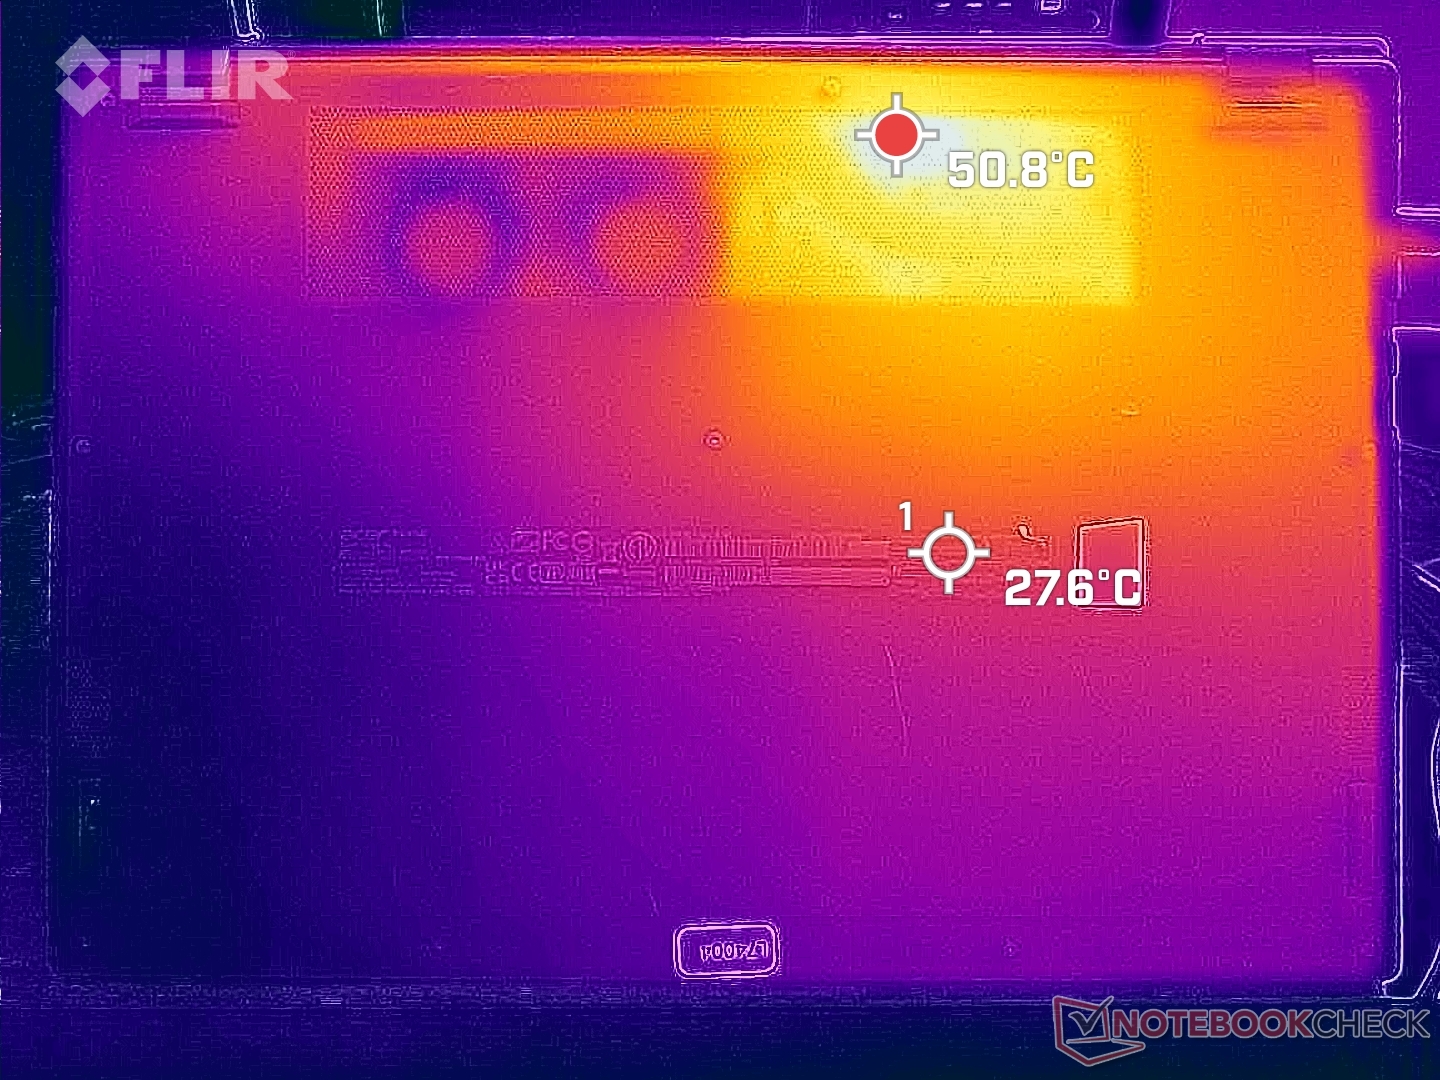
Temperatura
Las temperaturas superficiales no son significativamente más frías o más calientes que las que registramos en la Configuración Ryzen 7 7735U. Los puntos calientes de la parte inferior aún alcanzan más de 50 C cerca de las rejillas de ventilación mientras que la superficie superior cerca de las bisagras puede oscilar entre 40 C y 50 C dependiendo del ángulo de la tapa. Es poco probable que las manos toquen estas zonas calientes durante mucho tiempo cuando se juega.
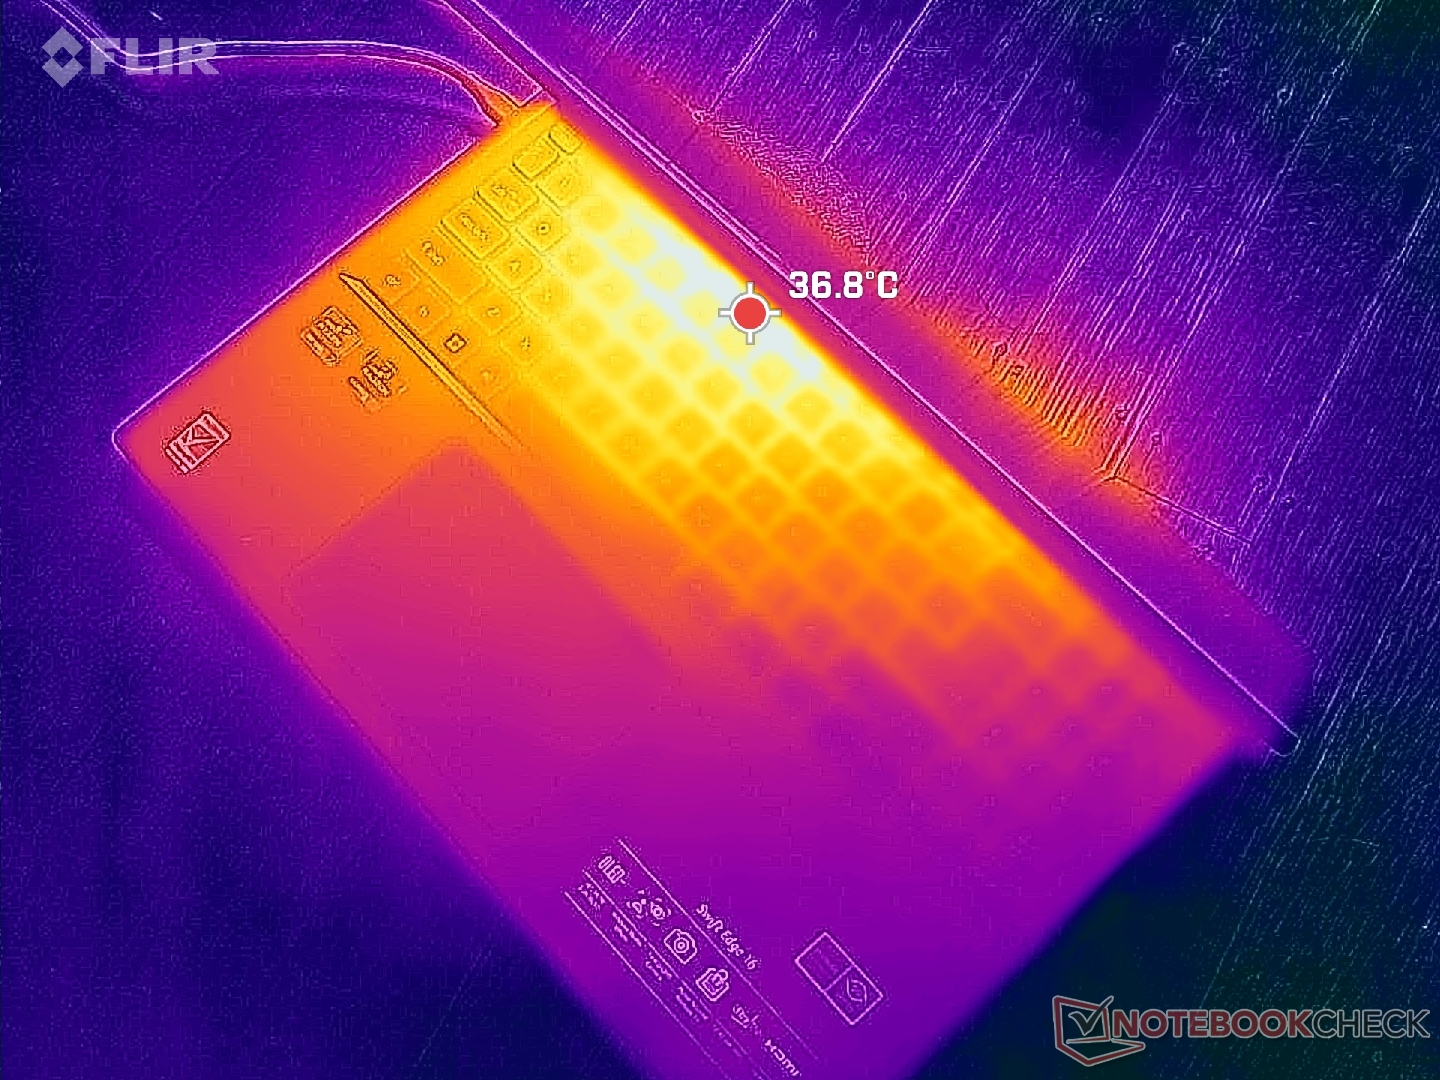
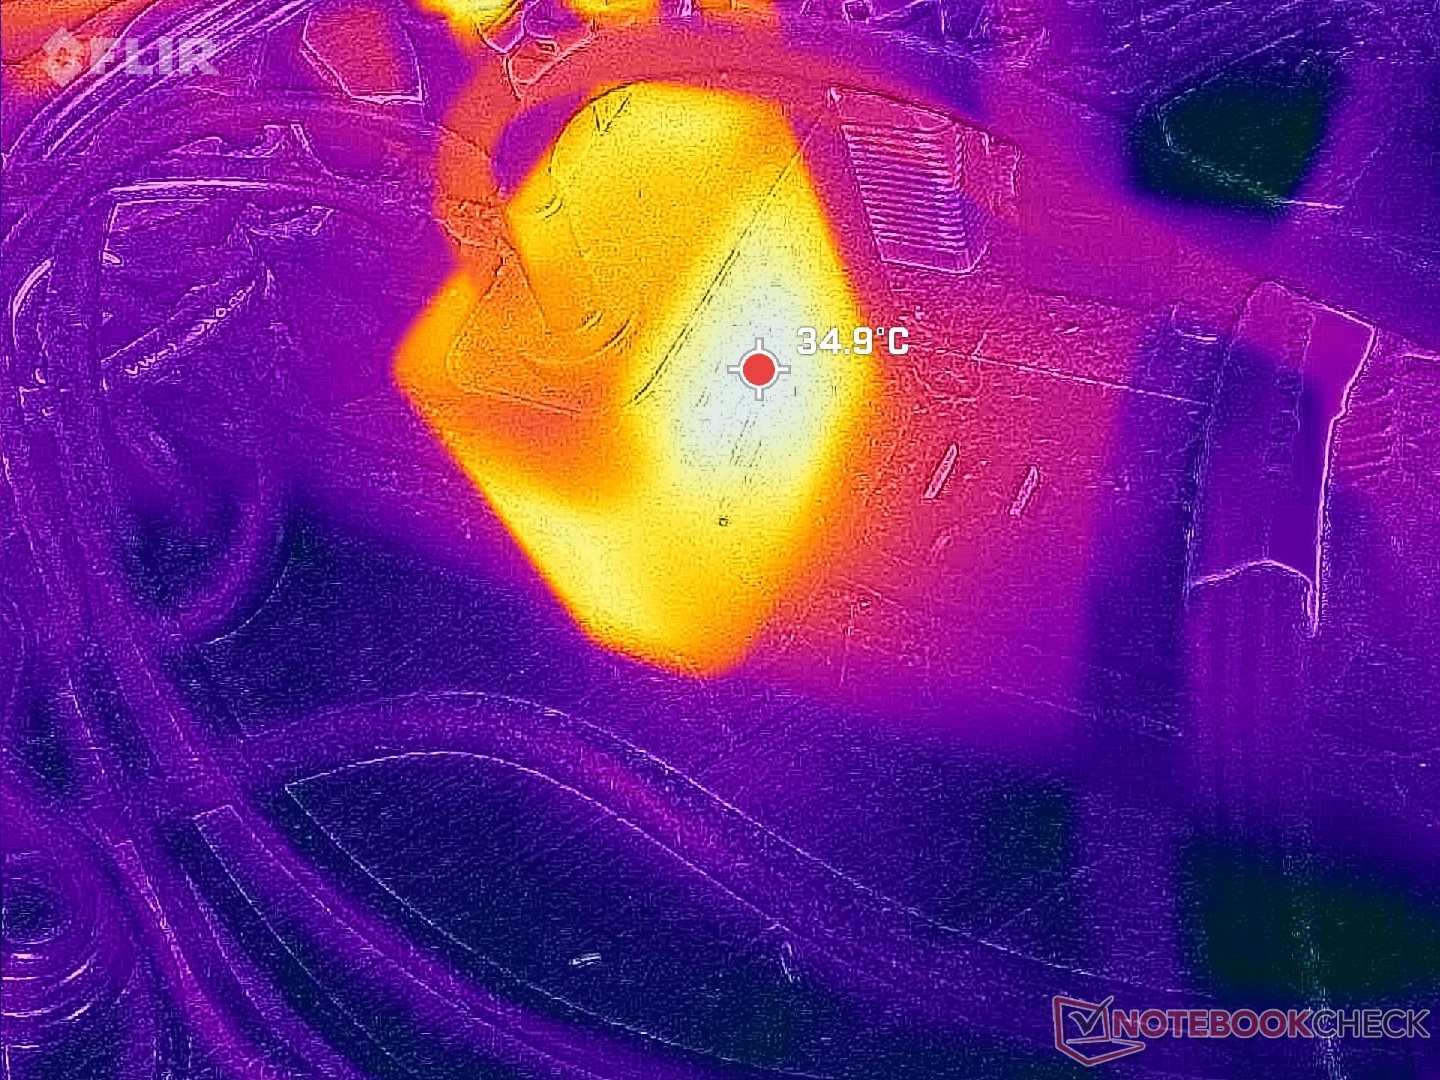
(±) La temperatura máxima en la parte superior es de 41.6 °C / 107 F, frente a la media de 34.3 °C / 94 F, que oscila entre 21.2 y 62.5 °C para la clase Office.
(-) El fondo se calienta hasta un máximo de 46.6 °C / 116 F, frente a la media de 36.8 °C / 98 F
(+) En reposo, la temperatura media de la parte superior es de 27 °C / 81# F, frente a la media del dispositivo de 29.5 °C / 85 F.
(+) El reposamanos y el panel táctil están a una temperatura inferior a la de la piel, con un máximo de 26.6 °C / 79.9 F y, por tanto, son fríos al tacto.
(±) La temperatura media de la zona del reposamanos de dispositivos similares fue de 27.5 °C / 81.5 F (+0.9 °C / 1.6 F).
| Acer Swift Edge SFE16 Ryzen 7 7840U AMD Ryzen 7 7840U, AMD Radeon 780M | Acer Swift Edge SFE16-42-R1GM AMD Ryzen 7 7735U, AMD Radeon 680M | Lenovo Slim Pro 9i 16IRP8 Intel Core i9-13905H, NVIDIA GeForce RTX 4050 Laptop GPU | Asus VivoBook Pro 16 Intel Core i7-12700H, NVIDIA GeForce RTX 3050 Ti Laptop GPU | Samsung Galaxy Book3 Ultra 16 Intel Core i7-13700H, NVIDIA GeForce RTX 4050 Laptop GPU | Huawei MateBook 16s i7 Intel Core i7-12700H, Intel Iris Xe Graphics G7 96EUs | |
|---|---|---|---|---|---|---|
| Heat | -7% | 3% | -13% | 12% | 1% | |
| Maximum Upper Side * (°C) | 41.6 | 49.4 -19% | 37.8 9% | 44.2 -6% | 41 1% | 40.9 2% |
| Maximum Bottom * (°C) | 46.6 | 44.7 4% | 44.8 4% | 53 -14% | 44 6% | 48.3 -4% |
| Idle Upper Side * (°C) | 30.4 | 34 -12% | 30.6 -1% | 32.1 -6% | 23 24% | 29.2 4% |
| Idle Bottom * (°C) | 31 | 31.6 -2% | 31 -0% | 38.4 -24% | 26 16% | 30.4 2% |
* ... más pequeño es mejor
Prueba de resistencia
El limitado potencial Turbo Core del Acer puede observarse al realizar pruebas de estrés con benchmarks. Las frecuencias de reloj y el consumo de energía de la placa al iniciar el estrés Prime95 aumentaban a 3,5 GHz y 30 W, respectivamente, antes de caer de forma constante a sólo 2,3 GHz y 18 W durante el siguiente minuto. La temperatura del núcleo también se estabilizó en unos relativamente bajos 64 C. Repitiendo esta prueba en el AMD Framework Laptop 13.5 con la misma CPU resultaría en valores más altos: 3.2 GHz, 35 W, y 85 C en comparación.
La temperatura del núcleo en funcionamiento Witcher 3 se estabilizaría en sólo 56 C o alrededor de 15 C más fría que en el Framework mencionado anteriormente. Está claro que el sistema prioriza las temperaturas superficiales más bajas sobre el rendimiento más alto.
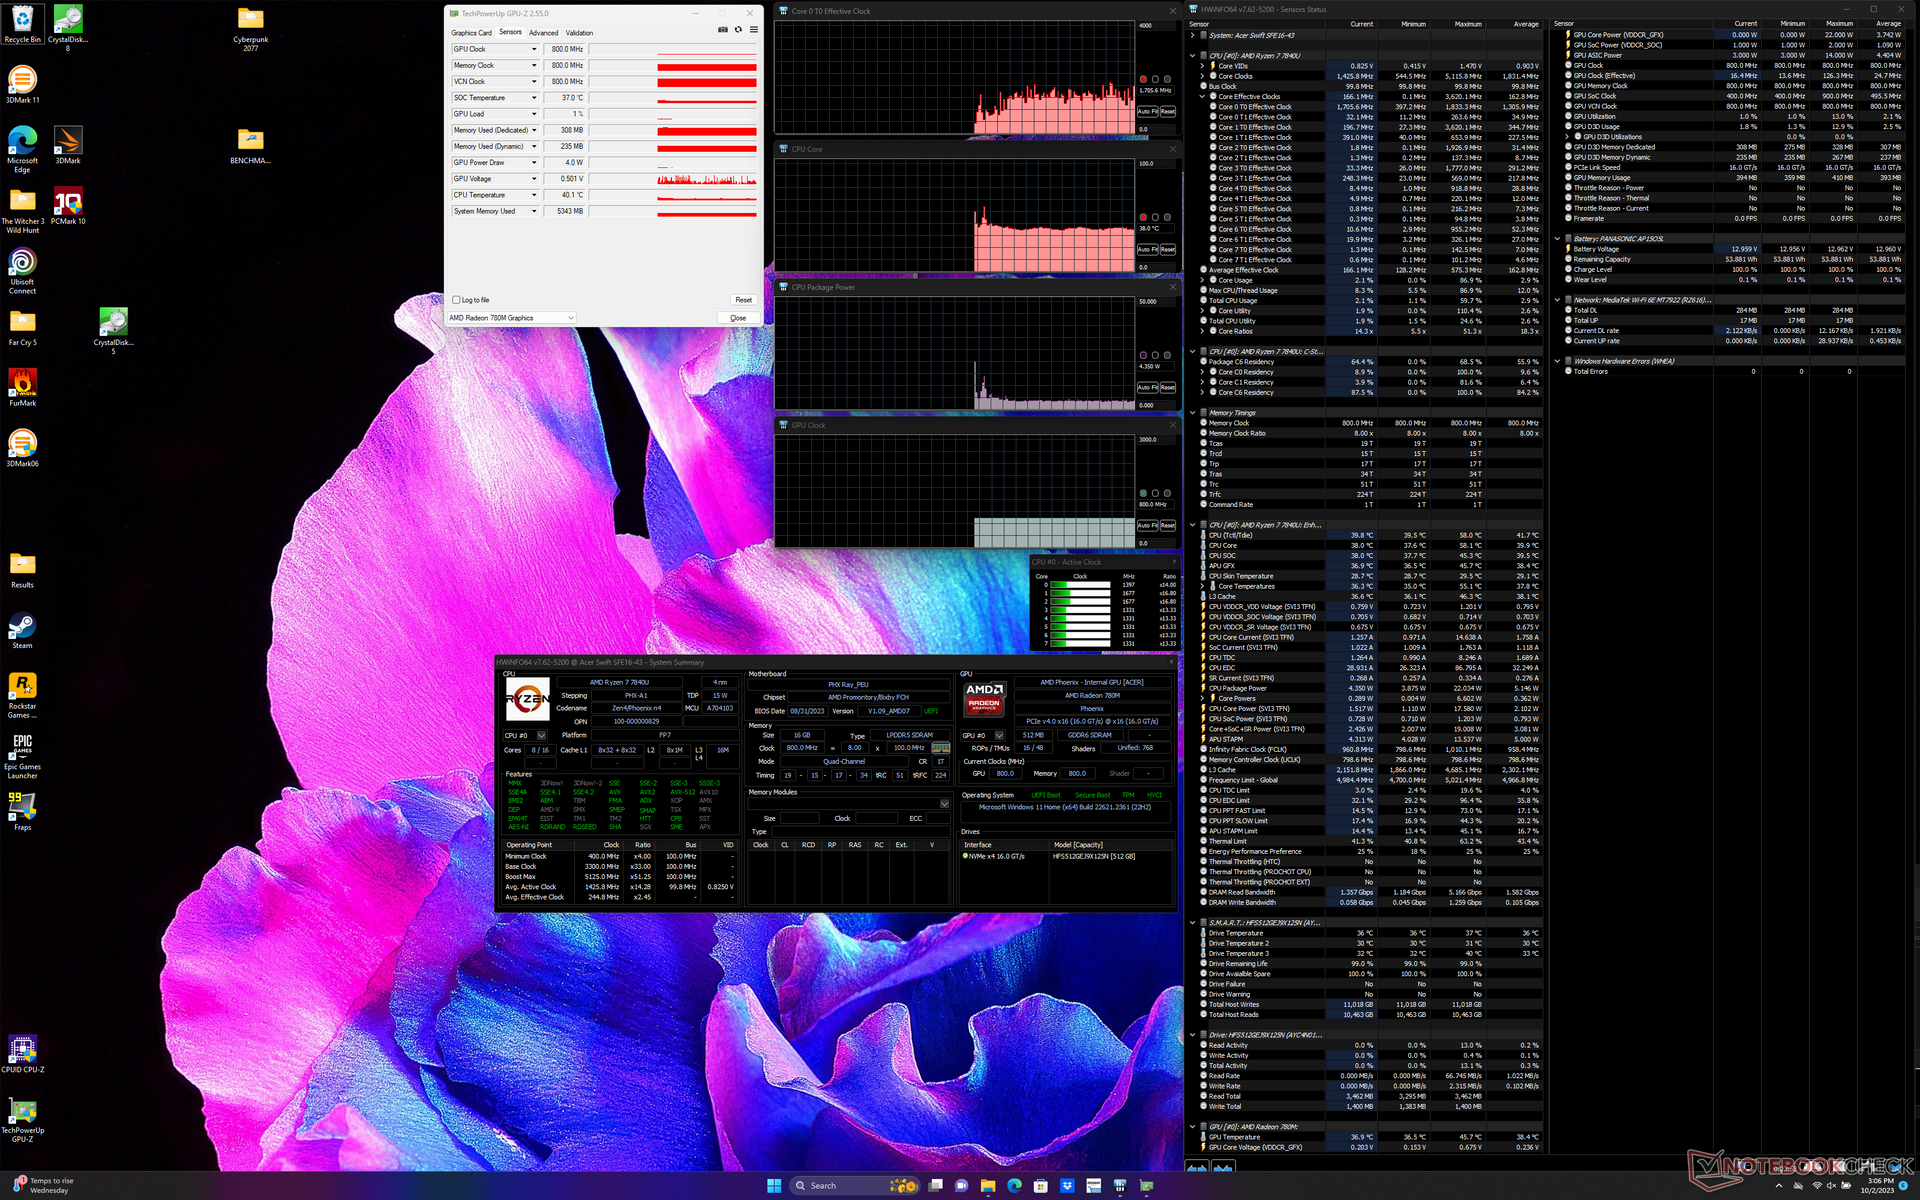
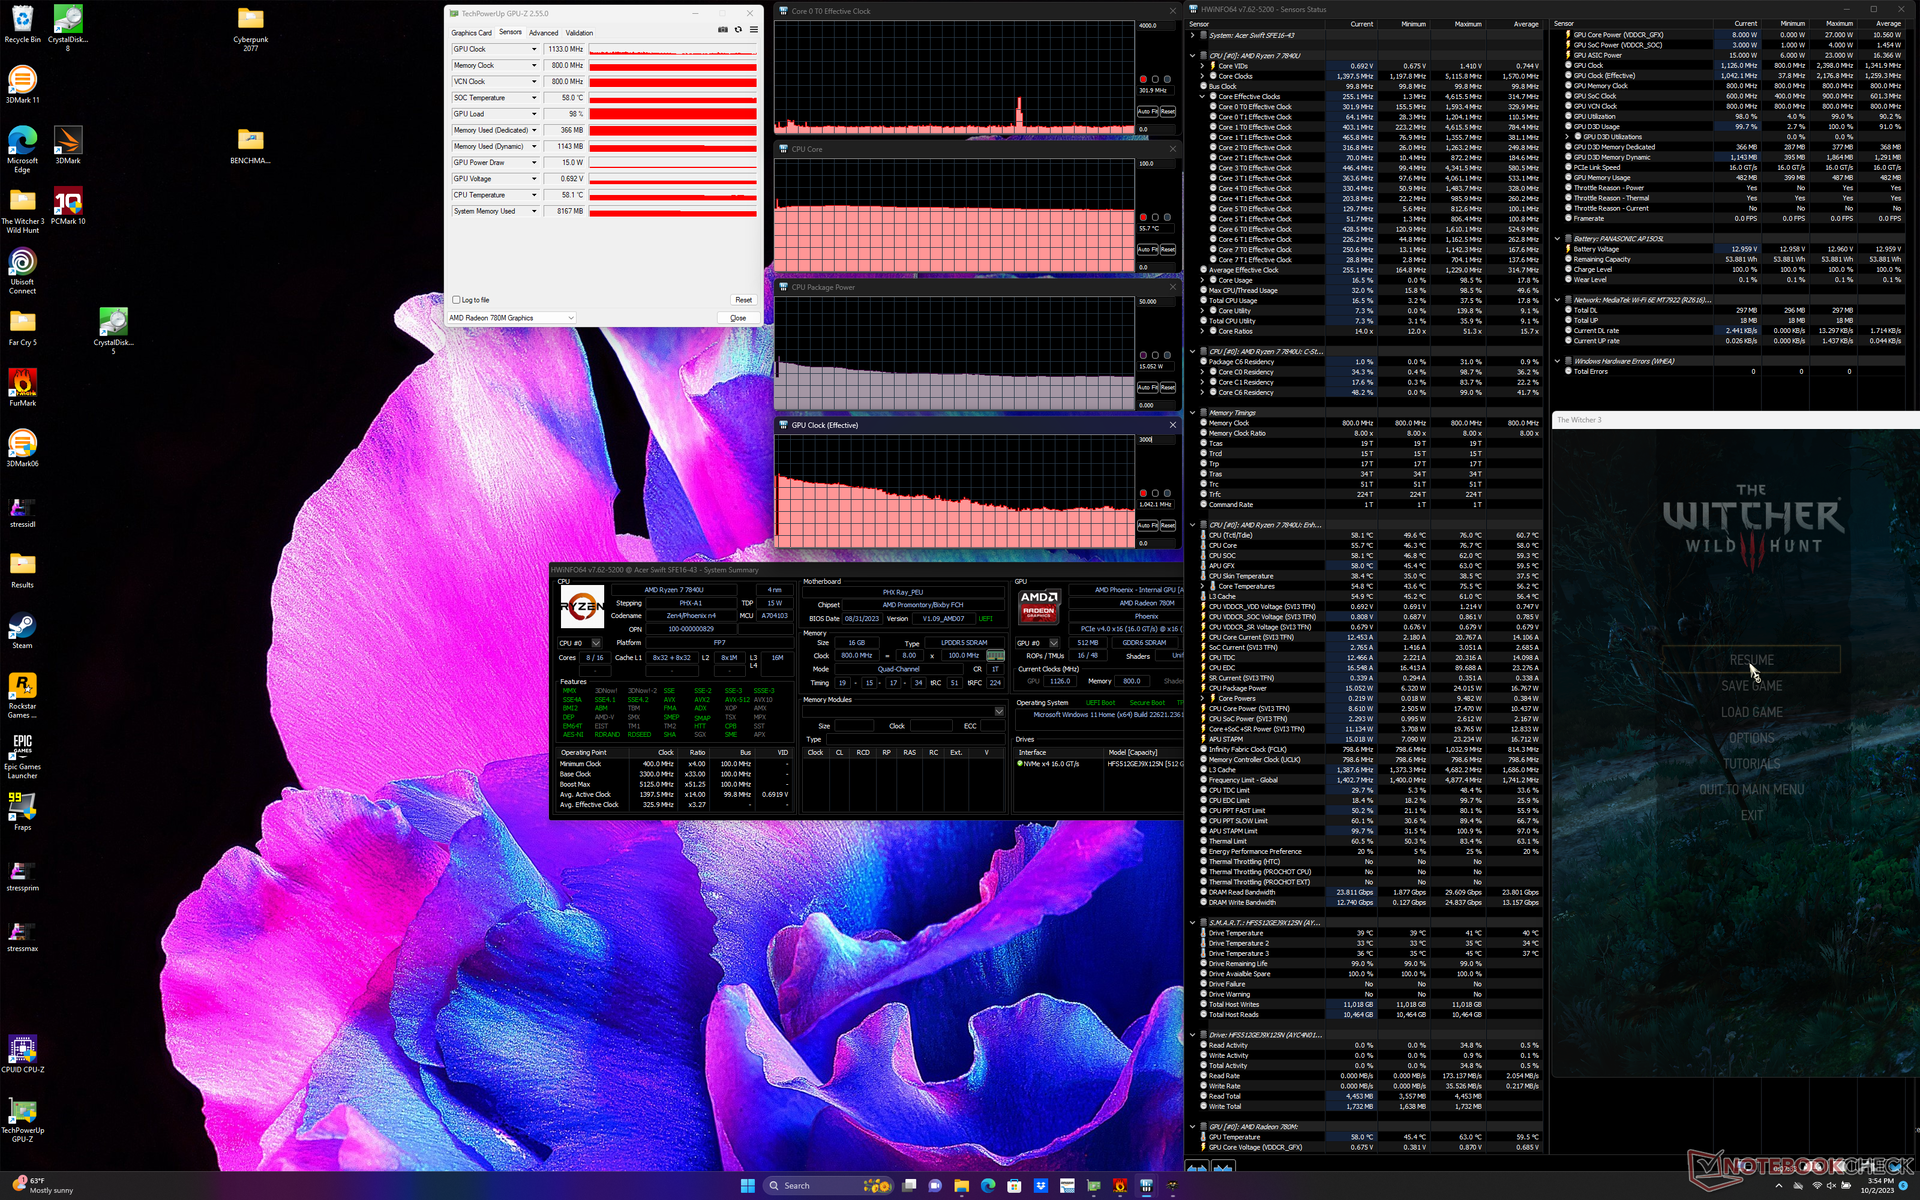
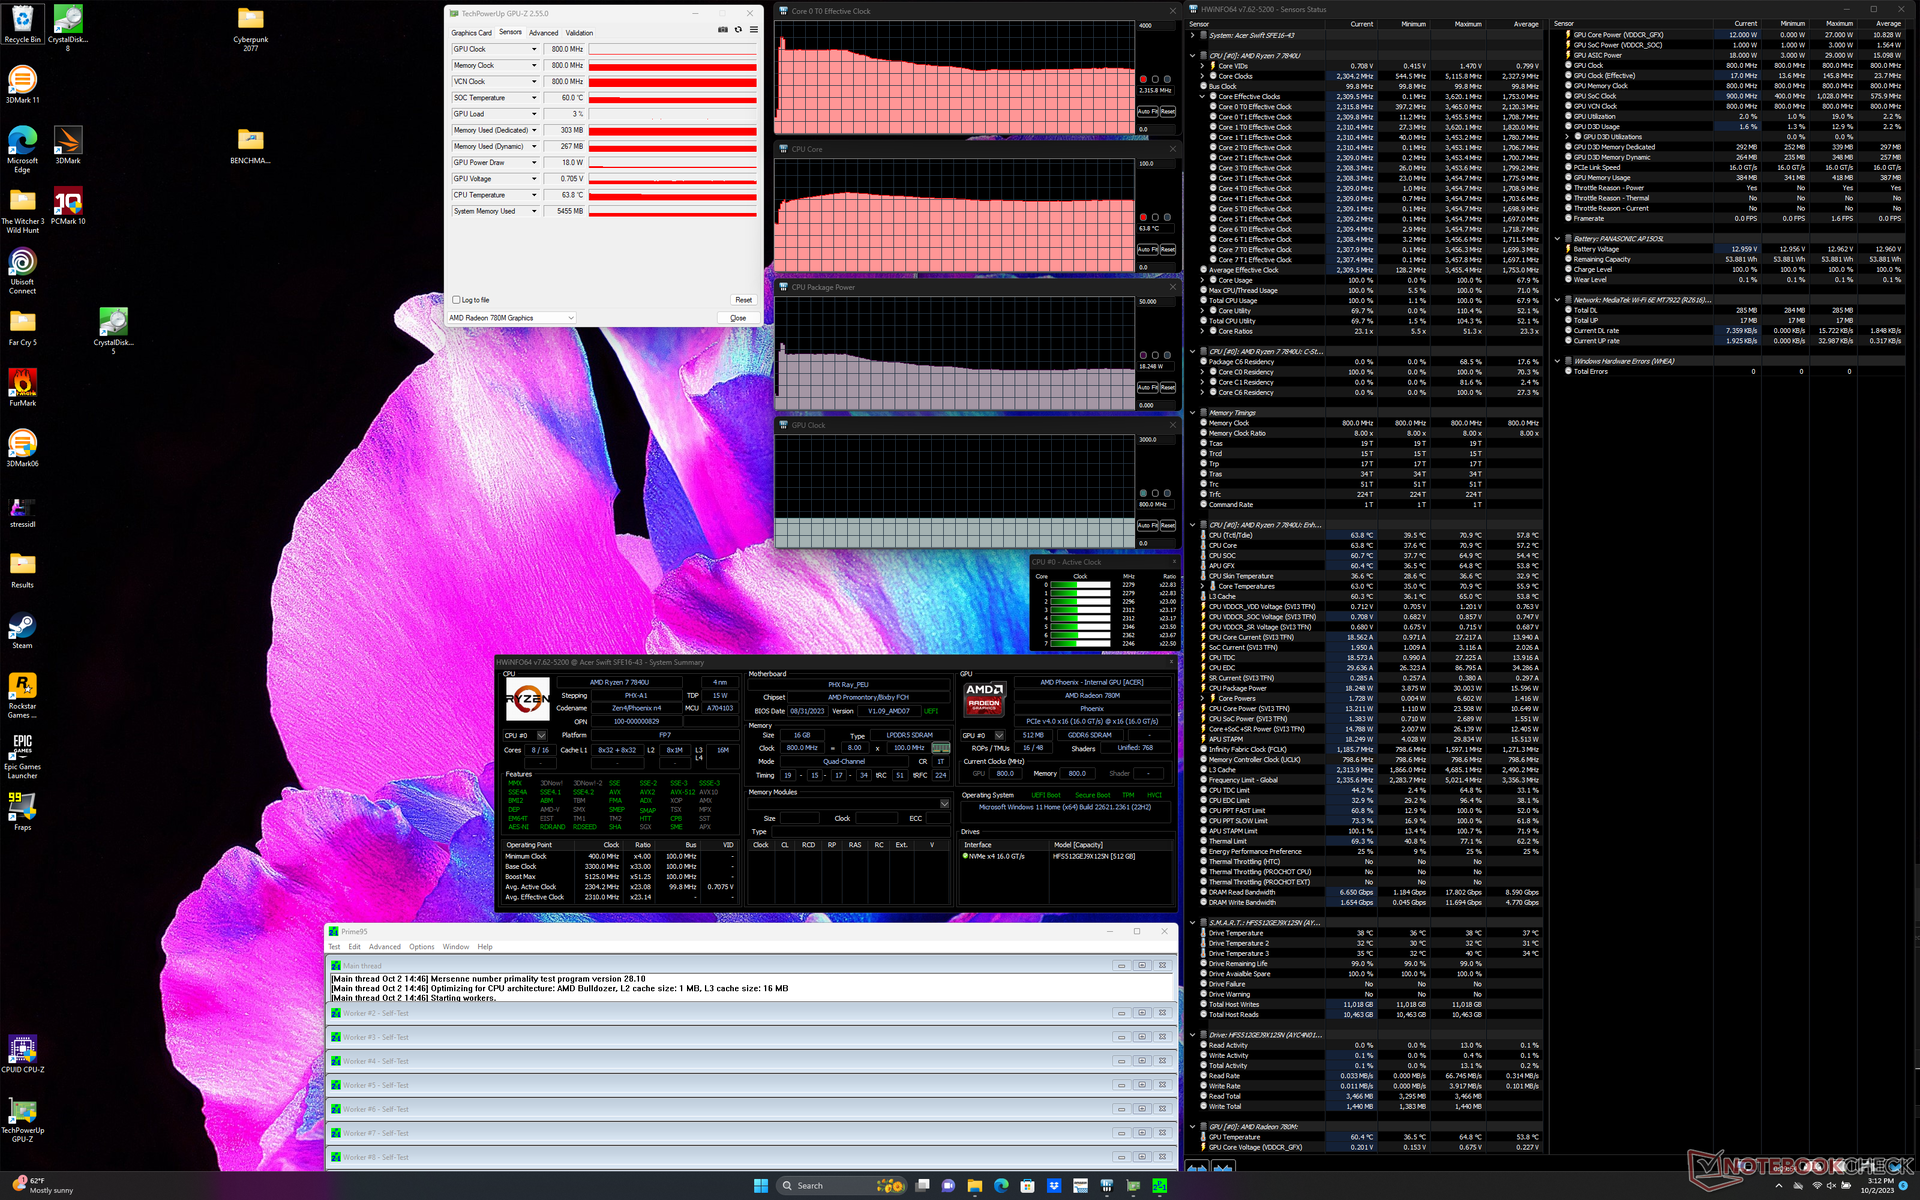
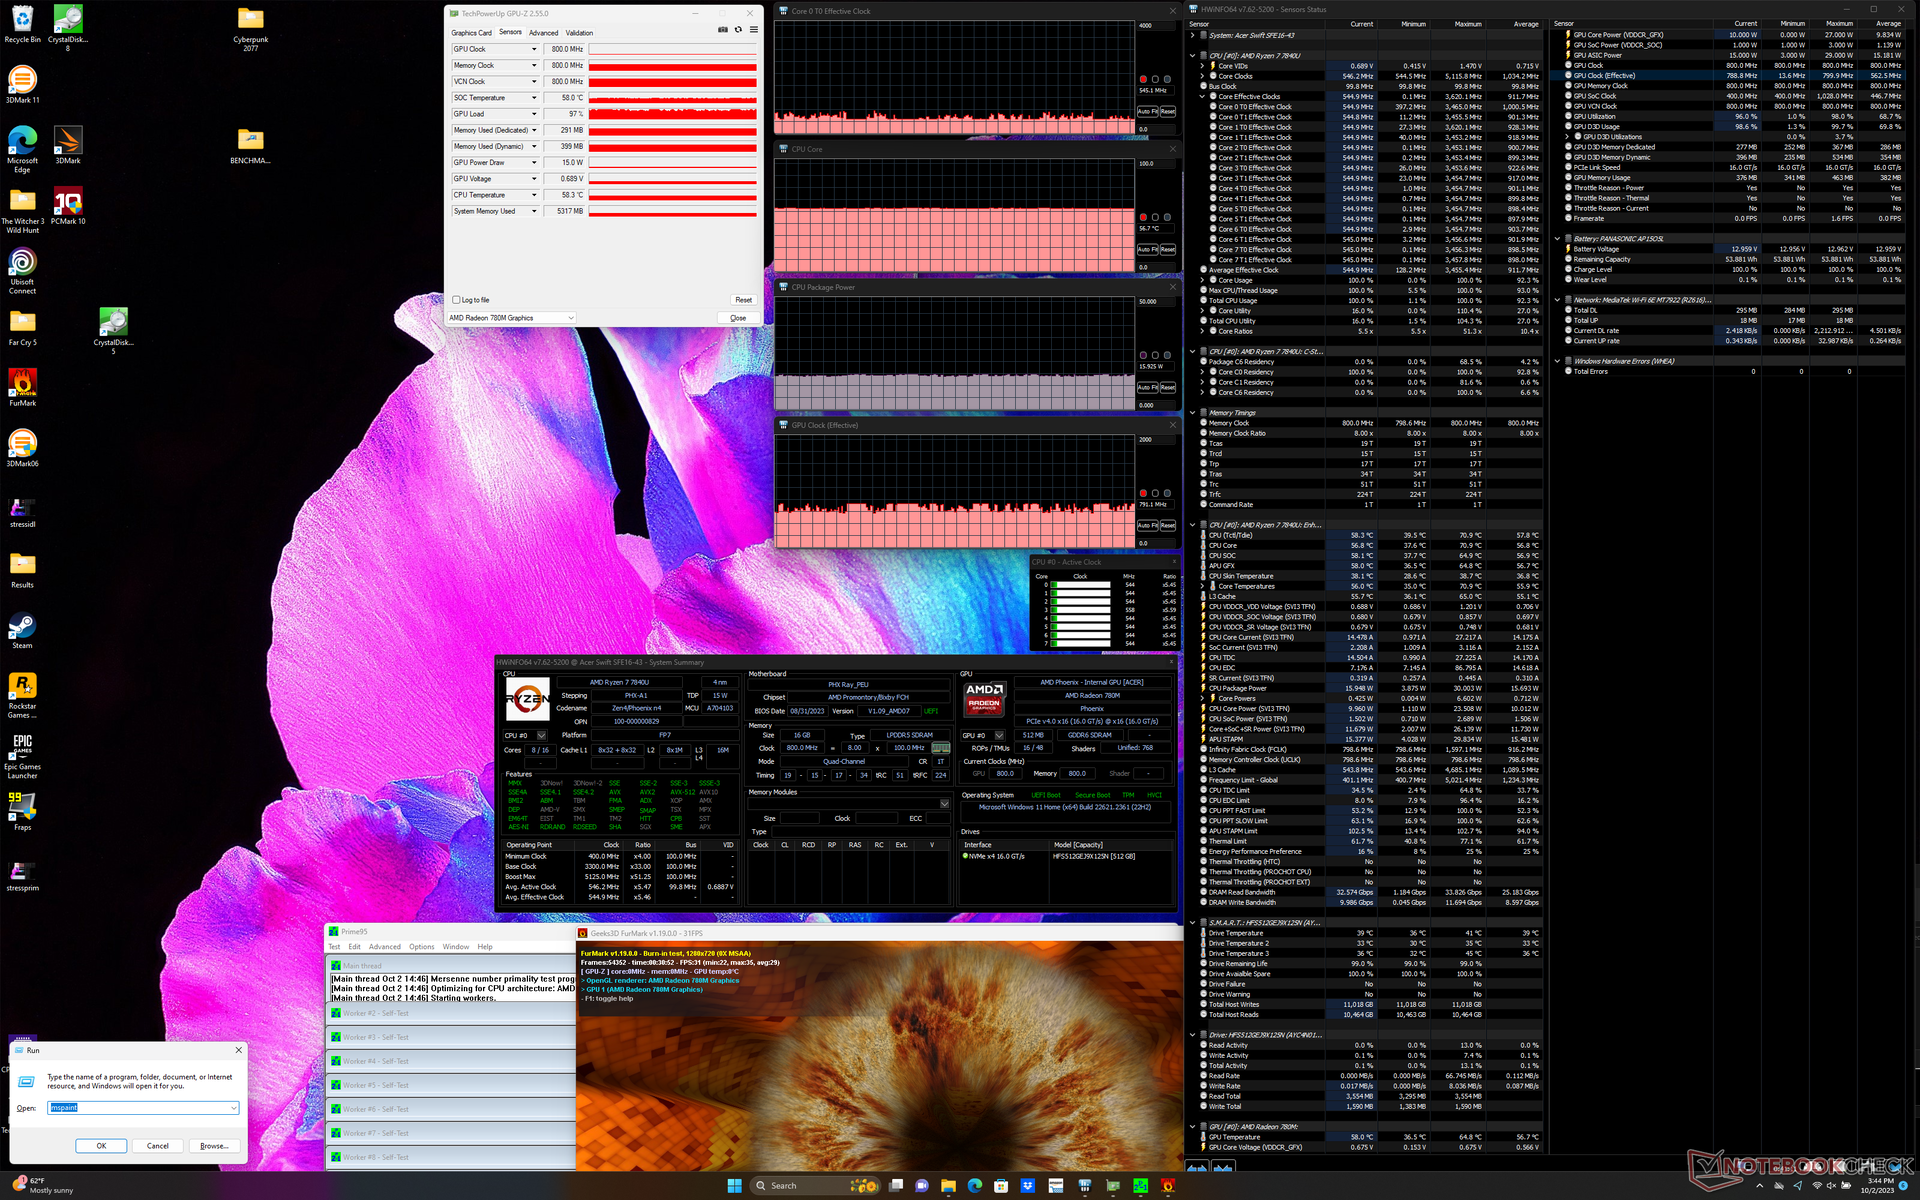
| RelojCPU (GHz) | Reloj GPU (MHz) | Temperatura media CPU (°C) | |
| Sistema en reposo | -- | -- | 38 |
| Prime95 Stress | 2.3 | -- | 64 |
| Prime95+ FurMark Estrés | 0,5 | 791 | 57 |
| Witcher 3 Estrés | 0,3 | 1042 | 56 |
Altavoces
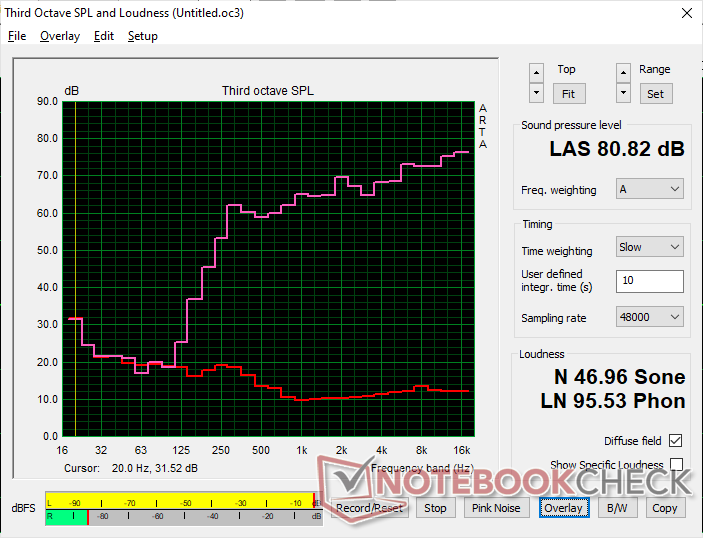
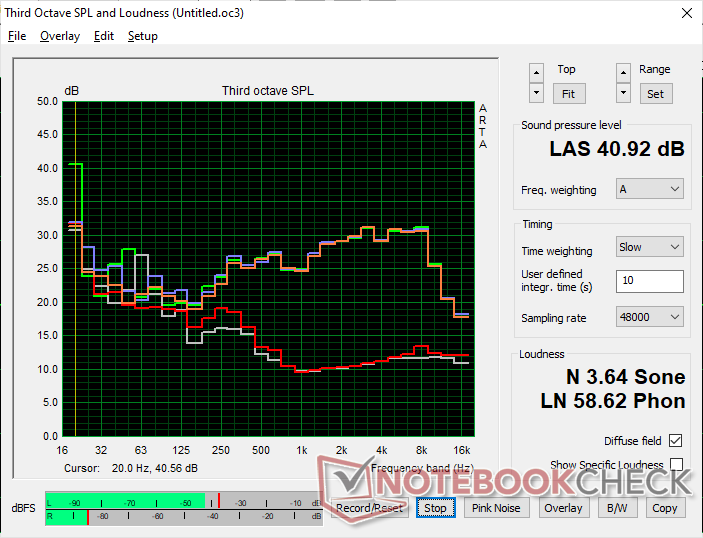
Acer Swift Edge SFE16 Ryzen 7 7840U análisis de audio
(±) | la sonoridad del altavoz es media pero buena (80.8 dB)
Graves 100 - 315 Hz
(-) | casi sin bajos - de media 24.5% inferior a la mediana
(±) | la linealidad de los graves es media (14.2% delta a frecuencia anterior)
Medios 400 - 2000 Hz
(+) | medios equilibrados - a sólo 2.9% de la mediana
(+) | los medios son lineales (3.5% delta a la frecuencia anterior)
Altos 2 - 16 kHz
(+) | máximos equilibrados - a sólo 4.8% de la mediana
(+) | los máximos son lineales (3.7% delta a la frecuencia anterior)
Total 100 - 16.000 Hz
(±) | la linealidad del sonido global es media (19.8% de diferencia con la mediana)
En comparación con la misma clase
» 41% de todos los dispositivos probados de esta clase eran mejores, 9% similares, 50% peores
» El mejor tuvo un delta de 7%, la media fue 21%, el peor fue ###max##%
En comparación con todos los dispositivos probados
» 51% de todos los dispositivos probados eran mejores, 7% similares, 42% peores
» El mejor tuvo un delta de 4%, la media fue 23%, el peor fue ###max##%
Apple MacBook Pro 16 2021 M1 Pro análisis de audio
(+) | los altavoces pueden reproducir a un volumen relativamente alto (#84.7 dB)
Graves 100 - 315 Hz
(+) | buen bajo - sólo 3.8% lejos de la mediana
(+) | el bajo es lineal (5.2% delta a la frecuencia anterior)
Medios 400 - 2000 Hz
(+) | medios equilibrados - a sólo 1.3% de la mediana
(+) | los medios son lineales (2.1% delta a la frecuencia anterior)
Altos 2 - 16 kHz
(+) | máximos equilibrados - a sólo 1.9% de la mediana
(+) | los máximos son lineales (2.7% delta a la frecuencia anterior)
Total 100 - 16.000 Hz
(+) | el sonido global es lineal (4.6% de diferencia con la mediana)
En comparación con la misma clase
» 0% de todos los dispositivos probados de esta clase eran mejores, 0% similares, 100% peores
» El mejor tuvo un delta de 5%, la media fue 17%, el peor fue ###max##%
En comparación con todos los dispositivos probados
» 0% de todos los dispositivos probados eran mejores, 0% similares, 100% peores
» El mejor tuvo un delta de 4%, la media fue 23%, el peor fue ###max##%
Gestión de la energía
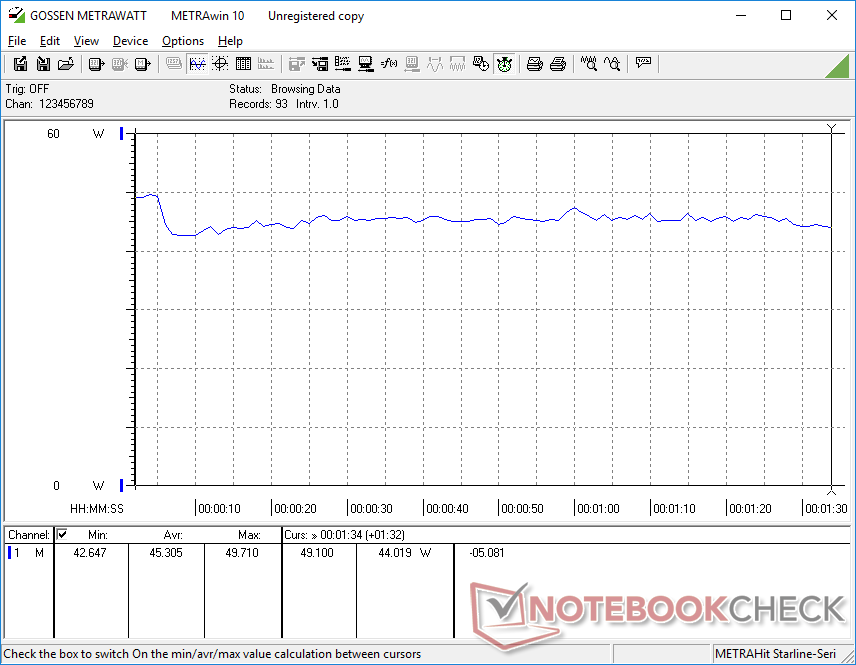
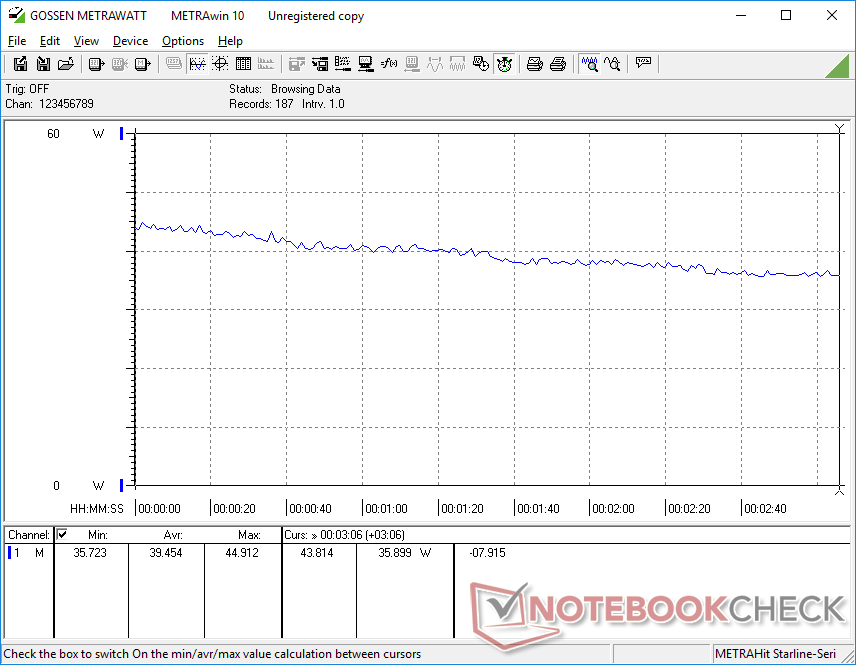
Consumo de energía
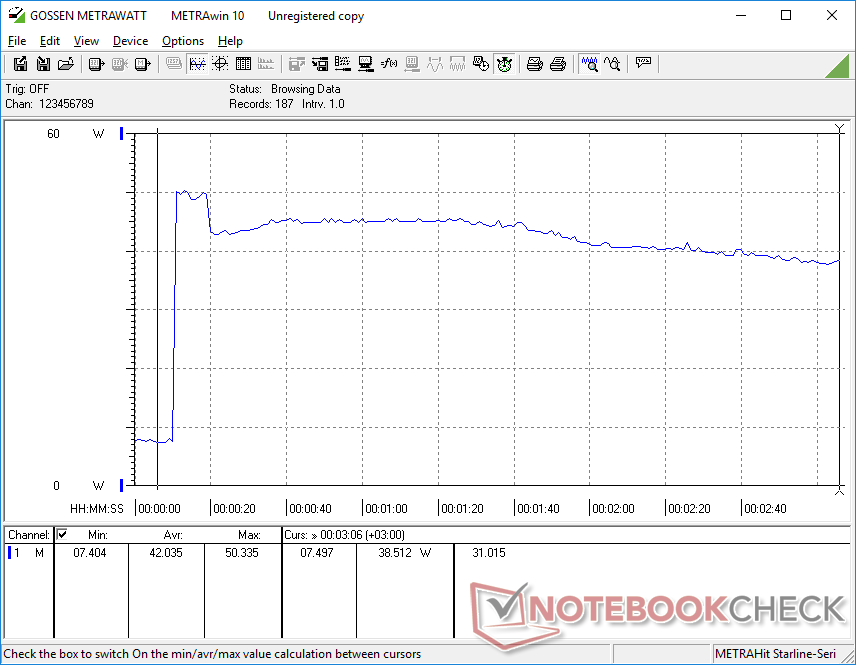
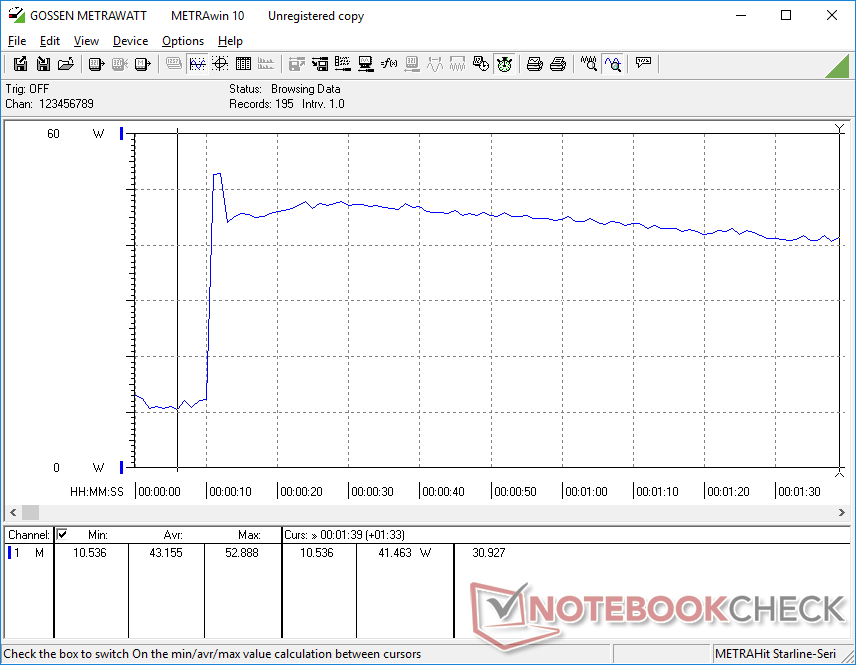
El consumo de energía en inactivo es mayor que en la mayoría de portátiles con GPU integrada debido a la alta frecuencia de refresco de 120 Hz y al panel OLED de nuestra configuración Acer, que se sabe que consumen más energía que los habituales IPS de 60 Hz. Mostrar una imagen totalmente blanca a 120 Hz consumiría hasta 19 W, frente a menos de la mitad en el Framework Laptop 13.5.
A la inversa, el consumo de energía al jugar sería menor de lo esperado debido a las tendencias de ralentización del procesador. El consumo empezaría siendo alto al principio de la prueba antes de caer constantemente con el tiempo, como muestran nuestros gráficos de abajo, lo que sugiere una ralentización del rendimiento.
| Off / Standby | |
| Ocioso | |
| Carga |
|
Clave:
min: | |
| Acer Swift Edge SFE16 Ryzen 7 7840U R7 7840U, Radeon 780M, SK hynix HFS512GEJ9X125N, OLED, 3200x2000, 16" | Acer Swift Edge SFE16-42-R1GM R7 7735U, Radeon 680M, Micron 3400 1TB MTFDKBA1T0TFH, OLED, 3840x2400, 16" | Lenovo Slim Pro 9i 16IRP8 i9-13905H, GeForce RTX 4050 Laptop GPU, Samsung PM9A1 MZVL21T0HCLR, Mini-LED, 3200x2000, 16" | Asus VivoBook Pro 16 i7-12700H, GeForce RTX 3050 Ti Laptop GPU, Intel SSD 670p SSDPEKNU010TZ, IPS, 2560x1600, 16" | Samsung Galaxy Book3 Ultra 16 i7-13700H, GeForce RTX 4050 Laptop GPU, Samsung PM9A1 MZVL2512HCJQ, AMOLED, 2880x1800, 16" | Huawei MateBook 16s i7 i7-12700H, Iris Xe G7 96EUs, Silicon Motion PCIe-8 SSD, IPS, 2520x1680, 16" | |
|---|---|---|---|---|---|---|
| Power Consumption | 4% | -166% | -102% | -15% | -30% | |
| Idle Minimum * (Watt) | 7.1 | 8.6 -21% | 16 -125% | 8.7 -23% | 3 58% | 6.8 4% |
| Idle Average * (Watt) | 10.1 | 7.7 24% | 30 -197% | 13.1 -30% | 5 50% | 13.2 -31% |
| Idle Maximum * (Watt) | 18.6 | 9.3 50% | 30.4 -63% | 18.3 2% | 11 41% | 13.8 26% |
| Load Average * (Watt) | 45.3 | 47.9 -6% | 78.9 -74% | 116 -156% | 72 -59% | 75.2 -66% |
| Witcher 3 ultra * (Watt) | 39.5 | 46.3 -17% | 155.3 -293% | 117.6 -198% | 69.7 -76% | 56.1 -42% |
| Load Maximum * (Watt) | 52.9 | 56 -6% | 180.4 -241% | 162 -206% | 108 -104% | 90.6 -71% |
* ... más pequeño es mejor
Power Consumption Witcher 3 / Stresstest
Power Consumption external Monitor
Duración de la batería
La duración WLAN es inferior a la que registramos en nuestra unidad anterior en casi dos horas enteras incluso cuando ambas están configuradas con los mismos ajustes de perfil de energía y las mismas condiciones de navegador. La frecuencia de refresco de 120 Hz es probablemente un factor que contribuye a las diferencias en la duración de la batería.
| Acer Swift Edge SFE16 Ryzen 7 7840U R7 7840U, Radeon 780M, 54 Wh | Acer Swift Edge SFE16-42-R1GM R7 7735U, Radeon 680M, 54 Wh | Lenovo Slim Pro 9i 16IRP8 i9-13905H, GeForce RTX 4050 Laptop GPU, 75 Wh | Asus VivoBook Pro 16 i7-12700H, GeForce RTX 3050 Ti Laptop GPU, 70 Wh | Samsung Galaxy Book3 Ultra 16 i7-13700H, GeForce RTX 4050 Laptop GPU, 76 Wh | Huawei MateBook 16s i7 i7-12700H, Iris Xe G7 96EUs, 84 Wh | |
|---|---|---|---|---|---|---|
| Duración de Batería | 30% | 18% | 30% | 71% | 45% | |
| WiFi v1.3 (h) | 5.6 | 7.3 30% | 6.6 18% | 7.3 30% | 9.6 71% | 8.1 45% |
| Reader / Idle (h) | 10.9 | 18.2 | ||||
| H.264 (h) | 8.6 | 13.4 | 9.3 | |||
| Load (h) | 1.5 | 1.8 | 1.9 |
Pro
Contra
Veredicto - Mejoras menores pero notables
El Zen 3+ Swift Edge 16 ya era uno de nuestros portátiles de 16 pulgadas favoritos y la configuración Zen 4 actualizada no hace más que consolidar nuestra postura. El nivel de potencia de CPU y especialmente de GPU disponible es alto teniendo en cuenta el bajo peso y el delgado perfil. Mientras tanto, la pantalla OLED 3.2K 120 Hz es una de las mejores que hemos visto en cualquier portátil multimedia para procesamiento de textos, edición, navegación, vídeo e incluso juegos. Si quieres maximizar el rendimiento y la calidad de la pantalla minimizando al máximo el peso, el Swift Edge 16 da en el clavo.
El Ryzen 7 7840U ofrece un aumento decente del rendimiento con respecto a la ya excelente configuración Ryzen 7 7735U Swift Edge 16. A los usuarios les encantará la OLED de 120 Hz y el bajo peso, pero la duración media de la batería y la ralentización del rendimiento pueden irritar a los usuarios avanzados.
Los recortes surgen al mirar más allá de la CPU y el display. Dado que el portátil es extremadamente ligero para su tamaño, hubo que eliminar o reducir ciertas características como la solución de refrigeración más pequeña, la menor capacidad de la batería y la falta de Gorilla Glass o pantalla táctil para mantener el peso bajo. Como resultado, la CPU va un poco más lenta de lo esperado, la duración de la batería es sólo media, el SSD se ralentiza bajo estrés, y la pantalla es más susceptible a torcerse y tambalearse de lo que nos gustaría. La ampliación también es limitada, ya que la RAM está soldada y sólo admite un SSD interno.
Si necesitas absolutamente la potencia de las CPU de la serie H y las GPU RTX de GeForce, quizá quieras considerar el más pesado Swift X 16, Asus VivoBook Pro 16o elGalaxy Book3 Ultra 16 en cambio. A los viajeros constantes les gustará más el Swift Edge 16, ya que pueden aprovechar más regularmente el bajo peso del sistema sin sacrificar la calidad de la pantalla ni demasiado rendimiento.
Precio y disponibilidad
El Acer Swift Edge SFE16 analizado con el Ryzen 7 7840U ya está disponible en Best Buy por $1300 USD.
Acer Swift Edge SFE16 Ryzen 7 7840U
- 10/06/2023 v7 (old)
Allen Ngo
Transparencia
La selección de los dispositivos que se van a reseñar corre a cargo de nuestro equipo editorial. La muestra de prueba fue proporcionada al autor en calidad de préstamo por el fabricante o el minorista a los efectos de esta reseña. El prestamista no tuvo ninguna influencia en esta reseña, ni el fabricante recibió una copia de la misma antes de su publicación. No había ninguna obligación de publicar esta reseña. Como empresa de medios independiente, Notebookcheck no está sujeta a la autoridad de fabricantes, minoristas o editores.
Así es como prueba Notebookcheck
Cada año, Notebookcheck revisa de forma independiente cientos de portátiles y smartphones utilizando procedimientos estandarizados para asegurar que todos los resultados son comparables. Hemos desarrollado continuamente nuestros métodos de prueba durante unos 20 años y hemos establecido los estándares de la industria en el proceso. En nuestros laboratorios de pruebas, técnicos y editores experimentados utilizan equipos de medición de alta calidad. Estas pruebas implican un proceso de validación en varias fases. Nuestro complejo sistema de clasificación se basa en cientos de mediciones y puntos de referencia bien fundamentados, lo que mantiene la objetividad.Price comparison

