Veredicto - Uno de los mejores descapotables de 16 pulgadas por 1.000 dólares
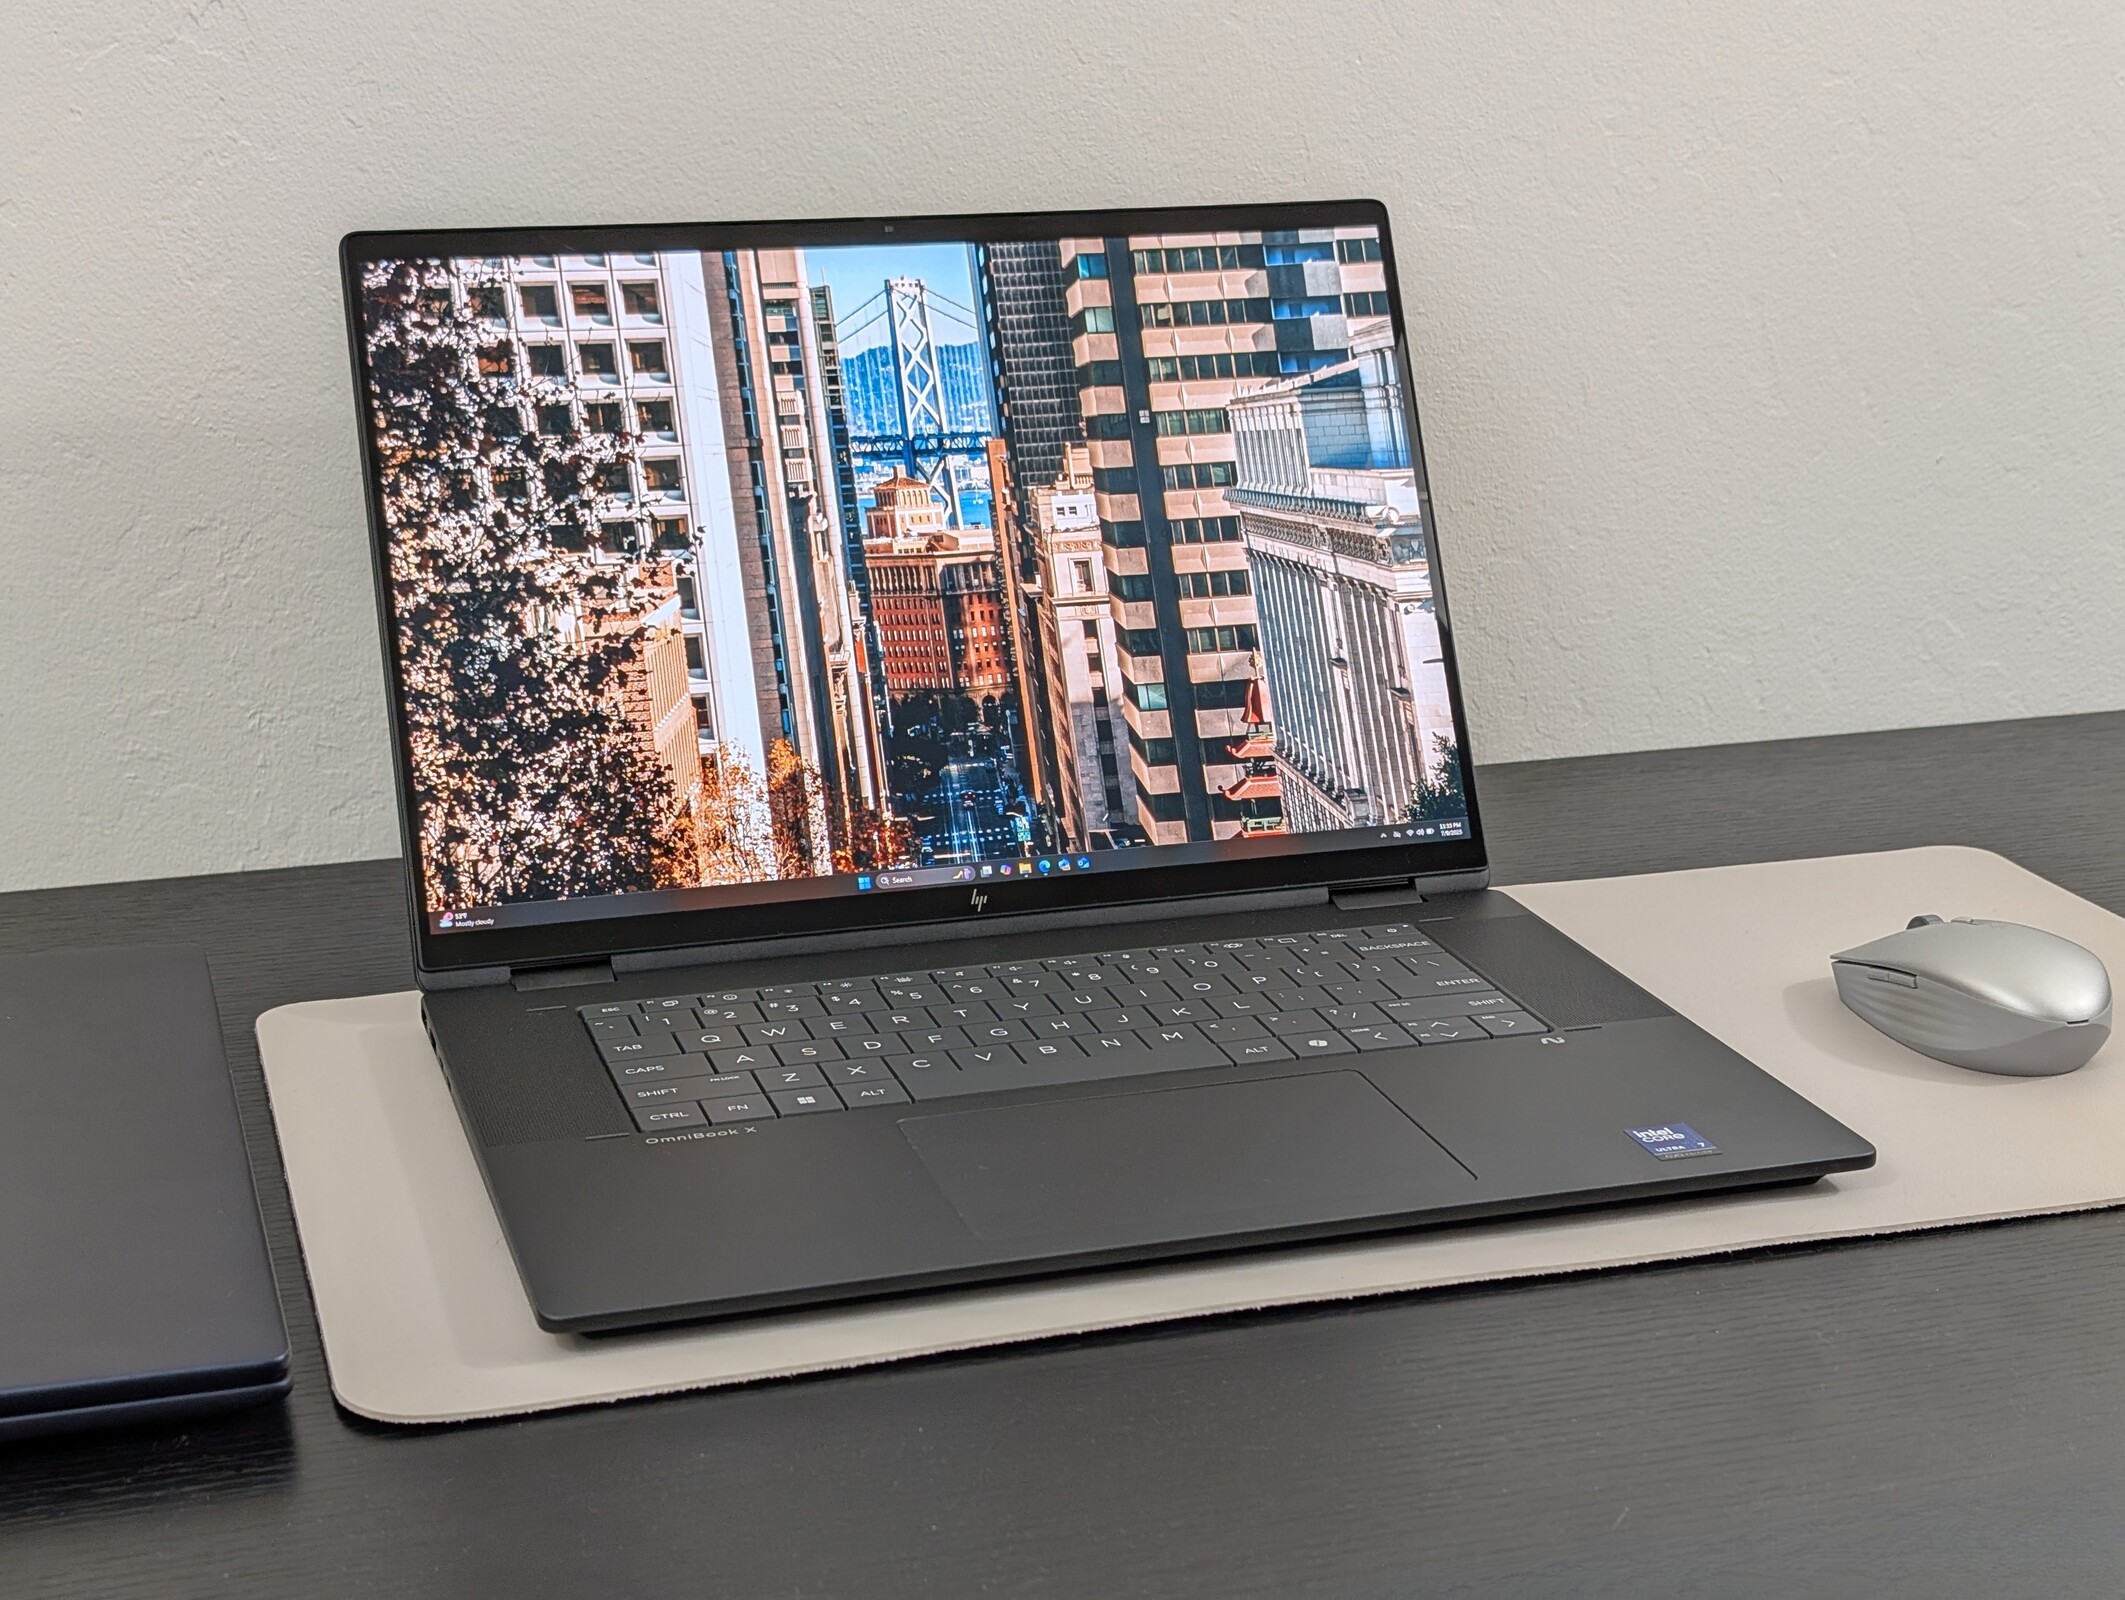
El OmniBook X Flip 16 tiene más en común con el buque insignia de la serie Spectre que con el menos caro de la serie Pavilion. Su suave diseño metálico, su pantalla táctil OLED y su moderno procesador Lunar Lake equilibran muy bien la portabilidad y la practicidad, especialmente si se compara con el competidor Dell 16 Plus 2 en 1 que parece más barato en comparación. Su factor de forma y los colores OLED son adecuados para todo tipo de entornos, desde el multimedia doméstico hasta la edición sobre la marcha - fiel al apodo "omni".
Es posible que algunos usuarios no aprecien lo diferente que se siente el teclado en comparación con la mayoría de los demás portátiles HP, por lo que la experiencia de escritura puede requerir cierto tiempo de adaptación. Además, el rendimiento bruto será más lento que el de muchos clamshells de 16 pulgadas como el propio Envy 16 de HP que suelen venir con procesadores de la serie H y gráficos discretos. Los usuarios avanzados pueden considerar el Serie Spectre x360 16 para obtener potencia adicional de edición y juegos. Para todos los demás, el OmniBook X Flip 16 es uno de los mejores y más versátiles convertibles de 16 pulgadas en el rango bajo de los 1000 dólares.
Pro
Contra
Precio y disponibilidad
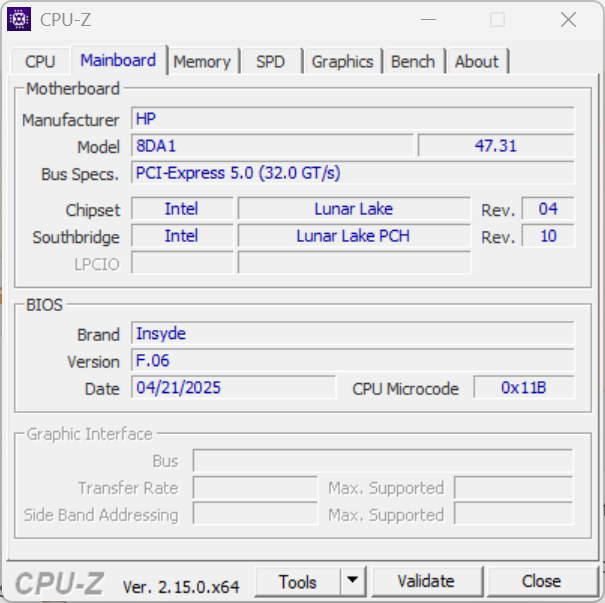
Amazon está enviando actualmente el OmniBook X Flip 16 por 1300 dólares tal y como está configurado en nuestra unidad de revisión Core Ultra 7 258V. Alternativamente, los usuarios pueden comprar directamente de HP por sólo $ 950 cuando está en oferta.
Índice
- Veredicto - Uno de los mejores descapotables de 16 pulgadas por 1.000 dólares
- Especificaciones
- Maletín - Más elegante que un Dell
- Conectividad
- Dispositivos de entrada
- Pantalla - 3K 120 Hz OLED
- Rendimiento - Eficiencia de Lunar Lake
- Emisiones
- Gestión de la energía
- Valoración de Notebookcheck
- Potential Competitors in Comparison
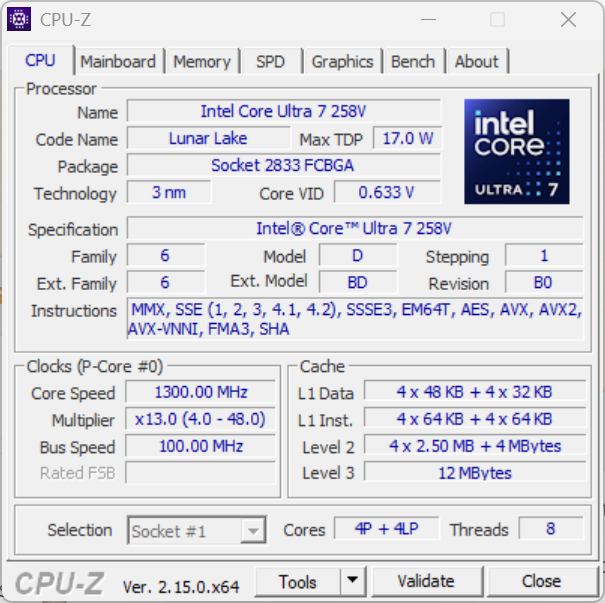
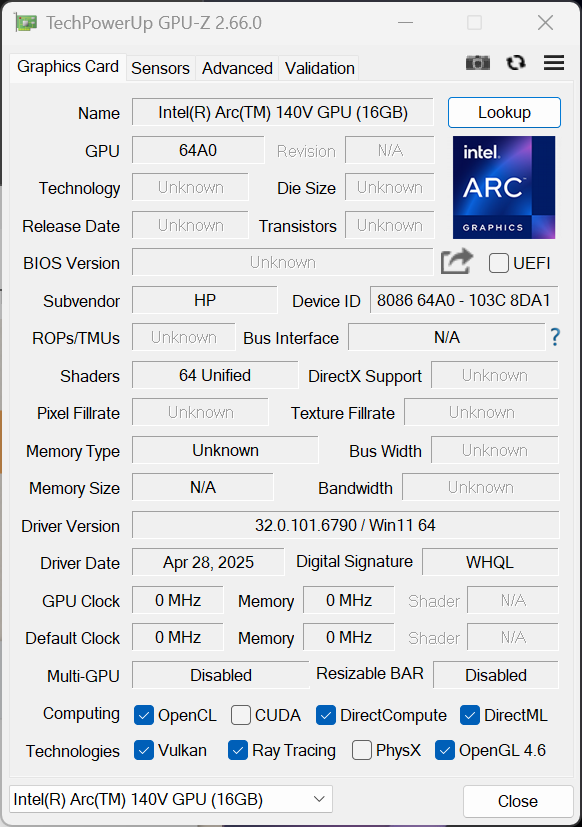
El HP OmniBook X Flip 16 es un convertible prosumer de 16 pulgadas que se sitúa justo por debajo del Serie Spectre x360 16 en términos de precio y características. Nuestra unidad de prueba es una configuración de gama alta con la CPU Intel Core Ultra 7 258V Lunar Lake y pantalla táctil OLED 3K de 120 Hz por aproximadamente 1.300 dólares o algo menos de 1.000 dólares cuando está a la venta.
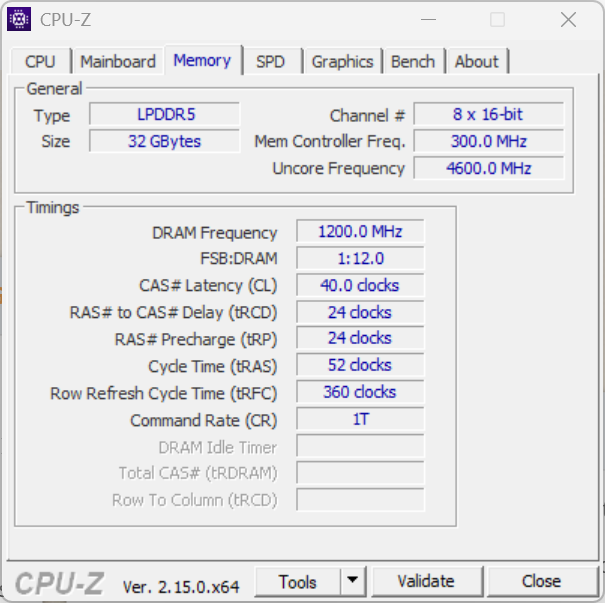
También hay disponible una variante AMD del modelo con el Ryzen AI 5 340 y pantalla táctil 1200p de menor resolución por unos 700 $. Sin embargo, todas las configuraciones de Intel por el momento vienen con la pantalla táctil OLED de 1800p y 120 Hz.
Los competidores en este espacio incluyen otros convertibles prosumer de 16 pulgadas como el Lenovo Yoga 7 2 en 1 de 16, Samsung Galaxy Book5 Pro 360o el Dell 16 Plus 2 en 1.
Más opiniones sobre HP:
Especificaciones
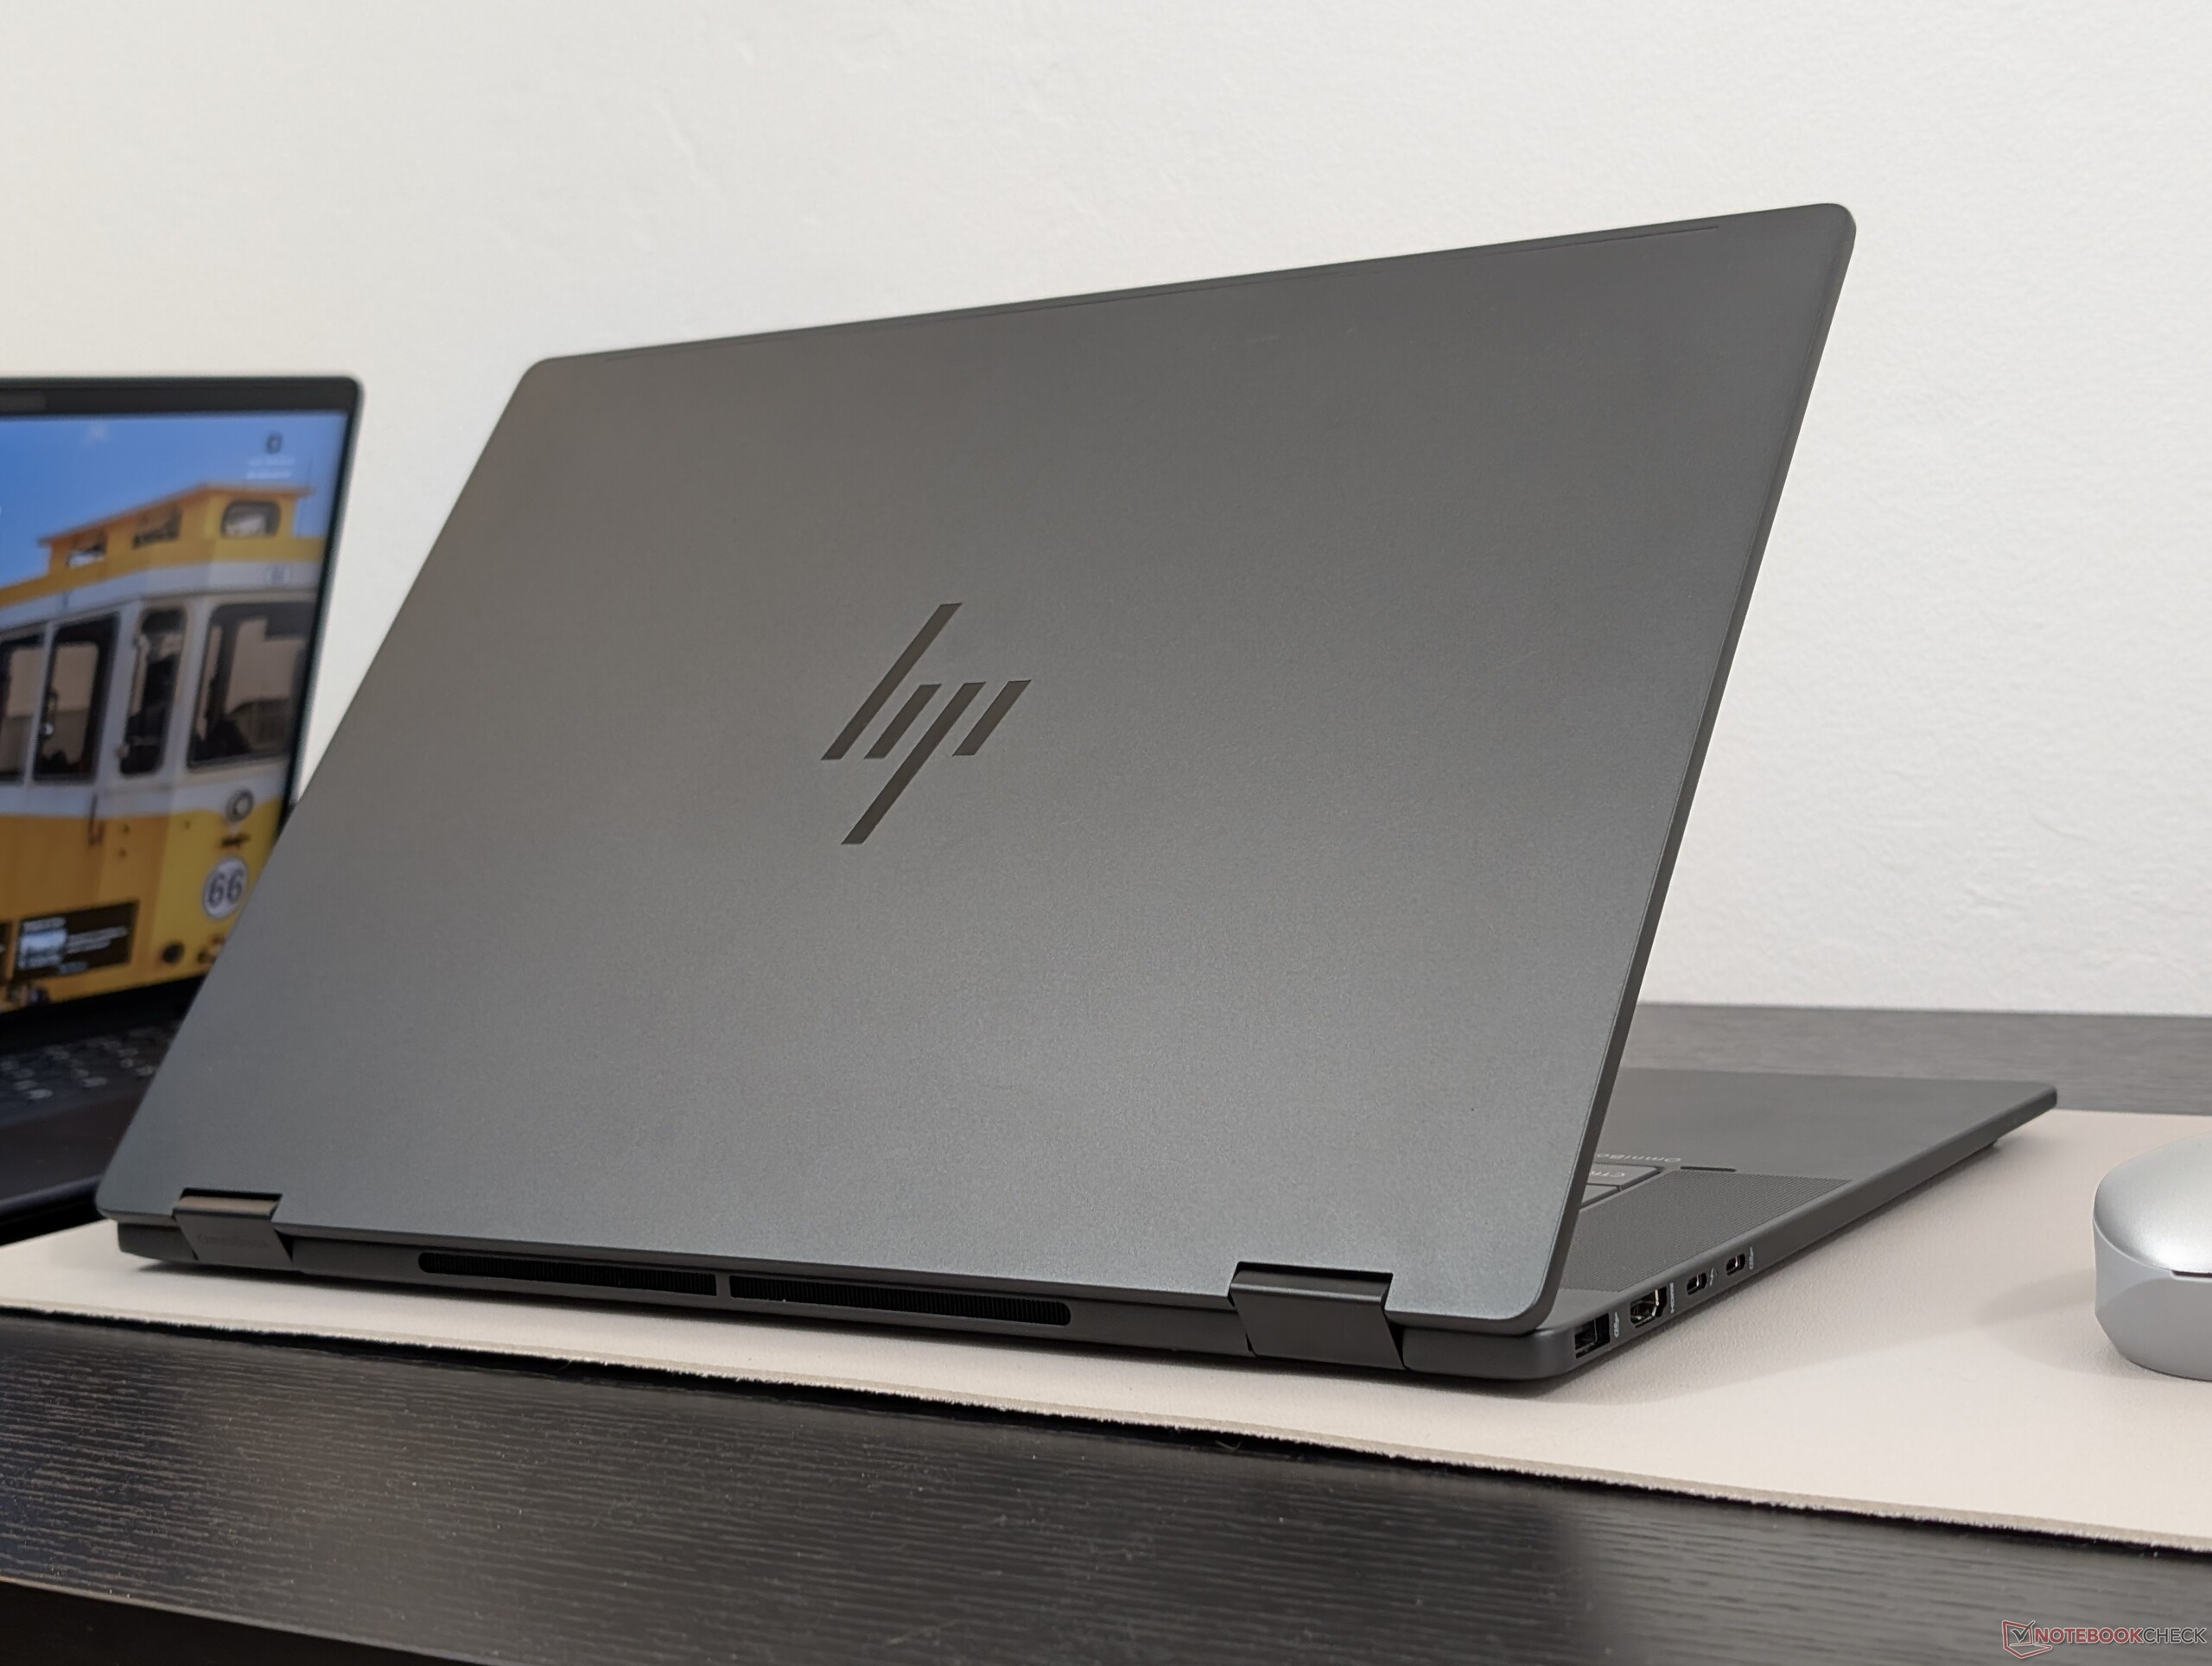
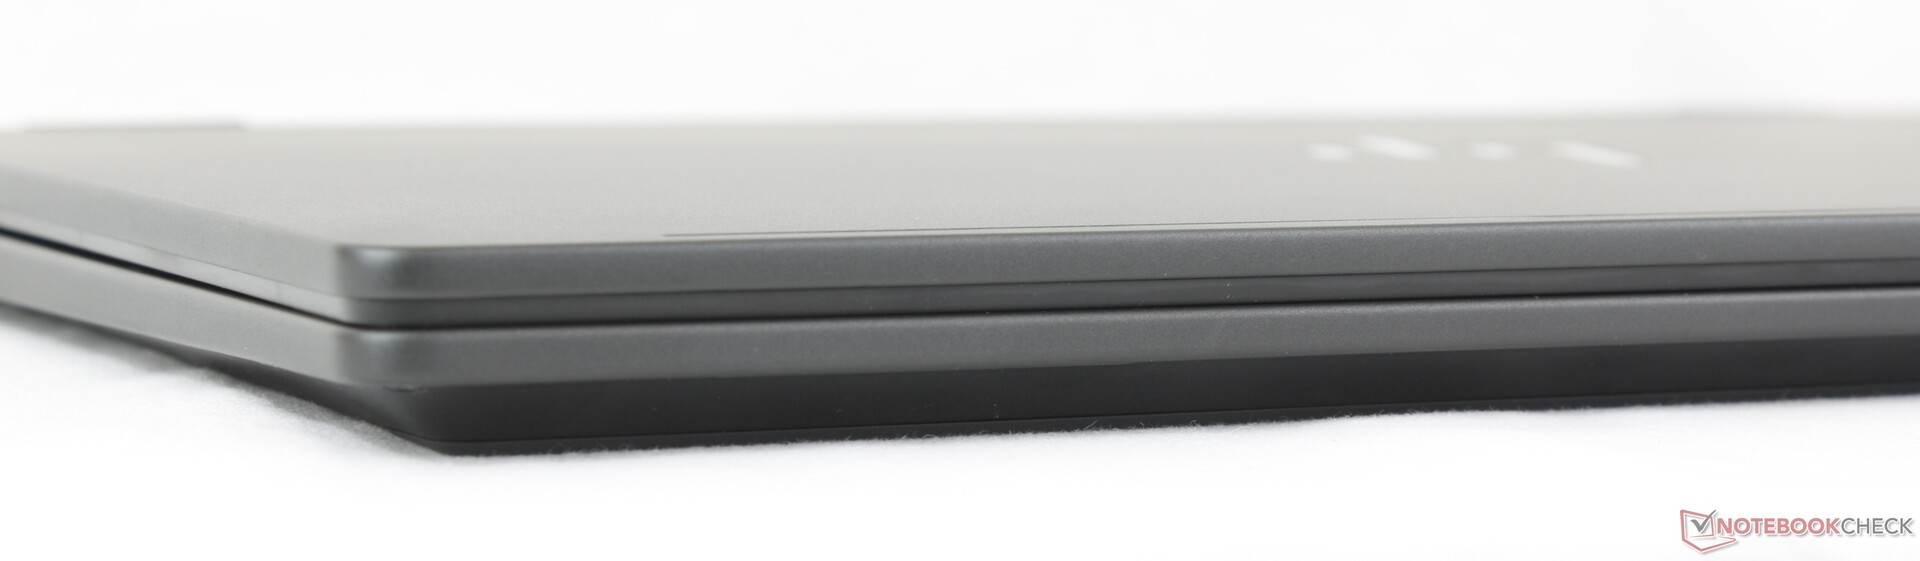
Maletín - Más elegante que un Dell
El diseño de metal mate unicolor se siente más resistente y lujoso que el 2 en 1 Dell 16 Plus de precio similar. Todavía se flexiona un poco más que el más caro Spectre x360 16 mientras que los usuarios que están dispuestos a gastar cientos de dólares más encontrarán el Samsung Galaxy Book5 Pro 360 una alternativa notablemente más ligera.
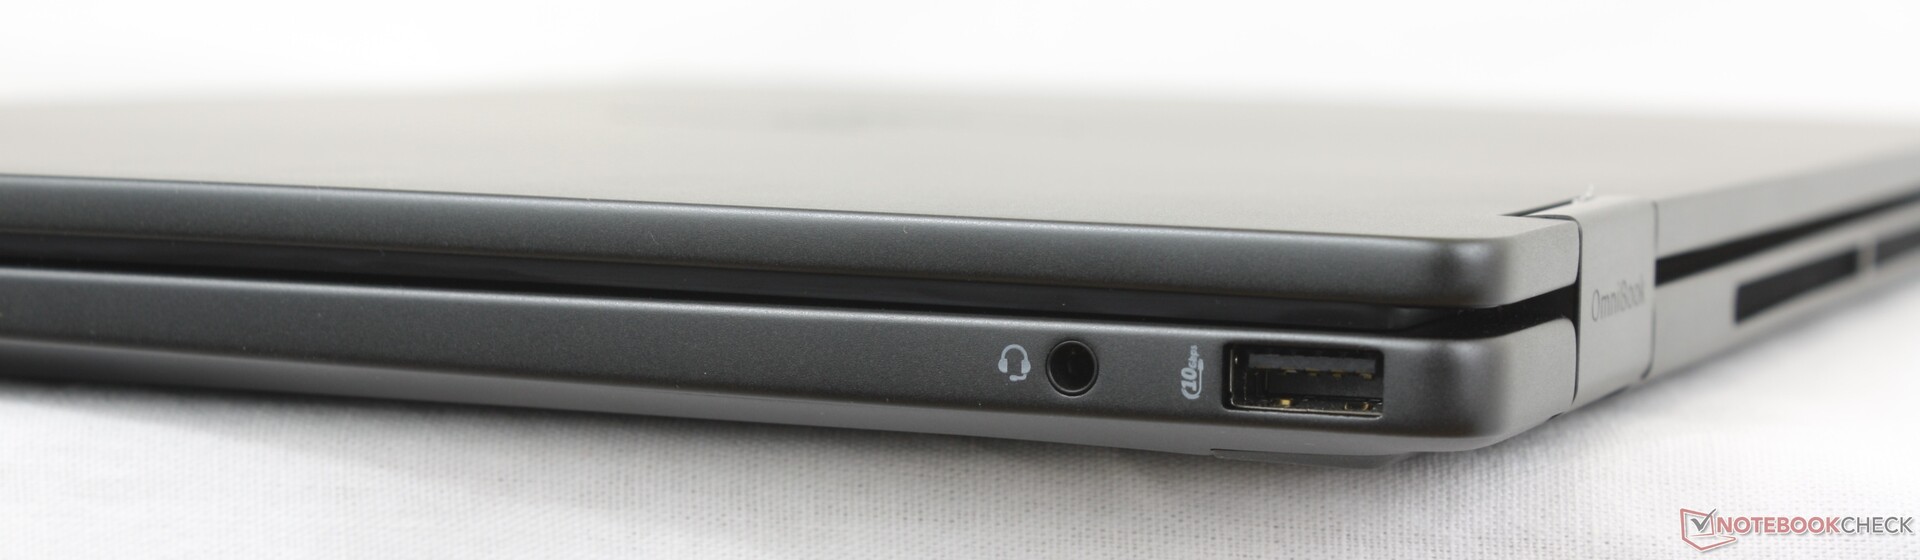
Conectividad
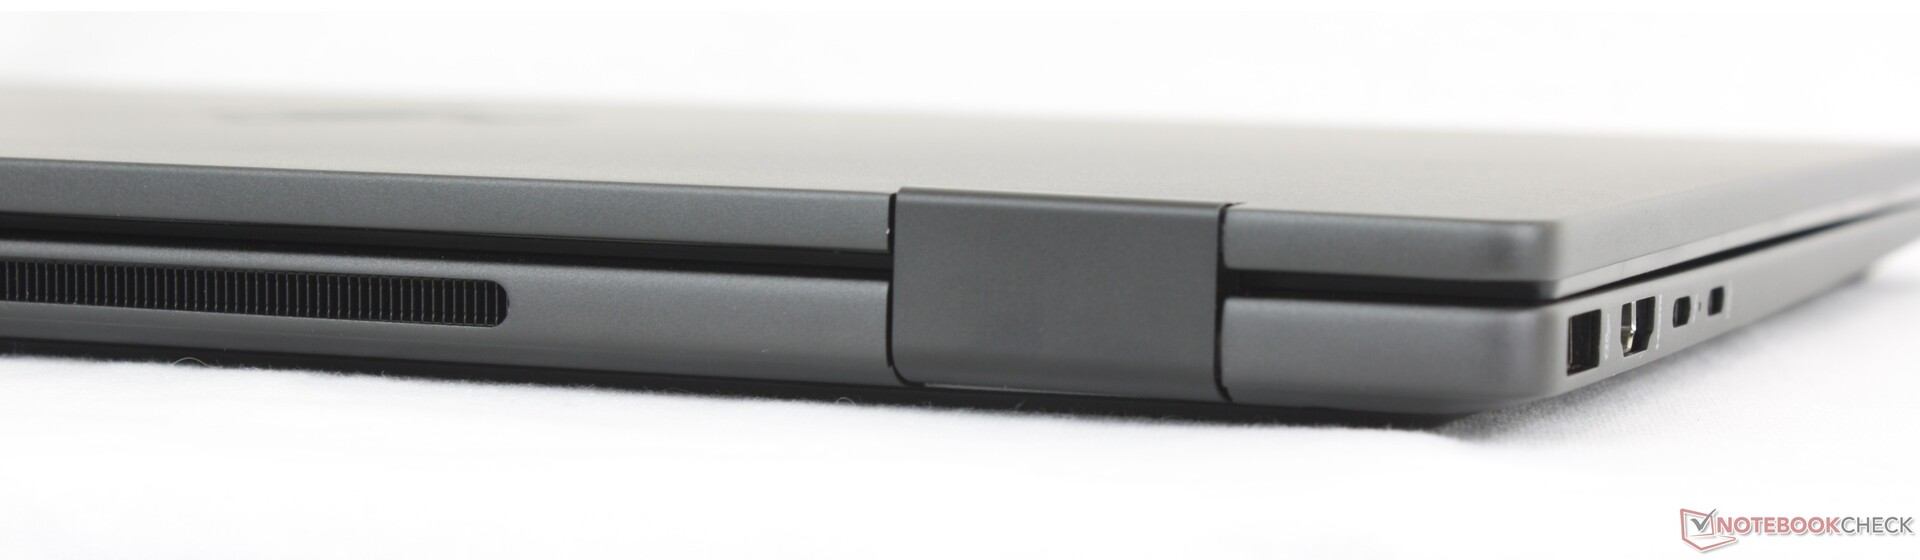
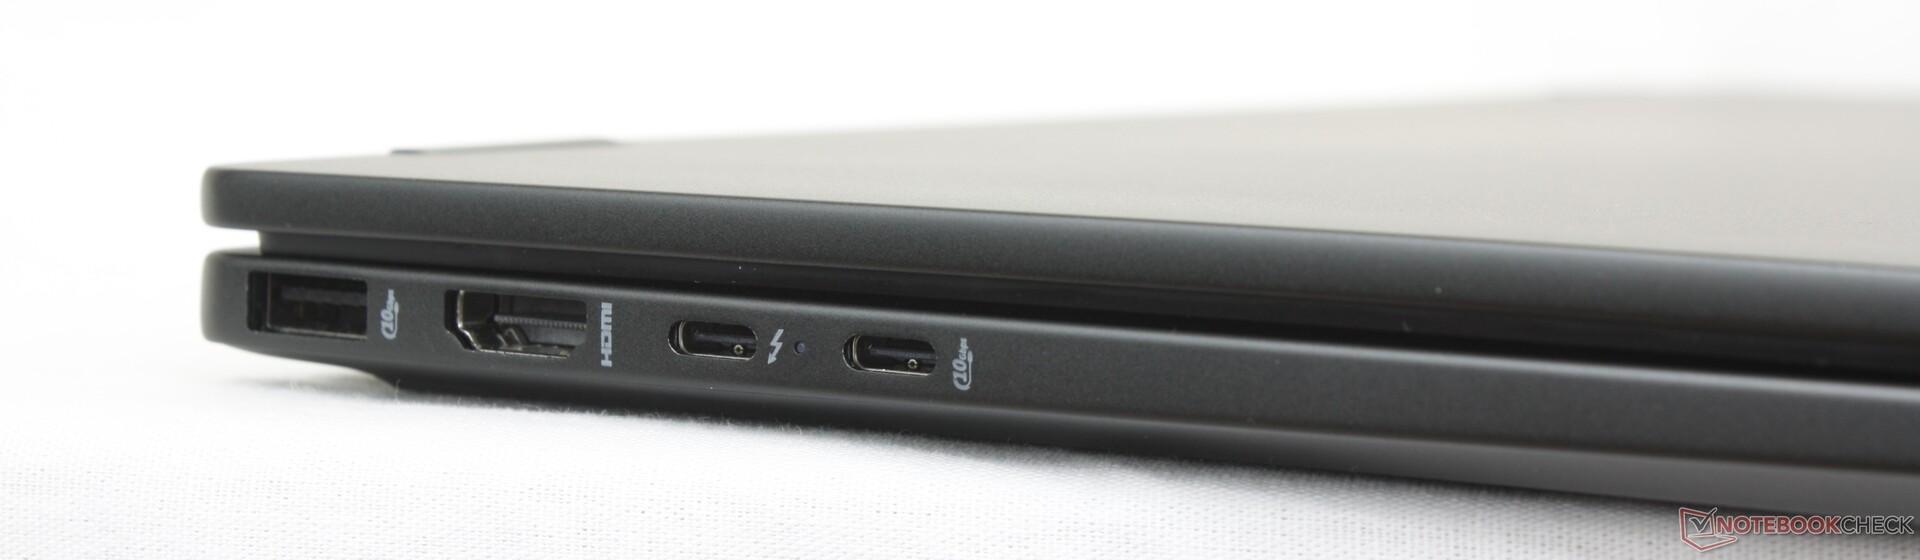
El HP incluye todos los puertos que se encuentran en el Dell Plus 16 2 en 1 más un puerto USB-A adicional a lo largo del borde izquierdo. Tenga en cuenta que solo uno de los dos puertos USB-C es compatible con Thunderbolt 4 y DisplayPort 2.1 mientras que el otro puerto USB-C es solo de 10 Gbps con DisplayPort 1.4.
Comunicación
Cámara web
La cámara web de 5 MP viene de serie con IR y un obturador físico.


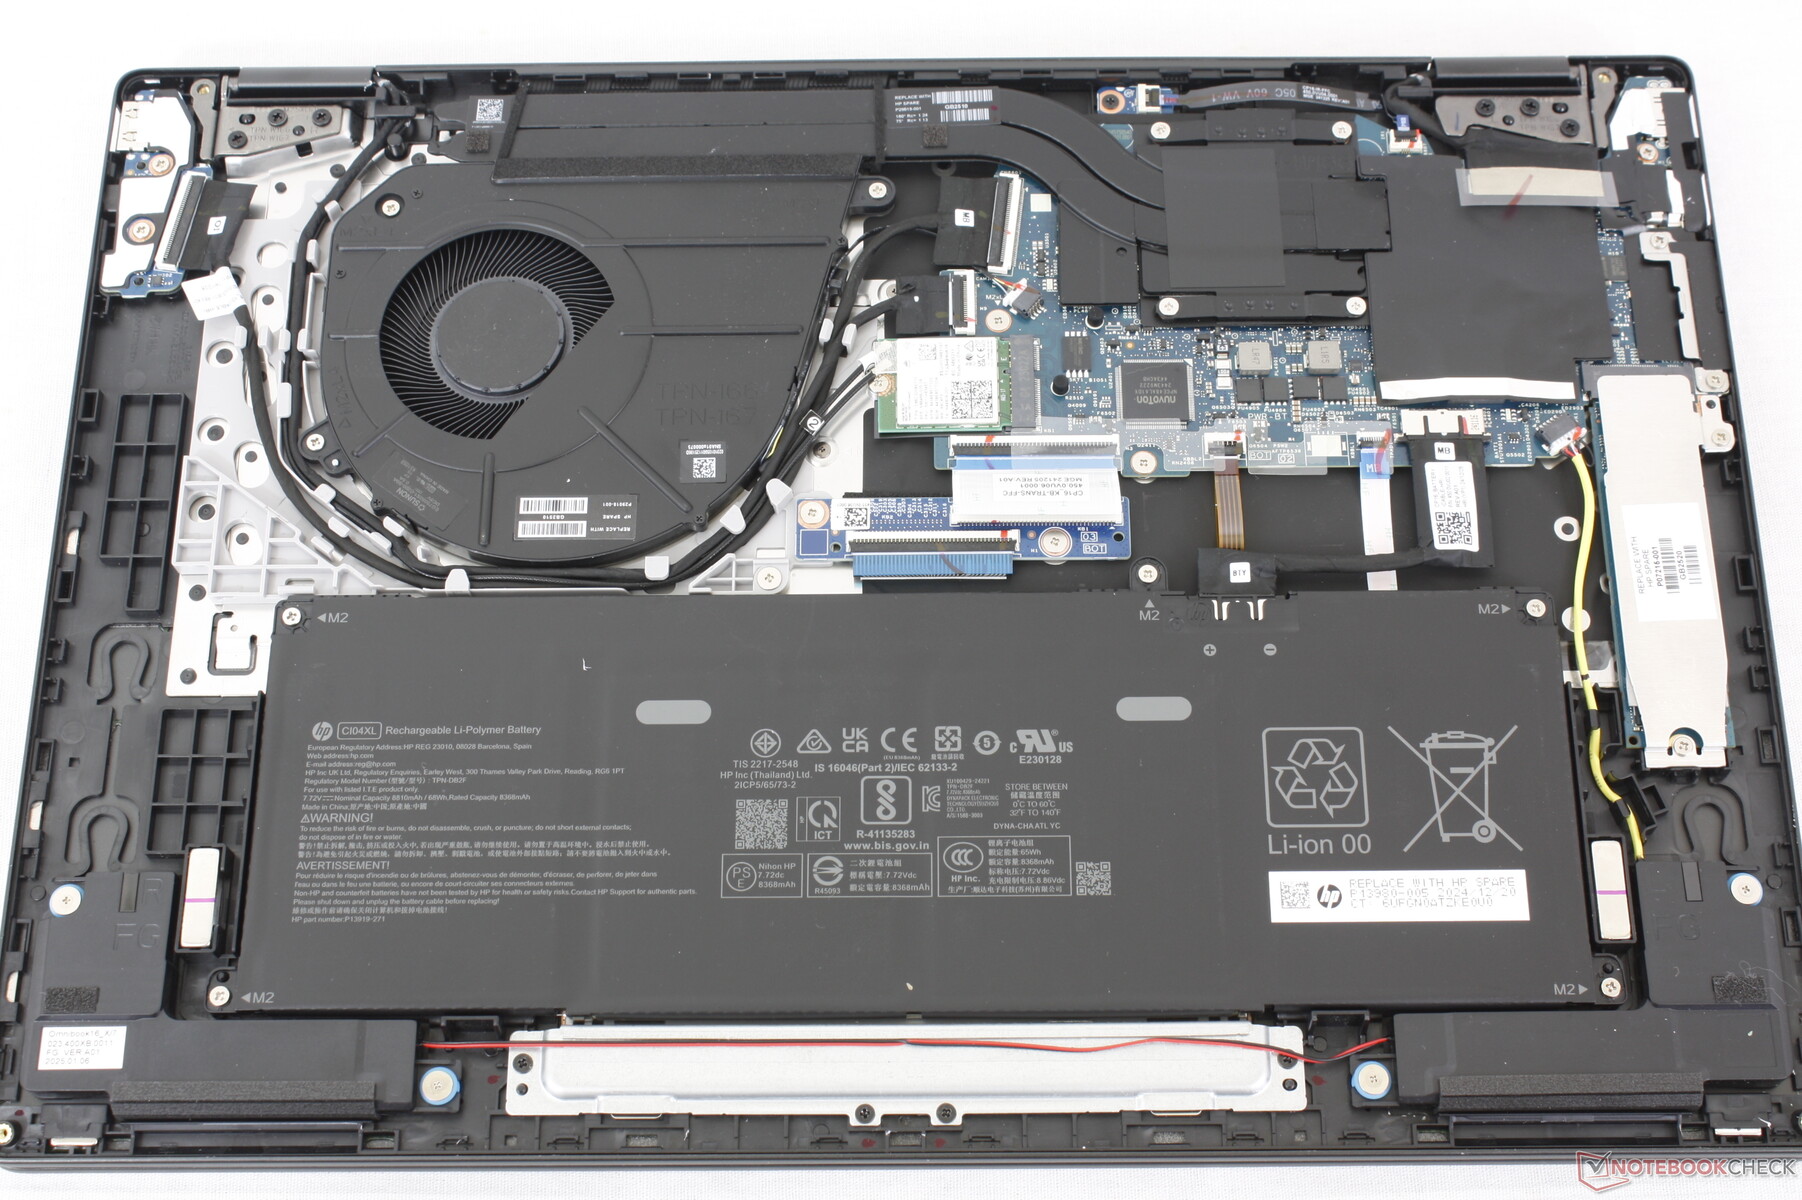
Mantenimiento
Sostenibilidad
HP incorpora diversas cantidades de metales y plásticos reciclados y renovables en la fabricación del OmniBook X Flip 16.
Accesorios y garantía
La caja de venta incluye un lápiz óptico activo (TPA-M005P) además de la documentación habitual y el adaptador de CA USB-C. Se aplica la garantía limitada estándar del fabricante de un año si se adquiere en EE. UU.
Dispositivos de entrada
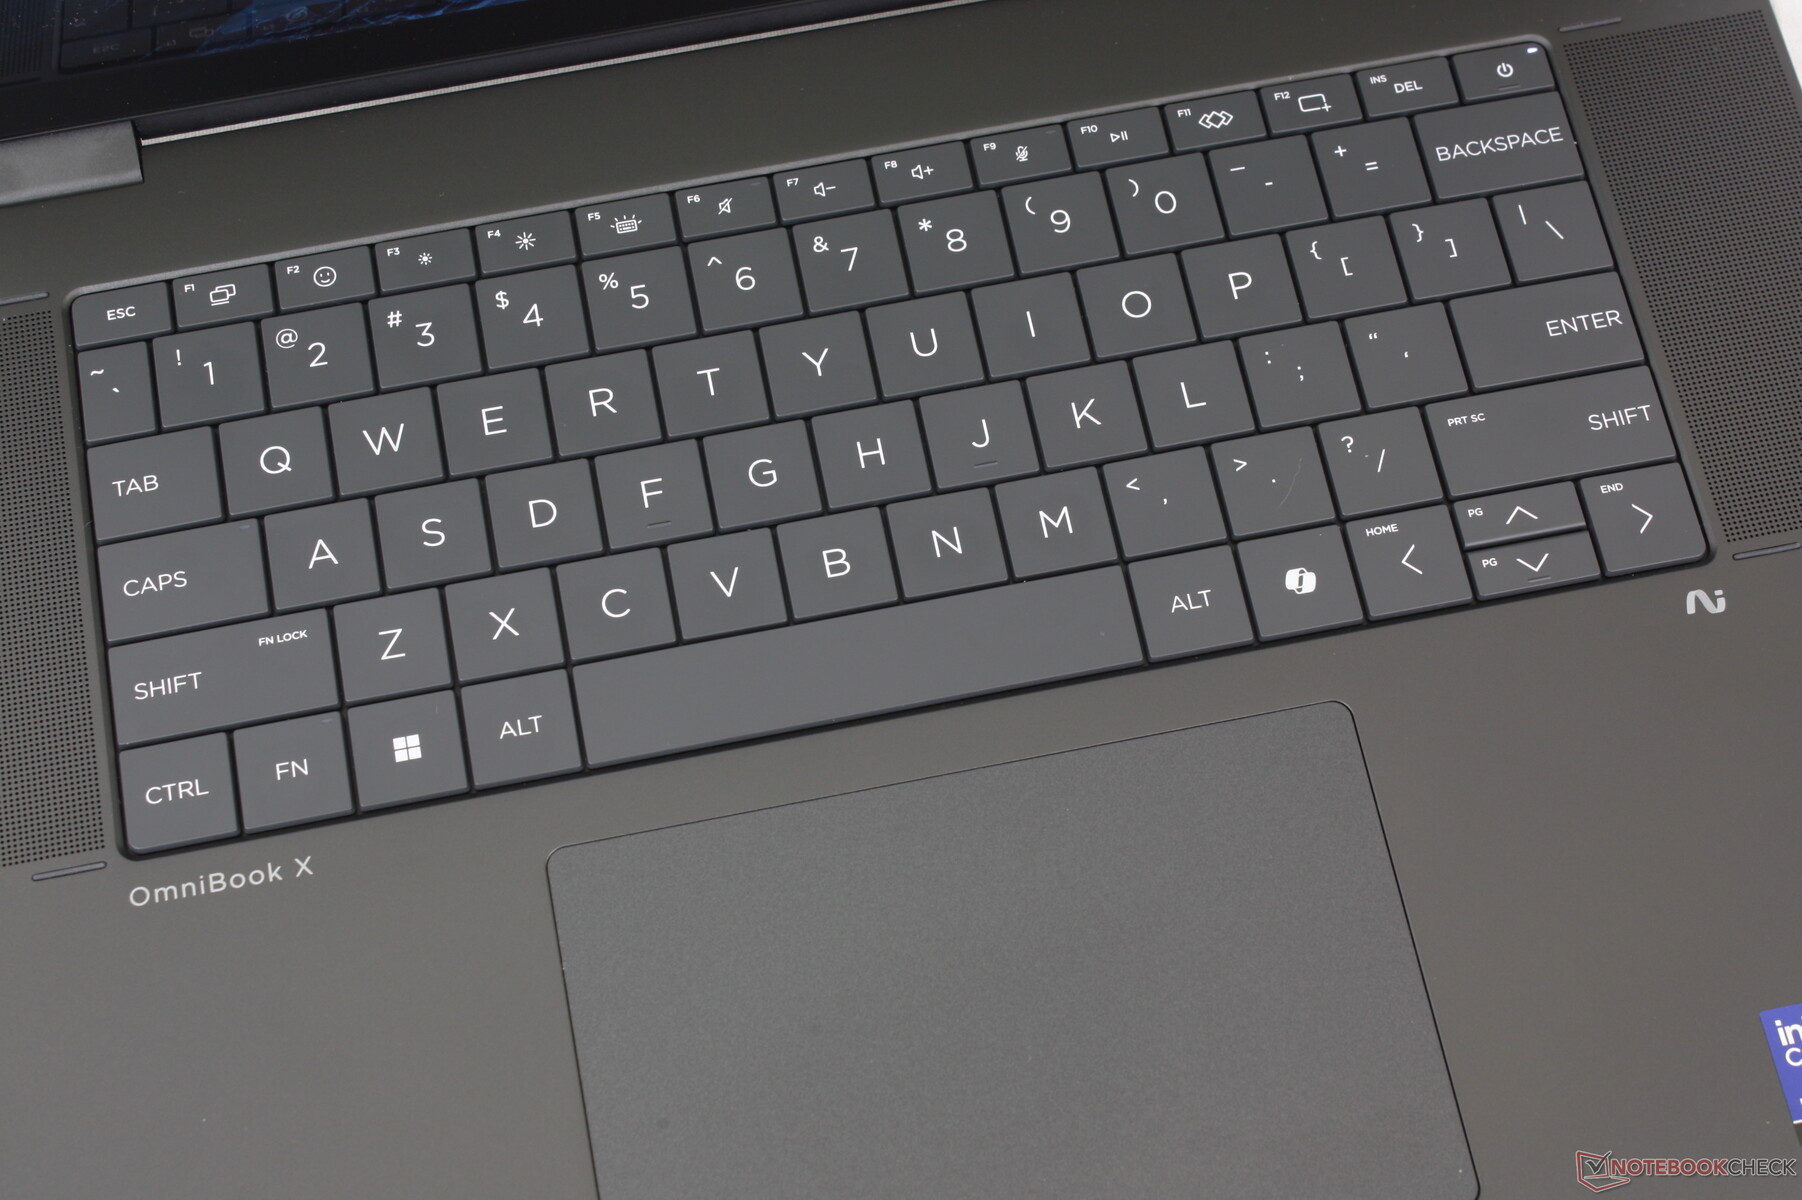
Teclado
El teclado de celosía cero es un cambio con respecto a la actual serie Spectre, la serie EliteBook y la serie Envy de la generación anterior. Aunque las teclas son más grandes, la respuesta es, por desgracia, más ligera y superficial que en los teclados más tradicionales de la mayoría de los otros portátiles HP.
Panel táctil
El clickpad tiene aproximadamente el mismo tamaño que en el Dell 16 Plus 2 en 1 (13,5 x 8,7 cm frente a 13,3 x 9 cm). Hacer clic es más fácil ya que requiere menos fuerza que en el convertible de Dell, pero la respuesta está en el lado esponjoso.
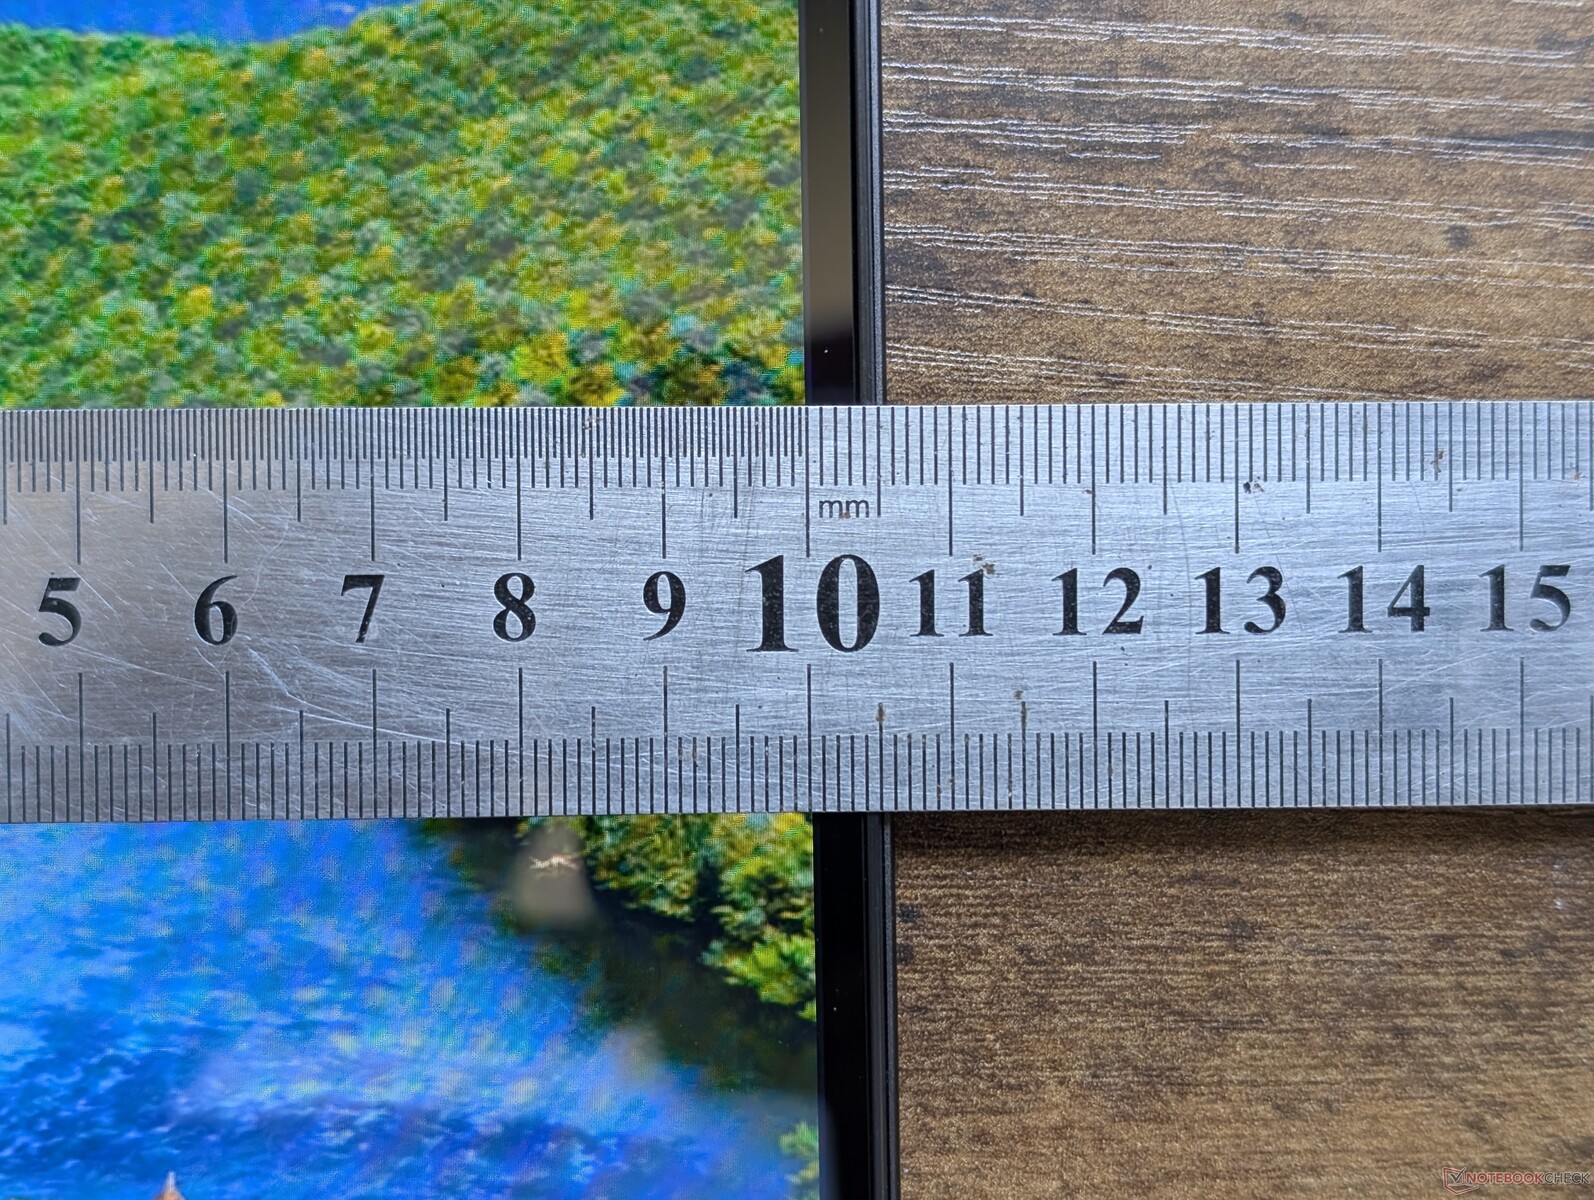
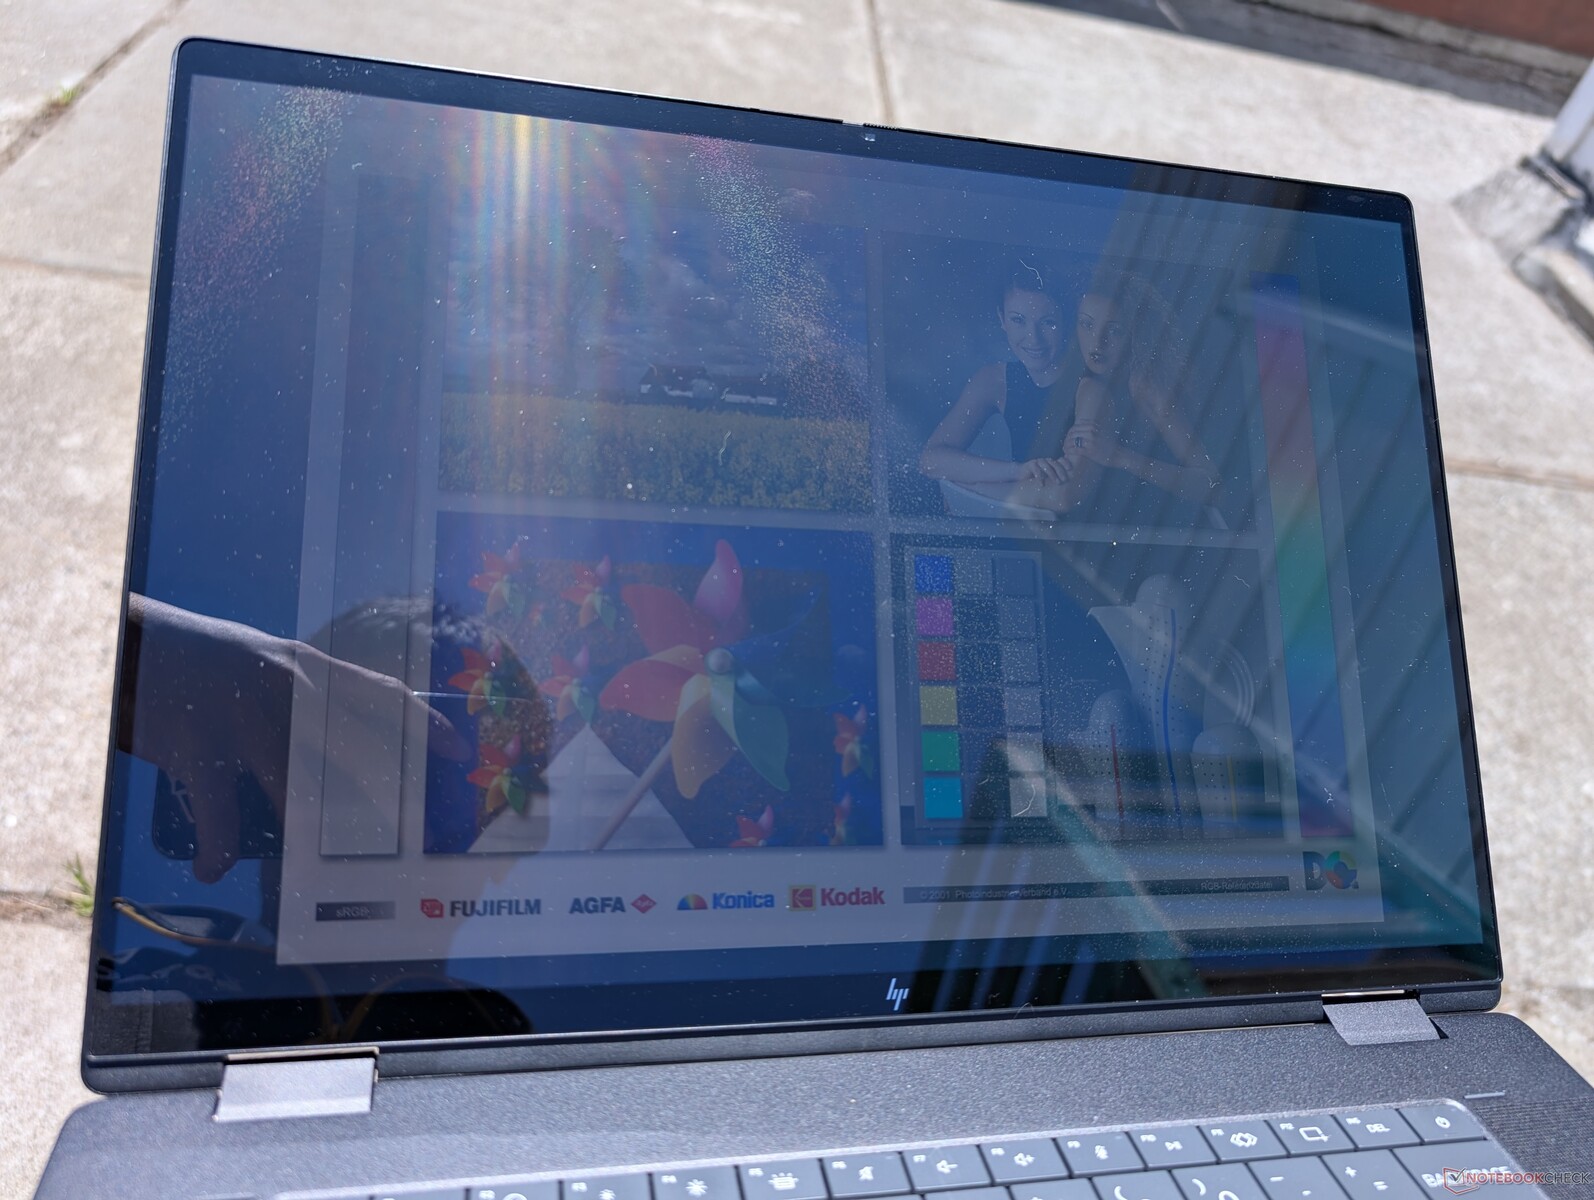
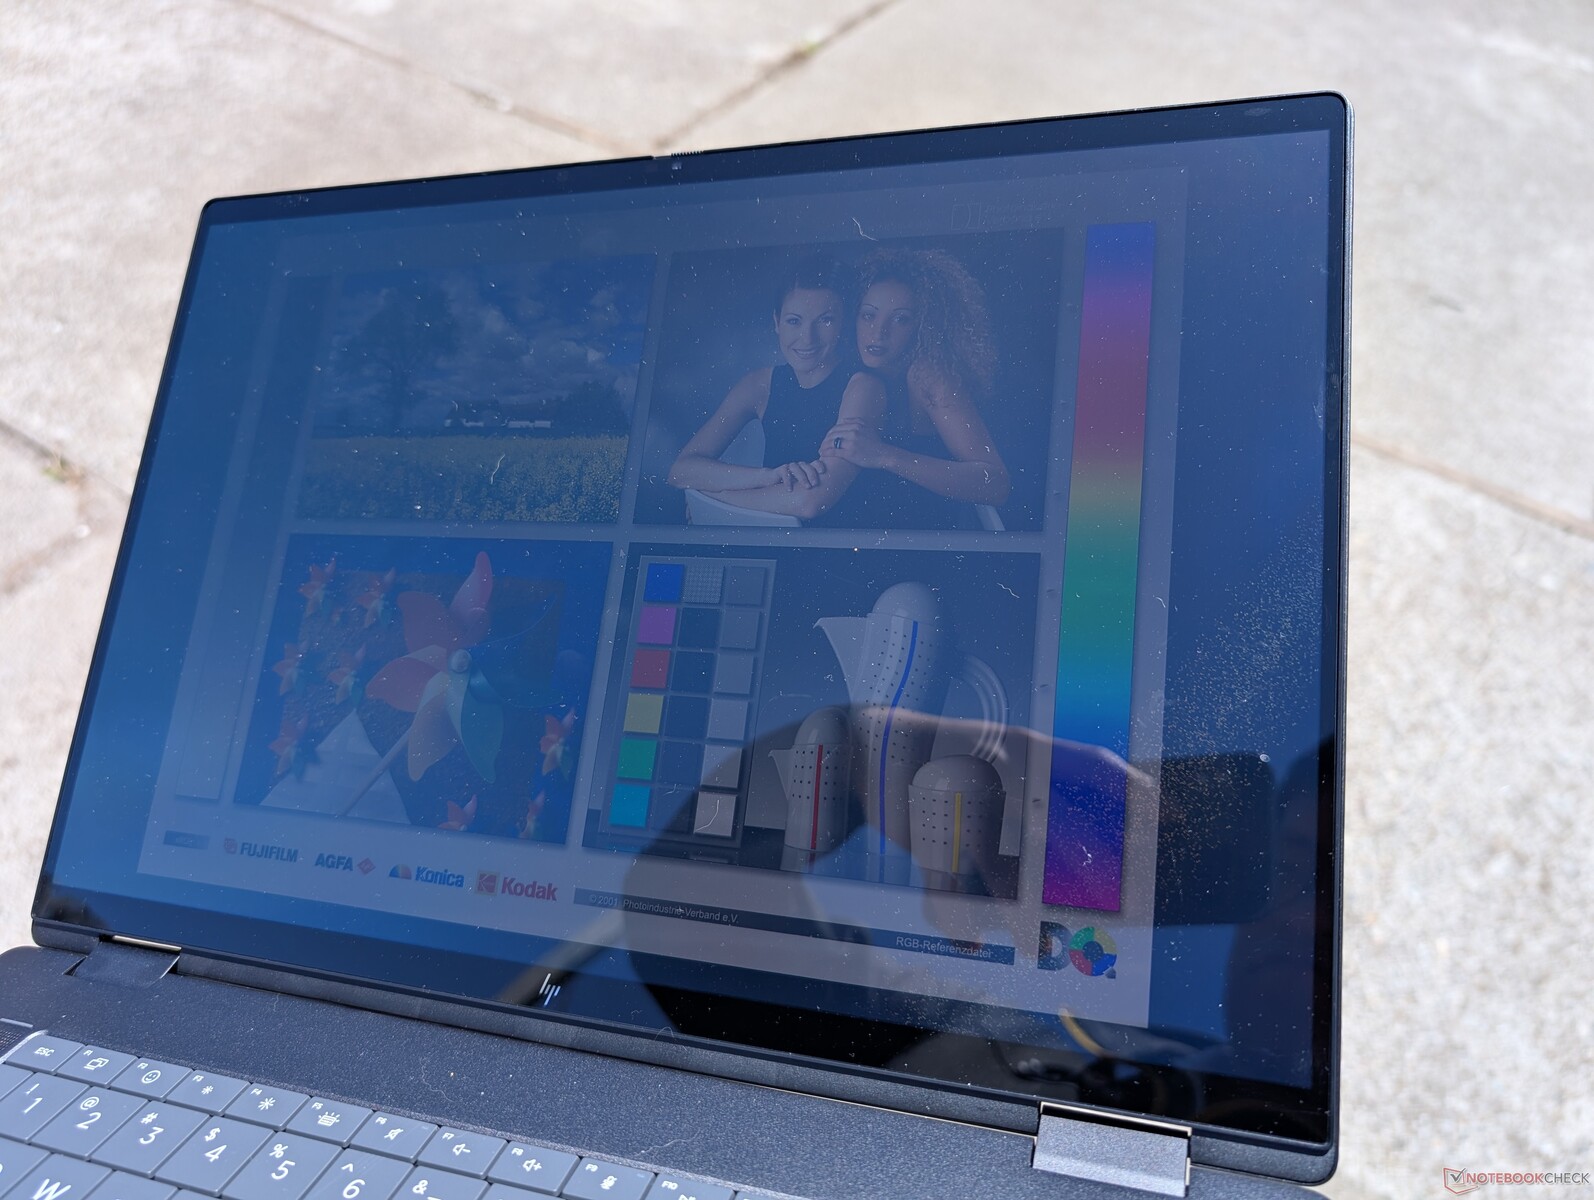
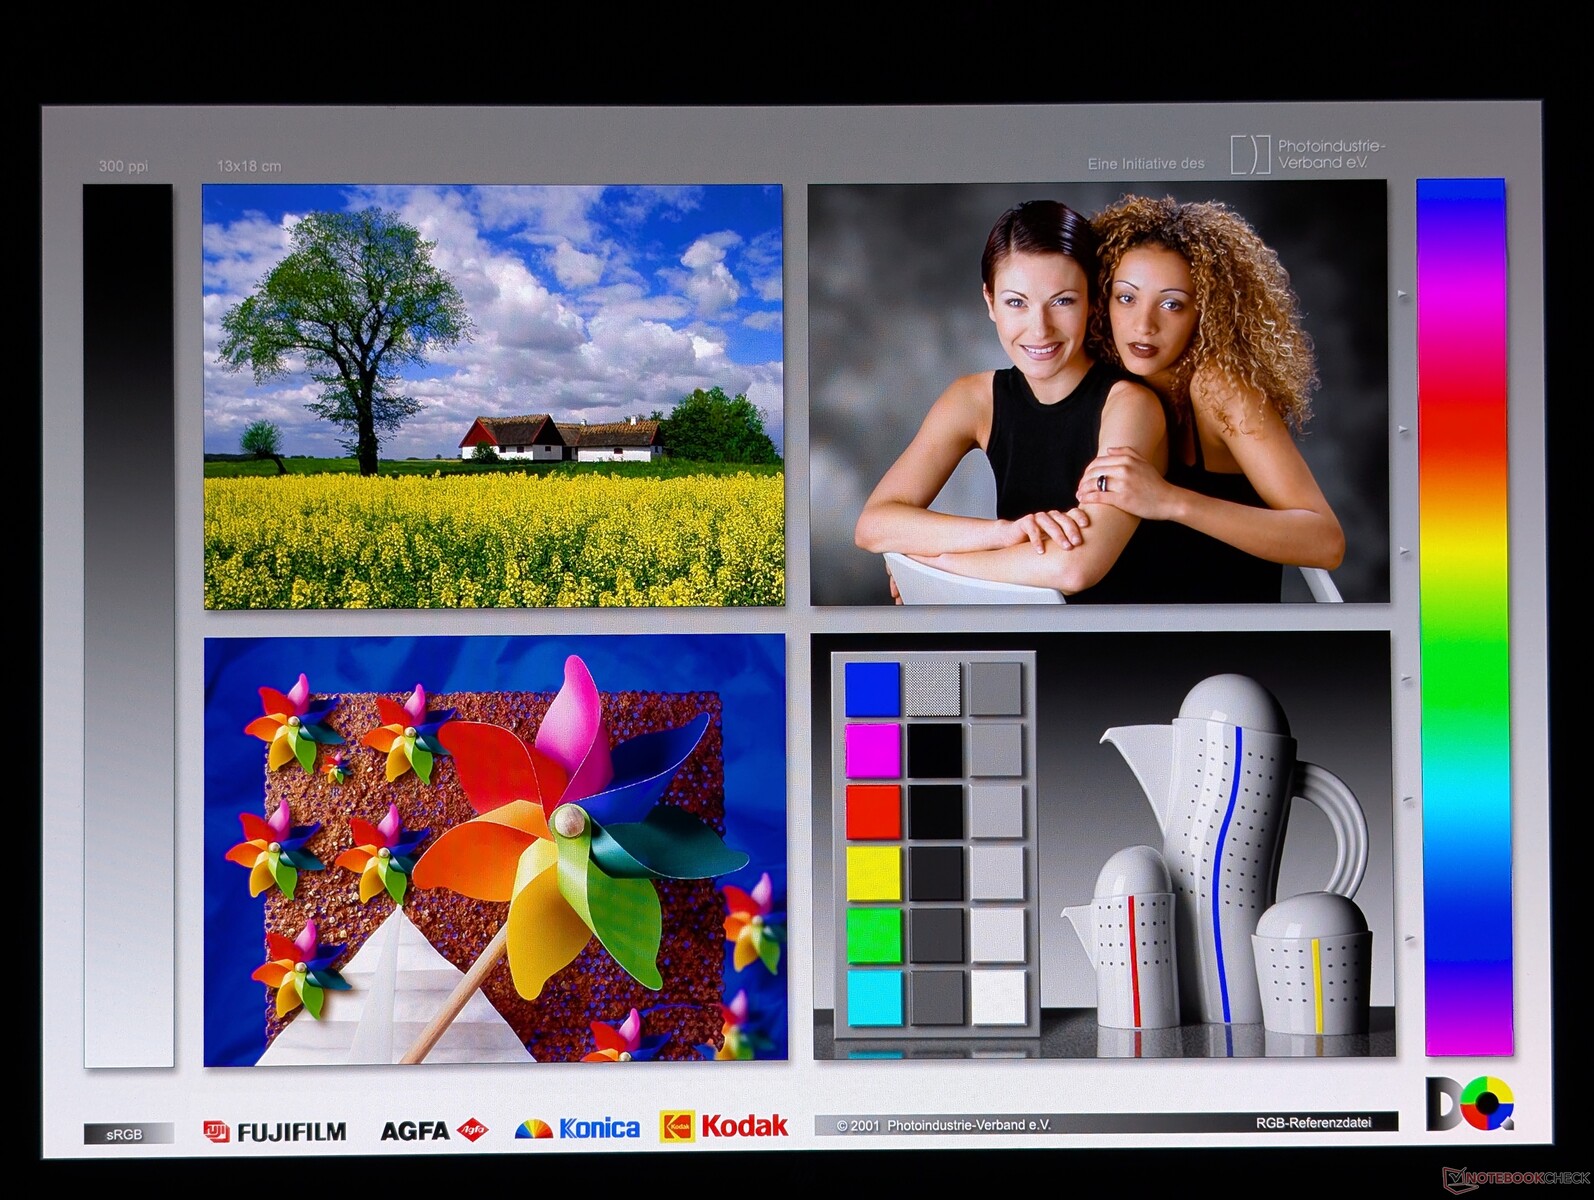
Pantalla - 3K 120 Hz OLED
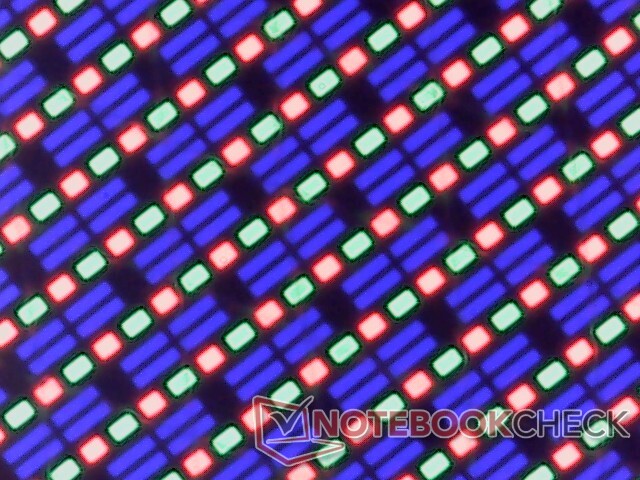
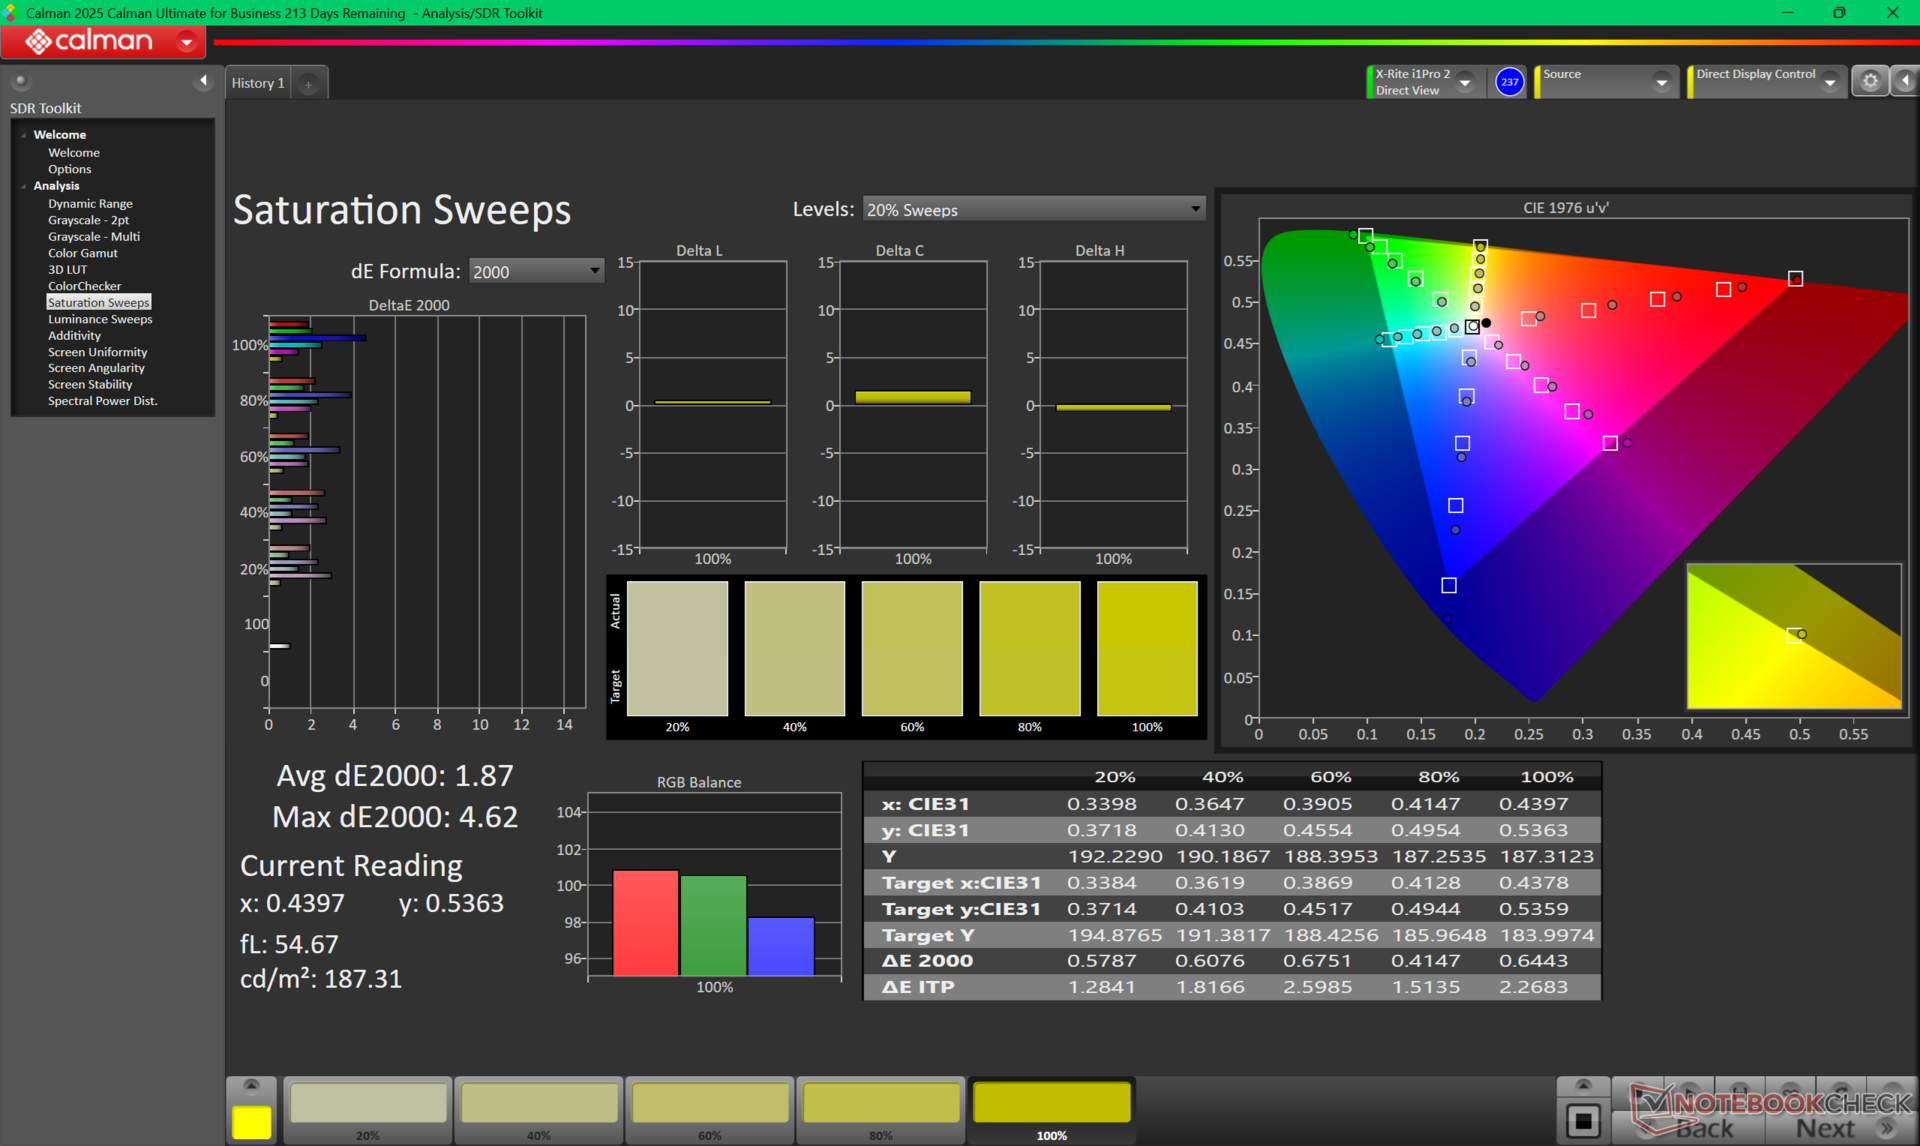
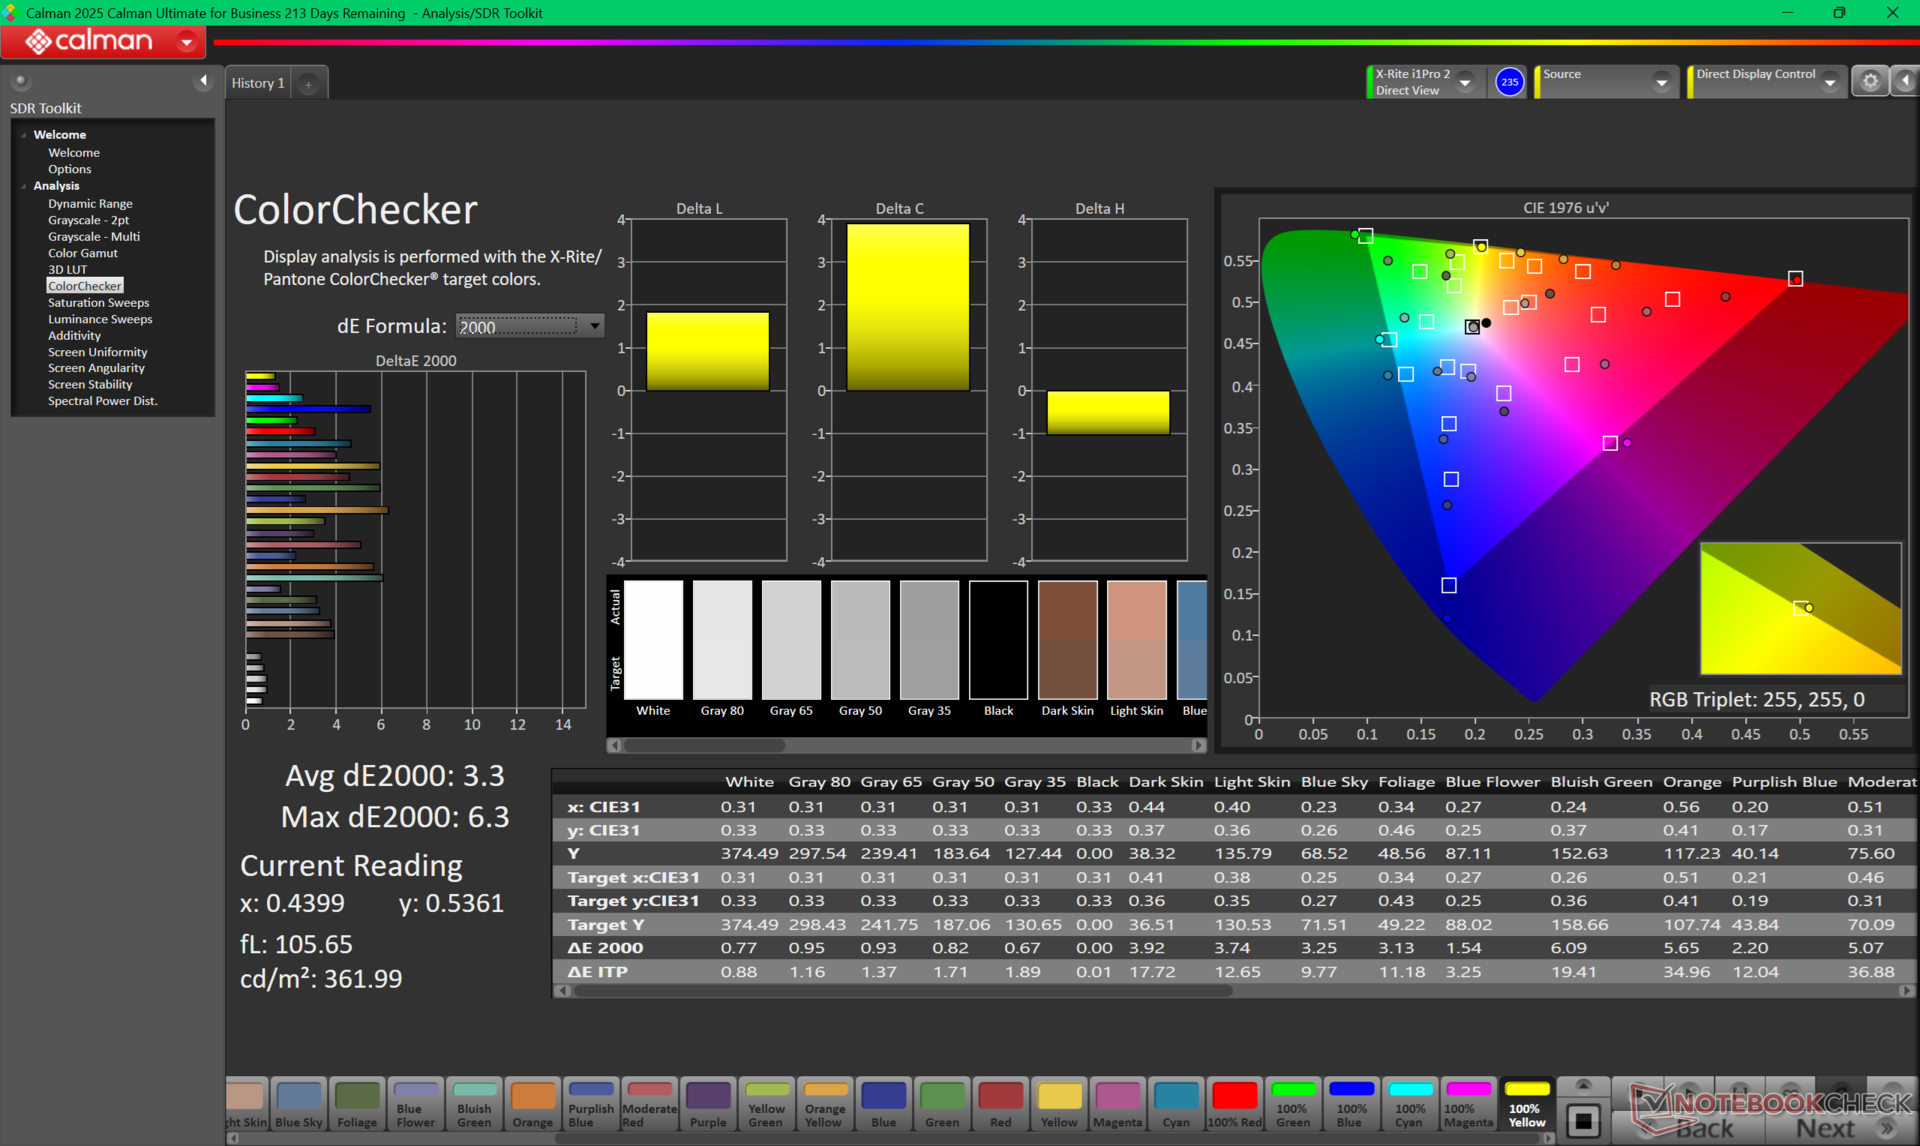
El OmniBook X Flip 16 utiliza una pantalla táctil Samsung OLED 1800p 120 Hz similar a la que se encuentra en el Galaxy Book5 Pro 360 o en HP Spectre x360 16. Ofrece una resolución nativa superior a la de los paneles Mini-LED o IPS del 2 en 1 Dell Plus 16 o el MSI Summit A16 AI Plus. El brillo máximo alcanza los 561 nits si está en modo HDR para soportar HDR500, pero por lo demás está limitado a 381 nits si está en modo SDR.

| |||||||||||||||||||||||||
iluminación: 98 %
Brillo con batería: 381.1 cd/m²
Contraste: ∞:1 (Negro: 0 cd/m²)
ΔE ColorChecker Calman: 3.3 | ∀{0.5-29.43 Ø4.72}
ΔE Greyscale Calman: 0.9 | ∀{0.09-98 Ø4.97}
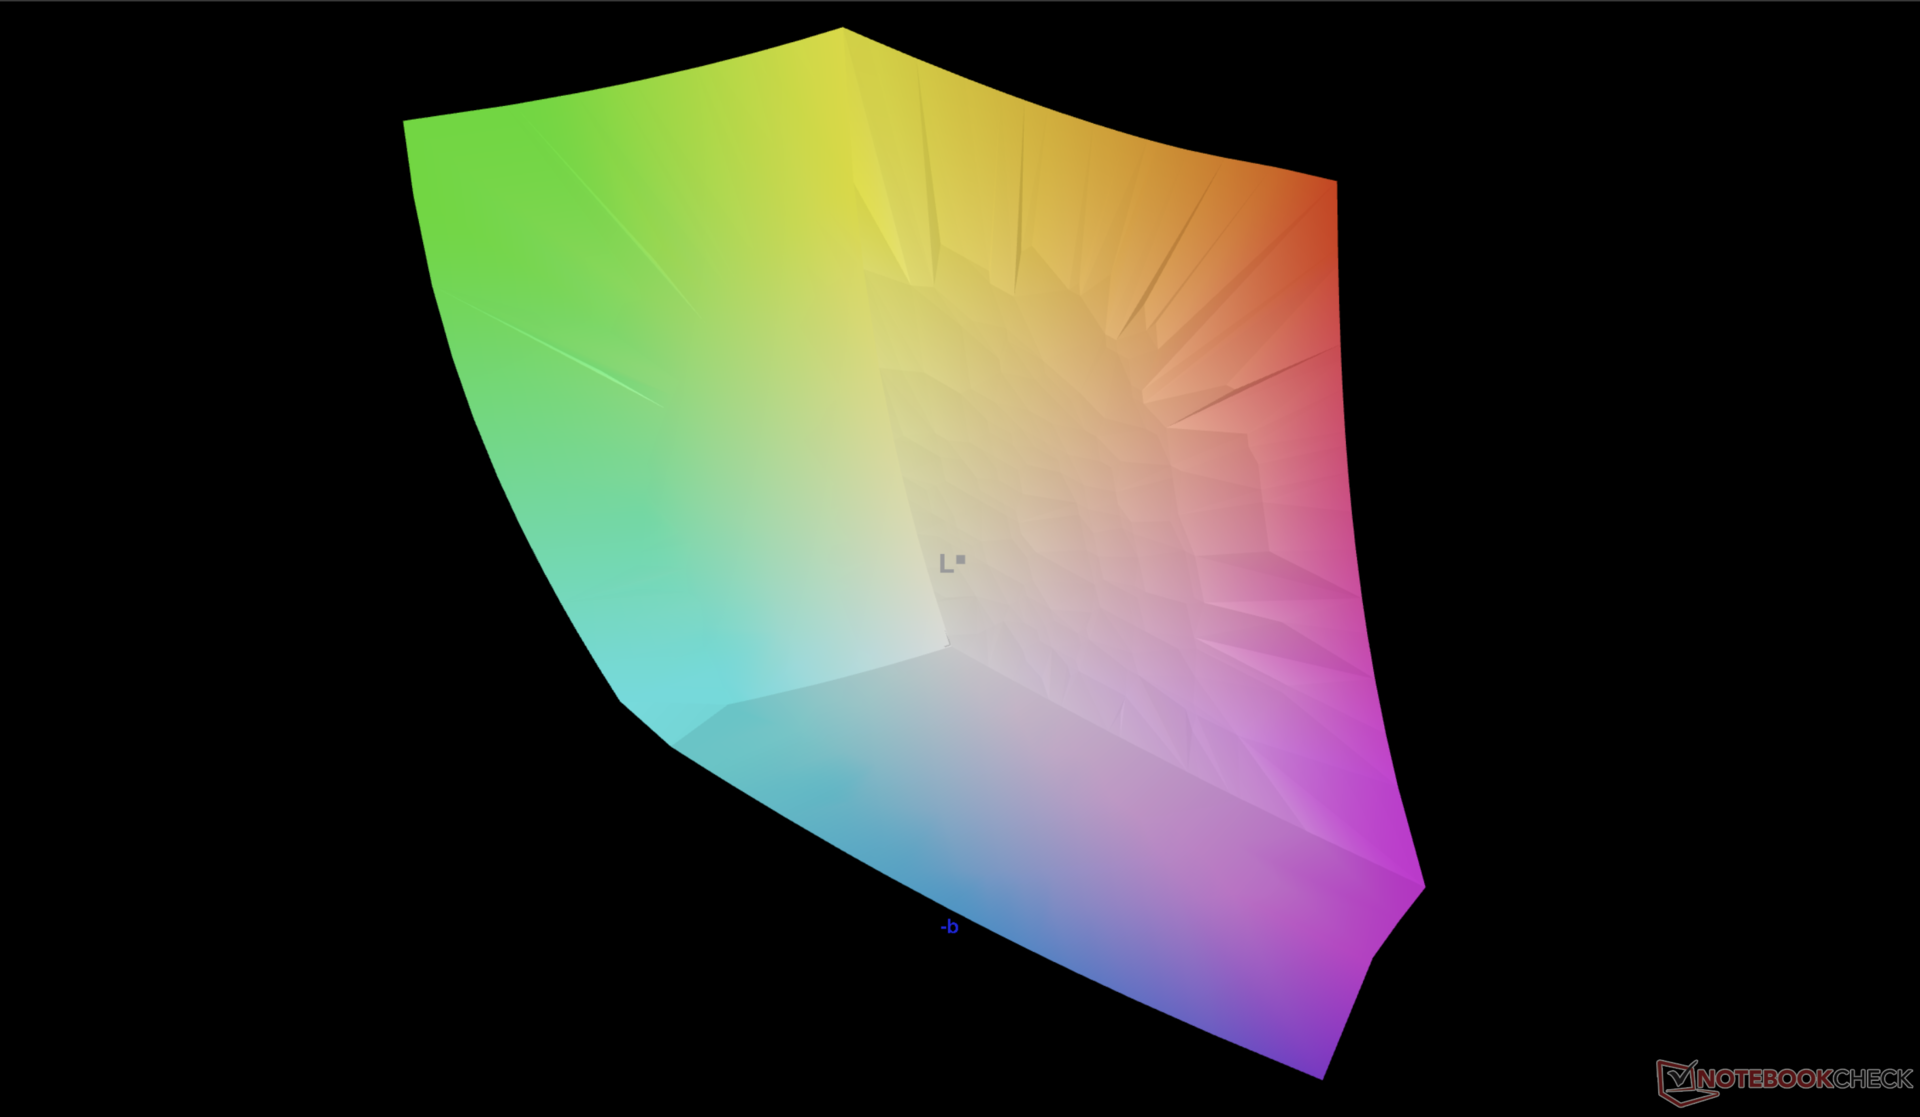
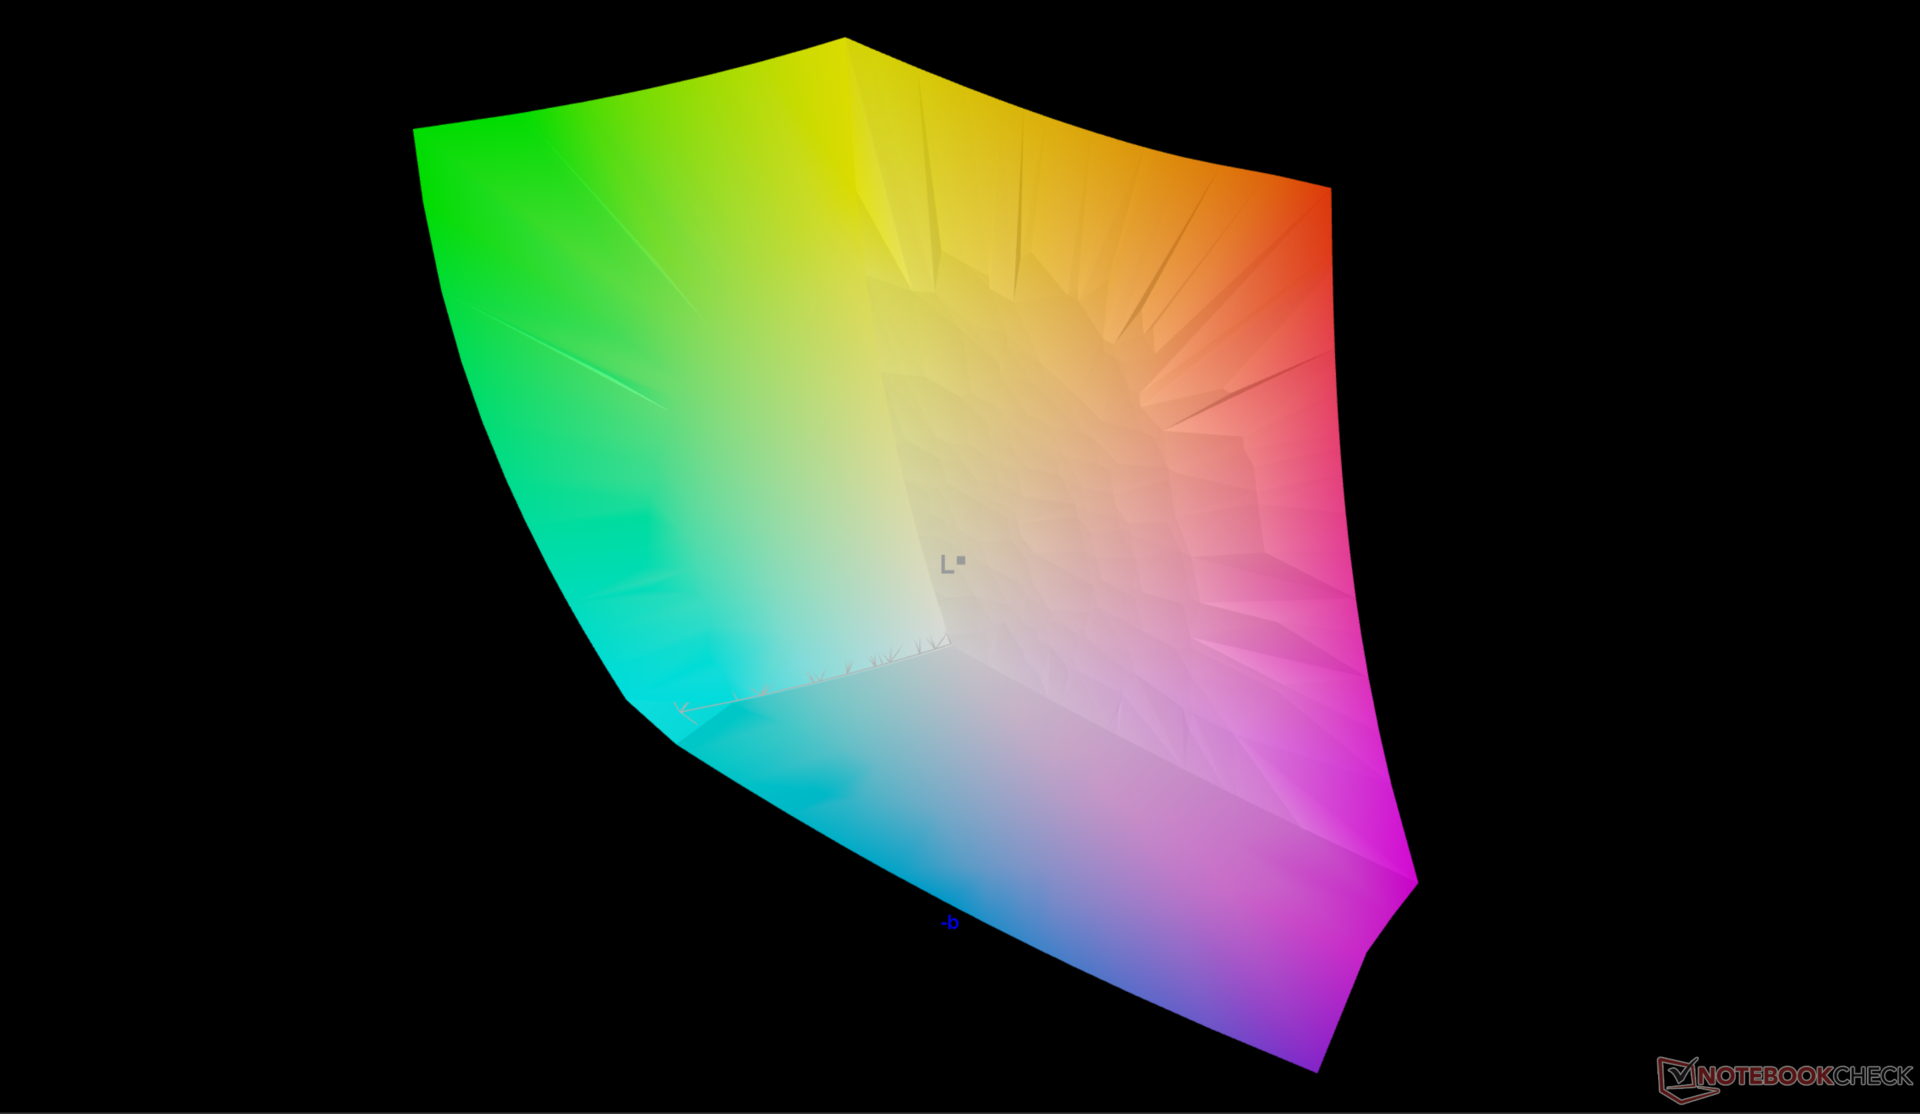
95.2% AdobeRGB 1998 (Argyll 3D)
100% sRGB (Argyll 3D)
99.9% Display P3 (Argyll 3D)
Gamma: 2.23
CCT: 6369 K
| HP OmniBook X Flip 16 Samsung SDC41BA, OLED, 2880x1800, 16", 120 Hz | Dell 16 Plus 2-in-1 AU Optronics B160QAT, Mini-LED, 2560x1600, 16", 90 Hz | Lenovo Yoga 7 2-in-1 16ILL10 LEN160WUM, IPS, 1920x1200, 16", 60 Hz | Samsung Galaxy Book5 Pro 360 ATNA60CL09-0, OLED, 2880x1800, 16", 120 Hz | MSI Summit A16 AI Plus A3HMTG AU Optronics B16QAN02.N, IPS, 2560x1600, 16", 165 Hz | HP Spectre x360 16 RTX 4050 Samsung SDC41A6, OLED, 2880x1800, 16", 120 Hz | |
|---|---|---|---|---|---|---|
| Display | -0% | -53% | 0% | -5% | 1% | |
| Display P3 Coverage (%) | 99.9 | 99.5 0% | 39.7 -60% | 99.9 0% | 96.8 -3% | 99.6 0% |
| sRGB Coverage (%) | 100 | 100 0% | 57.9 -42% | 100 0% | 99.8 0% | 100 0% |
| AdobeRGB 1998 Coverage (%) | 95.2 | 94.2 -1% | 41 -57% | 96.6 1% | 84.7 -11% | 96.7 2% |
| Response Times | -4178% | -3025% | -33% | -1201% | 3% | |
| Response Time Grey 50% / Grey 80% * (ms) | 0.8 ? | 48.8 ? -6000% | 30 ? -3650% | 0.48 ? 40% | 12.9 ? -1513% | 0.78 ? 2% |
| Response Time Black / White * (ms) | 0.9 ? | 57.6 ? -6300% | 22.5 ? -2400% | 0.64 ? 29% | 8.9 ? -889% | 0.86 ? 4% |
| PWM Frequency (Hz) | 473.8 ? | 2807 ? | 240 ? | 480 ? | ||
| PWM Amplitude * (%) | 15 | 50 -233% | 40 -167% | |||
| Screen | -3% | -172% | 9% | -34% | -17% | |
| Brightness middle (cd/m²) | 381.1 | 432.1 13% | 317.9 -17% | 387 2% | 475.4 25% | 385.2 1% |
| Brightness (cd/m²) | 381 | 426 12% | 304 -20% | 392 3% | 440 15% | 387 2% |
| Brightness Distribution (%) | 98 | 97 -1% | 90 -8% | 98 0% | 89 -9% | 99 1% |
| Black Level * (cd/m²) | 0.25 | 0.36 | ||||
| Colorchecker dE 2000 * | 3.3 | 1.95 41% | 7.39 -124% | 1 70% | 2.99 9% | 1.73 48% |
| Colorchecker dE 2000 max. * | 6.3 | 3.87 39% | 21.43 -240% | 1.9 70% | 7.64 -21% | 3.95 37% |
| Greyscale dE 2000 * | 0.9 | 2 -122% | 6.5 -622% | 1.7 -89% | 2.9 -222% | 2.6 -189% |
| Gamma | 2.23 99% | 2.3 96% | 2.22 99% | 2.25 98% | 2.31 95% | 2.17 101% |
| CCT | 6369 102% | 6222 104% | 6140 106% | 6325 103% | 6472 100% | 6133 106% |
| Colorchecker dE 2000 calibrated * | 1.16 | 3.06 | 0.74 | |||
| Contrast (:1) | 1272 | 1321 | ||||
| Media total (Programa/Opciones) | -1394% /
-1046% | -1083% /
-658% | -8% /
-3% | -413% /
-238% | -4% /
-8% |
* ... más pequeño es mejor

Tiempos de respuesta del display
| ↔ Tiempo de respuesta de Negro a Blanco | ||
|---|---|---|
| 0.9 ms ... subida ↗ y bajada ↘ combinada | ↗ 0.4 ms subida | 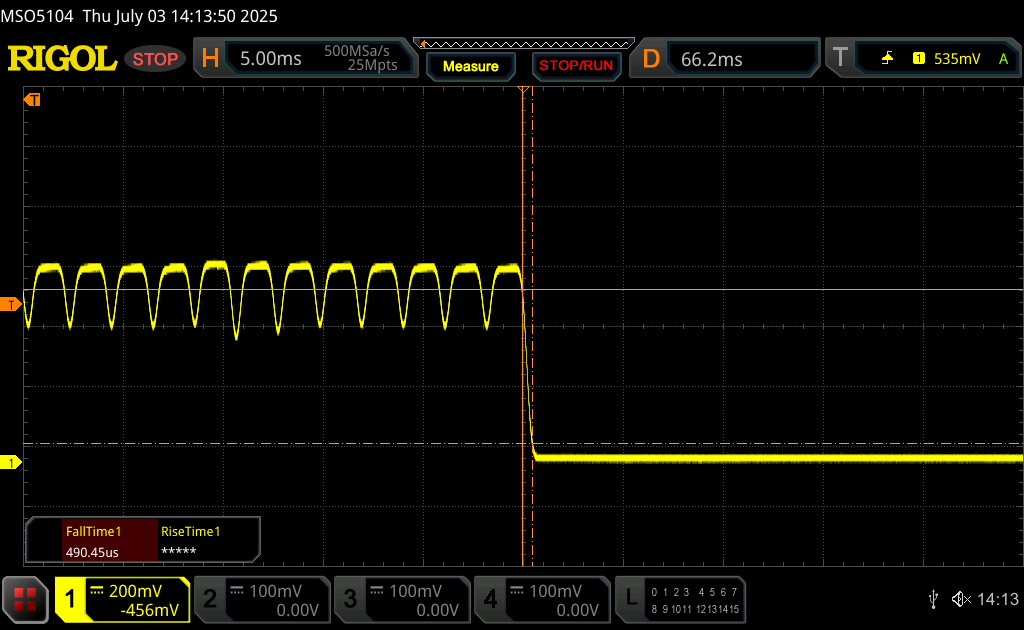 |
| ↘ 0.5 ms bajada | ||
| La pantalla mostró tiempos de respuesta muy rápidos en nuestros tests y debería ser adecuada para juegos frenéticos. En comparación, todos los dispositivos de prueba van de ##min### (mínimo) a 240 (máximo) ms. » 3 % de todos los dispositivos son mejores. Esto quiere decir que el tiempo de respuesta medido es mejor que la media (19.8 ms) de todos los dispositivos testados. | ||
| ↔ Tiempo de respuesta 50% Gris a 80% Gris | ||
| 0.8 ms ... subida ↗ y bajada ↘ combinada | ↗ 0.4 ms subida | 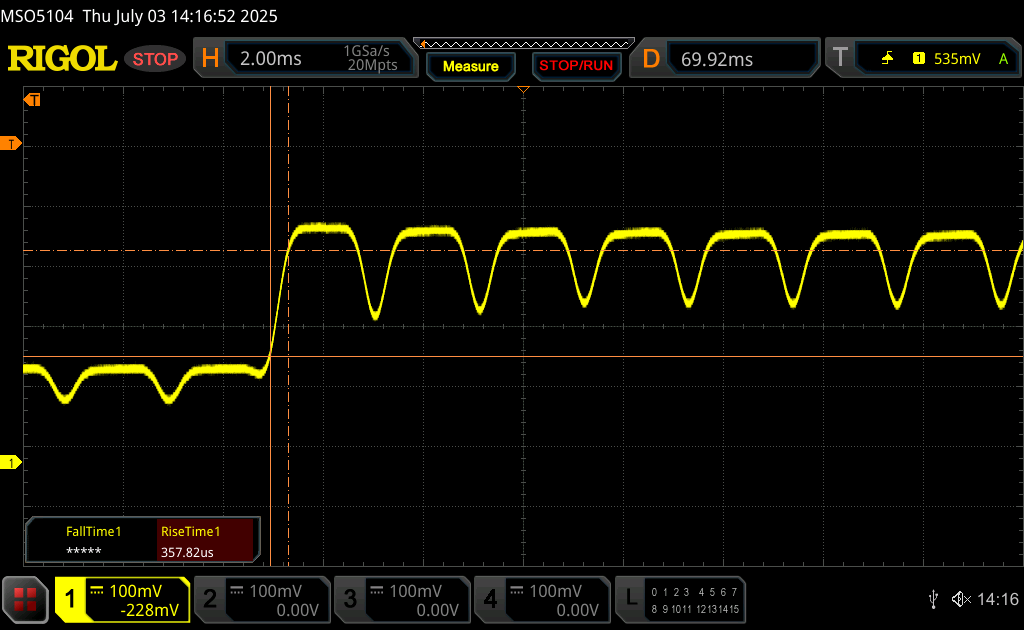 |
| ↘ 0.4 ms bajada | ||
| La pantalla mostró tiempos de respuesta muy rápidos en nuestros tests y debería ser adecuada para juegos frenéticos. En comparación, todos los dispositivos de prueba van de ##min### (mínimo) a 636 (máximo) ms. » 3 % de todos los dispositivos son mejores. Esto quiere decir que el tiempo de respuesta medido es mejor que la media (31 ms) de todos los dispositivos testados. | ||
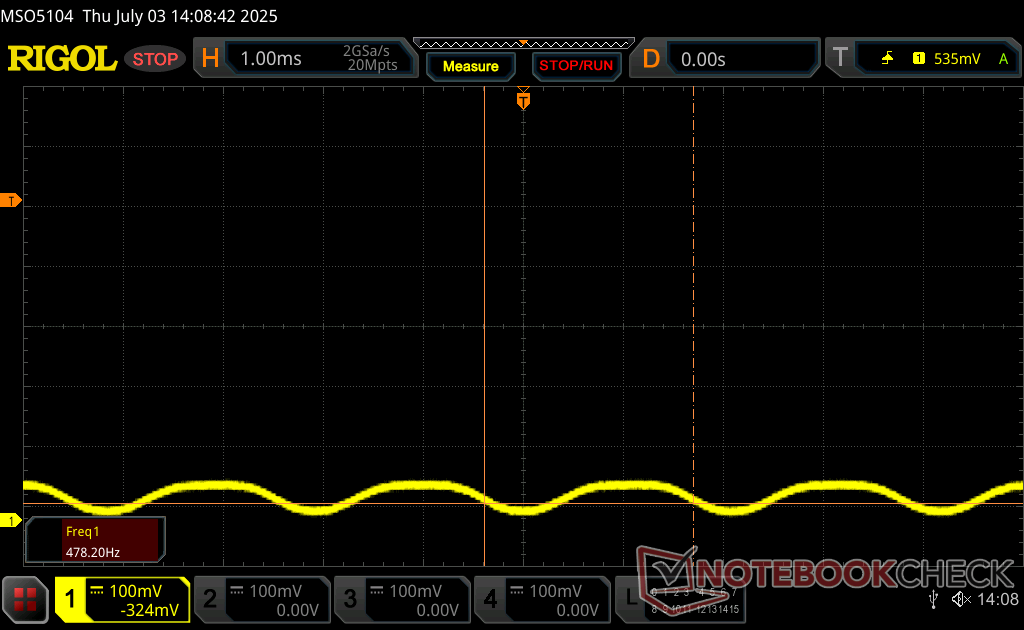
Parpadeo de Pantalla / PWM (Pulse-Width Modulation)
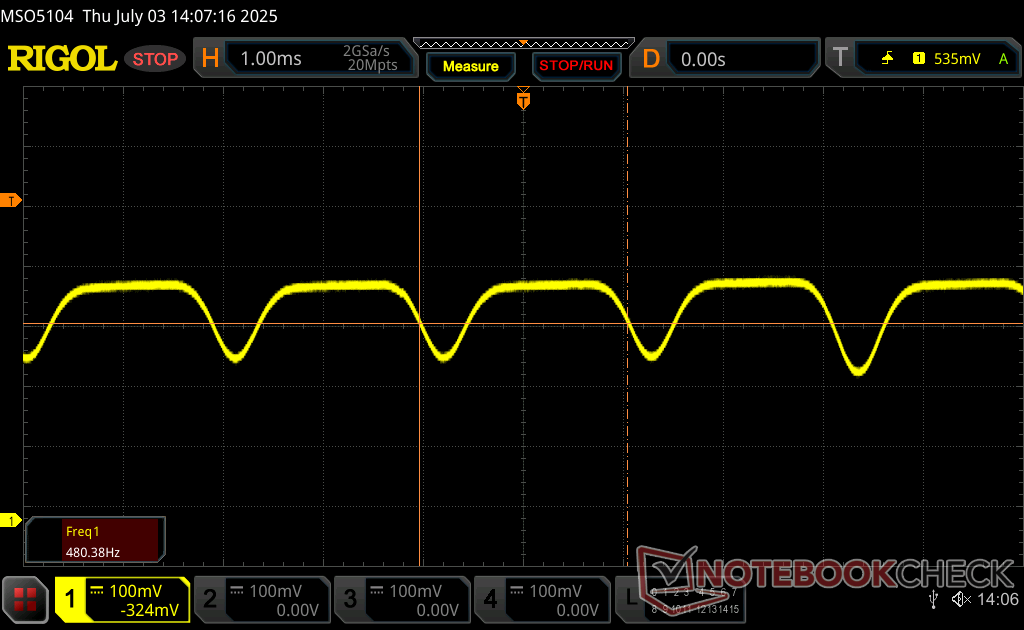
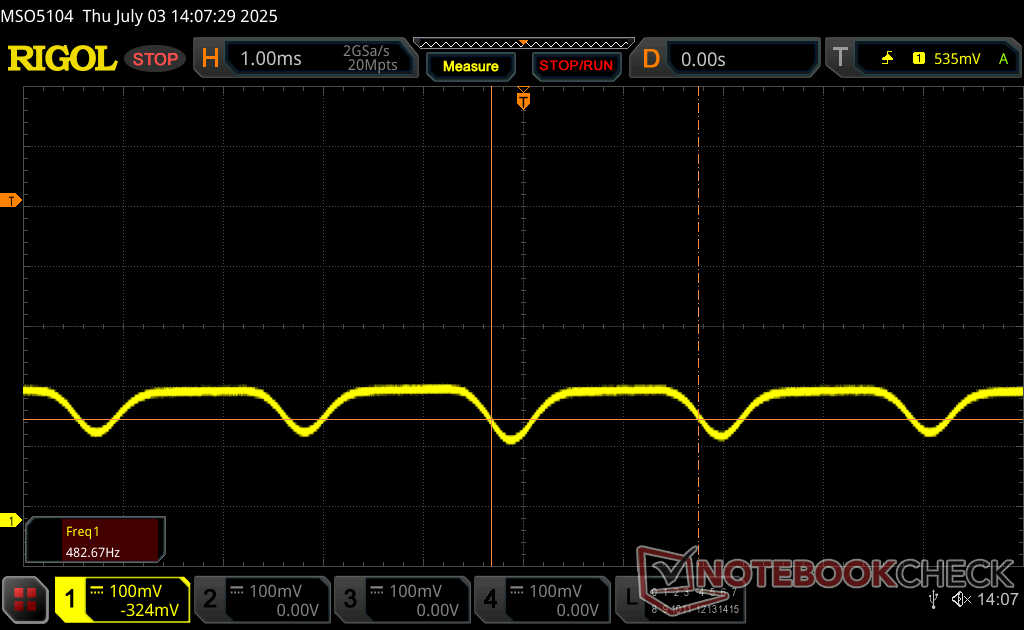
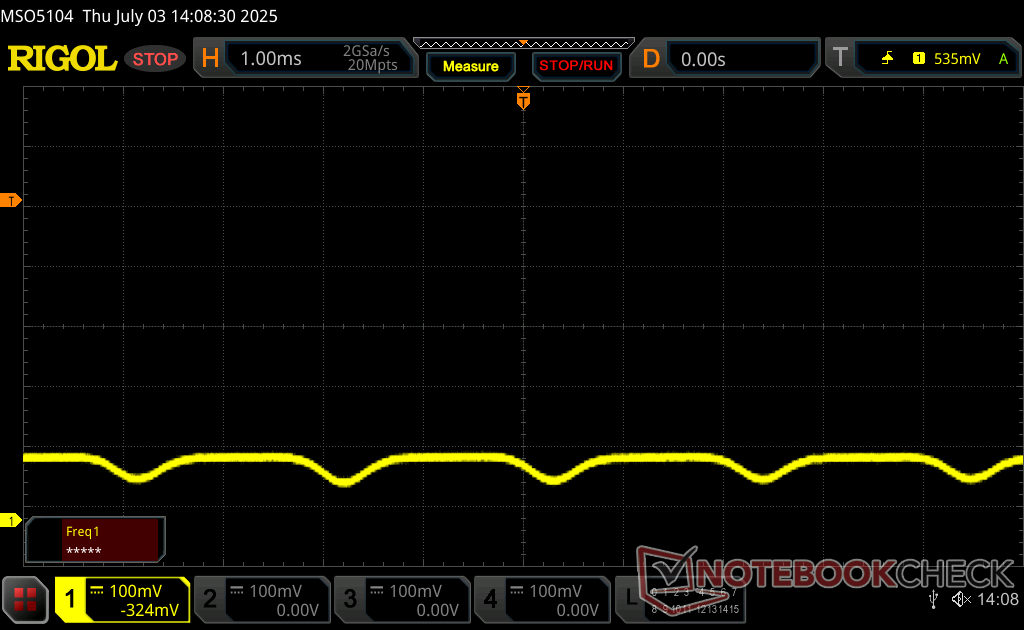
| Parpadeo de Pantalla / PWM detectado | 473.8 Hz Amplitude: 15 % | ≤ 100 % de brillo | 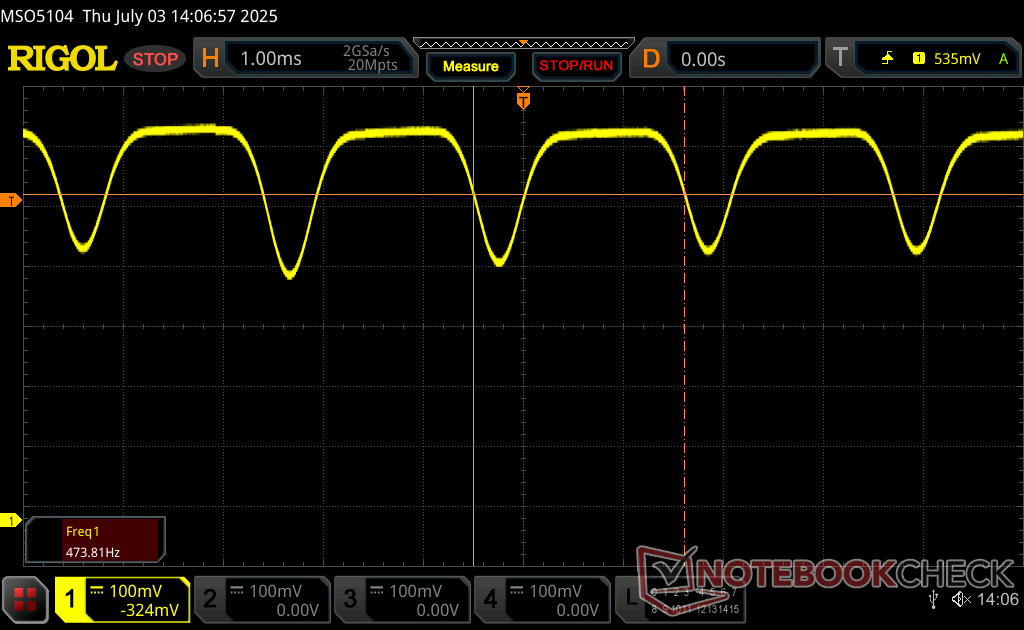 |
La retroiluminación del display parpadea a 473.8 Hz (seguramente usa PWM - Pulse-Width Modulation) a un brillo del 100 % e inferior. Sobre este nivel de brillo no debería darse parpadeo / PWM. La frecuencia de 473.8 Hz es relativamente alta, por lo que la mayoría de gente no debería ver parpadeo o tener fatiga visual. Sin embargo, hay informes de que algunas personas pueden seguir viendo parpadeos a 500 Hz y superior, por lo que cuidado. Comparación: 52 % de todos los dispositivos testados no usaron PWM para atenuar el display. Si se usó, medimos una media de 7750 (mínimo: 5 - máxmo: 343500) Hz. | |||


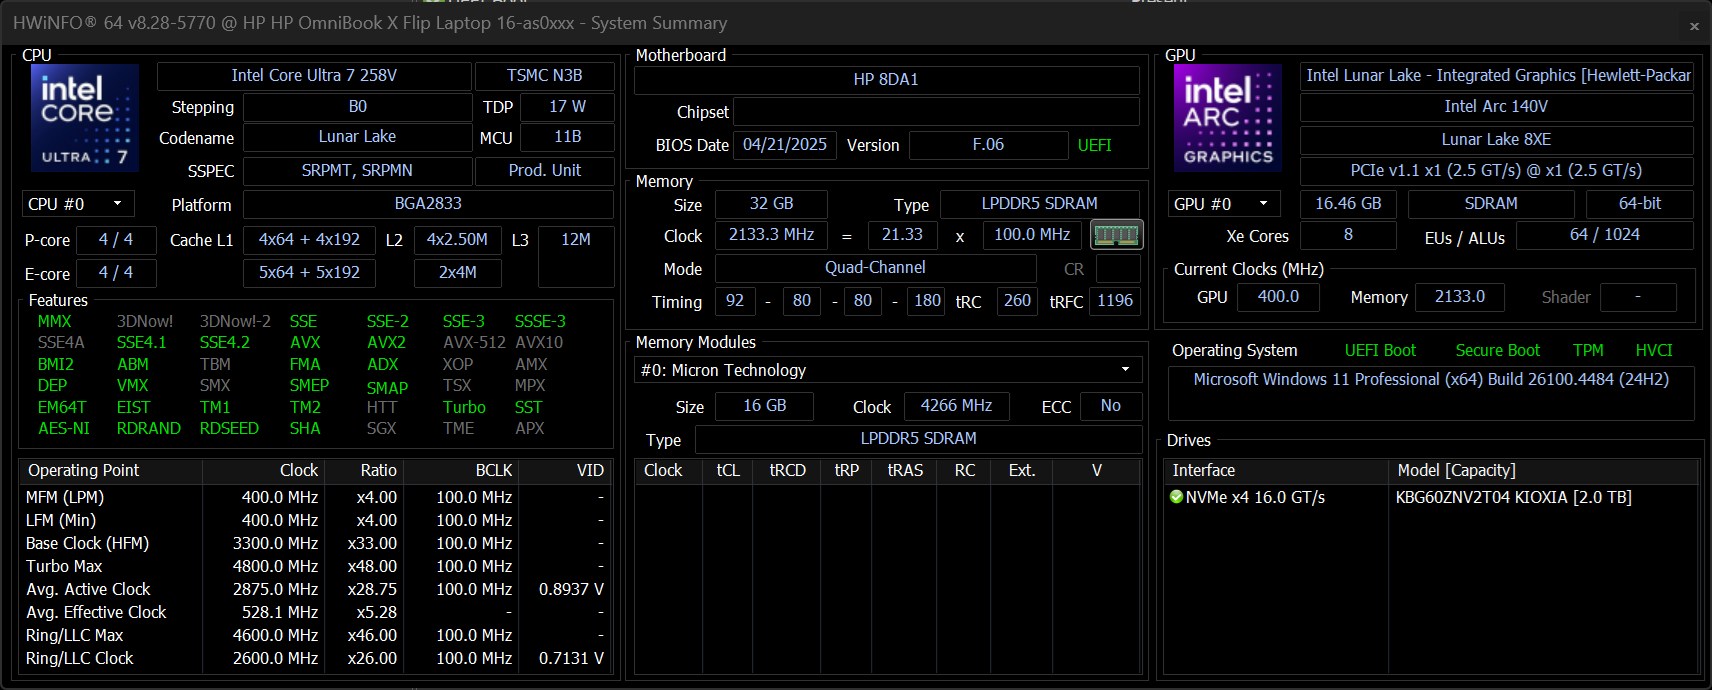
Rendimiento - Eficiencia de Lunar Lake
Condiciones de prueba
Pusimos Windows en modo Rendimiento antes de ejecutar las pruebas comparativas que se indican a continuación.
Procesador
El Core Ultra 7 258V ofrece un rendimiento multihilo similar al del menos caro Core Ultra 5 125U. La sostenibilidad del rendimiento también es decente, con un déficit de alrededor del 10 por ciento al ejecutar CineBench R15 xT en bucle.
Cinebench R15 Multi Loop
Cinebench R23: Multi Core | Single Core
Cinebench R20: CPU (Multi Core) | CPU (Single Core)
Cinebench R15: CPU Multi 64Bit | CPU Single 64Bit
Blender: v2.79 BMW27 CPU
7-Zip 18.03: 7z b 4 | 7z b 4 -mmt1
Geekbench 6.7: Multi-Core | Single-Core
Geekbench 5.5: Multi-Core | Single-Core
HWBOT x265 Benchmark v2.2: 4k Preset
LibreOffice : 20 Documents To PDF
R Benchmark 2.5: Overall mean
* ... más pequeño es mejor
AIDA64: FP32 Ray-Trace | FPU Julia | CPU SHA3 | CPU Queen | FPU SinJulia | FPU Mandel | CPU AES | CPU ZLib | FP64 Ray-Trace | CPU PhotoWorxx
| Performance rating | |
| MSI Summit A16 AI Plus A3HMTG | |
| HP Spectre x360 16 RTX 4050 | |
| Dell 16 Plus 2-in-1 | |
| HP OmniBook X Flip 16 | |
| Lenovo Yoga 7 2-in-1 16ILL10 | |
| Medio Intel Core Ultra 7 258V | |
| Samsung Galaxy Book5 Pro 360 | |
| AIDA64 / FP32 Ray-Trace | |
| MSI Summit A16 AI Plus A3HMTG | |
| HP Spectre x360 16 RTX 4050 | |
| Dell 16 Plus 2-in-1 | |
| Samsung Galaxy Book5 Pro 360 | |
| Lenovo Yoga 7 2-in-1 16ILL10 | |
| Medio Intel Core Ultra 7 258V (8454 - 12781, n=26) | |
| HP OmniBook X Flip 16 | |
| AIDA64 / FPU Julia | |
| MSI Summit A16 AI Plus A3HMTG | |
| HP Spectre x360 16 RTX 4050 | |
| Samsung Galaxy Book5 Pro 360 | |
| HP OmniBook X Flip 16 | |
| Lenovo Yoga 7 2-in-1 16ILL10 | |
| Dell 16 Plus 2-in-1 | |
| Medio Intel Core Ultra 7 258V (40875 - 63401, n=26) | |
| AIDA64 / CPU SHA3 | |
| MSI Summit A16 AI Plus A3HMTG | |
| HP Spectre x360 16 RTX 4050 | |
| Lenovo Yoga 7 2-in-1 16ILL10 | |
| HP OmniBook X Flip 16 | |
| Medio Intel Core Ultra 7 258V (1930 - 2817, n=26) | |
| Samsung Galaxy Book5 Pro 360 | |
| Dell 16 Plus 2-in-1 | |
| AIDA64 / CPU Queen | |
| MSI Summit A16 AI Plus A3HMTG | |
| HP Spectre x360 16 RTX 4050 | |
| Dell 16 Plus 2-in-1 | |
| HP OmniBook X Flip 16 | |
| Lenovo Yoga 7 2-in-1 16ILL10 | |
| Medio Intel Core Ultra 7 258V (48816 - 49818, n=24) | |
| Samsung Galaxy Book5 Pro 360 | |
| AIDA64 / FPU SinJulia | |
| MSI Summit A16 AI Plus A3HMTG | |
| HP Spectre x360 16 RTX 4050 | |
| Lenovo Yoga 7 2-in-1 16ILL10 | |
| HP OmniBook X Flip 16 | |
| Dell 16 Plus 2-in-1 | |
| Medio Intel Core Ultra 7 258V (3817 - 4440, n=26) | |
| Samsung Galaxy Book5 Pro 360 | |
| AIDA64 / FPU Mandel | |
| MSI Summit A16 AI Plus A3HMTG | |
| HP Spectre x360 16 RTX 4050 | |
| Samsung Galaxy Book5 Pro 360 | |
| Lenovo Yoga 7 2-in-1 16ILL10 | |
| HP OmniBook X Flip 16 | |
| Dell 16 Plus 2-in-1 | |
| Medio Intel Core Ultra 7 258V (21670 - 33565, n=26) | |
| AIDA64 / CPU AES | |
| MSI Summit A16 AI Plus A3HMTG | |
| HP Spectre x360 16 RTX 4050 | |
| HP OmniBook X Flip 16 | |
| Dell 16 Plus 2-in-1 | |
| Lenovo Yoga 7 2-in-1 16ILL10 | |
| Medio Intel Core Ultra 7 258V (30957 - 40753, n=26) | |
| Samsung Galaxy Book5 Pro 360 | |
| AIDA64 / CPU ZLib | |
| MSI Summit A16 AI Plus A3HMTG | |
| HP Spectre x360 16 RTX 4050 | |
| Lenovo Yoga 7 2-in-1 16ILL10 | |
| Dell 16 Plus 2-in-1 | |
| HP OmniBook X Flip 16 | |
| Medio Intel Core Ultra 7 258V (422 - 632, n=26) | |
| Samsung Galaxy Book5 Pro 360 | |
| AIDA64 / FP64 Ray-Trace | |
| MSI Summit A16 AI Plus A3HMTG | |
| HP Spectre x360 16 RTX 4050 | |
| Samsung Galaxy Book5 Pro 360 | |
| Dell 16 Plus 2-in-1 | |
| Lenovo Yoga 7 2-in-1 16ILL10 | |
| Medio Intel Core Ultra 7 258V (4258 - 6930, n=26) | |
| HP OmniBook X Flip 16 | |
| AIDA64 / CPU PhotoWorxx | |
| Dell 16 Plus 2-in-1 | |
| HP OmniBook X Flip 16 | |
| Medio Intel Core Ultra 7 258V (44223 - 59245, n=26) | |
| Lenovo Yoga 7 2-in-1 16ILL10 | |
| MSI Summit A16 AI Plus A3HMTG | |
| Samsung Galaxy Book5 Pro 360 | |
| HP Spectre x360 16 RTX 4050 | |
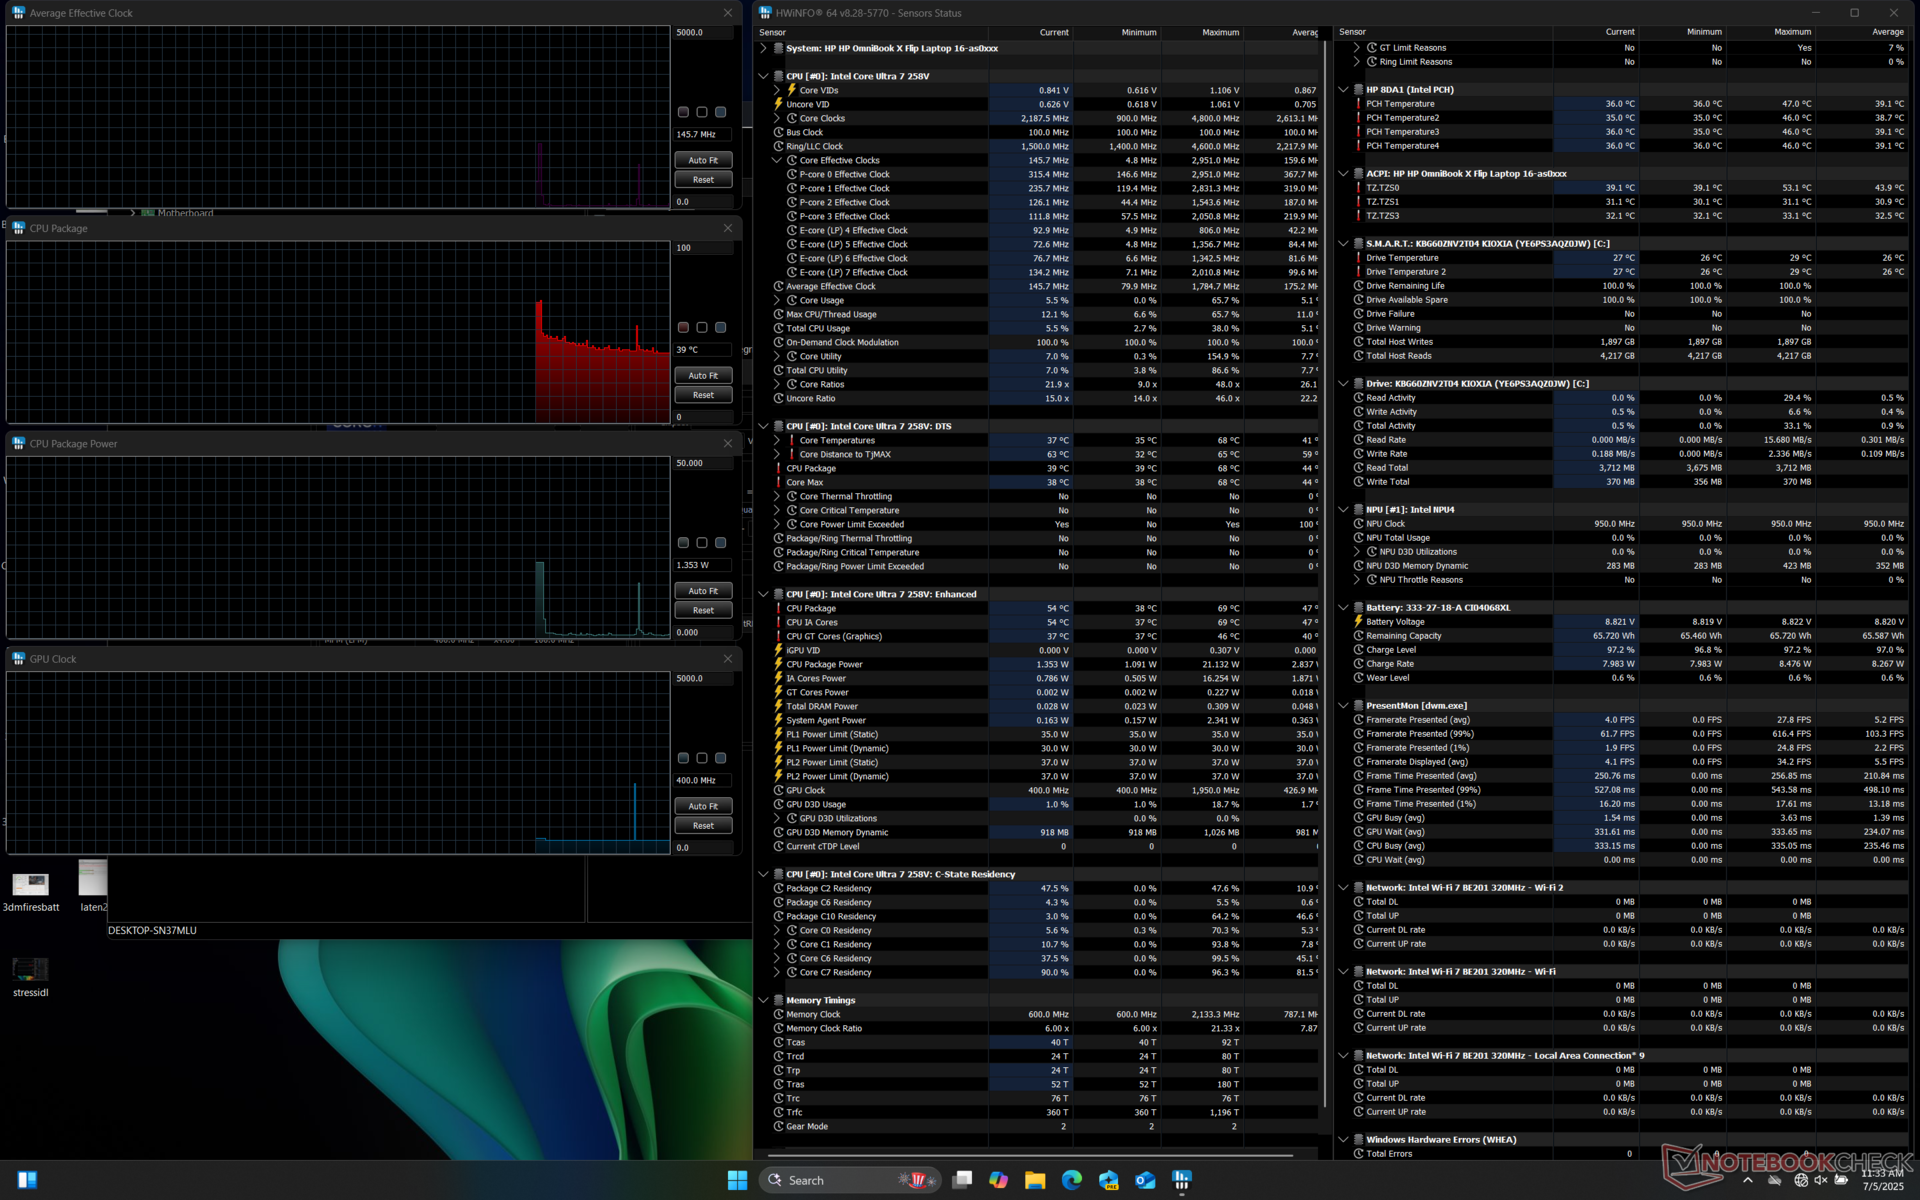
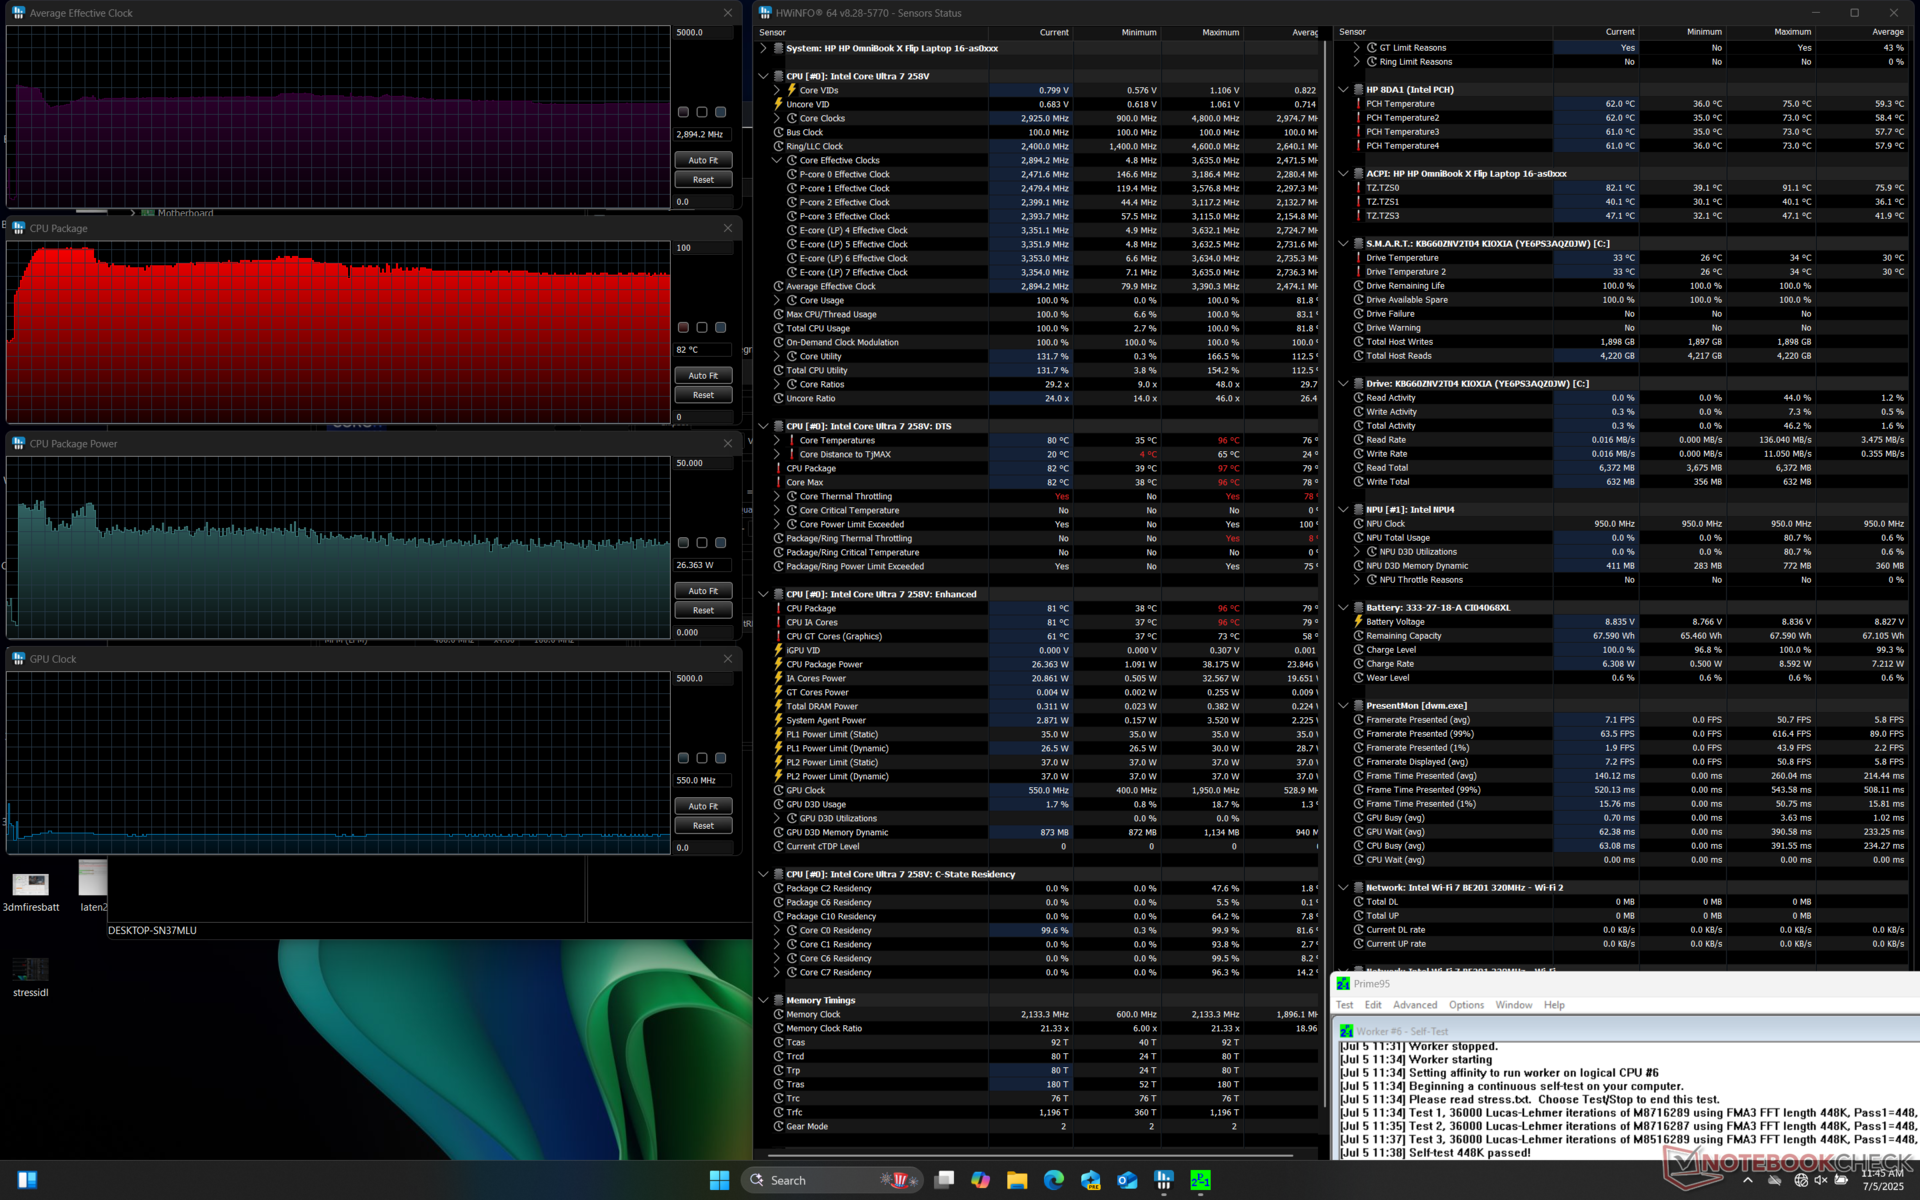
Prueba de estrés
La CPU se estabiliza en 2,9 GHz, 82 C y 26 W cuando se ejecuta el estrés Prime95 en comparación con los 2,5 GHz, 72 C y 22 W del 2 en 1 Dell Plus 16 con el mismo procesador Core Ultra 7 258V.

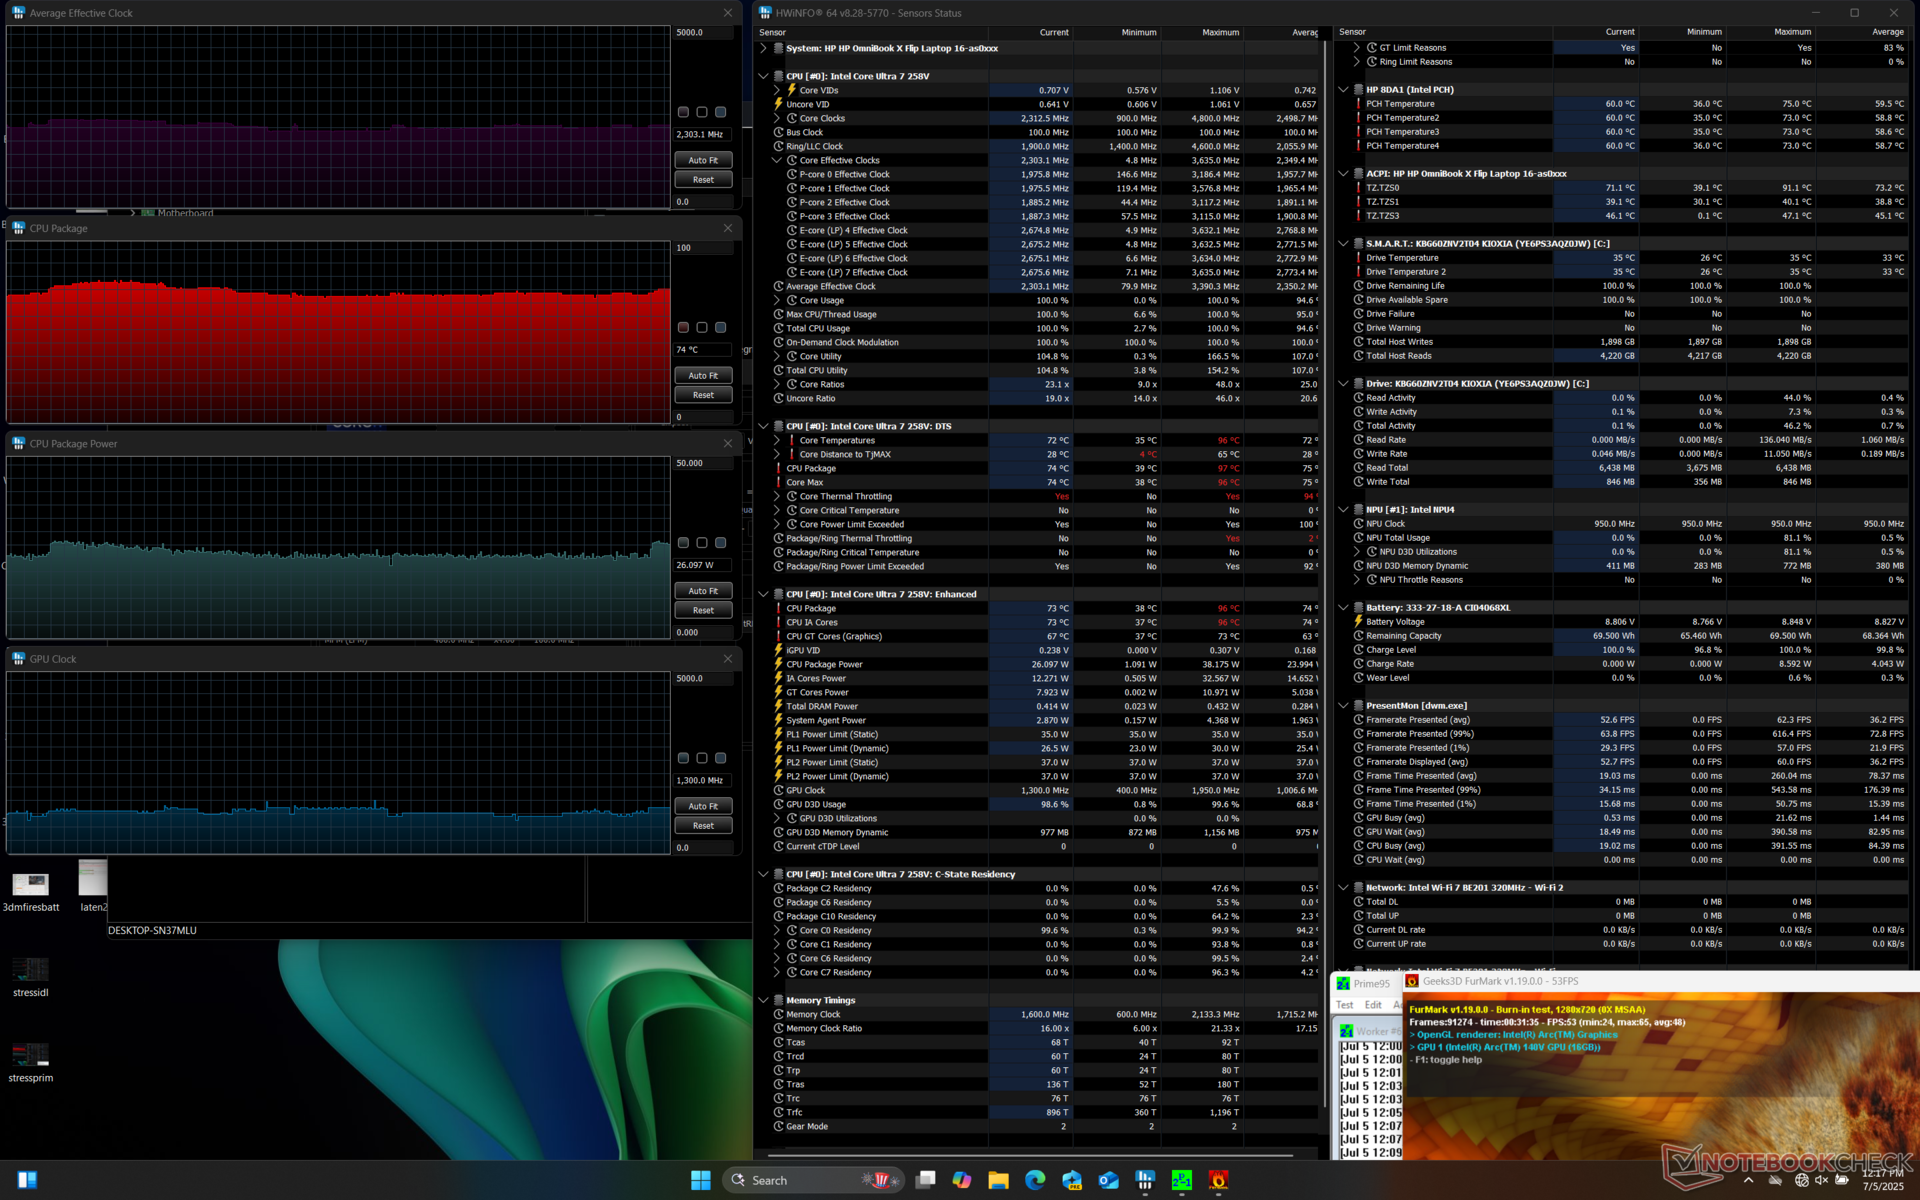
| Reloj medio de la CPU (GHz) | Reloj de la GPU (MHz) | Temperatura media de la CPU (°C) | |
| Sistema en reposo | -- | -- | 39 |
| Prime95 Stress | 2.9 | -- | 82 |
| Prime95 + FurMark Stress | 2.3 | 1300 | 74 |
| Cyberpunk 2077 Estrés | 1.3 | 1750 | 68 |
Rendimiento del sistema
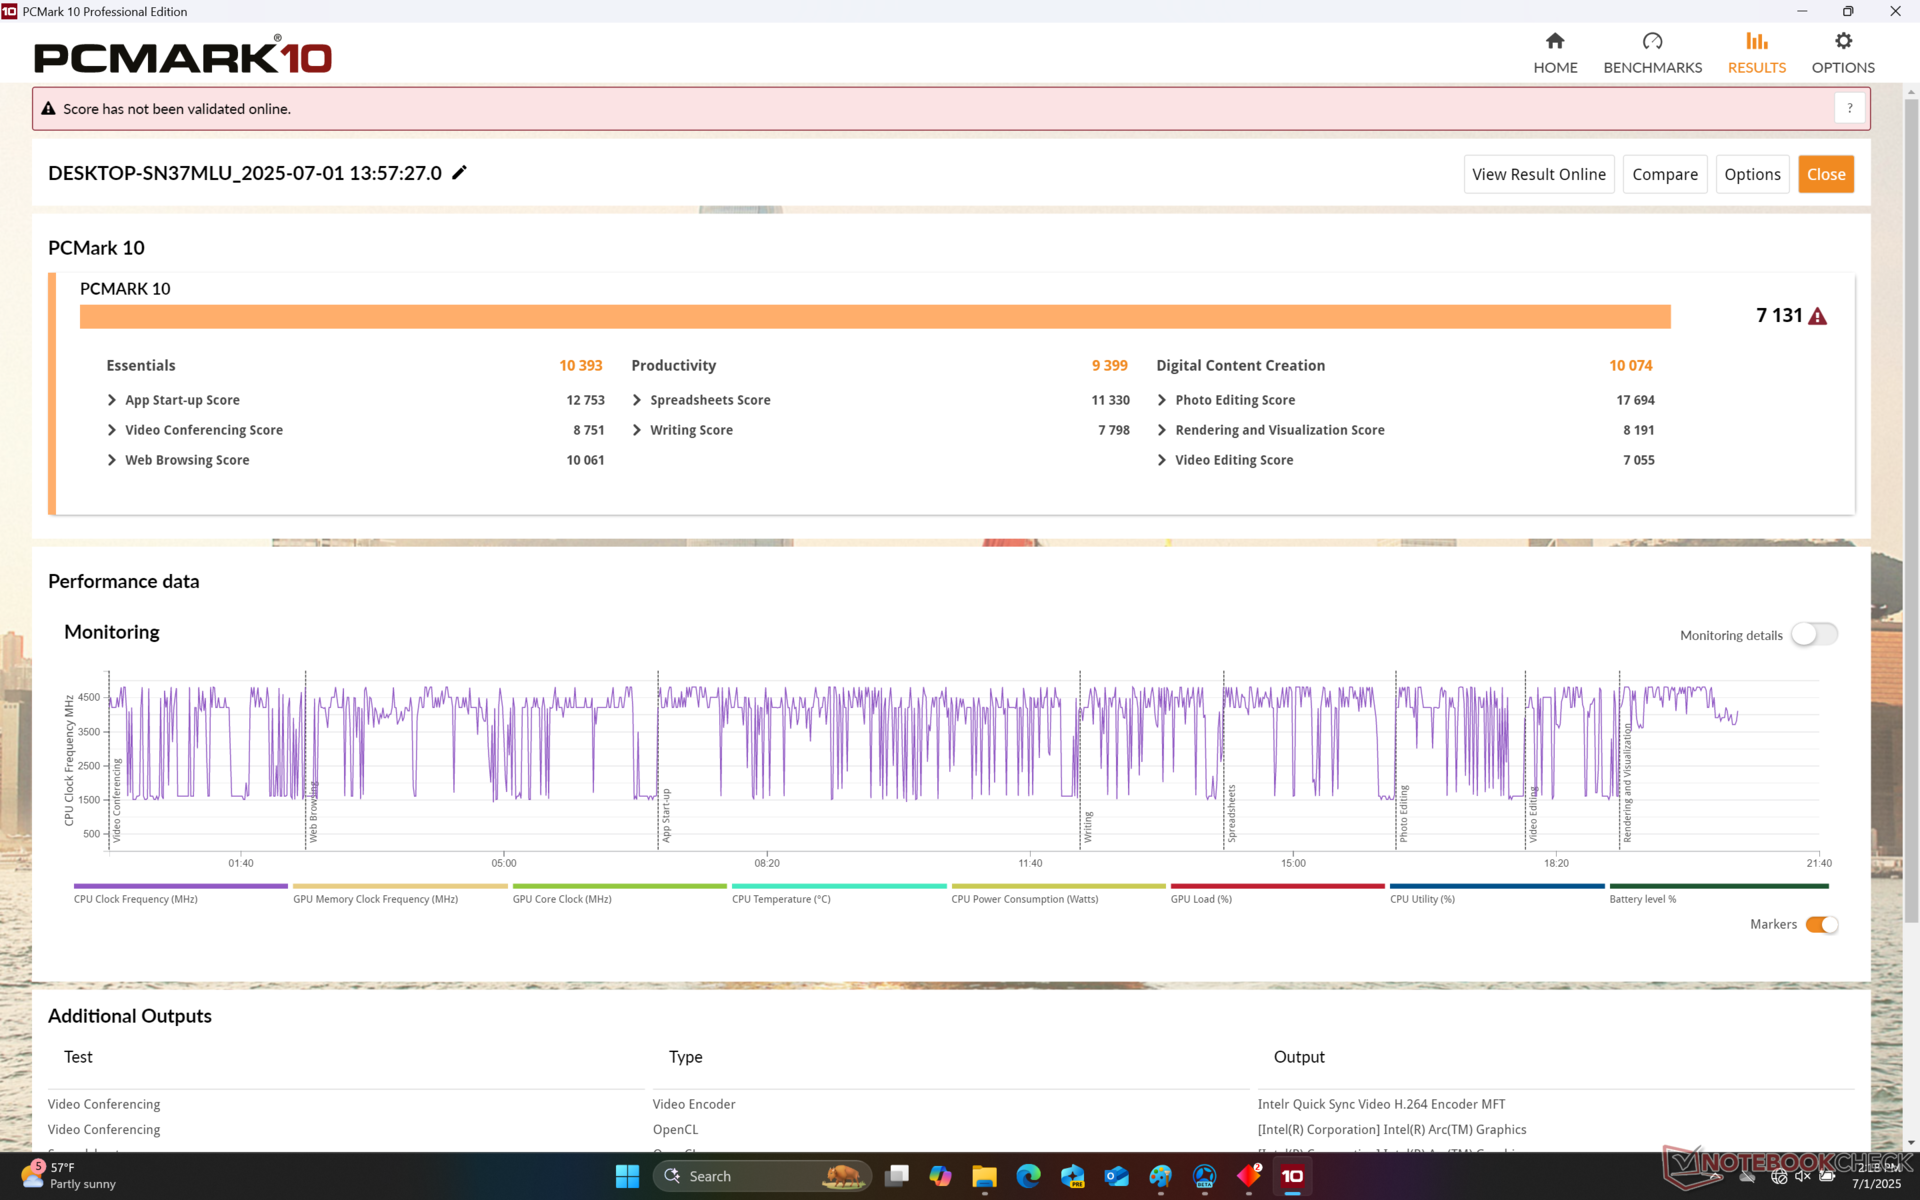
PCMark 10: Score | Essentials | Productivity | Digital Content Creation
CrossMark: Overall | Productivity | Creativity | Responsiveness
WebXPRT 3: Overall
WebXPRT 4: Overall
Mozilla Kraken 1.1: Total
| Performance rating | |
| MSI Summit A16 AI Plus A3HMTG | |
| Lenovo Yoga 7 2-in-1 16ILL10 | |
| HP OmniBook X Flip 16 | |
| Dell 16 Plus 2-in-1 | |
| Medio Intel Core Ultra 7 258V, Intel Arc Graphics 140V | |
| Samsung Galaxy Book5 Pro 360 | |
| HP Spectre x360 16 RTX 4050 | |
| PCMark 10 / Score | |
| MSI Summit A16 AI Plus A3HMTG | |
| Lenovo Yoga 7 2-in-1 16ILL10 | |
| HP OmniBook X Flip 16 | |
| Medio Intel Core Ultra 7 258V, Intel Arc Graphics 140V (6265 - 7420, n=23) | |
| Dell 16 Plus 2-in-1 | |
| HP Spectre x360 16 RTX 4050 | |
| Samsung Galaxy Book5 Pro 360 | |
| PCMark 10 / Essentials | |
| Lenovo Yoga 7 2-in-1 16ILL10 | |
| MSI Summit A16 AI Plus A3HMTG | |
| HP OmniBook X Flip 16 | |
| Medio Intel Core Ultra 7 258V, Intel Arc Graphics 140V (9295 - 11467, n=23) | |
| HP Spectre x360 16 RTX 4050 | |
| Dell 16 Plus 2-in-1 | |
| Samsung Galaxy Book5 Pro 360 | |
| PCMark 10 / Productivity | |
| MSI Summit A16 AI Plus A3HMTG | |
| Lenovo Yoga 7 2-in-1 16ILL10 | |
| HP OmniBook X Flip 16 | |
| HP Spectre x360 16 RTX 4050 | |
| Medio Intel Core Ultra 7 258V, Intel Arc Graphics 140V (7357 - 13600, n=23) | |
| Samsung Galaxy Book5 Pro 360 | |
| Dell 16 Plus 2-in-1 | |
| PCMark 10 / Digital Content Creation | |
| MSI Summit A16 AI Plus A3HMTG | |
| Lenovo Yoga 7 2-in-1 16ILL10 | |
| HP OmniBook X Flip 16 | |
| Medio Intel Core Ultra 7 258V, Intel Arc Graphics 140V (8160 - 10308, n=23) | |
| Dell 16 Plus 2-in-1 | |
| Samsung Galaxy Book5 Pro 360 | |
| HP Spectre x360 16 RTX 4050 | |
| CrossMark / Overall | |
| MSI Summit A16 AI Plus A3HMTG | |
| HP OmniBook X Flip 16 | |
| Lenovo Yoga 7 2-in-1 16ILL10 | |
| Dell 16 Plus 2-in-1 | |
| Medio Intel Core Ultra 7 258V, Intel Arc Graphics 140V (1275 - 1742, n=22) | |
| Samsung Galaxy Book5 Pro 360 | |
| HP Spectre x360 16 RTX 4050 | |
| CrossMark / Productivity | |
| HP OmniBook X Flip 16 | |
| Lenovo Yoga 7 2-in-1 16ILL10 | |
| Dell 16 Plus 2-in-1 | |
| Medio Intel Core Ultra 7 258V, Intel Arc Graphics 140V (1267 - 1684, n=22) | |
| MSI Summit A16 AI Plus A3HMTG | |
| Samsung Galaxy Book5 Pro 360 | |
| HP Spectre x360 16 RTX 4050 | |
| CrossMark / Creativity | |
| MSI Summit A16 AI Plus A3HMTG | |
| Lenovo Yoga 7 2-in-1 16ILL10 | |
| HP OmniBook X Flip 16 | |
| Dell 16 Plus 2-in-1 | |
| Medio Intel Core Ultra 7 258V, Intel Arc Graphics 140V (1393 - 1977, n=22) | |
| HP Spectre x360 16 RTX 4050 | |
| Samsung Galaxy Book5 Pro 360 | |
| CrossMark / Responsiveness | |
| MSI Summit A16 AI Plus A3HMTG | |
| HP OmniBook X Flip 16 | |
| Lenovo Yoga 7 2-in-1 16ILL10 | |
| Samsung Galaxy Book5 Pro 360 | |
| Medio Intel Core Ultra 7 258V, Intel Arc Graphics 140V (999 - 1411, n=22) | |
| Dell 16 Plus 2-in-1 | |
| HP Spectre x360 16 RTX 4050 | |
| WebXPRT 3 / Overall | |
| MSI Summit A16 AI Plus A3HMTG | |
| HP OmniBook X Flip 16 | |
| Lenovo Yoga 7 2-in-1 16ILL10 | |
| Dell 16 Plus 2-in-1 | |
| Medio Intel Core Ultra 7 258V, Intel Arc Graphics 140V (219 - 317, n=22) | |
| HP Spectre x360 16 RTX 4050 | |
| Samsung Galaxy Book5 Pro 360 | |
| WebXPRT 4 / Overall | |
| Lenovo Yoga 7 2-in-1 16ILL10 | |
| Dell 16 Plus 2-in-1 | |
| HP OmniBook X Flip 16 | |
| Medio Intel Core Ultra 7 258V, Intel Arc Graphics 140V (199.5 - 291, n=22) | |
| MSI Summit A16 AI Plus A3HMTG | |
| Samsung Galaxy Book5 Pro 360 | |
| HP Spectre x360 16 RTX 4050 | |
| Mozilla Kraken 1.1 / Total | |
| HP Spectre x360 16 RTX 4050 | |
| Samsung Galaxy Book5 Pro 360 | |
| HP OmniBook X Flip 16 | |
| Medio Intel Core Ultra 7 258V, Intel Arc Graphics 140V (468 - 559, n=24) | |
| Dell 16 Plus 2-in-1 | |
| Lenovo Yoga 7 2-in-1 16ILL10 | |
| MSI Summit A16 AI Plus A3HMTG | |
* ... más pequeño es mejor
| PCMark 10 Score | 7131 puntos | |
ayuda | ||
| AIDA64 / Memory Copy | |
| Medio Intel Core Ultra 7 258V (104408 - 114336, n=24) | |
| HP OmniBook X Flip 16 | |
| Dell 16 Plus 2-in-1 | |
| Samsung Galaxy Book5 Pro 360 | |
| Lenovo Yoga 7 2-in-1 16ILL10 | |
| MSI Summit A16 AI Plus A3HMTG | |
| HP Spectre x360 16 RTX 4050 | |
| AIDA64 / Memory Read | |
| MSI Summit A16 AI Plus A3HMTG | |
| Lenovo Yoga 7 2-in-1 16ILL10 | |
| Dell 16 Plus 2-in-1 | |
| Medio Intel Core Ultra 7 258V (82846 - 89417, n=24) | |
| HP Spectre x360 16 RTX 4050 | |
| HP OmniBook X Flip 16 | |
| Samsung Galaxy Book5 Pro 360 | |
| AIDA64 / Memory Write | |
| Lenovo Yoga 7 2-in-1 16ILL10 | |
| HP OmniBook X Flip 16 | |
| Dell 16 Plus 2-in-1 | |
| Medio Intel Core Ultra 7 258V (108824 - 117989, n=24) | |
| Samsung Galaxy Book5 Pro 360 | |
| MSI Summit A16 AI Plus A3HMTG | |
| HP Spectre x360 16 RTX 4050 | |
| AIDA64 / Memory Latency | |
| HP Spectre x360 16 RTX 4050 | |
| MSI Summit A16 AI Plus A3HMTG | |
| Dell 16 Plus 2-in-1 | |
| Lenovo Yoga 7 2-in-1 16ILL10 | |
| HP OmniBook X Flip 16 | |
| Medio Intel Core Ultra 7 258V (95 - 101.7, n=24) | |
| Samsung Galaxy Book5 Pro 360 | |
* ... más pequeño es mejor
Latencia del CPD
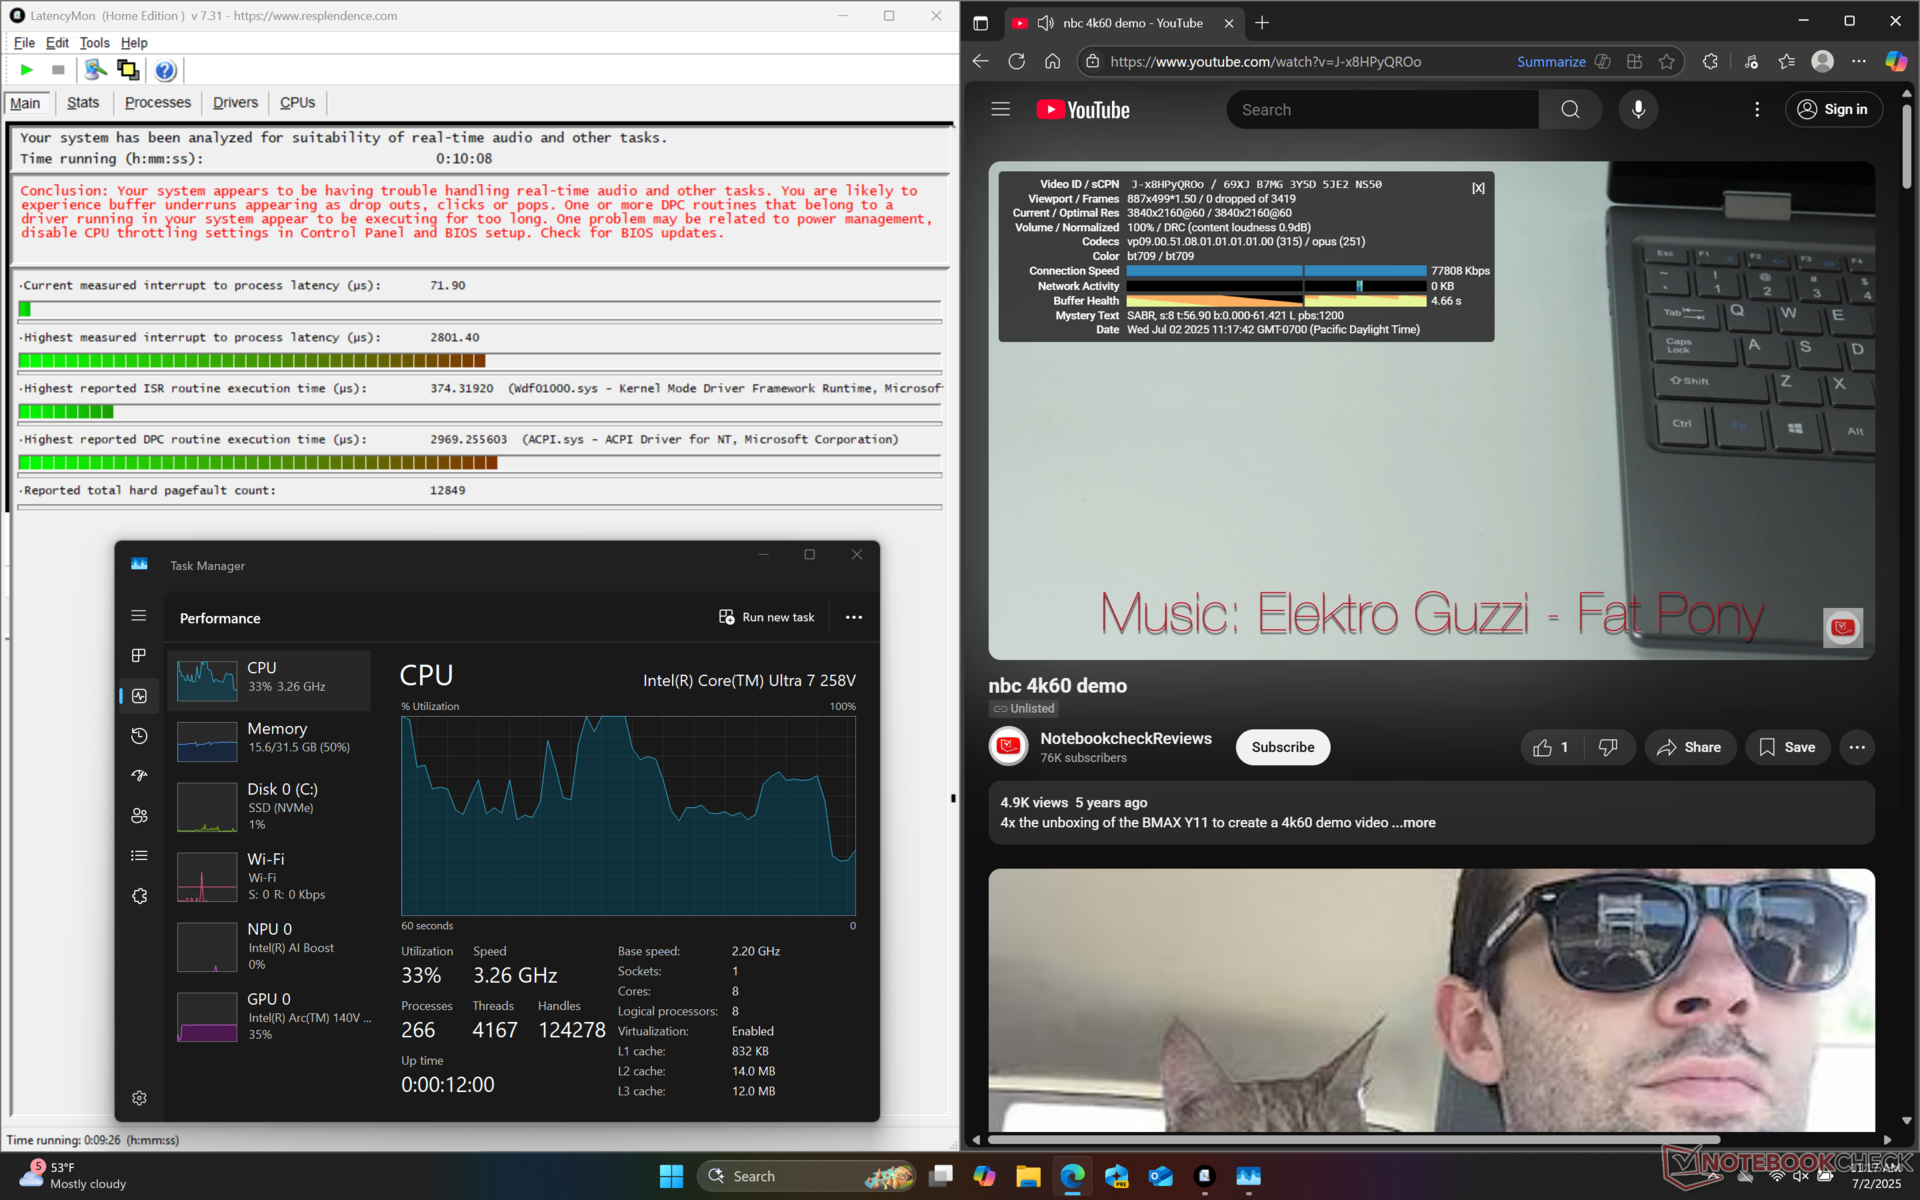
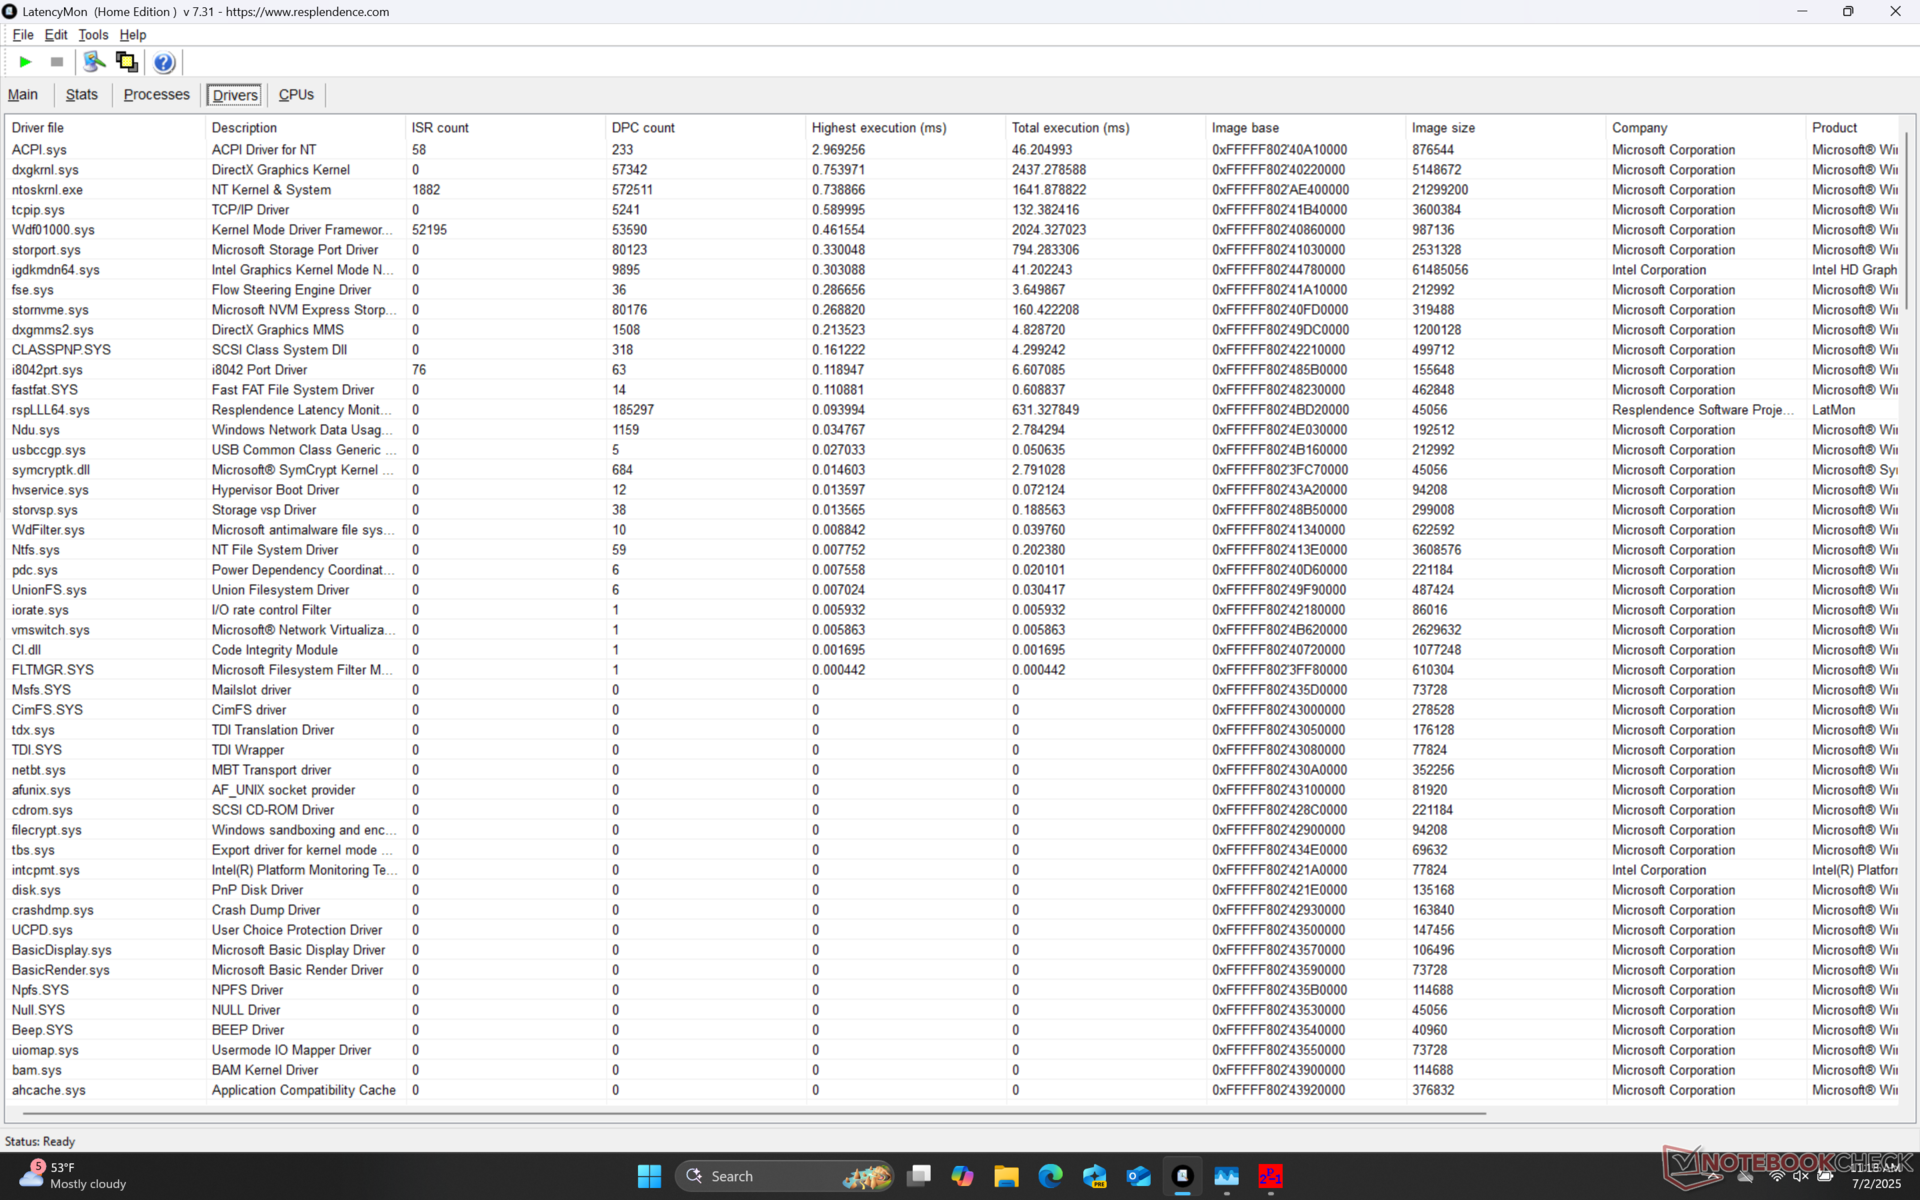
| DPC Latencies / LatencyMon - interrupt to process latency (max), Web, Youtube, Prime95 | |
| HP Spectre x360 16 RTX 4050 | |
| MSI Summit A16 AI Plus A3HMTG | |
| HP OmniBook X Flip 16 | |
| Dell 16 Plus 2-in-1 | |
| Samsung Galaxy Book5 Pro 360 | |
| Lenovo Yoga 7 2-in-1 16ILL10 | |
* ... más pequeño es mejor
Dispositivos de almacenamiento
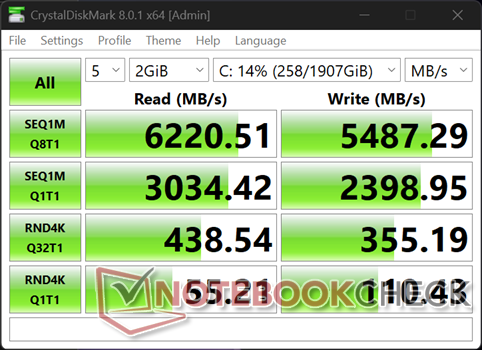
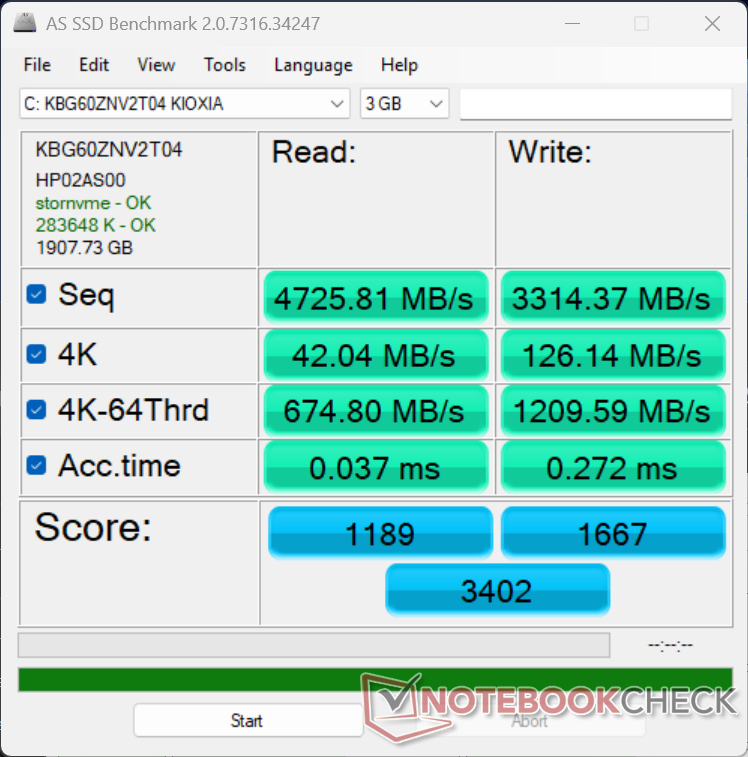

| Drive Performance rating - Percent | |
| Samsung Galaxy Book5 Pro 360 | |
| HP Spectre x360 16 RTX 4050 | |
| Lenovo Yoga 7 2-in-1 16ILL10 | |
| MSI Summit A16 AI Plus A3HMTG | |
| HP OmniBook X Flip 16 | |
| Dell 16 Plus 2-in-1 | |
* ... más pequeño es mejor
Disk Throttling: DiskSpd Read Loop, Queue Depth 8
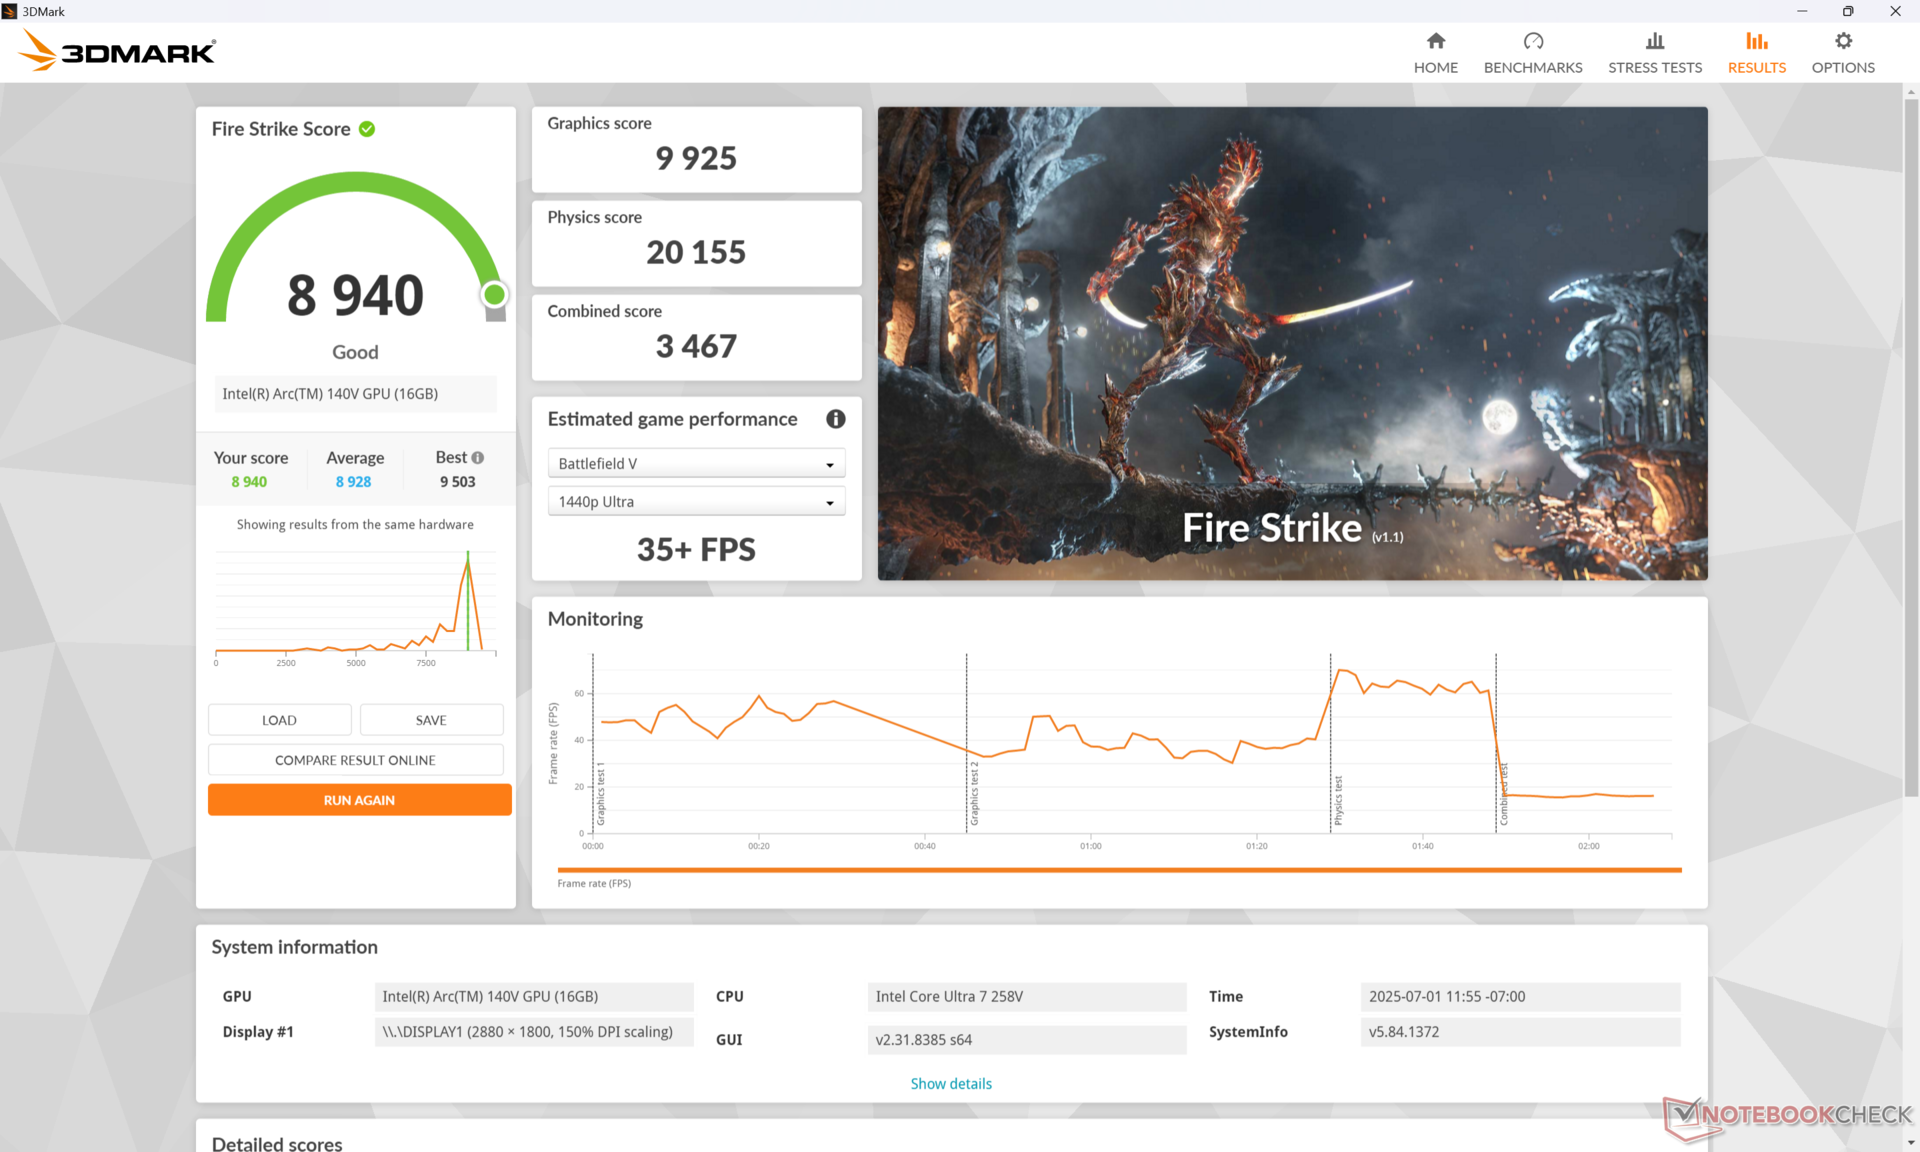
Rendimiento de la GPU
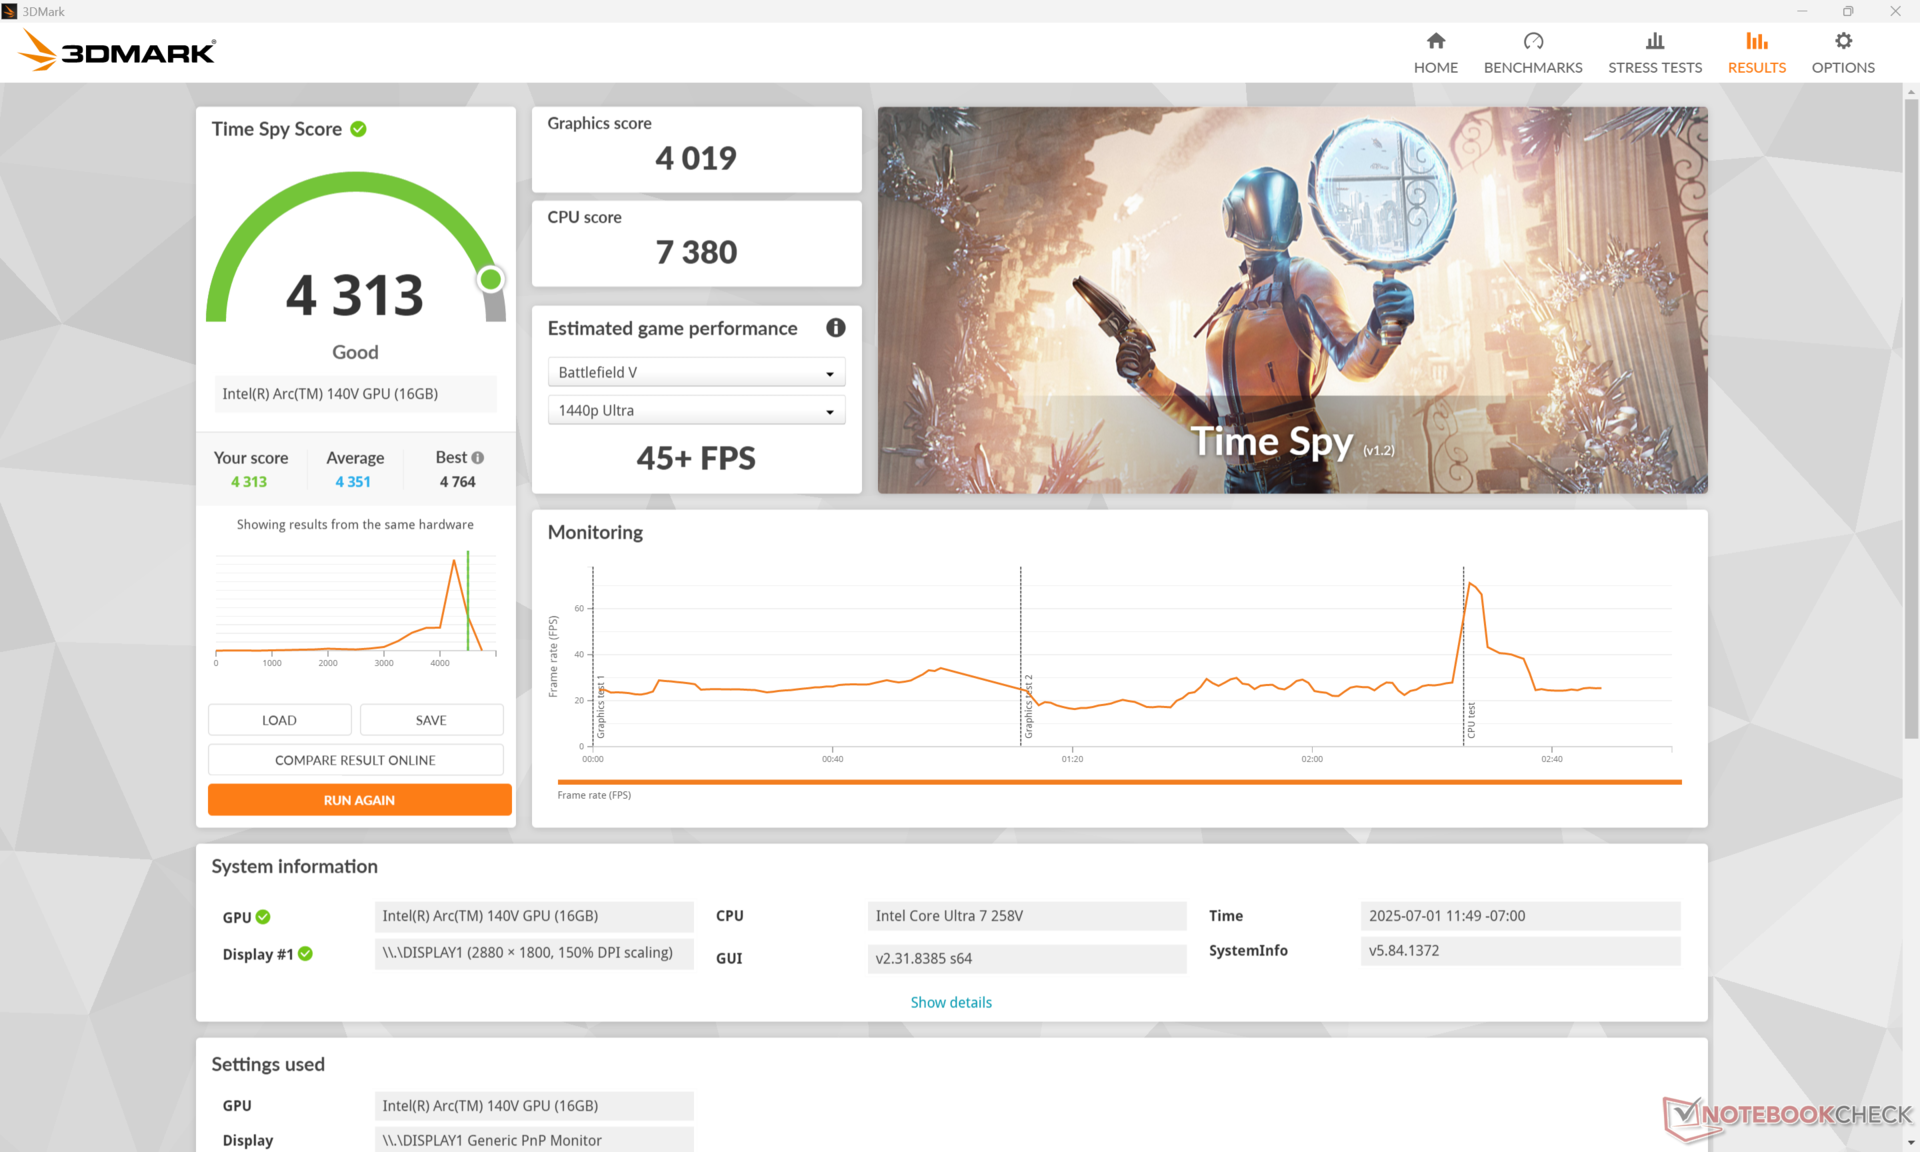
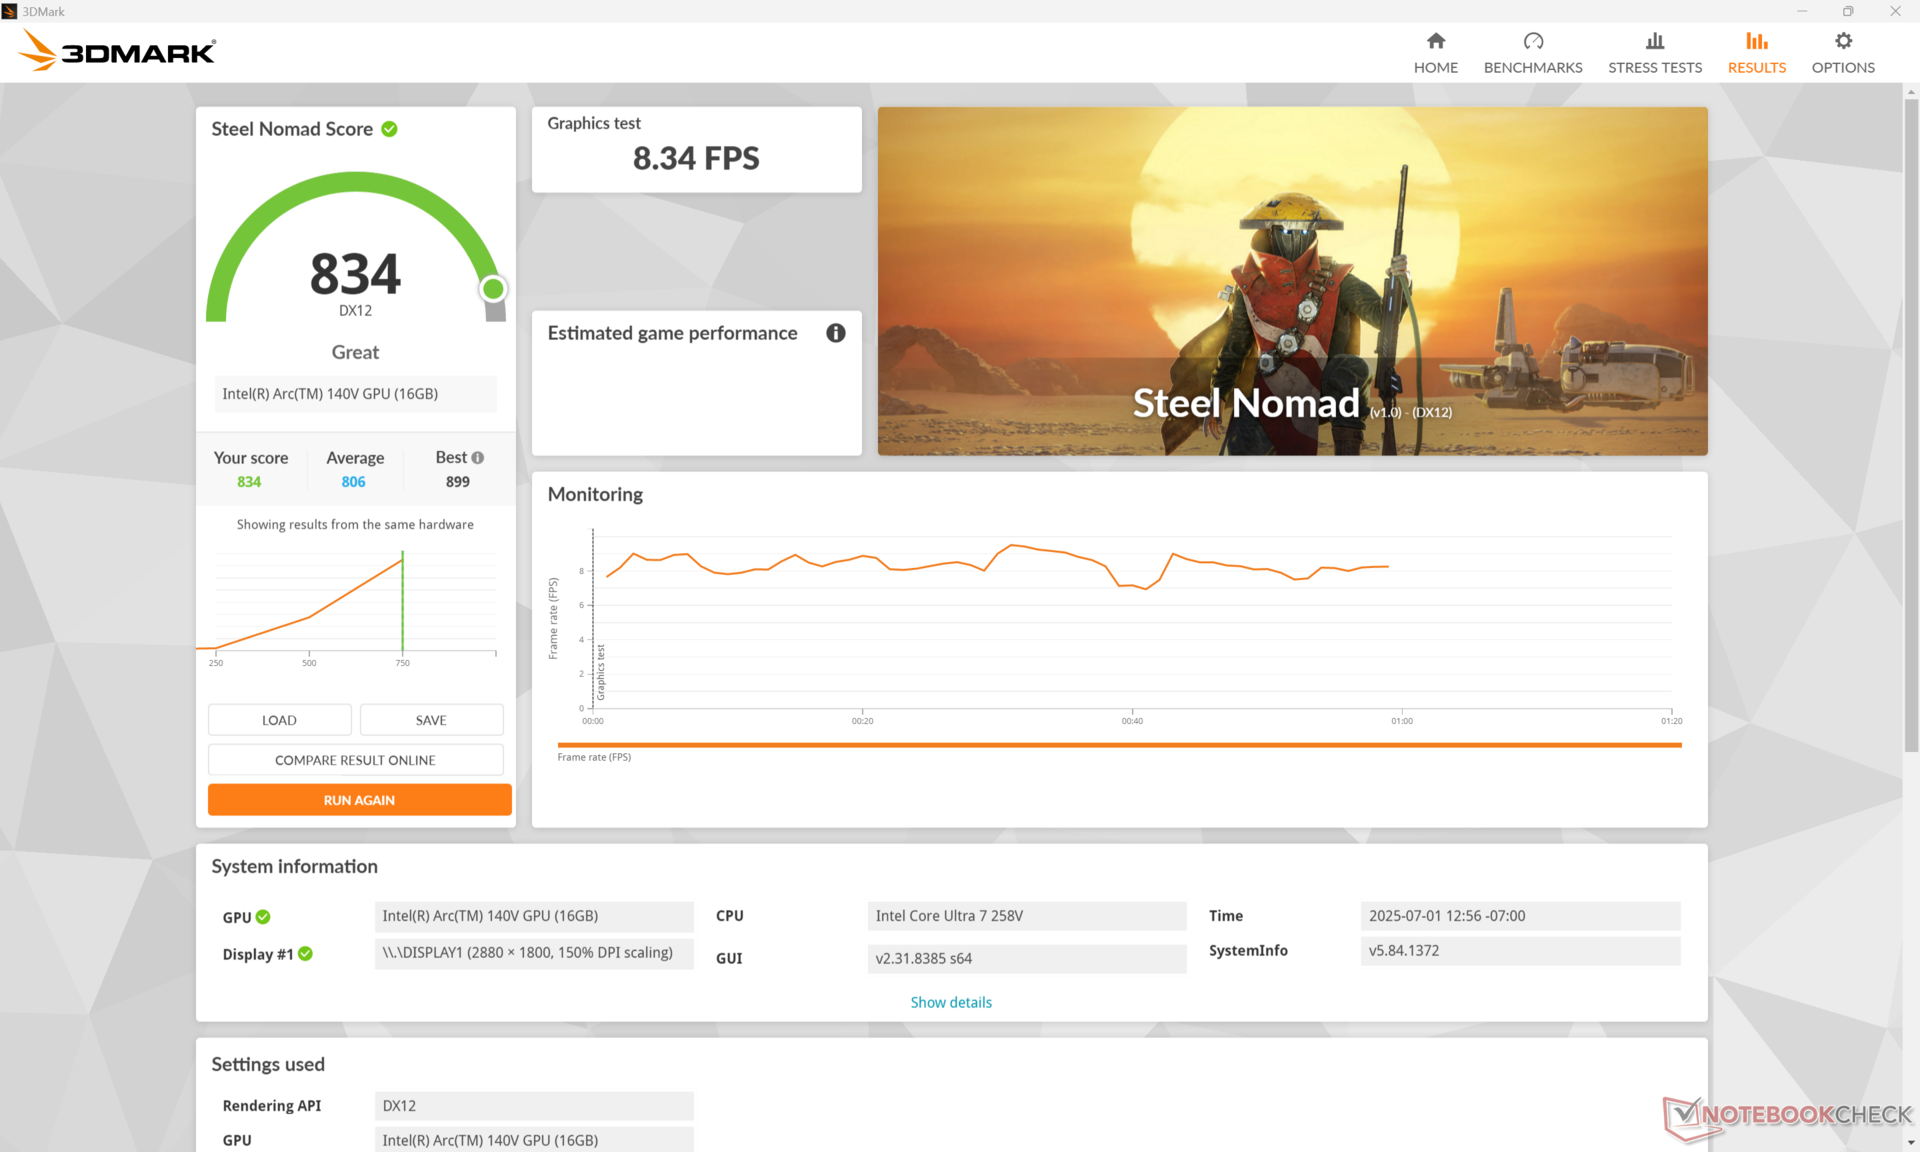
El Arc Graphics 140V es una mejora notable con respecto a la última generación Serie Iris Xe a la vez que es aproximadamente un 15 por ciento más rápida que la inferior Arc 130V configuración. Sigue sin ser rival para la GPU discreta Nvidia del HP Spectre x360 16sin embargo.
Funcionar con batería reduce el rendimiento hasta en un 20 por ciento.
| Perfil de energía | Puntuación de gráficos | Puntuación física | Puntuación combinada |
| Modo Rendimiento | 9925 | 20155 | 3467 |
| Modo equilibrado | 9910 (-0%) | 20635 (-0%) | 3466 (-0%) |
| Batería | 8048 (-19%) | 16246 (-19%) | 2499 (-28%) |
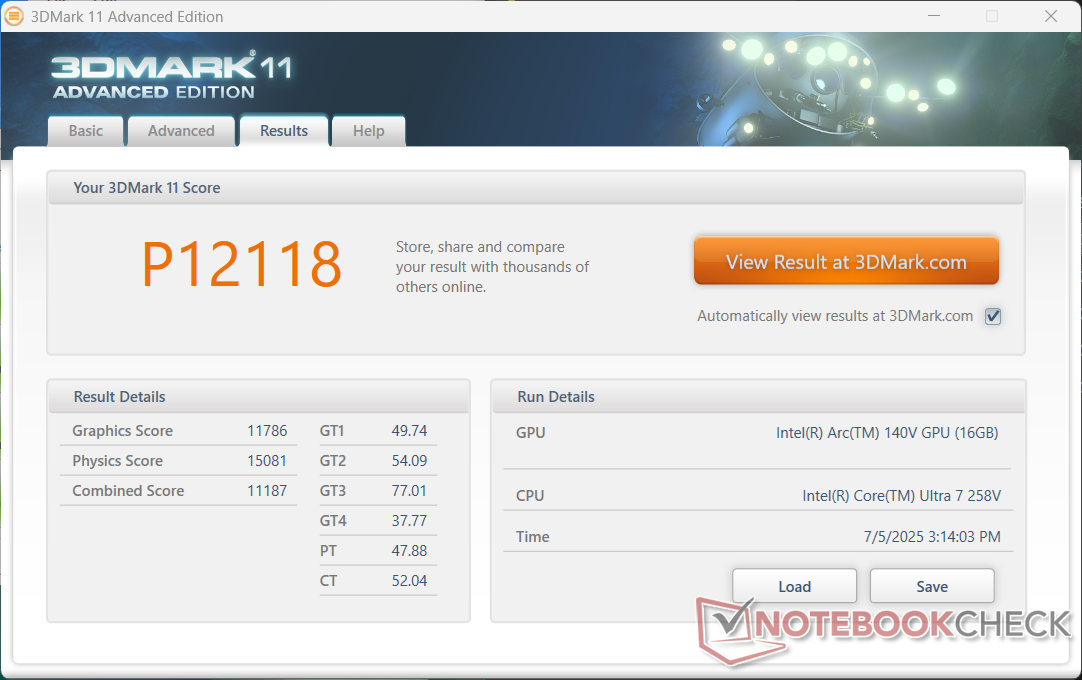
| 3DMark 11 Performance | 12118 puntos | |
| 3DMark Cloud Gate Standard Score | 32872 puntos | |
| 3DMark Fire Strike Score | 8940 puntos | |
| 3DMark Time Spy Score | 4313 puntos | |
| 3DMark Steel Nomad Score | 834 puntos | |
ayuda | ||
* ... más pequeño es mejor
| F1 24 | |
| 1920x1080 Low Preset AA:T AF:16x | |
| HP OmniBook X Flip 16 | |
| Lenovo Yoga 7 2-in-1 16ILL10 | |
| Dell 16 Plus 2-in-1 | |
| Medio Intel Arc Graphics 140V (54 - 99, n=25) | |
| Asus Zenbook S 16 UM5606WA-RK052W | |
| 1920x1080 Medium Preset AA:T AF:16x | |
| HP OmniBook X Flip 16 | |
| Lenovo Yoga 7 2-in-1 16ILL10 | |
| Dell 16 Plus 2-in-1 | |
| Medio Intel Arc Graphics 140V (49.2 - 88.2, n=24) | |
| Asus Zenbook S 16 UM5606WA-RK052W | |
| 1920x1080 High Preset AA:T AF:16x | |
| HP OmniBook X Flip 16 | |
| Dell 16 Plus 2-in-1 | |
| Lenovo Yoga 7 2-in-1 16ILL10 | |
| Medio Intel Arc Graphics 140V (34.4 - 66.4, n=27) | |
| Asus Zenbook S 16 UM5606WA-RK052W | |
| 1920x1080 Ultra High Preset AA:T AF:16x | |
| HP OmniBook X Flip 16 | |
| Lenovo Yoga 7 2-in-1 16ILL10 | |
| Dell 16 Plus 2-in-1 | |
| Medio Intel Arc Graphics 140V (14.6 - 22, n=25) | |
| Asus Zenbook S 16 UM5606WA-RK052W | |
Cyberpunk 2077 ultra FPS Chart
| bajo | medio | alto | ultra | |
|---|---|---|---|---|
| Dota 2 Reborn (2015) | 97.2 | 88.4 | 63.5 | 84.9 |
| Final Fantasy XV Benchmark (2018) | 92.9 | 48.8 | 35.5 | |
| X-Plane 11.11 (2018) | 41.8 | 37.9 | 31.9 | |
| Strange Brigade (2018) | 246 | 79.6 | 67.7 | 58.7 |
| Baldur's Gate 3 (2023) | 43 | 36.1 | 29.7 | 29.1 |
| Cyberpunk 2077 (2023) | 46.4 | 37.5 | 32.9 | 23.3 |
| F1 24 (2024) | 91.9 | 83.9 | 64.6 | 20.9 |
Emisiones
Ruido del sistema
El ruido del ventilador suele rondar los 28,6 dB(A) frente a un fondo silencioso de 27,5 dB(A) cuando se navega por Internet o se transmite vídeo. Alcanzaría su máximo de algo menos de 38 dB(A) con bastante rapidez cuando se introducen cargas mayores como juegos.
Ruido
| Ocioso |
| 28 / 28.3 / 28.3 dB(A) |
| Carga |
| 37.7 / 37.6 dB(A) |
 | ||
30 dB silencioso 40 dB(A) audible 50 dB(A) ruidosamente alto |
||
min: | ||
| HP OmniBook X Flip 16 Arc 140V, Core Ultra 7 258V | Dell 16 Plus 2-in-1 Arc 140V, Core Ultra 7 258V, Samsung BM9C1 1024GB | Lenovo Yoga 7 2-in-1 16ILL10 Arc 140V, Core Ultra 7 256V, WD PC SN7100S SDFPMSL-512G-1101 | Samsung Galaxy Book5 Pro 360 Arc 130V, Core Ultra 5 226V, Samsung PM9B1 512GB MZVL4512HBLU | MSI Summit A16 AI Plus A3HMTG Radeon 880M, Ryzen AI 9 365, Samsung PM9C1 MZVL81T0HELB-00BTW | HP Spectre x360 16 RTX 4050 GeForce RTX 4050 Laptop GPU, Ultra 7 155H, SK hynix PC801 HFS001TEJ9X101N | |
|---|---|---|---|---|---|---|
| Noise | 6% | 4% | 9% | -6% | 17% | |
| apagado / medio ambiente * (dB) | 27.5 | 23.2 16% | 23.3 15% | 23.6 14% | 23.8 13% | 23.3 15% |
| Idle Minimum * (dB) | 28 | 23 18% | 23.3 17% | 23.6 16% | 25 11% | 23.6 16% |
| Idle Average * (dB) | 28.3 | 23 19% | 23.3 18% | 23.6 17% | 25 12% | 23.6 17% |
| Idle Maximum * (dB) | 28.3 | 24.7 13% | 25.7 9% | 23.6 17% | 29.5 -4% | 23.6 17% |
| Load Average * (dB) | 37.7 | 32.5 14% | 40.2 -7% | 29.4 22% | 37.5 1% | 29.2 23% |
| Cyberpunk 2077 ultra * (dB) | 36.2 | 42.6 -18% | 41.6 -15% | 40.6 -12% | 46.5 -28% | |
| Load Maximum * (dB) | 37.6 | 45.6 -21% | 41.6 -11% | 40.6 -8% | 56.1 -49% | 32.1 15% |
| Witcher 3 ultra * (dB) | 32.1 |
* ... más pequeño es mejor
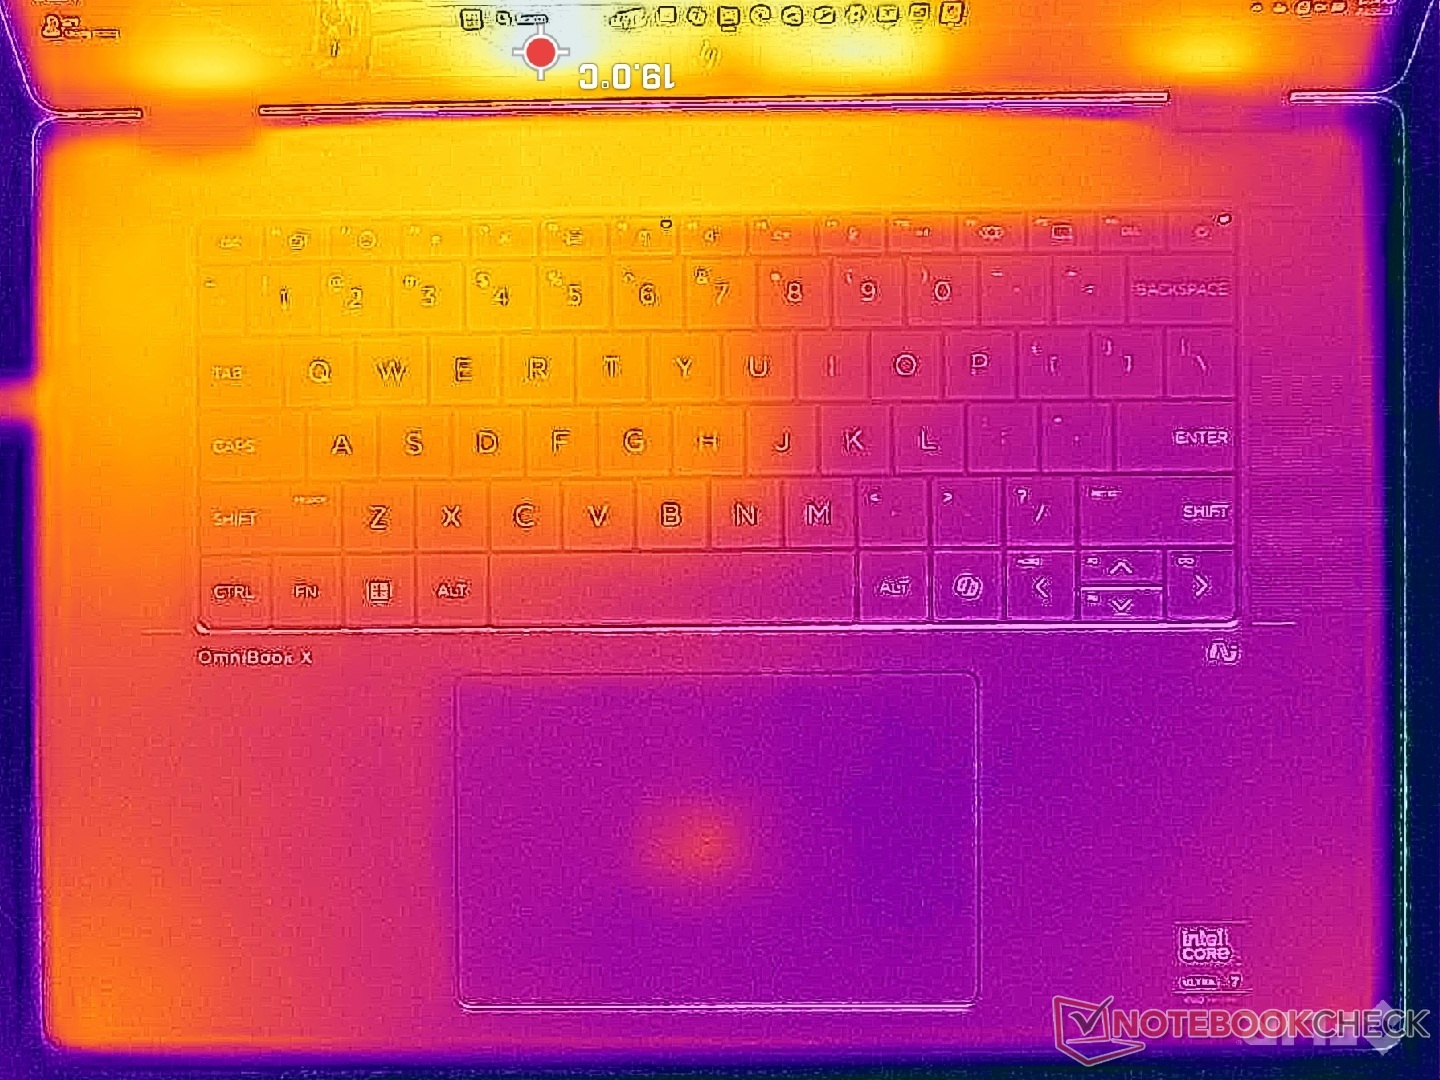
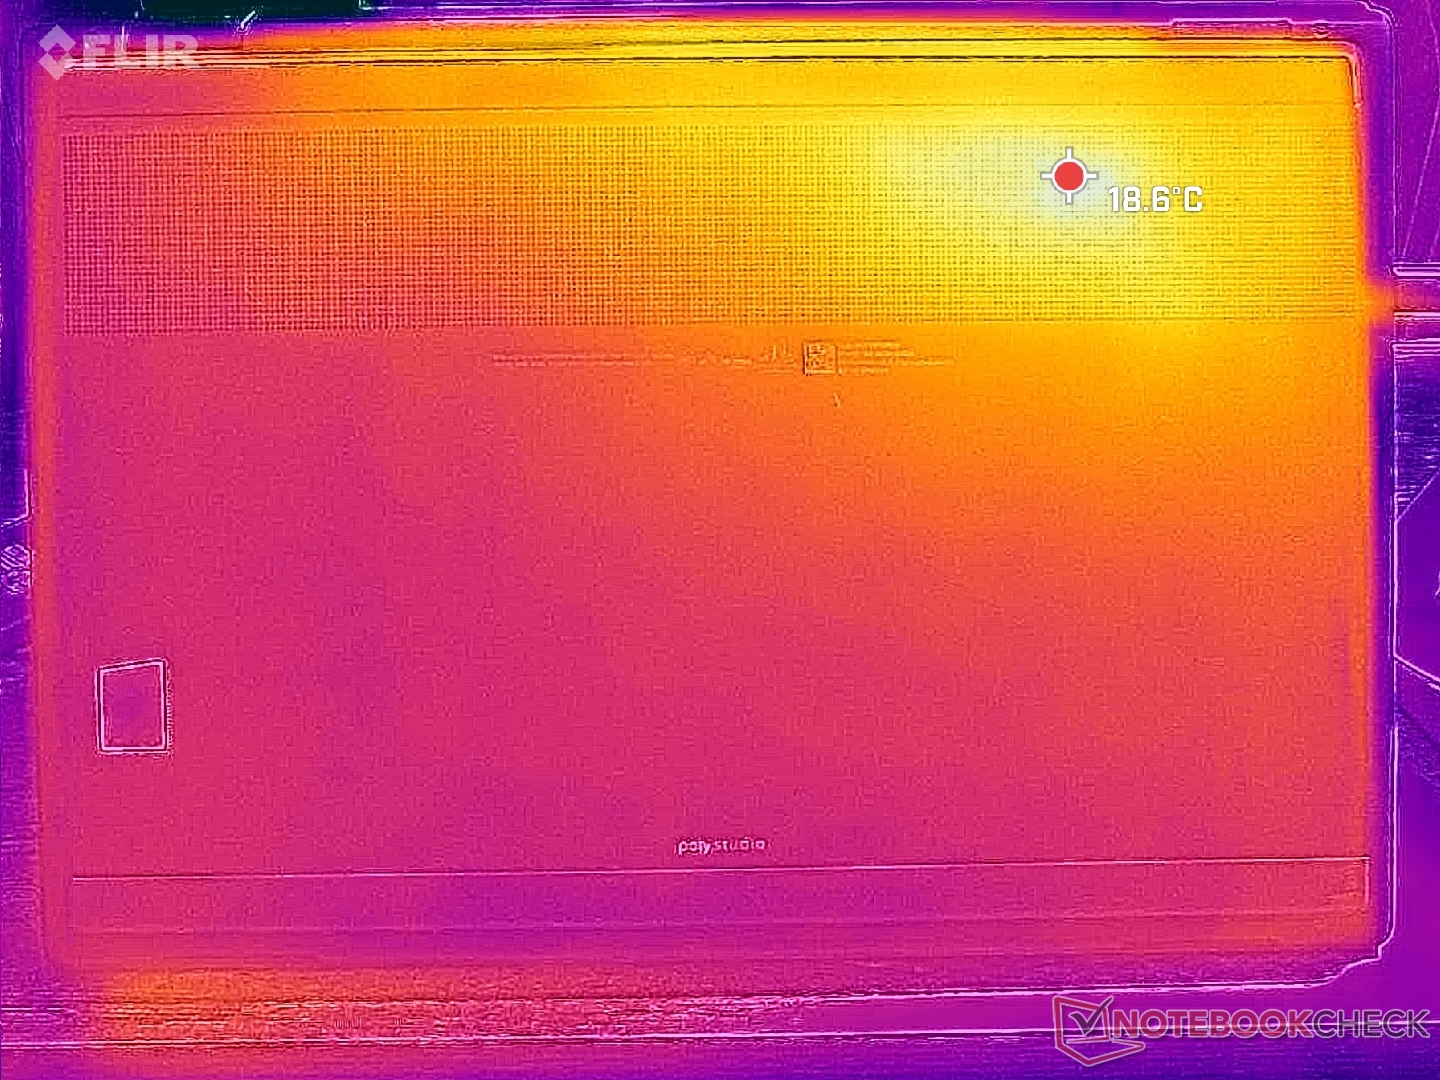
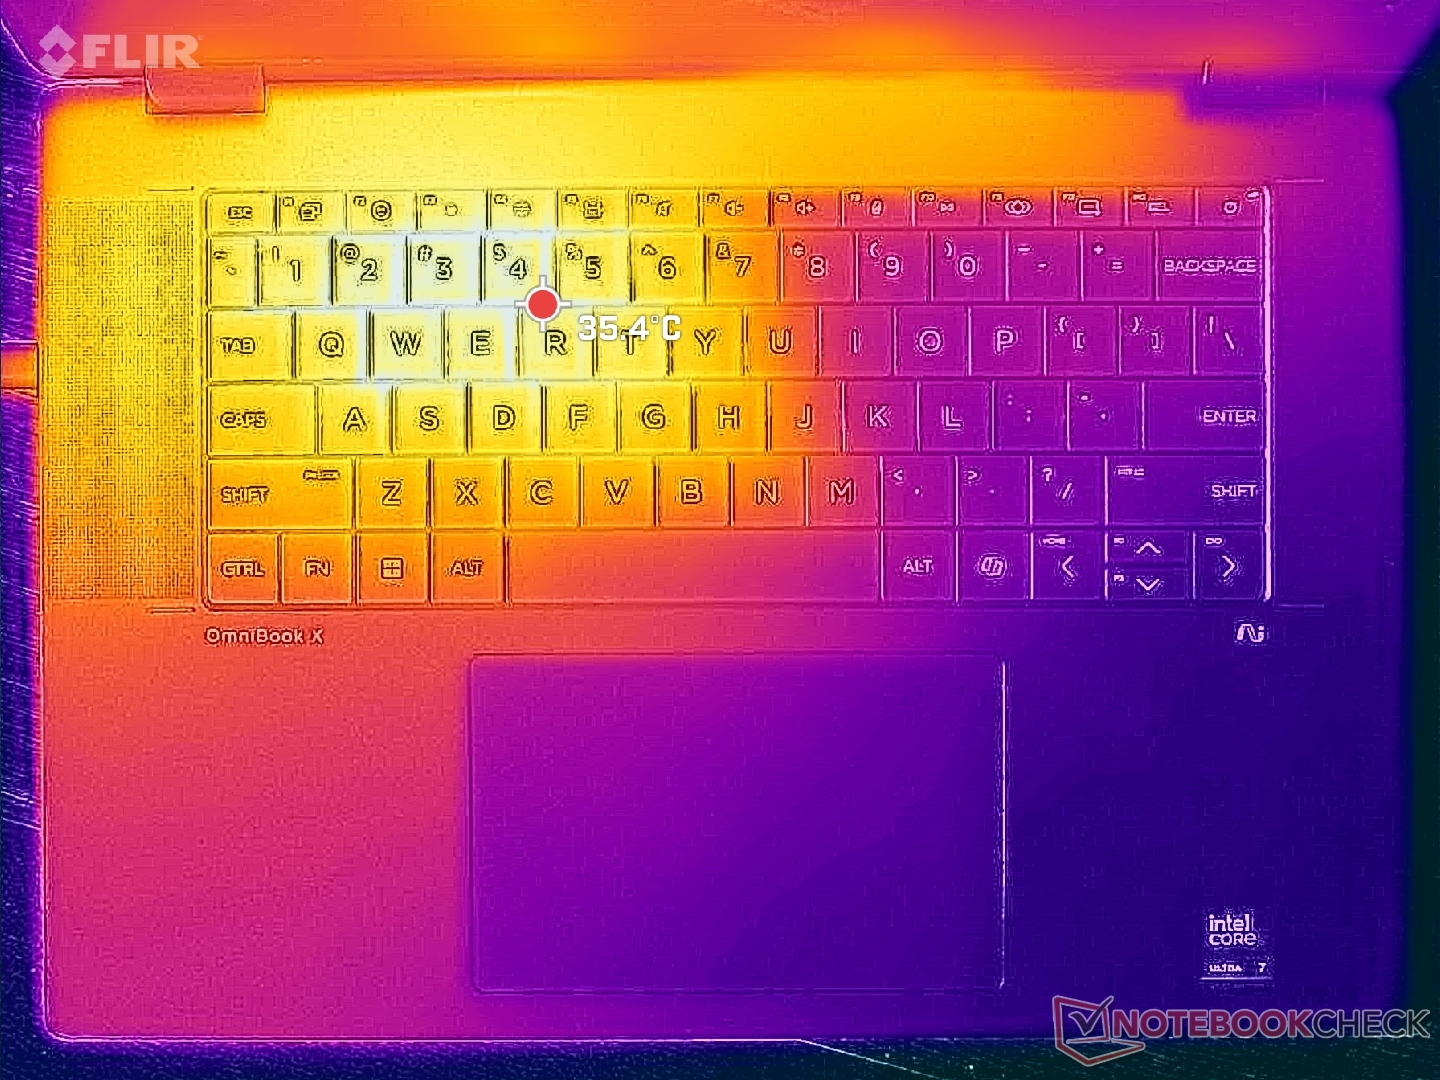
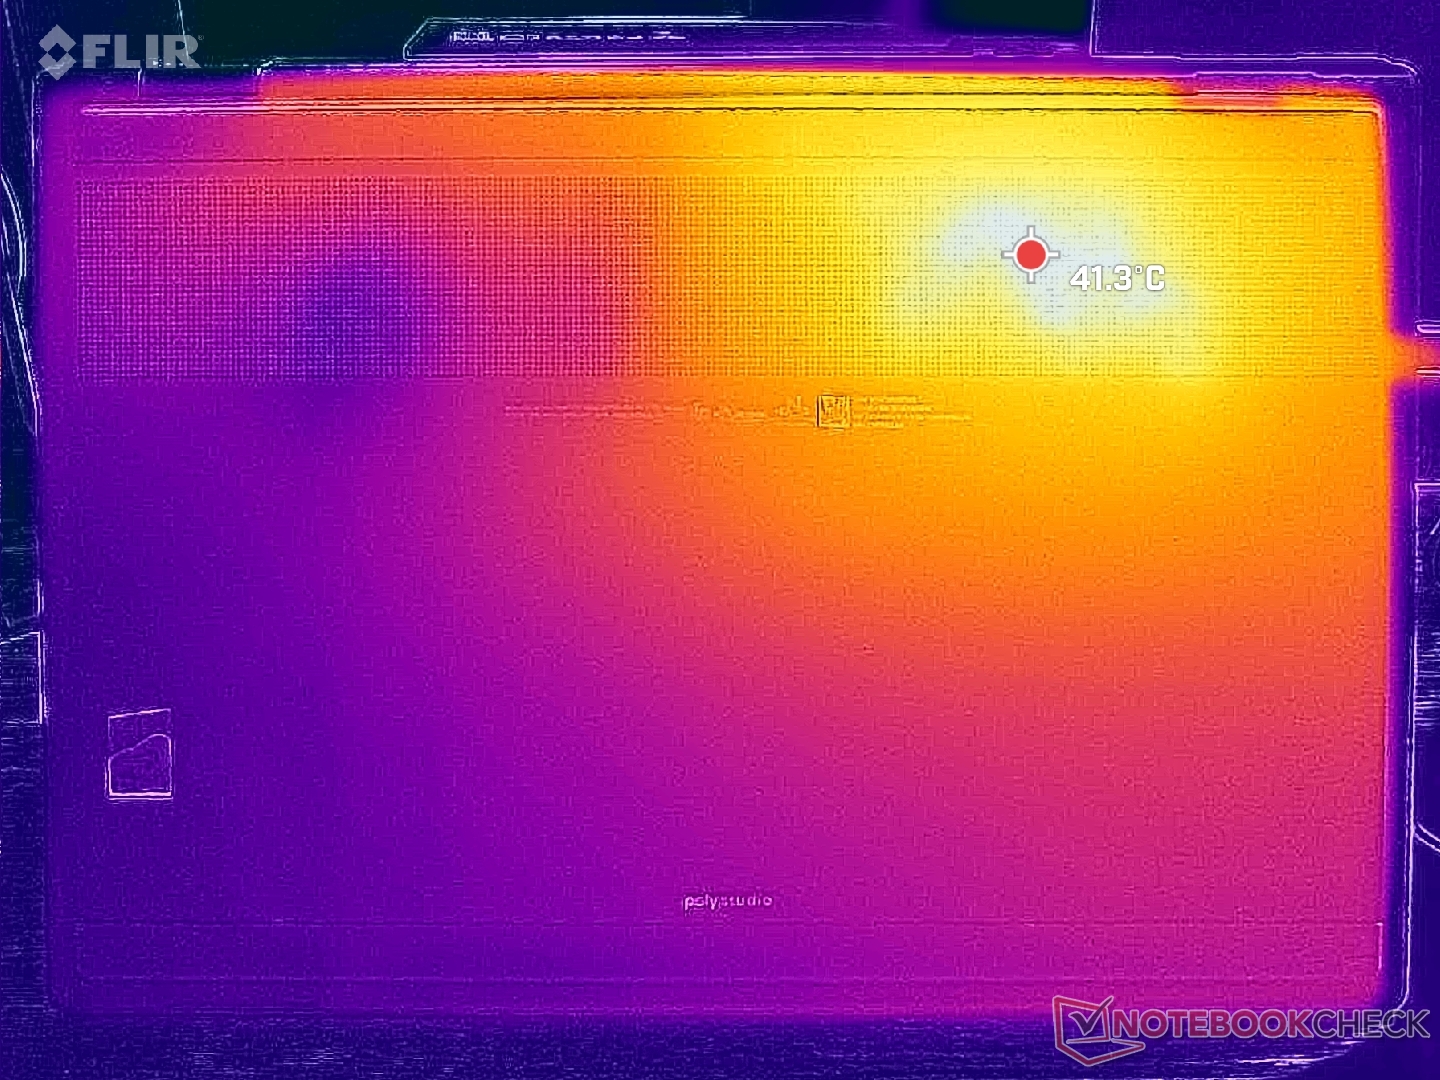
Temperatura
Los puntos calientes de la superficie son similares a los que observamos en el 2 en 1 Dell Plus 16 de la competencia. En el HP, sin embargo, los puntos calientes son notablemente más fríos en varios grados C.
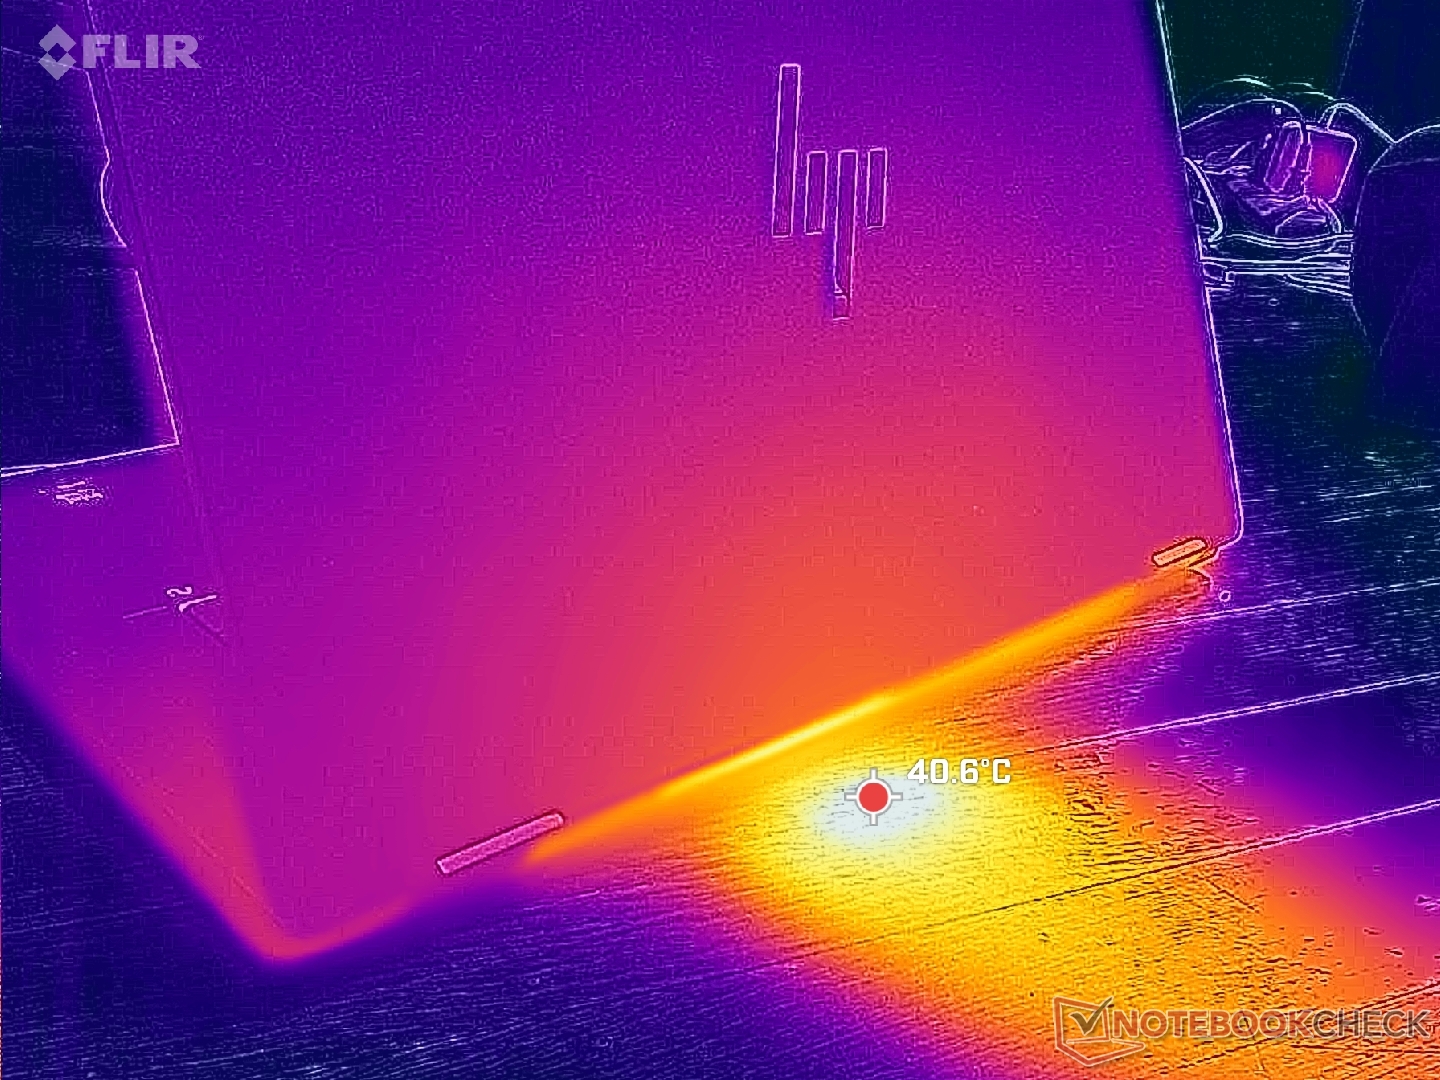
(+) La temperatura máxima en la parte superior es de 38 °C / 100 F, frente a la media de 35.4 °C / 96 F, que oscila entre 19.6 y 60 °C para la clase Convertible.
(+) El fondo se calienta hasta un máximo de 39.4 °C / 103 F, frente a la media de 36.9 °C / 98 F
(+) En reposo, la temperatura media de la parte superior es de 23 °C / 73# F, frente a la media del dispositivo de 30.3 °C / 87 F.
(+) El reposamanos y el panel táctil están a una temperatura inferior a la de la piel, con un máximo de 27.2 °C / 81 F y, por tanto, son fríos al tacto.
(±) La temperatura media de la zona del reposamanos de dispositivos similares fue de 28 °C / 82.4 F (+0.8 °C / 1.4 F).
| HP OmniBook X Flip 16 Intel Core Ultra 7 258V, Intel Arc Graphics 140V | Dell 16 Plus 2-in-1 Intel Core Ultra 7 258V, Intel Arc Graphics 140V | Lenovo Yoga 7 2-in-1 16ILL10 Intel Core Ultra 7 256V, Intel Arc Graphics 140V | Samsung Galaxy Book5 Pro 360 Intel Core Ultra 5 226V, Intel Arc Graphics 130V | MSI Summit A16 AI Plus A3HMTG AMD Ryzen AI 9 365, AMD Radeon 880M | HP Spectre x360 16 RTX 4050 Intel Core Ultra 7 155H, NVIDIA GeForce RTX 4050 Laptop GPU | |
|---|---|---|---|---|---|---|
| Heat | -20% | -4% | -3% | -22% | -11% | |
| Maximum Upper Side * (°C) | 38 | 44 -16% | 42.6 -12% | 40.9 -8% | 52.8 -39% | 39.6 -4% |
| Maximum Bottom * (°C) | 39.4 | 39.4 -0% | 36.8 7% | 45.1 -14% | 42 -7% | 39.2 1% |
| Idle Upper Side * (°C) | 25 | 31.8 -27% | 26.4 -6% | 23.8 5% | 30.6 -22% | 29 -16% |
| Idle Bottom * (°C) | 25 | 34.2 -37% | 26.6 -6% | 23.5 6% | 29.6 -18% | 31.6 -26% |
* ... más pequeño es mejor
Altavoces
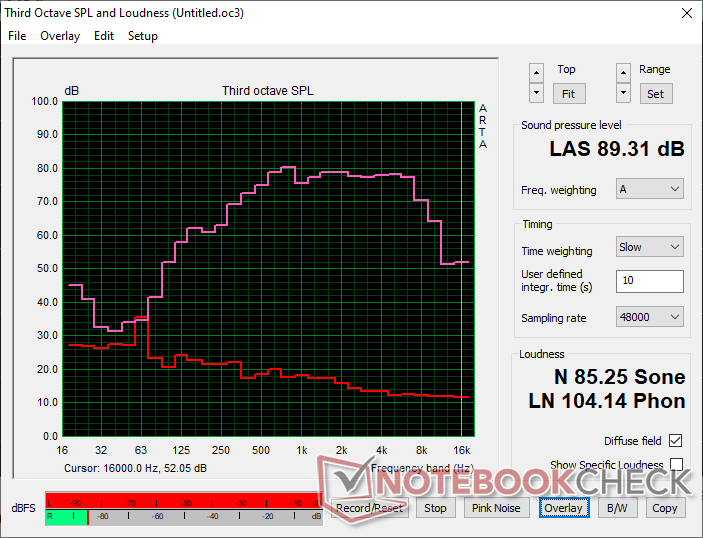
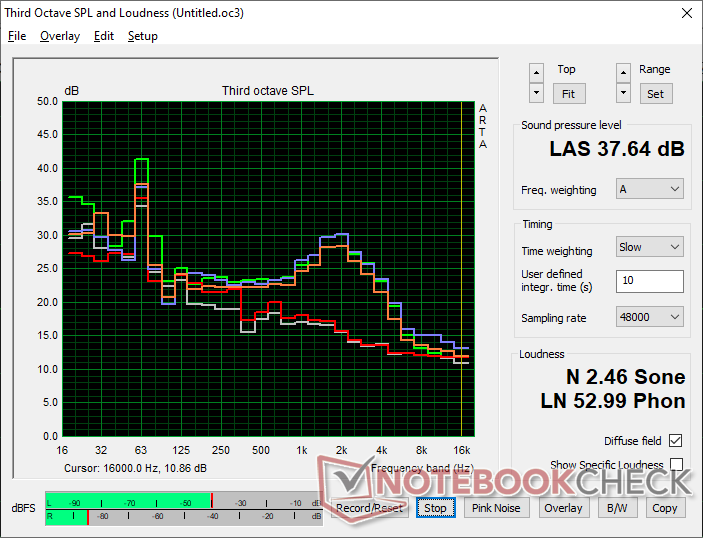
HP OmniBook X Flip 16 análisis de audio
(+) | los altavoces pueden reproducir a un volumen relativamente alto (#89.3 dB)
Graves 100 - 315 Hz
(±) | lubina reducida - en promedio 14.6% inferior a la mediana
(±) | la linealidad de los graves es media (8.6% delta a frecuencia anterior)
Medios 400 - 2000 Hz
(+) | medios equilibrados - a sólo 2.5% de la mediana
(+) | los medios son lineales (4.1% delta a la frecuencia anterior)
Altos 2 - 16 kHz
(+) | máximos equilibrados - a sólo 3.9% de la mediana
(+) | los máximos son lineales (4% delta a la frecuencia anterior)
Total 100 - 16.000 Hz
(+) | el sonido global es lineal (14.2% de diferencia con la mediana)
En comparación con la misma clase
» 21% de todos los dispositivos probados de esta clase eran mejores, 3% similares, 76% peores
» El mejor tuvo un delta de 6%, la media fue 20%, el peor fue ###max##%
En comparación con todos los dispositivos probados
» 17% de todos los dispositivos probados eran mejores, 4% similares, 79% peores
» El mejor tuvo un delta de 4%, la media fue 23%, el peor fue ###max##%
Apple MacBook Pro 16 2021 M1 Pro análisis de audio
(+) | los altavoces pueden reproducir a un volumen relativamente alto (#84.7 dB)
Graves 100 - 315 Hz
(+) | buen bajo - sólo 3.8% lejos de la mediana
(+) | el bajo es lineal (5.2% delta a la frecuencia anterior)
Medios 400 - 2000 Hz
(+) | medios equilibrados - a sólo 1.3% de la mediana
(+) | los medios son lineales (2.1% delta a la frecuencia anterior)
Altos 2 - 16 kHz
(+) | máximos equilibrados - a sólo 1.9% de la mediana
(+) | los máximos son lineales (2.7% delta a la frecuencia anterior)
Total 100 - 16.000 Hz
(+) | el sonido global es lineal (4.6% de diferencia con la mediana)
En comparación con la misma clase
» 0% de todos los dispositivos probados de esta clase eran mejores, 0% similares, 100% peores
» El mejor tuvo un delta de 5%, la media fue 17%, el peor fue ###max##%
En comparación con todos los dispositivos probados
» 0% de todos los dispositivos probados eran mejores, 0% similares, 100% peores
» El mejor tuvo un delta de 4%, la media fue 23%, el peor fue ###max##%
Gestión de la energía
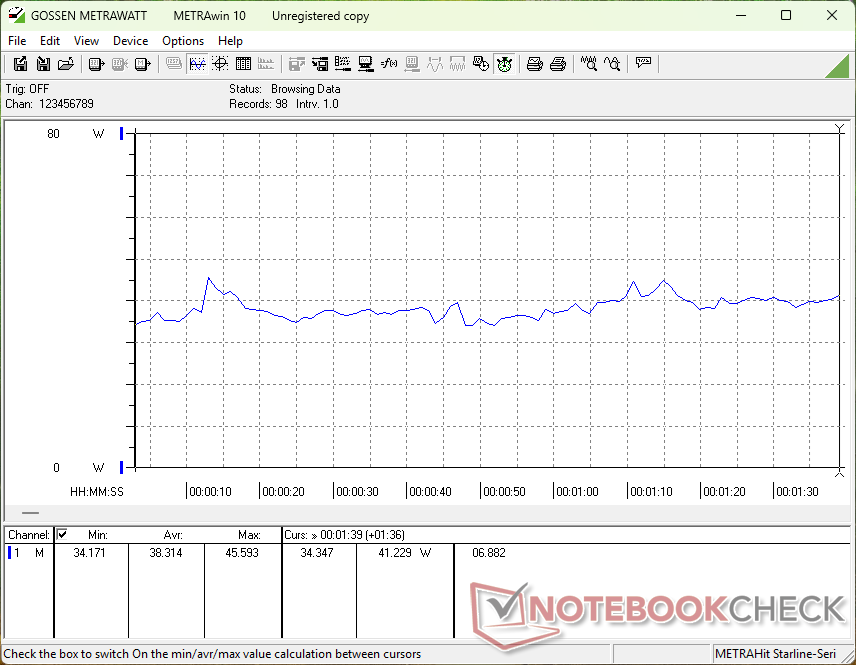
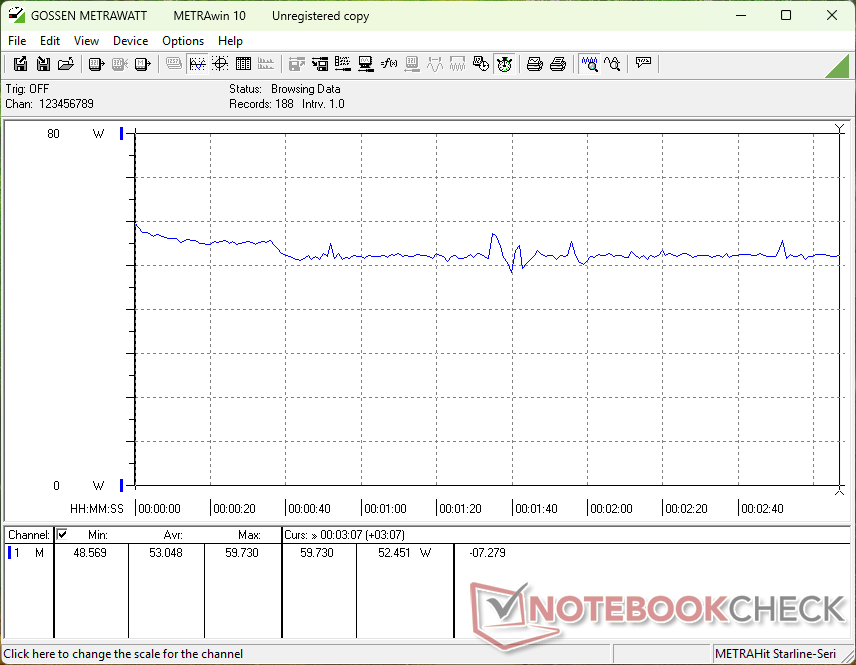
Consumo de energía
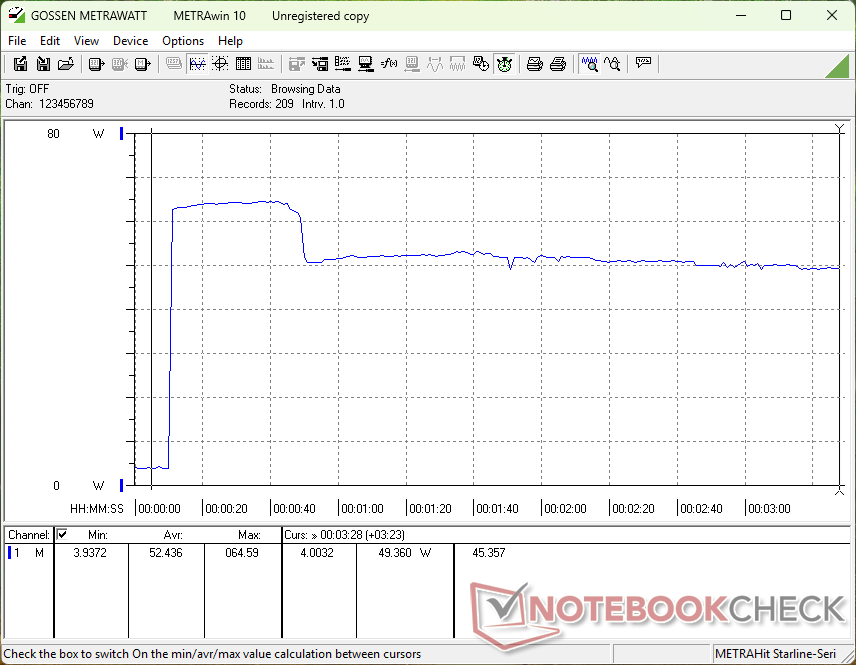
Intel Lunar Lake es extremadamente eficiente y esto sigue siendo cierto en el HP. Al ejecutar Cyberpunk 2077, por ejemplo, el OmniBook X Flip 16 demandaría menos energía que en el AMD-powered MSI Summit A16 AI Plus al tiempo que ofrece velocidades de fotogramas consistentemente más rápidas. Sin embargo, el rendimiento bruto del procesador sigue sin estar a la altura del Ryzen AI 9 365.
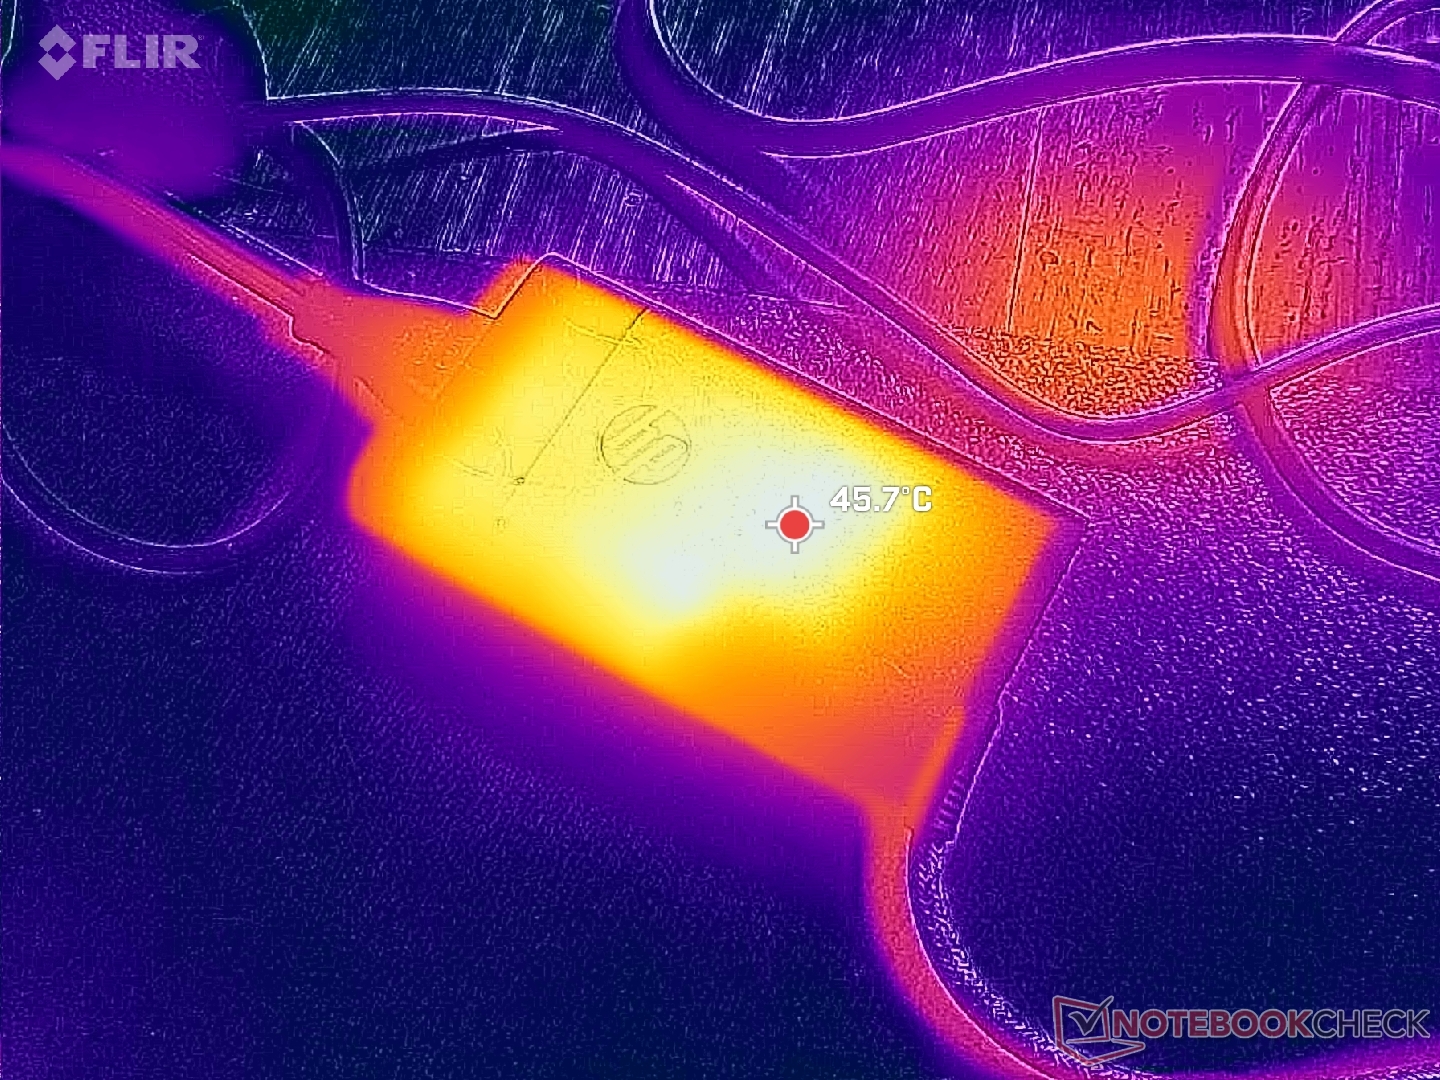
Somos capaces de registrar un consumo máximo temporal de 65 W desde el pequeño (~6,8 x 2,2 x 5,4 cm) adaptador de CA USB-C de 65 W cuando la CPU está al 100 por ciento de utilización.

| Off / Standby | |
| Ocioso | |
| Carga |
|
Clave:
min: | |
| HP OmniBook X Flip 16 Core Ultra 7 258V, Arc 140V, , OLED, 2880x1800, 16" | Dell 16 Plus 2-in-1 Core Ultra 7 258V, Arc 140V, Samsung BM9C1 1024GB, Mini-LED, 2560x1600, 16" | Lenovo Yoga 7 2-in-1 16ILL10 Core Ultra 7 256V, Arc 140V, WD PC SN7100S SDFPMSL-512G-1101, IPS, 1920x1200, 16" | Samsung Galaxy Book5 Pro 360 Core Ultra 5 226V, Arc 130V, Samsung PM9B1 512GB MZVL4512HBLU, OLED, 2880x1800, 16" | MSI Summit A16 AI Plus A3HMTG Ryzen AI 9 365, Radeon 880M, Samsung PM9C1 MZVL81T0HELB-00BTW, IPS, 2560x1600, 16" | HP Spectre x360 16 RTX 4050 Ultra 7 155H, GeForce RTX 4050 Laptop GPU, SK hynix PC801 HFS001TEJ9X101N, OLED, 2880x1800, 16" | |
|---|---|---|---|---|---|---|
| Power Consumption | -47% | -11% | -8% | -54% | -133% | |
| Idle Minimum * (Watt) | 3.1 | 7 -126% | 4.2 -35% | 5.3 -71% | 5.4 -74% | 5.8 -87% |
| Idle Average * (Watt) | 4.4 | 13.2 -200% | 8.3 -89% | 6.7 -52% | 11 -150% | 12.3 -180% |
| Idle Maximum * (Watt) | 11.4 | 13.4 -18% | 9.5 17% | 7.3 36% | 11.2 2% | 33.9 -197% |
| Load Average * (Watt) | 38.3 | 43.9 -15% | 40.3 -5% | 37.6 2% | 76.6 -100% | 83.3 -117% |
| Cyberpunk 2077 ultra external monitor * (Watt) | 48.7 | 40.7 16% | 40.8 16% | 42.8 12% | 49.2 -1% | |
| Cyberpunk 2077 ultra * (Watt) | 53.1 | 44.9 15% | 47.4 11% | 44.6 16% | 61.1 -15% | |
| Load Maximum * (Watt) | 64.9 | 67.8 -4% | 59 9% | 64.1 1% | 91.8 -41% | 120.8 -86% |
| Witcher 3 ultra * (Watt) | 89.1 |
* ... más pequeño es mejor
Power Consumption Cyberpunk / Stress Test
Power Consumption external Monitor
Duración de las pilas
| HP OmniBook X Flip 16 Core Ultra 7 258V, Arc 140V, 68 Wh | Dell 16 Plus 2-in-1 Core Ultra 7 258V, Arc 140V, 64 Wh | Lenovo Yoga 7 2-in-1 16ILL10 Core Ultra 7 256V, Arc 140V, 70 Wh | Samsung Galaxy Book5 Pro 360 Core Ultra 5 226V, Arc 130V, 76 Wh | MSI Summit A16 AI Plus A3HMTG Ryzen AI 9 365, Radeon 880M, 82 Wh | HP Spectre x360 16 RTX 4050 Ultra 7 155H, GeForce RTX 4050 Laptop GPU, 83 Wh | |
|---|---|---|---|---|---|---|
| Duración de Batería | -30% | 56% | -16% | -29% | -14% | |
| WiFi v1.3 (h) | 12.8 | 8.9 -30% | 20 56% | 10.8 -16% | 9.1 -29% | 11 -14% |
| H.264 (h) | 19.7 | |||||
| Load (h) | 2.1 |
Valoración de Notebookcheck
HP OmniBook X Flip 16
- 07/10/2025 v8
Allen Ngo
 Total Sustainability Score:
 Potential Competitors in Comparison
Imagen | Modelo | Precio | Peso | Altura | Pantalla |
|---|---|---|---|---|---|
1. 86.9%  | HP OmniBook X Flip 16 Intel Core Ultra 7 258V ⎘ Intel Arc Graphics 140V ⎘ 16 GB Memoría | Amazon: Precio de catálogo: 950 USD | 1.9 kg | 15.5 mm | 16.00" 2880x1800 212 PPI OLED |
2. 83.5%  | Dell 16 Plus 2-in-1 Intel Core Ultra 7 258V ⎘ Intel Arc Graphics 140V ⎘ 32 GB Memoría, 1024 GB SSD | Amazon: $1,149.99 Precio de catálogo: 1500 USD | 2 kg | 16.99 mm | 16.00" 2560x1600 189 PPI Mini-LED |
3. 84.3%  | Lenovo Yoga 7 2-in-1 16ILL10 Intel Core Ultra 7 256V ⎘ Intel Arc Graphics 140V ⎘ 16 GB Memoría, 512 GB SSD | Amazon: Precio de catálogo: 1000 USD | 1.9 kg | 15.85 mm | 16.00" 1920x1200 142 PPI IPS |
4. 85.9%  | Samsung Galaxy Book5 Pro 360 Intel Core Ultra 5 226V ⎘ Intel Arc Graphics 130V ⎘ 16 GB Memoría, 512 GB SSD | Amazon: Precio de catálogo: 1799€ | 1.7 kg | 12.8 mm | 16.00" 2880x1800 212 PPI OLED |
5. 81.9%  | MSI Summit A16 AI Plus A3HMTG AMD Ryzen AI 9 365 ⎘ AMD Radeon 880M ⎘ 32 GB Memoría, 1024 GB SSD | Amazon: Precio de catálogo: 1600 USD | 2.1 kg | 16.85 mm | 16.00" 2560x1600 189 PPI IPS |
6. 91.1% v7 (old)  | HP Spectre x360 16 RTX 4050 Intel Core Ultra 7 155H ⎘ NVIDIA GeForce RTX 4050 Laptop GPU ⎘ 16 GB Memoría, 1024 GB SSD | Amazon: Precio de catálogo: 1600 USD | 2 kg | 19.8 mm | 16.00" 2880x1800 212 PPI OLED |
Transparencia
La selección de los dispositivos que se van a reseñar corre a cargo de nuestro equipo editorial. La muestra de prueba fue proporcionada al autor en calidad de préstamo por el fabricante o el minorista a los efectos de esta reseña. El prestamista no tuvo ninguna influencia en esta reseña, ni el fabricante recibió una copia de la misma antes de su publicación. No había ninguna obligación de publicar esta reseña. Como empresa de medios independiente, Notebookcheck no está sujeta a la autoridad de fabricantes, minoristas o editores.
Así es como prueba Notebookcheck
Cada año, Notebookcheck revisa de forma independiente cientos de portátiles y smartphones utilizando procedimientos estandarizados para asegurar que todos los resultados son comparables. Hemos desarrollado continuamente nuestros métodos de prueba durante unos 20 años y hemos establecido los estándares de la industria en el proceso. En nuestros laboratorios de pruebas, técnicos y editores experimentados utilizan equipos de medición de alta calidad. Estas pruebas implican un proceso de validación en varias fases. Nuestro complejo sistema de clasificación se basa en cientos de mediciones y puntos de referencia bien fundamentados, lo que mantiene la objetividad.
