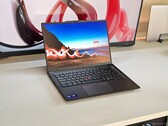
Análisis del Lenovo ThinkPad E14 Gen 7: Lunar Lake ofrece una mayor duración de la batería pero conlleva contrapartidas
Intel Core Ultra 5 228V | Intel Arc Graphics 130V | 14.00" | 1.4 kg
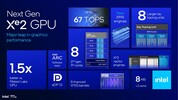
The Intel Arc Graphics 130V is an integrated graphics adapter that lower-end Intel Lunar Lake processors employ. This is a direct successor to the Arc 7 iGPU; it has 7 Xe² architecture cores running at up to 1,850 MHz and 7 ray tracing units at its disposal.
DirectX 12 Ultimate is fully supported here and the iGPU also supports hardware-decoding a long list of popular video codecs such as h.266 VVC, h.265 HEVC, h.264 AVC, AV1 and VP9. It can drive three SUHD 4320p monitors simultaneously via HDMI 2.1, eDP 1.5 and DP 2.1.
Just like it was with Meteor Lake, Intel taps its Foveros technology to build Lunar Lake chips meaning the iGPU and the CPU cores are found on different dies stacked on top of each other or next to each other.
Performance
Based on our in-house 140V testing results, we expect the 130V to be about as fast as the Radeon 780M for playable frame rates in most 2023 and some 2024 games at 1080p on low graphics settings.
Power consumption
Lunar Lake processors' power consumption figures are relatively modest at around 20 W to 30 W, with up to about a half of that getting consumed by the integrated GPU.
Gen13 / Xe² Serie
| |||||||
| Nombre Código | Lunar Lake iGPU | ||||||
| Arquitectura | Xe² Battlemage | ||||||
| Pipelines | 7 - unificado | ||||||
| Raytracing Cores | 7 | ||||||
| Velocidad del núcleo | 1850 (Boost) MHz | ||||||
| Tipo de Memoria | LPDDR5x | ||||||
| Max. Cantidad de Memoria | 16 GB | ||||||
| Memoria Compartida | si | ||||||
| API | DirectX 12_2, OpenGL 4.6, OpenCL 3.0, Vulkan 1.4 | ||||||
| tecnología | 3 nm | ||||||
| Displays | 3 Displays (max.), HDMI 2.1, DisplayPort 2.1 | ||||||
| Características | SUHD 4320p60 resolution support, AVC/HEVC/VVC/VP9/AV1 decoding | ||||||
| Fecha de Anuncio | 24.09.2024 | ||||||
| Predecessor | Arc 7-Core | ||||||
| ||||||||||||||||||||||||
Los siguientes benchmarks se derivan de nuestros benchmarks de los portátiles de análisis. El rendimiento depende de la memoria gráfica utilizada, velocidad de reloj, procesador, configuración del sistema, controladores y sistemas operativos. Así que los resultados no tienen que ser representativos de todos los portátiles con esta GPU. Para información más detallada sobre los resultados del benchmark, haga clic en el número de fps.


| bajo | medio | alto | ultra | QHD | 4K | |
|---|---|---|---|---|---|---|
| F1 25 | 67.1 | 53.4 | 43.8 | |||
| Until Dawn | 27.6 | 18.6 | 12.3 | 9.68 | ||
| God of War Ragnarök | 18.7 | 18.5 | 16.2 | 15.7 | ||
| Final Fantasy XVI | 14.7 | 13.6 | 11.7 | 11.5 | ||
| Space Marine 2 | 16.4 | 15 | 14.7 | 13.2 | ||
| Star Wars Outlaws | 8.56 | 7.3 | ||||
| F1 24 | 73 | 65 | 49 | 16 | ||
| Senua's Saga Hellblade 2 | 13.2 | 11.7 | 9.12 | |||
| Ghost of Tsushima | 22.5 | 20.8 | 17.8 | 13.6 | ||
| Horizon Forbidden West | 25.5 | 22.1 | 16.3 | 15.1 | ||
| Dragon's Dogma 2 | 17.6 | 13.1 | ||||
| Helldivers 2 | 33.4 | 25.6 | 23.5 | 22 | ||
| Prince of Persia The Lost Crown | 162.6 | 103.8 | 101.5 | |||
| Ready or Not | 52.5 | 40.8 | 26.5 | 19.9 | ||
| The Finals | 79.6 | 62.9 | 55.3 | 44.8 | ||
| Avatar Frontiers of Pandora | 12 | 11 | 8.7 | 7.1 | ||
| Alan Wake 2 | 15.1 | 12.6 | 11.2 | |||
| Lords of the Fallen | 17.1 | 16.1 | 14.3 | 11.4 | ||
| Total War Pharaoh | 99.8 | 55.5 | 31 | 25.4 | ||
| Assassin's Creed Mirage | 33 | 32 | 29 | |||
| Counter-Strike 2 | 50.7 | 47.1 | 28.3 | 21.4 | ||
| Cyberpunk 2077 | 40 | 31 | 27 | 24 | ||
| Baldur's Gate 3 | 33 | 26 | 23 | 22 | ||
| F1 22 | 91.2 | 81.3 | 59.7 | 18 | ||
| Tiny Tina's Wonderlands | 61.1 | 43.6 | 27.2 | 21.2 | ||
| Strange Brigade | 193 | 73 | 60 | 50 | ||
| Far Cry 5 | 77 | 43 | 39 | 36 | ||
| X-Plane 11.11 | 44 | 34 | 31 | |||
| Final Fantasy XV Benchmark | 78 | 42 | 29 | 23.4 | ||
| Dota 2 Reborn | 96 | 87 | 74 | 74 | ||
| GTA V | 150 | 132 | 55 | 23 | ||
| bajo | medio | alto | ultra | QHD | 4K | < 30 fps < 60 fps < 120 fps ≥ 120 fps | 12 7 9 2 | 13 10 5 2 | 19 8 3 | 18 3 2 | 1 | |
Para ver más juegos jugables y una lista de todos los juegos y tarjetas gráficas visita nuestroListado de juegos

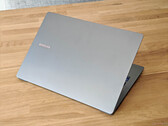
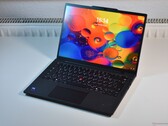
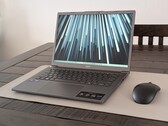
Asus Vivobook S 14 OLED S5406SA: Intel Core Ultra 5 226V, 14.00", 1.3 kg
análise » Análisis del Asus Vivobook S 14 OLED: Asequible, más silencioso y duradero gracias a Lunar Lake
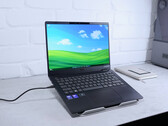
Samsung Galaxy Book5 Pro 360: Intel Core Ultra 5 226V, 16.00", 1.7 kg
análise » Análisis del portátil Samsung Galaxy Book5 Pro 360 - El gran convertible OLED se beneficia de Intel Lunar Lake
Acer Swift 14 AI SF14-51-58TU: Intel Core Ultra 5 226V, 14.00", 1.3 kg
análise » Análisis del Acer Swift 14 AI: El primer portátil con la Arc Graphics 130V
Lenovo Yoga 7 2-in-1 14ILL10: Intel Core Ultra 5 226V, 14.00", 1.4 kg
análise externo » Lenovo Yoga 7 2-in-1 14ILL10
Acer Swift Go 14 AI SFG14-75 : Intel Core Ultra 5 226V, 14.00", 1.2 kg
análise externo » Acer Swift Go 14 AI SFG14-75
HP OmniBook X Flip NGAI 14-fm0000: Intel Core Ultra 5 226V, 14.00", 1.4 kg
análise externo » HP OmniBook X Flip NGAI 14-fm0000
Acer Aspire 14 AI A14-53M: Intel Core Ultra 5 226V, 14.00", 1.2 kg
análise externo » Acer Aspire 14 AI A14-53M
Microsoft Surface Laptop 7 13.8, Ultra 5 238V: Intel Core Ultra 5 238V, 13.80", 1.4 kg
análise externo » Microsoft Surface Laptop 7 13.8, Ultra 5 238V
Asus VivoBook 14 Flip TP3407SA, Ultra 5 226V: Intel Core Ultra 5 226V, 14.00", 1.6 kg
análise externo » Asus VivoBook 14 Flip TP3407SA, Ultra 5 226V
Microsoft Surface Pro 11: Intel Core Ultra 5 236V, 13.00", 0.9 kg
análise externo » Microsoft Surface Pro 11
Acer Swift 16 AI SF16-51, Ultra 5 226V: Intel Core Ultra 5 226V, 16.00", 1.5 kg
análise externo » Acer Swift 16 AI SF16-51, Ultra 5 226V
Acer Aspire 14 AI N24Q14: Intel Core Ultra 5 226V, 14.00", 1.4 kg
análise externo » Acer Aspire 14 AI N24Q14
Asus Vivobook S 14 OLED S5406SA: Intel Core Ultra 5 226V, 14.00", 1.3 kg
análise externo » Asus Vivobook S 14 OLED S5406SA
Asus Vivobook S14 Q423: Intel Core Ultra 5 226V, 14.00", 1.3 kg
análise externo » Asus Vivobook S14 Q423
Acer Swift 14 AI SF14-51-58TU: Intel Core Ultra 5 226V, 14.00", 1.3 kg
análise externo » Acer Swift 14 AI SF14-51-58TU
Asus ZenBook S14 OLED UX5406SA: Intel Core Ultra 5 226V, 14.00", 1.2 kg
análise externo » Asus ZenBook S14 OLED UX5406SA
Lenovo ThinkPad E14 Gen 7 21U2002QGE: Intel Core Ultra 5 228V, 14.00", 1.4 kg
» Lenovo ofrece el ThinkPad E14 Gen 7 con CPU Intel modernas, pero sólo con CPU AMD antiguas
Samsung Galaxy Book5 Pro 14 940XHA: Intel Core Ultra 5 226V, 14.00", 1.2 kg
» Samsung cobra precios elevados por el Galaxy Book5 Pro, pero 1699 euros por 16 GB de RAM y una SSD de 512 GB es excesivo
» El panel OLED de Samsung en el Galaxy Book5 Pro 14 se queda atrás frente a la competencia
Acer TravelMate P6 TMP614-54-TCO-553Z: Intel Core Ultra 5 226V, 14.00", 1 kg
» Talentos ocultos: características inteligentes del Acer TravelMate P6 que brillan en el uso diario
Lenovo ThinkPad T14s Gen 6 Intel: Intel Core Ultra 5 228V, 14.00", 1.3 kg
» Máxima eficiencia: El Lenovo ThinkPad T14s Gen 6 demuestra por qué Lunar Lake es la elección perfecta para los portátiles de empresa
Asus Vivobook S 14 OLED S5406SA: Intel Core Ultra 5 226V, 14.00", 1.3 kg
» Lanzamiento del Asus Vivobook S 16 (S5606CA) con las últimas CPU móviles Intel Core Ultra 200H Arrow Lake y pantalla OLED Lumina
Posición aproximada del adaptador gráfico
Top 10 Análisis
» Top 10 Portátiles Multimedia
» Top 10 Portátiles de Juego
» Top 10 Portátiles de Juego ligeros
» Top 10 Portátiles Asequibles de Oficina/Empresa
» Top 10 Portátiles de Juego Ligeros
» Top 10 Portátiles de Oficina/Empresa Premium
» Top 10 Estaciones de Trabajo
» Top 10 Subportátiles
» Top 10 Ultrabooks
» Top 10 Convertibles
» Top 10 Tablets
» Top 10 Tablets Windows
» Top 10 Tablets de menos de 250 Euros
» Top 10 Phablets (>5.5")
» Top 10 Smartphones
» Top 10 Smartphones (≤5")
» Top 10 Smartphones de menos de 300 Euros
» Top 10 Smartphones de menos de 120 Euros
» Top 10 Portátiles de menos de 1000 Euros
» Top 10 Portátiles de menos de 500 Euros
» Top 10 Portátiles de menos de 300 Euros
» Los Mejores Displays de Portátiles Analizados por Notebookcheck