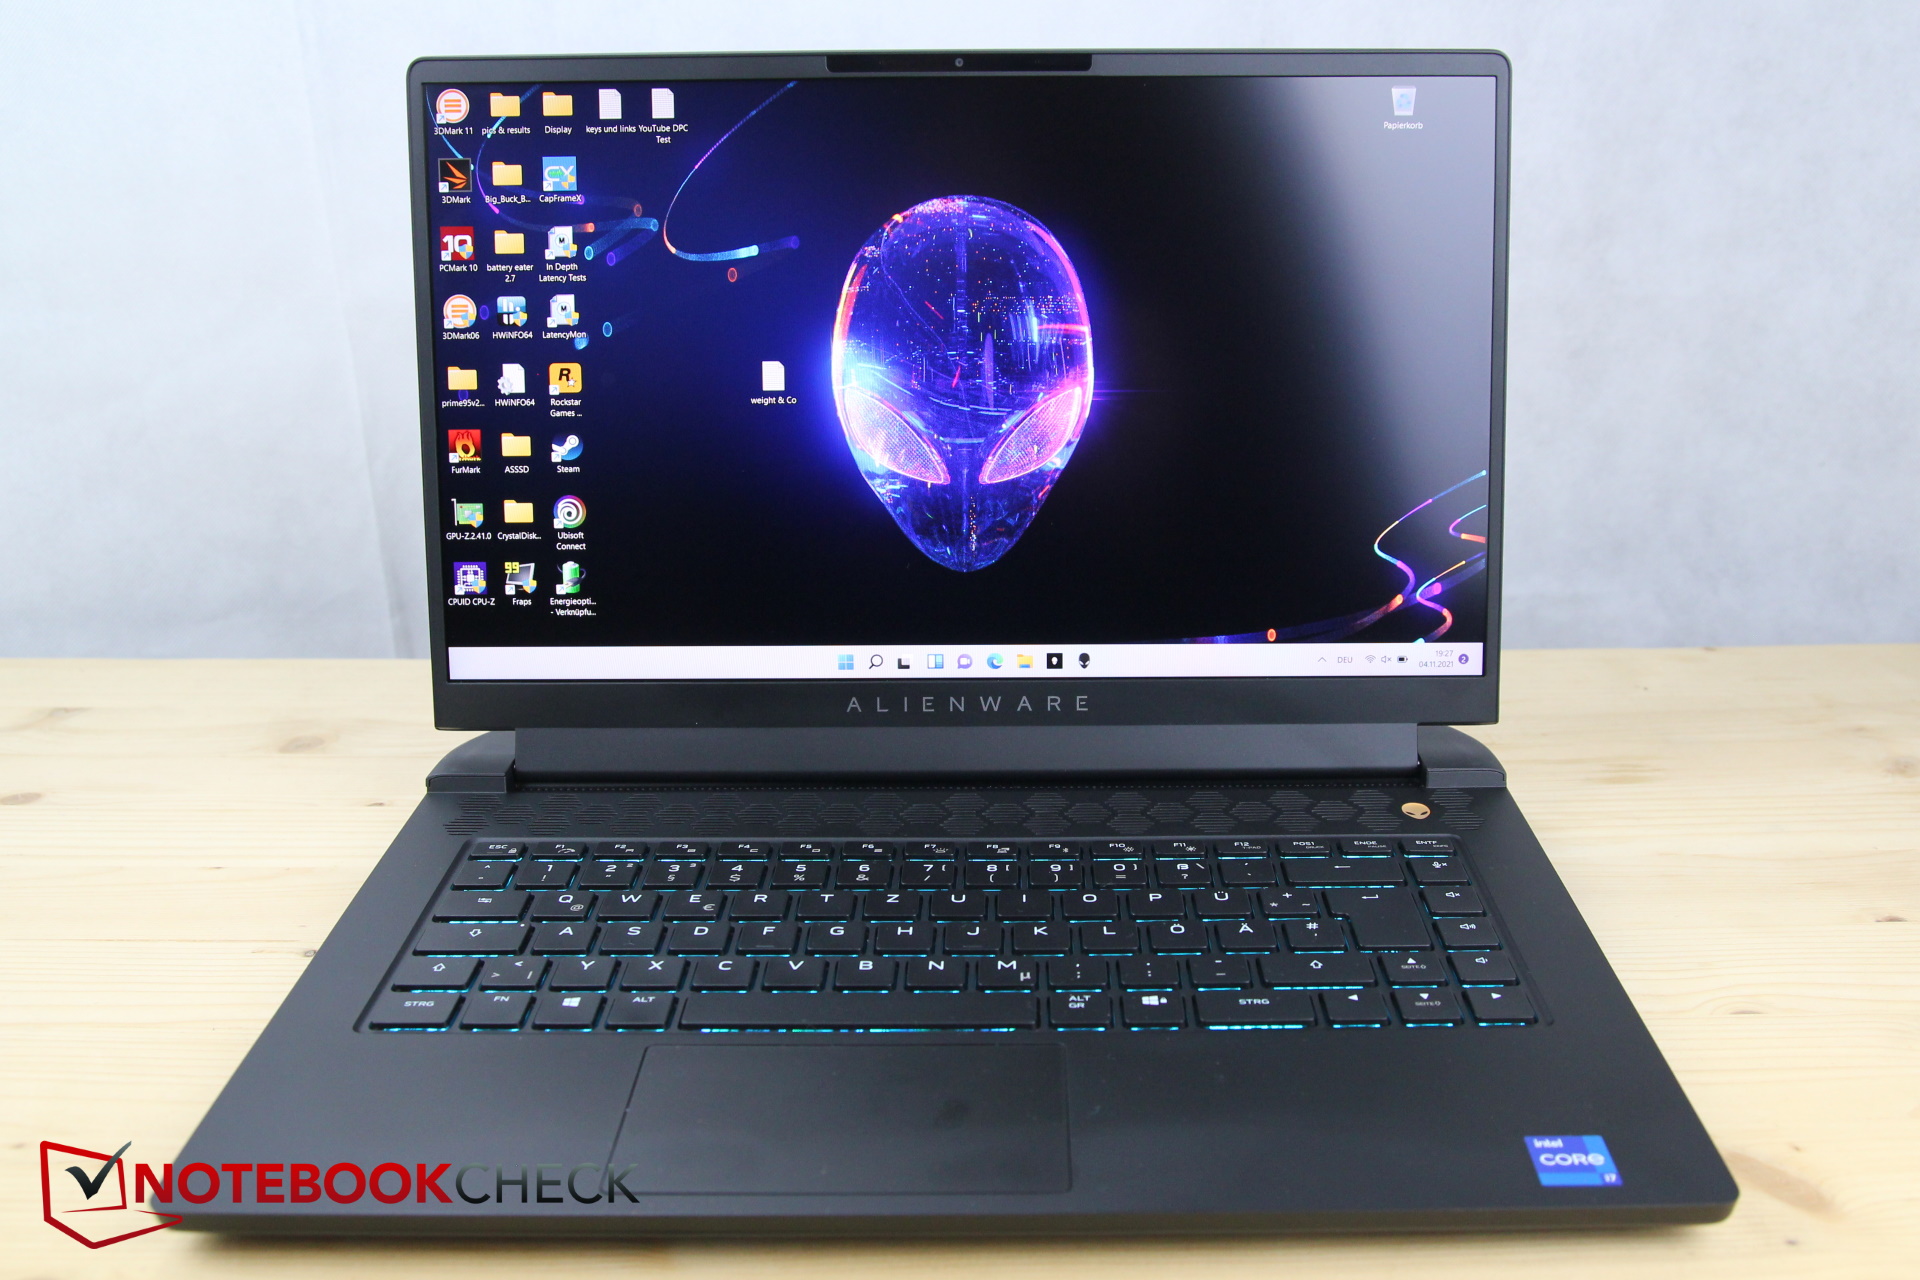
Análisis del portátil Alienware m15 R6: Más eficiente, pero la RTX 3080 es más lenta que en su predecesor
Es bastante sorprendente la cantidad de modelos del m15 que Dell ha presentado en tan poco tiempo. Ya probamos el m15 R4, el m15 R5, y ahora el m15 R6 - todos ellos en este año.
Lo que es confuso es que como el R6 ahora contiene una CPU Tiger Lake, realmente es un sucesor del R4 con la CPU Comet Lake y más bien un hermano del R5 con el procesador AMD. La carcasa y muchas otras características se corresponden con la m15 R5, por lo que no hablaremos de las características de la carcasa, los dispositivos de entrada, el equipo de conexión, etc. a menos que haya algunos cambios. Puedes encontrar información sobre estas áreas en nuestro análisis del Alienware m15 R5.
Por supuesto, también comparamos el Intel m15 R6 con el AMD m15 R5y el predecesor m15 R4 predecesor Comet Lakey además también con el Aorus 15P YD, el modeloModelo Razer Blade 15 proy el Schenker XMG Neo 15
Possible competitors in Comparison
Valoración | Fecha | Modelo | Peso | Altura | Tamaño | Resolución | Precio |
|---|---|---|---|---|---|---|---|
| 86.1 % v7 (old) | 11/2021 | Alienware m15 R6, i7-11800H RTX 3080 i7-11800H, GeForce RTX 3080 Laptop GPU | 2.5 kg | 22.85 mm | 15.60" | 1920x1080 | |
| 84.7 % v7 (old) | 06/2021 | Alienware m15 R5 Ryzen Edition R7 5800H, GeForce RTX 3060 Laptop GPU | 2.5 kg | 22.85 mm | 15.60" | 1920x1080 | |
| 86.1 % v7 (old) | 06/2021 | Alienware m15 R4 RTX 3080 i9-10980HK, GeForce RTX 3080 Laptop GPU | 2.4 kg | 20 mm | 15.60" | 1920x1080 | |
| 86.4 % v7 (old) | 06/2021 | Aorus 15P YD i7-11800H, GeForce RTX 3080 Laptop GPU | 2.2 kg | 27 mm | 15.60" | 1920x1080 | |
| 87 % v7 (old) | 06/2021 | Schenker XMG Neo 15 Tiger Lake i7-11800H, GeForce RTX 3080 Laptop GPU | 2.2 kg | 26 mm | 15.60" | 2560x1440 | |
| 88.9 % v7 (old) | 07/2021 | Razer Blade 15 Advanced (Mid 2021) i7-11800H, GeForce RTX 3080 Laptop GPU | 2 kg | 16.99 mm | 15.60" | 1920x1080 |
Caso - Diseño conocido
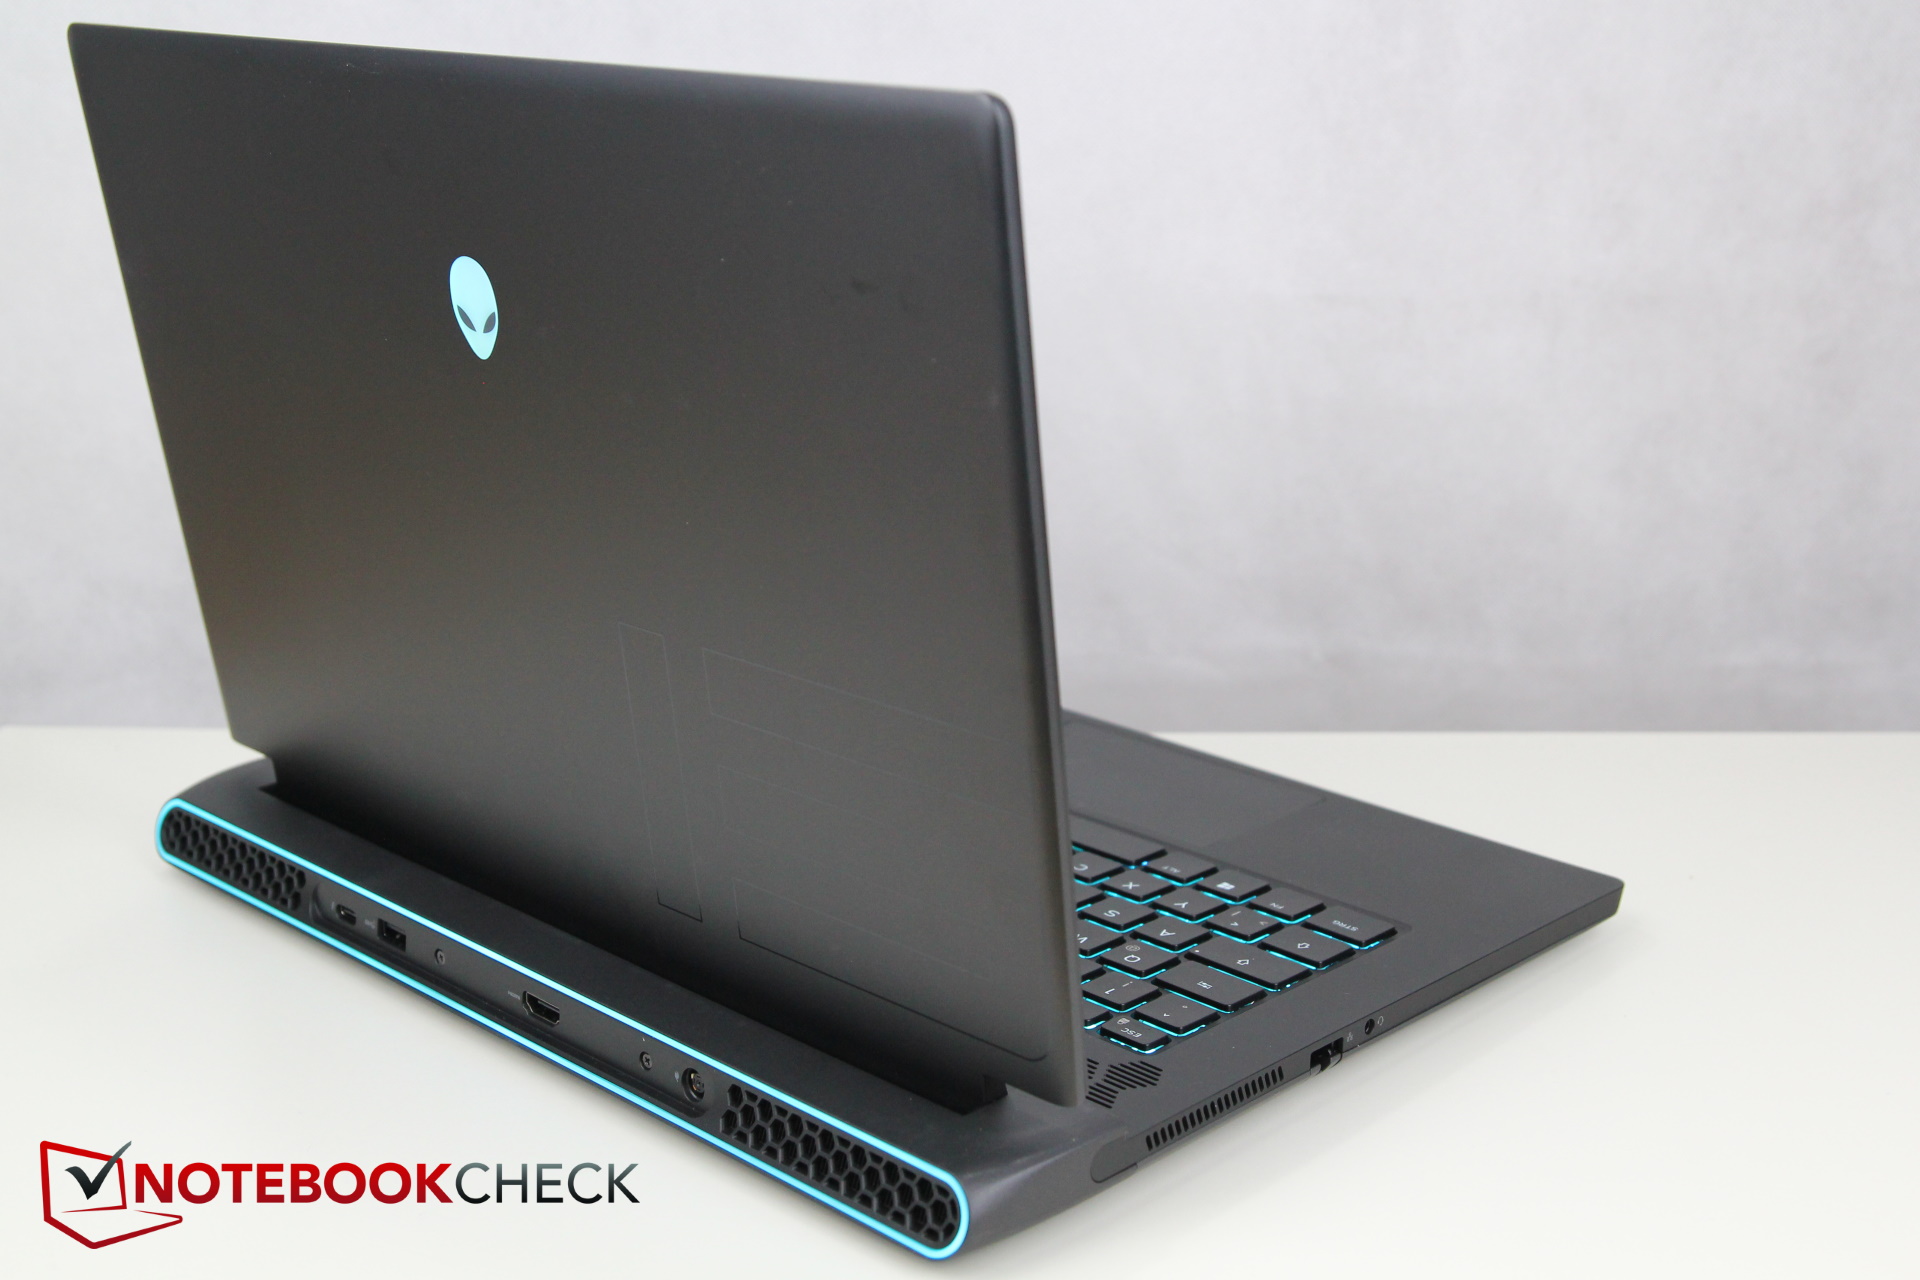
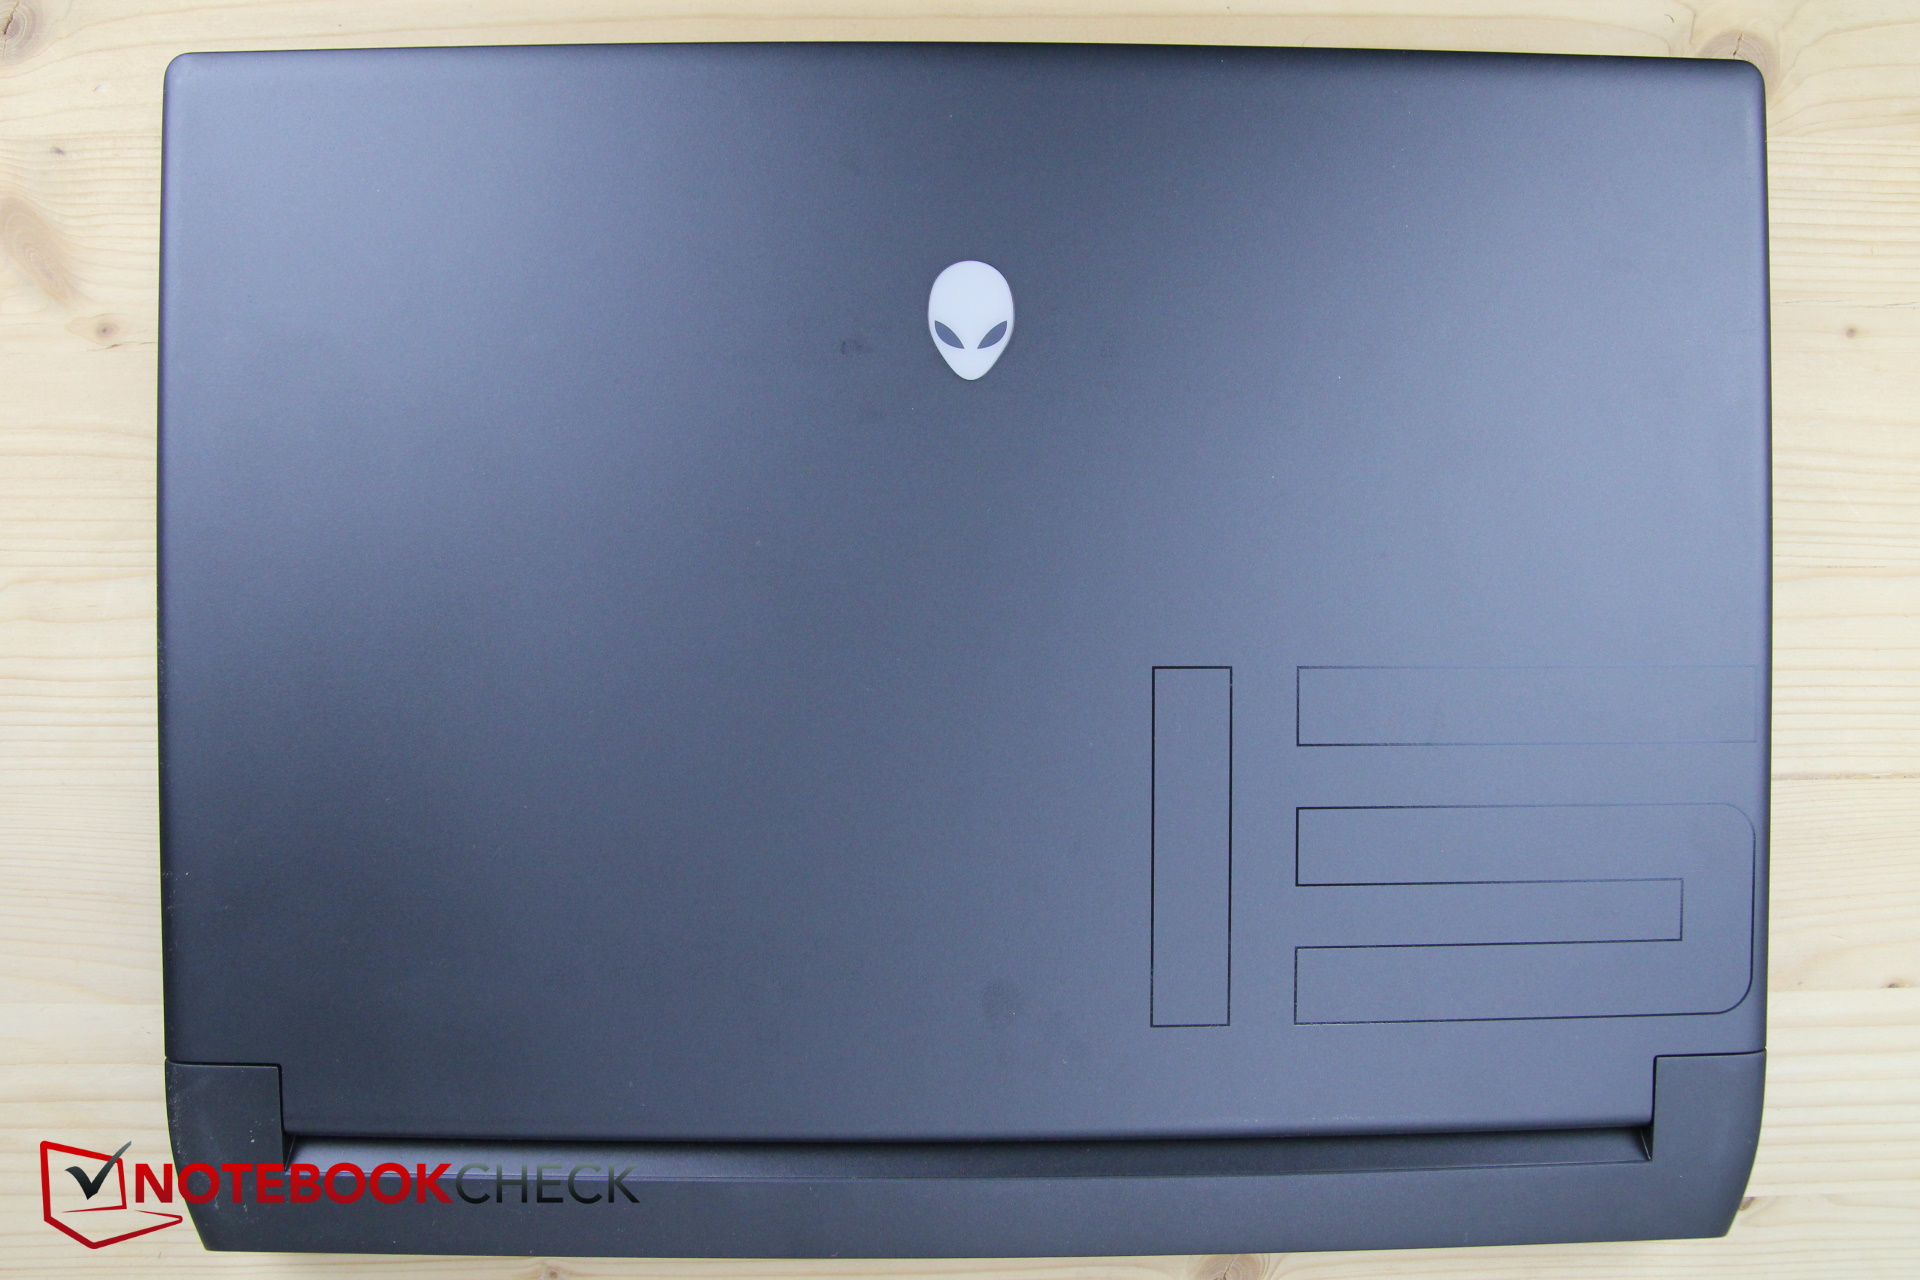
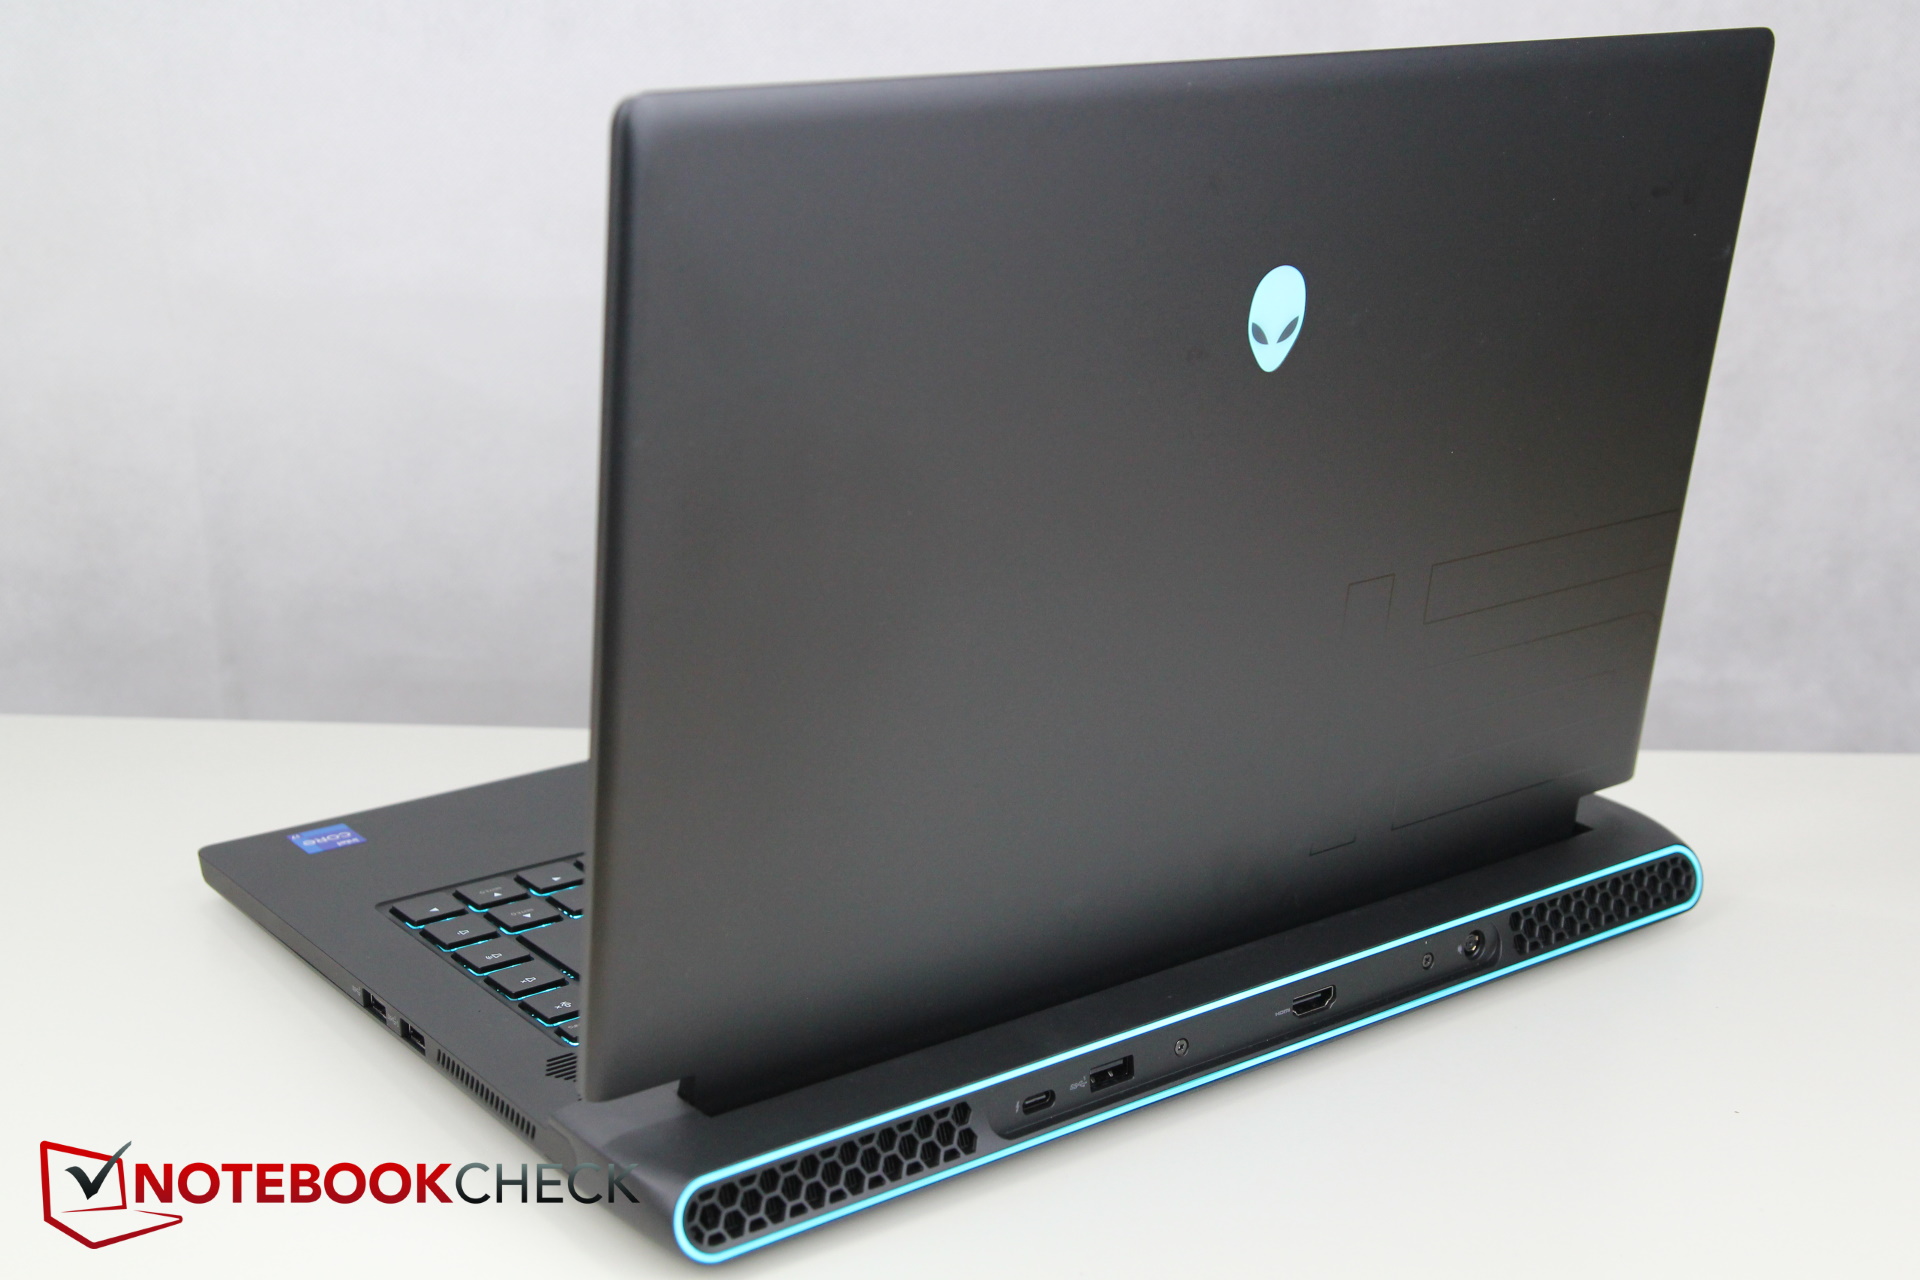
Los portátiles Alienware son conocidos por su gran sistema de refrigeración en la parte trasera, por lo que no es de extrañar que el modelo actual también sea significativamente más profundo que los competidores de otros fabricantes. Pero al menos es ligeramente más delgado que el Schenker o el Aorus, aunque ninguno de los modelos es capaz de vencer al Razer Blade en este aspecto
Con un peso de 2,5 kg, los portátiles Alienware son también entre 200 y 500 g más pesados que los dispositivos de la comparación
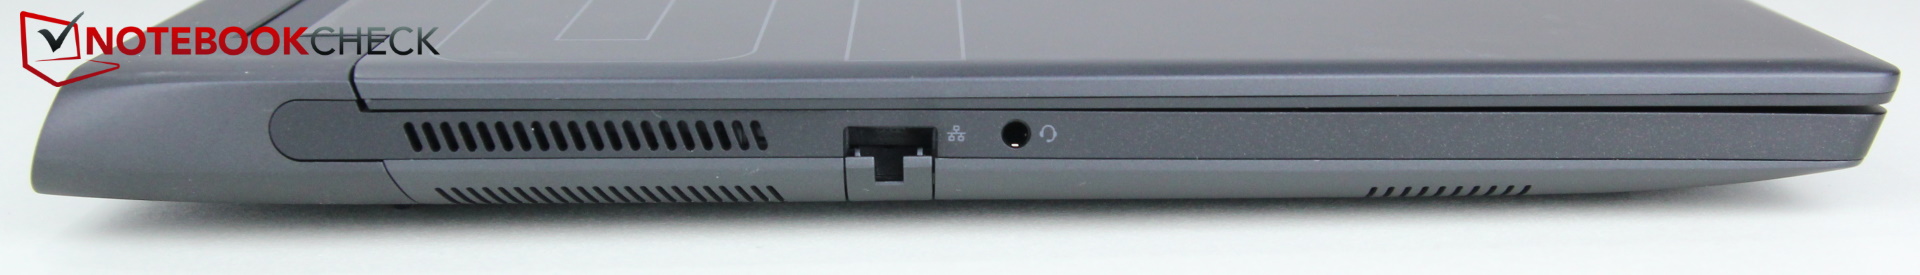
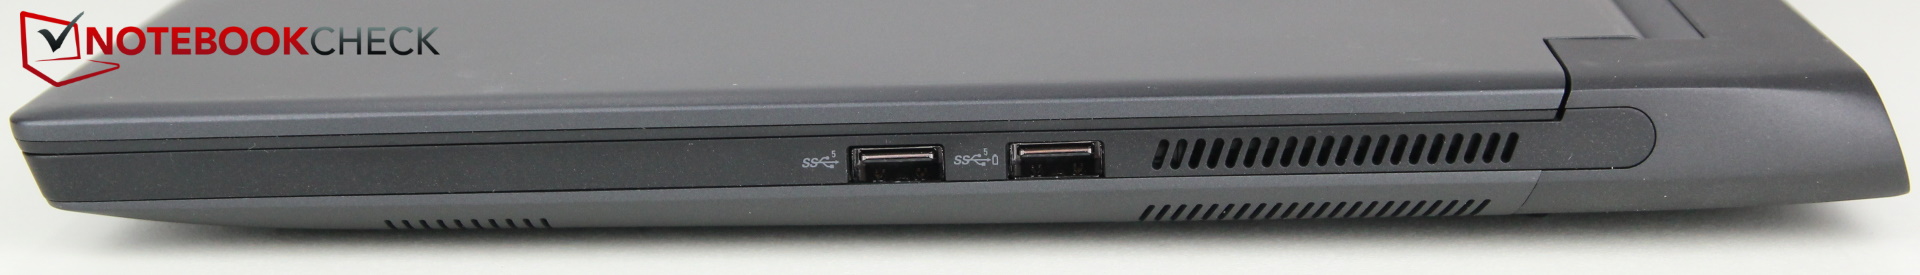
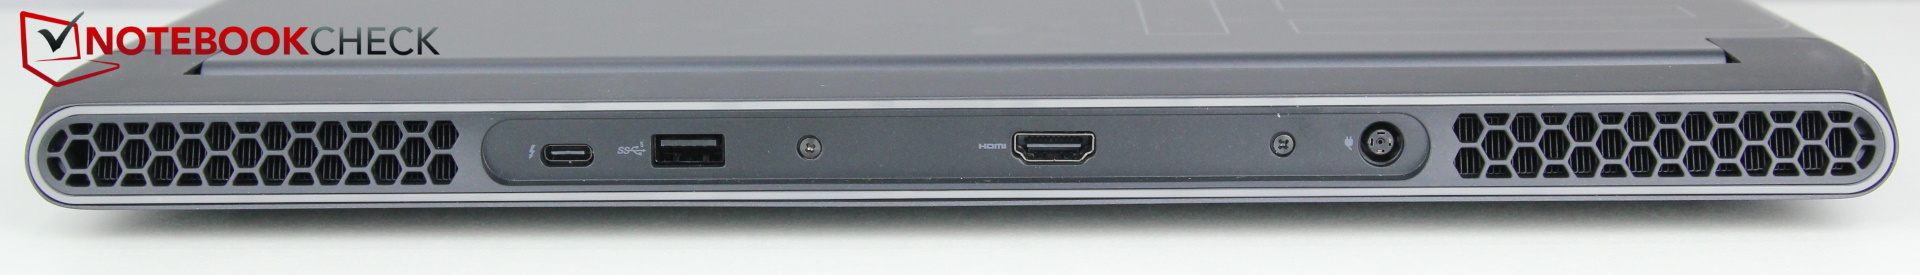
Equipo de conexión - Intel Alienware con Thunderbolt
En contraste con la versión AMD del m15 R5, el m15 R6 ahora soporta Thunderbolt 4 gracias a la CPU Intel, y el puerto USB-C correspondiente también soporta USB 3.2 Gen 2 en vez de Gen 1. Además, el puerto USB-C ahora también soporta Power Delivery, lo que significa que puede usarse para recargar, pero sólo hasta 15 watts. Por lo demás, las conexiones siguen siendo las mismas
Comunicación
Cámara web


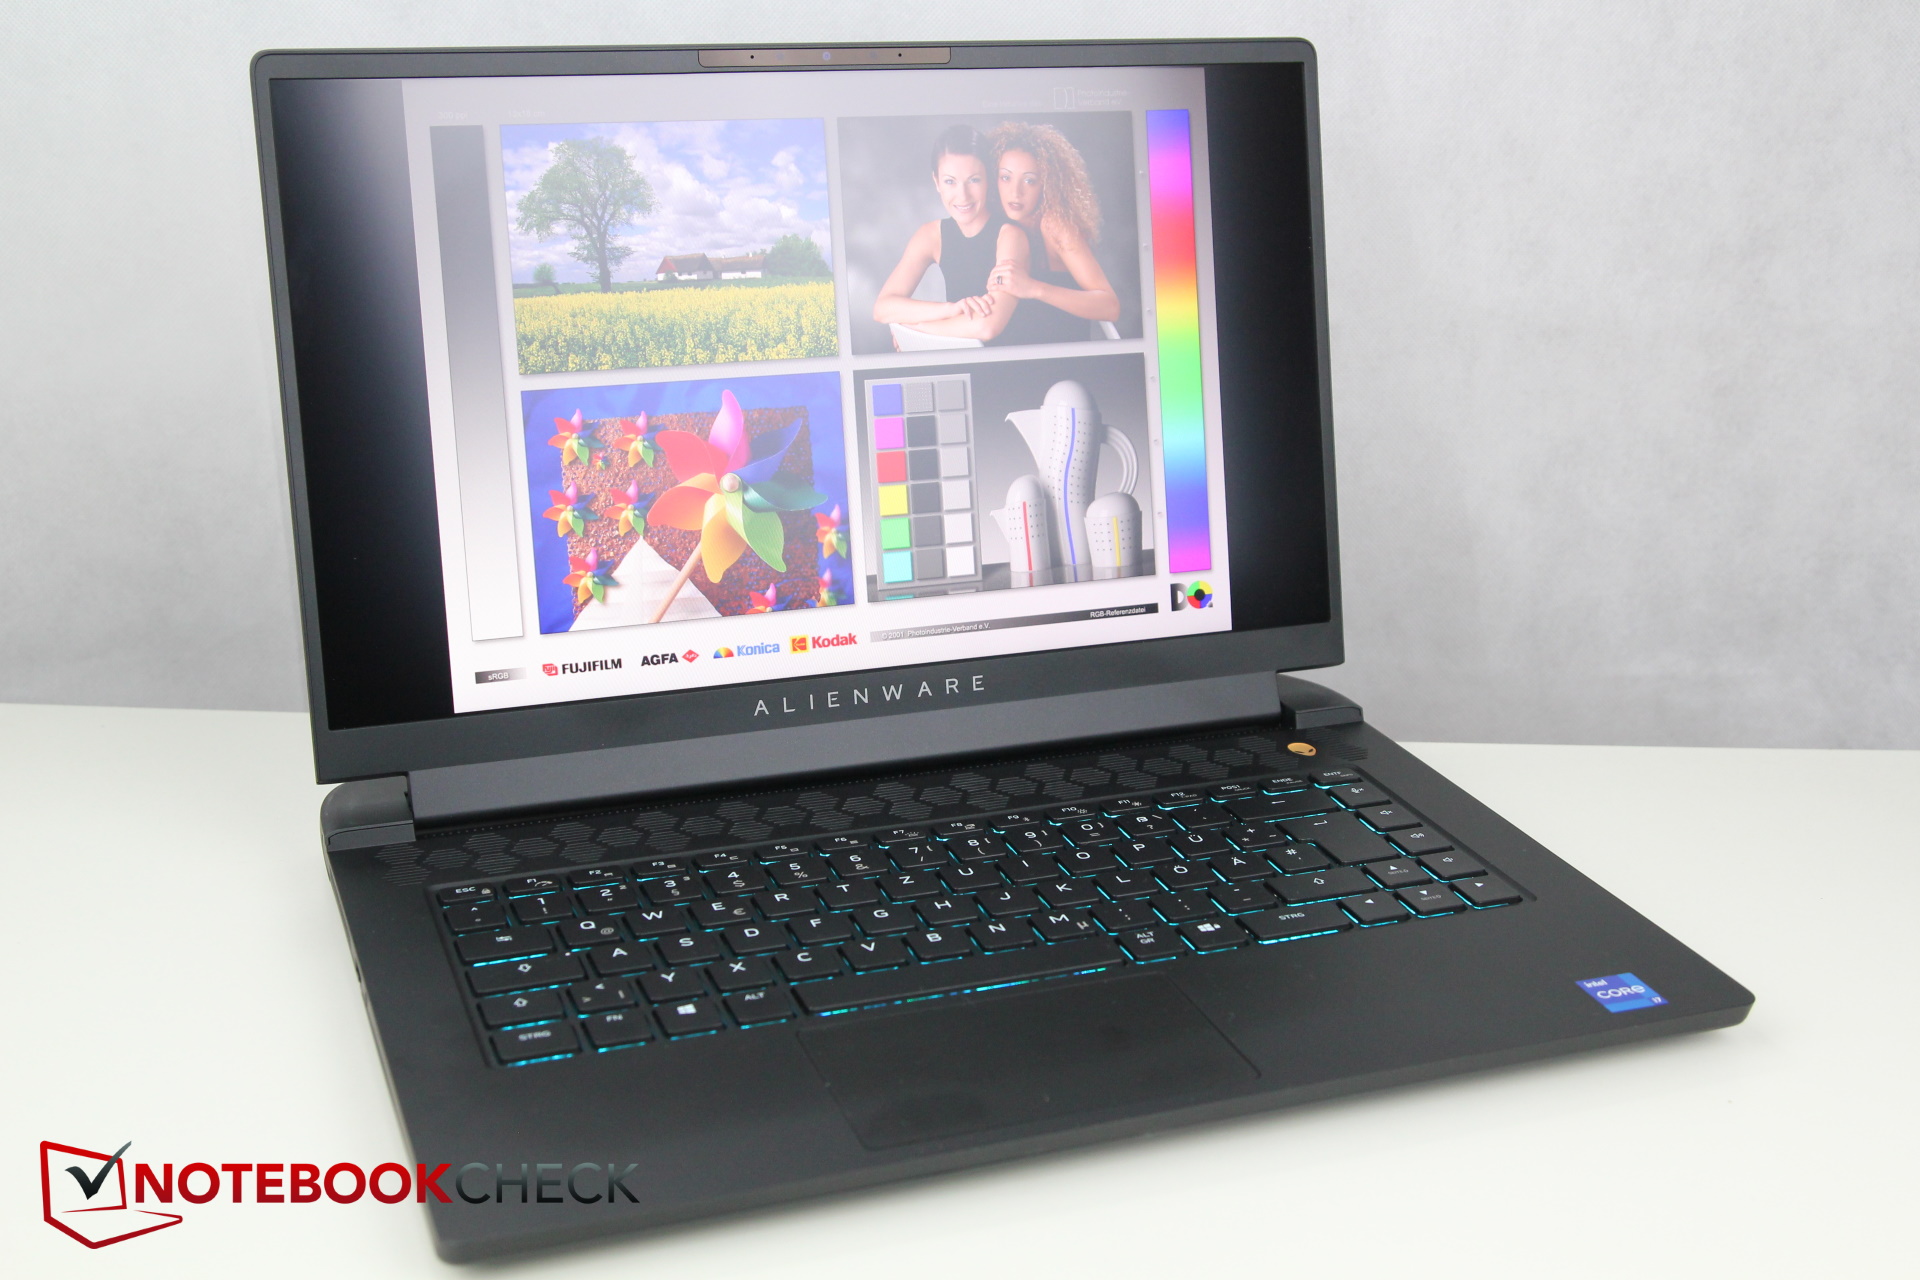
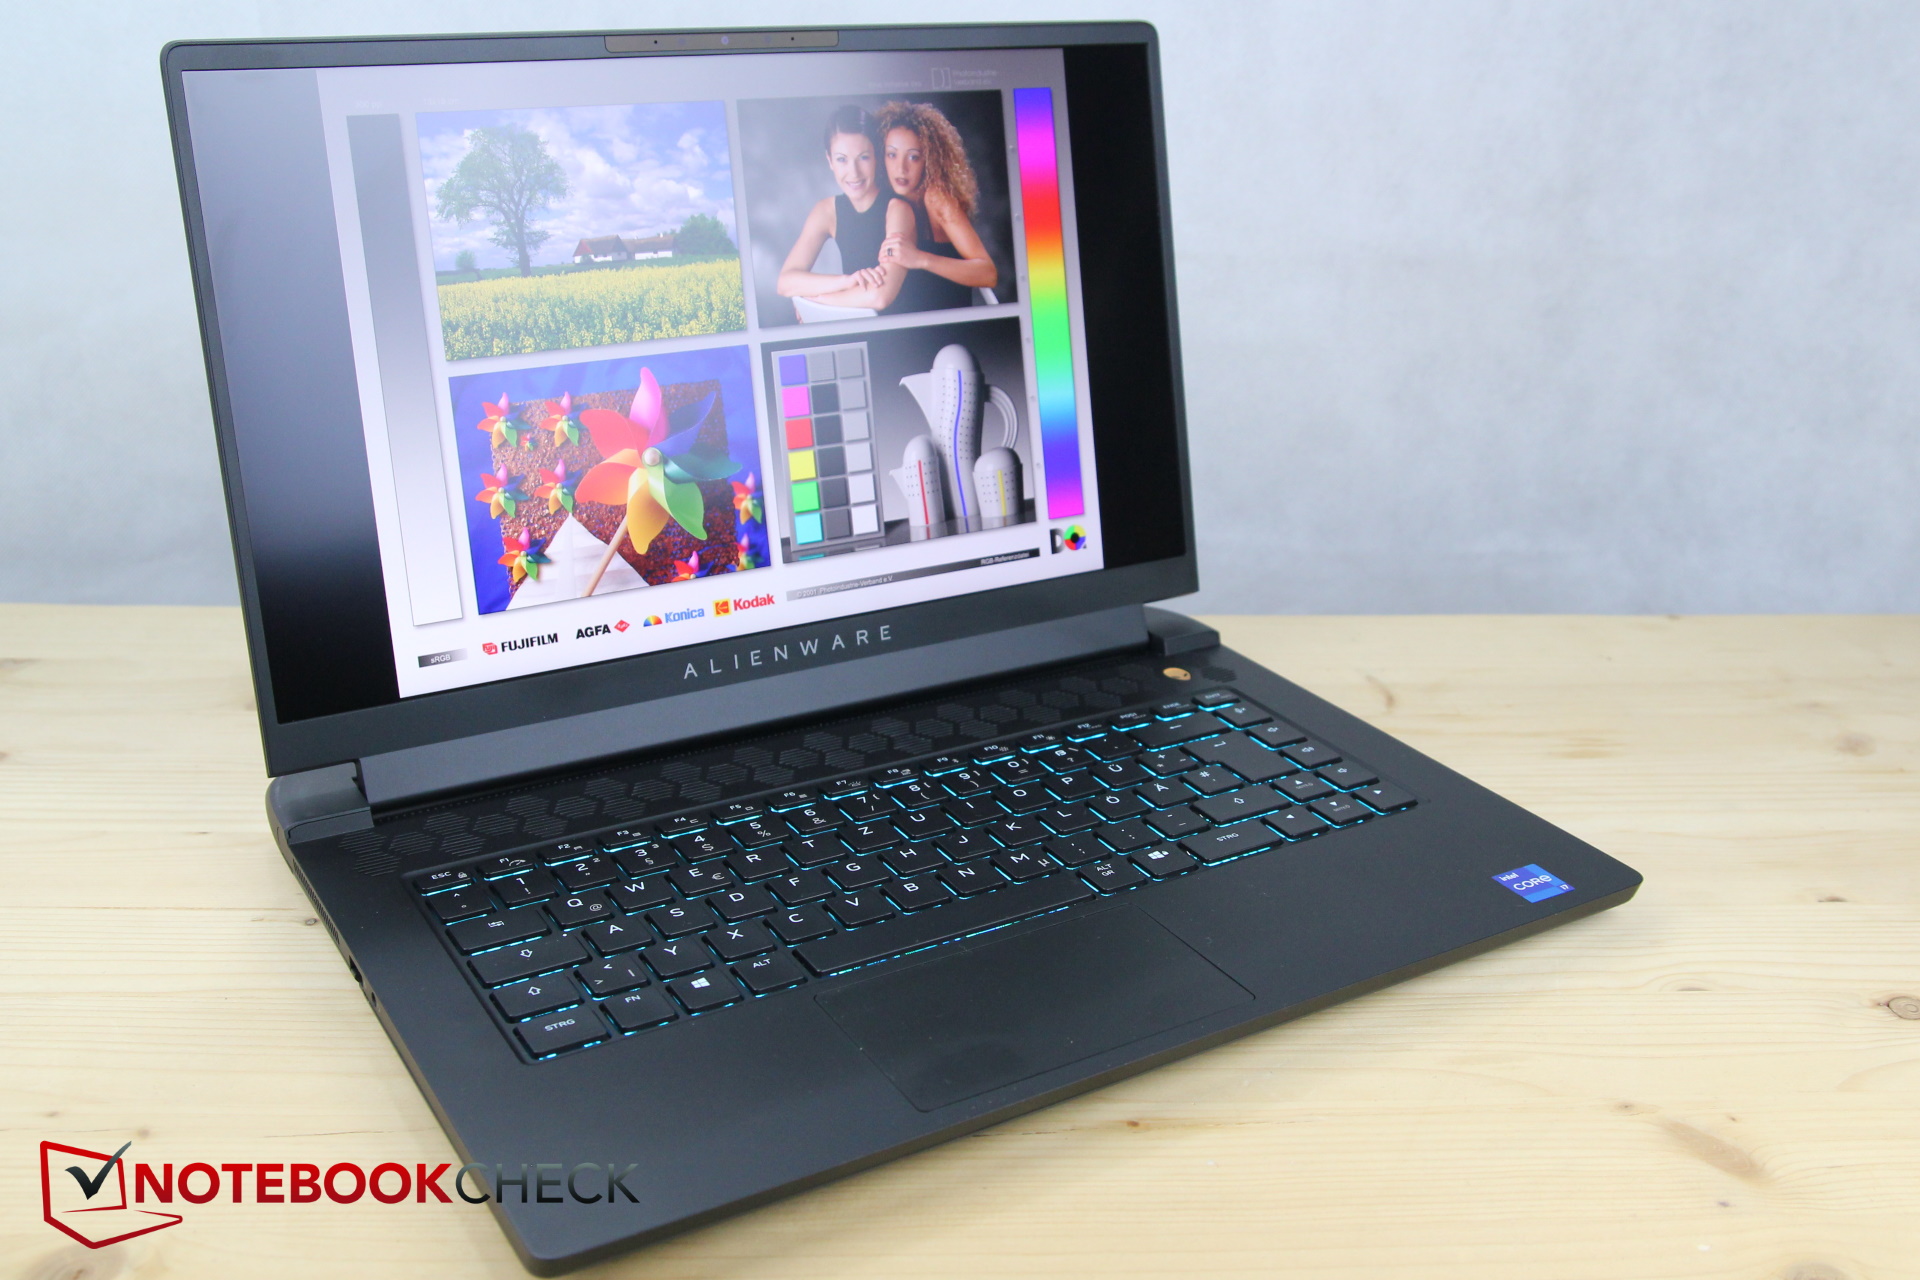
Pantalla - Velocidad aumentada a 360 Hz
Según HWinfo, la pantalla es el mismo panel FHD mate de AU Optronics que en el m15 R5. Sin embargo, el modelo actual ofrece una tasa de refresco de unos veloces 360 Hz, mientras que la del AMD m15 "sólo" domina los 165 Hz. Como alternativa, también se puede adquirir el R6 con el mismo panel de 165 Hz, y además también está disponible un panel QHD con 240 Hz. Pero, ¿por qué no hay una opción 4K para un portátil de juegos con la RTX 3080?
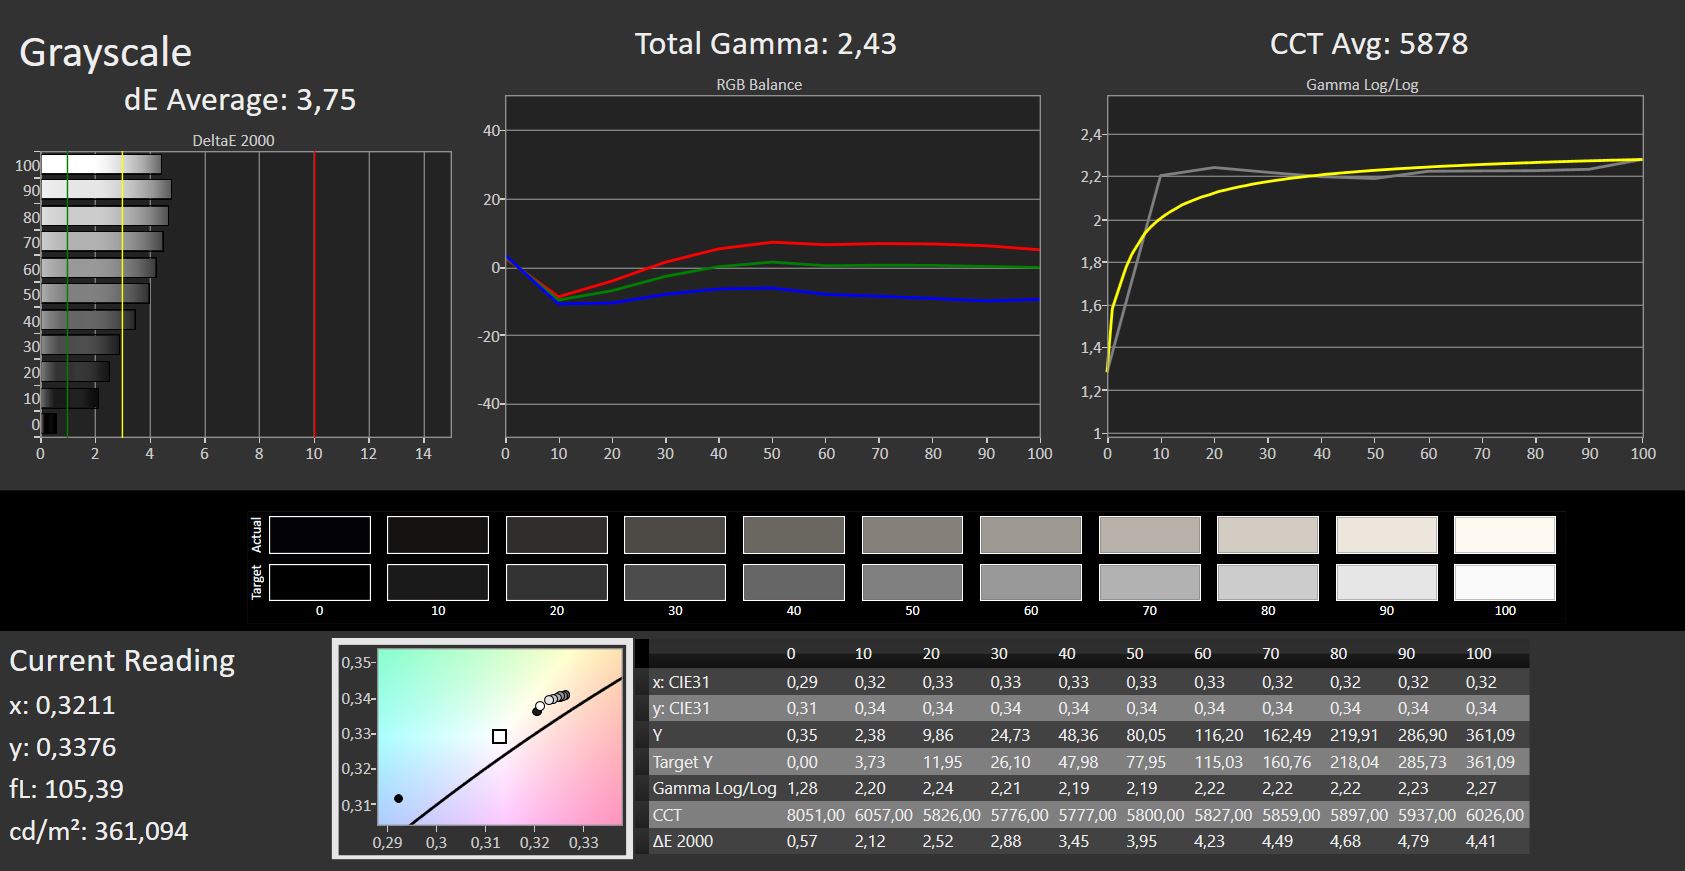
A pesar de compartir la misma etiqueta, los valores de ambos paneles también son diferentes. Si bien el brillo es ligeramente mejor, su distribución es peor. El valor de negro y el contraste también son ligeramente peores que en el modelo hermano
Los tiempos de respuesta de los dos paneles, muy cortos y por tanto sobresalientes, son positivos
| |||||||||||||||||||||||||
iluminación: 85 %
Brillo con batería: 360 cd/m²
Contraste: 1026:1 (Negro: 0.35 cd/m²)
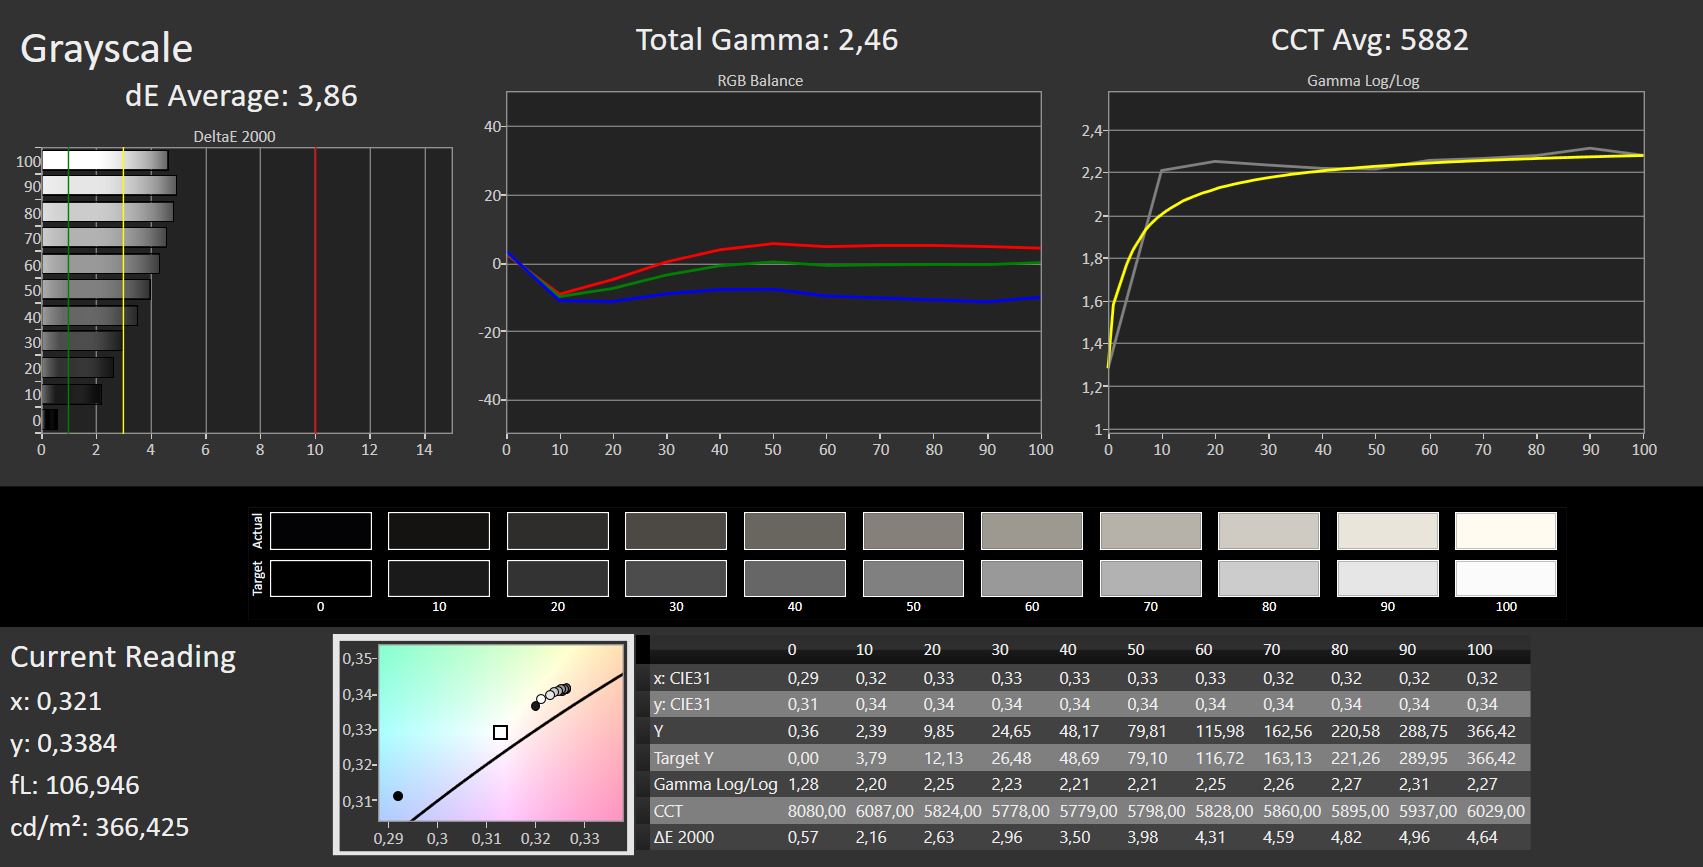
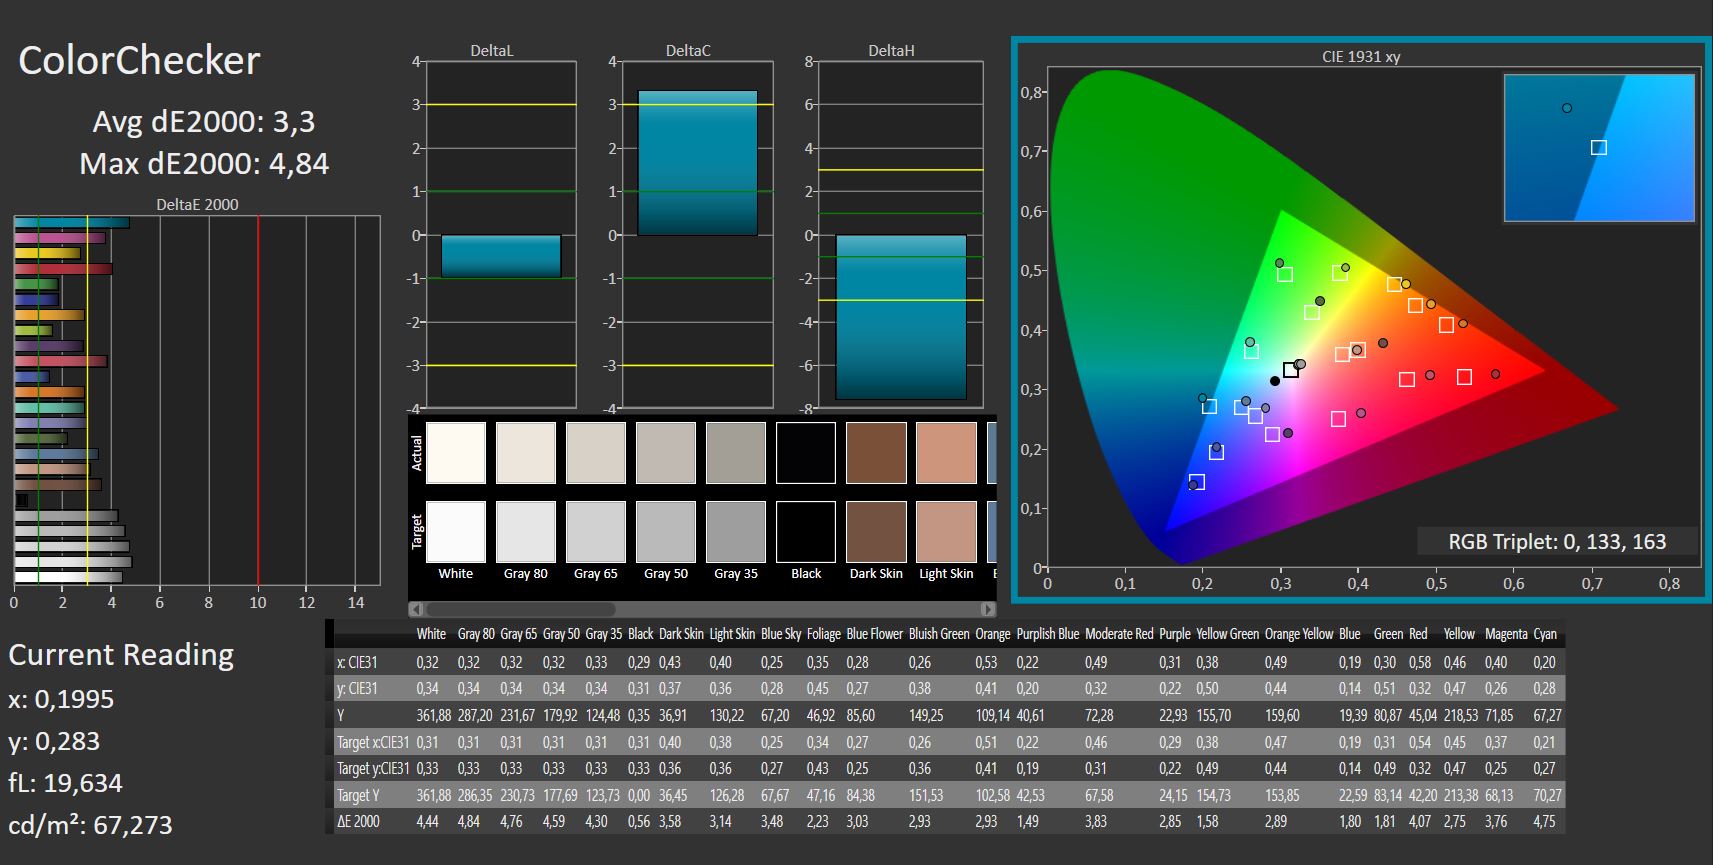
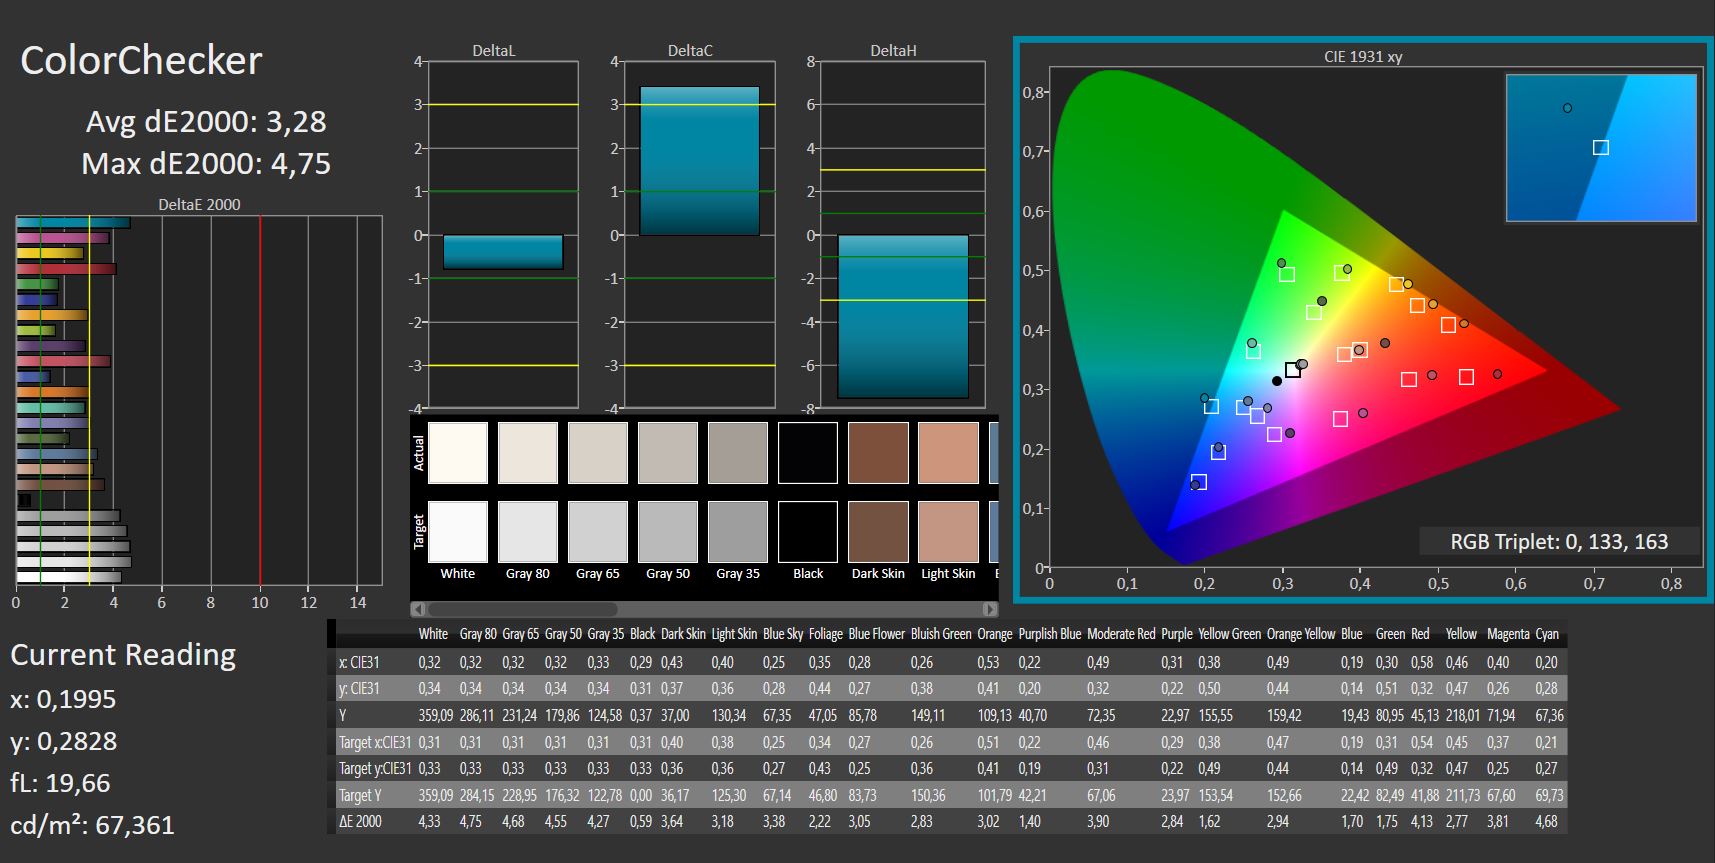
ΔE ColorChecker Calman: 3.3 | ∀{0.5-29.43 Ø4.71}
calibrated: 3.28
ΔE Greyscale Calman: 3.66 | ∀{0.09-98 Ø4.96}
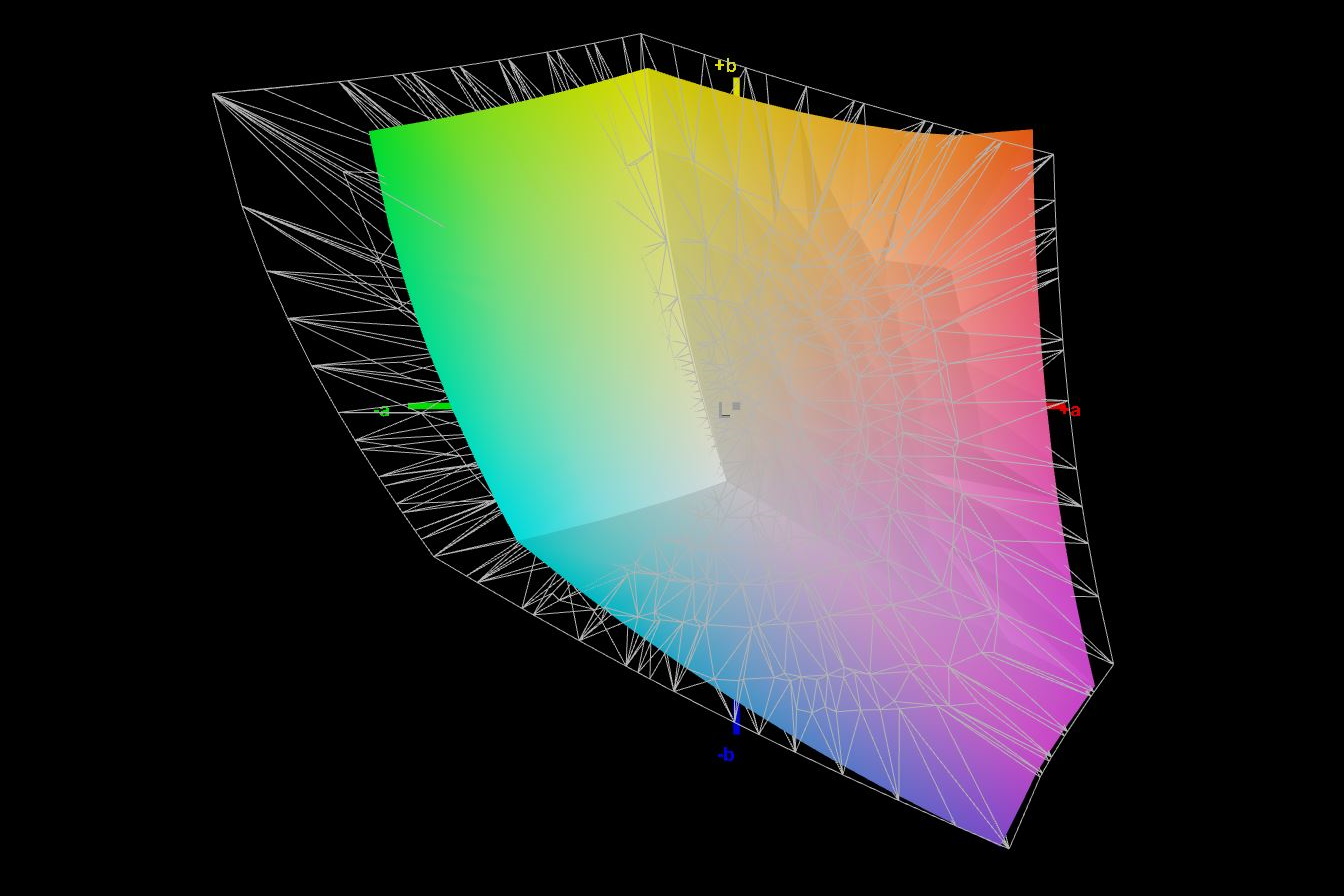
75.7% AdobeRGB 1998 (Argyll 3D)
99.5% sRGB (Argyll 3D)
74.1% Display P3 (Argyll 3D)
Gamma: 2.43
CCT: 5896 K
| Alienware m15 R6, i7-11800H RTX 3080 AU Optronics AUO9092 (B156HAN), IPS, 1920x1080, 15.6" | Alienware m15 R5 Ryzen Edition B156HAN, IPS, 1920x1080, 15.6" | Alienware m15 R4 RTX 3080 LG Philips LGD066E (156WFG), IPS, 1920x1080, 15.6" | Aorus 15P YD BOE09B9, IPS, 1920x1080, 15.6" | Schenker XMG Neo 15 Tiger Lake BOE CQ NE156QHM-NY2, IPS, 2560x1440, 15.6" | Razer Blade 15 Advanced (Mid 2021) TL156VDXP02-0, IPS, 1920x1080, 15.6" | |
|---|---|---|---|---|---|---|
| Display | -4% | -3% | -5% | -7% | ||
| Display P3 Coverage (%) | 74.1 | 70.1 -5% | 70.2 -5% | 68.6 -7% | 66.9 -10% | |
| sRGB Coverage (%) | 99.5 | 99.8 0% | 98.5 -1% | 98.6 -1% | 97.1 -2% | |
| AdobeRGB 1998 Coverage (%) | 75.7 | 71.5 -6% | 72.4 -4% | 69.3 -8% | 69 -9% | |
| Response Times | -47% | -121% | -236% | -293% | -65% | |
| Response Time Grey 50% / Grey 80% * (ms) | 2.8 | 4 ? -43% | 7.6 ? -171% | 14 ? -400% | 16 ? -471% | 4.2 ? -50% |
| Response Time Black / White * (ms) | 5.6 | 8.4 ? -50% | 9.6 ? -71% | 9.6 ? -71% | 12 ? -114% | 10 ? -79% |
| PWM Frequency (Hz) | ||||||
| Screen | 15% | 24% | -9% | -8% | 13% | |
| Brightness middle (cd/m²) | 359 | 329 -8% | 347 -3% | 337 -6% | 324 -10% | 353.4 -2% |
| Brightness (cd/m²) | 344 | 321 -7% | 318 -8% | 316 -8% | 307 -11% | 340 -1% |
| Brightness Distribution (%) | 85 | 92 8% | 86 1% | 85 0% | 91 7% | 92 8% |
| Black Level * (cd/m²) | 0.35 | 0.27 23% | 0.31 11% | 0.31 11% | 0.27 23% | 0.31 11% |
| Contrast (:1) | 1026 | 1219 19% | 1119 9% | 1087 6% | 1200 17% | 1140 11% |
| Colorchecker dE 2000 * | 3.3 | 2.78 16% | 1.68 49% | 3.87 -17% | 3.36 -2% | 2.17 34% |
| Colorchecker dE 2000 max. * | 4.84 | 4.88 -1% | 3.03 37% | 8.09 -67% | 9.87 -104% | 5.69 -18% |
| Colorchecker dE 2000 calibrated * | 3.28 | 1.63 50% | 1.08 67% | 1.15 65% | 1.23 62% | 1.05 68% |
| Greyscale dE 2000 * | 3.66 | 2.5 32% | 1.8 51% | 6.1 -67% | 5.8 -58% | 3.4 7% |
| Gamma | 2.43 91% | 2.106 104% | 2.262 97% | 2.132 103% | 2.311 95% | 2.2 100% |
| CCT | 5896 110% | 6201 105% | 6592 99% | 6891 94% | 7087 92% | 6830 95% |
| Color Space (Percent of AdobeRGB 1998) (%) | 76 | 71 | 72 | 69 | ||
| Color Space (Percent of sRGB) (%) | 99 | 94 | 94 | 93 | ||
| Media total (Programa/Opciones) | -16% /
4% | -34% /
-3% | -83% /
-40% | -102% /
-48% | -20% /
-2% |
* ... más pequeño es mejor
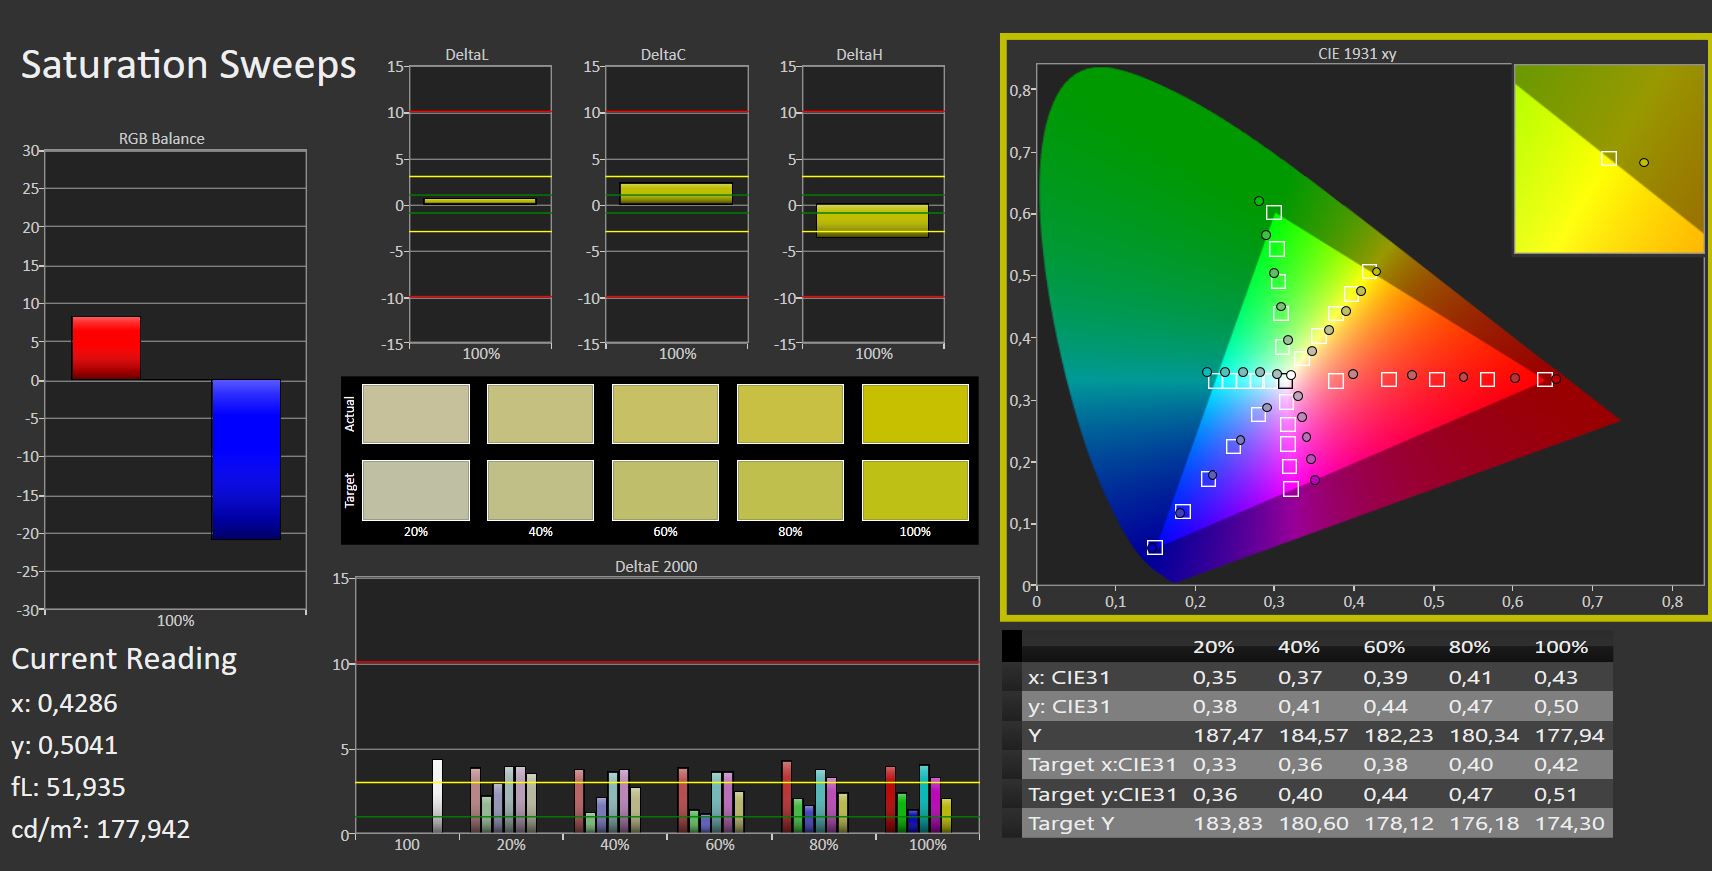
Con casi el 100% de sRGB y alrededor del 76% de AdobeRGB, la cobertura del espacio de color es muy buena, mientras que muchos competidores no llegan a esos valores
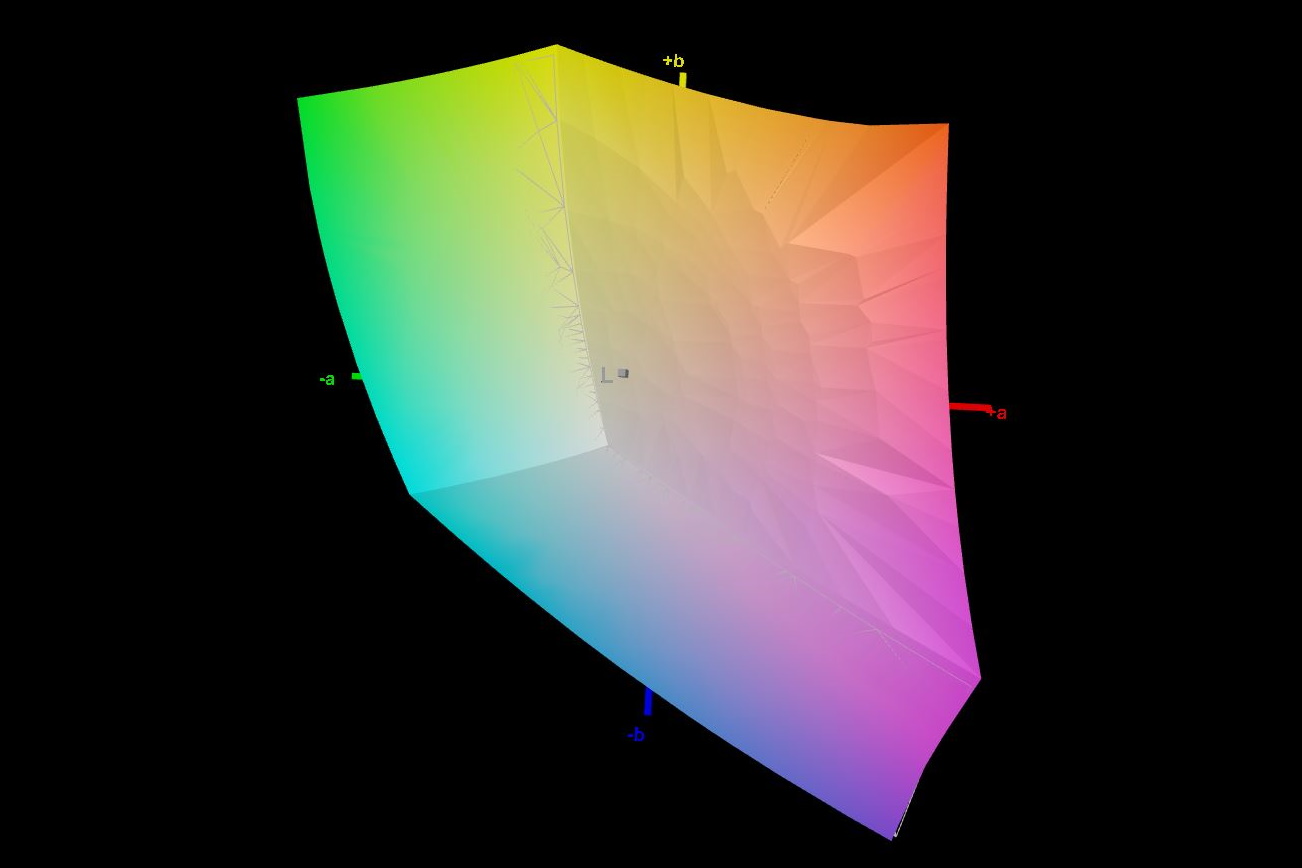
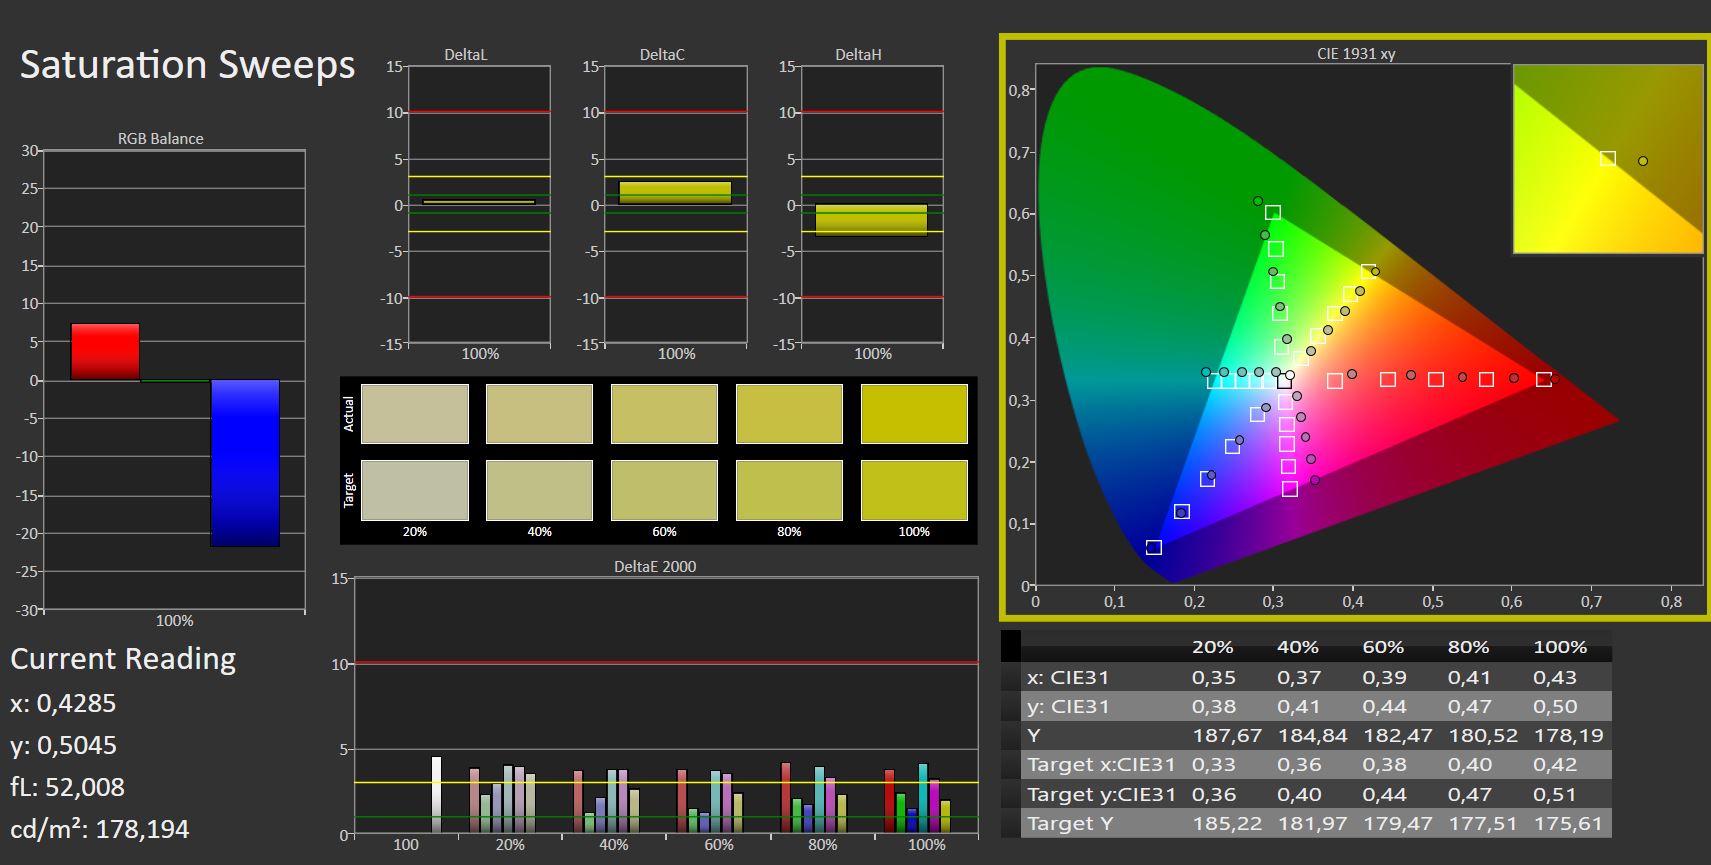
La pantalla está bastante bien calibrada ya en el estado de entrega, y una calibración manual no trae casi ninguna mejora significativa en términos de las desviaciones de color.
Tiempos de respuesta del display
| ↔ Tiempo de respuesta de Negro a Blanco | ||
|---|---|---|
| 5.6 ms ... subida ↗ y bajada ↘ combinada | ↗ ms subida | 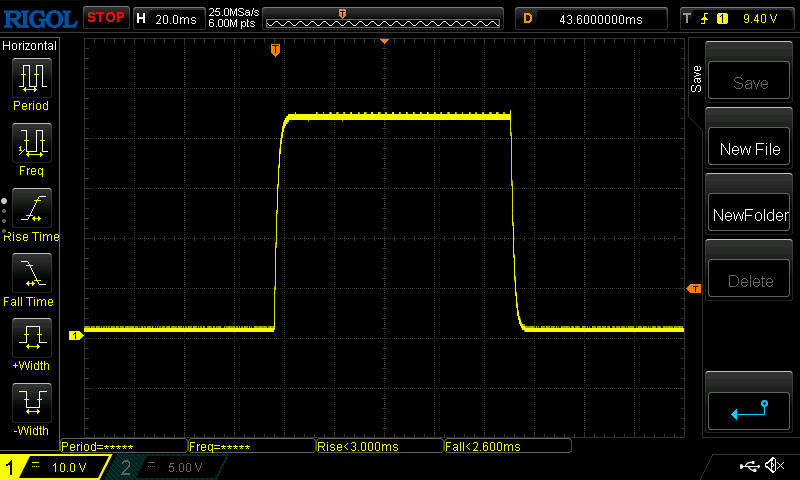 |
| ↘ ms bajada | ||
| La pantalla mostró tiempos de respuesta muy rápidos en nuestros tests y debería ser adecuada para juegos frenéticos. En comparación, todos los dispositivos de prueba van de ##min### (mínimo) a 240 (máximo) ms. » 18 % de todos los dispositivos son mejores. Esto quiere decir que el tiempo de respuesta medido es mejor que la media (19.8 ms) de todos los dispositivos testados. | ||
| ↔ Tiempo de respuesta 50% Gris a 80% Gris | ||
| 2.8 ms ... subida ↗ y bajada ↘ combinada | ↗ ms subida | 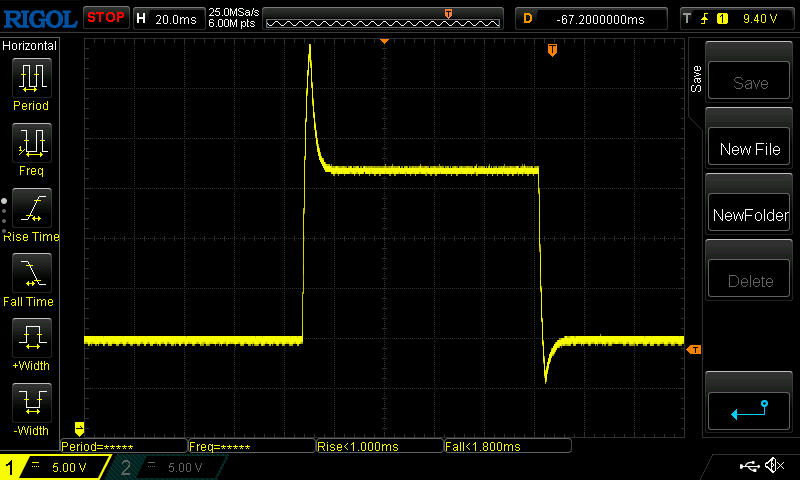 |
| ↘ ms bajada | ||
| La pantalla mostró tiempos de respuesta muy rápidos en nuestros tests y debería ser adecuada para juegos frenéticos. En comparación, todos los dispositivos de prueba van de ##min### (mínimo) a 636 (máximo) ms. » 12 % de todos los dispositivos son mejores. Esto quiere decir que el tiempo de respuesta medido es mejor que la media (31 ms) de todos los dispositivos testados. | ||
Parpadeo de Pantalla / PWM (Pulse-Width Modulation)
| Parpadeo de Pantalla / PWM no detectado | 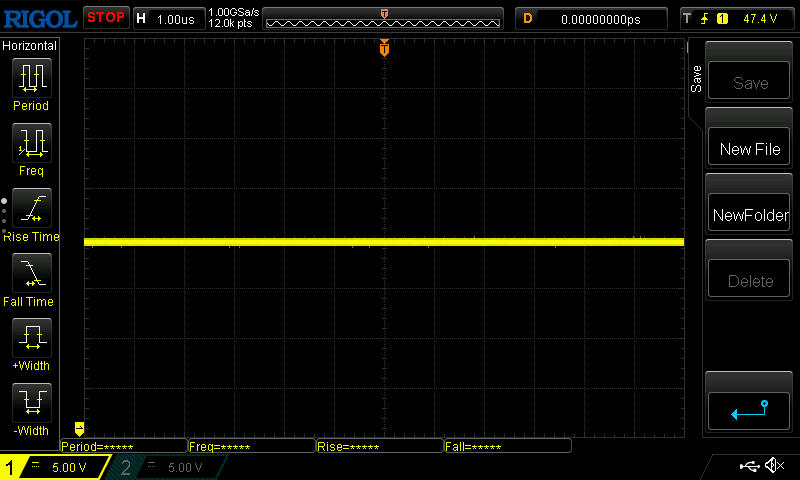 | ||
Comparación: 52 % de todos los dispositivos testados no usaron PWM para atenuar el display. Si se usó, medimos una media de 7757 (mínimo: 5 - máxmo: 343500) Hz. | |||
El hecho de que no haya mucho sol durante esta prueba contribuye a facilitar la legibilidad de los contenidos de la pantalla del Alienware. Incluso con ángulos de visión pronunciados, la pantalla mate y bastante brillante asegura una buena legibilidad, al menos en días nublados y a la sombra
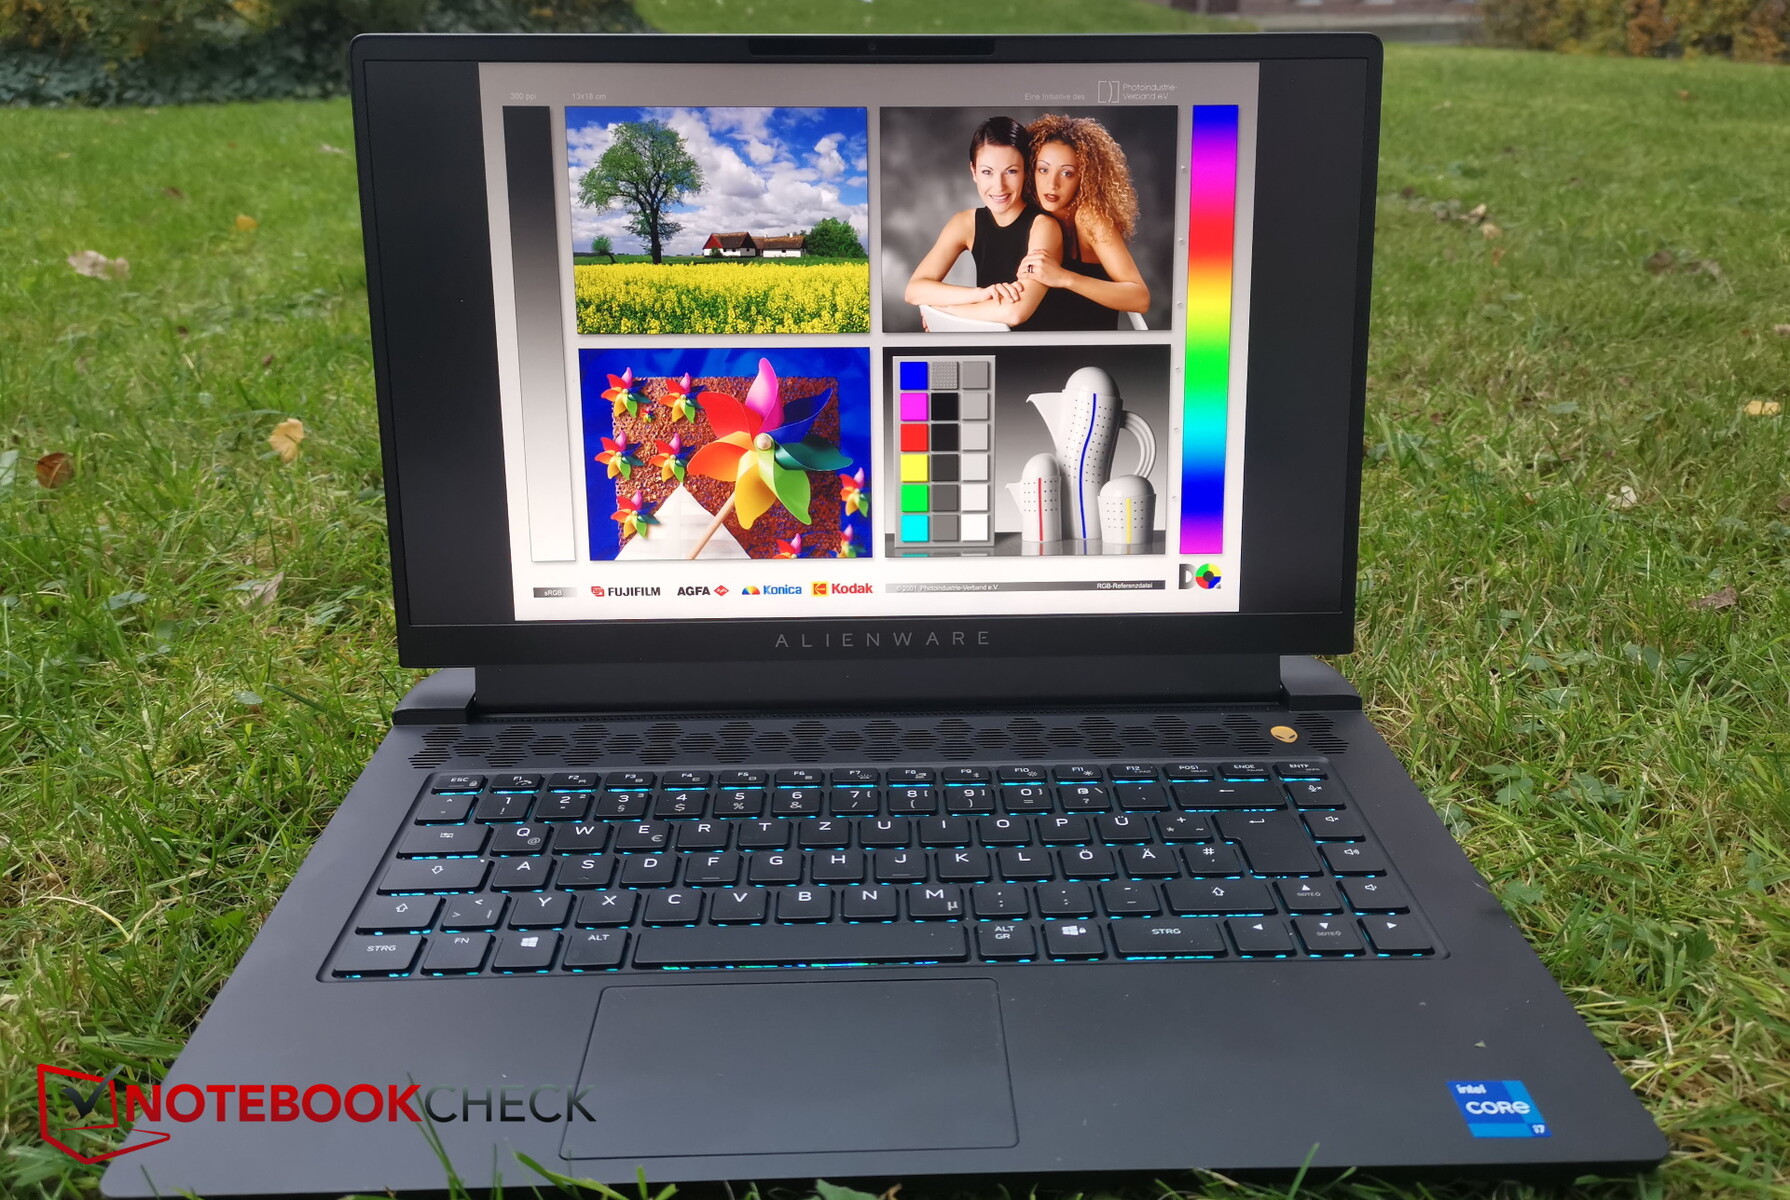
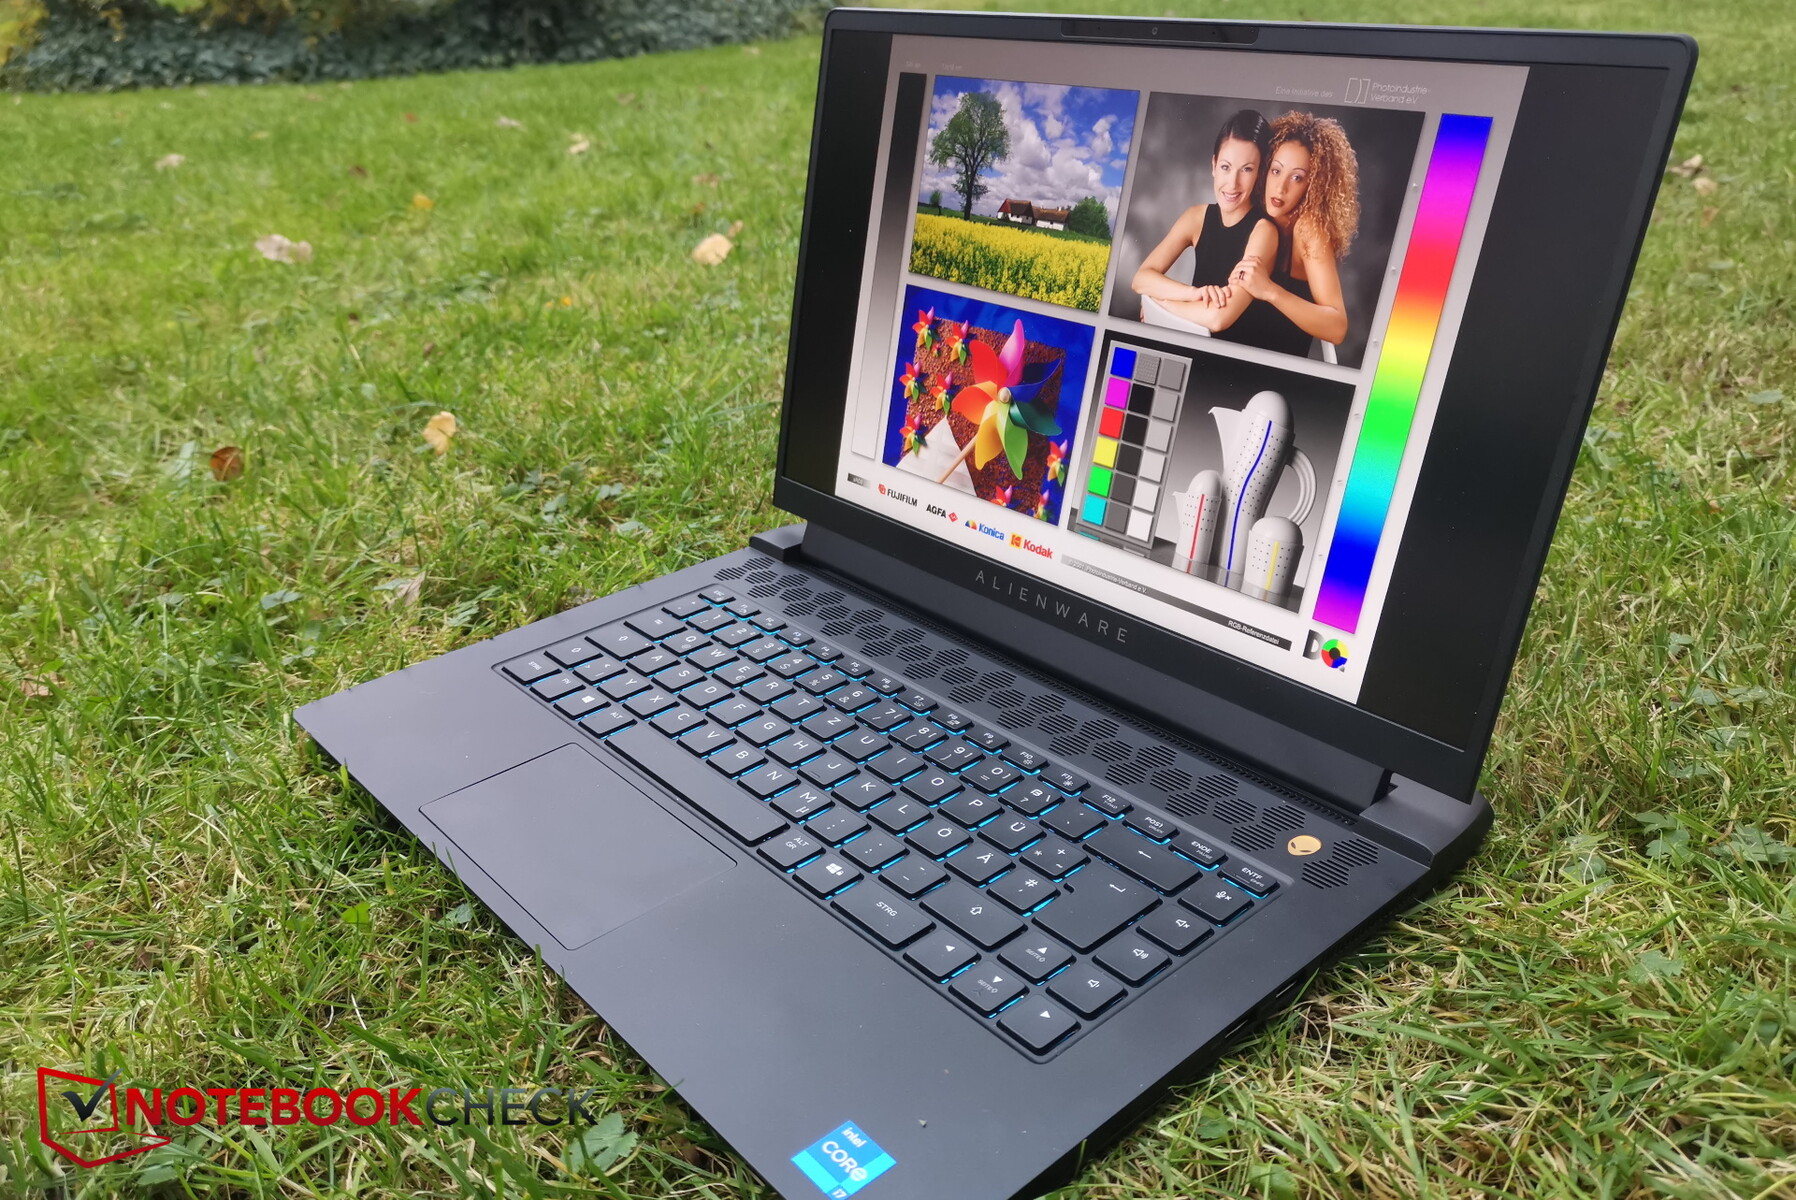
Como es típico de las pantallas IPS, la estabilidad del ángulo de visión es un tema menor. Sin embargo, todavía se nota que el brillo es mejor cuando se mira directamente a la pantalla que desde ángulos de visión pronunciados, pero esta ligera disminución sigue siendo aceptable.

Rendimiento - Sólo 125 W para la RTX 3080
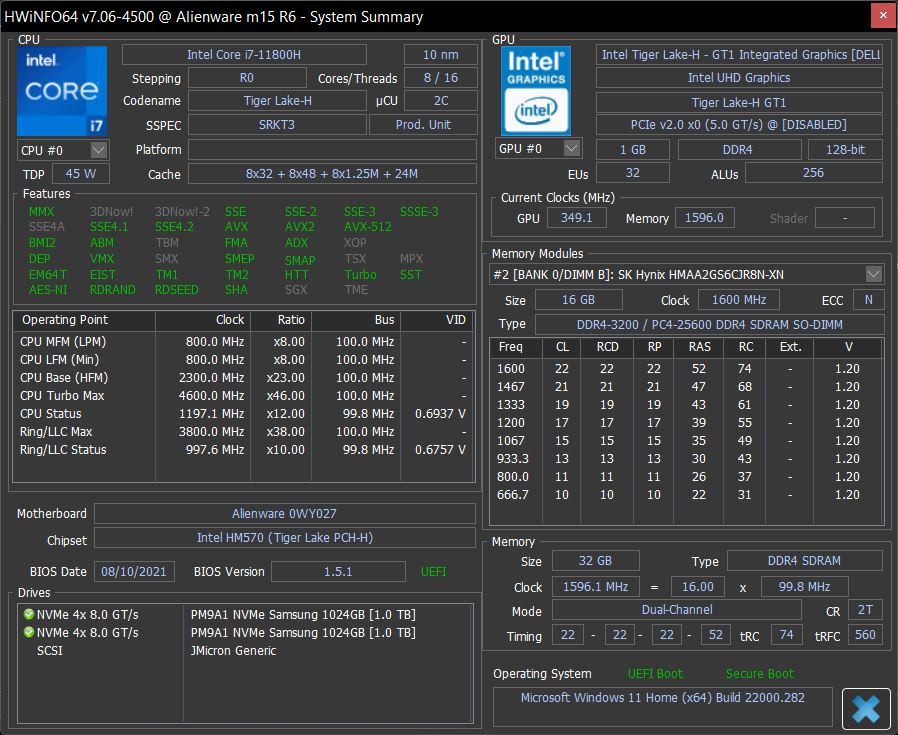
Con suIntel Core i7-11800Hy NVIDIA GeForce RTX 3080 Mobile GPUnuestra unidad de pruebas representa el extremo superior de las configuraciones. Como alternativa, también se puede configurar el Alienware, que puede considerarse claramente un portátil para juegos, con una RTX 3070 o RTX 3060, e incluso con un Intel Core i5 11400HCPU
Condiciones de la prueba
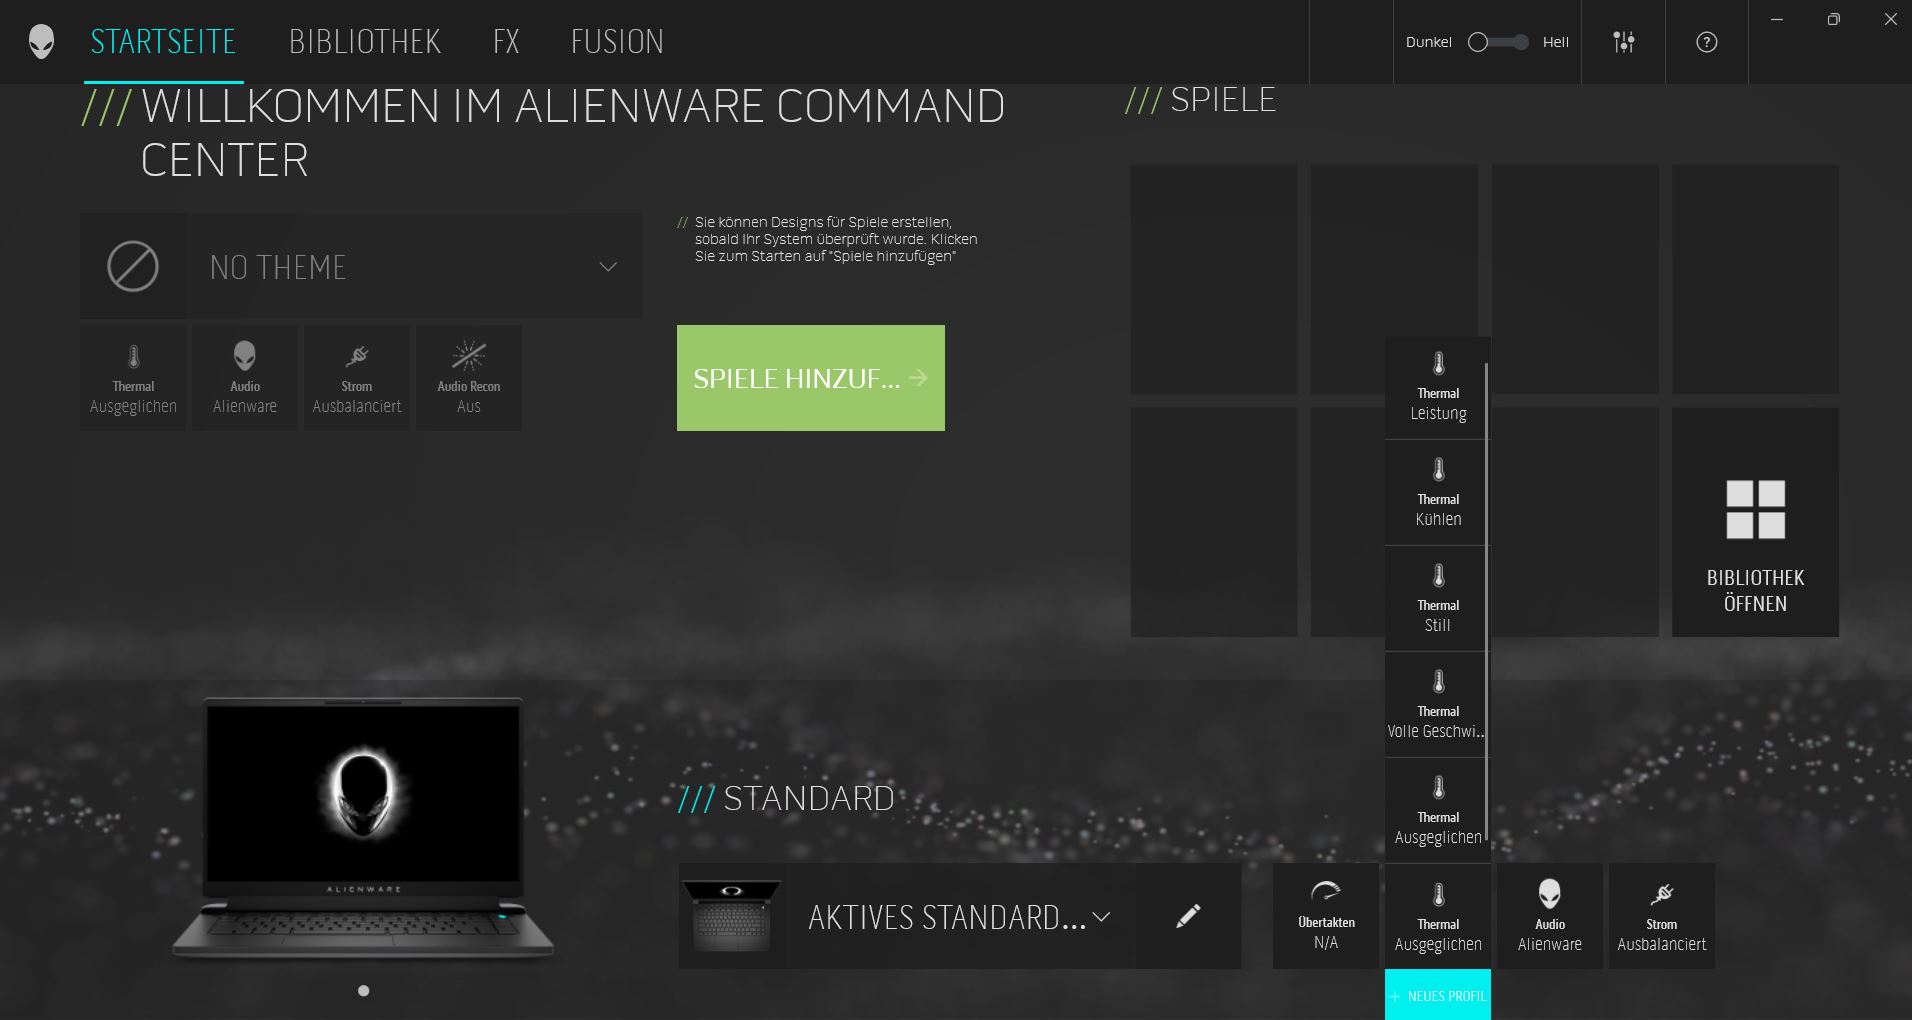
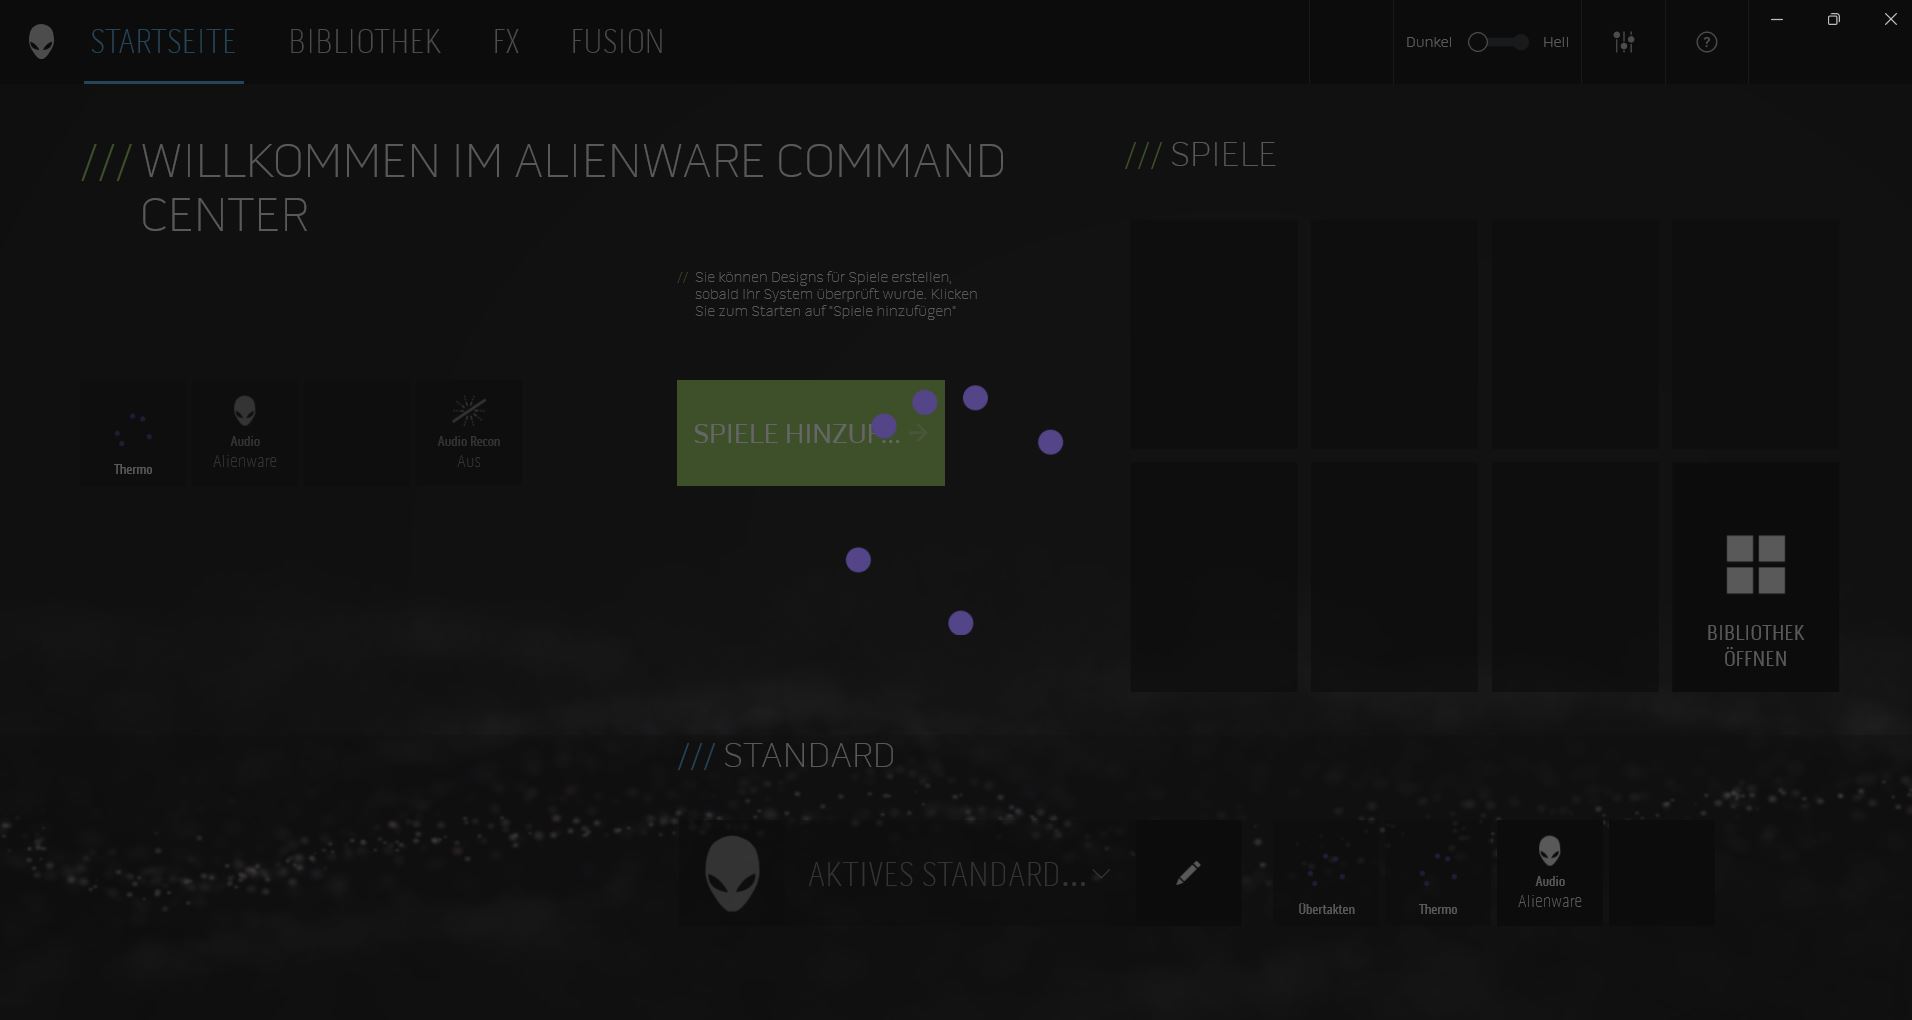
El Centro de Comando de Alienware ofrece muchos perfiles de ventiladores con nombres que no son muy intuitivos, y la descripción del modo sólo está implementada por un sistema de estrellitas. ¿Cuáles pueden ser las diferencias entre "Rendimiento", "Rendimiento total" y "Refrigeración"? Dado que los ventiladores siempre se aceleran de forma ruidosa en los tres modos, incluso durante el funcionamiento en vacío ("Rendimiento completo" es incluso más ruidoso que el modo "Rendimiento"), ejecutamos los benchmarks y las mediciones de ruido en el modo "Equilibrado". Aunque esto contradice nuestro enfoque de probar portátiles para juegos usando el modo de mayor rendimiento, al menos la medición de ruido tendrá entonces sentido.
El Alienware Command Center (ACC) también necesita un tiempo particularmente largo para completar la carga durante cada inicio del sistema. Incluso cuando subjetivamente todos los otros procesos de Windows han terminado de cargarse, el ACC todavía necesita más tiempo. Aunque ya puedes iniciarlo, todavía no puedes seleccionar los modos de ventilación en la vista general durante bastante tiempo
El comportamiento del Alienware al encenderlo también es extraño. Cuando presionas el botón de encendido, se ilumina en azul por varios segundos, pero luego no pasa nada más. Sólo cuando presionas el botón por segunda vez el portátil realmente arranca - ¡muy molesto!
Windows 11 está instalado como sistema operativo, lo que podría dar problemas con algunos benchmarks
Procesador
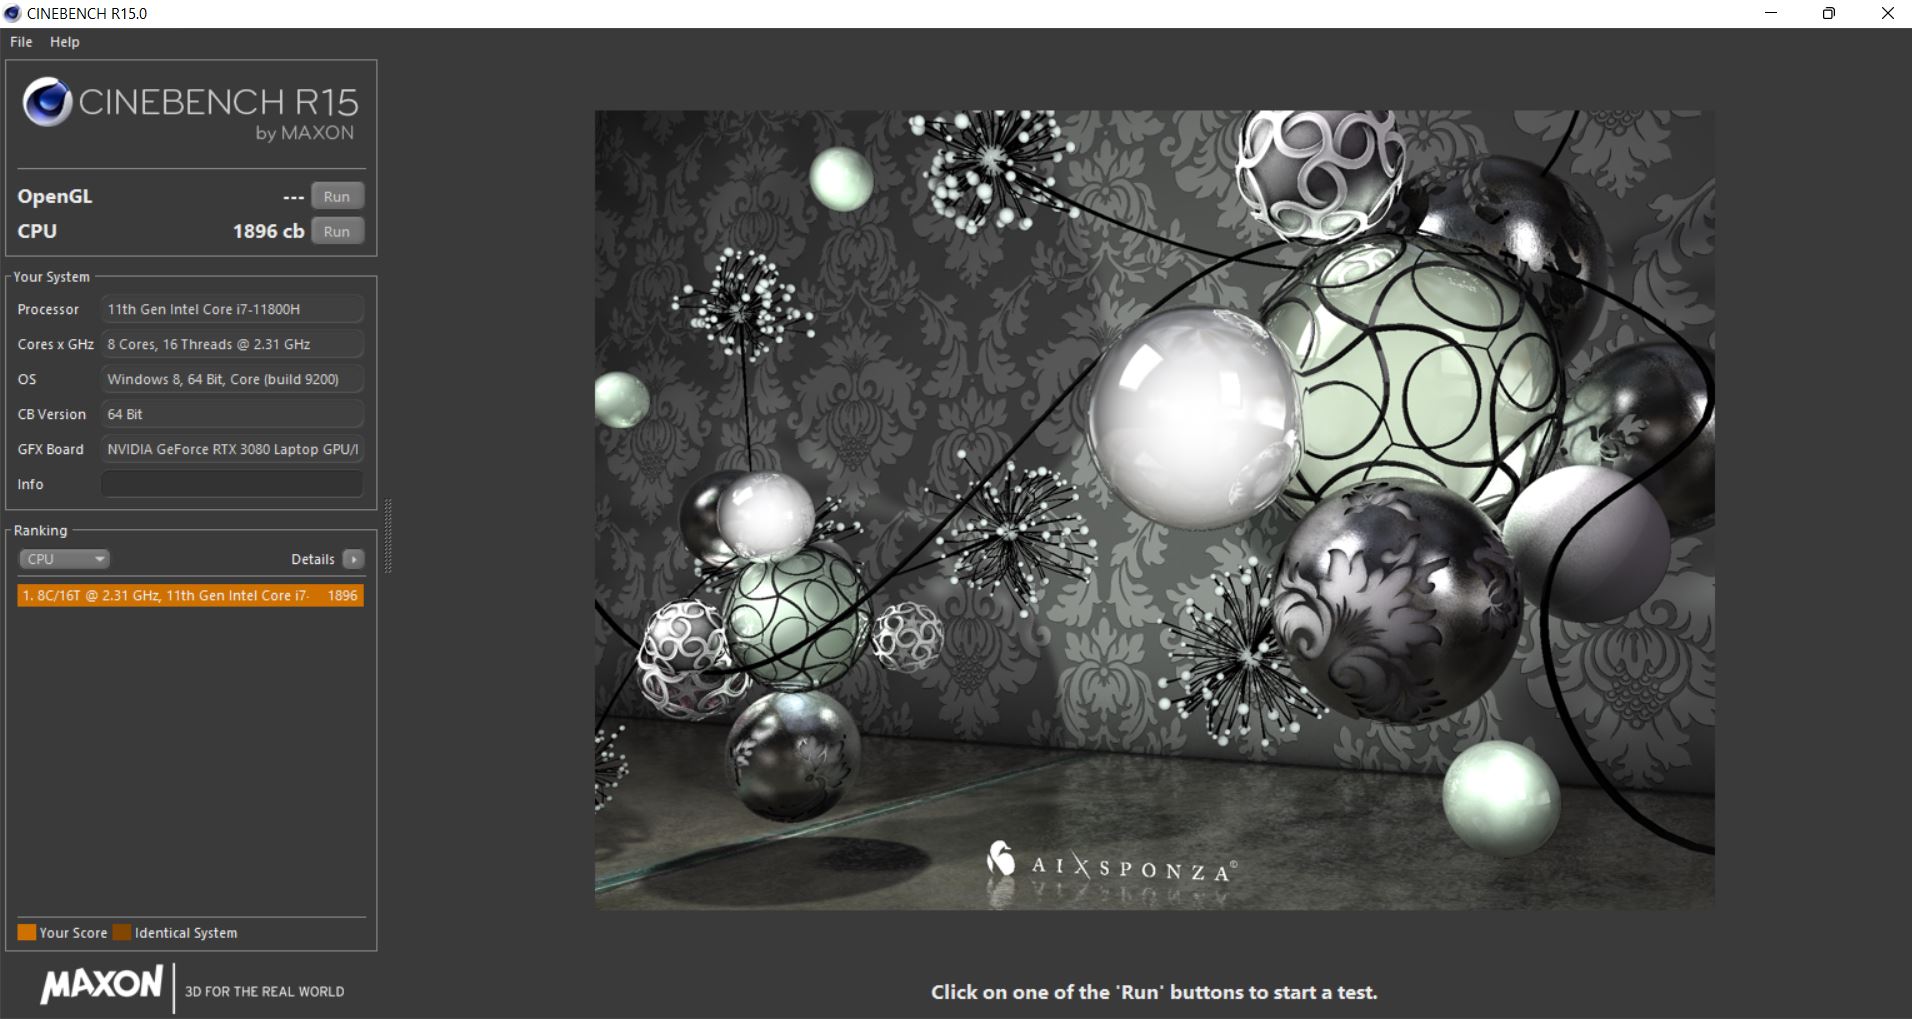
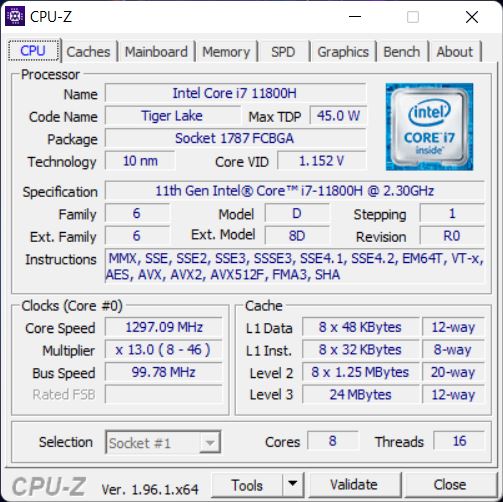
ElIntel Core i7-11800Hviene de la serie Tiger Lake, y sus 8 núcleos pueden alcanzar velocidades de reloj entre 2.3 y 4.6 GHz (Turbo de un solo núcleo)
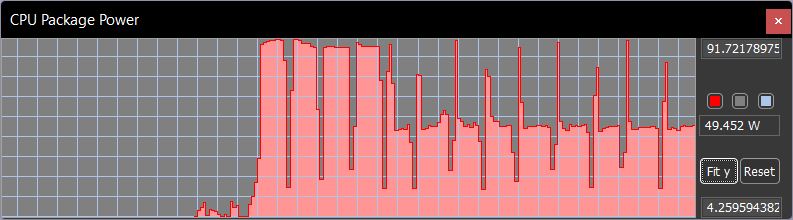
En el bucle de Cinebench, medimos una ligera caída de rendimiento tras las primeras cuatro ejecuciones. Después, el rendimiento es comparable al del Intel Core i7-11800H del Aorus. Durante las cuatro primeras ejecuciones, el TDP ronda los 90 vatios. Después empieza a limitarse, y en cada nueva ejecución, el TDP sólo alcanza el máximo brevemente, antes de caer a unos 50 vatios
En la comparación directa, el Core i7-11800H del Schenker ofrece el mejor rendimiento, pero la mayor parte del tiempo el Alienware se sitúa un 5% por detrás.
En el modo de batería, el rendimiento de la CPU del Cinebench R15 sólo cae un 10% en comparación con el rendimiento del principio
Cinebench R15 Multi Constant Load Test
Cinebench R23: Multi Core | Single Core
Cinebench R20: CPU (Multi Core) | CPU (Single Core)
Cinebench R15: CPU Multi 64Bit | CPU Single 64Bit
Blender: v2.79 BMW27 CPU
7-Zip 18.03: 7z b 4 | 7z b 4 -mmt1
Geekbench 5.5: Multi-Core | Single-Core
HWBOT x265 Benchmark v2.2: 4k Preset
LibreOffice : 20 Documents To PDF
R Benchmark 2.5: Overall mean
| CPU Performance rating | |
| Media de la clase Gaming | |
| Schenker XMG Neo 15 Tiger Lake | |
| Alienware m15 R6, i7-11800H RTX 3080 | |
| Alienware m15 R5 Ryzen Edition | |
| Razer Blade 15 Advanced (Mid 2021) -2! | |
| Medio Intel Core i7-11800H | |
| Aorus 15P YD -2! | |
| Alienware m15 R4 RTX 3080 | |
| Cinebench R23 / Multi Core | |
| Media de la clase Gaming (10488 - 42661, n=107, últimos 2 años) | |
| Schenker XMG Neo 15 Tiger Lake | |
| Alienware m15 R6, i7-11800H RTX 3080 | |
| Razer Blade 15 Advanced (Mid 2021) | |
| Alienware m15 R5 Ryzen Edition | |
| Medio Intel Core i7-11800H (6508 - 14088, n=48) | |
| Alienware m15 R4 RTX 3080 | |
| Cinebench R23 / Single Core | |
| Media de la clase Gaming (1166 - 2415, n=107, últimos 2 años) | |
| Schenker XMG Neo 15 Tiger Lake | |
| Razer Blade 15 Advanced (Mid 2021) | |
| Medio Intel Core i7-11800H (1386 - 1522, n=45) | |
| Alienware m15 R6, i7-11800H RTX 3080 | |
| Alienware m15 R5 Ryzen Edition | |
| Alienware m15 R4 RTX 3080 | |
| Cinebench R20 / CPU (Multi Core) | |
| Media de la clase Gaming (4029 - 16433, n=106, últimos 2 años) | |
| Schenker XMG Neo 15 Tiger Lake | |
| Aorus 15P YD | |
| Alienware m15 R5 Ryzen Edition | |
| Razer Blade 15 Advanced (Mid 2021) | |
| Alienware m15 R6, i7-11800H RTX 3080 | |
| Medio Intel Core i7-11800H (2498 - 5408, n=50) | |
| Alienware m15 R4 RTX 3080 | |
| Cinebench R20 / CPU (Single Core) | |
| Media de la clase Gaming (442 - 913, n=106, últimos 2 años) | |
| Aorus 15P YD | |
| Razer Blade 15 Advanced (Mid 2021) | |
| Schenker XMG Neo 15 Tiger Lake | |
| Alienware m15 R6, i7-11800H RTX 3080 | |
| Medio Intel Core i7-11800H (520 - 586, n=47) | |
| Alienware m15 R5 Ryzen Edition | |
| Alienware m15 R4 RTX 3080 | |
| Cinebench R15 / CPU Multi 64Bit | |
| Media de la clase Gaming (1578 - 6330, n=105, últimos 2 años) | |
| Schenker XMG Neo 15 Tiger Lake | |
| Alienware m15 R6, i7-11800H RTX 3080 | |
| Alienware m15 R5 Ryzen Edition | |
| Aorus 15P YD | |
| Medio Intel Core i7-11800H (1342 - 2173, n=50) | |
| Razer Blade 15 Advanced (Mid 2021) | |
| Alienware m15 R4 RTX 3080 | |
| Cinebench R15 / CPU Single 64Bit | |
| Media de la clase Gaming (188.8 - 350, n=106, últimos 2 años) | |
| Alienware m15 R5 Ryzen Edition | |
| Aorus 15P YD | |
| Schenker XMG Neo 15 Tiger Lake | |
| Razer Blade 15 Advanced (Mid 2021) | |
| Alienware m15 R6, i7-11800H RTX 3080 | |
| Medio Intel Core i7-11800H (201 - 231, n=46) | |
| Alienware m15 R4 RTX 3080 | |
| Blender / v2.79 BMW27 CPU | |
| Aorus 15P YD | |
| Alienware m15 R4 RTX 3080 | |
| Medio Intel Core i7-11800H (217 - 454, n=46) | |
| Alienware m15 R6, i7-11800H RTX 3080 | |
| Razer Blade 15 Advanced (Mid 2021) | |
| Alienware m15 R5 Ryzen Edition | |
| Schenker XMG Neo 15 Tiger Lake | |
| Media de la clase Gaming (79 - 330, n=104, últimos 2 años) | |
| 7-Zip 18.03 / 7z b 4 | |
| Media de la clase Gaming (33491 - 148086, n=105, últimos 2 años) | |
| Schenker XMG Neo 15 Tiger Lake | |
| Alienware m15 R5 Ryzen Edition | |
| Razer Blade 15 Advanced (Mid 2021) | |
| Alienware m15 R6, i7-11800H RTX 3080 | |
| Alienware m15 R4 RTX 3080 | |
| Medio Intel Core i7-11800H (33718 - 56758, n=46) | |
| Aorus 15P YD | |
| 7-Zip 18.03 / 7z b 4 -mmt1 | |
| Media de la clase Gaming (4199 - 7436, n=105, últimos 2 años) | |
| Schenker XMG Neo 15 Tiger Lake | |
| Alienware m15 R5 Ryzen Edition | |
| Aorus 15P YD | |
| Medio Intel Core i7-11800H (5138 - 5732, n=46) | |
| Razer Blade 15 Advanced (Mid 2021) | |
| Alienware m15 R6, i7-11800H RTX 3080 | |
| Alienware m15 R4 RTX 3080 | |
| Geekbench 5.5 / Multi-Core | |
| Media de la clase Gaming (6460 - 28263, n=105, últimos 2 años) | |
| Schenker XMG Neo 15 Tiger Lake | |
| Alienware m15 R6, i7-11800H RTX 3080 | |
| Aorus 15P YD | |
| Medio Intel Core i7-11800H (4655 - 9851, n=40) | |
| Alienware m15 R4 RTX 3080 | |
| Alienware m15 R5 Ryzen Edition | |
| Geekbench 5.5 / Single-Core | |
| Media de la clase Gaming (986 - 2474, n=105, últimos 2 años) | |
| Schenker XMG Neo 15 Tiger Lake | |
| Aorus 15P YD | |
| Alienware m15 R6, i7-11800H RTX 3080 | |
| Medio Intel Core i7-11800H (1429 - 1625, n=40) | |
| Alienware m15 R5 Ryzen Edition | |
| Alienware m15 R4 RTX 3080 | |
| HWBOT x265 Benchmark v2.2 / 4k Preset | |
| Media de la clase Gaming (11.5 - 44.4, n=105, últimos 2 años) | |
| Schenker XMG Neo 15 Tiger Lake | |
| Razer Blade 15 Advanced (Mid 2021) | |
| Alienware m15 R5 Ryzen Edition | |
| Medio Intel Core i7-11800H (7.38 - 17.4, n=46) | |
| Alienware m15 R6, i7-11800H RTX 3080 | |
| Alienware m15 R4 RTX 3080 | |
| Aorus 15P YD | |
| LibreOffice / 20 Documents To PDF | |
| Alienware m15 R4 RTX 3080 | |
| Alienware m15 R5 Ryzen Edition | |
| Media de la clase Gaming (33.2 - 88.8, n=105, últimos 2 años) | |
| Schenker XMG Neo 15 Tiger Lake | |
| Medio Intel Core i7-11800H (38.6 - 59.9, n=45) | |
| Razer Blade 15 Advanced (Mid 2021) | |
| Alienware m15 R6, i7-11800H RTX 3080 | |
| Aorus 15P YD | |
| R Benchmark 2.5 / Overall mean | |
| Alienware m15 R4 RTX 3080 | |
| Medio Intel Core i7-11800H (0.548 - 0.615, n=46) | |
| Aorus 15P YD | |
| Alienware m15 R6, i7-11800H RTX 3080 | |
| Schenker XMG Neo 15 Tiger Lake | |
| Razer Blade 15 Advanced (Mid 2021) | |
| Alienware m15 R5 Ryzen Edition | |
| Media de la clase Gaming (0.3439 - 0.759, n=106, últimos 2 años) | |
* ... más pequeño es mejor
AIDA64: FP32 Ray-Trace | FPU Julia | CPU SHA3 | CPU Queen | FPU SinJulia | FPU Mandel | CPU AES | CPU ZLib | FP64 Ray-Trace | CPU PhotoWorxx
| Performance rating | |
| Media de la clase Gaming | |
| Alienware m15 R6, i7-11800H RTX 3080 | |
| Alienware m15 R5 Ryzen Edition | |
| Medio Intel Core i7-11800H | |
| Alienware m15 R4 RTX 3080 | |
| Aorus 15P YD -9! | |
| Schenker XMG Neo 15 Tiger Lake -9! | |
| Razer Blade 15 Advanced (Mid 2021) -9! | |
| AIDA64 / FP32 Ray-Trace | |
| Media de la clase Gaming (10227 - 85542, n=105, últimos 2 años) | |
| Alienware m15 R6, i7-11800H RTX 3080 | |
| Alienware m15 R5 Ryzen Edition | |
| Alienware m15 R4 RTX 3080 | |
| Medio Intel Core i7-11800H (8772 - 15961, n=20) | |
| AIDA64 / FPU Julia | |
| Media de la clase Gaming (51376 - 238426, n=105, últimos 2 años) | |
| Alienware m15 R5 Ryzen Edition | |
| Alienware m15 R4 RTX 3080 | |
| Alienware m15 R6, i7-11800H RTX 3080 | |
| Medio Intel Core i7-11800H (39404 - 65636, n=20) | |
| AIDA64 / CPU SHA3 | |
| Media de la clase Gaming (2180 - 10115, n=105, últimos 2 años) | |
| Alienware m15 R6, i7-11800H RTX 3080 | |
| Medio Intel Core i7-11800H (2599 - 4439, n=20) | |
| Alienware m15 R4 RTX 3080 | |
| Alienware m15 R5 Ryzen Edition | |
| AIDA64 / CPU Queen | |
| Media de la clase Gaming (49785 - 173351, n=90, últimos 2 años) | |
| Alienware m15 R5 Ryzen Edition | |
| Alienware m15 R4 RTX 3080 | |
| Alienware m15 R6, i7-11800H RTX 3080 | |
| Medio Intel Core i7-11800H (85233 - 91941, n=20) | |
| AIDA64 / FPU SinJulia | |
| Media de la clase Gaming (4424 - 33636, n=105, últimos 2 años) | |
| Alienware m15 R5 Ryzen Edition | |
| Alienware m15 R4 RTX 3080 | |
| Alienware m15 R6, i7-11800H RTX 3080 | |
| Medio Intel Core i7-11800H (6420 - 9792, n=20) | |
| AIDA64 / FPU Mandel | |
| Media de la clase Gaming (25115 - 128721, n=105, últimos 2 años) | |
| Alienware m15 R5 Ryzen Edition | |
| Alienware m15 R6, i7-11800H RTX 3080 | |
| Medio Intel Core i7-11800H (23365 - 39464, n=20) | |
| Alienware m15 R4 RTX 3080 | |
| AIDA64 / CPU AES | |
| Alienware m15 R6, i7-11800H RTX 3080 | |
| Medio Intel Core i7-11800H (74617 - 149388, n=20) | |
| Alienware m15 R5 Ryzen Edition | |
| Media de la clase Gaming (39258 - 247074, n=105, últimos 2 años) | |
| Alienware m15 R4 RTX 3080 | |
| AIDA64 / CPU ZLib | |
| Media de la clase Gaming (574 - 2531, n=105, últimos 2 años) | |
| Alienware m15 R6, i7-11800H RTX 3080 | |
| Alienware m15 R5 Ryzen Edition | |
| Alienware m15 R4 RTX 3080 | |
| Medio Intel Core i7-11800H (461 - 830, n=43) | |
| Aorus 15P YD | |
| Schenker XMG Neo 15 Tiger Lake | |
| Razer Blade 15 Advanced (Mid 2021) | |
| AIDA64 / FP64 Ray-Trace | |
| Media de la clase Gaming (5509 - 45446, n=105, últimos 2 años) | |
| Alienware m15 R6, i7-11800H RTX 3080 | |
| Alienware m15 R5 Ryzen Edition | |
| Alienware m15 R4 RTX 3080 | |
| Medio Intel Core i7-11800H (4545 - 8717, n=21) | |
| AIDA64 / CPU PhotoWorxx | |
| Media de la clase Gaming (12271 - 89891, n=105, últimos 2 años) | |
| Alienware m15 R6, i7-11800H RTX 3080 | |
| Medio Intel Core i7-11800H (11898 - 26757, n=21) | |
| Alienware m15 R4 RTX 3080 | |
| Alienware m15 R5 Ryzen Edition | |
Rendimiento del sistema
El benchmark PCMark 10 no diferencia mucho a los competidores entre sí, al menos no en la puntuación general. El Razer Blade parece estar ligeramente por delante en las subpruebas, pero el Alienware lo desafía, quedando un 5% por detrás sólo en la prueba Essentials
| PCMark 10 / Score | |
| Media de la clase Gaming (5828 - 12414, n=93, últimos 2 años) | |
| Razer Blade 15 Advanced (Mid 2021) | |
| Aorus 15P YD | |
| Schenker XMG Neo 15 Tiger Lake | |
| Alienware m15 R6, i7-11800H RTX 3080 | |
| Medio Intel Core i7-11800H, NVIDIA GeForce RTX 3080 Laptop GPU (6673 - 7470, n=11) | |
| Alienware m15 R4 RTX 3080 | |
| Alienware m15 R5 Ryzen Edition | |
| PCMark 10 / Essentials | |
| Razer Blade 15 Advanced (Mid 2021) | |
| Media de la clase Gaming (8810 - 11935, n=97, últimos 2 años) | |
| Aorus 15P YD | |
| Medio Intel Core i7-11800H, NVIDIA GeForce RTX 3080 Laptop GPU (9862 - 11064, n=11) | |
| Schenker XMG Neo 15 Tiger Lake | |
| Alienware m15 R6, i7-11800H RTX 3080 | |
| Alienware m15 R4 RTX 3080 | |
| Alienware m15 R5 Ryzen Edition | |
| PCMark 10 / Productivity | |
| Media de la clase Gaming (6845 - 25323, n=95, últimos 2 años) | |
| Alienware m15 R6, i7-11800H RTX 3080 | |
| Alienware m15 R4 RTX 3080 | |
| Aorus 15P YD | |
| Medio Intel Core i7-11800H, NVIDIA GeForce RTX 3080 Laptop GPU (8278 - 9803, n=11) | |
| Razer Blade 15 Advanced (Mid 2021) | |
| Schenker XMG Neo 15 Tiger Lake | |
| Alienware m15 R5 Ryzen Edition | |
| PCMark 10 / Digital Content Creation | |
| Media de la clase Gaming (7602 - 19954, n=95, últimos 2 años) | |
| Schenker XMG Neo 15 Tiger Lake | |
| Razer Blade 15 Advanced (Mid 2021) | |
| Alienware m15 R6, i7-11800H RTX 3080 | |
| Medio Intel Core i7-11800H, NVIDIA GeForce RTX 3080 Laptop GPU (9881 - 11323, n=11) | |
| Aorus 15P YD | |
| Alienware m15 R4 RTX 3080 | |
| Alienware m15 R5 Ryzen Edition | |
| PCMark 10 Score | 7177 puntos | |
ayuda | ||
| AIDA64 / Memory Copy | |
| Media de la clase Gaming (21750 - 129946, n=105, últimos 2 años) | |
| Alienware m15 R6, i7-11800H RTX 3080 | |
| Medio Intel Core i7-11800H (24508 - 48144, n=21) | |
| Alienware m15 R5 Ryzen Edition | |
| Alienware m15 R4 RTX 3080 | |
| AIDA64 / Memory Read | |
| Media de la clase Gaming (22956 - 118858, n=105, últimos 2 años) | |
| Alienware m15 R6, i7-11800H RTX 3080 | |
| Medio Intel Core i7-11800H (25882 - 50365, n=20) | |
| Alienware m15 R5 Ryzen Edition | |
| Alienware m15 R4 RTX 3080 | |
| AIDA64 / Memory Write | |
| Media de la clase Gaming (22297 - 135096, n=105, últimos 2 años) | |
| Alienware m15 R6, i7-11800H RTX 3080 | |
| Medio Intel Core i7-11800H (22240 - 46214, n=20) | |
| Alienware m15 R4 RTX 3080 | |
| Alienware m15 R5 Ryzen Edition | |
| AIDA64 / Memory Latency | |
| Media de la clase Gaming (75.3 - 259, n=105, últimos 2 años) | |
| Alienware m15 R6, i7-11800H RTX 3080 | |
| Alienware m15 R5 Ryzen Edition | |
| Alienware m15 R4 RTX 3080 | |
| Medio Intel Core i7-11800H (71.9 - 104.1, n=44) | |
| Aorus 15P YD | |
| Schenker XMG Neo 15 Tiger Lake | |
| Razer Blade 15 Advanced (Mid 2021) | |
* ... más pequeño es mejor
Latencias del CPD
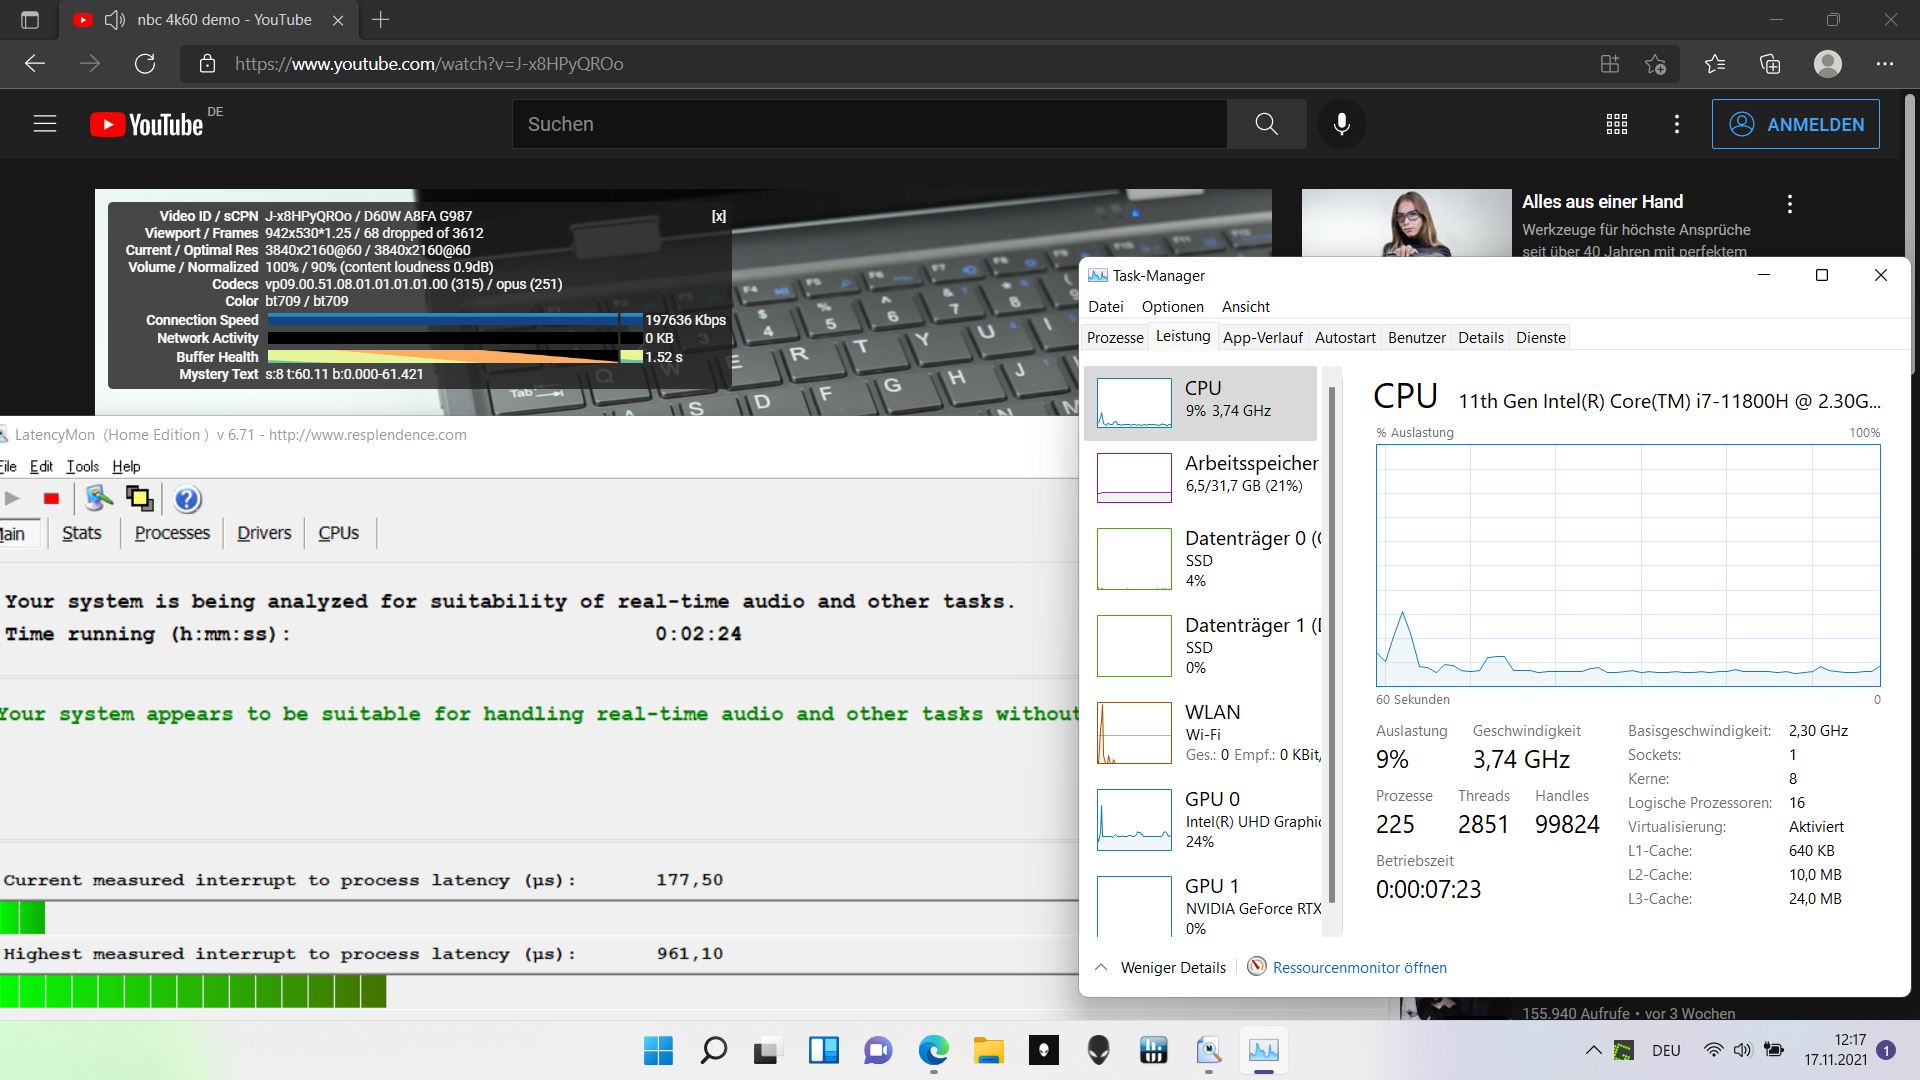
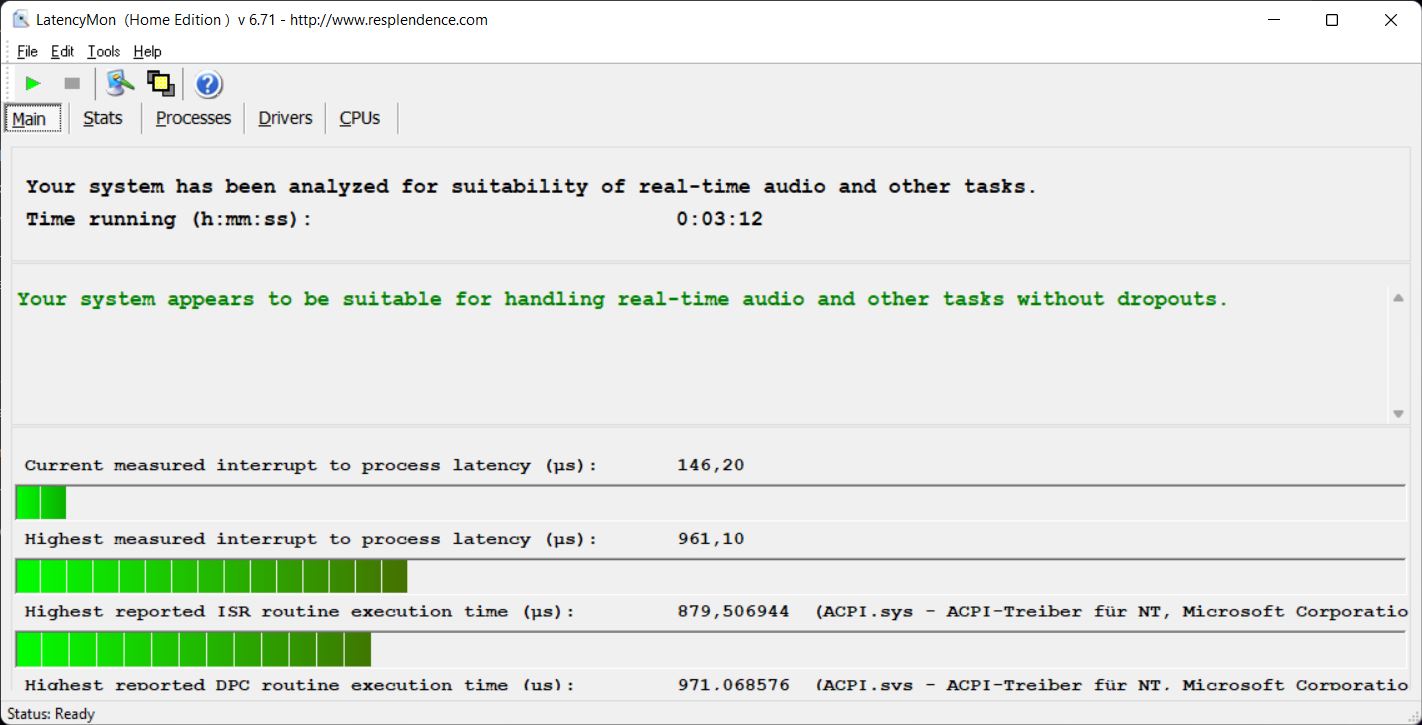
La herramienta LatencyMon no detecta retrasos significativos, ni al abrir varias pestañas del navegador, ni al transmitir vídeos o durante la carga de la CPU a través de Prime95. Por otro lado, nuestro vídeo 4K/60-fps de YouTube se reprodujo con un total de 68 fotogramas caídos

| DPC Latencies / LatencyMon - interrupt to process latency (max), Web, Youtube, Prime95 | |
| Razer Blade 15 Advanced (Mid 2021) | |
| Alienware m15 R6, i7-11800H RTX 3080 | |
| Aorus 15P YD | |
| Alienware m15 R4 RTX 3080 | |
| Schenker XMG Neo 15 Tiger Lake | |
| Alienware m15 R5 Ryzen Edition | |
* ... más pequeño es mejor
Solución de almacenamiento
Dell ha equipado el m15 R6 con dos SSDs NVMe de 1 TB de Samsung, por lo que hay una amplia cantidad de almacenamiento con un total de 2 TB. Aunque el Samsung PM9A1 ocupa el tercer lugar en nuestra Base de datos de SSDses incapaz de acercarse a sus teóricas altas velocidades en el R6. Hay algo de potencial desperdiciado aquí, pero la velocidad no es mala en absoluto

* ... más pequeño es mejor
Constant Performance Reading: DiskSpd Read Loop, Queue Depth 8
Tarjeta gráfica
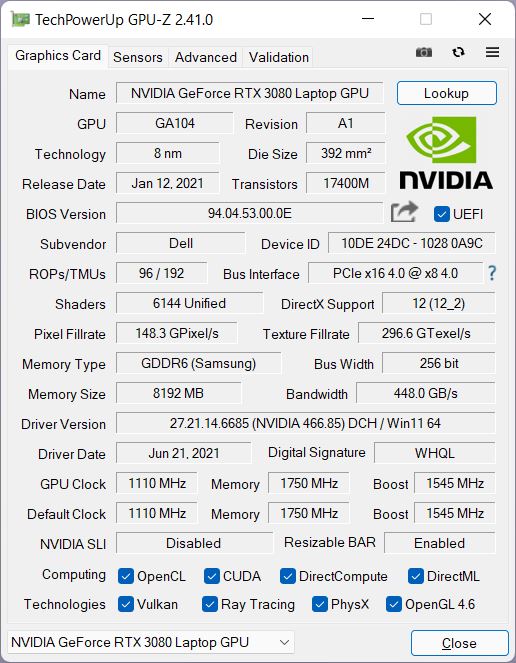
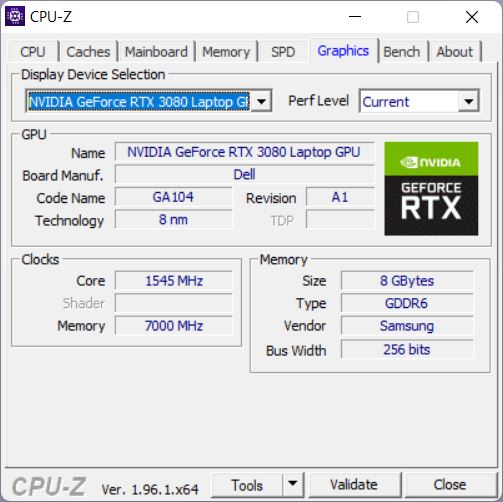
El R6 contiene una GPU NVIDIA GeForce RTX 3080 Mobileque es capaz de consumir 125 vatios, incluyendo 10 vatios de aumento dinámico. Teniendo en cuenta que algunos portátiles RTX 3080 están configurados con hasta 165 vatios, esto parece bastante bajo, especialmente para un portátil Alienware. Por ejemplo, incluso el R6 con la opción RTX 3070 es capaz de usar 130 vatios
En las pruebas 3DMark, el rendimiento del Alienware se corresponde con bastante exactitud con la media, en términos de su RTX 3080. Sin embargo, el "viejo" R4 con la RTX 3080 y Intel Core i9-10980HK La CPU Comet Lake es notablemente más rápida la mayor parte del tiempo. Esto no es una sorpresa, ya que la GPU del R4 es capaz de usar 140 vatios.
En el modo de batería, al ejecutar el 3DMark 11 se obtienen sólo 16.083 puntos en lugar de los 30.178 puntos anteriores, lo que corresponde a una disminución del 47%
| 3DMark 11 Performance | 30178 puntos | |
| 3DMark Cloud Gate Standard Score | 53399 puntos | |
| 3DMark Fire Strike Score | 24014 puntos | |
| 3DMark Time Spy Score | 10763 puntos | |
ayuda | ||
Rendimiento de los juegos
A pesar de la RTX 3080 ligeramente ralentizada, el Alienware es capaz de mostrar todos los juegos modernos al máximo detalle y en resolución Full HD, e incluso debería haber reservas suficientes para resoluciones 4K.
En general, el rendimiento del R6 vuelve a estar bastante cerca de la media de otros portátiles con una RTX 3080 de nuestra base de datos. Sin embargo, la mayoría de sus competidores directos siguen siendo más rápidos, con el antiguo m15 R4 a la cabeza. Parece un poco extraño que se limite el rendimiento en comparación con el predecesor, posiblemente para poder ofrecer una mejor refrigeración del sistema.
Los modos de ventilador parecen tener poca influencia en el rendimiento. En el modo de rendimiento, muchos juegos apenas se beneficiarán o no se beneficiarán en absoluto de la teórica refrigeración adicional (GTA V), pero en algunos juegos podemos ver una ventaja mínima (Strange Brigade, + 3-5%).
| New World | |
| 1920x1080 Medium Video Quality | |
| Alienware m15 R6, i7-11800H RTX 3080 | |
| Medio NVIDIA GeForce RTX 3080 Laptop GPU (80.8 - 105.4, n=4) | |
| 1920x1080 High Video Quality | |
| Alienware m15 R6, i7-11800H RTX 3080 | |
| Medio NVIDIA GeForce RTX 3080 Laptop GPU (75.1 - 96.7, n=4) | |
| 1920x1080 Very High Video Quality | |
| Alienware m15 R6, i7-11800H RTX 3080 | |
| Medio NVIDIA GeForce RTX 3080 Laptop GPU (71.5 - 90.4, n=4) | |
Durante una hora de ejecución de The Witcher 3, la tasa de fotogramas sólo desciende ligeramente, por lo que el rendimiento es bastante constante, y los valores atípicos o las caídas siguen siendo la excepción
The Witcher 3 FPS Chart
| bajo | medio | alto | ultra | |
|---|---|---|---|---|
| GTA V (2015) | 183 | 177 | 166 | 99.5 |
| The Witcher 3 (2015) | 312 | 276 | 149 | 108.4 |
| Dota 2 Reborn (2015) | 168 | 151 | 144 | 135 |
| X-Plane 11.11 (2018) | 127 | 110 | 87.9 | |
| Far Cry 5 (2018) | 132 | 126 | 119 | 113 |
| Strange Brigade (2018) | 424 | 261 | 216 | 190 |
| New World (2021) | 115.5 | 95.7 | 91.3 | 84 |
Emisiones - Más calientes que la mayoría de los competidores
Emisiones acústicas
Durante el funcionamiento en vacío, los ventiladores del 6 suelen permanecer apagados, al menos en el modo Balanceado o Silencioso. En el modo Performance, también son ruidosos durante el funcionamiento en vacío, y lo mismo en el modo "Cooling". En el modo "Full Performance", son aún más ruidosos.
En el modo Equilibrado, los ventiladores pueden incluso acelerarse de vez en cuando en funcionamiento en vacío máximo, hasta un nivel de ruido de unos 30 dB. Bajo carga media (3DMark06, primer benchmark), el R6 sigue siendo aún más silencioso que algunos de sus competidores.
Por otro lado, los ventiladores se aceleran bastante bajo carga pesada. Pero al menos no son más ruidosos que el Aorus o el Schenker aquí también. Sin embargo, este no es el caso cuando se utiliza el modo de rendimiento completo. Así que cada usuario tiene que decidir por sí mismo si unos pocos fotogramas más merecen la pena por el aumento del nivel de ruido.
Bajo algunos tipos de carga (3DMark06), podemos escuchar un ruido electrónico en forma de zumbido. Probablemente sólo sea perceptible bajo un nivel de carga medio, y después será ahogado por el ruido del ventilador.
Ruido
| Ocioso |
| 23 / 23 / 30 dB(A) |
| Carga |
| 41.26 / 53.37 dB(A) |
 | ||
30 dB silencioso 40 dB(A) audible 50 dB(A) ruidosamente alto |
||
min: | ||
| Alienware m15 R6, i7-11800H RTX 3080 GeForce RTX 3080 Laptop GPU, i7-11800H, Samsung PM9A1 MZVL21T0HCLR | Alienware m15 R5 Ryzen Edition GeForce RTX 3060 Laptop GPU, R7 5800H, Toshiba KBG40ZNS512G NVMe | Alienware m15 R4 RTX 3080 GeForce RTX 3080 Laptop GPU, i9-10980HK, 2x WDC PC SN730 SDBPNTY-512G (RAID 0) | Aorus 15P YD GeForce RTX 3080 Laptop GPU, i7-11800H, Samsung PM9A1 MZVL21T0HCLR | Schenker XMG Neo 15 Tiger Lake GeForce RTX 3080 Laptop GPU, i7-11800H, Samsung SSD 980 Pro 1TB MZ-V8P1T0BW | Razer Blade 15 Advanced (Mid 2021) GeForce RTX 3080 Laptop GPU, i7-11800H, SSSTC CA6-8D1024 | |
|---|---|---|---|---|---|---|
| Noise | -4% | -7% | -10% | -11% | 0% | |
| apagado / medio ambiente * (dB) | 23 | 24 -4% | 25 -9% | 25 -9% | 25 -9% | 25.1 -9% |
| Idle Minimum * (dB) | 23 | 24 -4% | 25 -9% | 26 -13% | 27 -17% | 25.3 -10% |
| Idle Average * (dB) | 23 | 25 -9% | 29 -26% | 30 -30% | 30 -30% | 25.3 -10% |
| Idle Maximum * (dB) | 30 | 35 -17% | 33 -10% | 34 -13% | 32 -7% | 25.3 16% |
| Load Average * (dB) | 41.26 | 44 -7% | 48 -16% | 43 -4% | 46 -11% | 42 -2% |
| Witcher 3 ultra * (dB) | 53.4 | 48 10% | 46 14% | 50 6% | 52 3% | 45.6 15% |
| Load Maximum * (dB) | 53.37 | 50 6% | 49 8% | 57 -7% | 55 -3% | 51.6 3% |
* ... más pequeño es mejor
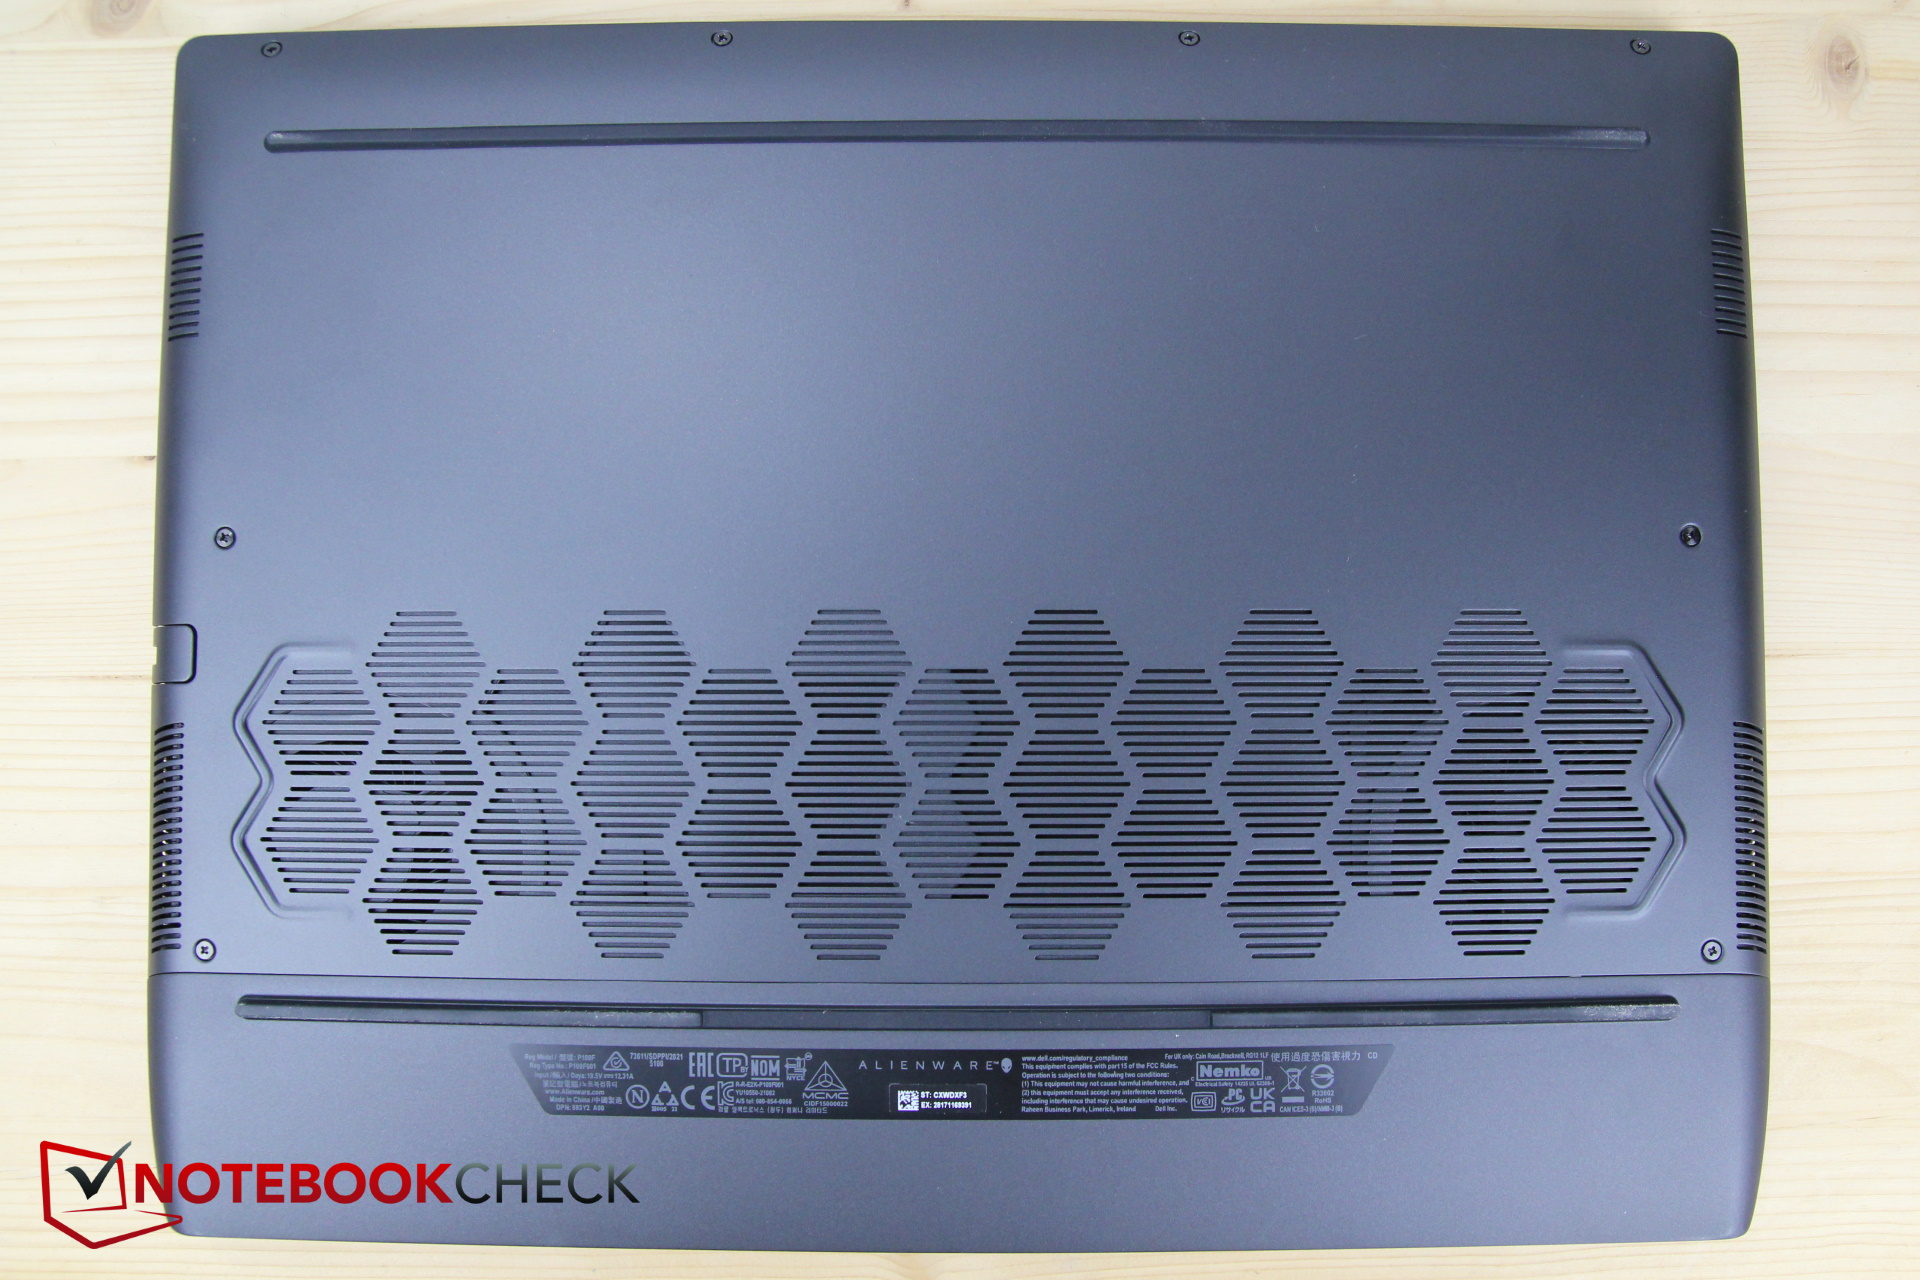
Temperatura
En funcionamiento en vacío, el R6 sigue siendo más frío que el R4. Sin embargo, bajo carga vuelve a calentarse igual, y eso aunque al menos el rendimiento 3D es ligeramente inferior.
Bajo un fuerte estrés, las superficies de la parte superior e inferior pueden alcanzar temperaturas de alrededor de 60 °C, lo que definitivamente ya no es adecuado para el funcionamiento en el regazo. Por otro lado, aquellos que viven en una fría cabaña de jardín pueden beneficiarse del R6 en otros aspectos: Mientras se juega, la temperatura alrededor de las teclas WASD sigue alcanzando unos acogedores 40 - 45 °C, pero al menos los reposamanos permanecen relativamente frescos
Curiosamente, el R5 con la RTX 3060 más débil y el Ryzen 7 5800H se calienta de forma similar. Sin embargo, el resto de los competidores permanece notablemente más fresco
(-) La temperatura máxima en la parte superior es de 61 °C / 142 F, frente a la media de 40.4 °C / 105 F, que oscila entre 21.2 y 68.8 °C para la clase Gaming.
(-) El fondo se calienta hasta un máximo de 58 °C / 136 F, frente a la media de 43.2 °C / 110 F
(+) En reposo, la temperatura media de la parte superior es de 29.6 °C / 85# F, frente a la media del dispositivo de 33.9 °C / 93 F.
(-) Jugando a The Witcher 3, la temperatura media de la parte superior es de 40.7 °C / 105 F, frente a la media del dispositivo de 33.9 °C / 93 F.
(±) El reposamanos y el touchpad pueden calentarse mucho al tacto con un máximo de 39 °C / 102.2 F.
(-) La temperatura media de la zona del reposamanos de dispositivos similares fue de 28.8 °C / 83.8 F (-10.2 °C / -18.4 F).
| Alienware m15 R6, i7-11800H RTX 3080 Intel Core i7-11800H, NVIDIA GeForce RTX 3080 Laptop GPU | Alienware m15 R5 Ryzen Edition AMD Ryzen 7 5800H, NVIDIA GeForce RTX 3060 Laptop GPU | Alienware m15 R4 RTX 3080 Intel Core i9-10980HK, NVIDIA GeForce RTX 3080 Laptop GPU | Aorus 15P YD Intel Core i7-11800H, NVIDIA GeForce RTX 3080 Laptop GPU | Schenker XMG Neo 15 Tiger Lake Intel Core i7-11800H, NVIDIA GeForce RTX 3080 Laptop GPU | Razer Blade 15 Advanced (Mid 2021) Intel Core i7-11800H, NVIDIA GeForce RTX 3080 Laptop GPU | |
|---|---|---|---|---|---|---|
| Heat | 2% | -7% | 9% | 15% | 7% | |
| Maximum Upper Side * (°C) | 61 | 62 -2% | 59 3% | 49 20% | 39 36% | 51 16% |
| Maximum Bottom * (°C) | 58 | 61 -5% | 61 -5% | 57 2% | 50 14% | 52 10% |
| Idle Upper Side * (°C) | 38 | 36 5% | 43 -13% | 33 13% | 34 11% | 35.2 7% |
| Idle Bottom * (°C) | 36 | 33 8% | 41 -14% | 36 -0% | 37 -3% | 37.8 -5% |
* ... más pequeño es mejor
Prueba de esfuerzo
En la prueba de estrés de una hora de duración, los núcleos arrancan a unos 4,2 GHz. Tras menos de media hora, la velocidad de reloj es de sólo 2,7 GHz. Hasta el final, varía ligeramente entre 2,7 y 2,9 GHz
Durante este tiempo, las temperaturas del núcleo se mantienen en unos 80 °C (176 °F) totalmente acríticos, aunque pueden aumentar temporalmente hasta los 98 °C (208 °F), lo que desencadena el estrangulamiento térmico
Al mismo tiempo, la velocidad de reloj de la GPU varía entre 1,3 y 1,7 GHz durante toda la prueba. Su temperatura se sitúa en torno a los 77 °C (171 °F), y el punto caliente alcanza unos 85 °C (185 °F)
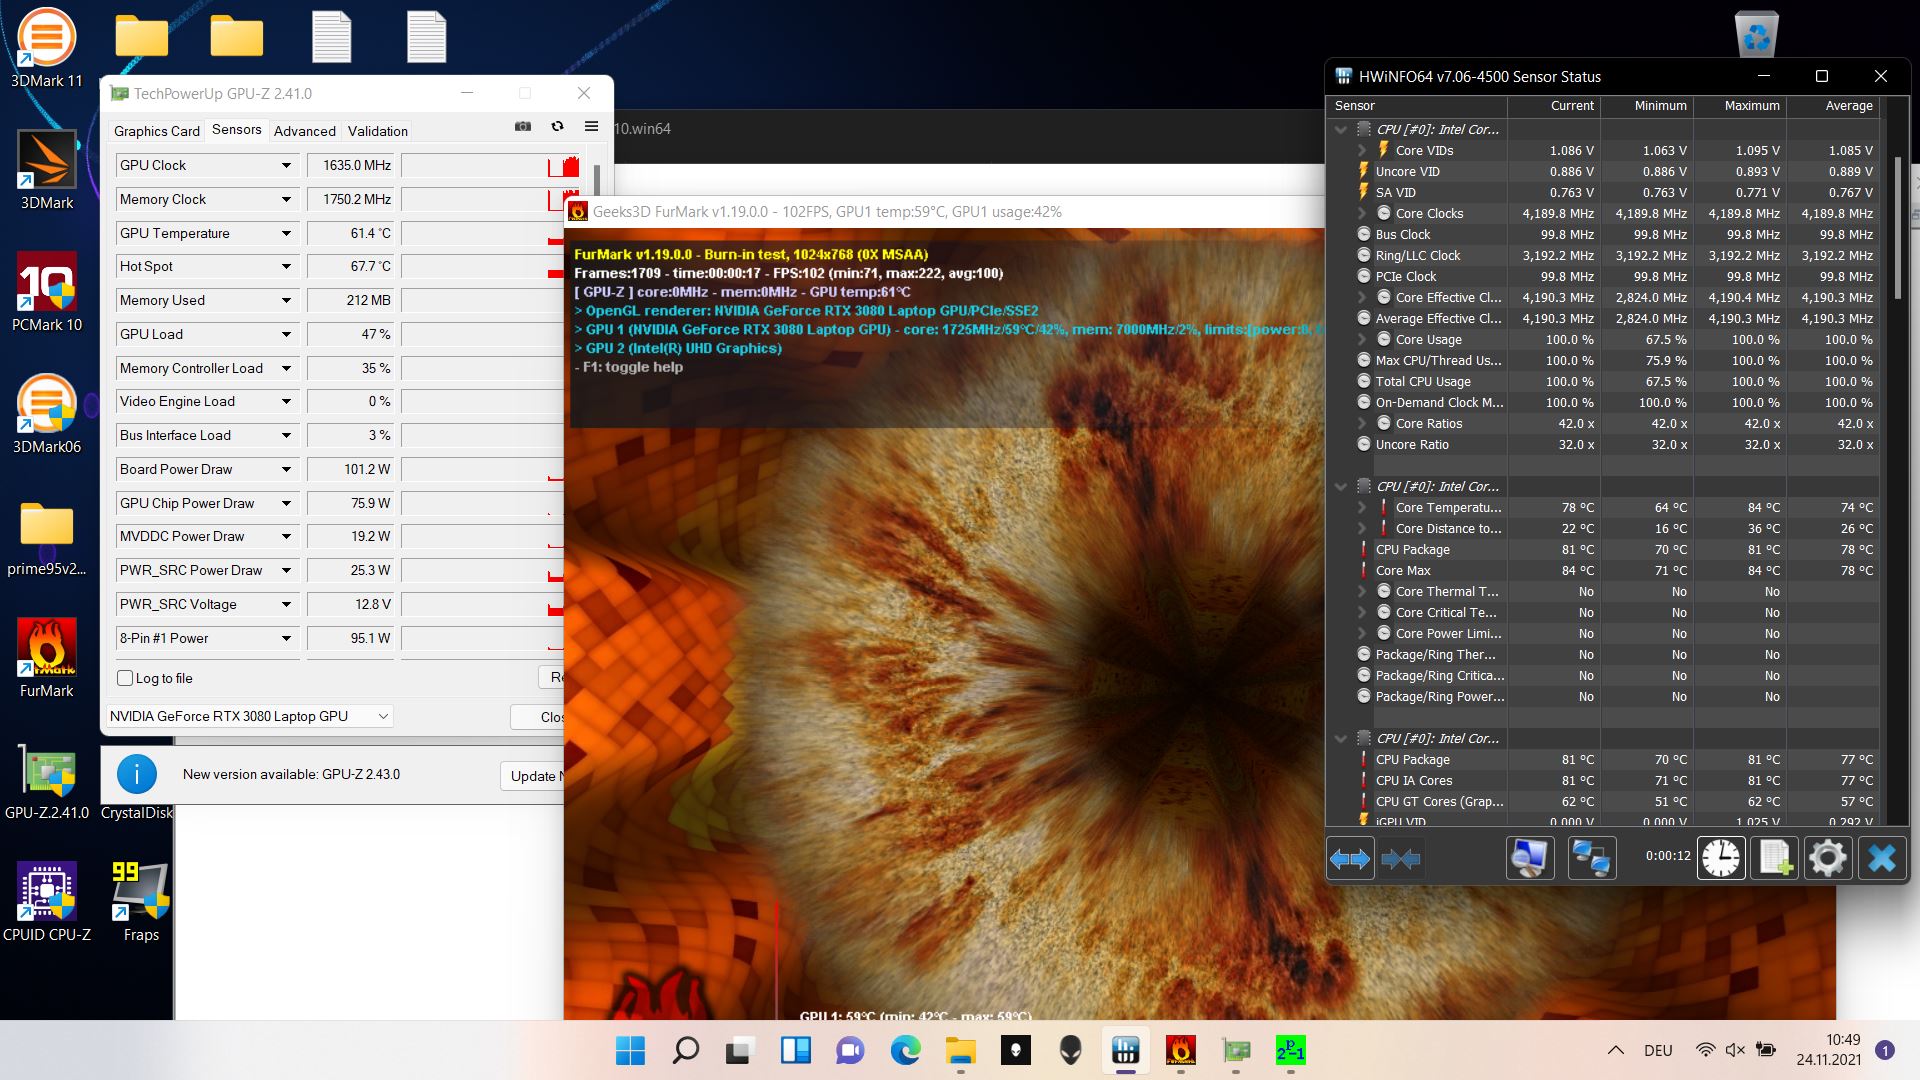
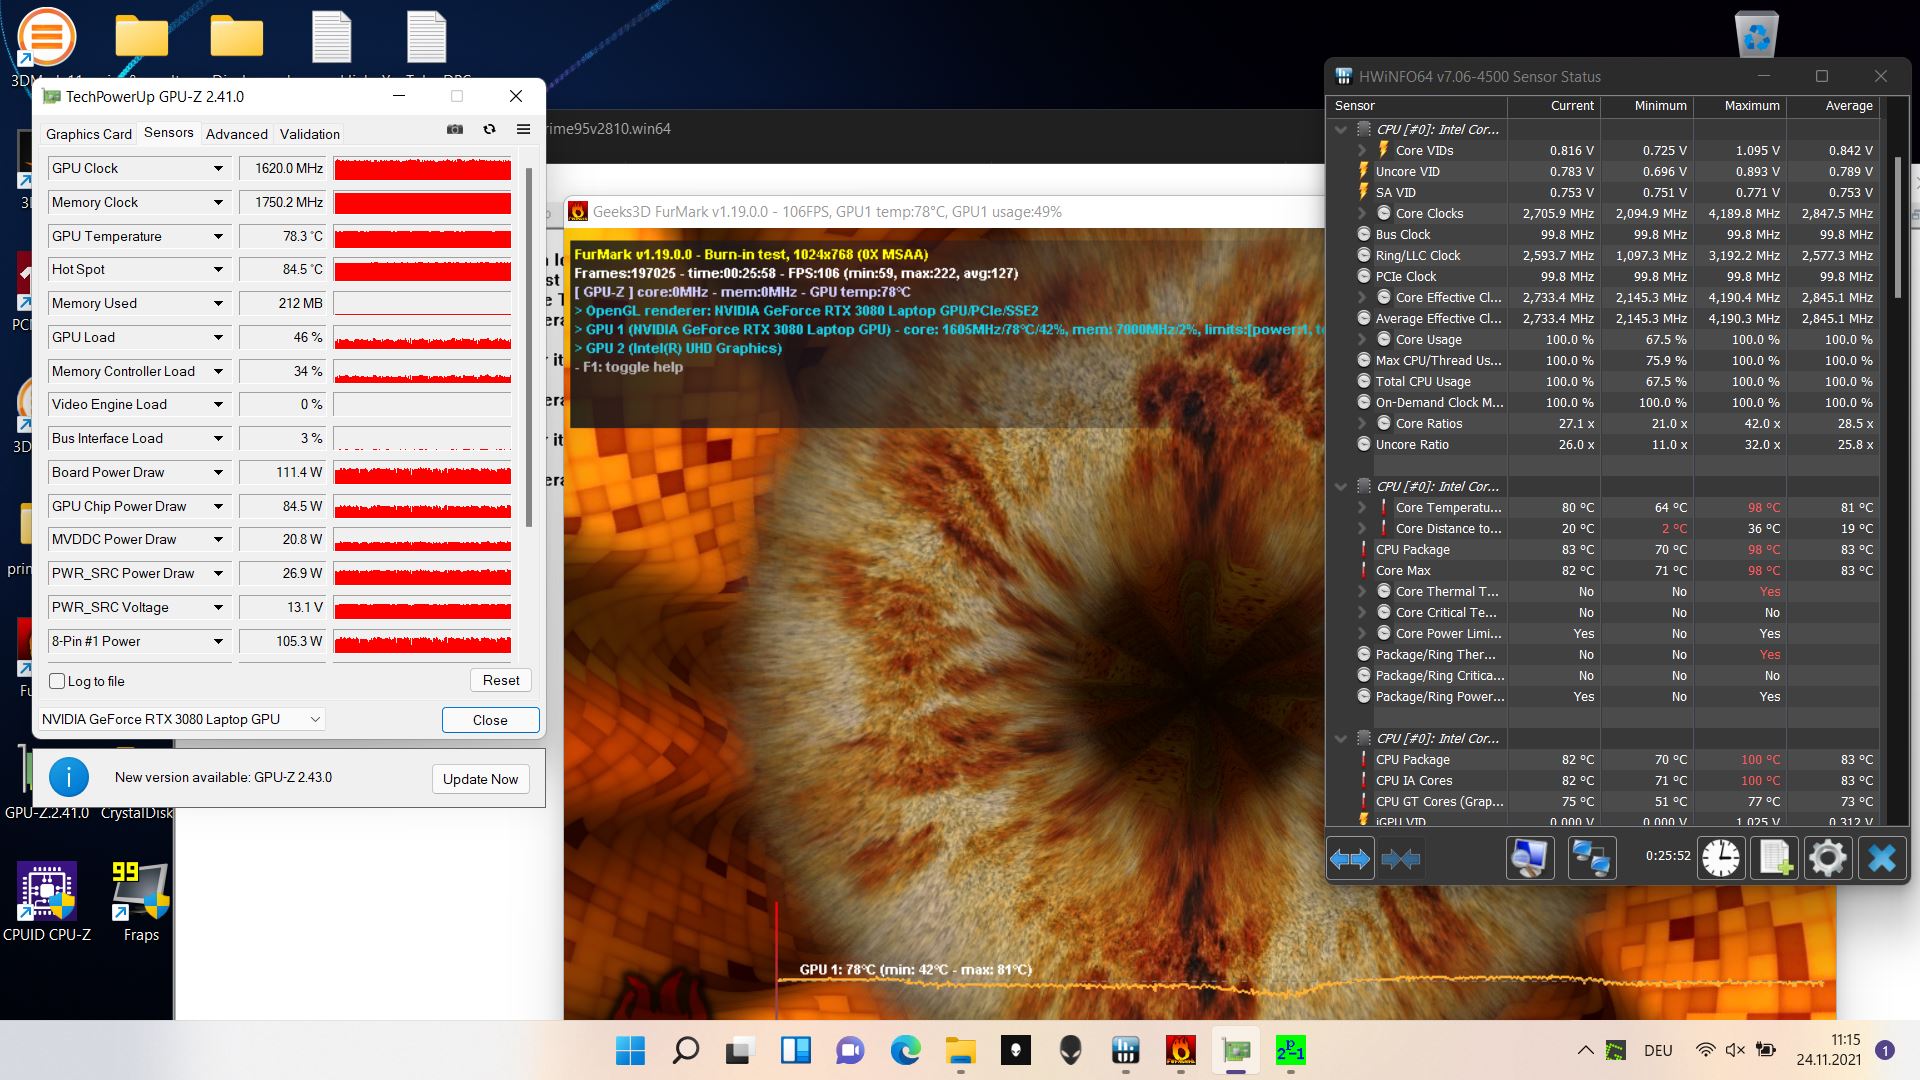
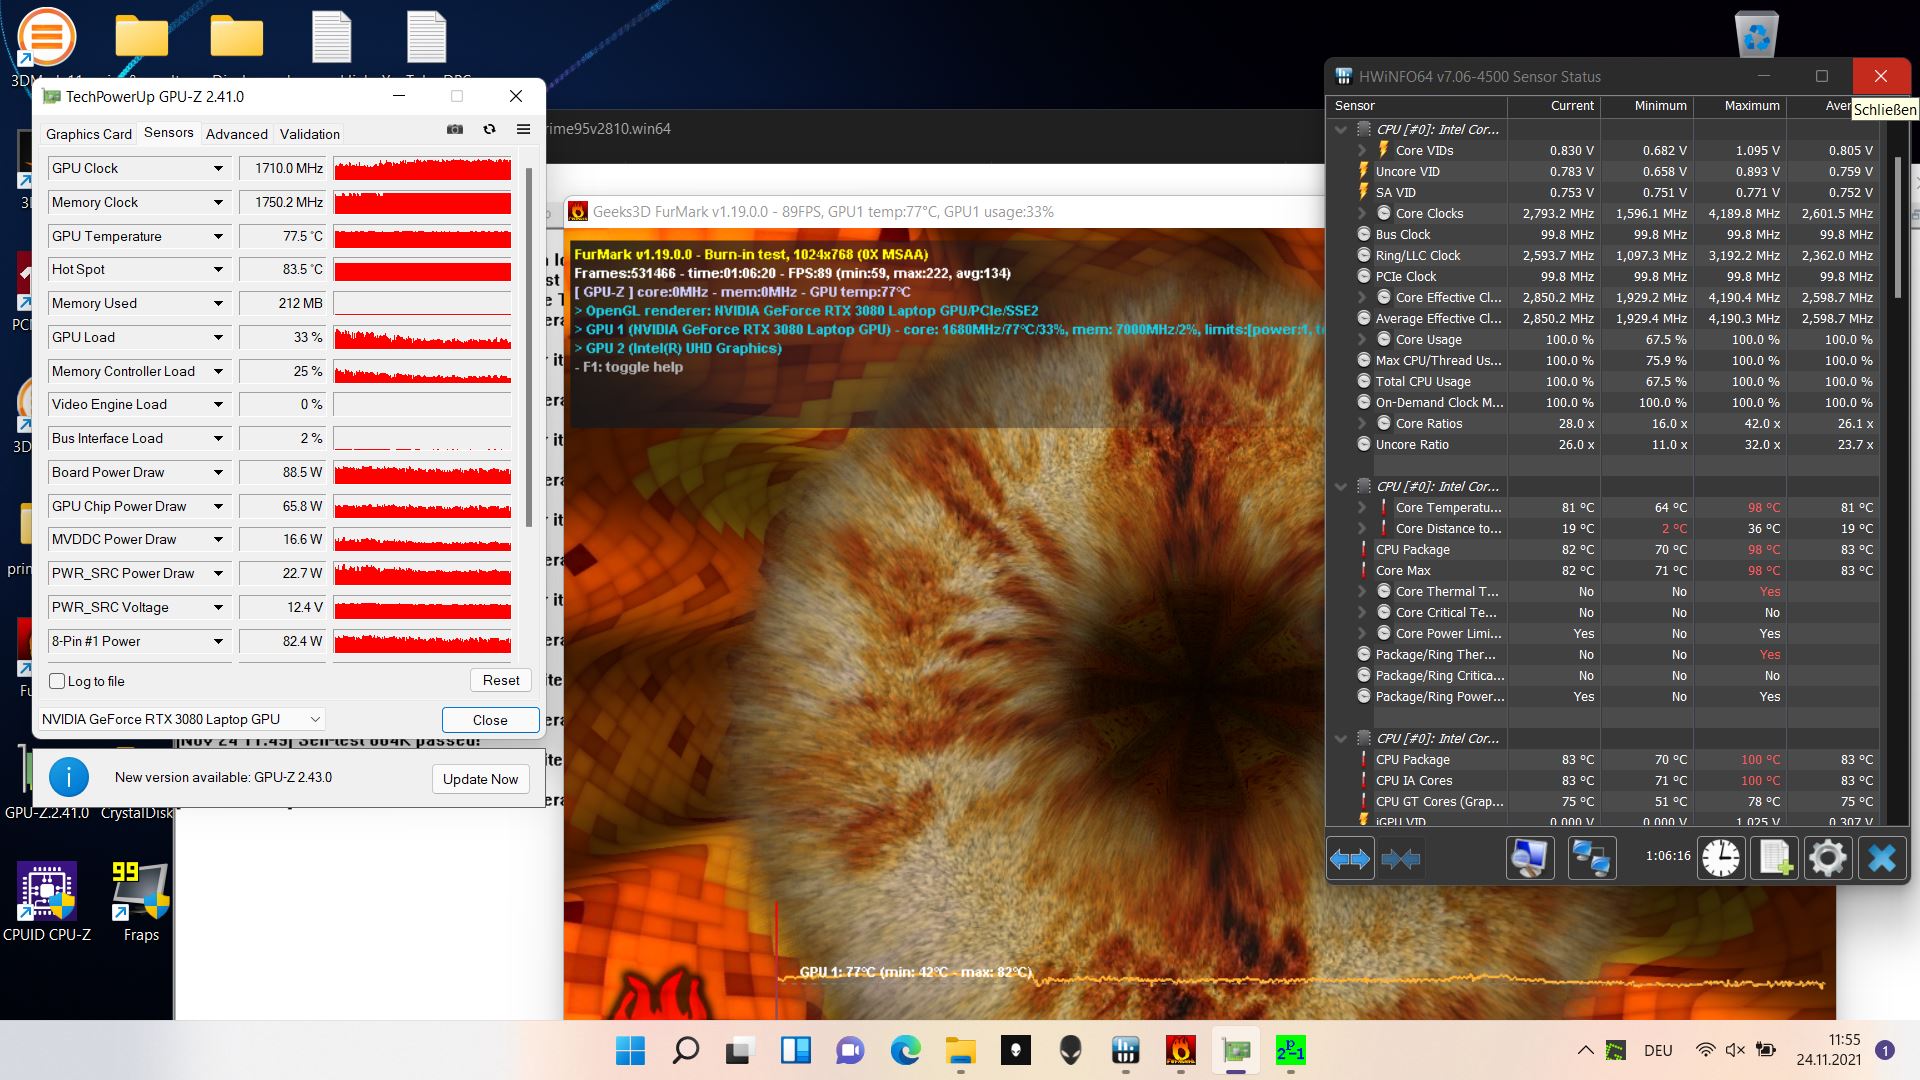
| Relojde la CPU(GHz) | Reloj dela GPU(MHz) | Temperatura media de la CPU (°C) | Temperaturamediade la GPU (°C) | |
| Prime95 + FurMark Stress | 2,7 - 2,9 | 1.395 - 1.710 | 80 | 77 |
Altavoces
El aspecto positivo es que el altavoz puede llegar a ser bastante fuerte. Pero, por desgracia, carecen de graves, y también escuchamos modelos mejores en cuanto a los medios. Debido a los fuertes ventiladores, se recomienda el uso de auriculares de todos modos, y hay un puerto de audio para esto
Alienware m15 R6, i7-11800H RTX 3080 análisis de audio
(+) | los altavoces pueden reproducir a un volumen relativamente alto (#85.2 dB)
Graves 100 - 315 Hz
(-) | casi sin bajos - de media 23.8% inferior a la mediana
(±) | la linealidad de los graves es media (12% delta a frecuencia anterior)
Medios 400 - 2000 Hz
(±) | medias más altas - de media 8.3% más altas que la mediana
(+) | los medios son lineales (6.9% delta a la frecuencia anterior)
Altos 2 - 16 kHz
(+) | máximos equilibrados - a sólo 3.3% de la mediana
(+) | los máximos son lineales (5.7% delta a la frecuencia anterior)
Total 100 - 16.000 Hz
(±) | la linealidad del sonido global es media (21.8% de diferencia con la mediana)
En comparación con la misma clase
» 78% de todos los dispositivos probados de esta clase eran mejores, 6% similares, 16% peores
» El mejor tuvo un delta de 6%, la media fue 18%, el peor fue ###max##%
En comparación con todos los dispositivos probados
» 62% de todos los dispositivos probados eran mejores, 7% similares, 31% peores
» El mejor tuvo un delta de 4%, la media fue 23%, el peor fue ###max##%
Apple MacBook 12 (Early 2016) 1.1 GHz análisis de audio
(+) | los altavoces pueden reproducir a un volumen relativamente alto (#83.6 dB)
Graves 100 - 315 Hz
(±) | lubina reducida - en promedio 11.3% inferior a la mediana
(±) | la linealidad de los graves es media (14.2% delta a frecuencia anterior)
Medios 400 - 2000 Hz
(+) | medios equilibrados - a sólo 2.4% de la mediana
(+) | los medios son lineales (5.5% delta a la frecuencia anterior)
Altos 2 - 16 kHz
(+) | máximos equilibrados - a sólo 2% de la mediana
(+) | los máximos son lineales (4.5% delta a la frecuencia anterior)
Total 100 - 16.000 Hz
(+) | el sonido global es lineal (10.2% de diferencia con la mediana)
En comparación con la misma clase
» 7% de todos los dispositivos probados de esta clase eran mejores, 2% similares, 90% peores
» El mejor tuvo un delta de 5%, la media fue 18%, el peor fue ###max##%
En comparación con todos los dispositivos probados
» 5% de todos los dispositivos probados eran mejores, 1% similares, 94% peores
» El mejor tuvo un delta de 4%, la media fue 23%, el peor fue ###max##%
Gestión de la energía - Más eficiente que su predecesor
Consumo de energía
Gracias a la conmutación Optimus, el R6 consume ahora notablemente menos energía que el R4, al menos durante el funcionamiento en vacío. Bajo carga, el consumo también es ligeramente inferior al de los competidores, pero esto también podría deberse al menor rendimiento 3D.
Medimos un consumo máximo de poco más de 200 vatios, lo que significa que la fuente de alimentación de 240 vatios debería ser suficiente para poder recargar el dispositivo de forma fiable en cualquier situación
| Ocioso | |
| Carga |
|
Clave:
min: | |
| Alienware m15 R6, i7-11800H RTX 3080 i7-11800H, GeForce RTX 3080 Laptop GPU, Samsung PM9A1 MZVL21T0HCLR, IPS, 1920x1080, 15.6" | Alienware m15 R5 Ryzen Edition R7 5800H, GeForce RTX 3060 Laptop GPU, Toshiba KBG40ZNS512G NVMe, IPS, 1920x1080, 15.6" | Alienware m15 R4 RTX 3080 i9-10980HK, GeForce RTX 3080 Laptop GPU, 2x WDC PC SN730 SDBPNTY-512G (RAID 0), IPS, 1920x1080, 15.6" | Aorus 15P YD i7-11800H, GeForce RTX 3080 Laptop GPU, Samsung PM9A1 MZVL21T0HCLR, IPS, 1920x1080, 15.6" | Schenker XMG Neo 15 Tiger Lake i7-11800H, GeForce RTX 3080 Laptop GPU, Samsung SSD 980 Pro 1TB MZ-V8P1T0BW, IPS, 2560x1440, 15.6" | Razer Blade 15 Advanced (Mid 2021) i7-11800H, GeForce RTX 3080 Laptop GPU, SSSTC CA6-8D1024, IPS, 1920x1080, 15.6" | Medio NVIDIA GeForce RTX 3080 Laptop GPU | Media de la clase Gaming | |
|---|---|---|---|---|---|---|---|---|
| Power Consumption | 4% | -70% | -29% | -0% | -18% | -24% | -6% | |
| Idle Minimum * (Watt) | 14 | 11 21% | 37 -164% | 23 -64% | 15 -7% | 19.5 -39% | 19.8 ? -41% | 13 ? 7% |
| Idle Average * (Watt) | 18 | 14 22% | 40 -122% | 25 -39% | 17 6% | 23.3 -29% | 24.3 ? -35% | 19 ? -6% |
| Idle Maximum * (Watt) | 29 | 25 14% | 53 -83% | 35 -21% | 22 24% | 40.1 -38% | 33.3 ? -15% | 24.6 ? 15% |
| Load Average * (Watt) | 93 | 123 -32% | 121 -30% | 101 -9% | 101 -9% | 98.9 -6% | 108.1 ? -16% | 110.7 ? -19% |
| Witcher 3 ultra * (Watt) | 190 | 176 7% | 193 -2% | 190 -0% | 195 -3% | 174 8% | ||
| Load Maximum * (Watt) | 203 | 226 -11% | 246 -21% | 280 -38% | 230 -13% | 214 -5% | 230 ? -13% | 259 ? -28% |
* ... más pequeño es mejor
Power Consumption The Witcher 3 / Stress Test
Power Consumption with an External Monitor
Duración de la batería
A pesar de su GPU más potente, el R6 no está equipado con una batería más grande que el R5 con la RTX 3060. Sin embargo, esto no parece tener necesariamente un efecto negativo en la duración de la batería, ya que durante nuestras pruebas de batería, la GPU integrada está activa la mayor parte del tiempo. Los resultados de la prueba WLAN están a la altura de los ojos, y sólo al reproducir vídeos, el R6 dura notablemente menos tiempo con 5,5 horas que el R5 con 8 horas.
| Alienware m15 R6, i7-11800H RTX 3080 i7-11800H, GeForce RTX 3080 Laptop GPU, 84 Wh | Alienware m15 R5 Ryzen Edition R7 5800H, GeForce RTX 3060 Laptop GPU, 86 Wh | Alienware m15 R4 RTX 3080 i9-10980HK, GeForce RTX 3080 Laptop GPU, 86 Wh | Aorus 15P YD i7-11800H, GeForce RTX 3080 Laptop GPU, 99 Wh | Schenker XMG Neo 15 Tiger Lake i7-11800H, GeForce RTX 3080 Laptop GPU, 93 Wh | Razer Blade 15 Advanced (Mid 2021) i7-11800H, GeForce RTX 3080 Laptop GPU, 80 Wh | Media de la clase Gaming | |
|---|---|---|---|---|---|---|---|
| Duración de Batería | 5% | -60% | 19% | 29% | 18% | 28% | |
| H.264 (h) | 5.6 | 8.8 57% | 1.9 -66% | 5.9 5% | 8.32 ? 49% | ||
| WiFi v1.3 (h) | 5 | 5.1 2% | 1.8 -64% | 5.3 6% | 5.6 12% | 5.9 18% | 7.11 ? 42% |
| Load (h) | 1.6 | 0.9 -44% | 0.8 -50% | 2.1 31% | 2.7 69% | 1.502 ? -6% | |
| Reader / Idle (h) | 14.7 | 7.5 | 8.27 ? | ||||
| Witcher 3 ultra (h) | 1.6 | 0.8 |
Pro
Contra
Veredicto - ¿Por qué tanto calor?
En comparación con el R4, la actualización de Tiger Lake hace que el R6 sea principalmente más eficiente y frugal, pero no necesariamente más rápido. Aunque el rendimiento de la CPU ha aumentado, el rendimiento 3D ha disminuido debido al menor TGP. Esto también disminuye el consumo. Los modos de refrigeración parecen tener poca influencia en el rendimiento, y la RTX 3080 sigue sin conseguir una mayor asignación de energía.
El rendimiento de la CPU es comparable al del Ryzen m15 R5. Además, tiene la ventaja de ser compatible con Thunderbolt. Pero por lo demás, el R5 y el R6 son extremadamente similares. Así que deberías elegir según el precio y lo importante que sea Thunderbolt para ti.
El sistema de refrigeración todavía revela la necesidad de optimización: A pesar del bajo consumo de la RTX 3080, las superficies del Alienware se calientan más que en la mayoría de los competidores, algunos de los cuales ofrecen un mayor rendimiento 3D.
La m15 R6 es más eficiente y frugal que su predecesora R4. Sin embargo, la RTX 3080 está acelerada aquí, y las superficies del Alienware siguen calentándose mucho.
ElAorus 15P YDproduce un rendimiento mínimamente superior sin dejar de ser más fresco, pero también tiene un mayor consumo. ElSchenker XMG Neo 15también ofrece un rendimiento 3D significativamente mayor y también se mantiene más fresco. Además, ofrece una mayor duración de la batería, pero por otro lado también es más ruidoso.
Precio y disponibilidad
Varias configuraciones del m15 R6 están actualmente disponibles en Dell a partir de unos 1200 dólares. Amazon ofrece una configuración de gama alta configuración por 1783 dólares
Alienware m15 R6, i7-11800H RTX 3080
- 11/25/2021 v7 (old)
Christian Hintze
Price comparison

