Análisis para el Intel Core i5-1240P procesador
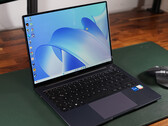
Nuevo análisis del Huawei MateBook 14: Un intento de alternativa al MacBook Air
Huawei ha actualizado el MateBook 14 y ahora ofrece un procesador Intel de 12ª generación en el ultrabook de gama media de alta calidad. Nuestra prueba muestra si merece la pena una actualización y cómo le va en nuestra comparativa al modelo que visualmente muestra un gran parecido con el MacBook Air.
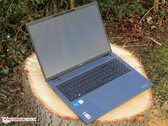
Intel Core i5-1240P, Iris Xe G7 80EUs, 14", 1.4 kgAnálisis del Acer TravelMate P4 TMP416-51: Portátil de oficina ligero con resistencia y potencia
El Acer TravelMate puntúa con una potente CPU Alder Lake, emisiones moderadas y buena duración de batería. Una gran pantalla de 16 pulgadas en formato 16:10 (1.920 x 1.200 píxeles) y tres años de garantía completan el conjunto.
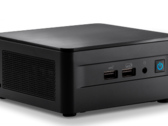
Intel Core i5-1240P, Iris Xe G7 80EUs, 16", 1.6 kgAnálisis del mini PC Intel NUC 12 Pro Kit (Core i5-1240P): Rápido y con gran conectividad
El Intel NUC 12 Pro Kit es un mini PC diminuto pero potente. Su potente Core i5-1240P Alder Lake de 12ª generación ofrece una gran potencia de cálculo, aunque le falta rendimiento gráfico. Al igual que su hermano mayor, quizá su mayor punto fuerte sea su excelente selección de puertos, que incluye dos puertos Thunderbolt 4.
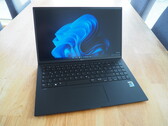
Intel Core i5-1240P, Iris Xe G7 80EUs, 549 gAnálisis del portátil LG Gram 15 (2022): Centrado en la portabilidad
Con el LG Gram 15, LG ha creado un portátil de 15 pulgadas que no sólo destaca por su portabilidad, sino también por la duración de la batería. Como mostrará nuestro análisis, sin embargo, el delgado factor de forma tiene el coste de un rendimiento más débil.
Intel Core i5-1240P, Iris Xe G7 80EUs, 15.6", 1.1 kgAnálisis del portátil Acer Swift X 14 con RTX 3050: Un i5-1240P con poca potencia
El Acer Swift X 14 es un portátil ligero, de 1.4 kg, con una Nvidia GeForce RTX 3050, una larga duración de batería, pantalla 16:10, y alto rendimiento de sistema. Sin embargo, el rendimiento gráfico sigue fallando por completo en batería, y ni siquiera el veloz SSD y el nítido teclado ayudan en ese caso.
Intel Core i5-1240P, NVIDIA GeForce RTX 3050 4GB Laptop GPU, 14", 1.4 kgAcer Swift X SFX16-52G-52VE: Intel Arc A370M, 16.00", 1.8 kg
análise » Análisis del Acer Swift X SFX16-52G: un portátil que equilibra eficiencia y rendimiento
LG Gram 14Z90Q: Intel Iris Xe Graphics G7 80EUs, 14.00", 1 kg
análise » Análisis del portátil LG Gram 14 (2022): Elegante, ligero y económico
Lenovo ThinkPad T16 G1 21BWS00200: Intel Iris Xe Graphics G7 80EUs, 16.00", 1.9 kg
análise » Análisis del portátil Lenovo ThinkPad T16 G1 Intel: un maratonista de 16 pulgadas
Acer Aspire 5 A515-57G-53N8: NVIDIA GeForce RTX 2050 Mobile, 15.60", 1.8 kg
análise » Análisis del portátil Acer Aspire 5 A515-57G: débil presentación de la RTX 2050
Dynabook Portégé X30L-K-139: Intel Iris Xe Graphics G7 80EUs, 13.30", 0.9 kg
análise » Análisis del Dynabook Portégé X30L-K-139 - El portátil para empresas sólo pesa 900 gramos
LG Gram 17 (2022): Intel Iris Xe Graphics G7 80EUs, 17.00", 1.4 kg
análise » Análisis del LG Gram 17 (2022): Un portátil de oficina ligero con una gran pantalla y una gran duración de la batería
Dell XPS 13 Plus 9320 i5-1240p: Intel Iris Xe Graphics G7 80EUs, 13.40", 1.2 kg
análise » Análisis del portátil Dell XPS 13 Plus: ¿Es la configuración base la mejor opción?
Lenovo Yoga Slim 7i Pro 14IAP G7: Intel Iris Xe Graphics G7 80EUs, 14.00", 1.3 kg
análise » Análisis del portátil Lenovo Yoga Slim 7i Pro 14IAP: Subportátil asequible con 12 núcleos y pantalla 2,8K
Samsung Galaxy Book2 Pro 13 NP930XED-KA1DE: Intel Iris Xe Graphics G7 80EUs, 13.30", 0.9 kg
análise » Análisis del Samsung Galaxy Book2 Pro 13: Subportátil con un eficiente Alder Lake i5
Acer TravelMate P4 TMP416-51-55KN: Intel Iris Xe Graphics G7 80EUs, 16.00", 1.6 kg
análise externo » Acer TravelMate P4 TMP416-51-55KN
Asus ExpertBook B5 B5602: Intel Iris Xe Graphics G7 80EUs, 16.00", 1.5 kg
análise externo » Asus ExpertBook B5 B5602
Lenovo Yoga Slim 6 14IAP8, i5-1240P: Intel Iris Xe Graphics G7 80EUs, 14.00", 1.3 kg
análise externo » Lenovo Yoga Slim 6 14IAP8, i5-1240P
Huawei MateBook D 14 2023: Intel Iris Xe Graphics G7 80EUs, 14.00", 1.4 kg
análise externo » Huawei MateBook D 14 2023
HP Pavilion 15-eg2000TU: Intel Iris Xe Graphics G7 80EUs, 15.60", 1.7 kg
análise externo » HP Pavilion 15-eg2000TU
Acer Aspire 7 A715-51G-51BY: NVIDIA GeForce RTX 3050 Ti Laptop GPU, 15.60", 2.1 kg
análise externo » Acer Aspire 7 A715-51G-51BY
HP Pavilion Plus 14-eh0000ns: Intel Iris Xe Graphics G7 80EUs, 14.00", 1.4 kg
análise externo » HP Pavilion Plus 14-eh0000ns
Lenovo ThinkPad P16s G1, i5-1240P: NVIDIA T550 Laptop GPU, 16.00", 1.7 kg
análise externo » Lenovo ThinkPad P16s G1, i5-1240P
Lenovo ThinkBook 14 G4, i5-1240P: Intel Iris Xe Graphics G7 80EUs, 14.00", 1.4 kg
análise externo » Lenovo ThinkBook 14 G4, i5-1240P
Asus Zenbook 14 Q409ZA, i5-1240P: Intel Iris Xe Graphics G7 80EUs, 14.00", 1.4 kg
análise externo » Asus Zenbook 14 Q409ZA, i5-1240P
HP Envy x360 15-ew0004ns: Intel Iris Xe Graphics G7 80EUs, 15.60", 1.8 kg
análise externo » HP Envy x360 15-ew0004ns
Acer TravelMate Spin P4 TMP414RN-52-595S: Intel Iris Xe Graphics G7 80EUs, 14.00", 1.5 kg
análise externo » Acer TravelMate Spin P4 TMP414RN-52-595S
Dynabook Portégé X40L-K-10S: Intel Iris Xe Graphics G7 80EUs, 14.00", 1.1 kg
análise externo » Dynabook Portégé X40L-K-10S
Lenovo Yoga Slim 7 Pro 14IAP7, i5-1240P: Intel Iris Xe Graphics G7 80EUs, 14.00", 1.3 kg
análise externo » Lenovo Yoga Slim 7 Pro 14IAP7, i5-1240P
Lenovo ThinkPad P14s G3 21AK003SGE: NVIDIA T550 Laptop GPU, 14.00", 1.2 kg
análise externo » Lenovo ThinkPad P14s G3 21AK003SGE
Lenovo Ideapad 5 Pro 14IAP7, i5-1240P: Intel Iris Xe Graphics G7 80EUs, 14.00", 1.4 kg
análise externo » Lenovo Ideapad 5 Pro 14IAP7, i5-1240P
Lenovo ThinkBook 13s G4 IAP, i5-1240P: Intel Iris Xe Graphics G7 80EUs, 13.30", 1.2 kg
análise externo » Lenovo ThinkBook 13s G4 IAP, i5-1240P
Lenovo ThinkPad X13 G3, i5-1240P: Intel Iris Xe Graphics G7 80EUs, 13.30", 1.3 kg
análise externo » Lenovo ThinkPad X13 G3, i5-1240P
Acer Chromebook 516 GE CBG516-1H-53SL: Intel Iris Xe Graphics G7 80EUs, 16.00", 1.7 kg
análise externo » Acer Chromebook 516 GE CBG516-1H-53SL
Asus ExpertBook B5 B5402CB, i5-1240P: Intel Iris Xe Graphics G7 80EUs, 14.00", 1.3 kg
análise externo » Asus ExpertBook B5 B5402CB, i5-1240P
Dell Vostro 16 5620, i5-1240P: Intel Iris Xe Graphics G7 80EUs, 16.00", 2 kg
análise externo » Dell Vostro 16 5620, i5-1240P
Asus ExpertBook B5 Flip B5402F, i5-1240P: Intel Iris Xe Graphics G7 80EUs, 14.00", 1.3 kg
análise externo » Asus ExpertBook B5 Flip B5402F, i5-1240P
LG Gram 14Z90Q: Intel Iris Xe Graphics G7 80EUs, 14.00", 1 kg
análise externo » LG Gram 14Z90Q
Dynabook Portégé X30L-K-139: Intel Iris Xe Graphics G7 80EUs, 13.30", 0.9 kg
análise externo » Dynabook Portégé X30L-K-139
Acer Aspire 7 A715-51G-529E: NVIDIA GeForce RTX 3050 4GB Laptop GPU, 15.60", 2.1 kg
análise externo » Acer Aspire 7 A715-51G-529E
MSI Prestige 14 A12UC-228: NVIDIA GeForce RTX 3050 4GB Laptop GPU, 14.00", 1.3 kg
análise externo » MSI Prestige 14 A12UC-228
Huawei MateBook 14 (2024): Intel Iris Xe Graphics G7 80EUs, 14.00", 1.4 kg
análise externo » Huawei MateBook 14 2022, i5-1240P
Lenovo ThinkPad T16 G1 21BV006DGE: Intel Iris Xe Graphics G7 80EUs, 16.00", 1.7 kg
análise externo » Lenovo ThinkPad T16 G1 21BV006DGE
MSI Prestige 14 Evo A12M-229: Intel Iris Xe Graphics G7 80EUs, 14.00", 1.3 kg
análise externo » MSI Prestige 14 Evo A12M-229
Lenovo Yoga 7 14IAL7-82QE003GGE: Intel Iris Xe Graphics G7 80EUs, 14.00", 1.4 kg
análise externo » Lenovo Yoga 7 14IAL7-82QE003GGE
MSI Summit E14 Evo A12M-051: Intel Iris Xe Graphics G7 80EUs, 14.00", 1.6 kg
análise externo » MSI Summit E14 Evo A12M-051
Asus ExpertBook B2 Flip B2502FBA-N80113X: Intel Iris Xe Graphics G7 80EUs, 14.00", 1.6 kg
análise externo » Asus ExpertBook B2 Flip B2502FBA-N80113X
LG Gram 17 (2022): Intel Iris Xe Graphics G7 80EUs, 17.00", 1.4 kg
análise externo » LG Gram 17 (2022)
Asus Zenbook 14 UX3402ZA, i5-1240P: Intel Iris Xe Graphics G7 80EUs, 14.00", 1.4 kg
análise externo » Asus Zenbook 14 UX3402ZA, i5-1240P
Samsung Galaxy Book2 Pro 15, i5-1240P: Intel Iris Xe Graphics G7 80EUs, 15.60", 1.1 kg
análise externo » Samsung Galaxy Book2 Pro 15, i5-1240P
Acer Swift 3 SF314-512-50F6: Intel Iris Xe Graphics G7 80EUs, 14.00", 1.3 kg
análise externo » Acer Swift 3 SF314-512-50F6
Dell XPS 13 Plus 9320 i5-1240p: Intel Iris Xe Graphics G7 80EUs, 13.40", 1.2 kg
análise externo » Dell XPS 13 Plus 9320 i5-1240p
Asus VivoBook 15 X1502ZA-BQ165W: Intel Iris Xe Graphics G7 80EUs, 15.60", 1.7 kg
análise externo » Asus VivoBook 15 X1502ZA-BQ165W
Samsung Galaxy Book2 Pro 13 NP930XED-KA1DE: Intel Iris Xe Graphics G7 80EUs, 13.30", 0.9 kg
análise externo » Samsung Galaxy Book2 Pro 13 NP930XED-KA1DE