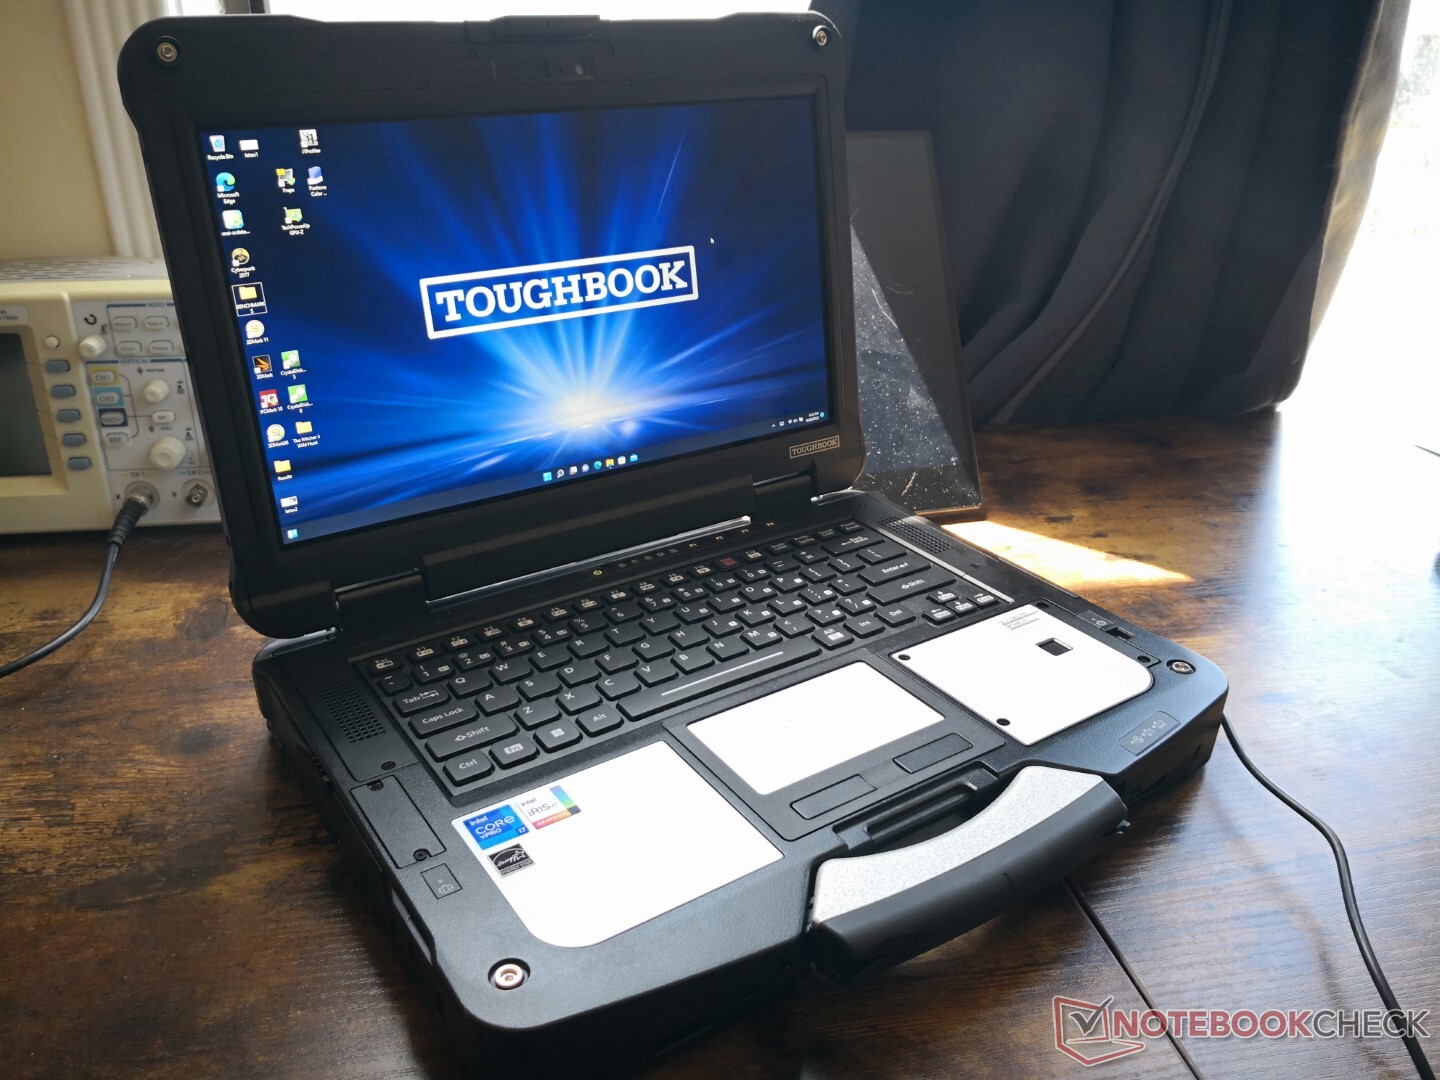
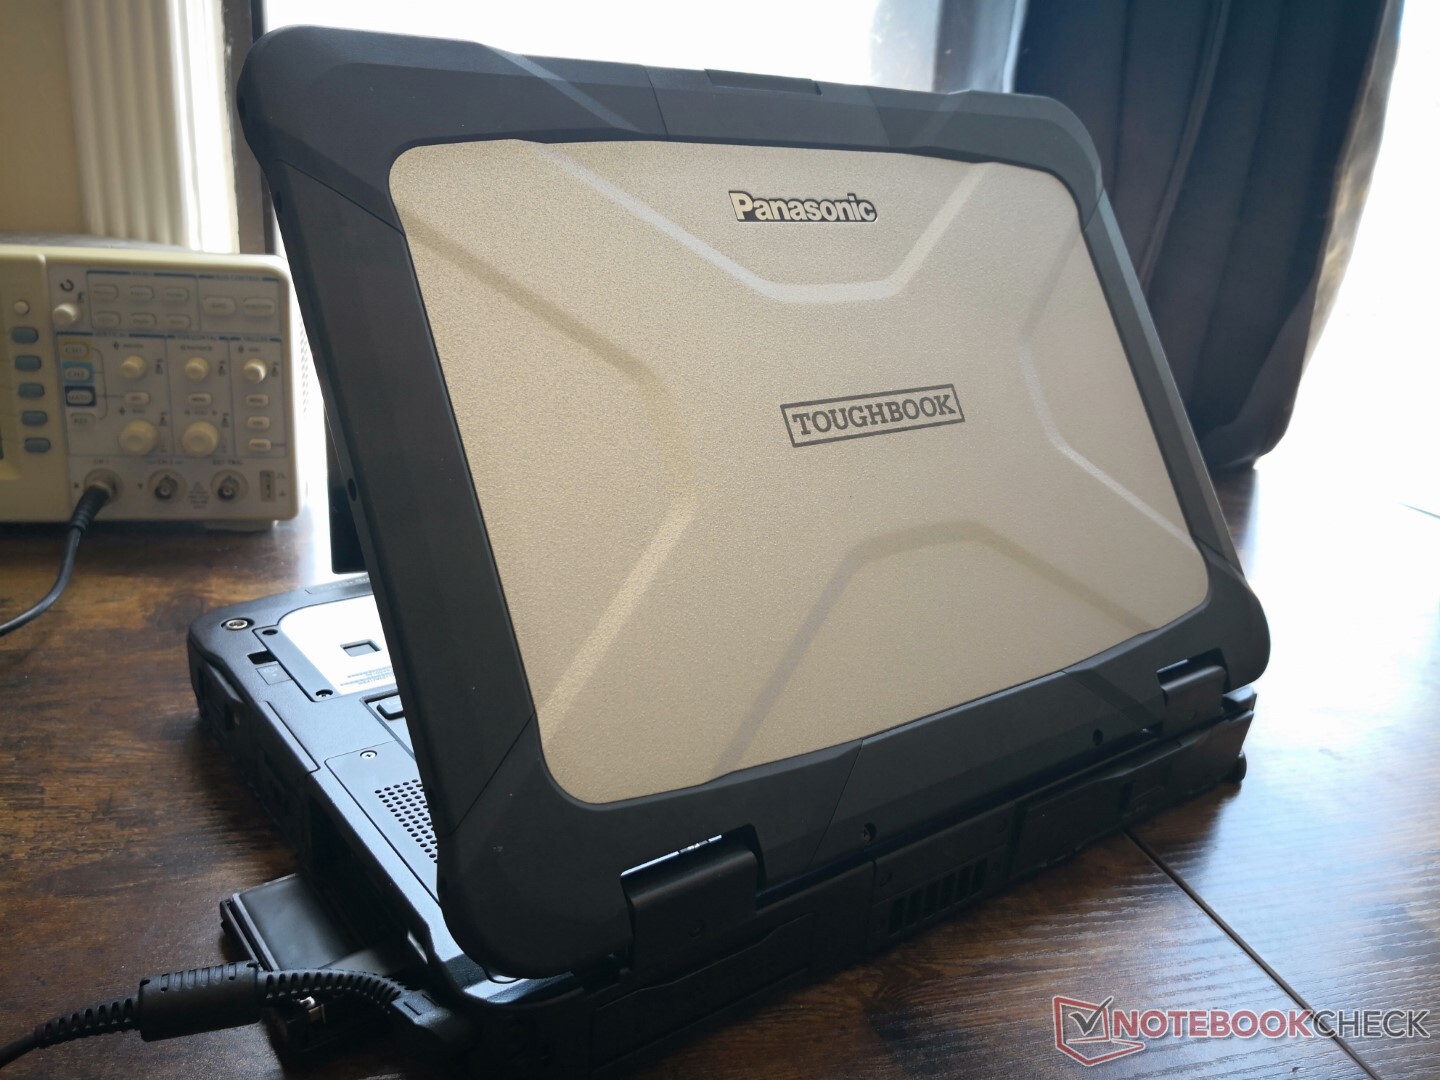
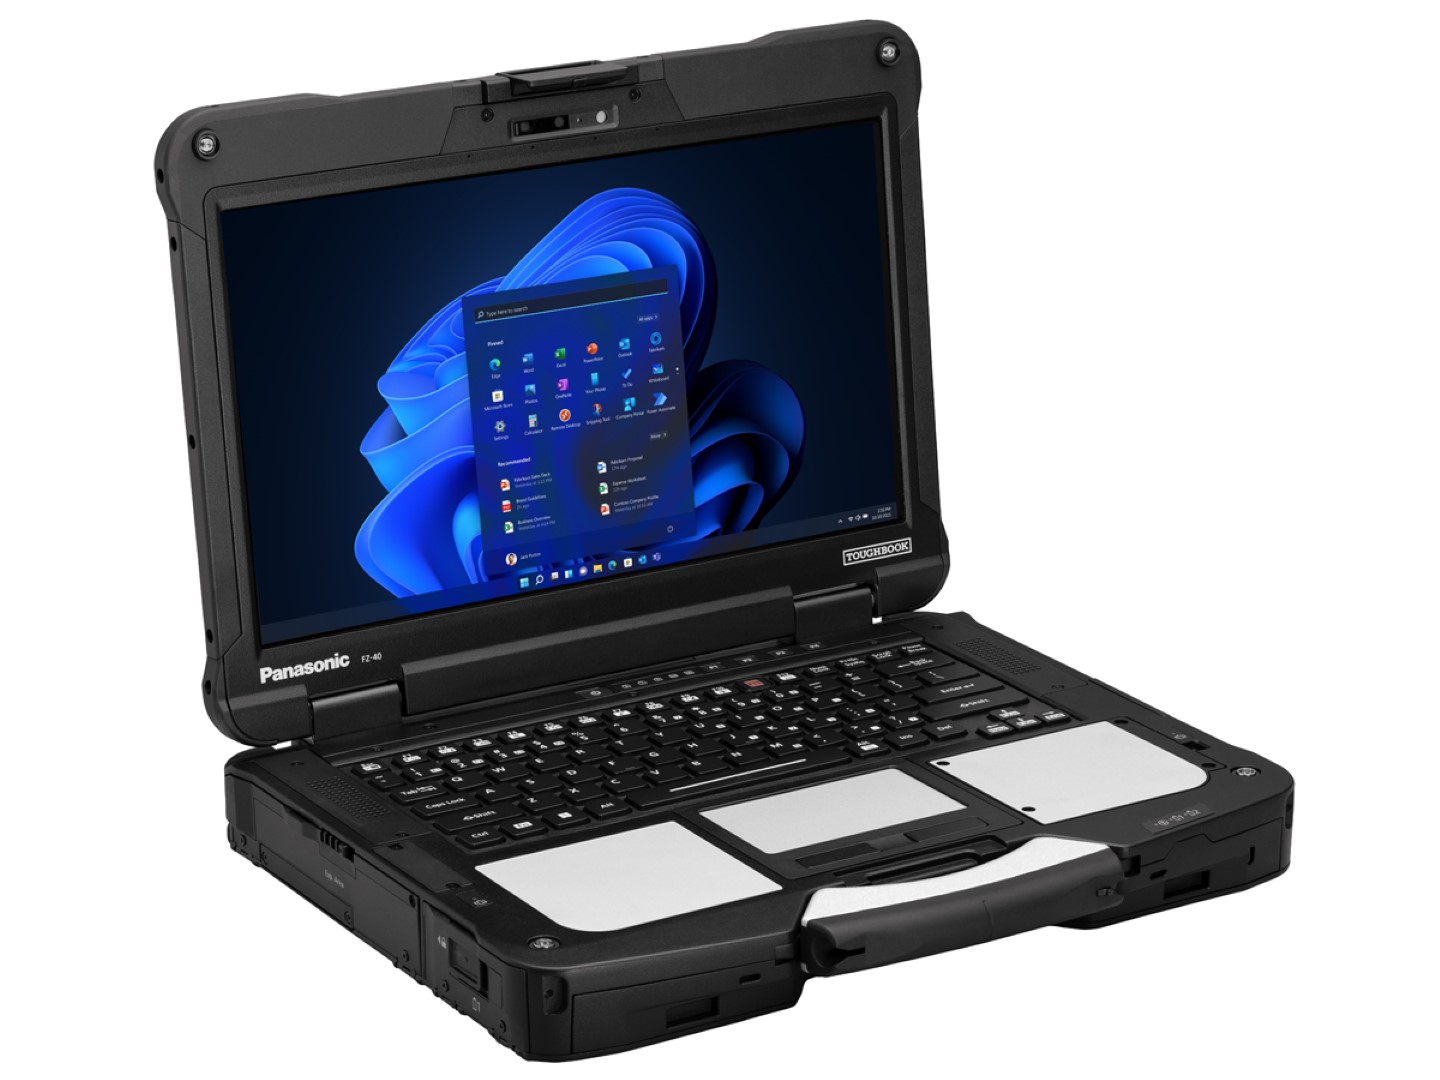
Análisis del portátil Panasonic Toughbook 40: Muy adaptable y modular
No debe confundirse con el Toughbook 55 de 14 pulgadas, más pequeño, el Toughbook 40 de 14 pulgadas es un portátil totalmente resistente diseñado con la capacidad de admitir hasta cuatro tarjetas de expansión modulares xPAK para adaptarse a las necesidades del usuario. Estas tarjetas opcionales ayudan a separar el Toughbook 40 de los modelos de la competencia, como el Getac S410, Dell Latitude 7400 Rugged o el Durabook S14I
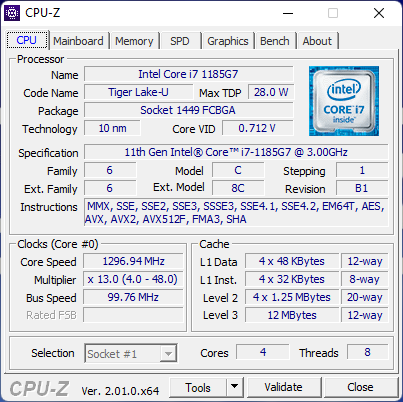
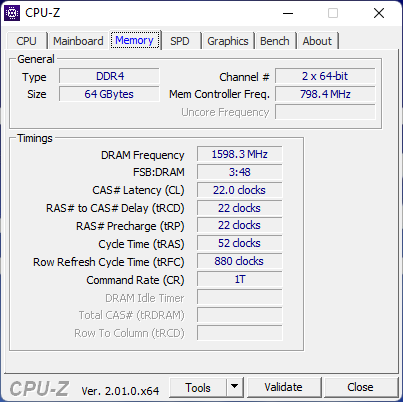
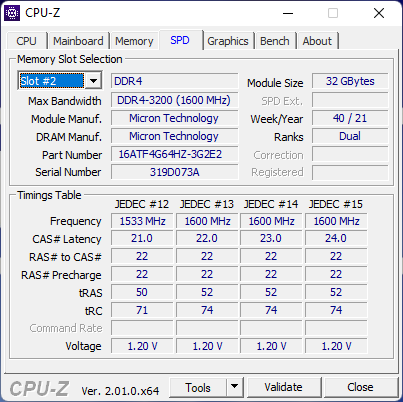
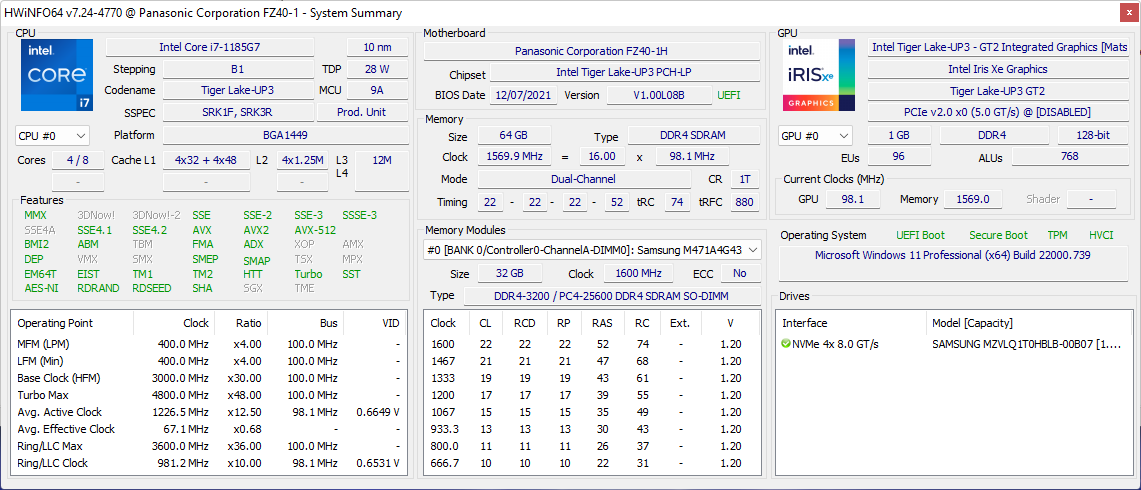
Internamente, nuestra unidad de prueba viene equipada con la 11ª generación Tiger Lake-U Core i7-1185G7 CPU, 64 GB de RAM, y una pantalla IPS ultra brillante de 1080p. Se pueden encontrar configuraciones adicionales en la página oficial del producto aquí
Más reseñas de Panasonic:
- Panasonic FZ-55 MK2
- Panasonic FZ-G2
- Panasonic FZ-S1
- Panasonic FZ-A3
Posibles contendientes en la comparación
Valoración | Fecha | Modelo | Peso | Altura | Tamaño | Resolución | Precio |
|---|---|---|---|---|---|---|---|
v (old) | 07/2022 | Panasonic Toughbook 40 i7-1185G7, Iris Xe G7 96EUs | 3.9 kg | 53.4 mm | 14.00" | 1920x1080 | |
| 83.9 % v7 (old) | 09/2021 | Panasonic Toughbook FZ-55 MK2 i7-1185G7, Iris Xe G7 96EUs | 2.3 kg | 33 mm | 14.00" | 1920x1080 | |
| 81.7 % v7 (old) | 05/2022 | Getac S410 Gen 4 i7-1185G7, Iris Xe G7 96EUs | 3.2 kg | 34.9 mm | 14.00" | 1920x1080 | |
| 89.2 % v6 (old) | 03/2019 | Dell Latitude 5420 Rugged-P85G i7-8650U, Radeon RX 540 | 2.8 kg | 32.9 mm | 14.00" | 1920x1080 | |
| 82.4 % v7 (old) | 12/2021 | Acer Enduro Urban N3 EUN314 i7-1165G7, Iris Xe G7 96EUs | 1.8 kg | 21.95 mm | 14.00" | 1920x1080 | |
v (old) | 04/2021 | Durabook S14I i7-1165G7, Iris Xe G7 96EUs | 3 kg | 38.1 mm | 14.00" | 1920x1080 |
Caso
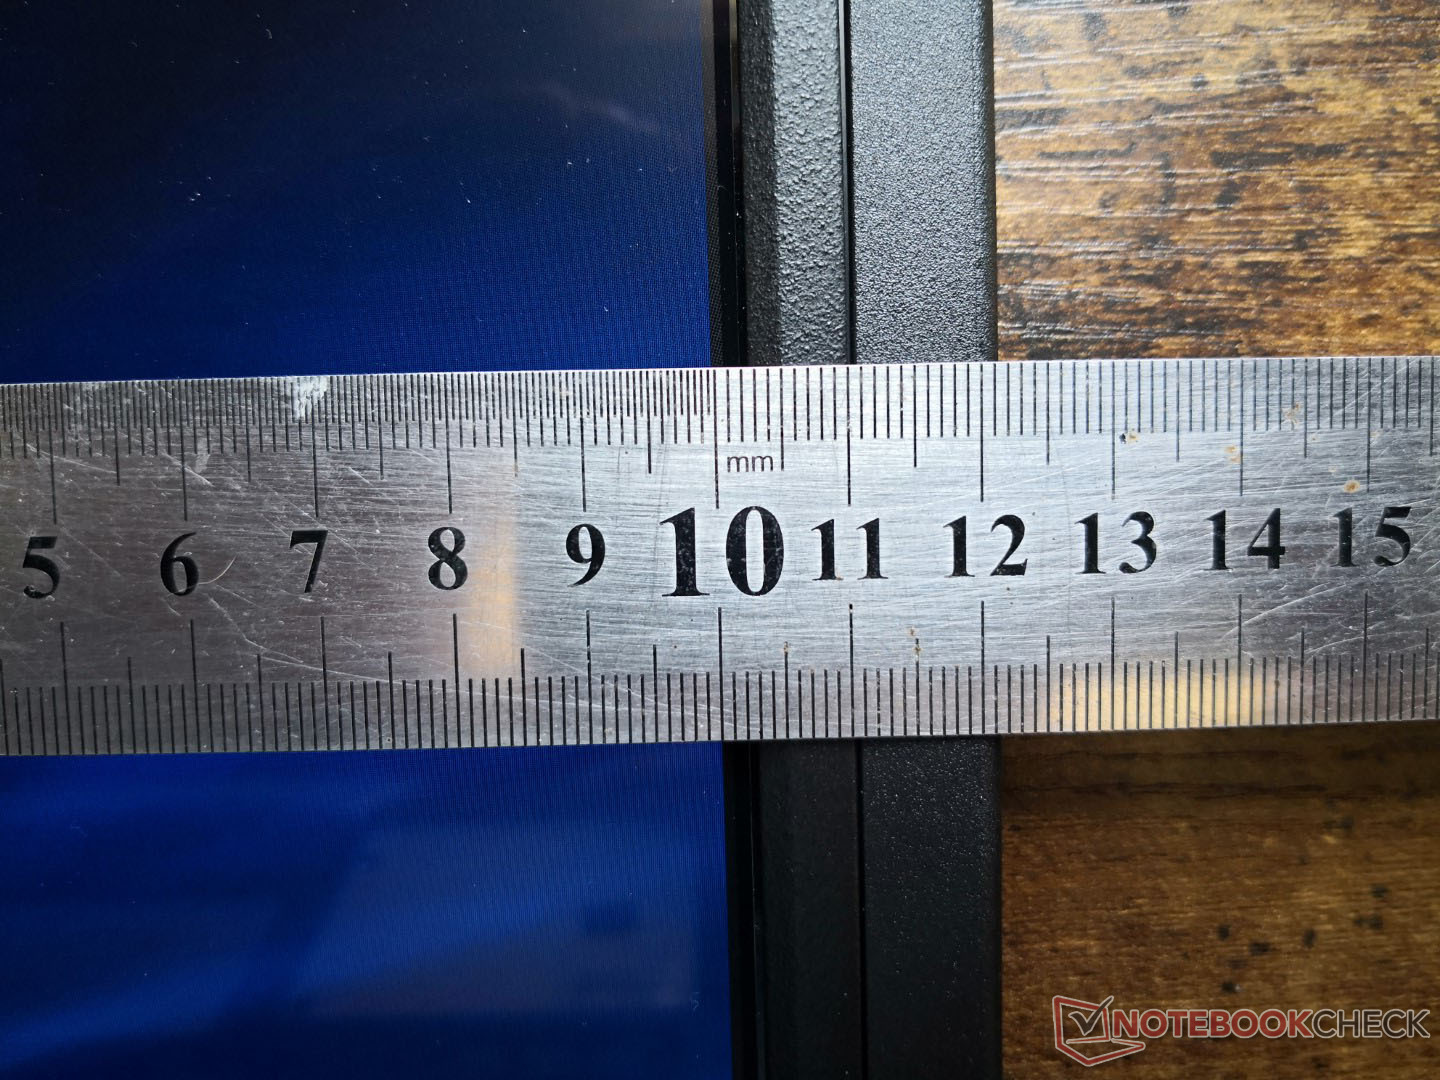
El modelo es grande y pesado, ya que se trata de un diseño totalmente robusto. El Durabook S14I semirrígido, por ejemplo, ofrece el mismo tamaño de pantalla y, sin embargo, es casi 1 kg más ligero, a la vez que es más pequeño en las tres dimensiones.

Conectividad y expansión de xPAK
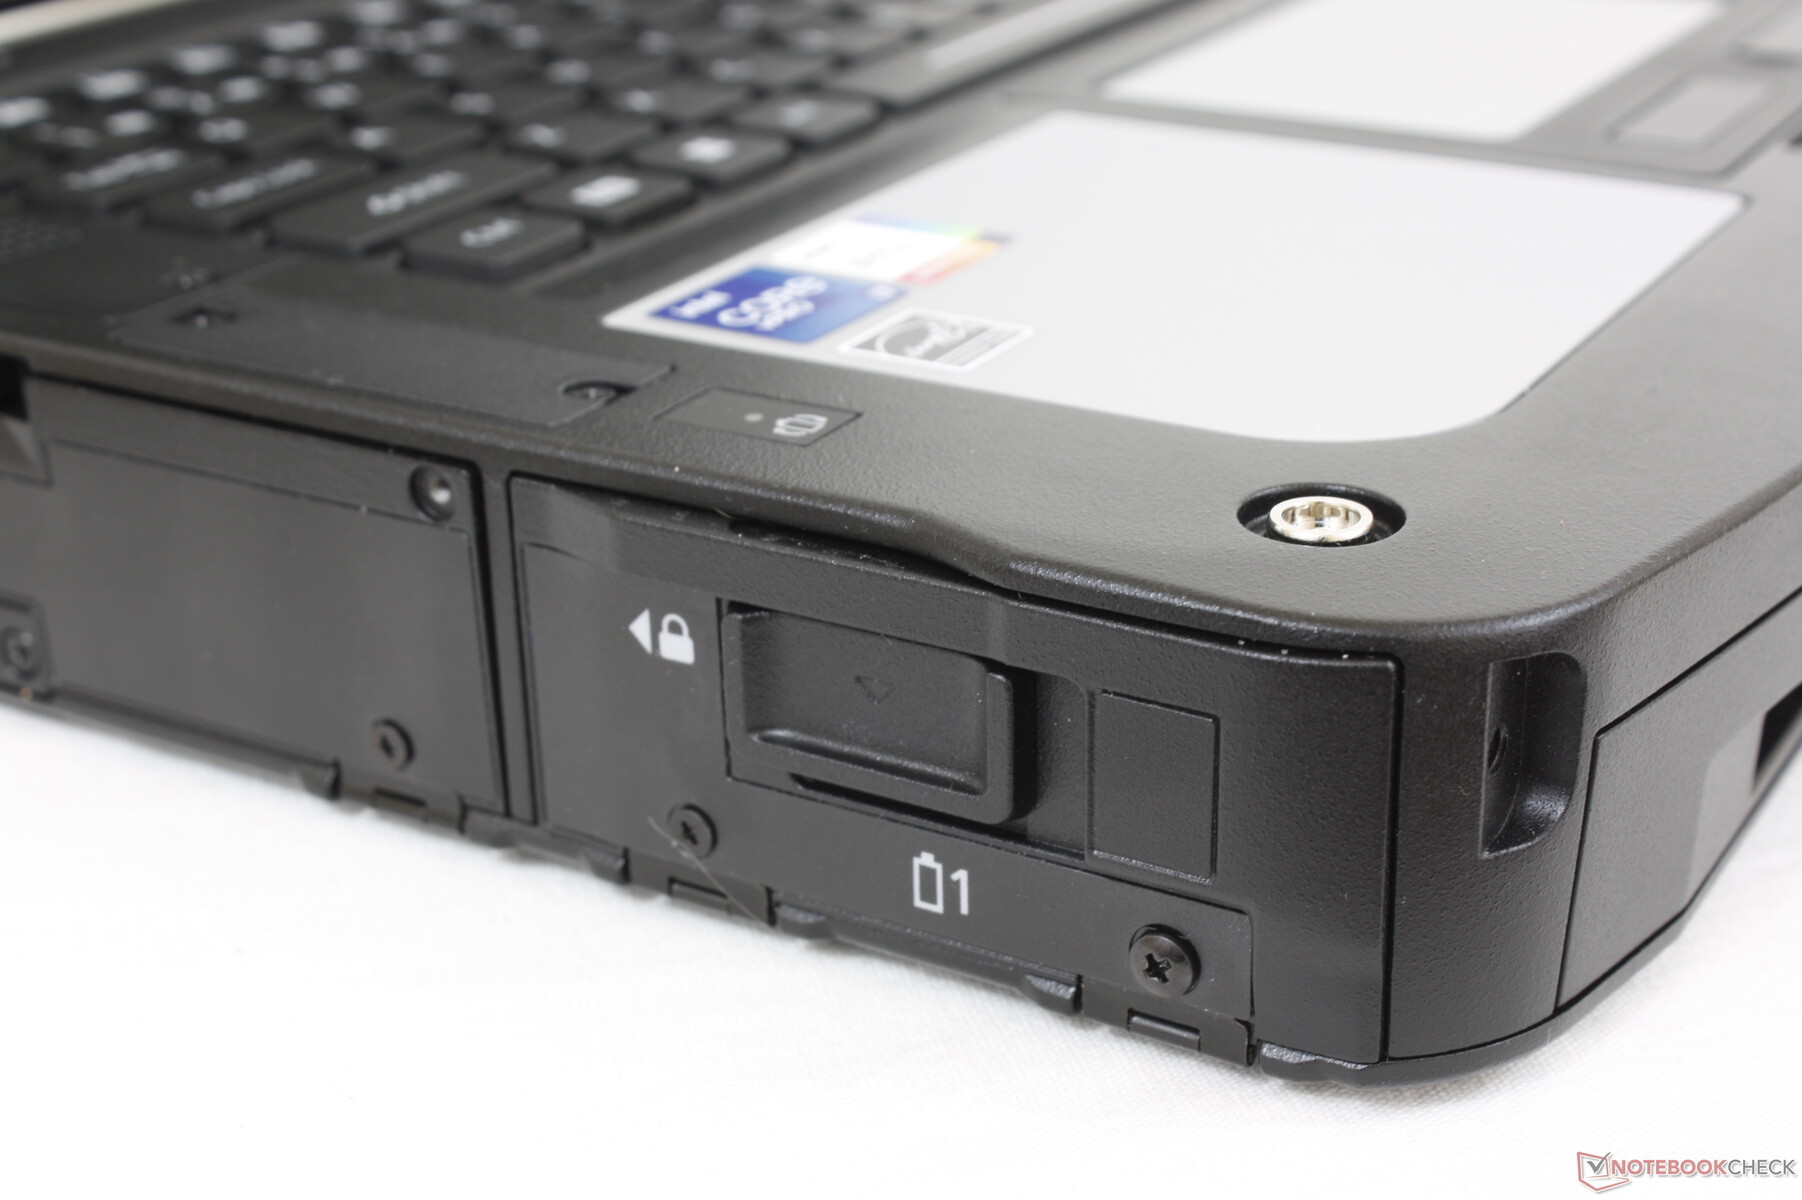
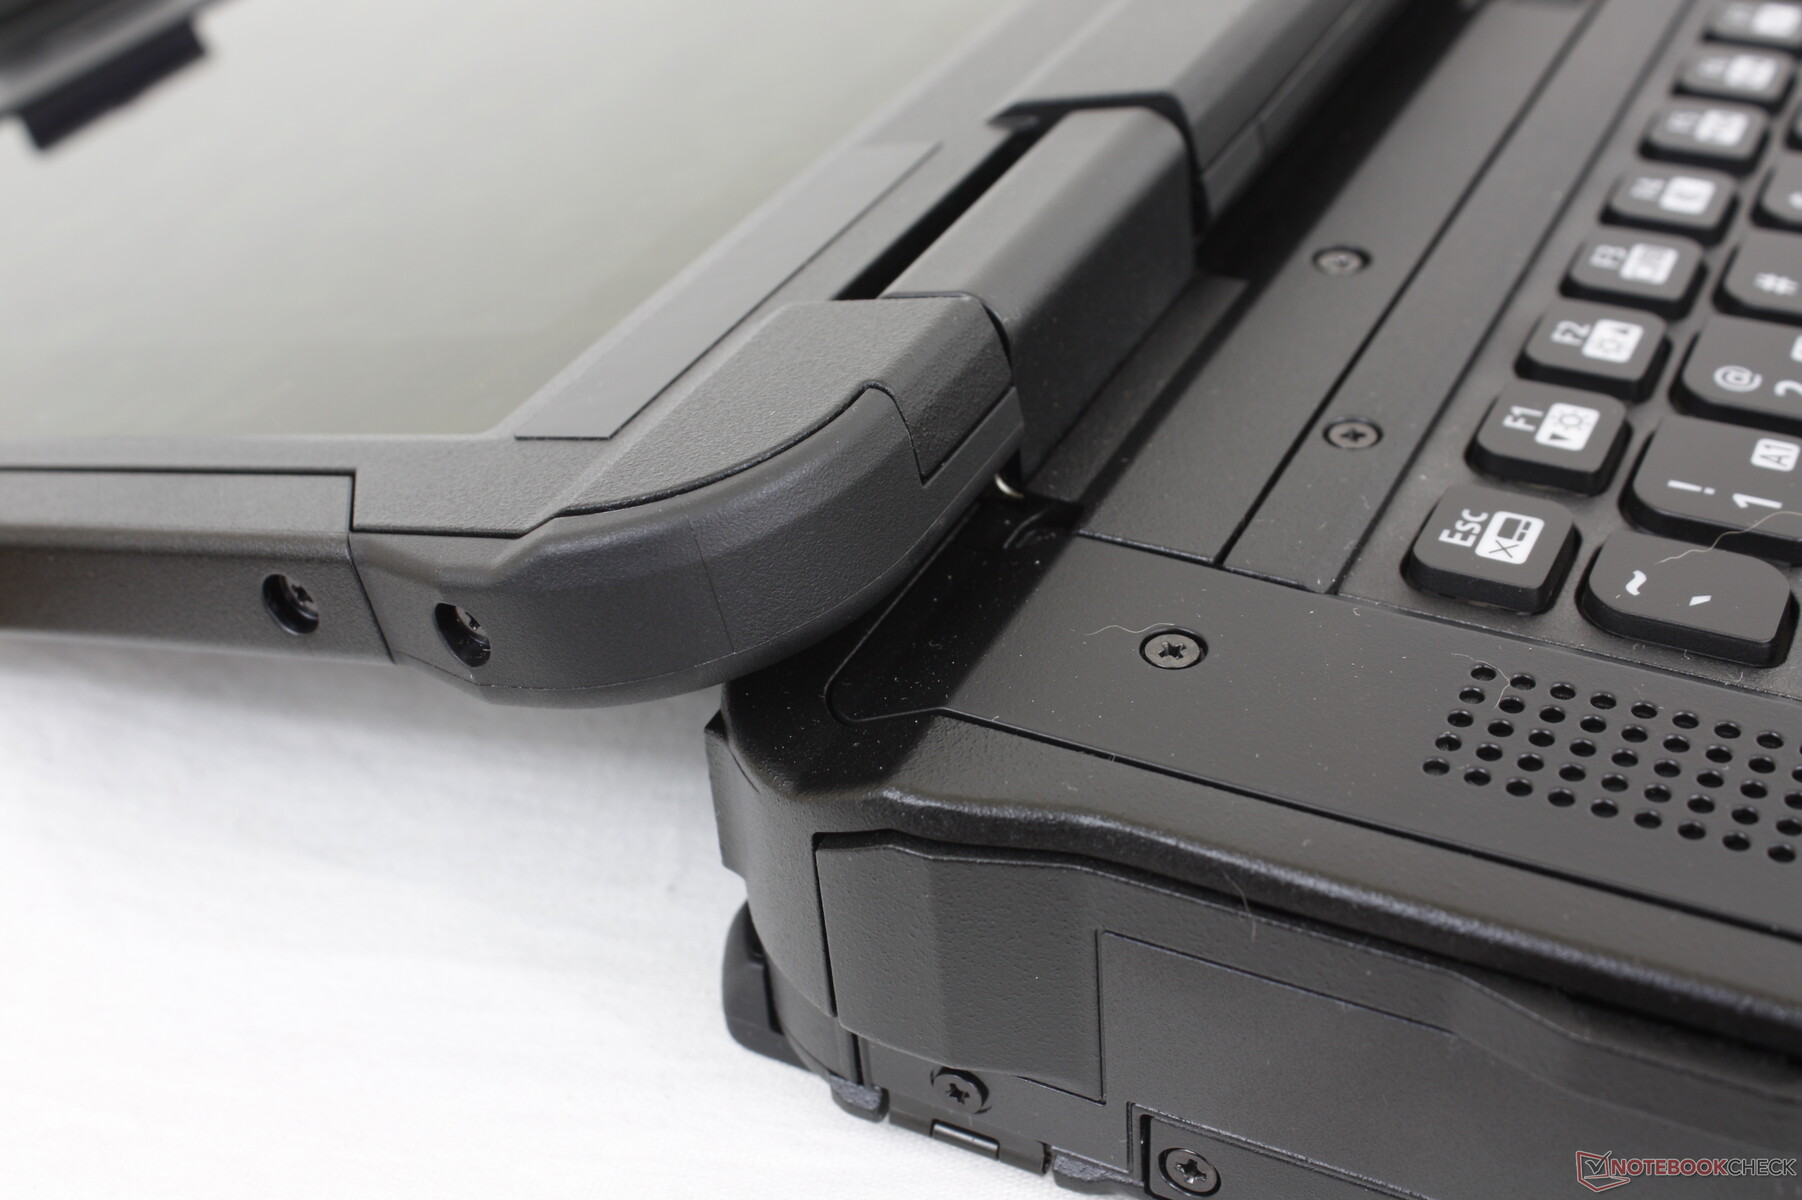
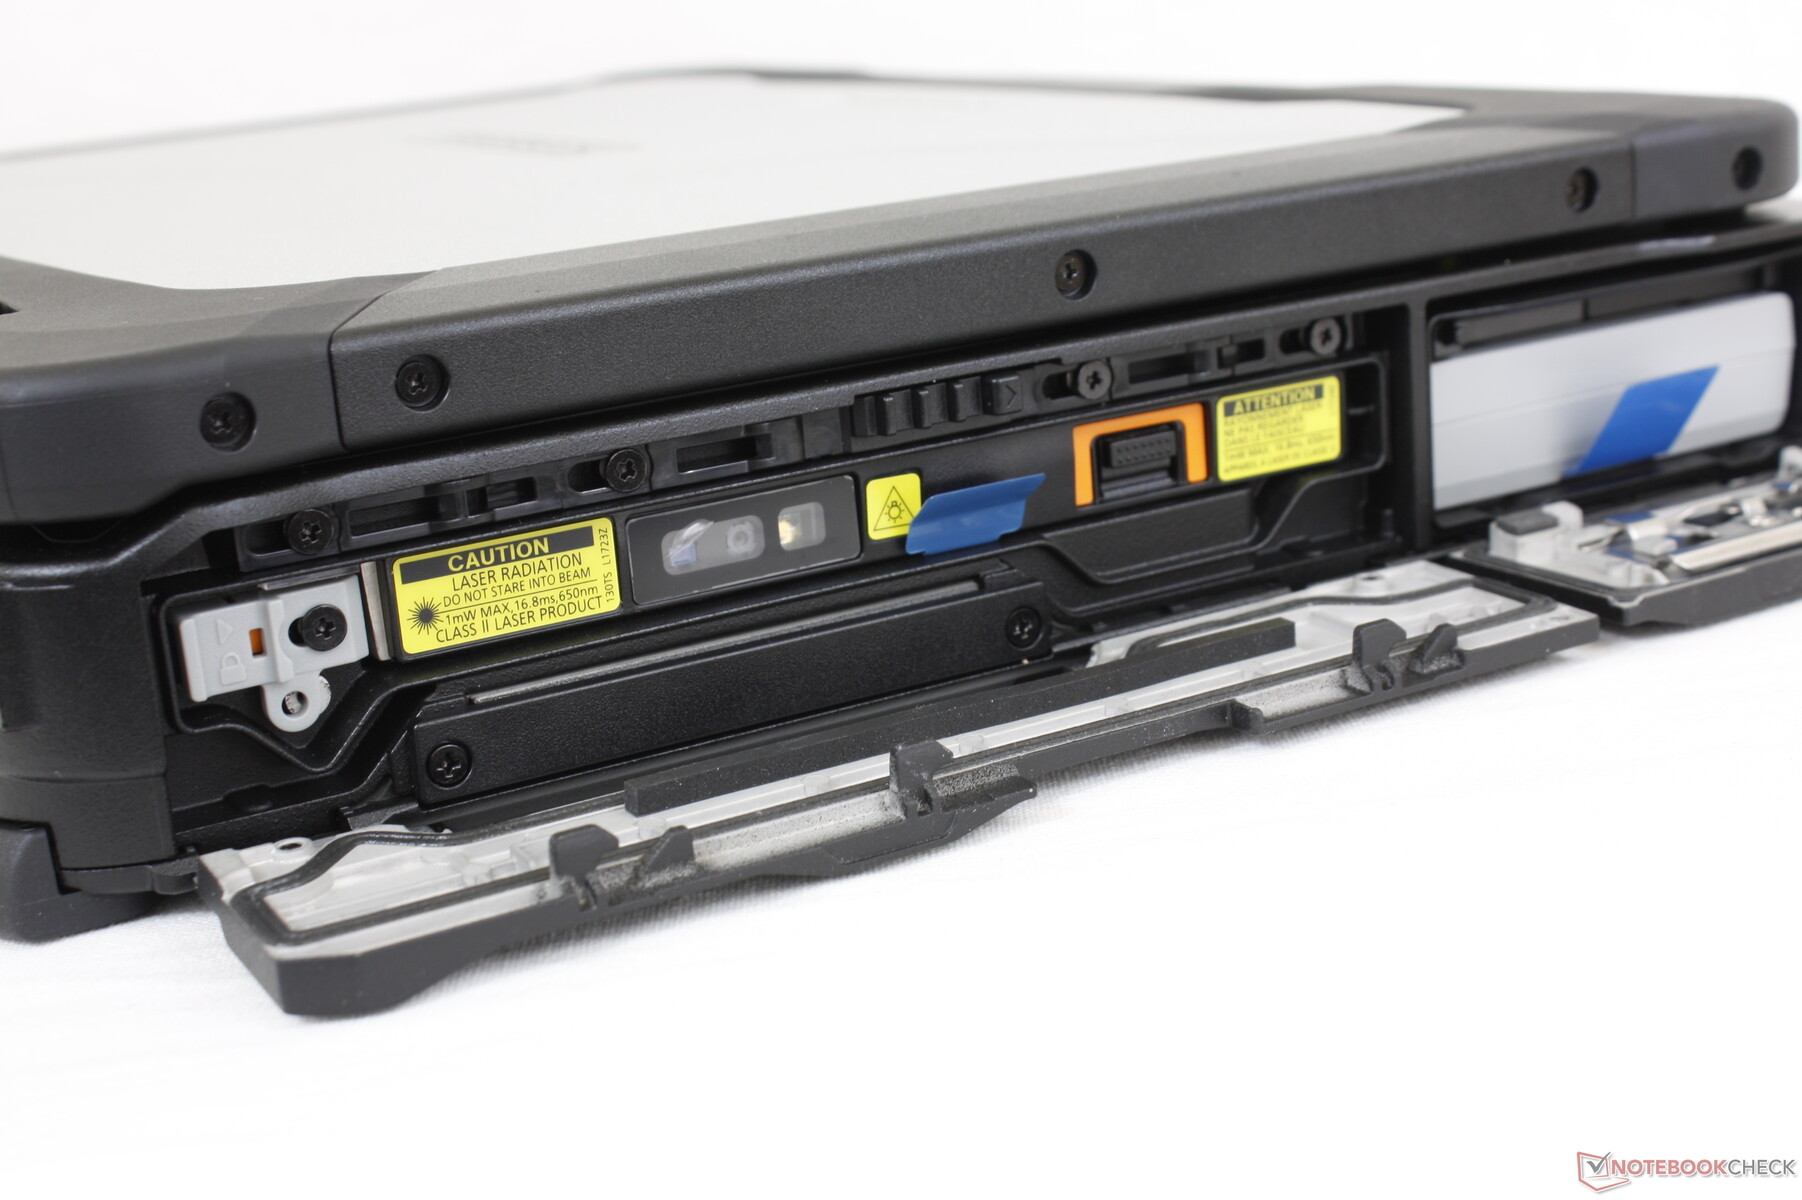
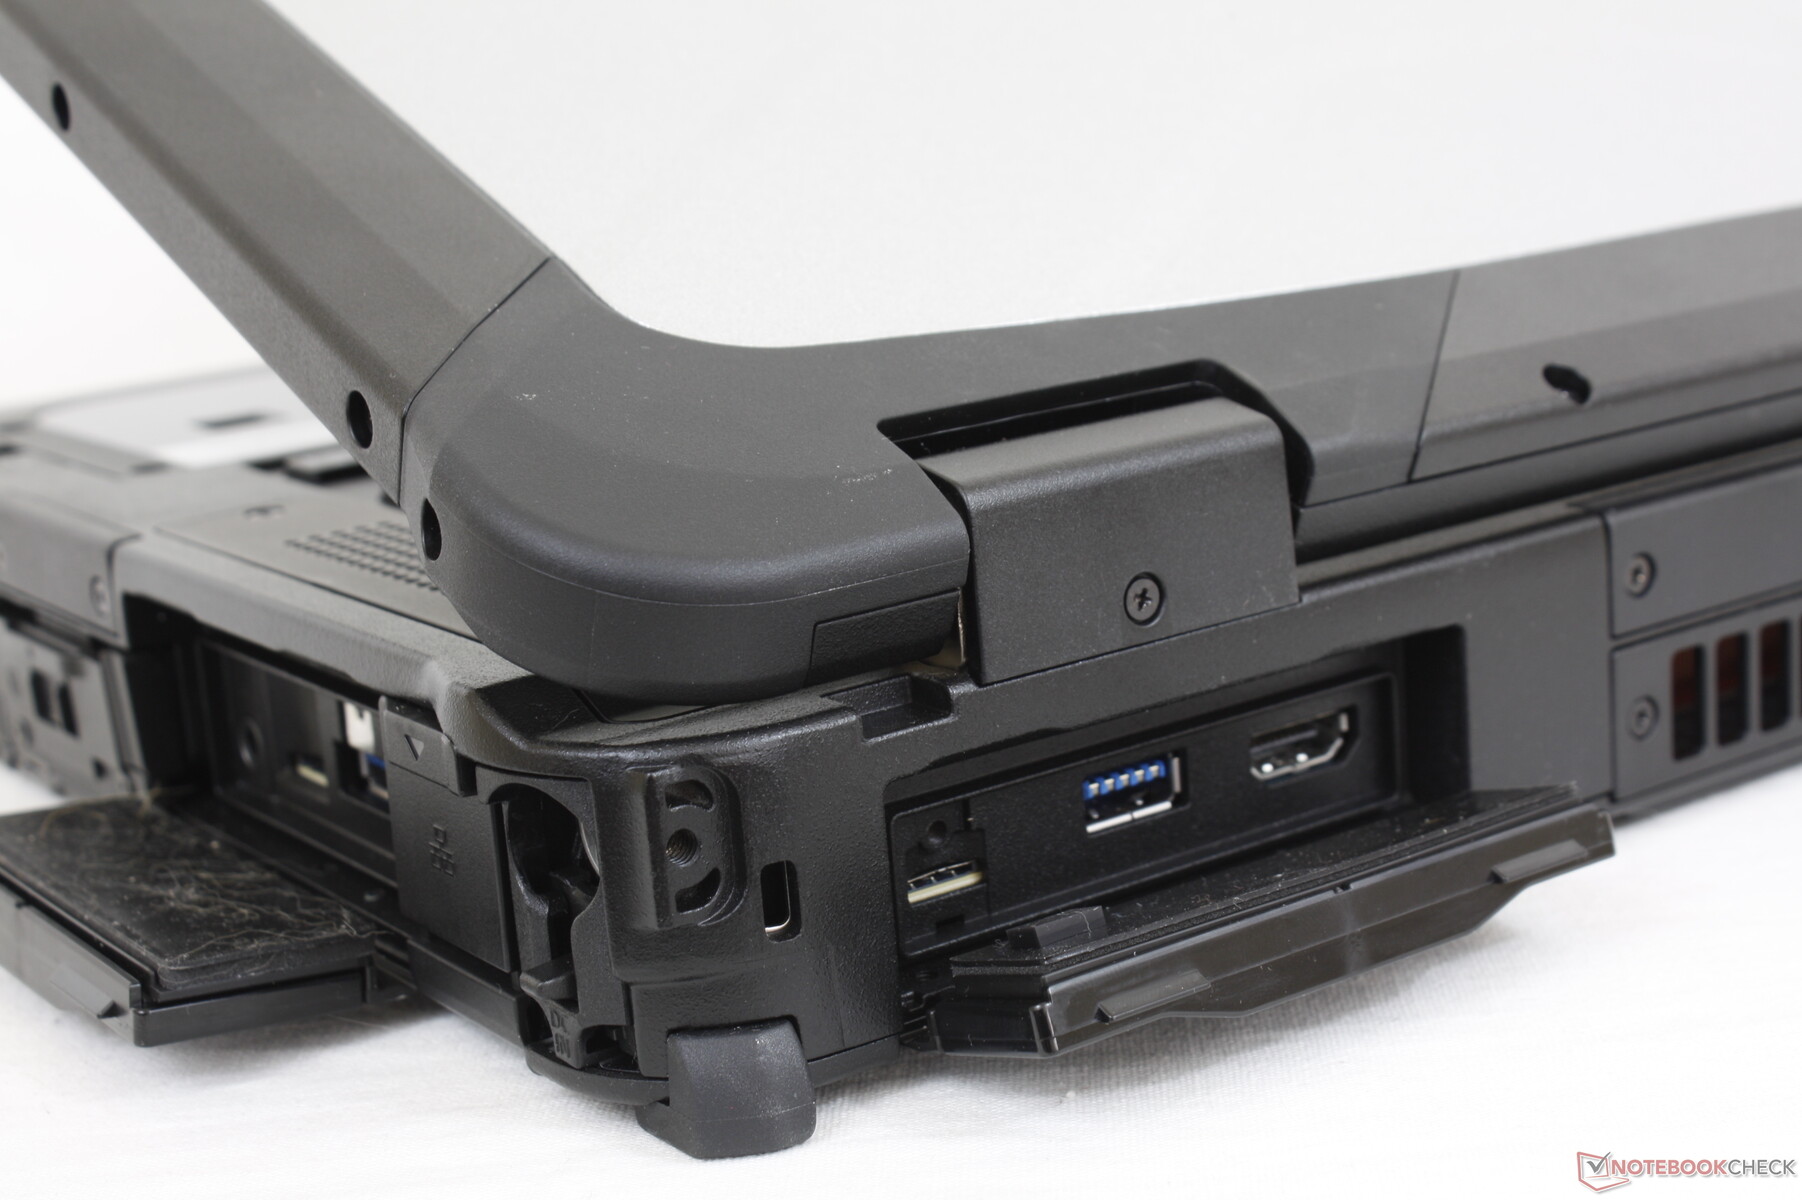
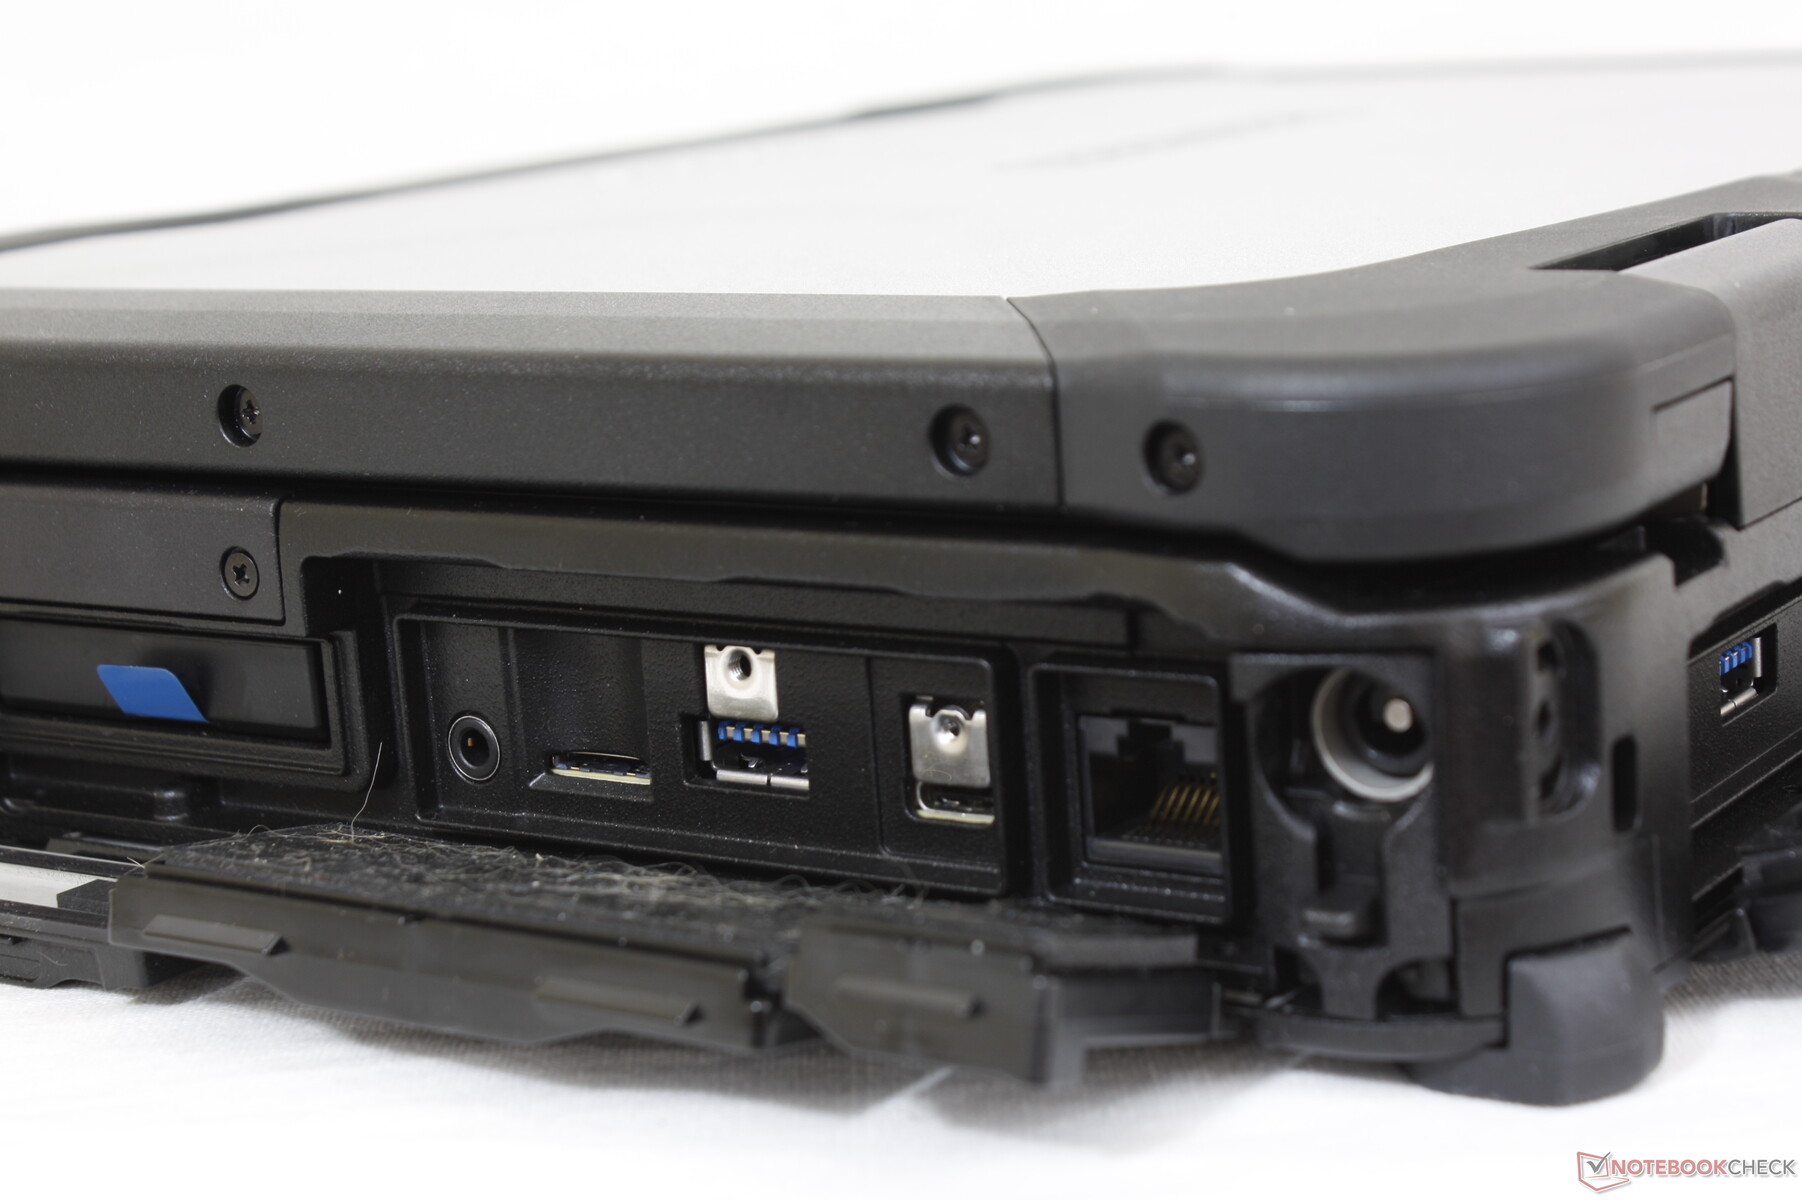
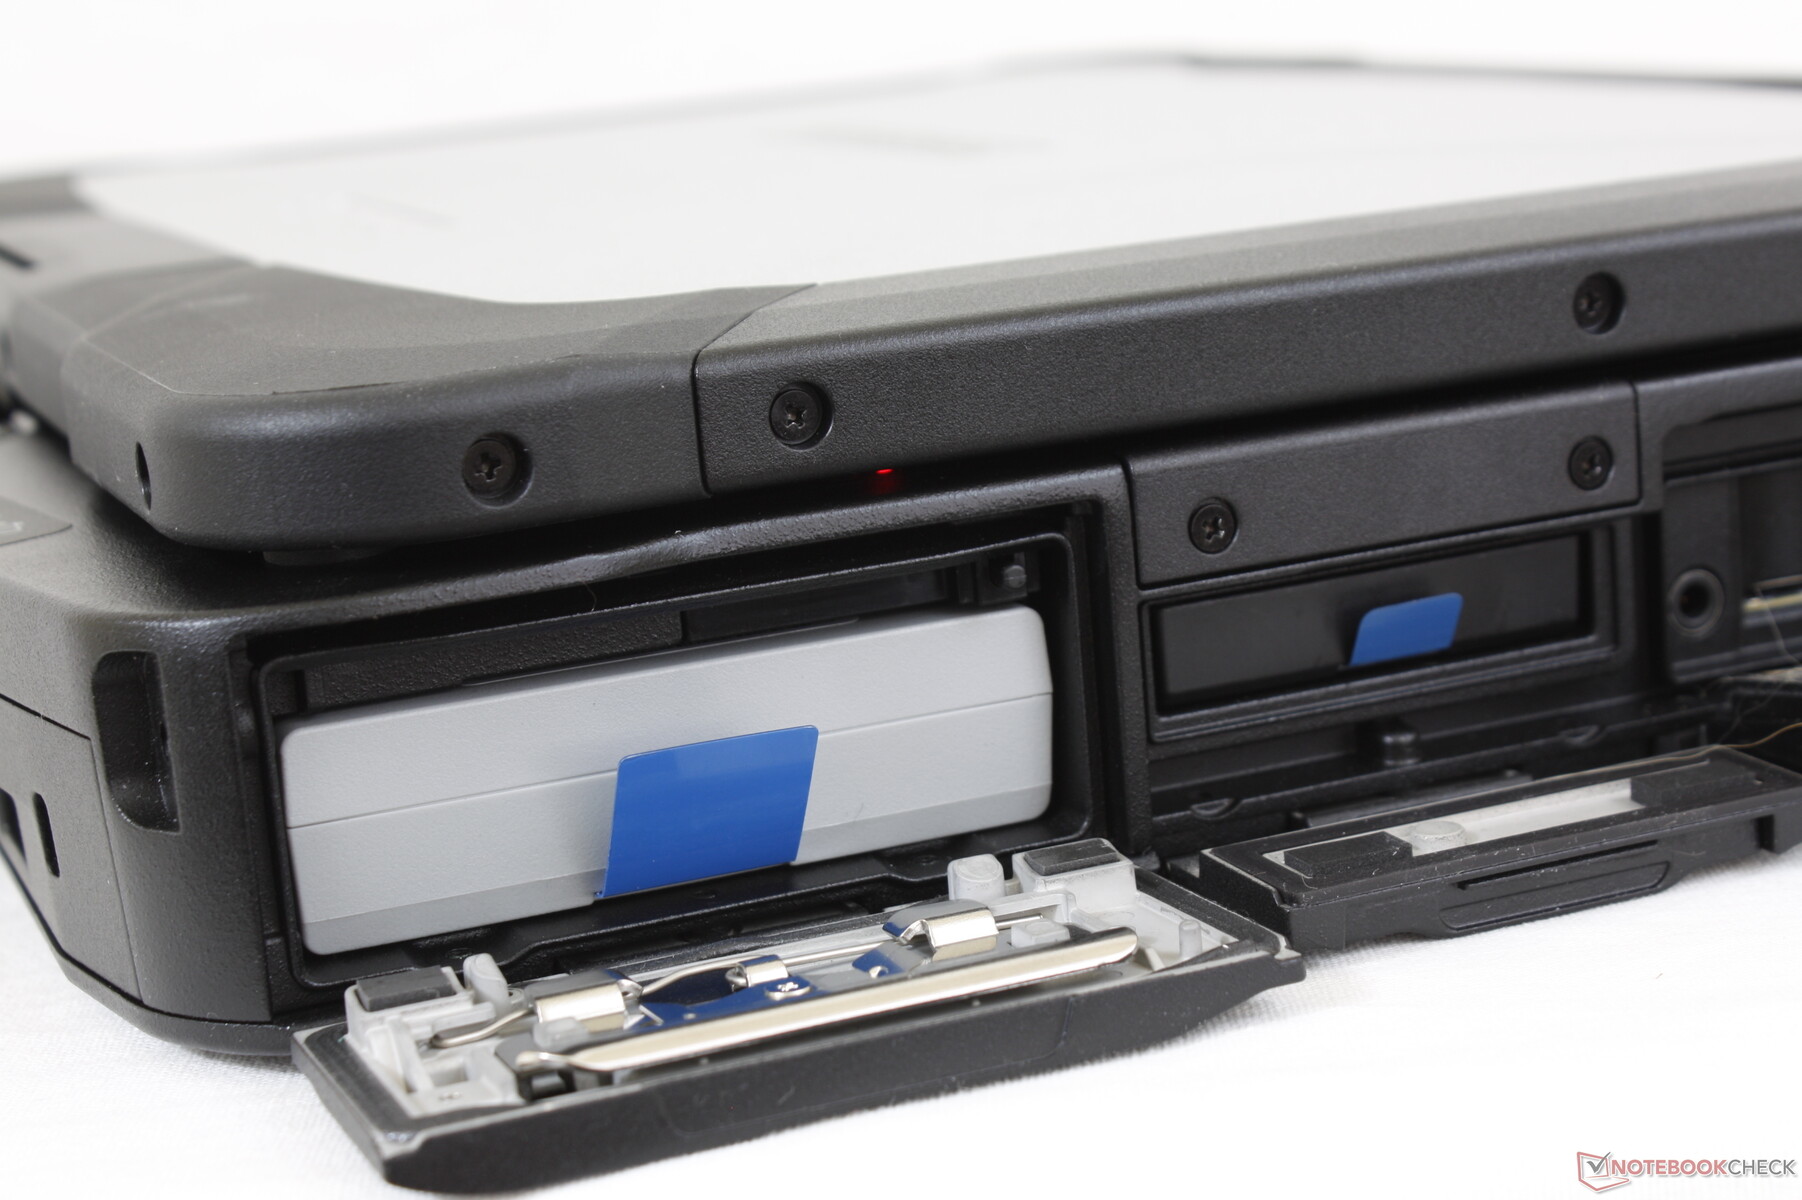
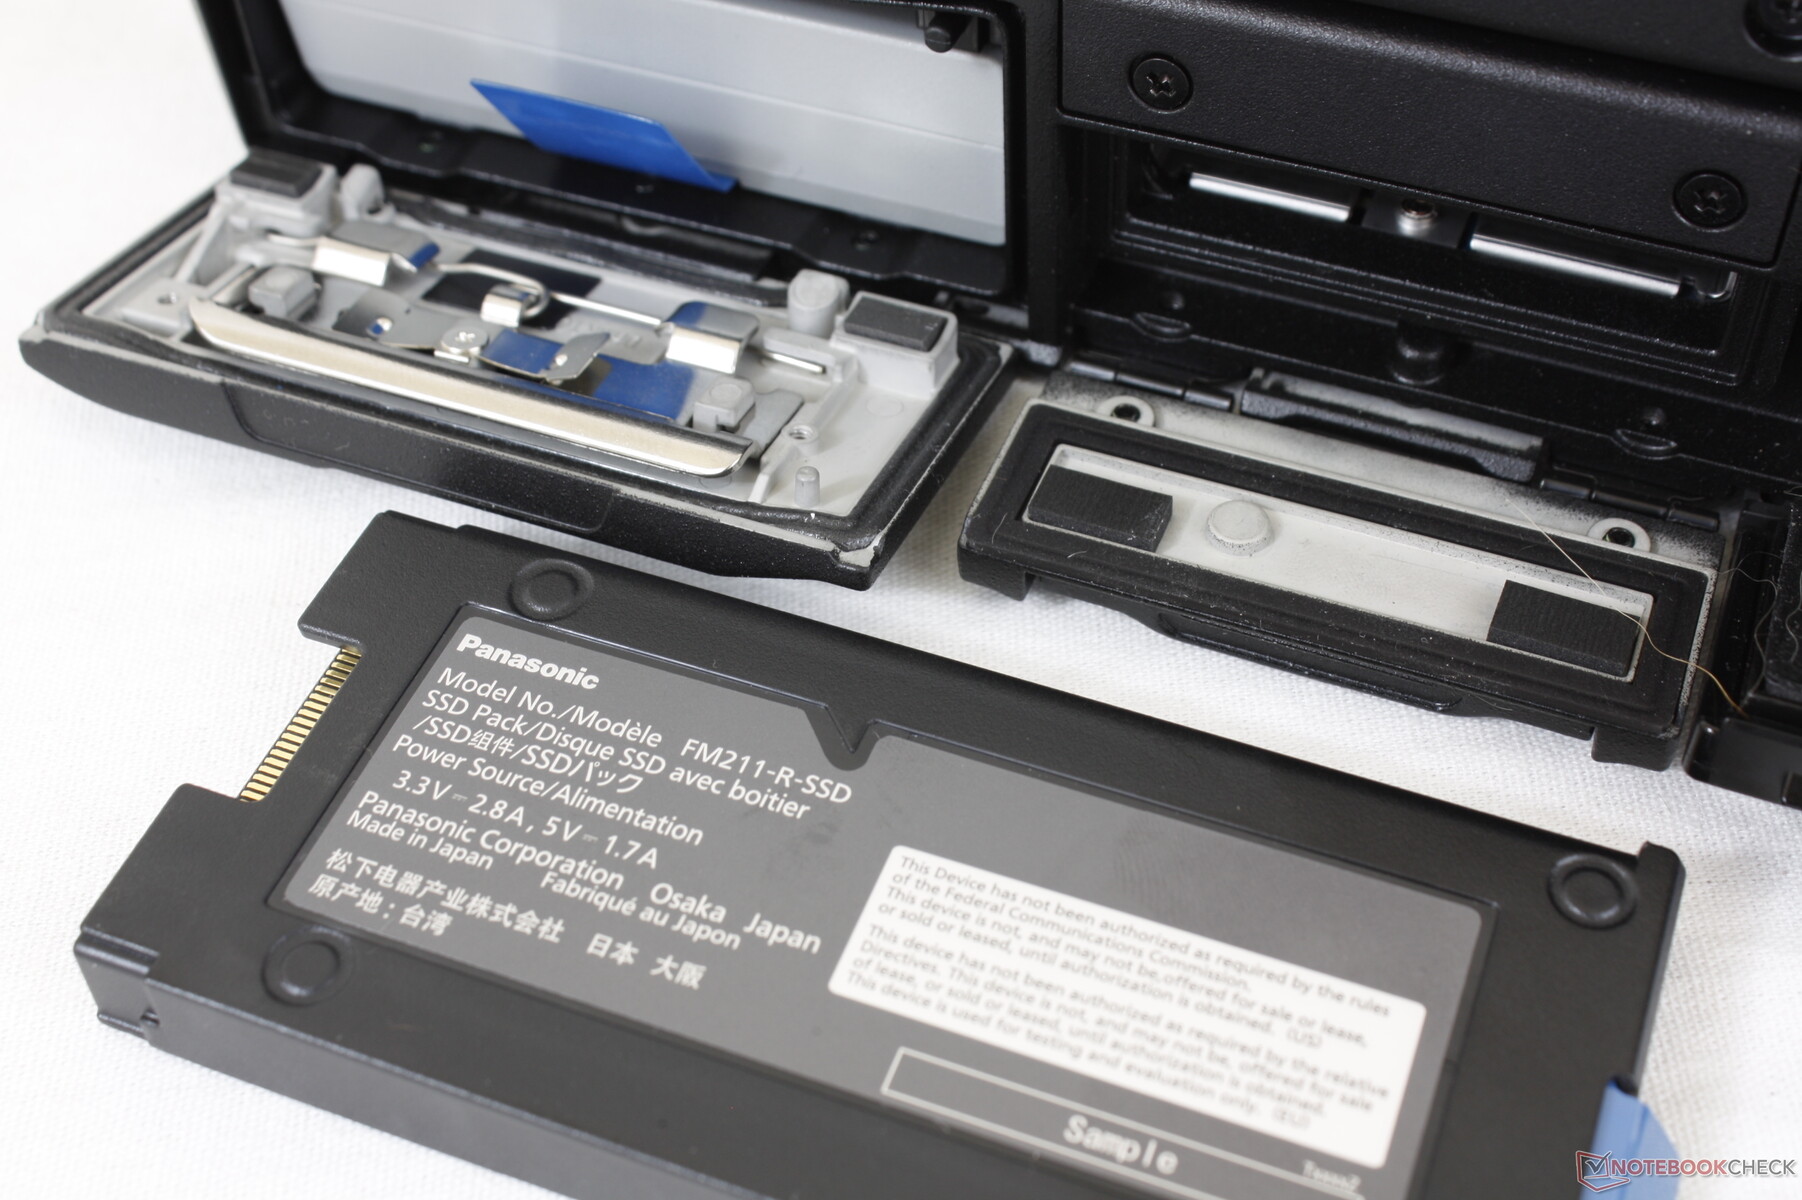
Los puertos intercambiables y las características de conectividad del Toughbook 40 son algunas de las más versátiles que hemos visto en cualquier portátil. El modelo admite hasta cuatro tarjetas xPAK extraíbles simultáneamente: Una a lo largo de la parte trasera, otra a lo largo del borde izquierdo, otra a lo largo del borde derecho y otra debajo del reposamanos derecho, como muestran las imágenes de abajo. Si tu escenario de uso no requiere HDMI, por ejemplo, entonces la cubierta de puertos puede cambiarse por otra que incluya un conjunto diferente de puertos. La batería primaria y el SSD también tienen sus propias ranuras a lo largo del borde izquierdo y el borde derecho, respectivamente, pero no se incluyen como parte de las cuatro ranuras xPAK. Ten en cuenta que cada una de las cuatro ranuras xPAK tiene tamaños y formas diferentes; una tarjeta diseñada para encajar en una ranura no encajará en ninguna de las otras.
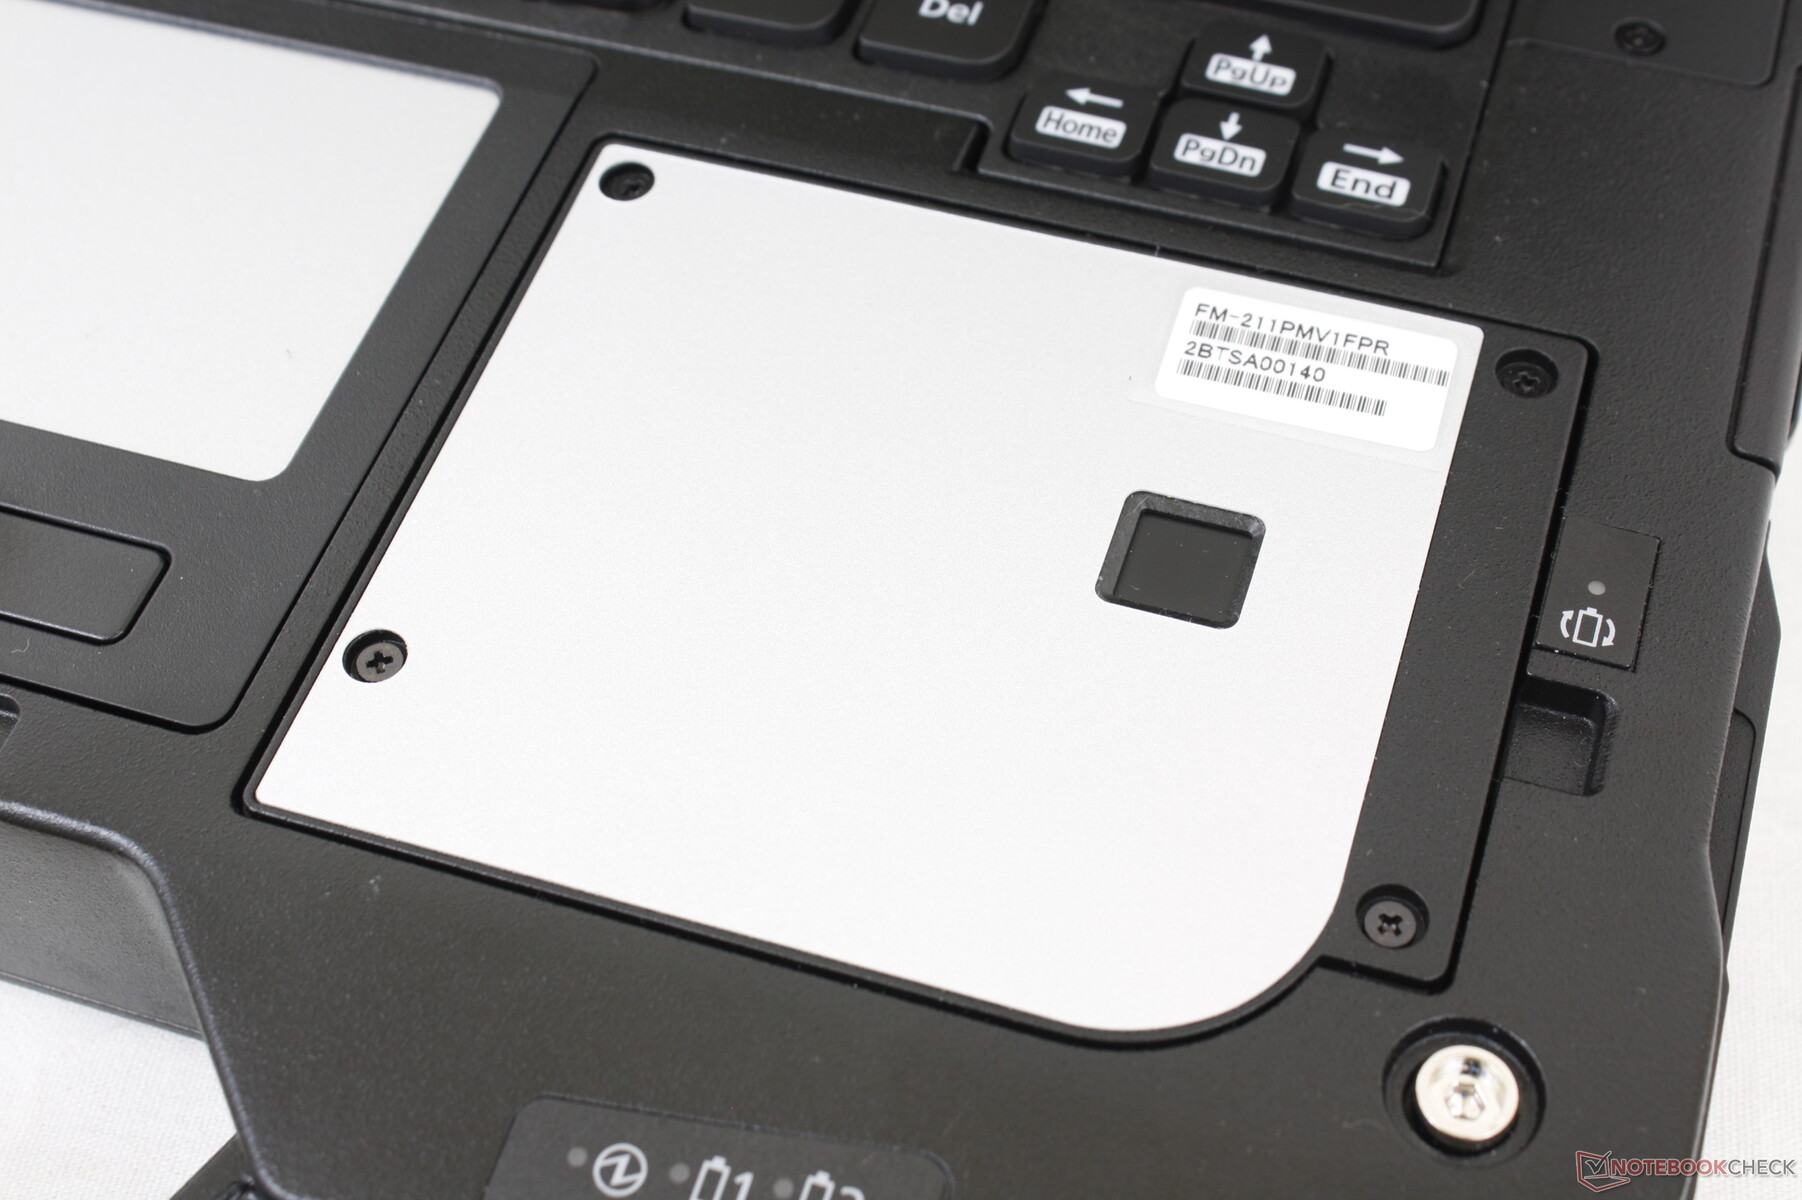
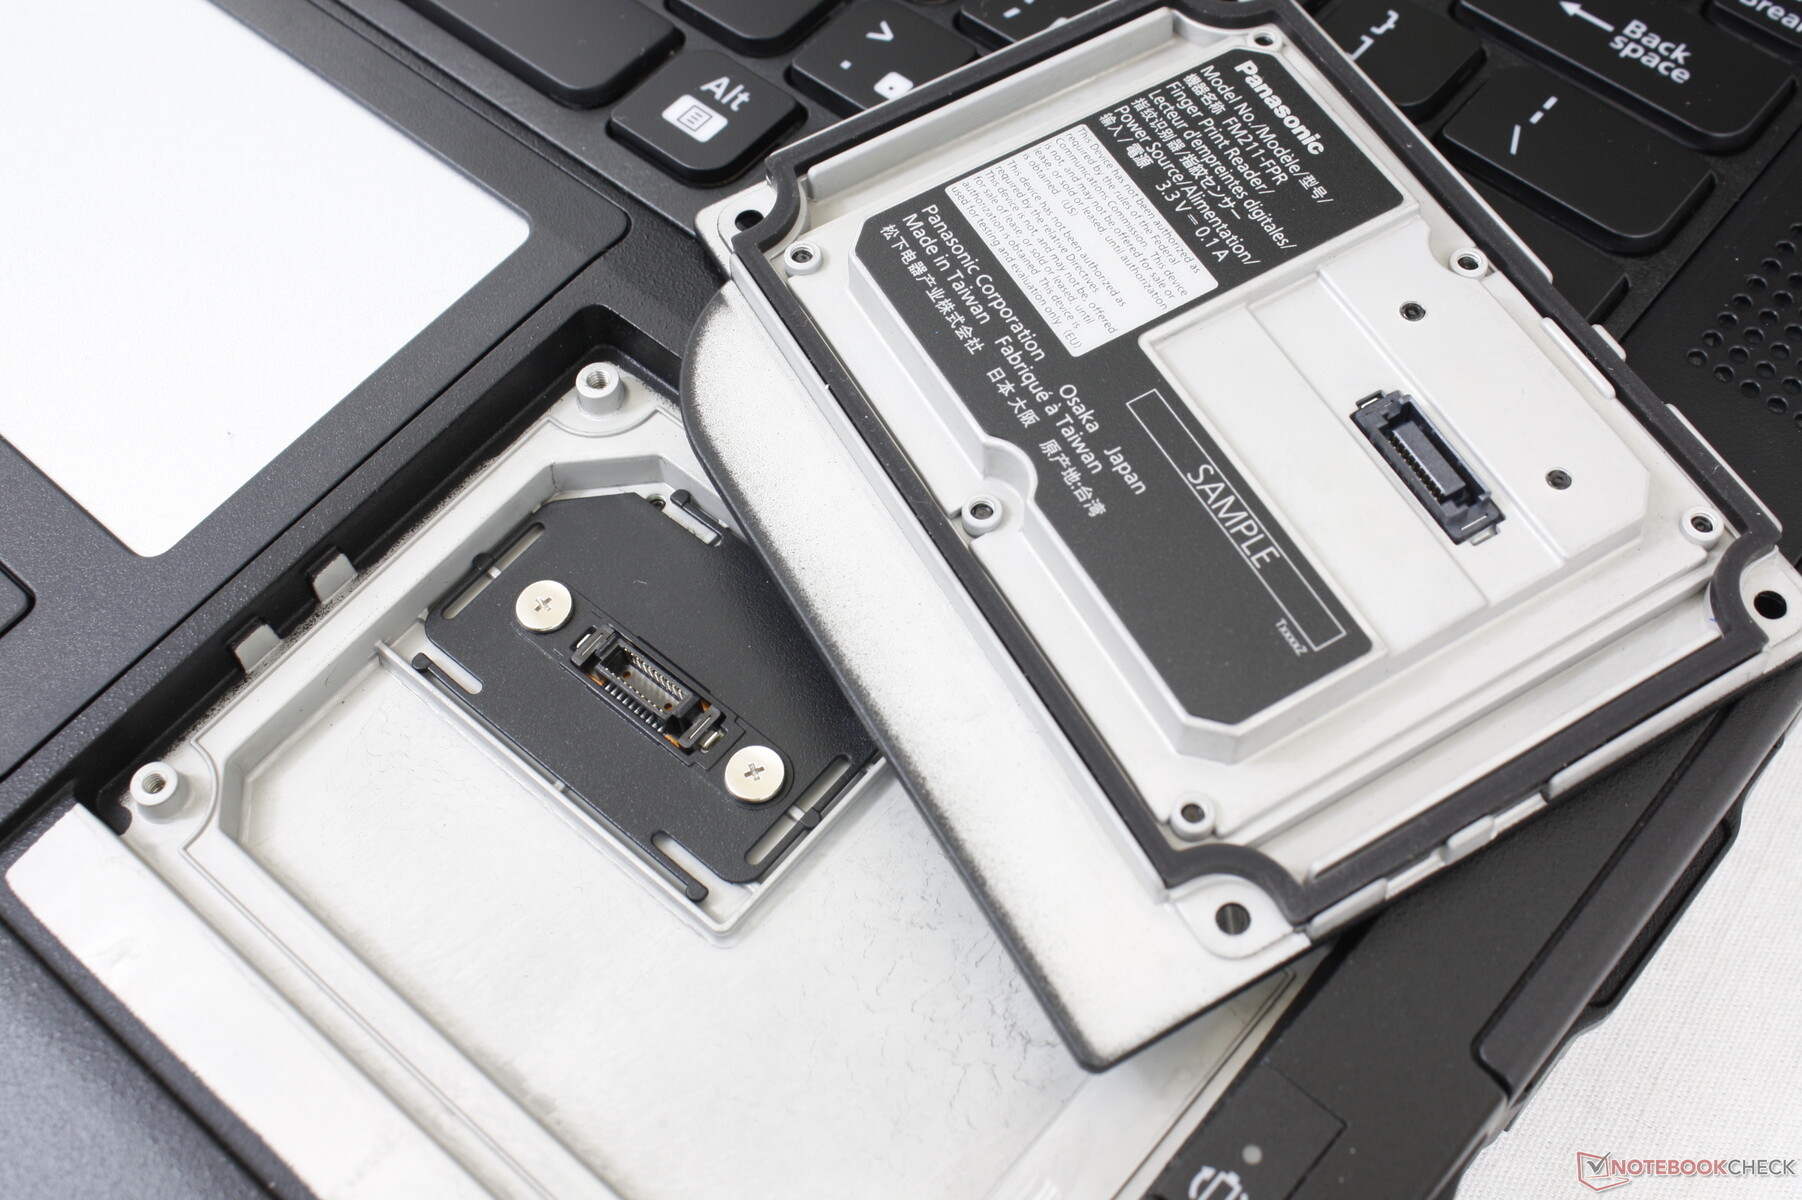
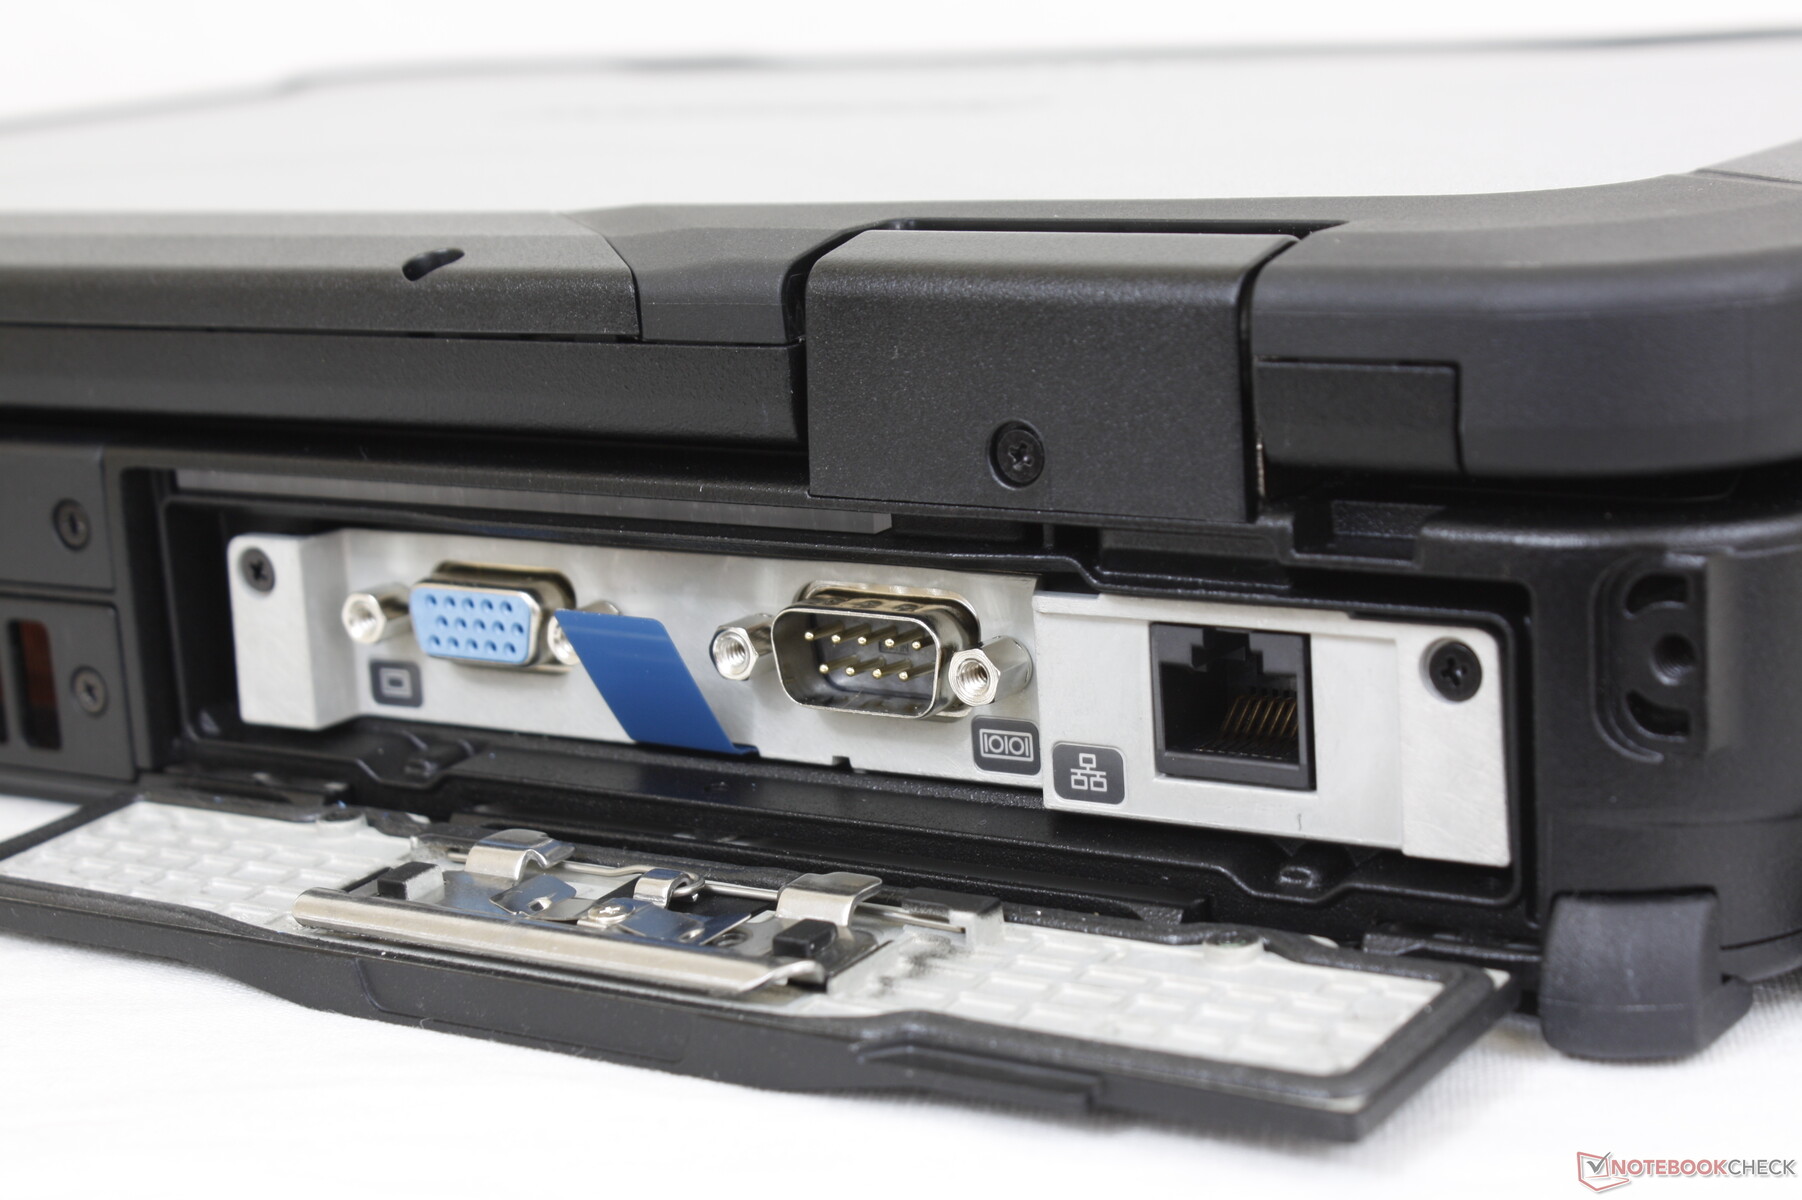
La primera ranura es la de expansión trasera, diseñada para puertos como VGA, serie, LAN, USB-A y HDMI. La segunda ranura, situada a lo largo del borde izquierdo, admite unidades ópticas, escáneres de códigos de barras, lectores de tarjetas inteligentes y unidades SSD secundarias. La tercera ranura del borde derecho admite baterías secundarias o lectores de tarjetas inteligentes. Y, por último, la ranura del reposamanos admite lectores de huellas dactilares y otras funciones de seguridad. El fabricante tiene previsto producir en un futuro próximo otras tarjetas de expansión para diversos fines.
Un problema molesto de todas estas ranuras es que las solapas que las cubren son muy delicadas y difíciles de abrir y bloquear, especialmente si se tienen manos pequeñas o dedos grasos. No hay suficiente agarre en estas solapas para que sean cómodas de usar. Las tapas a lo largo de los bordes del Dell Latitude 7330 Rugged son mucho más fáciles de agarrar y manejar en comparación.
Lector de tarjetas SD
| SD Card Reader | |
| average JPG Copy Test (av. of 3 runs) | |
| Dell Latitude 5420 Rugged-P85G (Toshiba Exceria Pro SDXC 64 GB UHS-II) | |
| Panasonic Toughbook FZ-55 MK2 (AV Pro V60) | |
| Panasonic Toughbook 40 (AV Pro V60) | |
| Acer Enduro Urban N3 EUN314 (AV Pro V60) | |
| Durabook S14I (Angelbird 128GB AV Pro UHS-II) | |
| maximum AS SSD Seq Read Test (1GB) | |
| Dell Latitude 5420 Rugged-P85G (Toshiba Exceria Pro SDXC 64 GB UHS-II) | |
| Panasonic Toughbook FZ-55 MK2 (AV Pro V60) | |
| Panasonic Toughbook 40 (AV Pro V60) | |
| Durabook S14I (Angelbird 128GB AV Pro UHS-II) | |
| Acer Enduro Urban N3 EUN314 (AV Pro V60) | |
Comunicación
Un Intel AX201 viene de serie para la conectividad Wi-Fi 6. No hay opciones de Wi-Fi 6E en el momento de escribir este artículo
Hay opciones opcionales de 4G LTE e incluso 5G.
| Networking | |
| iperf3 transmit AX12 | |
| Acer Enduro Urban N3 EUN314 | |
| Panasonic Toughbook FZ-55 MK2 | |
| Durabook S14I | |
| Getac S410 Gen 4 | |
| Dell Latitude 5420 Rugged-P85G | |
| iperf3 receive AX12 | |
| Durabook S14I | |
| Acer Enduro Urban N3 EUN314 | |
| Panasonic Toughbook FZ-55 MK2 | |
| Getac S410 Gen 4 | |
| Dell Latitude 5420 Rugged-P85G | |
| iperf3 receive AXE11000 | |
| Panasonic Toughbook 40 | |
| iperf3 transmit AXE11000 | |
| Panasonic Toughbook 40 | |
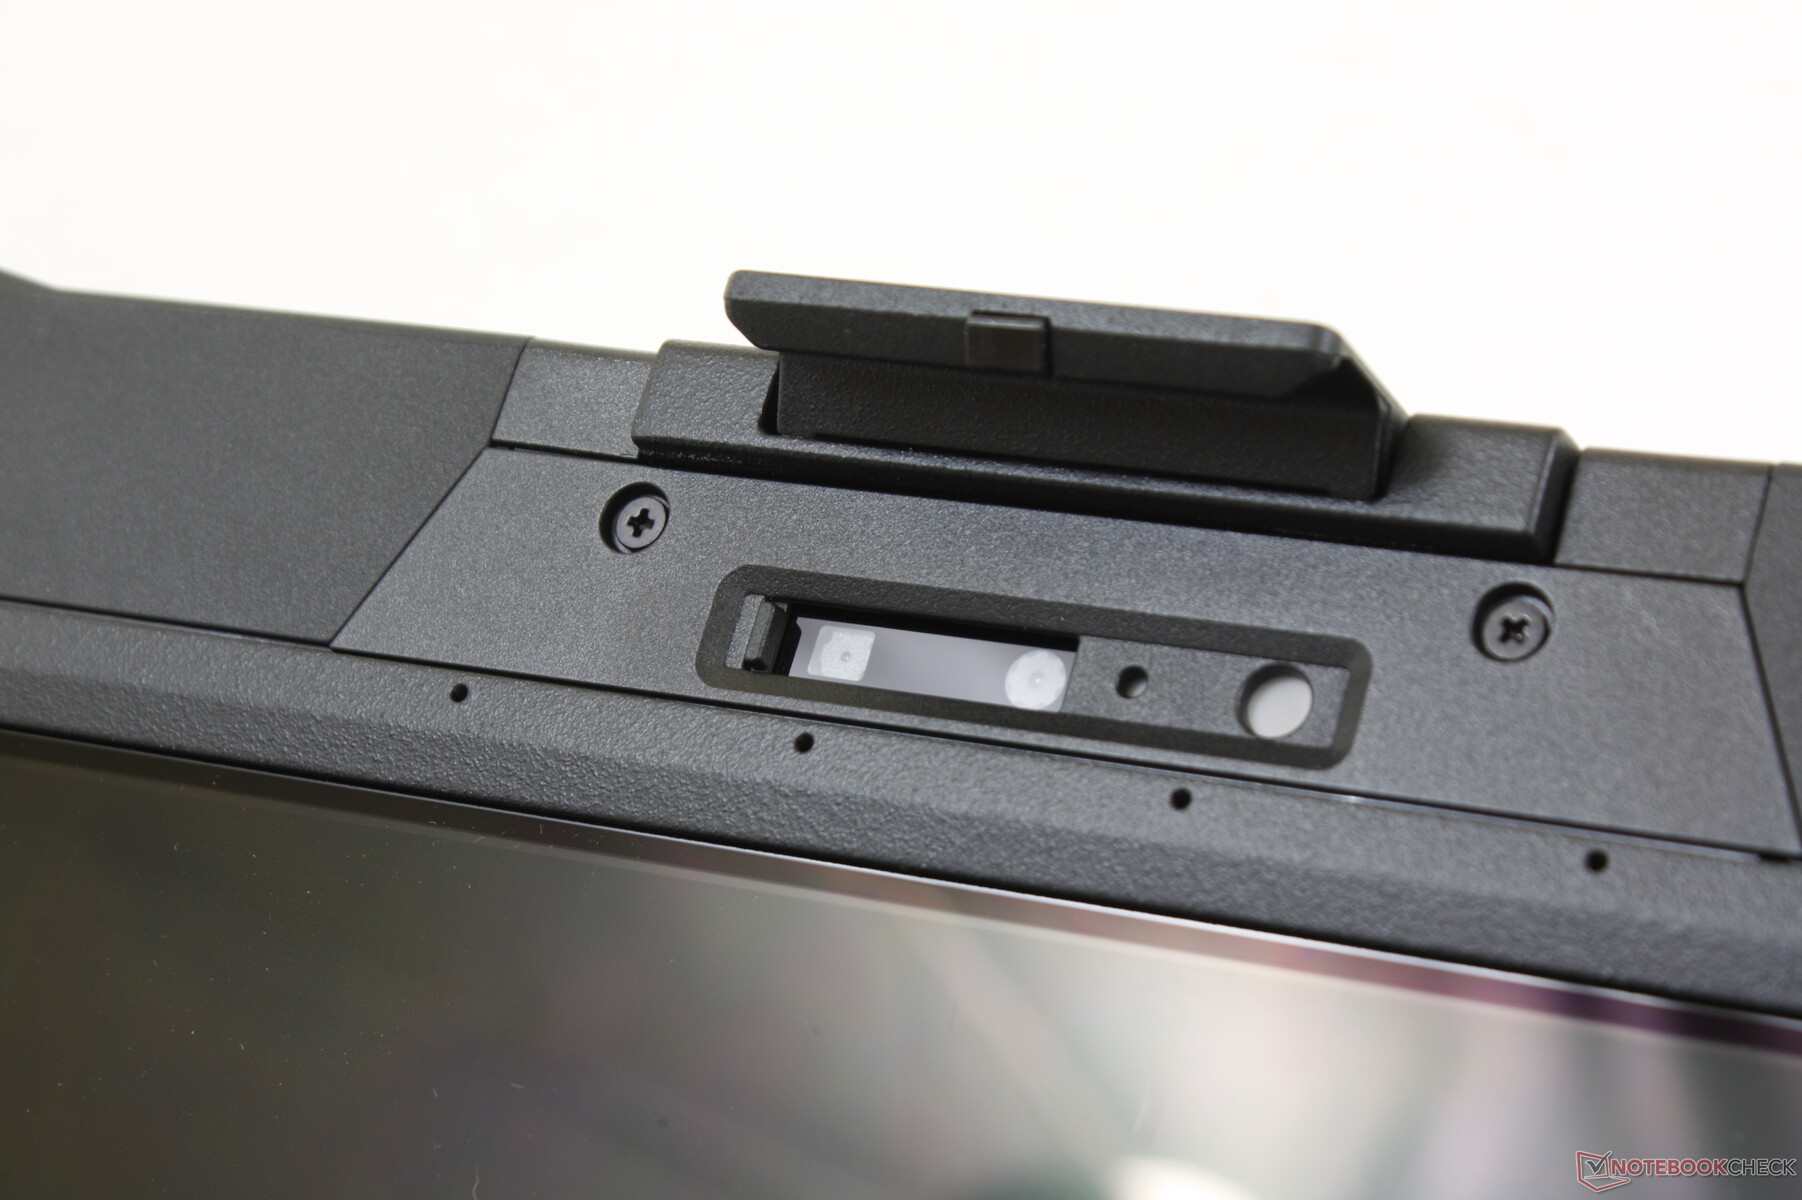
Cámara web
La cámara de 5 MP es más nítida que la de la mayoría de los otros portátiles, en los que lo habitual son 2 MP o menos. El IR está presente para el soporte de Windows Hello.


Mantenimiento
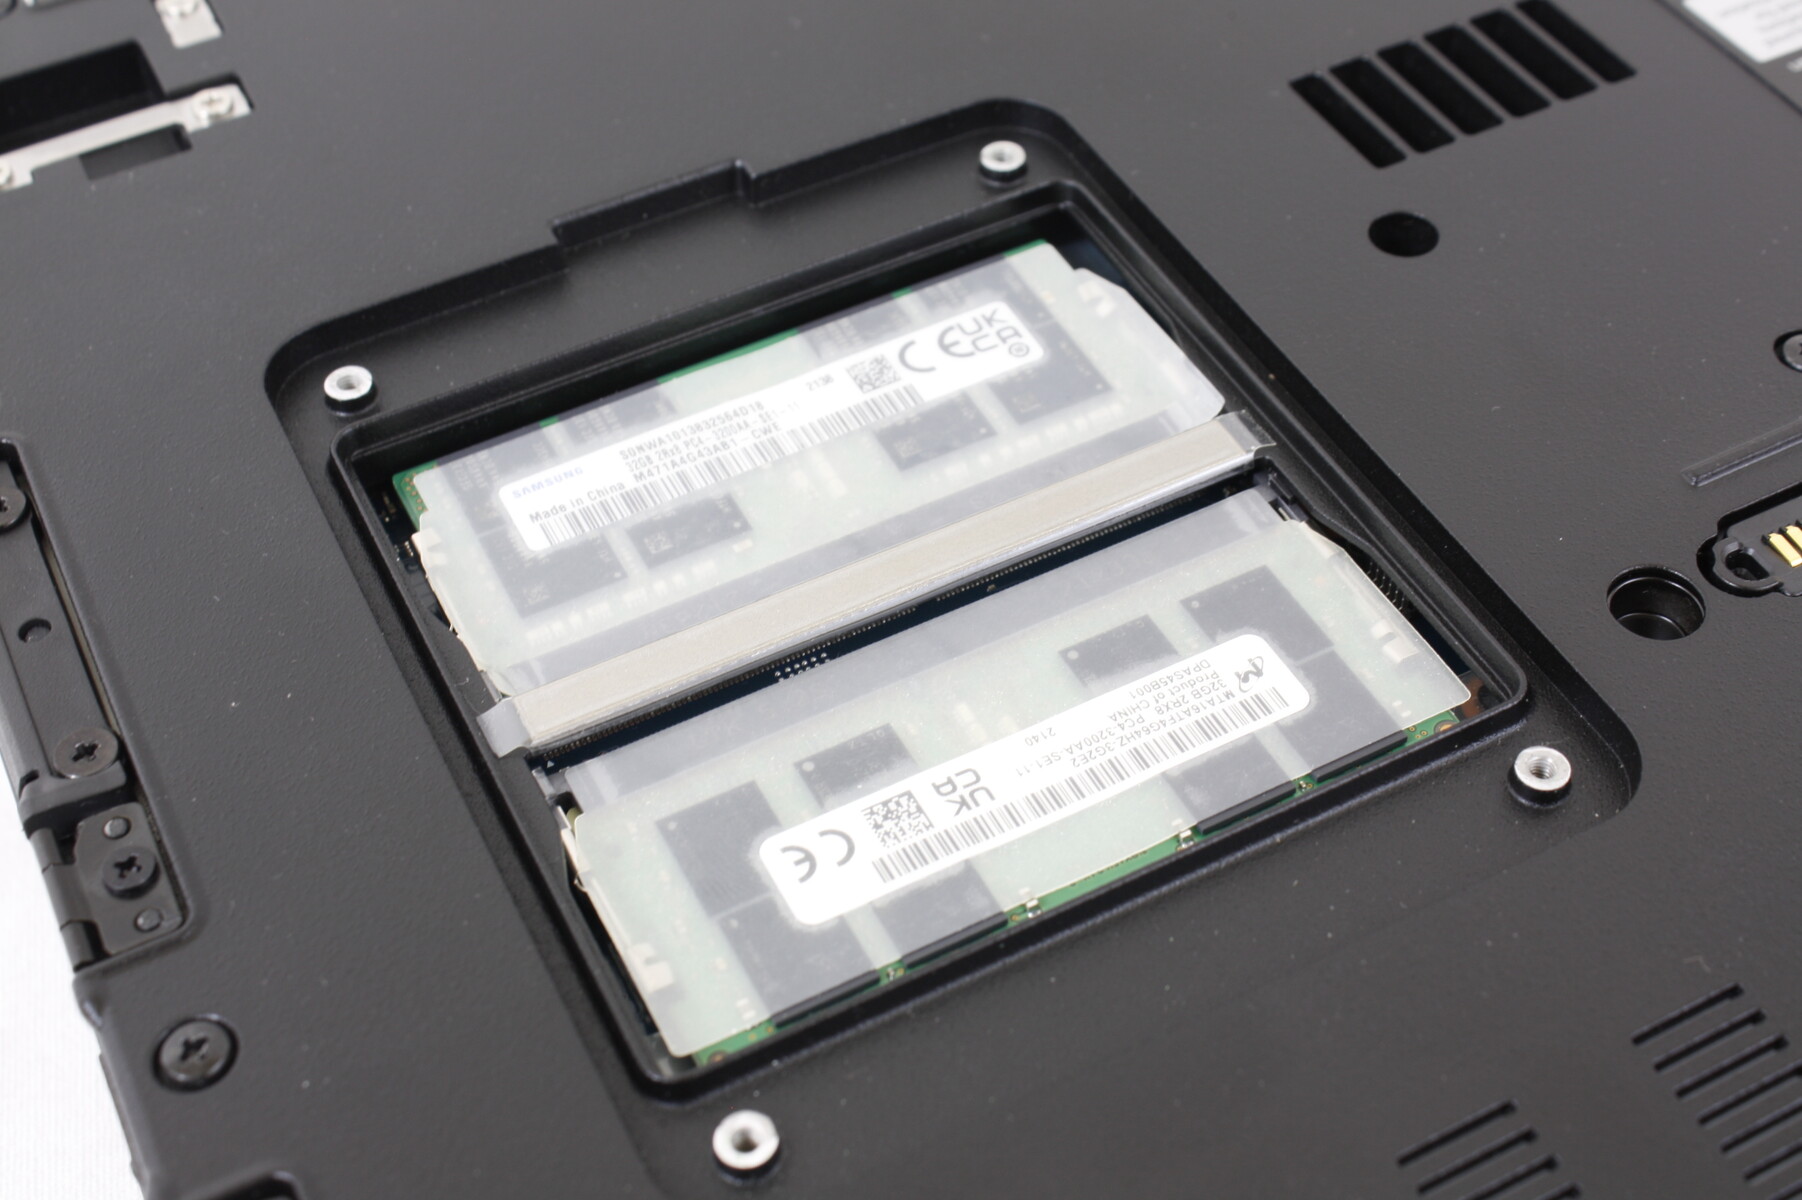
El panel inferior no se ha diseñado para que el usuario pueda retirarlo fácilmente. En su lugar, se ha incorporado una pequeña escotilla para acceder a las 2 ranuras SODIMM DDR4.
Accesorios y garantía
Un lápiz óptico pasivo se encuentra en el interior del mango a lo largo de la parte delantera de la unidad. Panasonic ofrece una amplia gama de accesorios para sus modelos de portátiles, como se detalla en https://na.panasonic.com/us/computers-tablets-handhelds/computers/laptops/toughbook-40.
Se aplica una garantía estándar de tres años limitada por el fabricante.
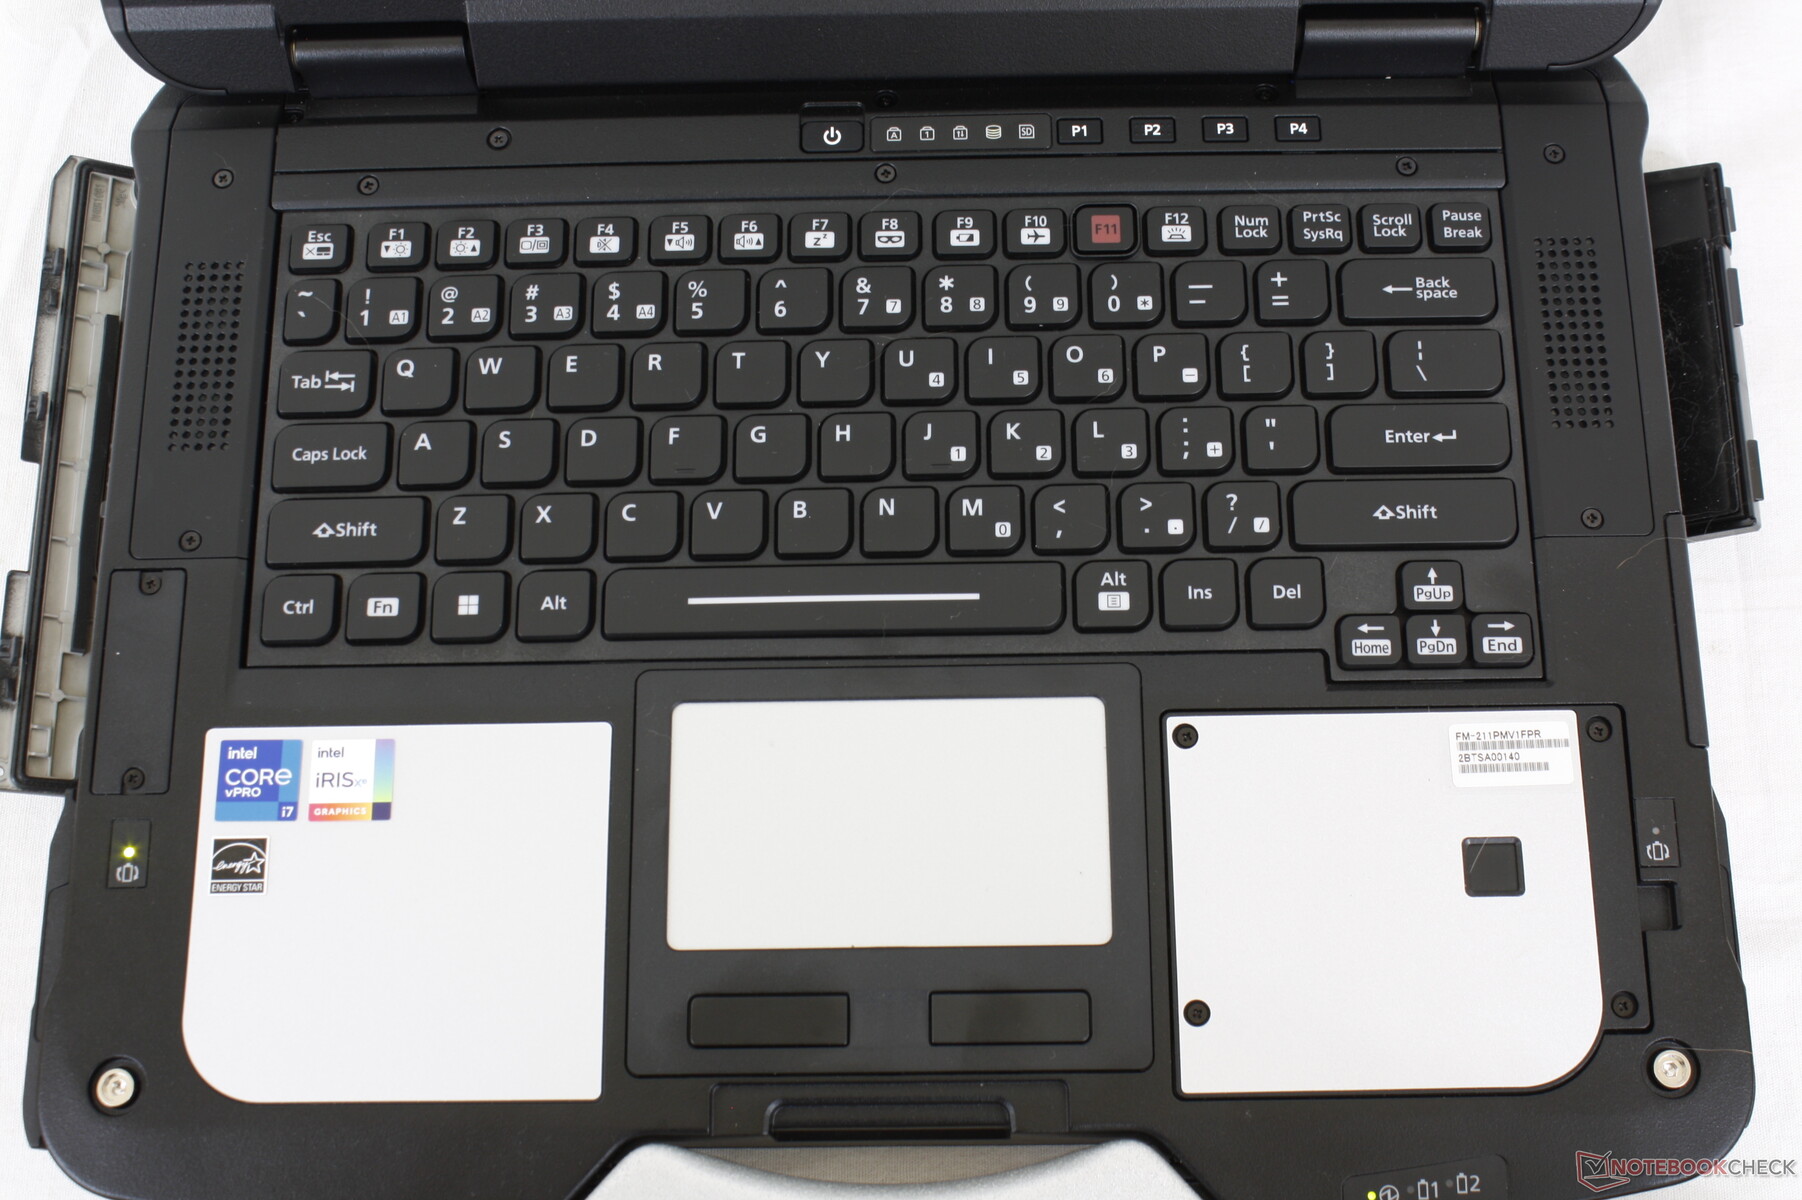
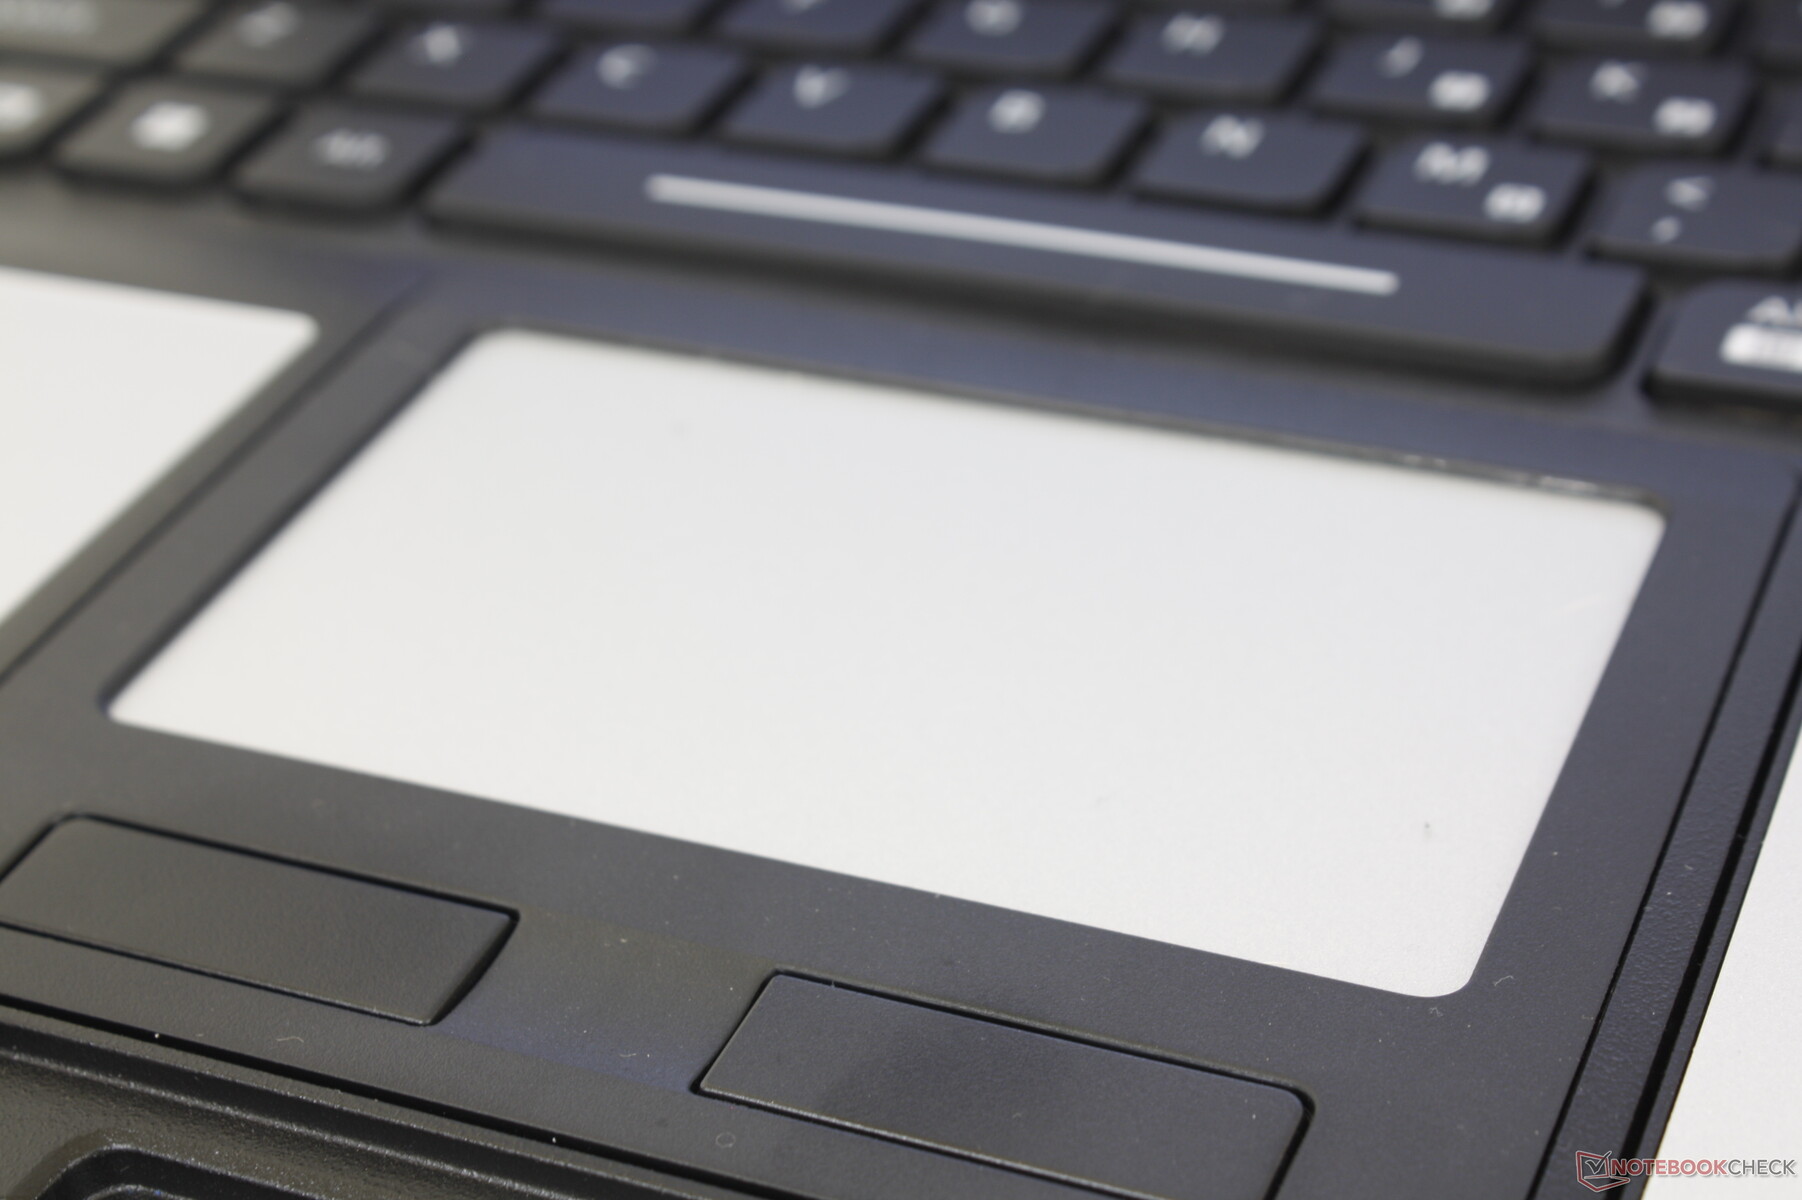
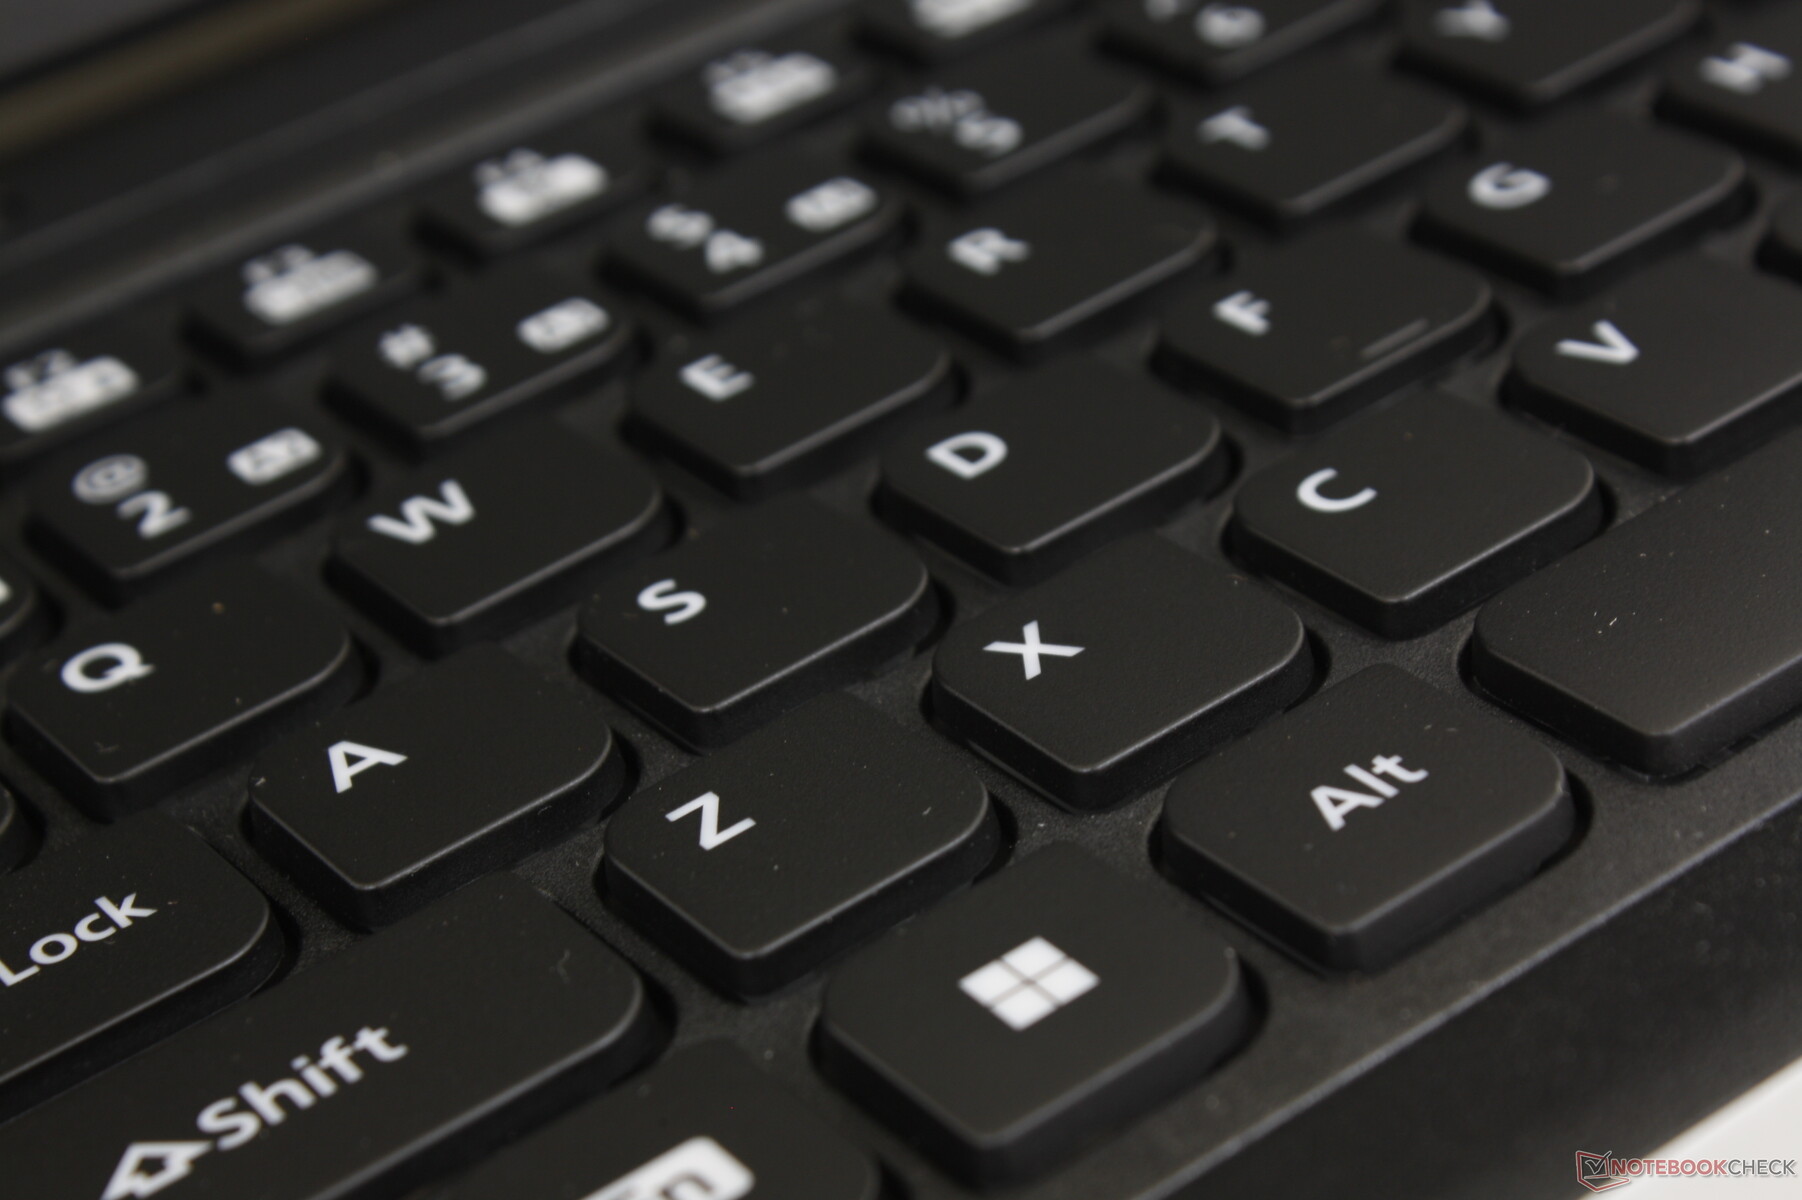
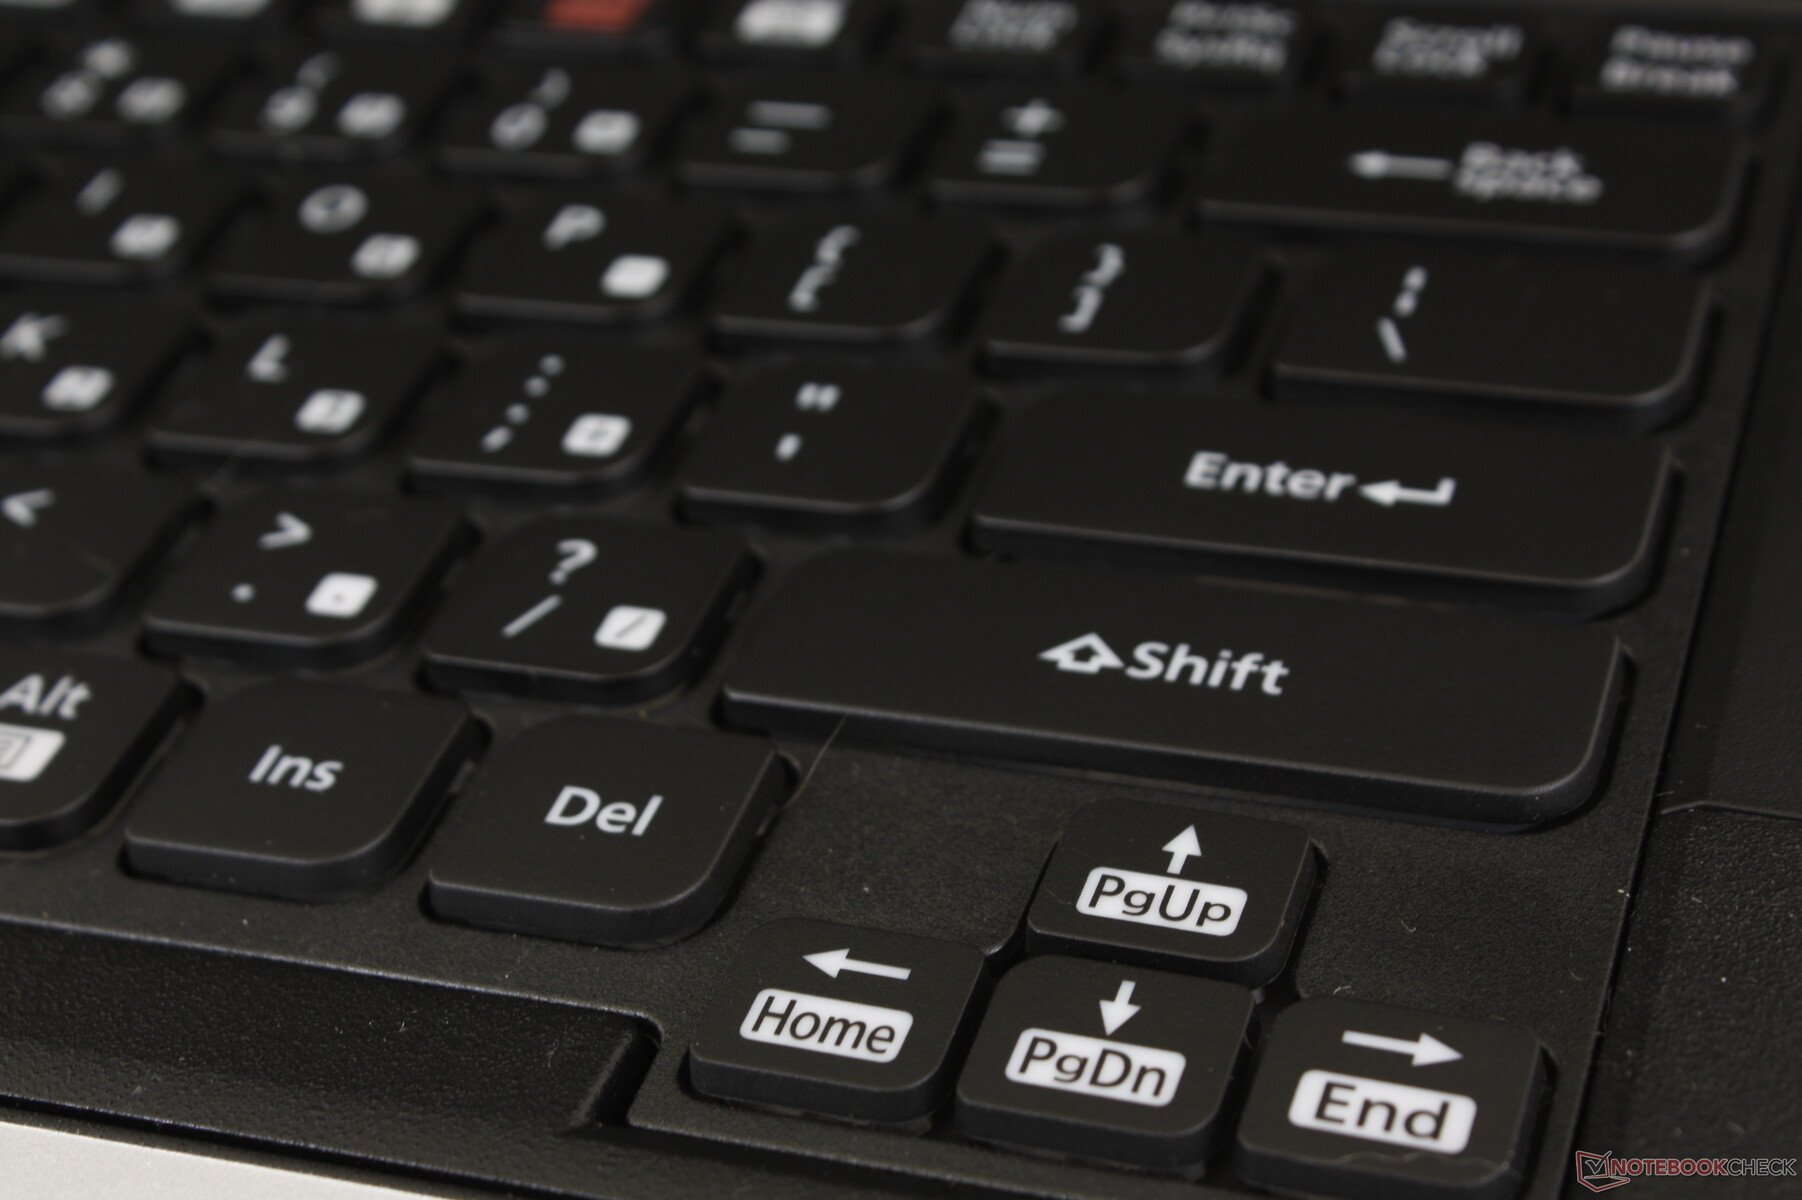
Dispositivos de entrada
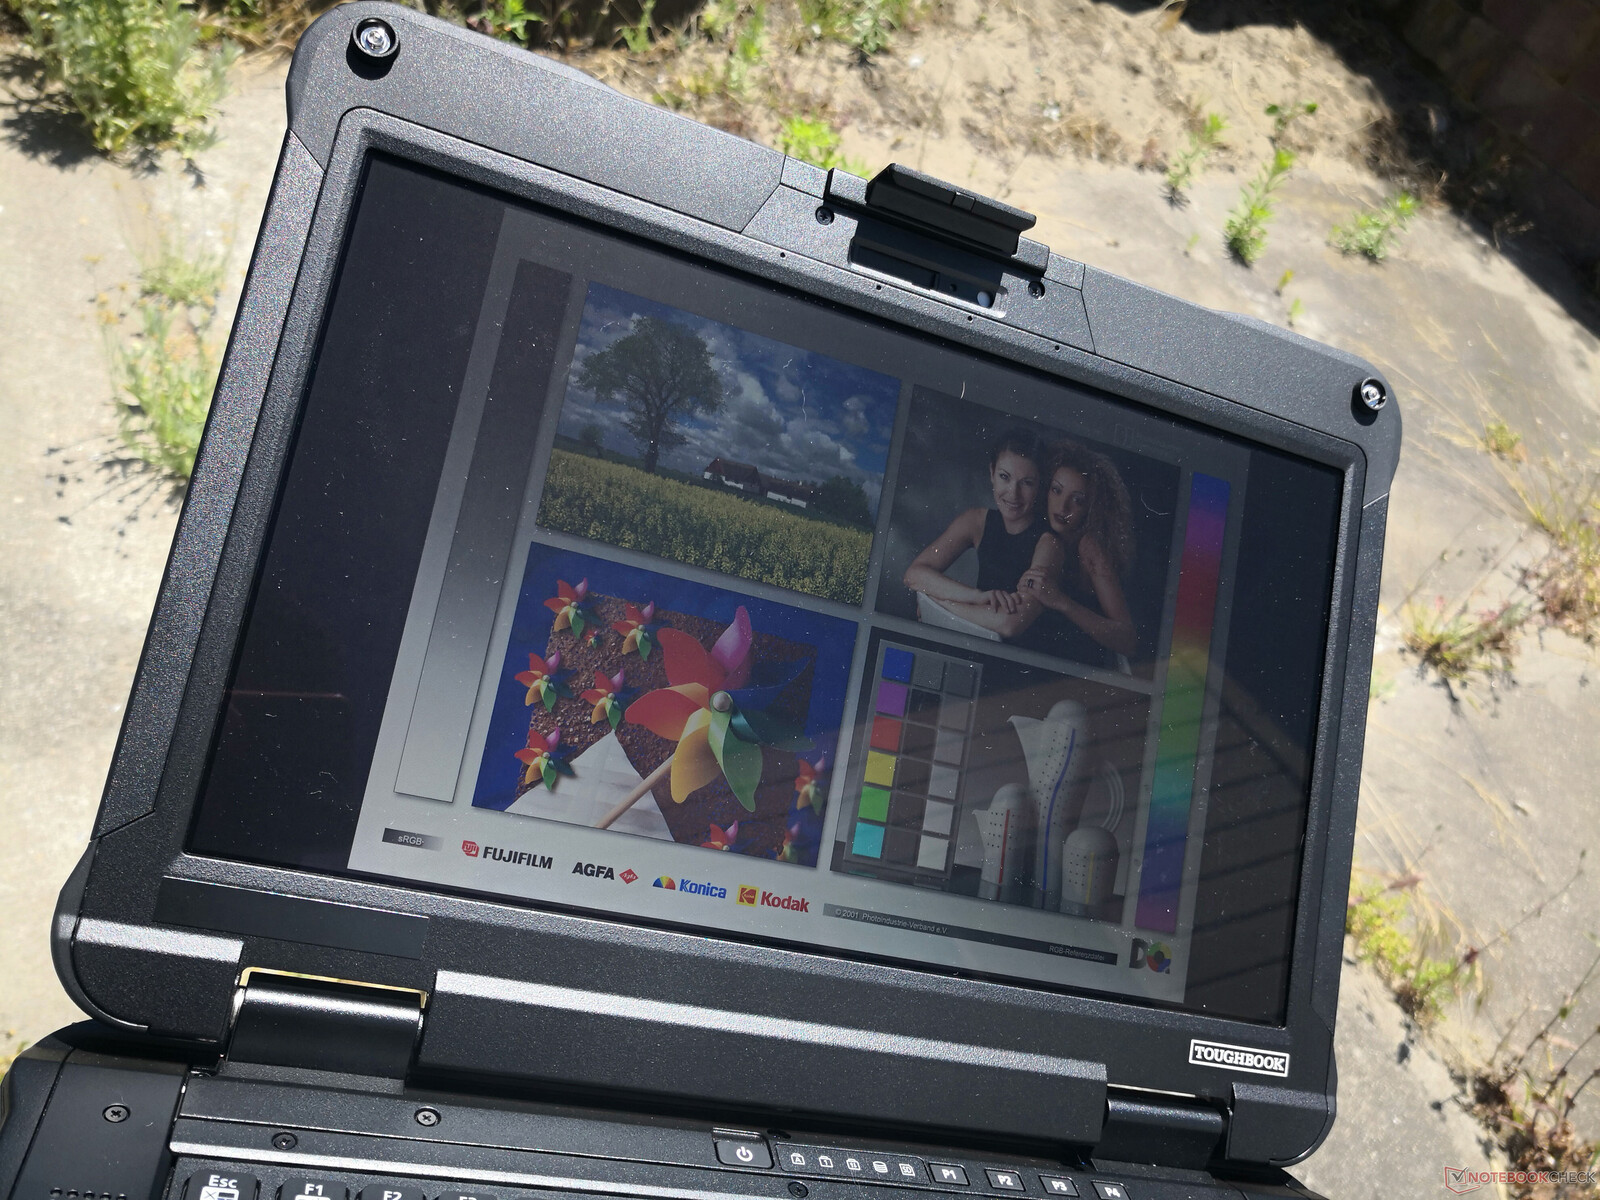
Mostrar
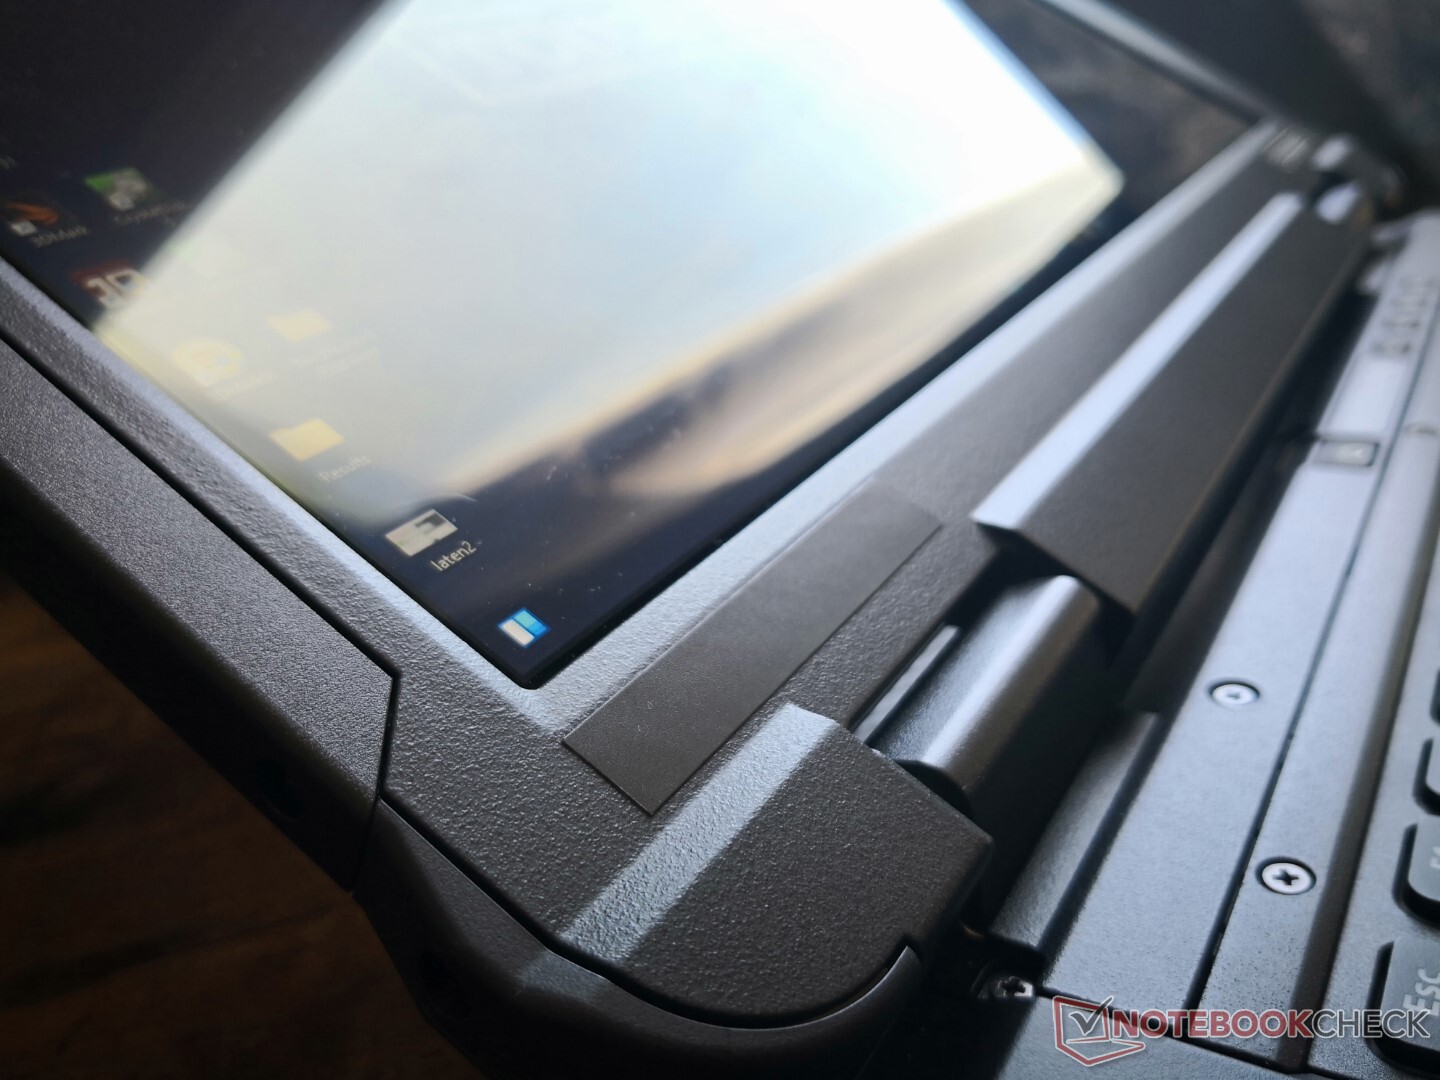
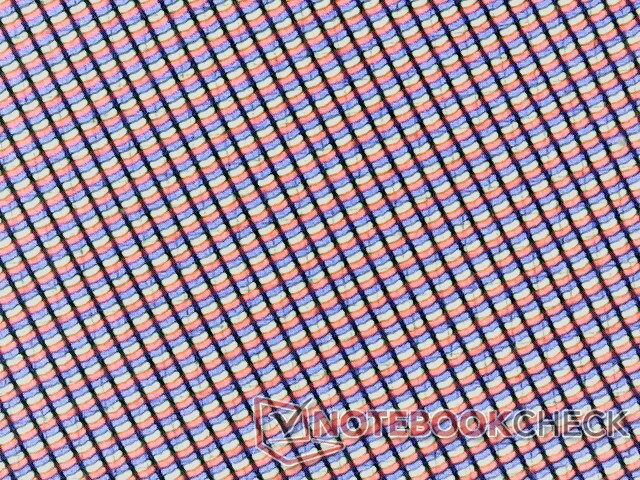
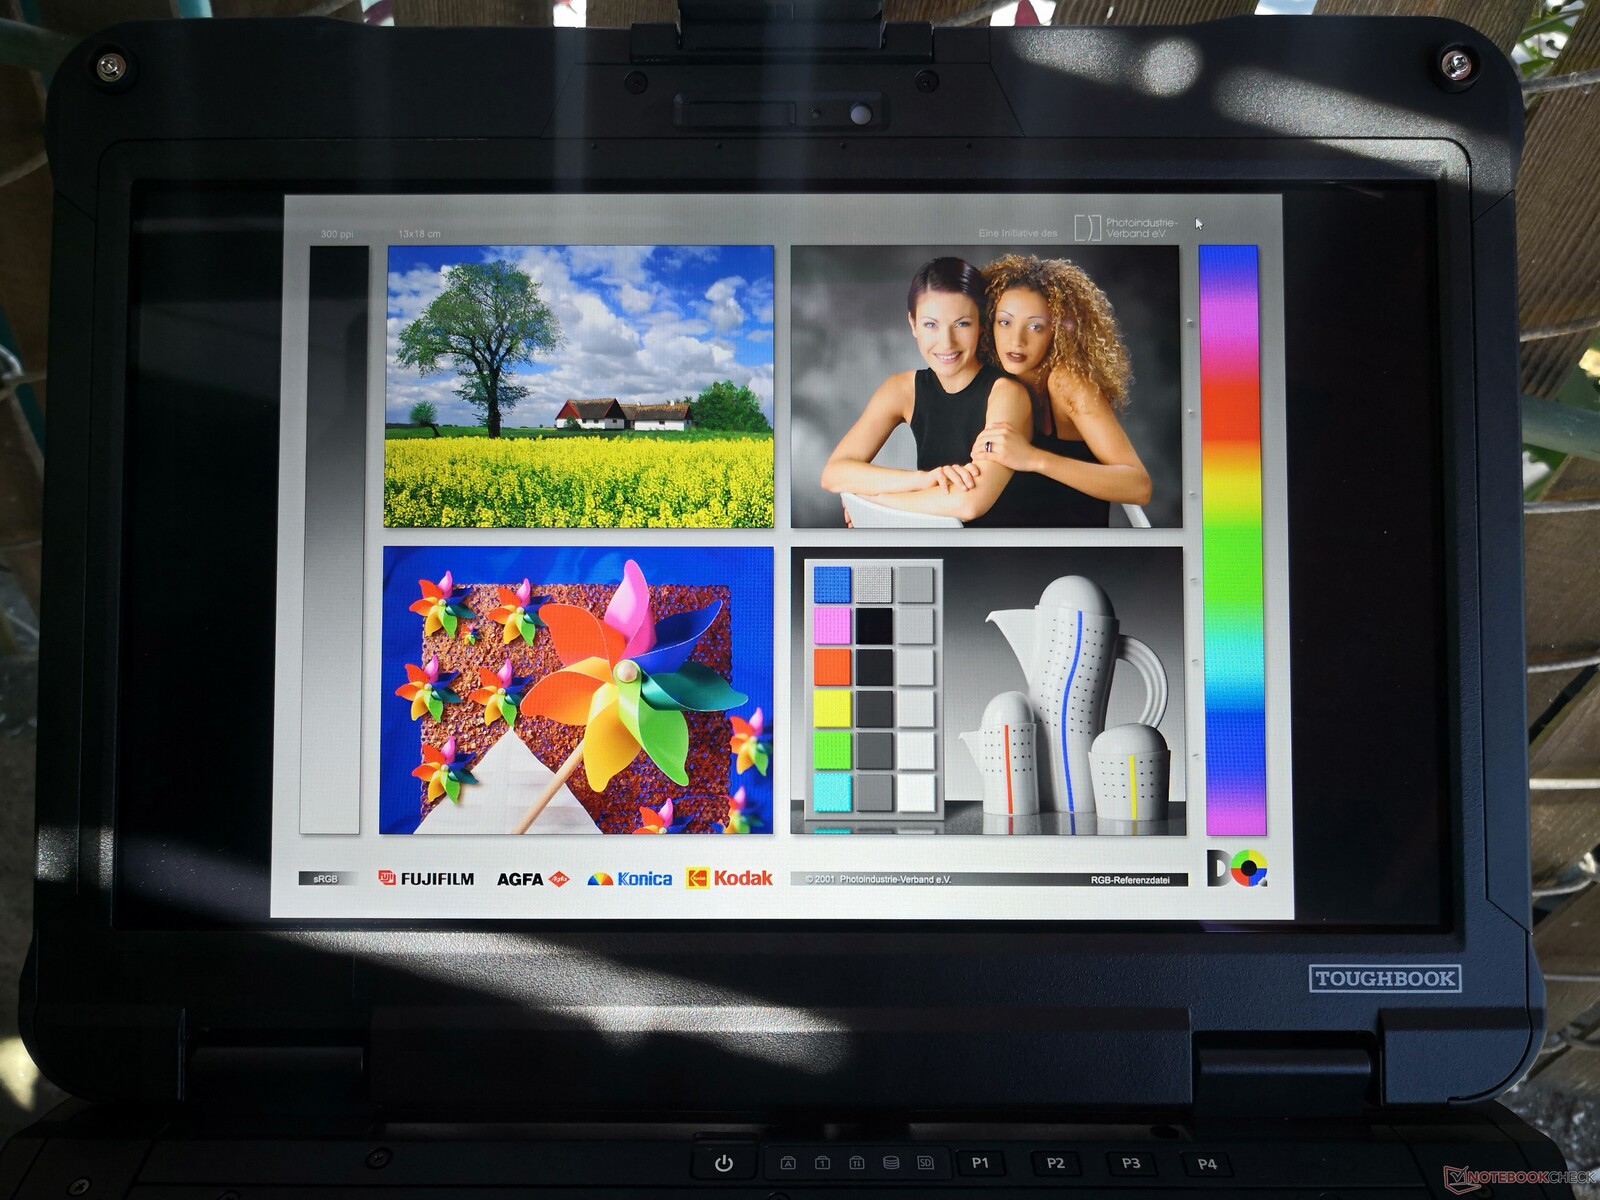
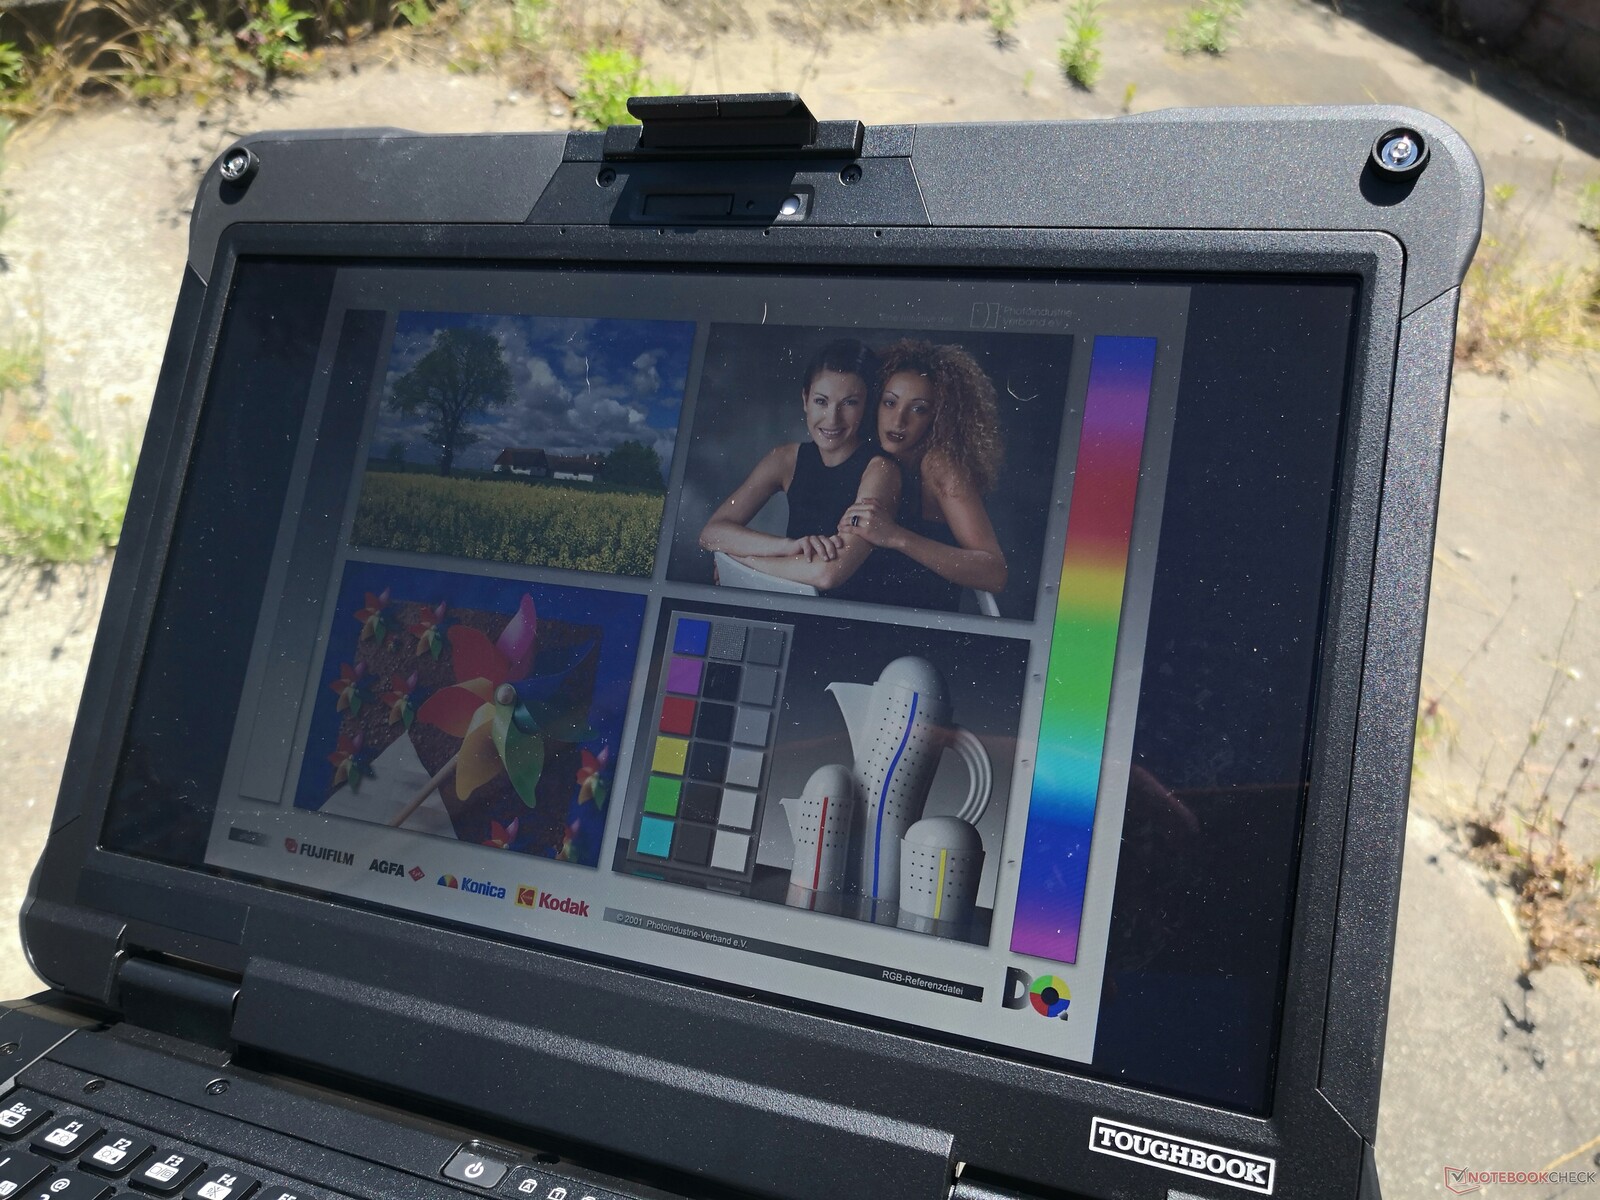
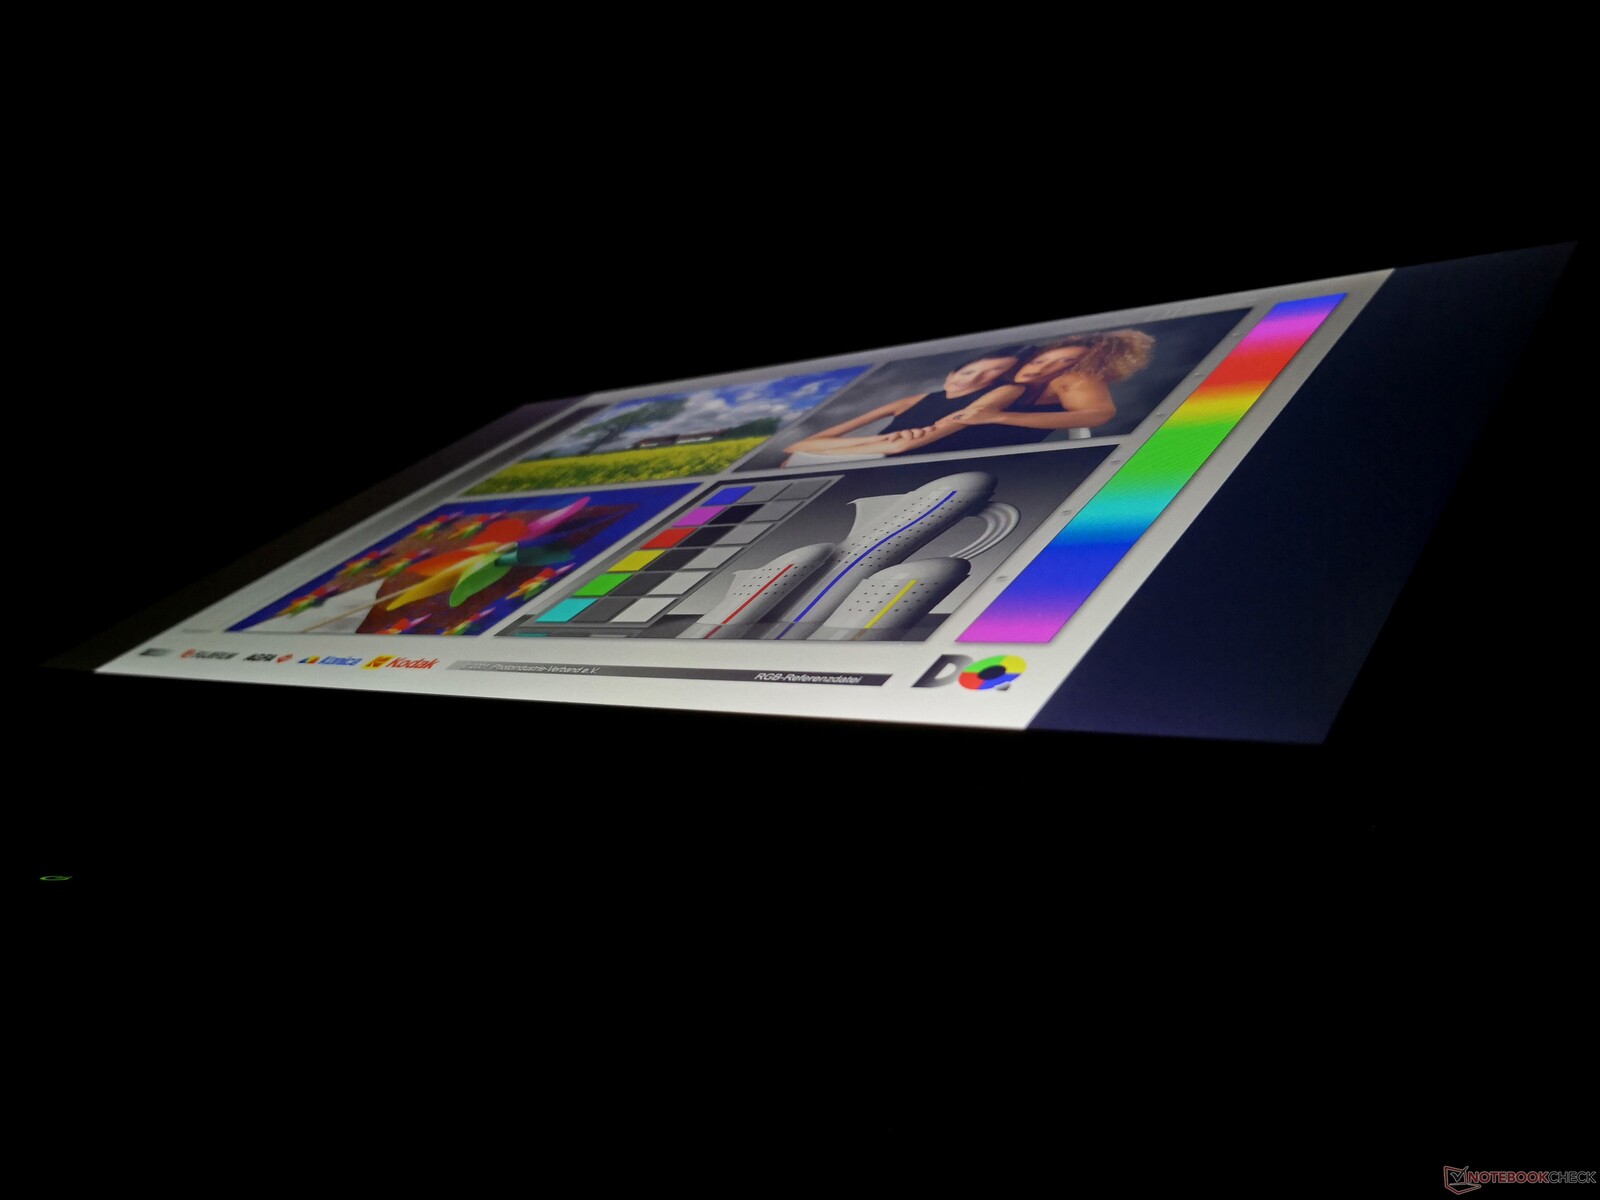
Sin embargo, la pantalla IPS es muy buena en lo que respecta a los portátiles robustos. No sufre los problemas de granulado que presentan muchos otros modelos robustos para obtener textos e imágenes más nítidos. También es muy brillante con casi 1400 nits mientras mantiene una buena relación de contraste de más de 1000:1 para ser mejor que la pantalla TN de 1400 nits del Durabook S14I
Lamentablemente, la modulación de ancho de pulso está presente en todos los niveles de brillo excepto en el máximo. Si tus ojos son sensibles a los parpadeos, entonces es posible que quieras evitar usar el Panasonic en configuraciones de alto brillo por períodos prolongados.
| |||||||||||||||||||||||||
iluminación: 82 %
Brillo con batería: 1284.3 cd/m²
Contraste: 1443:1 (Negro: 0.89 cd/m²)
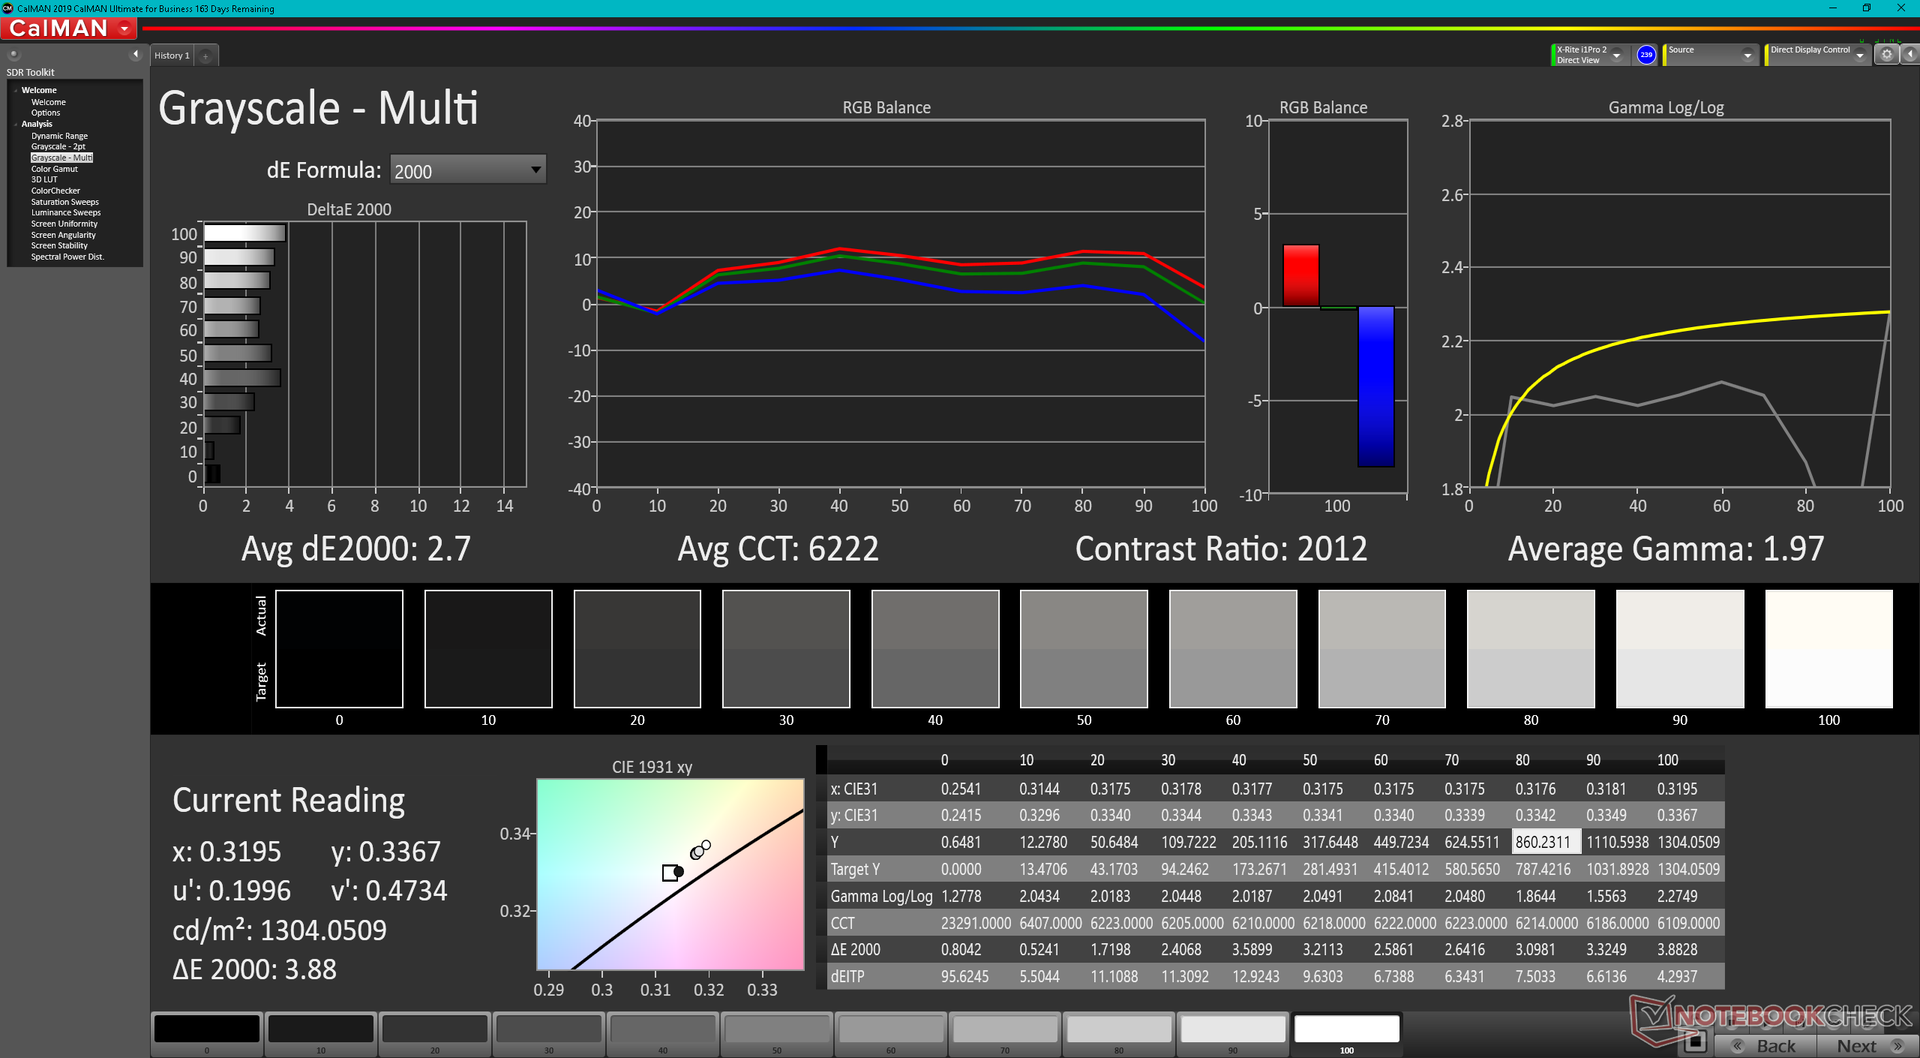
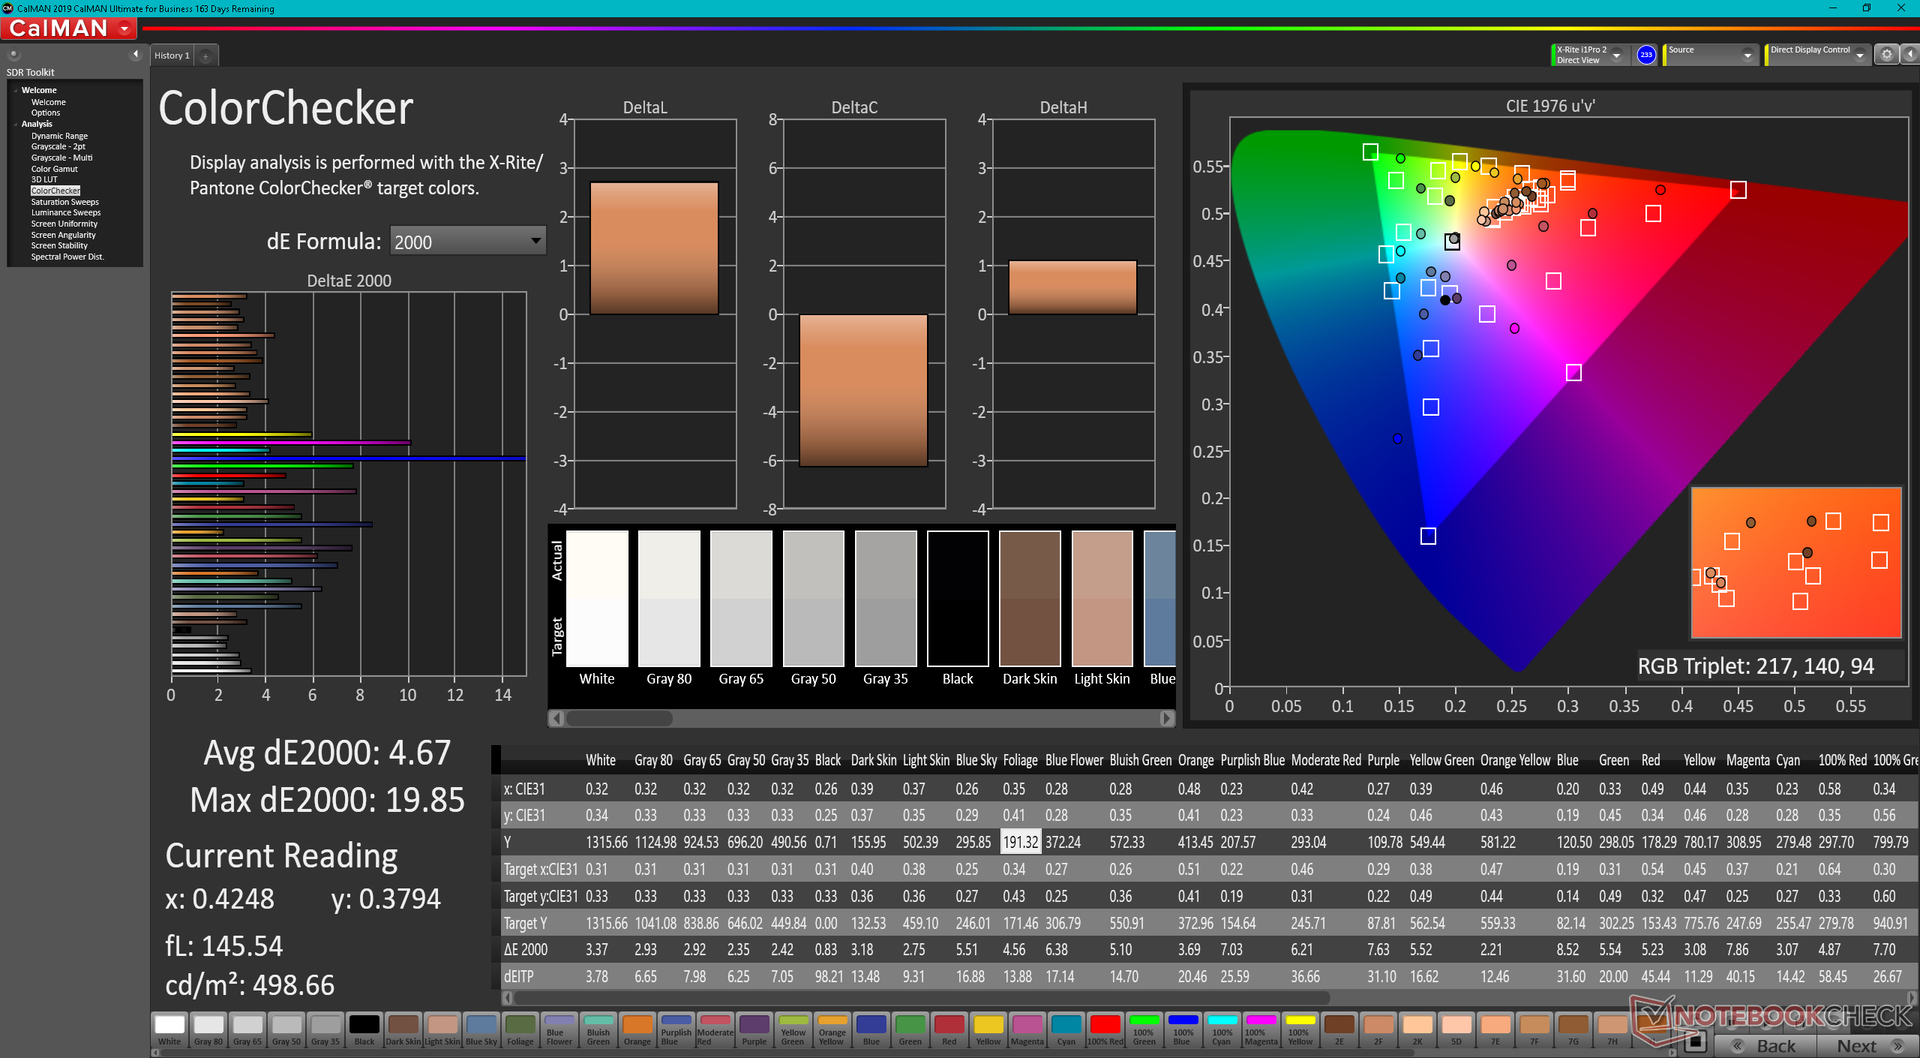
ΔE ColorChecker Calman: 4.67 | ∀{0.5-29.43 Ø4.71}
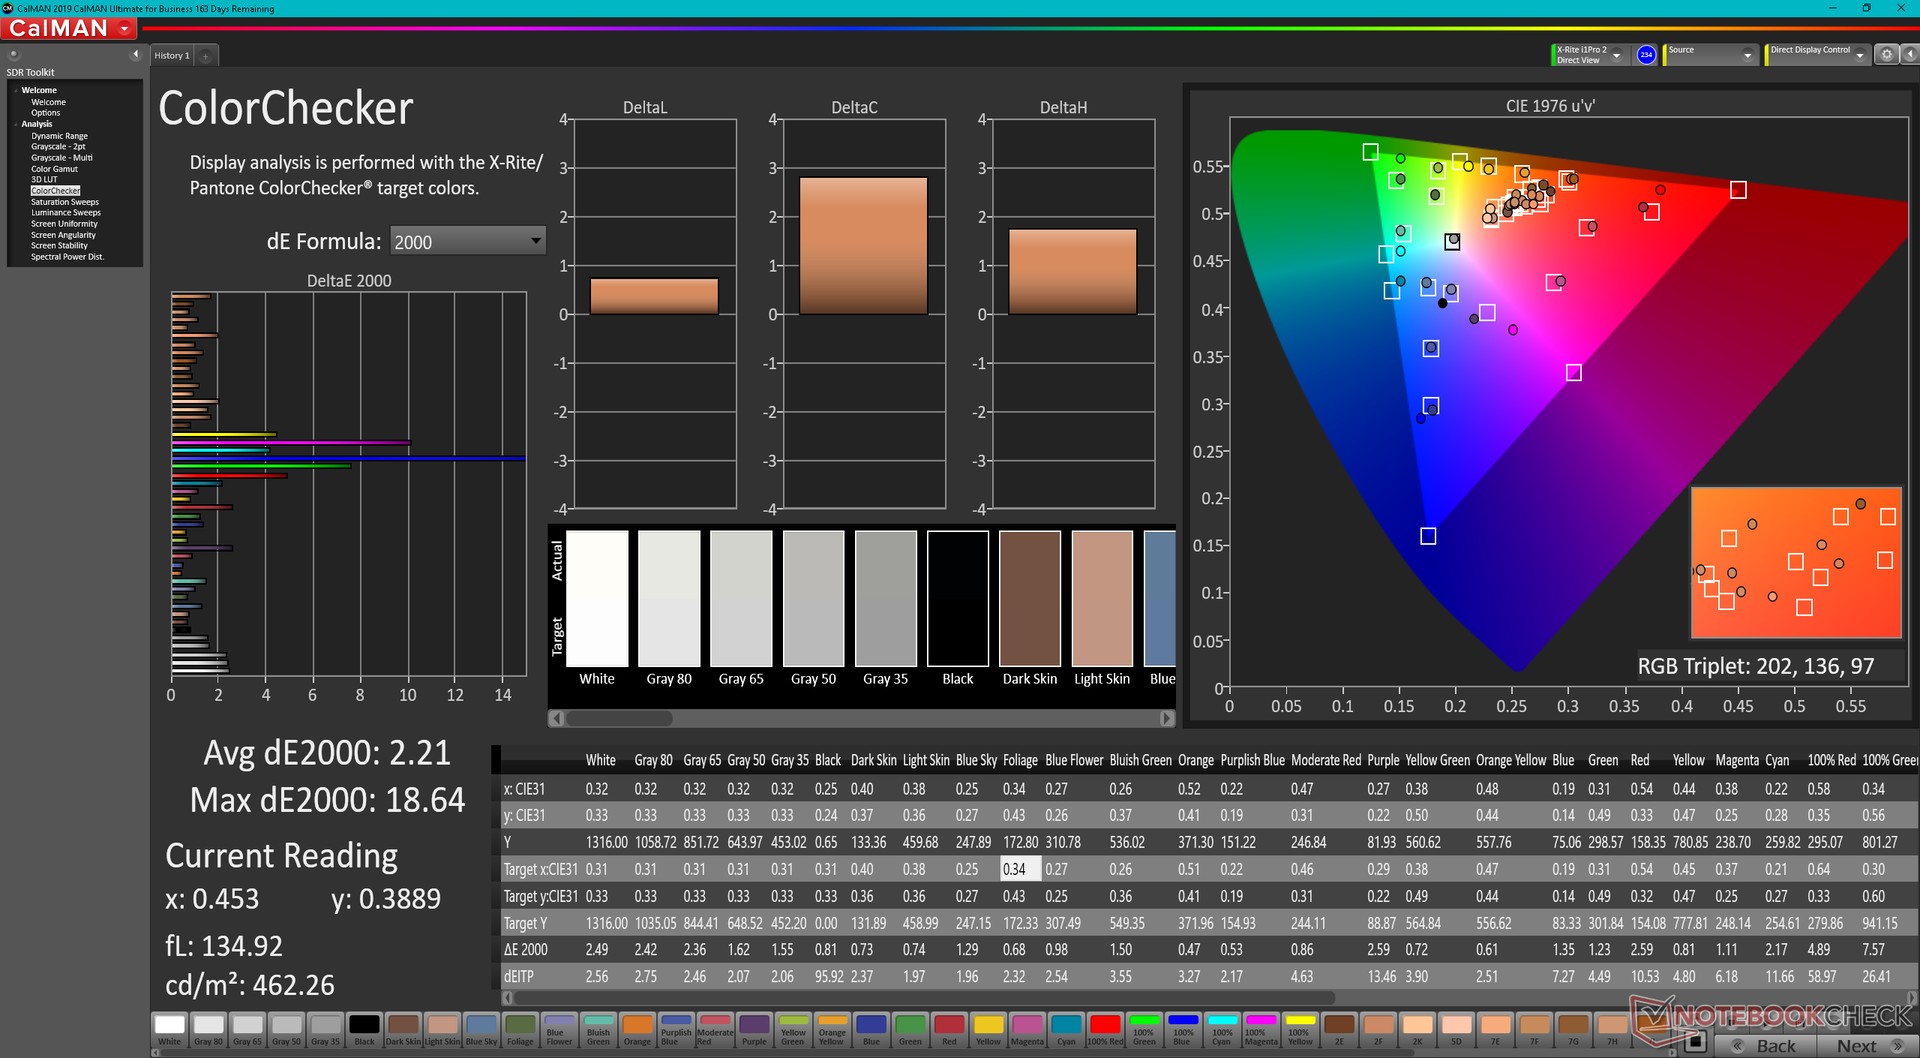
calibrated: 2.21
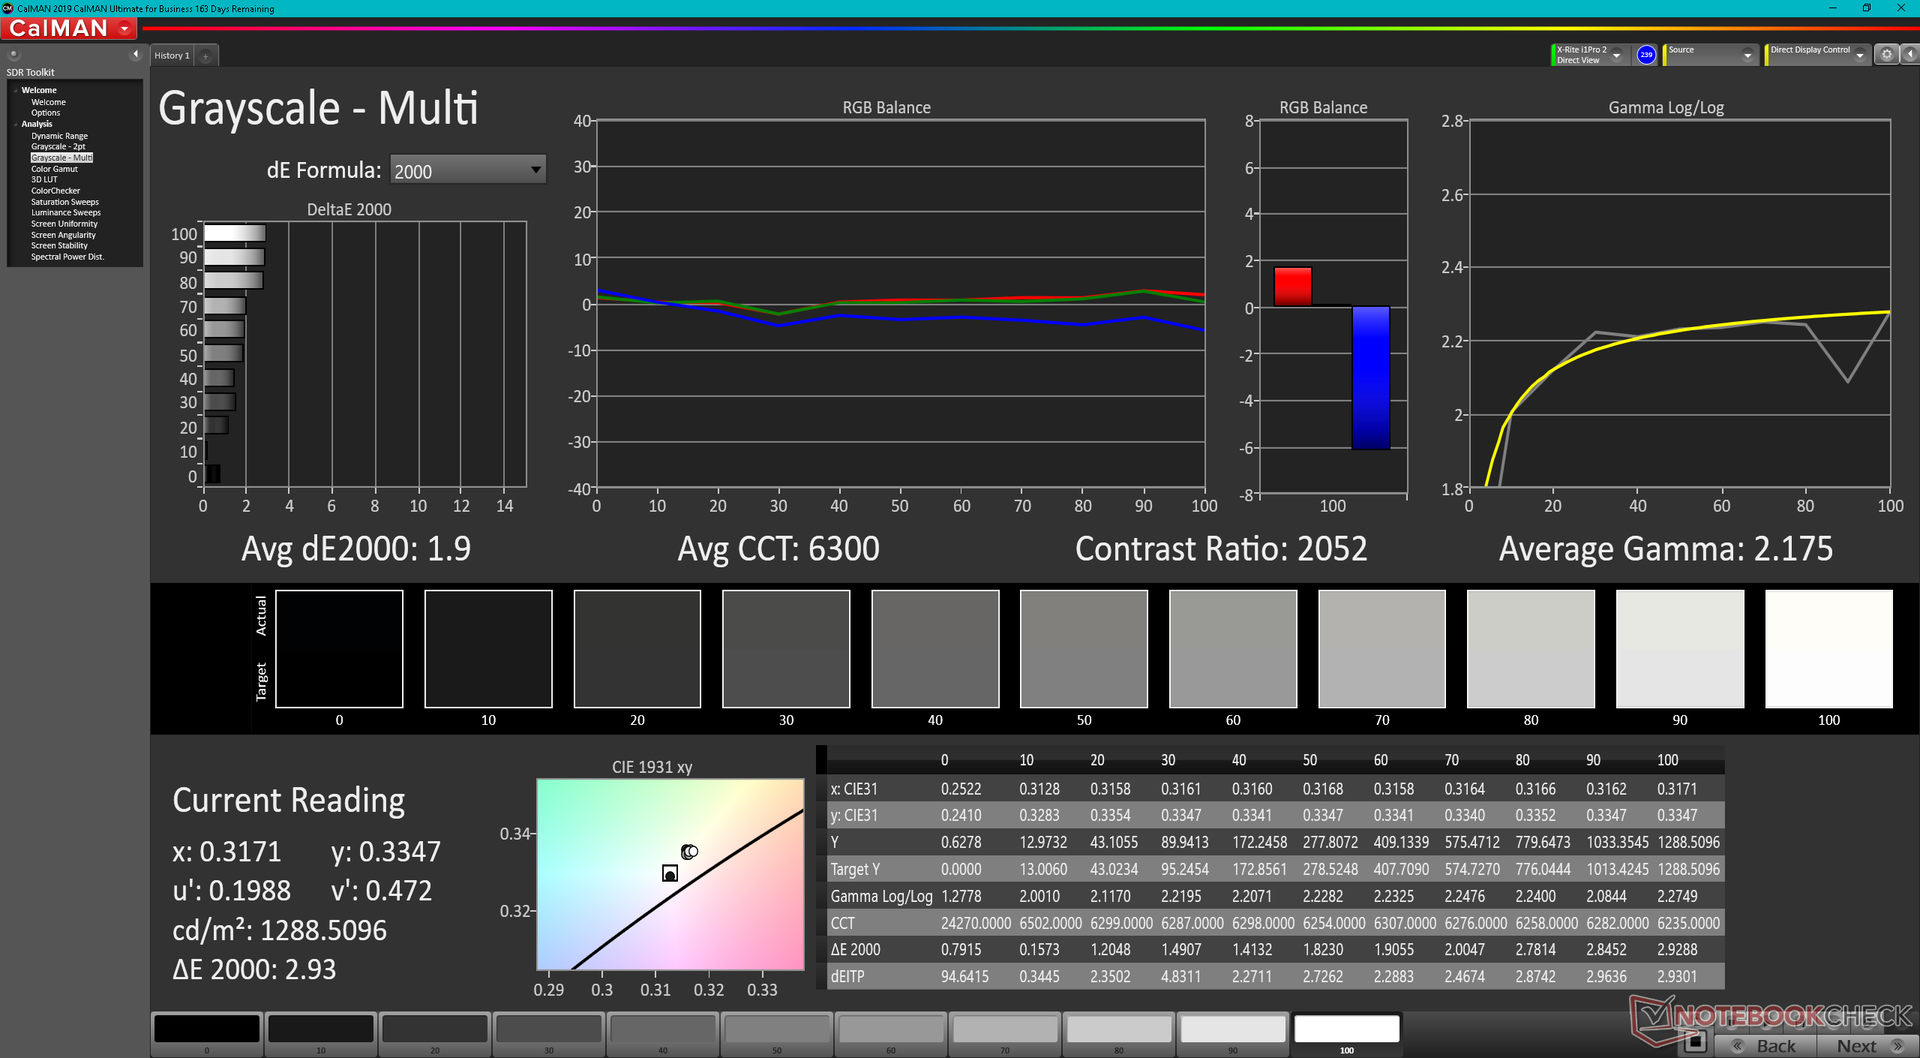
ΔE Greyscale Calman: 2.7 | ∀{0.09-98 Ø4.96}
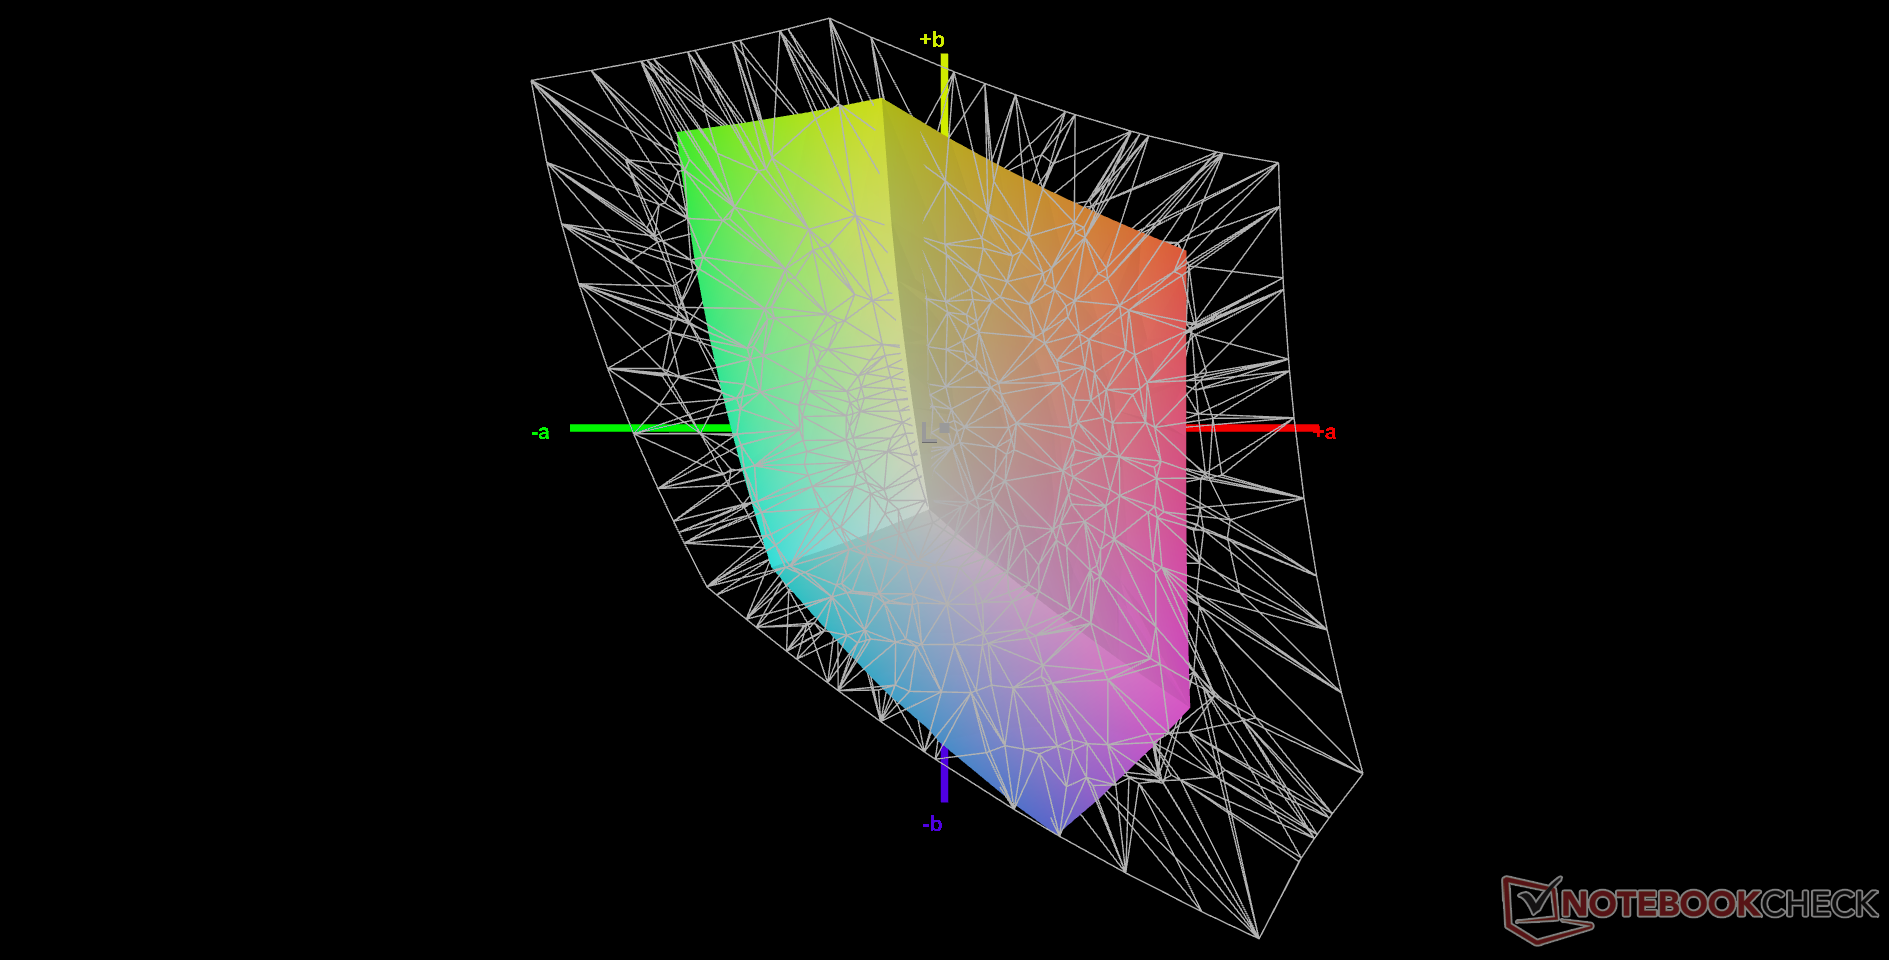
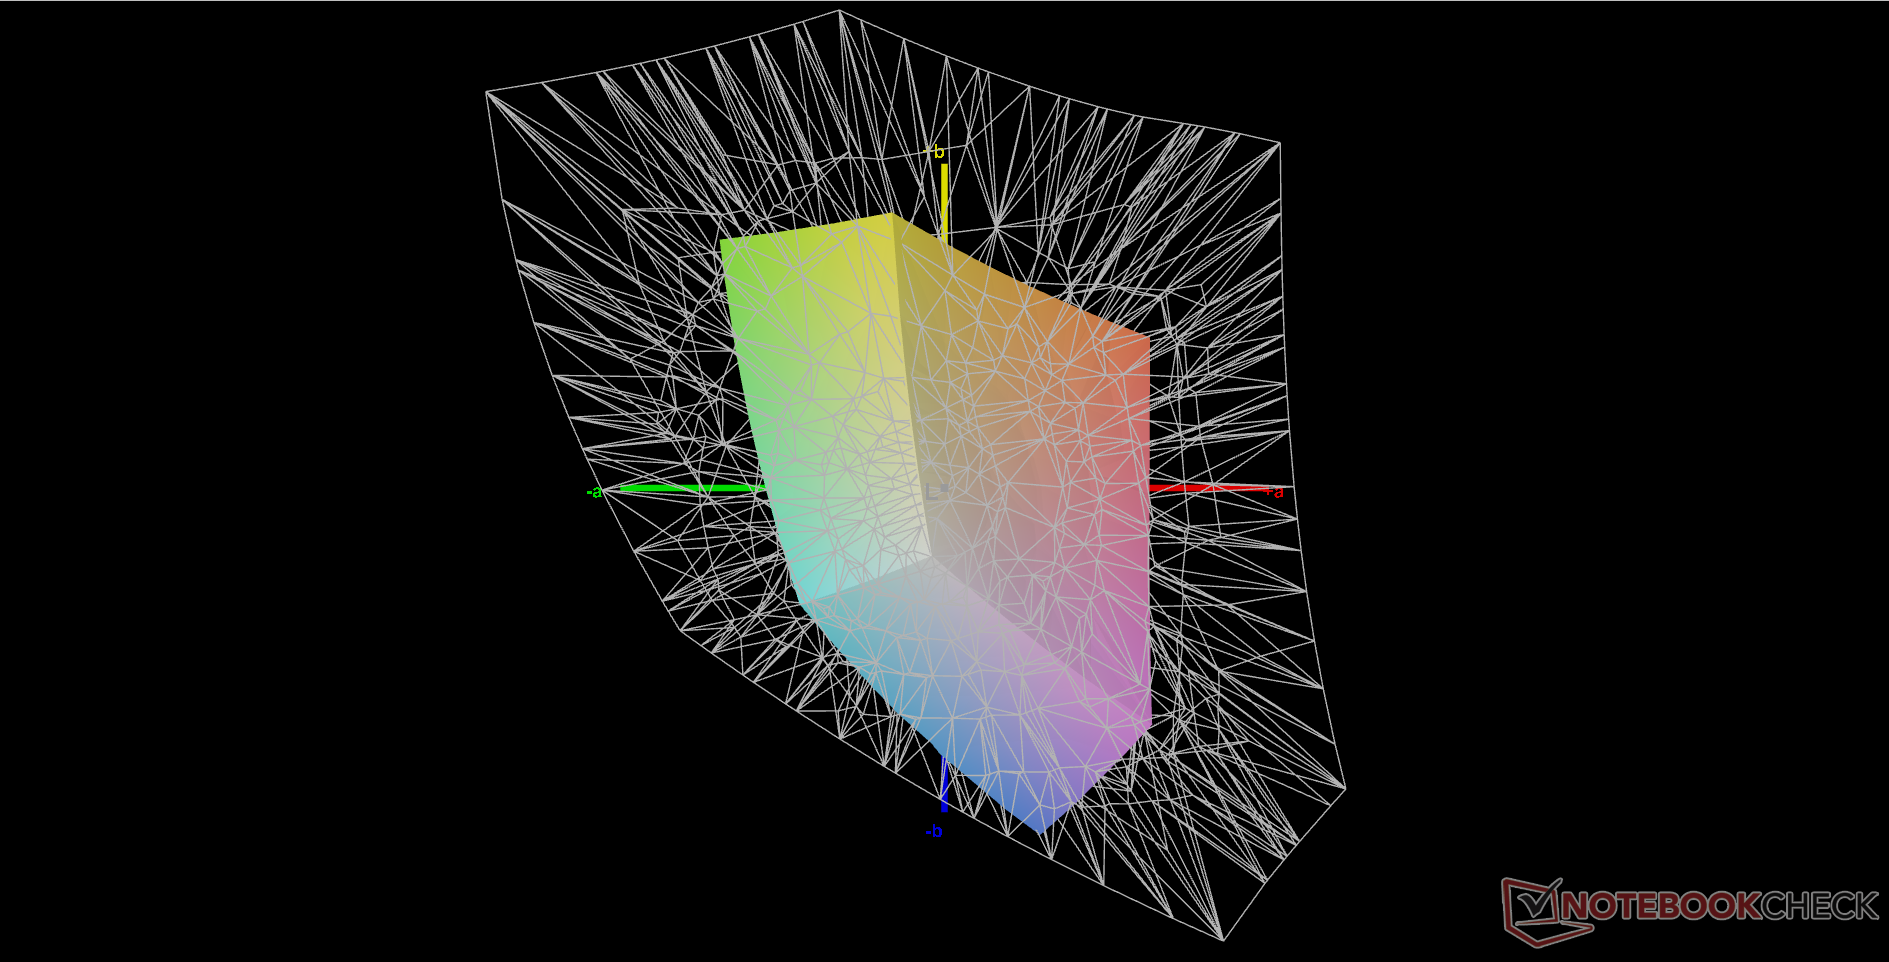
37% AdobeRGB 1998 (Argyll 3D)
53.8% sRGB (Argyll 3D)
35.8% Display P3 (Argyll 3D)
Gamma: 1.97
CCT: 6222 K
| Panasonic Toughbook 40 InfoVision M140NWF5 R3, IPS, 1920x1080, 14" | Panasonic Toughbook FZ-55 MK2 InfoVision M140NWF5 R3, IPS, 1920x1080, 14" | Getac S410 Gen 4 AU Optronics AUO413D, IPS, 1920x1080, 14" | Dell Latitude 5420 Rugged-P85G AU Optronics AUO523D, IPS, 1920x1080, 14" | Acer Enduro Urban N3 EUN314 XR140EA6T, IPS, 1920x1080, 14" | Durabook S14I KD140N0730A01, TN, 1920x1080, 14" | |
|---|---|---|---|---|---|---|
| Display | -3% | 7% | 74% | 75% | 22% | |
| Display P3 Coverage (%) | 35.8 | 34.8 -3% | 38.3 7% | 62.5 75% | 63.5 77% | 43.55 22% |
| sRGB Coverage (%) | 53.8 | 52.2 -3% | 57.2 6% | 92.4 72% | 91.9 71% | 65.4 22% |
| AdobeRGB 1998 Coverage (%) | 37 | 36 -3% | 39.5 7% | 64.2 74% | 65.5 77% | 45 22% |
| Response Times | 18% | 9% | -29% | -20% | 49% | |
| Response Time Grey 50% / Grey 80% * (ms) | 50.4 ? | 28.4 ? 44% | 35.2 ? 30% | 68 ? -35% | 56 ? -11% | 30.4 ? 40% |
| Response Time Black / White * (ms) | 27.6 ? | 30 ? -9% | 31.2 ? -13% | 33.6 ? -22% | 35.2 ? -28% | 11.8 ? 57% |
| PWM Frequency (Hz) | 694.4 ? | 685 ? | 870 ? | 735 ? | 1000 ? | 304.9 ? |
| Screen | -5% | -35% | -11% | -30% | -100% | |
| Brightness middle (cd/m²) | 1284.3 | 1061.1 -17% | 956.9 -25% | 1111.7 -13% | 487.8 -62% | 1180.7 -8% |
| Brightness (cd/m²) | 1289 | 997 -23% | 984 -24% | 1026 -20% | 464 -64% | 1102 -15% |
| Brightness Distribution (%) | 82 | 76 -7% | 84 2% | 80 -2% | 89 9% | 89 9% |
| Black Level * (cd/m²) | 0.89 | 0.7 21% | 0.81 9% | 0.81 9% | 0.48 46% | 1.91 -115% |
| Contrast (:1) | 1443 | 1516 5% | 1181 -18% | 1372 -5% | 1016 -30% | 618 -57% |
| Colorchecker dE 2000 * | 4.67 | 4.64 1% | 6.6 -41% | 3.83 18% | 6.51 -39% | 13.45 -188% |
| Colorchecker dE 2000 max. * | 19.85 | 20.92 -5% | 22.94 -16% | 7.85 60% | 11.36 43% | 22.52 -13% |
| Colorchecker dE 2000 calibrated * | 2.21 | 2.52 -14% | 4.05 -83% | 2.98 -35% | 1.77 20% | 3.19 -44% |
| Greyscale dE 2000 * | 2.7 | 2.8 -4% | 6 -122% | 5.6 -107% | 7.8 -189% | 15.4 -470% |
| Gamma | 1.97 112% | 2.08 106% | 2.19 100% | 2.306 95% | 2.28 96% | 1.97 112% |
| CCT | 6222 104% | 6364 102% | 7276 89% | 7676 85% | 8102 80% | 21134 31% |
| Color Space (Percent of AdobeRGB 1998) (%) | 59 | 41.6 | ||||
| Color Space (Percent of sRGB) (%) | 93 | 65.5 | ||||
| Media total (Programa/Opciones) | 3% /
-1% | -6% /
-20% | 11% /
5% | 8% /
-6% | -10% /
-53% |
* ... más pequeño es mejor
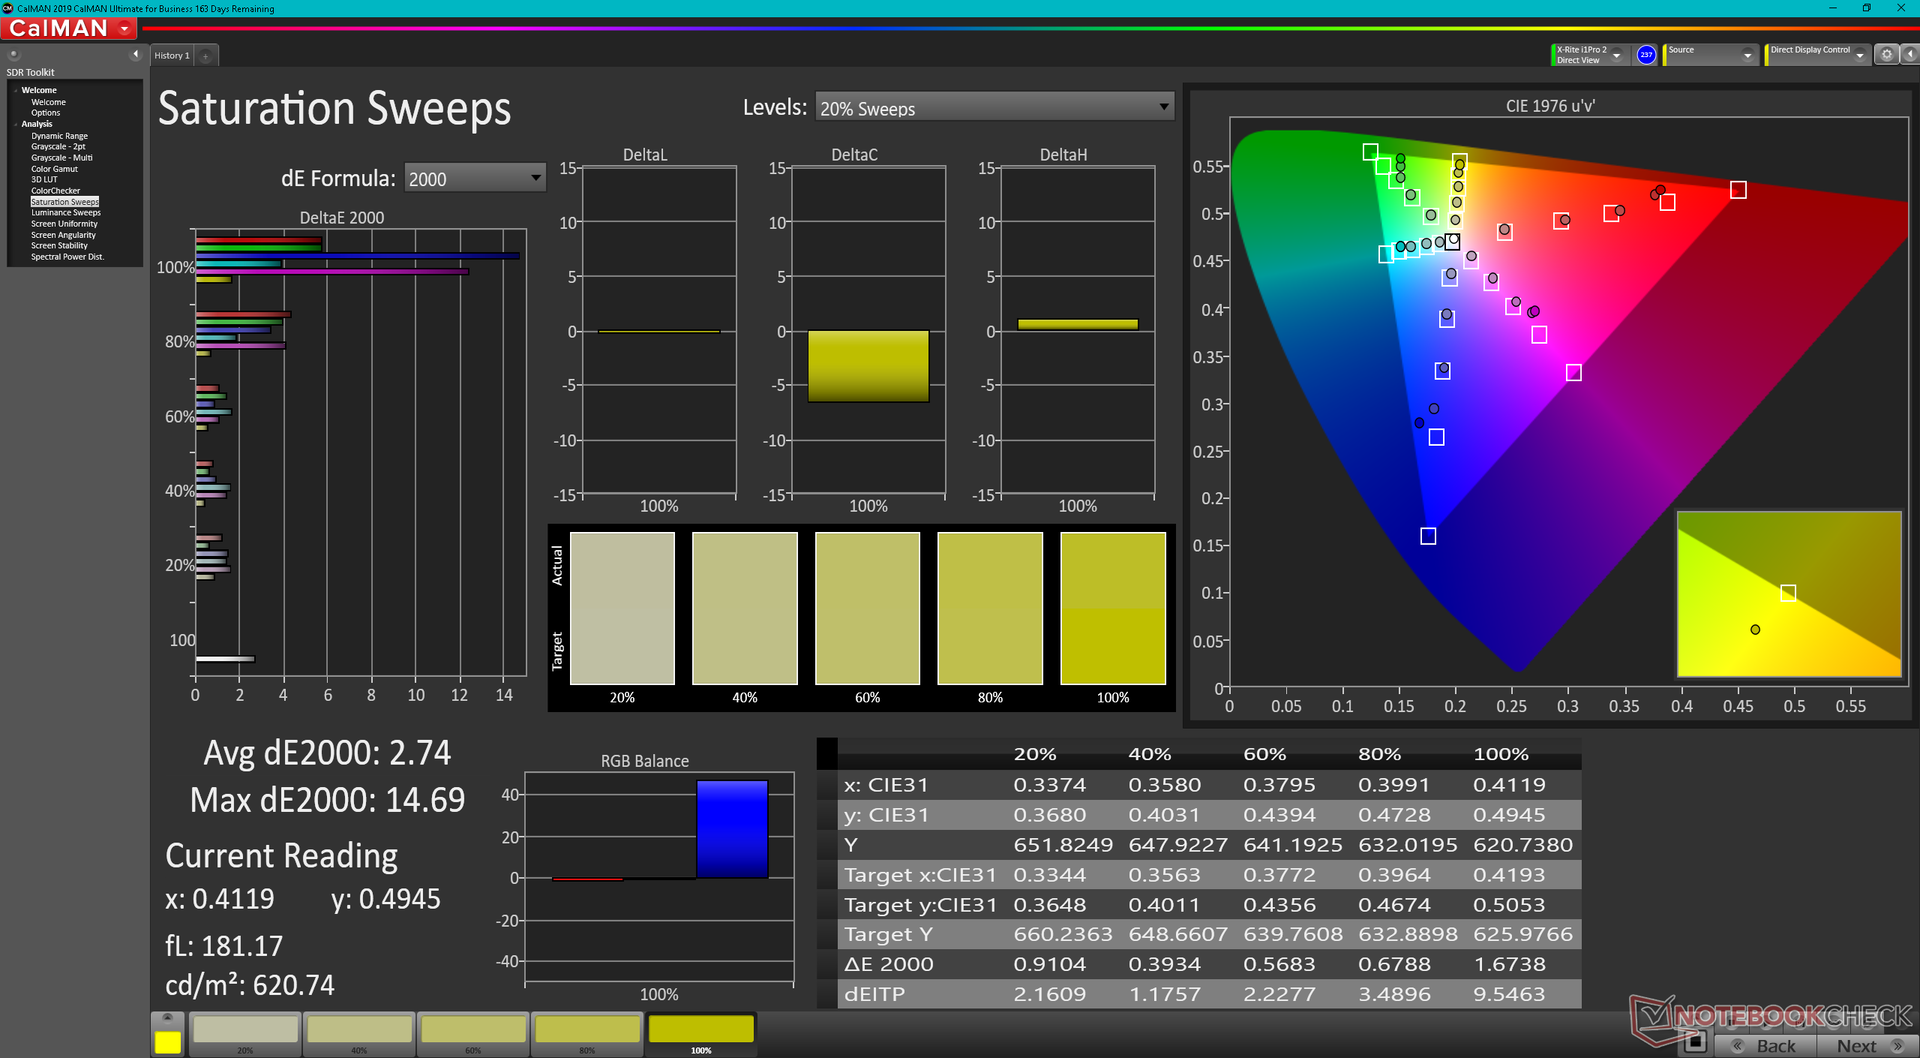
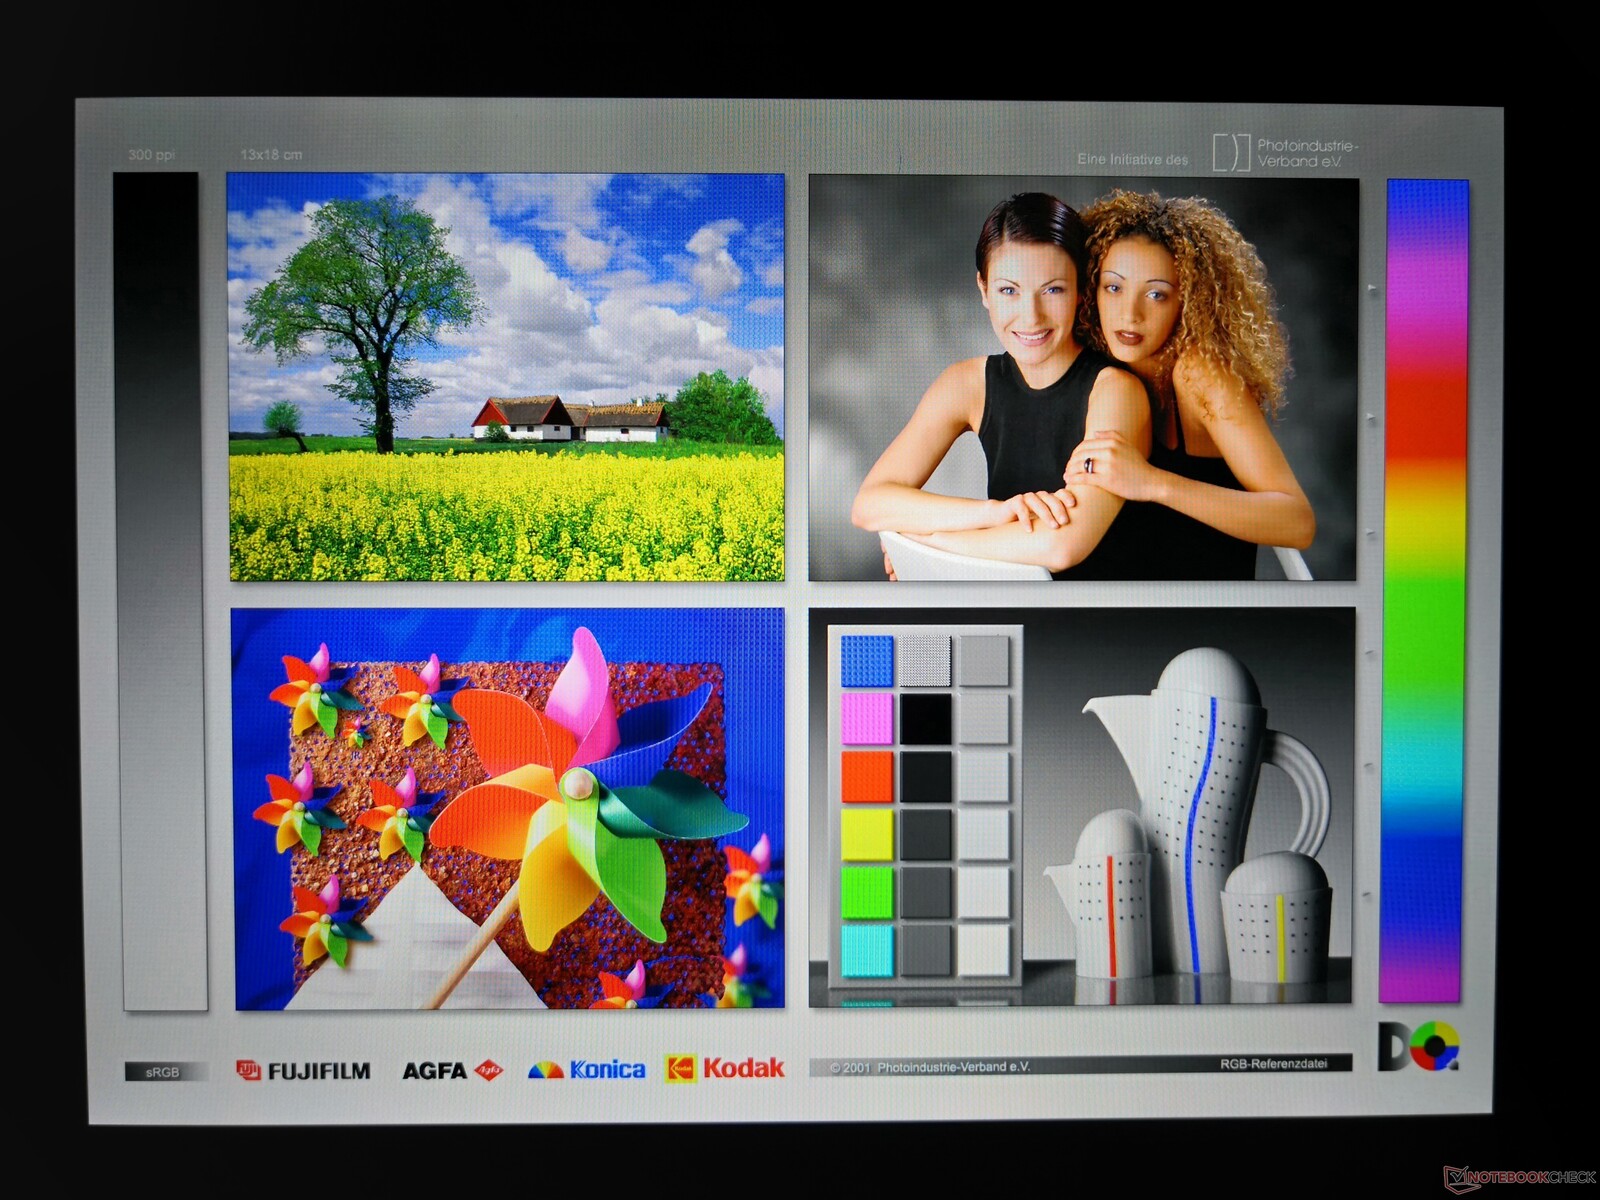
La gama es estrecha, con sólo el 54 por ciento de sRGB, en comparación con el >90 por ciento del Acer Enduro Urban N3dell Latitude 5420 Rugged, y la mayoría de los portátiles de gama media o superior. Esto generalmente no debería ser una preocupación a menos que si la precisión del color es esencial para sus aplicaciones.
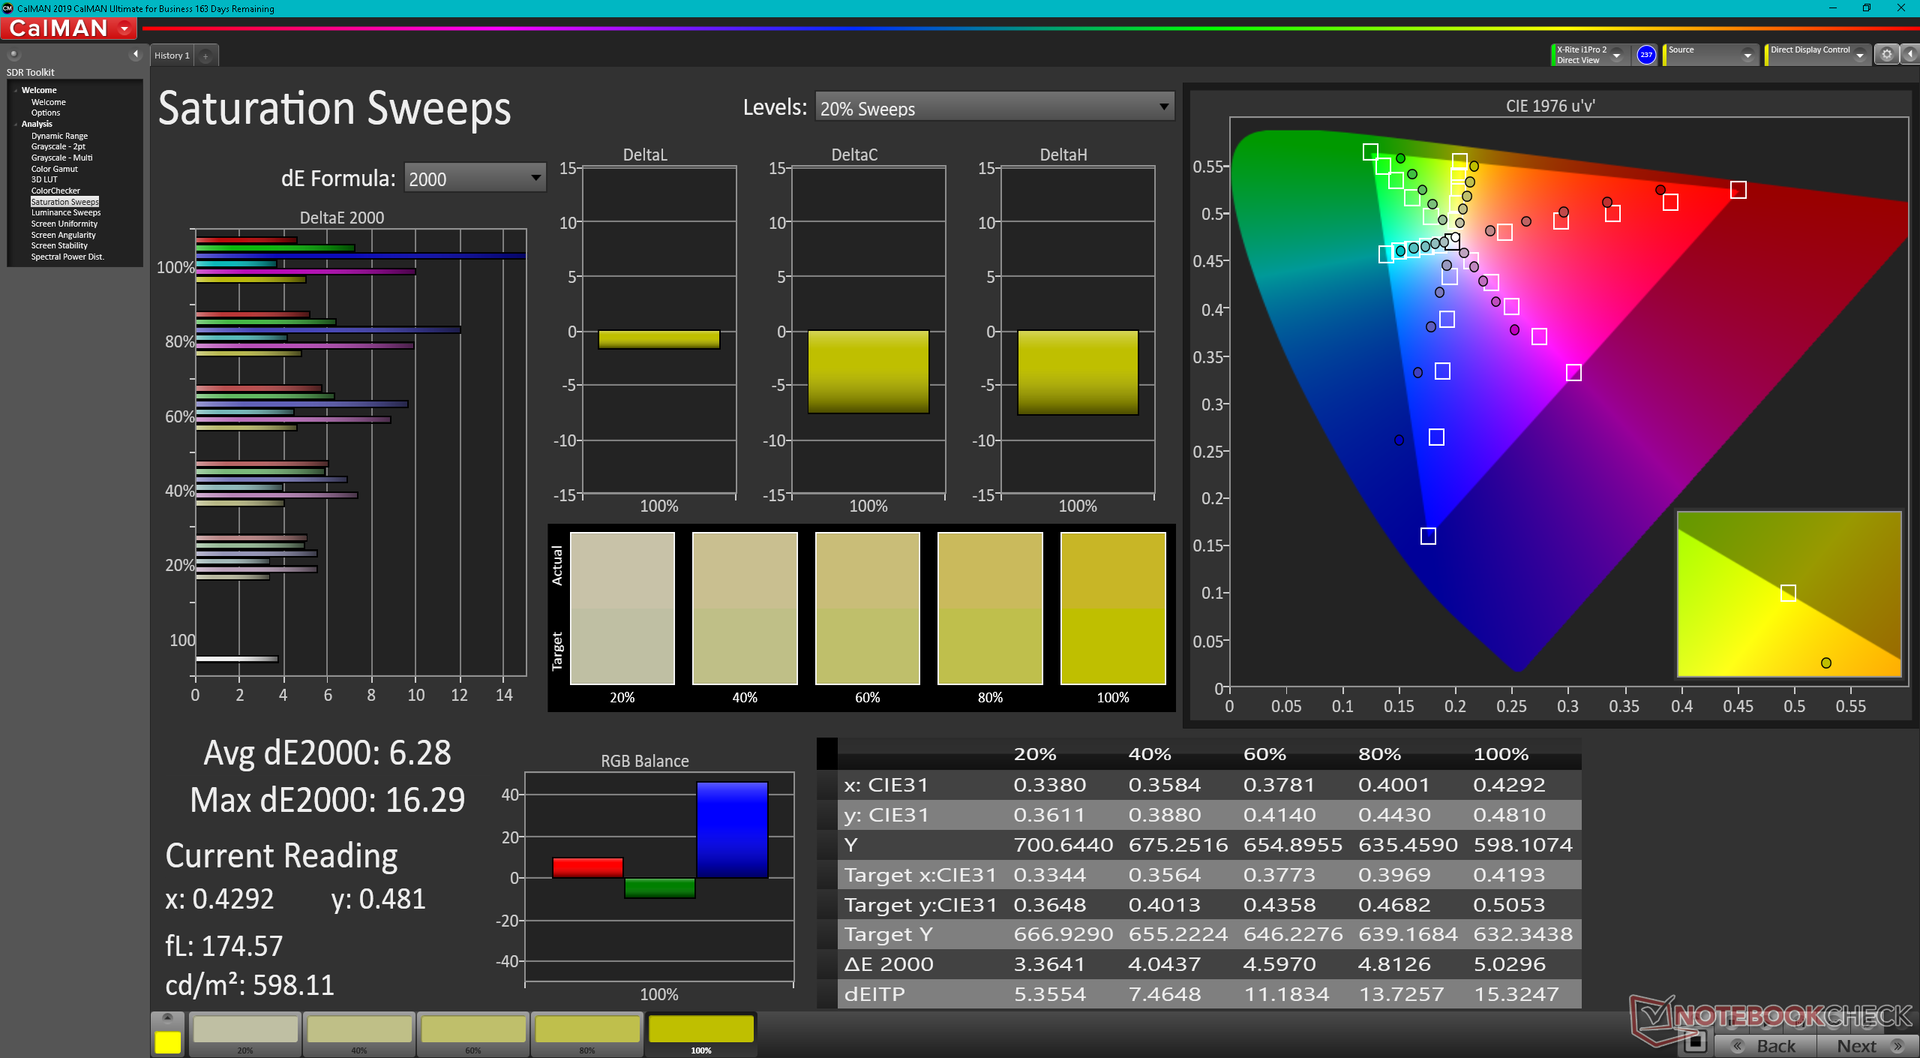
La pantalla no viene calibrada de fábrica. Calibrarla nosotros mismos mejoraría los valores medios de deltaE en toda la pantalla, pero los colores saturados siempre serán inexactos debido a la limitada cobertura sRGB mencionada anteriormente. Aun así, los usuarios pueden aplicar nuestro perfil ICM calibrado más arriba para sacar el máximo partido a la pantalla.
Tiempos de respuesta del display
| ↔ Tiempo de respuesta de Negro a Blanco | ||
|---|---|---|
| 27.6 ms ... subida ↗ y bajada ↘ combinada | ↗ 14.4 ms subida | 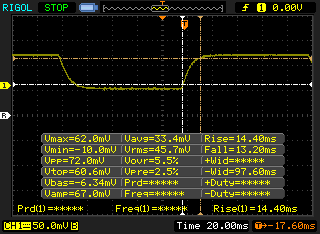 |
| ↘ 13.2 ms bajada | ||
| La pantalla mostró tiempos de respuesta relativamente lentos en nuestros tests pero podría ser demasiado lenta para los jugones. En comparación, todos los dispositivos de prueba van de ##min### (mínimo) a 240 (máximo) ms. » 70 % de todos los dispositivos son mejores. Eso quiere decir que el tiempo de respuesta es peor que la media (19.8 ms) de todos los dispositivos testados. | ||
| ↔ Tiempo de respuesta 50% Gris a 80% Gris | ||
| 50.4 ms ... subida ↗ y bajada ↘ combinada | ↗ 24.4 ms subida | 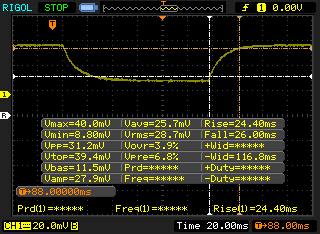 |
| ↘ 26 ms bajada | ||
| La pantalla mostró tiempos de respuesta lentos en nuestros tests y podría ser demasiado lenta para los jugones. En comparación, todos los dispositivos de prueba van de ##min### (mínimo) a 636 (máximo) ms. » 87 % de todos los dispositivos son mejores. Eso quiere decir que el tiempo de respuesta es peor que la media (31 ms) de todos los dispositivos testados. | ||
Parpadeo de Pantalla / PWM (Pulse-Width Modulation)
| Parpadeo de Pantalla / PWM detectado | 694.4 Hz | ≤ 99 % de brillo |  |
La retroiluminación del display parpadea a 694.4 Hz (seguramente usa PWM - Pulse-Width Modulation) a un brillo del 99 % e inferior. Sobre este nivel de brillo no debería darse parpadeo / PWM. La frecuencia de 694.4 Hz es bastante alta, por lo que la mayoría de gente sensible al parpadeo no debería ver parpadeo o tener fatiga visual. Comparación: 52 % de todos los dispositivos testados no usaron PWM para atenuar el display. Si se usó, medimos una media de 7757 (mínimo: 5 - máxmo: 343500) Hz. | |||
Rendimiento
Condiciones de la prueba
Hemos puesto nuestra unidad en el modo de rendimiento a través de Windows antes de ejecutar las pruebas de referencia que se indican a continuación.
Procesador
El rendimiento de la CPU es entre un 5 y un 10 por ciento más lento, tanto en cargas de trabajo de un solo hilo como de varios hilos, que el portátil medio de nuestra base de datos equipado con el mismo Core i7-1185G7 CPU. Esto no es inusual, ya que muchos portátiles robustos tienden a buscar velocidades de reloj más bajas para aumentar la estabilidad y la fiabilidad. El rendimiento general sigue siendo mucho más rápido que el de cualquier solución de la serie U del Core de 10ª generación o anterior.
Cinebench R15 Multi Loop
Cinebench R23: Multi Core | Single Core
Cinebench R15: CPU Multi 64Bit | CPU Single 64Bit
Blender: v2.79 BMW27 CPU
7-Zip 18.03: 7z b 4 | 7z b 4 -mmt1
Geekbench 5.5: Multi-Core | Single-Core
HWBOT x265 Benchmark v2.2: 4k Preset
LibreOffice : 20 Documents To PDF
R Benchmark 2.5: Overall mean
* ... más pequeño es mejor
AIDA64: FP32 Ray-Trace | FPU Julia | CPU SHA3 | CPU Queen | FPU SinJulia | FPU Mandel | CPU AES | CPU ZLib | FP64 Ray-Trace | CPU PhotoWorxx
| Performance rating | |
| Acer Enduro Urban N3 EUN314 | |
| Medio Intel Core i7-1185G7 | |
| Panasonic Toughbook FZ-55 MK2 | |
| Getac S410 Gen 4 | |
| Panasonic Toughbook 40 | |
| Durabook S14I | |
| AIDA64 / FP32 Ray-Trace | |
| Acer Enduro Urban N3 EUN314 | |
| Medio Intel Core i7-1185G7 (5621 - 7453, n=20) | |
| Panasonic Toughbook FZ-55 MK2 | |
| Getac S410 Gen 4 | |
| Panasonic Toughbook 40 | |
| Durabook S14I | |
| AIDA64 / FPU Julia | |
| Acer Enduro Urban N3 EUN314 | |
| Panasonic Toughbook FZ-55 MK2 | |
| Medio Intel Core i7-1185G7 (23248 - 32614, n=20) | |
| Getac S410 Gen 4 | |
| Panasonic Toughbook 40 | |
| Durabook S14I | |
| AIDA64 / CPU SHA3 | |
| Acer Enduro Urban N3 EUN314 | |
| Medio Intel Core i7-1185G7 (1530 - 2209, n=20) | |
| Panasonic Toughbook FZ-55 MK2 | |
| Getac S410 Gen 4 | |
| Panasonic Toughbook 40 | |
| Durabook S14I | |
| AIDA64 / CPU Queen | |
| Acer Enduro Urban N3 EUN314 | |
| Durabook S14I | |
| Panasonic Toughbook FZ-55 MK2 | |
| Medio Intel Core i7-1185G7 (44677 - 52815, n=20) | |
| Getac S410 Gen 4 | |
| Panasonic Toughbook 40 | |
| AIDA64 / FPU SinJulia | |
| Acer Enduro Urban N3 EUN314 | |
| Panasonic Toughbook FZ-55 MK2 | |
| Medio Intel Core i7-1185G7 (3870 - 5027, n=20) | |
| Getac S410 Gen 4 | |
| Panasonic Toughbook 40 | |
| Durabook S14I | |
| AIDA64 / FPU Mandel | |
| Acer Enduro Urban N3 EUN314 | |
| Panasonic Toughbook FZ-55 MK2 | |
| Medio Intel Core i7-1185G7 (14584 - 19594, n=20) | |
| Getac S410 Gen 4 | |
| Panasonic Toughbook 40 | |
| Durabook S14I | |
| AIDA64 / CPU AES | |
| Acer Enduro Urban N3 EUN314 | |
| Durabook S14I | |
| Medio Intel Core i7-1185G7 (33002 - 76826, n=20) | |
| Getac S410 Gen 4 | |
| Panasonic Toughbook FZ-55 MK2 | |
| Panasonic Toughbook 40 | |
| AIDA64 / CPU ZLib | |
| Acer Enduro Urban N3 EUN314 | |
| Panasonic Toughbook 40 | |
| Getac S410 Gen 4 | |
| Medio Intel Core i7-1185G7 (258 - 412, n=22) | |
| Panasonic Toughbook FZ-55 MK2 | |
| Durabook S14I | |
| AIDA64 / FP64 Ray-Trace | |
| Acer Enduro Urban N3 EUN314 | |
| Panasonic Toughbook FZ-55 MK2 | |
| Medio Intel Core i7-1185G7 (2821 - 4094, n=20) | |
| Getac S410 Gen 4 | |
| Panasonic Toughbook 40 | |
| Durabook S14I | |
| AIDA64 / CPU PhotoWorxx | |
| Medio Intel Core i7-1185G7 (22349 - 43701, n=20) | |
| Getac S410 Gen 4 | |
| Acer Enduro Urban N3 EUN314 | |
| Panasonic Toughbook FZ-55 MK2 | |
| Panasonic Toughbook 40 | |
| Durabook S14I | |
Rendimiento del sistema
CrossMark: Overall | Productivity | Creativity | Responsiveness
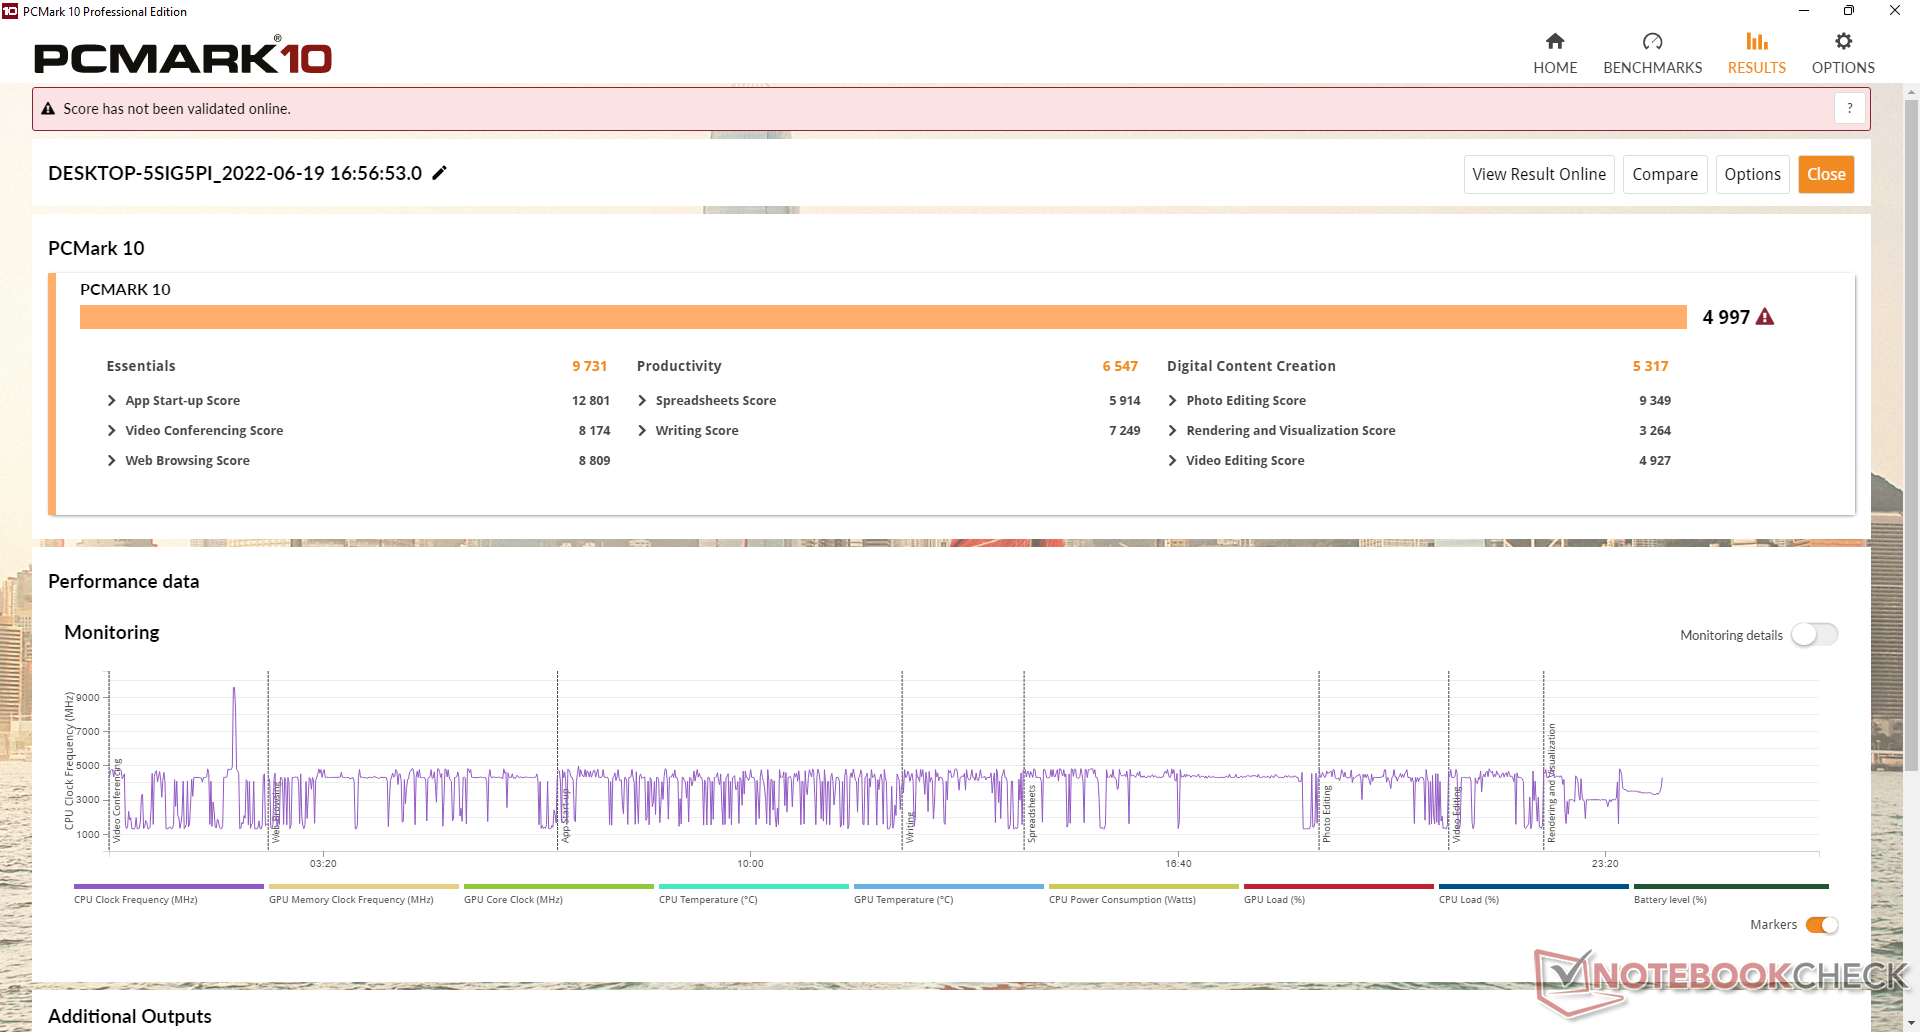
| PCMark 10 / Score | |
| Panasonic Toughbook FZ-55 MK2 | |
| Medio Intel Core i7-1185G7, Intel Iris Xe Graphics G7 96EUs (4746 - 5561, n=20) | |
| Panasonic Toughbook 40 | |
| Durabook S14I | |
| Getac S410 Gen 4 | |
| Acer Enduro Urban N3 EUN314 | |
| Dell Latitude 5420 Rugged-P85G | |
| PCMark 10 / Essentials | |
| Panasonic Toughbook FZ-55 MK2 | |
| Durabook S14I | |
| Getac S410 Gen 4 | |
| Medio Intel Core i7-1185G7, Intel Iris Xe Graphics G7 96EUs (8279 - 10664, n=20) | |
| Panasonic Toughbook 40 | |
| Acer Enduro Urban N3 EUN314 | |
| Dell Latitude 5420 Rugged-P85G | |
| PCMark 10 / Productivity | |
| Dell Latitude 5420 Rugged-P85G | |
| Durabook S14I | |
| Medio Intel Core i7-1185G7, Intel Iris Xe Graphics G7 96EUs (5799 - 8770, n=20) | |
| Panasonic Toughbook FZ-55 MK2 | |
| Panasonic Toughbook 40 | |
| Acer Enduro Urban N3 EUN314 | |
| Getac S410 Gen 4 | |
| PCMark 10 / Digital Content Creation | |
| Panasonic Toughbook 40 | |
| Panasonic Toughbook FZ-55 MK2 | |
| Medio Intel Core i7-1185G7, Intel Iris Xe Graphics G7 96EUs (4424 - 5684, n=20) | |
| Getac S410 Gen 4 | |
| Acer Enduro Urban N3 EUN314 | |
| Durabook S14I | |
| Dell Latitude 5420 Rugged-P85G | |
| CrossMark / Overall | |
| Medio Intel Core i7-1185G7, Intel Iris Xe Graphics G7 96EUs (1233 - 1474, n=5) | |
| Panasonic Toughbook 40 | |
| Getac S410 Gen 4 | |
| CrossMark / Productivity | |
| Medio Intel Core i7-1185G7, Intel Iris Xe Graphics G7 96EUs (1277 - 1506, n=5) | |
| Panasonic Toughbook 40 | |
| Getac S410 Gen 4 | |
| CrossMark / Creativity | |
| Medio Intel Core i7-1185G7, Intel Iris Xe Graphics G7 96EUs (1291 - 1513, n=5) | |
| Panasonic Toughbook 40 | |
| Getac S410 Gen 4 | |
| CrossMark / Responsiveness | |
| Medio Intel Core i7-1185G7, Intel Iris Xe Graphics G7 96EUs (969 - 1411, n=5) | |
| Panasonic Toughbook 40 | |
| Getac S410 Gen 4 | |
| PCMark 10 Score | 4997 puntos | |
ayuda | ||
| AIDA64 / Memory Copy | |
| Medio Intel Core i7-1185G7 (36515 - 68450, n=20) | |
| Acer Enduro Urban N3 EUN314 | |
| Panasonic Toughbook FZ-55 MK2 | |
| Getac S410 Gen 4 | |
| Panasonic Toughbook 40 | |
| Durabook S14I | |
| AIDA64 / Memory Read | |
| Medio Intel Core i7-1185G7 (38394 - 64291, n=20) | |
| Acer Enduro Urban N3 EUN314 | |
| Panasonic Toughbook FZ-55 MK2 | |
| Getac S410 Gen 4 | |
| Panasonic Toughbook 40 | |
| Durabook S14I | |
| AIDA64 / Memory Write | |
| Medio Intel Core i7-1185G7 (37684 - 66873, n=20) | |
| Acer Enduro Urban N3 EUN314 | |
| Panasonic Toughbook FZ-55 MK2 | |
| Getac S410 Gen 4 | |
| Panasonic Toughbook 40 | |
| Durabook S14I | |
| AIDA64 / Memory Latency | |
| Panasonic Toughbook 40 | |
| Medio Intel Core i7-1185G7 (78.3 - 117, n=22) | |
| Acer Enduro Urban N3 EUN314 | |
| Getac S410 Gen 4 | |
| Panasonic Toughbook FZ-55 MK2 | |
| Durabook S14I | |
* ... más pequeño es mejor
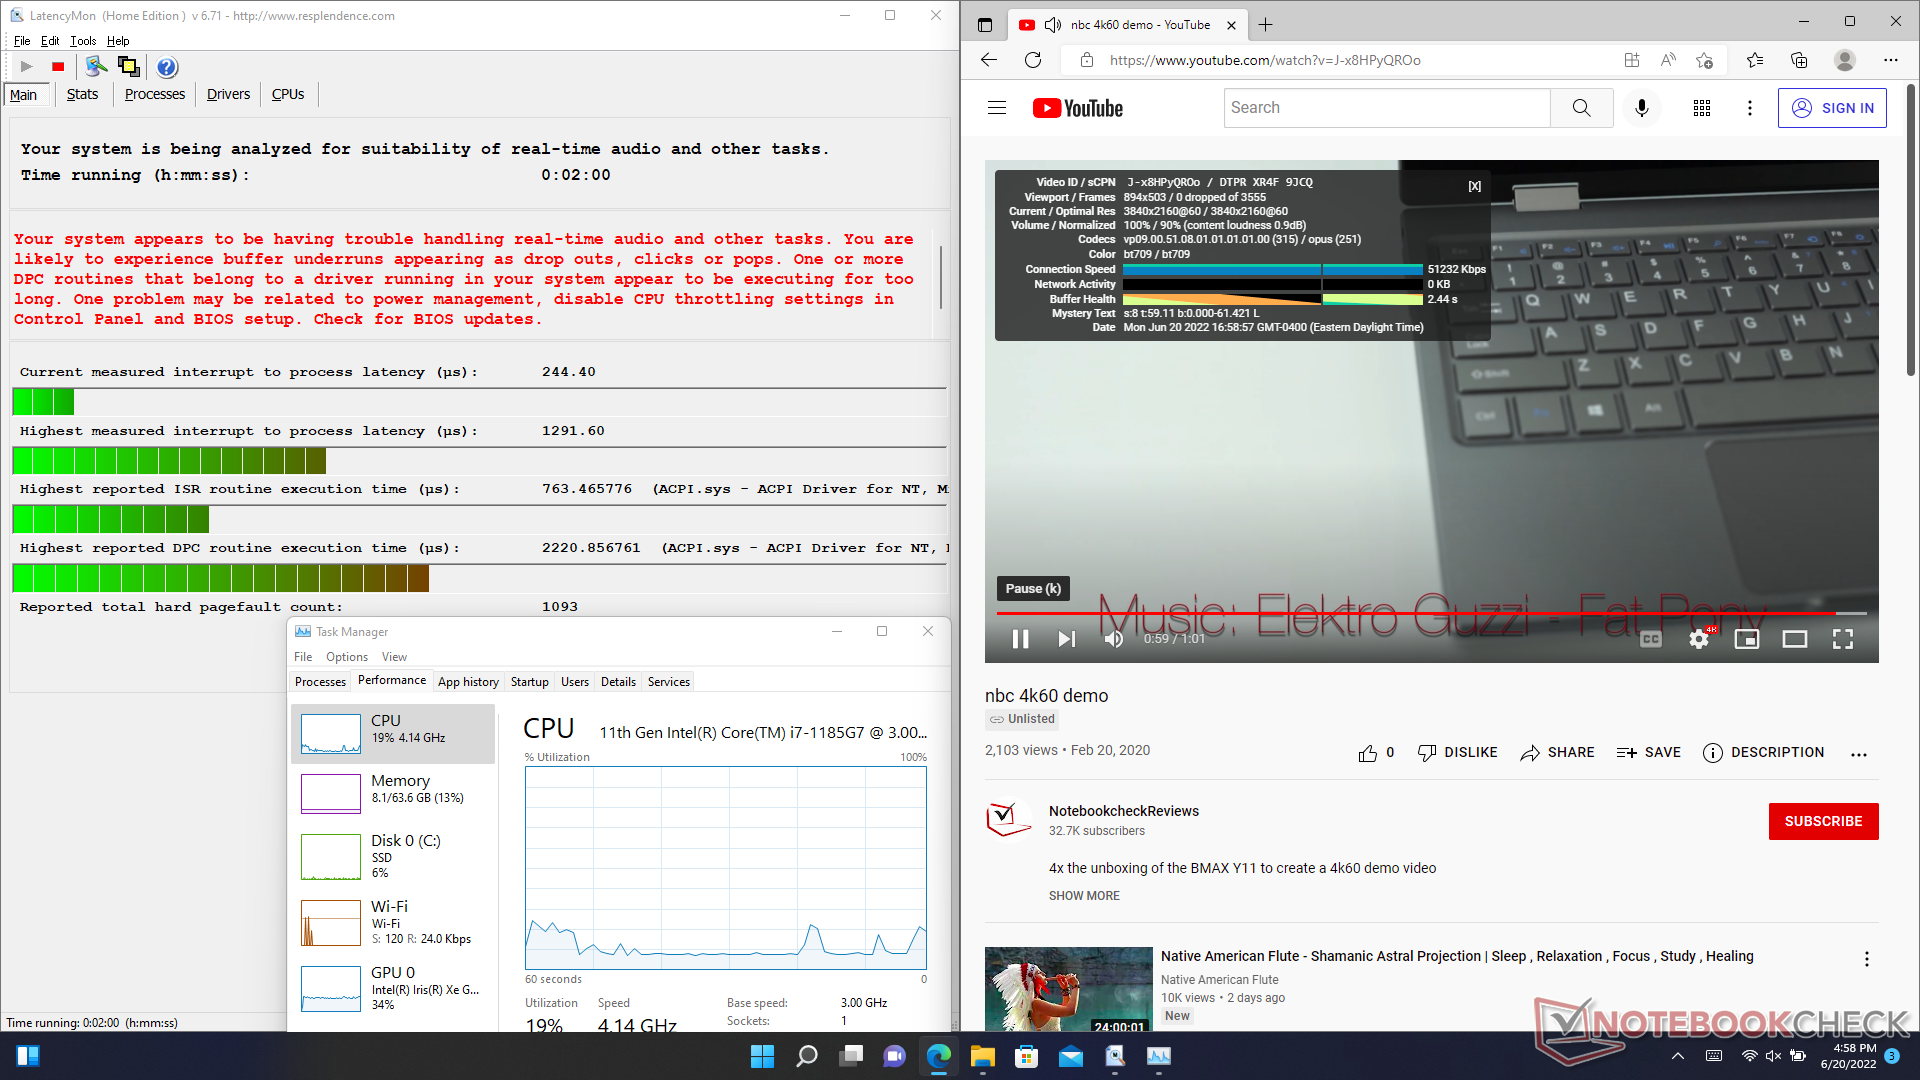
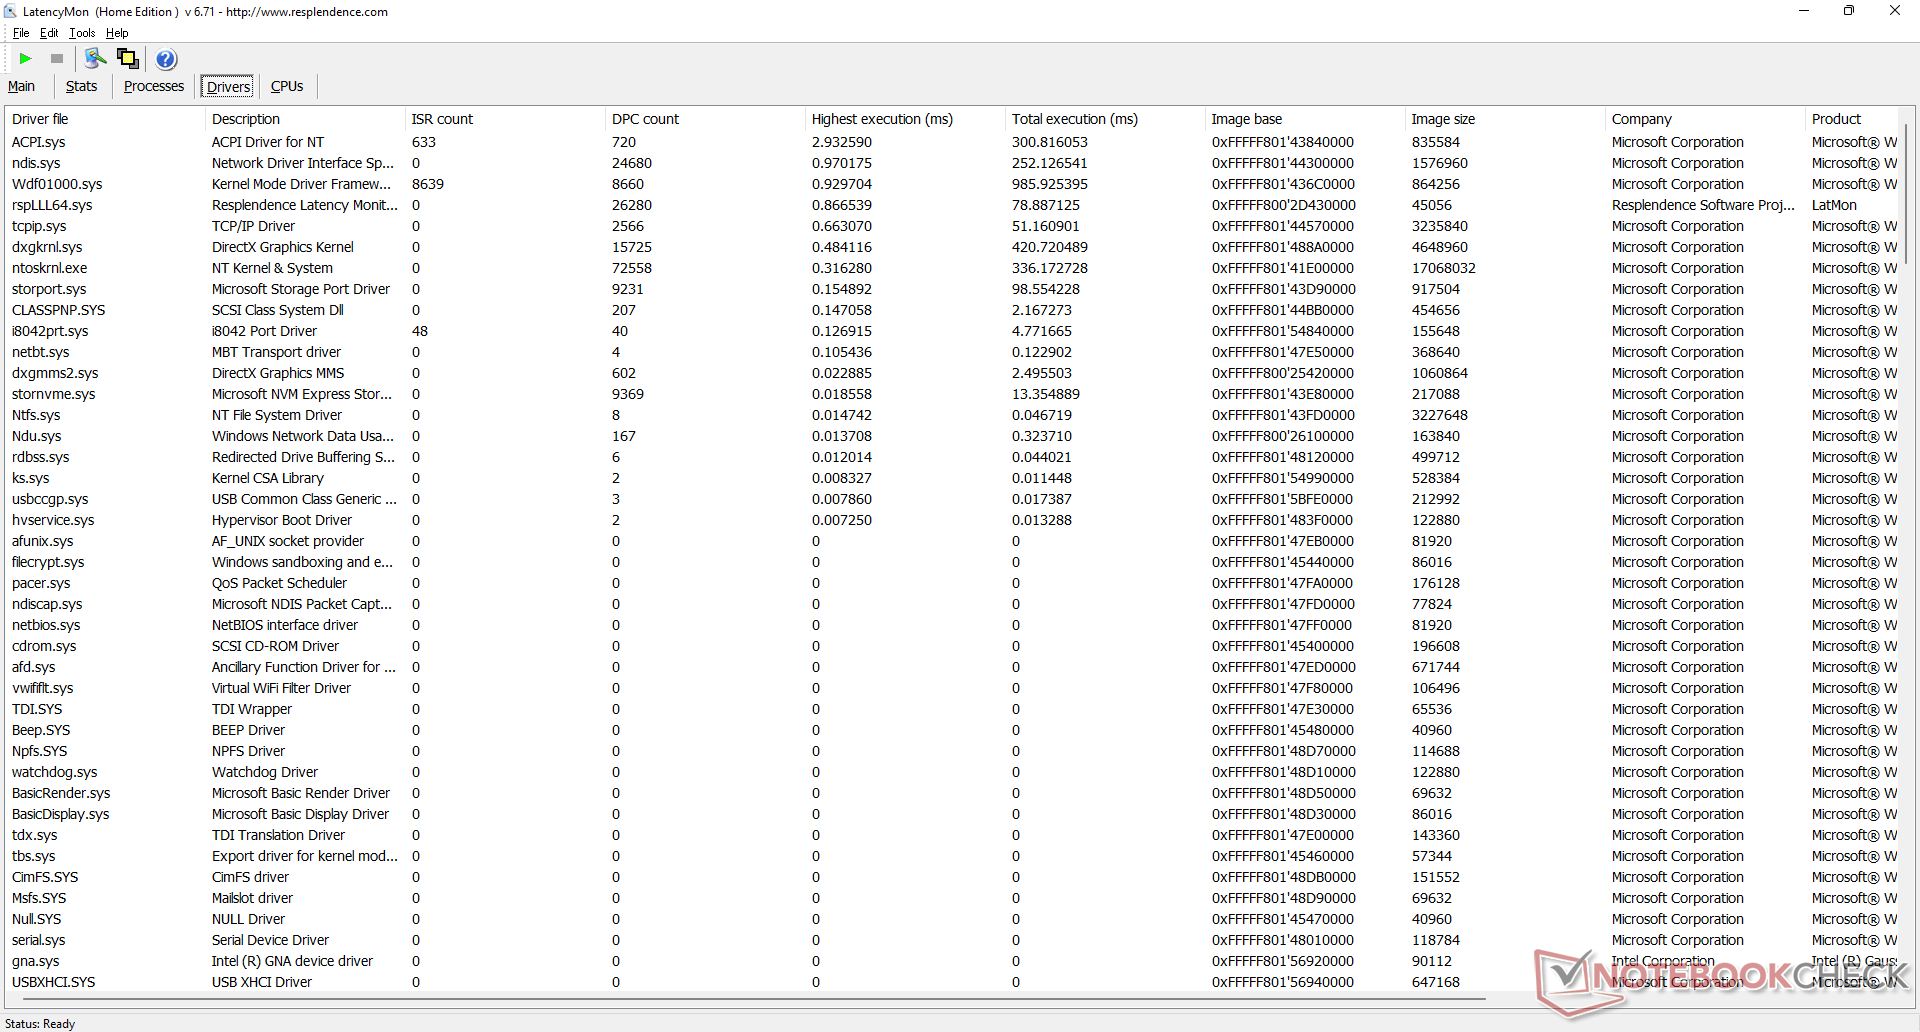
Latencia del CPD
LatencyMon revela problemas de CPD al abrir varias pestañas del navegador de nuestra página web. la reproducción de vídeo 4K a 60 FPS es, por lo demás, fluida y sin pérdida de fotogramas.
| DPC Latencies / LatencyMon - interrupt to process latency (max), Web, Youtube, Prime95 | |
| Acer Enduro Urban N3 EUN314 | |
| Panasonic Toughbook FZ-55 MK2 | |
| Durabook S14I | |
| Getac S410 Gen 4 | |
| Panasonic Toughbook 40 | |
* ... más pequeño es mejor
Dispositivos de almacenamiento
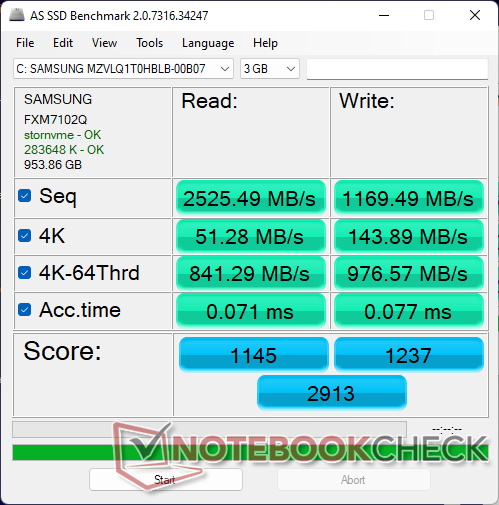
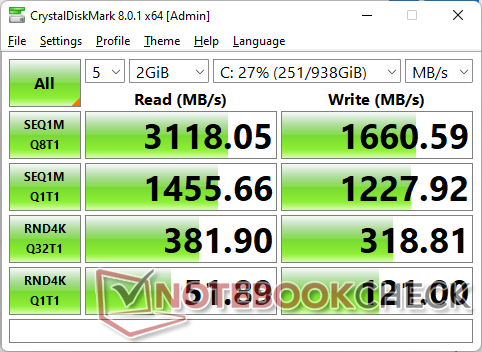
Nuestra unidad de prueba viene con un Samsung PM991 PCIe3 x4 NVMe SSD. También se puede instalar una unidad secundaria SATA utilizando una de las ranuras xPAK. Ambas unidades se conectan al portátil mediante ranuras de liberación rápida
El SSD de nuestra unidad es incapaz de mantener sus tasas de transferencia máximas durante periodos prolongados, probablemente debido a una mala disipación del calor. Cuando se ejecuta DiskSpd en un bucle, las tasas de transferencia comienzan siendo altas, de 3000 MB/s, antes de caer constantemente y estabilizarse finalmente en unos 1700 MB/s.

| Drive Performance rating - Percent | |
| Acer Enduro Urban N3 EUN314 | |
| Durabook S14I | |
| Panasonic Toughbook 40 | |
| Dell Latitude 5420 Rugged-P85G -8! | |
| Panasonic Toughbook FZ-55 MK2 | |
| Getac S410 Gen 4 | |
* ... más pequeño es mejor
Disk Throttling: DiskSpd Read Loop, Queue Depth 8
Rendimiento de la GPU
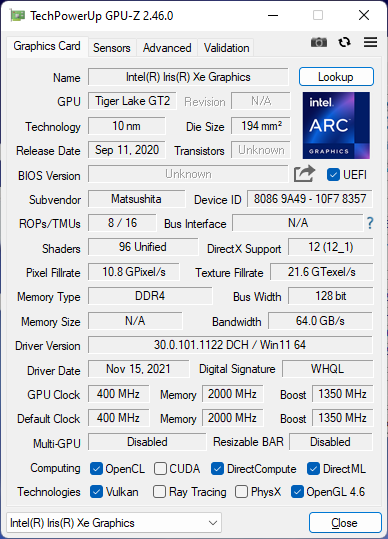
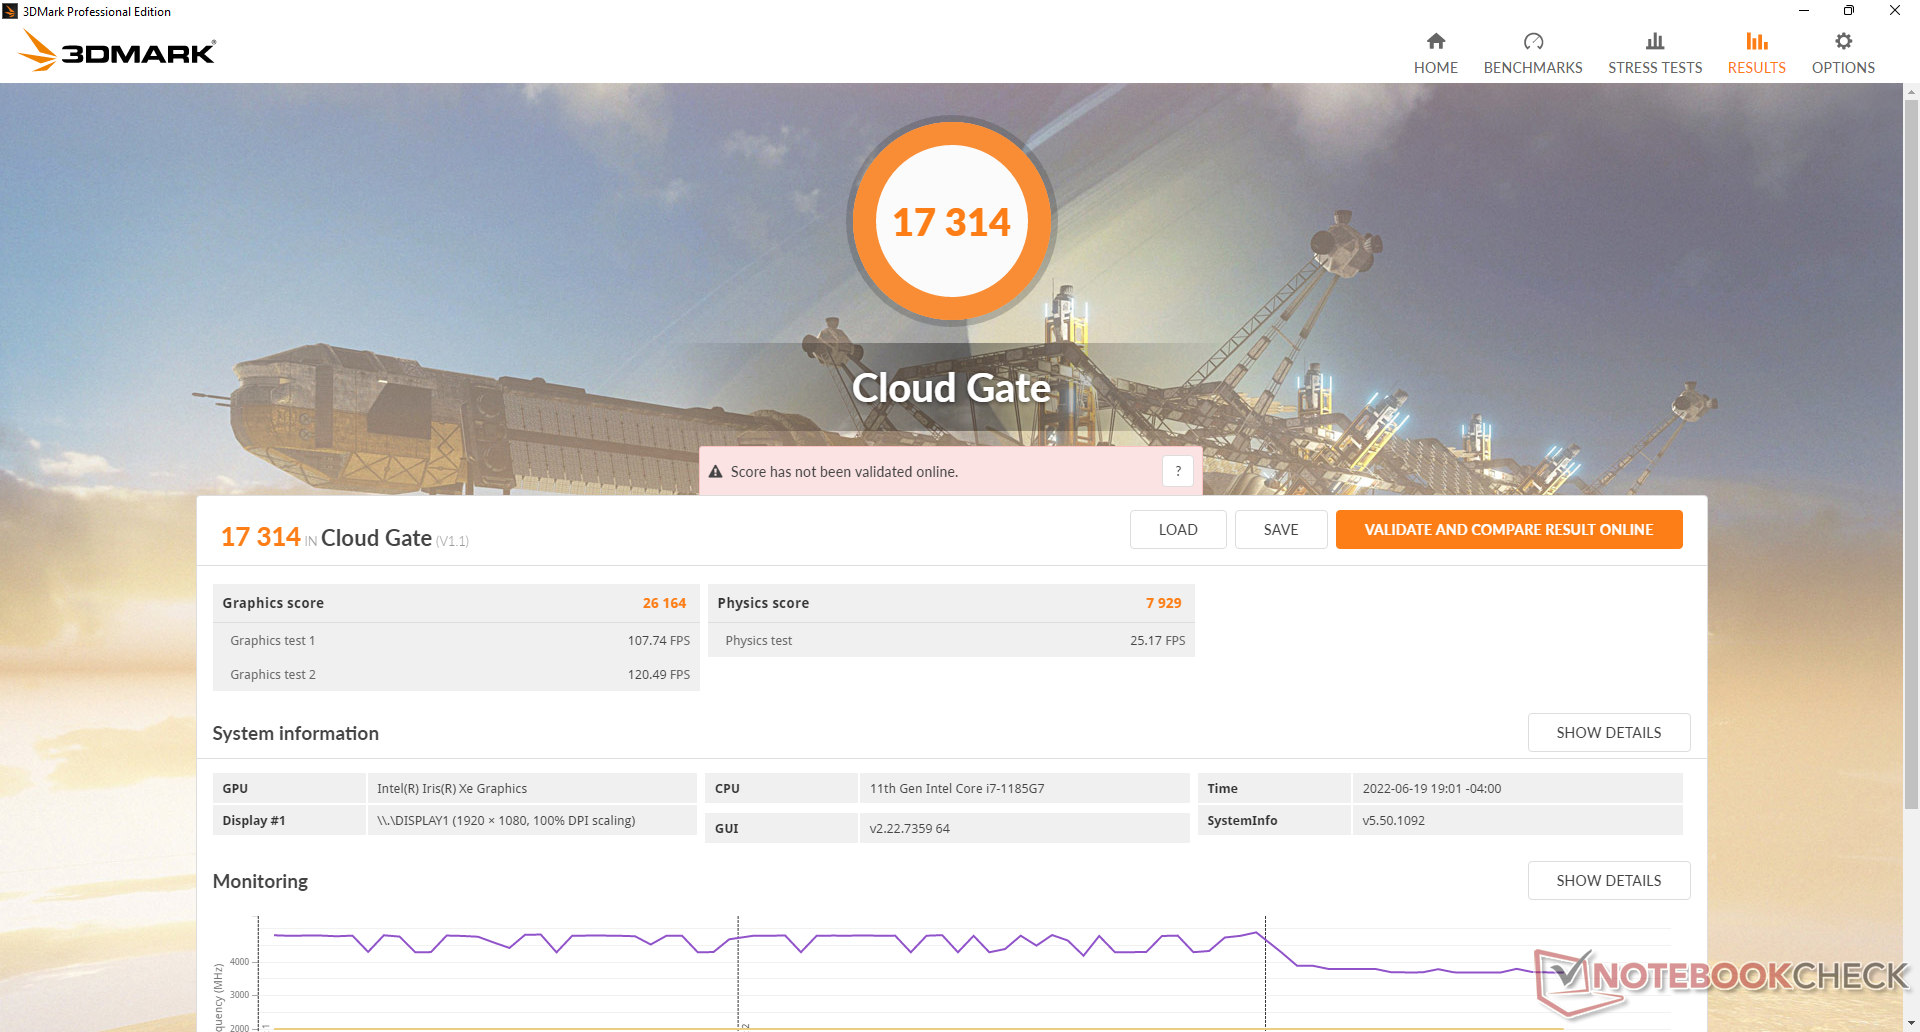
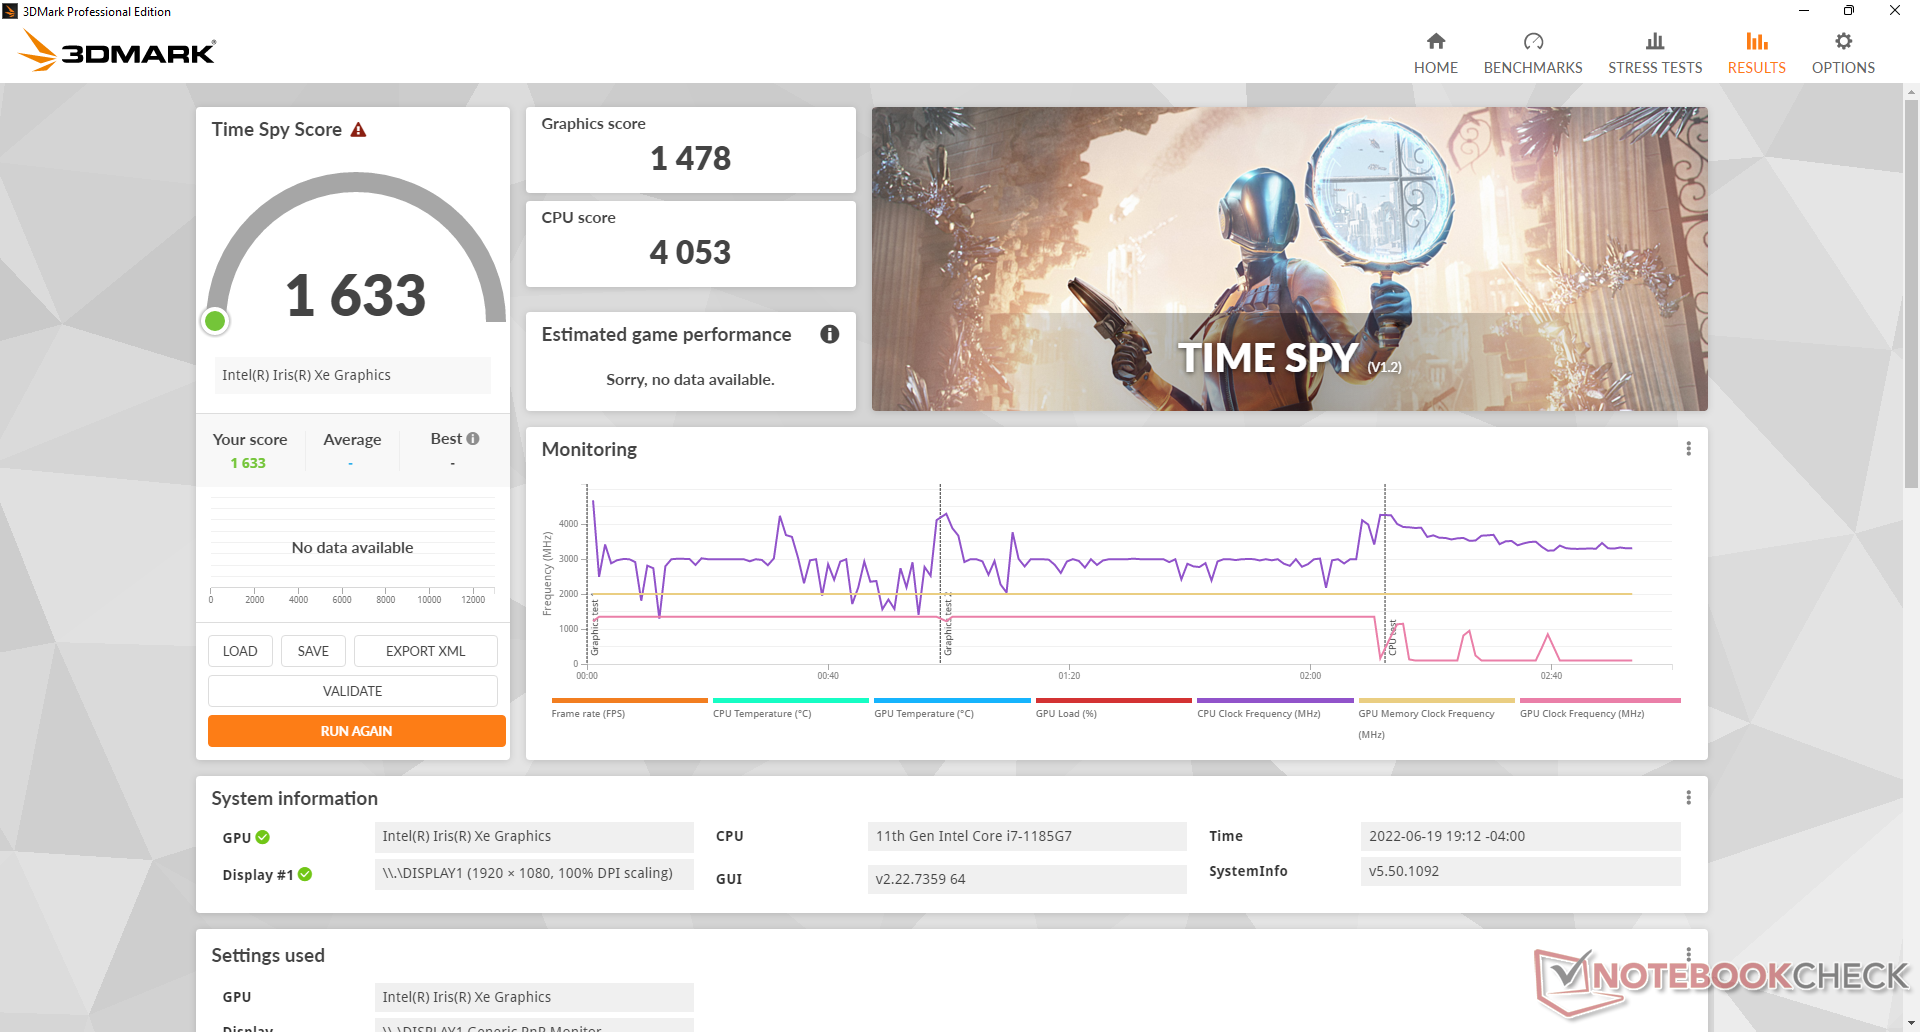
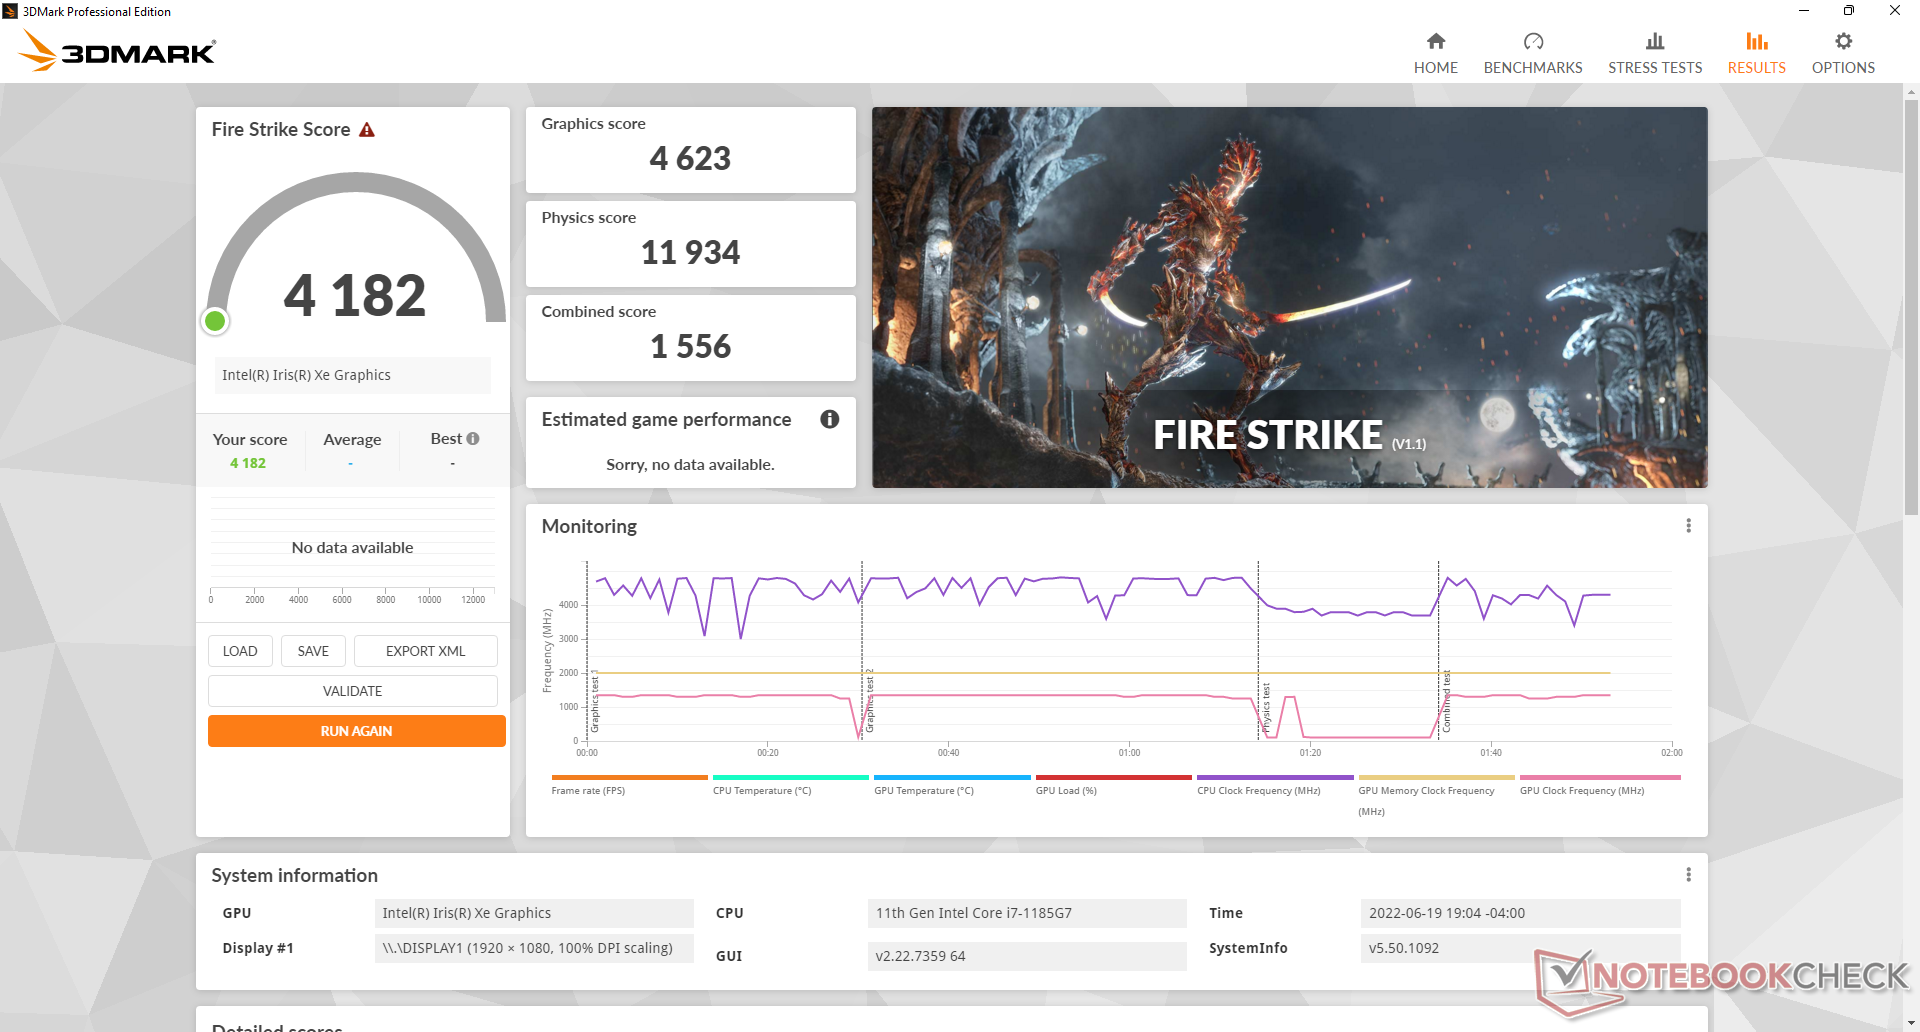
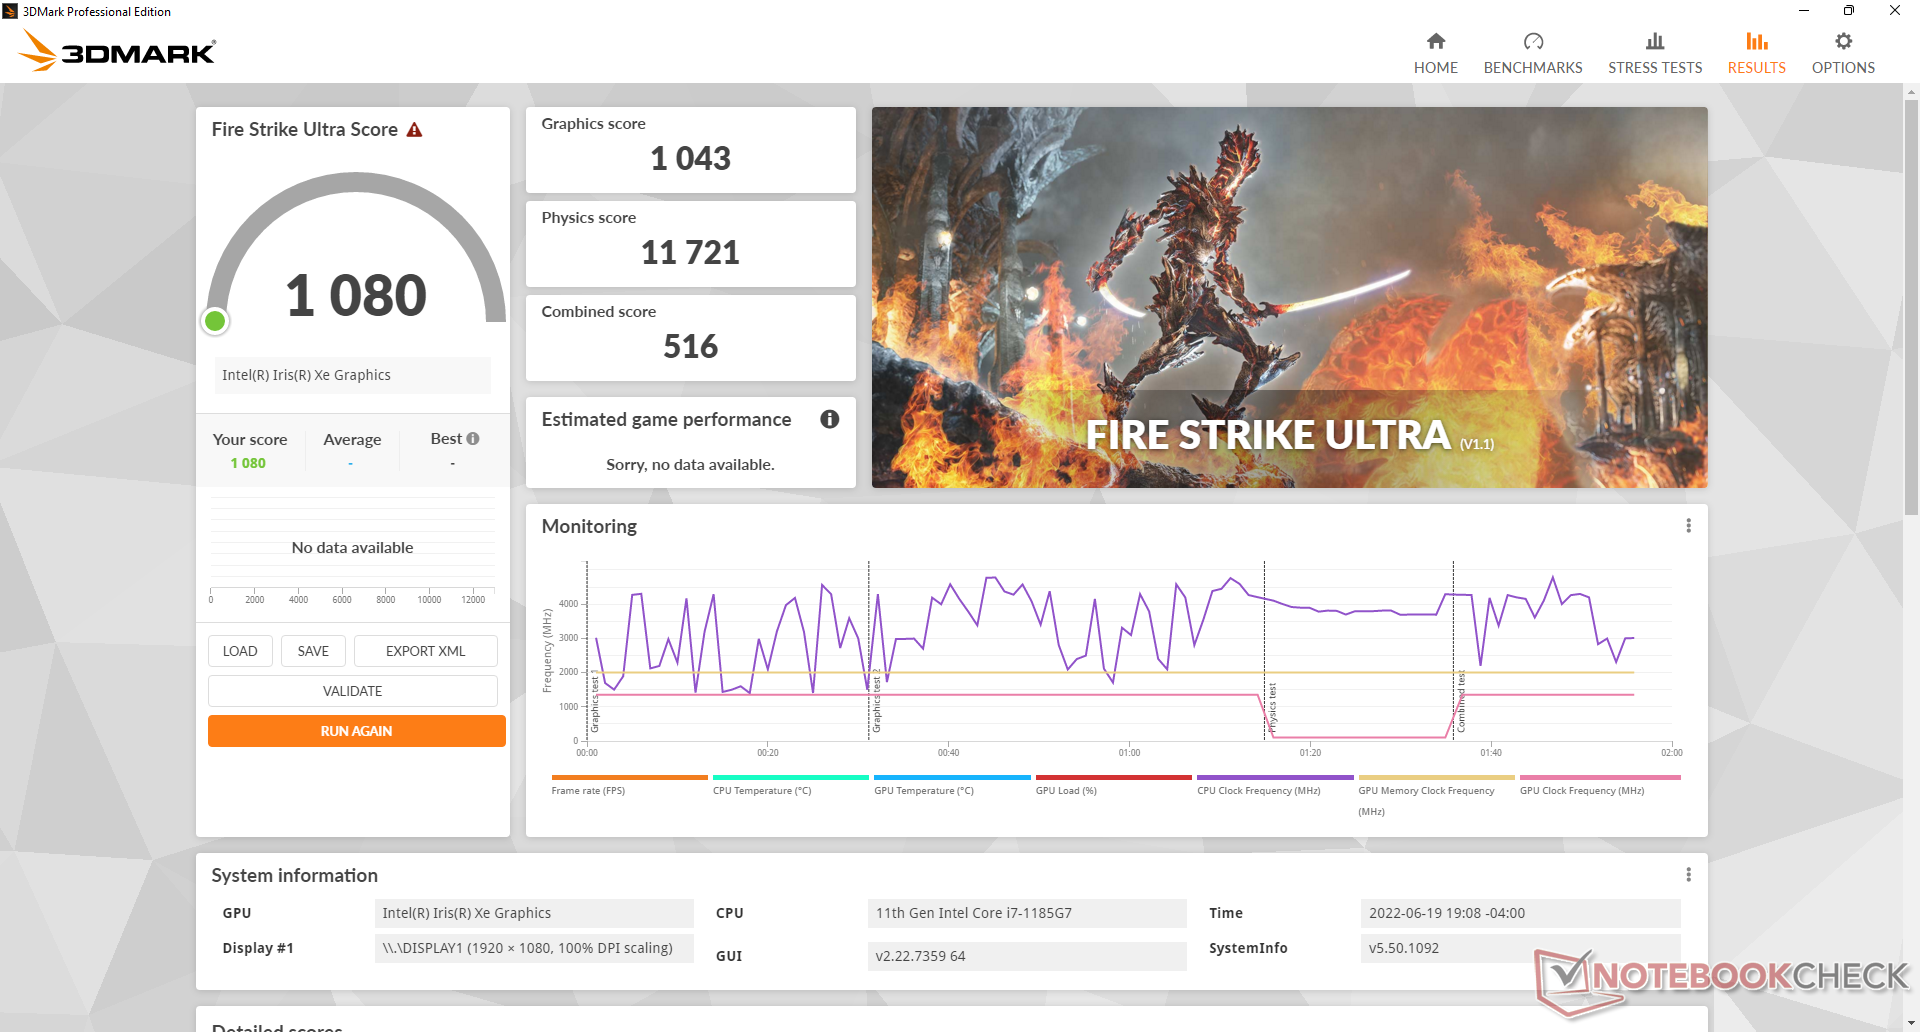
El sistema integrado Iris Xe 96 EUs está rindiendo donde esperamos que lo haga en relación con otros portátiles con la misma GPU. Tanto el rendimiento como el rendimiento por vatio son significativamente superiores a los de cualquier portátil robusto que aún funcione con los antiguos Gráficos UHD 620.
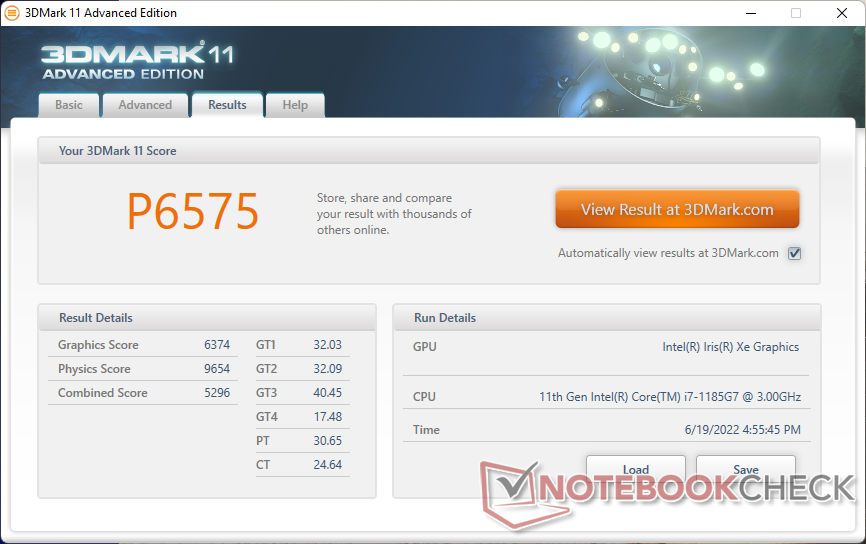
| 3DMark 11 Performance | 6575 puntos | |
| 3DMark Cloud Gate Standard Score | 17314 puntos | |
| 3DMark Fire Strike Score | 4182 puntos | |
| 3DMark Time Spy Score | 1633 puntos | |
ayuda | ||
Witcher 3 FPS Chart
| bajo | medio | alto | ultra | |
|---|---|---|---|---|
| The Witcher 3 (2015) | 85.9 | 54.2 | 29.5 | 14.8 |
| Dota 2 Reborn (2015) | 112.9 | 104.6 | 62.4 | 55.5 |
| Final Fantasy XV Benchmark (2018) | 40.1 | 21.3 | 15.5 | |
| X-Plane 11.11 (2018) | 24.8 | 23.3 | 25.9 | |
| Cyberpunk 2077 1.6 (2022) | 21.1 | 17.2 | 13 | 10.5 |
Emisiones
Ruido del sistema
El ventilador está siempre activo en nuestra experiencia con 26 dB(A) contra un fondo silencioso de 22,8 dB(A) incluso cuando está en reposo en el escritorio. Podemos notar algo de ruido electrónico o de bobina cuando colocamos una oreja cerca de las teclas del teclado también. Estos ruidos pasivos, afortunadamente, no son lo suficientemente fuertes como para ser preocupantes en la mayoría de los escenarios del mundo real
Ejecutando la primera escena de benchmark de 3DMark 06 induciría un ruido de ventilador de 37,6 dB(A) para ser más fuerte y suave que lo que observamos en el Toughbook FZ-55 MK2 y Getac S410 Gen 4, respectivamente. Espere este nivel de ruido cuando ejecute cargas exigentes.
Ruido
| Ocioso |
| 26 / 26 / 26 dB(A) |
| Carga |
| 37.6 / 40.3 dB(A) |
 | ||
30 dB silencioso 40 dB(A) audible 50 dB(A) ruidosamente alto |
||
min: | ||
| Panasonic Toughbook 40 Iris Xe G7 96EUs, i7-1185G7, Samsung PM991 MZVLQ1T0HALB | Panasonic Toughbook FZ-55 MK2 Iris Xe G7 96EUs, i7-1185G7, Toshiba KIOXIA KBG4AZNV512G M.2 2280 OPAL | Getac S410 Gen 4 Iris Xe G7 96EUs, i7-1185G7, SSSTC CA5-8D256 | Dell Latitude 5420 Rugged-P85G Radeon RX 540, i7-8650U, SK hynix PC401 NVMe 500 GB | Acer Enduro Urban N3 EUN314 Iris Xe G7 96EUs, i7-1165G7, Samsung PM991 MZVLQ1T0HALB | Durabook S14I Iris Xe G7 96EUs, i7-1165G7, UDinfo M2P M2P80DE512GBAEP | |
|---|---|---|---|---|---|---|
| Noise | 8% | -3% | -4% | 8% | -3% | |
| apagado / medio ambiente * (dB) | 22.8 | 23.8 -4% | 23.3 -2% | 28.3 -24% | 23.8 -4% | 25.2 -11% |
| Idle Minimum * (dB) | 26 | 24 8% | 23.5 10% | 28.3 -9% | 24.1 7% | 25.2 3% |
| Idle Average * (dB) | 26 | 24 8% | 23.5 10% | 28.3 -9% | 24.1 7% | 25.2 3% |
| Idle Maximum * (dB) | 26 | 24 8% | 28 -8% | 28.3 -9% | 24.1 7% | 34.5 -33% |
| Load Average * (dB) | 37.6 | 26.7 29% | 42.8 -14% | 29.9 20% | 27.9 26% | 34.5 8% |
| Witcher 3 ultra * (dB) | 37.8 | 42.3 -12% | 35.7 6% | |||
| Load Maximum * (dB) | 40.3 | 41.7 -3% | 42.6 -6% | 38 6% | 38.6 4% | 36.2 10% |
* ... más pequeño es mejor
Temperatura
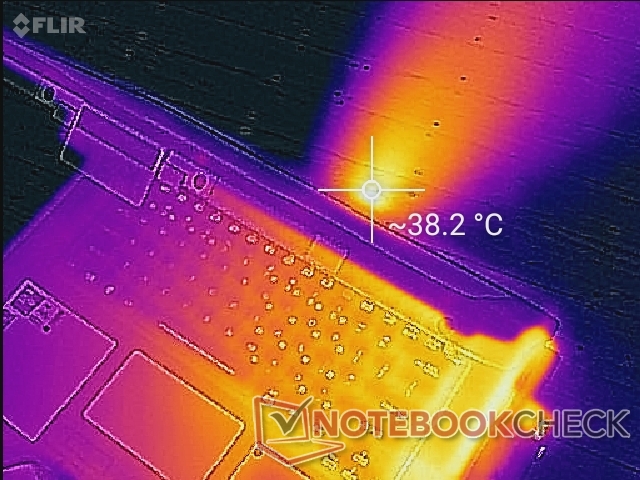
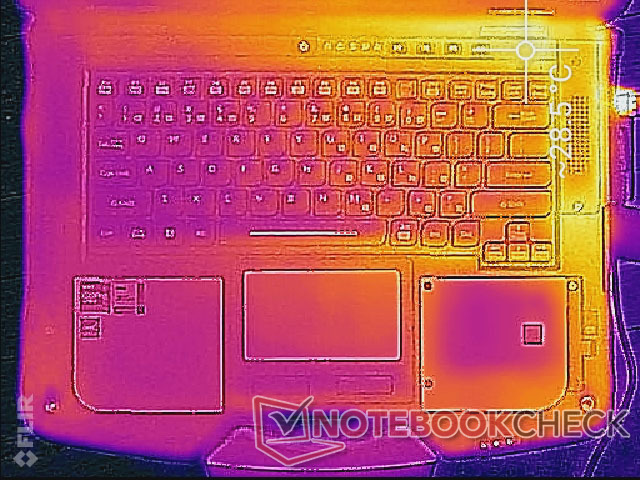
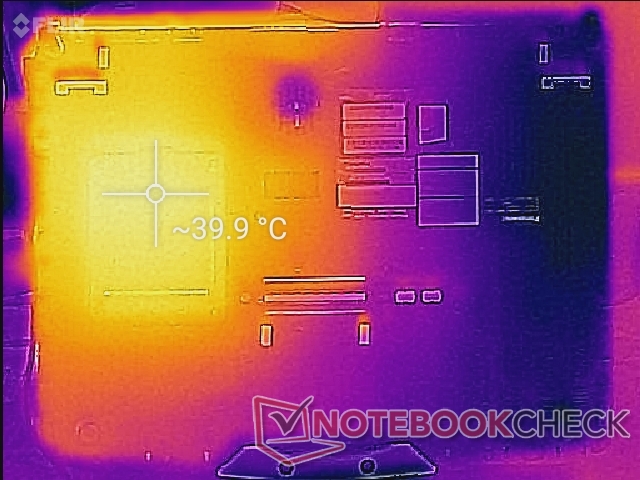
Las temperaturas de la superficie son generalmente frescas debido a la CPU de la serie Core U y al grueso diseño del chasis. Después de todo, es la misma CPU que se encuentra en muchos portátiles de consumo más delgados. Los puntos calientes pueden alcanzar los 29 C y 40 C en la parte superior e inferior, respectivamente, después de ejecutar cargas pesadas durante largos períodos.
La mitad derecha del modelo Toughbook siempre estará más caliente que la izquierda debido a la posición de la CPU y la solución de refrigeración en su interior.
(+) La temperatura máxima en la parte superior es de 35.6 °C / 96 F, frente a la media de 34.3 °C / 94 F, que oscila entre 21.2 y 62.5 °C para la clase Office.
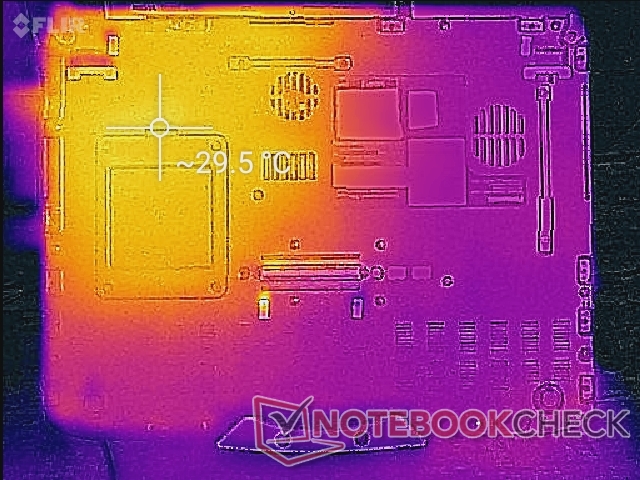
(±) El fondo se calienta hasta un máximo de 40 °C / 104 F, frente a la media de 36.8 °C / 98 F
(+) En reposo, la temperatura media de la parte superior es de 27.1 °C / 81# F, frente a la media del dispositivo de 29.5 °C / 85 F.
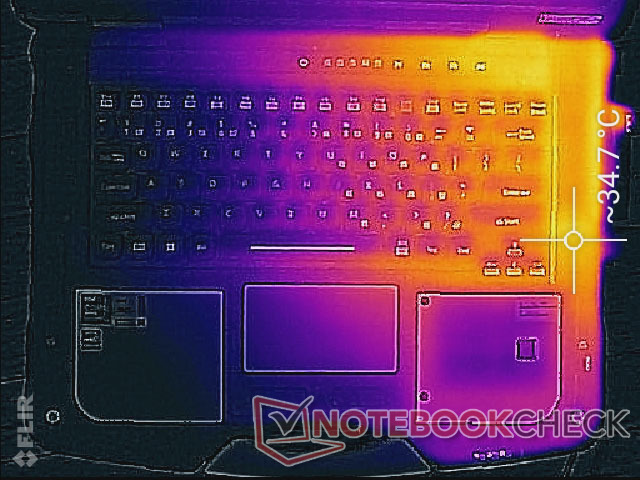
(+) El reposamanos y el panel táctil están a una temperatura inferior a la de la piel, con un máximo de 29 °C / 84.2 F y, por tanto, son fríos al tacto.
(±) La temperatura media de la zona del reposamanos de dispositivos similares fue de 27.5 °C / 81.5 F (-1.5 °C / -2.7 F).
| Panasonic Toughbook 40 Intel Core i7-1185G7, Intel Iris Xe Graphics G7 96EUs | Panasonic Toughbook FZ-55 MK2 Intel Core i7-1185G7, Intel Iris Xe Graphics G7 96EUs | Getac S410 Gen 4 Intel Core i7-1185G7, Intel Iris Xe Graphics G7 96EUs | Dell Latitude 5420 Rugged-P85G Intel Core i7-8650U, AMD Radeon RX 540 | Acer Enduro Urban N3 EUN314 Intel Core i7-1165G7, Intel Iris Xe Graphics G7 96EUs | Durabook S14I Intel Core i7-1165G7, Intel Iris Xe Graphics G7 96EUs | |
|---|---|---|---|---|---|---|
| Heat | -8% | -13% | -11% | -4% | -7% | |
| Maximum Upper Side * (°C) | 35.6 | 36.2 -2% | 36 -1% | 42.2 -19% | 37.8 -6% | 36.4 -2% |
| Maximum Bottom * (°C) | 40 | 42.2 -6% | 46.8 -17% | 42 -5% | 45.8 -15% | 38.6 3% |
| Idle Upper Side * (°C) | 28.6 | 31 -8% | 30 -5% | 31.6 -10% | 26.4 8% | 32.6 -14% |
| Idle Bottom * (°C) | 29.4 | 34 -16% | 38.2 -30% | 31.8 -8% | 30.2 -3% | 33.8 -15% |
* ... más pequeño es mejor
Prueba de esfuerzo
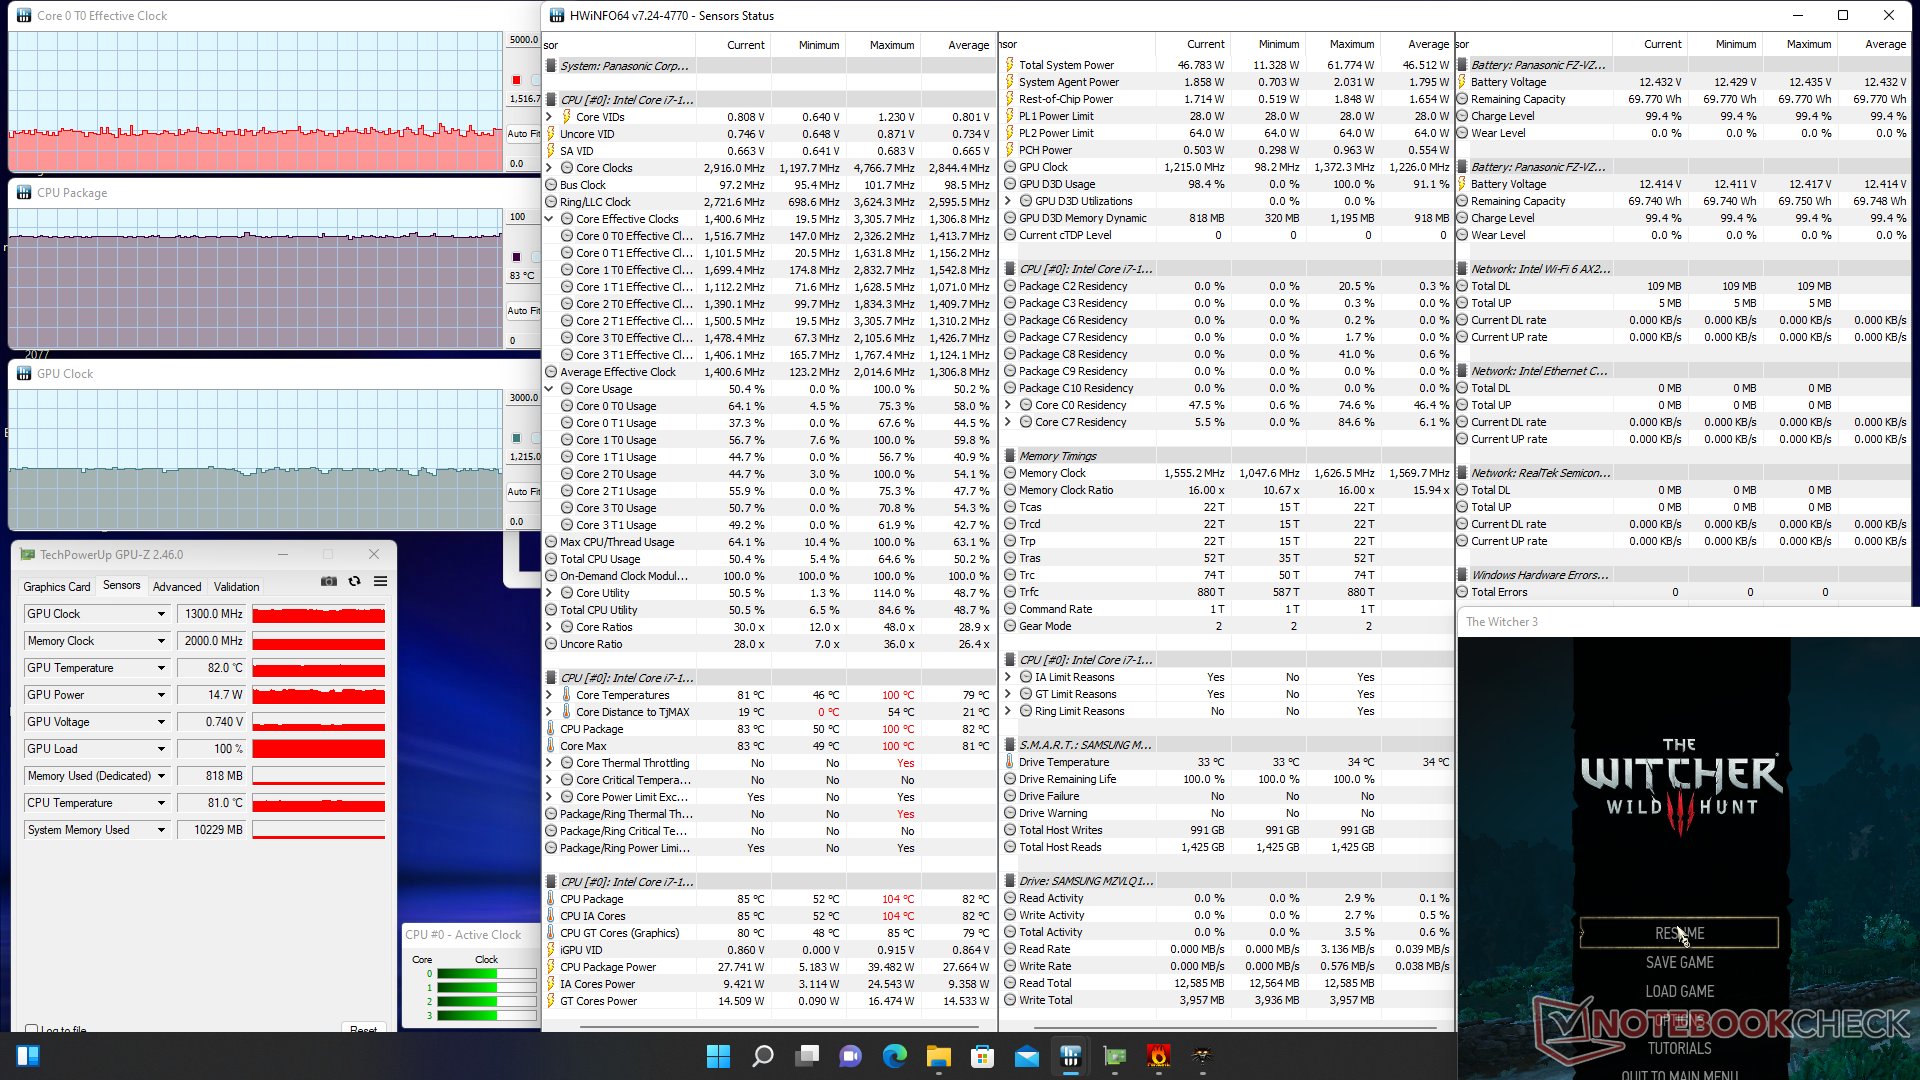
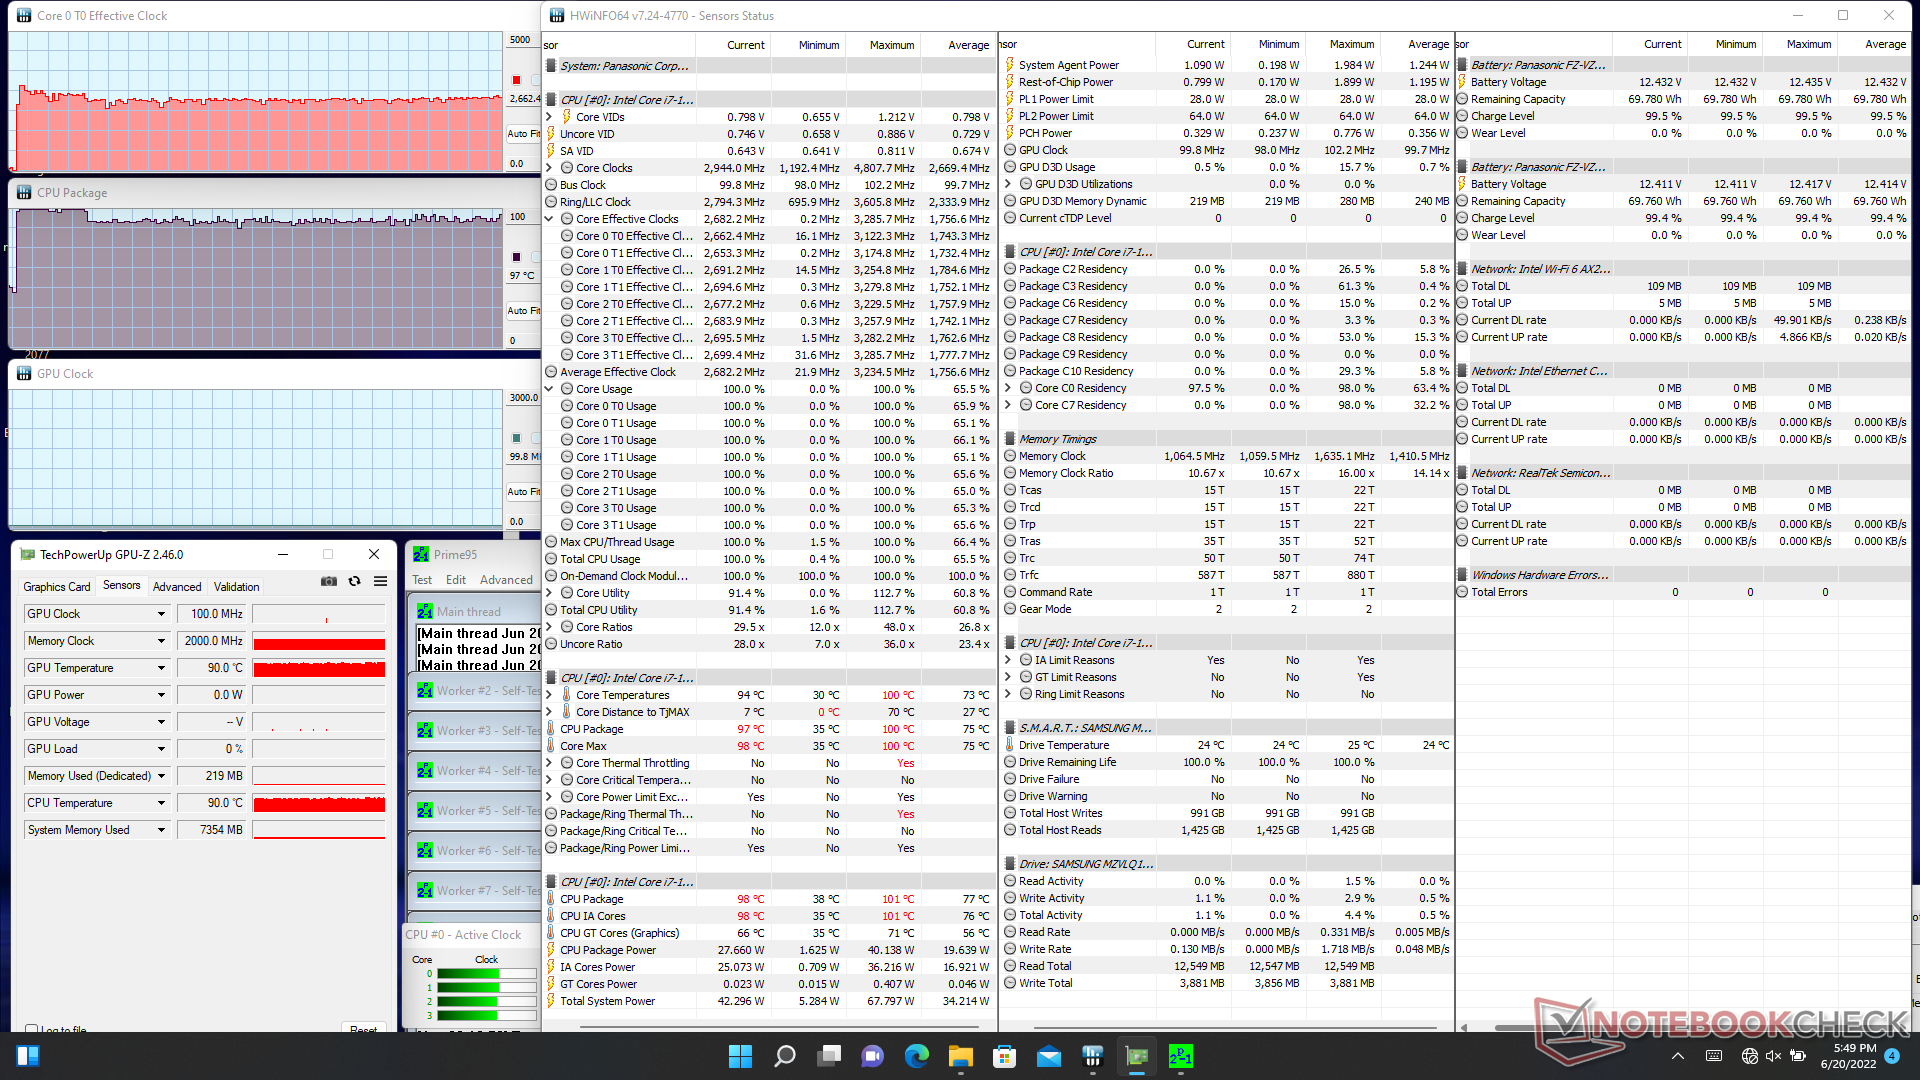
Cuando se ejecuta Prime95 para estresar la CPU, las velocidades de reloj y la temperatura del núcleo se disparan a 3,1 GHz y 100 C durante una fracción de segundo, respectivamente, antes de caer constantemente a 2,6 y ~95 C. La potencia del paquete de la CPU puede llegar a ser de 40 W durante el inicio de la prueba antes de estabilizarse en 28 W. Al ejecutar esta misma prueba en el Durabook S14I con una CPU Core i7-1165G7 resultaría en una temperatura estable del núcleo mucho más fría de 63 C, aunque a una velocidad de reloj más lenta de 1,8 GHz. Está claro que nuestro modelo Panasonic está favoreciendo el rendimiento de la CPU incluso si significa un procesador mucho más caliente en el proceso.
Cuando se ejecuta Witcher 3 para representar cargas exigentes, la temperatura del procesador se estabilizaba en 83 C, que es más caliente que en el mencionado Durabook (68 C) pero más frío que en el Getac S410 Gen 4 (95 C).
Funcionar con batería no limitará el rendimiento. Una prueba 3DMark 11 con baterías arroja resultados similares a los de la red eléctrica.
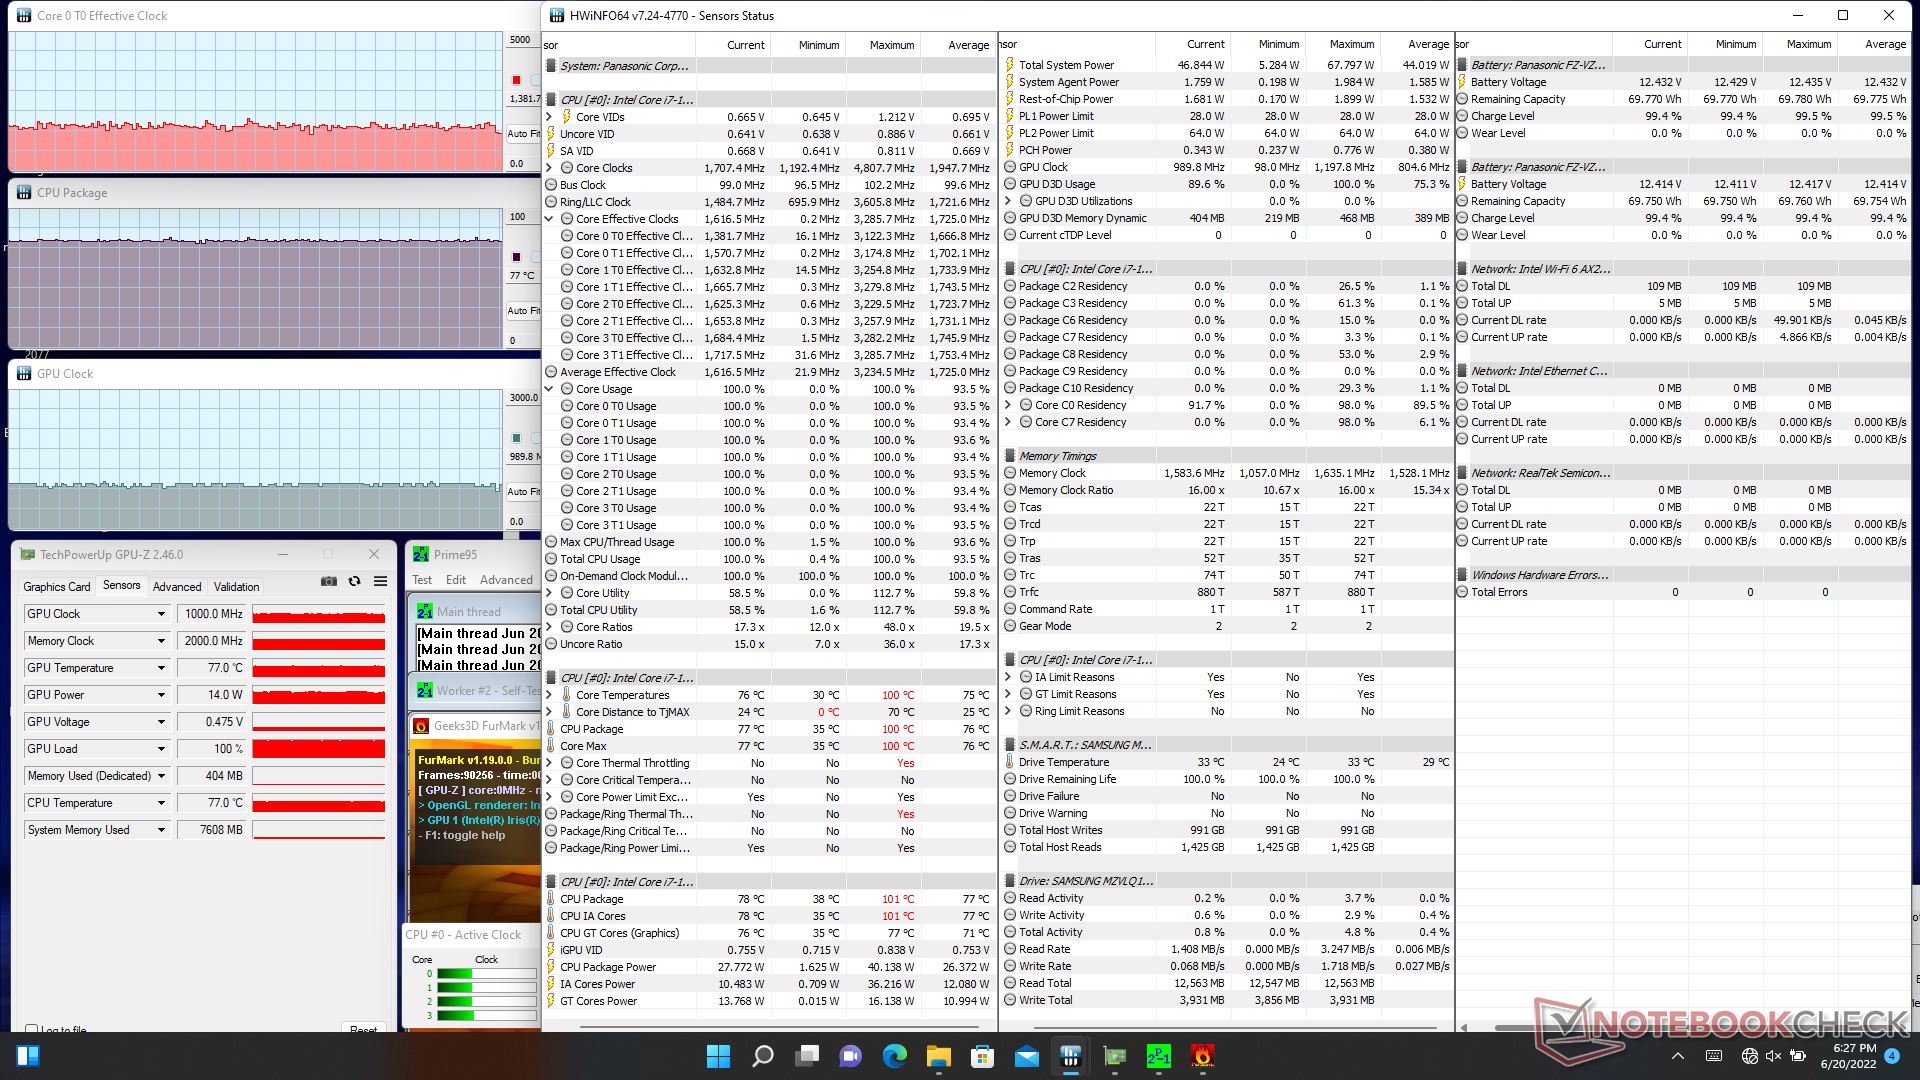
| Reloj dela CPU (GHz) | Reloj de la GPU (MHz) | Temperatura media de la CPU (°C) | |
| Sistema en reposo | -- | -- | 38 |
| Prime95 Stress | 2,7 | -- | 97 |
| Prime95+ FurMark Stress | 1,4 - 1,6 | 1000 | 77 |
| Witcher 3 Estrés | 1,4 - 1,6 | 1300 | 83 |
Altavoces
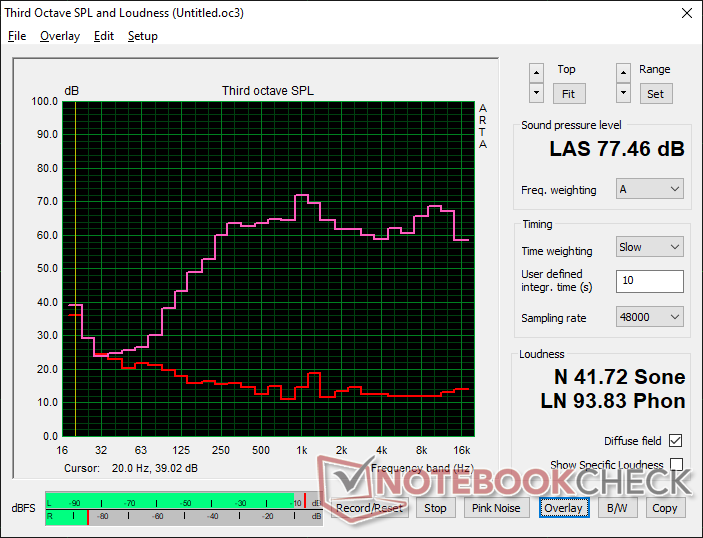
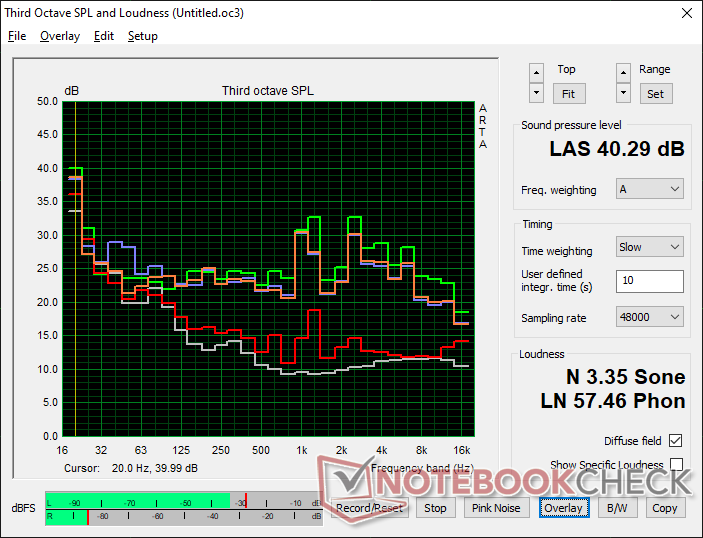
Panasonic Toughbook 40 análisis de audio
(±) | la sonoridad del altavoz es media pero buena (77.5 dB)
Graves 100 - 315 Hz
(±) | lubina reducida - en promedio 11.5% inferior a la mediana
(±) | la linealidad de los graves es media (11.6% delta a frecuencia anterior)
Medios 400 - 2000 Hz
(+) | medios equilibrados - a sólo 3.3% de la mediana
(+) | los medios son lineales (5.5% delta a la frecuencia anterior)
Altos 2 - 16 kHz
(+) | máximos equilibrados - a sólo 2.5% de la mediana
(+) | los máximos son lineales (4.8% delta a la frecuencia anterior)
Total 100 - 16.000 Hz
(+) | el sonido global es lineal (13.1% de diferencia con la mediana)
En comparación con la misma clase
» 7% de todos los dispositivos probados de esta clase eran mejores, 2% similares, 91% peores
» El mejor tuvo un delta de 7%, la media fue 21%, el peor fue ###max##%
En comparación con todos los dispositivos probados
» 13% de todos los dispositivos probados eran mejores, 3% similares, 84% peores
» El mejor tuvo un delta de 4%, la media fue 23%, el peor fue ###max##%
Apple MacBook Pro 16 2021 M1 Pro análisis de audio
(+) | los altavoces pueden reproducir a un volumen relativamente alto (#84.7 dB)
Graves 100 - 315 Hz
(+) | buen bajo - sólo 3.8% lejos de la mediana
(+) | el bajo es lineal (5.2% delta a la frecuencia anterior)
Medios 400 - 2000 Hz
(+) | medios equilibrados - a sólo 1.3% de la mediana
(+) | los medios son lineales (2.1% delta a la frecuencia anterior)
Altos 2 - 16 kHz
(+) | máximos equilibrados - a sólo 1.9% de la mediana
(+) | los máximos son lineales (2.7% delta a la frecuencia anterior)
Total 100 - 16.000 Hz
(+) | el sonido global es lineal (4.6% de diferencia con la mediana)
En comparación con la misma clase
» 0% de todos los dispositivos probados de esta clase eran mejores, 0% similares, 100% peores
» El mejor tuvo un delta de 5%, la media fue 17%, el peor fue ###max##%
En comparación con todos los dispositivos probados
» 0% de todos los dispositivos probados eran mejores, 0% similares, 100% peores
» El mejor tuvo un delta de 4%, la media fue 23%, el peor fue ###max##%
Gestión de la energía
Consumo de energía
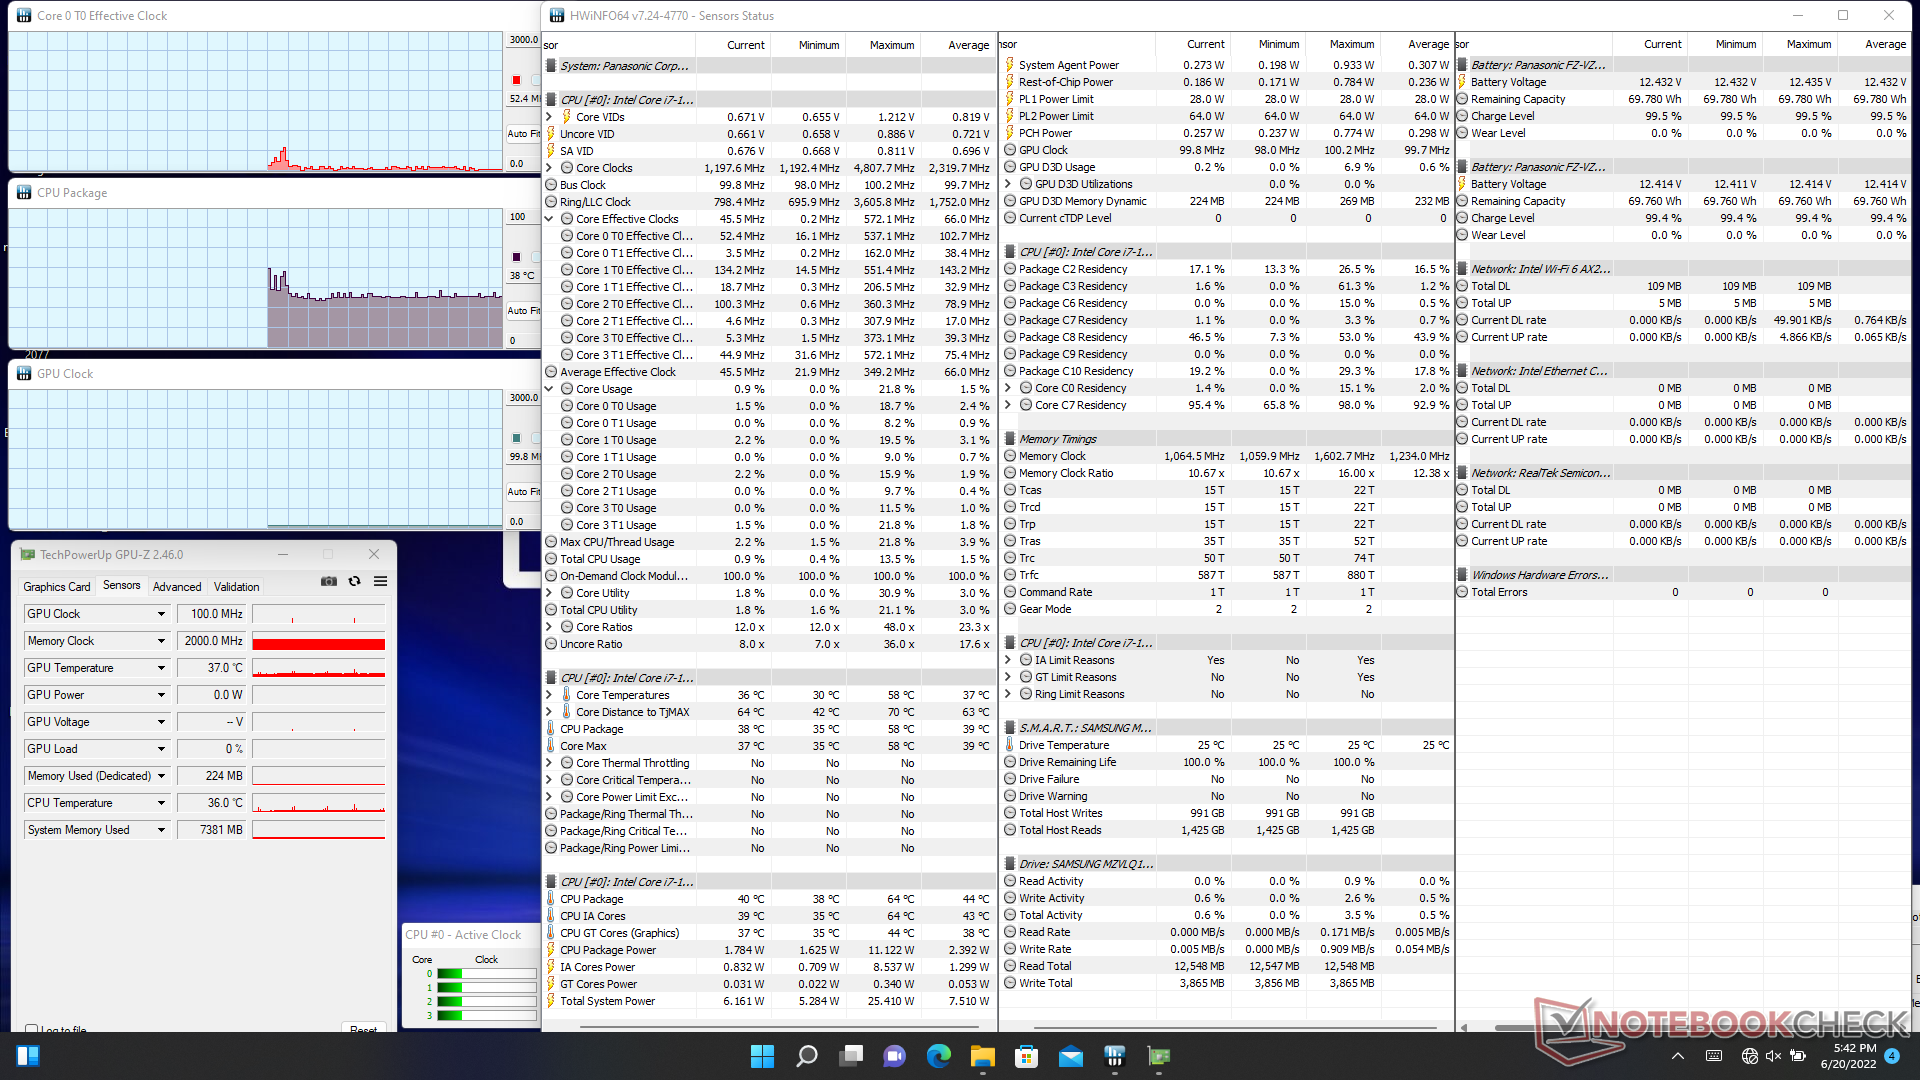
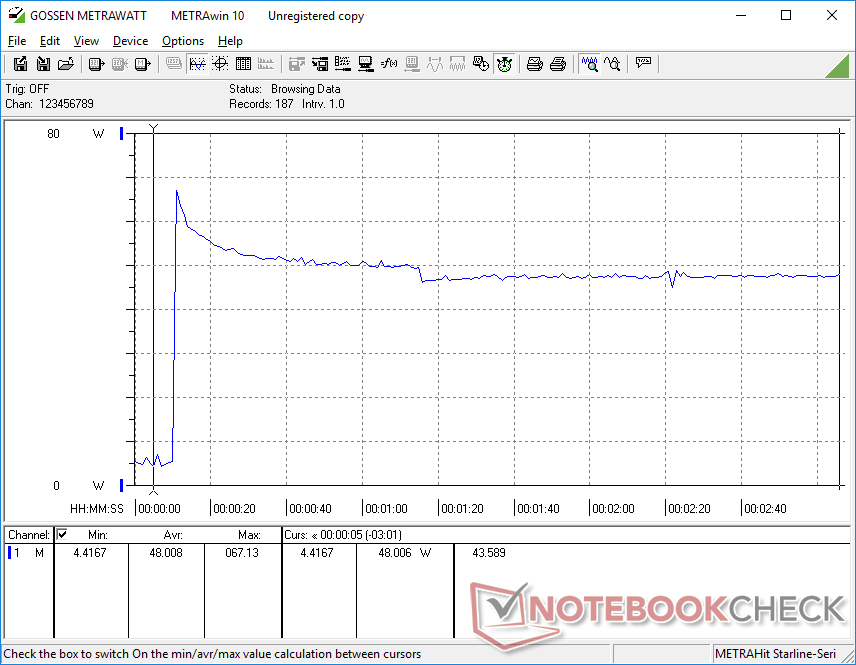
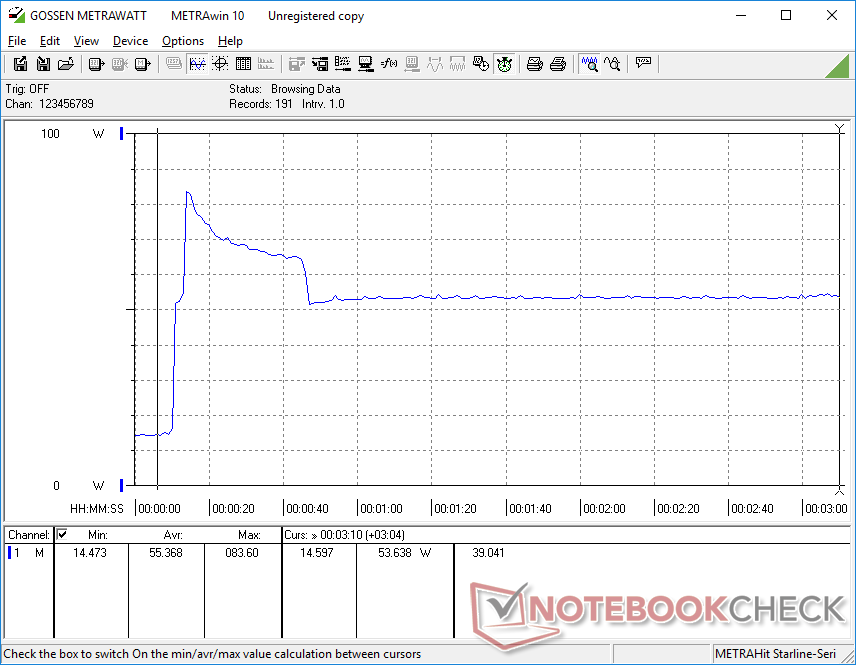
El funcionamiento en vacío del ordenador de sobremesa consume entre 4 W y 14 W, dependiendo del nivel de brillo y del perfil de potencia. El simple hecho de aumentar el brillo del 0% al 100% exige unos 8 W más debido a la brillante retroiluminación de 1400 nits
El consumo de energía bajo carga es similar al de otros modelos robustos equipados con CPUs de la serie Core U de 11ª generación, incluido el propio Toughbook FZ-55 MK2 de Panasonic. Tiger Lake-La serie U ofrece una gran mejora en el rendimiento por vatio con respecto a los modelos robustos de la generación anterior, como el Latitude 5420 con Kaby Lake-R y gráficos Radeon RX 540
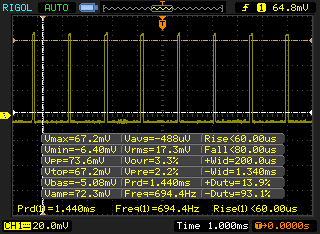
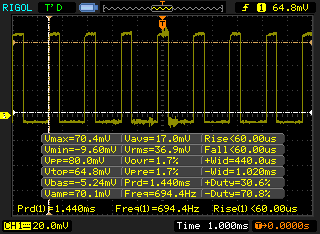
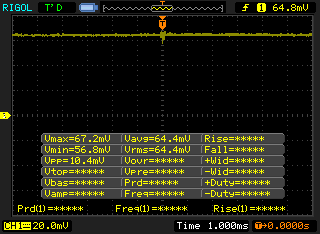
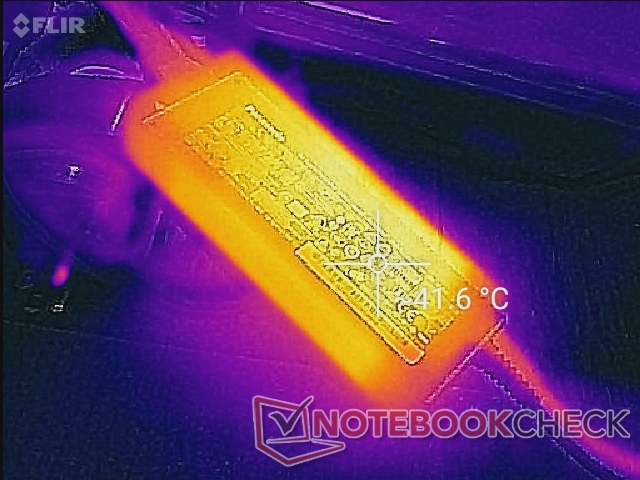
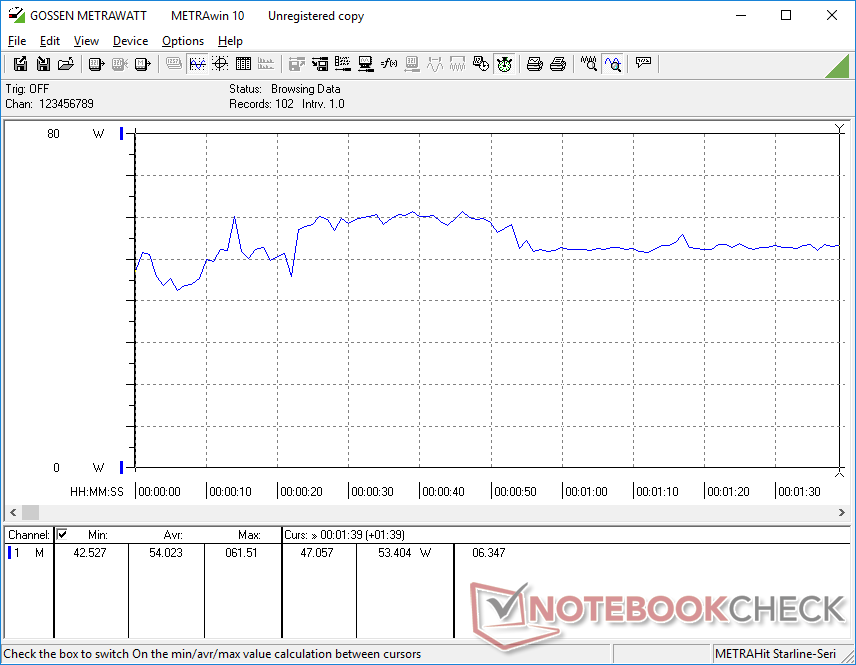
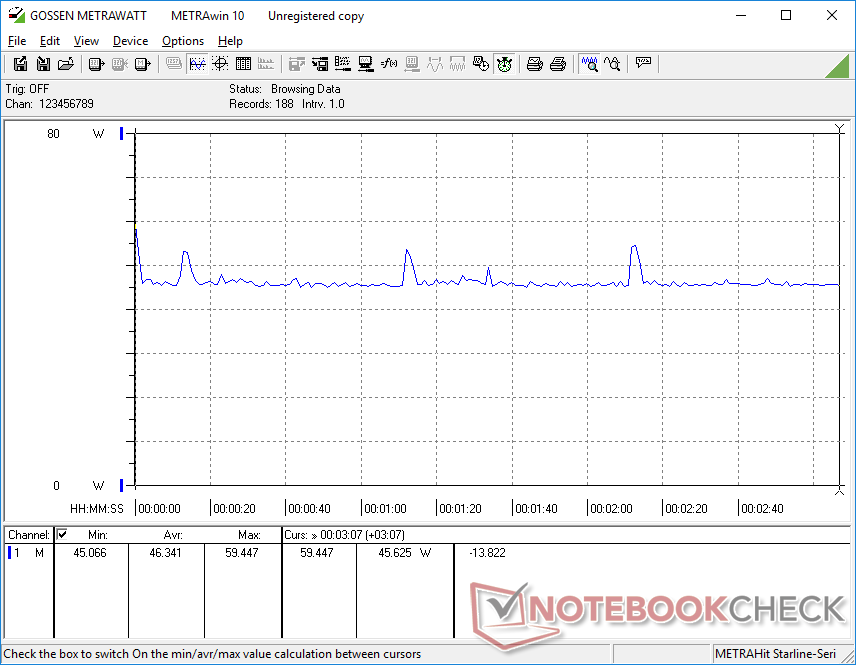
Registramos un consumo máximo de 83,6 W del pequeño (~14 x 5,4 x 3,1 cm) adaptador de CA de 110 W al ejecutar Prime95 y el estrés de FurMark. Este pico dura poco, como muestran nuestras capturas de pantalla a continuación, debido a las limitaciones térmicas.
| Off / Standby | |
| Ocioso | |
| Carga |
|
Clave:
min: | |
| Panasonic Toughbook 40 i7-1185G7, Iris Xe G7 96EUs, Samsung PM991 MZVLQ1T0HALB, IPS, 1920x1080, 14" | Panasonic Toughbook FZ-55 MK2 i7-1185G7, Iris Xe G7 96EUs, Toshiba KIOXIA KBG4AZNV512G M.2 2280 OPAL, IPS, 1920x1080, 14" | Getac S410 Gen 4 i7-1185G7, Iris Xe G7 96EUs, SSSTC CA5-8D256, IPS, 1920x1080, 14" | Dell Latitude 5420 Rugged-P85G i7-8650U, Radeon RX 540, SK hynix PC401 NVMe 500 GB, IPS, 1920x1080, 14" | Acer Enduro Urban N3 EUN314 i7-1165G7, Iris Xe G7 96EUs, Samsung PM991 MZVLQ1T0HALB, IPS, 1920x1080, 14" | Durabook S14I i7-1165G7, Iris Xe G7 96EUs, UDinfo M2P M2P80DE512GBAEP, TN, 1920x1080, 14" | |
|---|---|---|---|---|---|---|
| Power Consumption | 12% | -11% | -16% | 34% | -11% | |
| Idle Minimum * (Watt) | 4.9 | 3.5 29% | 8.3 -69% | 4.8 2% | 3.8 22% | 6.8 -39% |
| Idle Average * (Watt) | 12.3 | 10.4 15% | 10.5 15% | 13.6 -11% | 8 35% | 16.4 -33% |
| Idle Maximum * (Watt) | 14 | 10.5 25% | 14.9 -6% | 13.8 1% | 8.7 38% | 16.9 -21% |
| Load Average * (Watt) | 54 | 45.4 16% | 48.6 10% | 67.8 -26% | 34.6 36% | 39.2 27% |
| Witcher 3 ultra * (Watt) | 46.3 | 43 7% | 50.9 -10% | 69.1 -49% | 35.4 24% | |
| Load Maximum * (Watt) | 83.6 | 99.3 -19% | 90.1 -8% | 93.5 -12% | 45.4 46% | 73.1 13% |
* ... más pequeño es mejor
Power Consumption Witcher 3 / Stresstest
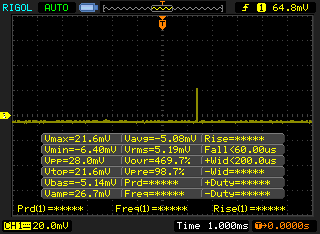
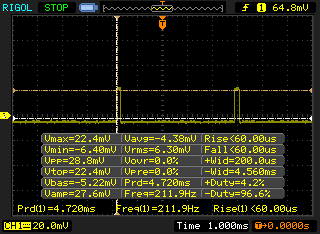
Power Consumption external Monitor
Duración de la batería
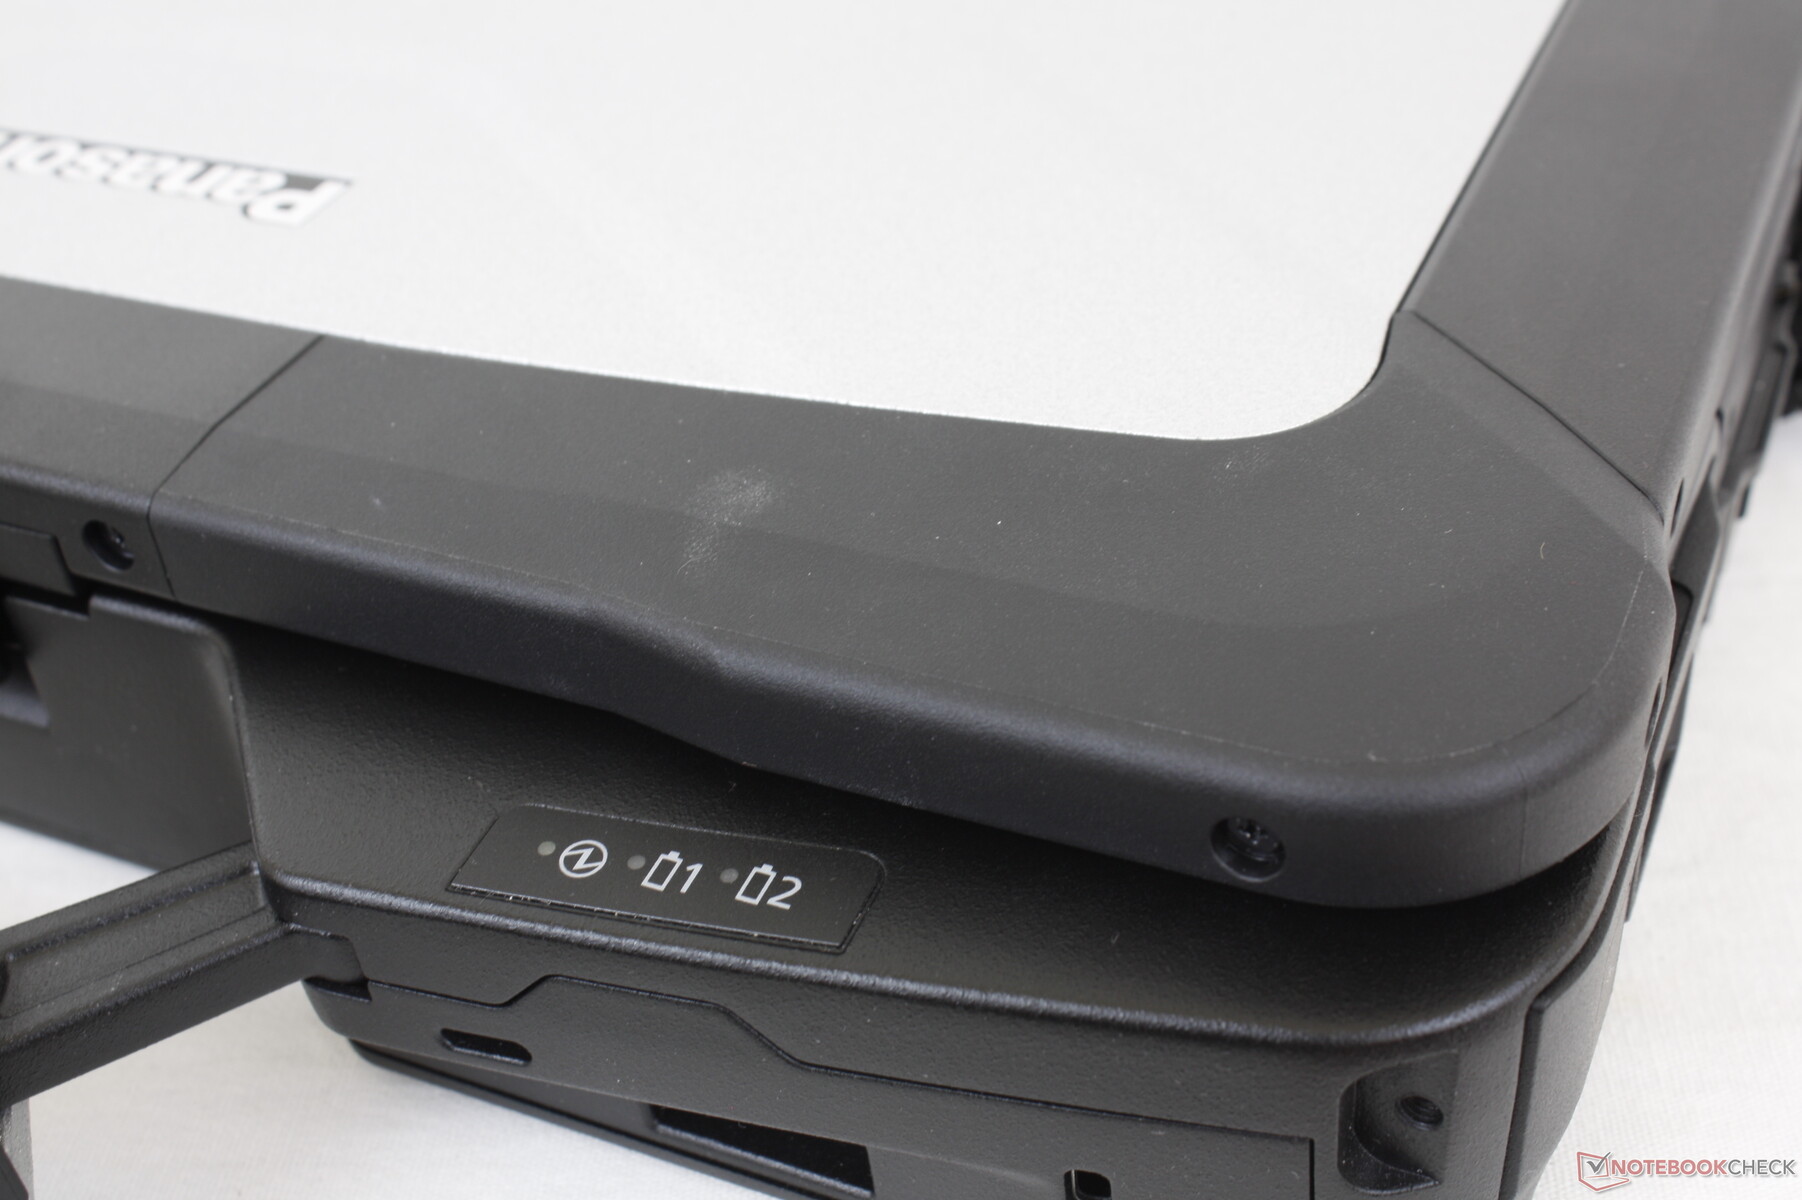
Nuestra unidad de prueba se envió con dos baterías extraíbles de 68 Wh, cada una de las cuales ocupaba una ranura de expansión en los laterales del chasis. También se pueden acoplar baterías adicionales en la parte inferior para una duración aún mayor. Hemos sido capaces de registrar casi 19 horas de navegación WLAN en el mundo real con un brillo de 150 nits con nuestras dos baterías conectadas antes de tener que recargar
Hablando de carga, la velocidad de recarga es, por desgracia, extremadamente lenta. El sistema sólo carga una batería a la vez aunque haya dos conectadas y cada batería tarda entre 2,5 y 3 horas en cargarse completamente. En comparación, la mayoría de los portátiles normales pueden recargarse por completo en solo 1,5 o 2 horas
Soporta la carga por USB-C, por lo que se pueden usar ciertos adaptadores USB-C de terceros en lugar del adaptador de corriente propio.
| Panasonic Toughbook 40 i7-1185G7, Iris Xe G7 96EUs, 136 Wh | Panasonic Toughbook FZ-55 MK2 i7-1185G7, Iris Xe G7 96EUs, 71 Wh | Getac S410 Gen 4 i7-1185G7, Iris Xe G7 96EUs, 194 Wh | Dell Latitude 5420 Rugged-P85G i7-8650U, Radeon RX 540, 102 Wh | Acer Enduro Urban N3 EUN314 i7-1165G7, Iris Xe G7 96EUs, 50.3 Wh | Durabook S14I i7-1165G7, Iris Xe G7 96EUs, 50 Wh | |
|---|---|---|---|---|---|---|
| Duración de Batería | -28% | 51% | -15% | -66% | -71% | |
| WiFi v1.3 (h) | 19 | 13.6 -28% | 28.6 51% | 16.2 -15% | 6.4 -66% | 5.5 -71% |
| Reader / Idle (h) | 31.4 | |||||
| Load (h) | 3.2 |
Pro
Contra
Veredicto
la capacidad de admitir no sólo una o dos, sino cuatro ranuras de expansión especializadas diferentes, proporciona al Toughbook 40 unas piernas más largas y una mayor versatilidad en su categoría. Si los módulos xPAK extraíbles no son prácticos para sus escenarios de uso, el atractivo del Toughbook 40 disminuye considerablemente. Alternativas como el Latitude 7424 Rugged Extreme son totalmente resistentes y más pequeños, aunque sin las capacidades de expansión del Panasonic.
Hay algunos aspectos molestos que nos gustaría ver mejorados. Las solapas que cubren los puertos, por ejemplo, son difíciles de agarrar y abrir o cerrar. El parpadeo de la pantalla está presente y no hay opciones de gama más amplia disponibles para colores más profundos. El rendimiento del SSD también podría ser mejor, mientras que la carga de la batería es demasiado lenta. Estos inconvenientes pueden no importar dependiendo del caso de uso.
Precio y disponibilidad
Los usuarios pueden solicitar un presupuesto a Panasonic a través de la página oficial del producto aquí.
Price comparison

