Breve análisis del Acer TravelMate P449-M-7407
| SD Card Reader | |
| average JPG Copy Test (av. of 3 runs) | |
| HP ProBook 450 G4 Y8B60EA | |
| Acer TravelMate P259-MG-71UU | |
| Lenovo ThinkPad E470-20H2S00400 | |
| Acer TravelMate P449-M-7407 | |
| maximum AS SSD Seq Read Test (1GB) | |
| HP ProBook 450 G4 Y8B60EA | |
| Lenovo ThinkPad E470-20H2S00400 | |
| Acer TravelMate P449-M-7407 | |
| Networking | |
| iperf3 transmit AX12 | |
| Acer TravelMate P259-MG-71UU | |
| Acer TravelMate P449-M-7407 | |
| Lenovo ThinkPad E470-20H2S00400 | |
| iperf3 receive AX12 | |
| Acer TravelMate P259-MG-71UU | |
| Lenovo ThinkPad E470-20H2S00400 | |
| Acer TravelMate P449-M-7407 | |
| |||||||||||||||||||||||||
iluminación: 90 %
Brillo con batería: 208.3 cd/m²
Contraste: 1096:1 (Negro: 0.19 cd/m²)
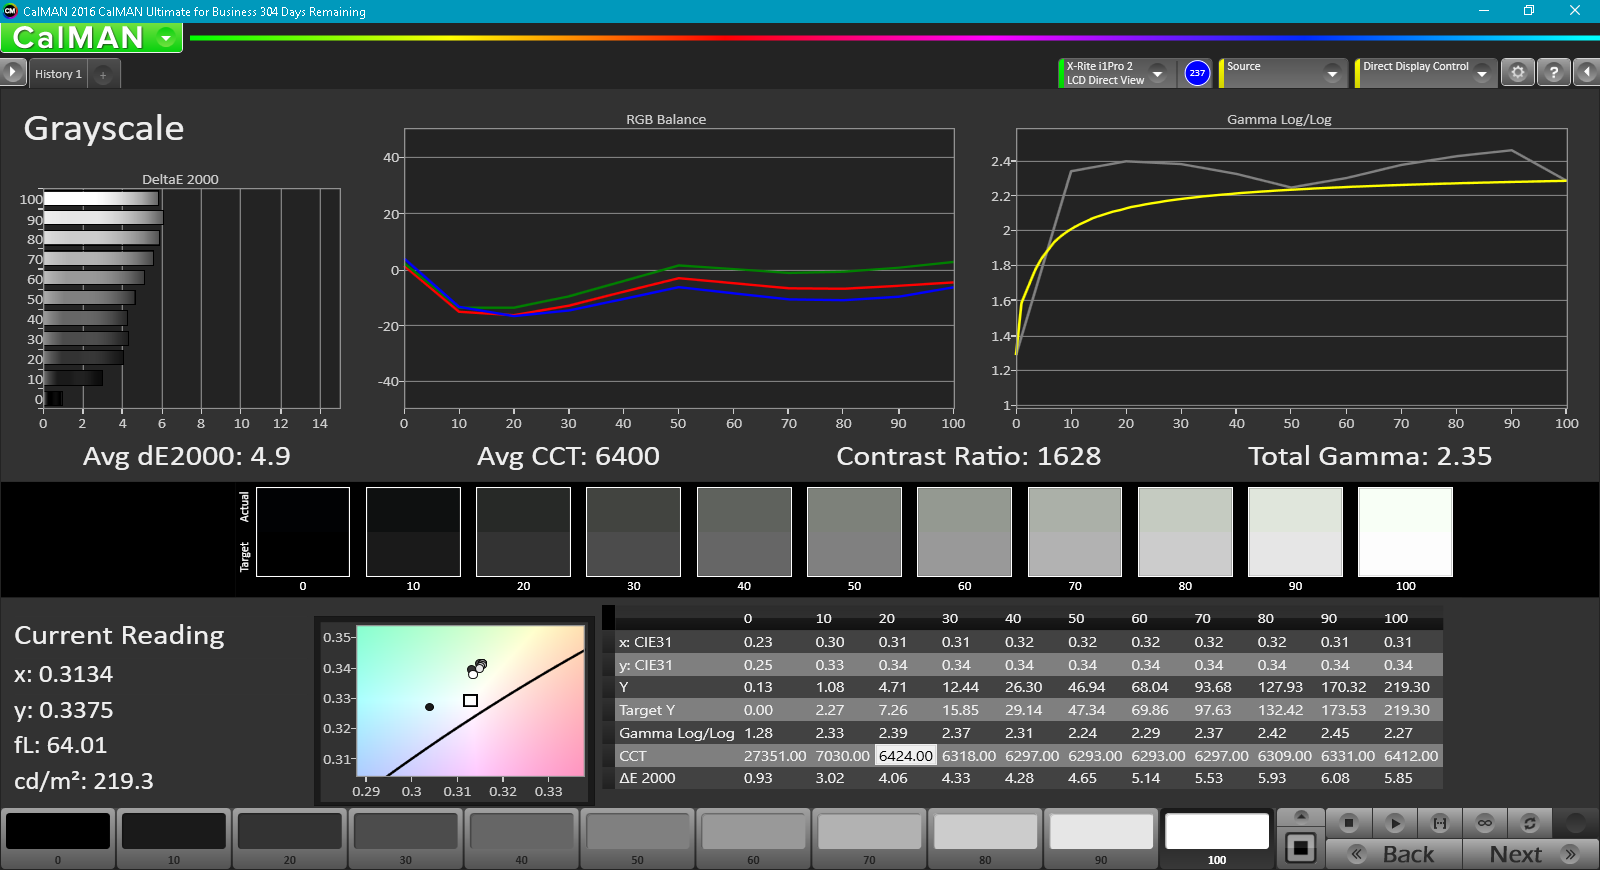
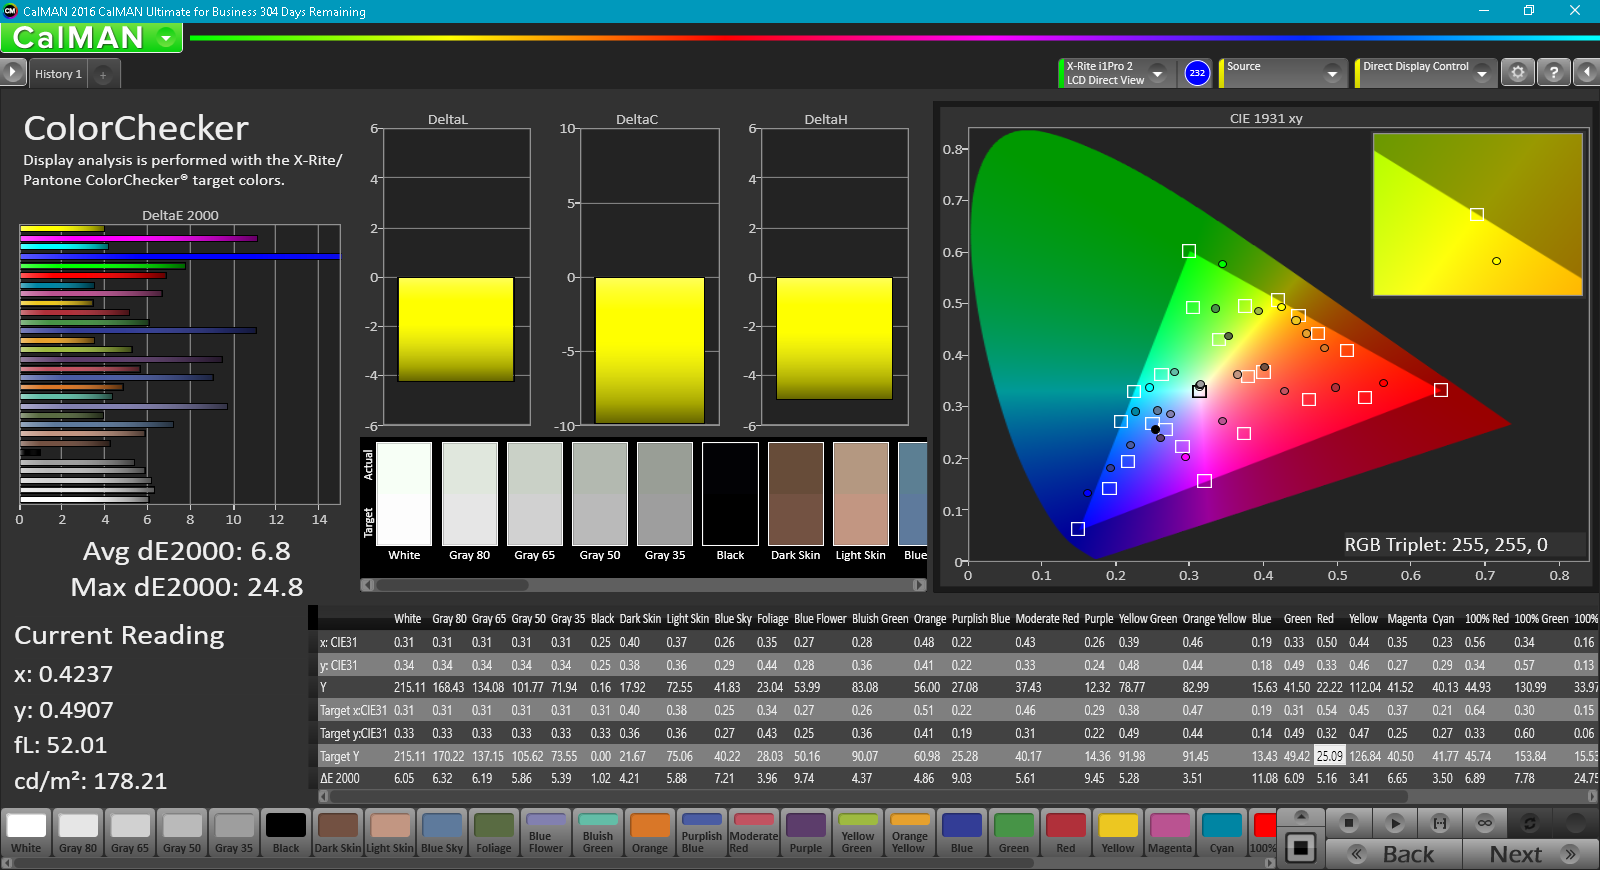
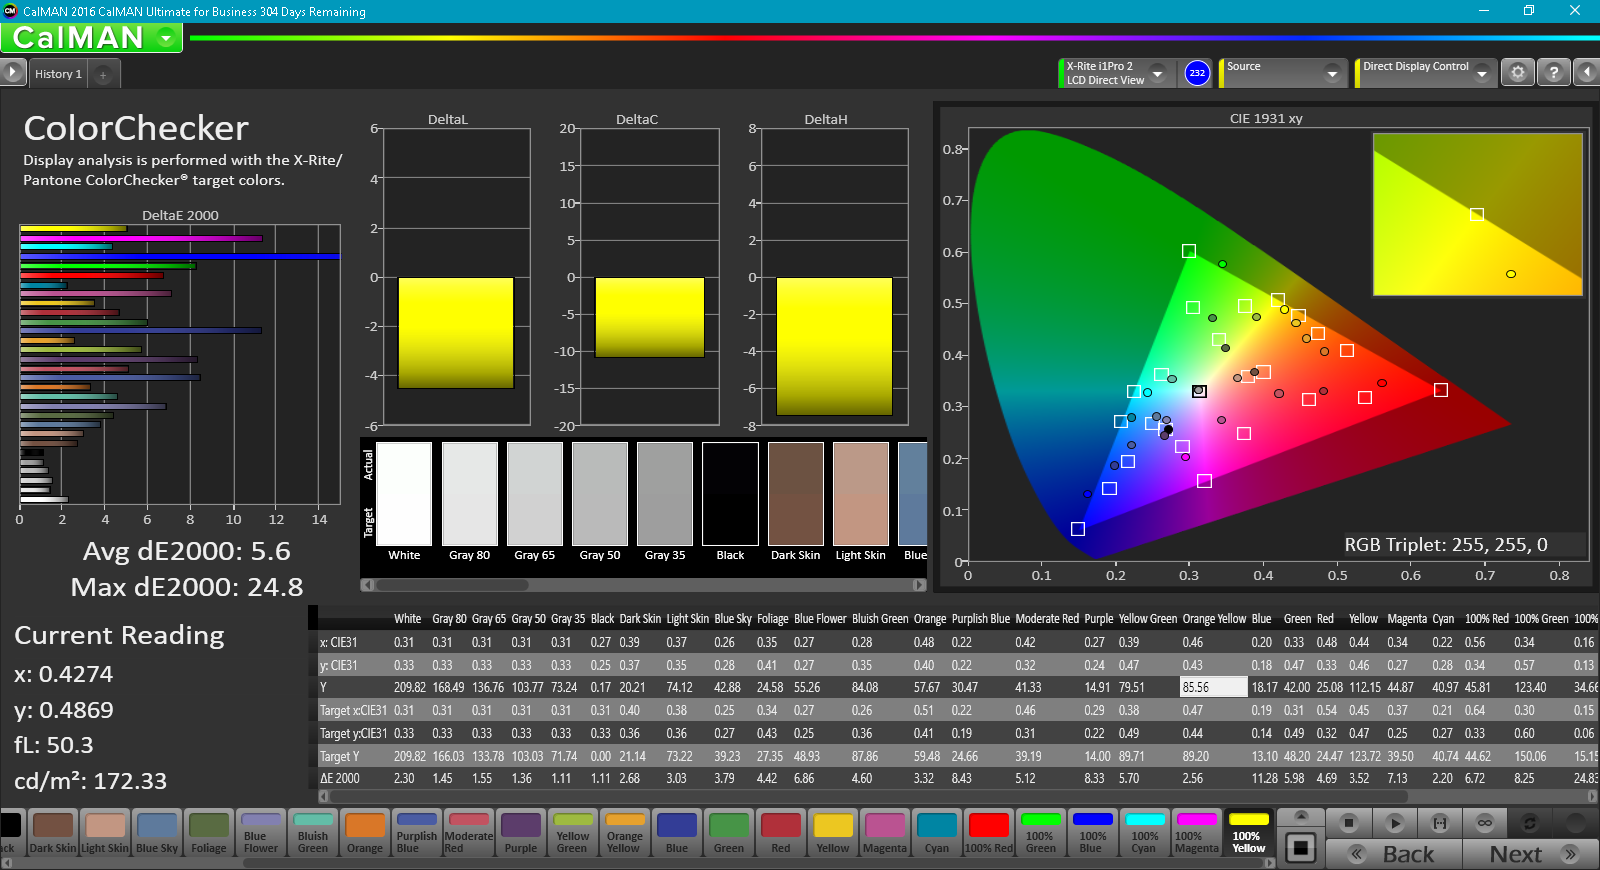
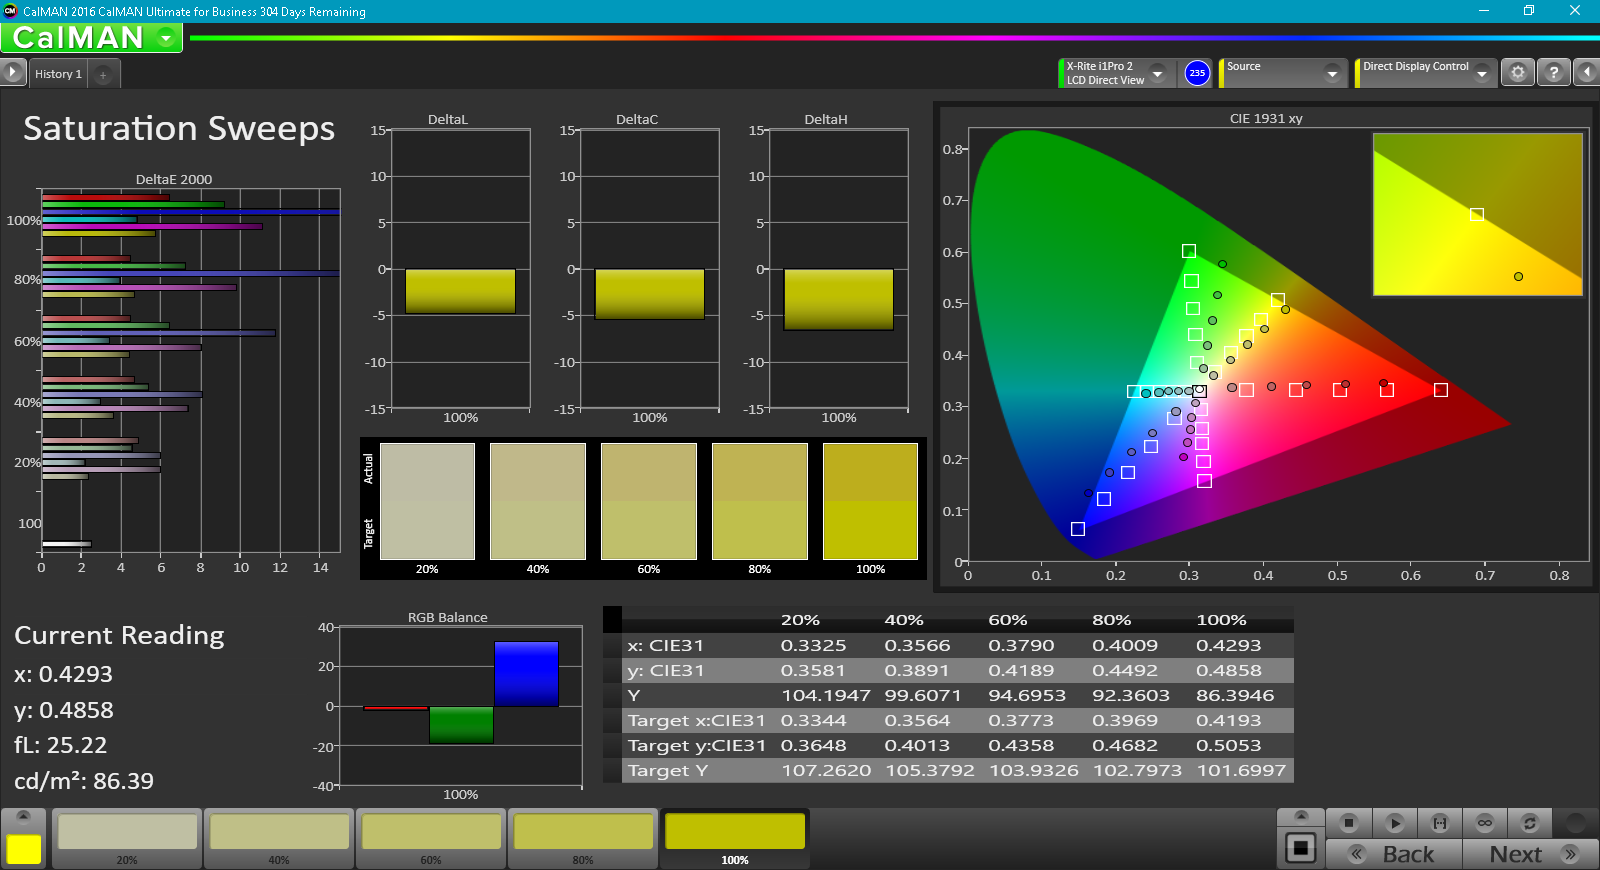
ΔE ColorChecker Calman: 6.8 | ∀{0.5-29.43 Ø4.73}
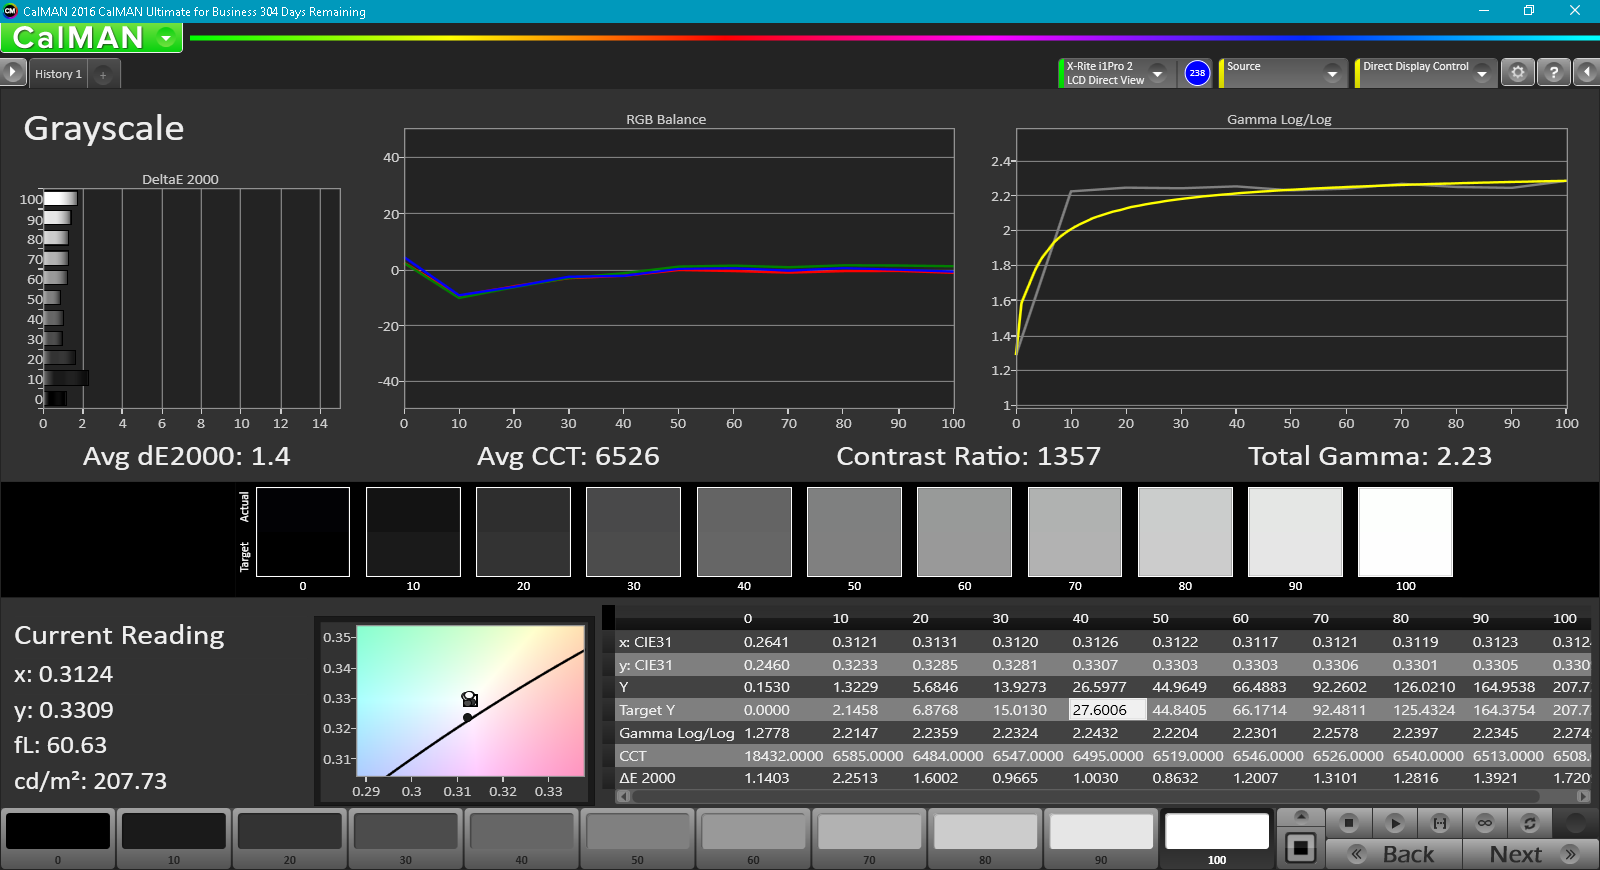
ΔE Greyscale Calman: 4.9 | ∀{0.09-98 Ø4.97}
54% sRGB (Argyll 1.6.3 3D)
34% AdobeRGB 1998 (Argyll 1.6.3 3D)
37.02% AdobeRGB 1998 (Argyll 3D)
53.9% sRGB (Argyll 3D)
35.83% Display P3 (Argyll 3D)
Gamma: 2.35
CCT: 6400 K
| Acer TravelMate P449-M-7407 AU Optronics AU0213D, IPS, 14", 1920x1080 | Acer TravelMate P259-MG-71UU BOE NT156FHM-N41, TN LED, 15.6", 1920x1080 | HP ProBook 450 G4 Y8B60EA Chi Mei CMN15C4, TN LED, 15.6", 1920x1080 | Lenovo ThinkPad E470-20H2S00400 N140HCA-EAB, IPS, 14", 1920x1080 | |
|---|---|---|---|---|
| Display | 8% | 11% | 15% | |
| Display P3 Coverage (%) | 35.83 | 38.58 8% | 39.89 11% | 41.23 15% |
| sRGB Coverage (%) | 53.9 | 58 8% | 59.5 10% | 61.4 14% |
| AdobeRGB 1998 Coverage (%) | 37.02 | 39.85 8% | 41.24 11% | 42.67 15% |
| Response Times | 21% | -1% | 9% | |
| Response Time Grey 50% / Grey 80% * (ms) | 50.8 ? | 43 ? 15% | 51 ? -0% | 40.8 ? 20% |
| Response Time Black / White * (ms) | 29.6 ? | 22 ? 26% | 30 ? -1% | 30.4 ? -3% |
| PWM Frequency (Hz) | 50 ? | |||
| Screen | -36% | -33% | -5% | |
| Brightness middle (cd/m²) | 208.3 | 180 -14% | 214 3% | 244 17% |
| Brightness (cd/m²) | 203 | 178 -12% | 201 -1% | 231 14% |
| Brightness Distribution (%) | 90 | 93 3% | 77 -14% | 89 -1% |
| Black Level * (cd/m²) | 0.19 | 0.45 -137% | 0.43 -126% | 0.37 -95% |
| Contrast (:1) | 1096 | 400 -64% | 498 -55% | 659 -40% |
| Colorchecker dE 2000 * | 6.8 | 9.91 -46% | 10.68 -57% | 6.41 6% |
| Colorchecker dE 2000 max. * | 24.8 | 18.19 27% | 18.07 27% | 13.4 46% |
| Greyscale dE 2000 * | 4.9 | 11.25 -130% | 11.32 -131% | 5.94 -21% |
| Gamma | 2.35 94% | 2.35 94% | 2.26 97% | 2.28 96% |
| CCT | 6400 102% | 12115 54% | 12204 53% | 6101 107% |
| Color Space (Percent of AdobeRGB 1998) (%) | 34 | 37 9% | 38 12% | 39.3 16% |
| Color Space (Percent of sRGB) (%) | 54 | 58 7% | 59 9% | 61.1 13% |
| Media total (Programa/Opciones) | -2% /
-19% | -8% /
-20% | 6% /
1% |
* ... más pequeño es mejor
Tiempos de respuesta del display
| ↔ Tiempo de respuesta de Negro a Blanco | ||
|---|---|---|
| 29.6 ms ... subida ↗ y bajada ↘ combinada | ↗ 6.8 ms subida | 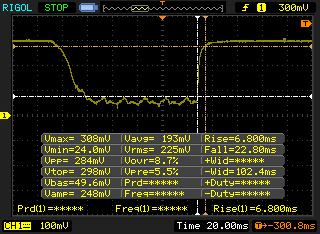 |
| ↘ 22.8 ms bajada | ||
| La pantalla mostró tiempos de respuesta relativamente lentos en nuestros tests pero podría ser demasiado lenta para los jugones. En comparación, todos los dispositivos de prueba van de ##min### (mínimo) a 240 (máximo) ms. » 79 % de todos los dispositivos son mejores. Eso quiere decir que el tiempo de respuesta es peor que la media (19.9 ms) de todos los dispositivos testados. | ||
| ↔ Tiempo de respuesta 50% Gris a 80% Gris | ||
| 50.8 ms ... subida ↗ y bajada ↘ combinada | ↗ 18.8 ms subida | 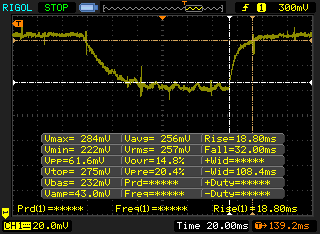 |
| ↘ 32 ms bajada | ||
| La pantalla mostró tiempos de respuesta lentos en nuestros tests y podría ser demasiado lenta para los jugones. En comparación, todos los dispositivos de prueba van de ##min### (mínimo) a 636 (máximo) ms. » 87 % de todos los dispositivos son mejores. Eso quiere decir que el tiempo de respuesta es peor que la media (31.1 ms) de todos los dispositivos testados. | ||
Parpadeo de Pantalla / PWM (Pulse-Width Modulation)
| Parpadeo de Pantalla / PWM no detectado | ||
Comparación: 52 % de todos los dispositivos testados no usaron PWM para atenuar el display. Si se usó, medimos una media de 7798 (mínimo: 5 - máxmo: 343500) Hz. | ||
| Cinebench R15 | |
| CPU Single 64Bit | |
| HP Pavilion 17t-ab200 | |
| HP ProBook 450 G4 Y8B60EA | |
| Asus UX310UQ-FC396T | |
| Acer TravelMate P259-MG-71UU | |
| Lenovo ThinkPad E470-20H2S00400 | |
| Acer TravelMate P449-M-7407 | |
| Acer Spin 5 SP513-51 | |
| HP ProBook 440 G4 Z2Y47ES | |
| CPU Multi 64Bit | |
| HP Pavilion 17t-ab200 | |
| HP ProBook 450 G4 Y8B60EA | |
| Asus UX310UQ-FC396T | |
| Lenovo ThinkPad E470-20H2S00400 | |
| Acer TravelMate P259-MG-71UU | |
| Acer TravelMate P449-M-7407 | |
| HP ProBook 440 G4 Z2Y47ES | |
| Acer Spin 5 SP513-51 | |
| Cinebench R10 | |
| Rendering Multiple CPUs 32Bit | |
| Asus UX310UQ-FC396T | |
| Acer TravelMate P259-MG-71UU | |
| Acer TravelMate P449-M-7407 | |
| Rendering Single 32Bit | |
| Asus UX310UQ-FC396T | |
| Acer TravelMate P259-MG-71UU | |
| Acer TravelMate P449-M-7407 | |
| wPrime 2.10 - 1024m | |
| HP ProBook 440 G4 Z2Y47ES | |
| Acer TravelMate P449-M-7407 | |
| HP Pavilion 17t-ab200 | |
* ... más pequeño es mejor
| PCMark 8 | |
| Home Score Accelerated v2 | |
| Acer TravelMate P259-MG-71UU | |
| Acer TravelMate P449-M-7407 | |
| Lenovo ThinkPad E470-20H2S00400 | |
| HP ProBook 450 G4 Y8B60EA | |
| Work Score Accelerated v2 | |
| HP ProBook 450 G4 Y8B60EA | |
| Acer TravelMate P259-MG-71UU | |
| Lenovo ThinkPad E470-20H2S00400 | |
| Acer TravelMate P449-M-7407 | |
| Creative Score Accelerated v2 | |
| Lenovo ThinkPad E470-20H2S00400 | |
| Acer TravelMate P449-M-7407 | |
| Acer TravelMate P259-MG-71UU | |
| PCMark 7 Score | 5504 puntos | |
| PCMark 8 Home Score Accelerated v2 | 3648 puntos | |
| PCMark 8 Creative Score Accelerated v2 | 4350 puntos | |
| PCMark 8 Work Score Accelerated v2 | 4511 puntos | |
ayuda | ||
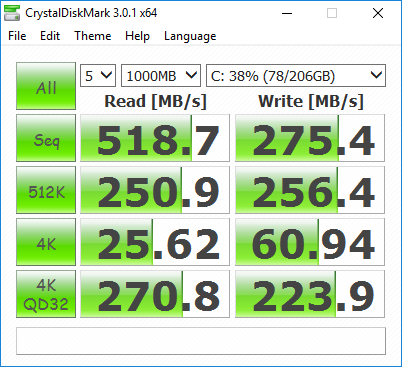
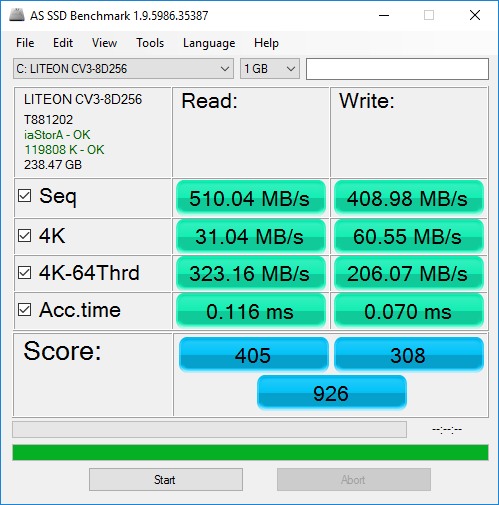
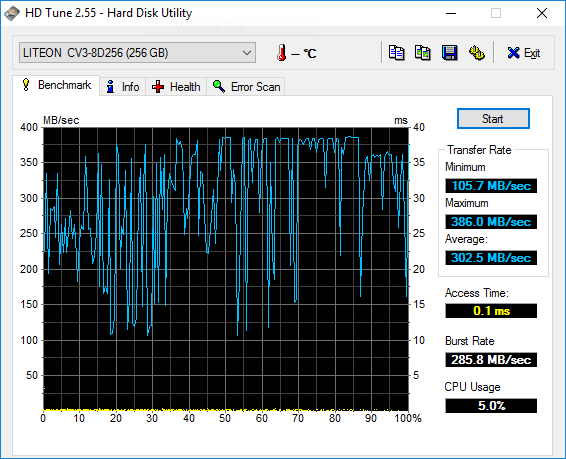
| Acer TravelMate P449-M-7407 Liteonit CV3-8D256 | Acer TravelMate P259-MG-71UU Liteonit CV3-8D256 | Lenovo ThinkPad E470-20H2S00400 SanDisk X400 SED 256GB, SATA (SD8TB8U-256G) | Asus Zenbook UX310UA-FC347T iGP Micron SSD 1100 (MTFDDAV256TBN) | HP Spectre x360 15-bl002xx Toshiba XG4 NVMe (THNSN5512GPUK) | |
|---|---|---|---|---|---|
| CrystalDiskMark 3.0 | 8% | 20% | 25% | 146% | |
| Read Seq (MB/s) | 519 | 478.5 -8% | 476.5 -8% | 489.4 -6% | 1266 144% |
| Write Seq (MB/s) | 275.4 | 258.2 -6% | 458.7 67% | 431.6 57% | 982 257% |
| Read 512 (MB/s) | 250.9 | 254.3 1% | 346.4 38% | 356.7 42% | 834 232% |
| Write 512 (MB/s) | 256.4 | 264.8 3% | 291.1 14% | 389.1 52% | 714 178% |
| Read 4k (MB/s) | 25.6 | 28.32 11% | 35.15 37% | 26.68 4% | 40.72 59% |
| Write 4k (MB/s) | 60.9 | 76.3 25% | 78.8 29% | 88.7 46% | 139.4 129% |
| Read 4k QD32 (MB/s) | 270.8 | 346.2 28% | 276 2% | 246.3 -9% | 527 95% |
| Write 4k QD32 (MB/s) | 223.9 | 240.2 7% | 178.3 -20% | 251.5 12% | 395.2 77% |

| 3DMark 11 Performance | 1578 puntos | |
| 3DMark Ice Storm Standard Score | 55532 puntos | |
| 3DMark Cloud Gate Standard Score | 5590 puntos | |
| 3DMark Fire Strike Score | 722 puntos | |
ayuda | ||
Ruido
| Ocioso |
| 29.2 / 29.2 / 31.2 dB(A) |
| Carga |
| 35.6 / 40.8 dB(A) |
 | ||
30 dB silencioso 40 dB(A) audible 50 dB(A) ruidosamente alto |
||
min: | ||
| Acer TravelMate P449-M-7407 HD Graphics 520, 6500U, Liteonit CV3-8D256 | Acer TravelMate P259-MG-71UU GeForce 940MX, 6500U, Liteonit CV3-8D256 | HP ProBook 450 G4 Y8B60EA GeForce 930MX, i7-7500U, SanDisk SD8SNAT256G1002 | Lenovo ThinkPad E470-20H2S00400 GeForce 940MX, i5-7200U, SanDisk X400 SED 256GB, SATA (SD8TB8U-256G) | Asus Zenbook UX310UQ-GL011T GeForce 940MX, 6500U, SanDisk SD8SNAT256G1002 | |
|---|---|---|---|---|---|
| Noise | -3% | -7% | 3% | -2% | |
| apagado / medio ambiente * (dB) | 29.2 | 30.5 -4% | 31.6 -8% | 29 1% | 30.5 -4% |
| Idle Minimum * (dB) | 29.2 | 31.6 -8% | 32.6 -12% | 29 1% | 30.5 -4% |
| Idle Average * (dB) | 29.2 | 31.6 -8% | 32.6 -12% | 29 1% | 30.5 -4% |
| Idle Maximum * (dB) | 31.2 | 32 -3% | 33 -6% | 29 7% | 31.5 -1% |
| Load Average * (dB) | 35.6 | 35.5 -0% | 38.9 -9% | 35.6 -0% | 36.2 -2% |
| Load Maximum * (dB) | 40.8 | 38.3 6% | 38.9 5% | 38.5 6% | 40 2% |
* ... más pequeño es mejor
(+) La temperatura máxima en la parte superior es de 35.2 °C / 95 F, frente a la media de 34.3 °C / 94 F, que oscila entre 21.2 y 62.5 °C para la clase Office.
(+) El fondo se calienta hasta un máximo de 37 °C / 99 F, frente a la media de 36.8 °C / 98 F
(+) En reposo, la temperatura media de la parte superior es de 22.6 °C / 73# F, frente a la media del dispositivo de 29.5 °C / 85 F.
(+) El reposamanos y el panel táctil están a una temperatura inferior a la de la piel, con un máximo de 21.8 °C / 71.2 F y, por tanto, son fríos al tacto.
(+) La temperatura media de la zona del reposamanos de dispositivos similares fue de 27.5 °C / 81.5 F (+5.7 °C / 10.3 F).
Acer TravelMate P449-M-7407 análisis de audio
(±) | la sonoridad del altavoz es media pero buena (78.9 dB)
Graves 100 - 315 Hz
(-) | casi sin bajos - de media 18.2% inferior a la mediana
(±) | la linealidad de los graves es media (14% delta a frecuencia anterior)
Medios 400 - 2000 Hz
(+) | medios equilibrados - a sólo 4.1% de la mediana
(±) | la linealidad de los medios es media (10.1% delta respecto a la frecuencia anterior)
Altos 2 - 16 kHz
(±) | máximos más altos - de media 5.6% más altos que la mediana
(±) | la linealidad de los máximos es media (10.5% delta a frecuencia anterior)
Total 100 - 16.000 Hz
(±) | la linealidad del sonido global es media (23.8% de diferencia con la mediana)
En comparación con la misma clase
» 68% de todos los dispositivos probados de esta clase eran mejores, 8% similares, 24% peores
» El mejor tuvo un delta de 7%, la media fue 21%, el peor fue ###max##%
En comparación con todos los dispositivos probados
» 71% de todos los dispositivos probados eran mejores, 6% similares, 22% peores
» El mejor tuvo un delta de 4%, la media fue 24%, el peor fue ###max##%
Lenovo ThinkPad E470-20H2S00400 análisis de audio
(+) | los altavoces pueden reproducir a un volumen relativamente alto (#84.8 dB)
Graves 100 - 315 Hz
(-) | casi sin bajos - de media 15.7% inferior a la mediana
(±) | la linealidad de los graves es media (11.2% delta a frecuencia anterior)
Medios 400 - 2000 Hz
(±) | medias más altas - de media 9% más altas que la mediana
(±) | la linealidad de los medios es media (11.1% delta respecto a la frecuencia anterior)
Altos 2 - 16 kHz
(±) | máximos más altos - de media 5.1% más altos que la mediana
(±) | la linealidad de los máximos es media (10.5% delta a frecuencia anterior)
Total 100 - 16.000 Hz
(±) | la linealidad del sonido global es media (23.8% de diferencia con la mediana)
En comparación con la misma clase
» 68% de todos los dispositivos probados de esta clase eran mejores, 8% similares, 24% peores
» El mejor tuvo un delta de 7%, la media fue 21%, el peor fue ###max##%
En comparación con todos los dispositivos probados
» 71% de todos los dispositivos probados eran mejores, 6% similares, 22% peores
» El mejor tuvo un delta de 4%, la media fue 24%, el peor fue ###max##%
| Off / Standby | |
| Ocioso | |
| Carga |
|
Clave:
min: | |
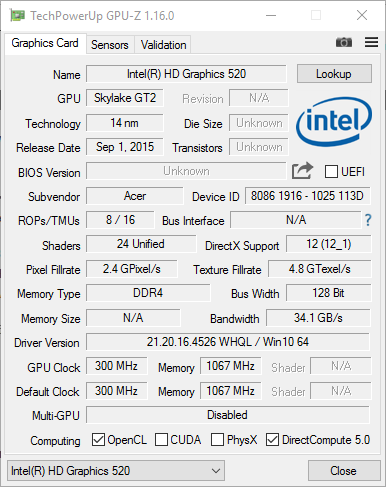
| Acer TravelMate P449-M-7407 6500U, HD Graphics 520, Liteonit CV3-8D256, IPS, 1920x1080, 14" | Acer TravelMate P259-MG-71UU 6500U, GeForce 940MX, Liteonit CV3-8D256, TN LED, 1920x1080, 15.6" | HP ProBook 450 G4 Y8B60EA i7-7500U, GeForce 930MX, SanDisk SD8SNAT256G1002, TN LED, 1920x1080, 15.6" | Lenovo ThinkPad E470-20H2S00400 i5-7200U, GeForce 940MX, SanDisk X400 SED 256GB, SATA (SD8TB8U-256G), IPS, 1920x1080, 14" | Asus Zenbook UX310UQ-GL011T 6500U, GeForce 940MX, SanDisk SD8SNAT256G1002, TN LED, 1920x1080, 13.3" | |
|---|---|---|---|---|---|
| Power Consumption | -62% | -34% | -27% | -32% | |
| Idle Minimum * (Watt) | 3.4 | 7 -106% | 3.8 -12% | 2.7 21% | 3 12% |
| Idle Average * (Watt) | 5.2 | 8 -54% | 6.6 -27% | 5.5 -6% | 5.6 -8% |
| Idle Maximum * (Watt) | 7.2 | 10.6 -47% | 11.3 -57% | 6.5 10% | 6.8 6% |
| Load Average * (Watt) | 28.2 | 39.7 -41% | 38 -35% | 44.2 -57% | 48.7 -73% |
| Load Maximum * (Watt) | 32 | 51.9 -62% | 45 -41% | 65.2 -104% | 63 -97% |
* ... más pequeño es mejor
| Acer TravelMate P449-M-7407 6500U, HD Graphics 520, 48.3 Wh | Acer TravelMate P259-MG-71UU 6500U, GeForce 940MX, 41 Wh | HP ProBook 450 G4 Y8B60EA i7-7500U, GeForce 930MX, 45 Wh | Lenovo ThinkPad E470-20H2S00400 i5-7200U, GeForce 940MX, 45 Wh | Asus Zenbook UX310UQ-GL011T 6500U, GeForce 940MX, 48 Wh | |
|---|---|---|---|---|---|
| Duración de Batería | -26% | 21% | 27% | 19% | |
| Reader / Idle (h) | 9.4 | 10.3 10% | 12.4 32% | 17.4 85% | 14.6 55% |
| WiFi v1.3 (h) | 8.5 | 4.7 -45% | 8.6 1% | 5.4 -36% | 8.1 -5% |
| Load (h) | 1.6 | 0.9 -44% | 2.1 31% | 2.1 31% | 1.7 6% |
Pro
Contra
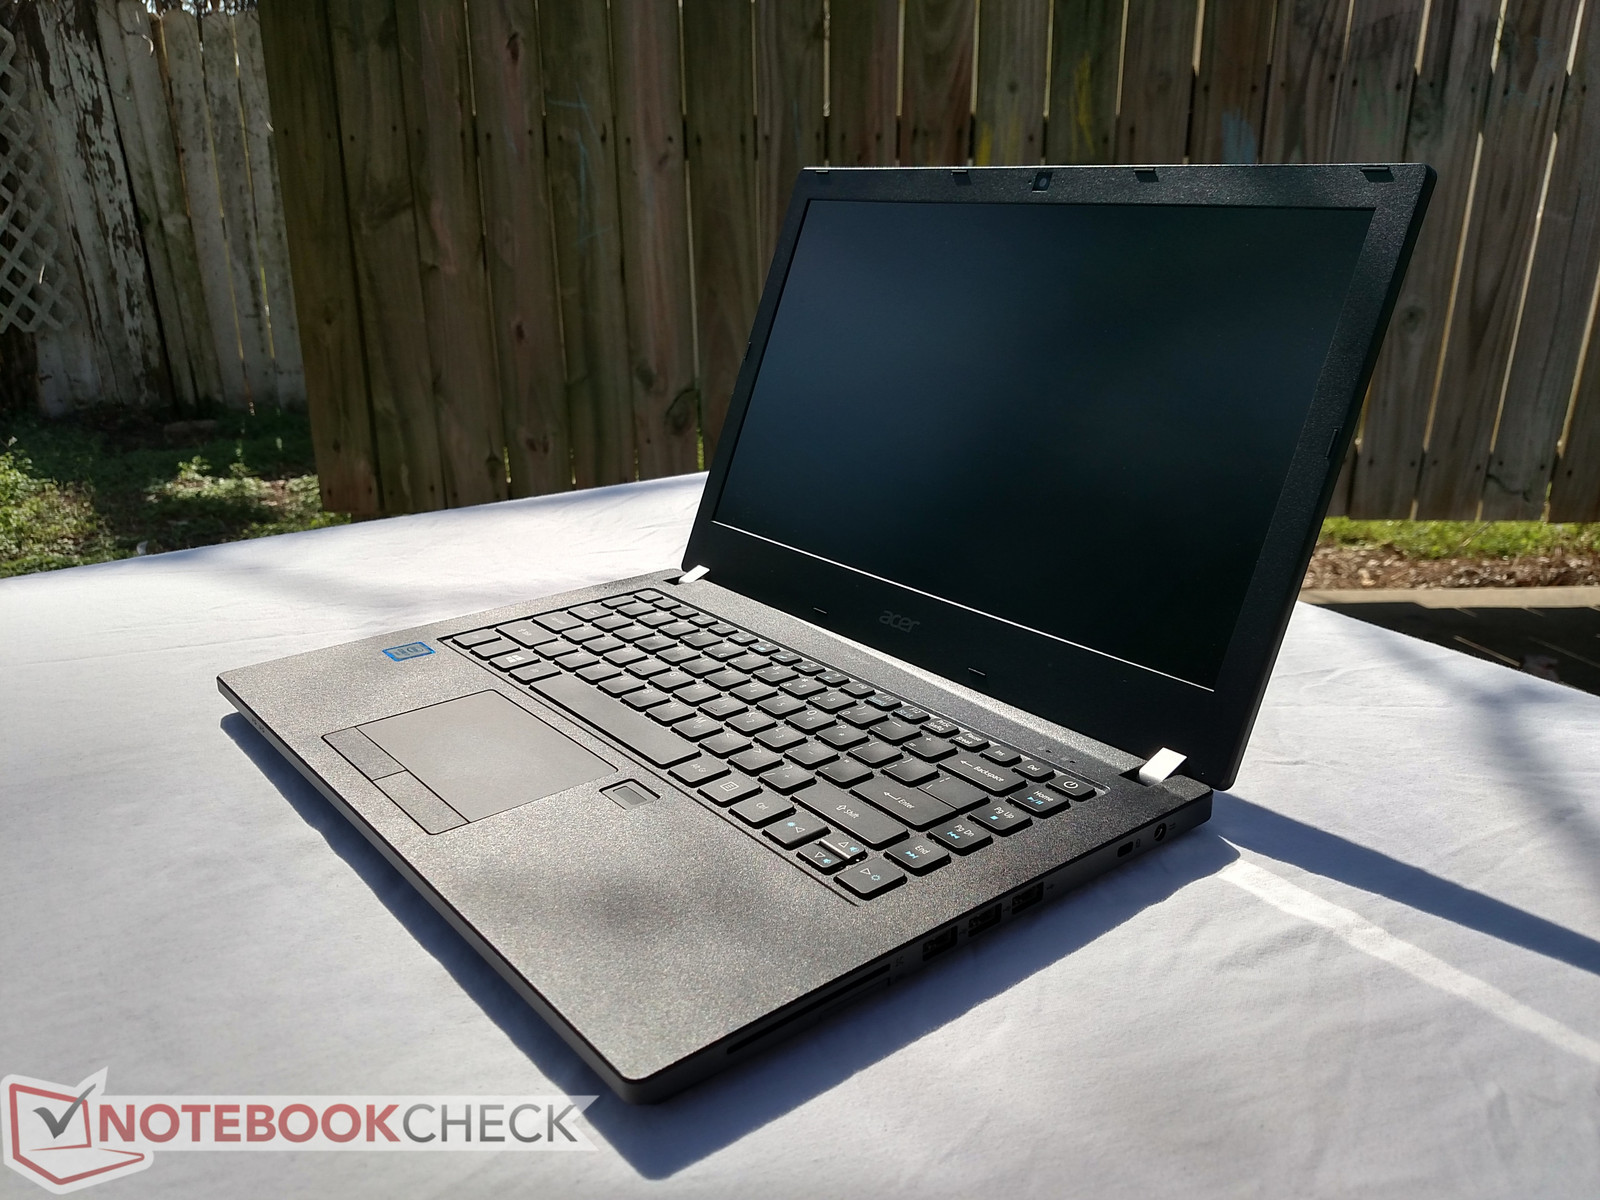
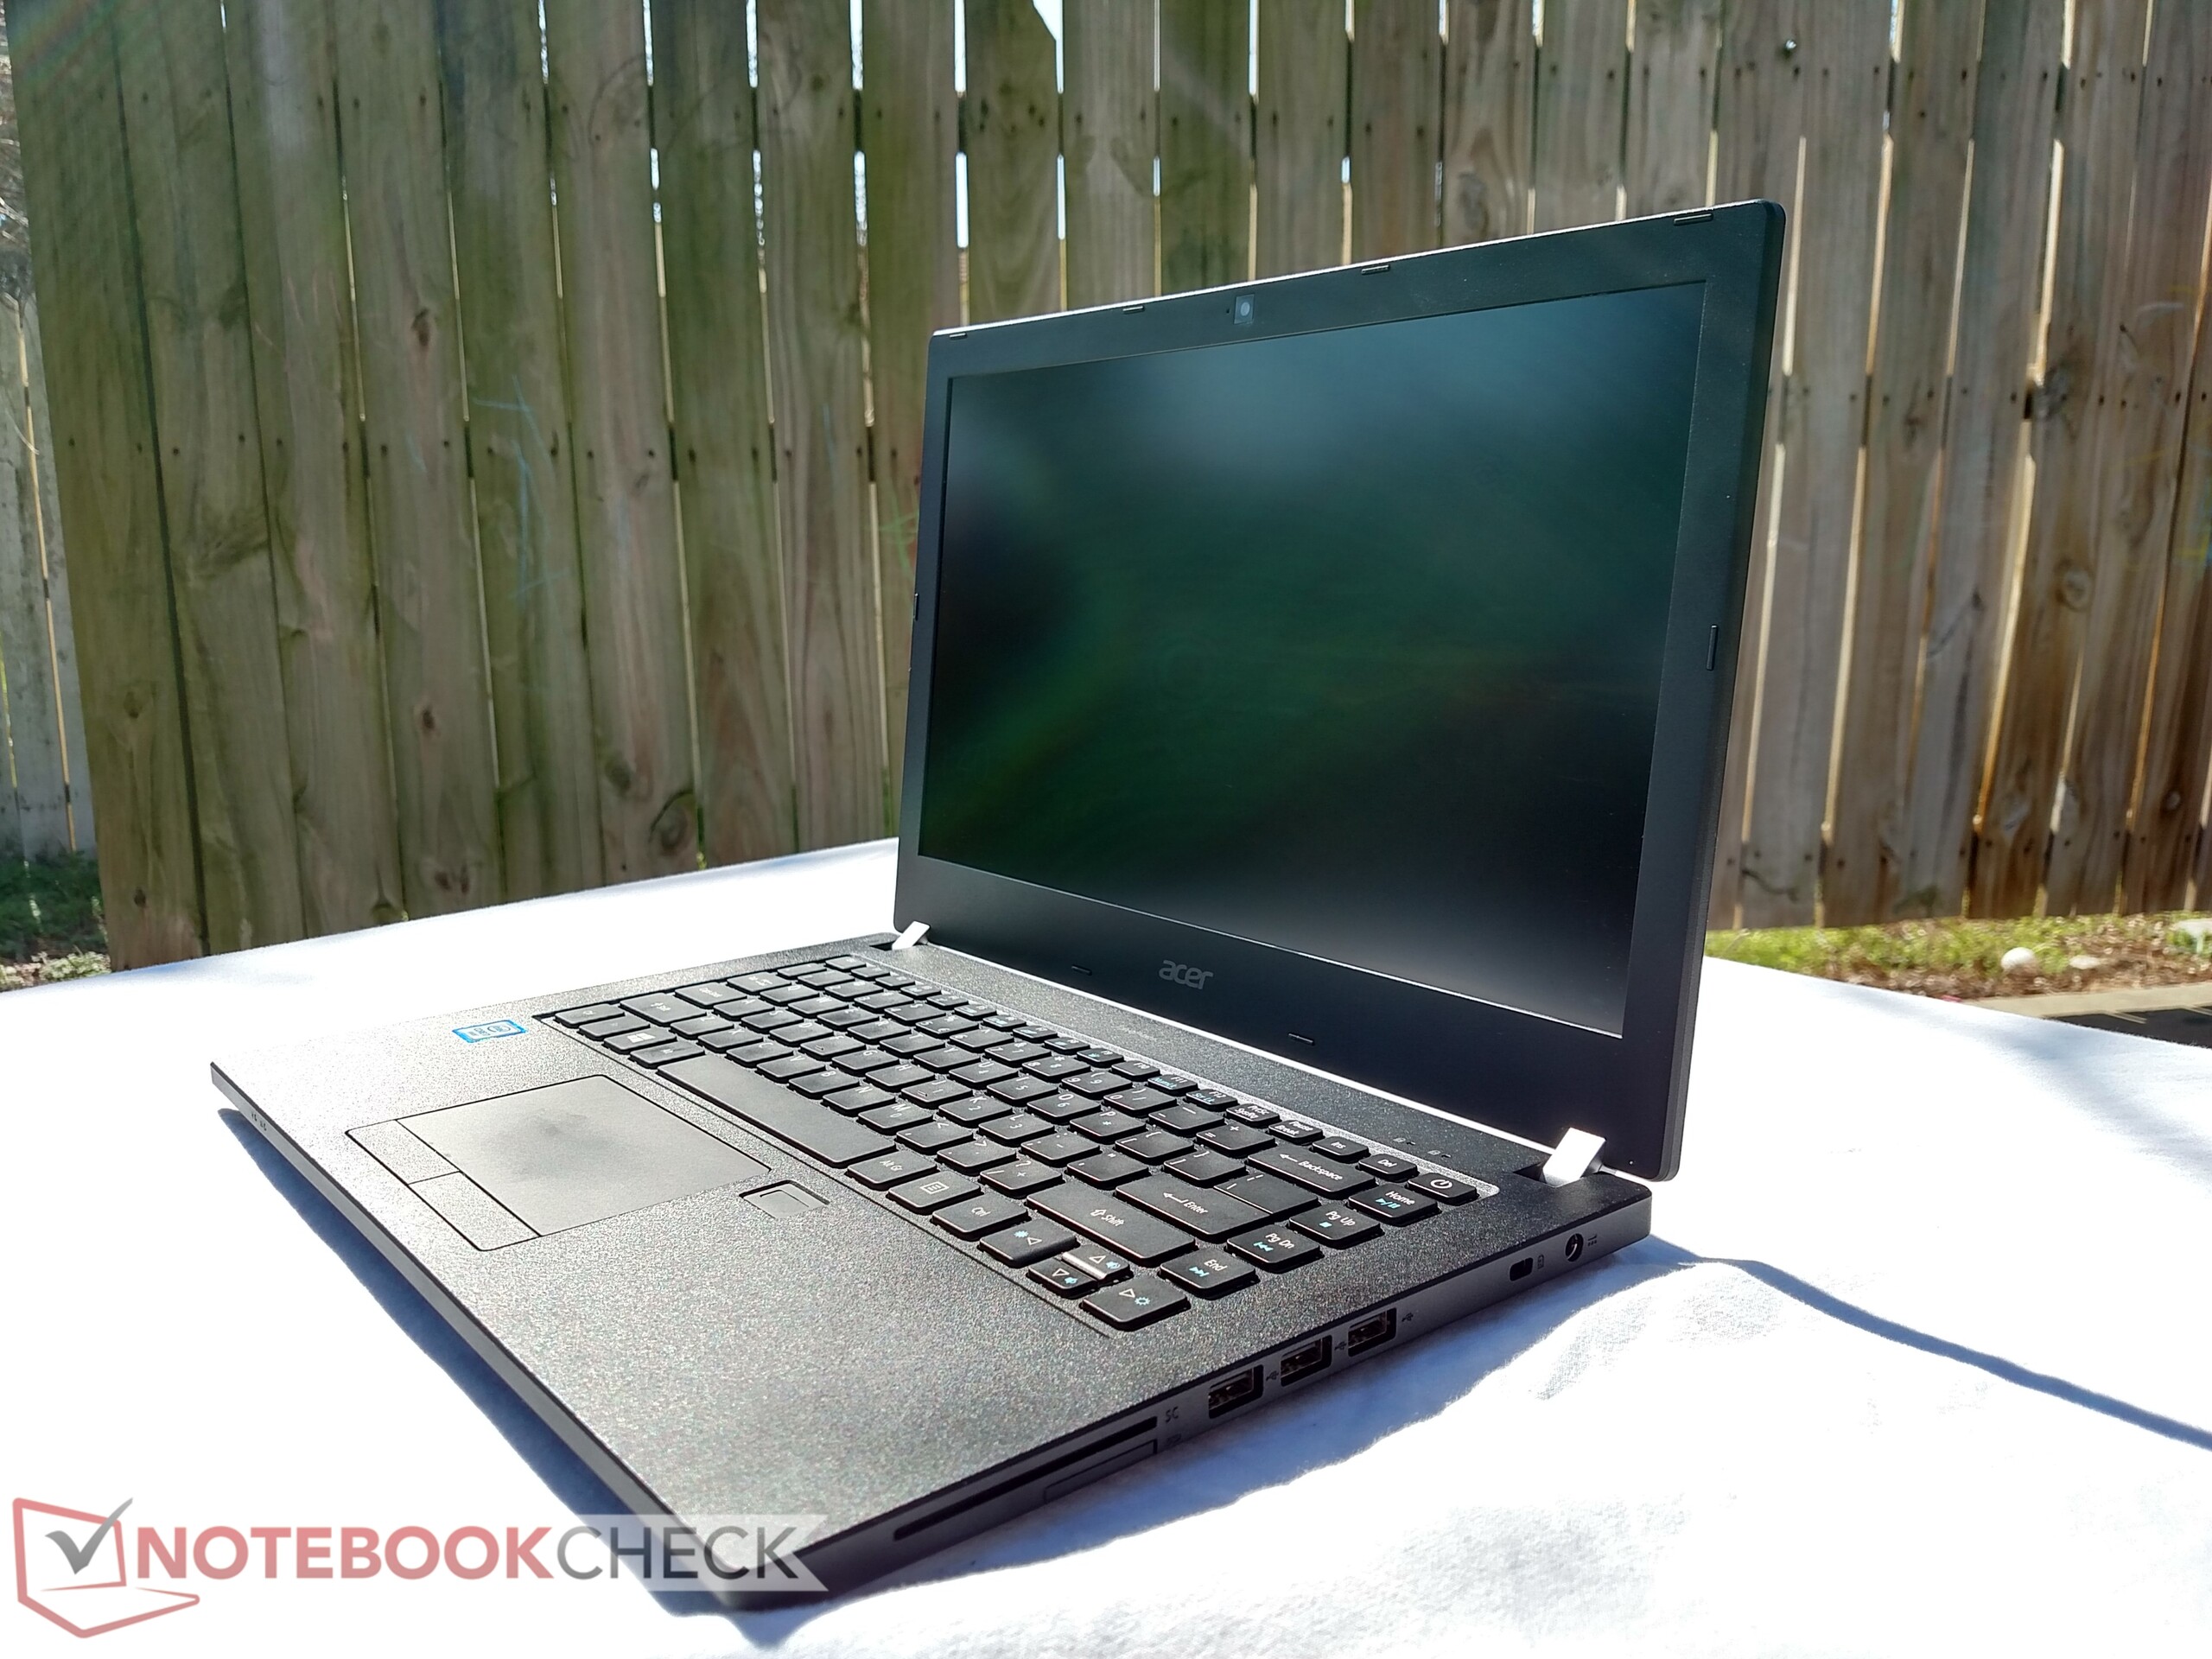
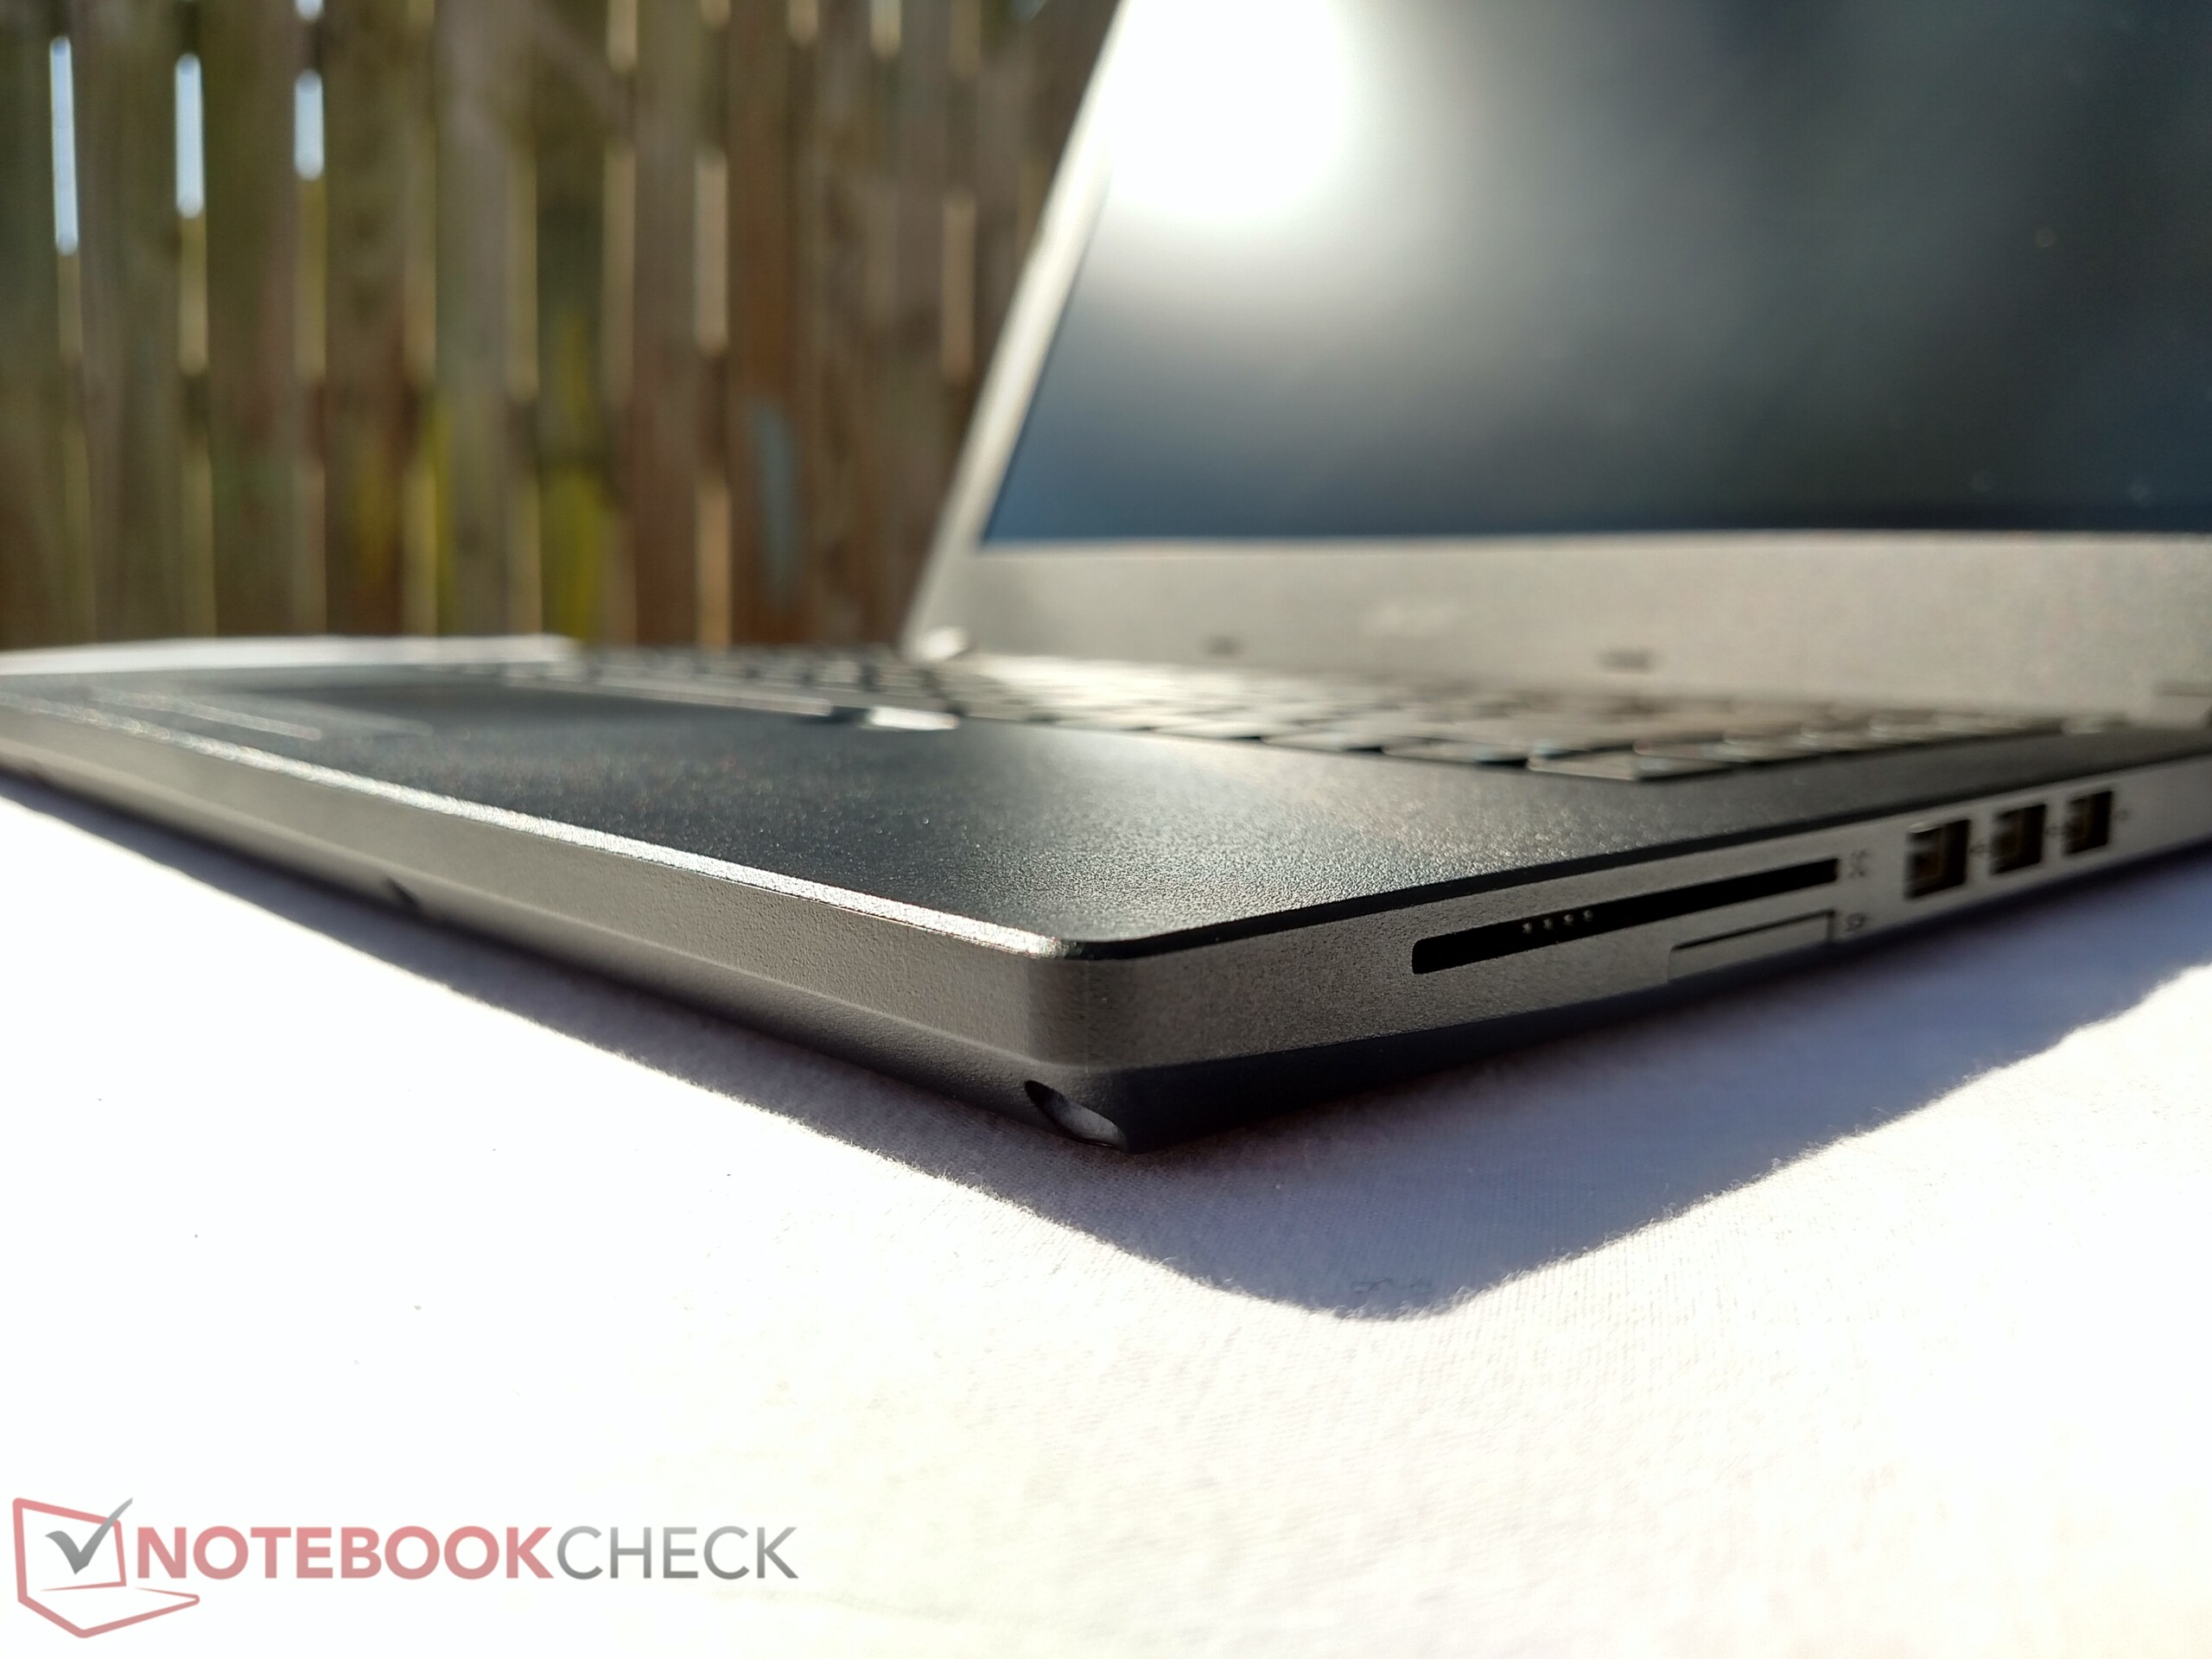
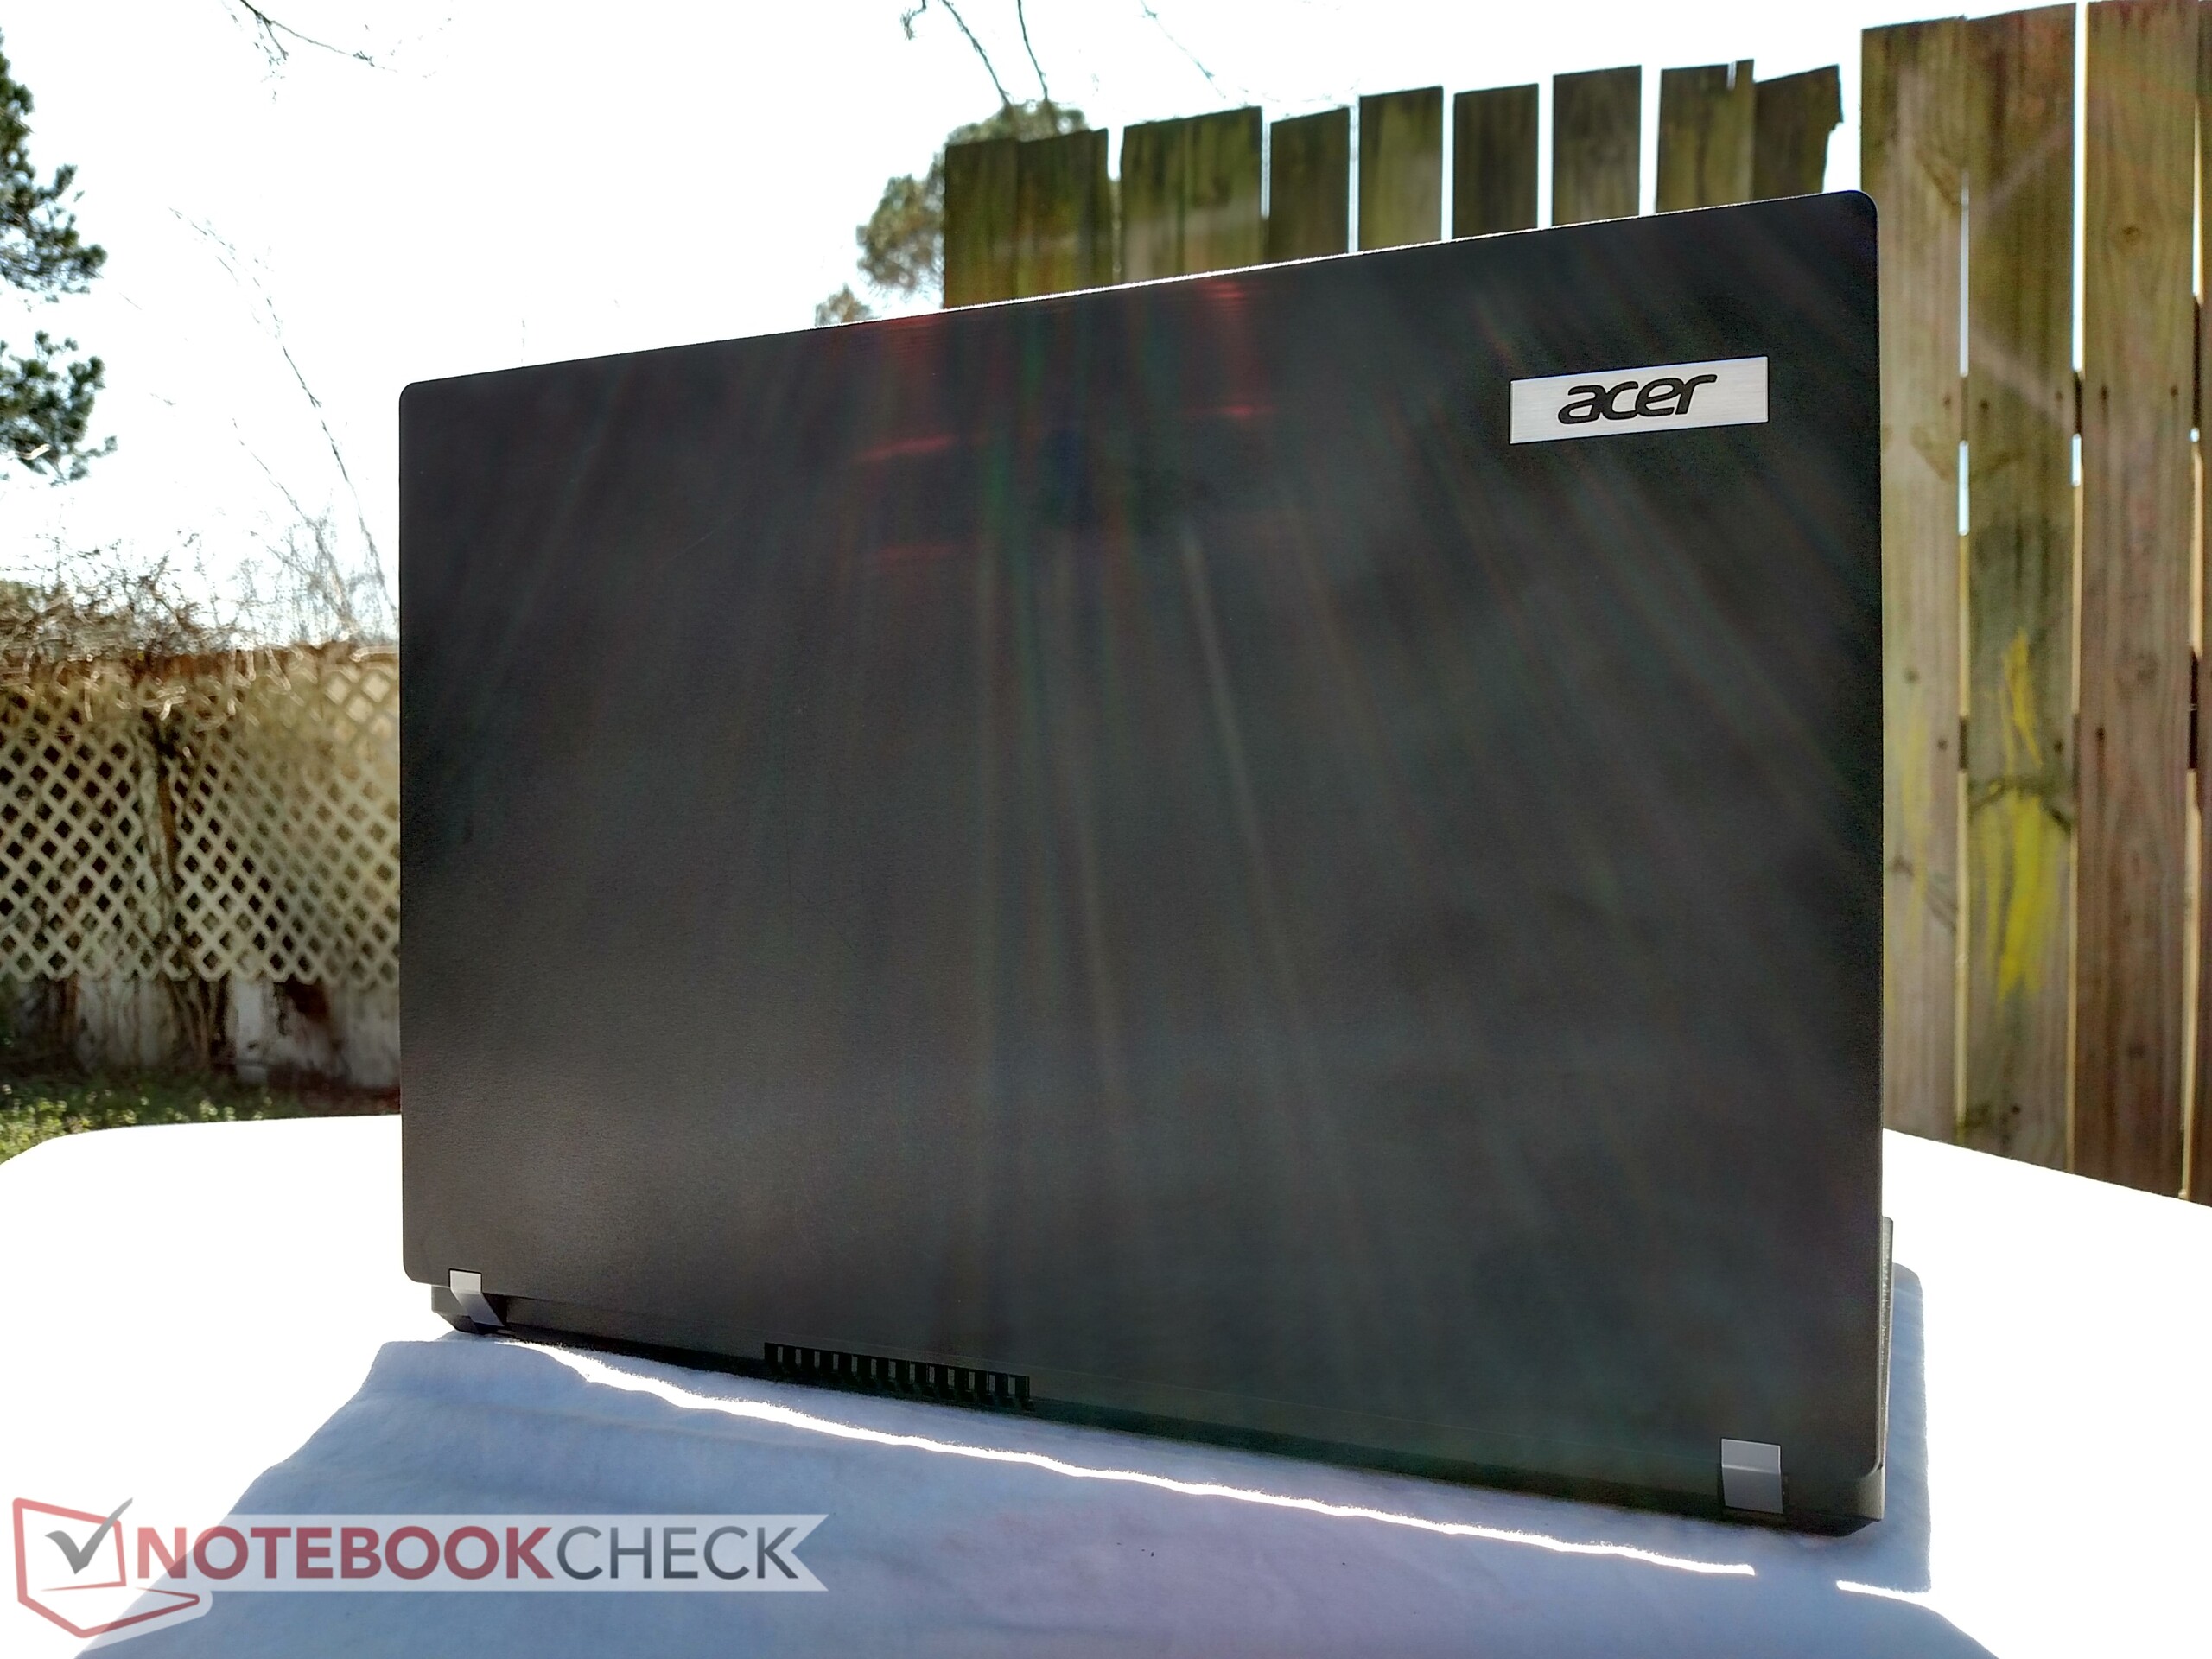
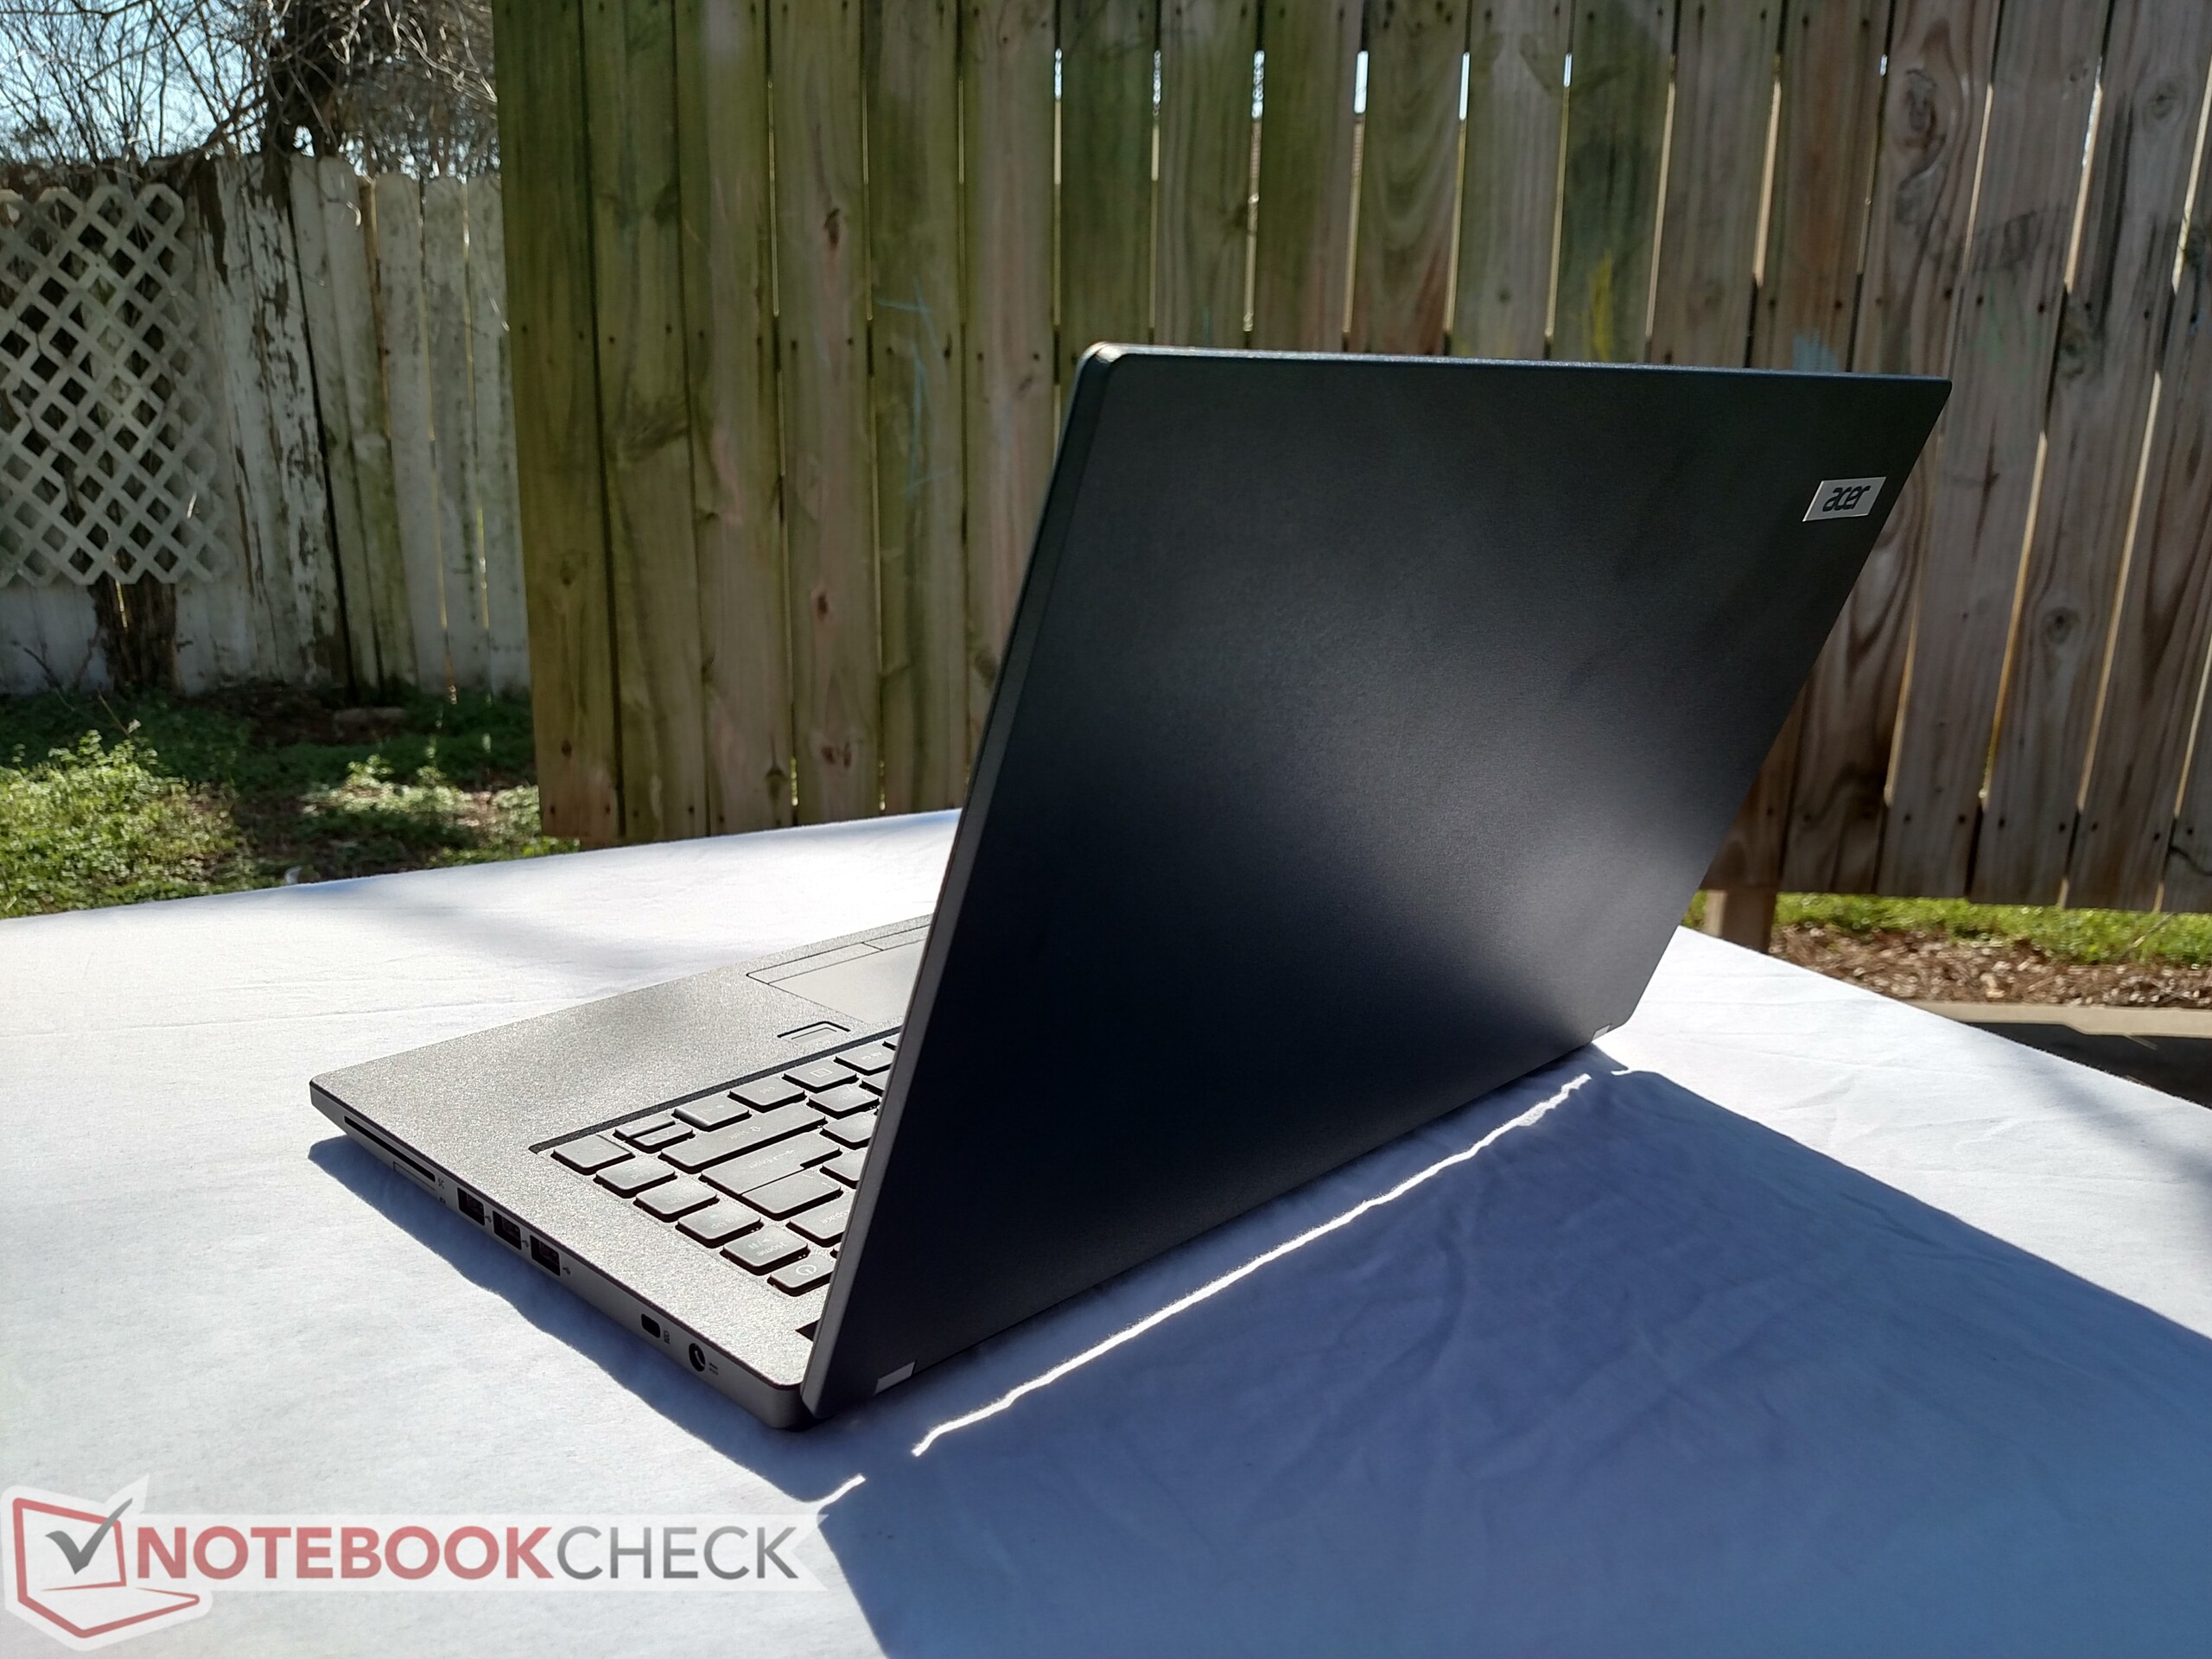
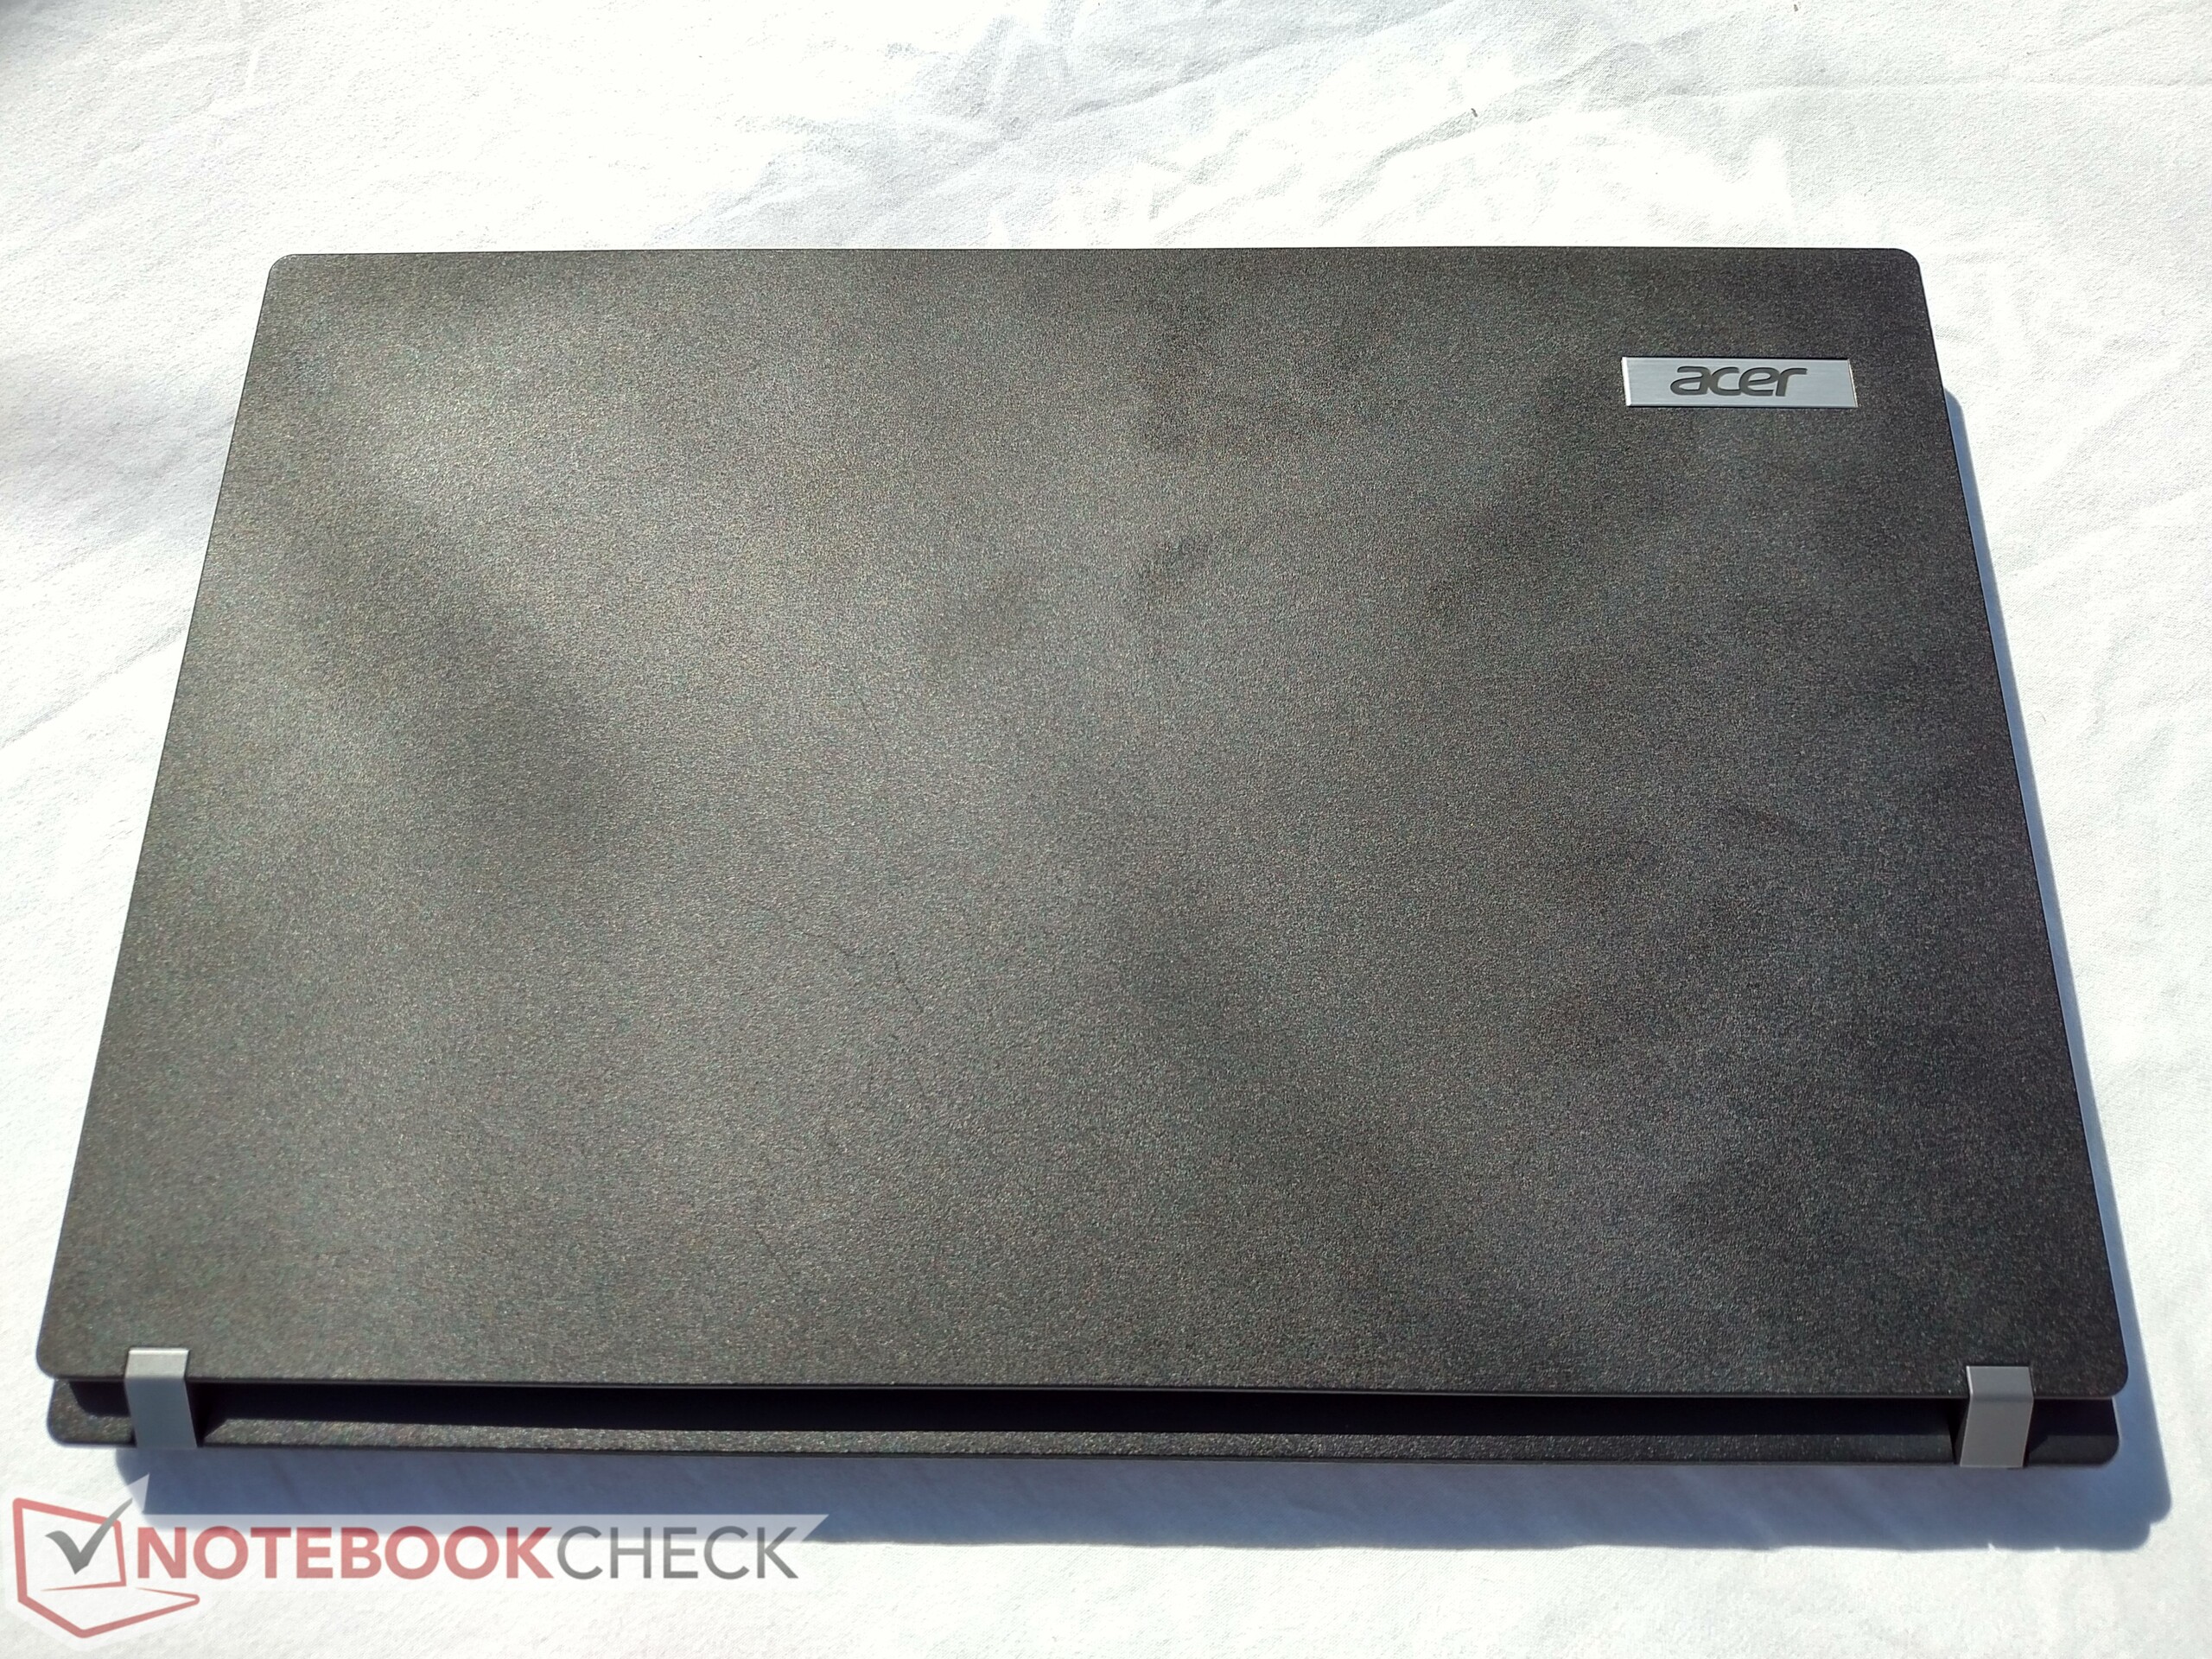
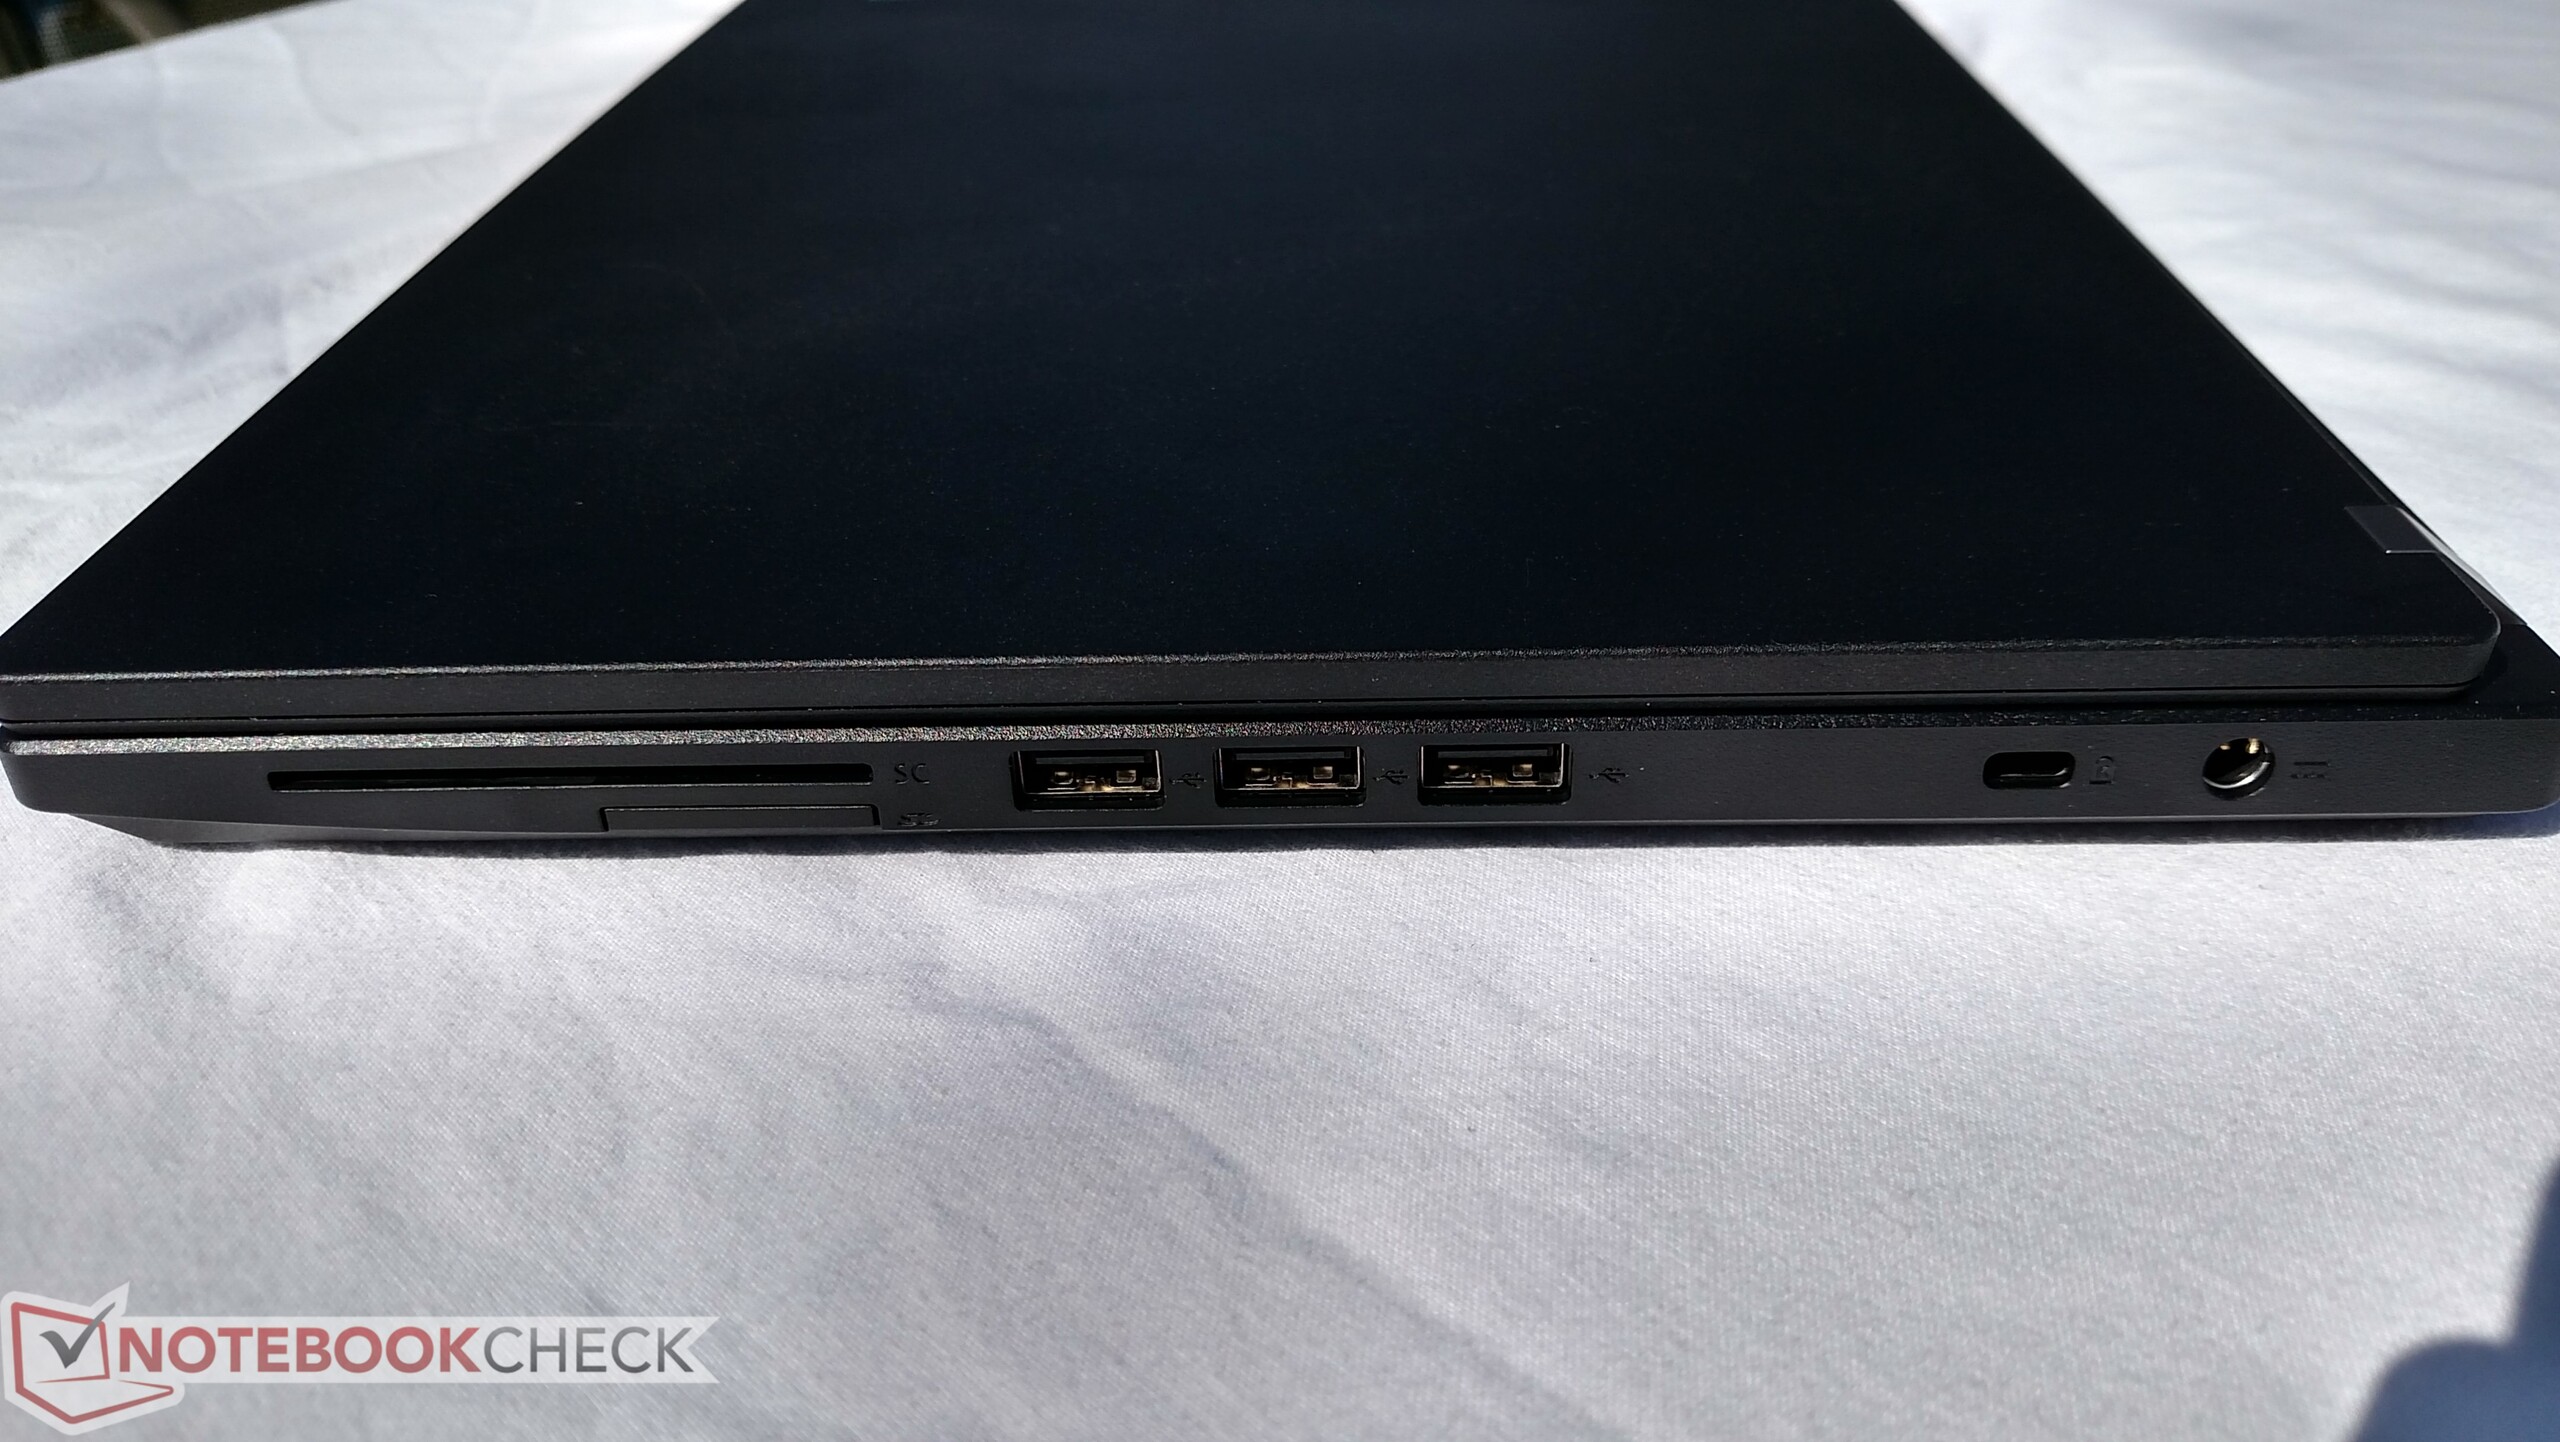
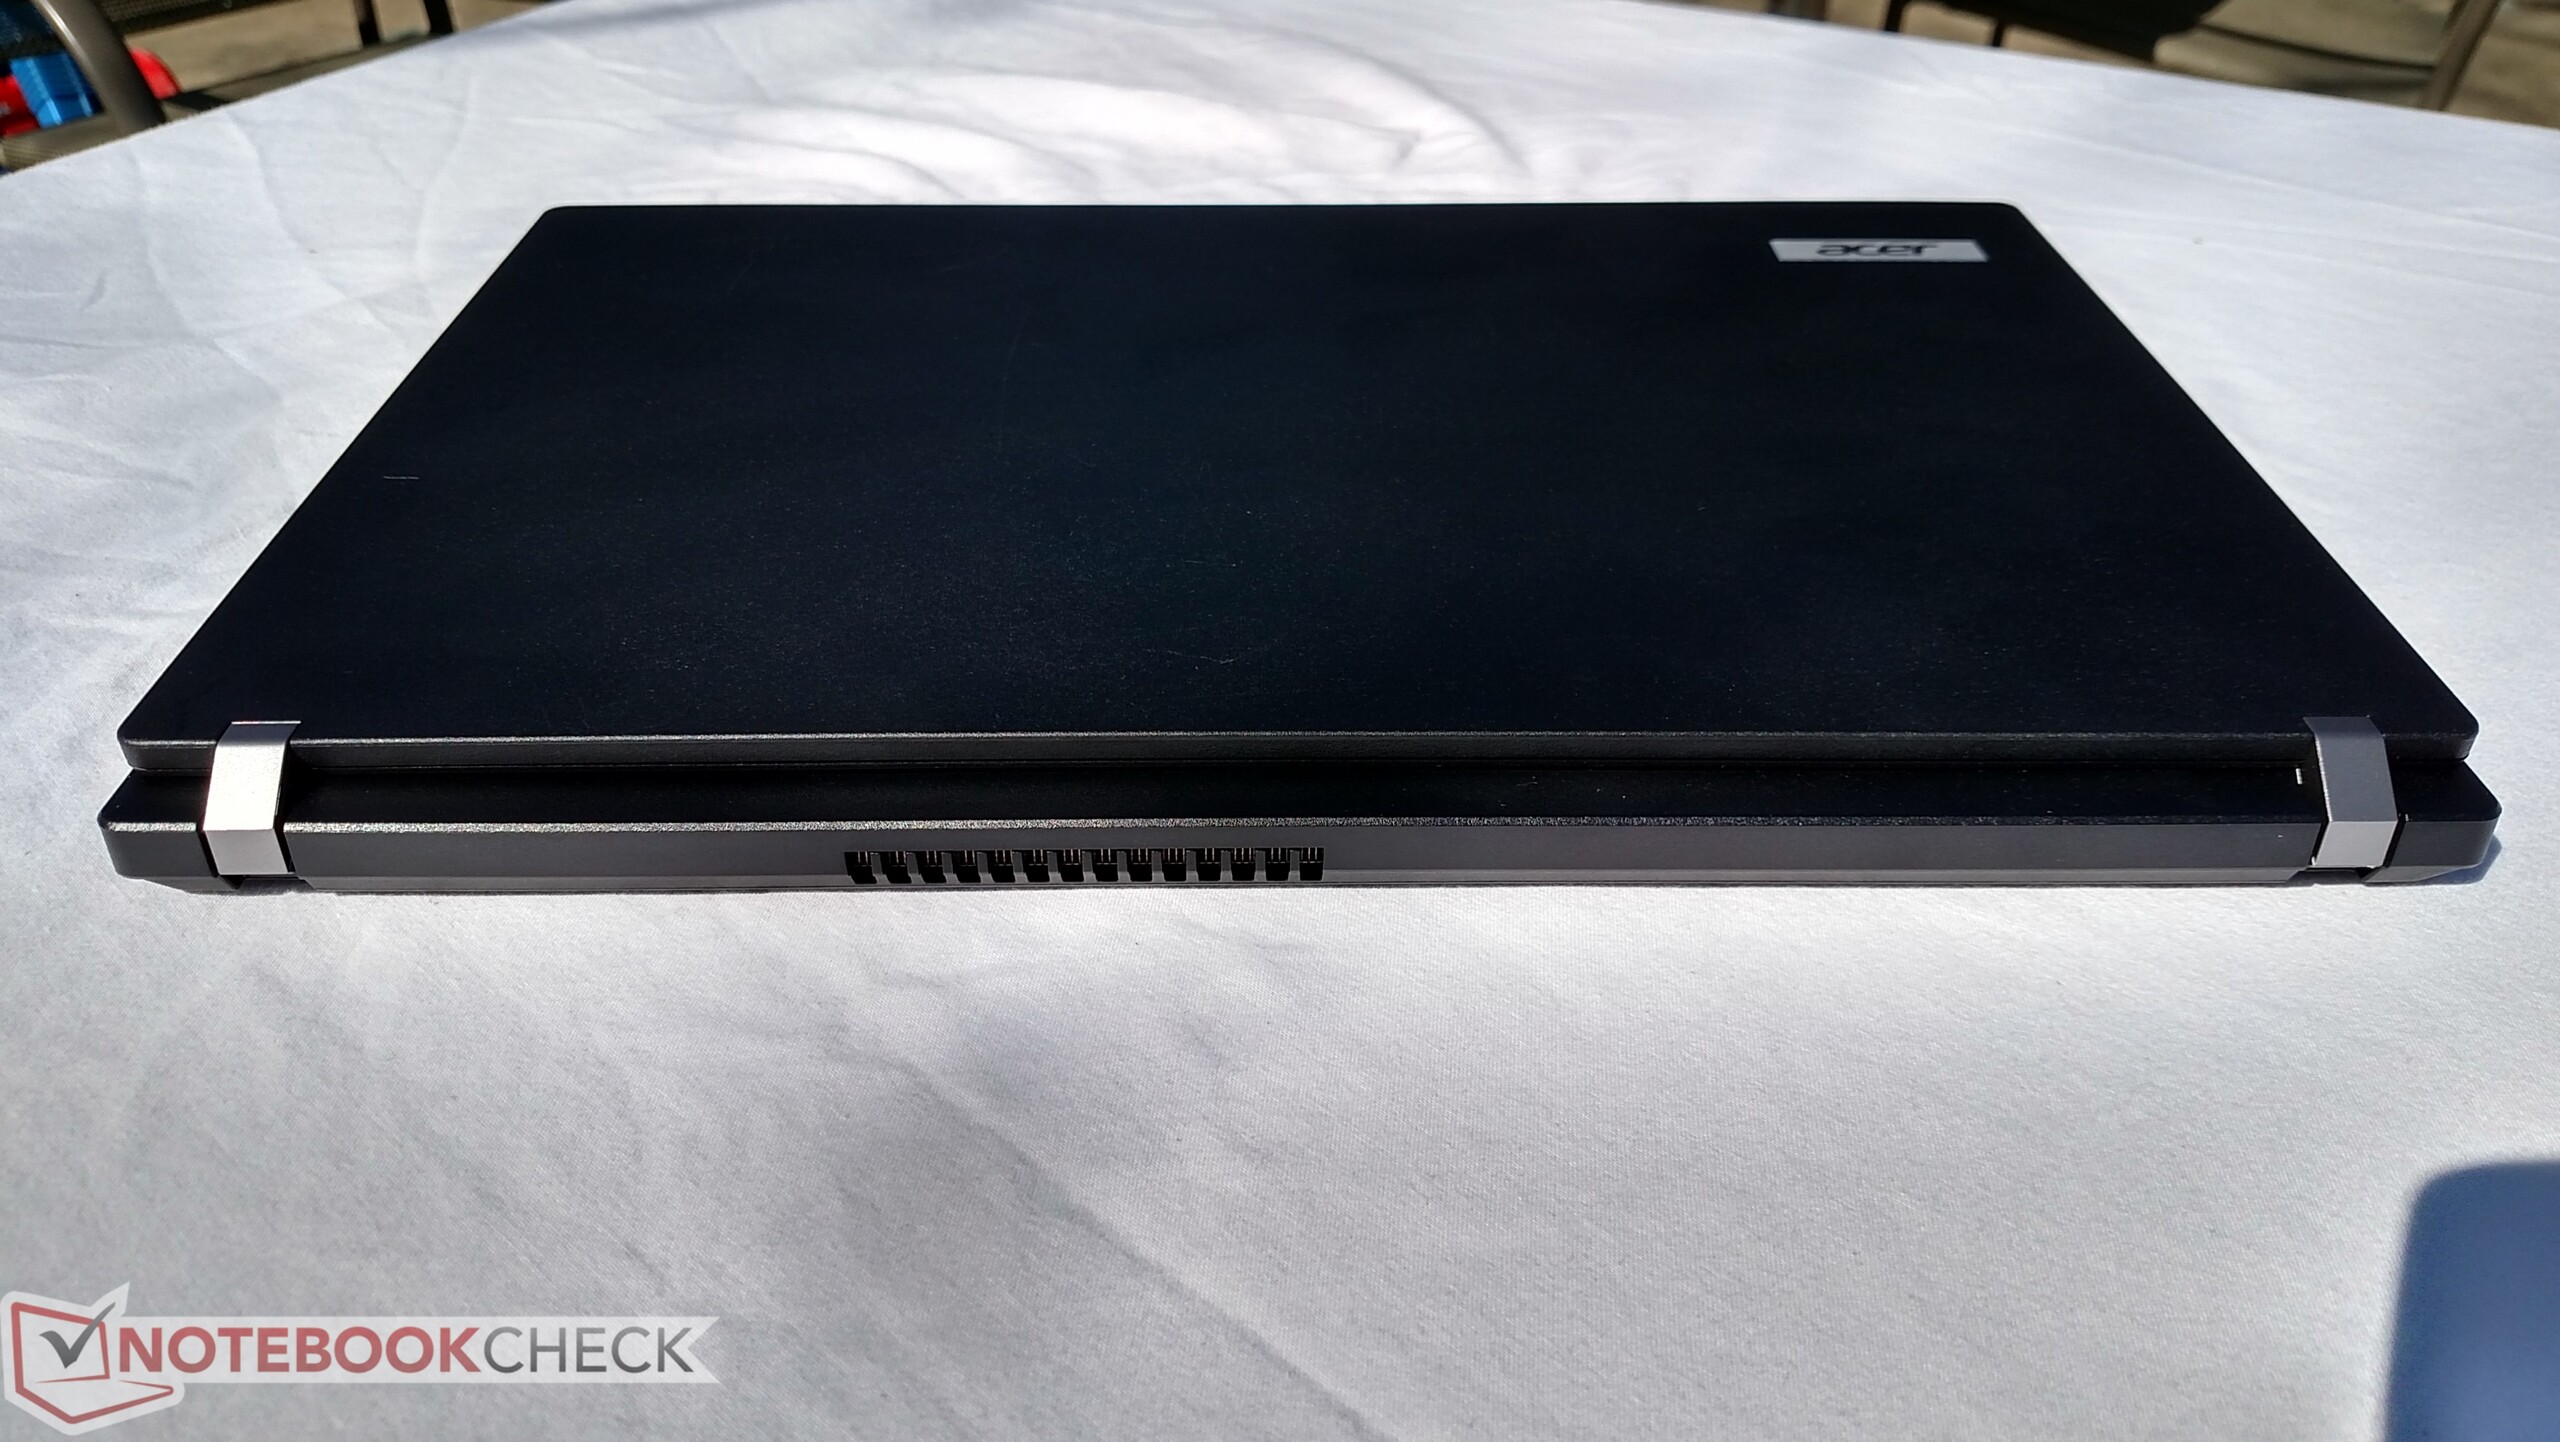
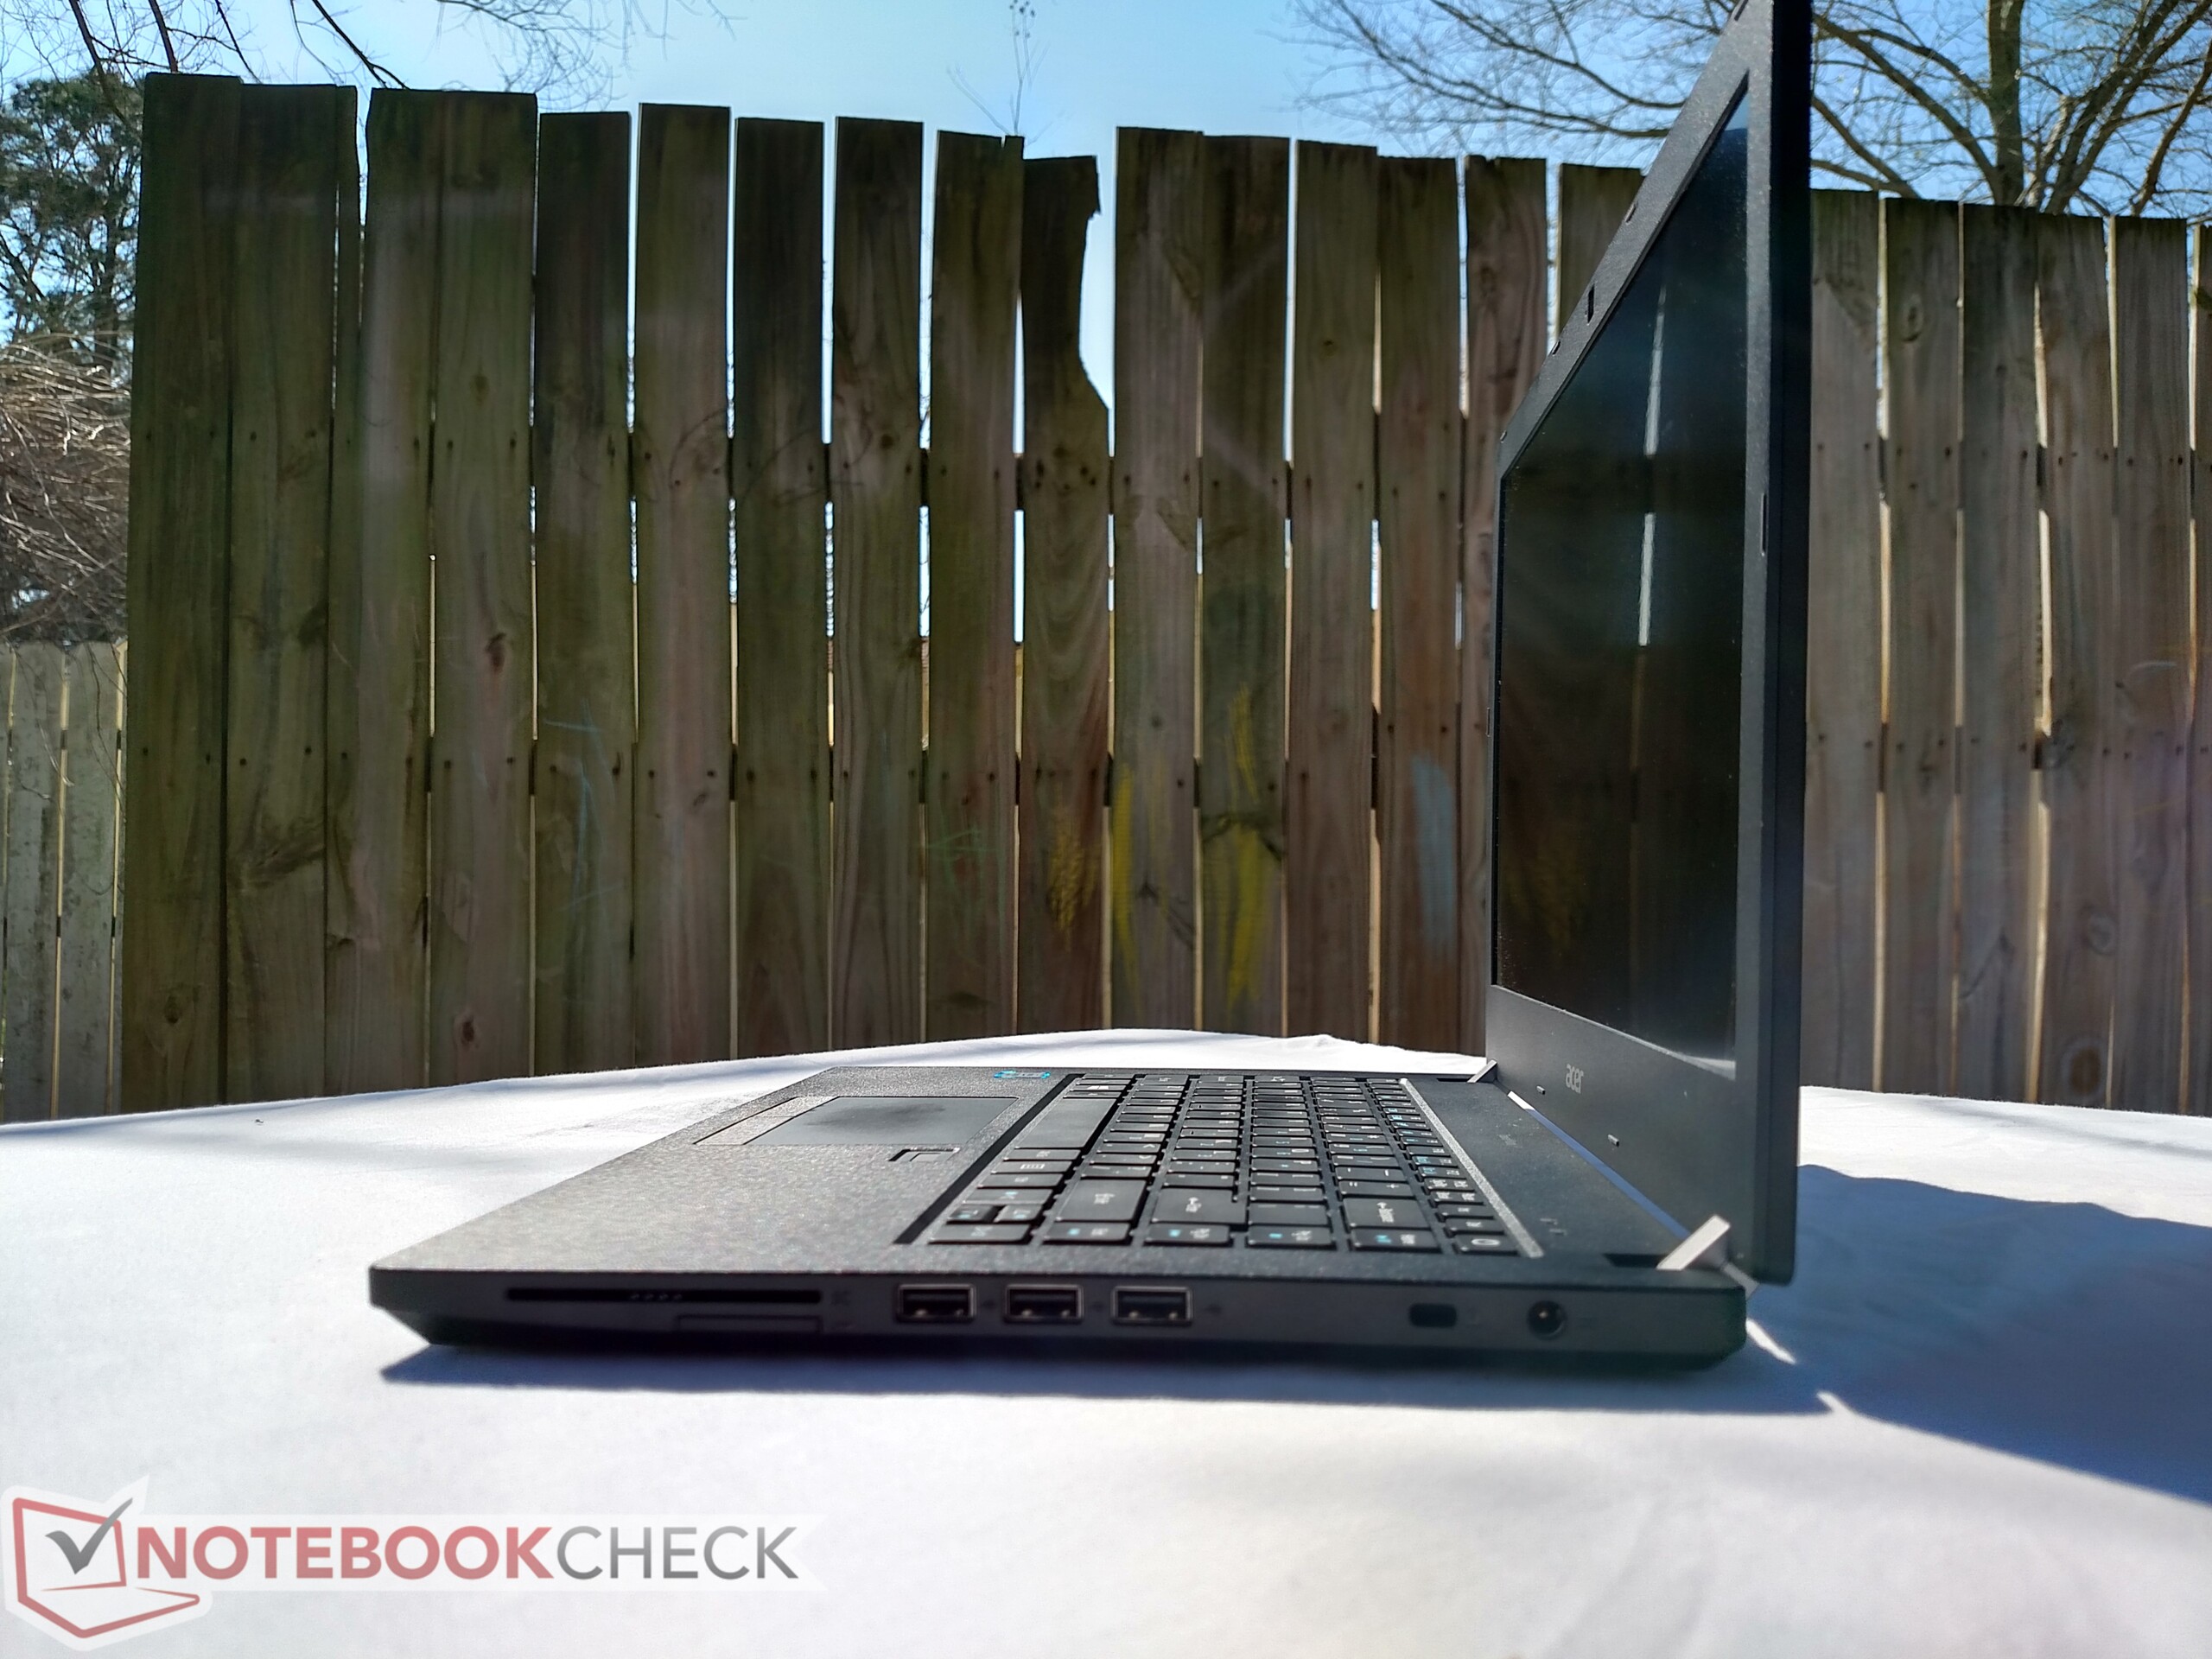
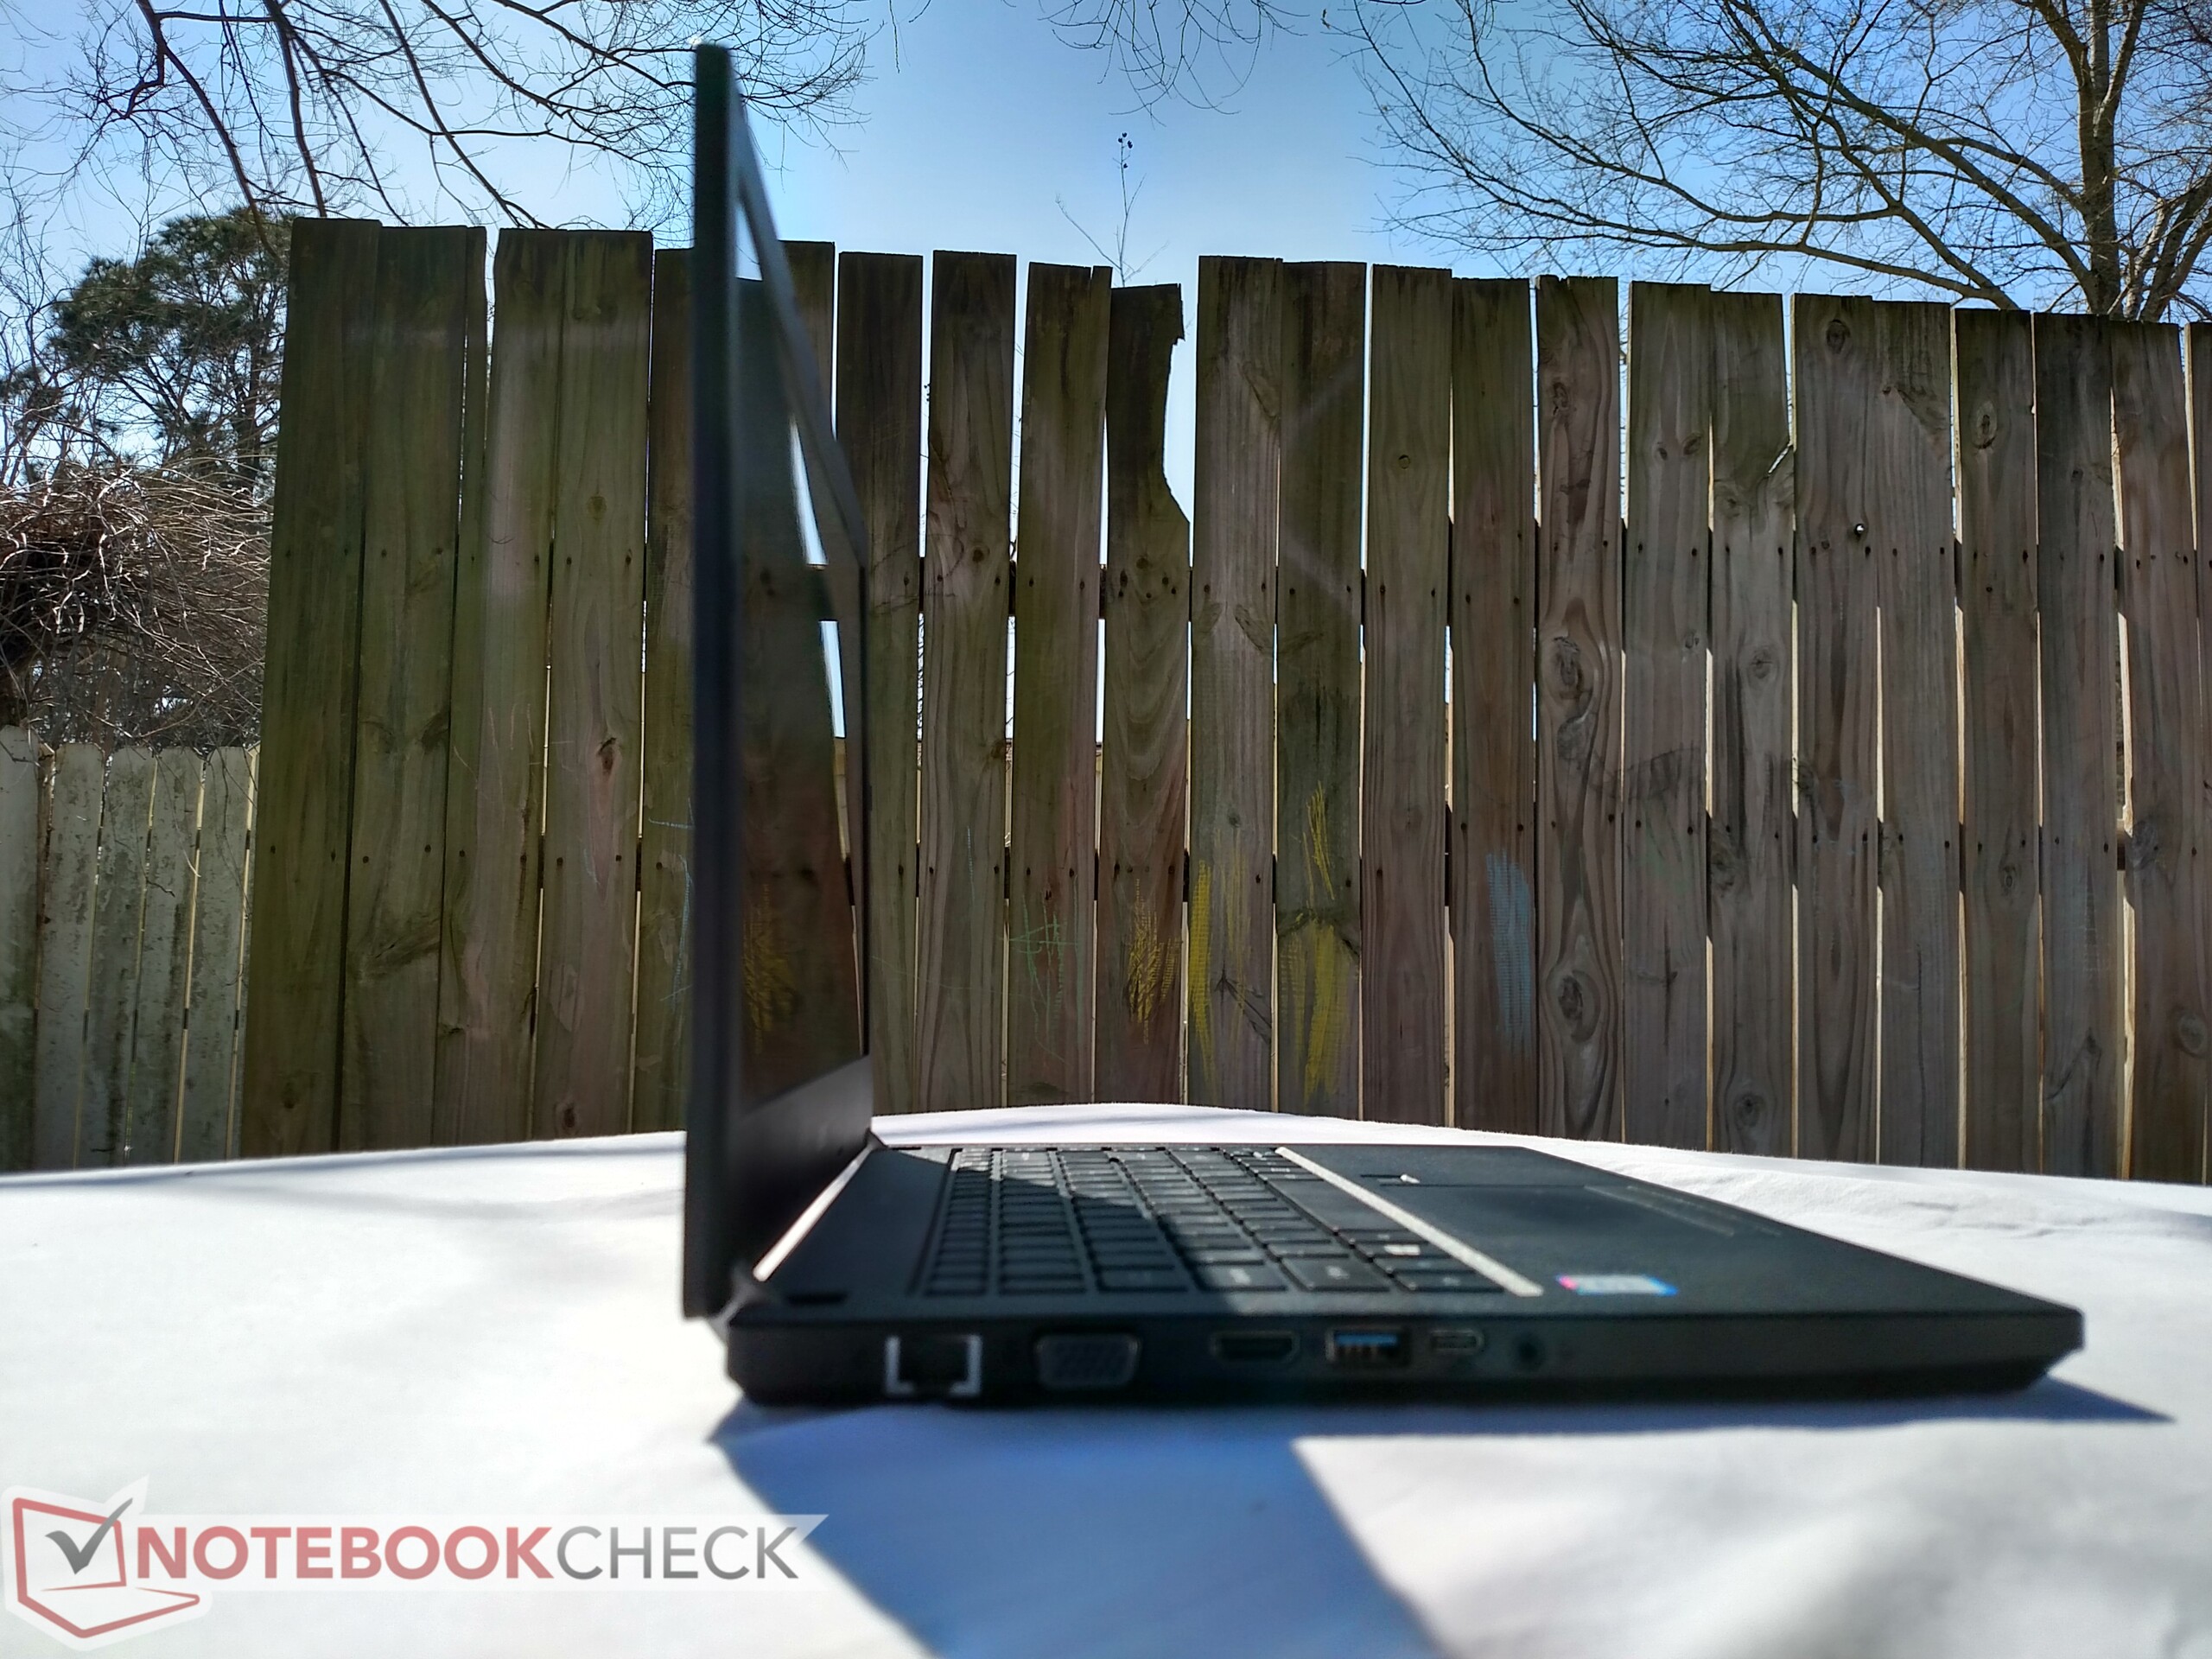
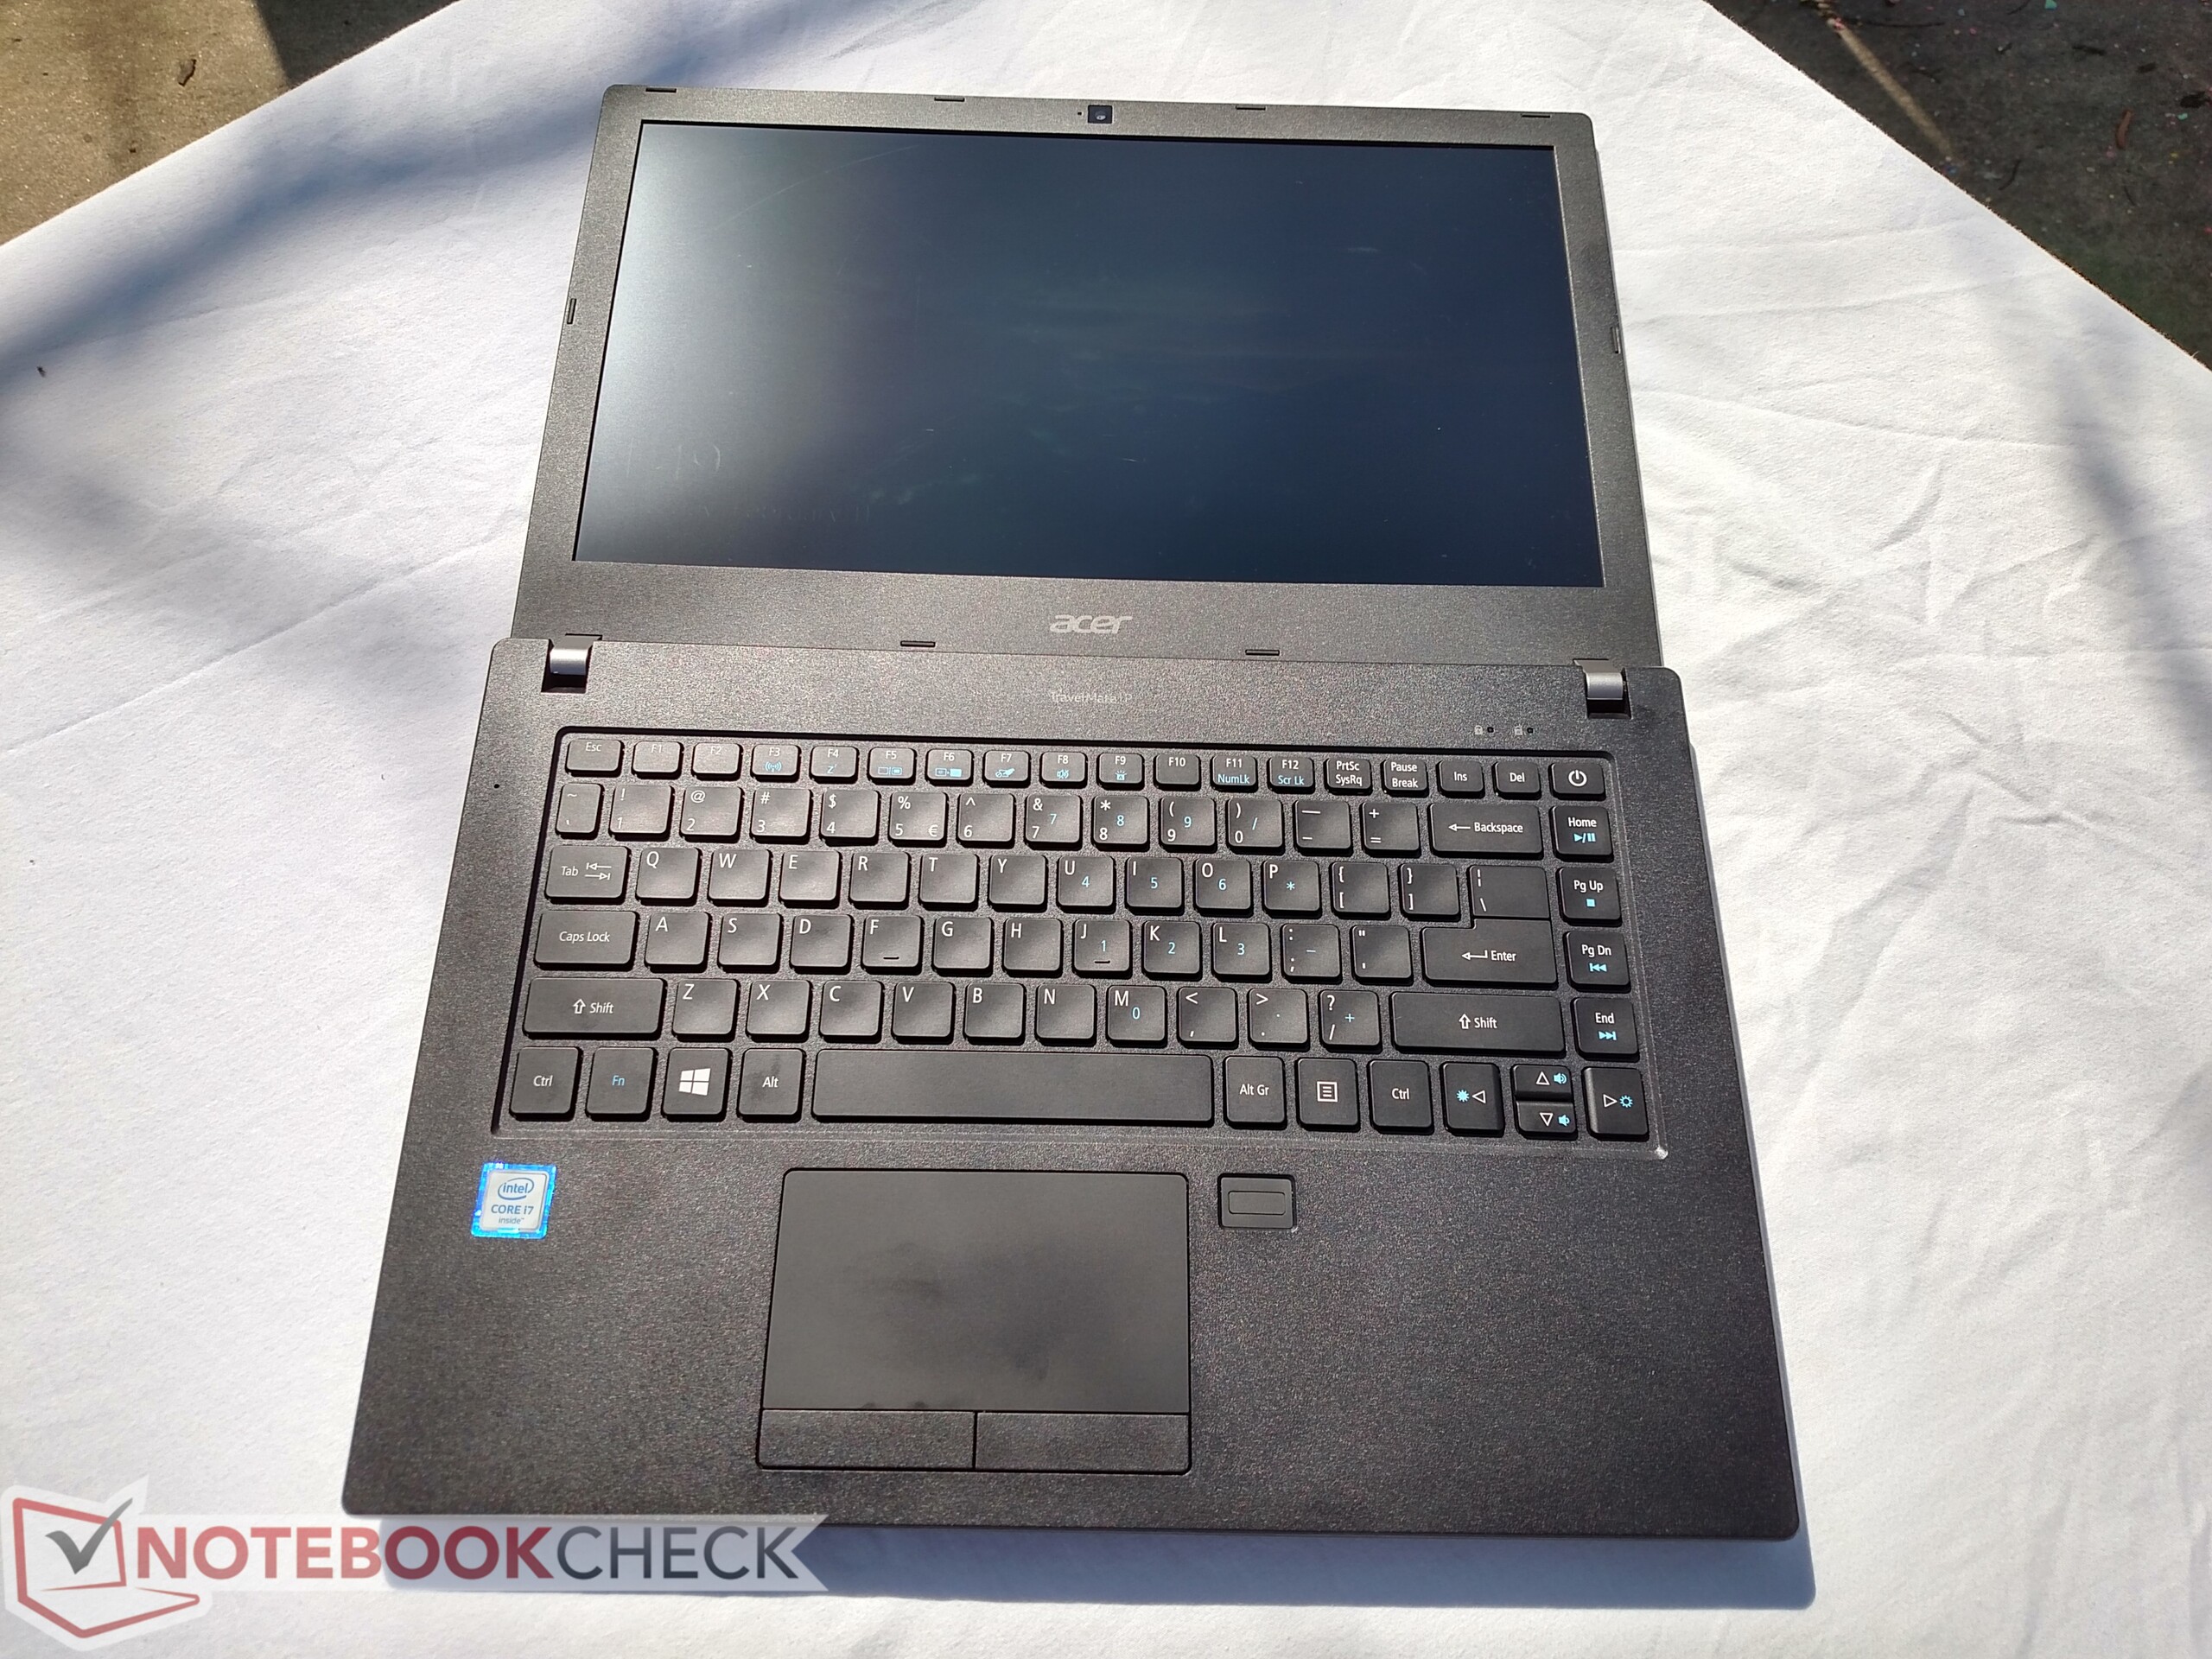
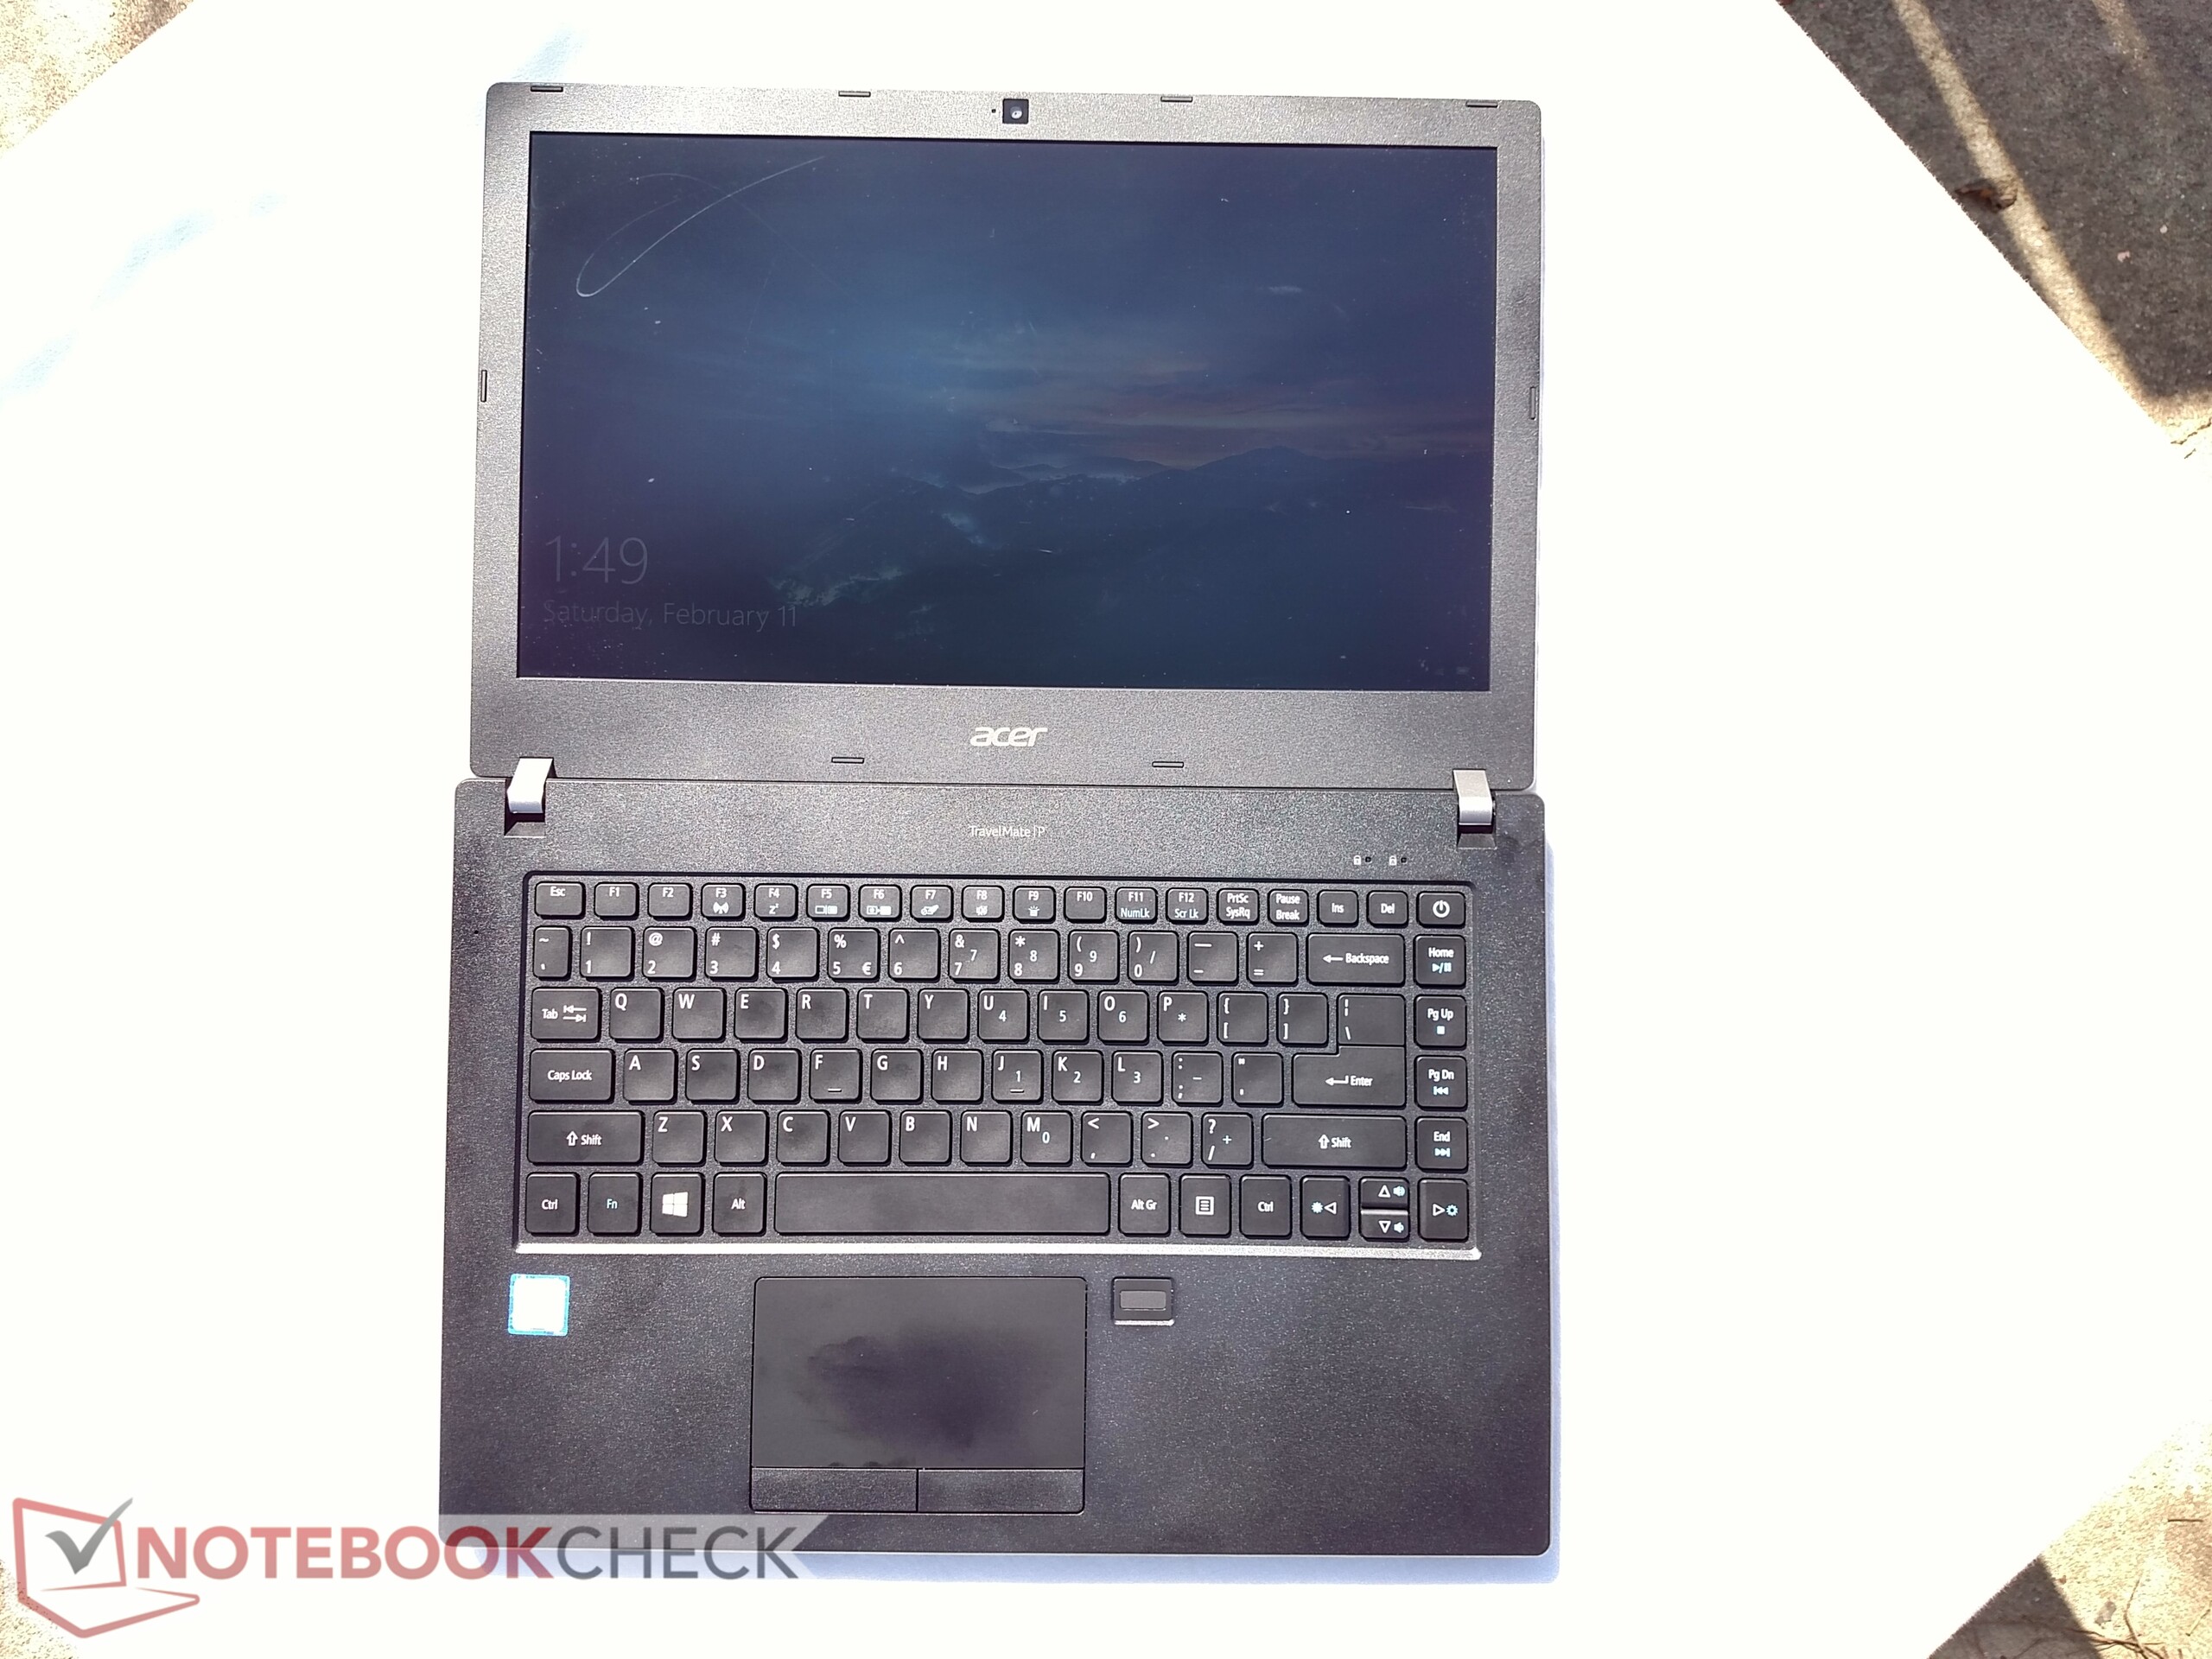
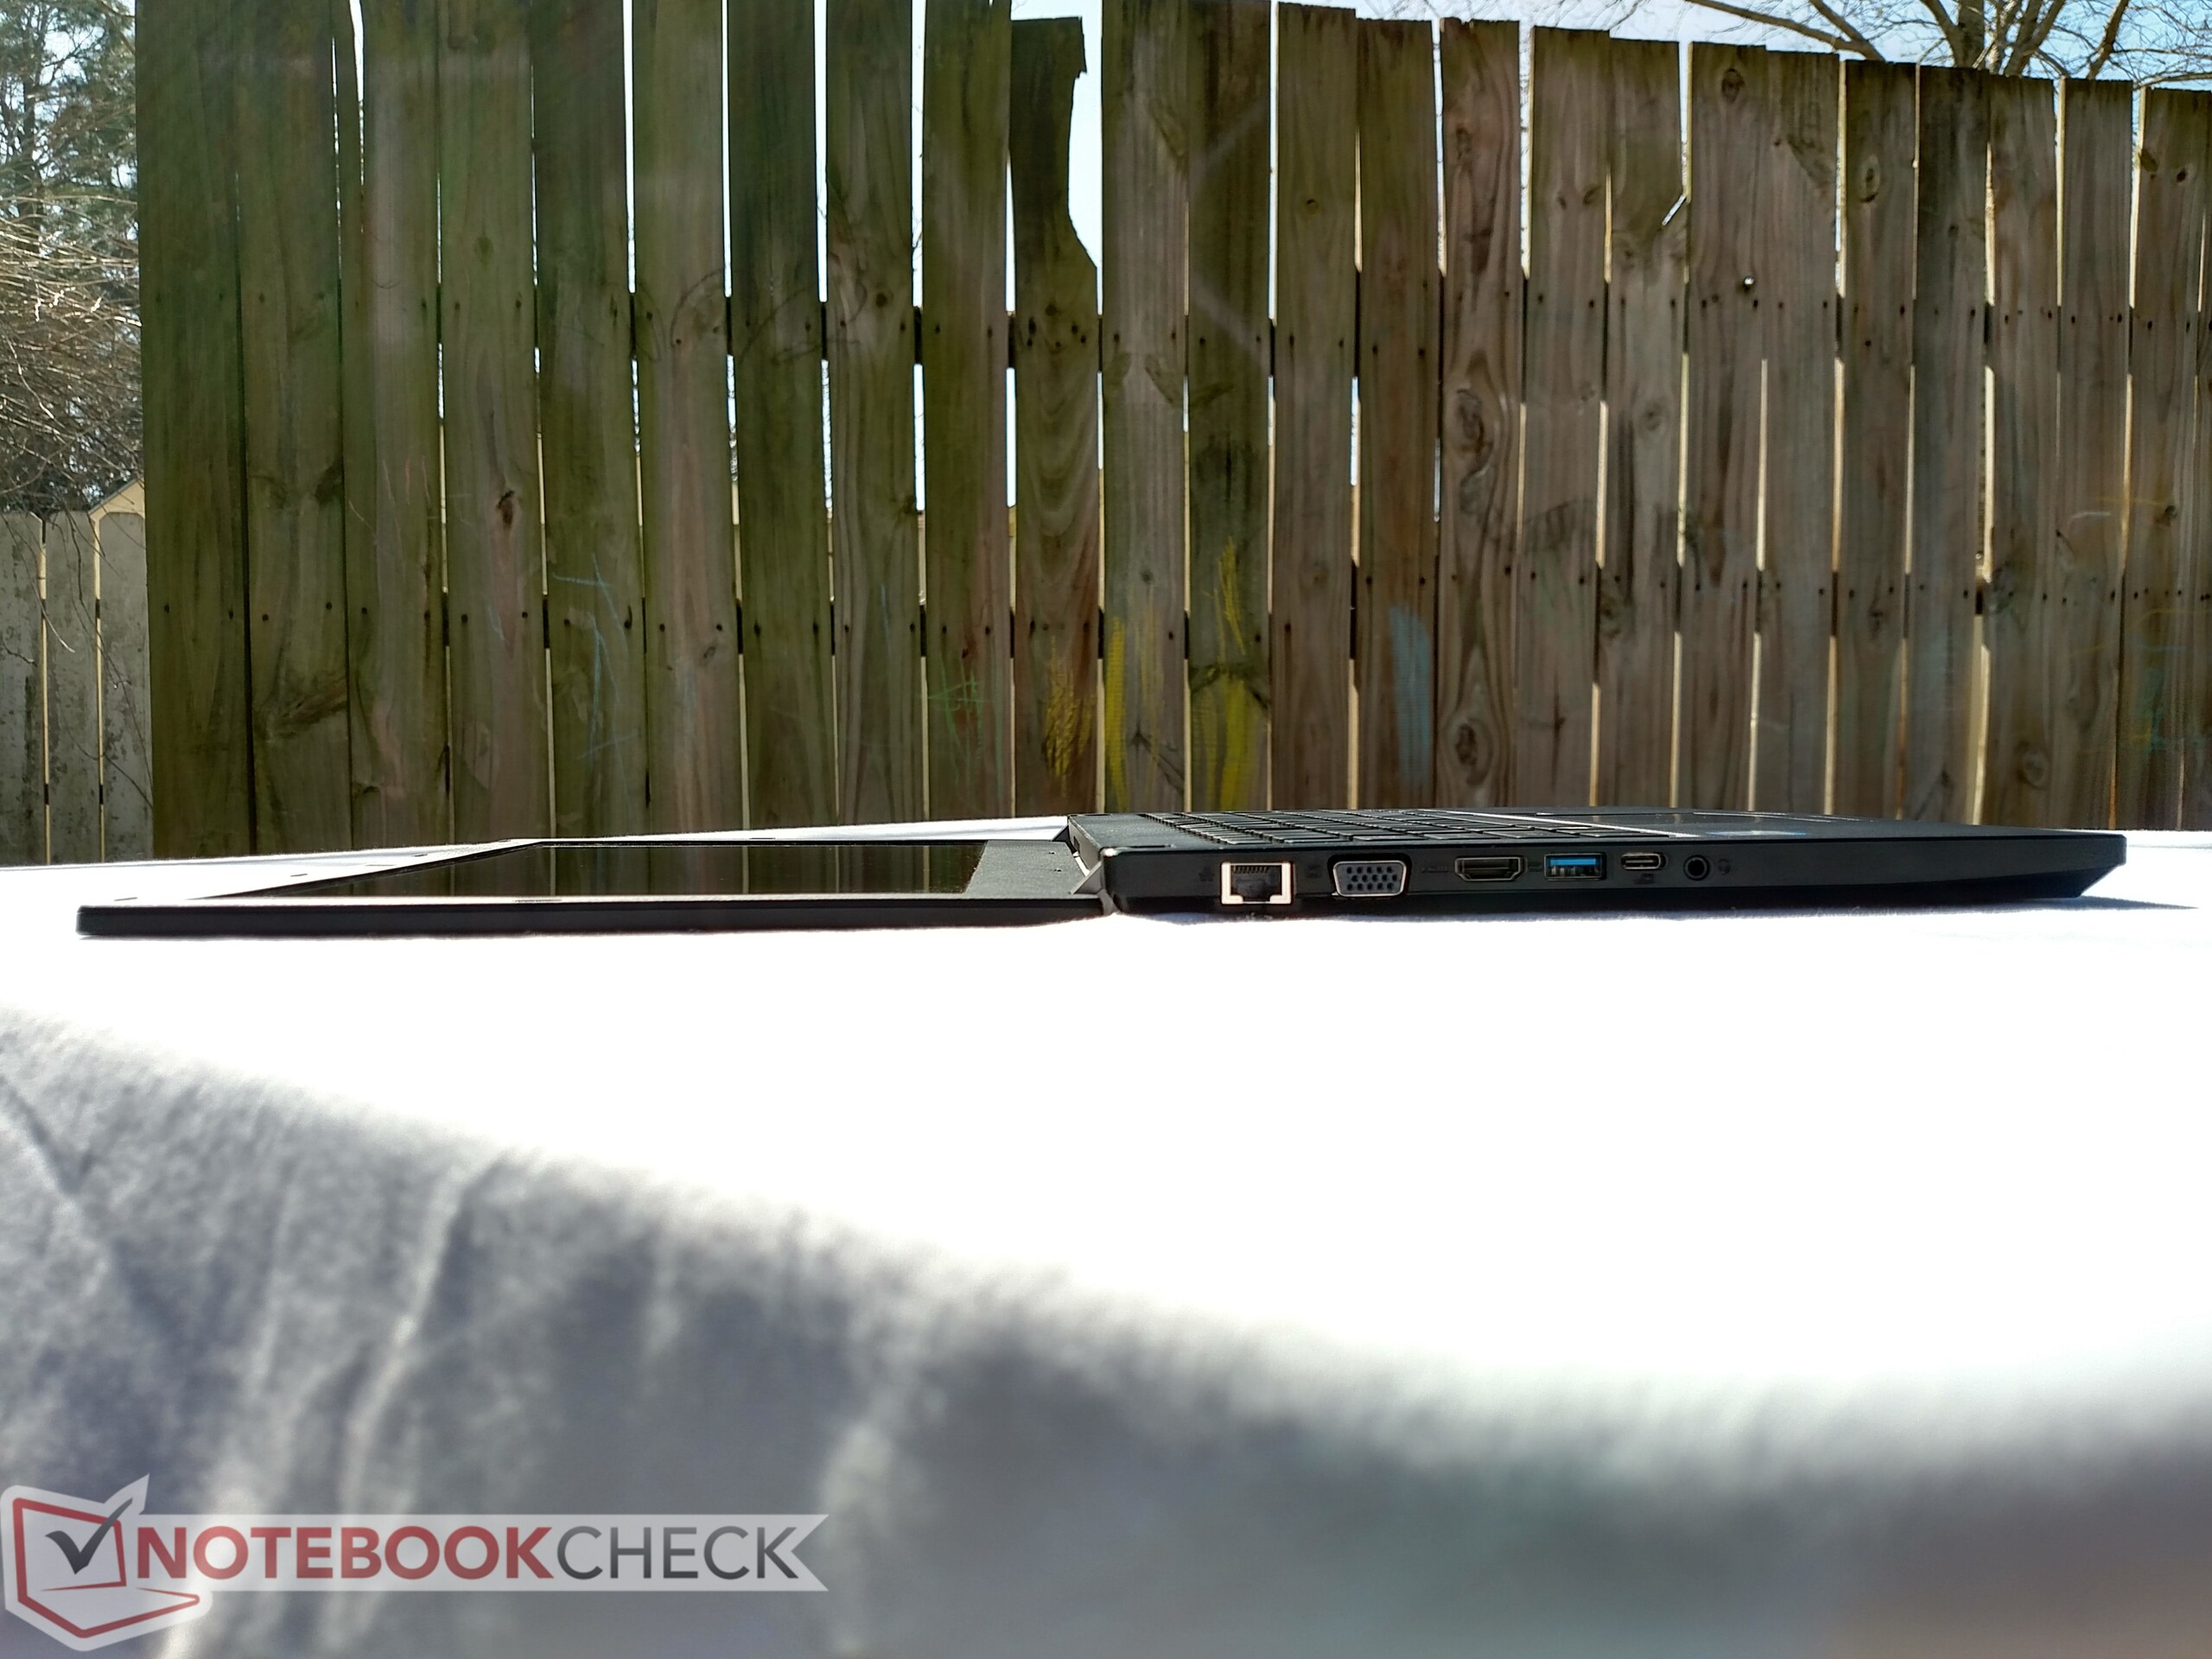
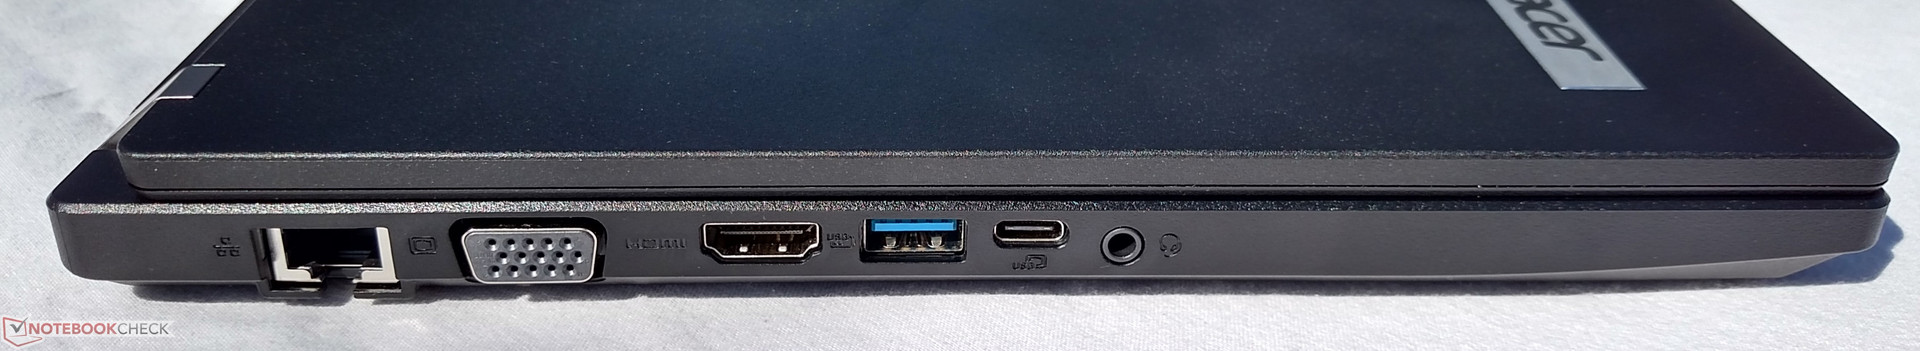
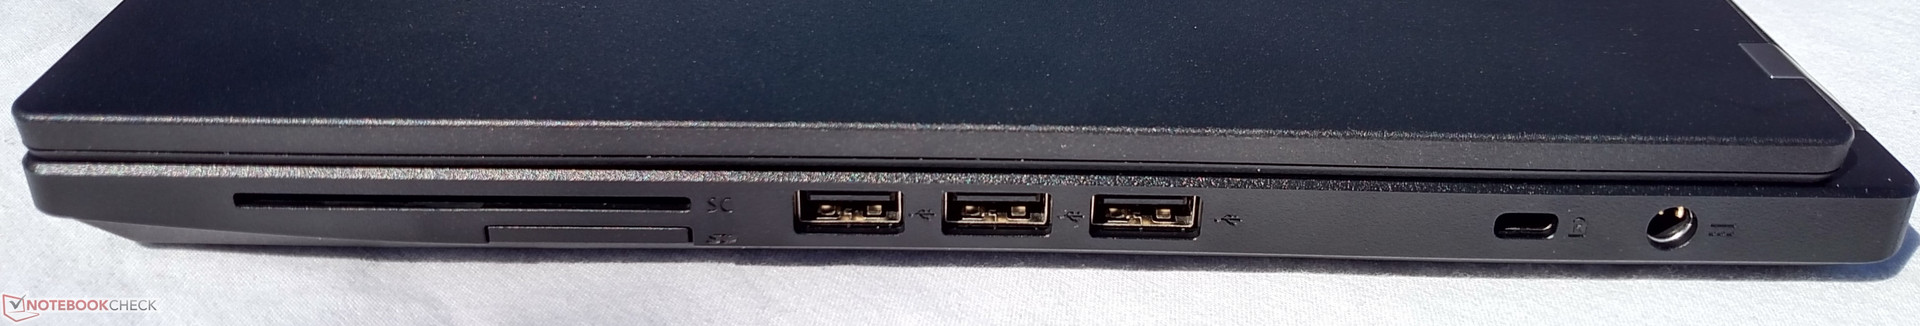
Al Acer TravelMate P449 le va bien lo de "aprendiz de mucho, maestro de nada". Es un dispositivo bien rematado que trae mucho a la mesa. Da en el clavo con el tamaño; el chasis es bastante pequeño y ligero para llevarlo fácilmente, pero la pantalla sigue siendo bastante grande para la multitarea y el trabajo ofimático. La carcasa parece atractiva y profesional, el teclado es genial, y el rendimiento más que adecuado para el trabajo business. El display ofrece alto contraste y colores geniales. El ventialdor se nota sólo bajo cargas extremas, pero las temperaturas están bien manejadas y el dispositivo permanece fresco incluso bajo carga compelta. La selección de puertos es generosa con cinco puertos 5 USB, 2 opciones de display, y un puerto ethernet, y la batería puede aguantar toda una jornada de trabajo.
El Acer TravelMate P449 es una buena opción para profesionales que necesitan una máquina portable con gran aguante. A pesar de unos pocos defectos, es una opción genial para los guerreros de la carretera limitados por el presupuesto.
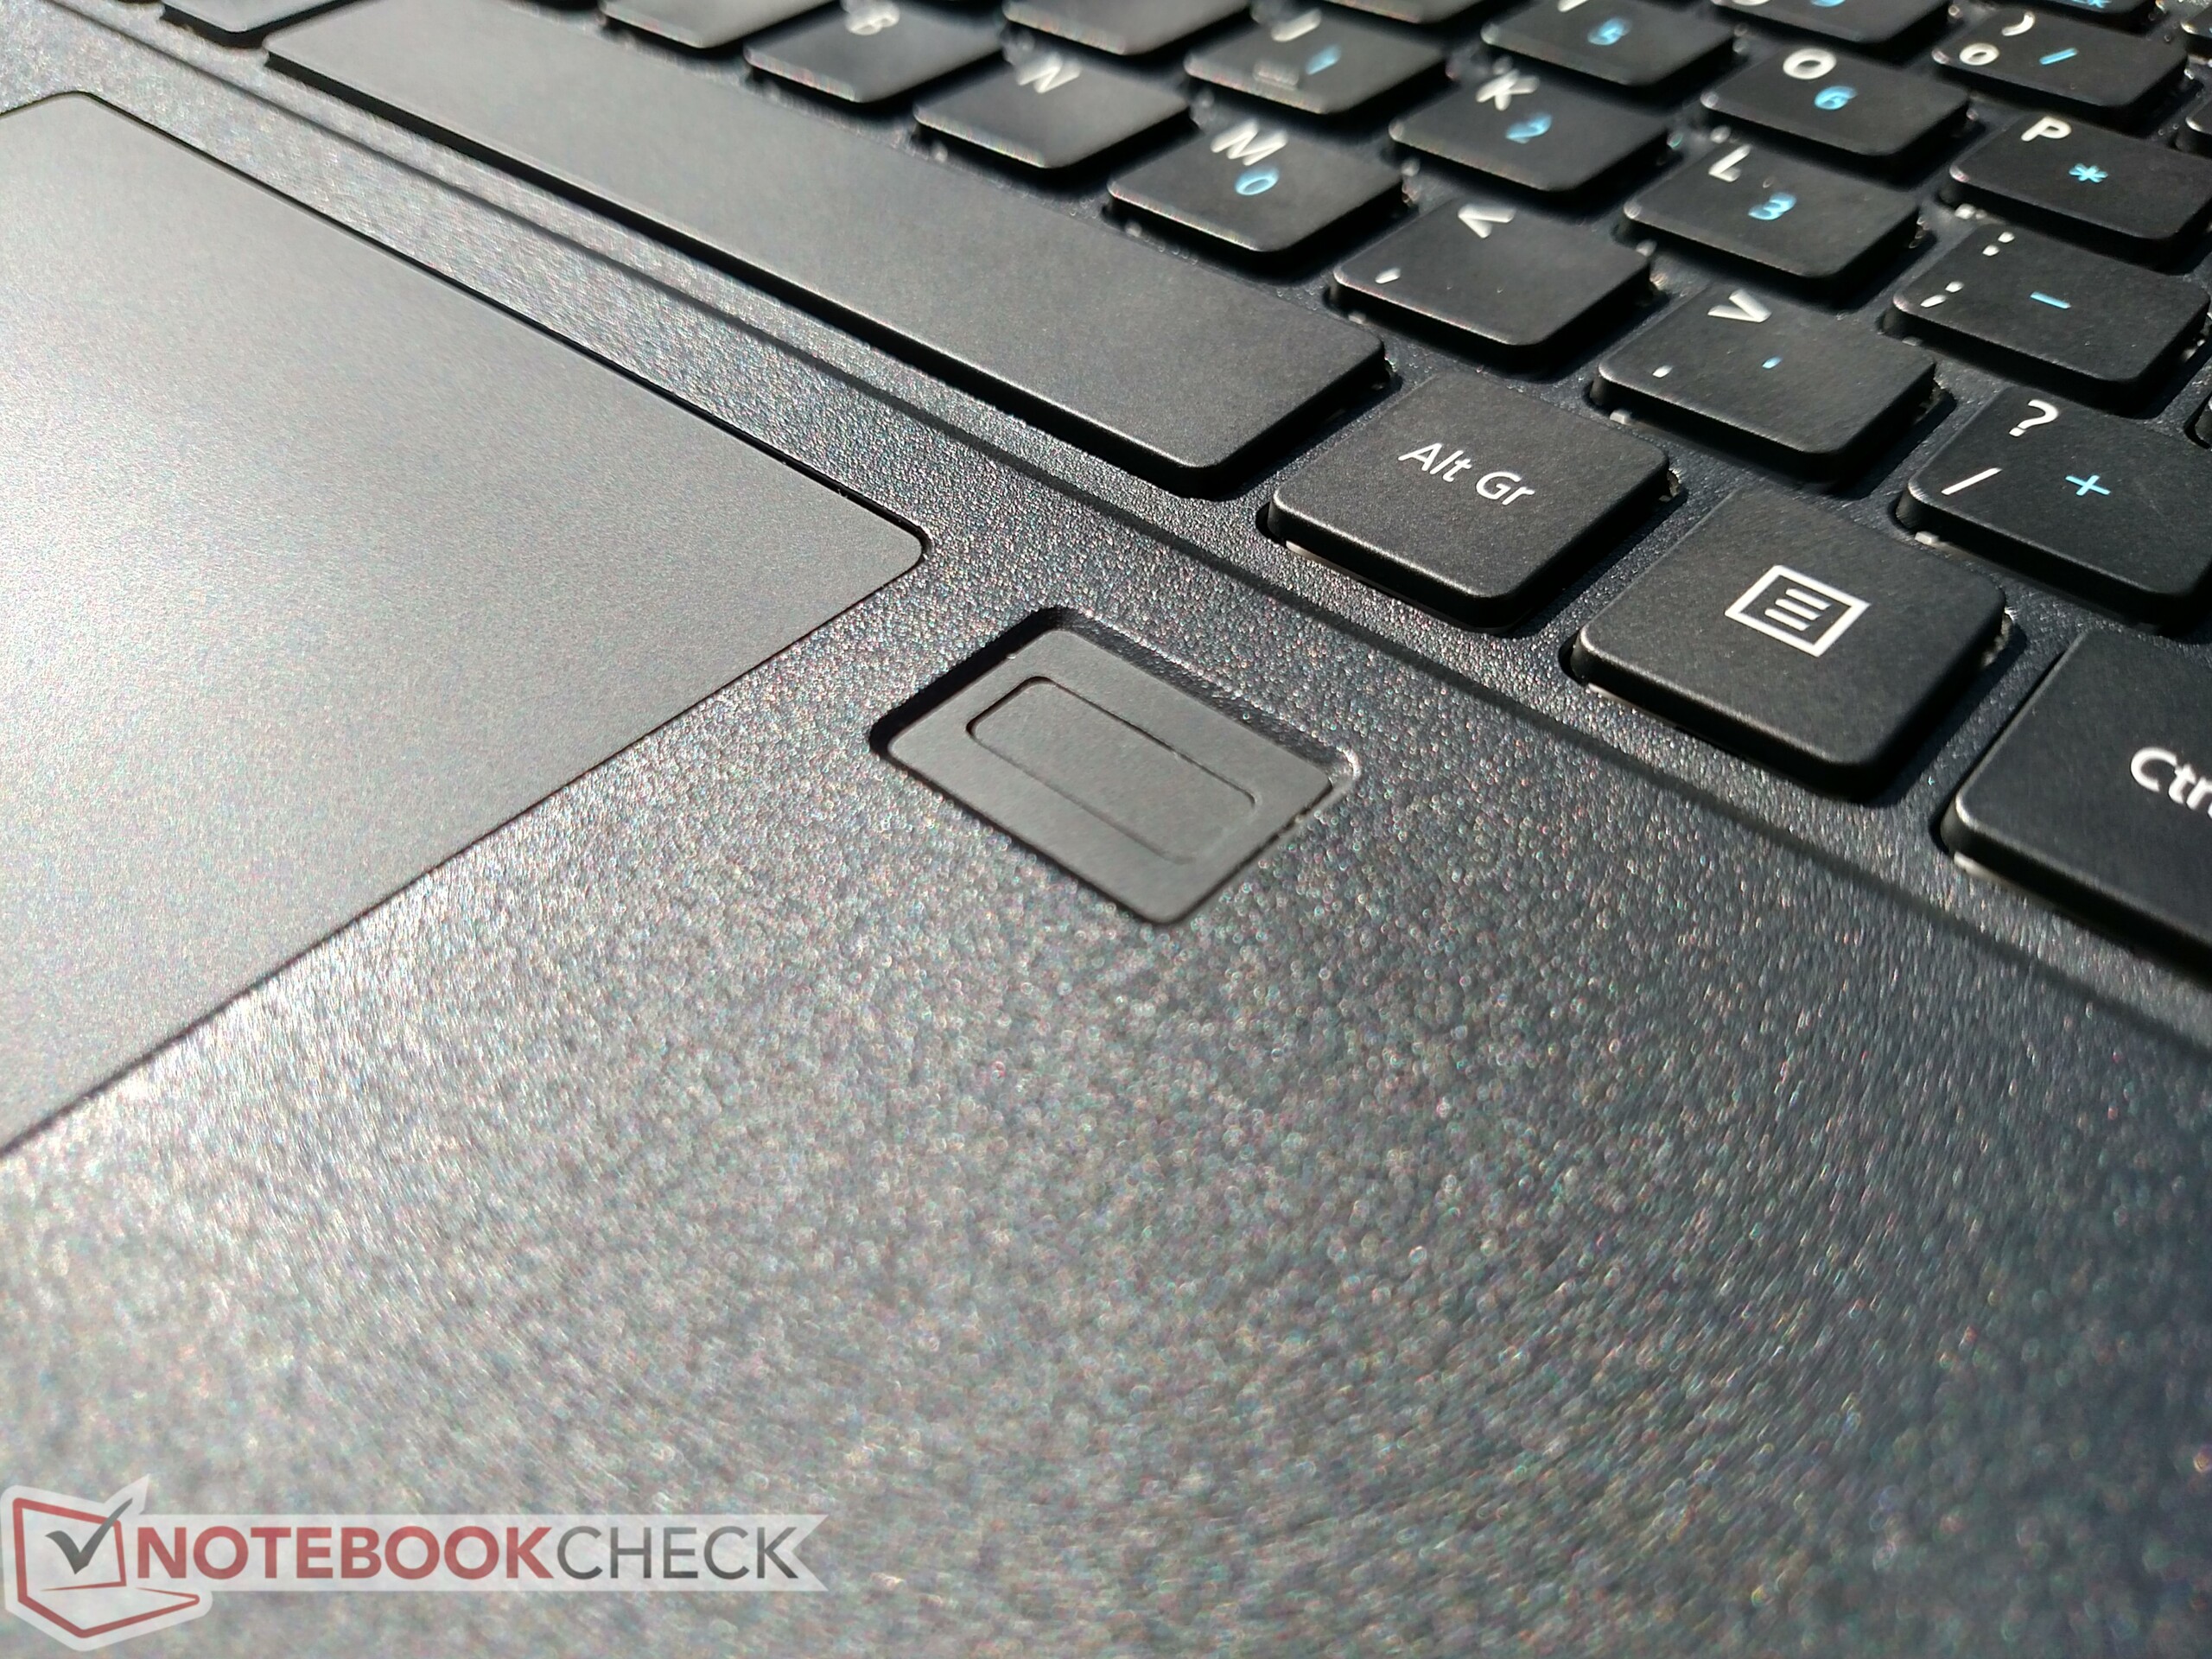
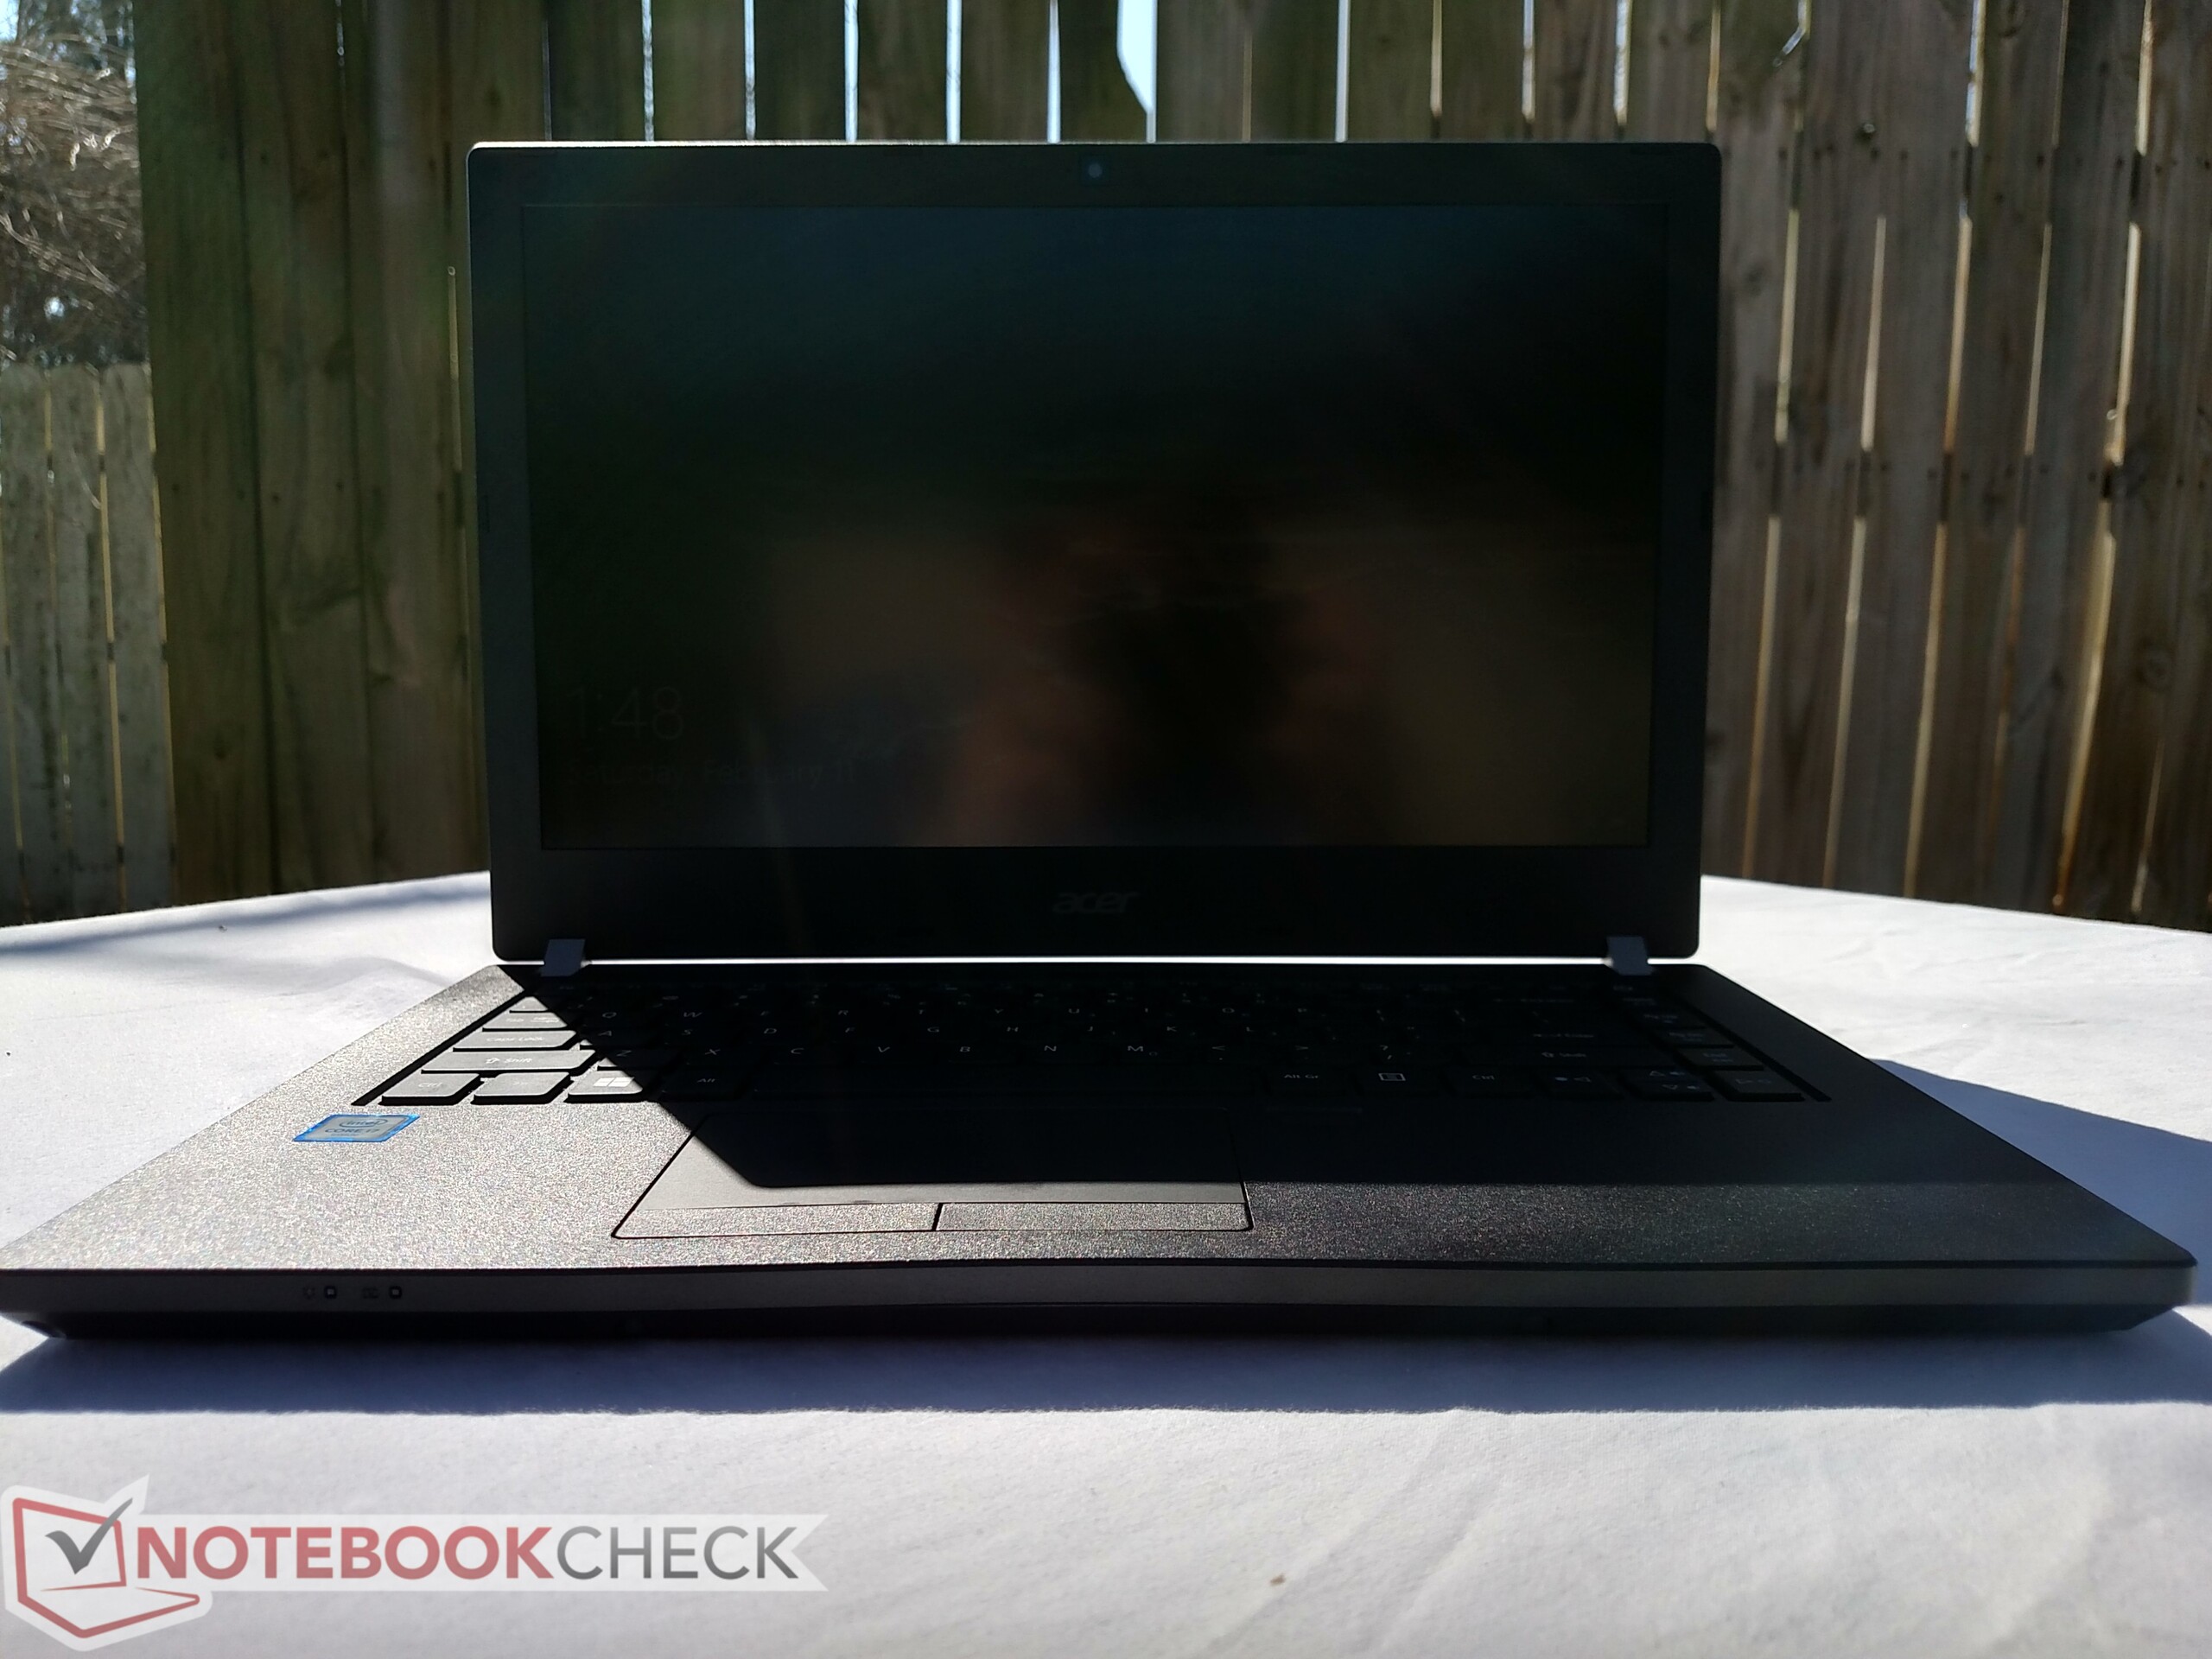
El TravelMate hace ciertos sacrificios para alcanzar el precio competitivo. La hermosa carcasa es delgada y parece barata, por lo que la durabilidad a largo tiempo es una preocupación. El touchpad es inconsistente y frustrante de usar, y el lector de huellas es casi inútil. La pantalla es ténue y casi inútil con luz brillante. La mayoría de las opciones de conexión son lentas o están desfasadas, y la CPU Skylake está desfasada y se ralentiza mucho.
A pesar de estos defectos, el Acer TravelMate P449-M-7407 sigue siendo una opción atractiva en el mercado business de menos de $1000. Sin embargo, cuesta pasar por alto el precio del Lenovo ThinkPad E470. Por unos $720, el E470 ofrece mejor rendimiento y calidad de construcción, aguante de batería similar, un buen display IPS, y una GPU dedicada. Por $130 más, el ThinkPad puede equiparse con una Kaby Lake i7-7500U y 16 GB de RAM. Ten en cuenta que estos modelos no traen SO y pueden estar disponibles sólo en mercados educativos. El ThinkPad E470 es una recomendación sólida respecto al TravelMate. Sin embargo, si el E470 no está disponible, el P449 es una segunda opción genial.
Ésta es una versión acortada del análisis original. Puedes leer el análisis completo en inglés aquí.
Acer TravelMate P449-M-7407
- 01/16/2024 v7 (old)
Sam Medley
Price comparison
