Review del Acer ConceptD 9 Pro: Estación de trabajo convertible para profesionales creativos

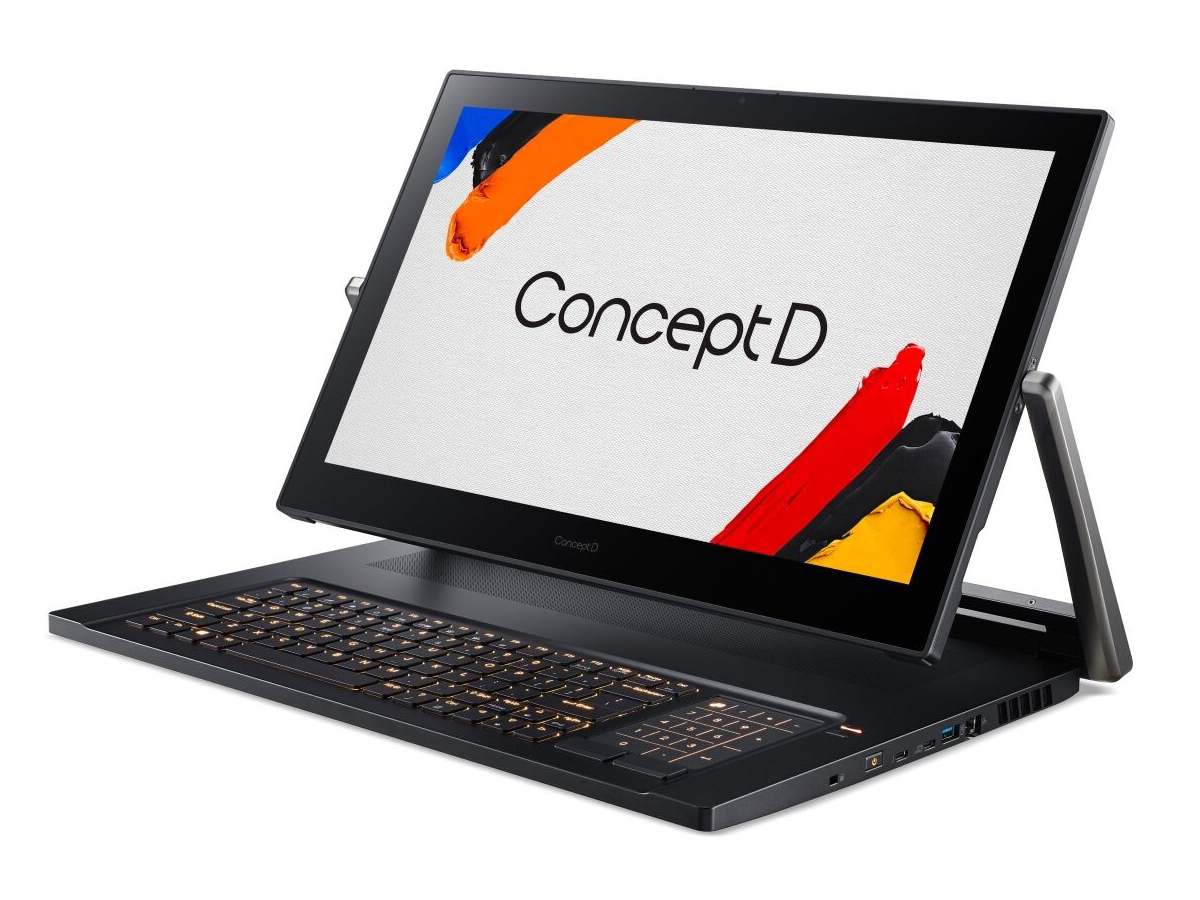
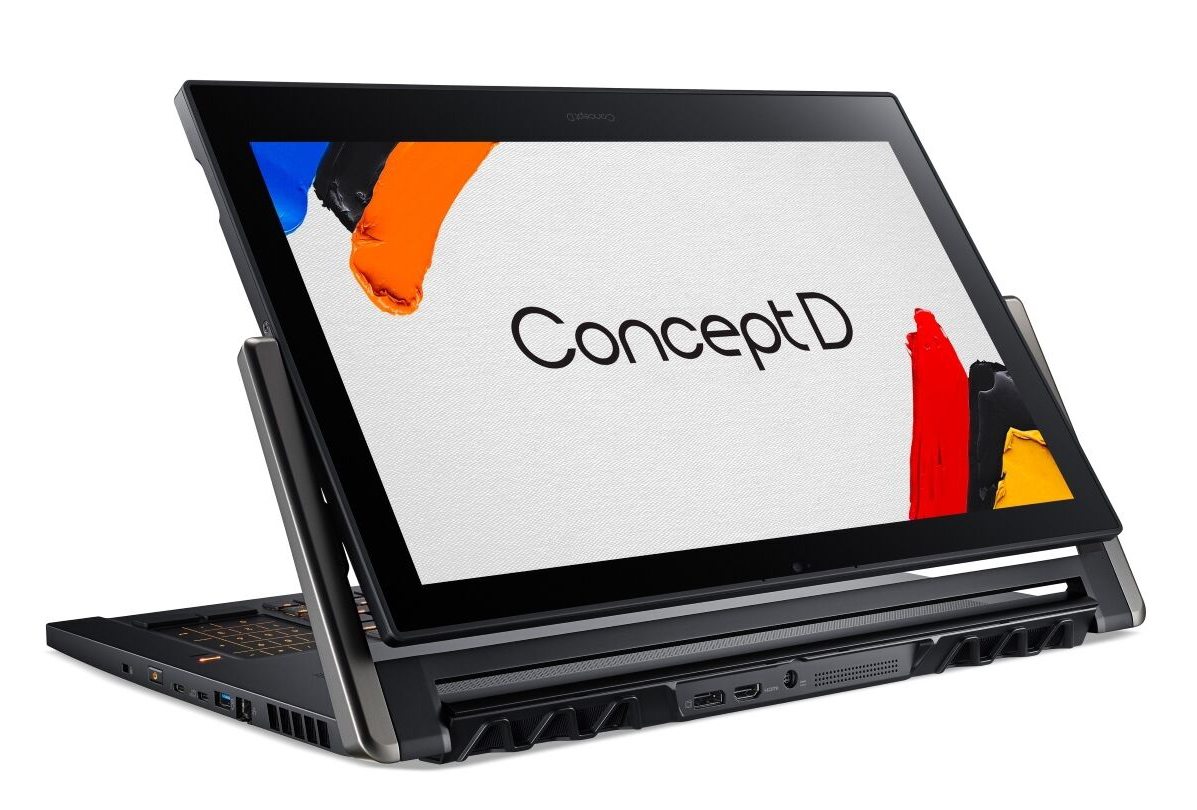
El Acer ConceptD 9 Pro no es una estación de trabajo normal de 17,3 pulgadas. La pantalla giratoria también puede ser utilizada como una tableta gráfica. Se pueden crear esbozos con la ayuda del lápiz digital Wacom (incluido). El dispositivo está alimentado por una CPU Core i9-9980HK y una GPU Quadro RTX 5000. No hay competidores directos en nuestra base de datos. Por lo tanto, usaremos estaciones de trabajo normales de 17,3 pulgadas para propósitos de comparación. Esto incluye dispositivos como el Lenovo ThinkPad P73, MSI WE75 9TK, Dell Precision 7730, Eurocom Tornado F7W y el Fujitsu Celsius H980.
Valoración | Fecha | Modelo | Peso | Altura | Tamaño | Resolución | Precio |
|---|---|---|---|---|---|---|---|
| 86.2 % v7 (old) | 04/2020 | Acer ConceptD 9 Pro i9-9980HK, Quadro RTX 5000 (Laptop) | 4.5 kg | 26.5 mm | 17.30" | 3840x2160 | |
| 86.6 % v7 (old) | 12/2019 | Lenovo ThinkPad P73-20QR002DGE i7-9850H, Quadro RTX 3000 (Laptop) | 3.5 kg | 31 mm | 17.30" | 1920x1080 | |
| 84.8 % v7 (old) | 11/2019 | MSI WE75 9TK i7-9750H, Quadro RTX 3000 (Laptop) | 2.6 kg | 27.5 mm | 17.30" | 1920x1080 | |
| 85.7 % v7 (old) | 05/2019 | Dell Precision 7730 i7-8850H, Quadro P3200 | 3.3 kg | 30 mm | 17.30" | 1920x1080 | |
| 86.3 % v6 (old) | 12/2018 | Eurocom Tornado F7W i9-9900K, Quadro P5200 | 4.2 kg | 51 mm | 17.30" | 3840x2160 | |
| 84.6 % v7 (old) | 02/2019 | Fujitsu Celsius H980 i7-8750H, Quadro P3200 | 3.5 kg | 30 mm | 17.30" | 1920x1080 |
Chasis - Estación de trabajo pesada
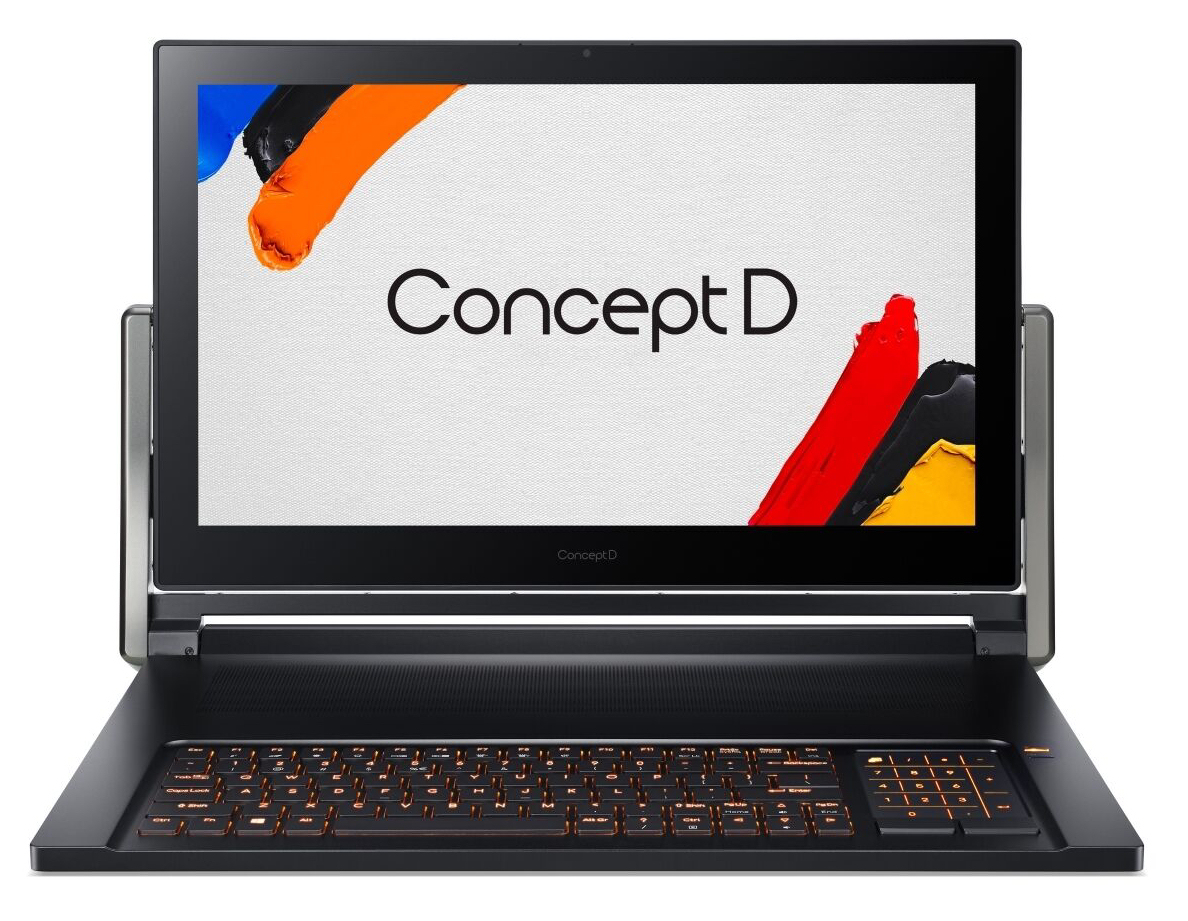
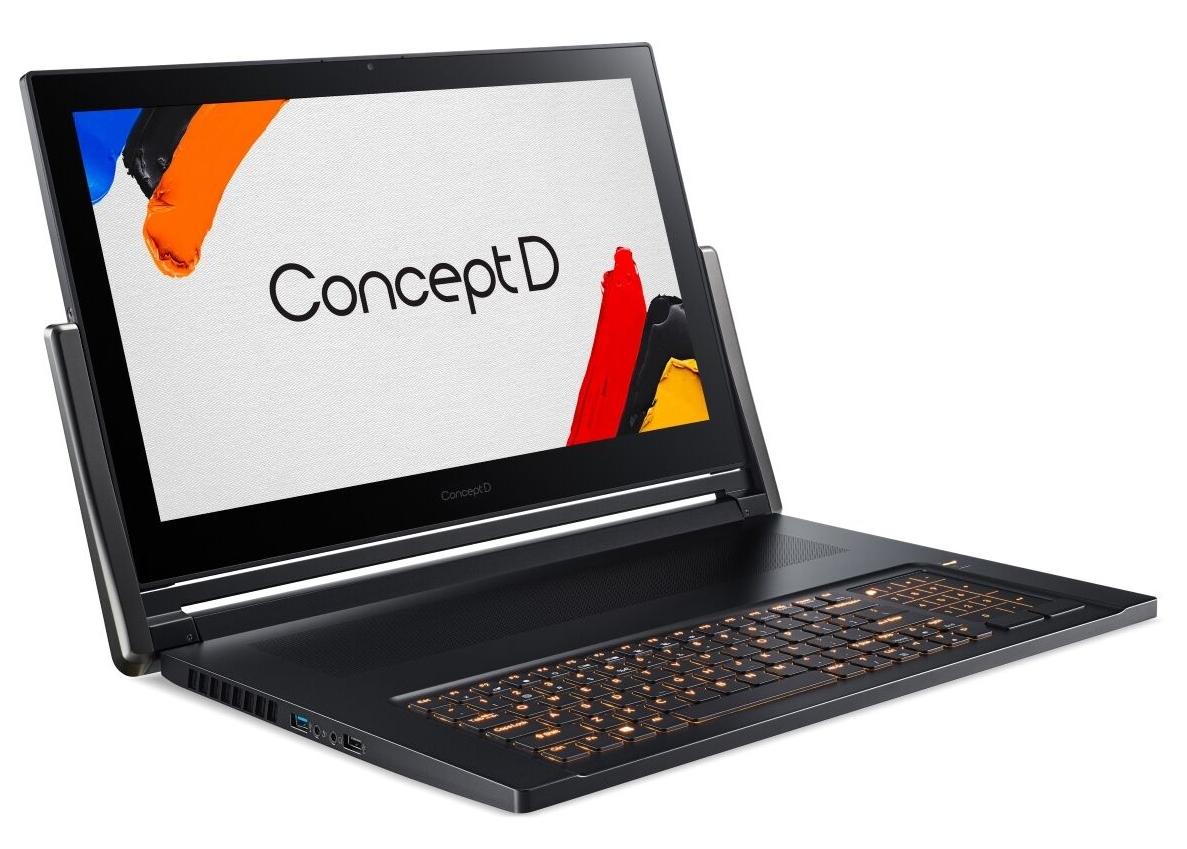
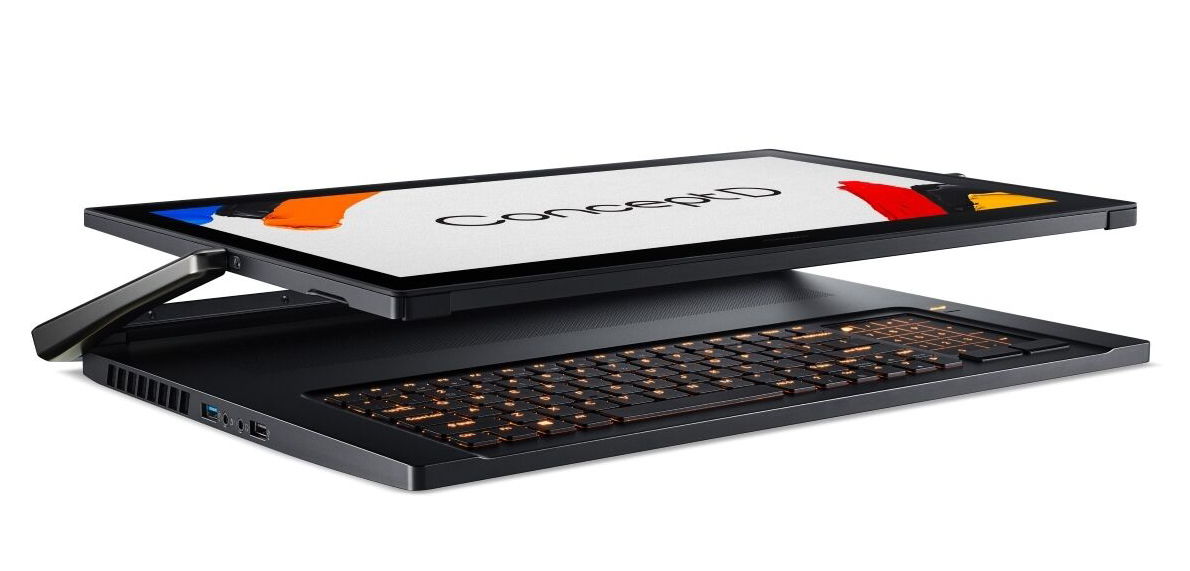
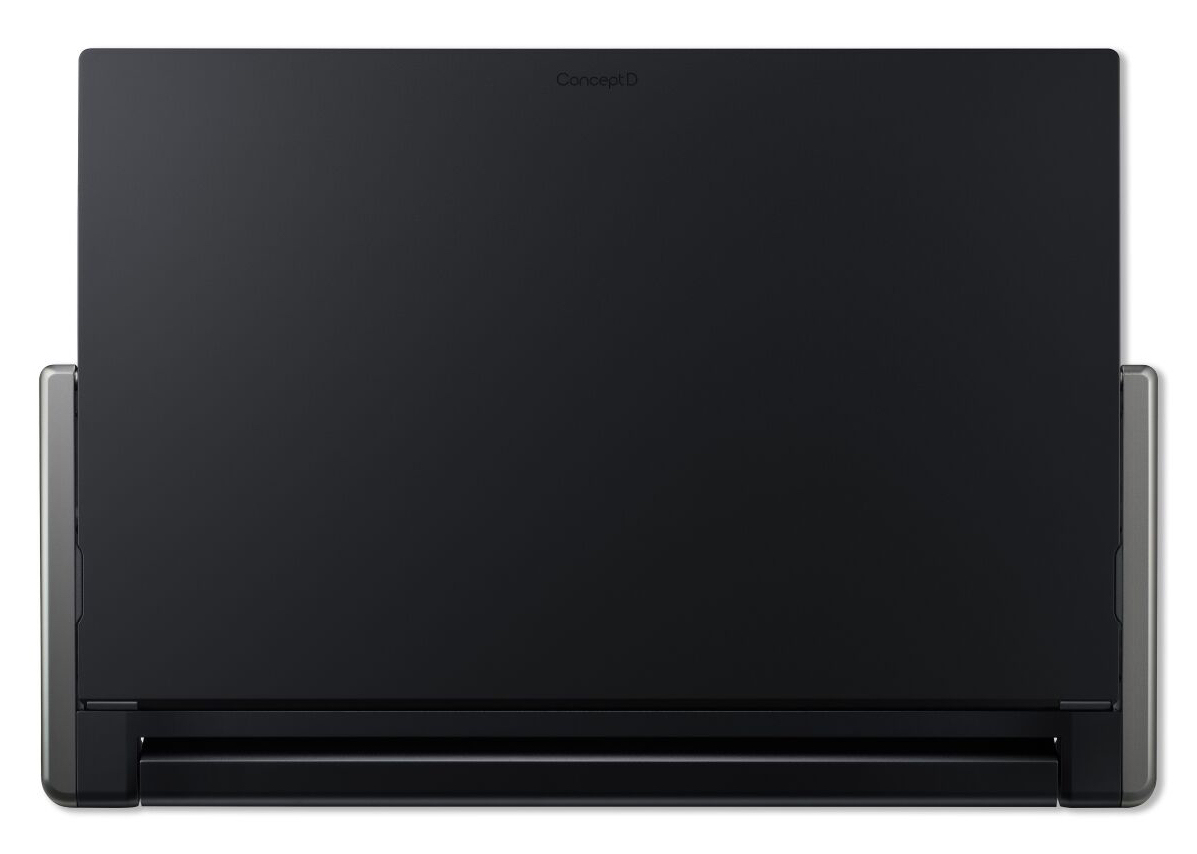
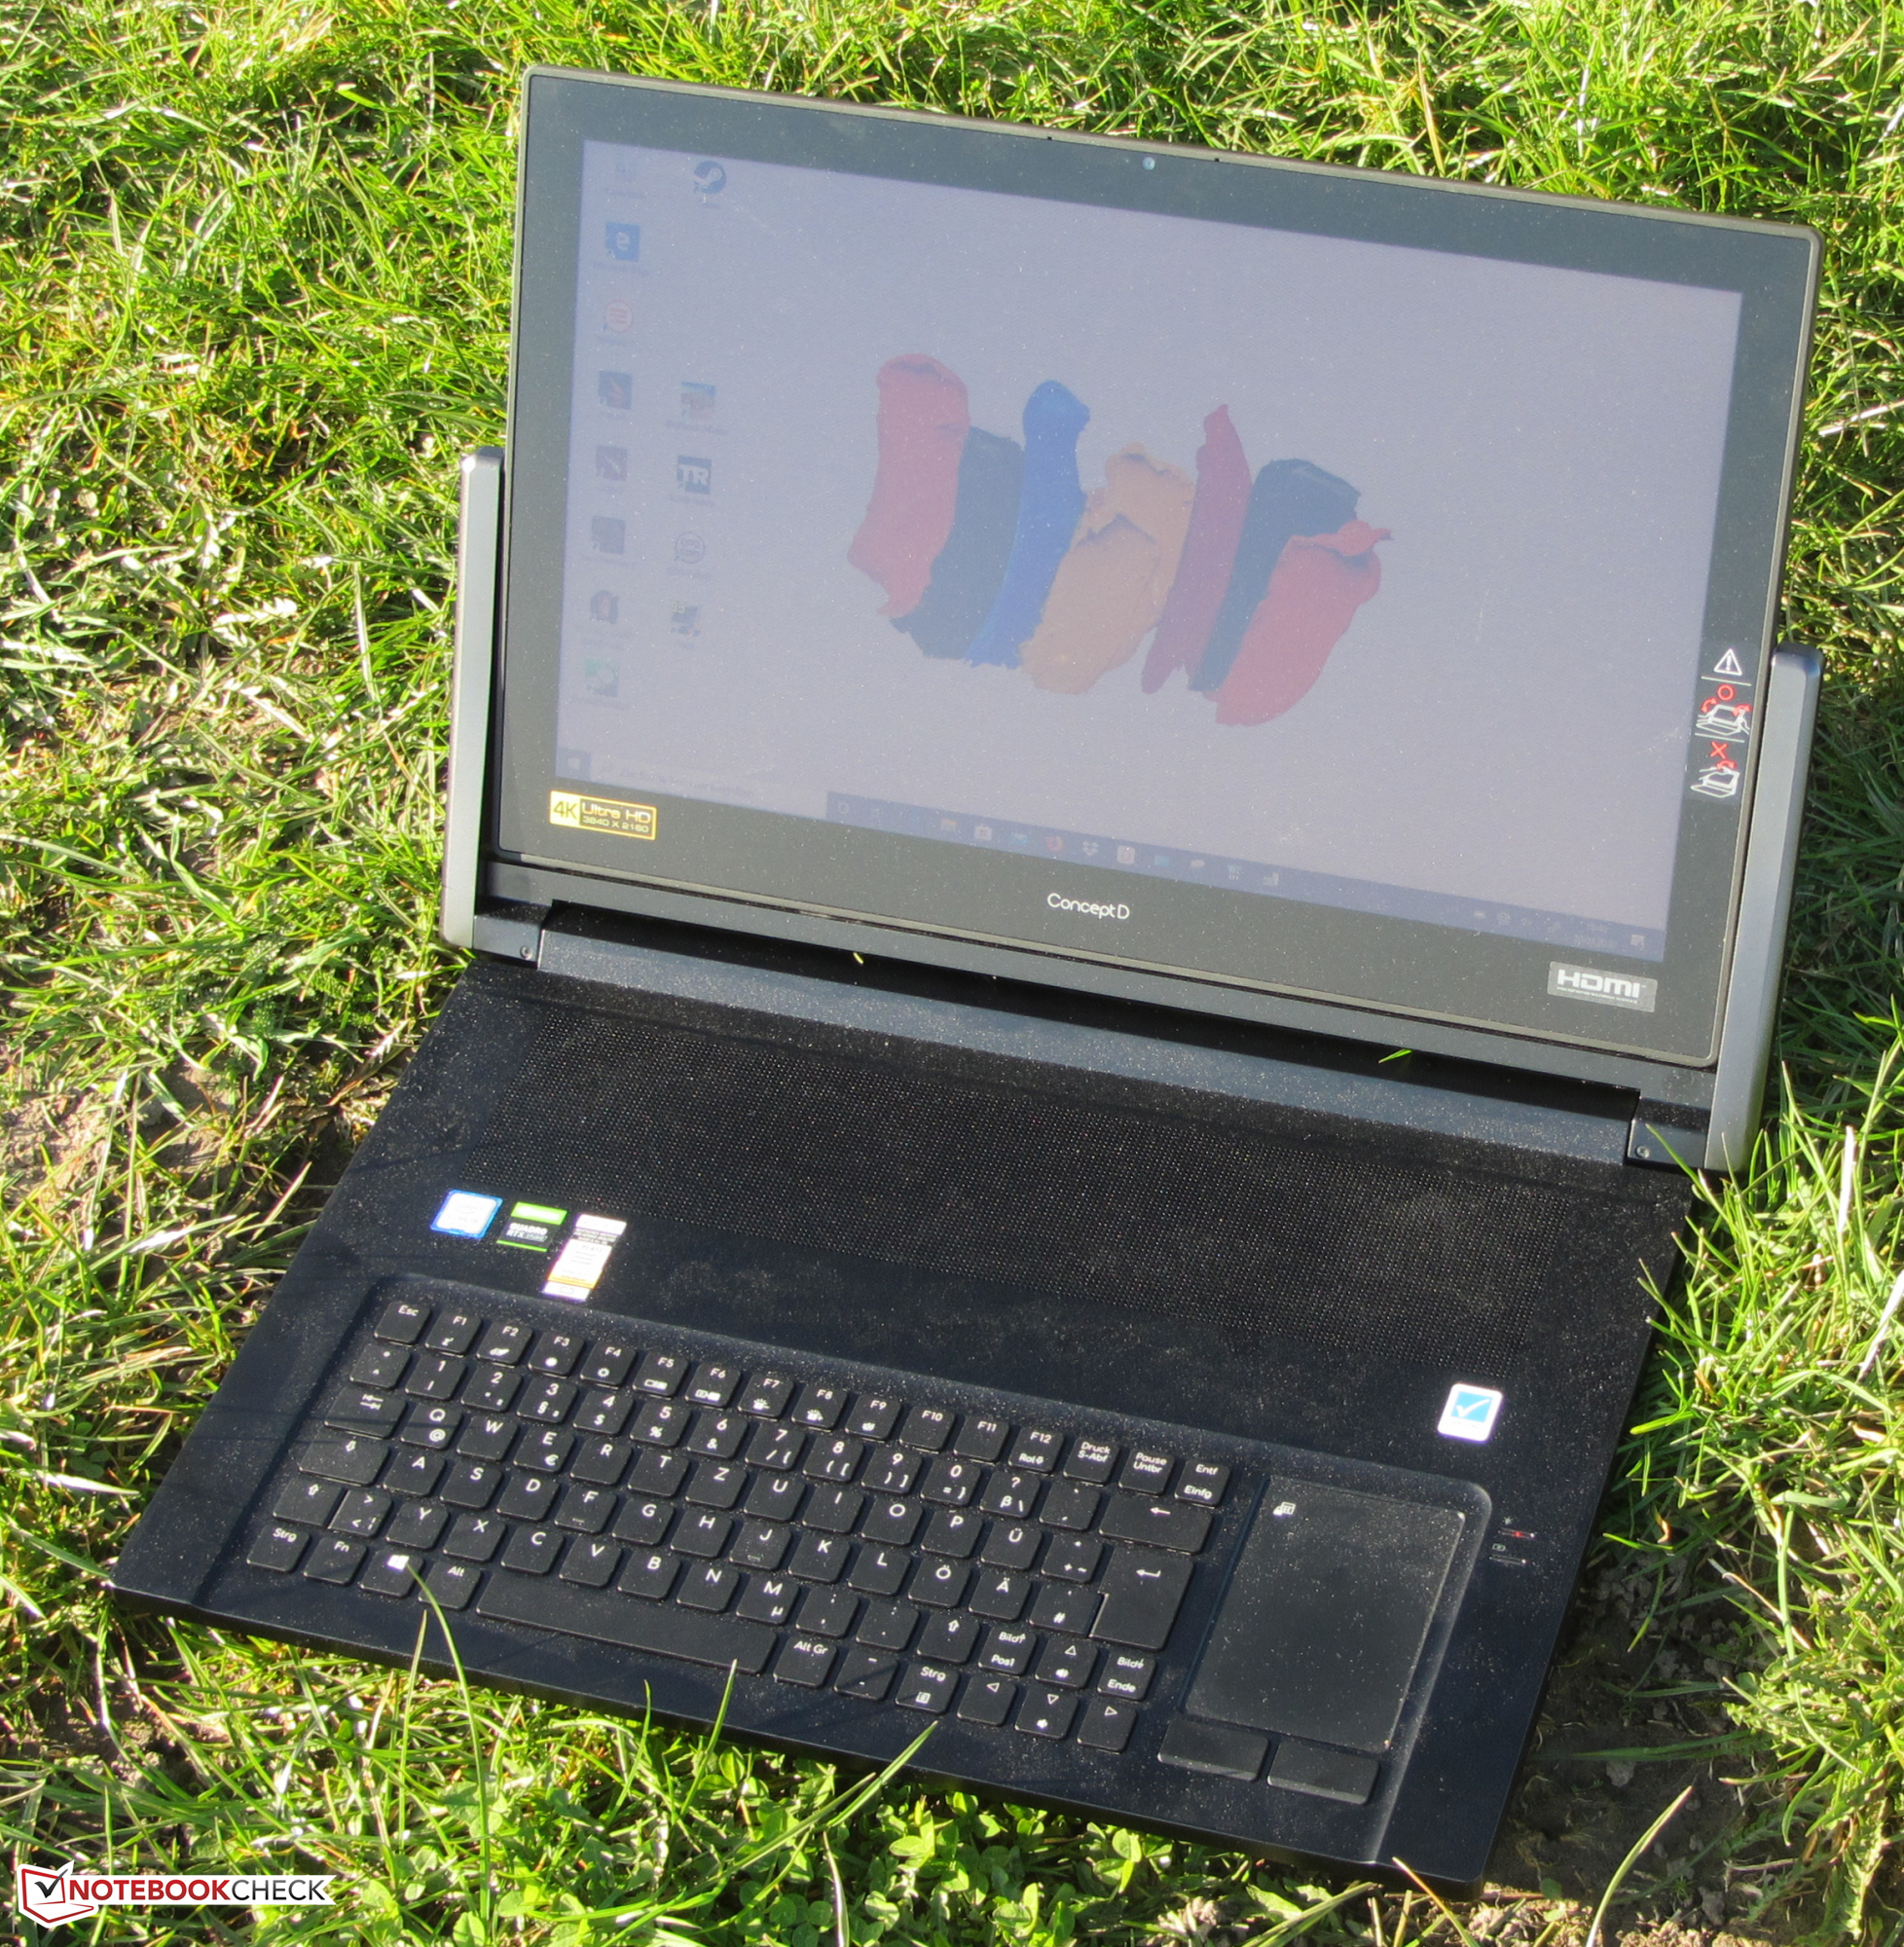
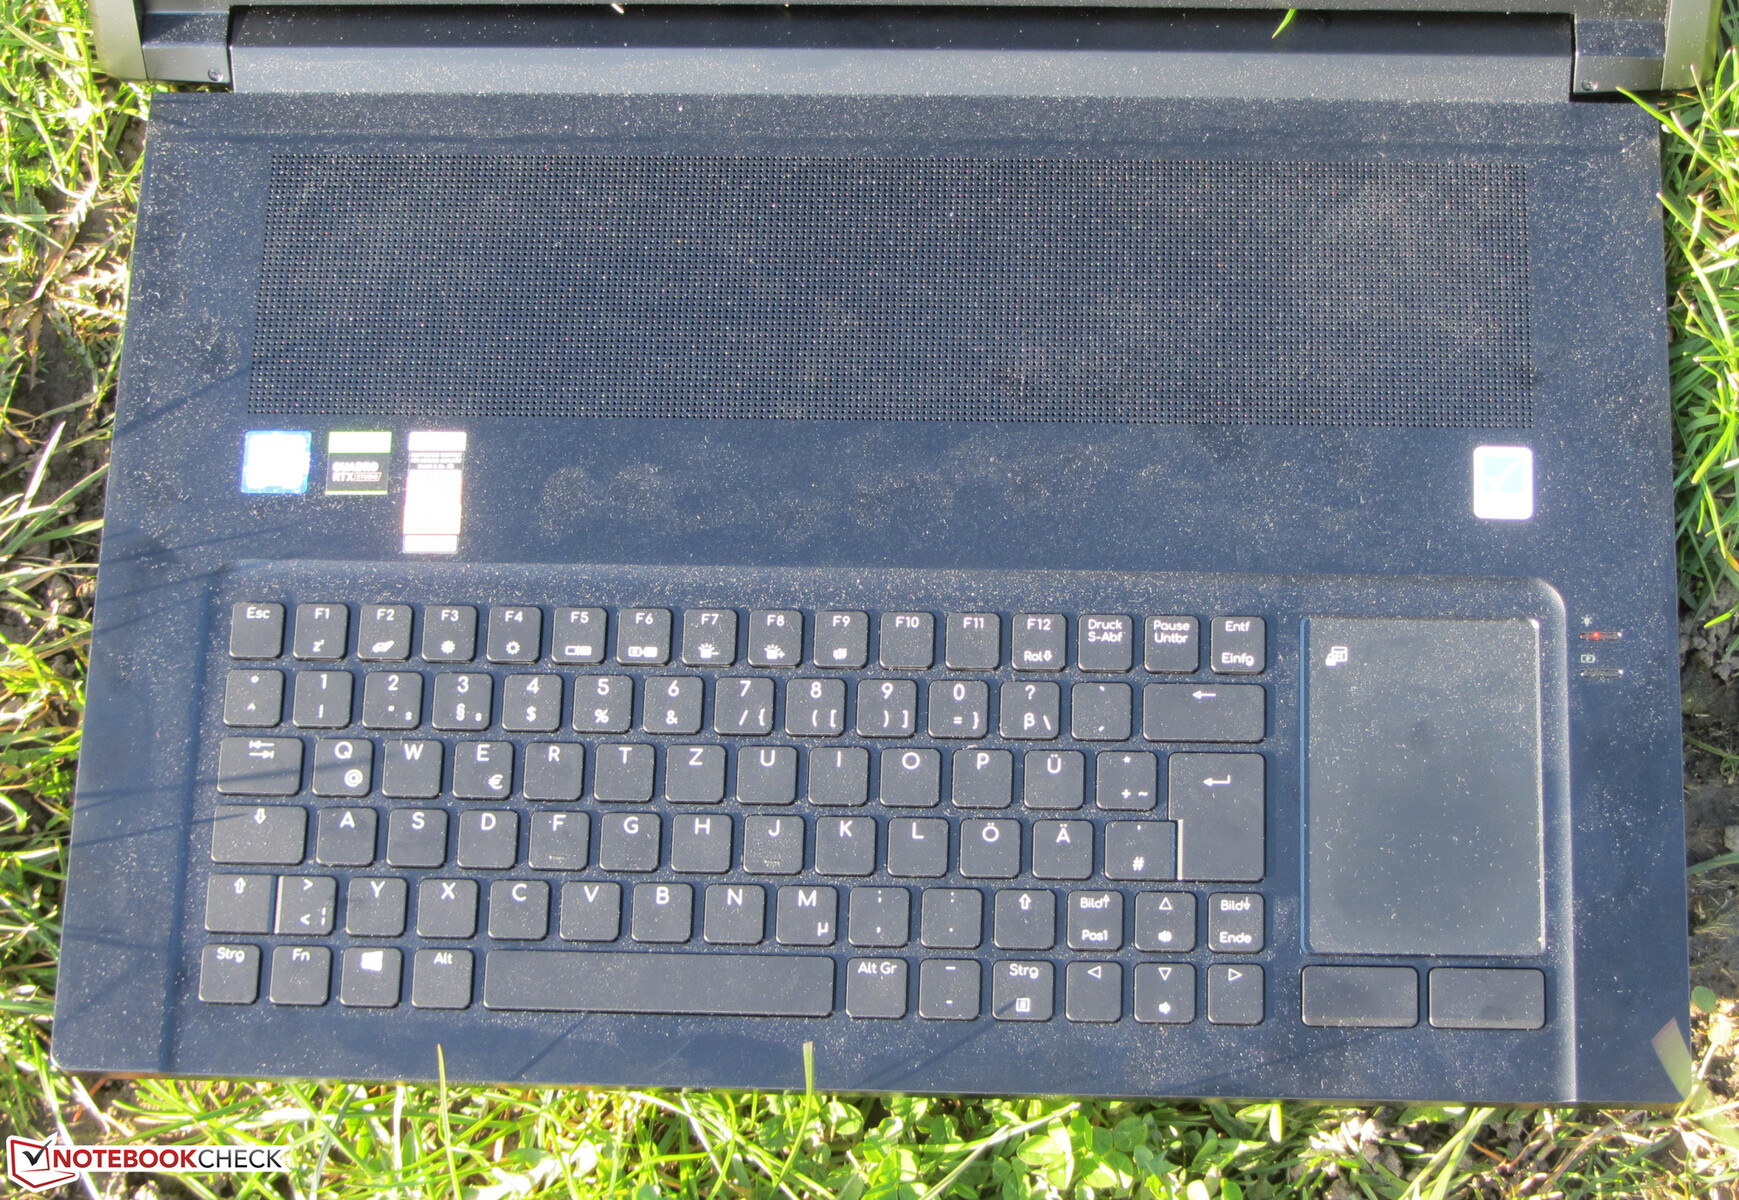
Acer se fue con un chasis de metal negro mate sin campanas ni silbidos para el ConceptD 9 Pro. El teclado se ha reubicado en la parte delantera de la unidad base, con el fin de hacer espacio para varias posiciones de la pantalla. El panel táctil está situado a la derecha del teclado. Sobre el teclado, hay una zona perforada que facilita el flujo de aire hacia el interior de la caja.
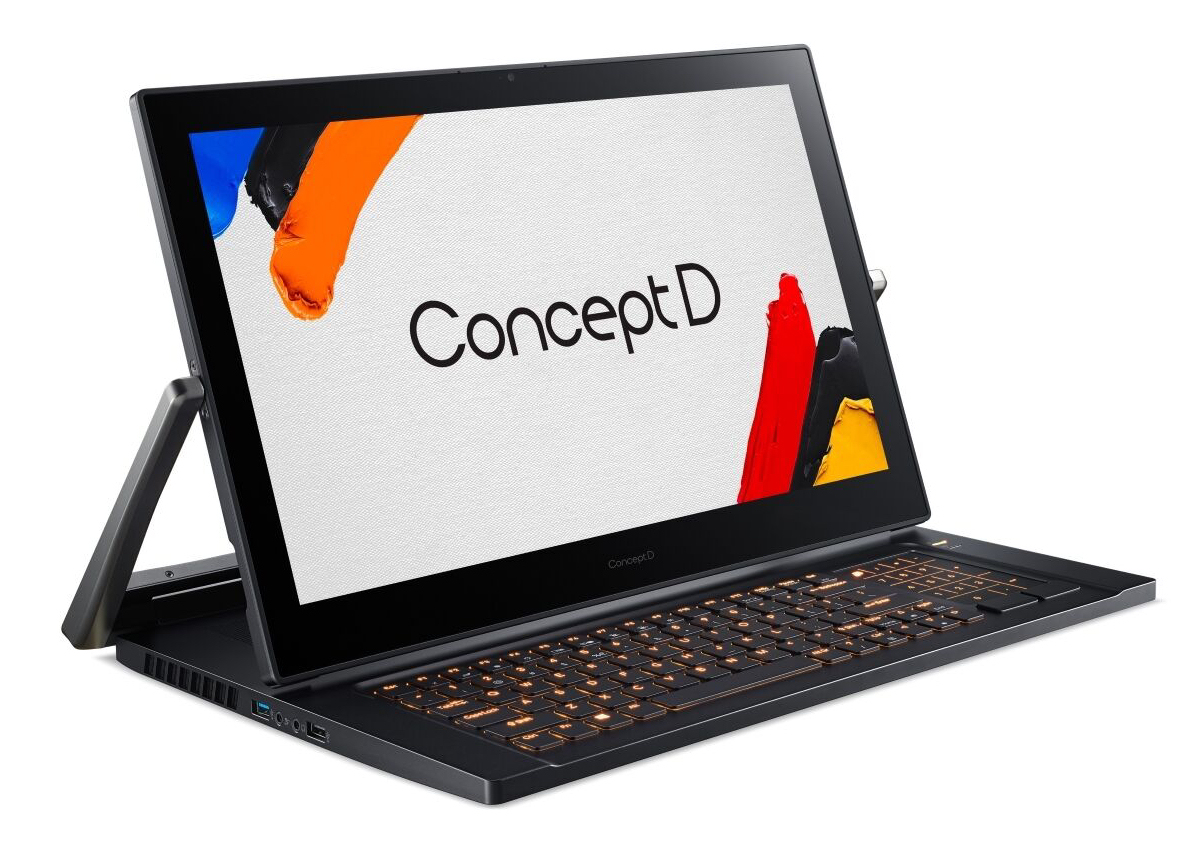
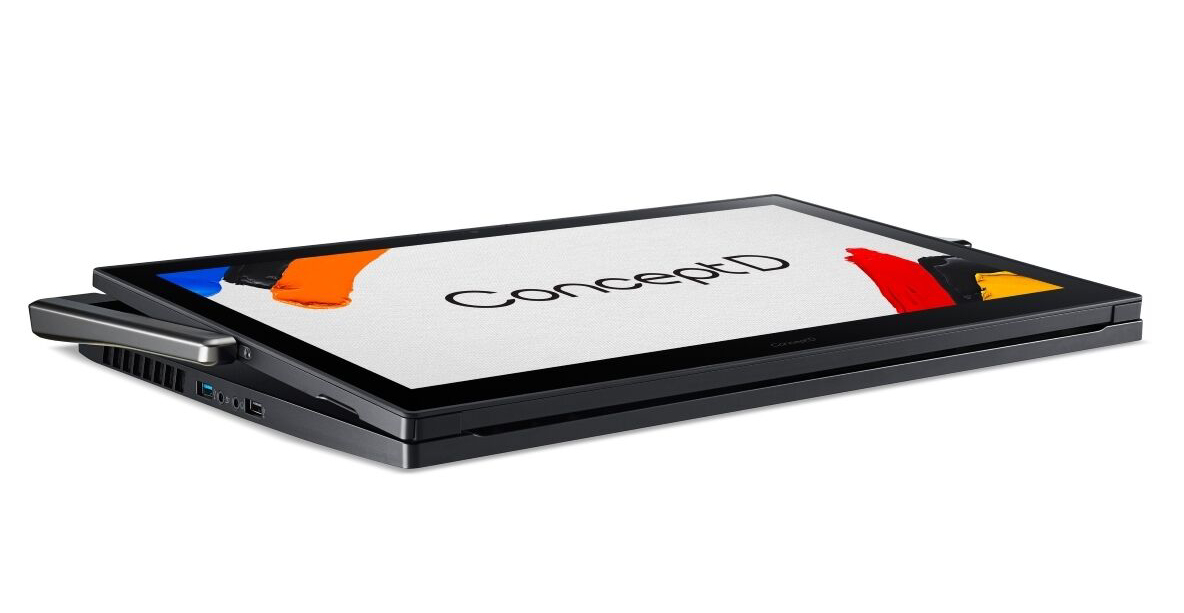
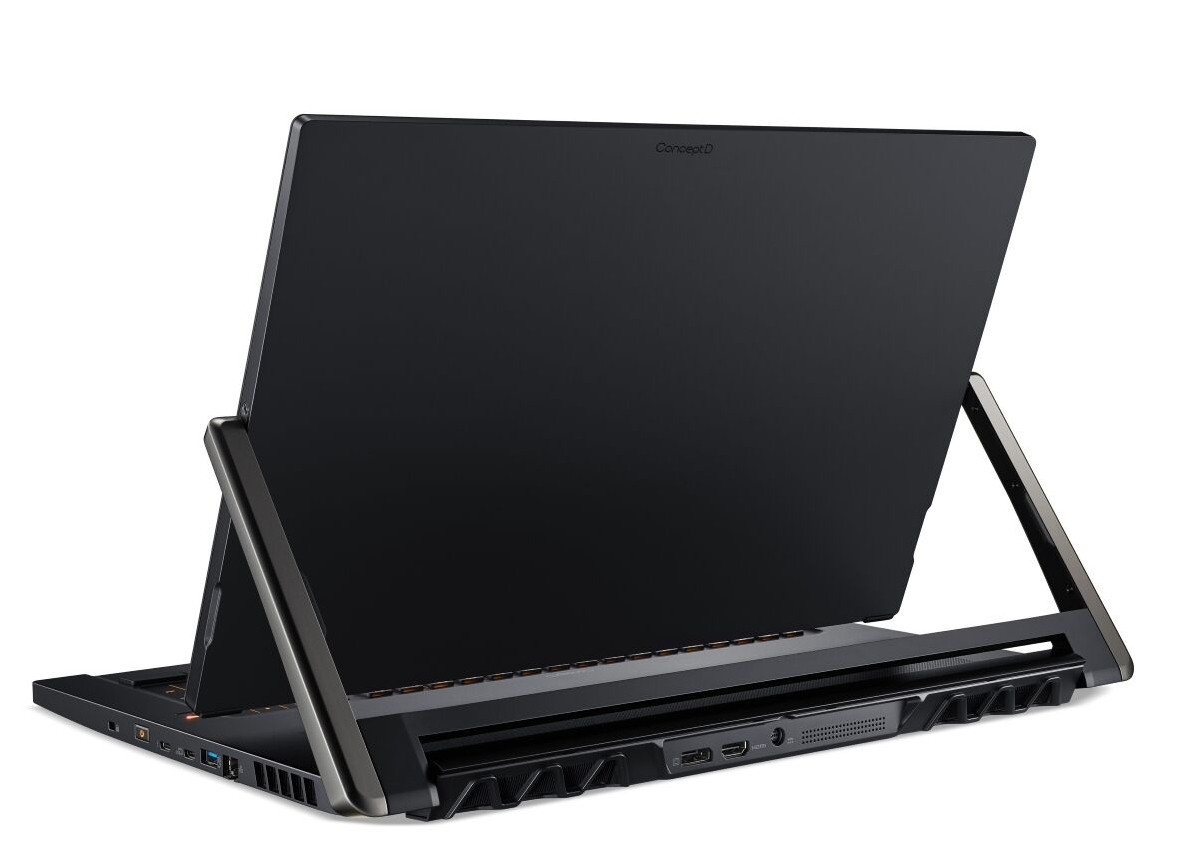
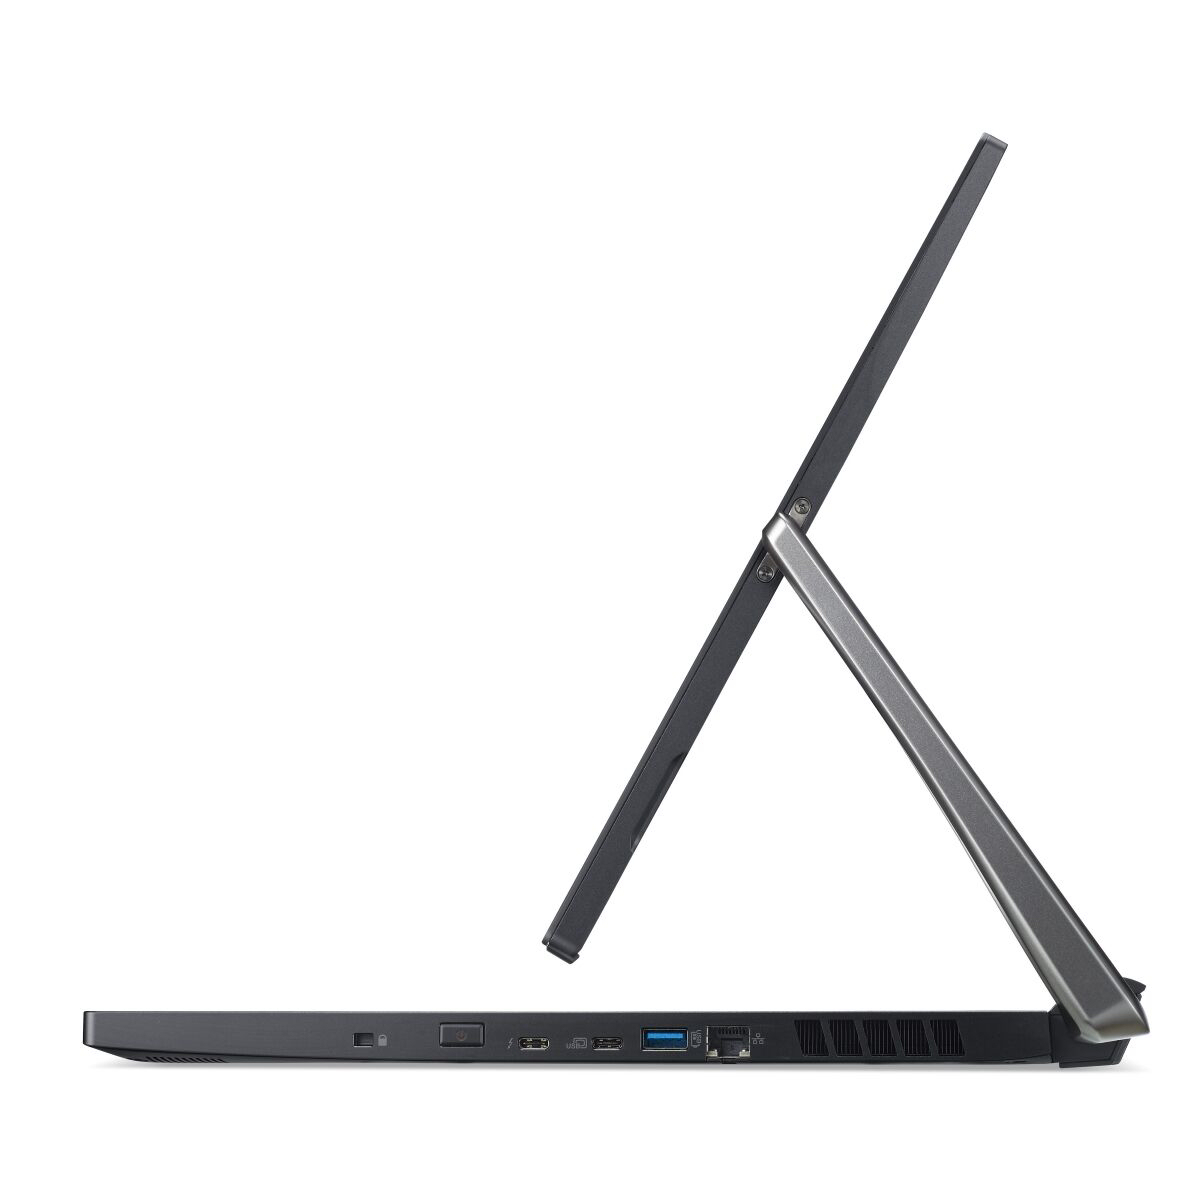
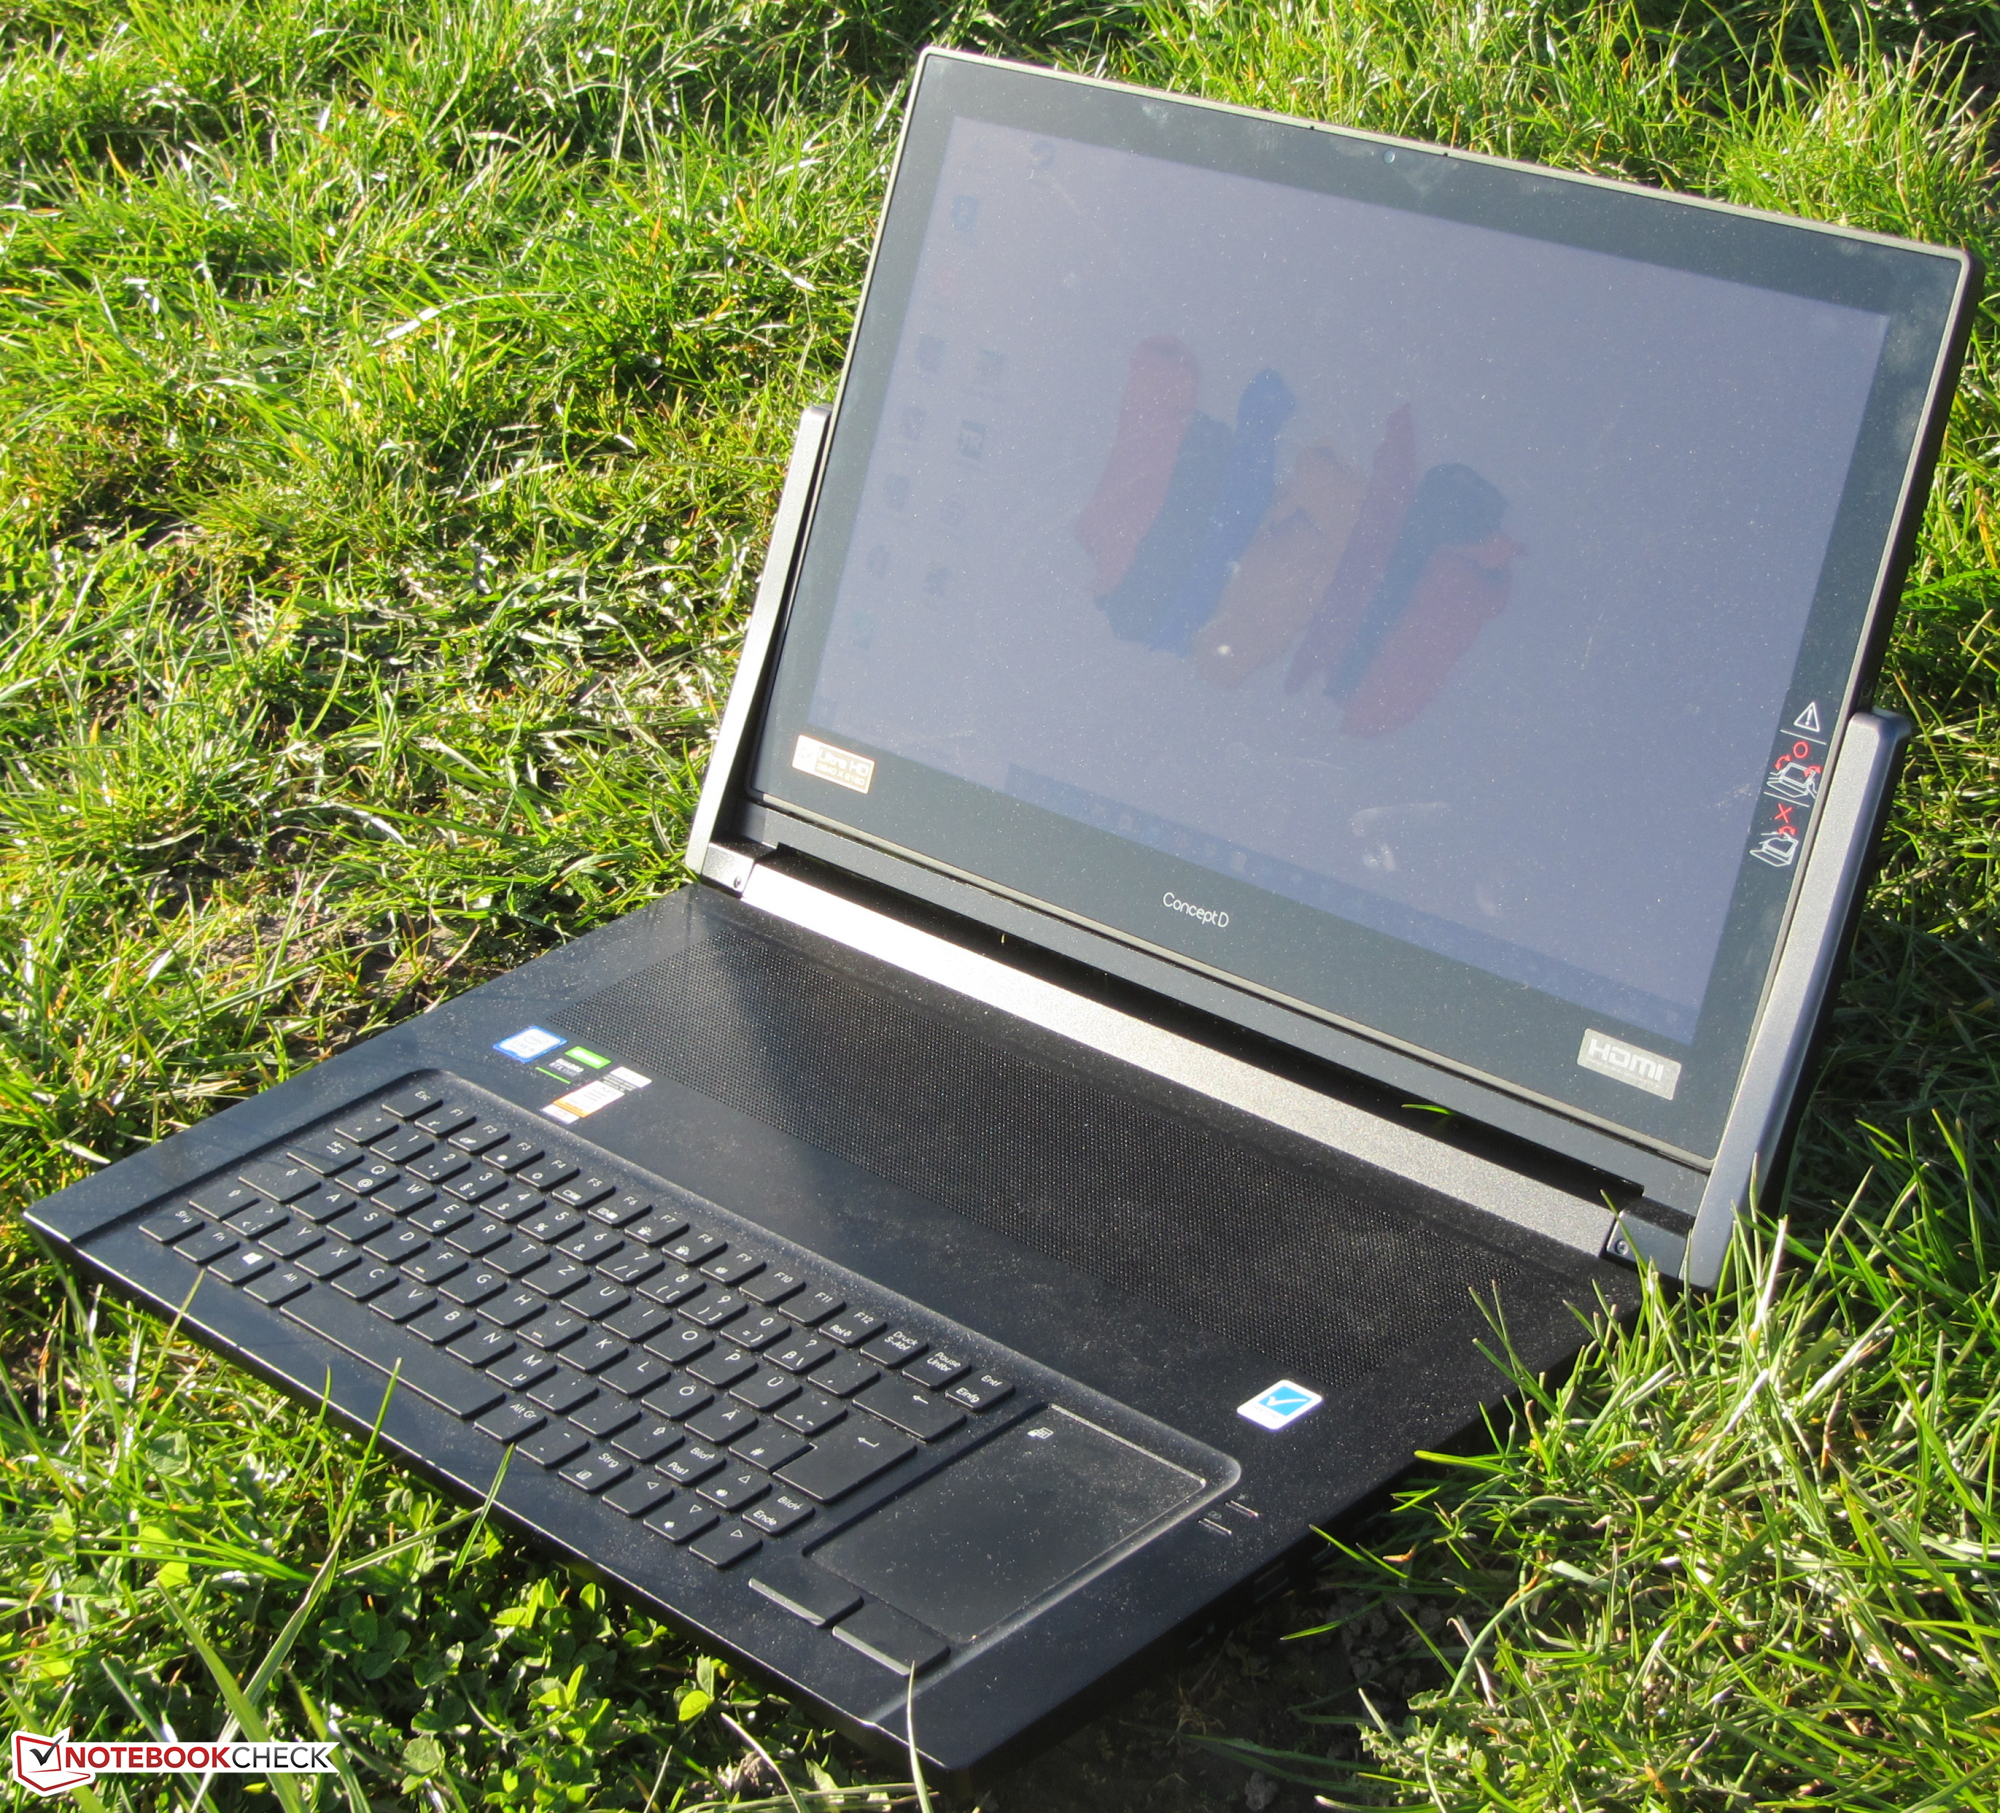
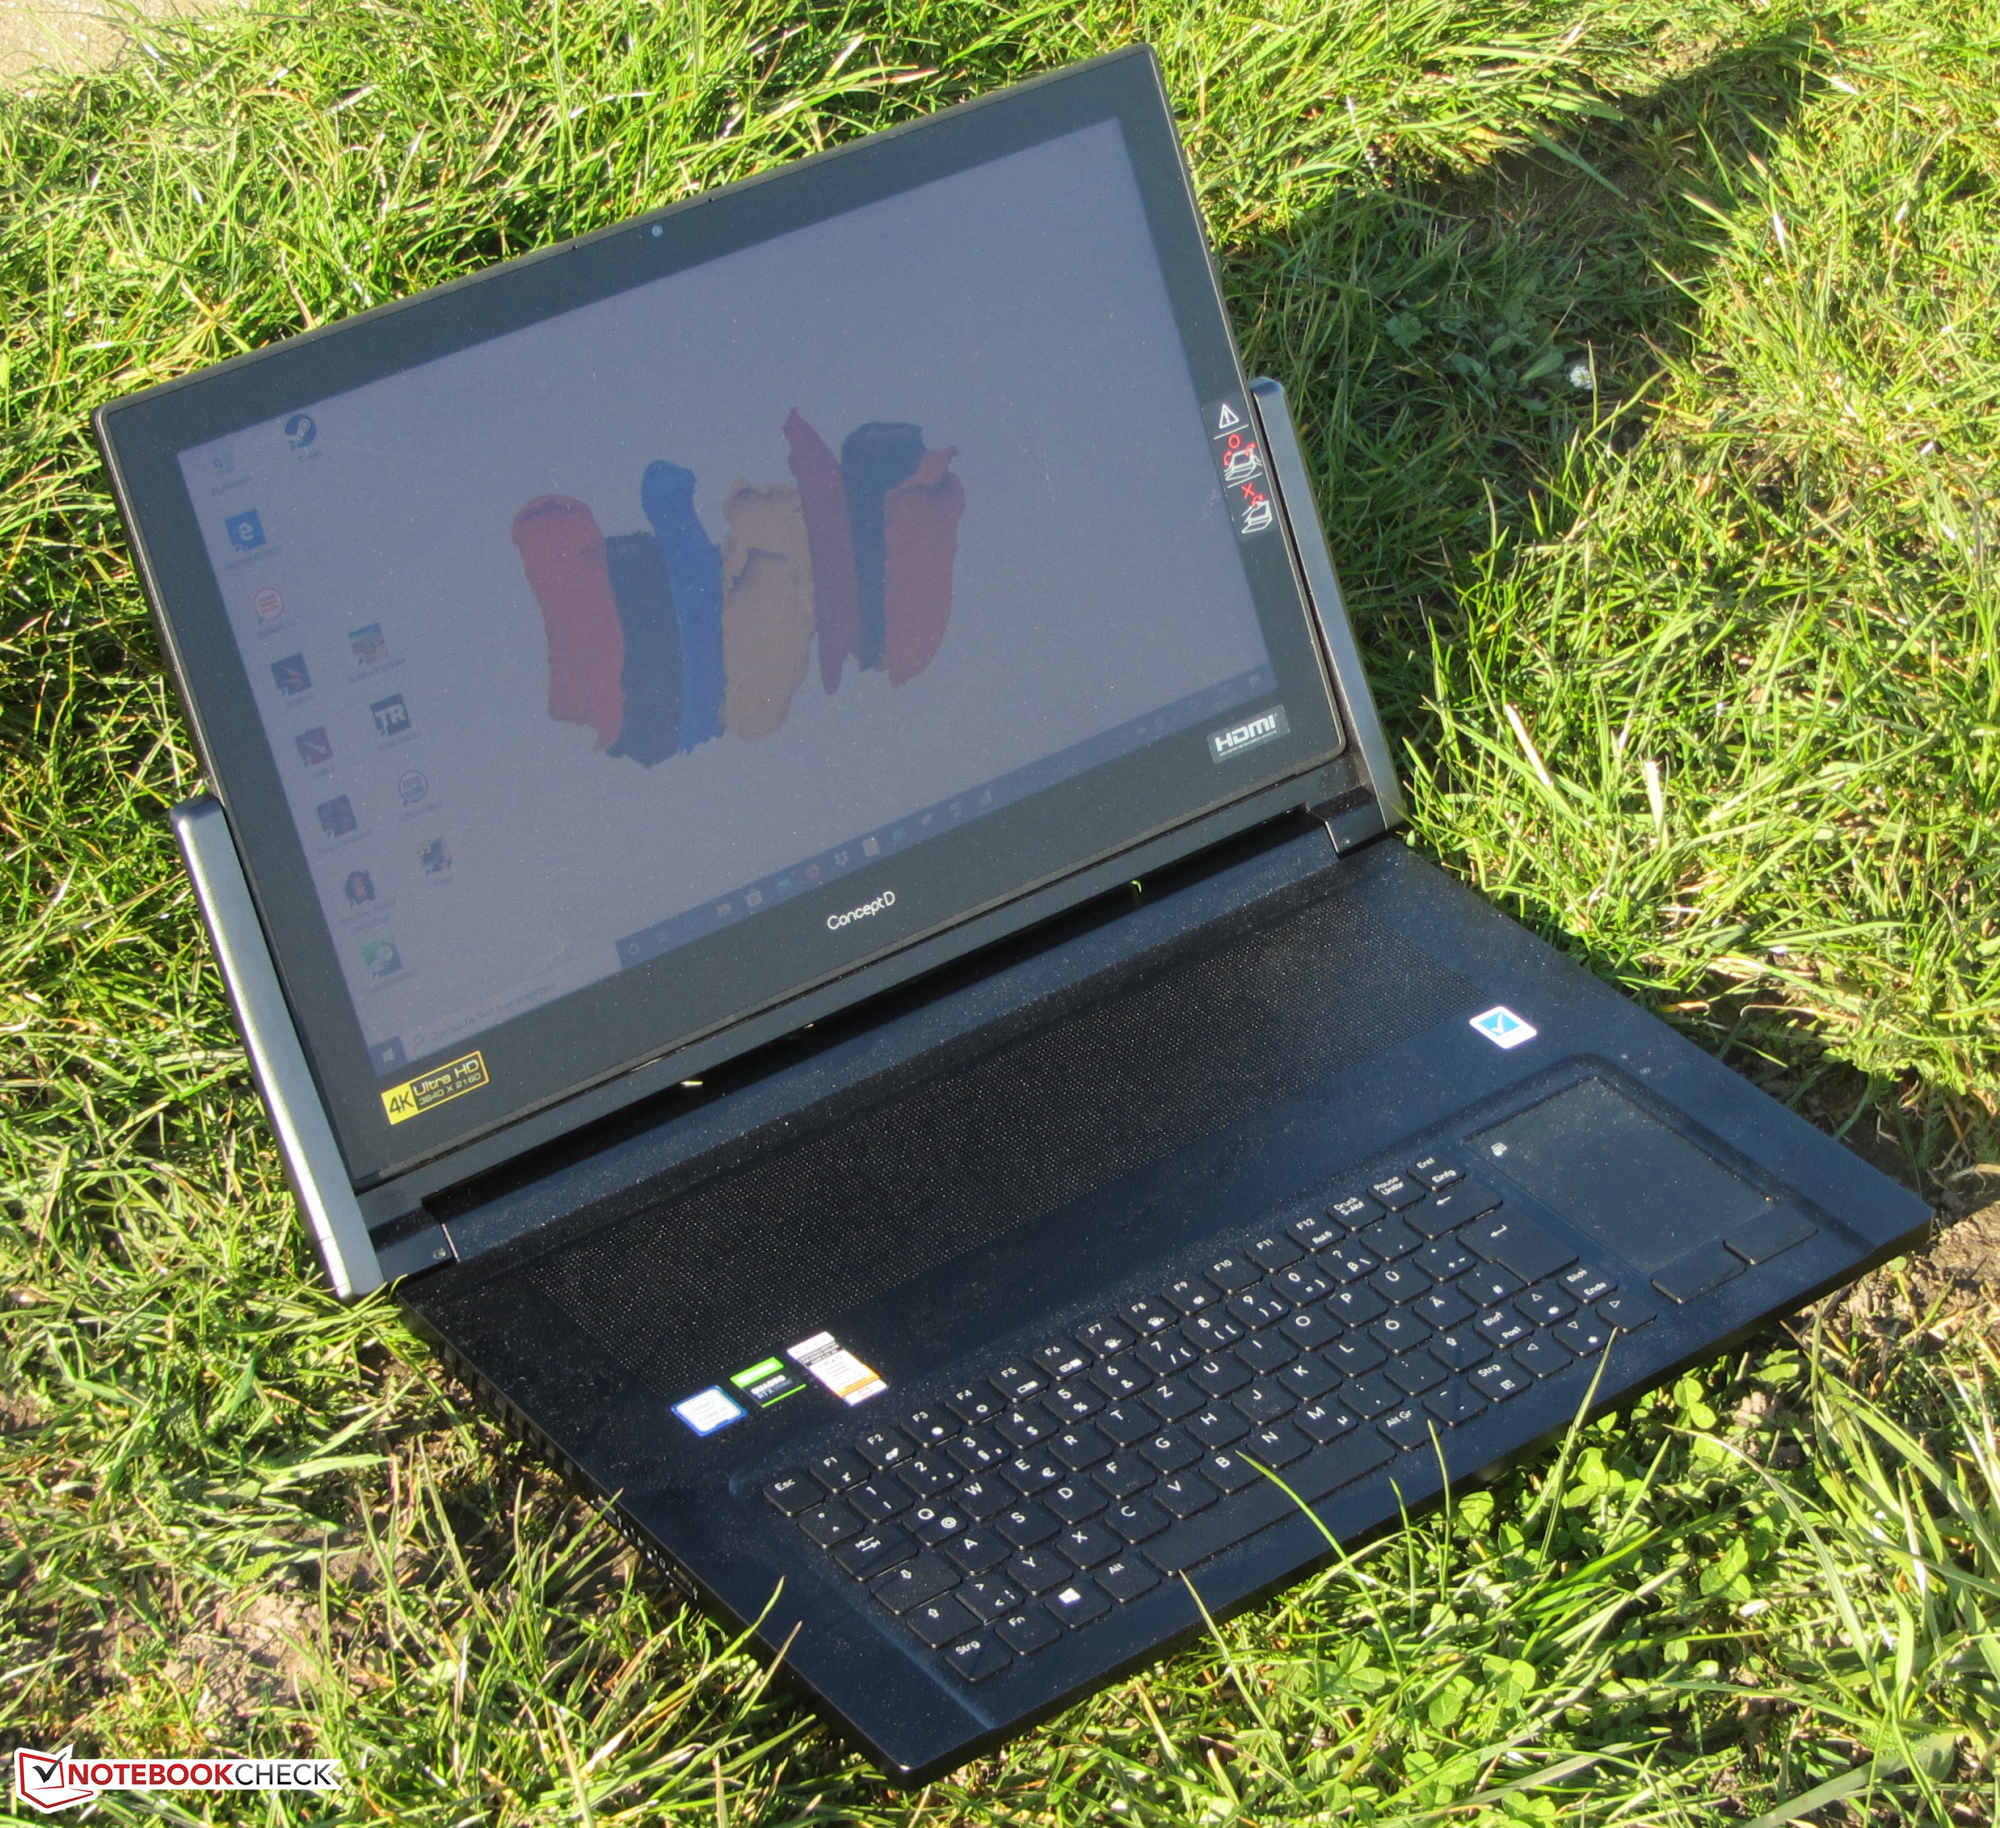
Las enormes bisagras del dispositivo son bastante llamativas. Sostienen firmemente la pantalla en su lugar, independientemente de su modo de funcionamiento, para permitir una cómoda introducción del bolígrafo. La tapa puede abrirse hasta un ángulo máximo de 110 a 120 grados. La pantalla también se puede girar 170 grados. En el modo de tableta, no se apoya de forma plana en la unidad base. En cambio, está ligeramente inclinada hacia el usuario. La tapa puede abrirse con una sola mano (cuando está cerrada).
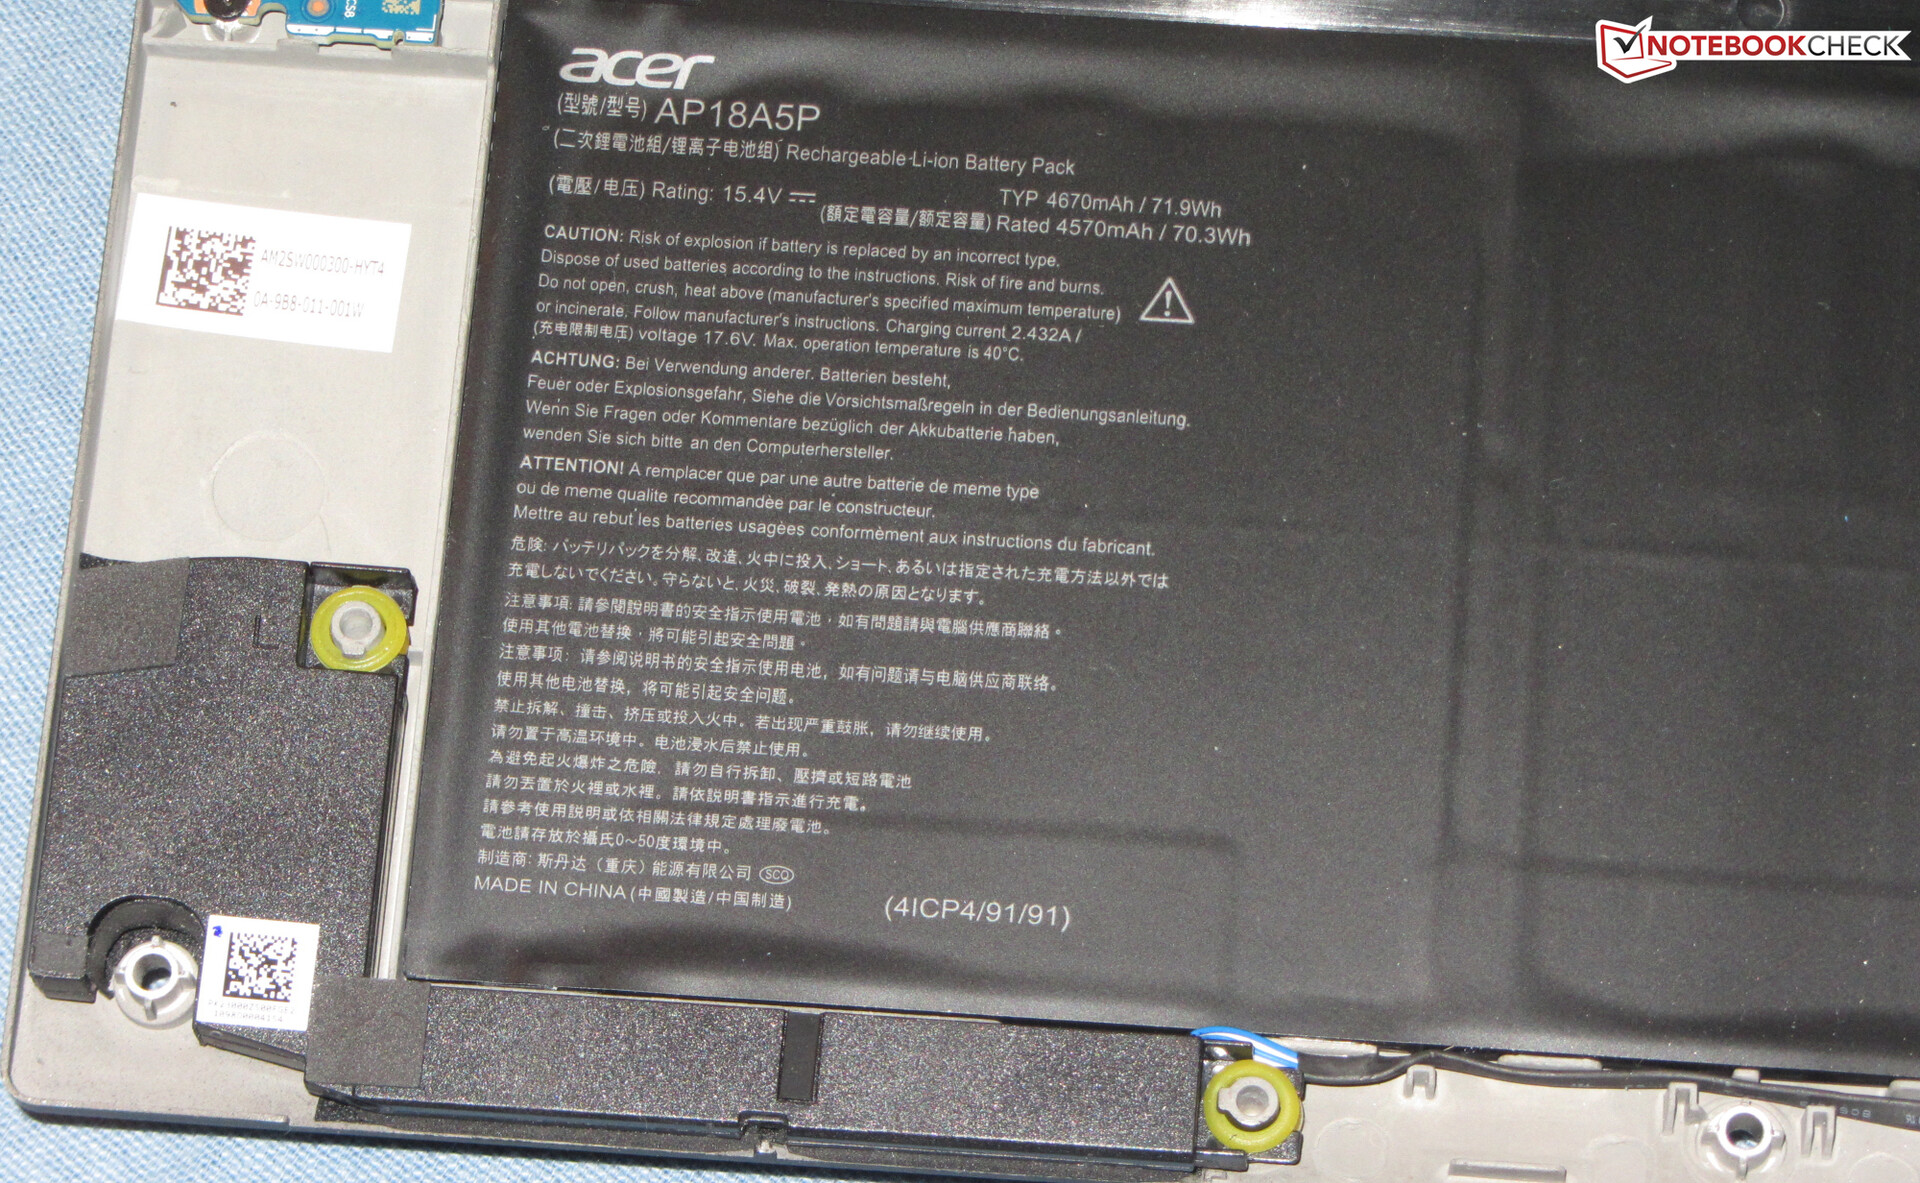
La calidad de construcción del portátil es buena. Las distancias son adecuadas y no hay exceso de materiales. Tampoco hay defectos en cuanto a la estabilidad. En el peor de los casos, la unidad de base y la tapa sólo se pueden torcer ligeramente. La rigidez de la unidad de base es particularmente buena. Aplicando presión en la parte posterior de la tapa no se distorsiona la imagen. La batería está fija. No hay escotilla de mantenimiento. Para llegar al interior, la caja debe ser abierta. Más sobre esto más tarde.
Con 4,5 kg, la estación de trabajo Acer no es exactamente un dispositivo ligero. La mayoría de los competidores que hemos seleccionado pesan alrededor de 1 o 2 kg menos. El Eurocom Tornado F7W es el único otro dispositivo que cruza la marca de los 4 kg. Tampoco debe sorprender que las dimensiones del ConceptD sean mayores que las de la mayoría de sus competidores. El Tornado F7W tiene la caja más gruesa y menos compacta en cuanto a la superficie que ocupa.
Características - ConceptD con Thunderbolt 3
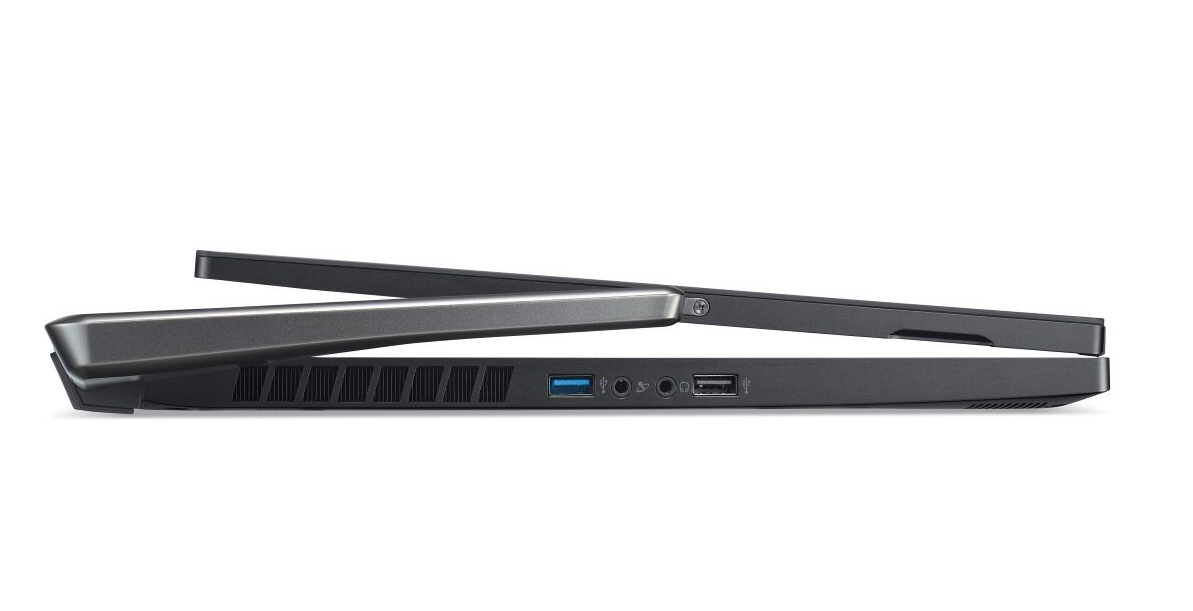
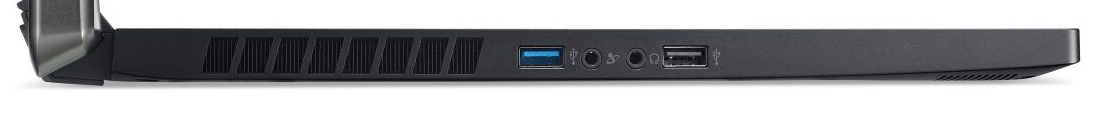
El portátil de Acer ofrece una selección de puertos muy completa. Hay tres puertos USB tipo A (2x USB 3.2 Gen 1, 1x USB 2.0) y dos puertos USB tipo C (1x USB 3.2 Gen 1, 1x Thunderbolt 3) disponibles en la estación de trabajo. Ambos puertos USB de tipo C admiten el DisplayPort a través de la función USB-C (aunque esto requiere un adaptador disponible por separado). En combinación con el DisplayPort dedicado y el puerto HDMI, esto hace que la estación de trabajo tenga un total de cuatro salidas de vídeo. Además, dos tomas de audio (salida de auriculares, entrada de micrófono), un puerto Gigabit Ethernet y una ranura de bloqueo completan el paquete. Mientras tanto, un lector de tarjetas no se encuentra en ningún lugar.
Los puertos están distribuidos en los lados izquierdo y derecho, así como en la parte posterior. Los puertos de los lados están centrados. Como resultado, es poco probable que los cables se interpongan cuando se utiliza un ratón externo.


Comunicación
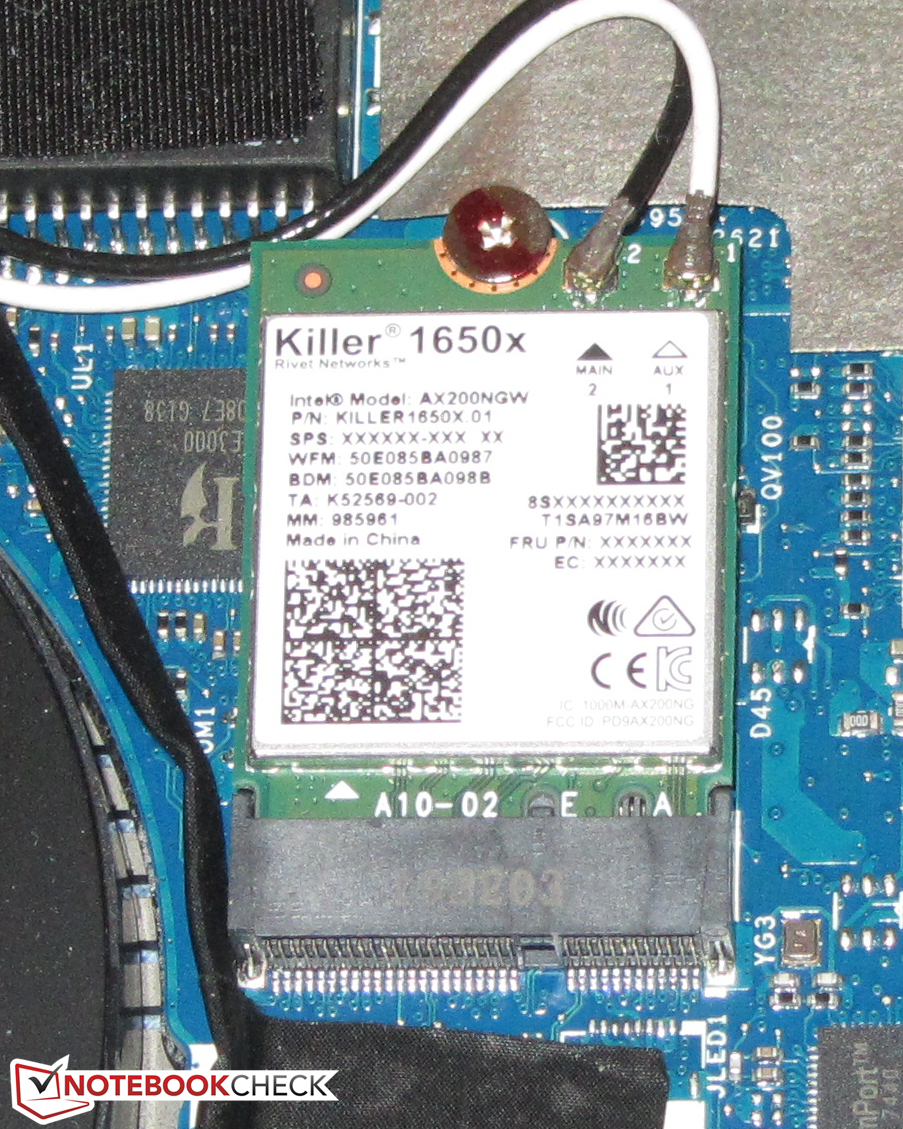
Además de los estándares Wi-Fi 802.11a/b/g/n/ac, el módulo Wi-Fi de Killer también soporta el estándar de ax más rápido. En condiciones óptimas (sin otros dispositivos Wi-Fi en la proximidad, corta distancia entre el portátil y el servidor), registramos muy buenas velocidades de transferencia. Un controlador Killer E3000 Gigabit Ethernet es el responsable de la conexión en red por cable. No hubo problemas con él durante nuestras pruebas.
Webcam
La webcam integrada de 2.1-MP puede tomar fotos con una resolución máxima de 1920x1080 píxeles. Los resultados son decentes. Sin embargo, la precisión del color deja mucho que desear. Su desviación de 33,6 está significativamente por encima del rango ideal (DeltaE de menos de tres).

, i9-9980HK, WDC PC SN720 SDAQNTW-1T00")
, i9-9980HK, WDC PC SN720 SDAQNTW-1T00")
Accesorios
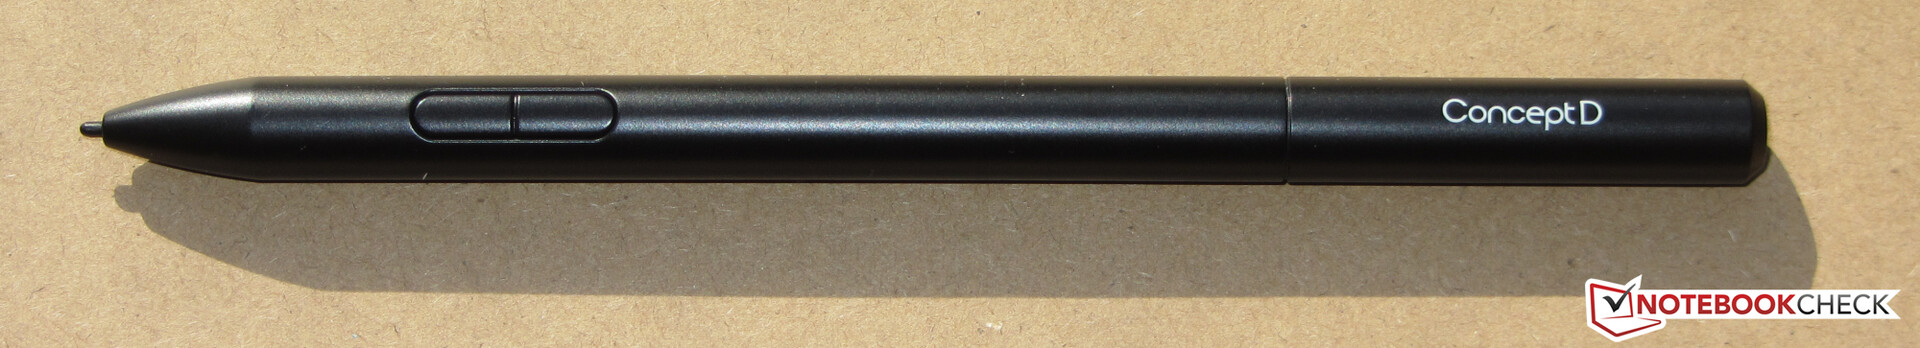
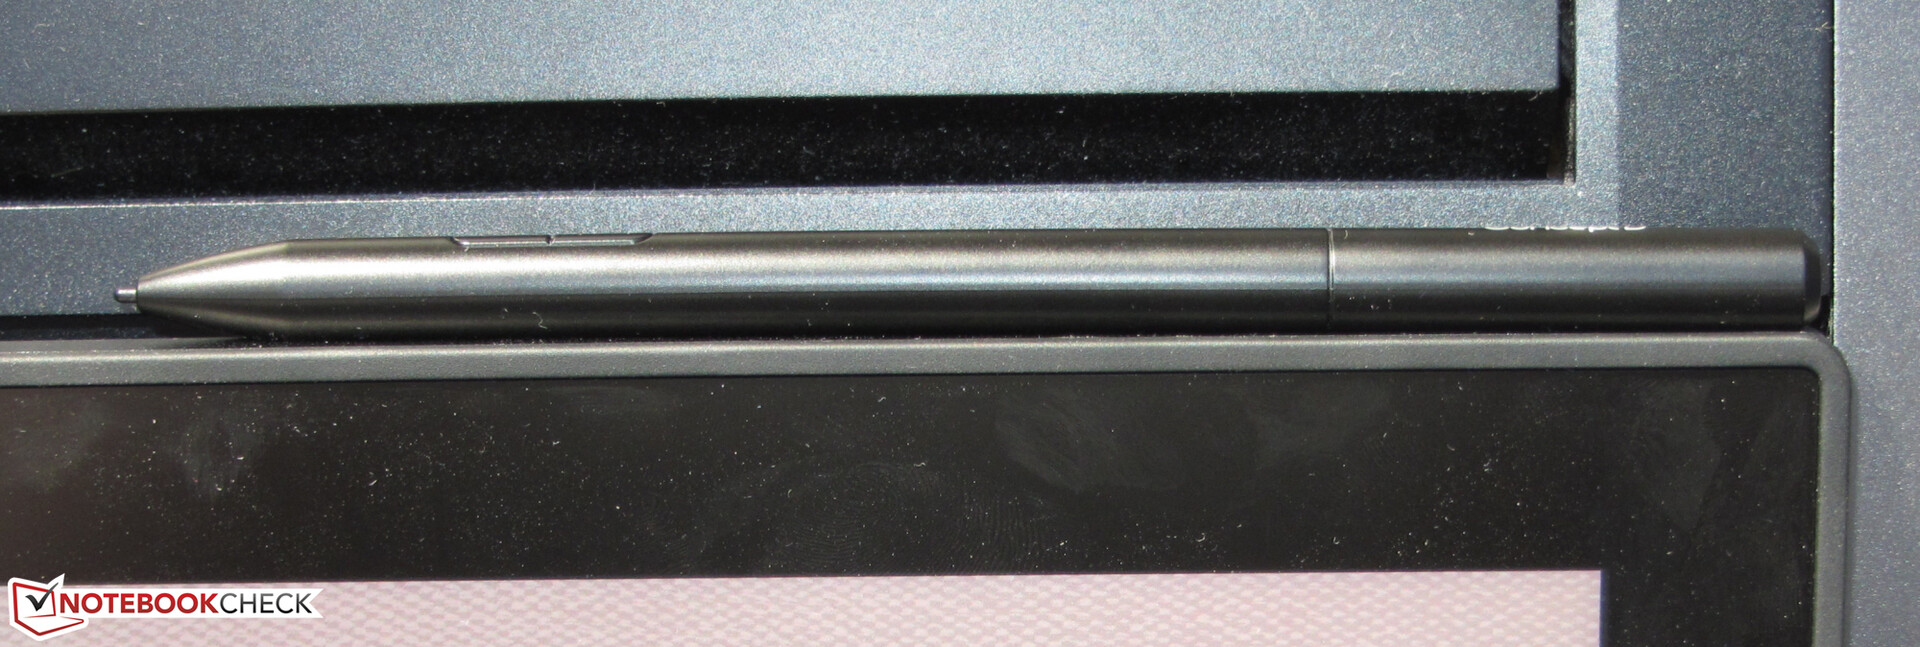
Además de los accesorios habituales (información sobre la garantía, guía de inicio rápido), el ConceptD también incluye un bolígrafo digital Wacom.
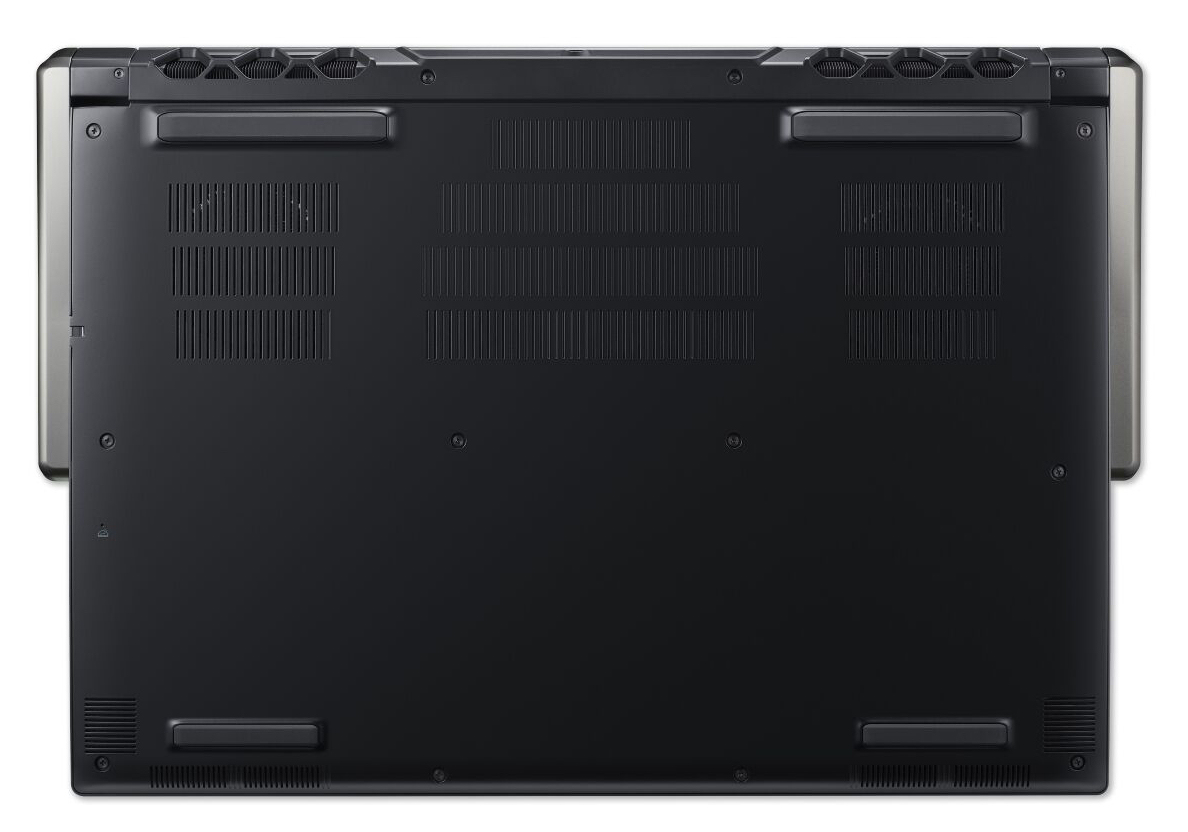
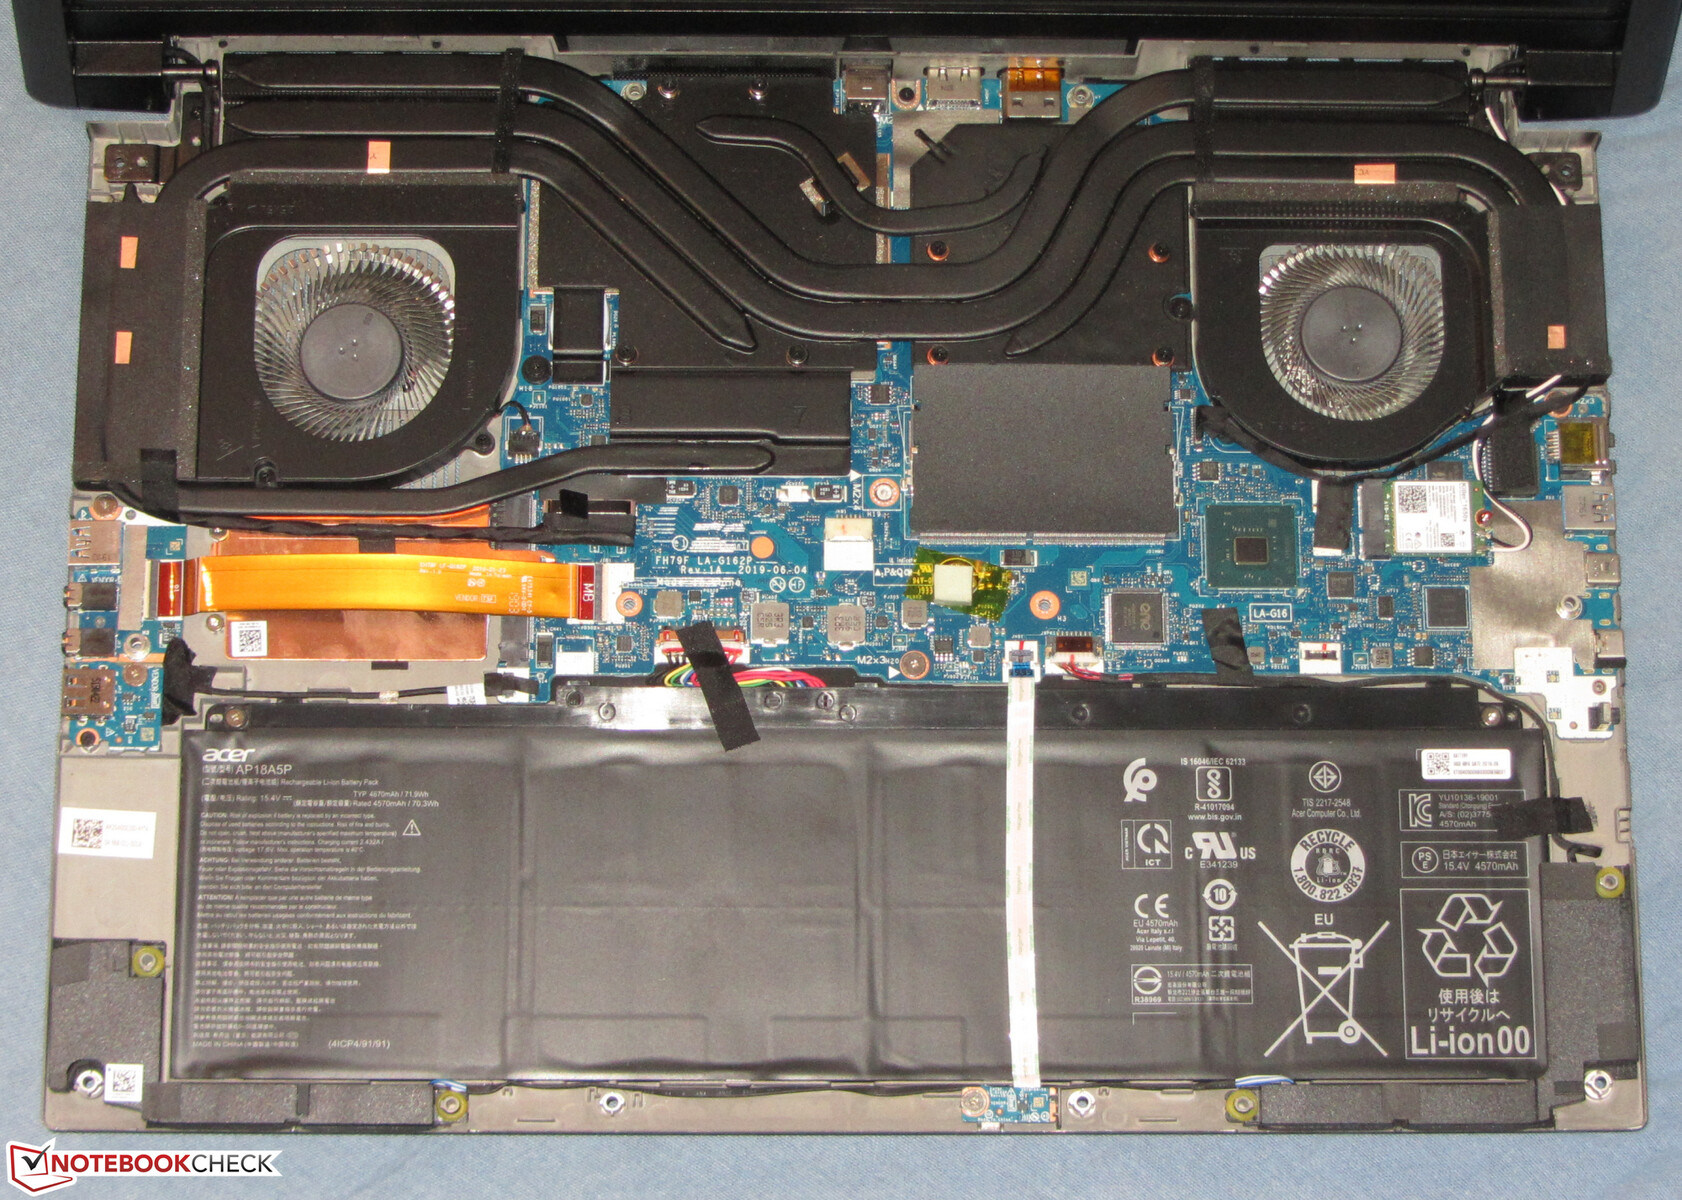
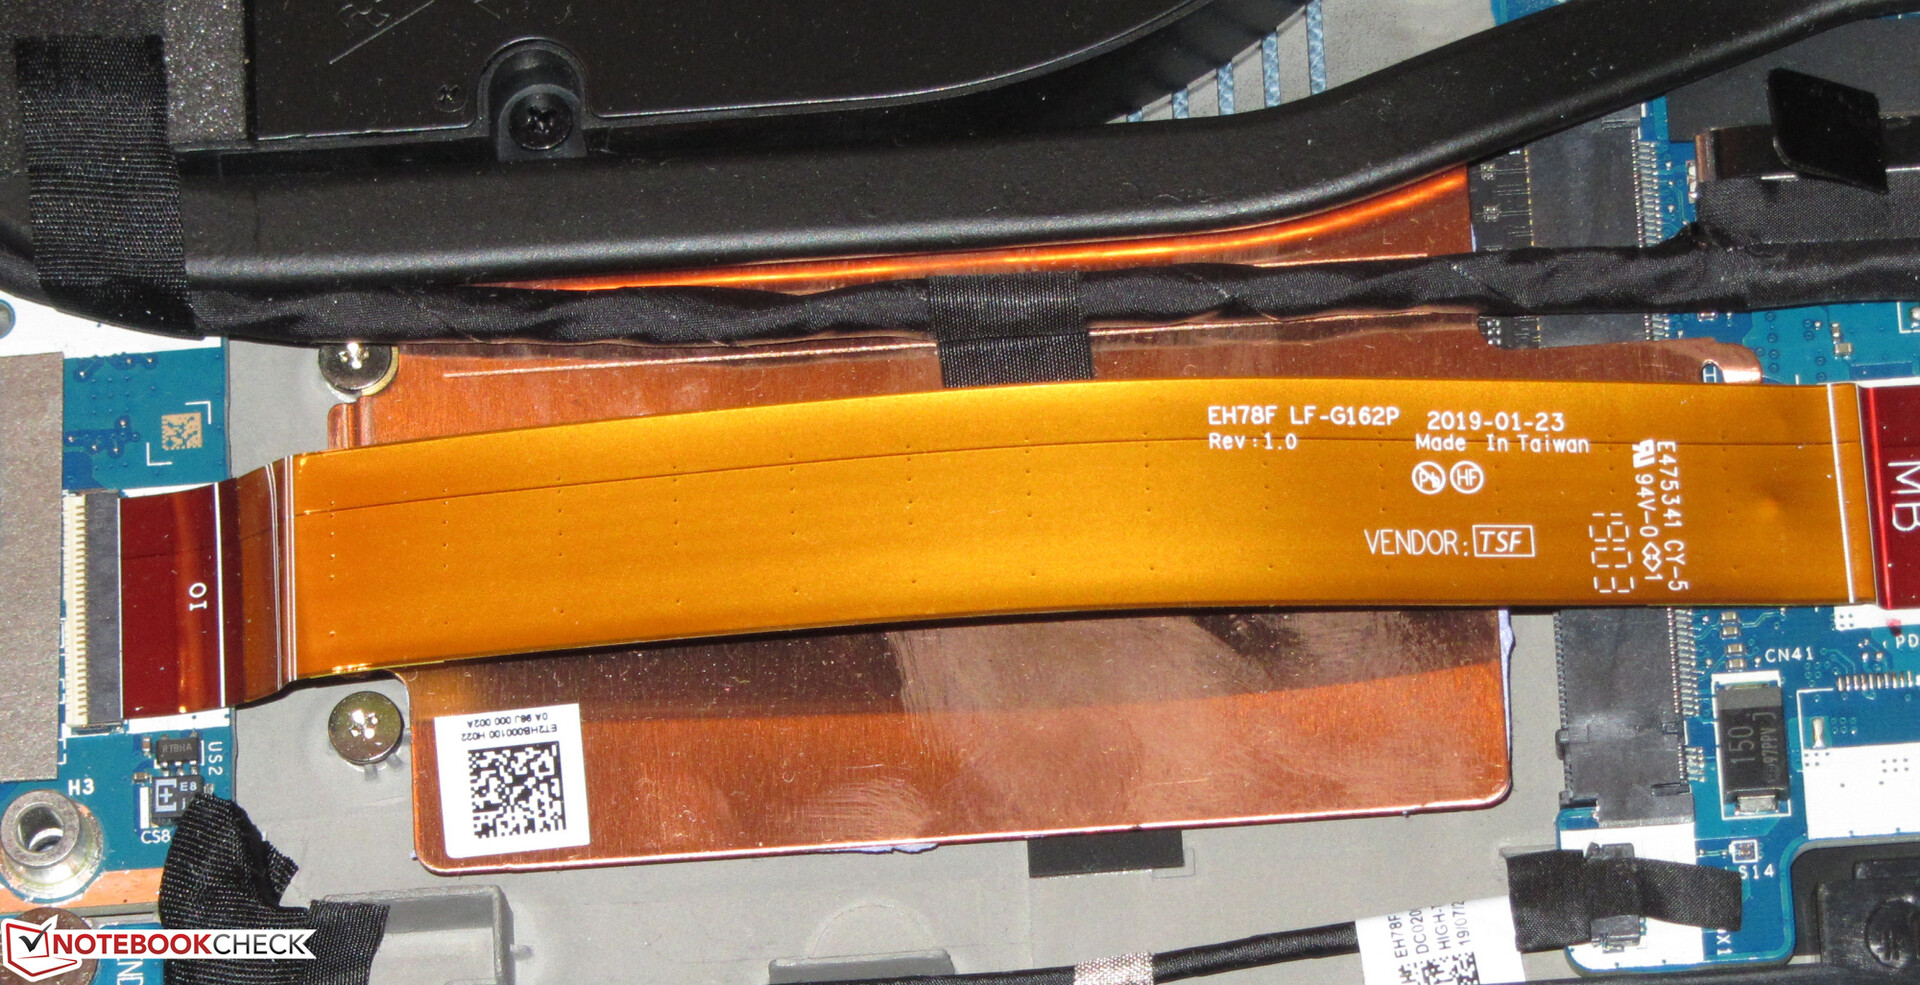
Maintenance
No hay una escotilla de mantenimiento disponible en la estación de trabajo. Para poder llegar a los componentes, hay que quitar el panel superior. Esto se puede lograr aflojando todos los tornillos de la parte inferior del dispositivo y volviendo a ponerlo en pie. Aunque el panel superior se puede levantar en este punto, todavía no se puede separar completamente, ya que todavía está sujeto por clips de plástico por encima de las rejillas de escape en la parte posterior. Los clips pueden ser removidos moviendo cuidadosamente la parte superior hacia adelante y hacia atrás. Con cuidado: La parte superior del chasis seguirá conectada a la placa madre a través de dos cables en este punto. Hay que desconectarlos antes de que el chasis pueda abrirse completamente.
Garantía
Acer ofrece a los compradores del ConceptD una garantía de dos años, incluyendo el servicio de recogida y entrega. La garantía también incluye el Servicio Premium Predator. Con este servicio, Acer se compromete a revisar y reparar un dispositivo defectuoso en un plazo de 72 horas.
Dispositivos de entrada - Bolígrafo digital Wacom incluido en el CN917-71P
Teclado
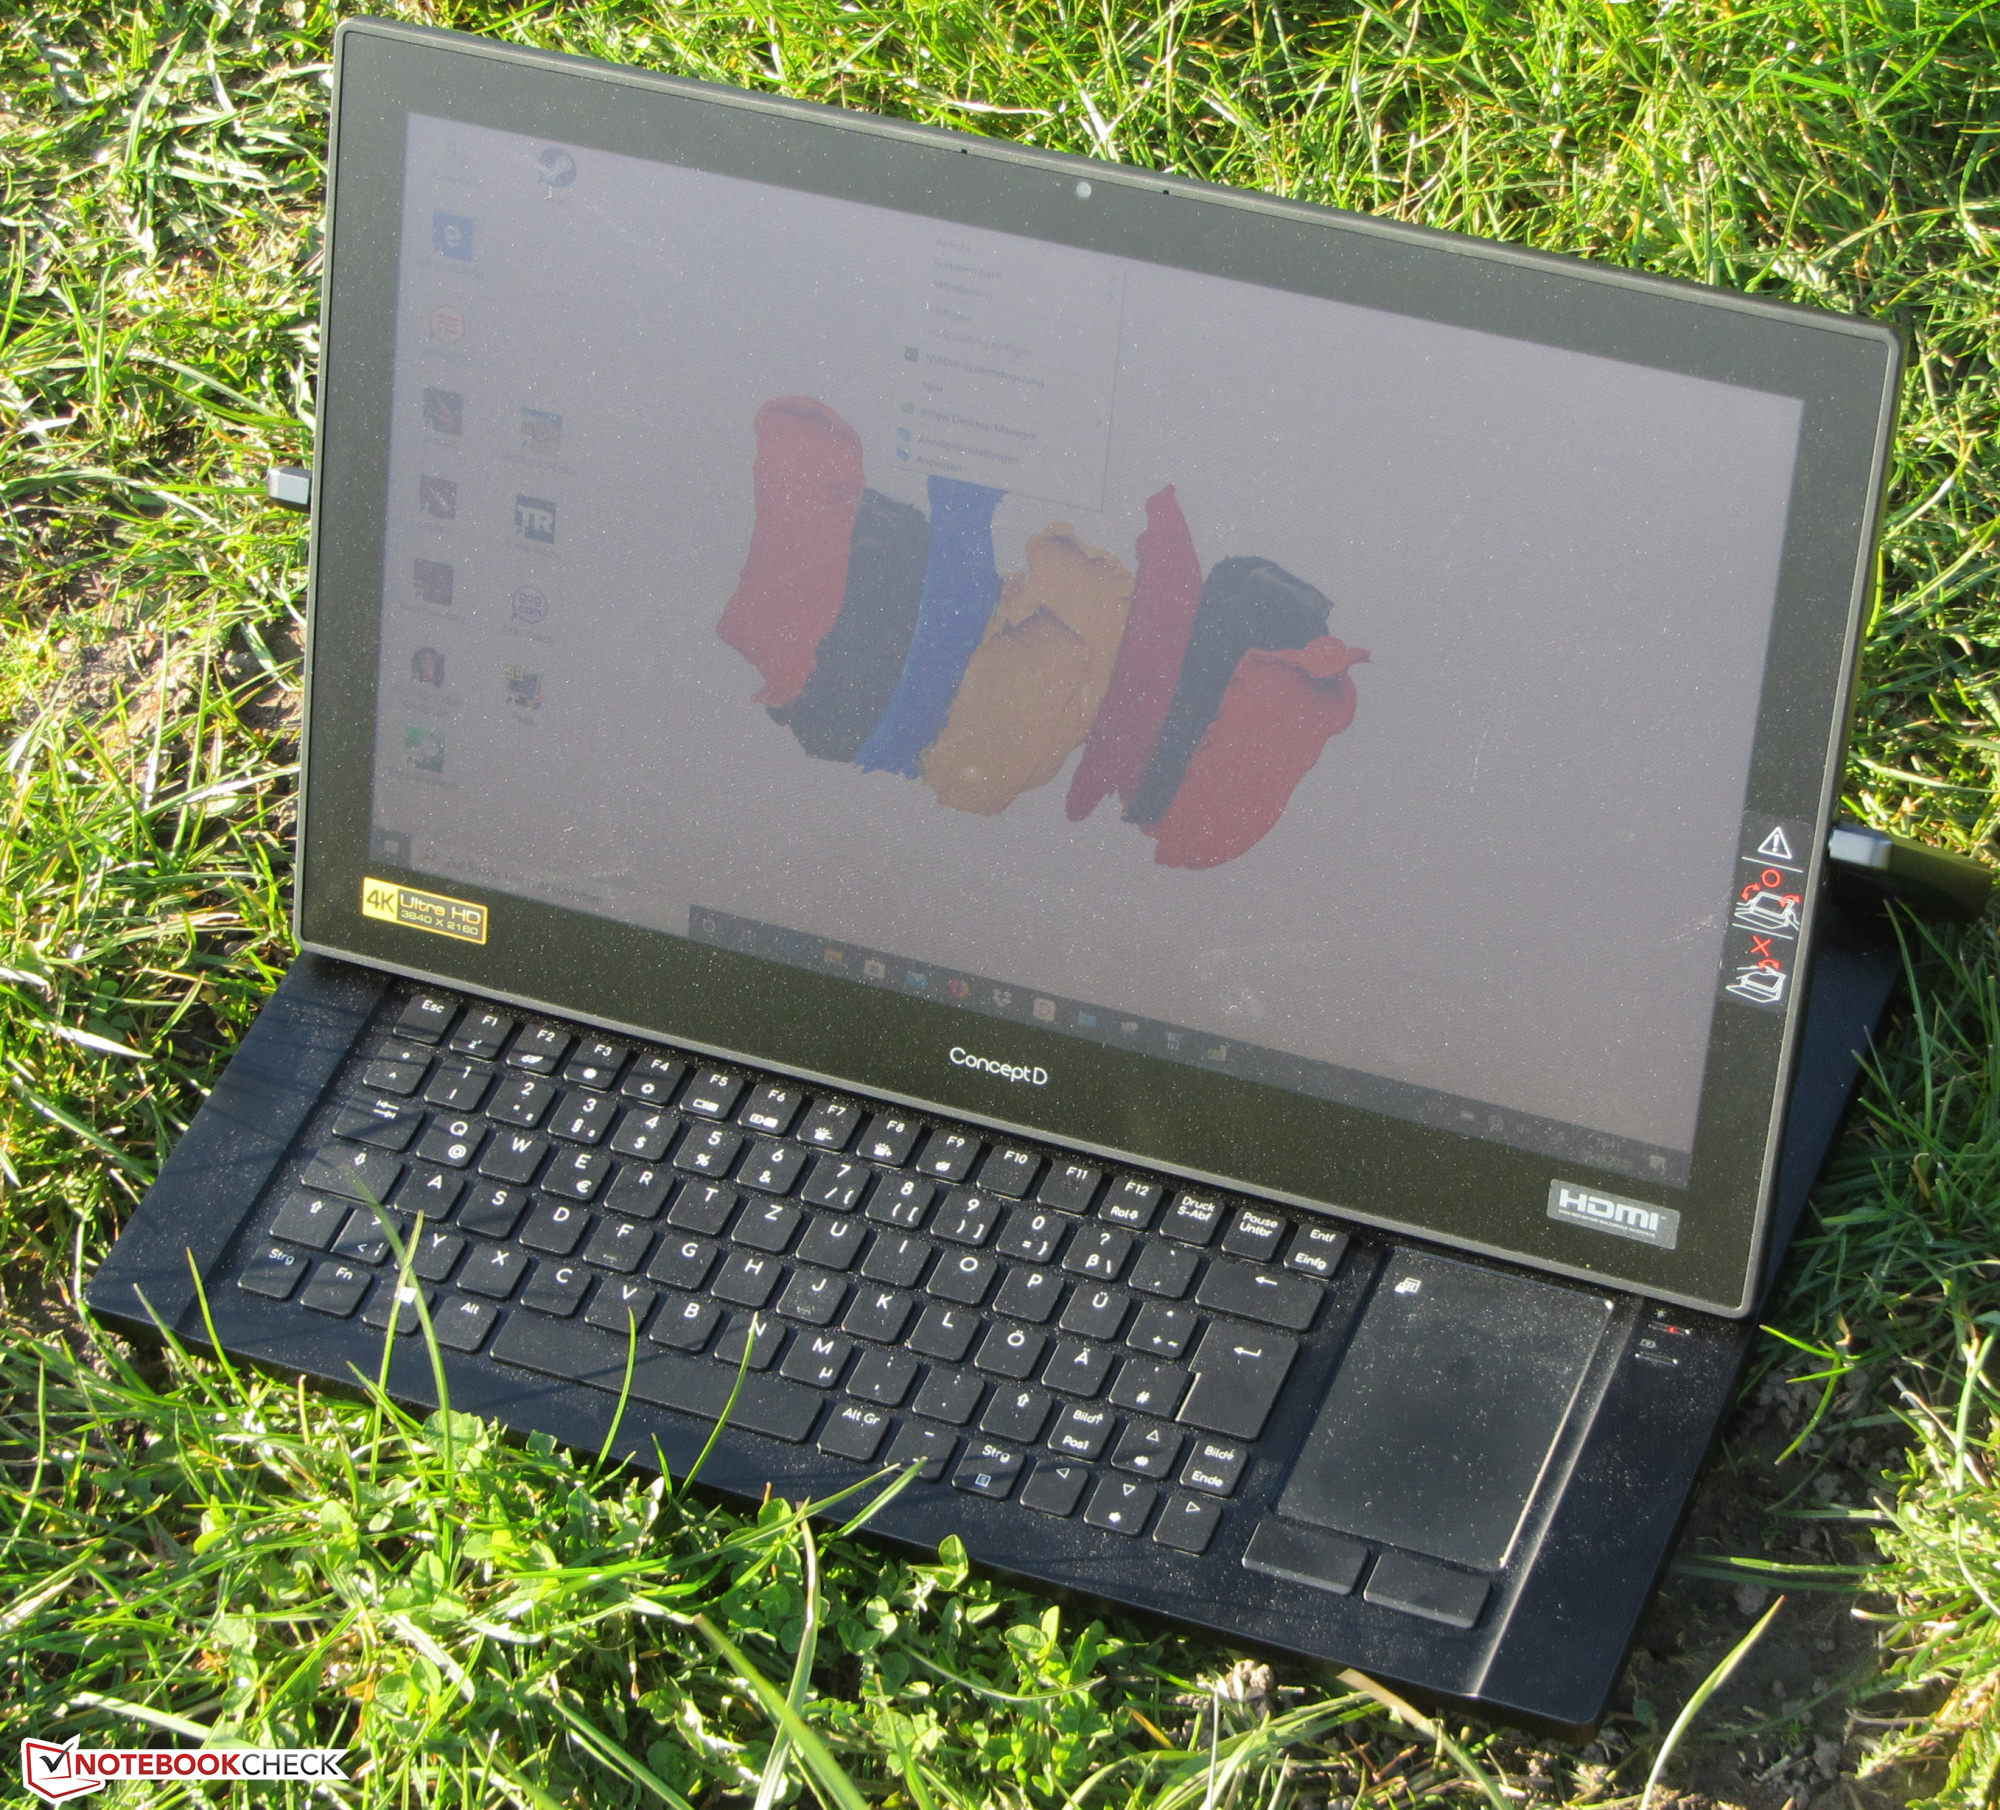
Acer ha equipado el convertible con un teclado chiclet retroiluminado. La "cálida y ambarina retroiluminación" (cita de un comunicado de prensa de Acer) se puede controlar a través de dos teclas de función. Las teclas del teclado son planas, suaves y ofrecen un recorrido poco profundo con un punto de accionamiento distinto que se puede sentir y también oír con bastante claridad. Las teclas individuales tienen una retroalimentación de clicks. Por lo tanto, el teclado no es adecuado para su uso en entornos silenciosos.
El teclado no tiene una disposición estándar. No todas las teclas están en su posición habitual. Algunas de las teclas que suelen formar la fila superior del teclado numérico se han integrado en el área principal del teclado. Además, el tamaño de las teclas de desplazamiento es bastante pequeño. Como resultado, a menudo nos encontramos buscándolas en el teclado. Como el teclado está situado cerca del borde frontal de la unidad base, no hay reposapiés. Por lo tanto, escribir nunca es una experiencia realmente cómoda.
Touchpad
El panel táctil multitáctil abarca un área de unos 6,2 x 9 cm. La superficie lisa no obstruye los dedos al deslizarse sobre ella. El panel táctil responde con precisión a las entradas hasta las esquinas. Debajo del panel táctil, hay dos botones dedicados al ratón que ofrecen un recorrido medio y una retroalimentación distintiva. Por último, se puede mostrar un teclado numérico en el panel táctil.

Pantalla táctil
La pantalla táctil soporta 10 puntos multitáctiles y responde rápidamente a las entradas. No encontramos ningún problema con ella durante nuestra revisión. La pantalla se puede usar con un dedo o con el bolígrafo digital Wacom incluido. El bolígrafo digital pesa 13 gramos y detecta 4.096 niveles de presión.
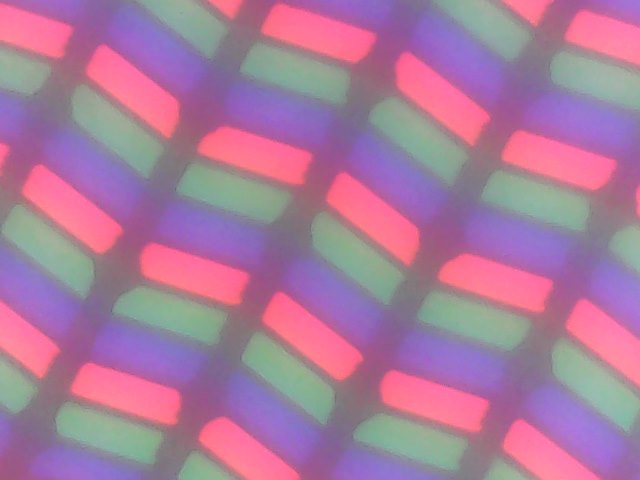
Pantalla - 4K IPS a bordo
La pantalla táctil mate de 17,3 pulgadas tiene una resolución nativa de 3840x2160 píxeles. La relación de contraste (1019:1) y el brillo (367,1 cd/m²) son buenos. Positivo: La pantalla no muestra parpadeo PWM.
| |||||||||||||||||||||||||
iluminación: 83 %
Brillo con batería: 381 cd/m²
Contraste: 1019:1 (Negro: 0.37 cd/m²)
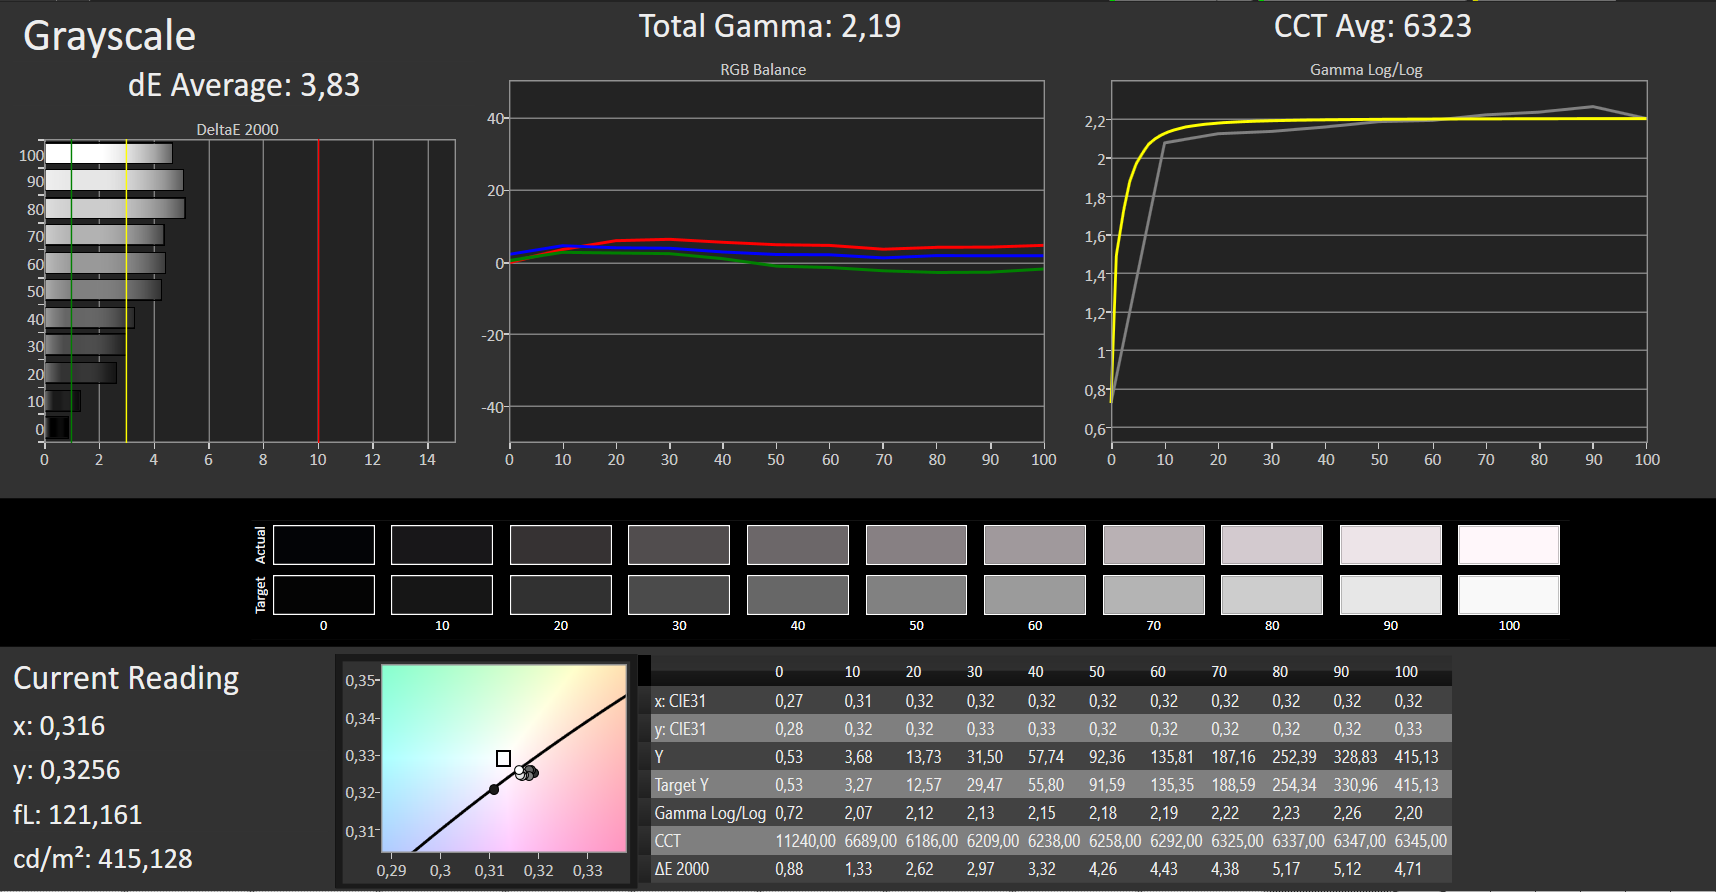
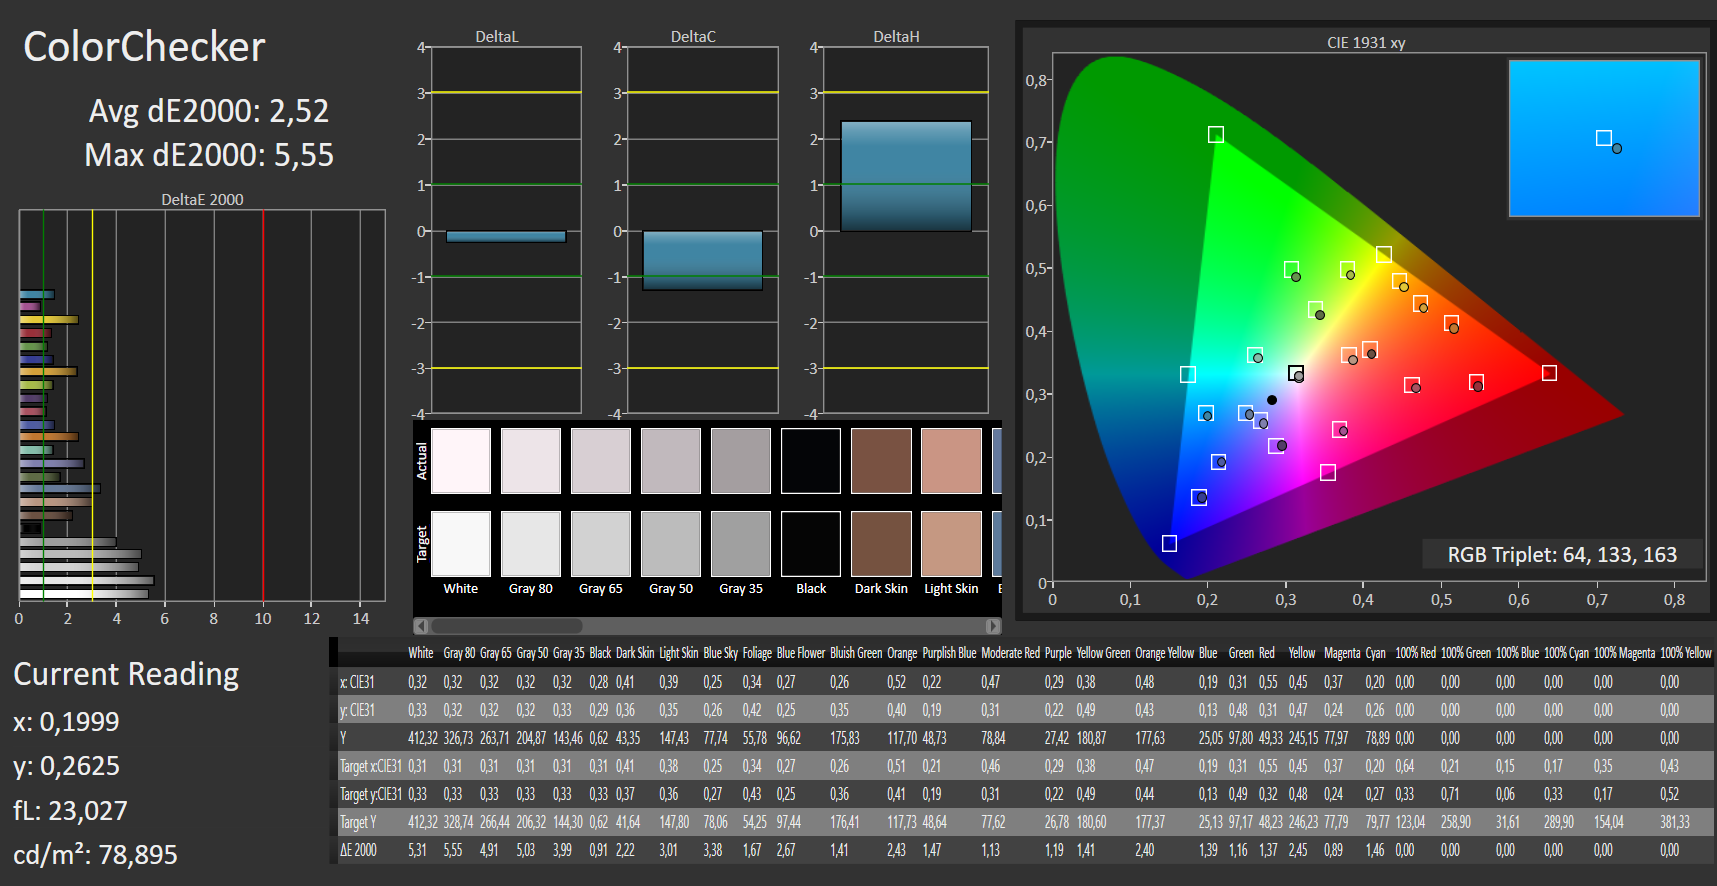
ΔE ColorChecker Calman: 2.52 | ∀{0.5-29.43 Ø4.73}
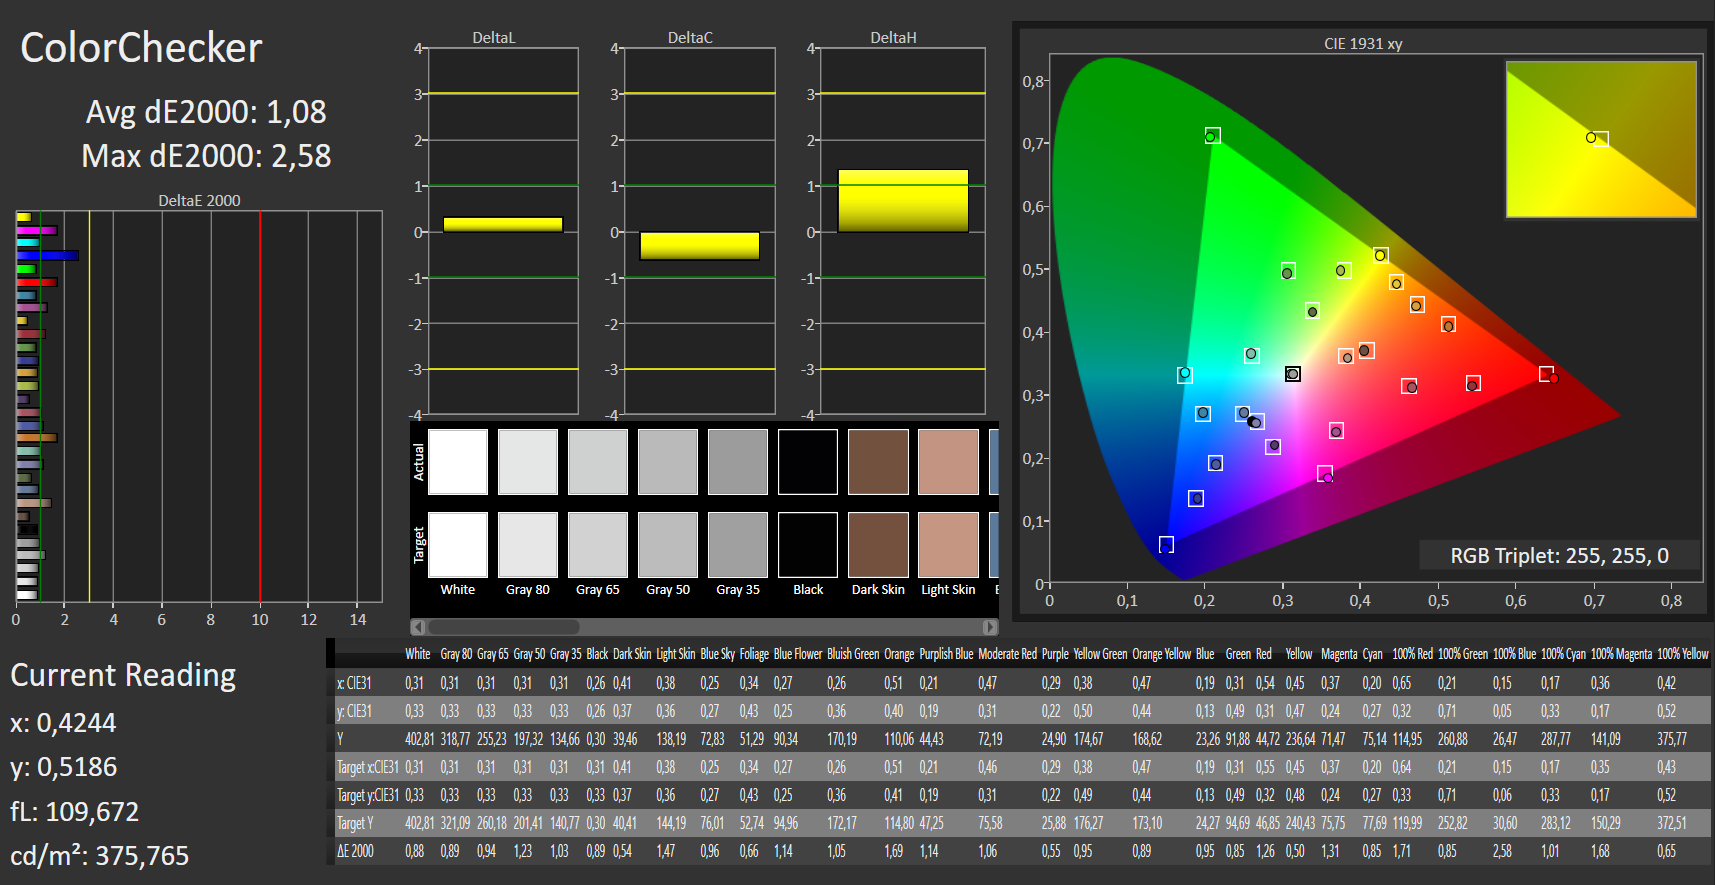
calibrated: 1.08
ΔE Greyscale Calman: 3.83 | ∀{0.09-98 Ø4.97}
98% sRGB (Argyll 1.6.3 3D)
84% AdobeRGB 1998 (Argyll 1.6.3 3D)
95.1% AdobeRGB 1998 (Argyll 3D)
97.9% sRGB (Argyll 3D)
80.9% Display P3 (Argyll 3D)
Gamma: 2.19
CCT: 6323 K
| Acer ConceptD 9 Pro IPS, 3840x2160, 17.3" | Lenovo ThinkPad P73-20QR002DGE IPS LED, 1920x1080, 17.3" | MSI WE75 9TK IPS, 1920x1080, 17.3" | Dell Precision 7730 IPS LED, 1920x1080, 17.3" | Eurocom Tornado F7W IPS, 3840x2160, 17.3" | Fujitsu Celsius H980 IPS, 1920x1080, 17.3" | |
|---|---|---|---|---|---|---|
| Display | -17% | -21% | -18% | 4% | -22% | |
| Display P3 Coverage (%) | 80.9 | 67.5 -17% | 63.2 -22% | 65 -20% | 85.9 6% | 67.3 -17% |
| sRGB Coverage (%) | 97.9 | 94.2 -4% | 89.9 -8% | 93.4 -5% | 100 2% | 85 -13% |
| AdobeRGB 1998 Coverage (%) | 95.1 | 67.8 -29% | 64.3 -32% | 66.3 -30% | 98.3 3% | 62.2 -35% |
| Response Times | 25% | 29% | 10% | 20% | 33% | |
| Response Time Grey 50% / Grey 80% * (ms) | 53 ? | 40 ? 25% | 30.8 ? 42% | 48.8 ? 8% | 40 ? 25% | 38 ? 28% |
| Response Time Black / White * (ms) | 37 ? | 28 ? 24% | 31.2 ? 16% | 32.8 ? 11% | 31.6 ? 15% | 23.2 ? 37% |
| PWM Frequency (Hz) | 25000 ? | 120500 ? | ||||
| Screen | -28% | -19% | 2% | -54% | -51% | |
| Brightness middle (cd/m²) | 377 | 333 -12% | 287.3 -24% | 322 -15% | 328.2 -13% | 400 6% |
| Brightness (cd/m²) | 368 | 310 -16% | 280 -24% | 316 -14% | 310 -16% | 394 7% |
| Brightness Distribution (%) | 83 | 83 0% | 89 7% | 84 1% | 92 11% | 92 11% |
| Black Level * (cd/m²) | 0.37 | 0.39 -5% | 0.26 30% | 0.24 35% | 0.37 -0% | 0.51 -38% |
| Contrast (:1) | 1019 | 854 -16% | 1105 8% | 1342 32% | 887 -13% | 784 -23% |
| Colorchecker dE 2000 * | 2.52 | 4.4 -75% | 2.98 -18% | 2.2 13% | 6.62 -163% | 5.3 -110% |
| Colorchecker dE 2000 max. * | 5.55 | 7.5 -35% | 5.08 8% | 4.6 17% | 9.49 -71% | 9.3 -68% |
| Colorchecker dE 2000 calibrated * | 1.08 | 2 -85% | 3.06 -183% | 1.9 -76% | 3.93 -264% | 3.8 -252% |
| Greyscale dE 2000 * | 3.83 | 5.1 -33% | 3 22% | 1.6 58% | 6.7 -75% | 5.5 -44% |
| Gamma | 2.19 100% | 2.39 92% | 2.28 96% | 2.19 100% | 2.44 90% | 2.17 101% |
| CCT | 6323 103% | 7061 92% | 6993 93% | 6621 98% | 6462 101% | 6686 97% |
| Color Space (Percent of AdobeRGB 1998) (%) | 84 | 61.1 -27% | 58.1 -31% | 60.4 -28% | 87.9 5% | 55.8 -34% |
| Color Space (Percent of sRGB) (%) | 98 | 94 -4% | 89.5 -9% | 93.3 -5% | 100 2% | 84.9 -13% |
| Media total (Programa/Opciones) | -7% /
-19% | -4% /
-14% | -2% /
-1% | -10% /
-34% | -13% /
-35% |
* ... más pequeño es mejor
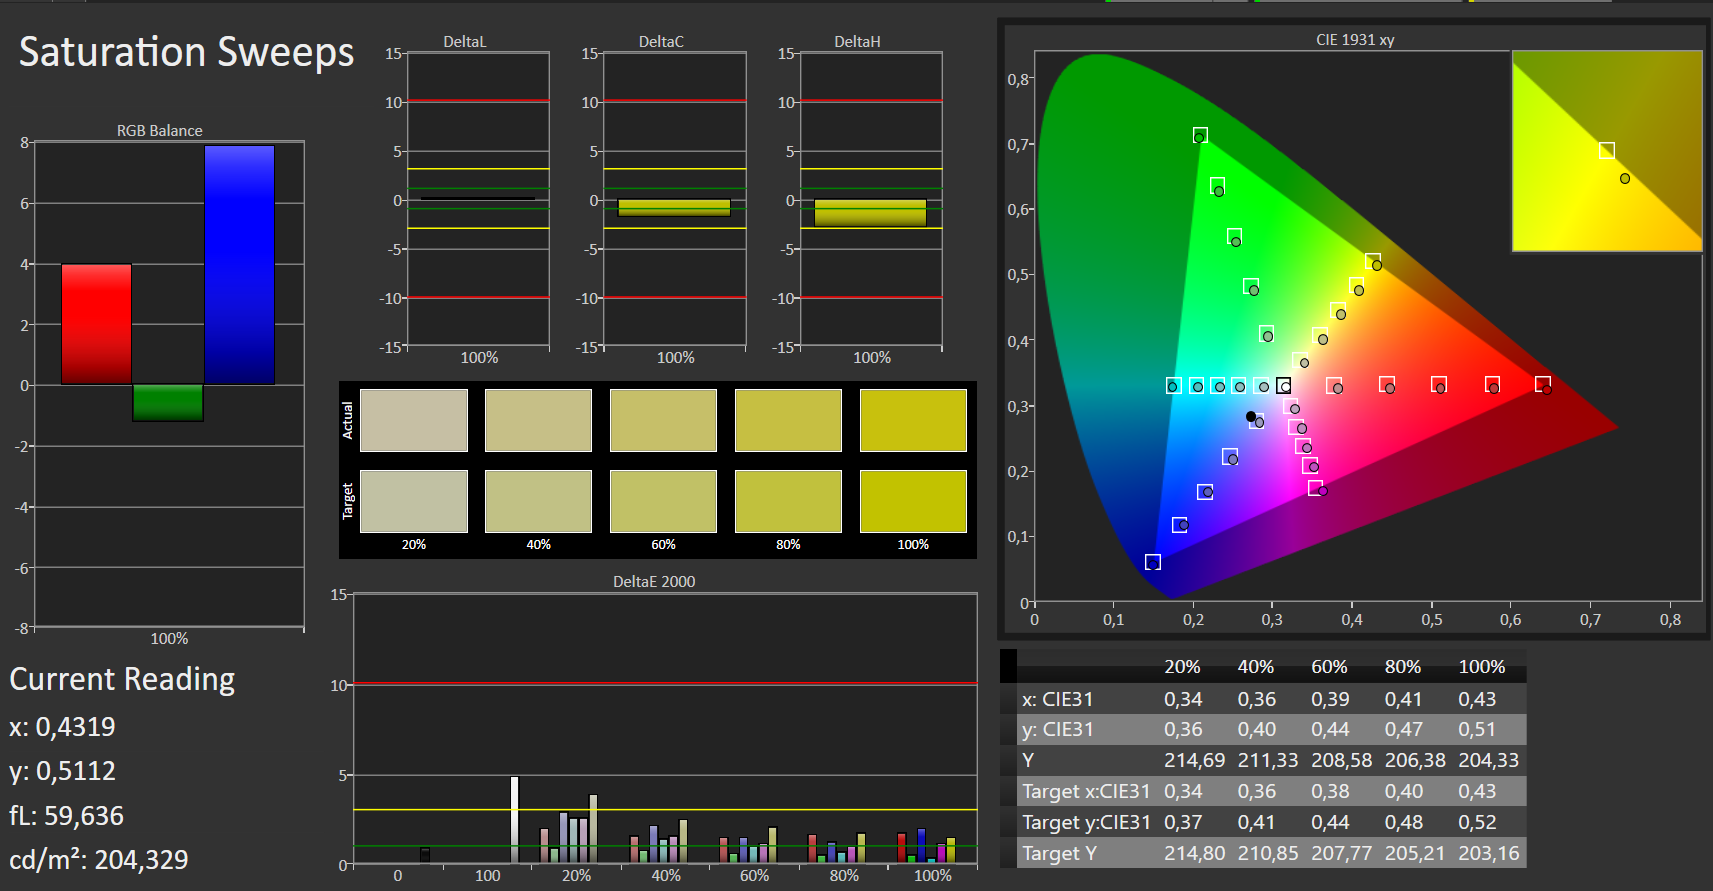
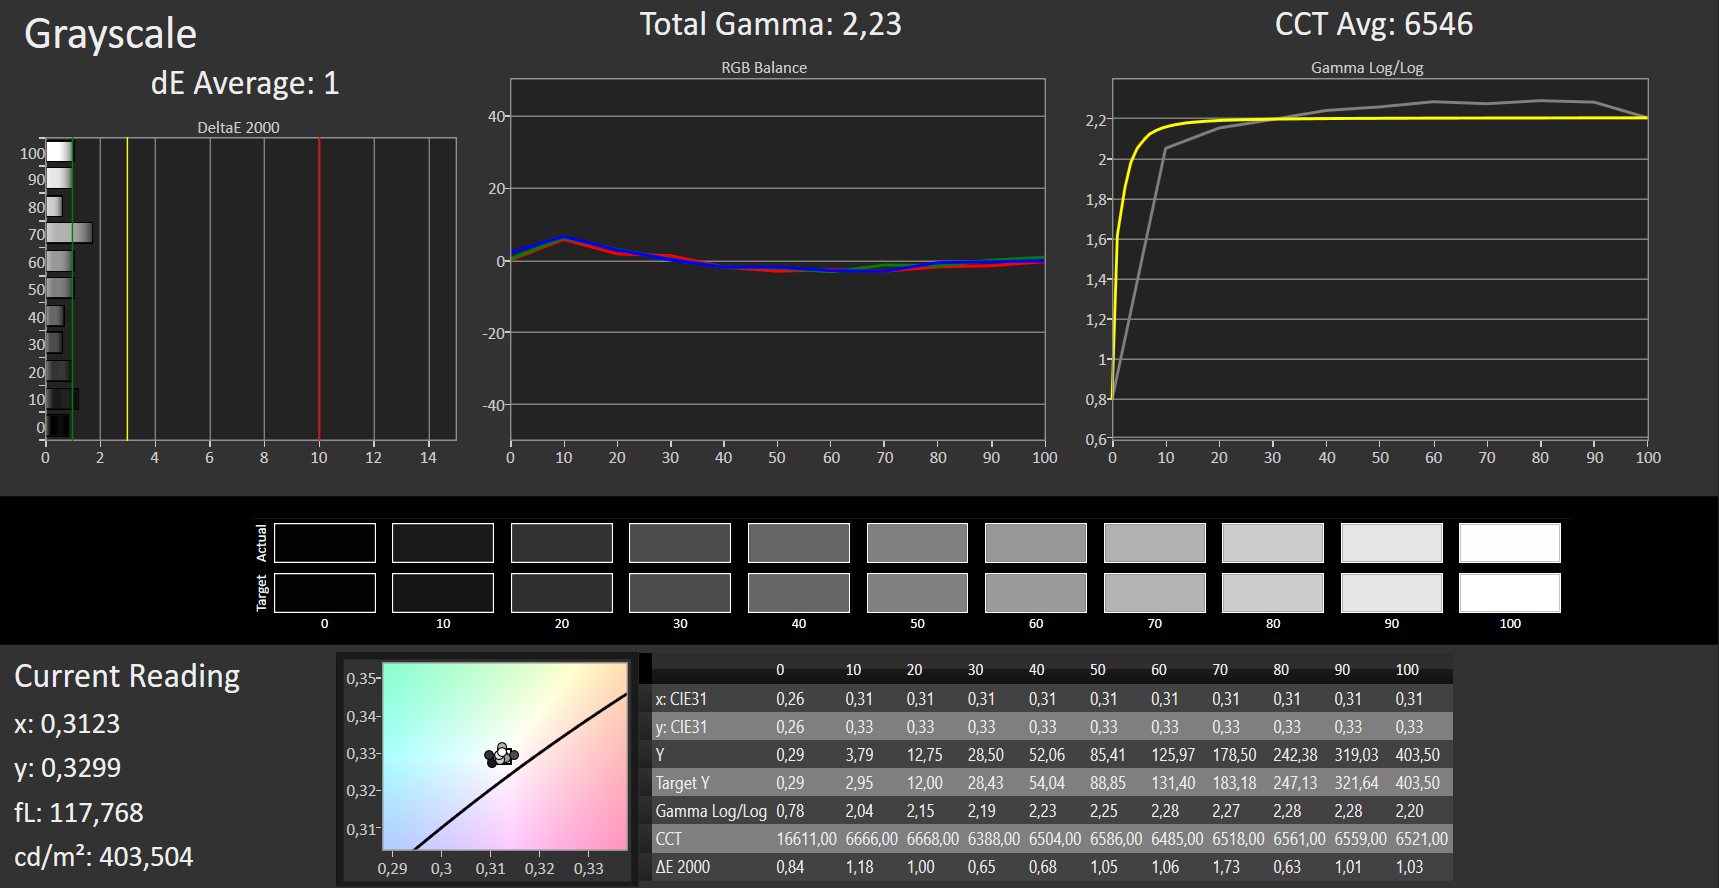
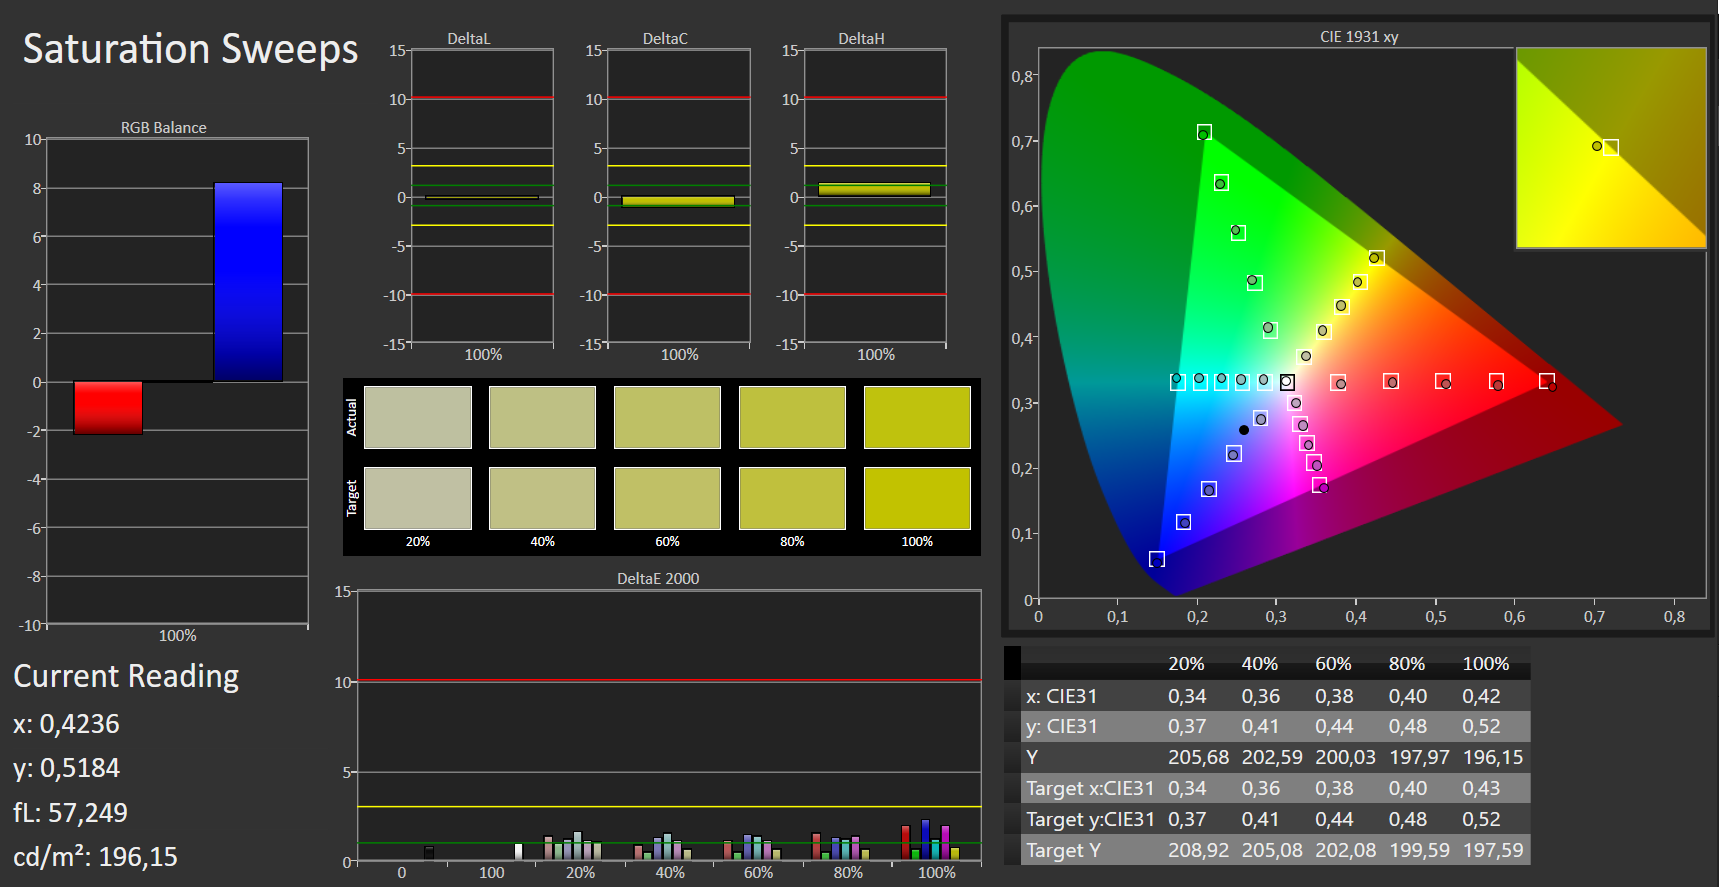
El panel puede mostrar un amplio espectro de colores de fábrica. Con una desviación de color DeltaE-2000 de alrededor de 2,5, se mantiene dentro del rango ideal (DeltaE de menos de tres). La pantalla no sufre de un tinte azul. Al realizar una calibración, pudimos mejorar aún más la visualización por un margen significativo. Esto causó que la escala de grises y el color DeltaE bajaran a 1. De fábrica, el valor de la escala de grises DeltaE era de 3.8.
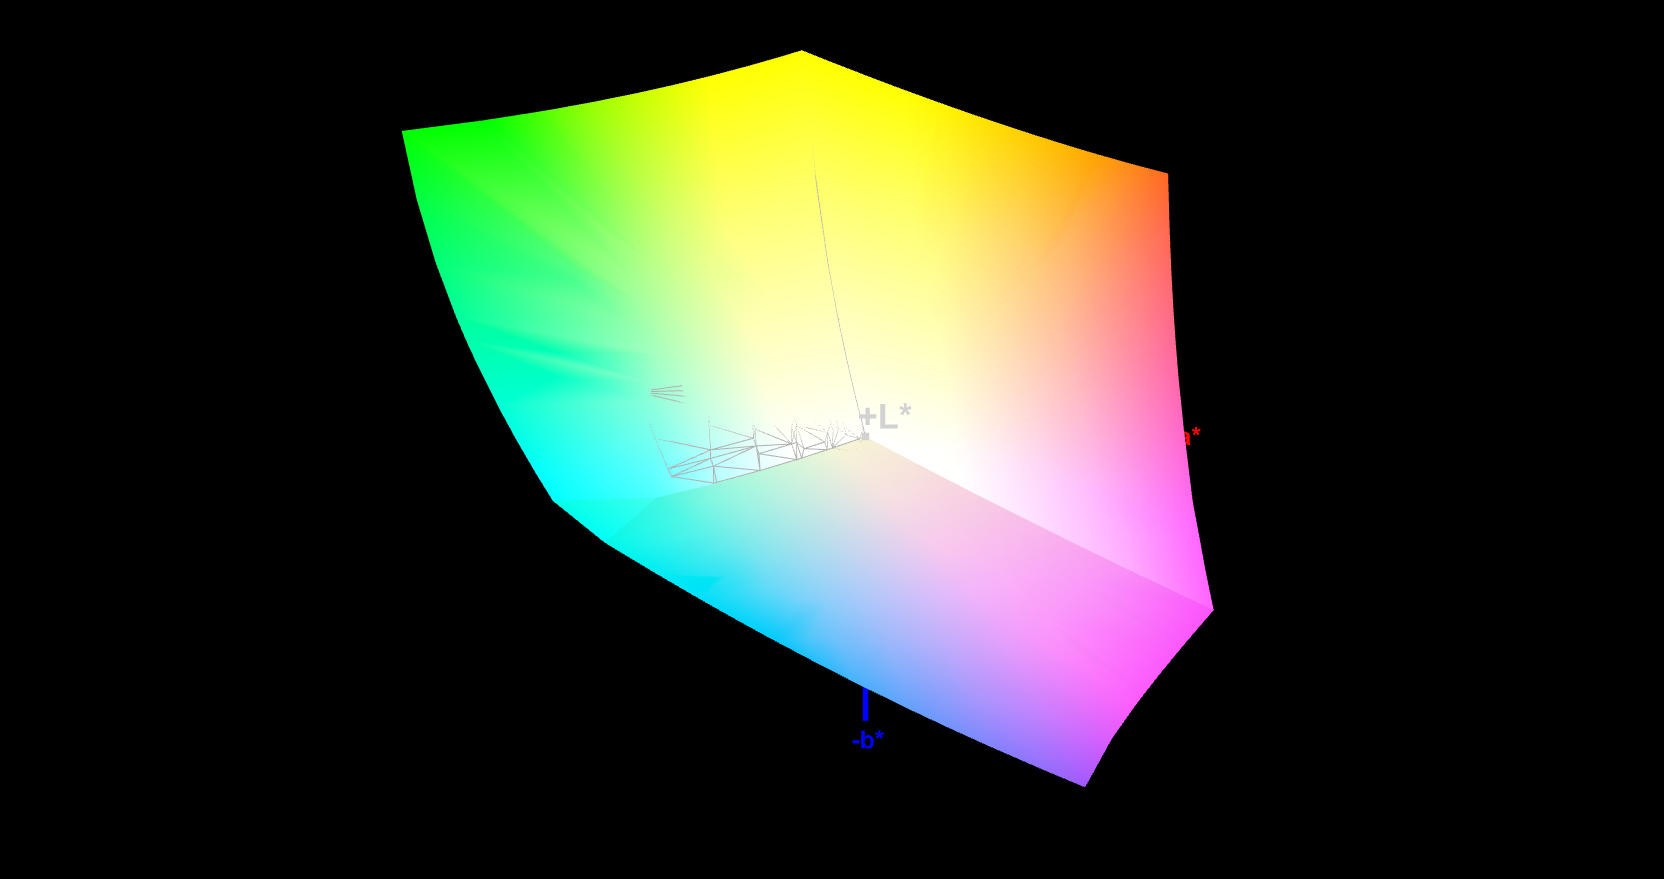
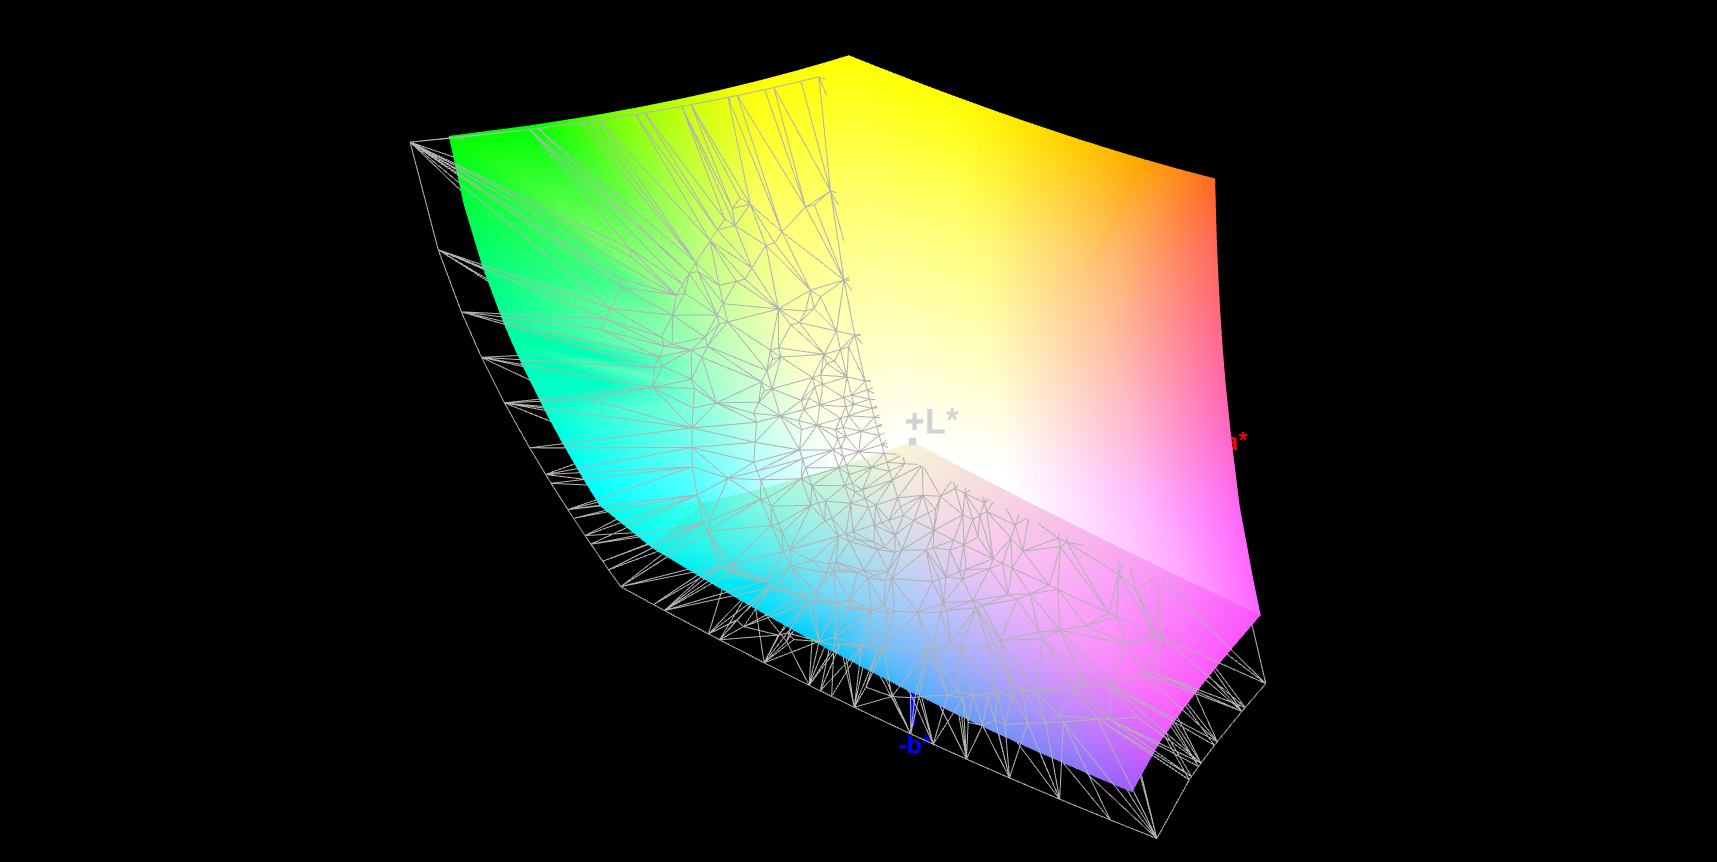
Si se necesita una representación exacta del color, la calibración vale la pena. Nuestro perfil de color calibrado se puede encontrar en el cuadro de arriba. La pantalla logra un muy buen resultado en términos de cobertura del espacio de color. Cubre el 84% (AdobeRGB) y el 98% (sRGB) de los respectivos espacios de color.
Tiempos de respuesta del display
| ↔ Tiempo de respuesta de Negro a Blanco | ||
|---|---|---|
| 37 ms ... subida ↗ y bajada ↘ combinada | ↗ 21 ms subida | 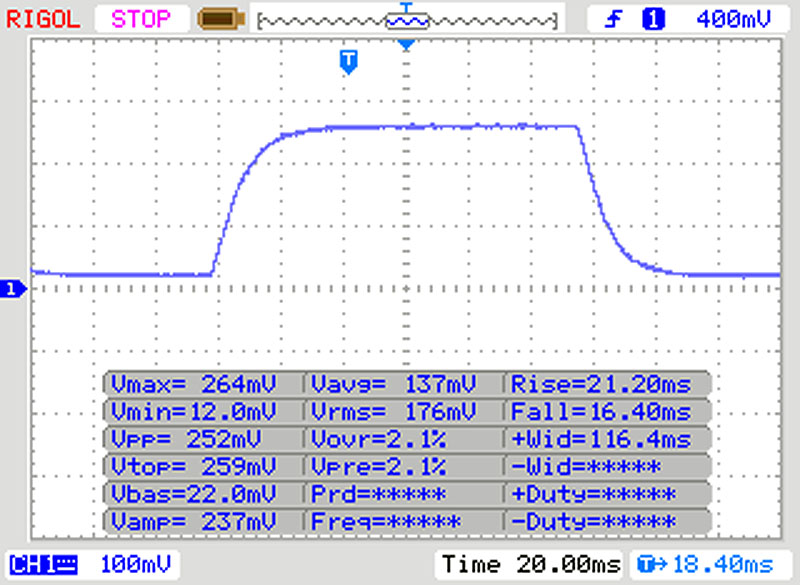 |
| ↘ 16 ms bajada | ||
| La pantalla mostró tiempos de respuesta lentos en nuestros tests y podría ser demasiado lenta para los jugones. En comparación, todos los dispositivos de prueba van de ##min### (mínimo) a 240 (máximo) ms. » 95 % de todos los dispositivos son mejores. Eso quiere decir que el tiempo de respuesta es peor que la media (19.9 ms) de todos los dispositivos testados. | ||
| ↔ Tiempo de respuesta 50% Gris a 80% Gris | ||
| 53 ms ... subida ↗ y bajada ↘ combinada | ↗ 27 ms subida | 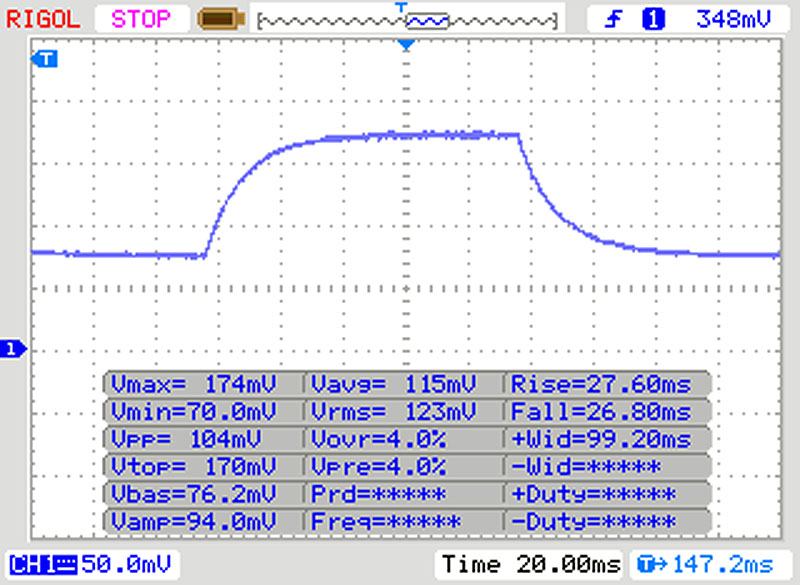 |
| ↘ 26 ms bajada | ||
| La pantalla mostró tiempos de respuesta lentos en nuestros tests y podría ser demasiado lenta para los jugones. En comparación, todos los dispositivos de prueba van de ##min### (mínimo) a 636 (máximo) ms. » 90 % de todos los dispositivos son mejores. Eso quiere decir que el tiempo de respuesta es peor que la media (31.1 ms) de todos los dispositivos testados. | ||
Parpadeo de Pantalla / PWM (Pulse-Width Modulation)
| Parpadeo de Pantalla / PWM no detectado | 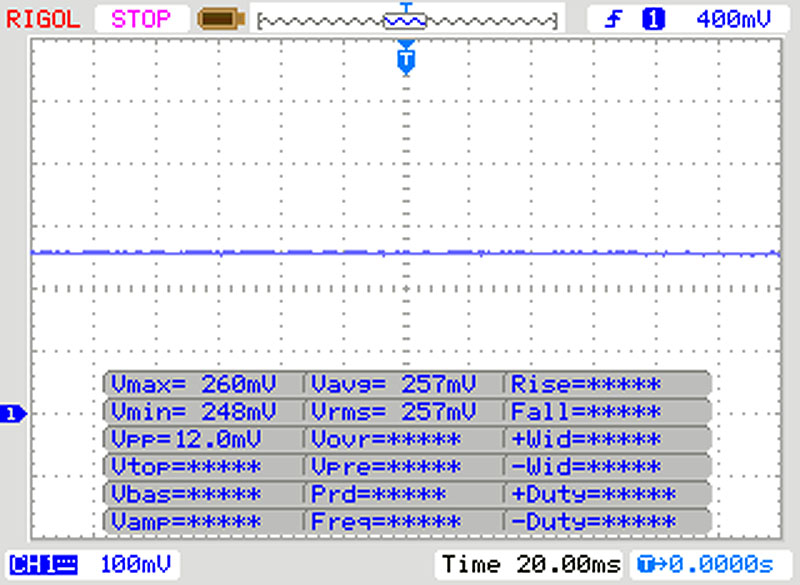 | ||
Comparación: 52 % de todos los dispositivos testados no usaron PWM para atenuar el display. Si se usó, medimos una media de 7794 (mínimo: 5 - máxmo: 343500) Hz. | |||
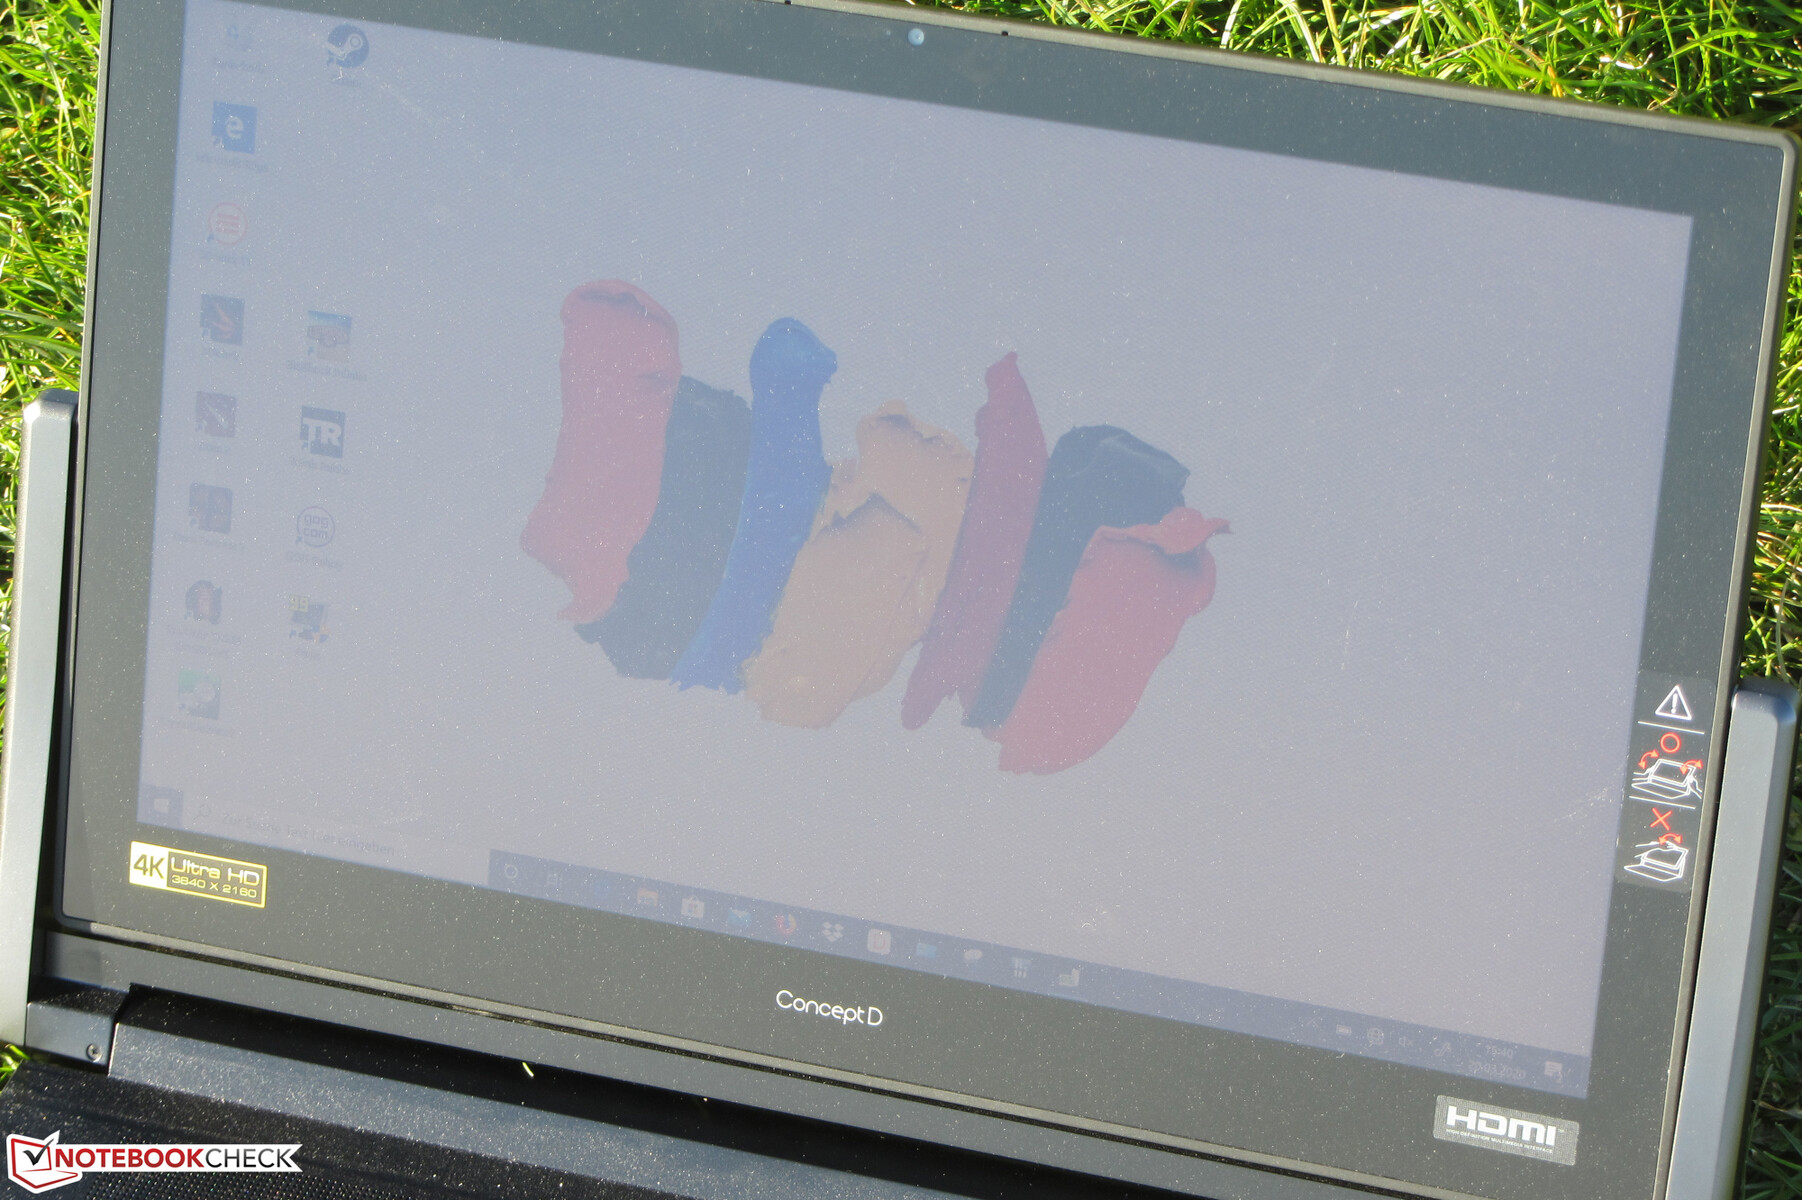
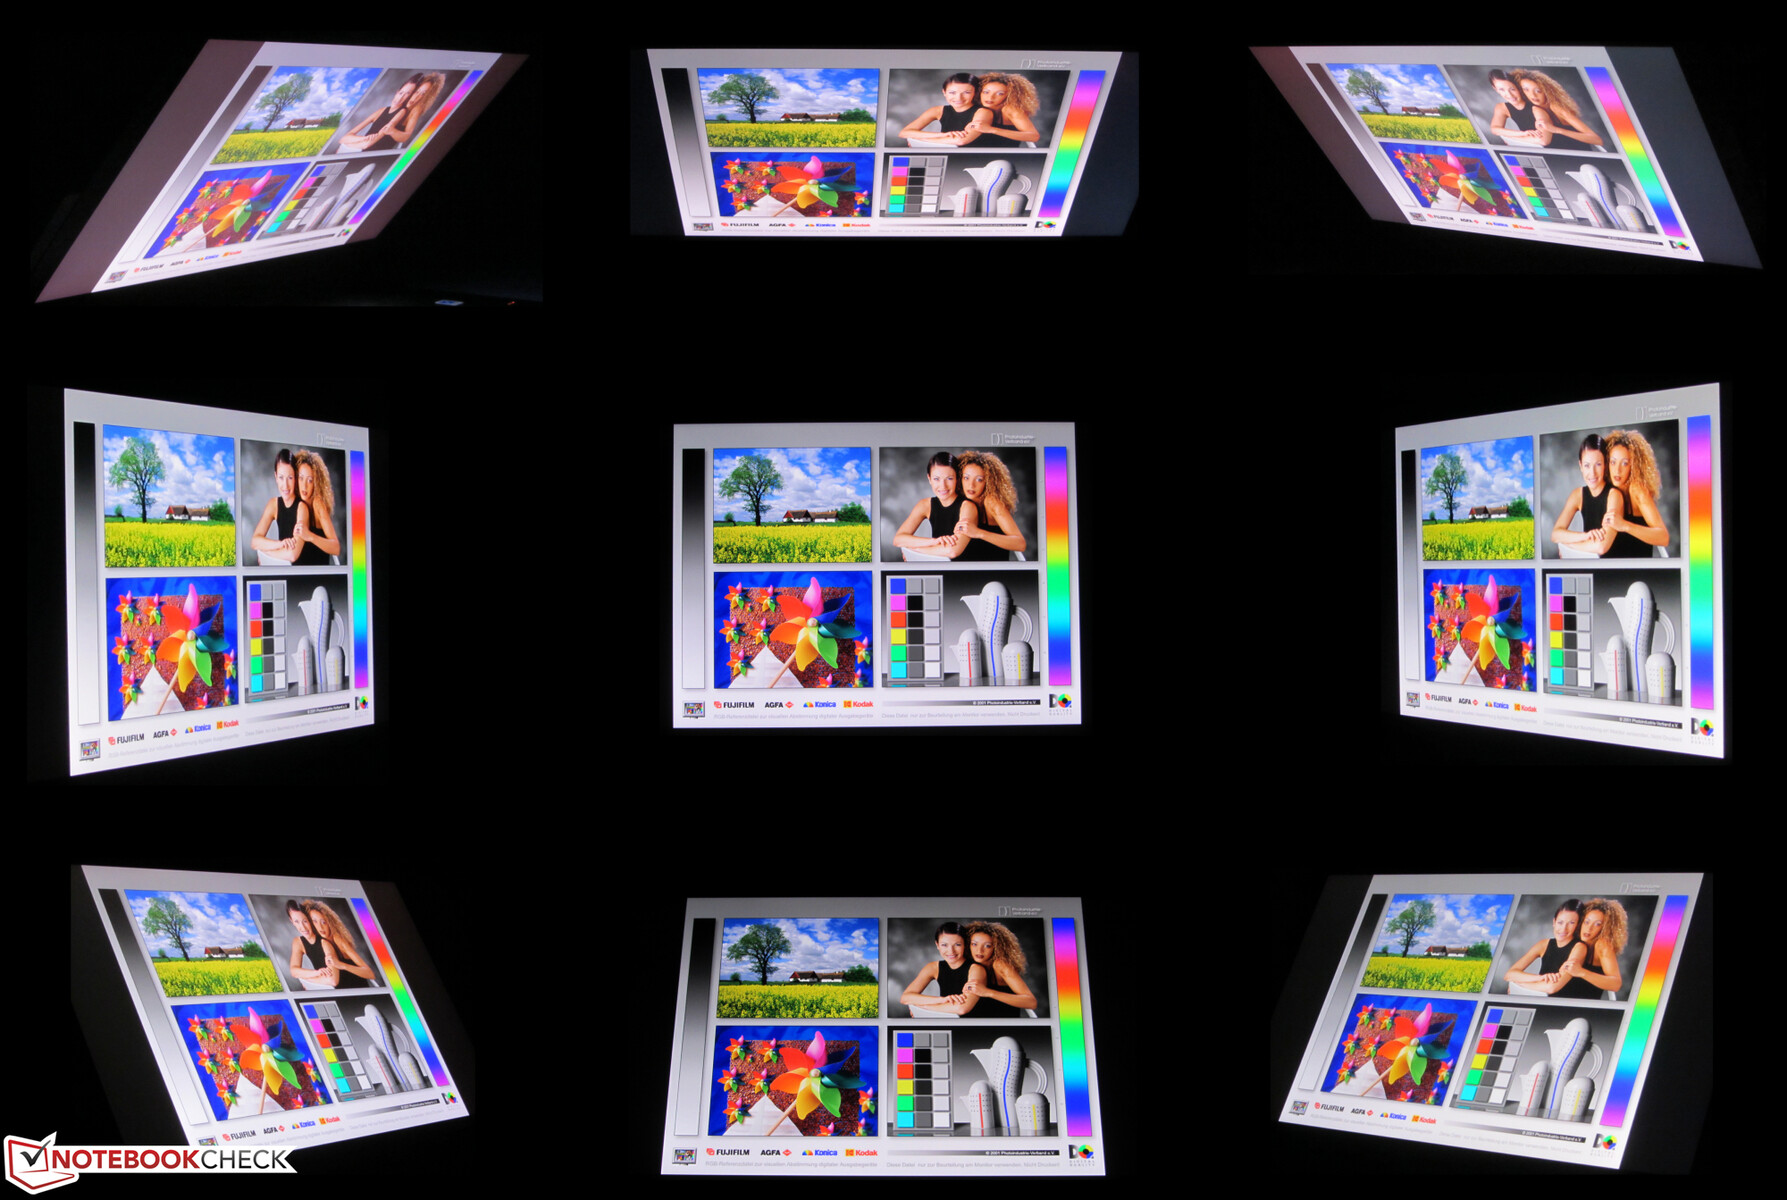
Acer ha equipado el ConceptD 9 con un panel IPS con amplios ángulos de visión. Como resultado, la pantalla puede ser leída desde cualquier posición. Siempre que el sol no brille demasiado, esto también es posible en el exterior.
Rendimiento - Ordenador Acer con hardware de gama alta
Con el ConceptD 9 Pro CN917-71P, Acer tiene una estación de trabajo de 17,3 pulgadas con una potencia de procesamiento más que suficiente para todos los casos de uso común que se ofrecen. La configuración del dispositivo puede adquirirse a partir de unos 5.500 euros (~6.073 dólares). También hay disponibles otras configuraciones.
Procesador
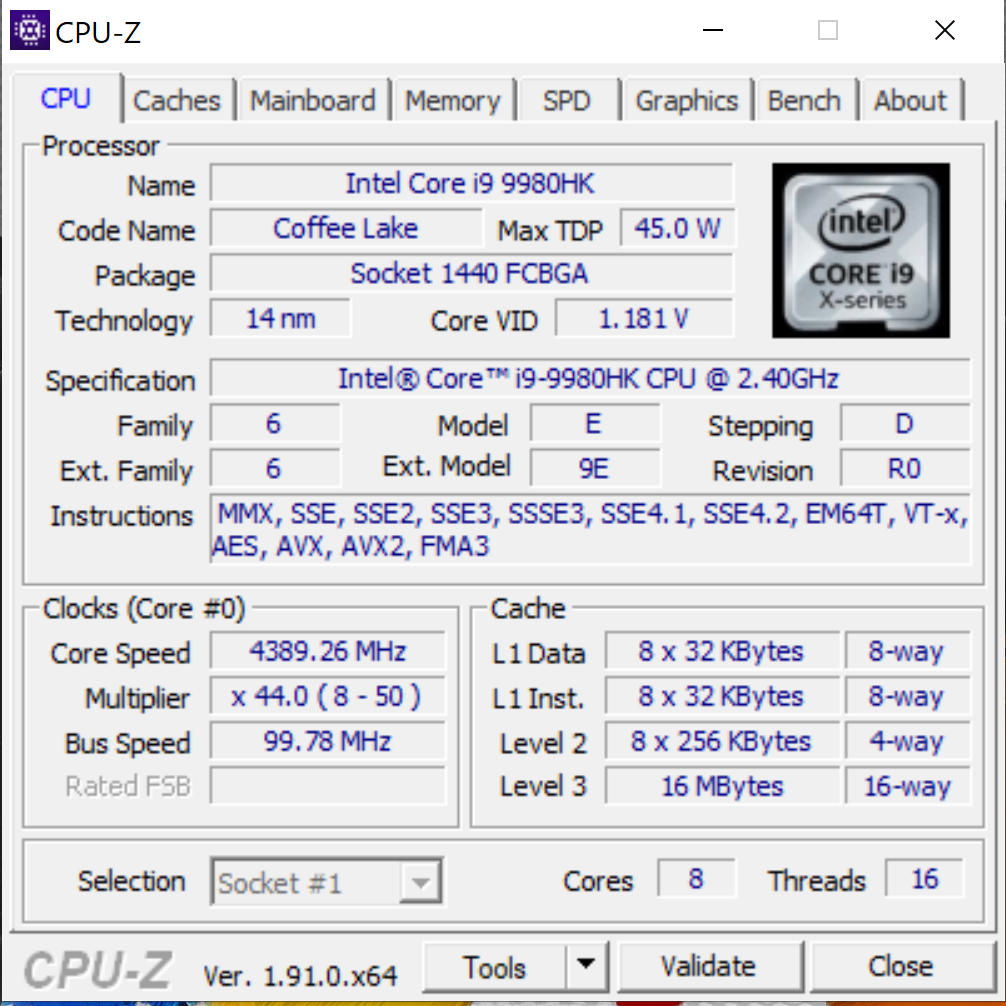
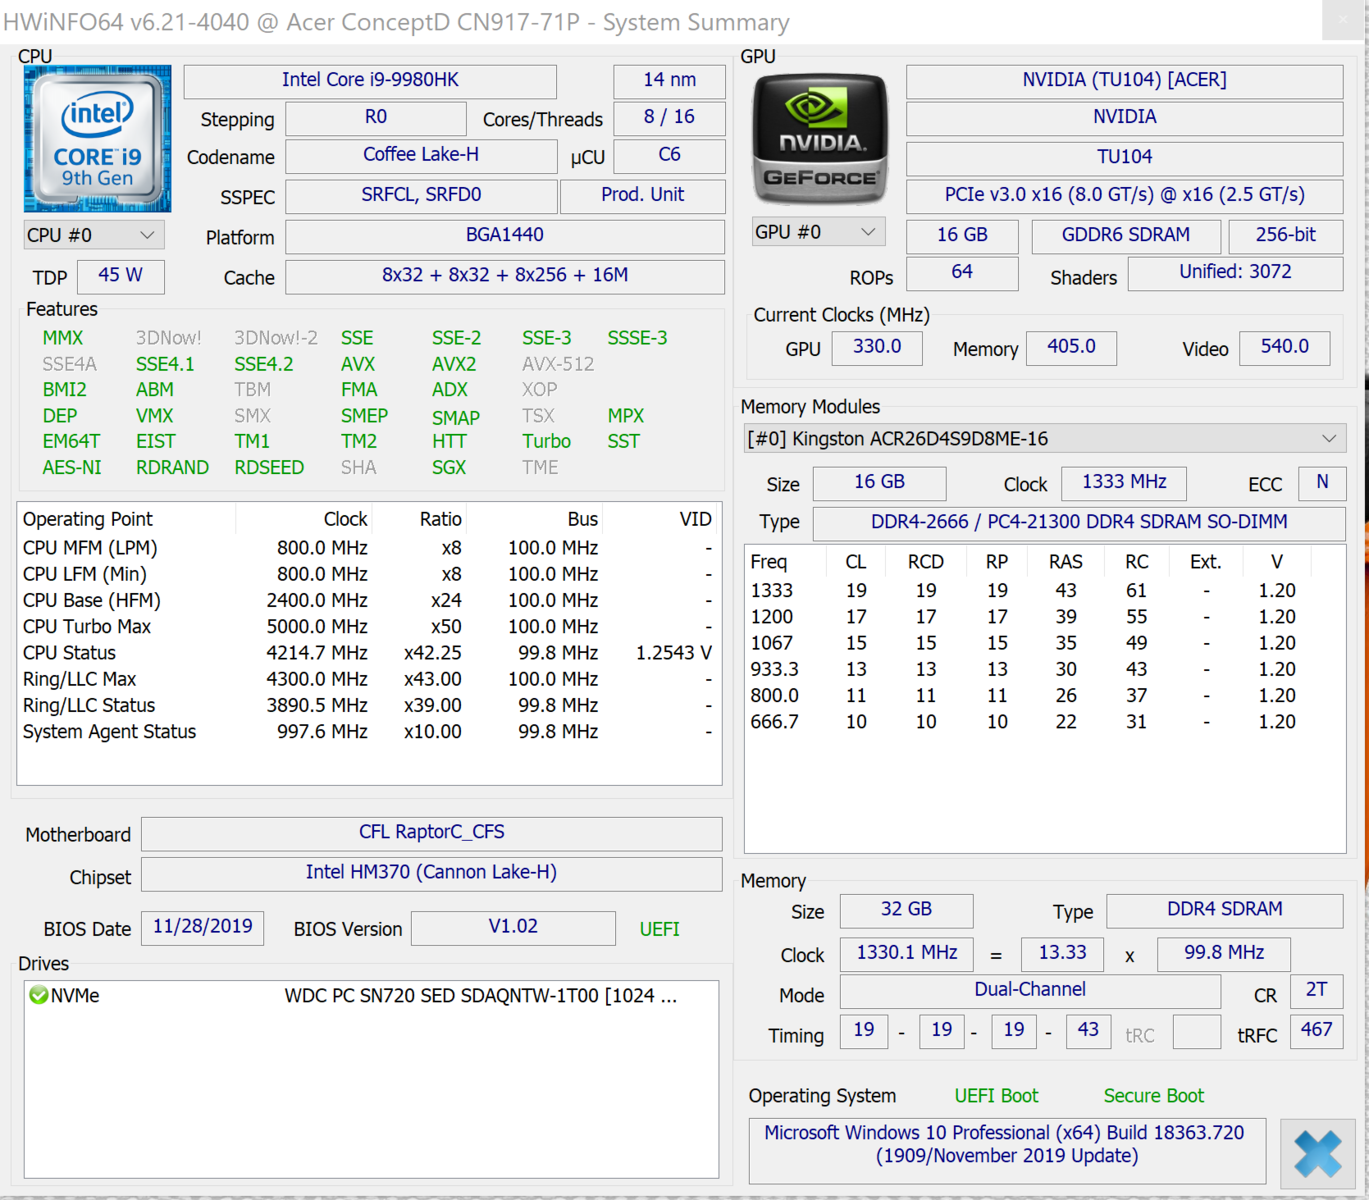
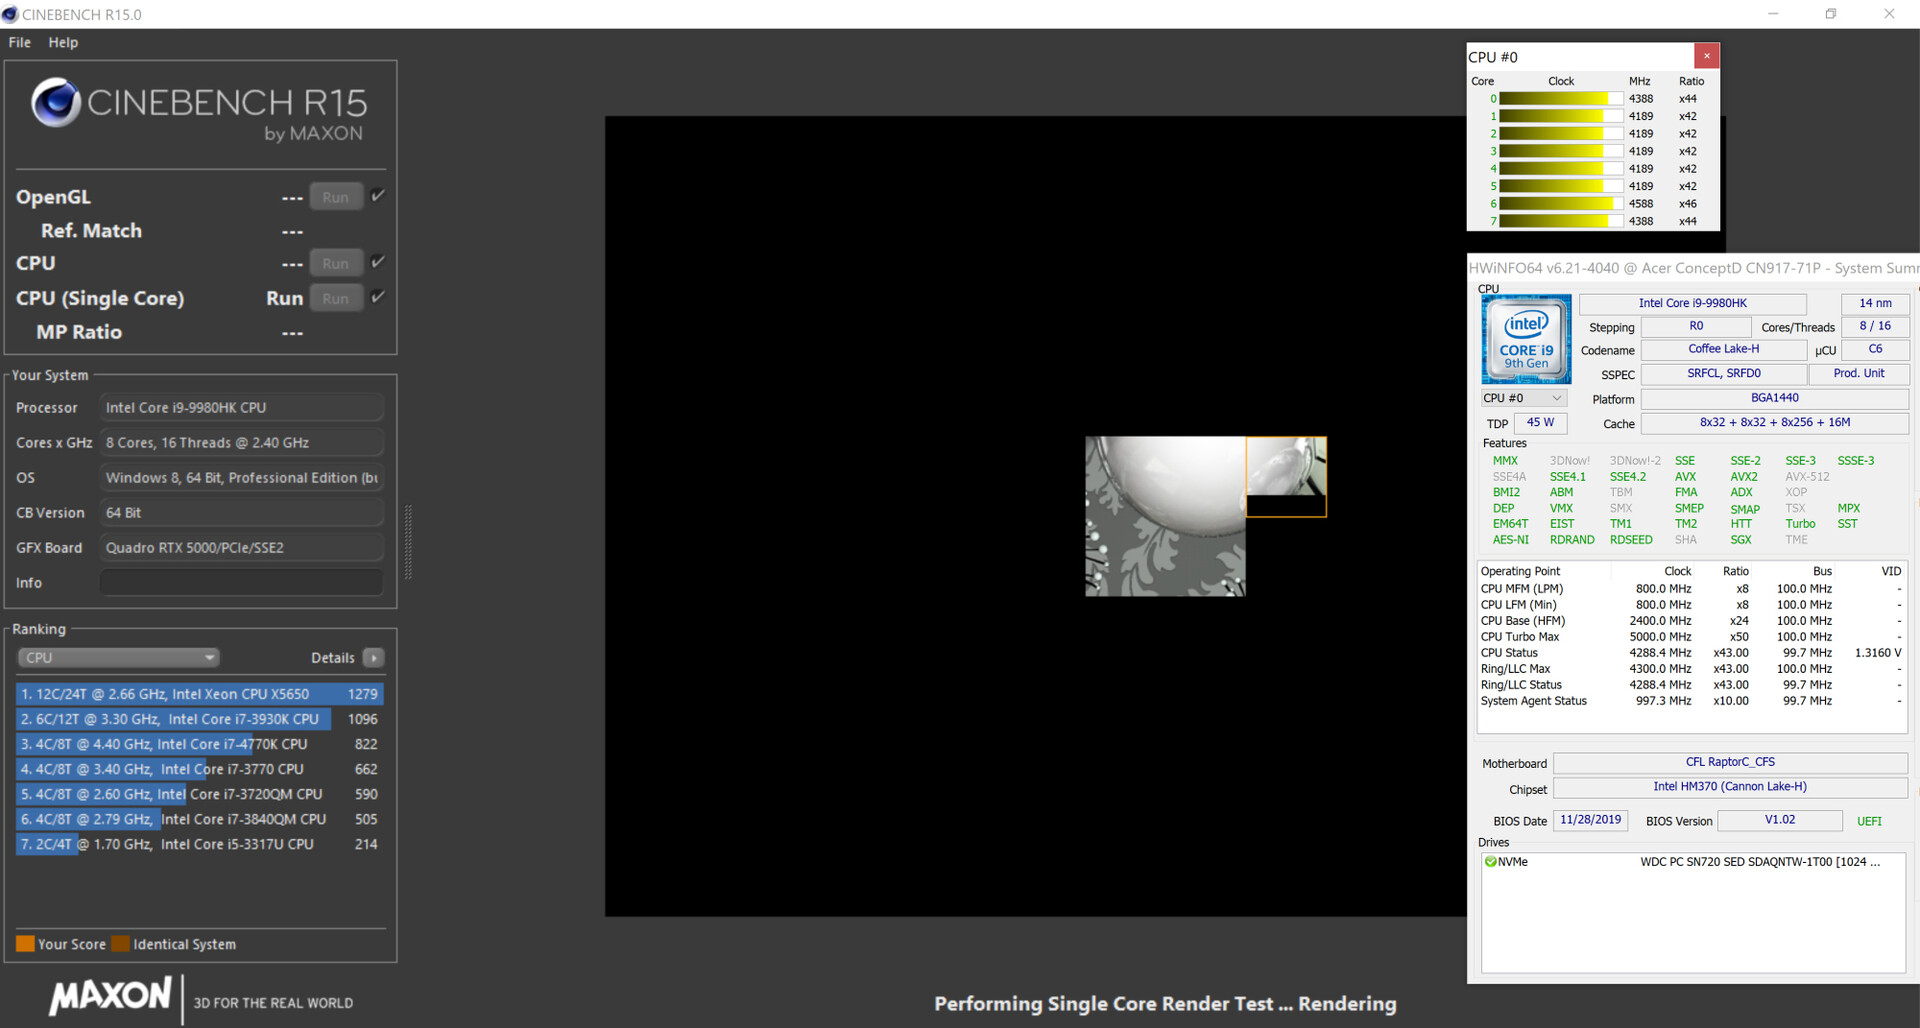
El ConceptD está alimentado por un procesador de ocho núcleos Core i9-9980HK (Coffee Lake). El CPU tiene un reloj base de 2,4 GHz. Mediante el Turbo Boost, la velocidad del reloj puede aumentarse a 4,2 GHz (ocho núcleos), 4,5 GHz (seis núcleos), 4,7 GHz (cuatro núcleos), 4,9 GHz (dos núcleos) o 5 GHz (un solo núcleo). Además, se admite el sistema Hyper-Threading (dos hilos por núcleo). Gracias al multiplicador desbloqueado, el overclocking del procesador es una tarea muy sencilla.
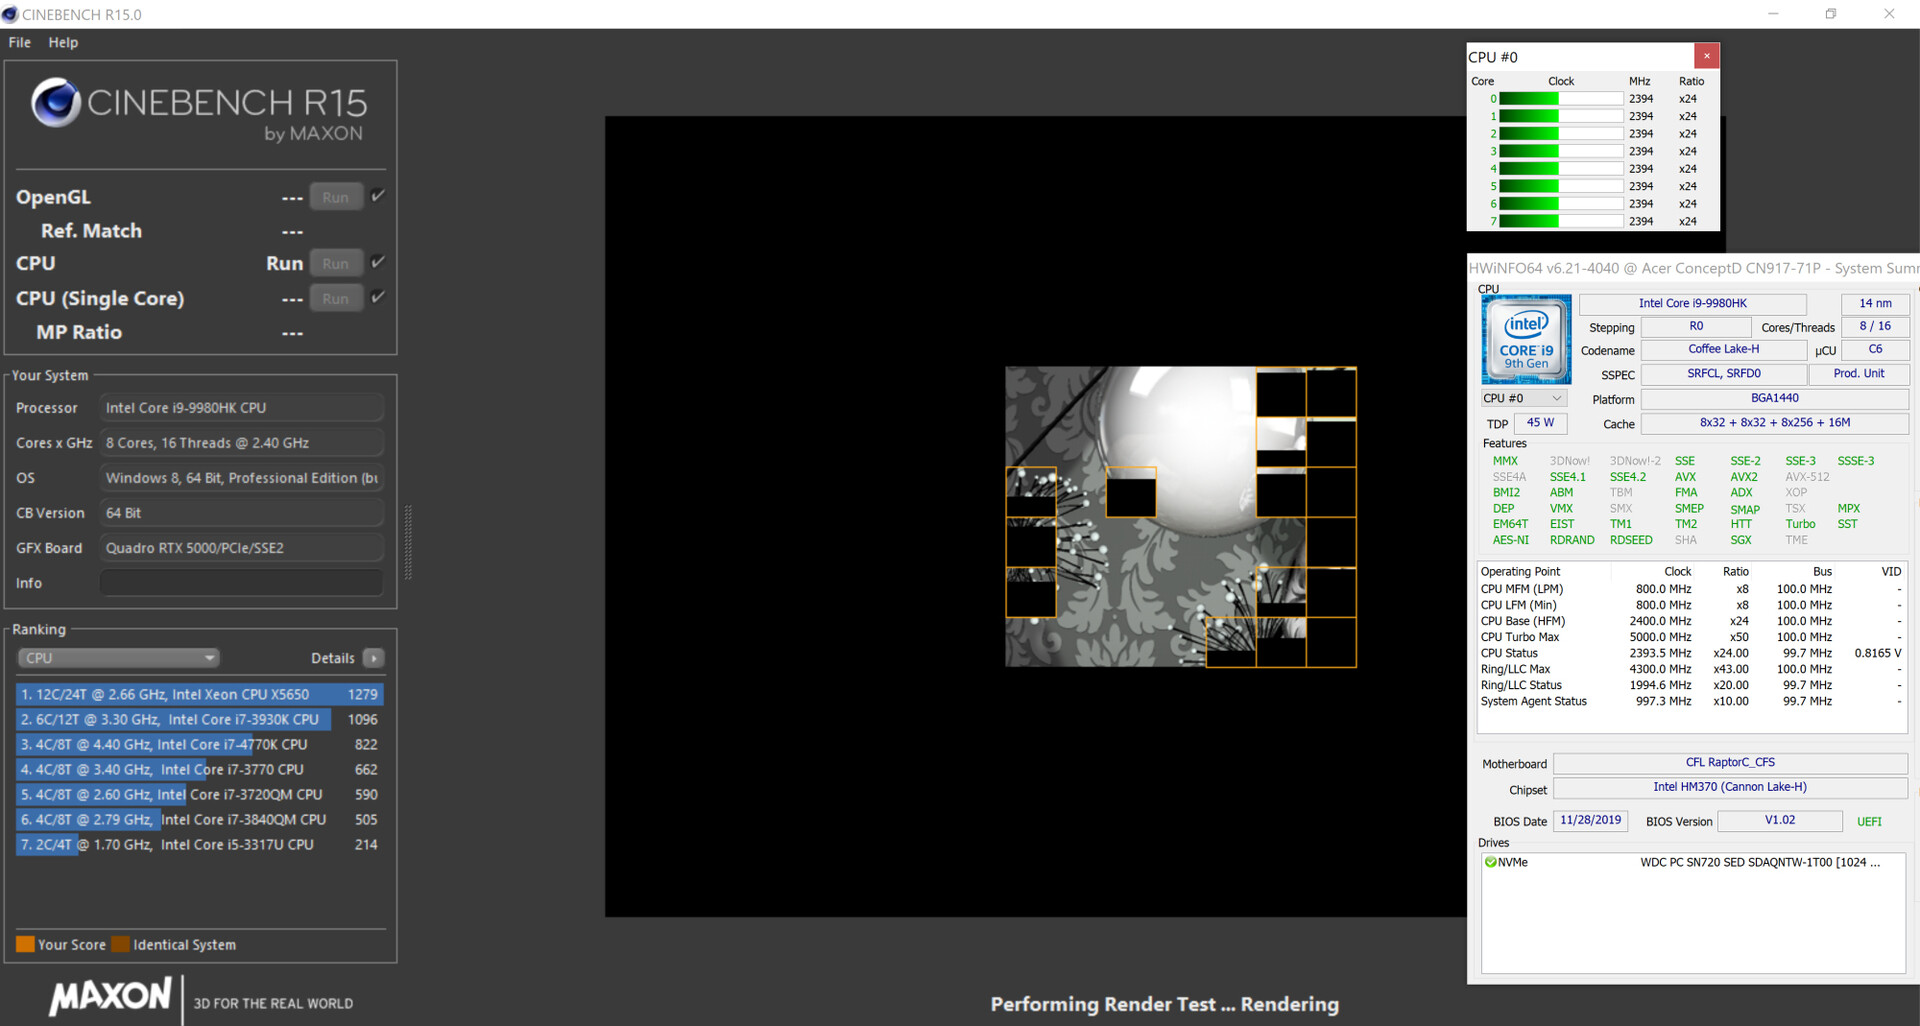
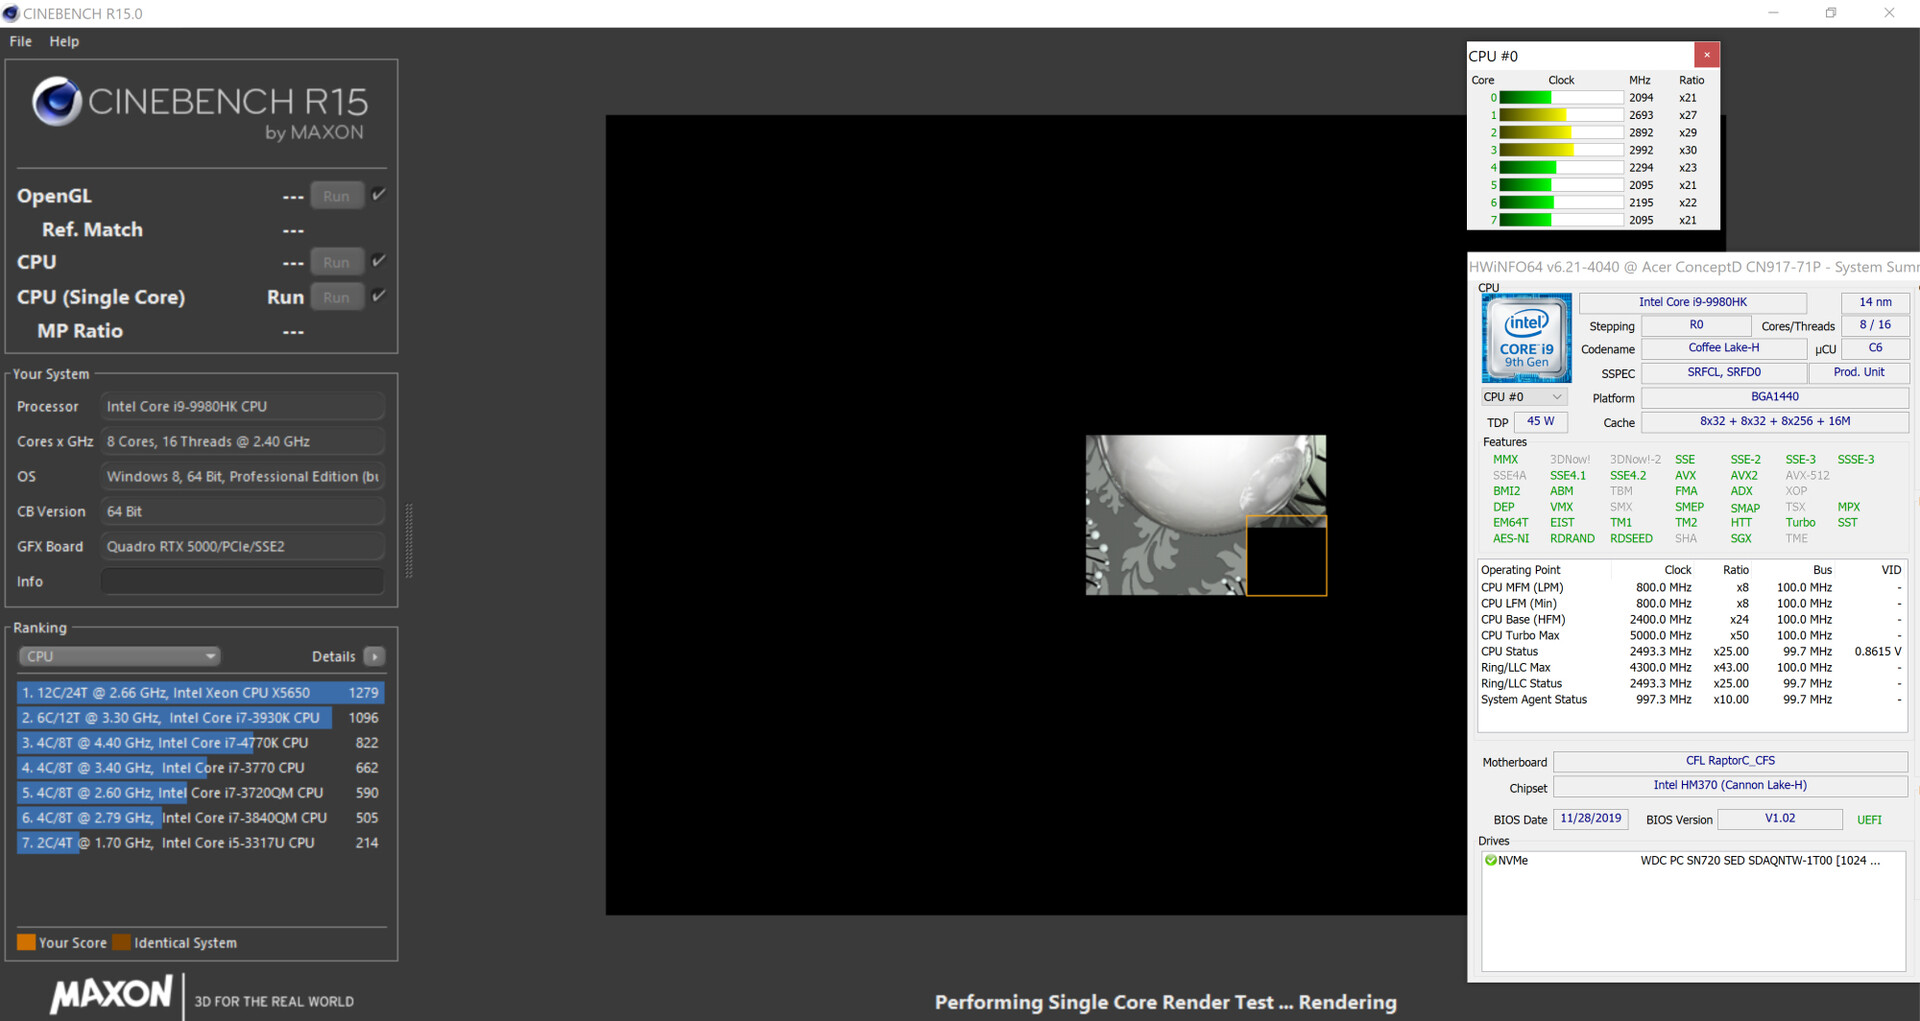
Durante la prueba de multihilo del Cinebench R15, el procesador funciona temporalmente a 4,1 a 4,2 GHz. Posteriormente, la velocidad de reloj baja a 2,8 a 2,9 GHz. Durante la prueba de un solo hilo, la velocidad de reloj va de 4,1 a 5 GHz. En el modo de batería, podemos observar una velocidad de reloj de 2,4 GHz (multihilo) y de 2,1 a 2,8 GHz (hilo único).

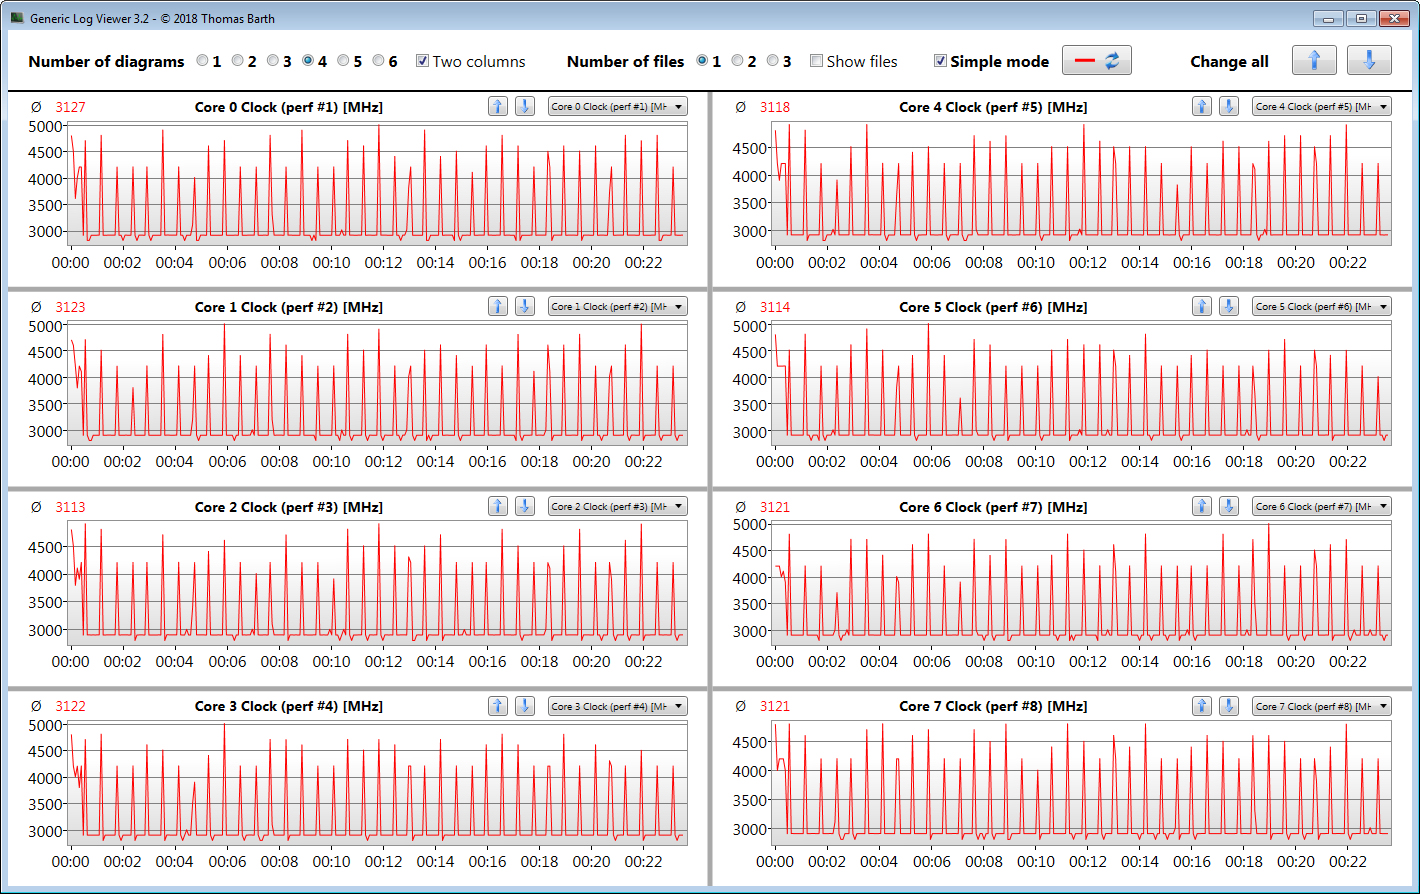
Ejecutando la prueba multihilo del Cinebench R15 en un bucle durante al menos 30 minutos, determinamos si el Turbo Boost del CPU está permanentemente activo mientras el portátil está conectado a una toma de corriente. Los resultados caen significativamente en el segundo bucle, y se estabilizan en un nivel bastante consistente después. Durante esto, el Turbo Boost aumenta ligeramente las velocidades del reloj.
| Cinebench R10 | |
| Rendering Single 32Bit | |
| Media de la clase Workstation (n=1últimos 2 años) | |
| Medio Intel Core i9-9980HK (7709 - 9734, n=4) | |
| Eurocom Tornado F7W | |
| Acer ConceptD 9 Pro | |
| Fujitsu Celsius H980 | |
| Rendering Multiple CPUs 32Bit | |
| Media de la clase Workstation (n=1últimos 2 años) | |
| Medio Intel Core i9-9980HK (39440 - 50439, n=4) | |
| Acer ConceptD 9 Pro | |
| Eurocom Tornado F7W | |
| Fujitsu Celsius H980 | |
| Geekbench 3 | |
| 32 Bit Multi-Core Score | |
| Acer ConceptD 9 Pro | |
| Medio Intel Core i9-9980HK (n=1) | |
| 32 Bit Single-Core Score | |
| Acer ConceptD 9 Pro | |
| Medio Intel Core i9-9980HK (n=1) | |
| Mozilla Kraken 1.1 - Total | |
| Fujitsu Celsius H980 (EDGE: 42.17134.1.0) | |
| Dell Precision 7730 (Edge) | |
| MSI WE75 9TK (Edge 44.17763.831.0) | |
| MSI WE75 9TK | |
| Lenovo ThinkPad P73-20QR002DGE (Edge) | |
| Acer ConceptD 9 Pro (Edge 44) | |
| Medio Intel Core i9-9980HK (705 - 999, n=9) | |
| Media de la clase Workstation (411 - 538, n=25, últimos 2 años) | |
| Octane V2 - Total Score | |
| Media de la clase Workstation (92715 - 129420, n=4, últimos 2 años) | |
| Medio Intel Core i9-9980HK (40364 - 46473, n=8) | |
| Acer ConceptD 9 Pro (Edge 44) | |
| Lenovo ThinkPad P73-20QR002DGE (Edge) | |
| MSI WE75 9TK (Edge 44.17763.831.0) | |
| Dell Precision 7730 (Edge) | |
| Fujitsu Celsius H980 (EDGE: 42.17134.1.0) | |
| JetStream 1.1 - 1.1 Total | |
| Eurocom Tornado F7W (Edge 42.17134.1.0) | |
| Acer ConceptD 9 Pro (Edge 44) | |
| Medio Intel Core i9-9980HK (257 - 318, n=8) | |
| MSI WE75 9TK (Edge 44.17763.831.0) | |
| Fujitsu Celsius H980 (EDGE: 42.17134.1.0) | |
* ... más pequeño es mejor
Rendimiento del sistema
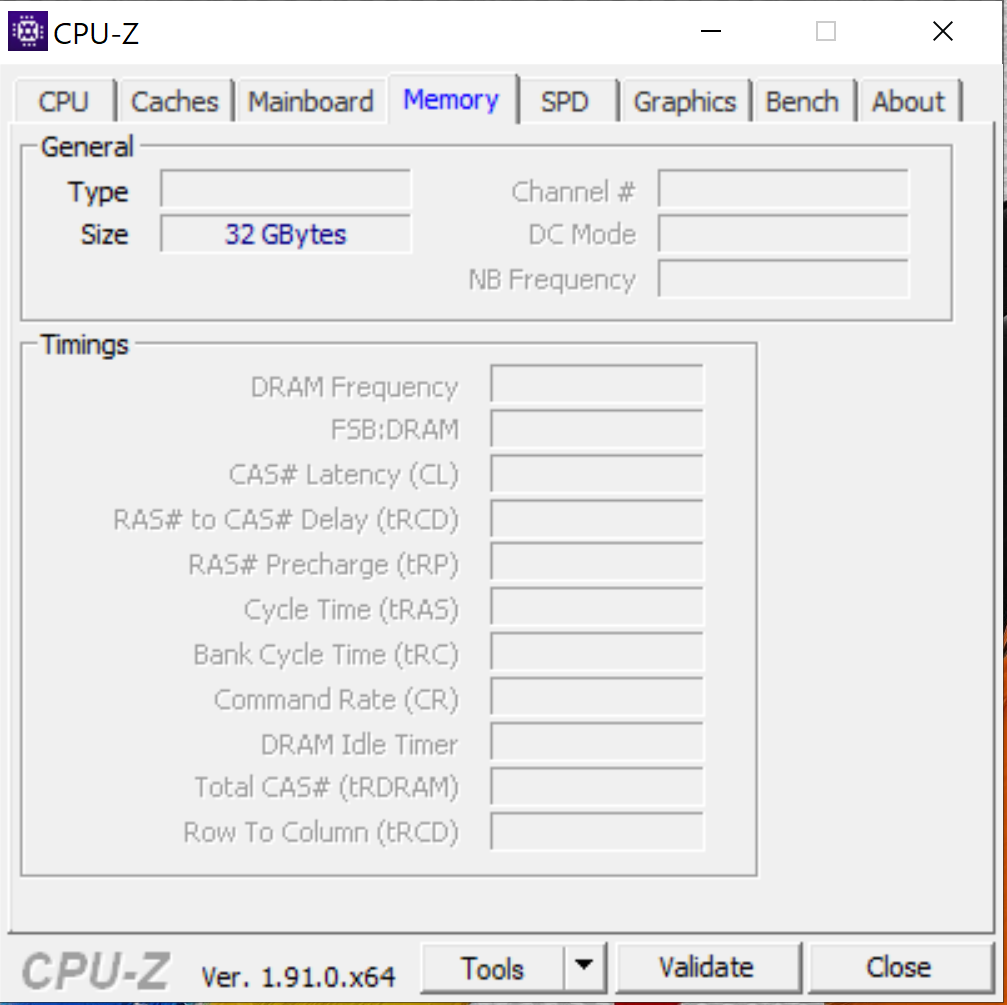
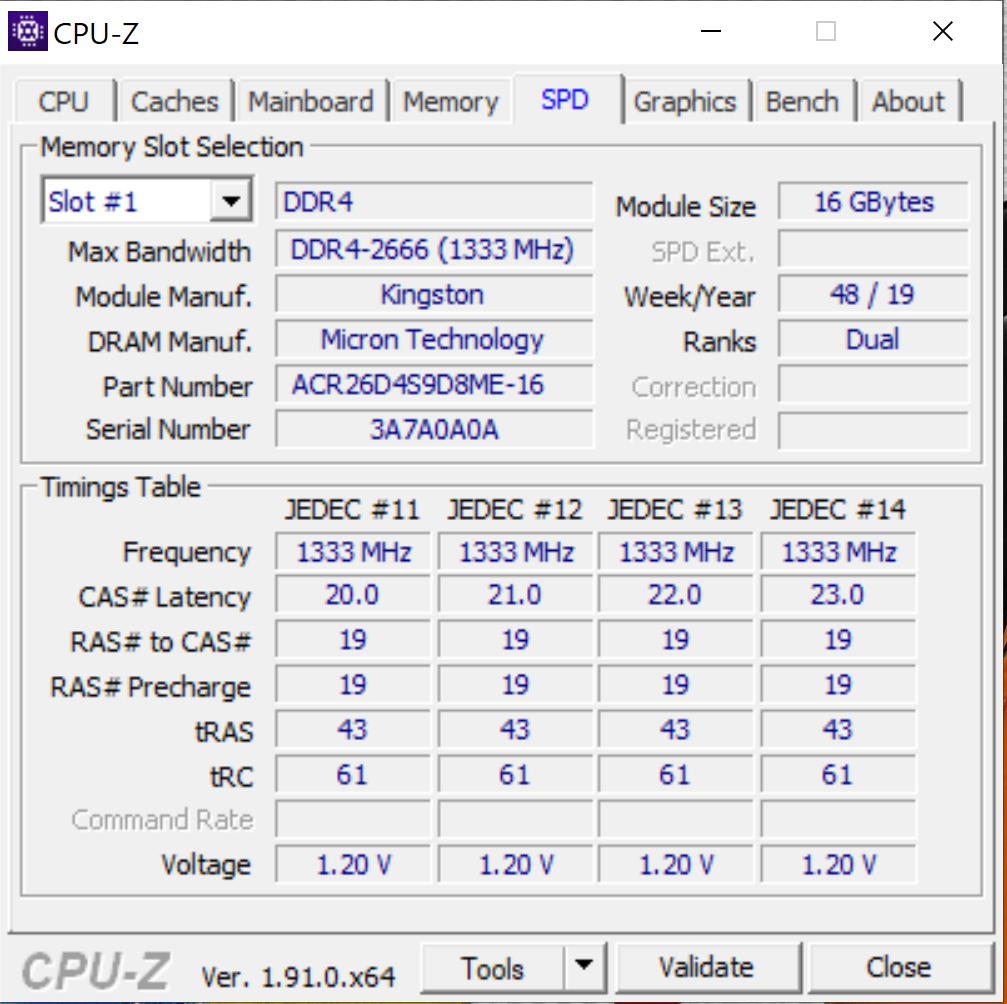
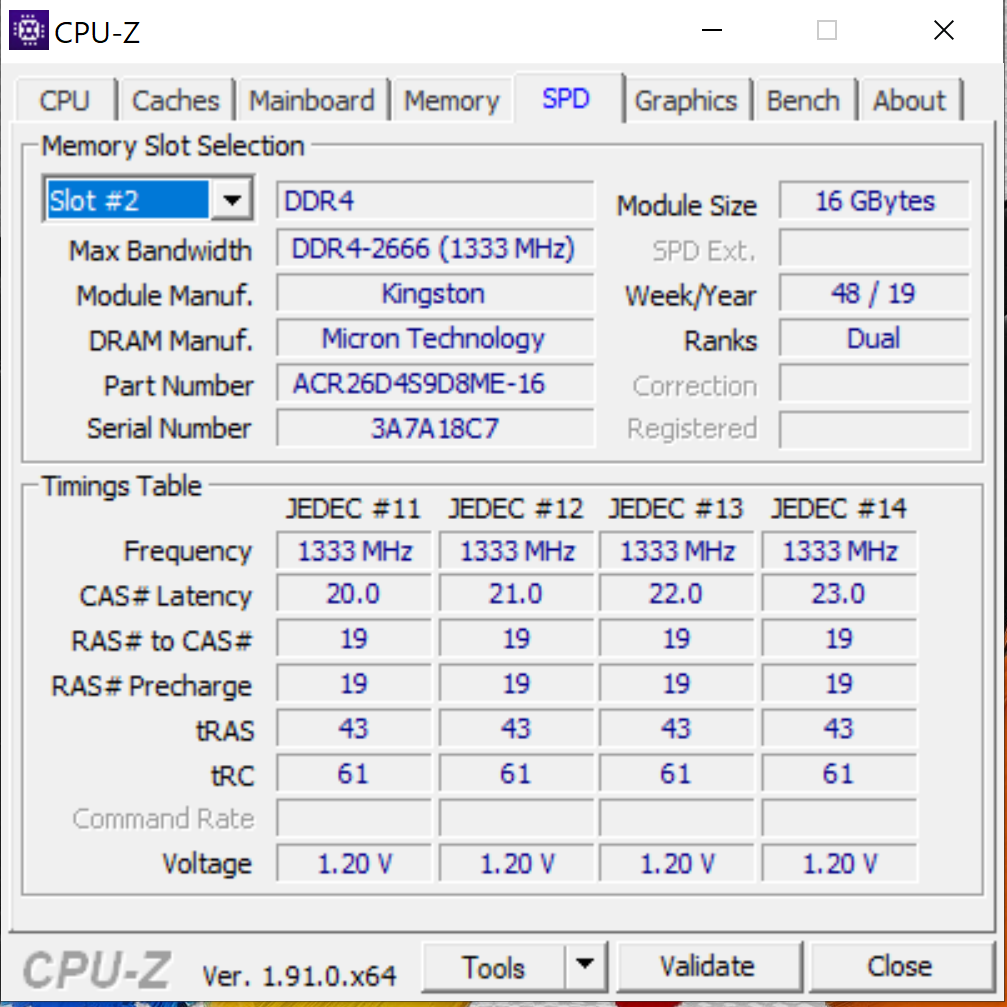
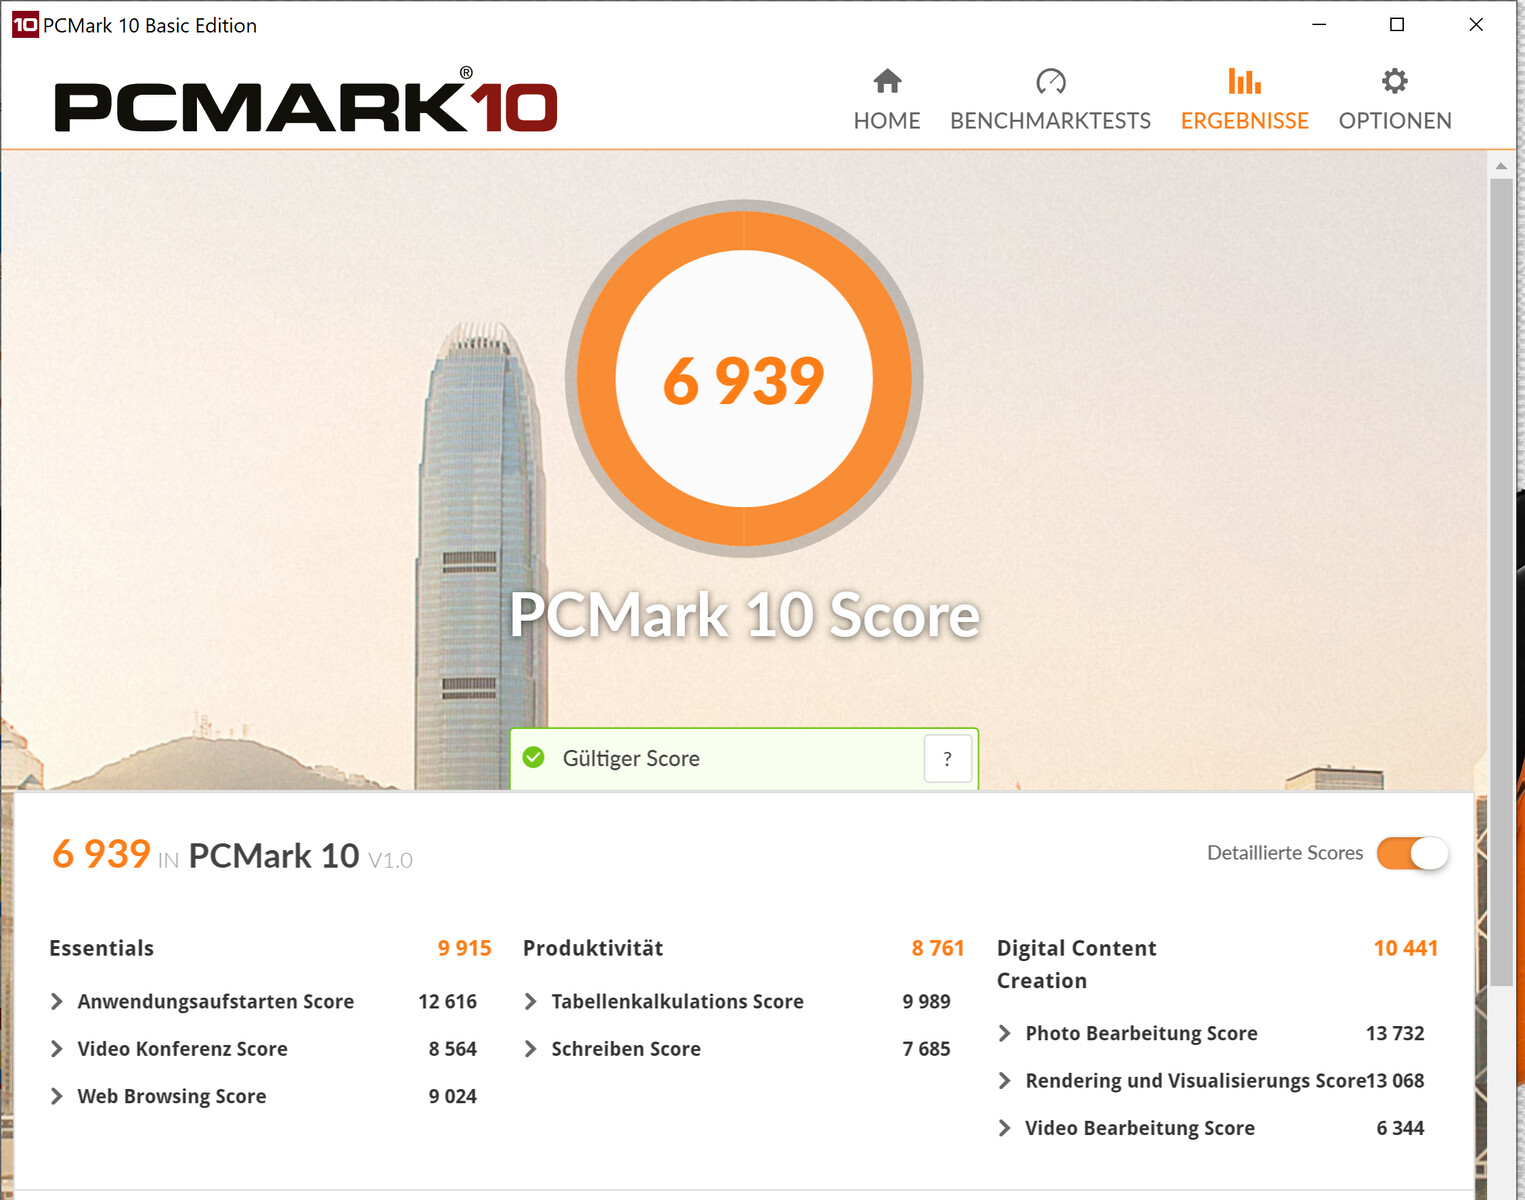
El portátil de 17,3 pulgadas no carece de rendimiento del sistema. Un potente procesador de ocho núcleos, una RAM de modo de doble canal y una rápida SSD NVMe hacen que el sistema funcione sin problemas y responda bien. Además, la estación de trabajo está equipada con una GPU de alta gama. Los resultados de la prueba de referencia PCMark son excelentes, lo que pone de relieve una vez más el hecho de que el portátil es lo suficientemente rápido para todos los casos de uso común.
| PCMark 8 Home Score Accelerated v2 | 4487 puntos | |
| PCMark 8 Creative Score Accelerated v2 | 6412 puntos | |
| PCMark 8 Work Score Accelerated v2 | 4884 puntos | |
| PCMark 10 Score | 6939 puntos | |
ayuda | ||
Solución de almacenamiento
Un SSD NVMe de Western Digital sirve como unidad de sistema. En este caso, es un modelo en el factor de forma M.2 2280 con 1 TB de espacio de almacenamiento. De fábrica, los usuarios disponen de unos 887 GB. El espacio restante está ocupado por la partición de recuperación y el sistema Windows. Las tasas de transferencia son buenas. En el interior de la estación de trabajo, hay una ranura adicional M.2 2280 disponible. Si se instalan dos discos, pueden funcionar en el RAID 0.


| Acer ConceptD 9 Pro WDC PC SN720 SDAQNTW-1T00 | Lenovo ThinkPad P73-20QR002DGE Intel SSD Pro 7600p SSDPEKKF512G8L | MSI WE75 9TK Samsung SSD PM981 MZVLB512HAJQ | Dell Precision 7730 Samsung SSD PM981 MZVLB512HAJQ | Eurocom Tornado F7W 3x Samsung SSD 970 Pro 512GB (RAID 0) | Fujitsu Celsius H980 Samsung SSD PM981 MZVLB512HAJQ | Medio WDC PC SN720 SDAQNTW-1T00 | |
|---|---|---|---|---|---|---|---|
| CrystalDiskMark 5.2 / 6 | -6% | -3% | -24% | 2% | -30% | -3% | |
| Write 4K (MB/s) | 176 | 154.3 -12% | 135.4 -23% | 103.2 -41% | 116.3 -34% | 111.8 -36% | 168.6 ? -4% |
| Read 4K (MB/s) | 48.06 | 66.4 38% | 56.6 18% | 41.39 -14% | 52.7 10% | 32.02 -33% | 47.6 ? -1% |
| Write Seq (MB/s) | 2736 | 1561 -43% | 1972 -28% | 1880 -31% | 2539 -7% | 1539 -44% | 2602 ? -5% |
| Read Seq (MB/s) | 2381 | 2460 3% | 2101 -12% | 2350 -1% | 2972 25% | 1252 -47% | 2084 ? -12% |
| Write 4K Q32T1 (MB/s) | 418.6 | 438 5% | 527 26% | 282.3 -33% | 454.6 9% | 355.4 -15% | 391 ? -7% |
| Read 4K Q32T1 (MB/s) | 460.8 | 568 23% | 578 25% | 314.3 -32% | 515 12% | 408.7 -11% | 481 ? 4% |
| Write Seq Q32T1 (MB/s) | 2791 | 1581 -43% | 1985 -29% | 1881 -33% | 3101 11% | 1913 -31% | 2792 ? 0% |
| Read Seq Q32T1 (MB/s) | 3430 | 2724 -21% | 3358 -2% | 3216 -6% | 3078 -10% | 2530 -26% | 3377 ? -2% |
Rendimiento de la GPU
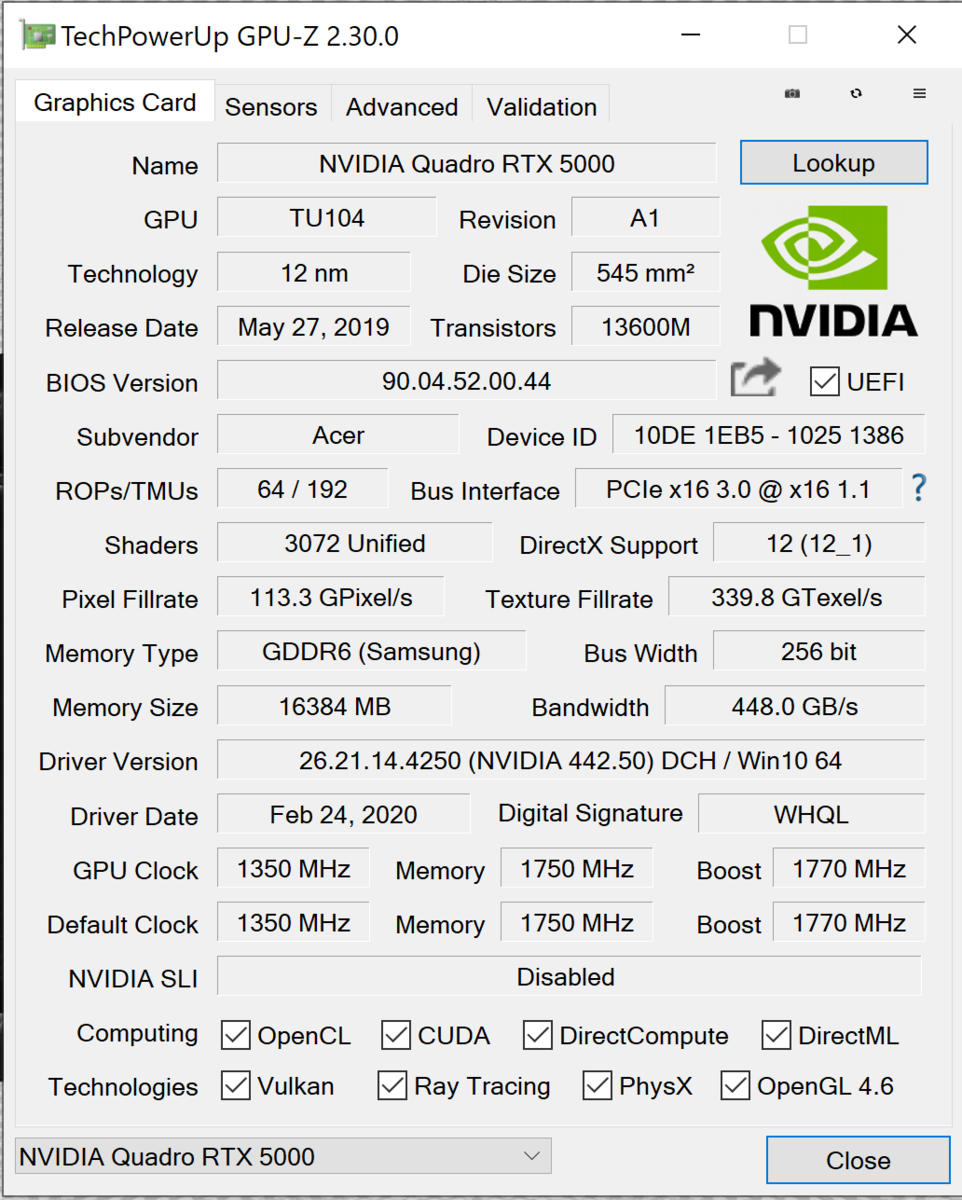
El portátil de Acer está equipado con una GPU Quadro RTX 5000. Esta GPU está basada en la arquitectura Turing de Nvidia y representa la versión profesional de la GPU GeForce RTX 2080. Sin embargo, el RTX 5000 tiene más unidades de sombreado (3.072 en lugar de 2.944). También tiene acceso a la rápida memoria GDDR6 (16.384 GB).
Hay dos variantes de la GPU del RTX 5000 móvil, que difieren en términos de su TGP (150 vatios contra 110 vatios) y por lo tanto de su rendimiento. La variante más potente está instalada en el ConceptD. Además, Nvidia también tiene tres versiones Max-Q del RTX 5000 en oferta.
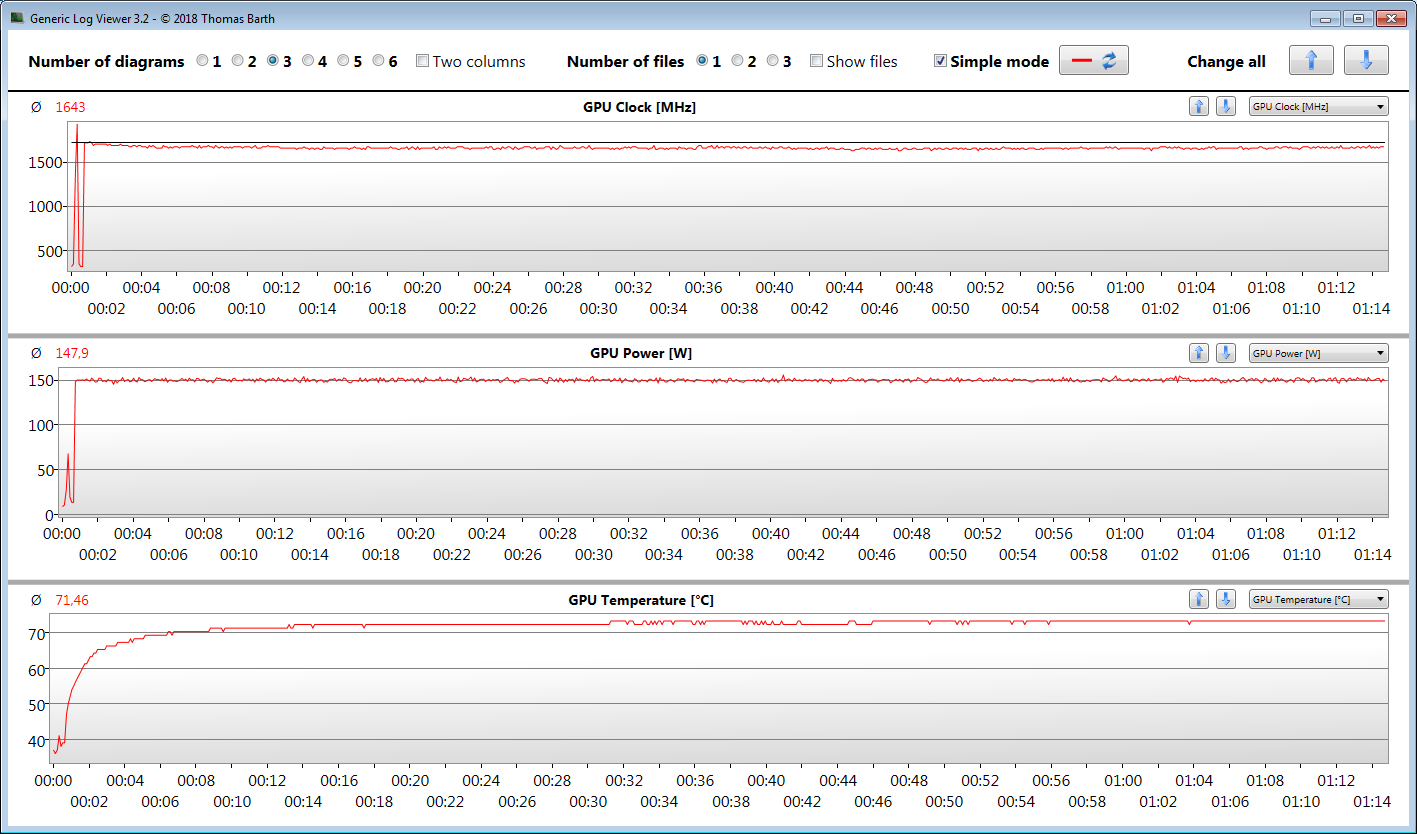
El RTX 5000 funciona a una velocidad de reloj base de 1350 MHz. Por medio de un impulso, se puede aumentar a 1770 MHz. Siempre que la GPU no cruce un cierto umbral predefinido de temperatura y/o consumo de energía, son posibles frecuencias aún más altas. Hemos registrado un pico en el reloj base de 1927 MHz. En nuestra prueba de The Witcher 3, la GPU funciona a una velocidad media de 1643 MHz.
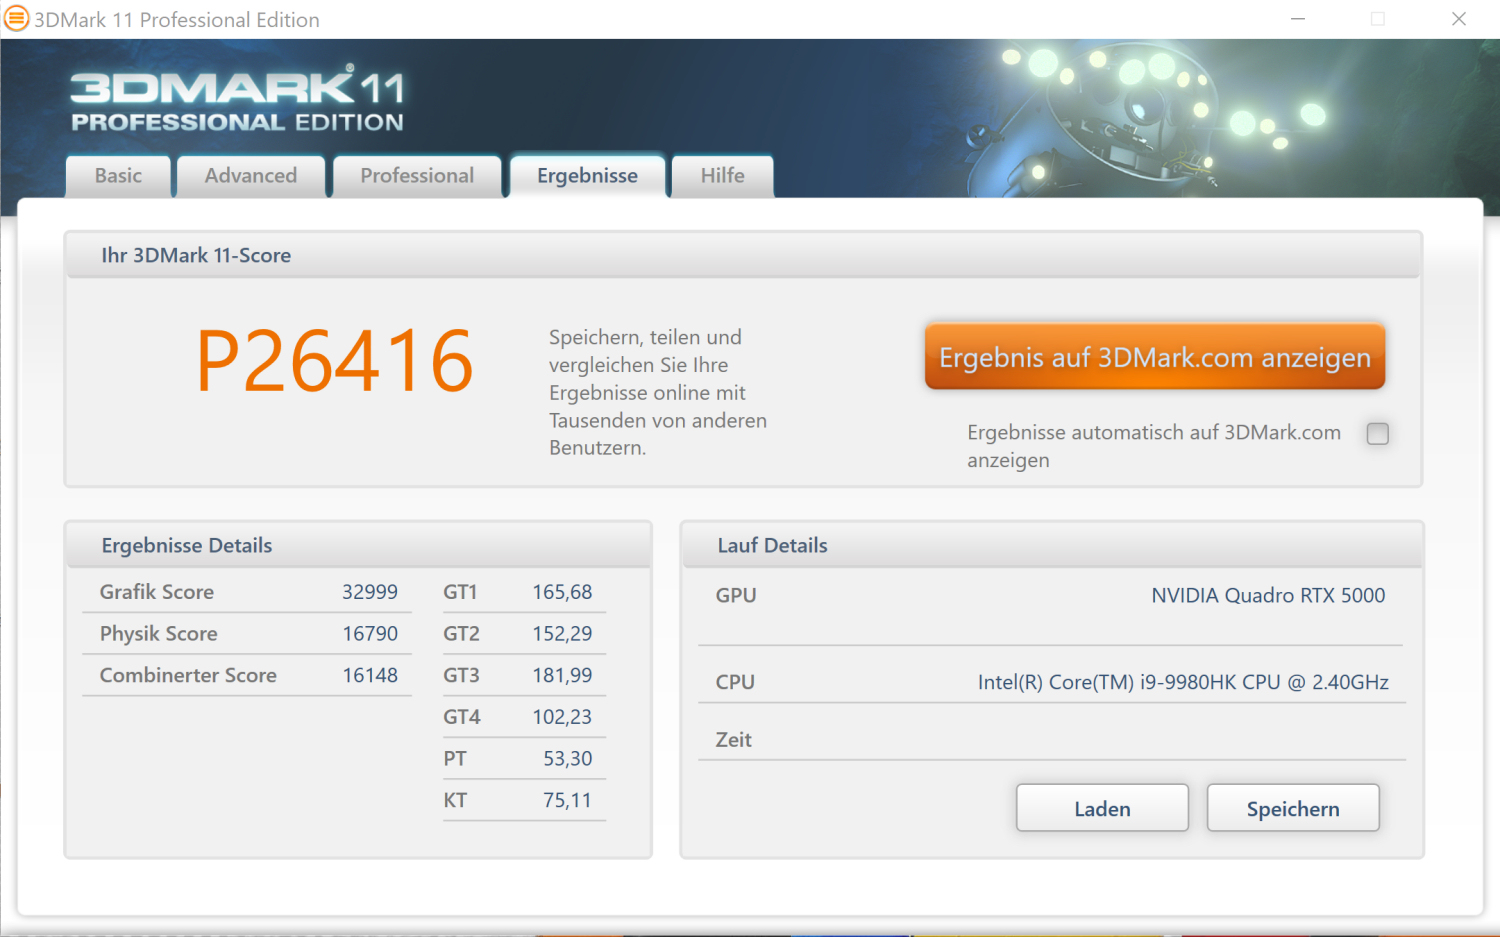
Los resultados de 3DMark coinciden con nuestras expectativas. La GPU UHD Graphics 630 integrada está desactivada y el portátil no utiliza la tecnología de conmutación de gráficos de Nvidia, Optimus.

| 3DMark 06 Standard Score | 45180 puntos | |
| 3DMark 11 Performance | 26416 puntos | |
| 3DMark Ice Storm Standard Score | 184872 puntos | |
| 3DMark Cloud Gate Standard Score | 44296 puntos | |
| 3DMark Fire Strike Score | 20374 puntos | |
| 3DMark Time Spy Score | 9779 puntos | |
ayuda | ||
| Geekbench 5.5 | |
| Vulkan Score 5.1 | |
| Acer ConceptD 9 Pro | |
| Medio NVIDIA Quadro RTX 5000 (Laptop) (n=1) | |
| OpenCL Score 5.1 | |
| Acer ConceptD 9 Pro | |
| Medio NVIDIA Quadro RTX 5000 (Laptop) (n=1) | |
| VRMark | |
| Cyan Room | |
| Acer ConceptD 9 Pro | |
| Medio NVIDIA Quadro RTX 5000 (Laptop) (n=1) | |
| Blue Room | |
| Acer ConceptD 9 Pro | |
| Medio NVIDIA Quadro RTX 5000 (Laptop) (n=1) | |
| Orange Room | |
| Acer ConceptD 9 Pro | |
| Medio NVIDIA Quadro RTX 5000 (Laptop) (n=1) | |
| Basemark GPU 1.2 | |
| 1920x1080 OpenGL Medium Offscreen | |
| Acer ConceptD 9 Pro | |
| Medio NVIDIA Quadro RTX 5000 (Laptop) (n=1) | |
| 3840x2160 Vulkan High Offscreen | |
| Acer ConceptD 9 Pro | |
| Medio NVIDIA Quadro RTX 5000 (Laptop) (n=1) | |
| Media de la clase Workstation (3.64 - 3.64, n=11, últimos 2 años) | |
| 1920x1080 Vulkan Medium Offscreen | |
| Acer ConceptD 9 Pro | |
| Medio NVIDIA Quadro RTX 5000 (Laptop) (n=1) | |
| Media de la clase Workstation (104.6 - 2585, n=23, últimos 2 años) | |
Rendimiento de los juegos
Aunque el CN917-71P no es técnicamente un portátil para juegos, puede ejecutar todos los juegos de nuestra base de datos en resolución Full HD, así como ajustes de máxima calidad y mostrarlos sin problemas en su pantalla mate. Incluso las resoluciones por encima de Full HD no son un gran desafío para esta GPU.
| The Witcher 3 - 1920x1080 Ultra Graphics & Postprocessing (HBAO+) | |
| Acer ConceptD 9 Pro | |
| Medio NVIDIA Quadro RTX 5000 (Laptop) (90.4 - 109.9, n=2) | |
| Razer Blade 15 Studio Edition | |
| Lenovo ThinkPad P53-20QN000YGE | |
| Eurocom Tornado F7W | |
| MSI WE75 9TK | |
| Media de la clase Workstation (26.3 - 91.7, n=3, últimos 2 años) | |
| Lenovo ThinkPad P73-20QR002DGE | |
| Dell Precision 7730 | |
| BioShock Infinite - 1920x1080 Ultra Preset, DX11 (DDOF) | |
| Acer ConceptD 9 Pro | |
| Medio NVIDIA Quadro RTX 5000 (Laptop) (n=1) | |
| Razer Blade 15 Studio Edition | |
| MSI WE75 9TK | |
| Lenovo ThinkPad P73-20QR002DGE | |
| Dell Precision 7730 | |
| Fujitsu Celsius H980 | |
| Far Cry 5 - 1920x1080 Ultra Preset AA:T | |
| Acer ConceptD 9 Pro | |
| Medio NVIDIA Quadro RTX 5000 (Laptop) (n=1) | |
| Media de la clase Workstation (37 - 128, n=11, últimos 2 años) | |
| Fujitsu Celsius H980 | |
| Shadow of the Tomb Raider - 1920x1080 Highest Preset AA:T | |
| Acer ConceptD 9 Pro | |
| Medio NVIDIA Quadro RTX 5000 (Laptop) (73.1 - 118, n=2) | |
| Lenovo ThinkPad P53-20QN000YGE | |
| MSI WE75 9TK | |
| Eurocom Tornado F7W | |
| Borderlands 3 - 1920x1080 Badass Overall Quality (DX11) | |
| Acer ConceptD 9 Pro | |
| Medio NVIDIA Quadro RTX 5000 (Laptop) (n=1) | |
| Razer Blade 15 Studio Edition | |
Para determinar si las frecuencias de cuadro se mantienen constantes durante un período de tiempo prolongado, ejecutamos The Witcher 3 durante unos 60 minutos con resolución Full HD y ajustes de máxima calidad. Durante todo el tiempo, el personaje retratado por el reproductor no se mueve. Nuestros resultados muestran que la frecuencia de fotogramas permanece en un nivel reproducible durante todo el tiempo. No observamos ninguna disminución en el rendimiento.
| bajo | medio | alto | ultra | QHD | 4K | |
|---|---|---|---|---|---|---|
| Tomb Raider (2013) | 757 | 681 | 625 | 319.6 | ||
| BioShock Infinite (2013) | 458 | 396.9 | 367.9 | 216.3 | ||
| The Witcher 3 (2015) | 375.3 | 308.5 | 198.6 | 109.9 | 71 | |
| Rainbow Six Siege (2015) | 350.2 | 296.1 | 279.6 | 266.2 | 138 | |
| For Honor (2017) | 329.3 | 216.9 | 206.8 | 160.4 | 68.4 | |
| Far Cry 5 (2018) | 150 | 128 | 123 | 115 | 102 | 56 |
| Shadow of the Tomb Raider (2018) | 147 | 130 | 126 | 118 | 87 | 47 |
| Assassin´s Creed Odyssey (2018) | 113 | 104 | 94 | 73 | 63 | 40 |
| Battlefield V (2018) | 187 | 164.6 | 161.7 | 151.9 | 123.9 | 72.7 |
| Apex Legends (2019) | 144 | 144 | 144 | 143.9 | 135 | 76.3 |
| Metro Exodus (2019) | 161 | 124.4 | 95.2 | 77 | 59.3 | 36.7 |
| Dirt Rally 2.0 (2019) | 289.3 | 208.4 | 200.1 | 115.5 | 84.3 | 51.2 |
| The Division 2 (2019) | 178 | 156 | 131 | 55 | 55 | 38 |
| Anno 1800 (2019) | 119.2 | 118.8 | 93.1 | 51.1 | 46.9 | 30.3 |
| Rage 2 (2019) | 303.8 | 160.4 | 137.1 | 133.8 | 85.8 | 42.2 |
| Total War: Three Kingdoms (2019) | 271.6 | 154.6 | 113.7 | 83.6 | 53.3 | 25.9 |
| F1 2019 (2019) | 243 | 210 | 182 | 144 | 146 | 78 |
| Control (2019) | 239 | 123.7 | 93.3 | 60.5 | 30.1 | |
| Borderlands 3 (2019) | 153.8 | 130.2 | 104.5 | 85.5 | 59.8 | 31.5 |
| Ghost Recon Breakpoint (2019) | 152 | 125 | 118 | 88 | 66 | 38 |
| GRID 2019 (2019) | 186.6 | 144.5 | 142.5 | 100.7 | 80.7 | 54.9 |
| Call of Duty Modern Warfare 2019 (2019) | 232.6 | 156.2 | 144.9 | 119.3 | 86.6 | 48.8 |
| Need for Speed Heat (2019) | 109.9 | 104.9 | 98.7 | 95.9 | 89 | 52.7 |
| Star Wars Jedi Fallen Order (2019) | 112.8 | 112.1 | 107.5 | 89.6 | 50.2 | |
| Red Dead Redemption 2 (2019) | 145.6 | 125.9 | 87.4 | 54.1 | 43.7 | 28.1 |
| Escape from Tarkov (2020) | 121 | 121 | 120.3 | 110.6 | 106.6 | 53.8 |
| Hunt Showdown (2020) | 231.1 | 163.8 | 130.4 | 87.8 | 77.1 | |
| Doom Eternal (2020) | 234.5 | 200.2 | 183.7 | 180.8 | 128.5 | 68.6 |
Emisiones - ConceptD 9 Pro con Ruido Moderado y Desarrollo de Calor
Ruido de sistema
Los fans del ConceptD Pro giran permanentemente a baja velocidad en reposo. Apenas son audibles en este modo. Bajo carga, giran notablemente. Durante nuestra prueba de esfuerzo, registramos un nivel de ruido del ventilador de 44,1 dB(A). Mientras realizamos nuestra prueba de The Witcher 3, este valor es ligeramente más alto.
Desafortunadamente, hay un frecuente y notable ruido electrónico que viene del interior de la caja. Ocurre cuando se mueven grandes trozos de datos, por ejemplo al iniciar un juego.
Ruido
| Ocioso |
| 31.6 / 31.6 / 31.9 dB(A) |
| Carga |
| 41.2 / 44.1 dB(A) |
 | ||
30 dB silencioso 40 dB(A) audible 50 dB(A) ruidosamente alto |
||
min: | ||
| Acer ConceptD 9 Pro i9-9980HK, Quadro RTX 5000 (Laptop) | Lenovo ThinkPad P73-20QR002DGE i7-9850H, Quadro RTX 3000 (Laptop) | MSI WE75 9TK i7-9750H, Quadro RTX 3000 (Laptop) | Dell Precision 7730 i7-8850H, Quadro P3200 | Eurocom Tornado F7W i9-9900K, Quadro P5200 | Fujitsu Celsius H980 i7-8750H, Quadro P3200 | Medio NVIDIA Quadro RTX 5000 (Laptop) | Media de la clase Workstation | |
|---|---|---|---|---|---|---|---|---|
| Noise | 16% | 3% | 9% | -12% | 2% | 4% | 12% | |
| apagado / medio ambiente * (dB) | 30.8 | 29.3 5% | 28.5 7% | 29.7 4% | 28.2 8% | 29.6 4% | 30.1 ? 2% | 24.1 ? 22% |
| Idle Minimum * (dB) | 31.6 | 29.3 7% | 29 8% | 29.7 6% | 33.2 -5% | 29.6 6% | 30.5 ? 3% | 24.8 ? 22% |
| Idle Average * (dB) | 31.6 | 29.3 7% | 29 8% | 29.7 6% | 33.2 -5% | 32.5 -3% | 30.5 ? 3% | 25.4 ? 20% |
| Idle Maximum * (dB) | 31.9 | 29.3 8% | 31.5 1% | 29.7 7% | 33.2 -4% | 32.5 -2% | 31.2 ? 2% | 26.7 ? 16% |
| Load Average * (dB) | 41.2 | 30.2 27% | 32 22% | 31.4 24% | 47 -14% | 34.9 15% | 36.9 ? 10% | 39.2 ? 5% |
| Witcher 3 ultra * (dB) | 44.6 | 30.7 31% | 44.7 -0% | 37.9 15% | 52.2 -17% | |||
| Load Maximum * (dB) | 44.1 | 33.1 25% | 56.5 -28% | 44.2 -0% | 64 -45% | 49.1 -11% | 41.6 ? 6% | 50.4 ? -14% |
* ... más pequeño es mejor
Temperatura
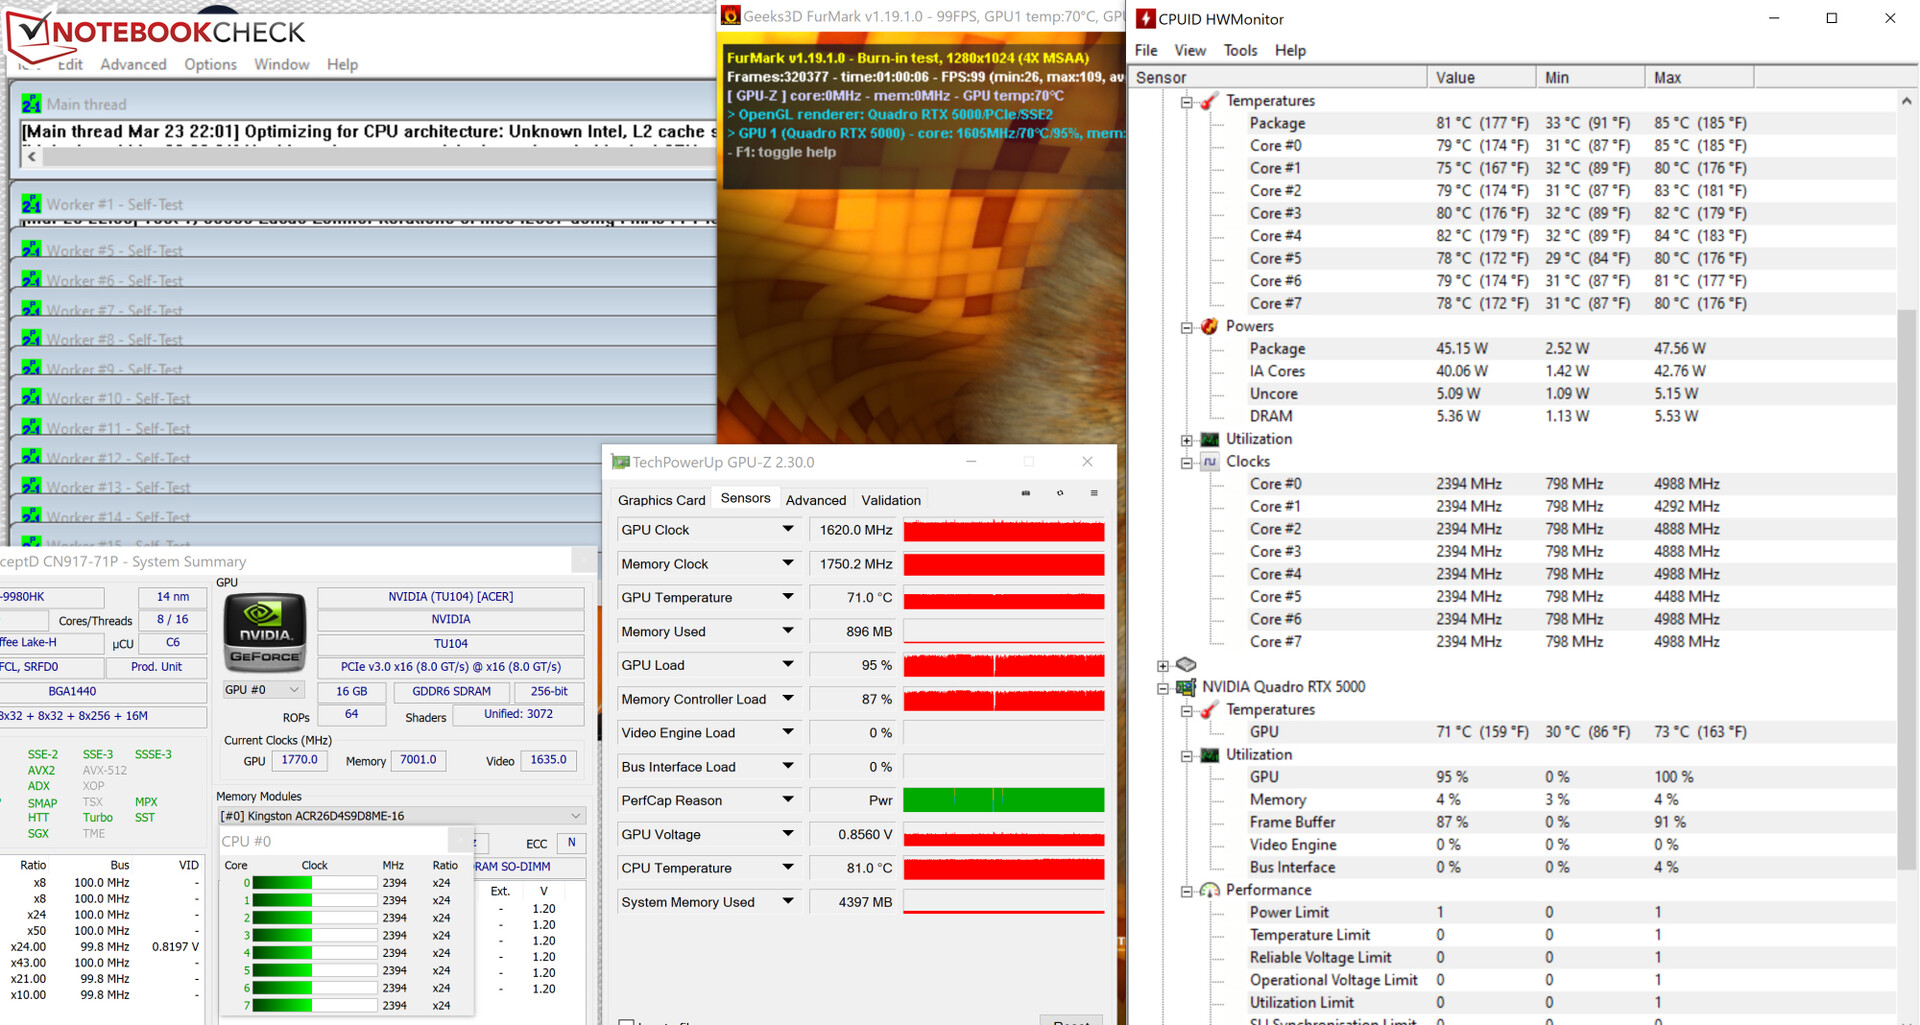
Durante nuestra prueba de estrés (ejecutando Prime95 y FurMark durante al menos una hora), la CPU y la GPU funcionan a 2,3-2,6 GHz y 1600 a 1700 MHz, respectivamente, mientras están en la red eléctrica. En el modo de batería, estos valores disminuyen a 800 MHz (CPU) y 300 MHz (GPU). La prueba de esfuerzo representa un caso extremo que no se produce durante el uso diario. Utilizamos esta prueba para determinar si el sistema es estable incluso bajo carga máxima.
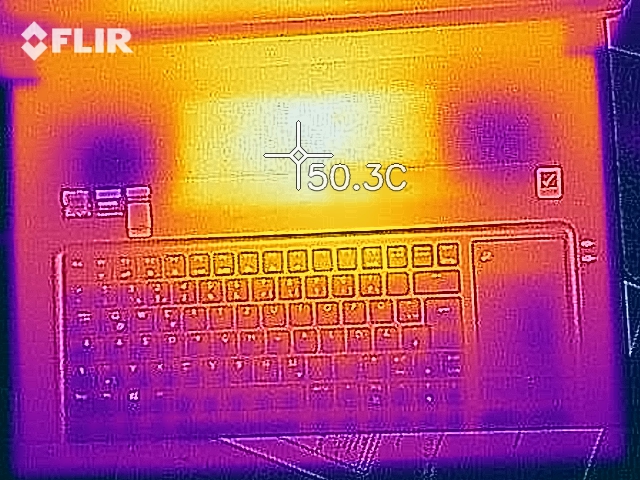
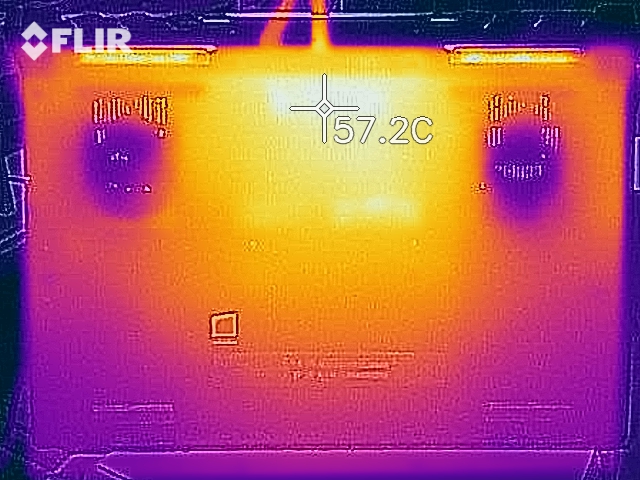
A pesar del potente hardware, el desarrollo de calor del portátil es moderado. Mientras realizamos nuestra prueba de estrés, sólo medimos una temperatura superior a 50 °C en un punto. Durante nuestra prueba de The Witcher 3, las temperaturas suben a niveles más altos. Los usuarios no tendrán que preocuparse por las temperaturas durante el uso diario.
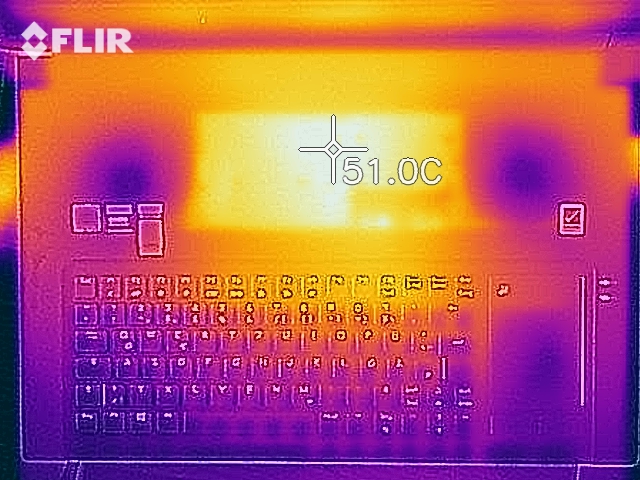
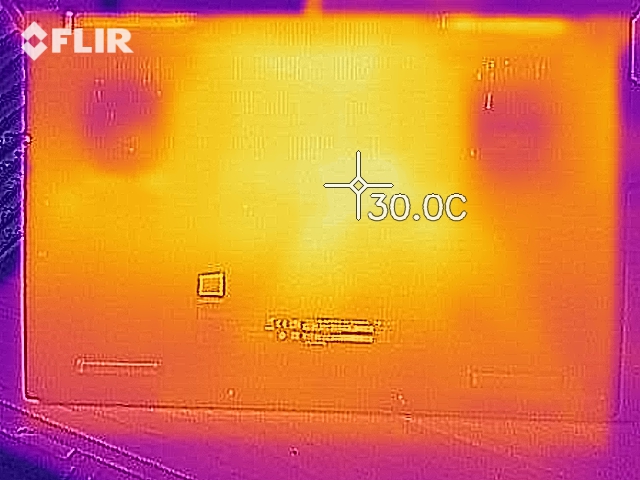
(±) La temperatura máxima en la parte superior es de 43 °C / 109 F, frente a la media de 38.2 °C / 101 F, que oscila entre 22.2 y 69.8 °C para la clase Workstation.
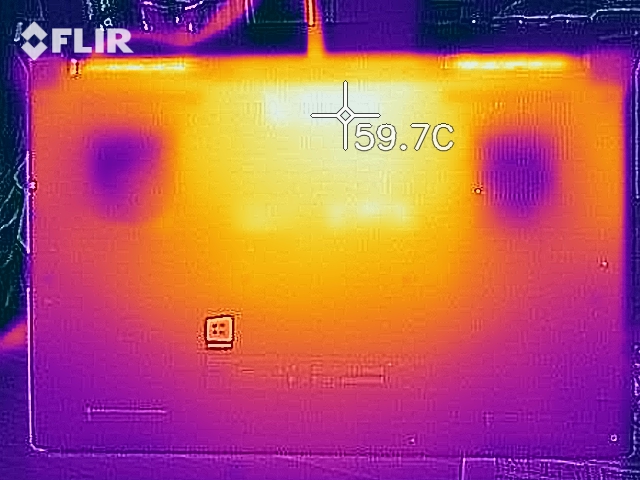
(-) El fondo se calienta hasta un máximo de 53 °C / 127 F, frente a la media de 41.1 °C / 106 F
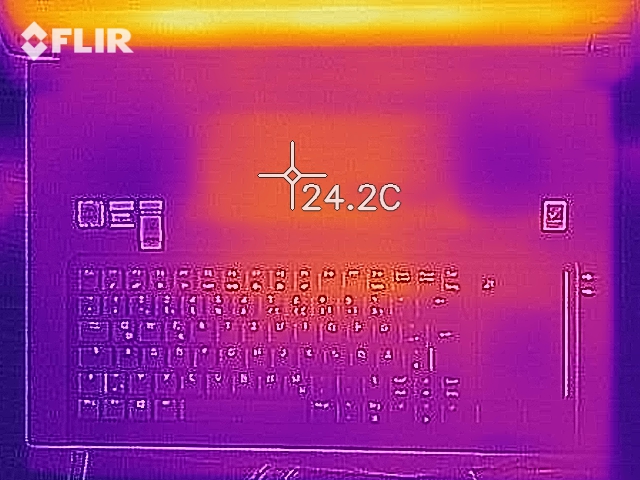
(+) En reposo, la temperatura media de la parte superior es de 23.9 °C / 75# F, frente a la media del dispositivo de 32 °C / 90 F.
(±) Jugando a The Witcher 3, la temperatura media de la parte superior es de 34.8 °C / 95 F, frente a la media del dispositivo de 32 °C / 90 F.
(+) Los reposamanos y el panel táctil alcanzan como máximo la temperatura de la piel (32.2 °C / 90 F) y, por tanto, no están calientes.
(-) La temperatura media de la zona del reposamanos de dispositivos similares fue de 27.8 °C / 82 F (-4.4 °C / -8 F).
| Acer ConceptD 9 Pro i9-9980HK, Quadro RTX 5000 (Laptop) | Lenovo ThinkPad P73-20QR002DGE i7-9850H, Quadro RTX 3000 (Laptop) | MSI WE75 9TK i7-9750H, Quadro RTX 3000 (Laptop) | Dell Precision 7730 i7-8850H, Quadro P3200 | Eurocom Tornado F7W i9-9900K, Quadro P5200 | Fujitsu Celsius H980 i7-8750H, Quadro P3200 | Medio NVIDIA Quadro RTX 5000 (Laptop) | Media de la clase Workstation | |
|---|---|---|---|---|---|---|---|---|
| Heat | -7% | -7% | -16% | 12% | 2% | -1% | -8% | |
| Maximum Upper Side * (°C) | 43 | 52.2 -21% | 40.6 6% | 50 -16% | 34 21% | 41.8 3% | 43.5 ? -1% | 43.8 ? -2% |
| Maximum Bottom * (°C) | 53 | 47.8 10% | 46 13% | 59.8 -13% | 47.6 10% | 46.2 13% | 54.3 ? -2% | 45 ? 15% |
| Idle Upper Side * (°C) | 24.8 | 26.9 -8% | 29.2 -18% | 27.9 -13% | 23 7% | 25.6 -3% | 25.1 ? -1% | 30.6 ? -23% |
| Idle Bottom * (°C) | 25.6 | 28 -9% | 32.4 -27% | 31.4 -23% | 23.4 9% | 26.6 -4% | 25.8 ? -1% | 31.6 ? -23% |
* ... más pequeño es mejor
Altavoces
Los cuatro altavoces de la estación de trabajo Acer están situados en la parte inferior, cerca de la parte delantera del dispositivo. Producen un sonido más que adecuado, aunque apenas hay bajos. Además, el nivel de volumen máximo podría ser ligeramente más alto.
Acer ConceptD 9 Pro análisis de audio
(-) | altavoces no muy altos (#69.9 dB)
Graves 100 - 315 Hz
(-) | casi sin bajos - de media 22.1% inferior a la mediana
(±) | la linealidad de los graves es media (11.8% delta a frecuencia anterior)
Medios 400 - 2000 Hz
(+) | medios equilibrados - a sólo 3.4% de la mediana
(±) | la linealidad de los medios es media (7.2% delta respecto a la frecuencia anterior)
Altos 2 - 16 kHz
(+) | máximos equilibrados - a sólo 3.3% de la mediana
(±) | la linealidad de los máximos es media (10.1% delta a frecuencia anterior)
Total 100 - 16.000 Hz
(±) | la linealidad del sonido global es media (20.8% de diferencia con la mediana)
En comparación con la misma clase
» 75% de todos los dispositivos probados de esta clase eran mejores, 6% similares, 18% peores
» El mejor tuvo un delta de 7%, la media fue 17%, el peor fue ###max##%
En comparación con todos los dispositivos probados
» 56% de todos los dispositivos probados eran mejores, 8% similares, 36% peores
» El mejor tuvo un delta de 4%, la media fue 24%, el peor fue ###max##%
Gestión de la energía - Alto consumo, baja resistencia
Consumo de energía
No debería sorprender que el CN917 consuma una buena cantidad de energía mientras está en reposo. El GPU RTX 5000 dedicado funciona a tiempo completo después de todo. Durante la prueba de estrés, el consumo de energía sube hasta un pico de 241 vatios. Durante el juego (prueba de Witcher 3), registramos un consumo medio de 221 vatios (de 216 a 229 vatios). El adaptador de corriente tiene una potencia nominal de 330 vatios.
| Off / Standby | |
| Ocioso | |
| Carga |
|
Clave:
min: | |
| Acer ConceptD 9 Pro i9-9980HK, Quadro RTX 5000 (Laptop) | Lenovo ThinkPad P73-20QR002DGE i7-9850H, Quadro RTX 3000 (Laptop) | MSI WE75 9TK i7-9750H, Quadro RTX 3000 (Laptop) | Dell Precision 7730 i7-8850H, Quadro P3200 | Eurocom Tornado F7W i9-9900K, Quadro P5200 | Fujitsu Celsius H980 i7-8750H, Quadro P3200 | Medio NVIDIA Quadro RTX 5000 (Laptop) | Media de la clase Workstation | |
|---|---|---|---|---|---|---|---|---|
| Power Consumption | 36% | 29% | 31% | -31% | 19% | 6% | 37% | |
| Idle Minimum * (Watt) | 18.8 | 8.9 53% | 12.1 36% | 10.1 46% | 28.5 -52% | 14.8 21% | 16.6 ? 12% | 8.94 ? 52% |
| Idle Average * (Watt) | 25 | 12.8 49% | 18.4 26% | 18 28% | 36.7 -47% | 20.4 18% | 22.1 ? 12% | 13.8 ? 45% |
| Idle Maximum * (Watt) | 30 | 16.4 45% | 18.8 37% | 19.7 34% | 37.8 -26% | 21.5 28% | 27.3 ? 9% | 17.5 ? 42% |
| Load Average * (Watt) | 116 | 108.4 7% | 95.1 18% | 89.6 23% | 144.6 -25% | 98.4 15% | 124.5 ? -7% | 95 ? 18% |
| Witcher 3 ultra * (Watt) | 221 | 153 31% | 135.5 39% | 134 39% | 218.9 1% | |||
| Load Maximum * (Watt) | 241 | 166 31% | 203.7 15% | 204 15% | 336 -39% | 213.5 11% | 232 ? 4% | 175.2 ? 27% |
* ... más pequeño es mejor
Duración de la batería
En nuestra prueba de Wi-Fi en el mundo real, el ConceptD 9 alcanza un tiempo de ejecución de 3:38 h. Aquí, simulamos una carga de navegación web con la ayuda de un guión. Para esta prueba, seleccionamos el perfil "equilibrado" y fijamos el brillo de la pantalla a unos 150 cd/m². En nuestra prueba de vídeo, la estación de trabajo de 17,3 pulgadas dura 3:32 h. Esta prueba consiste en reproducir el cortometraje Big Buck Bunny (códec H.264, 1920x1080 píxeles) en un bucle continuo. Antes de la prueba, seleccionamos el perfil de "ahorro de energía" y redujimos el brillo de la pantalla a 150 cd/m².
| Acer ConceptD 9 Pro i9-9980HK, Quadro RTX 5000 (Laptop), 71.9 Wh | Lenovo ThinkPad P73-20QR002DGE i7-9850H, Quadro RTX 3000 (Laptop), 99 Wh | MSI WE75 9TK i7-9750H, Quadro RTX 3000 (Laptop), 65 Wh | Dell Precision 7730 i7-8850H, Quadro P3200, 92 Wh | Eurocom Tornado F7W i9-9900K, Quadro P5200, 90 Wh | Fujitsu Celsius H980 i7-8750H, Quadro P3200, 96 Wh | Media de la clase Workstation | |
|---|---|---|---|---|---|---|---|
| Duración de Batería | 148% | 53% | 63% | -17% | 104% | 193% | |
| Reader / Idle (h) | 5.2 | 11 112% | 13.5 160% | 26.1 ? 402% | |||
| H.264 (h) | 3.5 | 9.8 180% | 5.8 66% | 5.9 69% | 9.51 ? 172% | ||
| WiFi v1.3 (h) | 3.6 | 11.1 208% | 4.9 36% | 5.6 56% | 3 -17% | 8.3 131% | 8.53 ? 137% |
| Load (h) | 0.9 | 1.4 56% | 1 11% | 1.5 67% | 1.4 56% | 1.429 ? 59% |
Pro
Contra
Veredicto
Con el ConceptD 9 Pro CN917-71P, Acer ha entregado una estación de trabajo móvil y convertible en el factor de forma de 17,3 pulgadas. En este caso, el término "móvil" sólo debe utilizarse en una capacidad limitada, ya que el dispositivo pesa casi 4,5 kg y ofrece una corta duración de la batería. Dicho esto, moverlo de un escritorio a otro no es un problema.
El ConceptD 9 Pro es una herramienta para usuarios creativos que causa una buena impresión general.
El procesador Core i9-9980HK y la GPU GeForce RTX 5000 dentro del portátil son algunos de los últimos componentes. Mientras que la CPU tiene que reducir su velocidad de reloj después de un corto período de estrés, la tarjeta gráfica es capaz de funcionar a velocidades turbo consistentemente altas. A través del puerto Thunderbolt 3, se puede conectar una GPU externa aún más potente.
Un elegante y bien construido chasis de metal sólido alberga el hardware del ConceptD. Las enormes bisagras del dispositivo son una característica física sorprendente. Sostienen la pantalla firmemente en su lugar, independientemente de su ángulo para una cómoda entrada de lápiz digital.
La impresionante pantalla táctil IPS 4K tiene una buena relación de contraste, buenos ángulos de visión, buen brillo y - gracias a la validación de Pantone- grandes colores. Sin embargo, no pudimos confirmar la cobertura completa del espacio de color AdobeRGB anunciada por el fabricante. De acuerdo con nuestras mediciones, sólo el 84% está cubierto (98% de sRGB).
Mientras tanto, el NVMe SSD instalado no sólo ofrece buenas tasas de transferencia, sino que también tiene mucho espacio de almacenamiento (1 TB). También hay una ranura para un SSD M.2 2280 secundario. Si se instalan dos unidades, pueden utilizarse en el RAID 0.
Acer ConceptD 9 Pro
- 03/30/2020 v7 (old)
Sascha Mölck
Price comparison
