Notebookcheck Logo

Review del Intel Core i7-1185G7 - Primeros puntos de referencia de Tiger Lake

Tiger Lake vs. Renoir Intel nos dio la oportunidad de comprobar la nueva CPU de alta gama para portátiles delgados. El nuevo chip Tiger Lake de Intel utiliza una nueva y más potente tarjeta gráfica integrada, para poder cerrar la brecha con AMD. Observamos más de cerca un portátil de desarrollo de Intel y probamos las capacidades del nuevo chip en numerosos benchmarks y con diferentes configuraciones de TDP.
Intel Core i7-1185G7 en review

Sistema de prueba

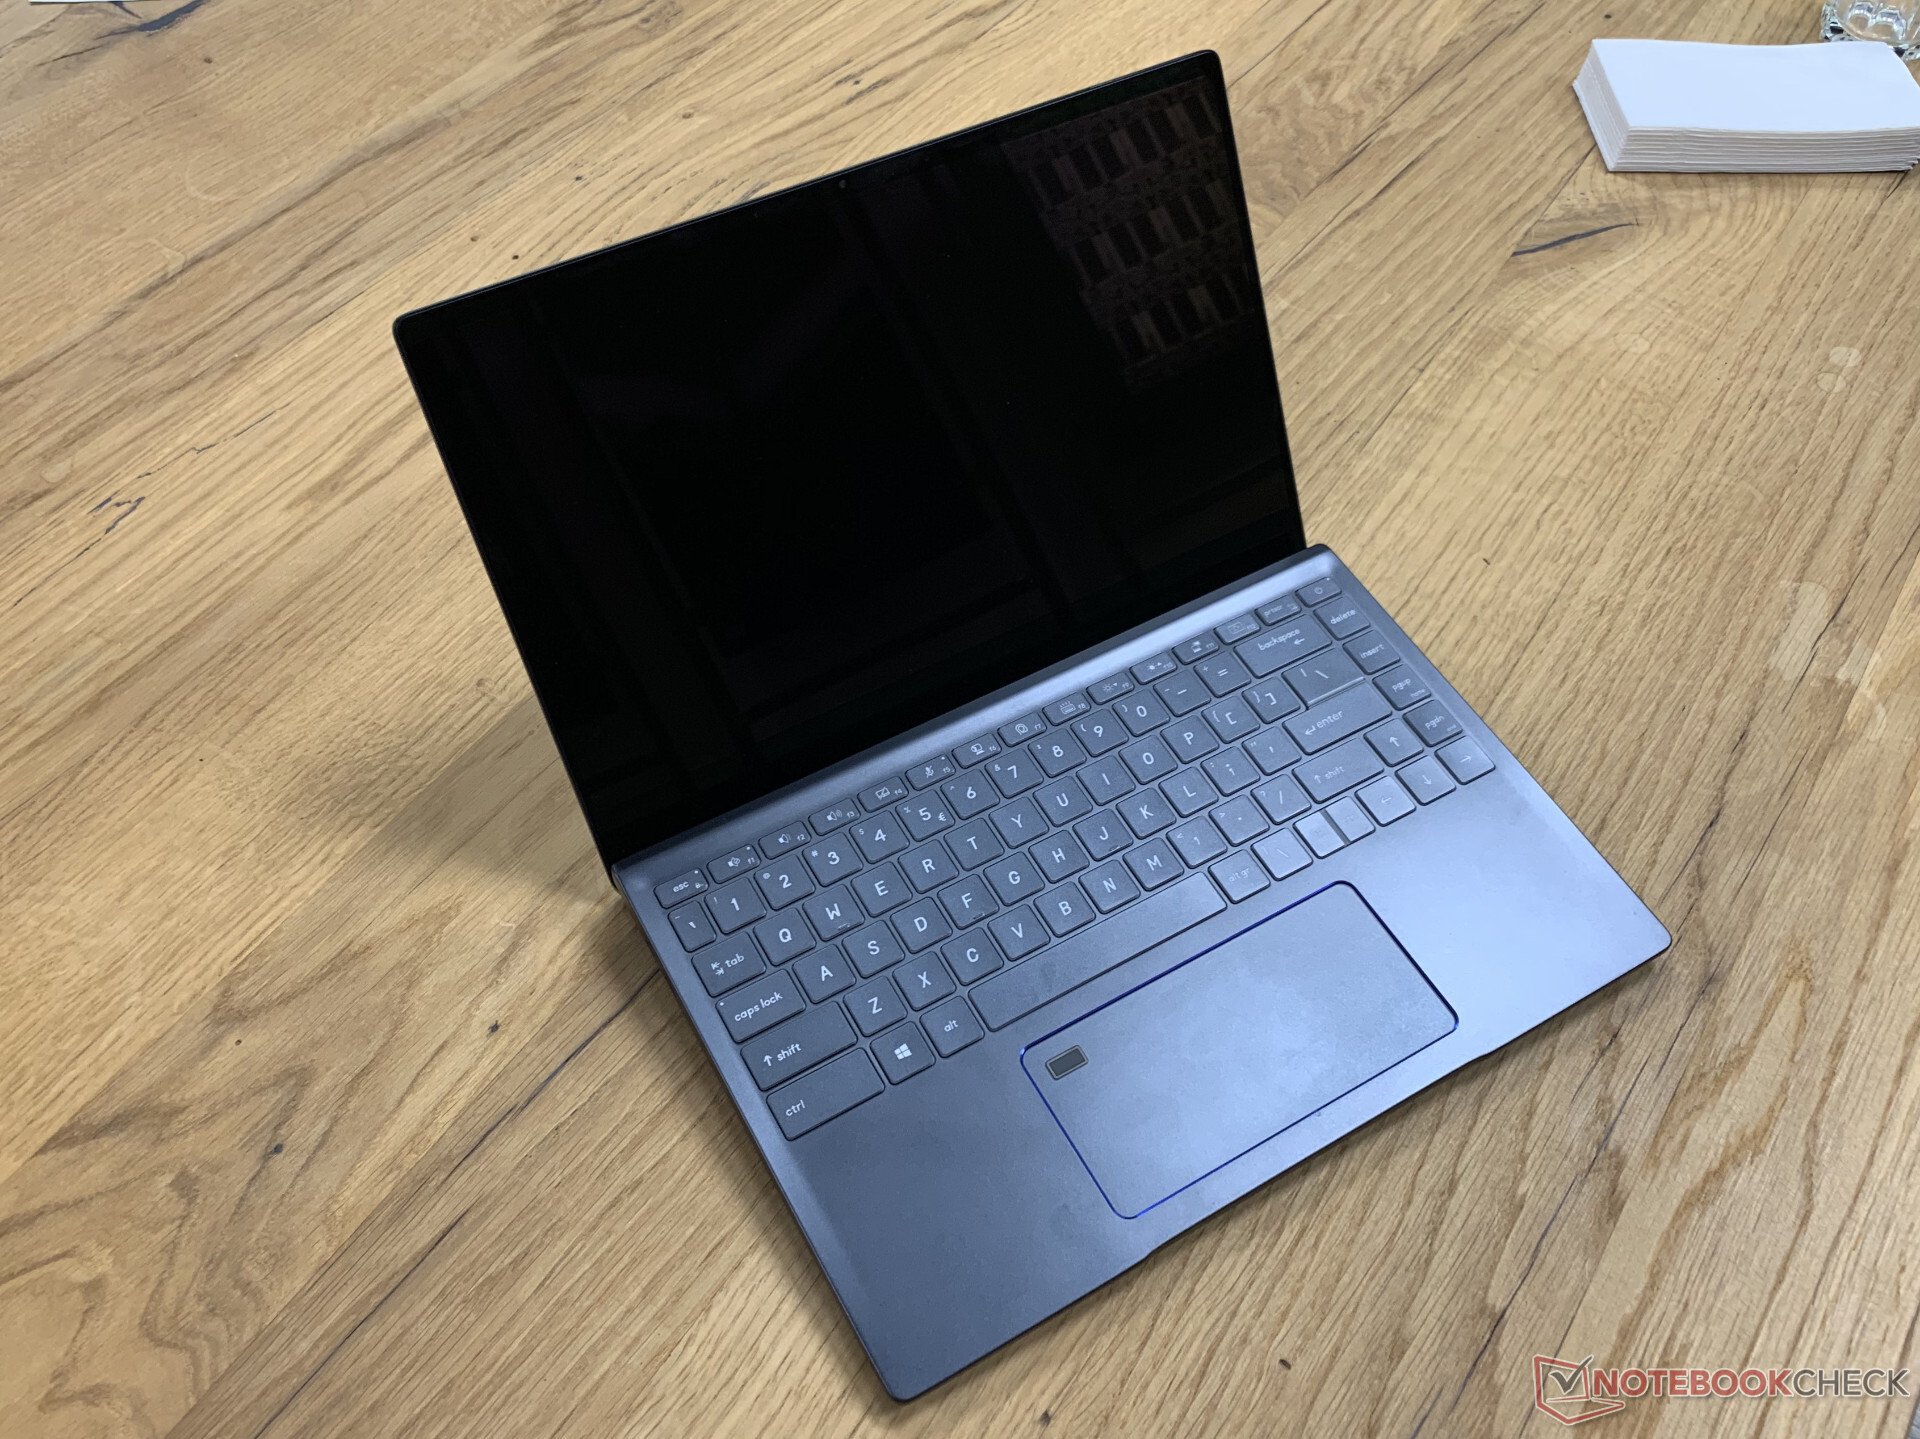
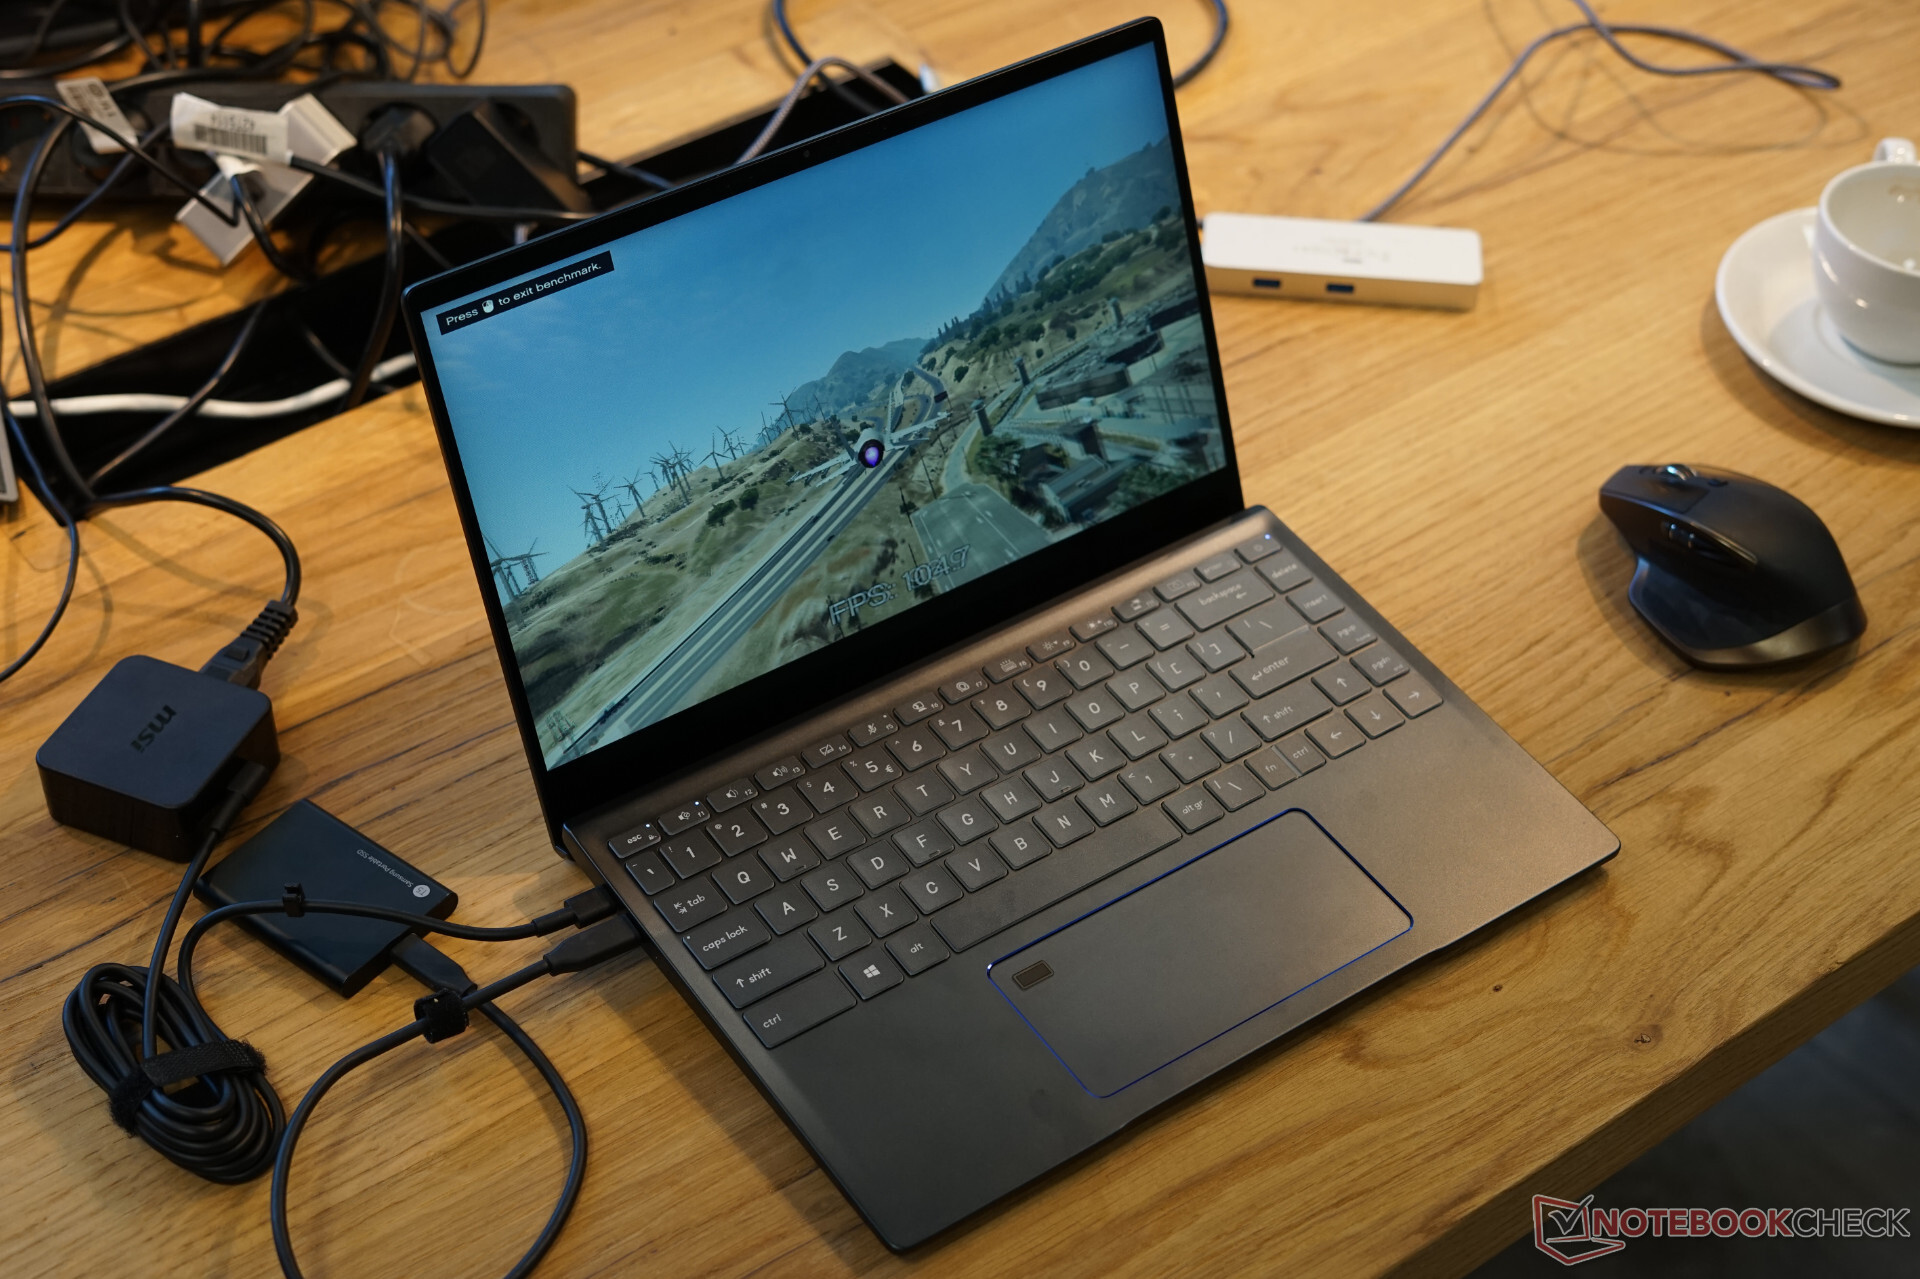
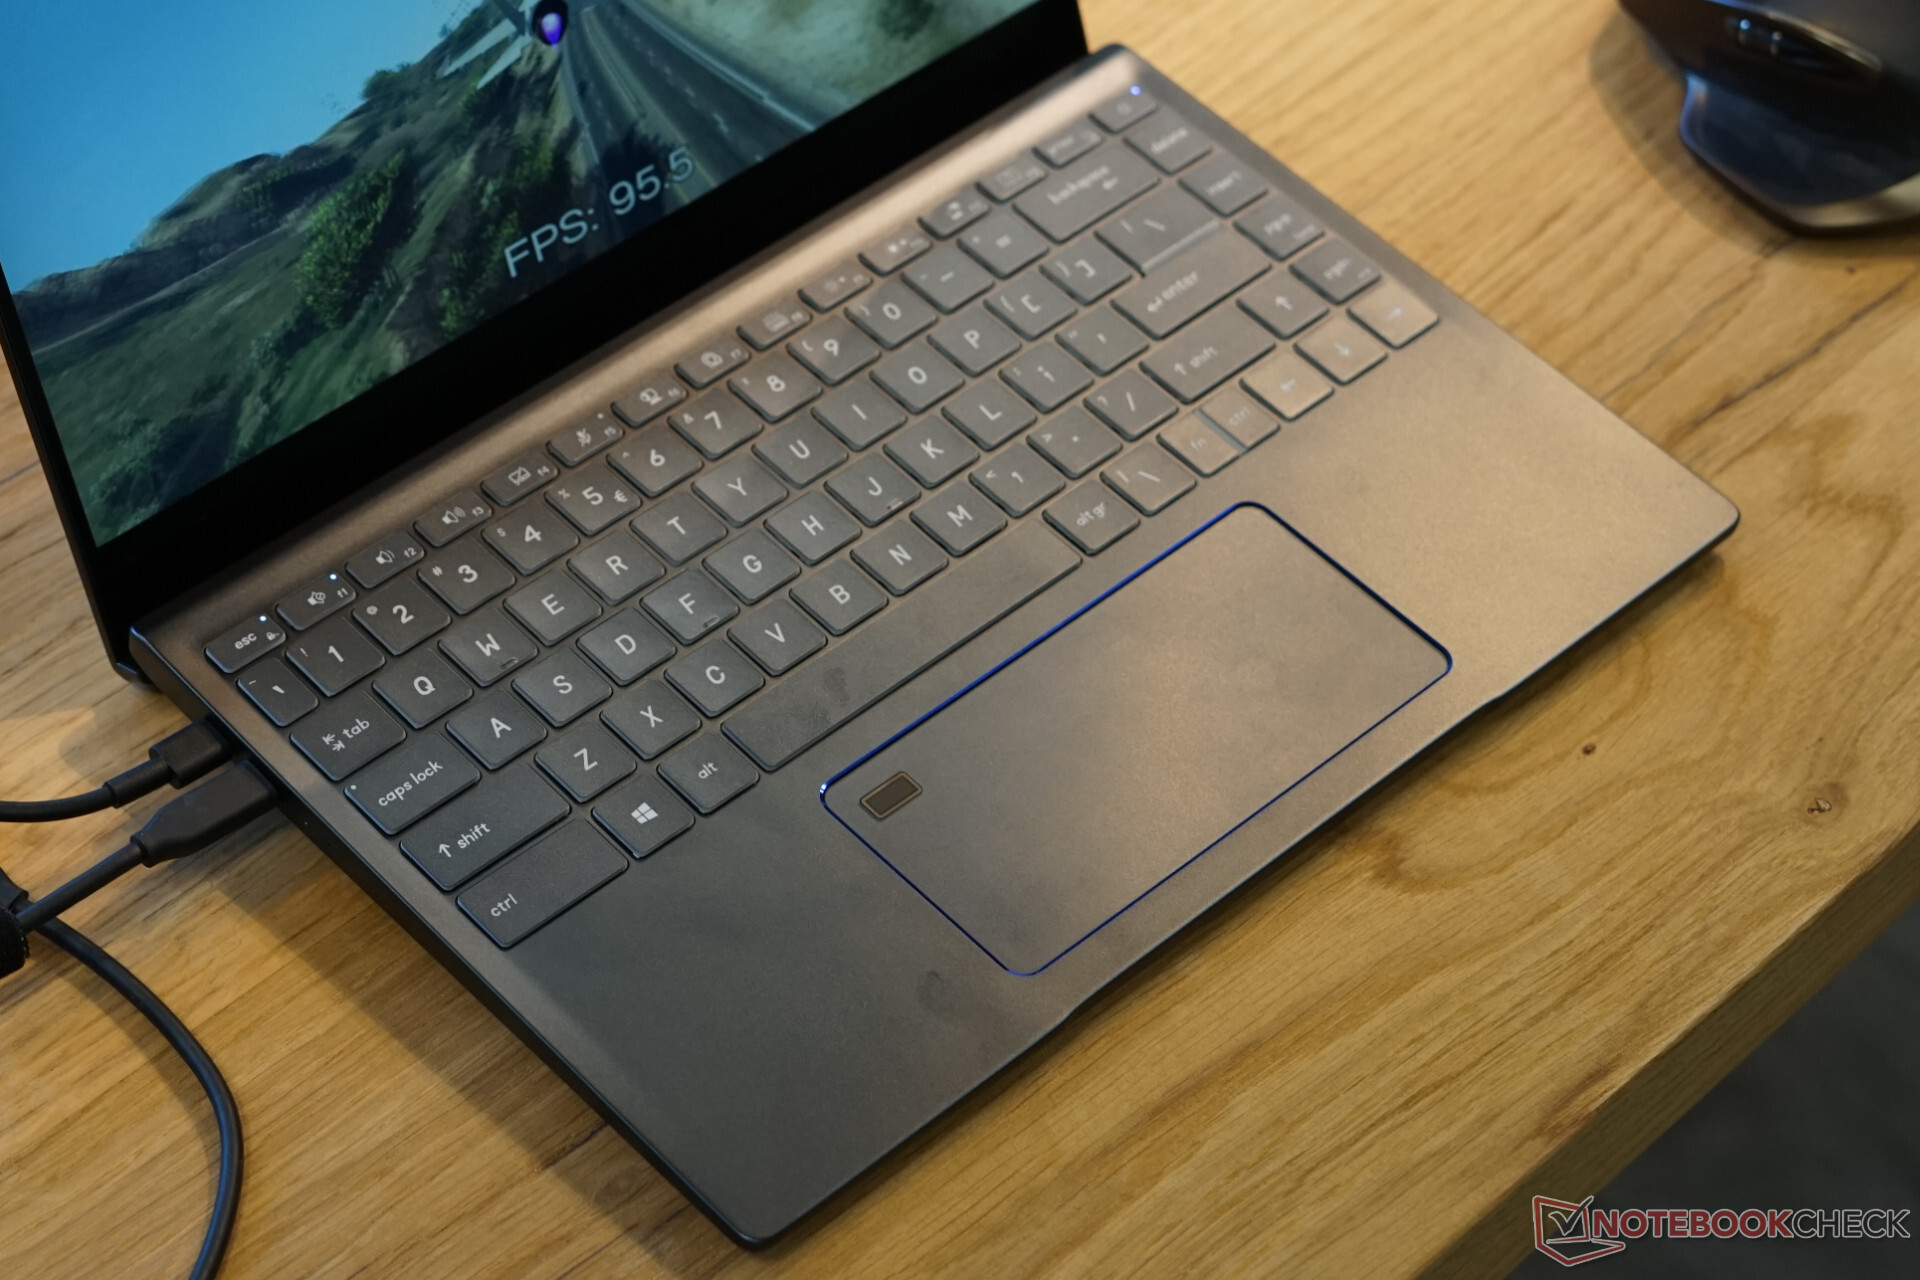
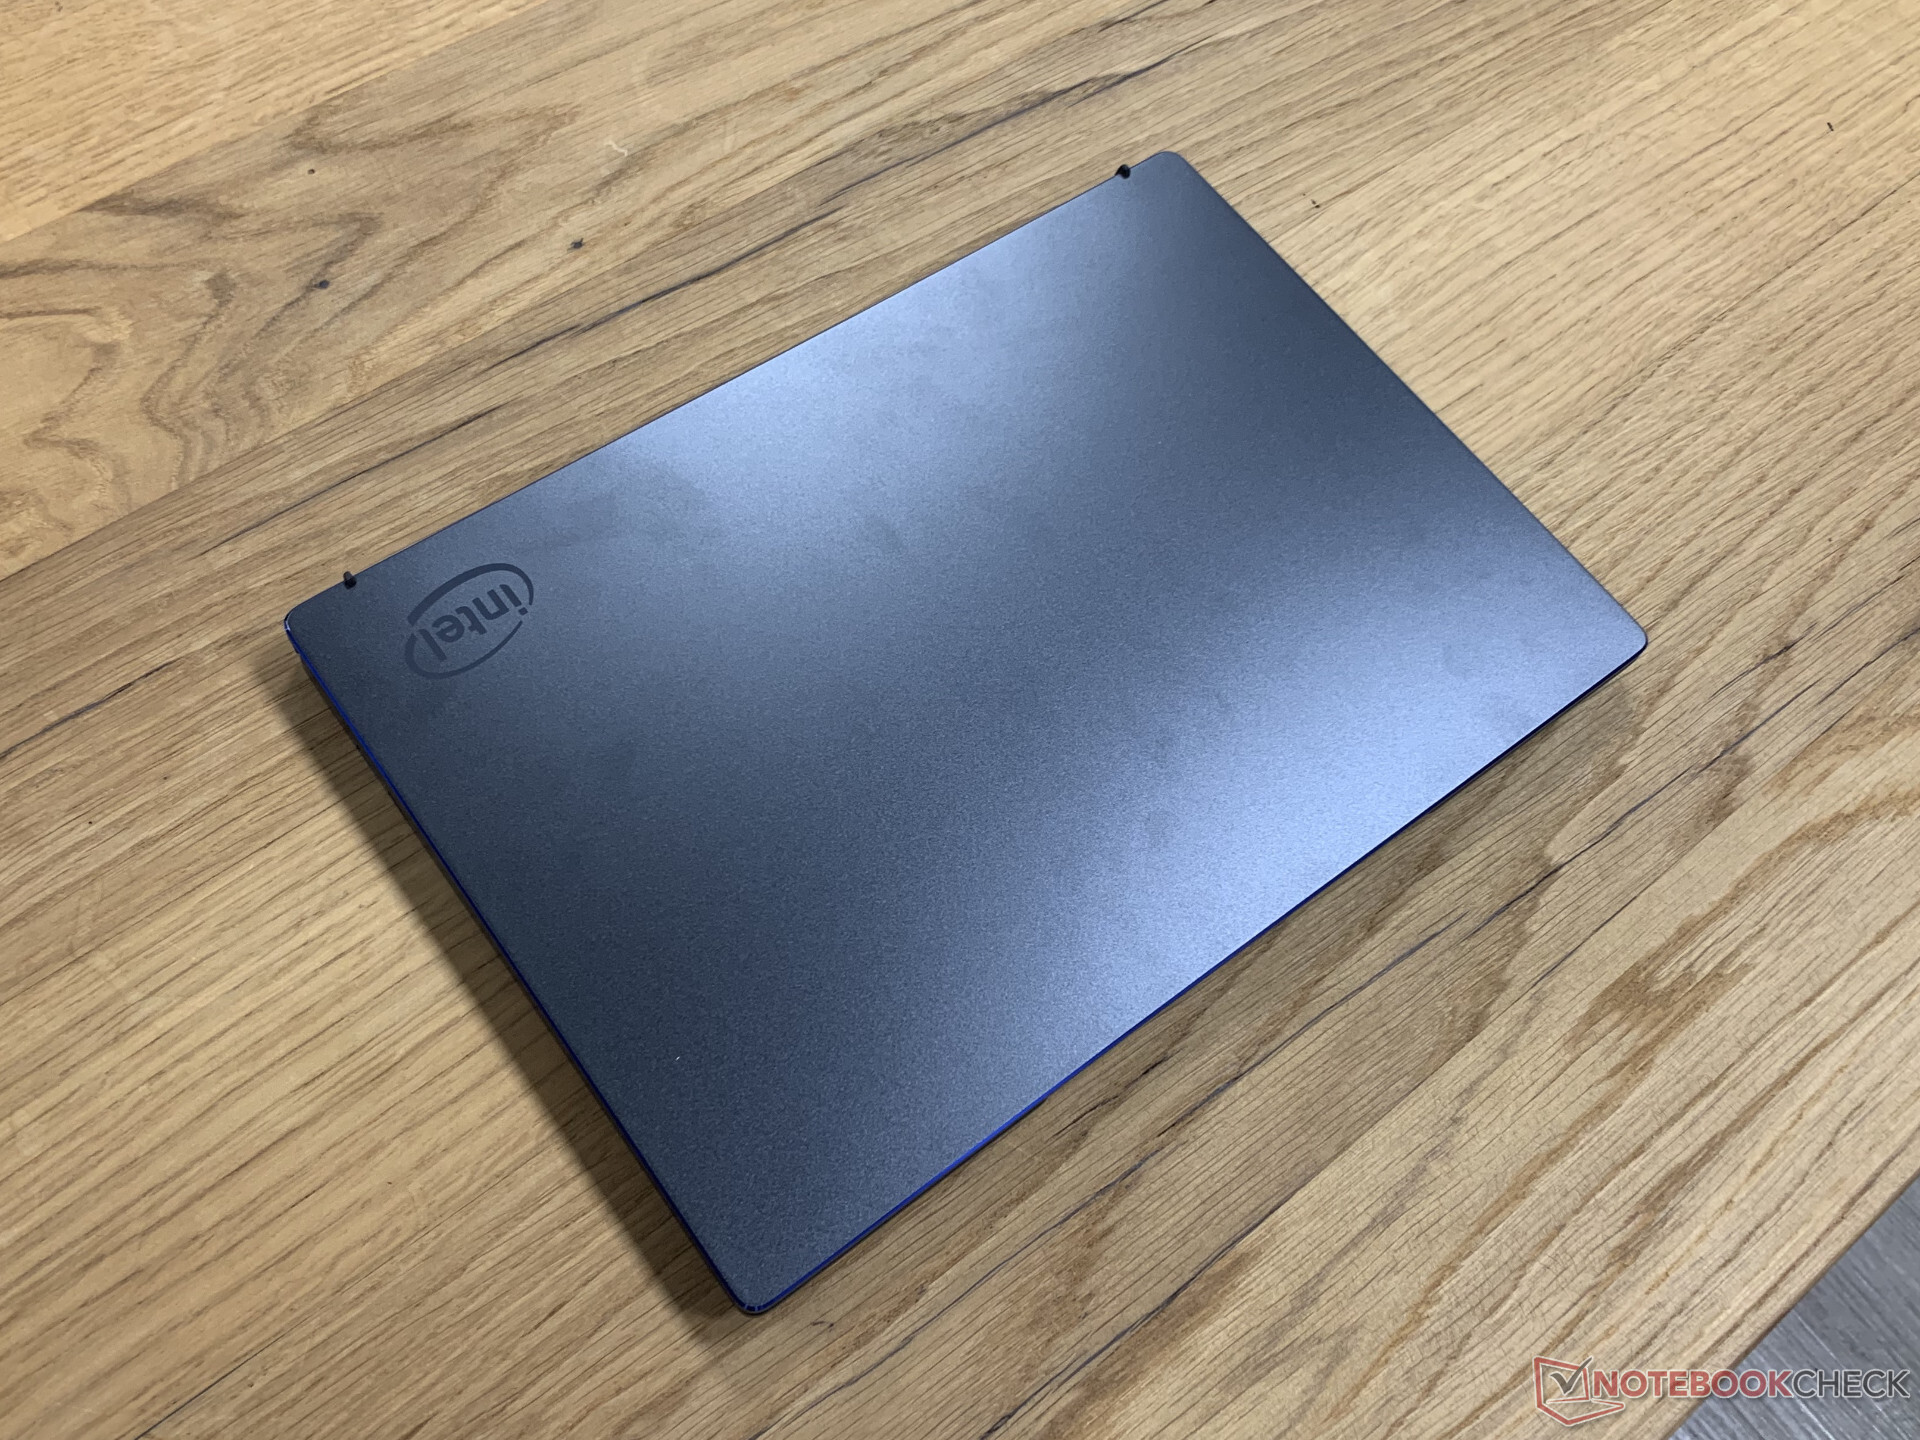
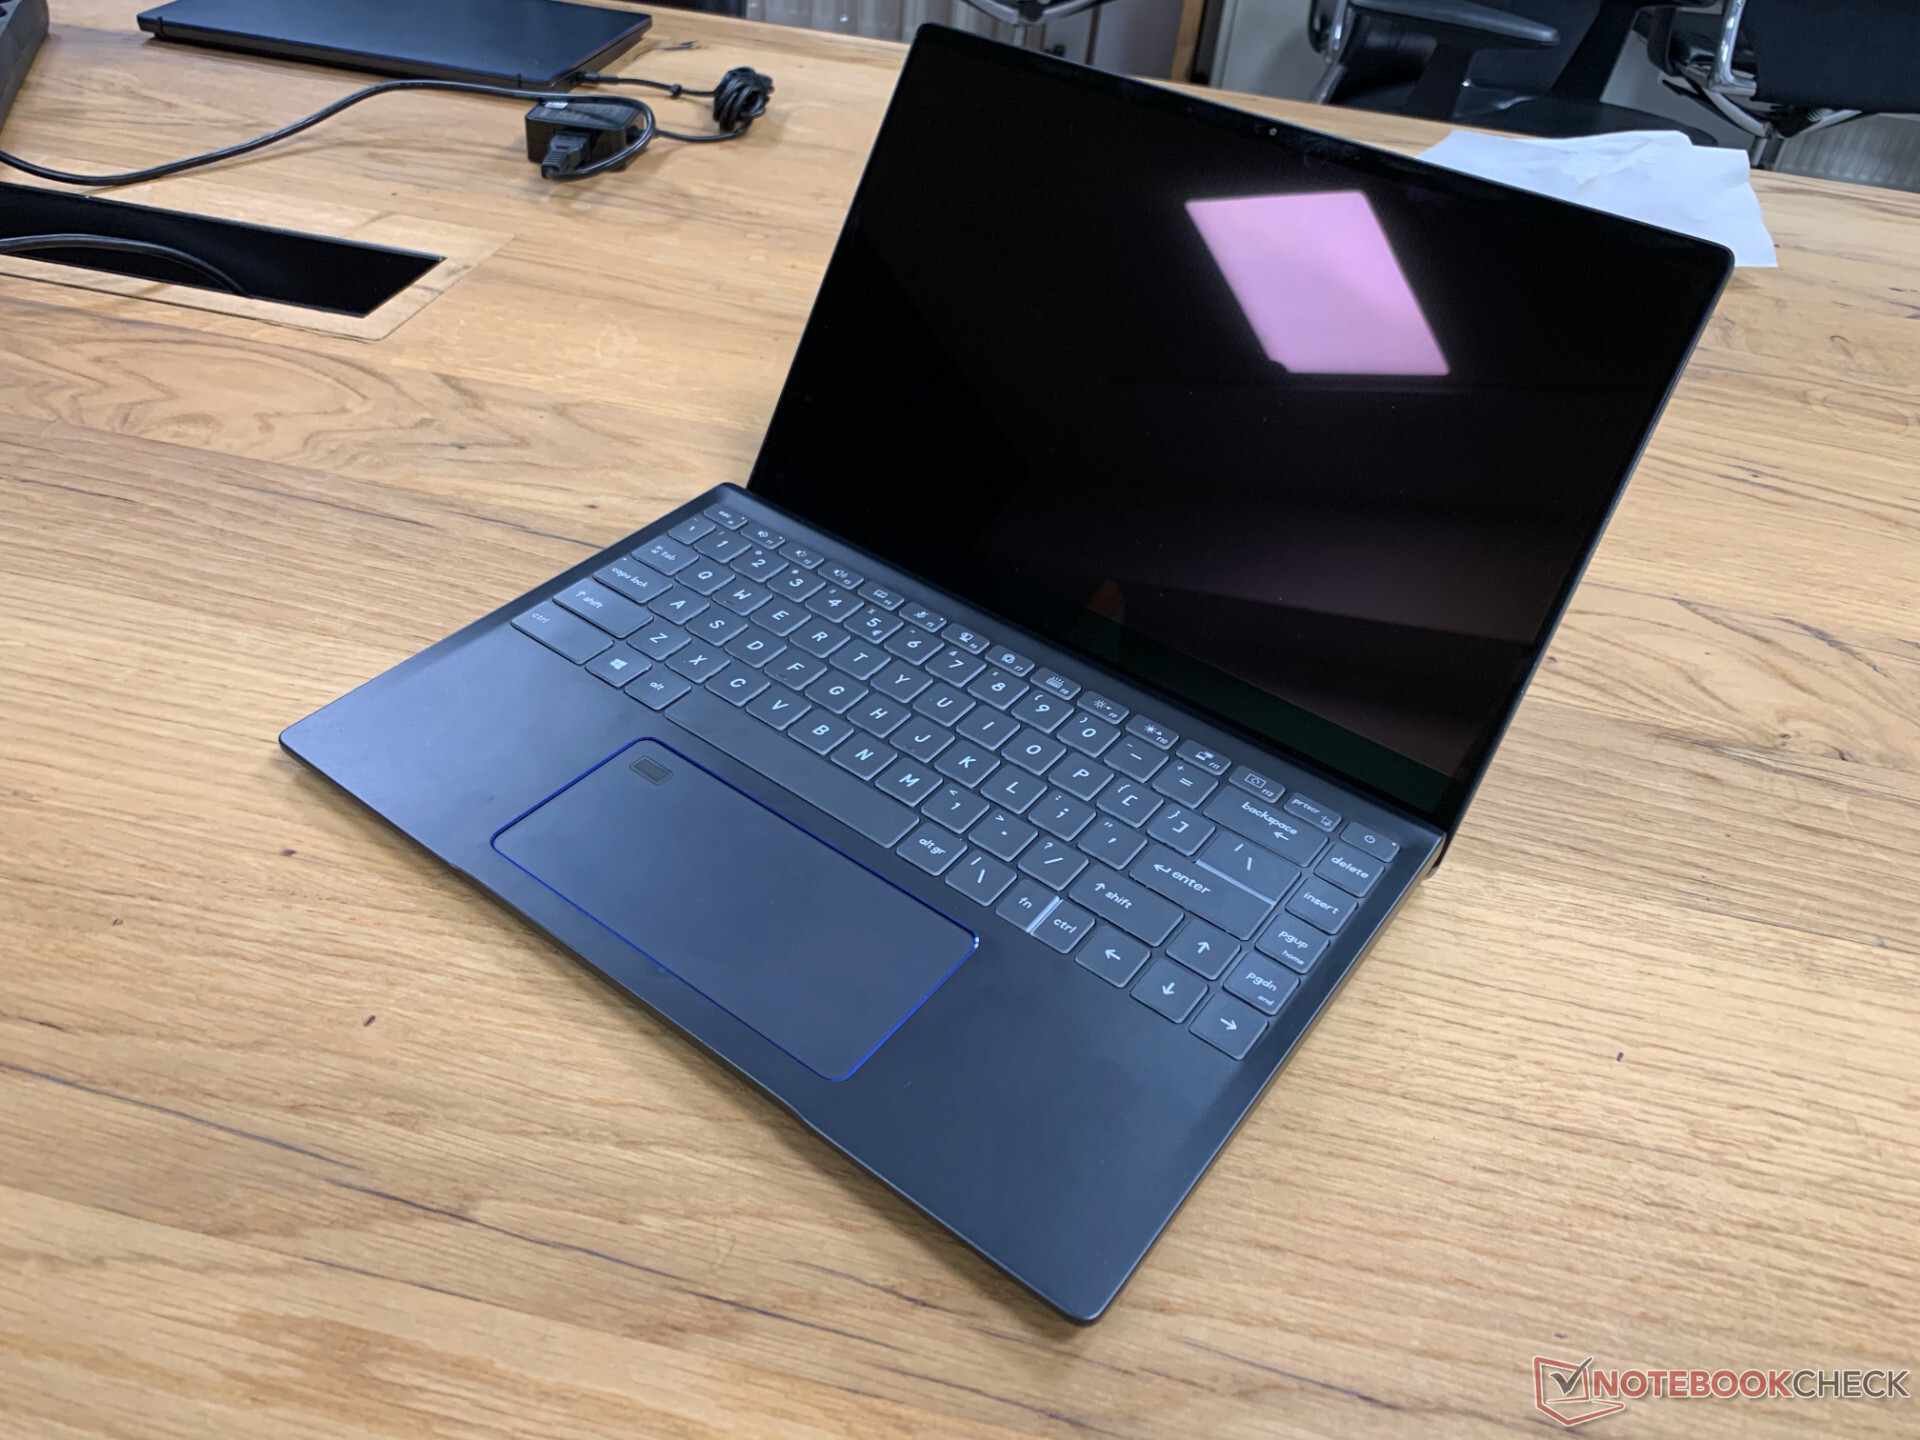
Probamos un "Sistema de Diseño de Referencia de Intel", que fue construido para Intel. Está basado en el portátil barebone MSI Prestige 14 (review con Comet Lake), que no estará disponible para la venta al público. Se trata de un portátil de 14 pulgadas comparativamente delgado, que se eleva ligeramente al abrir la tapa y aspira el aire de la parte inferior. El ruido del ventilador fue moderado durante nuestras pruebas de referencia. El chasis de aluminio se calentó bastante, pero no fue tan malo. Desafortunadamente no se nos permite publicar ninguna foto de los interiores.

Podríamos seleccionar tres niveles de rendimiento diferentes para nuestros puntos de referencia:

  1. Mejor batería: 15 W PL1 (carga sostenida, HWInfo: 14.8 W durante Blender) y 54 W PL2 (carga máxima de 28s, HWInfo 54.5 W durante Blender)
  2. Mejor rendimiento: 28 vatios PL1 (carga sostenida, HWInfo: 27,9 W en Blender) y 54 W PL2 (carga máxima de 28s, HWInfo: 54 W durante Blender)
  3. Mejor rendimiento: 28 ó 36 vatios con Dynamic Tuning (carga sostenida, HWInfo 35,3 vatios durante Blender) y 54 vatios PL2 (HWInfo 54,7 vatios durante Blender)

Intel recomendó el modo "Mejor rendimiento", porque probablemente sea el más representativo para las unidades de producción. Por lo tanto, realizamos la mayoría de nuestras pruebas con 28W y sólo comprobamos las pruebas individuales con 15W y 36W (Dynamic Tuning). El Dynamic Tuning mantiene los 36W PL1 siempre y cuando las temperaturas internas y las temperaturas de la "piel" no sean demasiado altas, de lo contrario bajará a 28W.

Intel Reference Design Laptop 28W
Procesador
Intel Core i7-1185G7 4 x 3 - 4.8 GHz, 28 W PL2 / Short Burst, 56 W PL1 / Sustained, Tiger Lake-UP3
Adaptador gráfico
Memoría
16 GB 
, LDDR4X-4266 Dual Channel
pantalla
14.00 pulgadas 16:9, 1920 x 1080 pixels 157 PPI, lustroso: si, 60 Hz
Disco duro
Samsung PM981a MZVLB1T0HBLR, 1024 GB 
Conexiones
2 Thunderbolt
Equipamento de red
Intel Wi-Fi 6 AX201 (a/b/g/h/n = Wi-Fi 4/ac = Wi-Fi 5/ax = Wi-Fi 6/)
Sistema Operativo
Microsoft Windows 10 Pro 64 Bit
Precio
0 Euros
Note: The manufacturer may use components from different suppliers including display panels, drives or memory sticks with similar specifications.


Rendimiento de la CPU - Ice Lake con Turbo

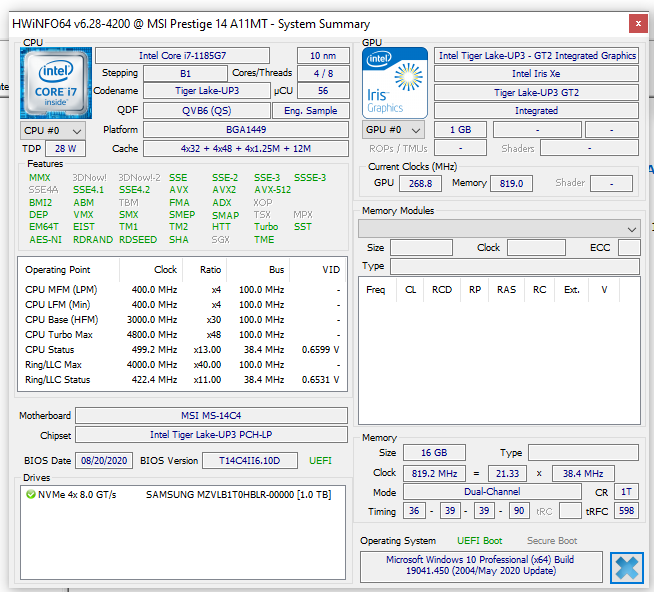
El probado Core i7-1185G7 es el modelo de alta gama para el lanzamiento de la generación U de Tiger Lake y ofrece cuatro núcleos de procesador (microarquitectura Willow Cove), que pueden funcionar hasta 4,8 GHz. Esto significa que el pico es mucho más alto comparado con el de Ice Lake y debería resultar en un mayor rendimiento de un solo núcleo. En comparación con los modelos actuales de AMD, Intel sigue utilizando cuatro núcleos y prefiere utilizar el chip para obtener una unidad gráfica más potente, así como Wi-Fi (parcialmente) integrado y Thunderbolt 4.

Si nos fijamos sólo en el rendimiento del procesador, hay una ventaja impresionante sobre el antiguo Core i7-1065G7 (como en el Dell XPS 13 9300, por ejemplo). Comparado con los rápidos procesadores AMD Renoir, el sistema de prueba se encuentra entre los dos chips de 8 núcleos Ryzen 7 4700U y 4800U - impresionante. El alto rendimiento de un solo núcleo realmente marca la diferencia aquí. El i7-1185G7 puede vencer a todos los rivales en las pruebas de Cinebench Single-Core. Incluso un Core i9-10900K de escritorio o un Ryzen 7 3800XT son ligeramente más lentos. Si miras los benchmarks de multi-core, como el test de Blender, que lleva mucho tiempo, los chips de 8 núcleos de AMD todavía tienen una gran ventaja. Sin embargo, Intel puede cerrar la brecha con el Ryzen 5 4500U 6-core CPU, que una vez más muestra el potencial de rendimiento de los cuatro núcleos de Tiger Lake.

Comparado con los propios chips Comet lake-U y H-series de Intel, Tiger Lake una vez más se desempeña muy bien. La serie U es claramente vencida - a pesar de los 6 núcleos (que difícilmente valen la pena debido a la baja envoltura de TDP). La serie H con 8 núcleos sigue ganando las pruebas multi-núcleo, pero las fichas de cuatro núcleos más pequeñas como el Core i5-10300H son derrotadas.

Performance Rating - Percent
Average Intel Core i9-10980HK
 
84.4 pt
Average Intel Core i7-10875H
 
78.9 pt
Lenovo Yoga Slim 7-14ARE
AMD Ryzen 7 4800U
74.7 pt
Intel Reference Design Laptop 35W Dynamic Tuning -4!
Intel Core i7-1185G7
72.9 pt
Average Intel Core i7-10750H
 
69 pt
Intel Reference Design Laptop 28W
Intel Core i7-1185G7
62.7 pt
Average AMD Ryzen 7 4700U
 
61.9 pt
Average Intel Core i7-1165G7
 
58.2 pt
Xiaomi RedmiBook 16 R5
AMD Ryzen 5 4500U
56.8 pt
Average Intel Core i5-10300H
 
54.1 pt
Average AMD Ryzen 5 4500U
 
53.9 pt
Intel Reference Design Laptop 15W
Intel Core i7-1185G7
52.7 pt
Average Intel Core i7-10710U
 
52.7 pt
Dell XPS 13 9300 4K UHD
Intel Core i7-1065G7
48.4 pt
Average Intel Core i7-10810U
 
48.4 pt
Average Intel Core i7-1065G7
 
41.9 pt
Average AMD Ryzen 3 4300U
 
40.6 pt
Cinebench R20
CPU (Multi Core)
Average Intel Core i9-10980HK
  (3526 - 4487, n=13)
3933 Points +78%
Average Intel Core i7-10875H
  (1986 - 4176, n=32)
3455 Points +56%
Lenovo Yoga Slim 7-14ARE
AMD Ryzen 7 4800U
3213 Points +45%
Average Intel Core i7-10750H
  (1749 - 3325, n=43)
2848 Points +29%
Average AMD Ryzen 7 4700U
  (2401 - 3095, n=9)
2698 Points +22%
Xiaomi RedmiBook 16 R5
AMD Ryzen 5 4500U
2440 Points +10%
Intel Reference Design Laptop 35W Dynamic Tuning
Intel Core i7-1185G7
2402 Points +8%
Average AMD Ryzen 5 4500U
  (1843 - 2530, n=13)
2236 Points +1%
Intel Reference Design Laptop 28W
Intel Core i7-1185G7
2214 Points
Average Intel Core i5-10300H
  (1397 - 2240, n=15)
2046 Points -8%
Average Intel Core i7-10710U
  (1181 - 2598, n=5)
2012 Points -9%
Average Intel Core i7-1165G7
  (1060 - 2657, n=81)
1967 Points -11%
Average Intel Core i7-10810U
  (1498 - 2344, n=5)
1778 Points -20%
Intel Reference Design Laptop 15W
Intel Core i7-1185G7
1560 Points -30%
Average AMD Ryzen 3 4300U
  (1432 - 1609, n=3)
1537 Points -31%
Average Intel Core i7-1065G7
  (1081 - 2024, n=31)
1510 Points -32%
Dell XPS 13 9300 4K UHD
Intel Core i7-1065G7
1396 Points -37%
CPU (Single Core)
Intel Reference Design Laptop 35W Dynamic Tuning
Intel Core i7-1185G7
593 Points +2%
Intel Reference Design Laptop 28W
Intel Core i7-1185G7
580 Points
Intel Reference Design Laptop 15W
Intel Core i7-1185G7
553 Points -5%
Average Intel Core i7-1165G7
  (442 - 589, n=81)
552 Points -5%
Average Intel Core i9-10980HK
  (465 - 507, n=13)
488 Points -16%
Average Intel Core i7-10875H
  (430 - 524, n=32)
486 Points -16%
Lenovo Yoga Slim 7-14ARE
AMD Ryzen 7 4800U
474 Points -18%
Average Intel Core i7-10750H
  (431 - 504, n=43)
473 Points -18%
Average AMD Ryzen 7 4700U
  (448 - 478, n=9)
467 Points -19%
Average Intel Core i7-10710U
  (429 - 480, n=4)
457 Points -21%
Dell XPS 13 9300 4K UHD
Intel Core i7-1065G7
453 Points -22%
Xiaomi RedmiBook 16 R5
AMD Ryzen 5 4500U
451 Points -22%
Average AMD Ryzen 5 4500U
  (424 - 453, n=12)
446 Points -23%
Average Intel Core i5-10300H
  (312 - 470, n=15)
443 Points -24%
Average Intel Core i7-1065G7
  (358 - 474, n=31)
438 Points -24%
Average Intel Core i7-10810U
  (396 - 447, n=5)
425 Points -27%
Average AMD Ryzen 3 4300U
  (412 - 427, n=3)
420 Points -28%
Blender - v2.79 BMW27 CPU
Average AMD Ryzen 3 4300U
  (868 - 907, n=2)
888 Seconds * -63%
Average Intel Core i7-1065G7
  (675 - 1650, n=23)
882 Seconds * -62%
Intel Reference Design Laptop 15W
Intel Core i7-1185G7
745 Seconds * -37%
Average Intel Core i7-10810U
  (571 - 875, n=5)
689 Seconds * -26%
Dell XPS 13 9300 4K UHD
Intel Core i7-1065G7
681 Seconds * -25%
Average Intel Core i7-10710U
  (468 - 892, n=4)
649 Seconds * -19%
Average Intel Core i7-1165G7
  (468 - 1138, n=80)
618 Seconds * -13%
Average AMD Ryzen 5 4500U
  (533 - 748, n=11)
603 Seconds * -11%
Intel Reference Design Laptop 28W
Intel Core i7-1185G7
545 Seconds *
Xiaomi RedmiBook 16 R5
AMD Ryzen 5 4500U
533 Seconds * +2%
Average Intel Core i5-10300H
  (479 - 555, n=14)
515 Seconds * +6%
Intel Reference Design Laptop 35W Dynamic Tuning
Intel Core i7-1185G7
513 Seconds * +6%
Average AMD Ryzen 7 4700U
  (407 - 537, n=8)
480 Seconds * +12%
Average Intel Core i7-10750H
  (322 - 587, n=43)
389 Seconds * +29%
Average Intel Core i7-10875H
  (259 - 535, n=30)
327 Seconds * +40%
Lenovo Yoga Slim 7-14ARE
AMD Ryzen 7 4800U
322 Seconds * +41%
Average Intel Core i9-10980HK
  (239 - 299, n=13)
277 Seconds * +49%
Cinebench R15
CPU Single 64Bit
Intel Reference Design Laptop 35W Dynamic Tuning
Intel Core i7-1185G7
230 Points +3%
Intel Reference Design Laptop 28W
Intel Core i7-1185G7
224 Points
Intel Reference Design Laptop 15W
Intel Core i7-1185G7
216 Points -4%
Average Intel Core i7-1165G7
  (115 - 230, n=78)
212 Points -5%
Average Intel Core i9-10980HK
  (198 - 219, n=15)
207 Points -8%
Average Intel Core i7-10875H
  (190 - 220, n=37)
204 Points -9%
Average Intel Core i7-10750H
  (184 - 213, n=45)
196.7 Points -12%
Lenovo Yoga Slim 7-14ARE
AMD Ryzen 7 4800U
182 Points -19%
Dell XPS 13 9300 4K UHD
Intel Core i7-1065G7
182 Points -19%
Average AMD Ryzen 7 4700U
  (176 - 185, n=11)
180.3 Points -20%
Xiaomi RedmiBook 16 R5
AMD Ryzen 5 4500U
176 Points -21%
Average Intel Core i7-10810U
  (161 - 183, n=5)
175.6 Points -22%
Average Intel Core i7-10710U
  (138 - 194, n=8)
174.9 Points -22%
Average Intel Core i7-1065G7
  (141 - 190, n=35)
174.2 Points -22%
Average Intel Core i5-10300H
  (108 - 194, n=17)
174 Points -22%
Average AMD Ryzen 5 4500U
  (156 - 177, n=13)
172.8 Points -23%
Average AMD Ryzen 3 4300U
  (162.8 - 165, n=2)
163.9 Points -27%
CPU Multi 64Bit
Average Intel Core i9-10980HK
  (1606 - 1862, n=15)
1739 Points +80%
Lenovo Yoga Slim 7-14ARE
AMD Ryzen 7 4800U
1639 (1505.17min - 1639.01max) Points +70%
Average Intel Core i7-10875H
  (1003 - 1833, n=38)
1554 Points +61%
Average Intel Core i7-10750H
  (804 - 1418, n=50)
1263 Points +31%
Average AMD Ryzen 7 4700U
  (801 - 1253, n=12)
1091 Points +13%
Intel Reference Design Laptop 35W Dynamic Tuning
Intel Core i7-1185G7
1066 Points +10%
Xiaomi RedmiBook 16 R5
AMD Ryzen 5 4500U
966 (866.27min - 966.32max) Points 0%
Intel Reference Design Laptop 28W
Intel Core i7-1185G7
966 Points
Intel Reference Design Laptop 28W
Intel Core i7-1185G7
866 (754.55min - 866.1max) Points -10%
Average Intel Core i7-10710U
  (513 - 1113, n=8)
957 Points -1%
Average AMD Ryzen 5 4500U
  (715 - 1007, n=18)
896 Points -7%
Average Intel Core i7-1165G7
  (553 - 1027, n=86)
846 Points -12%
Average Intel Core i5-10300H
  (536 - 921, n=17)
825 Points -15%
Average Intel Core i7-10810U
  (623 - 1064, n=4)
799 Points -17%
Dell XPS 13 9300 4K UHD
Intel Core i7-1065G7
760 (489.25min - 610.17max) Points -21%
Intel Reference Design Laptop 15W
Intel Core i7-1185G7
702 Points -27%
Intel Reference Design Laptop 15W
Intel Core i7-1185G7
628 (619.66min - 627.69max) Points -35%
Average Intel Core i7-1065G7
  (288 - 836, n=36)
648 Points -33%
Average AMD Ryzen 3 4300U
  (545 - 580, n=2)
563 Points -42%
7-Zip 18.03
7z b 4 -mmt1
Average Intel Core i9-10980HK
  (5081 - 5542, n=13)
5386 MIPS 0%
Intel Reference Design Laptop 28W
Intel Core i7-1185G7
5368 MIPS
Average Intel Core i7-10875H
  (5071 - 5780, n=31)
5360 MIPS 0%
Average Intel Core i7-1165G7
  (4478 - 5507, n=80)
5182 MIPS -3%
Intel Reference Design Laptop 15W
Intel Core i7-1185G7
5153 MIPS -4%
Average Intel Core i7-10750H
  (4504 - 5470, n=43)
5114 MIPS -5%
Average Intel Core i5-10300H
  (2945 - 4956, n=14)
4704 MIPS -12%
Average Intel Core i7-10710U
  (4425 - 4727, n=4)
4609 MIPS -14%
Average Intel Core i7-10810U
  (4398 - 4794, n=5)
4561 MIPS -15%
Dell XPS 13 9300 4K UHD
Intel Core i7-1065G7
4438 MIPS -17%
Lenovo Yoga Slim 7-14ARE
AMD Ryzen 7 4800U
4436 MIPS -17%
Average AMD Ryzen 7 4700U
  (4208 - 4470, n=8)
4361 MIPS -19%
Xiaomi RedmiBook 16 R5
AMD Ryzen 5 4500U
4321 MIPS -20%
Average AMD Ryzen 5 4500U
  (4235 - 4338, n=11)
4290 MIPS -20%
Average Intel Core i7-1065G7
  (3289 - 4589, n=24)
4284 MIPS -20%
Average AMD Ryzen 3 4300U
  (4014 - 4113, n=2)
4064 MIPS -24%
7z b 4
Average Intel Core i9-10980HK
  (43786 - 49275, n=13)
47126 MIPS +88%
Lenovo Yoga Slim 7-14ARE
AMD Ryzen 7 4800U
44804 MIPS +79%
Average Intel Core i7-10875H
  (29844 - 49562, n=31)
43117 MIPS +72%
Average Intel Core i7-10750H
  (26040 - 37345, n=43)
33946 MIPS +35%
Average AMD Ryzen 7 4700U
  (26652 - 33890, n=8)
30273 MIPS +21%
Xiaomi RedmiBook 16 R5
AMD Ryzen 5 4500U
25891 MIPS +3%
Intel Reference Design Laptop 28W
Intel Core i7-1185G7
25086 MIPS
Average AMD Ryzen 5 4500U
  (22466 - 25891, n=11)
24384 MIPS -3%
Average Intel Core i7-10710U
  (16713 - 29948, n=4)
23912 MIPS -5%
Average Intel Core i5-10300H
  (15146 - 24841, n=14)
23295 MIPS -7%
Average Intel Core i7-1165G7
  (15347 - 27405, n=80)
22935 MIPS -9%
Average Intel Core i7-10810U
  (16072 - 25244, n=5)
21290 MIPS -15%
Dell XPS 13 9300 4K UHD
Intel Core i7-1065G7
21139 MIPS -16%
Intel Reference Design Laptop 15W
Intel Core i7-1185G7
18936 MIPS -25%
Average Intel Core i7-1065G7
  (10406 - 22898, n=24)
17024 MIPS -32%
Average AMD Ryzen 3 4300U
  (15043 - 16605, n=2)
15824 MIPS -37%
HWBOT x265 Benchmark v2.2 - 4k Preset
Average Intel Core i9-10980HK
  (12 - 14.6, n=13)
13 fps +101%
Average Intel Core i7-10875H
  (7.27 - 14.1, n=27)
11.7 fps +81%
Lenovo Yoga Slim 7-14ARE
AMD Ryzen 7 4800U
10.77 fps +67%
Average Intel Core i7-10750H
  (5.54 - 11.6, n=43)
9.61 fps +49%
Average AMD Ryzen 7 4700U
  (6.79 - 10.1, n=8)
8.44 fps +31%
Xiaomi RedmiBook 16 R5
AMD Ryzen 5 4500U
7.16 fps +11%
Average Intel Core i5-10300H
  (6.13 - 7.78, n=14)
7.1 fps +10%
Average AMD Ryzen 5 4500U
  (5.86 - 7.33, n=10)
6.8 fps +5%
Intel Reference Design Laptop 28W
Intel Core i7-1185G7
6.46 fps
Average Intel Core i7-1165G7
  (1.39 - 8.47, n=80)
6.3 fps -2%
Dell XPS 13 9300 4K UHD
Intel Core i7-1065G7
6.08 fps -6%
Average Intel Core i7-10710U
  (4.2 - 7.95, n=4)
5.94 fps -8%
Average Intel Core i7-10810U
  (3.81 - 6.45, n=5)
5.31 fps -18%
Intel Reference Design Laptop 15W
Intel Core i7-1185G7
5.02 fps -22%
Average AMD Ryzen 3 4300U
  (4.37 - 5.36, n=2)
4.87 fps -25%
Average Intel Core i7-1065G7
  (2.2 - 6.38, n=22)
4.58 fps -29%
R Benchmark 2.5 - Overall mean
Average Intel Core i7-1065G7
  (0.661 - 0.798, n=18)
0.708 sec * -24%
Dell XPS 13 9300 4K UHD
Intel Core i7-1065G7
0.682 sec * -19%
Average Intel Core i7-10810U
  (0.651 - 0.717, n=5)
0.682 sec * -19%
Average Intel Core i5-10300H
  (0.625 - 1.088, n=14)
0.68 sec * -19%
Average AMD Ryzen 3 4300U
  (0.652 - 0.686, n=2)
0.669 sec * -17%
Average Intel Core i7-10710U
  (0.649 - 0.674, n=2)
0.662 sec * -16%
Average AMD Ryzen 5 4500U
  (0.614 - 0.654, n=10)
0.636 sec * -11%
Xiaomi RedmiBook 16 R5
AMD Ryzen 5 4500U
0.634 sec * -11%
Average AMD Ryzen 7 4700U
  (0.598 - 0.651, n=8)
0.618 sec * -8%
Lenovo Yoga Slim 7-14ARE
AMD Ryzen 7 4800U
0.613 sec * -7%
Average Intel Core i7-10750H
  (0.578 - 0.708, n=42)
0.611 sec * -7%
Average Intel Core i7-1165G7
  (0.552 - 1.002, n=80)
0.594 sec * -4%
Average Intel Core i7-10875H
  (0.546 - 0.662, n=29)
0.582 sec * -2%
Intel Reference Design Laptop 15W
Intel Core i7-1185G7
0.579 sec * -1%
Average Intel Core i9-10980HK
  (0.561 - 0.596, n=13)
0.576 sec * -1%
Intel Reference Design Laptop 28W
Intel Core i7-1185G7
0.571 sec *

* ... más pequeño es mejor

El rendimiento sostenido es estable en el portátil de referencia de Intel, y tampoco podemos ver la caída habitual después de que el benchmark inicial se ejecute en el modo de 28W o 15W.

0501001502002503003504004505005506006507007508008509009501000105011001150120012501300135014001450150015501600Tooltip
Intel Reference Design Laptop 28W Intel Core i7-1185G7, Intel Core i7-1185G7: Ø853 (754.55-866.1)
Lenovo Yoga Slim 7-14ARE AMD Ryzen 7 4800U, AMD Ryzen 7 4800U: Ø1522 (1505.17-1639.01)
Dell XPS 13 9300 4K UHD Intel Core i7-1065G7, Intel Core i7-1065G7: Ø573 (480.43-760.86)
Intel Reference Design Laptop 15W Intel Core i7-1185G7, Intel Core i7-1185G7: Ø625 (619.66-627.69)

Como ya hemos informado durante el lanzamiento, Tiger Lake ya no utiliza límites fijos de TDP, pero los fabricantes pueden elegir entre 15 y 28W (dependiendo de la solución de refrigeración). Incluyendo el Dynamic Tuning, la CPU puede incluso consumir hasta 36W durante períodos más largos. Nuestros puntos de referencia muestran claramente que estos ajustes de TDP tienen un efecto masivo en el rendimiento. El rendimiento de un solo núcleo no se ve afectado tanto, porque el límite de 15W ya es suficiente para los ritmos altos, pero el rendimiento de la CPU caerá un 27% o un 31%, respectivamente, en comparación con el ajuste máximo. Esto significa que aún habrá diferencias de rendimiento significativas de un ordenador portátil a otro. No se puede simplemente mirar la designación del modelo como i7-1185G7 por el rendimiento que obtendrá.

Cinebench R20
CPU (Multi Core)
Average Intel Core i9-10980HK
  (3526 - 4487, n=13)
3933 Points +78%
Average Intel Core i7-10875H
  (1986 - 4176, n=32)
3455 Points +56%
Lenovo Yoga Slim 7-14ARE
AMD Ryzen 7 4800U, AMD Radeon RX Vega 8 (Ryzen 4000/5000)
3213 Points +45%
Average AMD Ryzen 7 4800U
  (2943 - 3306, n=4)
3178 Points +44%
Average AMD Ryzen 7 4700U
  (2401 - 3095, n=9)
2698 Points +22%
Average AMD Ryzen 5 4600U
  (2544 - 2796, n=3)
2628 Points +19%
Xiaomi RedmiBook 16 R5
AMD Ryzen 5 4500U, AMD Radeon RX Vega 6 (Ryzen 4000/5000)
2440 Points +10%
Intel Reference Design Laptop 35W Dynamic Tuning
Intel Core i7-1185G7, Intel Iris Xe Graphics G7 96EUs
2402 Points +8%
Average AMD Ryzen 5 4500U
  (1843 - 2530, n=13)
2236 Points +1%
Intel Reference Design Laptop 28W
Intel Core i7-1185G7, Intel Iris Xe Graphics G7 96EUs
2214 Points
Average Intel Core i5-10300H
  (1397 - 2240, n=15)
2046 Points -8%
Average Intel Core i7-1165G7
  (1060 - 2657, n=81)
1967 Points -11%
Intel Reference Design Laptop 15W
Intel Core i7-1185G7, Intel Iris Xe Graphics G7 96EUs
1560 Points -30%
Average AMD Ryzen 3 4300U
  (1432 - 1609, n=3)
1537 Points -31%
CPU (Single Core)
Intel Reference Design Laptop 35W Dynamic Tuning
Intel Core i7-1185G7, Intel Iris Xe Graphics G7 96EUs
593 Points +2%
Intel Reference Design Laptop 28W
Intel Core i7-1185G7, Intel Iris Xe Graphics G7 96EUs
580 Points
Intel Reference Design Laptop 15W
Intel Core i7-1185G7, Intel Iris Xe Graphics G7 96EUs
553 Points -5%
Average Intel Core i7-1165G7
  (442 - 589, n=81)
552 Points -5%
Average Intel Core i9-10980HK
  (465 - 507, n=13)
488 Points -16%
Average Intel Core i7-10875H
  (430 - 524, n=32)
486 Points -16%
Average AMD Ryzen 7 4800U
  (474 - 488, n=4)
481 Points -17%
Lenovo Yoga Slim 7-14ARE
AMD Ryzen 7 4800U, AMD Radeon RX Vega 8 (Ryzen 4000/5000)
474 Points -18%
Average AMD Ryzen 7 4700U
  (448 - 478, n=9)
467 Points -19%
Xiaomi RedmiBook 16 R5
AMD Ryzen 5 4500U, AMD Radeon RX Vega 6 (Ryzen 4000/5000)
451 Points -22%
Average AMD Ryzen 5 4600U
  (447 - 453, n=3)
449 Points -23%
Average AMD Ryzen 5 4500U
  (424 - 453, n=12)
446 Points -23%
Average Intel Core i5-10300H
  (312 - 470, n=15)
443 Points -24%
Average AMD Ryzen 3 4300U
  (412 - 427, n=3)
420 Points -28%
Blender - v2.79 BMW27 CPU
Average AMD Ryzen 3 4300U
  (868 - 907, n=2)
888 Seconds * -63%
Intel Reference Design Laptop 15W
Intel Core i7-1185G7, Intel Iris Xe Graphics G7 96EUs
745 Seconds * -37%
Average Intel Core i7-1165G7
  (468 - 1138, n=80)
618 Seconds * -13%
Average AMD Ryzen 5 4500U
  (533 - 748, n=11)
603 Seconds * -11%
Intel Reference Design Laptop 28W
Intel Core i7-1185G7, Intel Iris Xe Graphics G7 96EUs
545 Seconds *
Xiaomi RedmiBook 16 R5
AMD Ryzen 5 4500U, AMD Radeon RX Vega 6 (Ryzen 4000/5000)
533 Seconds * +2%
Average Intel Core i5-10300H
  (479 - 555, n=14)
515 Seconds * +6%
Intel Reference Design Laptop 35W Dynamic Tuning
Intel Core i7-1185G7, Intel Iris Xe Graphics G7 96EUs
513 Seconds * +6%
Average AMD Ryzen 7 4700U
  (407 - 537, n=8)
480 Seconds * +12%
Average AMD Ryzen 5 4600U
  ()
402 Seconds * +26%
Average AMD Ryzen 7 4800U
  (322 - 374, n=3)
345 Seconds * +37%
Average Intel Core i7-10875H
  (259 - 535, n=30)
327 Seconds * +40%
Lenovo Yoga Slim 7-14ARE
AMD Ryzen 7 4800U, AMD Radeon RX Vega 8 (Ryzen 4000/5000)
322 Seconds * +41%
Average Intel Core i9-10980HK
  (239 - 299, n=13)
277 Seconds * +49%

* ... más pequeño es mejor

Rendimiento de la aplicación - PCMark 10

Seguimos usando el PCMark 10 normal para el rendimiento de la aplicación, que incluye software libre como LibreOffice, GIMP, Firefox y Chromium. Gracias al rápido SSD PM981a de 1TB de Samsung, el MSI barebone con Tiger Lake muestra un gran rendimiento. El sistema sólo retrocede un poco en la parte de creación de contenido, pero las otras dos subpruebas producen puntuaciones aún más altas en comparación con los rápidos portátiles para juegos con CPU CML-H de 8 núcleos (i9-10980HK). La puntuación global es menor en el sistema i7-1185G7, pero está ligeramente por delante del Lenovo Yoga Slim 7 con CPU Ryzen 7 4800U. El resultado es un indicador de lo bien que los sistemas basados en Tiger Lake deberían (o podrían, respectivamente) manejar las tareas de oficina y productivas.

PCMark 10 / Score
Average Intel Core i9-10980HK
  (5277 - 6988, n=12)
6288 Points +13%
Average Intel Core i7-10875H
  (4884 - 6739, n=24)
5970 Points +7%
Intel Reference Design Laptop 28W
Intel Core i7-1185G7, Intel Iris Xe Graphics G7 96EUs, Samsung PM981a MZVLB1T0HBLR
5561 Points
Lenovo Yoga Slim 7-14ARE
AMD Ryzen 7 4800U, AMD Radeon RX Vega 8 (Ryzen 4000/5000), Samsung SSD PM981a MZVLB512HBJQ
5383 Points -3%
Average AMD Ryzen 7 4800U
  (5233 - 5383, n=3)
5291 Points -5%
Average Intel Core i7-1165G7
  (4531 - 5931, n=72)
5070 Points -9%
Average AMD Ryzen 7 4700U
  (4527 - 5307, n=8)
4898 Points -12%
Xiaomi RedmiBook 16 R5
AMD Ryzen 5 4500U, AMD Radeon RX Vega 6 (Ryzen 4000/5000), Samsung PM881 MZNLH512HALU-0000/07
4784 Points -14%
Average AMD Ryzen 5 4600U
  ()
4772 Points -14%
Average Intel Core i5-10300H
  (4077 - 5301, n=13)
4748 Points -15%
Average AMD Ryzen 5 4500U
  (4393 - 5024, n=12)
4683 Points -16%
Dell XPS 13 9300 4K UHD
Intel Core i7-1065G7, Intel Iris Plus Graphics G7 (Ice Lake 64 EU), Intel SSDPEMKF512G8 NVMe SSD
4451 Points -20%
Average AMD Ryzen 3 4300U
  ()
4322 Points -22%
PCMark 10 / Essentials
Intel Reference Design Laptop 28W
Intel Core i7-1185G7, Intel Iris Xe Graphics G7 96EUs, Samsung PM981a MZVLB1T0HBLR
10484 Points
Average Intel Core i9-10980HK
  (9312 - 10829, n=12)
9798 Points -7%
Average Intel Core i7-1165G7
  (8026 - 11505, n=72)
9763 Points -7%
Lenovo Yoga Slim 7-14ARE
AMD Ryzen 7 4800U, AMD Radeon RX Vega 8 (Ryzen 4000/5000), Samsung SSD PM981a MZVLB512HBJQ
9637 Points -8%
Average Intel Core i7-10875H
  (7547 - 10458, n=24)
9567 Points -9%
Average AMD Ryzen 7 4800U
  (9188 - 9637, n=3)
9403 Points -10%
Average AMD Ryzen 5 4600U
  ()
9352 Points -11%
Dell XPS 13 9300 4K UHD
Intel Core i7-1065G7, Intel Iris Plus Graphics G7 (Ice Lake 64 EU), Intel SSDPEMKF512G8 NVMe SSD
9096 Points -13%
Average AMD Ryzen 7 4700U
  (8303 - 9559, n=8)
9009 Points -14%
Xiaomi RedmiBook 16 R5
AMD Ryzen 5 4500U, AMD Radeon RX Vega 6 (Ryzen 4000/5000), Samsung PM881 MZNLH512HALU-0000/07
8905 Points -15%
Average Intel Core i5-10300H
  (7148 - 9874, n=13)
8714 Points -17%
Average AMD Ryzen 5 4500U
  (8204 - 9124, n=11)
8669 Points -17%
Average AMD Ryzen 3 4300U
  ()
8600 Points -18%
PCMark 10 / Productivity
Intel Reference Design Laptop 28W
Intel Core i7-1185G7, Intel Iris Xe Graphics G7 96EUs, Samsung PM981a MZVLB1T0HBLR
8770 Points
Average Intel Core i9-10980HK
  (7641 - 9337, n=12)
8502 Points -3%
Average Intel Core i7-10875H
  (7534 - 9070, n=24)
8179 Points -7%
Average AMD Ryzen 7 4800U
  (7631 - 8091, n=3)
7879 Points -10%
Lenovo Yoga Slim 7-14ARE
AMD Ryzen 7 4800U, AMD Radeon RX Vega 8 (Ryzen 4000/5000), Samsung SSD PM981a MZVLB512HBJQ
7631 Points -13%
Average Intel Core i5-10300H
  (6732 - 8058, n=13)
7374 Points -16%
Average Intel Core i7-1165G7
  (5570 - 9317, n=72)
7252 Points -17%
Average AMD Ryzen 7 4700U
  (5348 - 7945, n=8)
7201 Points -18%
Xiaomi RedmiBook 16 R5
AMD Ryzen 5 4500U, AMD Radeon RX Vega 6 (Ryzen 4000/5000), Samsung PM881 MZNLH512HALU-0000/07
7096 Points -19%
Average AMD Ryzen 5 4500U
  (6400 - 7752, n=11)
6987 Points -20%
Dell XPS 13 9300 4K UHD
Intel Core i7-1065G7, Intel Iris Plus Graphics G7 (Ice Lake 64 EU), Intel SSDPEMKF512G8 NVMe SSD
6912 Points -21%
Average AMD Ryzen 3 4300U
  ()
6489 Points -26%
Average AMD Ryzen 5 4600U
  ()
6230 Points -29%
PCMark 10 / Digital Content Creation
Average Intel Core i9-10980HK
  (5177 - 10217, n=12)
8238 Points +62%
Average Intel Core i7-10875H
  (4563 - 9448, n=24)
7517 Points +48%
Lenovo Yoga Slim 7-14ARE
AMD Ryzen 7 4800U, AMD Radeon RX Vega 8 (Ryzen 4000/5000), Samsung SSD PM981a MZVLB512HBJQ
5758 Points +13%
Average AMD Ryzen 7 4800U
  (5123 - 5758, n=3)
5434 Points +7%
Intel Reference Design Laptop 28W
Intel Core i7-1185G7, Intel Iris Xe Graphics G7 96EUs, Samsung PM981a MZVLB1T0HBLR
5075 Points
Average AMD Ryzen 5 4600U
  ()
5062 Points 0%
Average Intel Core i7-1165G7
  (4083 - 6957, n=72)
5045 Points -1%
Average AMD Ryzen 7 4700U
  (4459 - 5495, n=8)
4947 Points -3%
Xiaomi RedmiBook 16 R5
AMD Ryzen 5 4500U, AMD Radeon RX Vega 6 (Ryzen 4000/5000), Samsung PM881 MZNLH512HALU-0000/07
4704 Points -7%
Average Intel Core i5-10300H
  (2928 - 6003, n=13)
4621 Points -9%
Average AMD Ryzen 5 4500U
  (4189 - 4808, n=11)
4517 Points -11%
Average AMD Ryzen 3 4300U
  ()
3926 Points -23%
Dell XPS 13 9300 4K UHD
Intel Core i7-1065G7, Intel Iris Plus Graphics G7 (Ice Lake 64 EU), Intel SSDPEMKF512G8 NVMe SSD
3807 Points -25%

Rendimiento de la GPU - La arquitectura Xe promete mucho rendimiento

El alto rendimiento del Iris Xe en las pruebas de 3DMark

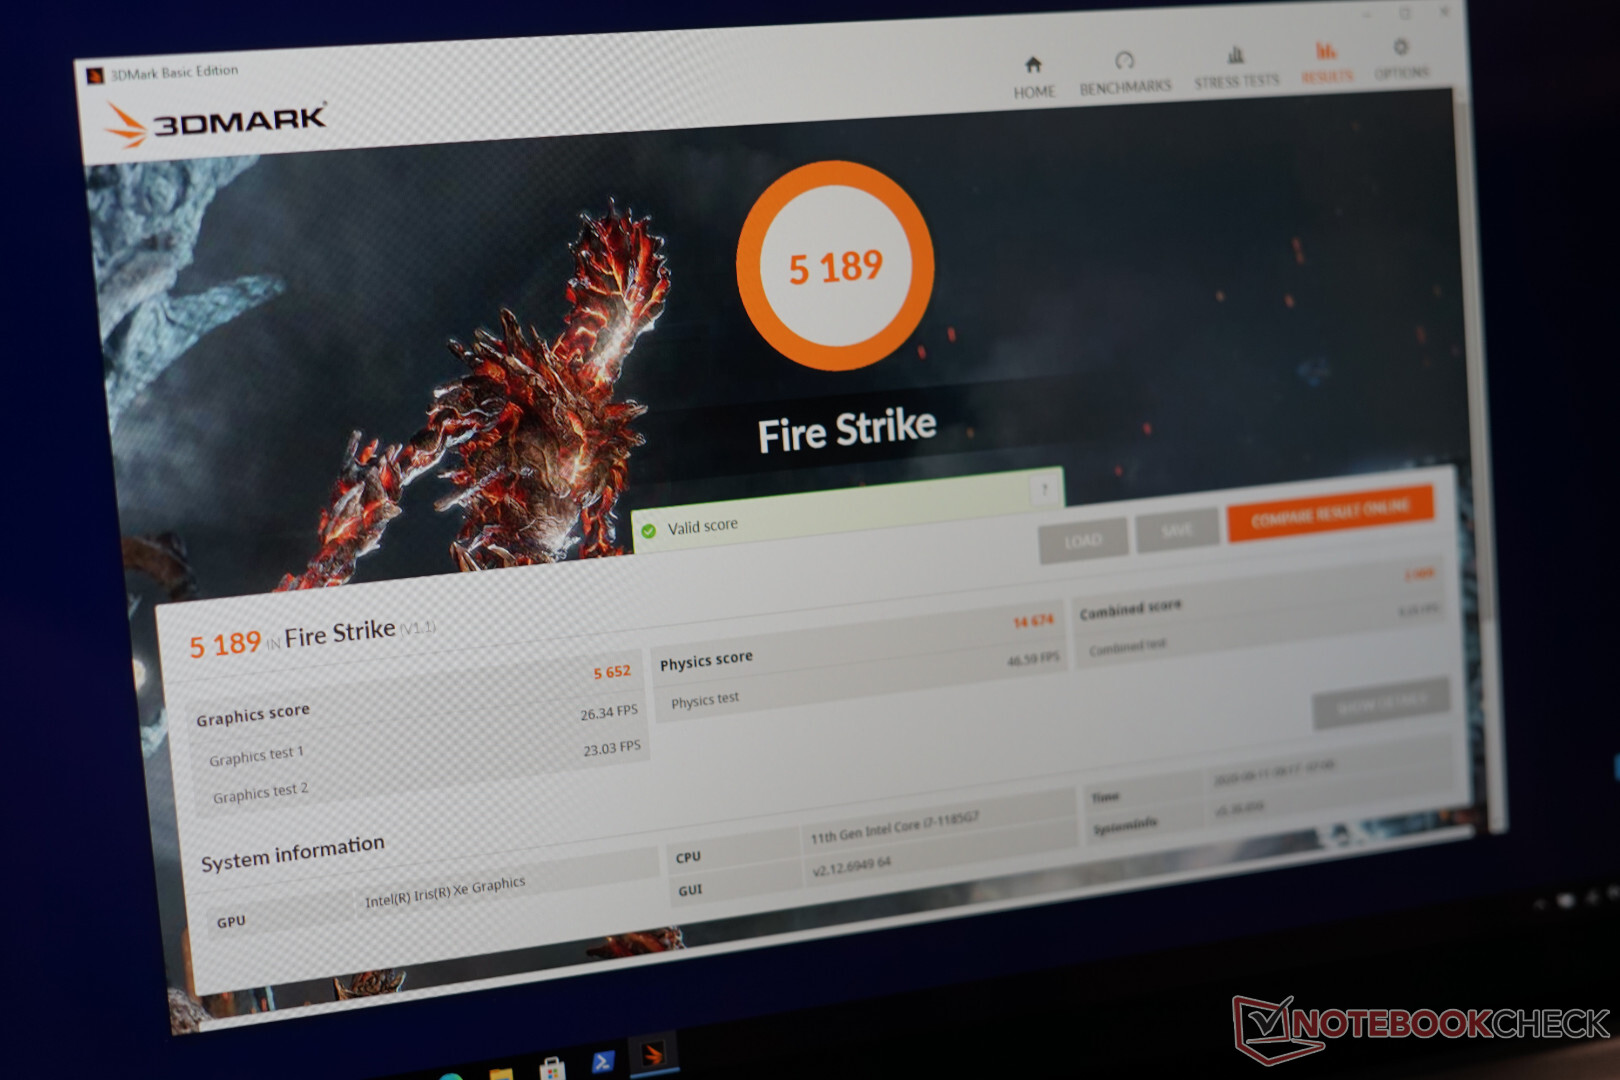
Los procesadores de Tiger Lake son los primeros chips con la nueva generación de gráficos Xe. Intel sólo lo llama "Intel Iris Xe Graphics" en nuestro Core i7-1185G7, y está soportado por 16 GB de RAM LPDDR4x-4266 en una configuración de doble canal. Sin embargo, la iGPU no tiene su propia memoria de gráficos (excepto para las cachés). Intel anuncia una gran ventaja de rendimiento sobre la Generación Ice Lake, por lo que es una gran mejora después de mucho tiempo de las conocidas iGPU.

La nueva GPU Xe funciona extremadamente bien en los benchmarks de gráficos sintéticos. Está a la par con una AMD Radeon Pro 560X dedicada en el Apple MacBook Pro 15 y las iGPU más rápidas de Ryzen (como la RX Vega 8 en la Ryzen 4000) son claramente superadas. Las tarjetas gráficas móviles de Nvidia como la GeForce MX350 también son mucho más lentas y la puntuación es más comparable a la del nuevo MX450

El rendimiento de cálculo de la GPU en V-Ray no es tan impresionante, pero sigue estando a la par de las antiguas GeForce MX250/MX330. Las GPU de AMD son más potentes en esta prueba.


3DMark
2560x1440 Time Spy Graphics
Average NVIDIA GeForce MX450
  (1086 - 2300, n=16)
1796 Points +11%
Average NVIDIA GeForce GTX 1050 Mobile
  (1416 - 2130, n=11)
1672 Points +3%
Intel Reference Design Laptop 28W
Intel Iris Xe Graphics G7 96EUs, Intel Core i7-1185G7
1618 Points
Average NVIDIA GeForce GTX 1050 Max-Q
  (1596 - 1634, n=2)
1615 Points 0%
Apple MacBook Pro 15 2018 (2.6 GHz, 560X)
AMD Radeon Pro 560X, Intel Core i7-8850H
1614 Points 0%
Intel Reference Design Laptop 35W Dynamic Tuning
Intel Iris Xe Graphics G7 96EUs, Intel Core i7-1185G7
1614 Points 0%
Average NVIDIA GeForce MX350
  (1123 - 1595, n=12)
1322 Points -18%
Lenovo Yoga Slim 7-14ARE
AMD Radeon RX Vega 8 (Ryzen 4000/5000), AMD Ryzen 7 4800U
1173 Points -28%
Average AMD Radeon RX Vega 8 (Ryzen 4000/5000)
  (540 - 1557, n=54)
1156 Points -29%
Average NVIDIA GeForce MX250
  (881 - 1169, n=22)
1070 Points -34%
Average AMD Radeon RX Vega 7
  (496 - 1249, n=57)
991 Points -39%
Average AMD Radeon RX Vega 9
  ()
872 Points -46%
Average AMD Radeon RX Vega 6 (Ryzen 4000/5000)
  (650 - 996, n=22)
821 Points -49%
Xiaomi RedmiBook 16 R5
AMD Radeon RX Vega 6 (Ryzen 4000/5000), AMD Ryzen 5 4500U
783 Points -52%
Average Intel Iris Plus Graphics G7 (Ice Lake 64 EU)
  (526 - 851, n=23)
744 Points -54%
1920x1080 Fire Strike Graphics
Average NVIDIA GeForce GTX 1050 Mobile
  (4935 - 6651, n=43)
6022 Points +7%
Apple MacBook Pro 15 2018 (2.6 GHz, 560X)
AMD Radeon Pro 560X, Intel Core i7-8850H
5699 Points +1%
Average NVIDIA GeForce GTX 1050 Max-Q
  (5616 - 5792, n=4)
5677 Points 0%
Intel Reference Design Laptop 28W
Intel Iris Xe Graphics G7 96EUs, Intel Core i7-1185G7
5652 Points
Average NVIDIA GeForce MX450
  (4336 - 5753, n=17)
4869 Points -14%
Average NVIDIA GeForce MX350
  (3999 - 4656, n=14)
4390 Points -22%
Lenovo Yoga Slim 7-14ARE
AMD Radeon RX Vega 8 (Ryzen 4000/5000), AMD Ryzen 7 4800U
3938 Points -30%
Average AMD Radeon RX Vega 8 (Ryzen 4000/5000)
  (1694 - 5041, n=54)
3676 Points -35%
Average NVIDIA GeForce MX250
  (2939 - 3885, n=29)
3531 Points -38%
Average AMD Radeon RX Vega 7
  (1772 - 4037, n=62)
3189 Points -44%
Average AMD Radeon RX Vega 9
  ()
2789 Points -51%
Average AMD Radeon RX Vega 6 (Ryzen 4000/5000)
  (2122 - 3239, n=23)
2673 Points -53%
Xiaomi RedmiBook 16 R5
AMD Radeon RX Vega 6 (Ryzen 4000/5000), AMD Ryzen 5 4500U
2656 Points -53%
Average Intel Iris Plus Graphics G7 (Ice Lake 64 EU)
  (1418 - 3156, n=27)
2594 Points -54%
Basemark GPU 1.2 - 1920x1080 Vulkan Medium Offscreen
Average NVIDIA GeForce MX450
  ()
235 fps +16%
Intel Reference Design Laptop 28W
Intel Iris Xe Graphics G7 96EUs, Intel Core i7-1185G7
202 (105min, 155P1 - 432max) fps
Apple MacBook Pro 15 2018 (2.6 GHz, 560X)
AMD Radeon Pro 560X, Intel Core i7-8850H
182 (113min, 133P1 - 370max) fps -10%
Apple MacBook Pro 15 2018 (2.6 GHz, 560X)
AMD Radeon Pro 560X, Intel Core i7-8850H
177.5 (107min - 390max) fps -12%
Intel Reference Design Laptop 15W
Intel Iris Xe Graphics G7 96EUs, Intel Core i7-1185G7
172 (89.2min, 133P1 - 403max) fps -15%
Average AMD Radeon RX Vega 8 (Ryzen 4000/5000)
  (76.9 - 289, n=9)
150.5 fps -25%
Average AMD Radeon RX Vega 7
  (104.6 - 289, n=10)
134.4 fps -33%
Average Intel Iris Plus Graphics G7 (Ice Lake 64 EU)
  ()
102 fps -50%
Average AMD Radeon RX Vega 6 (Ryzen 4000/5000)
  (82.6 - 104.6, n=2)
93.6 fps -54%
Xiaomi RedmiBook 16 R5
AMD Radeon RX Vega 6 (Ryzen 4000/5000), AMD Ryzen 5 4500U
82.6 (47.9min, 62.3P1 - 176max) fps -59%
Cinebench R15 - OpenGL 64Bit
Average NVIDIA GeForce MX450
  (84.6 - 150, n=19)
127 fps +19%
Average NVIDIA GeForce MX350
  (97.5 - 140, n=11)
116.7 fps +9%
Average AMD Radeon RX Vega 8 (Ryzen 4000/5000)
  (37.4 - 1714, n=55)
111.1 fps +4%
Intel Reference Design Laptop 28W
Intel Iris Xe Graphics G7 96EUs, Intel Core i7-1185G7
107 fps
Average NVIDIA GeForce GTX 1050 Max-Q
  (64.5 - 119.9, n=4)
100.9 fps -6%
Apple MacBook Pro 15 2018 (2.6 GHz, 560X)
AMD Radeon Pro 560X, Intel Core i7-8850H
98.4 fps -8%
Average NVIDIA GeForce GTX 1050 Mobile
  (0.99 - 122.9, n=41)
97.3 fps -9%
Average NVIDIA GeForce MX250
  (48.5 - 114.8, n=30)
96.8 fps -10%
Intel Reference Design Laptop 15W
Intel Iris Xe Graphics G7 96EUs, Intel Core i7-1185G7
88.3 fps -17%
Lenovo Yoga Slim 7-14ARE
AMD Radeon RX Vega 8 (Ryzen 4000/5000), AMD Ryzen 7 4800U
75.4 fps -30%
Lenovo Yoga Slim 7-14ARE
AMD Radeon RX Vega 8 (Ryzen 4000/5000), AMD Ryzen 7 4800U
73.1 fps -32%
Lenovo Yoga Slim 7-14ARE
AMD Radeon RX Vega 8 (Ryzen 4000/5000), AMD Ryzen 7 4800U
72.7 fps -32%
Average AMD Radeon RX Vega 7
  (37.3 - 123.2, n=59)
73.3 fps -31%
Average Intel Iris Plus Graphics G7 (Ice Lake 64 EU)
  (38.4 - 74.5, n=30)
62.8 fps -41%
Average AMD Radeon RX Vega 6 (Ryzen 4000/5000)
  (47.5 - 91.3, n=23)
59.6 fps -44%
Xiaomi RedmiBook 16 R5
AMD Radeon RX Vega 6 (Ryzen 4000/5000), AMD Ryzen 5 4500U
59.4 fps -44%
Average AMD Radeon RX Vega 9
  ()
55 fps -49%
V-Ray Benchmark Next 4.10 - GPU
Average NVIDIA GeForce GTX 1050 Mobile
  ()
61 mpaths +85%
Average AMD Radeon RX Vega 8 (Ryzen 4000/5000)
  (31 - 83, n=47)
59.9 mpaths +82%
Lenovo Yoga Slim 7-14ARE
AMD Radeon RX Vega 8 (Ryzen 4000/5000), AMD Ryzen 7 4800U
47 mpaths +42%
Average AMD Radeon RX Vega 7
  (14 - 70, n=47)
46.2 mpaths +40%
Average AMD Radeon RX Vega 6 (Ryzen 4000/5000)
  (30 - 52, n=15)
39.4 mpaths +19%
Intel Reference Design Laptop 35W Dynamic Tuning
Intel Iris Xe Graphics G7 96EUs, Intel Core i7-1185G7
37 mpaths +12%
Average NVIDIA GeForce MX350
  (33 - 41, n=10)
35.9 mpaths +9%
Average NVIDIA GeForce MX450
  (28 - 40, n=17)
34.6 mpaths +5%
Xiaomi RedmiBook 16 R5
AMD Radeon RX Vega 6 (Ryzen 4000/5000), AMD Ryzen 5 4500U
33 mpaths 0%
Intel Reference Design Laptop 28W
Intel Iris Xe Graphics G7 96EUs, Intel Core i7-1185G7
33 mpaths
Intel Reference Design Laptop 28W
Intel Iris Xe Graphics G7 96EUs, Intel Core i7-1185G7
29 mpaths -12%
Average NVIDIA GeForce MX250
  (24 - 34, n=5)
29.6 mpaths -10%
Intel Reference Design Laptop 15W
Intel Iris Xe Graphics G7 96EUs, Intel Core i7-1185G7
25 mpaths -24%
Average Intel Iris Plus Graphics G7 (Ice Lake 64 EU)
  (17 - 28, n=5)
21.2 mpaths -36%

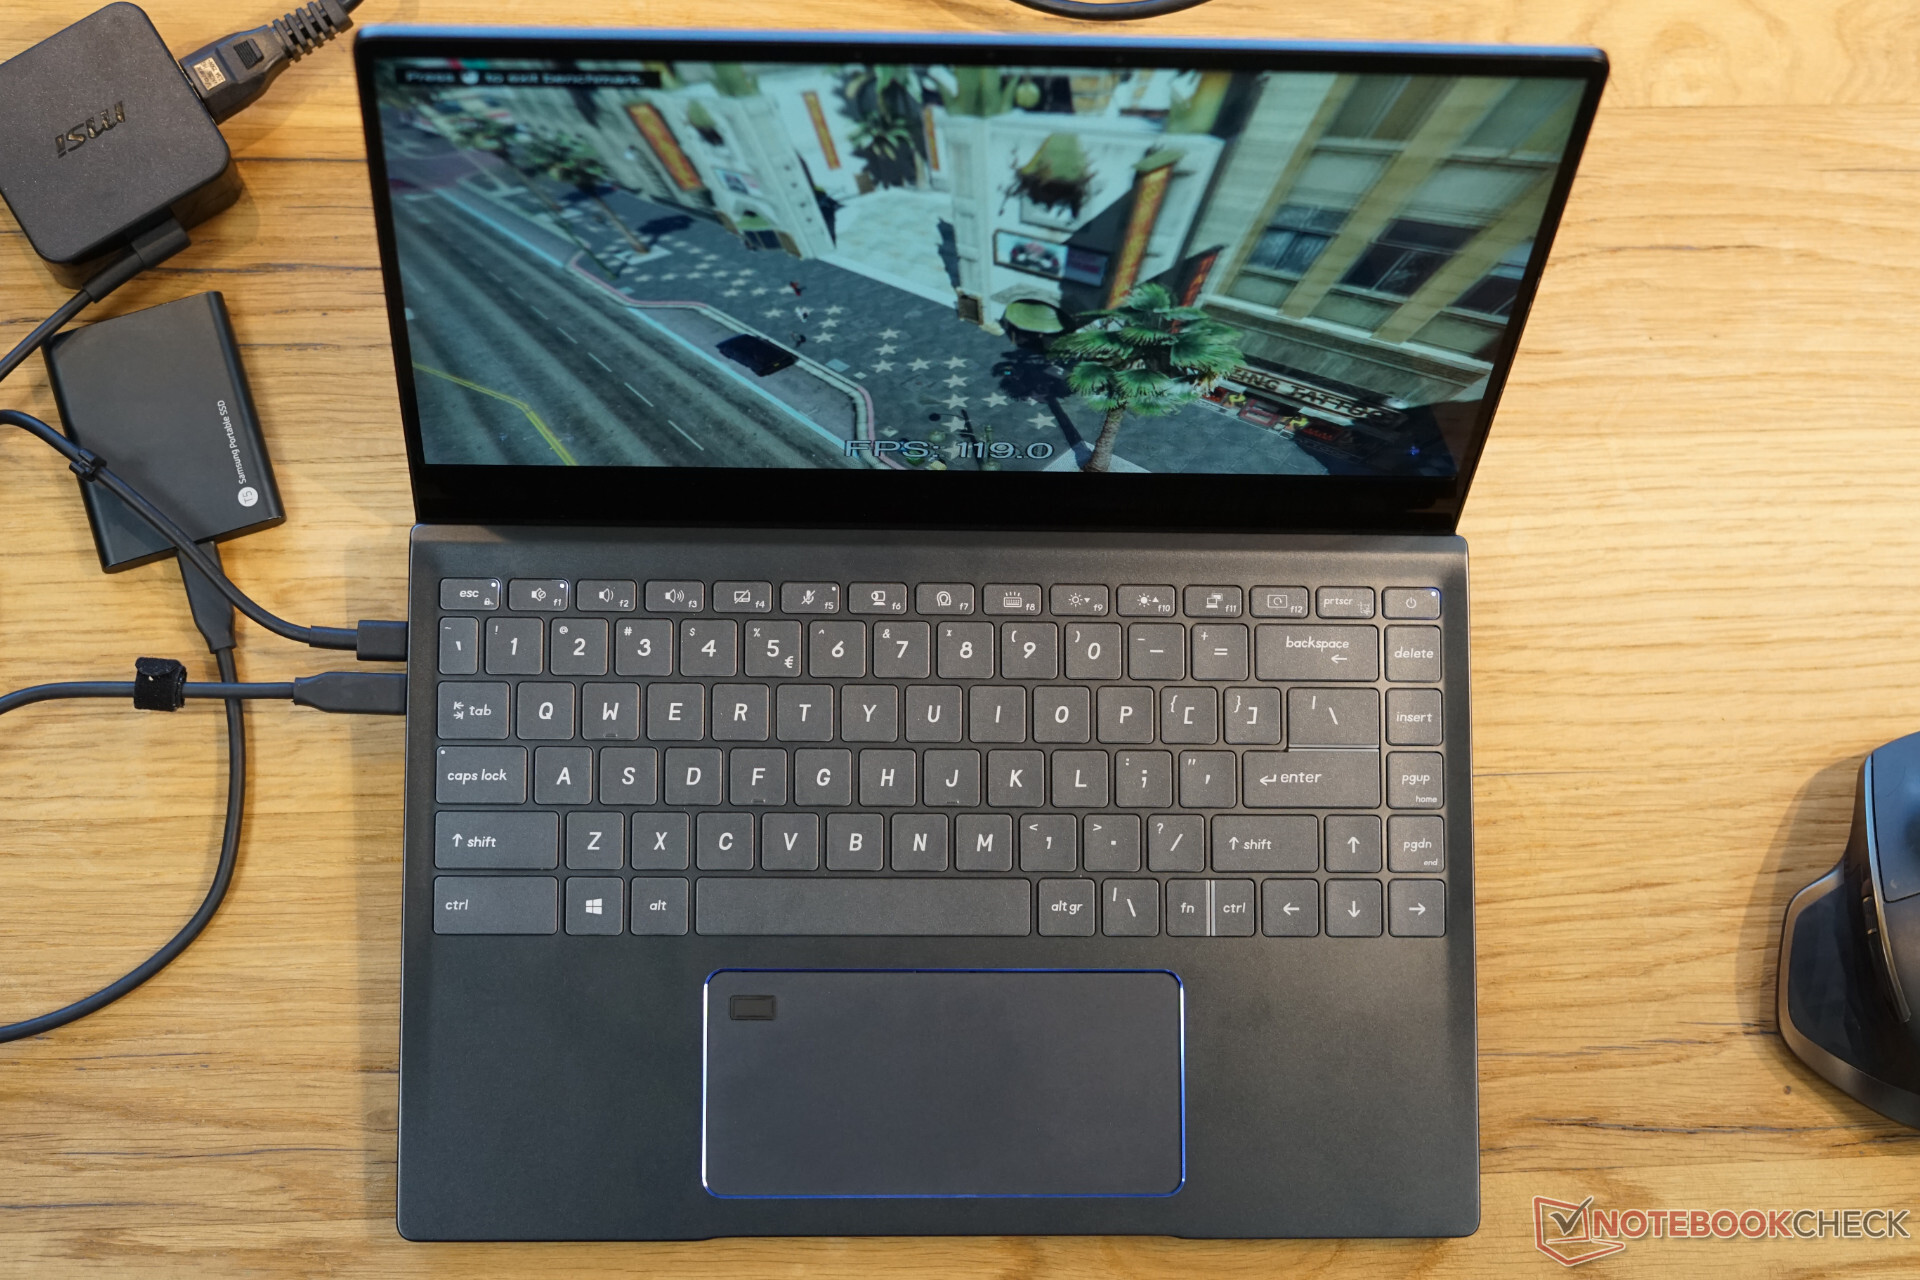
El rendimiento de los juegos

Los errores gráficos deben ser eliminados en las unidades de venta

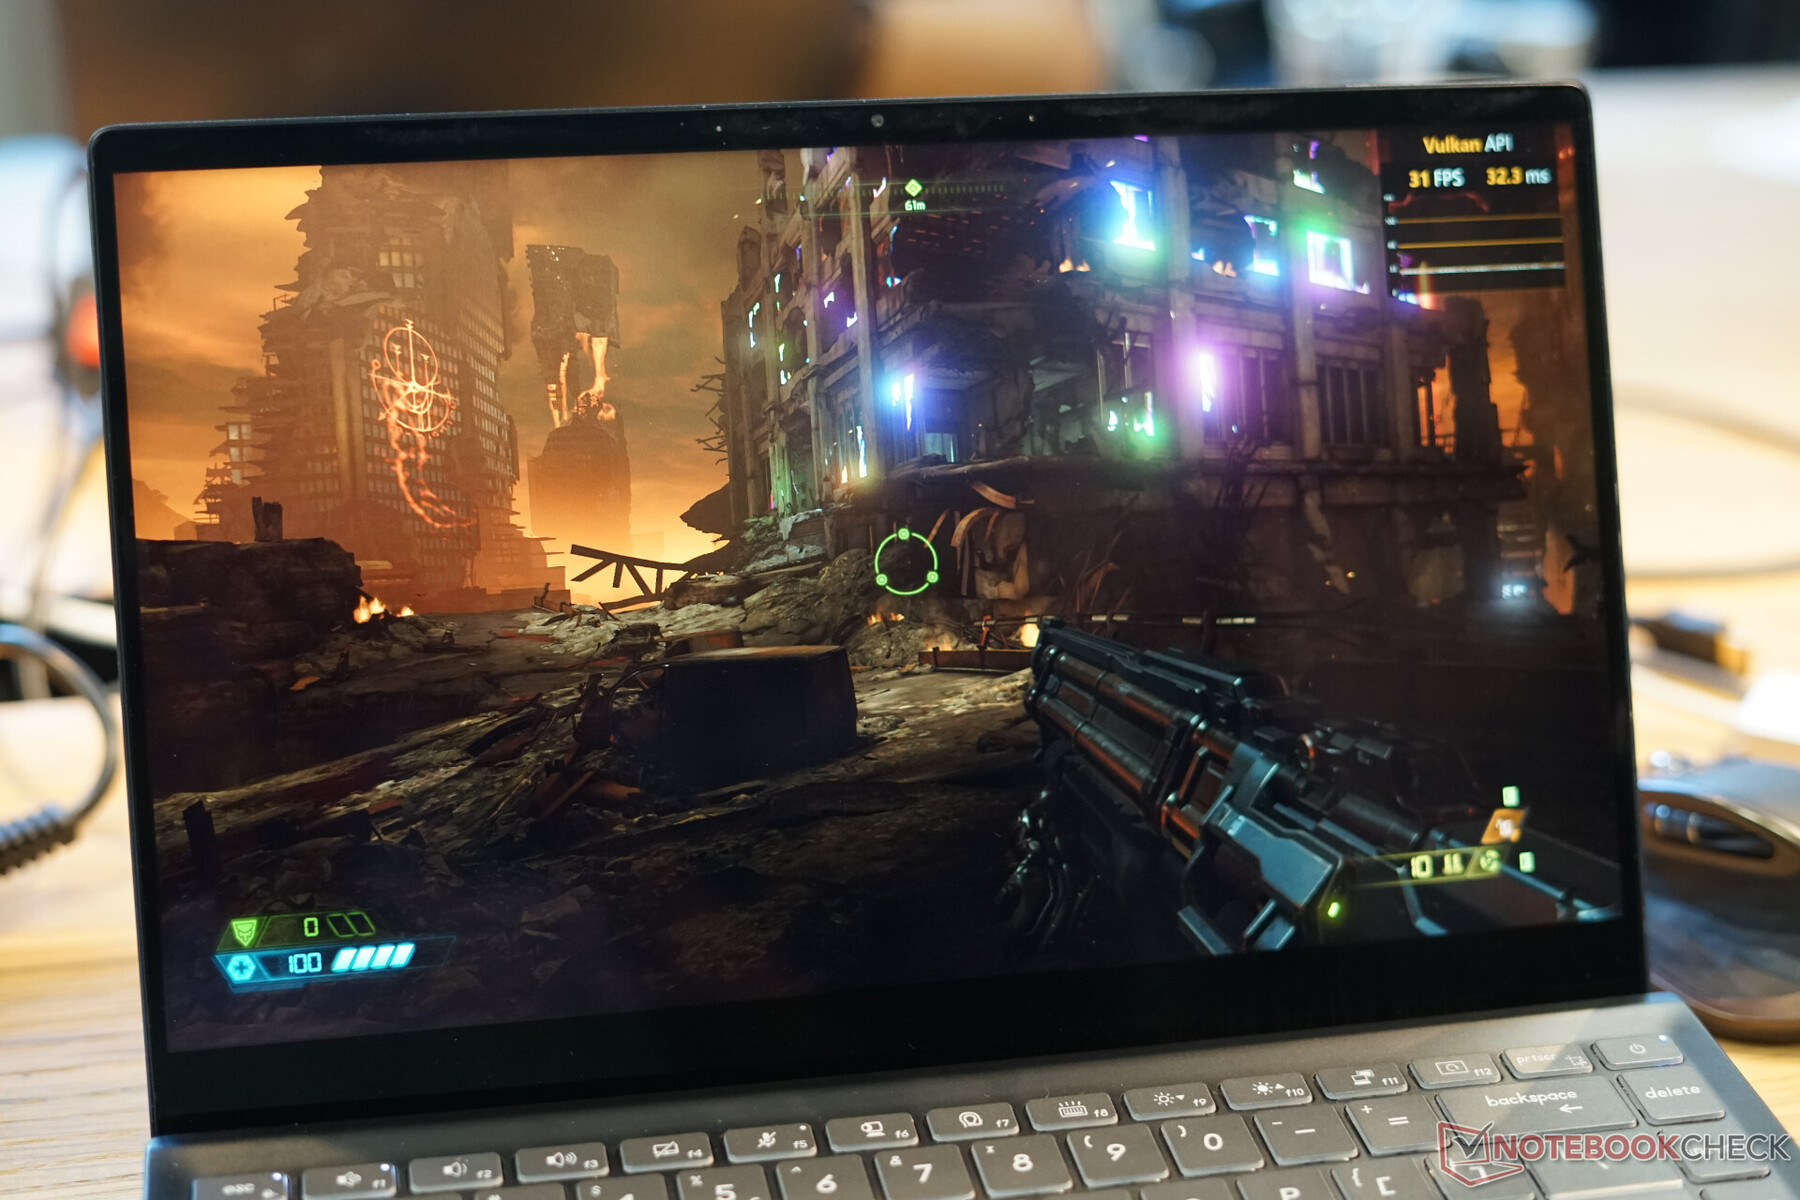
Gracias al rendimiento mucho más alto de la GPU, la iGPU también es mucho más adecuada para los juegos en comparación con las iGPU anteriores. Probamos un par de títulos e incluso Doom Eternal funcionó sin problemas con buenas frecuencias de cuadro, pero no registramos el resultado debido a un error gráfico causado por los controladores beta.

El exigente título "The Witcher 3" muestra muy bien el rendimiento de la iGPU. Está casi a la par de la GeForce GTX 1050 Max-Q y se puede reproducir a 1080p y a una configuración alta a 35 FPS. La GeForce MX350 es mucho más lenta, pero la situación cambia en el GTA 5, donde la MX350 puede manejar una clara ventaja. El AMD Vega 7 en el Acer Swift 3 SF314 es claramente superado en ambas ocasiones.

Nuestra prueba de una versión más antigua de DOTA 2 también coloca al Xe detrás del MX350 y a la par con el Vega 7, mientras que el Vega 8 en el Slim 7 es incluso un poco más rápido.

Las pruebas de juego en el mundo real muestran una vez más que el rendimiento depende de los controladores, las optimizaciones y la memoria gráfica. No siempre se puede decir que una GPU dedicada como la de un MX350 con una rápida VRAM GDDR5 es siempre superada, pero se puede ver el potencial de rendimiento del Iris Xe y que hace innecesarios los dGPU de nivel básico.

The Witcher 3 - 1920x1080 High Graphics & Postprocessing (Nvidia HairWorks Off)
Average NVIDIA GeForce GTX 1050 Mobile
  (29.1 - 43, n=29)
38 fps +6%
Average NVIDIA GeForce GTX 1050 Max-Q
  (34 - 41, n=3)
36.5 fps +2%
Intel Reference Design Laptop 28W
Intel Iris Xe Graphics G7 96EUs, Intel Core i7-1185G7
35.9 (31min - 41max) fps
Average NVIDIA GeForce MX450
  (21 - 46, n=16)
34.8 fps -3%
Average NVIDIA GeForce MX350
  (20.6 - 29.9, n=13)
26.3 fps -27%
Lenovo Yoga Slim 7-14ARE
AMD Radeon RX Vega 8 (Ryzen 4000/5000), AMD Ryzen 7 4800U
23.1 fps -36%
Average AMD Radeon RX Vega 8 (Ryzen 4000/5000)
  (8.7 - 26.8, n=46)
20.6 fps -43%
Average NVIDIA GeForce MX250
  (16.3 - 23.1, n=27)
20.1 fps -44%
Average AMD Radeon RX Vega 7
  (8.96 - 26.2, n=49)
18.1 fps -50%
Average Intel Iris Plus Graphics G7 (Ice Lake 64 EU)
  (10.9 - 20.1, n=18)
17 fps -53%
Xiaomi RedmiBook 16 R5
AMD Radeon RX Vega 6 (Ryzen 4000/5000), AMD Ryzen 5 4500U
15.7 (13min - 18max) fps -56%
Average AMD Radeon RX Vega 6 (Ryzen 4000/5000)
  (10.7 - 19.4, n=20)
15 fps -58%
Average AMD Radeon RX Vega 9
  ()
13.3 fps -63%
GTA V - 1920x1080 High/On (Advanced Graphics Off) AA:2xMSAA + FX AF:8x
Average NVIDIA GeForce GTX 1050 Mobile
  ()
65.9 fps +119%
Average NVIDIA GeForce GTX 1050 Max-Q
  (61.8 - 62.1, n=2)
62 fps +106%
Average NVIDIA GeForce MX450
  (30.6 - 68.3, n=11)
54.1 fps +80%
Average NVIDIA GeForce MX350
  (45.8 - 49.5, n=3)
47.4 fps +57%
Average NVIDIA GeForce MX250
  (35.9 - 41.5, n=4)
38.4 fps +28%
Intel Reference Design Laptop 28W
Intel Iris Xe Graphics G7 96EUs, Intel Core i7-1185G7
30.1 (7.4min, 20P1 - 122max) fps
Lenovo Yoga Slim 7-14ARE
AMD Radeon RX Vega 8 (Ryzen 4000/5000), AMD Ryzen 7 4800U
29.8 (3.22min, 21.3P1 - 83.4max) fps -1%
Average AMD Radeon RX Vega 8 (Ryzen 4000/5000)
  (13.8 - 40.6, n=44)
26.1 fps -13%
Average AMD Radeon RX Vega 7
  (11.3 - 32.2, n=36)
22.7 fps -25%
Average AMD Radeon RX Vega 6 (Ryzen 4000/5000)
  (20.1 - 24.6, n=6)
21.5 fps -29%
Xiaomi RedmiBook 16 R5
AMD Radeon RX Vega 6 (Ryzen 4000/5000), AMD Ryzen 5 4500U
20.5 (2.05min, 14.5P1 - 33.2max) fps -32%
Average Intel Iris Plus Graphics G7 (Ice Lake 64 EU)
  (12.7 - 13.3, n=2)
13 fps -57%
Dota 2 Reborn - 1920x1080 ultra (3/3) best looking
Average NVIDIA GeForce GTX 1050 Mobile
  (94.9 - 117, n=4)
106 fps +115%
Average NVIDIA GeForce GTX 1050 Max-Q
  ()
104.1 fps +111%
Average NVIDIA GeForce MX450
  (34.9 - 104.6, n=20)
79.9 fps +62%
Average NVIDIA GeForce MX350
  (52.3 - 80.6, n=14)
72.5 fps +47%
Average NVIDIA GeForce MX250
  (7.8 - 67.5, n=21)
53.6 fps +9%
Lenovo Yoga Slim 7-14ARE
AMD Radeon RX Vega 8 (Ryzen 4000/5000), AMD Ryzen 7 4800U
52.5 (47.3min) fps +6%
Intel Reference Design Laptop 28W
Intel Iris Xe Graphics G7 96EUs, Intel Core i7-1185G7
49.4 (33.1min) fps
Average AMD Radeon RX Vega 8 (Ryzen 4000/5000)
  (23.3 - 72, n=57)
48.6 fps -2%
Average AMD Radeon RX Vega 7
  (23.3 - 58.2, n=58)
41.9 fps -15%
Average AMD Radeon RX Vega 6 (Ryzen 4000/5000)
  (30.4 - 66.1, n=21)
40 fps -19%
Xiaomi RedmiBook 16 R5
AMD Radeon RX Vega 6 (Ryzen 4000/5000), AMD Ryzen 5 4500U
39.8 (36.6min) fps -19%
Intel Reference Design Laptop 15W
Intel Iris Xe Graphics G7 96EUs, Intel Core i7-1185G7
38 (25.9min) fps -23%
Average Intel Iris Plus Graphics G7 (Ice Lake 64 EU)
  (16.4 - 35.7, n=18)
26.9 fps -46%
X-Plane 11.11 - 1920x1080 high (fps_test=3)
Average NVIDIA GeForce GTX 1050 Max-Q
  ()
65.1 fps +56%
Average NVIDIA GeForce GTX 1050 Mobile
  (44.6 - 66.7, n=2)
55.7 fps +34%
Average NVIDIA GeForce MX450
  (35.4 - 71.4, n=20)
54.9 fps +32%
Average NVIDIA GeForce MX350
  (30.2 - 63.7, n=14)
48 fps +15%
Intel Reference Design Laptop 28W
Intel Iris Xe Graphics G7 96EUs, Intel Core i7-1185G7
41.7 fps
Average NVIDIA GeForce MX250
  (9.8 - 52.6, n=17)
39.4 fps -6%
Intel Reference Design Laptop 15W
Intel Iris Xe Graphics G7 96EUs, Intel Core i7-1185G7
33.1 fps -21%
Lenovo Yoga Slim 7-14ARE
AMD Radeon RX Vega 8 (Ryzen 4000/5000), AMD Ryzen 7 4800U
30.5 fps -27%
Average AMD Radeon RX Vega 8 (Ryzen 4000/5000)
  (19.1 - 43.1, n=57)
30.5 fps -27%
Average AMD Radeon RX Vega 7
  (17.4 - 35.7, n=56)
27.2 fps -35%
Xiaomi RedmiBook 16 R5
AMD Radeon RX Vega 6 (Ryzen 4000/5000), AMD Ryzen 5 4500U
26.2 fps -37%
Average AMD Radeon RX Vega 6 (Ryzen 4000/5000)
  (22.6 - 29.9, n=20)
25.8 fps -38%
Average Intel Iris Plus Graphics G7 (Ice Lake 64 EU)
  (10.8 - 19.7, n=18)
15 fps -64%

Veredicto

Nuestros puntos de referencia iniciales con un sistema de referencia de Intel con el nuevo chip Tiger Lake-U de alta gama, el Core i7-1185G7, son muy prometedores y el chip deja una excelente impresión. Intel muestra lo que es capaz de hacer una versión bien configurada con suficiente refrigeración. El rendimiento es muy impresionante para una CPU de cuatro núcleos y tanto los chips de Intel como los de 6 núcleos de AMD son superados. El rápido Ryzen 7 4800U con 8 núcleos sigue a la cabeza en muchas pruebas multi-core para este segmento TDP, pero lo más destacado es el excelente rendimiento de un solo núcleo gracias a los altos ritmos. El eficiente procesador móvil puede incluso superar a los modelos de escritorio de alta gama como el i9-10900K. Esto también da como resultado excelentes resultados en los puntos de referencia de las aplicaciones, lo cual se muestra en el PCMark 10.

La GPU Iris Xe  integrada es otro punto destacado. Intel logra superar a las GPU de nivel básico dedicadas como la GeForce MX330 o 350 en las pruebas de síntesis, pero tenemos que esperar y ver cómo será el rendimiento de los juegos en el mundo real. Nuestras pruebas iniciales son prometedoras en este sentido.

El rendimiento de Tiger Lake sigue siendo decente con 15 vatios, por lo que también esperamos que haya modelos rápidos de 6W. Sin embargo, la designación del modelo por sí sola no muestra el rendimiento, pero realmente depende de la configuración del TDP y el rendimiento de la refrigeración.

Please share our article, every link counts!
> Análisis y pruebas de ordenadores portátiles y móviles teléfonos > Análisis > Review del Intel Core i7-1185G7 - Primeros puntos de referencia de Tiger Lake
Klaus Hinum, 2020-09-17 (Update: 2020-09-17)