Análisis para el AMD Ryzen 7 4700U procesador
Lenovo Yoga Slim 7 14ARE05 en revisión: Una casa de energía compacta con una buena duración de la batería
El portátil de 14 pulgadas de Lenovo cuenta con un potente APU Ryzen 7 4700U con NVMe SSD y ofrece una duración de batería decente. Las emisiones de ruido y temperatura son bastante bajas para un dispositivo tan delgado.
AMD Ryzen 7 4700U, Vega 7, 14", 1.4 kgRevisión del ThinkPad E15 Gen.2 de Lenovo: Ordenador portátil de oficina con un chip AMD y un nuevo diseño
El portátil de oficina de 15,6 pulgadas de Lenovo viene con la carcasa rediseñada y sólo con CPU de AMD. Examinamos la segunda generación del ThinkPad E15 con un procesador Ryzen 7.
AMD Ryzen 7 4700U, Vega 7, 15.6", 1.8 kgReview del convertible Asus VivoBook Flip 14 TM420IA Ryzen 7: El Core i7 no tiene por qué estar vigente
Es otro jonrón para la asequible serie de Asus VivoBook Flip, ya que este convertible alimentado por AMD es más rápido y barato que muchas alternativas de Intel Core i7 en el mercado.
AMD Ryzen 7 4700U, Vega 7, 14", 1.6 kgReview del portátil HP ProBook 455 G7: Rendimiento más rápido gracias al Zen2
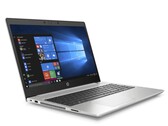
Con las CPU Renoir de AMD, HP ha elevado significativamente el nivel de rendimiento del ProBook 455 G7. Hemos mirado más de cerca y hemos determinado si la vida de la batería se ve afectada por este cambio. En esta revisión, también entraremos en todas las otras nuevas características y determinaremos si vale la pena comprar el portátil.
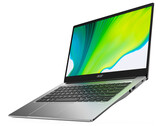
AMD Ryzen 7 4700U, Vega 7, 15.6", 1.8 kgReview del portátil Acer Swift 3 SF314-42: Rápido, delgado y con buena duración de batería - El subportátil Ryzen es casi completamente convincente
El nuevo portátil de 14 pulgadas de Acer tiene la nueva APU Ryzen 7 4700U de AMD a bordo, que no carece de rendimiento de la CPU ni de la GPU. Sin embargo, la buena duración de la batería no se ha visto comprometida a pesar de la gran potencia de cálculo de la máquina. El nuevo Swift 3 está bien equipado en otras áreas también, con Acer incluyendo un SSD NVMe, una pantalla IPS mate, un teclado retroiluminado y RAM de doble canal.
AMD Ryzen 7 4700U, Vega 7, 14", 1.2 kgFujitsu Lifebook U9311A, R7 4700U: AMD Radeon RX Vega 7, 13.30", 0.9 kg
análise externo » Fujitsu Lifebook U9311A, R7 4700U
Asus VivoBook Flip 14 TM420IA-EC230T: AMD Radeon RX Vega 7, 14.00", 1.5 kg
análise externo » Asus VivoBook Flip 14 TM420IA-EC230T
HP Envy x360 13-ay0004ns: AMD Radeon RX Vega 7, 13.30", 1.3 kg
análise externo » HP Envy x360 13-ay0004ns
LG Ultra PC 13U70P-G.AAW7U1: AMD Radeon RX Vega 7, 13.30", 1 kg
análise externo » LG Ultra PC 13U70P-G.AAW7U1
HP 15s-eq1073ns: AMD Radeon RX Vega 7, 15.60", 1.7 kg
análise externo » HP 15s-eq1073ns
HP 15s-eq1071ns: AMD Radeon RX Vega 7, 15.60", 1.7 kg
análise externo » HP 15s-eq1071ns
Acer Aspire 5 A515-44-R5QH: AMD Radeon RX Vega 7, 15.60", 1.8 kg
análise externo » Acer Aspire 5 A515-44-R5QH
HP 15s-eq1083ns: AMD Radeon RX Vega 7, 15.60", 1.7 kg
análise externo » HP 15s-eq1083ns
HP Envy x360 13-ay0003ns: AMD Radeon RX Vega 7, 13.30", 1.3 kg
análise externo » HP Envy x360 13-ay0003ns
Acer Swift 3 SF314-42-R7QS: AMD Radeon RX Vega 7, 14.00", 1.2 kg
análise externo » Acer Swift 3 SF314-42-R7QS
Asus VivoBook 15 S513IA-DB74: AMD Radeon RX Vega 7, 15.60", 1.6 kg
análise externo » Asus VivoBook 15 S513IA-DB74
HP Pavilion 15-eh0014na: AMD Radeon RX Vega 7, 15.60", 1.8 kg
análise externo » HP Pavilion 15-eh0014na
HP 15s-eq1105ns: AMD Radeon RX Vega 7, 15.60", 1.7 kg
análise externo » HP 15s-eq1105ns
HP Pavilion 15-eh0177ng: AMD Radeon RX Vega 7, 15.60", 1.8 kg
análise externo » HP Pavilion 15-eh0177ng
HP Probook 635 Aero G7, 4700U: AMD Radeon RX Vega 7, 13.30", 1 kg
análise externo » HP Probook 635 Aero G7, 4700U
Lenovo Yoga Slim 7 14ARE05-82A200ABMH: AMD Radeon RX Vega 7, 14.00", 1.3 kg
análise externo » Lenovo Yoga Slim 7 14ARE05-82A200ABMH
Asus VivoBook 15 M513IA-BQ443T: AMD Radeon RX Vega 7, 15.60", 1.8 kg
análise externo » Asus VivoBook 15 M513IA-BQ443T
Lenovo ThinkBook 14 G2 ARE-20VF000BGE: AMD Radeon RX Vega 7, 14.00", 1.4 kg
análise externo » Lenovo ThinkBook 14 G2 ARE-20VF000BGE
MSI Modern 14 B4MW-005TH: AMD Radeon RX Vega 7, 14.00", 1.3 kg
análise externo » MSI Modern 14 B4MW-005TH
Asus ZenBook 14 UM425IA-AM006T: AMD Radeon RX Vega 7, 14.00", 1.3 kg
análise externo » Asus ZenBook 14 UM425IA-AM006T
Asus VivoBook S15 M513IA-EJ354: AMD Radeon RX Vega 7, 15.60", 1.8 kg
análise externo » Asus VivoBook S15 M513IA-EJ354
Asus VivoBook Flip 14 TM420IA-EC207: AMD Radeon RX Vega 7, 14.00", 1.5 kg
análise externo » Asus VivoBook Flip 14 TM420IA-EC207
Acer Swift 3 SF314-42-R30P: AMD Radeon RX Vega 7, 14.00", 1.2 kg
análise externo » Acer Swift 3 SF314-42-R30P
Asus VivoBook S14 M433IA-EB069: AMD Radeon RX Vega 7, 14.00", 1.4 kg
análise externo » Asus VivoBook S14 M433IA-EB069
Asus ZenBook 14 UM421IA: AMD Radeon RX Vega 7, 14.00", 1.3 kg
análise externo » Asus ZenBook 14 UM421IA
Lenovo IdeaPad Flex 5 14ARE05-81X200DHMH: AMD Radeon RX Vega 7, 14.00", 1.5 kg
análise externo » Lenovo IdeaPad Flex 5 14ARE05-81X200DHMH
HP Envy x360 15-ee0425no: AMD Radeon RX Vega 7, 15.60", 2 kg
análise externo » HP Envy x360 15-ee0425no
Asus VivoBook 14 S413IA-EK663T: AMD Radeon RX Vega 7, 14.00", 1.4 kg
análise externo » Asus VivoBook 14 S413IA-EK663T
HP ProBook x360 435 G7, Ryzen 7 4700U: AMD Radeon RX Vega 7, 13.30", 1.5 kg
análise externo » HP ProBook x360 435 G7, Ryzen 7 4700U
Lenovo ThinkPad E15 Gen2-20T9S00K00: AMD Radeon RX Vega 7, 15.60", 1.8 kg
análise externo » Lenovo ThinkPad E15 Gen2-20T9S00K00
Lenovo Yoga Slim 7 14ARE05 82A20008GE: AMD Radeon RX Vega 7, 14.00", 1.4 kg
análise externo » Lenovo Yoga Slim 7 14ARE05 82A20008GE
HP Envy x360 13-ay0008nw: AMD Radeon RX Vega 7, 13.30", 1.4 kg
análise externo » HP Envy x360 13-ay0008nw
Lenovo Yoga 6 13, 4700U: AMD Radeon RX Vega 7, 13.30", 1.4 kg
análise externo » Lenovo Yoga 6 13, 4700U
Acer Swift 3 SF314-42-R3ZU: AMD Radeon RX Vega 7, 14.00", 1.2 kg
análise externo » Acer Swift 3 SF314-42-R3ZU
HP ProBook 445 G7, R7 4700U: AMD Radeon RX Vega 7, 14.00", 1.6 kg
análise externo » HP ProBook 445 G7, R7 4700U
Lenovo IdeaPad Flex 5 14ARE05-81X2004YGE: AMD Radeon RX Vega 7, 14.00", 1.5 kg
análise externo » Lenovo IdeaPad Flex 5 14ARE05-81X2004YGE
HP Envy x360 13-ay0003nd: AMD Radeon RX Vega 7, 13.30", 1.3 kg
análise externo » HP Envy x360 13-ay0003nd
HP Envy x360 15-ee0175nd: AMD Radeon RX Vega 7, 15.60", 2 kg
análise externo » HP Envy x360 15-ee0175nd
Asus VivoBook S15 M533IA-BQ070T: AMD Radeon RX Vega 7, 15.60", 1.8 kg
análise externo » Asus VivoBook S15 M533IA-BQ070T
HP ProBook 455 G7-175W8EA: AMD Radeon RX Vega 7, 15.60", 1.8 kg
análise externo » HP ProBook 455 G7-175W8EA
Asus VivoBook Flip 14 TM420IA: AMD Radeon RX Vega 7, 14.00", 1.6 kg
análise externo » Asus VivoBook Flip 14 TM420IA
Lenovo ThinkPad E14 Gen2-20T6000MGE: AMD Radeon RX Vega 7, 14.00", 1.6 kg
análise externo » Lenovo ThinkPad E14 Gen2-20T6000MGE
Acer Swift 3 SF314-42-R991: AMD Radeon RX Vega 7, 14.00", 1.2 kg
análise externo » Acer Swift 3 SF314-42-R991
HP Envy x360 13-ay0002ns: AMD Radeon RX Vega 7, 13.30", 1.3 kg
análise externo » HP Envy x360 13-ay0002ns
MSI Modern 14 B4MW-032XES: AMD Radeon RX Vega 7, 14.00", 1.3 kg
análise externo » MSI Modern 14 B4MW-032XES
Asus ZenBook 14 UM425IA-HM032R: AMD Radeon RX Vega 7, 14.00", 1.1 kg
análise externo » Asus ZenBook 14 UM425IA-HM032R
Acer Aspire 5 A515-44-R8VV: AMD Radeon RX Vega 7, 15.60", 1.8 kg
análise externo » Acer Aspire 5 A515-44-R8VV
Xiaomi RedmiBook 16 R7 4700U: AMD Radeon RX Vega 7, 16.10", 1.8 kg
análise externo » Xiaomi RedmiBook 16 R7 4700U
Lenovo Yoga Slim 7-14ARE05, Ryzen 7 4700U: AMD Radeon RX Vega 7, 14.00", 1.4 kg
análise externo » Lenovo Yoga Slim 7 14ARE05, Ryzen 7 4700U
Acer Swift 3 SF314-42-R9YN: AMD Radeon RX Vega 7, 14.00", 1.2 kg
análise externo » Acer Swift 3 SF314-42-R9YN
Lenovo IdeaPad 5 15ARE05-81YQ006JMH: AMD Radeon RX Vega 7, 15.60", 1.6 kg
análise externo » Lenovo IdeaPad 5 15ARE05-81YQ006JMH
Asus VivoBook S14 M433IA, Ryzen 7 4700U: AMD Radeon RX Vega 7, 14.00", 1.4 kg
análise externo » Asus VivoBook S14 M433IA, Ryzen 7 4700U
Asus ZenBook 14 UM433IQ-A5026T: NVIDIA GeForce MX350, 14.00", 1.2 kg
análise externo » Asus ZenBook 14 UM433IQ-A5026T
Acer Swift 3 SF314-42-R4XJ: AMD Radeon RX Vega 7, 14.00", 1.2 kg
análise externo » Acer Swift 3 SF314-42-R4XJ
Lenovo Yoga Slim 7 14ARE05 82A20008GE: AMD Radeon RX Vega 7, 14.00", 1.4 kg
» Ryzen 7 4700U Liberado - Lenovo no retiene el APU del Yoga 7 Slim 14ARE05
Lenovo ThinkPad E15 Gen2-20T9S00K00: AMD Radeon RX Vega 7, 15.60", 1.8 kg
» El ThinkPad E15 Gen.2 AMD de Lenovo ofrece un diseño más compacto y mucho más rendimiento
Asus VivoBook Flip 14 TM420IA: AMD Radeon RX Vega 7, 14.00", 1.6 kg
» El Asus VivoBook Flip 14 de Ryzen muestra lo mucho que Intel necesita para lanzar su plataforma Tiger Lake
Lenovo ThinkPad E15 Gen2-20T9S00K00: AMD Radeon RX Vega 7, 15.60", 1.8 kg
» El primer ThinkPad con Ryzen 4000 ha llegado: AMD mucho más rápido que Intel