Review del Schenker XMG Neo 17 (2020, Tongfang GM7MPHS): Overboost desata el procesador Core-i7

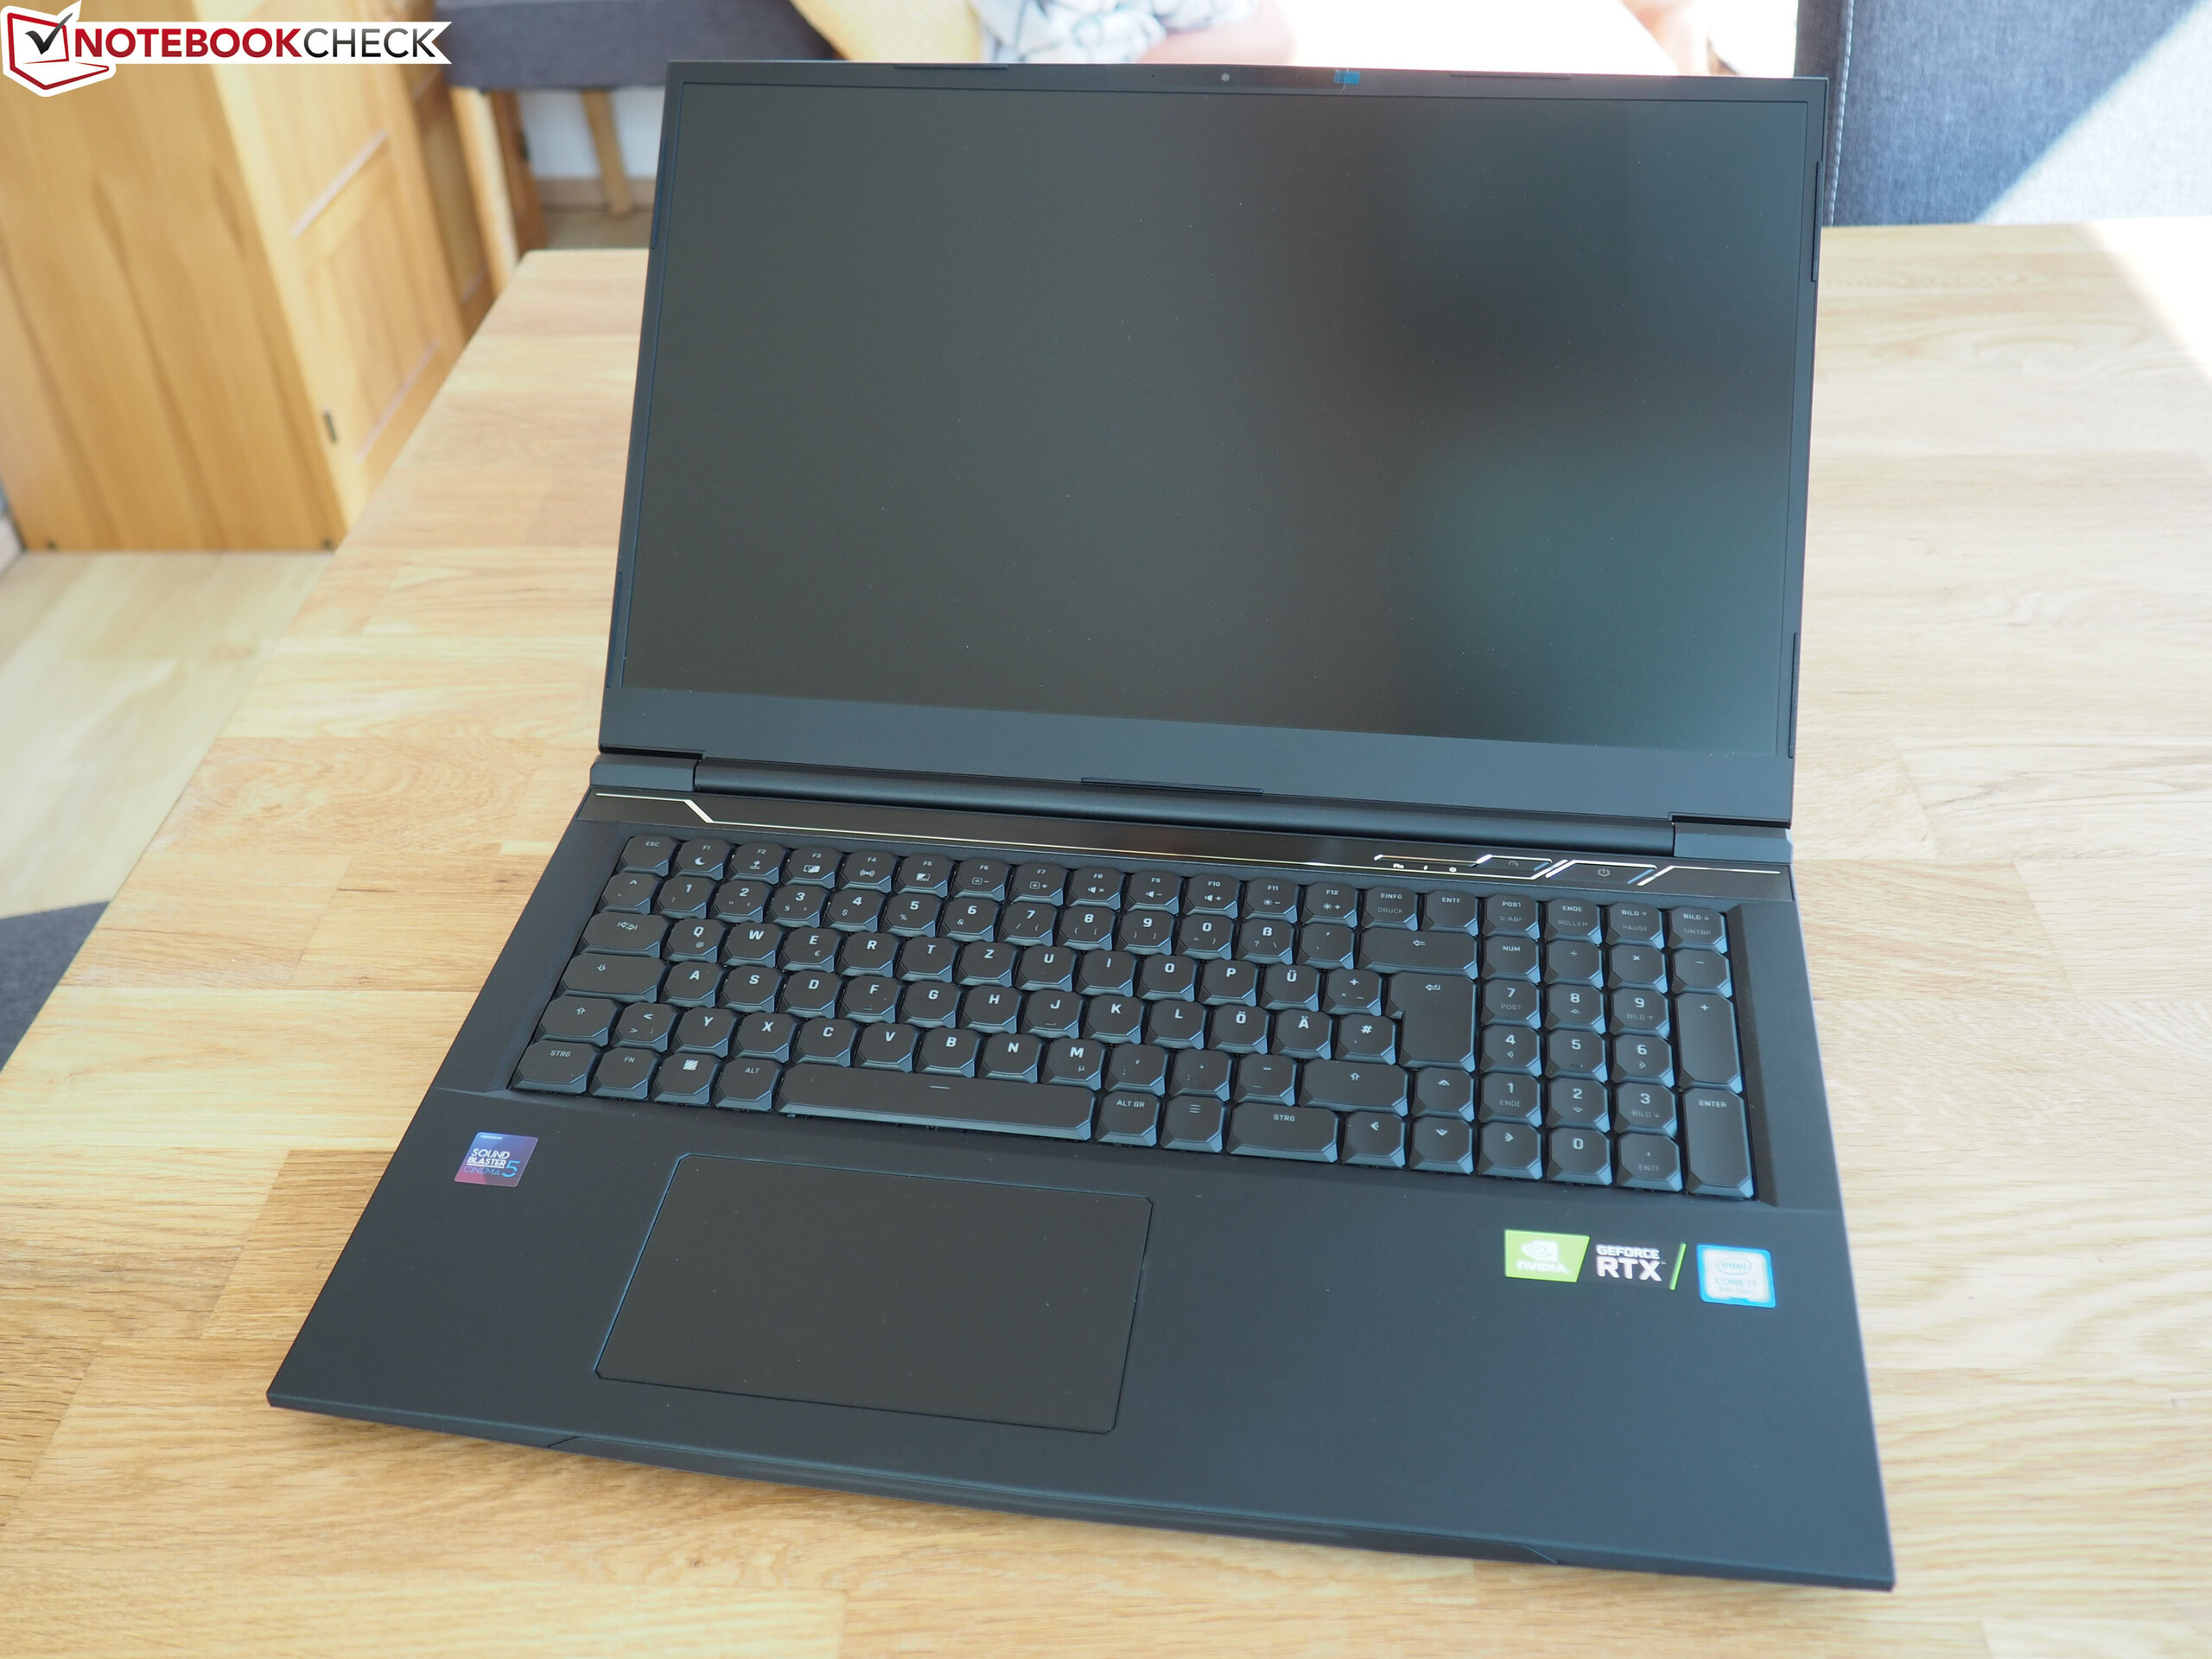
Con el XMG Neo 17, Schenker ofrece un portátil para juegos de 17,3 pulgadas equipado con un potente hardware. La unidad de prueba que se puso a nuestra disposición se ejecuta con un procesador Core i7-10875H octa-core y una GPU GeForce RTX-2070 Super. Entre los competidores se encuentran el Acer Predator Helios 300 PH317-54, el MSI GL75 10SFR, el Asus Strix G17 G712LWS y el Aorus 17G XB.
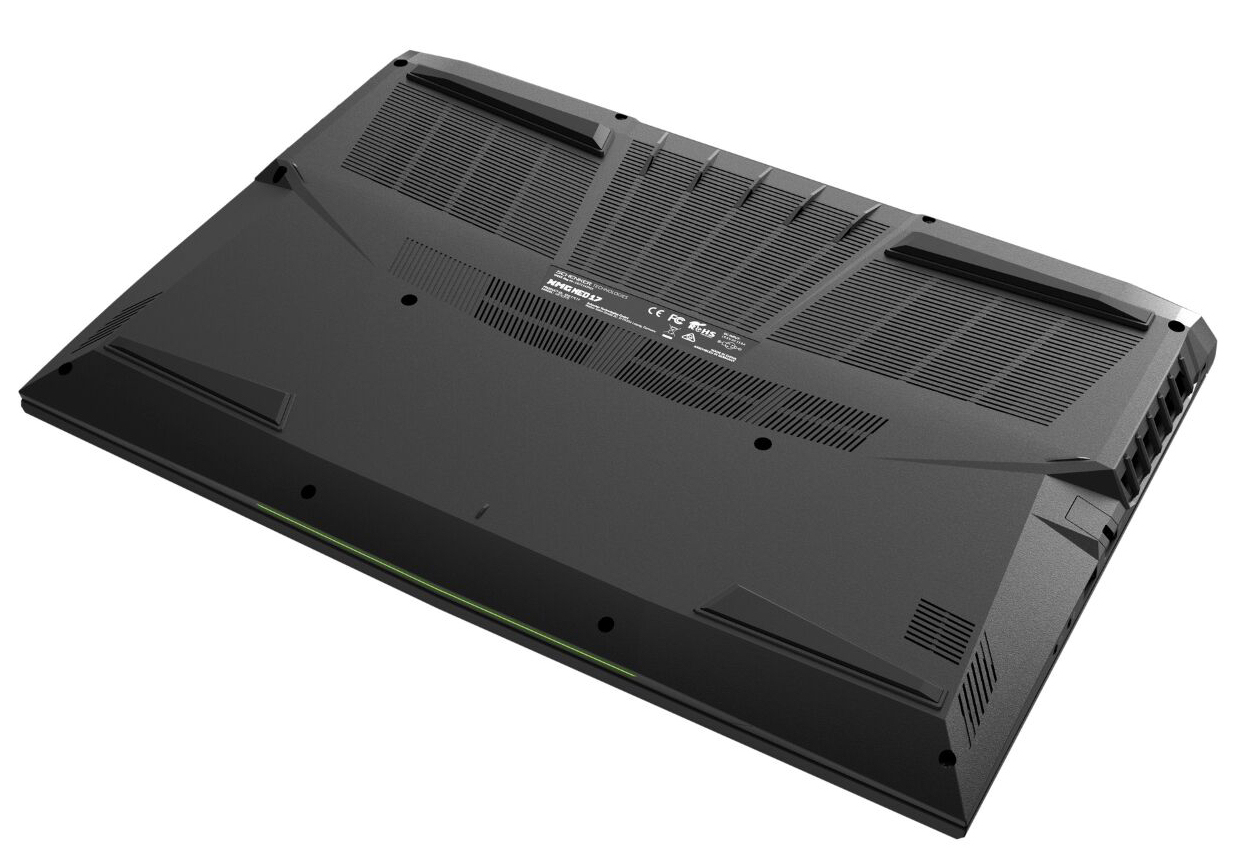
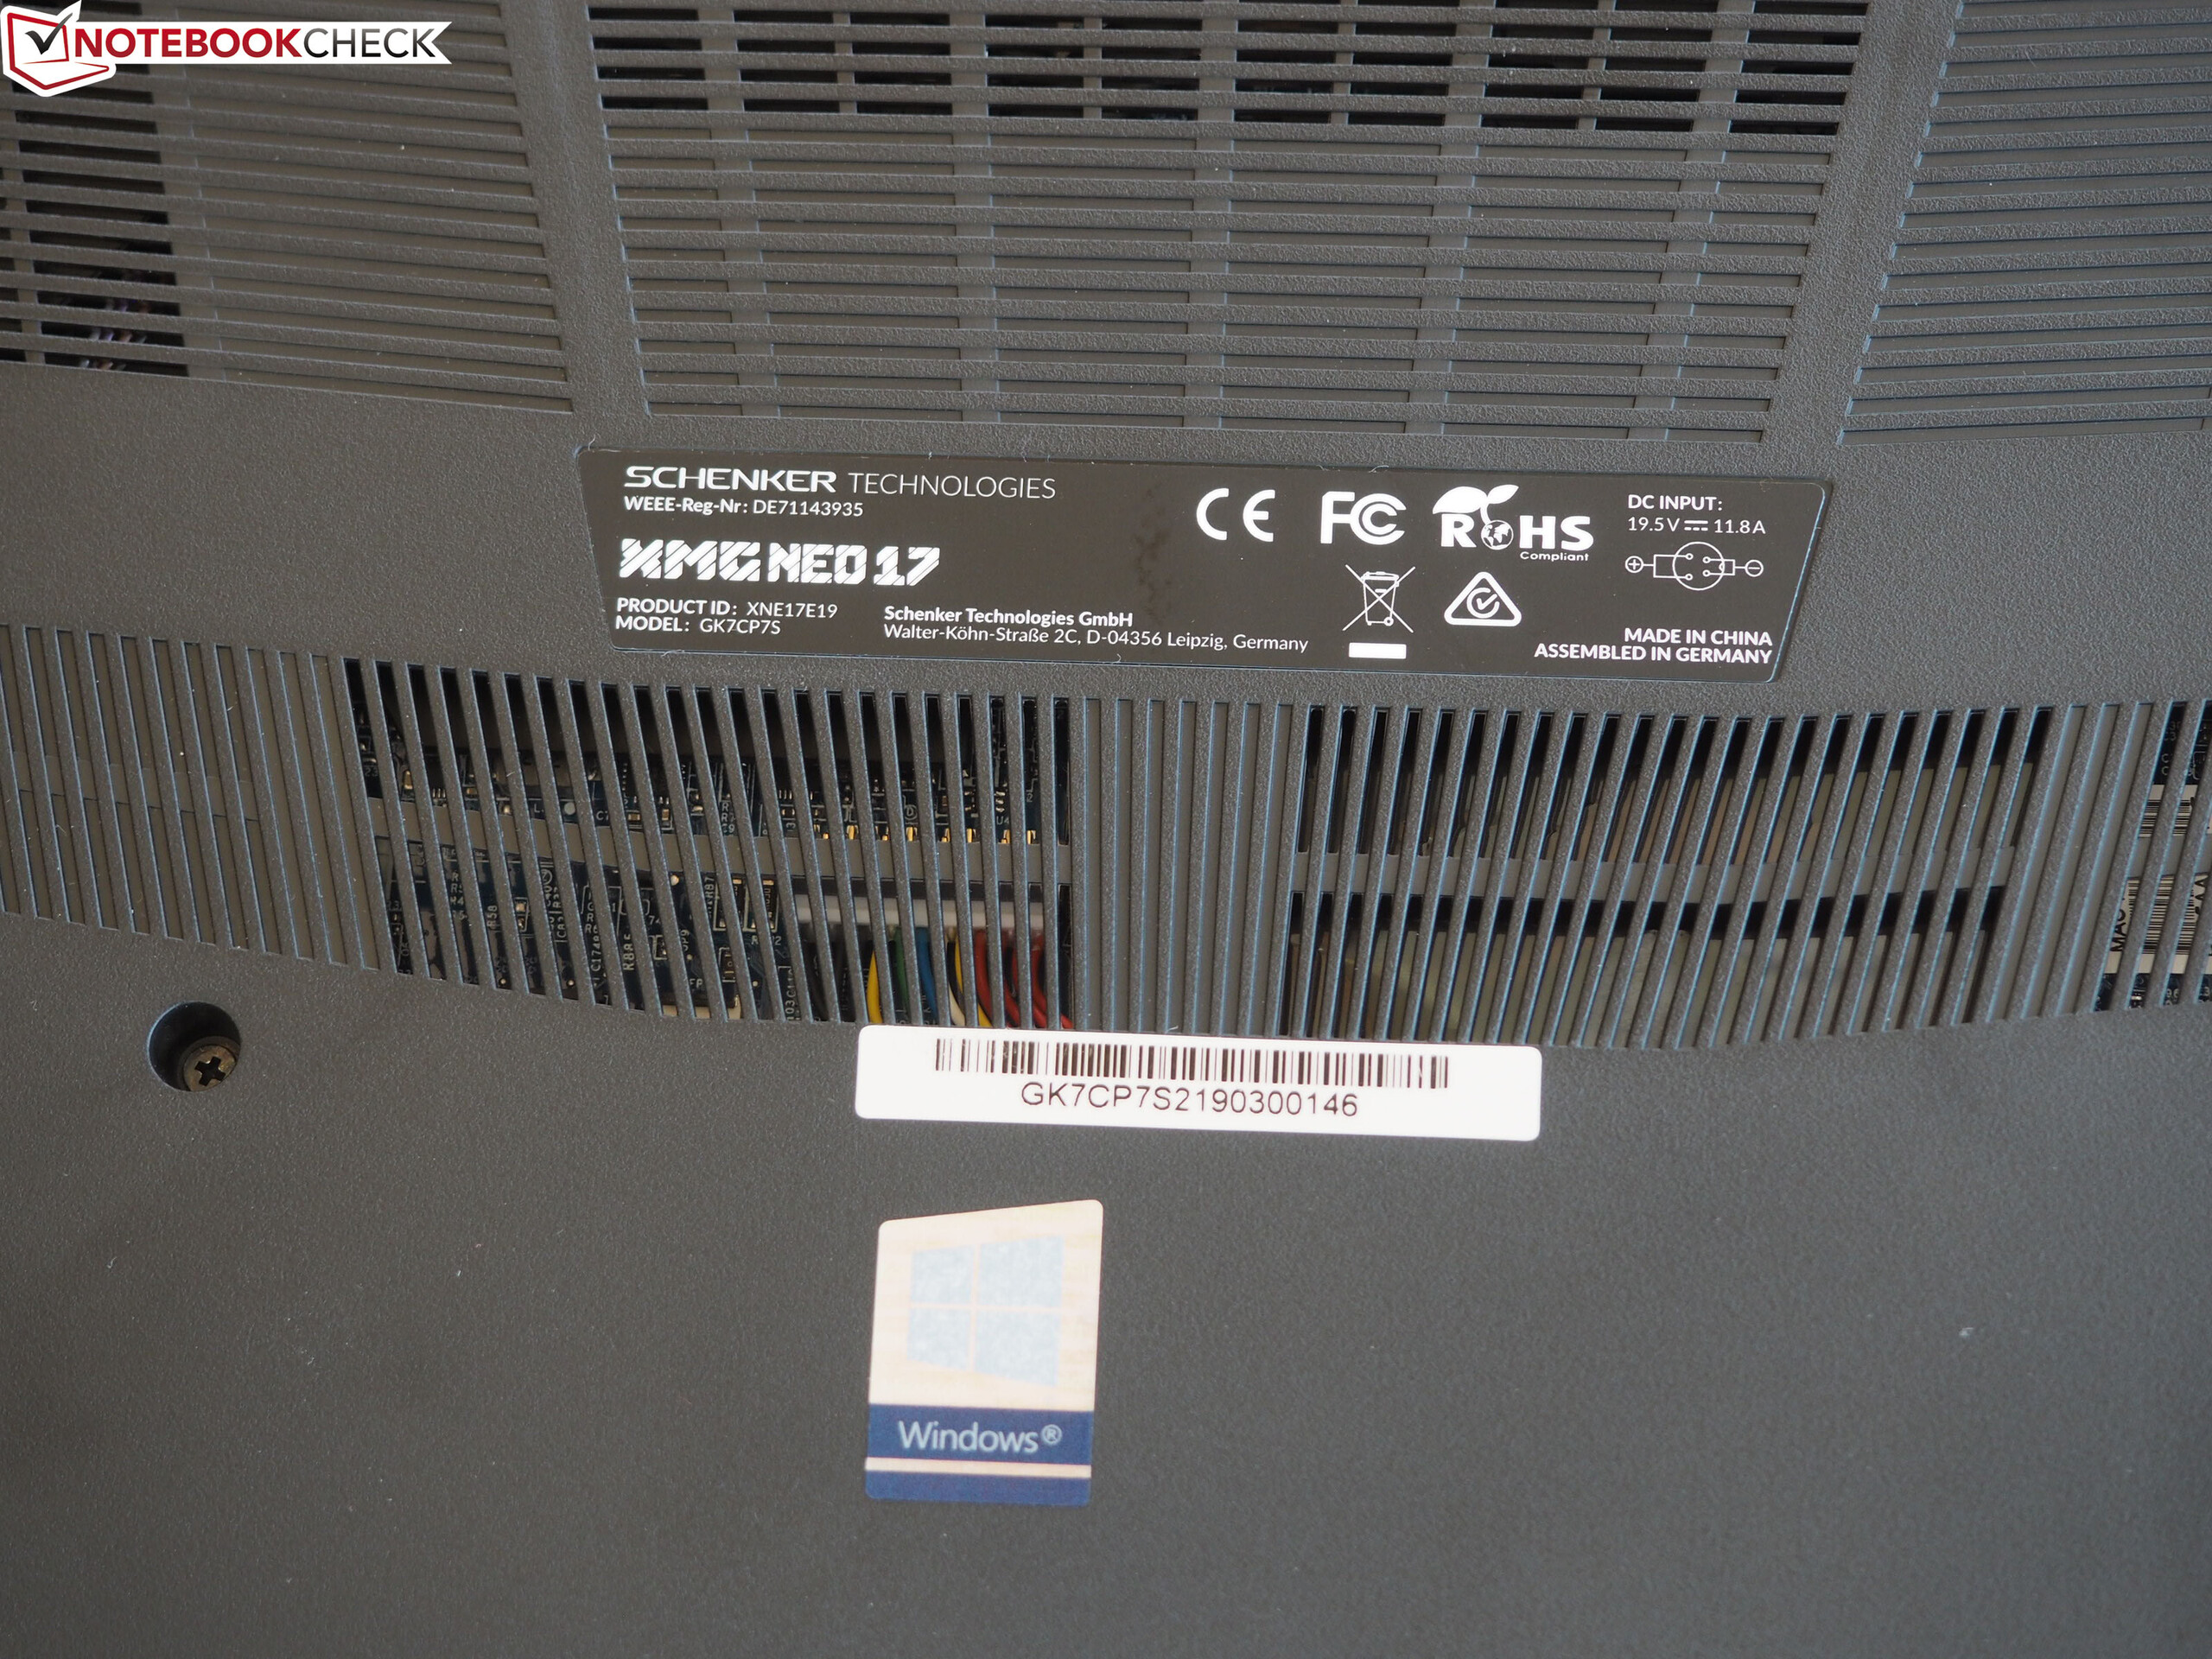
Dado que el dispositivo comparte una construcción idéntica con su predecesor, no volveremos a discutir el chasis, el equipo de conexión, los dispositivos de entrada o los altavoces, excepto cuando haya algunas diferencias. Puede encontrar la información correspondiente en nuestra revisión del Schenker XMG Neo 17 (Tongfang GK7CP7S).
Valoración | Fecha | Modelo | Peso | Altura | Tamaño | Resolución | Precio |
|---|---|---|---|---|---|---|---|
| 85.8 % v7 (old) | 11/2020 | Schenker XMG Neo 17 Comet Lake i7-10875H, GeForce RTX 2070 Super Mobile | 2.6 kg | 27.45 mm | 17.30" | 1920x1080 | |
| 83.6 % v7 (old) | 10/2020 | Acer Predator Helios 300 PH317-54-75G8 i7-10750H, GeForce RTX 2060 Mobile | 2.8 kg | 25 mm | 17.30" | 1920x1080 | |
| 83.5 % v7 (old) | 08/2020 | MSI GL75 10SFR i7-10750H, GeForce RTX 2070 Mobile | 2.6 kg | 28 mm | 17.30" | 1920x1080 | |
| 83.1 % v7 (old) | 10/2020 | Asus Strix G17 G712LWS i7-10750H, GeForce RTX 2070 Super Mobile | 2.8 kg | 26.5 mm | 17.30" | 1920x1080 | |
| 86.5 % v7 (old) | 05/2020 | Aorus 17G XB i7-10875H, GeForce RTX 2070 Super Max-Q | 2.7 kg | 26 mm | 17.30" | 1920x1080 |
Equipo - Neo 17 ahora con Thunderbolt 3
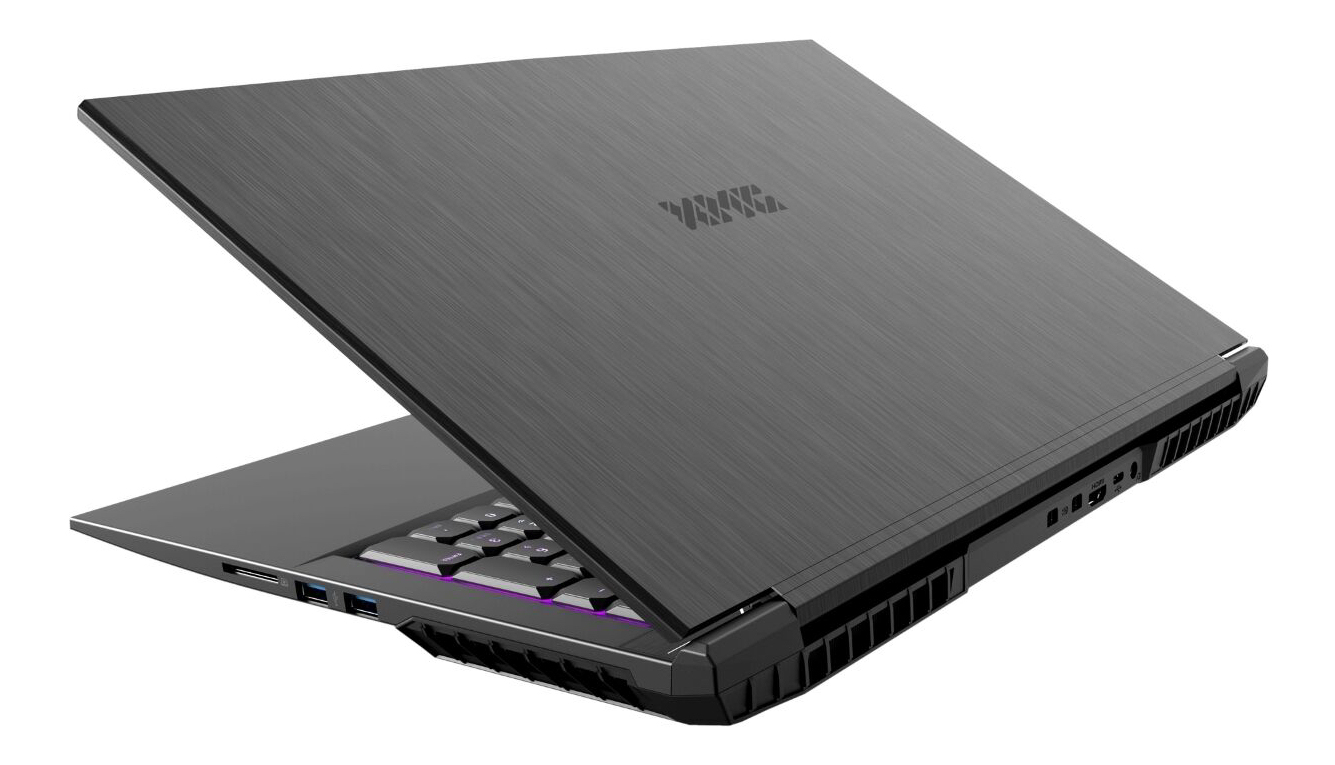
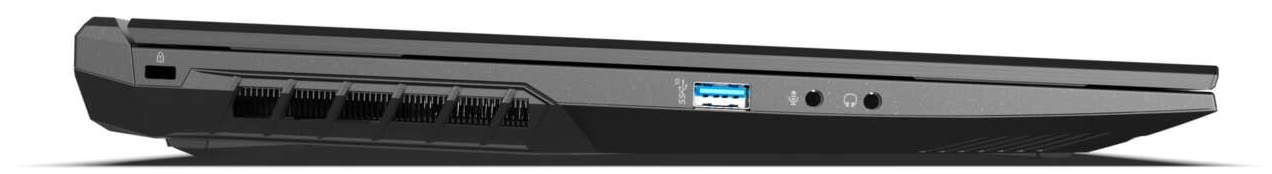
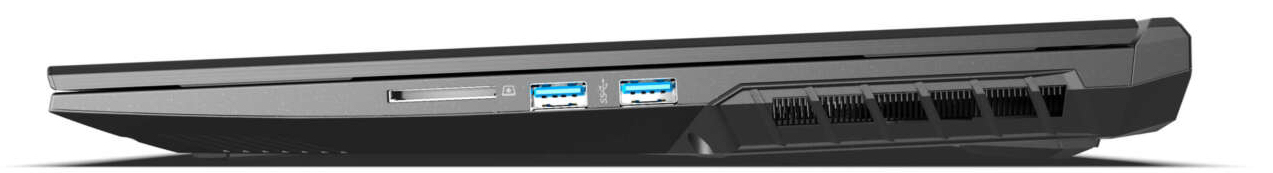
En cuanto a las conexiones, algunas cosas han cambiado en comparación con el modelo predecesor: los dos Mini DisplayPorts han sido reemplazados por una conexión Thunderbolt 3 (se admite DisplayPort-via-USB-C). Según Schenker, se pueden conectar dos monitores (en serie/MST) a la conexión TB3. Se incluye un adaptador de USB-Type-C a DisplayPort. Además, la conexión USB 2.0 se actualizó a una conexión USB 3.2 Gen 2 (Tipo A).
Equipo de conexión

| SD Card Reader | |
| average JPG Copy Test (av. of 3 runs) | |
| Aorus 17G XB (Toshiba Exceria Pro SDXC 64 GB UHS-II) | |
| Media de la clase Gaming (20.9 - 210, n=54, últimos 2 años) | |
| Schenker XMG Neo 17 Comet Lake (Toshiba Exceria Pro SDXC 64 GB UHS-II) | |
| Schenker XMG Neo 17 (Toshiba Exceria Pro SDXC 64 GB UHS-II) | |
| Schenker XMG Neo 17 XNE17M19 (Toshiba Exceria Pro SDXC 64 GB UHS-II) | |
| MSI GL75 10SFR (Toshiba Exceria Pro SDXC 64 GB UHS-II) | |
| maximum AS SSD Seq Read Test (1GB) | |
| Aorus 17G XB (Toshiba Exceria Pro SDXC 64 GB UHS-II) | |
| Media de la clase Gaming (25.5 - 261, n=51, últimos 2 años) | |
| Schenker XMG Neo 17 (Toshiba Exceria Pro SDXC 64 GB UHS-II) | |
| Schenker XMG Neo 17 XNE17M19 (Toshiba Exceria Pro SDXC 64 GB UHS-II) | |
| Schenker XMG Neo 17 Comet Lake (Toshiba Exceria Pro SDXC 64 GB UHS-II) | |
| MSI GL75 10SFR (Toshiba Exceria Pro SDXC 64 GB UHS-II) | |


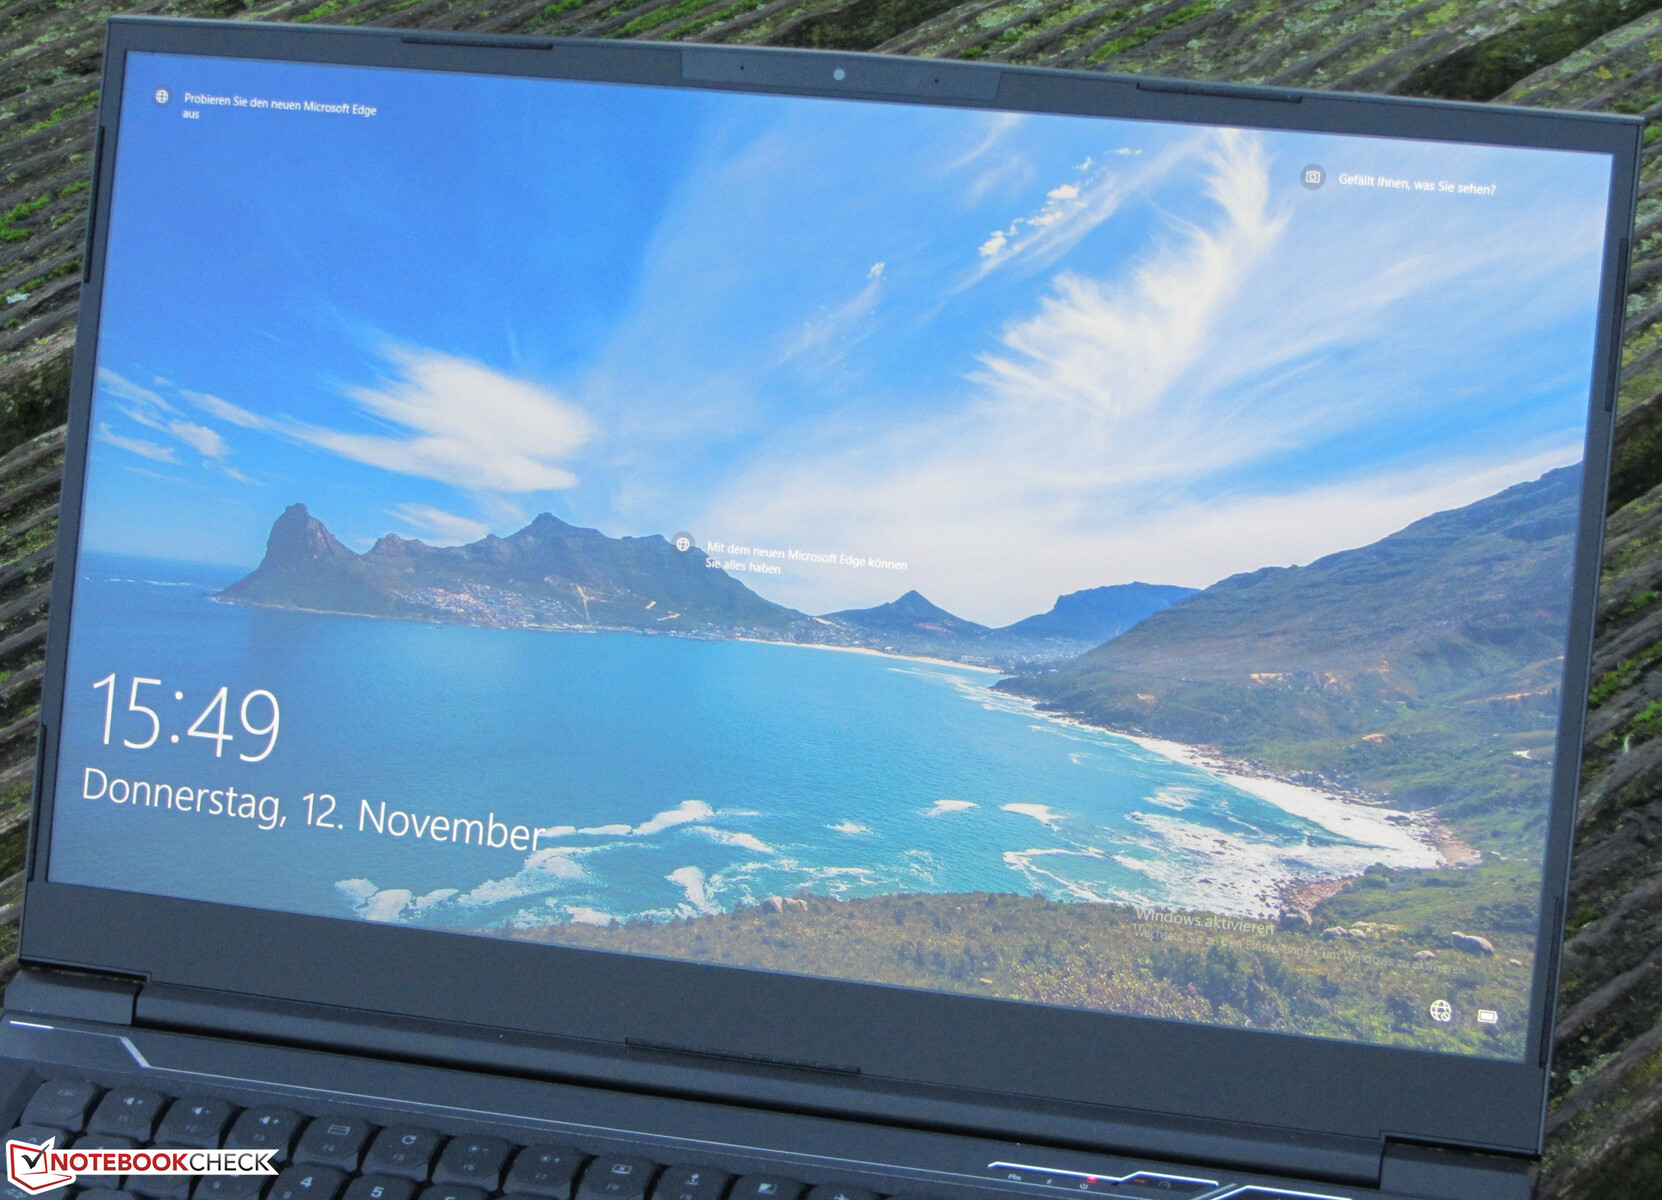
Pantalla - Panel IPS de 240 Hz
La pantalla mate de 17,3 pulgadas del Neo 17 ofrece una resolución nativa de 1920 x 1080 píxeles. El brillo (305,4 cd/m²) y el contraste (1022:1) resultan buenos. El panel de 240 Hz ofrece tiempos de respuesta cortos. Otro punto positivo es la falta de parpadeo de PWM.
| |||||||||||||||||||||||||
iluminación: 87 %
Brillo con batería: 327 cd/m²
Contraste: 1022:1 (Negro: 0.32 cd/m²)
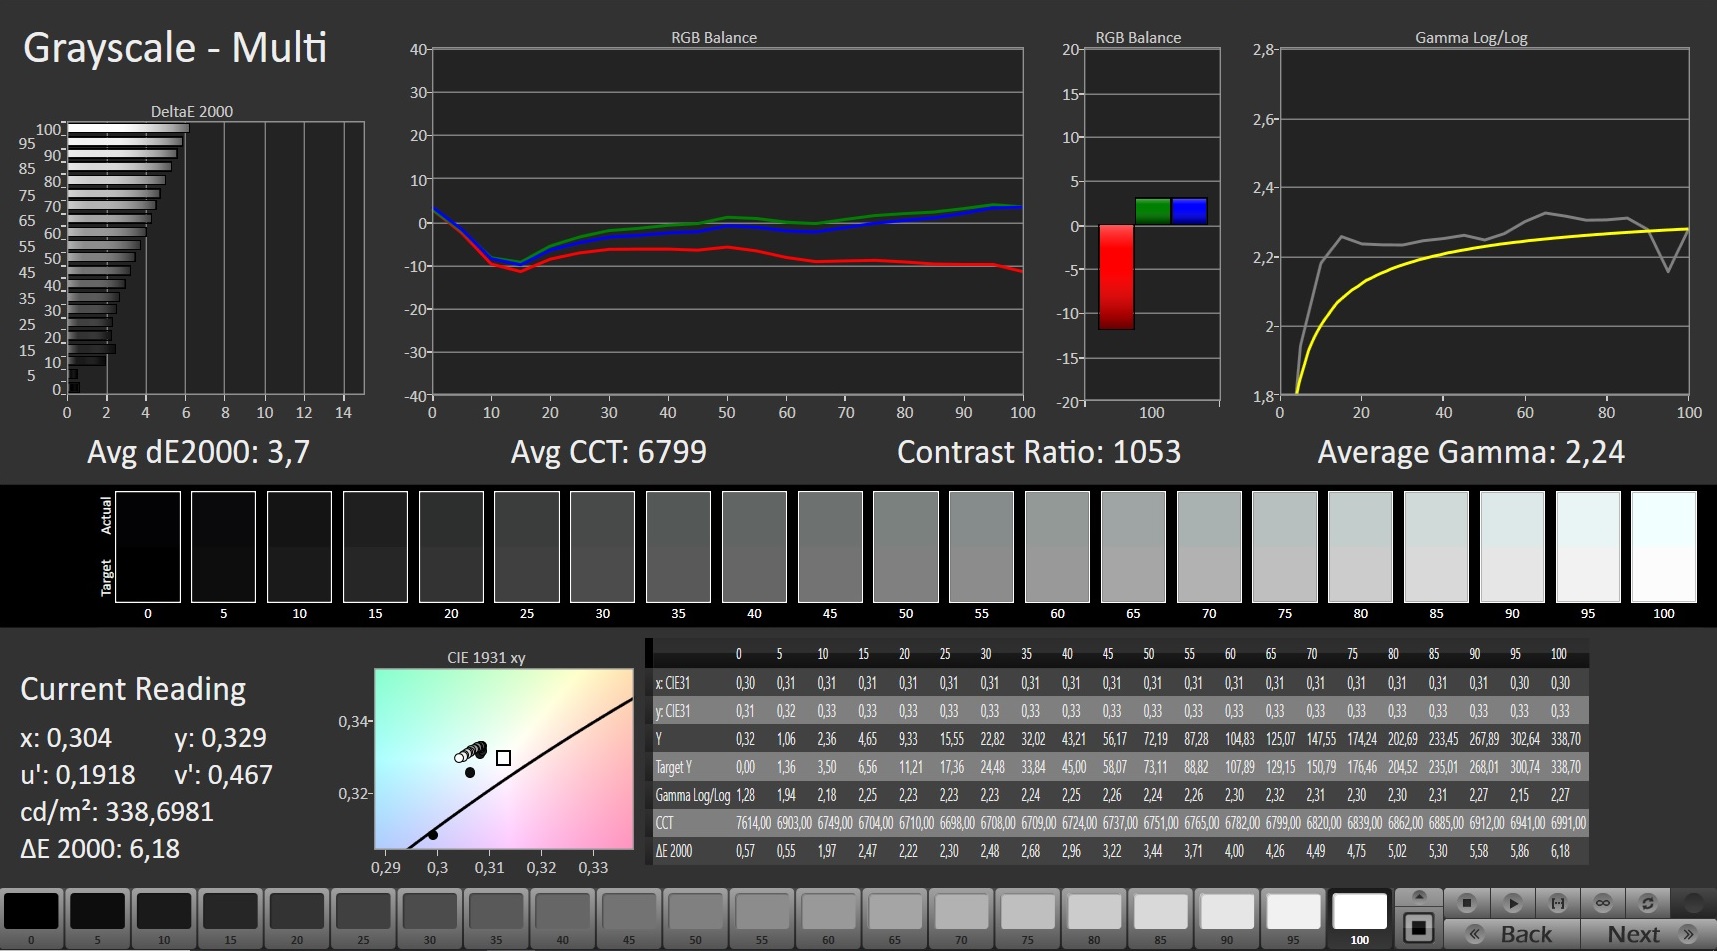
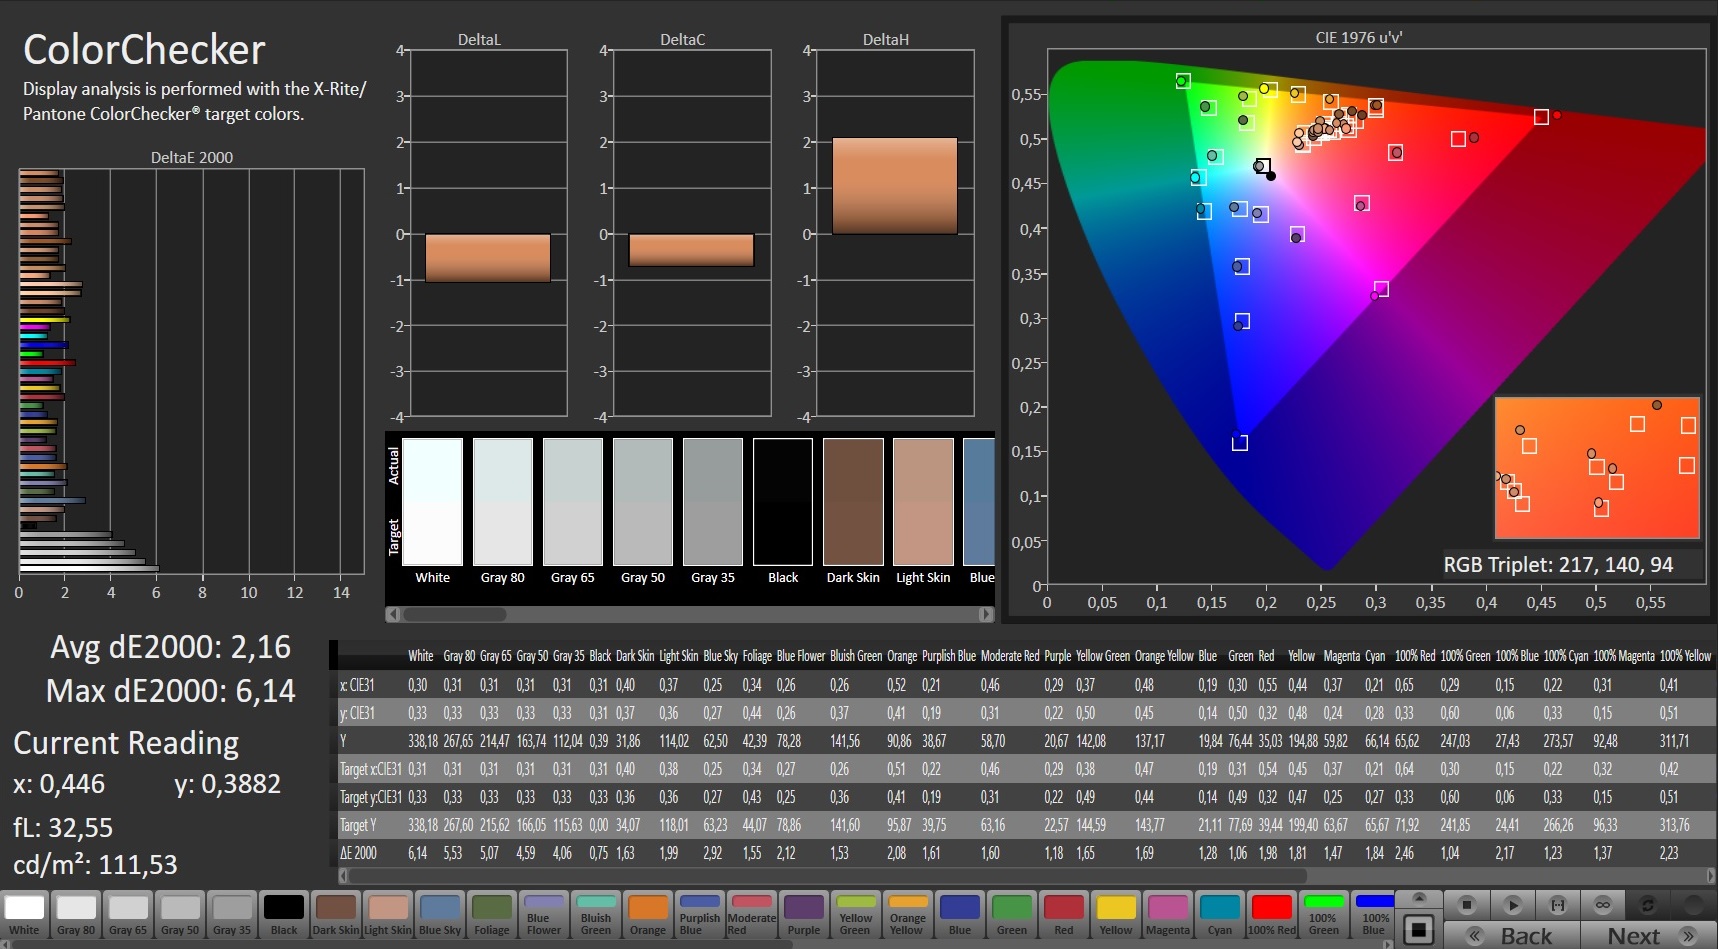
ΔE ColorChecker Calman: 2.16 | ∀{0.5-29.43 Ø4.72}
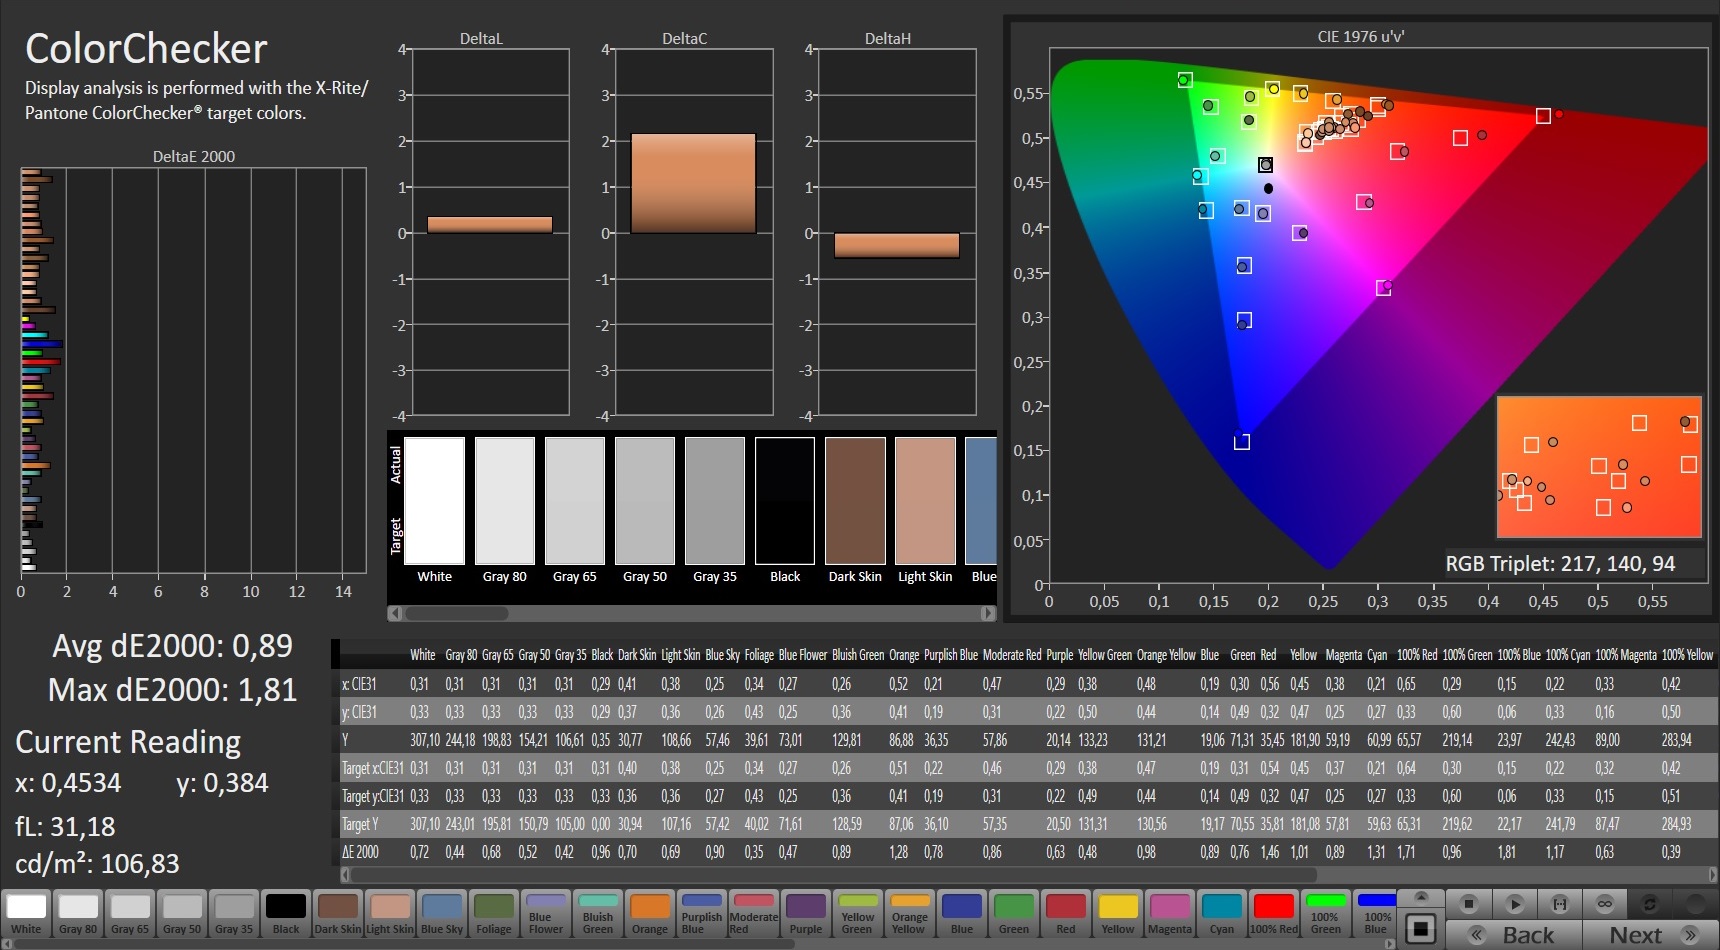
calibrated: 0.89
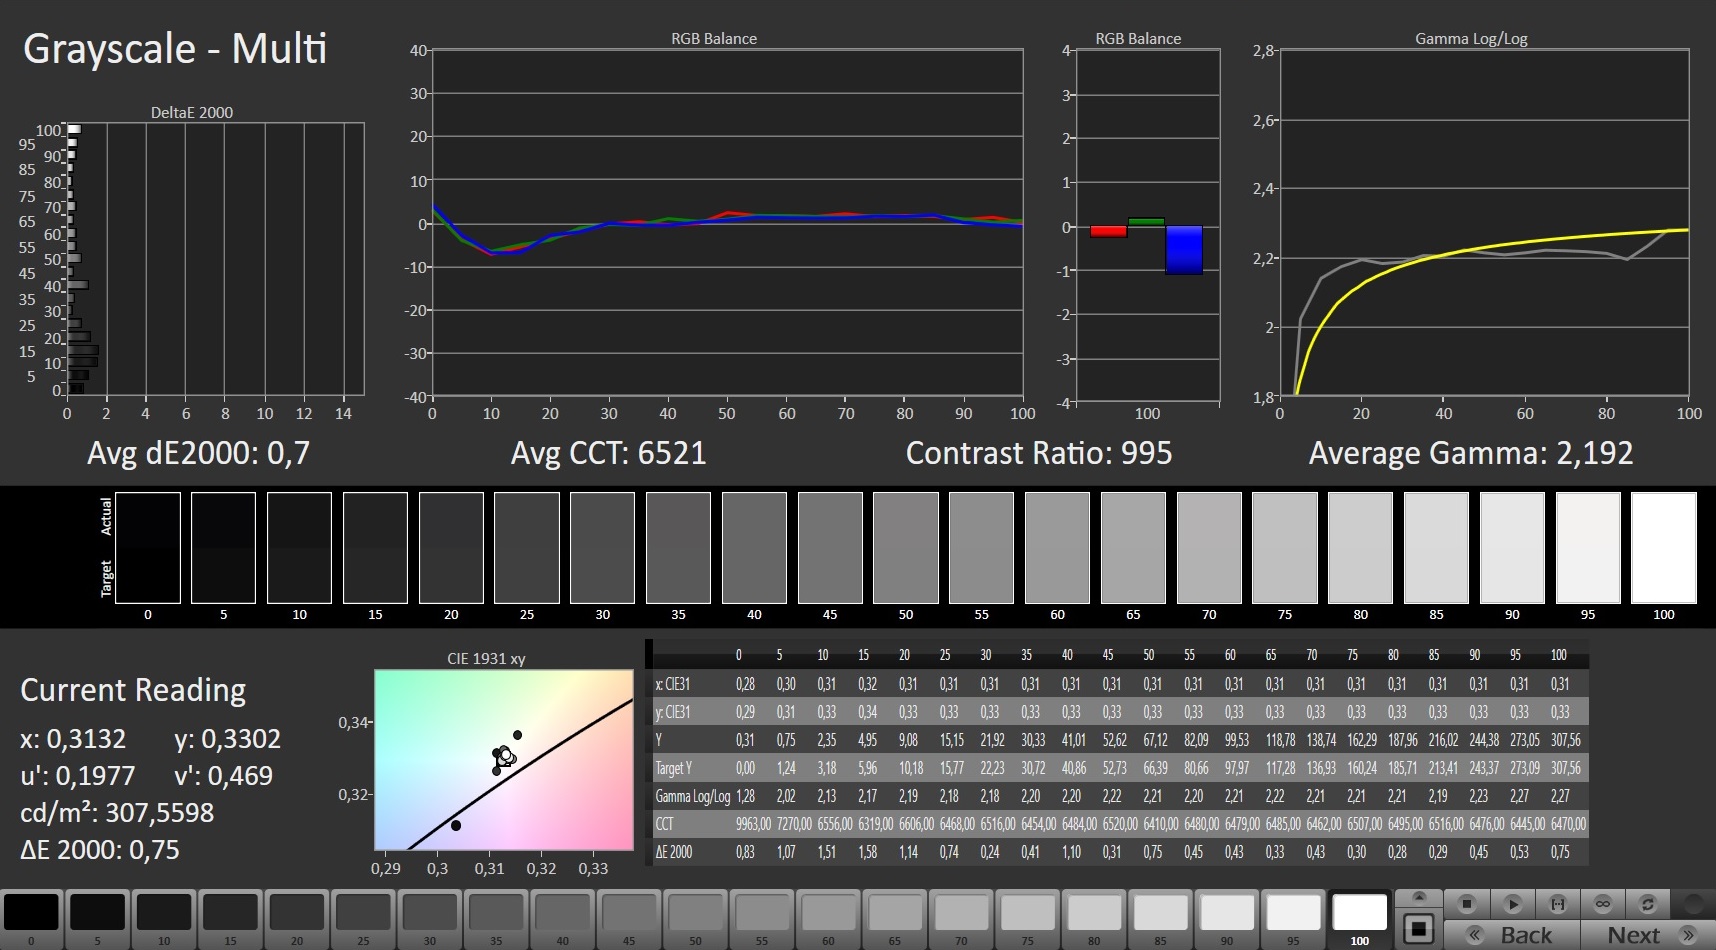
ΔE Greyscale Calman: 3.7 | ∀{0.09-98 Ø4.97}
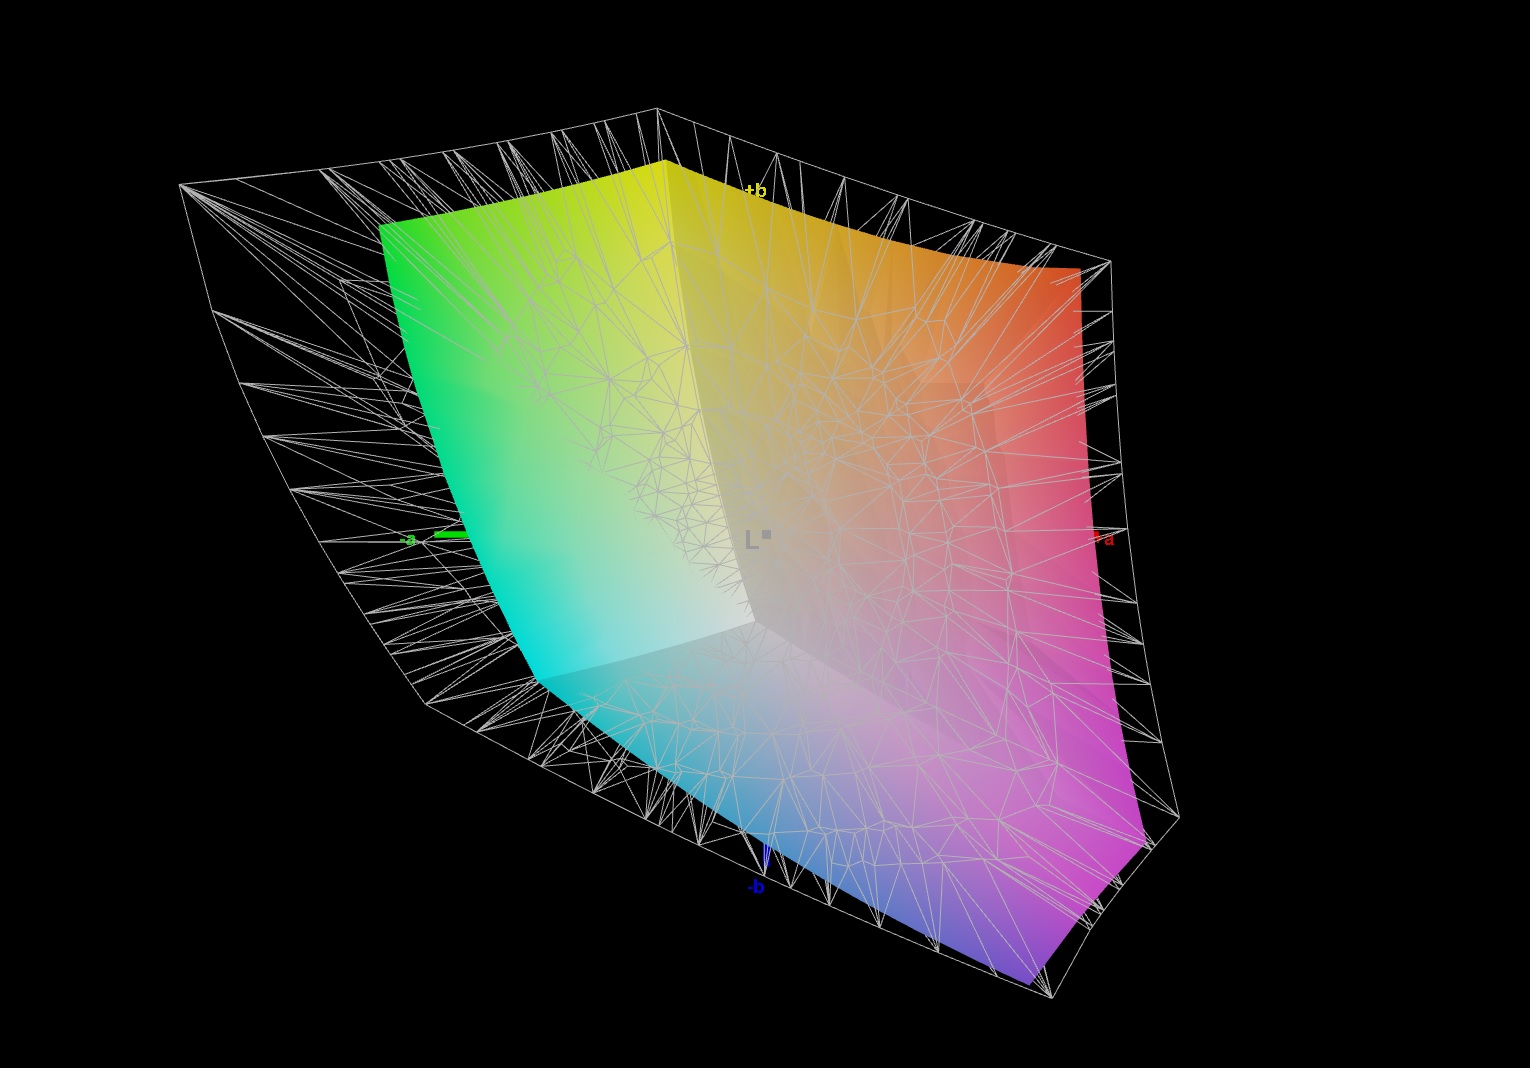
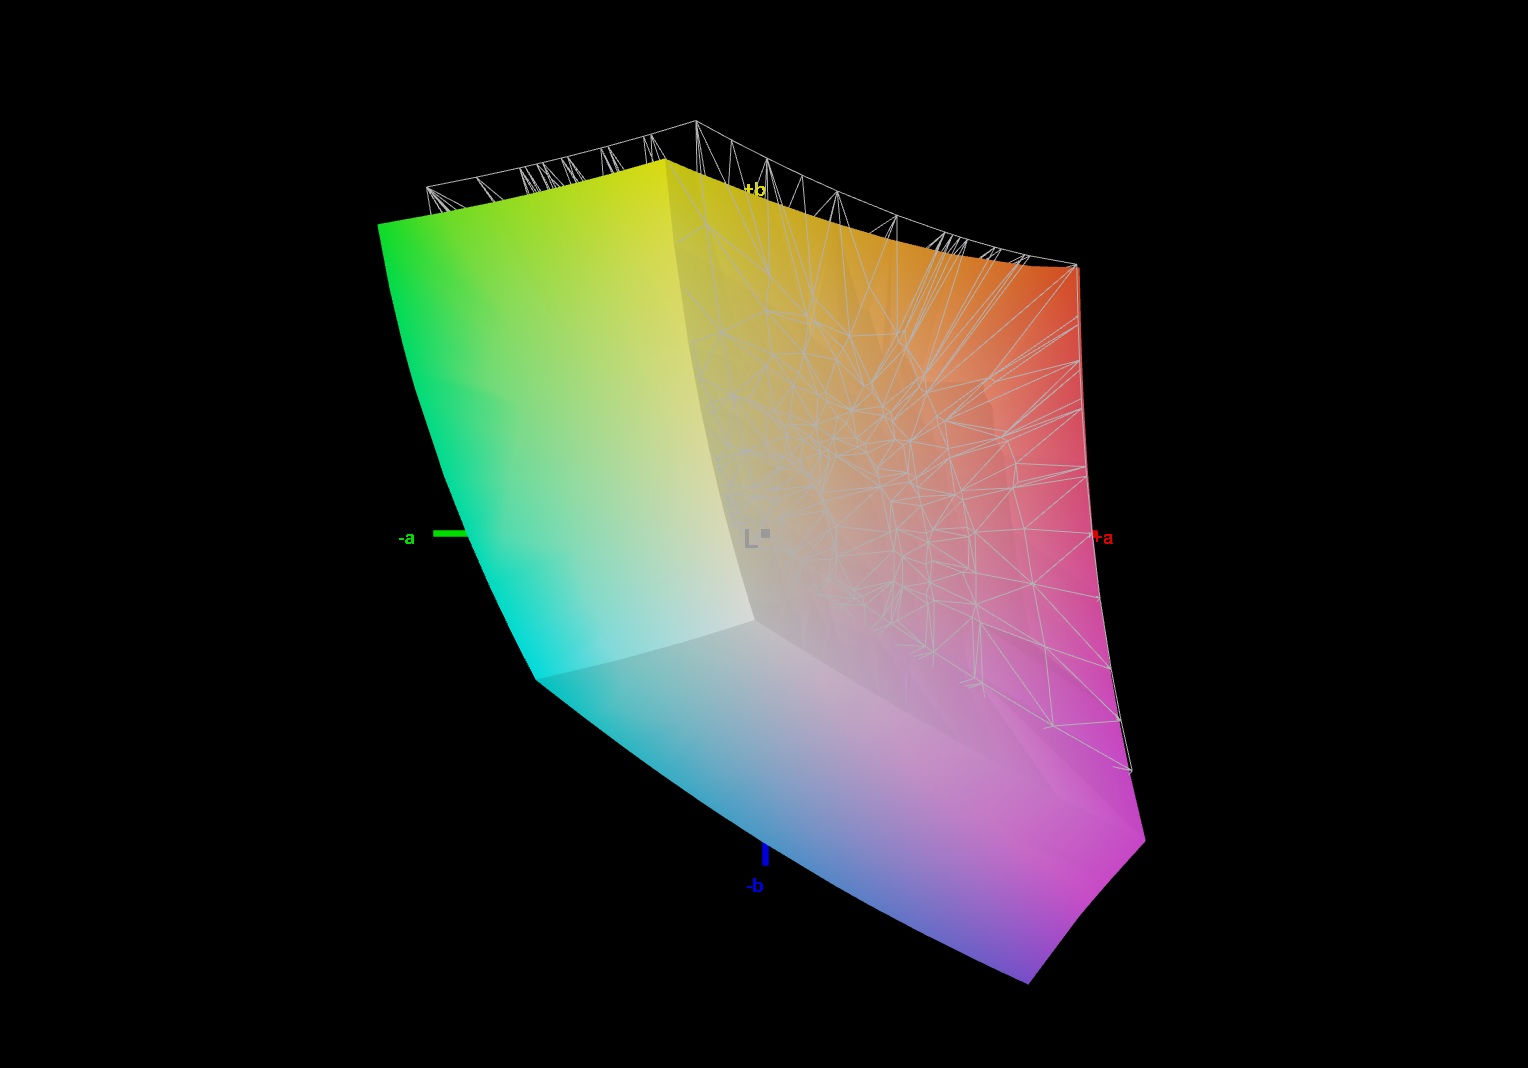
93% sRGB (Argyll 1.6.3 3D)
71% AdobeRGB 1998 (Argyll 1.6.3 3D)
70.9% AdobeRGB 1998 (Argyll 3D)
99.2% sRGB (Argyll 3D)
69.4% Display P3 (Argyll 3D)
Gamma: 2.24
CCT: 6799 K
| Schenker XMG Neo 17 Comet Lake BOE HF NE173FHM-NZ1, IPS, 1920x1080, 17.3" | Schenker XMG Neo 17 BOEhydis NV173FHM-N44 (BOE07B6), IPS, 1920x1080, 17.3" | Schenker XMG Neo 17 XNE17M19 LG LP173WFG-SPB1 (LGD0615), IPS, 1920x1080, 17.3" | Acer Predator Helios 300 PH317-54-75G8 Chi Mei N173HCE-G33, IPS, 1920x1080, 17.3" | MSI GL75 10SFR Chi Mei N173HCE-G33, IPS, 1920x1080, 17.3" | Asus Strix G17 G712LWS LG Philips LP173WFG-SPB3, IPS, 1920x1080, 17.3" | Aorus 17G XB AU Optronics B173HAN05.0 (AUO509D), IPS, 1920x1080, 17.3" | |
|---|---|---|---|---|---|---|---|
| Display | -6% | -6% | -8% | -6% | -5% | 1% | |
| Display P3 Coverage (%) | 69.4 | 65.2 -6% | 64.6 -7% | 62.6 -10% | 63.9 -8% | 65.2 -6% | 70.6 2% |
| sRGB Coverage (%) | 99.2 | 92.2 -7% | 95.6 -4% | 94.3 -5% | 96.2 -3% | 96.8 -2% | 97.2 -2% |
| AdobeRGB 1998 Coverage (%) | 70.9 | 66.5 -6% | 65.6 -7% | 64.7 -9% | 66 -7% | 66.4 -6% | 72.8 3% |
| Response Times | -81% | -63% | -61% | -26% | -48% | -68% | |
| Response Time Grey 50% / Grey 80% * (ms) | 10.8 ? | 18.8 ? -74% | 15.6 ? -44% | 16.4 ? -52% | 12 ? -11% | 14.4 ? -33% | 16 ? -48% |
| Response Time Black / White * (ms) | 6.4 ? | 12 ? -88% | 11.6 ? -81% | 10.8 ? -69% | 9 ? -41% | 10.4 ? -63% | 12 ? -88% |
| PWM Frequency (Hz) | 971 ? | 24510 ? | 208 ? | ||||
| Screen | -5% | -15% | 23% | 1% | -8% | 17% | |
| Brightness middle (cd/m²) | 327 | 304 -7% | 318 -3% | 322 -2% | 333 2% | 323 -1% | 293 -10% |
| Brightness (cd/m²) | 305 | 289 -5% | 286 -6% | 308 1% | 309 1% | 300 -2% | 285 -7% |
| Brightness Distribution (%) | 87 | 90 3% | 86 -1% | 92 6% | 86 -1% | 89 2% | 95 9% |
| Black Level * (cd/m²) | 0.32 | 0.26 19% | 0.23 28% | 0.18 44% | 0.215 33% | 0.31 3% | 0.24 25% |
| Contrast (:1) | 1022 | 1169 14% | 1383 35% | 1789 75% | 1549 52% | 1042 2% | 1221 19% |
| Colorchecker dE 2000 * | 2.16 | 2.65 -23% | 3.89 -80% | 1.53 29% | 1.98 8% | 3.01 -39% | 1.27 41% |
| Colorchecker dE 2000 max. * | 6.14 | 6.11 -0% | 10.56 -72% | 3.14 49% | 4.34 29% | 7.65 -25% | 2.24 64% |
| Colorchecker dE 2000 calibrated * | 0.89 | 1.5 -69% | 1.03 -16% | 0.74 17% | 2.01 -126% | 1 -12% | 1.06 -19% |
| Greyscale dE 2000 * | 3.7 | 2.75 26% | 5.3 -43% | 1.9 49% | 2.97 20% | 3.8 -3% | 1.34 64% |
| Gamma | 2.24 98% | 2.46 89% | 2.46 89% | 2.144 103% | 2.41 91% | 2.154 102% | 2.38 92% |
| CCT | 6799 96% | 6763 96% | 7462 87% | 6809 95% | 6750 96% | 7507 87% | 6542 99% |
| Color Space (Percent of AdobeRGB 1998) (%) | 71 | 60 -15% | 60 -15% | 65 -8% | 61 -14% | 66 -7% | 73 3% |
| Color Space (Percent of sRGB) (%) | 93 | 92 -1% | 96 3% | 87 -6% | 96 3% | 90 -3% | 94 1% |
| Media total (Programa/Opciones) | -31% /
-15% | -28% /
-20% | -15% /
7% | -10% /
-4% | -20% /
-12% | -17% /
4% |
* ... más pequeño es mejor
Tiempos de respuesta del display
| ↔ Tiempo de respuesta de Negro a Blanco | ||
|---|---|---|
| 6.4 ms ... subida ↗ y bajada ↘ combinada | ↗ 3 ms subida | 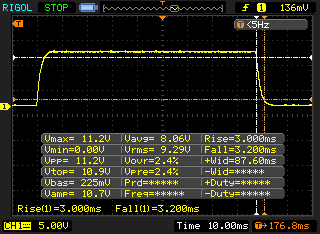 |
| ↘ 3.2 ms bajada | ||
| La pantalla mostró tiempos de respuesta muy rápidos en nuestros tests y debería ser adecuada para juegos frenéticos. En comparación, todos los dispositivos de prueba van de ##min### (mínimo) a 240 (máximo) ms. » 20 % de todos los dispositivos son mejores. Esto quiere decir que el tiempo de respuesta medido es mejor que la media (19.8 ms) de todos los dispositivos testados. | ||
| ↔ Tiempo de respuesta 50% Gris a 80% Gris | ||
| 10.8 ms ... subida ↗ y bajada ↘ combinada | ↗ 5.6 ms subida | 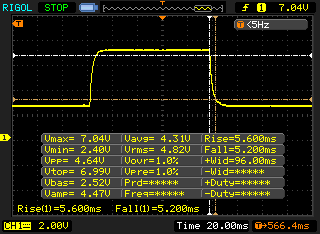 |
| ↘ 5.2 ms bajada | ||
| La pantalla mostró buenos tiempos de respuesta en nuestros tests pero podría ser demasiado lenta para los jugones competitivos. En comparación, todos los dispositivos de prueba van de ##min### (mínimo) a 636 (máximo) ms. » 24 % de todos los dispositivos son mejores. Esto quiere decir que el tiempo de respuesta medido es mejor que la media (31 ms) de todos los dispositivos testados. | ||
Parpadeo de Pantalla / PWM (Pulse-Width Modulation)
| Parpadeo de Pantalla / PWM no detectado | 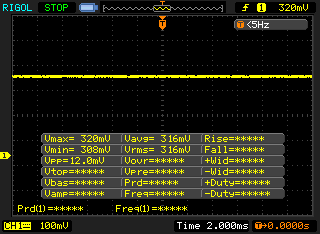 | ||
Comparación: 52 % de todos los dispositivos testados no usaron PWM para atenuar el display. Si se usó, medimos una media de 7769 (mínimo: 5 - máxmo: 343500) Hz. | |||
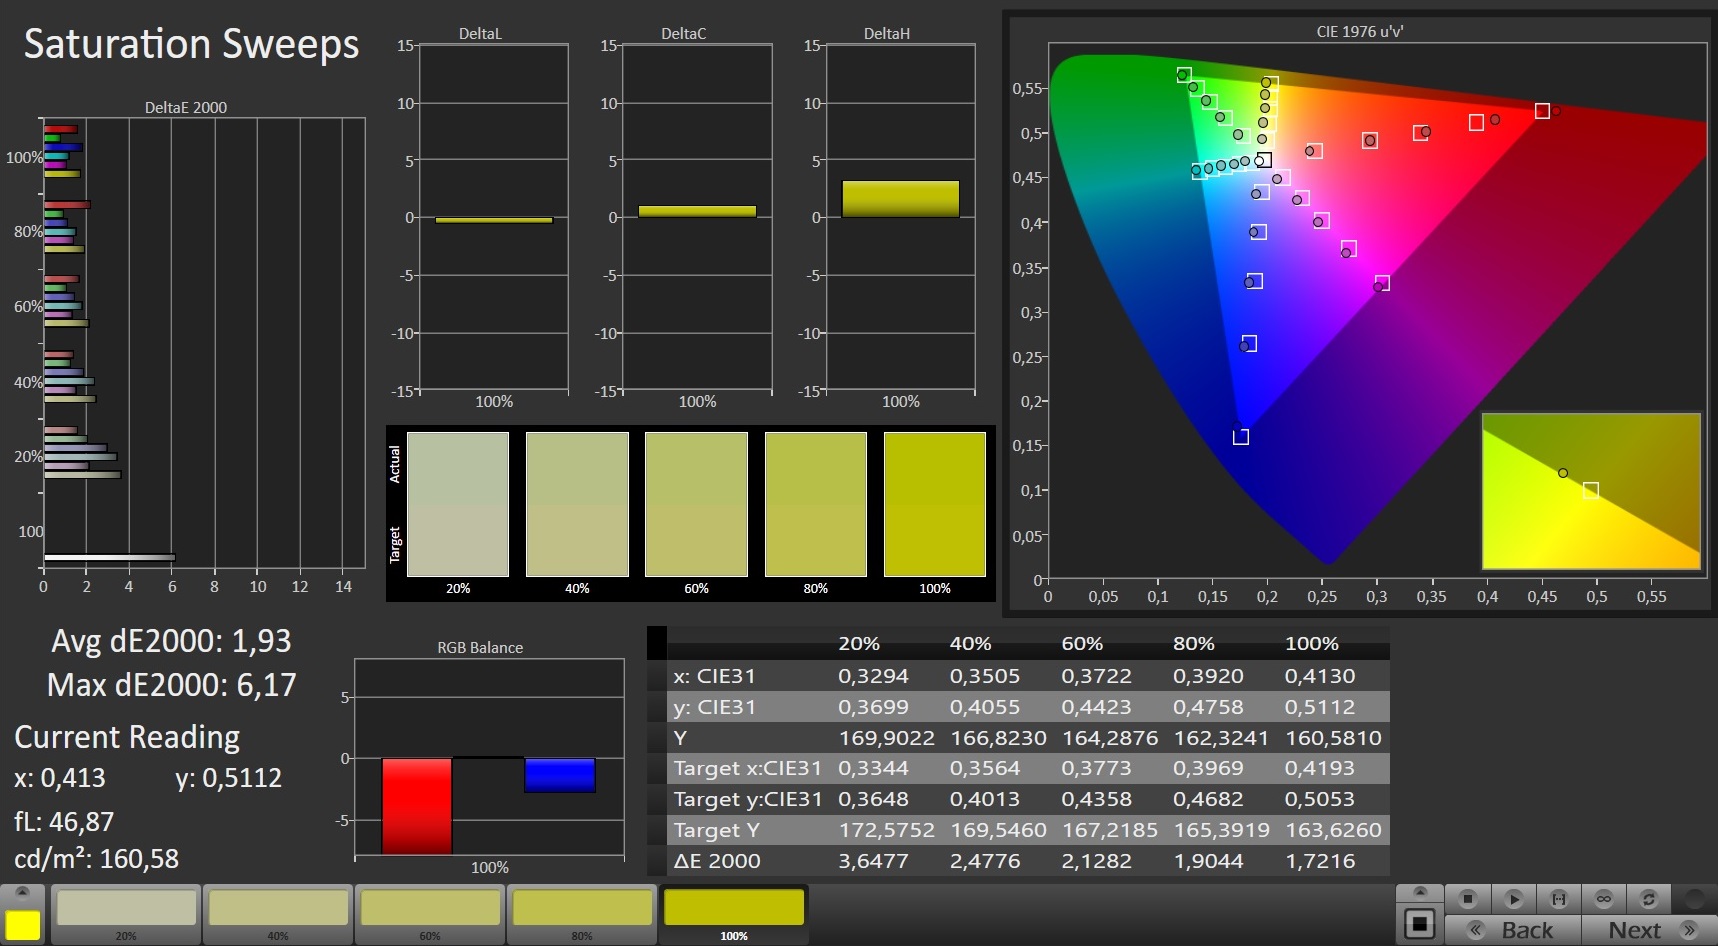
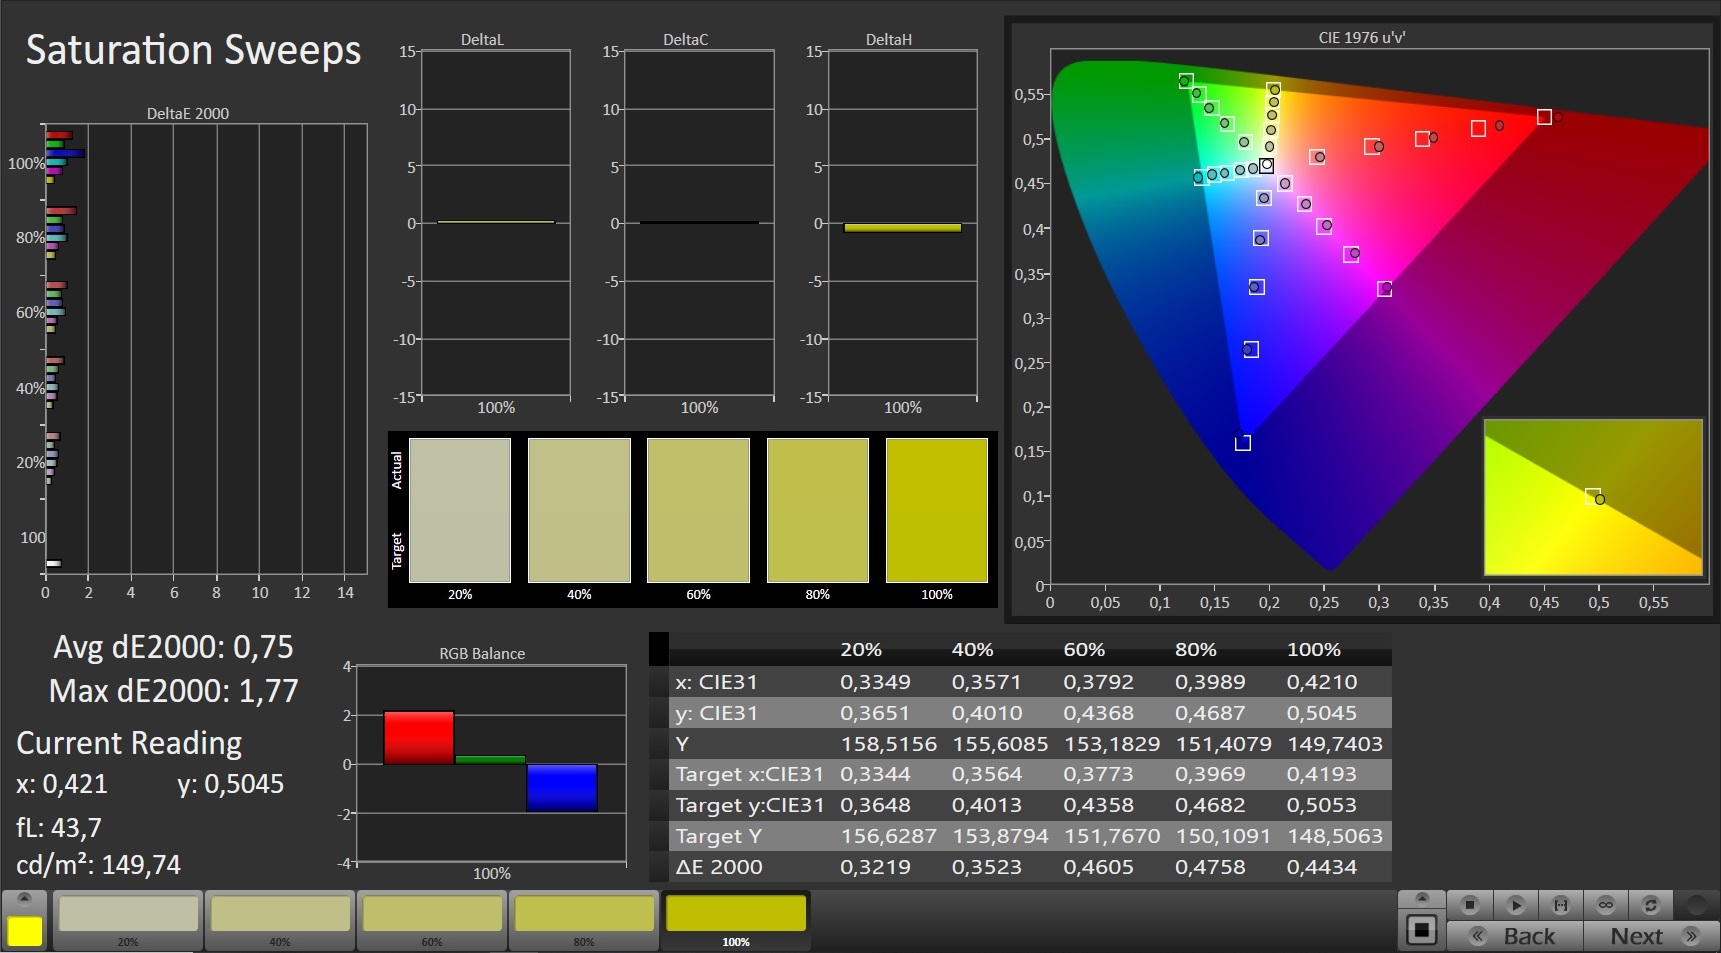
La pantalla muestra una buena reproducción del color. Con una desviación de color de 2,16, se alcanza el objetivo de Delta-E menor de 3. La pantalla no sufre de un tinte azul. Una calibración aún trae mejoras adicionales con la desviación de color cayendo a 0.89 y la pantalla en escala de grises se vuelve más balanceada. Los espacios de color AdobeRGB (71%) y sRGB (93%) no están completamente cubiertos.
Schenker ha equipado el portátil con un panel IPS con ángulos de visión estables, que le permite leer el contenido de la pantalla desde cualquier ángulo. En el exterior se puede leer el contenido de la pantalla cuando la luz del sol no es demasiado brillante.
Rendimiento - Suficiente para los próximos años
Con el Neo 17, Schenker ofrece un portátil para juegos de 17,3 pulgadas que lleva todos los juegos actuales a la pantalla sin problemas y que también da una buena imagen en otras áreas de aplicación. Tendrías que pagar unos 2349 euros (~$2781) por nuestra unidad de prueba. El dispositivo puede ser configurado individualmente en la tienda online de Schenker.
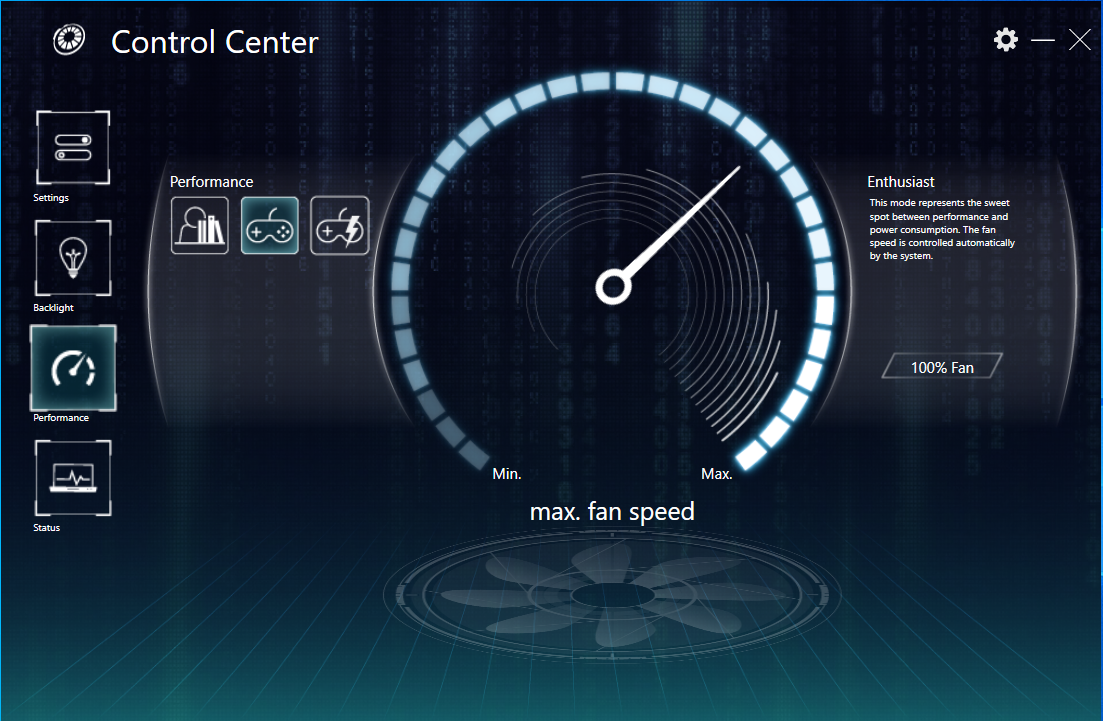
Condiciones de la prueba
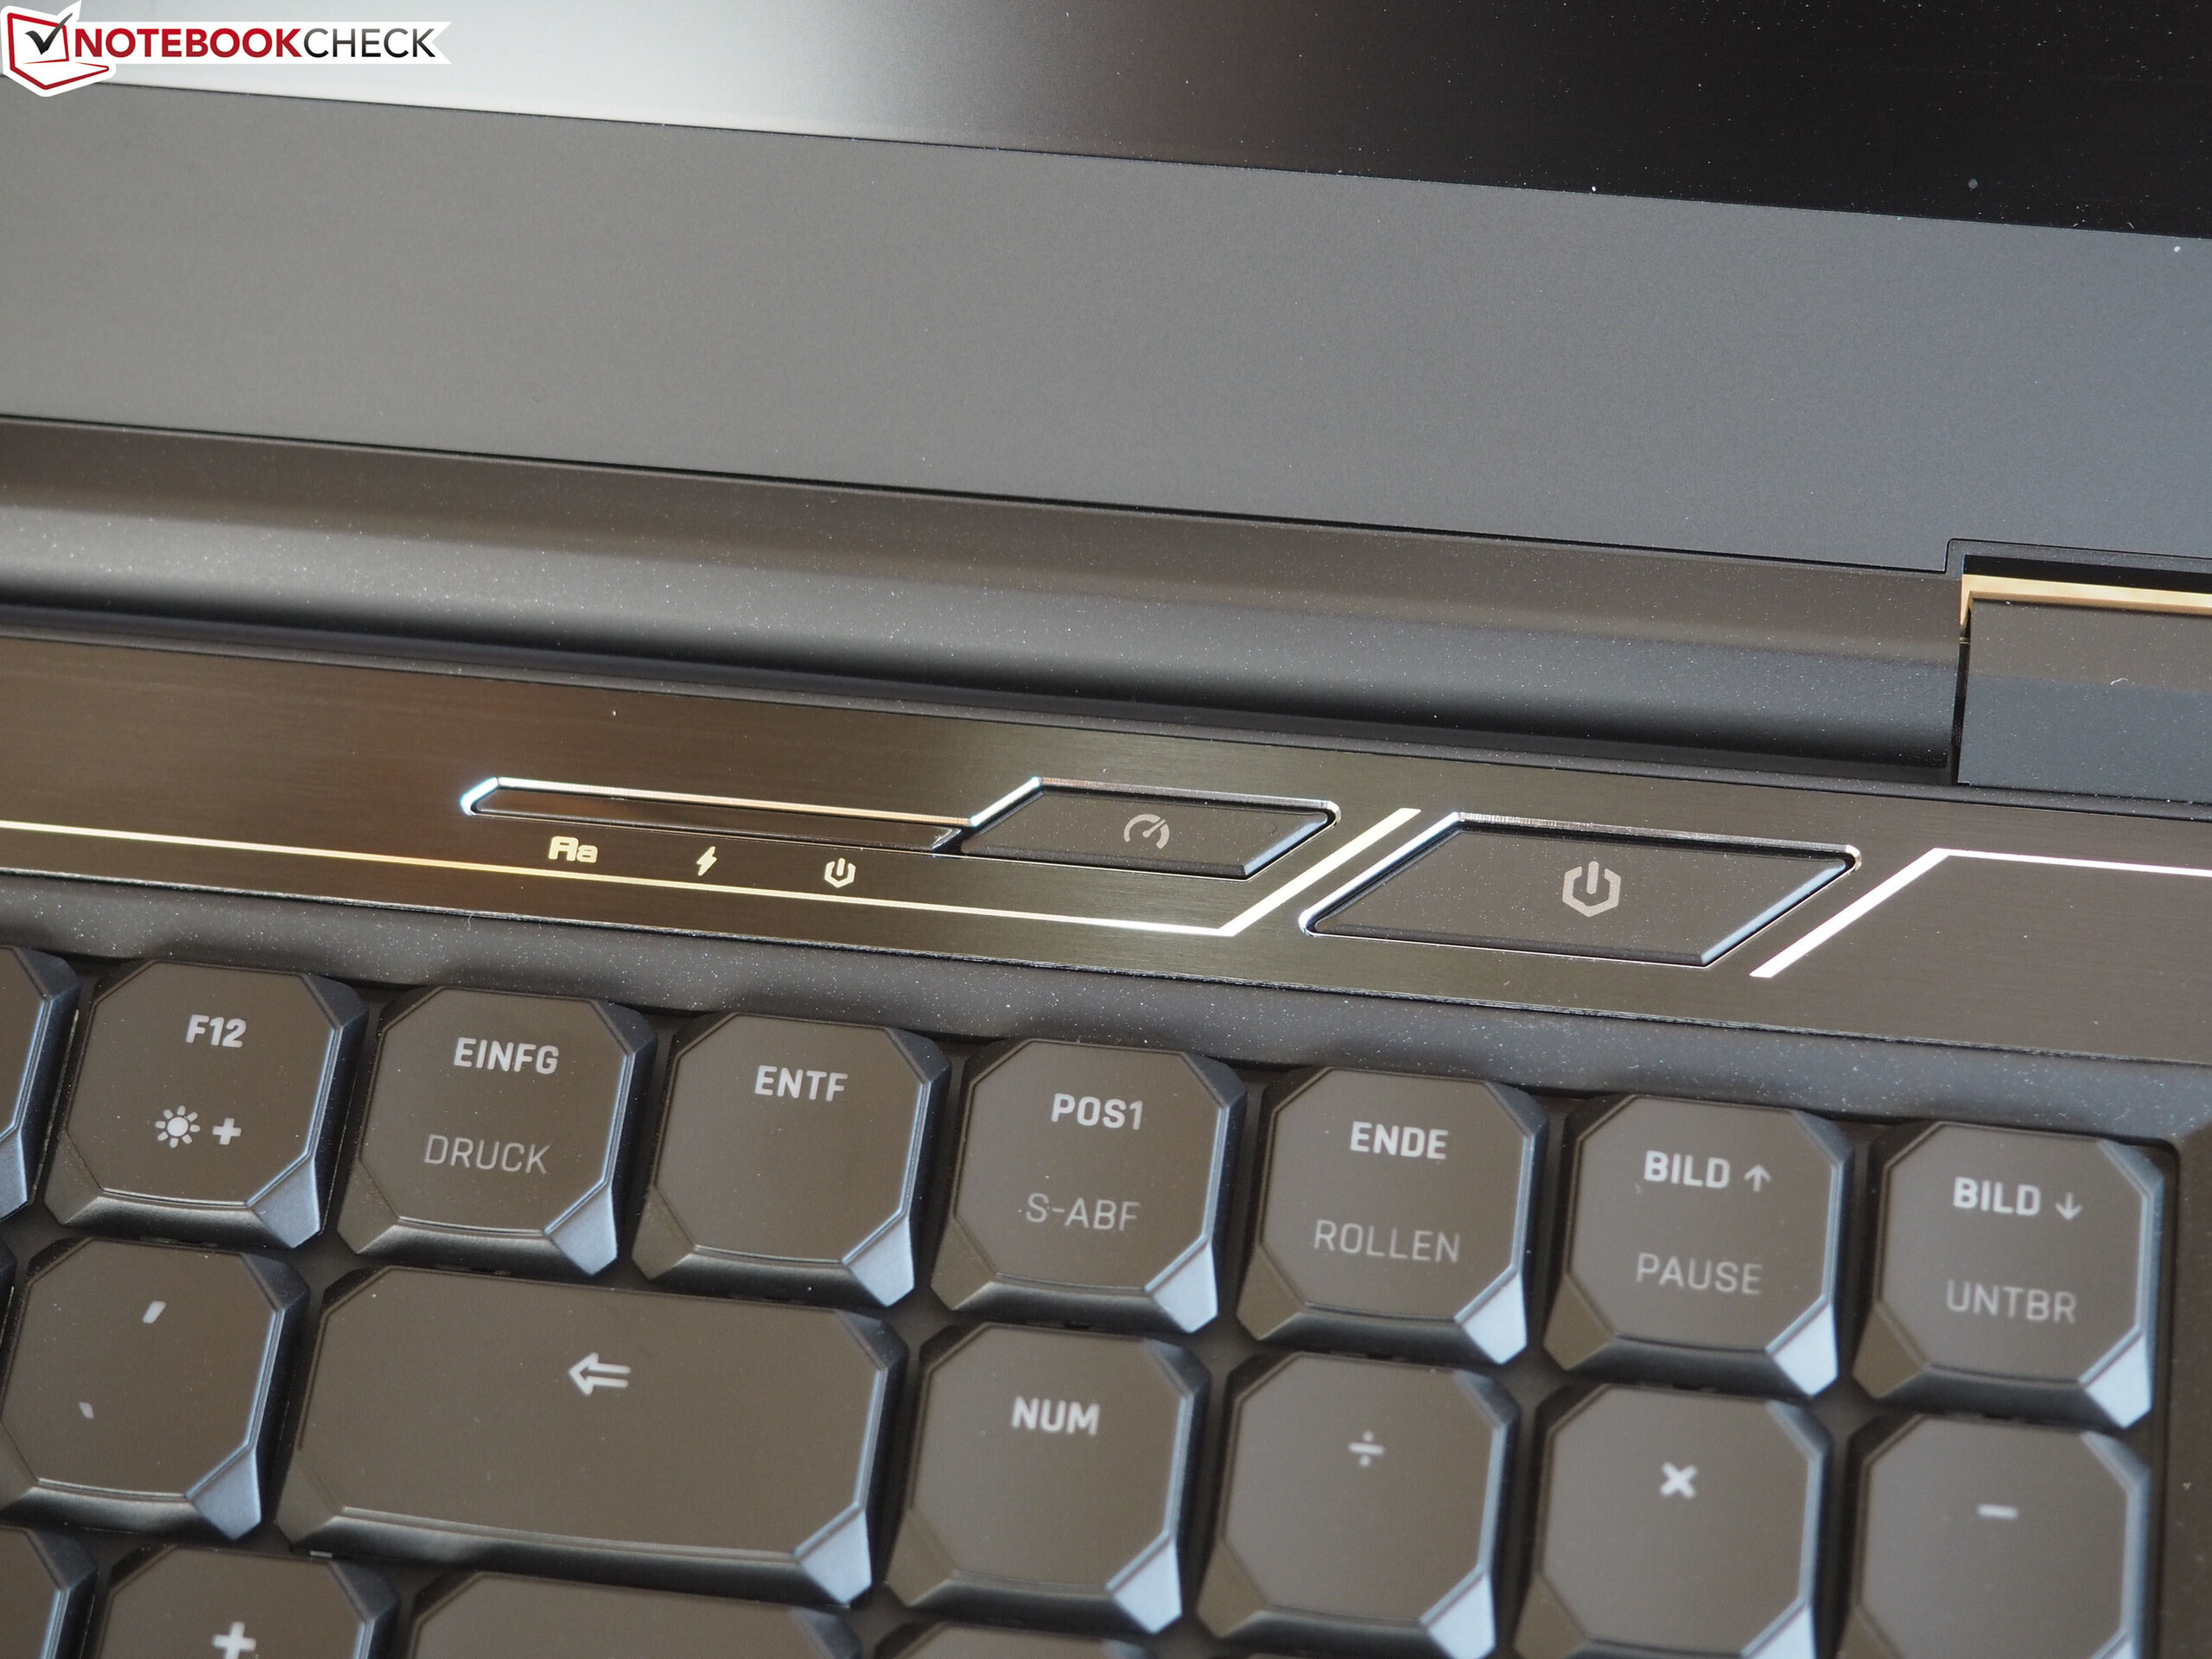
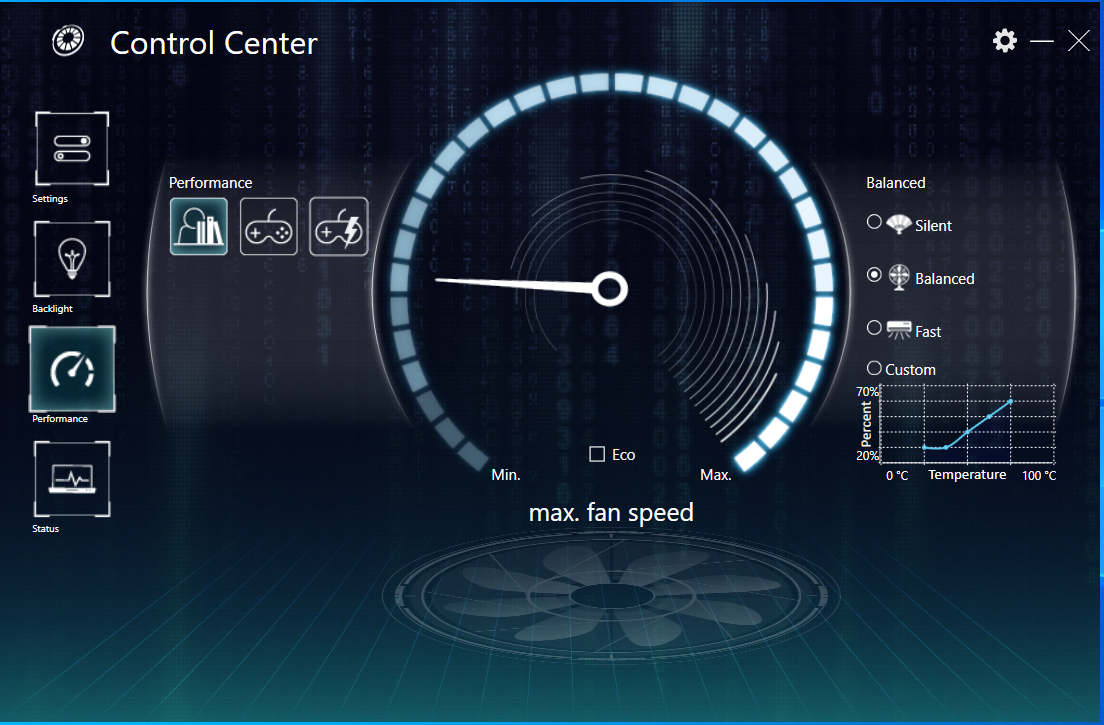
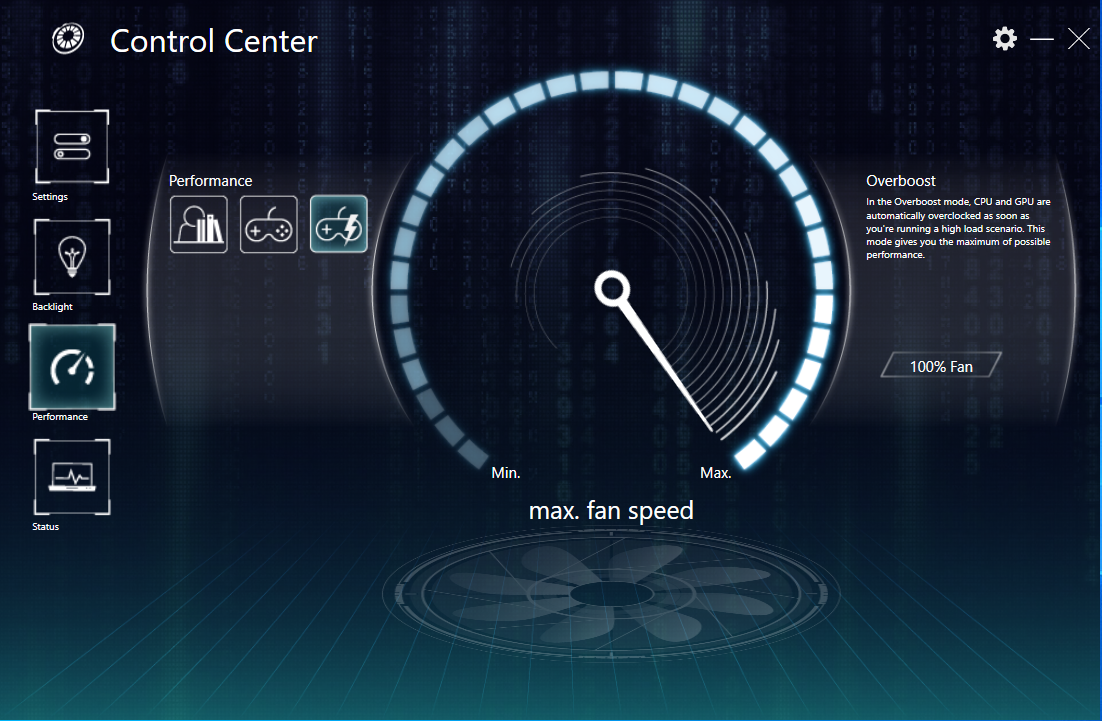
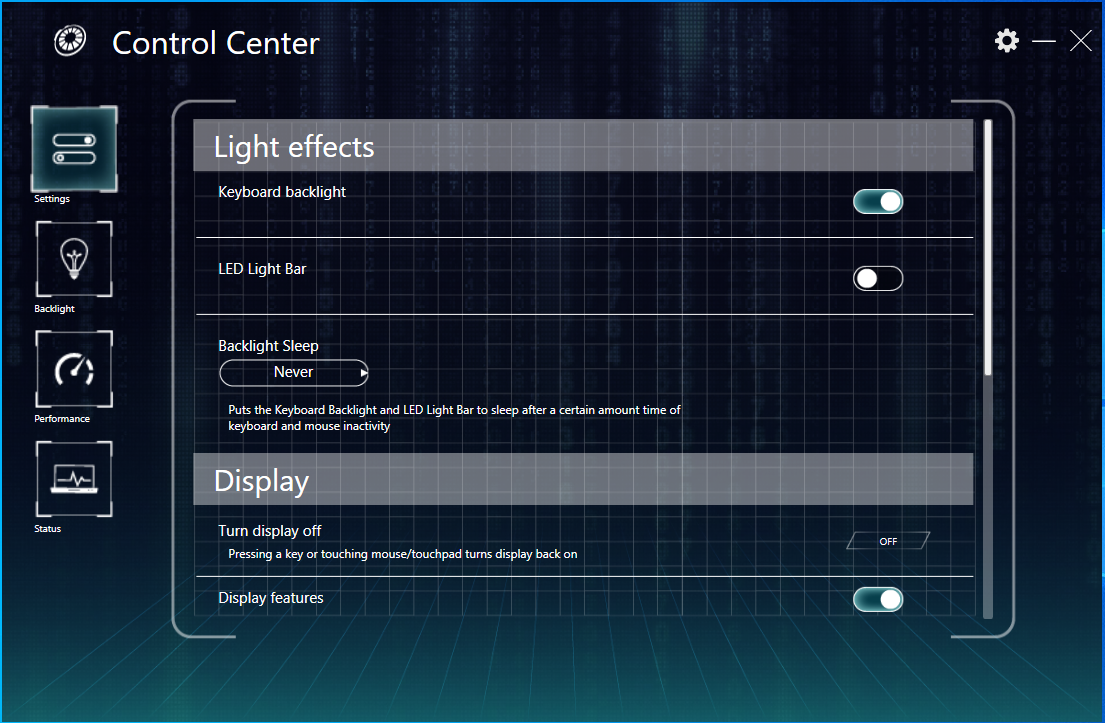
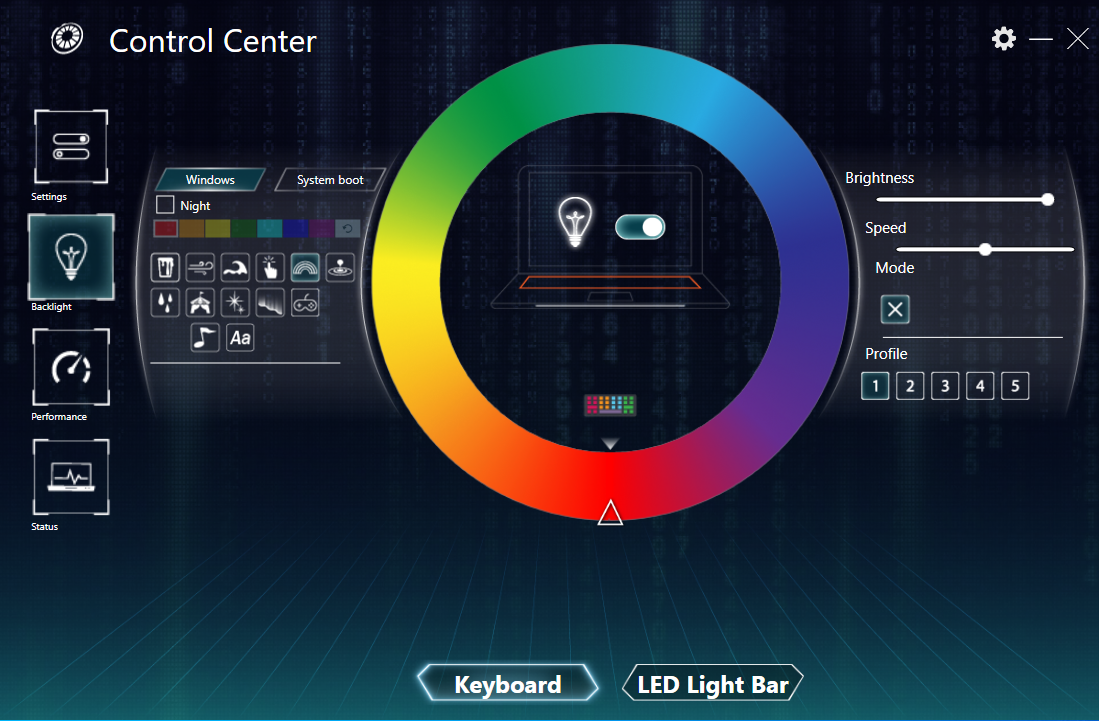
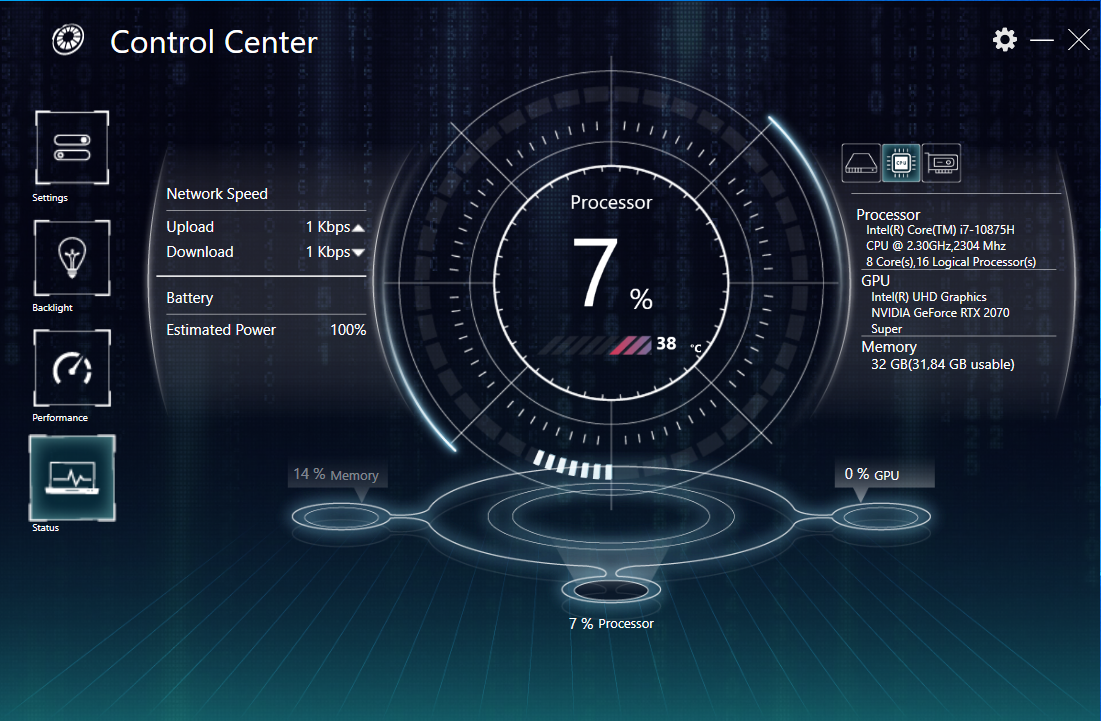
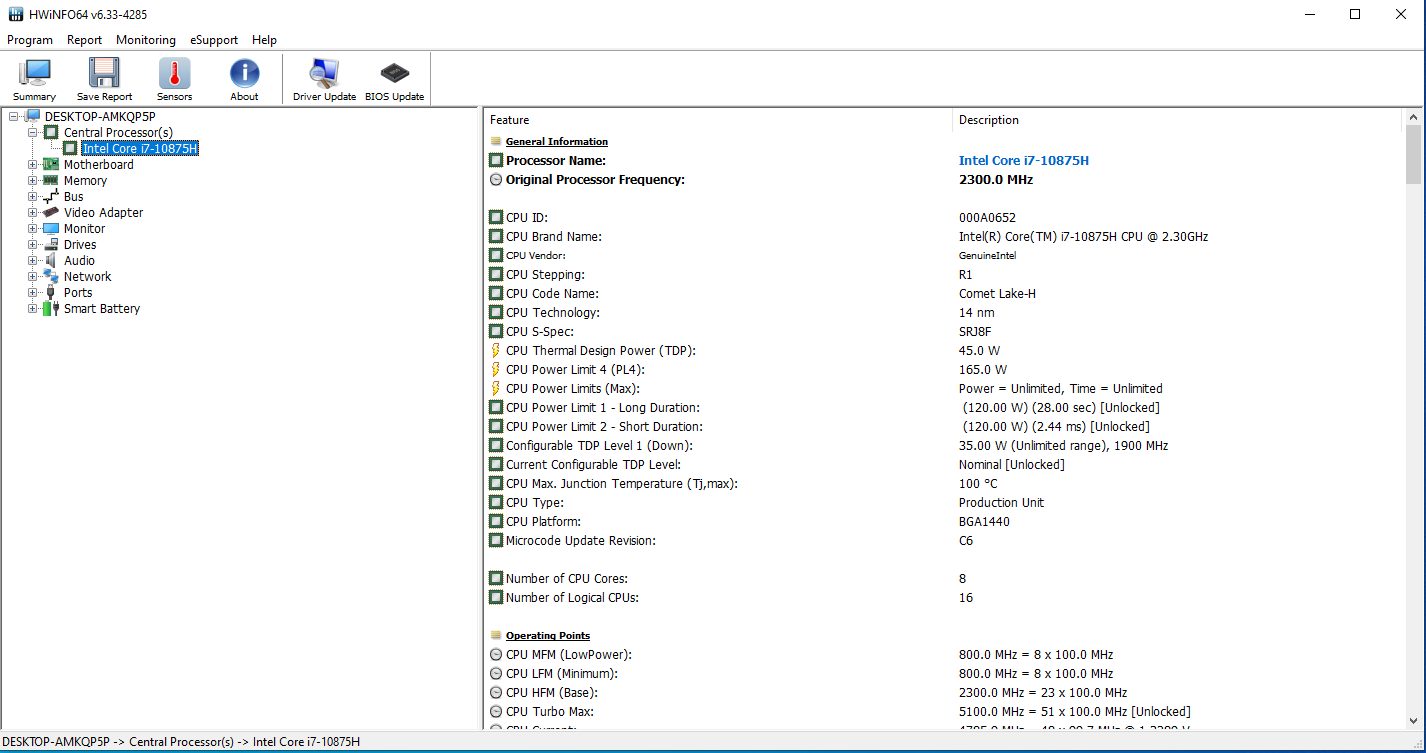
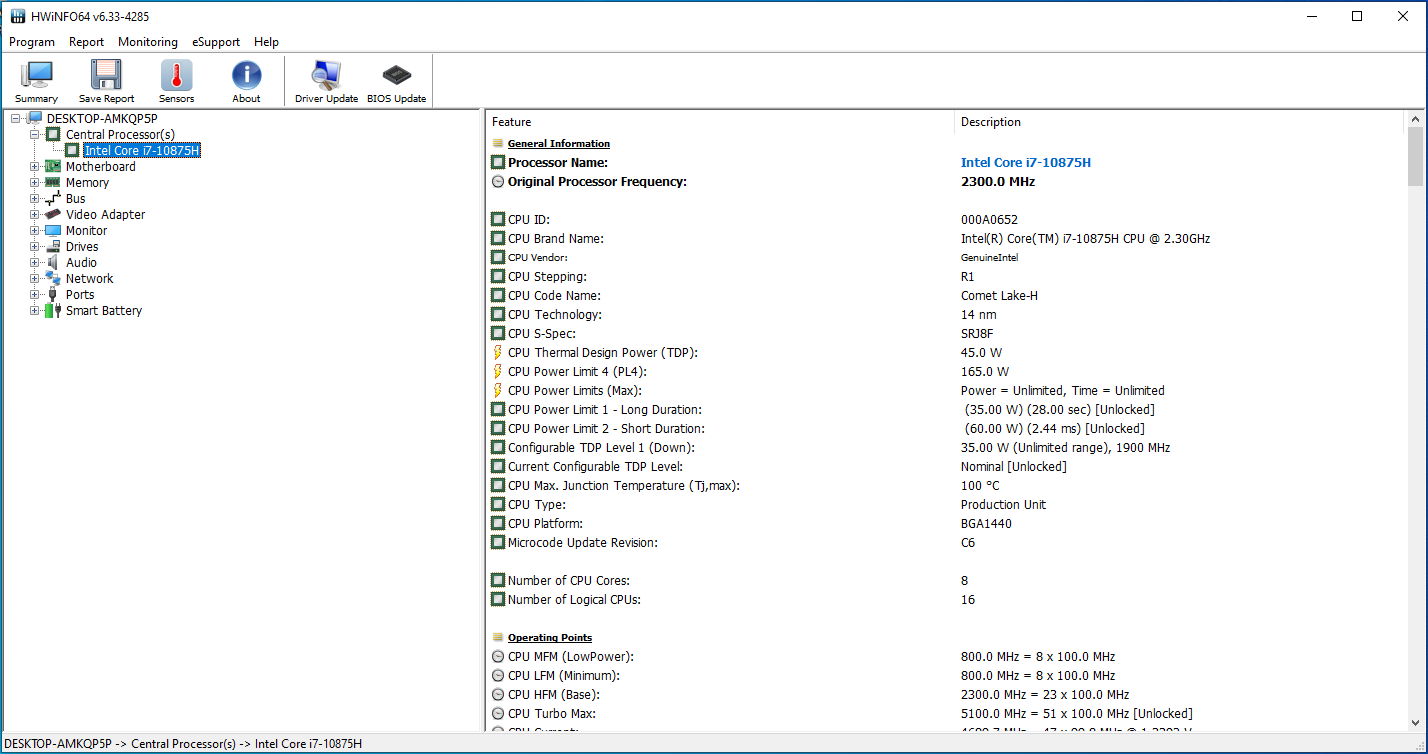
El Centro de Control preinstalado proporciona una visión general del estado del sistema y permite ajustar la iluminación del teclado, así como elegir un perfil de rendimiento ("Equilibrado", "Entusiasta" o "Sobreactuación"). Hicimos nuestra prueba con el perfil "Entusiasta" y el control automático del ventilador activado. También hicimos varias pruebas con el perfil "Overboost" activado. Pueden encontrar los resultados en los cuadros comparativos.
Procesador
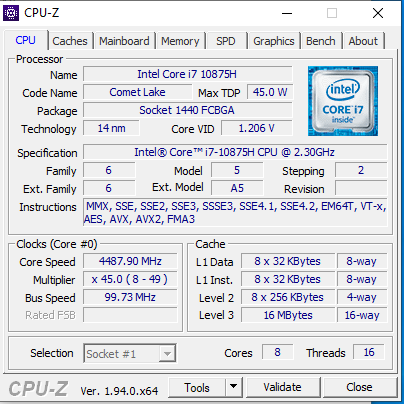
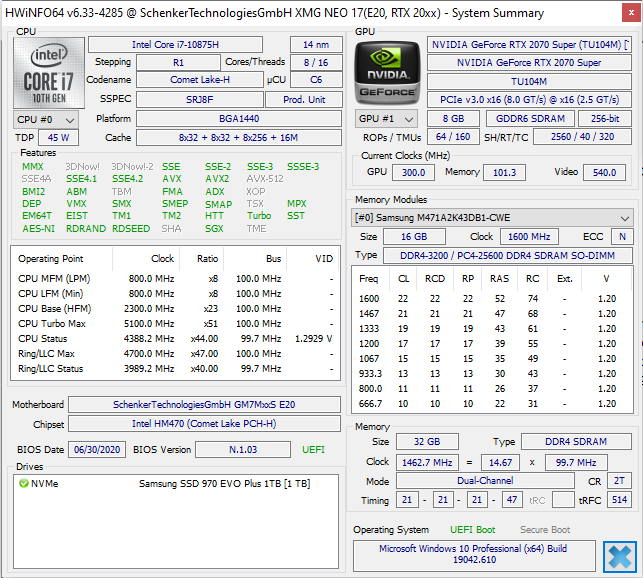
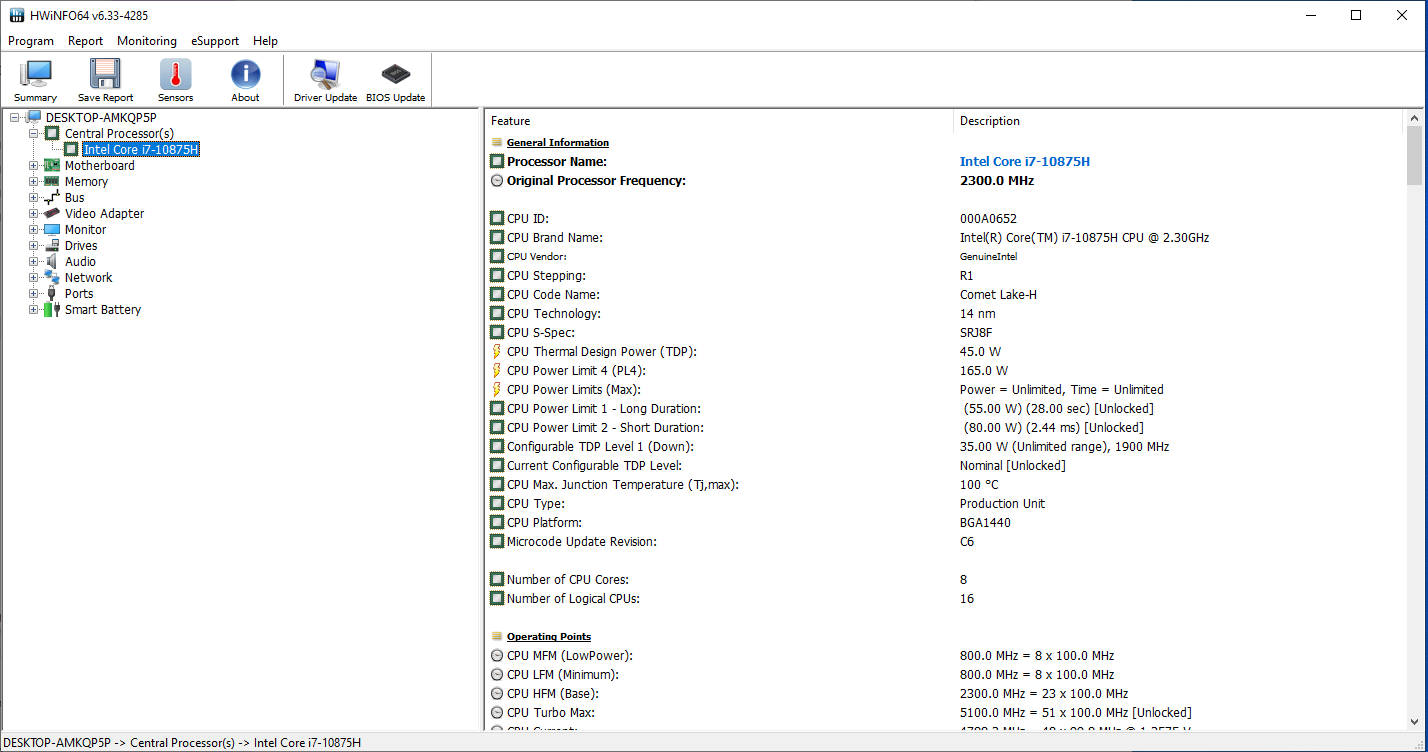
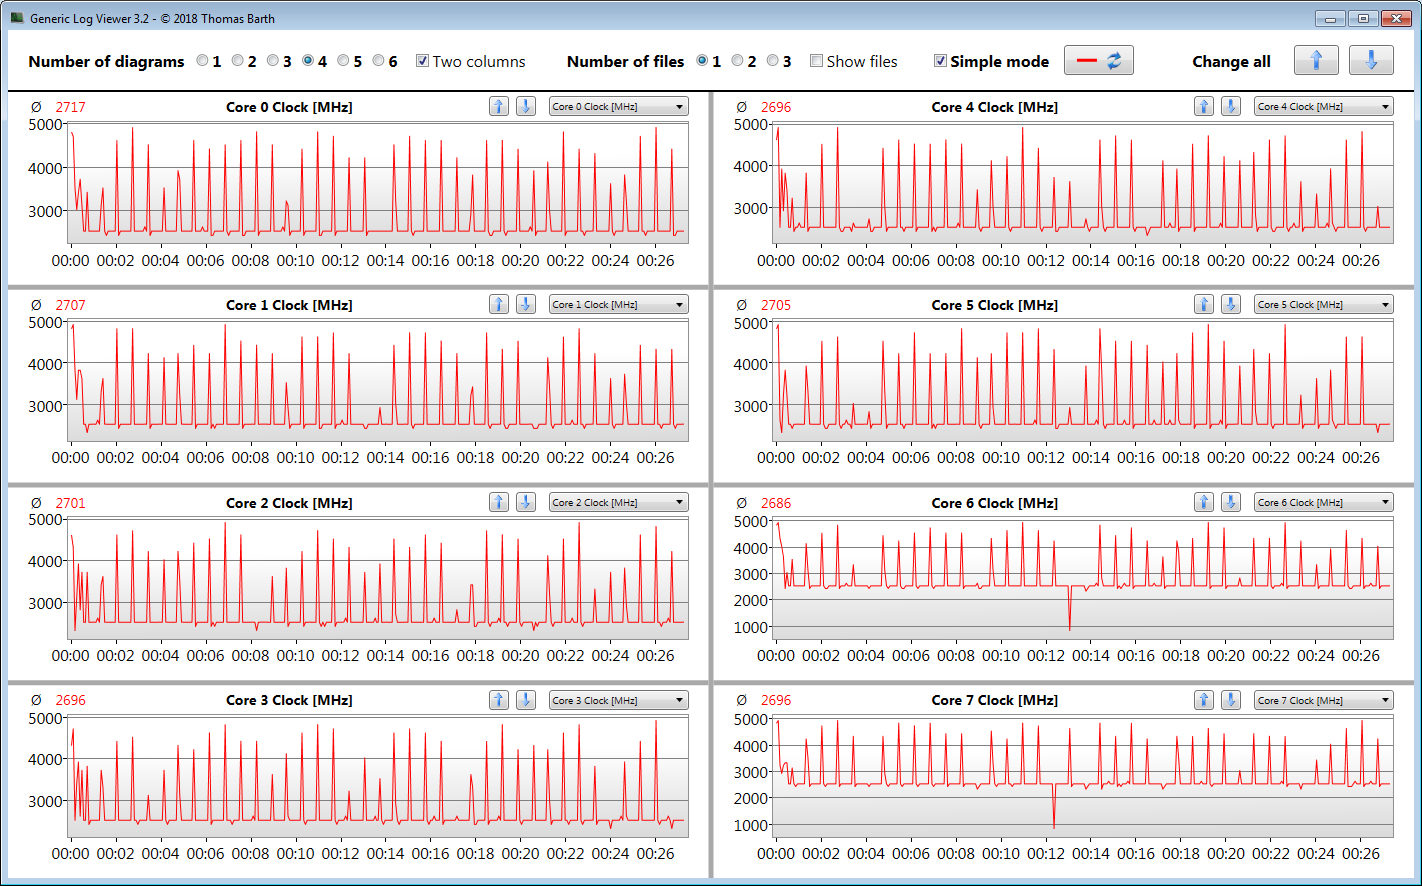
El procesador octa-core Core i7-10875H (Comet Lake) funciona a una velocidad básica de 2,3 GHz, que puede aumentarse mediante Turbo a 4,3 GHz (ocho núcleos) o hasta 5,1 GHz (un solo núcleo). Se admite el hiperhilado (dos hilos por núcleo).
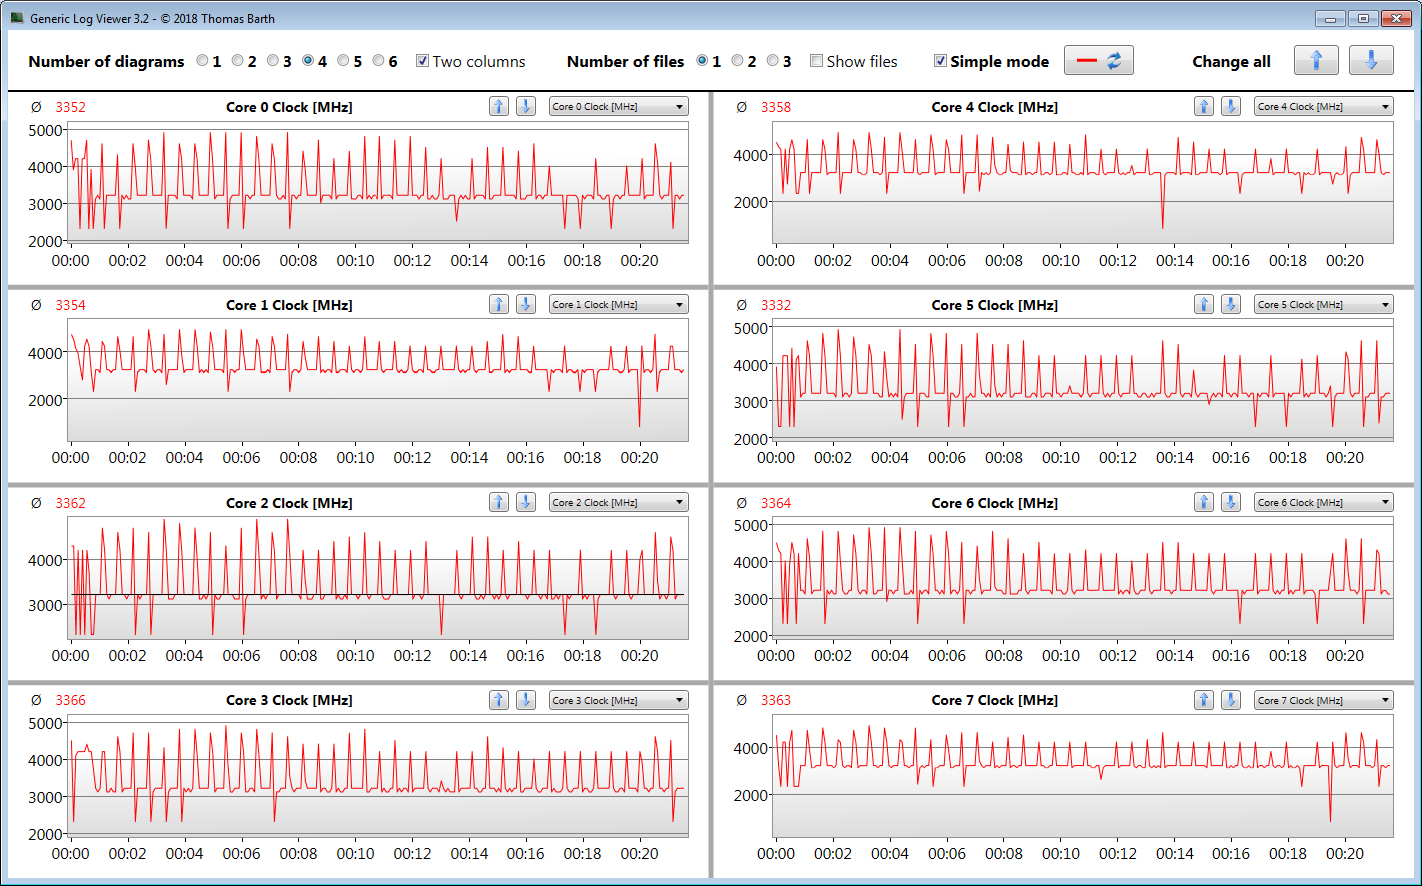
La CPU se ejecuta a través de la prueba multihilo del punto de referencia Cinebench R15 a velocidades entre 2,2 y 4,2 GHz y la prueba de un solo hilo entre 4 y 5,1 GHz. En el funcionamiento con baterías, la velocidad está entre 2,7 y 2,8 GHz (multihilo) y entre 2,4 y 4,2 GHz (monohilo).
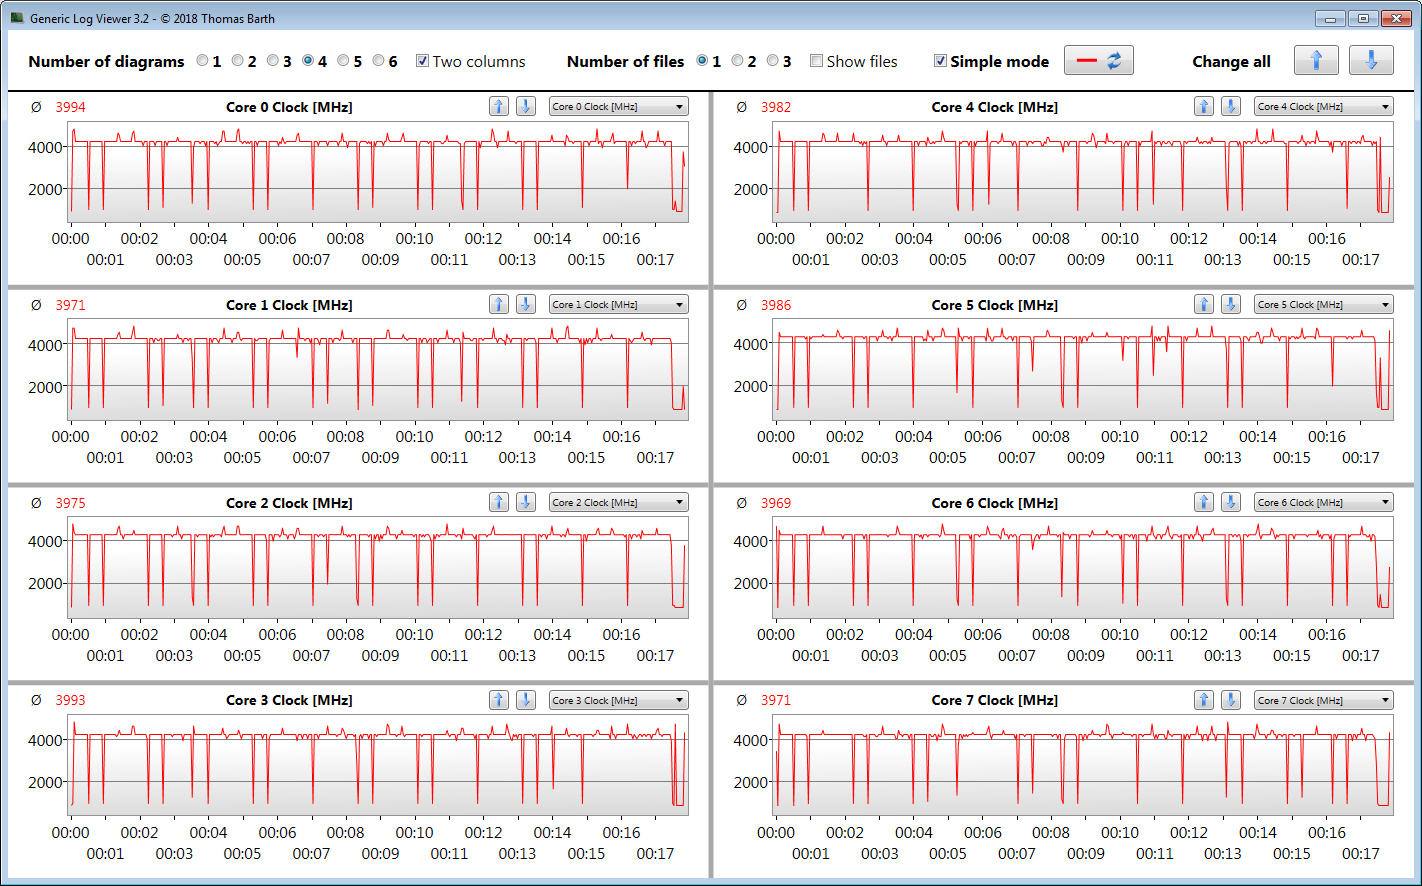
Evaluamos si el Turbo de la CPU también se utiliza constantemente en el funcionamiento de la red eléctrica ejecutando la prueba multi-hilo del benchmark Cinebench R15 durante al menos 30 minutos en un bucle constante. Hacia la tercera corrida, los resultados caen ligeramente pero luego se mantienen a un nivel constante. Se utiliza el Turbo, y el modo "Overboost" permite aumentar significativamente las velocidades del Turbo.
| Cinebench R15 | |
| CPU Single 64Bit | |
| Media de la clase Gaming (188.8 - 343, n=109, últimos 2 años) | |
| Schenker XMG Neo 17 Comet Lake | |
| Schenker XMG Neo 17 Comet Lake (Overboost) | |
| Medio Intel Core i7-10875H (190 - 220, n=37) | |
| Aorus 17G XB | |
| Asus Strix G17 G712LWS | |
| Acer Predator Helios 300 PH317-54-75G8 | |
| Schenker XMG Neo 17 XNE17M19 | |
| MSI GL75 10SFR | |
| Schenker XMG Neo 17 | |
| CPU Multi 64Bit | |
| Media de la clase Gaming (1578 - 6271, n=108, últimos 2 años) | |
| Aorus 17G XB | |
| Schenker XMG Neo 17 Comet Lake (Overboost) | |
| Medio Intel Core i7-10875H (1003 - 1833, n=38) | |
| Schenker XMG Neo 17 Comet Lake | |
| Asus Strix G17 G712LWS | |
| Acer Predator Helios 300 PH317-54-75G8 | |
| MSI GL75 10SFR | |
| Schenker XMG Neo 17 XNE17M19 | |
| Schenker XMG Neo 17 | |
| Blender - v2.79 BMW27 CPU | |
| MSI GL75 10SFR | |
| Acer Predator Helios 300 PH317-54-75G8 | |
| Asus Strix G17 G712LWS | |
| Medio Intel Core i7-10875H (259 - 535, n=30) | |
| Schenker XMG Neo 17 Comet Lake | |
| Aorus 17G XB | |
| Schenker XMG Neo 17 Comet Lake (Overboost) | |
| Media de la clase Gaming (80 - 330, n=107, últimos 2 años) | |
| 7-Zip 18.03 | |
| 7z b 4 -mmt1 | |
| Media de la clase Gaming (4199 - 7436, n=108, últimos 2 años) | |
| Schenker XMG Neo 17 Comet Lake | |
| Schenker XMG Neo 17 Comet Lake (Overboost) | |
| Medio Intel Core i7-10875H (5071 - 5780, n=31) | |
| Aorus 17G XB | |
| Acer Predator Helios 300 PH317-54-75G8 | |
| MSI GL75 10SFR | |
| Asus Strix G17 G712LWS | |
| 7z b 4 | |
| Media de la clase Gaming (33491 - 148086, n=108, últimos 2 años) | |
| Schenker XMG Neo 17 Comet Lake (Overboost) | |
| Aorus 17G XB | |
| Schenker XMG Neo 17 Comet Lake | |
| Medio Intel Core i7-10875H (29844 - 49562, n=31) | |
| Asus Strix G17 G712LWS | |
| MSI GL75 10SFR | |
| Acer Predator Helios 300 PH317-54-75G8 | |
| Cinebench R20 | |
| CPU (Single Core) | |
| Media de la clase Gaming (442 - 895, n=109, últimos 2 años) | |
| Schenker XMG Neo 17 Comet Lake | |
| Schenker XMG Neo 17 Comet Lake (Overboost) | |
| Asus Strix G17 G712LWS | |
| Aorus 17G XB | |
| Medio Intel Core i7-10875H (430 - 524, n=32) | |
| MSI GL75 10SFR | |
| Acer Predator Helios 300 PH317-54-75G8 | |
| Schenker XMG Neo 17 XNE17M19 | |
| CPU (Multi Core) | |
| Media de la clase Gaming (4029 - 16108, n=109, últimos 2 años) | |
| Schenker XMG Neo 17 Comet Lake (Overboost) | |
| Aorus 17G XB | |
| Medio Intel Core i7-10875H (1986 - 4176, n=32) | |
| Schenker XMG Neo 17 Comet Lake | |
| Asus Strix G17 G712LWS | |
| Acer Predator Helios 300 PH317-54-75G8 | |
| MSI GL75 10SFR | |
| Schenker XMG Neo 17 XNE17M19 | |
| Geekbench 5.5 | |
| Single-Core | |
| Media de la clase Gaming (986 - 2474, n=108, últimos 2 años) | |
| Schenker XMG Neo 17 Comet Lake | |
| Schenker XMG Neo 17 Comet Lake (Overboost) | |
| Medio Intel Core i7-10875H (1233 - 1371, n=29) | |
| Aorus 17G XB | |
| MSI GL75 10SFR | |
| Asus Strix G17 G712LWS | |
| Acer Predator Helios 300 PH317-54-75G8 | |
| Multi-Core | |
| Media de la clase Gaming (6460 - 27010, n=108, últimos 2 años) | |
| Schenker XMG Neo 17 Comet Lake (Overboost) | |
| Aorus 17G XB | |
| Medio Intel Core i7-10875H (5715 - 8620, n=29) | |
| Schenker XMG Neo 17 Comet Lake | |
| Asus Strix G17 G712LWS | |
| Acer Predator Helios 300 PH317-54-75G8 | |
| MSI GL75 10SFR | |
| HWBOT x265 Benchmark v2.2 - 4k Preset | |
| Media de la clase Gaming (11.5 - 44.3, n=108, últimos 2 años) | |
| Schenker XMG Neo 17 Comet Lake (Overboost) | |
| Aorus 17G XB | |
| Schenker XMG Neo 17 Comet Lake | |
| Medio Intel Core i7-10875H (7.27 - 14.1, n=27) | |
| Asus Strix G17 G712LWS | |
| Acer Predator Helios 300 PH317-54-75G8 | |
| MSI GL75 10SFR | |
| LibreOffice - 20 Documents To PDF | |
| Asus Strix G17 G712LWS | |
| Acer Predator Helios 300 PH317-54-75G8 | |
| Aorus 17G XB | |
| Schenker XMG Neo 17 Comet Lake | |
| MSI GL75 10SFR | |
| Medio Intel Core i7-10875H (30.2 - 84.3, n=30) | |
| Media de la clase Gaming (19 - 88.8, n=108, últimos 2 años) | |
| Schenker XMG Neo 17 Comet Lake (Overboost) | |
| R Benchmark 2.5 - Overall mean | |
| Acer Predator Helios 300 PH317-54-75G8 | |
| Asus Strix G17 G712LWS | |
| MSI GL75 10SFR | |
| Aorus 17G XB | |
| Medio Intel Core i7-10875H (0.546 - 0.662, n=29) | |
| Schenker XMG Neo 17 Comet Lake (Overboost) | |
| Schenker XMG Neo 17 Comet Lake | |
| Media de la clase Gaming (0.3439 - 0.759, n=109, últimos 2 años) | |
* ... más pequeño es mejor
Rendimiento del sistema
El sistema funciona rápidamente y sin problemas, y no tuvimos ningún problema. Los resultados de PC-Mark confirman que el portátil ofrece suficiente rendimiento informático para todas las áreas de aplicación habituales.
| PCMark 8 Home Score Accelerated v2 | 4405 puntos | |
| PCMark 8 Creative Score Accelerated v2 | 6494 puntos | |
| PCMark 8 Work Score Accelerated v2 | 5803 puntos | |
| PCMark 10 Score | 5747 puntos | |
ayuda | ||
Latencias DPC
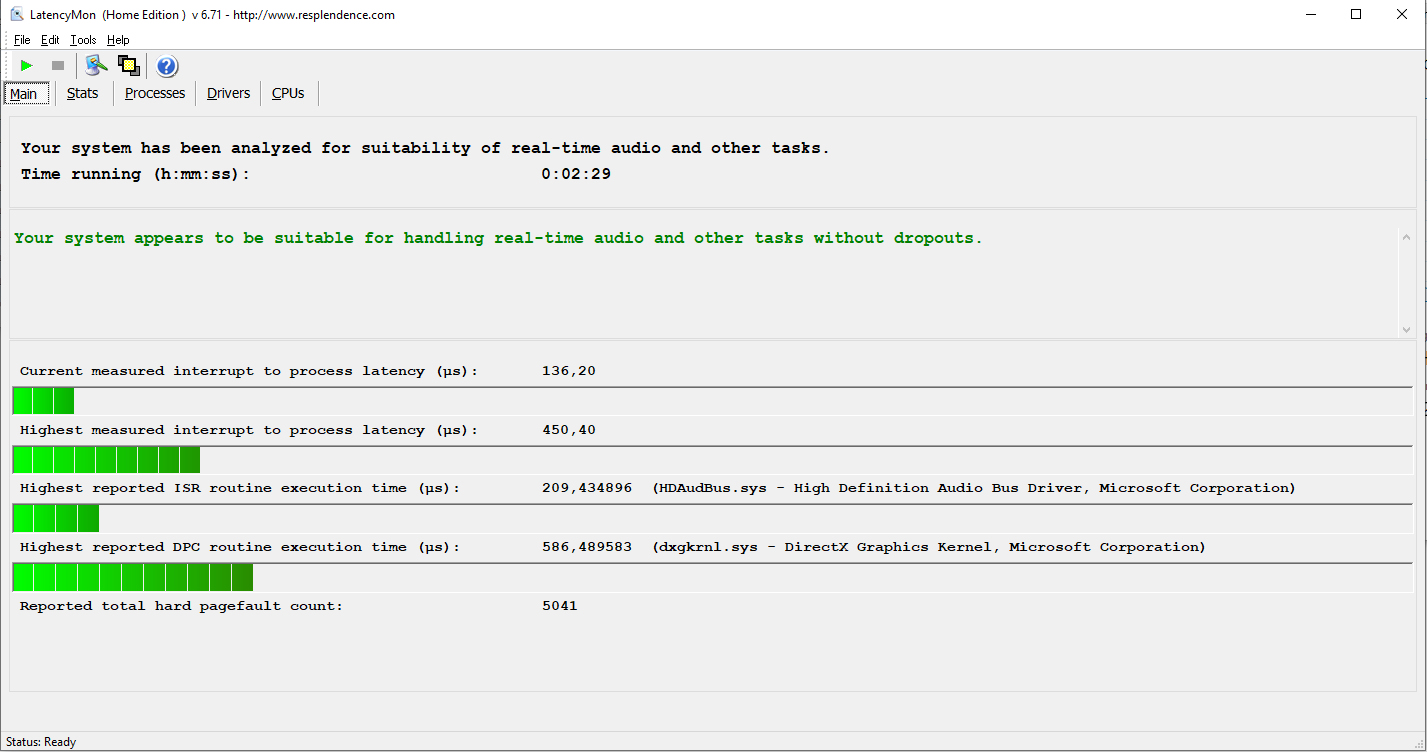
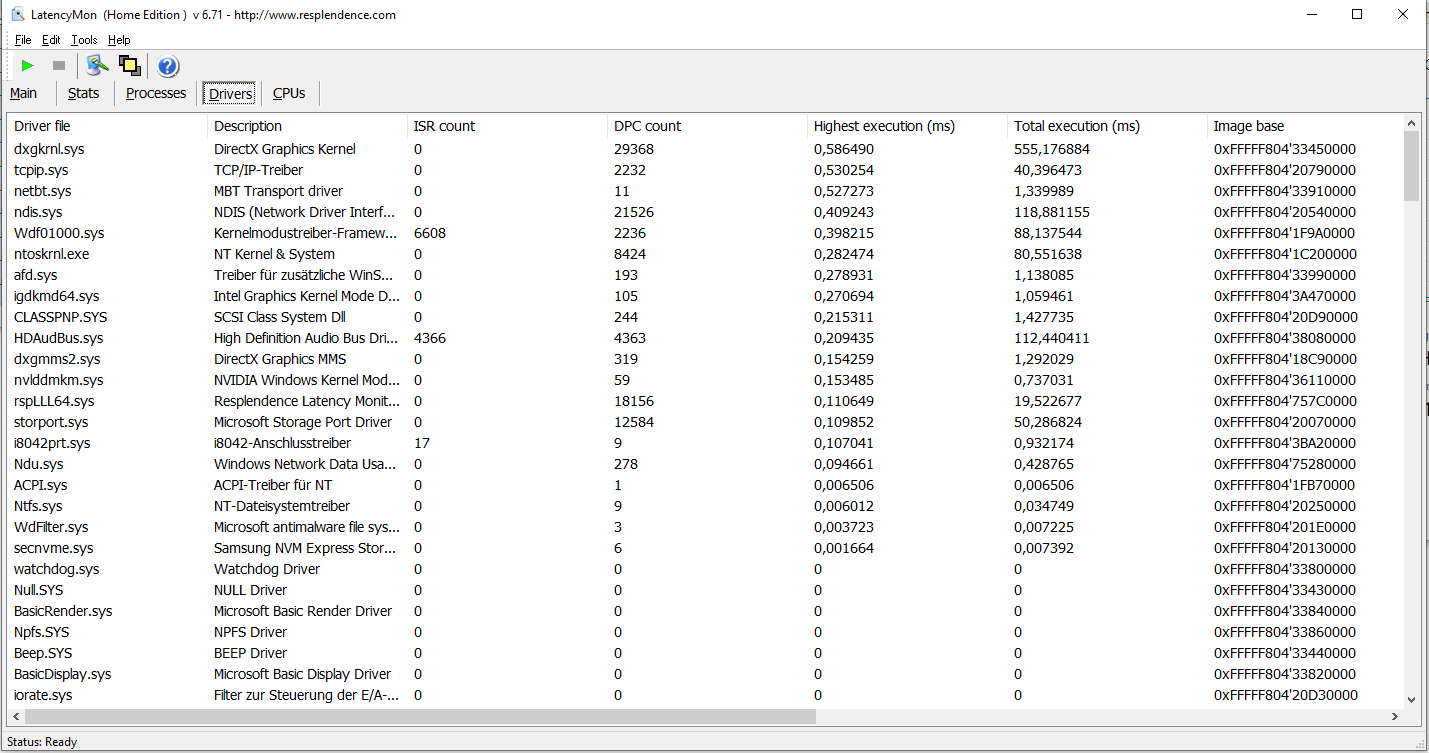
| DPC Latencies / LatencyMon - interrupt to process latency (max), Web, Youtube, Prime95 | |
| Aorus 17G XB | |
| Asus Strix G17 G712LWS | |
| MSI GL75 10SFR | |
| Acer Predator Helios 300 PH317-54-75G8 | |
| Schenker XMG Neo 17 Comet Lake | |
* ... más pequeño es mejor
Solución de almacenamiento
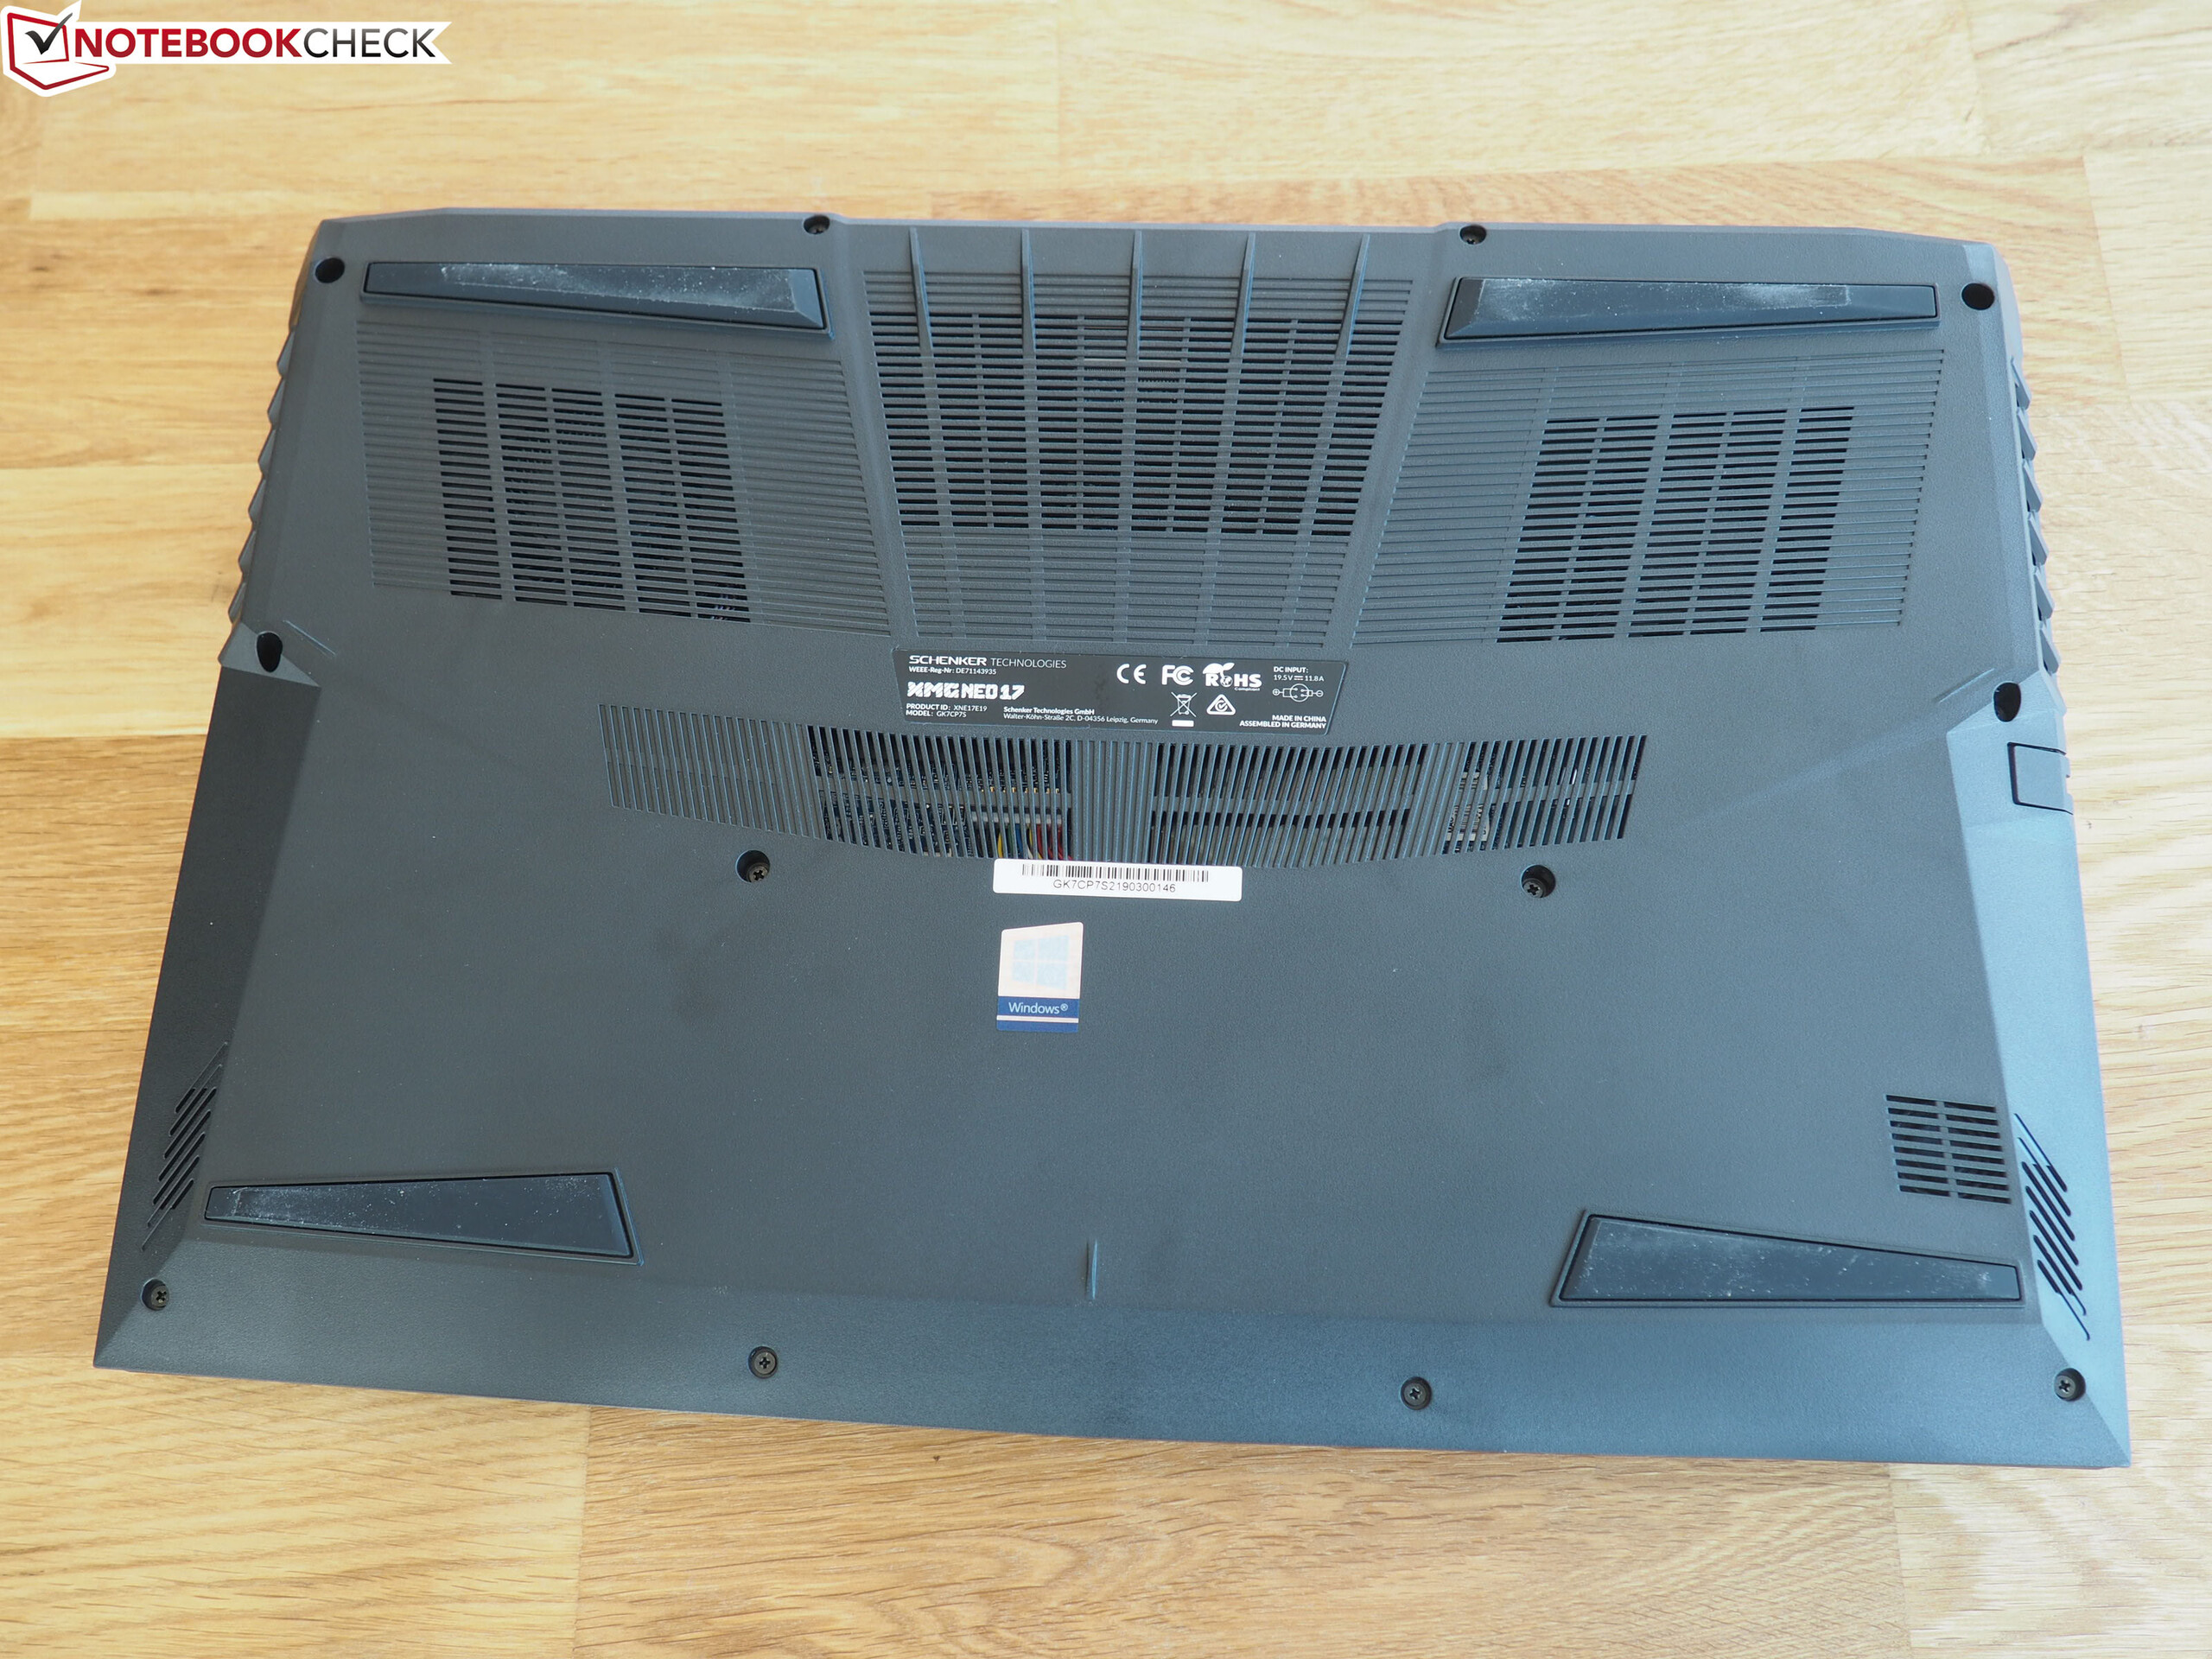
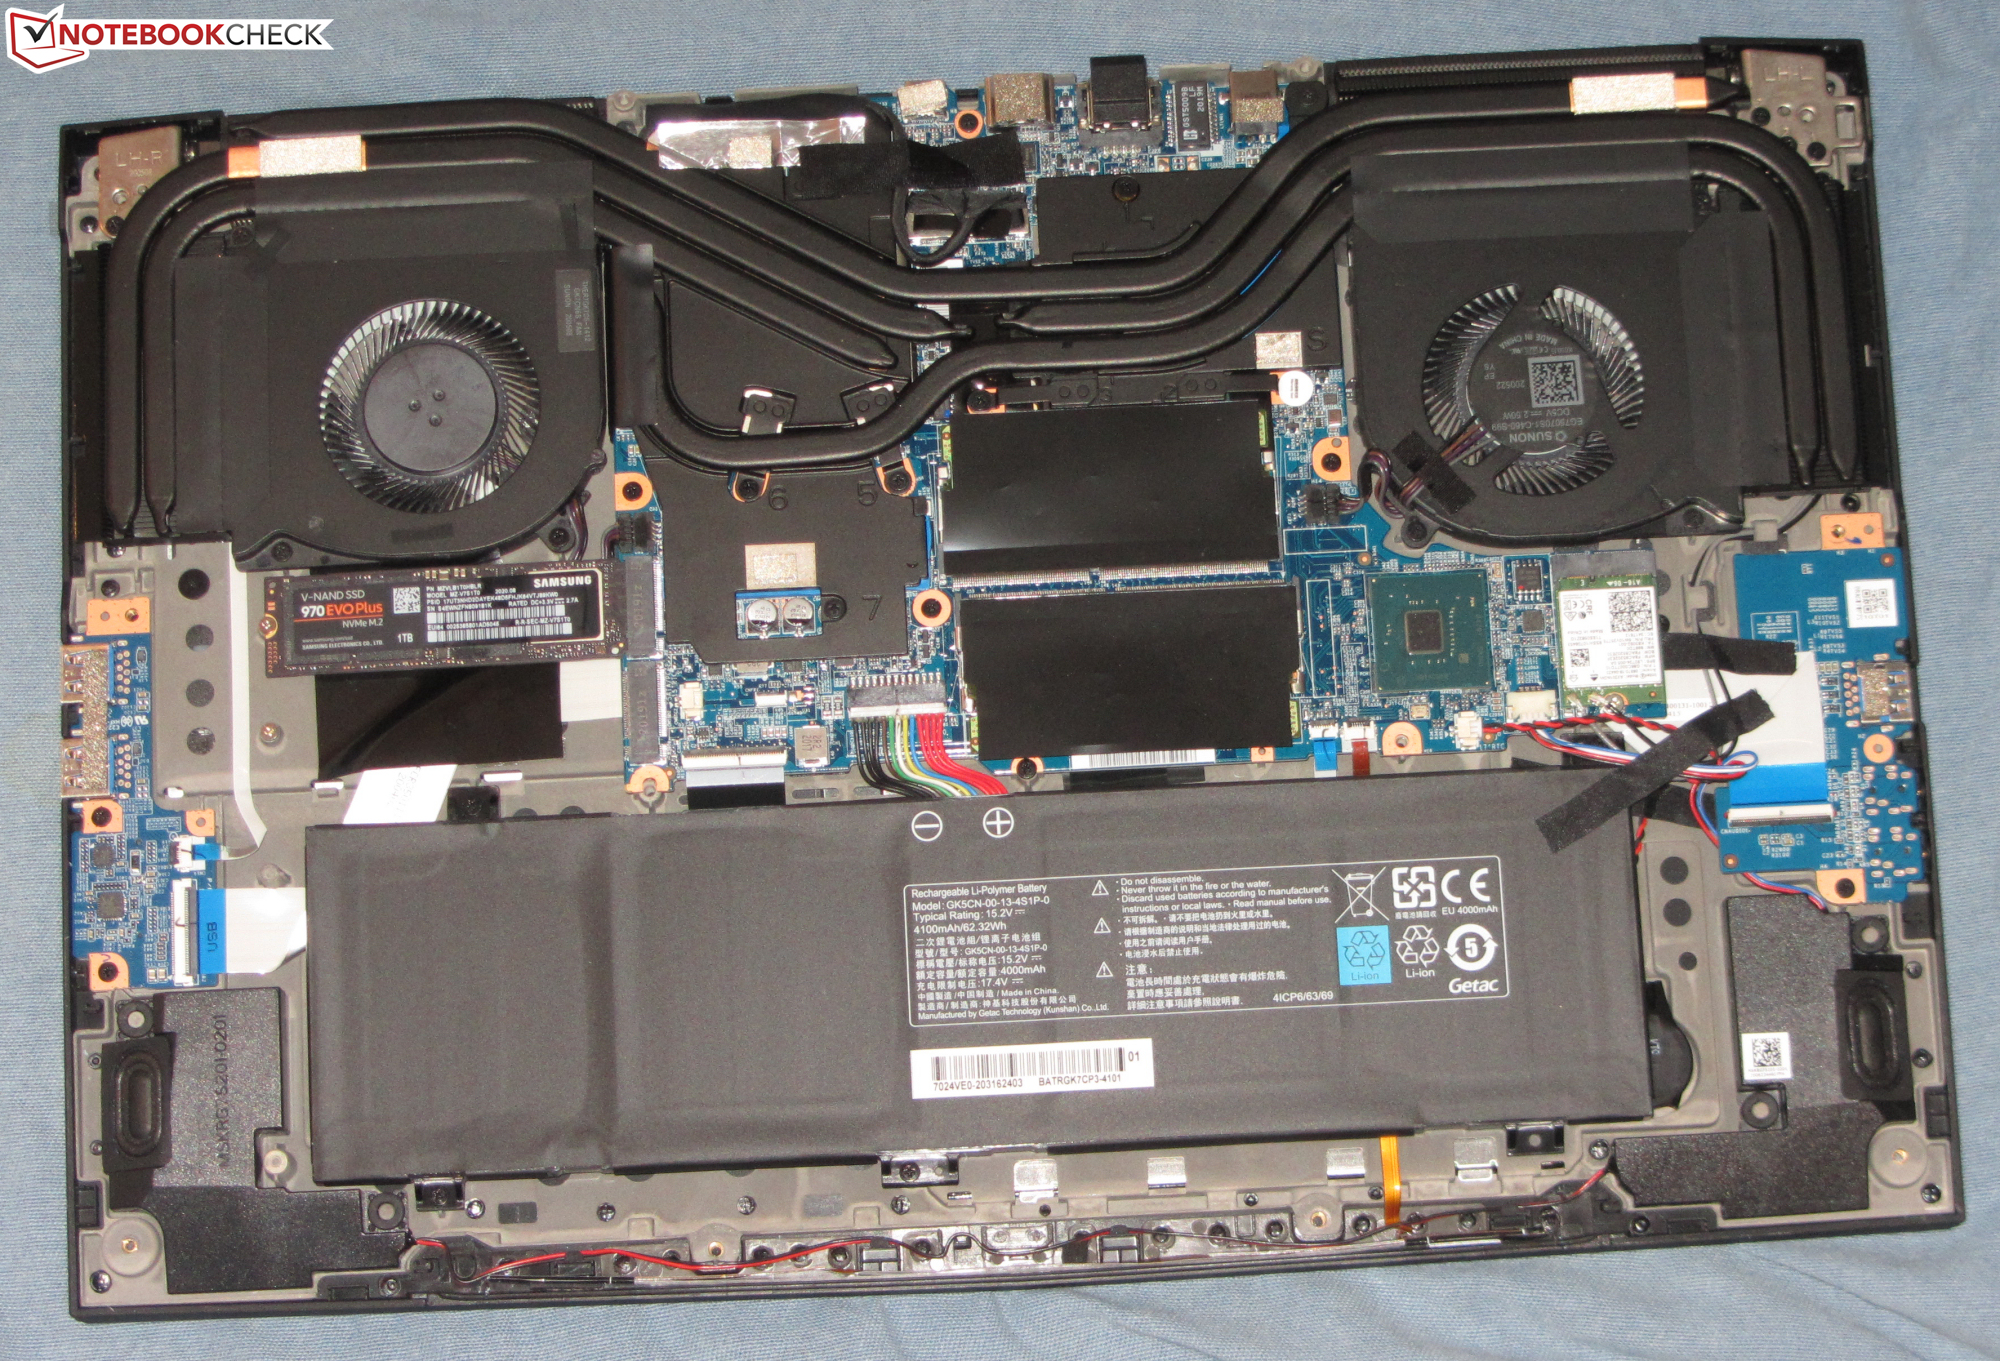
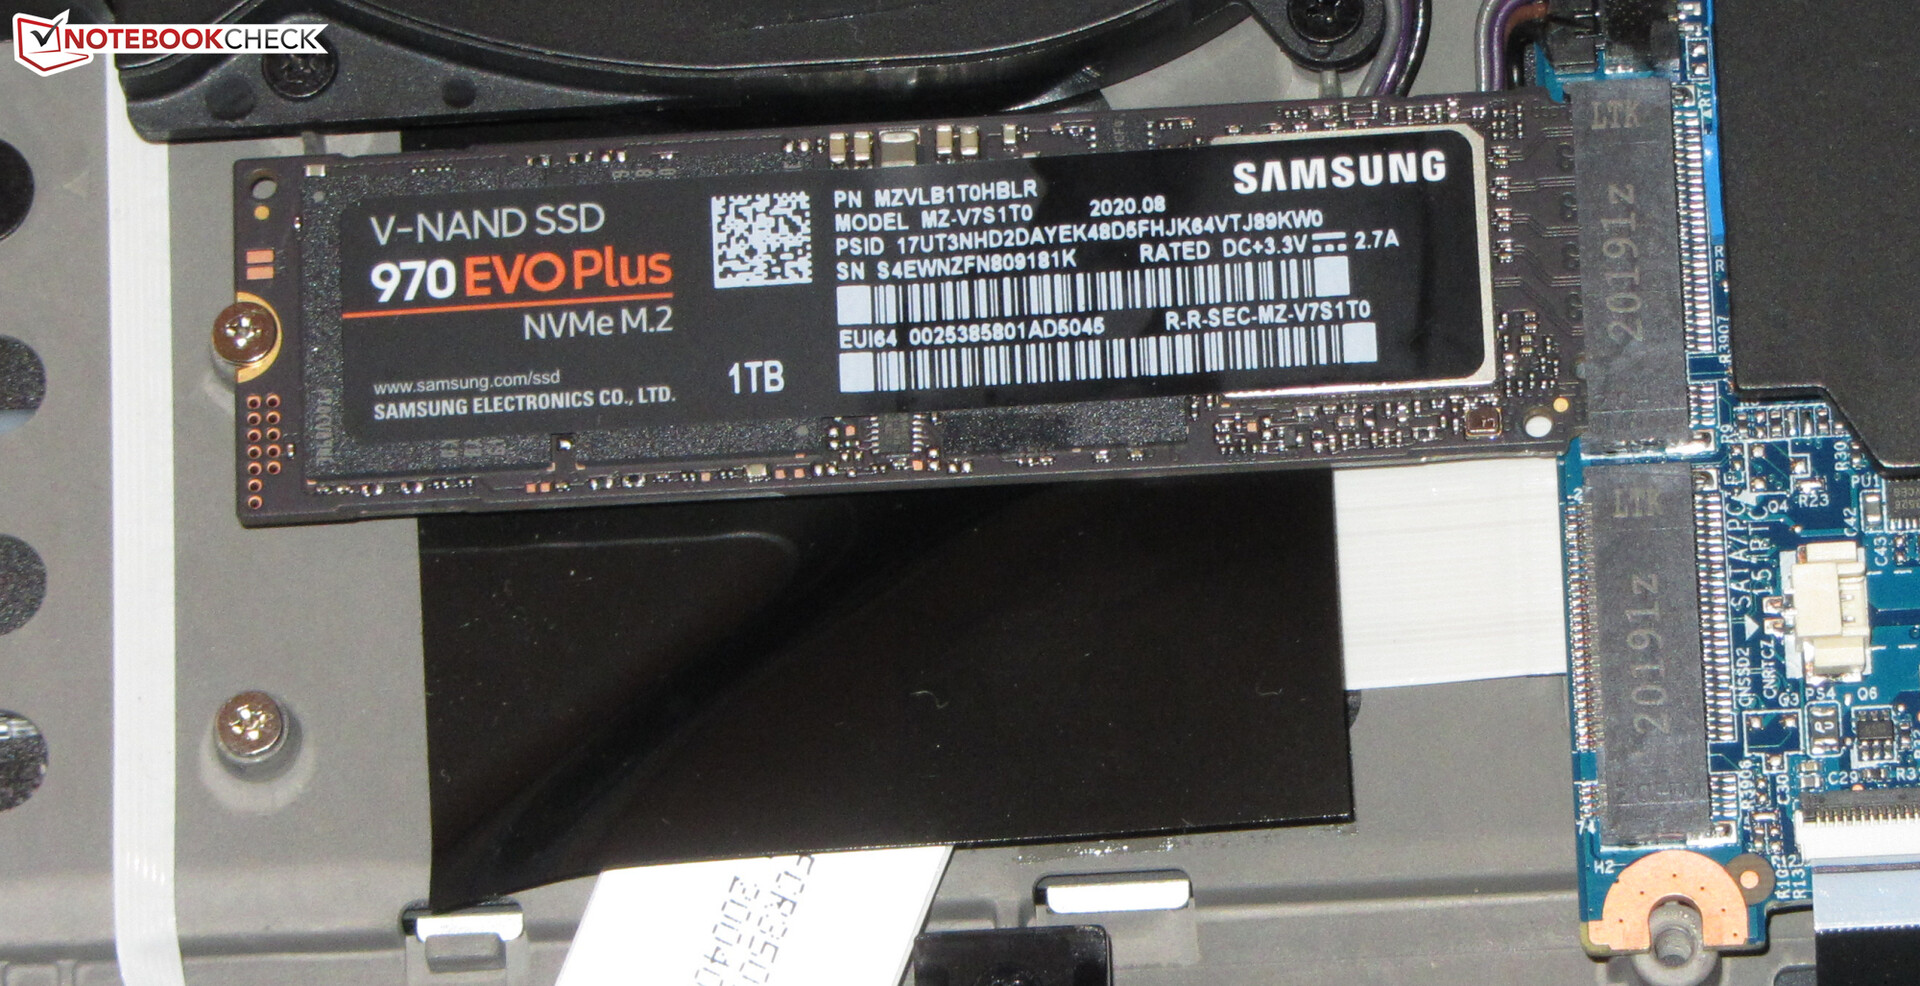
Una de las dos ranuras M.2-2280 (1x NVMe, 1x NVMe/SATA; RAID 0/1) está equipada con una SSD de 1 TB NVMe de Samsung, que ofrece excelentes tasas de transferencia.
Si bien en general el portátil sigue ofreciendo espacio para un medio de almacenamiento de 2,5 pulgadas, debido a que nuestra unidad de prueba está equipada con la mayor de las dos baterías disponibles (46 Wh, 62 Wh), la batería está ocupando el espacio adicional.

| Schenker XMG Neo 17 Comet Lake Samsung SSD 970 EVO Plus 1TB | Schenker XMG Neo 17 Samsung SSD 970 EVO Plus 1TB | Acer Predator Helios 300 PH317-54-75G8 WDC PC SN730 SDBQNTY-1T00 | MSI GL75 10SFR Lite-On CL1-8D512 | Asus Strix G17 G712LWS Intel SSD 660p 1TB SSDPEKNW010T8 | Aorus 17G XB Samsung SSD PM981a MZVLB512HBJQ | Medio Samsung SSD 970 EVO Plus 1TB | Media de la clase Gaming | |
|---|---|---|---|---|---|---|---|---|
| CrystalDiskMark 5.2 / 6 | -31% | -10% | -28% | -25% | -9% | -3% | 46% | |
| Write 4K (MB/s) | 158.6 | 92.7 -42% | 141.9 -11% | 132.2 -17% | 141.1 -11% | 123.4 -22% | 155.5 ? -2% | 202 ? 27% |
| Read 4K (MB/s) | 53.6 | 41.4 -23% | 48.75 -9% | 45.62 -15% | 60.9 14% | 45.02 -16% | 51.6 ? -4% | 78.2 ? 46% |
| Write Seq (MB/s) | 2671 | 1363 -49% | 2734 2% | 1511 -43% | 1681 -37% | 2526 -5% | 2660 ? 0% | 3726 ? 39% |
| Read Seq (MB/s) | 2130 | 1259 -41% | 1921 -10% | 1890 -11% | 1602 -25% | 2062 -3% | 2390 ? 12% | 3617 ? 70% |
| Write 4K Q32T1 (MB/s) | 525 | 289.7 -45% | 422.6 -20% | 375.9 -28% | 406.6 -23% | 497.9 -5% | 447 ? -15% | 611 ? 16% |
| Read 4K Q32T1 (MB/s) | 609 | 337.5 -45% | 509 -16% | 525 -14% | 470.2 -23% | 579 -5% | 544 ? -11% | 712 ? 17% |
| Write Seq Q32T1 (MB/s) | 3308 | 3332 1% | 3055 -8% | 1505 -55% | 1759 -47% | 2982 -10% | 3296 ? 0% | 5242 ? 58% |
| Read Seq Q32T1 (MB/s) | 3557 | 3477 -2% | 3257 -8% | 2008 -44% | 1932 -46% | 3440 -3% | 3551 ? 0% | 7011 ? 97% |
| AS SSD | -7% | -12% | -63% | -42% | -16% | 5% | 34% | |
| Seq Read (MB/s) | 2882 | 2359 -18% | 2828 -2% | 1923 -33% | 1778 -38% | 1791 -38% | 2800 ? -3% | 5511 ? 91% |
| Seq Write (MB/s) | 2764 | 2469 -11% | 2677 -3% | 1065 -61% | 1478 -47% | 2193 -21% | 2633 ? -5% | 3916 ? 42% |
| 4K Read (MB/s) | 55.9 | 53.5 -4% | 39.94 -29% | 25.43 -55% | 49.76 -11% | 50.7 -9% | 51.2 ? -8% | 70.2 ? 26% |
| 4K Write (MB/s) | 129.4 | 117.6 -9% | 100.9 -22% | 101.9 -21% | 117.9 -9% | 116.8 -10% | 131.2 ? 1% | 215 ? 66% |
| 4K-64 Read (MB/s) | 1793 | 1579 -12% | 1562 -13% | 477.9 -73% | 591 -67% | 1525 -15% | 1839 ? 3% | 1627 ? -9% |
| 4K-64 Write (MB/s) | 2140 | 2048 -4% | 1867 -13% | 563 -74% | 875 -59% | 1958 -9% | 2144 ? 0% | 2909 ? 36% |
| Access Time Read * (ms) | 0.054 | 0.048 11% | 0.053 2% | 0.082 -52% | 0.07 -30% | 0.04528 ? 16% | 0.06507 ? -21% | |
| Access Time Write * (ms) | 0.03 | 0.03 -0% | 0.037 -23% | 0.126 -320% | 0.041 -37% | 0.032 -7% | 0.03128 ? -4% | 0.03935 ? -31% |
| Score Read (Points) | 2137 | 1869 -13% | 1885 -12% | 696 -67% | 818 -62% | 1755 -18% | 2171 ? 2% | 2248 ? 5% |
| Score Write (Points) | 2546 | 2413 -5% | 2236 -12% | 771 -70% | 1140 -55% | 2294 -10% | 2539 ? 0% | 3515 ? 38% |
| Score Total (Points) | 5774 | 5248 -9% | 5076 -12% | 1785 -69% | 2377 -59% | 4972 -14% | 5812 ? 1% | 6841 ? 18% |
| Copy ISO MB/s (MB/s) | 2189 | 1870 -15% | 1710 -22% | 1495 -32% | 2133 ? -3% | 3102 ? 42% | ||
| Copy Program MB/s (MB/s) | 625 | 545 -13% | 465.3 -26% | 446 -29% | 698 ? 12% | 963 ? 54% | ||
| Copy Game MB/s (MB/s) | 936 | 1083 16% | 1042 11% | 697 -26% | 1521 ? 63% | 2062 ? 120% | ||
| Media total (Programa/Opciones) | -19% /
-17% | -11% /
-11% | -46% /
-50% | -34% /
-36% | -13% /
-13% | 1% /
3% | 40% /
39% |
* ... más pequeño es mejor
Lectura de velocidad constante: DiskSpd Read Loop, Queue Depth 8
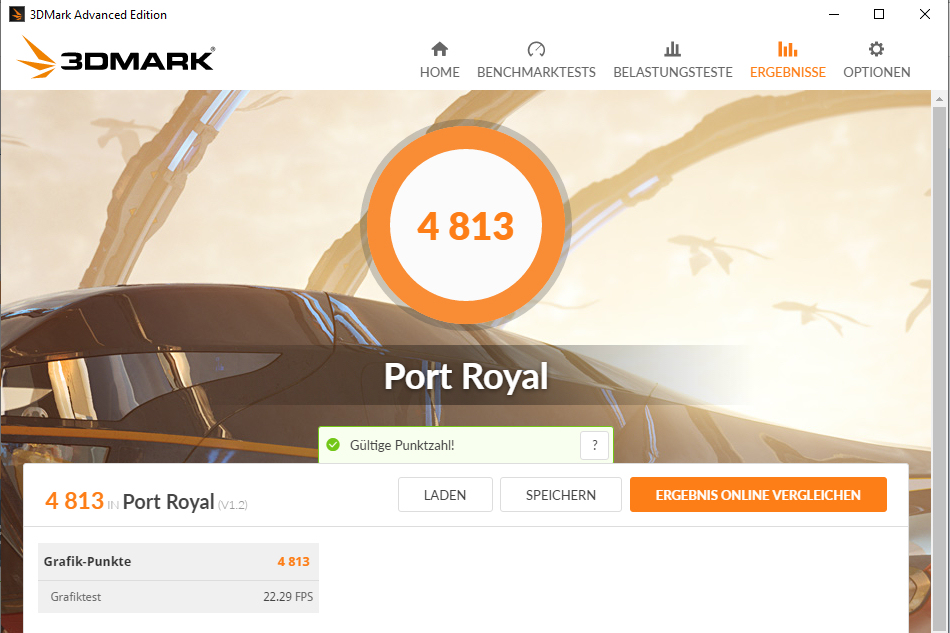
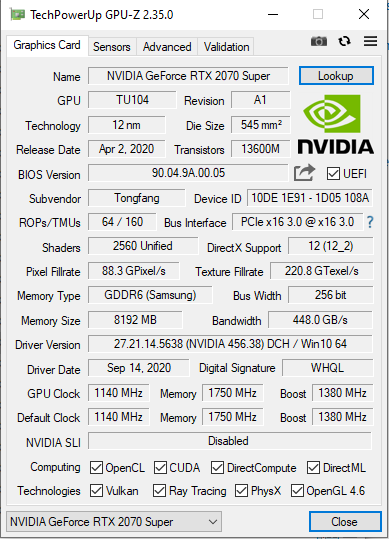
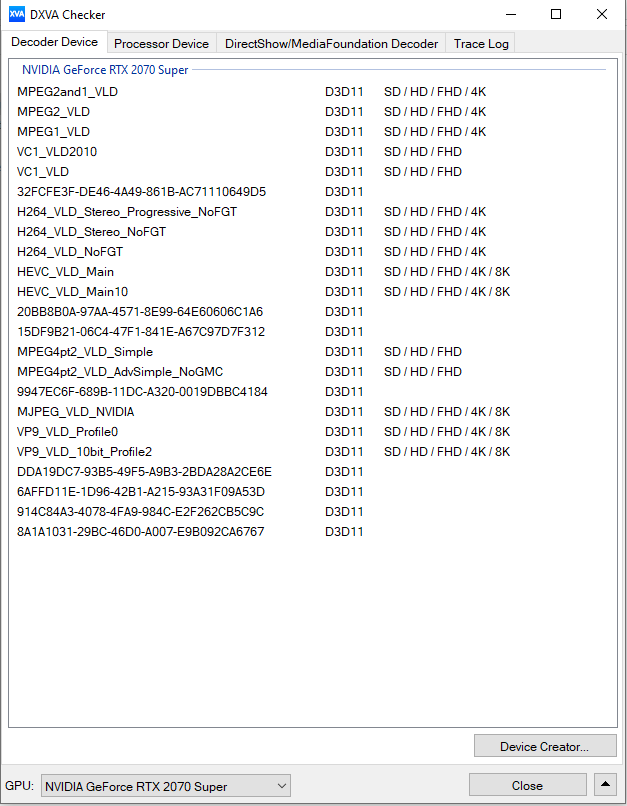
Tarjeta gráfica
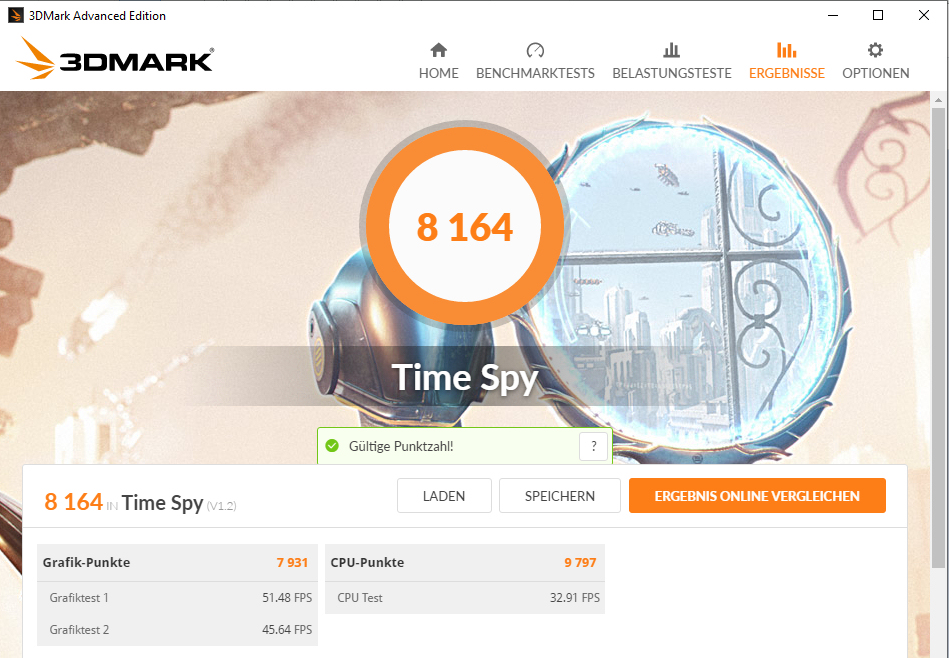
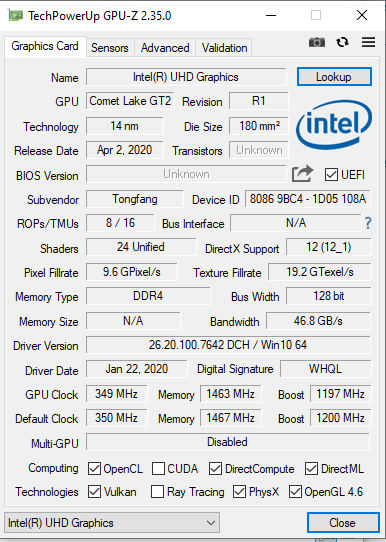
El núcleo de gráficos GeForce RTX-2070 Super (Turing) pertenece a la potente gama alta de la GPU, y va acompañado de un rápido almacenamiento GDDR6 (8192 GB). Los resultados de 3D-Mark se sitúan en un nivel normal para la GPU utilizada. El modo "Overboost" lleva a un aumento del rendimiento gráfico. La GPU integrada UHD Graphics-630 en el procesador está activa, y el portátil utiliza la solución de conmutación de gráficos Optimus de Nvidia.
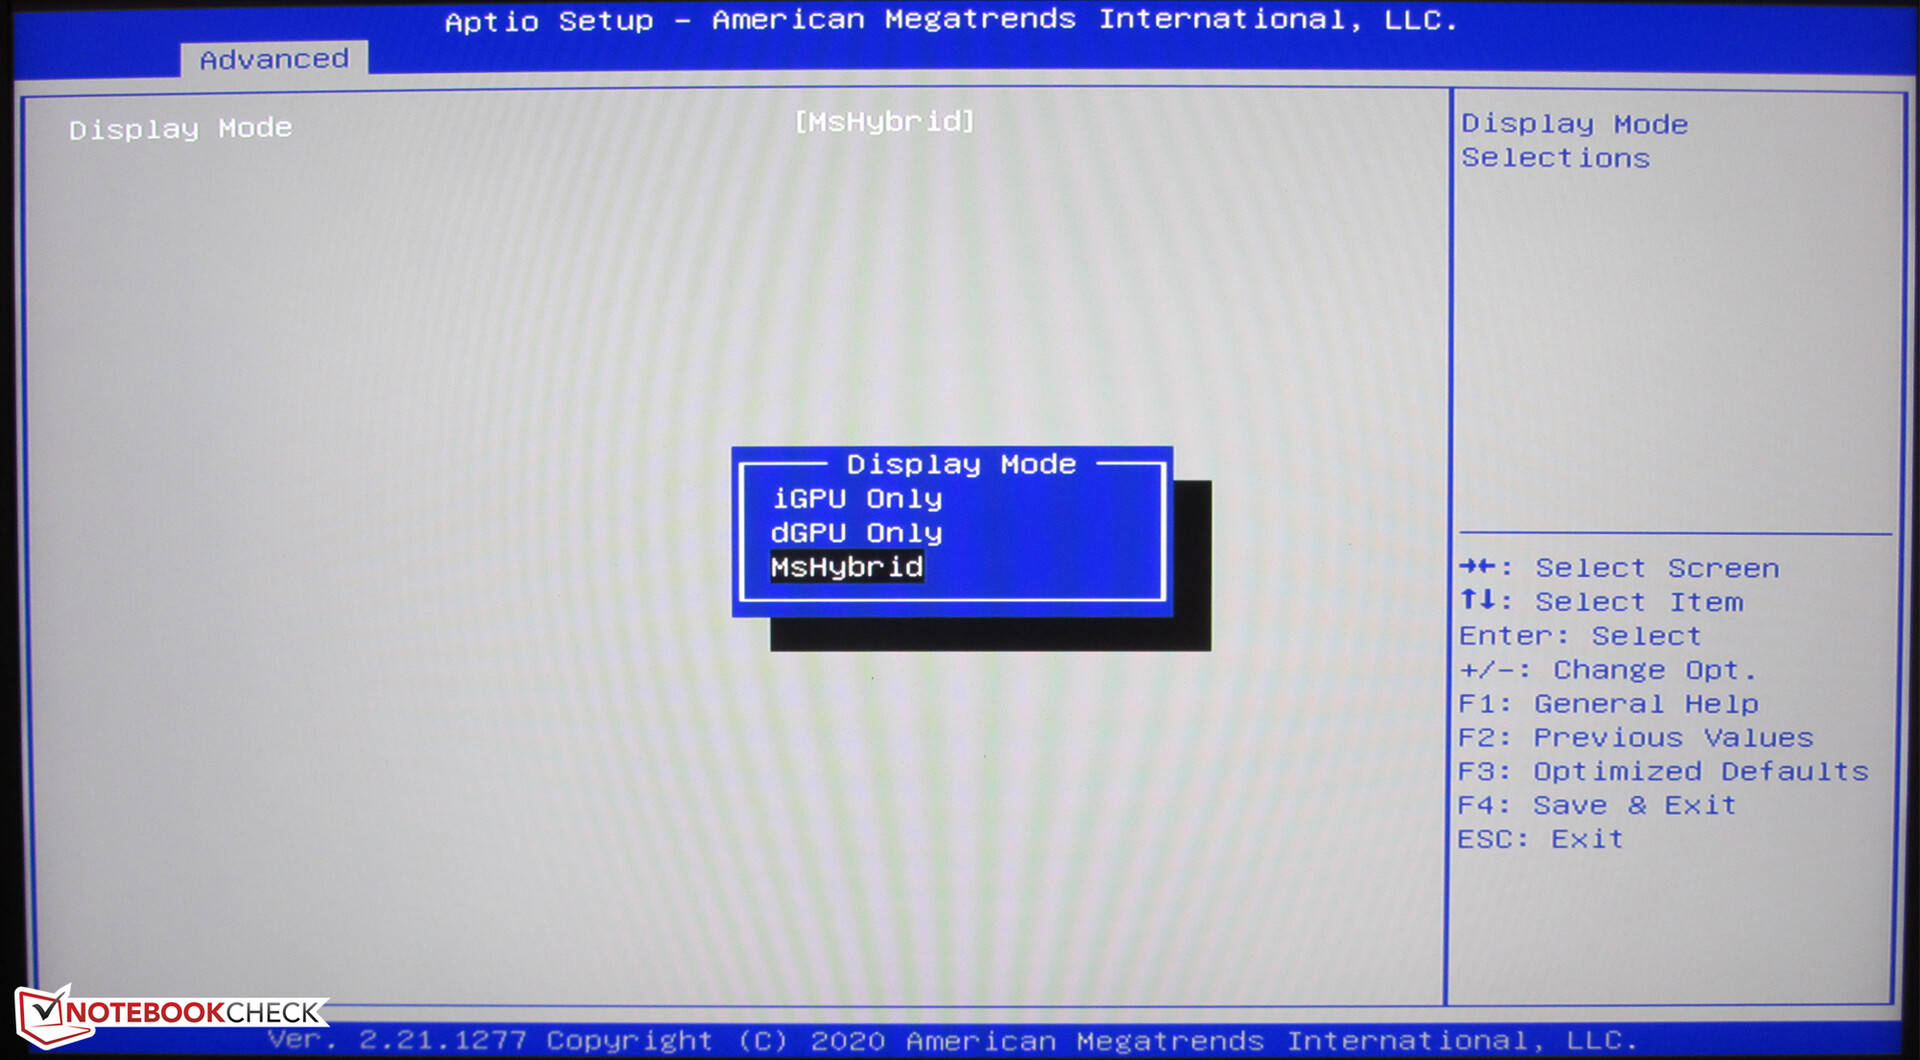
No es absolutamente necesario usar Optimus. La BIOS del portátil ofrece las tres opciones "MSHybrid" (= Optimus), "iGPU Only" (= UHD Graphics 630), y "dGPU Only" (= 2070 Super). Así que hay una opción para conectar directamente la pantalla a la GPU GeForce.


| 3DMark 11 Performance | 24031 puntos | |
| 3DMark Cloud Gate Standard Score | 46745 puntos | |
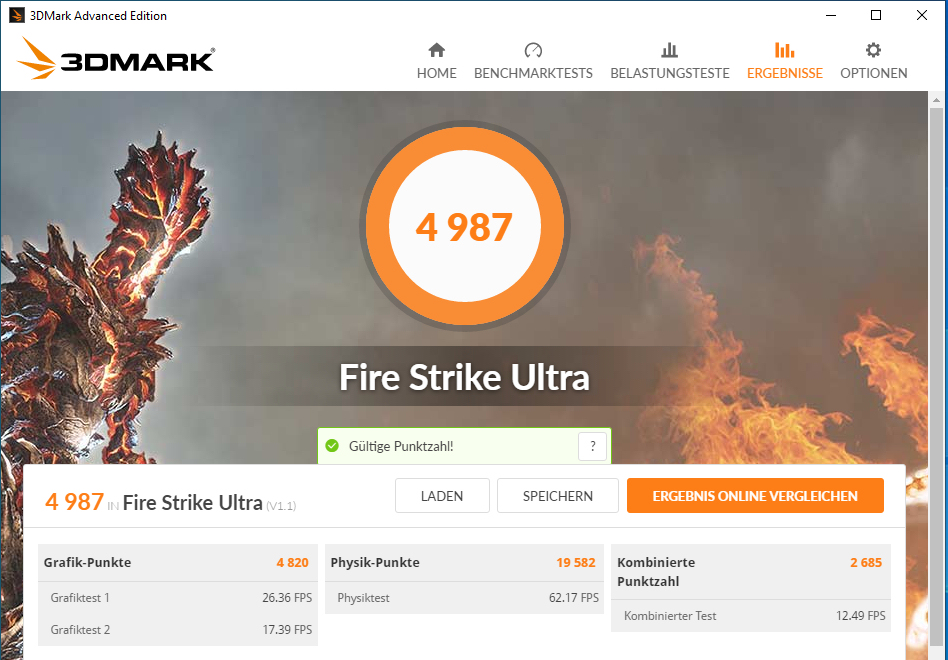
| 3DMark Fire Strike Score | 18229 puntos | |
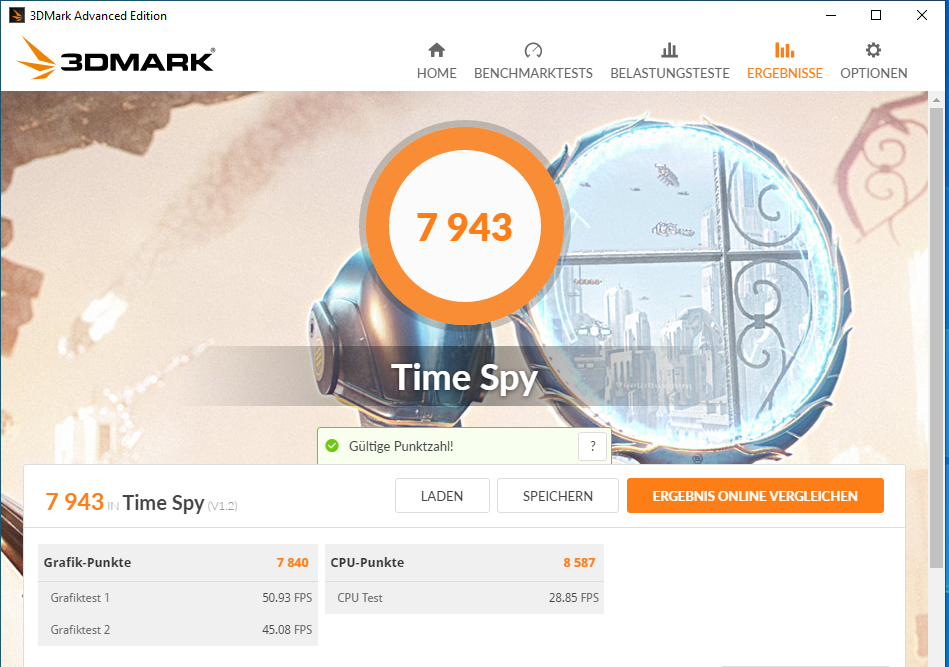
| 3DMark Time Spy Score | 7943 puntos | |
ayuda | ||
El rendimiento de los juegos
El Neo 17 lleva todos los juegos actuales sin problemas a la pantalla en resolución Full-HD y con ajustes de máxima calidad, y el hardware también es capaz de manejar resoluciones más altas (si se conecta el monitor correspondiente). El modo "Overboost" no conlleva ningún aumento de la velocidad de fotogramas (véase el cuadro comparativo).
| The Witcher 3 - 1920x1080 Ultra Graphics & Postprocessing (HBAO+) | |
| Media de la clase Gaming (95 - 240, n=8, últimos 2 años) | |
| Schenker XMG Neo 17 Comet Lake | |
| Asus Strix G17 G712LWS | |
| Medio NVIDIA GeForce RTX 2070 Super Mobile (76.3 - 94.6, n=8) | |
| MSI GL75 10SFR | |
| Aorus 17G XB | |
| Schenker XMG Neo 17 | |
| Acer Predator Helios 300 PH317-54-75G8 | |
| Schenker XMG Neo 17 XNE17M19 | |
| Serious Sam 4 - 1920x1080 Ultra (DX12) AA:2xMS | |
| Medio NVIDIA GeForce RTX 2070 Super Mobile (71.1 - 82.1, n=4) | |
| Schenker XMG Neo 17 Comet Lake | |
| Asus Strix G17 G712LWS | |
| Acer Predator Helios 300 PH317-54-75G8 | |
| Mafia Definitive Edition - 1920x1080 High Preset | |
| Schenker XMG Neo 17 Comet Lake | |
| Medio NVIDIA GeForce RTX 2070 Super Mobile (92 - 96.6, n=2) | |
| Asus Strix G17 G712LWS | |
| Acer Predator Helios 300 PH317-54-75G8 | |
| Doom Eternal - 1920x1080 Ultra Preset | |
| Medio NVIDIA GeForce RTX 2070 Super Mobile (151 - 190.4, n=5) | |
| Asus Strix G17 G712LWS | |
| Schenker XMG Neo 17 Comet Lake | |
| MSI GL75 10SFR | |
| Acer Predator Helios 300 PH317-54-75G8 | |
| Watch Dogs Legion - 1920x1080 Ultra Preset (DX12) | |
| Medio NVIDIA GeForce RTX 2070 Super Mobile (59.3 - 64, n=4) | |
| Schenker XMG Neo 17 Comet Lake (Overboost) | |
| Schenker XMG Neo 17 Comet Lake | |
| Dirt 5 - 1920x1080 Ultra High Preset | |
| Medio NVIDIA GeForce RTX 2070 Super Mobile (45.5 - 68.6, n=3) | |
| Schenker XMG Neo 17 Comet Lake | |
| Flight Simulator 2020 - 1920x1080 Ultra AA:TAA AF:16x | |
| Schenker XMG Neo 17 Comet Lake (Overboost) | |
| Schenker XMG Neo 17 Comet Lake | |
| Medio NVIDIA GeForce RTX 2070 Super Mobile (37.8 - 43.8, n=3) | |
| Asus Strix G17 G712LWS | |
| Acer Predator Helios 300 PH317-54-75G8 | |
Para evaluar si las frecuencias de cuadro se mantienen mayormente constantes durante largos períodos de tiempo, ejecutamos el juego "The Witcher 3" durante unos 60 minutos en resolución Full-HD y con ajustes de máxima calidad, sin mover el personaje del juego. No notamos ninguna caída en la frecuencia de fotogramas.
| bajo | medio | alto | ultra | |
|---|---|---|---|---|
| The Witcher 3 (2015) | 274 | 247.1 | 162.9 | 90.8 |
| Doom Eternal (2020) | 234.1 | 171.5 | 151.9 | 151 |
| Horizon Zero Dawn (2020) | 152 | 129 | 116 | 98 |
| Flight Simulator 2020 (2020) | 71.2 | 61.7 | 53.3 | 42.1 |
| Serious Sam 4 (2020) | 122 | 93.7 | 87.8 | 72.5 |
| Mafia Definitive Edition (2020) | 149.5 | 106 | 96.6 | |
| Watch Dogs Legion (2020) | 112.2 | 102.7 | 90.1 | 59.3 |
| Dirt 5 (2020) | 157 | 91 | 73.6 | 45.5 |
| Assassin´s Creed Valhalla (2020) | 122 | 83 | 71 | 60 |
Emisiones y gestión de la energía - El XMG Neo ofrece sólo una vida de batería mediocre
Emisiones de ruido
Durante el funcionamiento en vacío, los dos ventiladores funcionan principalmente a bajas velocidades. Ocasionalmente se apagan y hay silencio. Bajo carga, los ventiladores se aceleran y registramos niveles máximos de ruido de 52 dB(A) (prueba de esfuerzo) y 50 dB(A) (La prueba de The Witcher 3). Se recomienda el uso de un auricular.
Ruido
| Ocioso |
| 26 / 30 / 33 dB(A) |
| Carga |
| 50 / 52 dB(A) |
 | ||
30 dB silencioso 40 dB(A) audible 50 dB(A) ruidosamente alto |
||
min: | ||
Temperatura
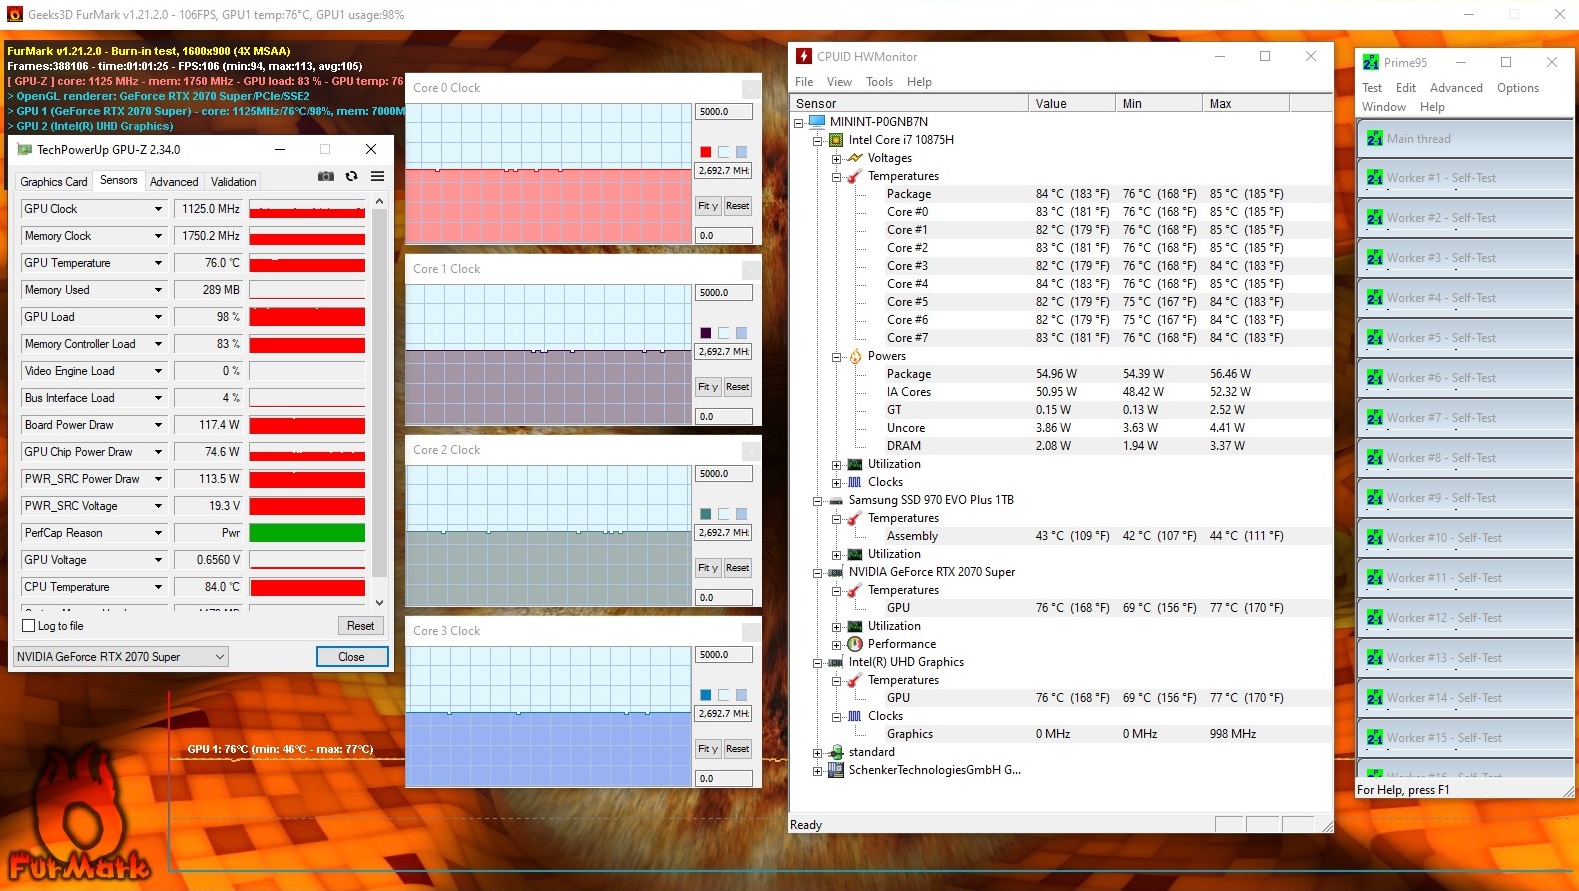
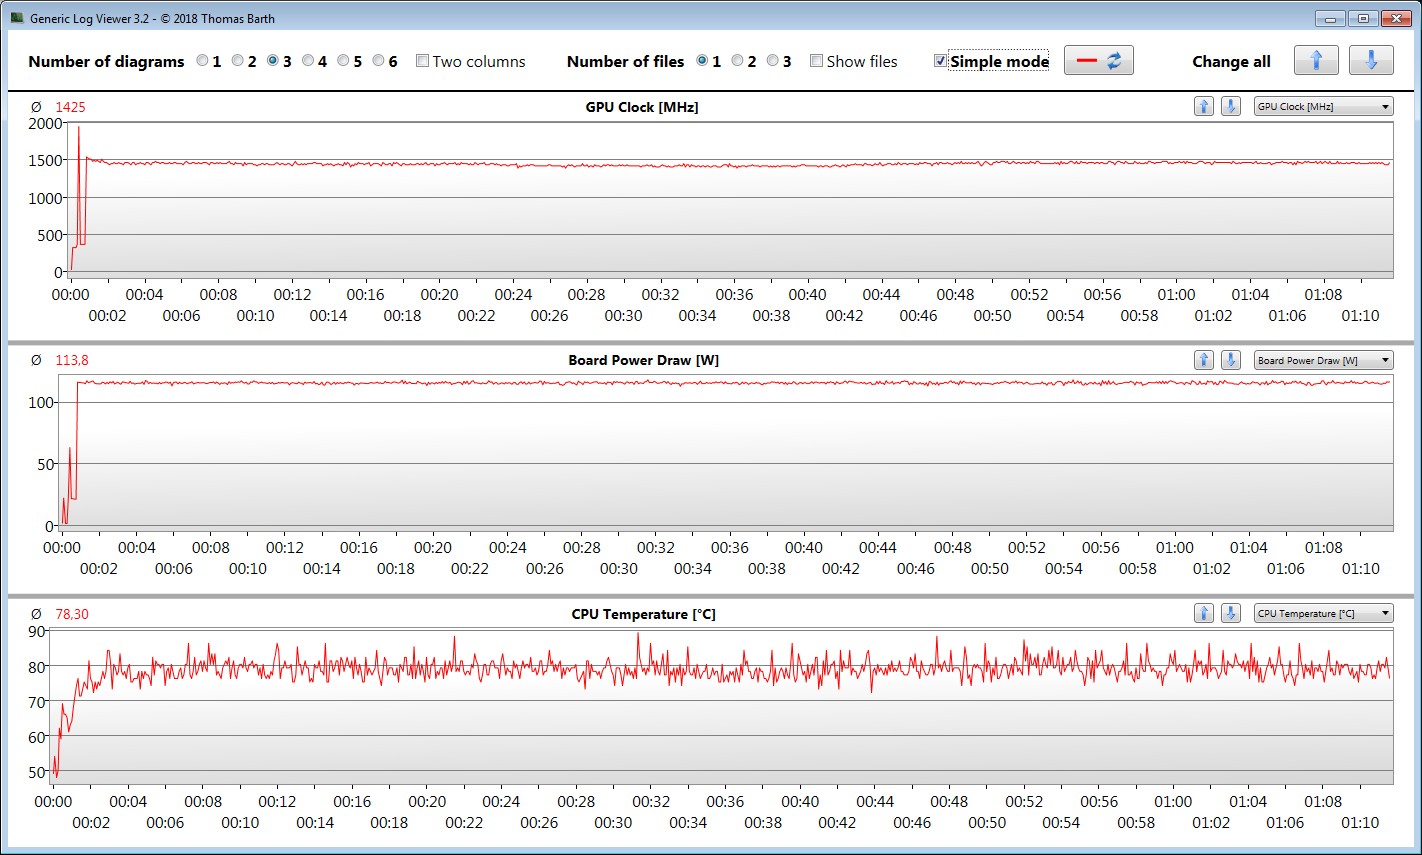
La CPU y la GPU pasan nuestra prueba de esfuerzo (con Prime95 y Furmark funcionando durante al menos una hora) a 2,7 GHz y 1125 MHz respectivamente. La prueba de estrés representa un escenario extremo. Estamos usando esta prueba para evaluar si el sistema también se mantiene estable bajo carga completa.
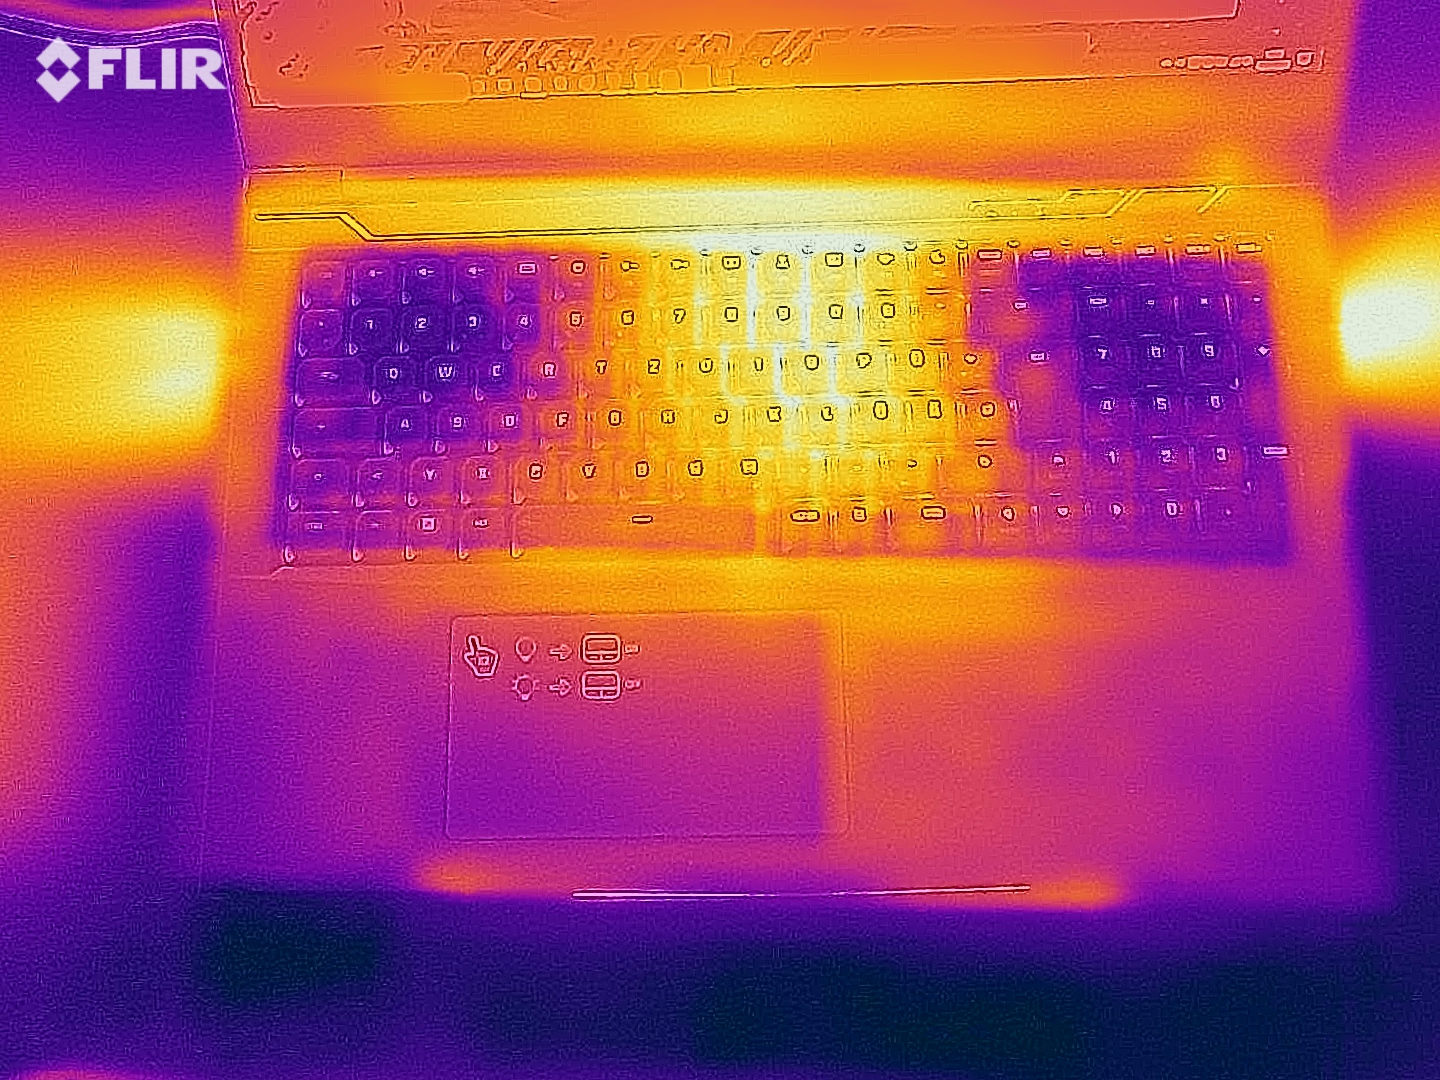
El portátil se calienta notablemente. Durante la prueba de esfuerzo, medimos las temperaturas en el rango de 50 grados centígrados en algunos puntos de medición. El desarrollo de calor resulta ligeramente inferior mientras se ejecuta nuestra prueba de The Witcher 3. Sin embargo, no debes colocar el dispositivo en tu regazo. En el funcionamiento diario, las temperaturas permanecen dentro del rango verde.
(-) La temperatura máxima en la parte superior es de 48 °C / 118 F, frente a la media de 40.4 °C / 105 F, que oscila entre 21.2 y 68.8 °C para la clase Gaming.
(-) El fondo se calienta hasta un máximo de 54 °C / 129 F, frente a la media de 43.2 °C / 110 F
(+) En reposo, la temperatura media de la parte superior es de 29.1 °C / 84# F, frente a la media del dispositivo de 33.9 °C / 93 F.
(-) Jugando a The Witcher 3, la temperatura media de la parte superior es de 41.6 °C / 107 F, frente a la media del dispositivo de 33.9 °C / 93 F.
(±) El reposamanos y el touchpad pueden calentarse mucho al tacto con un máximo de 39 °C / 102.2 F.
(-) La temperatura media de la zona del reposamanos de dispositivos similares fue de 28.8 °C / 83.8 F (-10.2 °C / -18.4 F).
Altavoces
Schenker XMG Neo 17 Comet Lake análisis de audio
(+) | los altavoces pueden reproducir a un volumen relativamente alto (#82 dB)
Graves 100 - 315 Hz
(-) | casi sin bajos - de media 25.2% inferior a la mediana
(±) | la linealidad de los graves es media (12.7% delta a frecuencia anterior)
Medios 400 - 2000 Hz
(+) | medios equilibrados - a sólo 3.3% de la mediana
(+) | los medios son lineales (4.4% delta a la frecuencia anterior)
Altos 2 - 16 kHz
(+) | máximos equilibrados - a sólo 2.8% de la mediana
(±) | la linealidad de los máximos es media (7.8% delta a frecuencia anterior)
Total 100 - 16.000 Hz
(±) | la linealidad del sonido global es media (17.1% de diferencia con la mediana)
En comparación con la misma clase
» 46% de todos los dispositivos probados de esta clase eran mejores, 12% similares, 43% peores
» El mejor tuvo un delta de 6%, la media fue 18%, el peor fue ###max##%
En comparación con todos los dispositivos probados
» 31% de todos los dispositivos probados eran mejores, 8% similares, 61% peores
» El mejor tuvo un delta de 4%, la media fue 24%, el peor fue ###max##%
Consumo de energía
En funcionamiento en reposo, registramos un consumo máximo de 29 vatios. La prueba de estrés y nuestra prueba de The Witcher 3 llevan a un aumento del consumo de hasta 258 vatios y un promedio de 199 vatios respectivamente.
| Off / Standby | |
| Ocioso | |
| Carga |
|
Clave:
min: | |
Duración de la batería
La duración de la batería no gana ningún elogio. El portátil de 17,3 pulgadas dura 3:47 horas en nuestra prueba de WLAN (carga de sitios web mediante un script y con un brillo de pantalla de unos 150 cd/m²). La capacidad adicional de la batería (62 Wh en lugar de 46 Wh) comparada con los modelos de 2019 que probamos no da ninguna ventaja al Neo 17 actual.
Pro
Contra
Veredicto
Gracias al procesador Core i7-10875H de octa-core, al núcleo gráfico GeForce RTX 2070-Super y a los 32 GB de memoria de trabajo, el XMG Neo 17 está equipado para cualquier posible reto. El hardware es capaz de llevar todos los juegos de ordenador actuales a la pantalla sin problemas, sin necesidad de ningún compromiso.
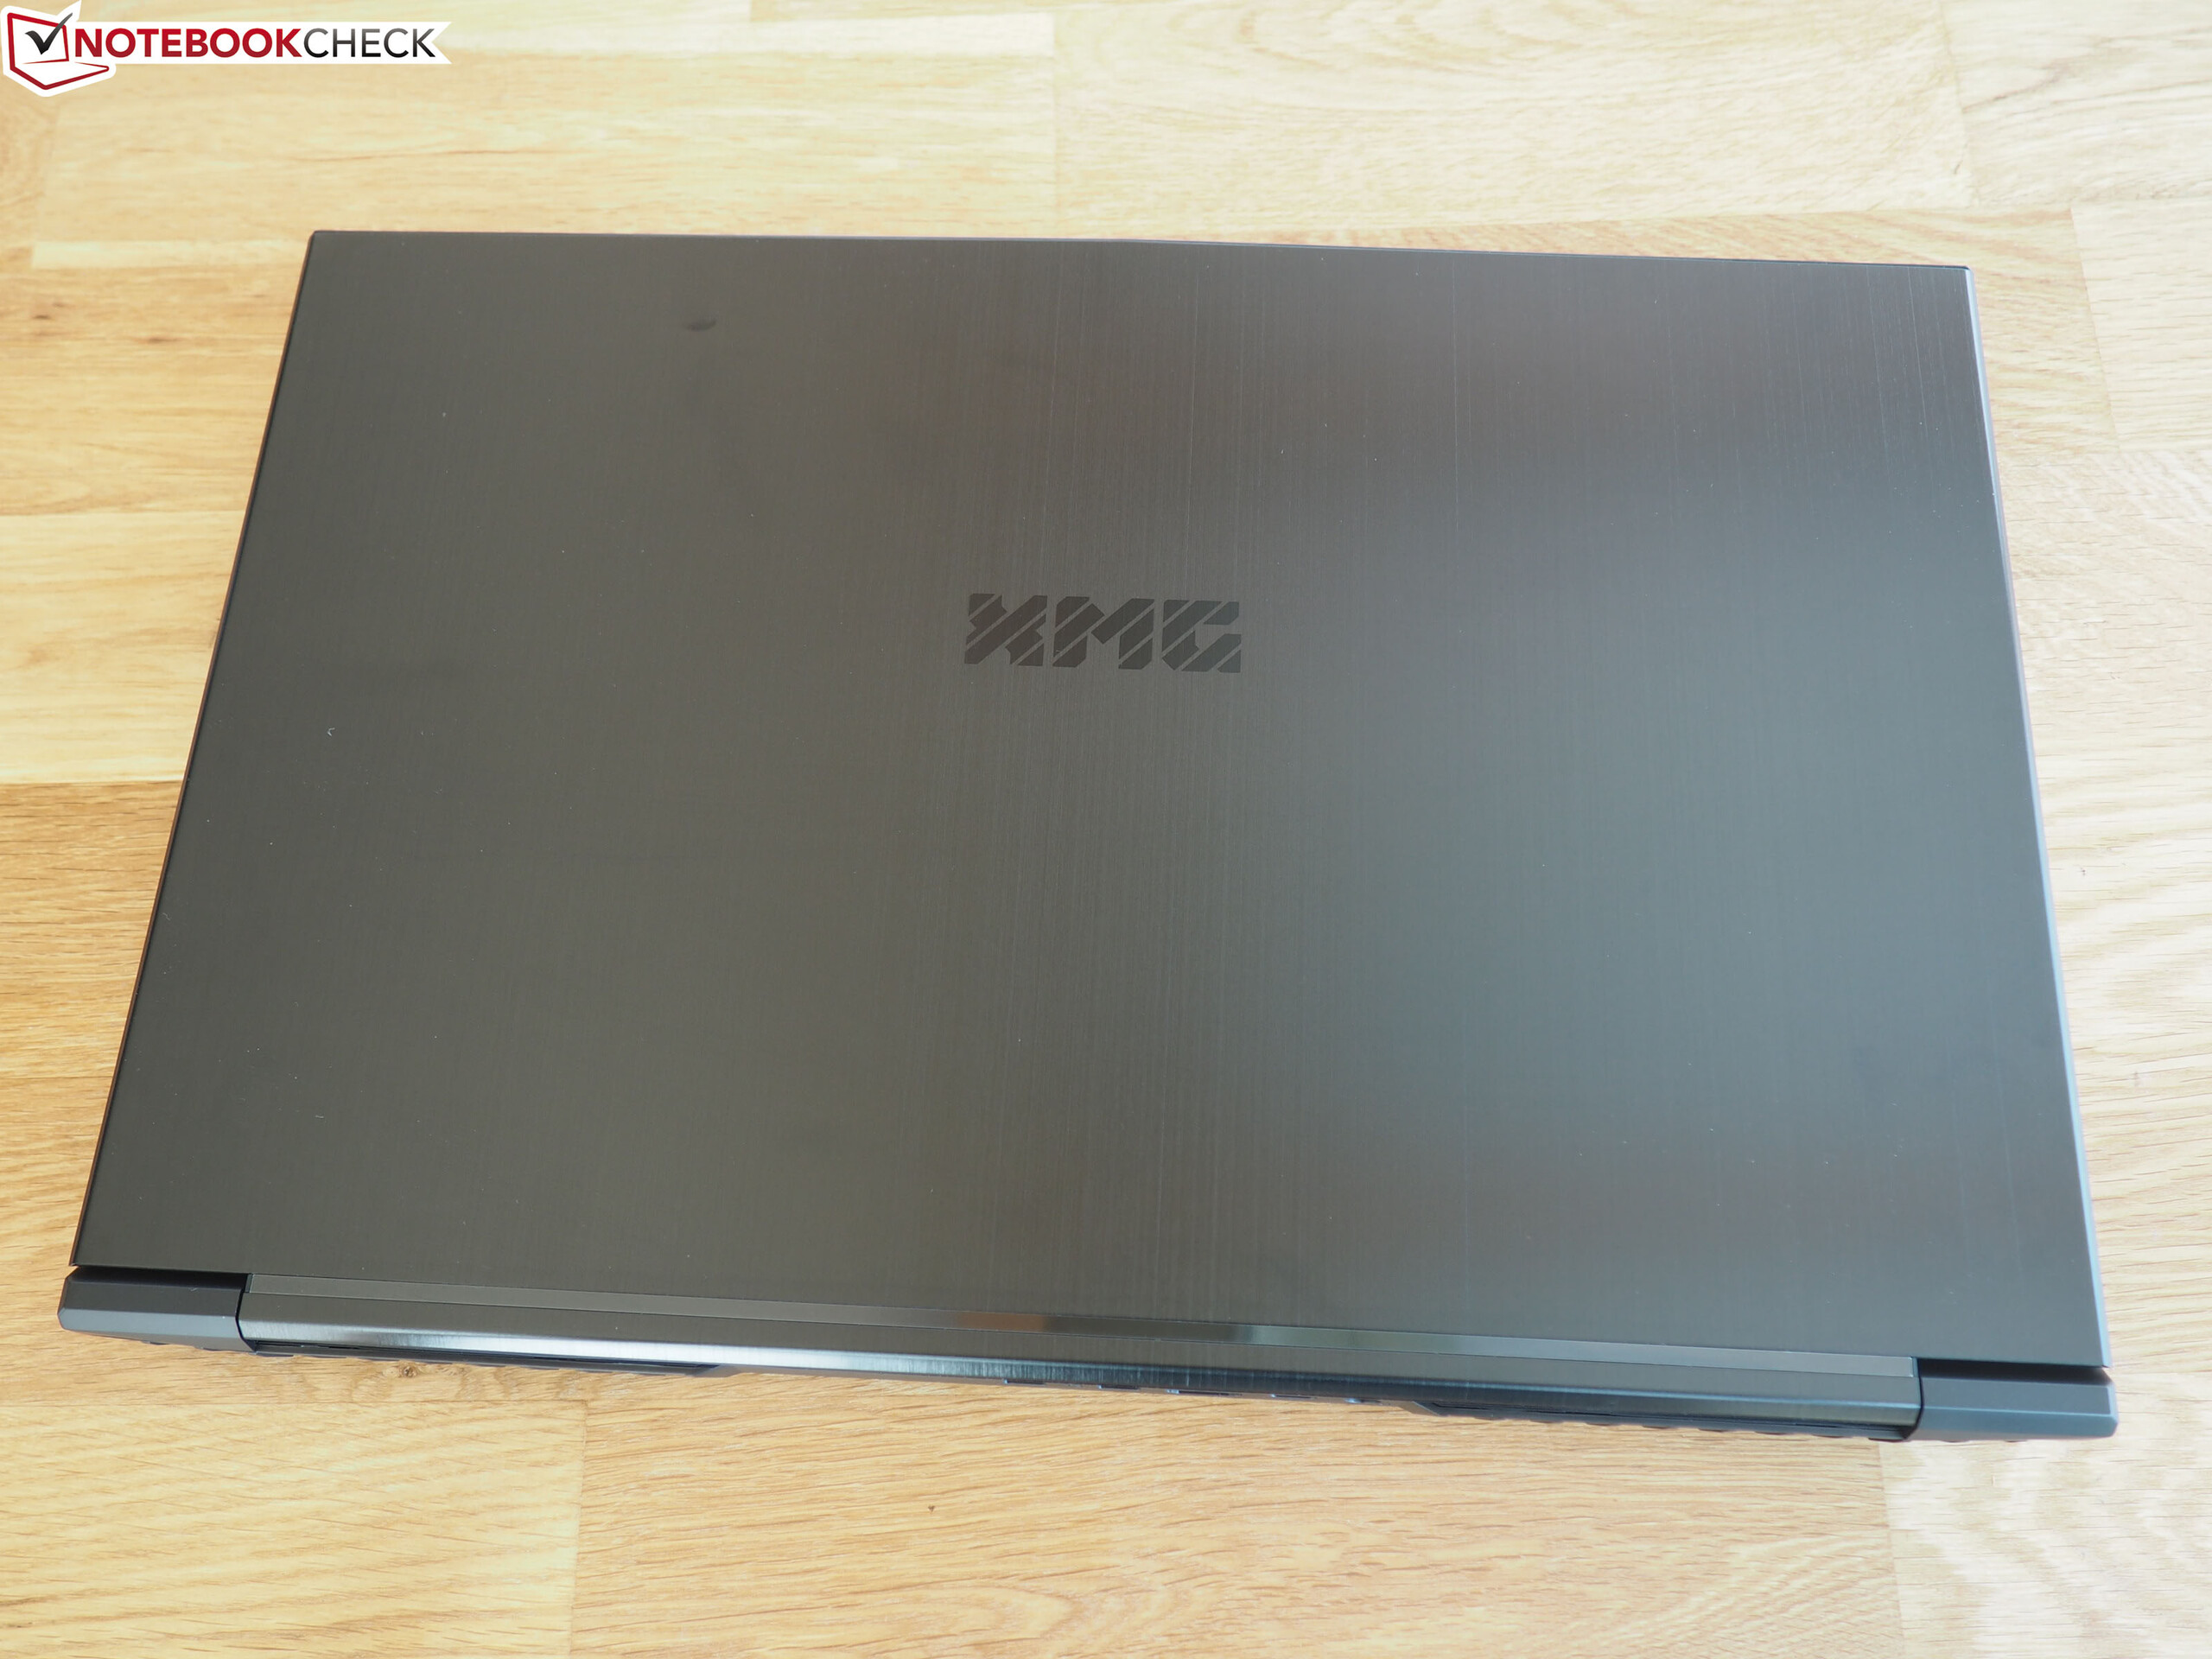
Con el XMG Neo 17 (2020), Schenker entrega un portátil para juegos extremadamente potente cuyo aspecto moderado permite usarlo en la oficina.
Si te quedas sin espacio de almacenamiento con la SSD de 1 TB NVMe incorporada, es posible realizar una actualización, ya que el portátil ofrece espacio para dos SSD M.2-2280 (1x NVMe, 1x NVMe/SATA; RAID 0/1). La pantalla de gran capacidad de respuesta (FHD, IPS, 240 Hz) se caracteriza por una buena reproducción del color y una cobertura aceptable del espacio de color. El brillo y el contraste cumplen los requisitos, pero la duración de la batería resulta mediocre.
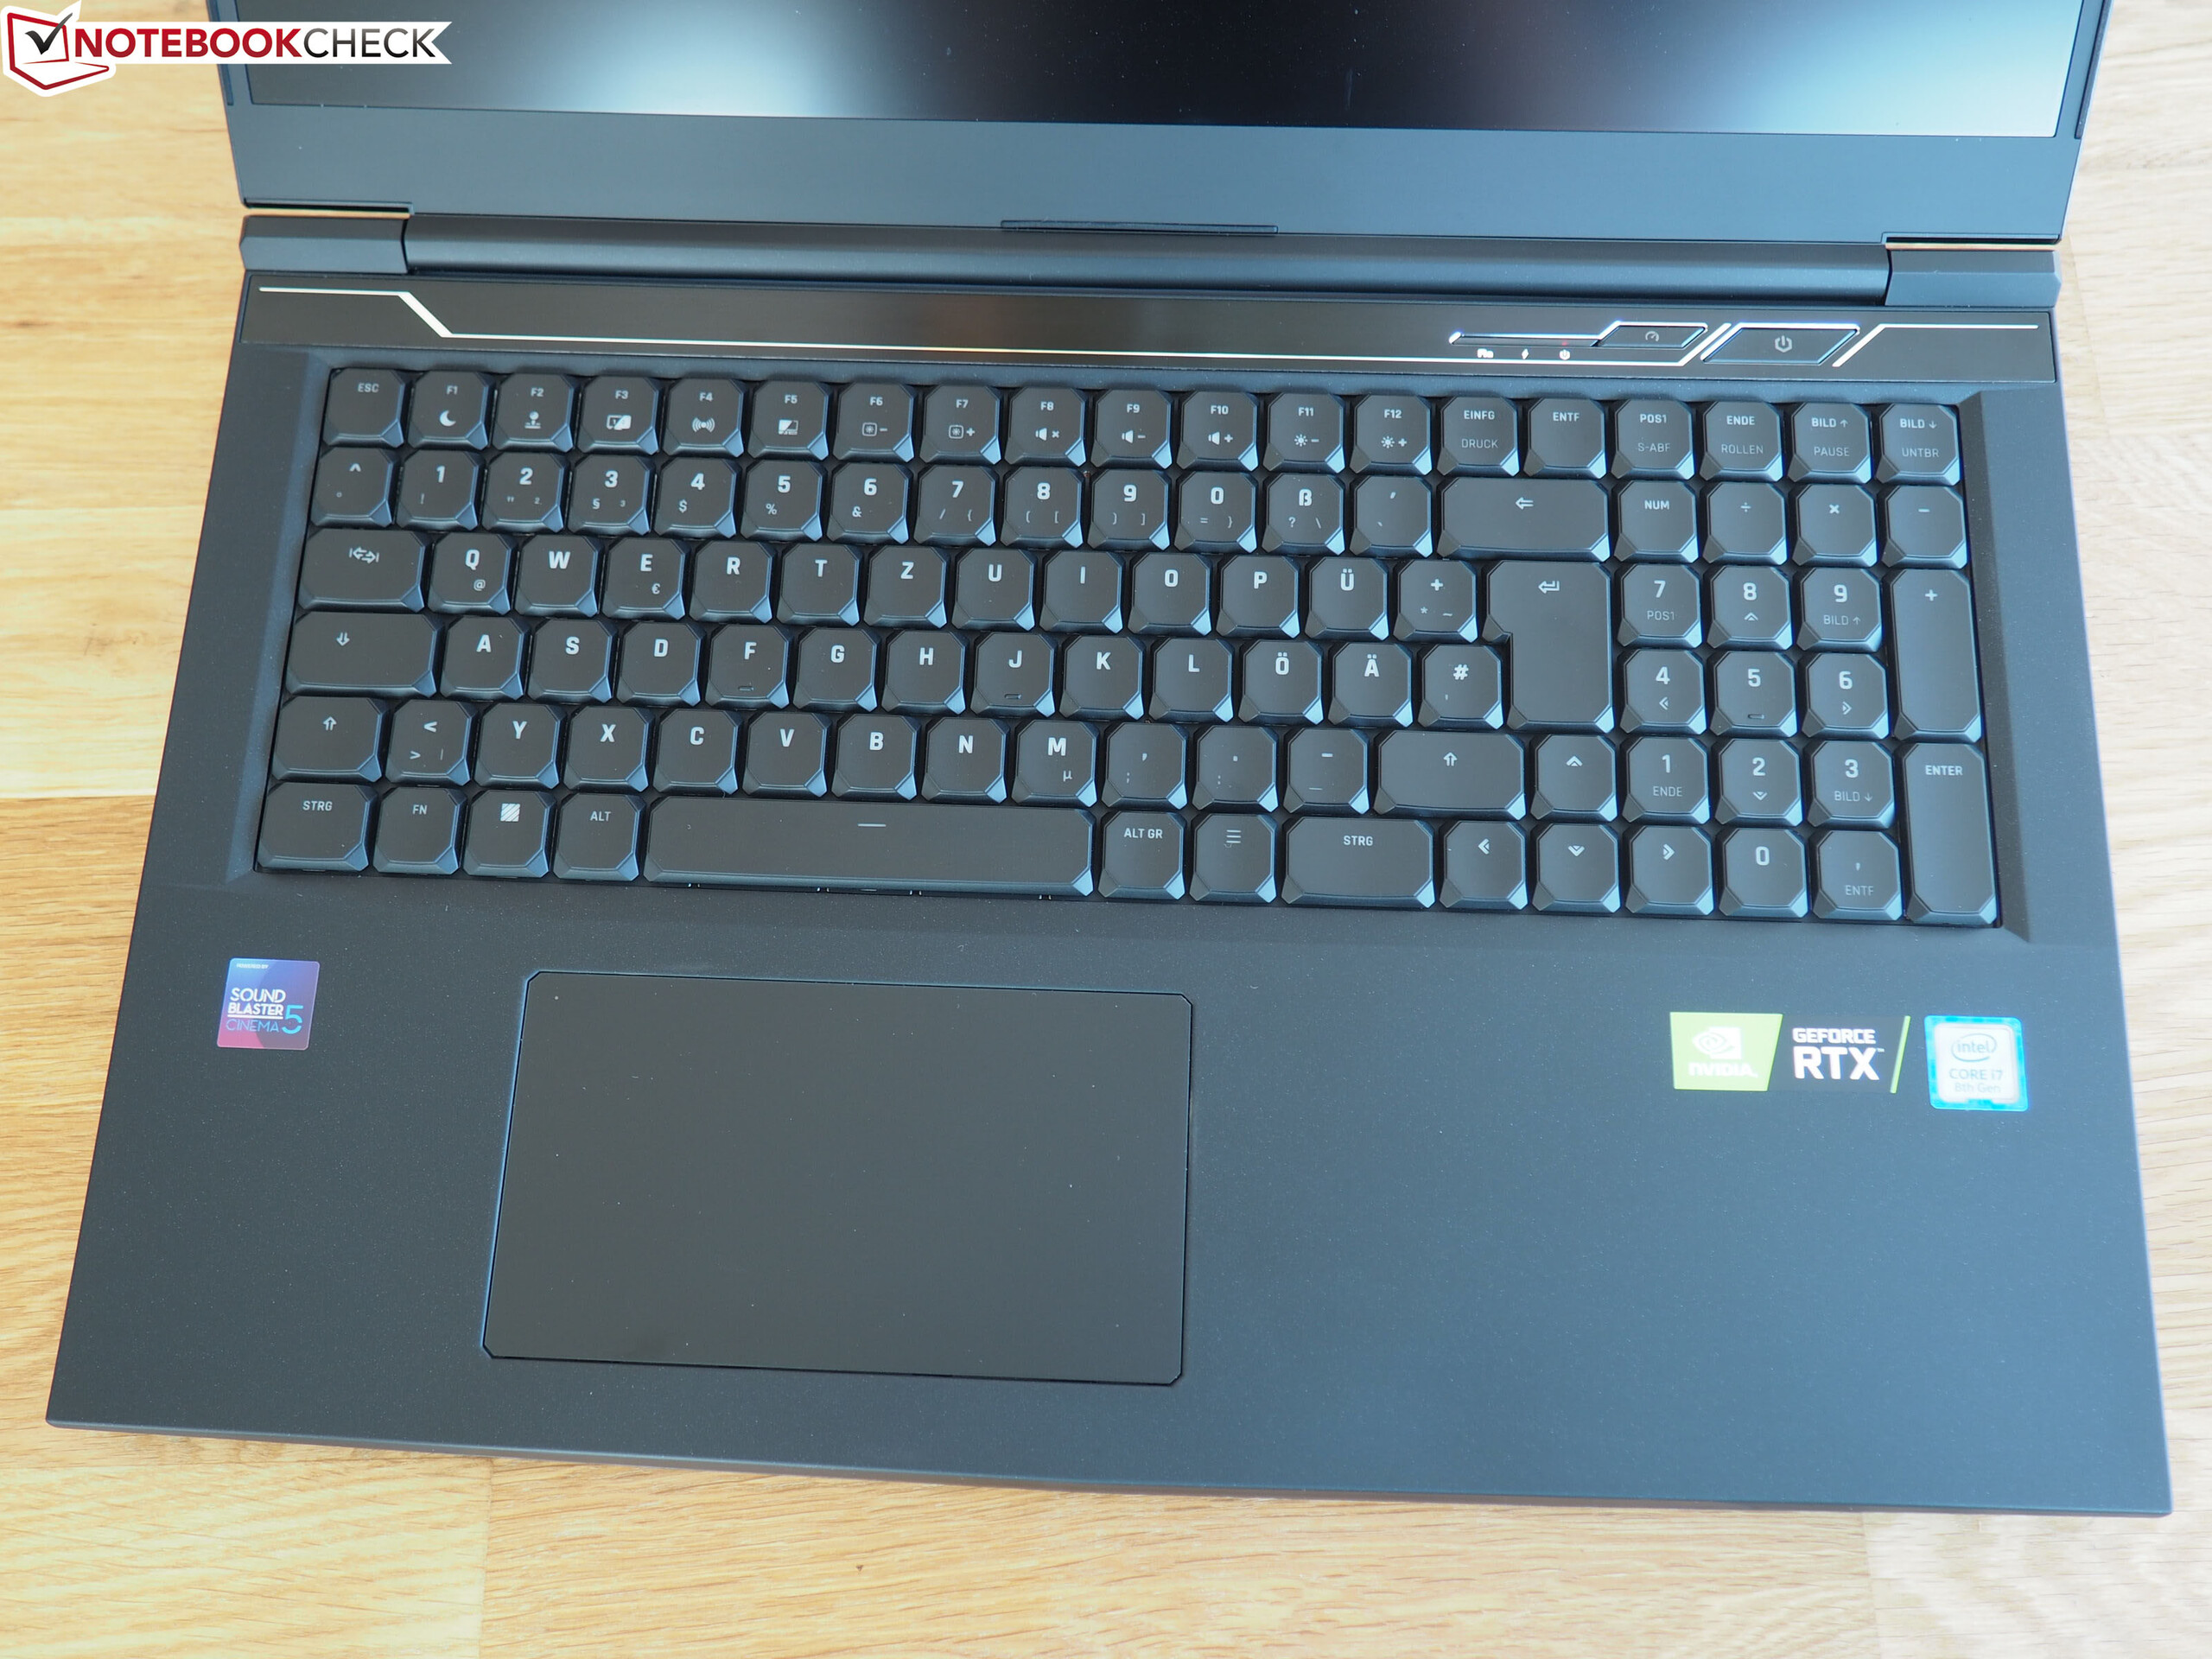
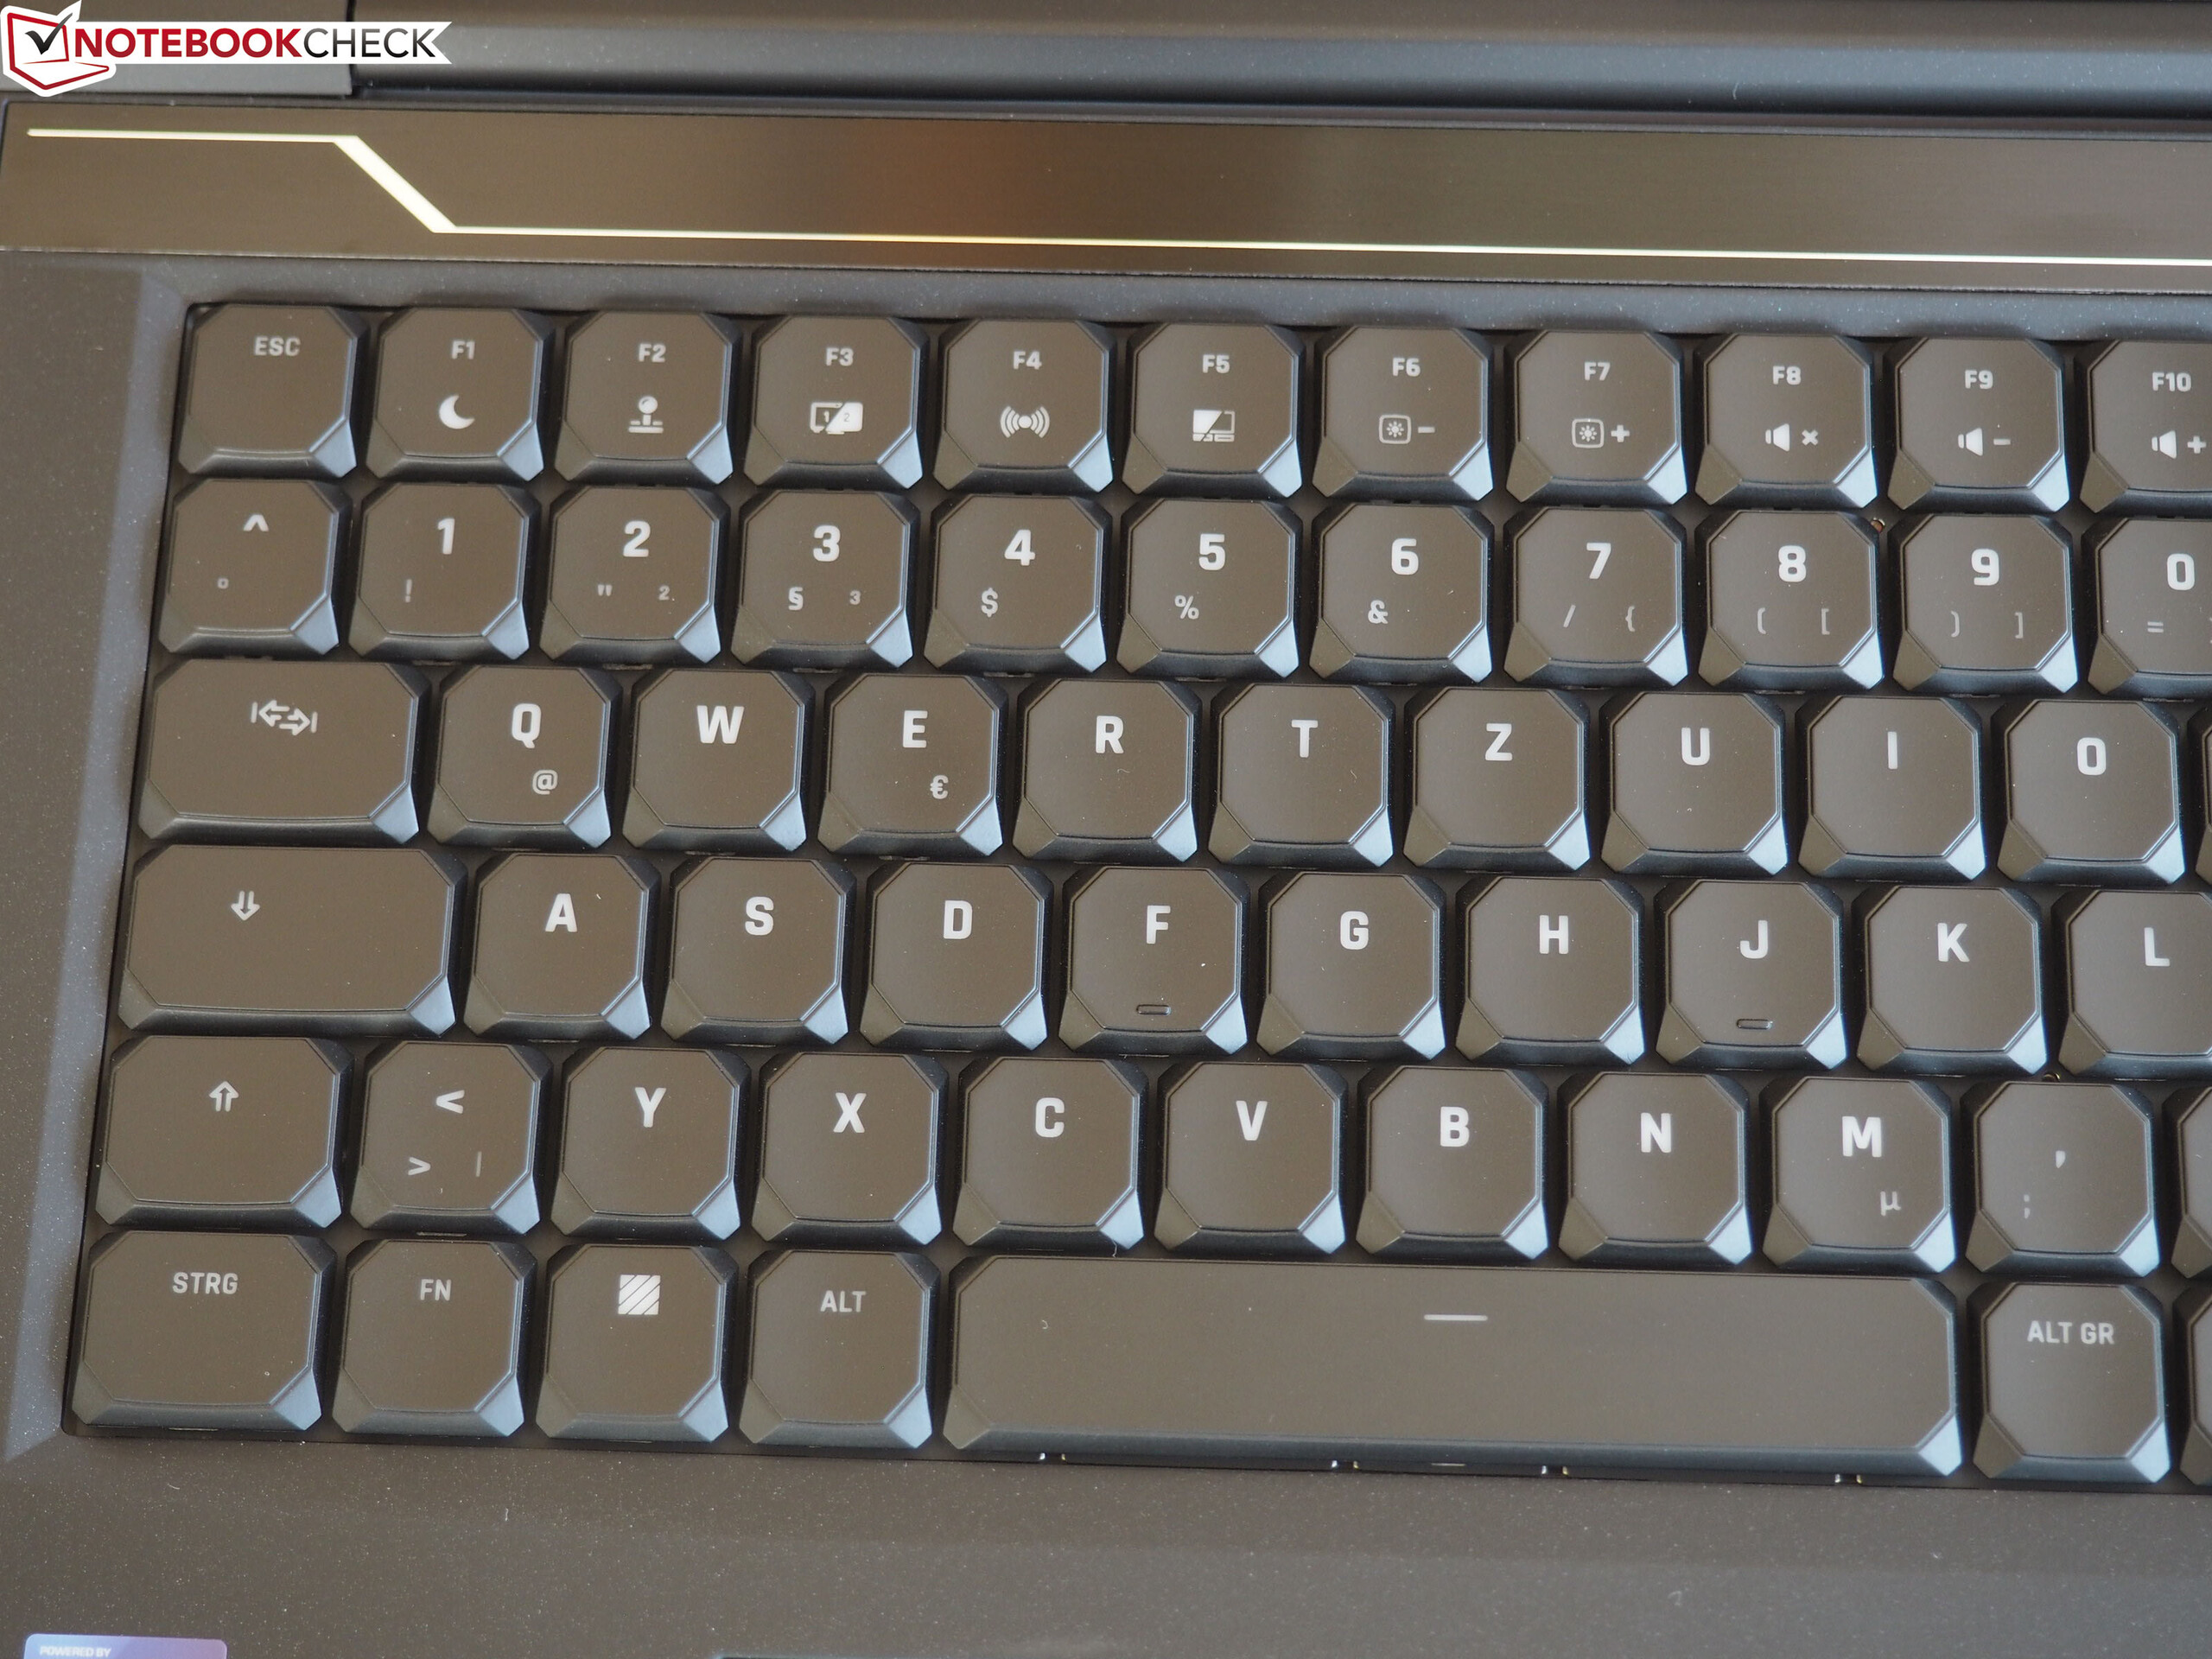
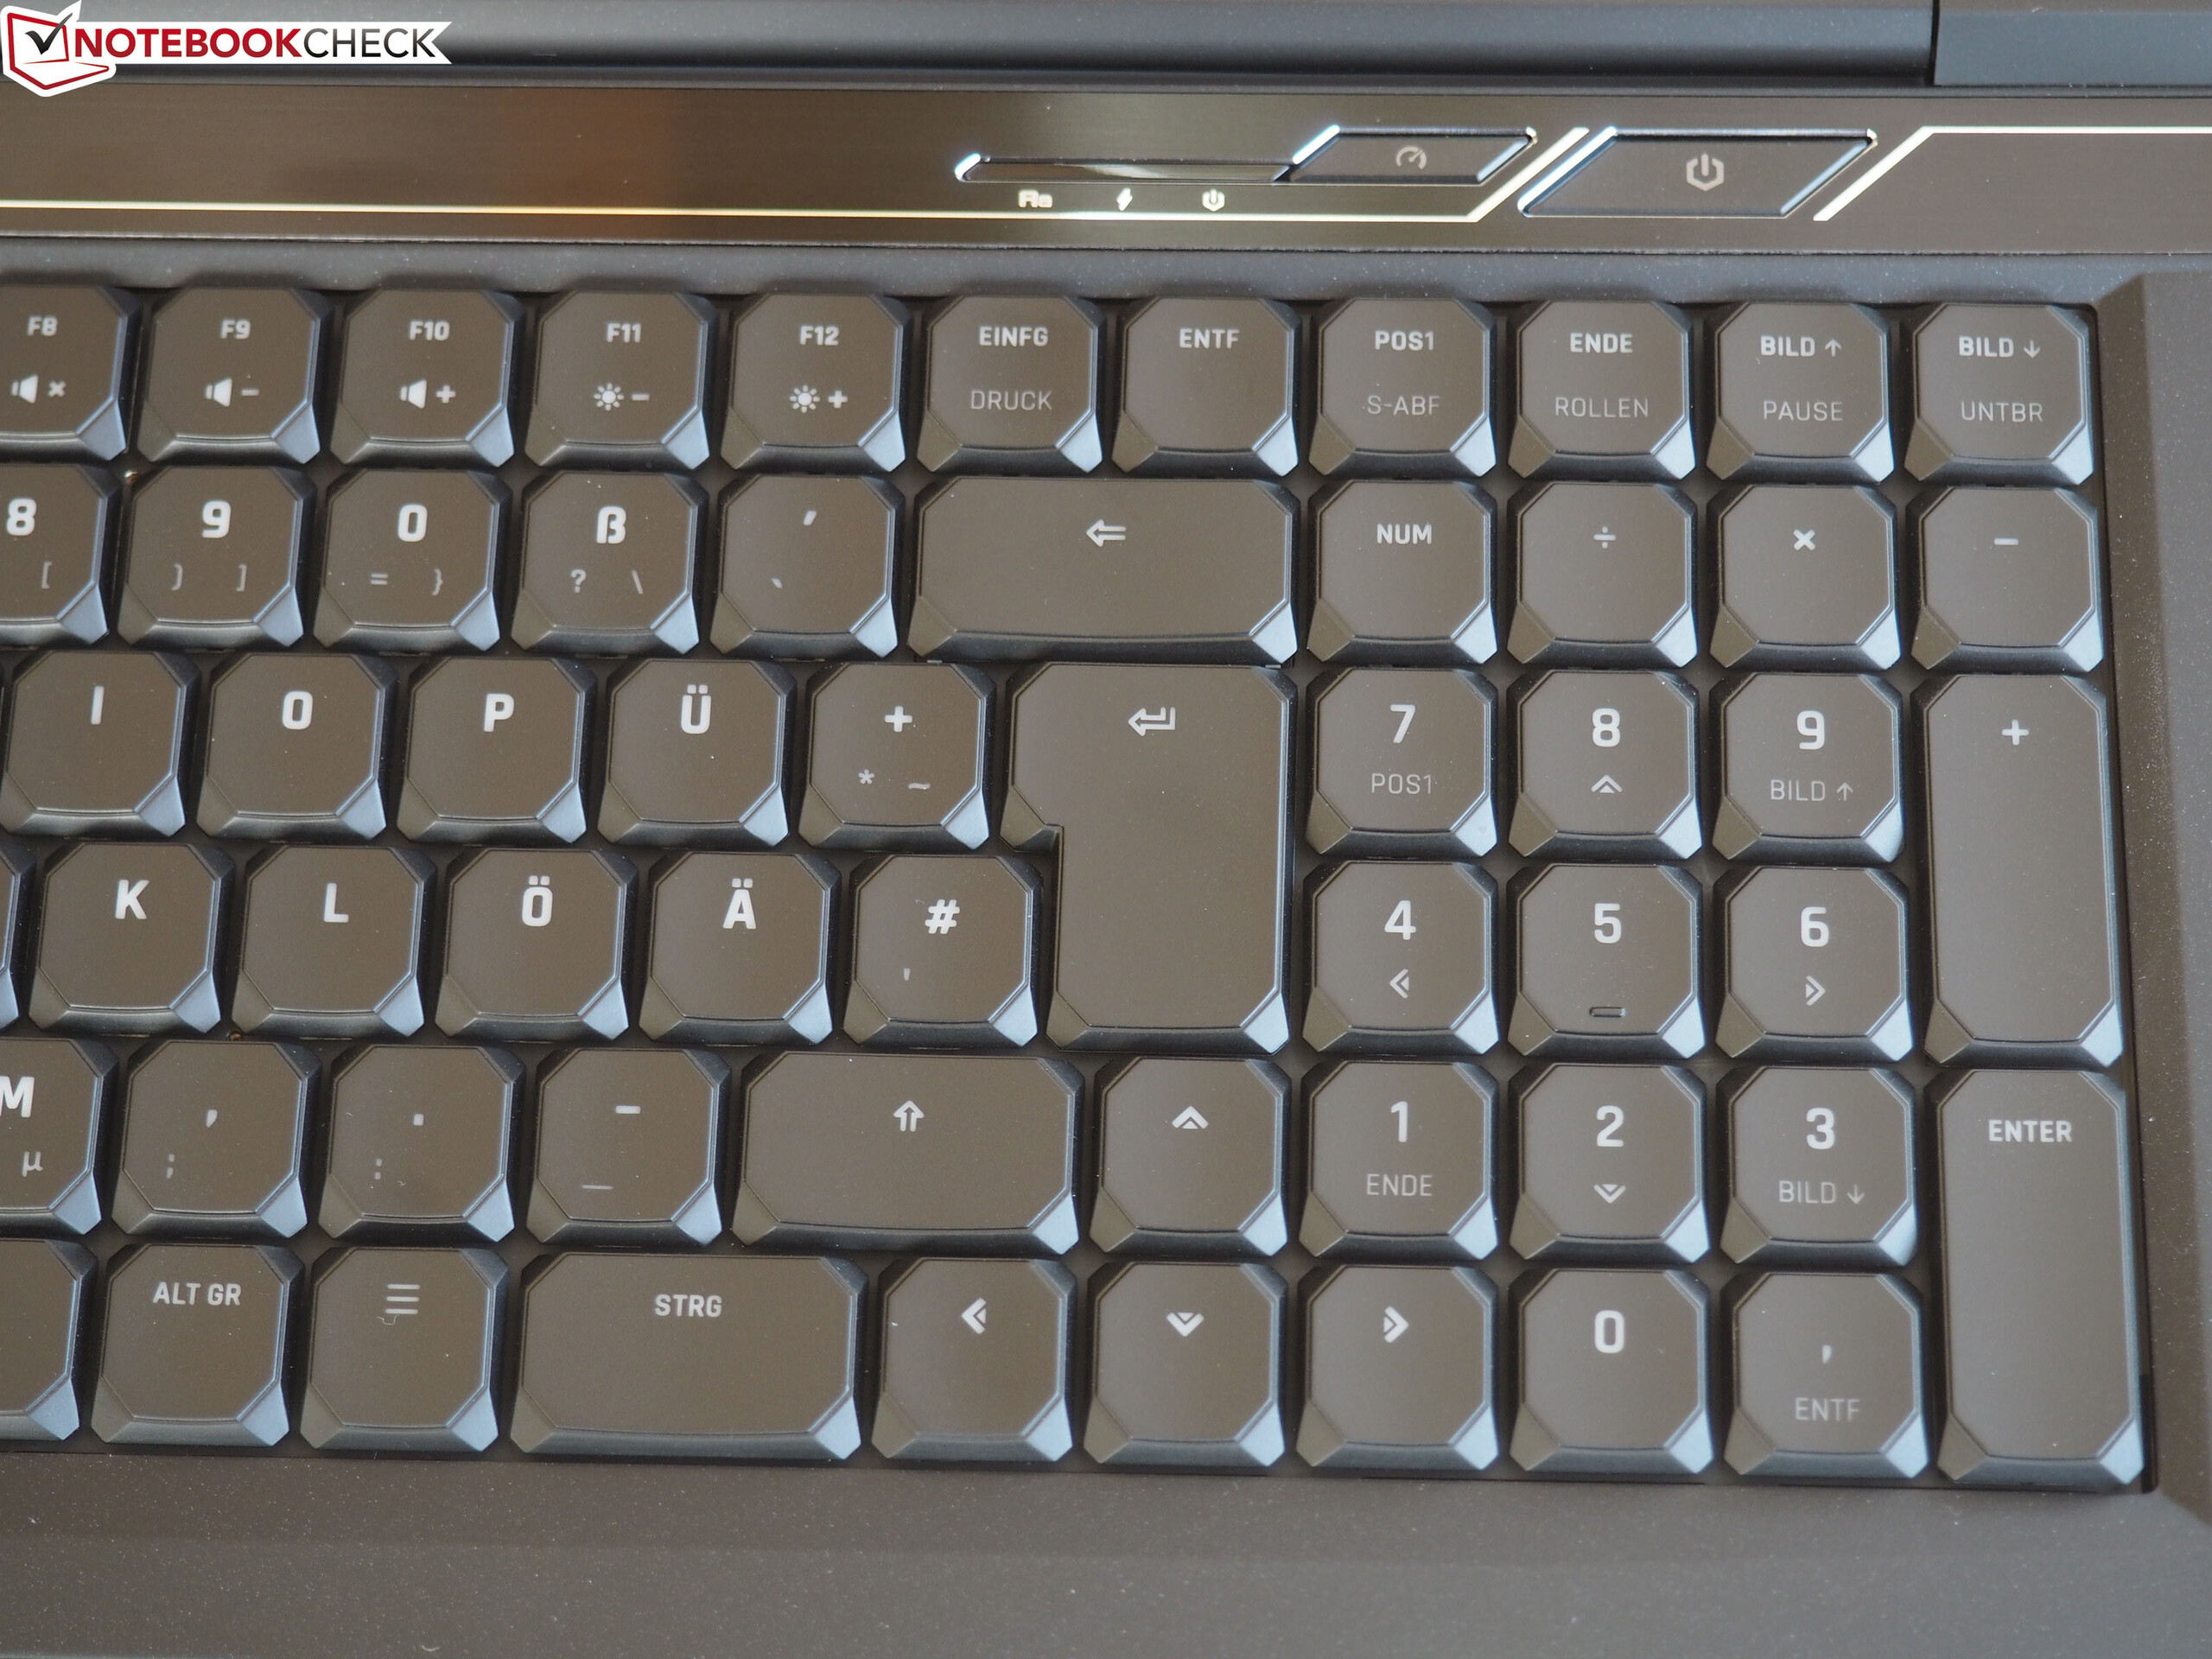
El teclado mecánico (con iluminación RGB) dejó una buena impresión y representará un importante punto de compra para muchos compradores potenciales. La conexión Thunderbolt 3 que se añadió en comparación con el predecesor permite conectar una extensa solución de acoplamiento o una GPU externa.
Schenker XMG Neo 17 Comet Lake
- 11/27/2020 v7 (old)
Sascha Mölck
Price comparison
