Estreno del Intel Core i9-12900H: Análisis del portátil Uniwill Technology GM7AG8P
Intel ha respondido finalmente a la impresionante serie Zen 3 H de AMD con su plataforma Alder Lake-H de 12ª generación. Schenker y Uniwill Technology nos han proporcionado uno de los primeros portátiles que llevan el Core i9-12900H de 12ª generación basado en el chasis GM7AG8P. Schenker aún no ha ofrecido públicamente esta configuración exacta en el momento de escribir este artículo, pero las opciones de venta al público podrían llegar más adelante.
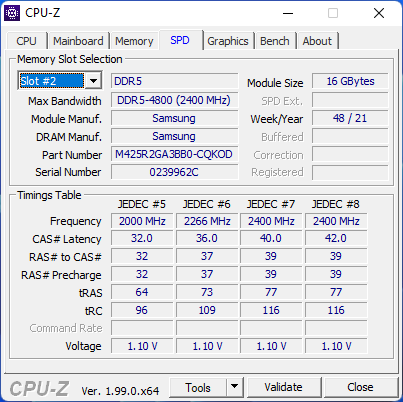
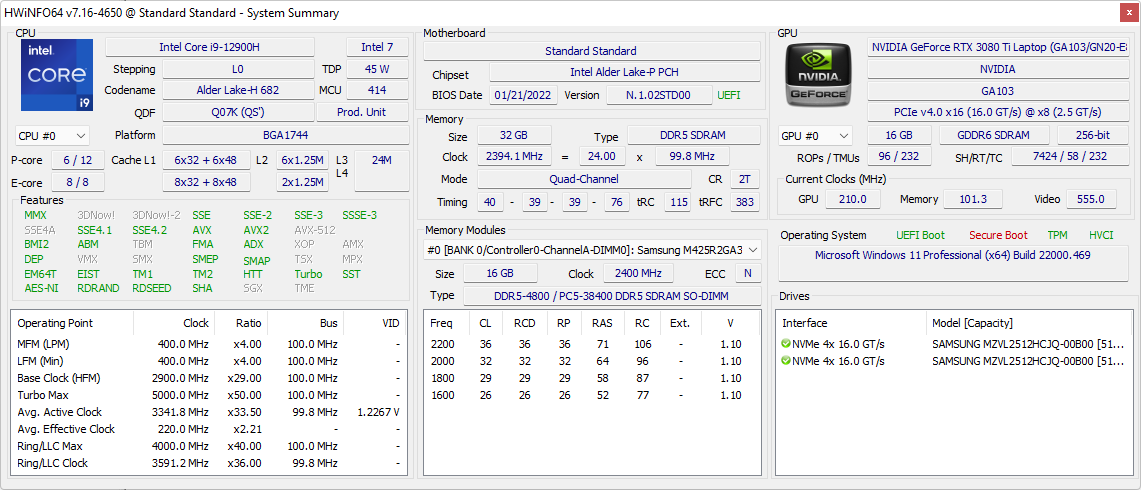
Nuestra unidad de prueba viene con la mencionada CPU Core i9, la nueva GPU GeForce RTX 3080 Ti, memoria RAM DDR5-4800 y pantalla IPS 1440p (QHD) de 165 Hz. Este análisis se centrará en el rendimiento para mostrar lo que los usuarios pueden esperar de la nueva CPU Intel y la GPU Nvidia en comparación con sus respectivas contrapartes de la última generación.
Más análisis de Schenker:
Posibles contendientes en la comparación
Valoración | Fecha | Modelo | Peso | Altura | Tamaño | Resolución | Precio |
|---|---|---|---|---|---|---|---|
| 86.9 % v7 (old) | 02/2022 | Schenker Uniwill Technology GM7AG8P i9-12900H, GeForce RTX 3080 Ti Laptop GPU | 2.3 kg | 20 mm | 17.30" | 2560x1440 | |
| 87.4 % v7 (old) | 09/2021 | Schenker XMG NEO 17 GM7TG8S i7-11800H, GeForce RTX 3080 Laptop GPU | 2.6 kg | 27.45 mm | 17.30" | 2560x1440 | |
| 89 % v7 (old) | 09/2021 | Alienware x17 RTX 3080 P48E i7-11800H, GeForce RTX 3080 Laptop GPU | 3.2 kg | 21.4 mm | 17.30" | 3840x2160 | |
| 89.4 % v7 (old) | 09/2021 | Razer Blade 17 RTX 3070 i7-11800H, GeForce RTX 3070 Laptop GPU | 2.8 kg | 19.9 mm | 17.30" | 1920x1080 | |
| 86.2 % v7 (old) | 09/2021 | MSI GS76 Stealth 11UH i9-11900H, GeForce RTX 3080 Laptop GPU | 2.4 kg | 20 mm | 17.30" | 3840x2160 | |
| 87.8 % v7 (old) | 09/2021 | Maingear Vector Pro MG-VCP17 i7-11800H, GeForce RTX 3080 Laptop GPU | 2.3 kg | 19.81 mm | 17.30" | 2560x1440 |
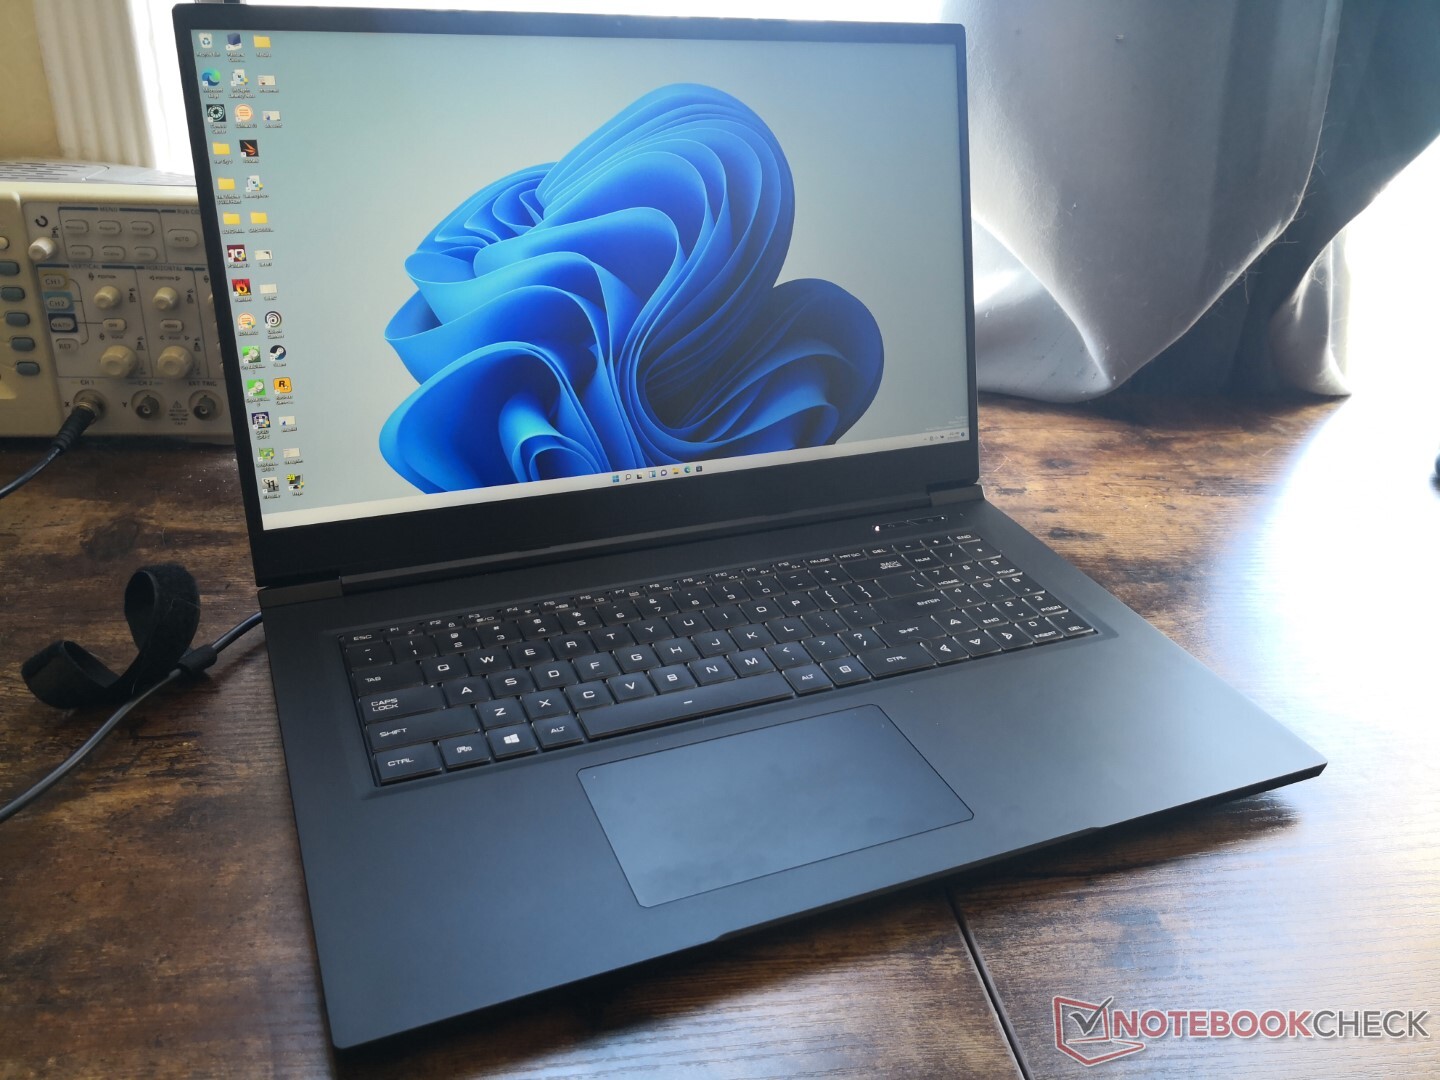
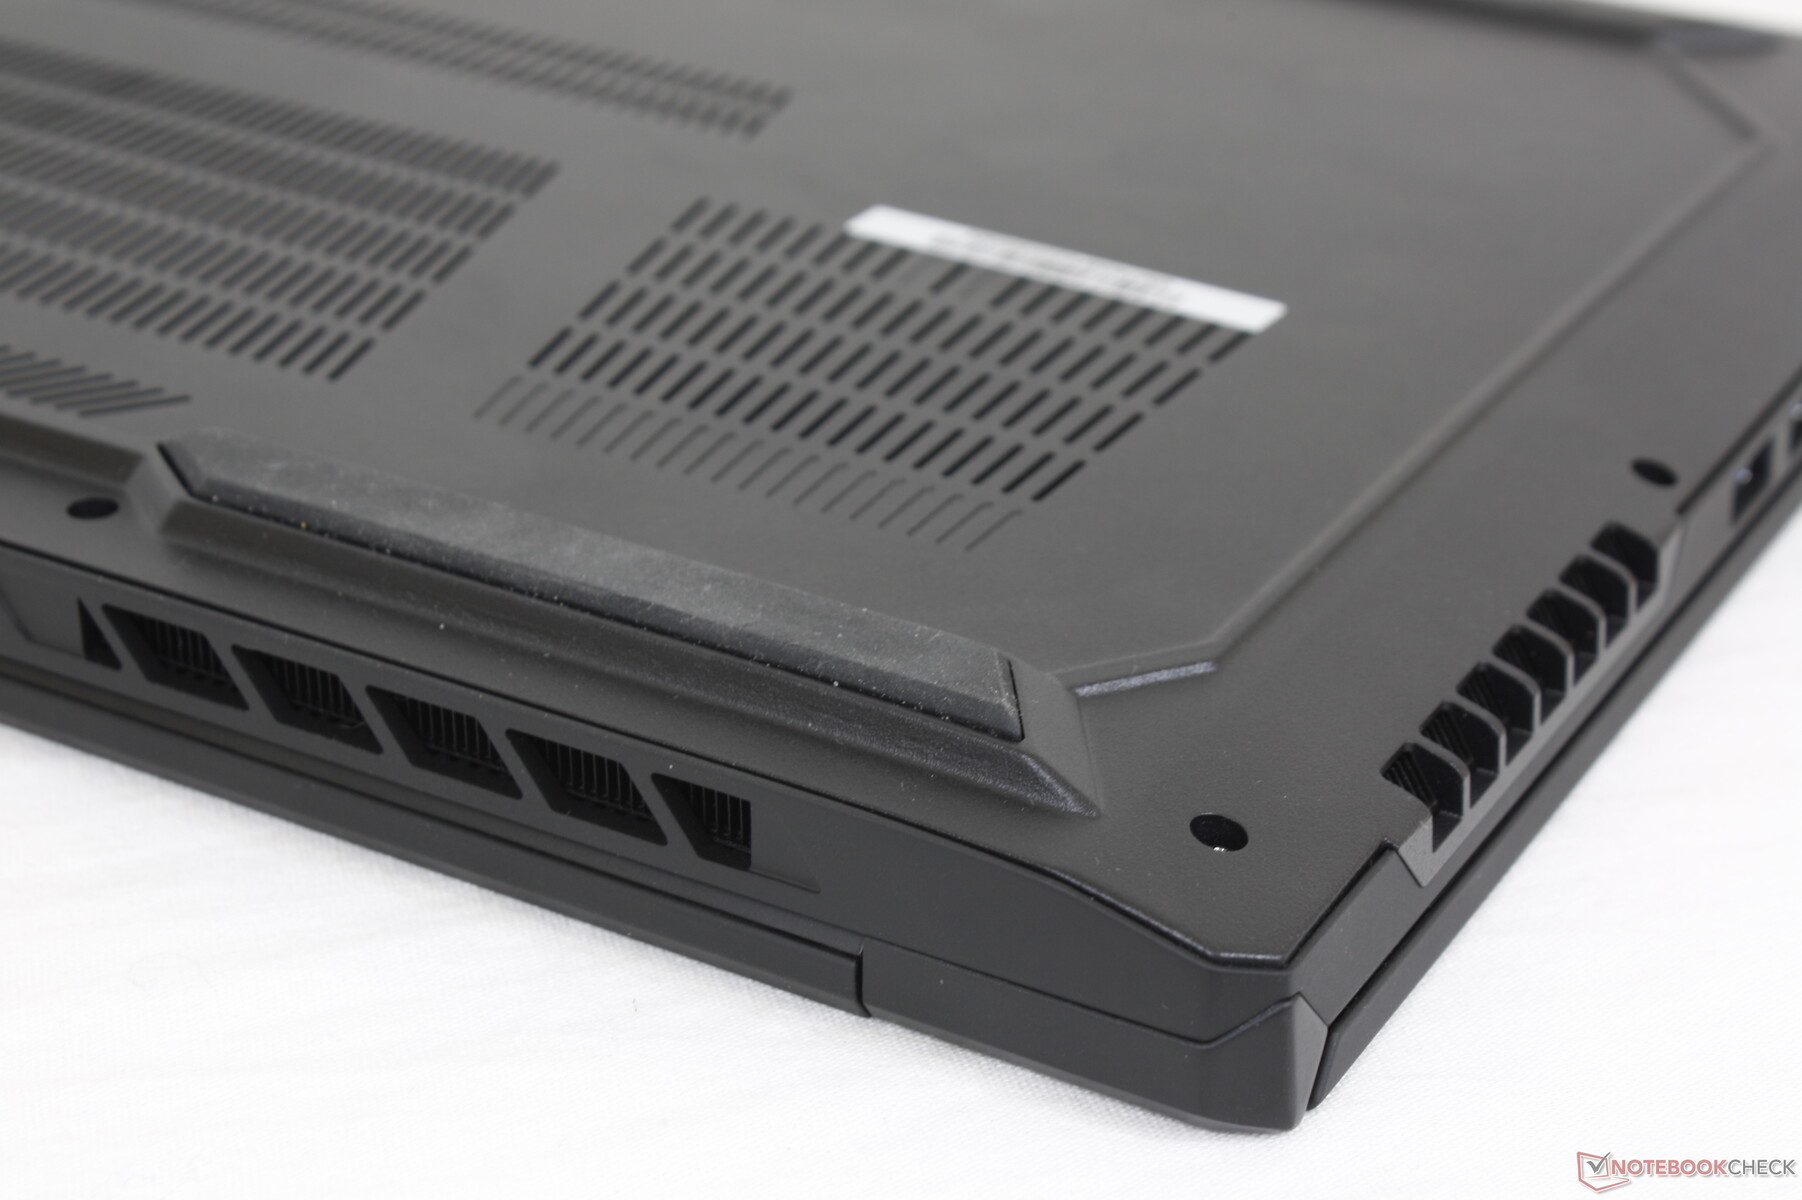
Caso - Tongfang típico
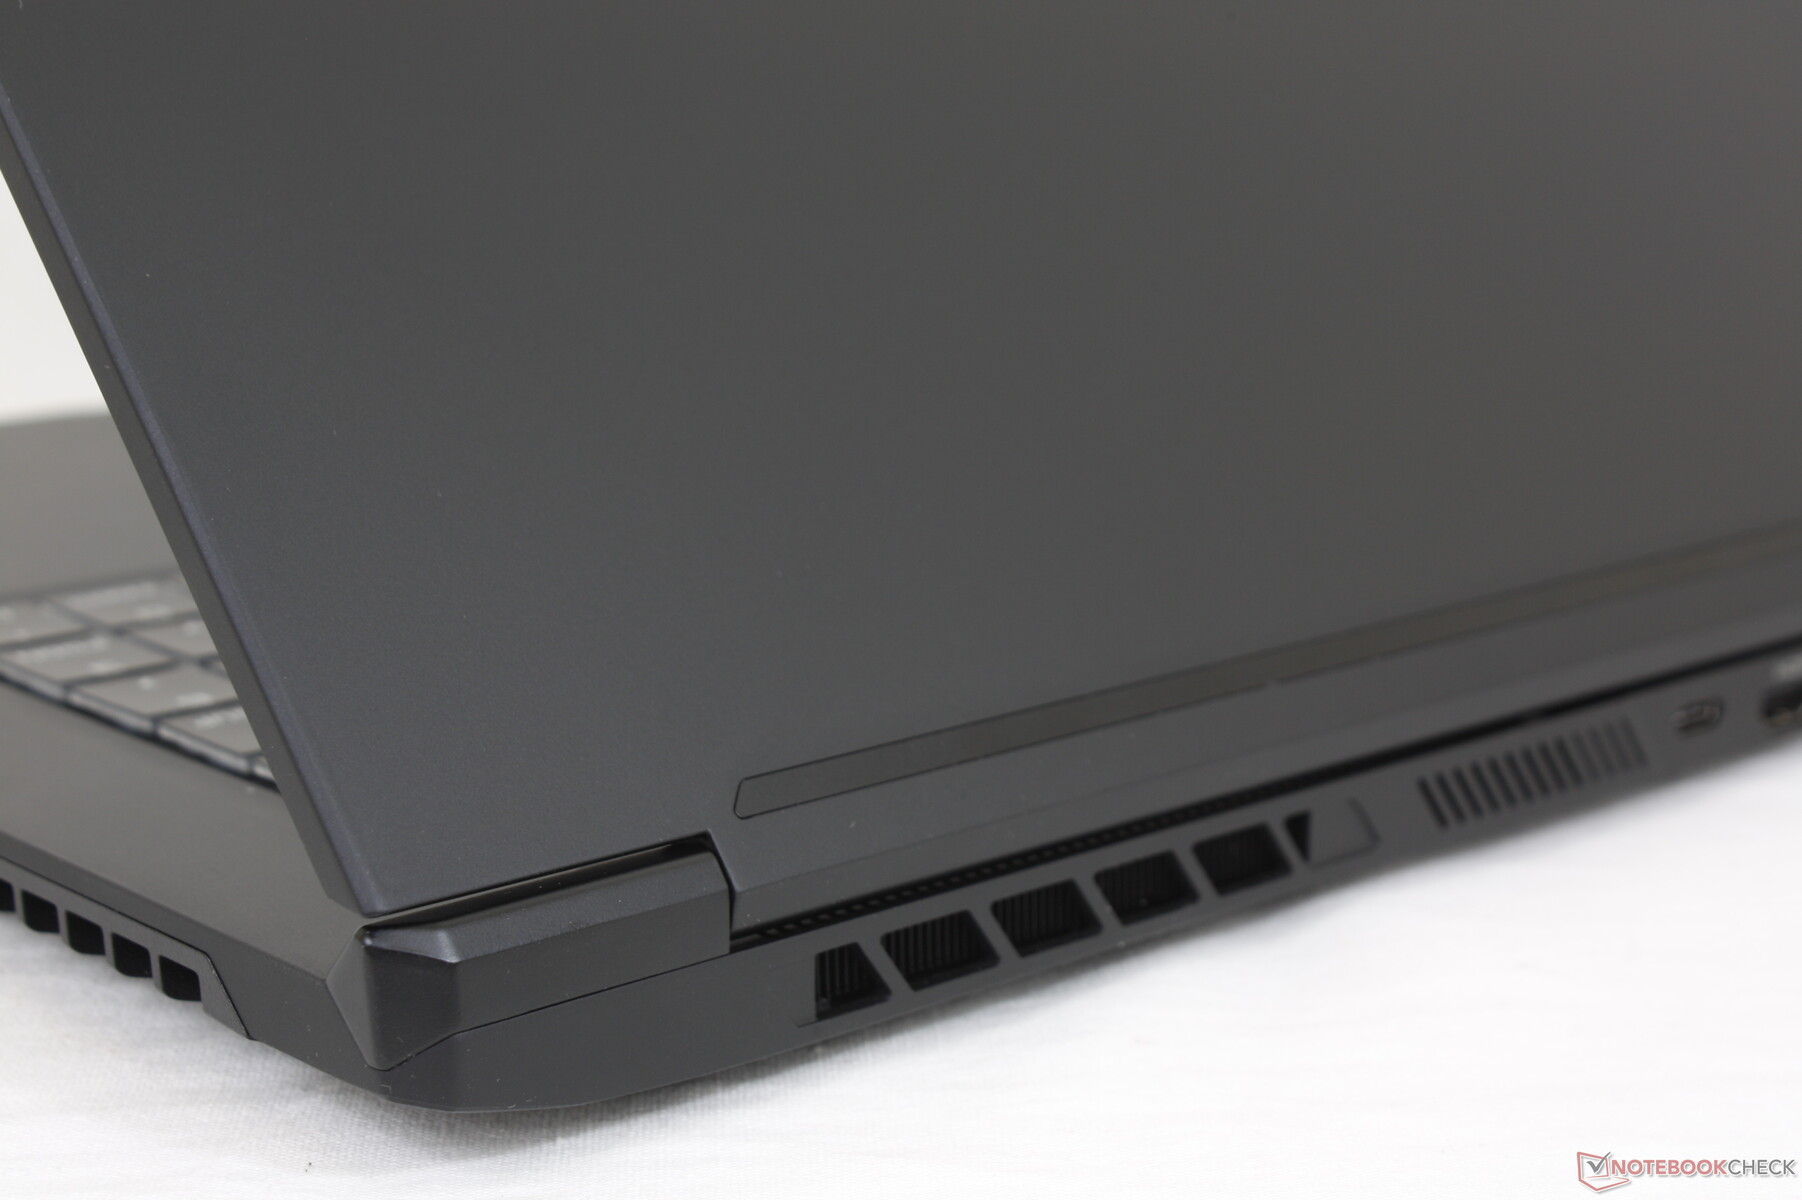
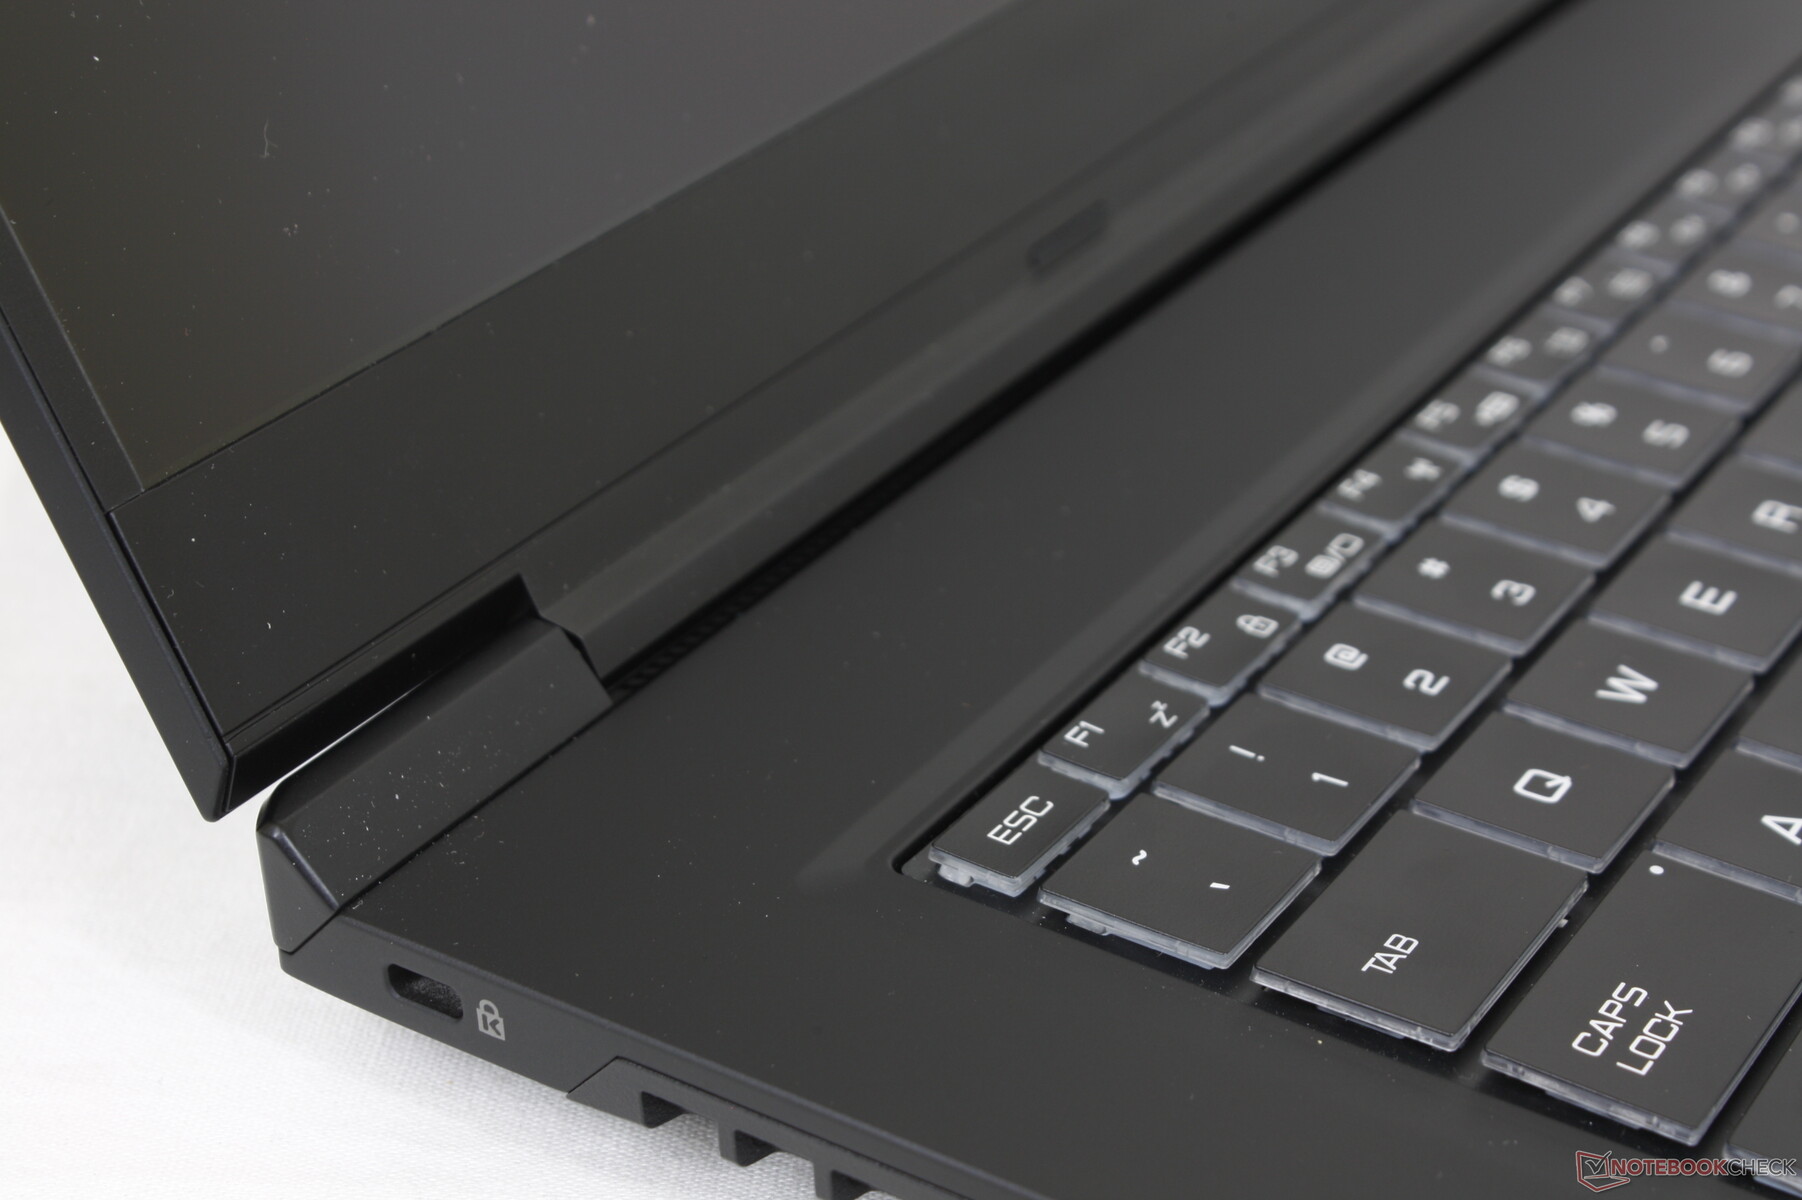
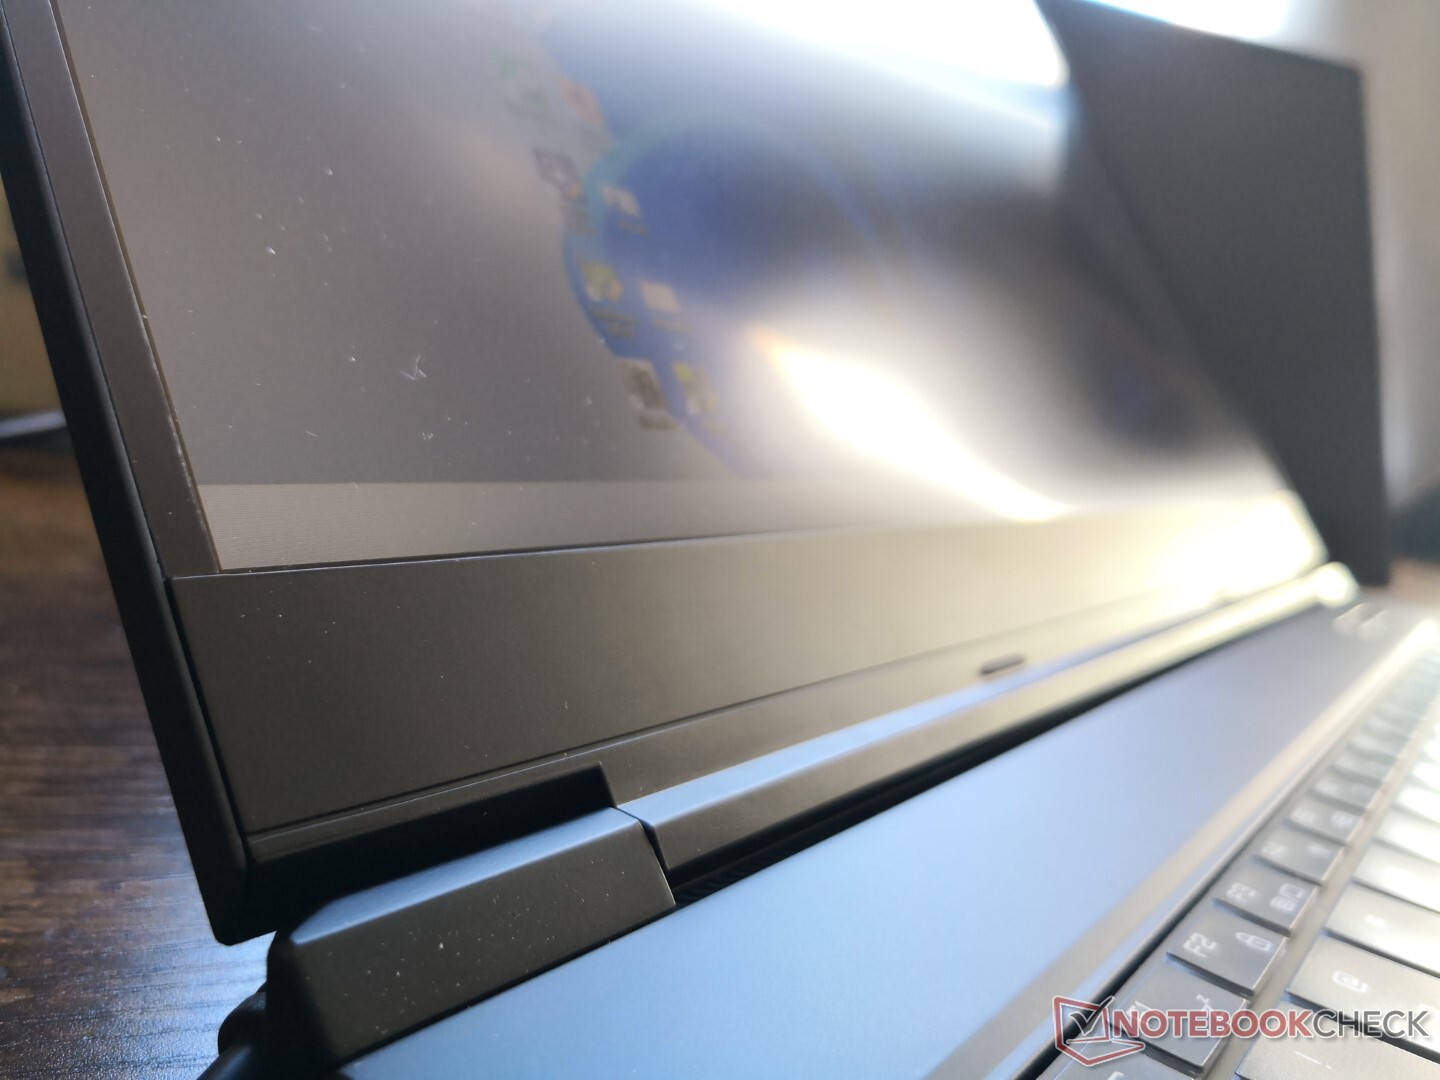
Anteriormente conocida como Tongfang, Uniwill Technology utiliza materiales y diseños similares en muchos de sus portátiles para juegos y estaciones de trabajo móviles. En este caso, el GM7AG8P tiene mucho en común con el XMG Neo 17 y el XMG Pro 17 en cuanto a características, rigidez y textura, aunque sus dimensiones, apariencia y tamaños sean ligeramente diferentes. Las dimensiones totales son casi idénticas a las del Razer Blade Pro 17, aunque pesa 500 gramos menos, sobre todo por la ausencia de un refrigerador con cámara de vapor en el GM7AG8P.
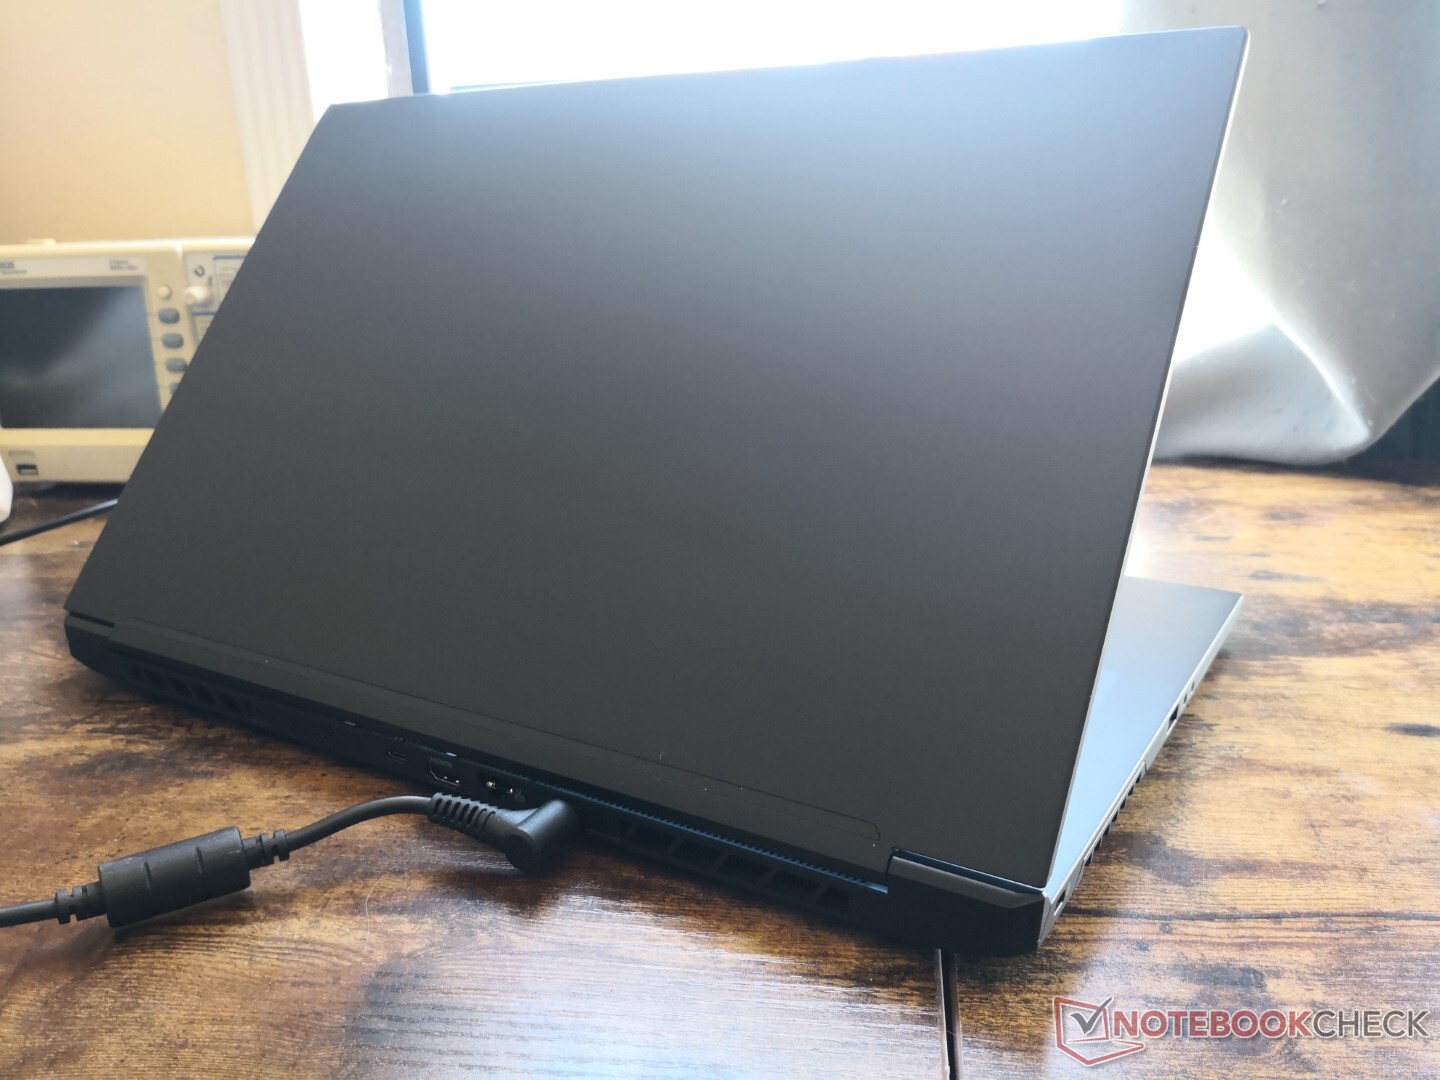
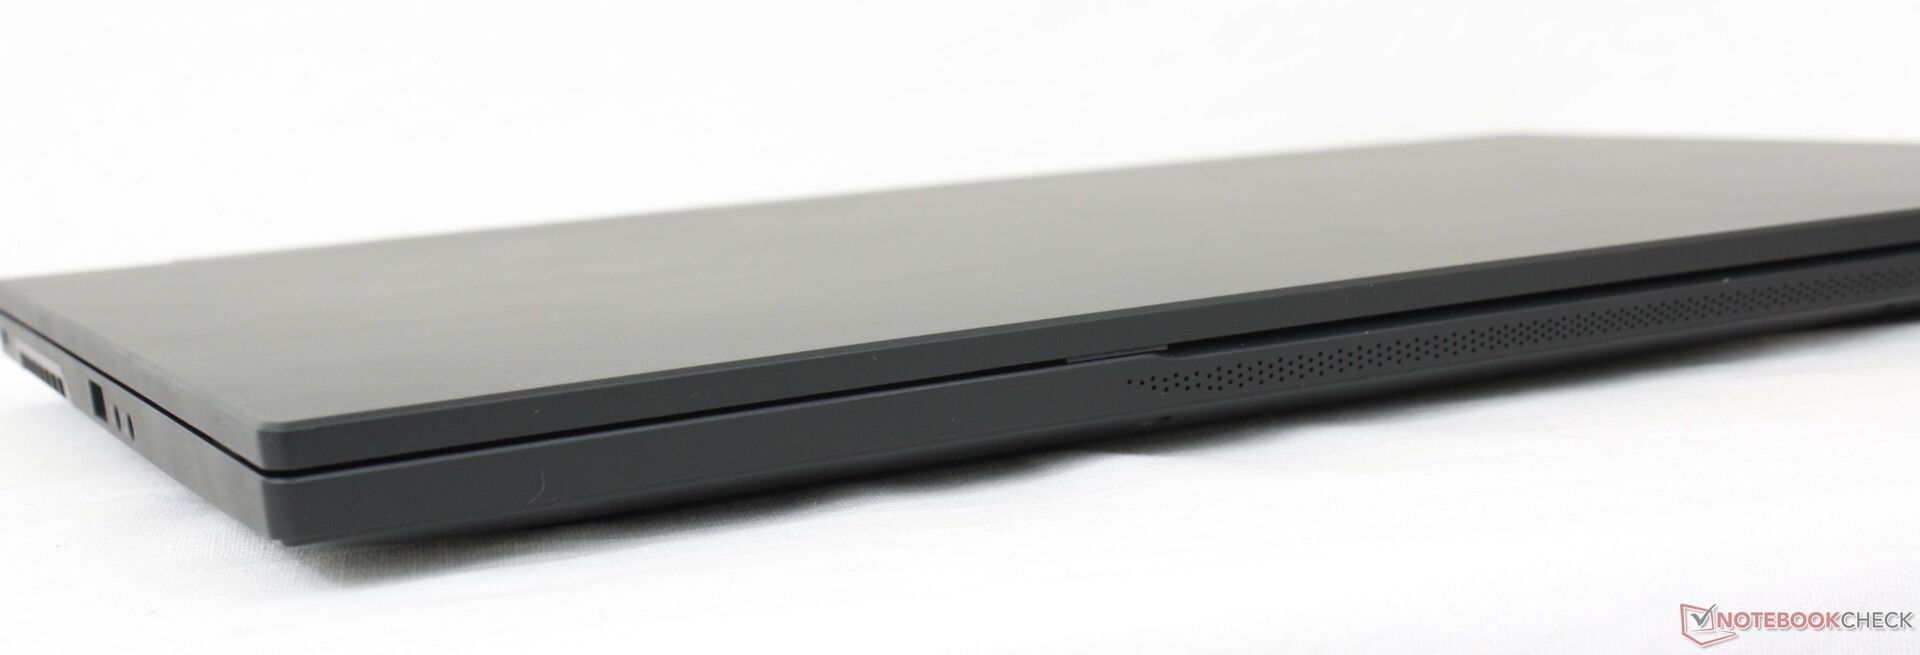
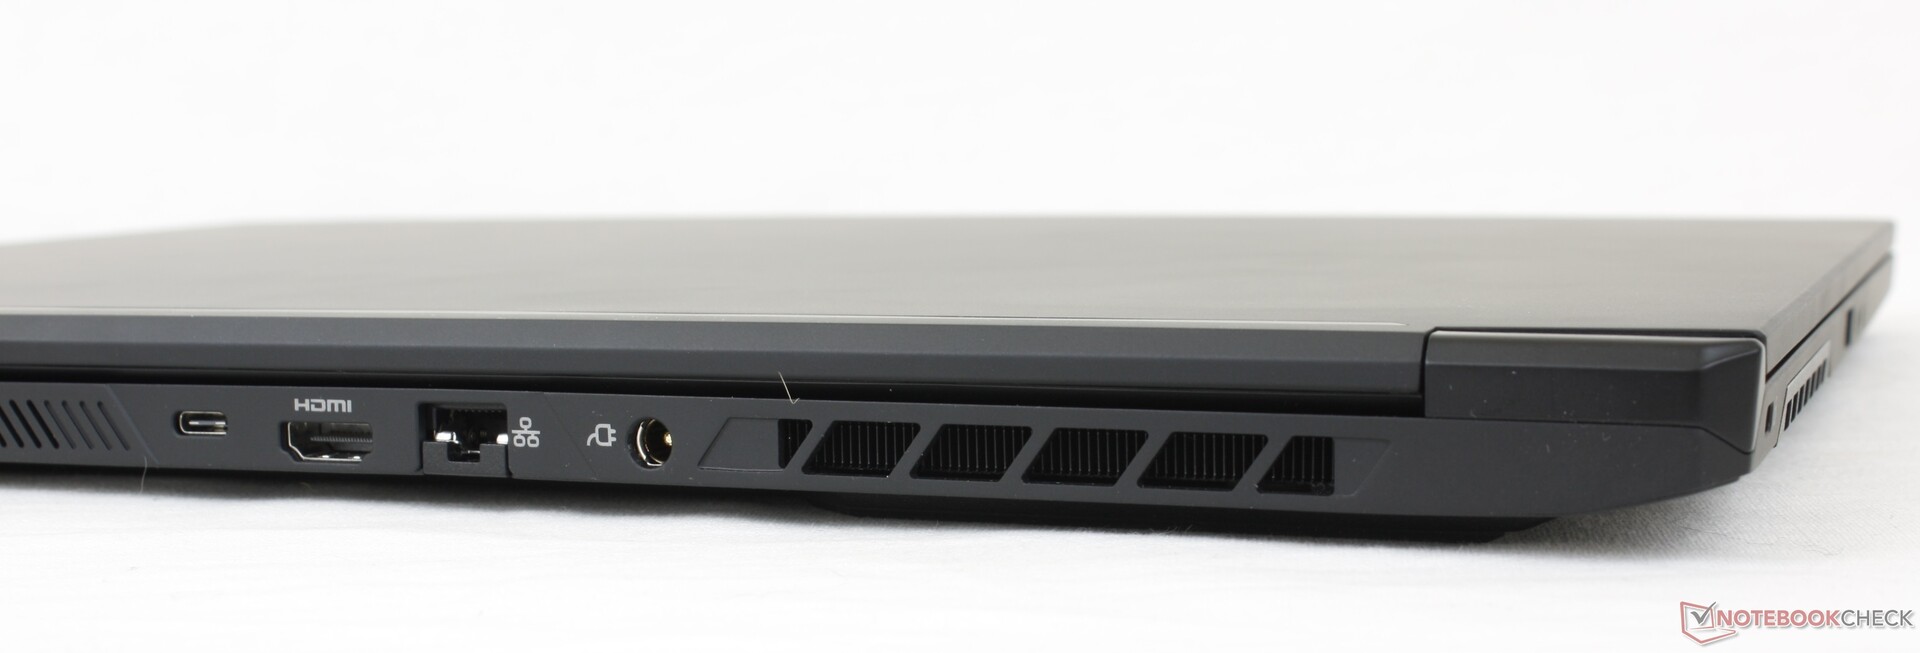
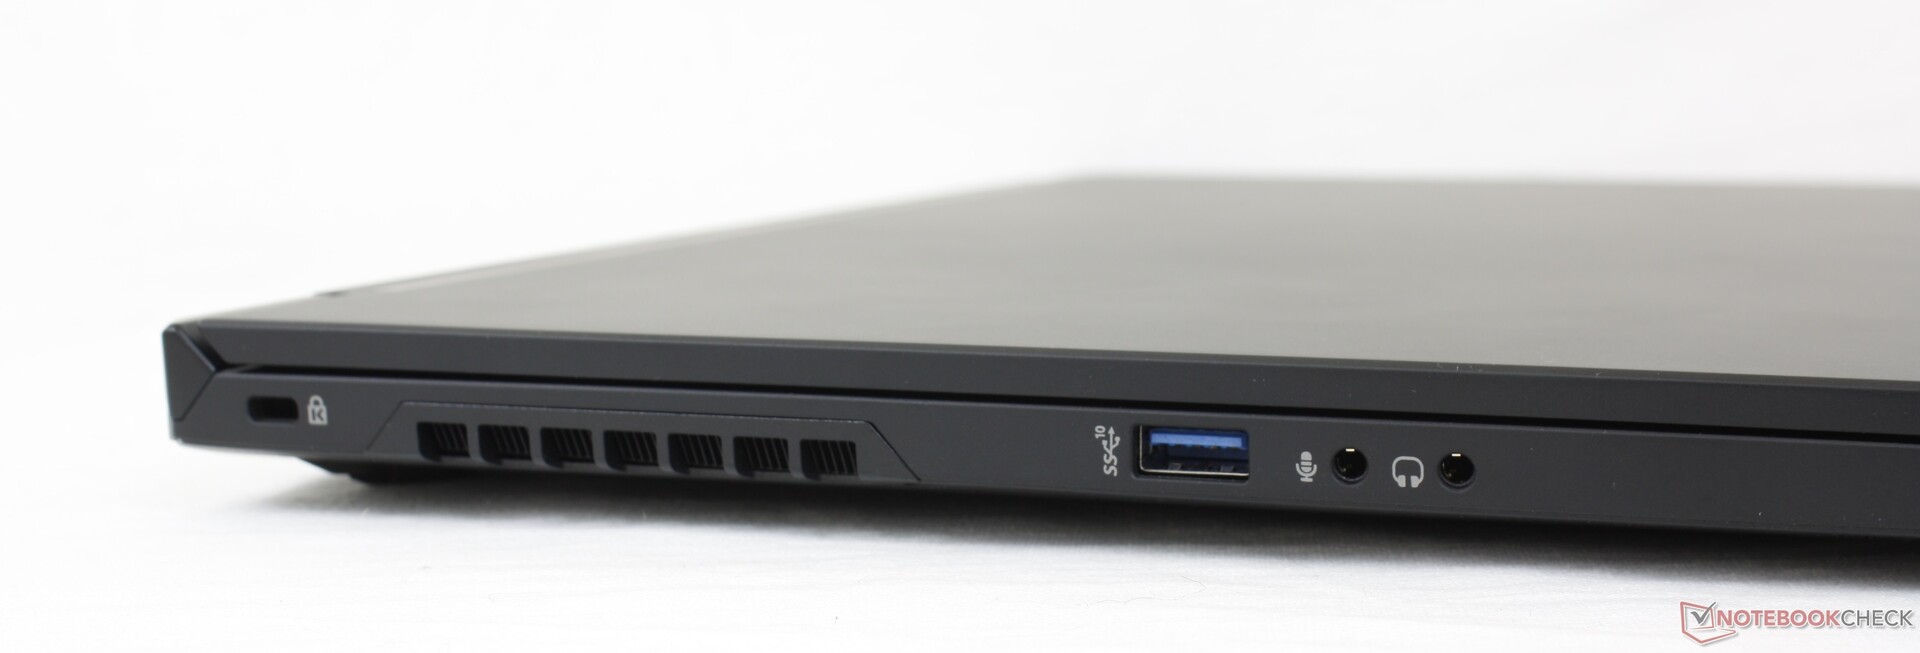
Conectividad - Thunderbolt 4... A veces
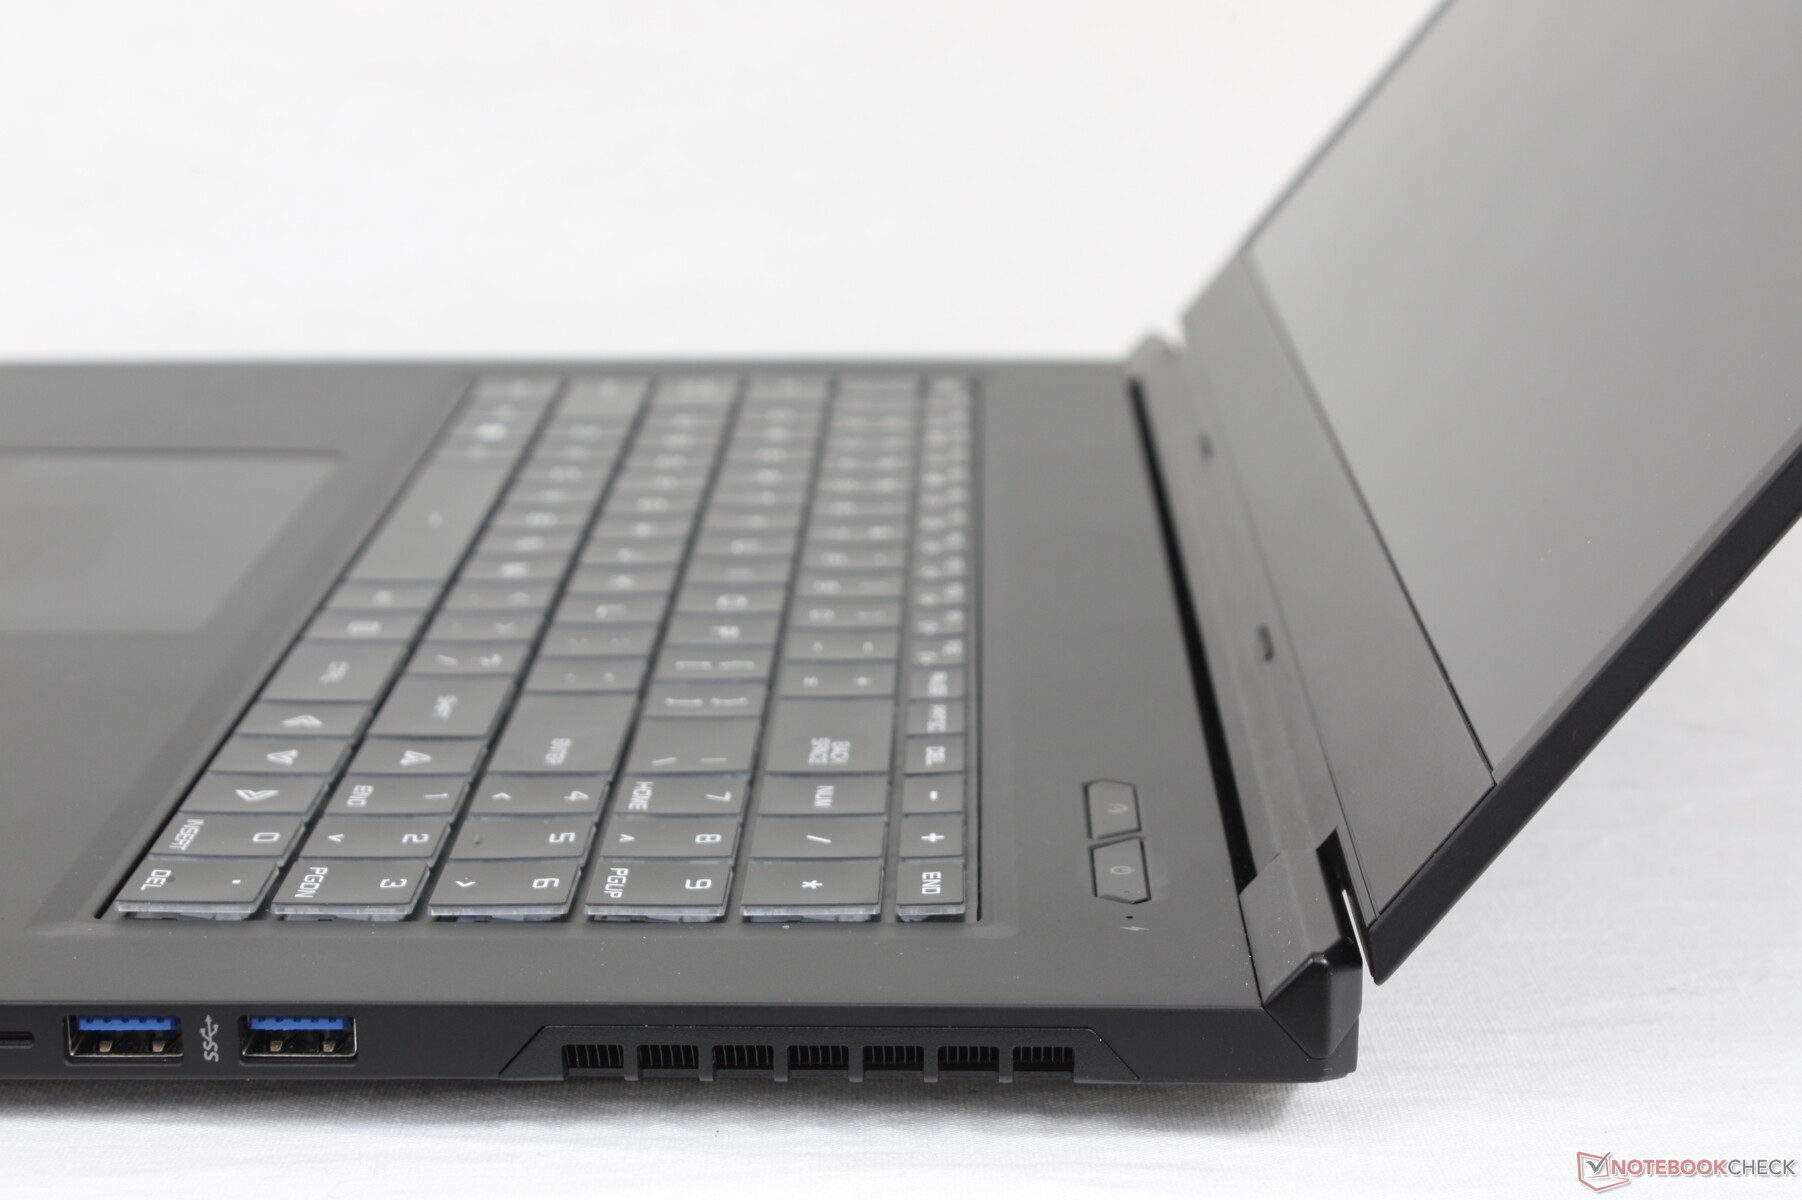
Las opciones de puerto son esencialmente idénticas a las del Schenker XMG Neo 17, pero con un par de diferencias importantes. El GM7AG8P utiliza un lector de tarjetas MicroSD más pequeño, por ejemplo, mientras que la compatibilidad con Thunderbolt 4 y G-Sync/Adaptive Sync externa solo se activará cuando se ejecute en modo MSHybrid.
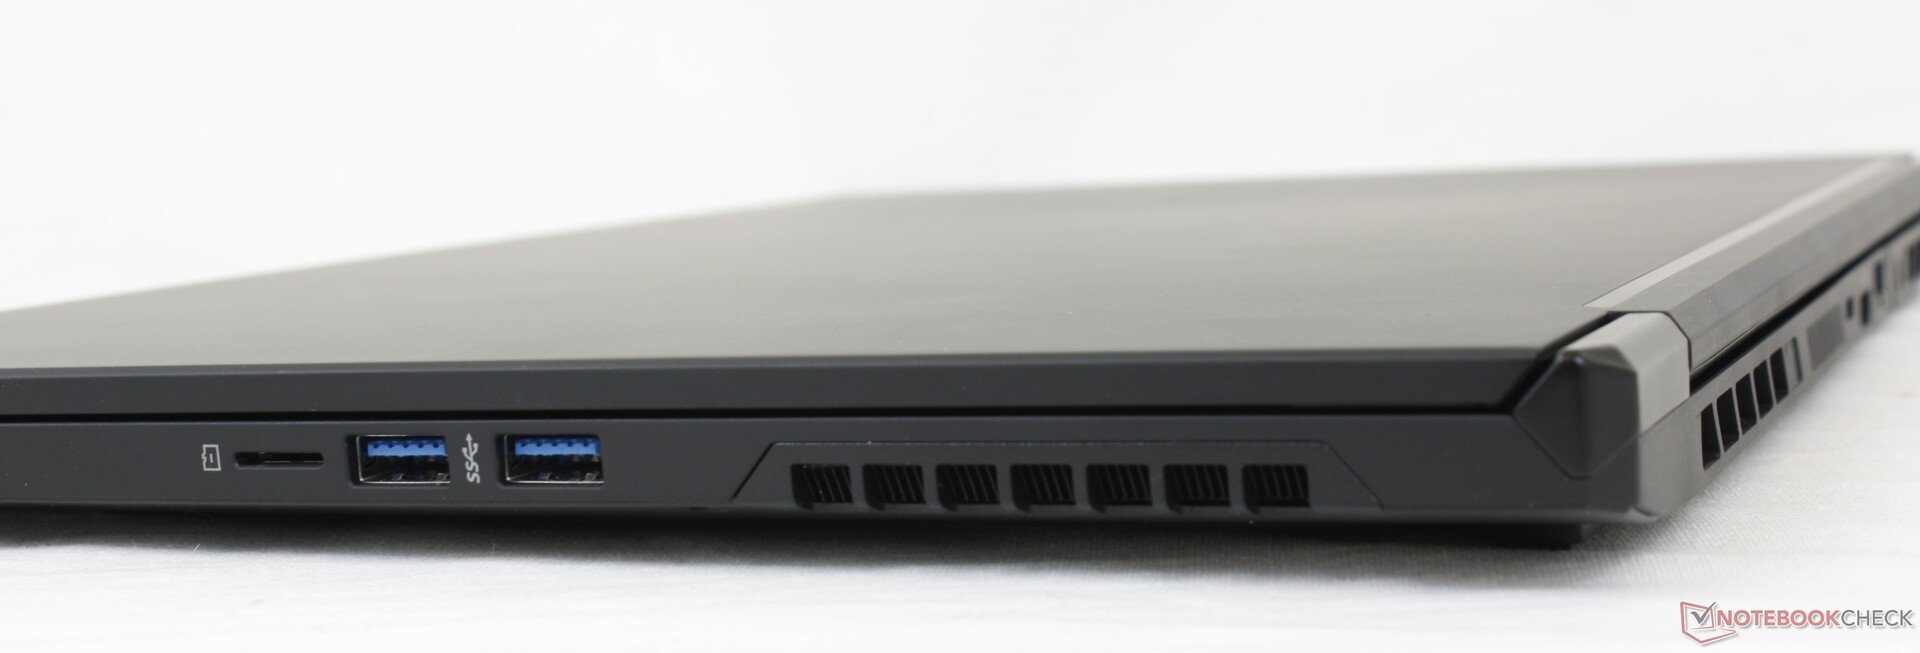
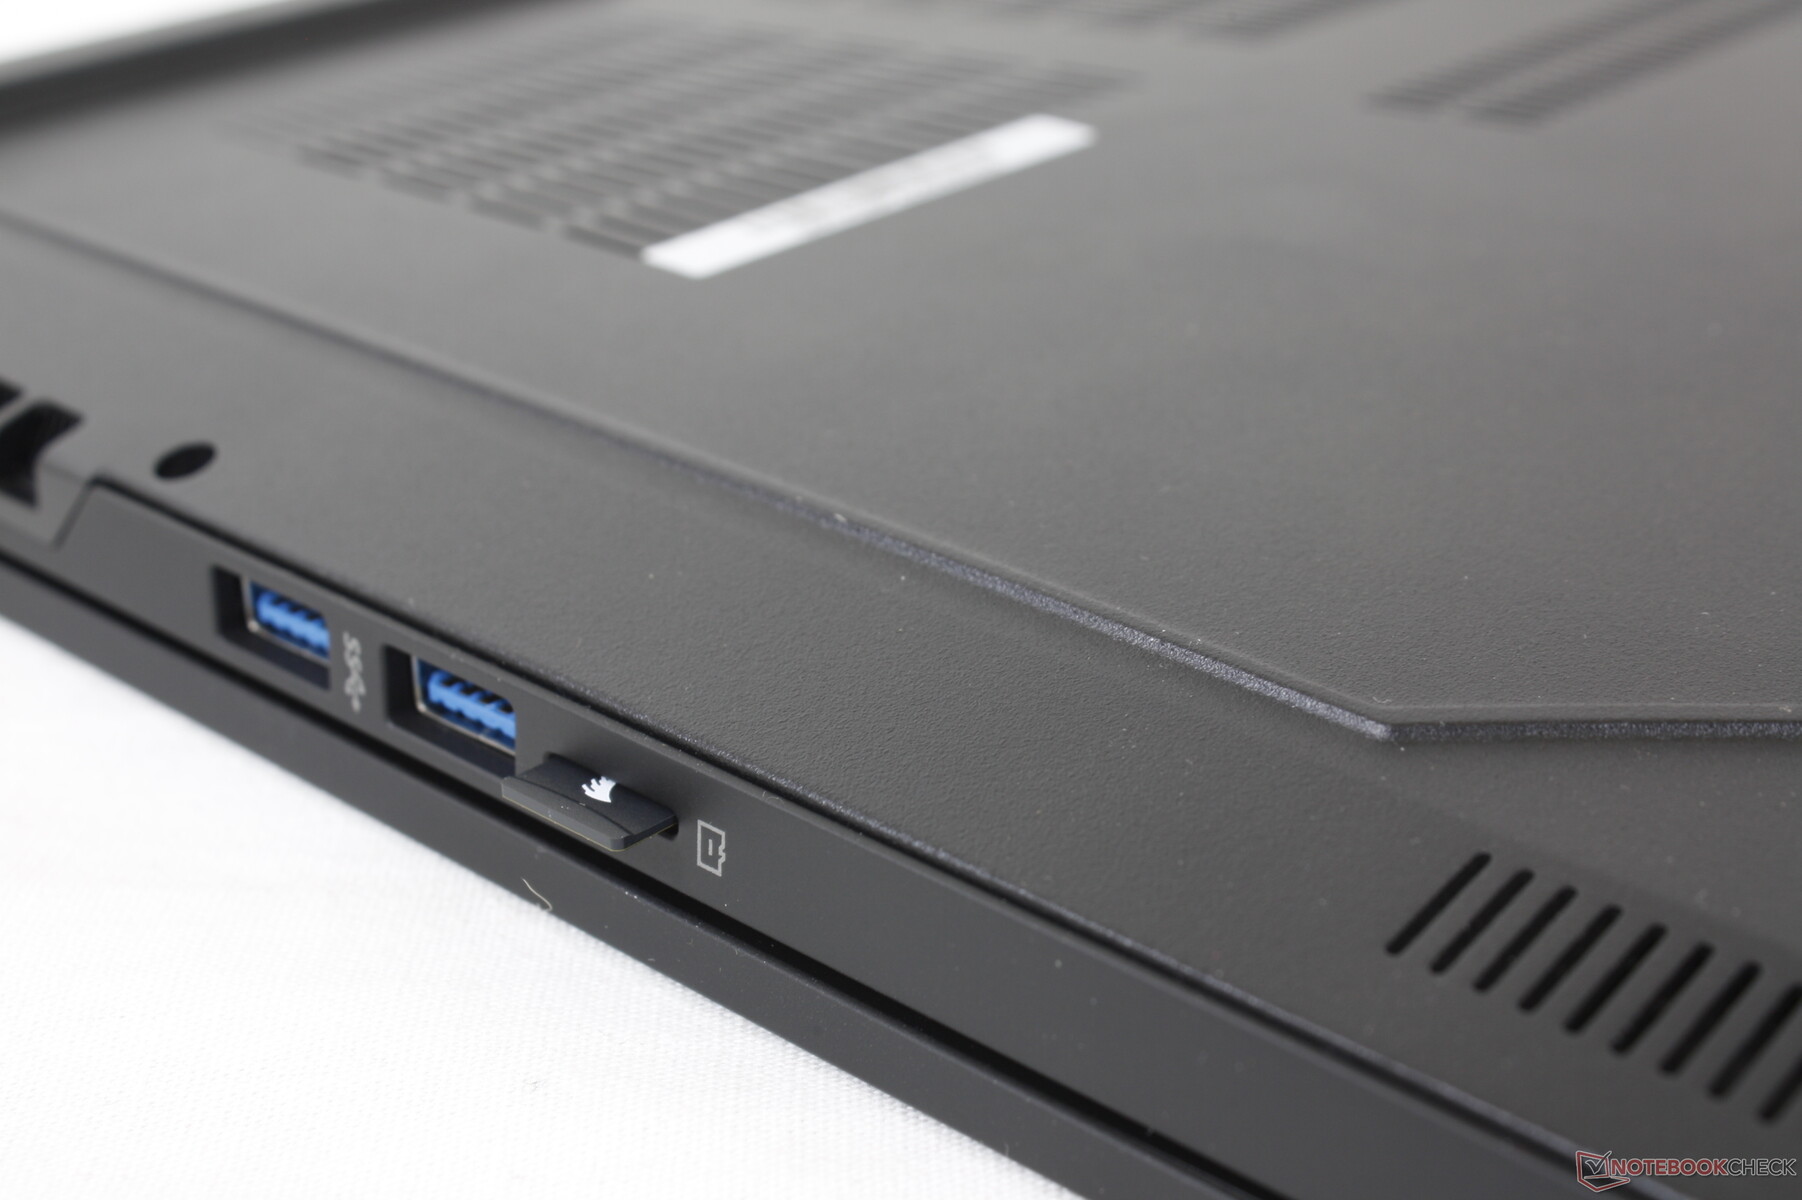
Lector de tarjetas SD - Sólo MicroSD
El sistema integra un lector de MicroSD a pesar del gran factor de forma de 17,3 pulgadas. Además, a diferencia de la mayoría de los lectores de MicroSD, el del GM7AG8P no tiene resorte y una tarjeta completamente insertada debe introducirse también al revés. Las velocidades de transferencia son medias, ya que se tarda unos 15 segundos en mover 1 GB de imágenes desde nuestra tarjeta de prueba UHS-II, en comparación con la mitad en el últimoRazer Blade 17.
| SD Card Reader | |
| average JPG Copy Test (av. of 3 runs) | |
| Razer Blade 17 RTX 3070 (AV Pro V60) | |
| MSI GS76 Stealth 11UH (AV PRO microSD 128 GB V60) | |
| Alienware x17 RTX 3080 P48E (AV Pro V60) | |
| Maingear Vector Pro MG-VCP17 (AV Pro V60) | |
| Schenker XMG NEO 17 GM7TG8S | |
| Schenker Uniwill Technology GM7AG8P (AV Pro V60) | |
| maximum AS SSD Seq Read Test (1GB) | |
| Alienware x17 RTX 3080 P48E (AV Pro V60) | |
| MSI GS76 Stealth 11UH (AV PRO microSD 128 GB V60) | |
| Razer Blade 17 RTX 3070 (AV Pro V60) | |
| Schenker XMG NEO 17 GM7TG8S | |
| Maingear Vector Pro MG-VCP17 (AV Pro V60) | |
| Schenker Uniwill Technology GM7AG8P (AV Pro V60) | |
Comunicación
Cámara web
La calidad de la cámara es pobre a pesar del sensor de 2 MP. Las imágenes son más granuladas de lo esperado, incluso para los ya bajos estándares de las webcams de los portátiles
El IR está integrado para el soporte de Windows Hello.


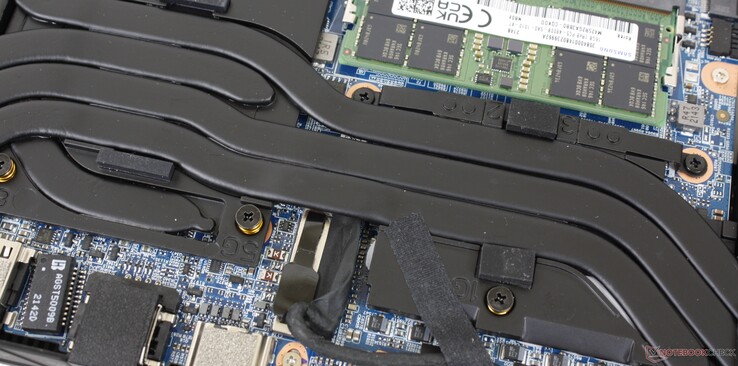
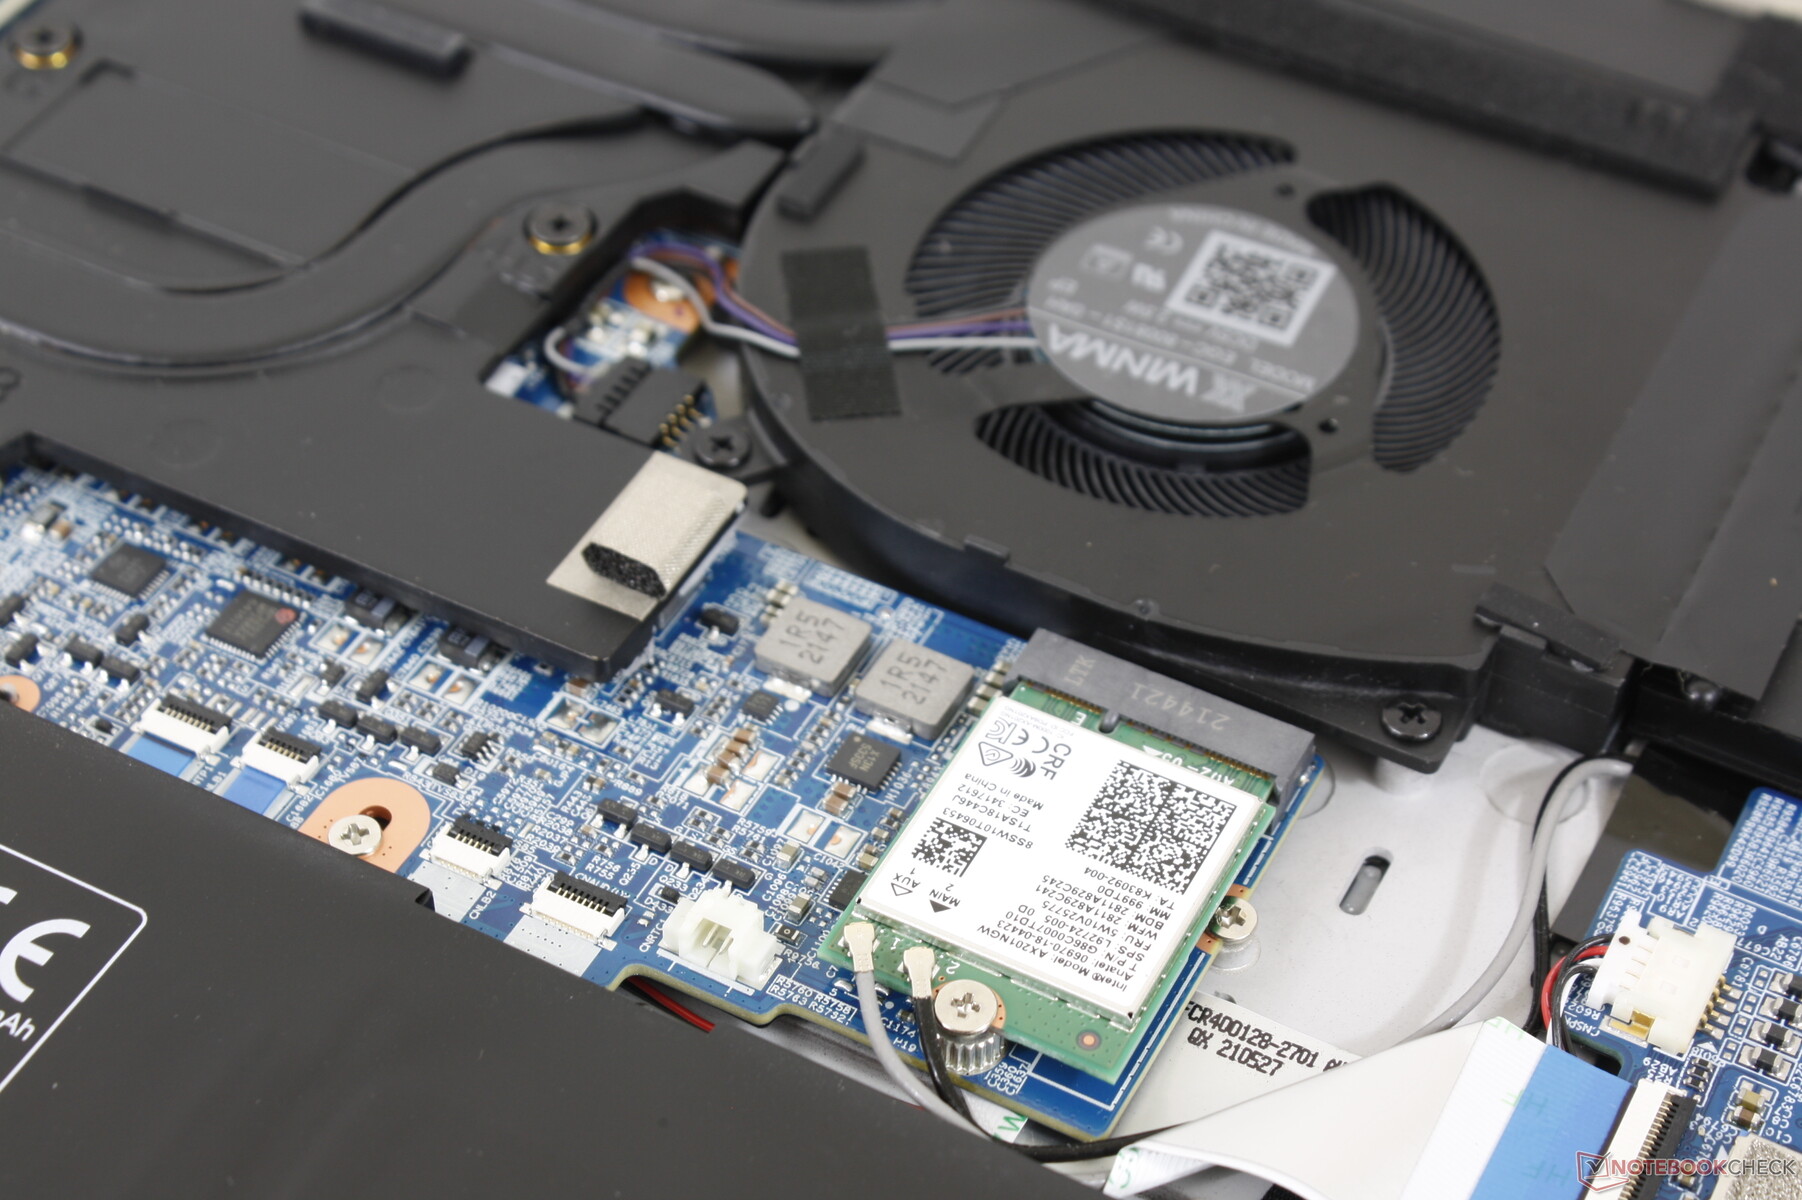
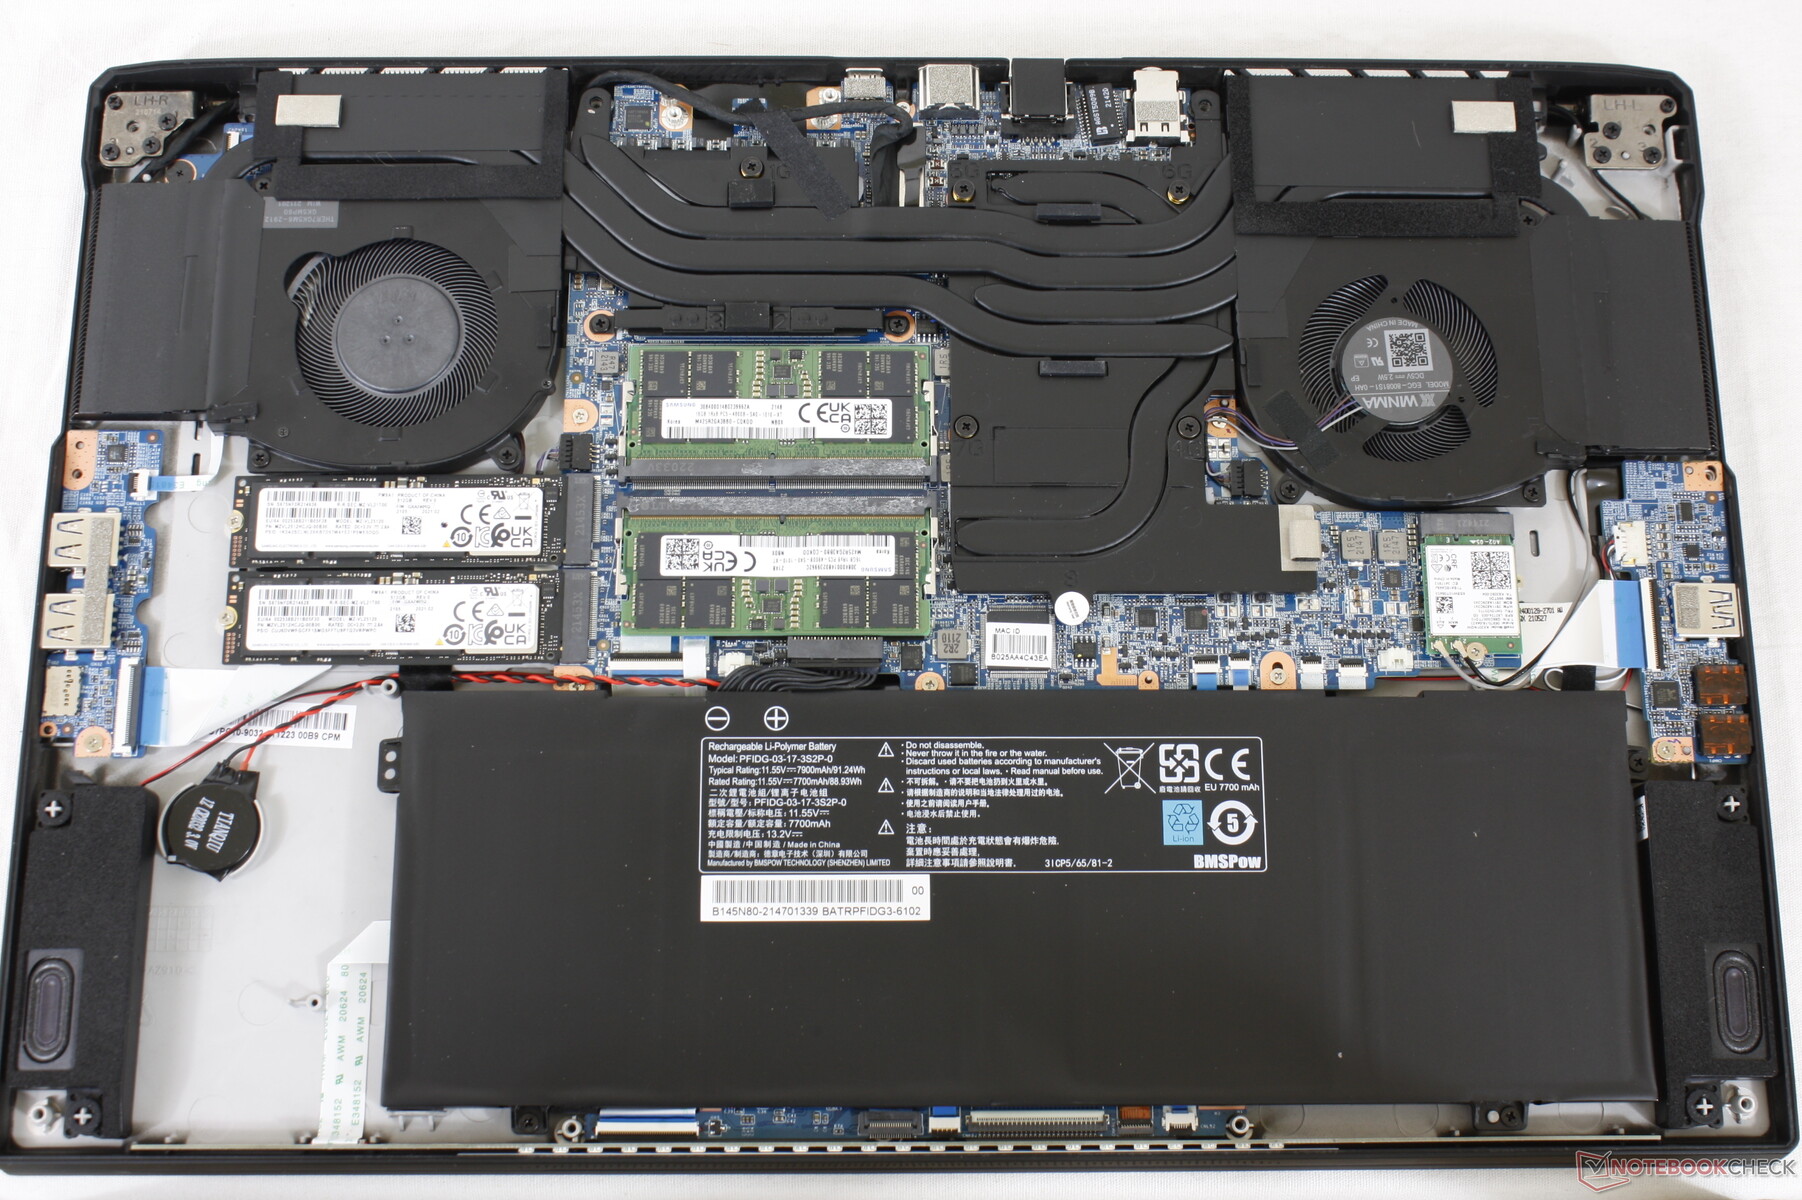
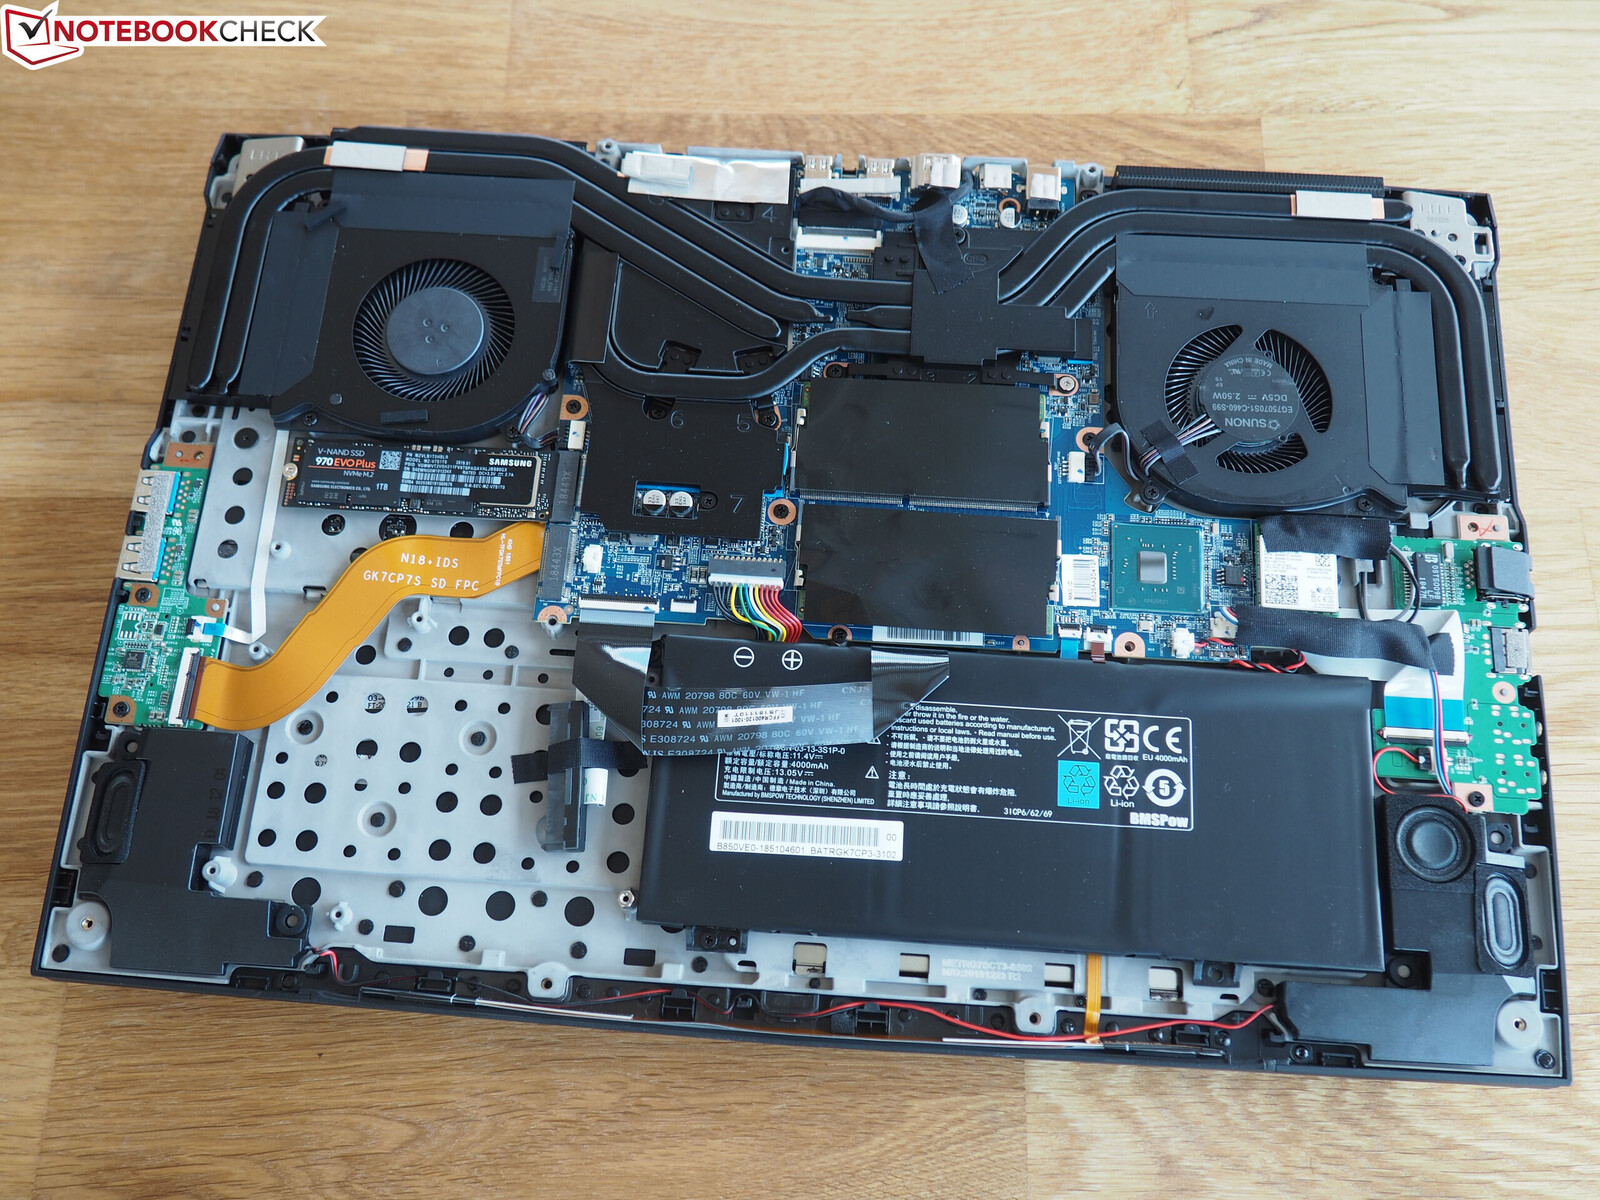
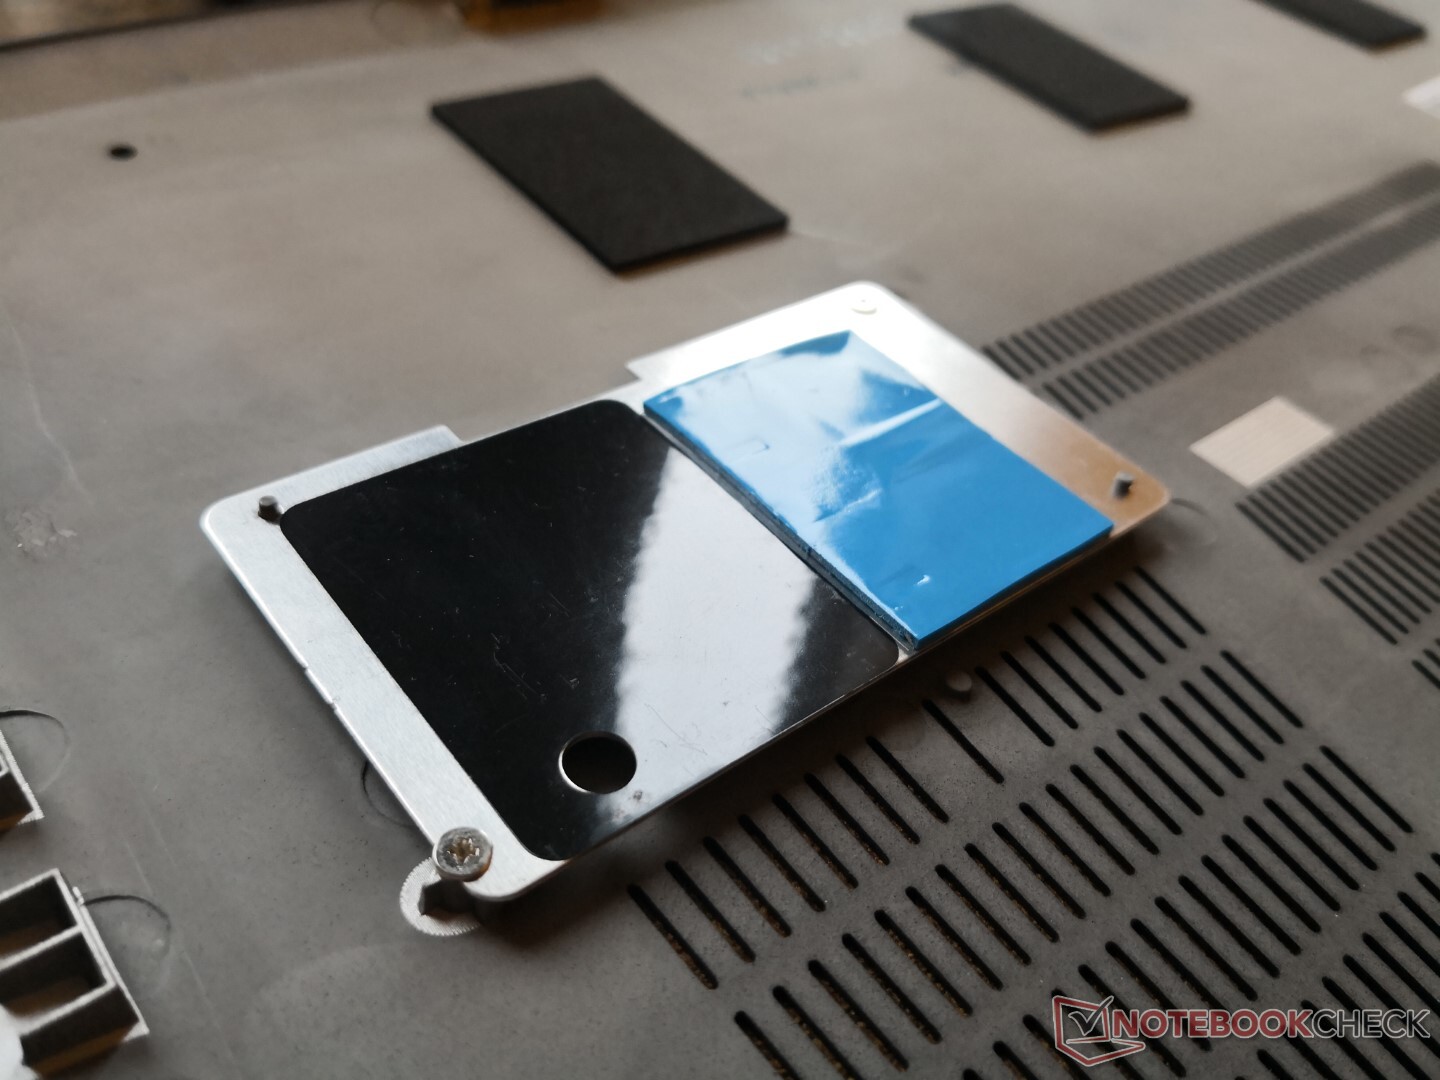
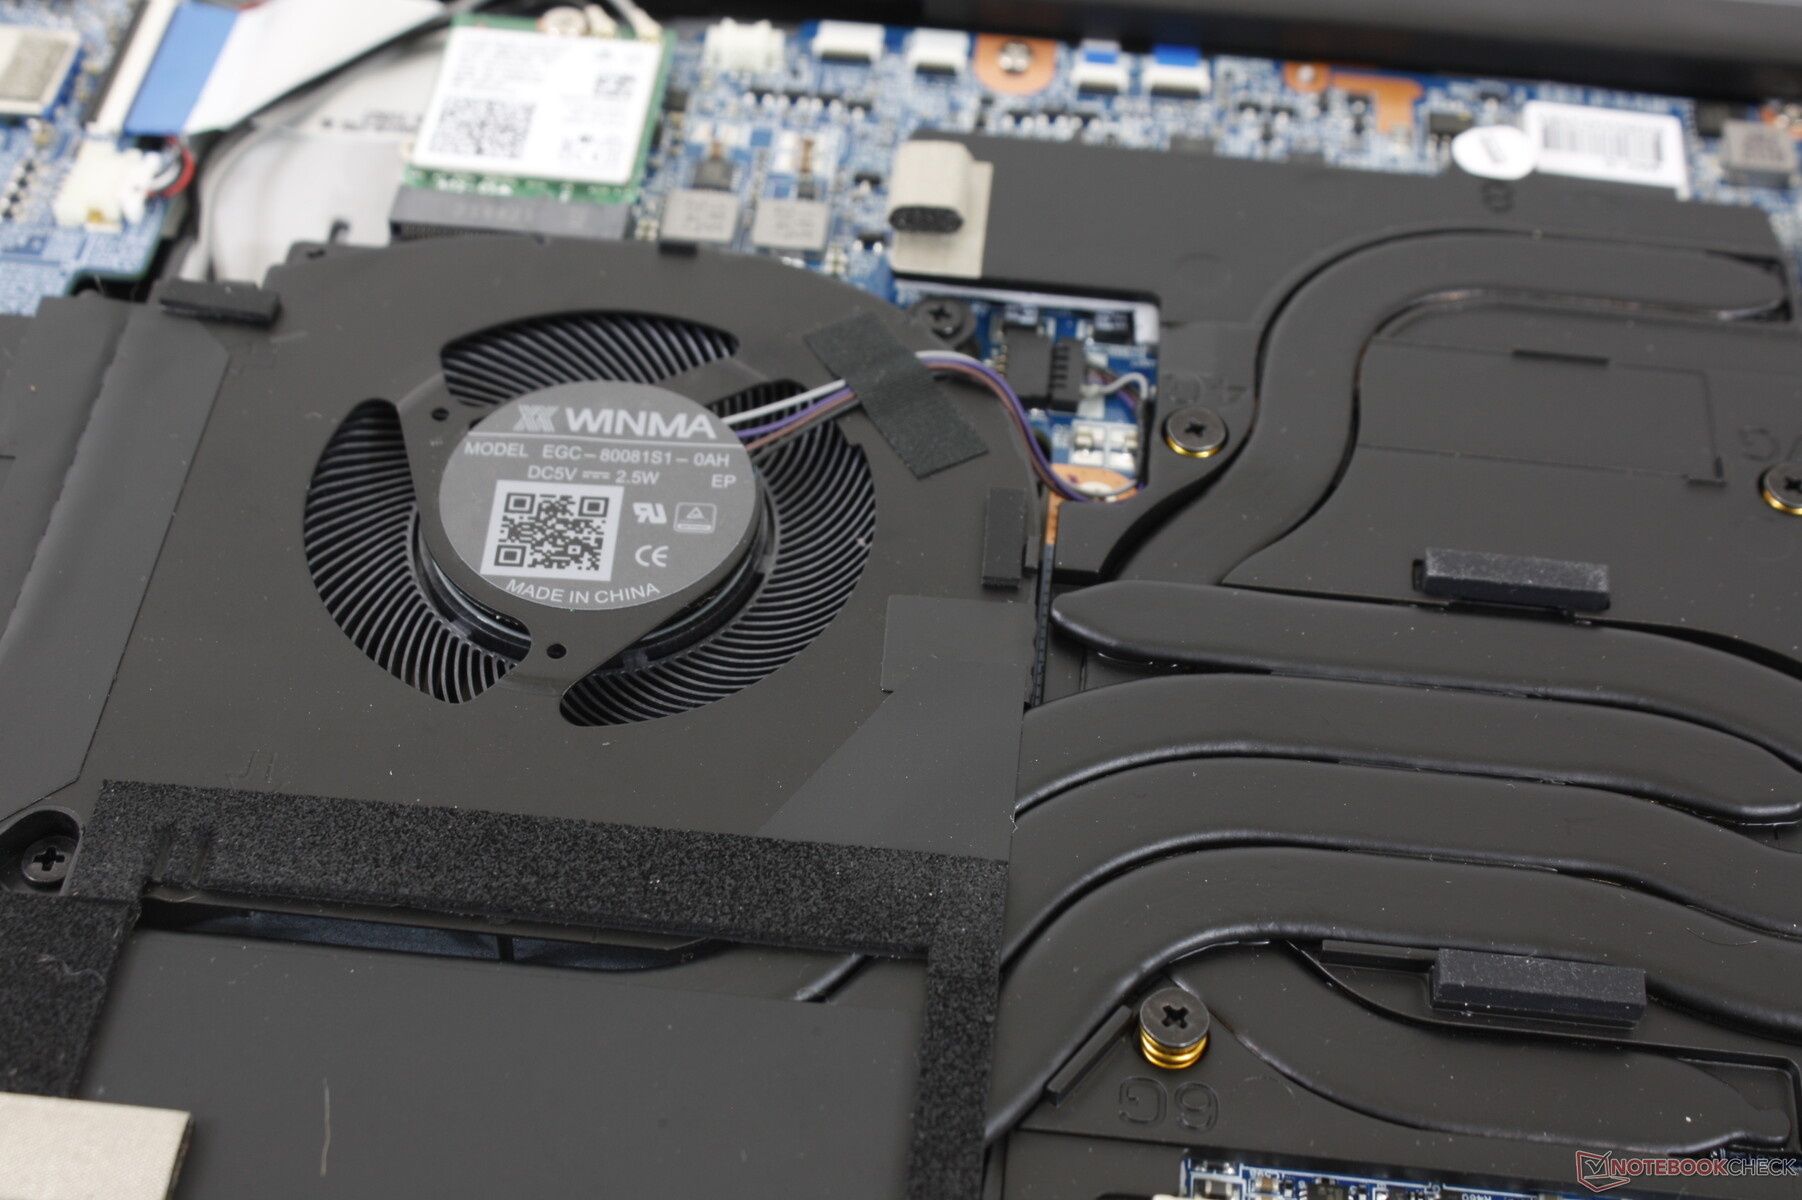
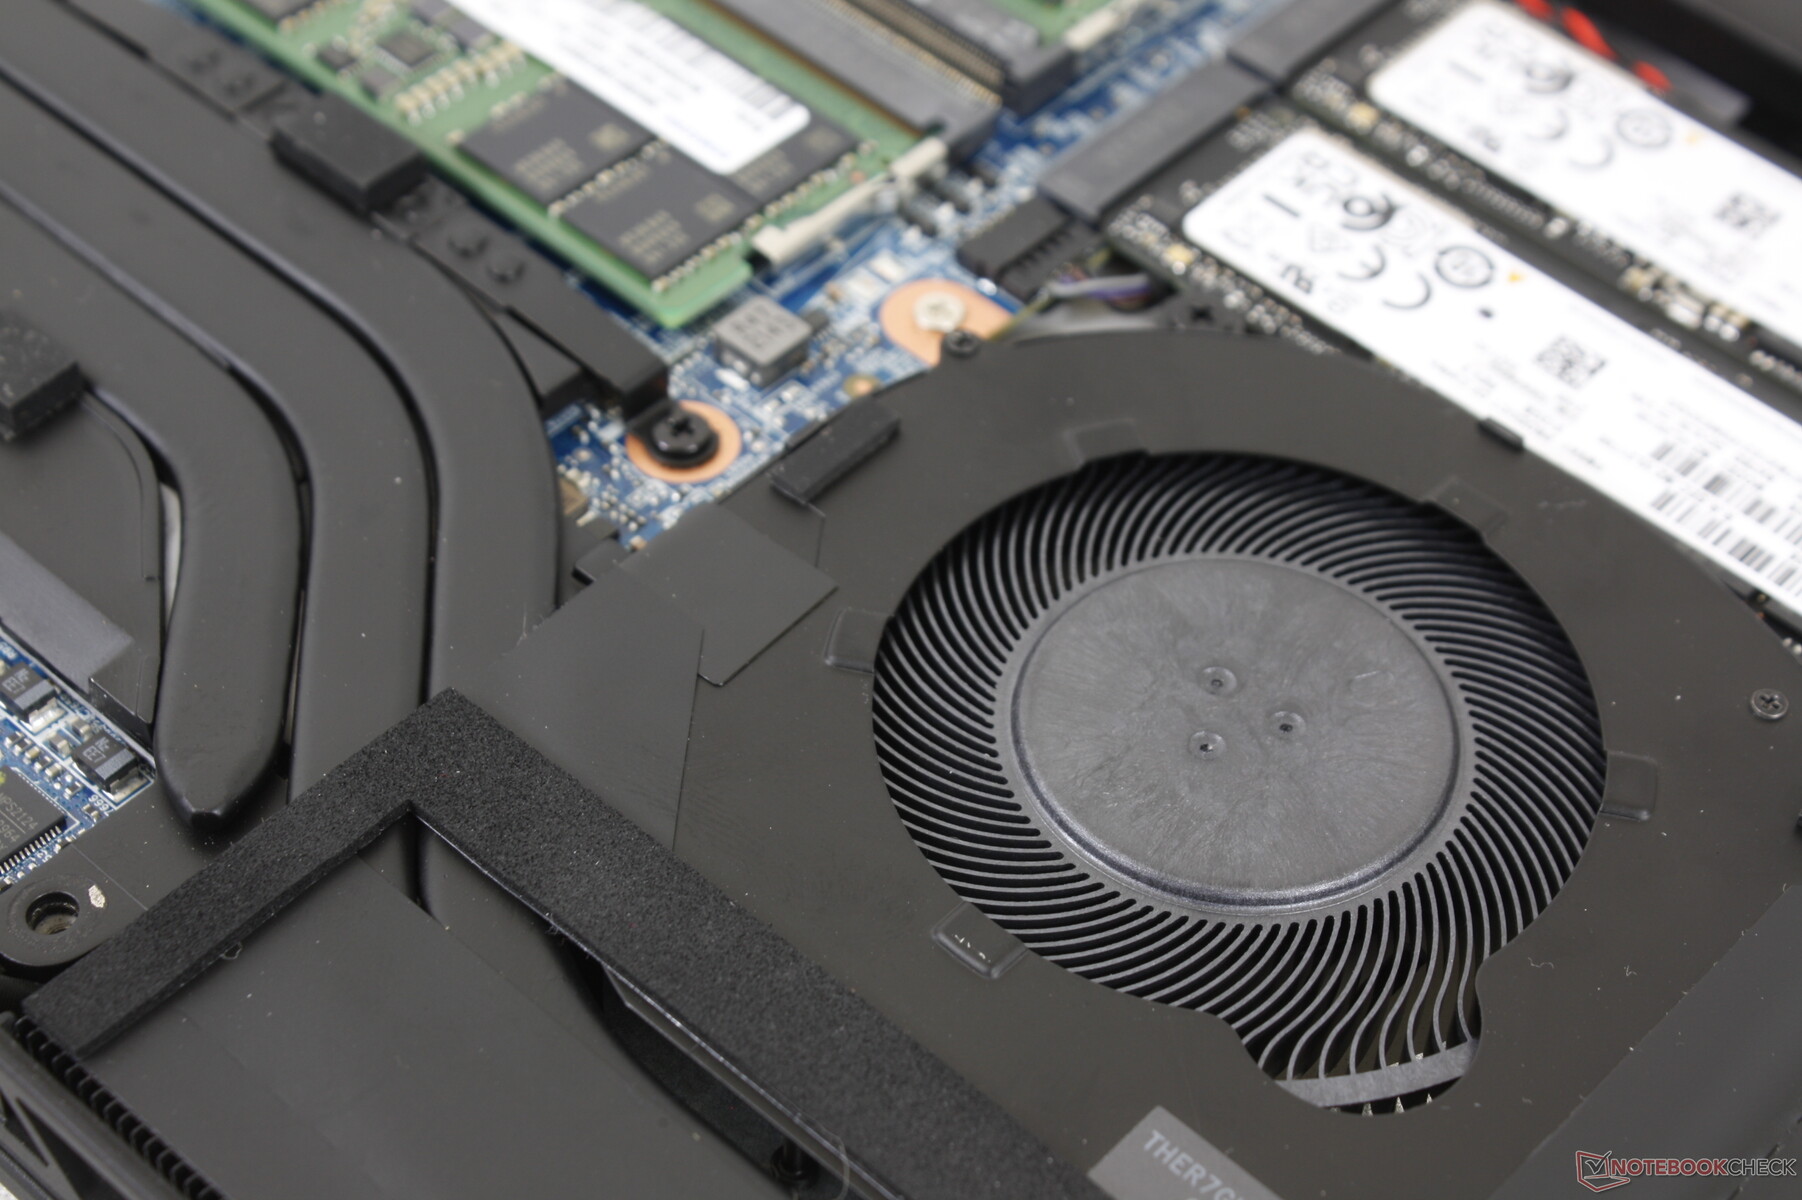
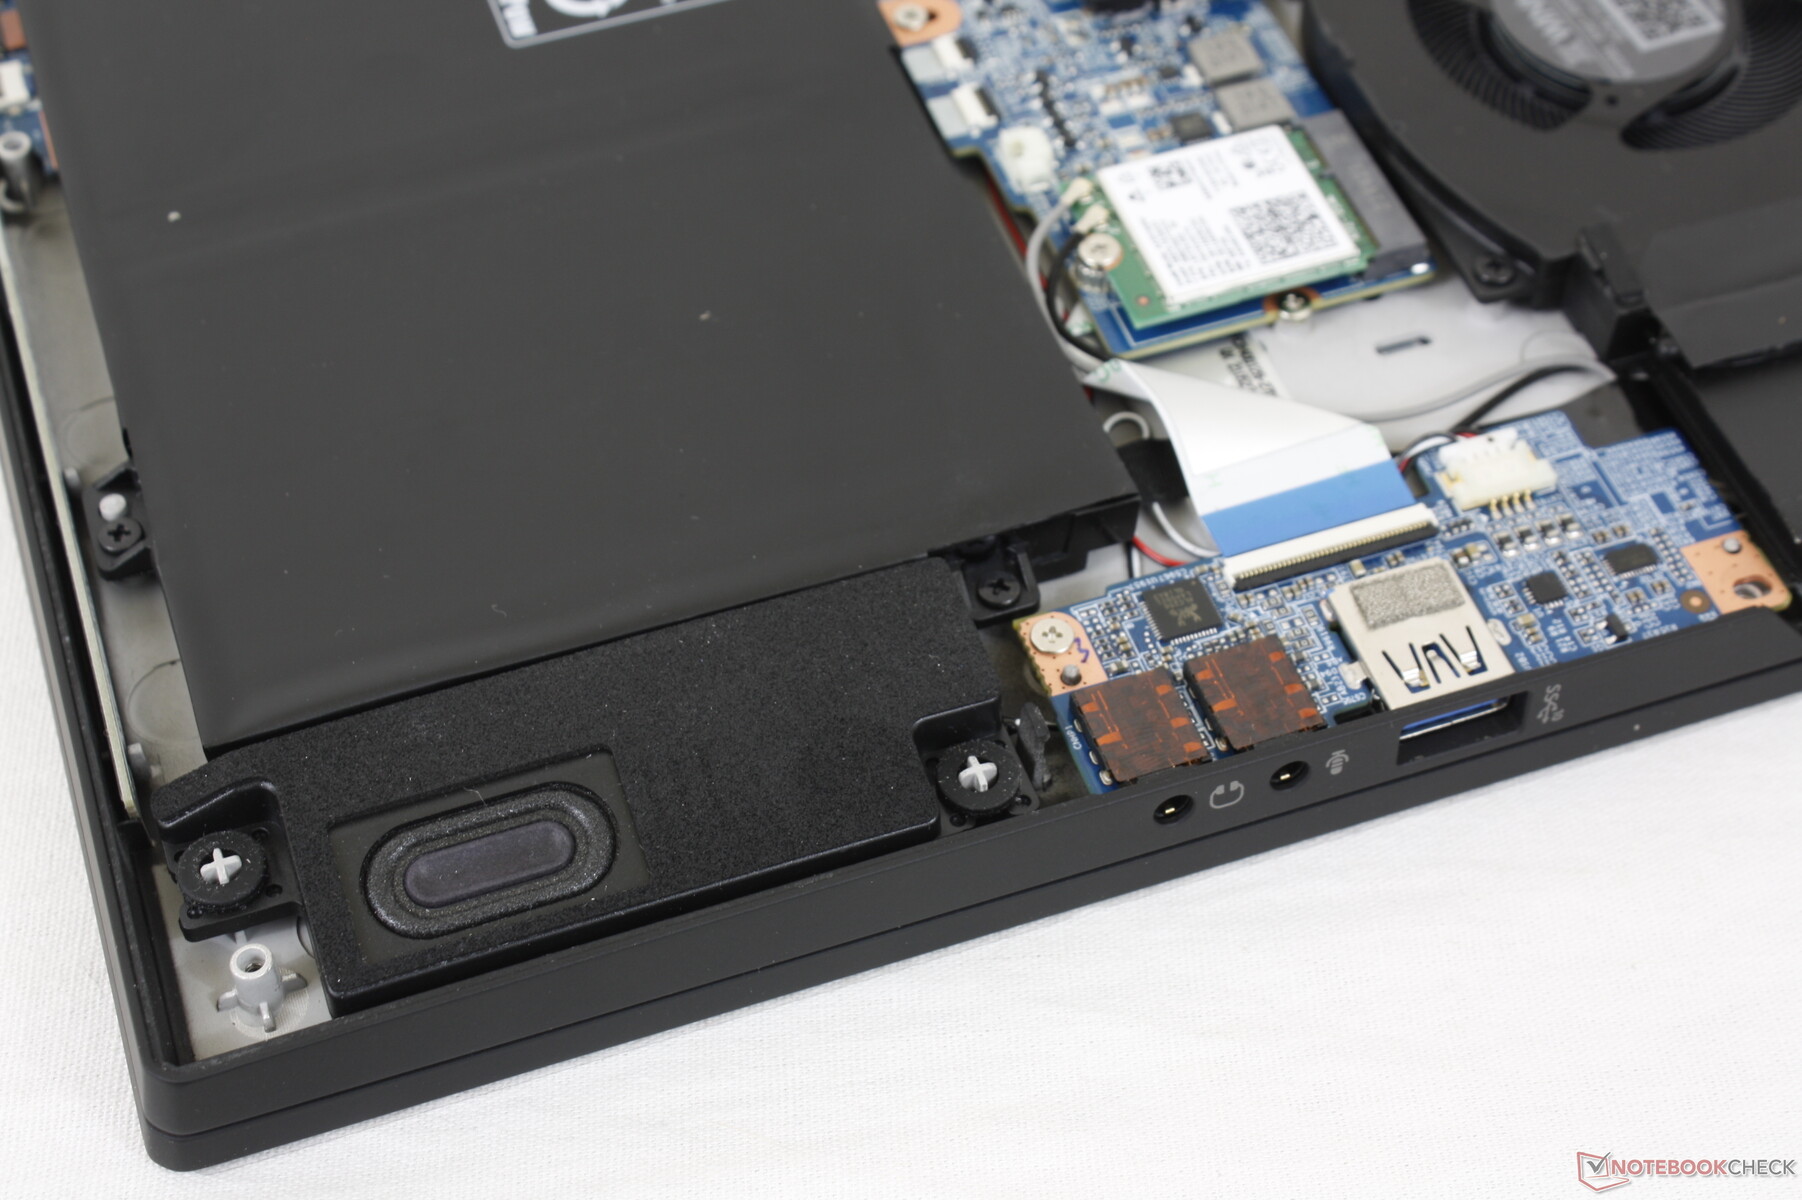
Mantenimiento
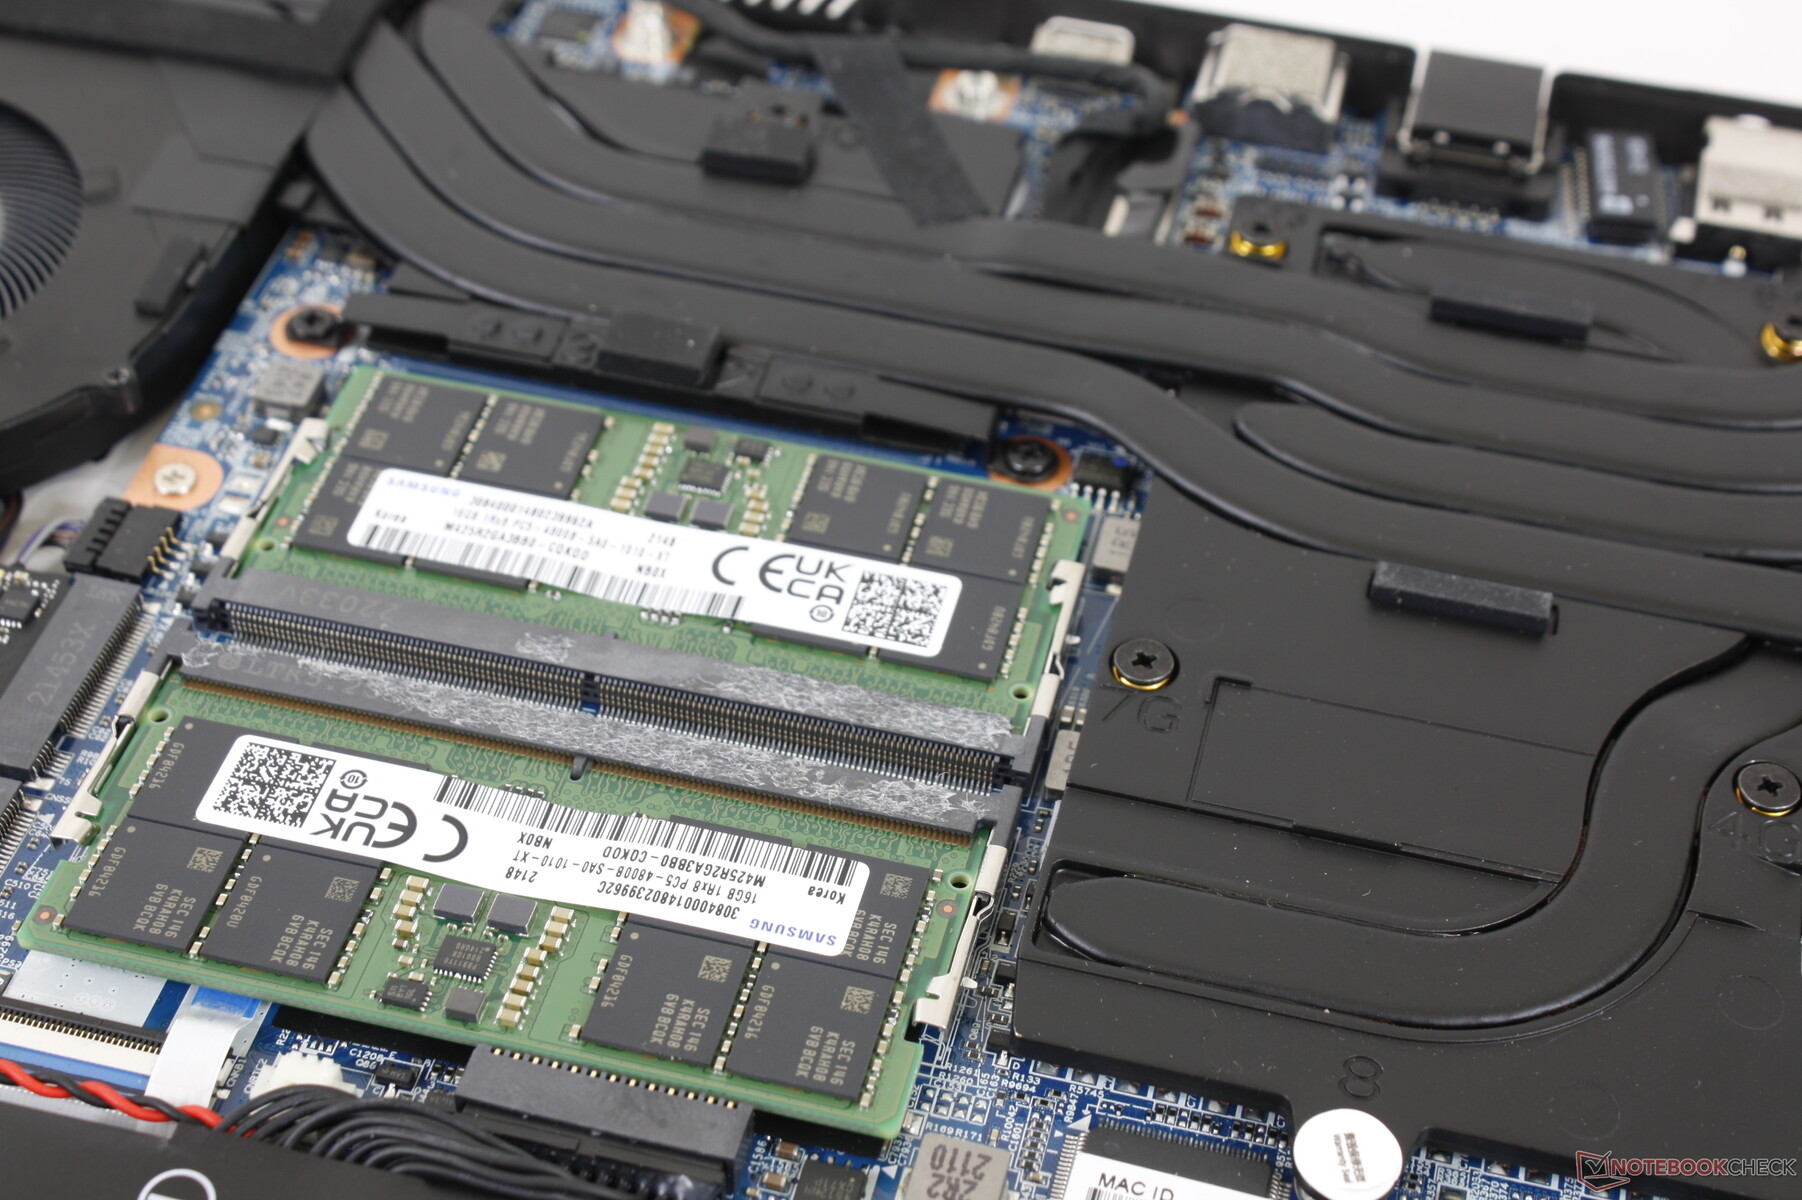
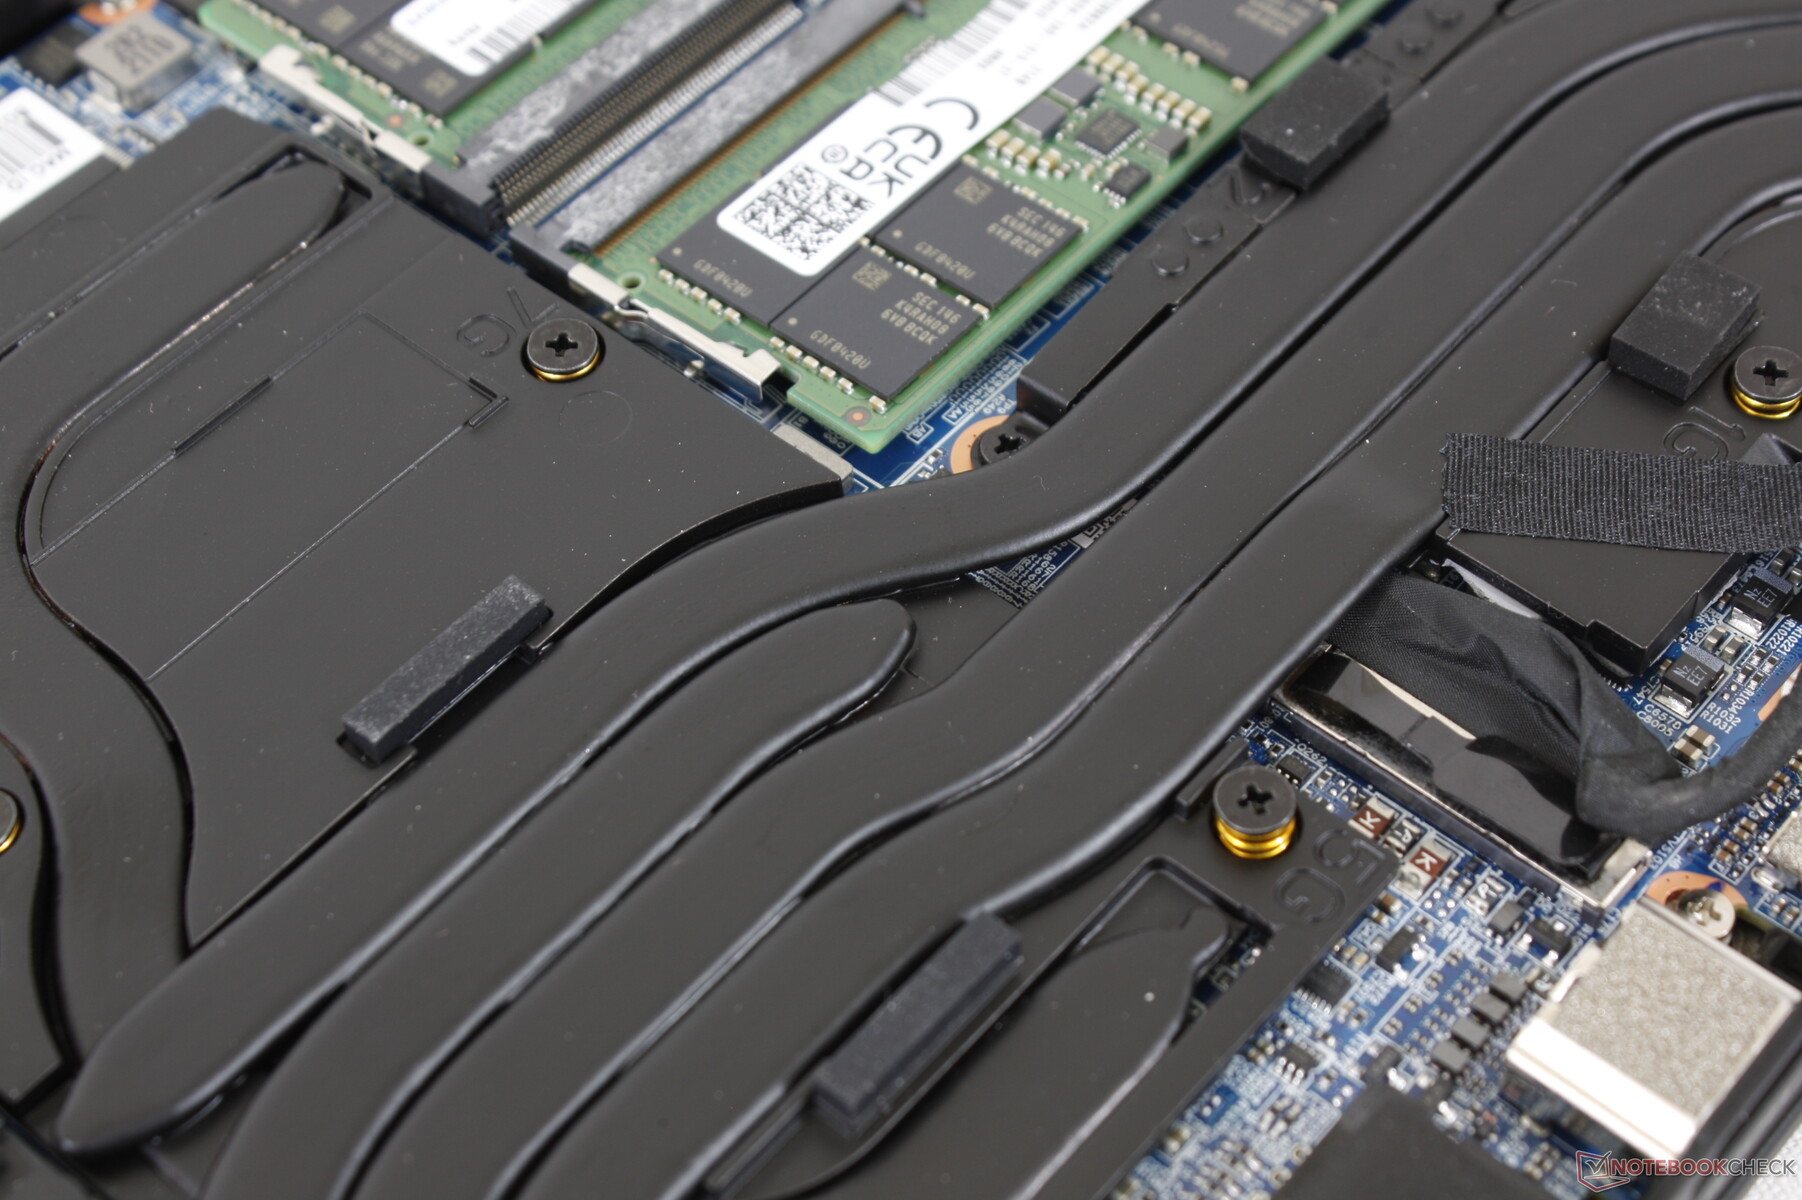
El panel inferior está asegurado por 10 tornillos Philips para facilitar el mantenimiento. Los usuarios tienen acceso directo a las dos bahías de almacenamiento M.2 2280, las dos ranuras SODIMM, las baterías principales y el módulo WLAN.
Accesorios y garantía
No hay más extras en la caja que el adaptador de CA y la documentación. La garantía estándar del fabricante es de uno a dos años, dependiendo de la región
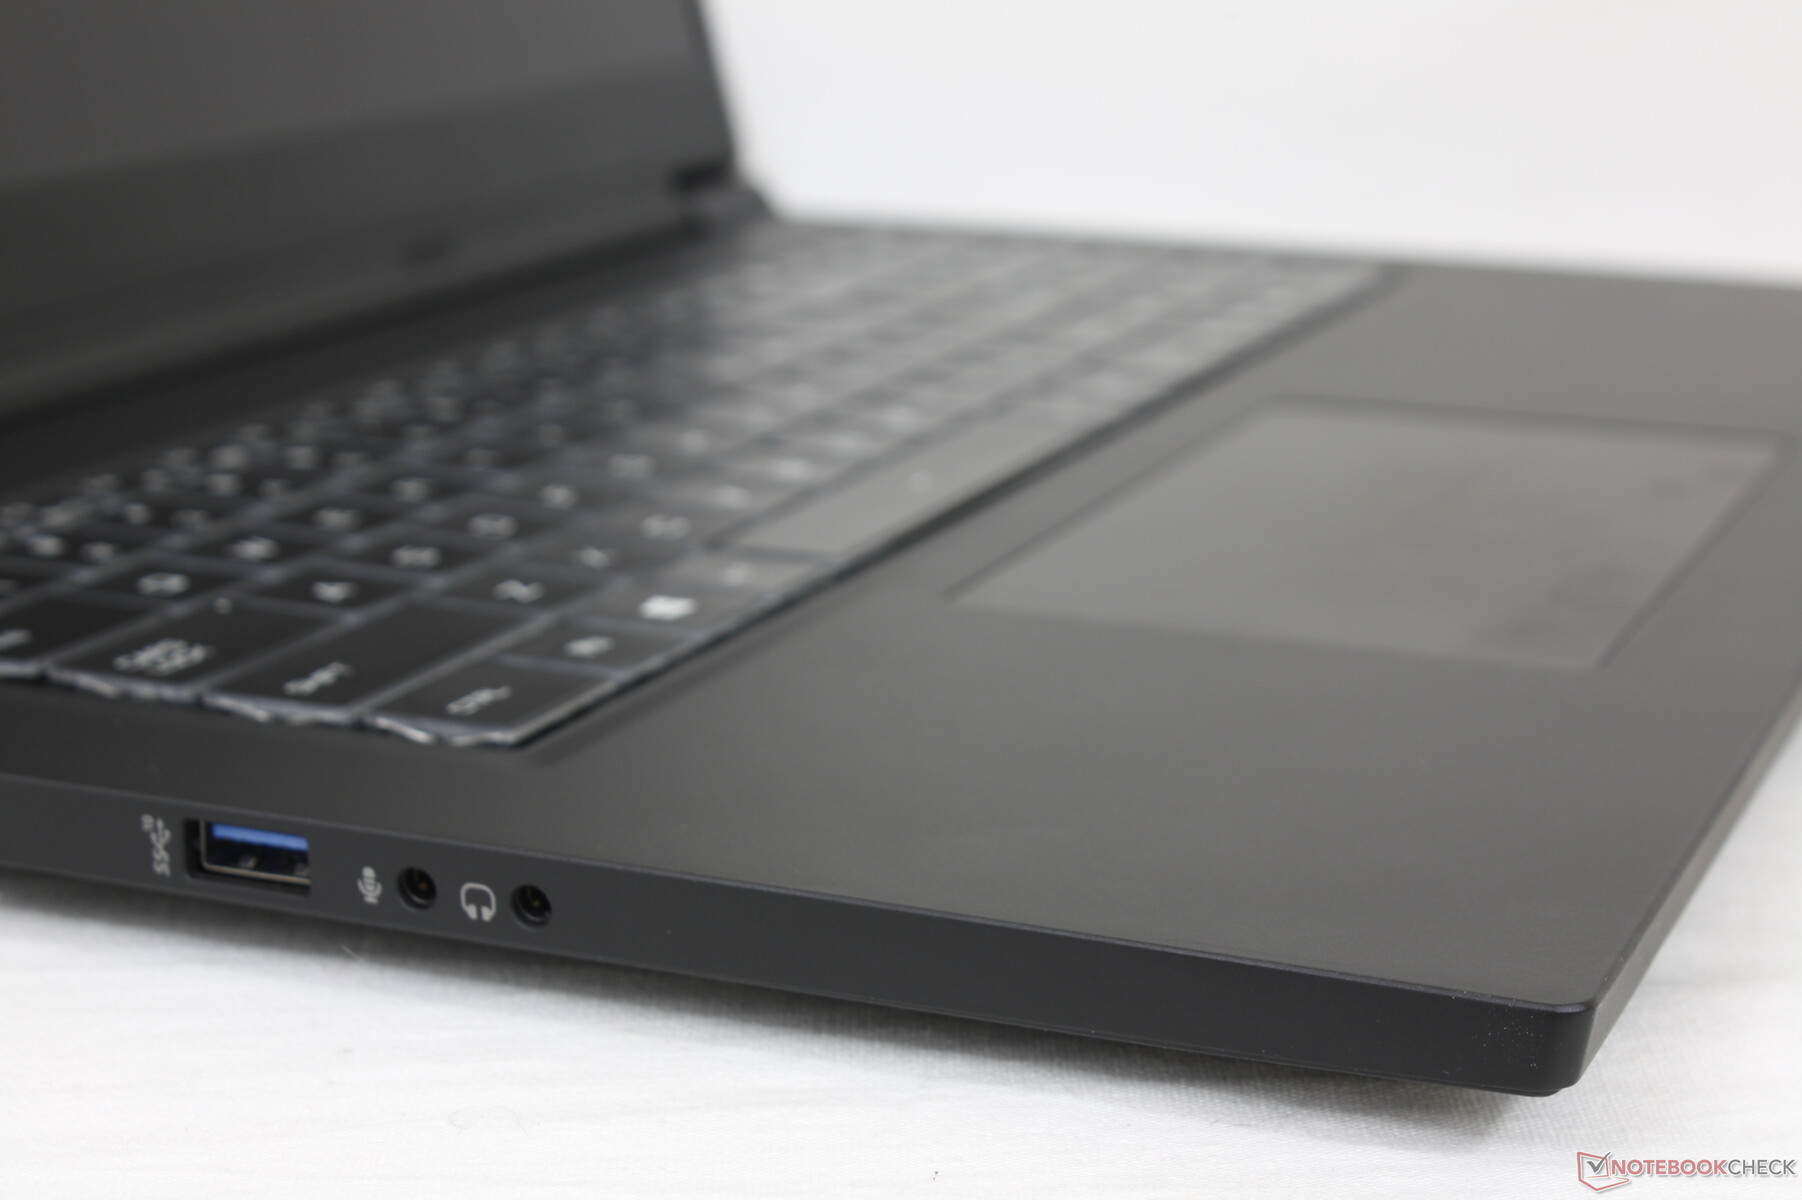
Dispositivos de entrada
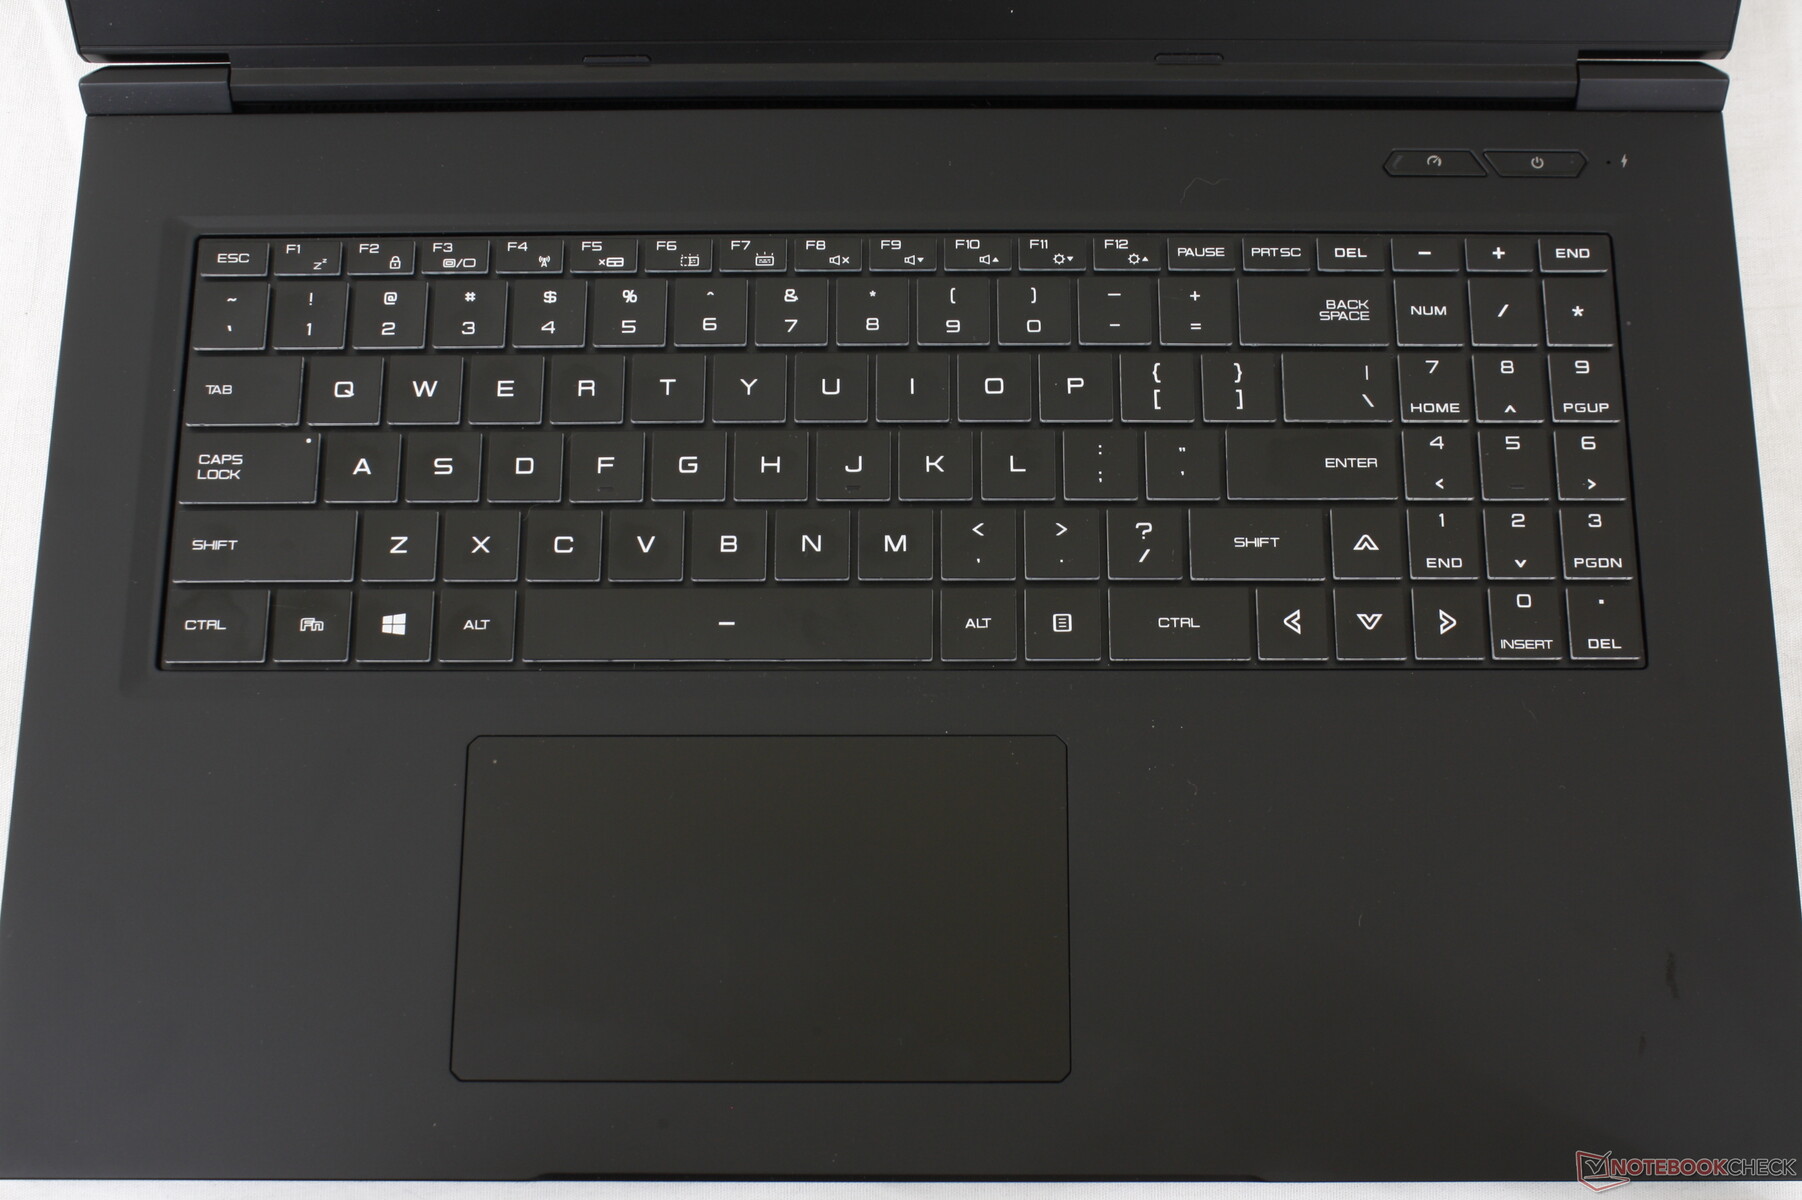
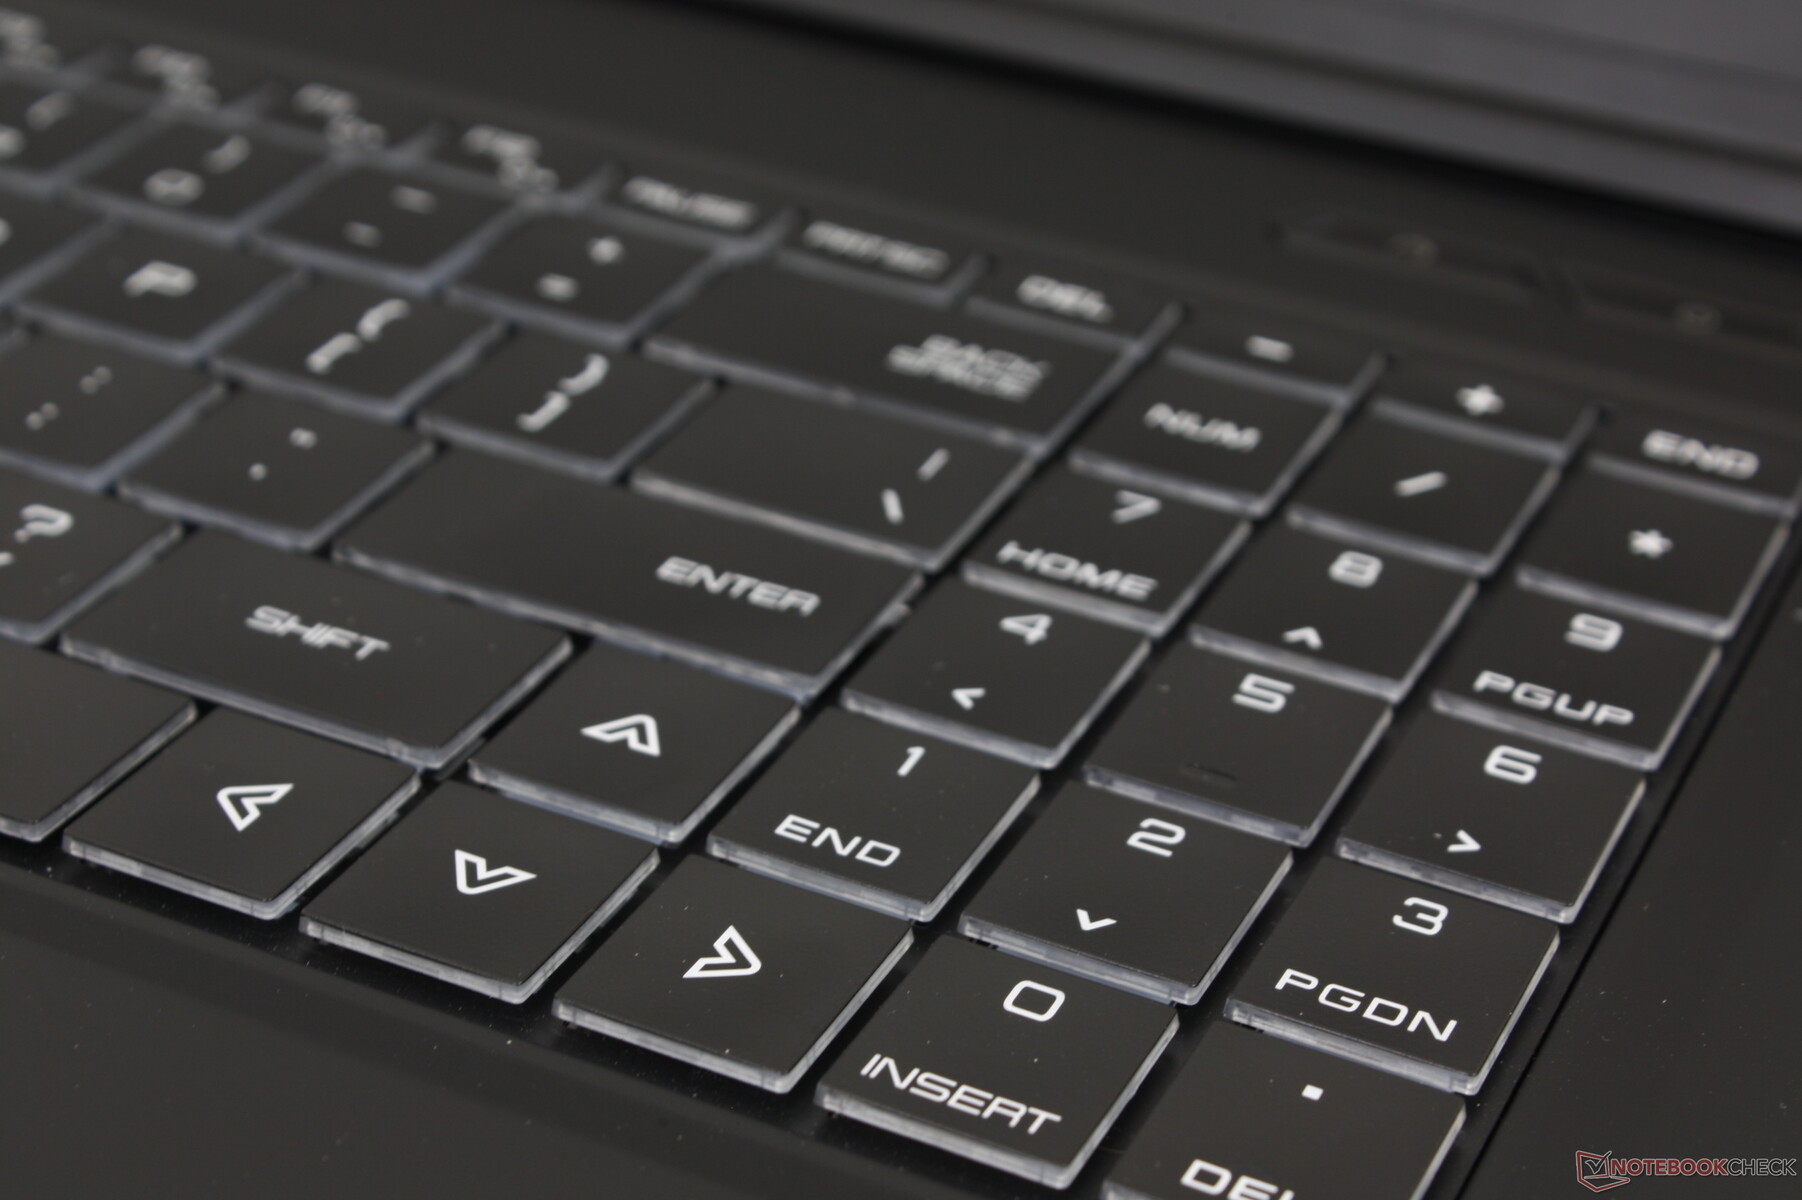
Teclado
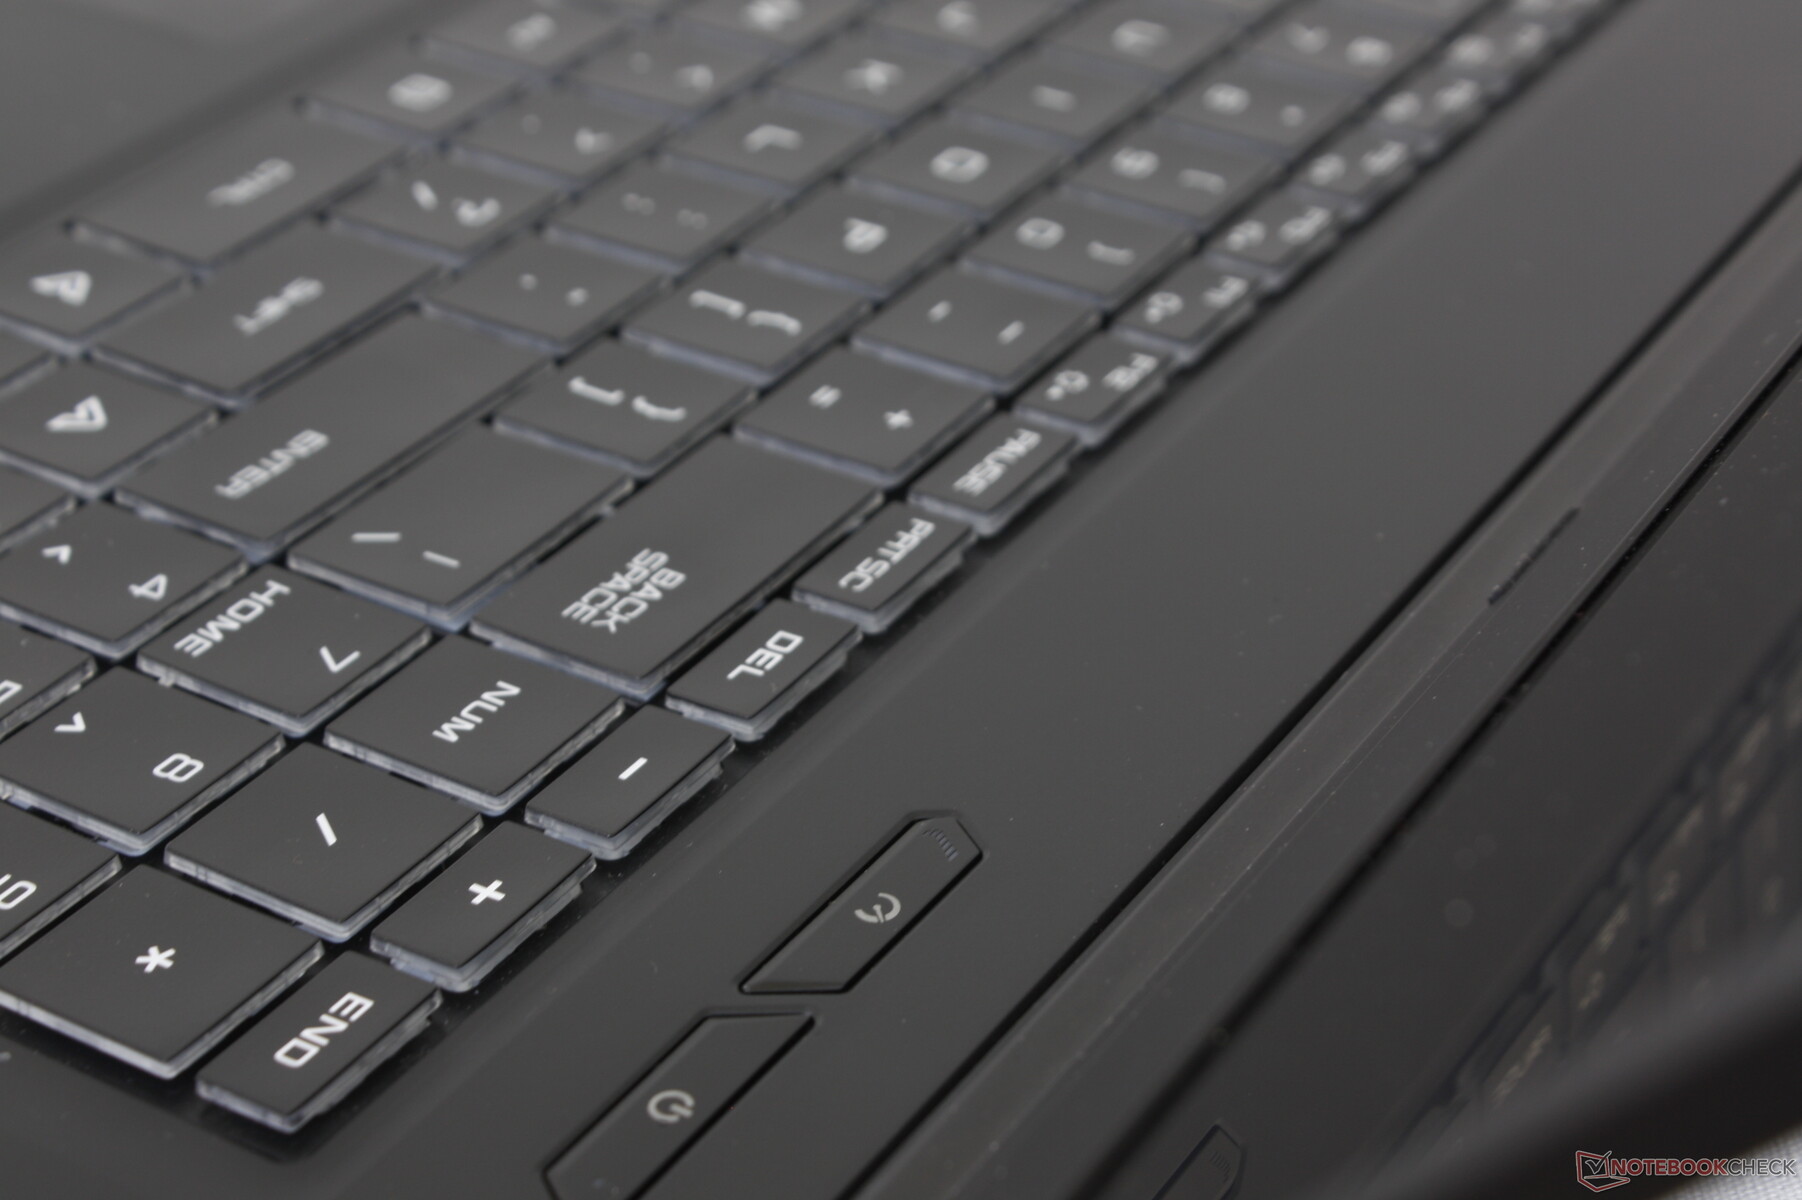
El GM7AG8P utiliza teclas tradicionales de membrana más parecidas a las del XMG Core 17 o XMG Pro 17 en lugar de las teclas mecánicas del XMG Neo 17. Sin embargo, a diferencia de las teclas tradicionales del XMG Core 17 o XMG Pro 17, las teclas aquí son físicamente más grandes para ser más fáciles de escribir. La respuesta de las teclas es uniforme, con un repiqueteo relativamente silencioso entre todas las teclas, pero nos hubiera gustado que el recorrido y la respuesta hubieran sido más firmes en general.
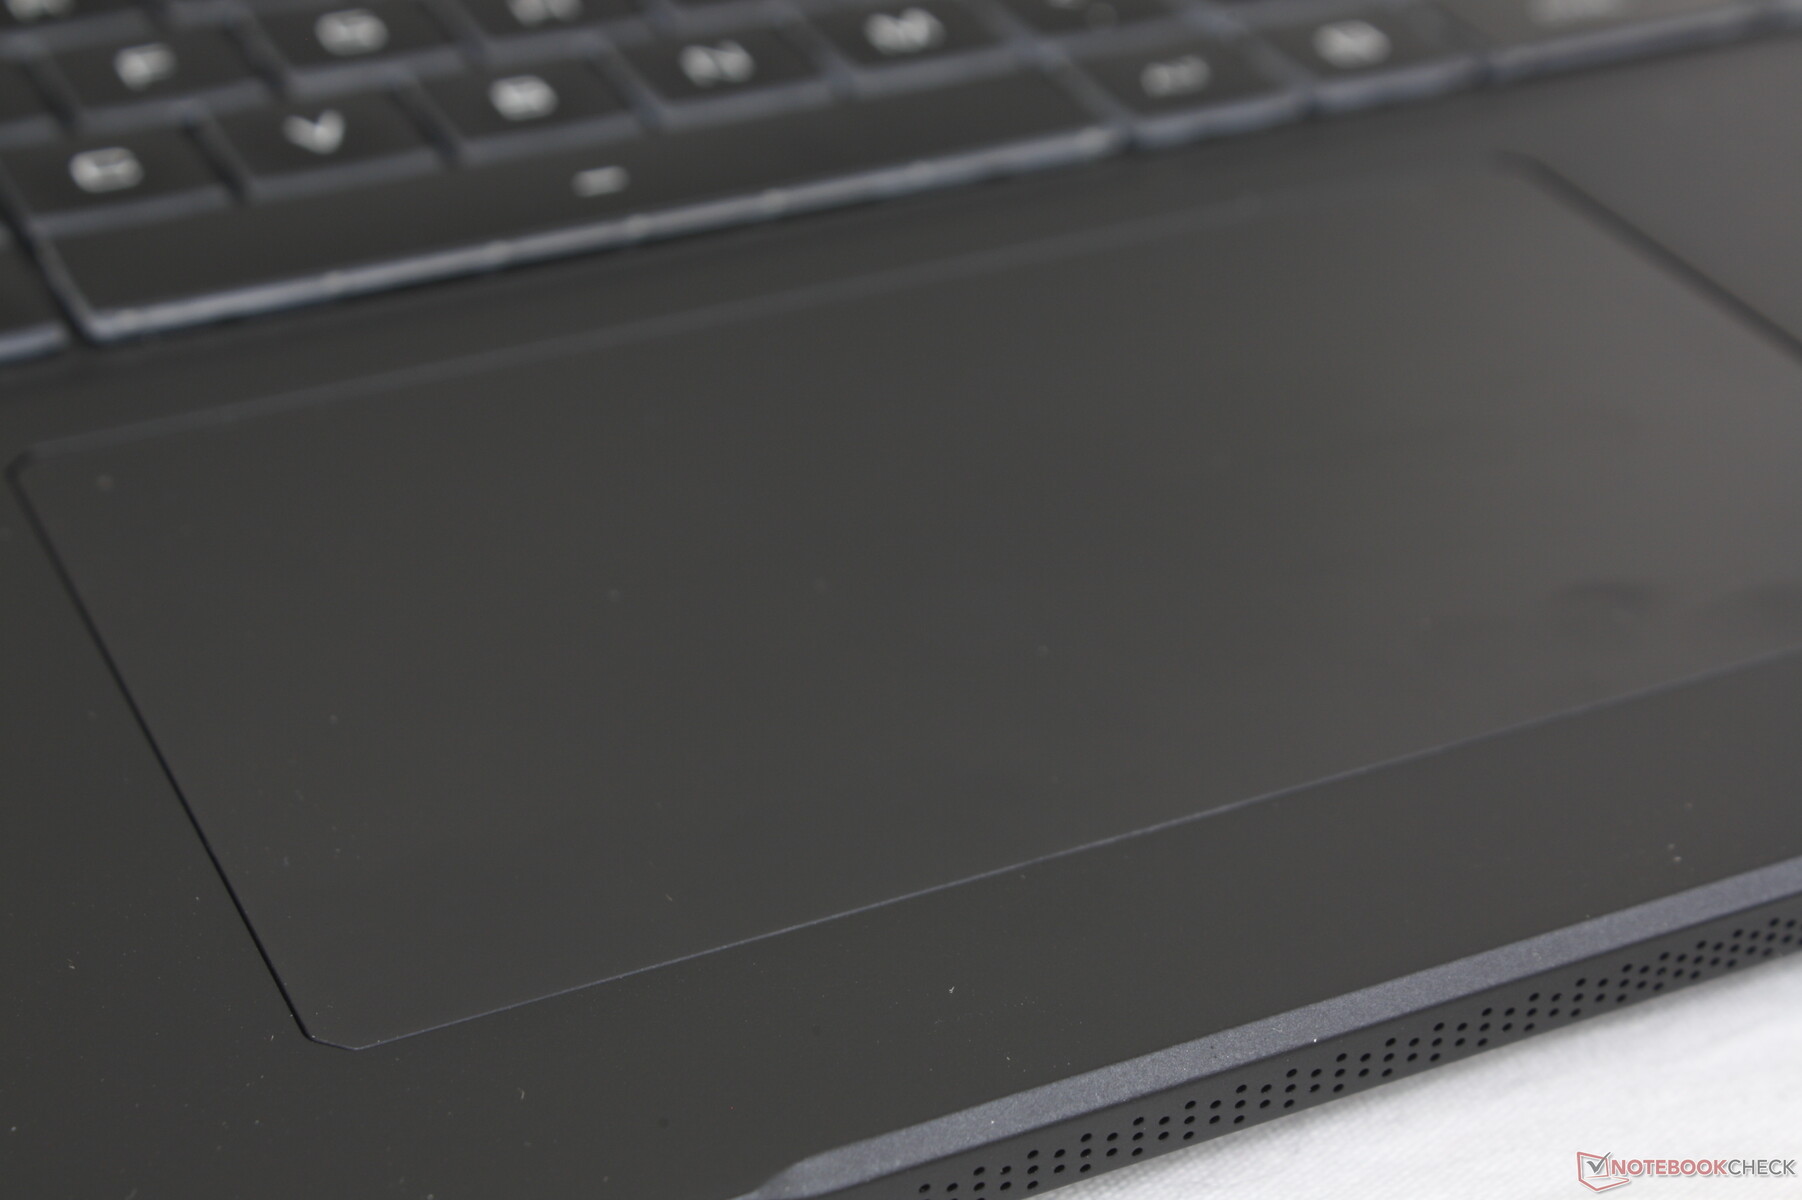
Panel táctil
El clickpad es casi del mismo tamaño que el del Blade Pro 17 (13,3 x 7,6 cm frente a 13 x 8 cm) pero con un clic más firme y ruidoso al pulsarlo. Las propiedades de deslizamiento son suaves con poco o nada de adherencia incluso cuando se mueve el cursor a velocidades más lentas.

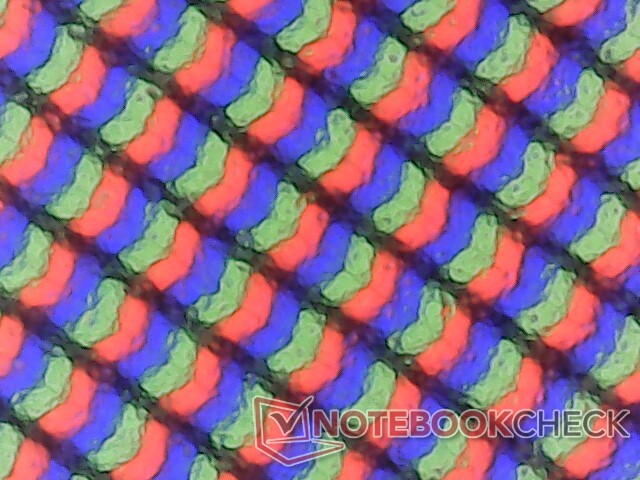
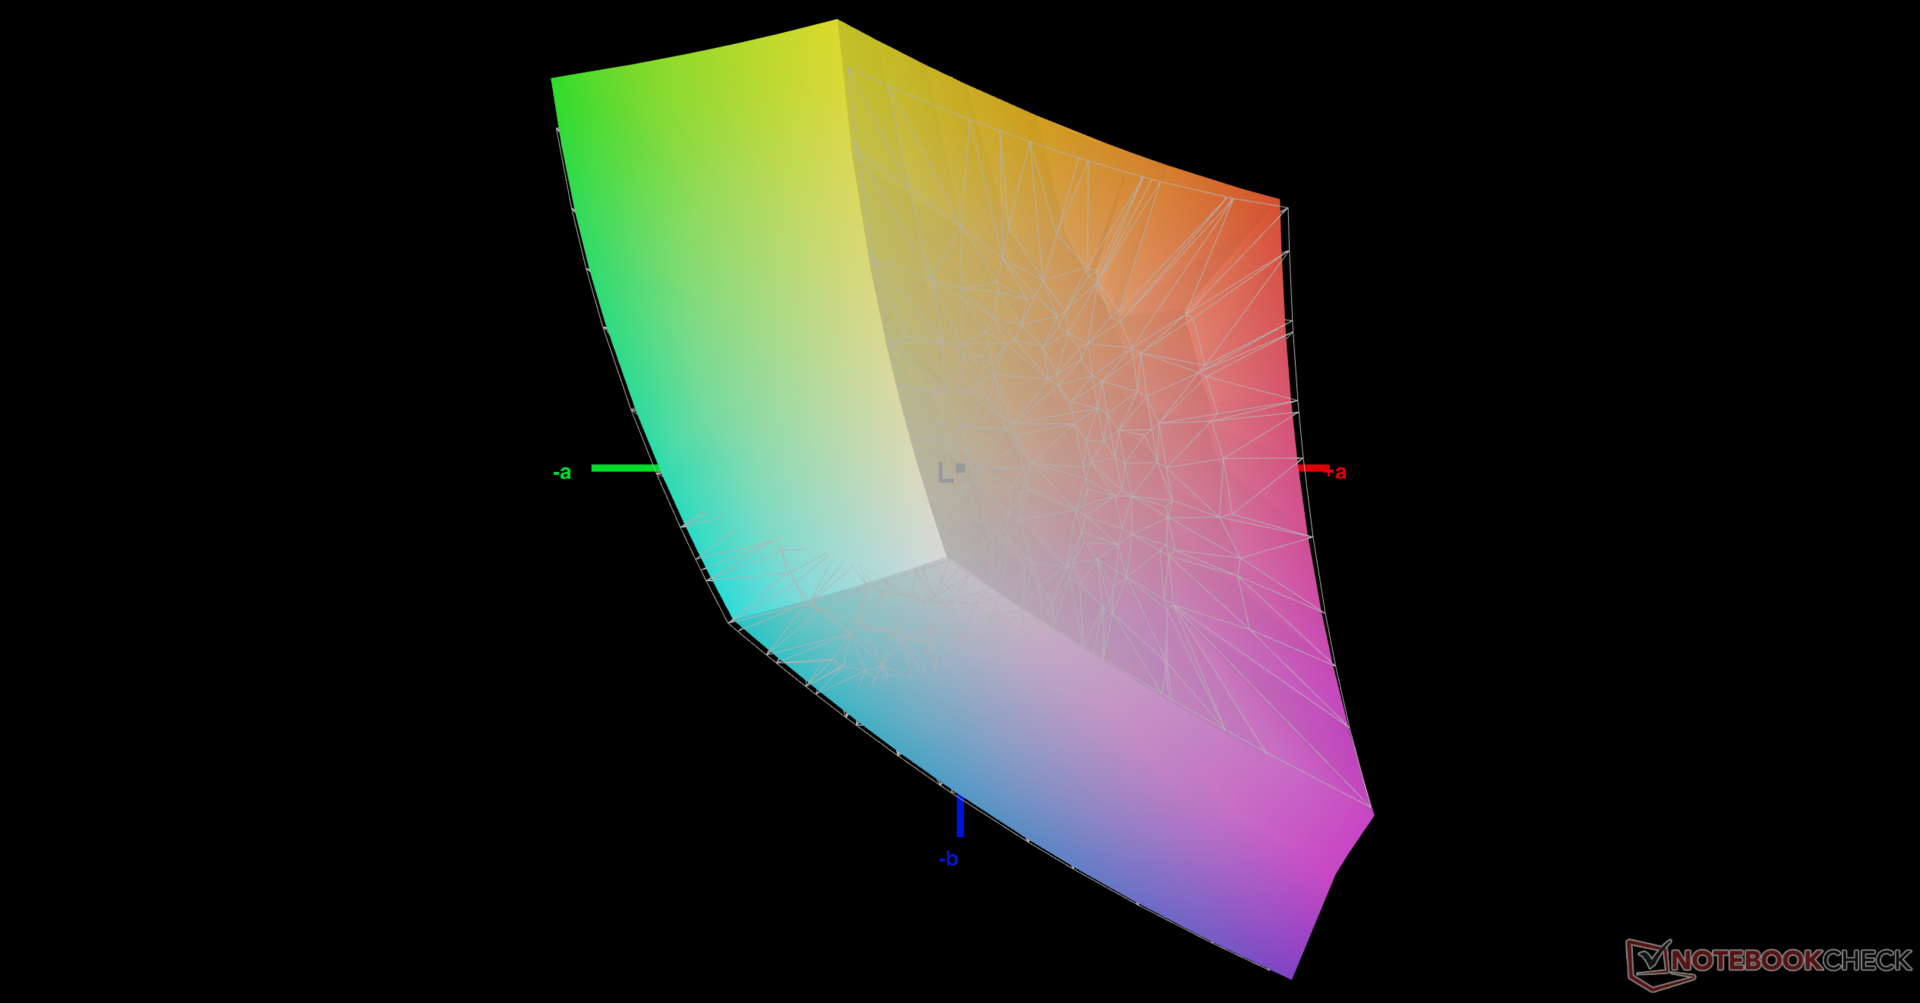
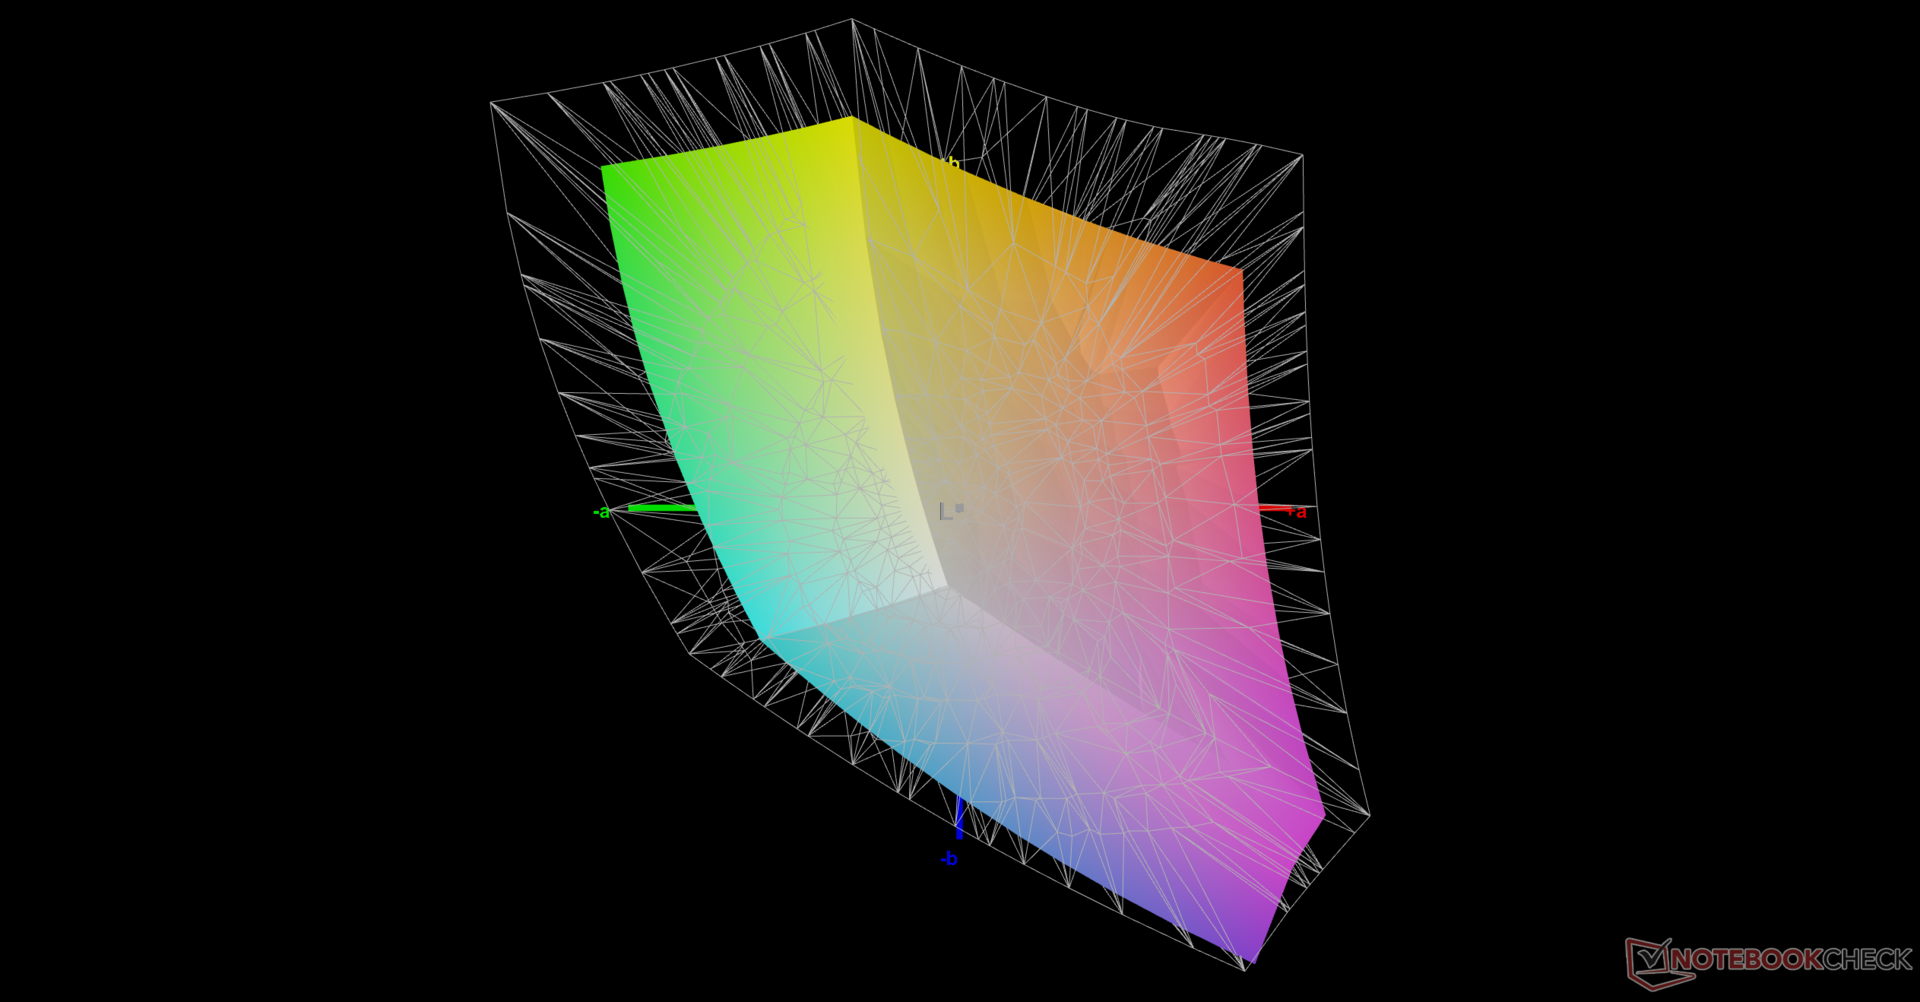
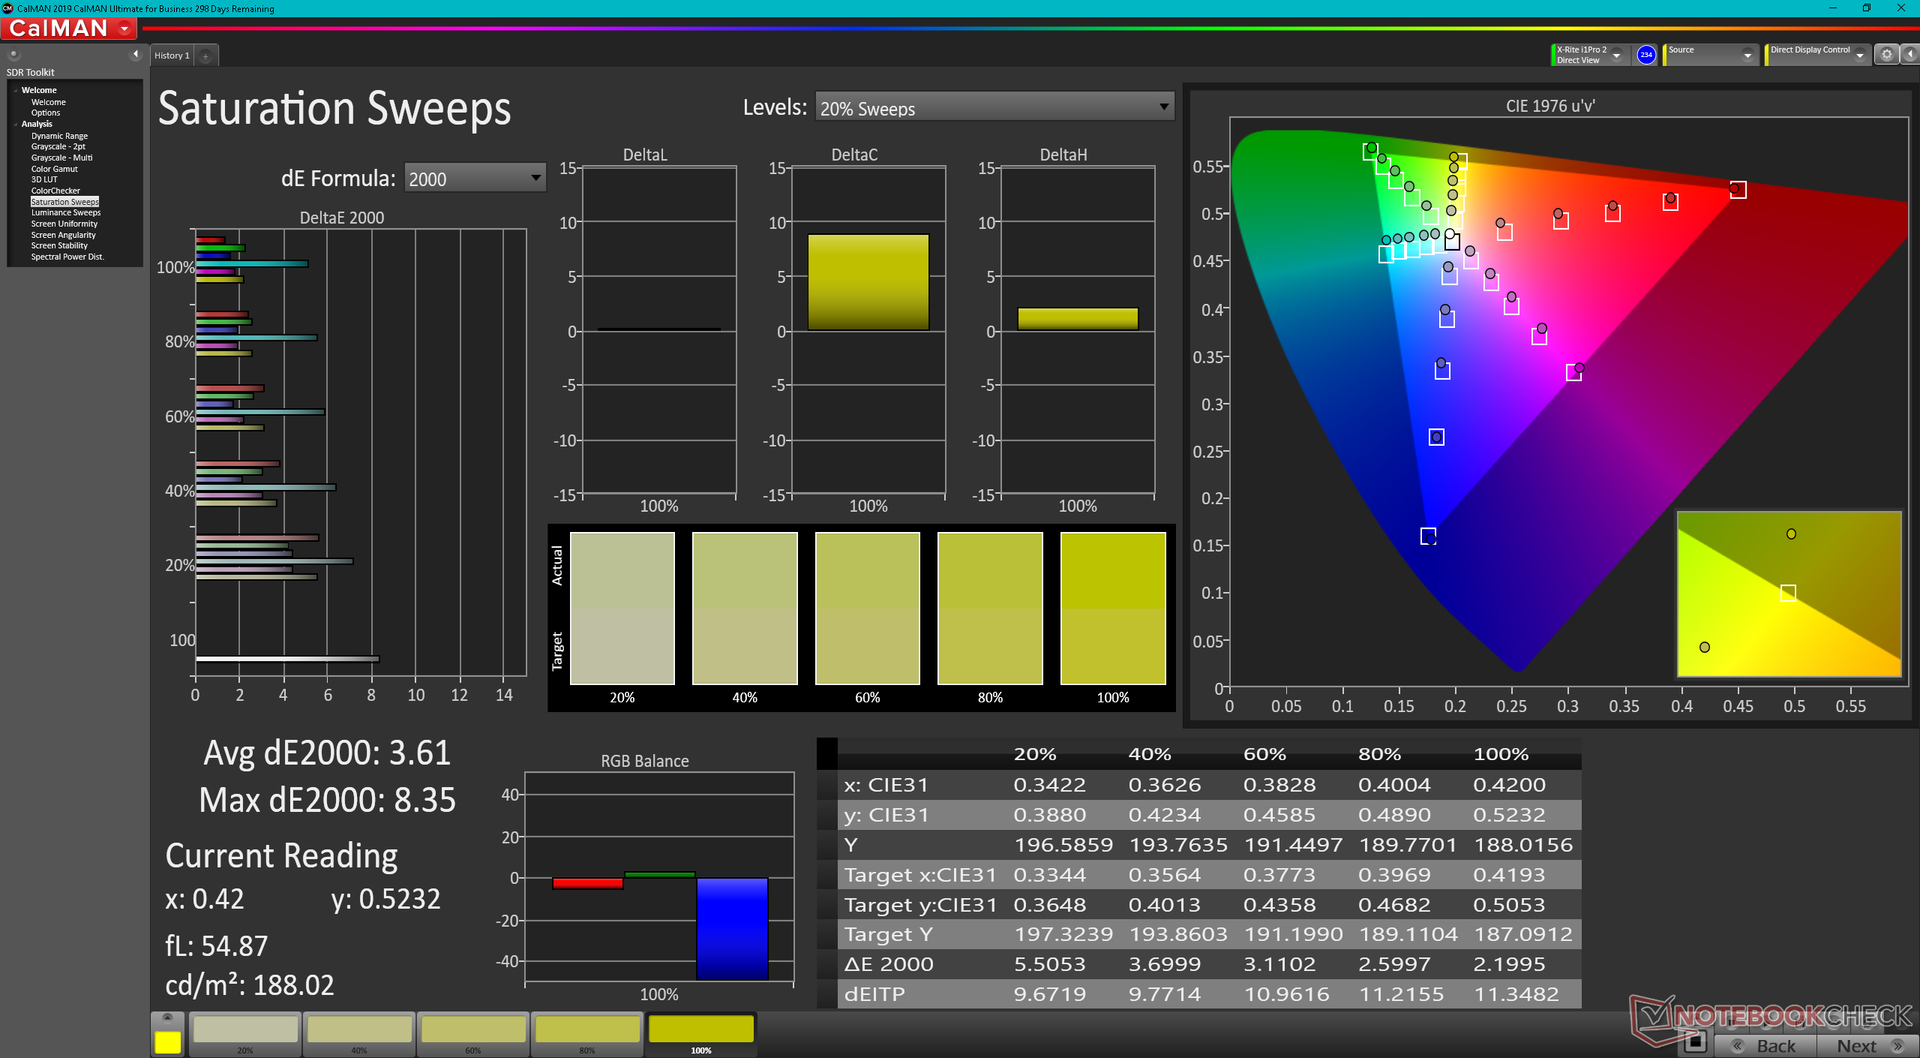
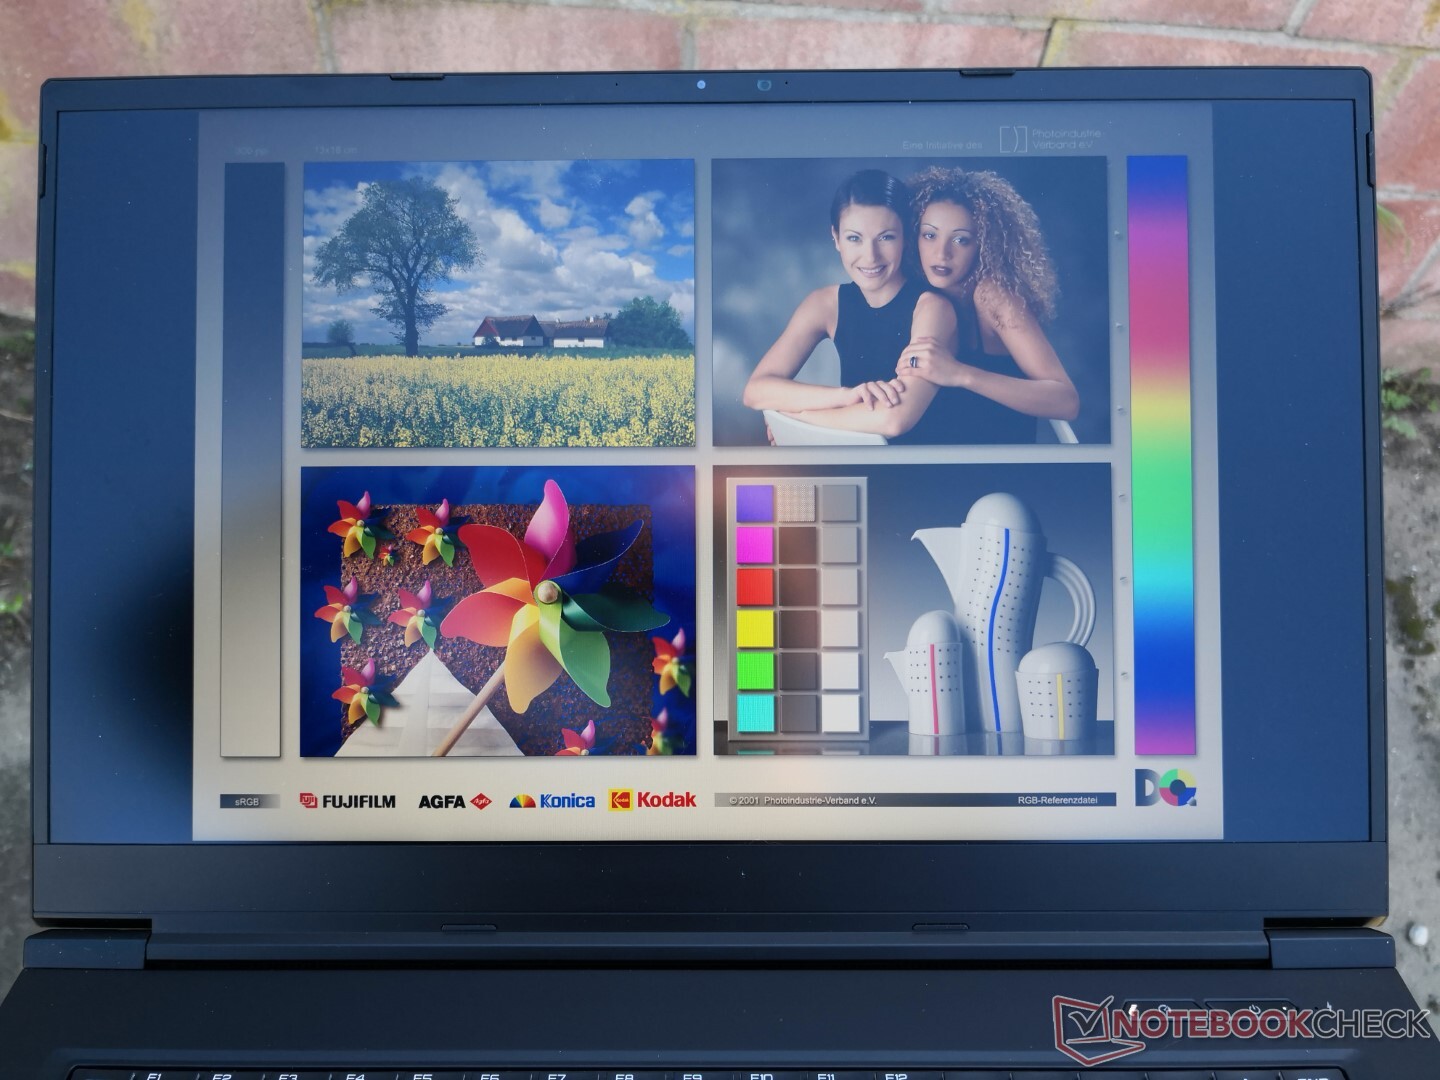
Pantalla - Rápida y colorida
Nuestra unidad de prueba GM7AG8P utiliza exactamente el mismo controlador de pantalla BOE0977 y el panel IPS NE173QHM-NY2 que se encuentra en elSchenker XMG Neo 17 GM7TG8S. Por tanto, la experiencia de visualización y los atributos de la pantalla entre estos dos portátiles son muy similares, incluyendo la resolución nativa de 1440p, los rápidos tiempos de respuesta, la relación de contraste de ~1000:1, la tasa de refresco de 165 Hz y la cobertura sRGB completa. El brillo máximo también sigue estando por debajo de los 400 nits.
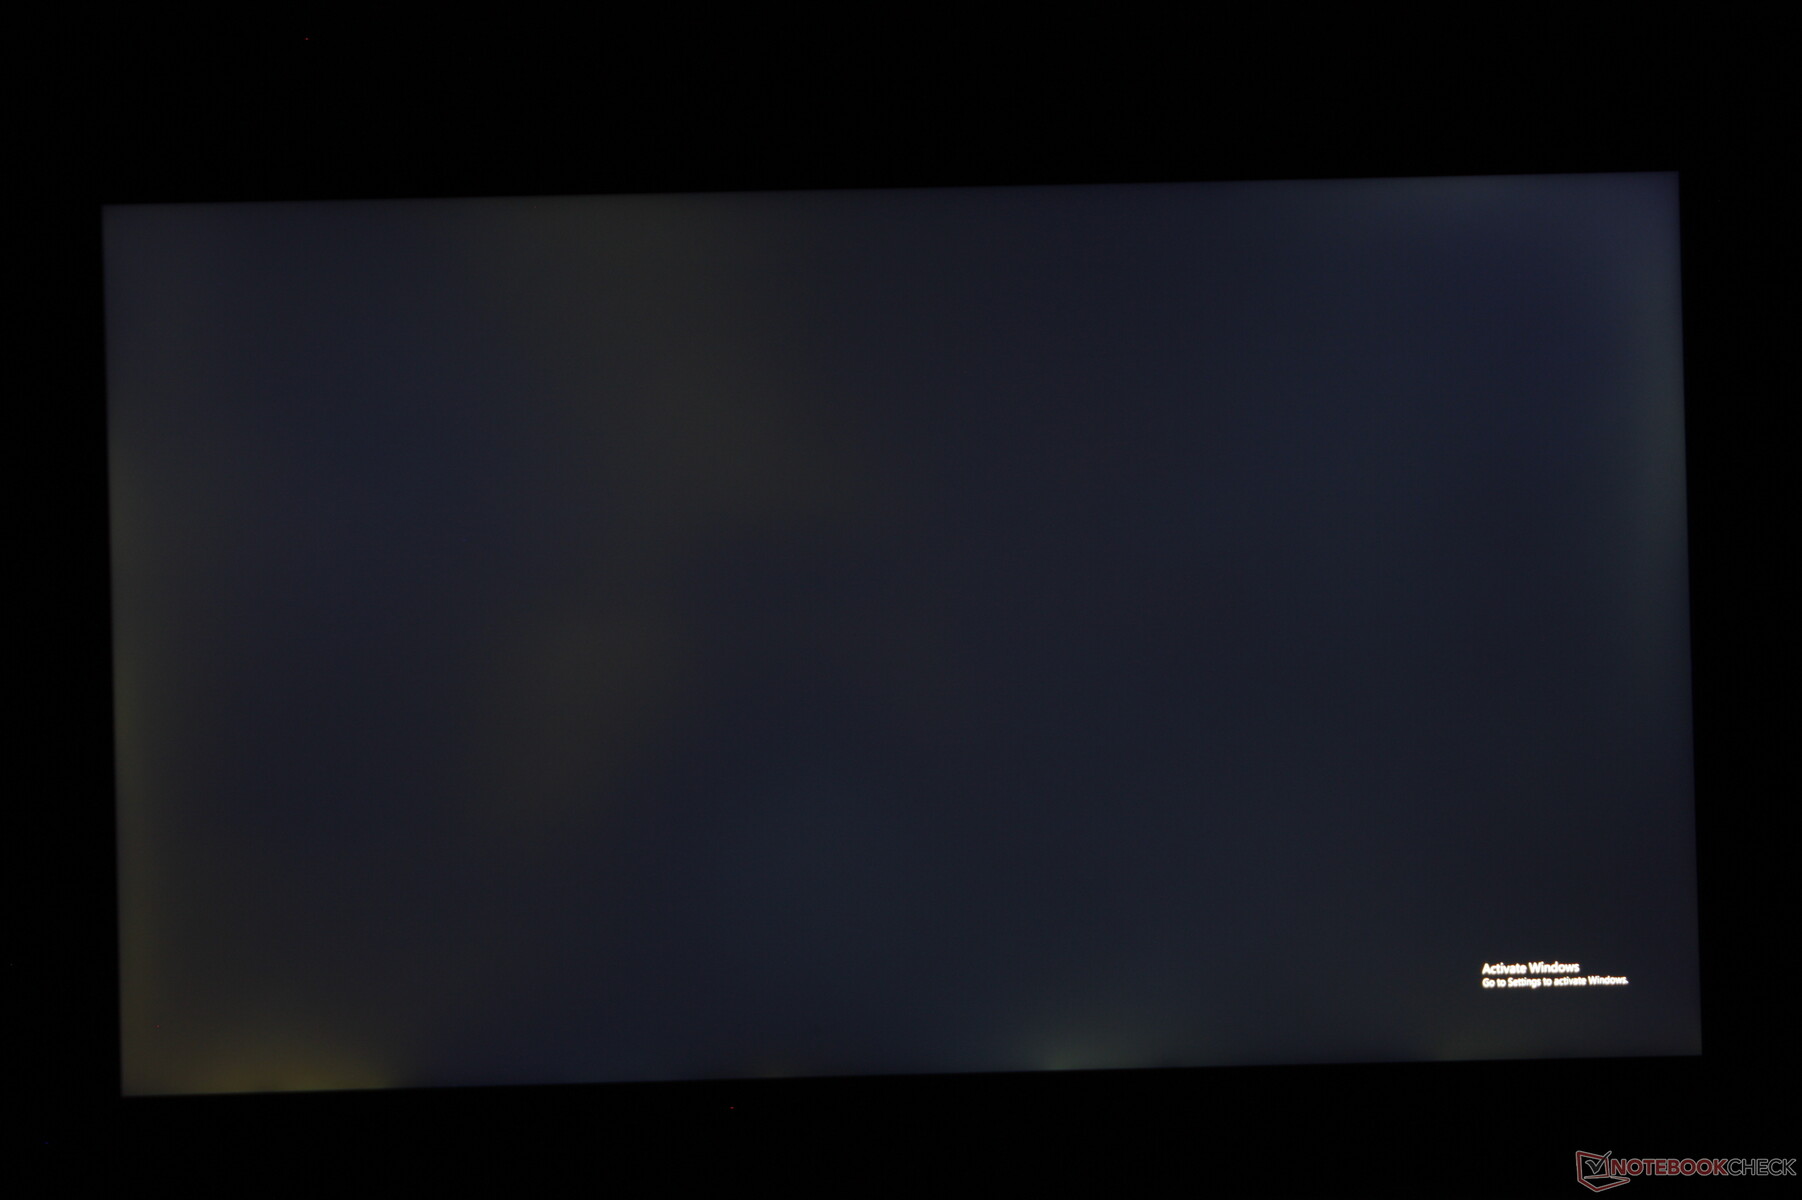
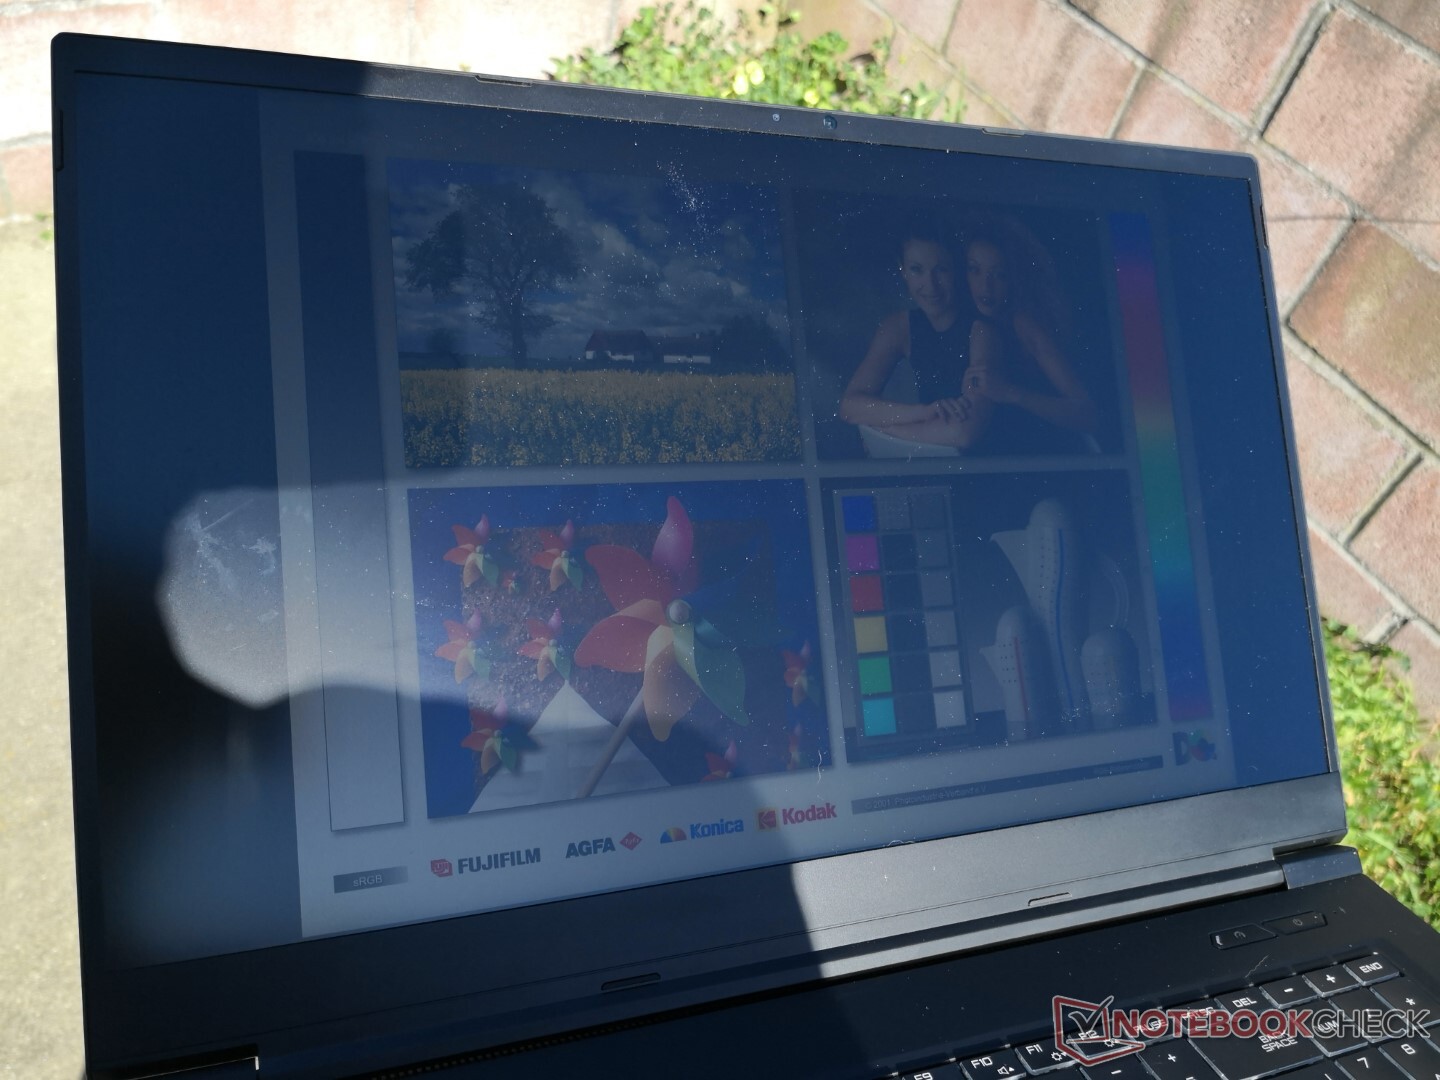
El sangrado de la retroiluminación en nuestra unidad de pruebas particular podría mejorarse, como muestra nuestra imagen de abajo. Aunque es de esperar algo de sangrado en los IPS, nuestra unidad mostró más de lo que nos gustaría.
| |||||||||||||||||||||||||
iluminación: 86 %
Brillo con batería: 387.1 cd/m²
Contraste: 1210:1 (Negro: 0.32 cd/m²)
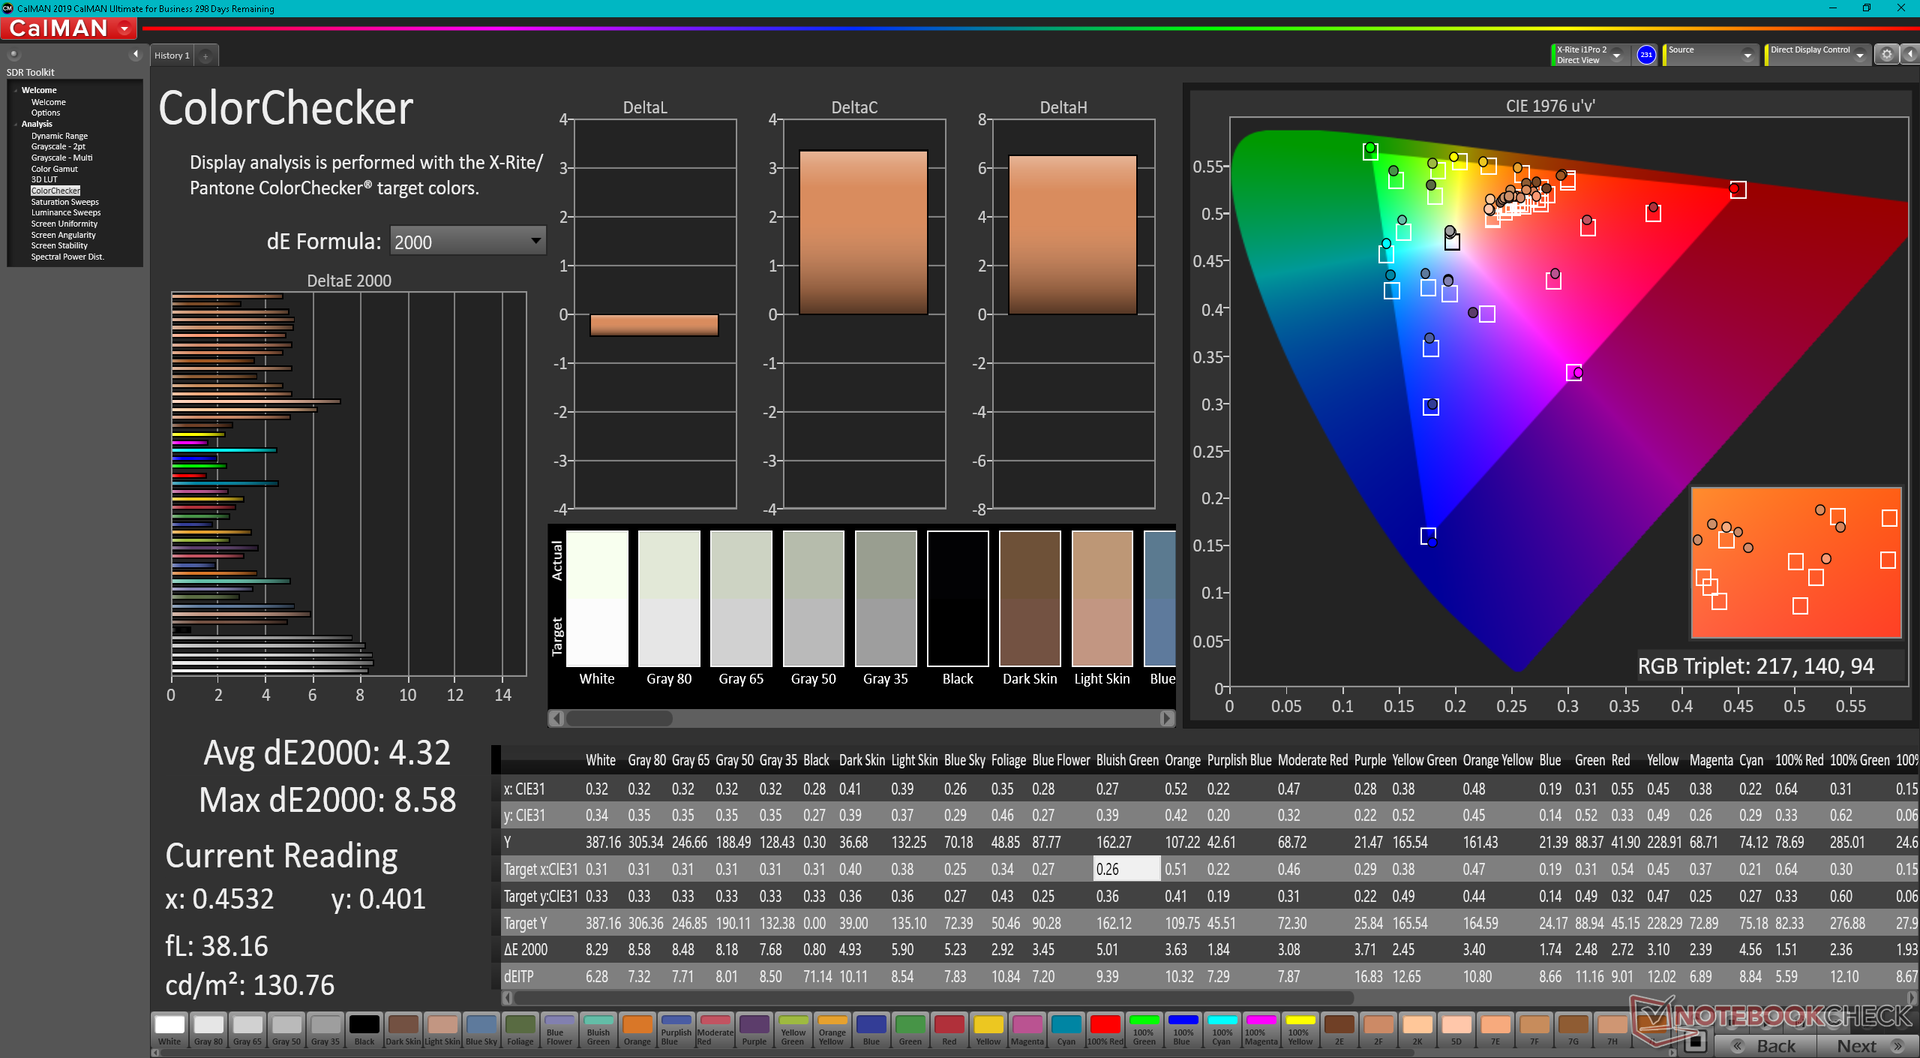
ΔE ColorChecker Calman: 4.32 | ∀{0.5-29.43 Ø4.71}
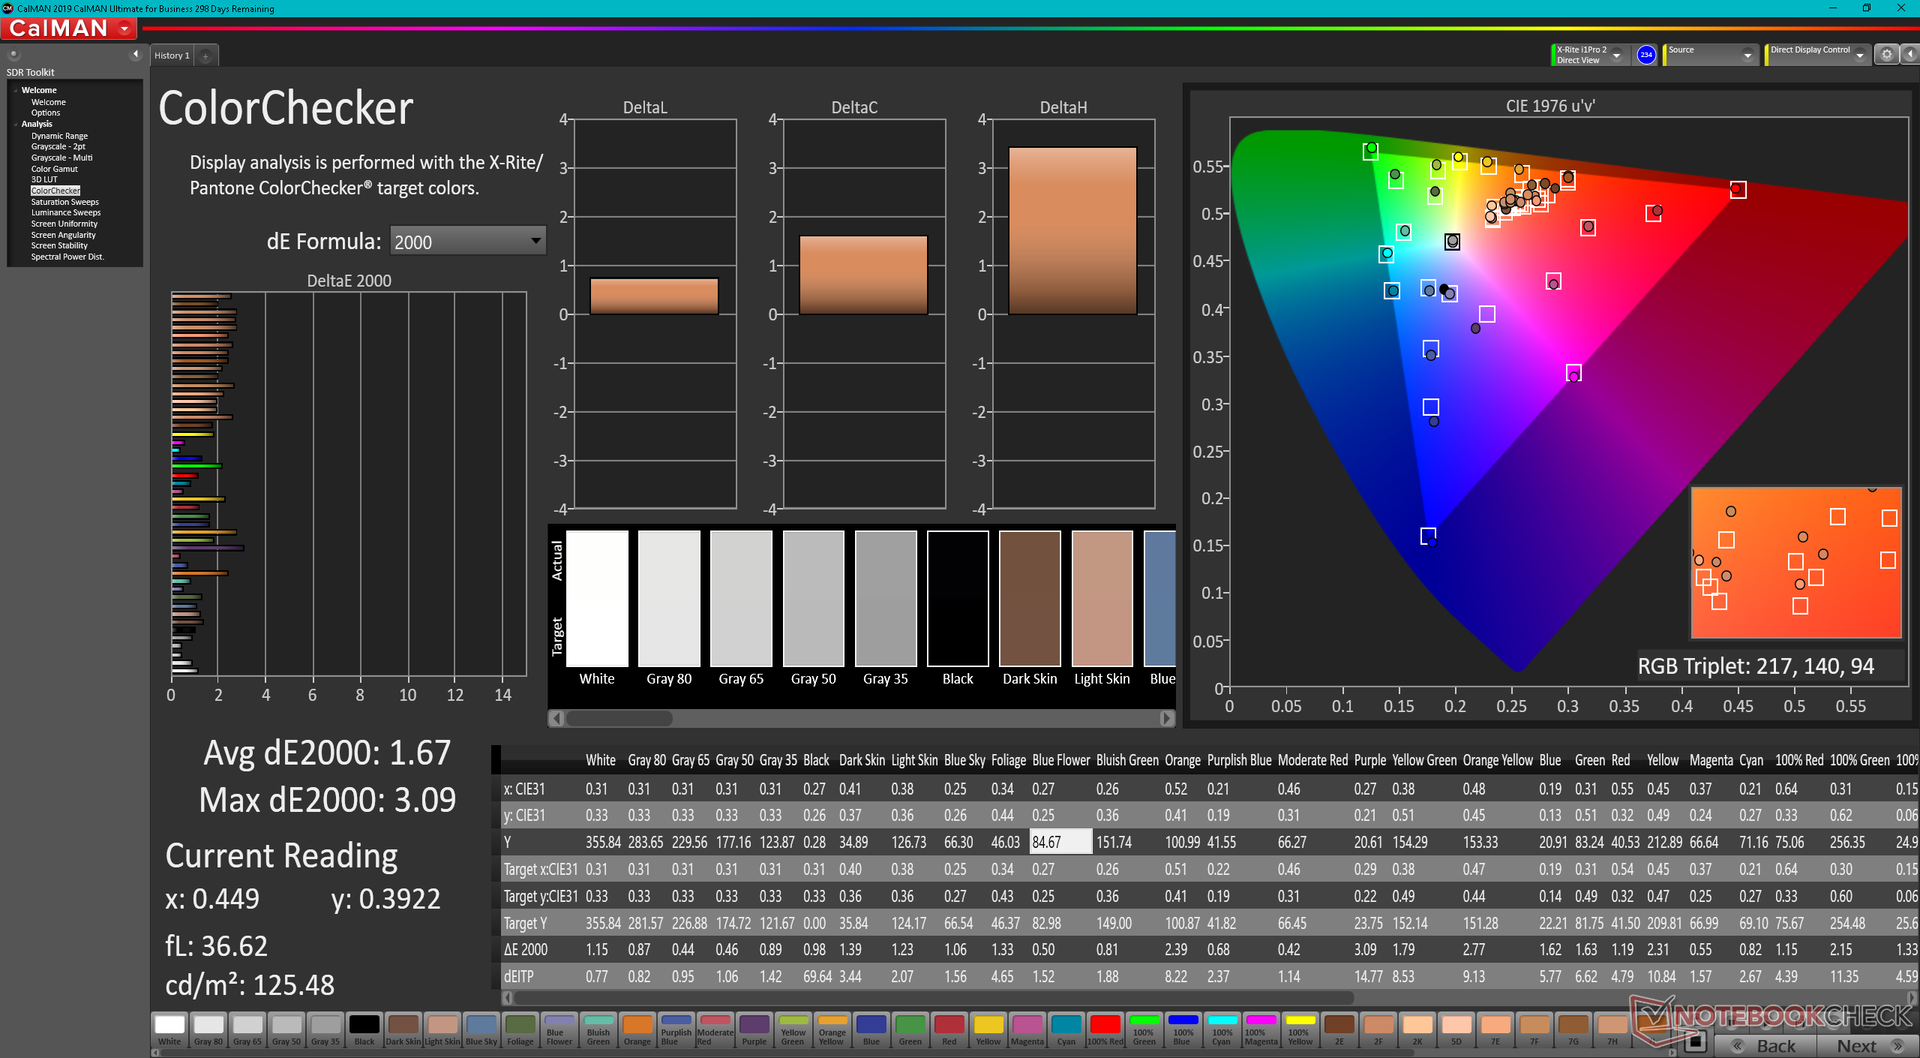
calibrated: 1.67
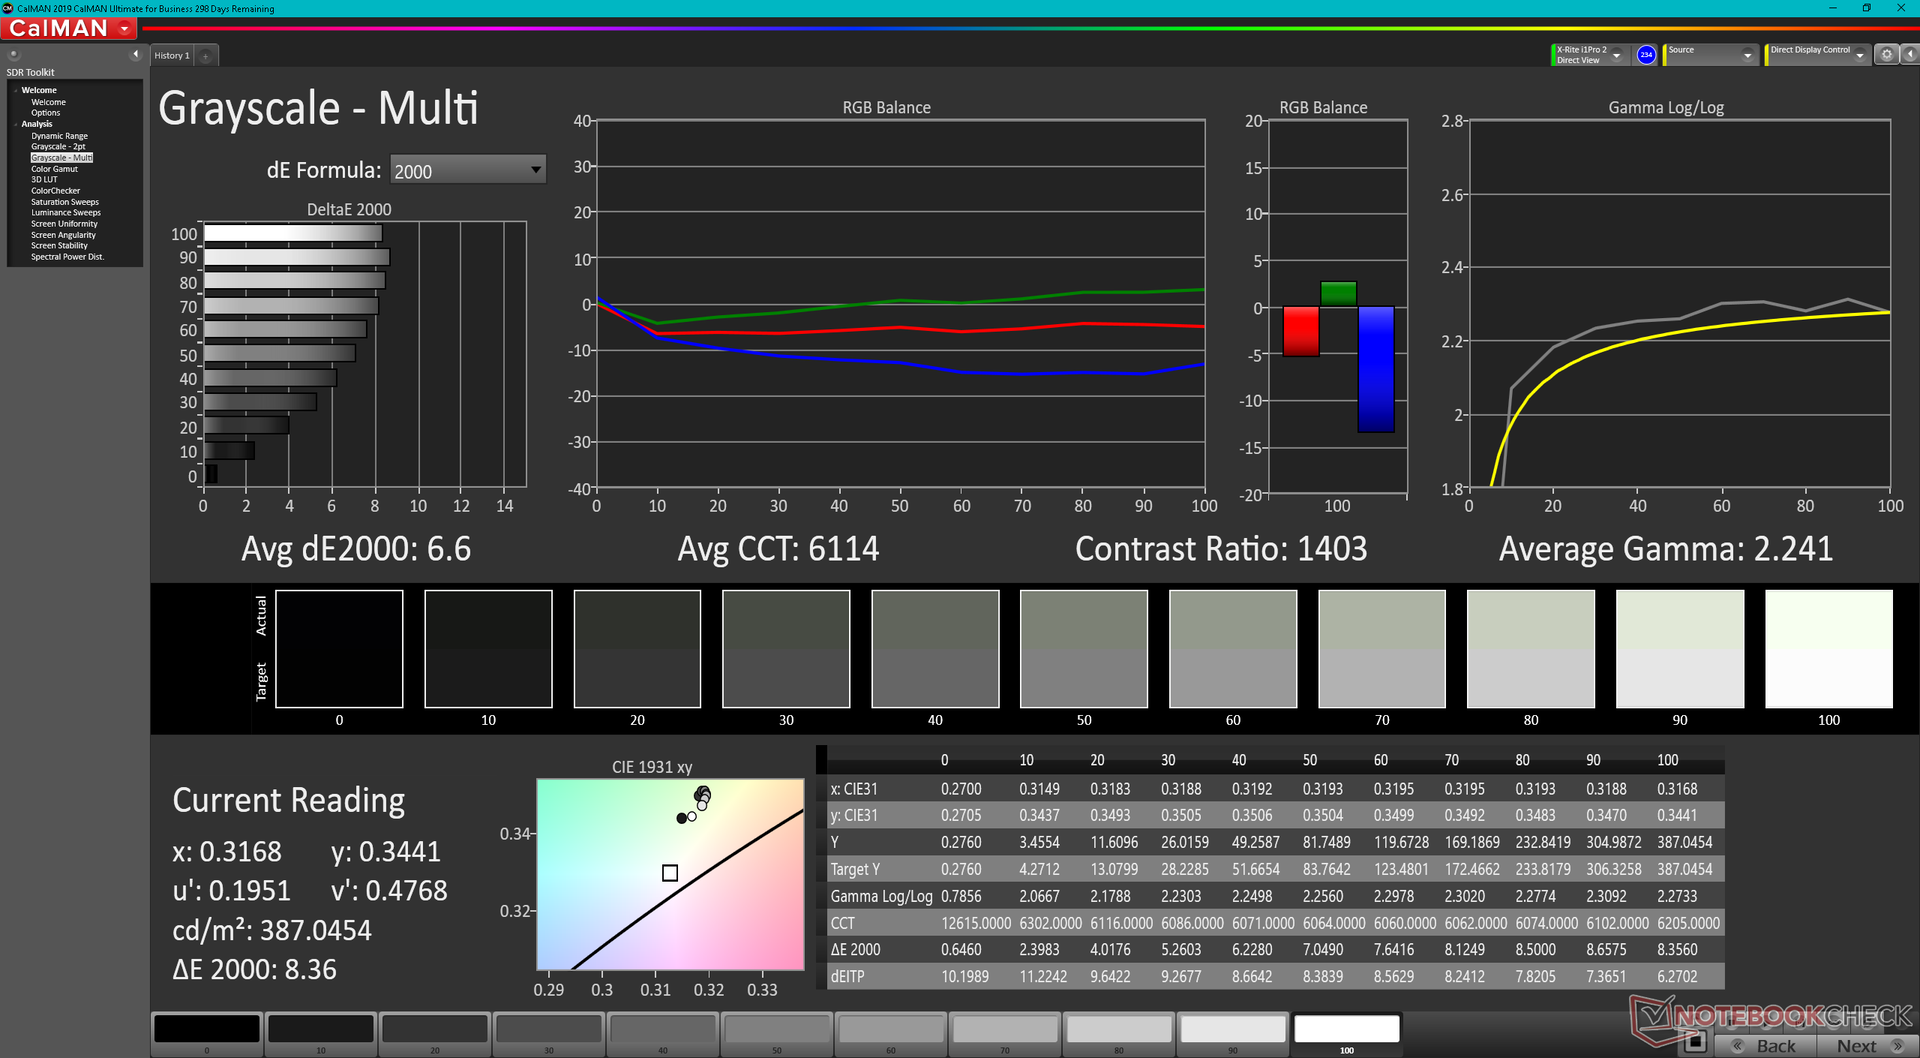
ΔE Greyscale Calman: 6.6 | ∀{0.09-98 Ø4.96}
70.7% AdobeRGB 1998 (Argyll 3D)
97.8% sRGB (Argyll 3D)
68.9% Display P3 (Argyll 3D)
Gamma: 2.24
CCT: 6114 K
| Schenker Uniwill Technology GM7AG8P BOE NE173QHM-NY2, IPS, 2560x1440, 17.3" | Schenker XMG NEO 17 GM7TG8S BOE0977 (NE173QHM-NY2), IPS, 2560x1440, 17.3" | Alienware x17 RTX 3080 P48E AU Optronics B173ZAN, IPS, 3840x2160, 17.3" | Razer Blade 17 RTX 3070 AU Optronics B173HAN05.4, IPS, 1920x1080, 17.3" | MSI GS76 Stealth 11UH AUO B173ZAN06.1 (AUODE95), IPS, 3840x2160, 17.3" | Maingear Vector Pro MG-VCP17 BOE NE173QHM-NY2, IPS, 2560x1440, 17.3" | |
|---|---|---|---|---|---|---|
| Display | -3% | 24% | 3% | -7% | 2% | |
| Display P3 Coverage (%) | 68.9 | 67.1 -3% | 88.3 28% | 71.7 4% | 63 -9% | 70.7 3% |
| sRGB Coverage (%) | 97.8 | 96.3 -2% | 100 2% | 98.8 1% | 94.8 -3% | 99.4 2% |
| AdobeRGB 1998 Coverage (%) | 70.7 | 68.6 -3% | 100 41% | 73.6 4% | 65 -8% | 71.7 1% |
| Response Times | 16% | 14% | 54% | 47% | 4% | |
| Response Time Grey 50% / Grey 80% * (ms) | 14.8 ? | 15.2 -3% | 14.4 ? 3% | 4.2 ? 72% | 8.8 ? 41% | 15.6 ? -5% |
| Response Time Black / White * (ms) | 13.6 ? | 8.8 35% | 10.4 ? 24% | 8.8 ? 35% | 6.4 ? 53% | 12 ? 12% |
| PWM Frequency (Hz) | ||||||
| Screen | 18% | 11% | -9% | 22% | 9% | |
| Brightness middle (cd/m²) | 387.1 | 396 2% | 438.7 13% | 323.3 -16% | 474 22% | 389.7 1% |
| Brightness (cd/m²) | 361 | 366 1% | 435 20% | 315 -13% | 454 26% | 363 1% |
| Brightness Distribution (%) | 86 | 82 -5% | 91 6% | 91 6% | 88 2% | 84 -2% |
| Black Level * (cd/m²) | 0.32 | 0.45 -41% | 0.48 -50% | 0.33 -3% | 0.46 -44% | 0.47 -47% |
| Contrast (:1) | 1210 | 880 -27% | 914 -24% | 980 -19% | 1030 -15% | 829 -31% |
| Colorchecker dE 2000 * | 4.32 | 1.43 67% | 4.34 -0% | 4.59 -6% | 1.5 65% | 1.93 55% |
| Colorchecker dE 2000 max. * | 8.58 | 2.2 74% | 7.3 15% | 10.82 -26% | 5.59 35% | 6.84 20% |
| Colorchecker dE 2000 calibrated * | 1.67 | 1.34 20% | 0.72 57% | 1.4 16% | 0.86 49% | 1.31 22% |
| Greyscale dE 2000 * | 6.6 | 1.8 73% | 2.4 64% | 7.9 -20% | 2.8 58% | 2.4 64% |
| Gamma | 2.24 98% | 2.4 92% | 2.09 105% | 2.28 96% | 2.158 102% | 2.12 104% |
| CCT | 6114 106% | 6489 100% | 6413 101% | 5941 109% | 6597 99% | 6658 98% |
| Media total (Programa/Opciones) | 10% /
13% | 16% /
14% | 16% /
3% | 21% /
19% | 5% /
7% |
* ... más pequeño es mejor
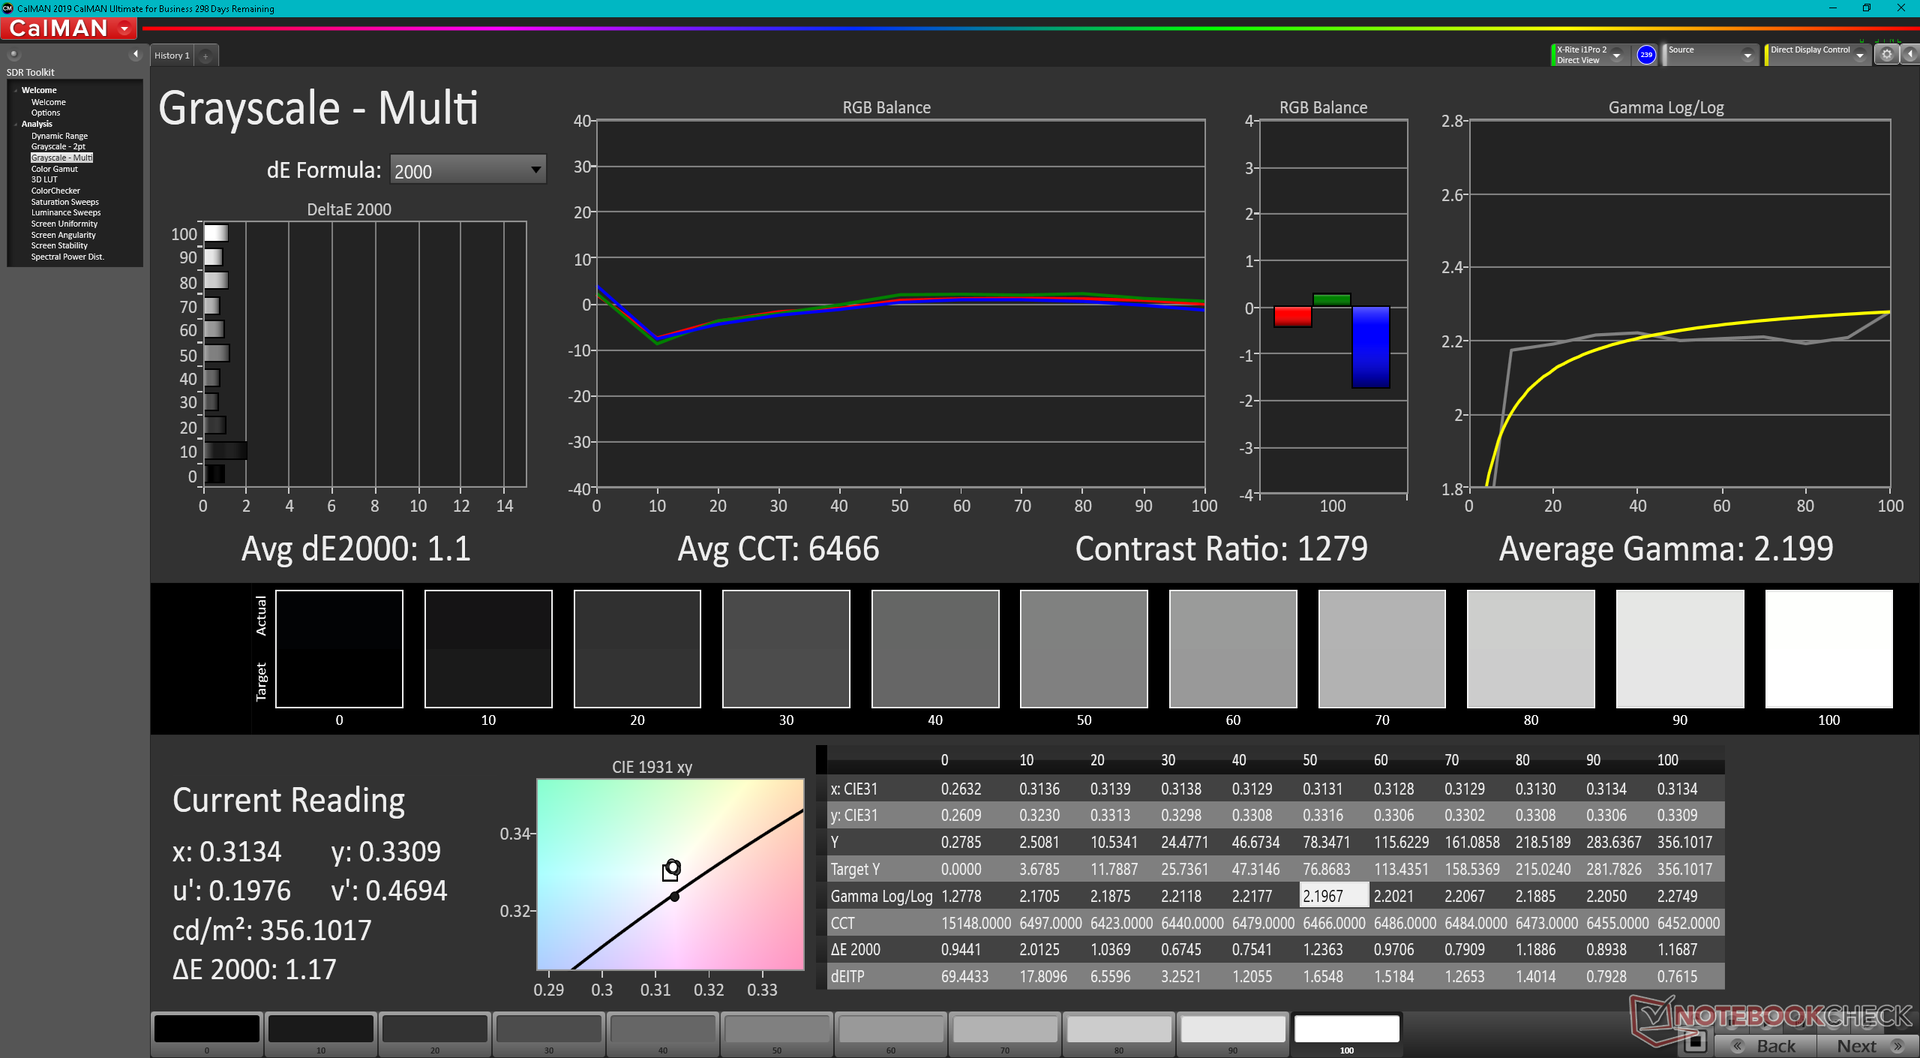
La escala de grises no está bien calibrada al sacarla de la caja con su valor medio de deltaE relativamente alto de 6,6 debido a la temperatura de color cálida de alrededor de 6100K. Una vez calibrados con nuestro colorímetro X-Rite, tanto la escala de grises como el ColorChecker mejorarían con valores finales medios de deltaE de sólo 1,1 y 1,67, respectivamente
Tiempos de respuesta del display
| ↔ Tiempo de respuesta de Negro a Blanco | ||
|---|---|---|
| 13.6 ms ... subida ↗ y bajada ↘ combinada | ↗ 7.6 ms subida | 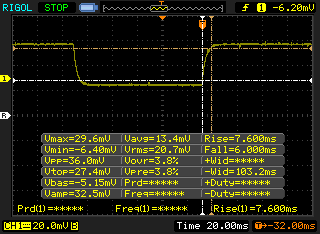 |
| ↘ 6 ms bajada | ||
| La pantalla mostró buenos tiempos de respuesta en nuestros tests pero podría ser demasiado lenta para los jugones competitivos. En comparación, todos los dispositivos de prueba van de ##min### (mínimo) a 240 (máximo) ms. » 34 % de todos los dispositivos son mejores. Esto quiere decir que el tiempo de respuesta medido es mejor que la media (19.8 ms) de todos los dispositivos testados. | ||
| ↔ Tiempo de respuesta 50% Gris a 80% Gris | ||
| 14.8 ms ... subida ↗ y bajada ↘ combinada | ↗ 8 ms subida | 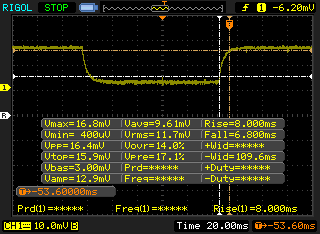 |
| ↘ 6.8 ms bajada | ||
| La pantalla mostró buenos tiempos de respuesta en nuestros tests pero podría ser demasiado lenta para los jugones competitivos. En comparación, todos los dispositivos de prueba van de ##min### (mínimo) a 636 (máximo) ms. » 29 % de todos los dispositivos son mejores. Esto quiere decir que el tiempo de respuesta medido es mejor que la media (31 ms) de todos los dispositivos testados. | ||
Parpadeo de Pantalla / PWM (Pulse-Width Modulation)
| Parpadeo de Pantalla / PWM no detectado | 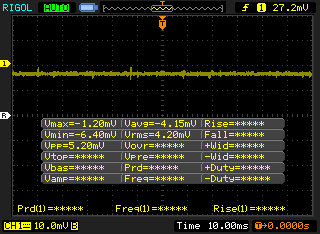 | ||
Comparación: 52 % de todos los dispositivos testados no usaron PWM para atenuar el display. Si se usó, medimos una media de 7754 (mínimo: 5 - máxmo: 343500) Hz. | |||
Rendimiento - Extremo para el tamaño
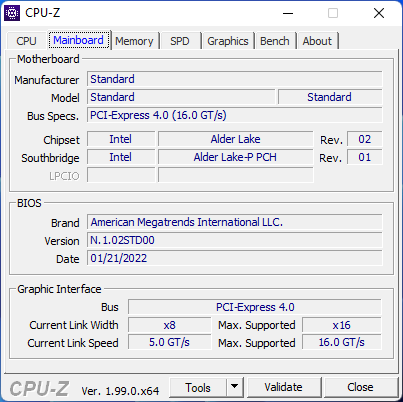
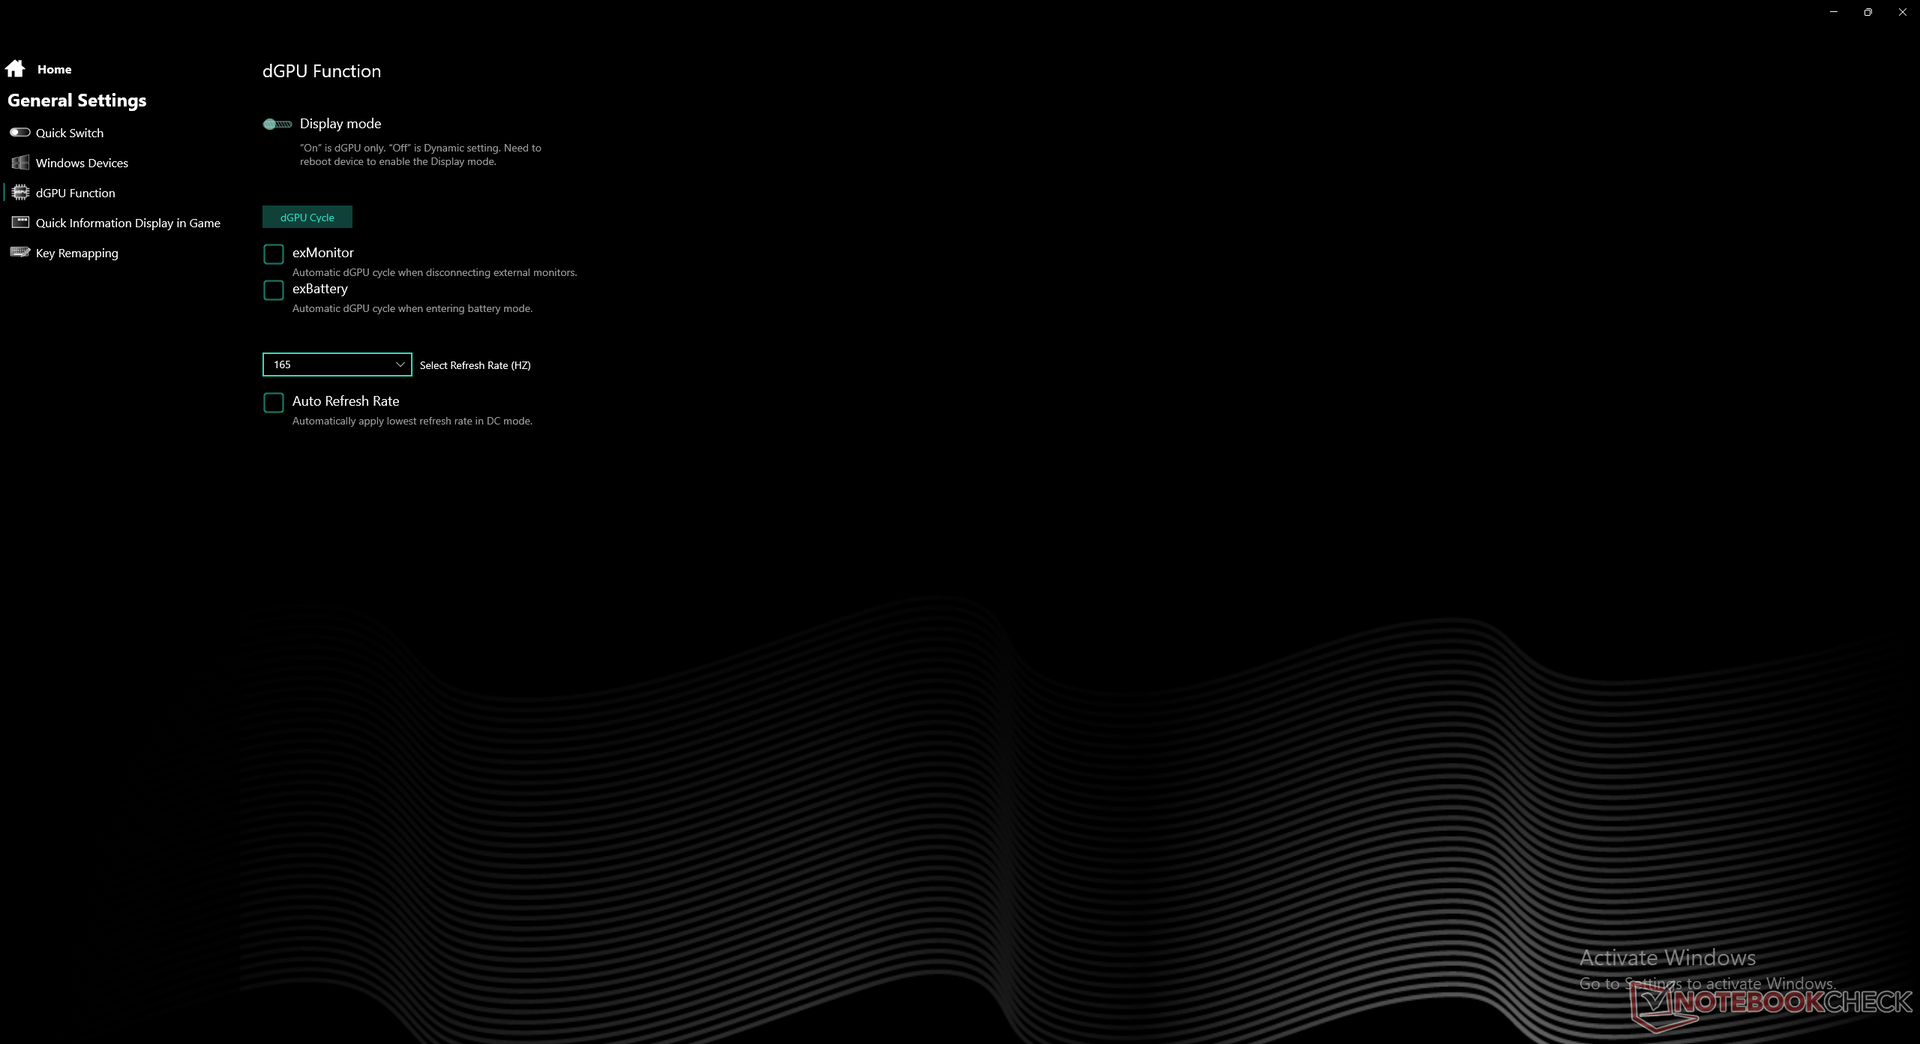
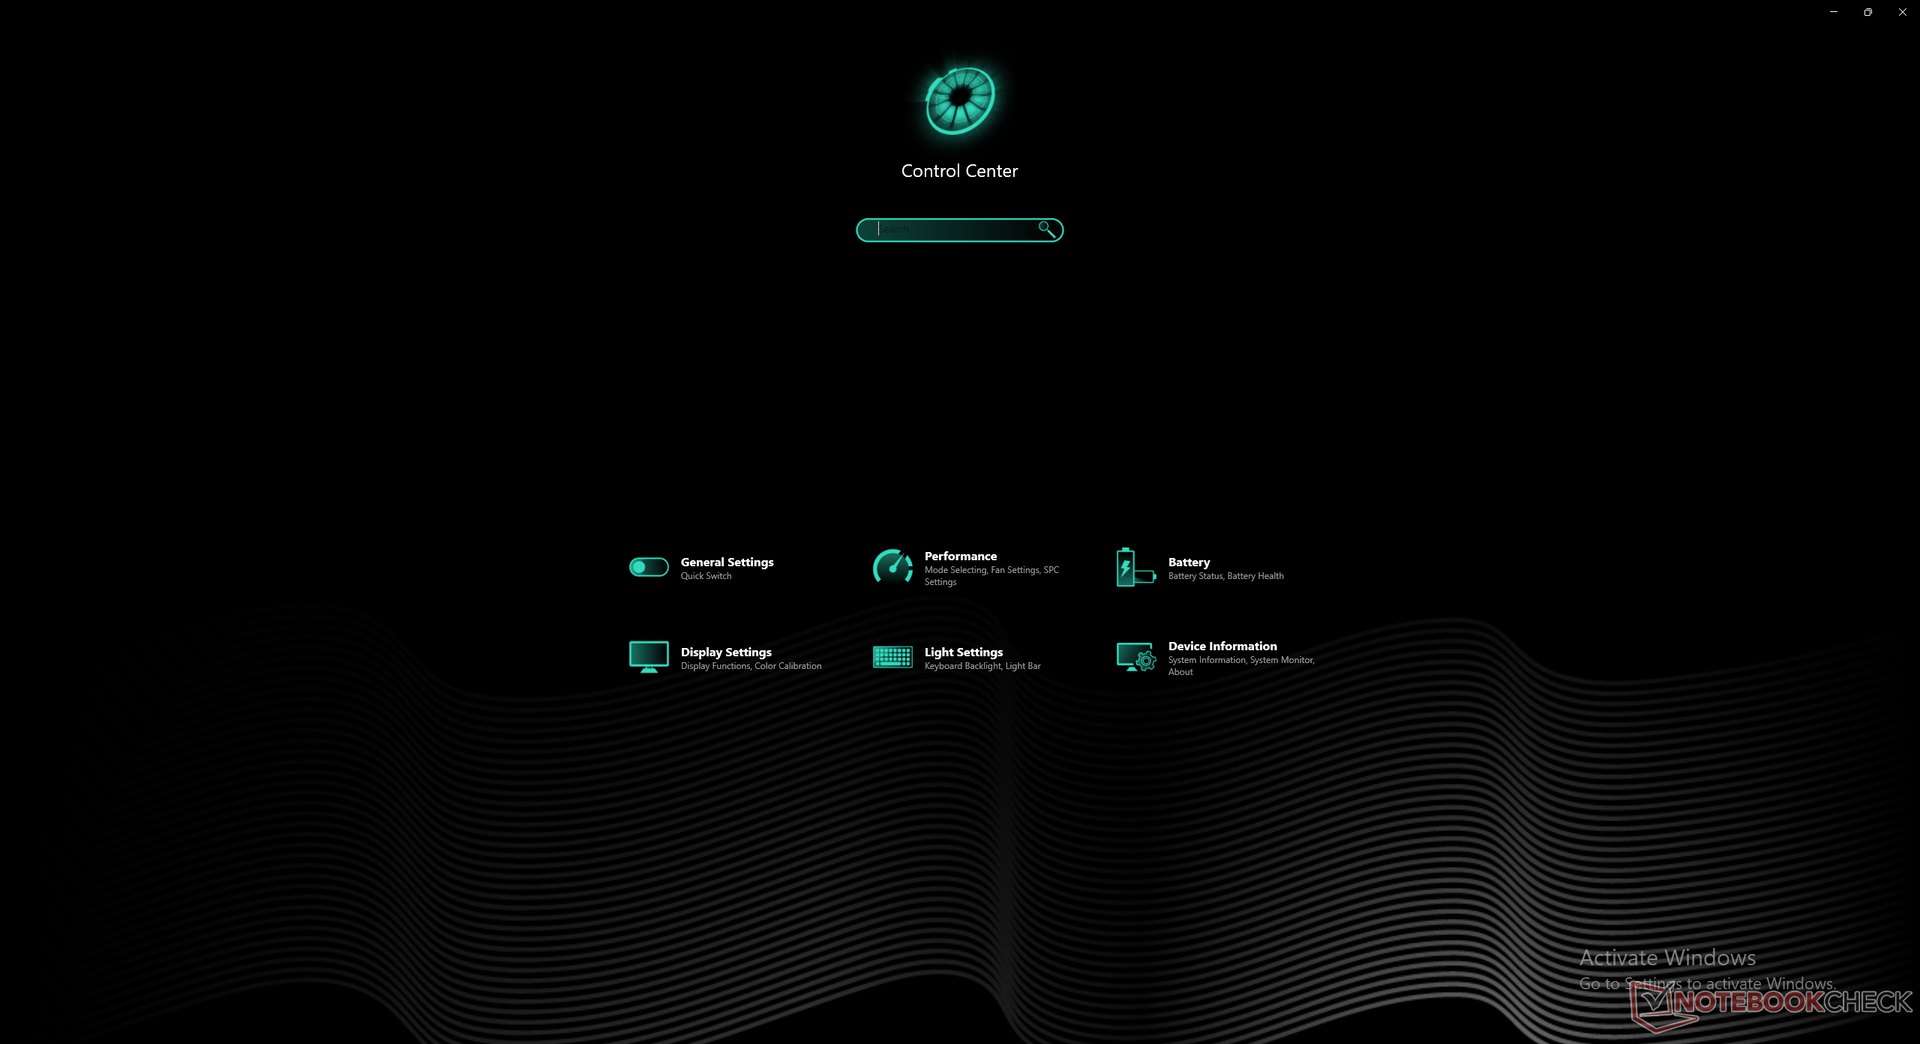
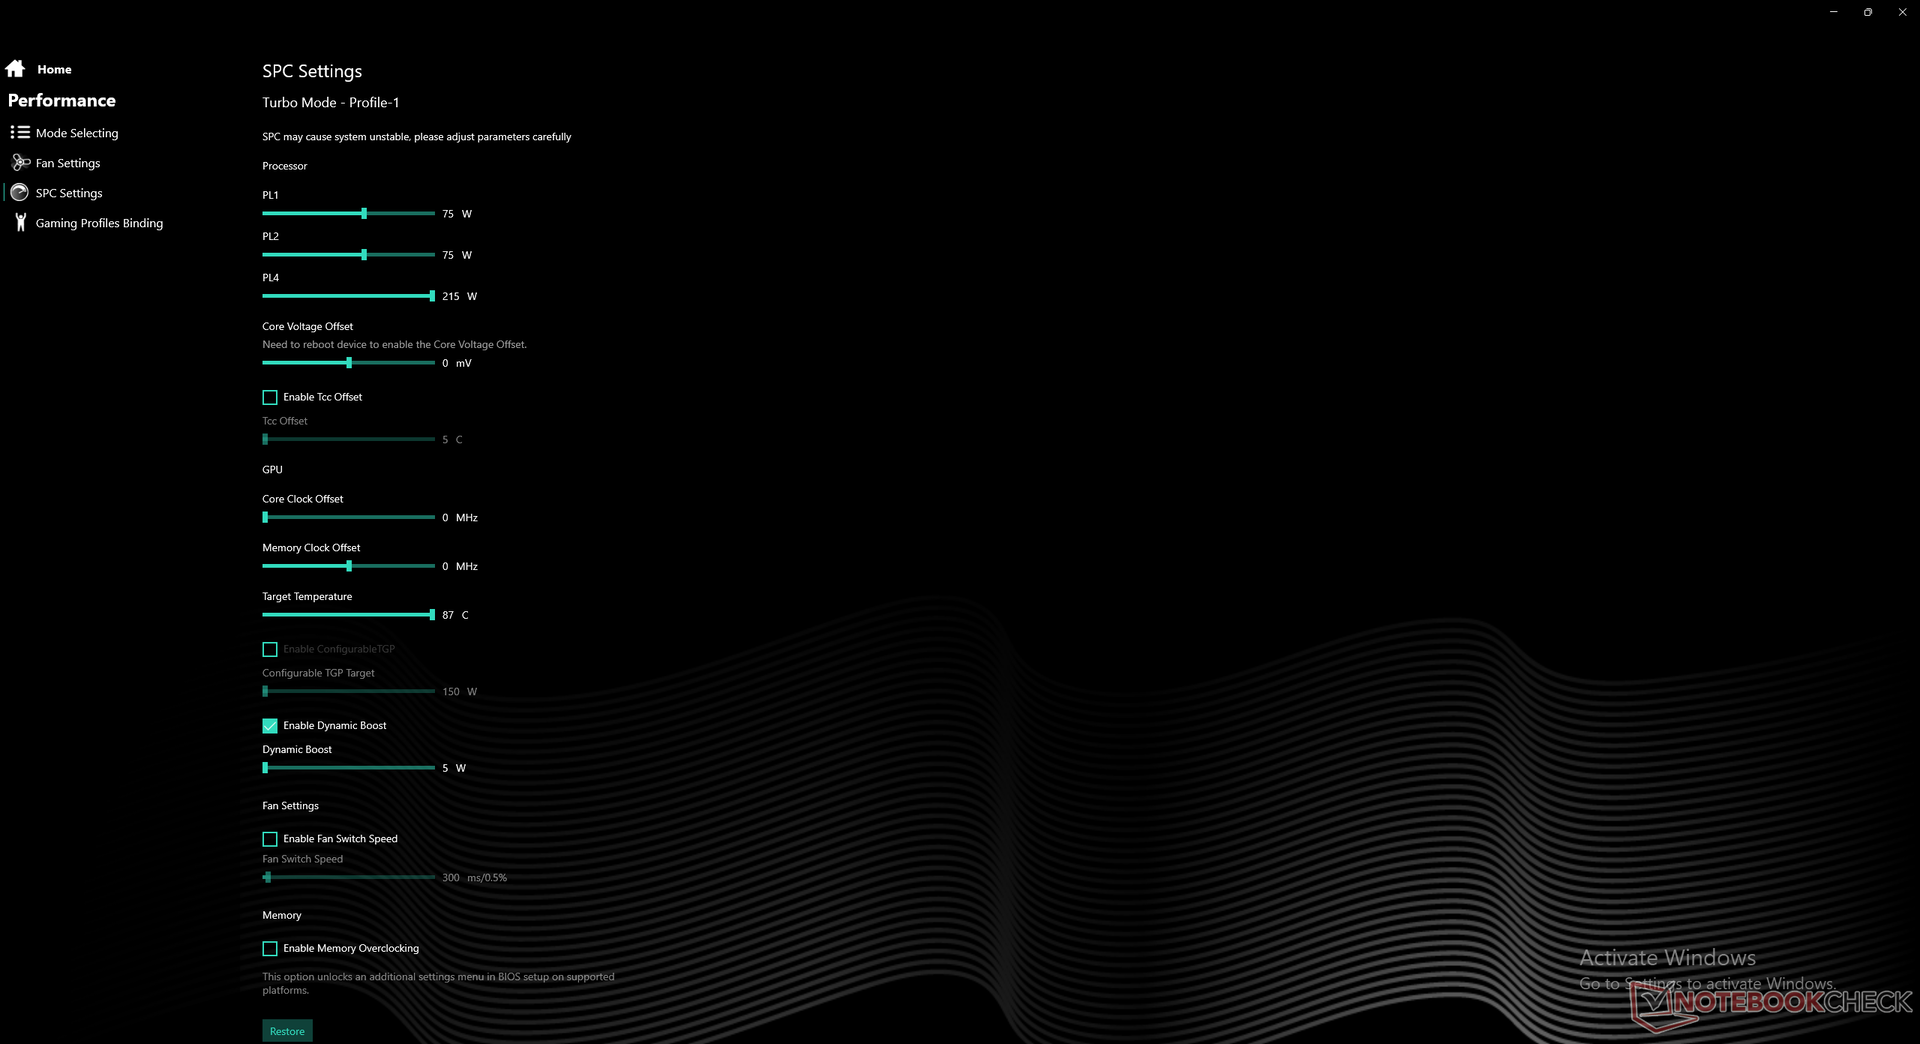
Advanced Optimus (u Optimus 2.0) no está disponible, lo que significa que los usuarios tendrán que cambiar entre la GPU discreta y el MSHybrid manualmente a través de la BIOS. Además, hay que tener en cuenta que la GPU GeForce RTX 3080 Ti está configurada por defecto a 150 W TGP aunque el Panel de Control de Nvidia afirma que es capaz de alcanzar hasta 175 W. Los usuarios tendrán que configurar manualmente la GPU a 175 W a través del software incluido en el Centro de Control

Condiciones de la prueba
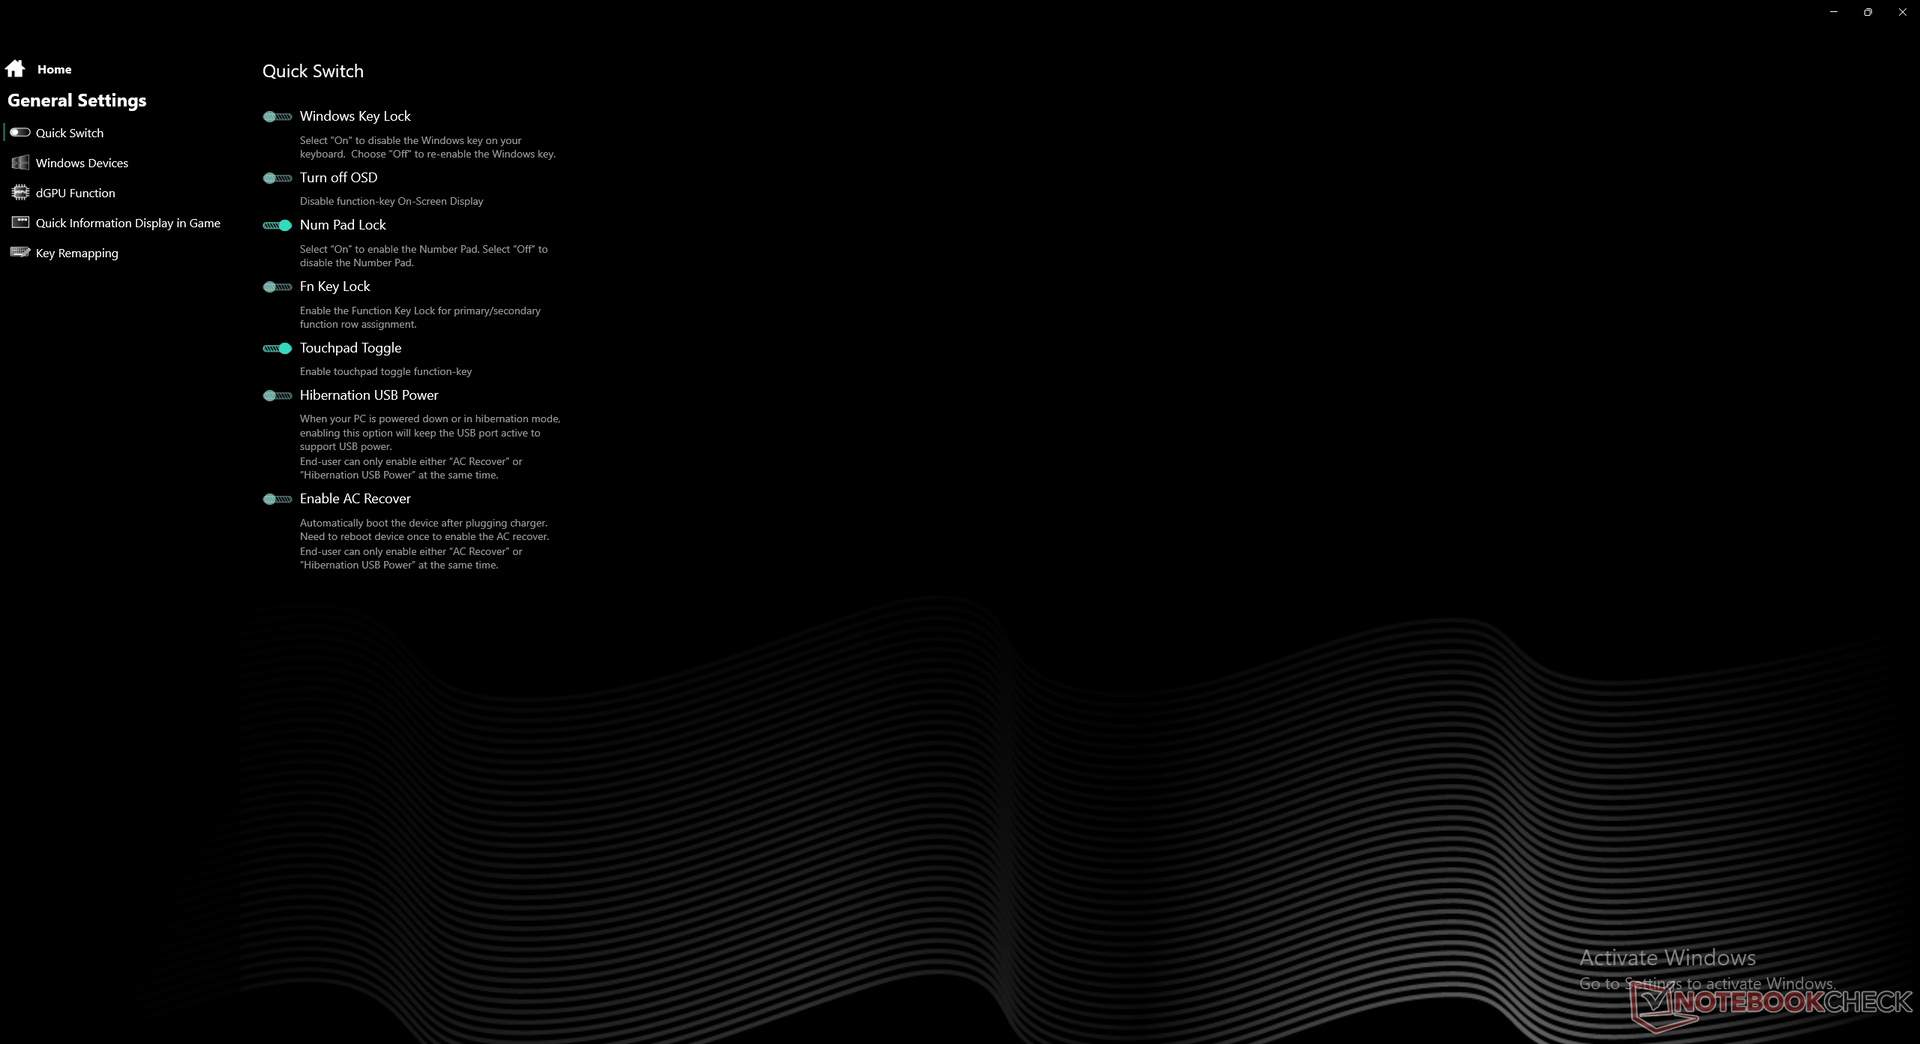
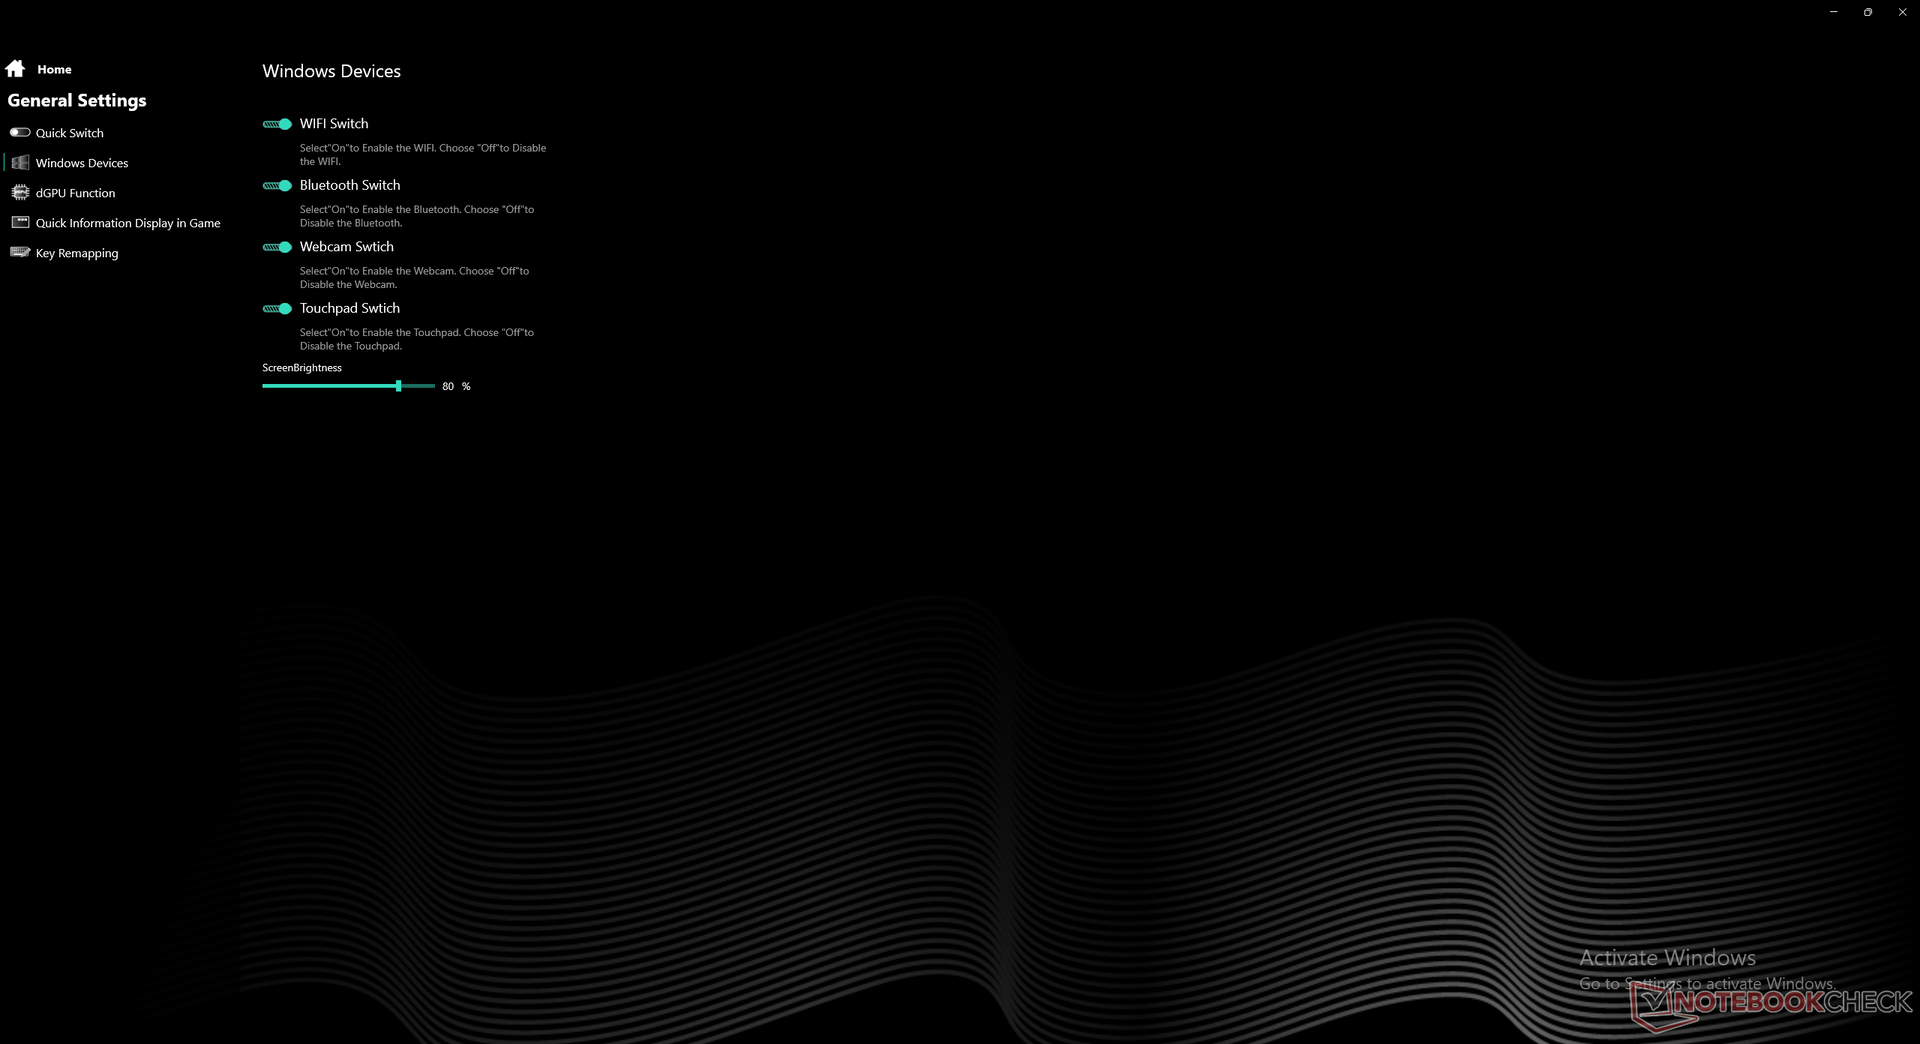
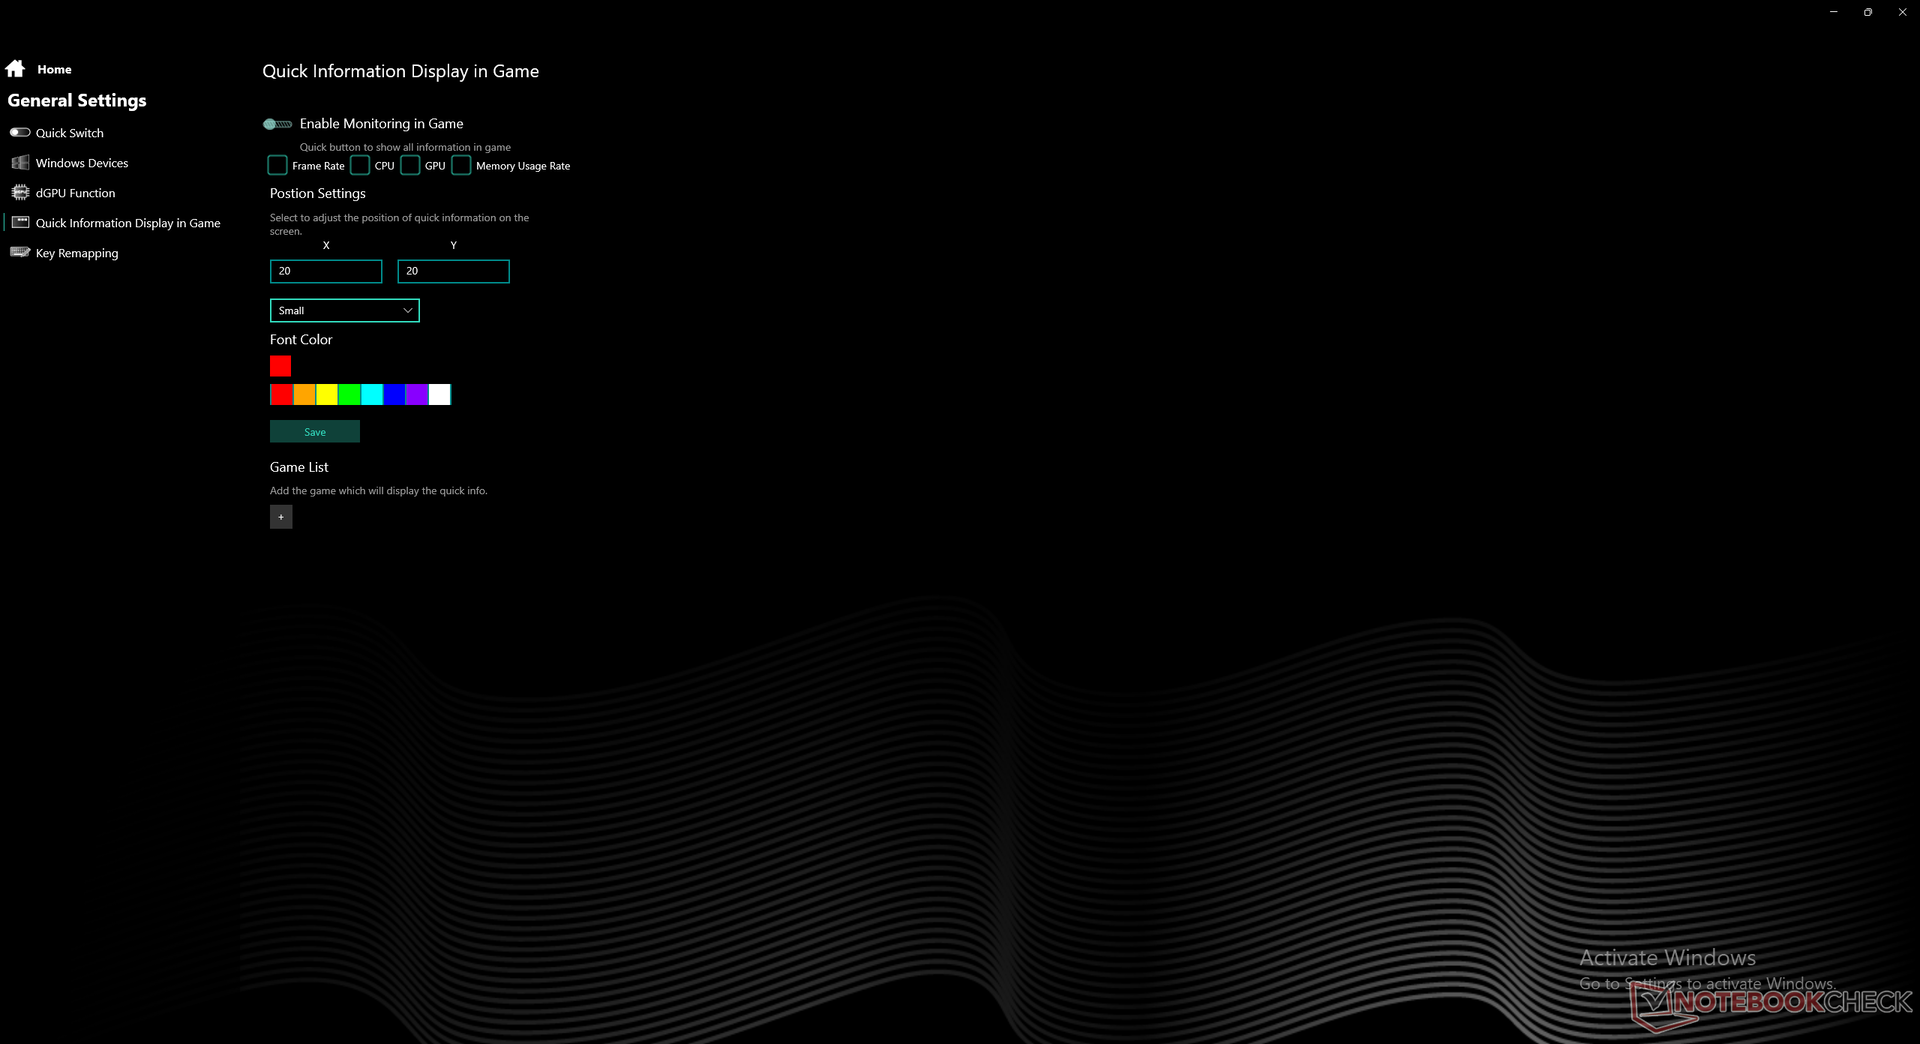
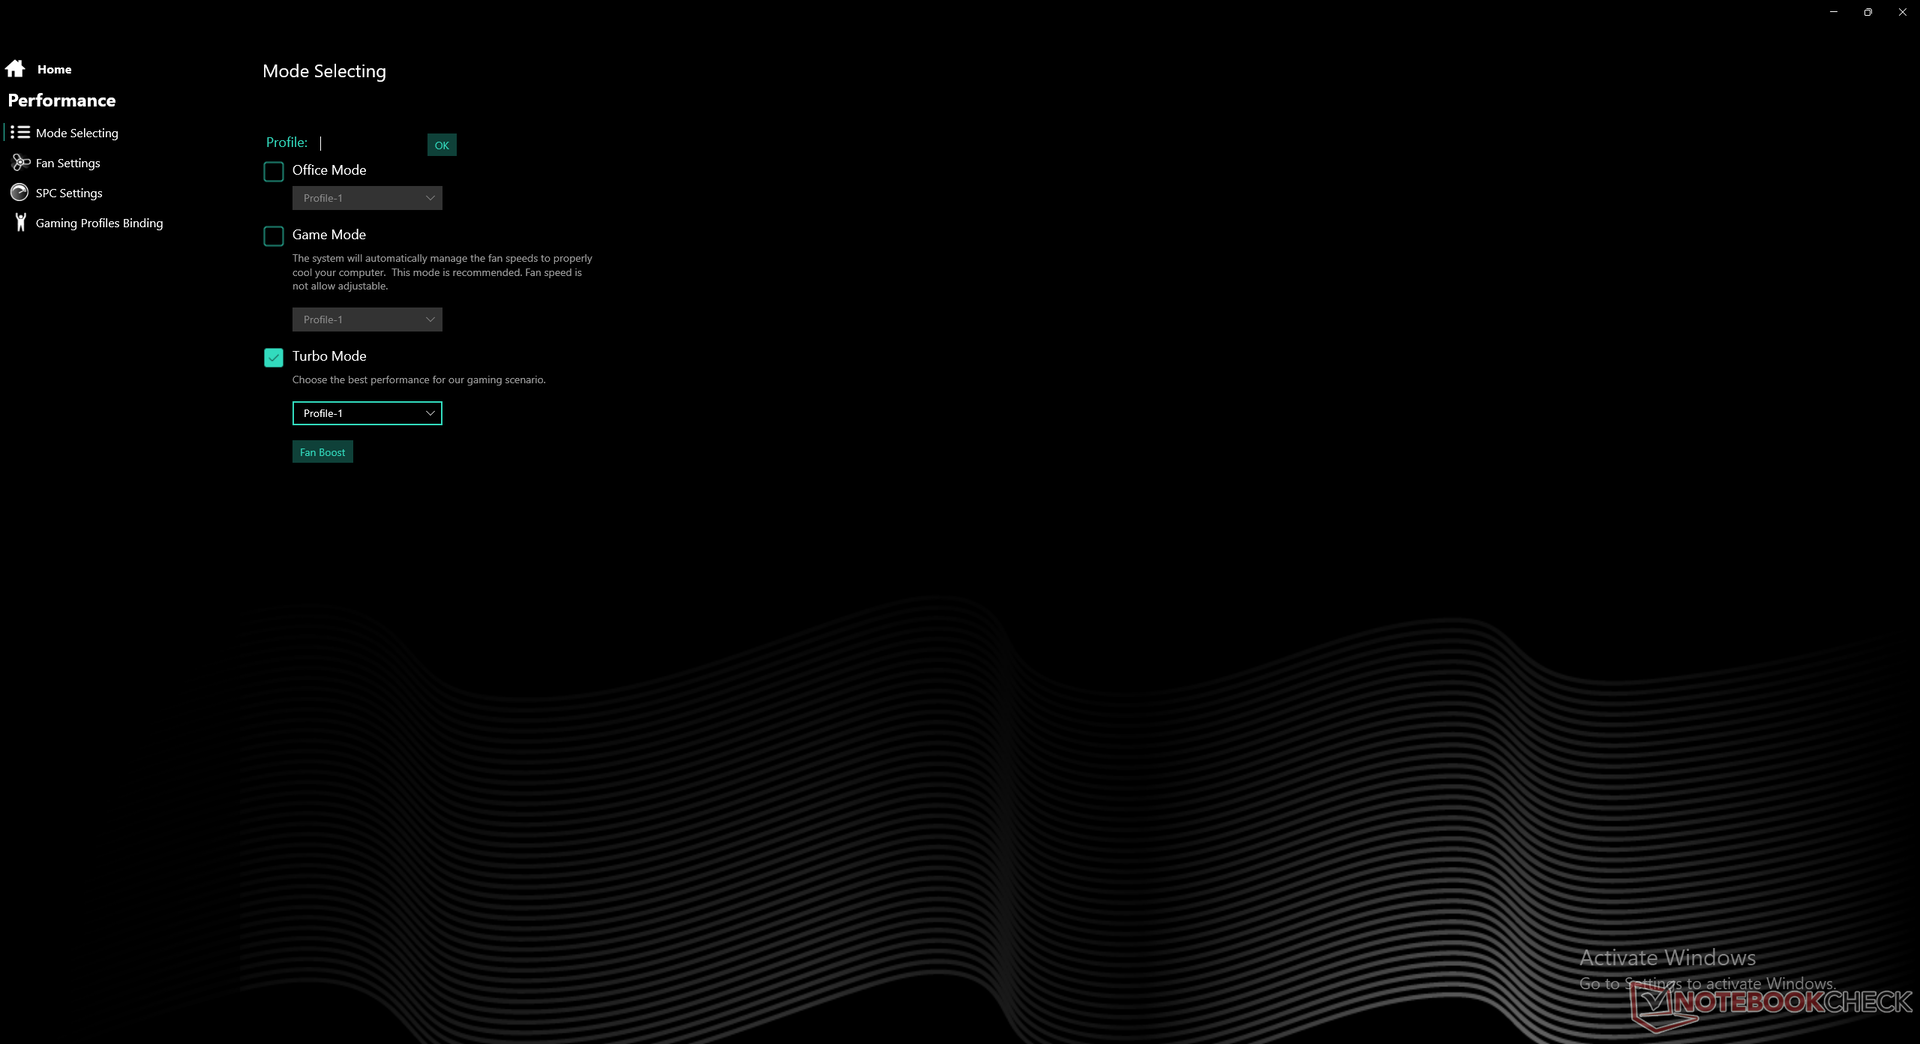
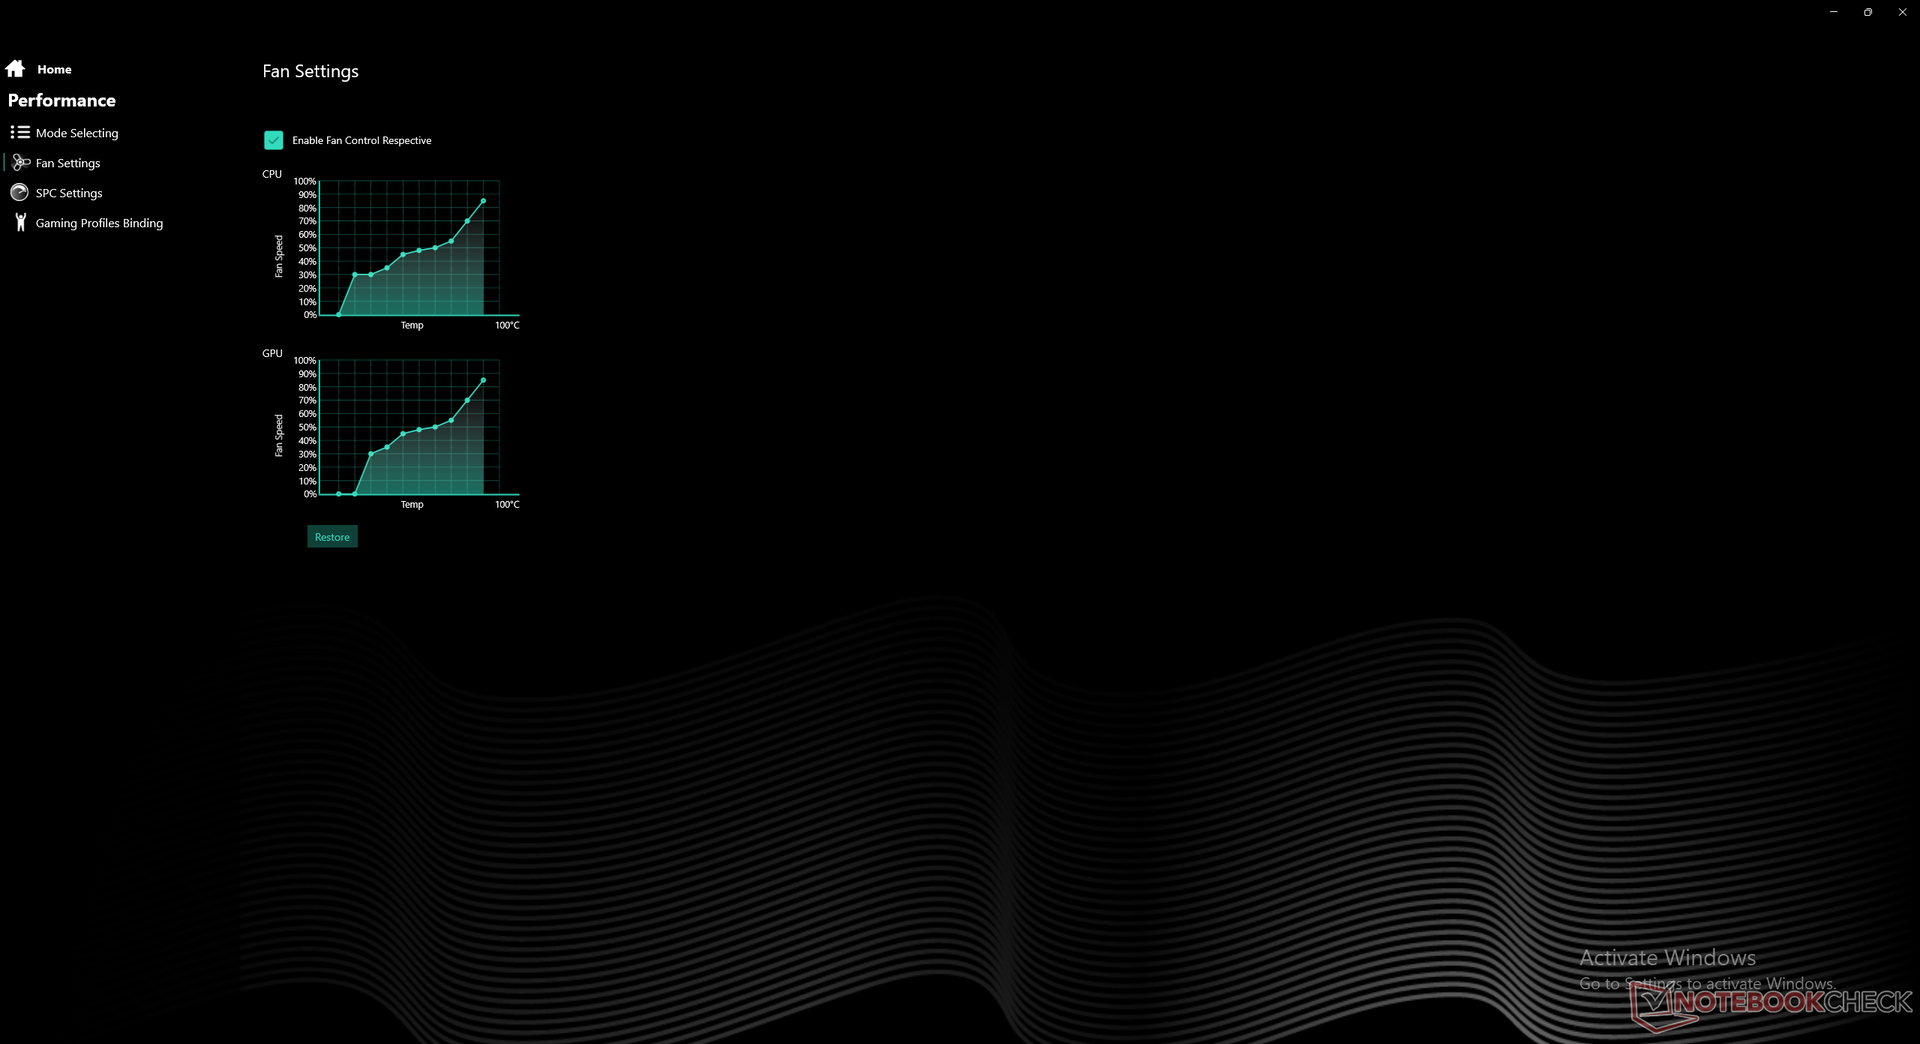
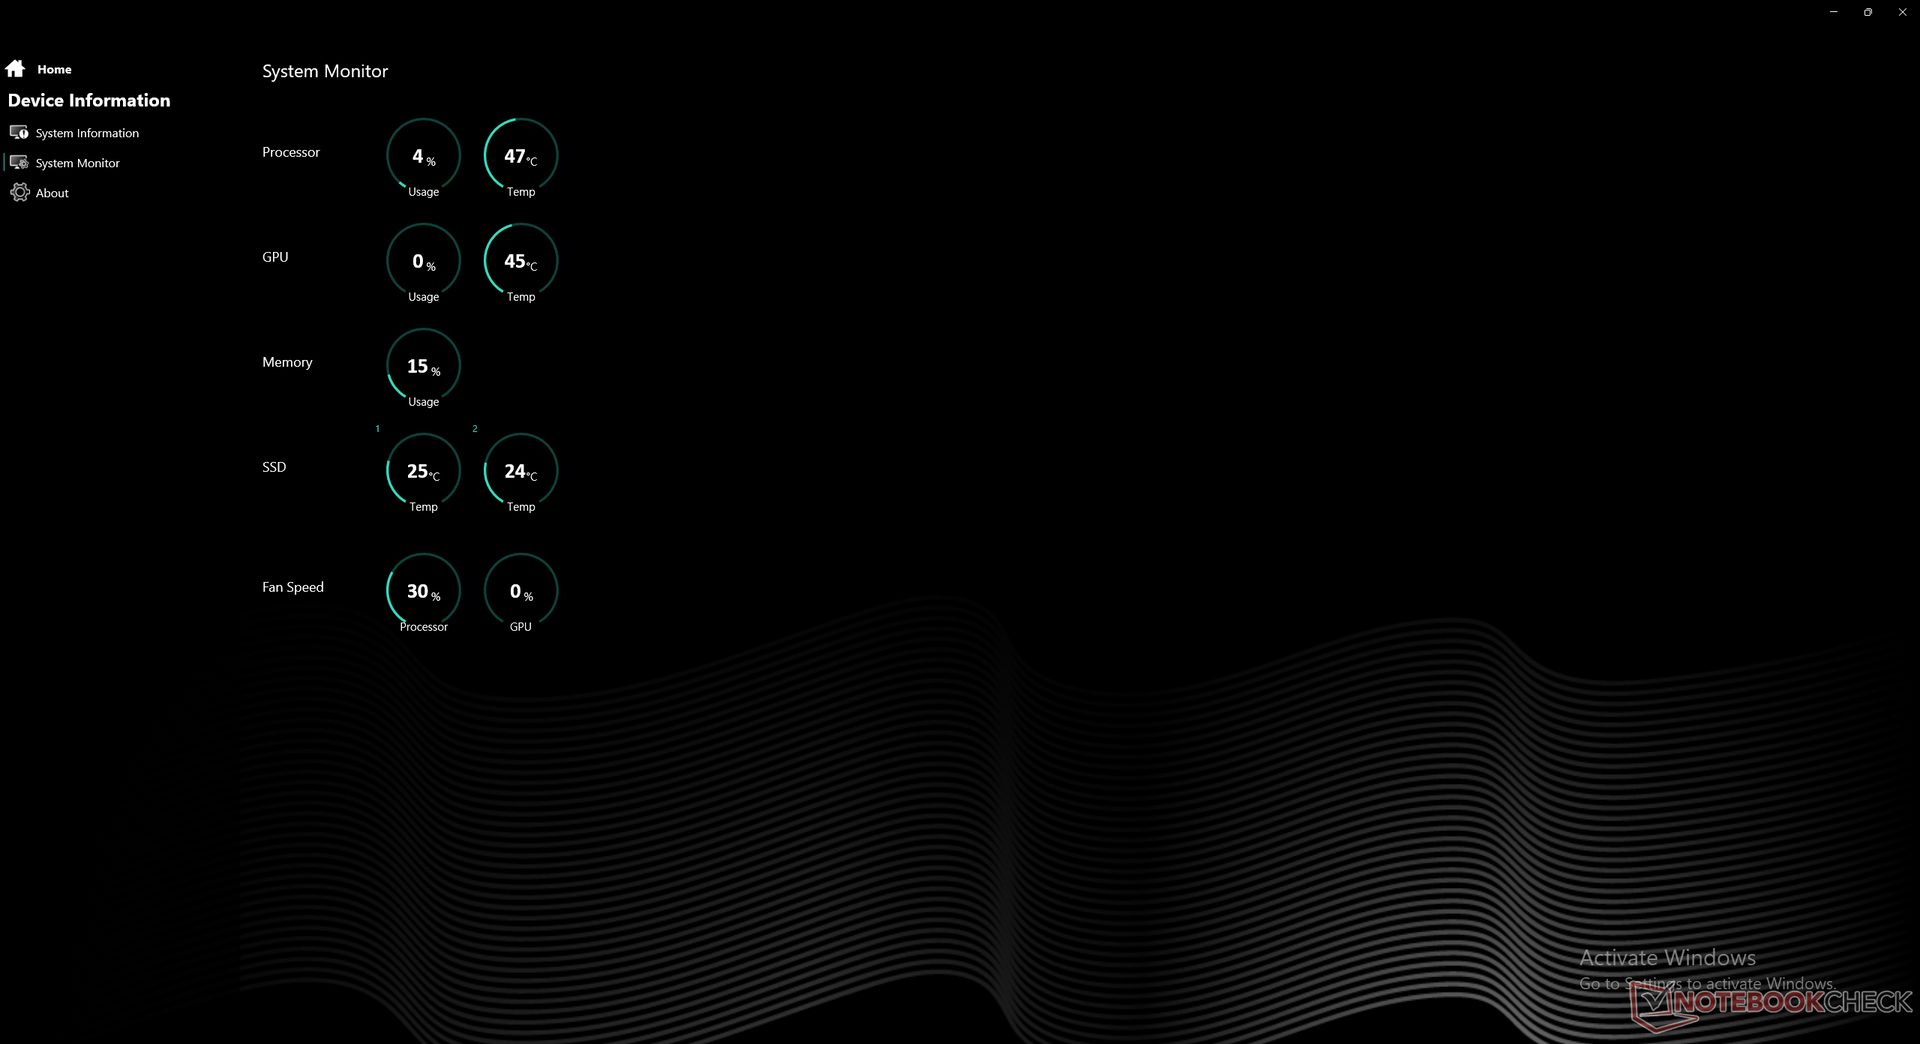
Hemos configurado nuestra unidad con los ajustes predeterminados de la BIOS y el Centro de Control antes de ejecutar cualquier prueba de rendimiento, aunque con el perfil de potencia Turbo activo. Recomendamos encarecidamente a los usuarios que se familiaricen con el Centro de Control, ya que aquí se pueden activar funciones importantes.
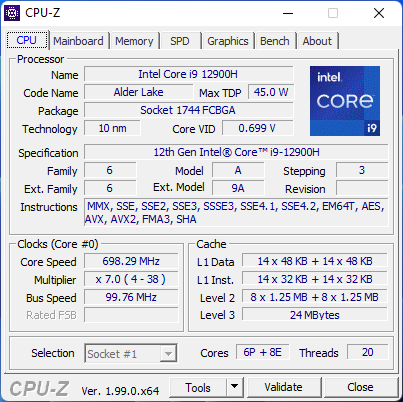
Procesador - Mejoras notables de generación a generación
El rendimiento bruto de la CPU es sólo un 9 por ciento más lento que el Core i9-12900HK que se encuentra en el nuevo MSI GE76. Cuando se compara con la última generación de Core i9-11900H que el Core i9-12900H a la que sustituye directamente, los usuarios pueden esperar un aumento del rendimiento en un solo hilo y en varios hilos de aproximadamente el 20 y el 30 por ciento, respectivamente. Este aumento es suficiente para impulsar la nueva CPU de Intel por encima del Ryzen 7 5800H y Ryzen 9 5900HX que son algunas de las CPU Zen 3 móviles más rápidas.
Se pueden encontrar más detalles sobre la plataforma Alder Lake en nuestro resumen aquí.
Cinebench R15 Multi Loop
Cinebench R23: Multi Core | Single Core
Cinebench R20: CPU (Multi Core) | CPU (Single Core)
Cinebench R15: CPU Multi 64Bit | CPU Single 64Bit
Blender: v2.79 BMW27 CPU
7-Zip 18.03: 7z b 4 | 7z b 4 -mmt1
Geekbench 5.5: Multi-Core | Single-Core
HWBOT x265 Benchmark v2.2: 4k Preset
LibreOffice : 20 Documents To PDF
R Benchmark 2.5: Overall mean
| CPU Performance rating | |
| Media de la clase Gaming | |
| MSI GE76 Raider | |
| Schenker Uniwill Technology GM7AG8P | |
| Medio Intel Core i9-12900H | |
| Schenker XMG Ultra 17 Rocket Lake | |
| MSI WE76 11UM-456 -1! | |
| MSI GS76 Stealth 11UH | |
| Medion Erazer Beast X25 | |
| Schenker XMG Apex 17 M21 | |
| Gigabyte A7 X1 | |
| Maingear Vector Pro MG-VCP17 -2! | |
| Alienware m17 R4 | |
| Lenovo ThinkPad P73-20QR0030GE | |
| Schenker XMG Core 17 (Early 2021) | |
| Acer Aspire 5 A517-52G-79Z5 | |
| HWBOT x265 Benchmark v2.2 / 4k Preset | |
| Media de la clase Gaming (11.5 - 44.4, n=105, últimos 2 años) | |
| MSI GE76 Raider | |
| Schenker Uniwill Technology GM7AG8P | |
| Schenker XMG Ultra 17 Rocket Lake | |
| Medio Intel Core i9-12900H (8.05 - 22.5, n=28) | |
| Schenker XMG Apex 17 M21 | |
| Medion Erazer Beast X25 | |
| MSI WE76 11UM-456 | |
| MSI GS76 Stealth 11UH | |
| Gigabyte A7 X1 | |
| Alienware m17 R4 | |
| Maingear Vector Pro MG-VCP17 | |
| Lenovo ThinkPad P73-20QR0030GE | |
| Schenker XMG Core 17 (Early 2021) | |
| Acer Aspire 5 A517-52G-79Z5 | |
Cinebench R23: Multi Core | Single Core
Cinebench R20: CPU (Multi Core) | CPU (Single Core)
Cinebench R15: CPU Multi 64Bit | CPU Single 64Bit
Blender: v2.79 BMW27 CPU
7-Zip 18.03: 7z b 4 | 7z b 4 -mmt1
Geekbench 5.5: Multi-Core | Single-Core
HWBOT x265 Benchmark v2.2: 4k Preset
LibreOffice : 20 Documents To PDF
R Benchmark 2.5: Overall mean
* ... más pequeño es mejor
| AIDA64 / FP32 Ray-Trace | |
| Schenker Uniwill Technology GM7AG8P | |
| AIDA64 / FPU Julia | |
| Schenker Uniwill Technology GM7AG8P | |
| AIDA64 / CPU SHA3 | |
| Schenker Uniwill Technology GM7AG8P | |
| AIDA64 / CPU Queen | |
| Schenker Uniwill Technology GM7AG8P | |
| AIDA64 / FPU SinJulia | |
| Schenker Uniwill Technology GM7AG8P | |
| AIDA64 / FPU Mandel | |
| Schenker Uniwill Technology GM7AG8P | |
| AIDA64 / CPU AES | |
| Schenker Uniwill Technology GM7AG8P | |
| AIDA64 / CPU ZLib | |
| Schenker Uniwill Technology GM7AG8P | |
| Schenker XMG NEO 17 GM7TG8S | |
| Maingear Vector Pro MG-VCP17 | |
| Razer Blade 17 RTX 3070 | |
| Alienware x17 RTX 3080 P48E | |
| AIDA64 / FP64 Ray-Trace | |
| Schenker Uniwill Technology GM7AG8P | |
| AIDA64 / CPU PhotoWorxx | |
| Schenker Uniwill Technology GM7AG8P | |
Rendimiento del sistema
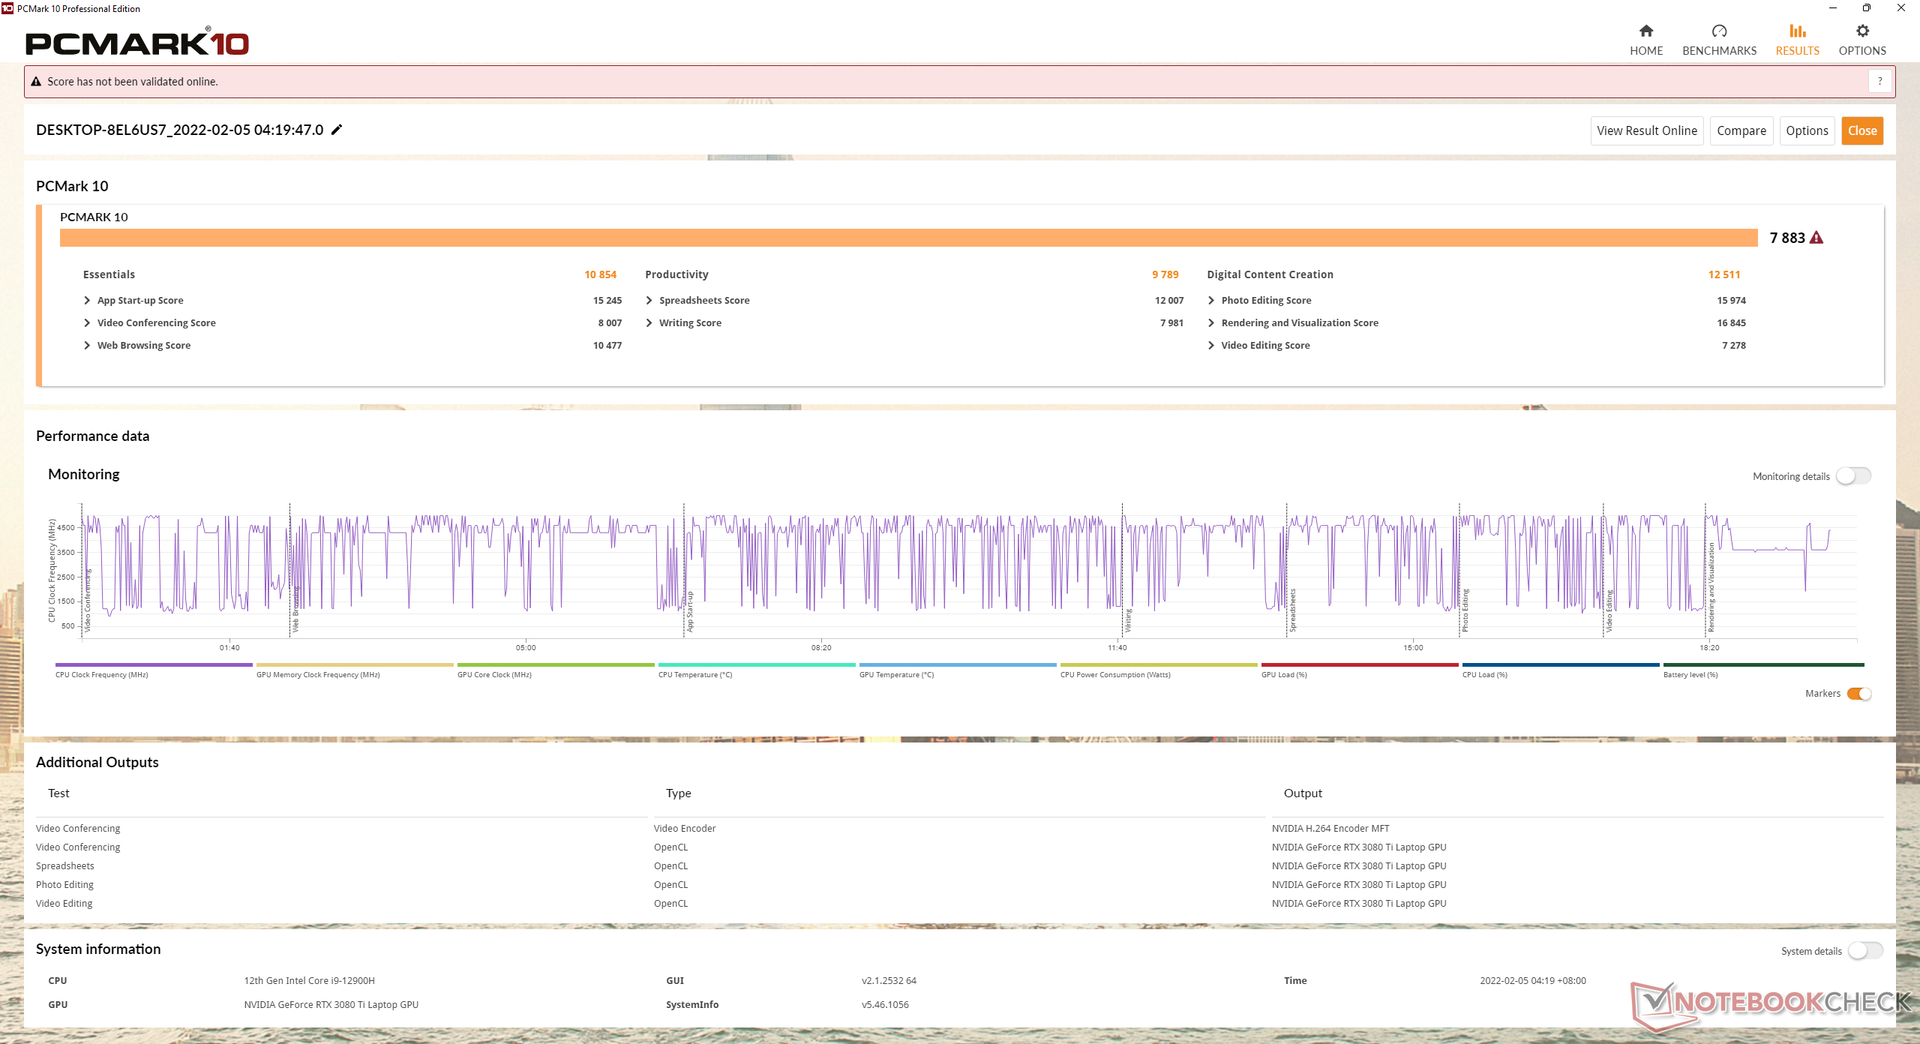
Las puntuaciones de PCMark son de las más altas de nuestra base de datos, rivalizando esencialmente con el Schenker XMG Ultra 17 equipado con el Core i9-11900K de sobremesa.
| PCMark 10 / Score | |
| Schenker XMG Ultra 17 Rocket Lake | |
| Schenker Uniwill Technology GM7AG8P | |
| Medio Intel Core i9-12900H, NVIDIA GeForce RTX 3080 Ti Laptop GPU (7139 - 8083, n=6) | |
| Eurocom Sky X4C i9-9900KS | |
| Schenker XMG Ultra 17 Comet Lake | |
| Schenker XMG NEO 17 GM7TG8S | |
| Schenker XMG Apex 17 M21 | |
| PCMark 10 / Essentials | |
| Eurocom Sky X4C i9-9900KS | |
| Schenker XMG Ultra 17 Rocket Lake | |
| Schenker Uniwill Technology GM7AG8P | |
| Medio Intel Core i9-12900H, NVIDIA GeForce RTX 3080 Ti Laptop GPU (10254 - 11178, n=6) | |
| Schenker XMG Ultra 17 Comet Lake | |
| Schenker XMG NEO 17 GM7TG8S | |
| Schenker XMG Apex 17 M21 | |
| PCMark 10 / Productivity | |
| Medio Intel Core i9-12900H, NVIDIA GeForce RTX 3080 Ti Laptop GPU (9102 - 11186, n=6) | |
| Schenker XMG Ultra 17 Rocket Lake | |
| Schenker Uniwill Technology GM7AG8P | |
| Schenker XMG NEO 17 GM7TG8S | |
| Schenker XMG Apex 17 M21 | |
| Eurocom Sky X4C i9-9900KS | |
| Schenker XMG Ultra 17 Comet Lake | |
| PCMark 10 / Digital Content Creation | |
| Schenker Uniwill Technology GM7AG8P | |
| Schenker XMG Ultra 17 Rocket Lake | |
| Schenker XMG Ultra 17 Comet Lake | |
| Medio Intel Core i9-12900H, NVIDIA GeForce RTX 3080 Ti Laptop GPU (9847 - 12627, n=6) | |
| Eurocom Sky X4C i9-9900KS | |
| Schenker XMG NEO 17 GM7TG8S | |
| Schenker XMG Apex 17 M21 | |
| PCMark 10 Score | 7883 puntos | |
ayuda | ||
| AIDA64 / Memory Copy | |
| MSI GE76 Raider | |
| Schenker Uniwill Technology GM7AG8P | |
| Schenker XMG Pro 17 (Late 2021, RTX 3080) | |
| Schenker XMG Apex 17 M21 | |
| AIDA64 / Memory Read | |
| MSI GE76 Raider | |
| Schenker Uniwill Technology GM7AG8P | |
| Schenker XMG Pro 17 (Late 2021, RTX 3080) | |
| Schenker XMG Apex 17 M21 | |
| AIDA64 / Memory Write | |
| Schenker Uniwill Technology GM7AG8P | |
| MSI GE76 Raider | |
| Schenker XMG Apex 17 M21 | |
| Schenker XMG Pro 17 (Late 2021, RTX 3080) | |
| AIDA64 / Memory Latency | |
| MSI GE76 Raider | |
| Schenker XMG Pro 17 (Late 2021, RTX 3080) | |
| Schenker XMG Apex 17 M21 | |
| Razer Blade 17 RTX 3070 | |
| Alienware x17 RTX 3080 P48E | |
| Schenker Uniwill Technology GM7AG8P | |
* ... más pequeño es mejor
Latencia del CPD
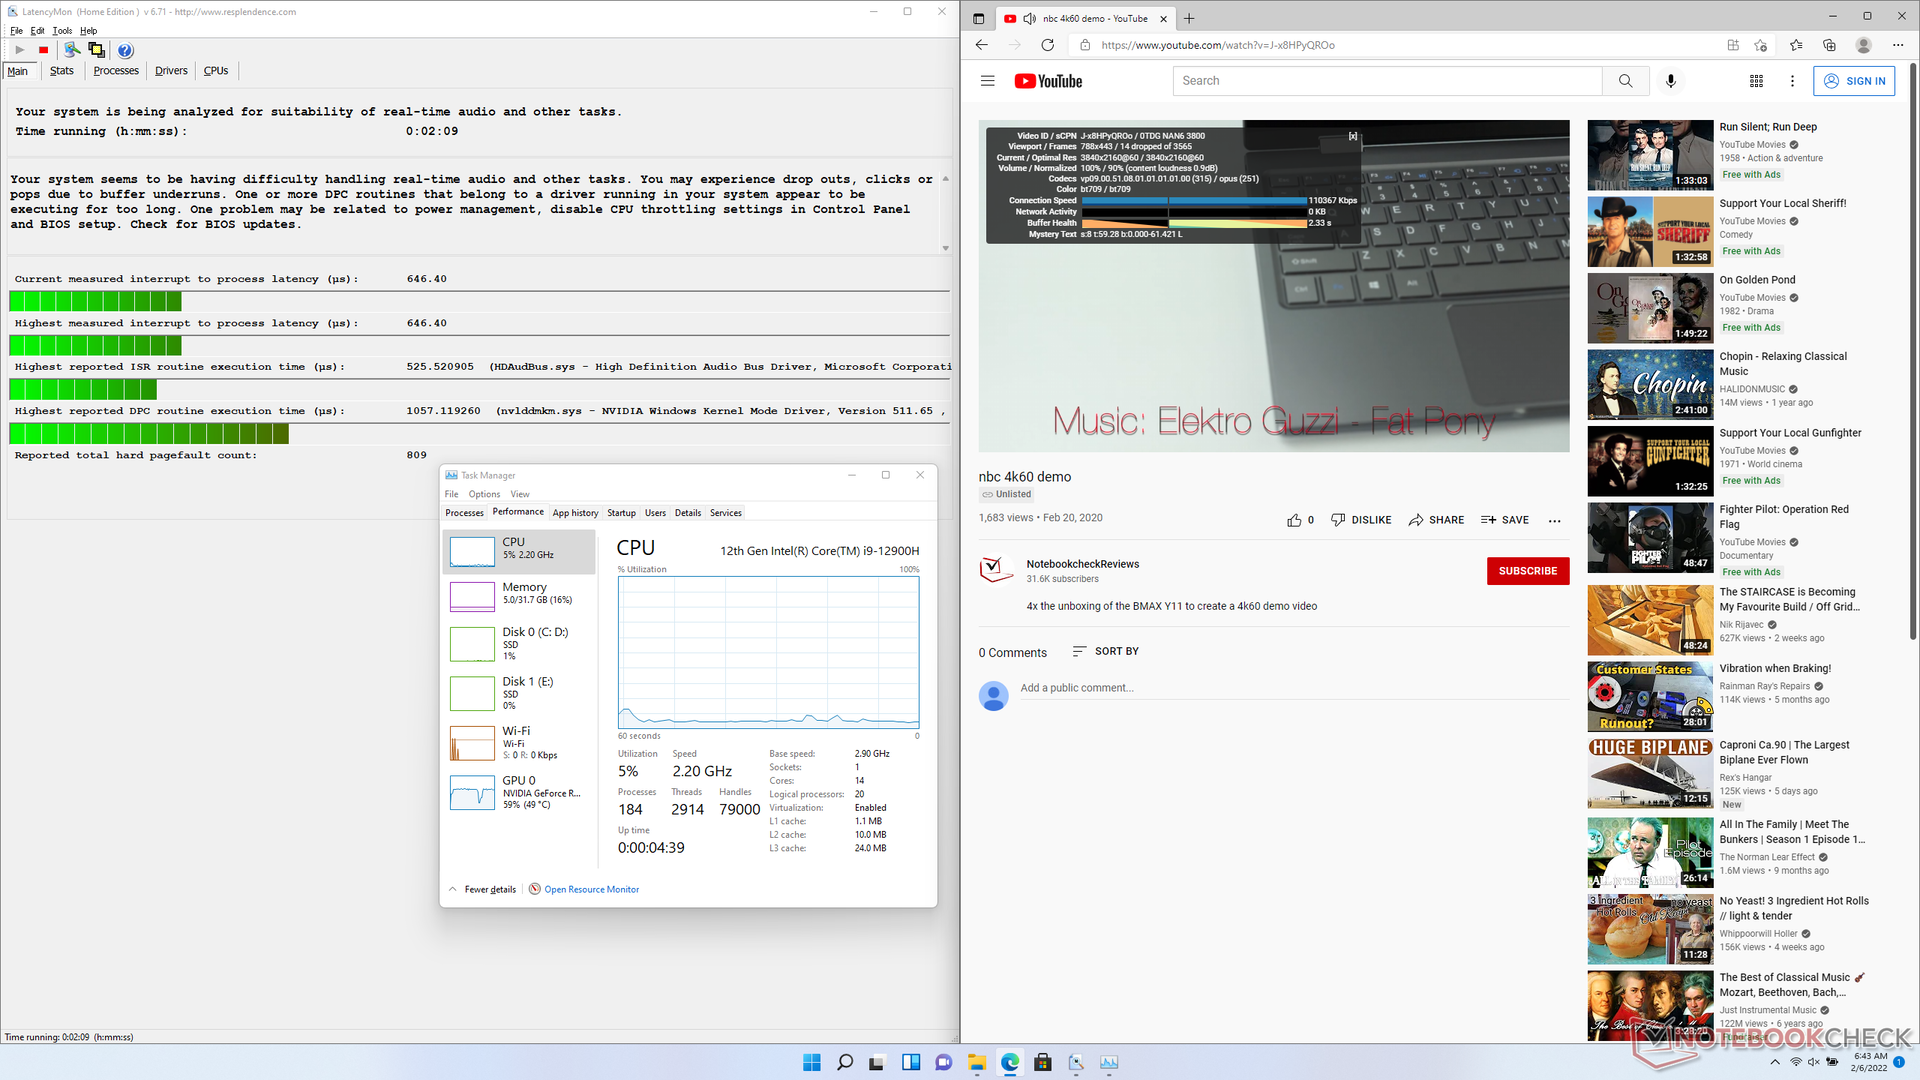
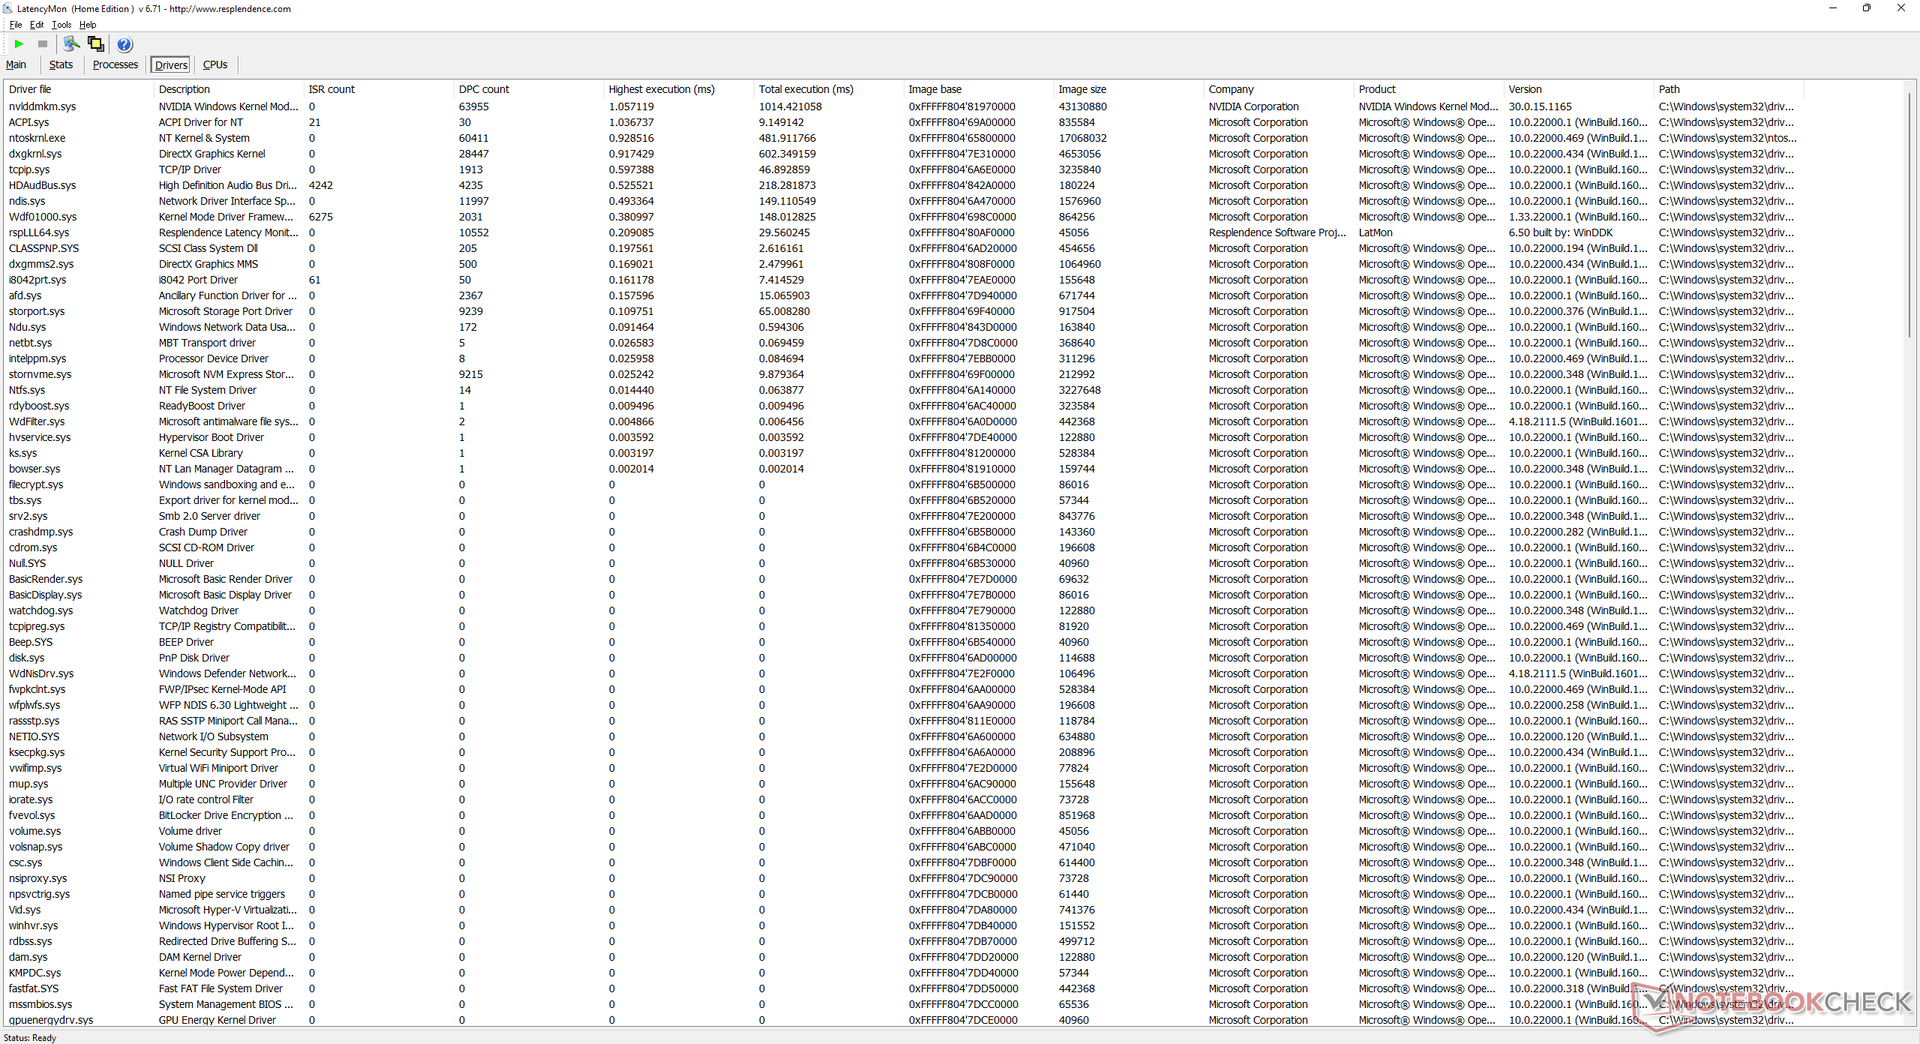
LatencyMon muestra problemas menores de CPD al abrir varias pestañas en nuestra página de inicio. la reproducción de vídeo 4K a 60 FPS es fluida pero no perfecta, ya que pudimos registrar 14 fotogramas perdidos durante nuestra prueba de vídeo de un minuto de duración.
| DPC Latencies / LatencyMon - interrupt to process latency (max), Web, Youtube, Prime95 | |
| Schenker XMG NEO 17 GM7TG8S | |
| Alienware x17 RTX 3080 P48E | |
| MSI GS76 Stealth 11UH | |
| Schenker Uniwill Technology GM7AG8P | |
| Maingear Vector Pro MG-VCP17 | |
| Razer Blade 17 RTX 3070 | |
* ... más pequeño es mejor
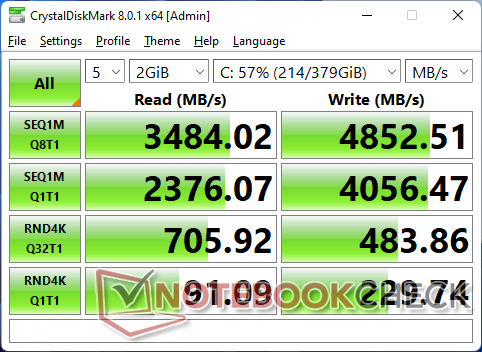
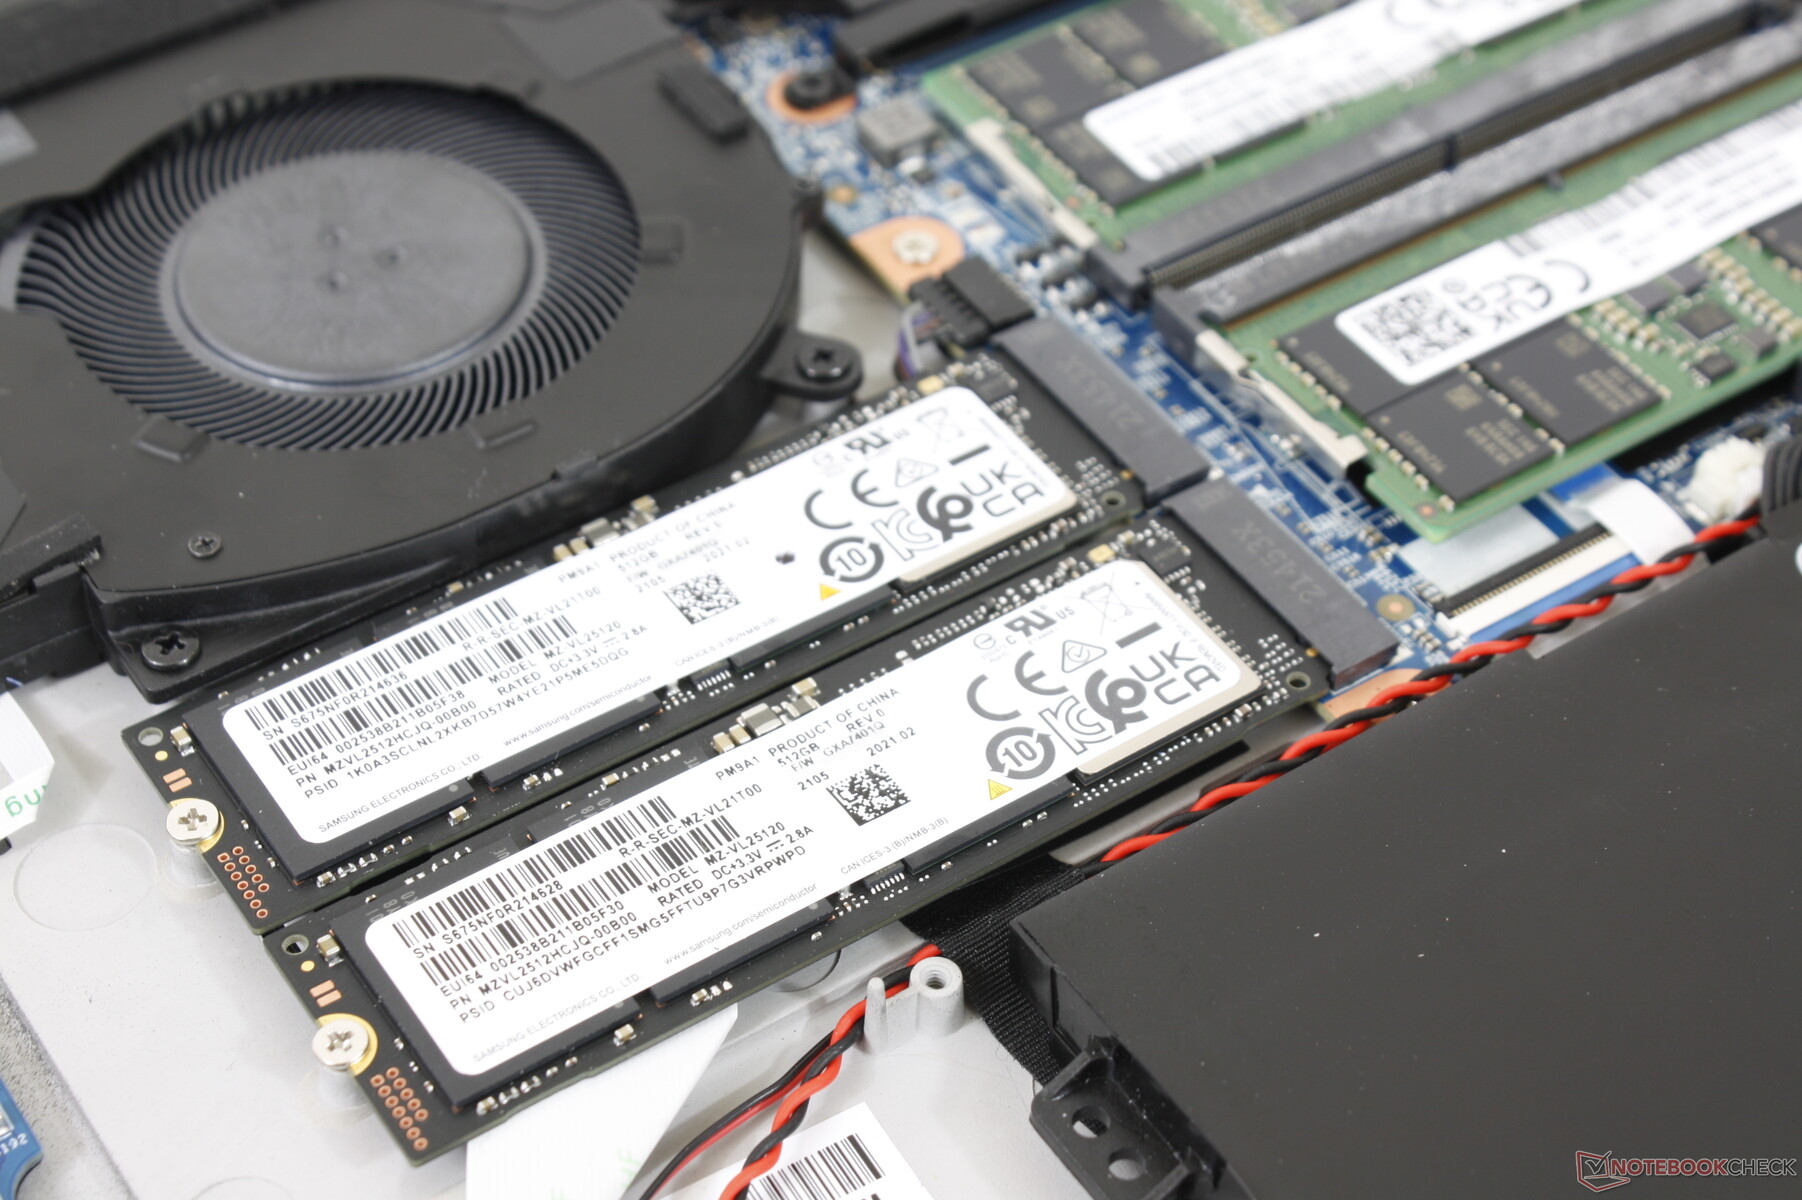
Dispositivos de almacenamiento - 2x M.2 PCIe4 x4 NVMe SSDs
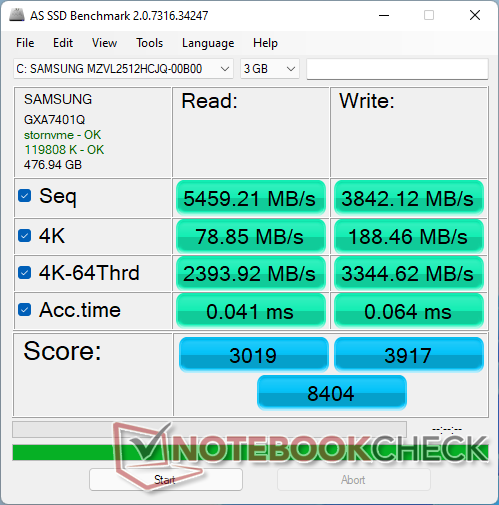
Los 512 GB Samsung PM9A1 ofrece velocidades de lectura y escritura secuenciales de hasta 6900 MB/s y 5000 MB/s, respectivamente. Podemos alcanzar casi las velocidades máximas cuando ejecutamos DiskSpd en un bucle, pero el rendimiento acaba cayendo por un precipicio a "sólo" 3200 MB/s hacia el final de nuestra prueba, como se muestra en el gráfico siguiente. Los resultados sugieren que la unidad es incapaz de mantener el máximo rendimiento durante períodos prolongados, posiblemente debido a las limitaciones de temperatura.

| Drive Performance rating - Percent | |
| Maingear Vector Pro MG-VCP17 | |
| Schenker XMG NEO 17 GM7TG8S | |
| MSI GS76 Stealth 11UH | |
| Schenker Uniwill Technology GM7AG8P | |
| Razer Blade 17 RTX 3070 | |
| Alienware x17 RTX 3080 P48E | |
* ... más pequeño es mejor
Disk Throttling: DiskSpd Read Loop, Queue Depth 8
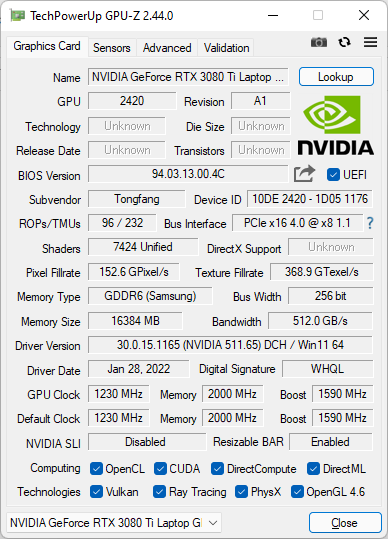
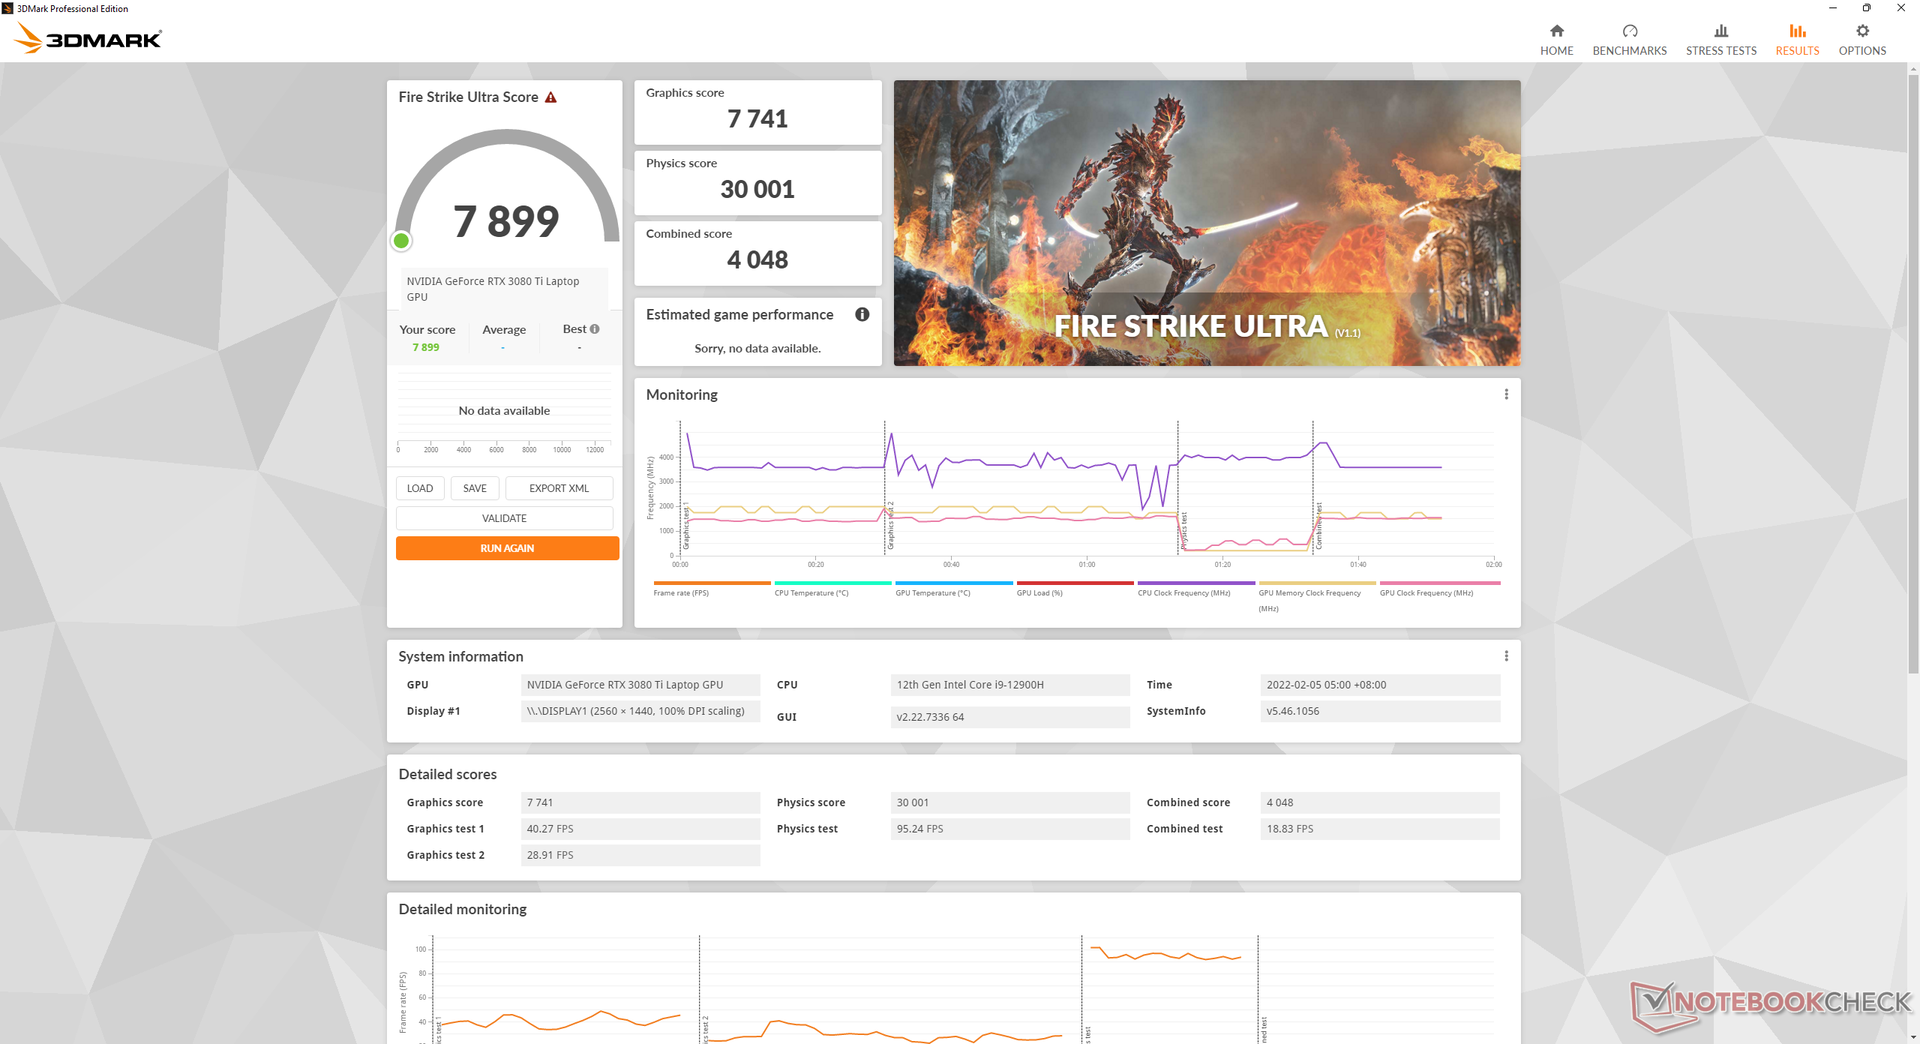
Rendimiento de la GPU: un poco mejor que la GeForce RTX 3080 para móviles
Al igual que la GeForce RTX 3080 Ti de sobremesa es un 10% más rápida que la GeForce RTX 3080 de sobremesa, la GeForce RTX 3080 Ti de portátil es solo un 10% más rápida que la GeForce RTX 3080 de portátil. Se espera que el rendimiento sea más similar al de la GeForce RTX 3070 de sobremesa, que se adapta perfectamente a la pantalla nativa QHD de 165 Hz.
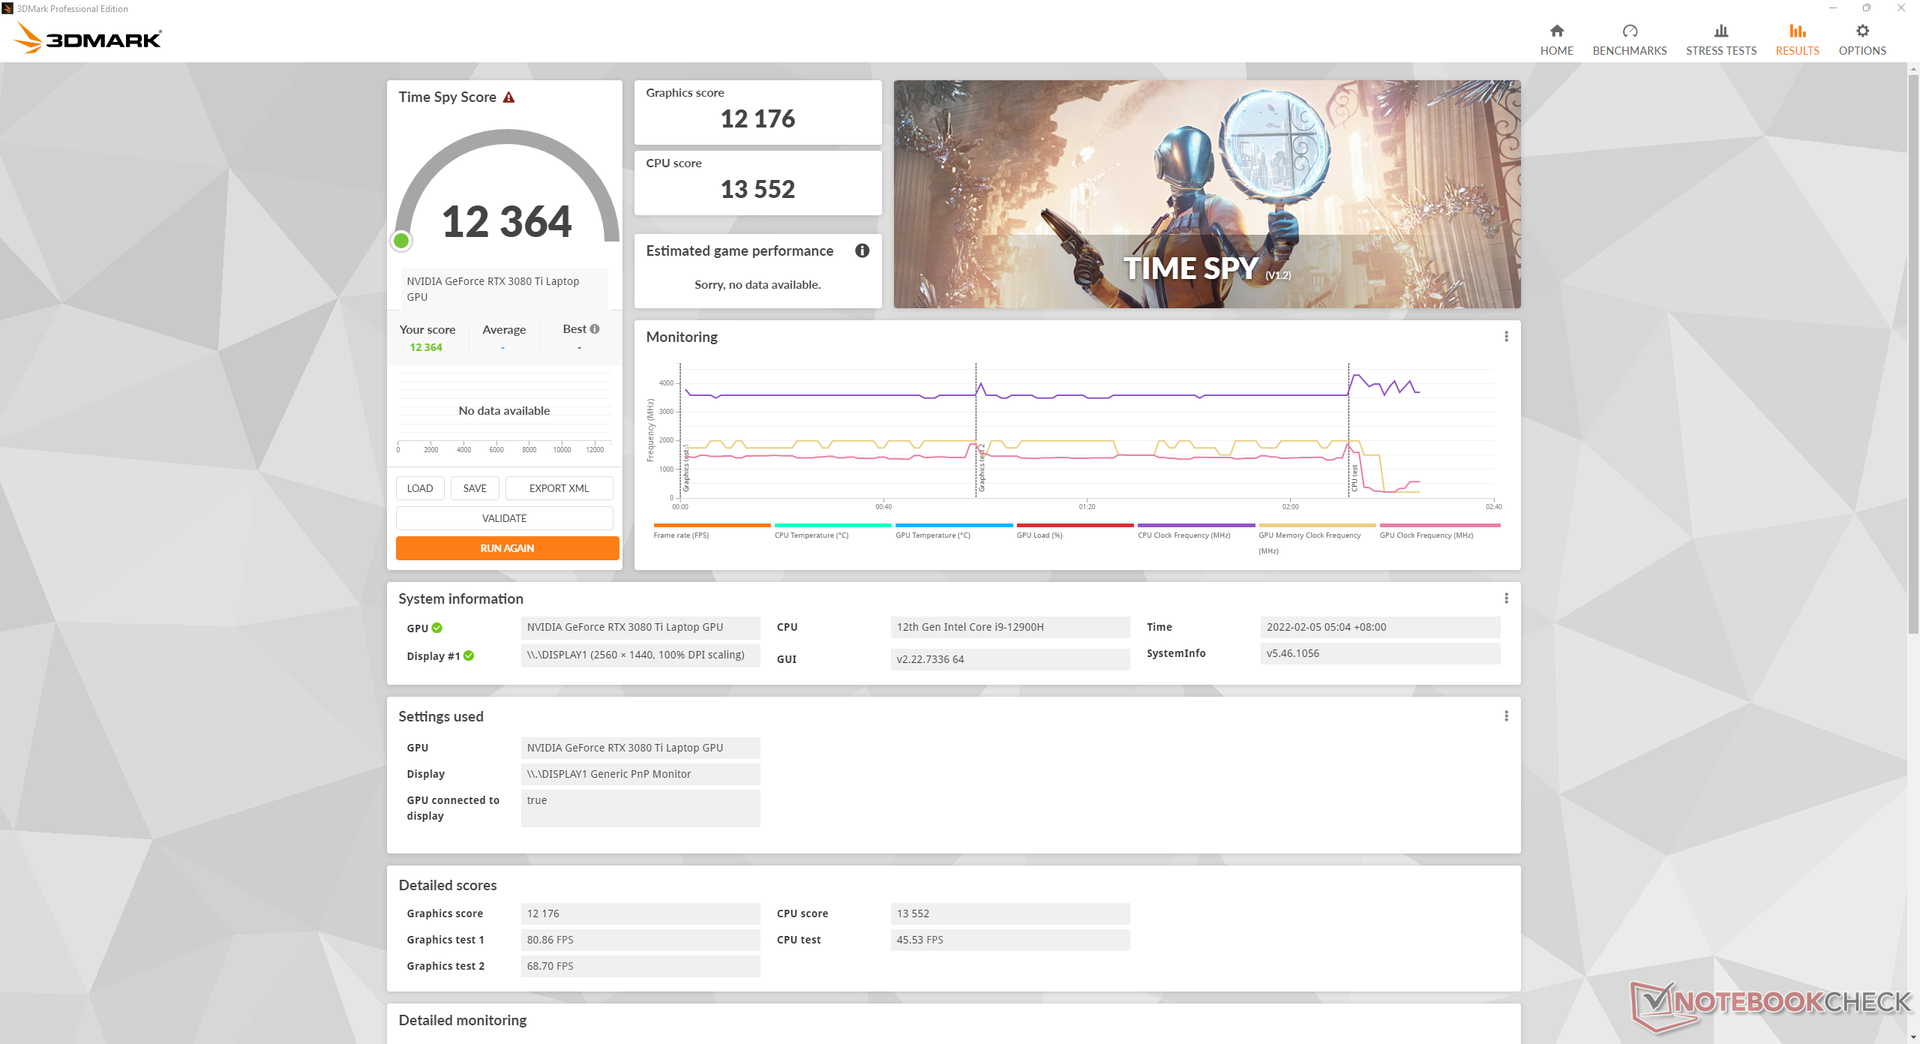
Si se ejecuta en modo MSHybrid en lugar de en modo dGPU, la puntuación de la GPU de Time Spy es un 1,2 por ciento inferior (12176 frente a 12020 puntos), lo que demuestra que la caída de rendimiento al cambiar a MSHybrid es casi insignificante.
Si configuramos la GPU a 175 W a través del Centro de Control, nuestra puntuación gráfica de Time Spy aumentaría a 12714 puntos, lo que supone un aumento del rendimiento de sólo el 4 o el 5 por ciento.
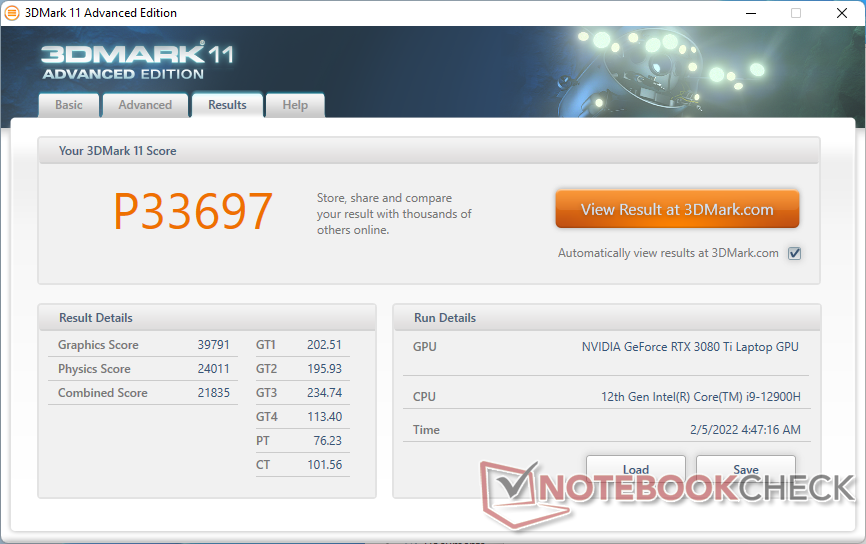
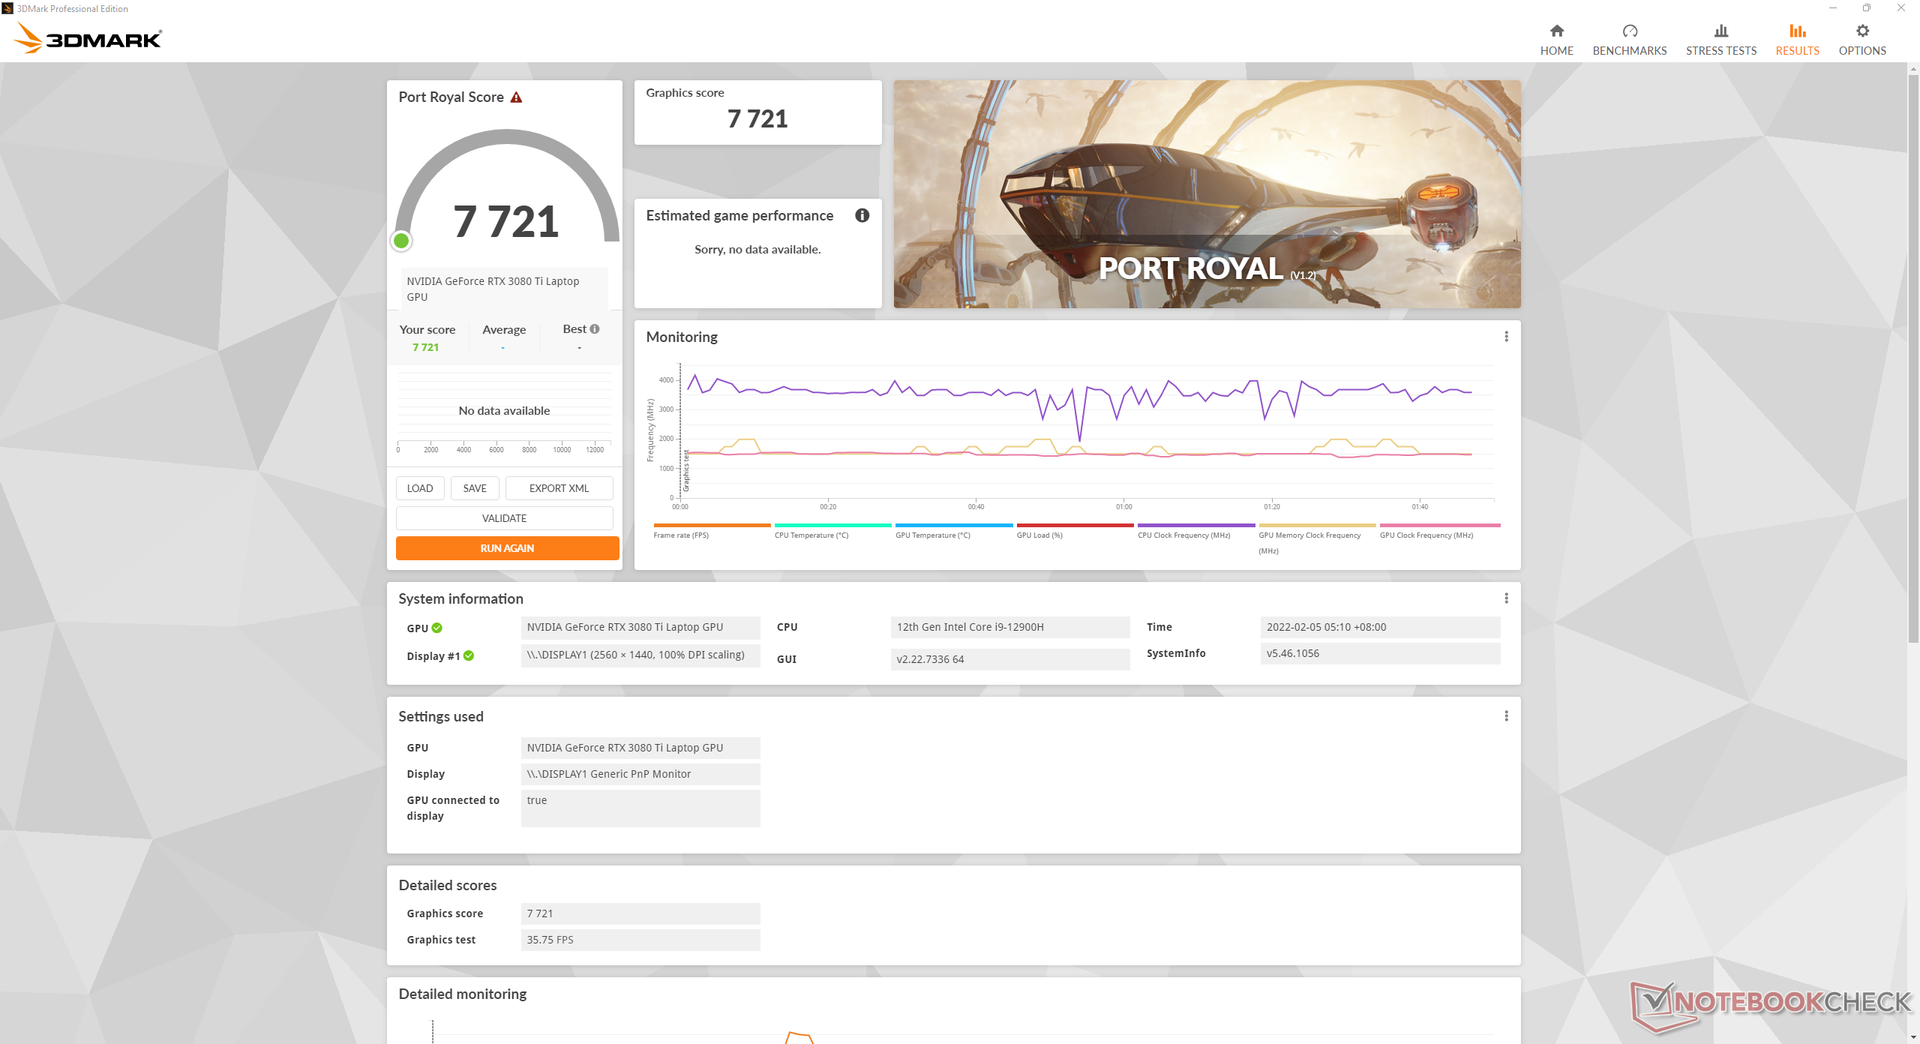
| 3DMark 11 Performance | 33697 puntos | |
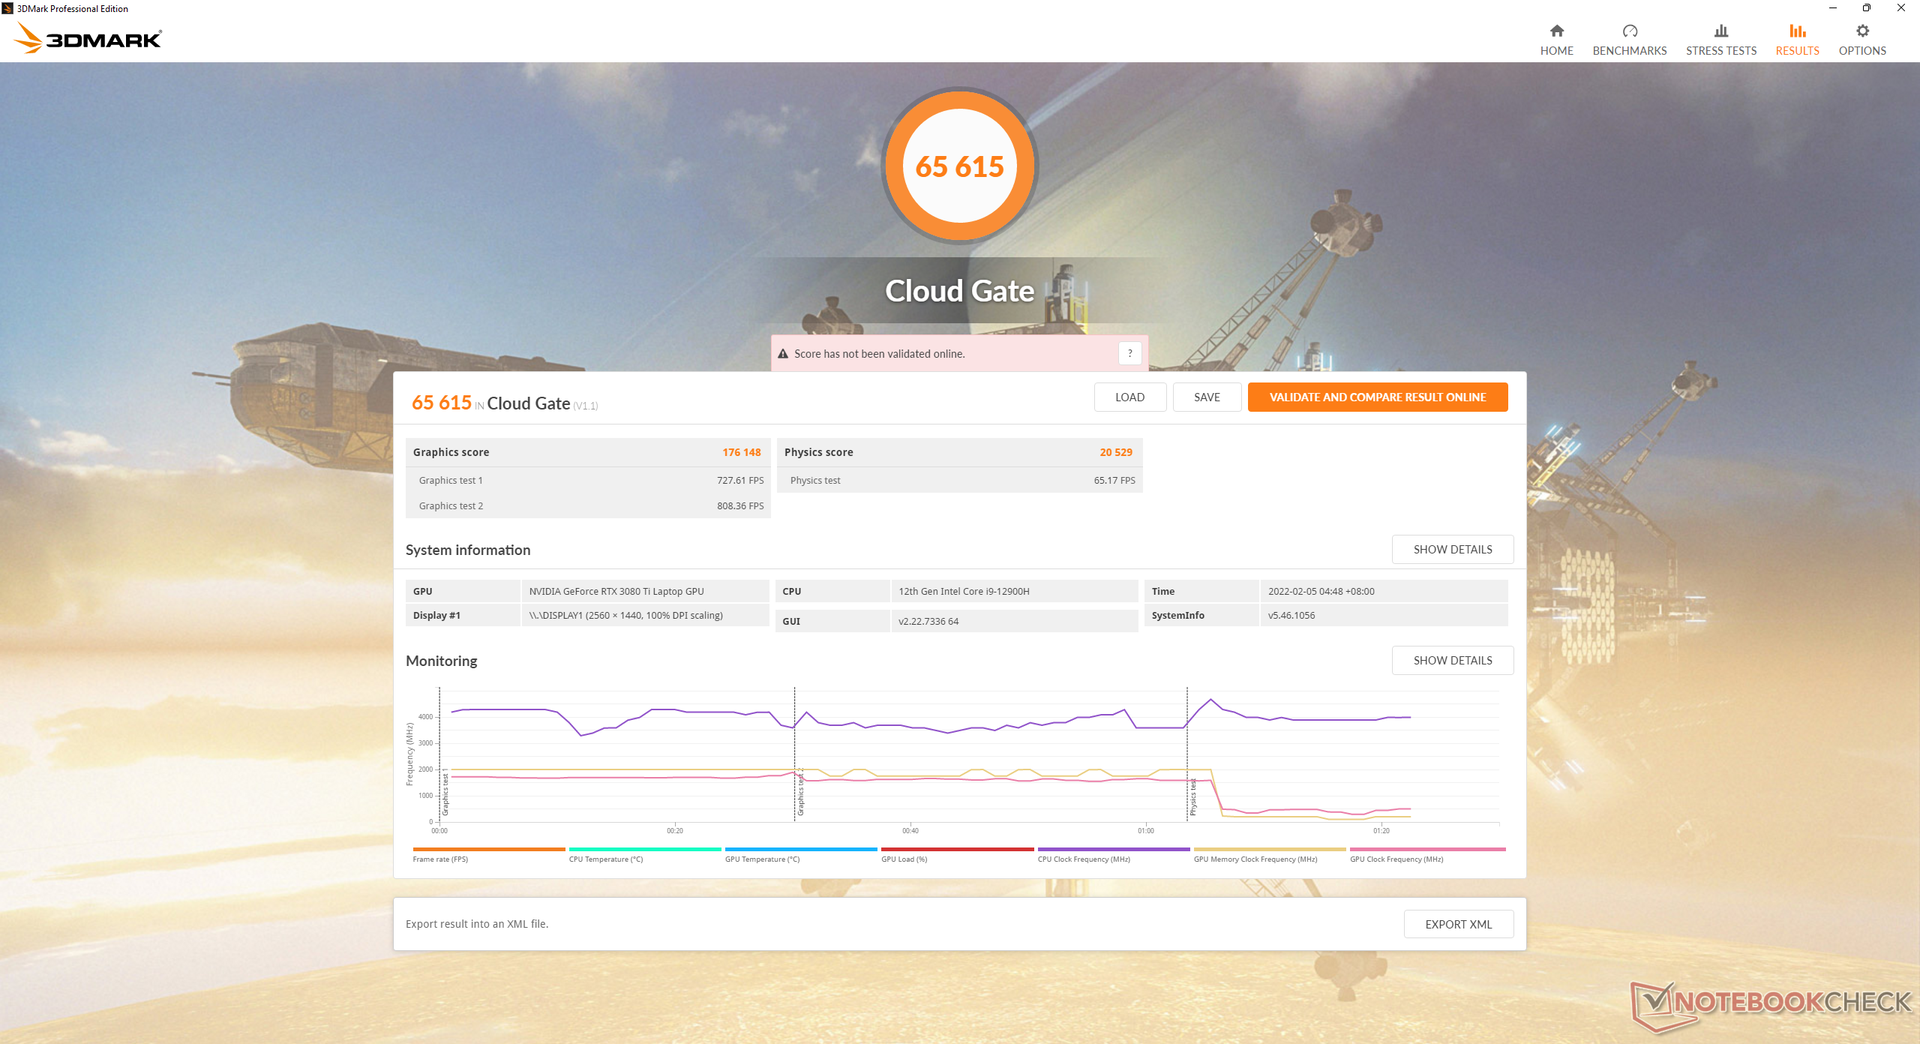
| 3DMark Cloud Gate Standard Score | 65615 puntos | |
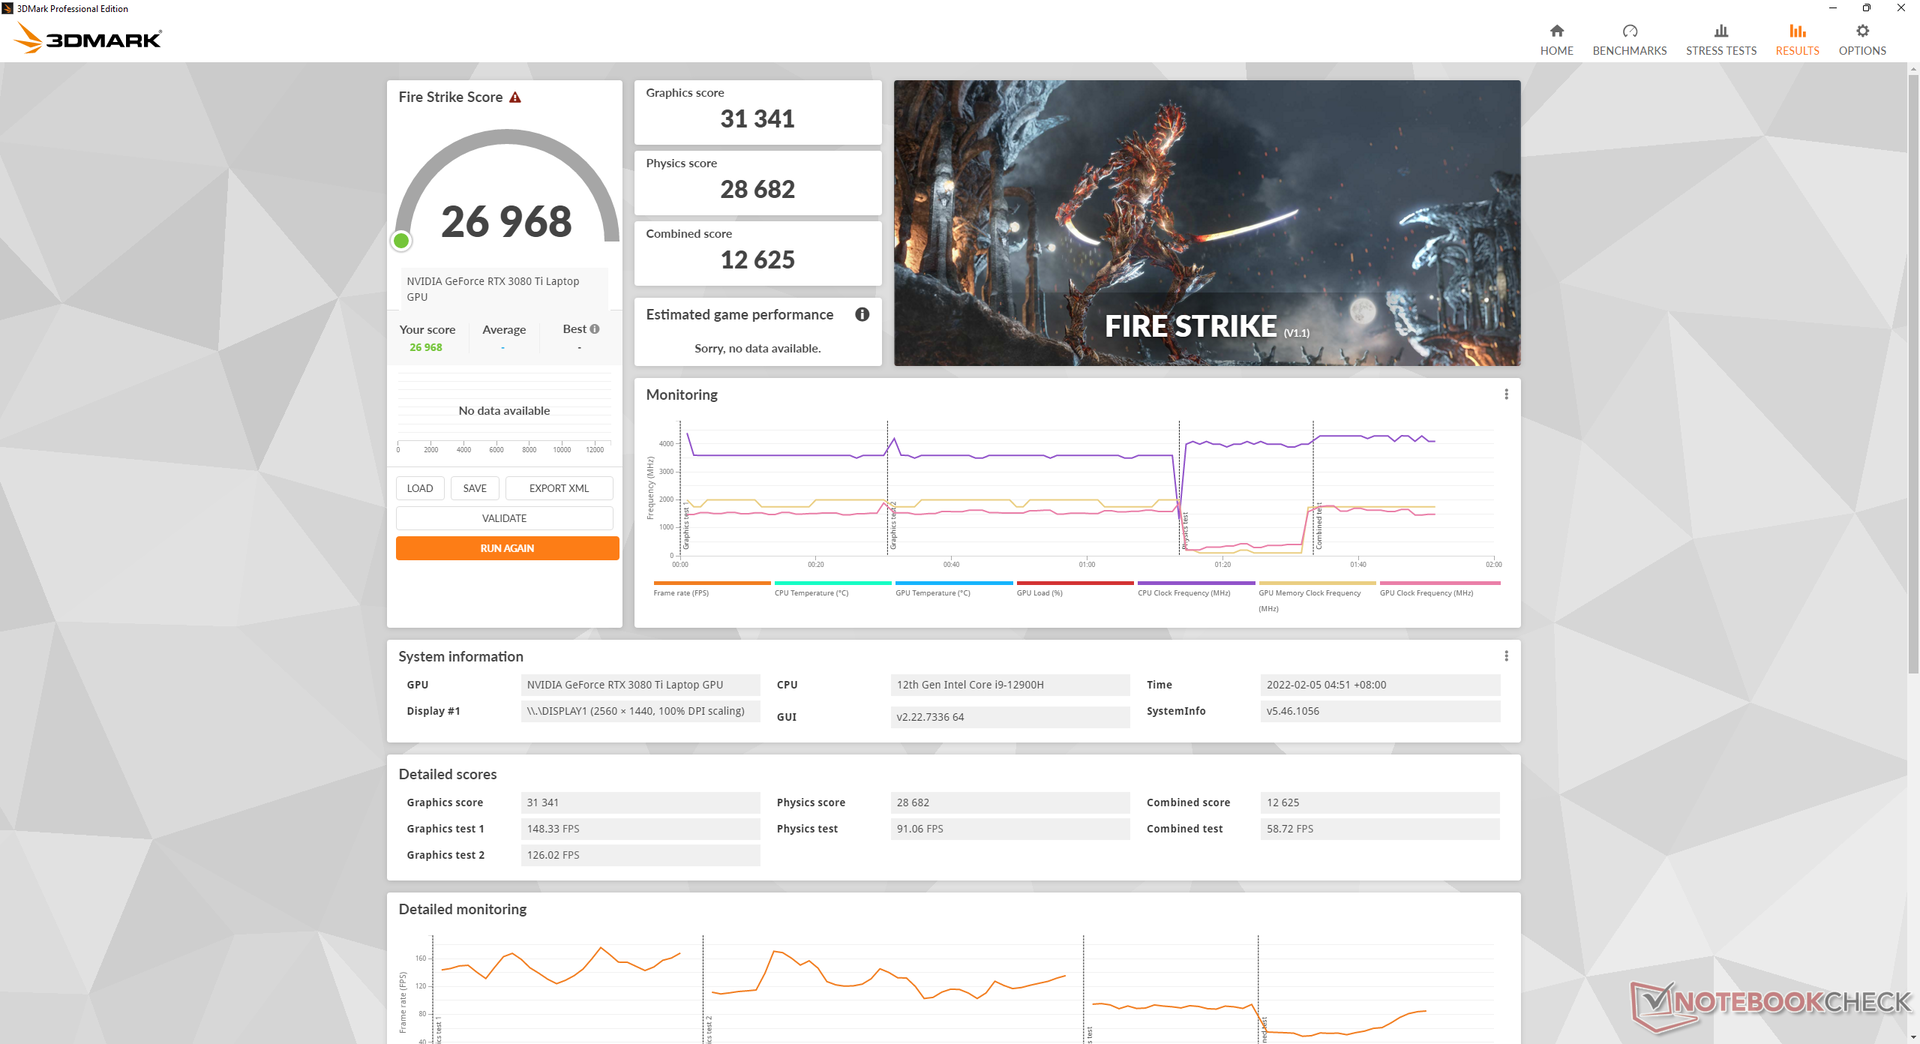
| 3DMark Fire Strike Score | 26968 puntos | |
| 3DMark Time Spy Score | 12364 puntos | |
ayuda | ||
Witcher 3 FPS Chart
| bajo | medio | alto | ultra | QHD | |
|---|---|---|---|---|---|
| GTA V (2015) | 186 | 183 | 179 | 125 | 111 |
| The Witcher 3 (2015) | 472.4 | 368.4 | 236.3 | 117.2 | |
| Dota 2 Reborn (2015) | 186 | 172 | 166 | 159 | |
| Final Fantasy XV Benchmark (2018) | 167 | 155 | 117 | ||
| X-Plane 11.11 (2018) | 160 | 142 | 107 | ||
| Far Cry 5 (2018) | 186 | 160 | 150 | 138 | 120 |
| Strange Brigade (2018) | 472 | 290 | 231 | 203 | 151 |
| Hunt Showdown (2020) | 243.2 | 197.9 | 167.6 | 103.6 | |
| Doom Eternal (2020) | 491.8 | 321.3 | 292.4 | 279 | 210.6 |
| Gears Tactics (2020) | 366.3 | 270 | 195.5 | 136.5 | 97.1 |
| Horizon Zero Dawn (2020) | 162 | 141 | 130 | 118 | 98 |
| Watch Dogs Legion (2020) | 137 | 128 | 116 | 84 | 64 |
| Dirt 5 (2020) | 217.5 | 167.8 | 136.8 | 105.4 | 85.6 |
| Assassin´s Creed Valhalla (2020) | 166 | 118 | 99 | 85 | 68 |
| Hitman 3 (2021) | 297.5 | 228.9 | 211.9 | 201.8 | 133.9 |
| F1 2021 (2021) | 364 | 328 | 271 | 103 | 71 |
| Far Cry 6 (2021) | 158 | 131 | 117 | 107 | 88 |
| Guardians of the Galaxy (2021) | 157 | 157 | 157 | 152 | 122 |
| Riders Republic (2021) | 207 | 159 | 133 | 122 | 90 |
| Halo Infinite (2021) | 260.3 | 165.7 | 146.7 | 137.3 | 96.3 |
| God of War (2022) | 158.5 | 135.2 | 110.1 | 79 | 64.4 |
Emisiones
Ruido del sistema - Sorprendentemente fuerte
Como la mayoría de los portátiles para juegos, no hace falta mucha actividad en la pantalla para que los ventiladores internos empiecen a girar. Las acciones poco exigentes, como la navegación por Internet o el streaming de vídeo, elevarán el ruido del ventilador a 30,8 dB(A) frente a un fondo silencioso de 23,1 dB(A). El aumento de ruido es notable, pero los ajustes de las RPM del ventilador son generalmente graduales en lugar de bruscos en el GM7AG8P para ser más tolerables.
La ejecución de cargas más elevadas, como los juegos, daría lugar a niveles de ruido muy similares a los que observamos en el XMG Neo 17 GM7TG8S. El ruido de los ventiladores puede estar en el rango de 50 dB(A) en tales condiciones, que es un rango común para los portátiles de juego de los entusiastas. Los ventiladores pueden ser tan ruidosos que recomendamos usar auriculares cuando se juega a títulos como Fortnite, donde las señales de audio más silenciosas son vitales para el juego.
Ruido
| Ocioso |
| 28.1 / 28.1 / 30.8 dB(A) |
| Carga |
| 39.1 / 52.5 dB(A) |
 | ||
30 dB silencioso 40 dB(A) audible 50 dB(A) ruidosamente alto |
||
min: | ||
| Schenker Uniwill Technology GM7AG8P GeForce RTX 3080 Ti Laptop GPU, i9-12900H, Samsung PM9A1 MZVL2512HCJQ | Schenker XMG NEO 17 GM7TG8S GeForce RTX 3080 Laptop GPU, i7-11800H, Samsung SSD 980 Pro 1TB MZ-V8P1T0BW | Alienware x17 RTX 3080 P48E GeForce RTX 3080 Laptop GPU, i7-11800H, 2x WDC PC SN730 SDBPNTY-1T00 (RAID 0) | Razer Blade 17 RTX 3070 GeForce RTX 3070 Laptop GPU, i7-11800H, Samsung PM9A1 MZVL21T0HCLR | MSI GS76 Stealth 11UH GeForce RTX 3080 Laptop GPU, i9-11900H, Samsung PM9A1 MZVL22T0HBLB | Maingear Vector Pro MG-VCP17 GeForce RTX 3080 Laptop GPU, i7-11800H, Samsung PM9A1 MZVL21T0HCLR | |
|---|---|---|---|---|---|---|
| Noise | 7% | 6% | 4% | -2% | 6% | |
| apagado / medio ambiente * (dB) | 23.1 | 23 -0% | 24.9 -8% | 24.2 -5% | 24 -4% | 23.8 -3% |
| Idle Minimum * (dB) | 28.1 | 23 18% | 24.9 11% | 24.7 12% | 24 15% | 23.9 15% |
| Idle Average * (dB) | 28.1 | 23 18% | 24.9 11% | 24.7 12% | 25 11% | 23.9 15% |
| Idle Maximum * (dB) | 30.8 | 23 25% | 29.6 4% | 24.7 20% | 42 -36% | 23.9 22% |
| Load Average * (dB) | 39.1 | 39.5 -1% | 31.1 20% | 44.3 -13% | 46 -18% | 38 3% |
| Witcher 3 ultra * (dB) | 52.4 | 54.5 -4% | 49.7 5% | 56.3 -7% | 48 8% | 55.9 -7% |
| Load Maximum * (dB) | 52.5 | 55.09 -5% | 54.8 -4% | 47.7 9% | 48 9% | 55.9 -6% |
* ... más pequeño es mejor
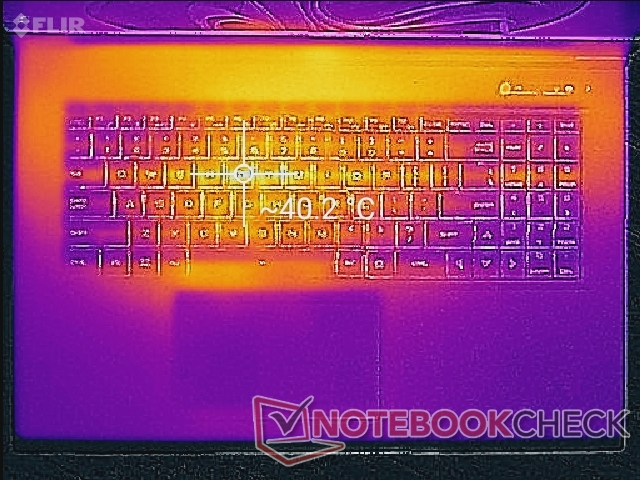
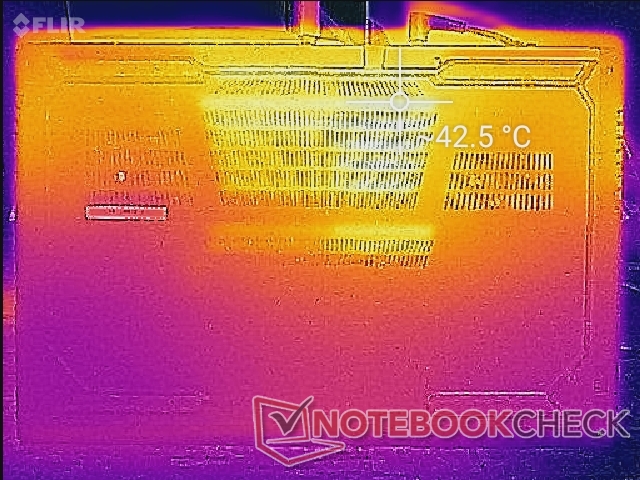
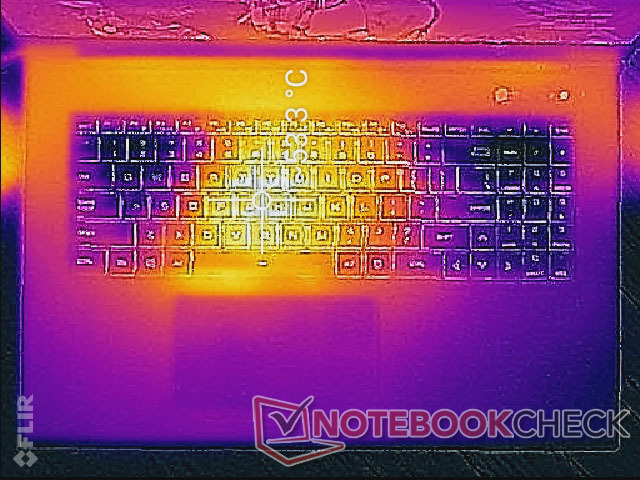
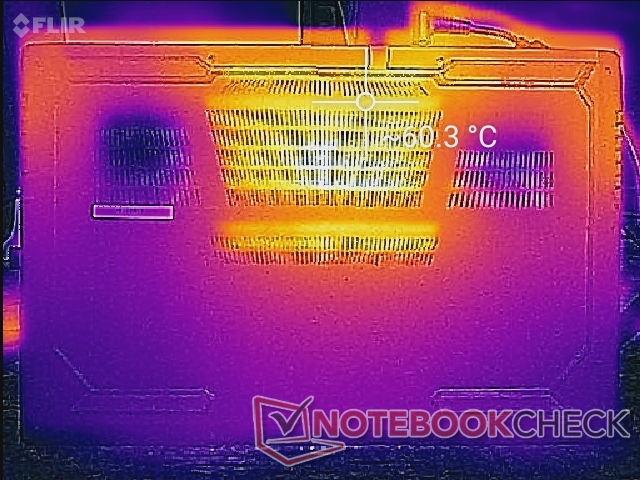
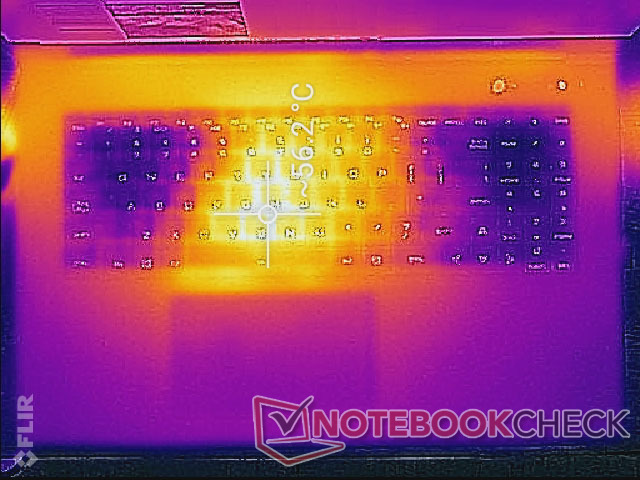
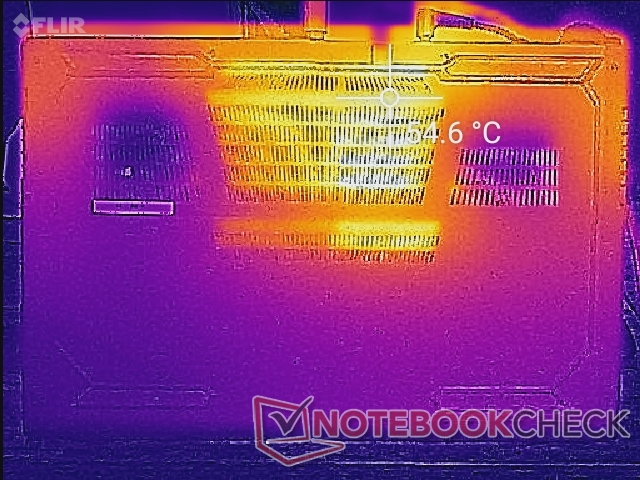
Temperatura - Centro caliente, esquinas frías
Las temperaturas de la superficie siempre serán bastante cálidas hacia las áreas centrales del chasis. Cuando está en reposo en el escritorio sin otras aplicaciones en marcha, por ejemplo, el centro del teclado y la parte trasera del panel inferior pueden llegar a calentarse hasta 40 C. Estas mismas áreas pueden calentarse hasta 57 C cuando se ejecutan aplicaciones más exigentes como los juegos
Las temperaturas medias de la superficie son en general más frías que las del Razer Blade Pro 17 de la competencia, que utiliza un chasis de aleación de magnesio en lugar de plástico ABS. Así, el reposamanos de nuestro GM7AG8P consigue mantenerse más fresco y cómodo que en el Razer cuando se juega por más de unos pocos grados C.
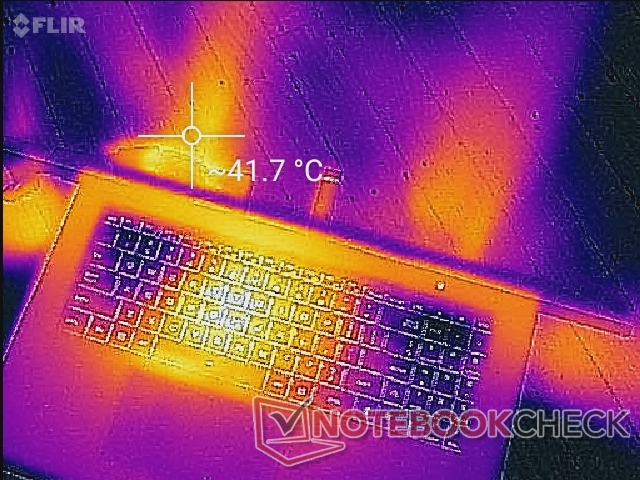
(-) La temperatura máxima en la parte superior es de 56.8 °C / 134 F, frente a la media de 40.4 °C / 105 F, que oscila entre 21.2 y 68.8 °C para la clase Gaming.
(-) El fondo se calienta hasta un máximo de 60.2 °C / 140 F, frente a la media de 43.2 °C / 110 F
(+) En reposo, la temperatura media de la parte superior es de 31.1 °C / 88# F, frente a la media del dispositivo de 33.9 °C / 93 F.
(±) Jugando a The Witcher 3, la temperatura media de la parte superior es de 35.3 °C / 96 F, frente a la media del dispositivo de 33.9 °C / 93 F.
(+) El reposamanos y el panel táctil están a una temperatura inferior a la de la piel, con un máximo de 30.2 °C / 86.4 F y, por tanto, son fríos al tacto.
(±) La temperatura media de la zona del reposamanos de dispositivos similares fue de 28.8 °C / 83.8 F (-1.4 °C / -2.6 F).
| Schenker Uniwill Technology GM7AG8P Intel Core i9-12900H, NVIDIA GeForce RTX 3080 Ti Laptop GPU | Schenker XMG NEO 17 GM7TG8S Intel Core i7-11800H, NVIDIA GeForce RTX 3080 Laptop GPU | Alienware x17 RTX 3080 P48E Intel Core i7-11800H, NVIDIA GeForce RTX 3080 Laptop GPU | Razer Blade 17 RTX 3070 Intel Core i7-11800H, NVIDIA GeForce RTX 3070 Laptop GPU | MSI GS76 Stealth 11UH Intel Core i9-11900H, NVIDIA GeForce RTX 3080 Laptop GPU | Maingear Vector Pro MG-VCP17 Intel Core i7-11800H, NVIDIA GeForce RTX 3080 Laptop GPU | |
|---|---|---|---|---|---|---|
| Heat | 8% | 13% | 19% | 20% | 7% | |
| Maximum Upper Side * (°C) | 56.8 | 51 10% | 58.4 -3% | 41 28% | 49 14% | 54.2 5% |
| Maximum Bottom * (°C) | 60.2 | 62 -3% | 49 19% | 47.2 22% | 57 5% | 52.2 13% |
| Idle Upper Side * (°C) | 40.2 | 35 13% | 33.6 16% | 33.2 17% | 28 30% | 37.4 7% |
| Idle Bottom * (°C) | 43 | 38 12% | 34.6 20% | 39 9% | 30 30% | 41.4 4% |
* ... más pequeño es mejor
Prueba de esfuerzo
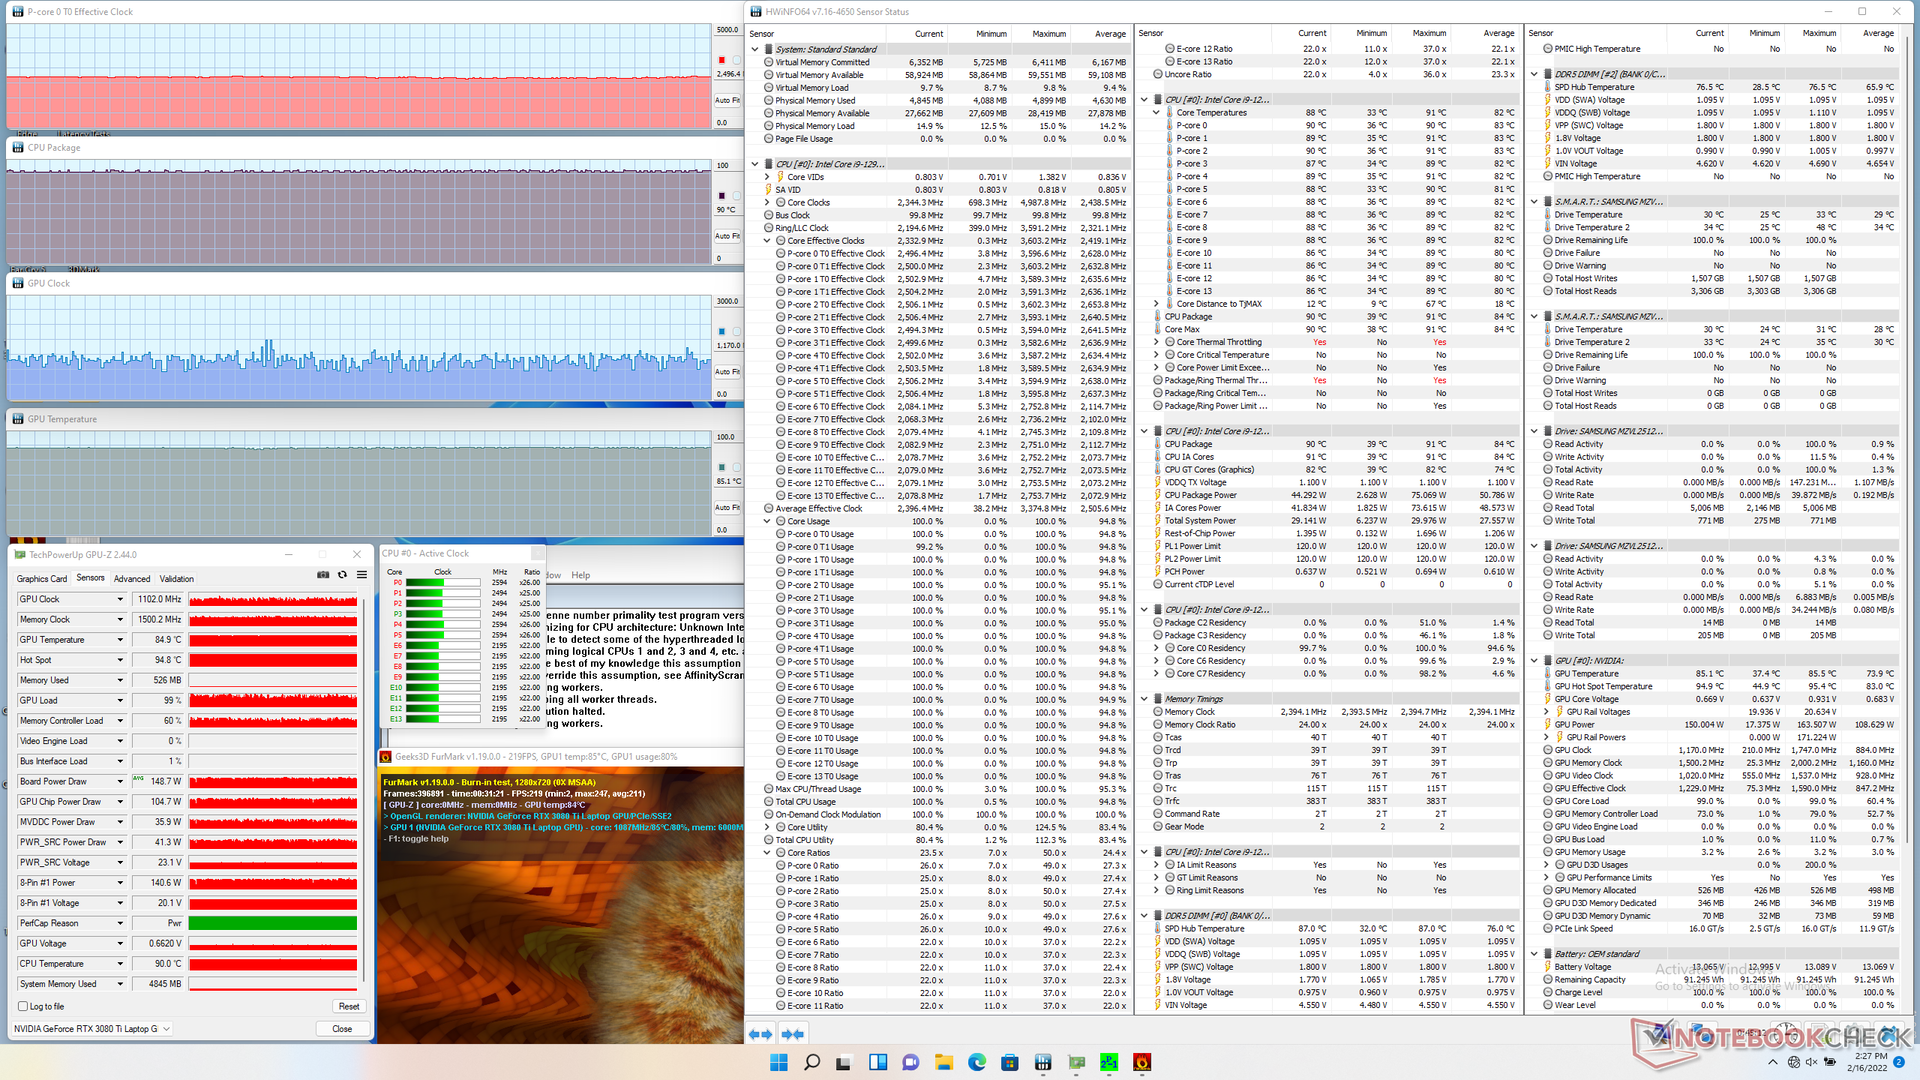
Si se ejecuta Prime95 para estresar la CPU, se obtendrá un aumento de la velocidad de reloj hasta el rango de 3,2 a 3,6 GHz y una temperatura estable del núcleo de 80 C. La potencia del paquete de la CPU también se estabilizará en 75 W indefinidamente, que es la configuración TDP por defecto. Los usuarios pueden aumentar los límites de PL1 y PL2 hasta 120 W cada uno a través del Centro de Control si lo desean.
Ejecutando Witcher 3 con la dGPU ajustada a los 150 W por defecto, la temperatura de la GPU es de 76 C y el consumo de energía de la placa es de unos 150 W, según GPU-Z. Si se ajusta a 175 W a través del Centro de Control, el reloj de la memoria aumentaría de 1750 MHz a 1800 MHz, mientras que la temperatura de la GPU también aumentaría de 76 C a 86 C. El consumo de energía de la placa se mantendría estable en torno a los 170 W, es decir, justo por debajo del máximo de 175 W. Curiosamente, la velocidad de reloj de la GPU se mantendría en el rango de 1500 - 1600 MHz tanto en el modo TGP de 150 W como en el de 175 W.
Funcionar con la energía de la batería limitará el rendimiento en mayor medida de lo esperado. Un test en Time Spy con dGPU y baterías arrojaría unas puntuaciones de Física y Gráficos de sólo 7150 y 897 puntos, respectivamente, en comparación con los 13552 y 12176 puntos cuando está conectado a la red eléctrica, incluso con Nvidia Whisper Mode 2.0 y Battery Boost desactivados.
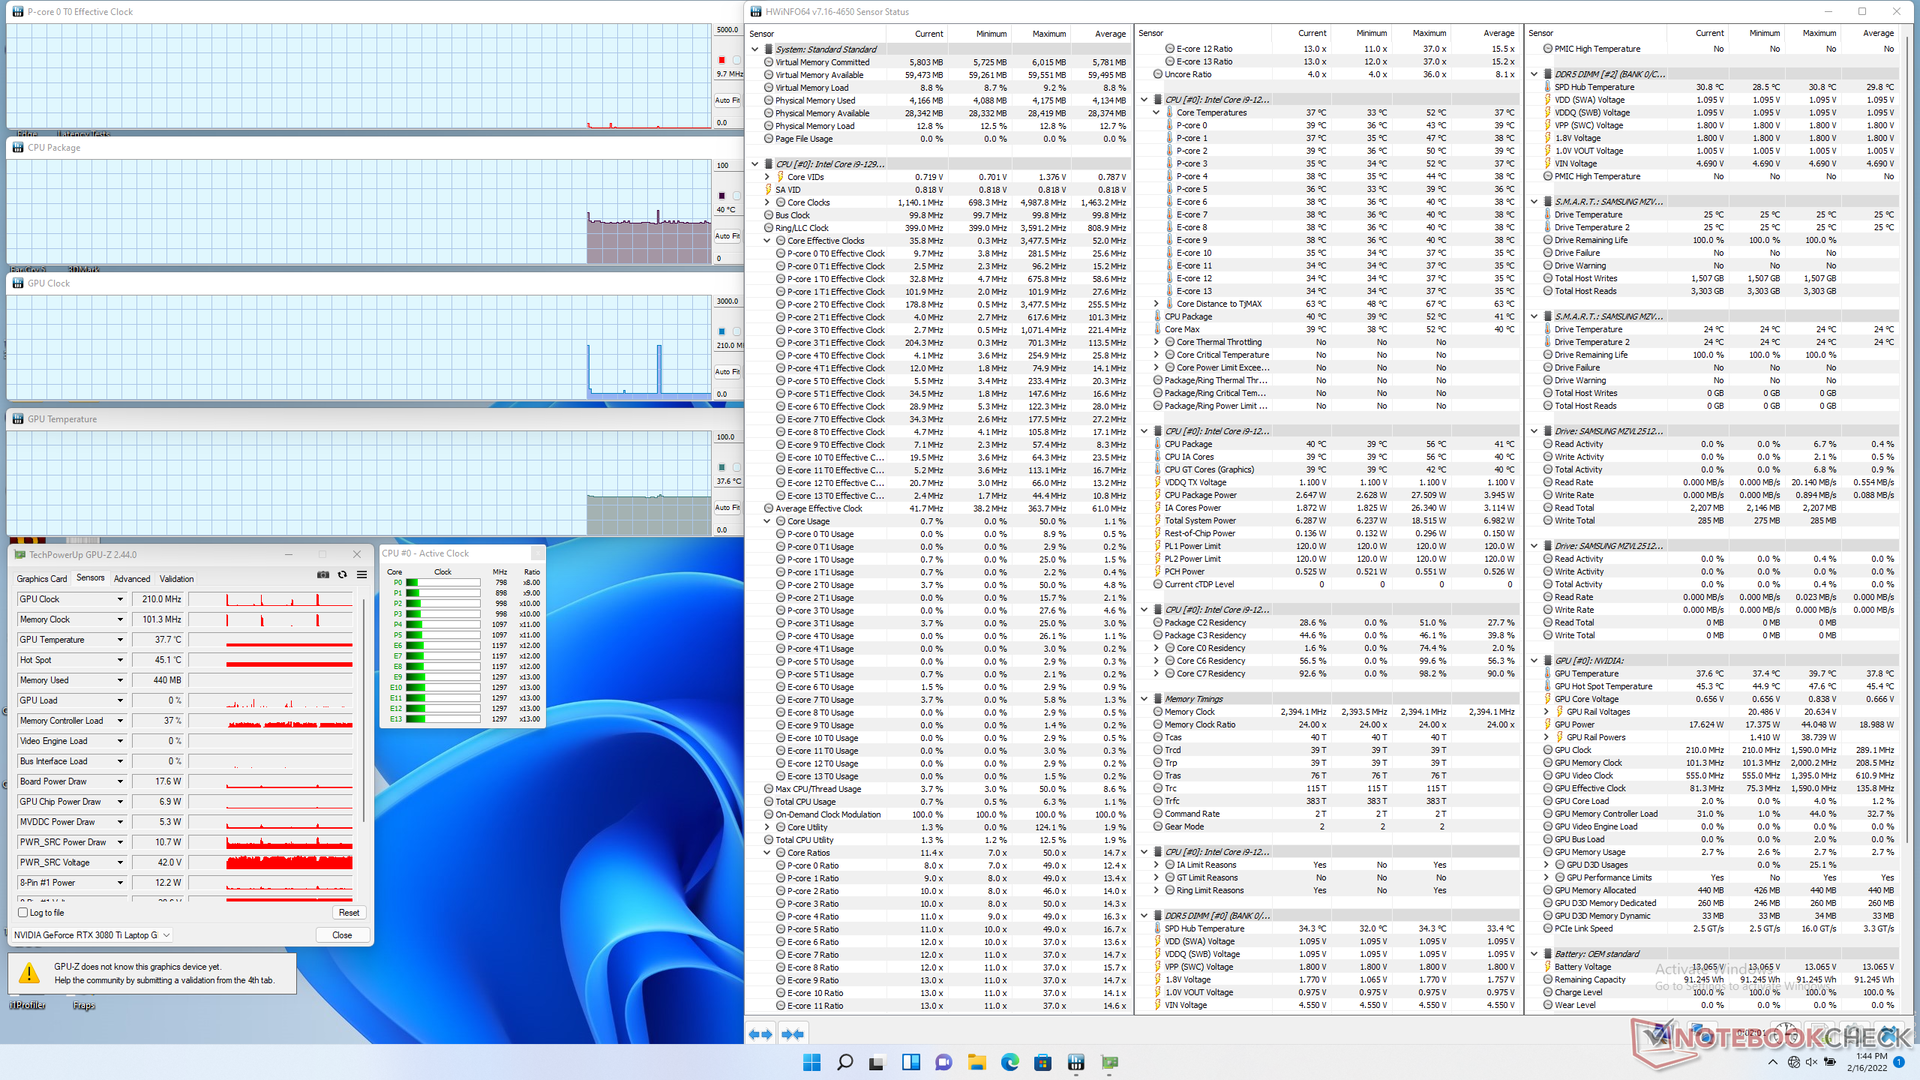
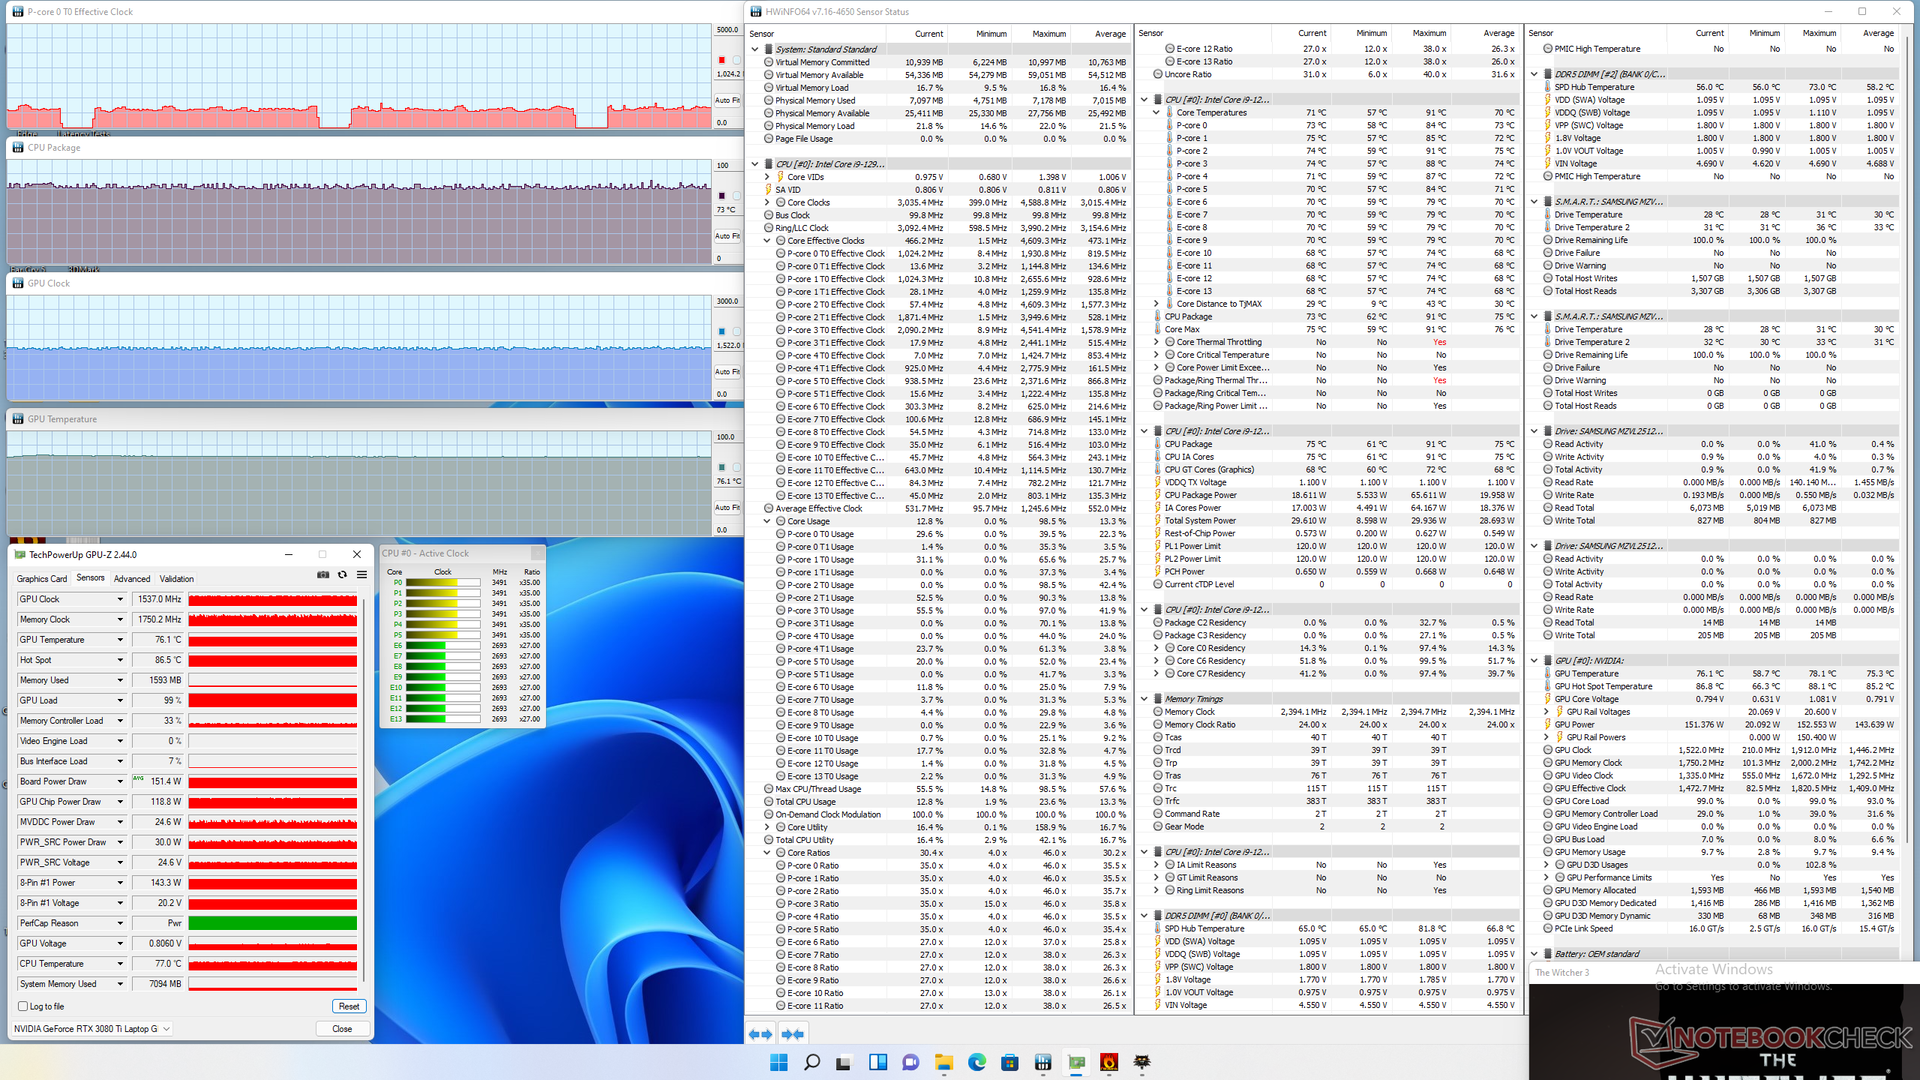
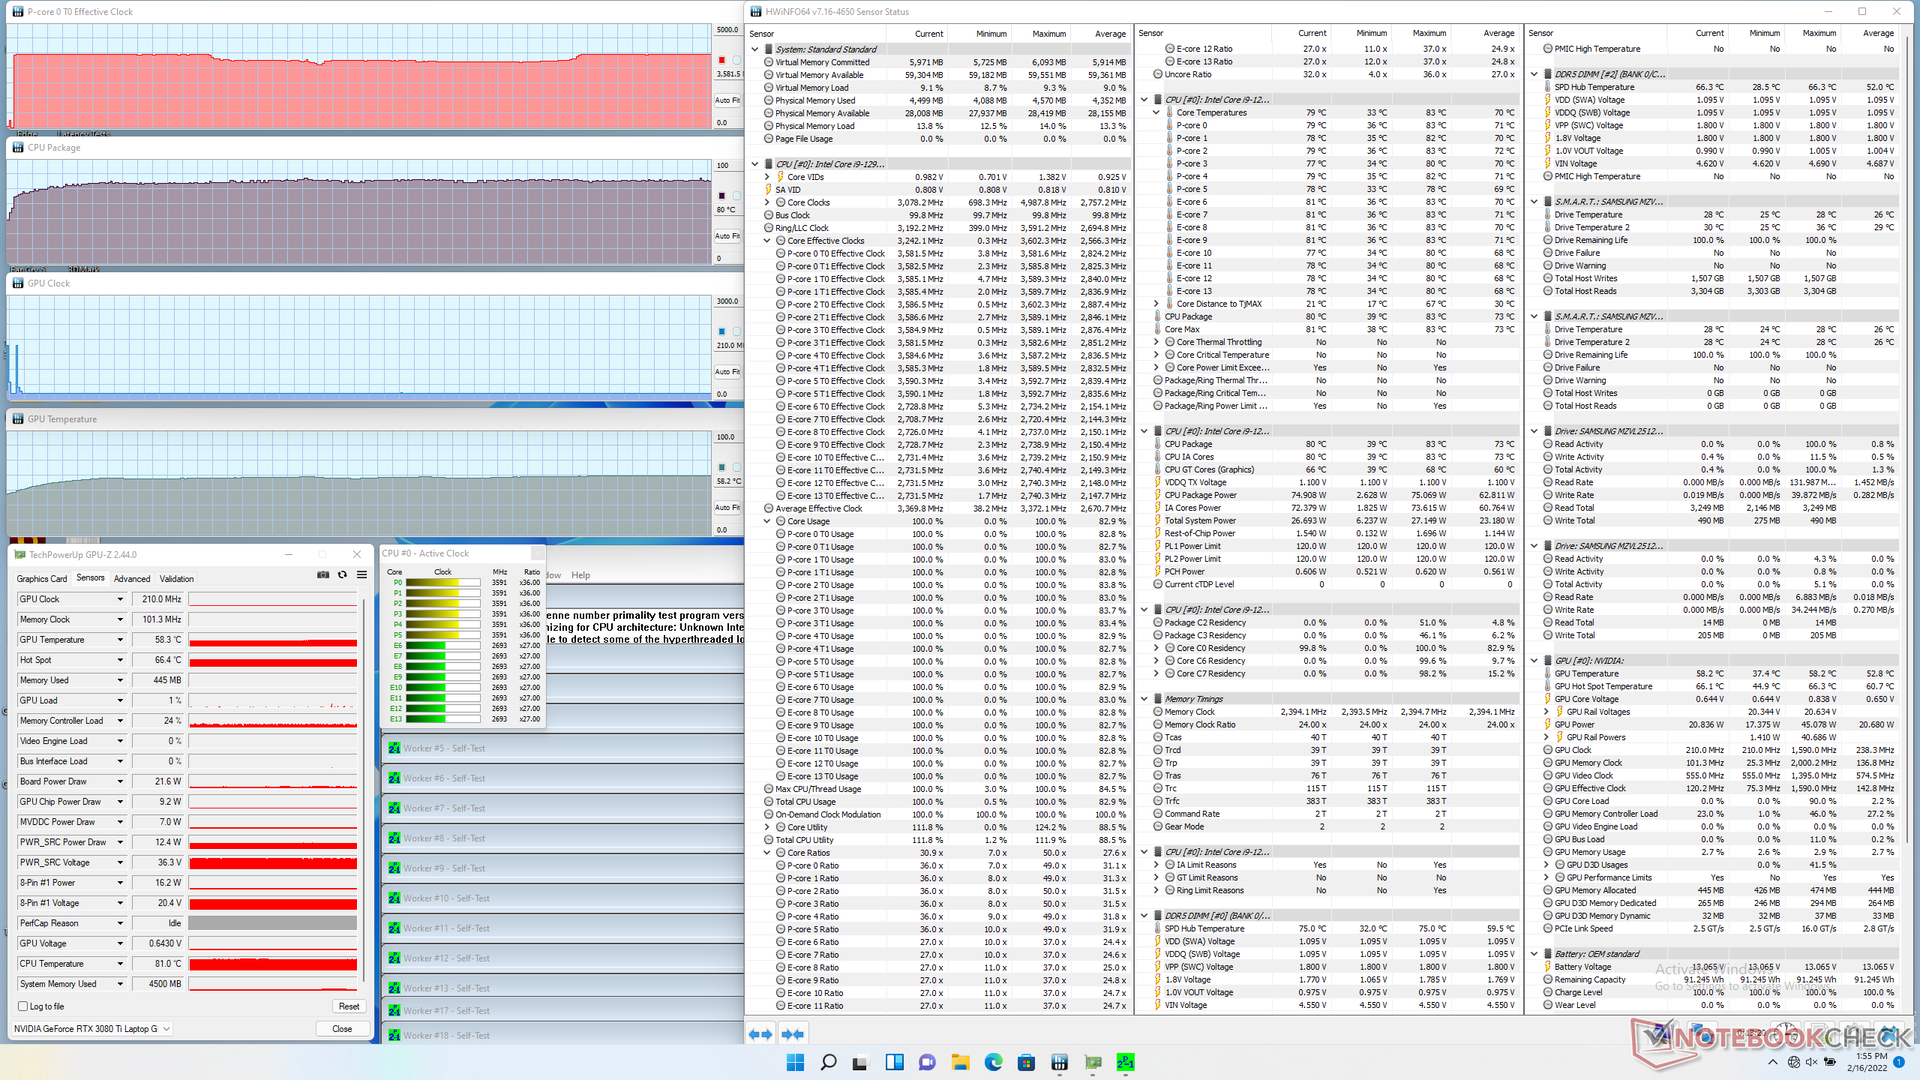
| Reloj de la CPU (GHz) | Reloj de la GPU (MHz) | Temperaturamediadela CPU (°C) | Temperatura media de la GPU (°C) | |
| Sistema en reposo | -- | -- | 40 | 38 |
| EstrésdePrime95 | 3,2 - 3,6 | -- | 80 | 58 |
| Prime95+ FurMarkStress | 2,5 | ~1102 | 90 | 85 |
| Witcher 3 Estrés (modo TGP de 150 W) | ~1,0 | ~1537 | 73 | 76 |
Altavoces
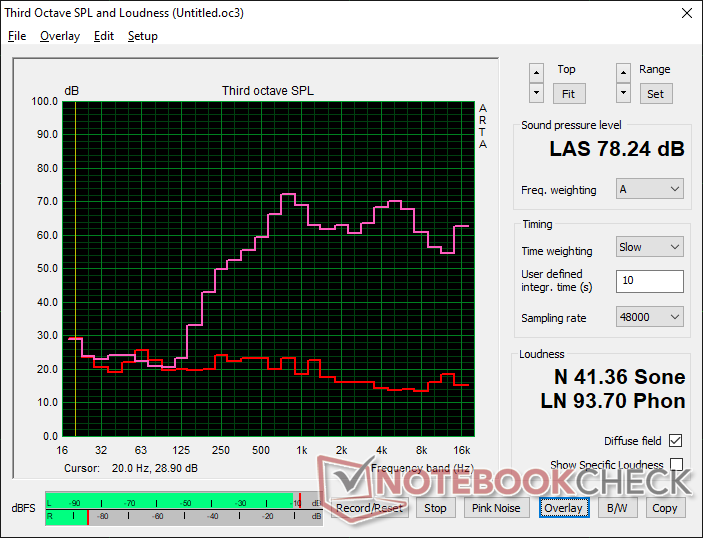
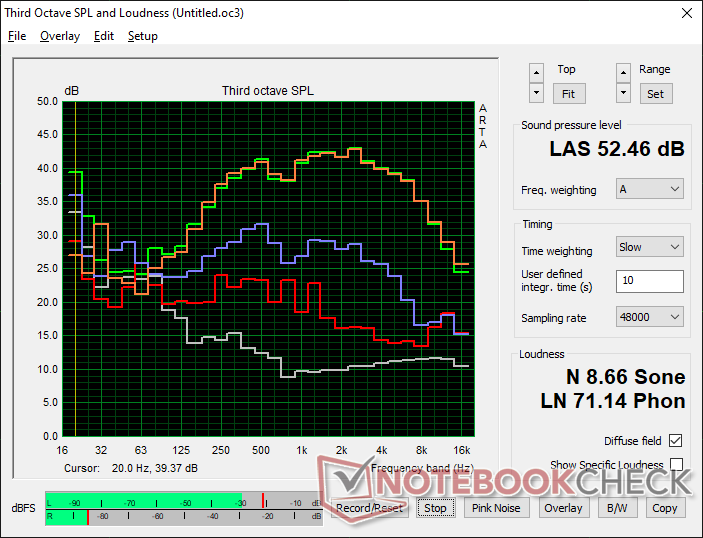
Schenker Uniwill Technology GM7AG8P análisis de audio
(±) | la sonoridad del altavoz es media pero buena (78.2 dB)
Graves 100 - 315 Hz
(-) | casi sin bajos - de media 23.7% inferior a la mediana
(±) | la linealidad de los graves es media (12.8% delta a frecuencia anterior)
Medios 400 - 2000 Hz
(+) | medios equilibrados - a sólo 4.6% de la mediana
(±) | la linealidad de los medios es media (9.2% delta respecto a la frecuencia anterior)
Altos 2 - 16 kHz
(+) | máximos equilibrados - a sólo 4.5% de la mediana
(±) | la linealidad de los máximos es media (8.6% delta a frecuencia anterior)
Total 100 - 16.000 Hz
(±) | la linealidad del sonido global es media (24.1% de diferencia con la mediana)
En comparación con la misma clase
» 87% de todos los dispositivos probados de esta clase eran mejores, 4% similares, 9% peores
» El mejor tuvo un delta de 6%, la media fue 18%, el peor fue ###max##%
En comparación con todos los dispositivos probados
» 73% de todos los dispositivos probados eran mejores, 6% similares, 21% peores
» El mejor tuvo un delta de 4%, la media fue 23%, el peor fue ###max##%
Apple MacBook Pro 16 2021 M1 Pro análisis de audio
(+) | los altavoces pueden reproducir a un volumen relativamente alto (#84.7 dB)
Graves 100 - 315 Hz
(+) | buen bajo - sólo 3.8% lejos de la mediana
(+) | el bajo es lineal (5.2% delta a la frecuencia anterior)
Medios 400 - 2000 Hz
(+) | medios equilibrados - a sólo 1.3% de la mediana
(+) | los medios son lineales (2.1% delta a la frecuencia anterior)
Altos 2 - 16 kHz
(+) | máximos equilibrados - a sólo 1.9% de la mediana
(+) | los máximos son lineales (2.7% delta a la frecuencia anterior)
Total 100 - 16.000 Hz
(+) | el sonido global es lineal (4.6% de diferencia con la mediana)
En comparación con la misma clase
» 0% de todos los dispositivos probados de esta clase eran mejores, 0% similares, 100% peores
» El mejor tuvo un delta de 5%, la media fue 17%, el peor fue ###max##%
En comparación con todos los dispositivos probados
» 0% de todos los dispositivos probados eran mejores, 0% similares, 100% peores
» El mejor tuvo un delta de 4%, la media fue 23%, el peor fue ###max##%
Gestión de la energía
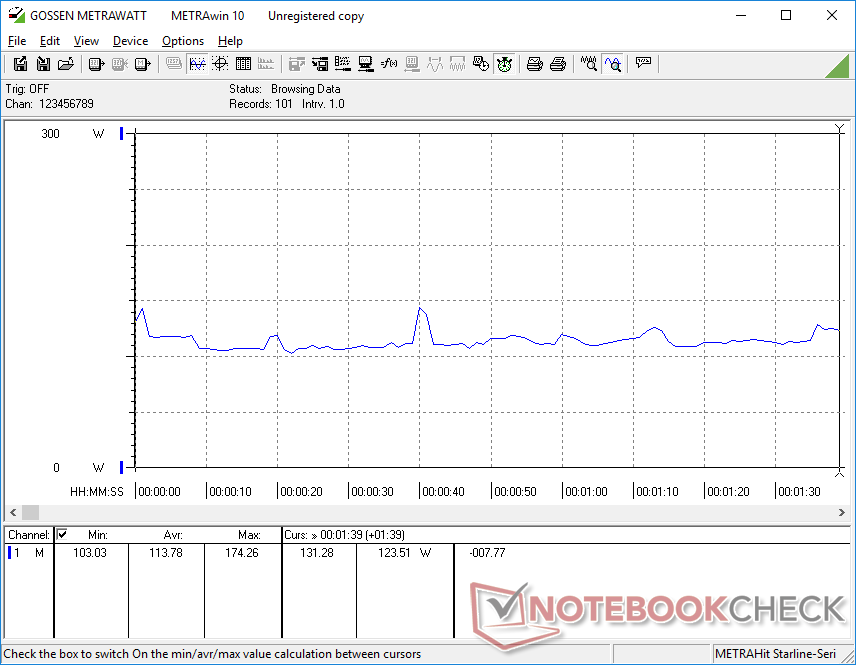
Consumo de energía - Componentes exigentes
Nuestras pruebas anteriores muestran una mejora de entre el 20 y el 30 por ciento en el rendimiento de la CPU y un aumento del 10 por ciento en el rendimiento de la GPU con respecto al Core i9-11900H y a la GeForce RTX 3080, respectivamente, que se encuentran en elSchenker XMG Neo 17 GM7TG8S. No obstante, las mediciones de Metrahit muestran que nuestro GM7AG8P consume ligeramente más energía que el antiguo GM7TG8S en condiciones similares. La ejecución de Prime95, en particular, consume entre un 10 y un 15 por ciento más de energía en el GM7AG8P, lo que significa que el mencionado aumento del rendimiento de la CPU no es precisamente gratuito. Por lo tanto, el rendimiento por vatio con Alder Lake-H no es mucho mayor en comparación con Tiger Lake-H.
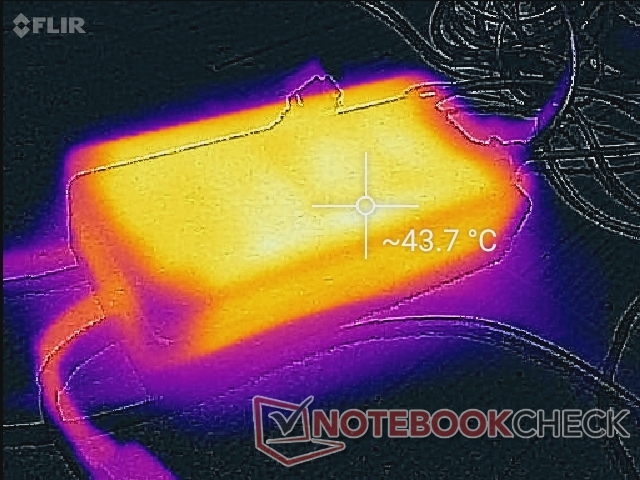
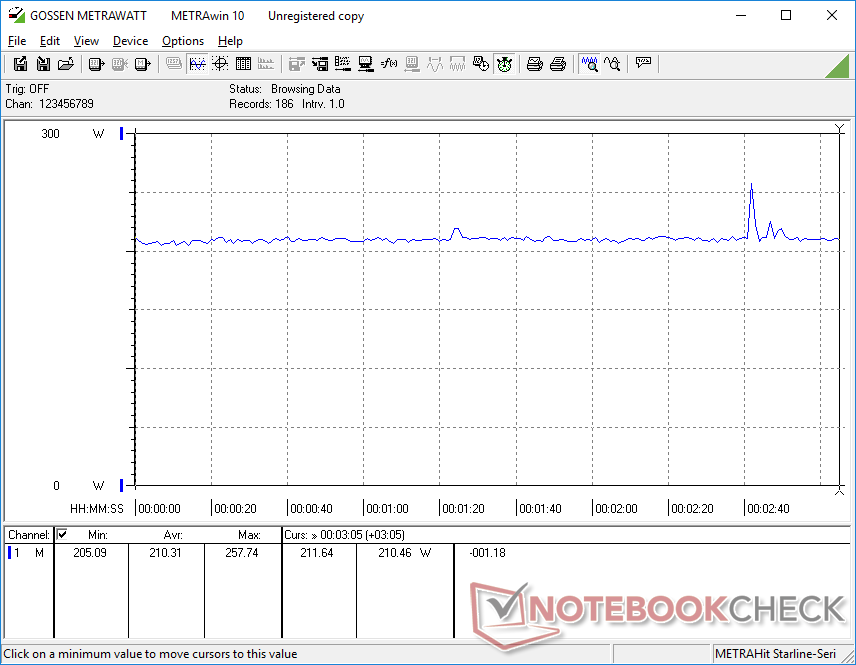
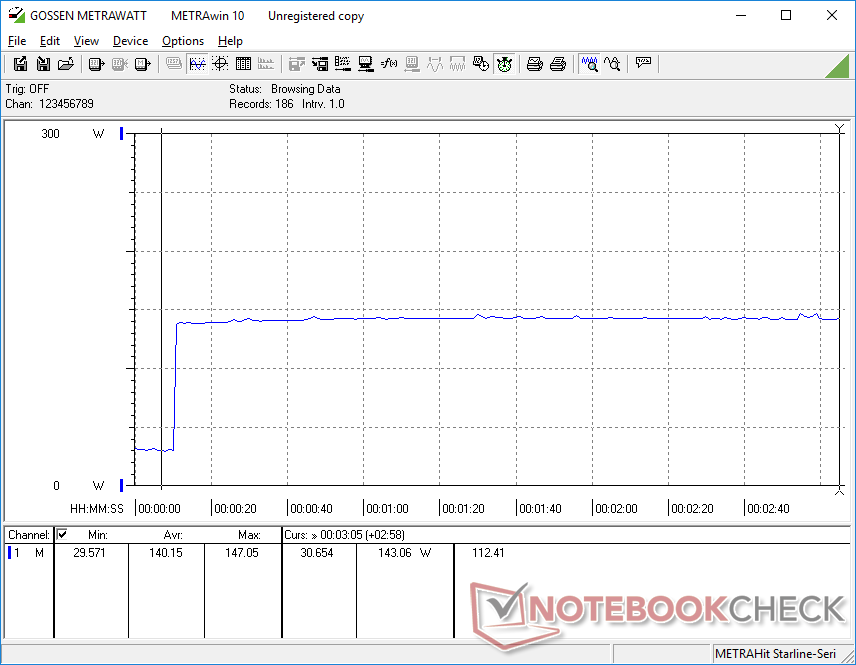
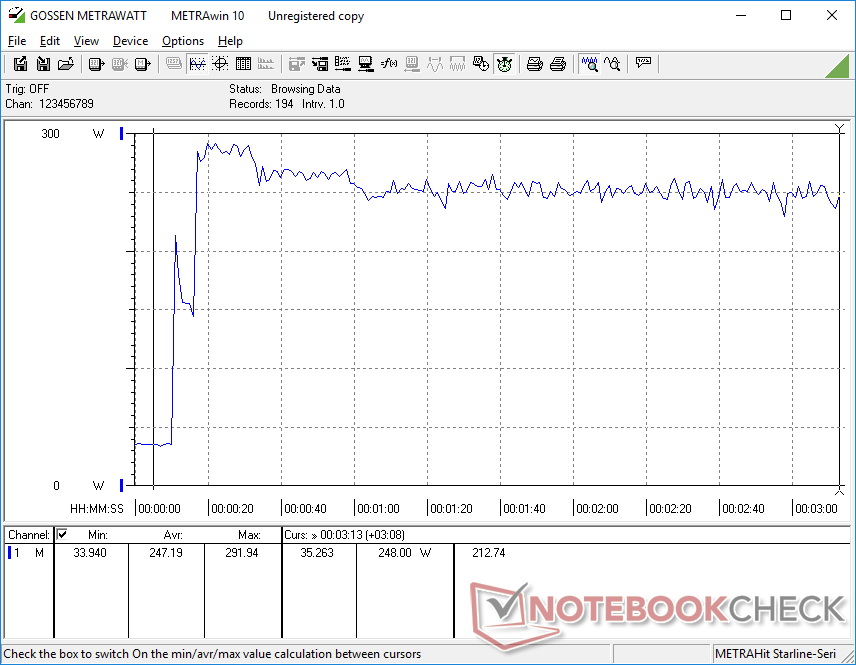
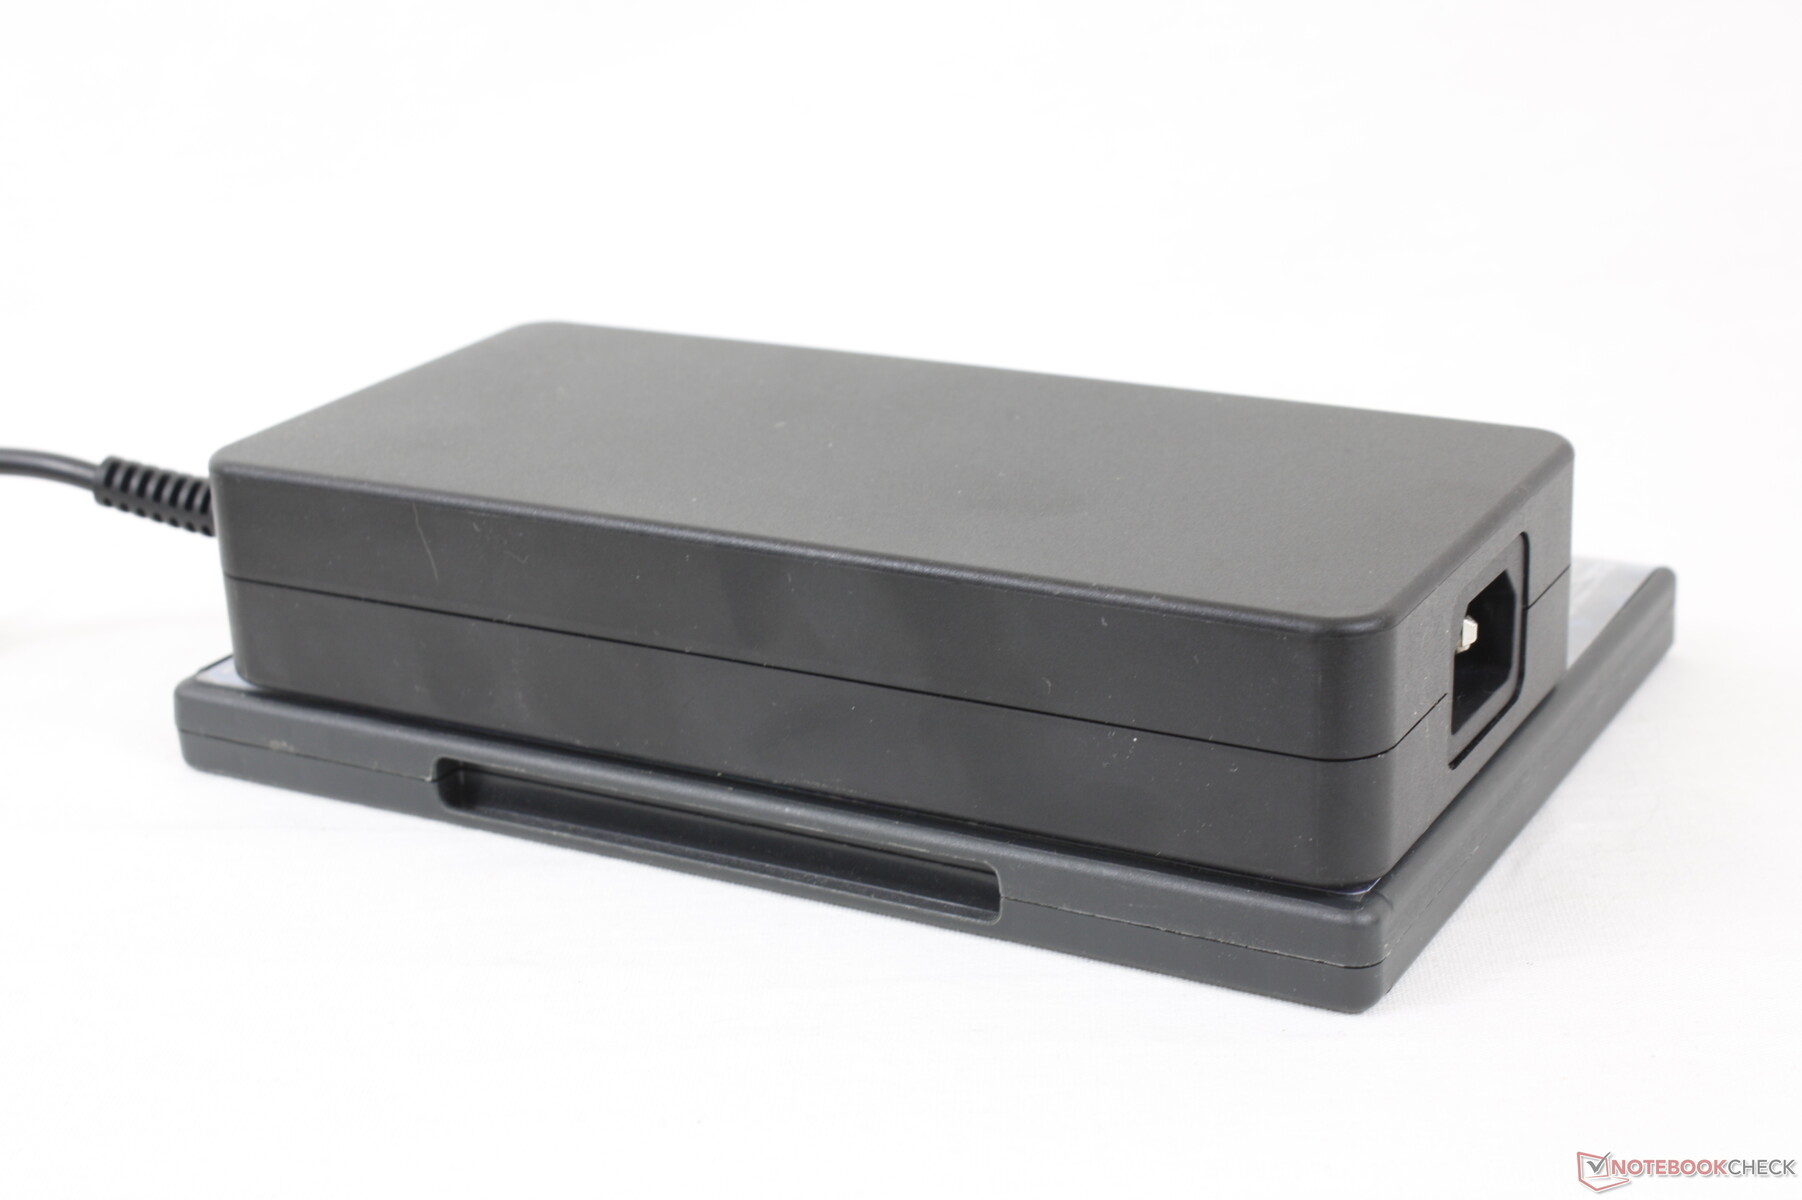
Hemos podido registrar un consumo máximo temporal de 292 W del gran adaptador de CA (~18 x 8.5 x 3.5 cm) de 280 W cuando ejecutamos Prime95 y FurMark stress simultáneamente. Es de esperar que este máximo sea incluso superior en 20 W o más si se ajusta manualmente la GPU al modo de 175 W. Esta tasa duraría unos 20 segundos antes de caer y estabilizarse en torno a los 250 W, como muestra nuestra captura de pantalla de abajo, probablemente debido a las limitaciones térmicas.
| Off / Standby | |
| Ocioso | |
| Carga |
|
Clave:
min: | |
| Schenker Uniwill Technology GM7AG8P i9-12900H, GeForce RTX 3080 Ti Laptop GPU, Samsung PM9A1 MZVL2512HCJQ, IPS, 2560x1440, 17.3" | Schenker XMG NEO 17 GM7TG8S i7-11800H, GeForce RTX 3080 Laptop GPU, Samsung SSD 980 Pro 1TB MZ-V8P1T0BW, IPS, 2560x1440, 17.3" | Alienware x17 RTX 3080 P48E i7-11800H, GeForce RTX 3080 Laptop GPU, 2x WDC PC SN730 SDBPNTY-1T00 (RAID 0), IPS, 3840x2160, 17.3" | Razer Blade 17 RTX 3070 i7-11800H, GeForce RTX 3070 Laptop GPU, Samsung PM9A1 MZVL21T0HCLR, IPS, 1920x1080, 17.3" | MSI GS76 Stealth 11UH i9-11900H, GeForce RTX 3080 Laptop GPU, Samsung PM9A1 MZVL22T0HBLB, IPS, 3840x2160, 17.3" | Maingear Vector Pro MG-VCP17 i7-11800H, GeForce RTX 3080 Laptop GPU, Samsung PM9A1 MZVL21T0HCLR, IPS, 2560x1440, 17.3" | |
|---|---|---|---|---|---|---|
| Power Consumption | 18% | 9% | 11% | 29% | 28% | |
| Idle Minimum * (Watt) | 29.7 | 19 36% | 10.2 66% | 20.9 30% | 14 53% | 11 63% |
| Idle Average * (Watt) | 33.6 | 25 26% | 21.2 37% | 25.1 25% | 19 43% | 15.6 54% |
| Idle Maximum * (Watt) | 35.5 | 28 21% | 48.4 -36% | 45 -27% | 31 13% | 34 4% |
| Load Average * (Watt) | 113.8 | 105 8% | 118.7 -4% | 102 10% | 97 15% | 81.2 29% |
| Witcher 3 ultra * (Watt) | 210 | 223 -6% | 249 -19% | 189 10% | 156 26% | 204 3% |
| Load Maximum * (Watt) | 292 | 226 23% | 262 10% | 234.8 20% | 231 21% | 257.3 12% |
* ... más pequeño es mejor
Power Consumption Witcher 3 / Stresstest
Power Consumption external Monitor
Duración de la batería
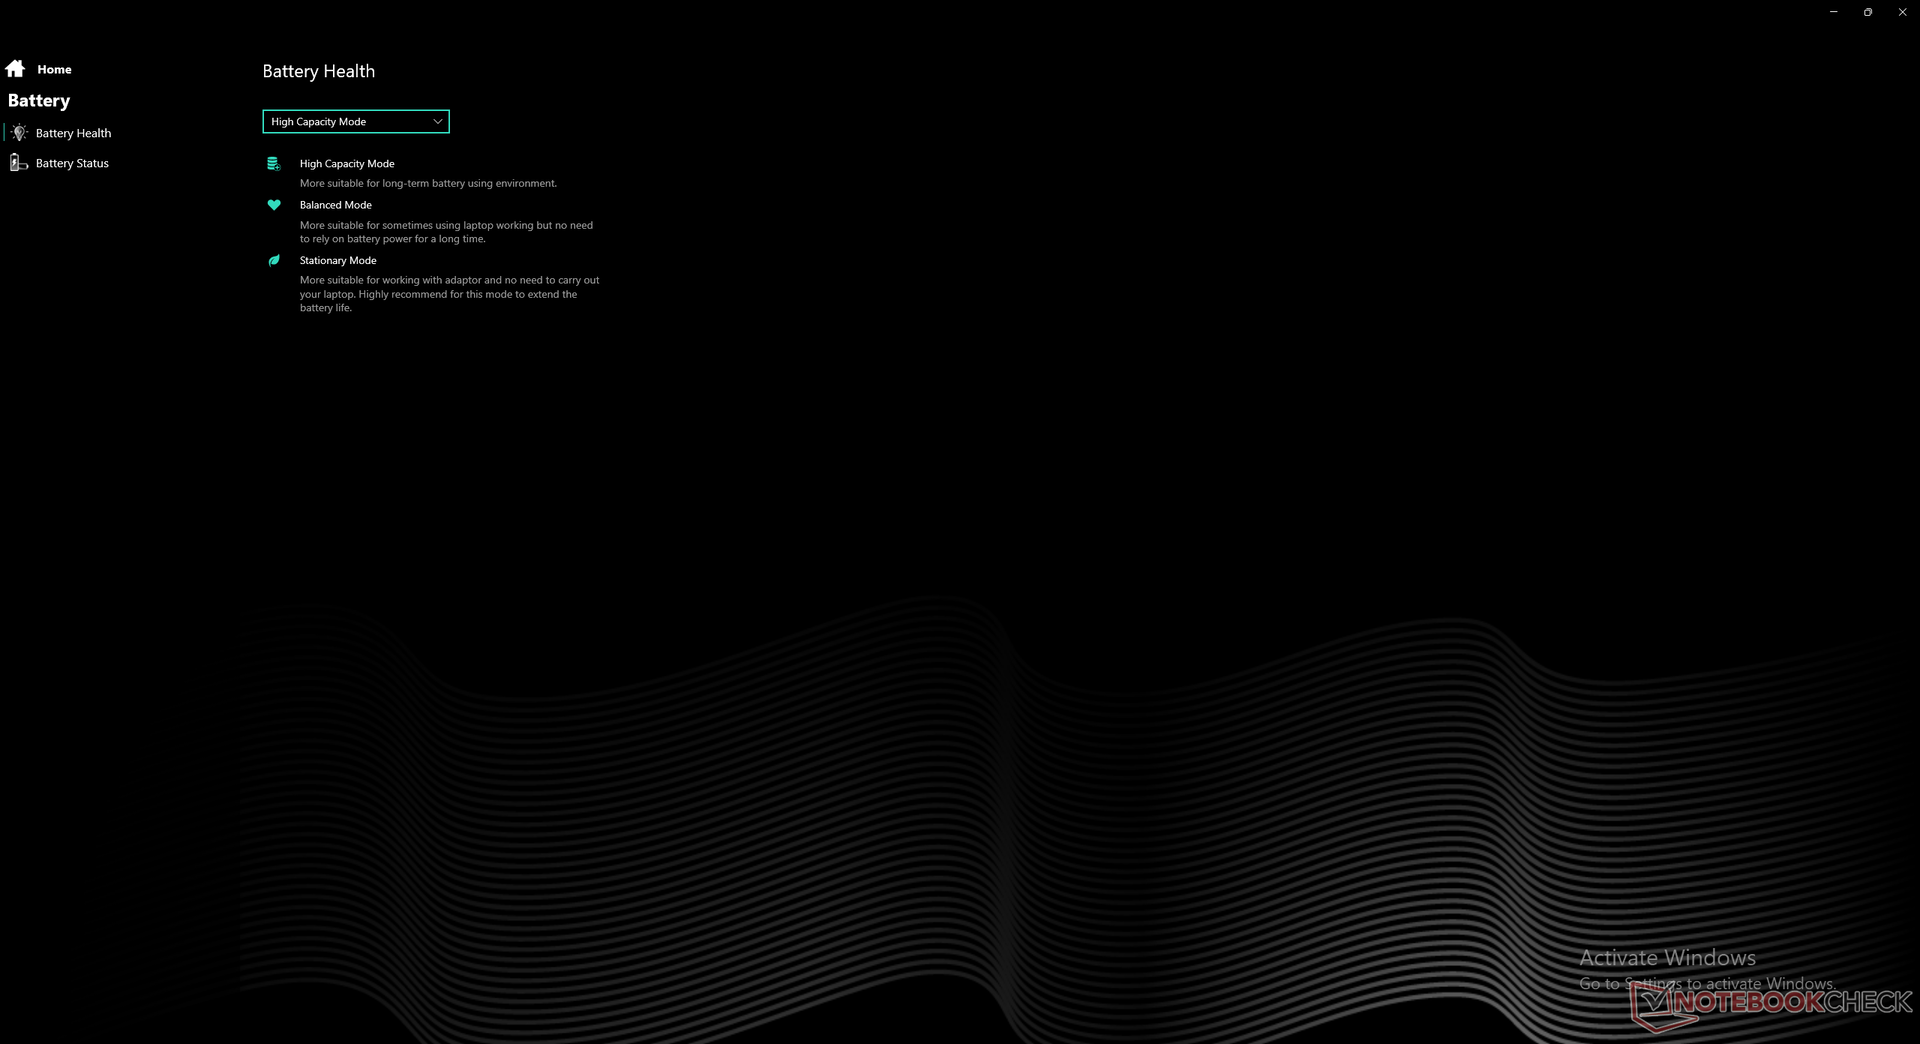
La batería integrada es relativamente grande con 91 Wh comparada con los 62 W del XMG Neo 17 con Intel de 11ª generación. No obstante, la duración de la batería sigue siendo mediocre en el mejor de los casos con sólo 3 horas de uso real de la WLAN incluso cuando se ajusta a los perfiles de energía Equilibrada u Oficina.
La carga de vacío a lleno con el adaptador de CA incluido es mucho más lenta de lo esperado con 3 horas. En otras palabras, el sistema tarda tanto en cargarse como en agotarse cuando se navega por la web. La mayoría de los Ultrabooks y otros portátiles para juegos pueden recargarse completamente en 2 horas o más rápido.
Por desgracia, el sistema no puede recargarse con adaptadores USB-C de terceros, a diferencia del Razer Blade Pro y la mayoría de portátiles de juego de Asus o Alienware.
| Schenker Uniwill Technology GM7AG8P i9-12900H, GeForce RTX 3080 Ti Laptop GPU, 91 Wh | Schenker XMG NEO 17 GM7TG8S i7-11800H, GeForce RTX 3080 Laptop GPU, 62 Wh | Alienware x17 RTX 3080 P48E i7-11800H, GeForce RTX 3080 Laptop GPU, 87 Wh | Razer Blade 17 RTX 3070 i7-11800H, GeForce RTX 3070 Laptop GPU, 70 Wh | MSI GS76 Stealth 11UH i9-11900H, GeForce RTX 3080 Laptop GPU, 99.9 Wh | Maingear Vector Pro MG-VCP17 i7-11800H, GeForce RTX 3080 Laptop GPU, 91 Wh | |
|---|---|---|---|---|---|---|
| Duración de Batería | -18% | -28% | -10% | -7% | 8% | |
| Reader / Idle (h) | 7 | 6.7 | 9.9 | |||
| WiFi v1.3 (h) | 6.4 | 3.7 -42% | 5.9 -8% | 5.2 -19% | 6.4 0% | 6.9 8% |
| Load (h) | 1.5 | 1.6 7% | 0.8 -47% | 1.5 0% | 1.3 -13% | |
| H.264 (h) | 3.7 |
Pro
Contra
Veredicto - Muy alto rendimiento por volumen
El móvil GeForce RTX 3070 Ti y RTX 3080 Ti se introdujeron para prolongar la vida de la serie GeForce RTX 3000 antes del inevitable lanzamiento de la serie GeForce 4000 para móviles. Hasta entonces, sin embargo, la RTX 3080 Ti móvil puede proporcionar el impulso extra de rendimiento que los entusiastas están deseando. Aunque la GPU es sólo marginalmente más rápida que la RTX 3080 Ti móvil, sigue siendo impresionante ver que un modelo ultradelgado como la GM7AG8P supera a una alternativa mucho más gruesa y pesada como la MSI GE76 10UH con la antigua RTX 3080
Quizás el aspecto más destacable del GM7AG8P es su capacidad para sostener un objetivo TGP de más de 150 W a pesar de su perfil delgado y su peso relativamente bajo. El Razer Blade Pro y MSI GS76 Stealthque tienen casi el mismo tamaño pero son más pesados, vienen con un objetivo TGP de 95 W a 100 W cada uno. Uniwill Technology ha conseguido meter una GPU más potente de lo que esperábamos inicialmente basándonos en nuestra experiencia con otros portátiles de juego ultradelgados
La CPU y la GPU son de las más rápidas para cualquier portátil de juegos sin importar el tamaño y el peso, pero el voluminoso adaptador de CA de 280 W resta valor al diseño, por lo demás delgado y portátil, del portátil.
En cuanto al Core i9-12900H El aumento de rendimiento con respecto al Core i9-11900H es más significativo que el salto de una RTX 3080 móvil a la RTX 3080 Ti móvil. La mejora de generación a generación es lo suficientemente grande como para desplazar cómodamente a la serie H de AMD Zen 3 como la mejor CPU para portátiles de juegos
Uno de los mayores inconvenientes del GM7AG8P es su gran ladrillo de 280 W, necesario para alimentar los exigentes procesadores de su interior. Con casi un kilo de peso, el adaptador y los cables asociados son tan pesados como algunos Ultrabooks de 15,6 pulgadas. Es una pena que el sistema no pueda recargarse por USB-C, lo que obliga a los propietarios a llevar el voluminoso adaptador consigo cuando viajan. En cambio, los portátiles Asus ROG Zephyrus y Alienware pueden recargarse a través de adaptadores USB-C de terceros aptos para viajes. También hay que esperar un fuerte ruido de ventilador cuando se juega, lo que es un rasgo común entre todos los portátiles de juego de esta categoría en particular.
Precio y disponibilidad
El GM7AG8P de Uniwill Technology aún no está disponible para su compra. Es posible que revendedores como Schenker y Eluktronics adopten el chasis en un futuro con especificaciones similares
Schenker Uniwill Technology GM7AG8P
- 02/22/2022 v7 (old)
Allen Ngo
Price comparison

