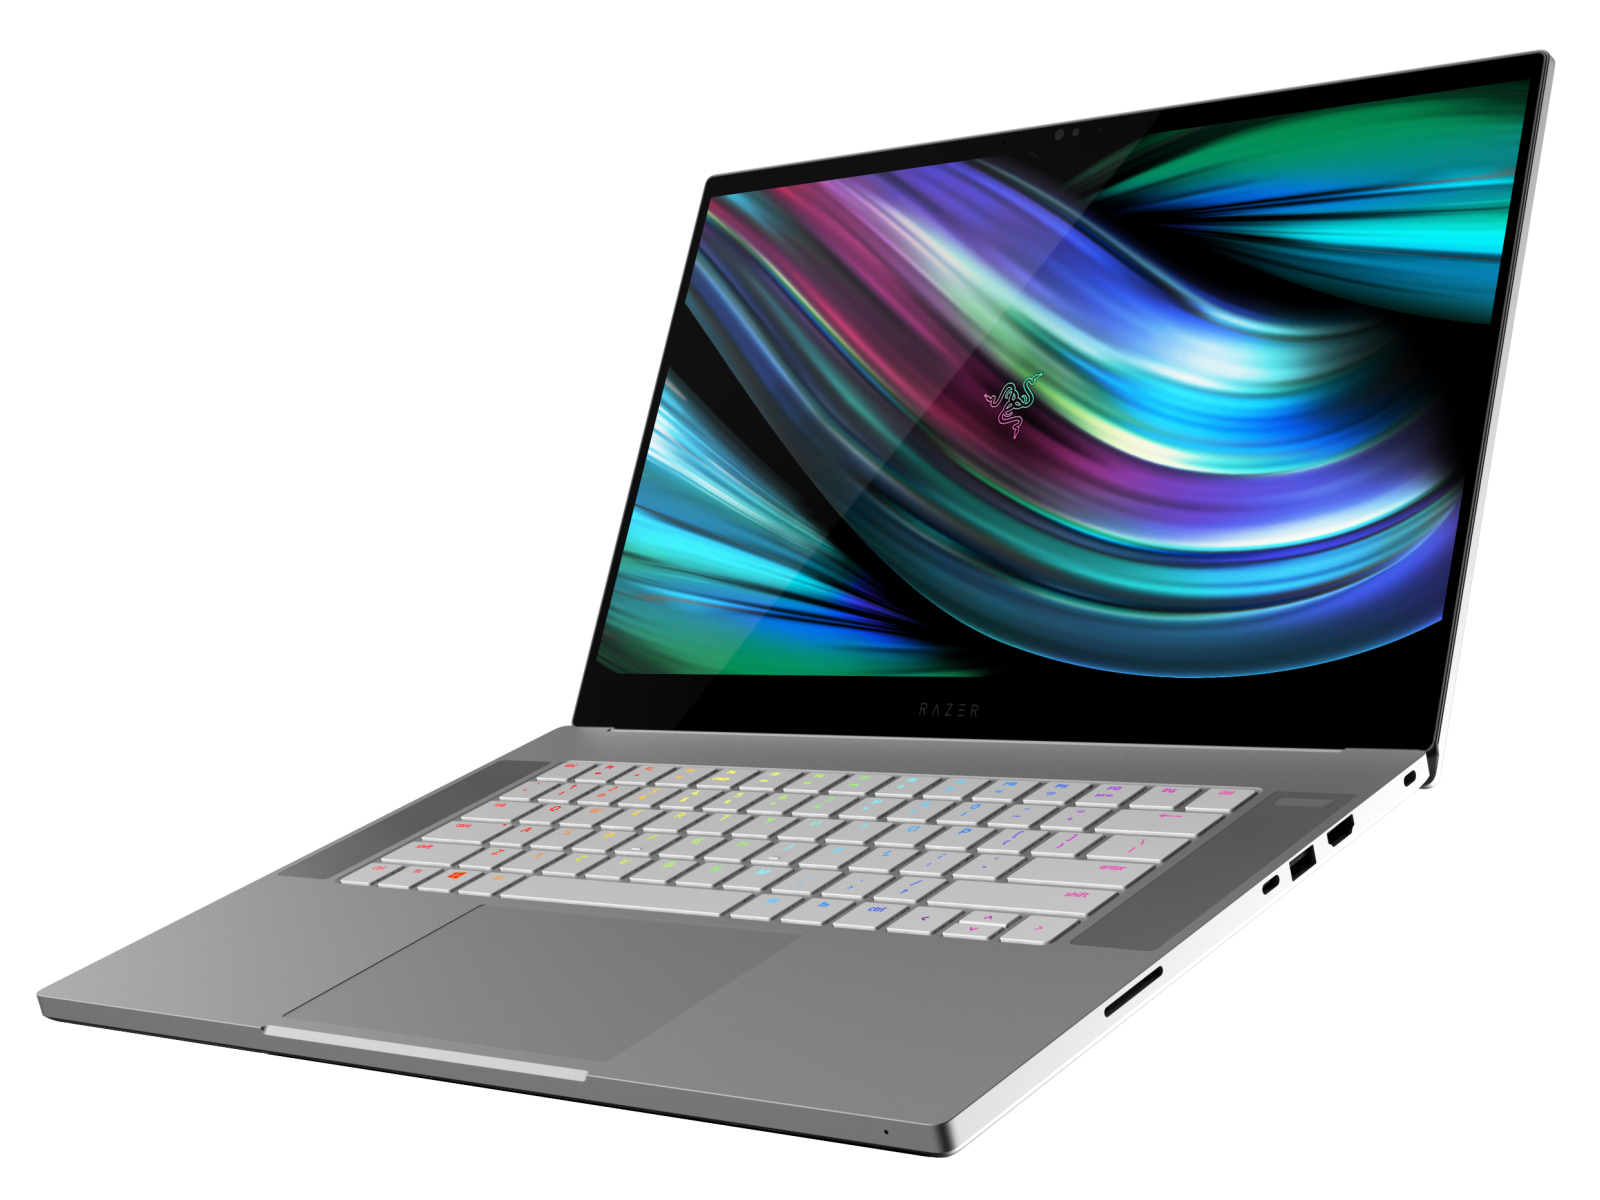
Review del portátil de Razer Blade 15 Studio Edition (2020): Pequeños cambios, mejor paquete general

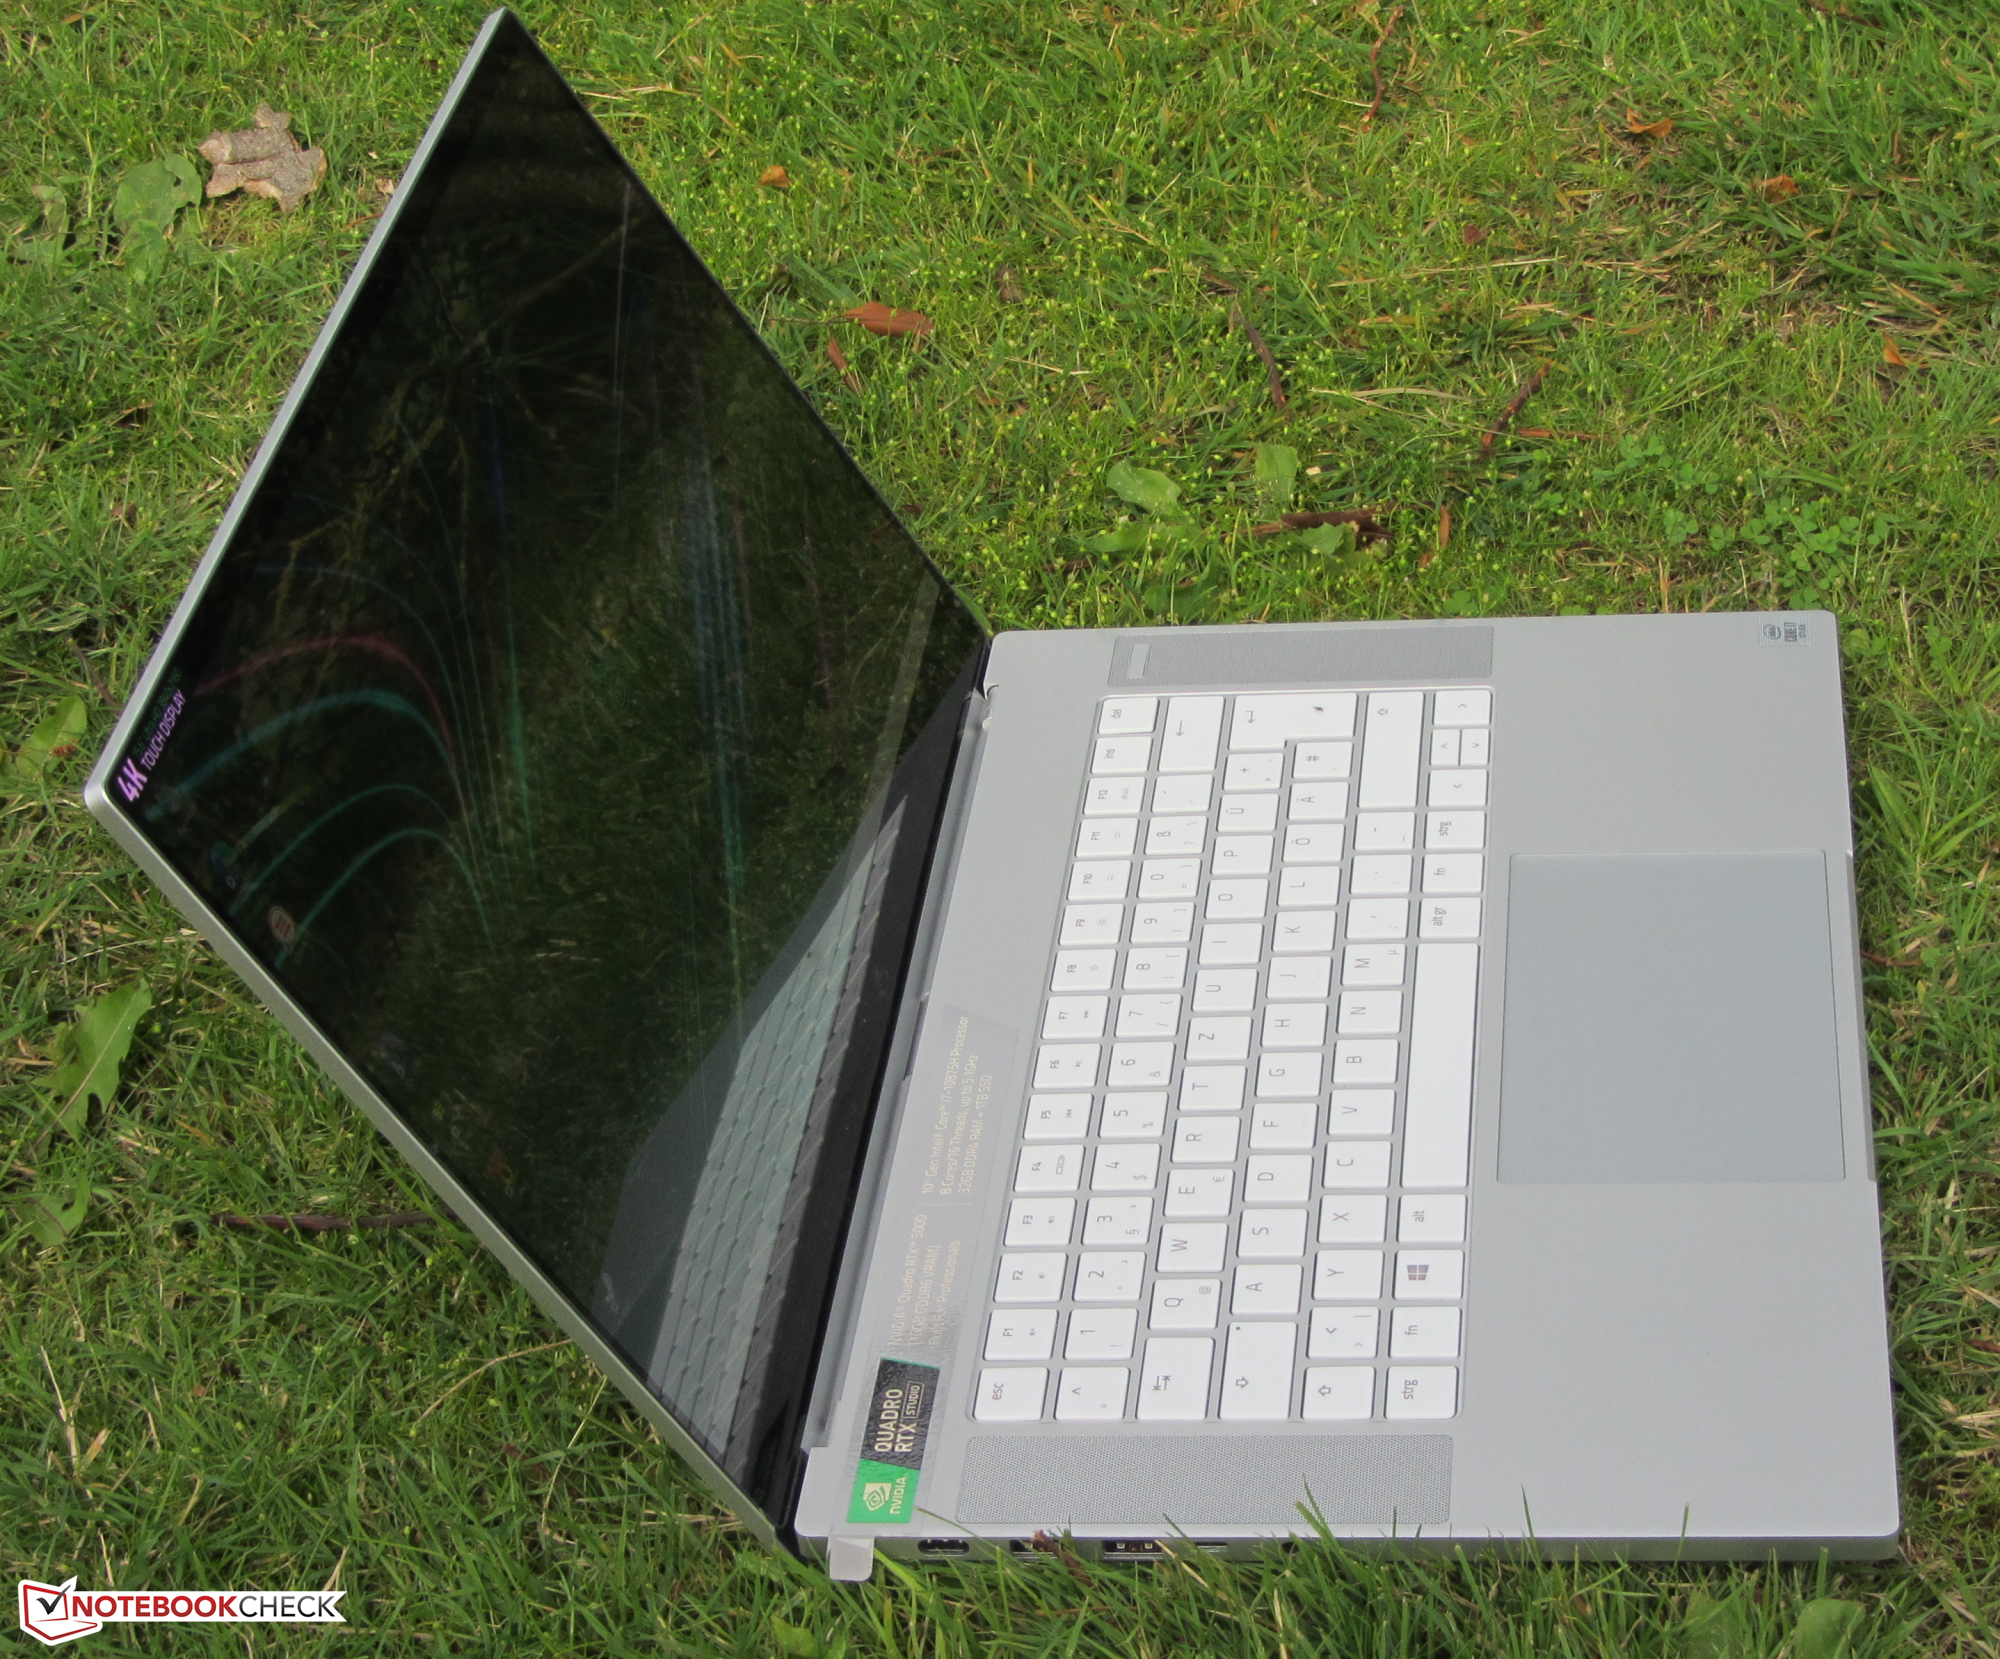
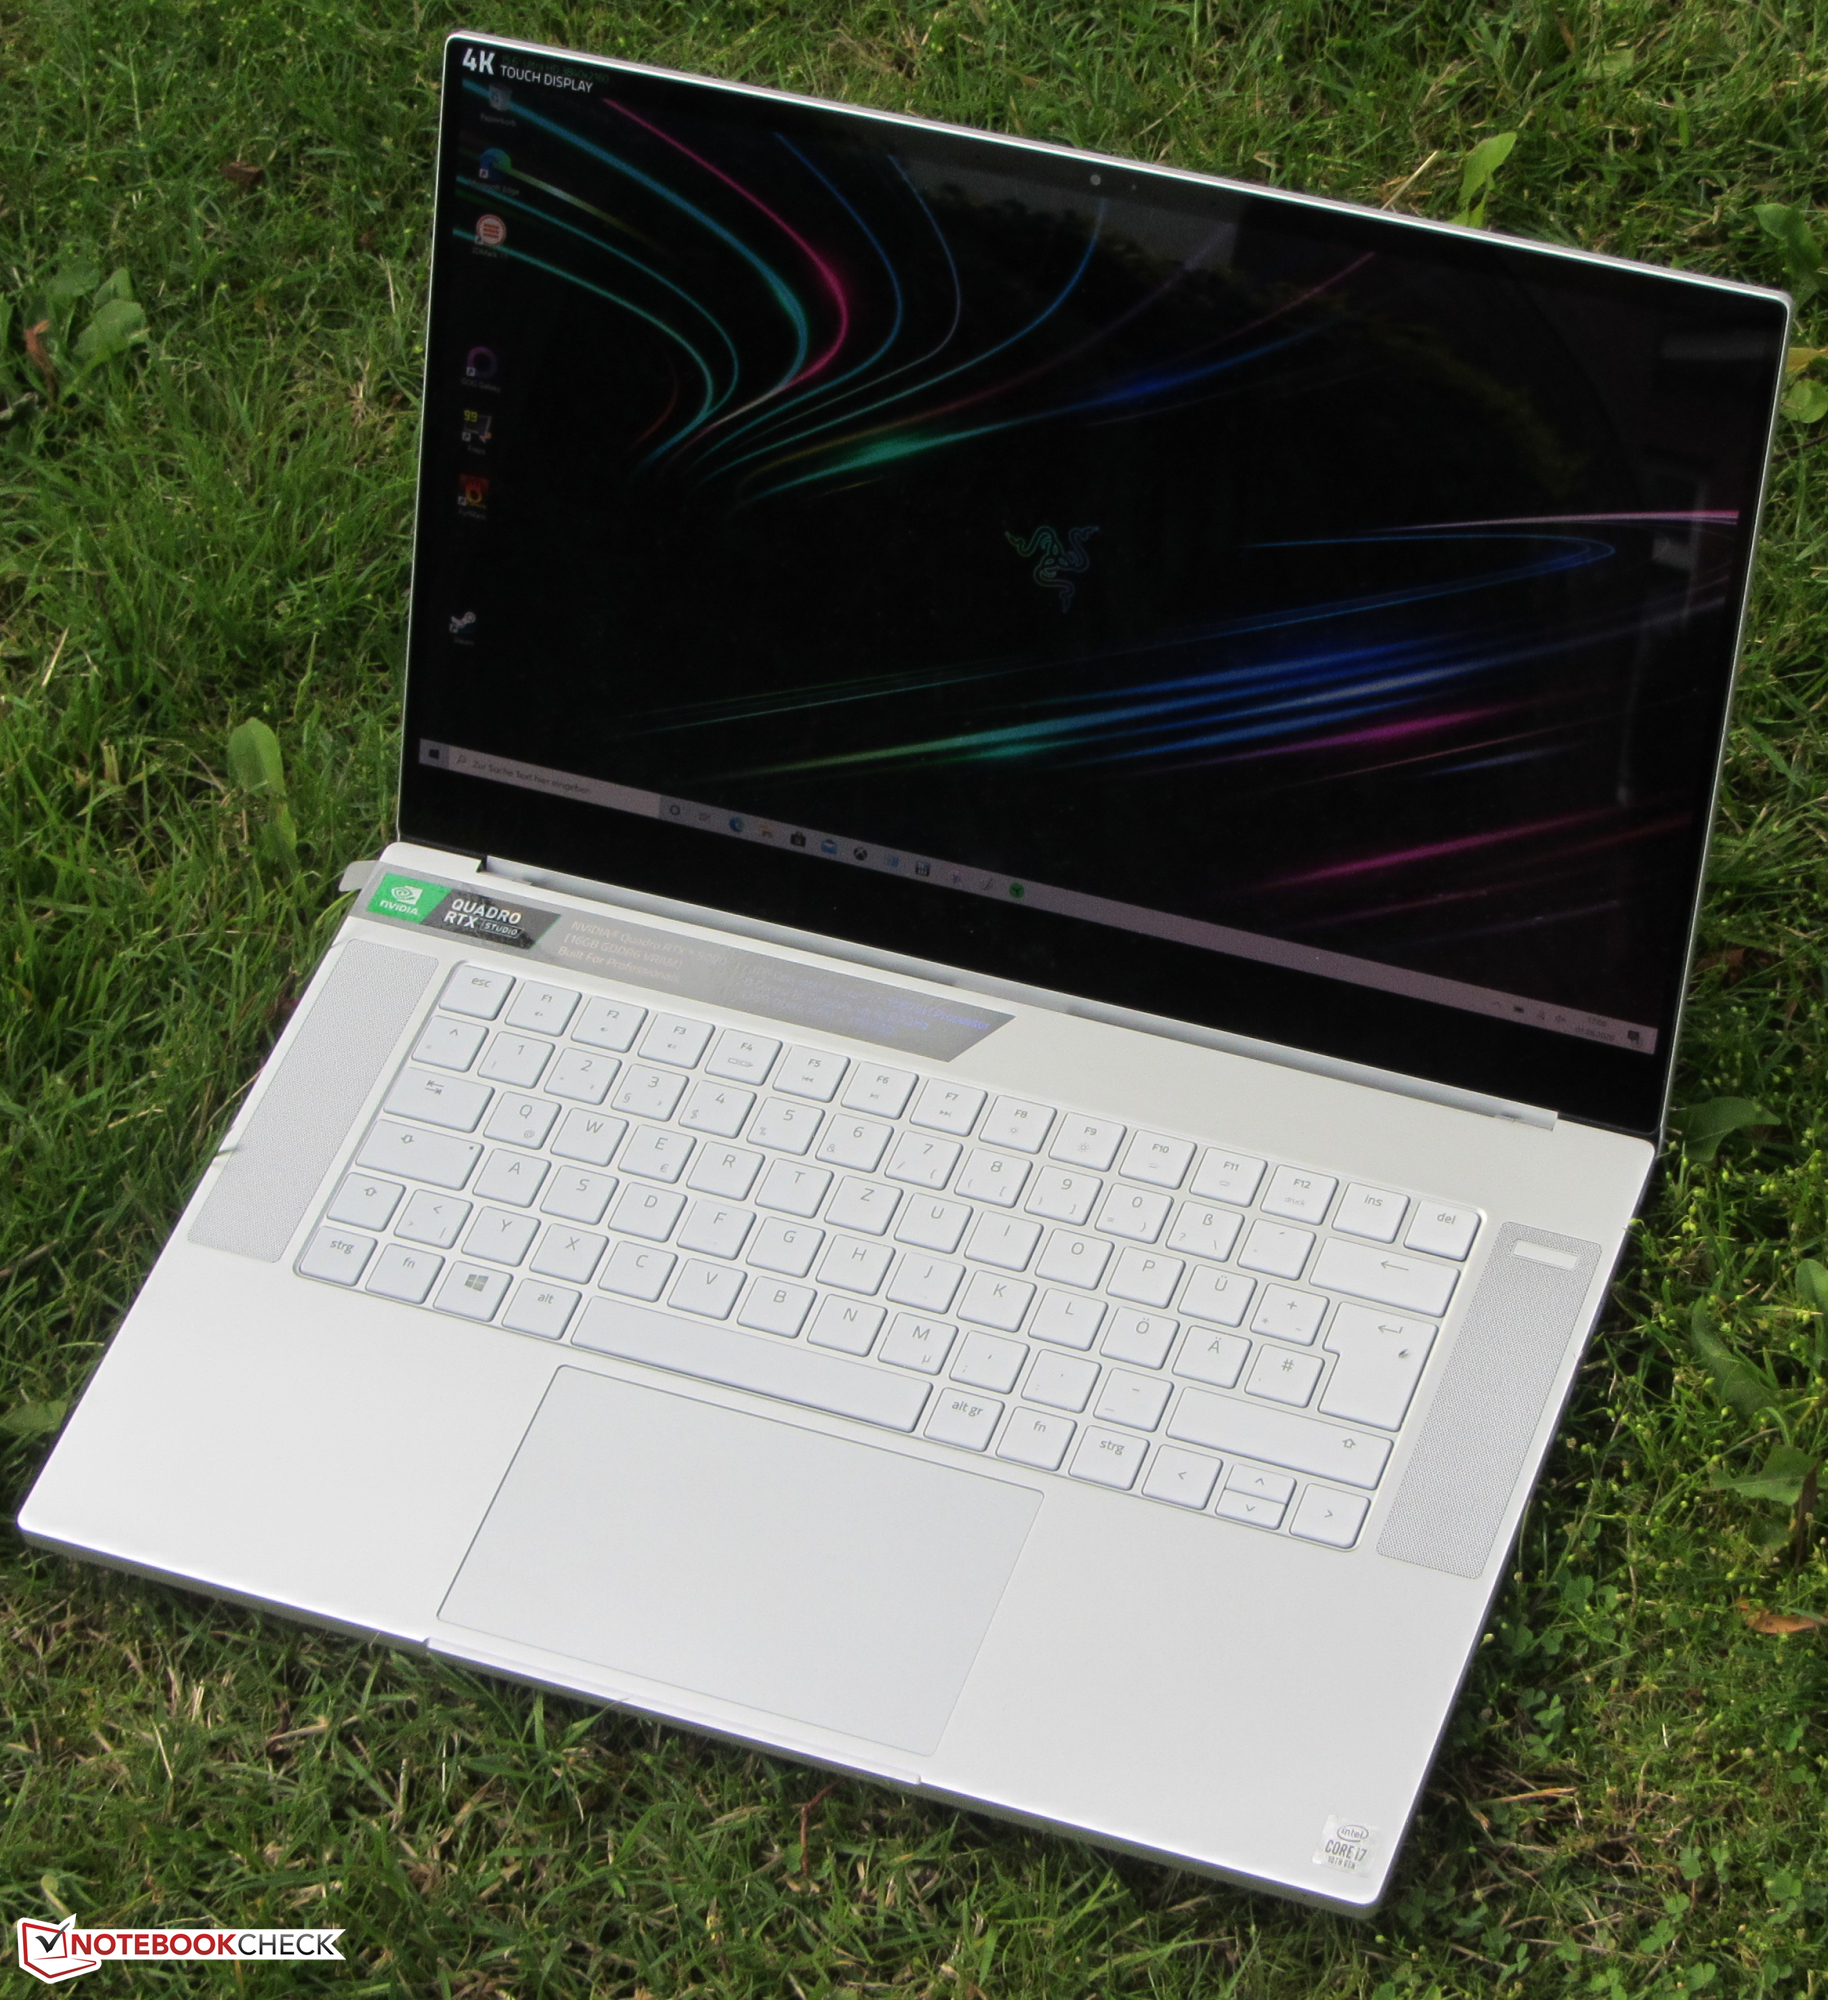
El Razer Blade 15 Studio Edition es una estación de trabajo con un Intel Core i7-10875H y una NVIDIA Quadro RTX 5000 Max-Q. La joya de la corona del Blade 15 es una pantalla táctil OLED de 4K, que también se usó en el Blade 15 2019 del año pasado, de idéntica construcción. Los dispositivos competidores incluyen: el Lenovo ThinkPad P53, el MSI P65 Creator 9SF y el Dell Precision 5540.
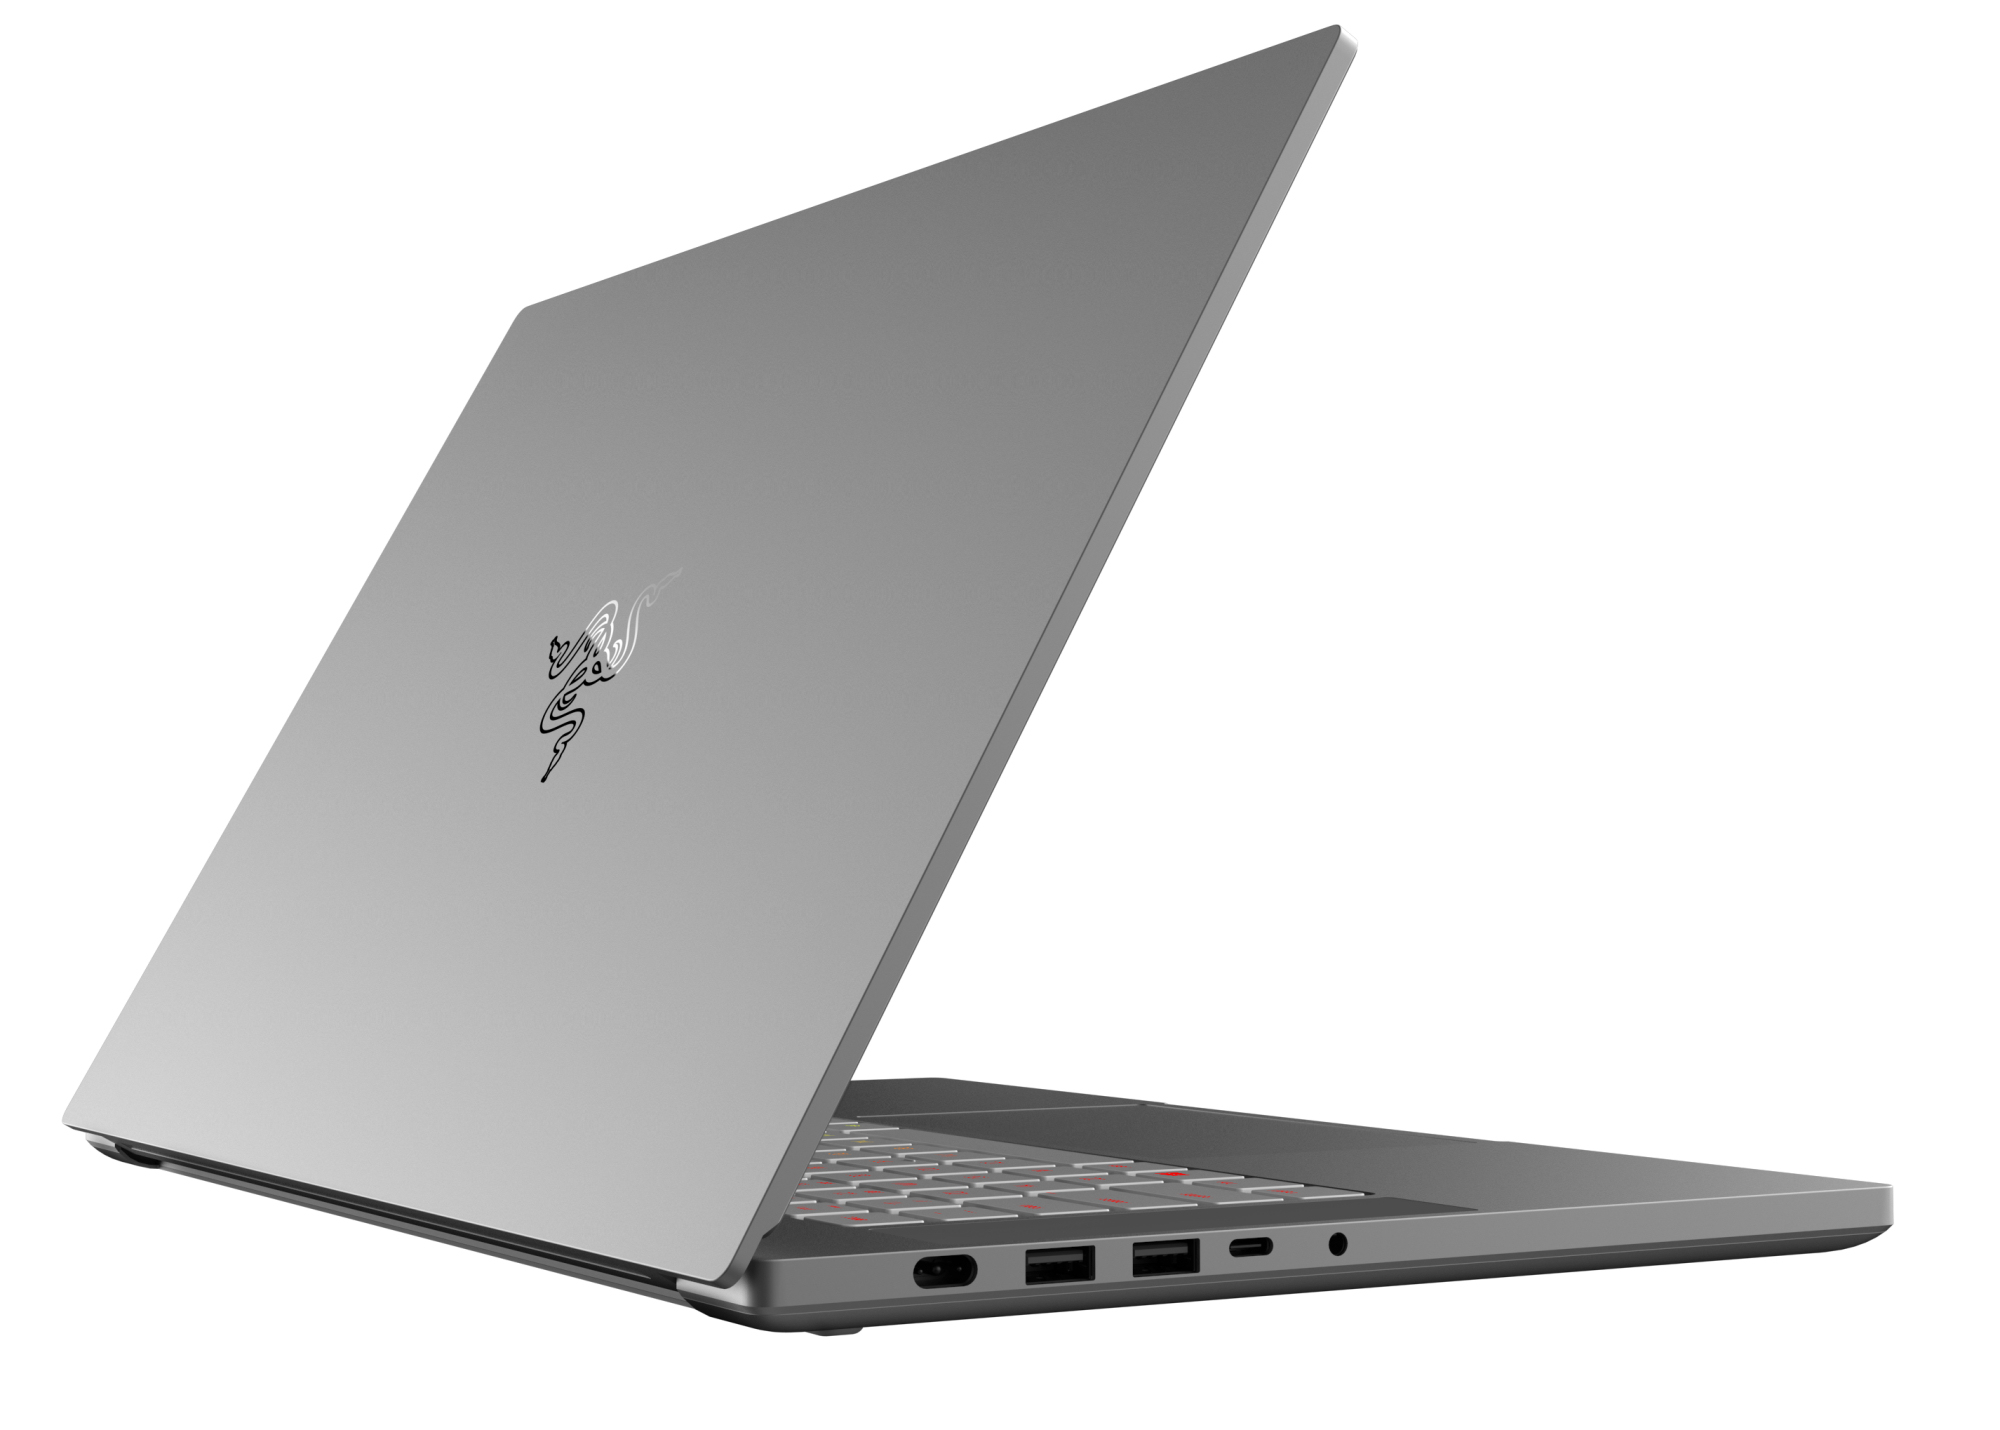
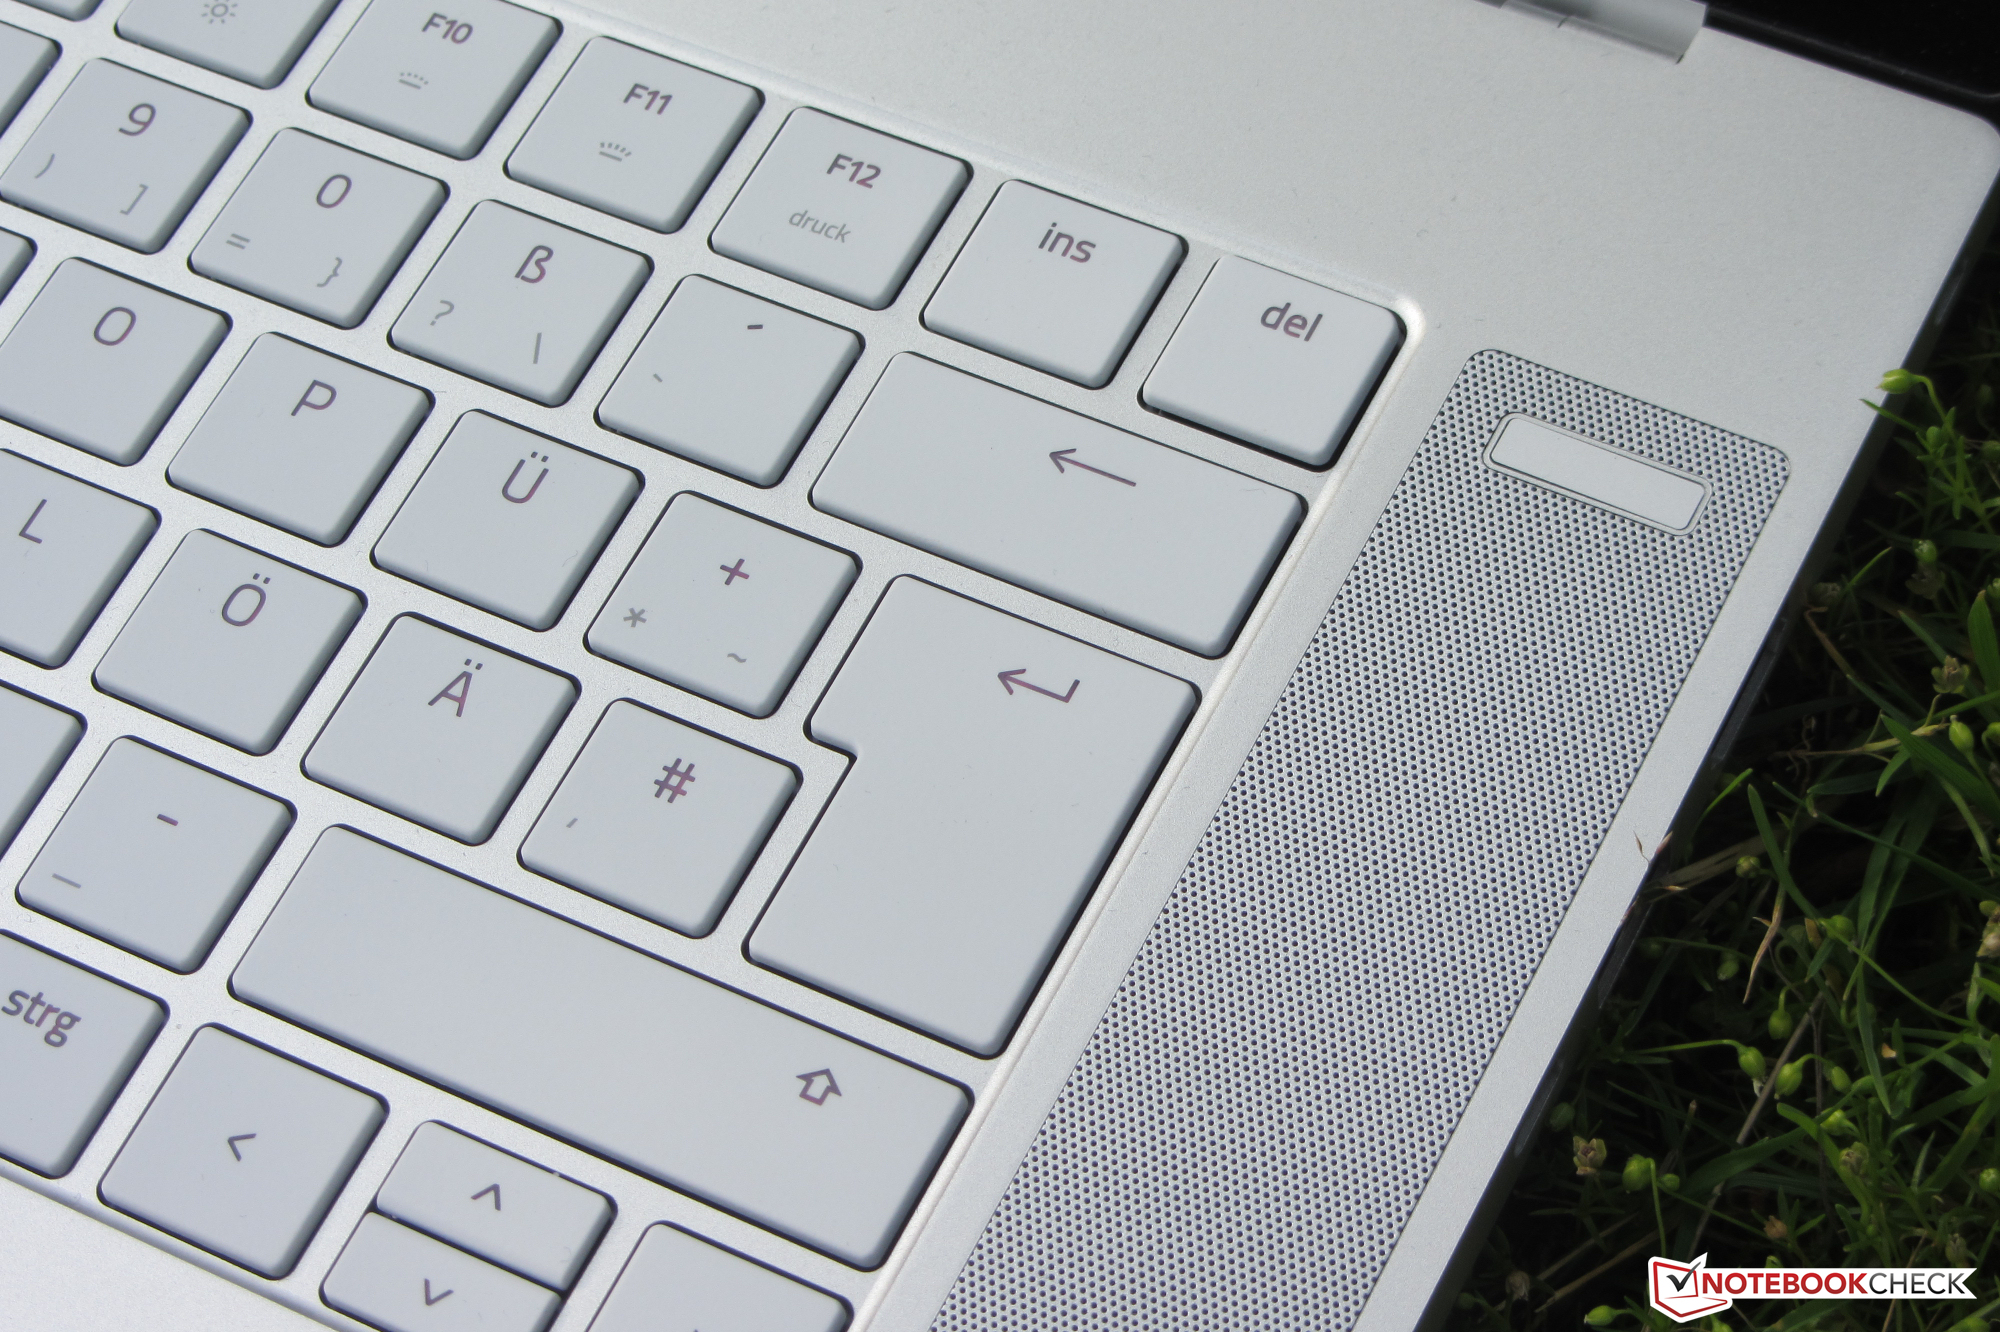
Debido a que el Blade 15 2020 y el Blade 15 2019 están construidos de forma idéntica, no proporcionaremos descripciones extensas de la carcasa, los puertos, los dispositivos de entrada y los altavoces - con la excepción de cualquier cambio. Puede encontrar toda la información relevante en nuestra reseña de la Blade 15 Studio Edition (2019).
Valoración | Fecha | Modelo | Peso | Altura | Tamaño | Resolución | Precio |
|---|---|---|---|---|---|---|---|
| 87 % v7 (old) | 08/2020 | Razer Blade 15 Studio Edition 2020 i7-10875H, Quadro RTX 5000 Max-Q | 2.2 kg | 13.98 mm | 15.60" | 3840x2160 | |
| 86.6 % v7 (old) | 12/2019 | Razer Blade 15 Studio Edition i7-9750H, Quadro RTX 5000 Max-Q | 2.2 kg | 17.8 mm | 15.60" | 3840x2160 | |
| 89.8 % v7 (old) | 11/2019 | Lenovo ThinkPad P53-20QN000YGE i7-9850H, Quadro RTX 5000 Max-Q | 2.7 kg | 29.4 mm | 15.60" | 1920x1080 | |
| 85 % v7 (old) | 06/2019 | MSI P65 Creator 9SF-657 i9-9880H, GeForce RTX 2070 Max-Q | 1.9 kg | 18 mm | 15.60" | 3840x2160 | |
| 86.9 % v7 (old) | 11/2019 | Dell Precision 5540 i9-9980HK, Quadro T2000 Max-Q | 2 kg | 17 mm | 15.60" | 3840x2160 |
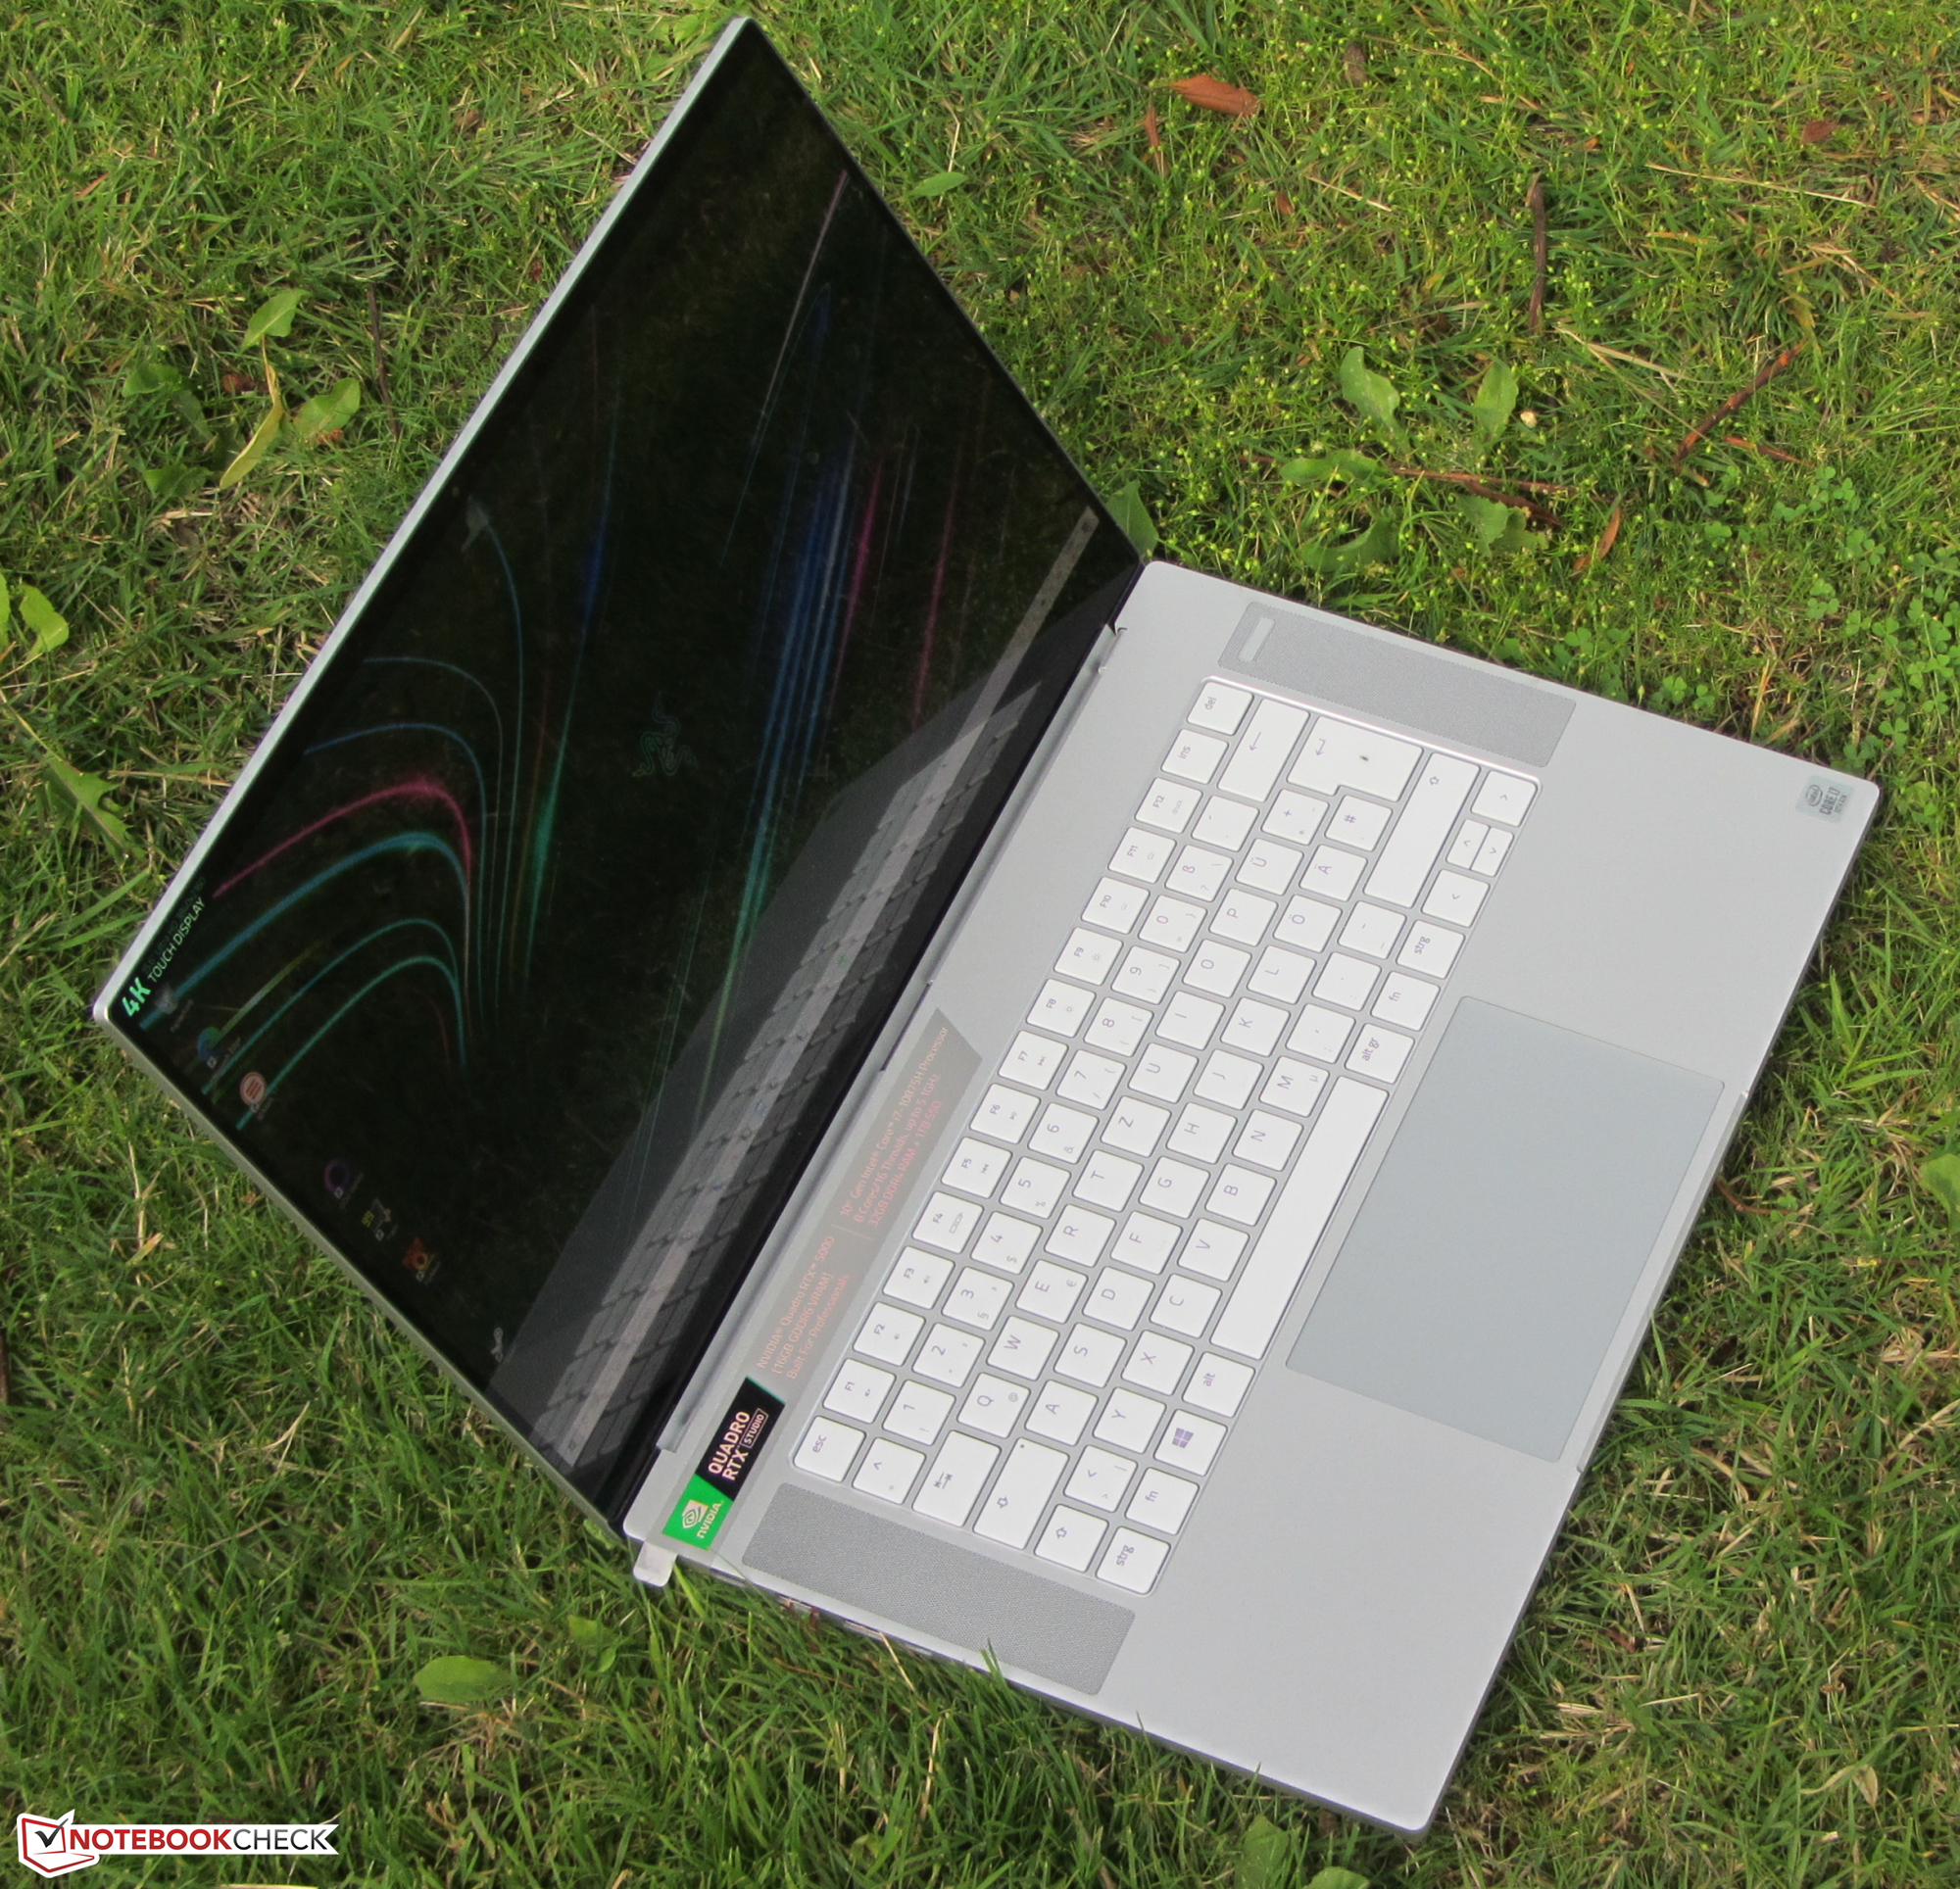
Conectividad - USB 3.2 Gen 2 sustituye al Mini DisplayPort
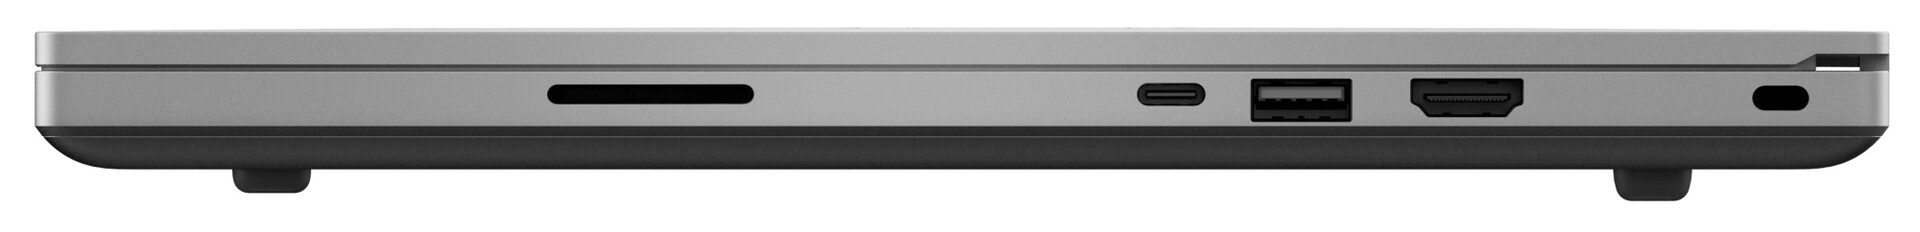
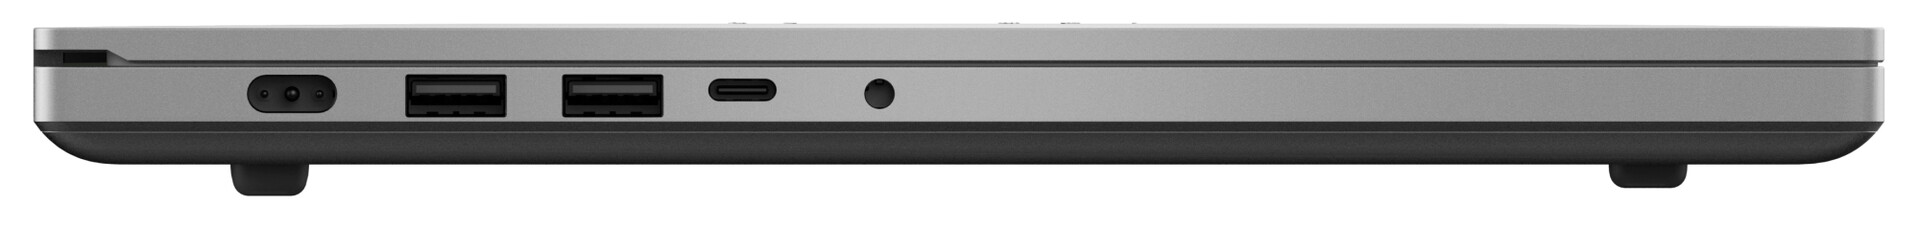
Razer ha hecho algunos cambios menores en la selección de los puertos. El puerto MiniDP ha sido reemplazado por el puerto USB 3.2 Gen 2 Tipo-C, que puede emitir una señal DisplayPort. Los tres puertos Tipo A ahora operan a velocidades USB 3.2 Gen 2.
| SD Card Reader | |
| average JPG Copy Test (av. of 3 runs) | |
| Lenovo ThinkPad P53-20QN000YGE (Toshiba Exceria Pro SDXC 64 GB UHS-II) | |
| Dell Precision 5540 (Toshiba Exceria Pro SDXC 64 GB UHS-II) | |
| Media de la clase Workstation (49.6 - 681, n=14, últimos 2 años) | |
| Razer Blade 15 Studio Edition (Toshiba Exceria Pro SDXC 64 GB UHS-II) | |
| Razer Blade 15 Studio Edition 2020 (Toshiba Exceria Pro SDXC 64 GB UHS-II) | |
| maximum AS SSD Seq Read Test (1GB) | |
| Media de la clase Workstation (87.6 - 1455, n=14, últimos 2 años) | |
| Lenovo ThinkPad P53-20QN000YGE (Toshiba Exceria Pro SDXC 64 GB UHS-II) | |
| Dell Precision 5540 (Toshiba Exceria Pro SDXC 64 GB UHS-II) | |


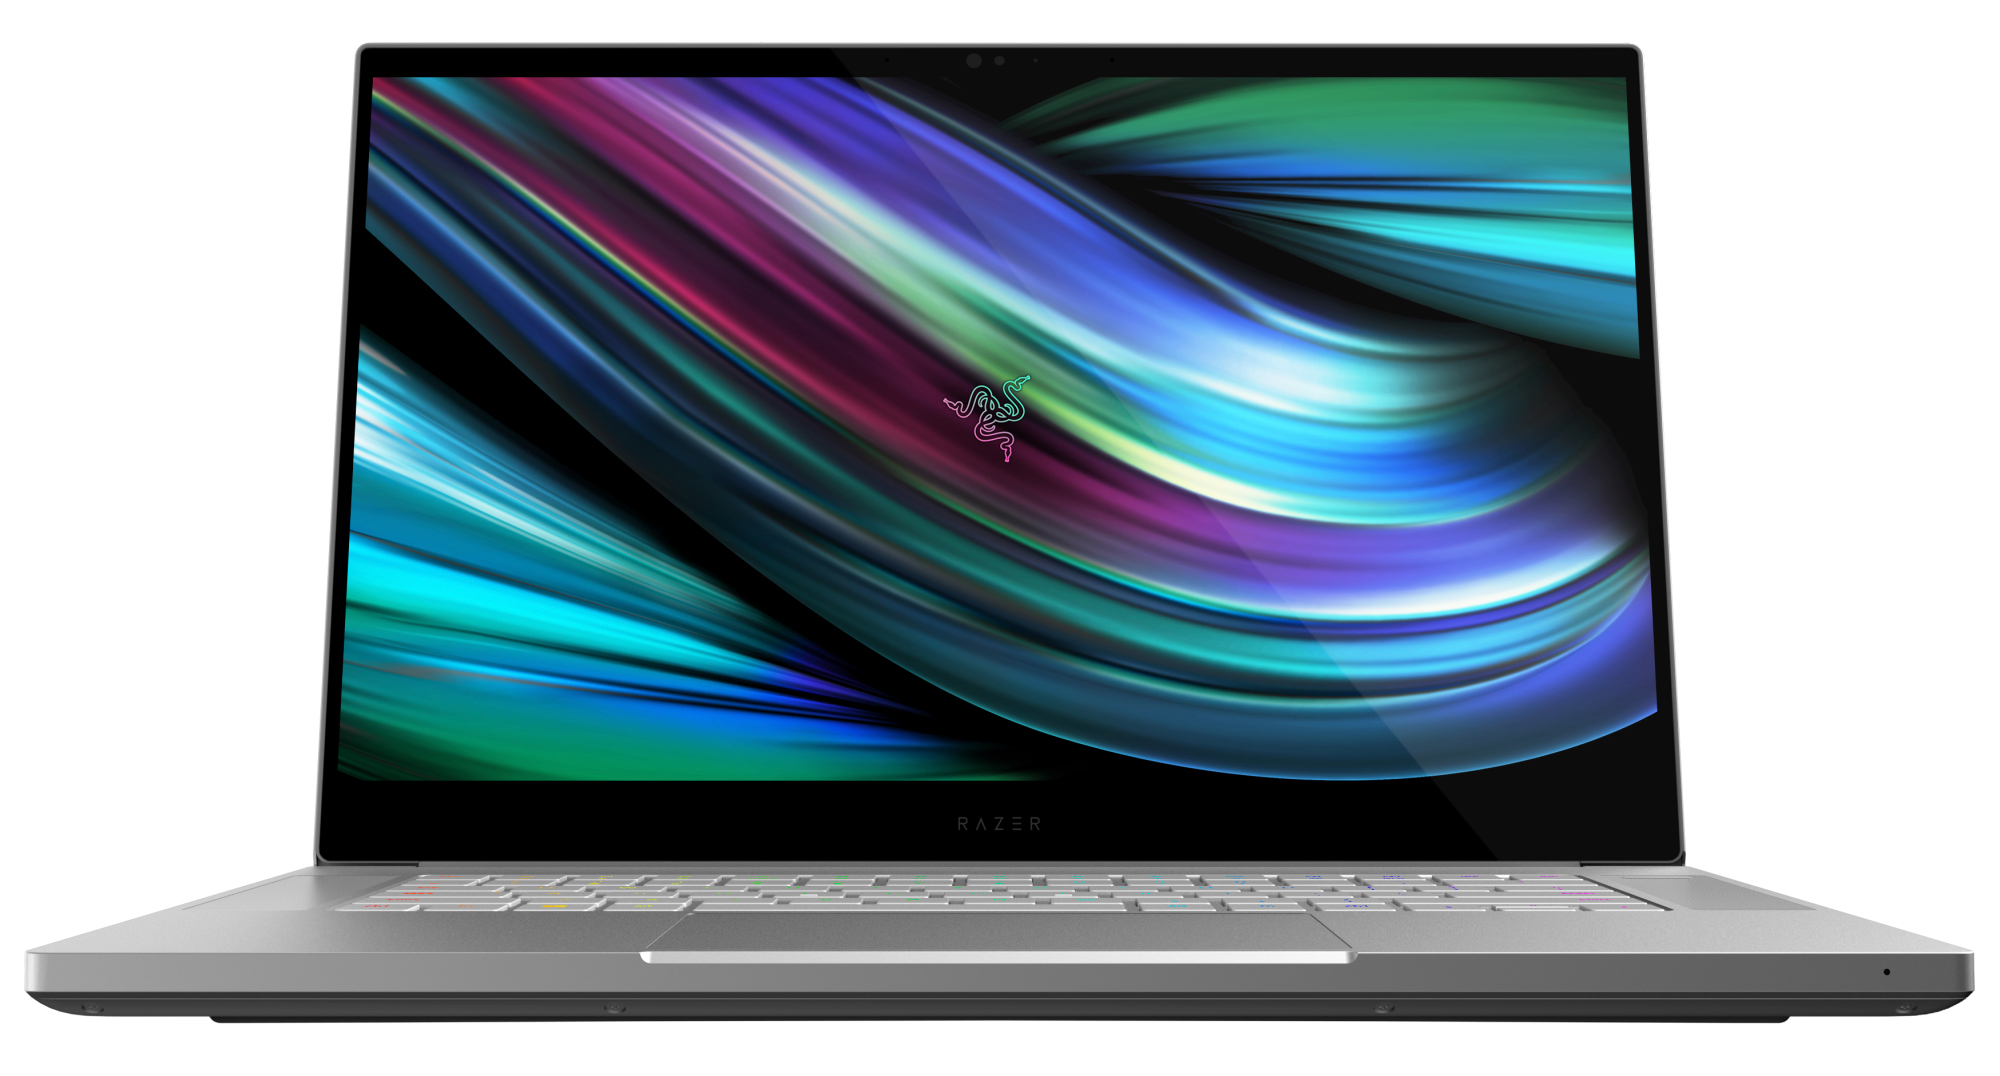
Pantalla - El panel OLED ofrece una magnífica relación de contraste
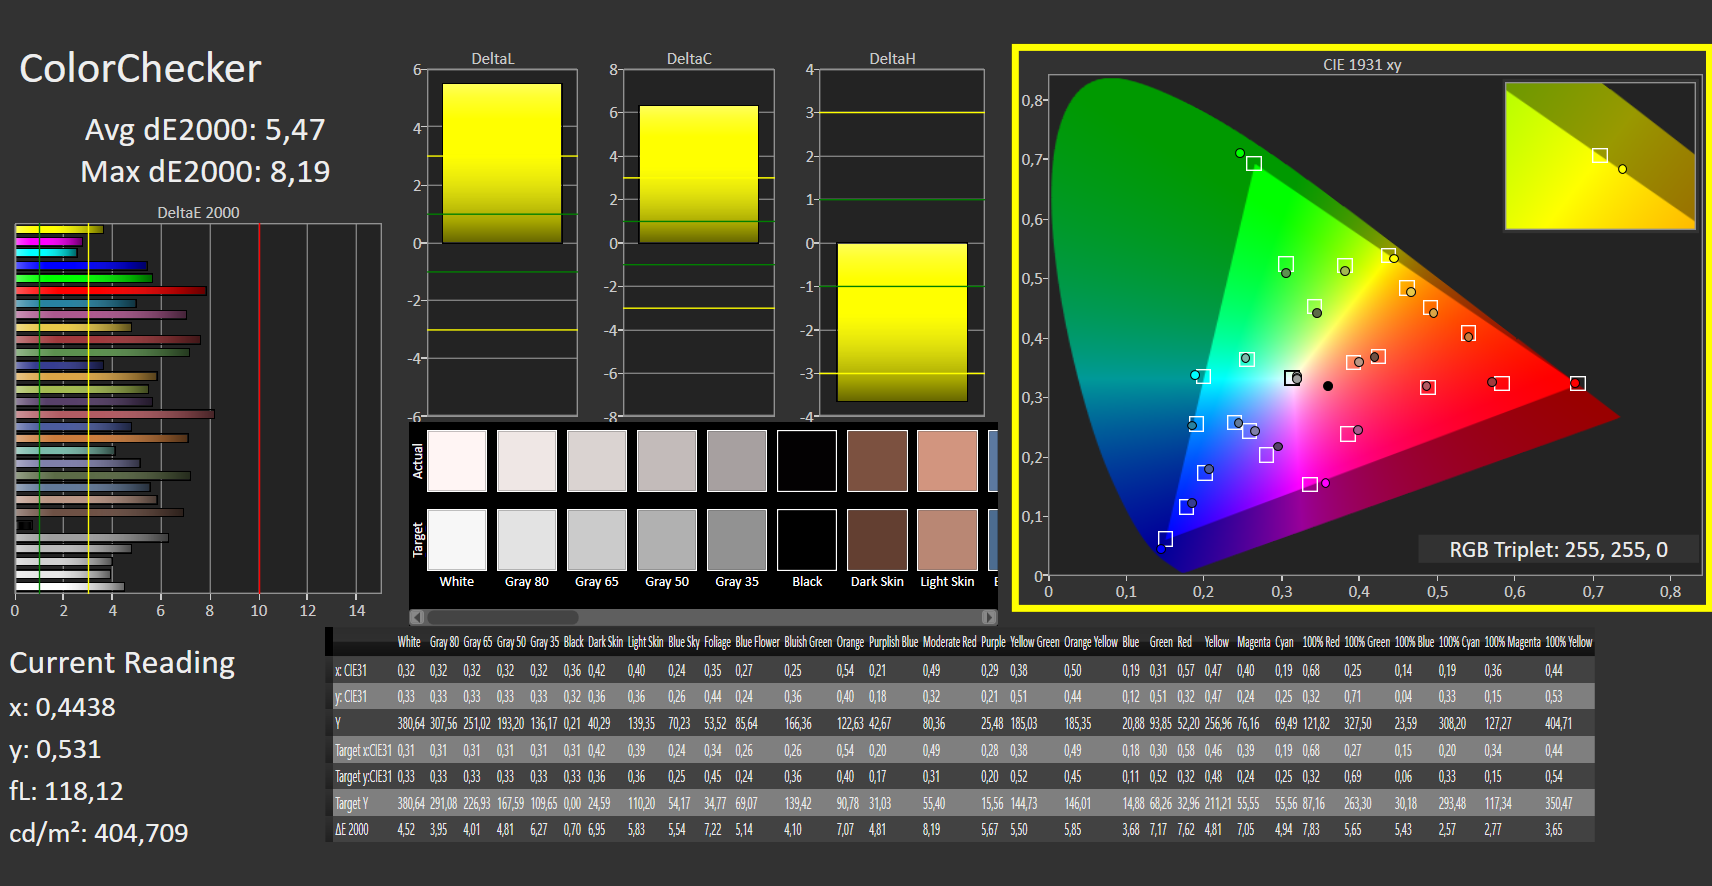
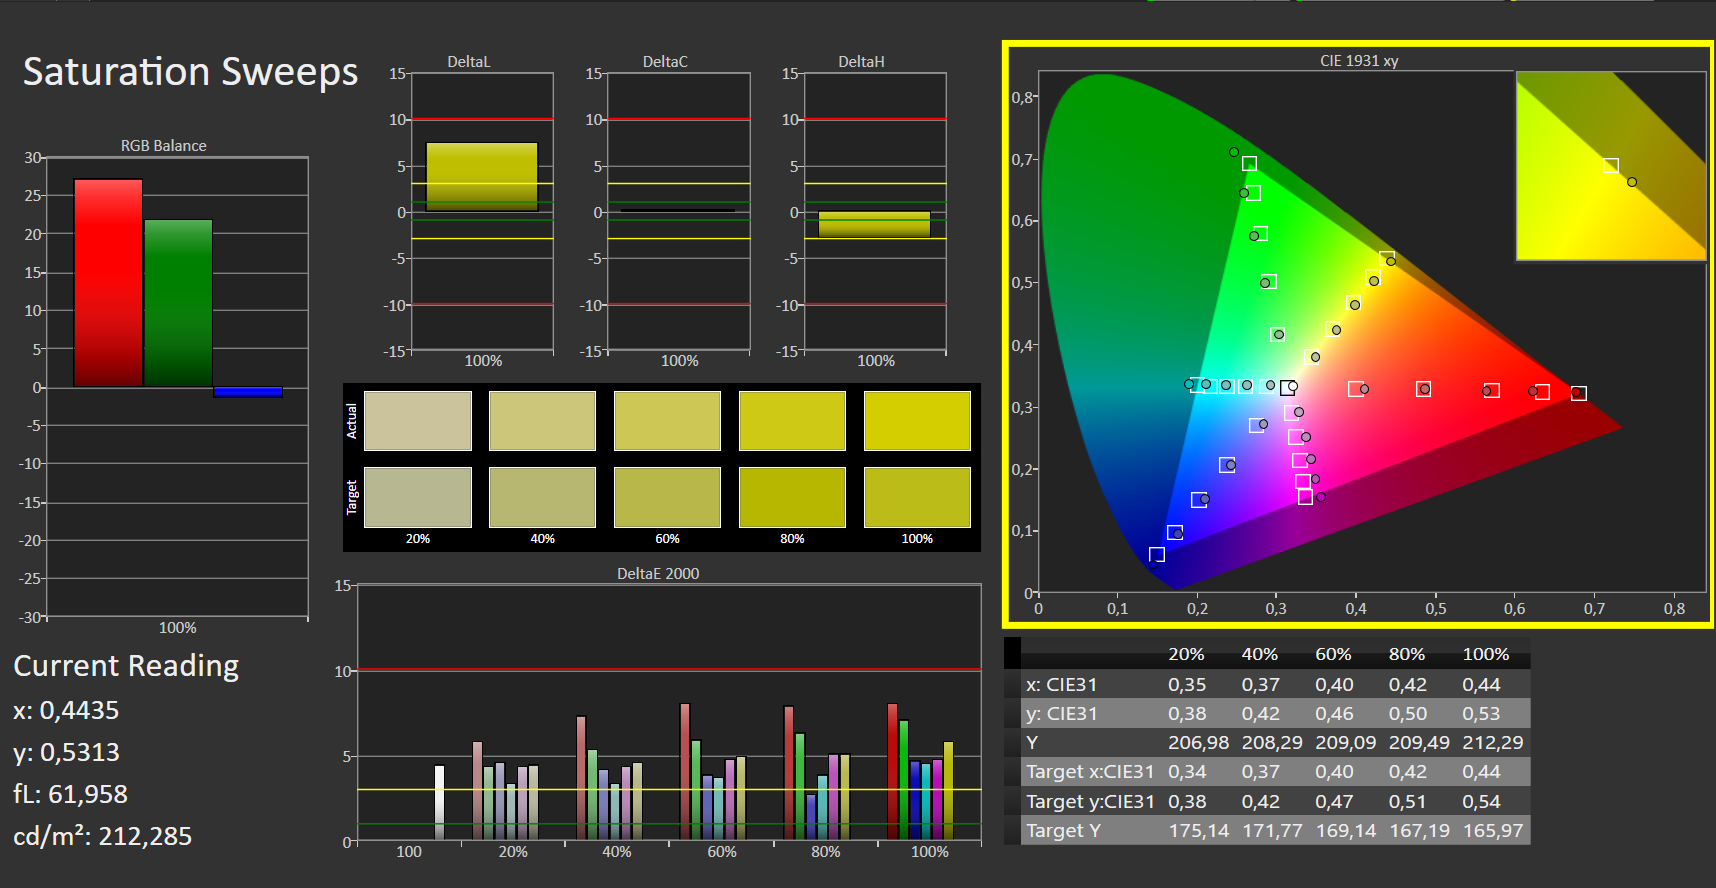
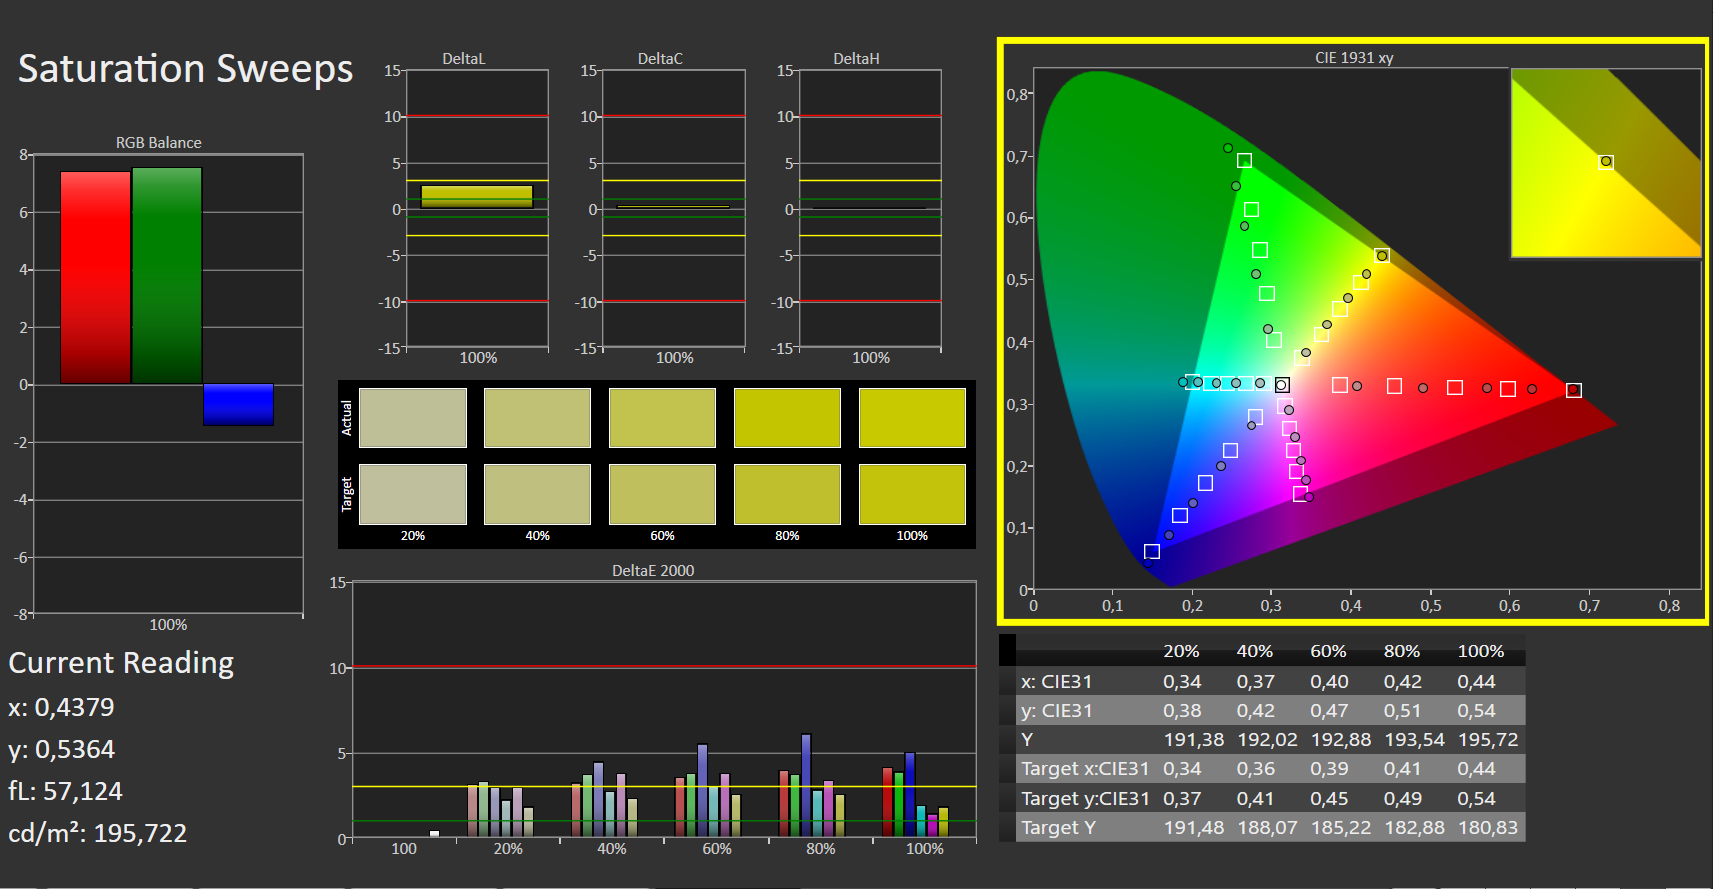
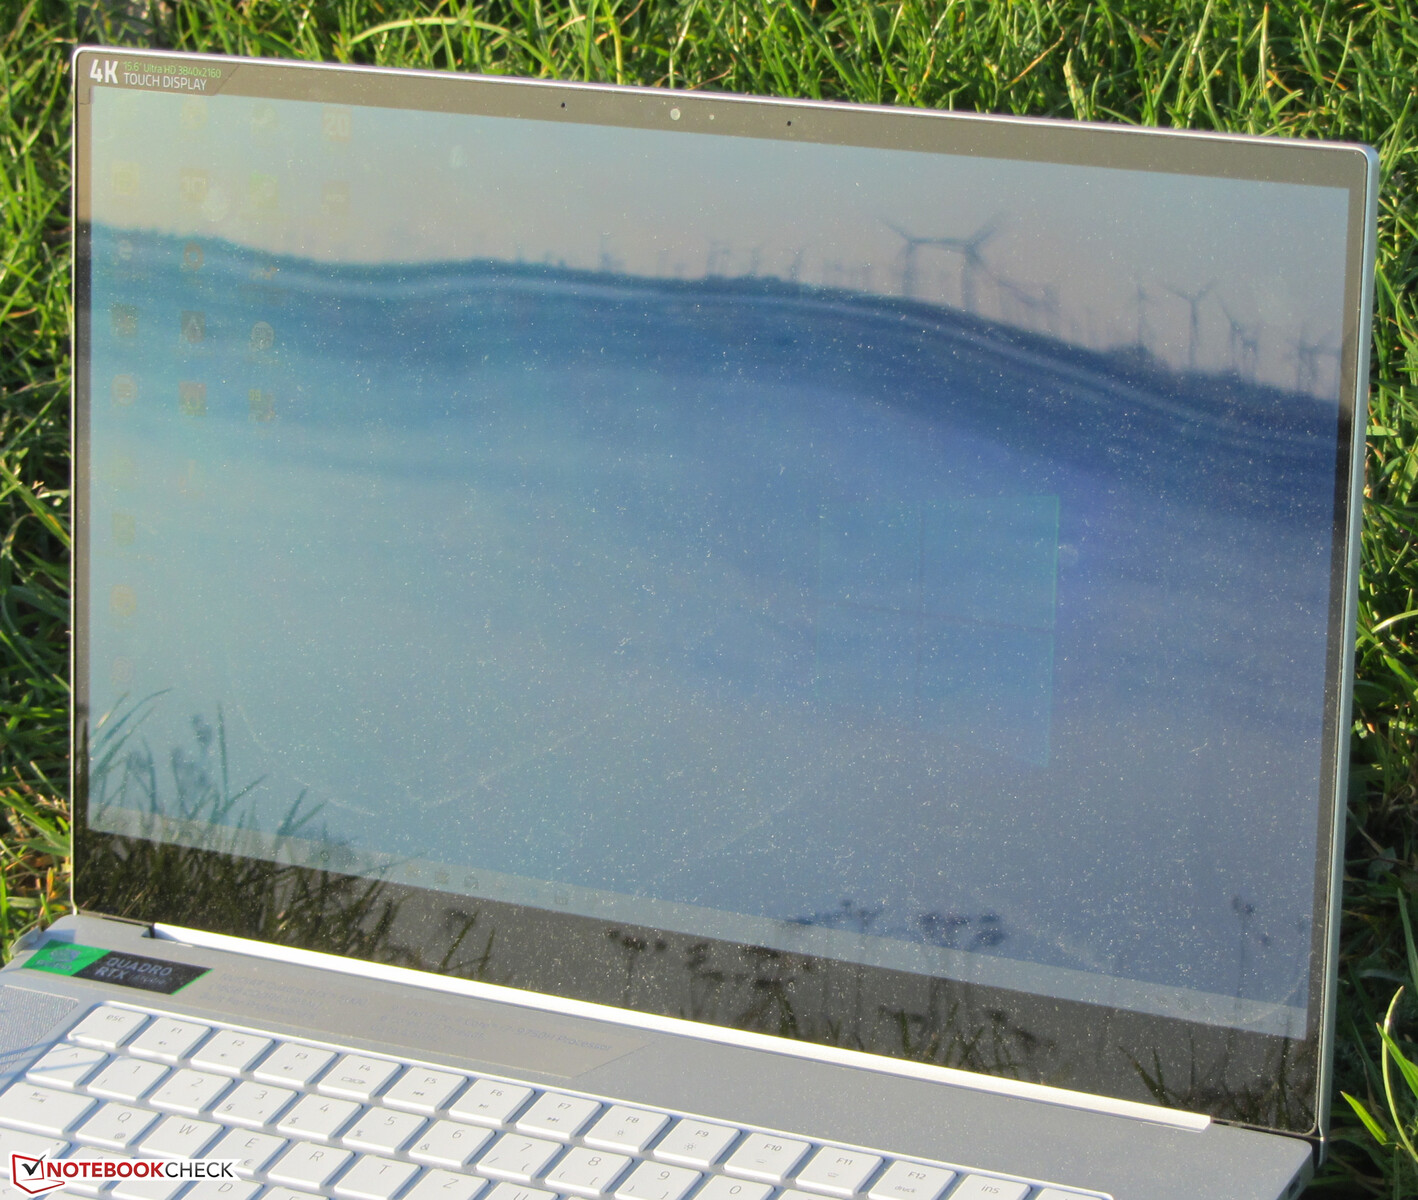
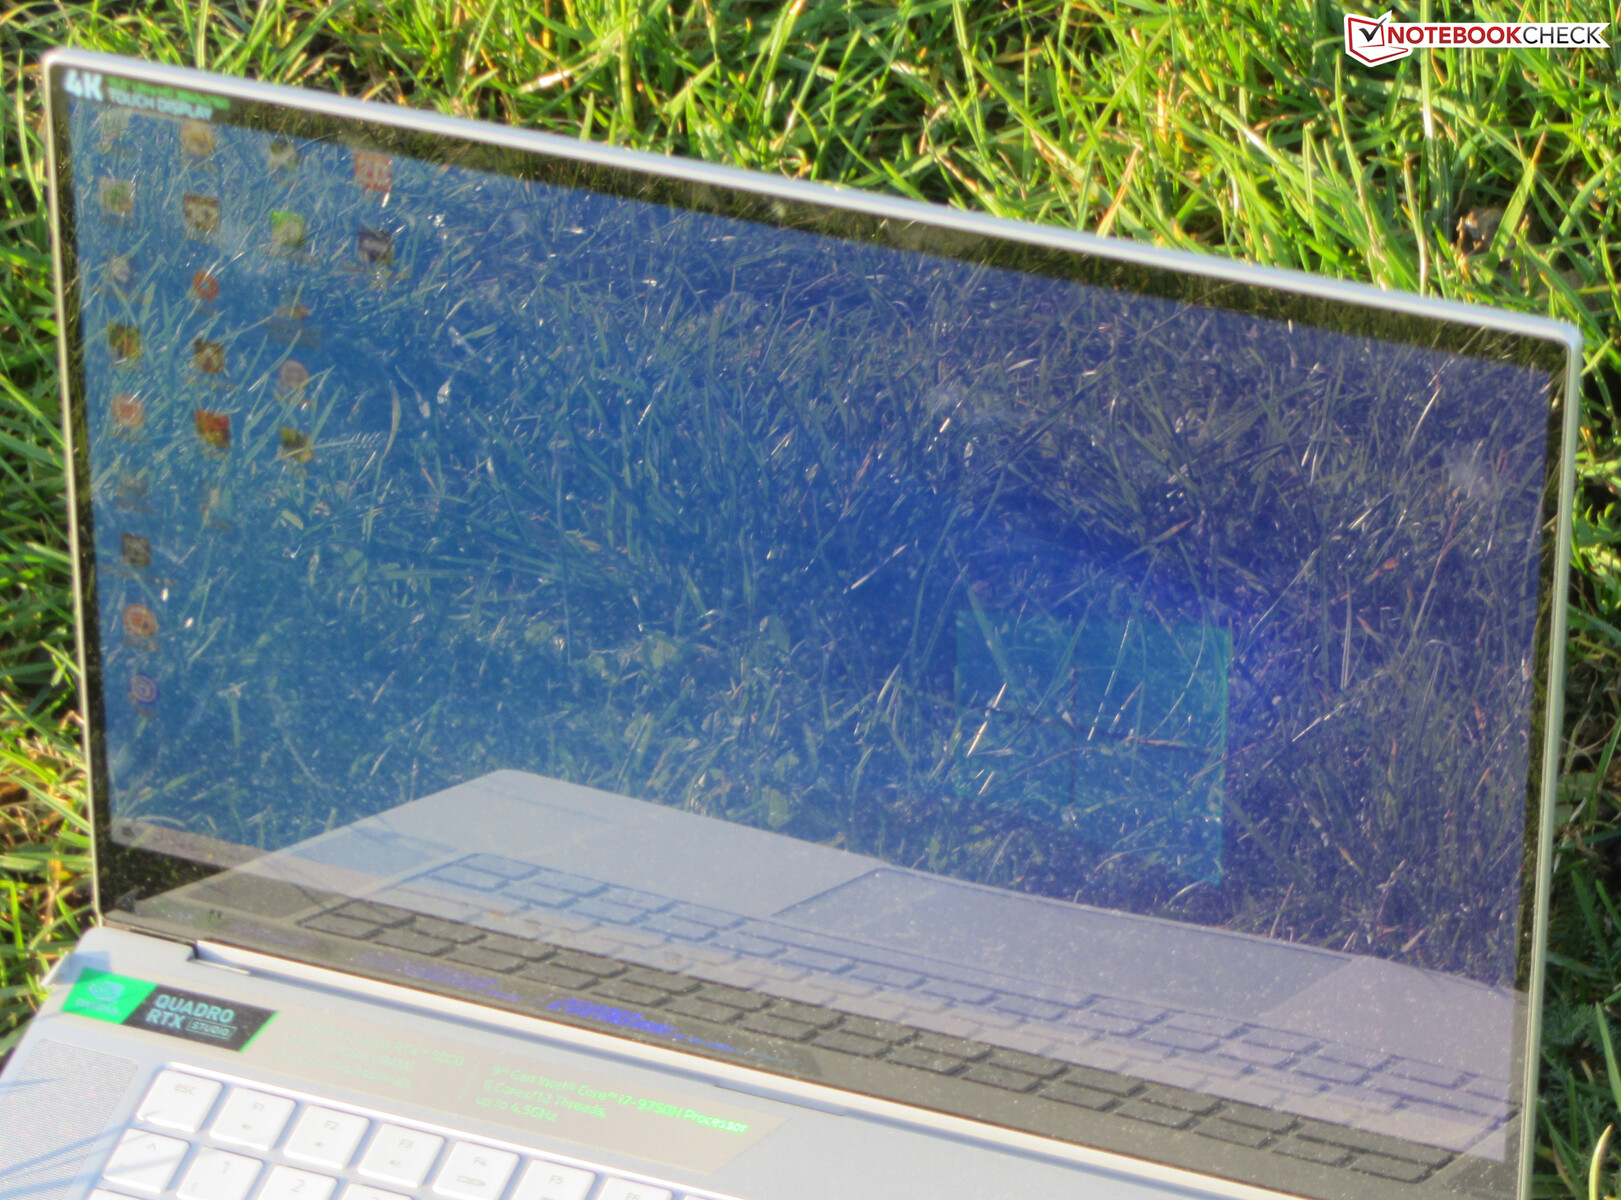
El Razer Blade 15 tiene una pantalla táctil OLED de 15,6 pulgadas con una resolución nativa de 3840x2160. La pantalla ofrece una magnífica relación de contraste (21111:1), un impresionante valor de negro (0,018), un buen brillo máximo (388,4 cd/m²) y rápidos tiempos de respuesta. Cubre el 100% del espacio de color sRGB. Positivo: La pantalla no sufre de parpadeo PWM.
El Blade 15 2020 viene con el mismo panel que el modelo predecesor. Sin embargo, hay alguna diferencia entre los dos paneles. Sin embargo, esto es bastante normal, porque dos pantallas de construcción similar nunca son 100% idénticas.
| |||||||||||||||||||||||||
iluminación: 93 %
Brillo con batería: 380 cd/m²
Contraste: 21111:1 (Negro: 0.018 cd/m²)
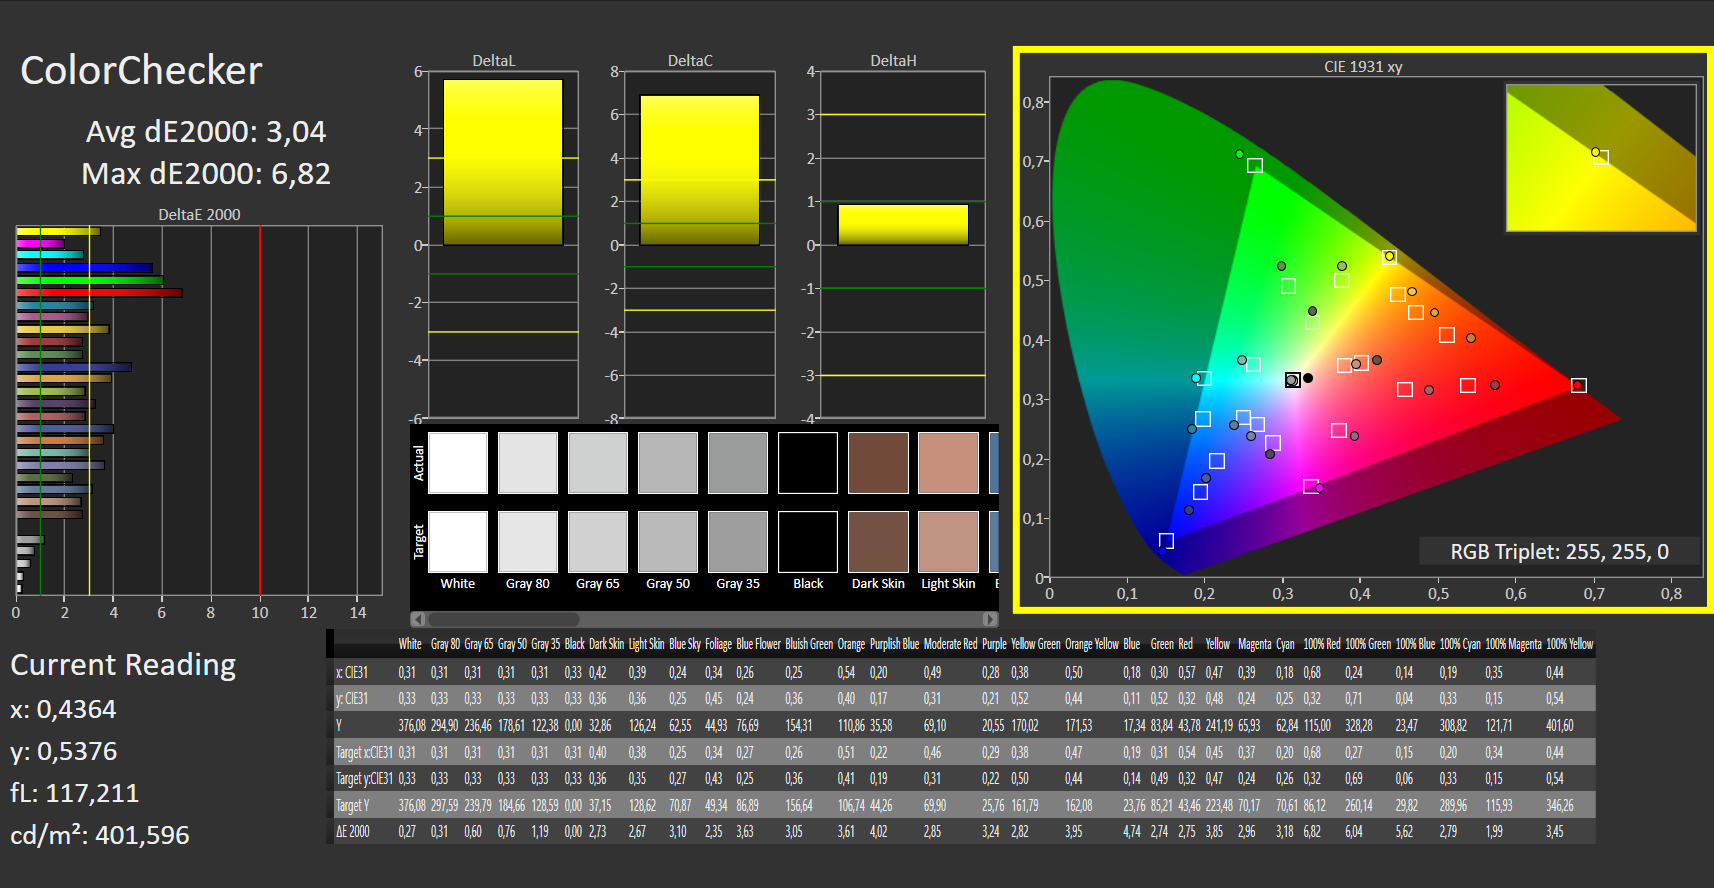
ΔE ColorChecker Calman: 5.47 | ∀{0.5-29.43 Ø4.72}
calibrated: 3.04
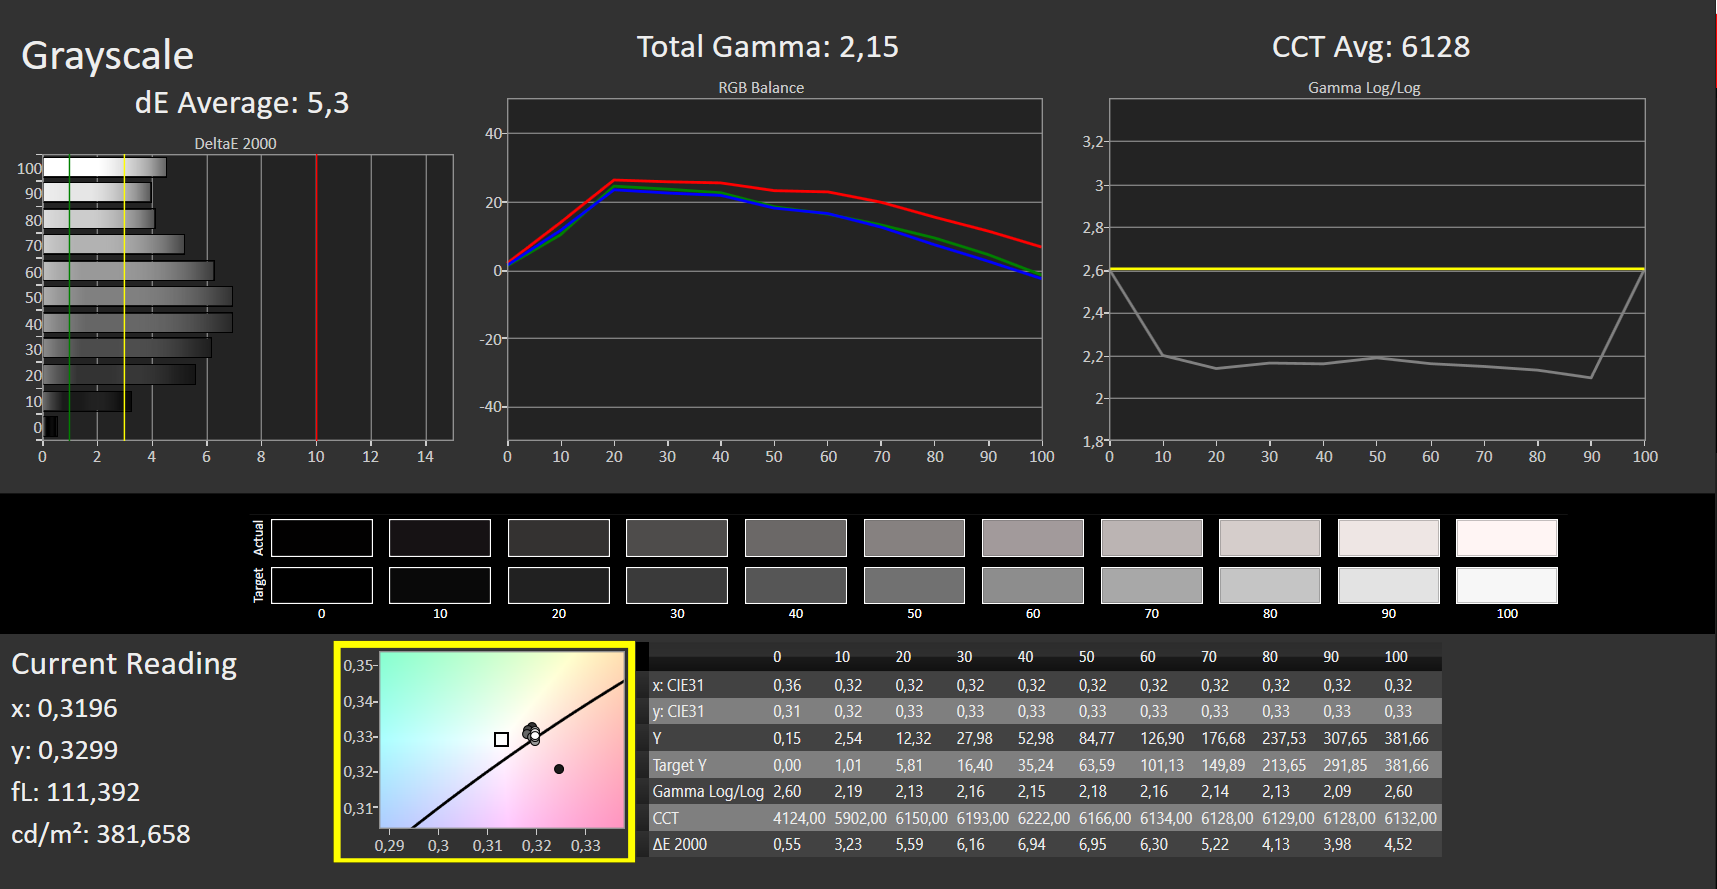
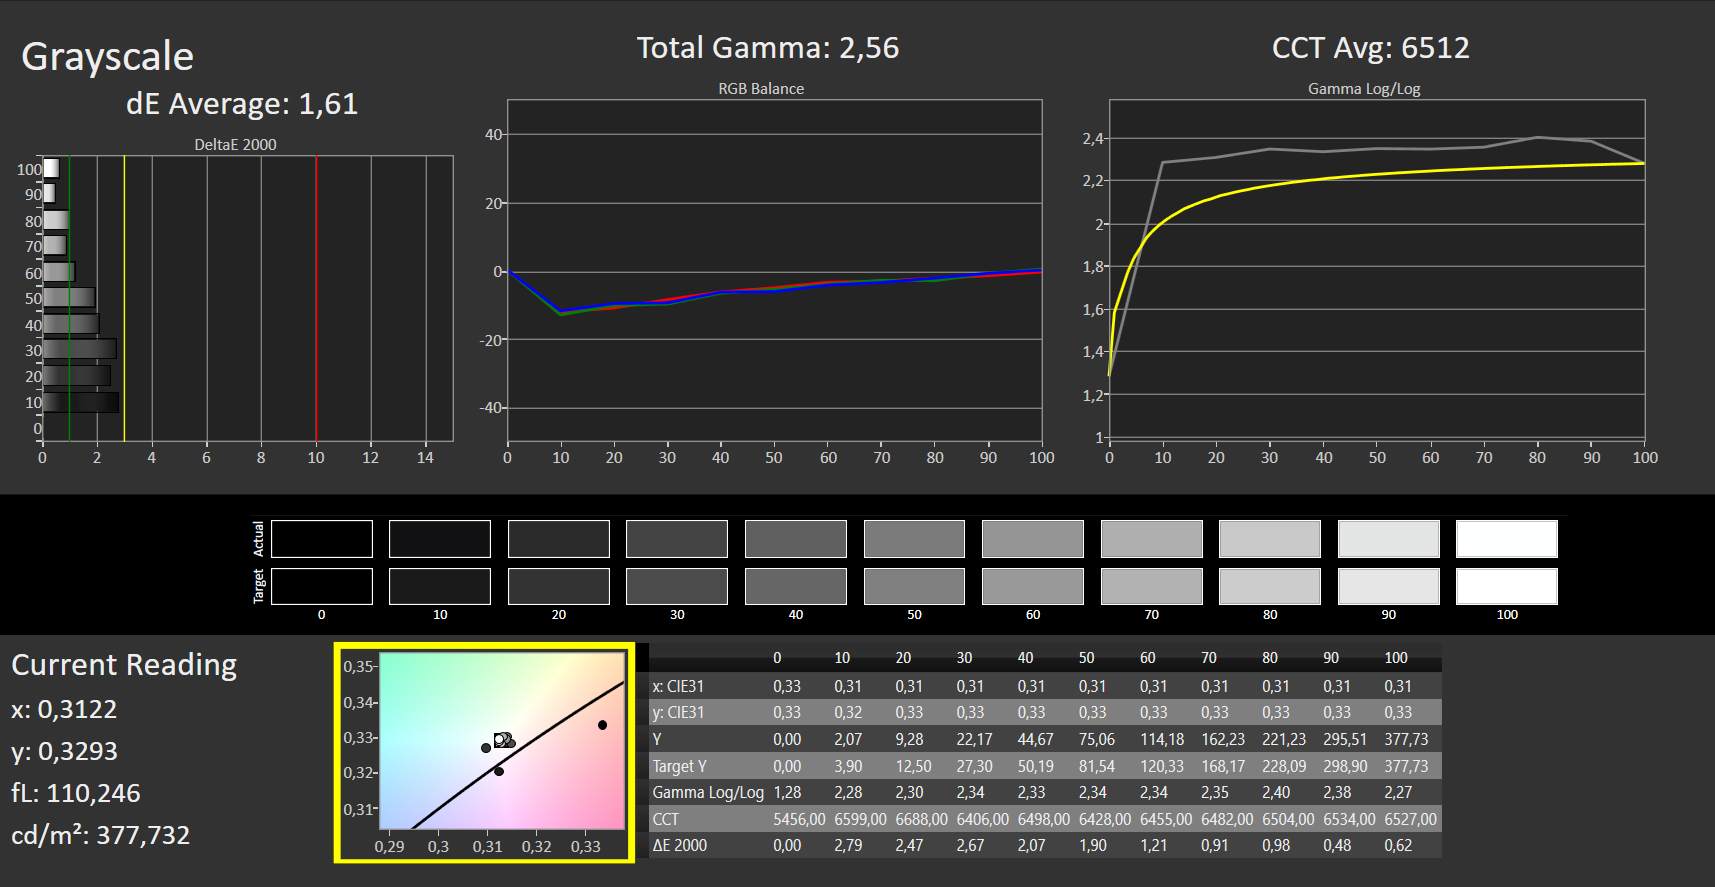
ΔE Greyscale Calman: 5.3 | ∀{0.09-98 Ø4.97}
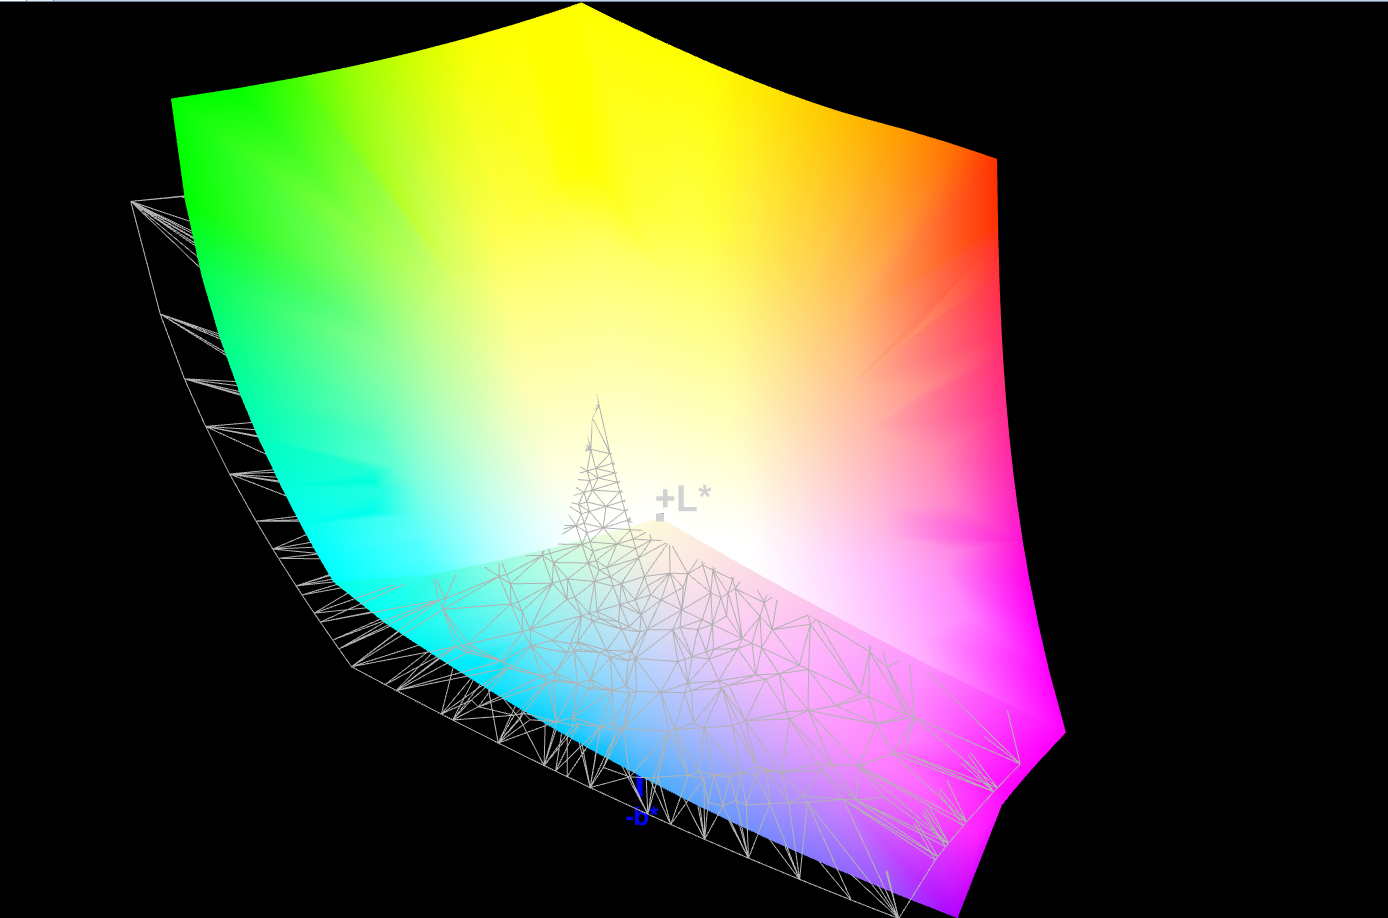
100% sRGB (Argyll 1.6.3 3D)
86% AdobeRGB 1998 (Argyll 1.6.3 3D)
97.3% AdobeRGB 1998 (Argyll 3D)
100% sRGB (Argyll 3D)
99.9% Display P3 (Argyll 3D)
Gamma: 2.15
CCT: 6128 K
| Razer Blade 15 Studio Edition 2020 Samsung SDCA029, OLED, 3840x2160, 15.6" | Razer Blade 15 Studio Edition Samsung SDCA029, OLED, 3840x2160, 15.6" | Lenovo ThinkPad P53-20QN000YGE N156HCE-GN1, IPS, 1920x1080, 15.6" | MSI P65 Creator 9SF-657 AU Optronics AUO41EB, IPS, 3840x2160, 15.6" | Dell Precision 5540 SDCA029, OLED, 3840x2160, 15.6" | |
|---|---|---|---|---|---|
| Display | -0% | -26% | -5% | 0% | |
| Display P3 Coverage (%) | 99.9 | 99.9 0% | 63.2 -37% | 84.4 -16% | 99.9 0% |
| sRGB Coverage (%) | 100 | 100 0% | 92.9 -7% | 100 0% | 100 0% |
| AdobeRGB 1998 Coverage (%) | 97.3 | 96.4 -1% | 64.3 -34% | 98.5 1% | 97.3 0% |
| Response Times | 13% | -695% | -925% | 25% | |
| Response Time Grey 50% / Grey 80% * (ms) | 4 ? | 3 ? 25% | 38.4 ? -860% | 51 ? -1175% | 2.8 ? 30% |
| Response Time Black / White * (ms) | 4 ? | 4 ? -0% | 25.2 ? -530% | 31 ? -675% | 3.2 ? 20% |
| PWM Frequency (Hz) | 26040 ? | 240.9 ? | |||
| Screen | -2% | -163% | -272% | 14% | |
| Brightness middle (cd/m²) | 380 | 361 -5% | 510 34% | 445 17% | 427 12% |
| Brightness (cd/m²) | 388 | 357 -8% | 468 21% | 462 19% | 411 6% |
| Brightness Distribution (%) | 93 | 89 -4% | 89 -4% | 83 -11% | 89 -4% |
| Black Level * (cd/m²) | 0.018 | 0.015 17% | 0.36 -1900% | 0.5 -2678% | |
| Contrast (:1) | 21111 | 24067 14% | 1417 -93% | 890 -96% | |
| Colorchecker dE 2000 * | 5.47 | 5.3 3% | 2.3 58% | 4.75 13% | 3.2 41% |
| Colorchecker dE 2000 max. * | 8.19 | 11.5 -40% | 5.5 33% | 7.79 5% | 8.4 -3% |
| Colorchecker dE 2000 calibrated * | 3.04 | 4.7 -55% | 1.2 61% | 2.8 8% | |
| Greyscale dE 2000 * | 5.3 | 2.1 60% | 3.2 40% | 4.49 15% | 1.8 66% |
| Gamma | 2.15 102% | 2.14 103% | 2.34 94% | 2.49 88% | 2.15 102% |
| CCT | 6128 106% | 6149 106% | 7036 92% | 7374 88% | 6176 105% |
| Color Space (Percent of AdobeRGB 1998) (%) | 86 | 86 0% | 59.4 -31% | 87 1% | 86.8 1% |
| Color Space (Percent of sRGB) (%) | 100 | 100 0% | 93.1 -7% | 100 0% | 100 0% |
| Media total (Programa/Opciones) | 4% /
0% | -295% /
-204% | -401% /
-305% | 13% /
13% |
* ... más pequeño es mejor

Tiempos de respuesta del display
| ↔ Tiempo de respuesta de Negro a Blanco | ||
|---|---|---|
| 4 ms ... subida ↗ y bajada ↘ combinada | ↗ 2 ms subida | 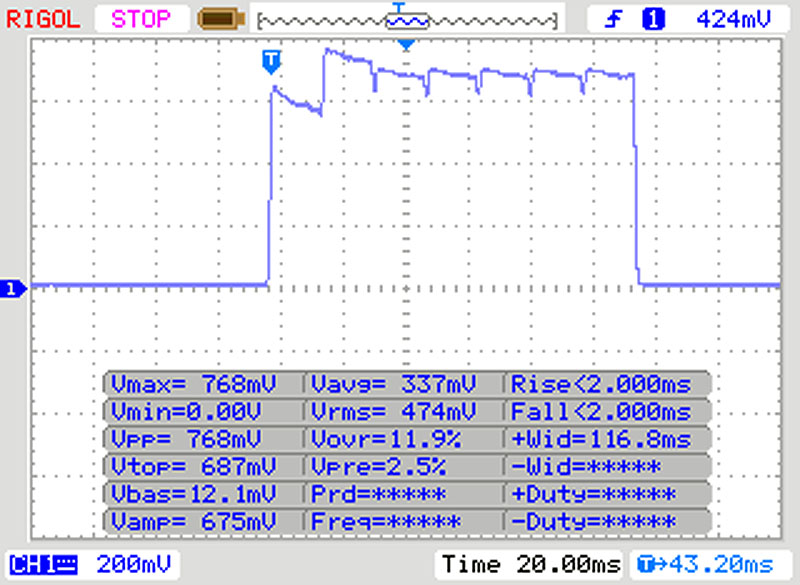 |
| ↘ 2 ms bajada | ||
| La pantalla mostró tiempos de respuesta muy rápidos en nuestros tests y debería ser adecuada para juegos frenéticos. En comparación, todos los dispositivos de prueba van de ##min### (mínimo) a 240 (máximo) ms. » 16 % de todos los dispositivos son mejores. Esto quiere decir que el tiempo de respuesta medido es mejor que la media (19.9 ms) de todos los dispositivos testados. | ||
| ↔ Tiempo de respuesta 50% Gris a 80% Gris | ||
| 4 ms ... subida ↗ y bajada ↘ combinada | ↗ 2 ms subida | 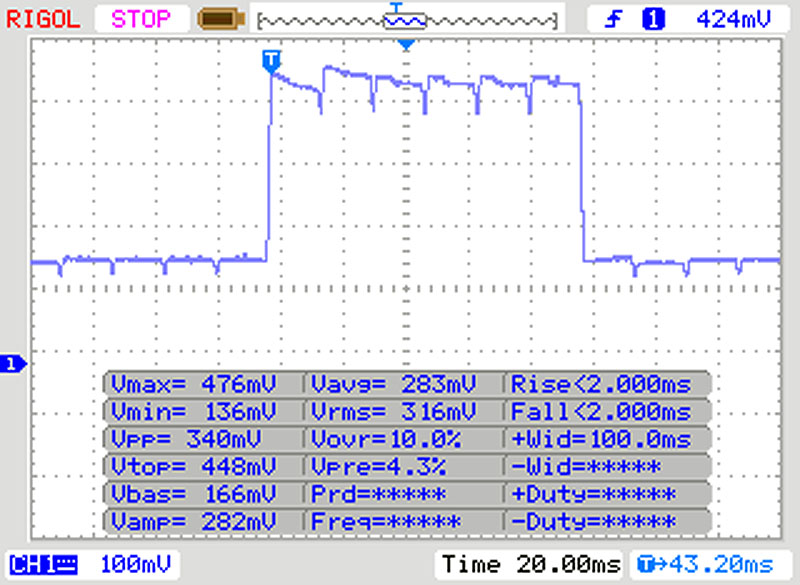 |
| ↘ 2 ms bajada | ||
| La pantalla mostró tiempos de respuesta muy rápidos en nuestros tests y debería ser adecuada para juegos frenéticos. En comparación, todos los dispositivos de prueba van de ##min### (mínimo) a 636 (máximo) ms. » 15 % de todos los dispositivos son mejores. Esto quiere decir que el tiempo de respuesta medido es mejor que la media (31.1 ms) de todos los dispositivos testados. | ||
Parpadeo de Pantalla / PWM (Pulse-Width Modulation)
| Parpadeo de Pantalla / PWM no detectado | 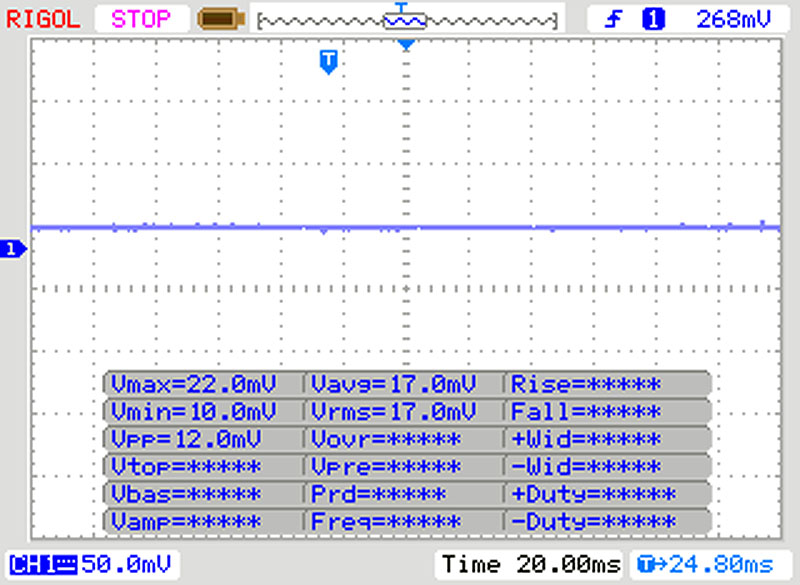 | ||
Comparación: 52 % de todos los dispositivos testados no usaron PWM para atenuar el display. Si se usó, medimos una media de 7784 (mínimo: 5 - máxmo: 343500) Hz. | |||
Rendimiento - Dos núcleos adicionales de CPU para el Blade 15
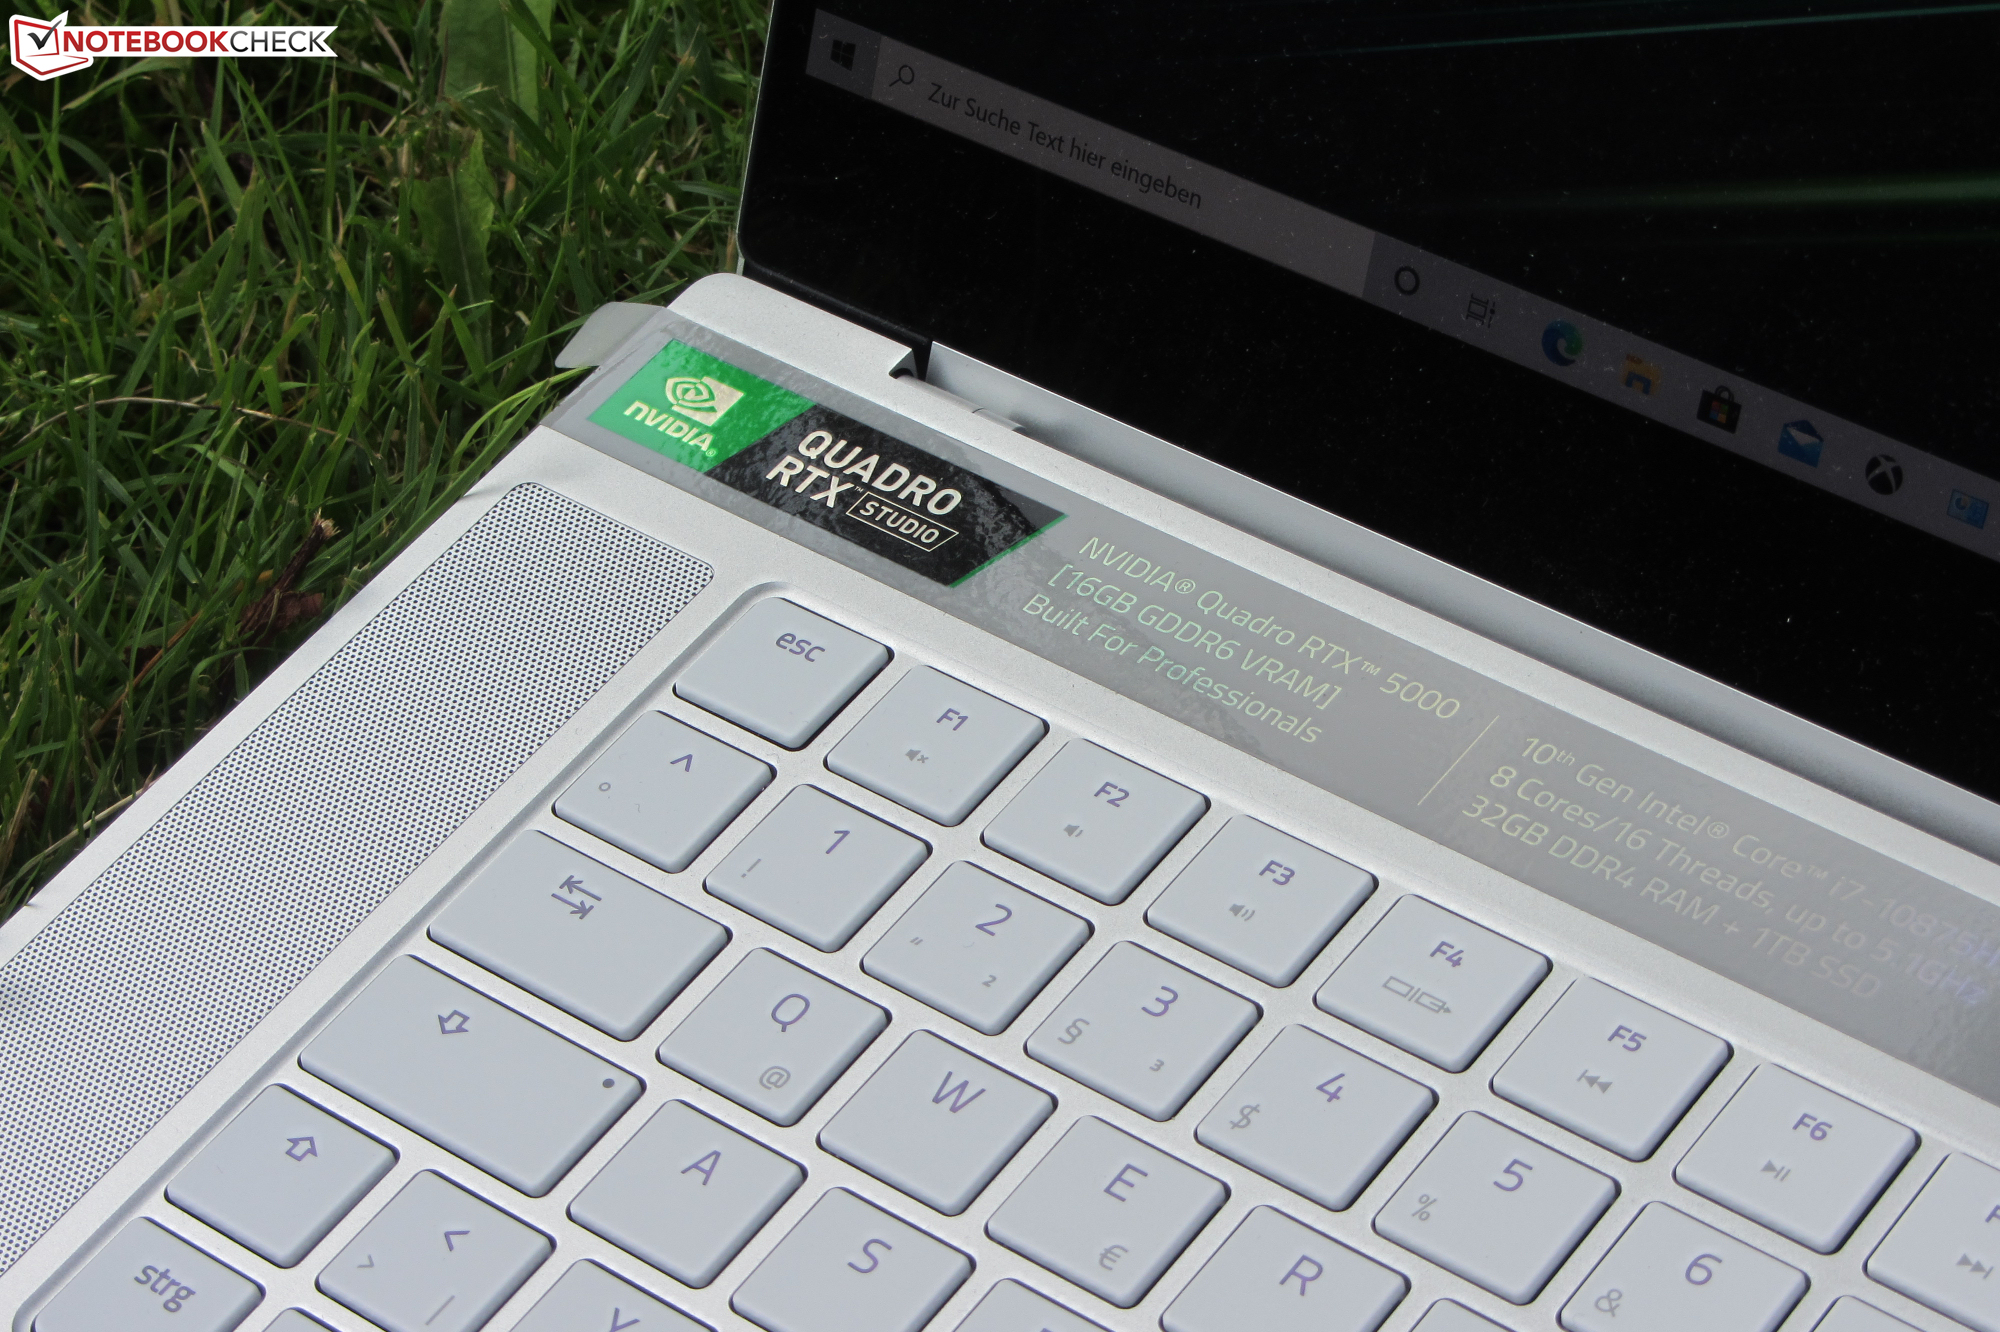
El Blade 15 Studio Edition de Razer es una estación de trabajo de 15,6 pulgadas. Ofrece suficiente rendimiento para todas las aplicaciones actuales. Nuestro dispositivo de revisión se vende por 4.700 euros (5.526 dólares). Otras configuraciones de hardware no están disponibles.
Ajustes del sistema
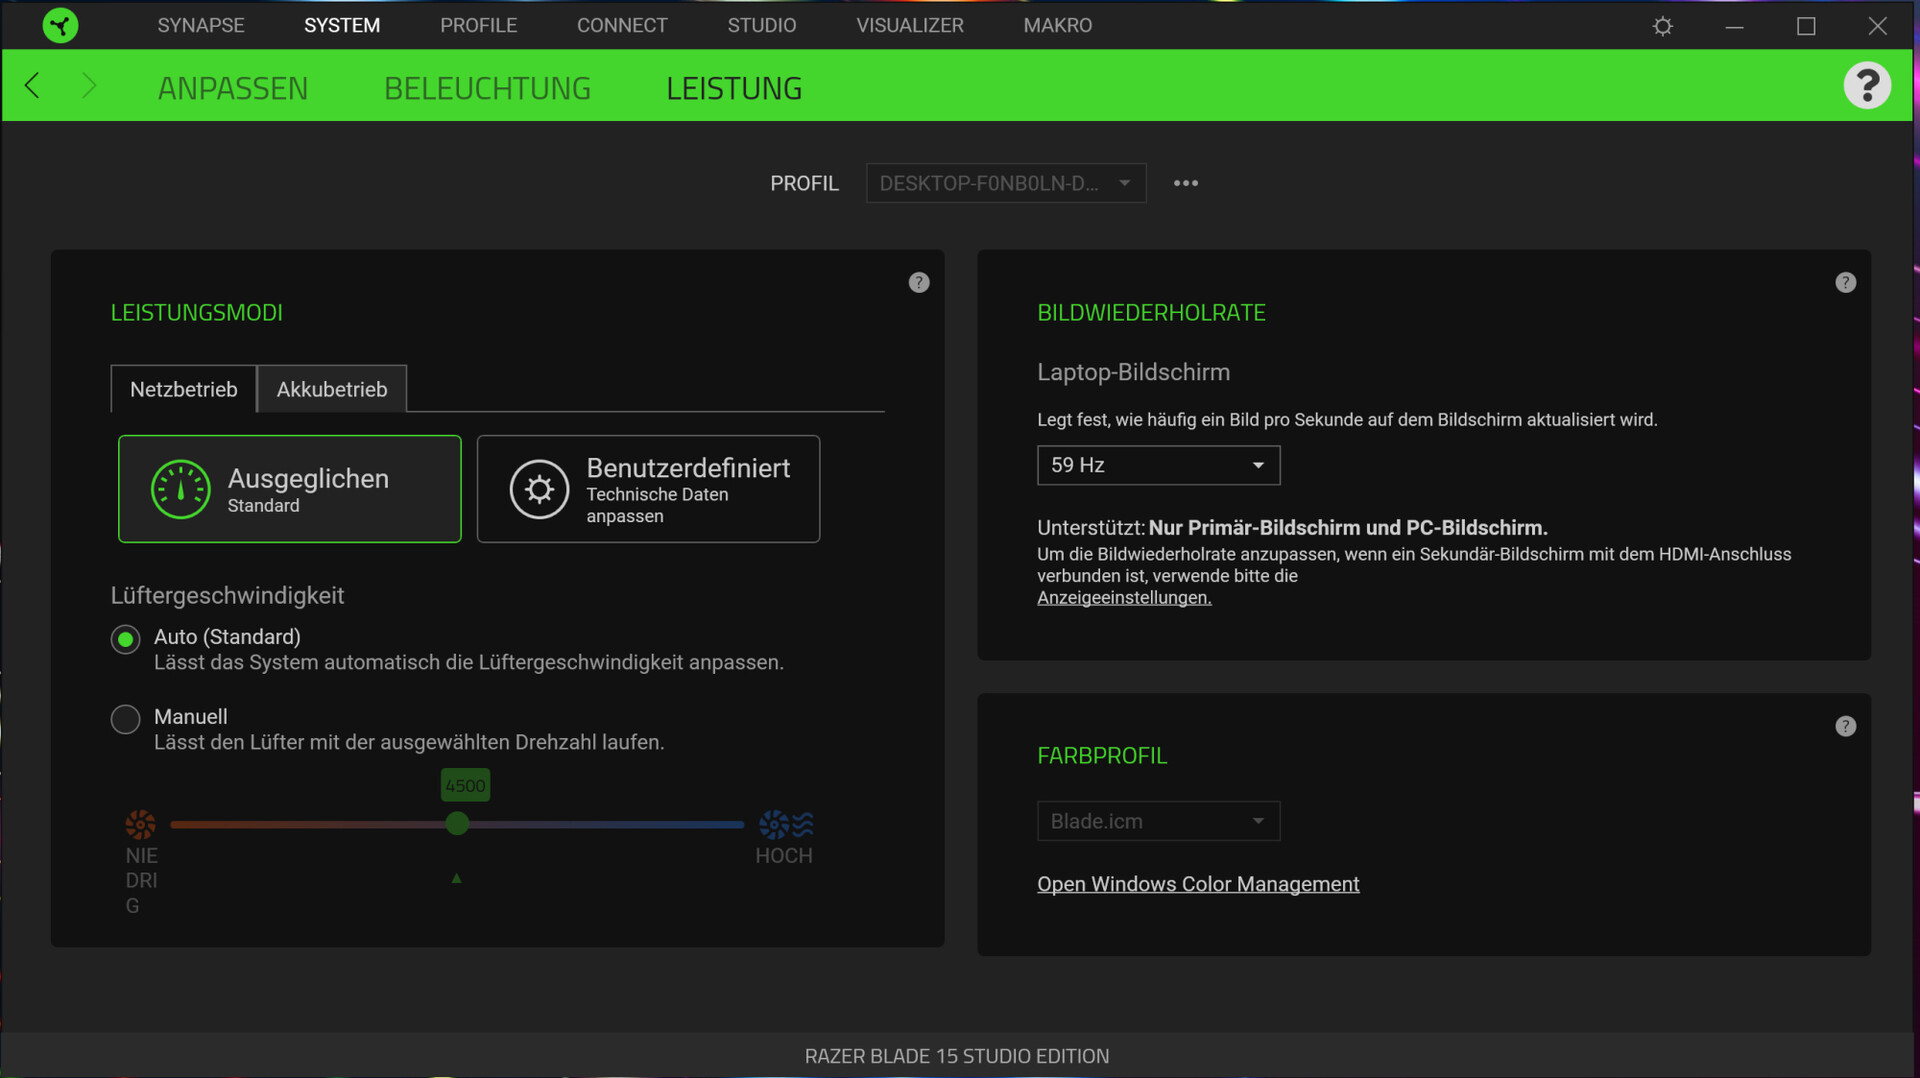
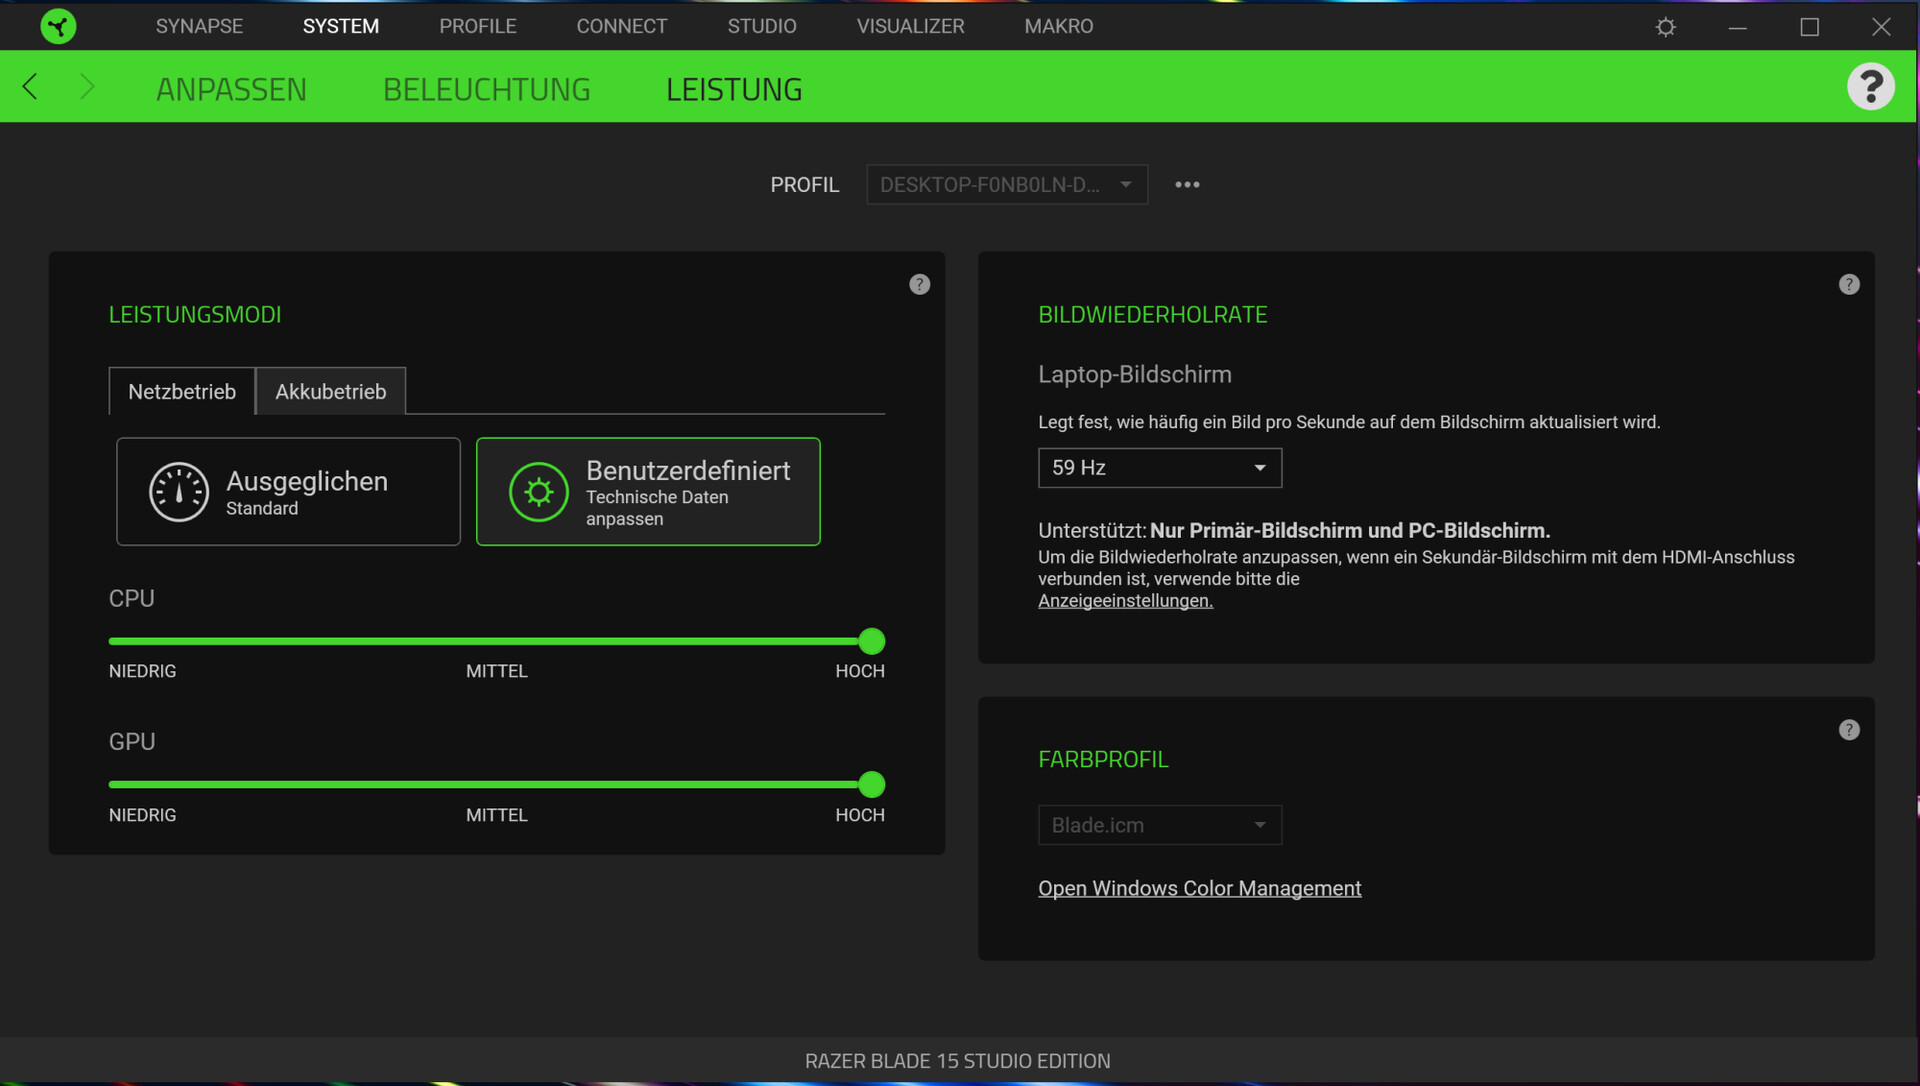
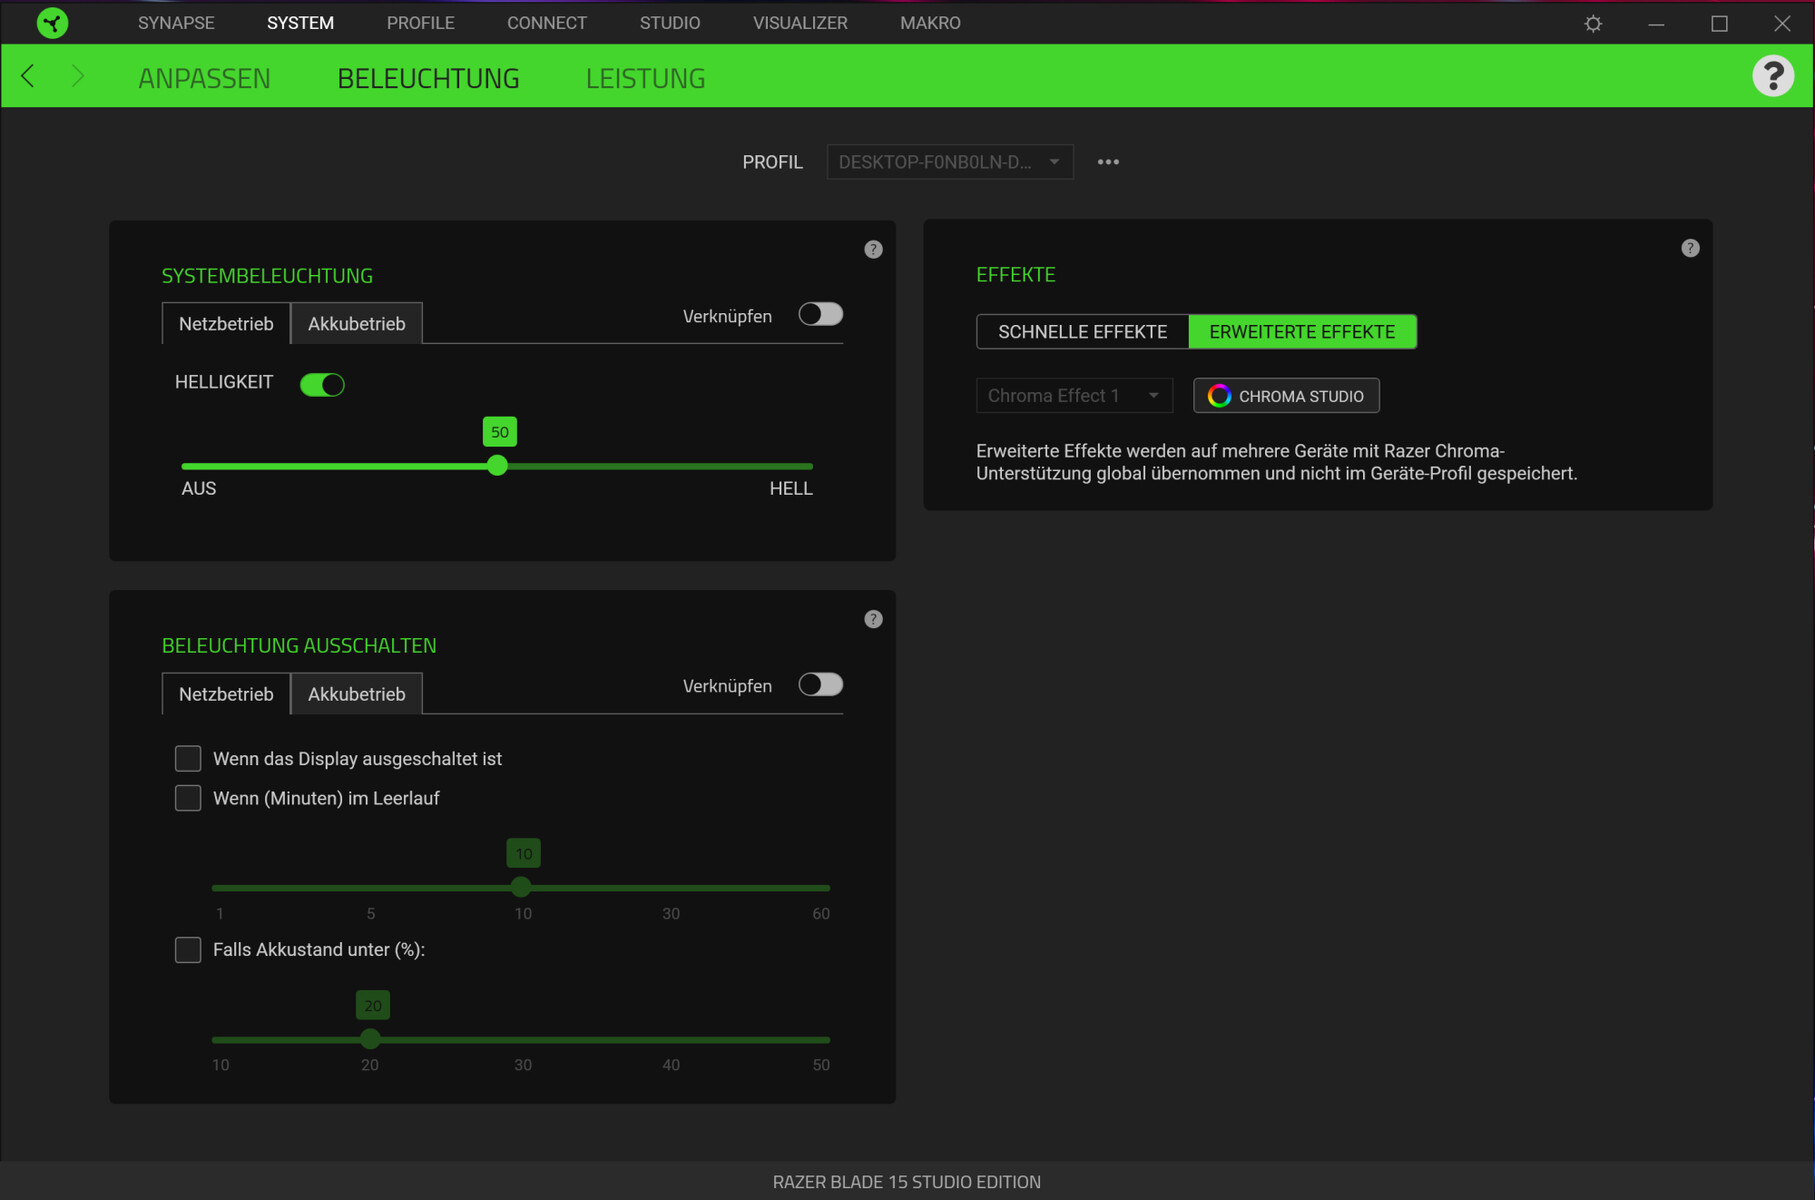
La utilidad preinstalada "Synapse" ofrece opciones para la personalización del rendimiento de la CPU y la GPU. Realizamos todos nuestros benchmarks con la velocidad del ventilador ajustada a "Auto". También utilizamos el plan de potencia "equilibrado". Sin embargo, algunos de nuestros benchmarks se llevaron a cabo con el rendimiento de la CPU y la GPU al máximo. Marcamos claramente todos los resultados de los puntos de referencia que obtuvimos con los límites de potencia desactivados.
Procesador
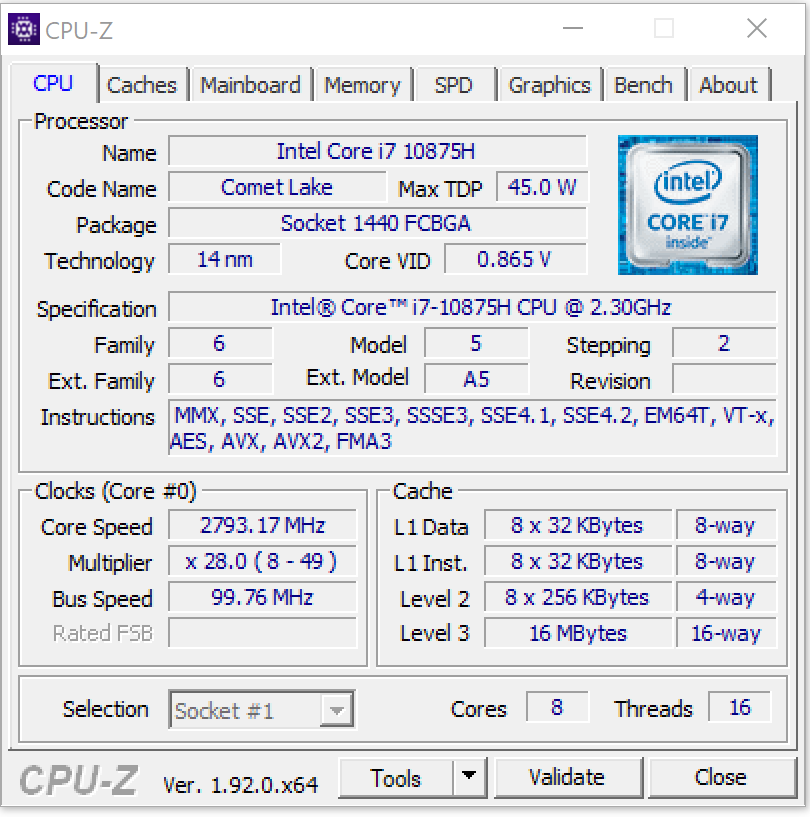
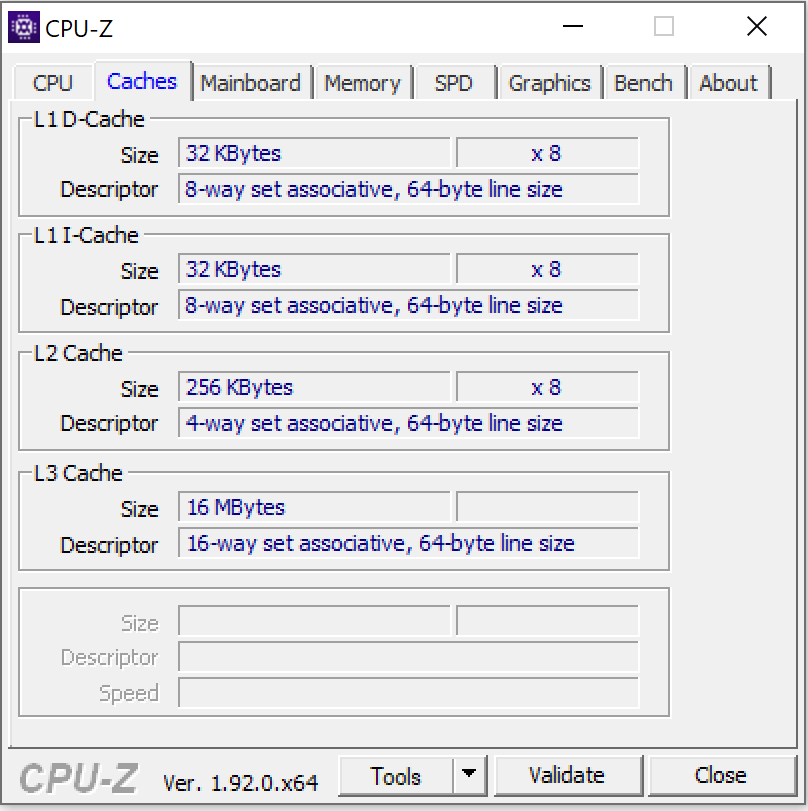
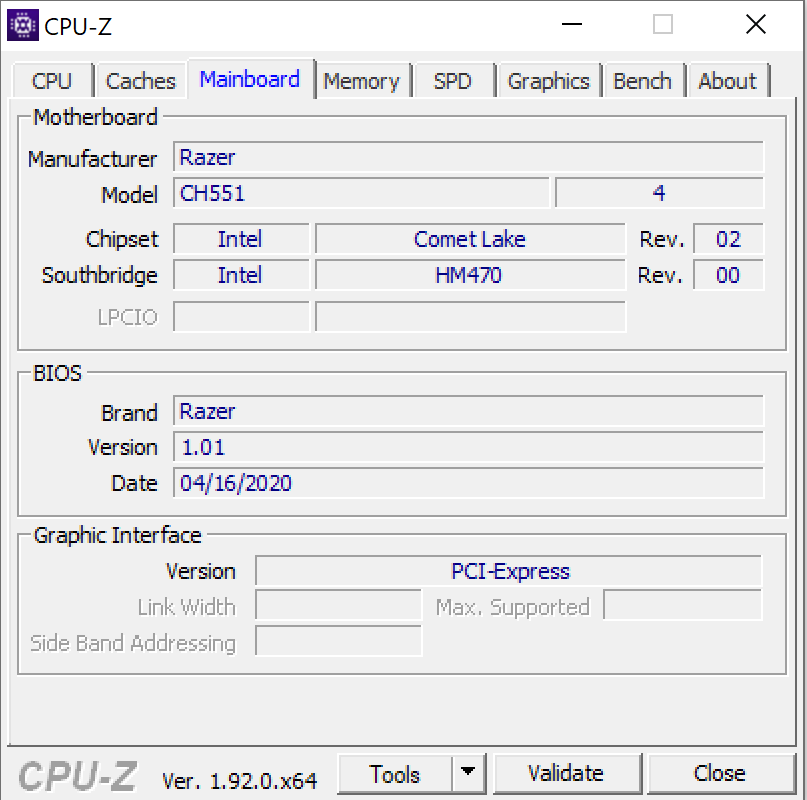
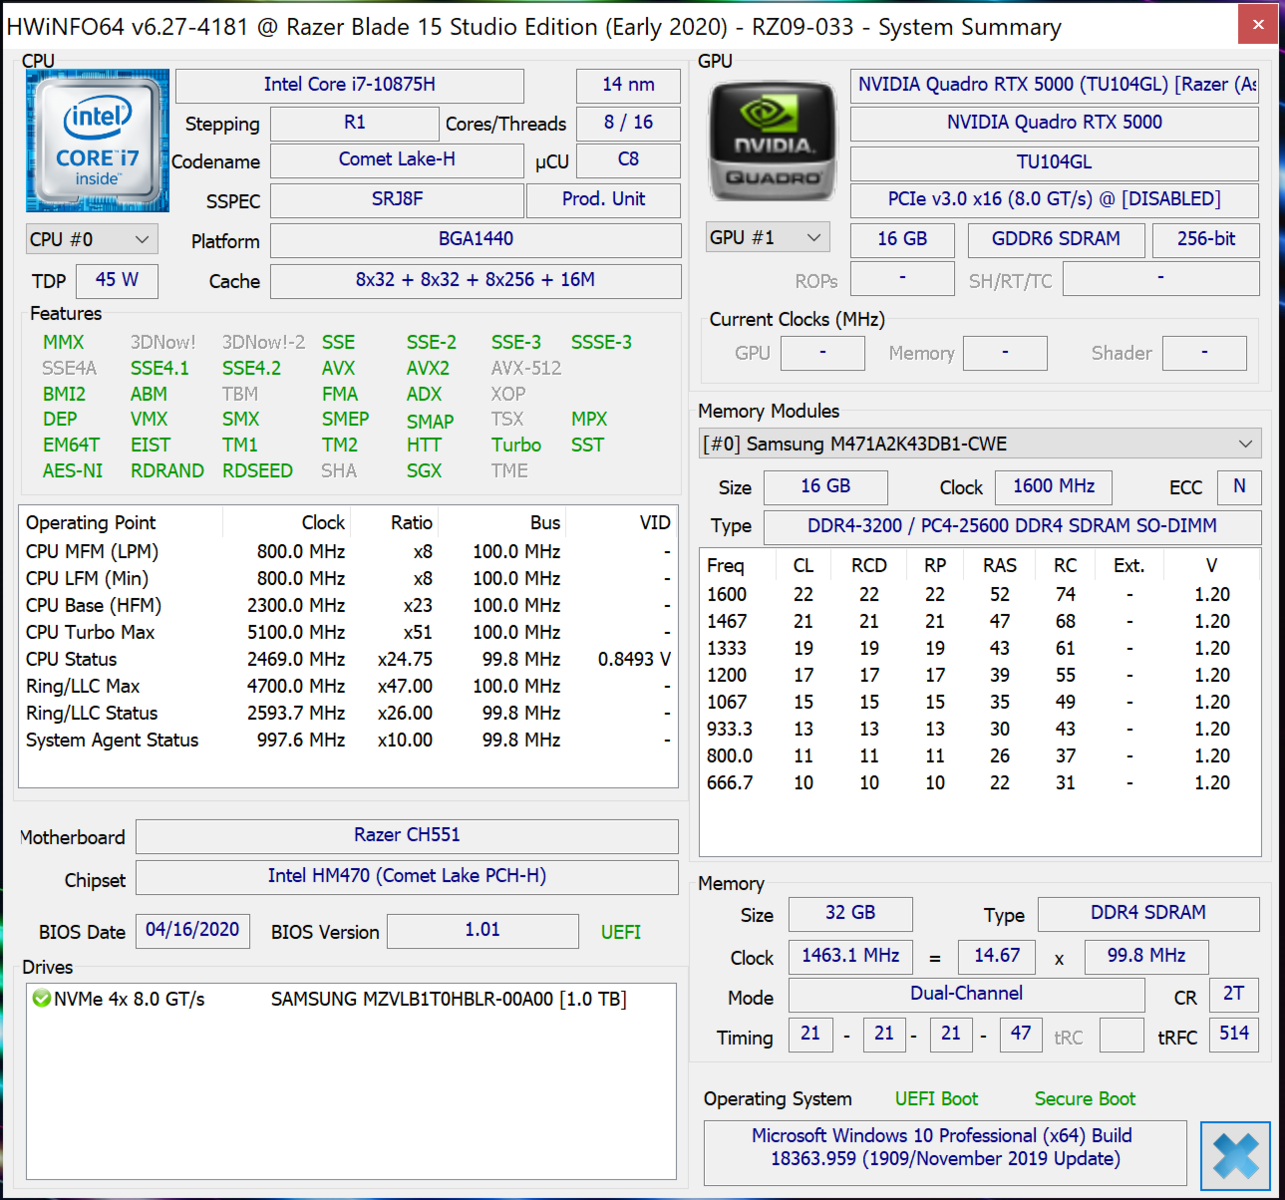
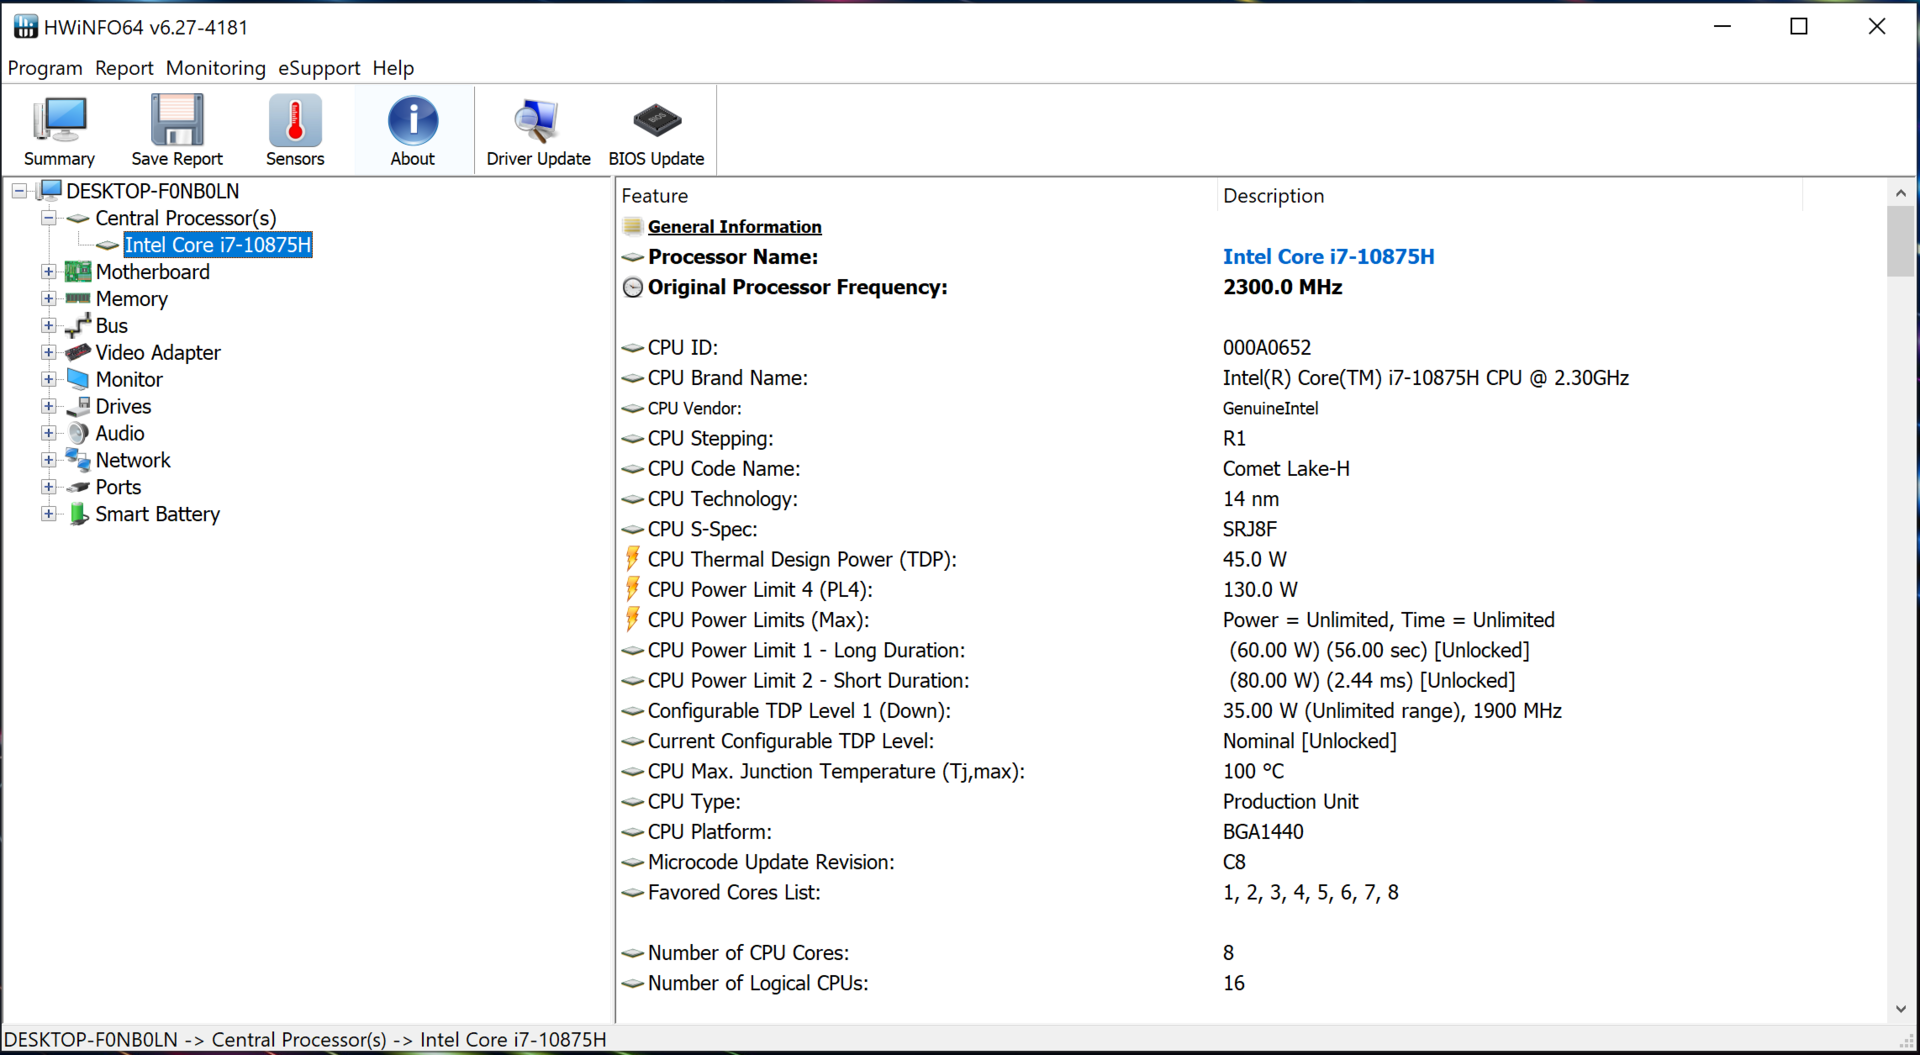
El Core i7-10875H del Blade 15 es un procesador de octava base Comet Lake. Tiene una velocidad base de 2,3 GHz y un Turbo de 4,3 GHz para los ocho núcleos y 5,1 GHz para un núcleo. La CPU soporta Hyper-Threading, lo que significa que un núcleo puede procesar dos hilos al mismo tiempo.
En los puntos de referencia del Cinebench R15 de varios núcleos, la CPU funciona a 2,6 a 3 GHz durante un corto período de tiempo. Posteriormente, la frecuencia de la CPU cae a 2,1 a 2,2 GHz. En el punto de referencia de un solo núcleo, el procesador funciona a 4 a 4,9 GHz. Cuando funciona con energía de la batería, el procesador funciona a 1,6 a 1,7 GHz en el punto de referencia de CB15 multi-núcleo y a 2,2 a 3,3 GHz en el punto de referencia de CB15 de un solo núcleo.
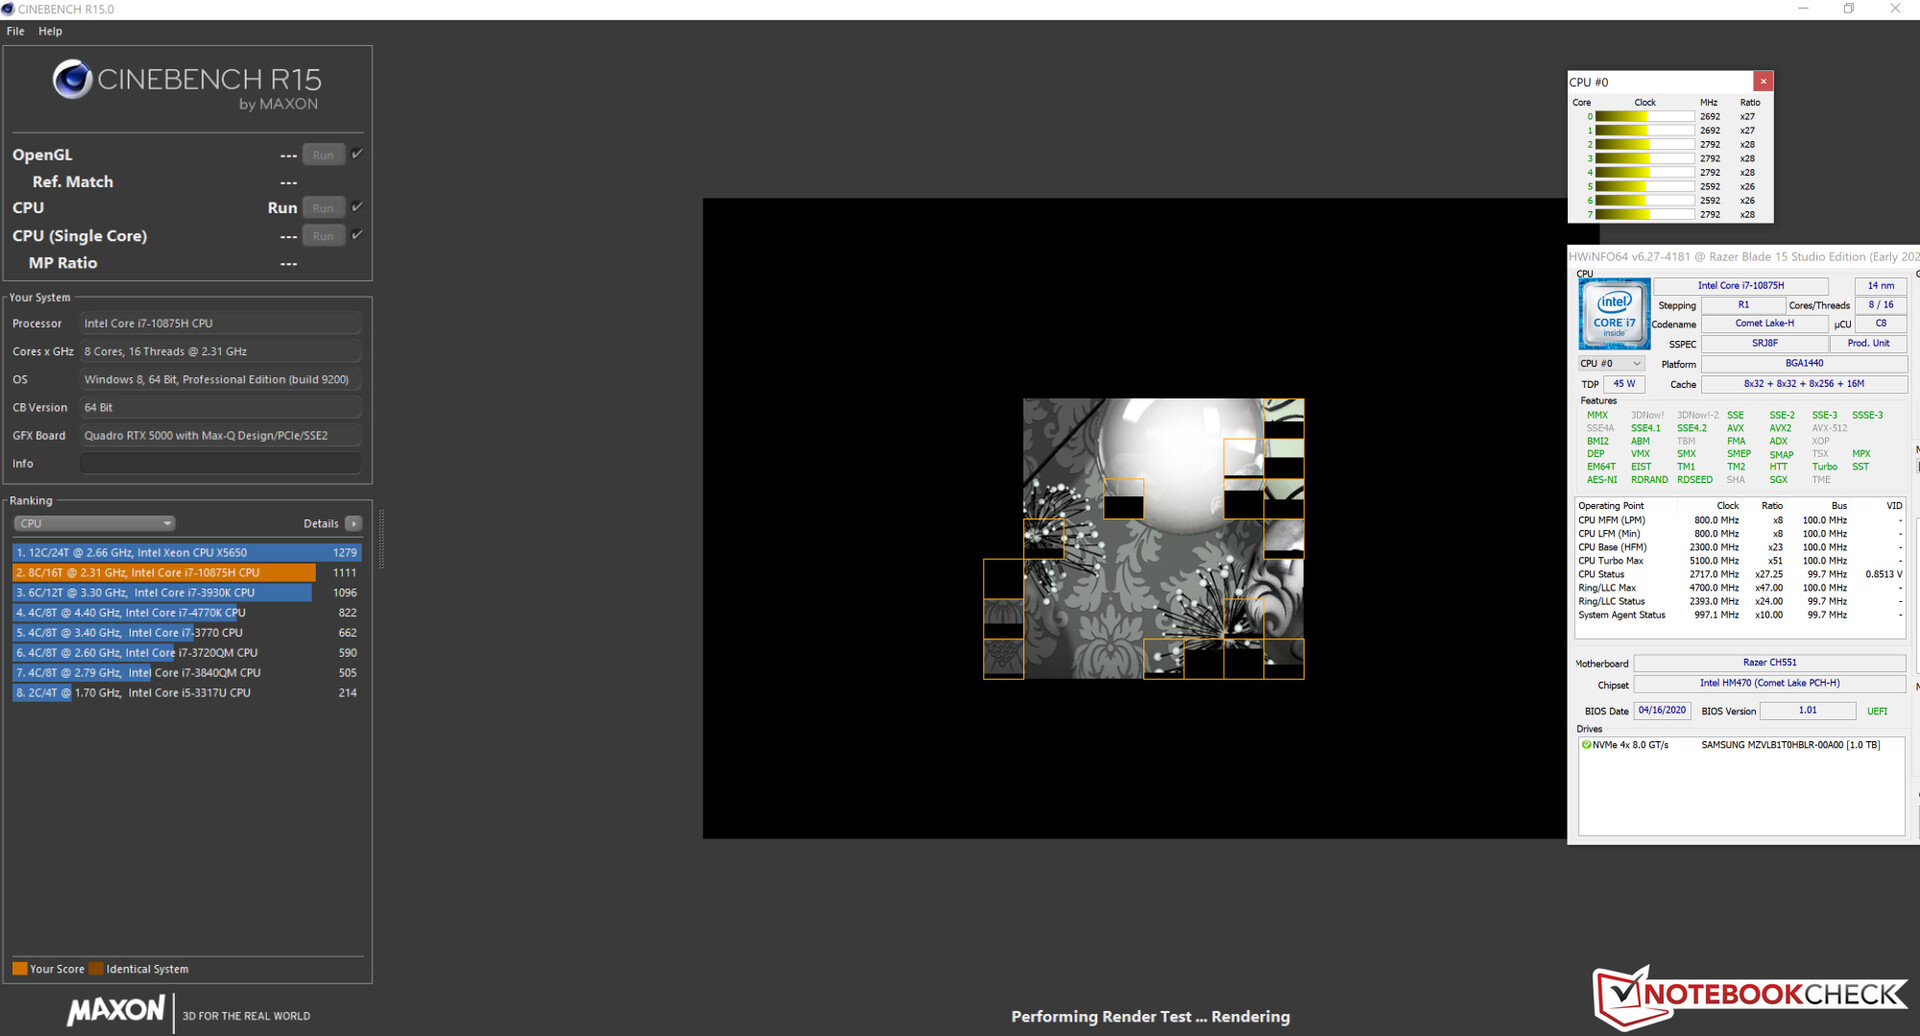
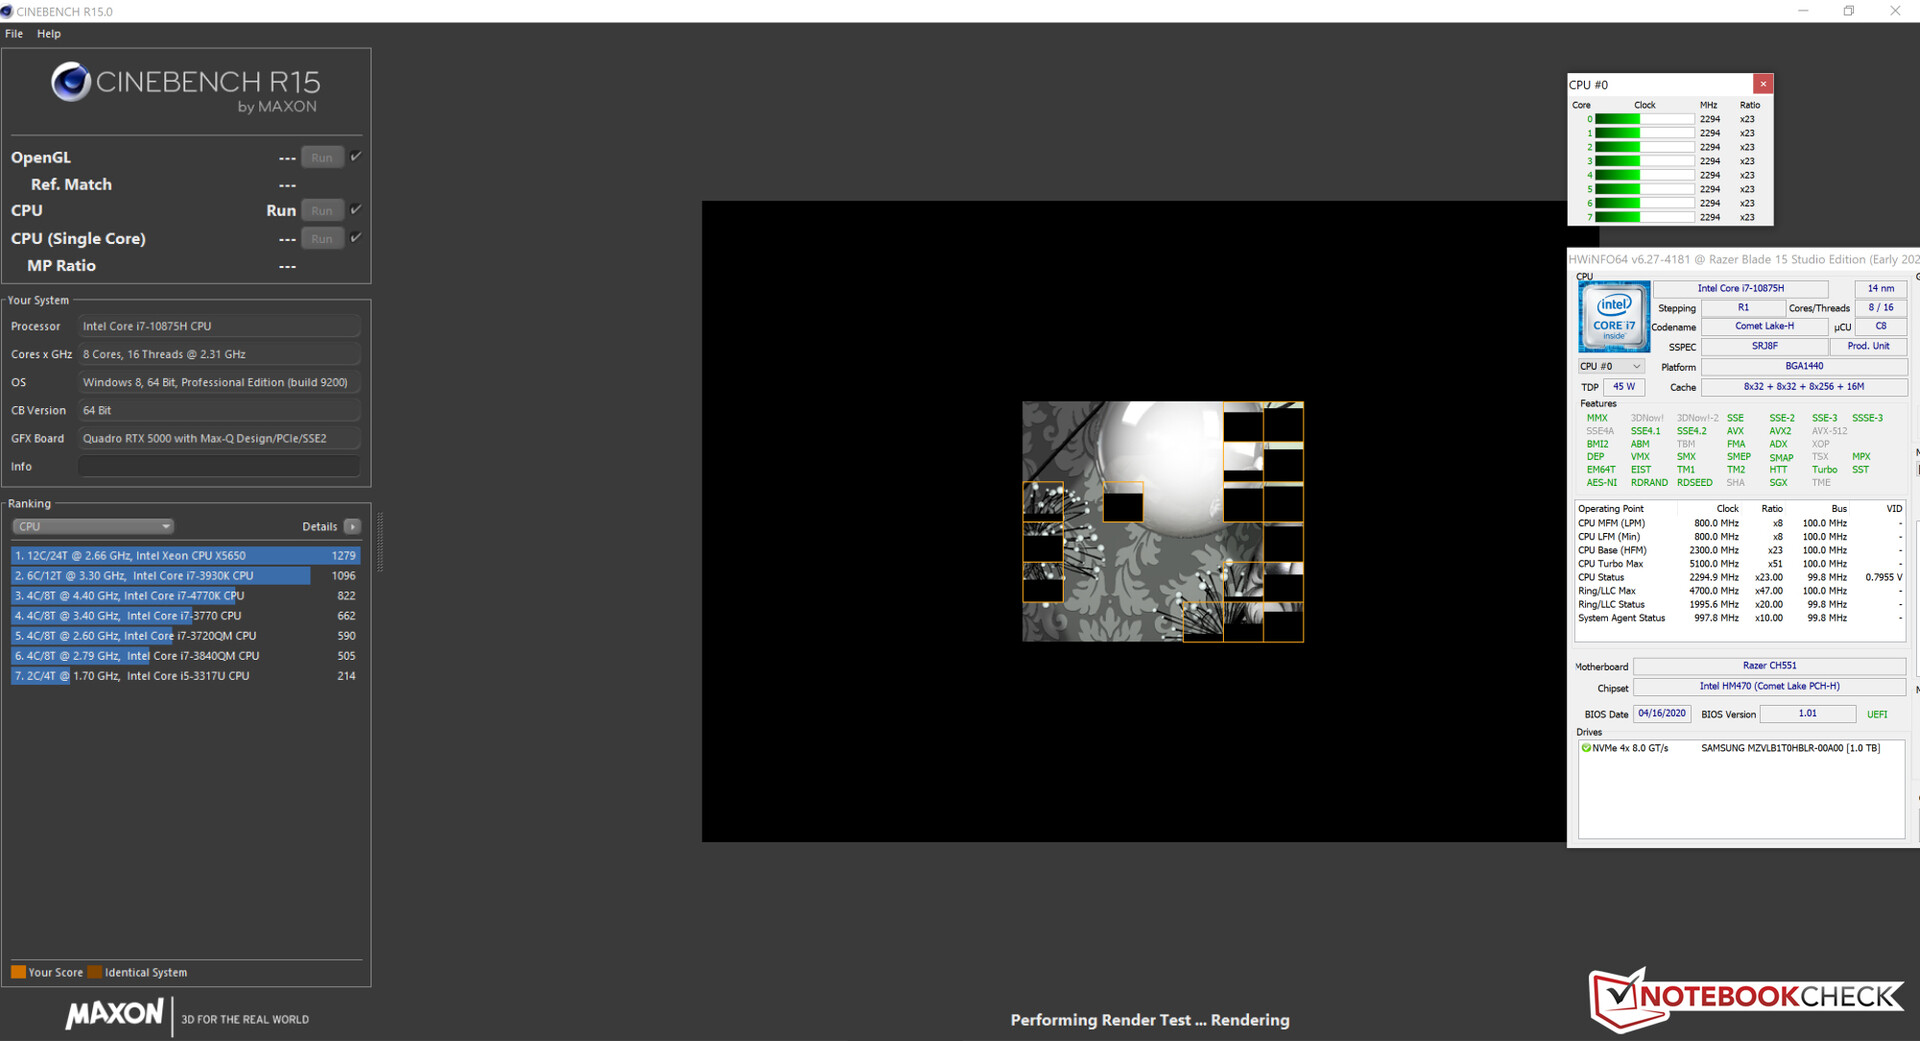
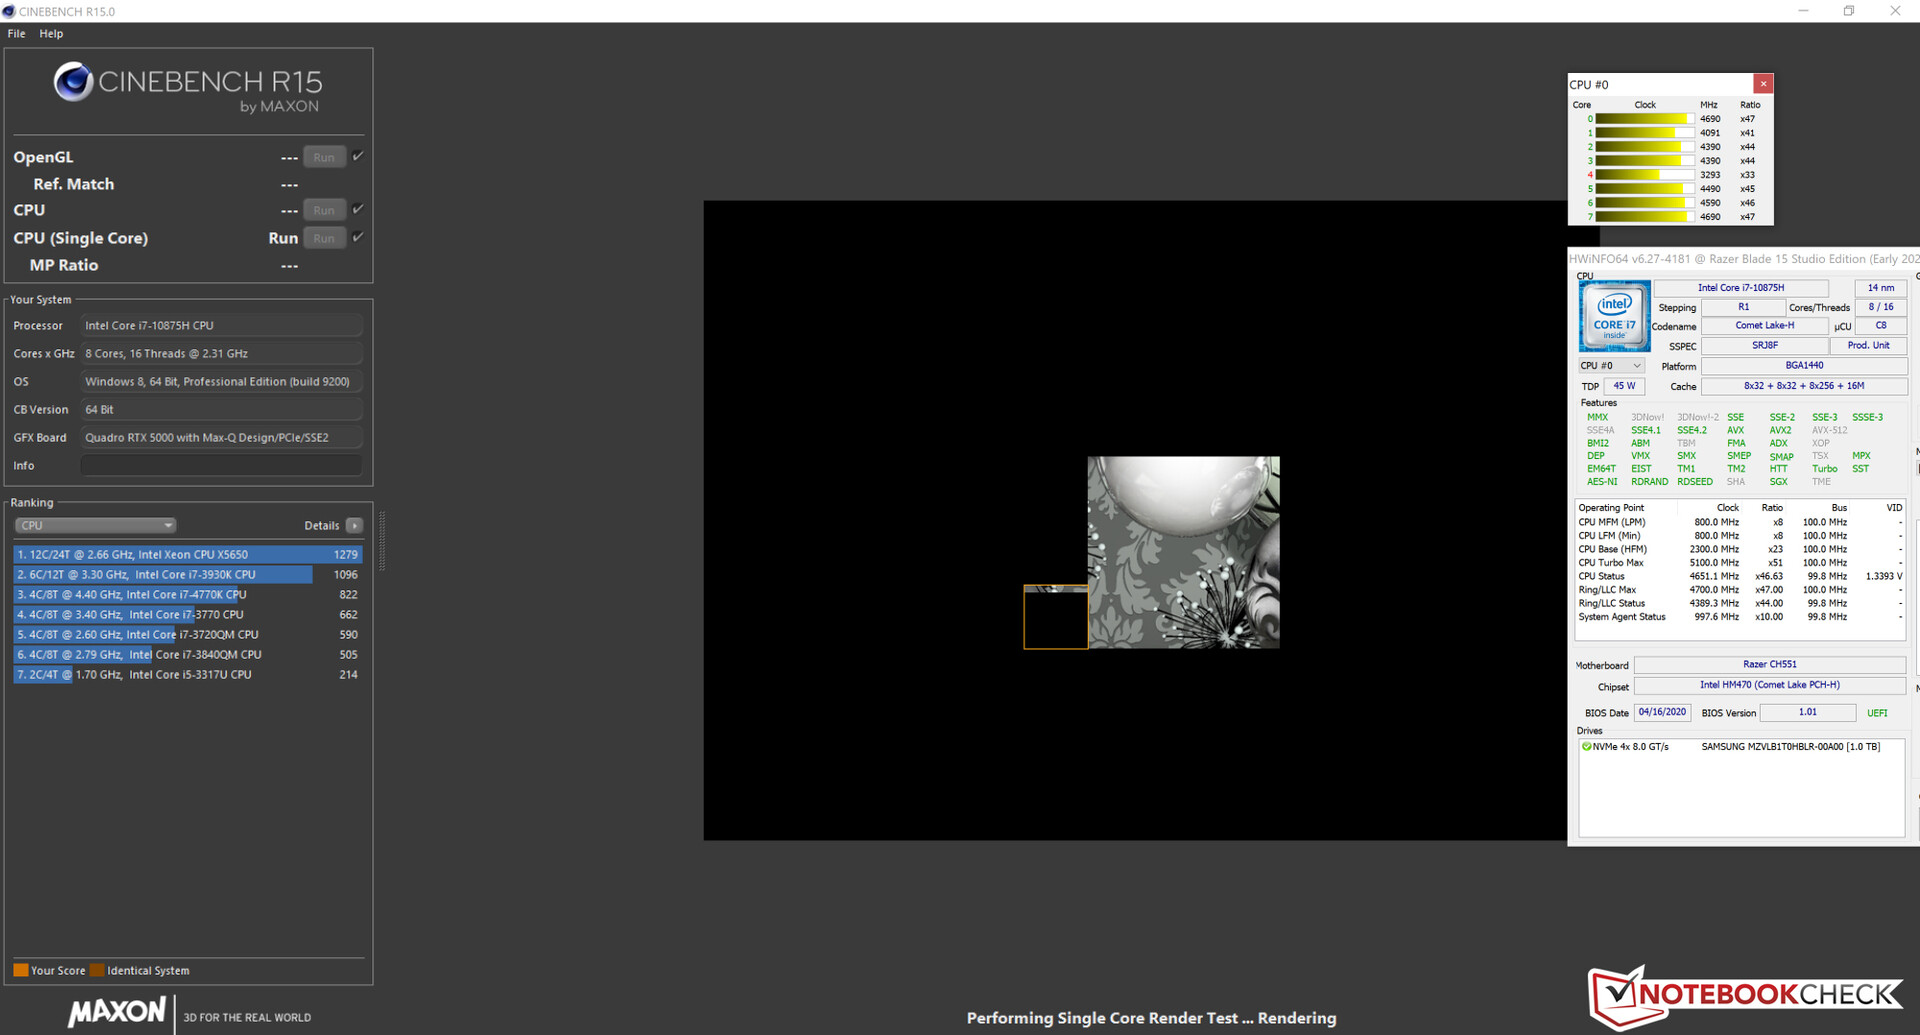
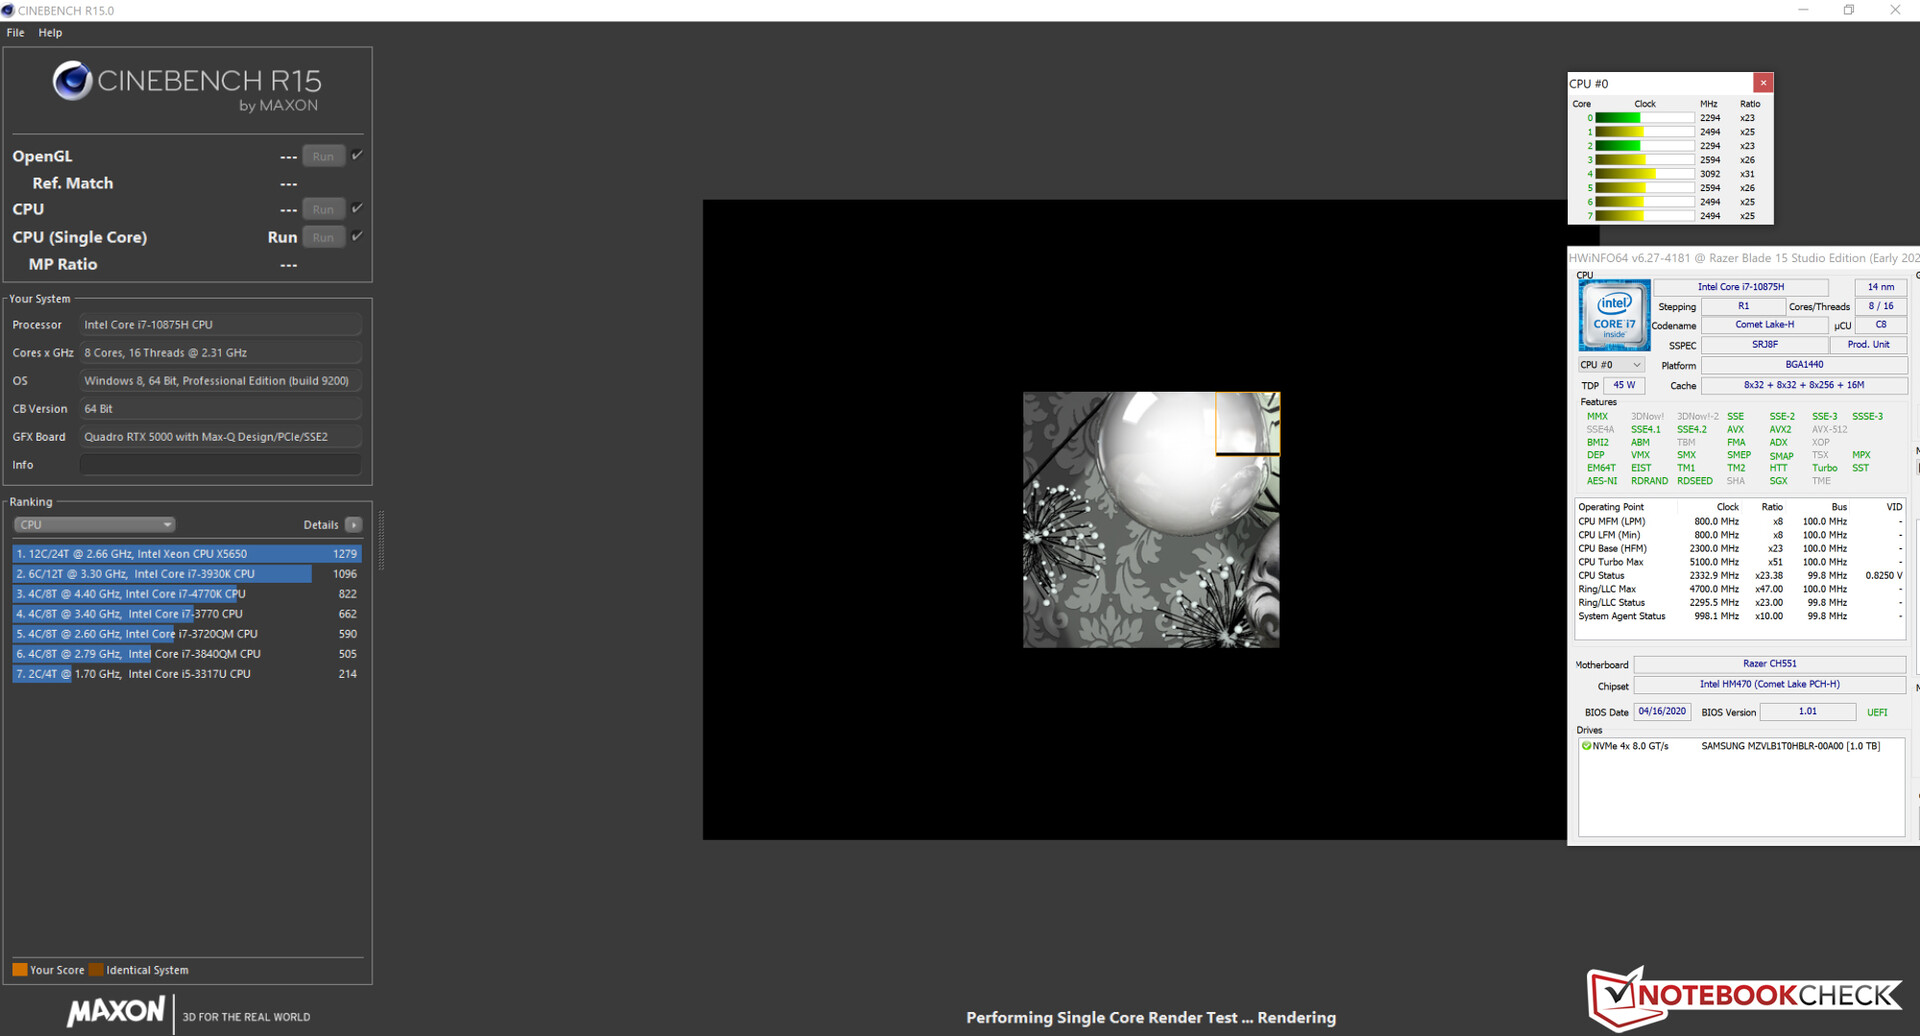
Comprobamos si el impulso del Turbo se puede utilizar de forma consistente ejecutando el benchmark multi-núcleo del Cinebench R15 en un bucle continuo durante 30 minutos. Los resultados caen de la primera a la segunda corrida de referencia. Después de eso, se mantienen consistentemente en el mismo nivel. La potencia de turbo se utiliza pero a un nivel bajo.
Si los usuarios seleccionan el modo de máximo rendimiento de la CPU en la utilidad "Synapse" de Razer, entonces la CPU podrá aumentar más, lo que resultará en un mayor nivel de rendimiento.


| Cinebench R15 | |
| CPU Single 64Bit | |
| Media de la clase Workstation (191.4 - 328, n=25, últimos 2 años) | |
| Medio Intel Core i7-10875H (190 - 220, n=37) | |
| Razer Blade 15 Studio Edition 2020 (Max. CPU, max. GPU) | |
| Lenovo ThinkPad P53-20QN000YGE | |
| MSI P65 Creator 9SF-657 | |
| Dell Precision 5540 | |
| Razer Blade 15 Studio Edition 2020 | |
| Razer Blade 15 Studio Edition | |
| CPU Multi 64Bit | |
| Media de la clase Workstation (2489 - 5810, n=25, últimos 2 años) | |
| Medio Intel Core i7-10875H (1003 - 1833, n=38) | |
| MSI P65 Creator 9SF-657 | |
| Dell Precision 5540 | |
| Razer Blade 15 Studio Edition 2020 (Max. CPU, max. GPU) | |
| Lenovo ThinkPad P53-20QN000YGE | |
| Razer Blade 15 Studio Edition 2020 | |
| Razer Blade 15 Studio Edition | |
| LibreOffice - 20 Documents To PDF | |
| Medio Intel Core i7-10875H (30.2 - 84.3, n=30) | |
| Media de la clase Workstation (37.1 - 74.7, n=25, últimos 2 años) | |
| Razer Blade 15 Studio Edition 2020 | |
| R Benchmark 2.5 - Overall mean | |
| Razer Blade 15 Studio Edition 2020 | |
| Medio Intel Core i7-10875H (0.546 - 0.662, n=29) | |
| Media de la clase Workstation (0.3825 - 0.603, n=25, últimos 2 años) | |
* ... más pequeño es mejor
Rendimiento del sistema
El sistema funciona sin problemas. No hemos encontrado ningún problema. El Blade 15 ofrece suficiente rendimiento para todas las aplicaciones actuales. Los puntos de referencia del PCMark lo confirman.
| PCMark 8 Home Score Accelerated v2 | 3654 puntos | |
| PCMark 8 Creative Score Accelerated v2 | 3874 puntos | |
| PCMark 8 Work Score Accelerated v2 | 4638 puntos | |
| PCMark 10 Score | 4884 puntos | |
ayuda | ||
Latencias DPC
No observamos ningún pico en nuestra prueba de latencia, que incluye navegación por Internet, reproducción de vídeo 4K y una prueba de esfuerzo de alta carga (Prime95). El sistema parece ser apto para la edición de audio y vídeo en tiempo real.
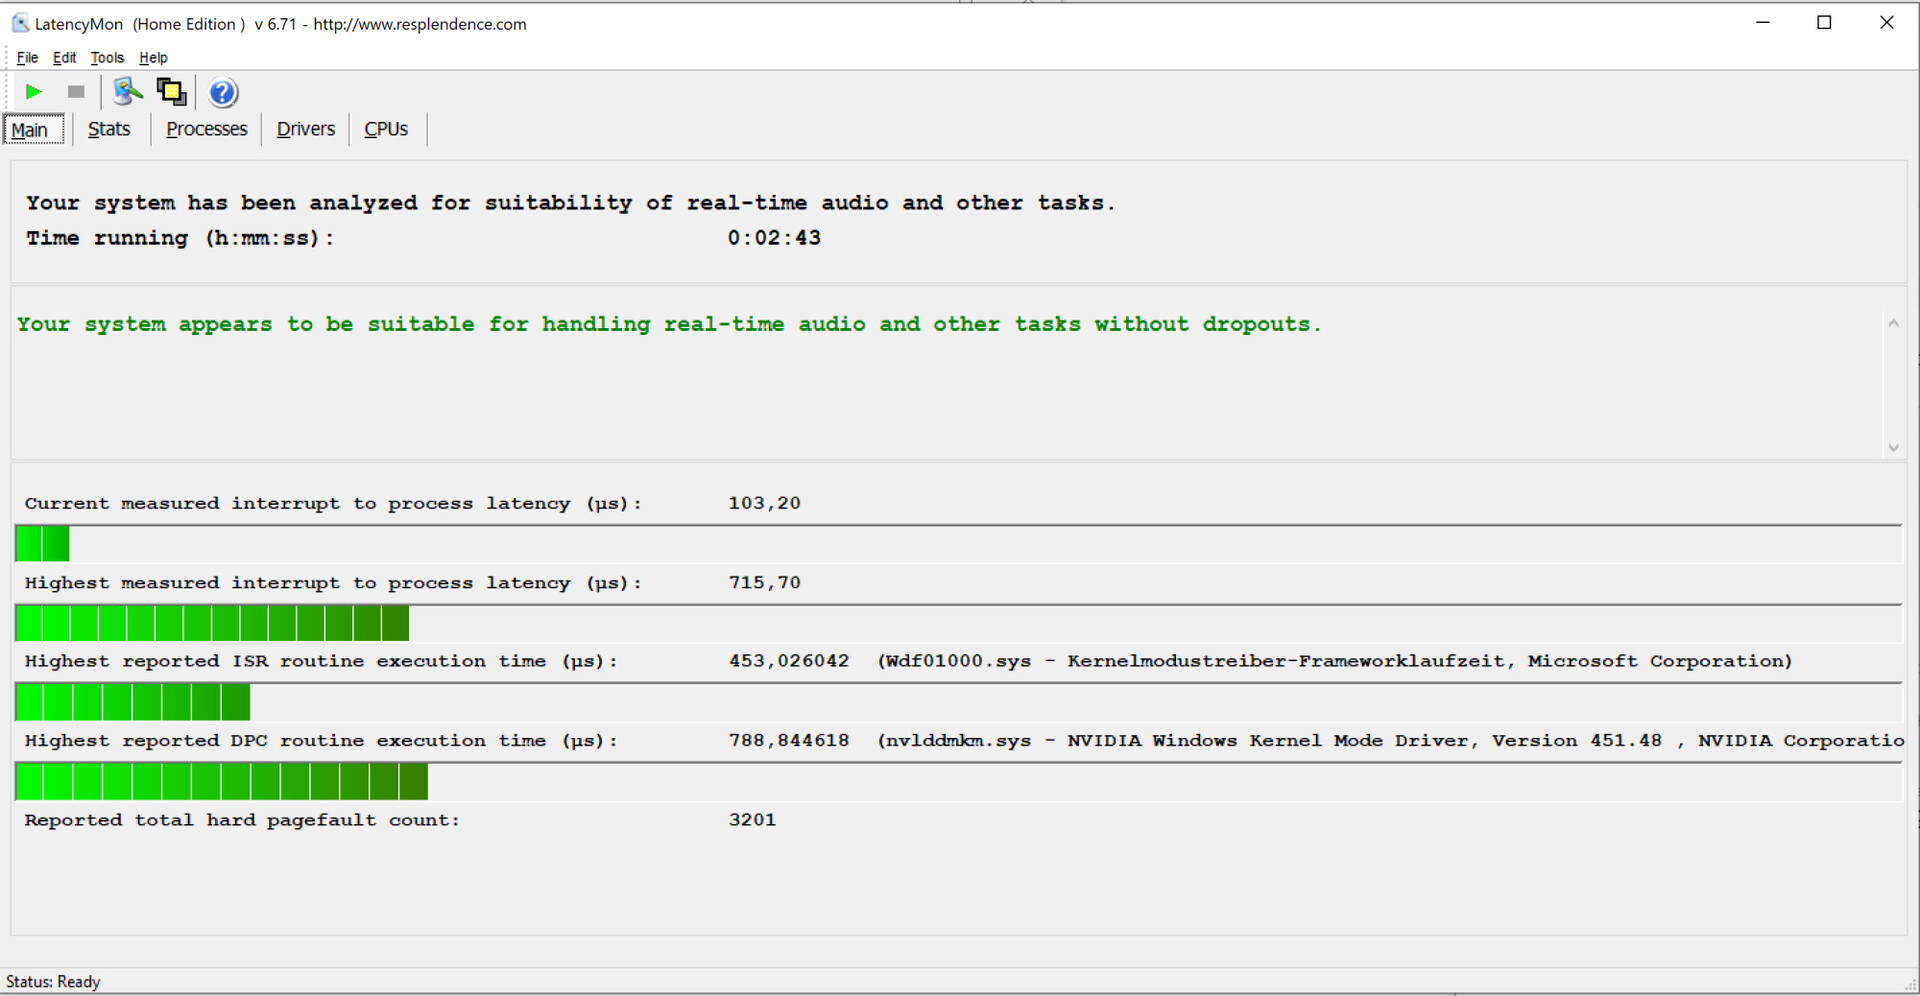
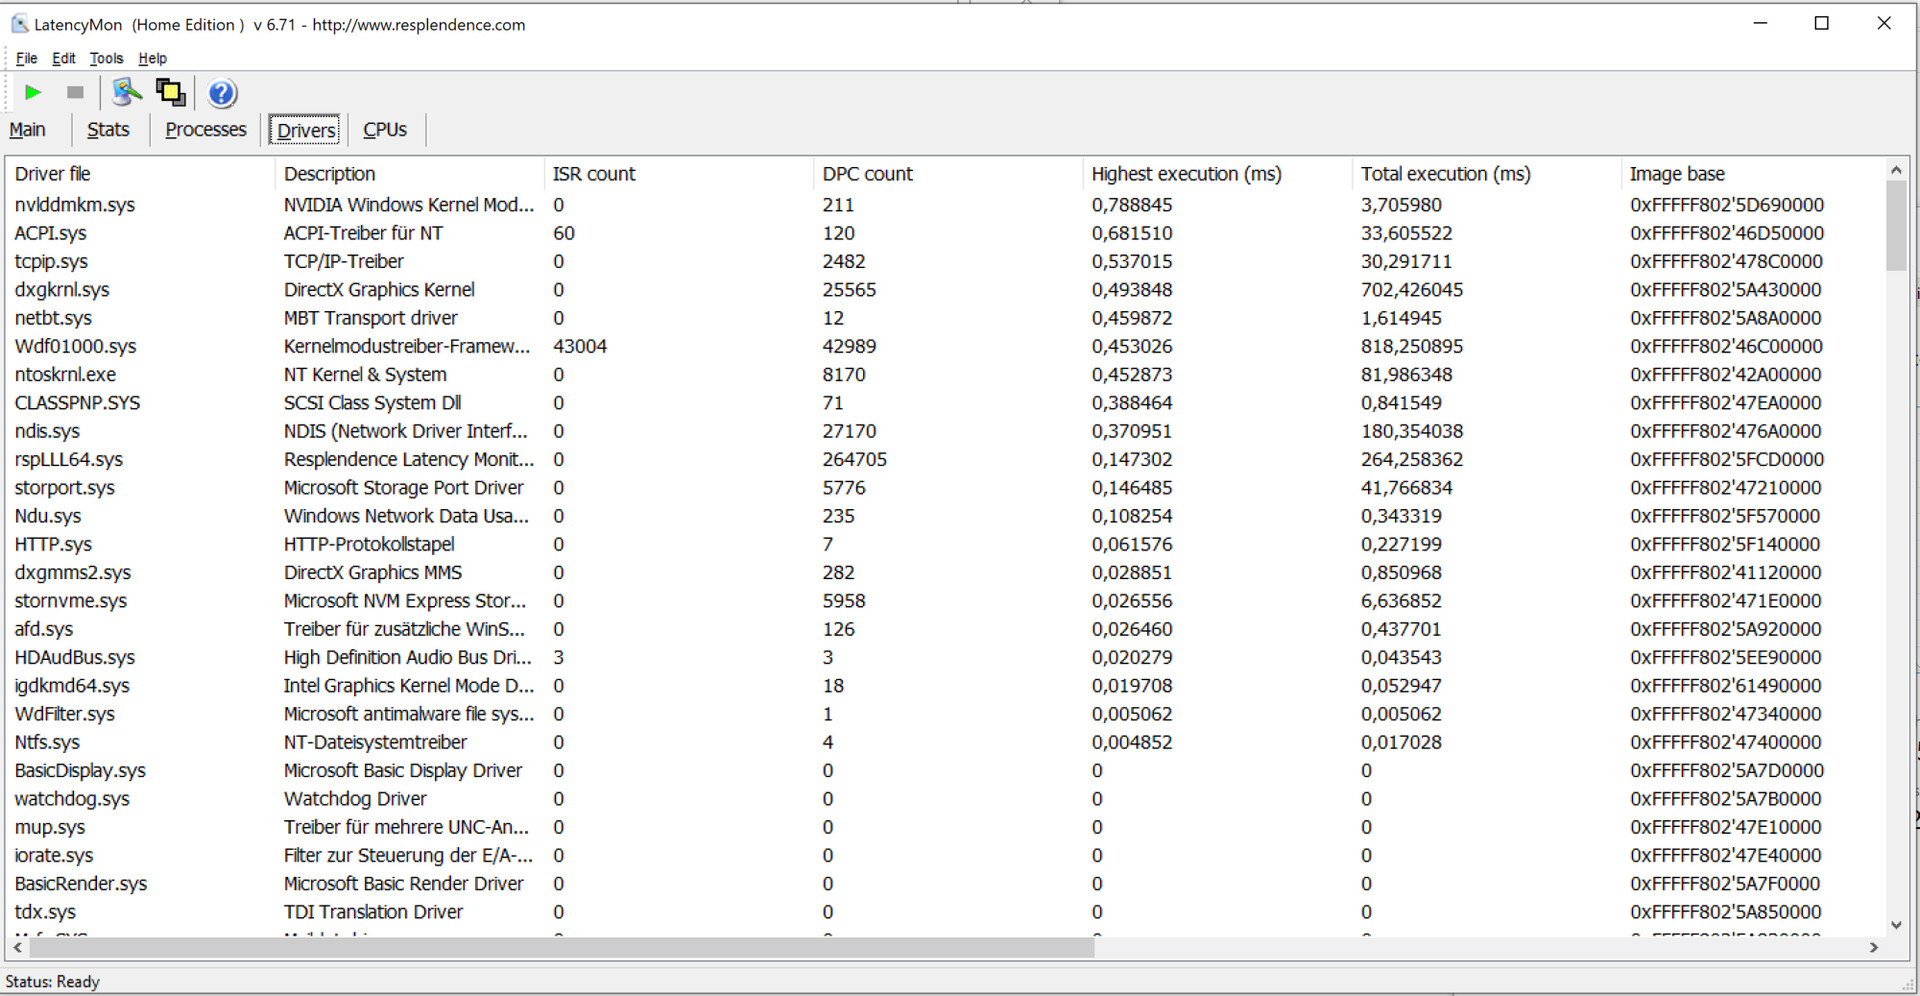
| DPC Latencies / LatencyMon - interrupt to process latency (max), Web, Youtube, Prime95 | |
| Razer Blade 15 Studio Edition 2020 | |
* ... más pequeño es mejor
Dispositivos de almacenamiento
Un SSD M.2-2280 NVMe de Samsung sirve como unidad de sistema. Ofrece una capacidad de almacenamiento de 1 TB. La velocidad de transferencia es excelente.


| Razer Blade 15 Studio Edition 2020 Samsung PM981a MZVLB1T0HBLR | Razer Blade 15 Studio Edition Samsung SSD PM981 MZVLB1T0HALR | Lenovo ThinkPad P53-20QN000YGE Samsung PM981a MZVLB1T0HBLR | MSI P65 Creator 9SF-657 2x Samsung SSD PM981 MZVLB512HAJQ (RAID 0) | Dell Precision 5540 SK hynix PC400 512 GB | Medio Samsung PM981a MZVLB1T0HBLR | |
|---|---|---|---|---|---|---|
| CrystalDiskMark 5.2 / 6 | -23% | -4% | 12% | -29% | -0% | |
| Write 4K (MB/s) | 132.9 | 100.4 -24% | 147 11% | 105.6 -21% | 98 -26% | 139.7 ? 5% |
| Read 4K (MB/s) | 46.73 | 42.03 -10% | 48.3 3% | 46.32 -1% | 41.25 -12% | 49.9 ? 7% |
| Write Seq (MB/s) | 2214 | 1185 -46% | 1402 -37% | 2910 31% | 1295 -42% | 2036 ? -8% |
| Read Seq (MB/s) | 2018 | 1132 -44% | 1503 -26% | 2820 40% | 1441 -29% | 2014 ? 0% |
| Write 4K Q32T1 (MB/s) | 478.9 | 371.4 -22% | 475.2 -1% | 545 14% | 429.2 -10% | 461 ? -4% |
| Read 4K Q32T1 (MB/s) | 540 | 422.6 -22% | 581 8% | 632 17% | 400.1 -26% | 499 ? -8% |
| Write Seq Q32T1 (MB/s) | 2975 | 2379 -20% | 2936 -1% | 3349 13% | 1366 -54% | 2903 ? -2% |
| Read Seq Q32T1 (MB/s) | 3195 | 3222 1% | 3539 11% | 3333 4% | 2201 -31% | 3479 ? 9% |
| AS SSD | -12% | 27% | 6% | -29% | 9% | |
| Seq Read (MB/s) | 1982 | 2328 17% | 2655 34% | 2860 44% | 1743 -12% | 2553 ? 29% |
| Seq Write (MB/s) | 2252 | 2344 4% | 2454 9% | 2604 16% | 930 -59% | 2084 ? -7% |
| 4K Read (MB/s) | 47.13 | 43.68 -7% | 59.1 25% | 45.15 -4% | 39.1 -17% | 53.1 ? 13% |
| 4K Write (MB/s) | 88.2 | 10.28 -88% | 138.1 57% | 100.2 14% | 92.1 4% | 131.2 ? 49% |
| 4K-64 Read (MB/s) | 1481 | 1469 -1% | 2009 36% | 1428 -4% | 956 -35% | 1477 ? 0% |
| 4K-64 Write (MB/s) | 1842 | 992 -46% | 1907 4% | 1401 -24% | 863 -53% | 1805 ? -2% |
| Access Time Read * (ms) | 0.087 | 0.067 23% | 0.054 38% | 0.049 44% | 0.074 15% | 0.04983 ? 43% |
| Access Time Write * (ms) | 0.04 | 0.035 12% | 0.028 30% | 0.037 7% | 0.053 -33% | 0.04222 ? -6% |
| Score Read (Points) | 1726 | 1745 1% | 2333 35% | 1759 2% | 1170 -32% | 1786 ? 3% |
| Score Write (Points) | 2155 | 1328 -38% | 2291 6% | 1762 -18% | 1048 -51% | 2144 ? -1% |
| Score Total (Points) | 4781 | 3968 -17% | 5810 22% | 4411 -8% | 2781 -42% | 4826 ? 1% |
| Copy ISO MB/s (MB/s) | 1982 | 1609 -19% | 2098 ? 6% | |||
| Copy Program MB/s (MB/s) | 501 | 445.1 -11% | 500 ? 0% | |||
| Copy Game MB/s (MB/s) | 1140 | 1089 -4% | 1132 ? -1% | |||
| Media total (Programa/Opciones) | -18% /
-16% | 12% /
14% | 9% /
9% | -29% /
-29% | 5% /
6% |
* ... más pequeño es mejor
Dauerleistung Lesen: DiskSpd Read Loop, Queue Depth 8
Tarjeta gráfica
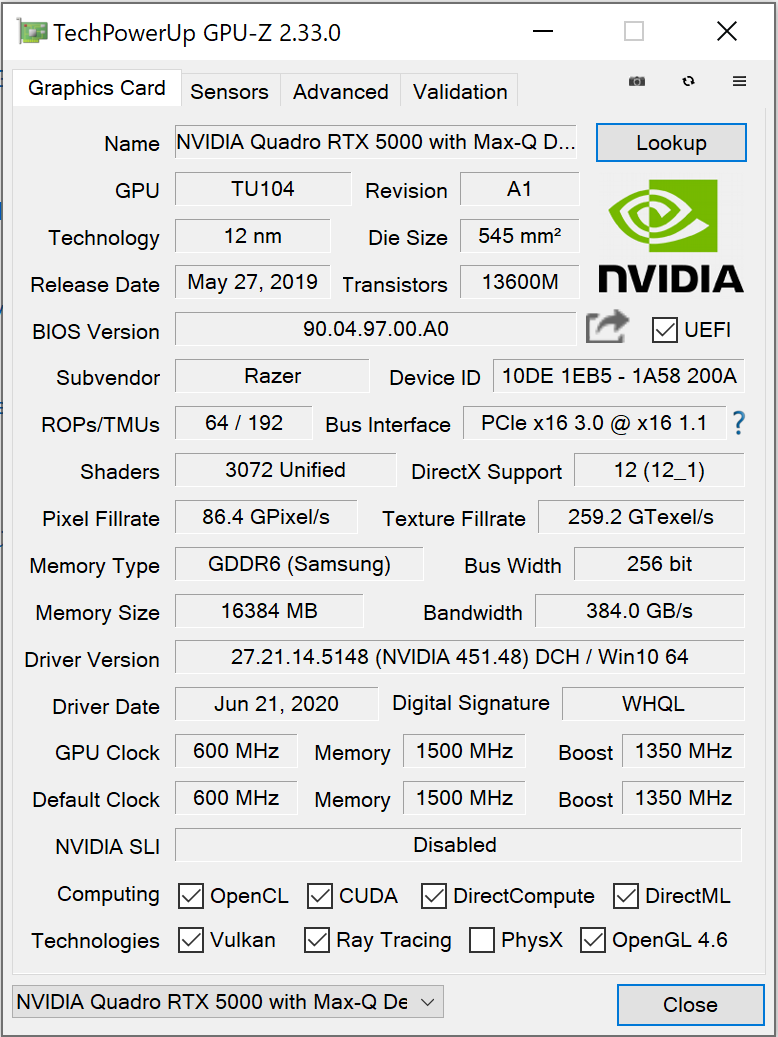
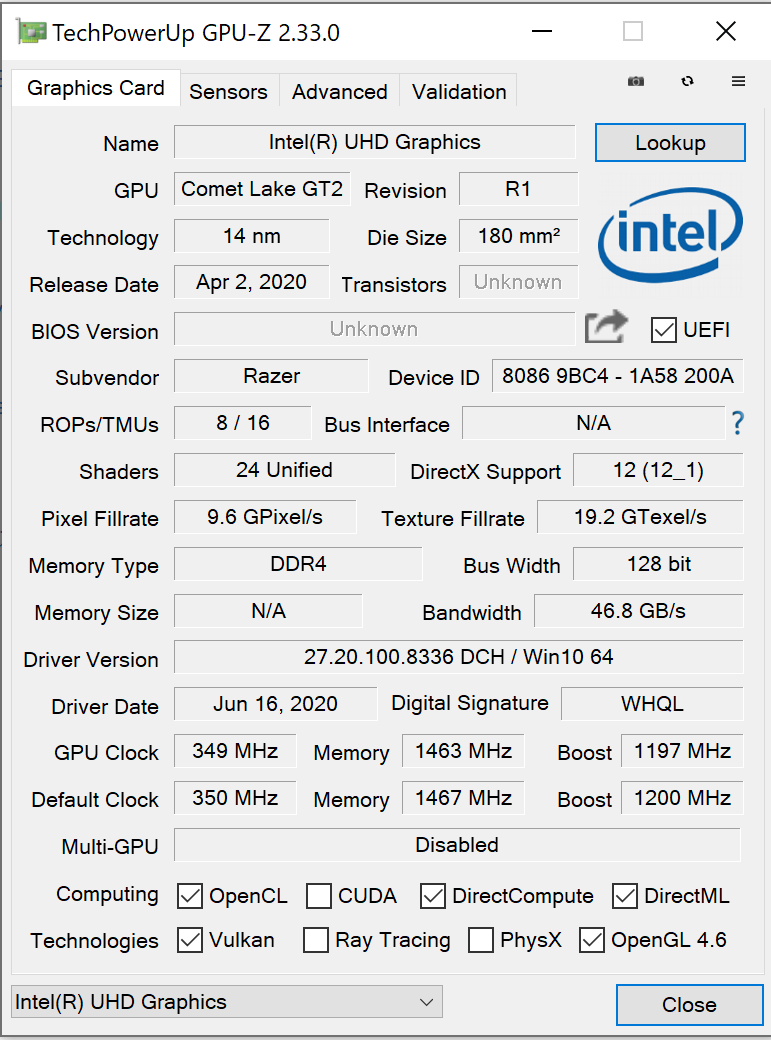
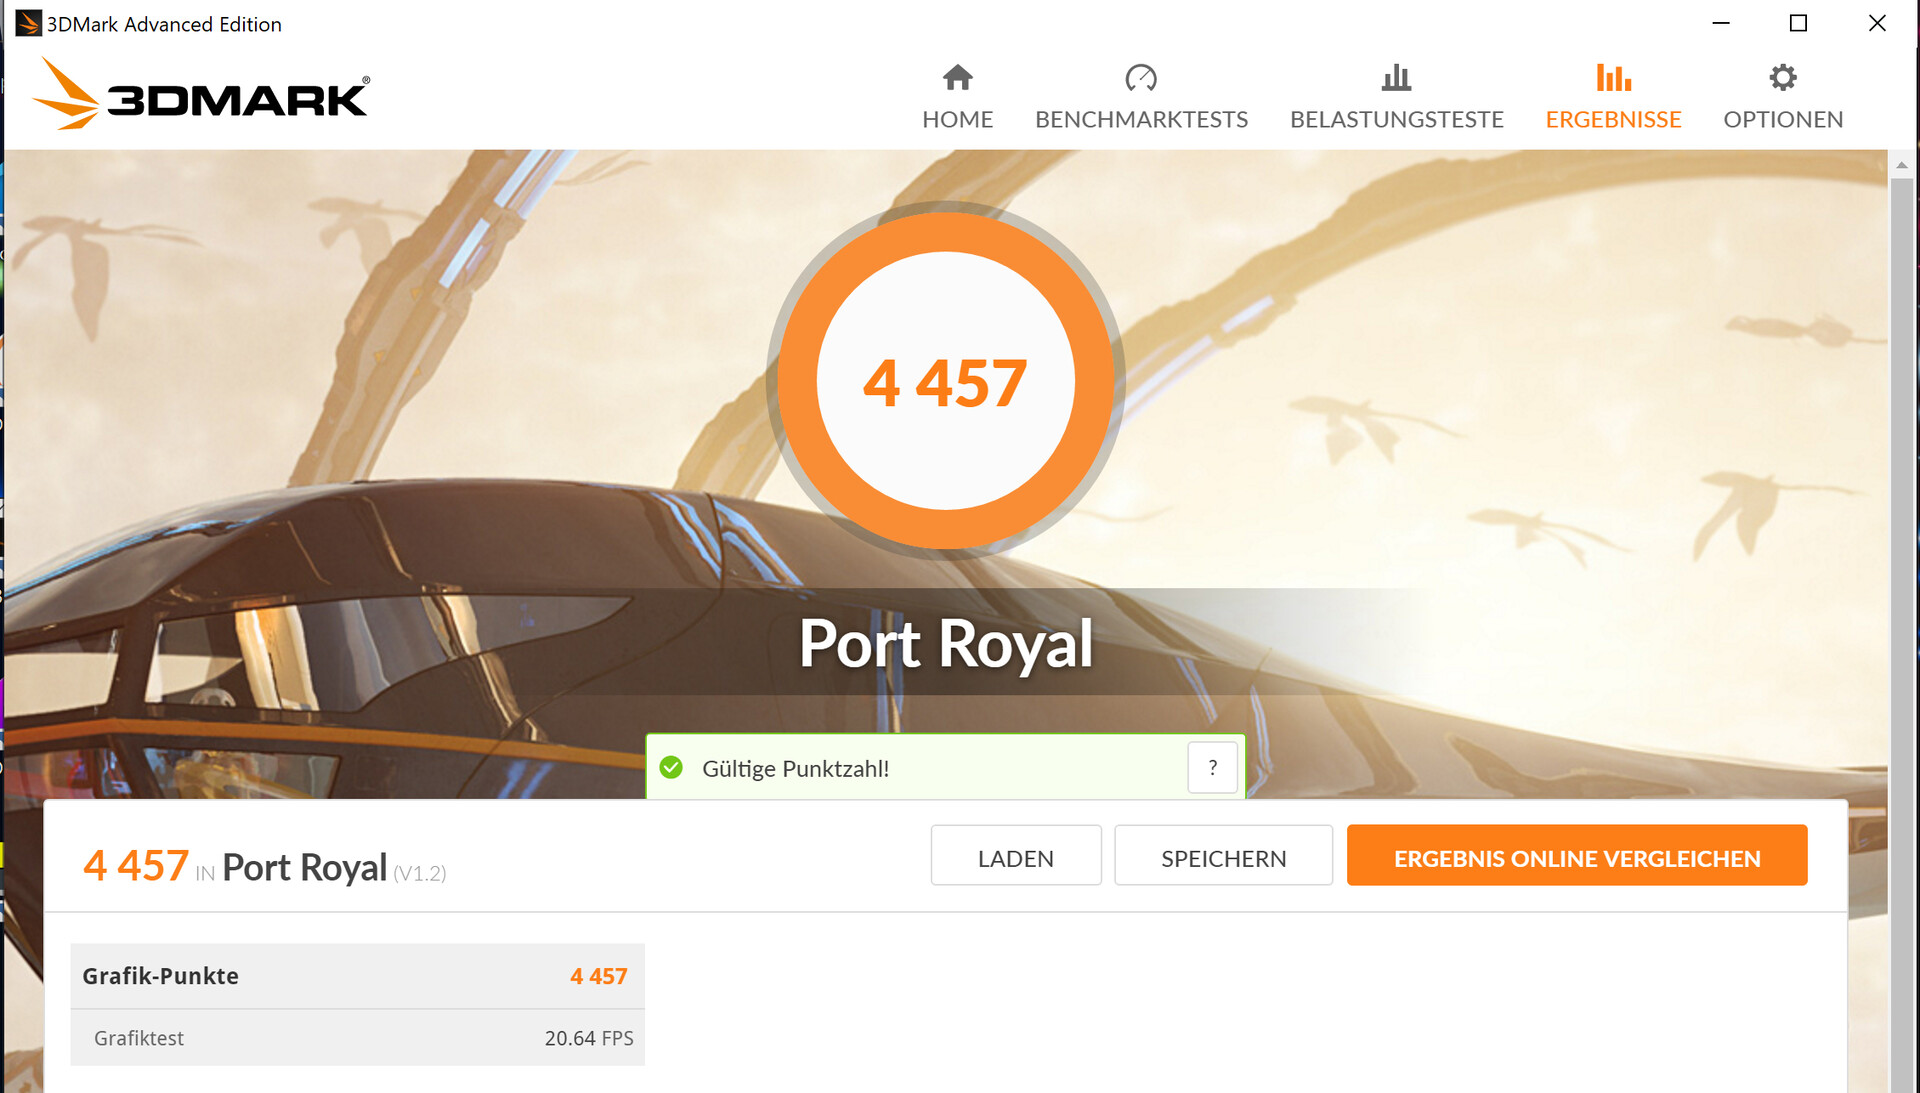
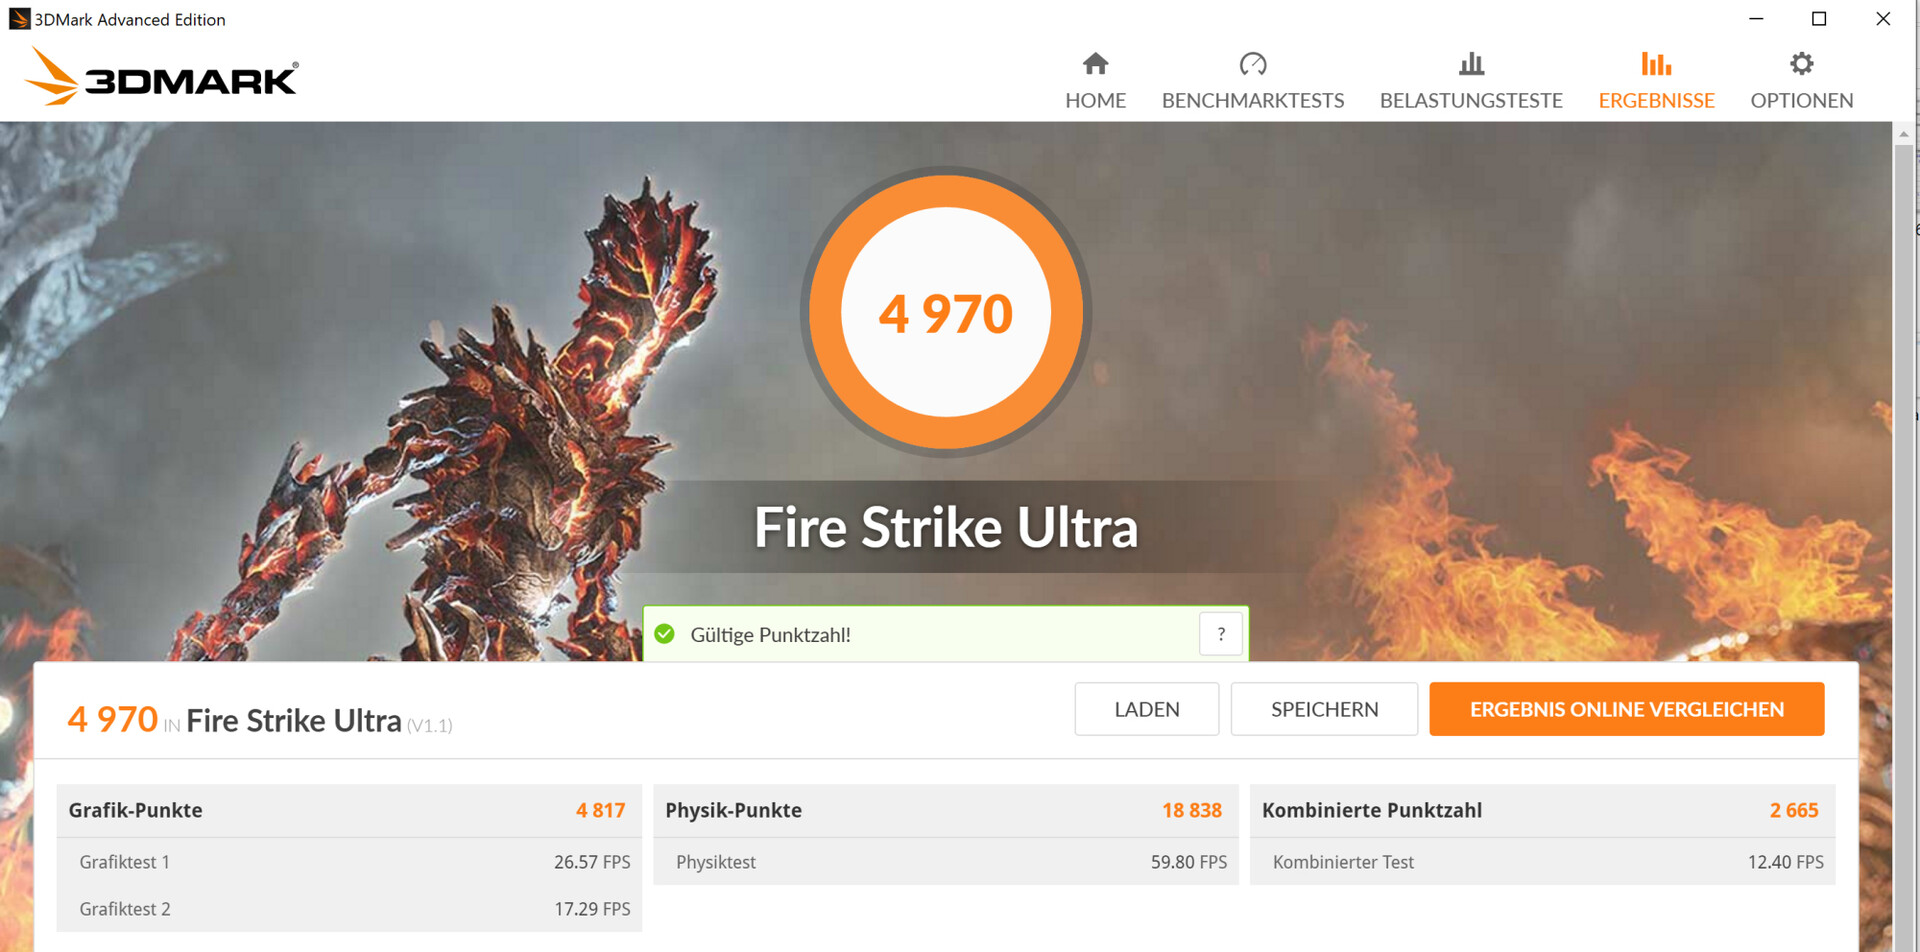
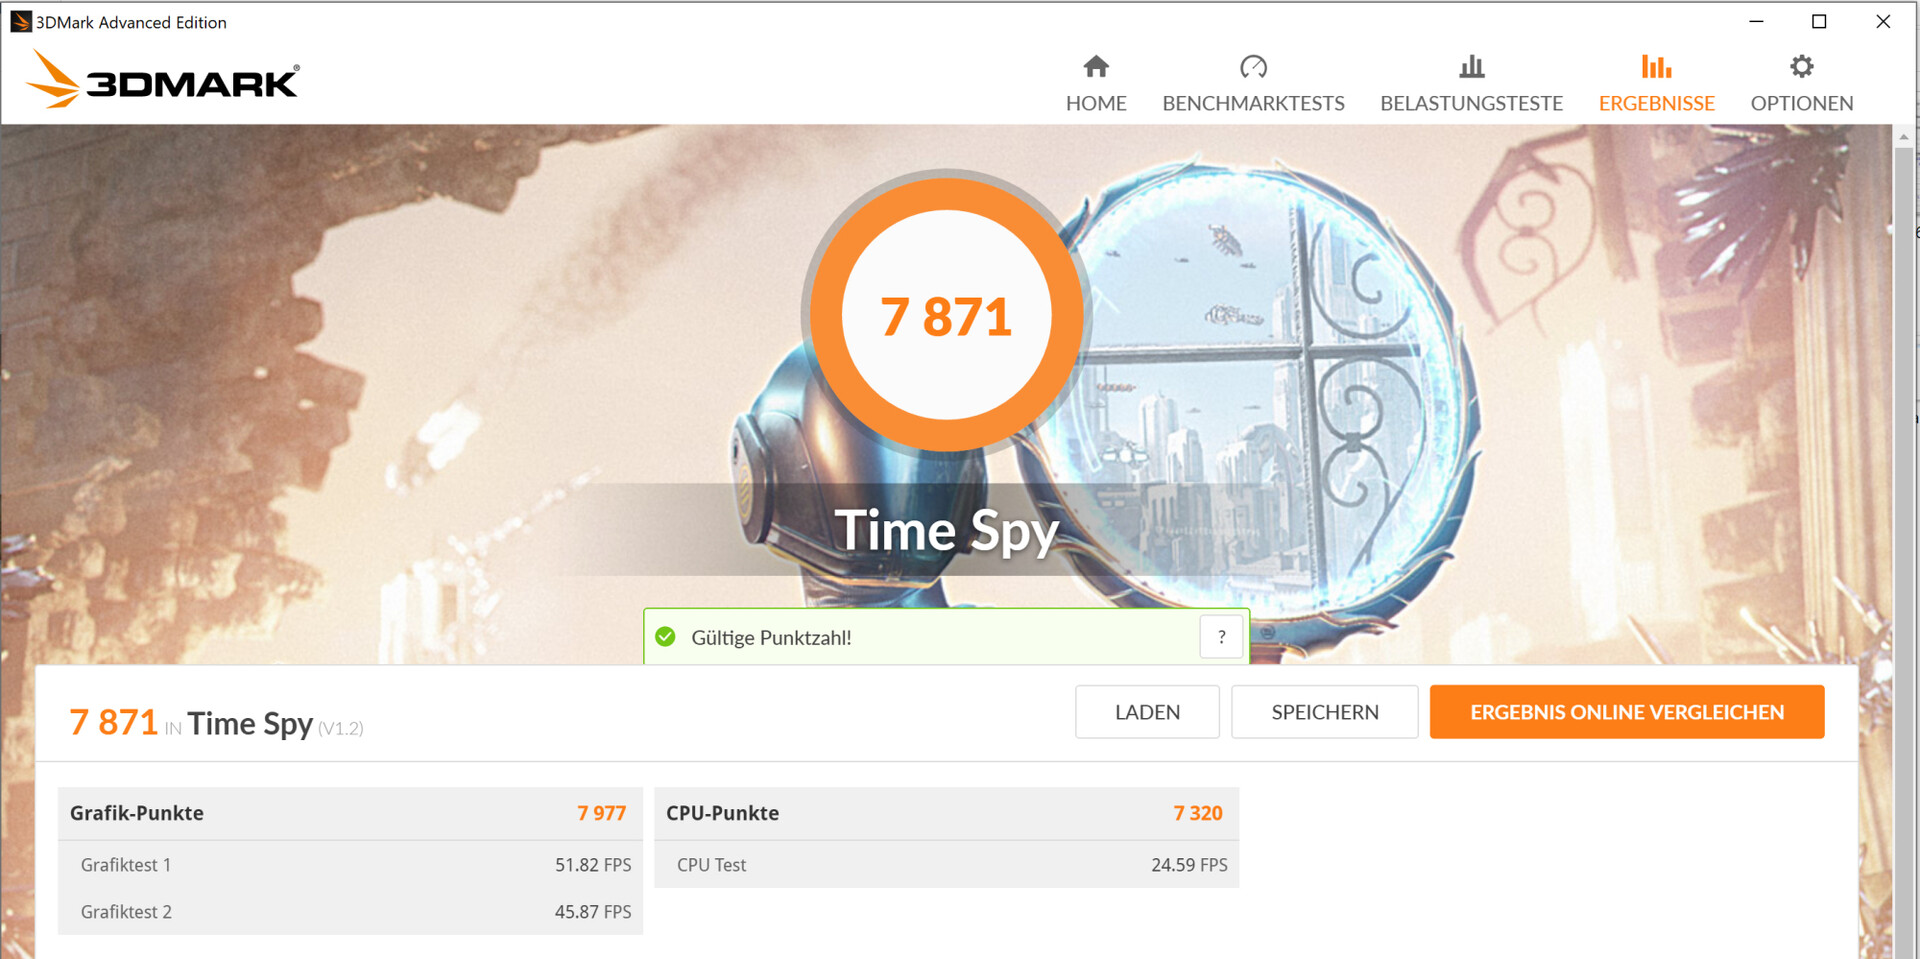
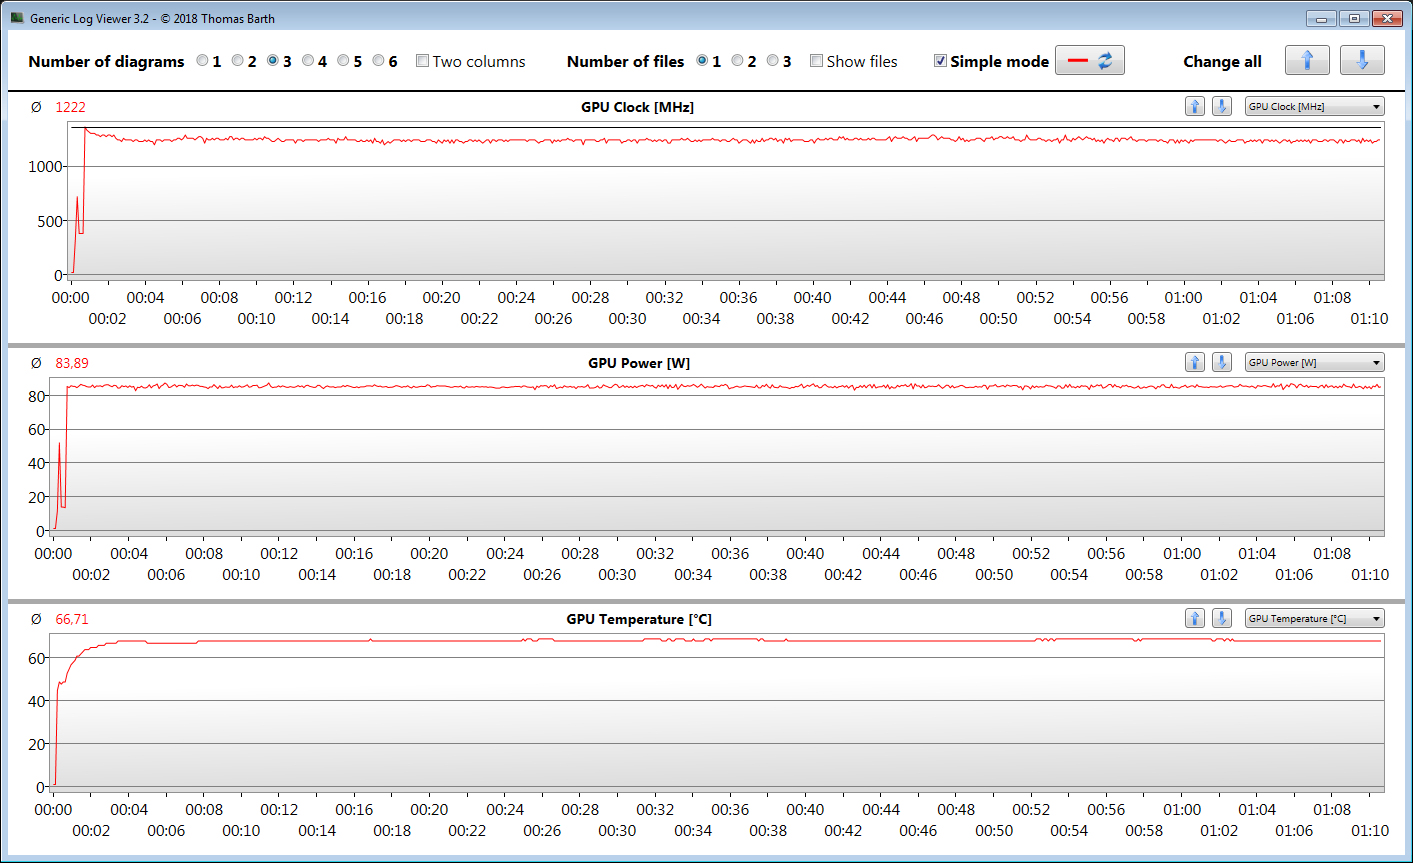
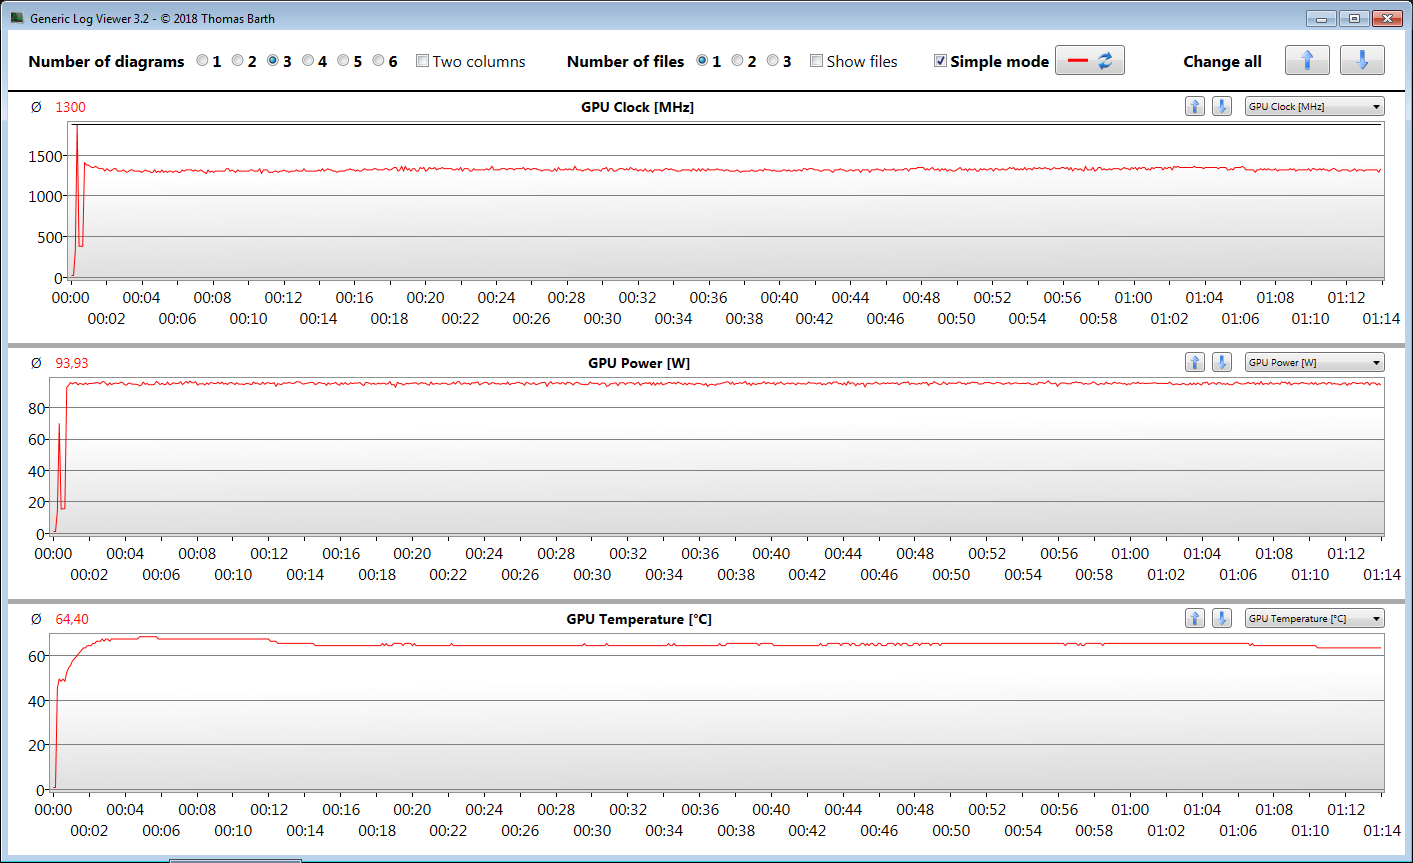
El Quadro RTX 5000 Max-Q de Turing ofrece una velocidad base de 600 MHz y un Turbo de 1350 MHz. La GPU puede aumentar aún más su potencia siempre y cuando no exceda los límites térmicos y de potencia. La velocidad más alta que observamos en nuestra revisión fue de 1889 MHz. En nuestra prueba de esfuerzo con The Witcher 3, la GPU tenía una velocidad promedio de 1222 MHz en modo balanceado y 1300 MHz en modo de rendimiento. La GPU viene con 16 GB de memoria GDDR6 rápida.
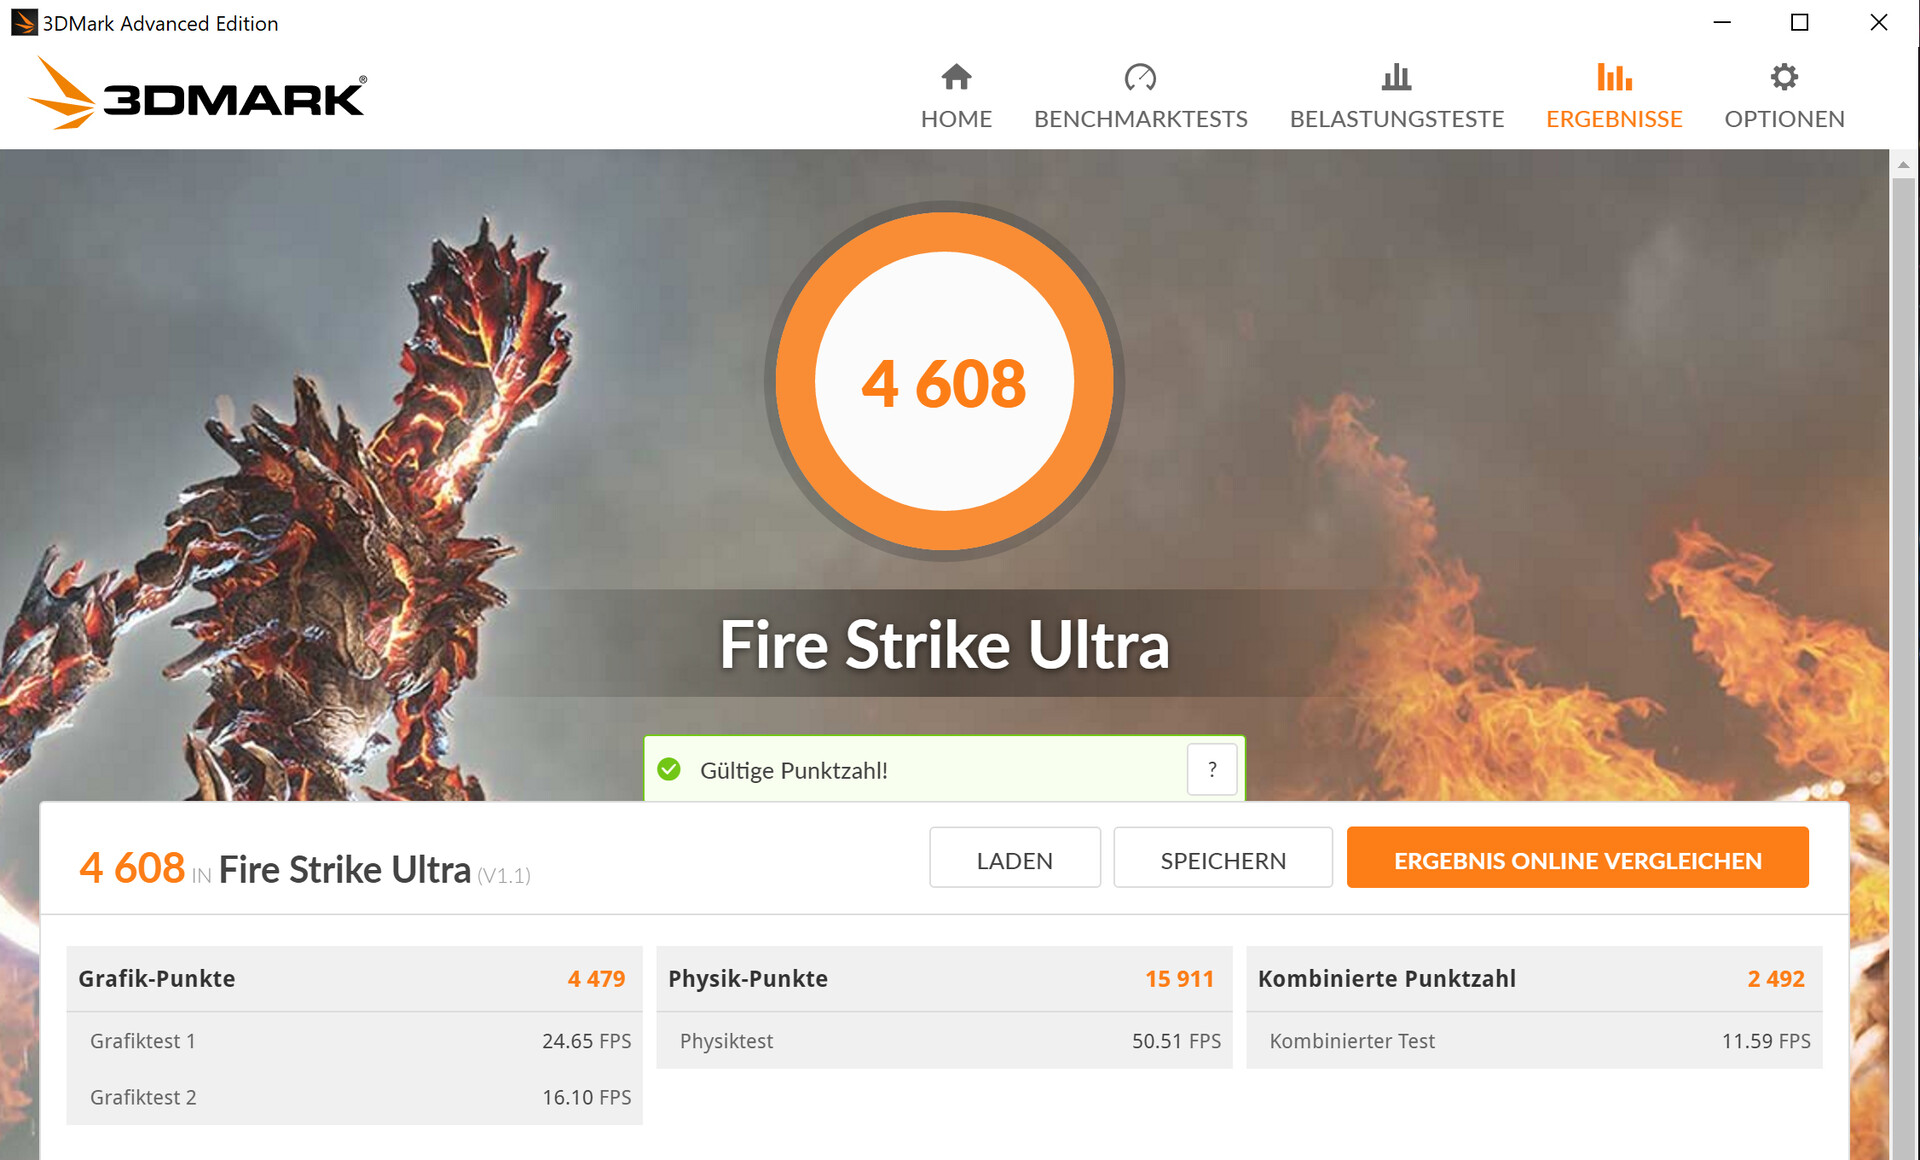
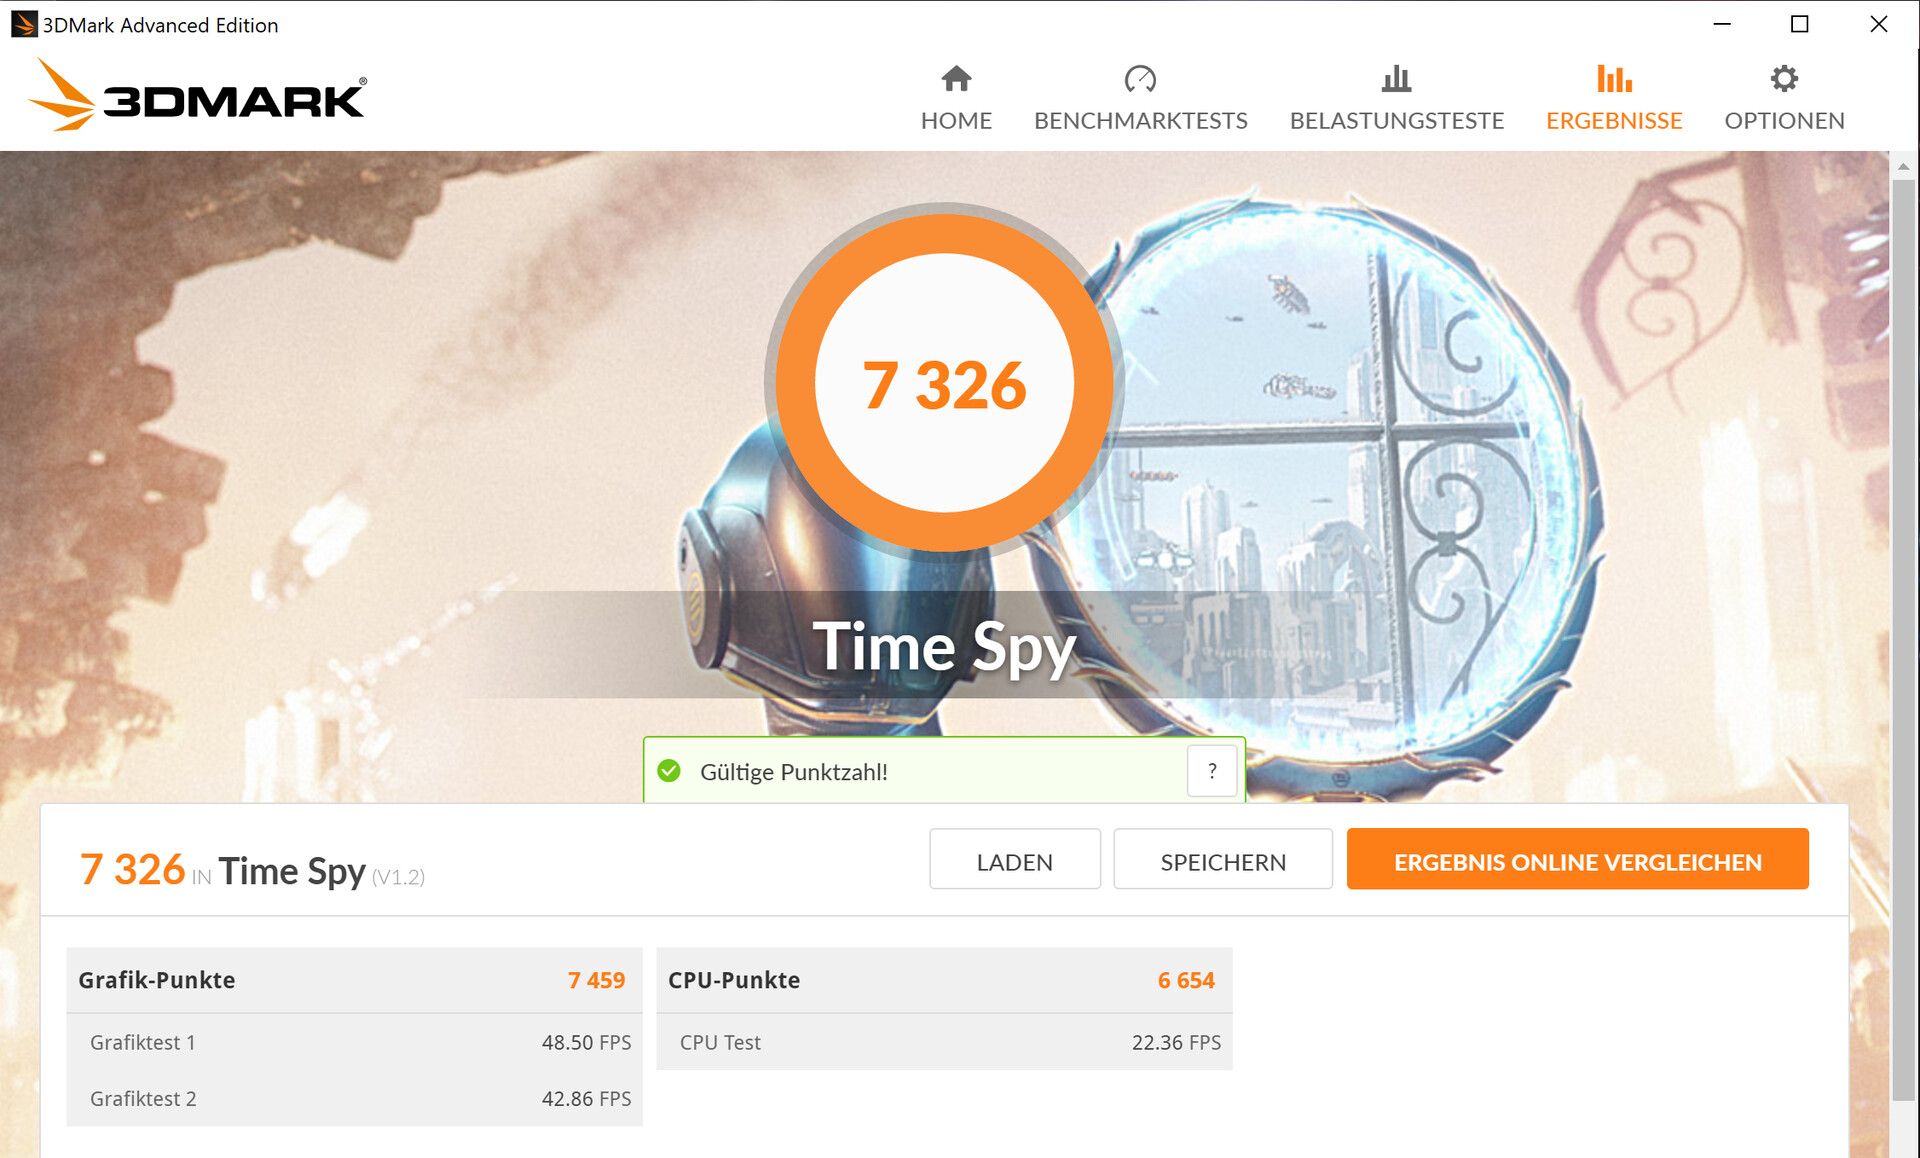
Los resultados de 3DMark están en un nivel normal. El UHD Graphics 630 integrado en el Core i7-10875H está activado, por lo que se utiliza la tecnología Optimus de NVIDIA.
Si los usuarios seleccionan el modo de máximo rendimiento de la GPU en la utilidad "Synapse" de Razer, entonces el TGP (Potencia Gráfica Total) aumenta ligeramente. Esto da como resultado un ligero aumento en las puntuaciones de las pruebas de referencia. Las tasas de fotogramas también aumentan, pero no mucho. Vimos un ligero aumento en la frecuencia de fotogramas en The Witcher 3.

| 3DMark 11 Performance | 20883 puntos | |
| 3DMark Cloud Gate Standard Score | 32096 puntos | |
| 3DMark Fire Strike Score | 16179 puntos | |
| 3DMark Time Spy Score | 7326 puntos | |
ayuda | ||
| 3DMark 11 - 1280x720 Performance GPU | |
| Media de la clase Workstation (10888 - 69594, n=25, últimos 2 años) | |
| Razer Blade 15 Studio Edition 2020 (Max. CPU, max. GPU) | |
| Razer Blade 15 Studio Edition 2020 | |
| Medio NVIDIA Quadro RTX 5000 Max-Q (24156 - 28524, n=9) | |
| Razer Blade 15 Studio Edition | |
| Lenovo ThinkPad P53-20QN000YGE | |
| MSI P65 Creator 9SF-657 | |
| Dell Precision 5540 | |
| 3DMark | |
| 1280x720 Cloud Gate Standard Graphics | |
| Lenovo ThinkPad P53-20QN000YGE | |
| Media de la clase Workstation (46927 - 152418, n=15, últimos 2 años) | |
| Medio NVIDIA Quadro RTX 5000 Max-Q (50993 - 126073, n=7) | |
| Razer Blade 15 Studio Edition 2020 | |
| MSI P65 Creator 9SF-657 | |
| Razer Blade 15 Studio Edition | |
| Dell Precision 5540 | |
| 1920x1080 Fire Strike Graphics | |
| Media de la clase Workstation (7578 - 52560, n=25, últimos 2 años) | |
| Razer Blade 15 Studio Edition 2020 (Max. CPU, max. GPU) | |
| Razer Blade 15 Studio Edition 2020 | |
| Medio NVIDIA Quadro RTX 5000 Max-Q (18247 - 21115, n=10) | |
| Razer Blade 15 Studio Edition | |
| Lenovo ThinkPad P53-20QN000YGE | |
| MSI P65 Creator 9SF-657 | |
| Dell Precision 5540 | |
| 2560x1440 Time Spy Graphics | |
| Media de la clase Workstation (2725 - 24806, n=25, últimos 2 años) | |
| Razer Blade 15 Studio Edition 2020 (Max. CPU, max. GPU) | |
| Razer Blade 15 Studio Edition 2020 | |
| Medio NVIDIA Quadro RTX 5000 Max-Q (6999 - 7977, n=10) | |
| Razer Blade 15 Studio Edition | |
| Lenovo ThinkPad P53-20QN000YGE | |
| Dell Precision 5540 | |
El rendimiento de los juegos
El Blade 15 puede ejecutar todos los juegos actuales sin problemas. Normalmente puede alcanzar velocidades de cuadro jugables a 1080p en los ajustes más altos. Los títulos modernos también se pueden jugar con resoluciones superiores a 1080p, pero sólo con ajustes más bajos, especialmente a 4K.
| The Witcher 3 - 1920x1080 Ultra Graphics & Postprocessing (HBAO+) | |
| Razer Blade 15 Studio Edition 2020 (Max. CPU, Max. GPU) | |
| Razer Blade 15 Studio Edition 2020 | |
| Razer Blade 15 Studio Edition | |
| Medio NVIDIA Quadro RTX 5000 Max-Q (71 - 88.5, n=10) | |
| MSI P65 Creator 9SF-657 | |
| Lenovo ThinkPad P53-20QN000YGE | |
| Media de la clase Workstation (26.3 - 91.7, n=3, últimos 2 años) | |
| Dell Precision 5540 | |
| BioShock Infinite - 1920x1080 Ultra Preset, DX11 (DDOF) | |
| Razer Blade 15 Studio Edition 2020 (Max. CPU, max. GPU) | |
| Medio NVIDIA Quadro RTX 5000 Max-Q (167.2 - 174.3, n=3) | |
| Razer Blade 15 Studio Edition 2020 | |
| Razer Blade 15 Studio Edition | |
| MSI P65 Creator 9SF-657 | |
| Dell Precision 5540 | |
| Shadow of the Tomb Raider - 1920x1080 Highest Preset AA:T | |
| Razer Blade 15 Studio Edition 2020 (Max. CPU, max. GPU) | |
| Medio NVIDIA Quadro RTX 5000 Max-Q (85 - 90, n=3) | |
| Lenovo ThinkPad P53-20QN000YGE | |
| Razer Blade 15 Studio Edition 2020 | |
| Metro Exodus - 1920x1080 Ultra Quality AF:16x | |
| Razer Blade 15 Studio Edition 2020 | |
| Medio NVIDIA Quadro RTX 5000 Max-Q (55.4 - 59.2, n=2) | |
| Razer Blade 15 Studio Edition | |
| Control - 1920x1080 High Quality Preset | |
| Razer Blade 15 Studio Edition 2020 | |
| Medio NVIDIA Quadro RTX 5000 Max-Q (66.5 - 69.9, n=2) | |
| Razer Blade 15 Studio Edition | |
| Total War: Three Kingdoms - 1920x1080 Ultra (incl textures) | |
| Razer Blade 15 Studio Edition | |
| Medio NVIDIA Quadro RTX 5000 Max-Q (57.5 - 64.9, n=2) | |
| Razer Blade 15 Studio Edition 2020 | |
| Red Dead Redemption 2 - 1920x1080 High Settings | |
| Medio NVIDIA Quadro RTX 5000 Max-Q (54.8 - 63.9, n=2) | |
| Razer Blade 15 Studio Edition 2020 | |
| Doom Eternal - 1920x1080 Ultra Preset | |
| Medio NVIDIA Quadro RTX 5000 Max-Q (137.8 - 145.3, n=3) | |
| Razer Blade 15 Studio Edition 2020 | |
Usamos el videojuego The Witcher 3 para comprobar si la velocidad de fotogramas se puede mantener constante durante un período de tiempo prolongado. Para ello, ejecutamos el juego con la configuración más alta a 1080p durante una hora. Durante toda la partida, el personaje controlado por el jugador se queda quieto. No hay caídas en la tasa de fotogramas que reportar.
| bajo | medio | alto | ultra | QHD | 4K | |
|---|---|---|---|---|---|---|
| BioShock Infinite (2013) | 365.3 | 321.5 | 296.5 | 168.5 | ||
| The Witcher 3 (2015) | 323.2 | 238.8 | 125.4 | 83.6 | 47.5 | |
| Dota 2 Reborn (2015) | 138.4 | 130.1 | 124.5 | 122.3 | ||
| X-Plane 11.11 (2018) | 109 | 94.9 | 78.7 | |||
| Far Cry 5 (2018) | 128 | 106 | 101 | 96 | 74 | 40 |
| Shadow of the Tomb Raider (2018) | 105 | 94 | 91 | 85 | 62 | 33 |
| Assassin´s Creed Odyssey (2018) | 107 | 91 | 80 | 57 | 48 | 31 |
| Battlefield V (2018) | 156.6 | 130.7 | 124.5 | 114.7 | 90.8 | 53.4 |
| Metro Exodus (2019) | 145.6 | 96.3 | 72.8 | 59.2 | 45.6 | 27 |
| Total War: Three Kingdoms (2019) | 243.7 | 129 | 80.9 | 57.5 | 34.1 | 18.5 |
| Control (2019) | 228.8 | 96.7 | 69.9 | 43 | 20 | |
| Call of Duty Modern Warfare 2019 (2019) | 156.5 | 111.2 | 99 | 86.7 | 62.2 | 34 |
| Star Wars Jedi Fallen Order (2019) | 105 | 99.5 | 89.7 | 66.3 | 34 | |
| Red Dead Redemption 2 (2019) | 124.2 | 84.8 | 54.8 | 39.7 | 32 | 19.8 |
| Doom Eternal (2020) | 216.7 | 161.9 | 145 | 140.6 | 92.5 | 47.1 |
| Gears Tactics (2020) | 177.7 | 126.6 | 90.7 | 73.6 | 50 | 24 |
| F1 2020 (2020) | 214 | 166 | 143 | 107 | 82.8 | 44.4 |
| Death Stranding (2020) | 127.2 | 112.6 | 103.8 | 101.5 | 73.7 | 41.1 |
Emisiones - El Blade 15 no se calienta ni hace mucho ruido
Ruido de sistema
Cuando están inactivos, los ventiladores a menudo se paran, lo que lleva a un funcionamiento silencioso. Bajo carga, los ventiladores comienzan a girar. Medimos 42,3 dB(A) bajo carga media, 42,1 dB(A) durante la prueba de esfuerzo y 48,2 dB(A) en la prueba de estabilidad de los juegos con The Witcher 3.
Ruido
| Ocioso |
| 30.1 / 30.1 / 30.1 dB(A) |
| Carga |
| 42.3 / 42.1 dB(A) |
 | ||
30 dB silencioso 40 dB(A) audible 50 dB(A) ruidosamente alto |
||
min: | ||
| Razer Blade 15 Studio Edition 2020 i7-10875H, Quadro RTX 5000 Max-Q | Razer Blade 15 Studio Edition i7-9750H, Quadro RTX 5000 Max-Q | Lenovo ThinkPad P53-20QN000YGE i7-9850H, Quadro RTX 5000 Max-Q | MSI P65 Creator 9SF-657 i9-9880H, GeForce RTX 2070 Max-Q | Dell Precision 5540 i9-9980HK, Quadro T2000 Max-Q | Medio NVIDIA Quadro RTX 5000 Max-Q | Media de la clase Workstation | |
|---|---|---|---|---|---|---|---|
| Noise | -1% | 12% | -5% | 11% | 3% | 9% | |
| apagado / medio ambiente * (dB) | 30.1 | 30.6 -2% | 28.3 6% | 30.2 -0% | 28.6 5% | 27.5 ? 9% | 24.1 ? 20% |
| Idle Minimum * (dB) | 30.1 | 30.6 -2% | 28.3 6% | 32.8 -9% | 28.6 5% | 28.7 ? 5% | 24.8 ? 18% |
| Idle Average * (dB) | 30.1 | 30.6 -2% | 28.3 6% | 32.8 -9% | 28.6 5% | 28.7 ? 5% | 25.4 ? 16% |
| Idle Maximum * (dB) | 30.1 | 30.6 -2% | 28.3 6% | 33.6 -12% | 28.6 5% | 28.7 ? 5% | 26.7 ? 11% |
| Load Average * (dB) | 42.3 | 43 -2% | 29.8 30% | 40.9 3% | 33.3 21% | 41 ? 3% | 39.2 ? 7% |
| Witcher 3 ultra * (dB) | 48.2 | 38.3 21% | 34.7 28% | ||||
| Load Maximum * (dB) | 42.1 | 41 3% | 38.3 9% | 42.7 -1% | 38 10% | 46.7 ? -11% | 50.4 ? -20% |
* ... más pequeño es mejor
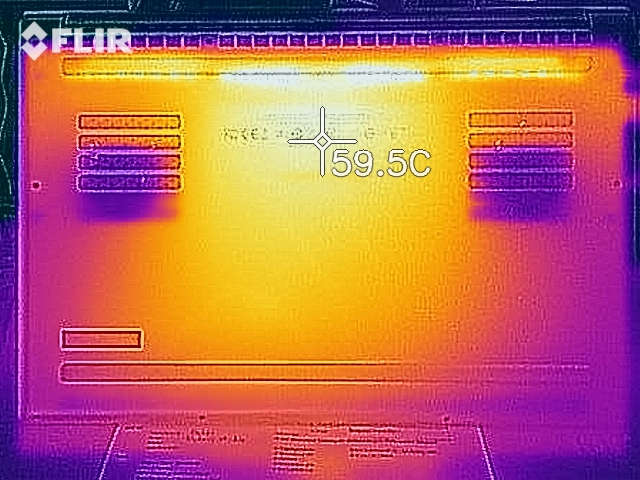
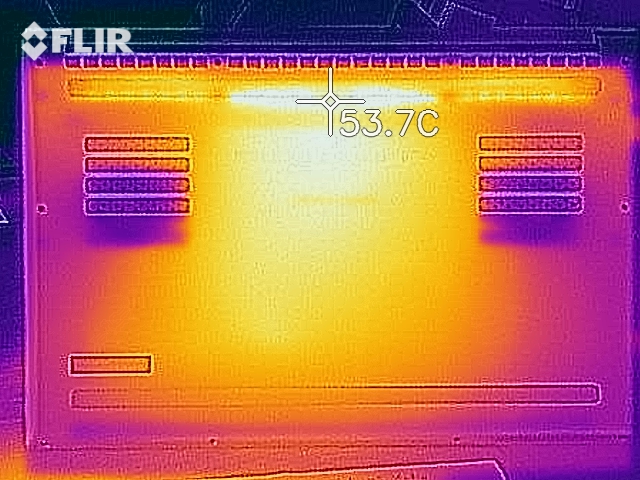
Temperatura
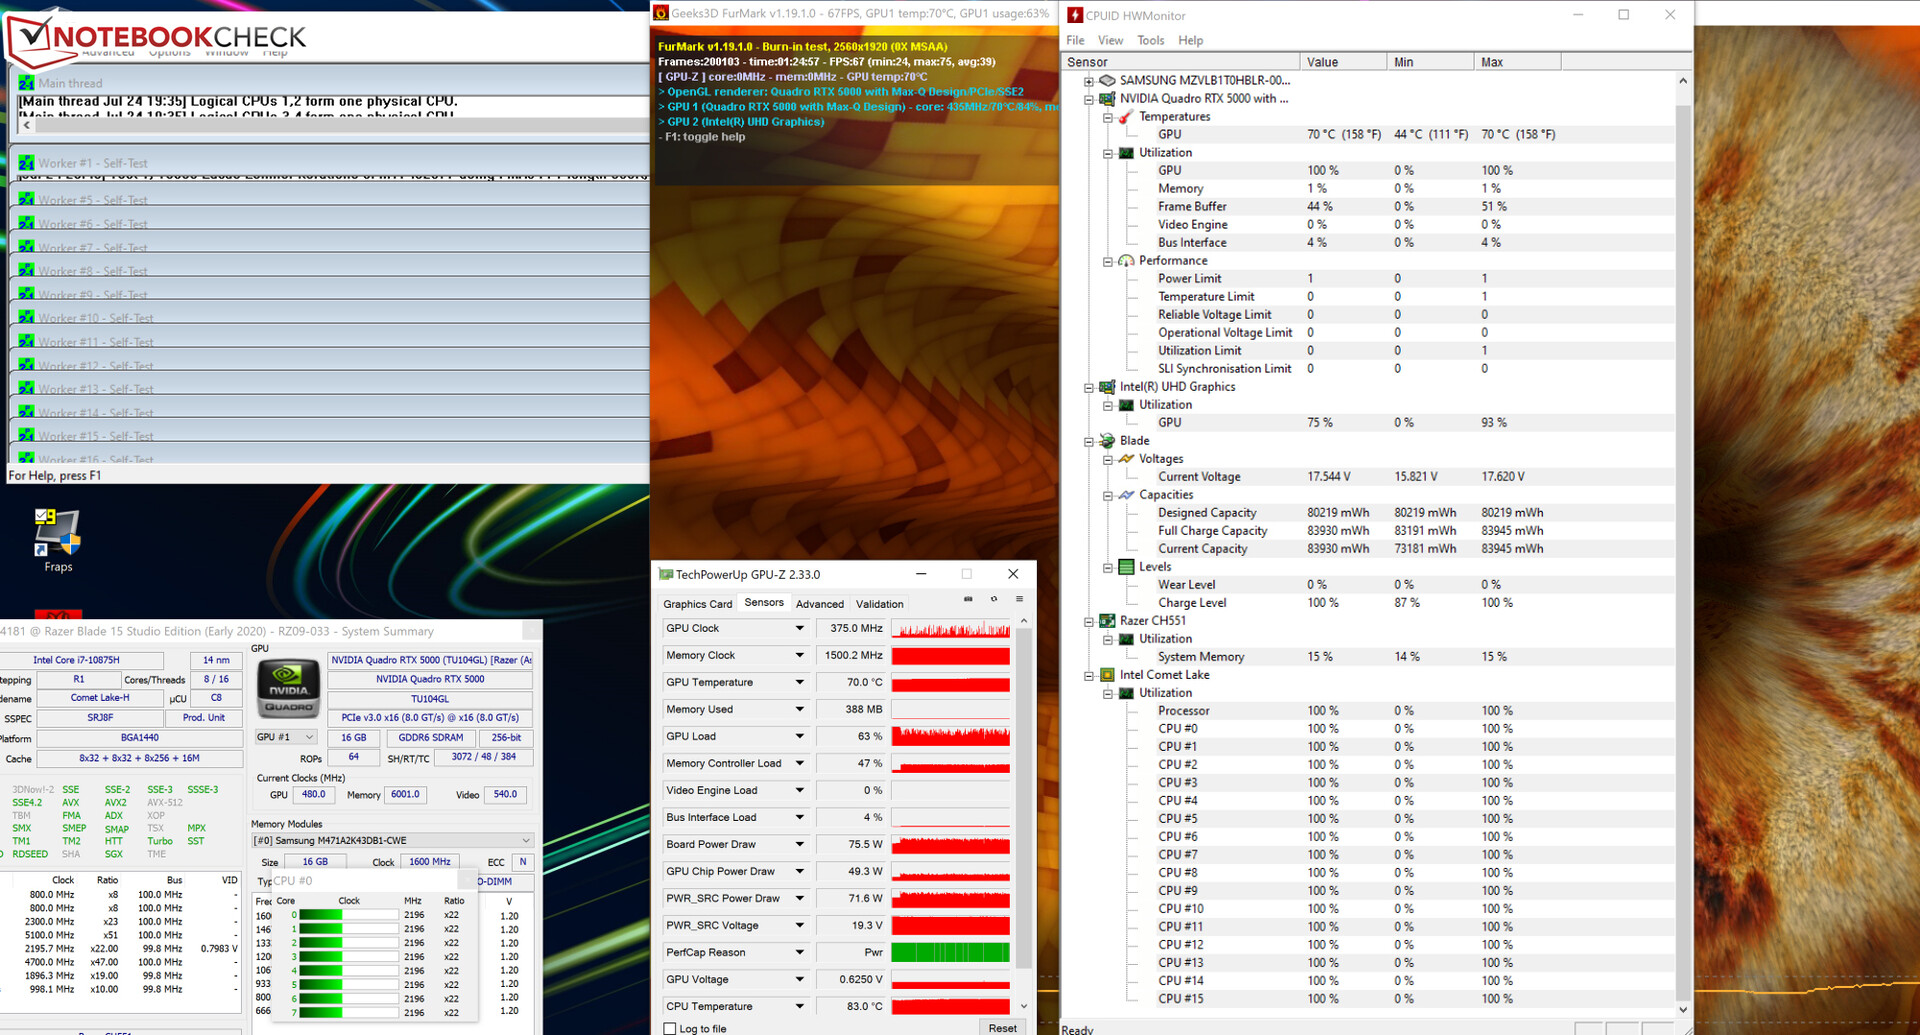
En nuestra prueba de esfuerzo (Prime95 y FurMark funcionando continuamente durante al menos una hora), el procesador funciona a 2,1 a 2,2 GHz. Durante los primeros 10 minutos, la GPU funciona a 1000 a 1600 MHz. Posteriormente, la velocidad de la GPU se reduce a 300 MHz. Cuando funciona con la energía de la batería, la CPU opera a 800 a 1800 MHz y la GPU a 300 MHz. La prueba de esfuerzo es un escenario de caso extremo, que es muy poco probable que ocurra en la vida real. La usamos para probar la estabilidad del sistema.
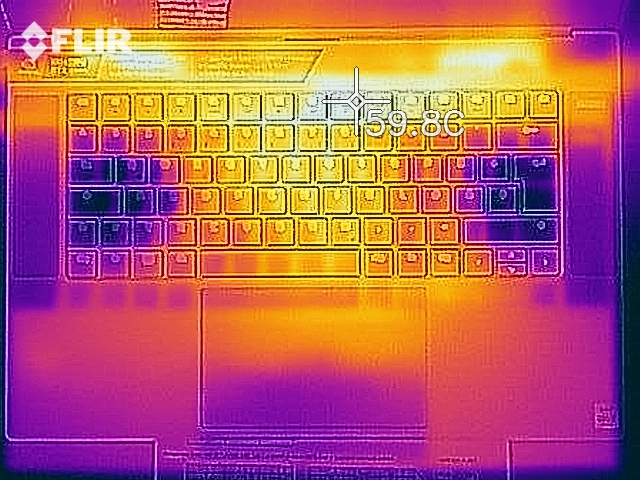
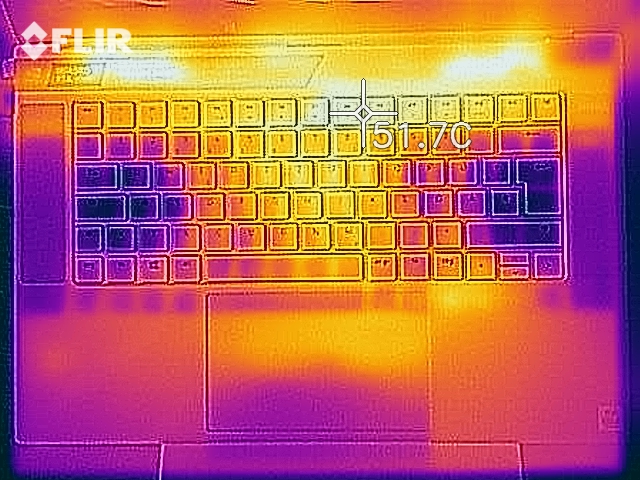
El Blade se calienta considerablemente. Durante nuestra prueba de estrés, la marca de 50°C (122°F) fue excedida en varios puntos de medición. Medimos temperaturas algo más bajas durante nuestra prueba de estabilidad del sistema con The Witcher 3. En el uso diario, las temperaturas siempre se mantienen razonables.
(-) La temperatura máxima en la parte superior es de 54.1 °C / 129 F, frente a la media de 38.2 °C / 101 F, que oscila entre 22.2 y 69.8 °C para la clase Workstation.
(-) El fondo se calienta hasta un máximo de 54 °C / 129 F, frente a la media de 41.1 °C / 106 F
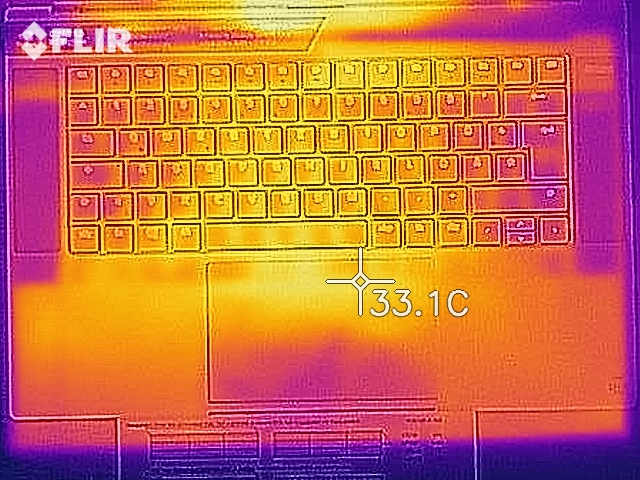
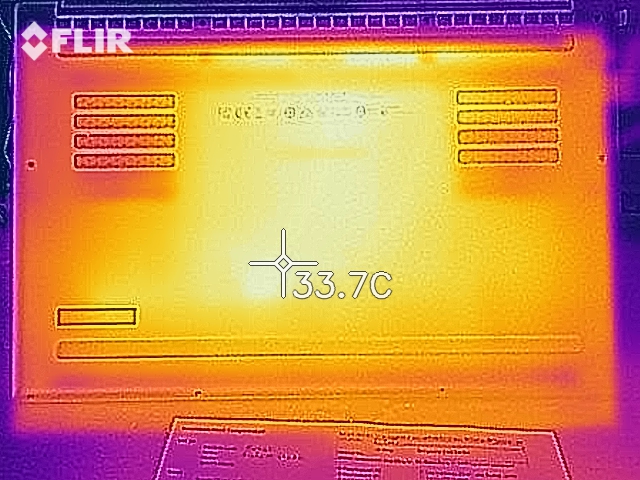
(+) En reposo, la temperatura media de la parte superior es de 28.2 °C / 83# F, frente a la media del dispositivo de 32 °C / 90 F.
(-) Jugando a The Witcher 3, la temperatura media de la parte superior es de 39.1 °C / 102 F, frente a la media del dispositivo de 32 °C / 90 F.
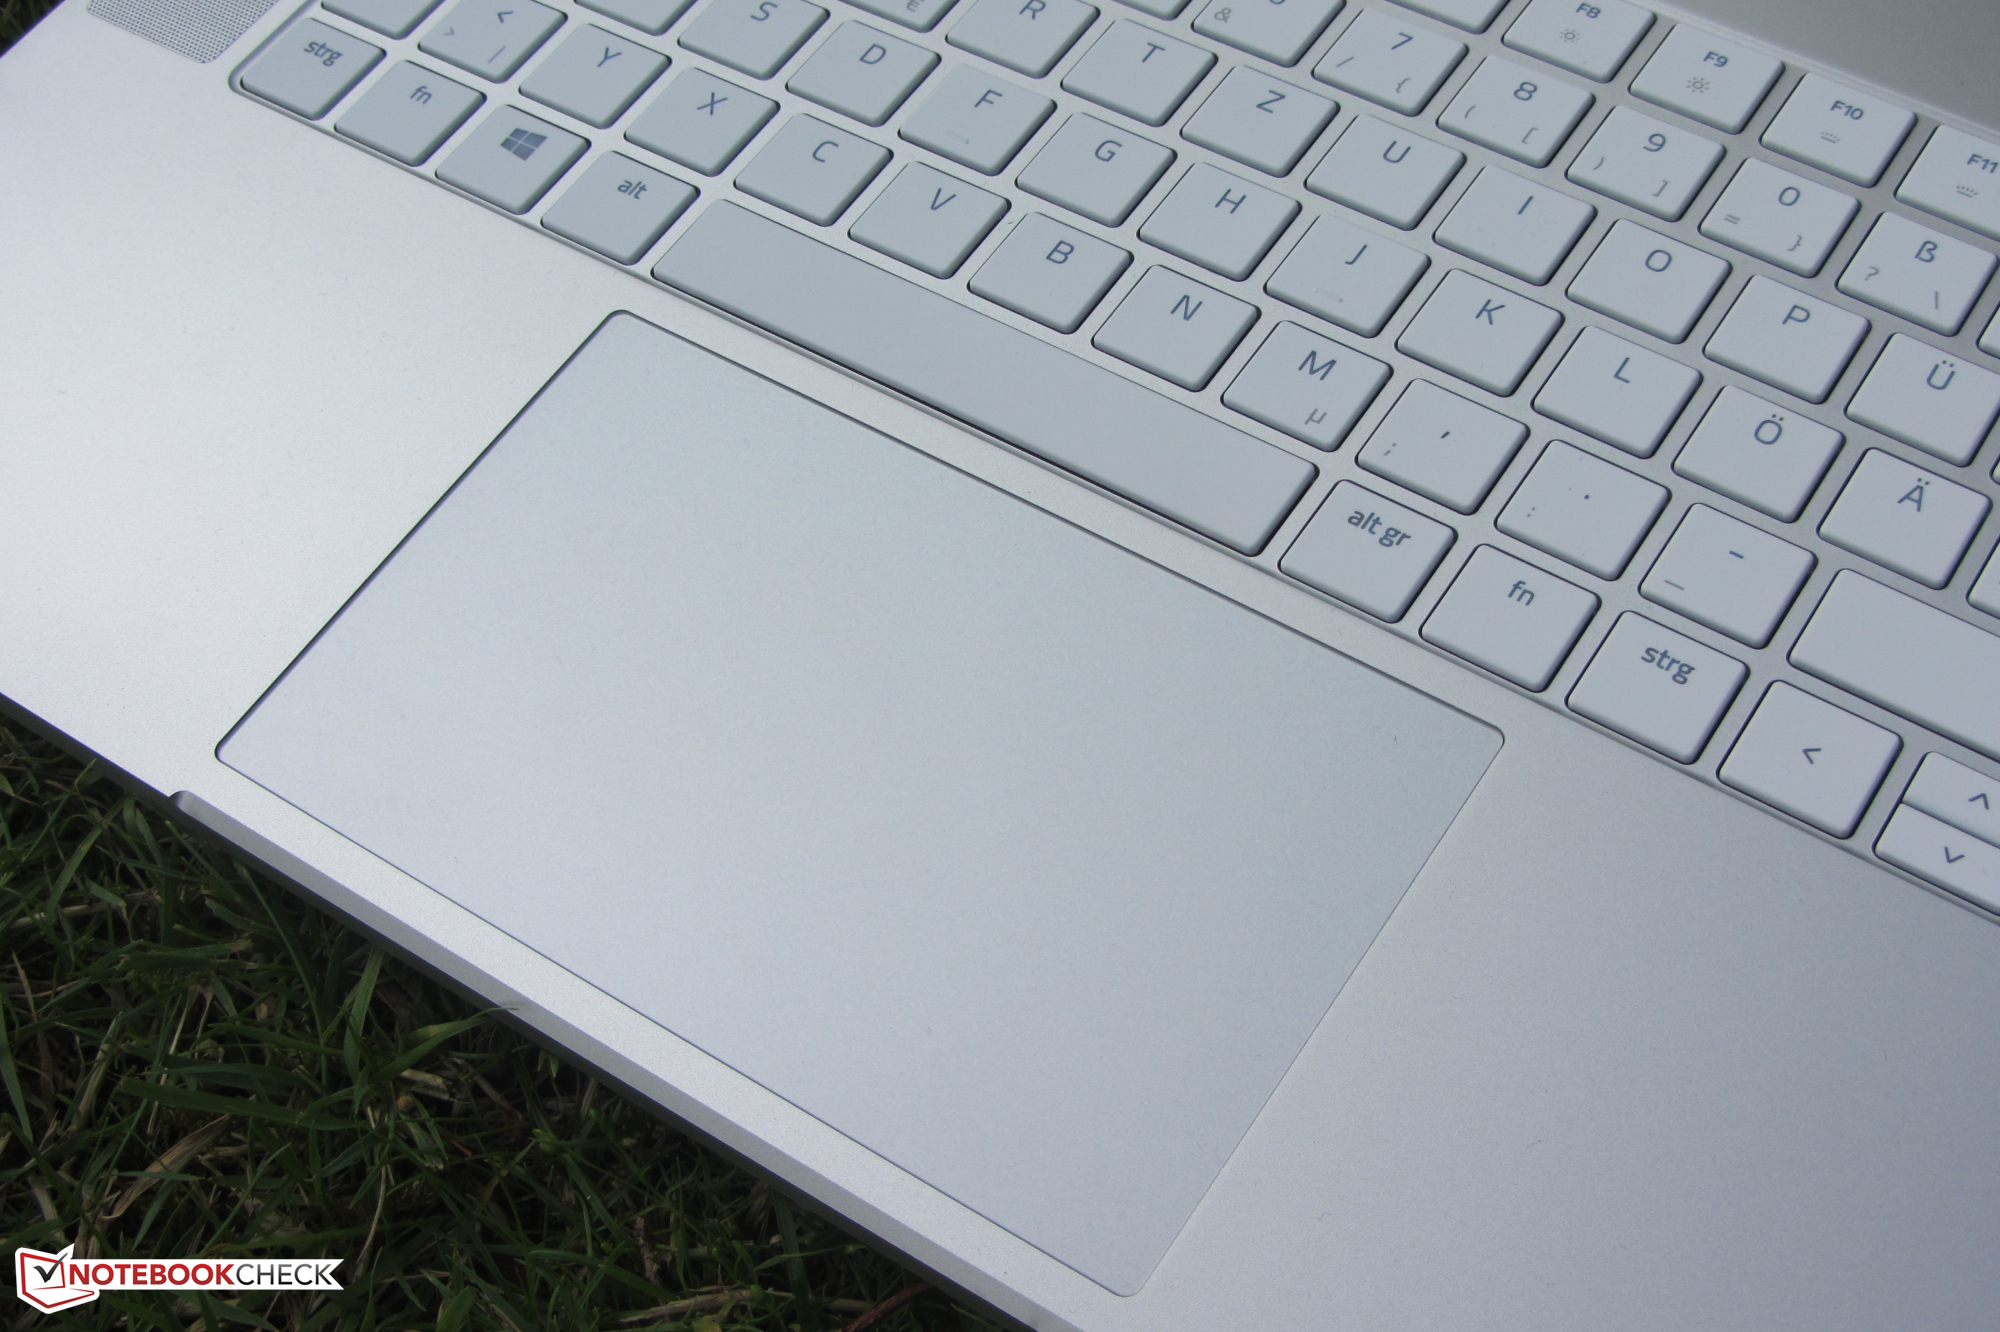
(-) El reposamanos y el touchpad pueden calentarse mucho al tacto con un máximo de 40 °C / 104 F.
(-) La temperatura media de la zona del reposamanos de dispositivos similares fue de 27.8 °C / 82 F (-12.2 °C / -22 F).
| Razer Blade 15 Studio Edition 2020 i7-10875H, Quadro RTX 5000 Max-Q | Razer Blade 15 Studio Edition i7-9750H, Quadro RTX 5000 Max-Q | Lenovo ThinkPad P53-20QN000YGE i7-9850H, Quadro RTX 5000 Max-Q | MSI P65 Creator 9SF-657 i9-9880H, GeForce RTX 2070 Max-Q | Dell Precision 5540 i9-9980HK, Quadro T2000 Max-Q | Medio NVIDIA Quadro RTX 5000 Max-Q | Media de la clase Workstation | |
|---|---|---|---|---|---|---|---|
| Heat | 8% | 21% | 0% | 10% | 2% | 6% | |
| Maximum Upper Side * (°C) | 54.1 | 46.1 15% | 41.8 23% | 49.7 8% | 46.2 15% | 49.4 ? 9% | 43.8 ? 19% |
| Maximum Bottom * (°C) | 54 | 45.2 16% | 46.1 15% | 60.4 -12% | 45.7 15% | 53 ? 2% | 45 ? 17% |
| Idle Upper Side * (°C) | 28.9 | 28.9 -0% | 22.2 23% | 28.4 2% | 27.4 5% | 28.6 ? 1% | 30.6 ? -6% |
| Idle Bottom * (°C) | 29.7 | 29.6 -0% | 23 23% | 29.2 2% | 27.8 6% | 30.5 ? -3% | 31.6 ? -6% |
* ... más pequeño es mejor
Altavoces
Razer Blade 15 Studio Edition 2020 análisis de audio
(±) | la sonoridad del altavoz es media pero buena (75.1 dB)
Graves 100 - 315 Hz
(-) | casi sin bajos - de media 18.3% inferior a la mediana
(±) | la linealidad de los graves es media (10.1% delta a frecuencia anterior)
Medios 400 - 2000 Hz
(+) | medios equilibrados - a sólo 4.6% de la mediana
(+) | los medios son lineales (5.9% delta a la frecuencia anterior)
Altos 2 - 16 kHz
(+) | máximos equilibrados - a sólo 3.4% de la mediana
(+) | los máximos son lineales (3.8% delta a la frecuencia anterior)
Total 100 - 16.000 Hz
(±) | la linealidad del sonido global es media (19.1% de diferencia con la mediana)
En comparación con la misma clase
» 67% de todos los dispositivos probados de esta clase eran mejores, 6% similares, 28% peores
» El mejor tuvo un delta de 7%, la media fue 17%, el peor fue ###max##%
En comparación con todos los dispositivos probados
» 46% de todos los dispositivos probados eran mejores, 7% similares, 47% peores
» El mejor tuvo un delta de 4%, la media fue 24%, el peor fue ###max##%
Gestión de la energía - Blade Studio con batería utilizable
Consumo de energía
Cuando está inactivo, el dispositivo consume 26,1 vatios. Cuando estábamos probando el sistema, el consumo de energía alcanzó los 195 vatios. En The Witcher 3, el Blade 15 consumió 145 vatios de media (139 a 148 vatios). La potencia nominal del adaptador de CA es de 230 vatios. En total, el Blade 15 consume más energía que su predecesor.
| Off / Standby | |
| Ocioso | |
| Carga |
|
Clave:
min: | |
| Razer Blade 15 Studio Edition 2020 i7-10875H, Quadro RTX 5000 Max-Q | Razer Blade 15 Studio Edition i7-9750H, Quadro RTX 5000 Max-Q | Lenovo ThinkPad P53-20QN000YGE i7-9850H, Quadro RTX 5000 Max-Q | MSI P65 Creator 9SF-657 i9-9880H, GeForce RTX 2070 Max-Q | Dell Precision 5540 i9-9980HK, Quadro T2000 Max-Q | Medio NVIDIA Quadro RTX 5000 Max-Q | Media de la clase Workstation | |
|---|---|---|---|---|---|---|---|
| Power Consumption | 15% | 18% | 7% | 33% | 6% | 20% | |
| Idle Minimum * (Watt) | 13.4 | 13.2 1% | 7.9 41% | 9.4 30% | 7.4 45% | 10.4 ? 22% | 8.94 ? 33% |
| Idle Average * (Watt) | 18 | 15 17% | 11.8 34% | 17.4 3% | 12.1 33% | 16.1 ? 11% | 13.8 ? 23% |
| Idle Maximum * (Watt) | 26.1 | 17.4 33% | 14.9 43% | 19.6 25% | 12.7 51% | 23.8 ? 9% | 17.5 ? 33% |
| Load Average * (Watt) | 115 | 99 14% | 96 17% | 103 10% | 98 15% | 109.5 ? 5% | 95 ? 17% |
| Witcher 3 ultra * (Watt) | 145 | 149 -3% | 89.9 38% | ||||
| Load Maximum * (Watt) | 165 | 148 10% | 207.8 -26% | 216 -31% | 135.1 18% | 189.5 ? -15% | 175.2 ? -6% |
* ... más pequeño es mejor
Duración de la batería
El Blade 15 dura 5 h 41 m en nuestra prueba de Wi-Fi orientada a la práctica, en la que ejecutamos un script que simula cargas que son consistentes con la navegación web. El portátil de 15,6 pulgadas alcanza una autonomía de 6 h 23 m en nuestra prueba de vídeo. En esta prueba, reproducimos el cortometraje Big Buck Bunny (H.264, 1920x1080) en un bucle continuo. Ajustes del sistema: Las funciones de ahorro de energía y los módulos de comunicación están apagados (sólo en la prueba de vídeo), el brillo se ajusta a 150 cd/m².
| Razer Blade 15 Studio Edition 2020 i7-10875H, Quadro RTX 5000 Max-Q, 80 Wh | Razer Blade 15 Studio Edition i7-9750H, Quadro RTX 5000 Max-Q, 80 Wh | Lenovo ThinkPad P53-20QN000YGE i7-9850H, Quadro RTX 5000 Max-Q, 90 Wh | MSI P65 Creator 9SF-657 i9-9880H, GeForce RTX 2070 Max-Q, 82 Wh | Dell Precision 5540 i9-9980HK, Quadro T2000 Max-Q, 97 Wh | Media de la clase Workstation | |
|---|---|---|---|---|---|---|
| Duración de Batería | 5% | 49% | -10% | 39% | 67% | |
| Reader / Idle (h) | 8.8 | 9.6 9% | 9.6 9% | 15 70% | 26.1 ? 197% | |
| H.264 (h) | 6.4 | 7.6 19% | 9.8 53% | 10.6 66% | 9.51 ? 49% | |
| WiFi v1.3 (h) | 5.7 | 5.5 -4% | 11.1 95% | 6 5% | 7.7 35% | 8.53 ? 50% |
| Load (h) | 2 | 1.9 -5% | 2 0% | 1.1 -45% | 1.7 -15% | 1.429 ? -29% |
Pro
Contra
Veredicto
El Razer Blade 15 viene con un Quadro RTX 5000 Max-Q de NVIDIA y un Intel Core i7-10875H. Gracias a dos núcleos adicionales, el Core i7-10875H ofrece más rendimiento que el chip Coffee Lake hexa-core del modelo predecesor. Aunque no se trata de un portátil para juegos, el Blade 15 Studio Edition puede ejecutar sin problemas todos los títulos actuales
Razer le hizo un lifting a la edición de estudio del Blade 15 (2020). Una nueva arquitectura de CPU asegura un aumento en el rendimiento y la selección de los puertos es mejor.
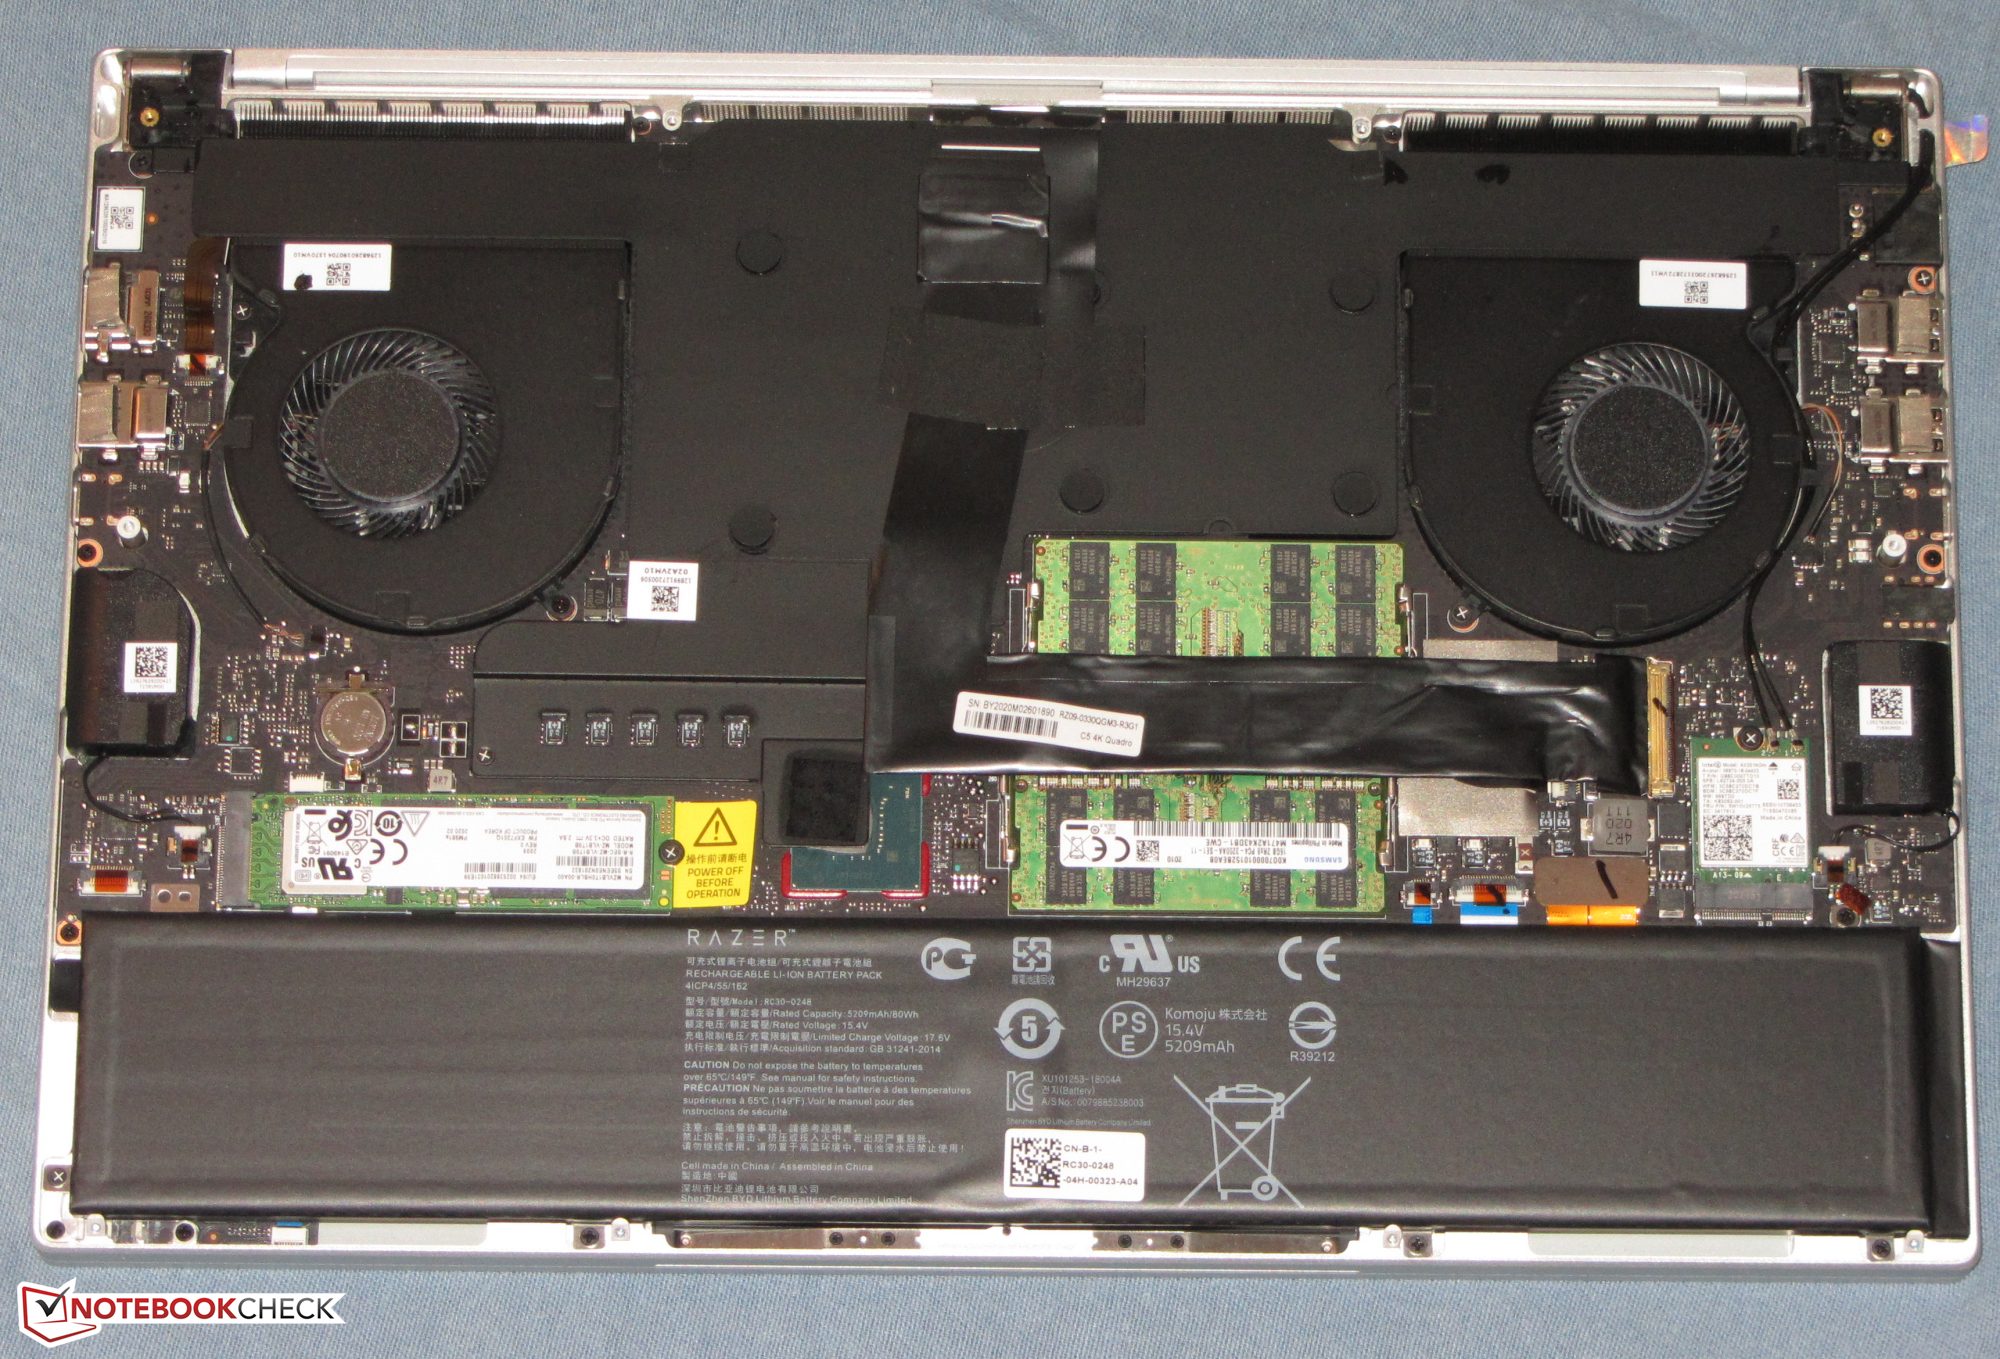
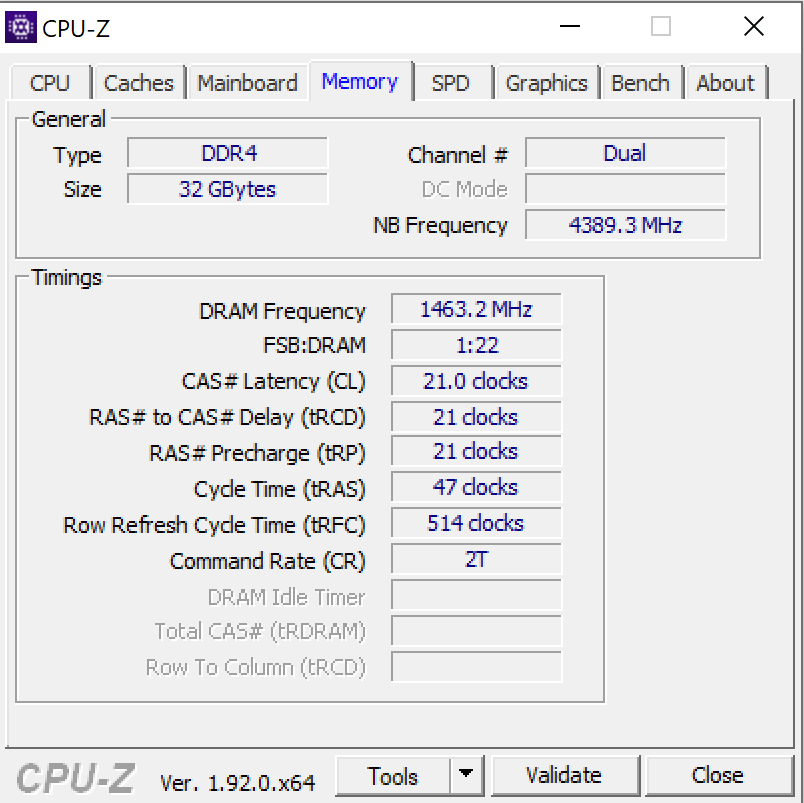
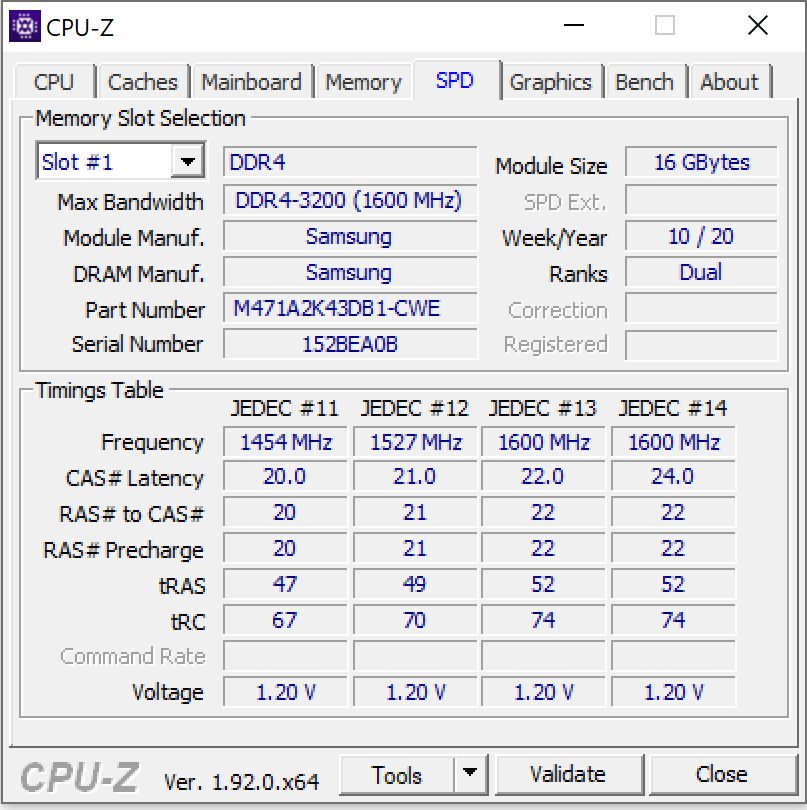
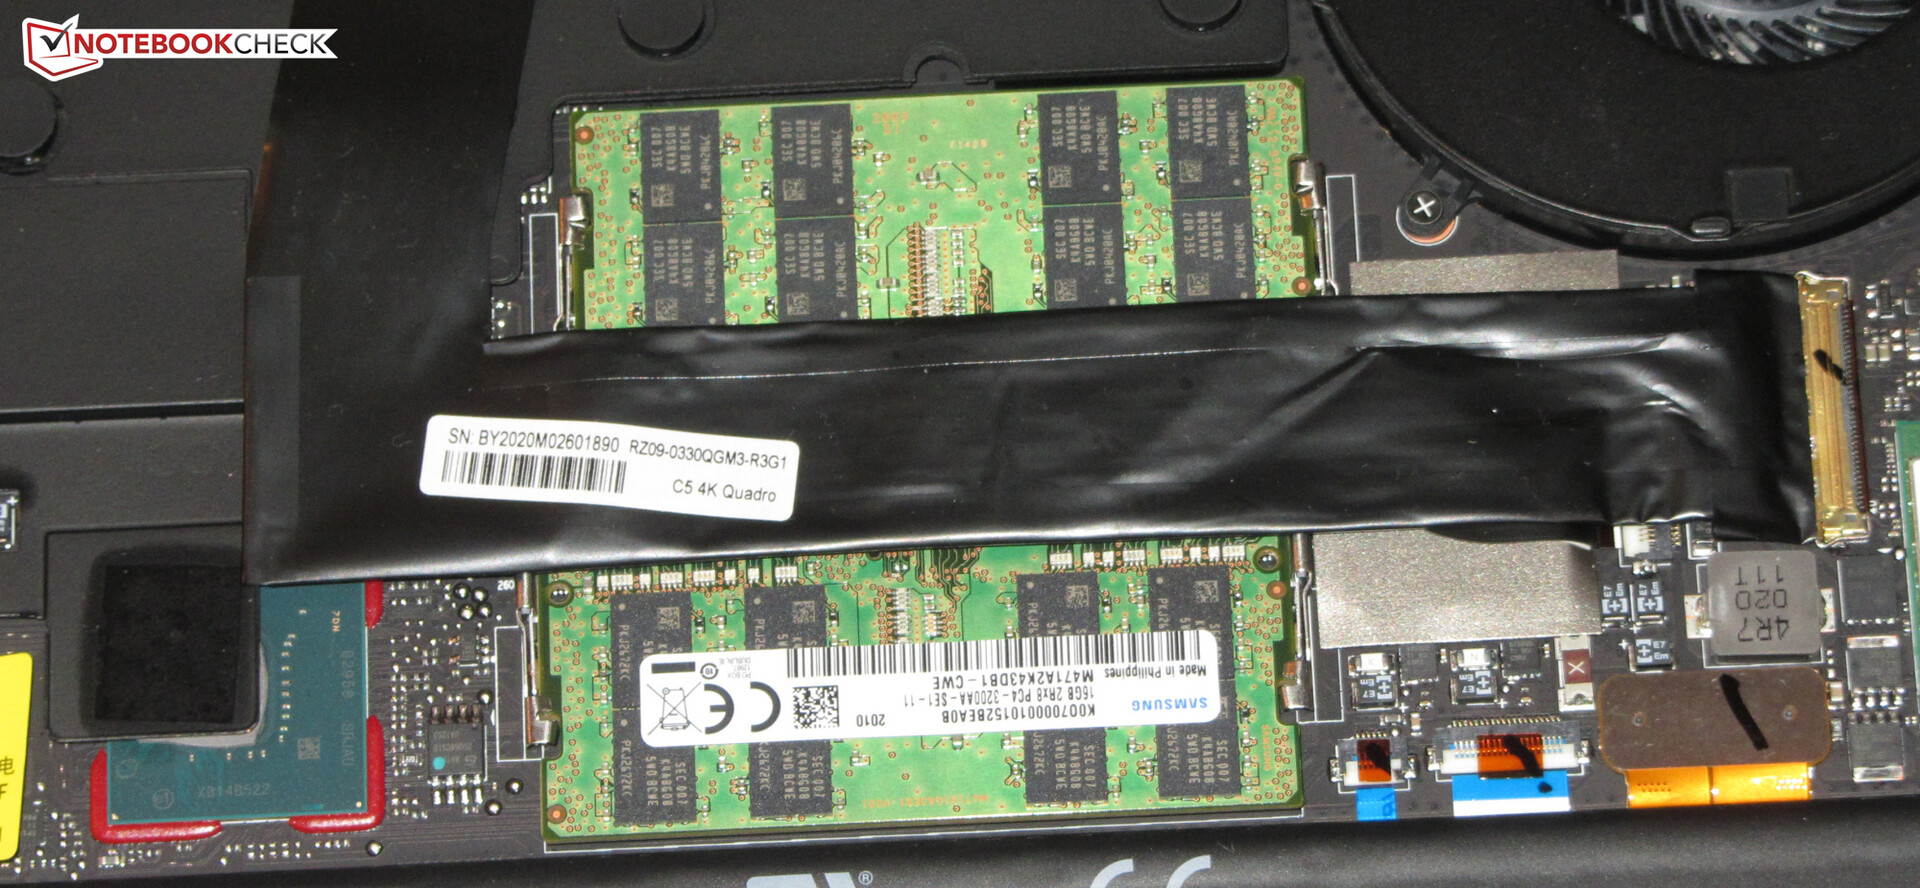
El sistema tiene 32 GB de RAM (funcionando en modo de doble canal) a su disposición. La cantidad de RAM puede ampliarse hasta 64 GB. El muy rápido SSD de 1 TB también puede ser actualizado. Ambas actualizaciones pueden realizarse fácilmente, ya que la tapa inferior puede retirarse sin dificultad.
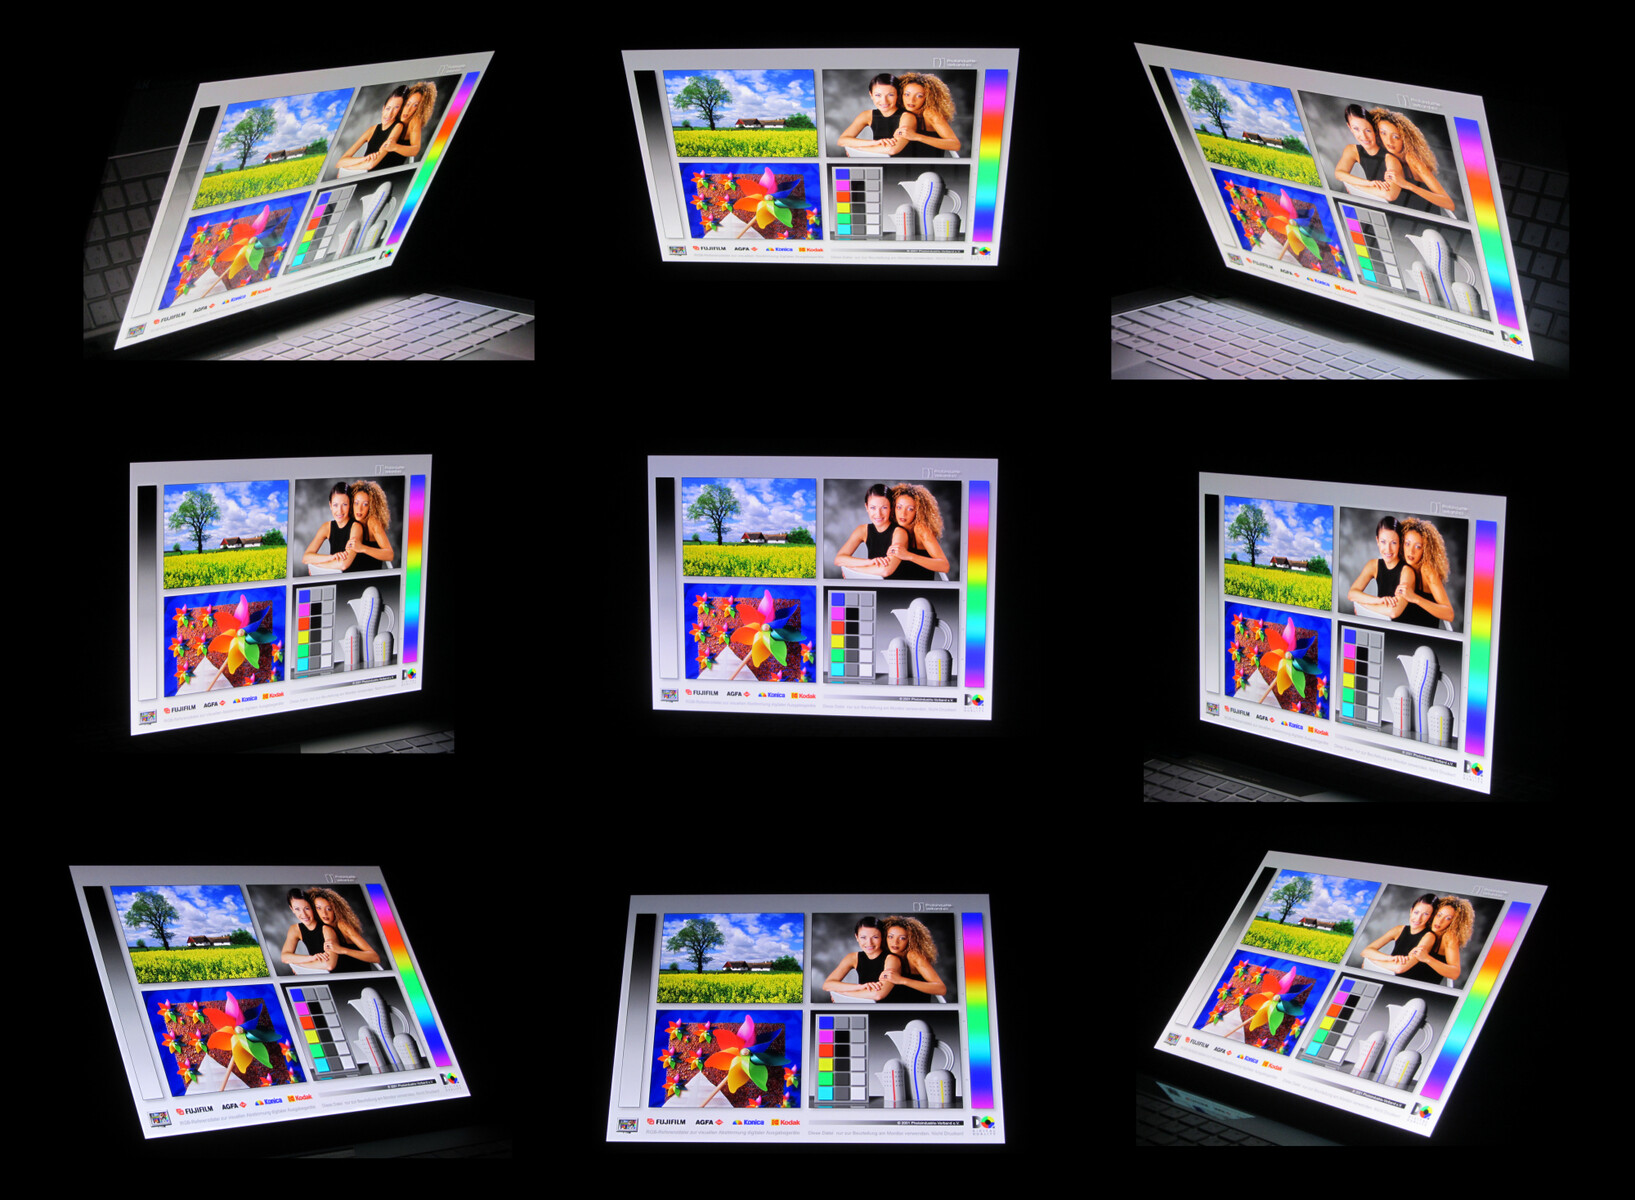
La pantalla táctil OLED 4K impresiona por su gran valor de negro, buen brillo, ángulos de visión estables, tiempos de respuesta rápidos y buena cobertura del espacio de color. Cubre el 100% del espacio de color sRGB. La reproducción del color es también bastante buena.
El puerto miniDP ha sido reemplazado por un puerto USB 3.2 Gen 2 Tipo-C, que puede emitir una señal DisplayPort. Los puertos Tipo A ahora también funcionan a velocidades USB 3.2 Gen 2. El puerto Thunderbolt 3 todavía está presente. Puede utilizarse para conectar estaciones de acoplamiento o GPU externas al dispositivo. La batería del Blade 15 puede cargarse a través del puerto Thunderbolt 3. Pudimos cargar el dispositivo con un adaptador de corriente de 45 vatios.
Razer Blade 15 Studio Edition 2020
- 08/03/2020 v7 (old)
Sascha Mölck