Análisis del portátil Eurocom Nightsky TXi317: 125 W GeForce RTX 3080 Ti speedster
")
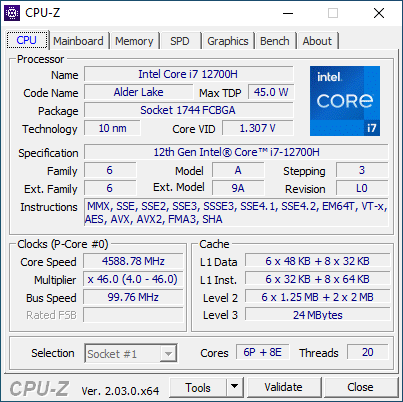
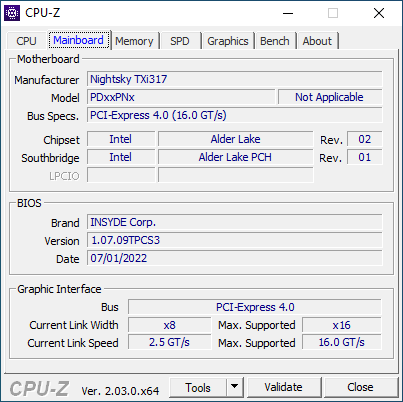
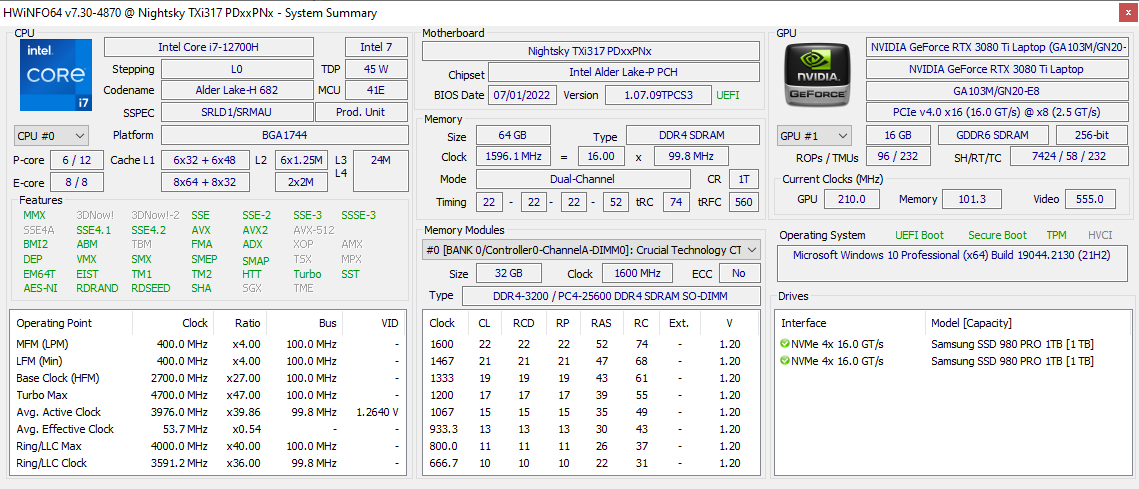
El Nightsky TXi317 es el último portátil para juegos de 17,3 pulgadas de Eurocom que utiliza las CPU Alder Lake-H de 12ª generación de Intel y una GPU GeForce RTX 3080 Ti de 155 W para ser uno de los portátiles para juegos más rápidos disponibles actualmente. Comparte el mismo diseño de chasis Tongfang que el Schenker XMG Pro 17 E22, por lo que recomendamos consultar nuestro análisis existente aquí para más detalles sobre el chasis y sus características físicas.
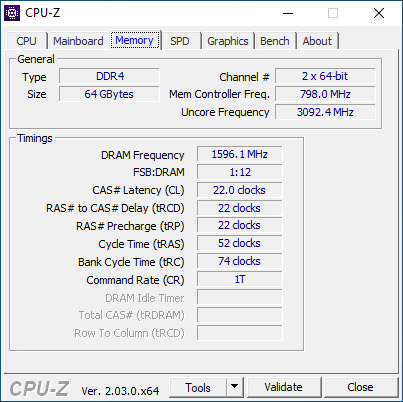
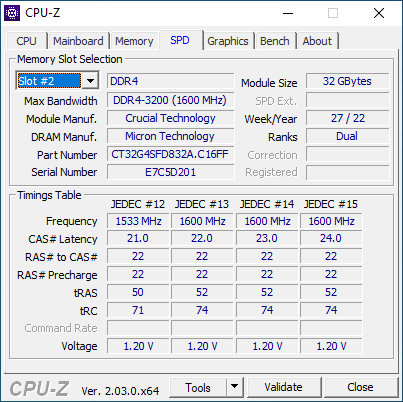
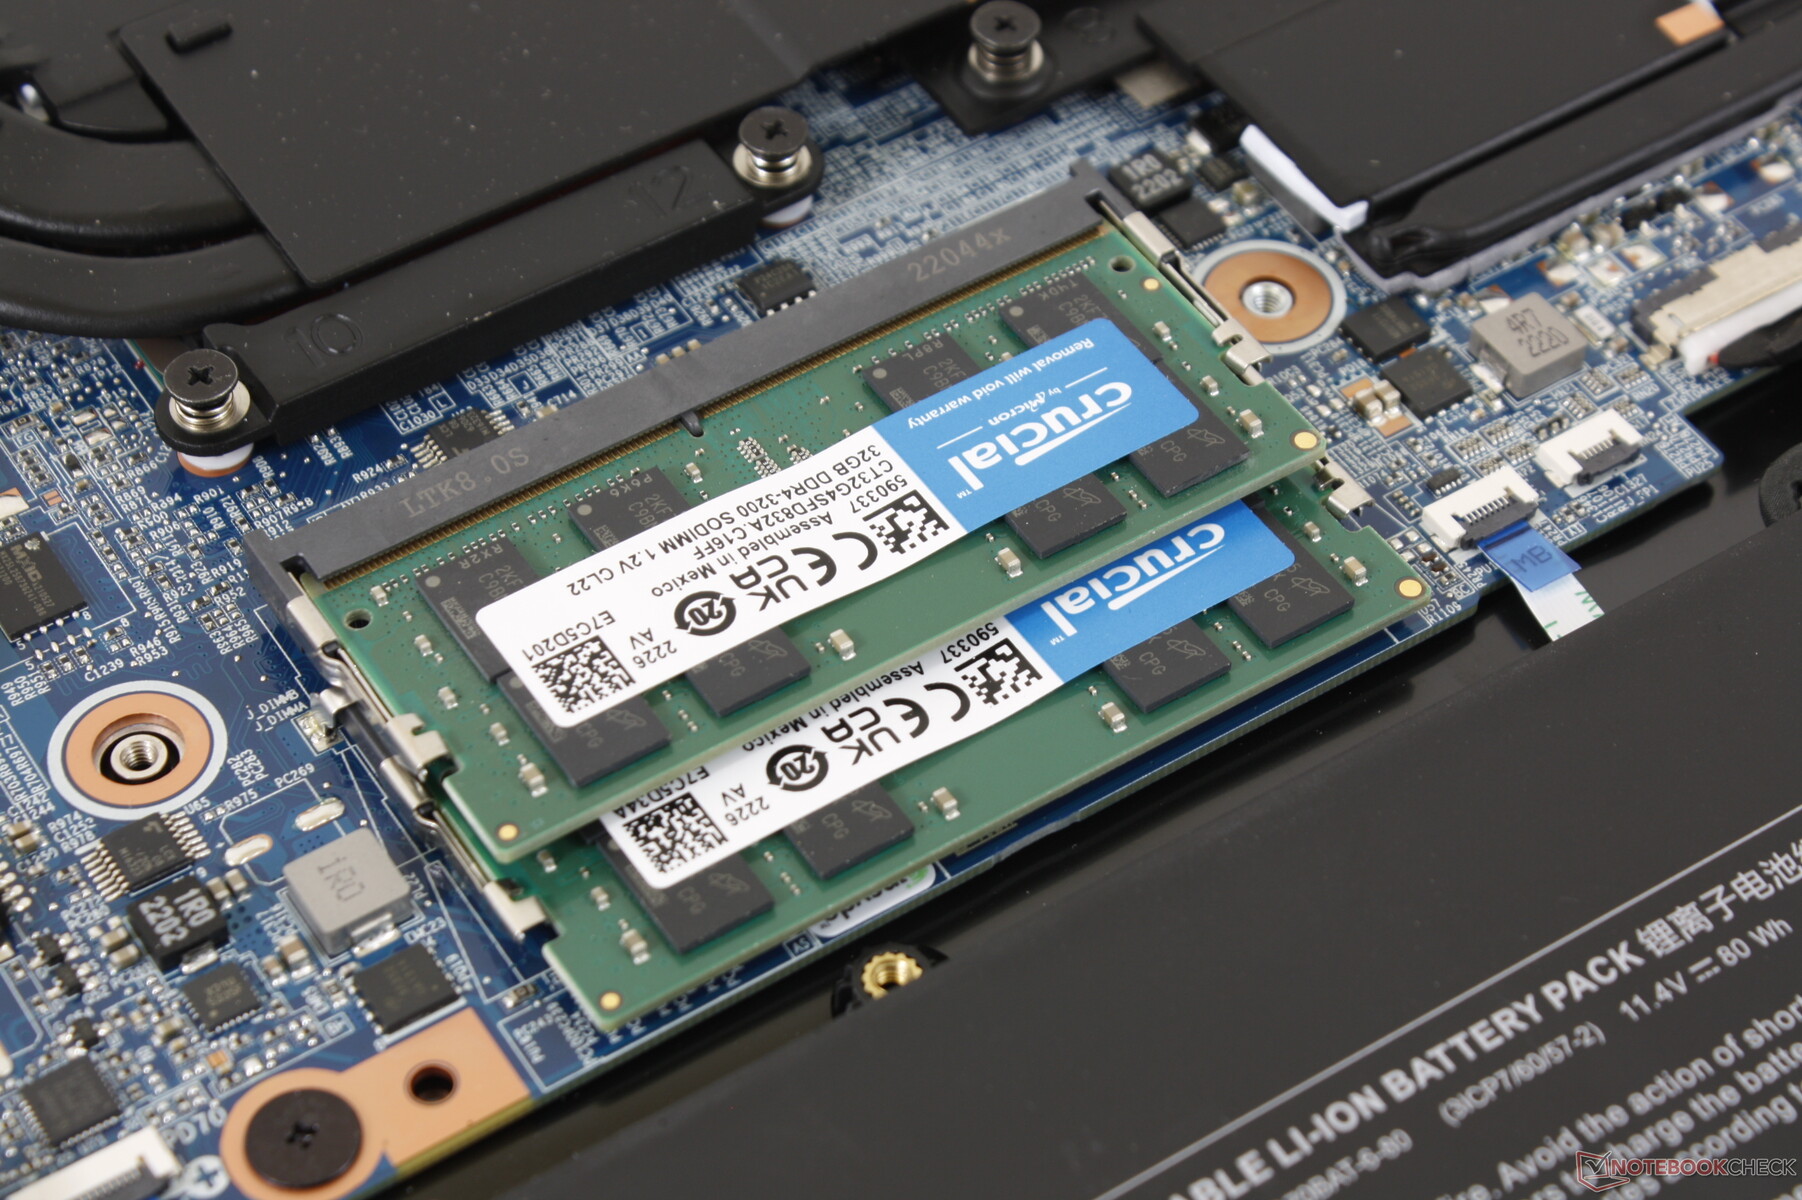
Nuestra configuración de análisis viene equipada con la CPU Core i7-12700H, pantalla IPS 1080p a 144 Hz, GPU GeForce RTX 3080 Ti y 64 GB de RAM por unos 4100 dólares. La opción de GPU más baja es la GeForce RTX 3070 Ti, lo que sitúa al Nightsky TXi317 directamente en el mercado de portátiles de juego para entusiastas.
Entre los competidores directos se encuentran otros portátiles para juegos de 17 pulgadas de alto rendimiento como el Aorus 17X,MSI Raider GE77o elAlienware x17 R2.
Más reseñas de Eurocom:
Posibles contendientes en la comparación
Valoración | Fecha | Modelo | Peso | Altura | Tamaño | Resolución | Precio |
|---|---|---|---|---|---|---|---|
| 85.3 % v7 (old) | 10/2022 | Eurocom Nightsky TXi317 i7-12700H, GeForce RTX 3080 Ti Laptop GPU | 2.9 kg | 27 mm | 17.30" | 1920x1080 | |
| 85.4 % v7 (old) | 07/2022 | Schenker XMG Pro 17 E22 i9-12900H, GeForce RTX 3080 Ti Laptop GPU | 2.8 kg | 27 mm | 17.30" | 2560x1440 | |
| 83.7 % v7 (old) | 08/2022 | Aorus 17X XES i9-12900HX, GeForce RTX 3070 Ti Laptop GPU | 2.7 kg | 30 mm | 17.30" | 1920x1080 | |
| 86.8 % v7 (old) | 07/2022 | MSI Raider GE77 HX 12UHS i9-12900HX, GeForce RTX 3080 Ti Laptop GPU | 3.1 kg | 25.9 mm | 17.30" | 3840x2160 | |
| 89.9 % v7 (old) | 07/2022 | Razer Blade 17 Early 2022 i9-12900H, GeForce RTX 3080 Ti Laptop GPU | 2.8 kg | 19.9 mm | 17.30" | 3840x2160 | |
| 89.2 % v7 (old) | 05/2022 | Alienware x17 R2 P48E i9-12900HK, GeForce RTX 3080 Ti Laptop GPU | 3.1 kg | 20.9 mm | 17.30" | 1920x1080 |
Caso
Hay una diferencia superficial entre el Nightsky TXi317 y el XMG Pro 17 E22: las esquinas traseras del diseño de Eurocom incorporan adornos brillantes de color bronce, mientras que el diseño de Schenker no. Por lo demás, los diseños de sus chasis son idénticos.
Lector de tarjetas SD
| SD Card Reader | |
| average JPG Copy Test (av. of 3 runs) | |
| Alienware x17 R2 P48E (AV Pro V60) | |
| Razer Blade 17 Early 2022 (AV PRO microSD 128 GB V60) | |
| Schenker XMG Pro 17 E22 (AV PRO microSD 128 GB V60) | |
| MSI Raider GE77 HX 12UHS (AV PRO microSD 128 GB V60) | |
| Eurocom Nightsky TXi317 (AV Pro V60) | |
| maximum AS SSD Seq Read Test (1GB) | |
| Alienware x17 R2 P48E (AV Pro V60) | |
| Eurocom Nightsky TXi317 (AV Pro V60) | |
| Schenker XMG Pro 17 E22 (AV PRO microSD 128 GB V60) | |
Comunicación
El Wi-Fi 6 viene de serie y el fabricante no ofrece ninguna opción de Wi-Fi 6E a pesar del elevado precio del modelo. Las tasas de transferencia son, no obstante, constantes y sin problemas de conectividad.
| Networking | |
| iperf3 transmit AX12 | |
| Alienware x17 R2 P48E | |
| iperf3 receive AX12 | |
| Alienware x17 R2 P48E | |
| iperf3 receive AXE11000 6GHz | |
| Aorus 17X XES | |
| MSI Raider GE77 HX 12UHS | |
| iperf3 receive AXE11000 | |
| Schenker XMG Pro 17 E22 | |
| Razer Blade 17 Early 2022 | |
| Eurocom Nightsky TXi317 | |
| iperf3 transmit AXE11000 6GHz | |
| Aorus 17X XES | |
| iperf3 transmit AXE11000 | |
| Eurocom Nightsky TXi317 | |
Cámara web
La cámara es de sólo 1 MP, sin opciones de 2 MP, lo que vuelve a ser decepcionante teniendo en cuenta el elevado precio del modelo.


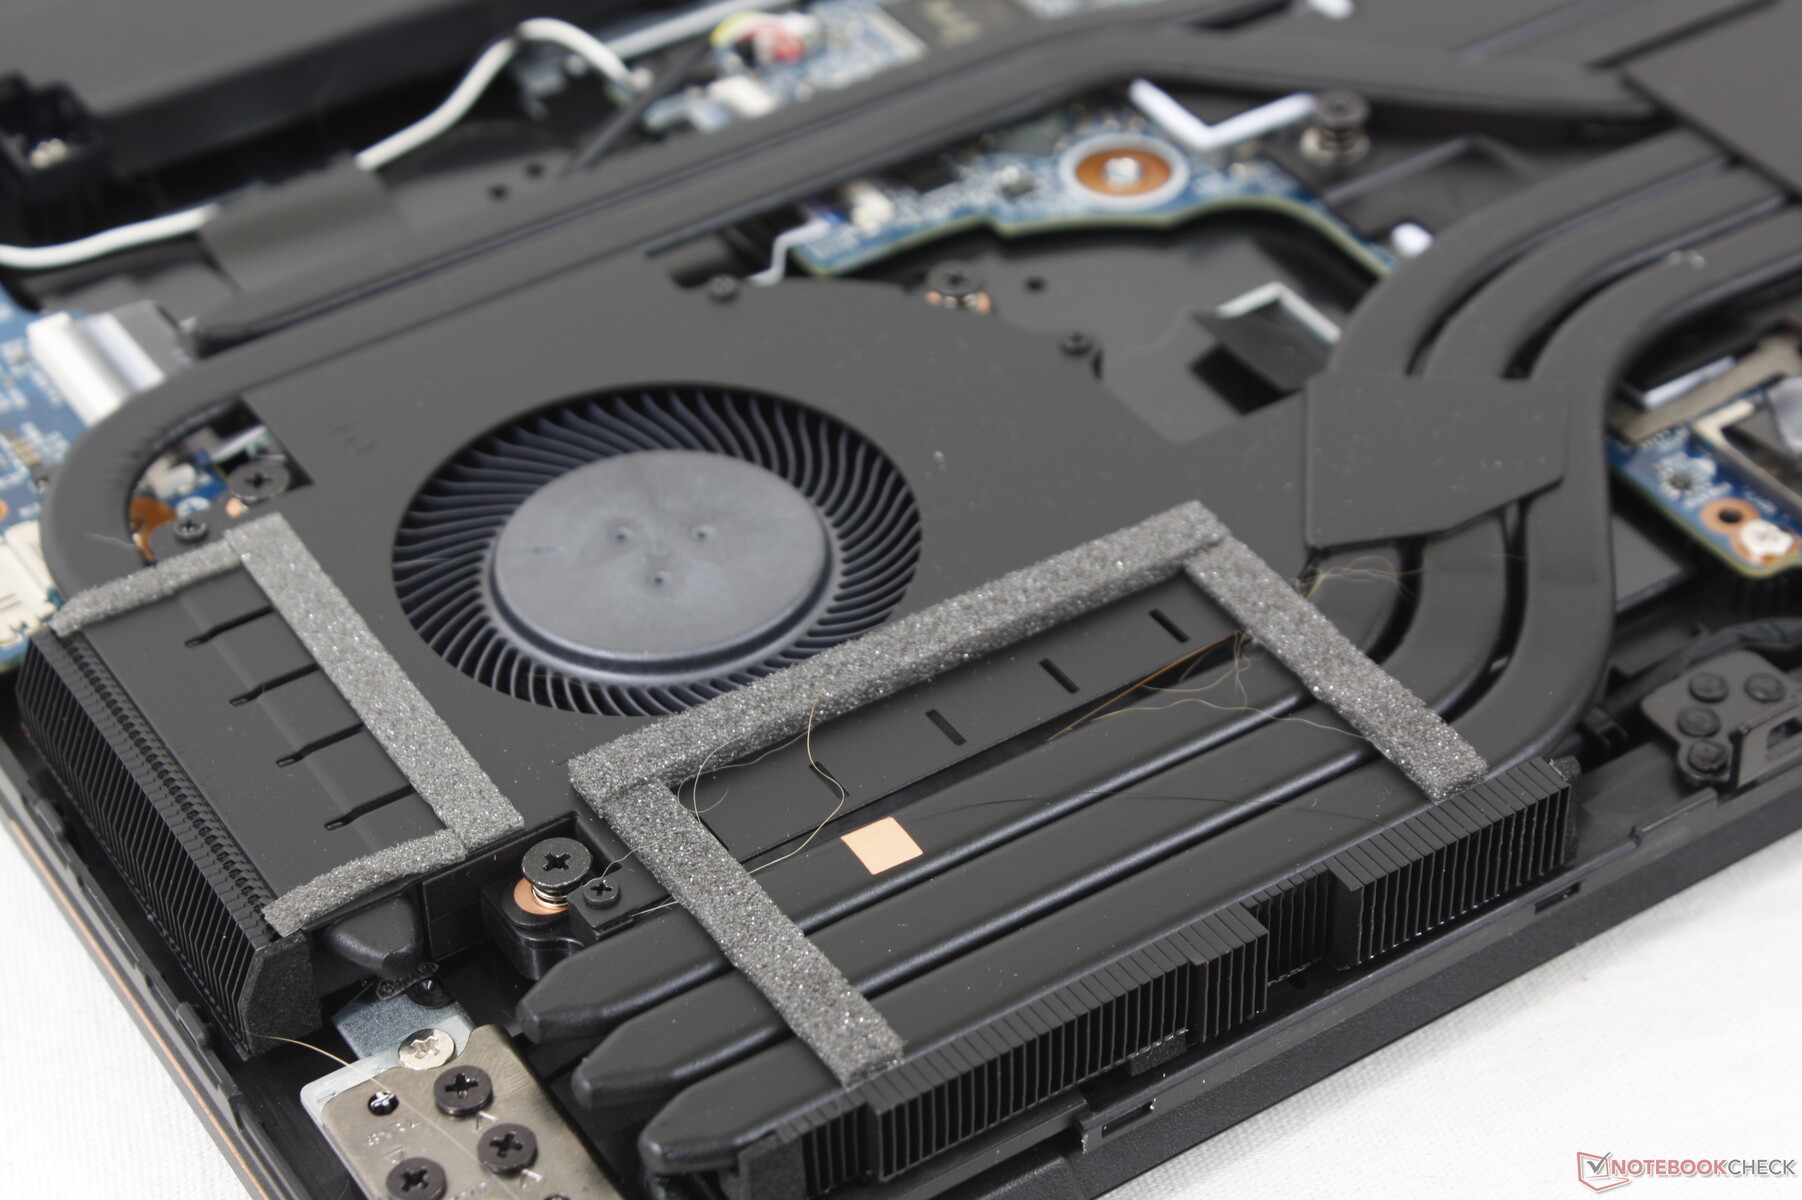
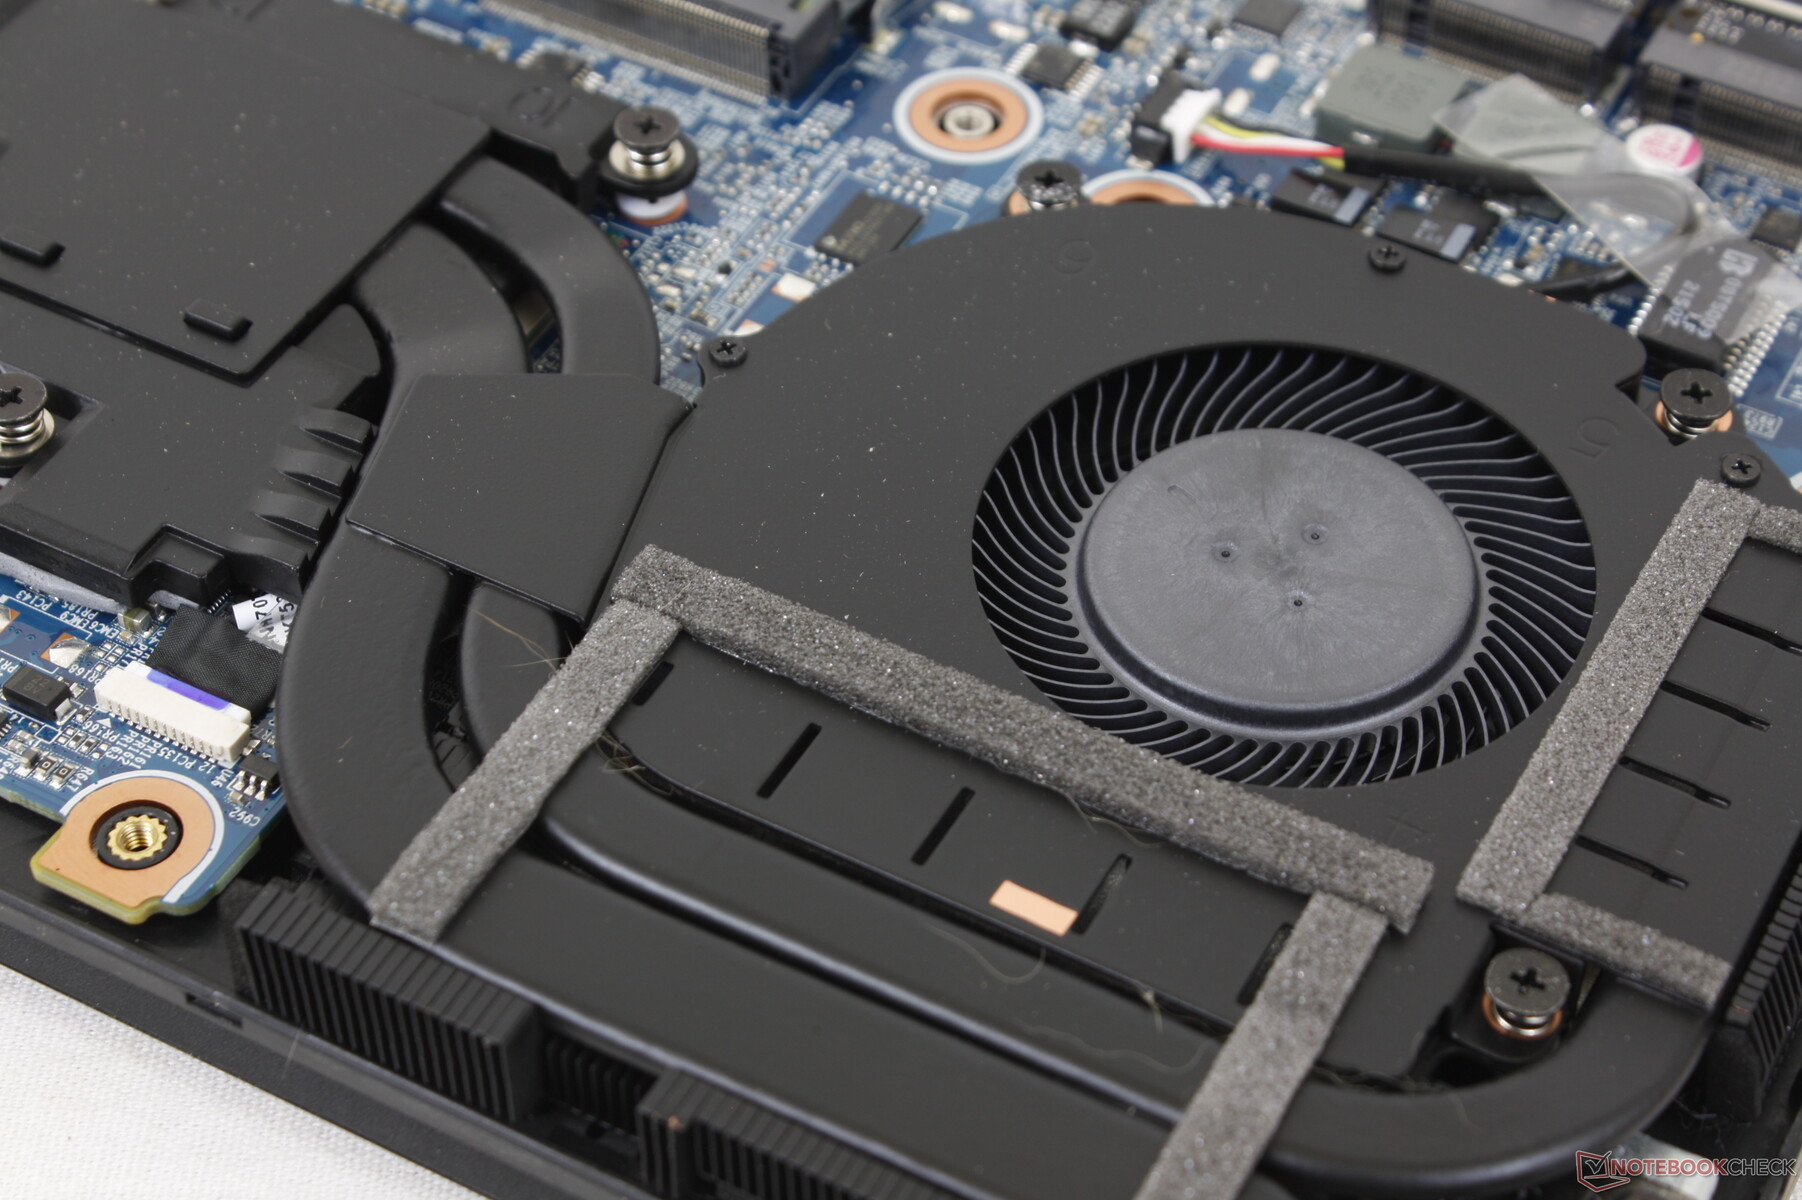
Mantenimiento
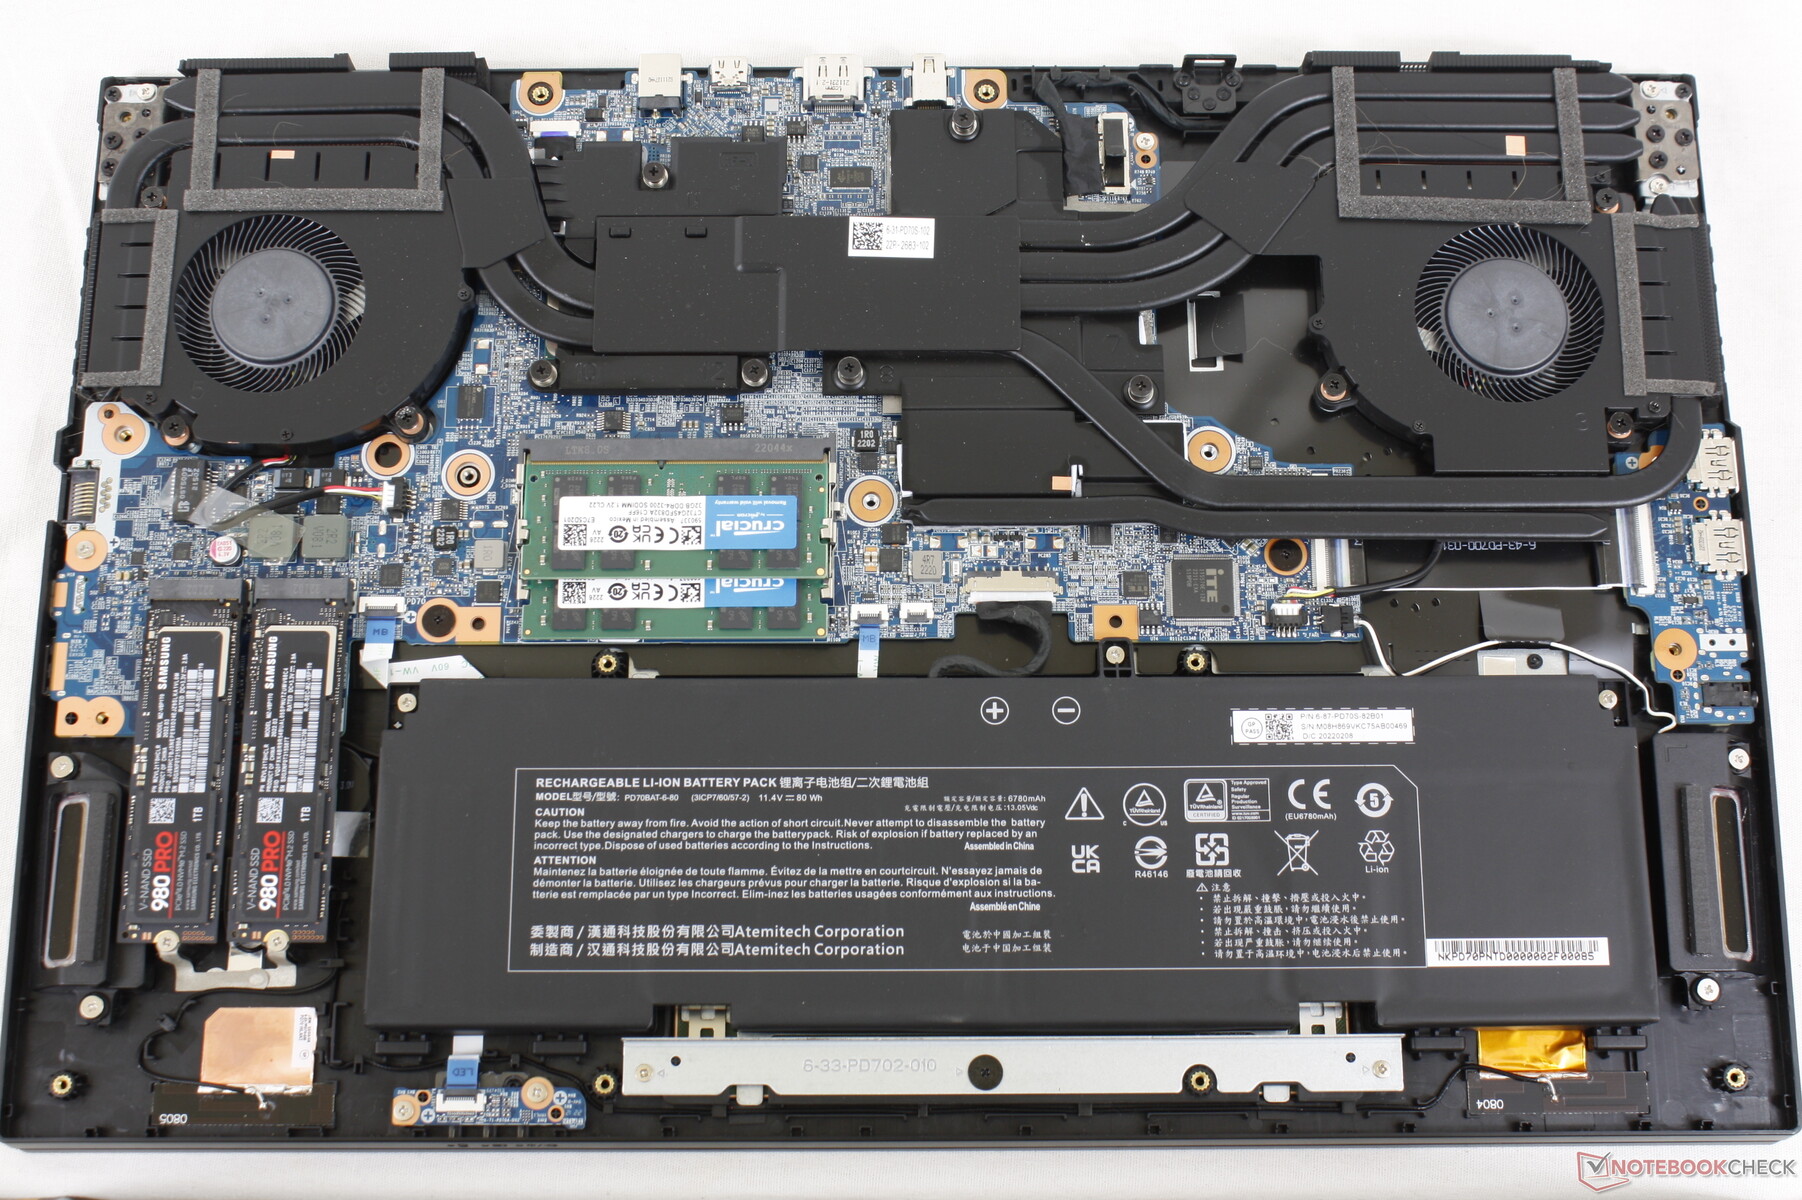
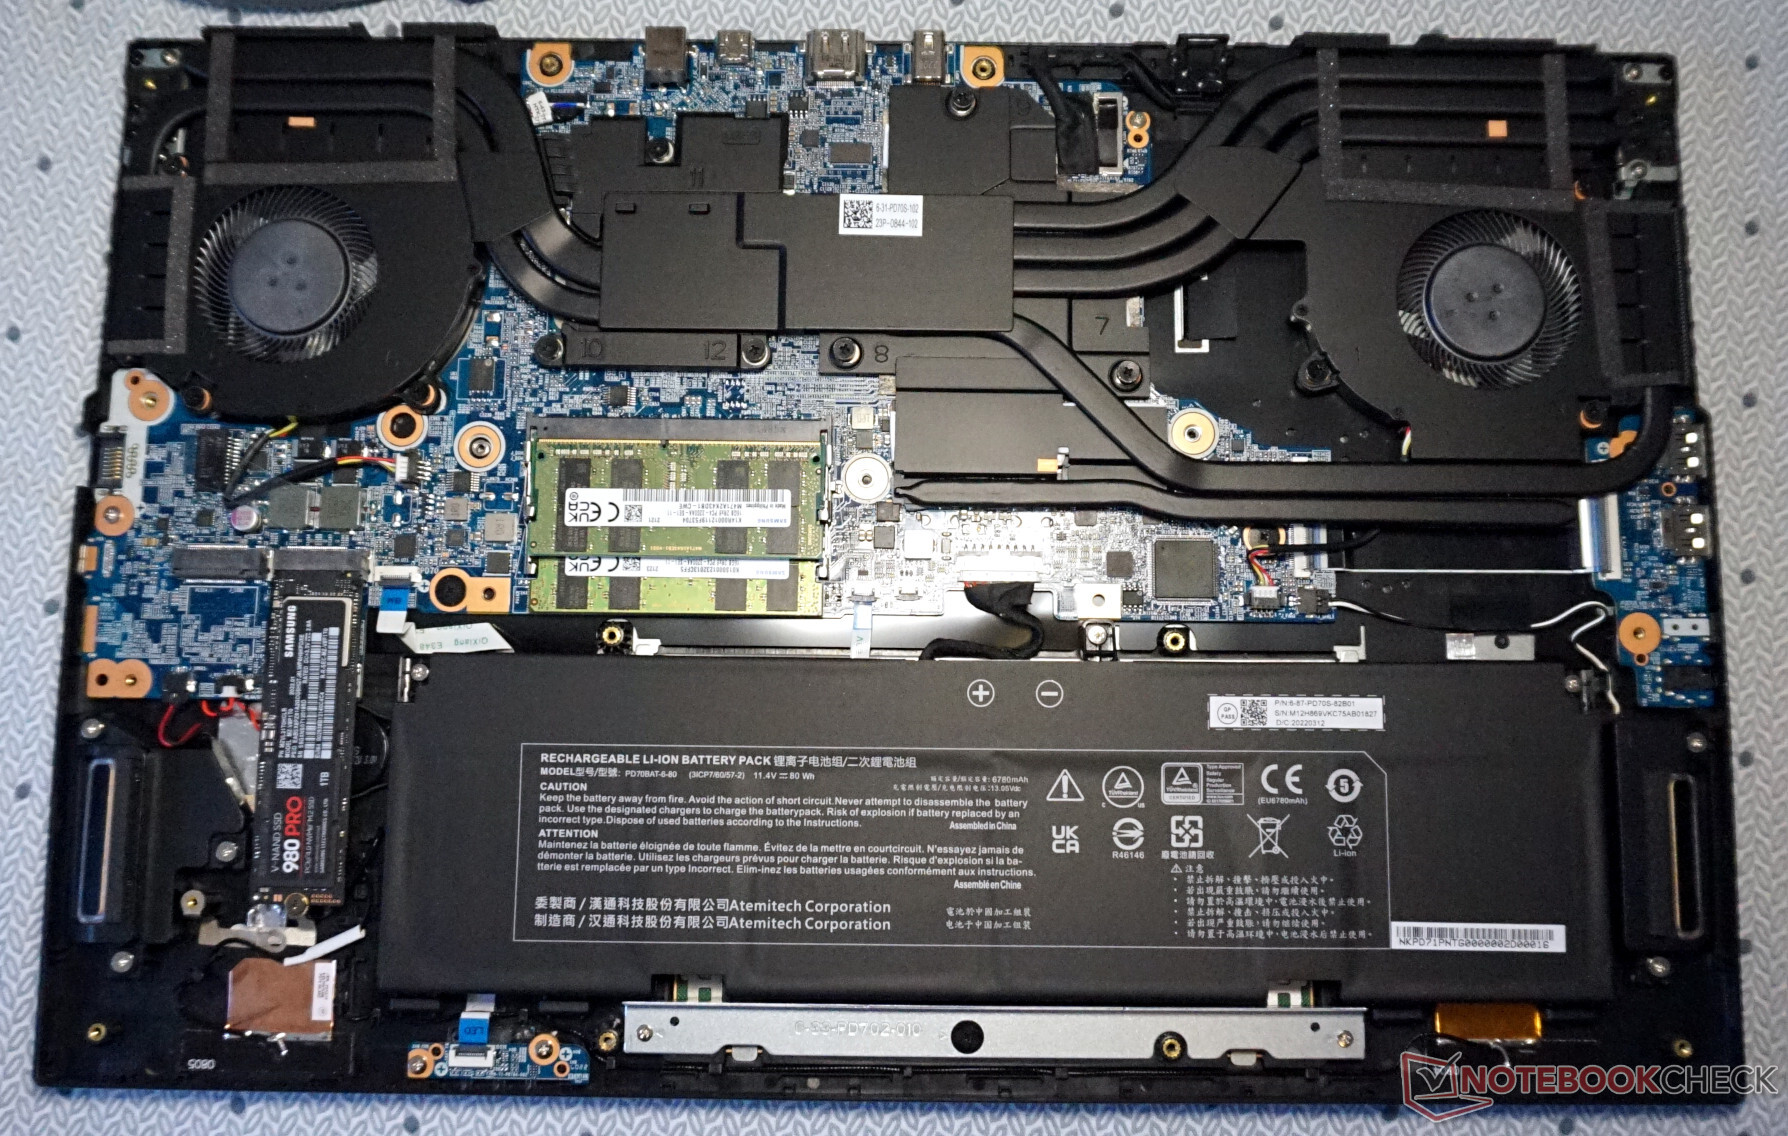
El panel inferior está asegurado por 16 tornillos Philips para facilitar el mantenimiento. Sin embargo, la mayoría de los otros portátiles para juegos tienen muchos menos tornillos, por lo que se necesita un poco más de paciencia para abrir el Eurocom.
Accesorios y garantía
La caja de venta al público no incluye más extras que el adaptador de CA y la documentación. La garantía estándar de un año limitada del fabricante se aplica si se compra en los Estados Unidos.
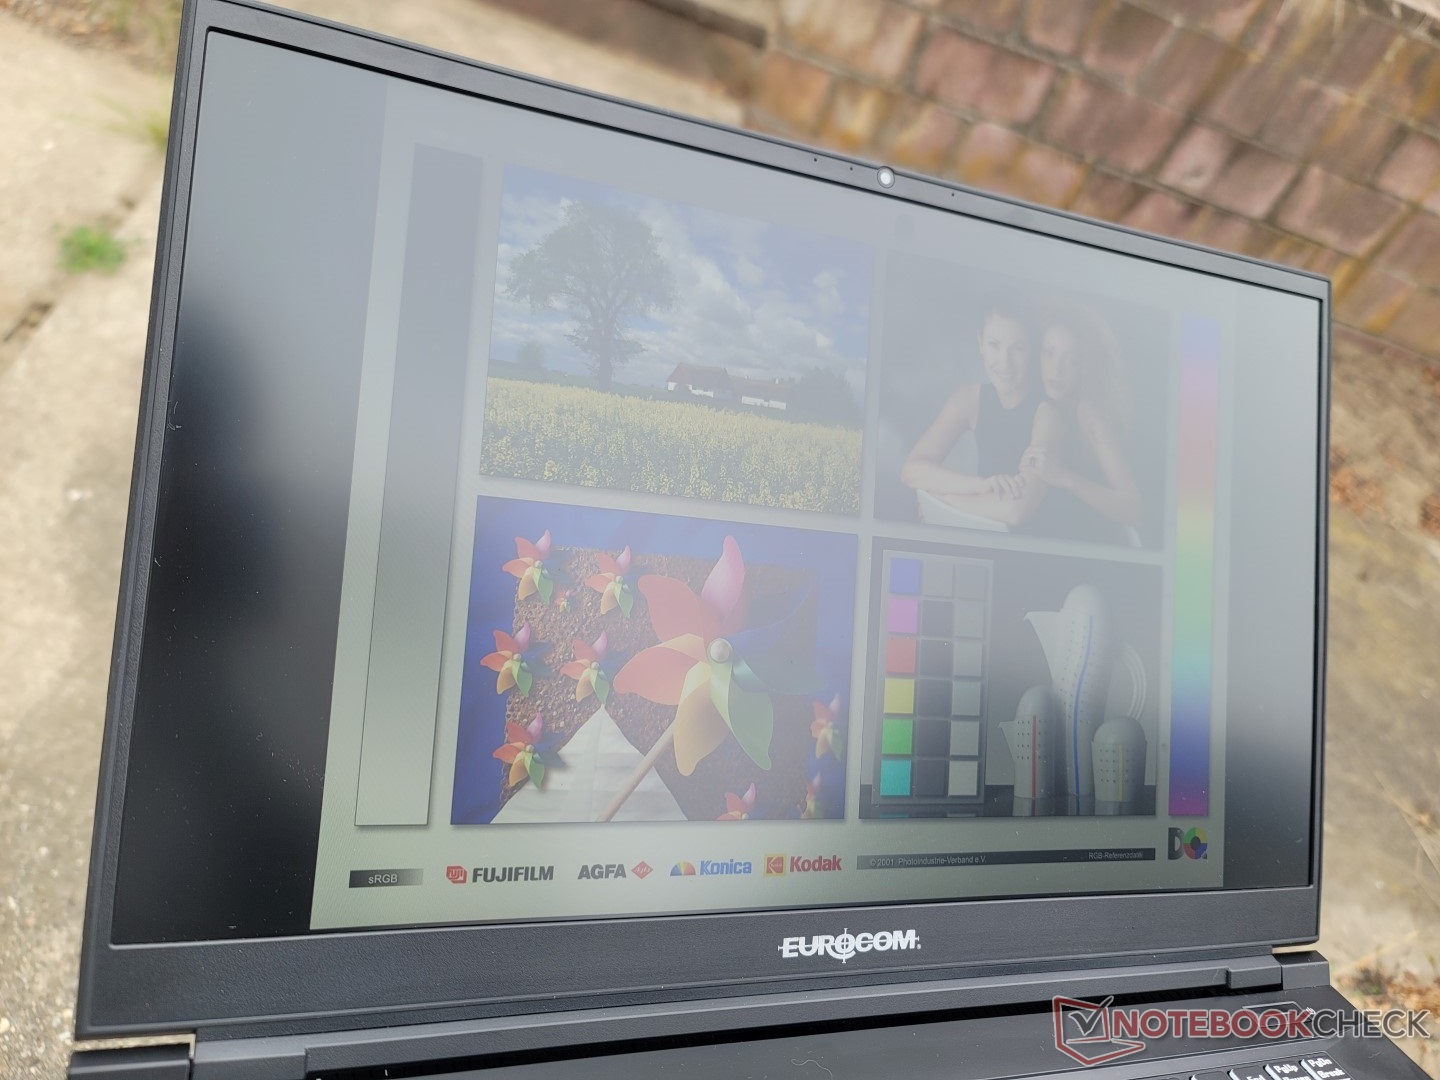
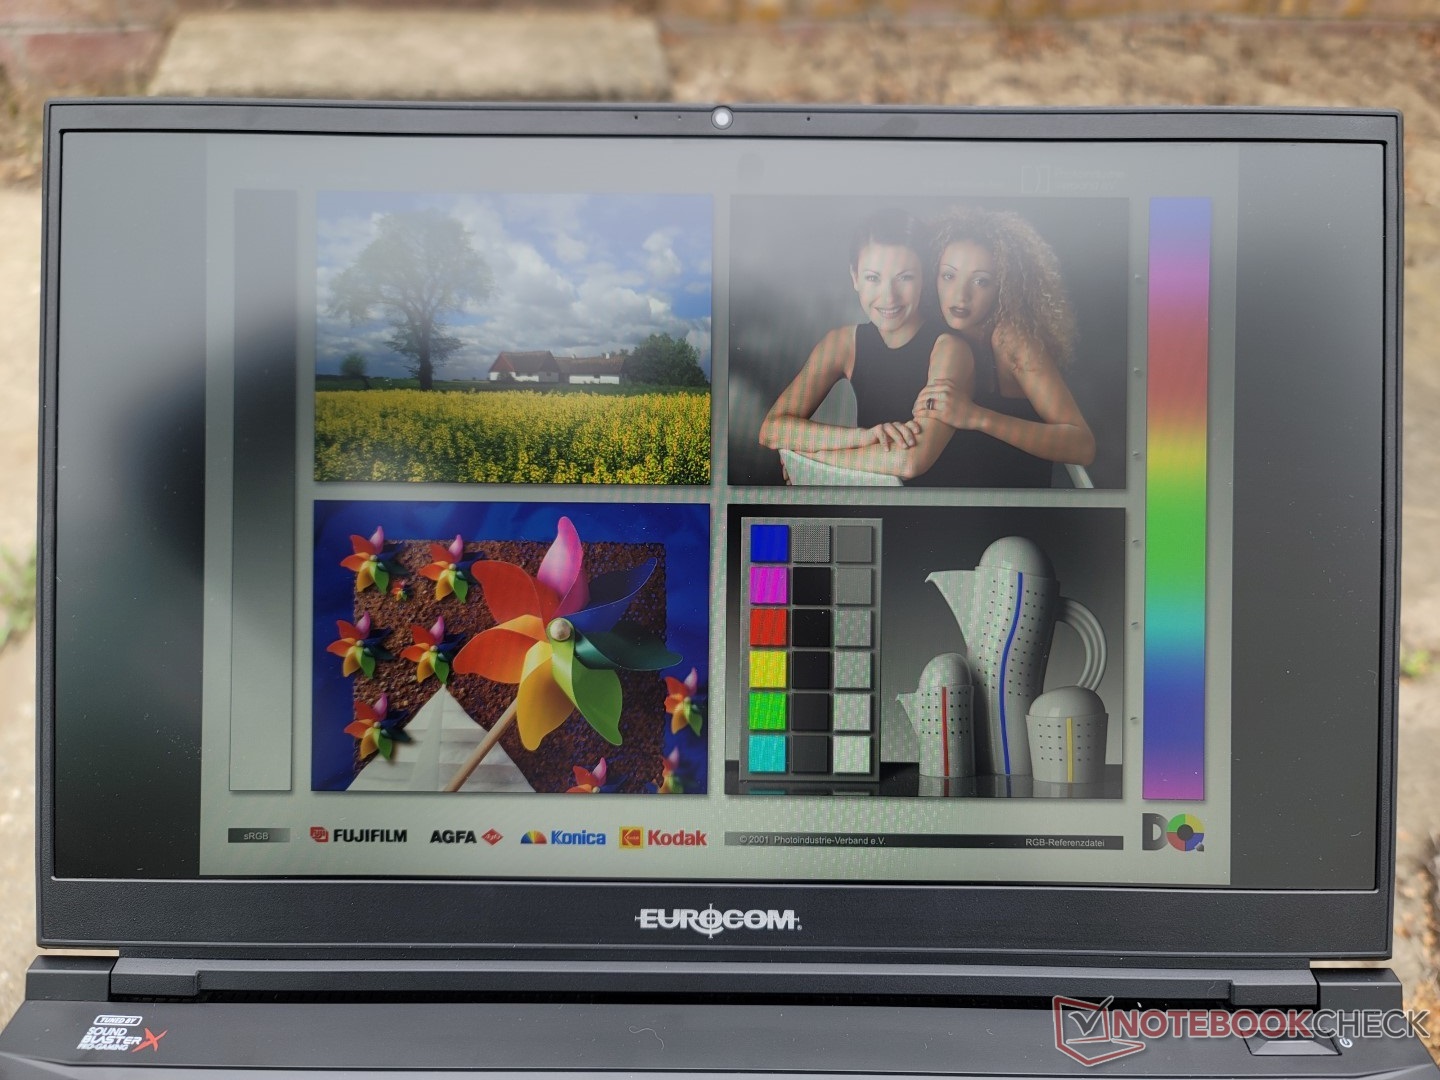
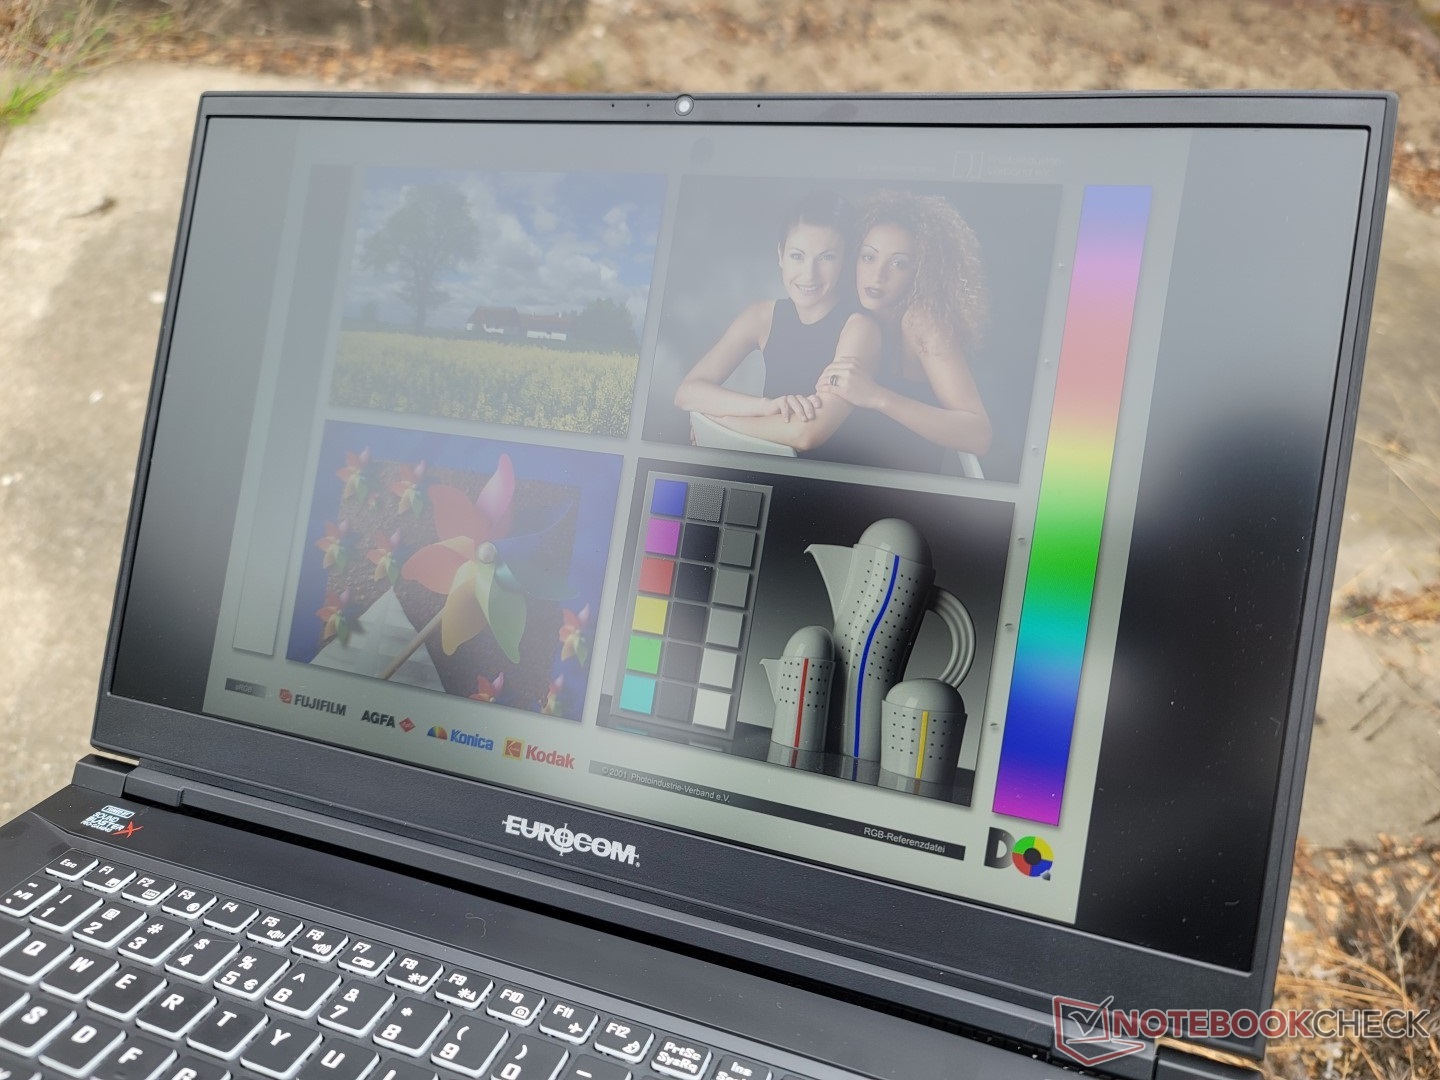
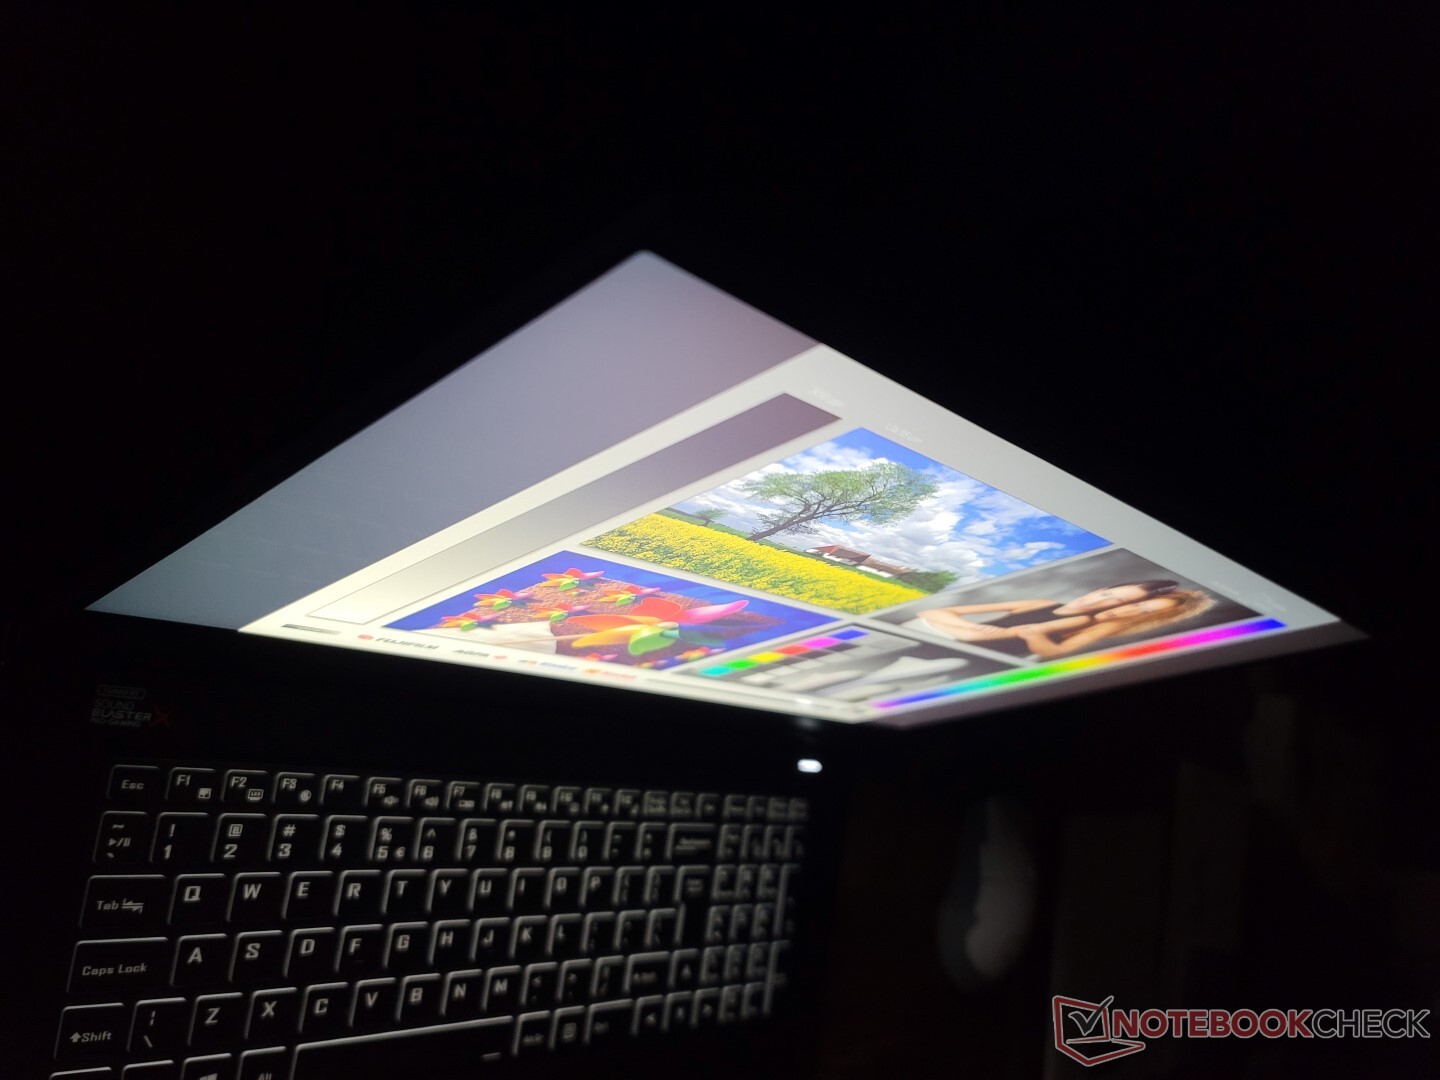
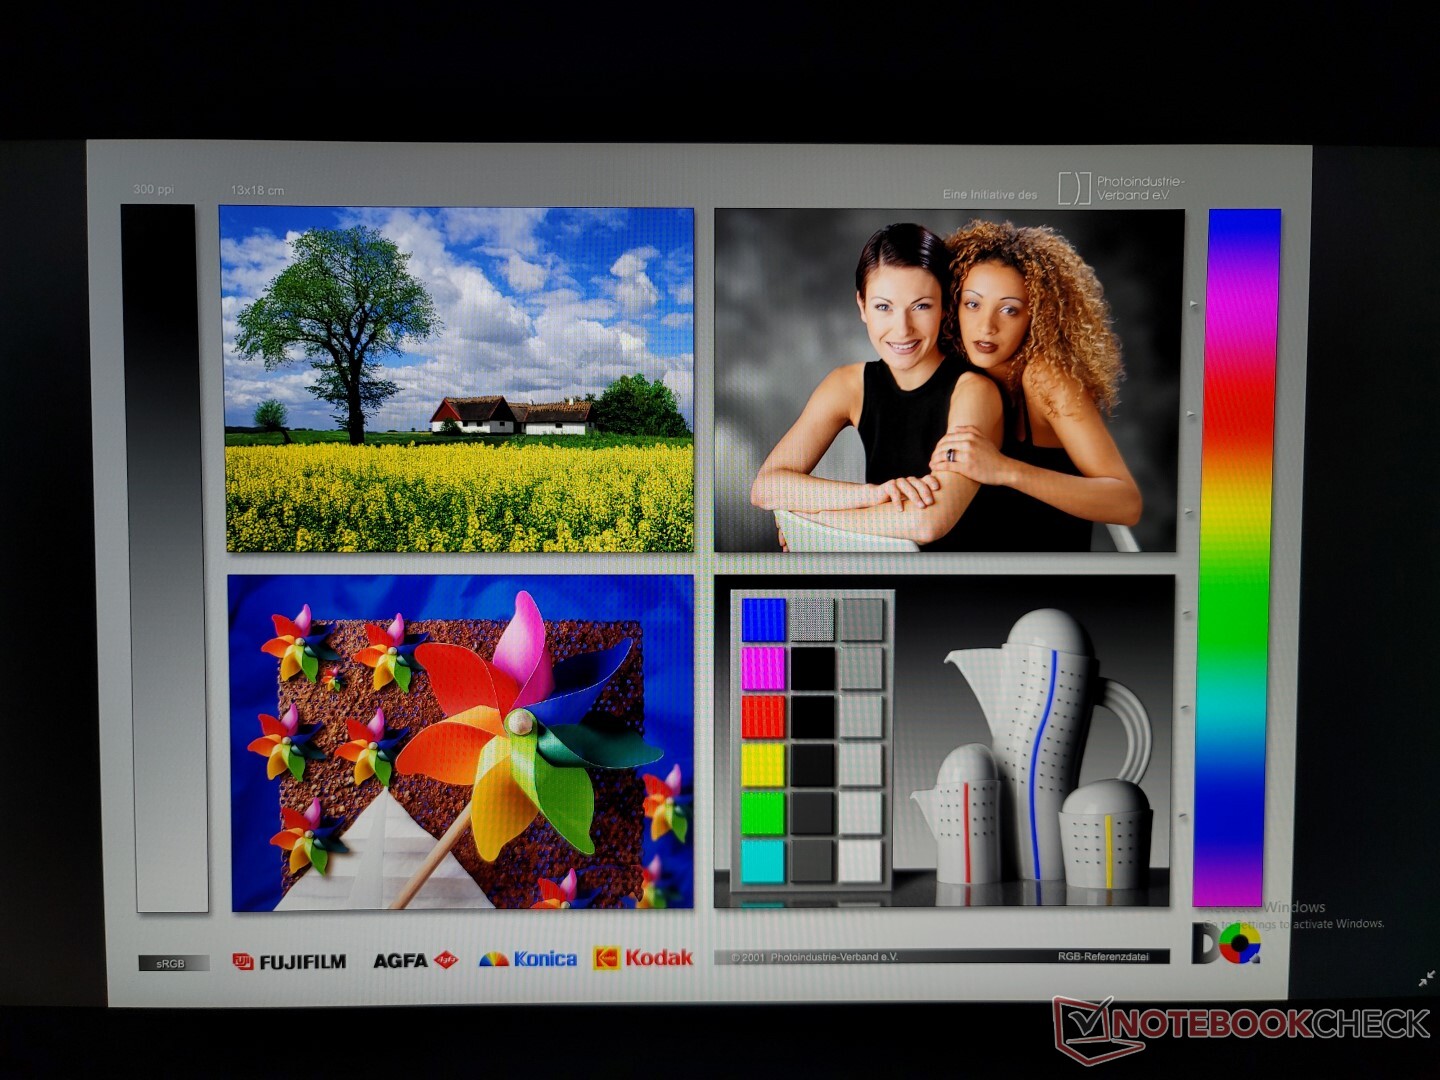
Mostrar
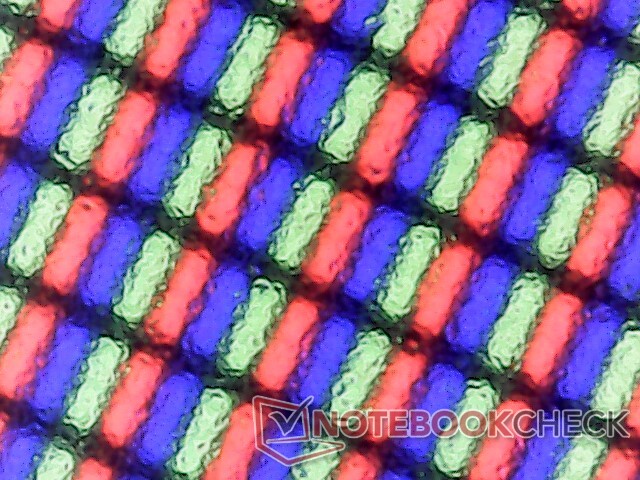
Nuestra unidad de prueba utiliza el mismo panel IPS LG Philips LP173WFG-SPB3 que se encuentra en el Schenker XMG Focus 17. Si lo comparamos con el panel BOE de 1440p del XMG Pro 17 E22, nuestro panel LG Philips de 1080p ofrece colores más estrechos, una frecuencia de refresco más lenta y tiempos de respuesta en blanco y negro más lentos para ser más una pantalla de gama media que una de gama alta. No obstante, sigue siendo muy bueno, pero 1440p es definitivamente mejor que 1080p para un portátil que funciona con una GPU GeForce RTX 3080 Ti.
Por suerte, el TXi317 viene con tres paneles a elegir que van de 1080p a 4K. Hay que tener en cuenta que ninguno es OLED ni puede ofrecer una cobertura completa de AdobeRGB.
- 1080p, 144 Hz, 100% sRGB, IPS
- 1440p, 165 Hz, 100% sRGB, IPS
- 2160p, 60 Hz, 100% sRGB, IPS
| |||||||||||||||||||||||||
iluminación: 88 %
Brillo con batería: 303.9 cd/m²
Contraste: 1013:1 (Negro: 0.3 cd/m²)
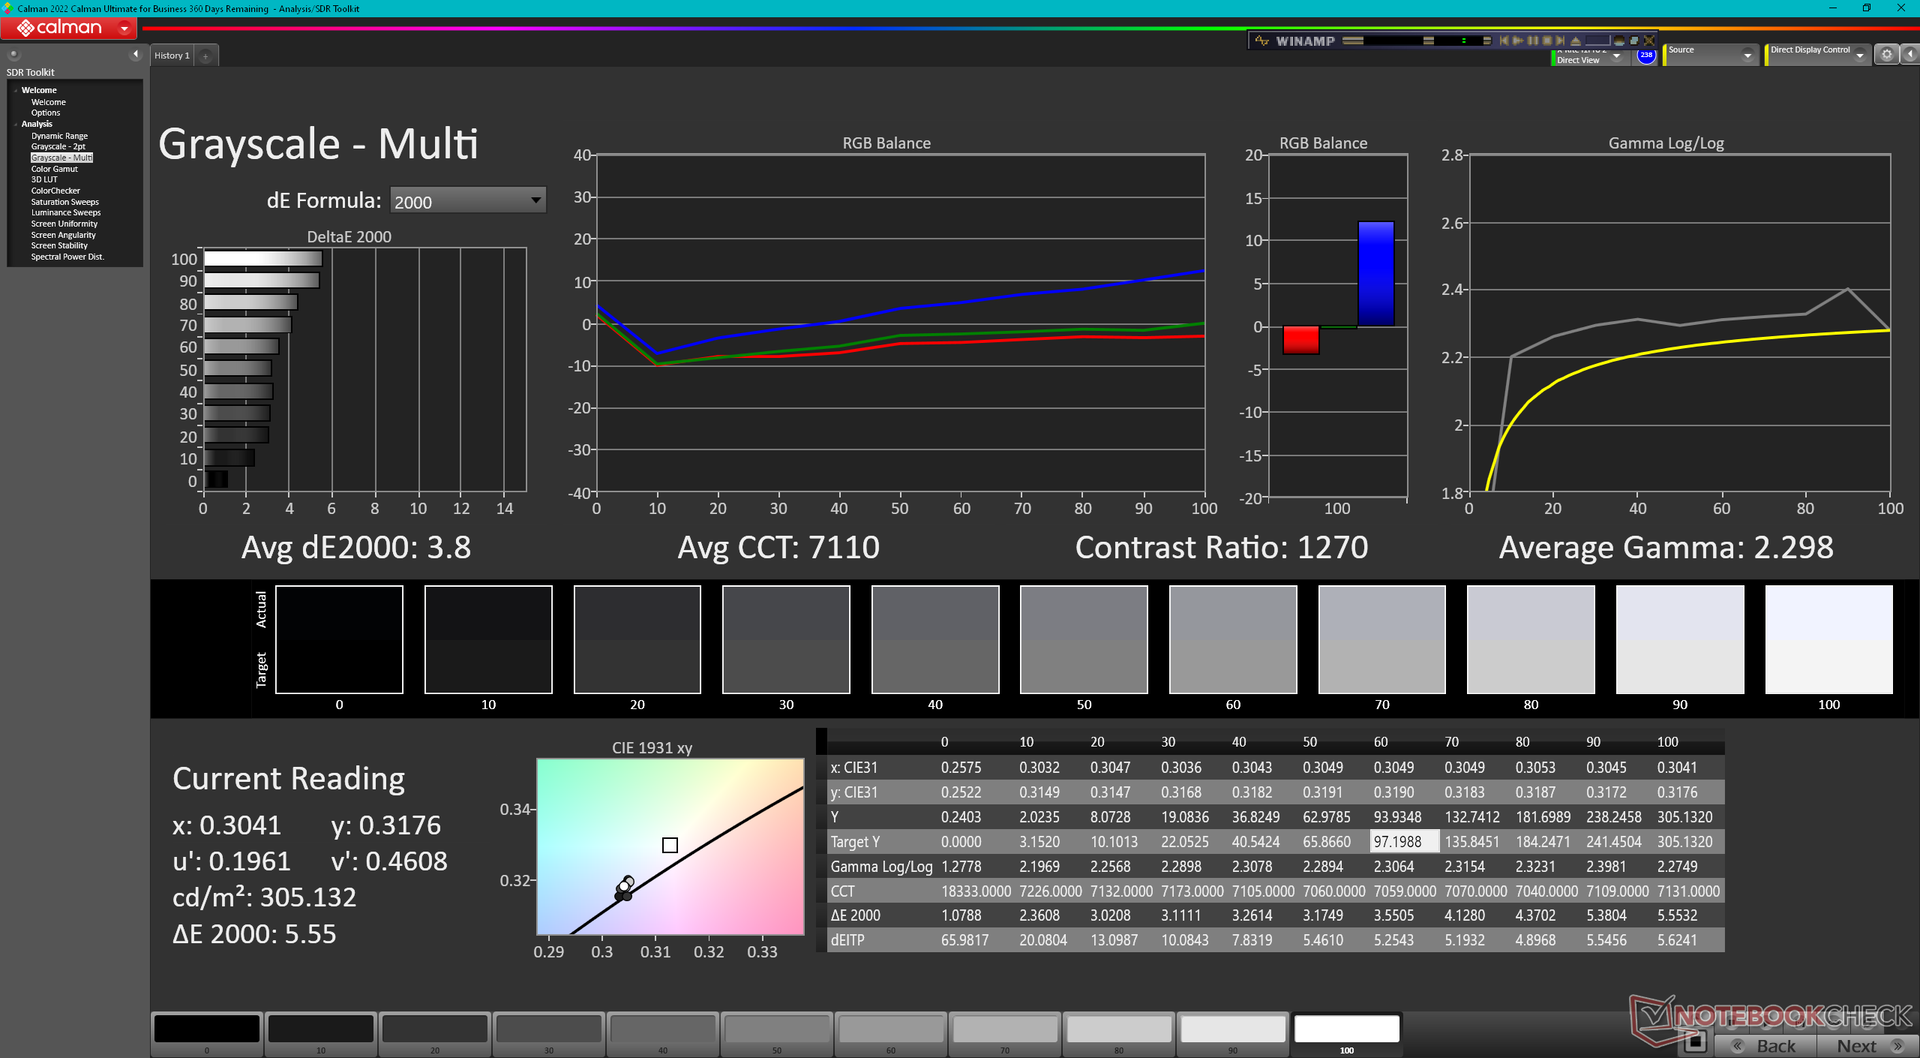
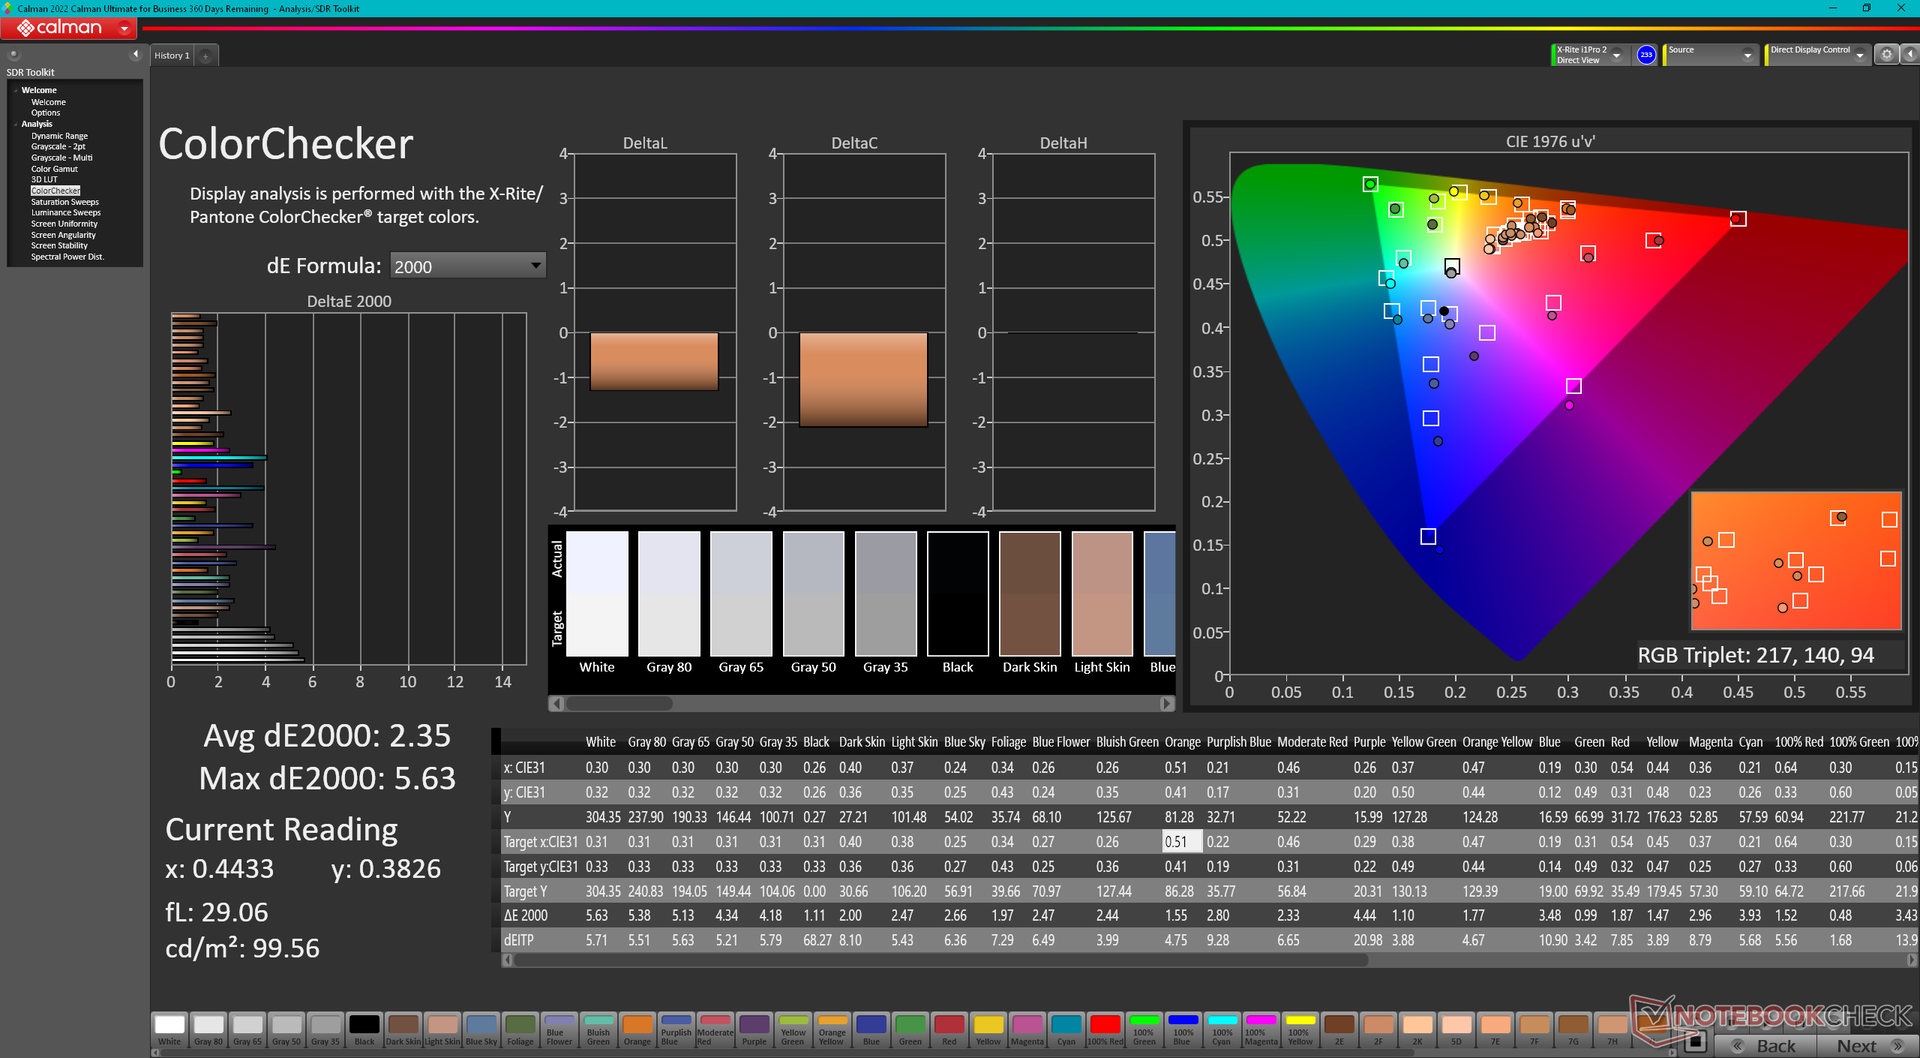
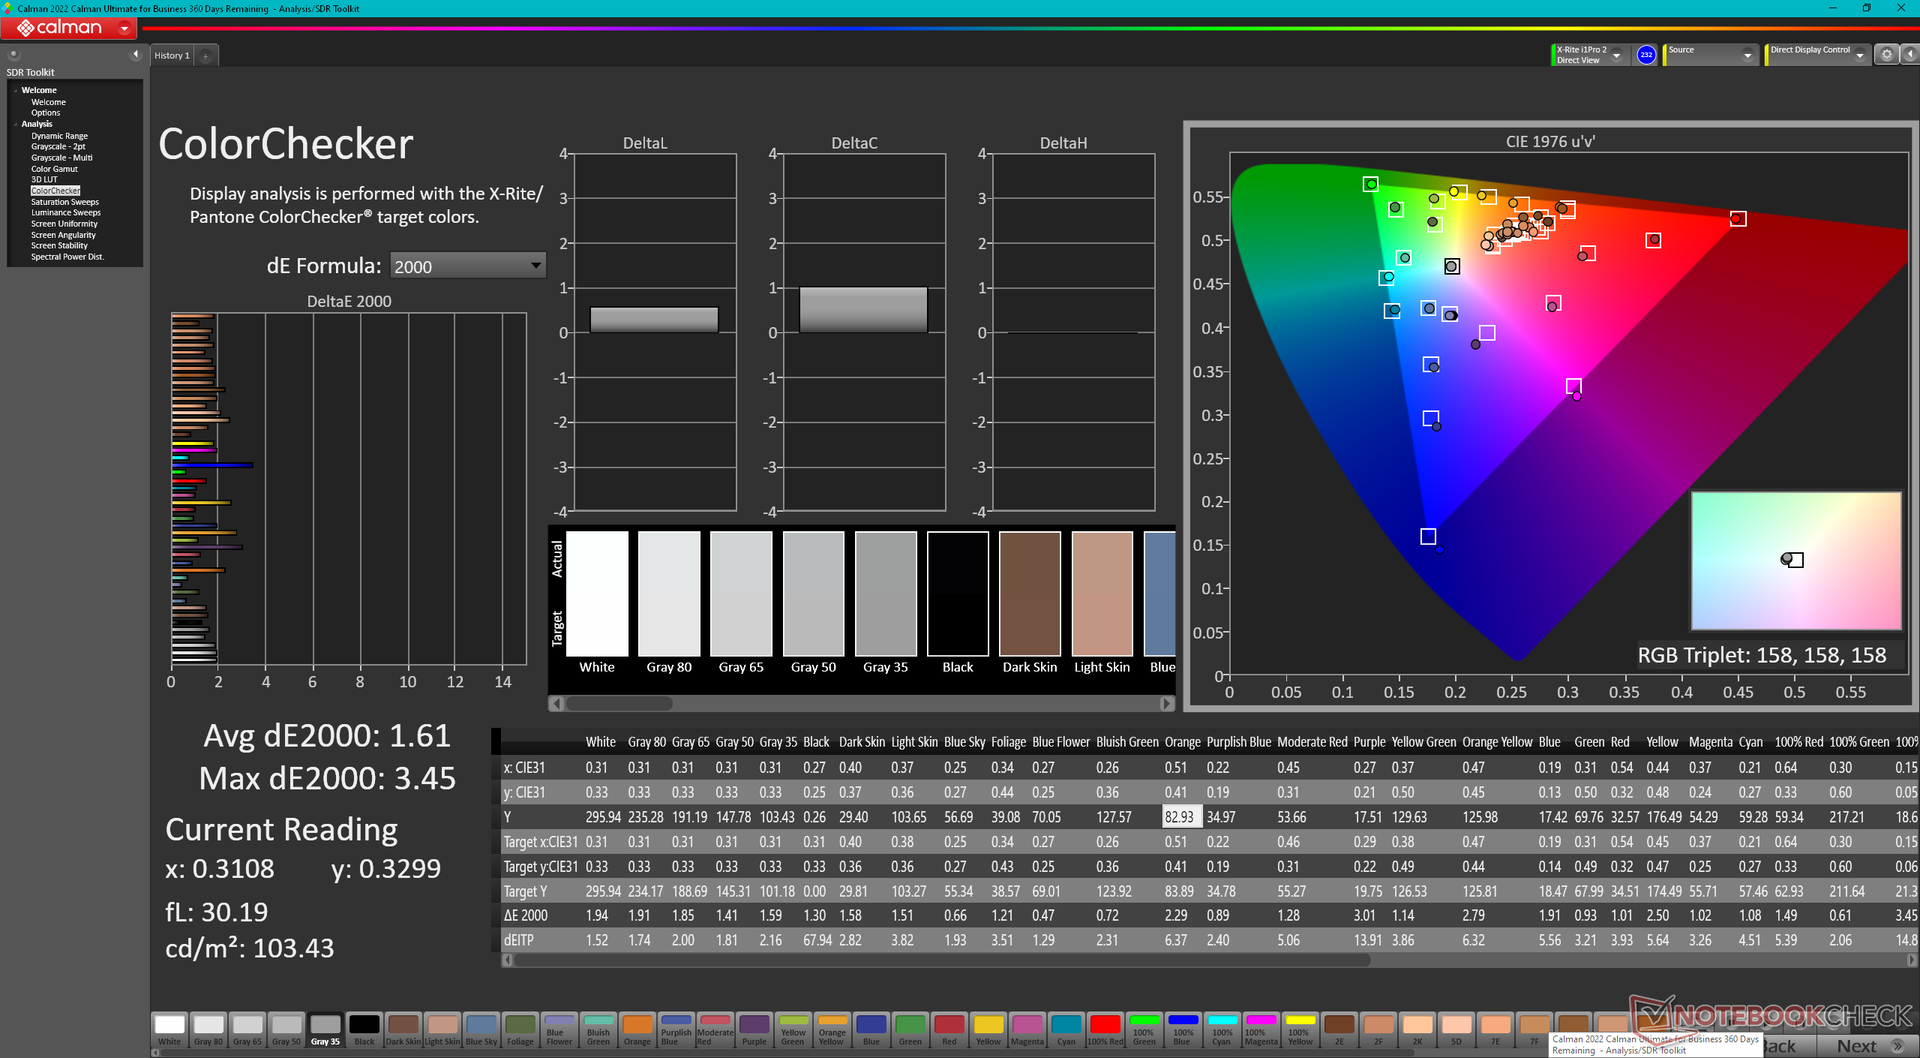
ΔE ColorChecker Calman: 2.35 | ∀{0.5-29.43 Ø4.71}
calibrated: 1.61
ΔE Greyscale Calman: 3.8 | ∀{0.09-98 Ø4.96}
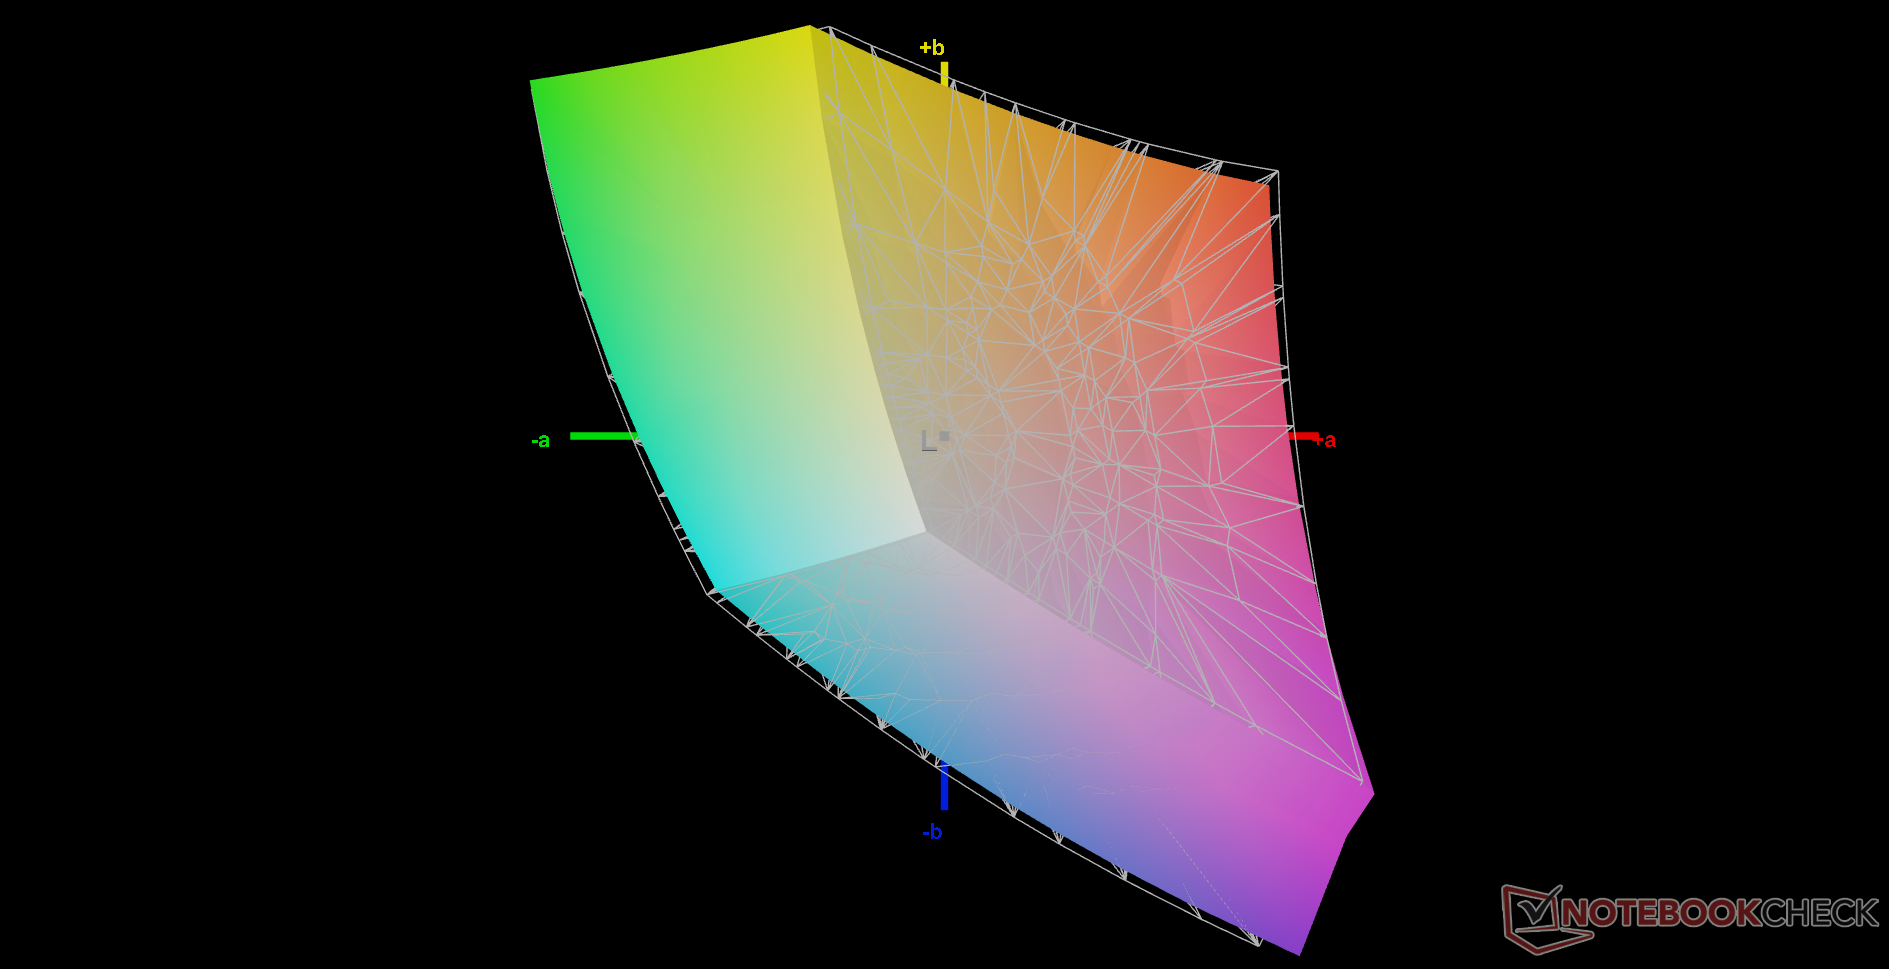
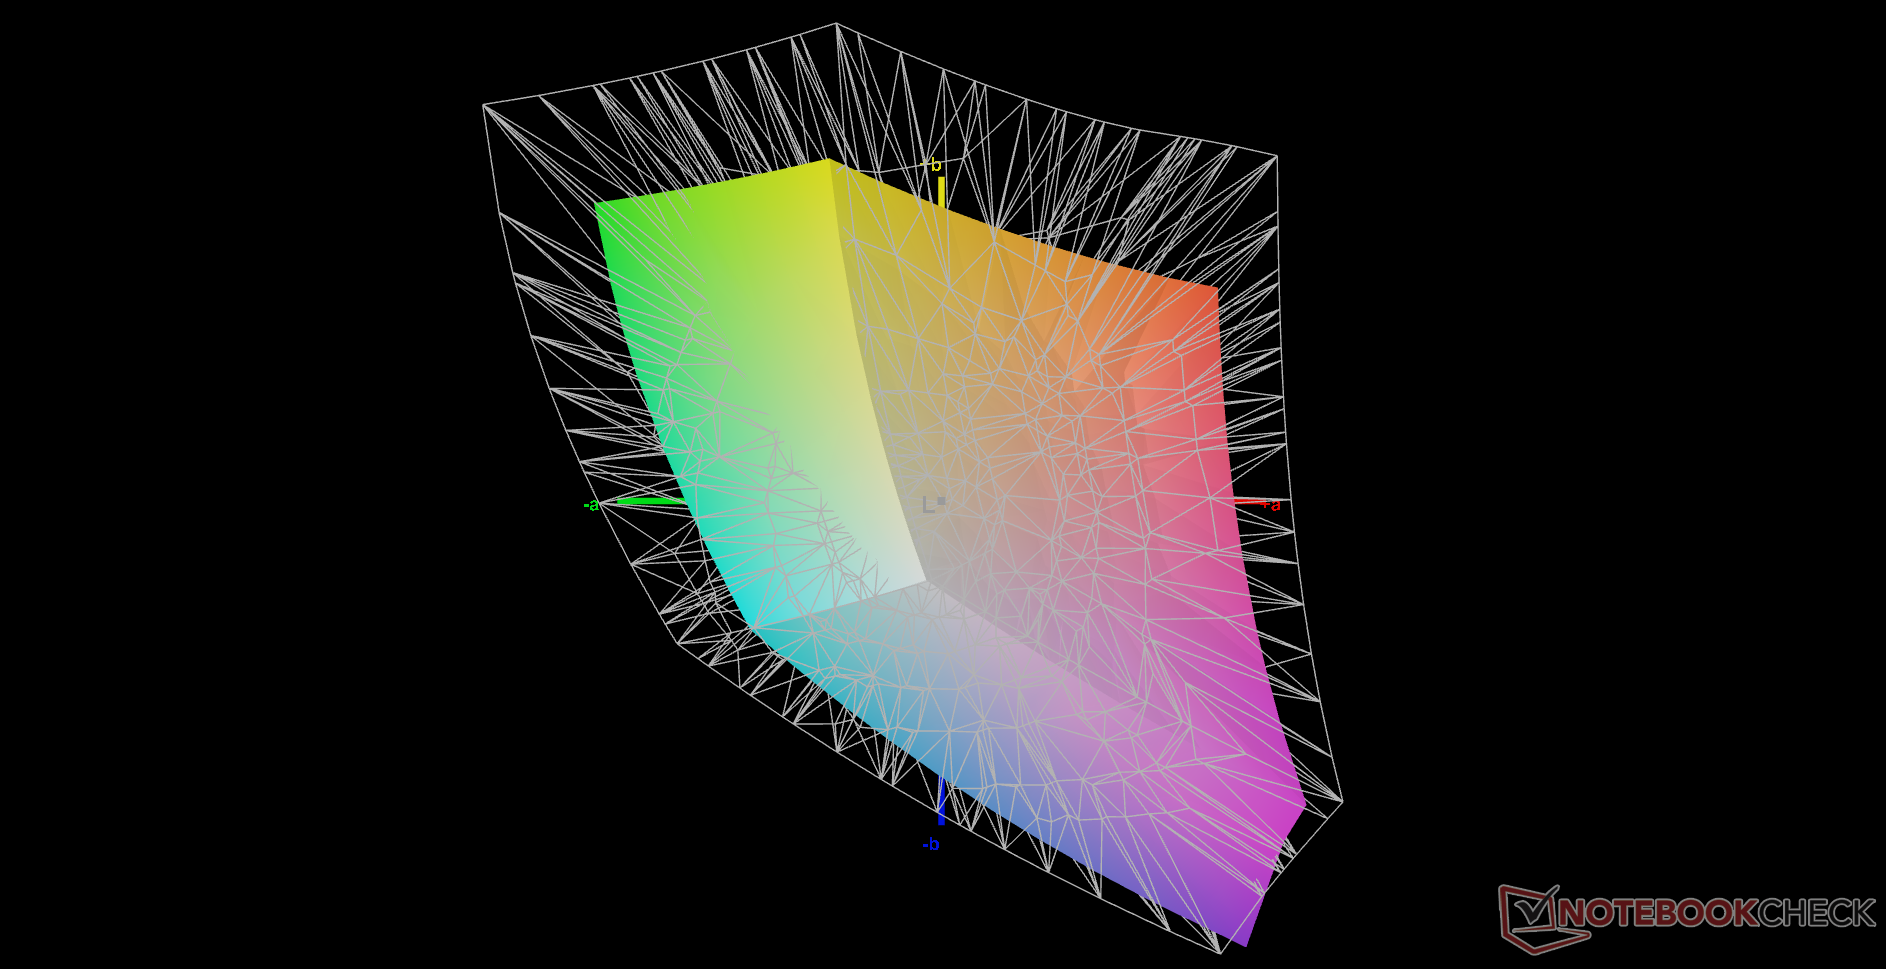
65.4% AdobeRGB 1998 (Argyll 3D)
95.2% sRGB (Argyll 3D)
64.5% Display P3 (Argyll 3D)
Gamma: 2.3
CCT: 7110 K
| Eurocom Nightsky TXi317 LG Philips LP173WFG-SPB3, IPS, 1920x1080, 17.3" | Schenker XMG Pro 17 E22 BOE099D, IPS, 2560x1440, 17.3" | Aorus 17X XES Sharp SHP1563, IPS, 1920x1080, 17.3" | MSI Raider GE77 HX 12UHS AU Optronics B173ZAN06.1, IPS, 3840x2160, 17.3" | Razer Blade 17 Early 2022 AU Optronics B173ZAN06.9, IPS, 3840x2160, 17.3" | Alienware x17 R2 P48E AU Optronics B173HAN, IPS, 1920x1080, 17.3" | |
|---|---|---|---|---|---|---|
| Display | 29% | 8% | 29% | 31% | 17% | |
| Display P3 Coverage (%) | 64.5 | 97.5 51% | 70.1 9% | 96.6 50% | 99.4 54% | 79.2 23% |
| sRGB Coverage (%) | 95.2 | 99.9 5% | 99.9 5% | 99.8 5% | 100 5% | 99.8 5% |
| AdobeRGB 1998 Coverage (%) | 65.4 | 85.2 30% | 71.9 10% | 85.8 31% | 87.3 33% | 79.6 22% |
| Response Times | 44% | 58% | 47% | 39% | -1% | |
| Response Time Grey 50% / Grey 80% * (ms) | 10.4 ? | 5.4 ? 48% | 3.4 ? 67% | 5.8 ? 44% | 7.5 ? 28% | 12.4 ? -19% |
| Response Time Black / White * (ms) | 11.2 ? | 6.8 ? 39% | 5.8 ? 48% | 5.6 ? 50% | 5.6 ? 50% | 9.2 ? 18% |
| PWM Frequency (Hz) | ||||||
| Screen | 5% | -24% | -19% | 33% | 2% | |
| Brightness middle (cd/m²) | 303.9 | 349 15% | 278 -9% | 381 25% | 503 66% | 365.4 20% |
| Brightness (cd/m²) | 292 | 319 9% | 273 -7% | 371 27% | 486 66% | 344 18% |
| Brightness Distribution (%) | 88 | 83 -6% | 79 -10% | 84 -5% | 84 -5% | 85 -3% |
| Black Level * (cd/m²) | 0.3 | 0.32 -7% | 0.26 13% | 0.52 -73% | 0.44 -47% | 0.29 3% |
| Contrast (:1) | 1013 | 1091 8% | 1069 6% | 733 -28% | 1143 13% | 1260 24% |
| Colorchecker dE 2000 * | 2.35 | 2.5 -6% | 3.96 -69% | 1.08 54% | 3.17 -35% | |
| Colorchecker dE 2000 max. * | 5.63 | 6.87 -22% | 10.78 -91% | 4.54 19% | 7.69 -37% | |
| Colorchecker dE 2000 calibrated * | 1.61 | 0.64 60% | 1.07 34% | 2.53 -57% | 0.6 63% | 0.51 68% |
| Greyscale dE 2000 * | 3.8 | 3.9 -3% | 6.8 -79% | 1.3 66% | 5.3 -39% | |
| Gamma | 2.3 96% | 2.09 105% | 2.224 99% | 2.151 102% | 2.18 101% | |
| CCT | 7110 91% | 7192 90% | 7651 85% | 6541 99% | 5879 111% | |
| Media total (Programa/Opciones) | 26% /
16% | 14% /
-5% | 19% /
6% | 34% /
33% | 6% /
5% |
* ... más pequeño es mejor
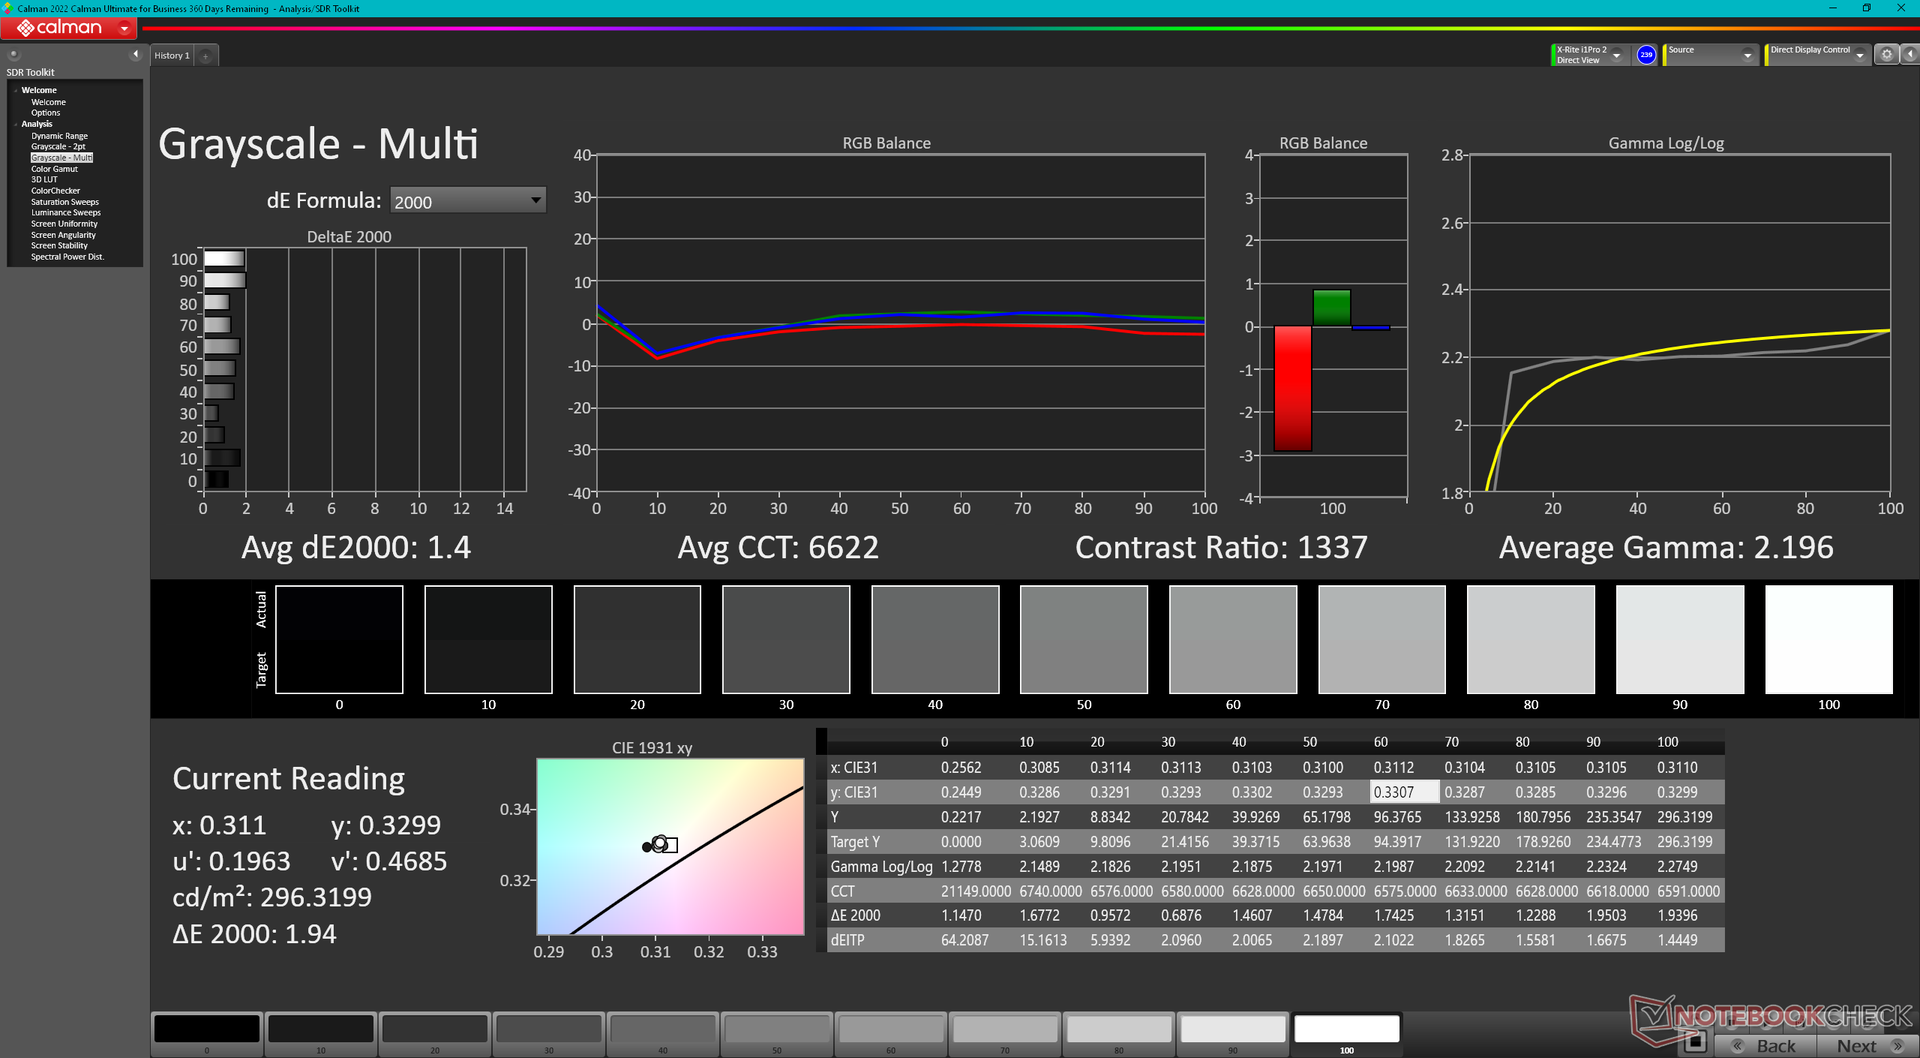
Eurocom se encarga de calibrar la pantalla a cambio de una cuota. Nuestra unidad de prueba llegó sin calibrar con unos valores medios de escala de grises y color deltaE de 3,8 y 2,35, respectivamente, lo que no está nada mal. Calibrando el panel nosotros mismos, estos promedios mejorarían aún más, hasta 1,4 y 1,61. Nuestro perfil calibrado puede descargarse gratuitamente más arriba.

Tiempos de respuesta del display
| ↔ Tiempo de respuesta de Negro a Blanco | ||
|---|---|---|
| 11.2 ms ... subida ↗ y bajada ↘ combinada | ↗ 6 ms subida | 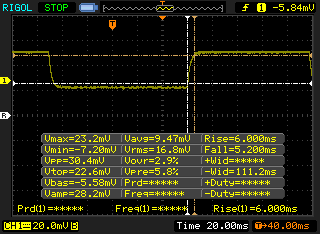 |
| ↘ 5.2 ms bajada | ||
| La pantalla mostró buenos tiempos de respuesta en nuestros tests pero podría ser demasiado lenta para los jugones competitivos. En comparación, todos los dispositivos de prueba van de ##min### (mínimo) a 240 (máximo) ms. » 30 % de todos los dispositivos son mejores. Esto quiere decir que el tiempo de respuesta medido es mejor que la media (19.8 ms) de todos los dispositivos testados. | ||
| ↔ Tiempo de respuesta 50% Gris a 80% Gris | ||
| 10.4 ms ... subida ↗ y bajada ↘ combinada | ↗ 6 ms subida | 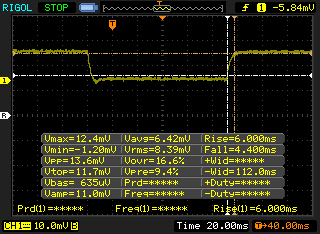 |
| ↘ 4.4 ms bajada | ||
| La pantalla mostró buenos tiempos de respuesta en nuestros tests pero podría ser demasiado lenta para los jugones competitivos. En comparación, todos los dispositivos de prueba van de ##min### (mínimo) a 636 (máximo) ms. » 24 % de todos los dispositivos son mejores. Esto quiere decir que el tiempo de respuesta medido es mejor que la media (31 ms) de todos los dispositivos testados. | ||
Parpadeo de Pantalla / PWM (Pulse-Width Modulation)
| Parpadeo de Pantalla / PWM no detectado | 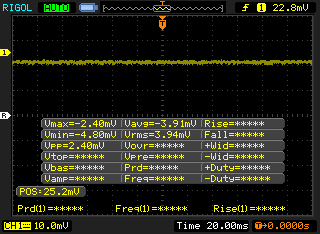 | ||
Comparación: 52 % de todos los dispositivos testados no usaron PWM para atenuar el display. Si se usó, medimos una media de 7754 (mínimo: 5 - máxmo: 343500) Hz. | |||
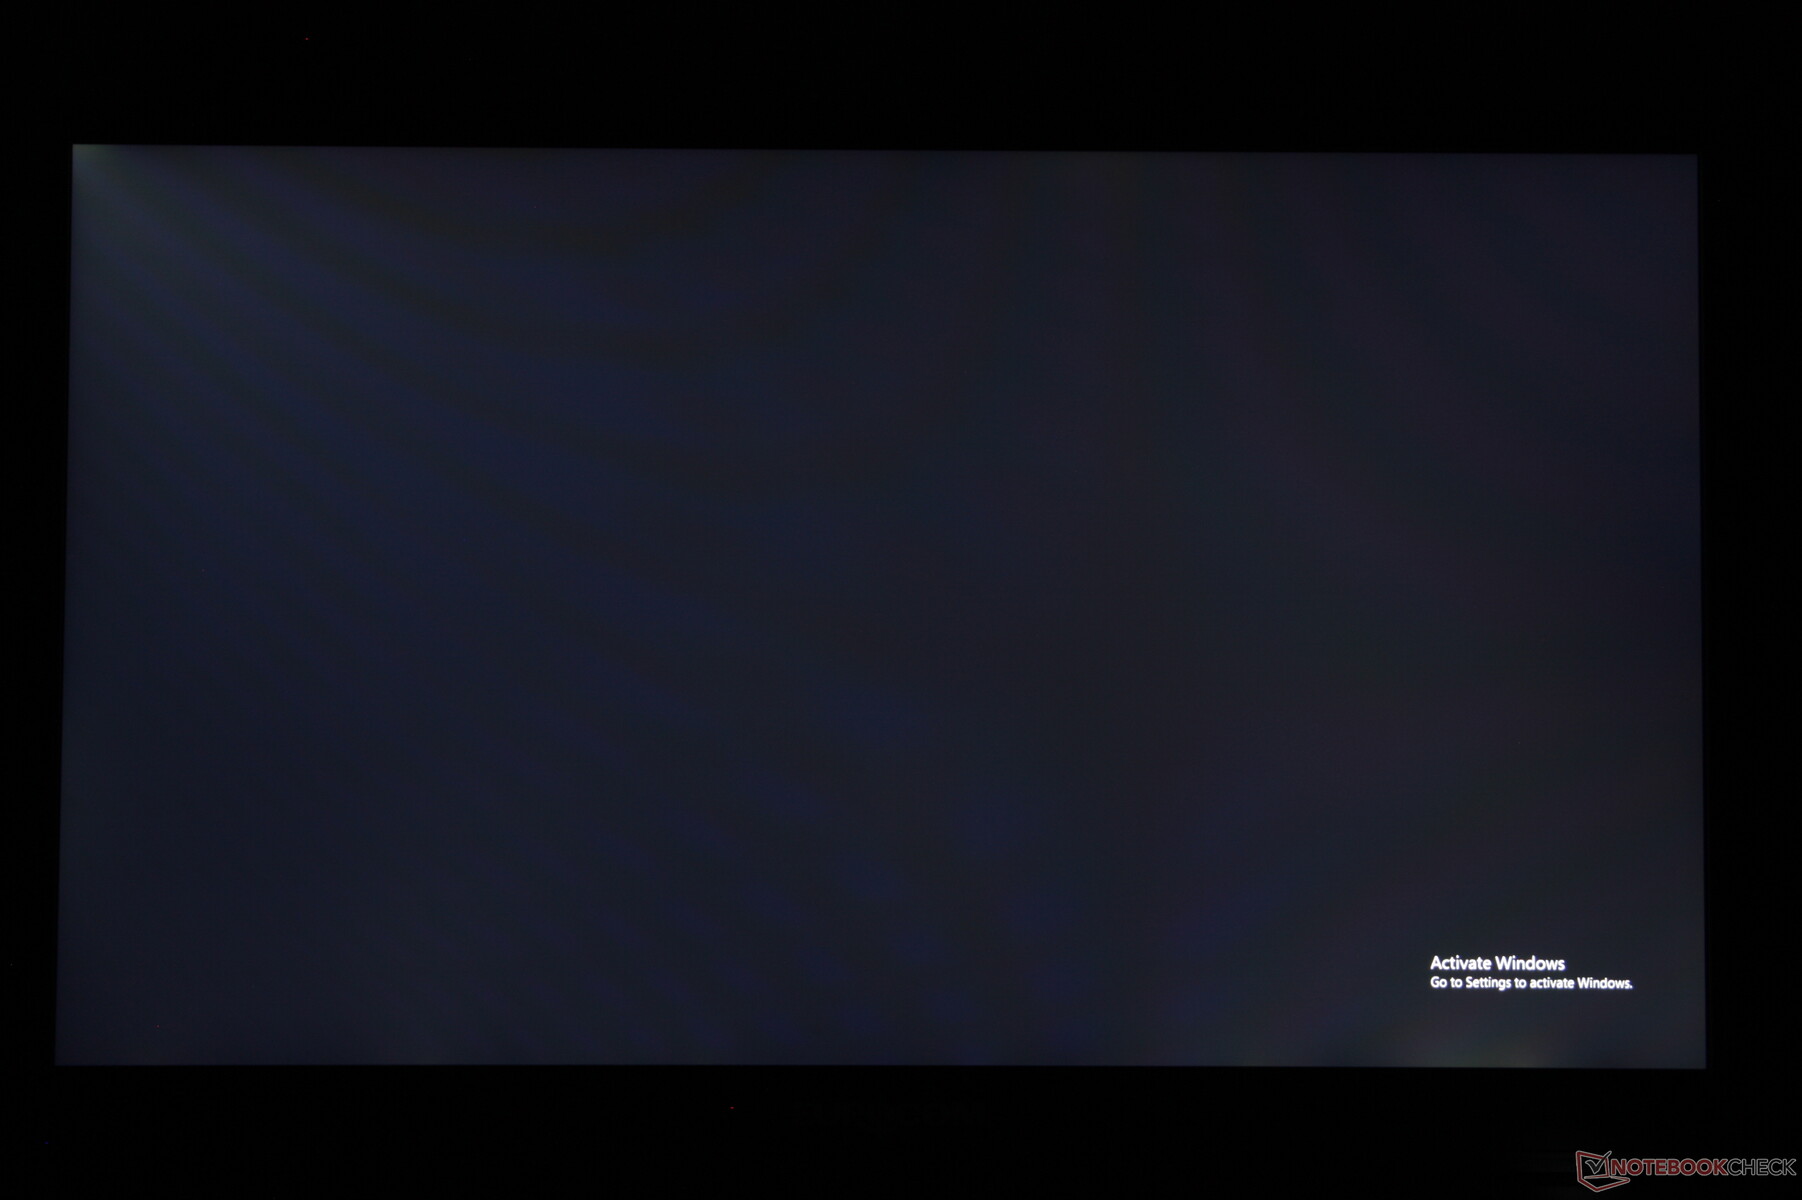
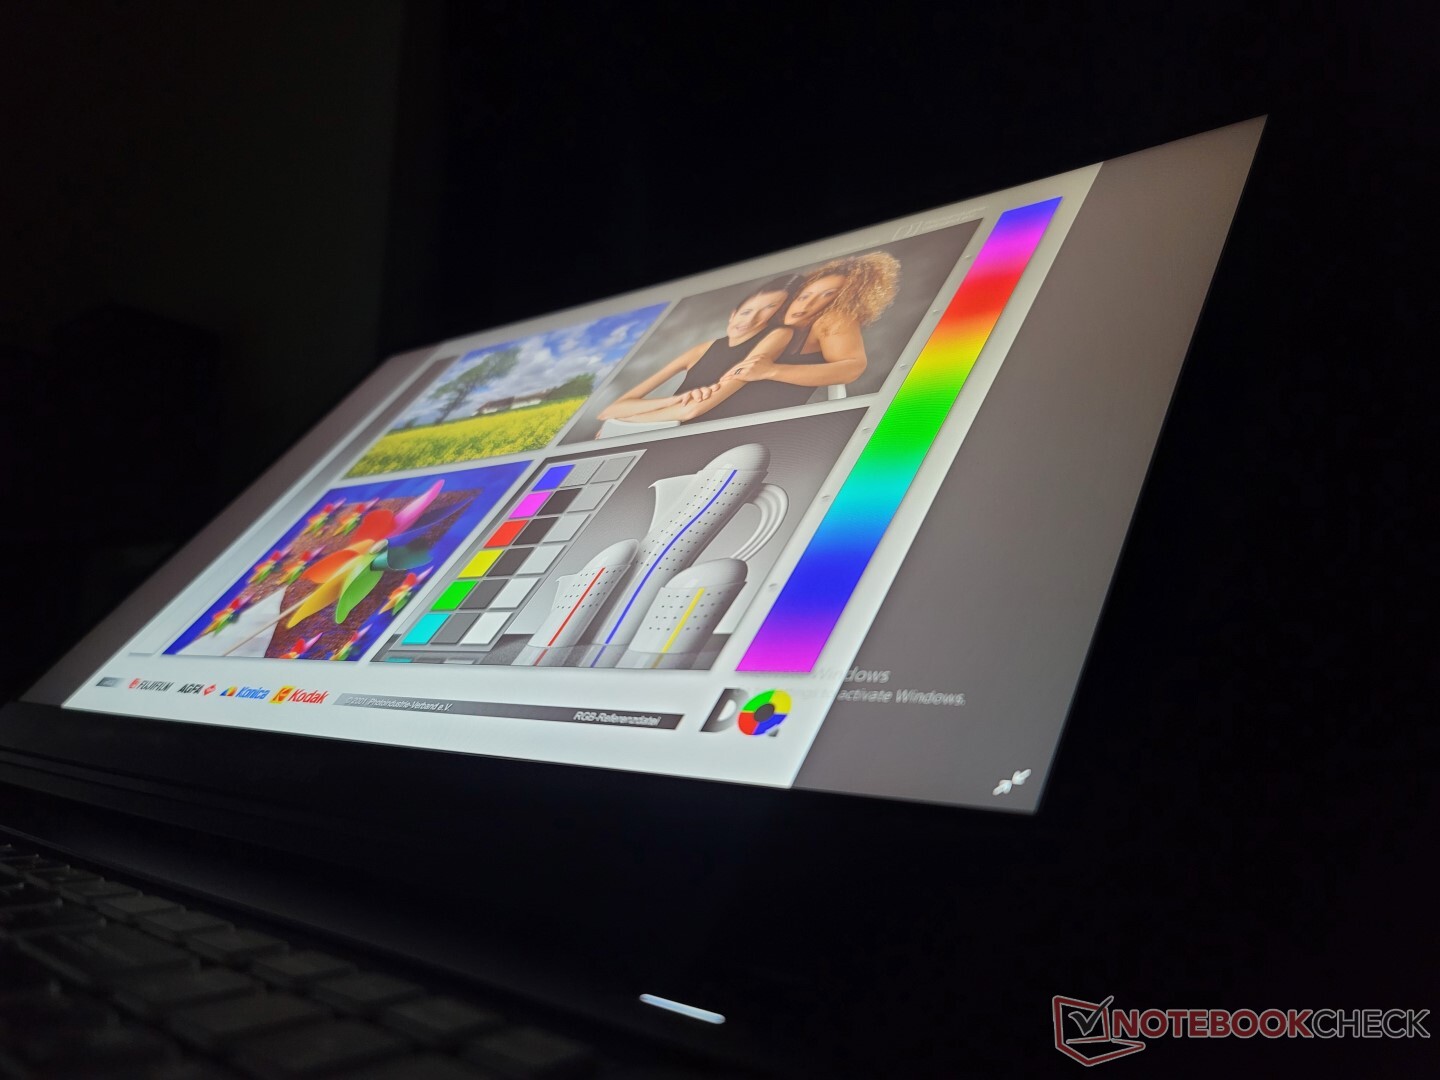
Con un máximo de 300 nits, la pantalla está en la media de la visibilidad en exteriores si se compara con otros portátiles de 17 pulgadas para juegos. Algunas alternativas, como elRazer Blade 17tienen pantallas mucho más brillantes de más de 500 nits para facilitar la lectura en exteriores.
Rendimiento
Condiciones de la prueba
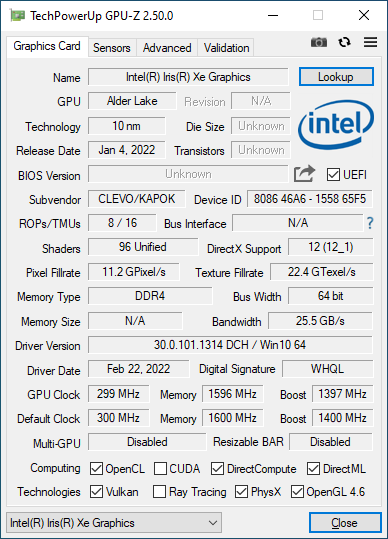
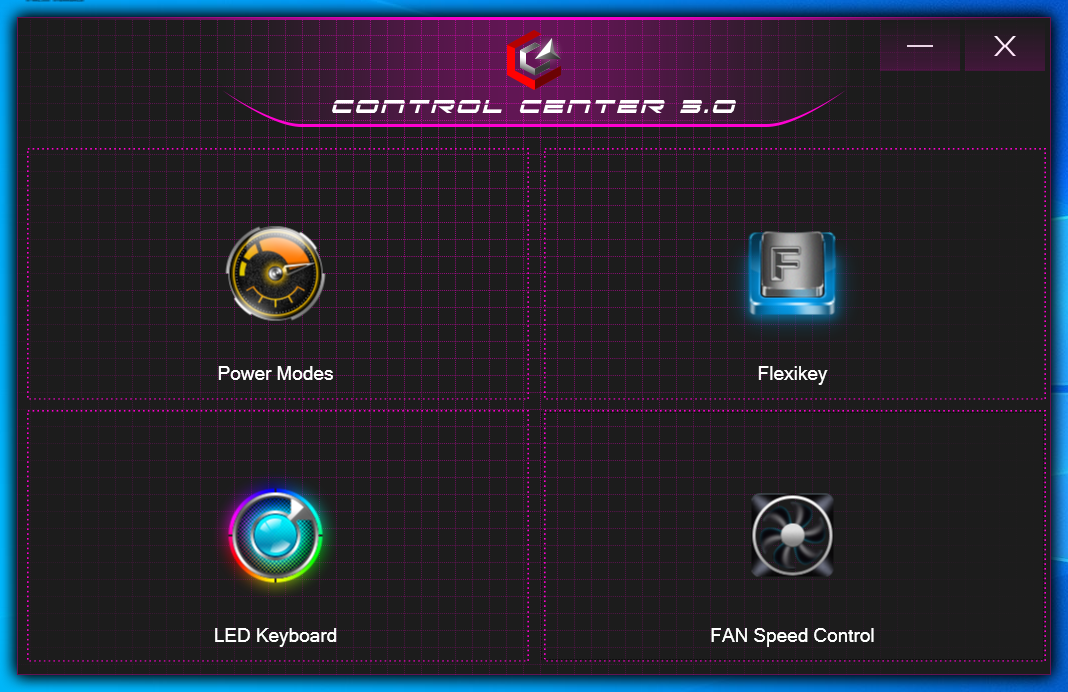
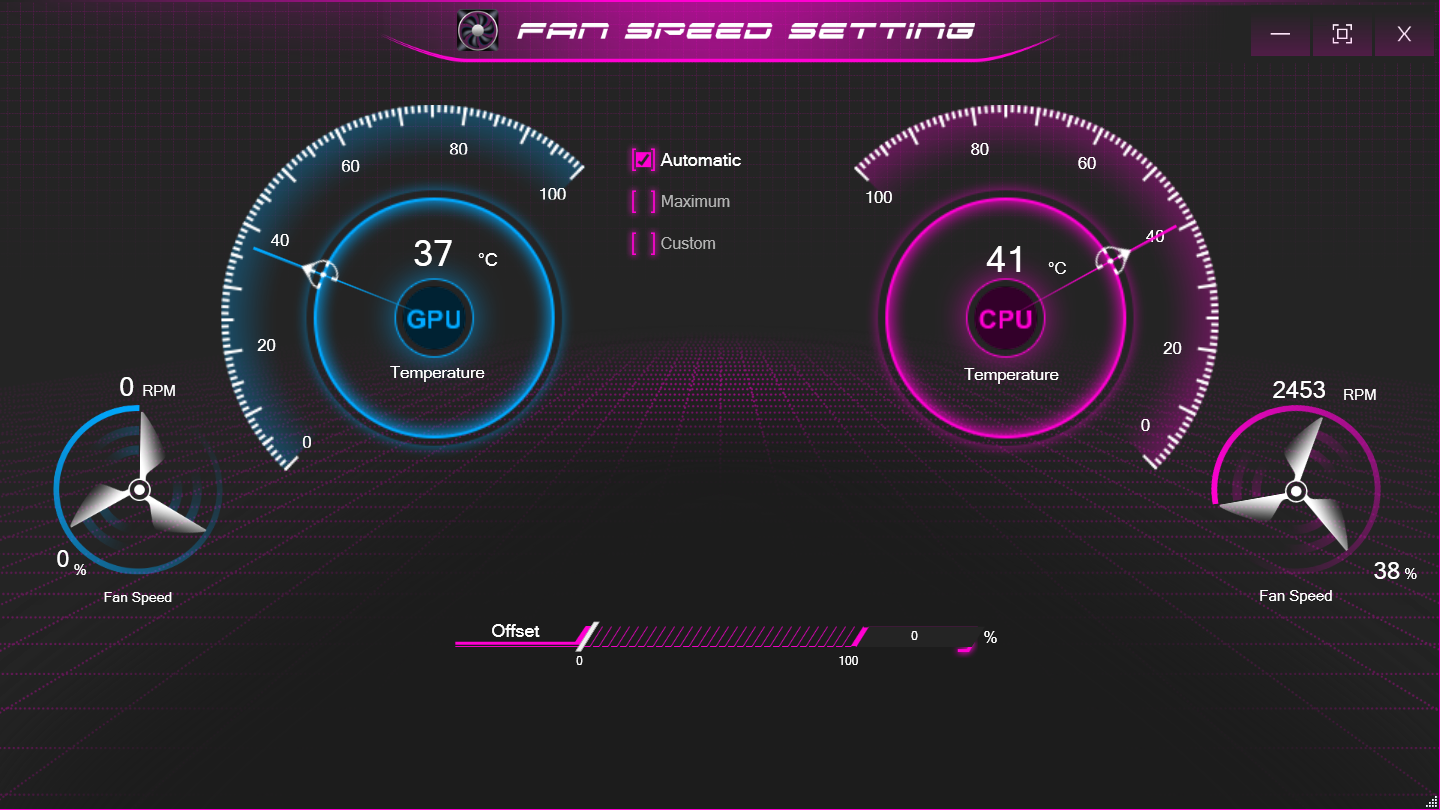
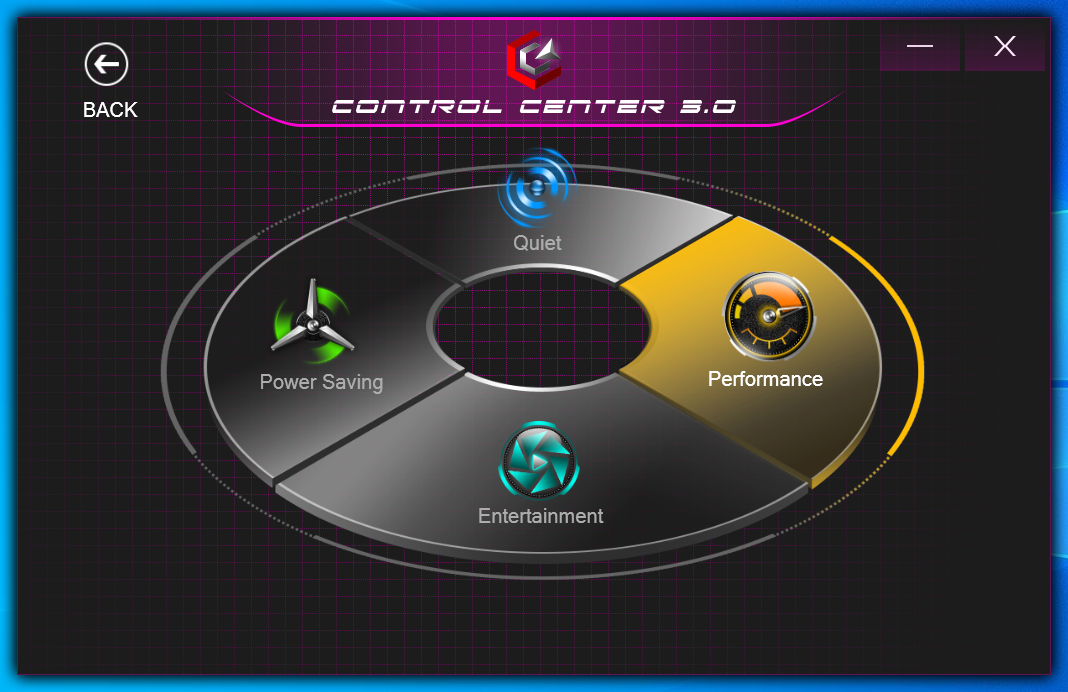
Nuestra unidad se configuró en modo Rendimiento a través de Windows y del software preinstalado Control Center 3.0 antes de ejecutar cualquier prueba de rendimiento para obtener las puntuaciones más altas posibles. También nos aseguramos de ajustar Nvidia Optimus a gráficos discretos; lamentablemente, MUX no es compatible con este modo.
Procesador
El rendimiento multihilo en bruto es aproximadamente un 10 por ciento más rápido que el portátil medio de nuestra base de datos equipado con el mismo Core i7-12700H. El procesador del HP Envy 16por ejemplo, es mucho más lento que nuestro Eurocom, incluso después de tener en cuenta cualquier estrangulamiento del rendimiento
La actualización al Core i9-12900H se espera que aumente el rendimiento del procesador sólo marginalmente en alrededor de 5 a 10 por ciento basado en nuestra experiencia con el Alienware x15 R2 y el Schenker XMG Pro 17 E22
CineBench R15 no se ejecuta correctamente en nuestra unidad, al igual que en el último sistema Eurocom que revisamos a principios de este año. Nos hemos puesto en contacto con el fabricante y nos han confirmado nuestros resultados. El benchmark ha sido omitido en este análisis.
Cinebench R23 Multi Loop
Cinebench R23: Multi Core | Single Core
Cinebench R15: CPU Multi 64Bit | CPU Single 64Bit
Blender: v2.79 BMW27 CPU
7-Zip 18.03: 7z b 4 | 7z b 4 -mmt1
Geekbench 5.5: Multi-Core | Single-Core
HWBOT x265 Benchmark v2.2: 4k Preset
LibreOffice : 20 Documents To PDF
R Benchmark 2.5: Overall mean
Cinebench R23: Multi Core | Single Core
Cinebench R15: CPU Multi 64Bit | CPU Single 64Bit
Blender: v2.79 BMW27 CPU
7-Zip 18.03: 7z b 4 | 7z b 4 -mmt1
Geekbench 5.5: Multi-Core | Single-Core
HWBOT x265 Benchmark v2.2: 4k Preset
LibreOffice : 20 Documents To PDF
R Benchmark 2.5: Overall mean
* ... más pequeño es mejor
AIDA64: FP32 Ray-Trace | FPU Julia | CPU SHA3 | CPU Queen | FPU SinJulia | FPU Mandel | CPU AES | CPU ZLib | FP64 Ray-Trace | CPU PhotoWorxx
| Performance rating | |
| MSI Raider GE77 HX 12UHS | |
| Aorus 17X XES | |
| Eurocom Nightsky TXi317 | |
| Alienware x17 R2 P48E | |
| Medio Intel Core i7-12700H | |
| Schenker XMG Pro 17 E22 | |
| Razer Blade 17 Early 2022 | |
| AIDA64 / FP32 Ray-Trace | |
| MSI Raider GE77 HX 12UHS | |
| Eurocom Nightsky TXi317 | |
| Aorus 17X XES | |
| Medio Intel Core i7-12700H (2585 - 17957, n=64) | |
| Alienware x17 R2 P48E | |
| Schenker XMG Pro 17 E22 | |
| Razer Blade 17 Early 2022 | |
| AIDA64 / FPU Julia | |
| MSI Raider GE77 HX 12UHS | |
| Eurocom Nightsky TXi317 | |
| Aorus 17X XES | |
| Medio Intel Core i7-12700H (12439 - 90760, n=64) | |
| Alienware x17 R2 P48E | |
| Schenker XMG Pro 17 E22 | |
| Razer Blade 17 Early 2022 | |
| AIDA64 / CPU SHA3 | |
| MSI Raider GE77 HX 12UHS | |
| Eurocom Nightsky TXi317 | |
| Aorus 17X XES | |
| Alienware x17 R2 P48E | |
| Medio Intel Core i7-12700H (833 - 4242, n=64) | |
| Schenker XMG Pro 17 E22 | |
| Razer Blade 17 Early 2022 | |
| AIDA64 / CPU Queen | |
| Alienware x17 R2 P48E | |
| Schenker XMG Pro 17 E22 | |
| Aorus 17X XES | |
| Eurocom Nightsky TXi317 | |
| MSI Raider GE77 HX 12UHS | |
| Medio Intel Core i7-12700H (57923 - 103202, n=63) | |
| Razer Blade 17 Early 2022 | |
| AIDA64 / FPU SinJulia | |
| MSI Raider GE77 HX 12UHS | |
| Aorus 17X XES | |
| Alienware x17 R2 P48E | |
| Eurocom Nightsky TXi317 | |
| Schenker XMG Pro 17 E22 | |
| Medio Intel Core i7-12700H (3249 - 9939, n=64) | |
| Razer Blade 17 Early 2022 | |
| AIDA64 / FPU Mandel | |
| MSI Raider GE77 HX 12UHS | |
| Aorus 17X XES | |
| Eurocom Nightsky TXi317 | |
| Medio Intel Core i7-12700H (7135 - 44760, n=64) | |
| Alienware x17 R2 P48E | |
| Schenker XMG Pro 17 E22 | |
| Razer Blade 17 Early 2022 | |
| AIDA64 / CPU AES | |
| MSI Raider GE77 HX 12UHS | |
| Eurocom Nightsky TXi317 | |
| Aorus 17X XES | |
| Alienware x17 R2 P48E | |
| Schenker XMG Pro 17 E22 | |
| Medio Intel Core i7-12700H (31839 - 144360, n=64) | |
| Razer Blade 17 Early 2022 | |
| AIDA64 / CPU ZLib | |
| MSI Raider GE77 HX 12UHS | |
| Alienware x17 R2 P48E | |
| Eurocom Nightsky TXi317 | |
| Schenker XMG Pro 17 E22 | |
| Aorus 17X XES | |
| Medio Intel Core i7-12700H (305 - 1171, n=64) | |
| Razer Blade 17 Early 2022 | |
| AIDA64 / FP64 Ray-Trace | |
| MSI Raider GE77 HX 12UHS | |
| Aorus 17X XES | |
| Eurocom Nightsky TXi317 | |
| Medio Intel Core i7-12700H (1437 - 9692, n=64) | |
| Alienware x17 R2 P48E | |
| Schenker XMG Pro 17 E22 | |
| Razer Blade 17 Early 2022 | |
| AIDA64 / CPU PhotoWorxx | |
| MSI Raider GE77 HX 12UHS | |
| Aorus 17X XES | |
| Razer Blade 17 Early 2022 | |
| Alienware x17 R2 P48E | |
| Medio Intel Core i7-12700H (12863 - 52207, n=64) | |
| Eurocom Nightsky TXi317 | |
| Schenker XMG Pro 17 E22 | |
Rendimiento del sistema
CrossMark: Overall | Productivity | Creativity | Responsiveness
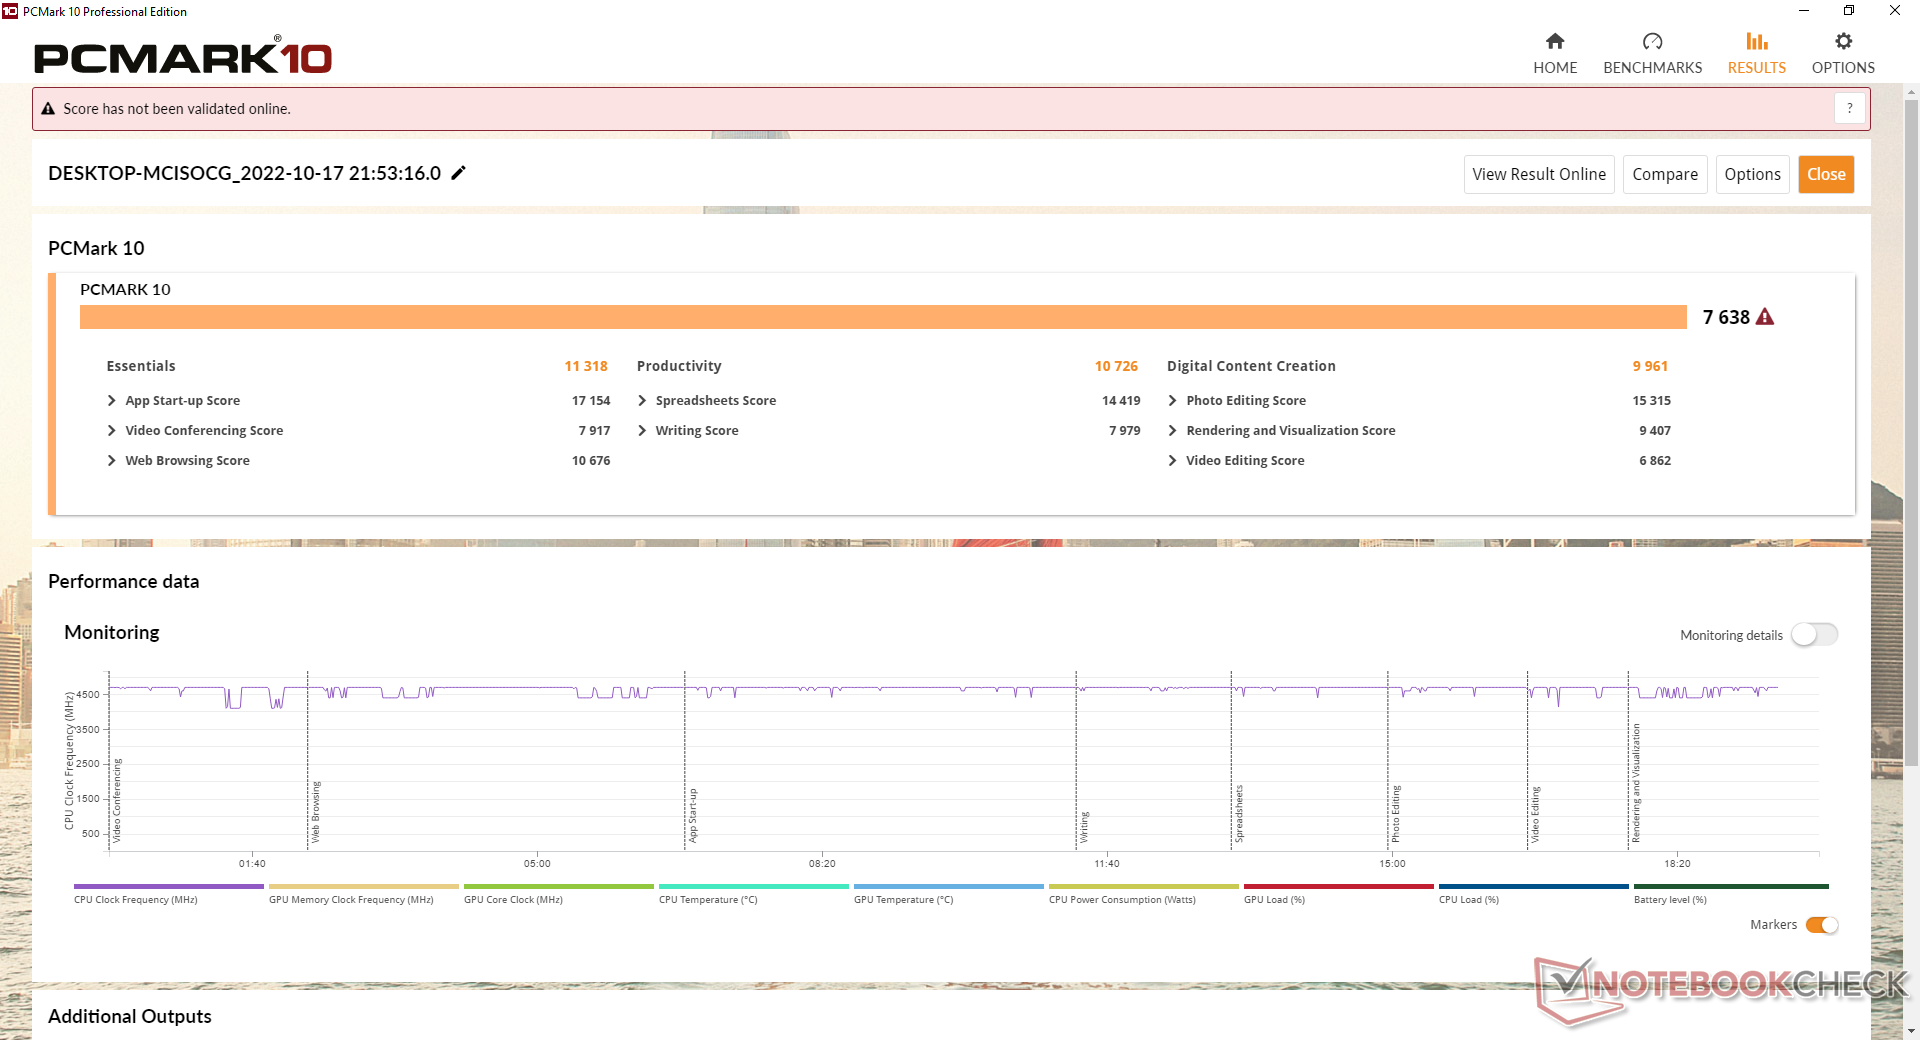
| PCMark 10 / Score | |
| Alienware x17 R2 P48E | |
| Aorus 17X XES | |
| Schenker XMG Pro 17 E22 | |
| Eurocom Nightsky TXi317 | |
| Medio Intel Core i7-12700H, NVIDIA GeForce RTX 3080 Ti Laptop GPU (6868 - 7638, n=7) | |
| Razer Blade 17 Early 2022 | |
| MSI Raider GE77 HX 12UHS | |
| PCMark 10 / Essentials | |
| Eurocom Nightsky TXi317 | |
| Alienware x17 R2 P48E | |
| Schenker XMG Pro 17 E22 | |
| Aorus 17X XES | |
| Medio Intel Core i7-12700H, NVIDIA GeForce RTX 3080 Ti Laptop GPU (9987 - 11318, n=7) | |
| Razer Blade 17 Early 2022 | |
| MSI Raider GE77 HX 12UHS | |
| PCMark 10 / Productivity | |
| Eurocom Nightsky TXi317 | |
| Aorus 17X XES | |
| Schenker XMG Pro 17 E22 | |
| Alienware x17 R2 P48E | |
| MSI Raider GE77 HX 12UHS | |
| Medio Intel Core i7-12700H, NVIDIA GeForce RTX 3080 Ti Laptop GPU (8944 - 10726, n=7) | |
| Razer Blade 17 Early 2022 | |
| PCMark 10 / Digital Content Creation | |
| Alienware x17 R2 P48E | |
| Aorus 17X XES | |
| Schenker XMG Pro 17 E22 | |
| Medio Intel Core i7-12700H, NVIDIA GeForce RTX 3080 Ti Laptop GPU (8956 - 12249, n=7) | |
| Razer Blade 17 Early 2022 | |
| Eurocom Nightsky TXi317 | |
| MSI Raider GE77 HX 12UHS | |
| CrossMark / Overall | |
| MSI Raider GE77 HX 12UHS | |
| Aorus 17X XES | |
| Alienware x17 R2 P48E | |
| Eurocom Nightsky TXi317 | |
| Medio Intel Core i7-12700H, NVIDIA GeForce RTX 3080 Ti Laptop GPU (1761 - 1861, n=4) | |
| Razer Blade 17 Early 2022 | |
| CrossMark / Productivity | |
| MSI Raider GE77 HX 12UHS | |
| Aorus 17X XES | |
| Alienware x17 R2 P48E | |
| Eurocom Nightsky TXi317 | |
| Razer Blade 17 Early 2022 | |
| Medio Intel Core i7-12700H, NVIDIA GeForce RTX 3080 Ti Laptop GPU (1645 - 1800, n=4) | |
| CrossMark / Creativity | |
| MSI Raider GE77 HX 12UHS | |
| Aorus 17X XES | |
| Alienware x17 R2 P48E | |
| Medio Intel Core i7-12700H, NVIDIA GeForce RTX 3080 Ti Laptop GPU (1936 - 2041, n=4) | |
| Eurocom Nightsky TXi317 | |
| Razer Blade 17 Early 2022 | |
| CrossMark / Responsiveness | |
| Aorus 17X XES | |
| MSI Raider GE77 HX 12UHS | |
| Eurocom Nightsky TXi317 | |
| Alienware x17 R2 P48E | |
| Medio Intel Core i7-12700H, NVIDIA GeForce RTX 3080 Ti Laptop GPU (1461 - 1868, n=4) | |
| Razer Blade 17 Early 2022 | |
| PCMark 10 Score | 7638 puntos | |
ayuda | ||
| AIDA64 / Memory Copy | |
| MSI Raider GE77 HX 12UHS | |
| Aorus 17X XES | |
| Razer Blade 17 Early 2022 | |
| Alienware x17 R2 P48E | |
| Medio Intel Core i7-12700H (25615 - 80511, n=64) | |
| Eurocom Nightsky TXi317 | |
| Schenker XMG Pro 17 E22 | |
| AIDA64 / Memory Read | |
| MSI Raider GE77 HX 12UHS | |
| Aorus 17X XES | |
| Razer Blade 17 Early 2022 | |
| Alienware x17 R2 P48E | |
| Medio Intel Core i7-12700H (25586 - 79442, n=64) | |
| Eurocom Nightsky TXi317 | |
| Schenker XMG Pro 17 E22 | |
| AIDA64 / Memory Write | |
| MSI Raider GE77 HX 12UHS | |
| Aorus 17X XES | |
| Razer Blade 17 Early 2022 | |
| Medio Intel Core i7-12700H (23679 - 88660, n=64) | |
| Alienware x17 R2 P48E | |
| Eurocom Nightsky TXi317 | |
| Schenker XMG Pro 17 E22 | |
| AIDA64 / Memory Latency | |
| Alienware x17 R2 P48E | |
| Schenker XMG Pro 17 E22 | |
| Eurocom Nightsky TXi317 | |
| Aorus 17X XES | |
| MSI Raider GE77 HX 12UHS | |
| Medio Intel Core i7-12700H (76.2 - 133.9, n=62) | |
* ... más pequeño es mejor
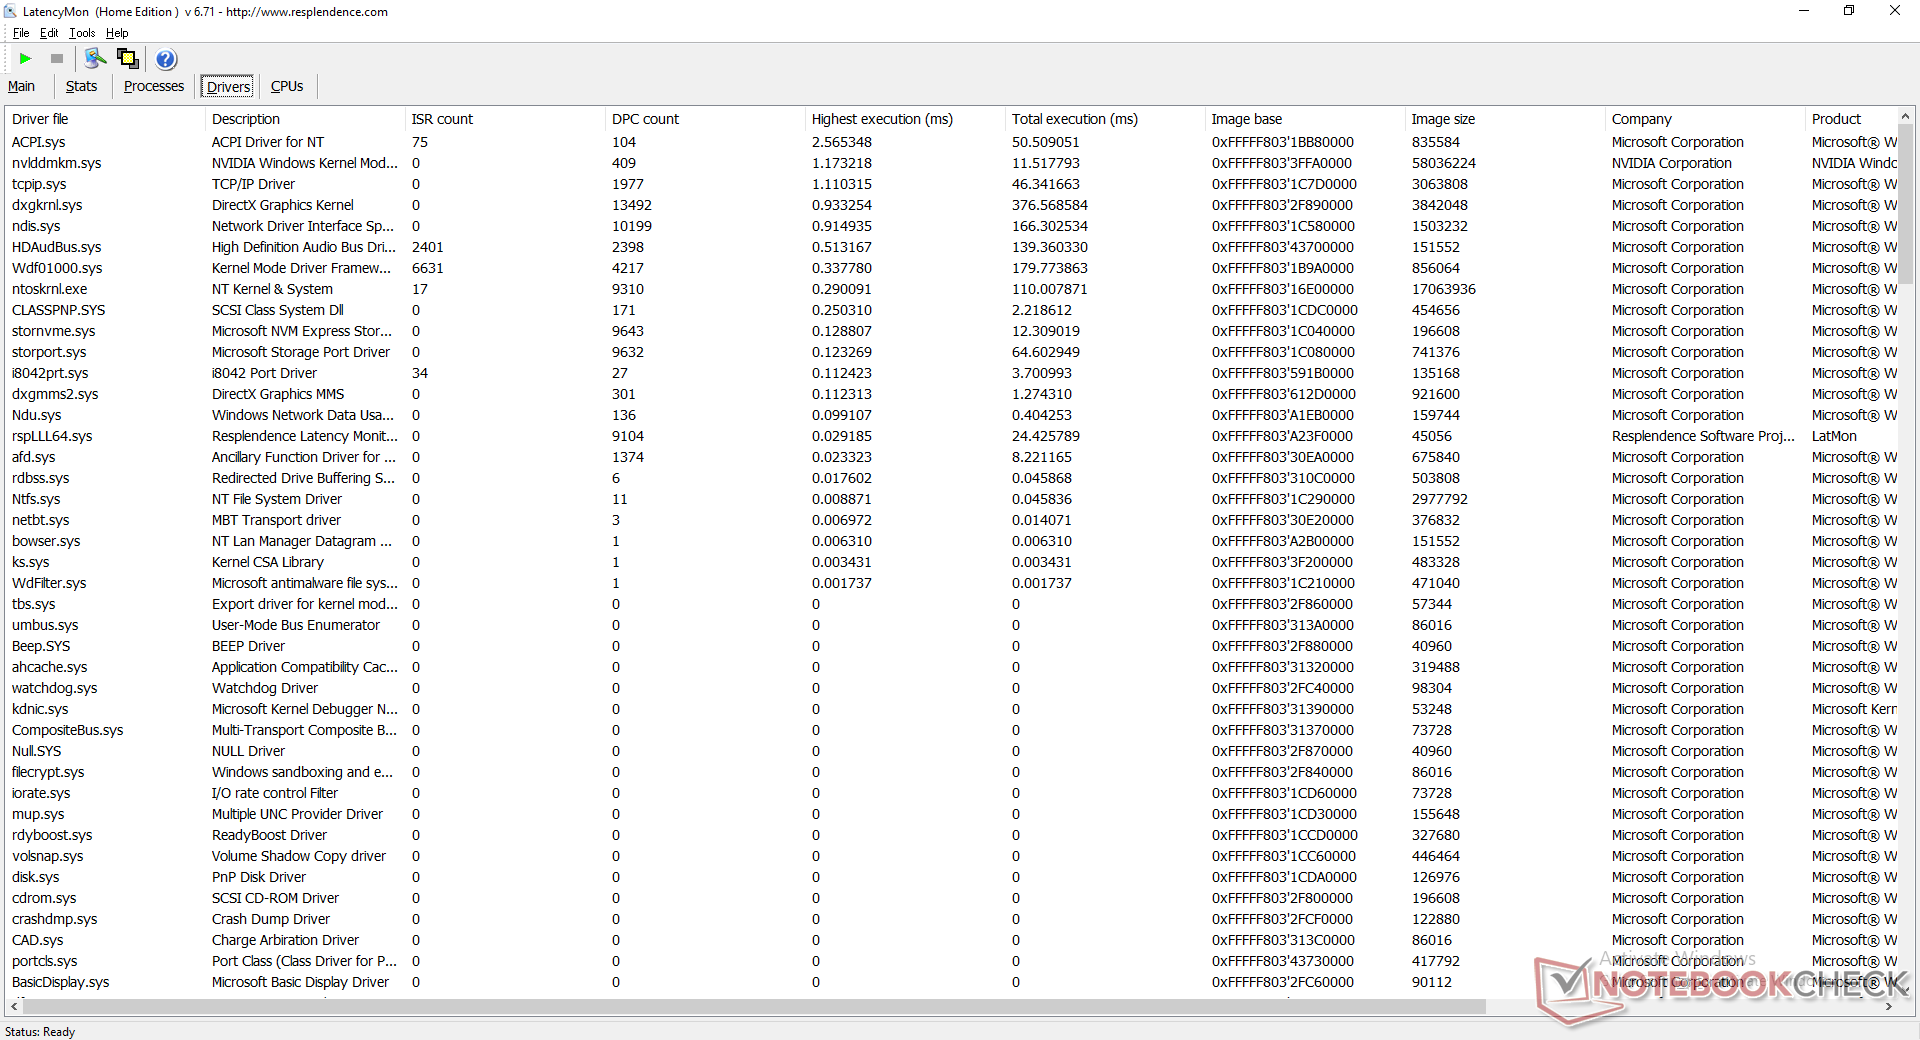
Latencia del CPD
LatencyMon revela problemas de CPD al abrir varias pestañas del navegador en nuestra página web. por lo demás, la reproducción de vídeo 4K a 60 FPS es perfecta, sin pérdida de fotogramas.
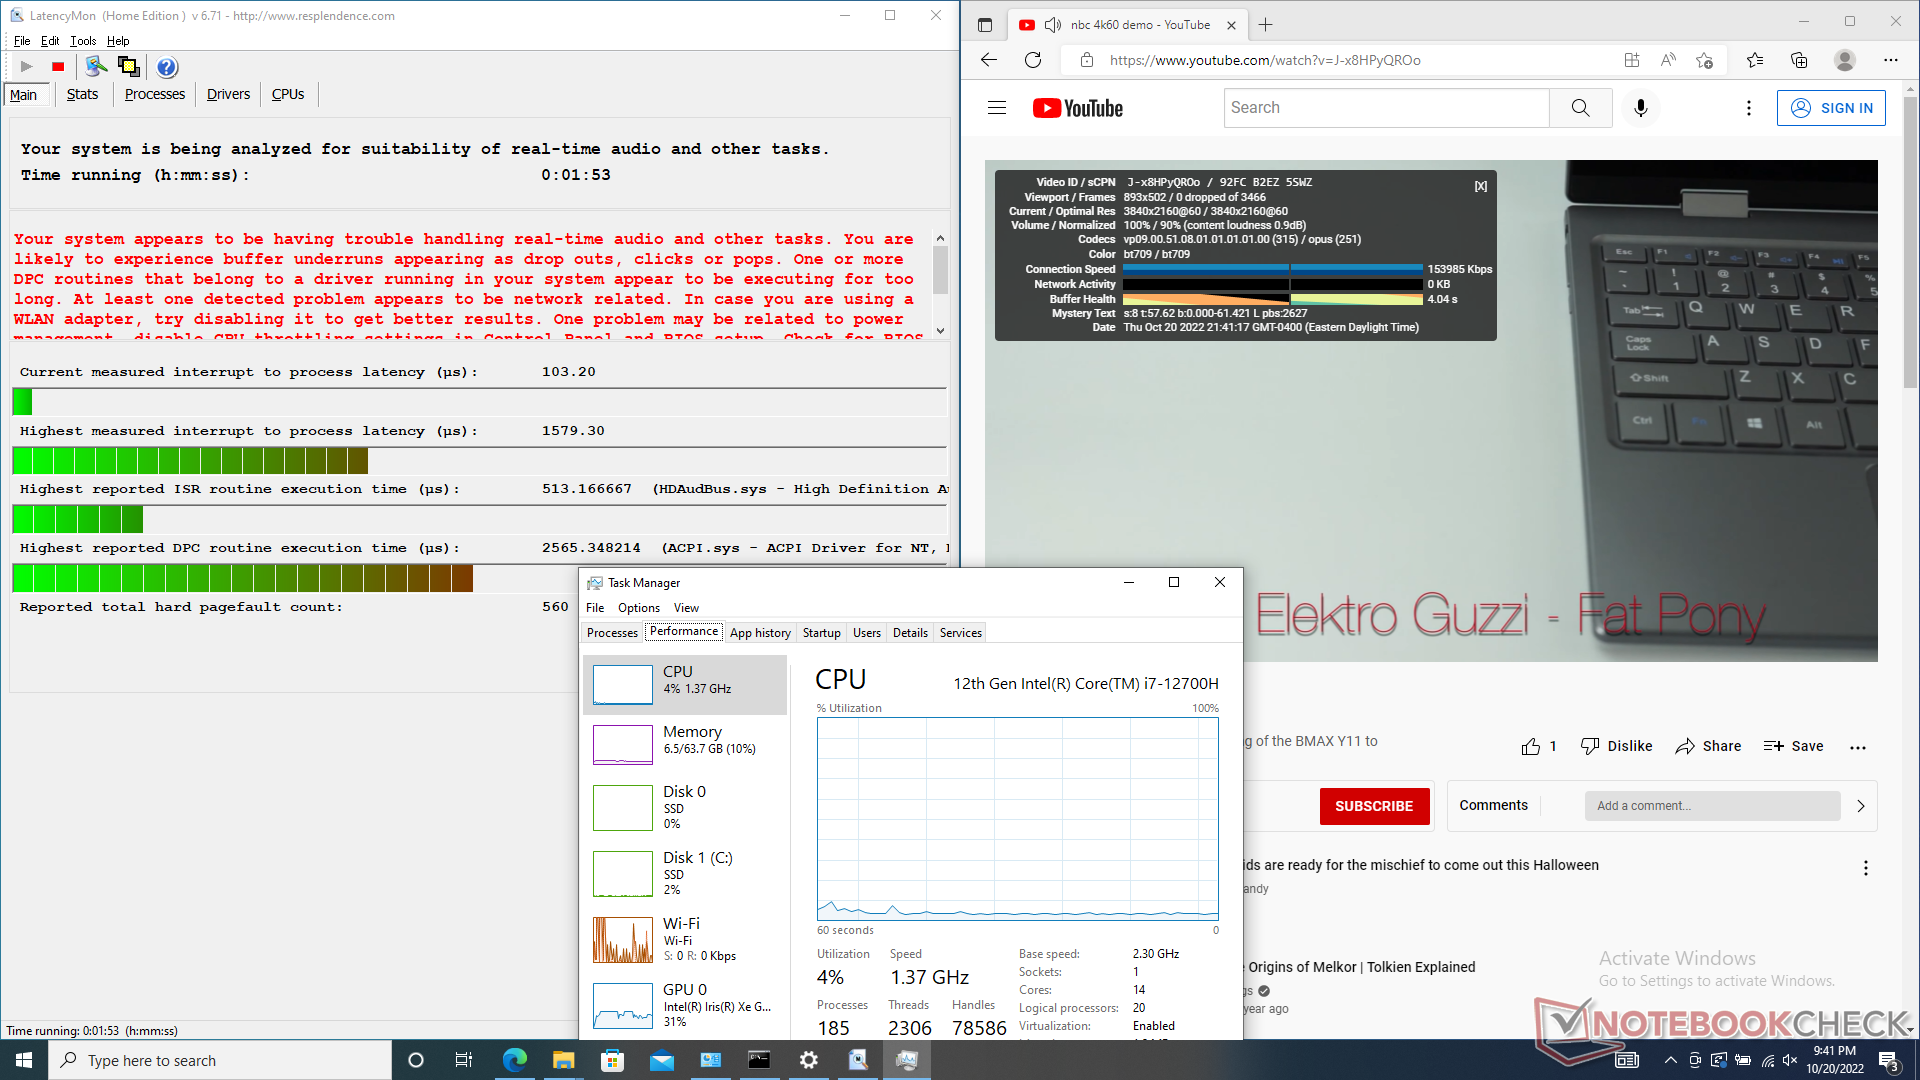
| DPC Latencies / LatencyMon - interrupt to process latency (max), Web, Youtube, Prime95 | |
| MSI Raider GE77 HX 12UHS | |
| Eurocom Nightsky TXi317 | |
| Aorus 17X XES | |
| Alienware x17 R2 P48E | |
| Schenker XMG Pro 17 E22 | |
| Razer Blade 17 Early 2022 | |
* ... más pequeño es mejor
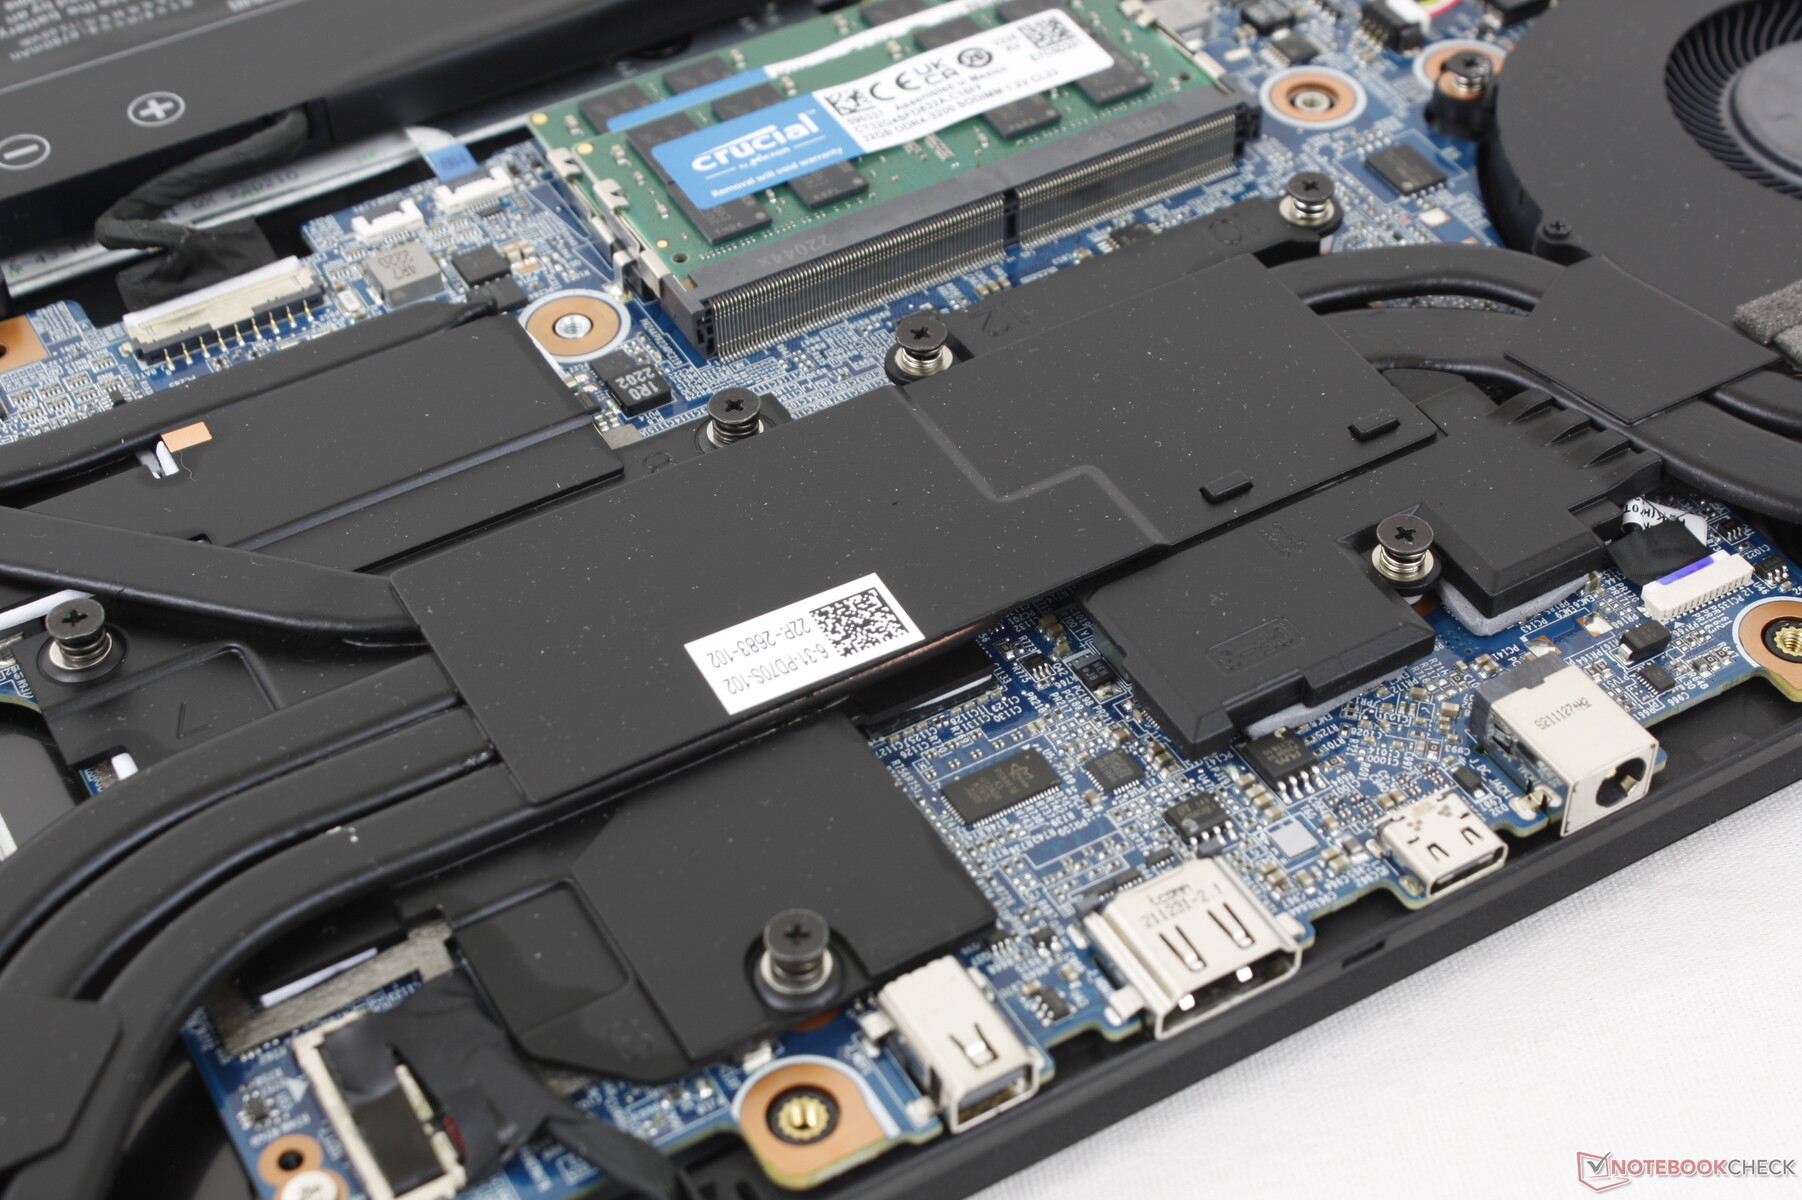
Dispositivos de almacenamiento
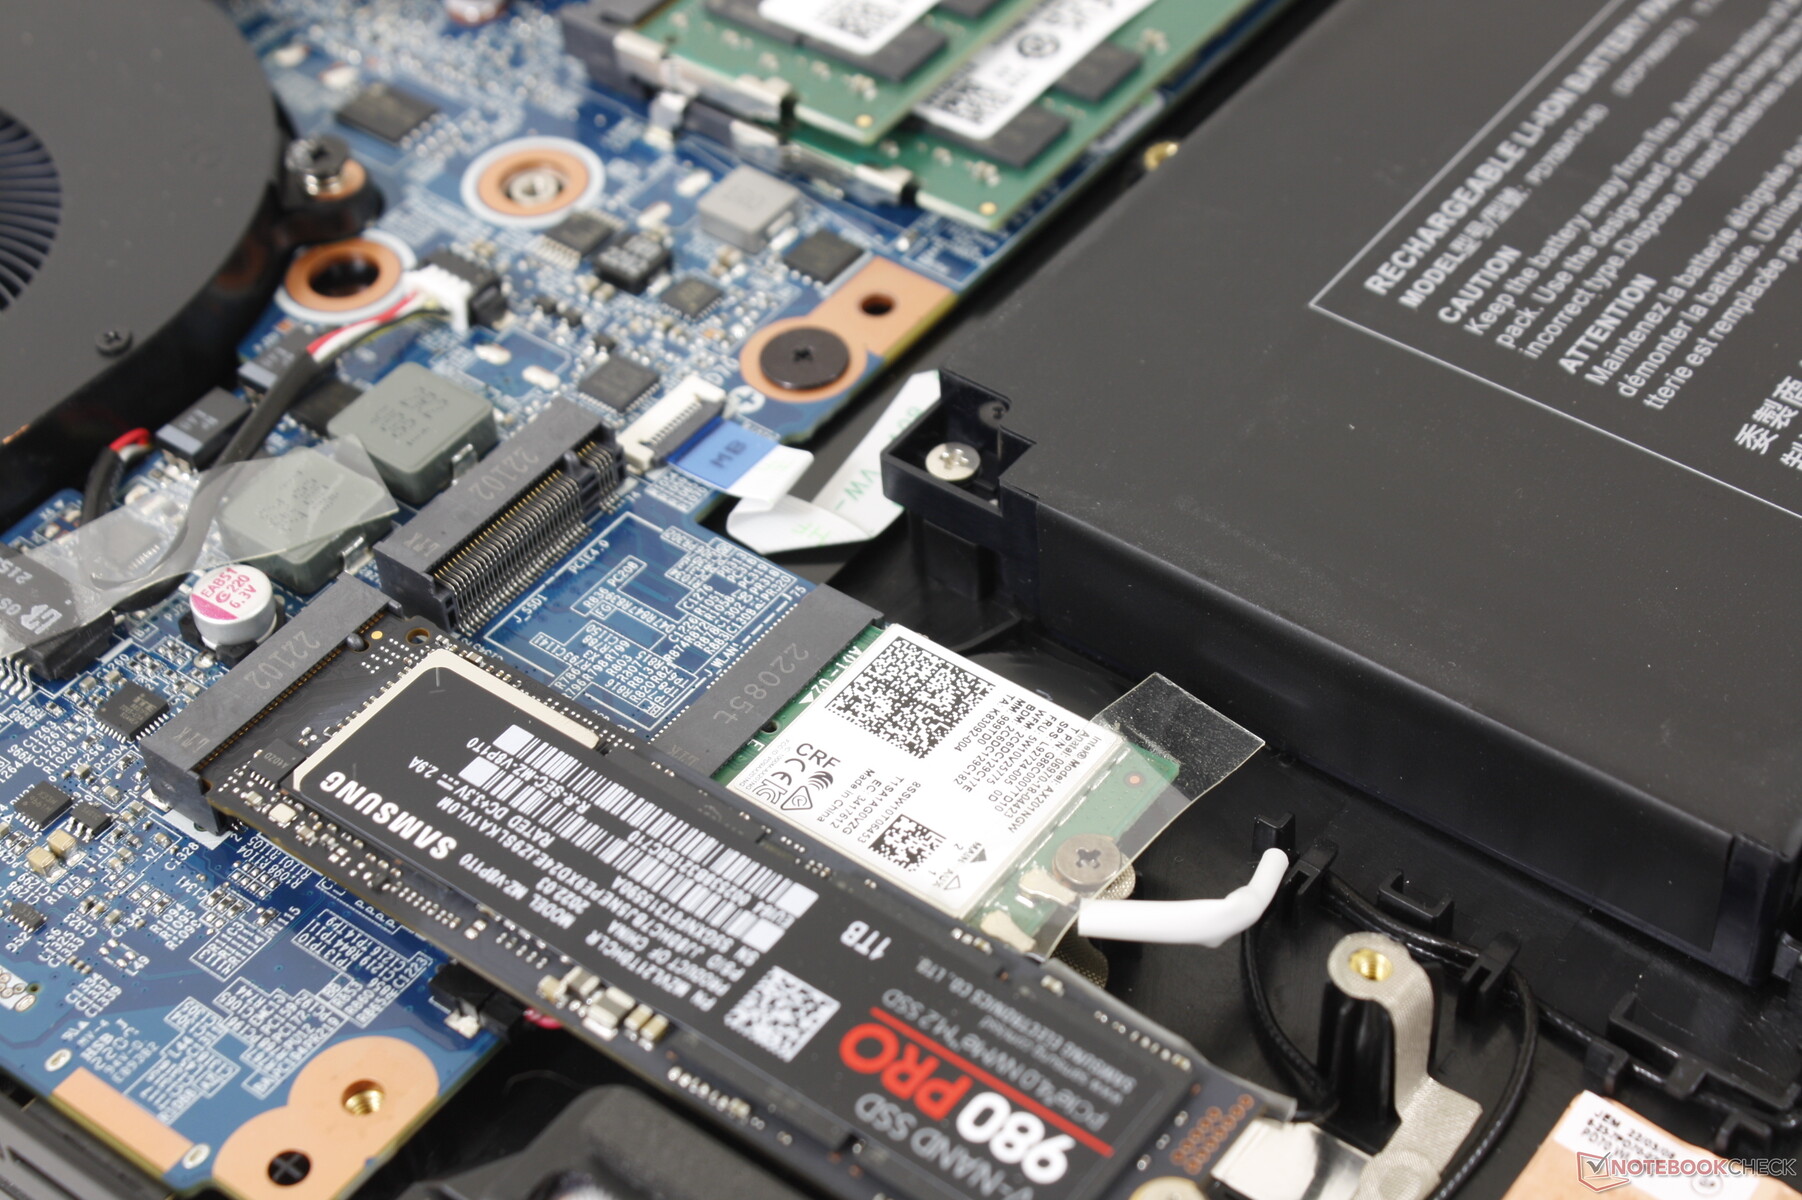
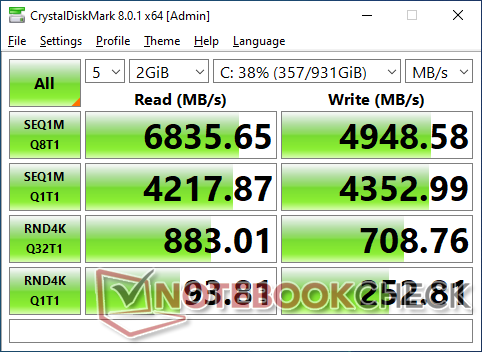
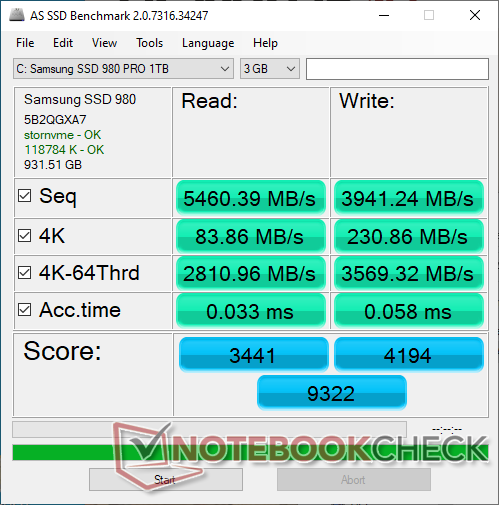
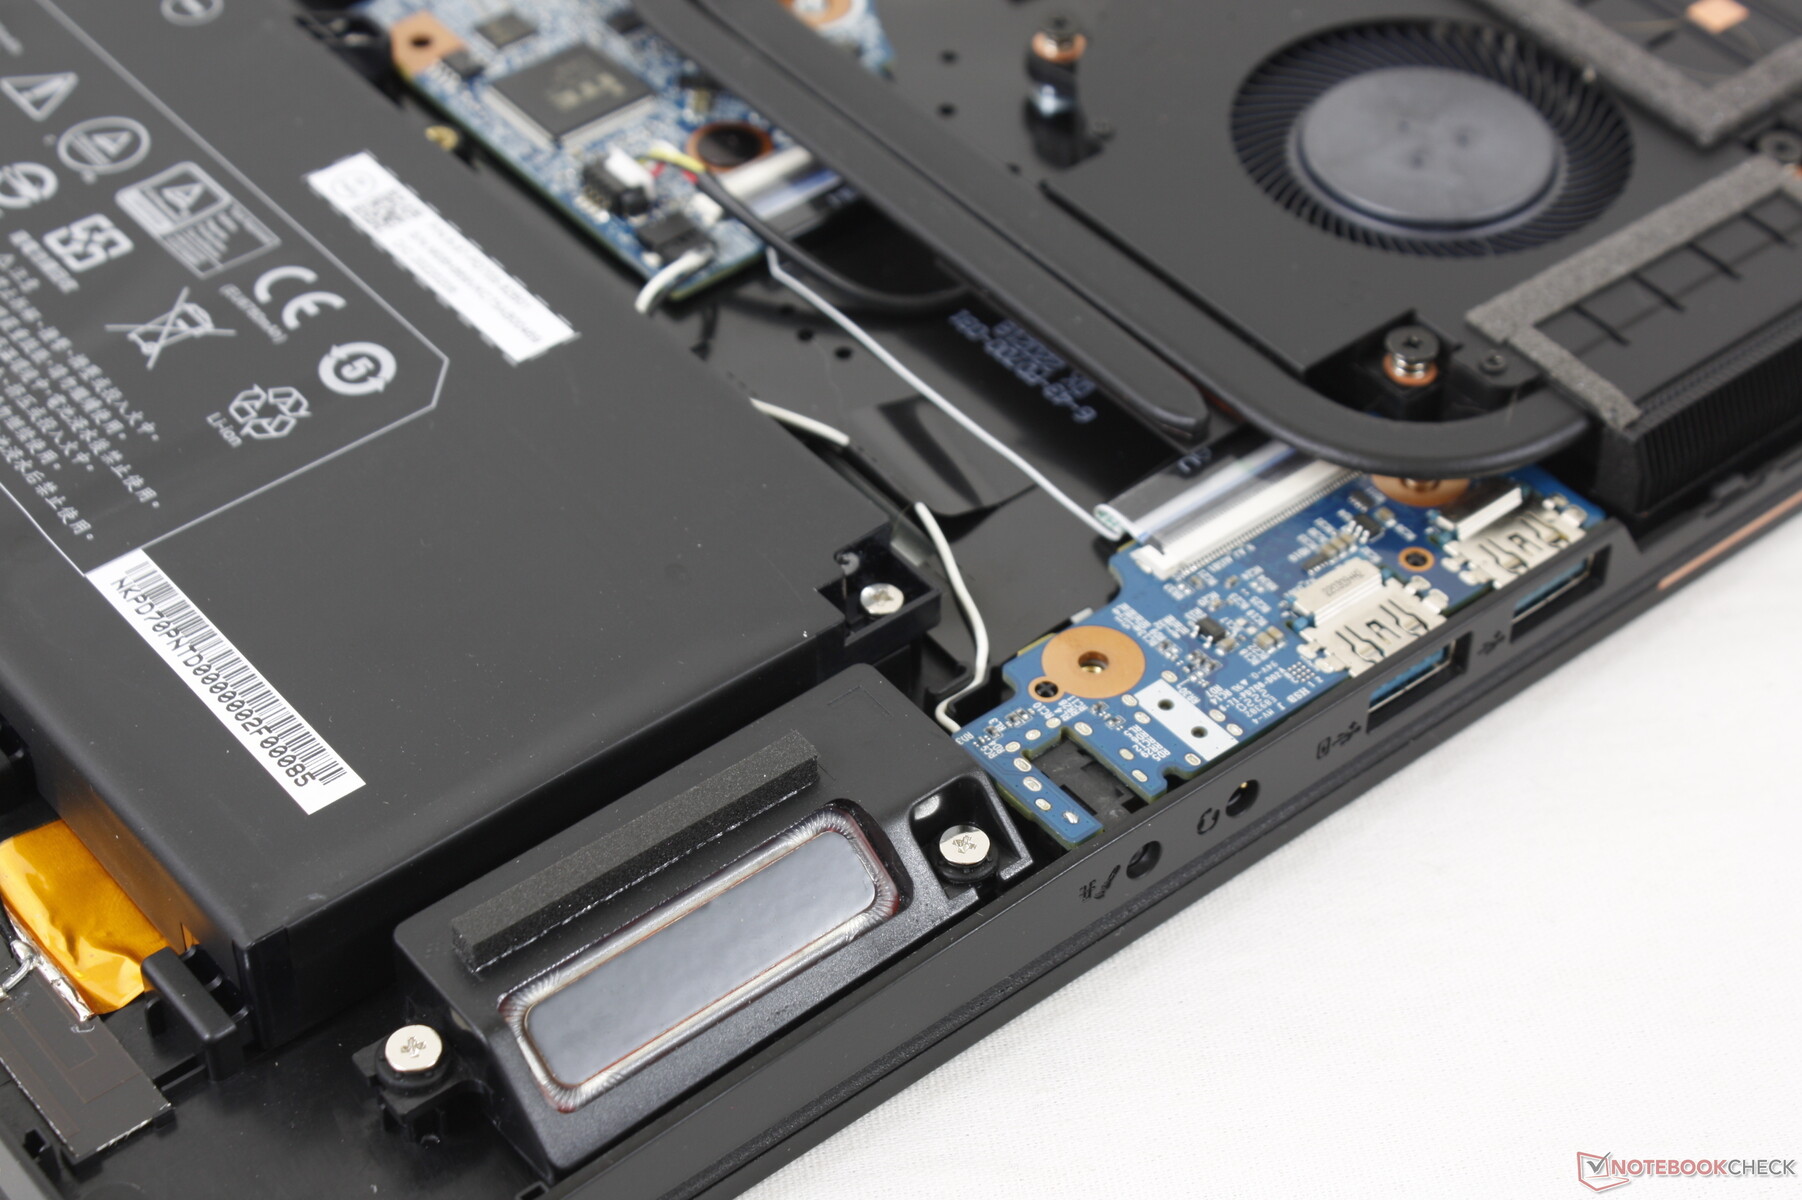
Las dos ranuras internas M.2 2280 pueden soportar sendos SSD PCIe4 x4 para alcanzar velocidades de locura, al menos en teoría. En realidad, sin embargo, es probable que las unidades se ralenticen, ya que el chasis no tiene un disipador de calor integrado para los SSD. La unidad de 1 TB Samsung 980 Pro PCIe4 x4 NVMe de 1 TB de nuestra unidad de prueba cayó a 1400 MB/s desde un máximo inicial de 6800 MB/s cuando se ejecutó DiskSpd en un bucle, como se muestra en nuestro gráfico siguiente. Estos resultados suelen ser aceptables para portátiles de juego económicos, pero son decepcionantes en máquinas de gama alta como esta.

| Drive Performance rating - Percent | |
| MSI Raider GE77 HX 12UHS | |
| Eurocom Nightsky TXi317 | |
| Aorus 17X XES | |
| Schenker XMG Pro 17 E22 | |
| Razer Blade 17 Early 2022 | |
| Alienware x17 R2 P48E | |
* ... más pequeño es mejor
Disk Throttling: DiskSpd Read Loop, Queue Depth 8
Rendimiento de la GPU
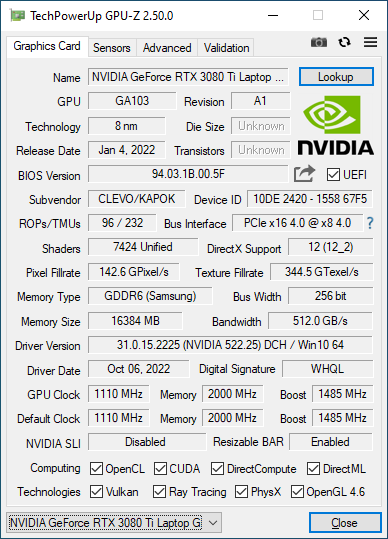
El rendimiento gráfico es excelente con resultados que están ligeramente por delante de la mayoría de los portátiles con la misma GeForce RTX 3080 Ti GPU. El TGP de 125 W no es el más alto como el Alienware x17 R2 e incluso el Razer Blade 17 tienen objetivos más altos, pero al menos es más alto que en muchos portátiles ultradelgados como la serie MSI GS.
Curiosamente, el Panel de Control de Nvidia afirma un TGP de 155 W mientras que Eurocom afirma un TGP de 125 W. Este último número parece ser el objetivo más preciso como mostrará nuestra sección de Prueba de Estrés más adelante.
Al cambiar a la GeForce RTX 3070 Ti sólo afectará al rendimiento gráfico en un 10 por ciento. El rendimiento general es aproximadamente entre un 20 y un 30 por ciento más lento que el de nuestro escritorio GeForce RTX 3080.
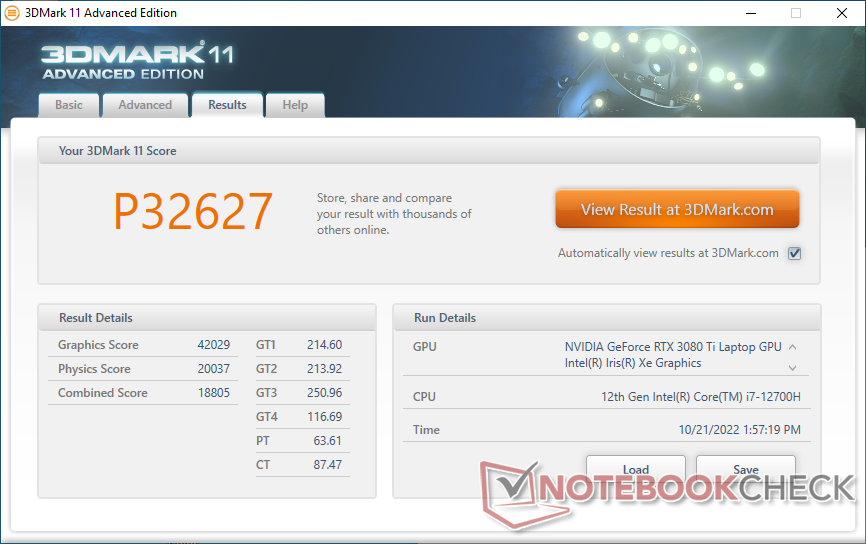
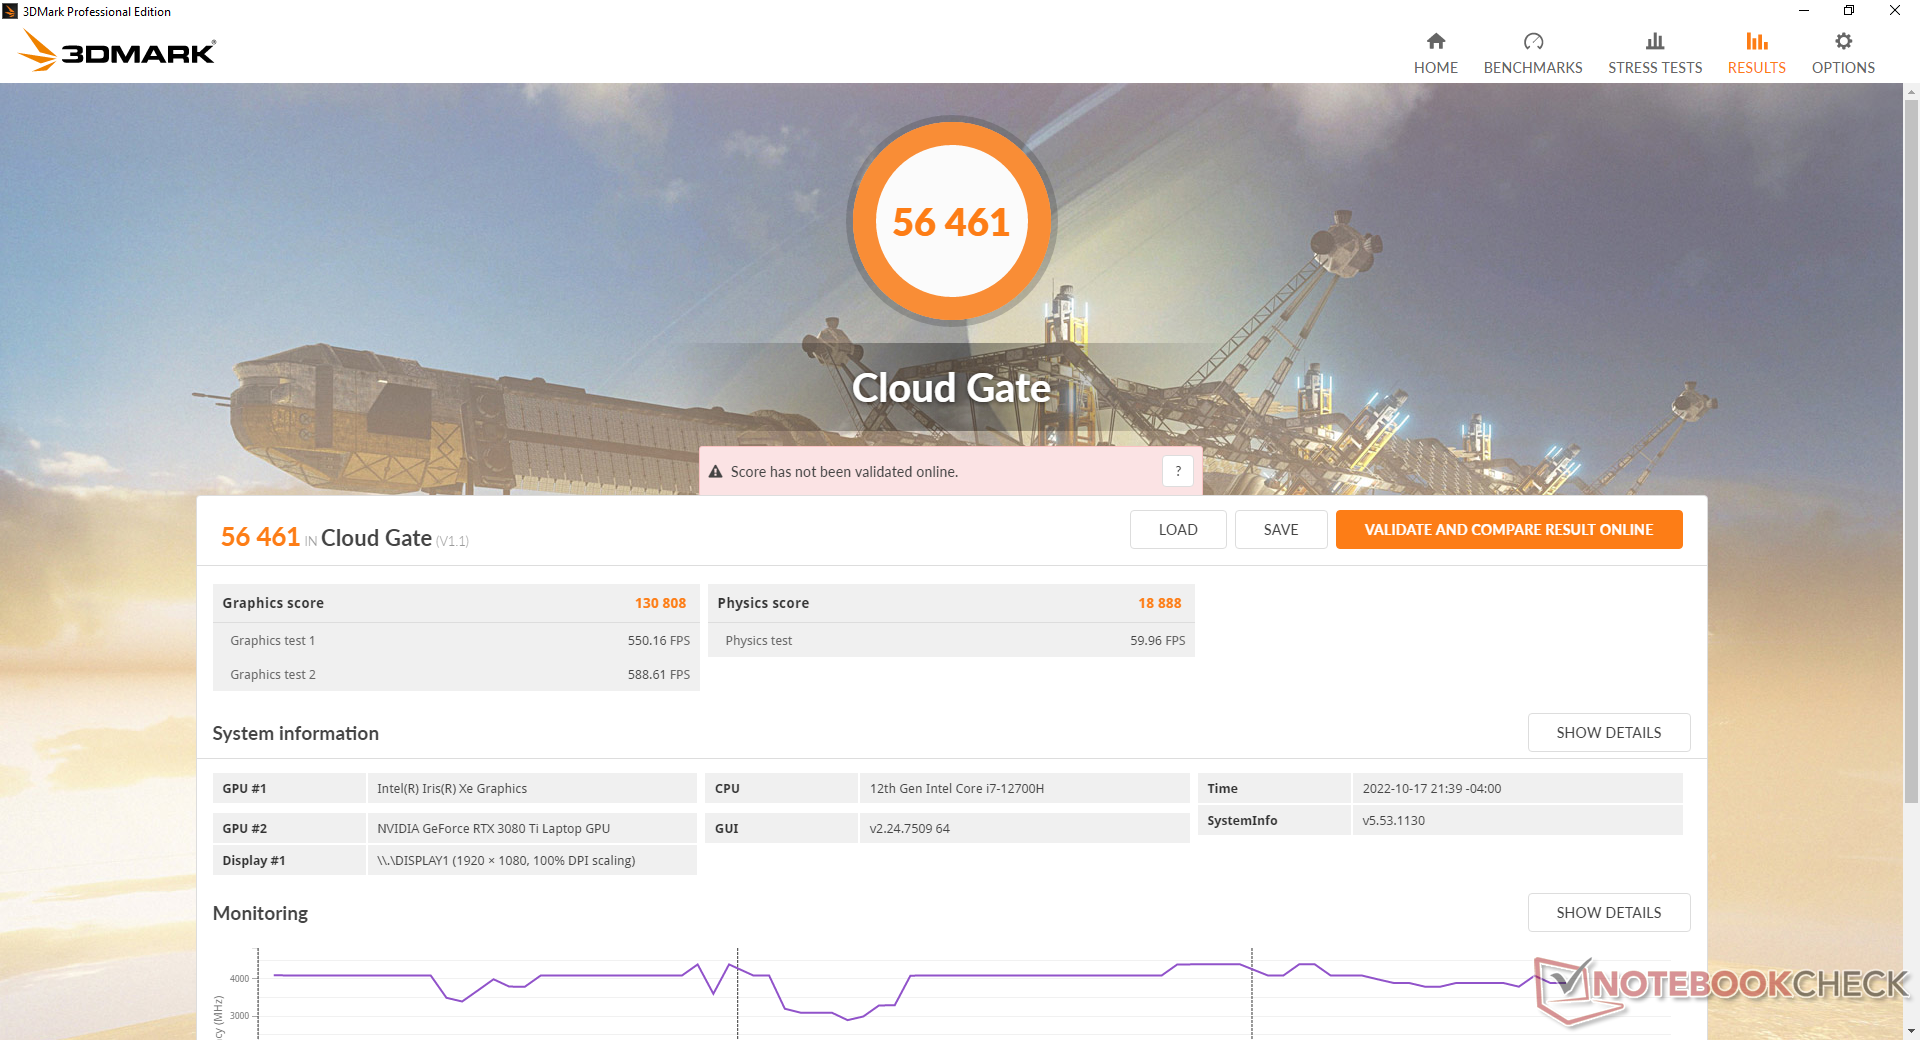
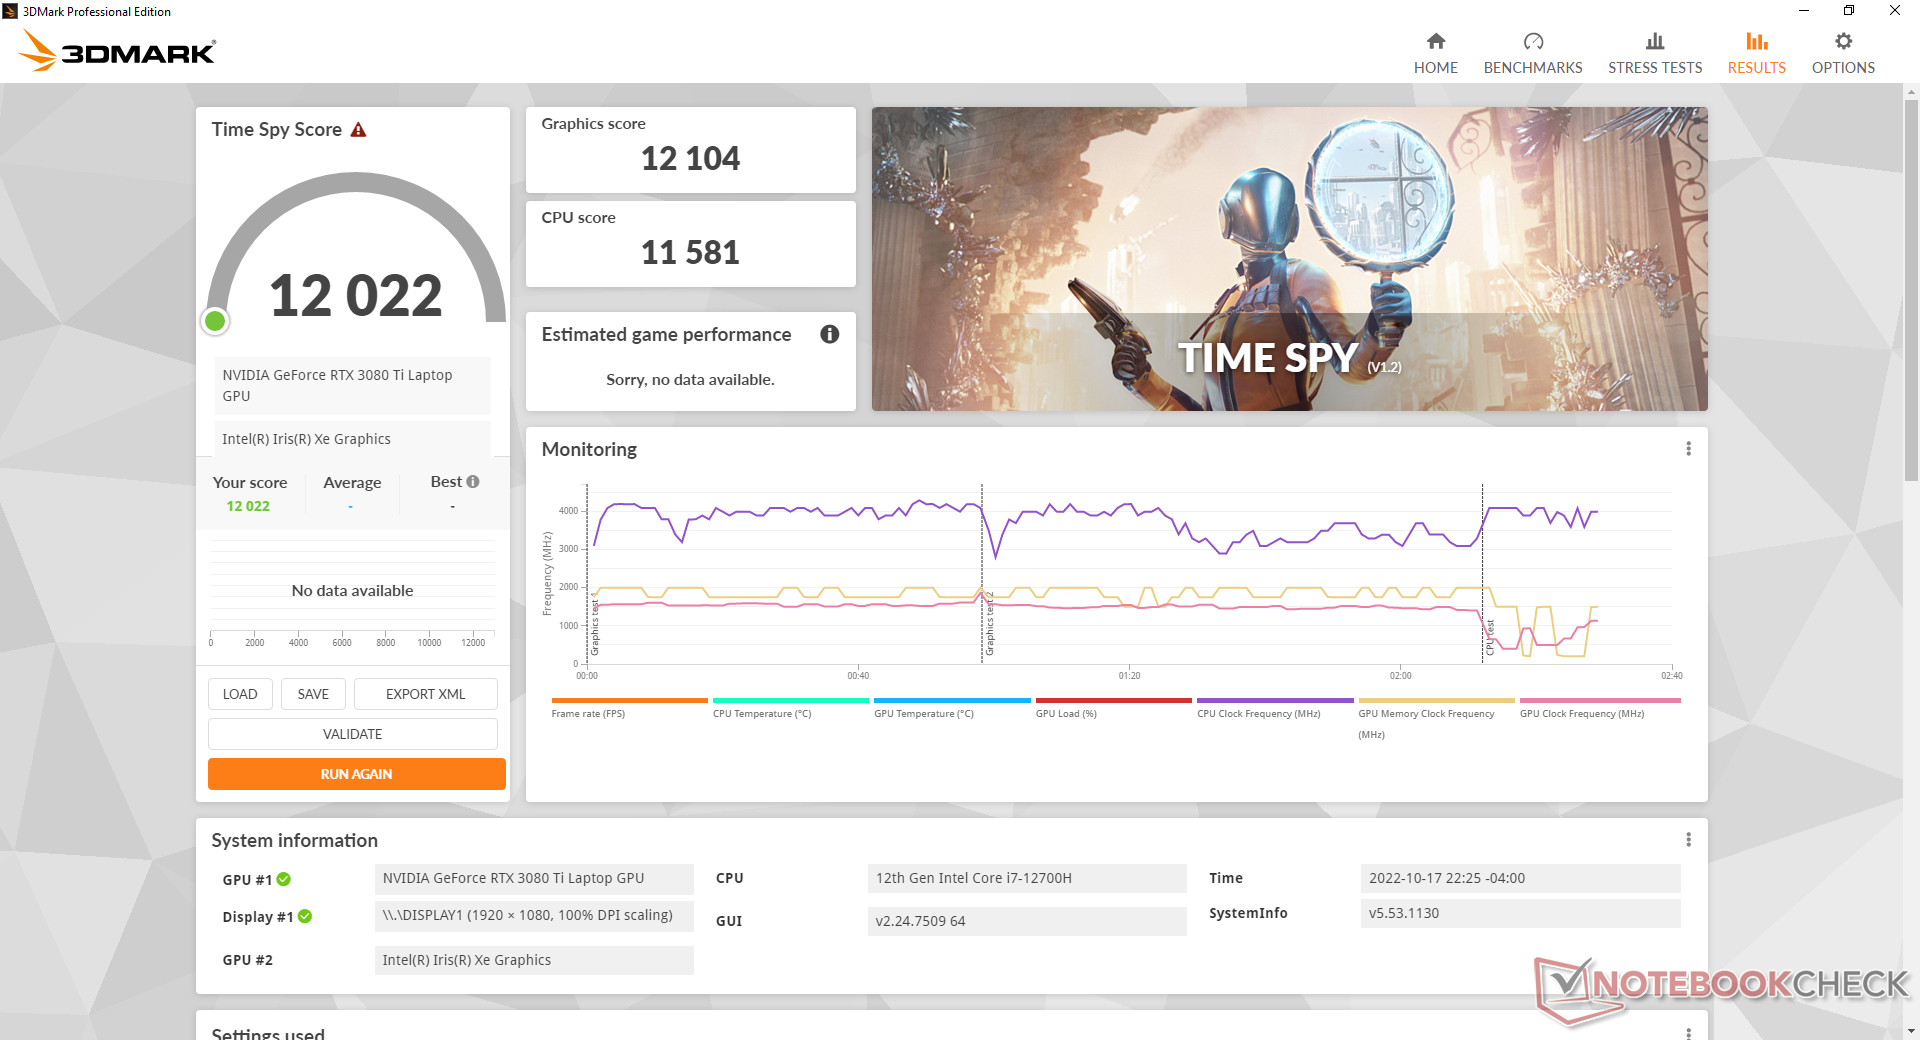
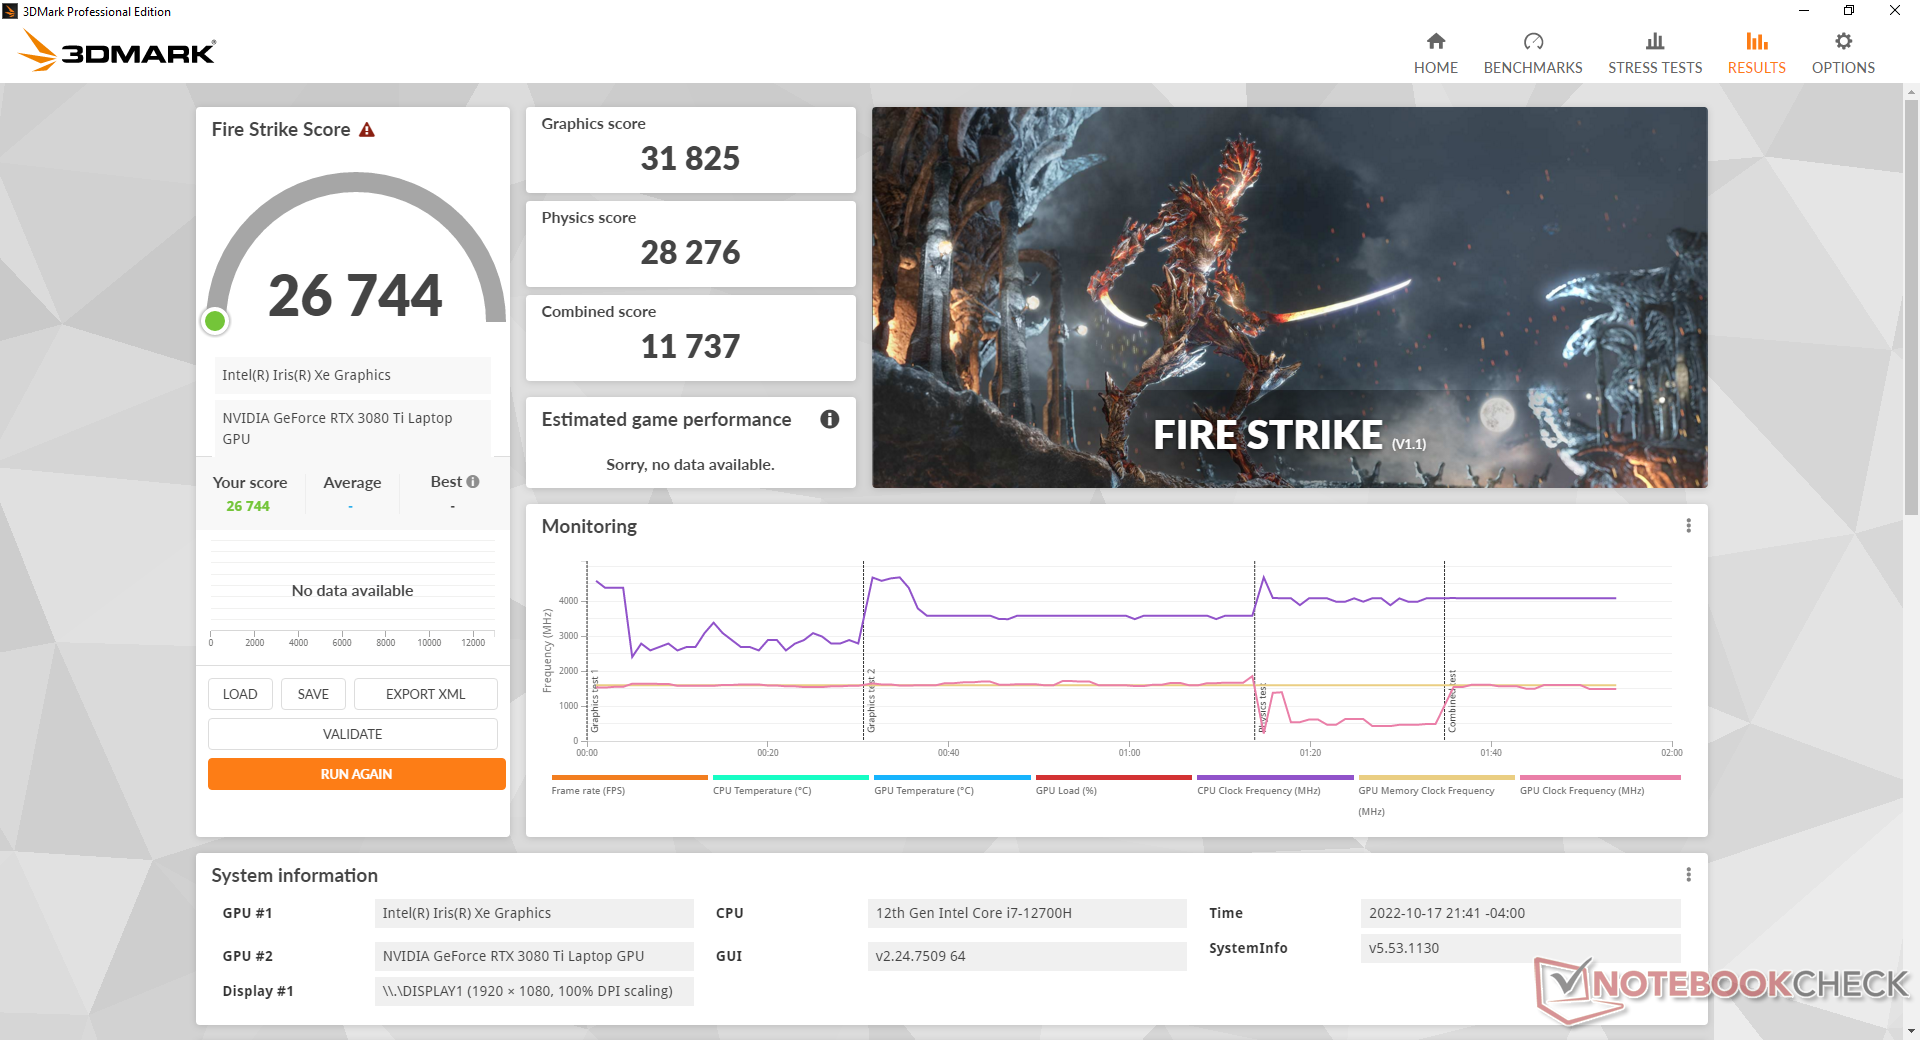
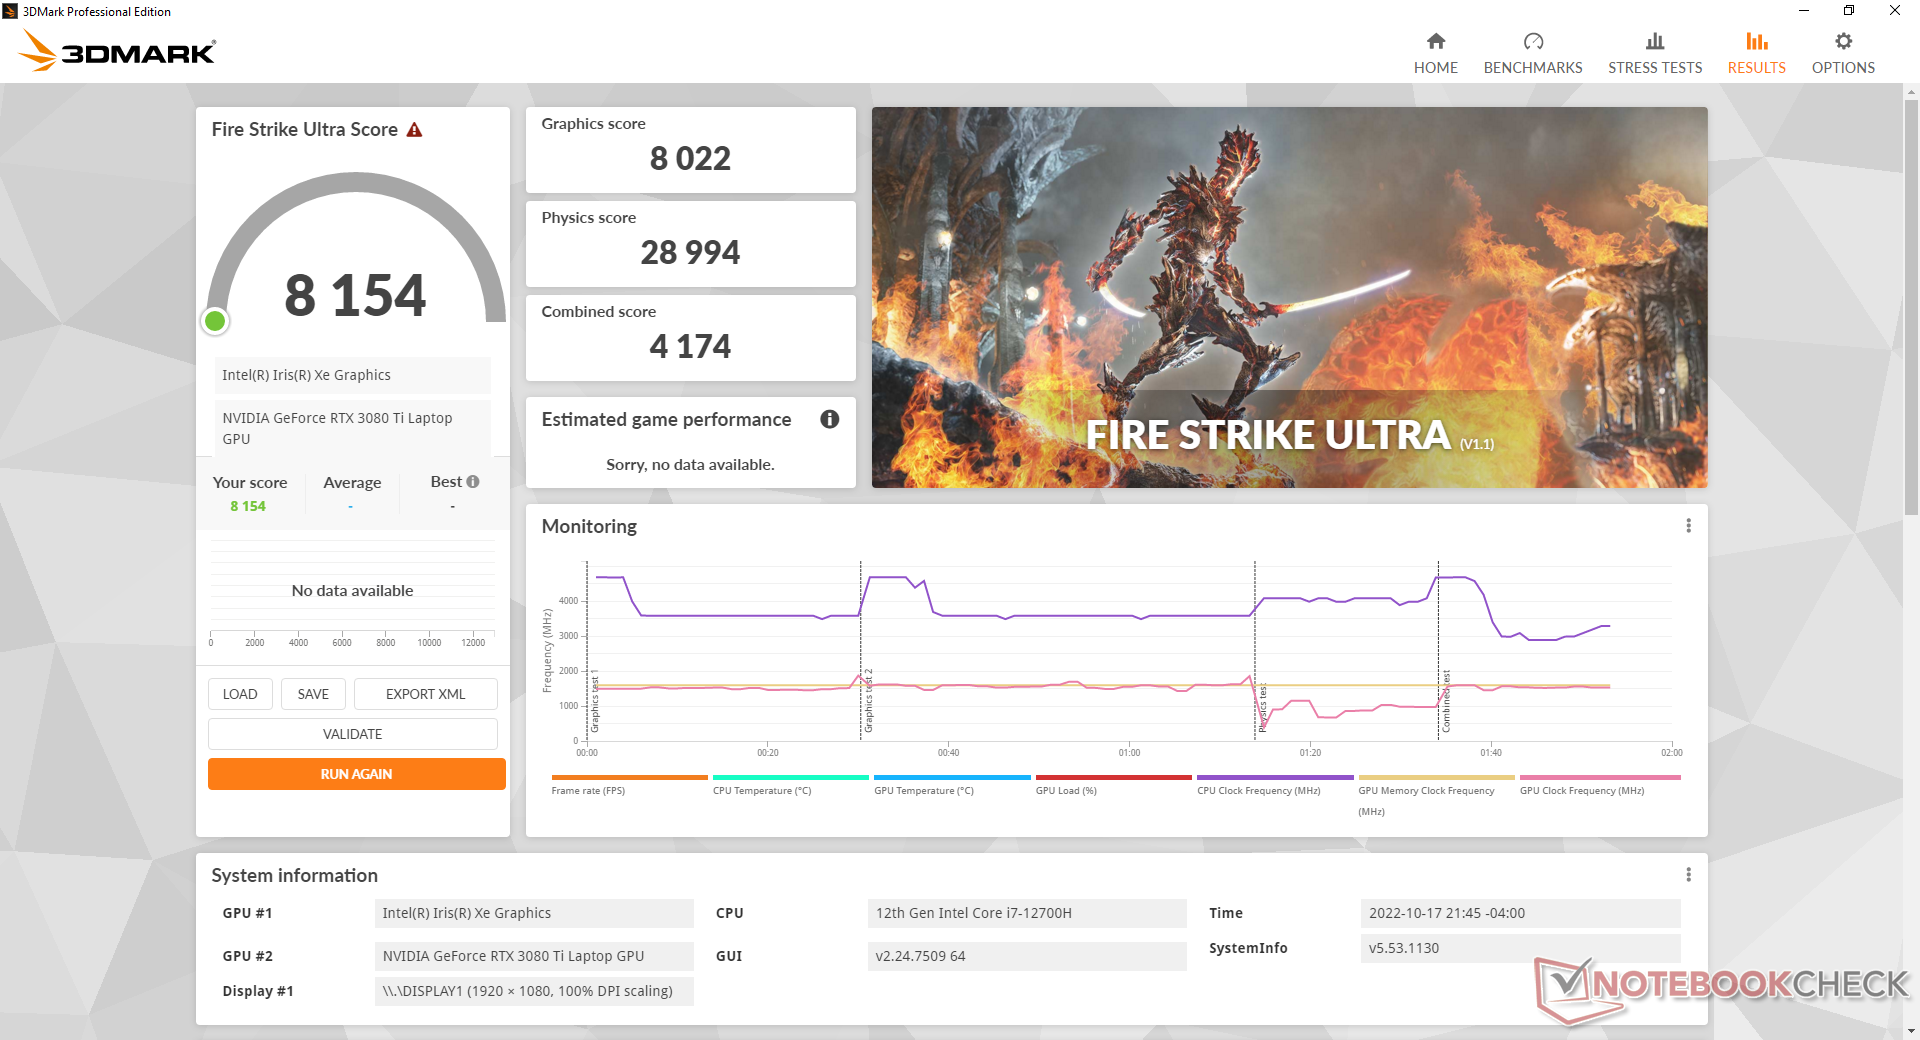
| 3DMark 11 Performance | 32627 puntos | |
| 3DMark Cloud Gate Standard Score | 56461 puntos | |
| 3DMark Fire Strike Score | 26744 puntos | |
| 3DMark Time Spy Score | 12022 puntos | |
ayuda | ||
* ... más pequeño es mejor
Witcher 3 FPS Chart
| bajo | medio | alto | ultra | |
|---|---|---|---|---|
| GTA V (2015) | 186.2 | 181.3 | 169.5 | 107.4 |
| The Witcher 3 (2015) | 391.9 | 313.9 | 212.5 | 109.4 |
| Dota 2 Reborn (2015) | 176.1 | 157.9 | 148.6 | 140.8 |
| Final Fantasy XV Benchmark (2018) | 200 | 147.4 | 115.1 | |
| X-Plane 11.11 (2018) | 124.3 | 106.6 | 96.4 | |
| Strange Brigade (2018) | 416 | 273 | 226 | 199.8 |
| Cyberpunk 2077 1.6 (2022) | 135.4 | 123.2 | 96.2 | 80 |
Emisiones
Ruido del sistema
Casi siempre hay algún ruido de ventilador de la máquina. Los ventiladores tienden a estar en reposo si están en el escritorio, pero incluso las cargas más ligeras como la navegación por internet inducen un ruido de ventilador de 30 dB(A) contra un fondo silencioso de 23 dB(A). El ruido del ventilador alcanzaría rápidamente su máximo de 56 dB(A) cuando se ejecutan cargas más exigentes como 3DMark 06 o juegos, incluso si se establece en el perfil de energía equilibrada. Este es un portátil para juegos que no teme ser ruidoso sin importar la configuración del perfil de energía.
La mayoría de los otros portátiles de 17 pulgadas para juegos también alcanzan el rango de 50 dB(A) o más cuando están en condiciones similares, por lo que este problema no es exclusivo de Eurocom. Sin embargo, la máquina de Eurocom tiende a volverse más ruidosa de repente y a un ritmo más rápido.
Ruido
| Ocioso |
| 23.3 / 30.7 / 30.7 dB(A) |
| Carga |
| 56.2 / 55.9 dB(A) |
 | ||
30 dB silencioso 40 dB(A) audible 50 dB(A) ruidosamente alto |
||
min: | ||
| Eurocom Nightsky TXi317 GeForce RTX 3080 Ti Laptop GPU, i7-12700H, Samsung SSD 980 Pro 1TB MZ-V8P1T0BW | Schenker XMG Pro 17 E22 GeForce RTX 3080 Ti Laptop GPU, i9-12900H, Samsung SSD 980 Pro 1TB MZ-V8P1T0BW | Aorus 17X XES GeForce RTX 3070 Ti Laptop GPU, i9-12900HX, Gigabyte AG470S1TB-SI B10 | MSI Raider GE77 HX 12UHS GeForce RTX 3080 Ti Laptop GPU, i9-12900HX, Samsung PM9A1 MZVL22T0HBLB | Razer Blade 17 Early 2022 GeForce RTX 3080 Ti Laptop GPU, i9-12900H, Samsung PM9A1 MZVL21T0HCLR | Alienware x17 R2 P48E GeForce RTX 3080 Ti Laptop GPU, i9-12900HK, 2x Samsung PM9A1 1TB (RAID 0) | |
|---|---|---|---|---|---|---|
| Noise | -12% | -7% | -11% | 2% | 16% | |
| apagado / medio ambiente * (dB) | 23.3 | 26 -12% | 26 -12% | 26 -12% | 26 -12% | 22.7 3% |
| Idle Minimum * (dB) | 23.3 | 26 -12% | 28 -20% | 26 -12% | 26 -12% | 23.1 1% |
| Idle Average * (dB) | 30.7 | 34 -11% | 32 -4% | 34 -11% | 27 12% | 23.1 25% |
| Idle Maximum * (dB) | 30.7 | 42 -37% | 38 -24% | 46 -50% | 32 -4% | 23.1 25% |
| Load Average * (dB) | 56.2 | 58 -3% | 53 6% | 50 11% | 50 11% | 31.9 43% |
| Witcher 3 ultra * (dB) | 56.1 | 57 -2% | 54 4% | 55 2% | 51 9% | 52.5 6% |
| Load Maximum * (dB) | 55.9 | 58 -4% | 55 2% | 57 -2% | 51 9% | 52.5 6% |
* ... más pequeño es mejor
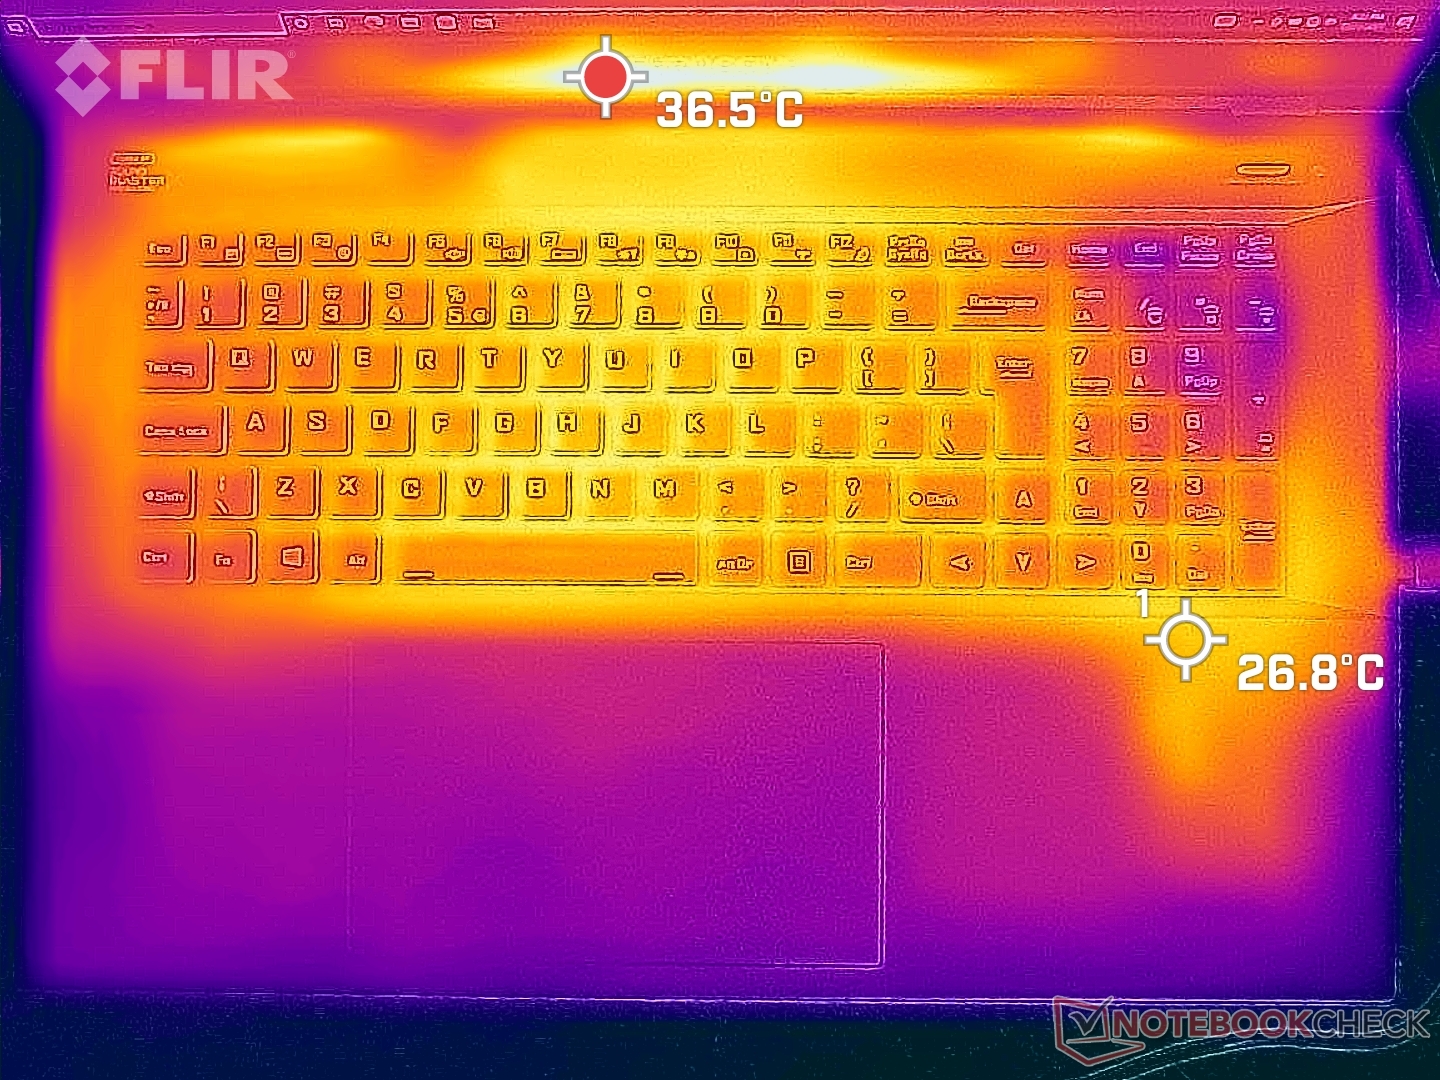
Temperatura
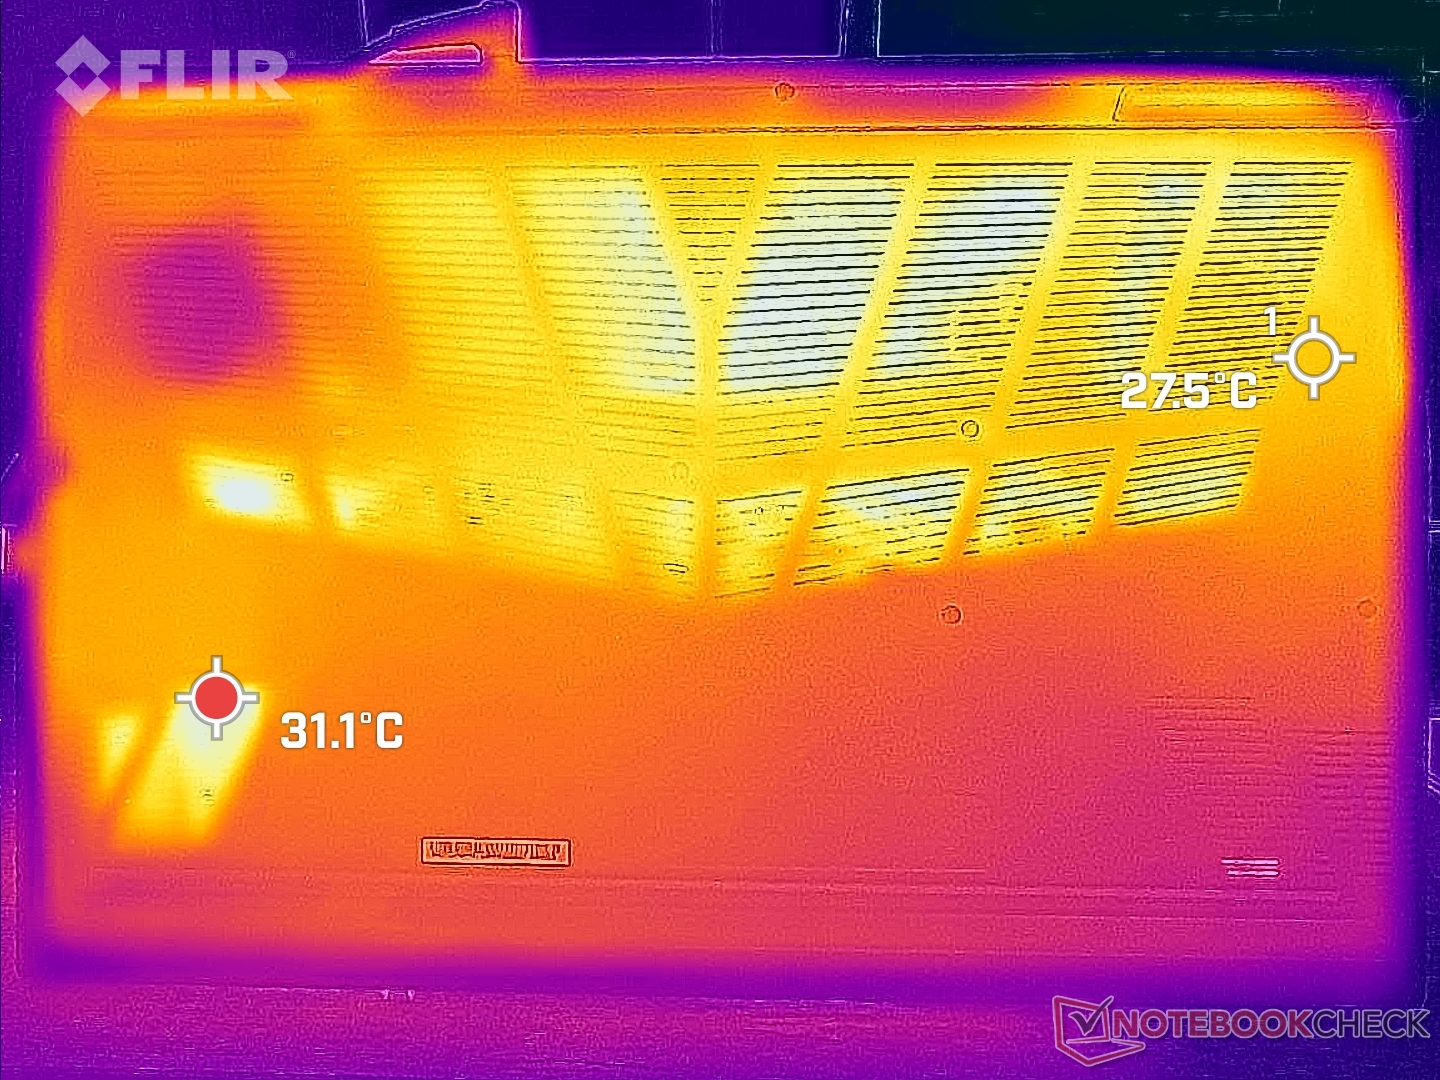
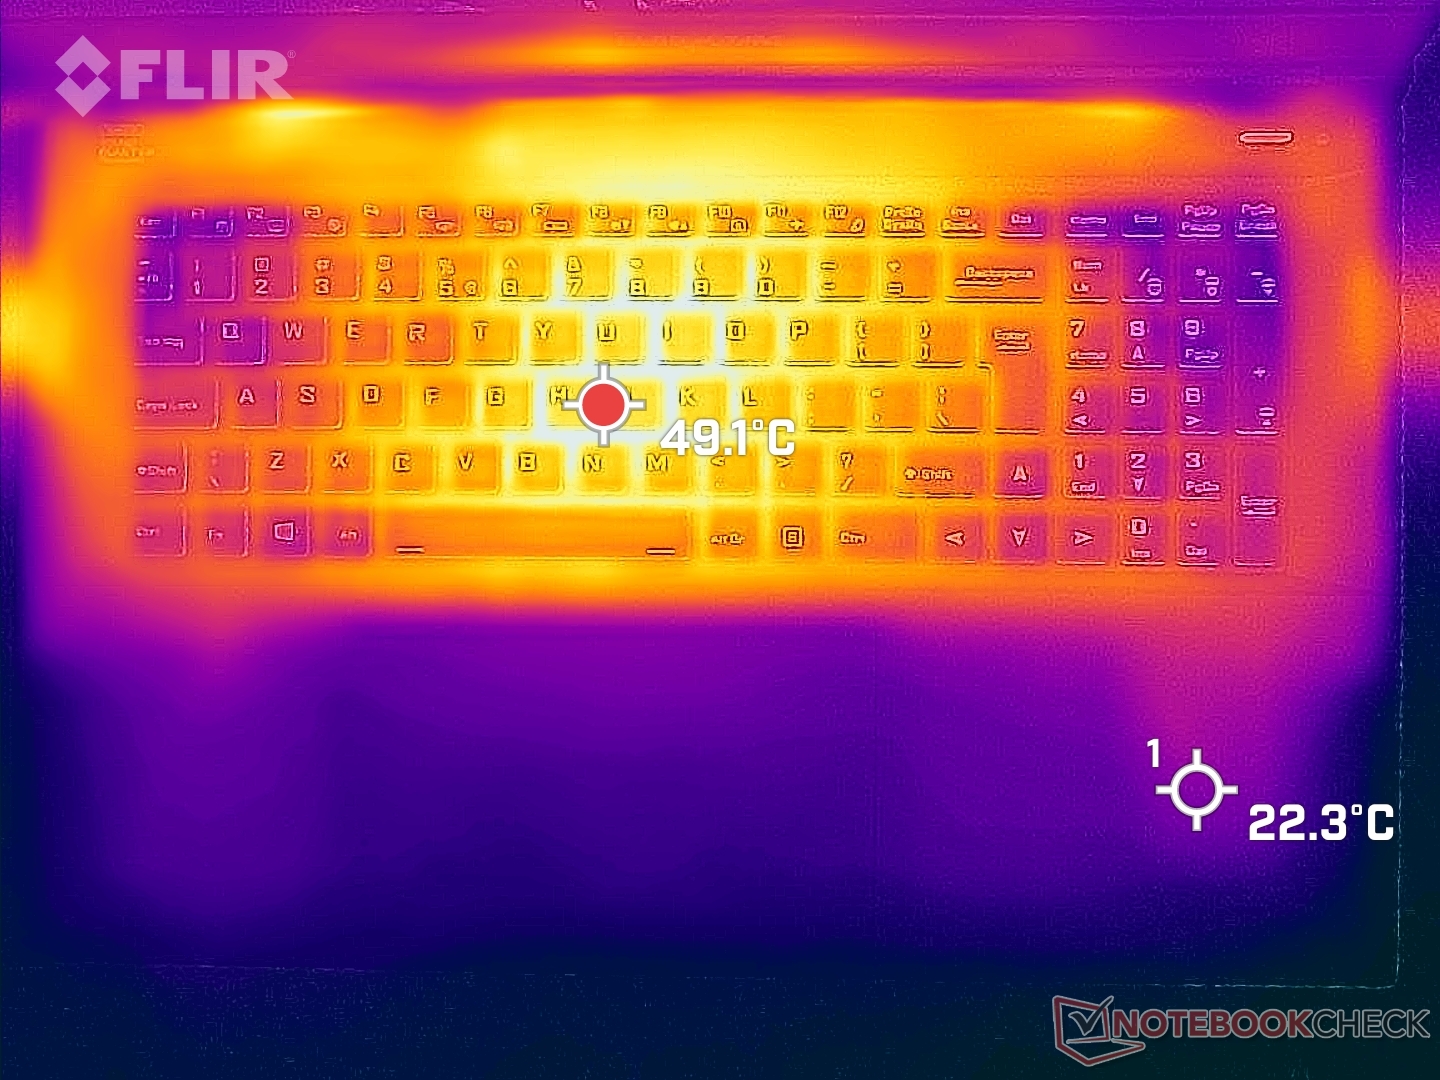
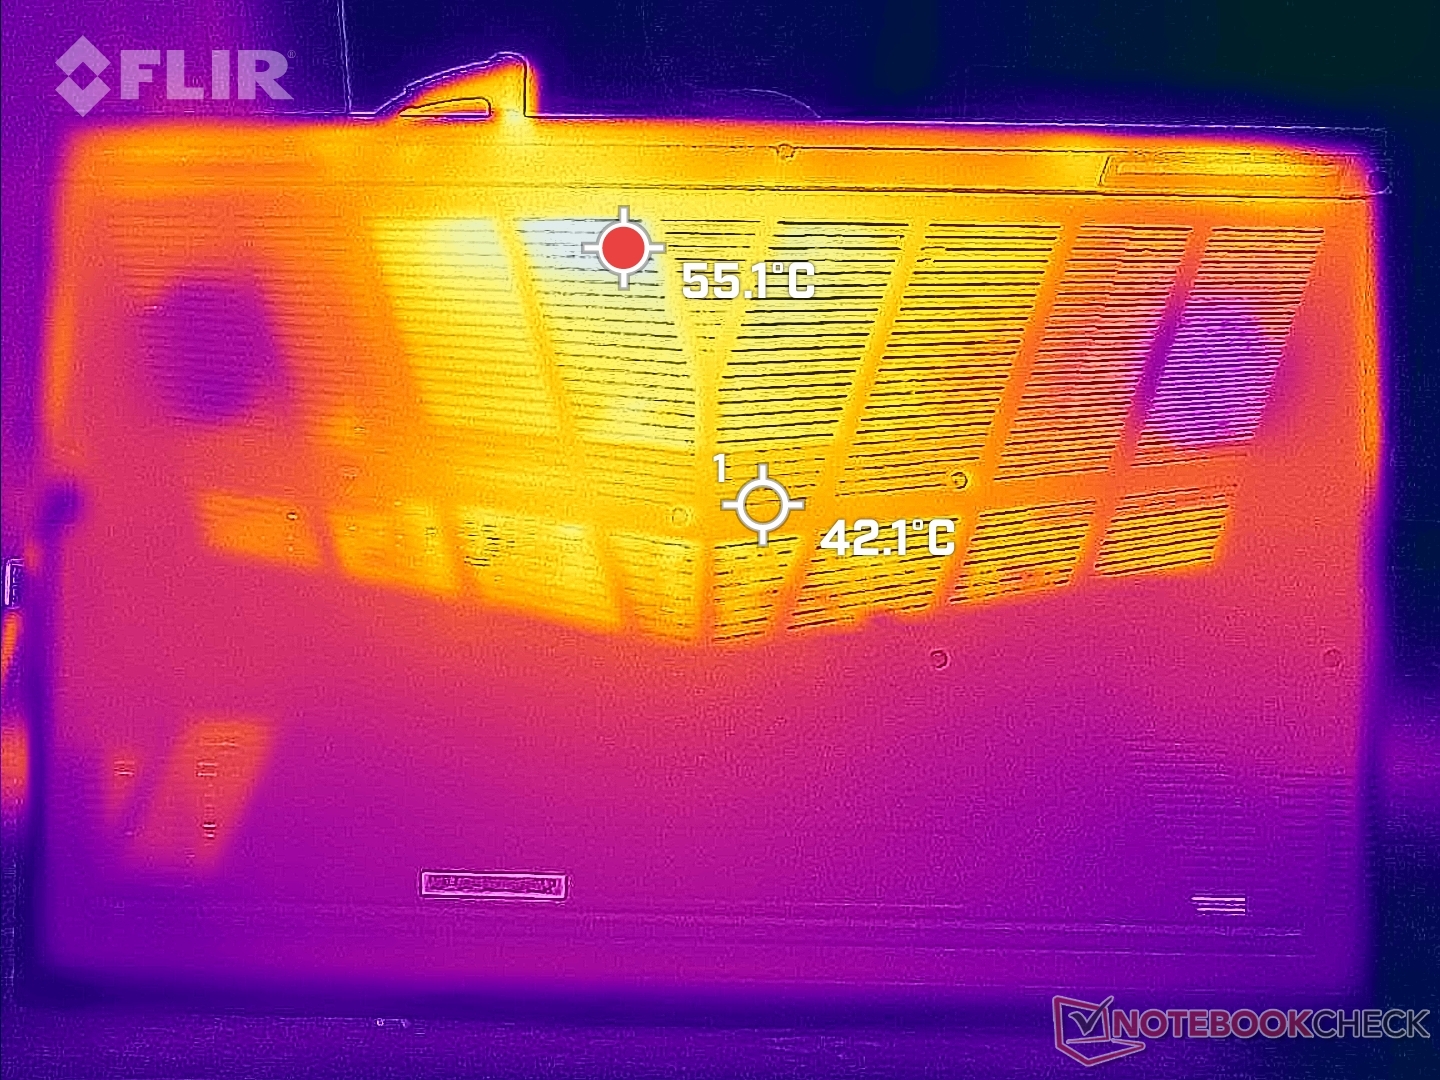
Las temperaturas de la superficie son más cálidas hacia el centro del teclado, mientras que los reposamanos son mucho más fríos para un juego más cómodo. Los portátiles más finos, como el Razer Blade 17 tienen reposamanos notablemente más calientes para ser más incómodos en la mano
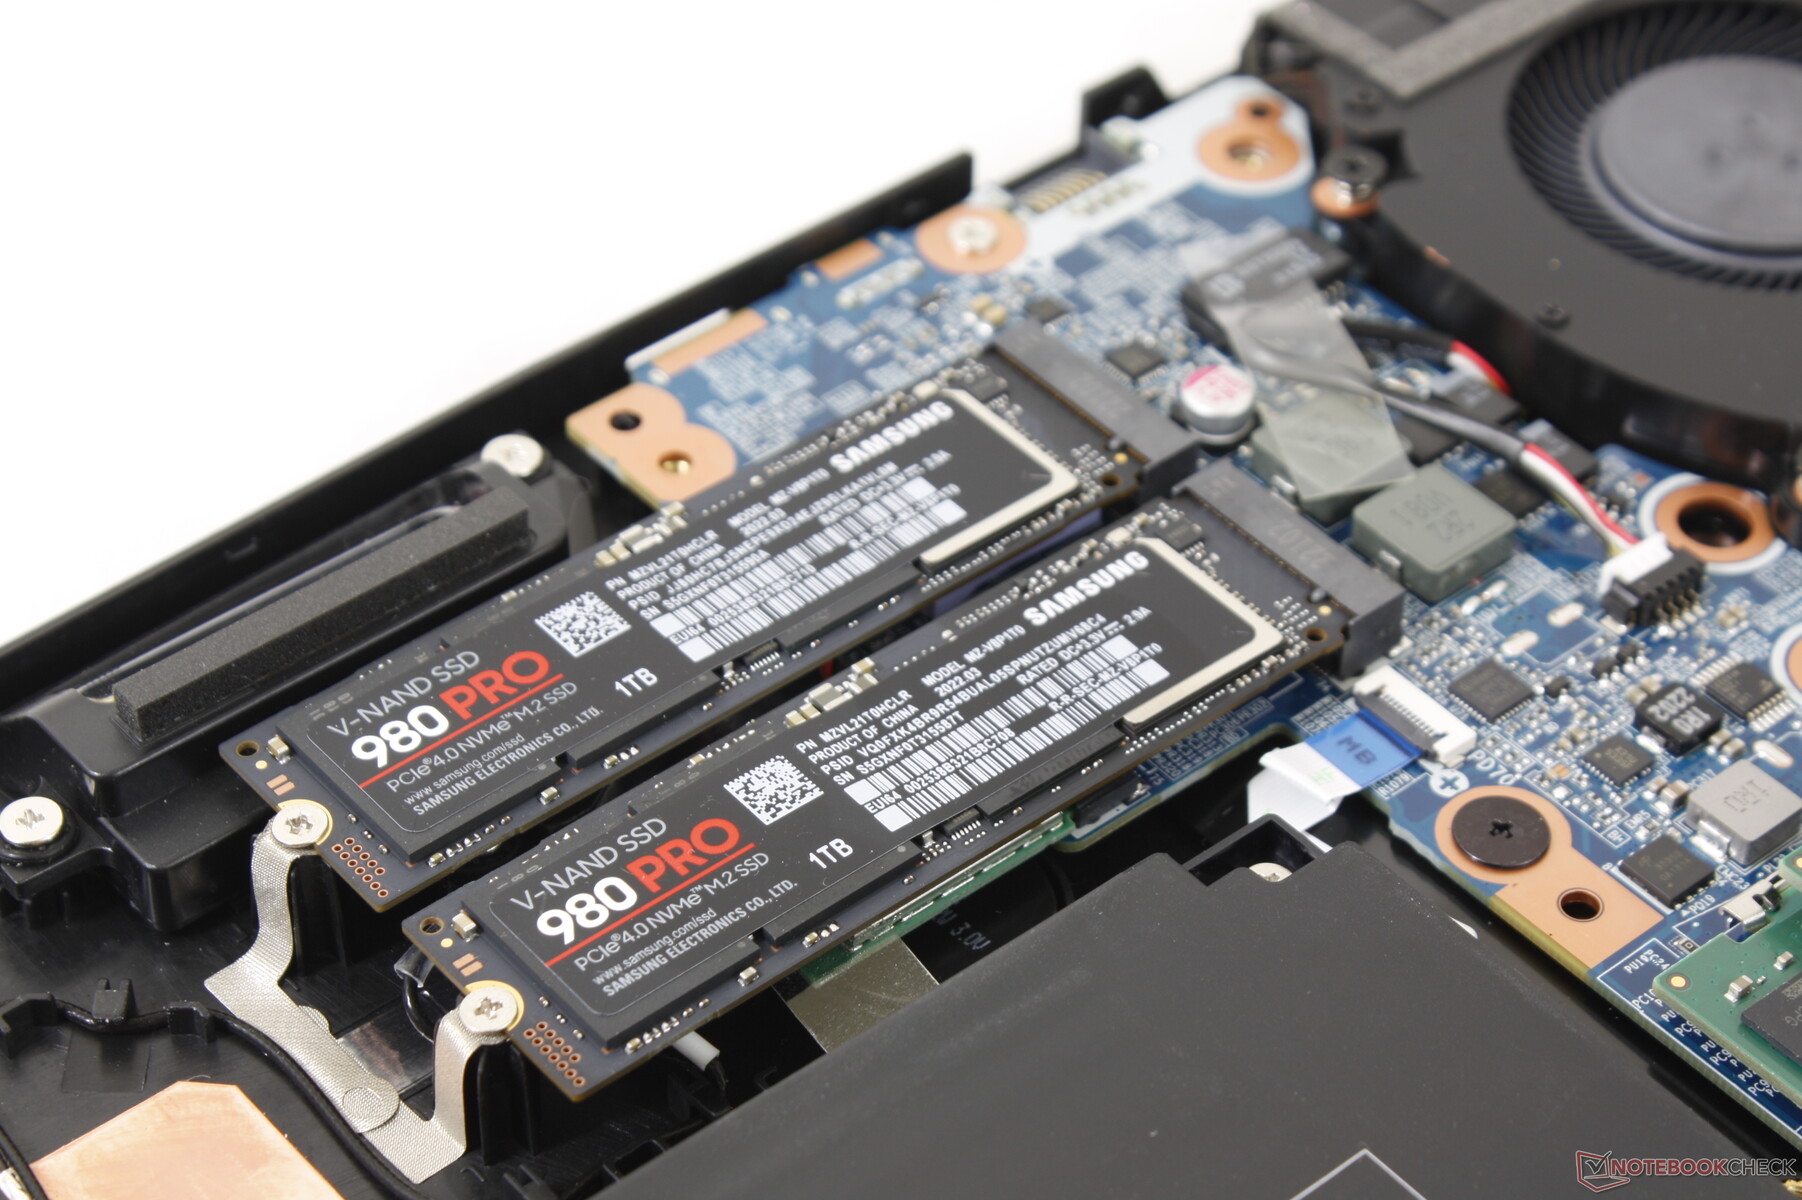
Ten en cuenta que el reposamanos derecho del Nightsky TXi317 siempre estará un poco más caliente que el izquierdo, ya que los SSD M.2 están situados debajo del reposamanos derecho.
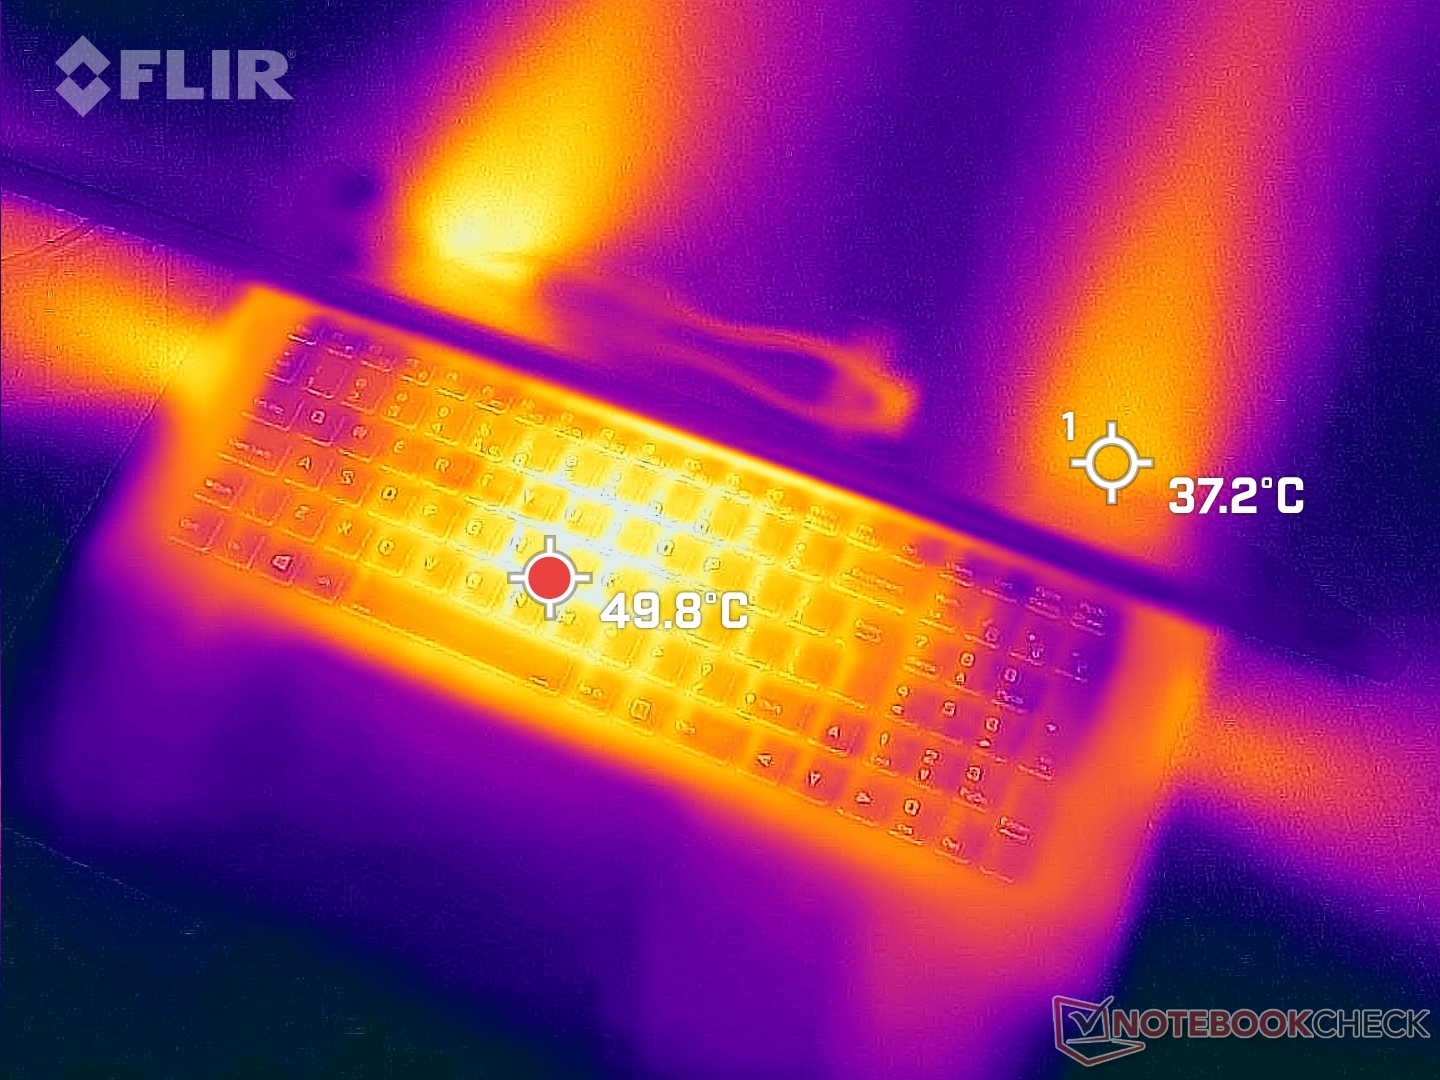
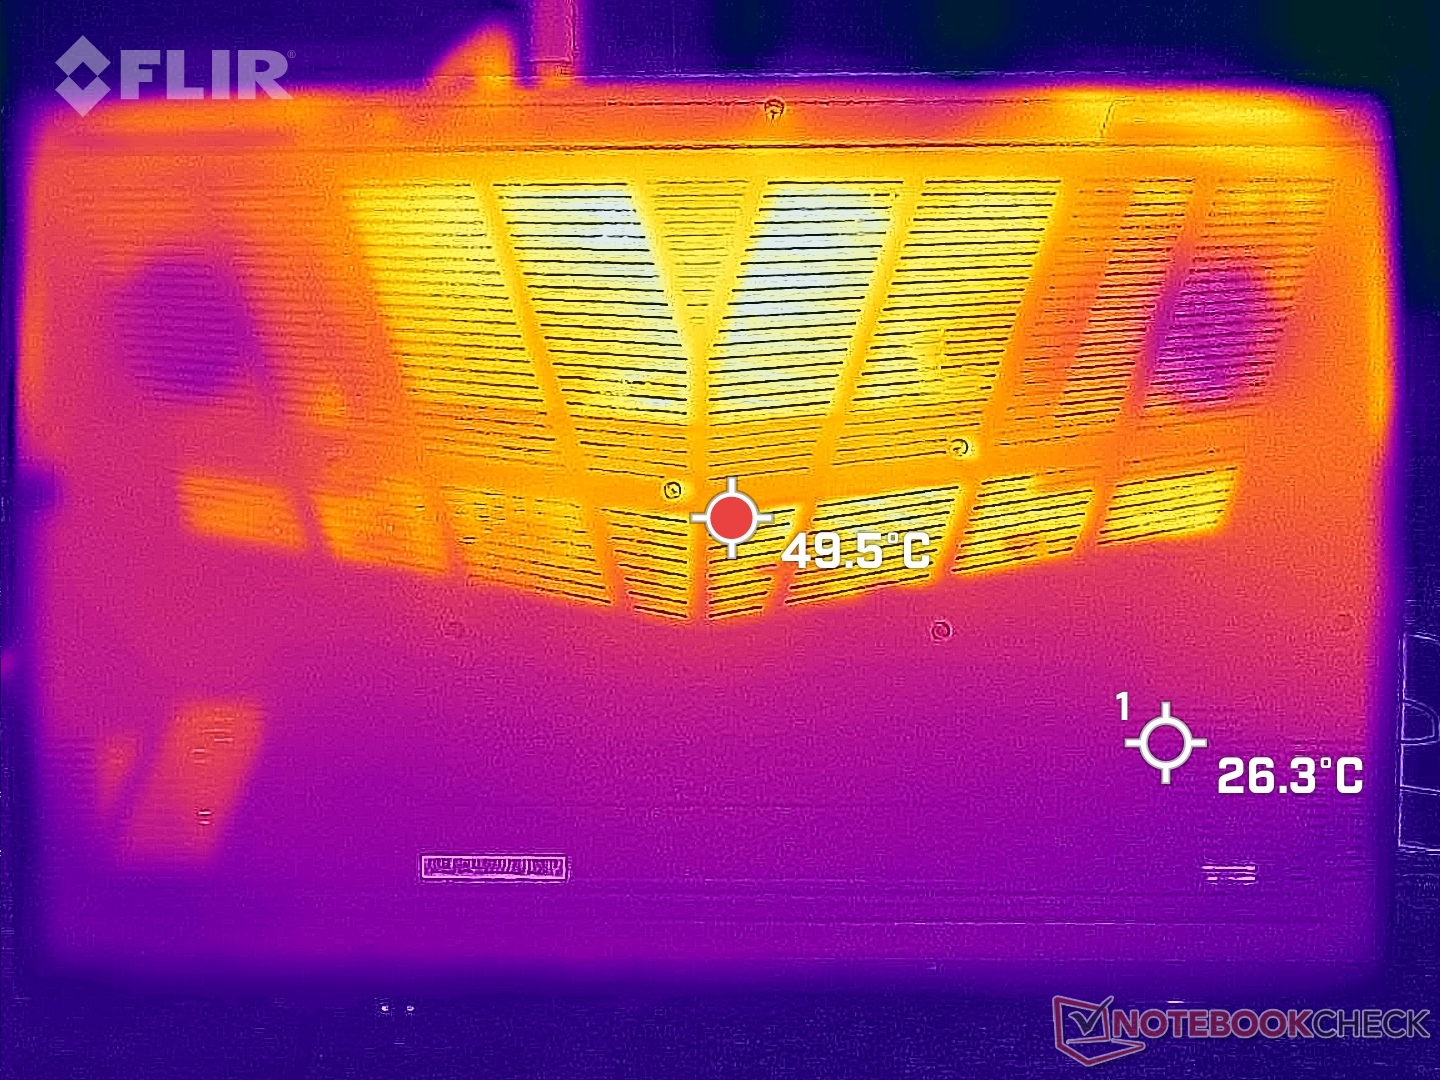
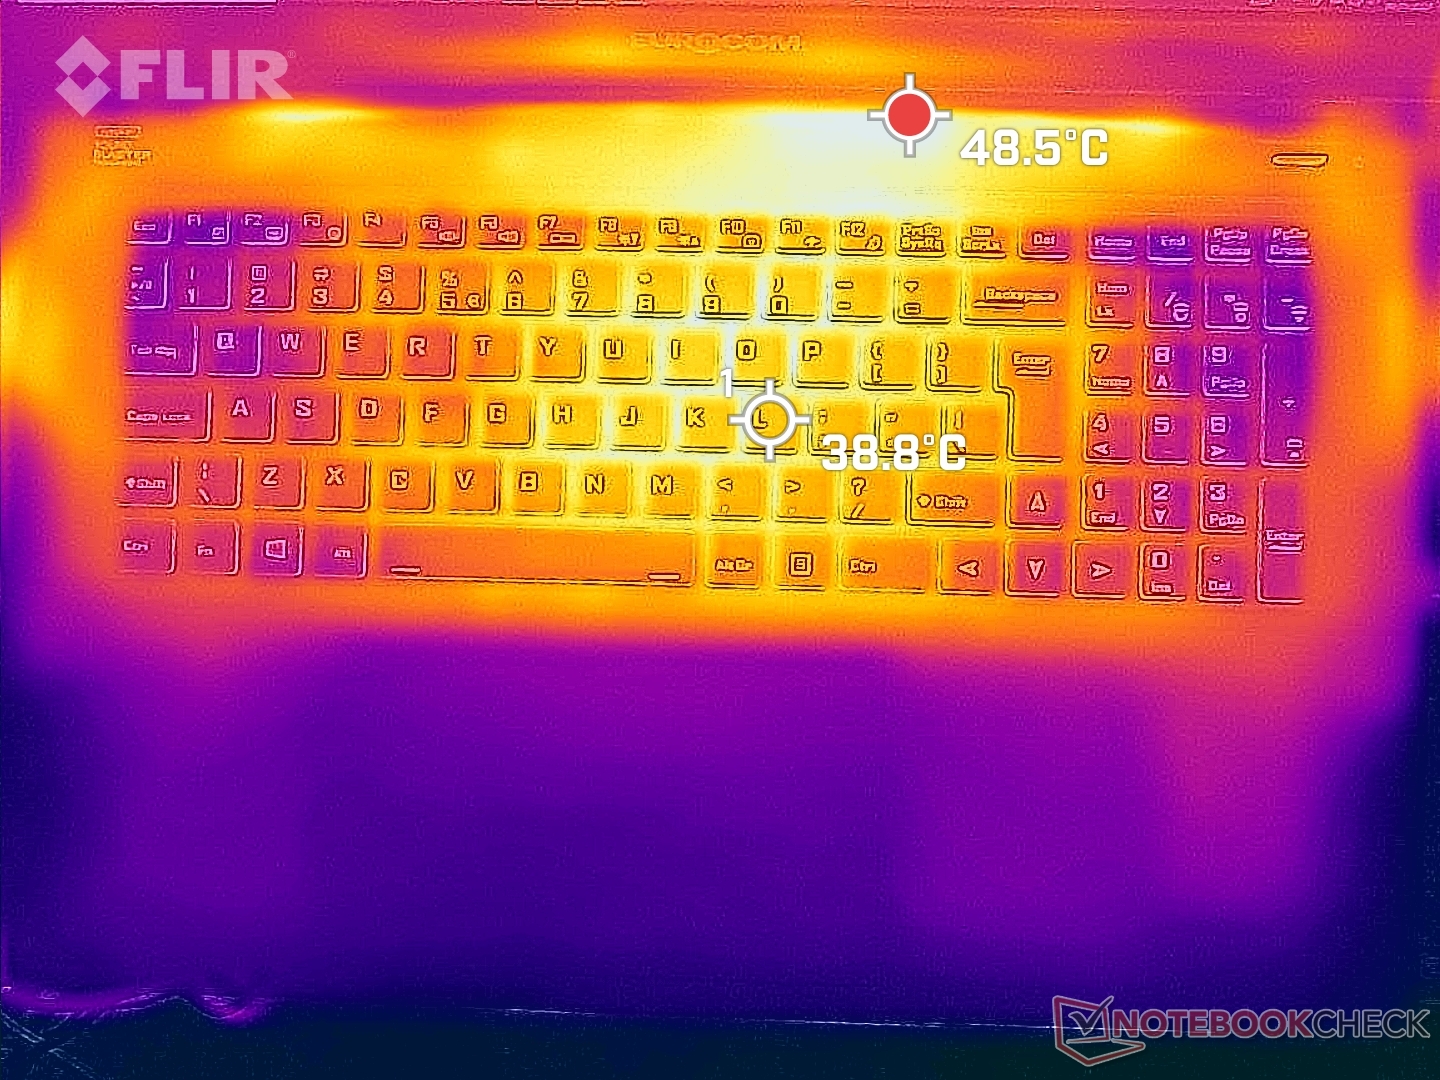
(-) La temperatura máxima en la parte superior es de 50.4 °C / 123 F, frente a la media de 40.4 °C / 105 F, que oscila entre 21.2 y 68.8 °C para la clase Gaming.
(-) El fondo se calienta hasta un máximo de 47.6 °C / 118 F, frente a la media de 43.2 °C / 110 F
(+) En reposo, la temperatura media de la parte superior es de 29.4 °C / 85# F, frente a la media del dispositivo de 33.9 °C / 93 F.
(-) Jugando a The Witcher 3, la temperatura media de la parte superior es de 39.2 °C / 103 F, frente a la media del dispositivo de 33.9 °C / 93 F.
(+) El reposamanos y el panel táctil están a una temperatura inferior a la de la piel, con un máximo de 31.2 °C / 88.2 F y, por tanto, son fríos al tacto.
(-) La temperatura media de la zona del reposamanos de dispositivos similares fue de 28.8 °C / 83.8 F (-2.4 °C / -4.4 F).
| Eurocom Nightsky TXi317 Intel Core i7-12700H, NVIDIA GeForce RTX 3080 Ti Laptop GPU | Schenker XMG Pro 17 E22 Intel Core i9-12900H, NVIDIA GeForce RTX 3080 Ti Laptop GPU | Aorus 17X XES Intel Core i9-12900HX, NVIDIA GeForce RTX 3070 Ti Laptop GPU | MSI Raider GE77 HX 12UHS Intel Core i9-12900HX, NVIDIA GeForce RTX 3080 Ti Laptop GPU | Razer Blade 17 Early 2022 Intel Core i9-12900H, NVIDIA GeForce RTX 3080 Ti Laptop GPU | Alienware x17 R2 P48E Intel Core i9-12900HK, NVIDIA GeForce RTX 3080 Ti Laptop GPU | |
|---|---|---|---|---|---|---|
| Heat | -12% | -15% | -19% | -10% | 7% | |
| Maximum Upper Side * (°C) | 50.4 | 56 -11% | 54 -7% | 53 -5% | 50 1% | 49.6 2% |
| Maximum Bottom * (°C) | 47.6 | 60 -26% | 58 -22% | 58 -22% | 56 -18% | 42.4 11% |
| Idle Upper Side * (°C) | 32.6 | 34 -4% | 37 -13% | 38 -17% | 36 -10% | 29.2 10% |
| Idle Bottom * (°C) | 33.2 | 36 -8% | 39 -17% | 43 -30% | 38 -14% | 32 4% |
* ... más pequeño es mejor
Prueba de esfuerzo
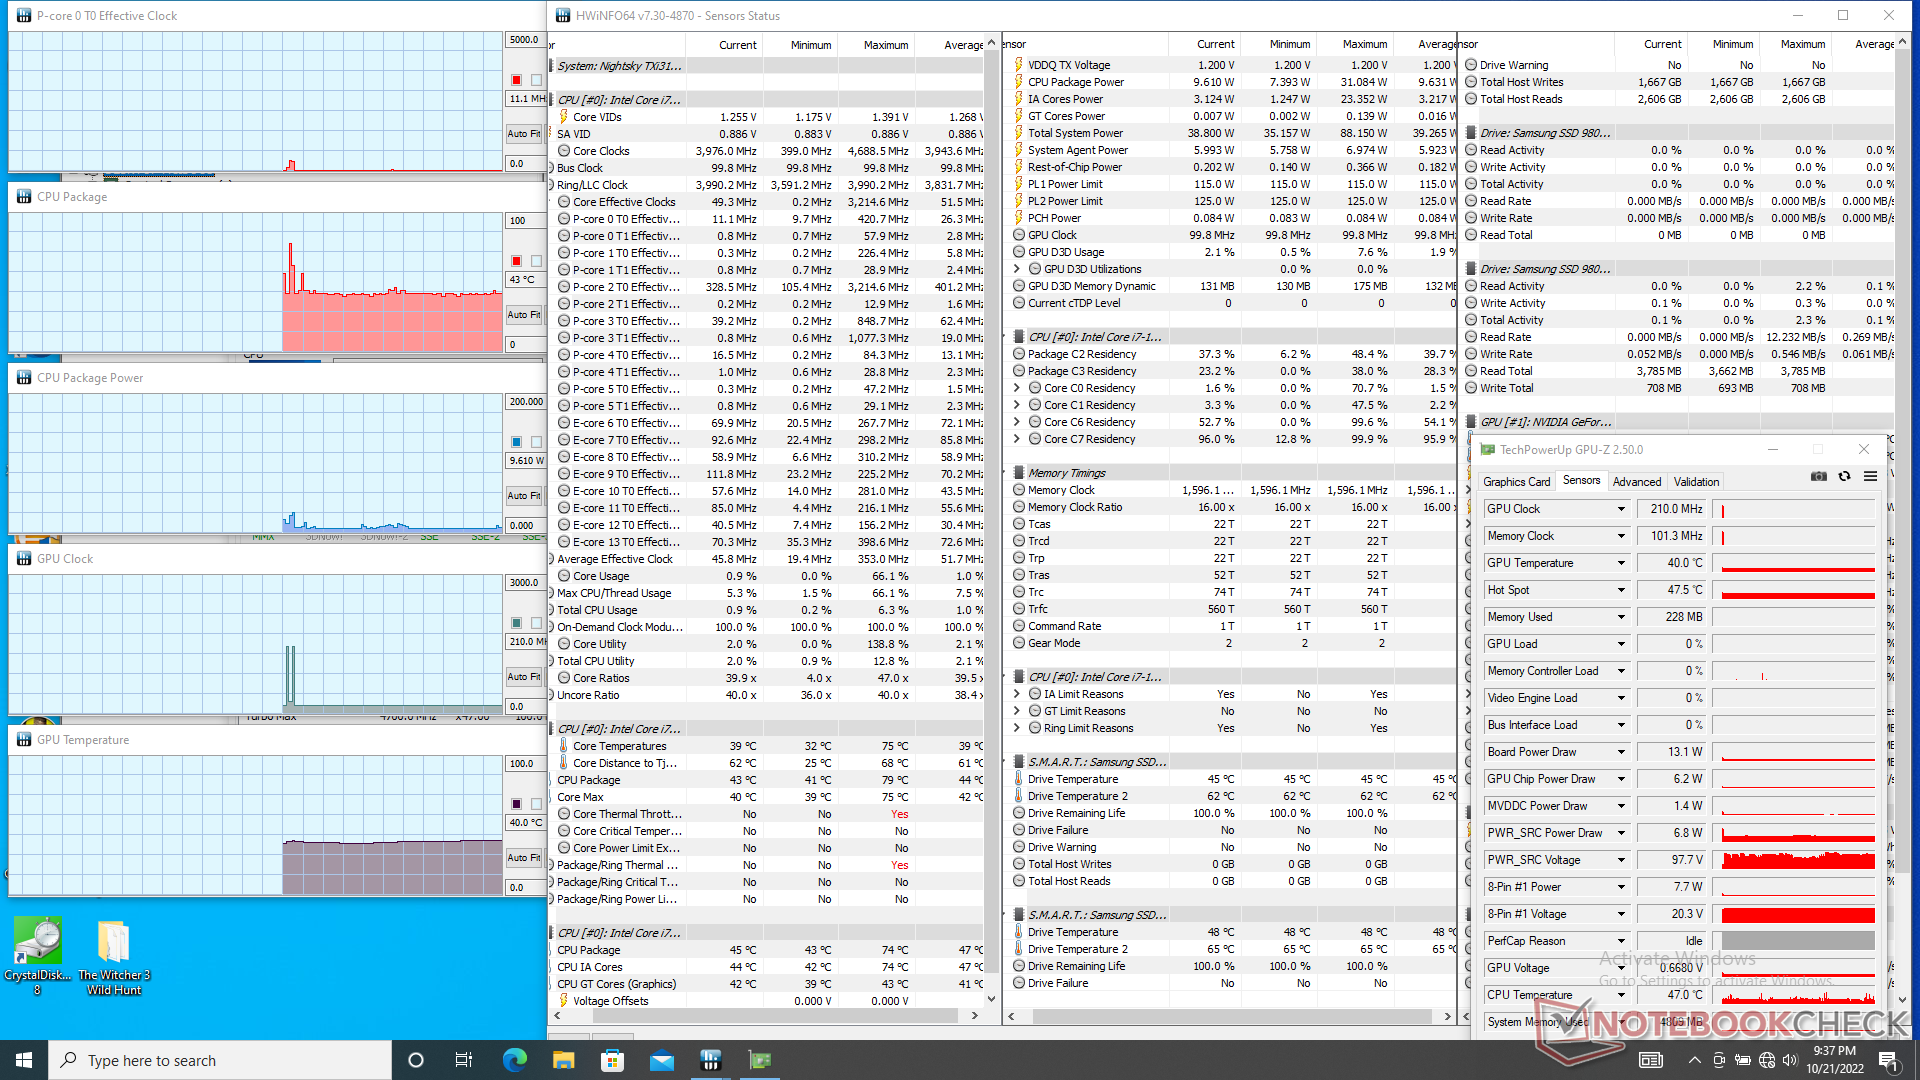
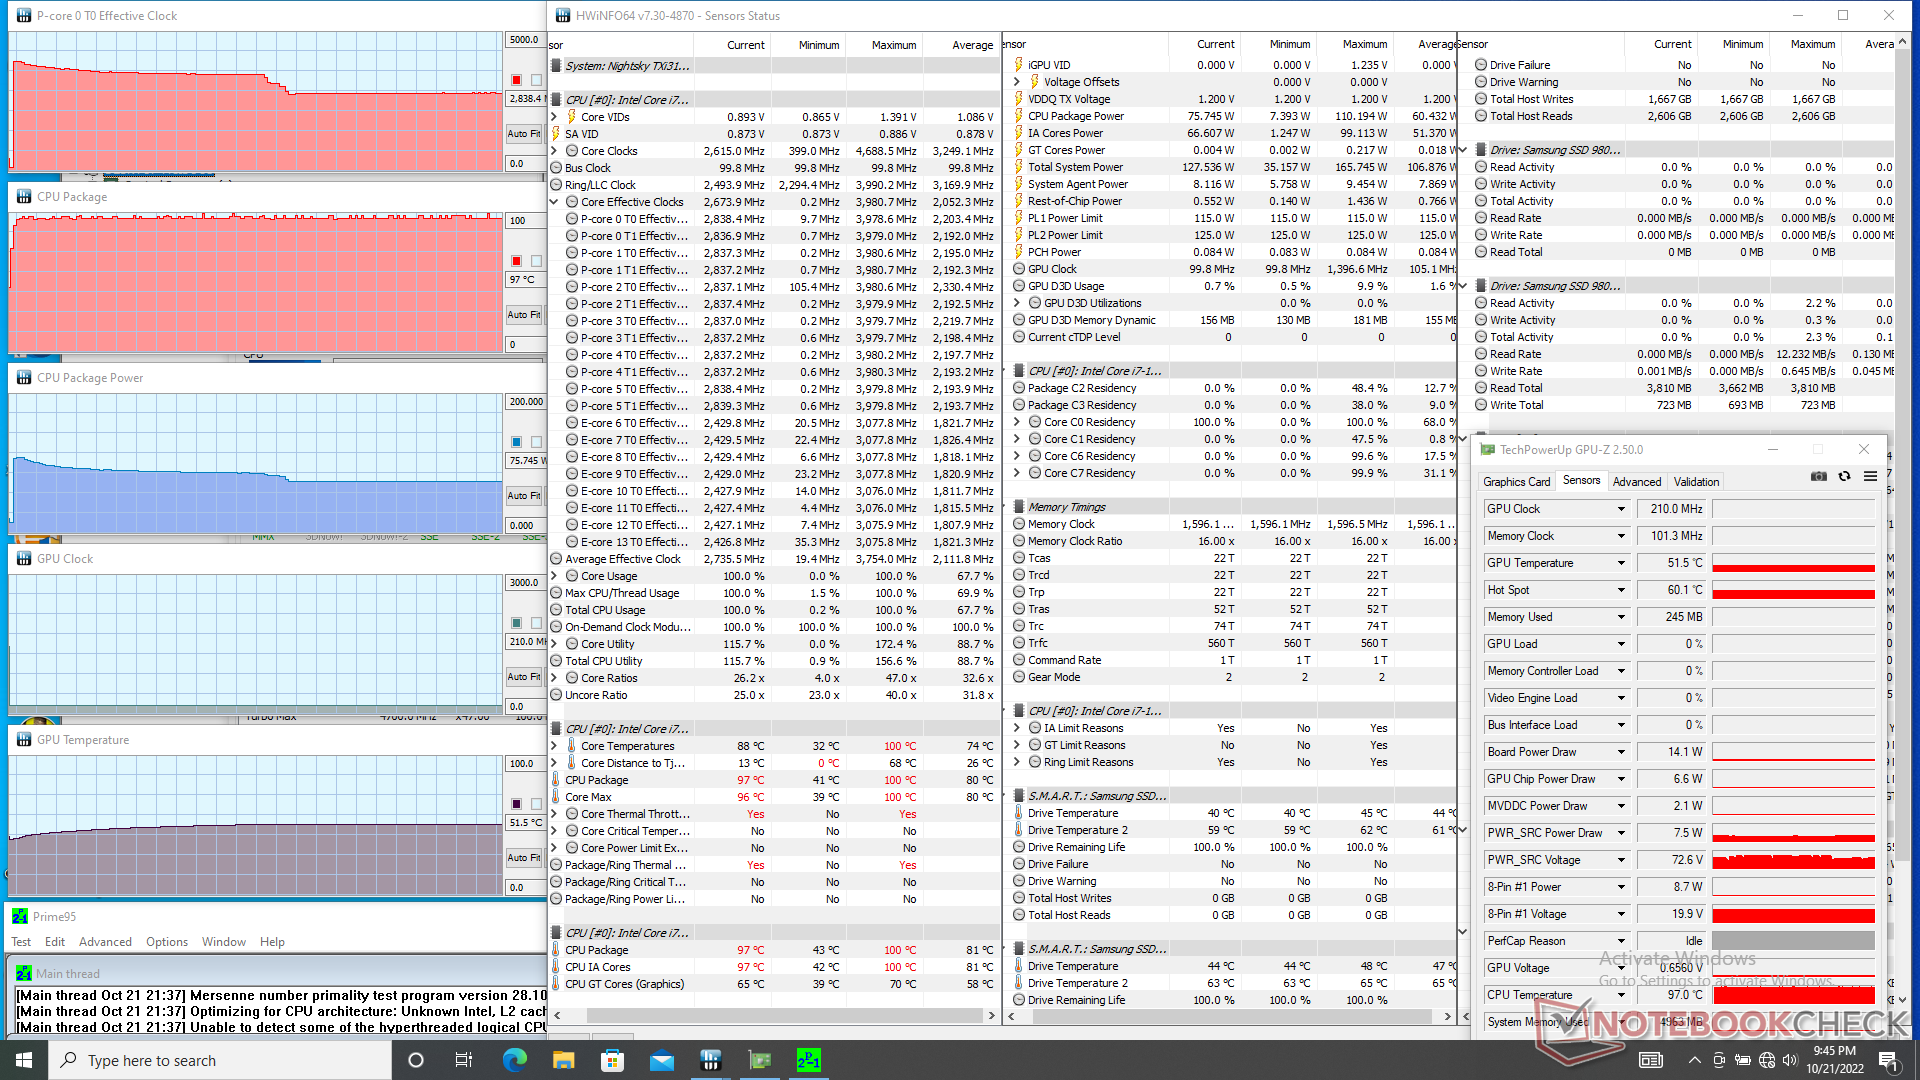
La velocidad de reloj de la CPU, la temperatura y el consumo de energía de la placa se disparan a 4 GHz, 97 C y 110 W, respectivamente, cuando se inicia el estrés de Prime95. A continuación, la velocidad de reloj y el consumo de energía caen de forma constante antes de estabilizarse en 2,8 GHz y 76 W, respectivamente, sin cambios en la temperatura del núcleo. Repitiendo esta misma prueba en elDell G16 7620 con un procesador idéntico daría como resultado unas velocidades de reloj estables ligeramente más rápidas, de unos 3,3 GHz, pero unas temperaturas del núcleo similares, de casi 100 C.
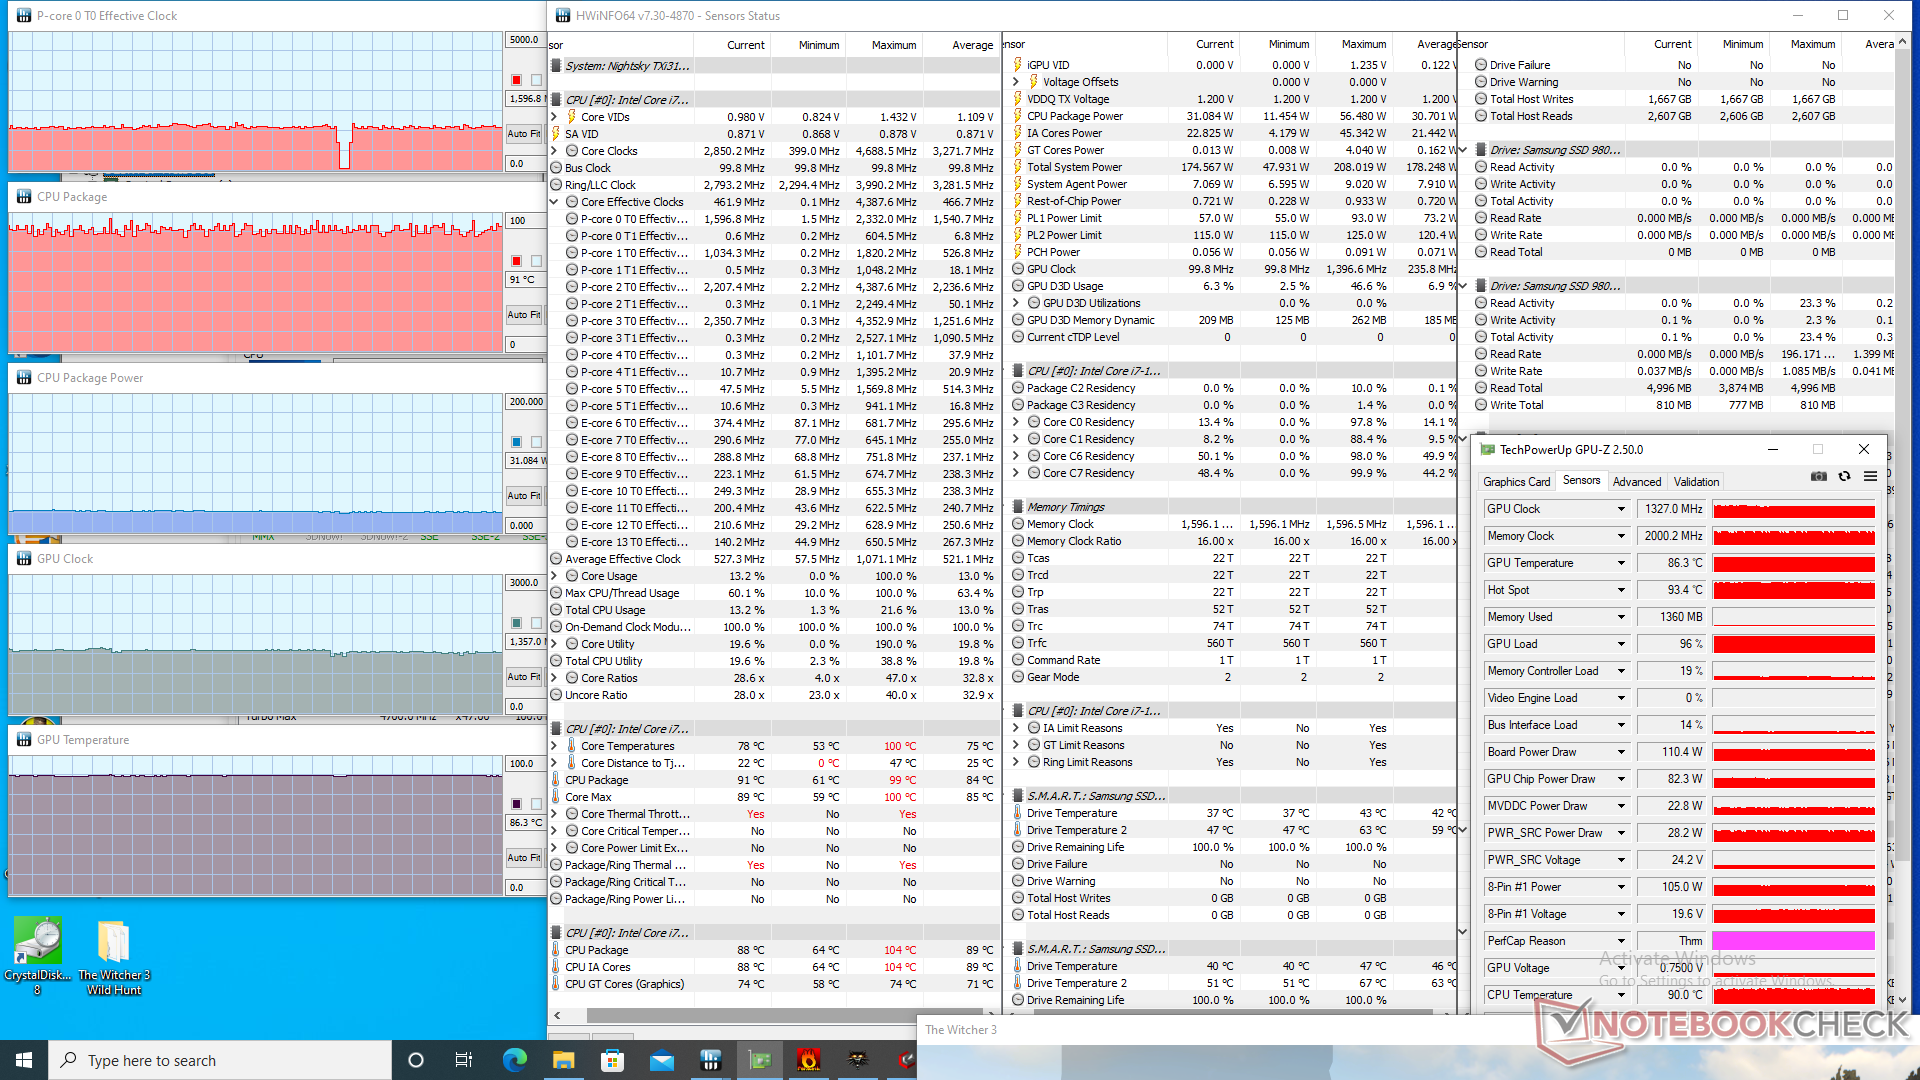
La velocidad de reloj de la GPU, la temperatura y el consumo de energía de la placa se estabilizarían en 1432 MHz, 87 C y 121 W, respectivamente, cuando se ejecuta Witcher 3. Si se repite esta prueba con el perfil de energía "Entretenimiento", el rendimiento de la GPU se reduce ligeramente: la velocidad de reloj y el consumo de energía caen a 1327 MHz y 110 W, respectivamente, sin cambios en la temperatura. Es una pena que no podamos acercarnos al objetivo de 125 W a 155 W del TGP.
Ejecutando Witcher 3 en el MSI GS77 con la misma GPU RTX 3080 Ti resultaría en una velocidad de reloj de la GPU más lenta, una temperatura del núcleo más fría y un menor consumo de energía de la placa de 1432 MHz, 75 C y 105 W, respectivamente, en comparación con nuestro Eurocom.
El rendimiento es limitado si funciona con baterías. Una prueba de Fire Strike con la energía de la batería devolvería puntuaciones de Física y Gráficos de 12300 y 5071 puntos, respectivamente, en comparación con 28276 y 31825 puntos cuando está conectado a la red eléctrica.

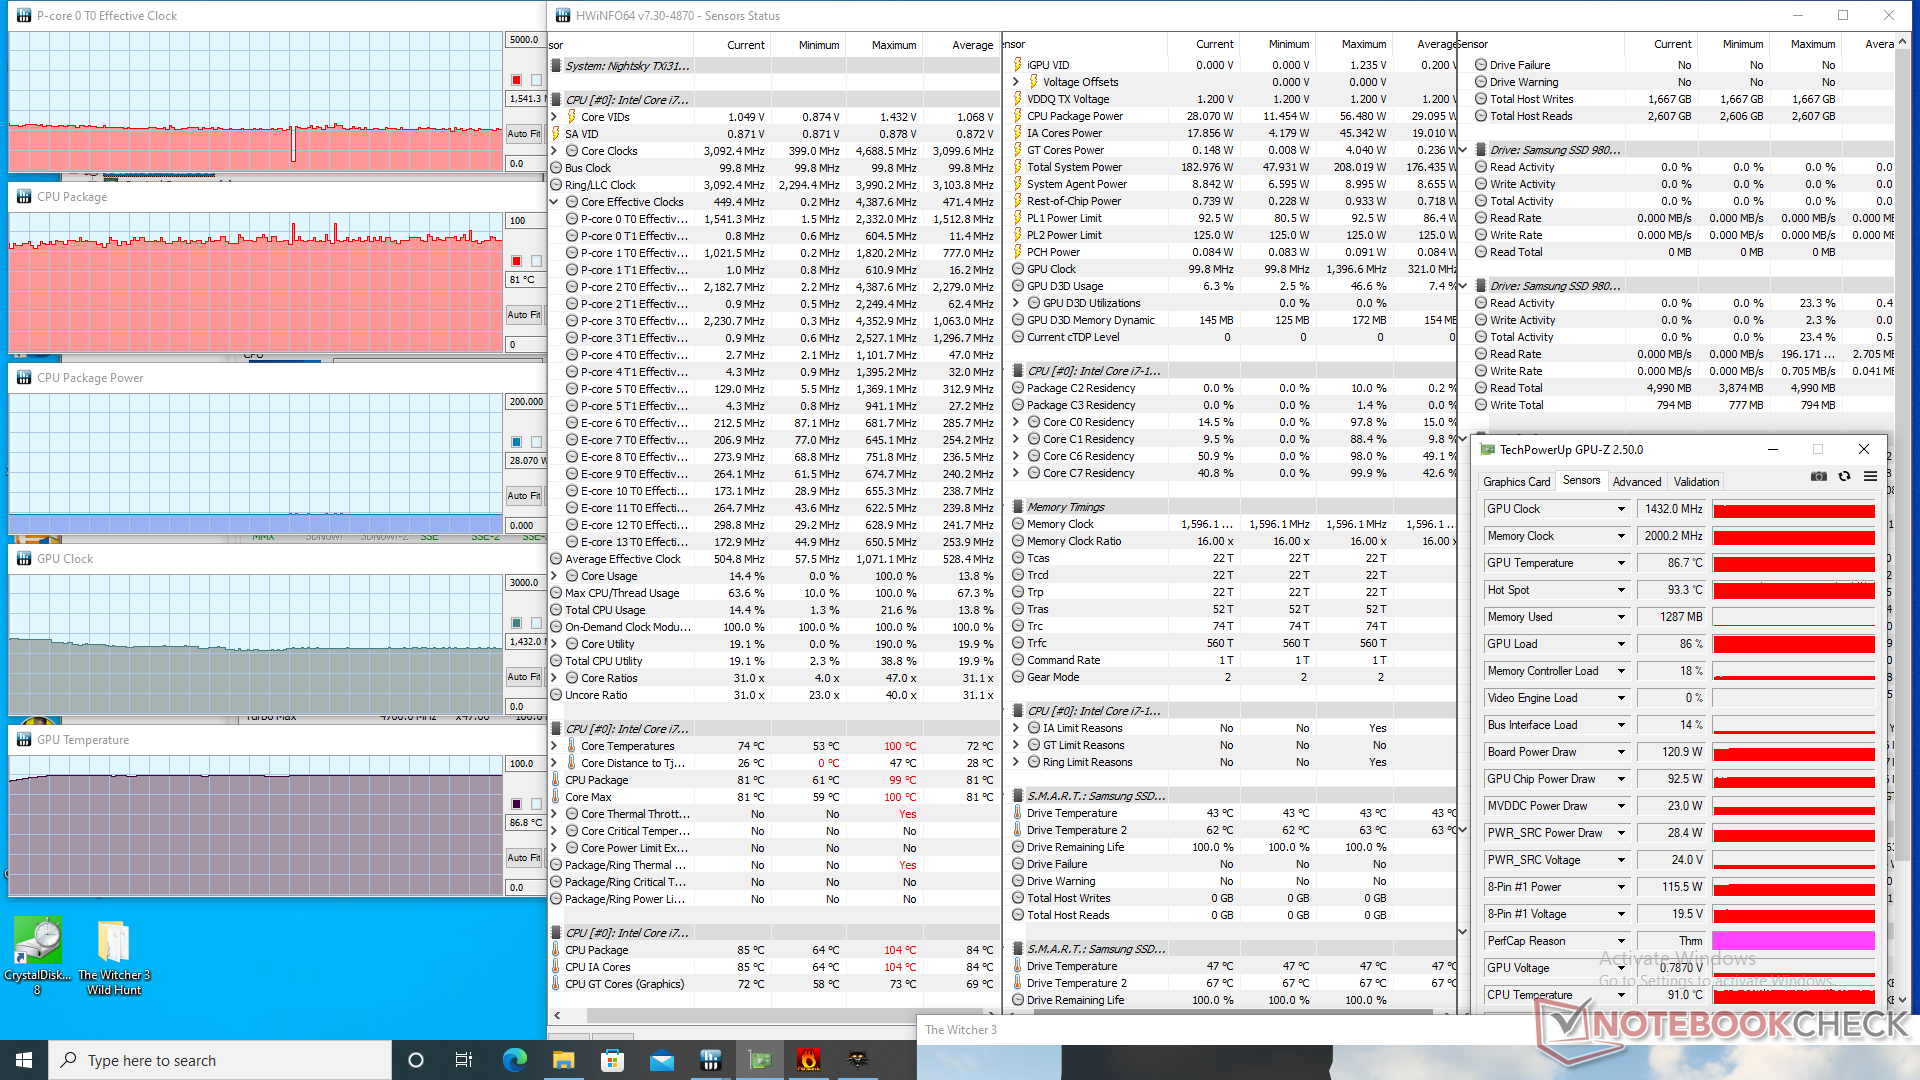
| Reloj dela CPU (GHz) | Reloj de la GPU (MHz) | Temperatura media dela CPU (°C) | Temperatura media de la GPU (°C) | |
| Sistema en reposo | -- | -- | 43 | 40 |
| Prime95Stress | 2.8 | -- | 97 | 52 |
| Prime95+ FurMark Stress | 2,3 - 2,8 | 1267 - 1755 | 97 | 84 |
| Witcher 3 Stress | 1,5 | 1432 | 81 | 87 |
Altavoces
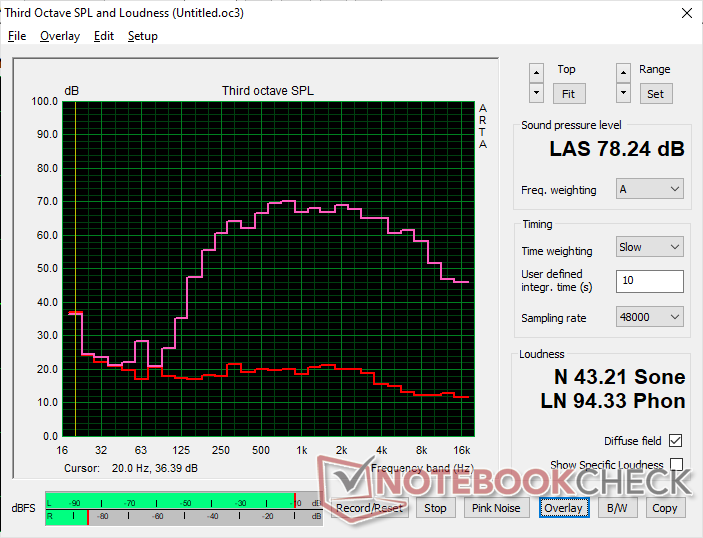
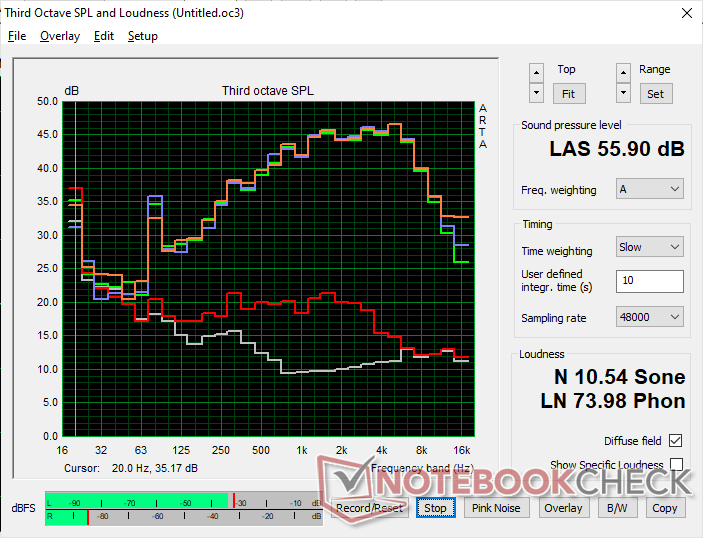
Eurocom Nightsky TXi317 análisis de audio
(±) | la sonoridad del altavoz es media pero buena (78.2 dB)
Graves 100 - 315 Hz
(±) | lubina reducida - en promedio 14.6% inferior a la mediana
(-) | los graves no son lineales (16.5% delta a la frecuencia anterior)
Medios 400 - 2000 Hz
(±) | medias más altas - de media 5.1% más altas que la mediana
(+) | los medios son lineales (5% delta a la frecuencia anterior)
Altos 2 - 16 kHz
(+) | máximos equilibrados - a sólo 4% de la mediana
(+) | los máximos son lineales (6.2% delta a la frecuencia anterior)
Total 100 - 16.000 Hz
(±) | la linealidad del sonido global es media (20.4% de diferencia con la mediana)
En comparación con la misma clase
» 72% de todos los dispositivos probados de esta clase eran mejores, 6% similares, 22% peores
» El mejor tuvo un delta de 6%, la media fue 18%, el peor fue ###max##%
En comparación con todos los dispositivos probados
» 54% de todos los dispositivos probados eran mejores, 8% similares, 38% peores
» El mejor tuvo un delta de 4%, la media fue 23%, el peor fue ###max##%
Apple MacBook Pro 16 2021 M1 Pro análisis de audio
(+) | los altavoces pueden reproducir a un volumen relativamente alto (#84.7 dB)
Graves 100 - 315 Hz
(+) | buen bajo - sólo 3.8% lejos de la mediana
(+) | el bajo es lineal (5.2% delta a la frecuencia anterior)
Medios 400 - 2000 Hz
(+) | medios equilibrados - a sólo 1.3% de la mediana
(+) | los medios son lineales (2.1% delta a la frecuencia anterior)
Altos 2 - 16 kHz
(+) | máximos equilibrados - a sólo 1.9% de la mediana
(+) | los máximos son lineales (2.7% delta a la frecuencia anterior)
Total 100 - 16.000 Hz
(+) | el sonido global es lineal (4.6% de diferencia con la mediana)
En comparación con la misma clase
» 0% de todos los dispositivos probados de esta clase eran mejores, 0% similares, 100% peores
» El mejor tuvo un delta de 5%, la media fue 17%, el peor fue ###max##%
En comparación con todos los dispositivos probados
» 0% de todos los dispositivos probados eran mejores, 0% similares, 100% peores
» El mejor tuvo un delta de 4%, la media fue 23%, el peor fue ###max##%
Gestión de la energía
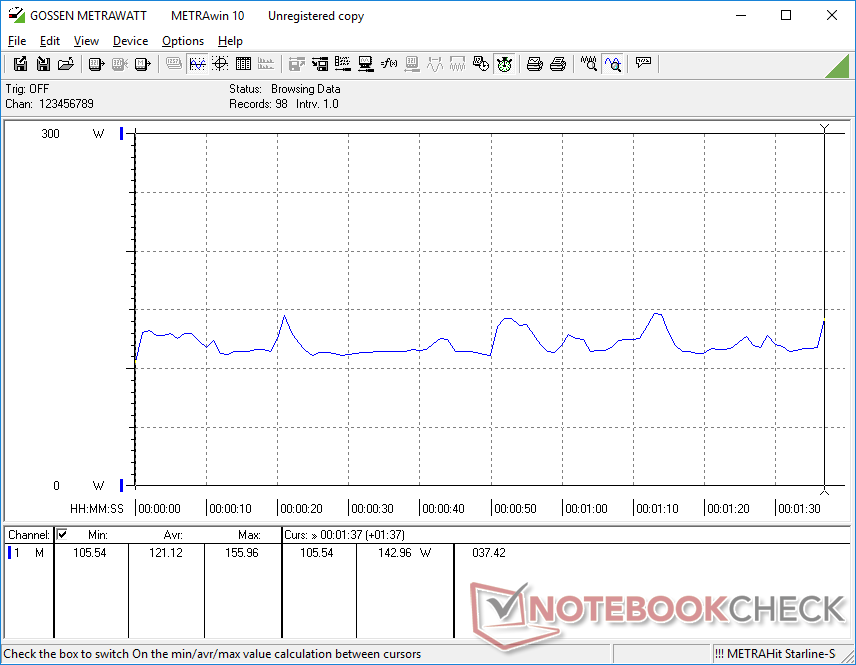
Consumo de energía
El funcionamiento en vacío en el escritorio con la configuración de brillo y el perfil de energía más bajos requeriría algo menos de 13 W para ser comparable con el XMG Pro 17 E22. Sin embargo, esto puede aumentar hasta 40 W si se utiliza la configuración de brillo máxima y el perfil de energía de rendimiento con la GPU Nvidia discreta activa. Se recomienda utilizar una configuración de energía más baja si no se necesita el rendimiento extra debido al importante ahorro de energía.
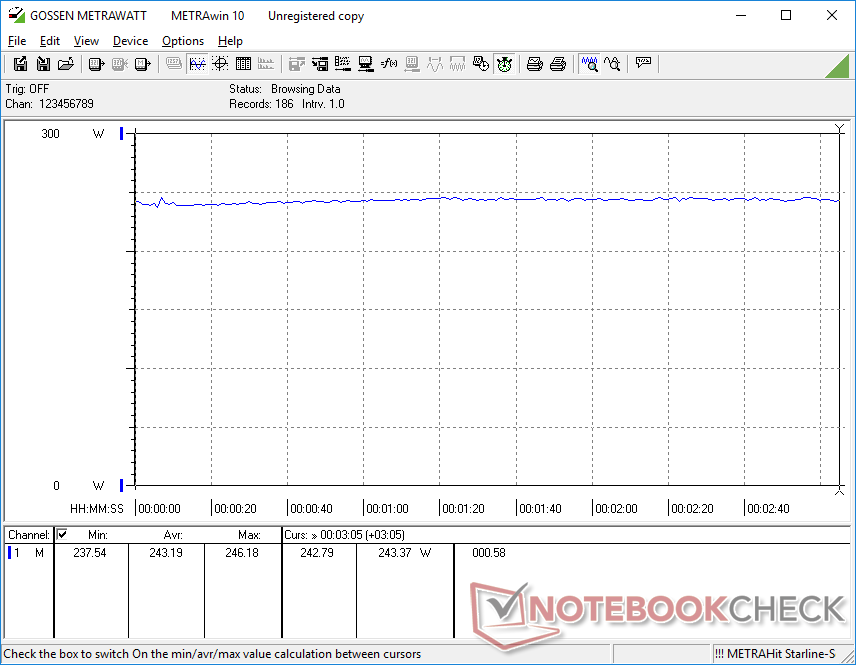
El consumo de energía cuando se ejecuta Witcher 3 es casi idéntico al que registramos en elMSI Raider GE77 equipado con la misma GPU. El sistema es mucho más exigente que los portátiles de juego más antiguos que funcionan con la GeForce RTX 2080, como elLenovo Legion 7 15 en más de 80 W
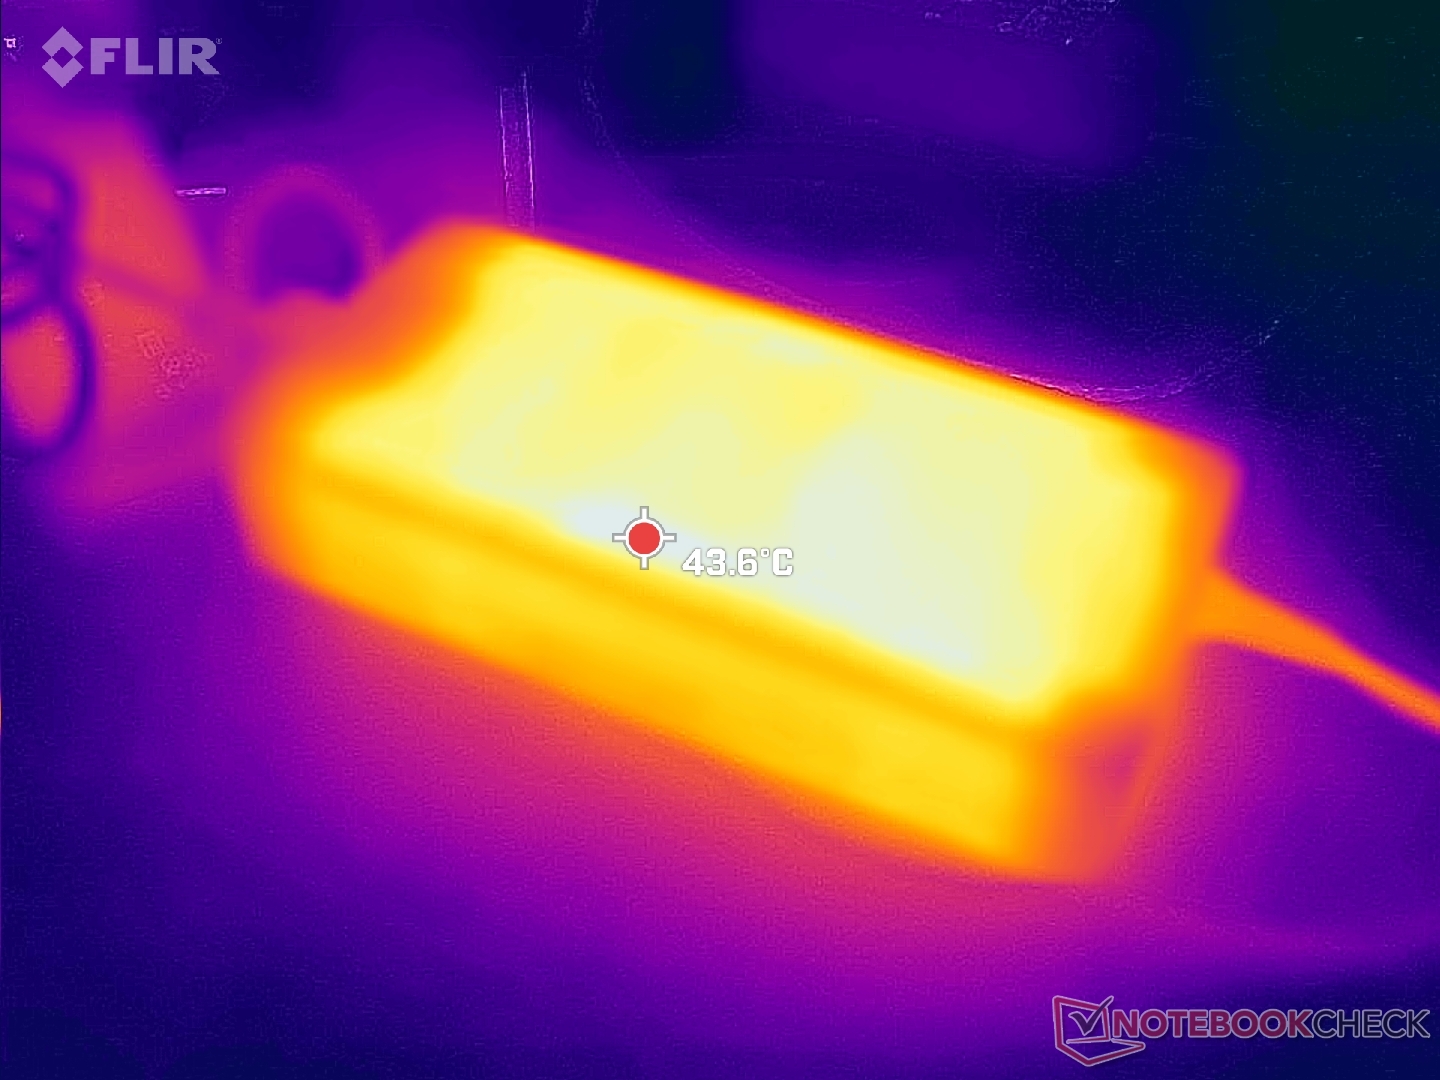
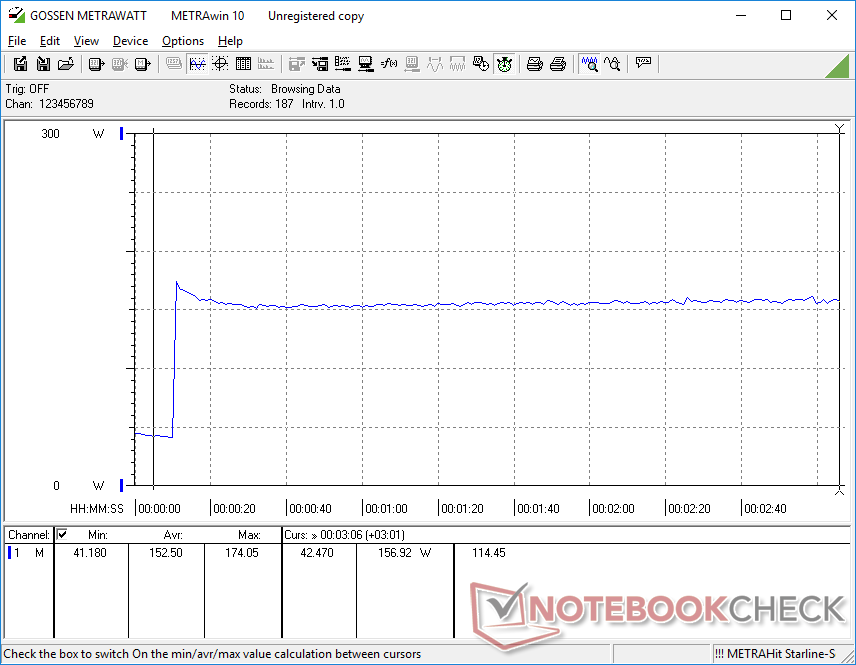
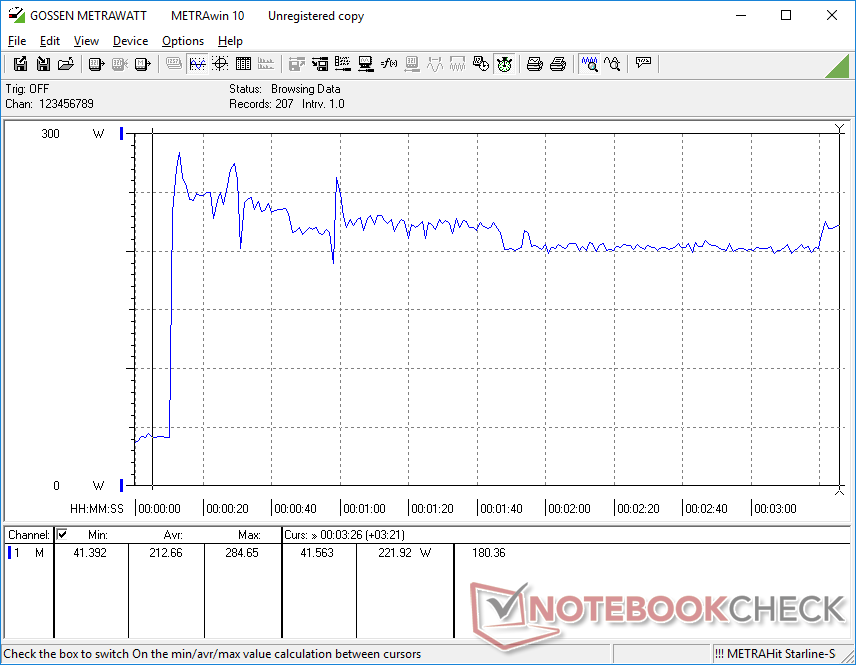
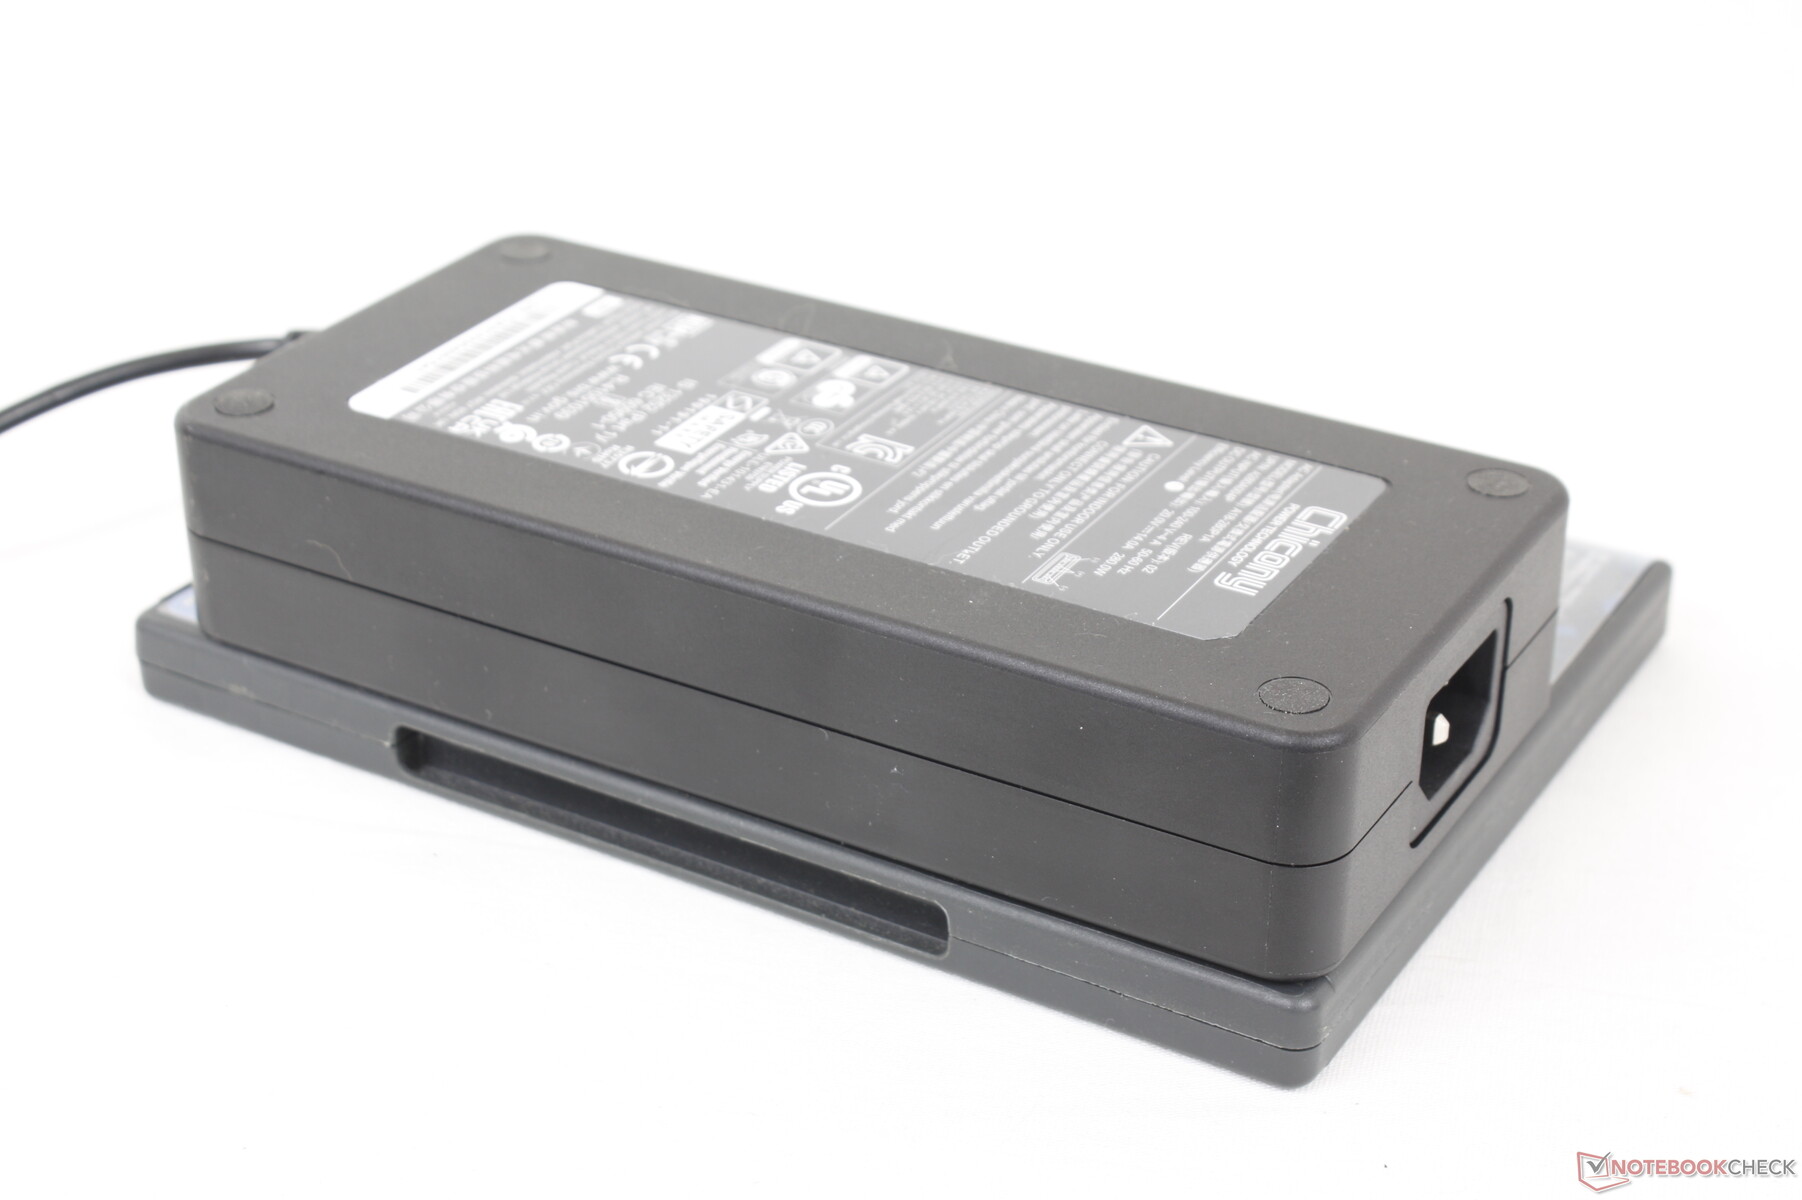
Pudimos registrar un consumo máximo de 285 W del gran adaptador de corriente (~18 x 8.5 x 3.5 cm) de 280 W cuando tanto la CPU como la GPU están al 100% de utilización. Esta tasa es sólo temporal, como muestra nuestro gráfico de abajo, debido a las limitaciones térmicas. El sistema aún puede ejecutar juegos y recargar a un ritmo razonable simultáneamente.
| Off / Standby | |
| Ocioso | |
| Carga |
|
Clave:
min: | |
| Eurocom Nightsky TXi317 i7-12700H, GeForce RTX 3080 Ti Laptop GPU, Samsung SSD 980 Pro 1TB MZ-V8P1T0BW, IPS, 1920x1080, 17.3" | Schenker XMG Pro 17 E22 i9-12900H, GeForce RTX 3080 Ti Laptop GPU, Samsung SSD 980 Pro 1TB MZ-V8P1T0BW, IPS, 2560x1440, 17.3" | Aorus 17X XES i9-12900HX, GeForce RTX 3070 Ti Laptop GPU, Gigabyte AG470S1TB-SI B10, IPS, 1920x1080, 17.3" | MSI Raider GE77 HX 12UHS i9-12900HX, GeForce RTX 3080 Ti Laptop GPU, Samsung PM9A1 MZVL22T0HBLB, IPS, 3840x2160, 17.3" | Razer Blade 17 Early 2022 i9-12900H, GeForce RTX 3080 Ti Laptop GPU, Samsung PM9A1 MZVL21T0HCLR, IPS, 3840x2160, 17.3" | Alienware x17 R2 P48E i9-12900HK, GeForce RTX 3080 Ti Laptop GPU, 2x Samsung PM9A1 1TB (RAID 0), IPS, 1920x1080, 17.3" | |
|---|---|---|---|---|---|---|
| Power Consumption | 17% | -6% | 4% | 6% | -25% | |
| Idle Minimum * (Watt) | 12.8 | 13 -2% | 18 -41% | 13 -2% | 17 -33% | 24.1 -88% |
| Idle Average * (Watt) | 33.9 | 17 50% | 28 17% | 19 44% | 23 32% | 28.5 16% |
| Idle Maximum * (Watt) | 39.1 | 26 34% | 36 8% | 29 26% | 34 13% | 60 -53% |
| Load Average * (Watt) | 121.1 | 120 1% | 153 -26% | 143 -18% | 120 1% | 128.7 -6% |
| Witcher 3 ultra * (Watt) | 243 | 221 9% | 221 9% | 247 -2% | 229 6% | 254 -5% |
| Load Maximum * (Watt) | 284.7 | 266 7% | 290 -2% | 352 -24% | 243 15% | 323 -13% |
* ... más pequeño es mejor
Power Consumption Witcher 3 / Stresstest
Power Consumption external Monitor
Duración de la batería
La duración de la WLAN es corta con poco más de 4 horas de navegación en el mundo real antes de tener que recargar. Nuestra unidad se configuró en el perfil de energía equilibrado con la iGPU activa antes de ejecutar la prueba de duración de la batería. Los resultados son similares a los del Razer Blade 17 o el Aorus 17X pero más de dos horas menos que en el Schenker XMG Pro 17 E22.
La carga de vacío a plena capacidad es muy lenta, de unas 2,5 horas. La mayoría de portátiles de juego sólo tardan entre 1.5 y 2 horas en comparación. El sistema no se puede recargar por USB-C.
| Eurocom Nightsky TXi317 i7-12700H, GeForce RTX 3080 Ti Laptop GPU, 80 Wh | Schenker XMG Pro 17 E22 i9-12900H, GeForce RTX 3080 Ti Laptop GPU, 80 Wh | Aorus 17X XES i9-12900HX, GeForce RTX 3070 Ti Laptop GPU, 99 Wh | MSI Raider GE77 HX 12UHS i9-12900HX, GeForce RTX 3080 Ti Laptop GPU, 99.99 Wh | Razer Blade 17 Early 2022 i9-12900H, GeForce RTX 3080 Ti Laptop GPU, 82 Wh | Alienware x17 R2 P48E i9-12900HK, GeForce RTX 3080 Ti Laptop GPU, 87 Wh | |
|---|---|---|---|---|---|---|
| Duración de Batería | 62% | 5% | 29% | -10% | -52% | |
| WiFi v1.3 (h) | 4.2 | 6.8 62% | 4.4 5% | 5.4 29% | 3.8 -10% | 2 -52% |
| H.264 (h) | 4.6 | 3.8 | 6.5 | 4.8 | ||
| Load (h) | 1.5 | 1.4 | 2 | 1.7 | 0.8 | |
| Reader / Idle (h) | 9.8 | 7.1 | 3.9 |
Pro
Contra
Veredicto - Necesita una renovación del chasis
El Eurocom Nightsky TXi317 tiene el rendimiento de la CPU y la GPU de un gran portátil de juegos insignia, pero sin muchas de las características auxiliares que hemos llegado a esperar de un diseño de tamaño medio. Lo más destacable es que el modelo es incapaz de ejecutar discos SSD durante periodos prolongados sin necesidad de estrangular las tasas de transferencia. Es más probable que el público objetivo de los usuarios de rendimiento se sienta decepcionado por no poder aprovechar al máximo sus nuevas unidades PCIe4 x4. Alternativas como el Alienware x17o MSI GE66 suelen tener disipadores de calor sobre sus SSDs internos por esta misma razón.
El Eurocom Nightsky TXi317 tiene el rendimiento de un portátil de juego caro, pero carece de muchas características auxiliares básicas y avanzadas de uno.
Otros inconvenientes menores son la bajísima resolución de la webcam, la ausencia de obturador de privacidad, la falta de soporte USB-C PD, la ausencia de Advanced Optimus, la ausencia de opciones Wi-Fi 6E, y las muy cálidas temperaturas del núcleo que alcanzan casi los 90 C cuando se juega. El chasis incluso se queda atrás a la hora de realizar el mantenimiento, ya que el panel inferior tarda más en quitarse que en la mayoría de portátiles para juegos de hoy en día. A partir de 3000 dólares, el Nightsky TXi317 no ofrece tanto como otros competidores de gama alta.
Precio y disponibilidad
El Nightsky TXi317 se puede comprar directamente en Eurocom aquí en varias configuraciones a partir de $3000 USD.
Eurocom Nightsky TXi317
- 10/26/2022 v7 (old)
Allen Ngo
Price comparison

