Reseña del Framework Laptop 13.5 Intel 12th gen: Como el Microsoft Surface, pero realmente reparable
El Framework Laptop original de 13,5 pulgadas se lanzó en 2021 equipado con procesadores Intel 11th gen Tiger Lake-U. A diferencia de otros modelos ultradelgados de grandes fabricantes que suelen ser cerrados y difíciles de reparar, el diseño de Framework daría prioridad a la reparabilidad y fomentaría las actualizaciones del usuario final. De hecho, el fabricante vende abiertamente componentes individuales del Framework Laptop a la carta en caso de que los propietarios necesiten sustituir alguna pieza. El último modelo 2022 está ahora disponible con CPUs Intel de 12ª generación Alder Lake-P más rápidas, pero con el mismo diseño general del chasis para preservar la compatibilidad con los accesorios y componentes existentes
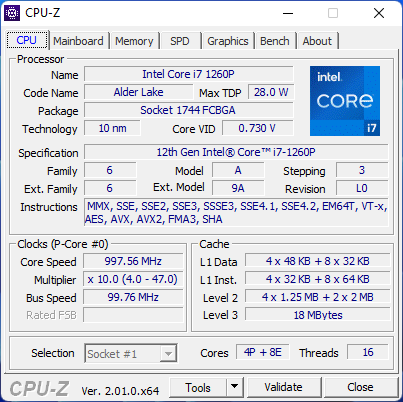
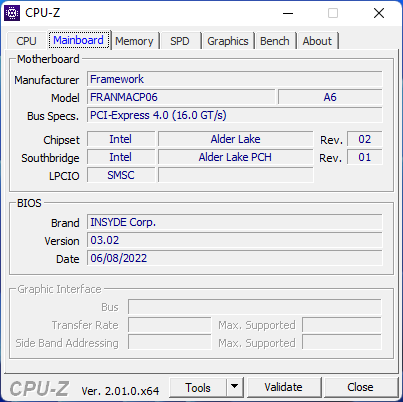
Como el esqueleto no ha cambiado, recomendamos consultar nuestro análisis existente en sobre el modelo 2021 para obtener más información sobre los atributos físicos del modelo 2022. Todo, desde la pantalla hasta el teclado y la mayoría de los materiales, ha vuelto sin cambios importantes. Nuestra unidad de análisis en particular viene con el Core i7-1260P por unos 1450 dólares, pero los usuarios pueden configurarlo con el i5-1240P de menor potencia o el i7-1280P de mayor potencia si lo desean. Sin embargo, todas las unidades vienen con el mismo panel IPS de 2256 x 1504.
Las alternativas al Framework Laptop incluyen otros Ultrabooks de 13 pulgadas como el HP Spectre x360 14, Lenovo ThinkPad X1, Asus Zenbook S13, y por supuesto el Microsoft Surface Laptop 4 13.
Posibles contendientes en la comparación
Valoración | Fecha | Modelo | Peso | Altura | Tamaño | Resolución | Precio |
|---|---|---|---|---|---|---|---|
| 85.1 % v7 (old) | 07/2022 | Framework Laptop 13.5 12th Gen Intel i7-1260P, Iris Xe G7 96EUs | 1.3 kg | 15.85 mm | 13.50" | 2256x1504 | |
| 85.4 % v7 (old) | 07/2021 | Framework Laptop 13.5 i7-1165G7, Iris Xe G7 96EUs | 1.3 kg | 15.85 mm | 13.50" | 2256x1504 | |
| 88.5 % v7 (old) | Lenovo ThinkPad X1 Titanium Yoga G1 20QB0016GE i5-1140G7, Iris Xe G7 80EUs | 1.2 kg | 11.5 mm | 13.50" | 2256x1504 | ||
| 84 % v7 (old) | 08/2021 | HP EliteBook Folio 13.5-3G2L2EA SD 8cx Gen 2 5G, Adreno 680 | 1.3 kg | 16 mm | 13.50" | 1920x1280 | |
| 85.2 % v7 (old) | 05/2021 | Microsoft Surface Laptop 4 13 Ryzen 5 R5 4680U, Vega 7 | 1.3 kg | 14 mm | 13.50" | 2256x1504 | |
| 89.5 % v7 (old) | 05/2021 | HP Spectre x360 14-ea0378ng i7-1165G7, Iris Xe G7 96EUs | 1.3 kg | 16.9 mm | 13.50" | 3000x2000 |
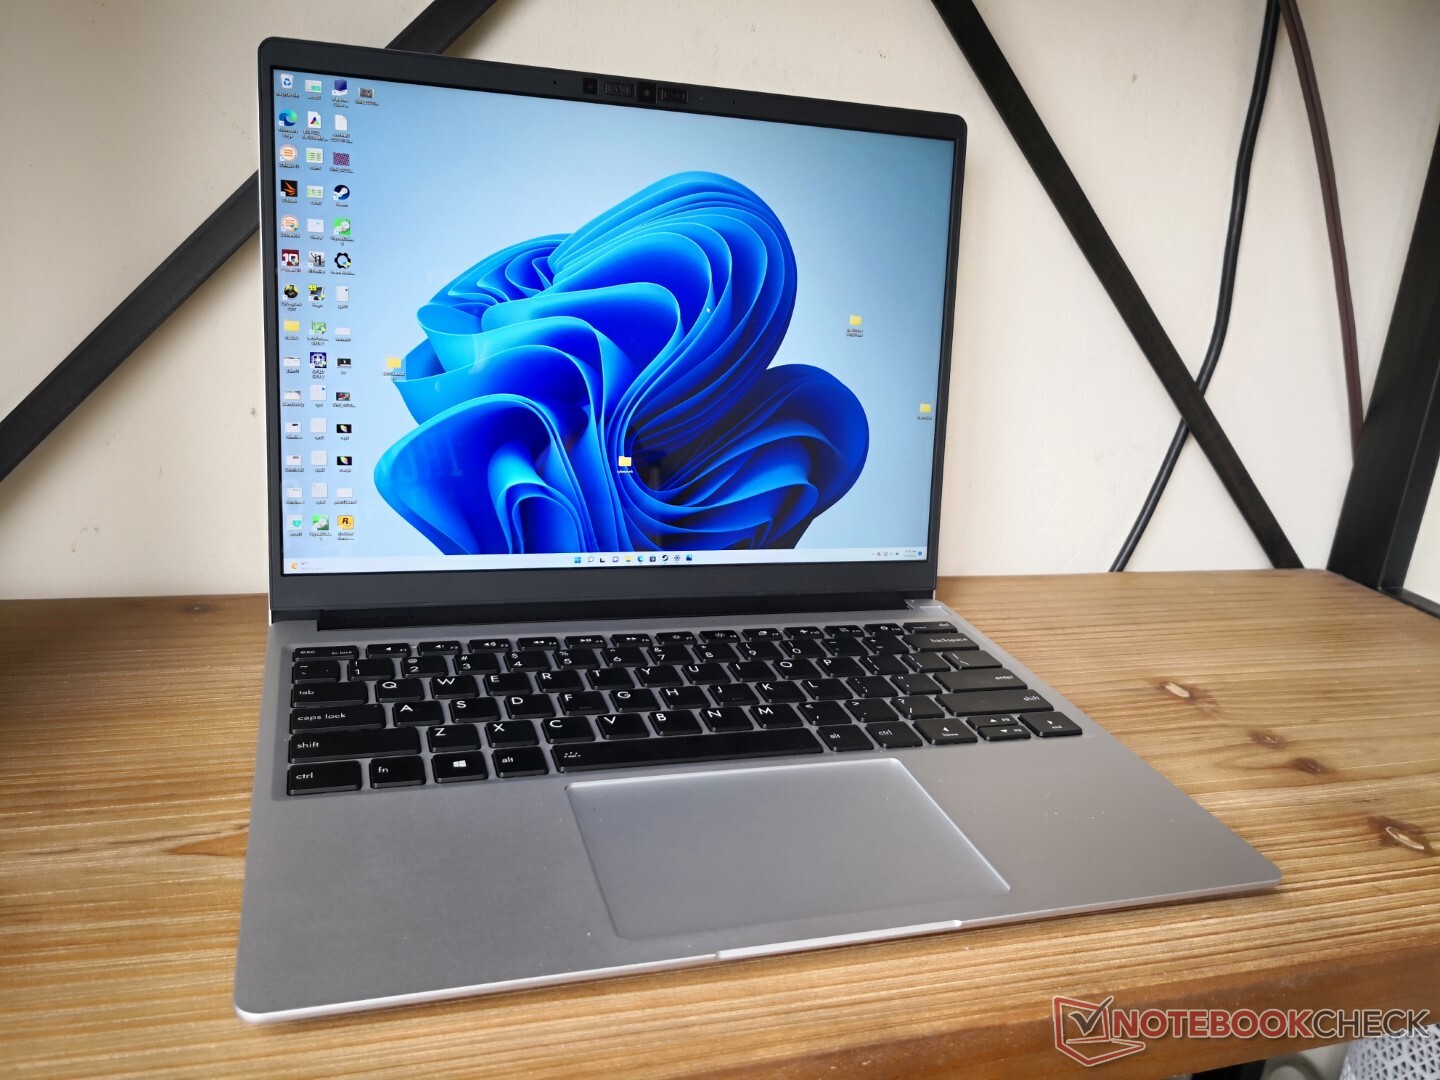
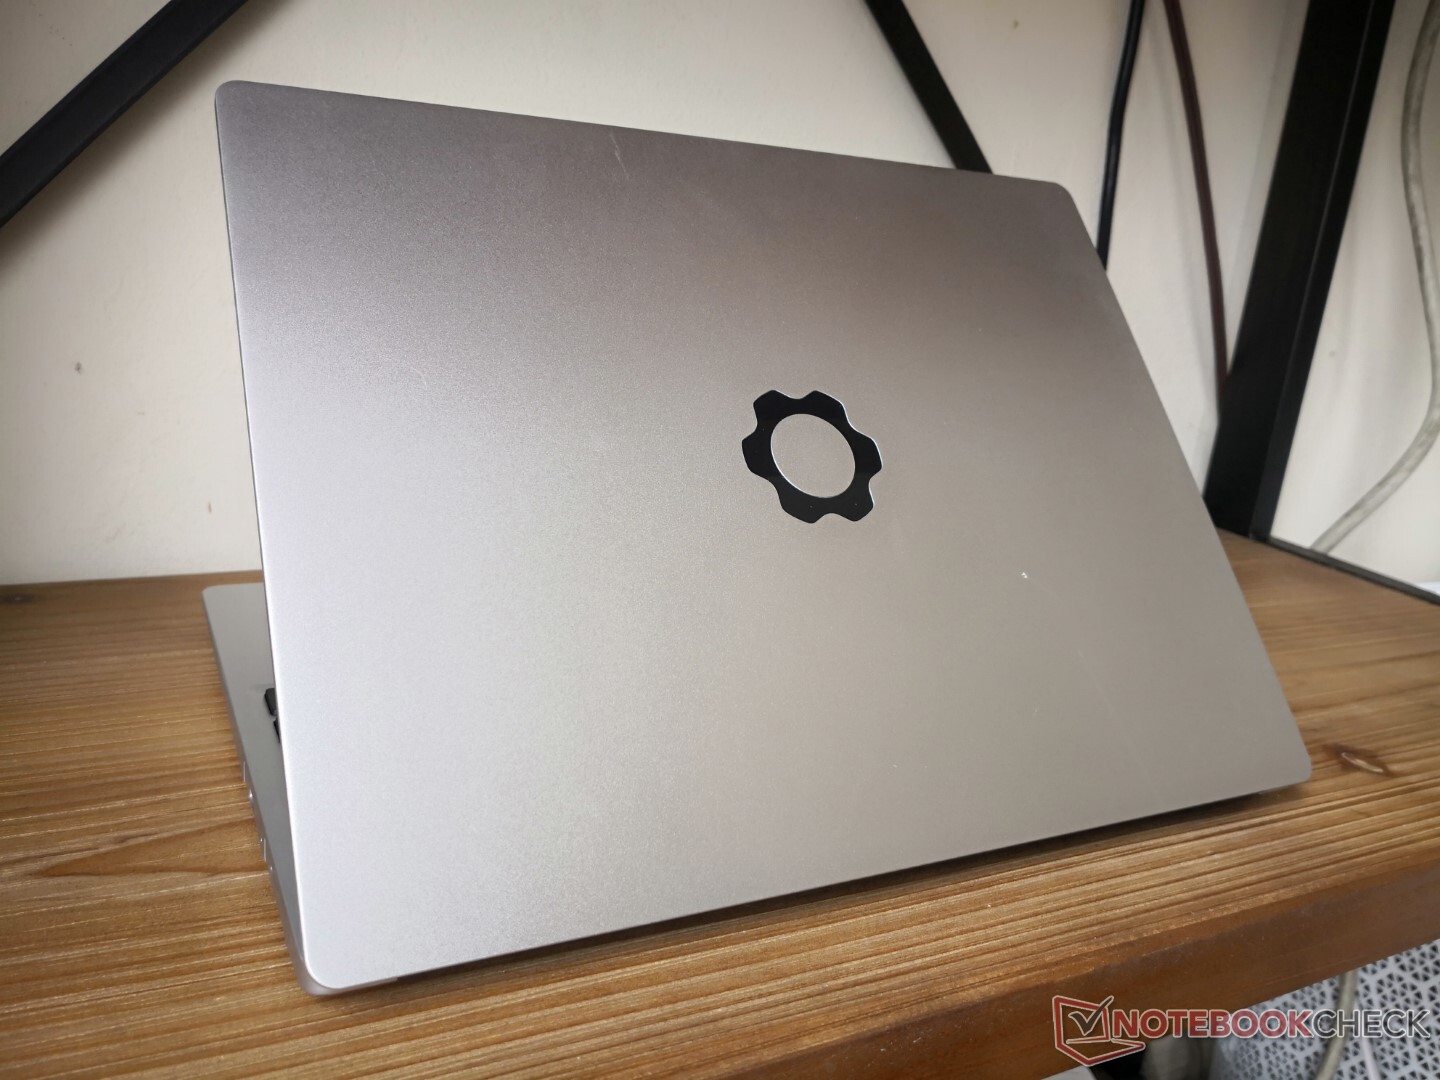
Caso
El único cambio realizado en el chasis consiste en el cambio a la fabricación y el montaje CNC de la tapa superior para mejorar la rigidez de la misma sin cambiar las dimensiones totales. Encontramos que la tapa era endeble en la versión 2021, por lo que el nuevo diseño es un cambio bienvenido. Aun así, las tapas de la mayoría de alternativas de la competencia como el XPS 13, Spectre x360 14, Zenbook S13, Razer Blade Stealtho el Serie MateBook X siguen siendo mucho más fuertes y rígidas. El diseño del Marco carece notablemente de cualquier opción de Gorilla Glass que habría reforzado y endurecido la tapa.
Lector de tarjetas SD
| SD Card Reader | |
| average JPG Copy Test (av. of 3 runs) | |
| HP Spectre x360 14-ea0378ng (Toshiba Exceria Pro M501 microSDXC 64GB) | |
| Framework Laptop 13.5 (AV Pro UHS-II V60) | |
| Framework Laptop 13.5 12th Gen Intel (AV Pro UHS-II V60) | |
| maximum AS SSD Seq Read Test (1GB) | |
| HP Spectre x360 14-ea0378ng (Toshiba Exceria Pro M501 microSDXC 64GB) | |
| Framework Laptop 13.5 (AV Pro UHS-II V60) | |
| Framework Laptop 13.5 12th Gen Intel (AV Pro UHS-II V60) | |
Comunicación
Aunque el módulo Intel AX210 no ha cambiado con respecto al modelo del año pasado, desde entonces hemos actualizado nuestros routers de prueba para que admitan la conectividad de 6 GHz y, por tanto, se pueden registrar tasas de transferencia medias más rápidas, como se muestra a continuación.
Todavía no hay opciones 4G o WAN disponibles.
| Networking | |
| iperf3 transmit AX12 | |
| Microsoft Surface Laptop 4 13 Ryzen 5 | |
| Framework Laptop 13.5 | |
| HP Spectre x360 14-ea0378ng | |
| HP EliteBook Folio 13.5-3G2L2EA | |
| iperf3 receive AX12 | |
| Microsoft Surface Laptop 4 13 Ryzen 5 | |
| Framework Laptop 13.5 | |
| HP Spectre x360 14-ea0378ng | |
| HP EliteBook Folio 13.5-3G2L2EA | |
| iperf3 receive AXE11000 6GHz | |
| Framework Laptop 13.5 12th Gen Intel | |
| iperf3 transmit AXE11000 6GHz | |
| Framework Laptop 13.5 12th Gen Intel | |
Cámara web


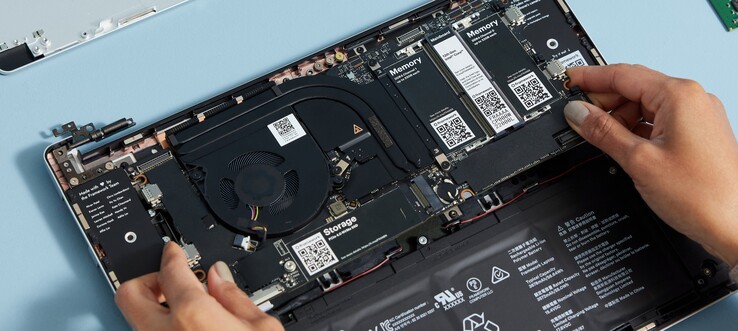
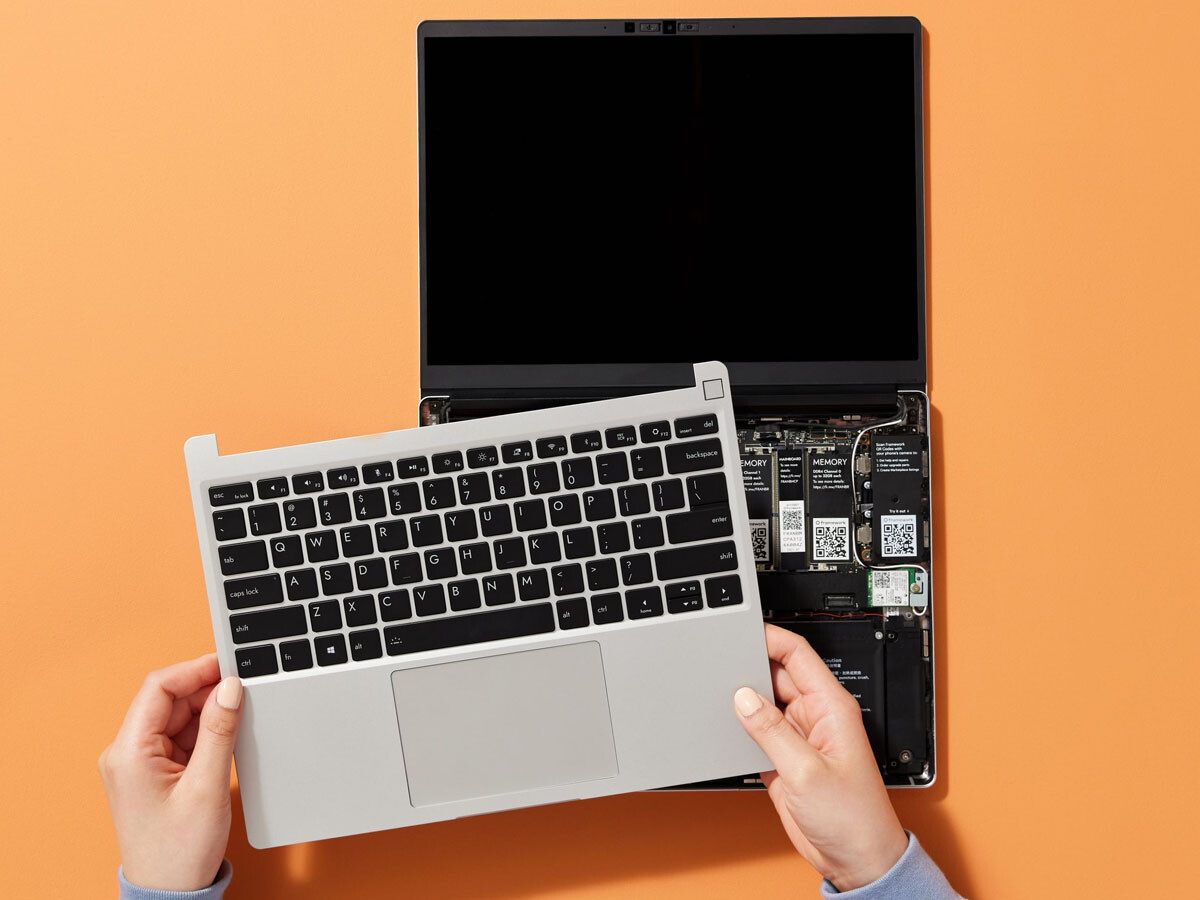
Mantenimiento
El equipo es uno de los modelos de portátiles más fáciles de reparar, como cabría esperar. Framework también vende placas base y kits de bricolaje para los usuarios que deseen montar el portátil ellos mismos.
Accesorios
Las exclusivas tarjetas de expansión basadas en USB-C han vuelto este año, además de una nueva tarjeta de expansión Ethernet que admite velocidades de hasta 2,5 Gbit. Todas son opcionales y configurables en el momento de la compra. El fabricante seguirá desarrollando diferentes tarjetas de expansión en función de la demanda de los usuarios.
Cada caja de venta incluye una llave Torx para el mantenimiento de la unidad.
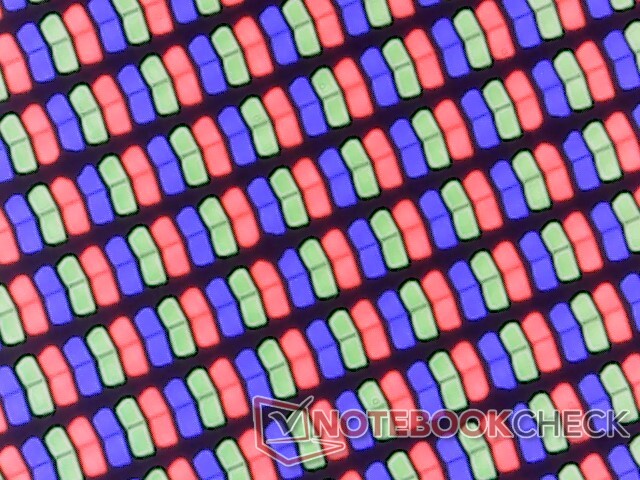
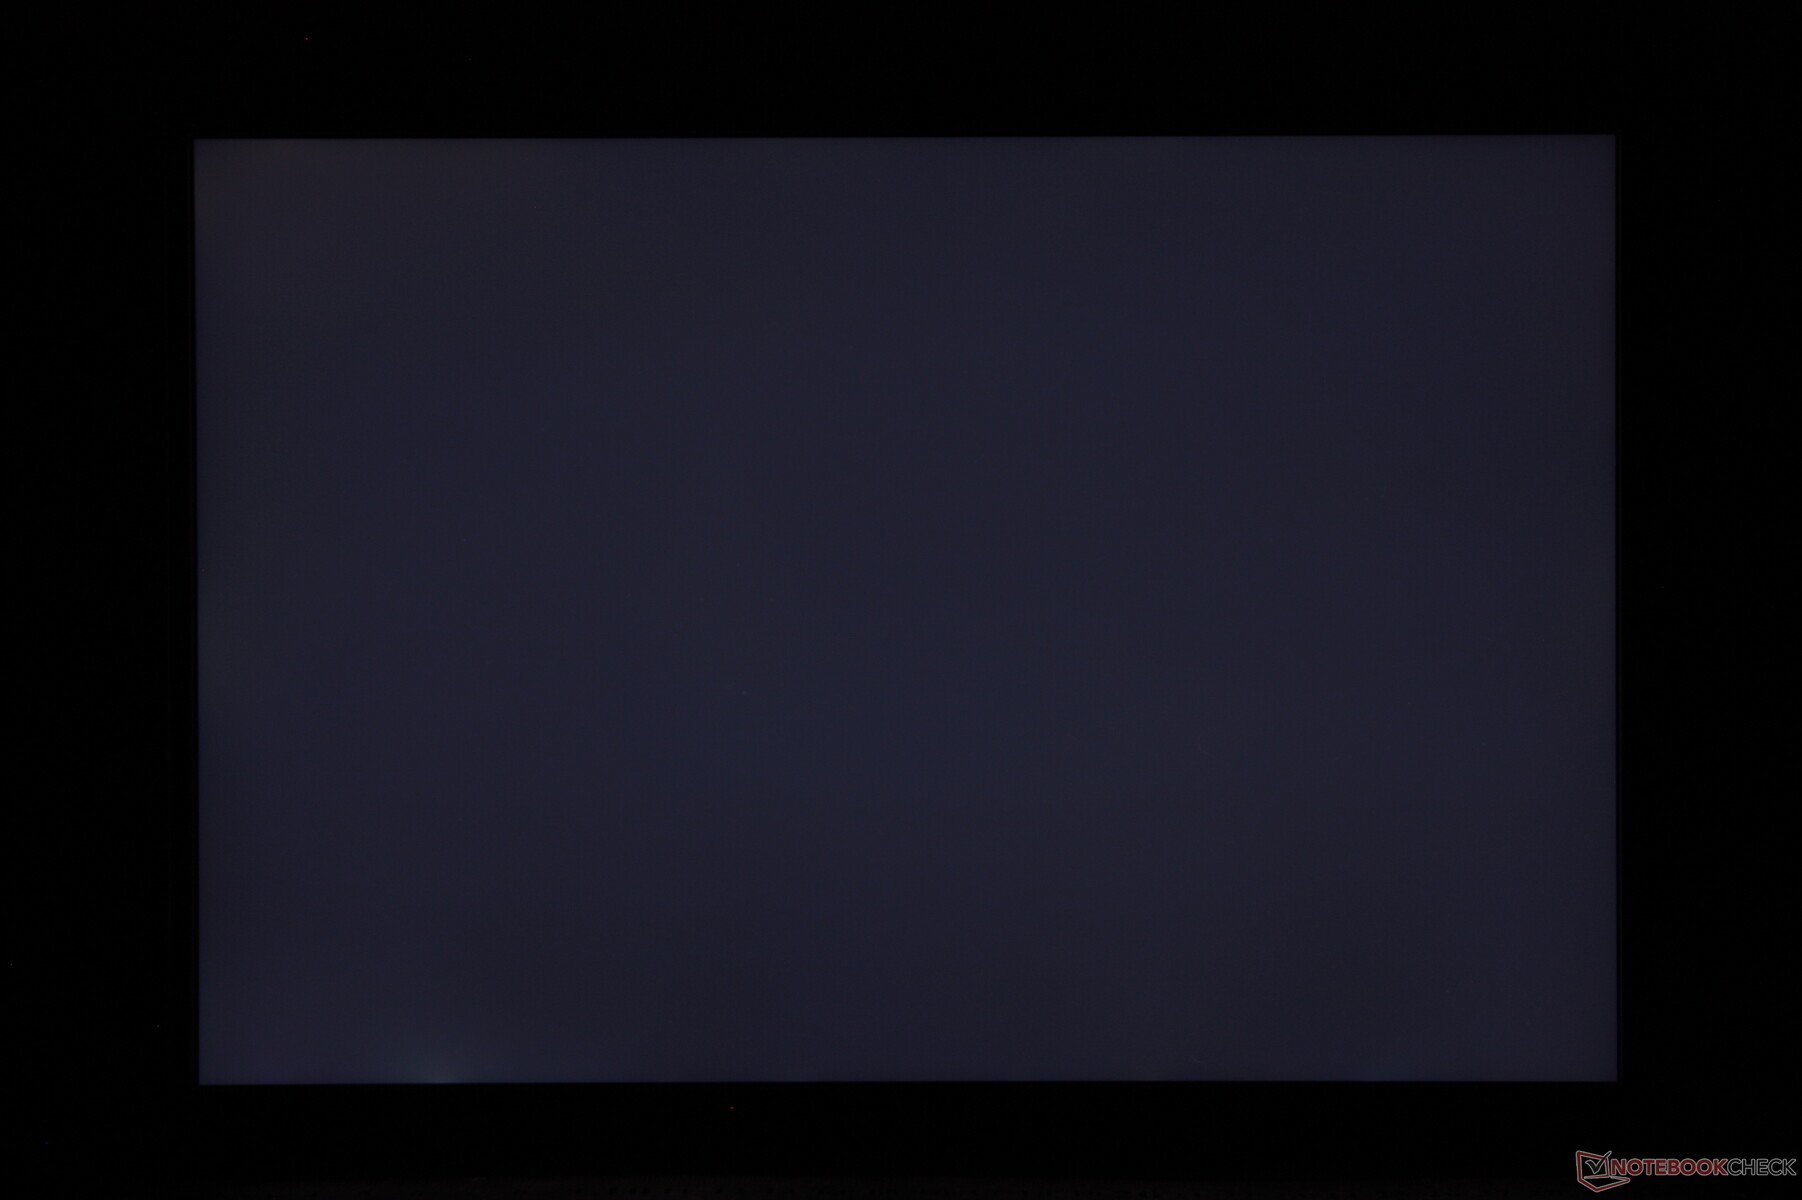
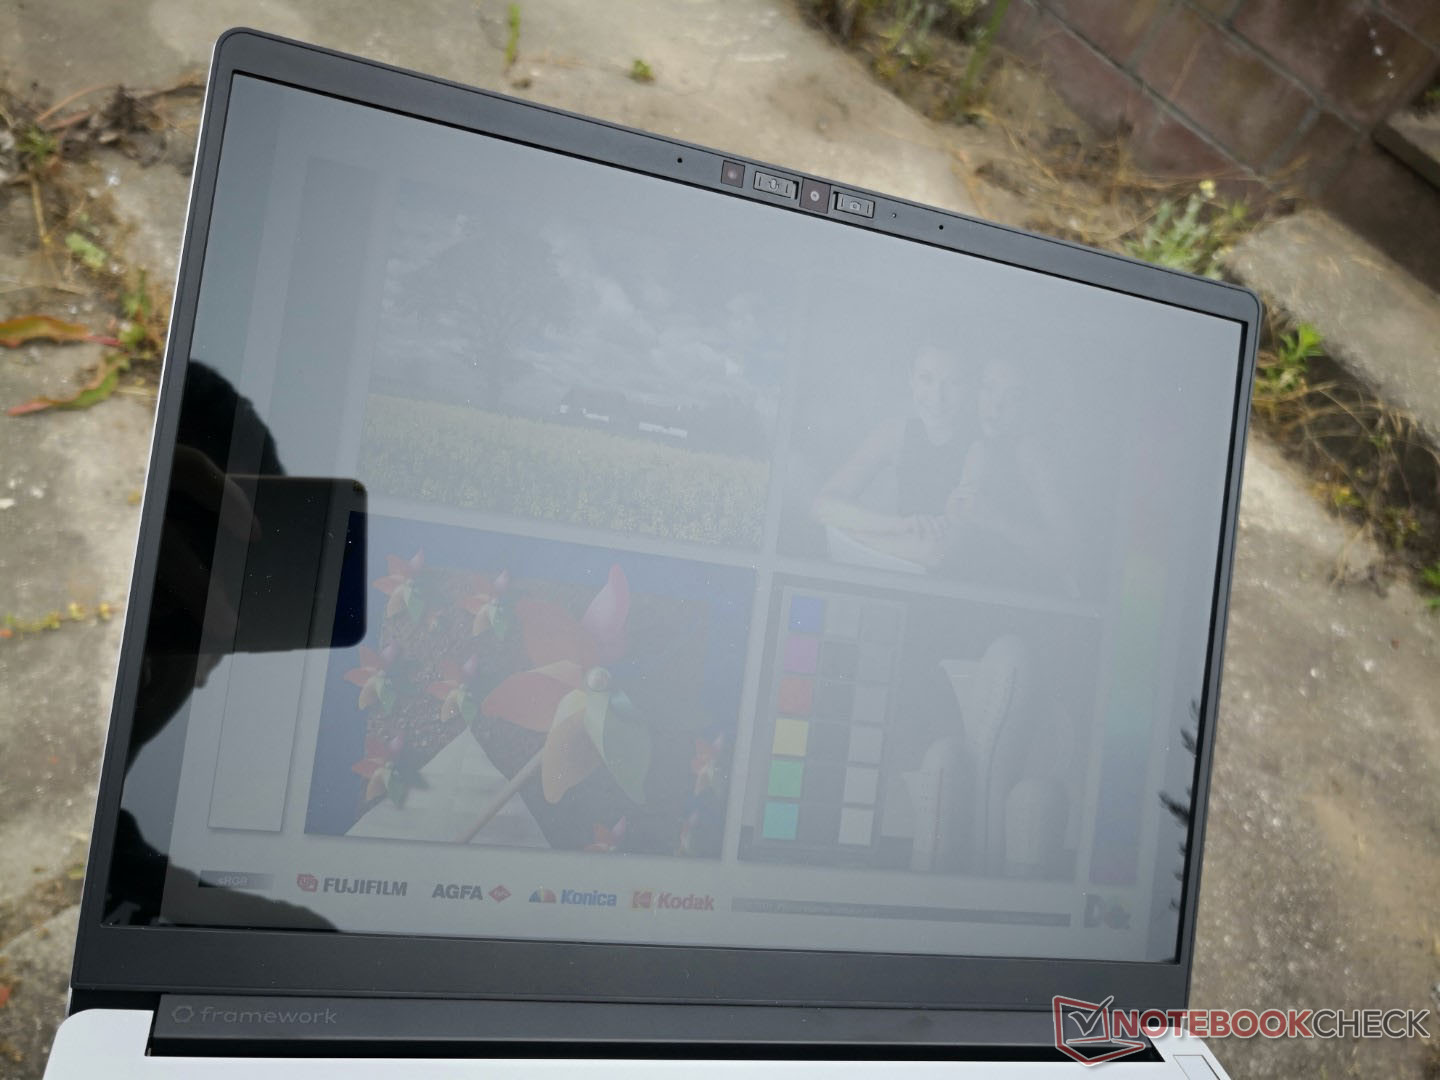
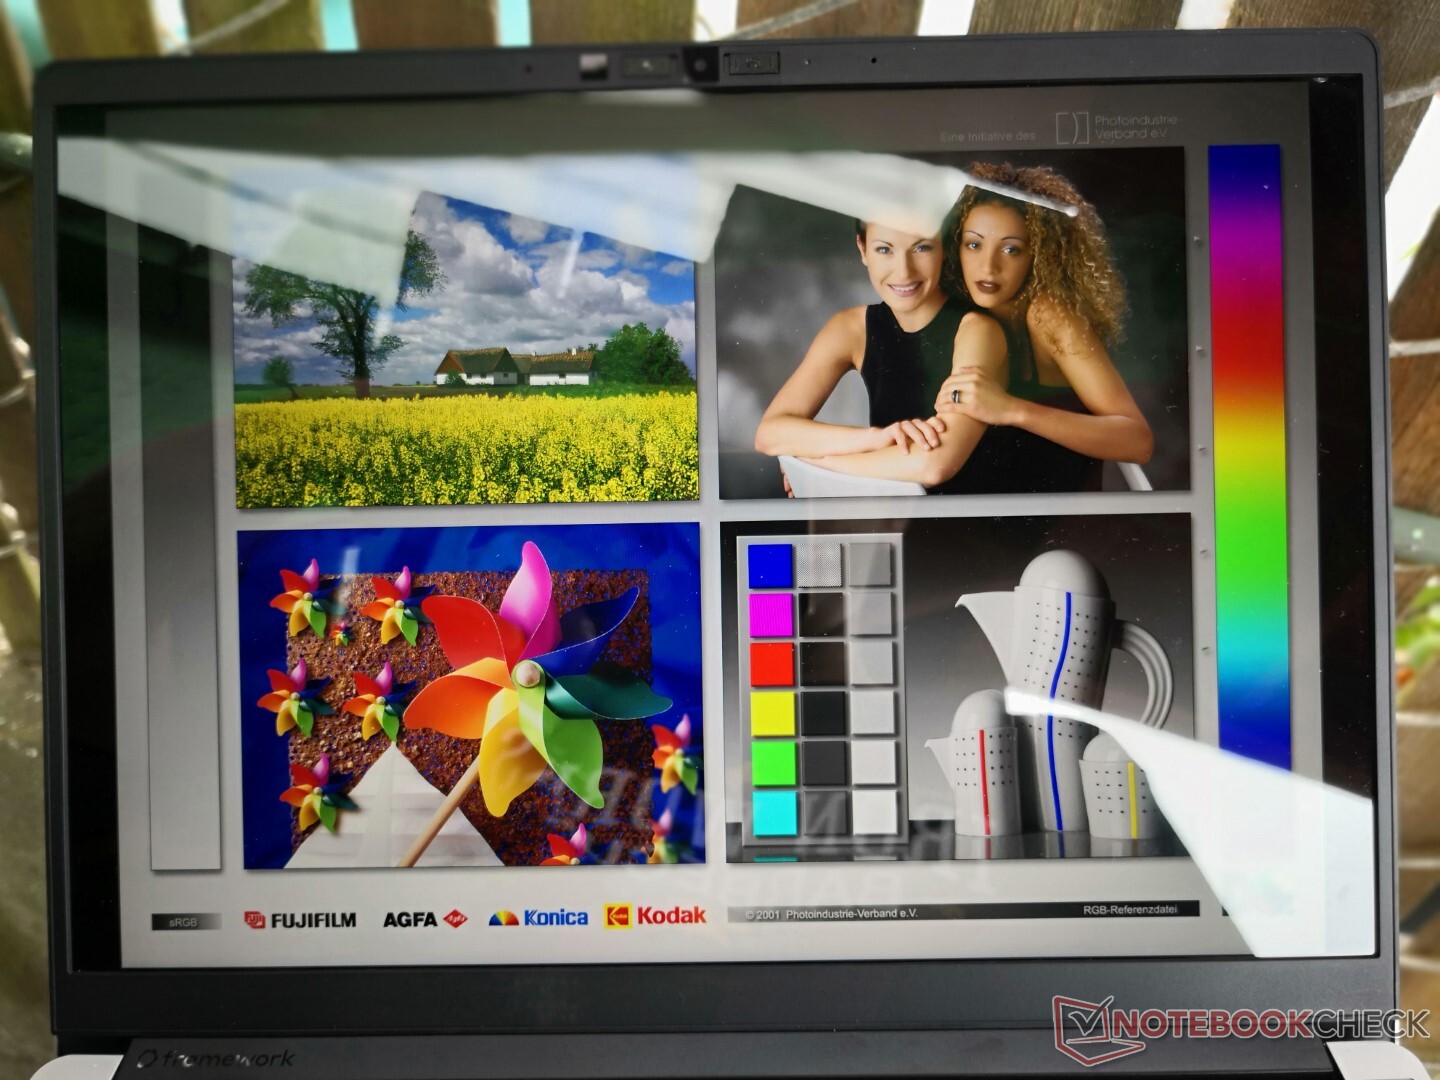
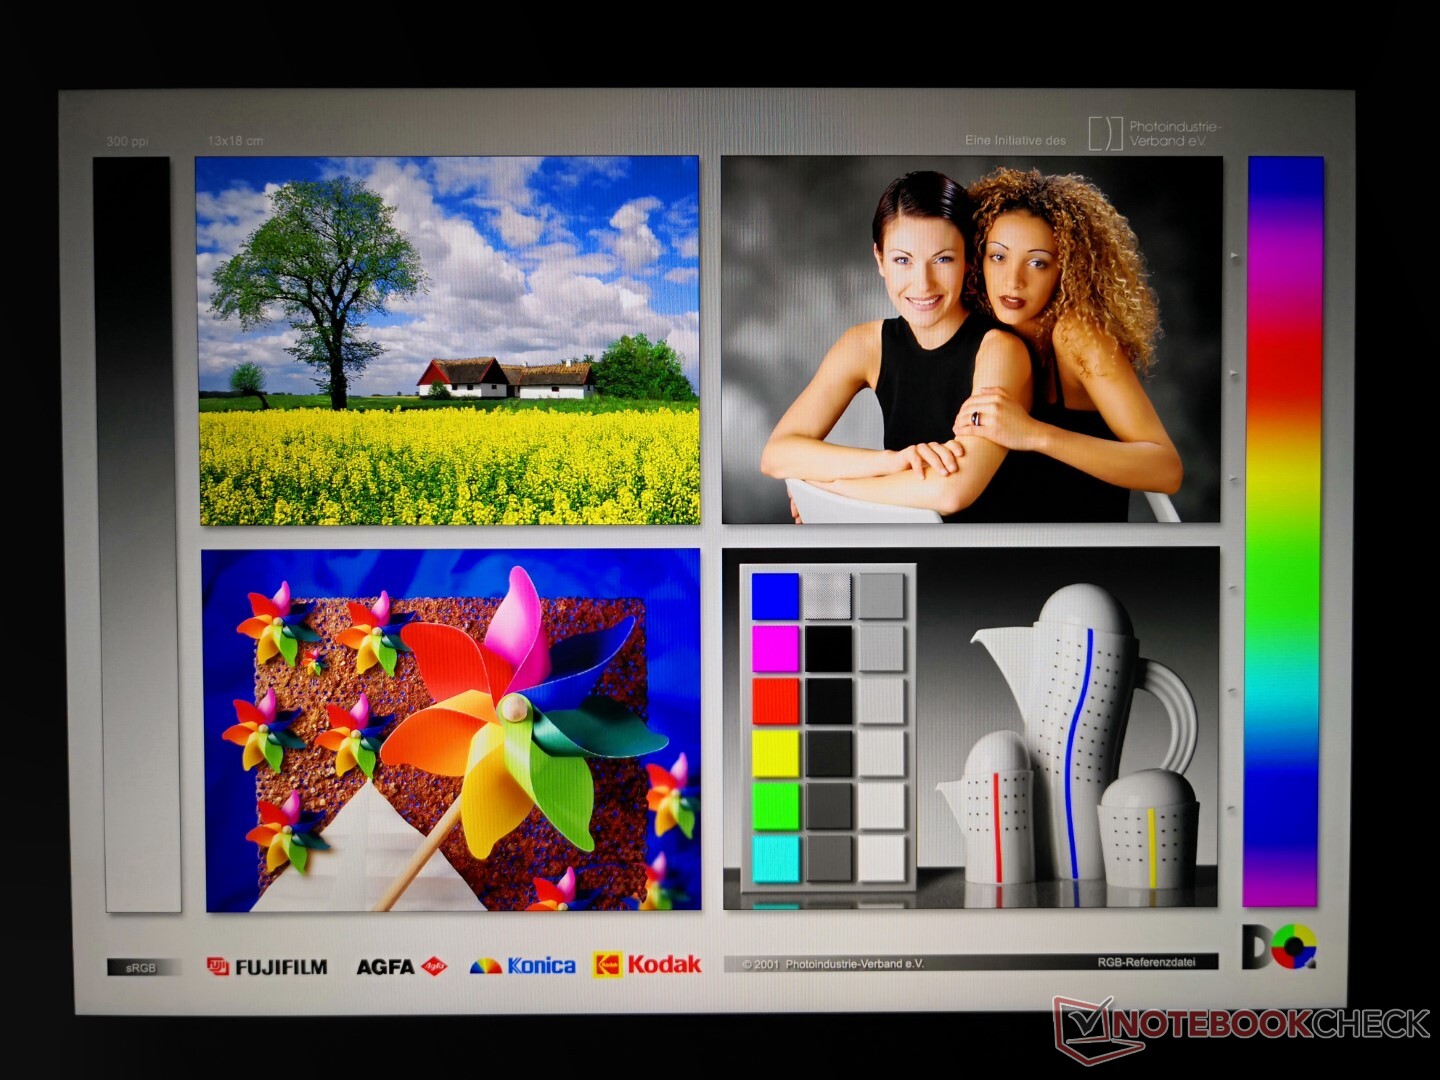
Mostrar
| |||||||||||||||||||||||||
iluminación: 90 %
Brillo con batería: 449.6 cd/m²
Contraste: 1450:1 (Negro: 0.31 cd/m²)
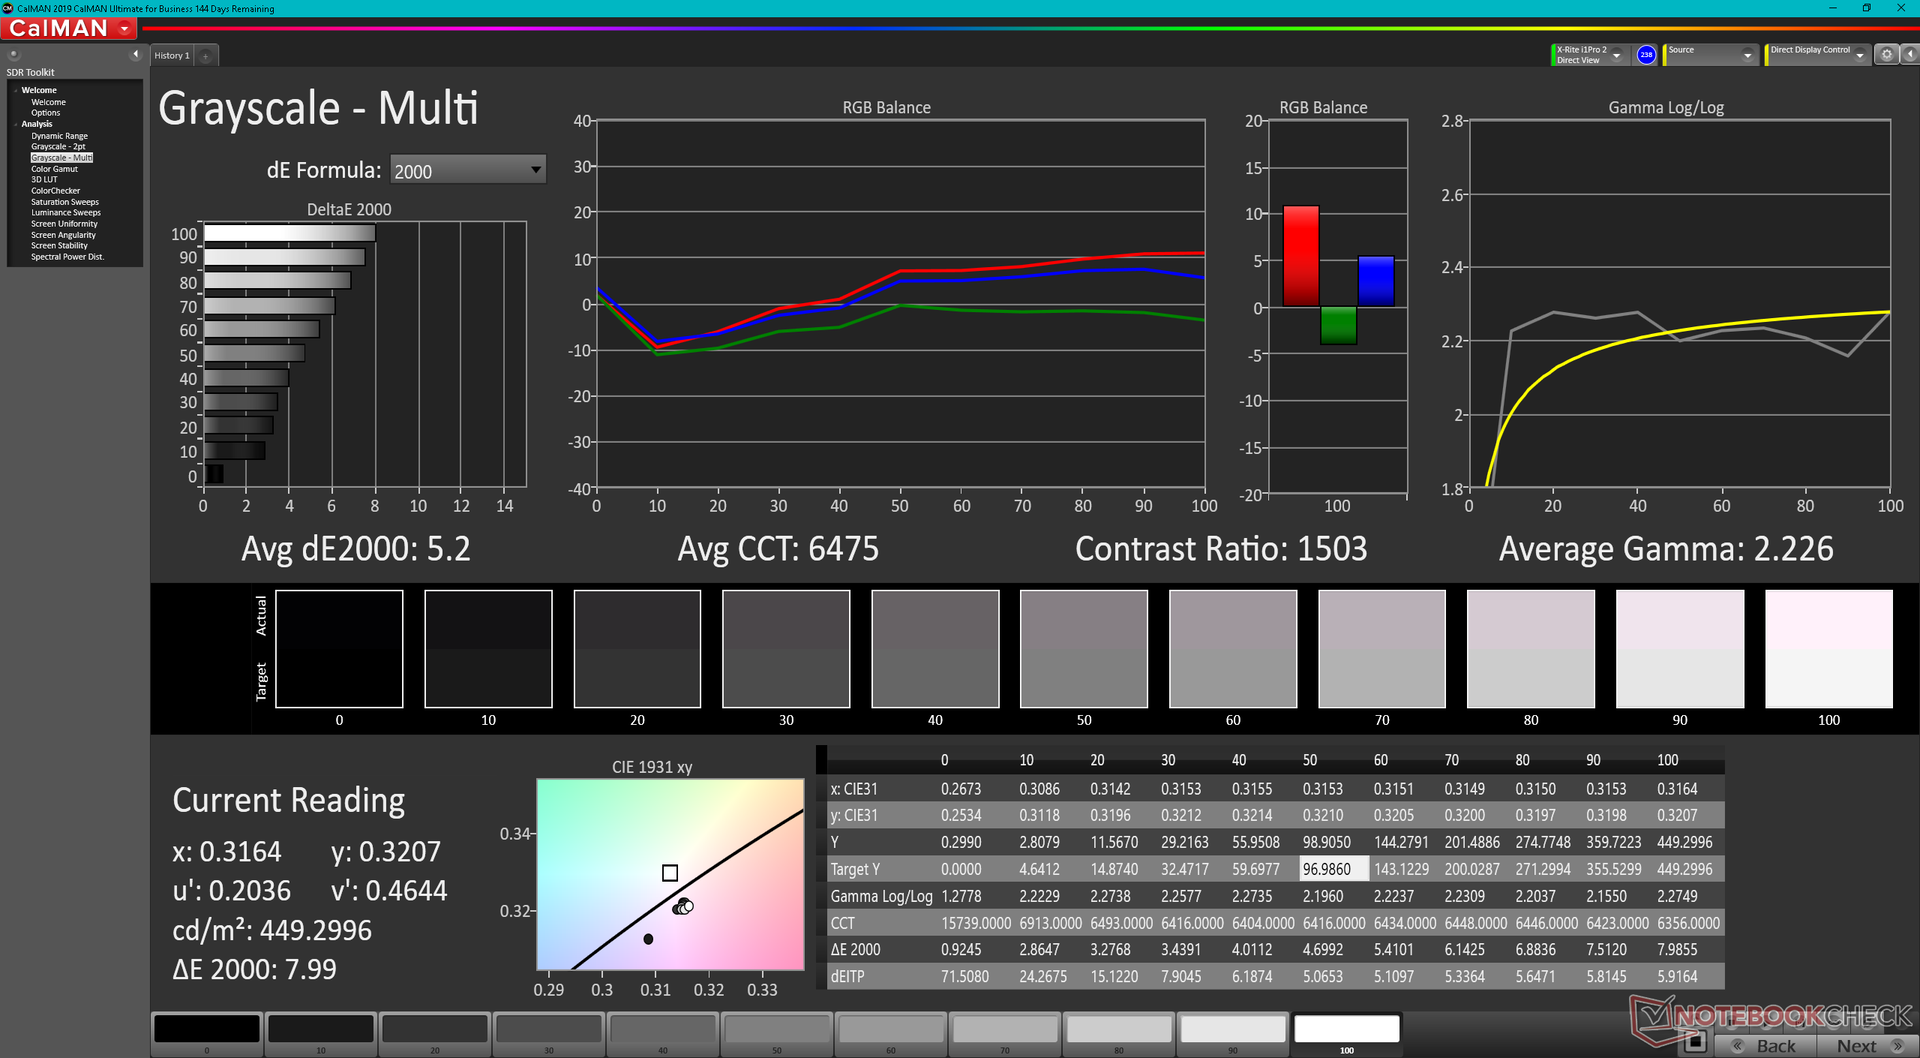
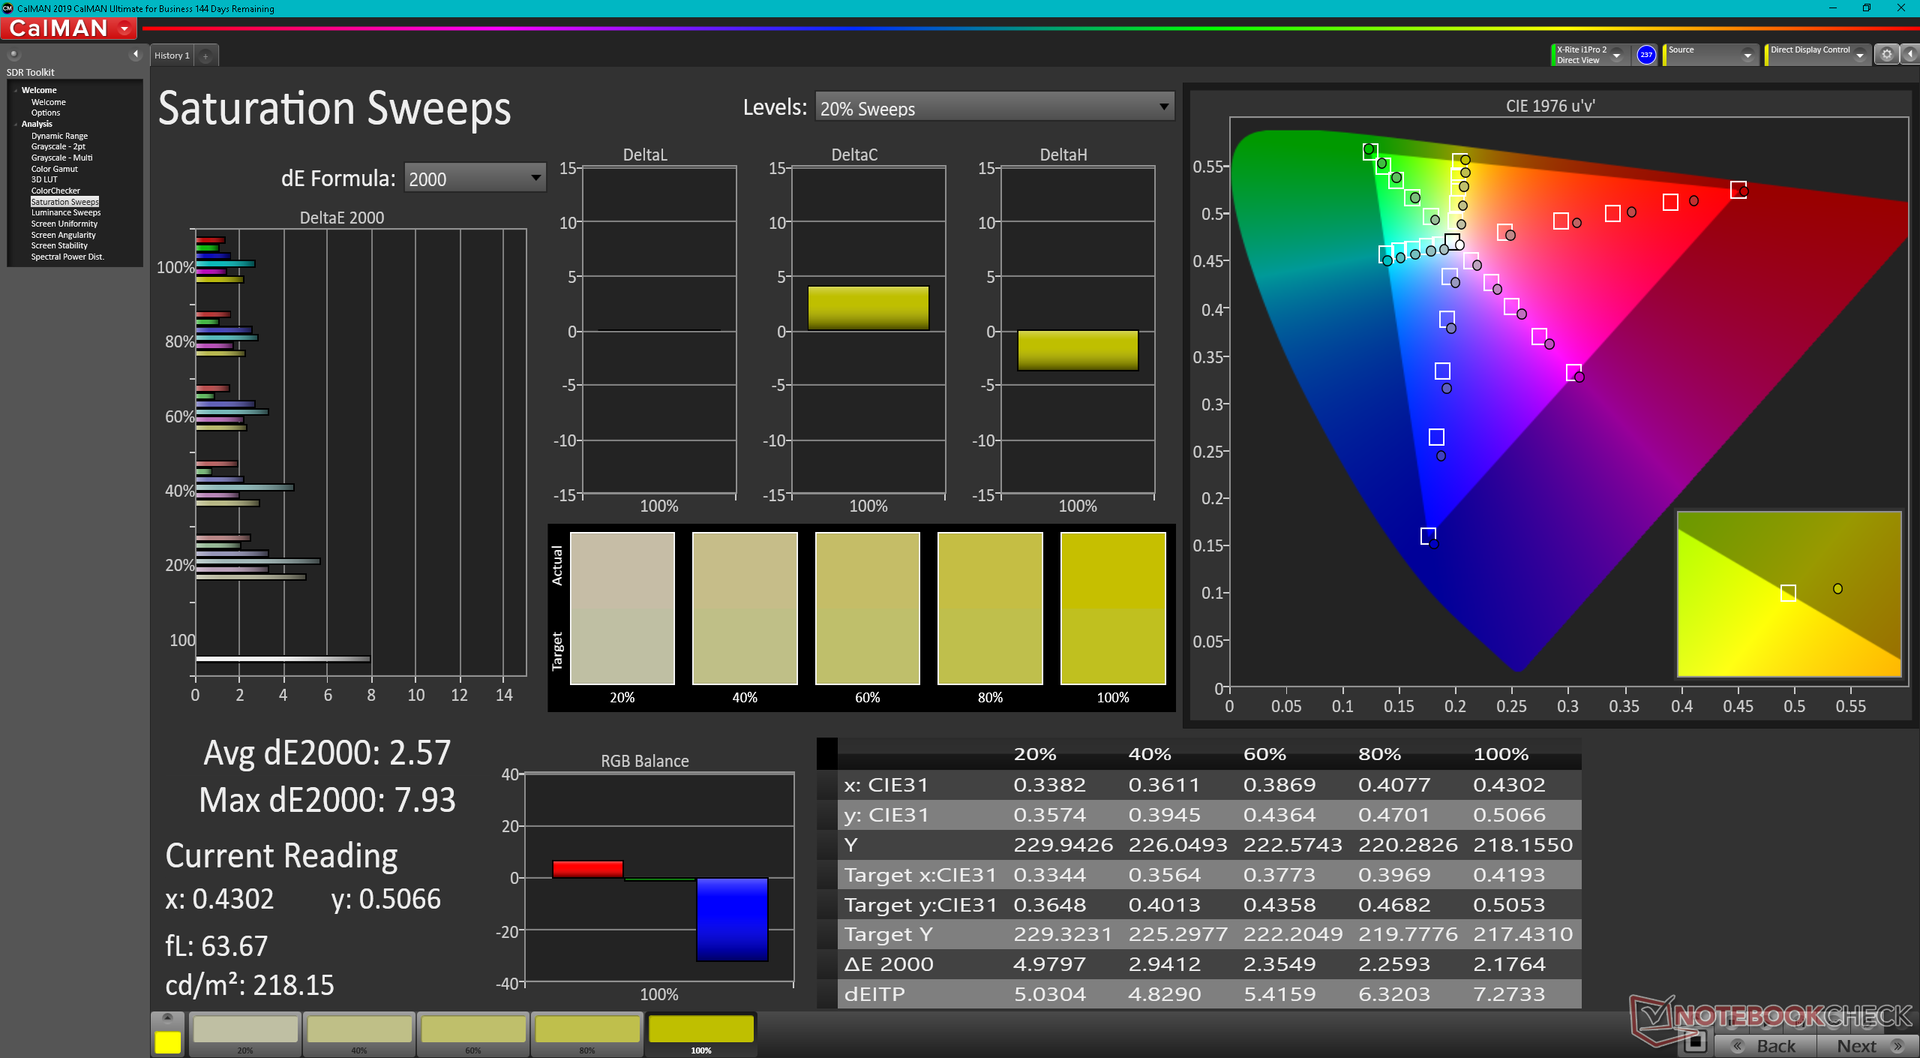
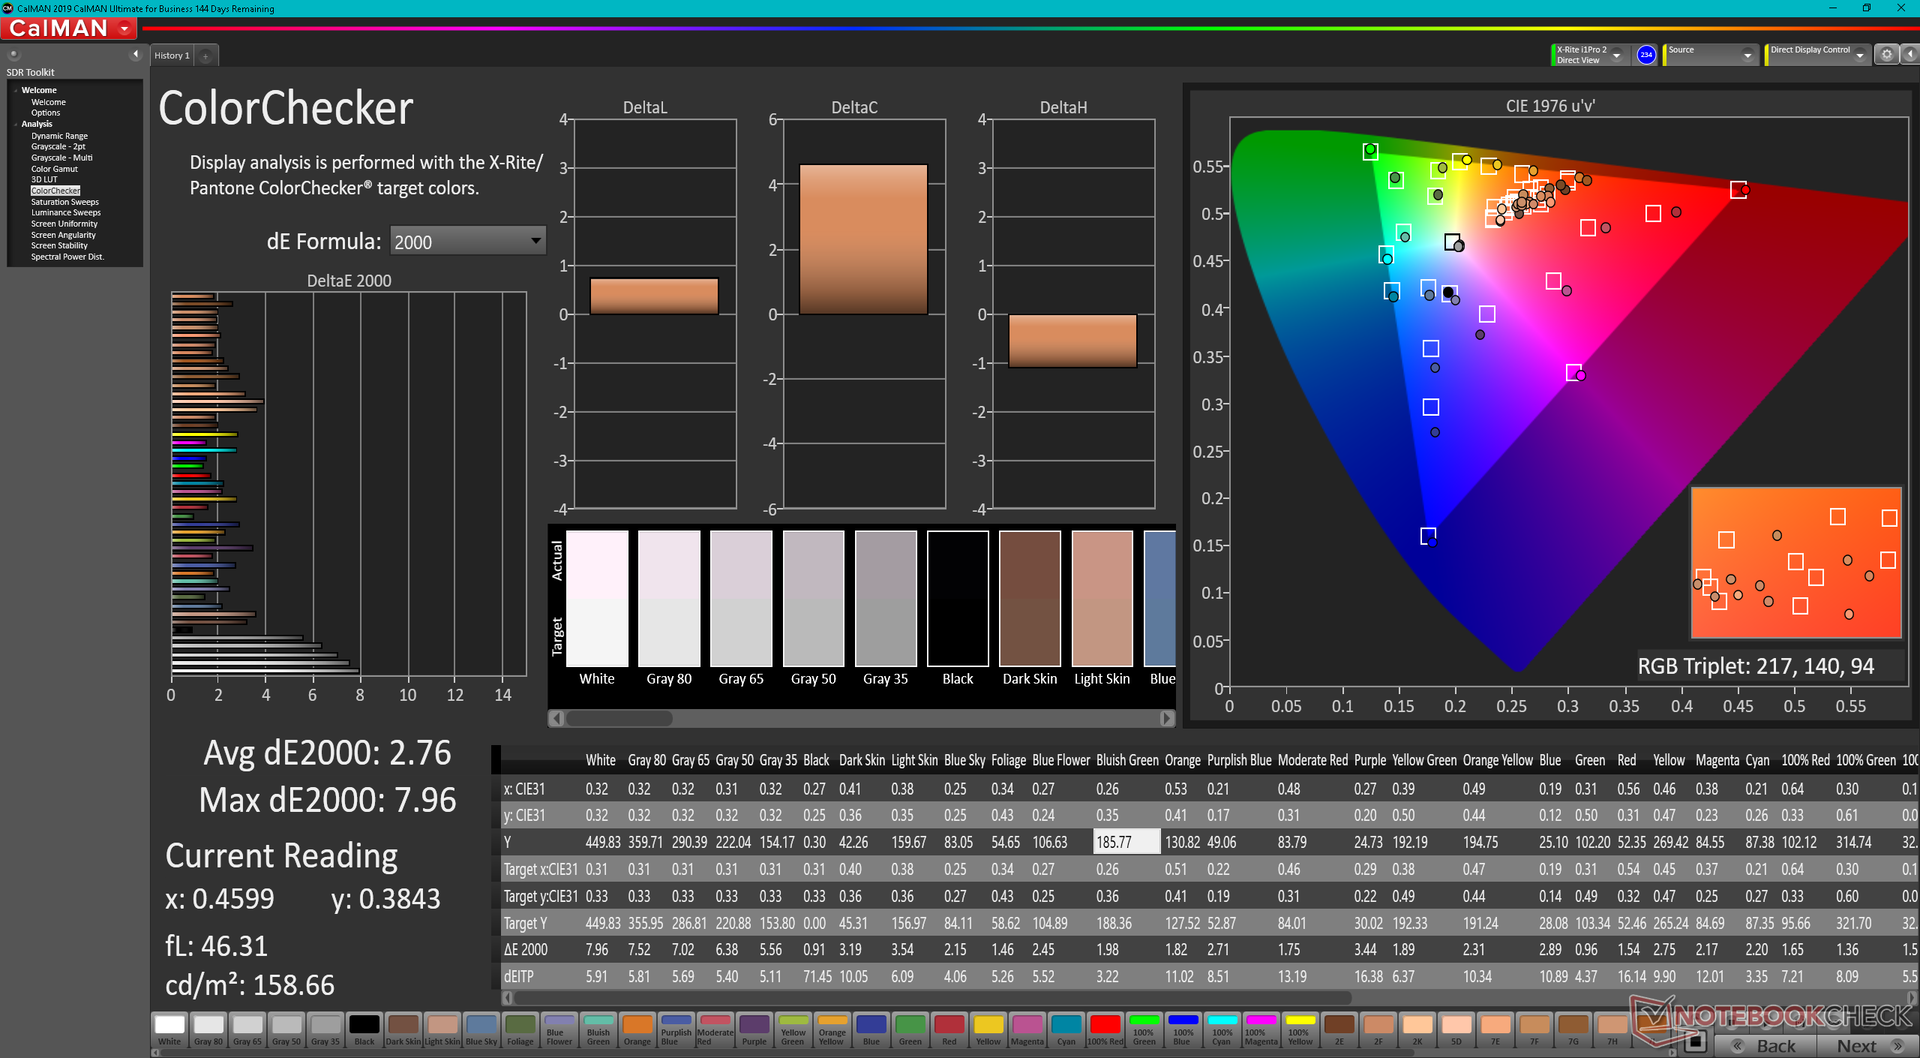
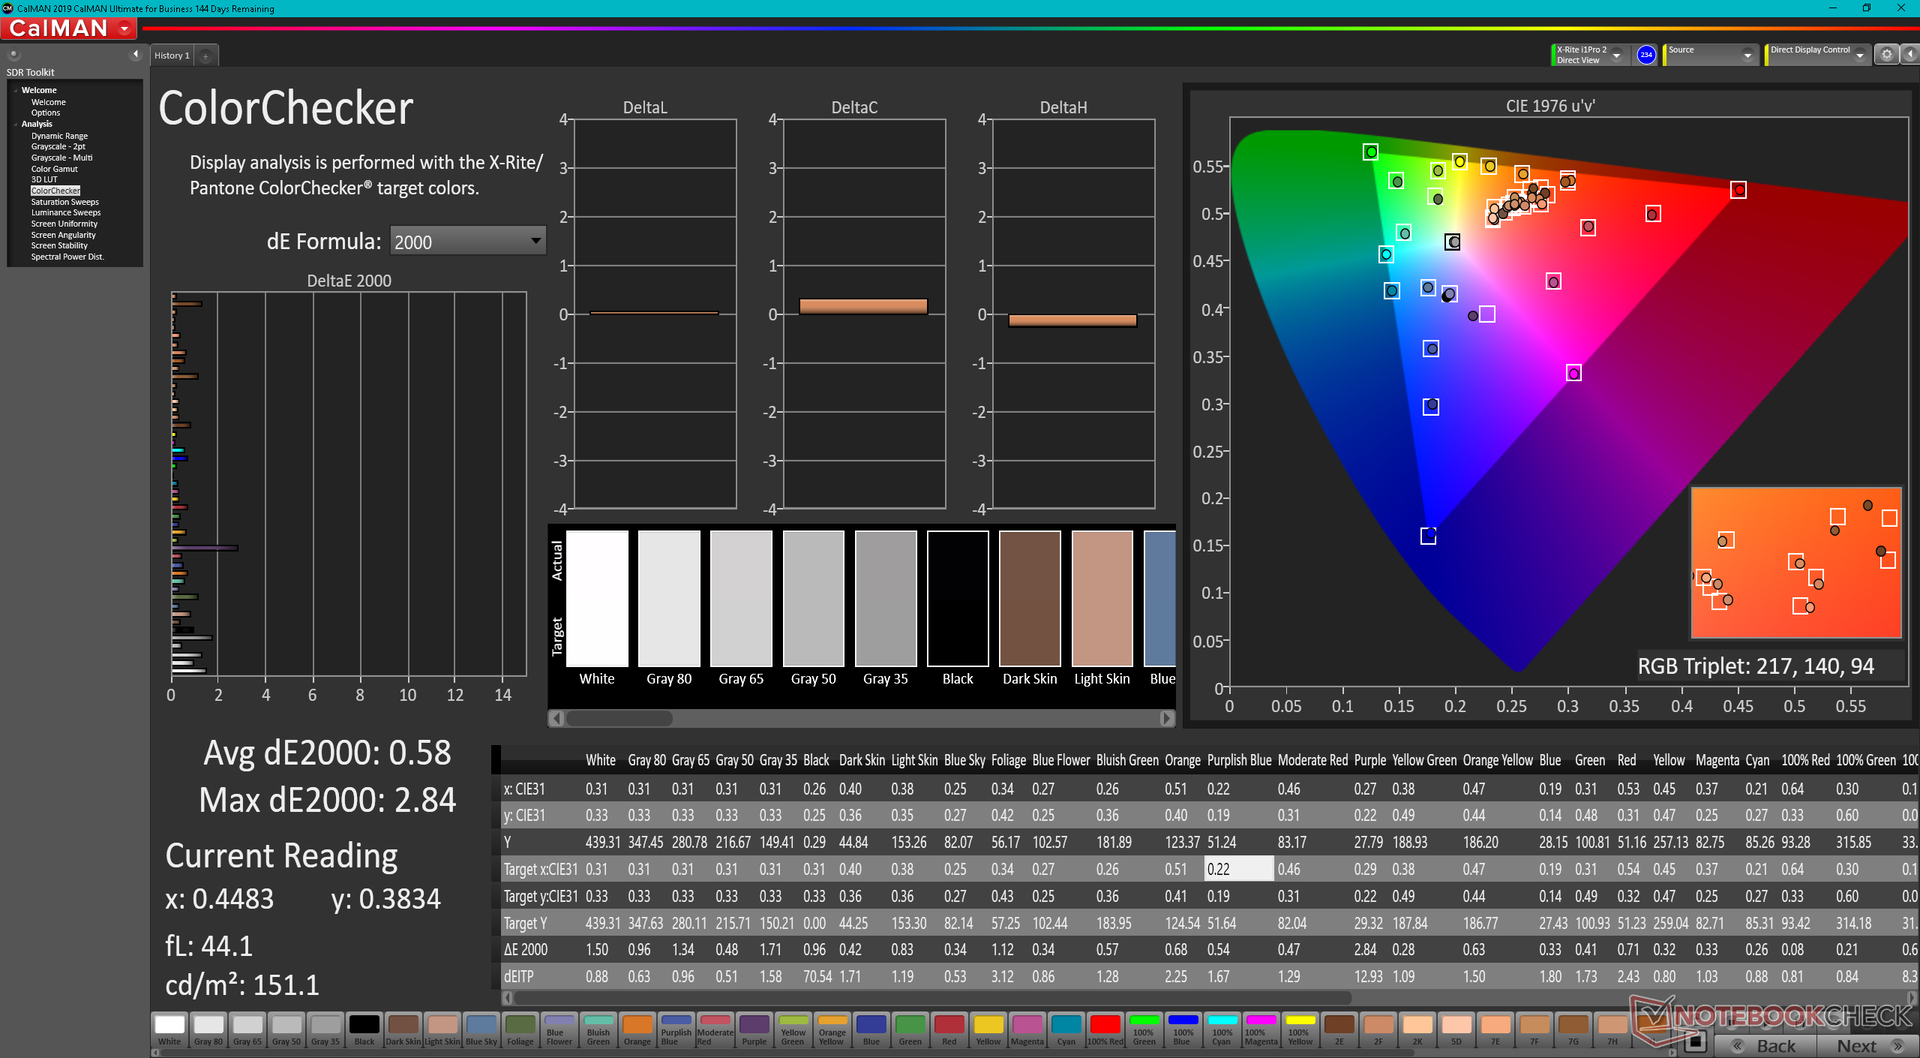
ΔE ColorChecker Calman: 2.76 | ∀{0.5-29.43 Ø4.71}
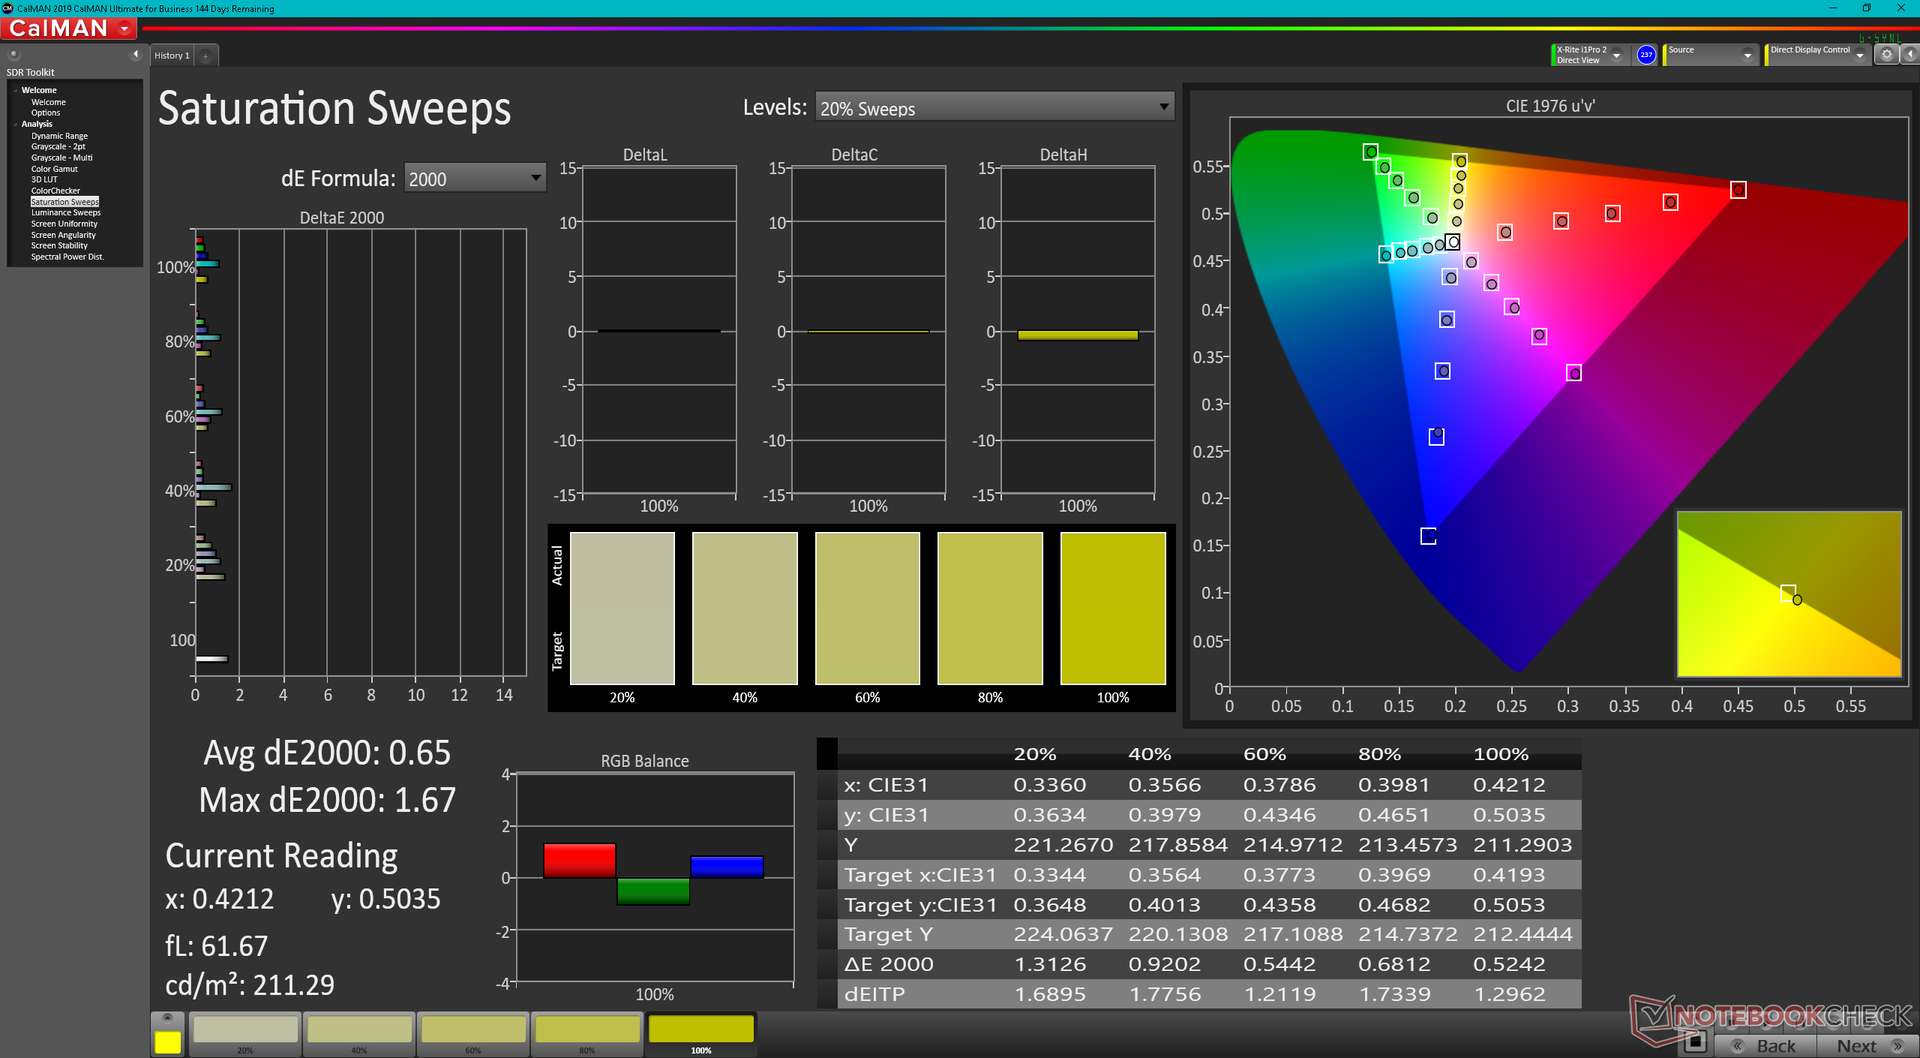
calibrated: 0.58
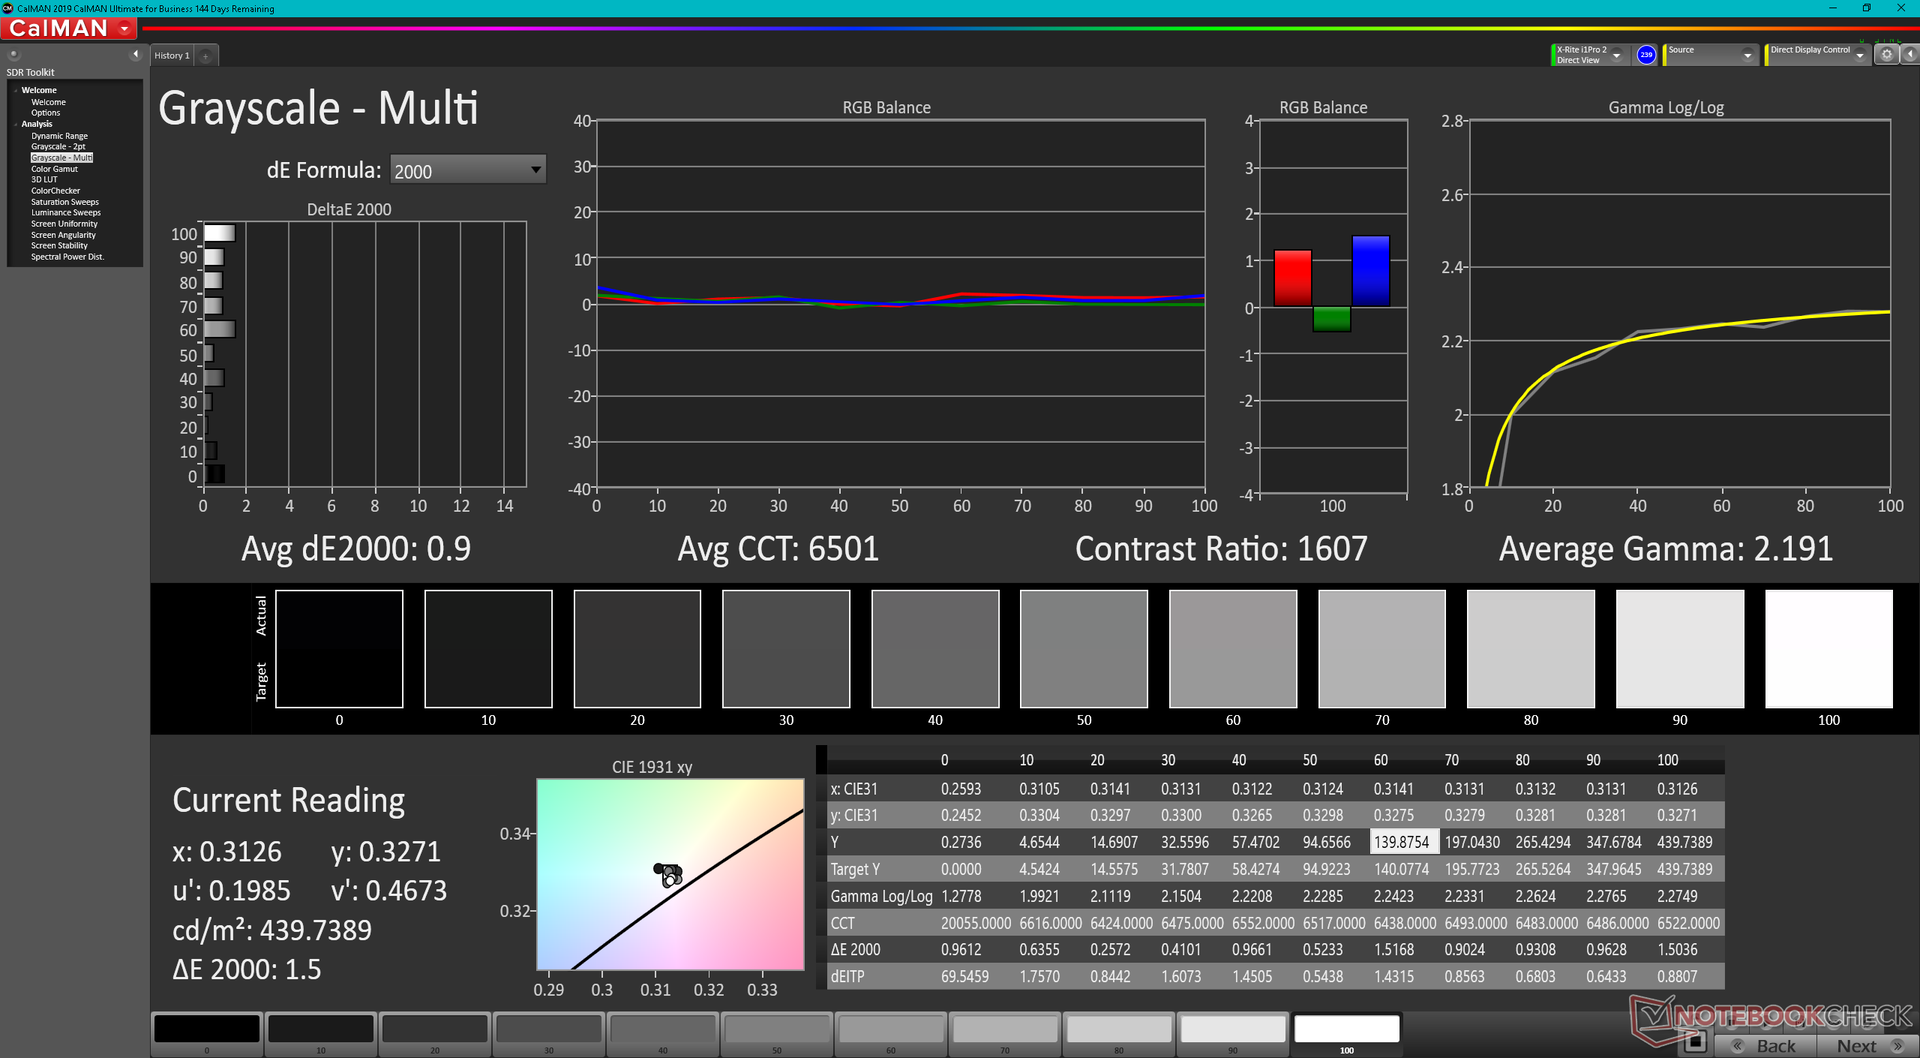
ΔE Greyscale Calman: 5.2 | ∀{0.09-98 Ø4.96}
71.1% AdobeRGB 1998 (Argyll 3D)
99.4% sRGB (Argyll 3D)
69.9% Display P3 (Argyll 3D)
Gamma: 2.23
CCT: 6475 K
| Framework Laptop 13.5 12th Gen Intel BOE CQ NE135FBM-N41, IPS, 2256x1504, 13.5" | Framework Laptop 13.5 BOE CQ NE135FBM-N41, IPS, 2256x1504, 13.5" | Lenovo ThinkPad X1 Titanium Yoga G1 20QB0016GE LPM135M467, IPS LED, 2256x1504, 13.5" | HP EliteBook Folio 13.5-3G2L2EA LGD0663, IPS, 1920x1280, 13.5" | HP Spectre x360 14-ea0378ng Samsung SDC4148, OLED, 3000x2000, 13.5" | Microsoft Surface Laptop 4 13 i7 LQ135P1JX51, IPS, 2256x1504, 13.5" | |
|---|---|---|---|---|---|---|
| Display | -1% | -3% | 26% | -5% | ||
| Display P3 Coverage (%) | 69.9 | 69 -1% | 66.8 -4% | 99.9 43% | 64.7 -7% | |
| sRGB Coverage (%) | 99.4 | 99.3 0% | 98 -1% | 100 1% | 97.2 -2% | |
| AdobeRGB 1998 Coverage (%) | 71.1 | 70.3 -1% | 68.6 -4% | 96.1 35% | 66.9 -6% | |
| Response Times | -46% | -72% | -13% | 94% | -63% | |
| Response Time Grey 50% / Grey 80% * (ms) | 34.7 ? | 55.6 ? -60% | 64 ? -84% | 44 ? -27% | 2 ? 94% | 62.8 ? -81% |
| Response Time Black / White * (ms) | 27.5 ? | 36 ? -31% | 44 ? -60% | 27 ? 2% | 2 ? 93% | 39.8 ? -45% |
| PWM Frequency (Hz) | 250 ? | 21930 ? | ||||
| Screen | -8% | 14% | -9% | 259% | 3% | |
| Brightness middle (cd/m²) | 449.6 | 449 0% | 465 3% | 250 -44% | 370 -18% | 413 -8% |
| Brightness (cd/m²) | 431 | 435 1% | 451 5% | 226 -48% | 374 -13% | 400 -7% |
| Brightness Distribution (%) | 90 | 93 3% | 92 2% | 82 -9% | 90 0% | 94 4% |
| Black Level * (cd/m²) | 0.31 | 0.39 -26% | 0.28 10% | 0.215 31% | 0.01 97% | 0.29 6% |
| Contrast (:1) | 1450 | 1151 -21% | 1661 15% | 1163 -20% | 37000 2452% | 1424 -2% |
| Colorchecker dE 2000 * | 2.76 | 2.34 15% | 2 28% | 3.59 -30% | 2.57 7% | 2.8 -1% |
| Colorchecker dE 2000 max. * | 7.96 | 7.07 11% | 4.7 41% | 5.9 26% | 4.52 43% | 7.2 10% |
| Colorchecker dE 2000 calibrated * | 0.58 | 0.96 -66% | 0.7 -21% | 2.31 -298% | 0.8 -38% | |
| Greyscale dE 2000 * | 5.2 | 4.7 10% | 2.9 44% | 3.99 23% | 2.2 58% | 1.9 63% |
| Gamma | 2.23 99% | 2.29 96% | 2.09 105% | 2.98 74% | 2.36 93% | 2.12 104% |
| CCT | 6475 100% | 6760 96% | 6181 105% | 6765 96% | 6154 106% | 6510 100% |
| Color Space (Percent of AdobeRGB 1998) (%) | 85.8 | 61.6 | ||||
| Color Space (Percent of sRGB) (%) | 100 | 97.2 | ||||
| Media total (Programa/Opciones) | -18% /
-12% | -20% /
-2% | -11% /
-10% | 126% /
185% | -22% /
-8% |
* ... más pequeño es mejor
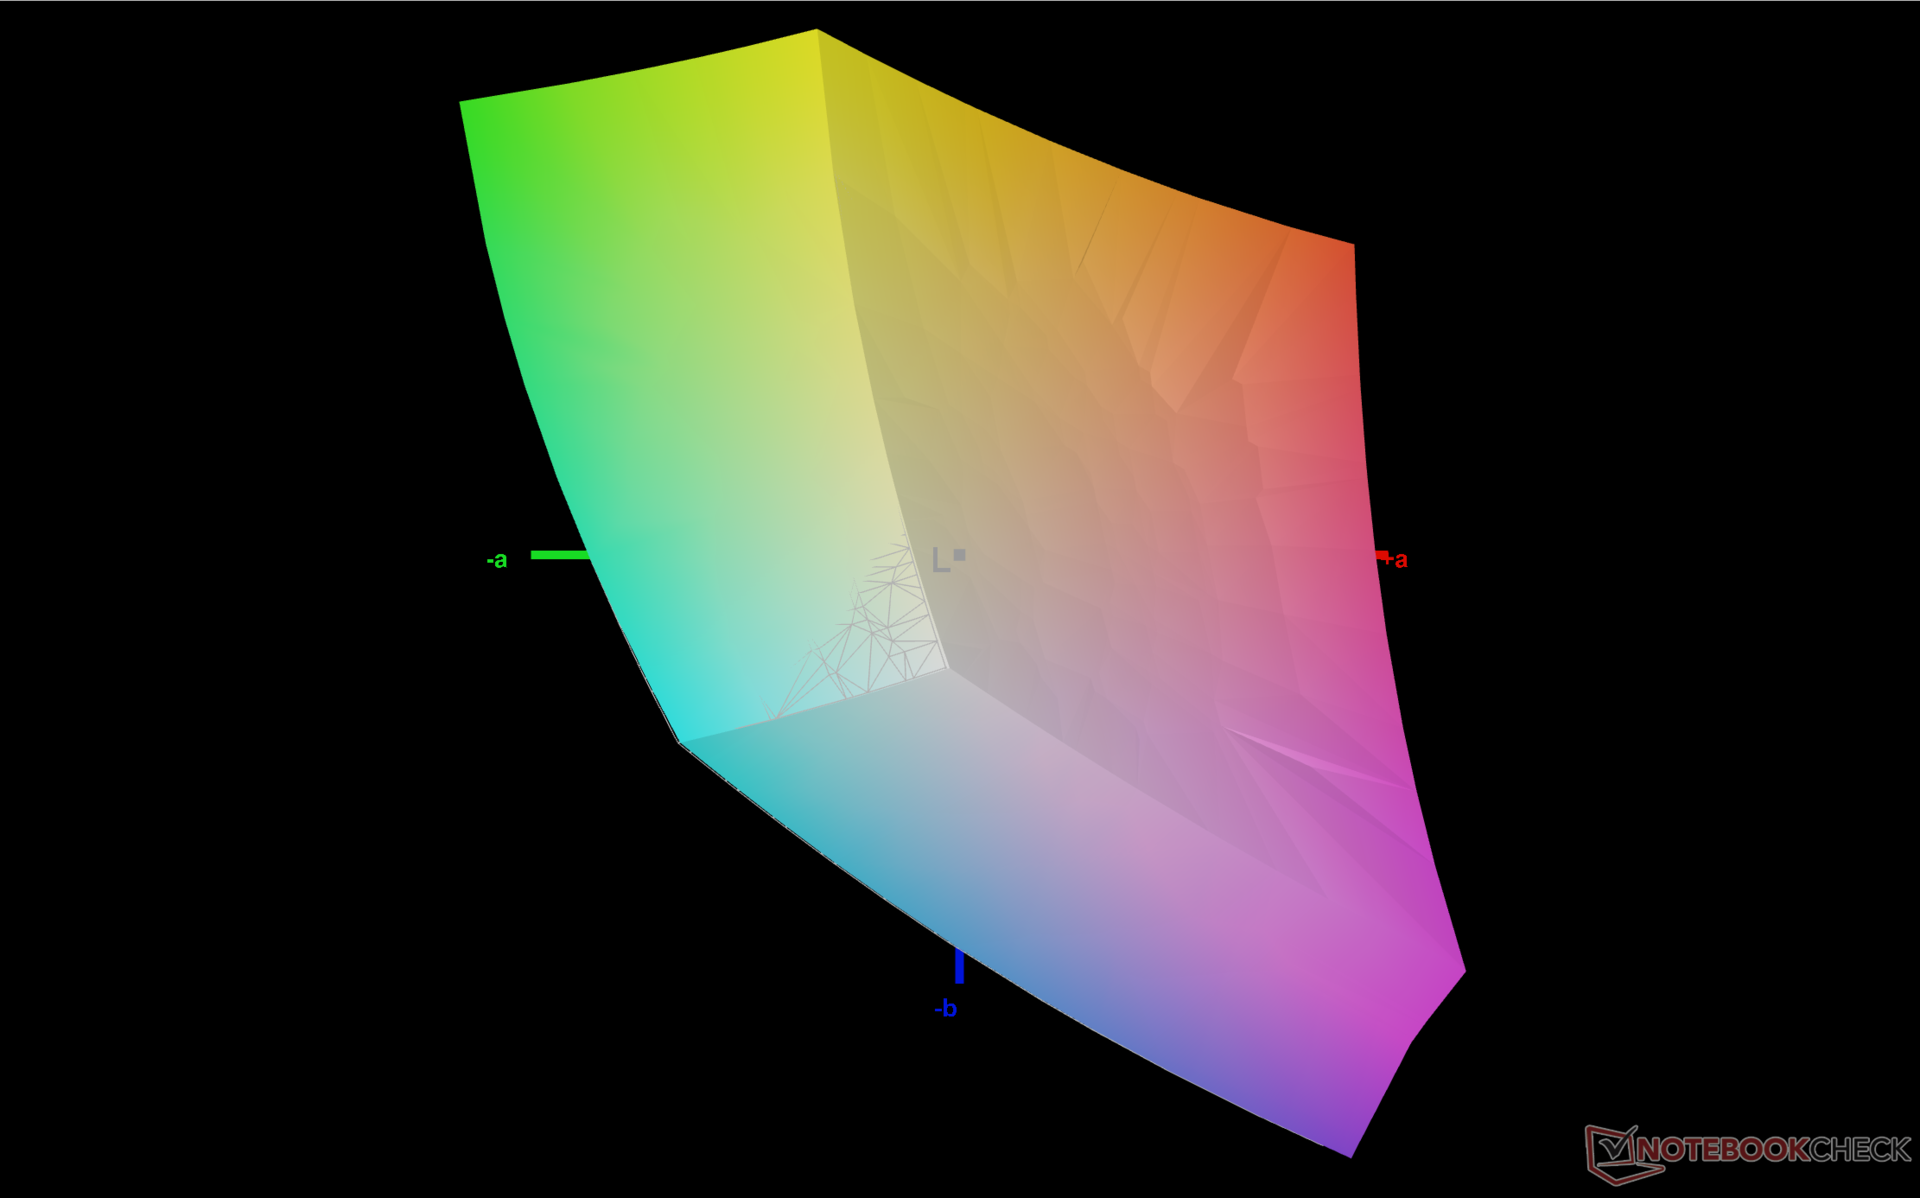
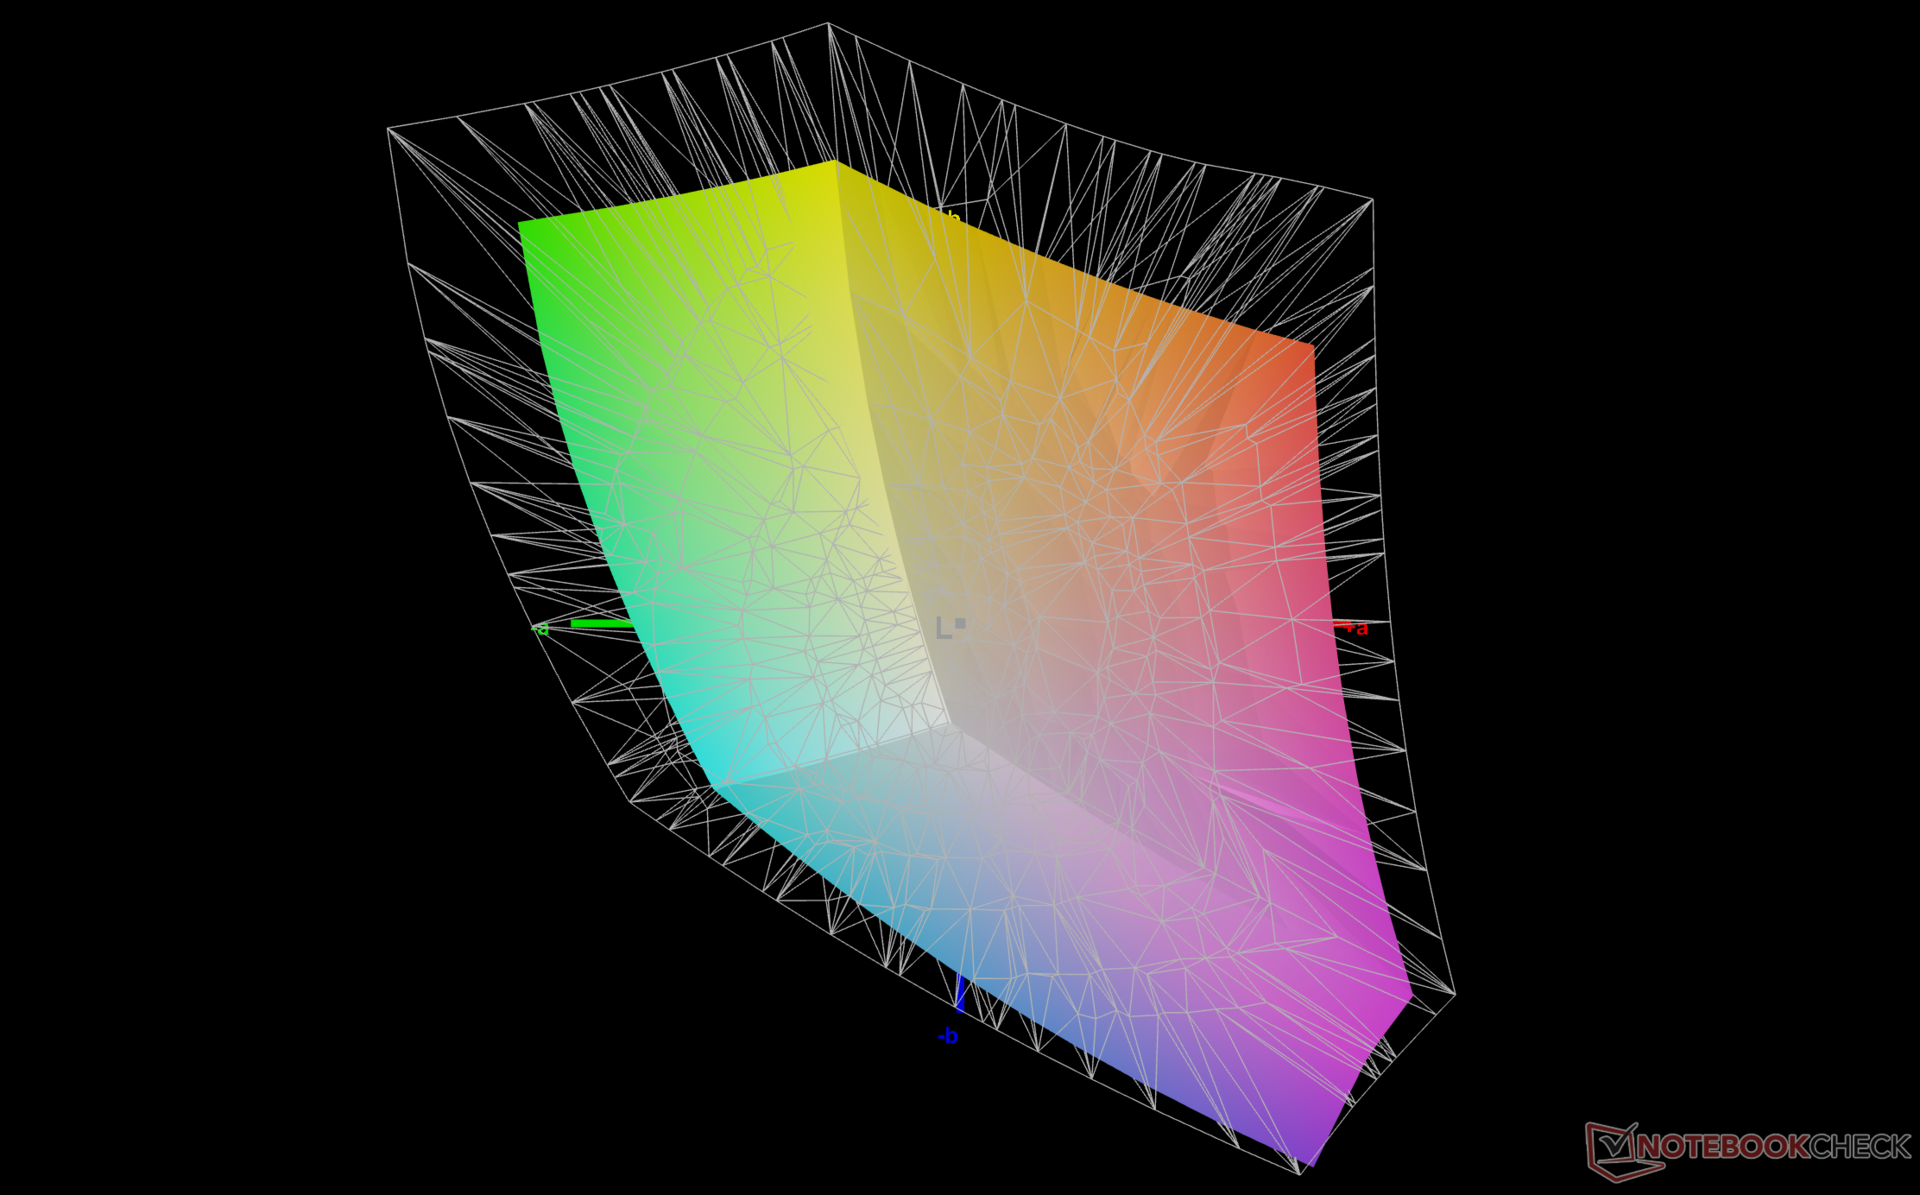
El fabricante no calibra su Framework Laptop en fábrica, lo que es una pena ya que el panel ofrece una cobertura sRGB completa. Los valores promedio de escala de grises y color DeltaE en nuestra unidad de prueba serían de 5,2 y 2,76 fuera de la caja, respectivamente, en comparación con sólo 0,9 y 0,58 después de calibrar el panel nosotros mismos. La temperatura del color, en particular, es demasiado cálida sin una calibración adecuada. Recomendamos aplicar nuestro perfil ICM para sacar el máximo partido a la pantalla.
Tiempos de respuesta del display
| ↔ Tiempo de respuesta de Negro a Blanco | ||
|---|---|---|
| 27.5 ms ... subida ↗ y bajada ↘ combinada | ↗ 14.8 ms subida | 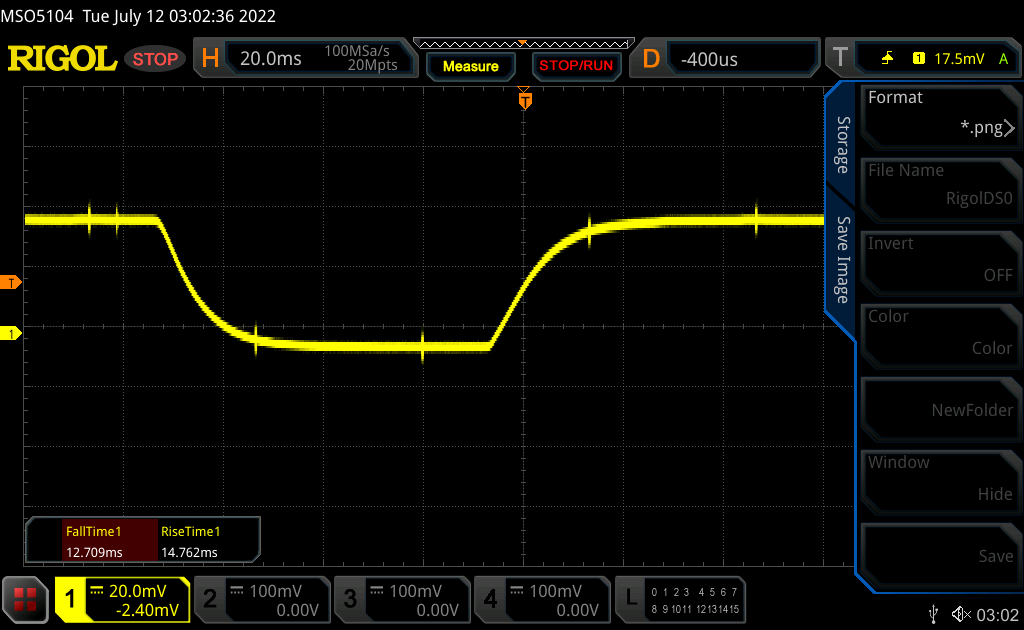 |
| ↘ 12.7 ms bajada | ||
| La pantalla mostró tiempos de respuesta relativamente lentos en nuestros tests pero podría ser demasiado lenta para los jugones. En comparación, todos los dispositivos de prueba van de ##min### (mínimo) a 240 (máximo) ms. » 70 % de todos los dispositivos son mejores. Eso quiere decir que el tiempo de respuesta es peor que la media (19.8 ms) de todos los dispositivos testados. | ||
| ↔ Tiempo de respuesta 50% Gris a 80% Gris | ||
| 34.7 ms ... subida ↗ y bajada ↘ combinada | ↗ 17.7 ms subida | 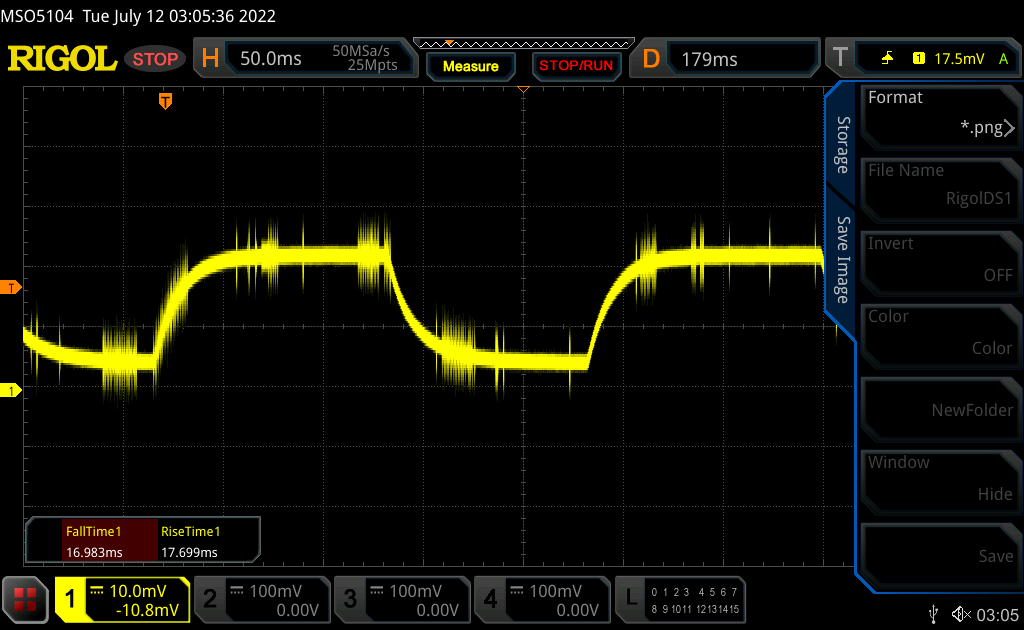 |
| ↘ 17 ms bajada | ||
| La pantalla mostró tiempos de respuesta lentos en nuestros tests y podría ser demasiado lenta para los jugones. En comparación, todos los dispositivos de prueba van de ##min### (mínimo) a 636 (máximo) ms. » 49 % de todos los dispositivos son mejores. Eso quiere decir que el tiempo de respuesta es peor que la media (31 ms) de todos los dispositivos testados. | ||
Parpadeo de Pantalla / PWM (Pulse-Width Modulation)
| Parpadeo de Pantalla / PWM no detectado | 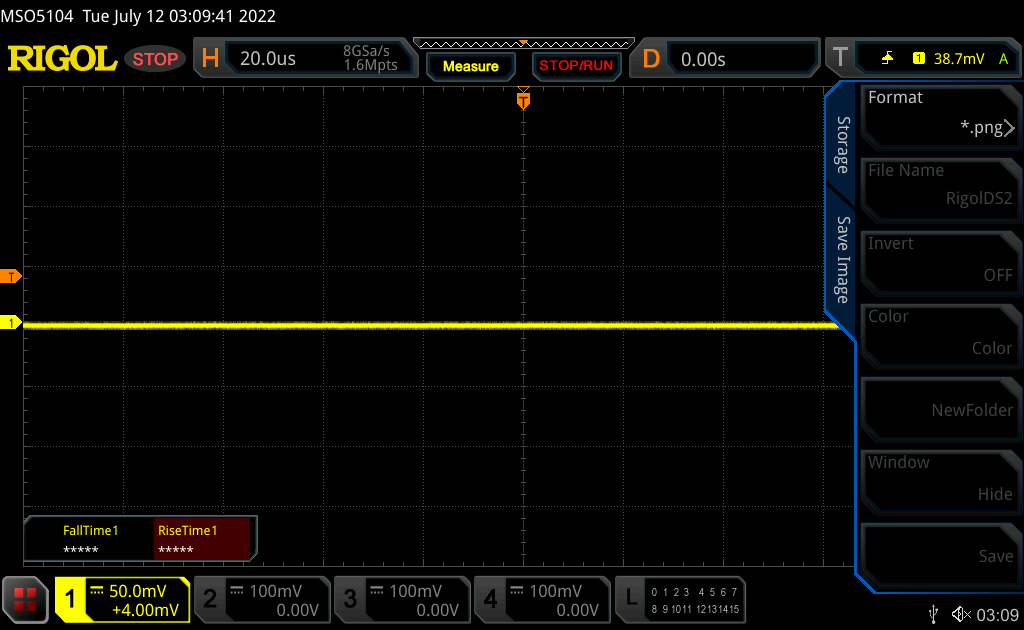 | ||
Comparación: 52 % de todos los dispositivos testados no usaron PWM para atenuar el display. Si se usó, medimos una media de 7754 (mínimo: 5 - máxmo: 343500) Hz. | |||
Rendimiento
Condiciones de la prueba
Hemos puesto nuestra unidad en el modo de rendimiento a través de Windows antes de ejecutar las pruebas de rendimiento que se indican a continuación.
Procesador
En comparación con el Core i7-1165G7 del portátil original, el Core i7-1260P del modelo Framework 2022 puede ofrecer un rendimiento de un solo hilo y de varios hilos un 20% y un 90% más rápido, respectivamente. De hecho, el modelo Framework funciona entre un 20 y un 25 por ciento más rápido que la media de los portátiles de nuestra base de datos que funcionan con la misma CPU Core i7-1260P hasta ahora. Nos alegramos de que el fabricante ofrezca CPUs de la serie P de 12ª generación en lugar de la serie U de 12ª generación como el Core i5-1235U y i7-1255U ofrecen ventajas de rendimiento mucho menores respecto a la 11ª generación de la serie U
El cambio al Core i5-1240P desde nuestro Core i7-1260P supondrá un déficit de rendimiento multihilo del 45%, mientras que la actualización al Core i7-1280P sólo aumentaría el rendimiento en un 10 por ciento. Por tanto, la opción más recomendada es el Core i7-1260P.
Cinebench R15 Multi Loop
Cinebench R23: Multi Core | Single Core
Cinebench R15: CPU Multi 64Bit | CPU Single 64Bit
Blender: v2.79 BMW27 CPU
7-Zip 18.03: 7z b 4 | 7z b 4 -mmt1
Geekbench 5.5: Multi-Core | Single-Core
HWBOT x265 Benchmark v2.2: 4k Preset
LibreOffice : 20 Documents To PDF
R Benchmark 2.5: Overall mean
Cinebench R23: Multi Core | Single Core
Cinebench R15: CPU Multi 64Bit | CPU Single 64Bit
Blender: v2.79 BMW27 CPU
7-Zip 18.03: 7z b 4 | 7z b 4 -mmt1
Geekbench 5.5: Multi-Core | Single-Core
HWBOT x265 Benchmark v2.2: 4k Preset
LibreOffice : 20 Documents To PDF
R Benchmark 2.5: Overall mean
* ... más pequeño es mejor
AIDA64: FP32 Ray-Trace | FPU Julia | CPU SHA3 | CPU Queen | FPU SinJulia | FPU Mandel | CPU AES | CPU ZLib | FP64 Ray-Trace | CPU PhotoWorxx
| Performance rating | |
| Microsoft Surface Laptop 4 13 Ryzen 5 | |
| Framework Laptop 13.5 12th Gen Intel | |
| Medio Intel Core i7-1260P | |
| Framework Laptop 13.5 | |
| HP Spectre x360 14-ea0378ng | |
| Lenovo ThinkPad X1 Titanium Yoga G1 20QB0016GE | |
| AIDA64 / FP32 Ray-Trace | |
| Microsoft Surface Laptop 4 13 Ryzen 5 | |
| Framework Laptop 13.5 | |
| Medio Intel Core i7-1260P (2176 - 10898, n=26) | |
| Framework Laptop 13.5 12th Gen Intel | |
| HP Spectre x360 14-ea0378ng | |
| Lenovo ThinkPad X1 Titanium Yoga G1 20QB0016GE | |
| AIDA64 / FPU Julia | |
| Microsoft Surface Laptop 4 13 Ryzen 5 | |
| Medio Intel Core i7-1260P (11015 - 56906, n=26) | |
| Framework Laptop 13.5 | |
| Framework Laptop 13.5 12th Gen Intel | |
| Lenovo ThinkPad X1 Titanium Yoga G1 20QB0016GE | |
| HP Spectre x360 14-ea0378ng | |
| AIDA64 / CPU SHA3 | |
| Framework Laptop 13.5 | |
| Framework Laptop 13.5 12th Gen Intel | |
| Medio Intel Core i7-1260P (669 - 2709, n=26) | |
| Microsoft Surface Laptop 4 13 Ryzen 5 | |
| Lenovo ThinkPad X1 Titanium Yoga G1 20QB0016GE | |
| HP Spectre x360 14-ea0378ng | |
| AIDA64 / CPU Queen | |
| Framework Laptop 13.5 12th Gen Intel | |
| Medio Intel Core i7-1260P (42571 - 82493, n=26) | |
| Microsoft Surface Laptop 4 13 Ryzen 5 | |
| HP Spectre x360 14-ea0378ng | |
| Framework Laptop 13.5 | |
| Lenovo ThinkPad X1 Titanium Yoga G1 20QB0016GE | |
| AIDA64 / FPU SinJulia | |
| Microsoft Surface Laptop 4 13 Ryzen 5 | |
| Framework Laptop 13.5 12th Gen Intel | |
| Medio Intel Core i7-1260P (2901 - 6975, n=26) | |
| Framework Laptop 13.5 | |
| HP Spectre x360 14-ea0378ng | |
| Lenovo ThinkPad X1 Titanium Yoga G1 20QB0016GE | |
| AIDA64 / FPU Mandel | |
| Microsoft Surface Laptop 4 13 Ryzen 5 | |
| Framework Laptop 13.5 | |
| Medio Intel Core i7-1260P (5950 - 26376, n=26) | |
| Framework Laptop 13.5 12th Gen Intel | |
| HP Spectre x360 14-ea0378ng | |
| Lenovo ThinkPad X1 Titanium Yoga G1 20QB0016GE | |
| AIDA64 / CPU AES | |
| Framework Laptop 13.5 | |
| Framework Laptop 13.5 12th Gen Intel | |
| Lenovo ThinkPad X1 Titanium Yoga G1 20QB0016GE | |
| HP Spectre x360 14-ea0378ng | |
| Medio Intel Core i7-1260P (16041 - 92356, n=26) | |
| Microsoft Surface Laptop 4 13 Ryzen 5 | |
| AIDA64 / CPU ZLib | |
| Framework Laptop 13.5 12th Gen Intel | |
| Medio Intel Core i7-1260P (259 - 771, n=26) | |
| Microsoft Surface Laptop 4 13 Ryzen 5 | |
| Framework Laptop 13.5 | |
| HP Spectre x360 14-ea0378ng | |
| Lenovo ThinkPad X1 Titanium Yoga G1 20QB0016GE | |
| AIDA64 / FP64 Ray-Trace | |
| Microsoft Surface Laptop 4 13 Ryzen 5 | |
| Framework Laptop 13.5 | |
| Medio Intel Core i7-1260P (1237 - 5858, n=26) | |
| Framework Laptop 13.5 12th Gen Intel | |
| HP Spectre x360 14-ea0378ng | |
| Lenovo ThinkPad X1 Titanium Yoga G1 20QB0016GE | |
| AIDA64 / CPU PhotoWorxx | |
| HP Spectre x360 14-ea0378ng | |
| Lenovo ThinkPad X1 Titanium Yoga G1 20QB0016GE | |
| Medio Intel Core i7-1260P (13261 - 43652, n=26) | |
| Framework Laptop 13.5 12th Gen Intel | |
| Microsoft Surface Laptop 4 13 Ryzen 5 | |
| Framework Laptop 13.5 | |
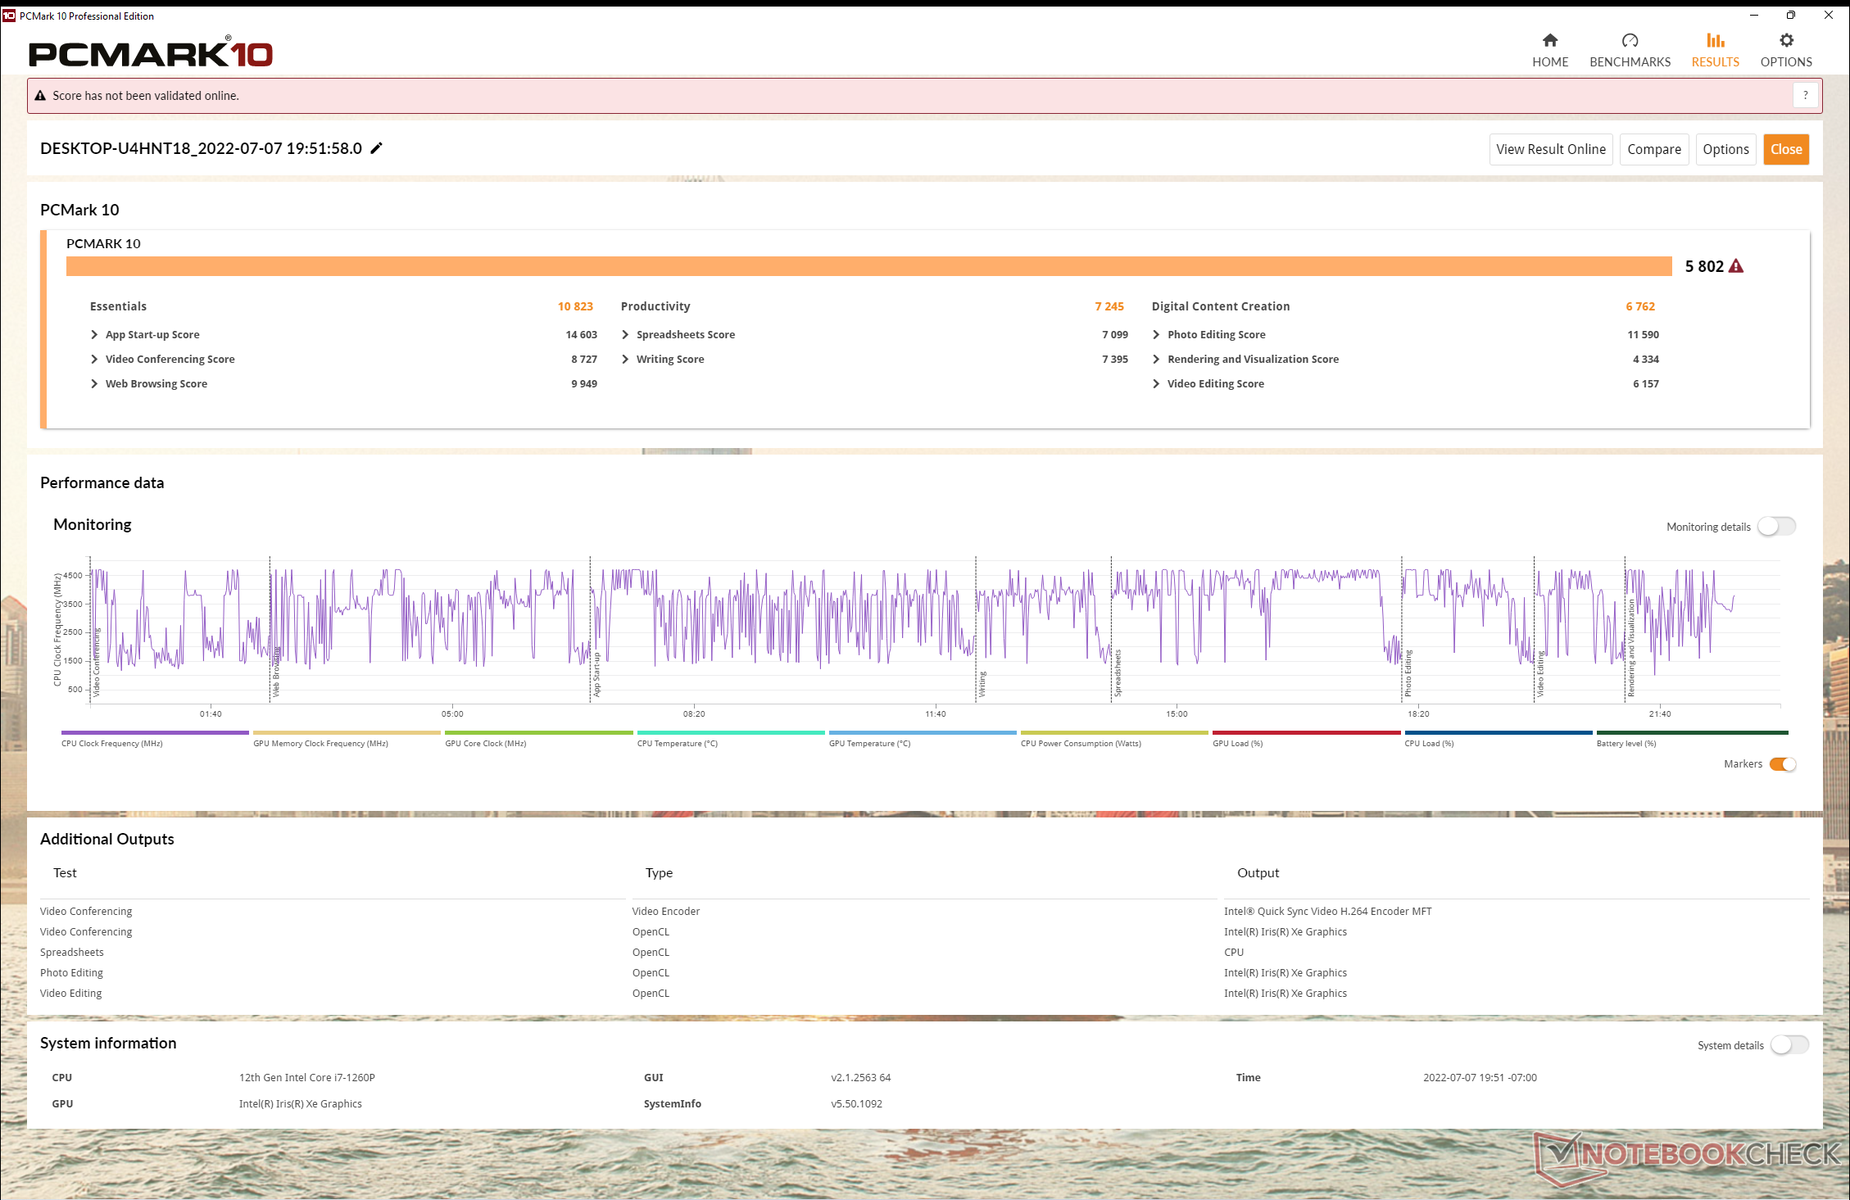
Rendimiento del sistema
Los resultados de PCMark 10 son sistemáticamente superiores a los del Framework Laptop del año pasado y a los de la mayoría de los Ultrabooks que funcionan con CPUs de 11ª generación o anteriores.
CrossMark: Overall | Productivity | Creativity | Responsiveness
| PCMark 10 / Score | |
| Framework Laptop 13.5 12th Gen Intel | |
| Medio Intel Core i7-1260P, Intel Iris Xe Graphics G7 96EUs (4796 - 6068, n=17) | |
| Framework Laptop 13.5 | |
| Microsoft Surface Laptop 4 13 Ryzen 5 | |
| HP Spectre x360 14-ea0378ng | |
| Lenovo ThinkPad X1 Titanium Yoga G1 20QB0016GE | |
| PCMark 10 / Essentials | |
| Framework Laptop 13.5 12th Gen Intel | |
| Medio Intel Core i7-1260P, Intel Iris Xe Graphics G7 96EUs (9260 - 11251, n=17) | |
| Framework Laptop 13.5 | |
| Lenovo ThinkPad X1 Titanium Yoga G1 20QB0016GE | |
| HP Spectre x360 14-ea0378ng | |
| Microsoft Surface Laptop 4 13 Ryzen 5 | |
| PCMark 10 / Productivity | |
| Framework Laptop 13.5 12th Gen Intel | |
| Medio Intel Core i7-1260P, Intel Iris Xe Graphics G7 96EUs (6167 - 8629, n=17) | |
| Microsoft Surface Laptop 4 13 Ryzen 5 | |
| HP Spectre x360 14-ea0378ng | |
| Lenovo ThinkPad X1 Titanium Yoga G1 20QB0016GE | |
| Framework Laptop 13.5 | |
| PCMark 10 / Digital Content Creation | |
| Framework Laptop 13.5 12th Gen Intel | |
| Medio Intel Core i7-1260P, Intel Iris Xe Graphics G7 96EUs (5231 - 6908, n=17) | |
| Framework Laptop 13.5 | |
| Microsoft Surface Laptop 4 13 Ryzen 5 | |
| HP Spectre x360 14-ea0378ng | |
| Lenovo ThinkPad X1 Titanium Yoga G1 20QB0016GE | |
| CrossMark / Overall | |
| Framework Laptop 13.5 12th Gen Intel | |
| Medio Intel Core i7-1260P, Intel Iris Xe Graphics G7 96EUs (1484 - 1811, n=16) | |
| CrossMark / Productivity | |
| Framework Laptop 13.5 12th Gen Intel | |
| Medio Intel Core i7-1260P, Intel Iris Xe Graphics G7 96EUs (1486 - 1755, n=16) | |
| CrossMark / Creativity | |
| Framework Laptop 13.5 12th Gen Intel | |
| Medio Intel Core i7-1260P, Intel Iris Xe Graphics G7 96EUs (1451 - 1872, n=16) | |
| CrossMark / Responsiveness | |
| Framework Laptop 13.5 12th Gen Intel | |
| Medio Intel Core i7-1260P, Intel Iris Xe Graphics G7 96EUs (1253 - 1807, n=16) | |
| PCMark 10 Score | 5802 puntos | |
ayuda | ||
| AIDA64 / Memory Copy | |
| HP Spectre x360 14-ea0378ng | |
| Lenovo ThinkPad X1 Titanium Yoga G1 20QB0016GE | |
| Medio Intel Core i7-1260P (25125 - 71544, n=25) | |
| Framework Laptop 13.5 12th Gen Intel | |
| Microsoft Surface Laptop 4 13 Ryzen 5 | |
| Framework Laptop 13.5 | |
| AIDA64 / Memory Read | |
| Lenovo ThinkPad X1 Titanium Yoga G1 20QB0016GE | |
| Medio Intel Core i7-1260P (24983 - 72065, n=25) | |
| HP Spectre x360 14-ea0378ng | |
| Framework Laptop 13.5 12th Gen Intel | |
| Microsoft Surface Laptop 4 13 Ryzen 5 | |
| Framework Laptop 13.5 | |
| AIDA64 / Memory Write | |
| Lenovo ThinkPad X1 Titanium Yoga G1 20QB0016GE | |
| HP Spectre x360 14-ea0378ng | |
| Medio Intel Core i7-1260P (23512 - 66799, n=25) | |
| Framework Laptop 13.5 12th Gen Intel | |
| Microsoft Surface Laptop 4 13 Ryzen 5 | |
| Framework Laptop 13.5 | |
| AIDA64 / Memory Latency | |
| Microsoft Surface Laptop 4 13 Ryzen 5 | |
| Lenovo ThinkPad X1 Titanium Yoga G1 20QB0016GE | |
| HP Spectre x360 14-ea0378ng | |
| Framework Laptop 13.5 12th Gen Intel | |
| Medio Intel Core i7-1260P (77.9 - 118.4, n=21) | |
| Framework Laptop 13.5 | |
* ... más pequeño es mejor
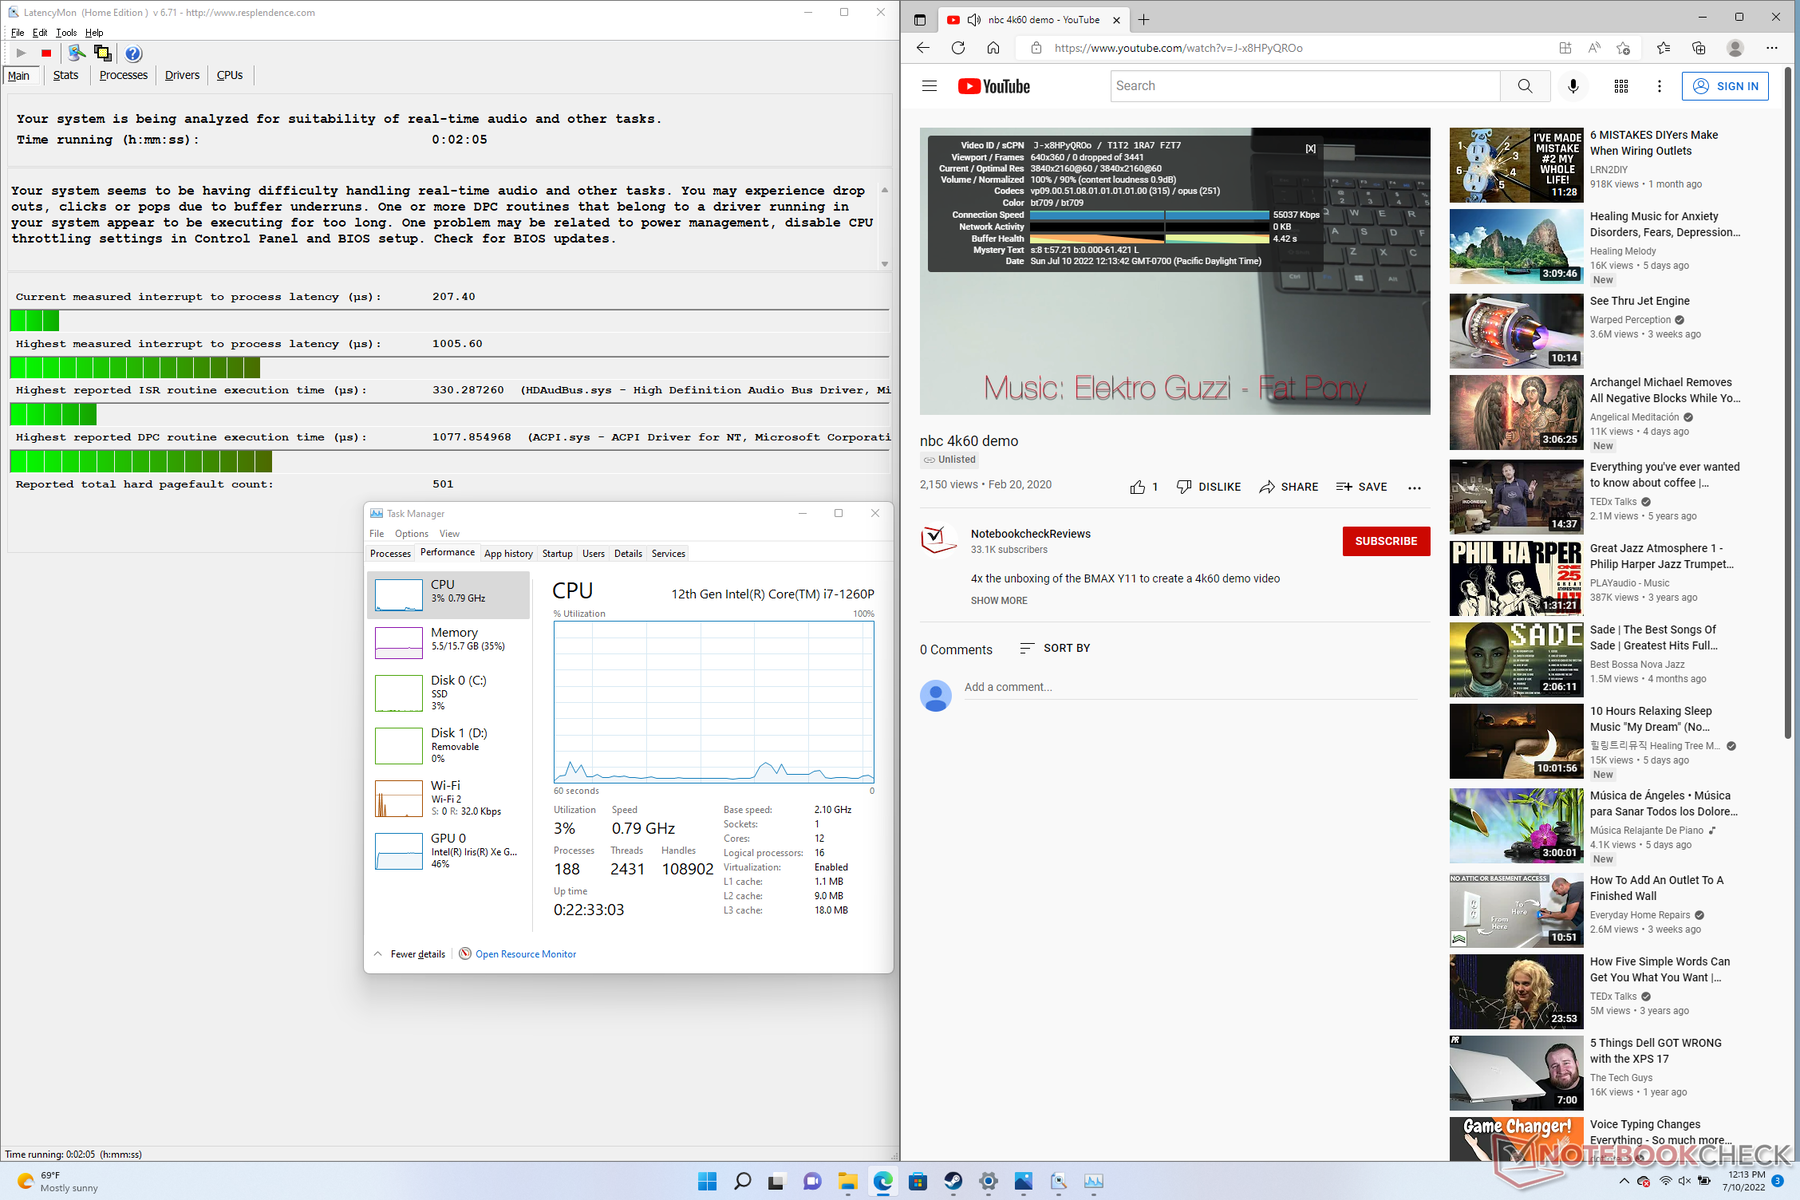
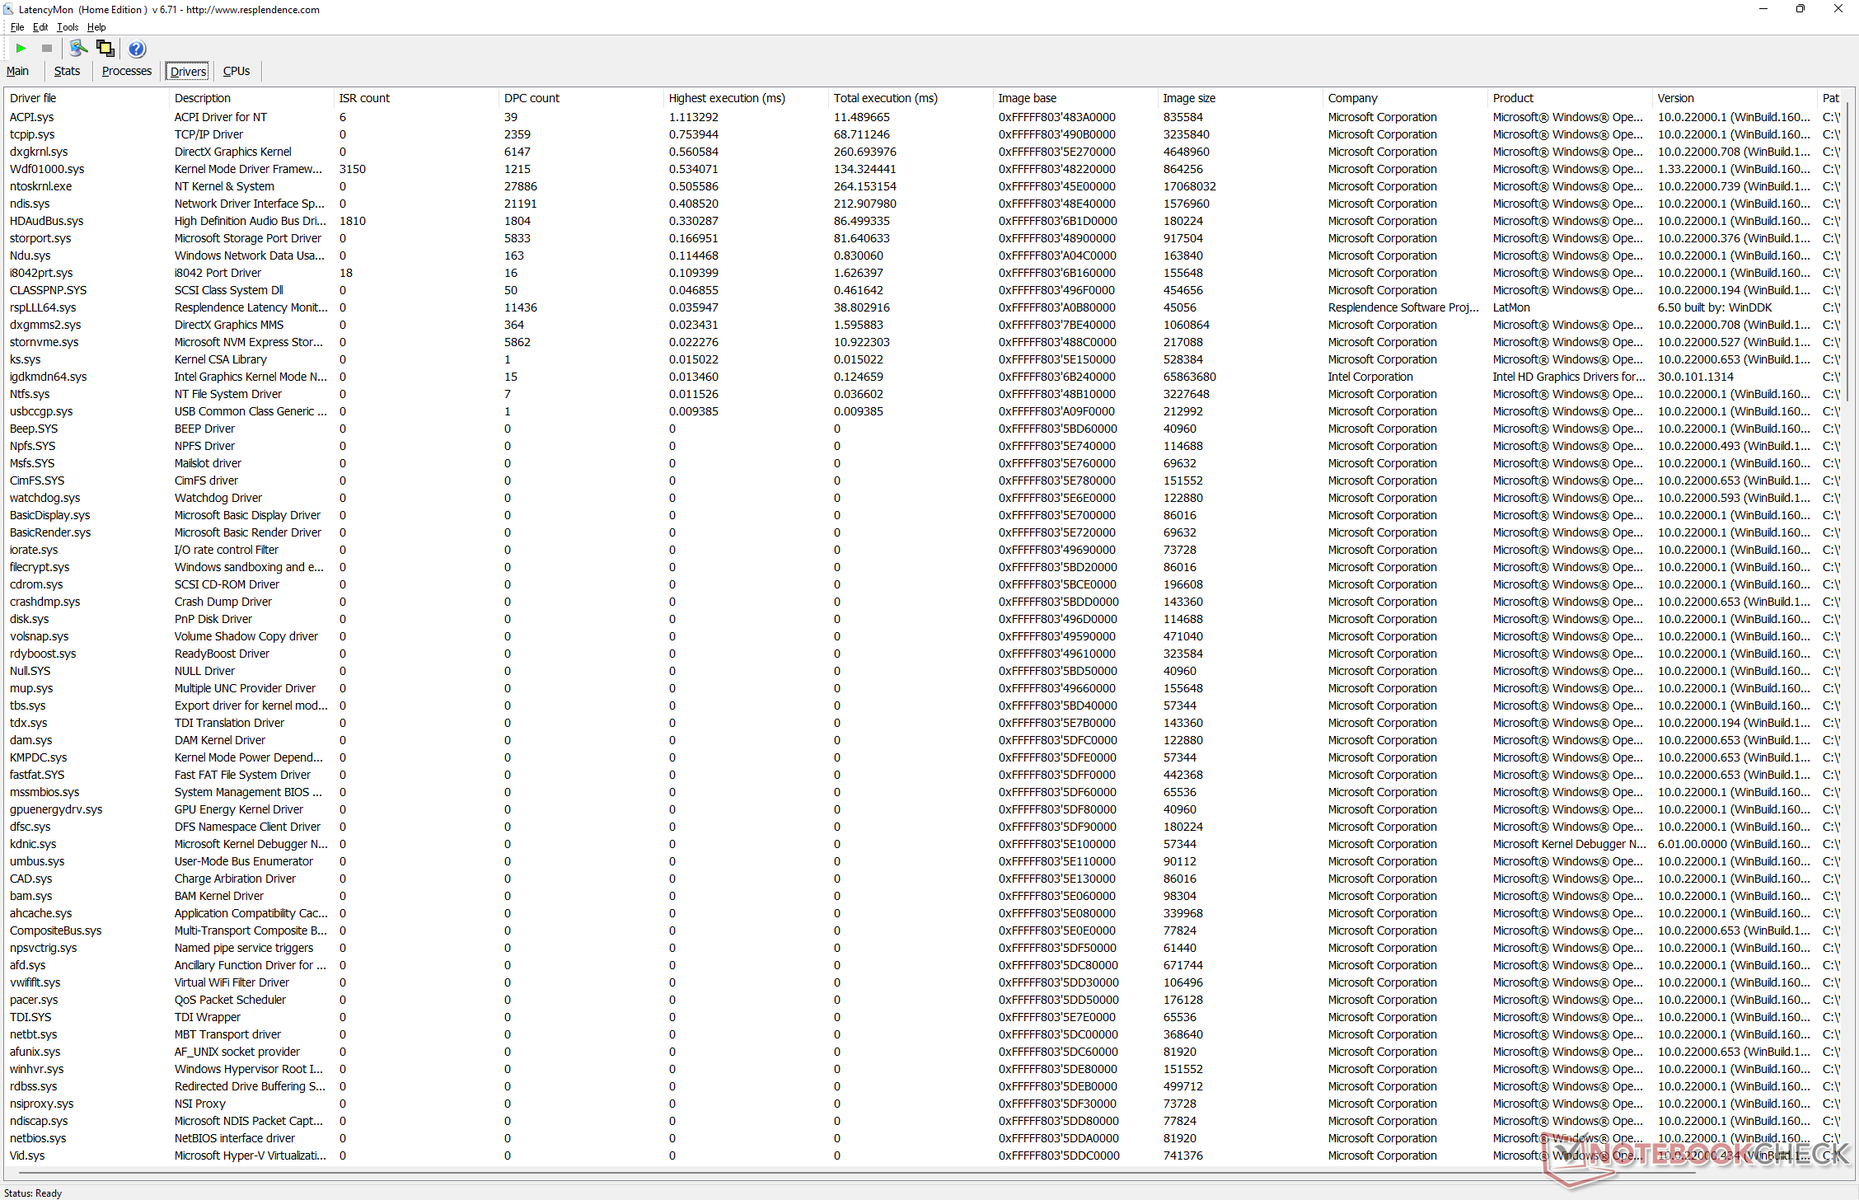
Latencia del CPD
LatencyMon revela problemas menores de CPD al abrir varias pestañas del navegador de nuestra página web. por lo demás, la reproducción de vídeo 4K a 60 FPS es perfecta y sin pérdida de fotogramas.
| DPC Latencies / LatencyMon - interrupt to process latency (max), Web, Youtube, Prime95 | |
| Framework Laptop 13.5 | |
| HP Spectre x360 14-ea0378ng | |
| Framework Laptop 13.5 12th Gen Intel | |
| Microsoft Surface Laptop 4 13 Ryzen 5 | |
| Lenovo ThinkPad X1 Titanium Yoga G1 20QB0016GE | |
* ... más pequeño es mejor
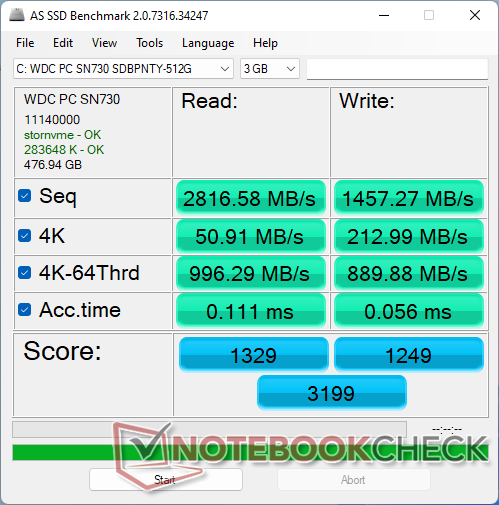
Dispositivos de almacenamiento
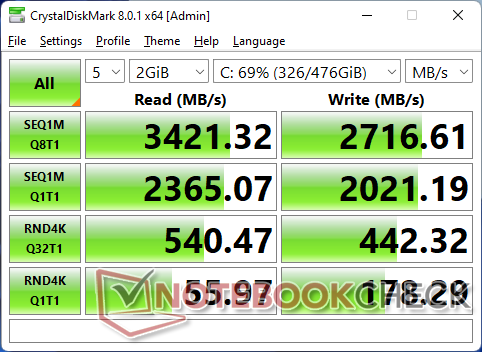
Mientras que nuestra unidad marco 2021 se enviaría con una SSD M.2 NVMe PCIe4 x4 WD SN850, nuestra unidad 2022 se enviaría con una PCIe3 x4 más lentaWD SN730 Más lenta. Los usuarios pueden actualizar a un SSD PCIe4 x4 más rápido, por supuesto.
Sólo se admite una unidad interna.

| Drive Performance rating - Percent | |
| Framework Laptop 13.5 | |
| Framework Laptop 13.5 12th Gen Intel | |
| Lenovo ThinkPad X1 Titanium Yoga G1 20QB0016GE | |
| HP Spectre x360 14-ea0378ng | |
| Microsoft Surface Laptop 4 13 Ryzen 5 | |
| HP EliteBook Folio 13.5-3G2L2EA -8! | |
* ... más pequeño es mejor
Disk Throttling: DiskSpd Read Loop, Queue Depth 8
Rendimiento de la GPU
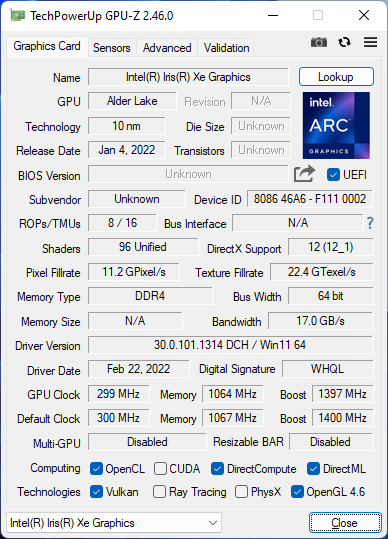
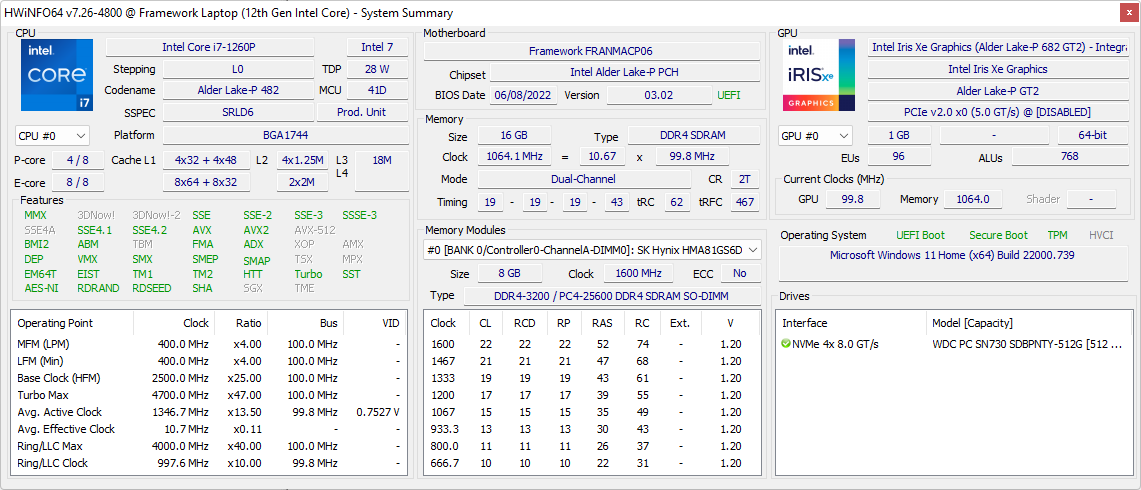
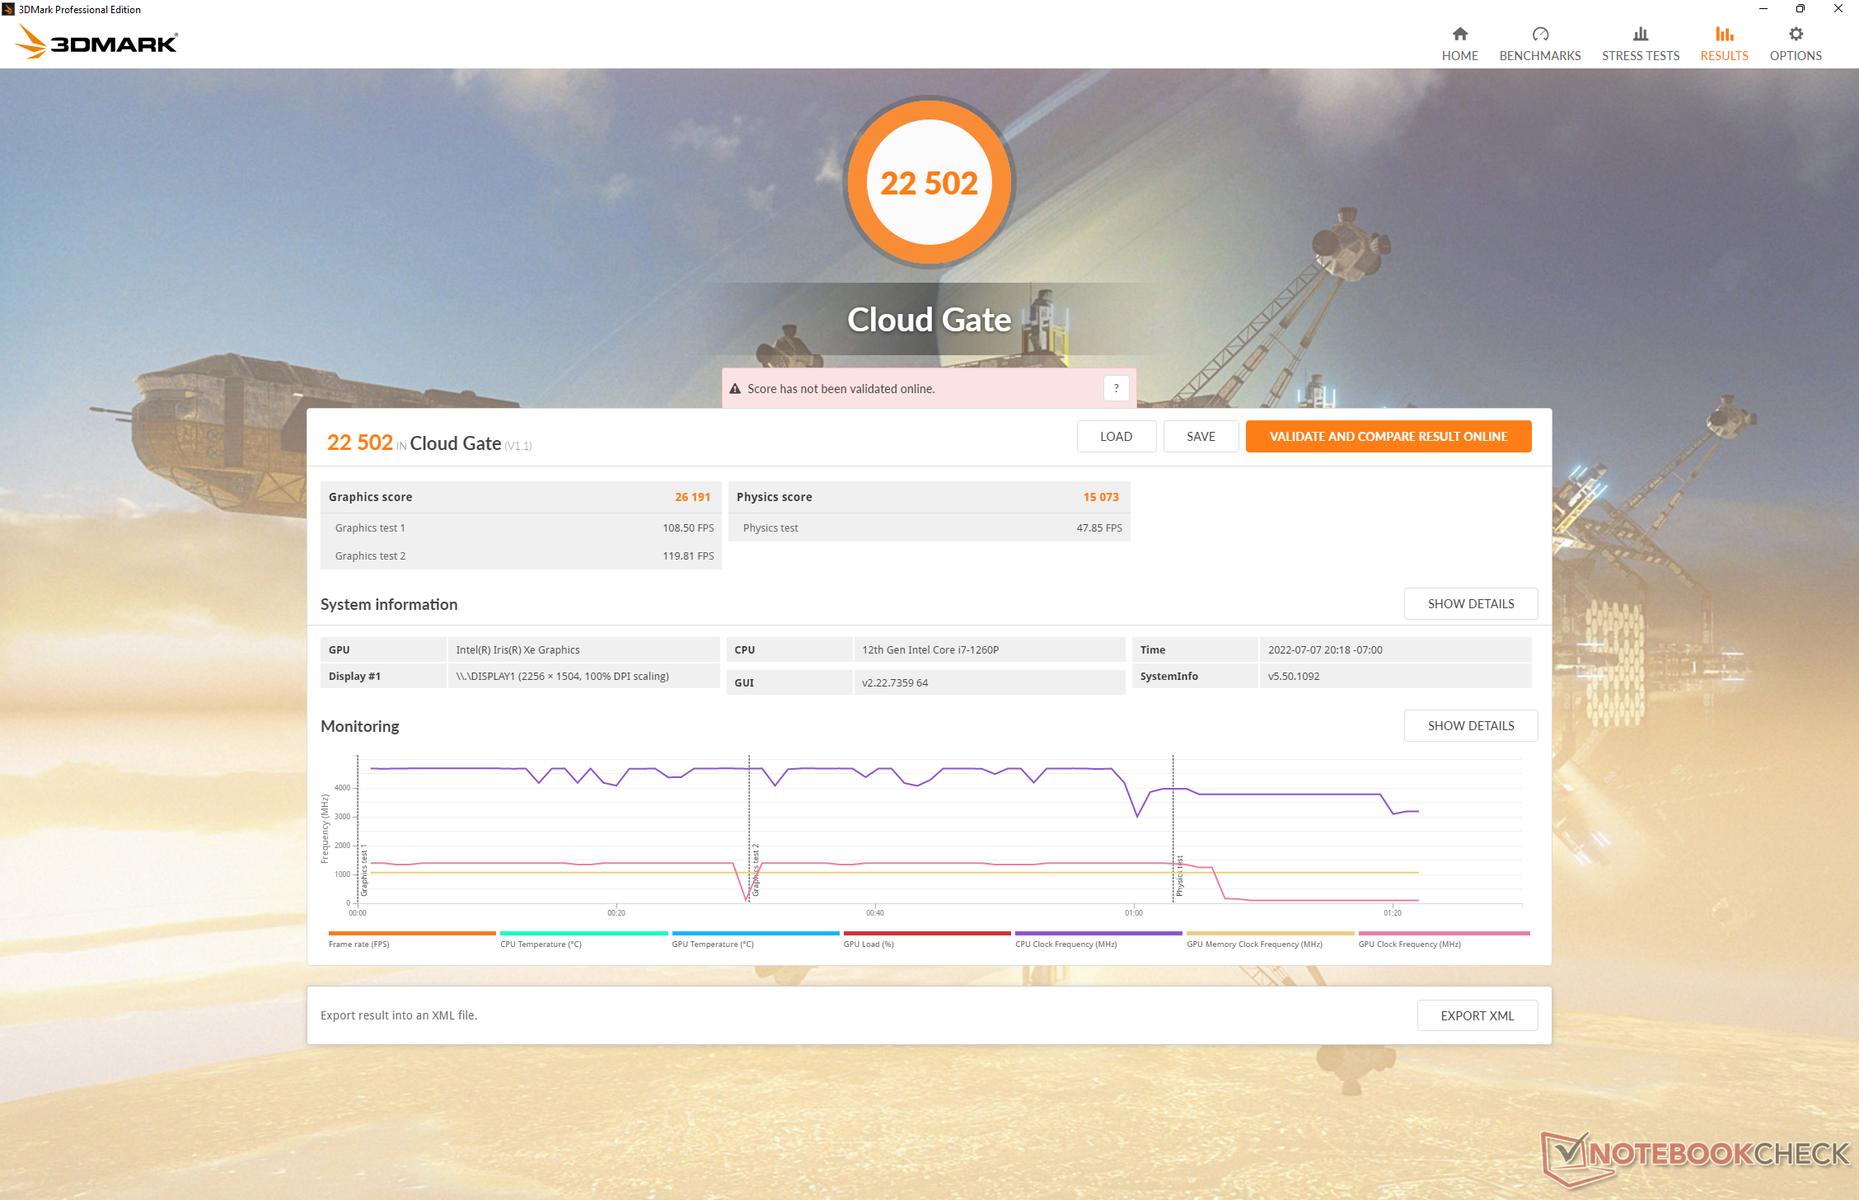
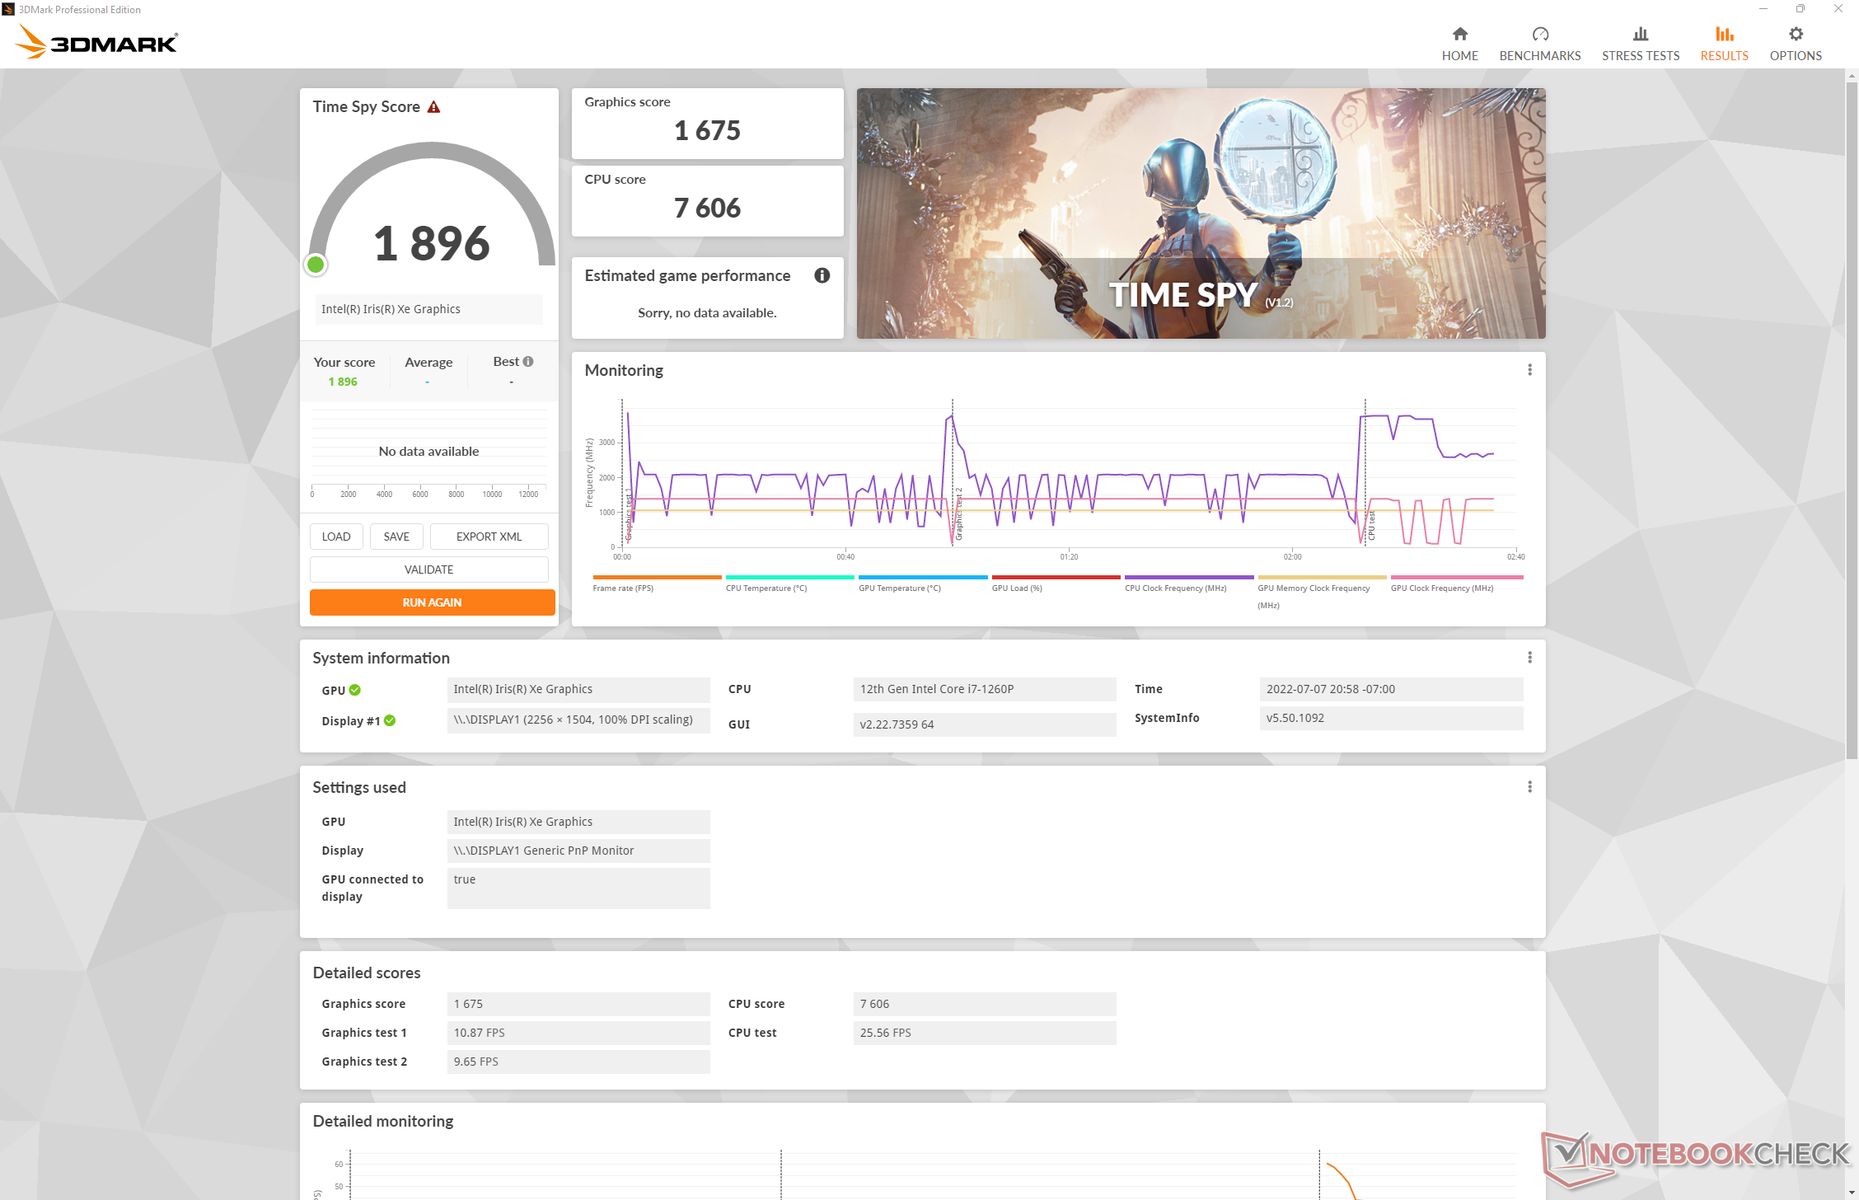
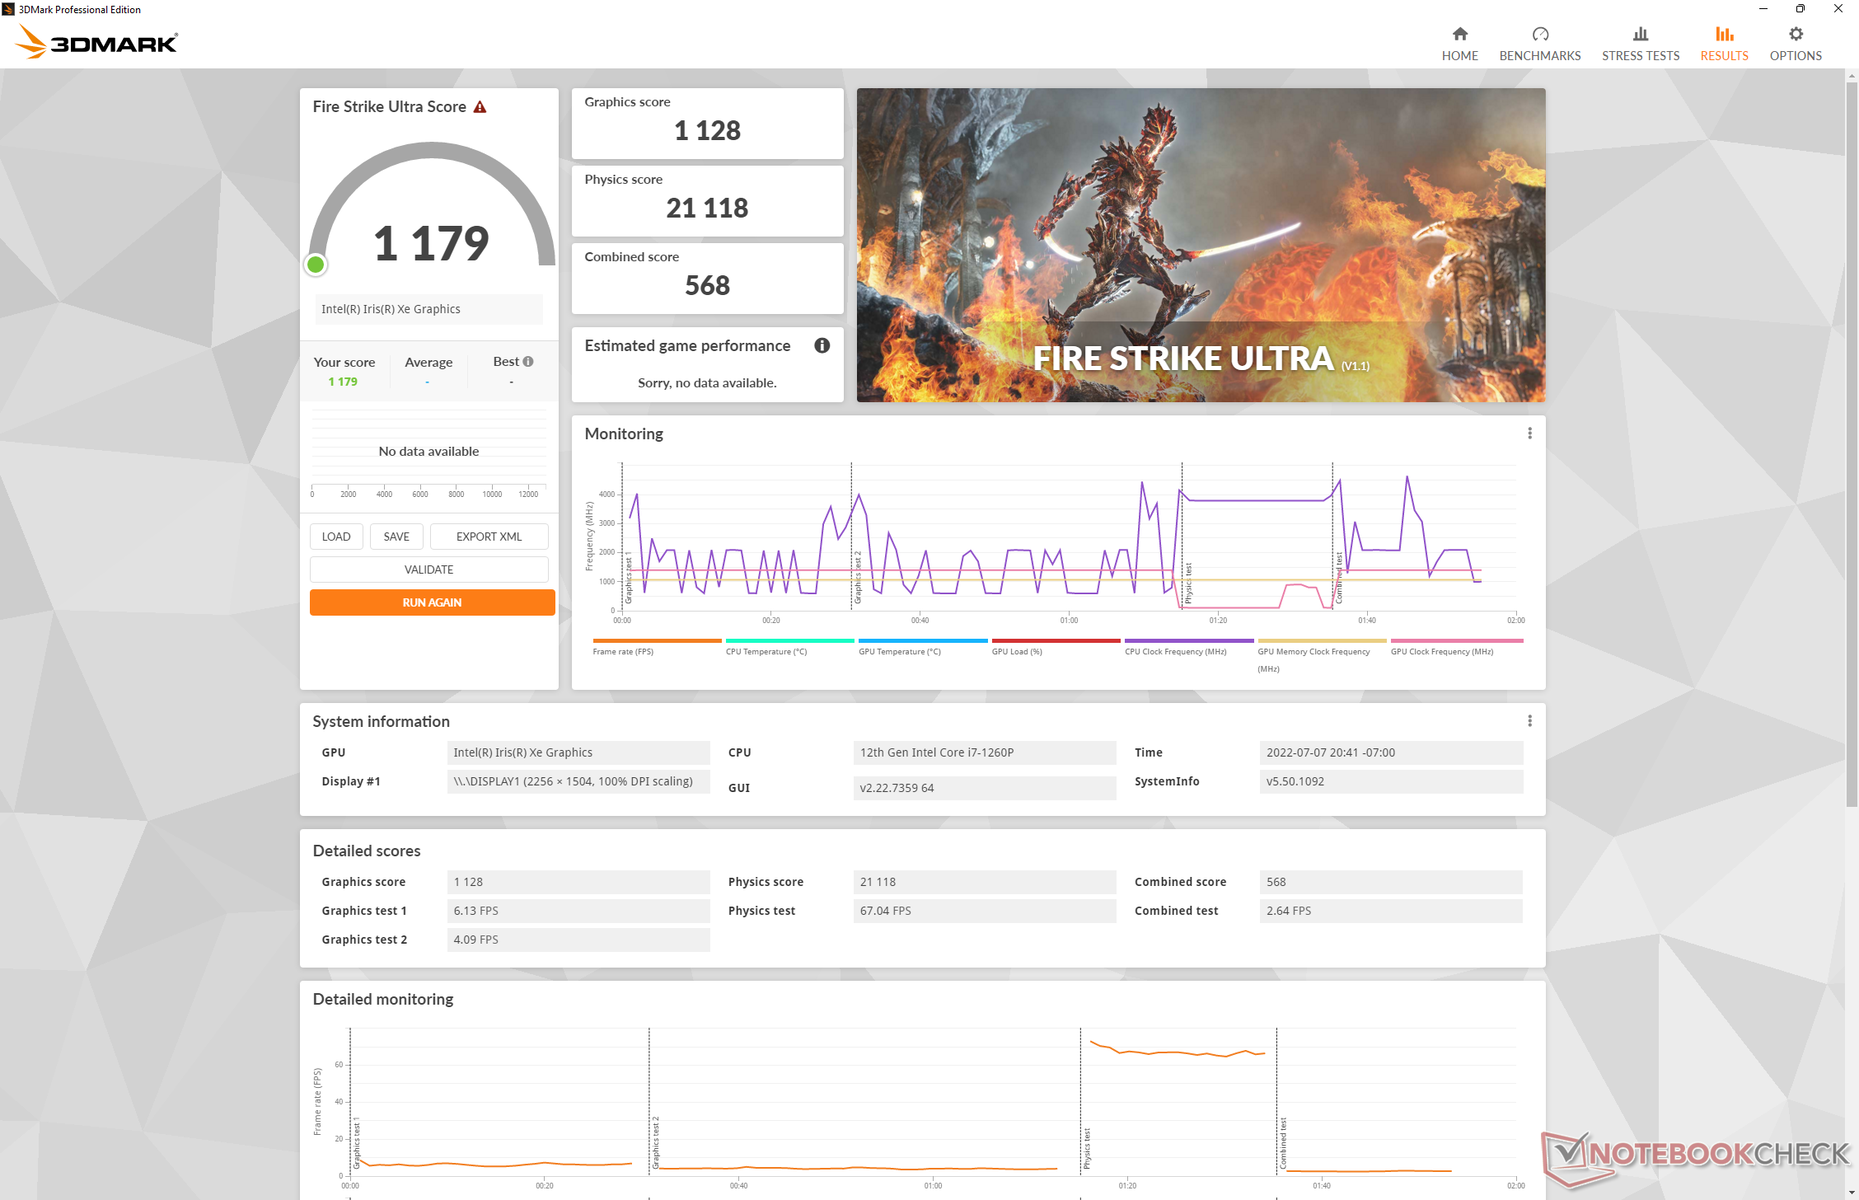
El rendimiento de los gráficos es entre un 5 y un 15 por ciento más rápido que el de la media de los portátiles de nuestra base de datos equipados con la misma Iris Xe 96 UE integrados. El rendimiento fue mucho más lento en nuestra unidad de prueba original 2021 debido a que se ejecuta en la memoria de un solo canal. Si los gráficos son importantes para tus cargas de trabajo, es muy recomendable configurarlos con memoria de doble canal.
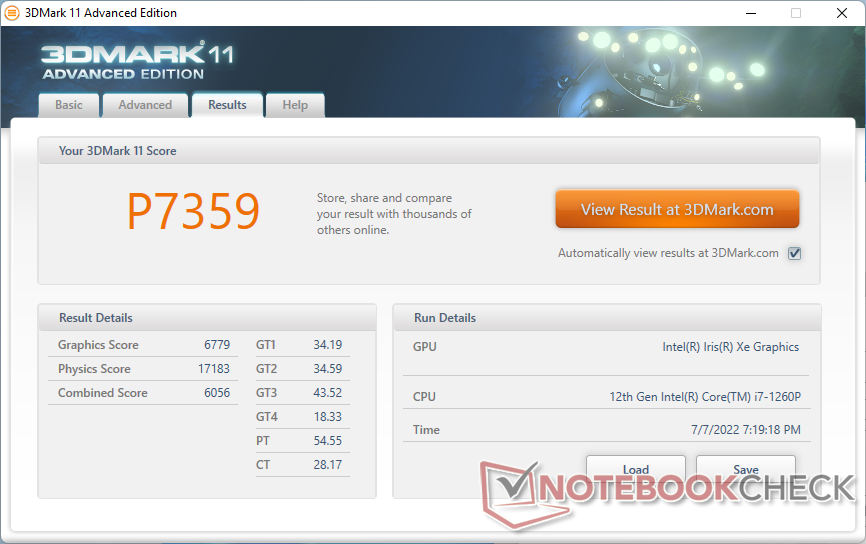
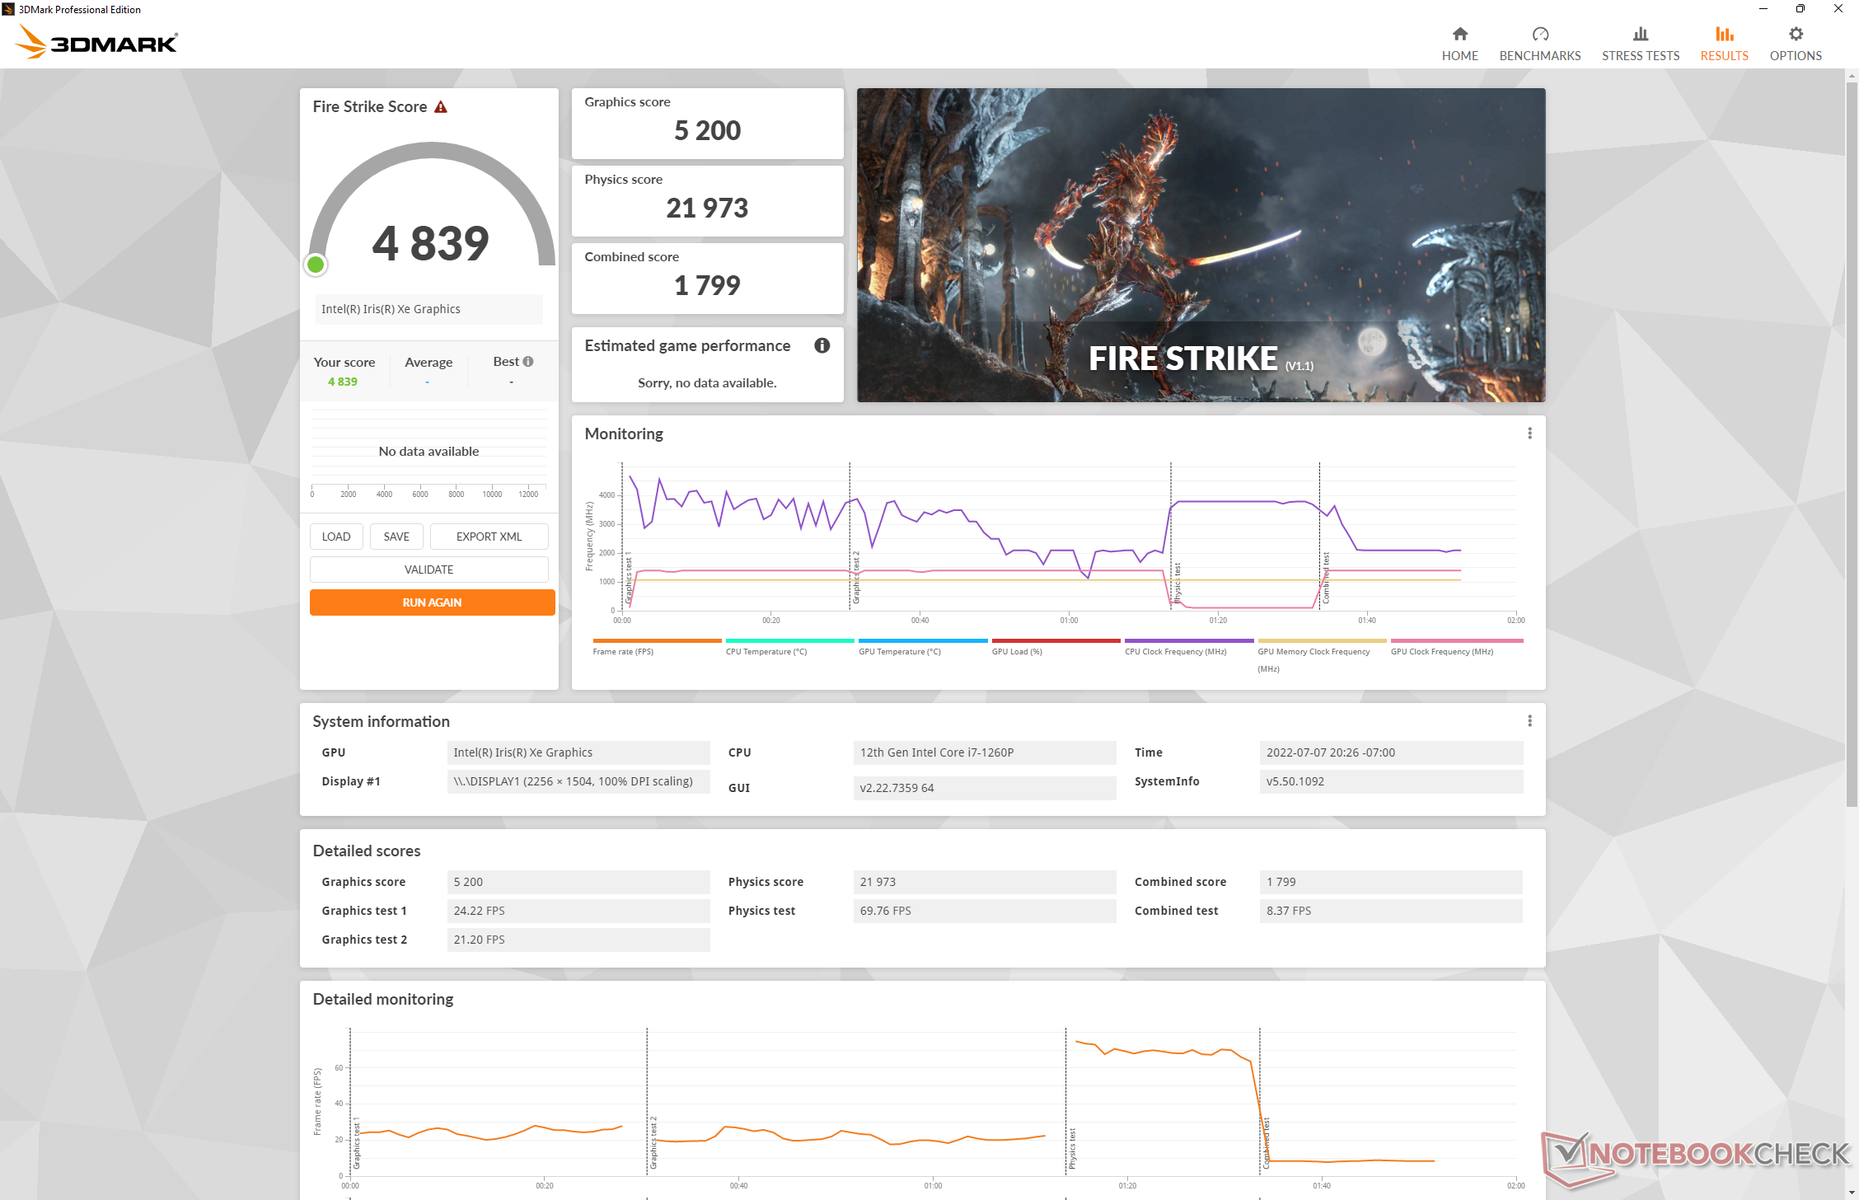
| 3DMark 11 Performance | 7359 puntos | |
| 3DMark Cloud Gate Standard Score | 22502 puntos | |
| 3DMark Fire Strike Score | 4839 puntos | |
| 3DMark Time Spy Score | 1896 puntos | |
ayuda | ||
| Cyberpunk 2077 1.6 | |
| 1920x1080 Low Preset | |
| Asus Zenbook S 13 OLED | |
| Framework Laptop 13.5 12th Gen Intel | |
| Medio Intel Iris Xe Graphics G7 96EUs (13 - 25.9, n=42) | |
| 1920x1080 Medium Preset | |
| Asus Zenbook S 13 OLED | |
| Framework Laptop 13.5 12th Gen Intel | |
| Medio Intel Iris Xe Graphics G7 96EUs (10.8 - 21.7, n=37) | |
| 1920x1080 High Preset | |
| Asus Zenbook S 13 OLED | |
| Framework Laptop 13.5 12th Gen Intel | |
| Medio Intel Iris Xe Graphics G7 96EUs (9.8 - 16.9, n=34) | |
| 1920x1080 Ultra Preset | |
| Asus Zenbook S 13 OLED | |
| Framework Laptop 13.5 12th Gen Intel | |
| Medio Intel Iris Xe Graphics G7 96EUs (7.4 - 16.8, n=32) | |
Witcher 3 FPS Chart
| bajo | medio | alto | ultra | |
|---|---|---|---|---|
| GTA V (2015) | 117.5 | 96.9 | 20 | 8.36 |
| The Witcher 3 (2015) | 97.5 | 60.5 | 32.3 | 15.1 |
| Dota 2 Reborn (2015) | 121.7 | 90.3 | 62.6 | 57.7 |
| Final Fantasy XV Benchmark (2018) | 42.5 | 23.3 | 23.3 | |
| X-Plane 11.11 (2018) | 62.6 | 45.9 | 41.3 | |
| Strange Brigade (2018) | 90.2 | 39.6 | 32.6 | 26.2 |
| Cyberpunk 2077 1.6 (2022) | 21.9 | 18.5 | 13.7 | 11.2 |
Emisiones
Ruido del sistema
El ruido del ventilador sigue siendo más fuerte que en la mayoría de otros Ultrabooks, particularmente cuando está bajo carga. Ejecutando la primera escena de pruebas de 3DMark 06 para simular cargas medias, el ruido del ventilador sería de 47 dB(A), siendo uno de los subportátiles de la serie U más ruidosos que hemos probado. Si se juega, el ruido del ventilador tiende a rondar entre 41 y 47 dB(A). Si se pretende ejecutar cargas exigentes para explotar el rápido rendimiento del procesador, el sistema será muy ruidoso.
Si se ejecutan cargas menos exigentes como la navegación o el streaming de vídeo, el ruido del ventilador tiende a permanecer por debajo de los 28 dB(A) frente a un fondo silencioso de 22,8 dB(A). Las pulsaciones del ventilador en este rango no son lo suficientemente fuertes como para distraer.
Ruido
| Ocioso |
| 23 / 23 / 23 dB(A) |
| Carga |
| 47.3 / 49.8 dB(A) |
 | ||
30 dB silencioso 40 dB(A) audible 50 dB(A) ruidosamente alto |
||
min: | ||
| Framework Laptop 13.5 12th Gen Intel Iris Xe G7 96EUs, i7-1260P, WDC PC SN730 SDBPNTY-512G | Framework Laptop 13.5 Iris Xe G7 96EUs, i7-1165G7, Western Digital WD_BLACK SN850 WDS100T1X0E | Lenovo ThinkPad X1 Titanium Yoga G1 20QB0016GE Iris Xe G7 80EUs, i5-1140G7, Lenovo UMIS RPJTJ256MEE1OWX | Microsoft Surface Laptop 4 13 Ryzen 5 Vega 7, R5 4680U, Samsung PM991 MZ9LQ256HBJQ | HP Spectre x360 14-ea0378ng Iris Xe G7 96EUs, i7-1165G7, Intel Optane Memory H10 with Solid State Storage 32GB + 1TB HBRPEKNX0203AH(L/H) | |
|---|---|---|---|---|---|
| Noise | -1% | -2% | 1% | -1% | |
| apagado / medio ambiente * (dB) | 22.8 | 23.9 -5% | 25.61 -12% | 24.6 -8% | 26 -14% |
| Idle Minimum * (dB) | 23 | 23.9 -4% | 25.61 -11% | 24.6 -7% | 26 -13% |
| Idle Average * (dB) | 23 | 23.9 -4% | 25.61 -11% | 24.6 -7% | 26 -13% |
| Idle Maximum * (dB) | 23 | 23.9 -4% | 25.61 -11% | 24.6 -7% | 26 -13% |
| Load Average * (dB) | 47.3 | 45.6 4% | 40.14 15% | 39.5 16% | 37.5 21% |
| Witcher 3 ultra * (dB) | 47.3 | 47.1 -0% | |||
| Load Maximum * (dB) | 49.8 | 47.9 4% | 40.14 19% | 39.5 21% | 36.3 27% |
* ... más pequeño es mejor
Temperatura
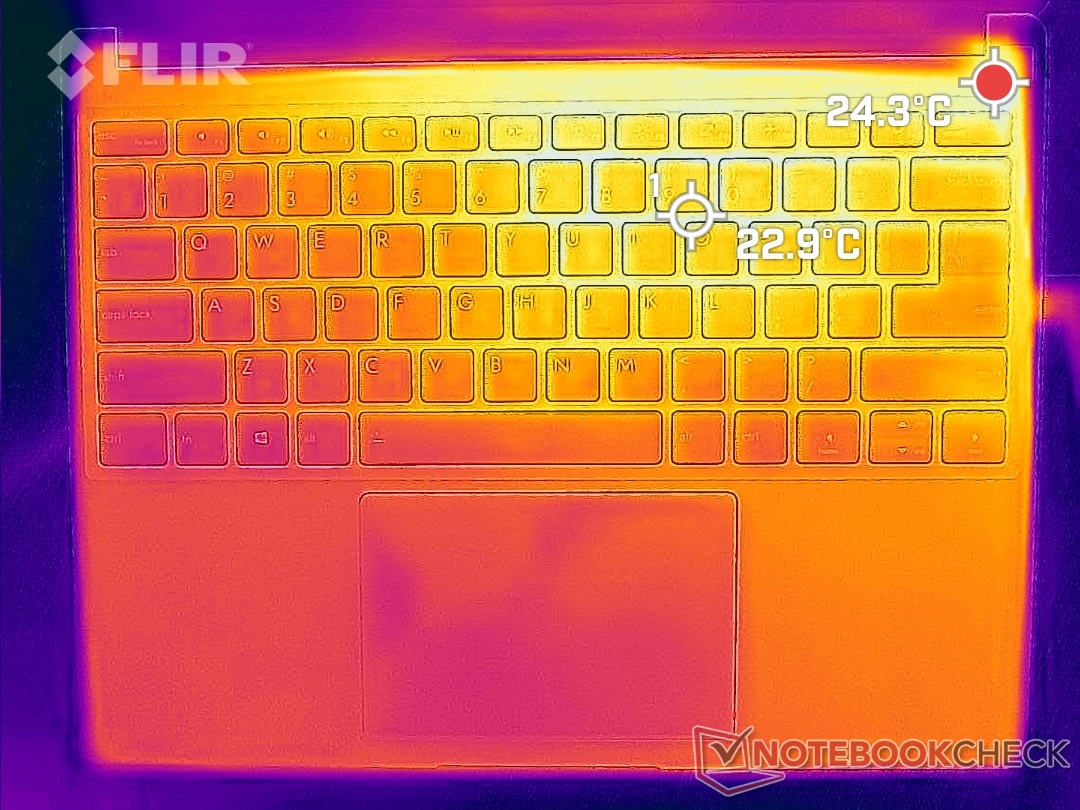
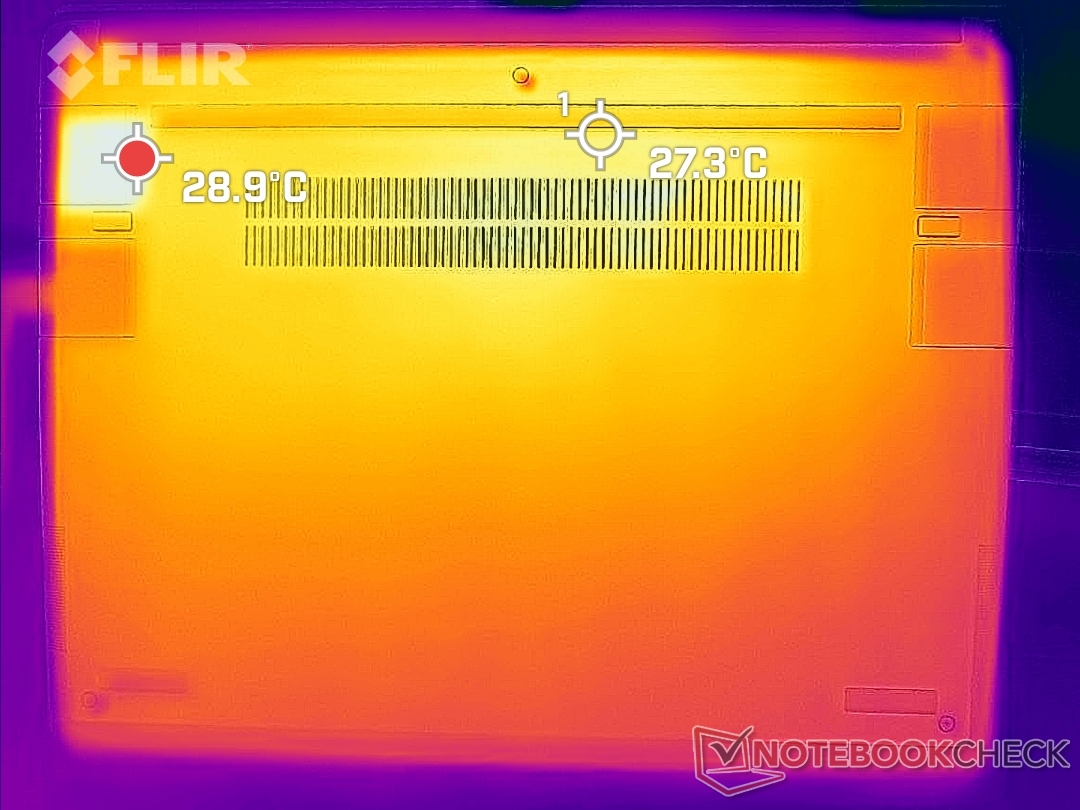
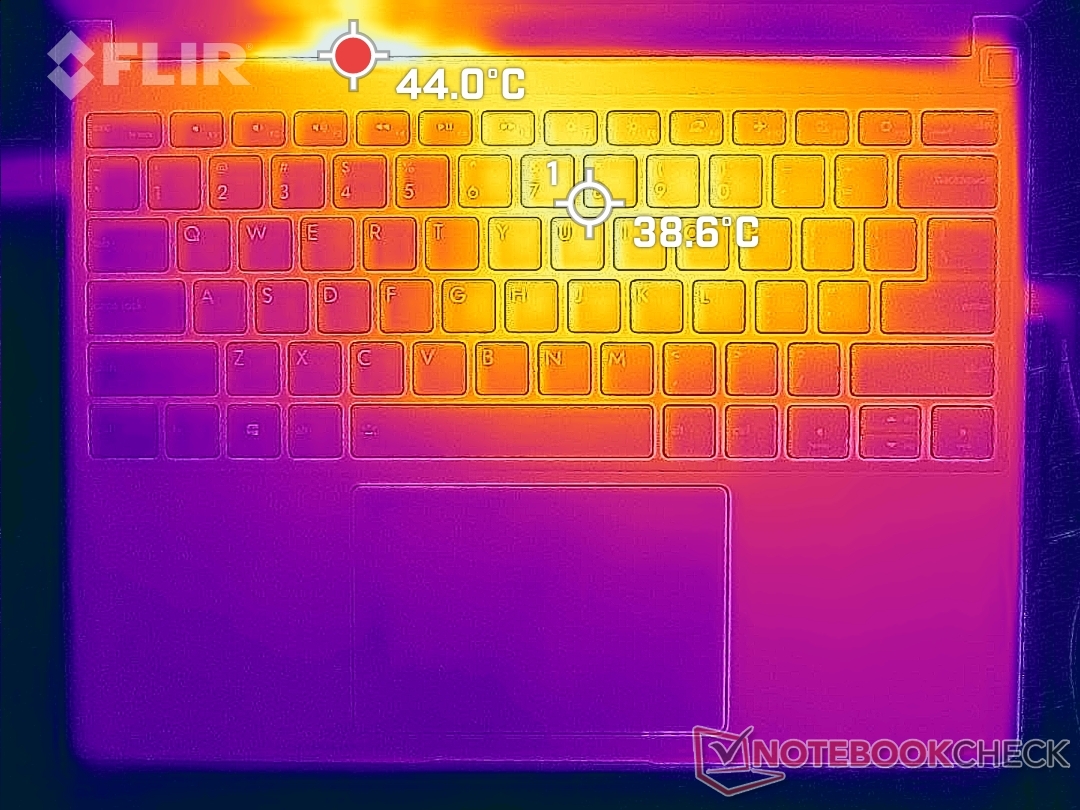
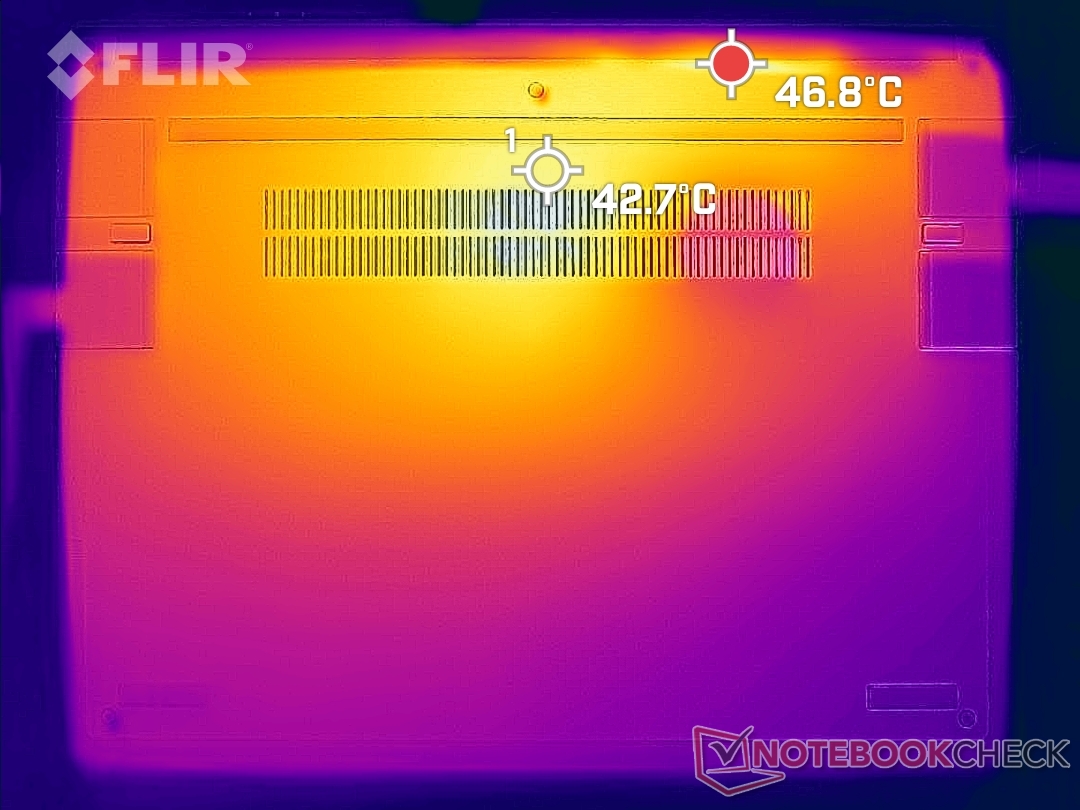
Los puntos calientes de la superficie pueden alcanzar 39 C y 43 C en la parte superior e inferior, respectivamente, en comparación con los 45 C y 46 C del Surface Laptop 4 13 o los 40 C y 51 C del HP Spectre x360 14. No es lo bastante cálido como para ser molesto, pero definitivamente se nota durante el uso. Unas rejillas de ventilación más grandes en la parte inferior podrían haber mejorado la temperatura.
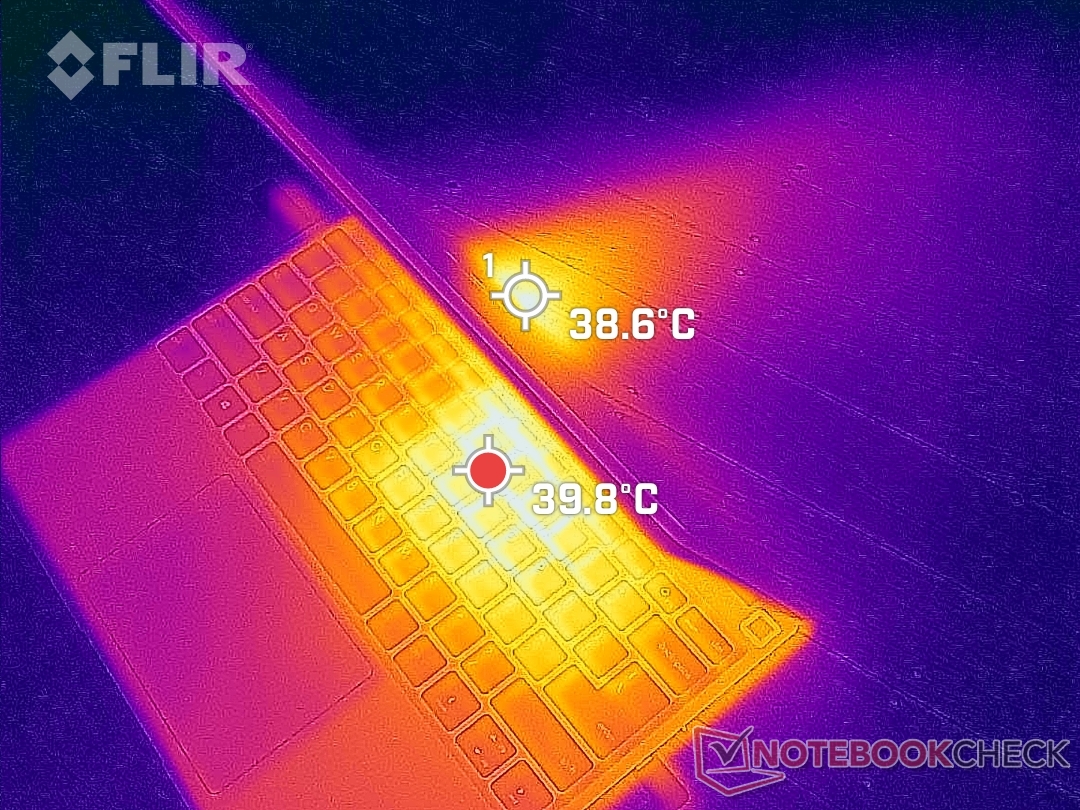
(+) La temperatura máxima en la parte superior es de 36.8 °C / 98 F, frente a la media de 34.3 °C / 94 F, que oscila entre 21.2 y 62.5 °C para la clase Office.
(±) El fondo se calienta hasta un máximo de 42.4 °C / 108 F, frente a la media de 36.8 °C / 98 F
(+) En reposo, la temperatura media de la parte superior es de 21.2 °C / 70# F, frente a la media del dispositivo de 29.5 °C / 85 F.
(+) El reposamanos y el panel táctil están a una temperatura inferior a la de la piel, con un máximo de 24.4 °C / 75.9 F y, por tanto, son fríos al tacto.
(+) La temperatura media de la zona del reposamanos de dispositivos similares fue de 27.5 °C / 81.5 F (+3.1 °C / 5.6 F).
| Framework Laptop 13.5 12th Gen Intel Intel Core i7-1260P, Intel Iris Xe Graphics G7 96EUs | Framework Laptop 13.5 Intel Core i7-1165G7, Intel Iris Xe Graphics G7 96EUs | Lenovo ThinkPad X1 Titanium Yoga G1 20QB0016GE Intel Core i5-1140G7, Intel Iris Xe Graphics G7 80EUs | HP EliteBook Folio 13.5-3G2L2EA Qualcomm Snapdragon 8cx Gen 2 5G, Qualcomm Adreno 680 | Microsoft Surface Laptop 4 13 Ryzen 5 AMD Ryzen 5 4680U, AMD Radeon RX Vega 7 | HP Spectre x360 14-ea0378ng Intel Core i7-1165G7, Intel Iris Xe Graphics G7 96EUs | |
|---|---|---|---|---|---|---|
| Heat | -5% | -9% | 8% | -6% | -6% | |
| Maximum Upper Side * (°C) | 36.8 | 47.2 -28% | 46.3 -26% | 34.3 7% | 45.8 -24% | 37.1 -1% |
| Maximum Bottom * (°C) | 42.4 | 39.4 7% | 43.3 -2% | 35.4 17% | 45.5 -7% | 43.1 -2% |
| Idle Upper Side * (°C) | 24.2 | 25.2 -4% | 26.8 -11% | 25.7 -6% | 24.9 -3% | 29 -20% |
| Idle Bottom * (°C) | 29 | 27.8 4% | 28.3 2% | 25.1 13% | 25.7 11% | 28.6 1% |
* ... más pequeño es mejor
Prueba de esfuerzo
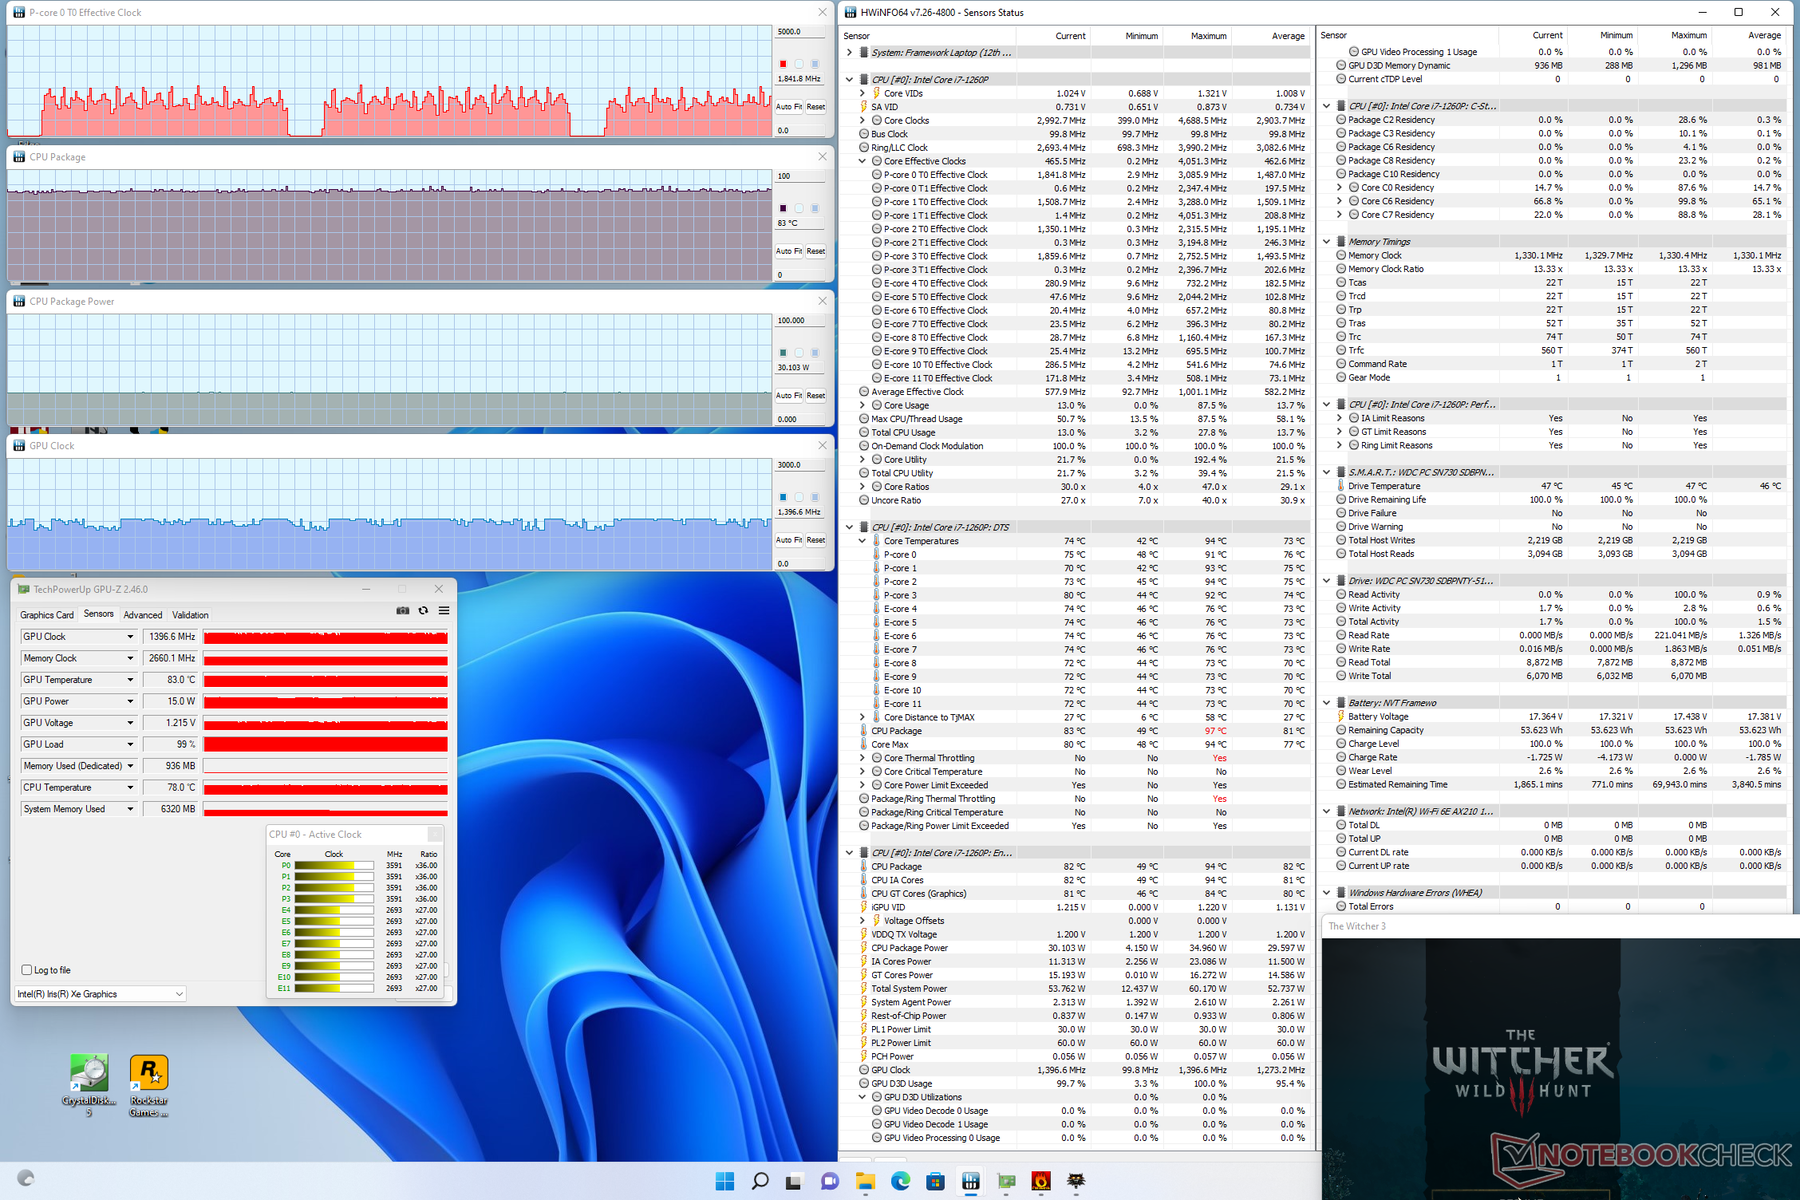
Cuando se ejecuta Prime95, la velocidad de reloj de la CPU aumenta a 3,5 GHz durante los primeros 10 segundos hasta alcanzar una temperatura del núcleo de 94 C. A continuación, la velocidad de reloj y el paquete de energía de la CPU descienden al rango de 2,4 a 2,6 GHz y de 52 W a 30 W, respectivamente, para mantener una temperatura del núcleo más fría de 87 C. Las temperaturas generales del núcleo siguen siendo notablemente más cálidas que las que registramos en el modelo del año pasado, donde las temperaturas se estabilizaban en 82 C en condiciones similares.
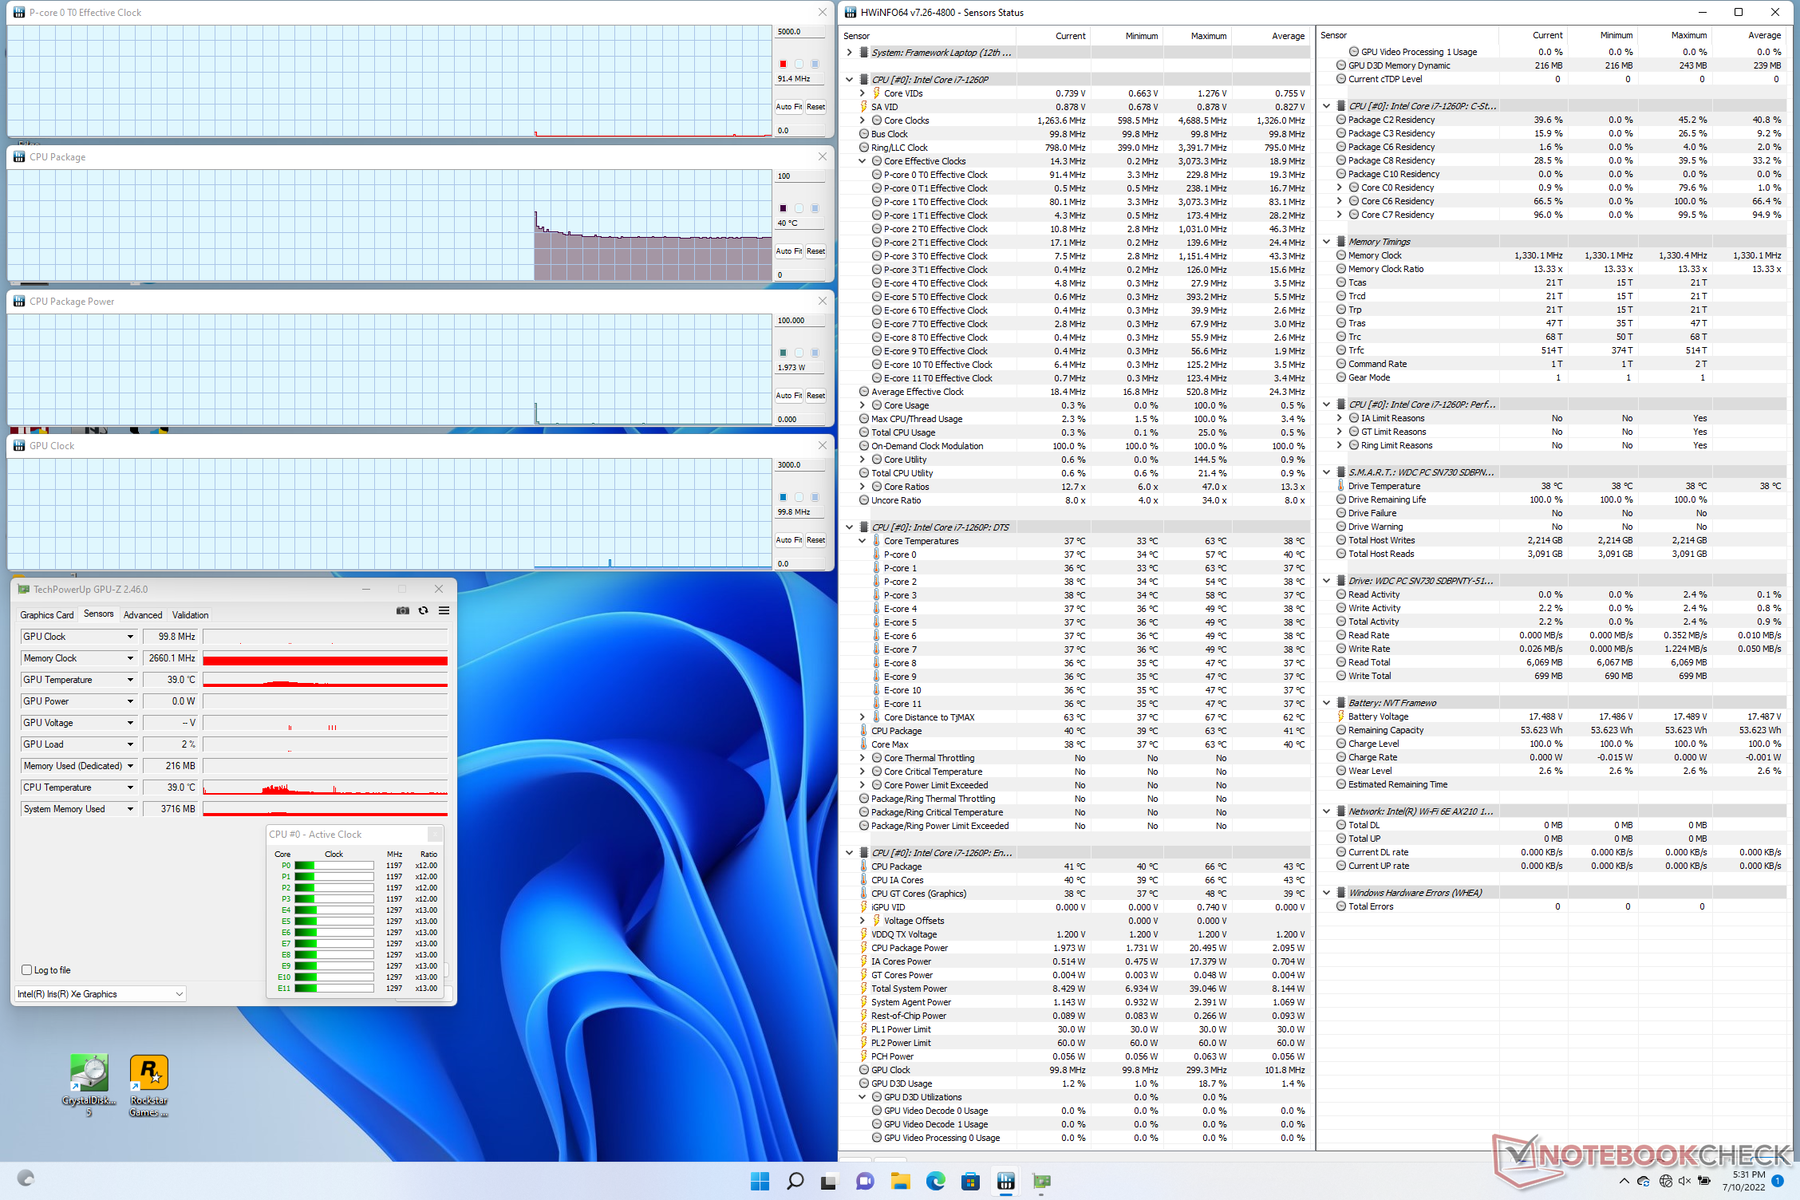
Cuando se ejecuta Witcher 3 para representar cargas de juego, la temperatura del núcleo vuelve a ser más cálida que en el modelo del año pasado (83 C frente a 73 C).
Funcionar con batería puede afectar ligeramente al rendimiento de la CPU. Un test 3DMark 11 con baterías arrojaría unas puntuaciones de Física y Gráficos de 14919 y 6604 puntos, respectivamente, frente a los 17183 y 6779 puntos con la red eléctrica.
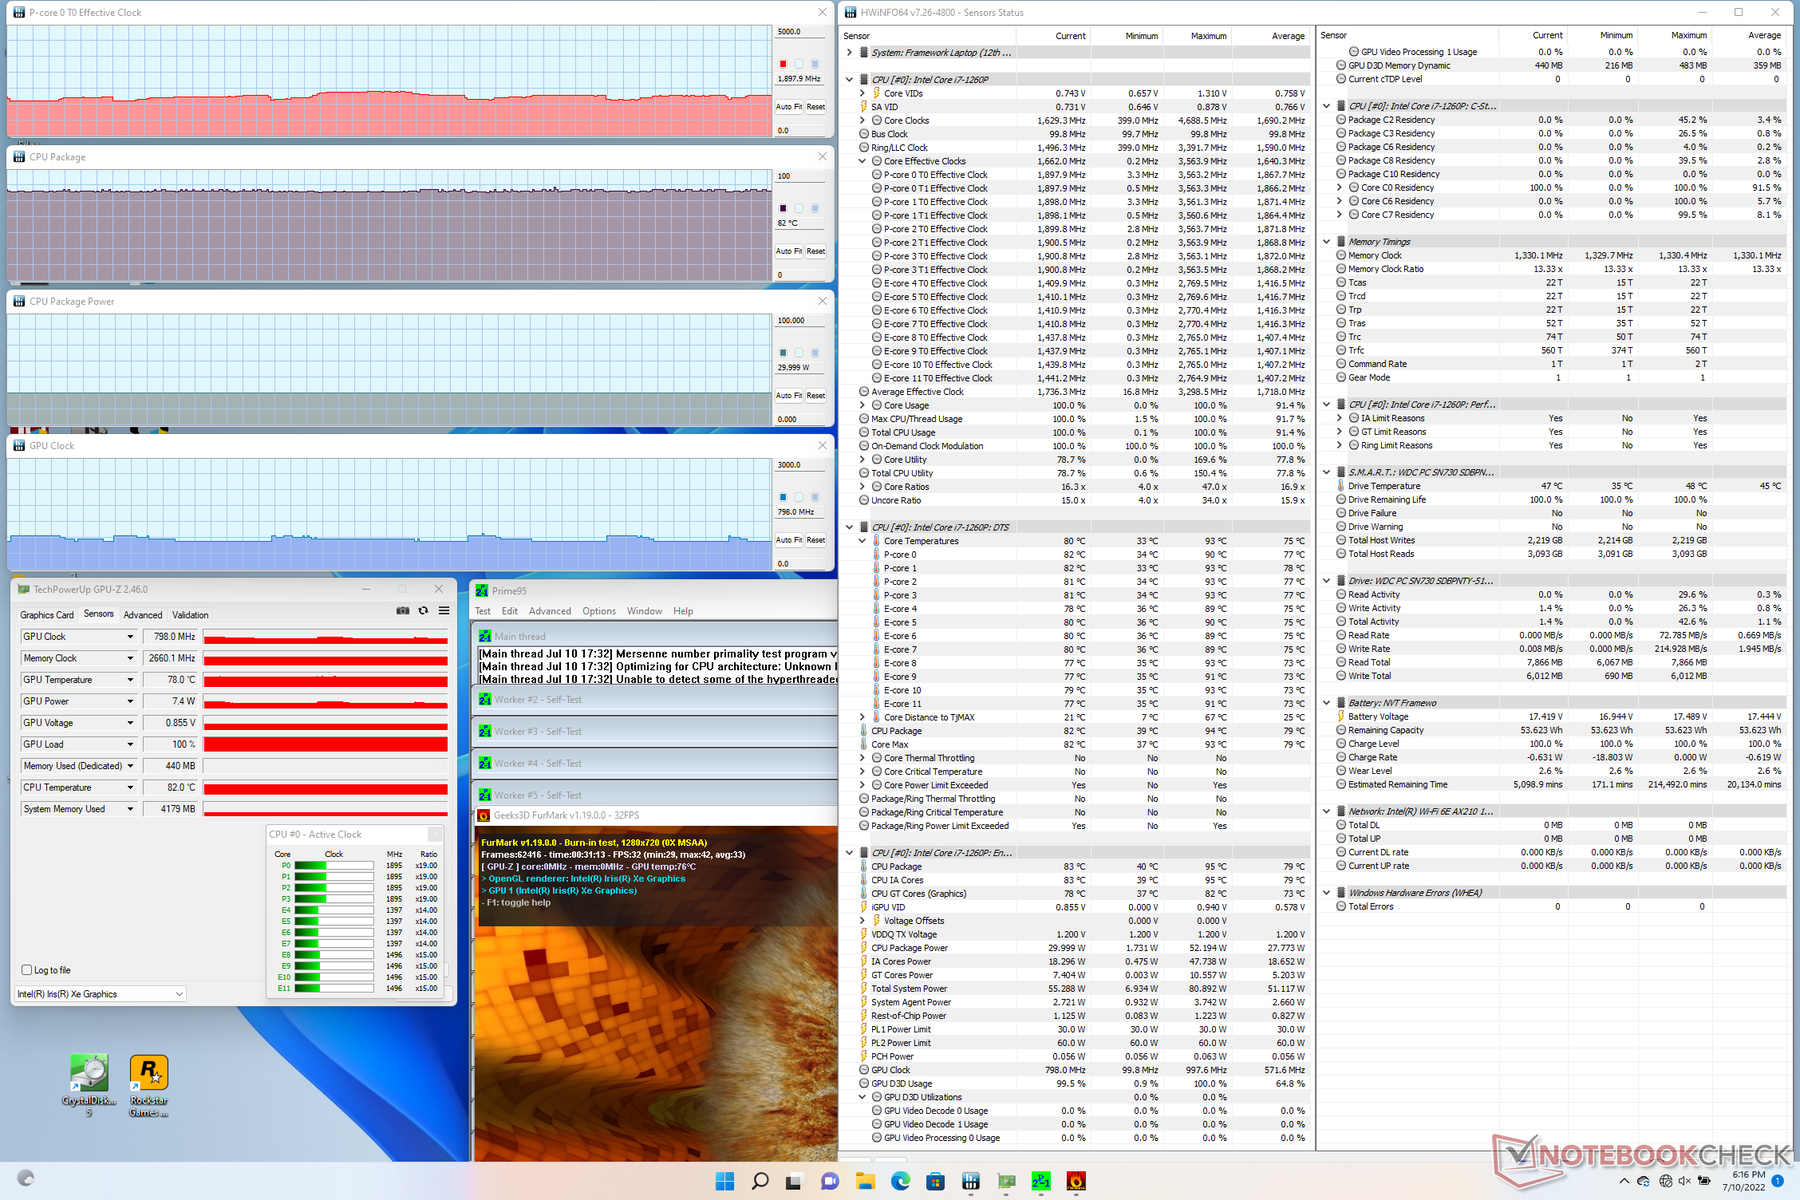
| Reloj dela CPU (GHz) | Reloj de la GPU (MHz) | Temperatura media de la CPU (°C) | |
| Sistema en reposo | -- | -- | 40 |
| Prime95 Stress | 2,4 - 2,6 | -- | 87 |
| Prime95+ FurMark Stress | 1,7 - 1,9 | 0,8 - 0,9 | 82 |
| Witcher 3 Stress | ~1,8 | 1396 | 83 |
Altavoces
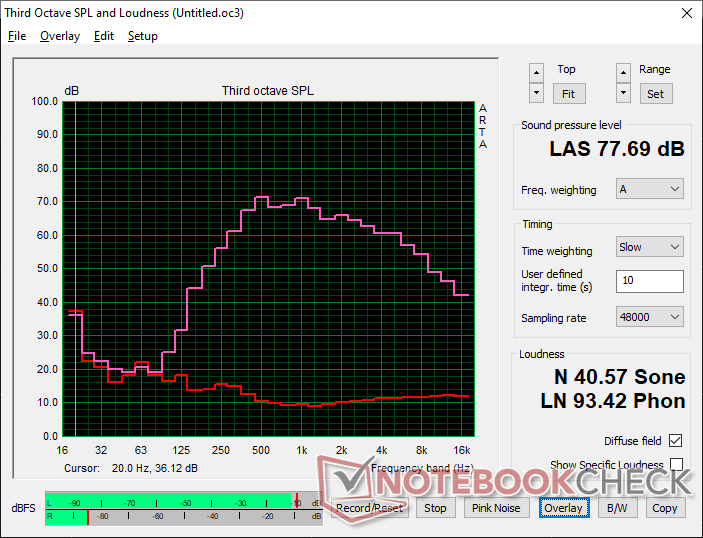
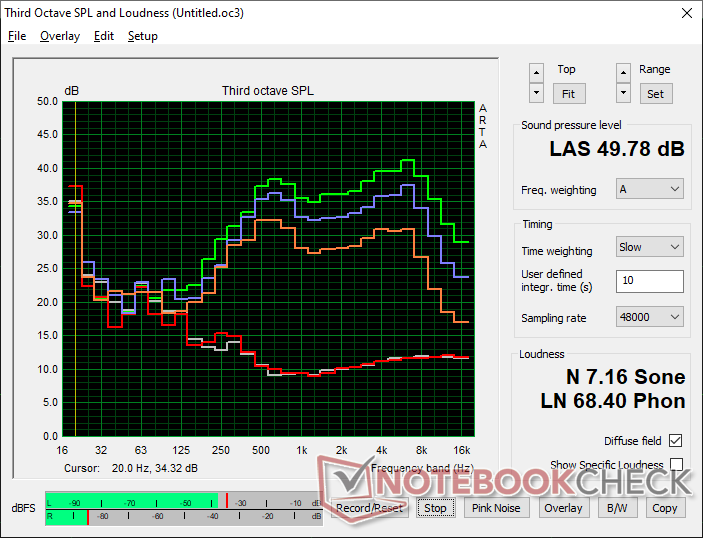
Framework Laptop 13.5 12th Gen Intel análisis de audio
(±) | la sonoridad del altavoz es media pero buena (77.7 dB)
Graves 100 - 315 Hz
(-) | casi sin bajos - de media 16.1% inferior a la mediana
(±) | la linealidad de los graves es media (14.3% delta a frecuencia anterior)
Medios 400 - 2000 Hz
(±) | medias más altas - de media 7.5% más altas que la mediana
(+) | los medios son lineales (5.9% delta a la frecuencia anterior)
Altos 2 - 16 kHz
(+) | máximos equilibrados - a sólo 4% de la mediana
(+) | los máximos son lineales (5% delta a la frecuencia anterior)
Total 100 - 16.000 Hz
(±) | la linealidad del sonido global es media (20.7% de diferencia con la mediana)
En comparación con la misma clase
» 48% de todos los dispositivos probados de esta clase eran mejores, 10% similares, 42% peores
» El mejor tuvo un delta de 7%, la media fue 21%, el peor fue ###max##%
En comparación con todos los dispositivos probados
» 56% de todos los dispositivos probados eran mejores, 8% similares, 36% peores
» El mejor tuvo un delta de 4%, la media fue 23%, el peor fue ###max##%
Apple MacBook Pro 16 2021 M1 Pro análisis de audio
(+) | los altavoces pueden reproducir a un volumen relativamente alto (#84.7 dB)
Graves 100 - 315 Hz
(+) | buen bajo - sólo 3.8% lejos de la mediana
(+) | el bajo es lineal (5.2% delta a la frecuencia anterior)
Medios 400 - 2000 Hz
(+) | medios equilibrados - a sólo 1.3% de la mediana
(+) | los medios son lineales (2.1% delta a la frecuencia anterior)
Altos 2 - 16 kHz
(+) | máximos equilibrados - a sólo 1.9% de la mediana
(+) | los máximos son lineales (2.7% delta a la frecuencia anterior)
Total 100 - 16.000 Hz
(+) | el sonido global es lineal (4.6% de diferencia con la mediana)
En comparación con la misma clase
» 0% de todos los dispositivos probados de esta clase eran mejores, 0% similares, 100% peores
» El mejor tuvo un delta de 5%, la media fue 17%, el peor fue ###max##%
En comparación con todos los dispositivos probados
» 0% de todos los dispositivos probados eran mejores, 0% similares, 100% peores
» El mejor tuvo un delta de 4%, la media fue 23%, el peor fue ###max##%
Gestión de la energía
Consumo de energía
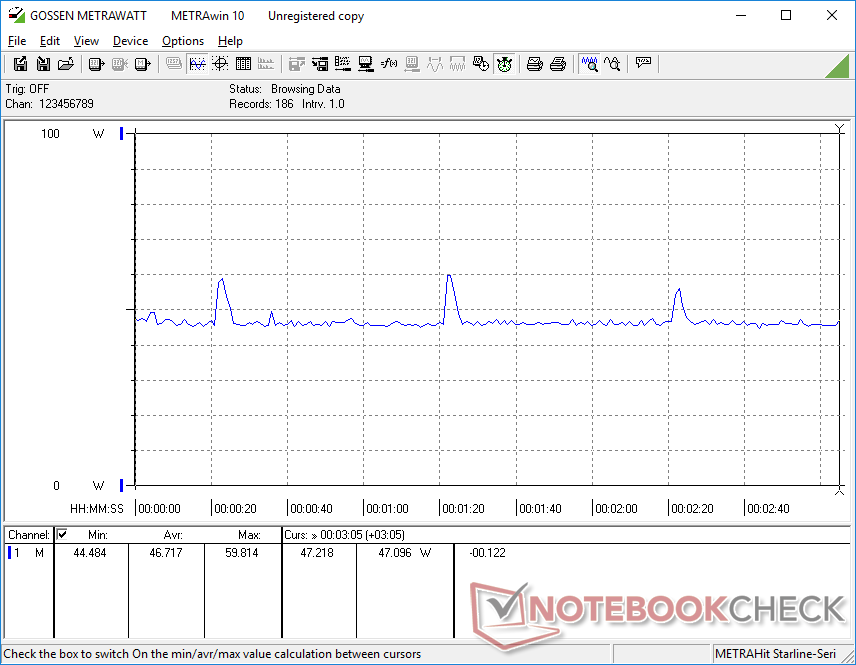
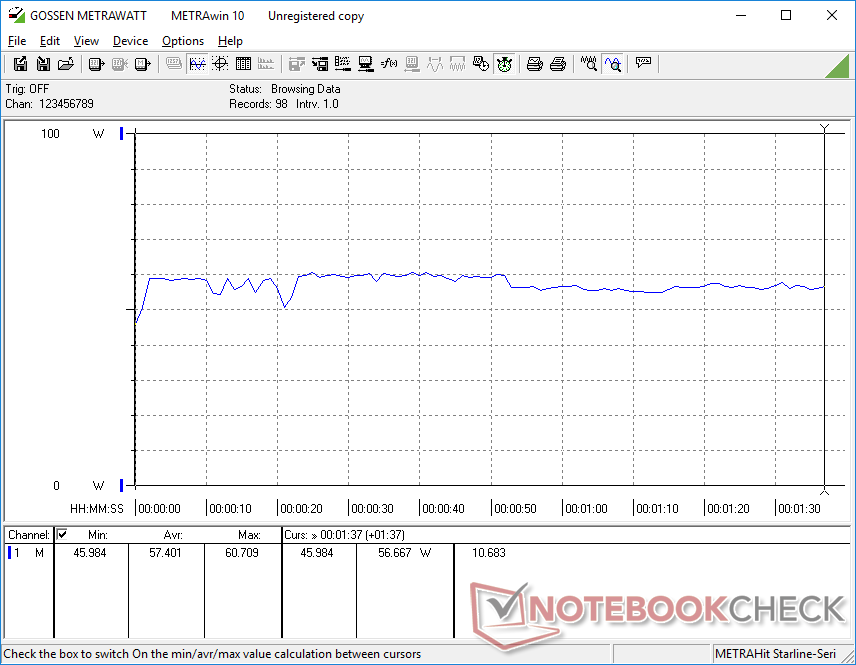
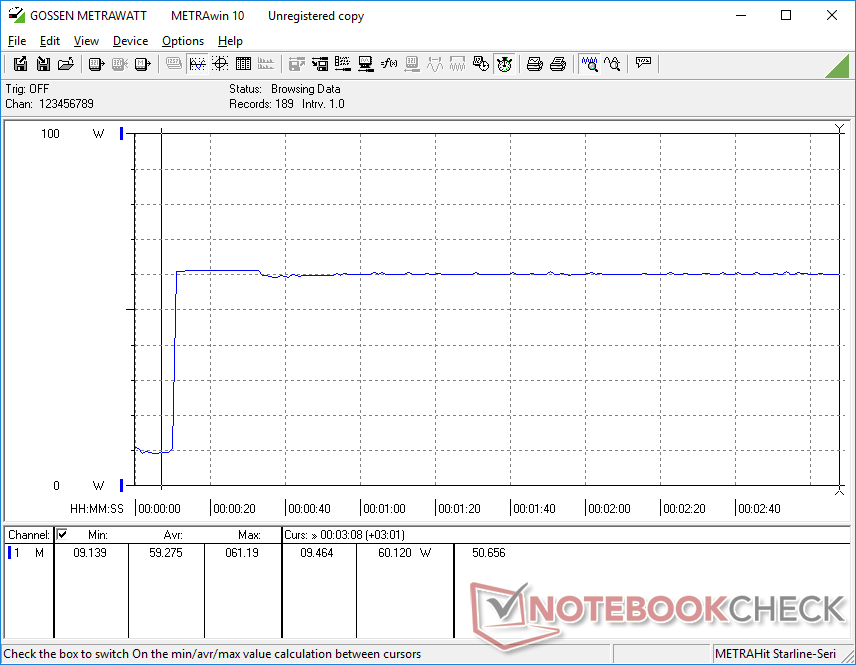
Como era de esperar en un sistema Alder Lake-P de 12ª generación, el consumo general de energía es superior al de muchos portátiles que funcionan con procesadores Tiger Lake-U de 11ª generación, incluido el modelo Framework del año pasado. Ejecutar Prime95 consumiría 60 W para ser un 25 por ciento más exigente con respecto al año anterior. El mayor rendimiento del procesador no es gratuito en este sentido
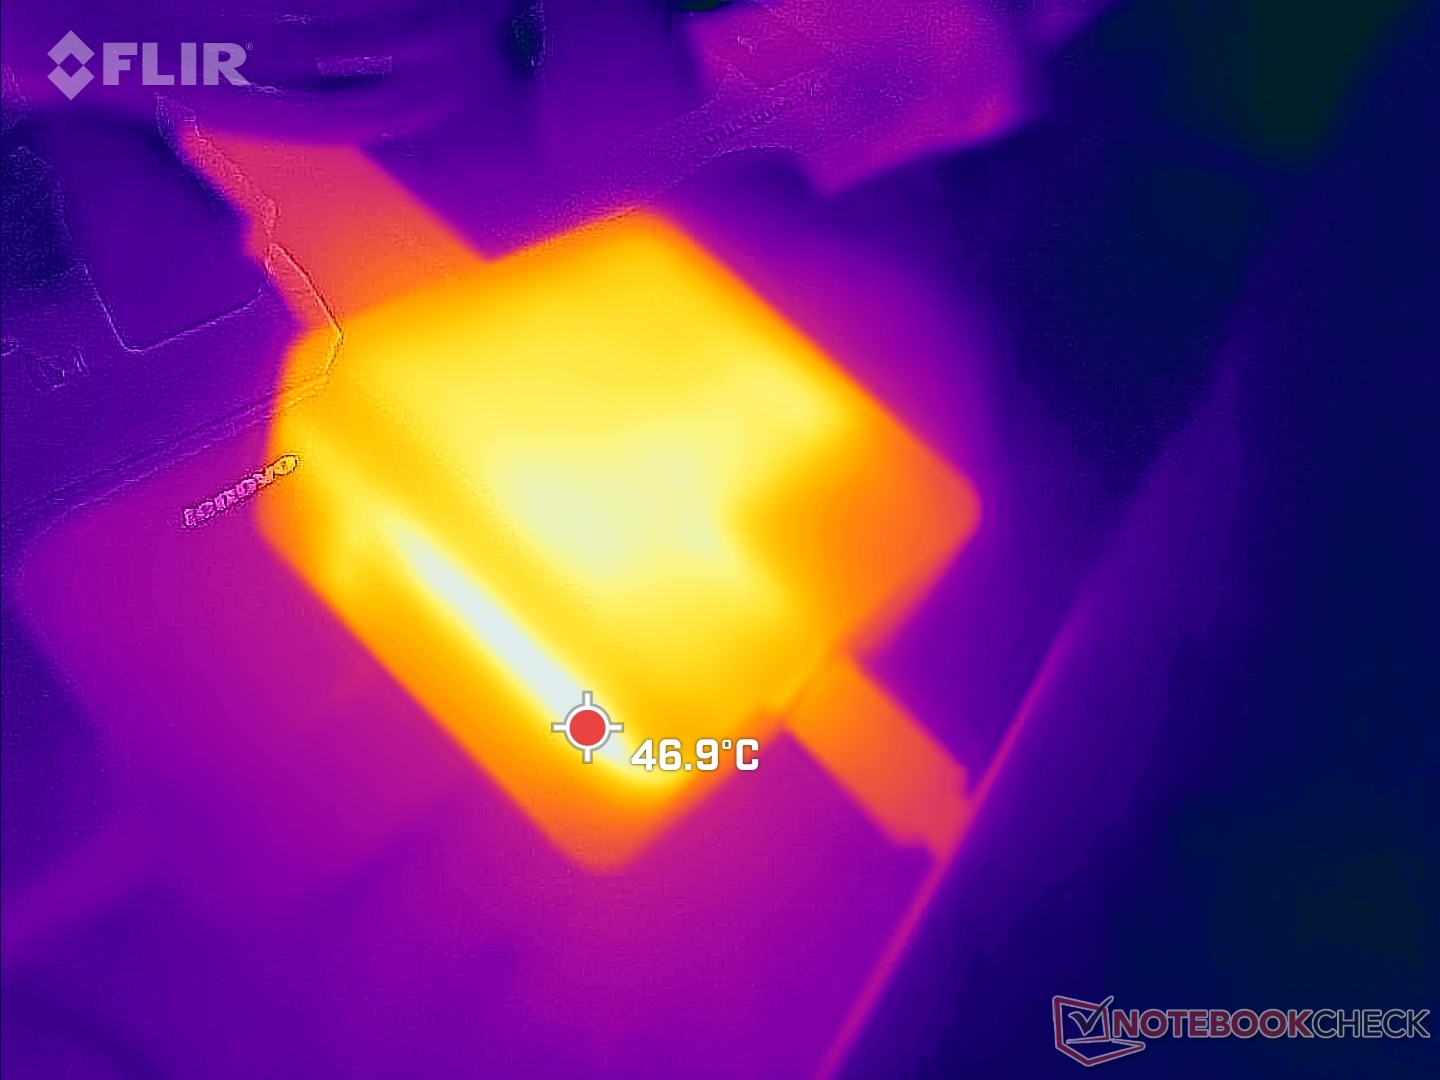
Registramos un consumo máximo de 61,2 W del pequeño (~5,8 x 5,8 x 2,7 cm) adaptador de CA de 60 W al ejecutar cargas de Prime95. El fabricante no ha hecho ningún cambio en el adaptador de CA a pesar de que el nuevo procesador es más exigente este año. Un adaptador de CA de mayor capacidad podría haber permitido un mejor rendimiento de Turbo Boost o una carga más rápida al ejecutar cargas exigentes. La página webGPD Win Max 2por ejemplo, viene con la misma CPU Core i7-1260P y sin embargo viene con un adaptador de CA de 100 W.

| Off / Standby | |
| Ocioso | |
| Carga |
|
Clave:
min: | |
| Framework Laptop 13.5 12th Gen Intel i7-1260P, Iris Xe G7 96EUs, WDC PC SN730 SDBPNTY-512G, IPS, 2256x1504, 13.5" | Framework Laptop 13.5 i7-1165G7, Iris Xe G7 96EUs, Western Digital WD_BLACK SN850 WDS100T1X0E, IPS, 2256x1504, 13.5" | Lenovo ThinkPad X1 Titanium Yoga G1 20QB0016GE i5-1140G7, Iris Xe G7 80EUs, Lenovo UMIS RPJTJ256MEE1OWX, IPS LED, 2256x1504, 13.5" | HP EliteBook Folio 13.5-3G2L2EA SD 8cx Gen 2 5G, Adreno 680, Toshiba XG6 KXG60ZNV512G, IPS, 1920x1280, 13.5" | Microsoft Surface Laptop 4 13 Ryzen 5 R5 4680U, Vega 7, Samsung PM991 MZ9LQ256HBJQ, IPS, 2256x1504, 13.5" | HP Spectre x360 14-ea0378ng i7-1165G7, Iris Xe G7 96EUs, Intel Optane Memory H10 with Solid State Storage 32GB + 1TB HBRPEKNX0203AH(L/H), OLED, 3000x2000, 13.5" | |
|---|---|---|---|---|---|---|
| Power Consumption | 12% | 31% | 60% | 24% | 3% | |
| Idle Minimum * (Watt) | 5.3 | 4.3 19% | 3.75 29% | 2.3 57% | 3.4 36% | 6.3 -19% |
| Idle Average * (Watt) | 8.4 | 8.2 2% | 7.75 8% | 3.7 56% | 6.3 25% | 11.2 -33% |
| Idle Maximum * (Watt) | 11.2 | 8.7 22% | 8.69 22% | 5.6 50% | 8.1 28% | 13.3 -19% |
| Load Average * (Watt) | 57.4 | 43.5 24% | 33.12 42% | 13 77% | 36.2 37% | 32 44% |
| Witcher 3 ultra * (Watt) | 46.7 | 43.5 7% | 28.7 39% | |||
| Load Maximum * (Watt) | 61.2 | 61.8 -1% | 35.19 43% | 25 59% | 64.1 -5% | 35.6 42% |
* ... más pequeño es mejor
Power Consumption Witcher 3 / Stresstest
Power Consumption external Monitor
Duración de la batería
Los tiempos de ejecución son menores en apenas media hora en comparación con el modelo del año pasado a pesar del rendimiento mucho más rápido del procesador. 7.5 horas de uso real de la WLAN deberían ser suficientes para la mayoría de usuarios, aunque son varias horas menos que en el Surface Laptop 4 13
La carga de vacío a plena capacidad con el adaptador de CA incluido tarda unos 90 minutos. Sin embargo, la carga se ralentizará significativamente cuando se ejecuten cargas exigentes debido al adaptador de CA de 60 W, como ya se ha mencionado.
| Framework Laptop 13.5 12th Gen Intel i7-1260P, Iris Xe G7 96EUs, 55 Wh | Framework Laptop 13.5 i7-1165G7, Iris Xe G7 96EUs, 55 Wh | Lenovo ThinkPad X1 Titanium Yoga G1 20QA001RGE i7-1160G7, Iris Xe G7 96EUs, 44.5 Wh | HP EliteBook Folio 13.5-3G2L2EA SD 8cx Gen 2 5G, Adreno 680, 46 Wh | Microsoft Surface Laptop 4 13 Ryzen 5 R5 4680U, Vega 7, 47.4 Wh | HP Spectre x360 14-ea0378ng i7-1165G7, Iris Xe G7 96EUs, 66 Wh | |
|---|---|---|---|---|---|---|
| Duración de Batería | 7% | 12% | 95% | 45% | 4% | |
| WiFi v1.3 (h) | 7.5 | 8 7% | 8.4 12% | 14.6 95% | 10.9 45% | 7.8 4% |
| H.264 (h) | 11.4 | 11.1 | ||||
| Load (h) | 1.9 | 4.2 | 2.6 | |||
| Reader / Idle (h) | 13.4 |
Pro
Contra
Veredicto - Una solución a largo plazo
Framework había prometido que el diseño de su portátil permitiría actualizarlo fácilmente cuando la última generación de procesadores estuviera disponible. El modelo 2022 ha hecho exactamente eso con kits de actualización de la placa base DIY para los propietarios existentes o configuraciones listas para usar para los nuevos que quieran subirse al carro. En comparación con el modelo 2021 con Intel 11th gen, el modelo 2022 puede ofrecer un aumento del rendimiento de la CPU de hasta el 90 por ciento que los entusiastas seguramente pueden apreciar. Sin embargo, tiene el coste de unas temperaturas de núcleo más elevadas y una duración de la batería ligeramente inferior, pero las compensaciones pueden merecer la pena dependiendo de los escenarios de uso.
Aparte de la actualización de la CPU, la experiencia sigue siendo la misma, lo que puede ser tanto bueno como malo. Es bueno por la consistencia garantizada y la previsibilidad entre las actualizaciones anuales, pero también es malo ya que ciertos inconvenientes no pueden ser abordados muy fácilmente. Los nuevos Ultrabooks como los de Asuspor ejemplo, están empezando a salir al mercado con pantallas Intel/AMD y OLED de alta frecuencia de actualización, mientras que el modelo Framework sigue teniendo sólo una opción de pantalla y no tiene CPU Ryzen. La base y la tapa siguen siendo más susceptibles de crujir y torcerse que los modelos insignia de Dell, HP o Lenovo. Nos encantaría ver opciones de WAN e IR también, quizá en forma de tarjeta de expansión si no es posible hacer cambios internos en la placa base. Incluir algunas de estas características podría ser difícil ya que el fabricante está limitado a su diseño de chasis y piezas originales de 2021.
Incluso teniendo en cuenta los desafíos percibidos, no quitan la alta personalización o el diseño fácil de usar del portátil Framework. Los propietarios que valoran la reparabilidad y la facilidad para adquirir piezas de repuesto para sus costosos productos encontrarán el Framework Laptop menos frustrante de usar que una alternativa cerrada como el Surface Laptop.
Precio y disponibilidad
Framework es y ya está aceptando pedidos para su portátil Intel de 12ª generación a partir de 1050 USD para la versión Core i5 o 1450 USD para nuestra configuración de revisión.
Framework Laptop 13.5 12th Gen Intel
- 07/12/2022 v7 (old)
Allen Ngo
Price comparison

