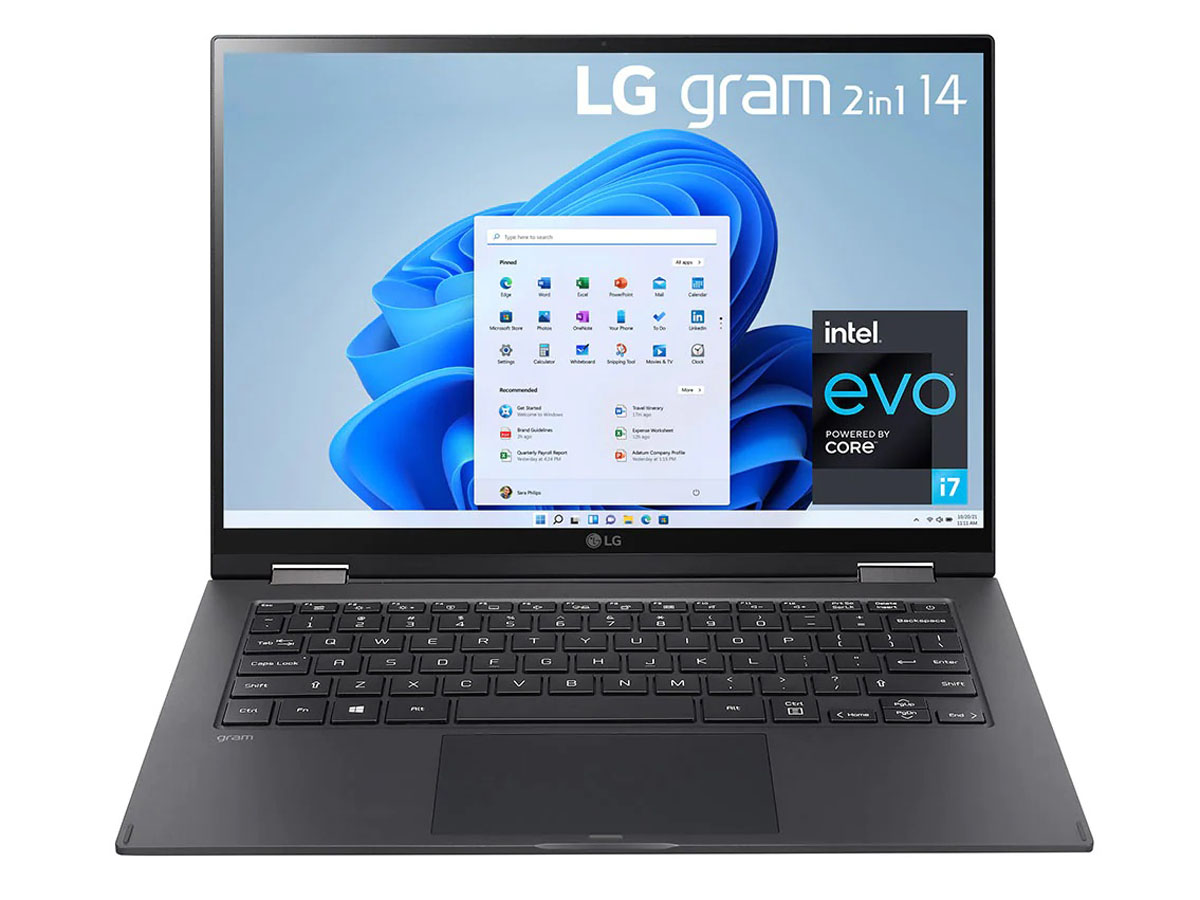
Análisis del convertible LG Gram 14T90P: El aspirante al Lenovo Yoga y al HP Spectre
El LG Gram 14T90P de 16:10 sucede a la generación anterior de 16:9 Gram 14T90N introduciendo opciones de procesadores Intel de 11ª generación más rápidos y un nuevo diseño de chasis para ser una renovación de serie en toda regla. Al igual que el resto de modelos Gram, el Gram 14T90P pretende maximizar la calidad de la pantalla y minimizar el peso para ser uno de los portátiles Core de la serie U más ligeros para su categoría de tamaño.
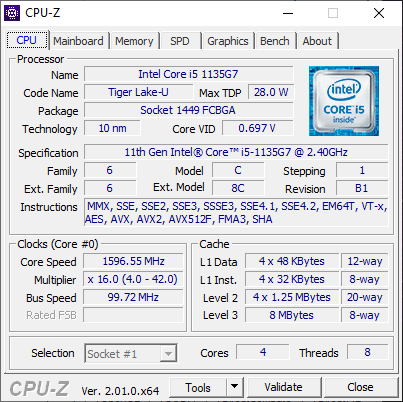
Nuestra unidad en revisión ha sido configurada con la CPU Core i5-1135G7, 16 GB de RAM soldada, 512 GB de SSD NVMe y una pantalla táctil IPS de 14 pulgadas de 1200p por un precio de venta al público de aproximadamente $1000 a $1100 USD. Hay otros modelos disponibles con el Core i7-1165G7, pero todos vienen con el mismo panel de 1200p.
Los competidores directos en este espacio incluyen otros convertibles subportátiles de gama alta como el Asus Zenbook Flip 14, HP Spectre x360 14, Dell XPS 13 2-en-1, MSI Summit E13 Flipo Lenovo Yoga 9 14.
Más opiniones de LG:
Posibles competidores en comparación
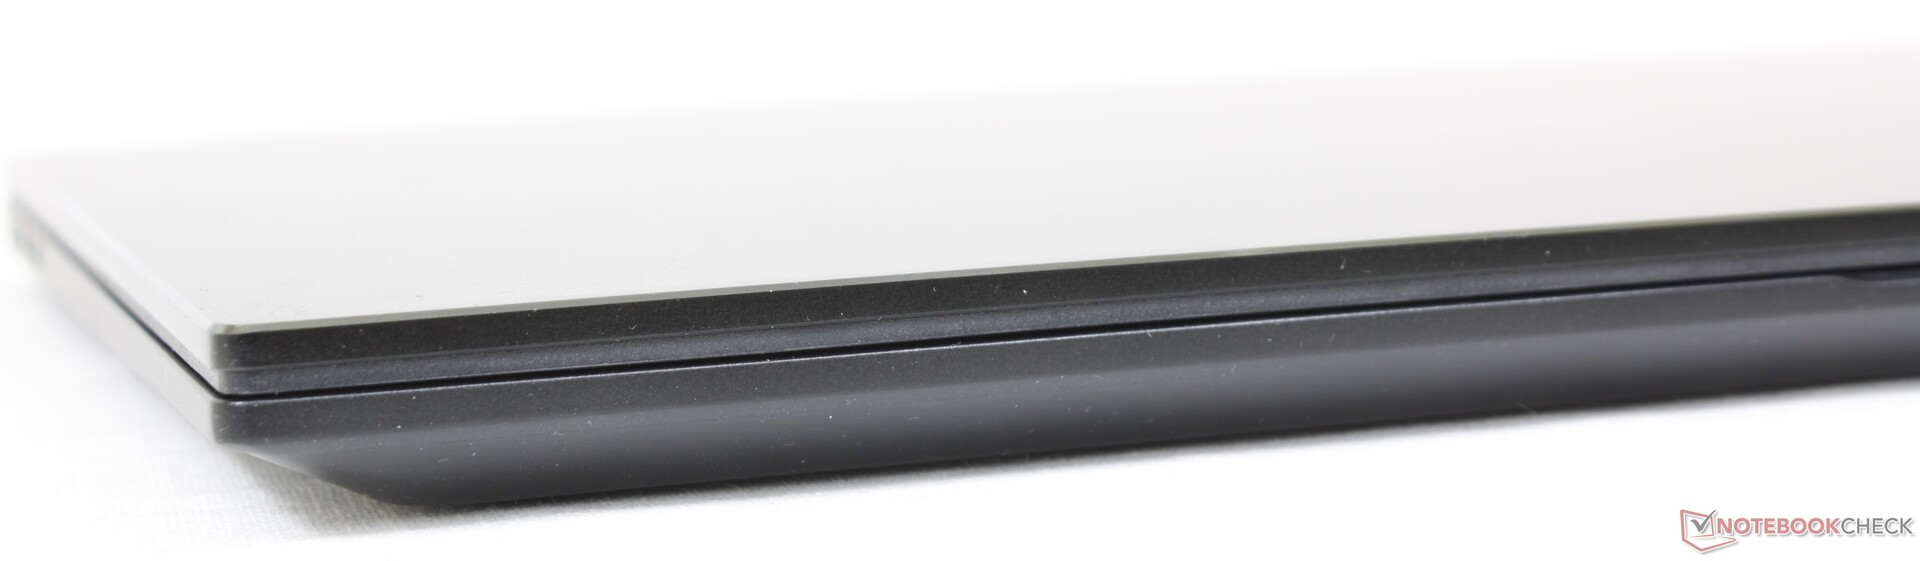
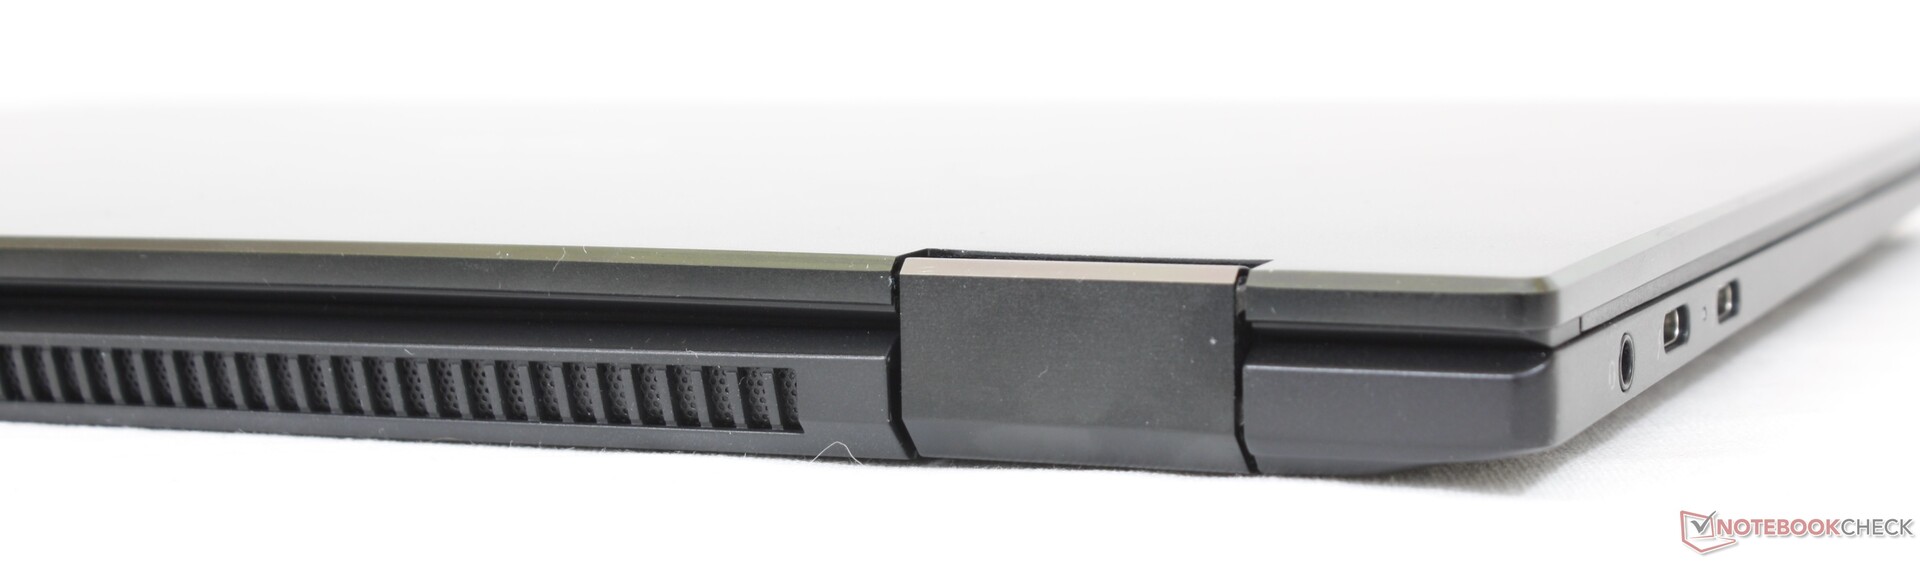
Caja - Mejora significativa del diseño anterior
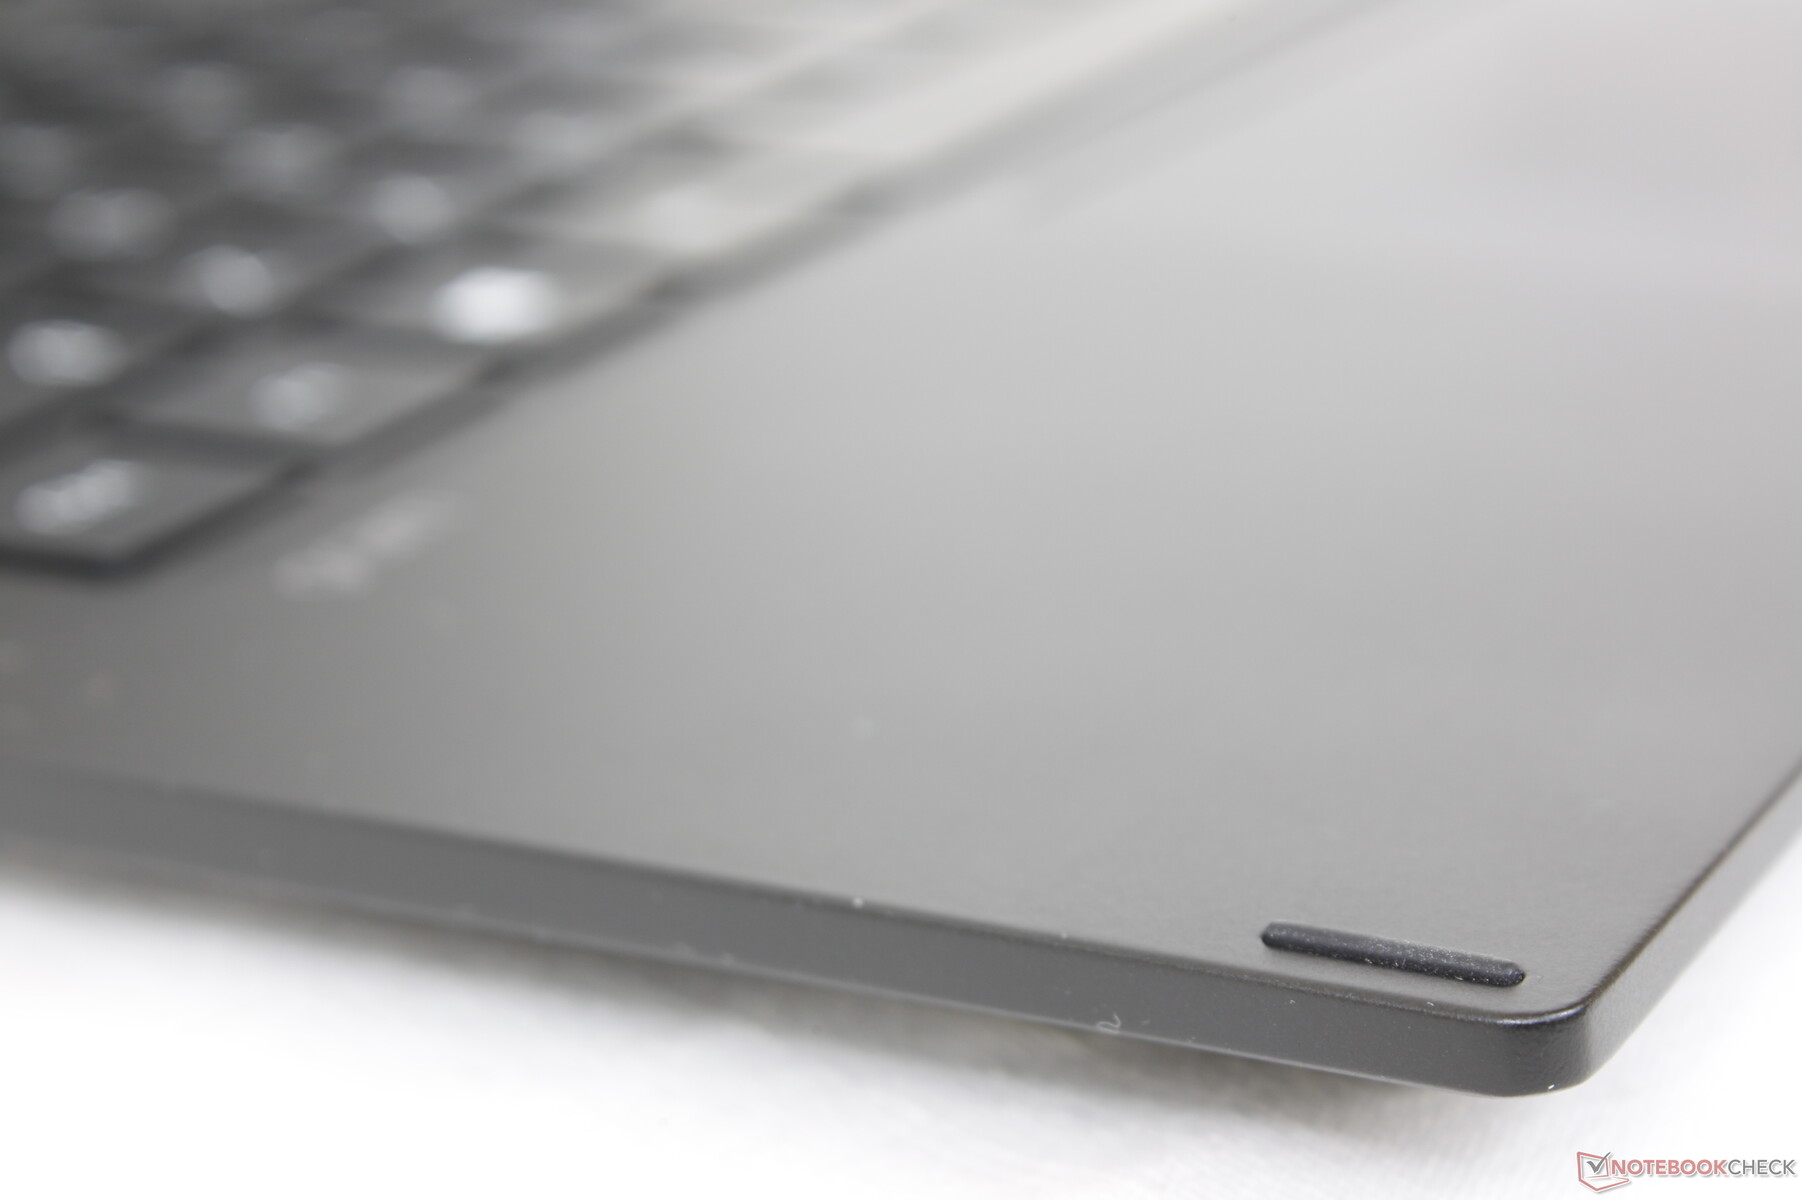
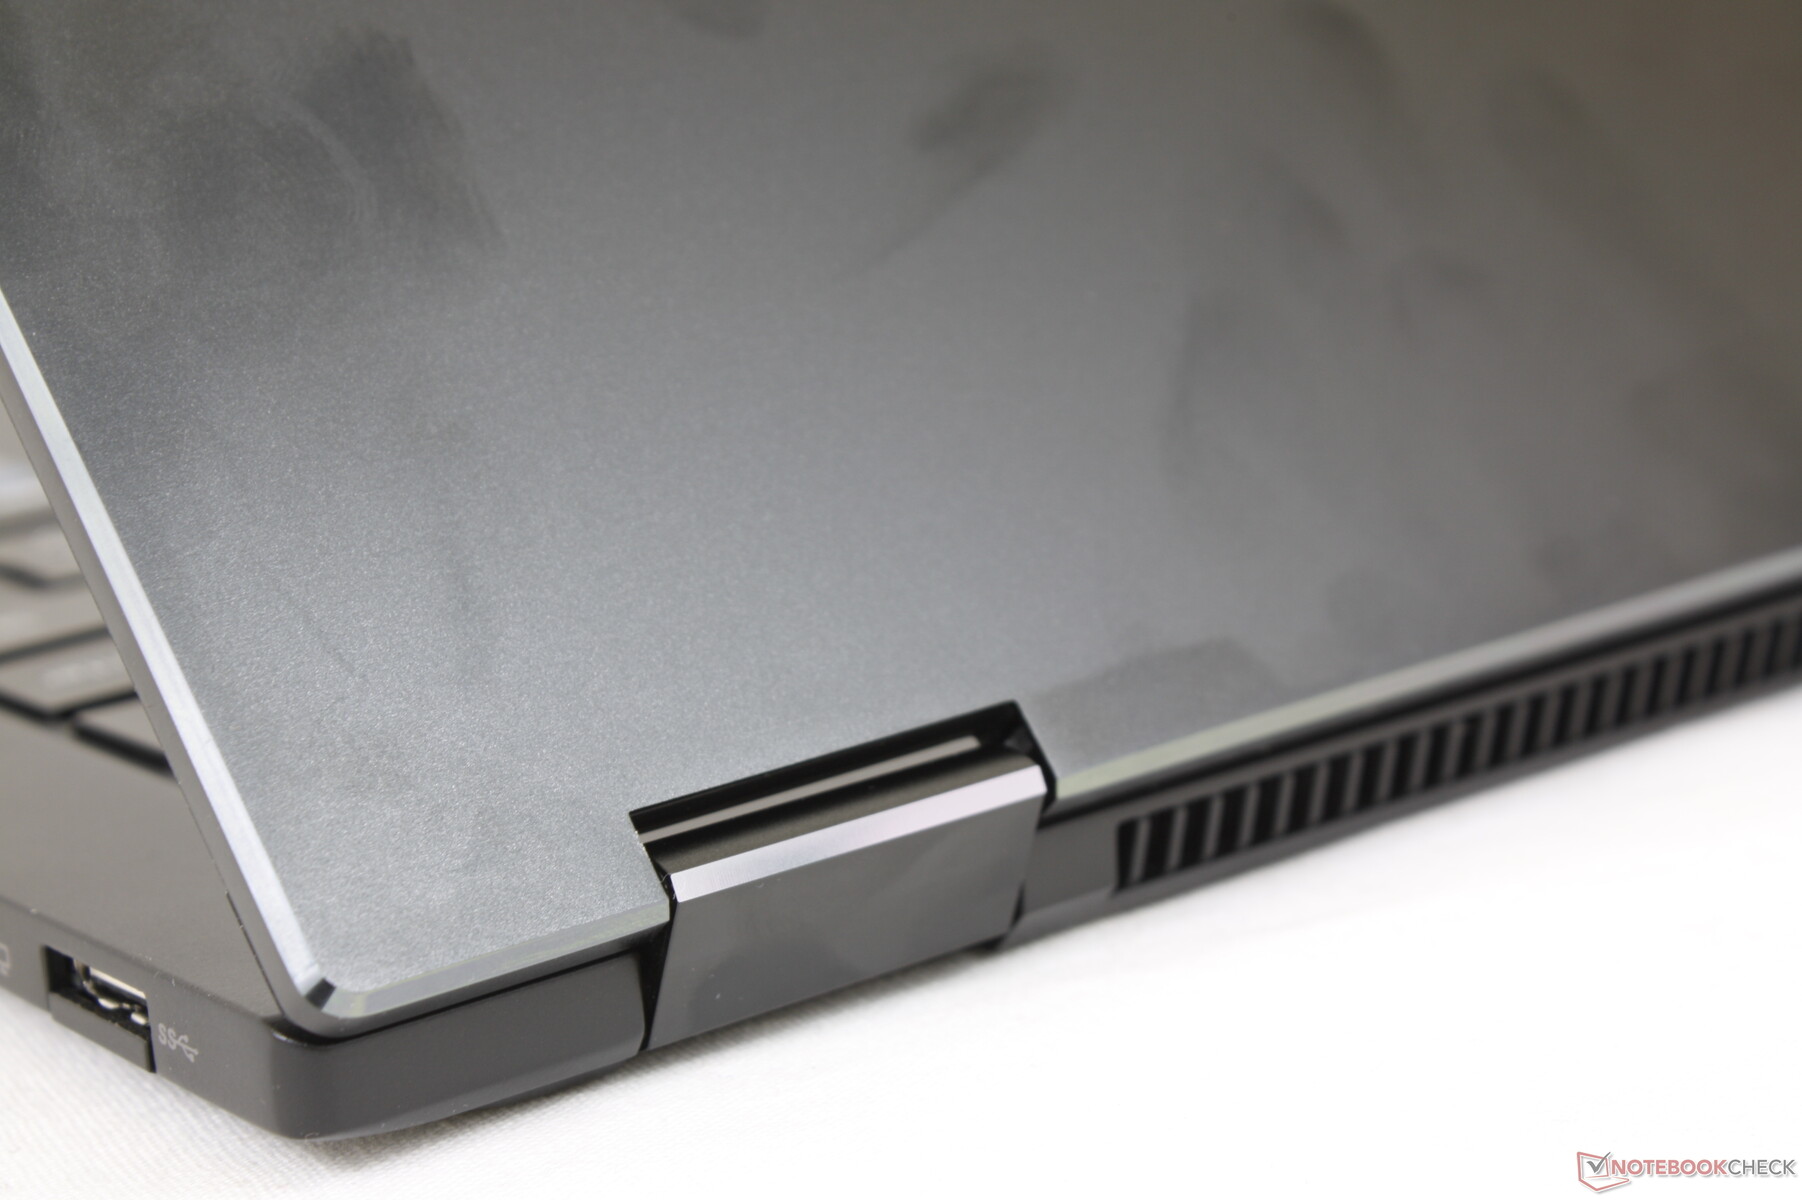
El diseño del chasis es esencialmente una versión miniaturizada del reciente Gram de 16 pulgadas 16T90P. Puede que no sea tan llamativo visualmente como la serie Dell XPS, HP Spectre o Asus Zenbook, pero lo compensa siendo más ligero y estando certificado bajo las especificaciones MIL-STD 810G. Su base y su tapa también son más firmes que en el antiguo Gram 14T90N, con una torsión mínima y sin crujidos, para ser menos propenso a la flexión o a los daños que con la Samsung Galaxy Book Pro 360.
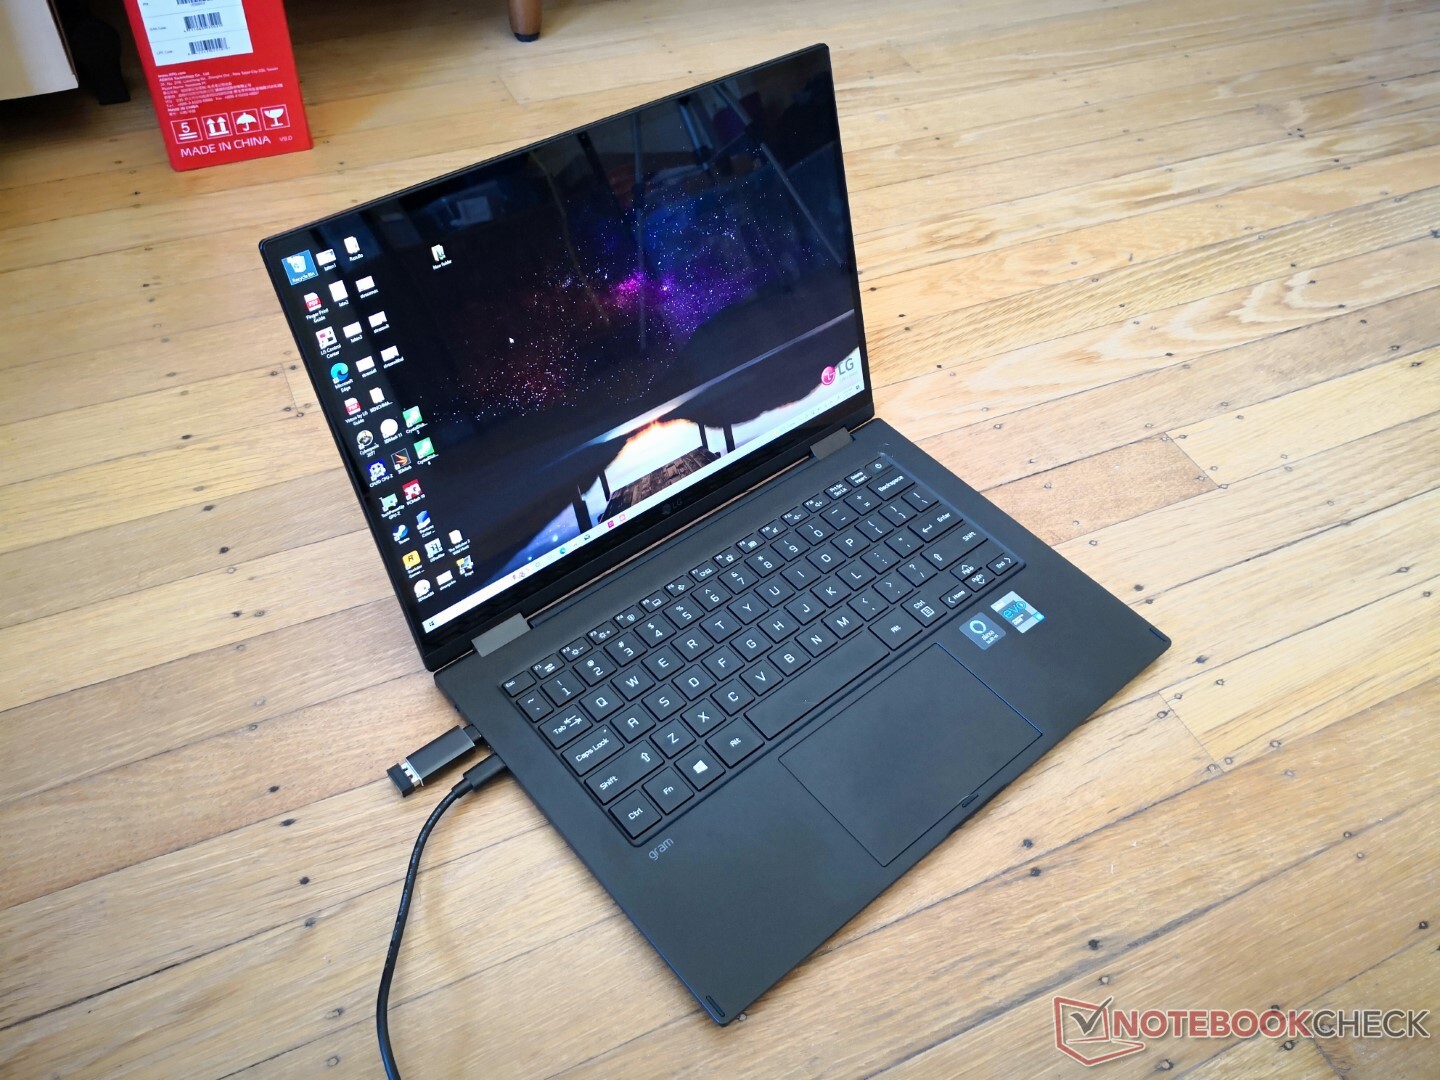
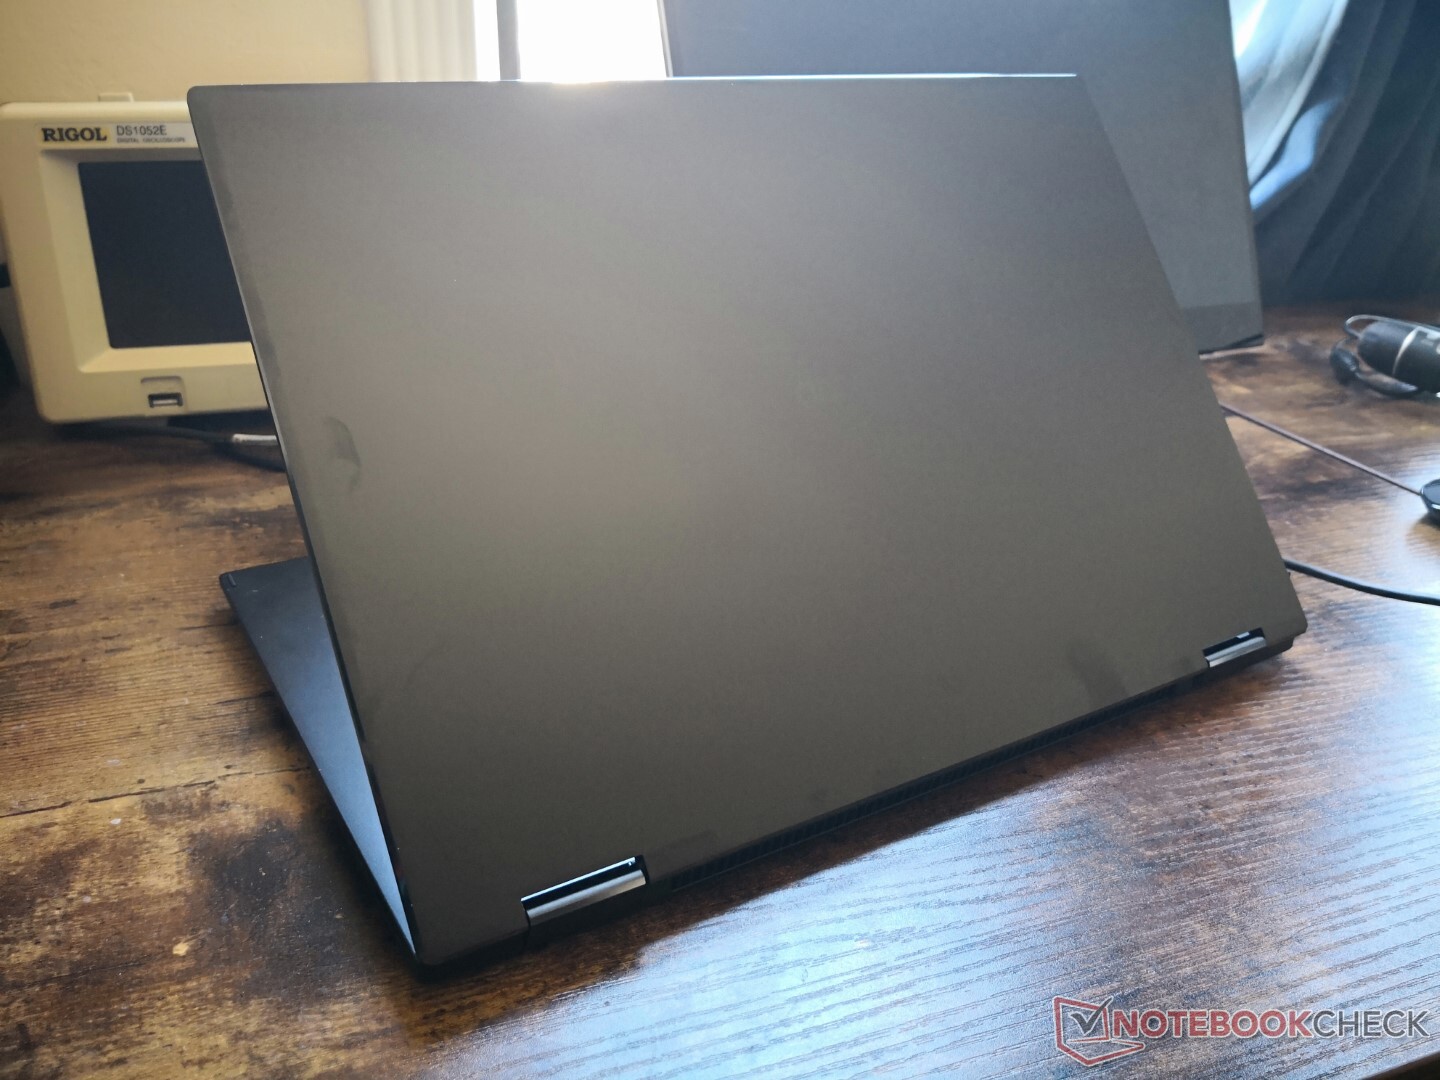
Las dimensiones son ligeramente diferentes a las del anterior Gram 14T90N, pero el volumen y el peso totales son prácticamente los mismos. Así, los usuarios obtienen una pantalla táctil 16:10 más grande sin necesidad de un chasis más grande o pesado. El sistema es entre 100 y 200 g más ligero que la mayoría de los convertibles de la competencia, lo que se nota a la hora de manejarlo o viajar.
Comparación de tamaños
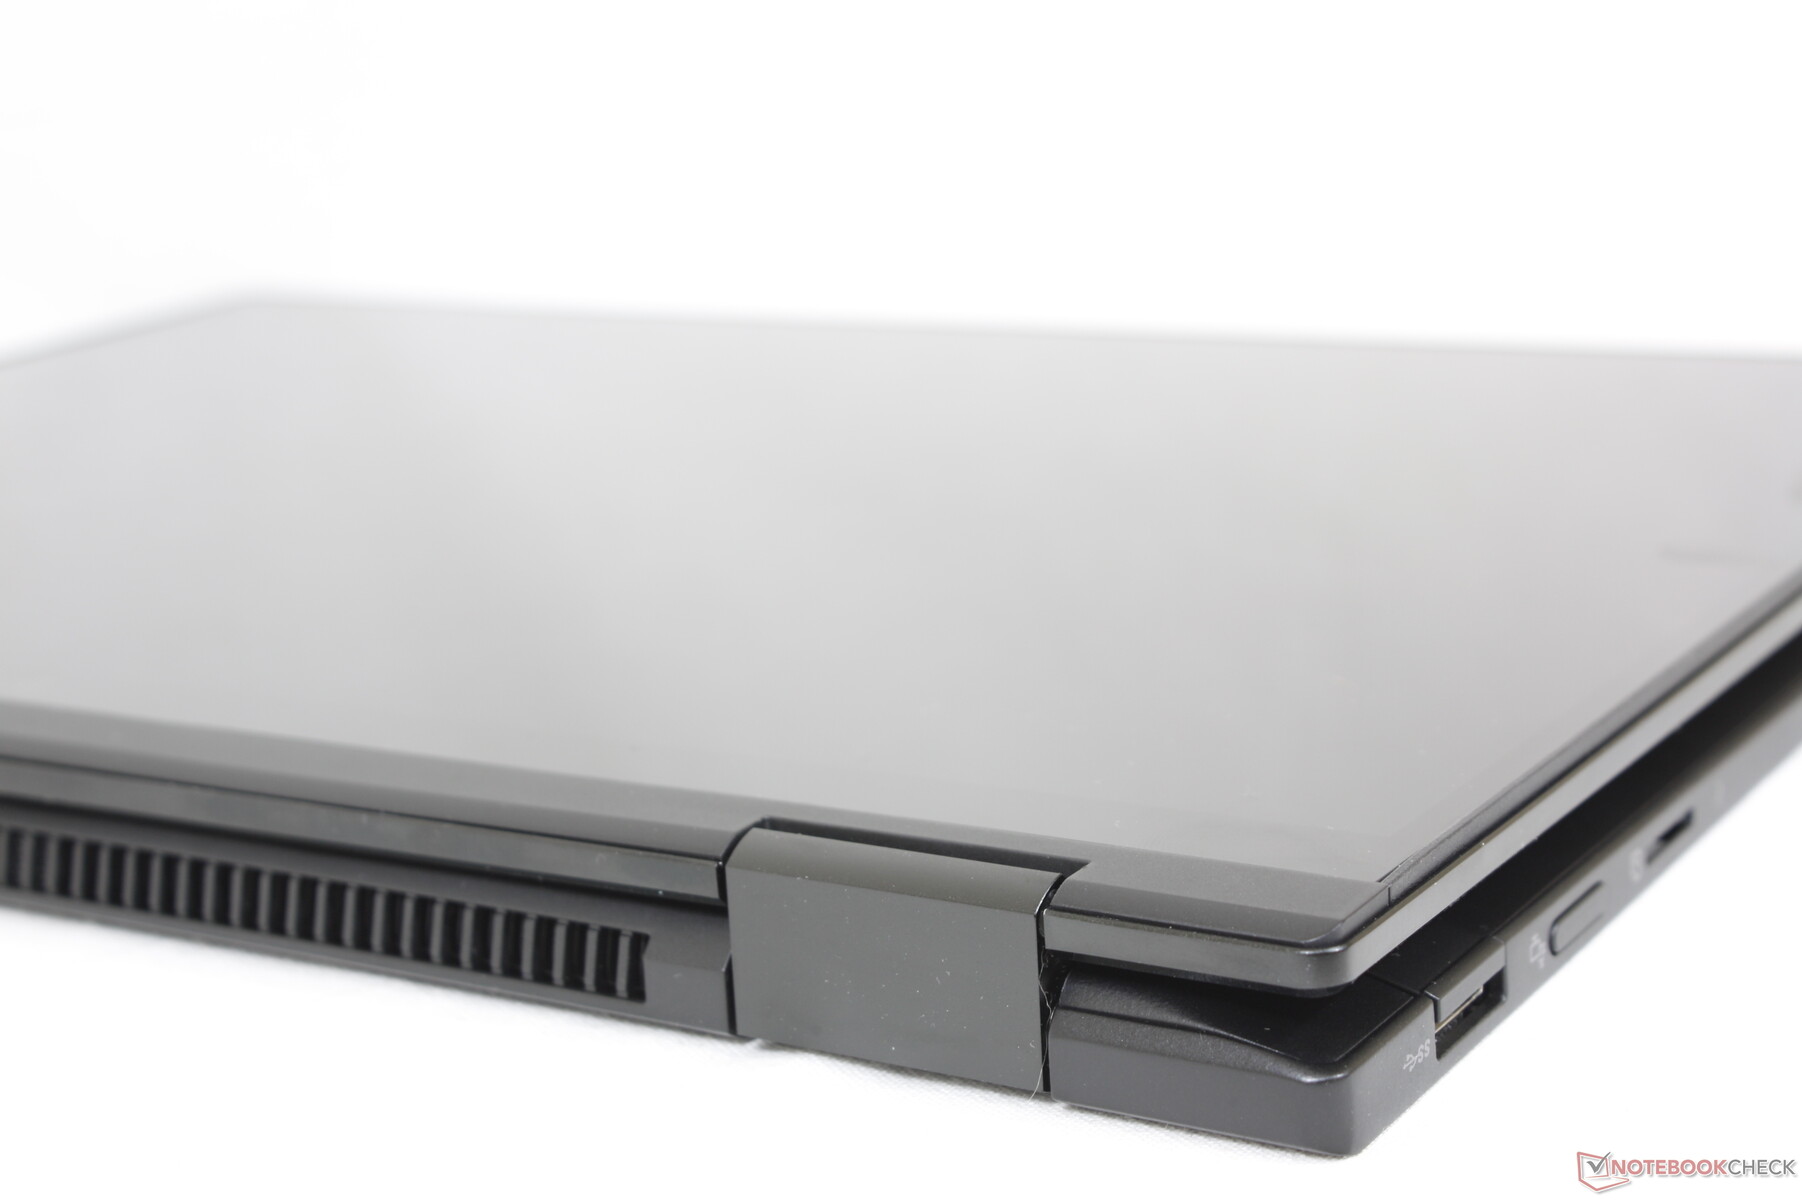
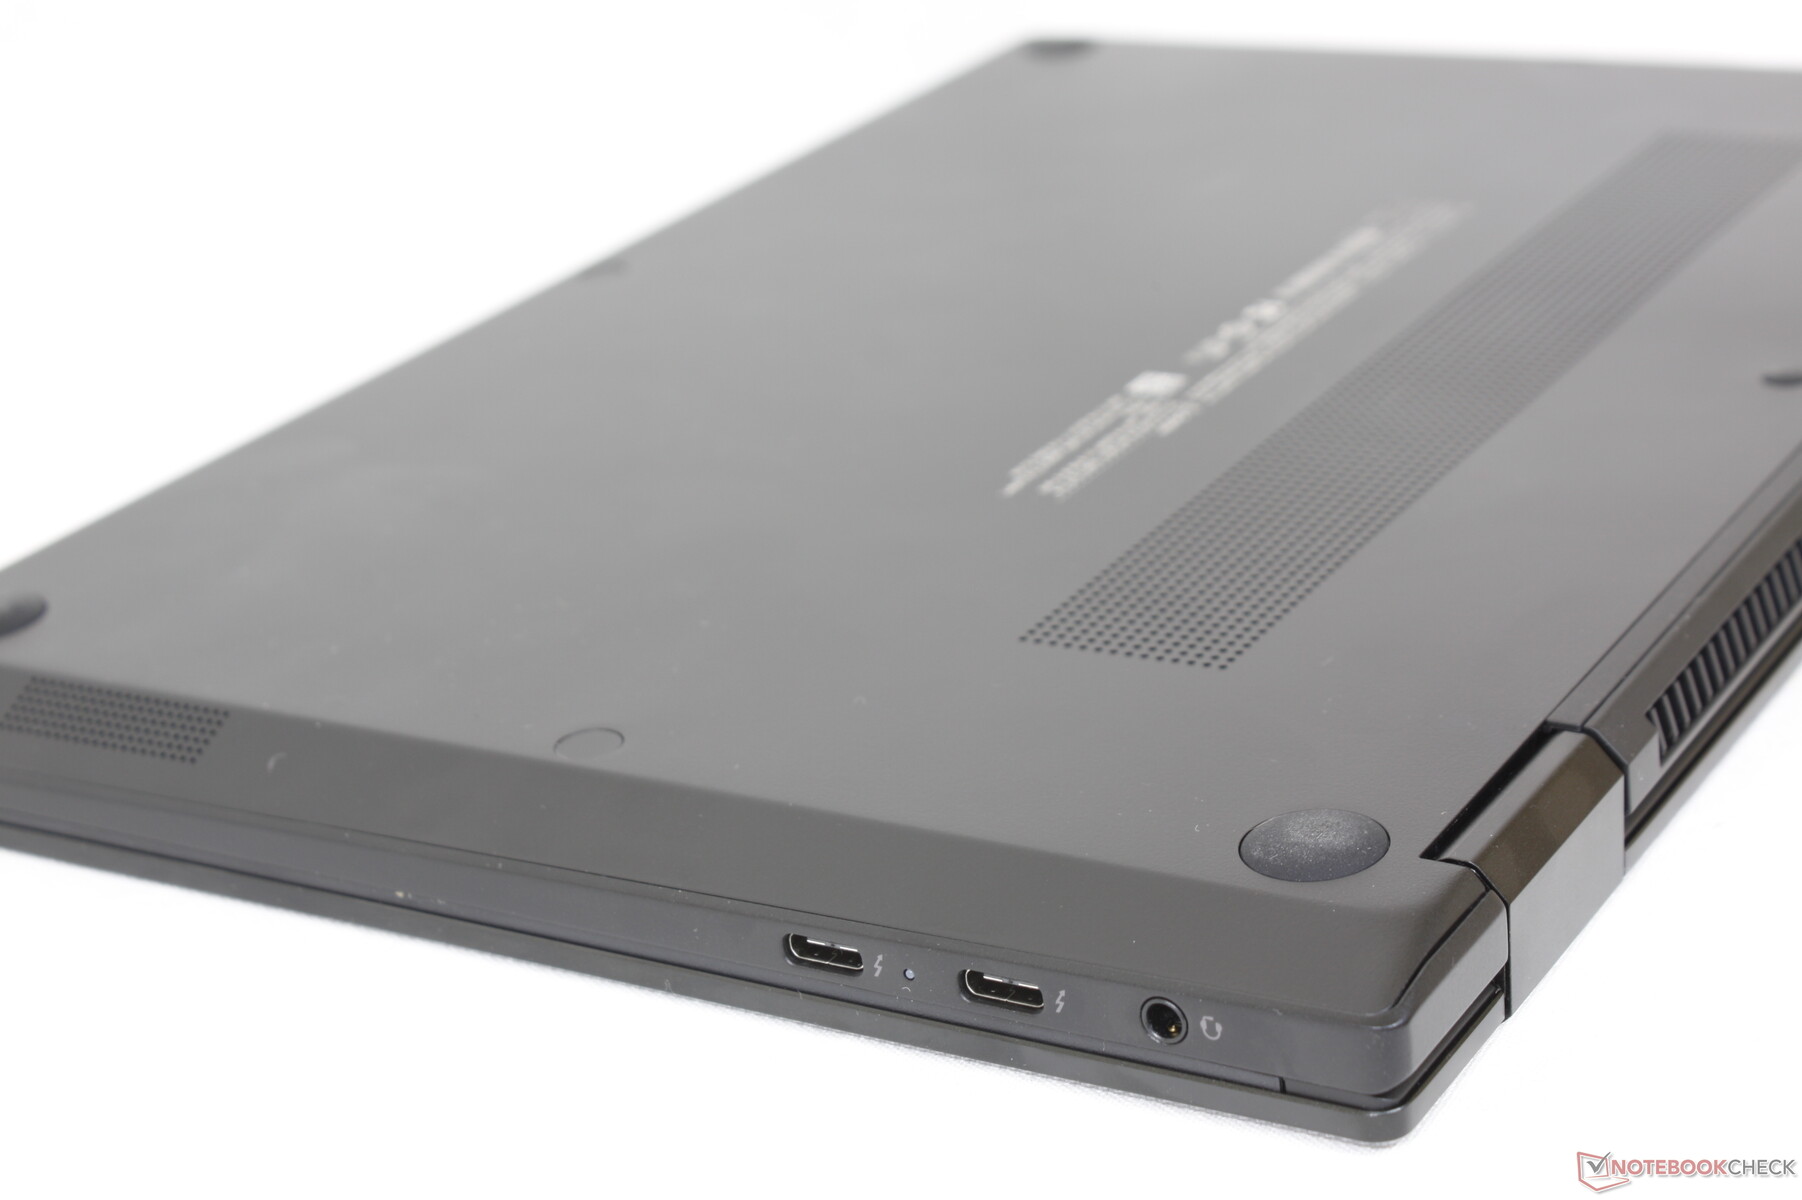
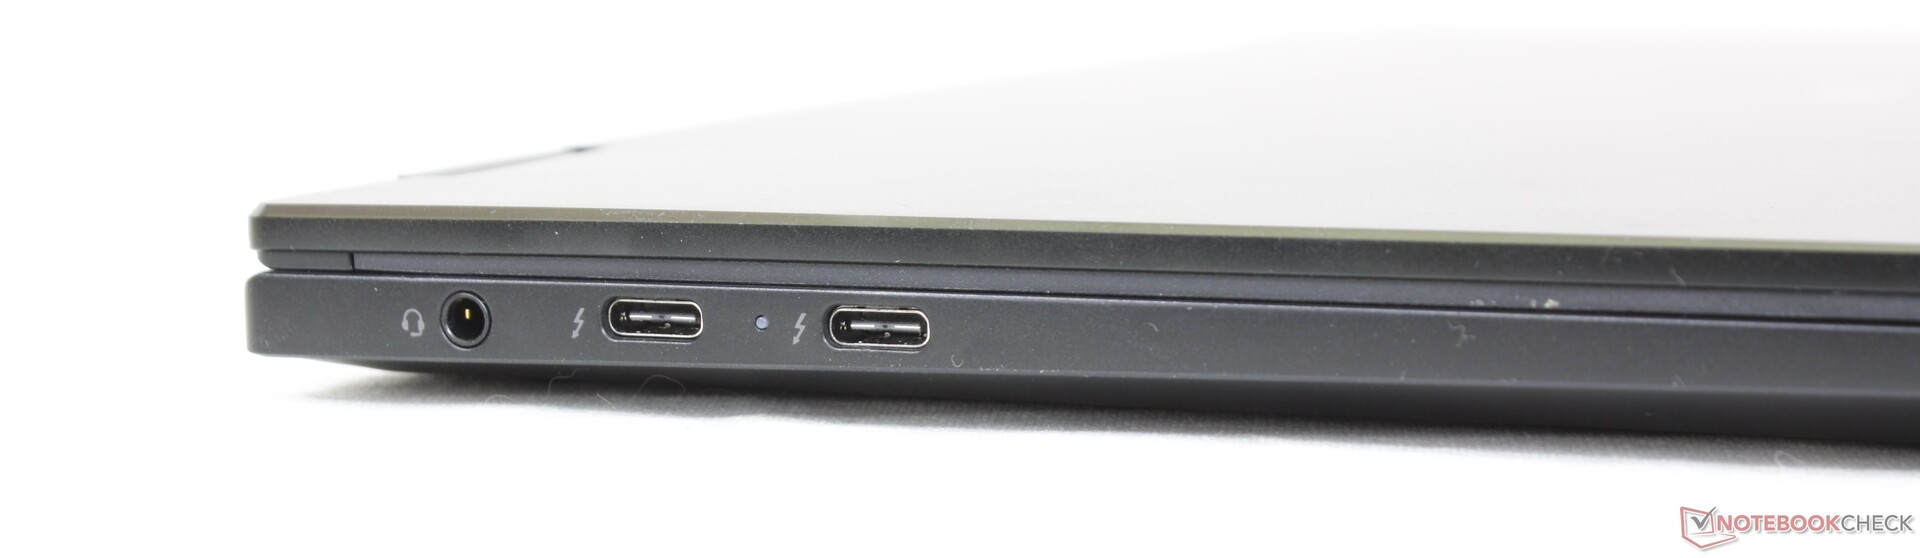
Conectividad - 2x Thunderbolt 4
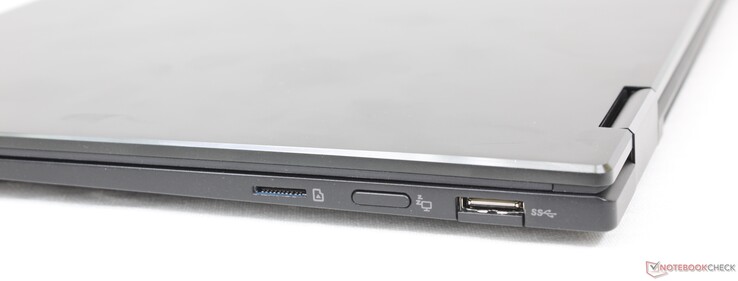
Las opciones de puerto son idénticas a las del Gram 16T90P, de mayor tamaño. El Gram 14T90P ha eliminado el puerto HDMI y la ranura de bloqueo Kensington que se encuentran en el Gram 14Z90P o el Gram 14T90N, y ofrece menos opciones que el 14Z90P. Sólo hay un puerto USB-A de tamaño completo en lugar de dos, por ejemplo, lo que significa que se anima a los propietarios a utilizar accesorios USB-C o estaciones de acoplamiento en su lugar.
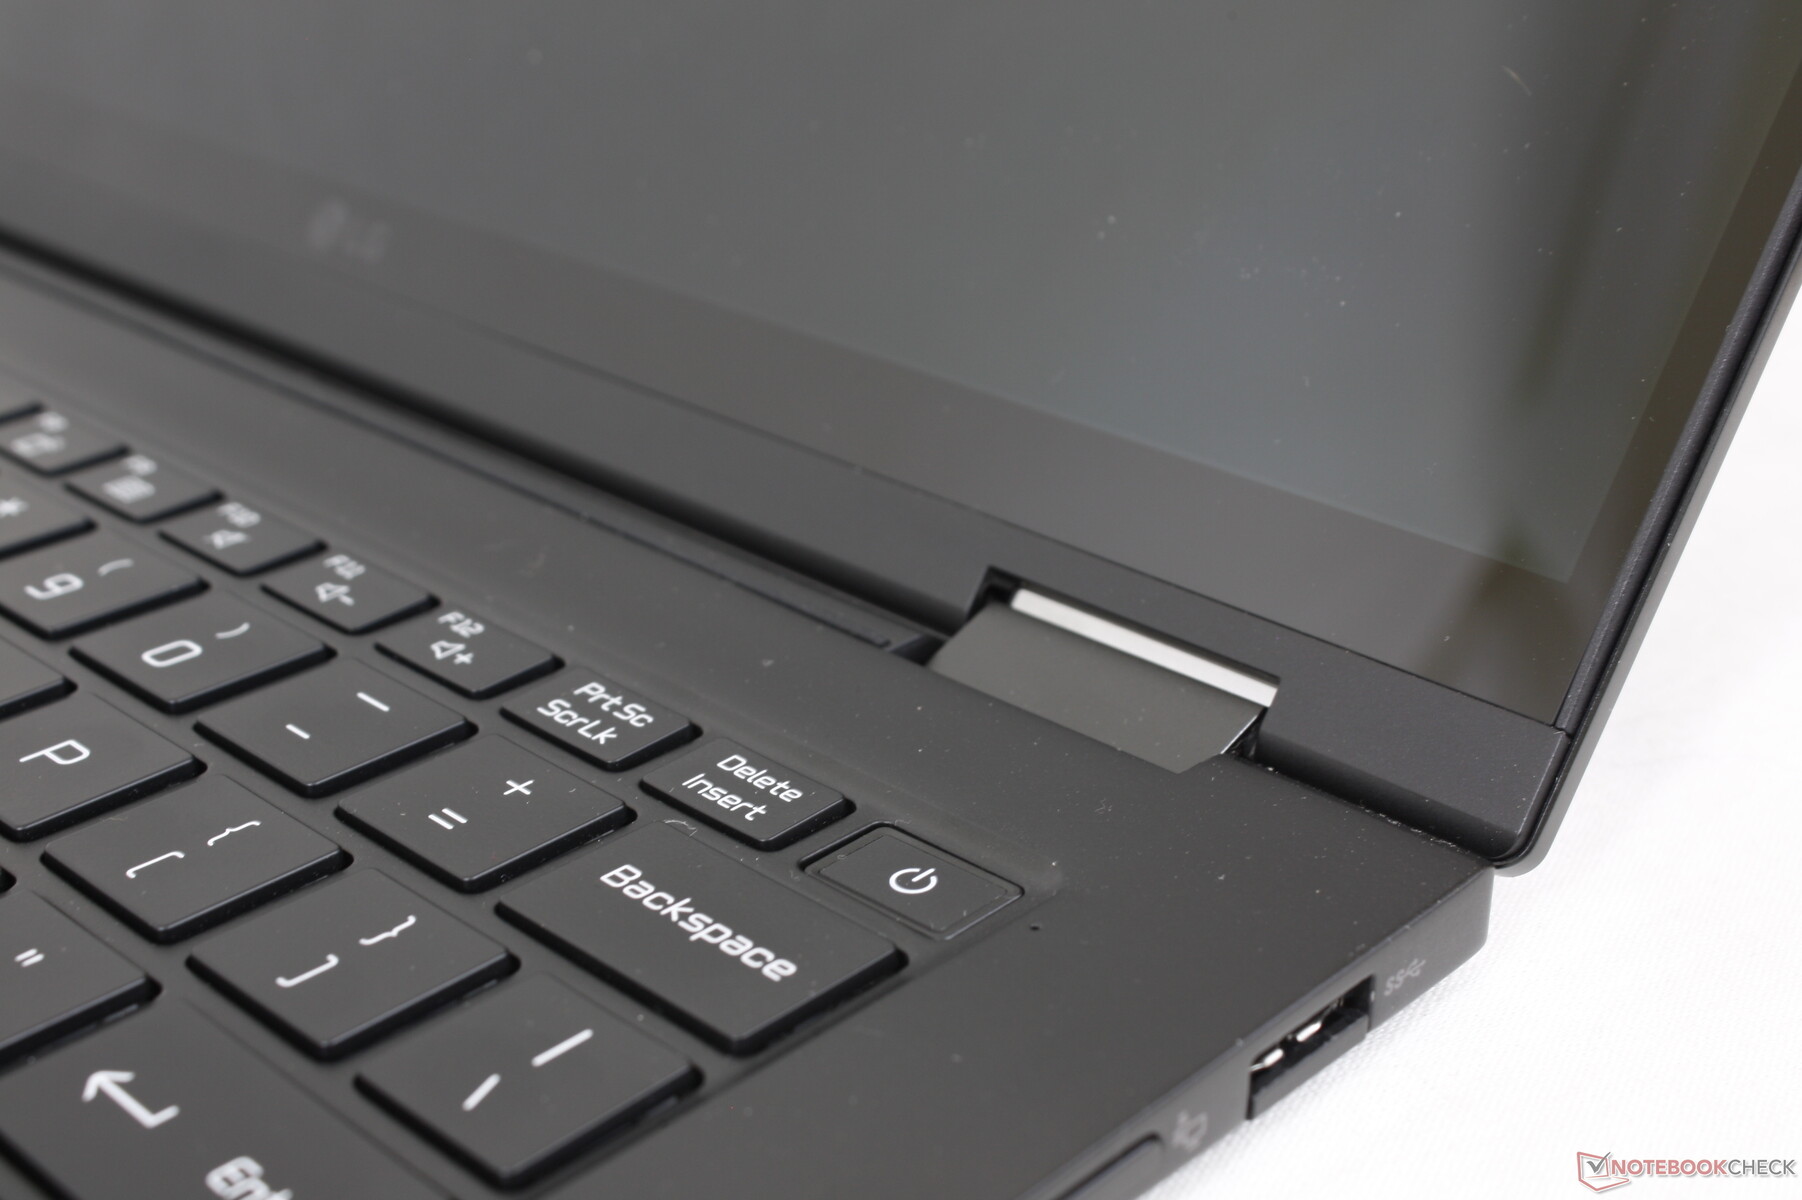
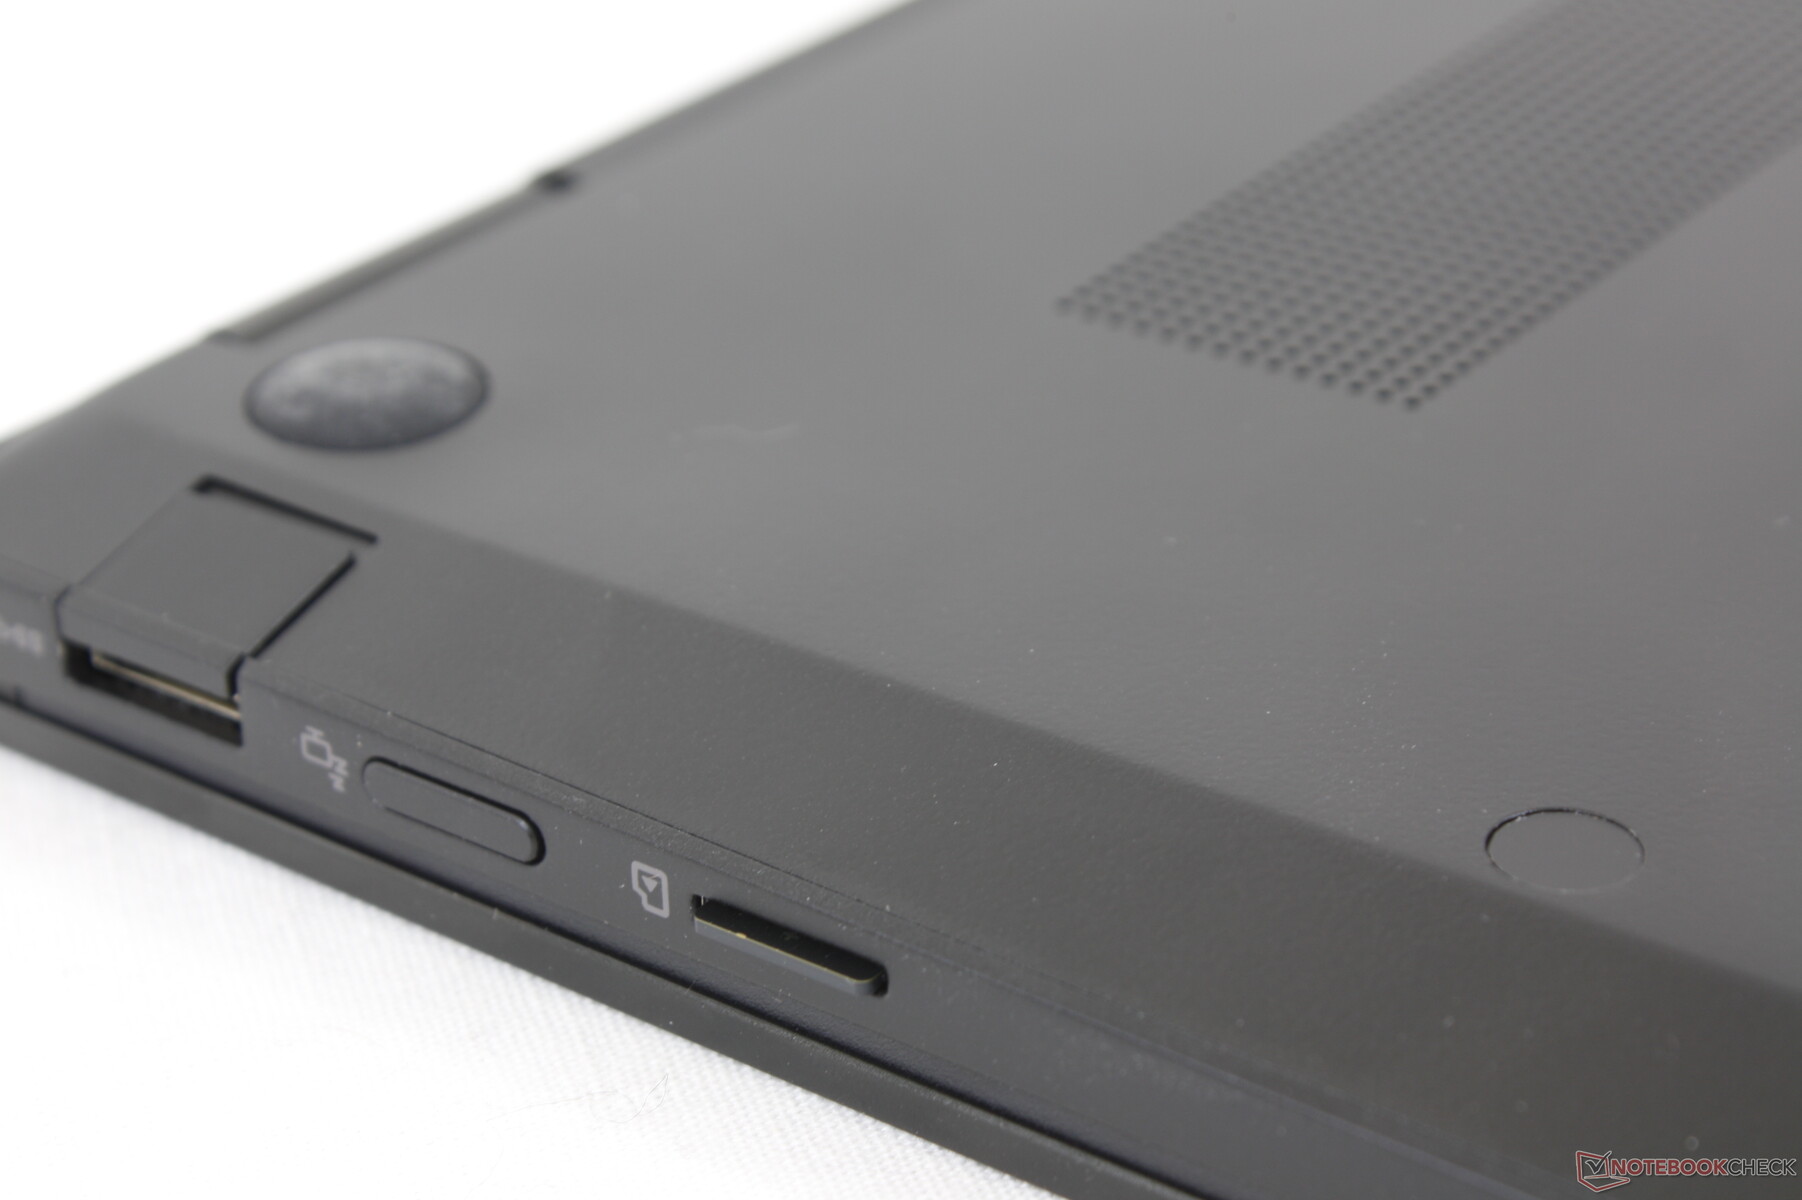
Al pulsar el botón del borde derecho se enciende o apaga la pantalla. Es una característica extraña que no vemos en muchos otros convertibles y, por desgracia, no es personalizable por el usuario.
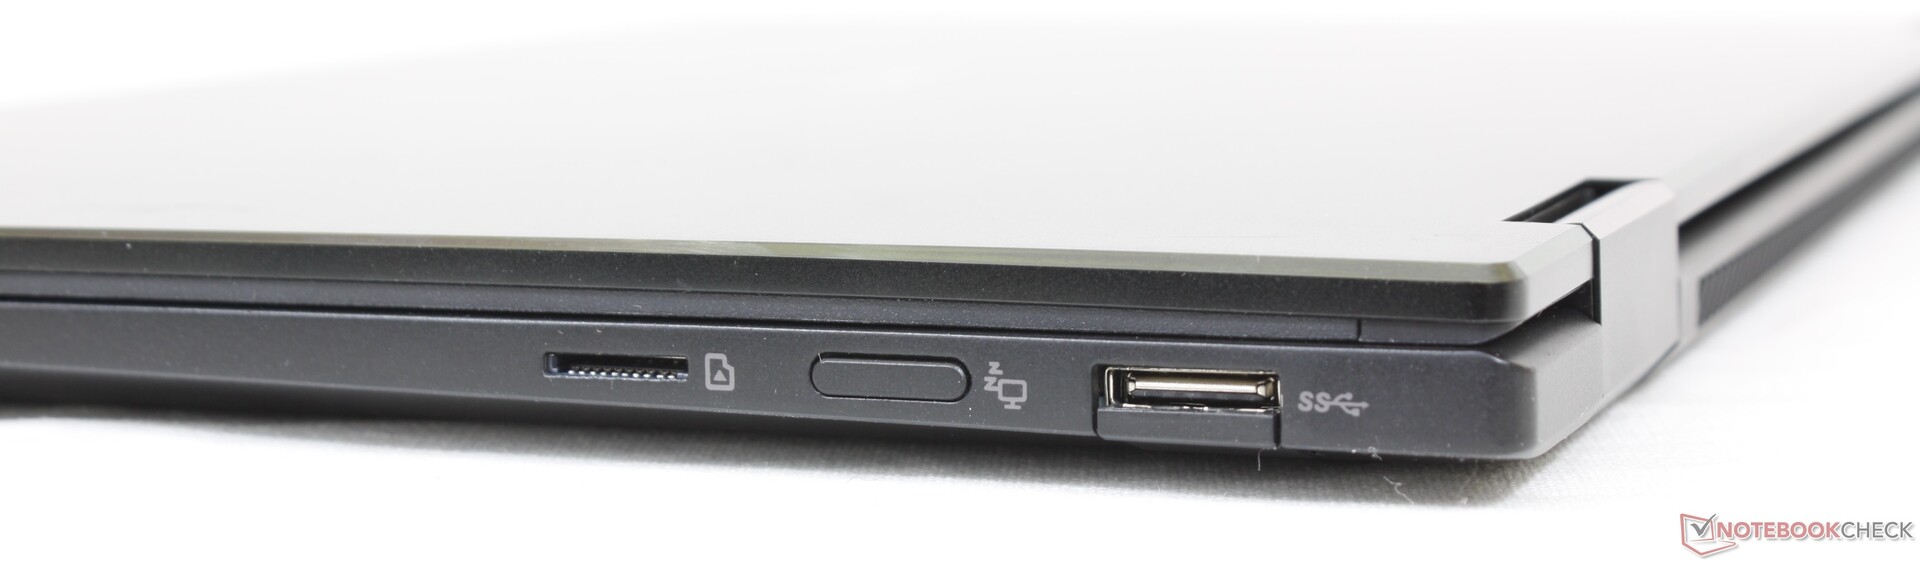
Lector de tarjetas SD
La velocidad de transferencia desde el lector de tarjetas MicroSD con muelle es media, de unos 85 MB/s. Mover 1 GB de fotos desde nuestra tarjeta UHS-II al escritorio tarda unos 15 segundos siendo similar a todos los demás modelos Gram hasta ahora.
| SD Card Reader | |
| average JPG Copy Test (av. of 3 runs) | |
| HP Spectre x360 14-ea0378ng (Toshiba Exceria Pro M501 microSDXC 64GB) | |
| Dell XPS 13 9310 2-in-1 (AV Pro V60) | |
| Asus ZenBook Flip 14 UN5401QA-KN085W (AV Pro SD microSD 128 GB V60) | |
| LG Gram 14T90N (Toshiba Exceria Pro M501 64 GB UHS-II) | |
| MSI Summit E13 Flip Evo A11MT (AV PRO microSD 128 GB V60) | |
| LG Gram 14T90P (AV Pro V60) | |
| maximum AS SSD Seq Read Test (1GB) | |
| HP Spectre x360 14-ea0378ng (Toshiba Exceria Pro M501 microSDXC 64GB) | |
| Dell XPS 13 9310 2-in-1 (AV Pro V60) | |
| Asus ZenBook Flip 14 UN5401QA-KN085W (AV Pro SD microSD 128 GB V60) | |
| LG Gram 14T90P (AV Pro V60) | |
| MSI Summit E13 Flip Evo A11MT (AV PRO microSD 128 GB V60) | |
| LG Gram 14T90N (Toshiba Exceria Pro M501 64 GB UHS-II) | |
Comunicación
Un Intel AX201 viene de serie para el soporte de Wi-Fi 6 y Bluetooth 5.2. No experimentamos ningún problema de conectividad cuando lo emparejamos con nuestro Asus GT-AXE11000, a diferencia de lo que observamos en el reciente Asus Zenbook Pro 15.
| Networking | |
| iperf3 transmit AX12 | |
| Asus ZenBook Flip 14 UN5401QA-KN085W | |
| Lenovo Yoga 9 14IAP7 82LU0001US | |
| Dell XPS 13 9310 2-in-1 | |
| HP Spectre x360 14-ea0378ng | |
| MSI Summit E13 Flip Evo A11MT | |
| LG Gram 14T90N | |
| iperf3 receive AX12 | |
| Asus ZenBook Flip 14 UN5401QA-KN085W | |
| Dell XPS 13 9310 2-in-1 | |
| Lenovo Yoga 9 14IAP7 82LU0001US | |
| MSI Summit E13 Flip Evo A11MT | |
| LG Gram 14T90N | |
| HP Spectre x360 14-ea0378ng | |
| iperf3 receive AXE11000 | |
| LG Gram 14T90P | |
| iperf3 transmit AXE11000 | |
| LG Gram 14T90P | |
Cámara web
La cámara es sólo de 720p sin soporte para Windows Hello o incluso un obturador de privacidad. Esto definitivamente necesita ser abordado en futuros modelos.


Mantenimiento
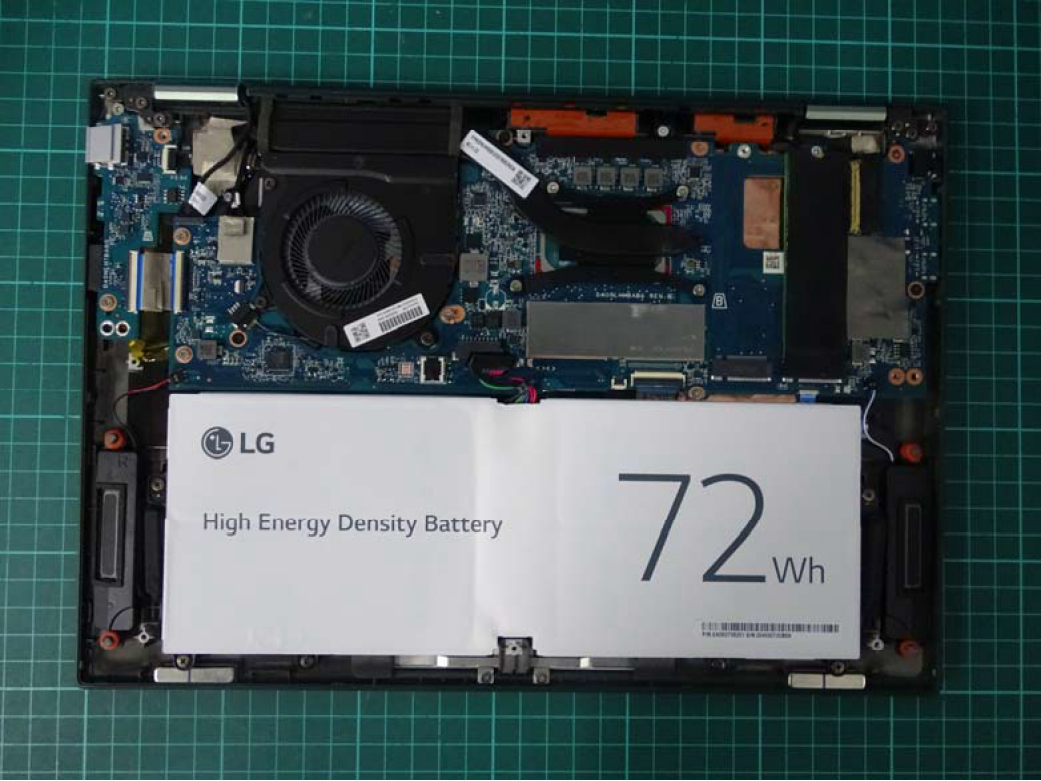
Al igual que con todos los demás portátiles Gram hasta ahora, el panel inferior fue diseñado para ser muy difícil de abrir, ya que los tornillos están ocultos bajo pegatinas y pies de goma. Es una pena porque el sistema puede soportar hasta dos SSDs M.2 2280 internos en lugar de uno para espacio de almacenamiento adicional, pero LG ha hecho que sea molesto para los propietarios añadir sus propias unidades
Tanto la RAM como la WLAN están soldadas y no son actualizables por el usuario
Como no pudimos abrir nuestra unidad de pruebas sin dañarla, podemos remitirnos a las imágenes oficiales de la FCC aquí.
Accesorios y garantía
La caja incluye un lápiz óptico activo de Wacom https://www.lg.com/us/mobile-accessories/lg-aaa77804301-wacom-active-stylus-pen junto con la documentación habitual y el adaptador de CA. Se aplica la garantía limitada estándar de un año.
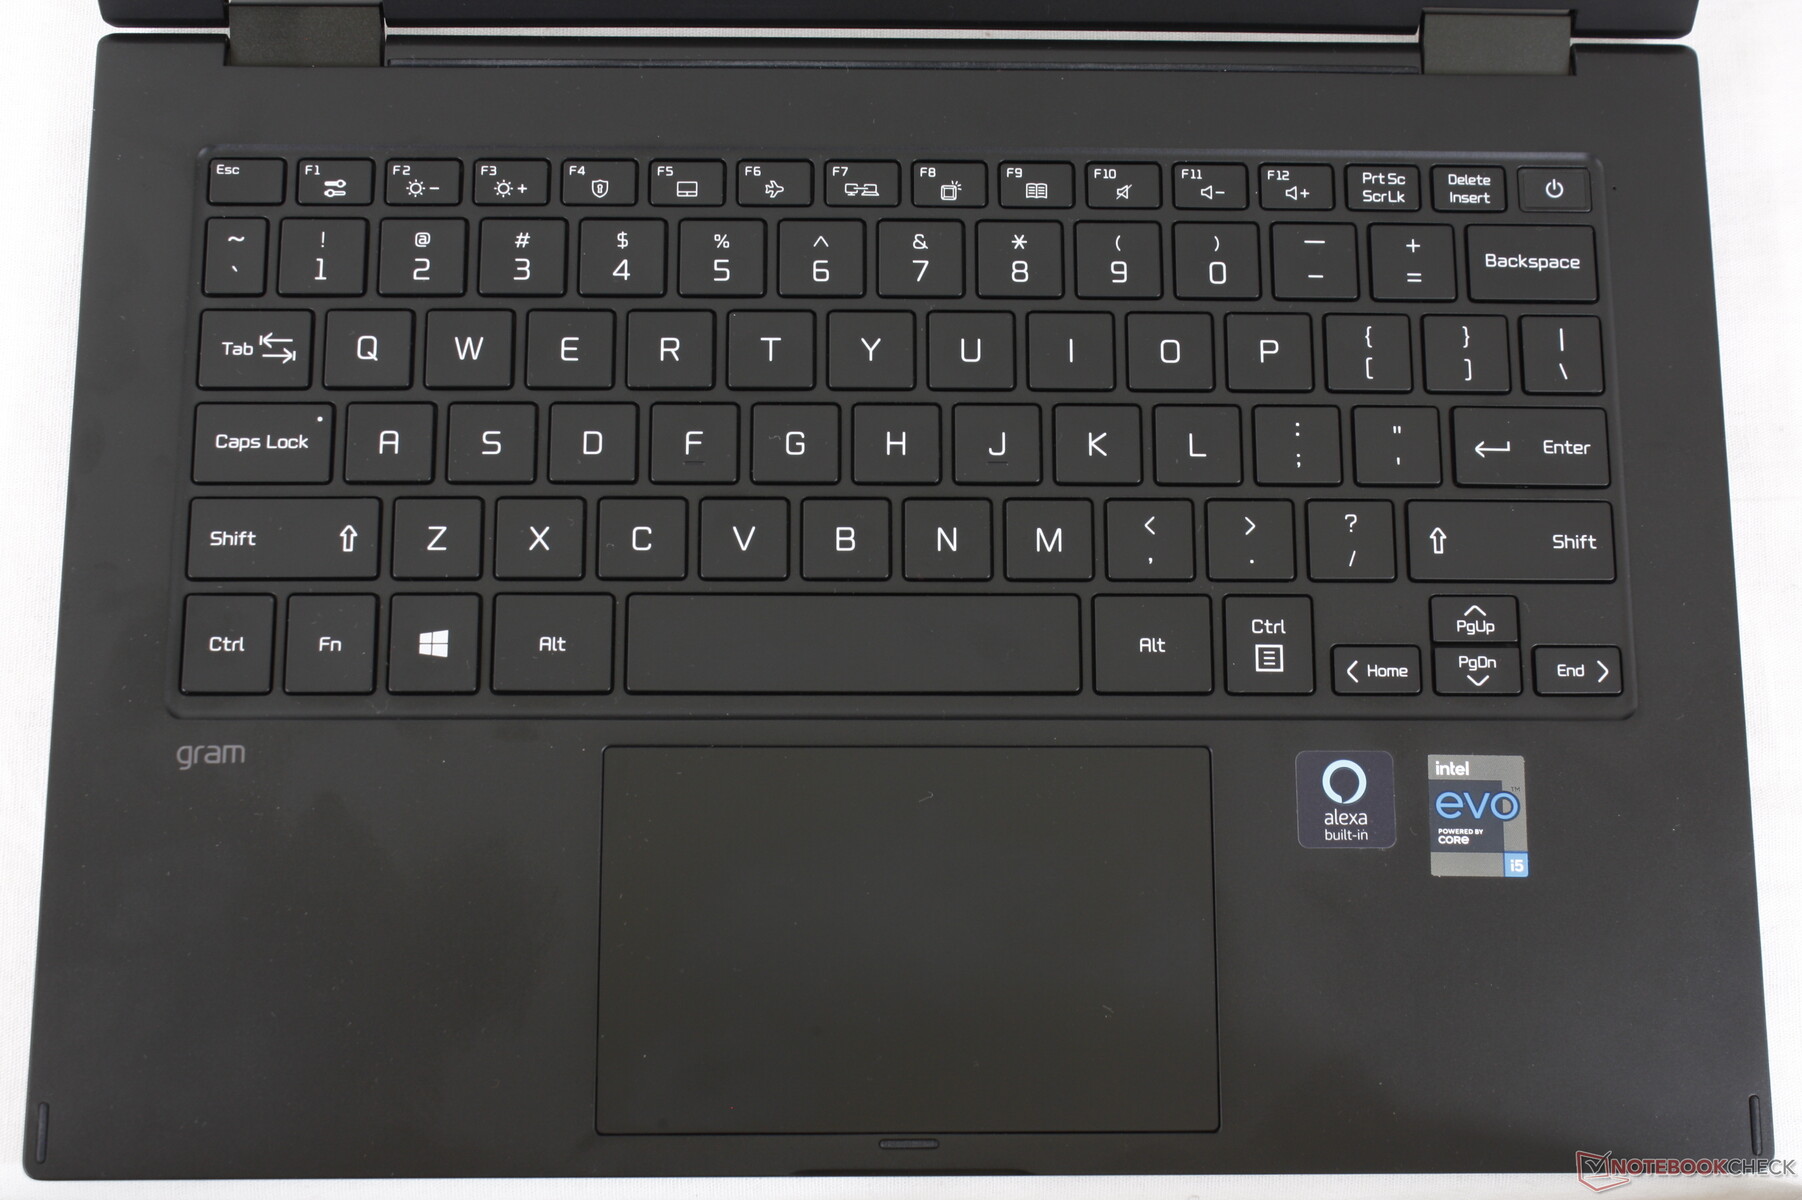
Dispositivos de entrada - Gran teclado, Clickpad para mí
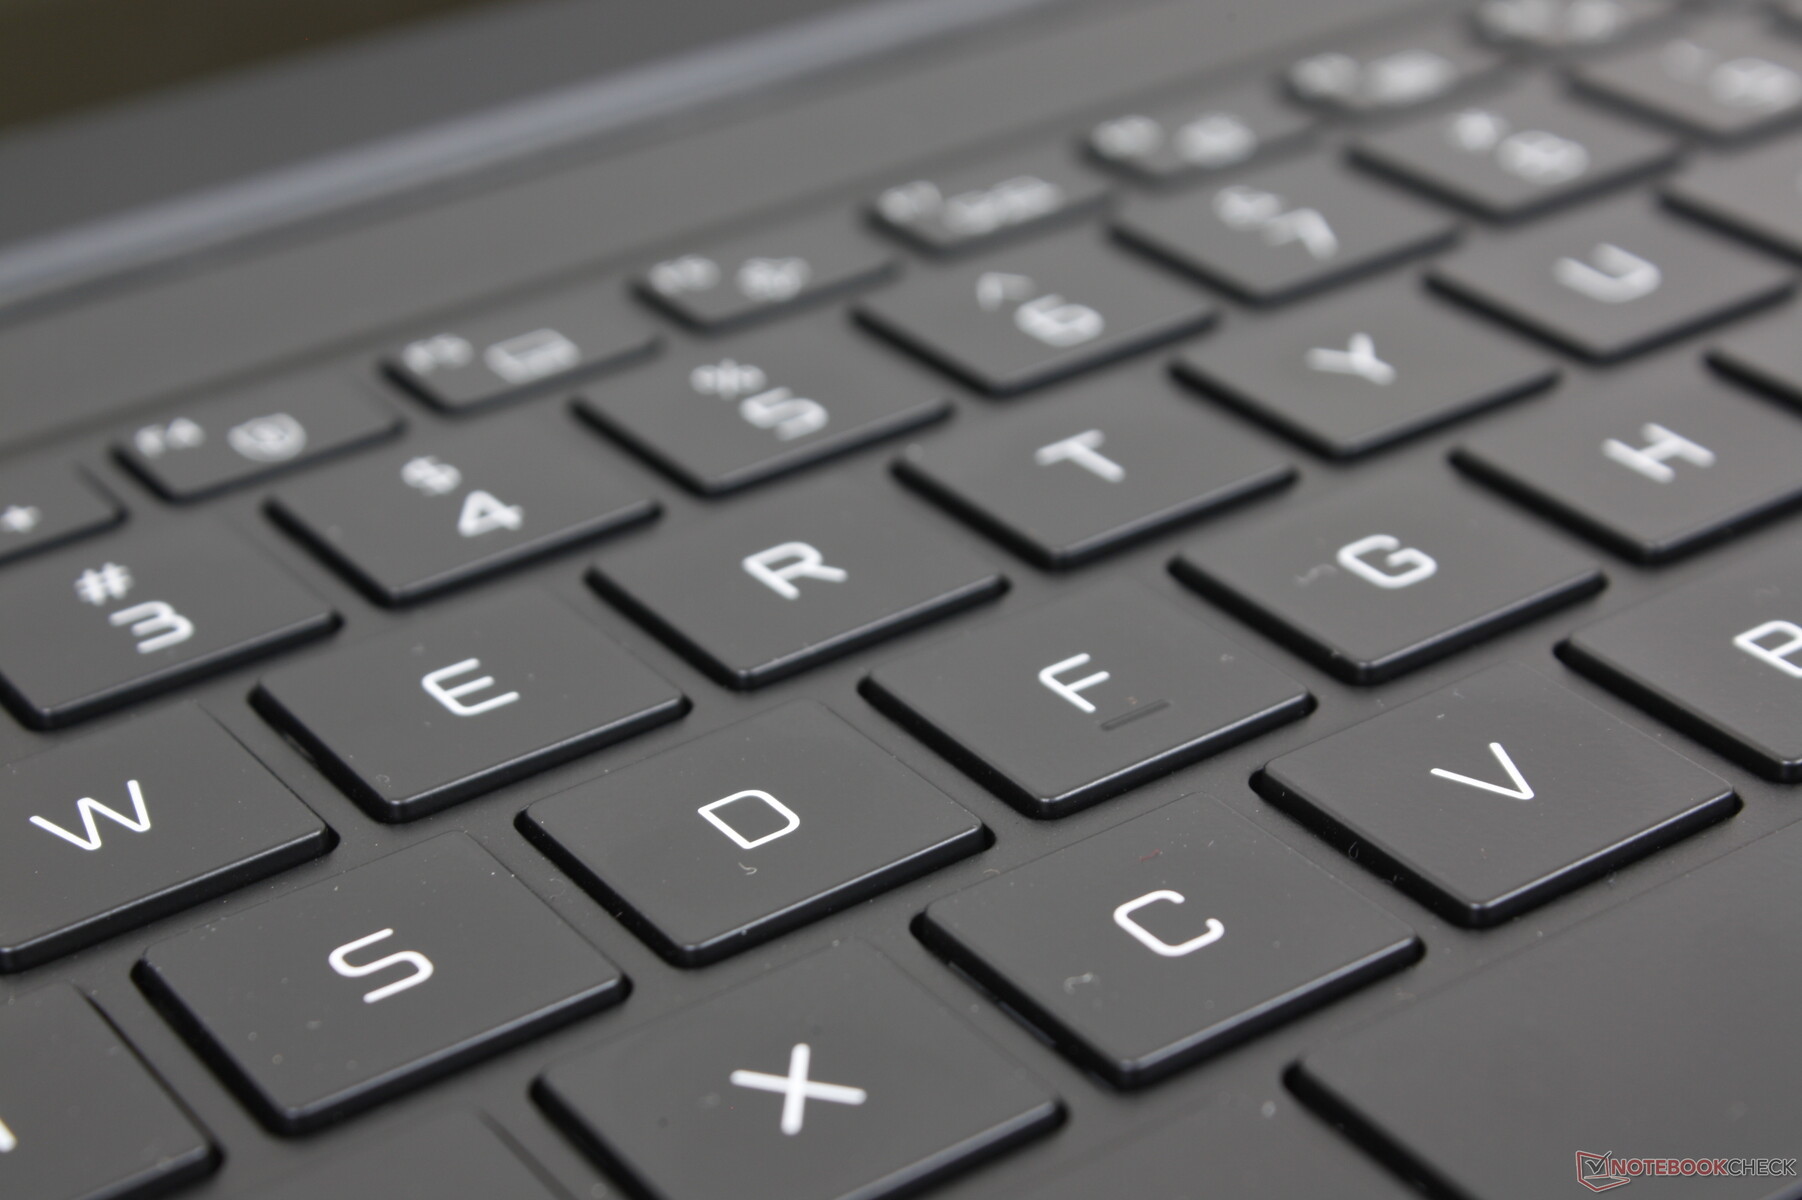
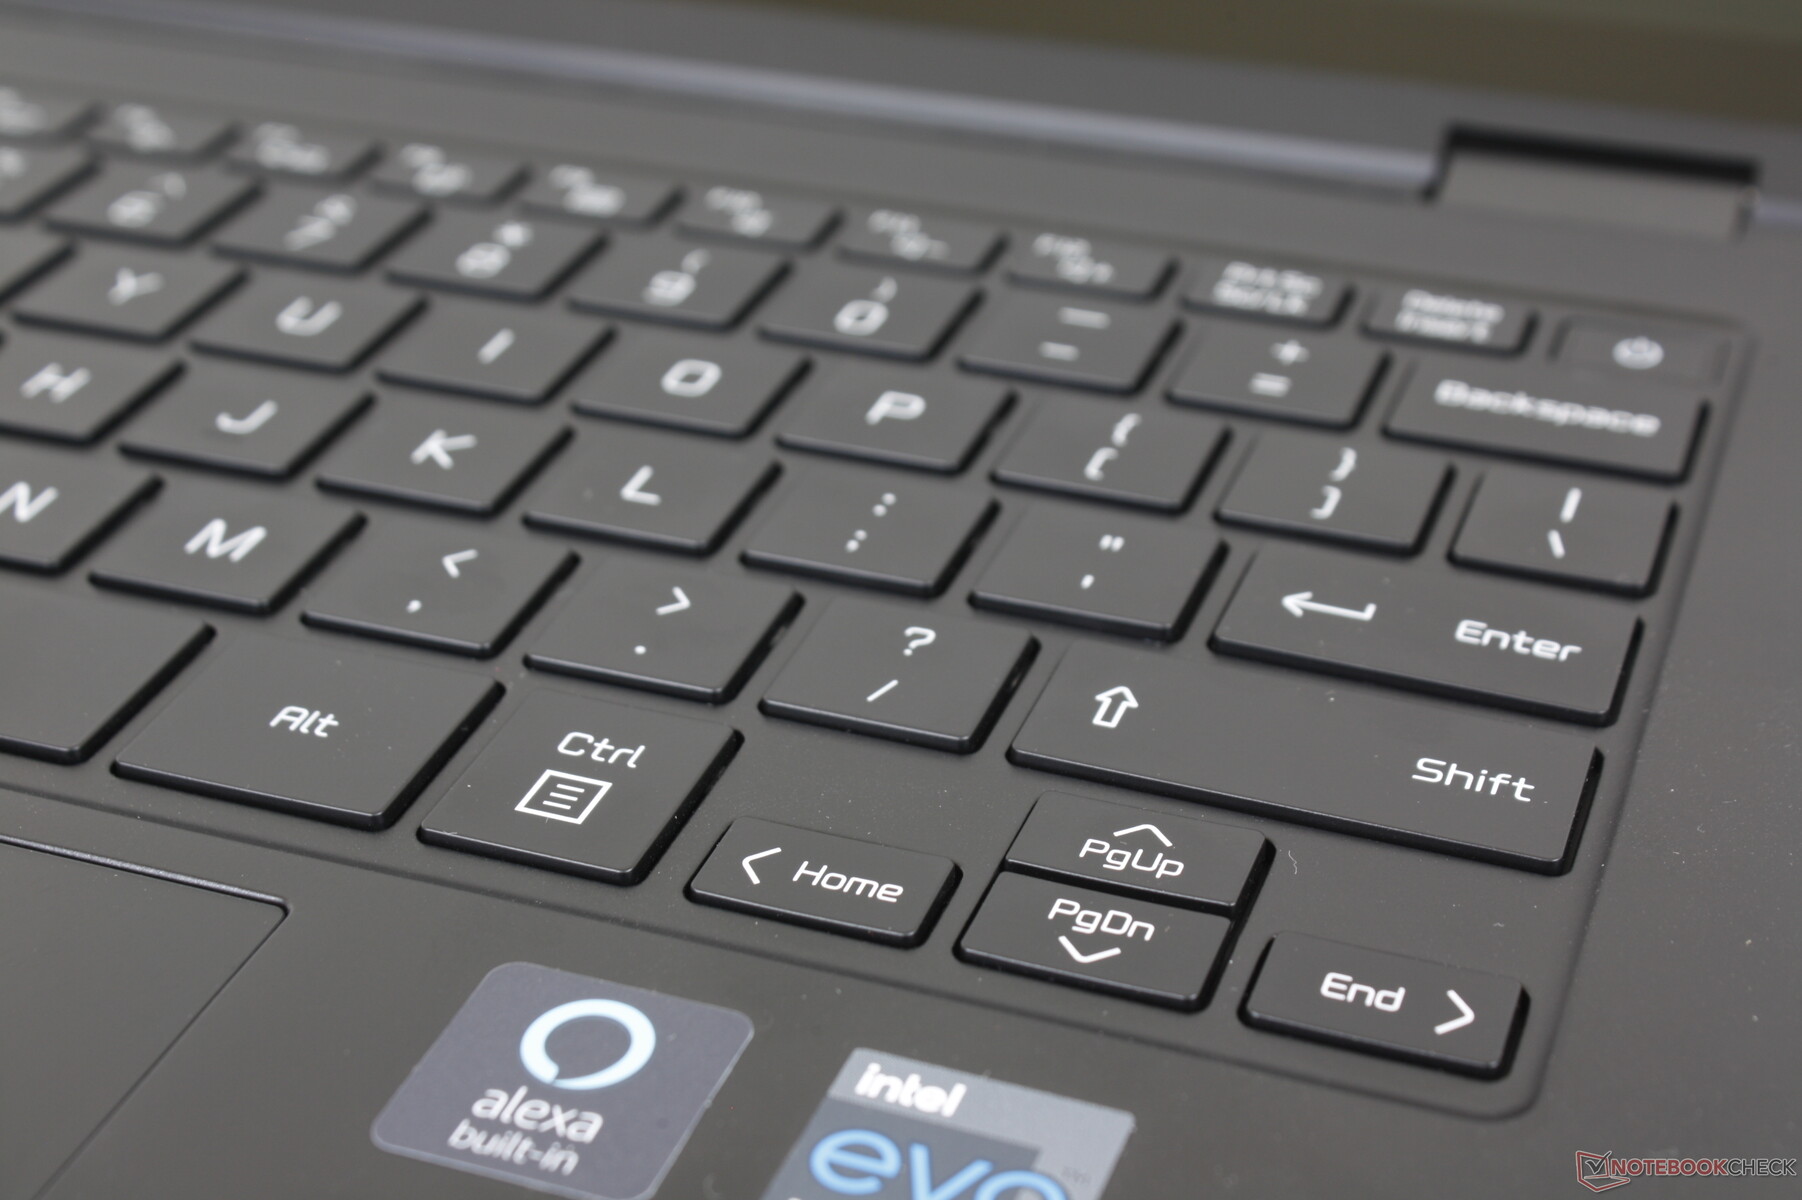
Teclado
La respuesta de las teclas del teclado es notablemente más firme y menos esponjosa que en la mayoría de los otros Ultrabooks. Si estás acostumbrado a escribir en teclas más suaves como en un Asus Vivobook, HP Pavilion, Lenovo IdeaPad, o incluso el Razer Blade, entonces te sorprenderá lo rígidas que son las teclas del Gram 14T90P. Sin embargo, una de las consecuencias de estas teclas más firmes es que el sonido es más fuerte que la media y la experiencia de escribir es más ruidosa.
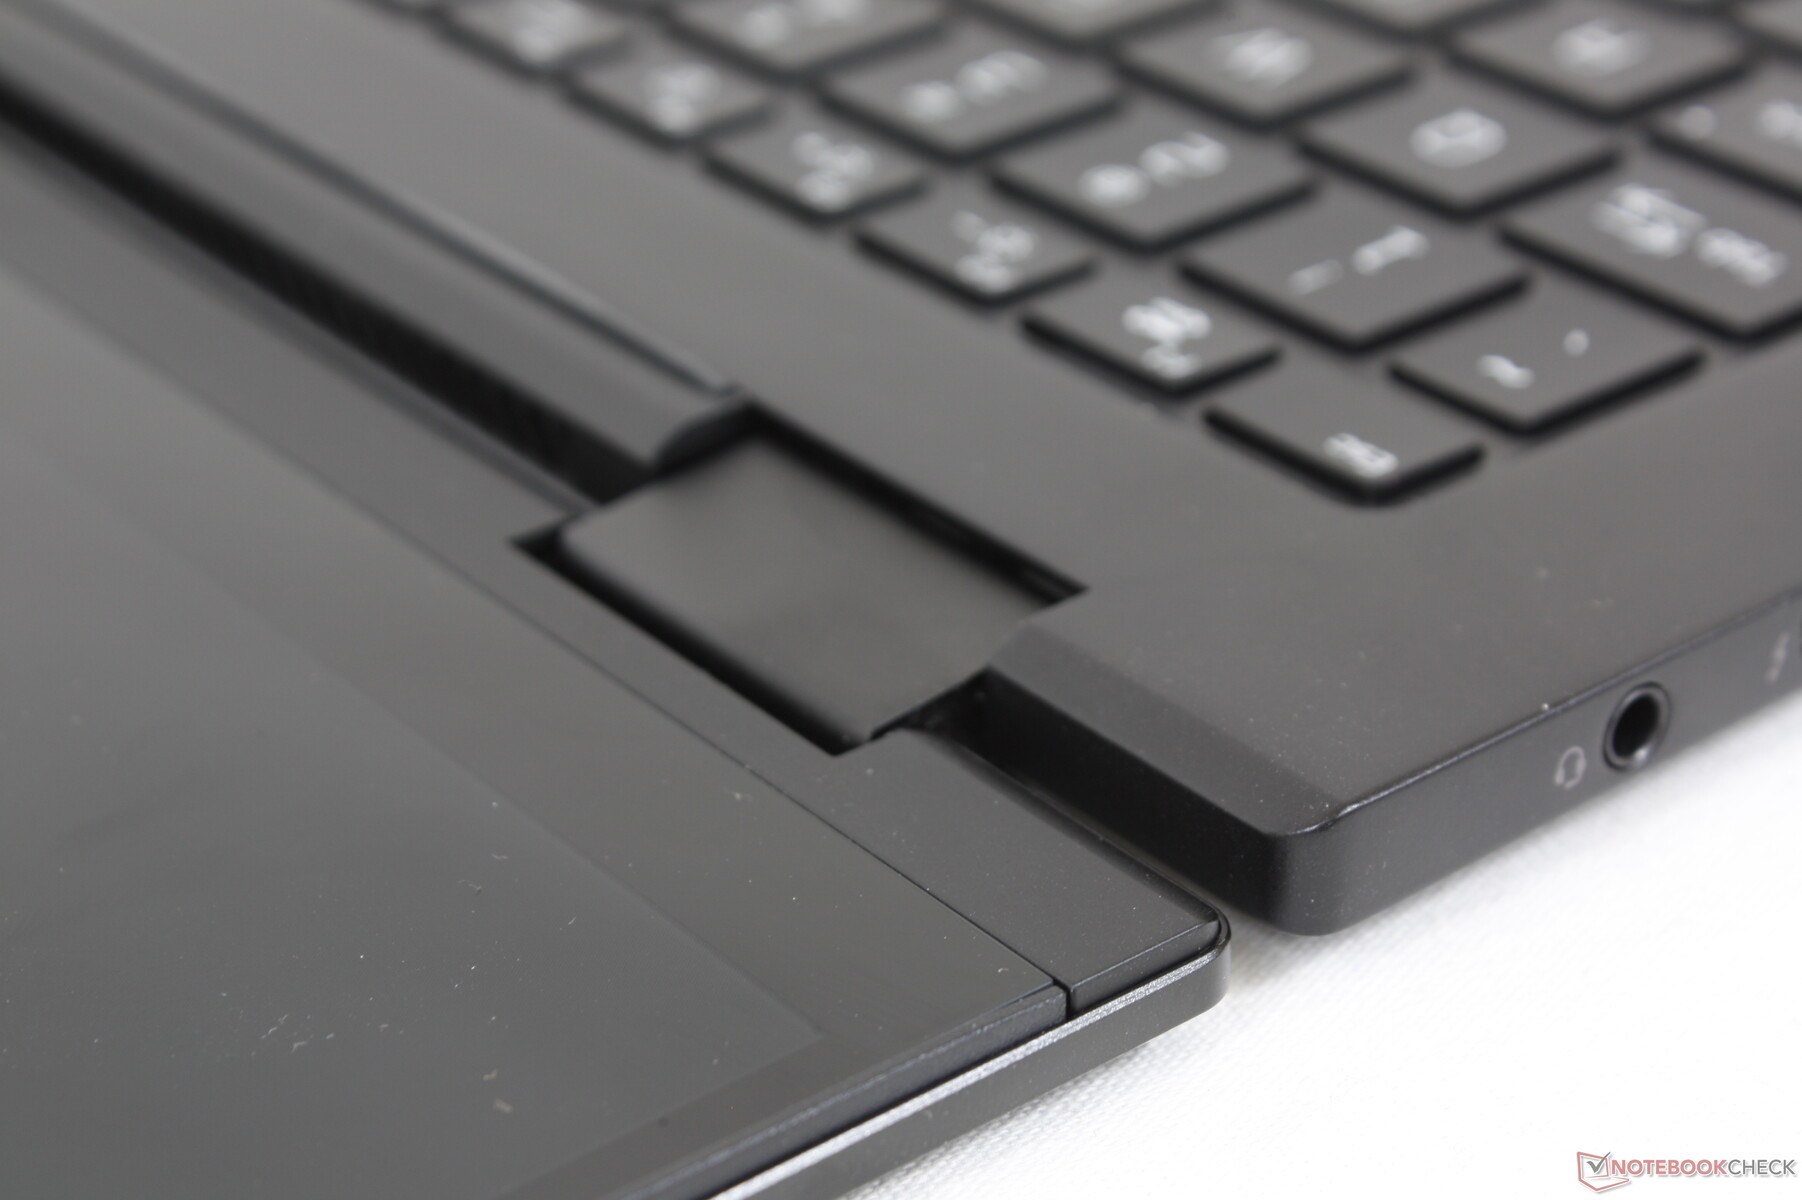
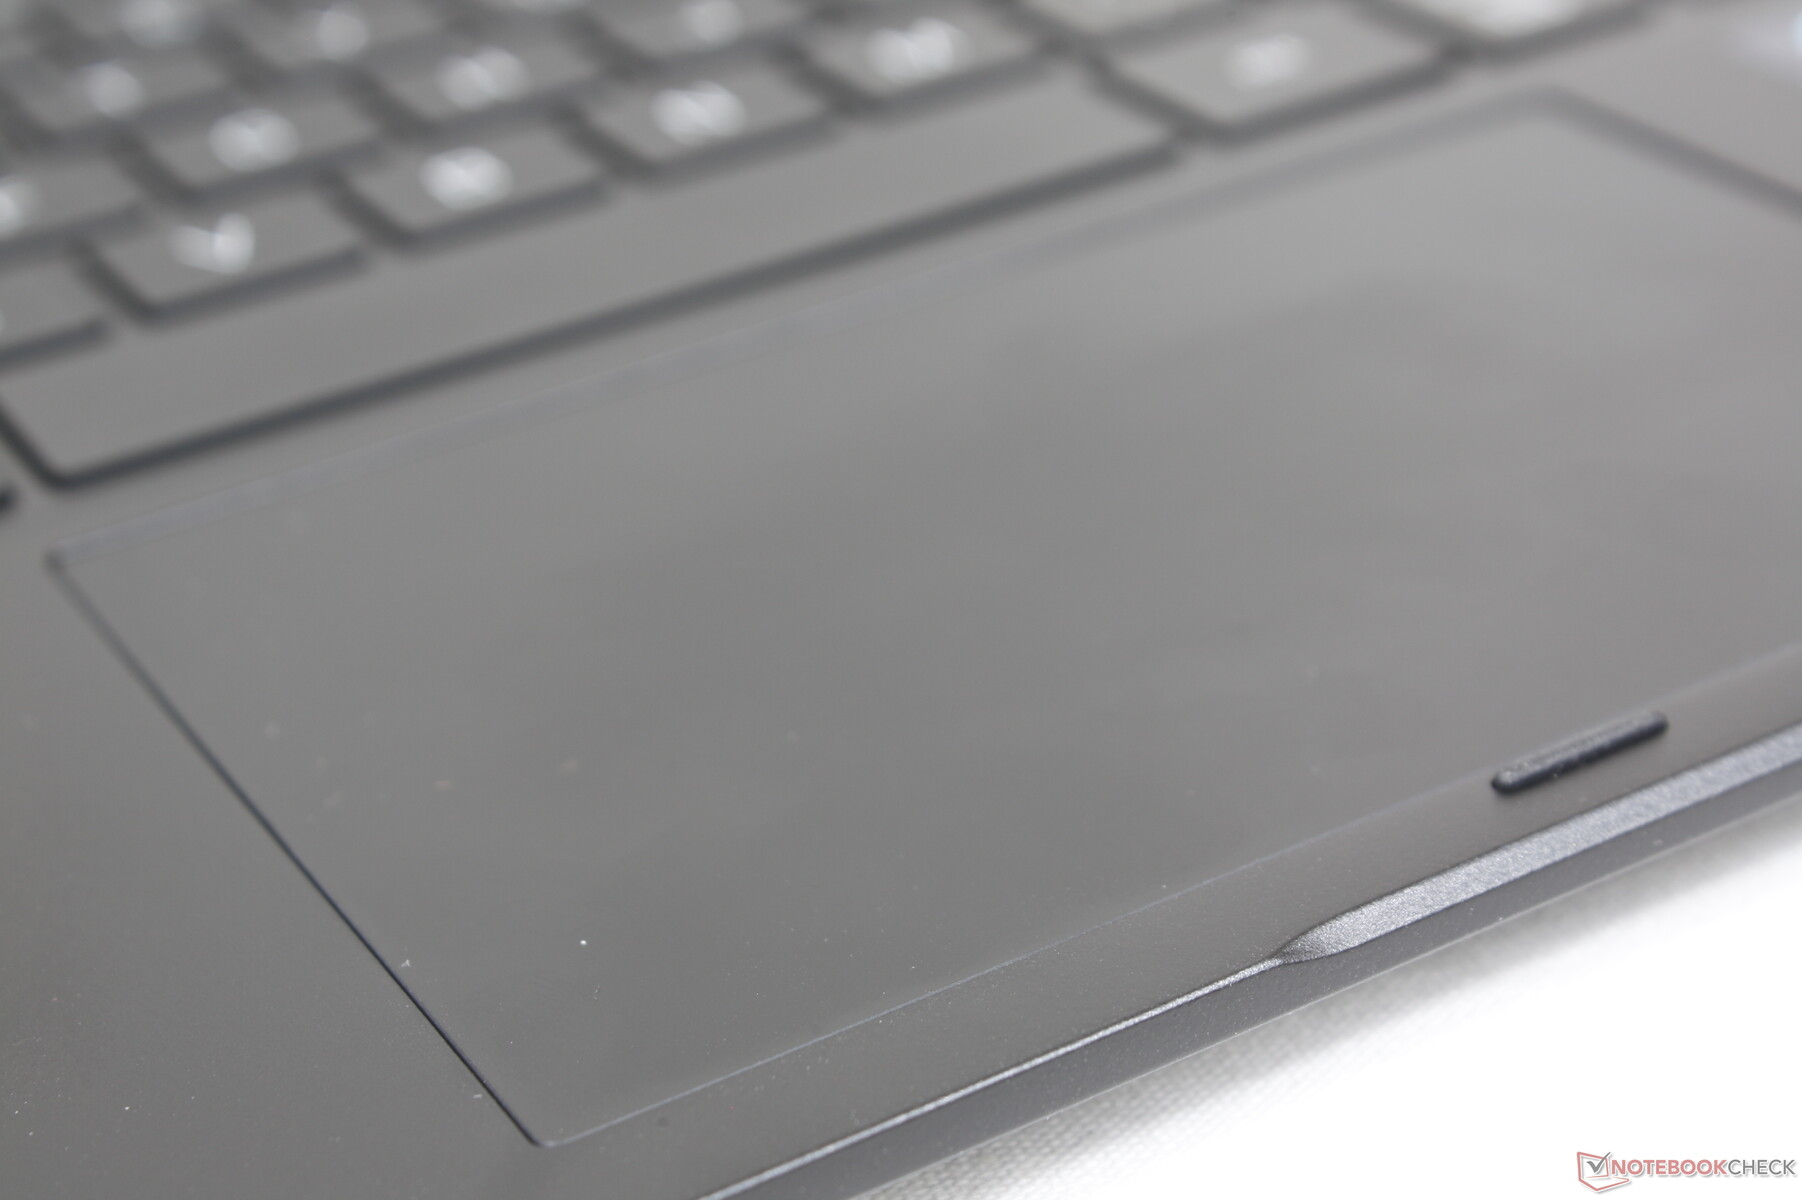
Teclado táctil
Nos impresiona menos el clickpad en comparación con el teclado. Aunque es más grande que el clickpad del Gram 14T90N (11,3 x 7 cm frente a 10,5 x 6,5 cm) para facilitar el control del cursor y las entradas multitáctiles, la respuesta al pulsar es demasiado suave y silenciosa. Una retroalimentación más firme habría dado una sensación más satisfactoria.
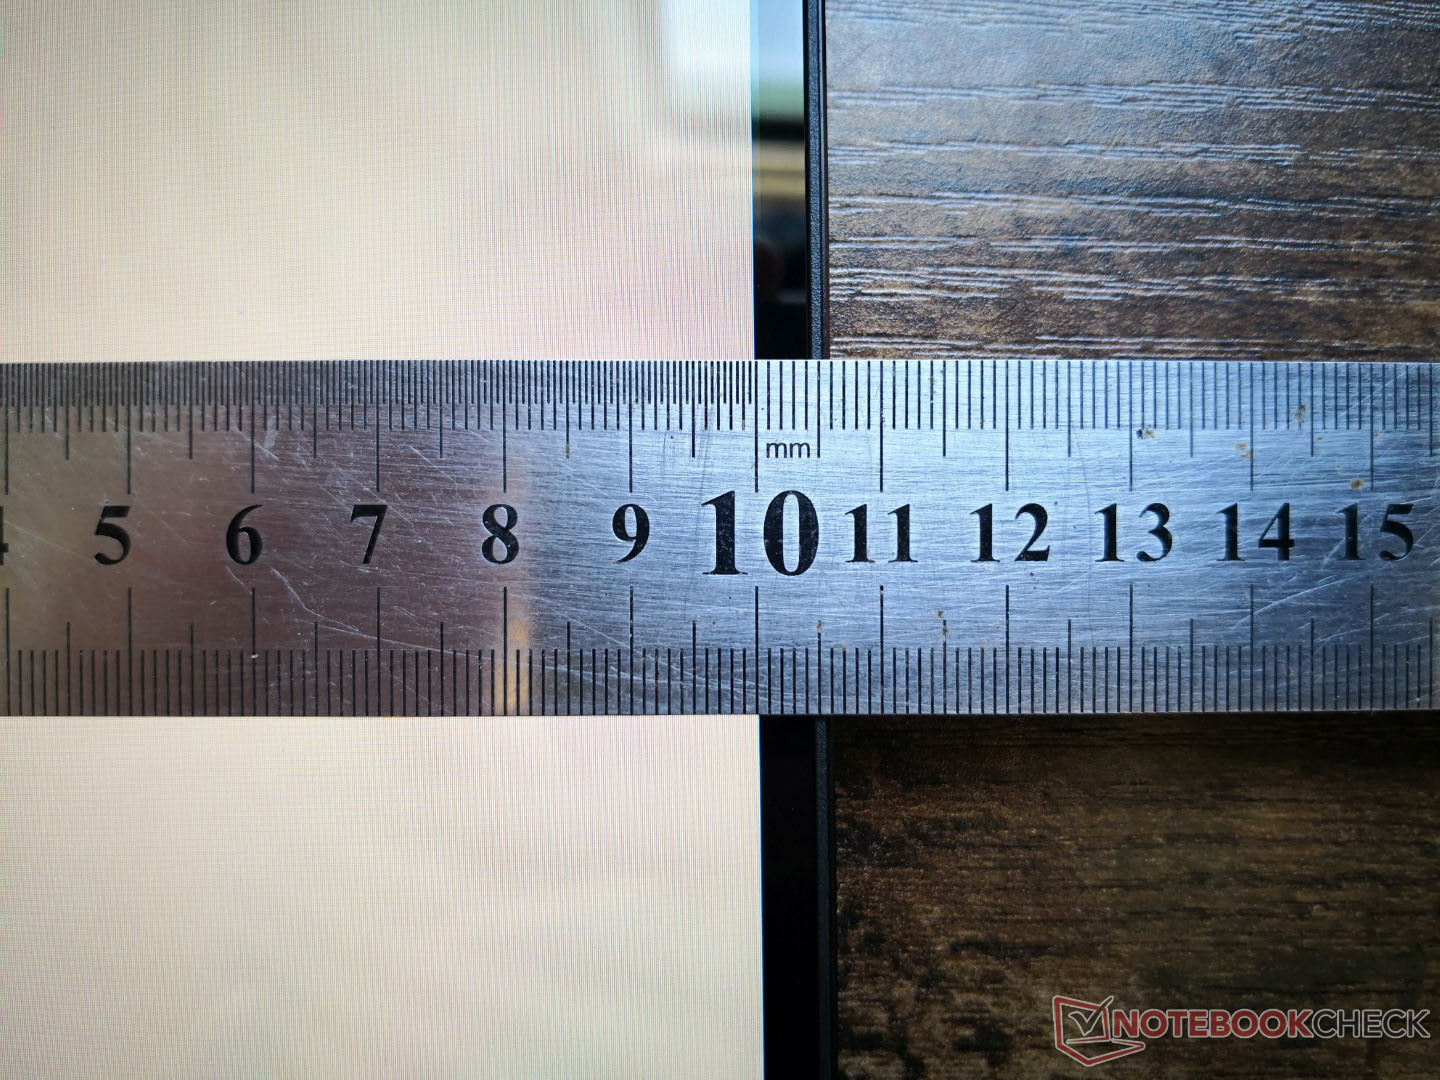
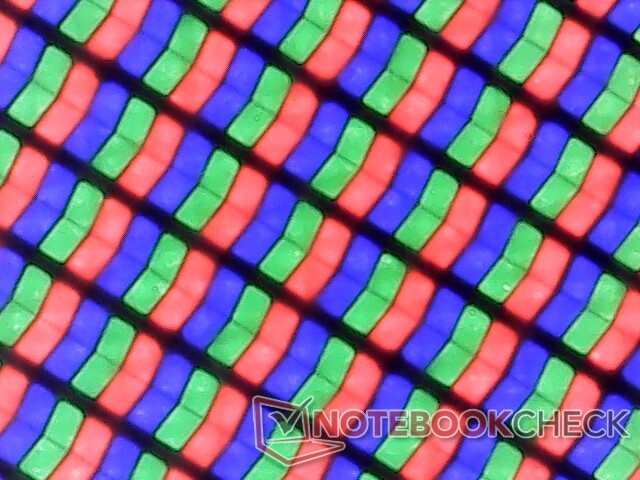
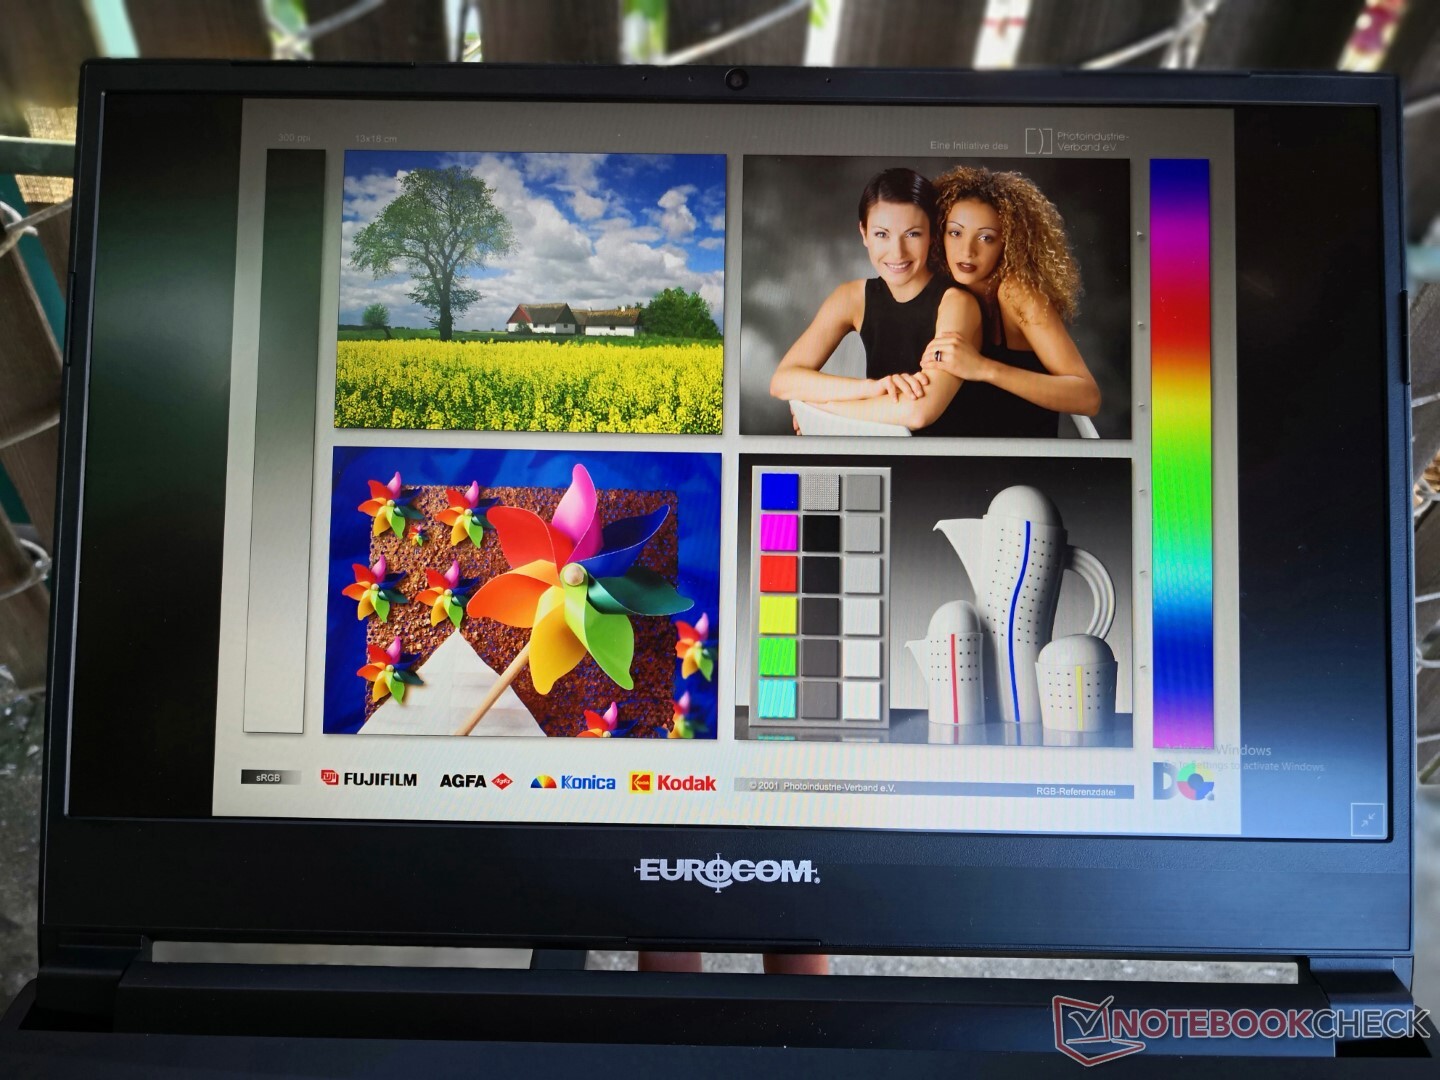
Pantalla: nítida y con excelentes colores
El LG Gram 14T90P utiliza el mismo panel IPS de alta calidad LG Philips LP140WU1-SPA1 que se encuentra en el Gram 14Z90P. Por lo tanto, atributos como la reproducción del color, los tiempos de respuesta y el contraste son prácticamente iguales entre ellos para una experiencia de visualización muy similar.
En comparación con la pantalla del Gram 14T90N, nuestro Gram 14T90P ofrece colores más profundos y tiempos de respuesta en blanco y negro y gris ligeramente más rápidos sin que ello afecte al brillo o al contraste. Aun así, nos encantaría ver paneles OLED y/o de 90 Hz en el futuro, ya que estas características se están convirtiendo en la norma en los subportátiles de gama alta, como en el competidorAsus Zenbook Flip 14.
| |||||||||||||||||||||||||
iluminación: 87 %
Brillo con batería: 305.5 cd/m²
Contraste: 1131:1 (Negro: 0.27 cd/m²)
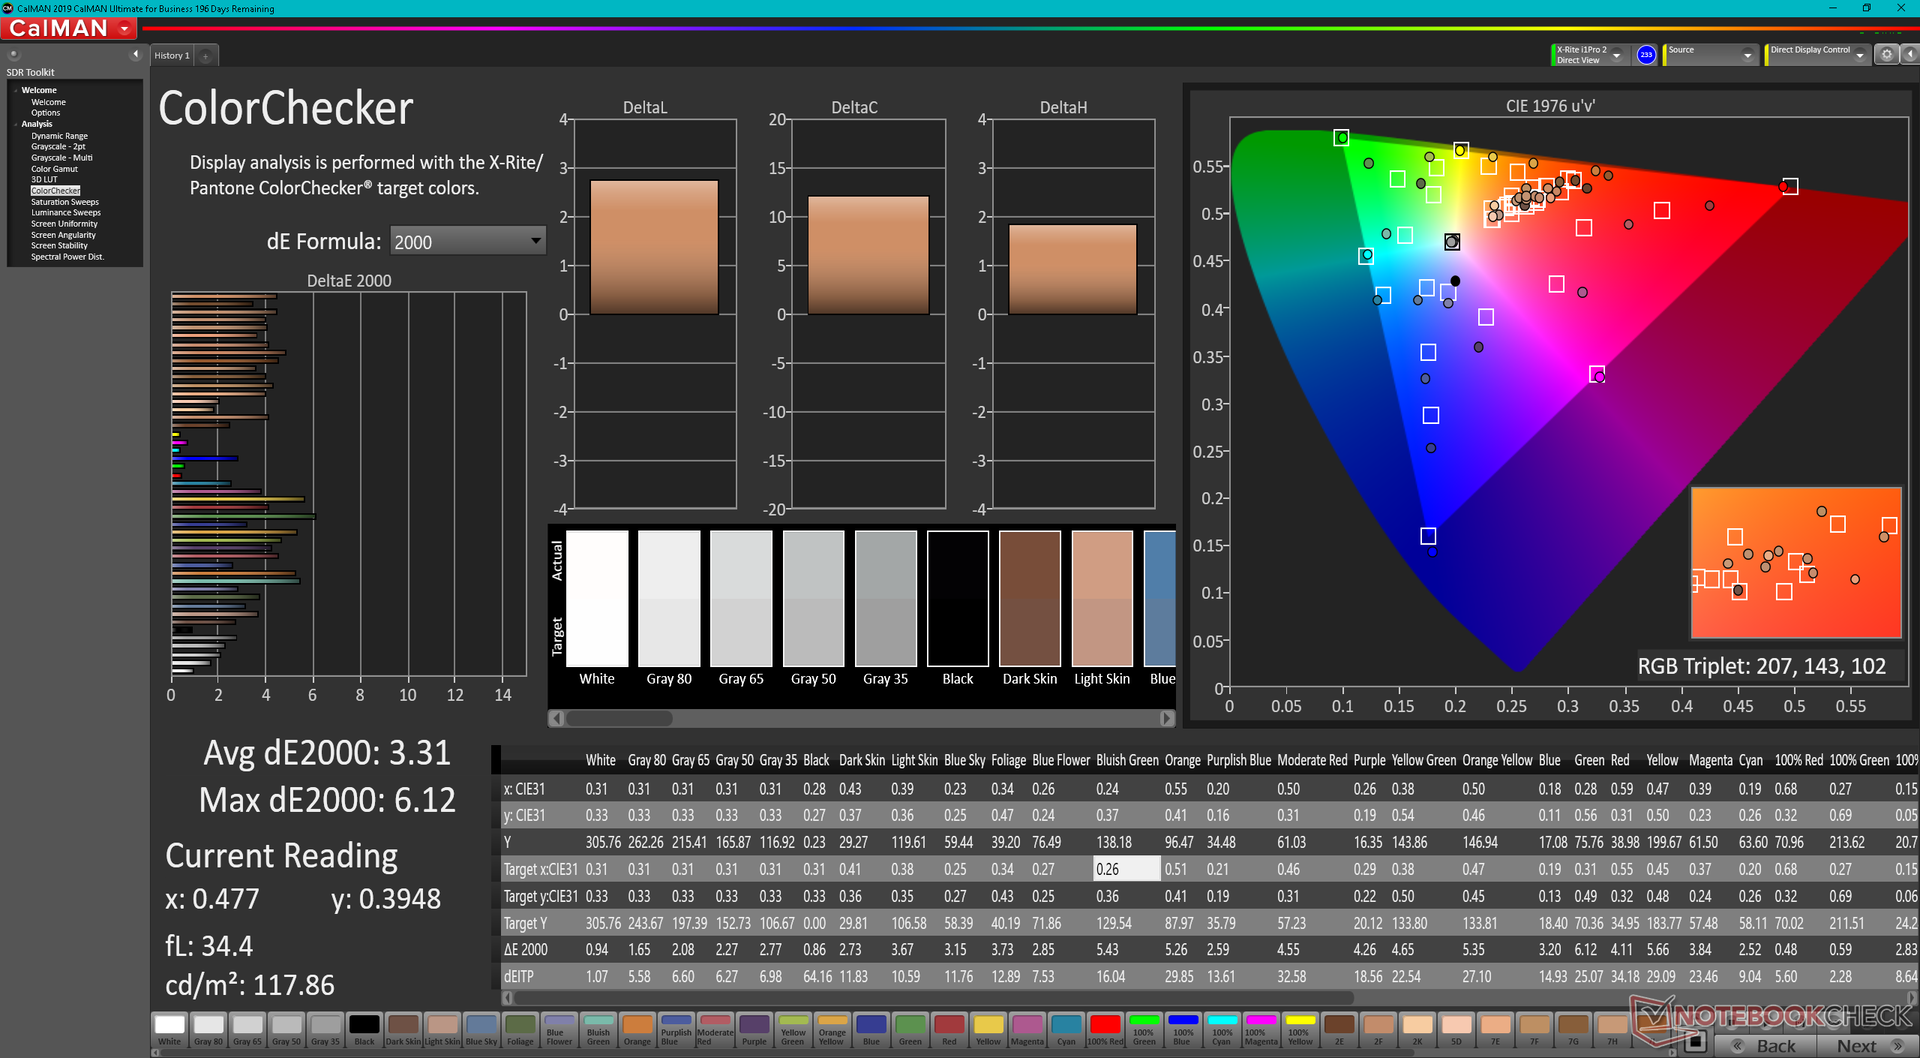
ΔE ColorChecker Calman: 3.31 | ∀{0.5-29.43 Ø4.71}
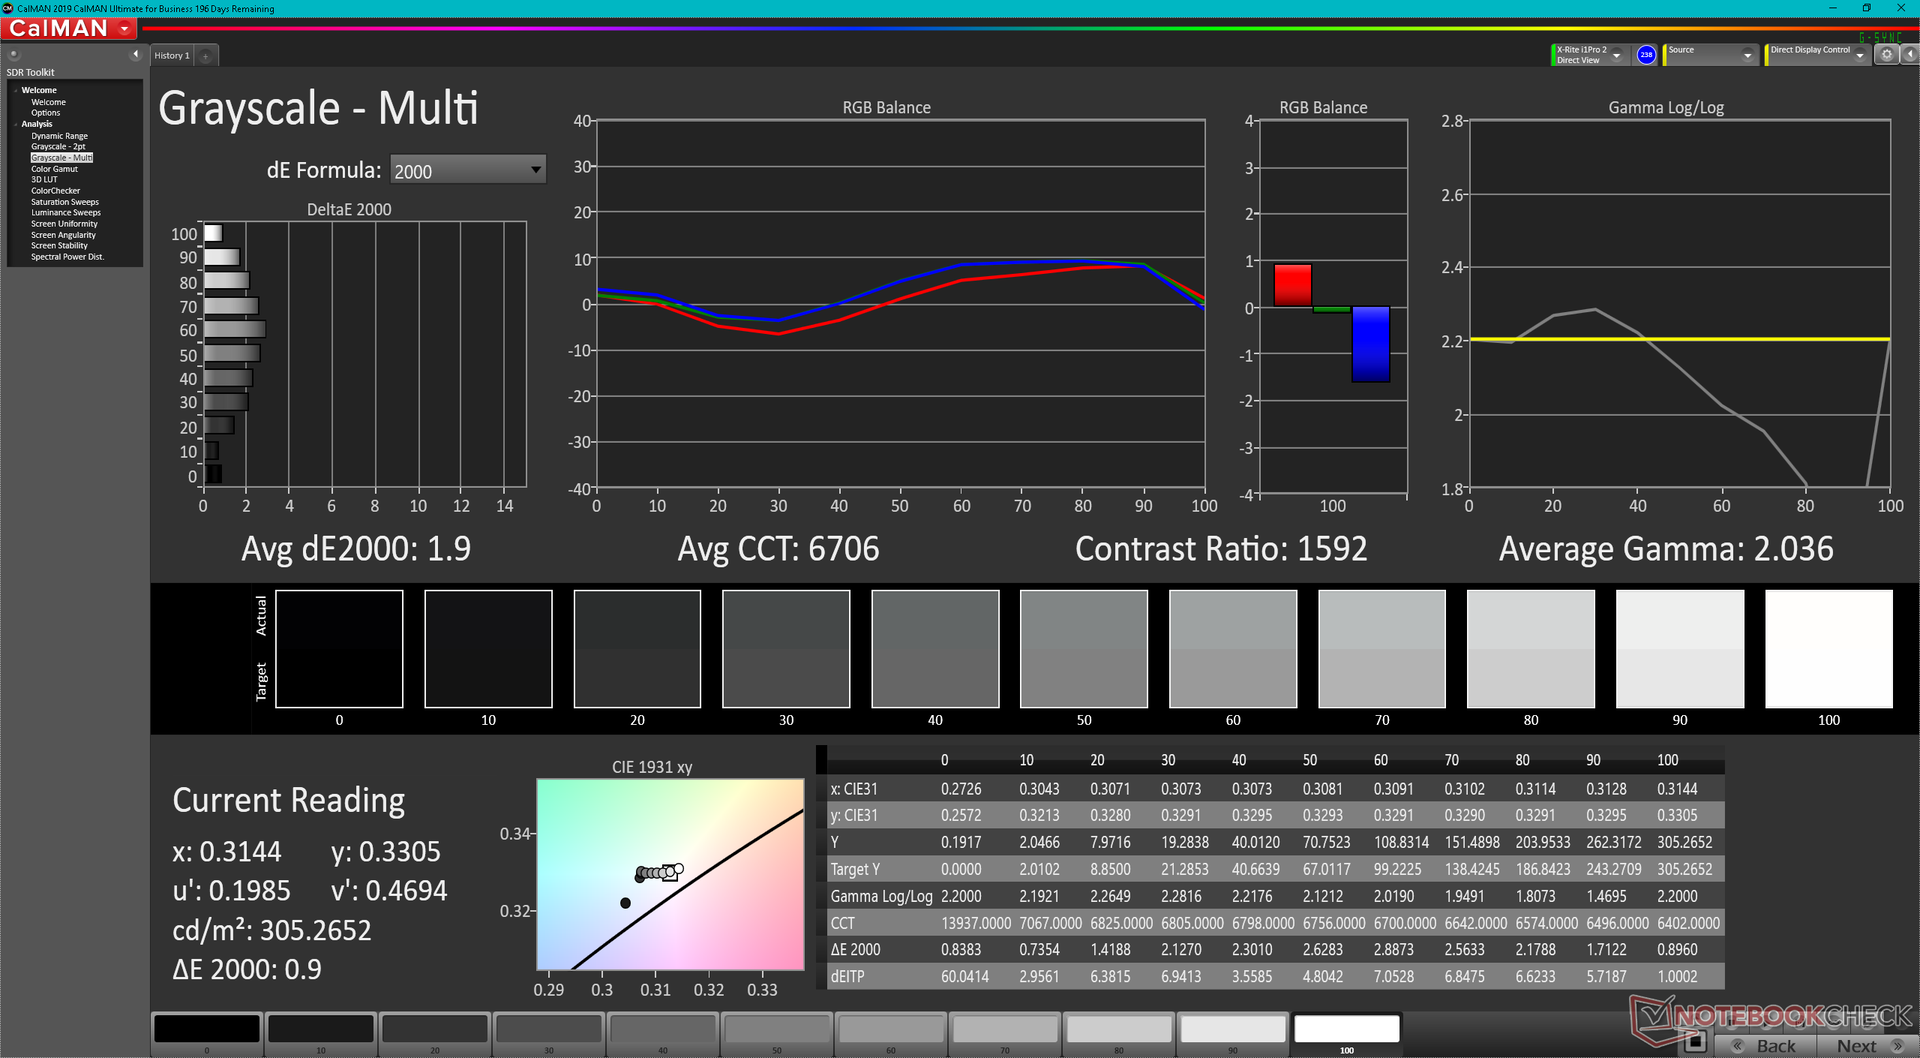
ΔE Greyscale Calman: 1.9 | ∀{0.09-98 Ø4.96}
100% sRGB (Argyll 3D)
98.8% Display P3 (Argyll 3D)
Gamma: 2.04
CCT: 6706 K
| LG Gram 14T90P LG Philips LP140WU1-SPA1, IPS, 1900x1200, 14" | Dell XPS 13 9310 2-in-1 Sharp LQ134N1, IPS, 1920x1200, 13.4" | Lenovo Yoga 9 14IAP7 82LU0001US Lenovo LEN140WQ+, OLED, 2880x1800, 14" | Asus ZenBook Flip 14 UN5401QA-KN085W SDC4154, OLED, 2880x1800, 14" | HP Spectre x360 14-ea0378ng Samsung SDC4148, OLED, 3000x2000, 13.5" | MSI Summit E13 Flip Evo A11MT Sharp LQ134N1JW53, IPS, 1920x1200, 13.4" | LG Gram 14T90N LG Philips LP140WFA-SPY1, IPS, 1920x1080, 14" | |
|---|---|---|---|---|---|---|---|
| Display | -15% | 1% | 1% | 1% | -15% | -19% | |
| Display P3 Coverage (%) | 98.8 | 69.7 -29% | 99.8 1% | 99.7 1% | 99.9 1% | 69.8 -29% | 65 -34% |
| sRGB Coverage (%) | 100 | 99 -1% | 100 0% | 100 0% | 100 0% | 98.8 -1% | 95.7 -4% |
| AdobeRGB 1998 Coverage (%) | 71.7 | 98.7 | 98.6 | 96.1 | 70.6 | 66.7 | |
| Response Times | -31% | 97% | 94% | 94% | -46% | -16% | |
| Response Time Grey 50% / Grey 80% * (ms) | 44 ? | 55.6 ? -26% | 1.2 ? 97% | 2 ? 95% | 2 ? 95% | 64 ? -45% | 54 ? -23% |
| Response Time Black / White * (ms) | 30 ? | 40.4 ? -35% | 1.2 ? 96% | 2 ? 93% | 2 ? 93% | 44 ? -47% | 32.8 ? -9% |
| PWM Frequency (Hz) | 2500 ? | 347.2 ? | 250 ? | ||||
| Screen | -16% | -13% | 11% | 419% | 38% | -12% | |
| Brightness middle (cd/m²) | 305.5 | 555.7 82% | 367.3 20% | 366 20% | 370 21% | 551.3 80% | 322.2 5% |
| Brightness (cd/m²) | 289 | 528 83% | 369 28% | 369 28% | 374 29% | 517 79% | 301 4% |
| Brightness Distribution (%) | 87 | 90 3% | 97 11% | 96 10% | 90 3% | 91 5% | 86 -1% |
| Black Level * (cd/m²) | 0.27 | 0.35 -30% | 0.01 96% | 0.37 -37% | 0.25 7% | ||
| Contrast (:1) | 1131 | 1588 40% | 37000 3171% | 1490 32% | 1289 14% | ||
| Colorchecker dE 2000 * | 3.31 | 4.83 -46% | 5.2 -57% | 2.84 14% | 2.57 22% | 1.45 56% | 3.62 -9% |
| Colorchecker dE 2000 max. * | 6.12 | 8.46 -38% | 8.04 -31% | 5.29 14% | 4.52 26% | 2.86 53% | 6.9 -13% |
| Greyscale dE 2000 * | 1.9 | 6.1 -221% | 2.8 -47% | 2.32 -22% | 2.2 -16% | 1.3 32% | 3.9 -105% |
| Gamma | 2.04 108% | 1.98 111% | 2.21 100% | 2.44 90% | 2.36 93% | 2.14 103% | 2.43 91% |
| CCT | 6706 97% | 6686 97% | 5992 108% | 6170 105% | 6154 106% | 6580 99% | 6344 102% |
| Colorchecker dE 2000 calibrated * | 0.76 | 2.81 | 2.31 | 1.7 | 1.22 | ||
| Color Space (Percent of AdobeRGB 1998) (%) | 85.8 | 65 | 61.3 | ||||
| Color Space (Percent of sRGB) (%) | 100 | 99 | 95.6 | ||||
| Media total (Programa/Opciones) | -21% /
-18% | 28% /
12% | 35% /
25% | 171% /
295% | -8% /
15% | -16% /
-14% |
* ... más pequeño es mejor
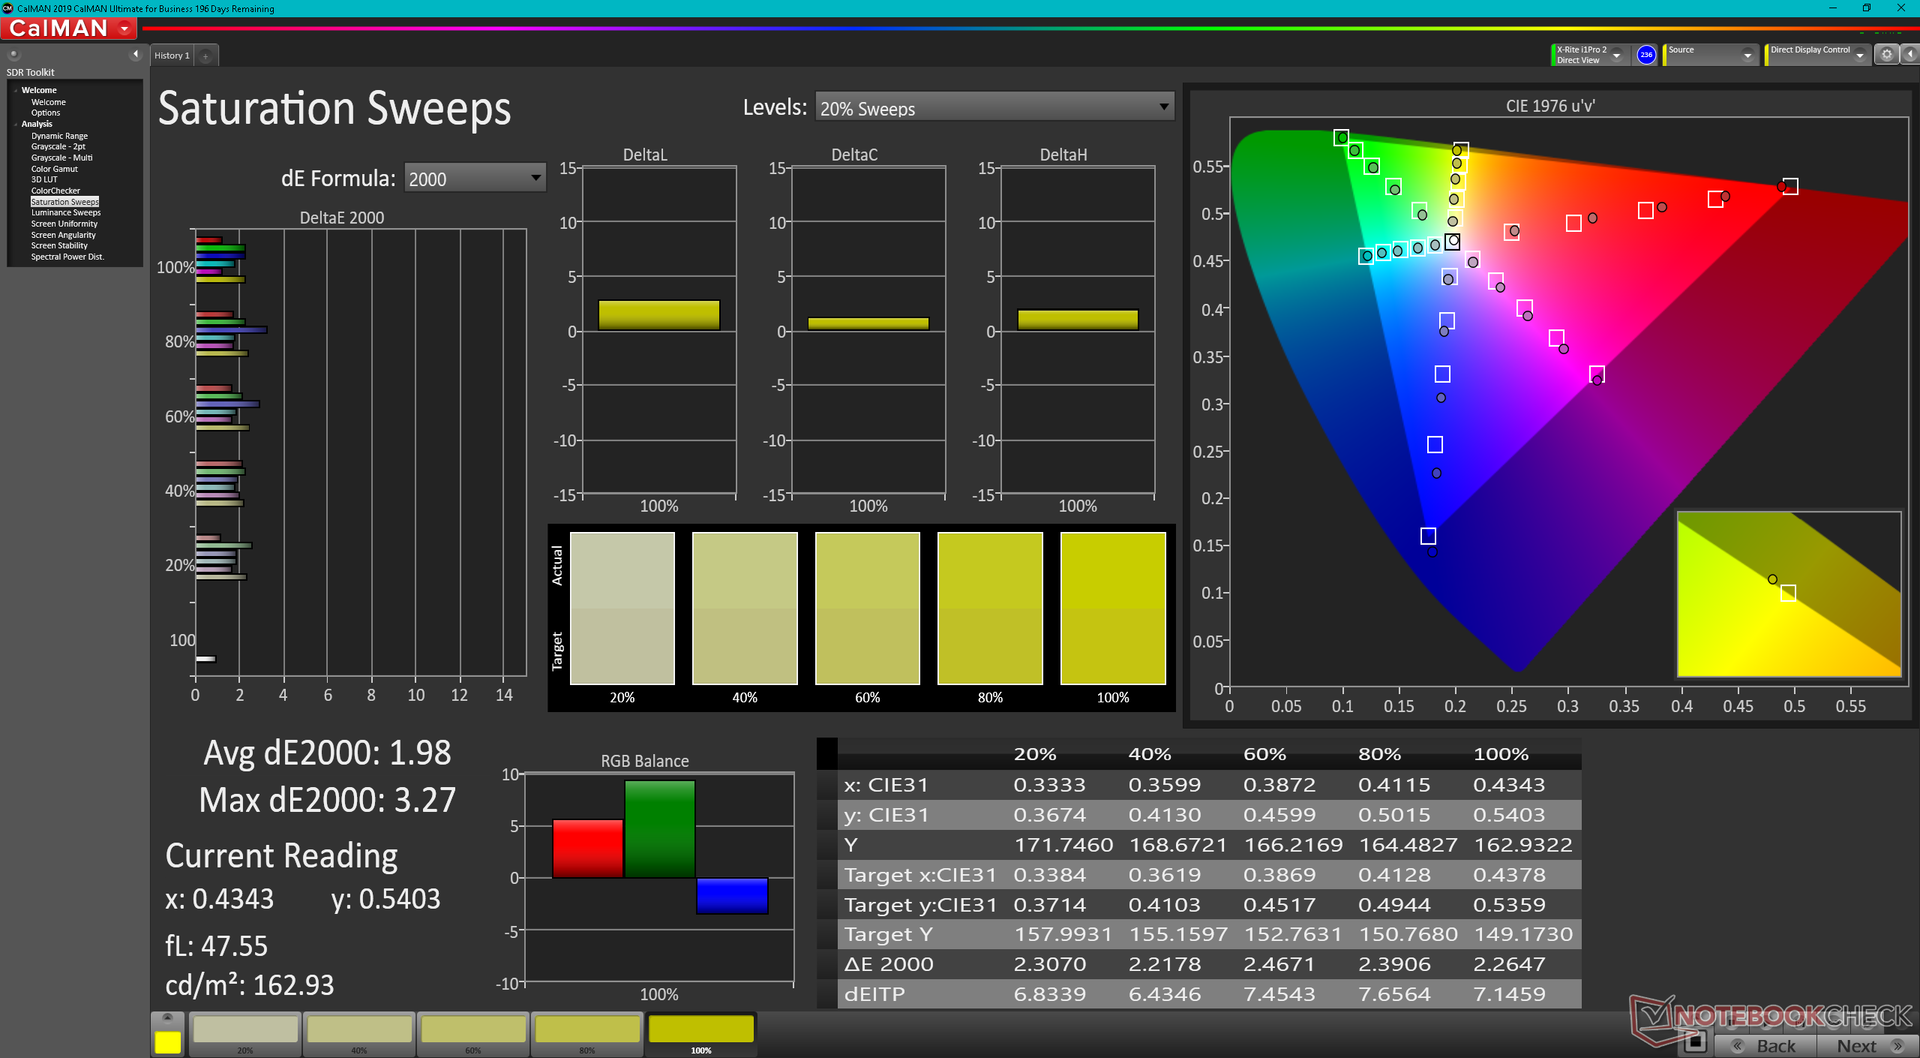
LG anuncia un 99% de cobertura DCI-P3 y podemos confirmarlo con nuestro propio colorímetro X-Rite. El cálculo de AdobeRGB da lugar a un error, extrañamente, pero la cobertura debería ser, no obstante, muy similar, de ~99 por ciento. Es uno de los pocos paneles IPS 16:10 de 14 pulgadas que ofrece una gama similar a la de la mayoría de paneles OLED.
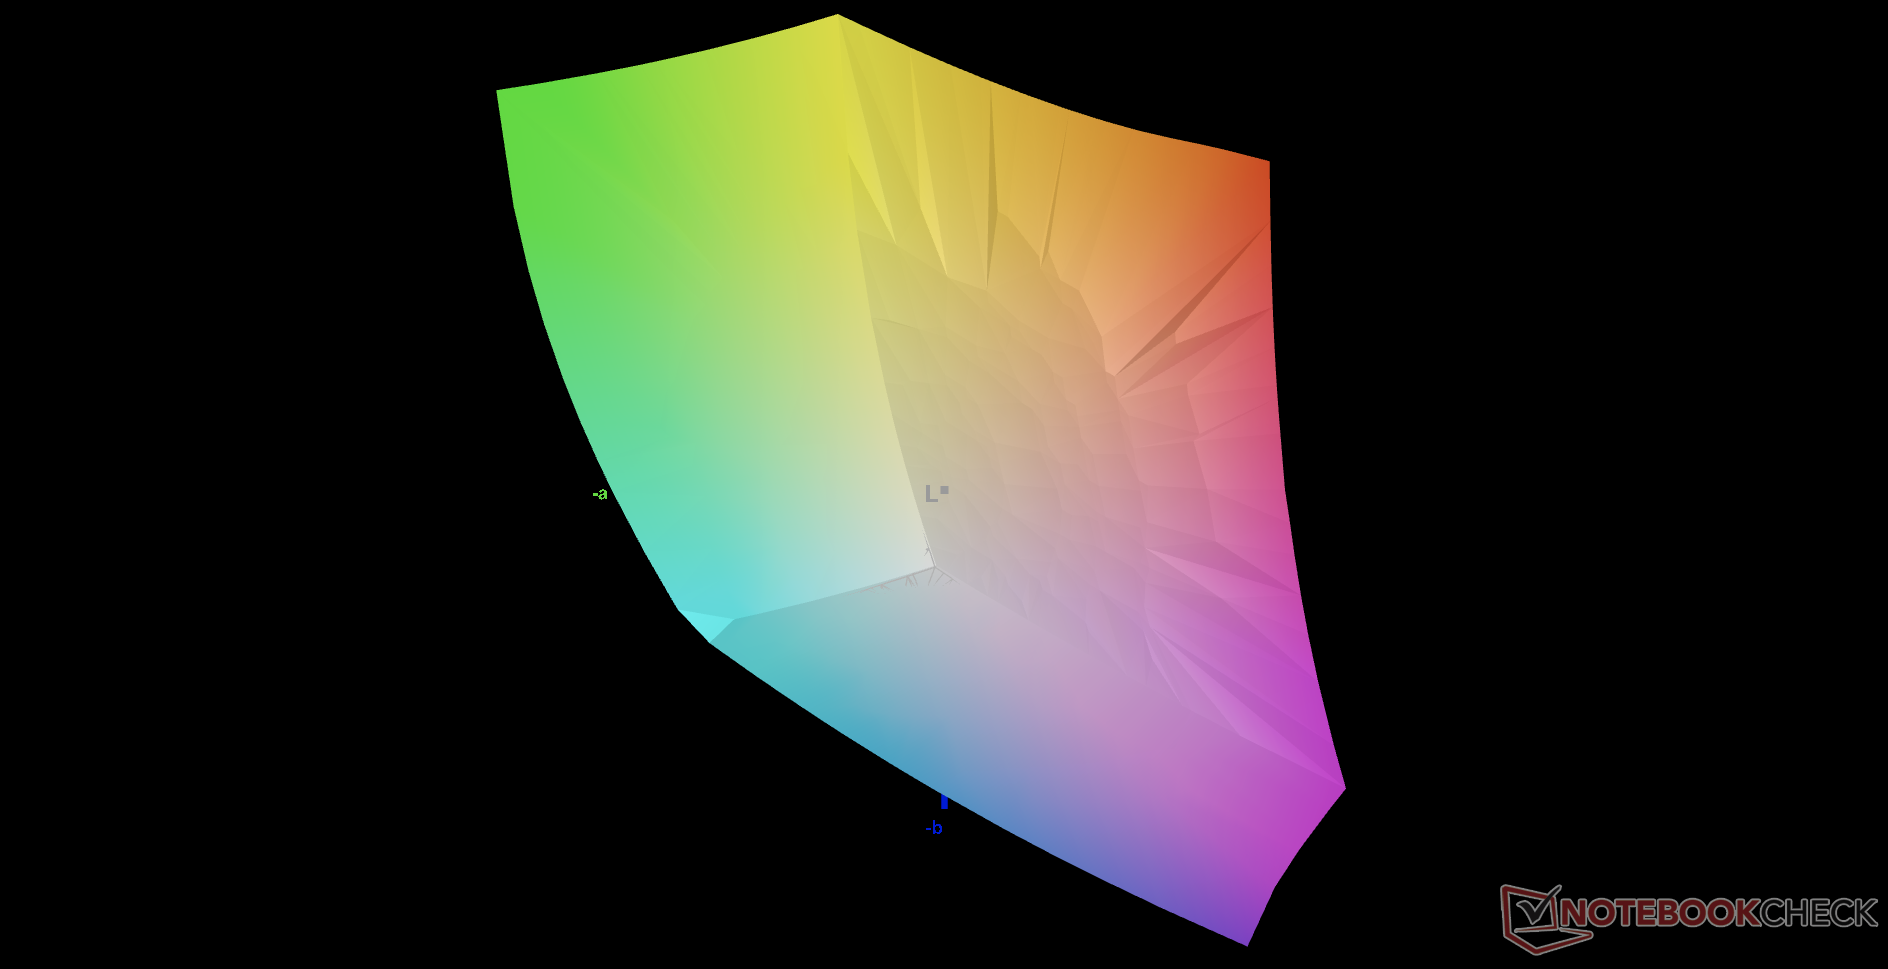
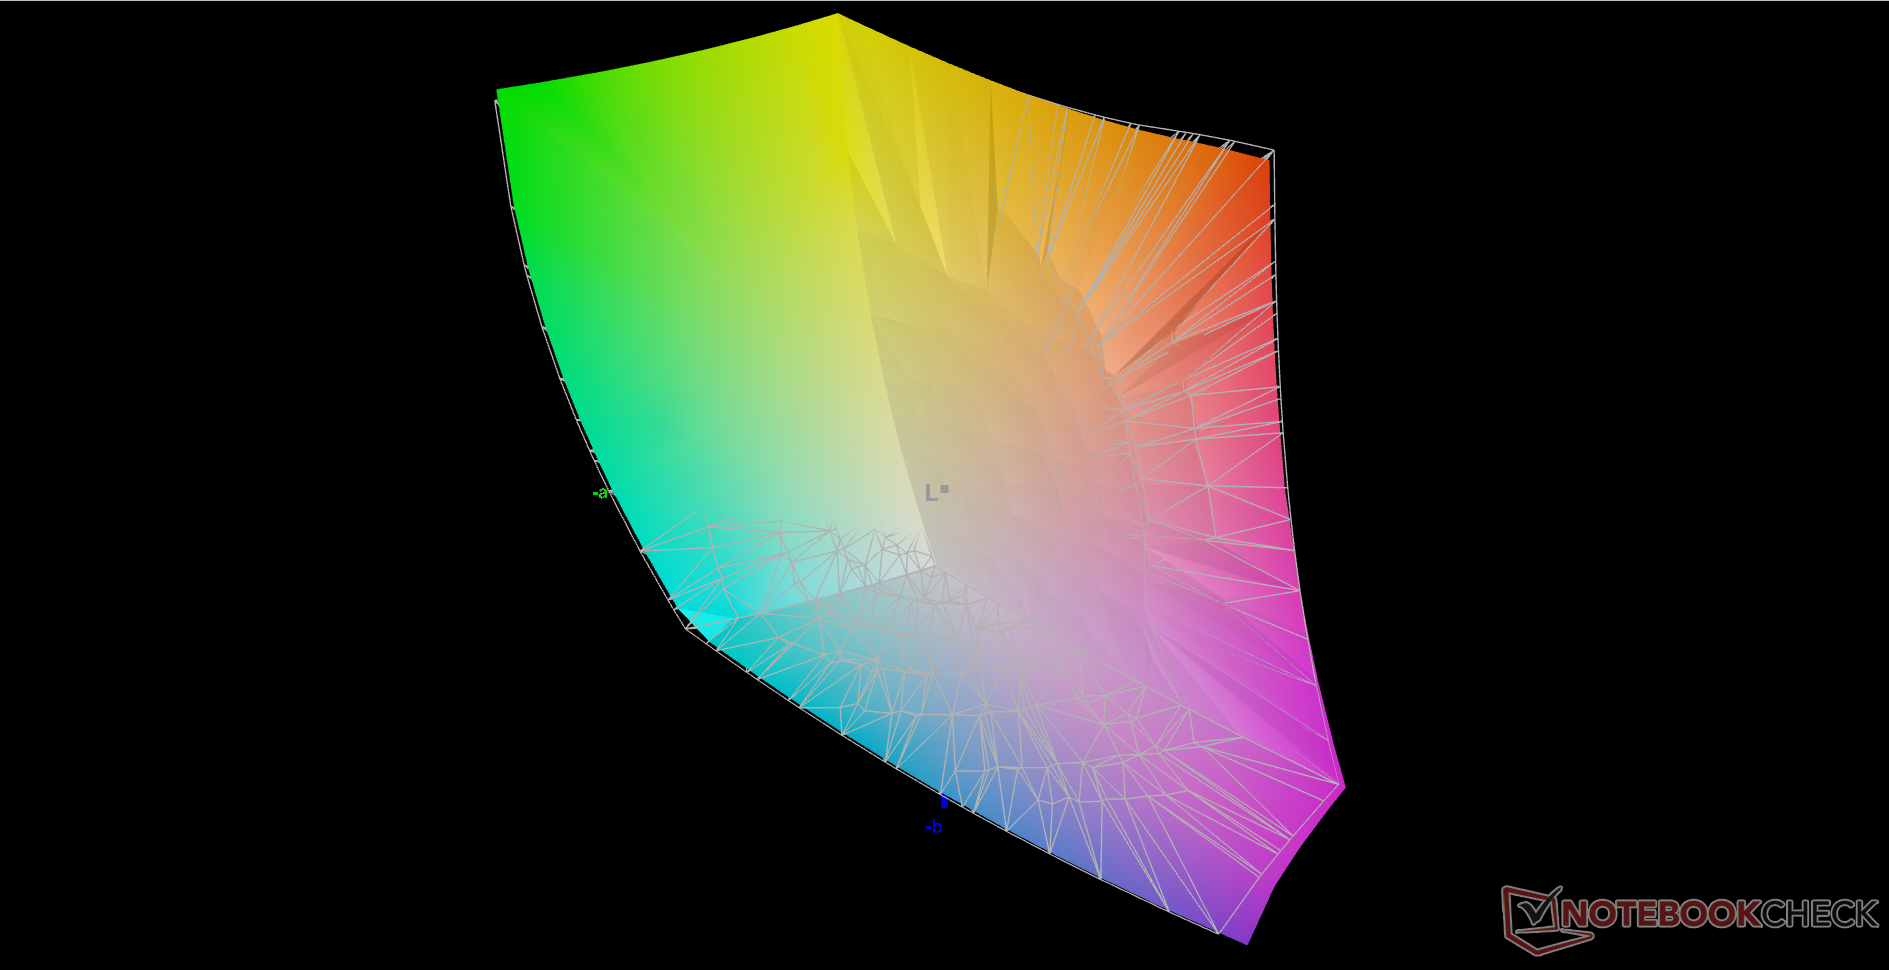
La pantalla está decentemente calibrada al sacarla de la caja. Los valores medios de escala de grises y ColorChecker DeltaE se sitúan en 1,9 y 3,31, respectivamente.
Tiempos de respuesta del display
| ↔ Tiempo de respuesta de Negro a Blanco | ||
|---|---|---|
| 30 ms ... subida ↗ y bajada ↘ combinada | ↗ 15.2 ms subida | 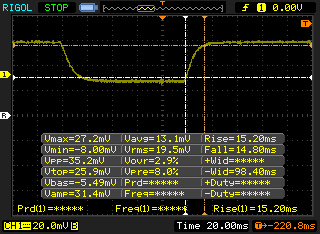 |
| ↘ 14.8 ms bajada | ||
| La pantalla mostró tiempos de respuesta lentos en nuestros tests y podría ser demasiado lenta para los jugones. En comparación, todos los dispositivos de prueba van de ##min### (mínimo) a 240 (máximo) ms. » 80 % de todos los dispositivos son mejores. Eso quiere decir que el tiempo de respuesta es peor que la media (19.8 ms) de todos los dispositivos testados. | ||
| ↔ Tiempo de respuesta 50% Gris a 80% Gris | ||
| 44 ms ... subida ↗ y bajada ↘ combinada | ↗ 21.2 ms subida | 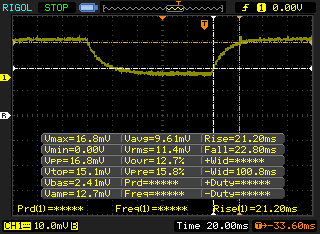 |
| ↘ 22.8 ms bajada | ||
| La pantalla mostró tiempos de respuesta lentos en nuestros tests y podría ser demasiado lenta para los jugones. En comparación, todos los dispositivos de prueba van de ##min### (mínimo) a 636 (máximo) ms. » 73 % de todos los dispositivos son mejores. Eso quiere decir que el tiempo de respuesta es peor que la media (31 ms) de todos los dispositivos testados. | ||
Parpadeo de Pantalla / PWM (Pulse-Width Modulation)
| Parpadeo de Pantalla / PWM no detectado | 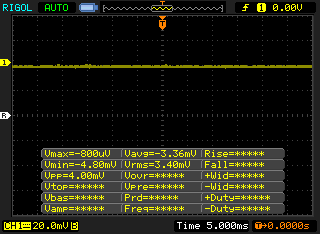 | ||
Comparación: 52 % de todos los dispositivos testados no usaron PWM para atenuar el display. Si se usó, medimos una media de 7757 (mínimo: 5 - máxmo: 343500) Hz. | |||
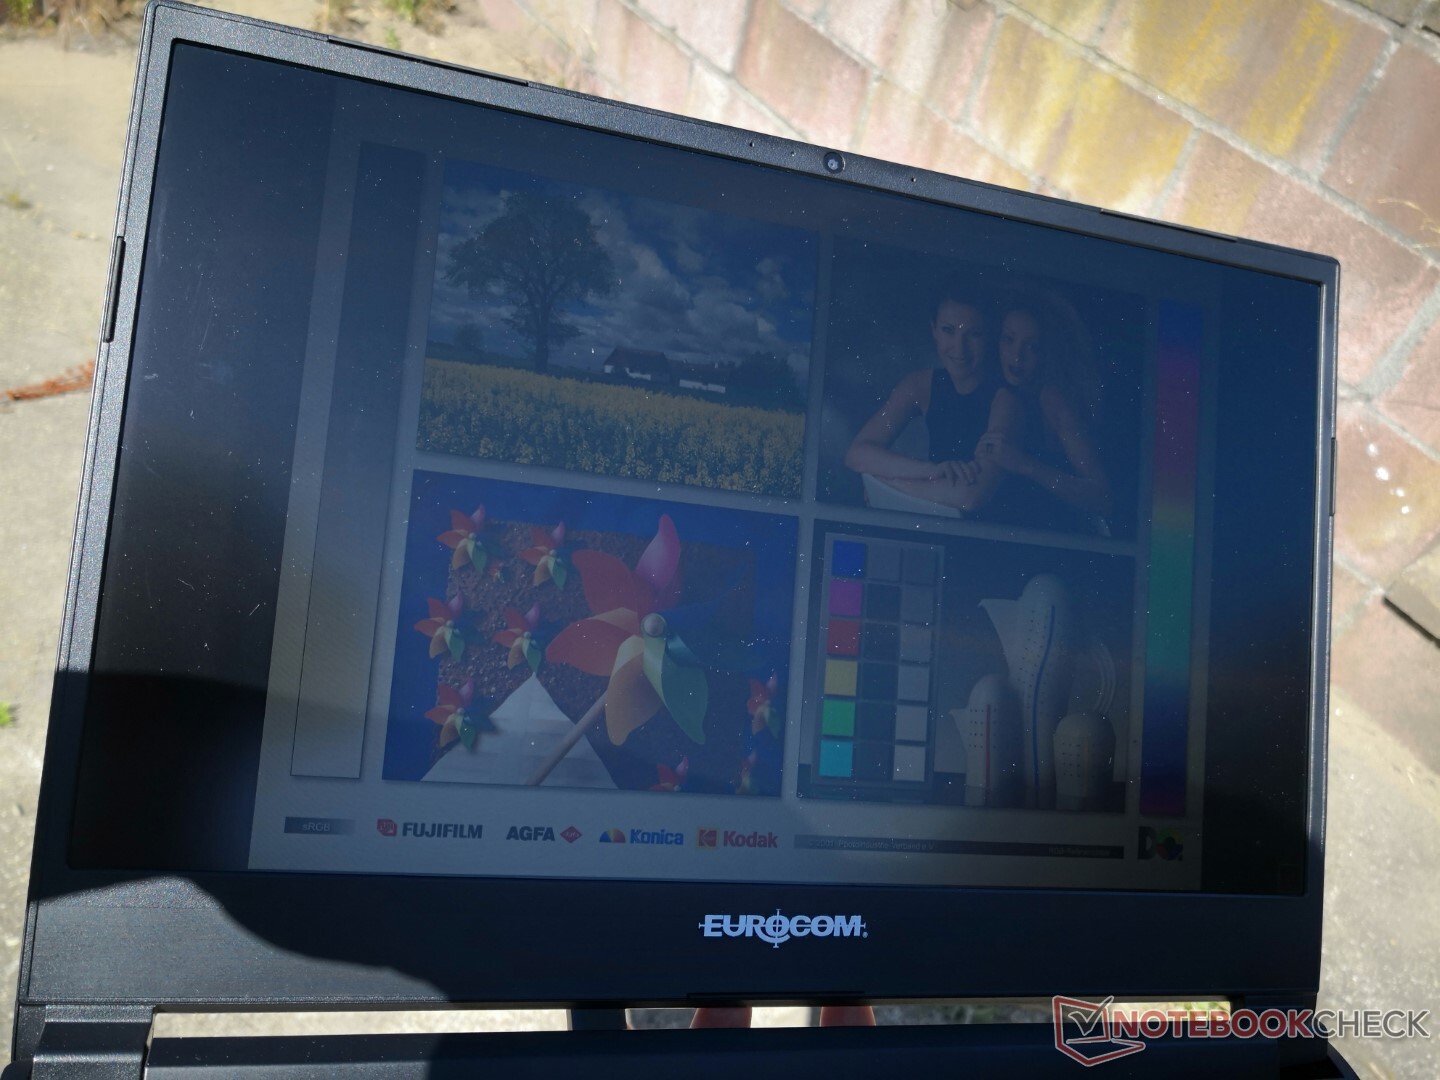
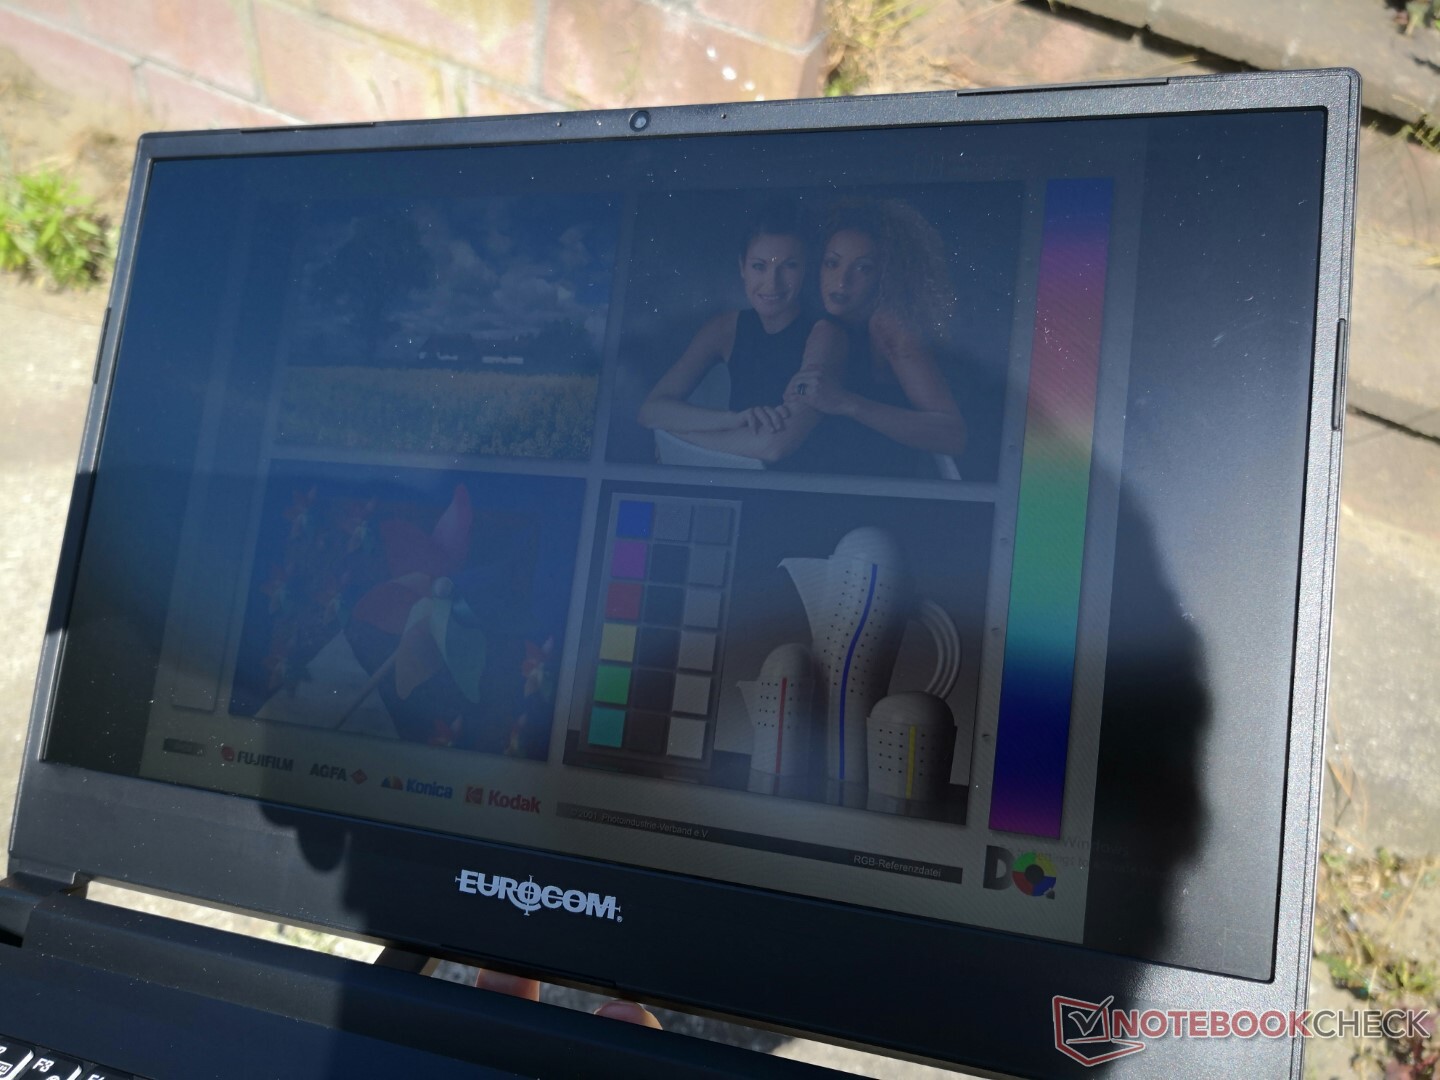
Con 300 nits, la pantalla es lo suficientemente brillante para condiciones de interior, pero no está cerca de lo necesario para una visión cómoda en exteriores. Alternativas como elDell XPS 13 9310 2 en 1 o el MSI Summit E13 Flip tienen pantallas mucho más brillantes, con más de 500 nits cada una, para ser más fácilmente visibles en exteriores.
Rendimiento - Intel de 11ª generación

Condiciones de la prueba
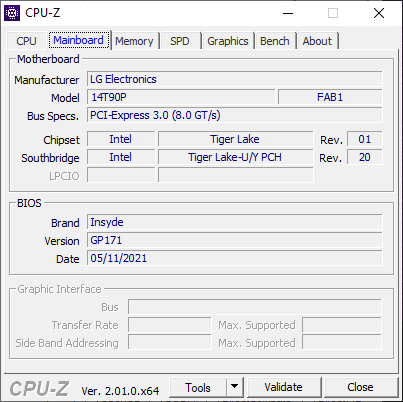
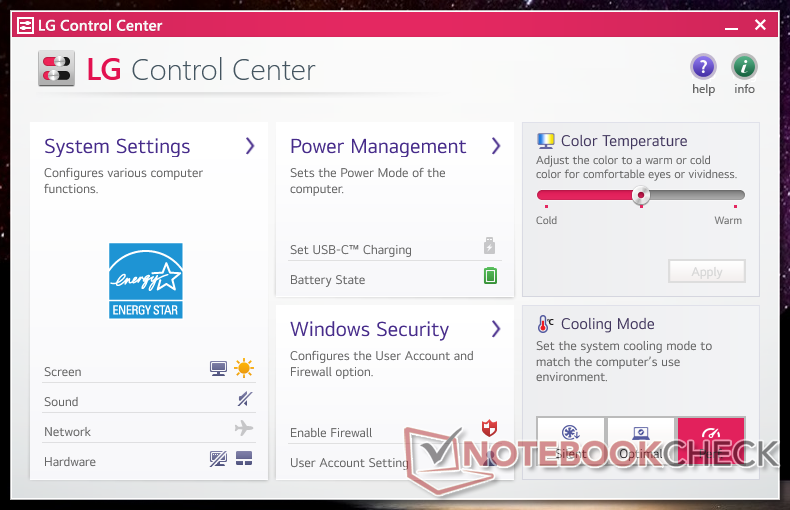
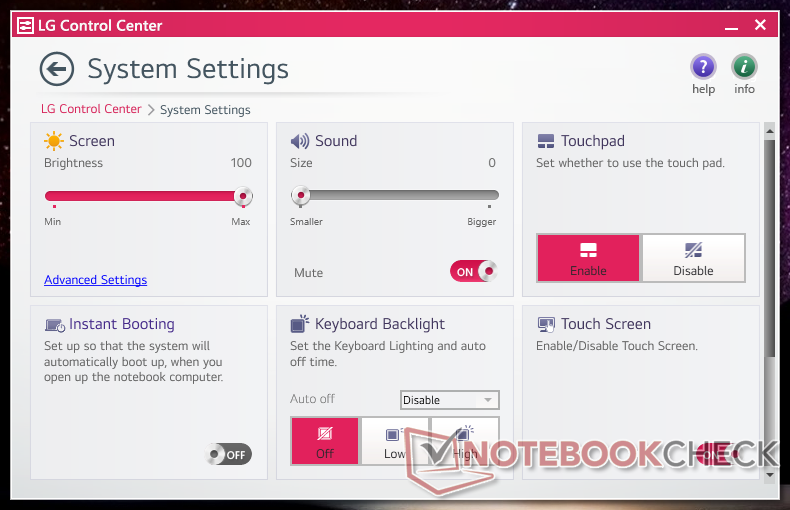
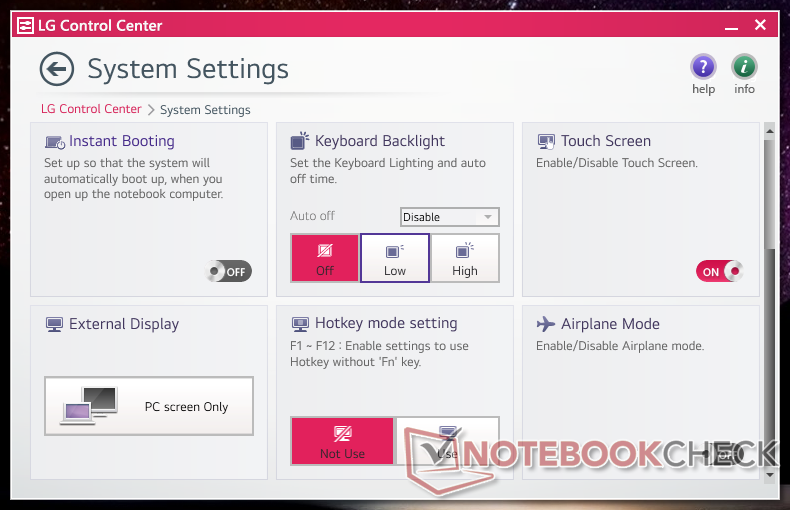
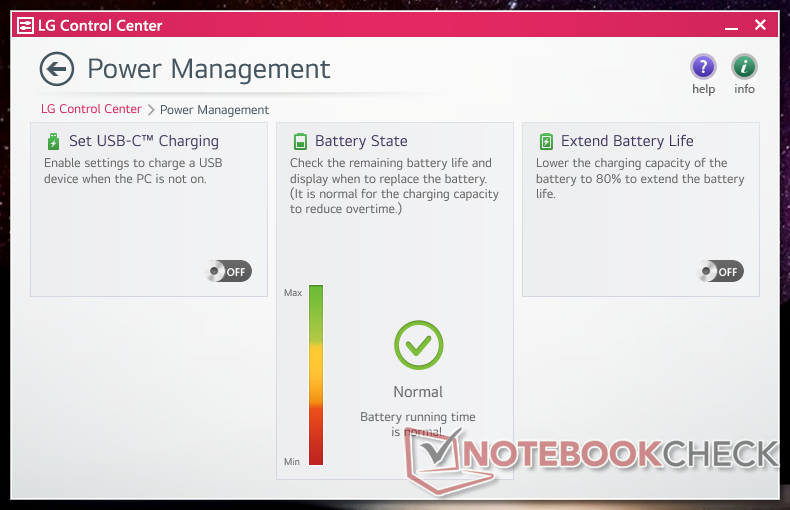
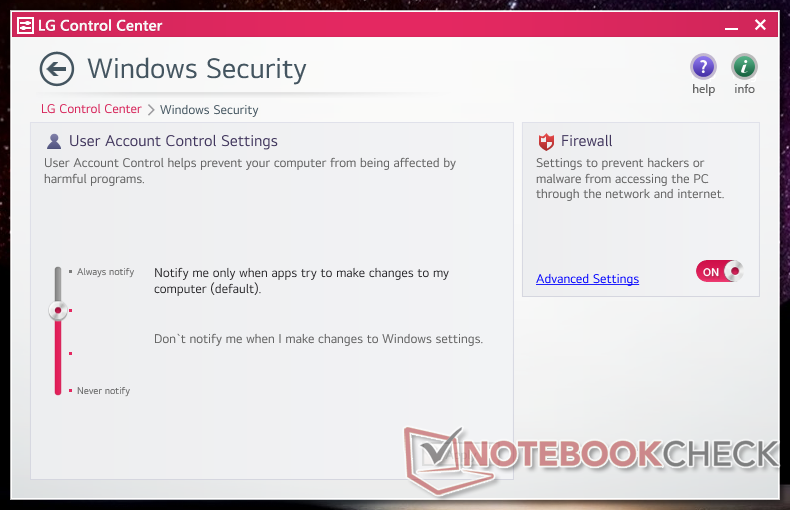
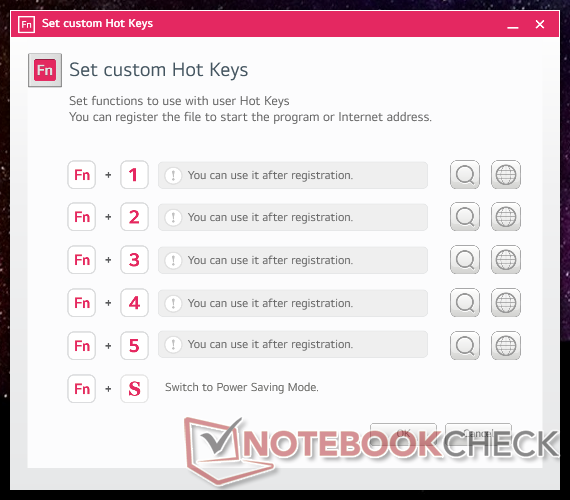
Nuestra unidad fue configurada en el modo de rendimiento antes de ejecutar cualquier prueba de rendimiento para obtener las puntuaciones más altas posibles. Es muy recomendable familiarizarse con el software preinstalado del Centro de Control de LG, ya que los ajustes y las características clave se activan aquí, como se muestra en las capturas de pantalla a continuación. Lamentablemente, la interfaz de usuario del software es muy pequeña y no se puede maximizar
Tenga en cuenta que el sistema se restablecerá automáticamente al modo equilibrado después de cada reinicio o apagado, incluso si el perfil de energía se estableció en silencio o rendimiento de antemano.
Procesador
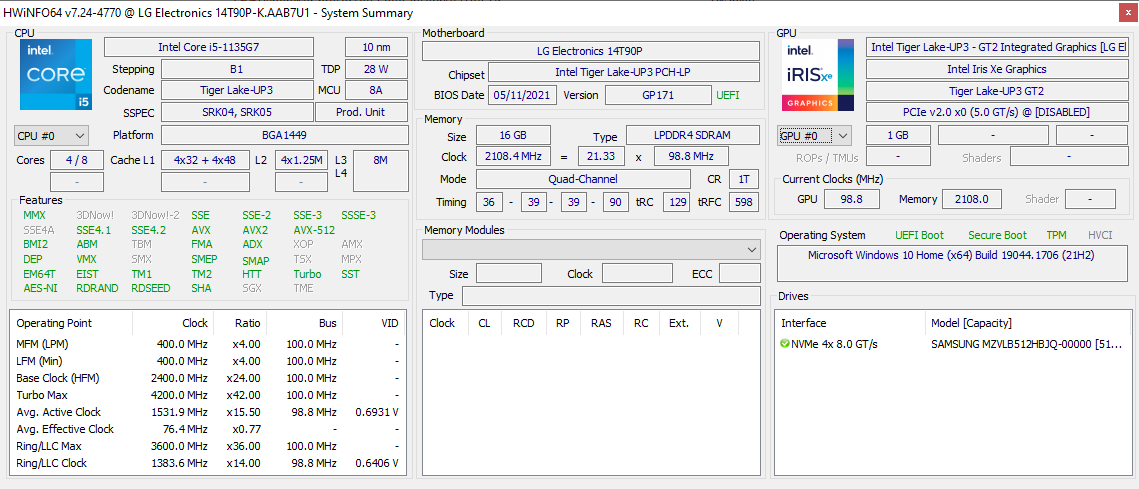
El rendimiento de la CPU está dentro de unos pocos puntos porcentuales de la media de portátiles de nuestra base de datos equipados con el mismo Core i5-1135G7 que el mismo Core i5-1135G7. Por lo tanto, el rendimiento no se ha reducido demasiado sólo para encajar en un diseño de chasis convertible ultraligero. La actualización al Core i7-1165G7 Tiene el potencial de aumentar el rendimiento multihilo hasta un 25 por ciento, pero probablemente será mucho menos ya que el Core i5 en nuestra configuración ya puede alcanzar temperaturas de más de 90 C
La sostenibilidad de Turbo Boost es buena pero no perfecta. Al ejecutar CineBench R15 xT en un bucle, nuestra puntuación inicial de 796 puntos acabaría cayendo y estabilizándose en unos 666 puntos, lo que representa una caída de rendimiento del 16 por ciento con el tiempo debido a las limitaciones térmicas. Tanto el Dell Latitude 14 comoAcer Swift 3 SF314 son capaces de ejecutar el mismo procesador consistentemente más rápido como se muestra en nuestro gráfico de comparación a continuación.
Cinebench R15 Multi Loop
Cinebench R23: Multi Core | Single Core
Cinebench R15: CPU Multi 64Bit | CPU Single 64Bit
Blender: v2.79 BMW27 CPU
7-Zip 18.03: 7z b 4 | 7z b 4 -mmt1
Geekbench 5.5: Multi-Core | Single-Core
HWBOT x265 Benchmark v2.2: 4k Preset
LibreOffice : 20 Documents To PDF
R Benchmark 2.5: Overall mean
Cinebench R23: Multi Core | Single Core
Cinebench R15: CPU Multi 64Bit | CPU Single 64Bit
Blender: v2.79 BMW27 CPU
7-Zip 18.03: 7z b 4 | 7z b 4 -mmt1
Geekbench 5.5: Multi-Core | Single-Core
HWBOT x265 Benchmark v2.2: 4k Preset
LibreOffice : 20 Documents To PDF
R Benchmark 2.5: Overall mean
* ... más pequeño es mejor
AIDA64: FP32 Ray-Trace | FPU Julia | CPU SHA3 | CPU Queen | FPU SinJulia | FPU Mandel | CPU AES | CPU ZLib | FP64 Ray-Trace | CPU PhotoWorxx
| Performance rating | |
| Asus ZenBook Flip 14 UN5401QA-KN085W | |
| Lenovo Yoga 9 14IAP7 82LU0001US | |
| MSI Summit E13 Flip Evo A11MT | |
| LG Gram 14T90P | |
| Dell XPS 13 9310 2-in-1 | |
| Medio Intel Core i5-1135G7 | |
| HP Spectre x360 14-ea0378ng | |
| AIDA64 / FP32 Ray-Trace | |
| Asus ZenBook Flip 14 UN5401QA-KN085W | |
| MSI Summit E13 Flip Evo A11MT | |
| LG Gram 14T90P | |
| Dell XPS 13 9310 2-in-1 | |
| Medio Intel Core i5-1135G7 (4313 - 7952, n=45) | |
| Lenovo Yoga 9 14IAP7 82LU0001US | |
| HP Spectre x360 14-ea0378ng | |
| AIDA64 / FPU Julia | |
| Asus ZenBook Flip 14 UN5401QA-KN085W | |
| MSI Summit E13 Flip Evo A11MT | |
| Dell XPS 13 9310 2-in-1 | |
| LG Gram 14T90P | |
| Medio Intel Core i5-1135G7 (19402 - 32283, n=45) | |
| Lenovo Yoga 9 14IAP7 82LU0001US | |
| HP Spectre x360 14-ea0378ng | |
| AIDA64 / CPU SHA3 | |
| Asus ZenBook Flip 14 UN5401QA-KN085W | |
| MSI Summit E13 Flip Evo A11MT | |
| Dell XPS 13 9310 2-in-1 | |
| LG Gram 14T90P | |
| Lenovo Yoga 9 14IAP7 82LU0001US | |
| Medio Intel Core i5-1135G7 (1316 - 2172, n=45) | |
| HP Spectre x360 14-ea0378ng | |
| AIDA64 / CPU Queen | |
| Asus ZenBook Flip 14 UN5401QA-KN085W | |
| Lenovo Yoga 9 14IAP7 82LU0001US | |
| MSI Summit E13 Flip Evo A11MT | |
| HP Spectre x360 14-ea0378ng | |
| Dell XPS 13 9310 2-in-1 | |
| LG Gram 14T90P | |
| Medio Intel Core i5-1135G7 (39000 - 46951, n=45) | |
| AIDA64 / FPU SinJulia | |
| Asus ZenBook Flip 14 UN5401QA-KN085W | |
| Lenovo Yoga 9 14IAP7 82LU0001US | |
| MSI Summit E13 Flip Evo A11MT | |
| LG Gram 14T90P | |
| Dell XPS 13 9310 2-in-1 | |
| Medio Intel Core i5-1135G7 (3497 - 4445, n=45) | |
| HP Spectre x360 14-ea0378ng | |
| AIDA64 / FPU Mandel | |
| Asus ZenBook Flip 14 UN5401QA-KN085W | |
| MSI Summit E13 Flip Evo A11MT | |
| Dell XPS 13 9310 2-in-1 | |
| LG Gram 14T90P | |
| Medio Intel Core i5-1135G7 (12569 - 19635, n=45) | |
| Lenovo Yoga 9 14IAP7 82LU0001US | |
| HP Spectre x360 14-ea0378ng | |
| AIDA64 / CPU AES | |
| Asus ZenBook Flip 14 UN5401QA-KN085W | |
| MSI Summit E13 Flip Evo A11MT | |
| Dell XPS 13 9310 2-in-1 | |
| LG Gram 14T90P | |
| Medio Intel Core i5-1135G7 (28988 - 67977, n=45) | |
| HP Spectre x360 14-ea0378ng | |
| Lenovo Yoga 9 14IAP7 82LU0001US | |
| AIDA64 / CPU ZLib | |
| Asus ZenBook Flip 14 UN5401QA-KN085W | |
| Lenovo Yoga 9 14IAP7 82LU0001US | |
| MSI Summit E13 Flip Evo A11MT | |
| LG Gram 14T90P | |
| Dell XPS 13 9310 2-in-1 | |
| Medio Intel Core i5-1135G7 (265 - 373, n=51) | |
| HP Spectre x360 14-ea0378ng | |
| AIDA64 / FP64 Ray-Trace | |
| Asus ZenBook Flip 14 UN5401QA-KN085W | |
| MSI Summit E13 Flip Evo A11MT | |
| LG Gram 14T90P | |
| Dell XPS 13 9310 2-in-1 | |
| Medio Intel Core i5-1135G7 (2226 - 4291, n=45) | |
| Lenovo Yoga 9 14IAP7 82LU0001US | |
| HP Spectre x360 14-ea0378ng | |
| AIDA64 / CPU PhotoWorxx | |
| Lenovo Yoga 9 14IAP7 82LU0001US | |
| LG Gram 14T90P | |
| MSI Summit E13 Flip Evo A11MT | |
| Dell XPS 13 9310 2-in-1 | |
| HP Spectre x360 14-ea0378ng | |
| Medio Intel Core i5-1135G7 (9004 - 45366, n=45) | |
| Asus ZenBook Flip 14 UN5401QA-KN085W | |
Rendimiento del sistema
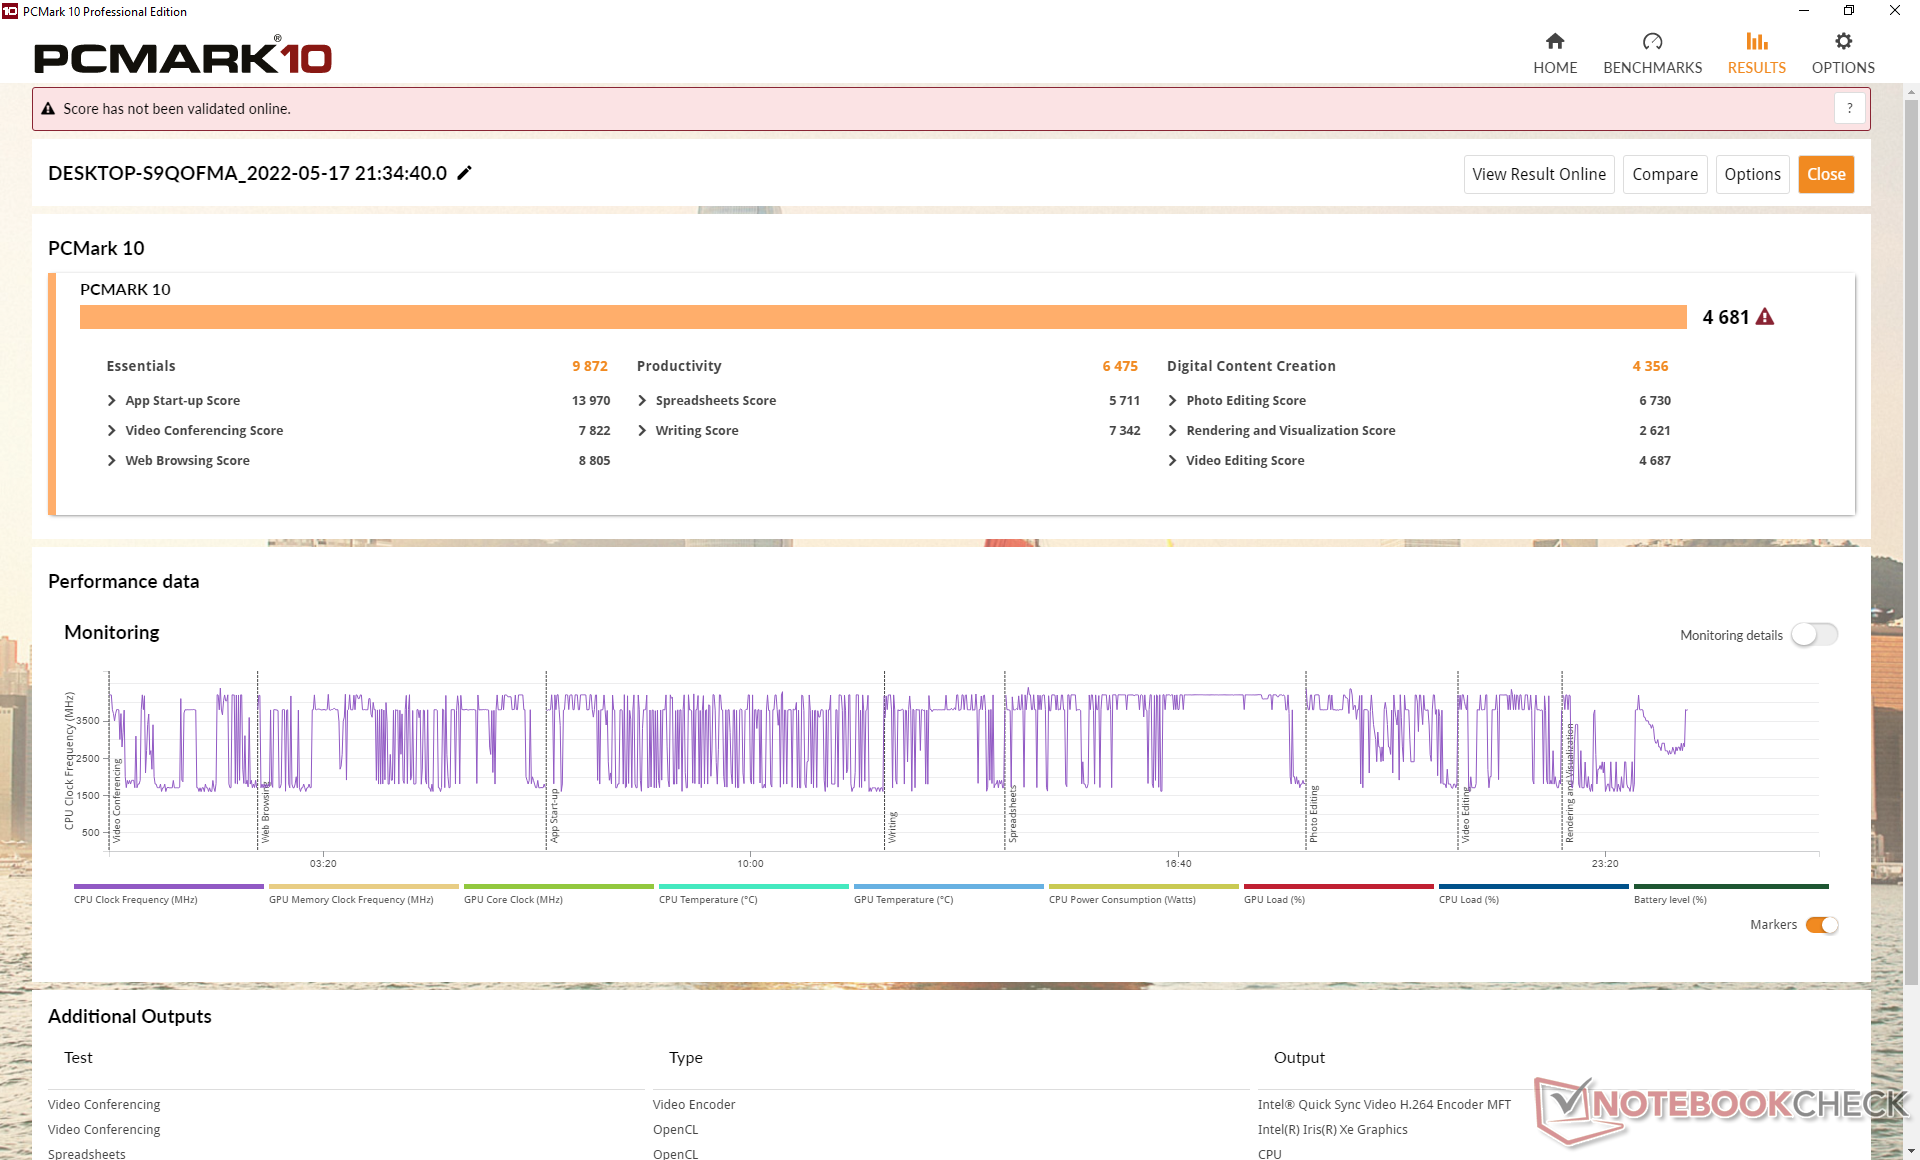
Los resultados de PCMark 10 son en general más altos que en el antiguo Gram 14T90N, especialmente en la subprueba de Creación de Contenido Digital, donde el rendimiento de la GPU se ve favorecido. Nuestra puntuación de productividad, sin embargo, es inferior por razones desconocidas.
CrossMark: Overall | Productivity | Creativity | Responsiveness
| PCMark 10 / Score | |
| Asus ZenBook Flip 14 UN5401QA-KN085W | |
| Lenovo Yoga 9 14IAP7 82LU0001US | |
| Dell XPS 13 9310 2-in-1 | |
| MSI Summit E13 Flip Evo A11MT | |
| LG Gram 14T90P | |
| Medio Intel Core i5-1135G7, Intel Iris Xe Graphics G7 80EUs (4026 - 4952, n=53) | |
| HP Spectre x360 14-ea0378ng | |
| LG Gram 14T90N | |
| PCMark 10 / Essentials | |
| Lenovo Yoga 9 14IAP7 82LU0001US | |
| Dell XPS 13 9310 2-in-1 | |
| Asus ZenBook Flip 14 UN5401QA-KN085W | |
| LG Gram 14T90P | |
| HP Spectre x360 14-ea0378ng | |
| Medio Intel Core i5-1135G7, Intel Iris Xe Graphics G7 80EUs (8149 - 9917, n=53) | |
| LG Gram 14T90N | |
| MSI Summit E13 Flip Evo A11MT | |
| PCMark 10 / Productivity | |
| Asus ZenBook Flip 14 UN5401QA-KN085W | |
| LG Gram 14T90N | |
| MSI Summit E13 Flip Evo A11MT | |
| Dell XPS 13 9310 2-in-1 | |
| LG Gram 14T90P | |
| Lenovo Yoga 9 14IAP7 82LU0001US | |
| HP Spectre x360 14-ea0378ng | |
| Medio Intel Core i5-1135G7, Intel Iris Xe Graphics G7 80EUs (5040 - 6619, n=53) | |
| PCMark 10 / Digital Content Creation | |
| Lenovo Yoga 9 14IAP7 82LU0001US | |
| Asus ZenBook Flip 14 UN5401QA-KN085W | |
| Dell XPS 13 9310 2-in-1 | |
| MSI Summit E13 Flip Evo A11MT | |
| Medio Intel Core i5-1135G7, Intel Iris Xe Graphics G7 80EUs (3548 - 5255, n=53) | |
| LG Gram 14T90P | |
| HP Spectre x360 14-ea0378ng | |
| LG Gram 14T90N | |
| CrossMark / Overall | |
| Lenovo Yoga 9 14IAP7 82LU0001US | |
| LG Gram 14T90P | |
| Medio Intel Core i5-1135G7, Intel Iris Xe Graphics G7 80EUs (1058 - 1293, n=11) | |
| CrossMark / Productivity | |
| Lenovo Yoga 9 14IAP7 82LU0001US | |
| LG Gram 14T90P | |
| Medio Intel Core i5-1135G7, Intel Iris Xe Graphics G7 80EUs (1148 - 1332, n=11) | |
| CrossMark / Creativity | |
| Lenovo Yoga 9 14IAP7 82LU0001US | |
| LG Gram 14T90P | |
| Medio Intel Core i5-1135G7, Intel Iris Xe Graphics G7 80EUs (895 - 1263, n=11) | |
| CrossMark / Responsiveness | |
| Lenovo Yoga 9 14IAP7 82LU0001US | |
| LG Gram 14T90P | |
| Medio Intel Core i5-1135G7, Intel Iris Xe Graphics G7 80EUs (923 - 1320, n=11) | |
| PCMark 10 Score | 4681 puntos | |
ayuda | ||
| AIDA64 / Memory Copy | |
| Lenovo Yoga 9 14IAP7 82LU0001US | |
| LG Gram 14T90P | |
| Dell XPS 13 9310 2-in-1 | |
| MSI Summit E13 Flip Evo A11MT | |
| HP Spectre x360 14-ea0378ng | |
| Medio Intel Core i5-1135G7 (17443 - 63889, n=45) | |
| Asus ZenBook Flip 14 UN5401QA-KN085W | |
| AIDA64 / Memory Read | |
| Lenovo Yoga 9 14IAP7 82LU0001US | |
| LG Gram 14T90P | |
| Dell XPS 13 9310 2-in-1 | |
| MSI Summit E13 Flip Evo A11MT | |
| HP Spectre x360 14-ea0378ng | |
| Medio Intel Core i5-1135G7 (19716 - 63705, n=45) | |
| Asus ZenBook Flip 14 UN5401QA-KN085W | |
| AIDA64 / Memory Write | |
| LG Gram 14T90P | |
| Dell XPS 13 9310 2-in-1 | |
| Lenovo Yoga 9 14IAP7 82LU0001US | |
| MSI Summit E13 Flip Evo A11MT | |
| HP Spectre x360 14-ea0378ng | |
| Medio Intel Core i5-1135G7 (18722 - 66778, n=45) | |
| Asus ZenBook Flip 14 UN5401QA-KN085W | |
| AIDA64 / Memory Latency | |
| Asus ZenBook Flip 14 UN5401QA-KN085W | |
| MSI Summit E13 Flip Evo A11MT | |
| Dell XPS 13 9310 2-in-1 | |
| HP Spectre x360 14-ea0378ng | |
| LG Gram 14T90P | |
| Medio Intel Core i5-1135G7 (68.3 - 107, n=51) | |
* ... más pequeño es mejor
Latencia del CPD
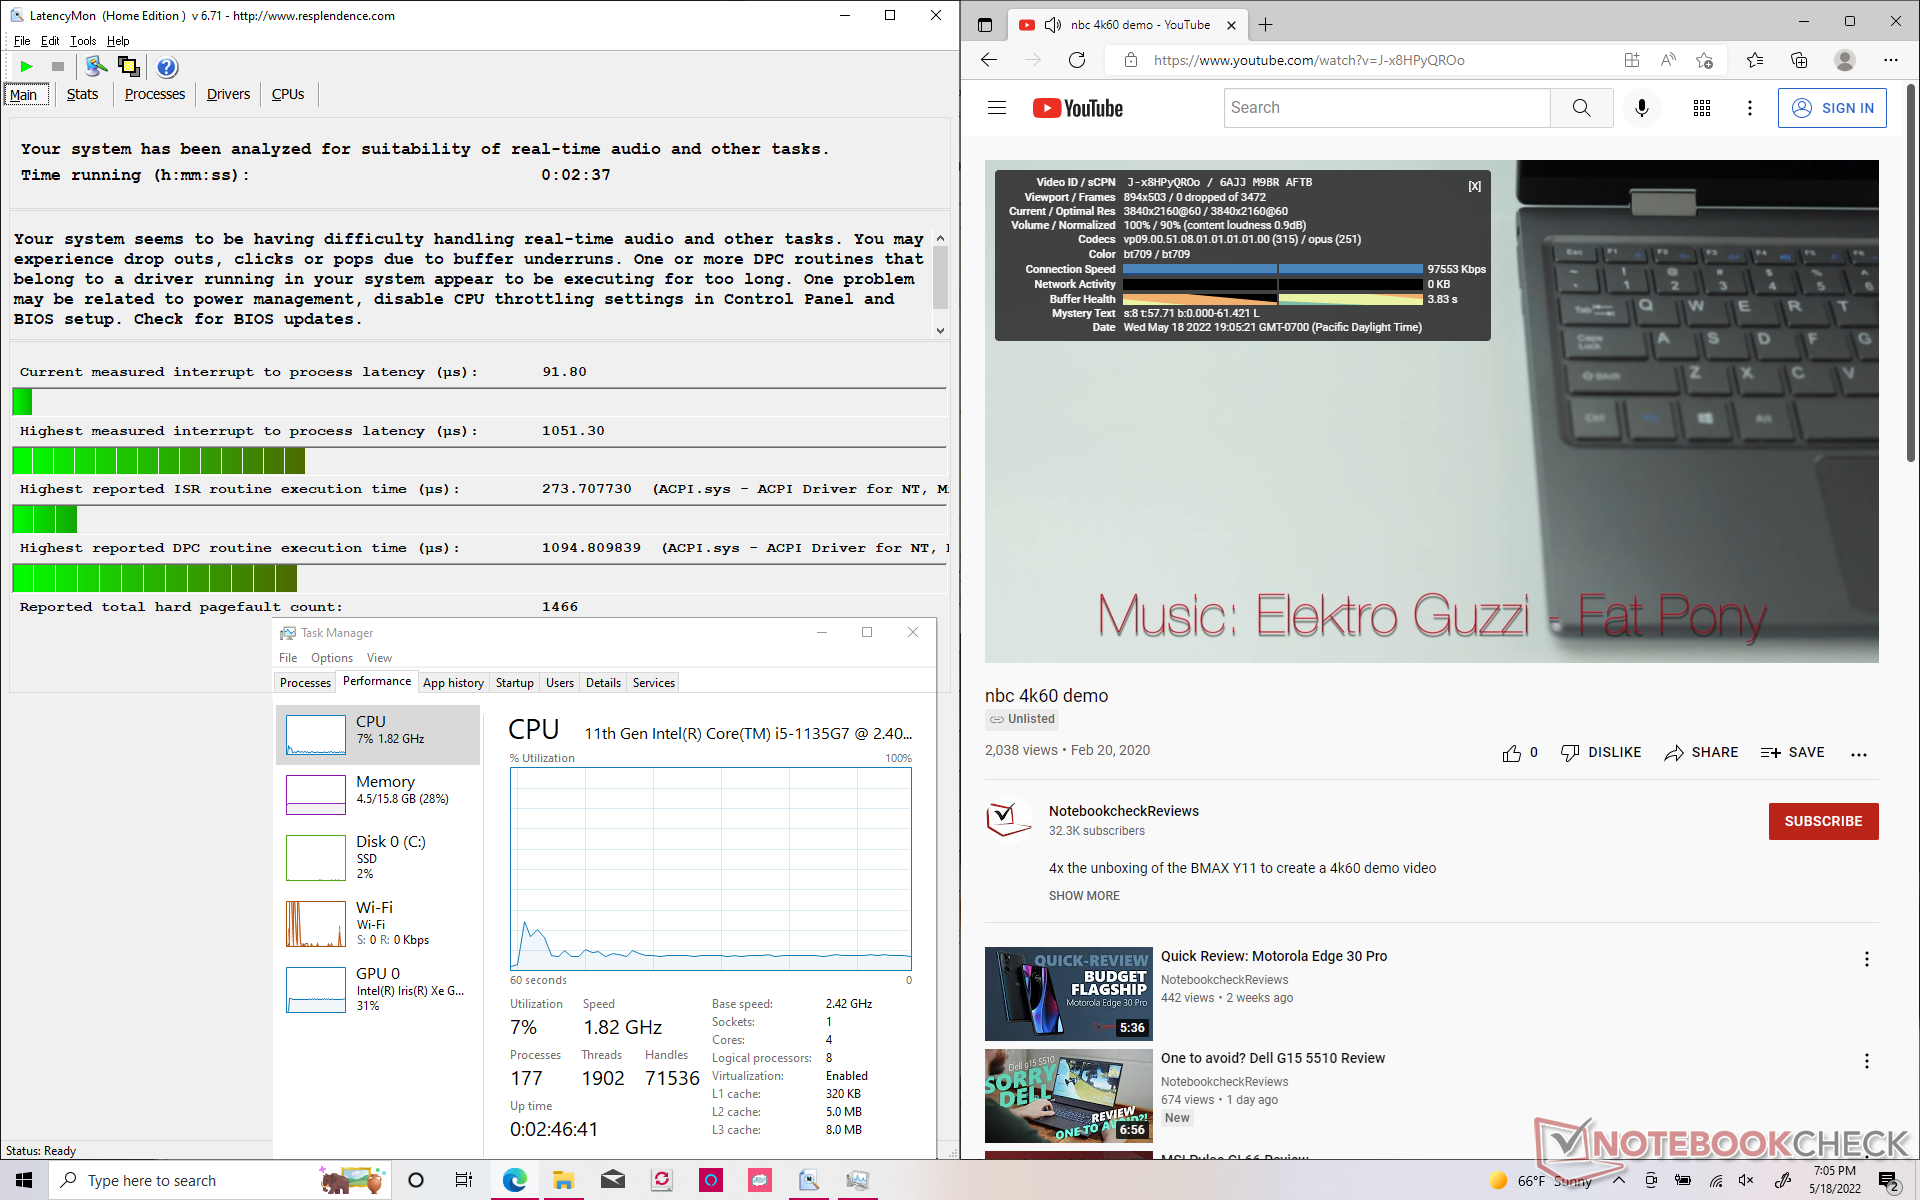
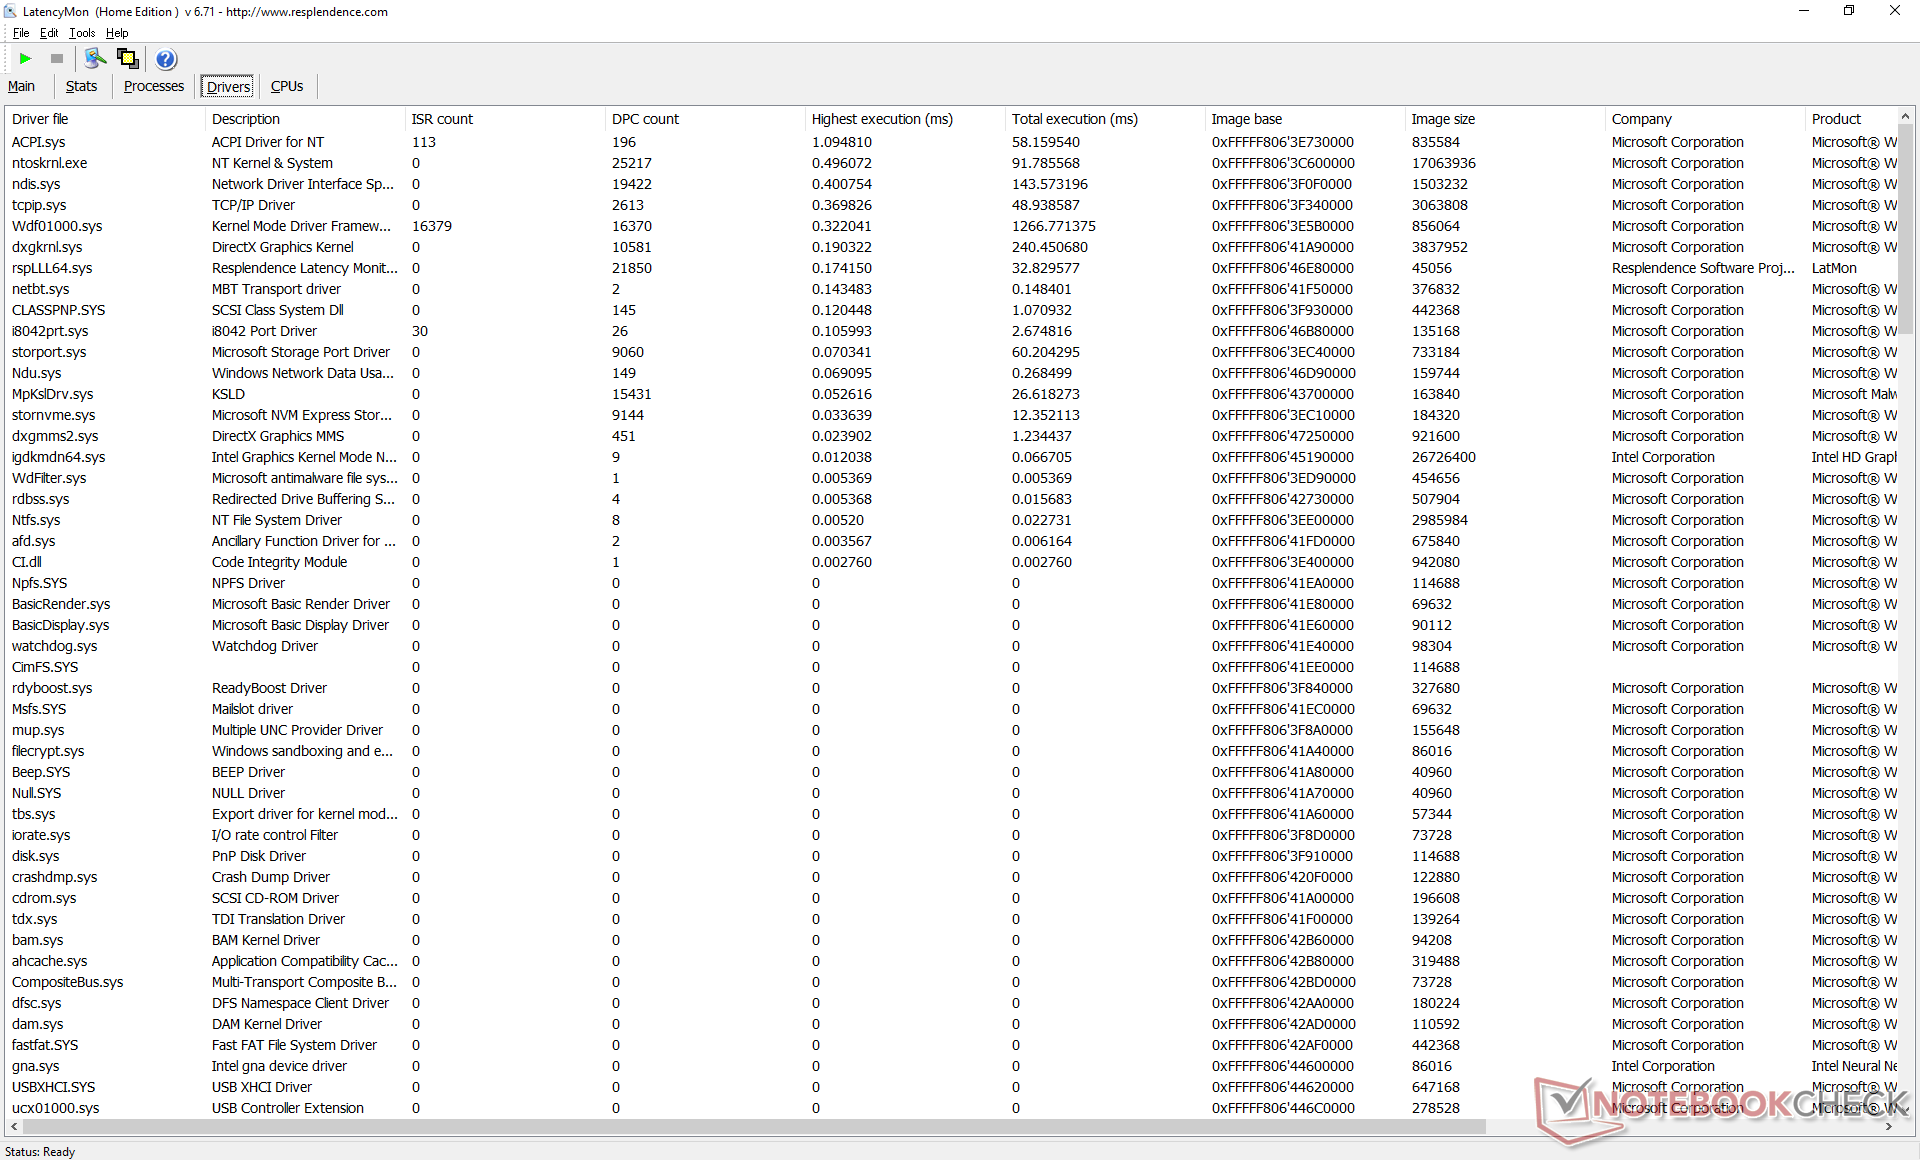
LatencyMon muestra problemas menores de CPD al abrir varias pestañas del navegador en nuestra página web. por lo demás, la reproducción de vídeo 4K a 60 FPS es perfecta, sin ninguna pérdida de fotogramas.
| DPC Latencies / LatencyMon - interrupt to process latency (max), Web, Youtube, Prime95 | |
| MSI Summit E13 Flip Evo A11MT | |
| HP Spectre x360 14-ea0378ng | |
| Lenovo Yoga 9 14IAP7 82LU0001US | |
| LG Gram 14T90N | |
| LG Gram 14T90P | |
| Asus ZenBook Flip 14 UN5401QA-KN085W | |
| Dell XPS 13 9310 2-in-1 | |
* ... más pequeño es mejor
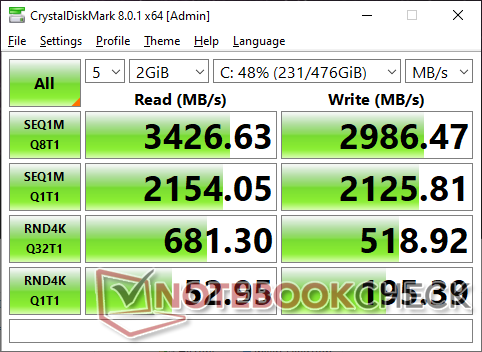
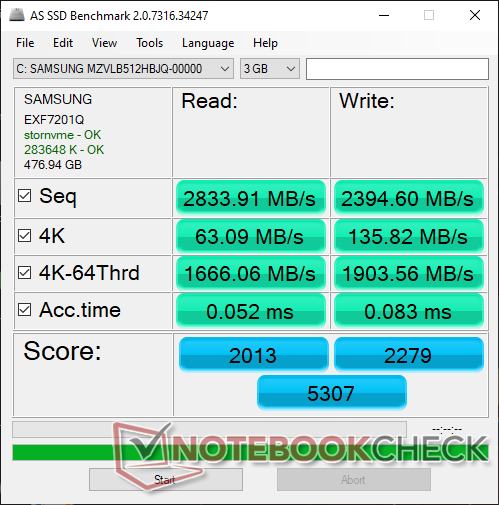
Dispositivos de almacenamiento - Se envía con unidades PCIe3
Nuestra unidad viene con los mismos 512 GBSamsung PM981a PCIe3 x4 SSD NVMe que en el Gram 14T90N aunque la placa base Tiger Lake-UP3 debería poder soportar actualizaciones de usuario final PCIe4 x4 para velocidades más rápidas. No obstante, el PM981a no tiene problemas para mantener su tasa de transferencia máxima de ~3400 MB/s durante periodos prolongados en nuestras pruebas. Sigue siendo una de las unidades PCIe3 NVMe más rápidas para los consumidores.

* ... más pequeño es mejor
Disk Throttling: DiskSpd Read Loop, Queue Depth 8
Rendimiento de la GPU
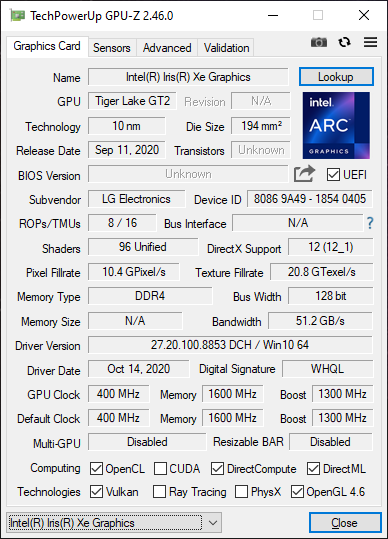
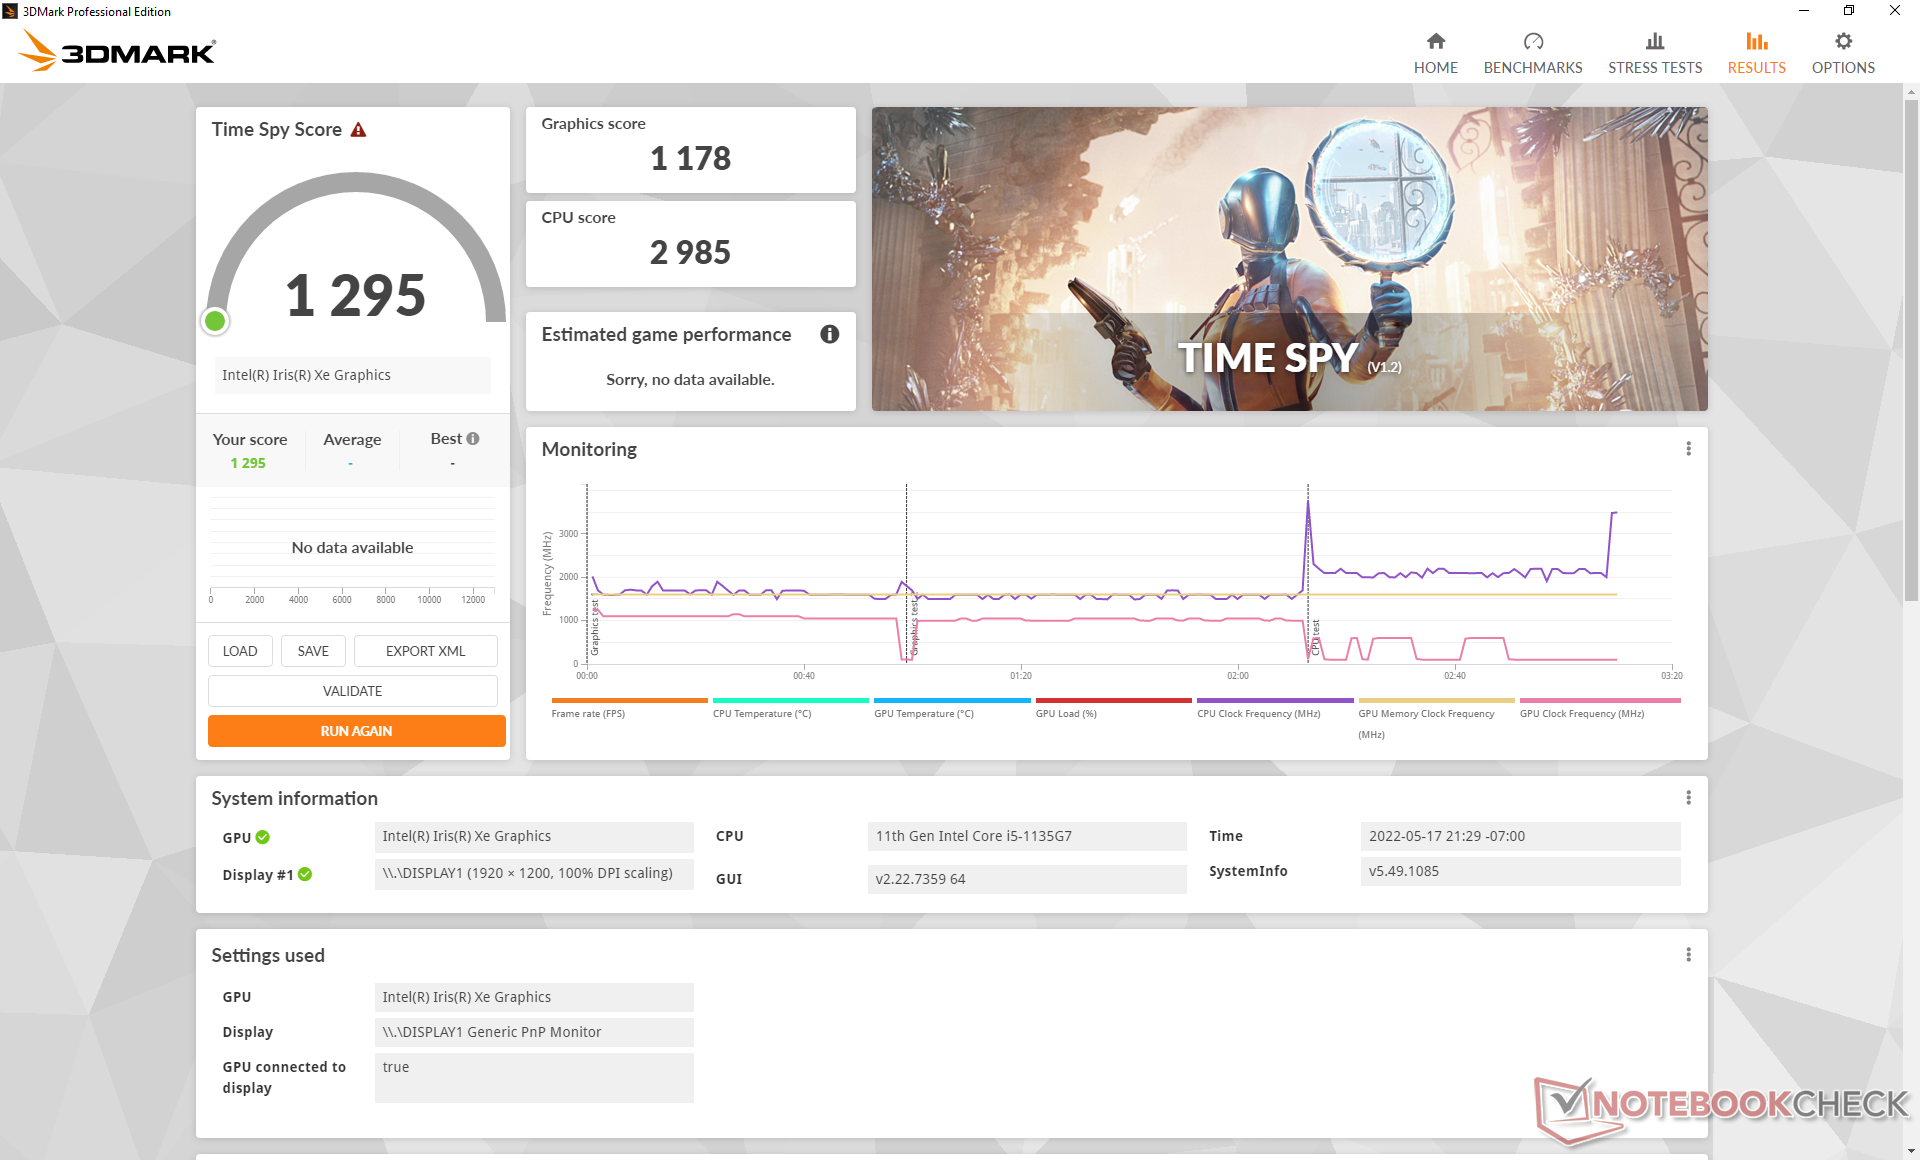
El rendimiento de los gráficos integrados Iris Xe 80 UE es excelente y más rápido que en la mayoría de los portátiles equipados con la misma GPU. Cuando se compara con el más común Core i7 Iris Xe 96 EUsnuestros Core i5 Iris Xe 80 UE pueden ser entre un 15 y un 30 por ciento más lentos. Aun así, es una mejora significativa con respecto a los UHD Graphics 620 del antiguo Gram 14T90N
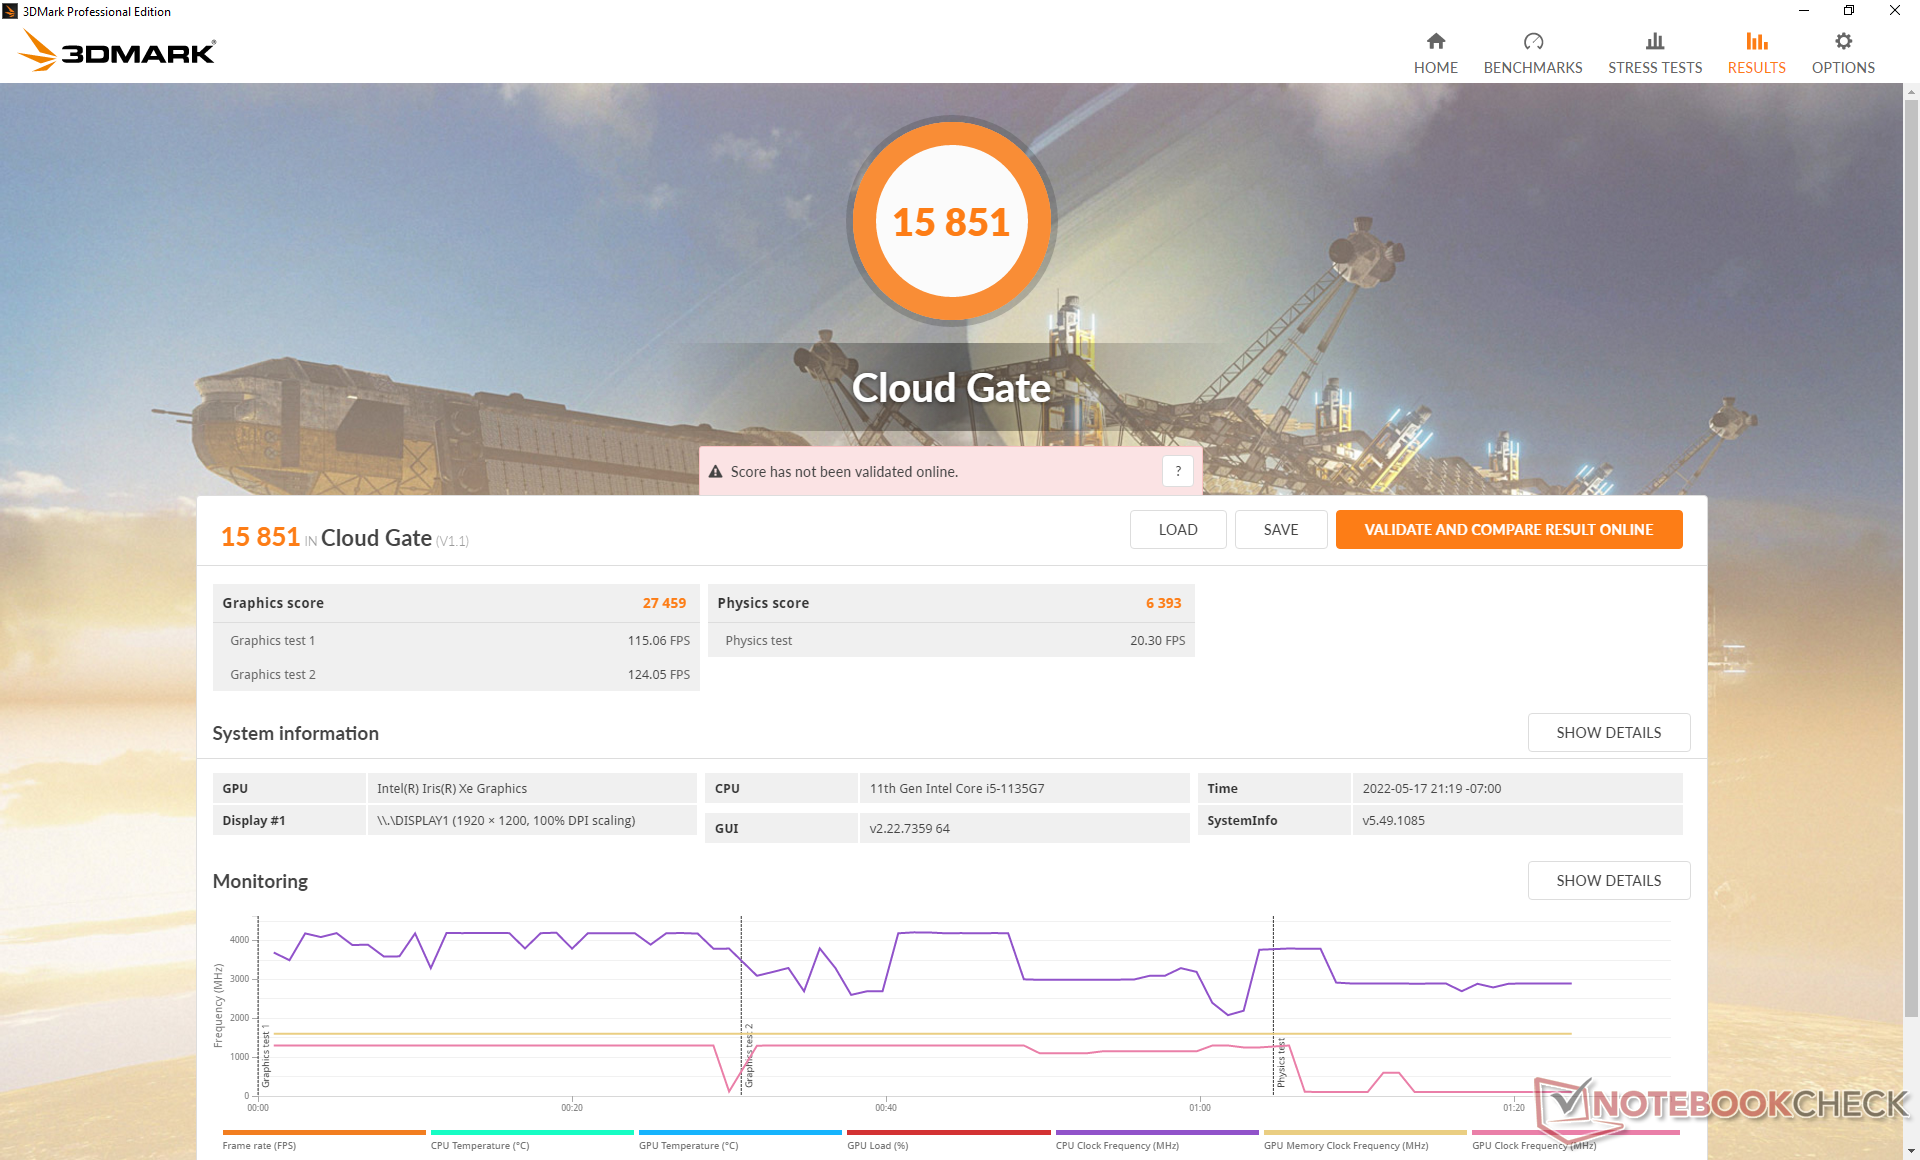
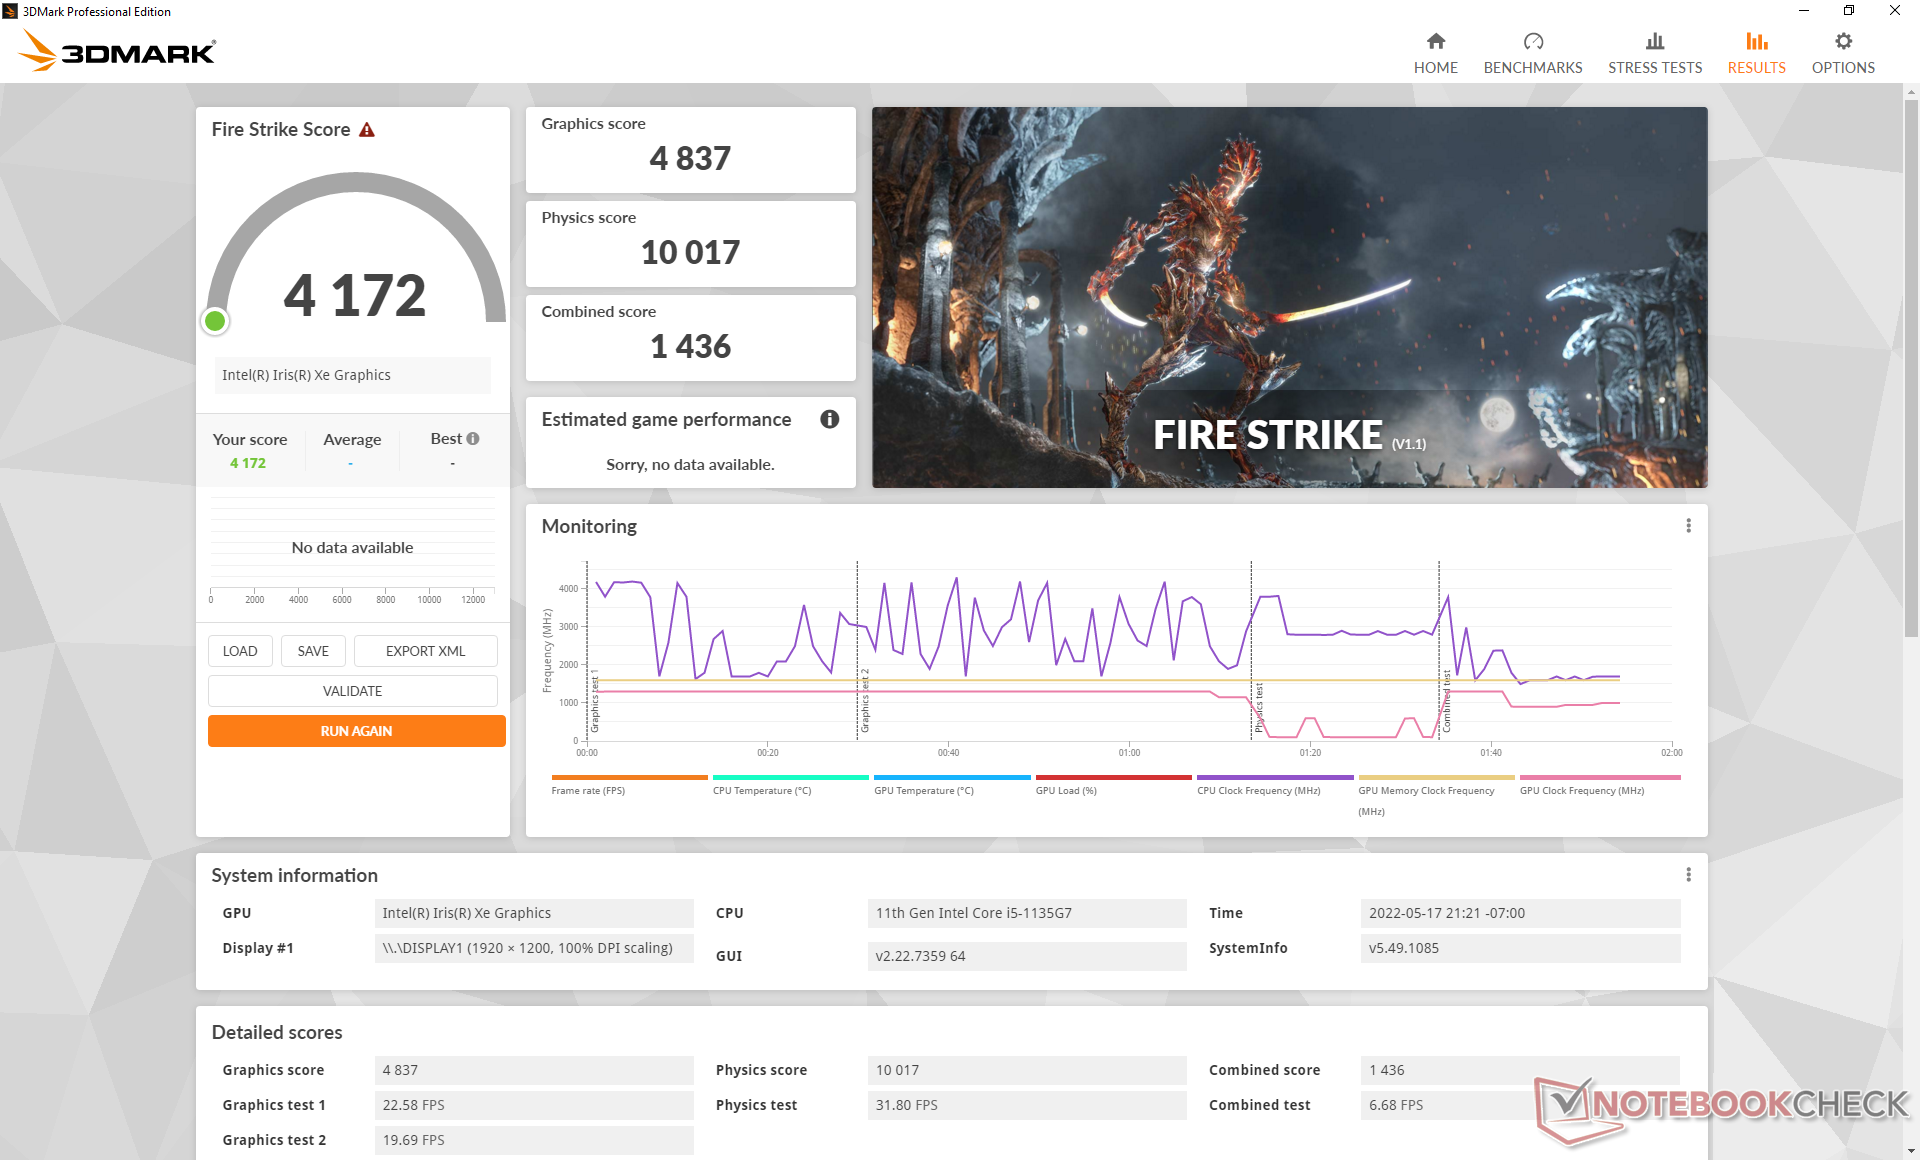
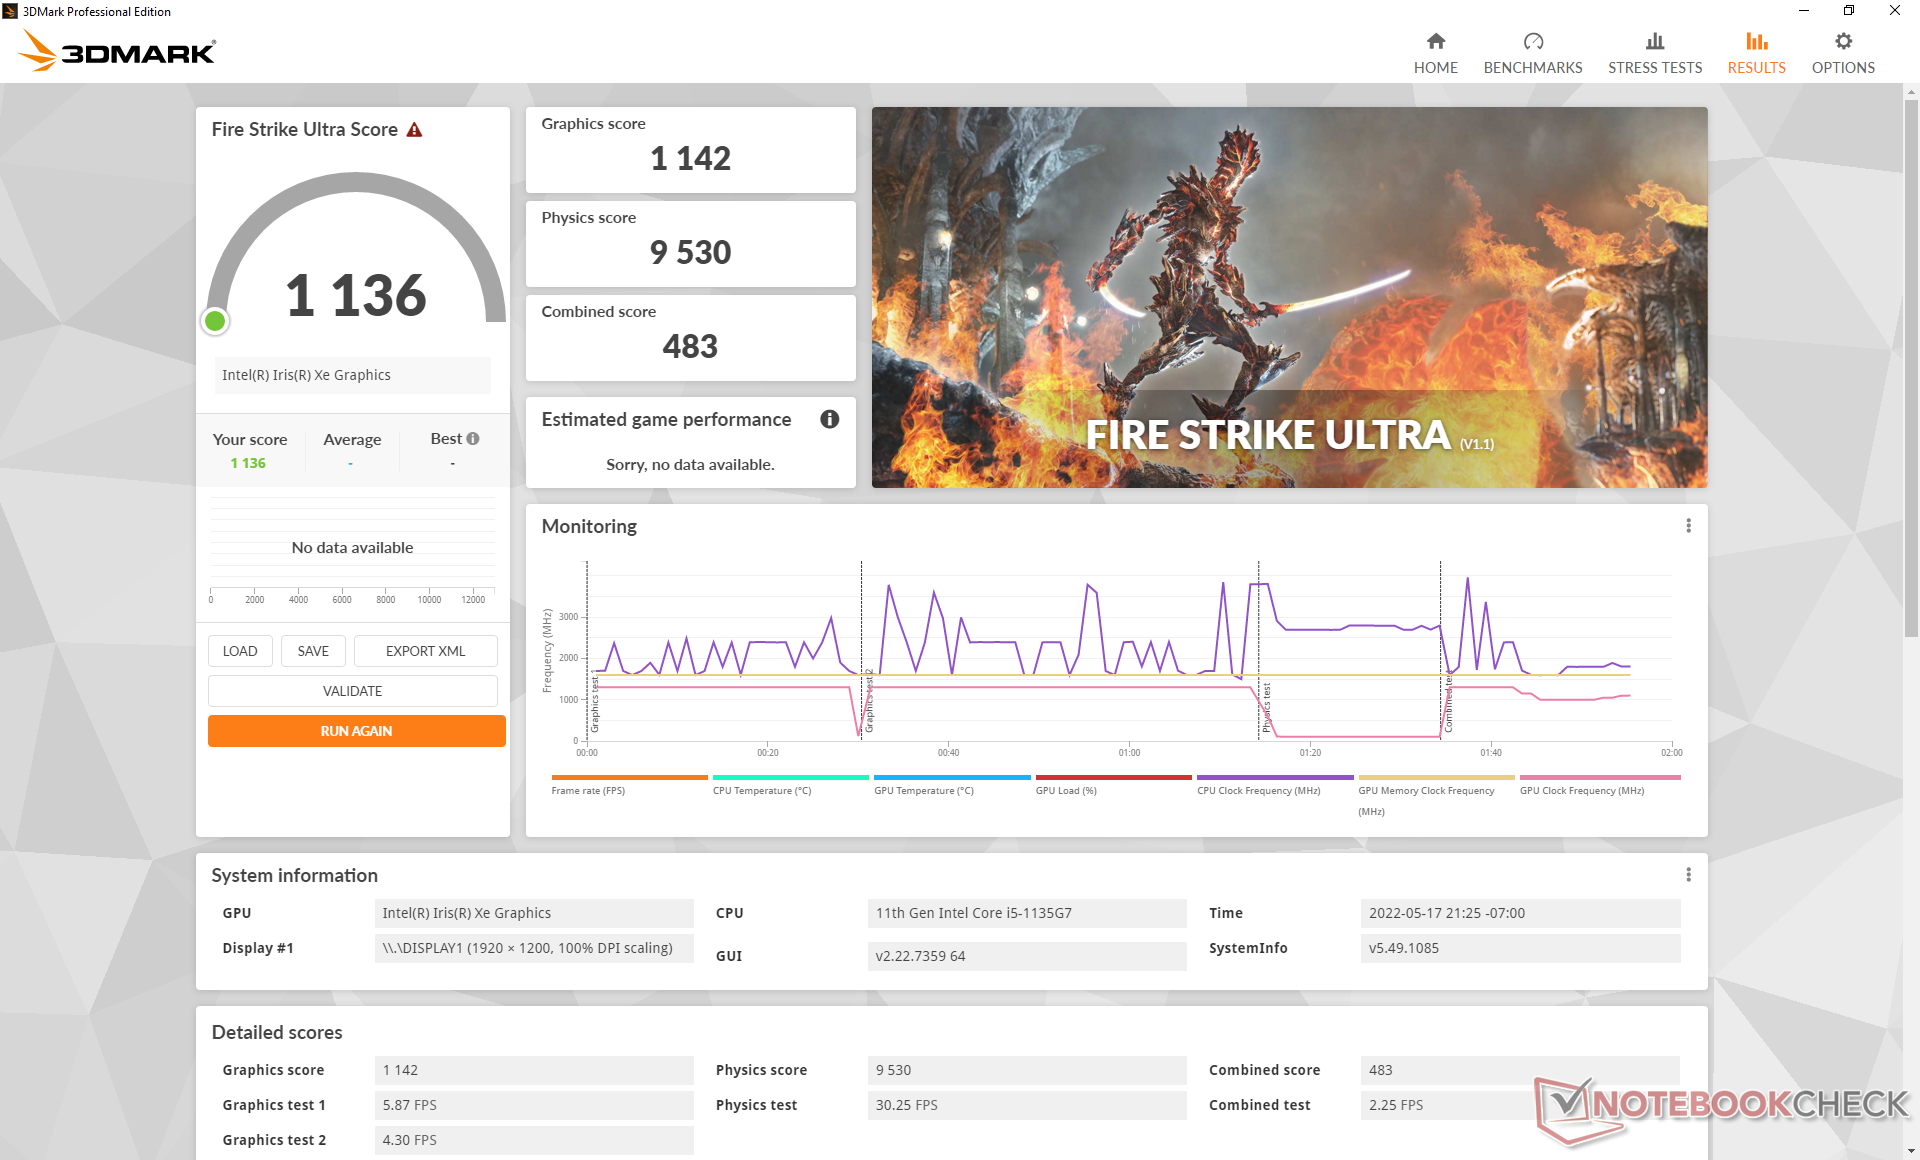
Por desgracia, el rendimiento no es tan estable como nos gustaría. Por ejemplo, cuando está en reposo Witcher 3 en la configuración baja de 720p, por ejemplo, las velocidades de fotogramas fluctuaban entre 75 y 85 FPS en lugar de permanecer estables como en la mayoría de los otros portátiles. Ejecutar Fire Strike dos veces seguidas también dio lugar a una discrepancia relativamente amplia en la puntuación de Physics (10017 puntos frente a 11226 puntos). Recomendamos activar vsync para limitar el tearing de la pantalla y los tiempos de fotogramas inestables.
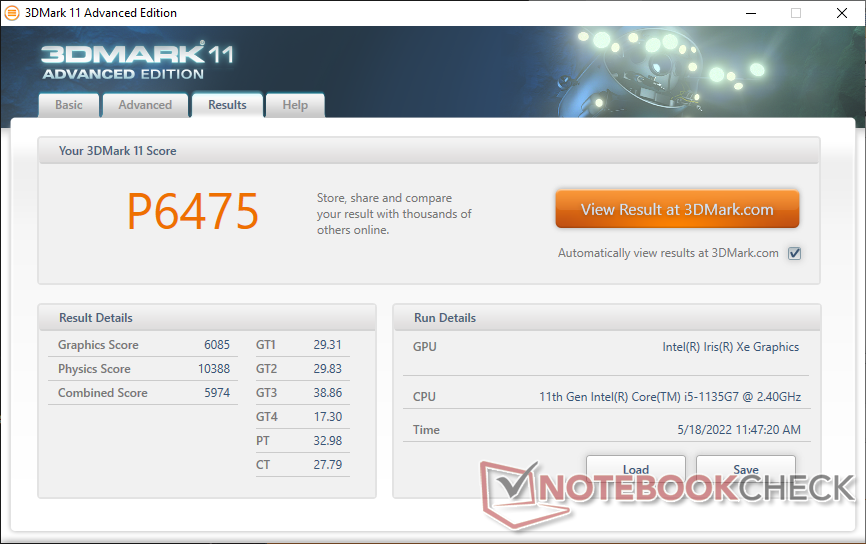
| 3DMark 11 Performance | 6475 puntos | |
| 3DMark Cloud Gate Standard Score | 15851 puntos | |
| 3DMark Fire Strike Score | 4172 puntos | |
| 3DMark Time Spy Score | 1295 puntos | |
ayuda | ||
Witcher 3 FPS Chart
| bajo | medio | alto | ultra | |
|---|---|---|---|---|
| GTA V (2015) | 83.3 | 75.1 | 25.9 | 11.4 |
| The Witcher 3 (2015) | 89.8 | 55.6 | 32.3 | 14.1 |
| Dota 2 Reborn (2015) | 85.8 | 73.3 | 46 | 42.2 |
| Final Fantasy XV Benchmark (2018) | 34.4 | 20.1 | 15.6 | |
| X-Plane 11.11 (2018) | 40.5 | 32.8 | 30.2 | |
| Strange Brigade (2018) | 88.3 | 36.3 | 28.4 | 23.2 |
Emisiones
Ruido del sistema: silencioso en la mayoría de las condiciones
El comportamiento del ruido del ventilador es similar al que observamos en el Gram 14T90N que ya era una máquina relativamente silenciosa. Somos capaces de medir sólo 28,3 dB(A) incluso después de ejecutar la primera escena de benchmark de 3DMark 06 para ser más silencioso que el Dell XPS 13, Lenovo Yoga 9 14y el Asus ZenBook Flip 14 en condiciones similares. El ruido del ventilador parece alcanzar un máximo de 35 dB(A) cuando se juega o si la CPU está al 100% de uso.
Ruido
| Ocioso |
| 25.5 / 25.5 / 25.5 dB(A) |
| Carga |
| 28.3 / 35 dB(A) |
 | ||
30 dB silencioso 40 dB(A) audible 50 dB(A) ruidosamente alto |
||
min: | ||
| LG Gram 14T90P Iris Xe G7 80EUs, i5-1135G7, Samsung SSD PM981a MZVLB512HBJQ | Dell XPS 13 9310 2-in-1 Iris Xe G7 96EUs, i7-1165G7, Toshiba BG4 KBG40ZPZ512G | Lenovo Yoga 9 14IAP7 82LU0001US Iris Xe G7 96EUs, i7-1260P, Samsung PM9A1 MZVL2512HCJQ | Asus ZenBook Flip 14 UN5401QA-KN085W Vega 8, R7 5800H, Intel SSD 600p SSDPEKKW512G7 | HP Spectre x360 14-ea0378ng Iris Xe G7 96EUs, i7-1165G7, Intel Optane Memory H10 with Solid State Storage 32GB + 1TB HBRPEKNX0203AH(L/H) | MSI Summit E13 Flip Evo A11MT Iris Xe G7 96EUs, i7-1185G7, Phison 1TB SM2801T24GKBB4S-E162 | LG Gram 14T90N UHD Graphics 620, i7-10510U, Samsung SSD PM981a MZVLB512HBJQ | |
|---|---|---|---|---|---|---|---|
| Noise | -7% | -5% | -13% | -8% | -12% | -16% | |
| apagado / medio ambiente * (dB) | 25.4 | 24.3 4% | 22.9 10% | 26 -2% | 26 -2% | 24.5 4% | 29 -14% |
| Idle Minimum * (dB) | 25.5 | 24.8 3% | 23.3 9% | 26 -2% | 26 -2% | 24.7 3% | 30 -18% |
| Idle Average * (dB) | 25.5 | 24.8 3% | 23.5 8% | 26 -2% | 26 -2% | 24.7 3% | 30 -18% |
| Idle Maximum * (dB) | 25.5 | 24.8 3% | 23.5 8% | 27.3 -7% | 26 -2% | 26.4 -4% | 30 -18% |
| Load Average * (dB) | 28.3 | 38 -34% | 33.2 -17% | 39.8 -41% | 37.5 -33% | 37.8 -34% | 35.2 -24% |
| Witcher 3 ultra * (dB) | 35 | 38 -9% | 44.9 -28% | 41.4 -18% | |||
| Load Maximum * (dB) | 35 | 41.5 -19% | 44.6 -27% | 42.4 -21% | 36.3 -4% | 48.8 -39% | 37 -6% |
* ... más pequeño es mejor
Temperatura
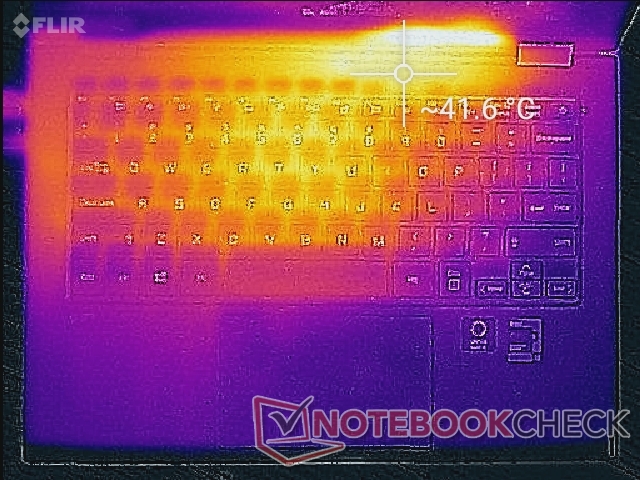
Las temperaturas superficiales son más frías que las que observamos en el Lenovo Yoga 9 14IAP7 de la competencia cuando se ejecutan cargas bajas, mientras que son más o menos las mismas entre ellos cuando se ejecutan cargas más exigentes. Los puntos calientes están más cerca del centro del teclado donde puede alcanzar los 40 C para ser comparable con el Gram 14T90N o el mencionado Lenovo.
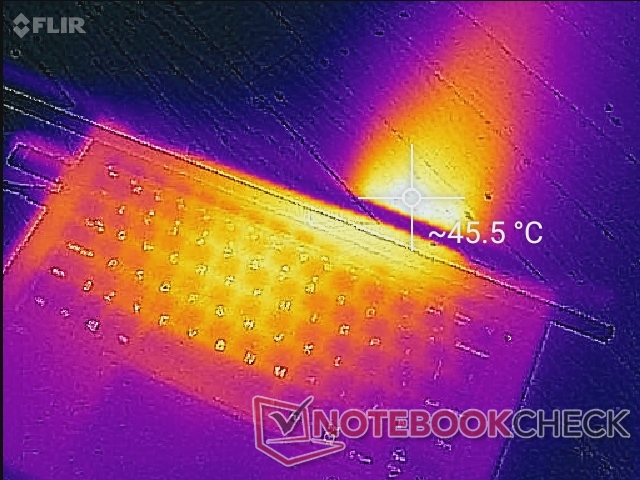
(±) La temperatura máxima en la parte superior es de 41.6 °C / 107 F, frente a la media de 35.4 °C / 96 F, que oscila entre 19.6 y 60 °C para la clase Convertible.
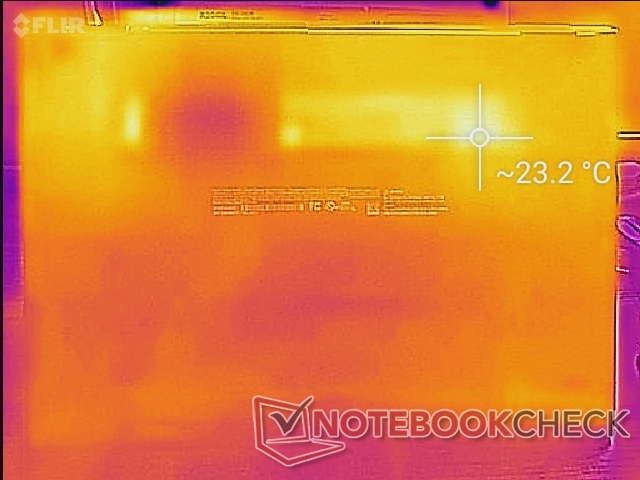
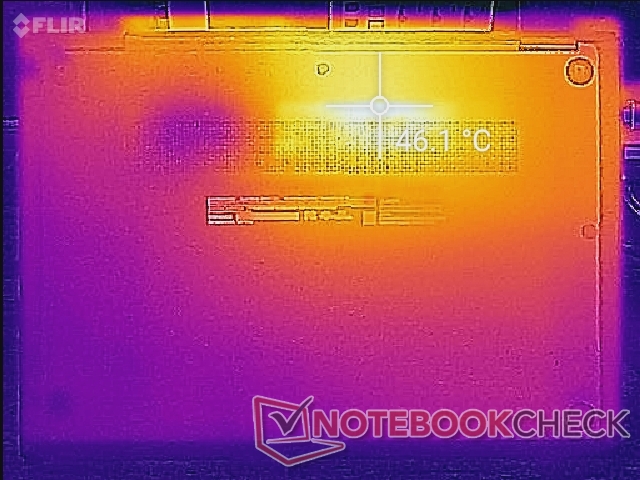
(-) El fondo se calienta hasta un máximo de 46.2 °C / 115 F, frente a la media de 36.9 °C / 98 F
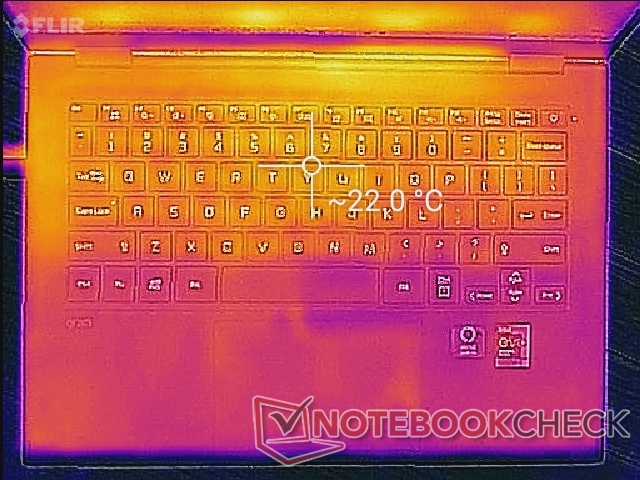
(+) En reposo, la temperatura media de la parte superior es de 21.6 °C / 71# F, frente a la media del dispositivo de 30.3 °C / 87 F.
(+) El reposamanos y el panel táctil están a una temperatura inferior a la de la piel, con un máximo de 26.2 °C / 79.2 F y, por tanto, son fríos al tacto.
(±) La temperatura media de la zona del reposamanos de dispositivos similares fue de 28 °C / 82.4 F (+1.8 °C / 3.2 F).
| LG Gram 14T90P Intel Core i5-1135G7, Intel Iris Xe Graphics G7 80EUs | Dell XPS 13 9310 2-in-1 Intel Core i7-1165G7, Intel Iris Xe Graphics G7 96EUs | Lenovo Yoga 9 14IAP7 82LU0001US Intel Core i7-1260P, Intel Iris Xe Graphics G7 96EUs | Asus ZenBook Flip 14 UN5401QA-KN085W AMD Ryzen 7 5800H, AMD Radeon RX Vega 8 (Ryzen 4000/5000) | HP Spectre x360 14-ea0378ng Intel Core i7-1165G7, Intel Iris Xe Graphics G7 96EUs | MSI Summit E13 Flip Evo A11MT Intel Core i7-1185G7, Intel Iris Xe Graphics G7 96EUs | LG Gram 14T90N Intel Core i7-10510U, Intel UHD Graphics 620 | |
|---|---|---|---|---|---|---|---|
| Heat | -12% | -29% | -29% | -8% | -33% | -14% | |
| Maximum Upper Side * (°C) | 41.6 | 51 -23% | 43.2 -4% | 42.7 -3% | 37.1 11% | 52 -25% | 43.2 -4% |
| Maximum Bottom * (°C) | 46.2 | 45.4 2% | 45.6 1% | 53.1 -15% | 43.1 7% | 57.4 -24% | 41.6 10% |
| Idle Upper Side * (°C) | 22.6 | 24.4 -8% | 34.6 -53% | 32.9 -46% | 29 -28% | 30.4 -35% | 29.2 -29% |
| Idle Bottom * (°C) | 23.2 | 27.4 -18% | 37 -59% | 35.2 -52% | 28.6 -23% | 34.2 -47% | 30.6 -32% |
* ... más pequeño es mejor
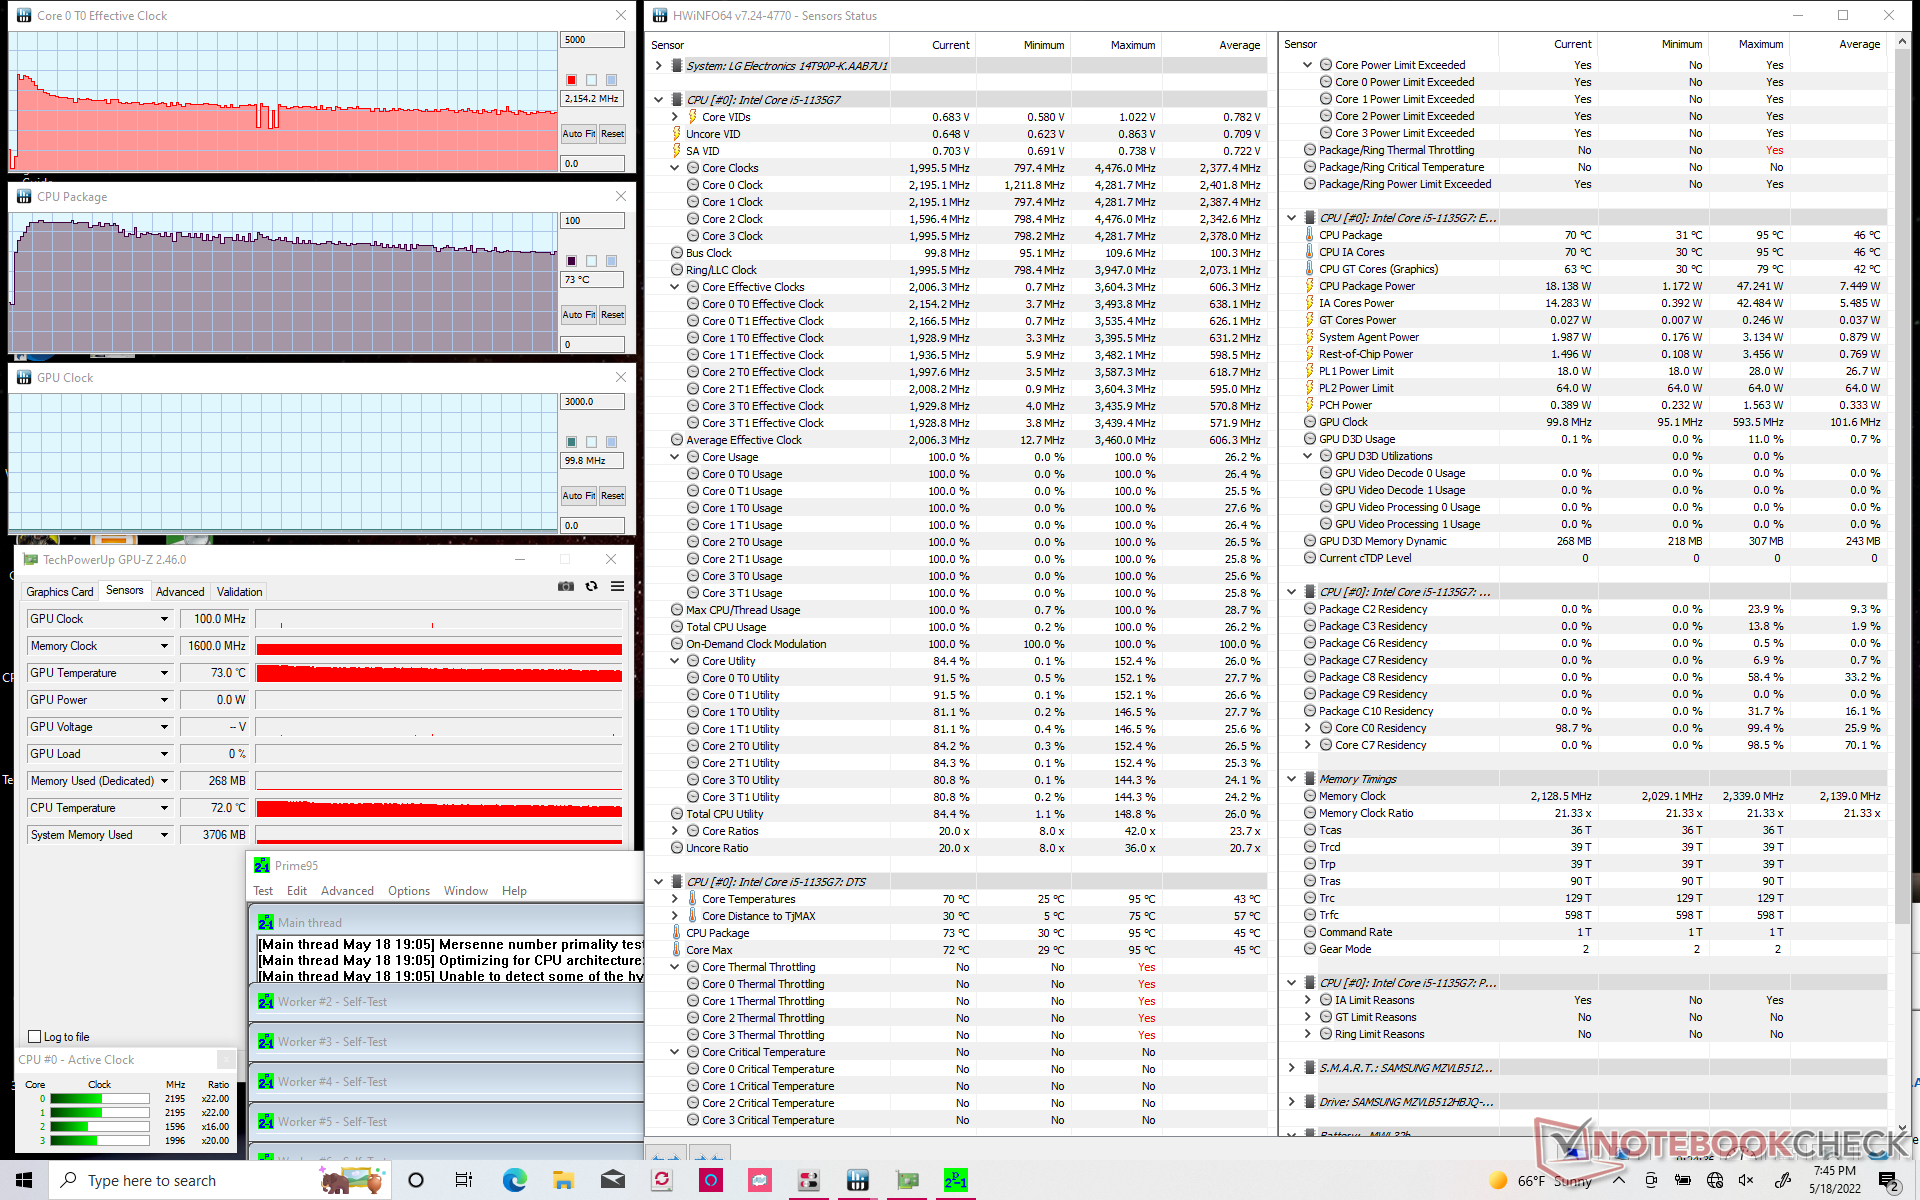
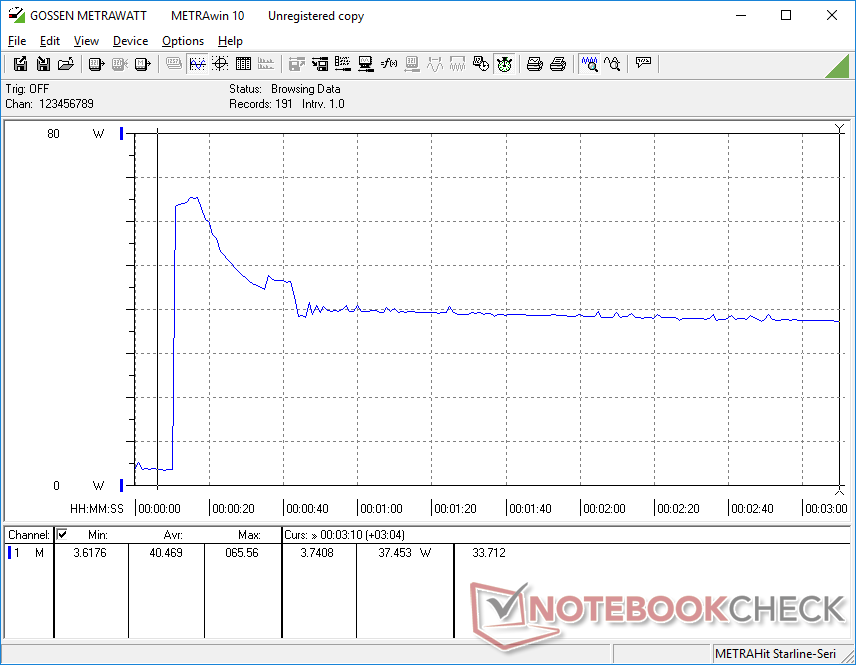
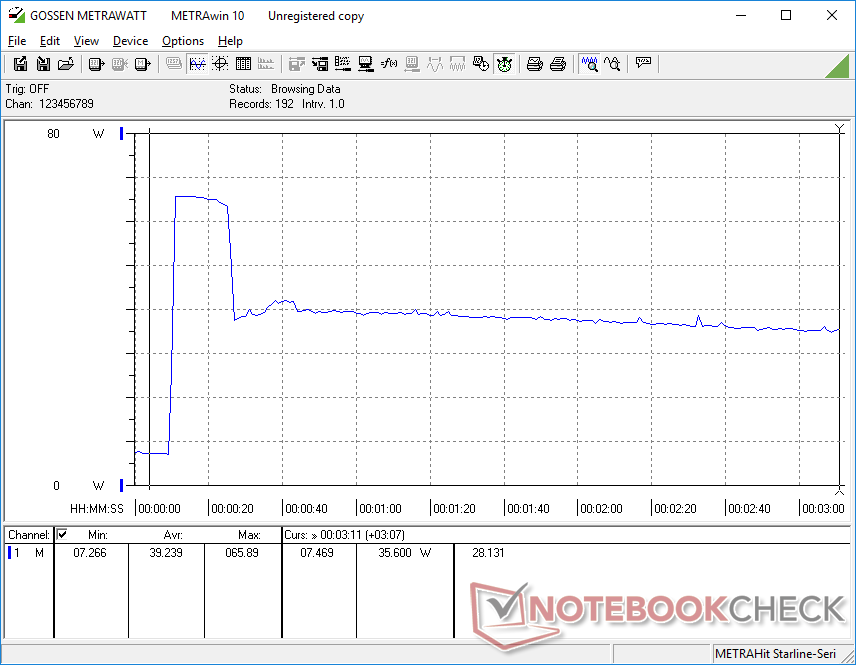
Prueba de esfuerzo
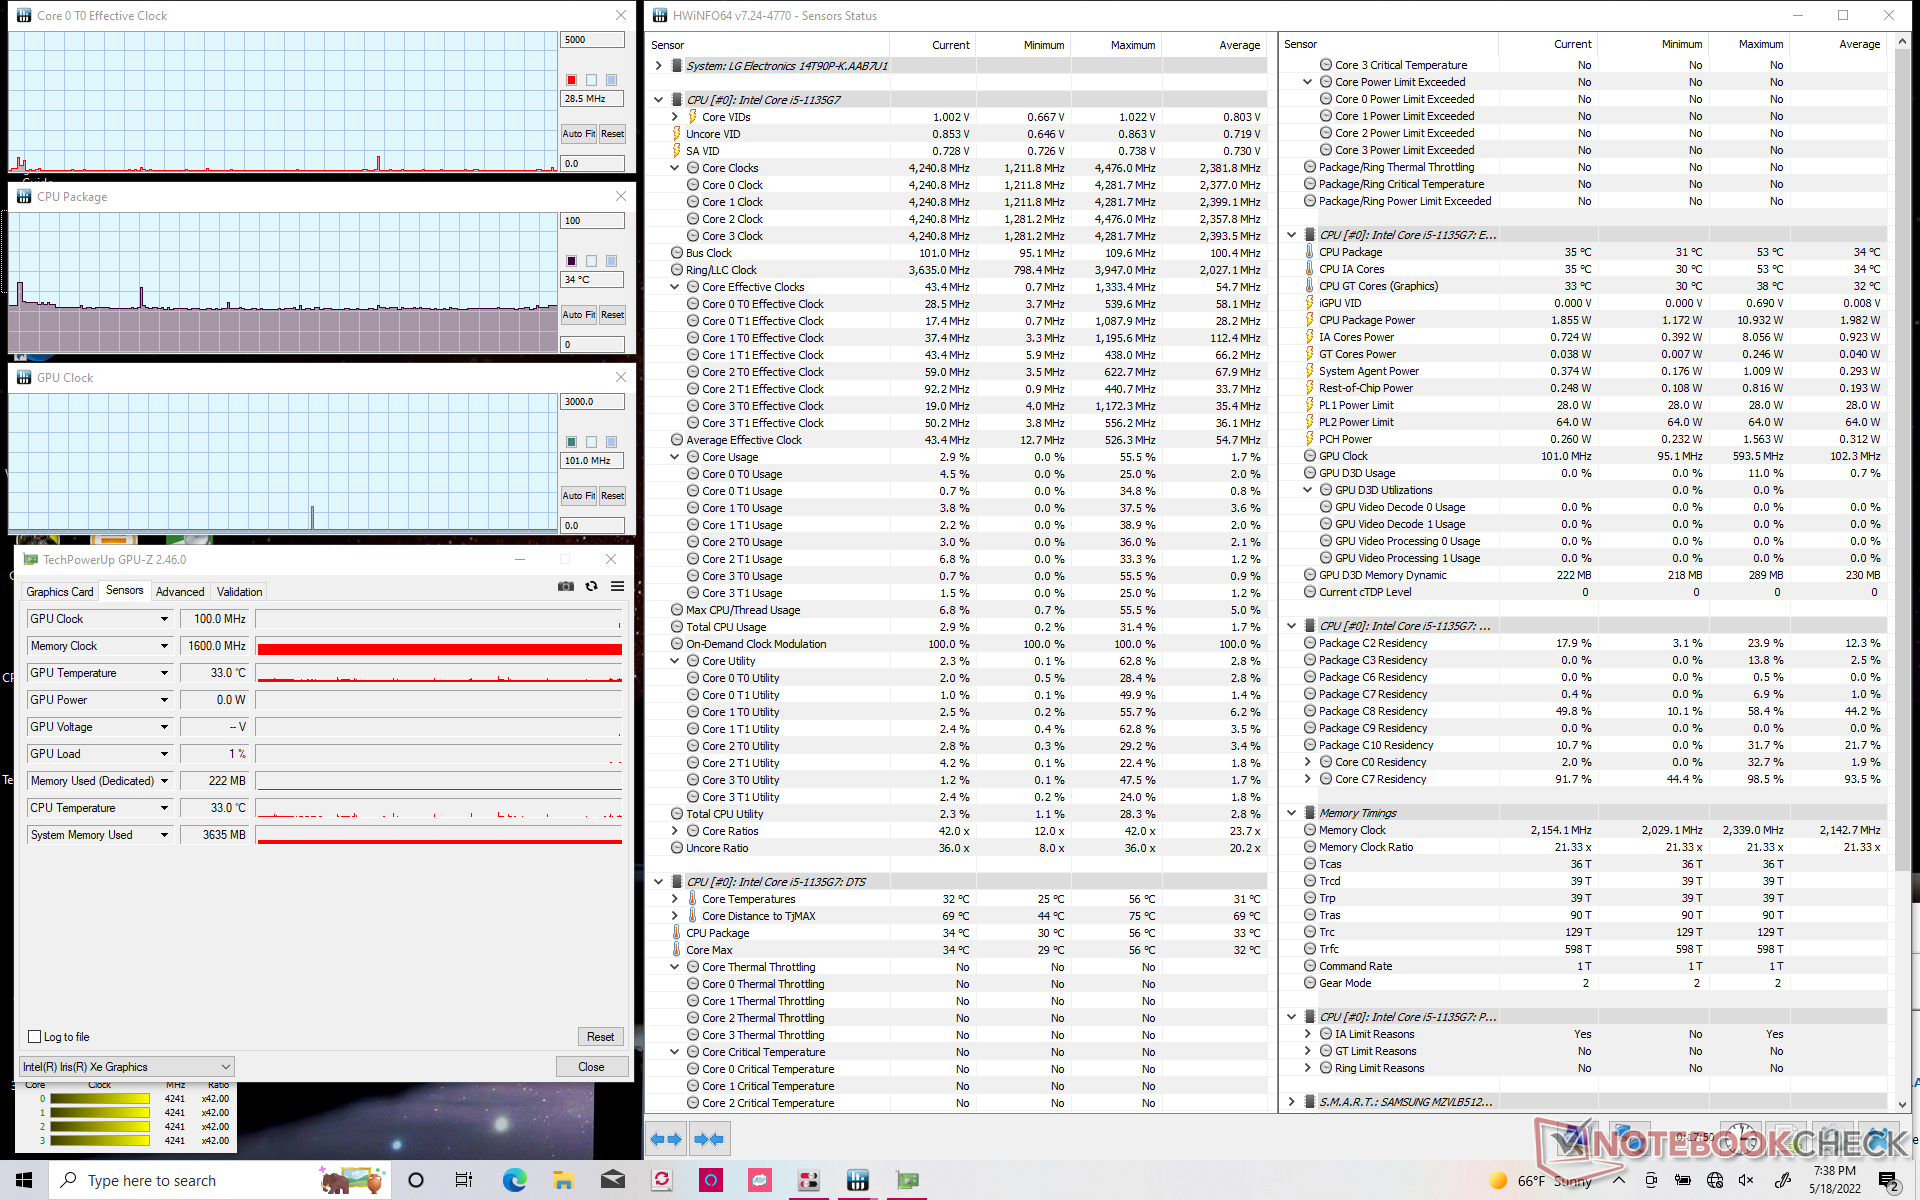
Cuando se estresa bajo Prime95, la CPU sube a 3,5 GHz y 95 C durante unos segundos antes de caer constantemente y finalmente estabilizarse en 2,1 GHz y 73 C. Sospechamos que el procesador no se estabilizará a velocidades de reloj más altas para mantener la temperatura de la piel bajo control. El TDP de la CPU llegaría a los 47 W durante el inicio de la prueba antes de estabilizarse en sólo 18 W como resultado. En comparación, ejecutando esta misma prueba en el HP Spectre x360 14 con el Core i7-1165G7 resultaría en una velocidad de reloj de CPU cíclica y una temperatura de 2,1 - 3,4 GHz y 75 - 95 C, respectivamente, para un rendimiento superior de media.
Si se ejecuta en el modo de rendimiento, las velocidades de reloj y las temperaturas son más elevadas, como se muestra en nuestros gráficos y en la tabla siguiente.
El rendimiento no se verá limitado si se ejecuta con la energía de la batería, ya que las puntuaciones de Fire Strike en la red eléctrica y en las baterías son muy similares.
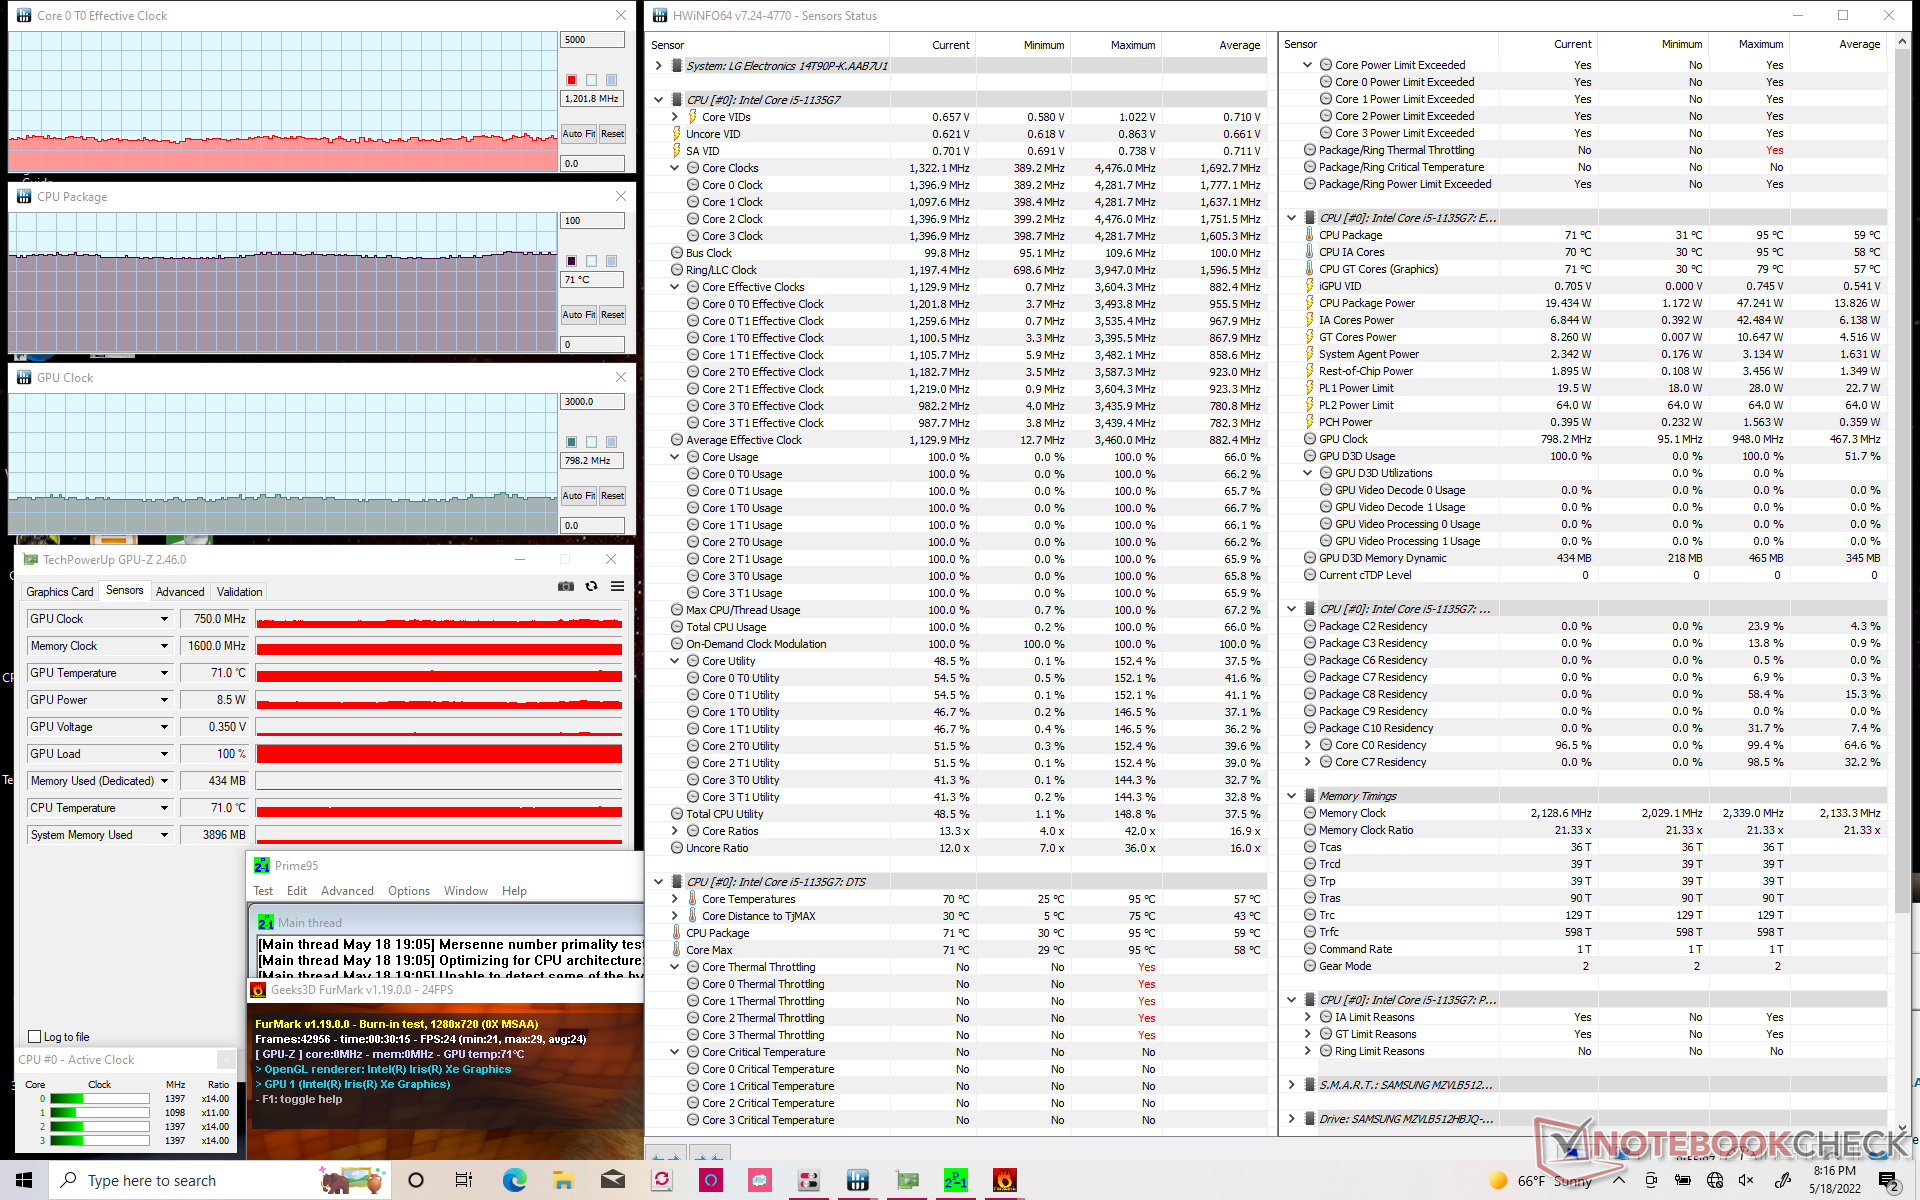
| Reloj dela CPU (GHz) | Reloj de la GPU (MHz) | Temperatura media de la CPU (°C) | |
| Sistema en reposo | -- | -- | 34 |
| Prime95Stress | 2.1 | -- | 73 |
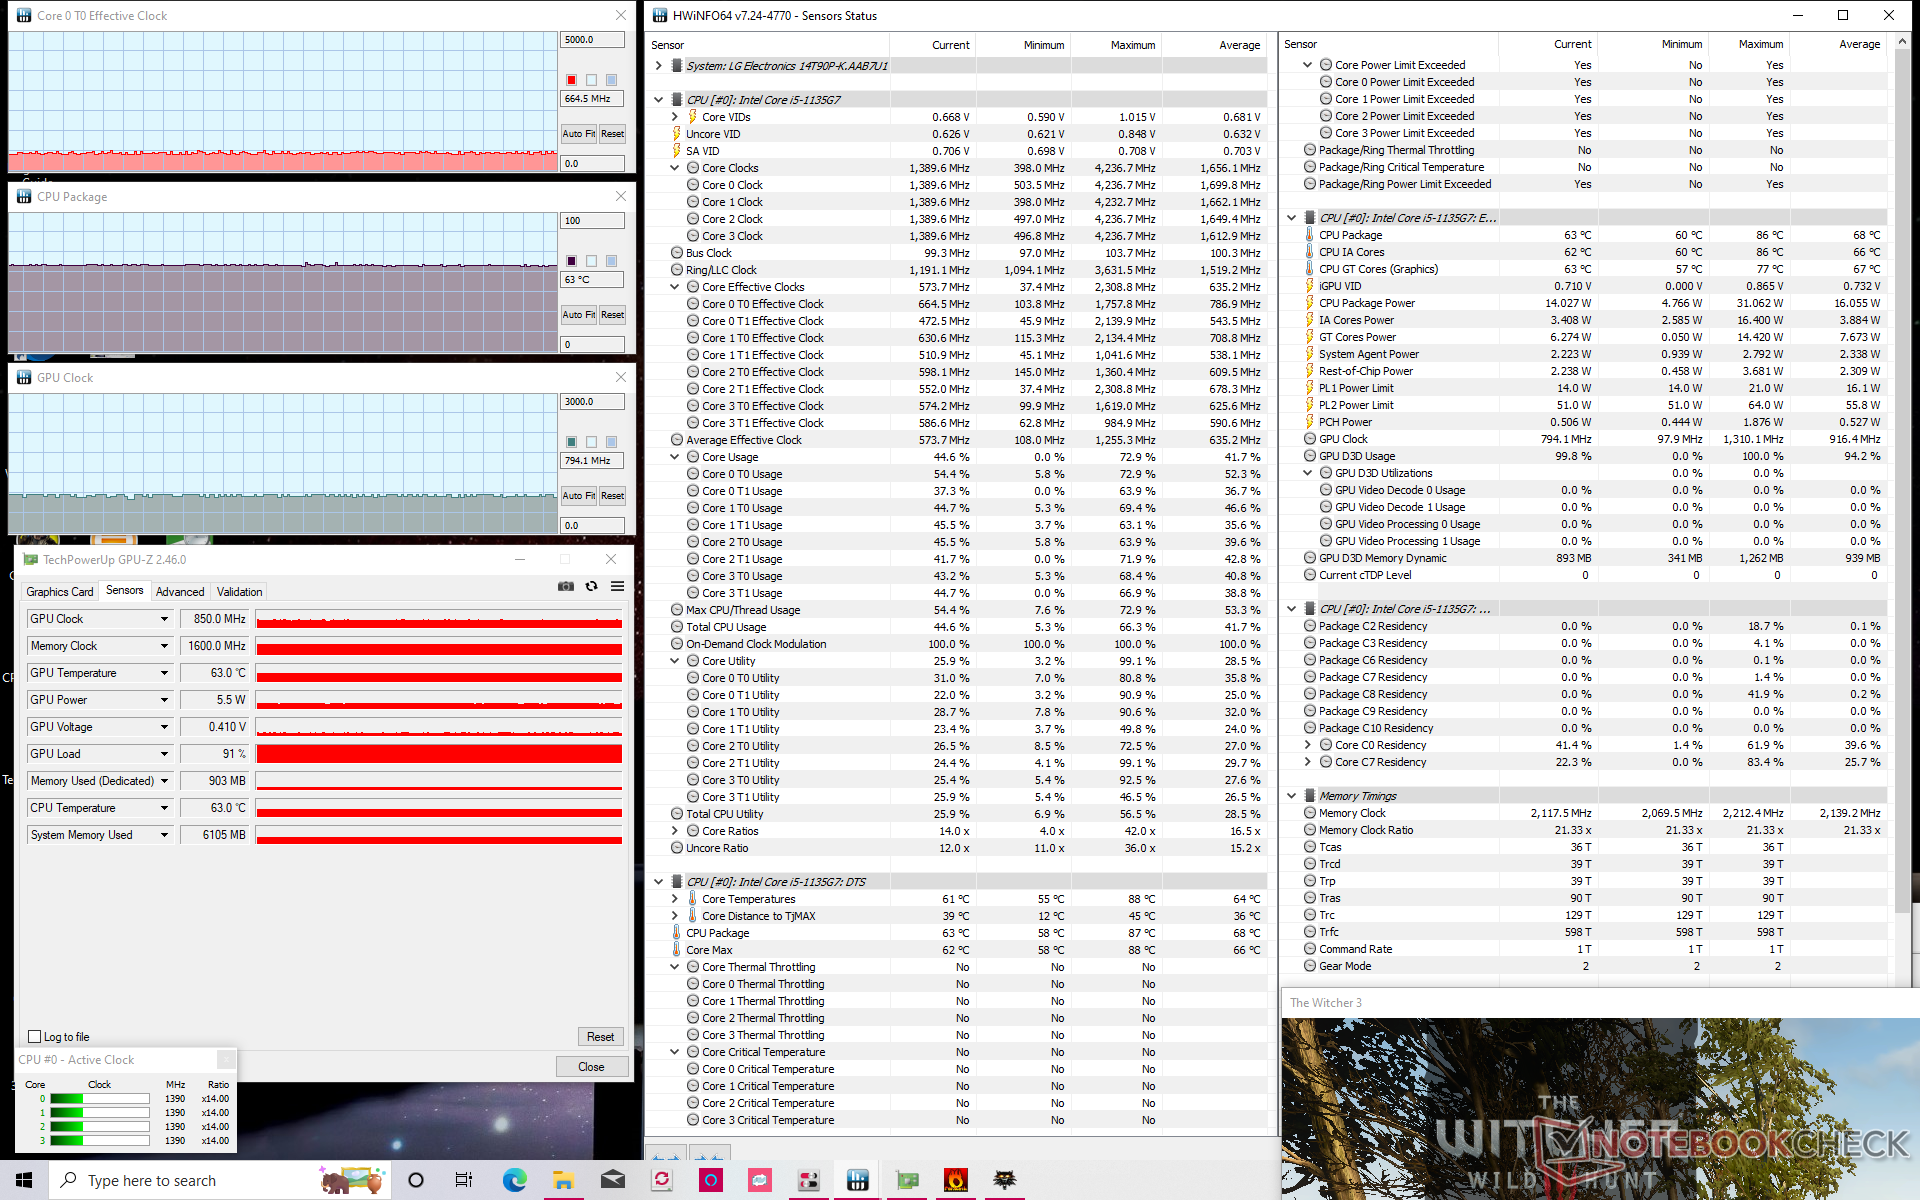
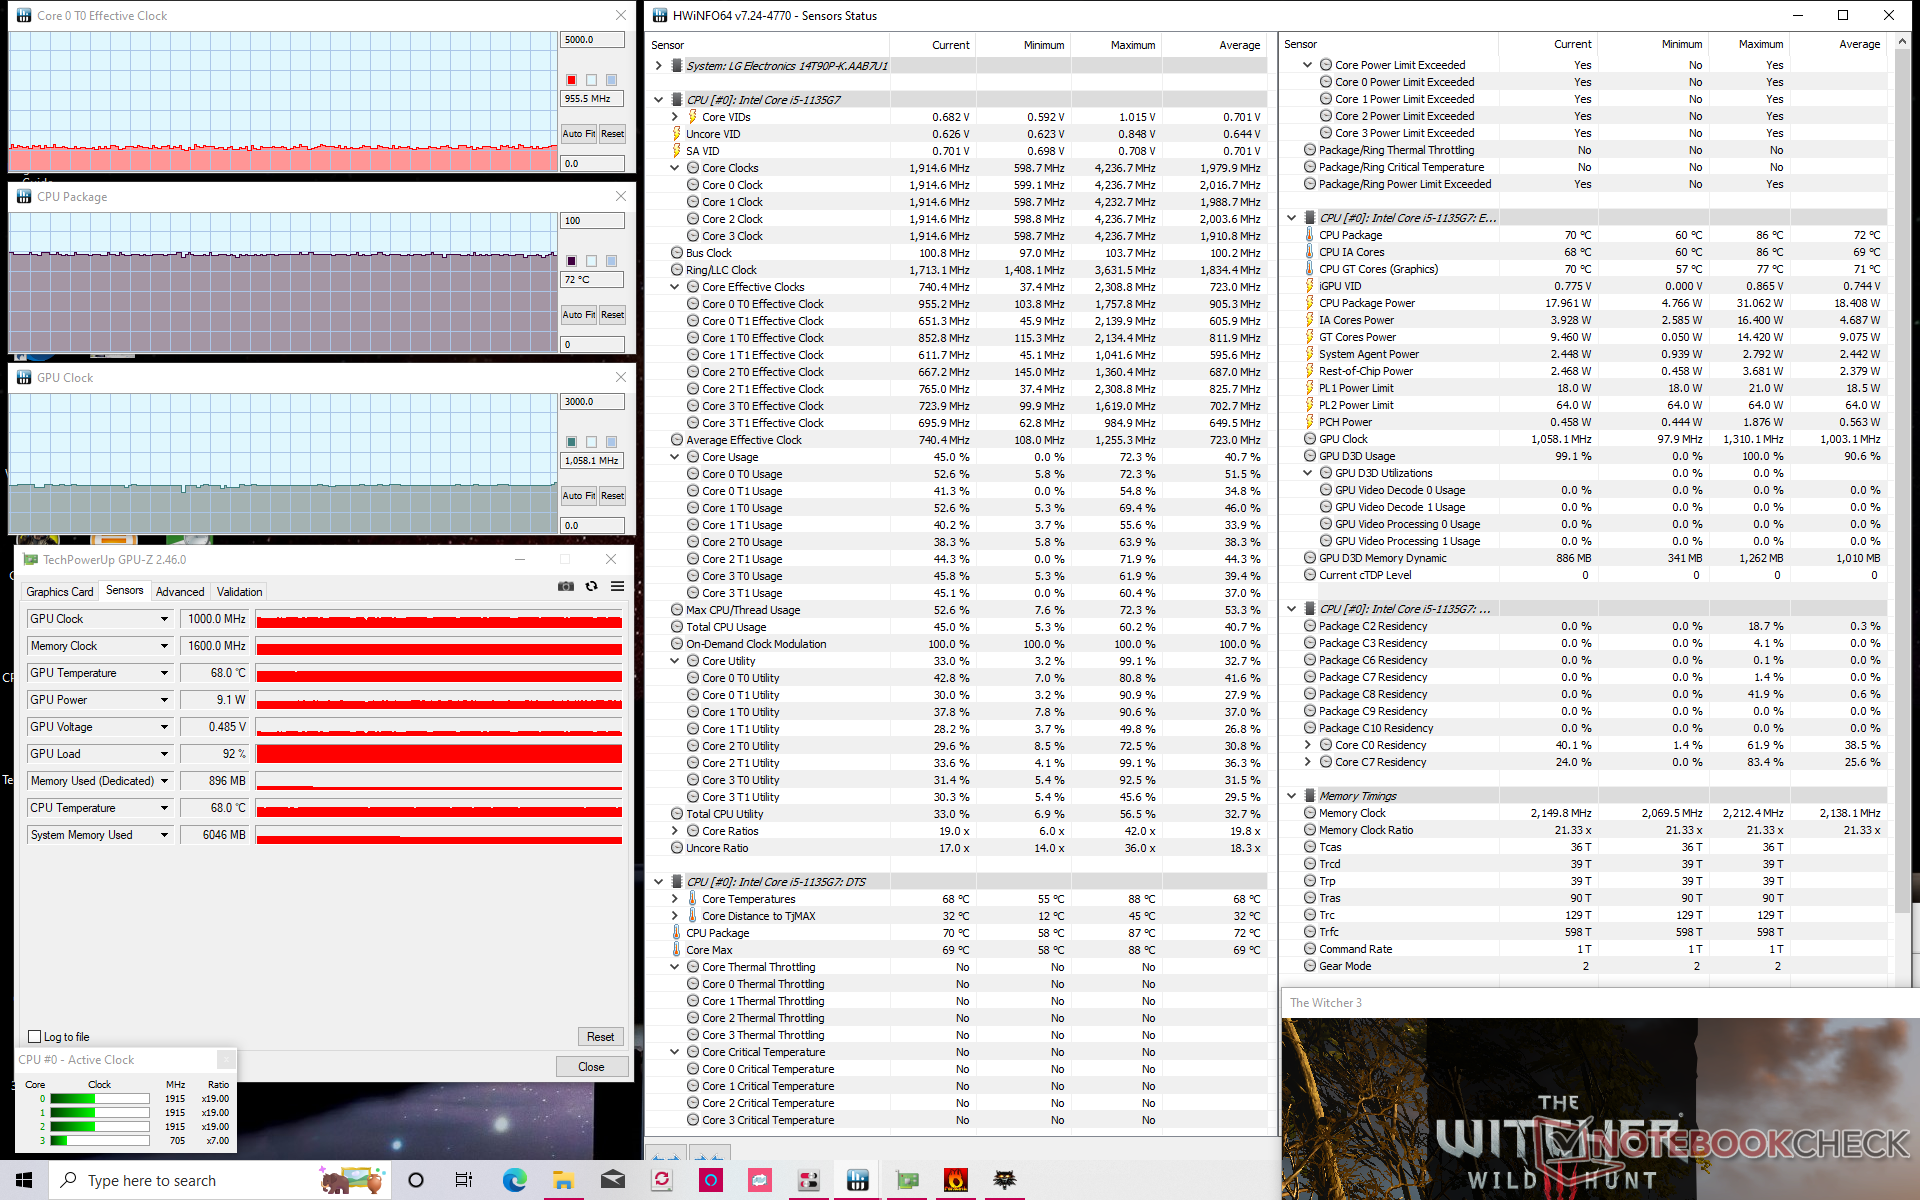
| Estrés de Prime95+ FurMark | ~1,2 | 750 - 900 | 71 |
| Witcher 3 Estrés (perfil de potenciaequilibrado) | 0,6 | 800 | 63 |
| Witcher 3 Estrés (perfil de potenciaderendimiento) | ~1,0 | 1000 | 72 |
Altavoces
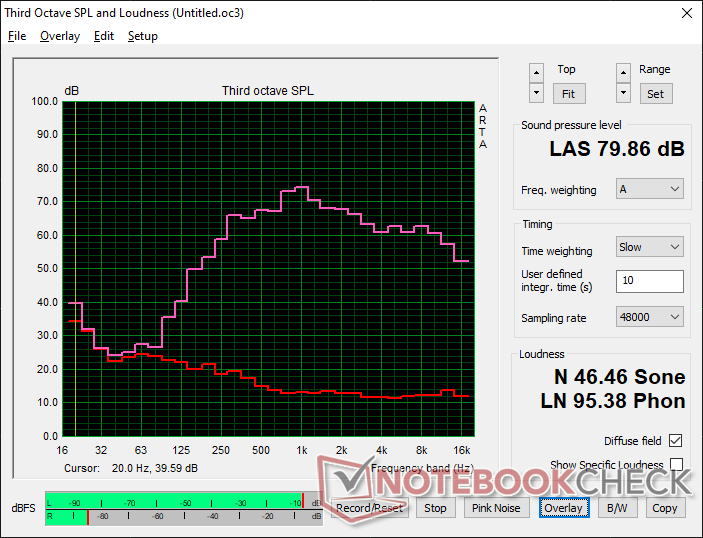
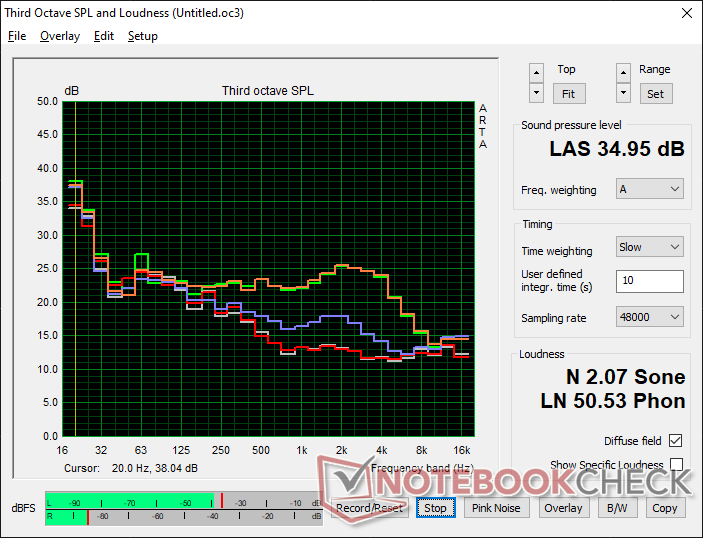
LG Gram 14T90P análisis de audio
(±) | la sonoridad del altavoz es media pero buena (79.9 dB)
Graves 100 - 315 Hz
(±) | lubina reducida - en promedio 13.1% inferior a la mediana
(±) | la linealidad de los graves es media (13.3% delta a frecuencia anterior)
Medios 400 - 2000 Hz
(±) | medias más altas - de media 6.6% más altas que la mediana
(+) | los medios son lineales (4.3% delta a la frecuencia anterior)
Altos 2 - 16 kHz
(+) | máximos equilibrados - a sólo 1.3% de la mediana
(+) | los máximos son lineales (3.9% delta a la frecuencia anterior)
Total 100 - 16.000 Hz
(±) | la linealidad del sonido global es media (15.3% de diferencia con la mediana)
En comparación con la misma clase
» 25% de todos los dispositivos probados de esta clase eran mejores, 5% similares, 70% peores
» El mejor tuvo un delta de 6%, la media fue 20%, el peor fue ###max##%
En comparación con todos los dispositivos probados
» 22% de todos los dispositivos probados eran mejores, 4% similares, 74% peores
» El mejor tuvo un delta de 4%, la media fue 23%, el peor fue ###max##%
Apple MacBook Pro 16 2021 M1 Pro análisis de audio
(+) | los altavoces pueden reproducir a un volumen relativamente alto (#84.7 dB)
Graves 100 - 315 Hz
(+) | buen bajo - sólo 3.8% lejos de la mediana
(+) | el bajo es lineal (5.2% delta a la frecuencia anterior)
Medios 400 - 2000 Hz
(+) | medios equilibrados - a sólo 1.3% de la mediana
(+) | los medios son lineales (2.1% delta a la frecuencia anterior)
Altos 2 - 16 kHz
(+) | máximos equilibrados - a sólo 1.9% de la mediana
(+) | los máximos son lineales (2.7% delta a la frecuencia anterior)
Total 100 - 16.000 Hz
(+) | el sonido global es lineal (4.6% de diferencia con la mediana)
En comparación con la misma clase
» 0% de todos los dispositivos probados de esta clase eran mejores, 0% similares, 100% peores
» El mejor tuvo un delta de 5%, la media fue 17%, el peor fue ###max##%
En comparación con todos los dispositivos probados
» 0% de todos los dispositivos probados eran mejores, 0% similares, 100% peores
» El mejor tuvo un delta de 4%, la media fue 23%, el peor fue ###max##%
Gestión de la energía
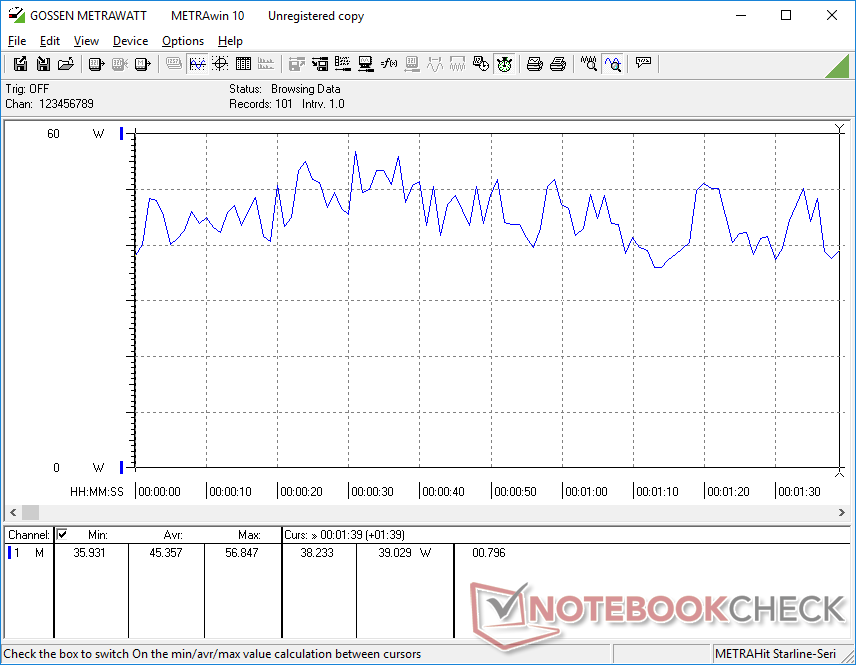
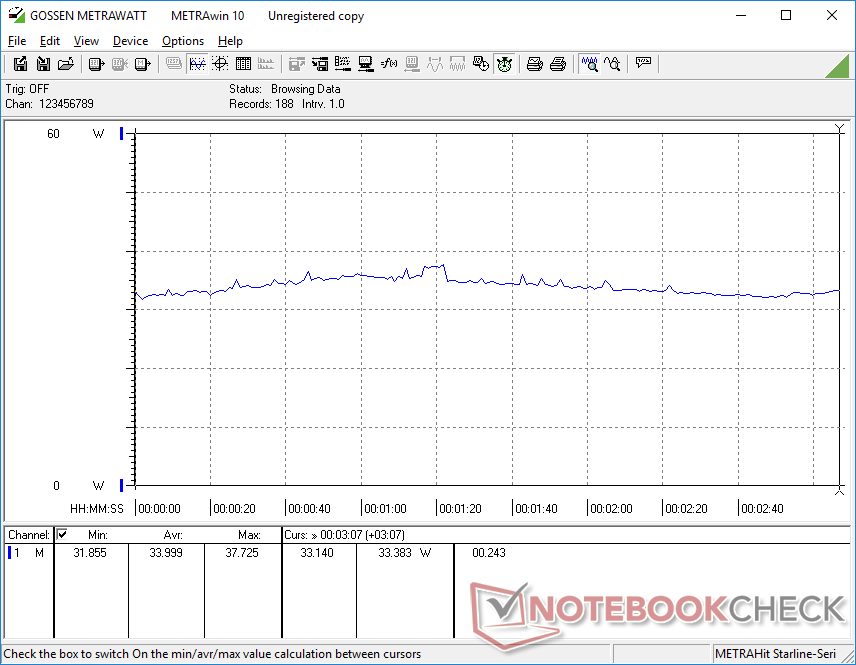
Consumo de energía
El sistema es muy eficiente en cuanto al consumo de energía, ya que sólo consume entre 2 y 7 W cuando está en reposo en el escritorio, dependiendo del perfil de energía y la configuración del brillo. La ejecución de cargas de nivel de juego exigirá alrededor de 45 W o aproximadamente un 36 por ciento más de energía que en el LG Gram 14T90N. Sin embargo, el rendimiento de la GPU es al menos entre 2 y 3 veces más rápido, por lo que el mayor consumo de energía merece la pena por la mejora de los gráficos
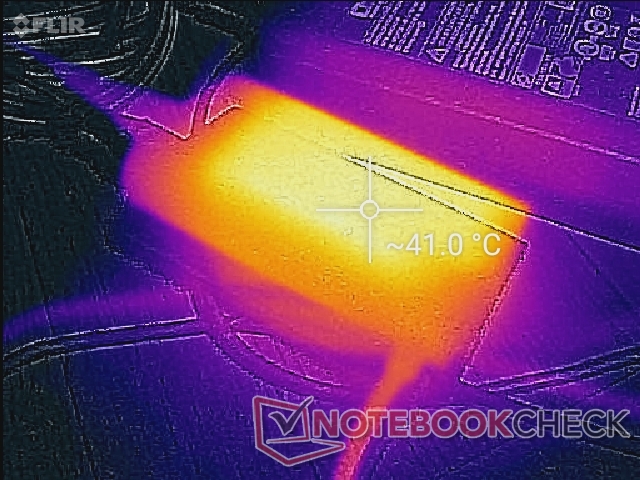
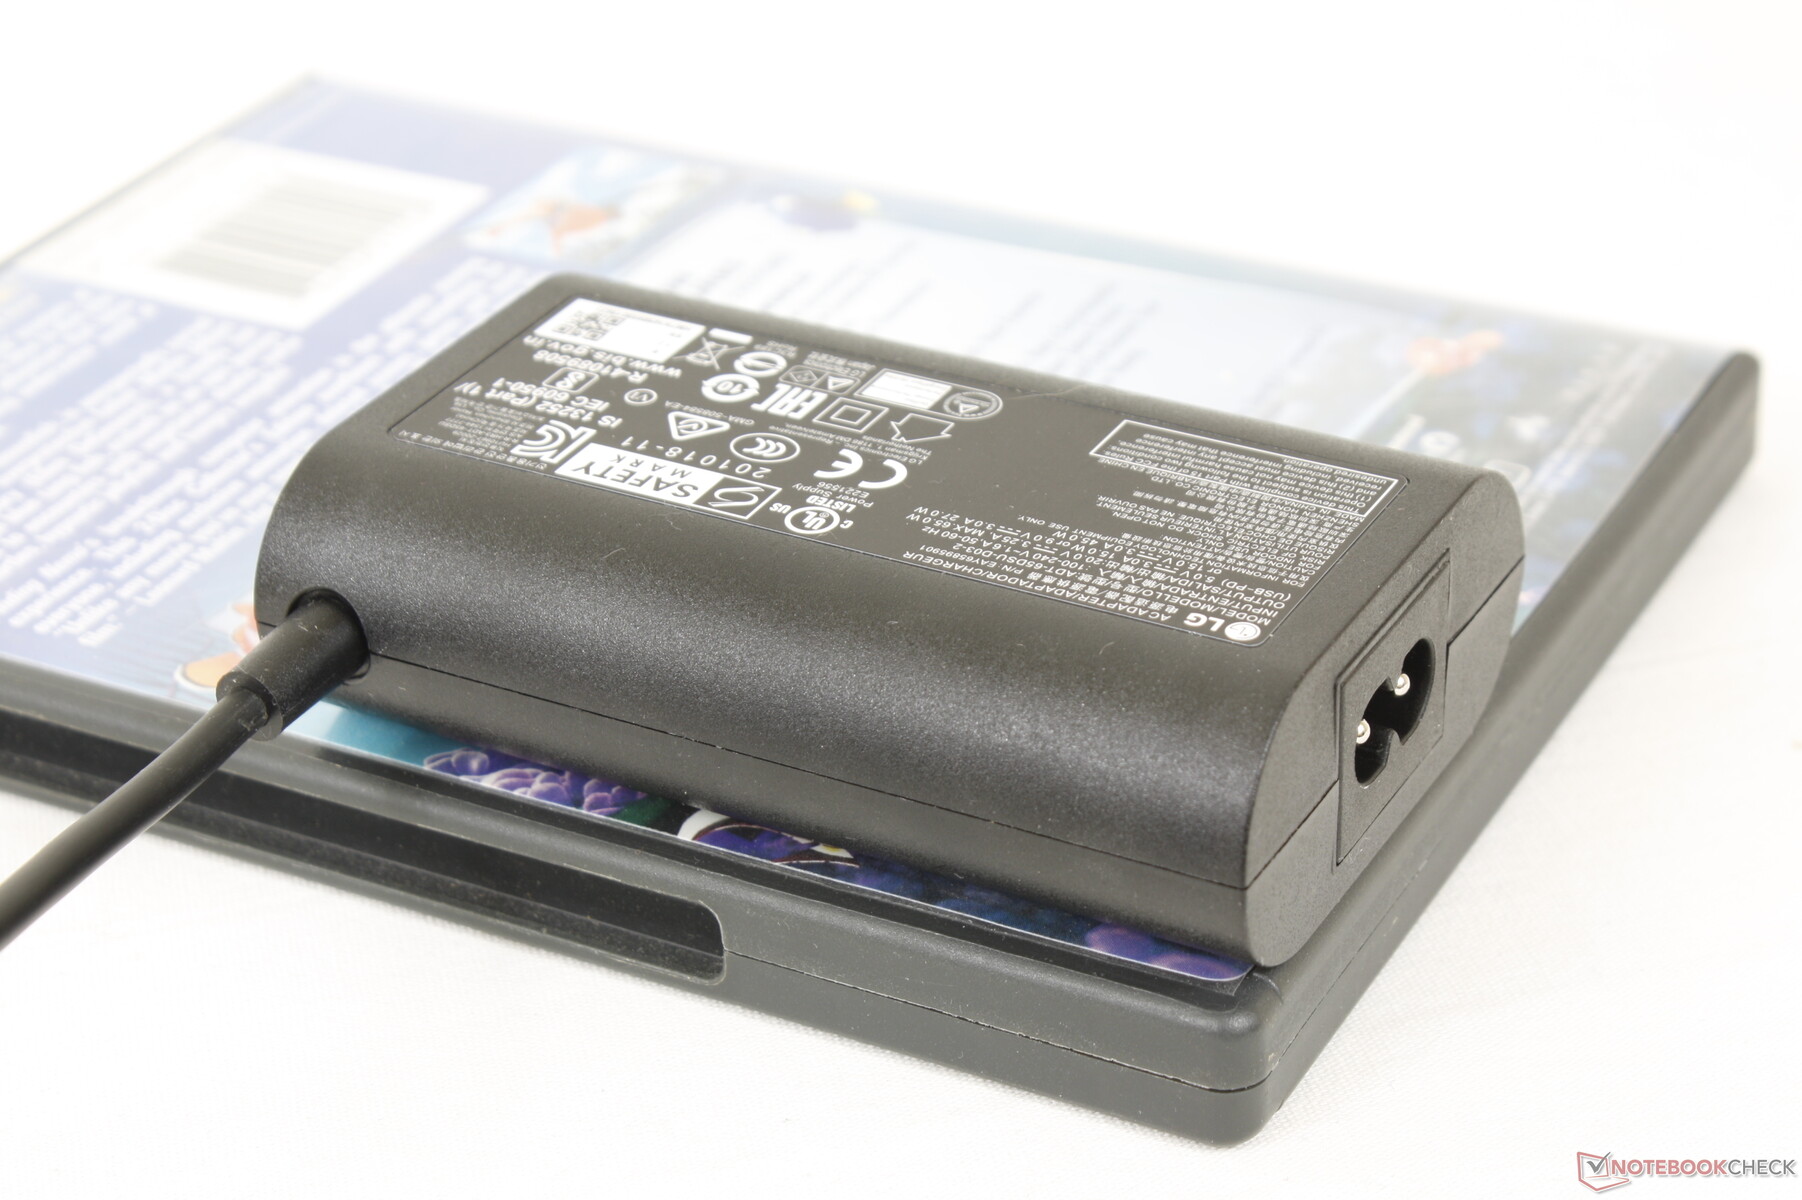
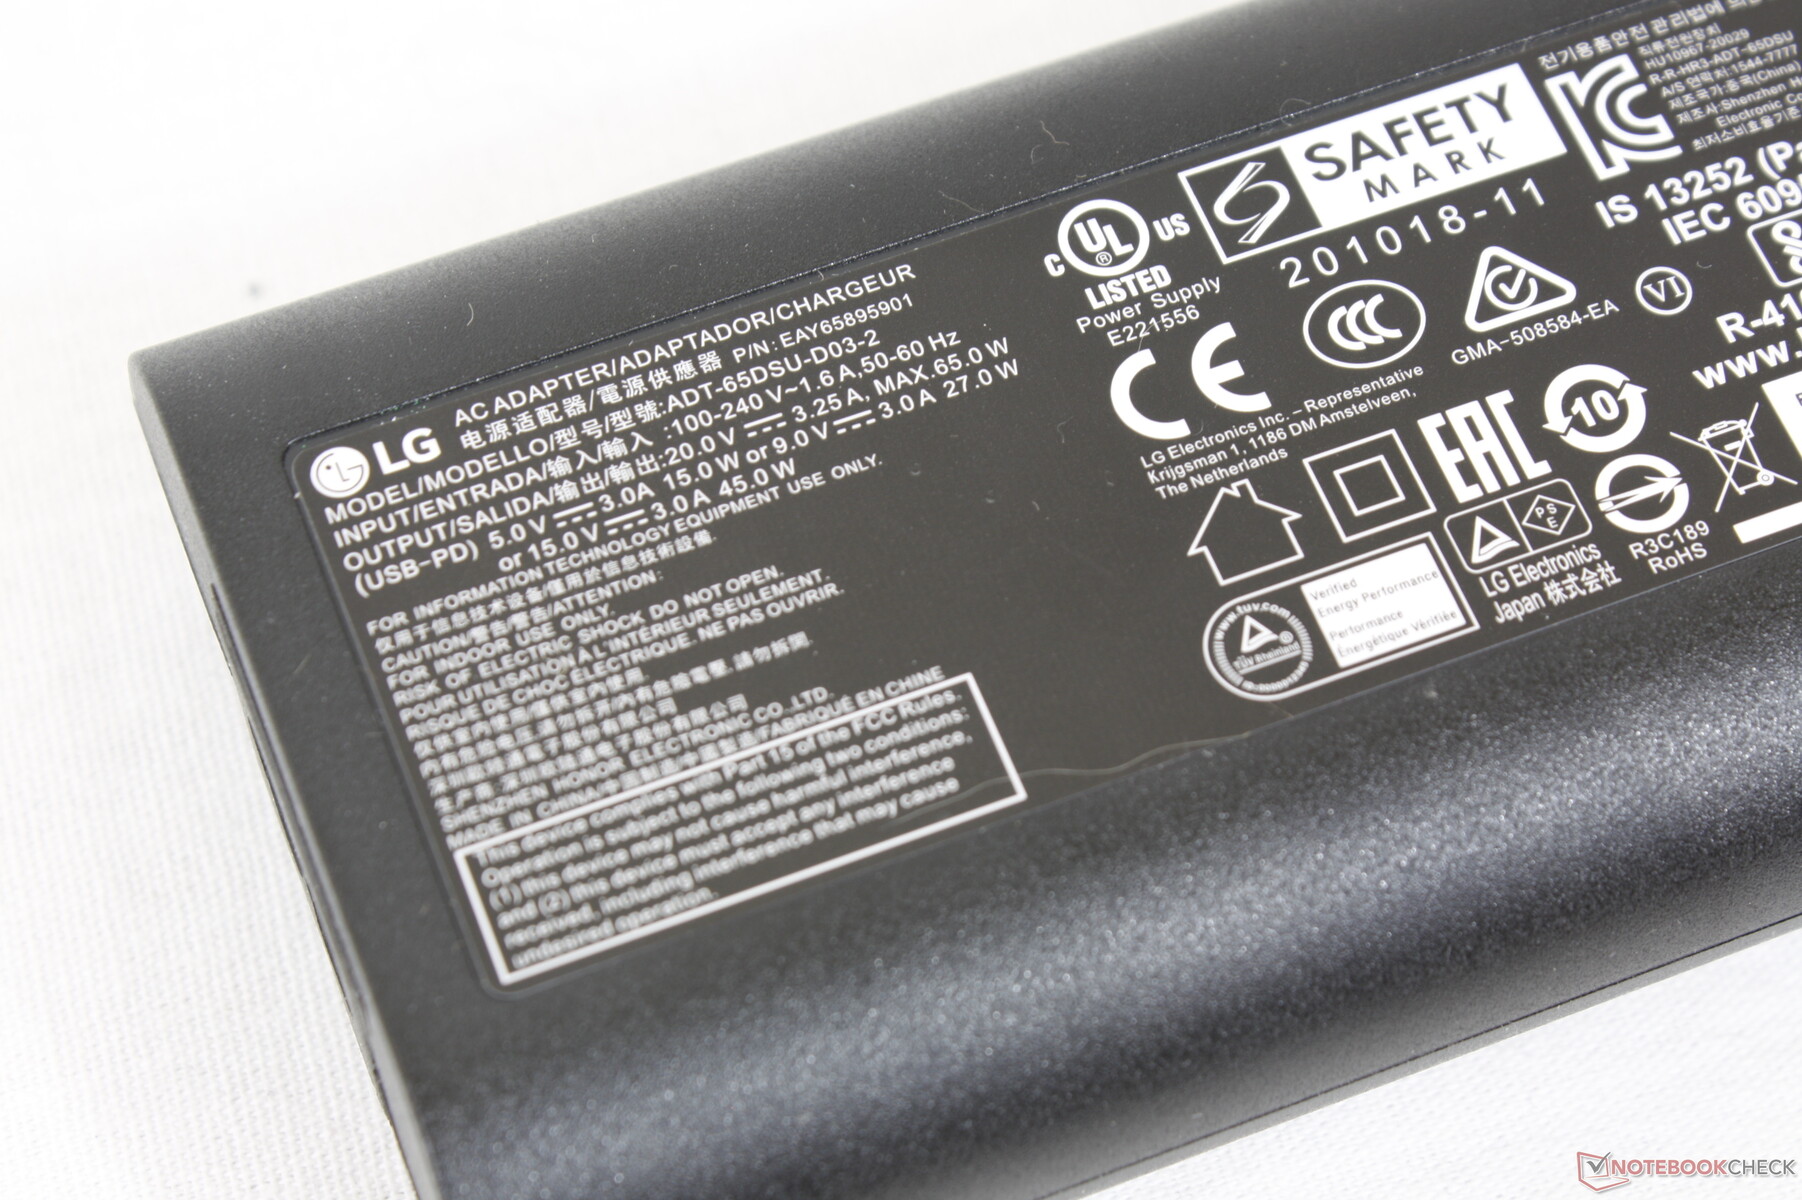
Pudimos registrar un consumo temporal máximo de 66 W del pequeño (~9.8 x 6 x 2.7 cm) adaptador USB-C AC de 65 W cuando la CPU está al 100% de uso.
| Off / Standby | |
| Ocioso | |
| Carga |
|
Clave:
min: | |
| LG Gram 14T90P i5-1135G7, Iris Xe G7 80EUs, Samsung SSD PM981a MZVLB512HBJQ, IPS, 1900x1200, 14" | Dell XPS 13 9310 2-in-1 i7-1165G7, Iris Xe G7 96EUs, Toshiba BG4 KBG40ZPZ512G, IPS, 1920x1200, 13.4" | Lenovo Yoga 9 14IAP7 82LU0001US i7-1260P, Iris Xe G7 96EUs, Samsung PM9A1 MZVL2512HCJQ, OLED, 2880x1800, 14" | Asus ZenBook Flip 14 UN5401QA-KN085W R7 5800H, Vega 8, Intel SSD 600p SSDPEKKW512G7, OLED, 2880x1800, 14" | HP Spectre x360 14-ea0378ng i7-1165G7, Iris Xe G7 96EUs, Intel Optane Memory H10 with Solid State Storage 32GB + 1TB HBRPEKNX0203AH(L/H), OLED, 3000x2000, 13.5" | MSI Summit E13 Flip Evo A11MT i7-1185G7, Iris Xe G7 96EUs, Phison 1TB SM2801T24GKBB4S-E162, IPS, 1920x1200, 13.4" | LG Gram 14T90N i7-10510U, UHD Graphics 620, Samsung SSD PM981a MZVLB512HBJQ, IPS, 1920x1080, 14" | |
|---|---|---|---|---|---|---|---|
| Power Consumption | 6% | -93% | -57% | -52% | -36% | 10% | |
| Idle Minimum * (Watt) | 2.8 | 2.6 7% | 8 -186% | 6.4 -129% | 6.3 -125% | 4.8 -71% | 2.9 -4% |
| Idle Average * (Watt) | 5.5 | 6.4 -16% | 14 -155% | 9.4 -71% | 11.2 -104% | 8.4 -53% | 5.8 -5% |
| Idle Maximum * (Watt) | 6.4 | 7.7 -20% | 14.4 -125% | 10.7 -67% | 13.3 -108% | 8.6 -34% | 6.2 3% |
| Load Average * (Watt) | 45.4 | 29.9 34% | 59.6 -31% | 52.2 -15% | 32 30% | 47.1 -4% | 32.9 28% |
| Witcher 3 ultra * (Watt) | 34 | 32.2 5% | 53.6 -58% | 53 -56% | 51.6 -52% | ||
| Load Maximum * (Watt) | 65.9 | 47.5 28% | 68.1 -3% | 69 -5% | 35.6 46% | 65.9 -0% | 48.5 26% |
* ... más pequeño es mejor
Power Consumption Witcher 3 / Stresstest
Power Consumption external Monitor
Duración de la batería - Un día completo de navegación
La capacidad de la batería es la misma que en el antiguo Gram 14T90N, con 72 Wh. Tal vez no sea una coincidencia que la duración de la WLAN sea casi idéntica, con algo más de 12 horas de navegación en el mundo real. Es bueno ver que la duración de la batería no se ha visto afectada a pesar de que el rendimiento del procesador ha aumentado significativamente en comparación con el Comet Lake-U de 10ª generación
La carga de vacío a pleno rendimiento es muy lenta, con 2,5 horas, frente a 1,5 horas o más en la mayoría de los demás Ultrabooks.
| LG Gram 14T90P i5-1135G7, Iris Xe G7 80EUs, 72 Wh | Dell XPS 13 9310 2-in-1 i7-1165G7, Iris Xe G7 96EUs, 51 Wh | Lenovo Yoga 9 14IAP7 82LU0001US i7-1260P, Iris Xe G7 96EUs, 75 Wh | Asus ZenBook Flip 14 UN5401QA-KN085W R7 5800H, Vega 8, 63 Wh | HP Spectre x360 14-ea0378ng i7-1165G7, Iris Xe G7 96EUs, 66 Wh | MSI Summit E13 Flip Evo A11MT i7-1185G7, Iris Xe G7 96EUs, 70 Wh | LG Gram 14T90N i7-10510U, UHD Graphics 620, 72 Wh | |
|---|---|---|---|---|---|---|---|
| Duración de Batería | 18% | -44% | -19% | -12% | -15% | 8% | |
| WiFi v1.3 (h) | 12.1 | 10.7 -12% | 6.8 -44% | 8.7 -28% | 7.8 -36% | 11.2 -7% | 12.5 3% |
| Load (h) | 2.3 | 3.4 48% | 2.1 -9% | 2.6 13% | 1.8 -22% | 2.6 13% | |
| Reader / Idle (h) | 25.4 | 13.4 | 21.1 | 32.8 | |||
| H.264 (h) | 9 | 11.1 |
Pro
Contra
Veredicto - El gramo que hay que conseguir
El peso más ligero que la media, la nítida pantalla táctil 16:10 DCI-P3 y la excelente duración de la batería son los aspectos más destacados del Gram 14T90P. Su nuevo diseño es más resistente sin añadir peso para mantener una de las mayores ventajas de la serie Gram de 14 pulgadas frente a competidores como el más pesado Lenovo Yoga 9 14, HP Spectre x360 14, o Dell XPS 13 2-en-1. El chasis puede ser ligeramente menos rígido, pero el ahorro de peso puede valer la pena el inconveniente para los viajeros o estudiantes.
El Gram 14T90P es la actualización en toda regla que necesitaba la serie Gram de 14 pulgadas.
Por desgracia, hay una lista decente de pegas que nos gustaría ver mejoradas. La lentitud de la carga, la inestabilidad de la velocidad de fotogramas en los juegos, el esponjoso clickpad, el brillo medio de la pantalla, la falta de soporte para Windows Hello, la dificultad de mantenimiento y la rigidez media de la bisagra hacen decaer un convertible de 14 pulgadas por lo demás excelente. Si LG puede arreglar estos inconvenientes principales manteniendo el bajo peso, el Gram 14 se pondría fácilmente a la altura de las alternativas más populares de Dell, Lenovo o HP.
Precio y disponibilidad
LG Gram 14T90P
- 05/21/2022 v7 (old)
Allen Ngo
Price comparison

