Análisis del portátil Asus ROG Strix Scar 15 G533QS: AMD Zen 3 y 165 Hz 1440p Sweet Spot
La serie Asus ROG Strix Scar 15 alberga los principales portátiles gaming de 15,6 pulgadas de la compañía en contraste con la serie ROG Zephyrus S15, más delgada, o la serie ROG Chimera, más voluminosa, de 17,3 pulgadas. Sucede directamente al Strix Scar 15 G532 del año pasado introduciendo varios cambios tanto en el interior como en el exterior, incluyendo el cambio de CPUs Intel a AMD Ryzen Zen 3.
Nuestra unidad de prueba es una configuración de gama alta equipada con la CPU Ryzen 9 5900HX, la GPU GeForce RTX 3080 de 130 W, y la pantalla WQHD con una frecuencia de refresco de 165 Hz y tiempos de respuesta de 3 ms por unos 3800 dólares al por menor. En cambio, hay SKUs inferiores con el Ryzen 7 4800H, RTX 3070 y panel FHD de 300 Hz.También hay una versiónde 17,3 pulgadas de nuestro Strix Scar 15 G533 llamada Strix Scar 17 G733.
Entre los competidores del Strix Scar 15 se encuentran otros portátiles para juegos de 15,6 pulgadas de gama media y alta como el Razer Blade 15, MSI GE66o elLenovo Legion C7.
Más opiniones de Asus:
potential competitors in comparison
Valoración | Fecha | Modelo | Peso | Altura | Tamaño | Resolución | Precio |
|---|---|---|---|---|---|---|---|
| 86.3 % v7 (old) | 07/2021 | Asus ROG Strix Scar 15 G533QS R9 5900HX, GeForce RTX 3080 Laptop GPU | 2.3 kg | 27.2 mm | 15.60" | 2560x1440 | |
| 84.4 % v7 (old) | 07/2020 | Asus ROG Strix Scar 15 G532LWS i9-10980HK, GeForce RTX 2070 Super Mobile | 2.4 kg | 24.9 mm | 15.60" | 1920x1080 | |
| 84.6 % v7 (old) | 12/2020 | MSI GE66 Raider 10SFS i9-10980HK, GeForce RTX 2070 Super Mobile | 2.4 kg | 23 mm | 15.60" | 1920x1080 | |
| 88.9 % v7 (old) | 07/2021 | Razer Blade 15 Advanced (Mid 2021) i7-11800H, GeForce RTX 3080 Laptop GPU | 2 kg | 16.99 mm | 15.60" | 1920x1080 | |
| 84.7 % v7 (old) | 06/2021 | Alienware m15 R5 Ryzen Edition R7 5800H, GeForce RTX 3060 Laptop GPU | 2.5 kg | 22.85 mm | 15.60" | 1920x1080 | |
| 85.5 % v7 (old) | 04/2021 | Lenovo Legion C7 15IMH05 82EH0030GE i7-10875H, GeForce RTX 2070 Max-Q | 2.3 kg | 19.9 mm | 15.60" | 1920x1080 |
Estuche - Nuevo, con menos aspecto de plástico
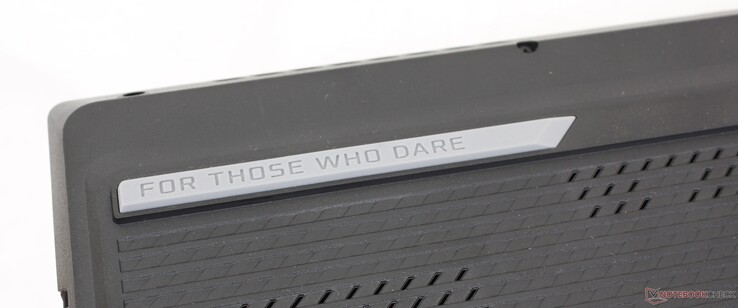
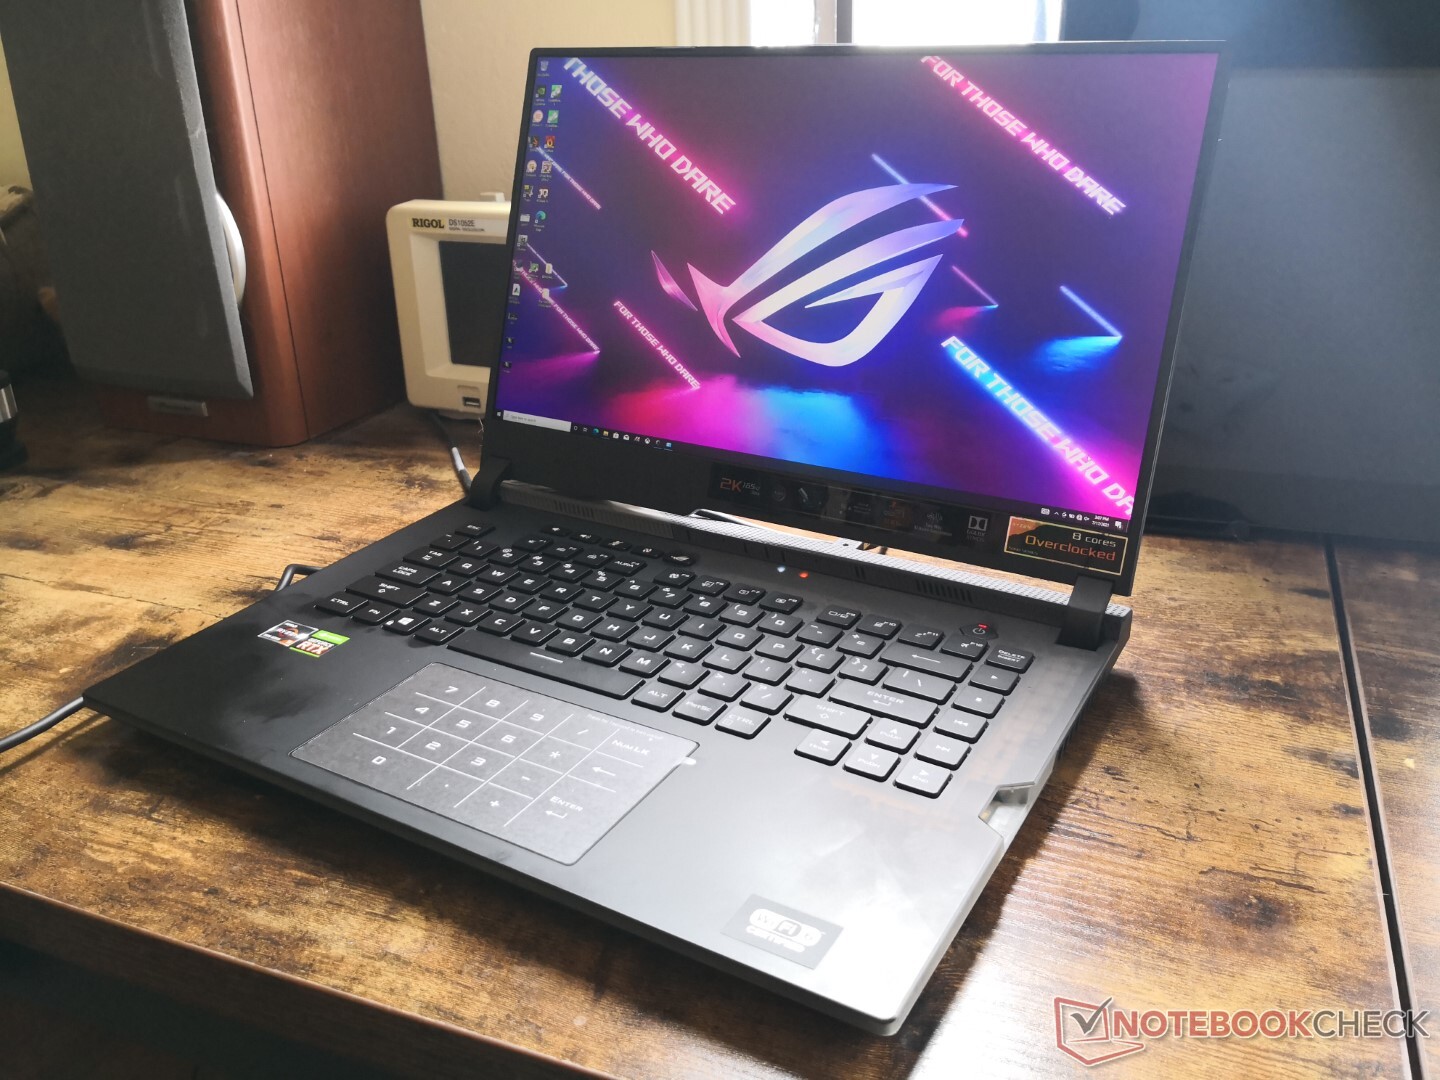
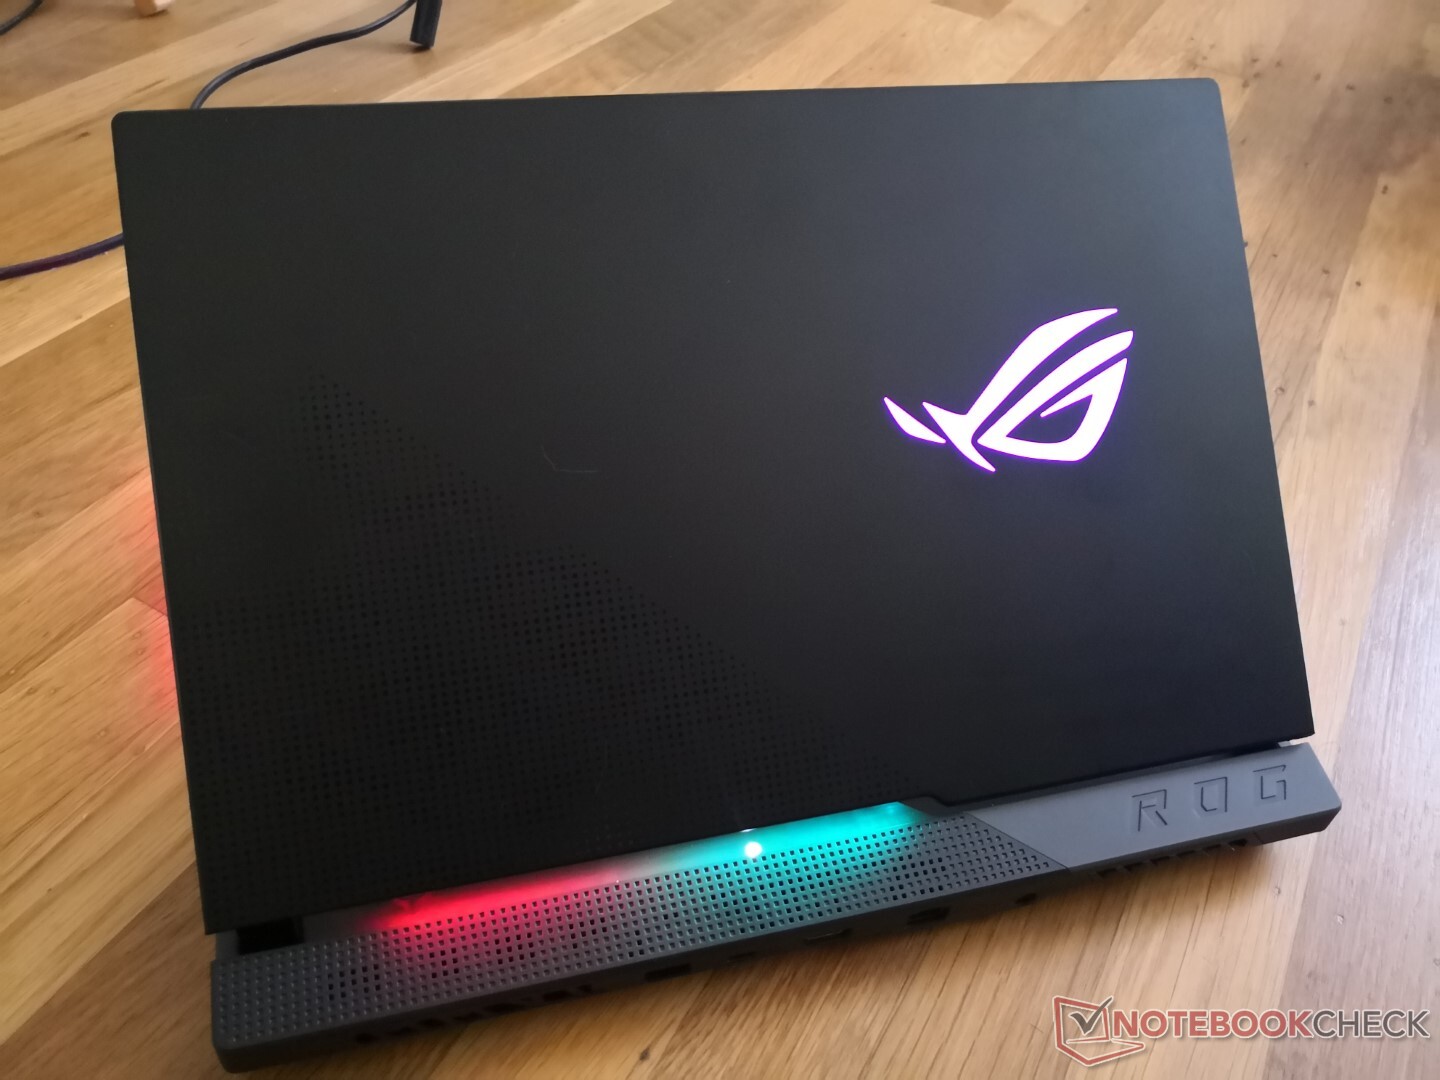
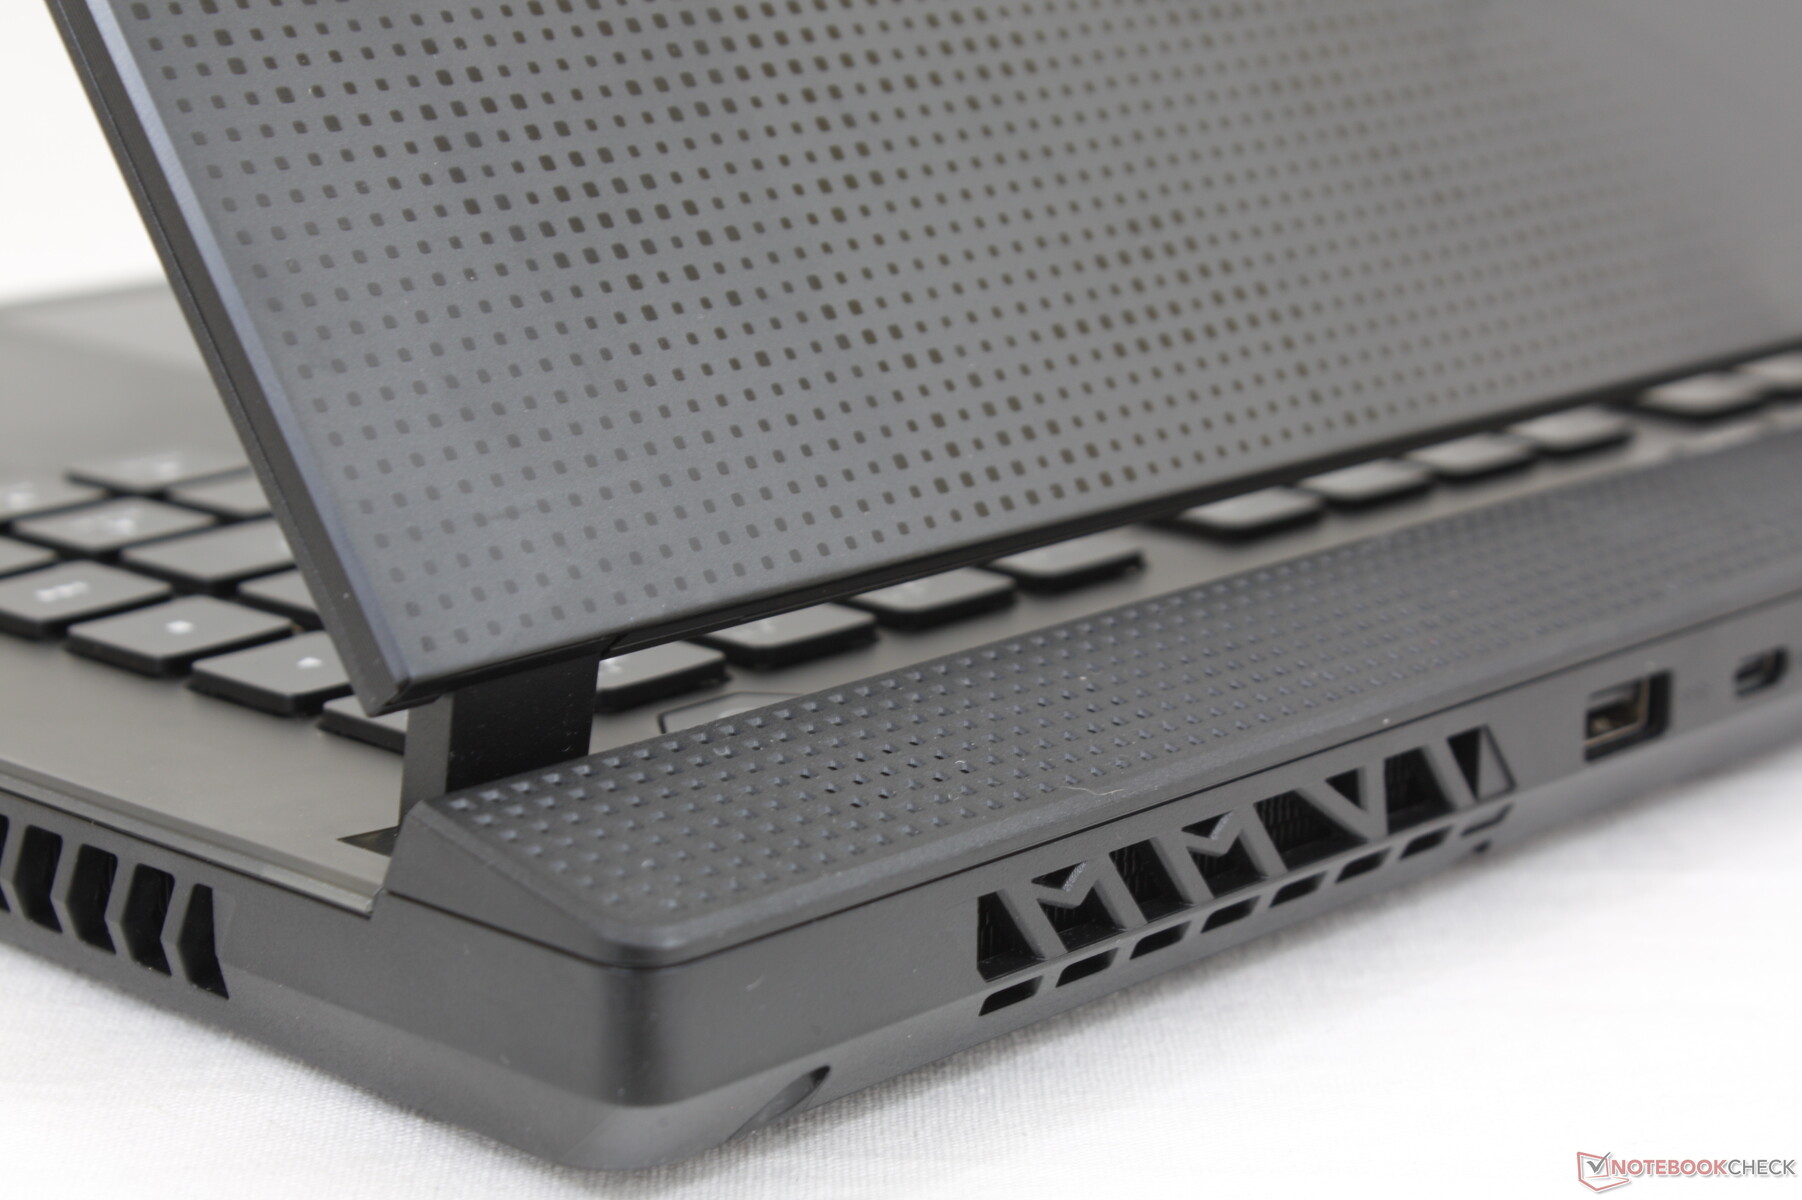
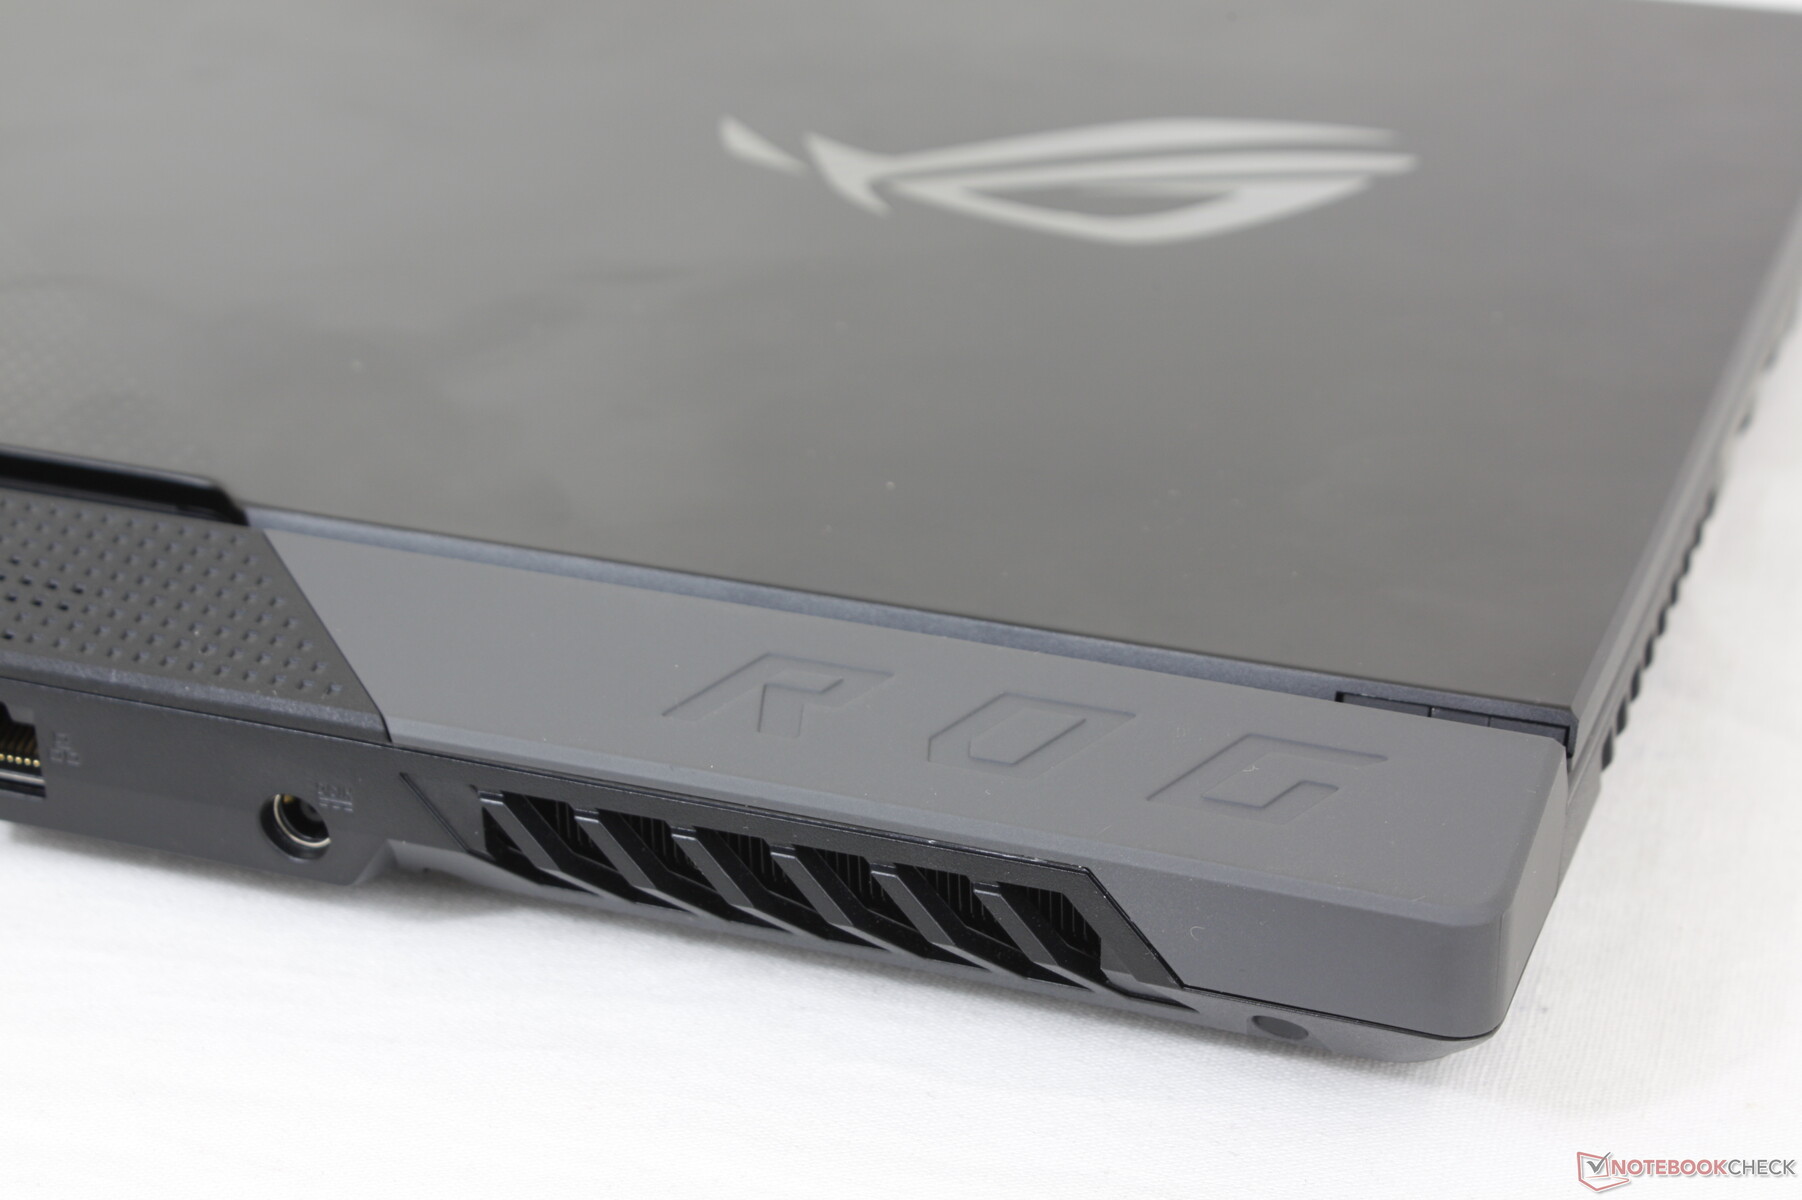
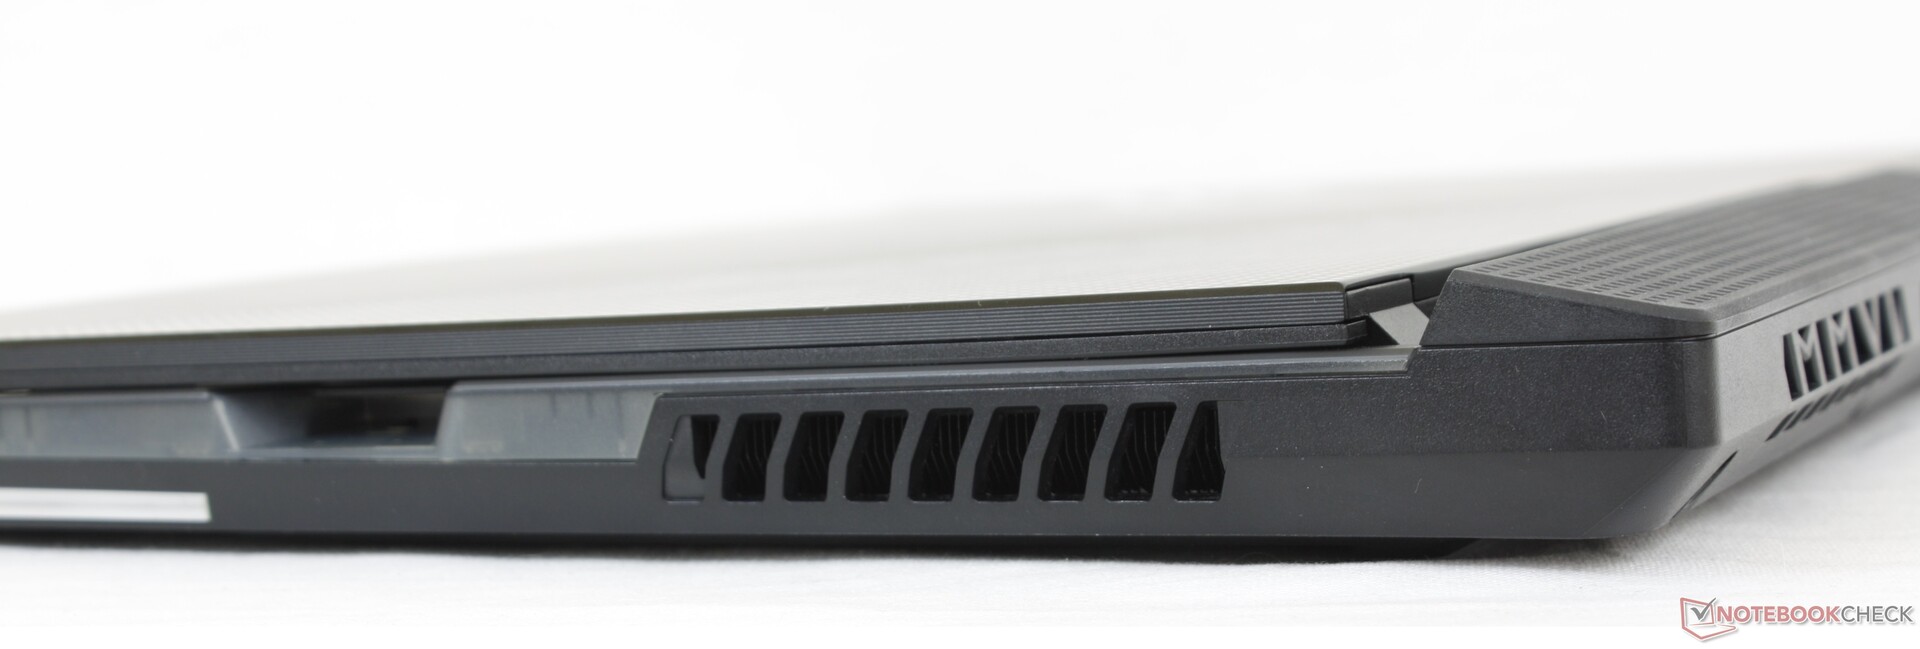
Asus ha renovado el chasis manteniendo el aspecto general familiar de la serie Strix Scar. La gruesa parte trasera, las grandes bisagras y los LEDs frontales siguen presentes, por ejemplo, pero la parte trasera es más plana y con una textura diferente mientras que los LEDs frontales son más cortos en los laterales. El borde derecho de la cubierta del teclado también es más plano y ahora es semitransparente, lo cual es una forma fácil de distinguir los nuevos modelos ROG de los anteriores. En conjunto, los cambios hacen que el sistema parezca más elegante y lujoso sin dejar de lado ninguna de las características LED originales.
Todas las actualizaciones del chasis parecen ser principalmente visuales, por lo que la rigidez parece ser la misma que en el G532, para bien o para mal. El G532 no era de mala calidad ni nada por el estilo, pero habría sido estupendo ver mejoras notables que fueran más allá de la superficie.
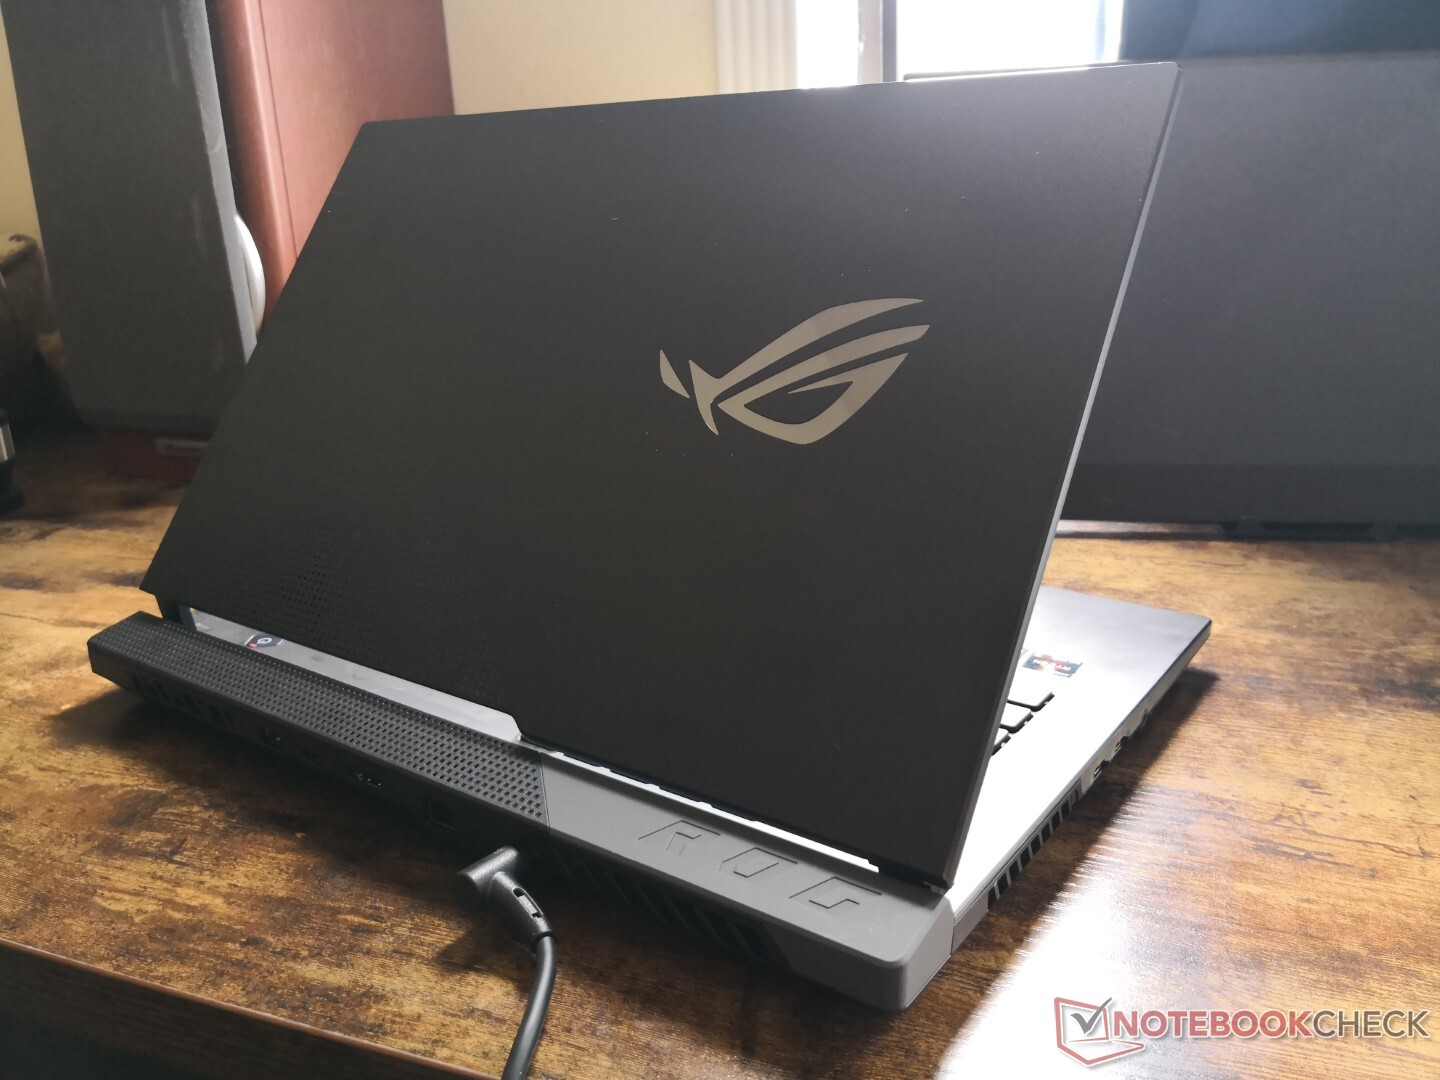
El nuevo chasis ocupa menos espacio que el antiguo G532, pero es ligeramente más grueso, unos 2 mm. Sin embargo, sigue siendo algo grande, especialmente porque el G532 ya era más grueso que muchos modelos de la competencia, incluido el Alienware m15 R5. El peso total se mantiene en la media de la categoría con unos 2,3 kg.
Conectividad - Sin Thunderbolt a diferencia de Intel
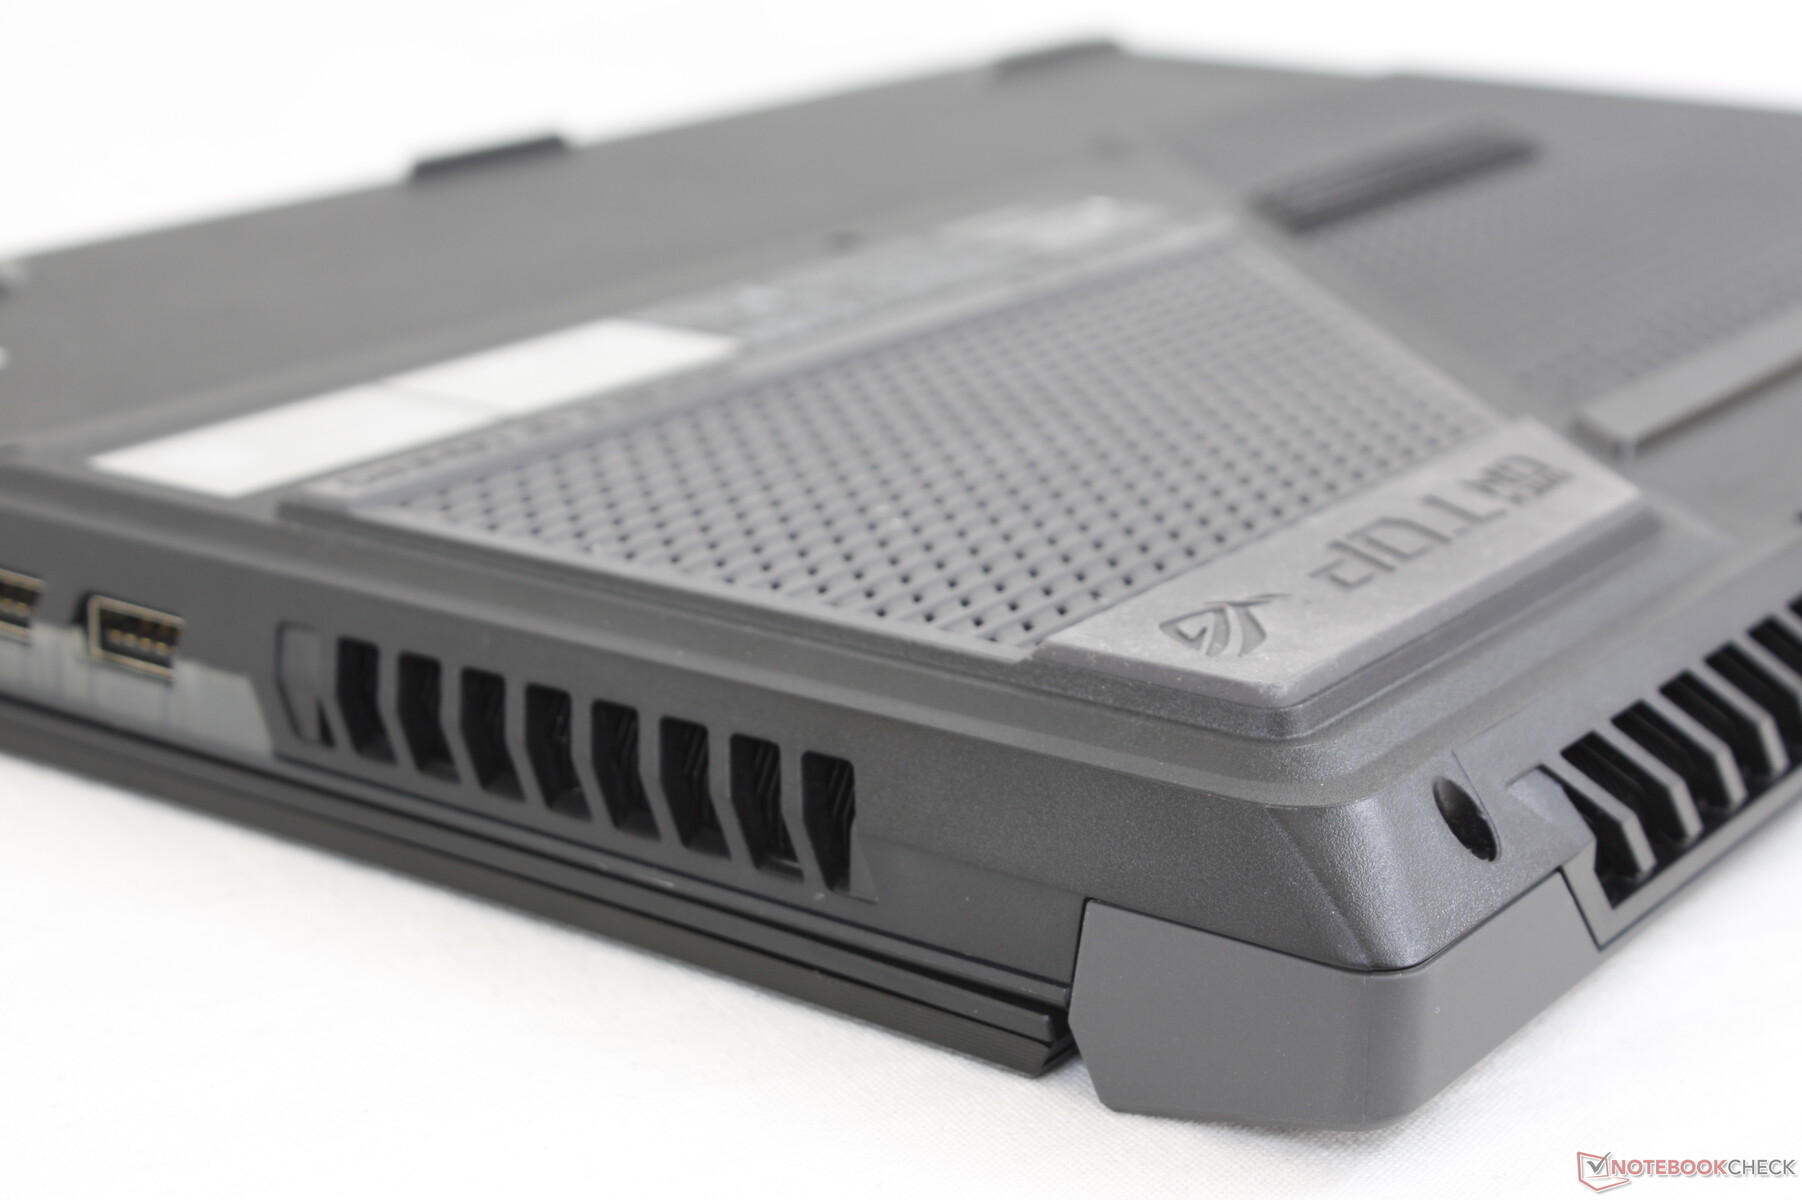
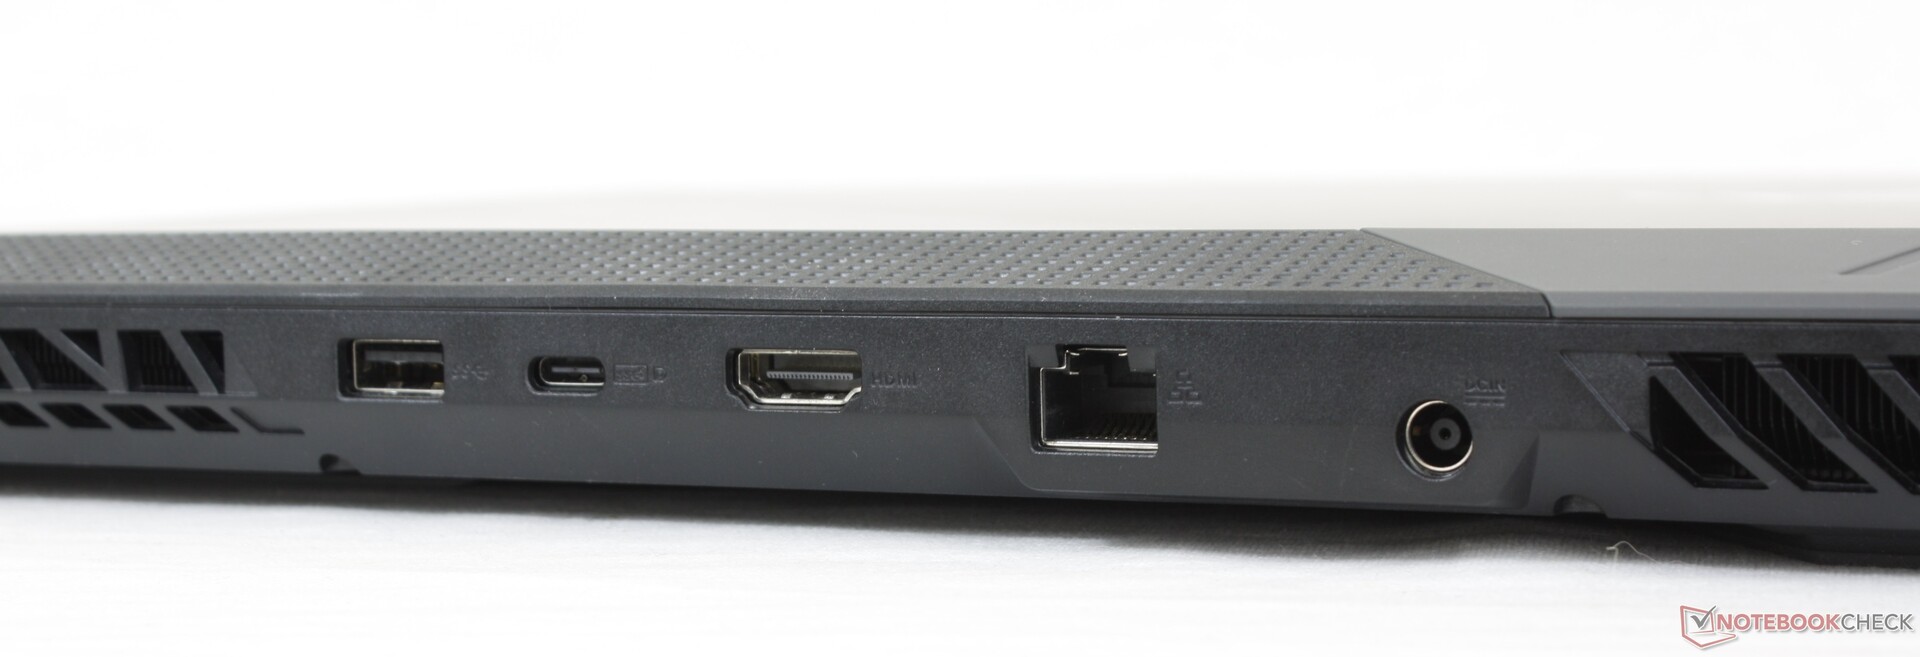
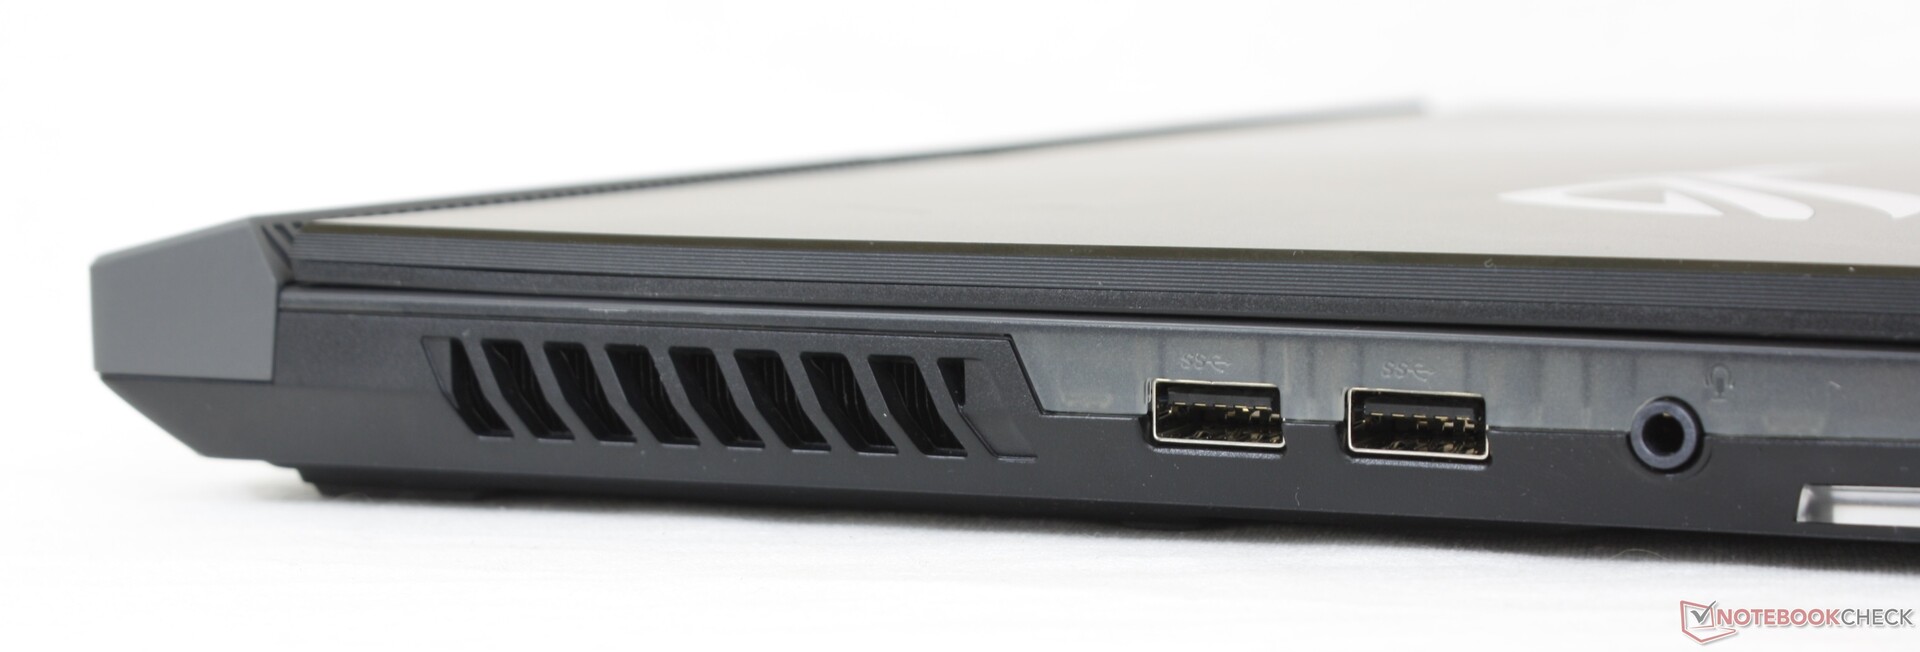
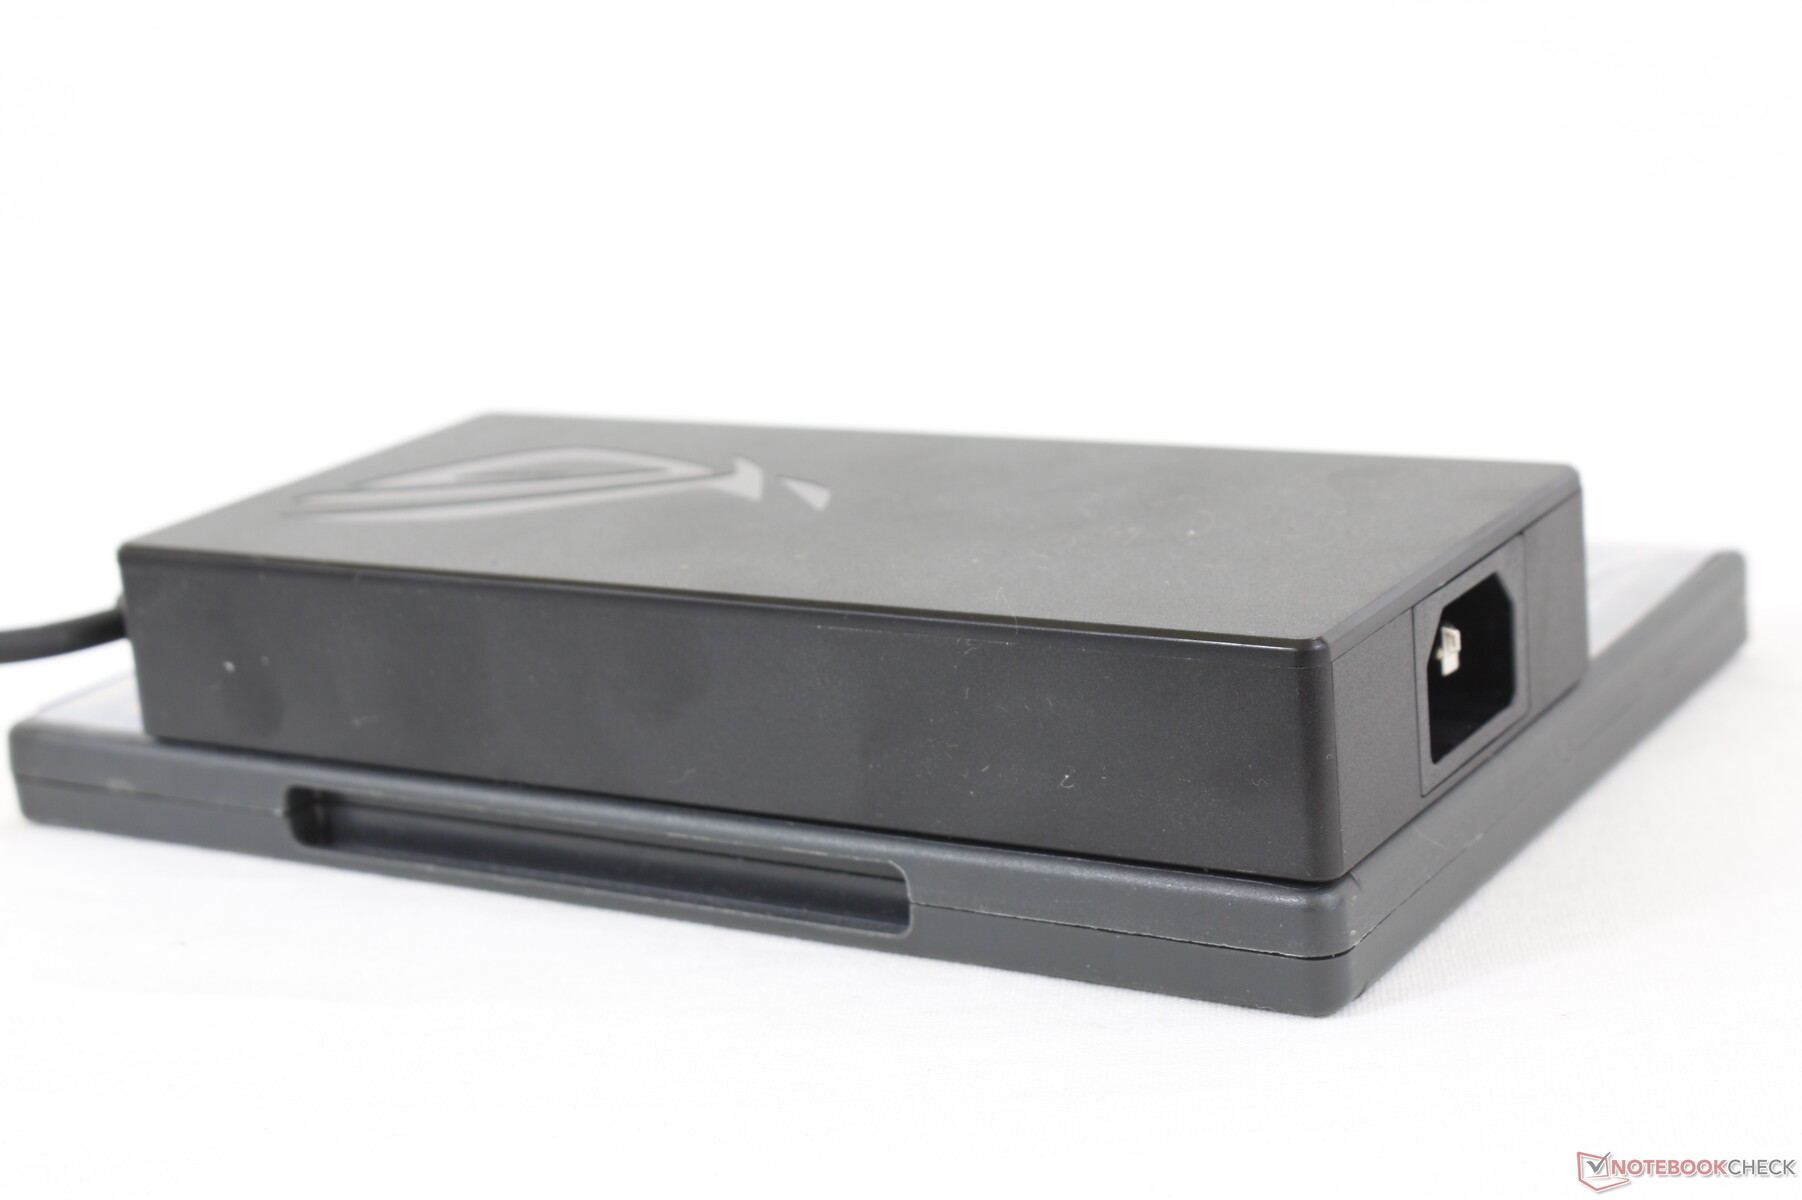
Uno de los puertos USB-A del borde izquierdo se ha trasladado a la parte trasera de la serie G533. Por lo demás, todos los puertos son idénticos de una generación a otra, incluyendo el puerto USB-C Gen. 2 y la falta de soporte Thunderbolt. Habría sido genial ver al menos un RJ-45 de 10 Gbps en vez del puerto estándar de 1 Gbps
Comunicación
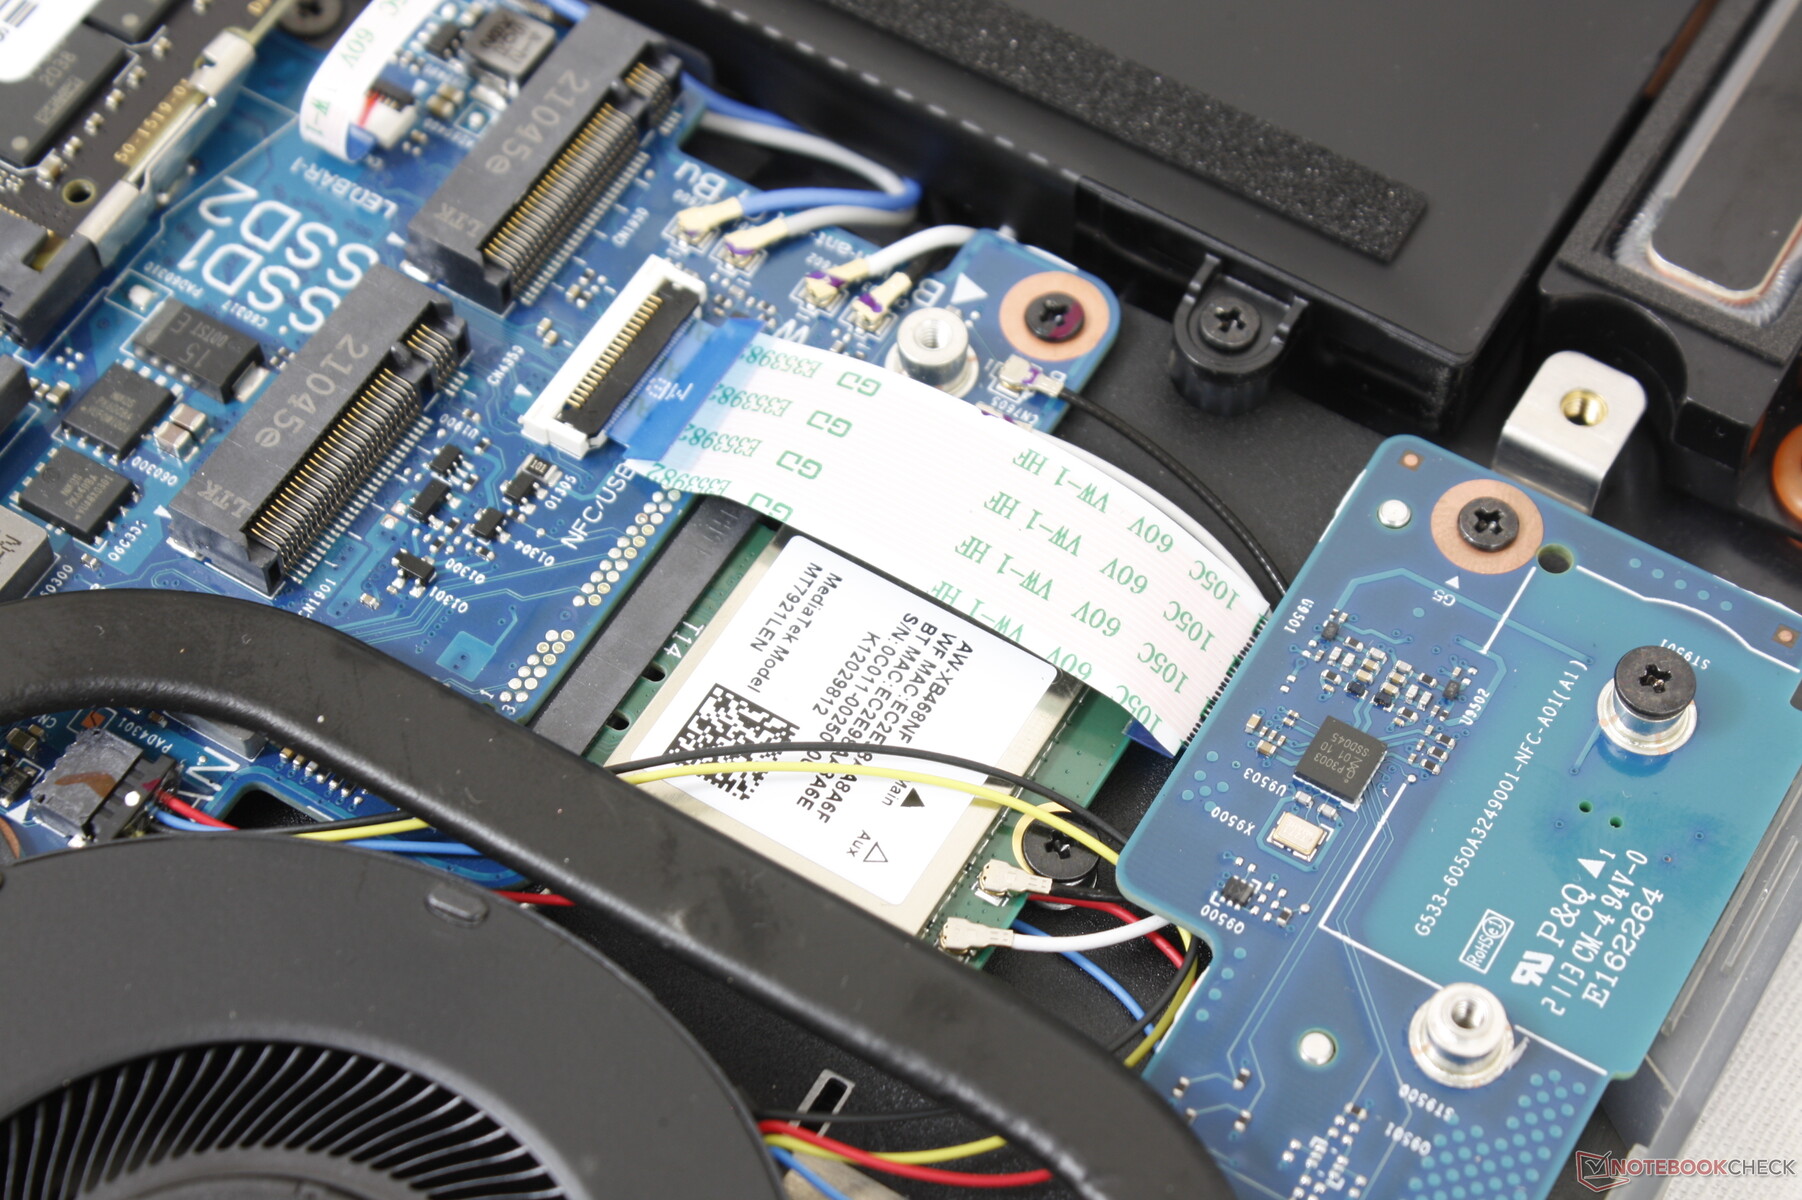
Nuestra unidad venía con el MediaTek MT7921 con Wi-Fi 6 en lugar del Intel AX201 del G532 del año pasado. El MediaTek es, por desgracia, una mejora con tasas de transferencia que son consistentemente más lentas que las que hemos registrado en la mayoría de portátiles con el módulo Intel de la competencia. Los usuarios siempre pueden quitar el módulo MediaTek en el G533 para la versión Intel más rápida si lo desean.
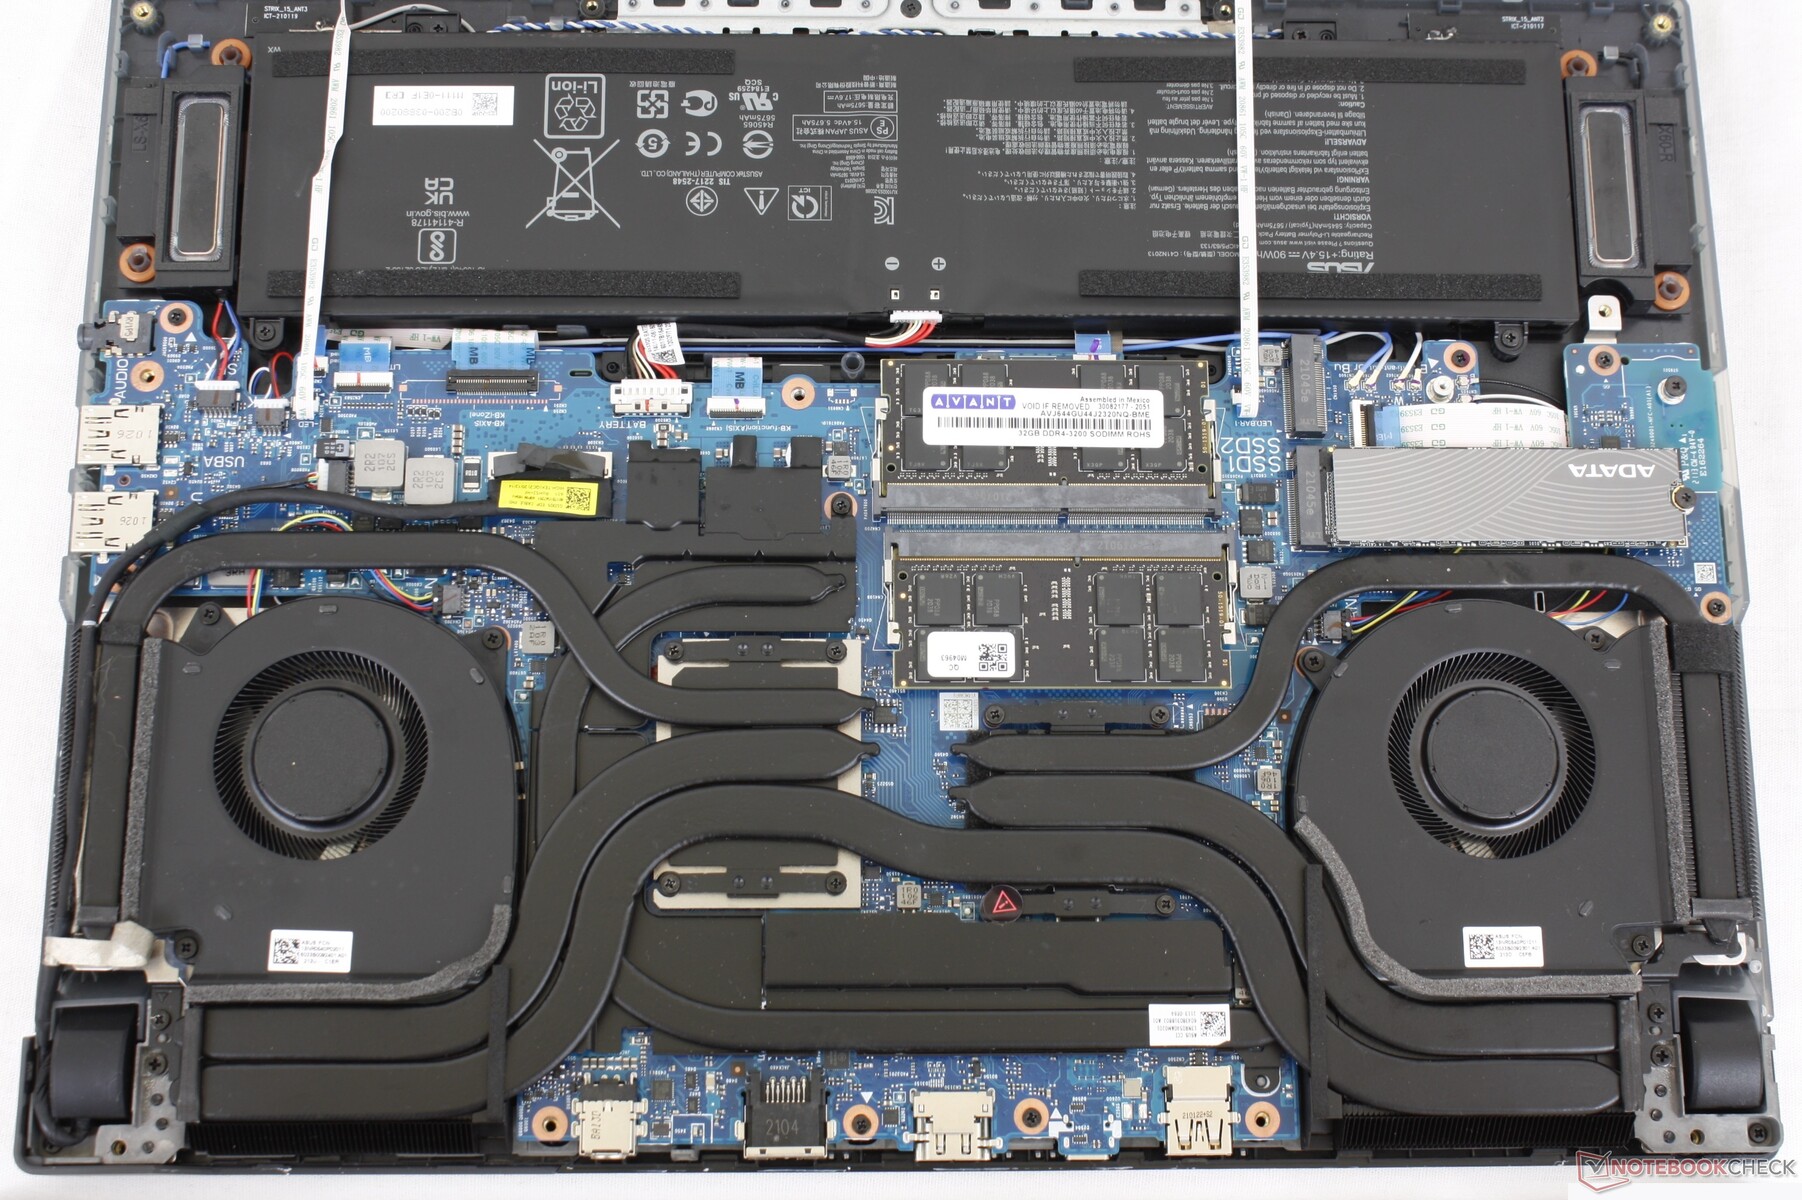
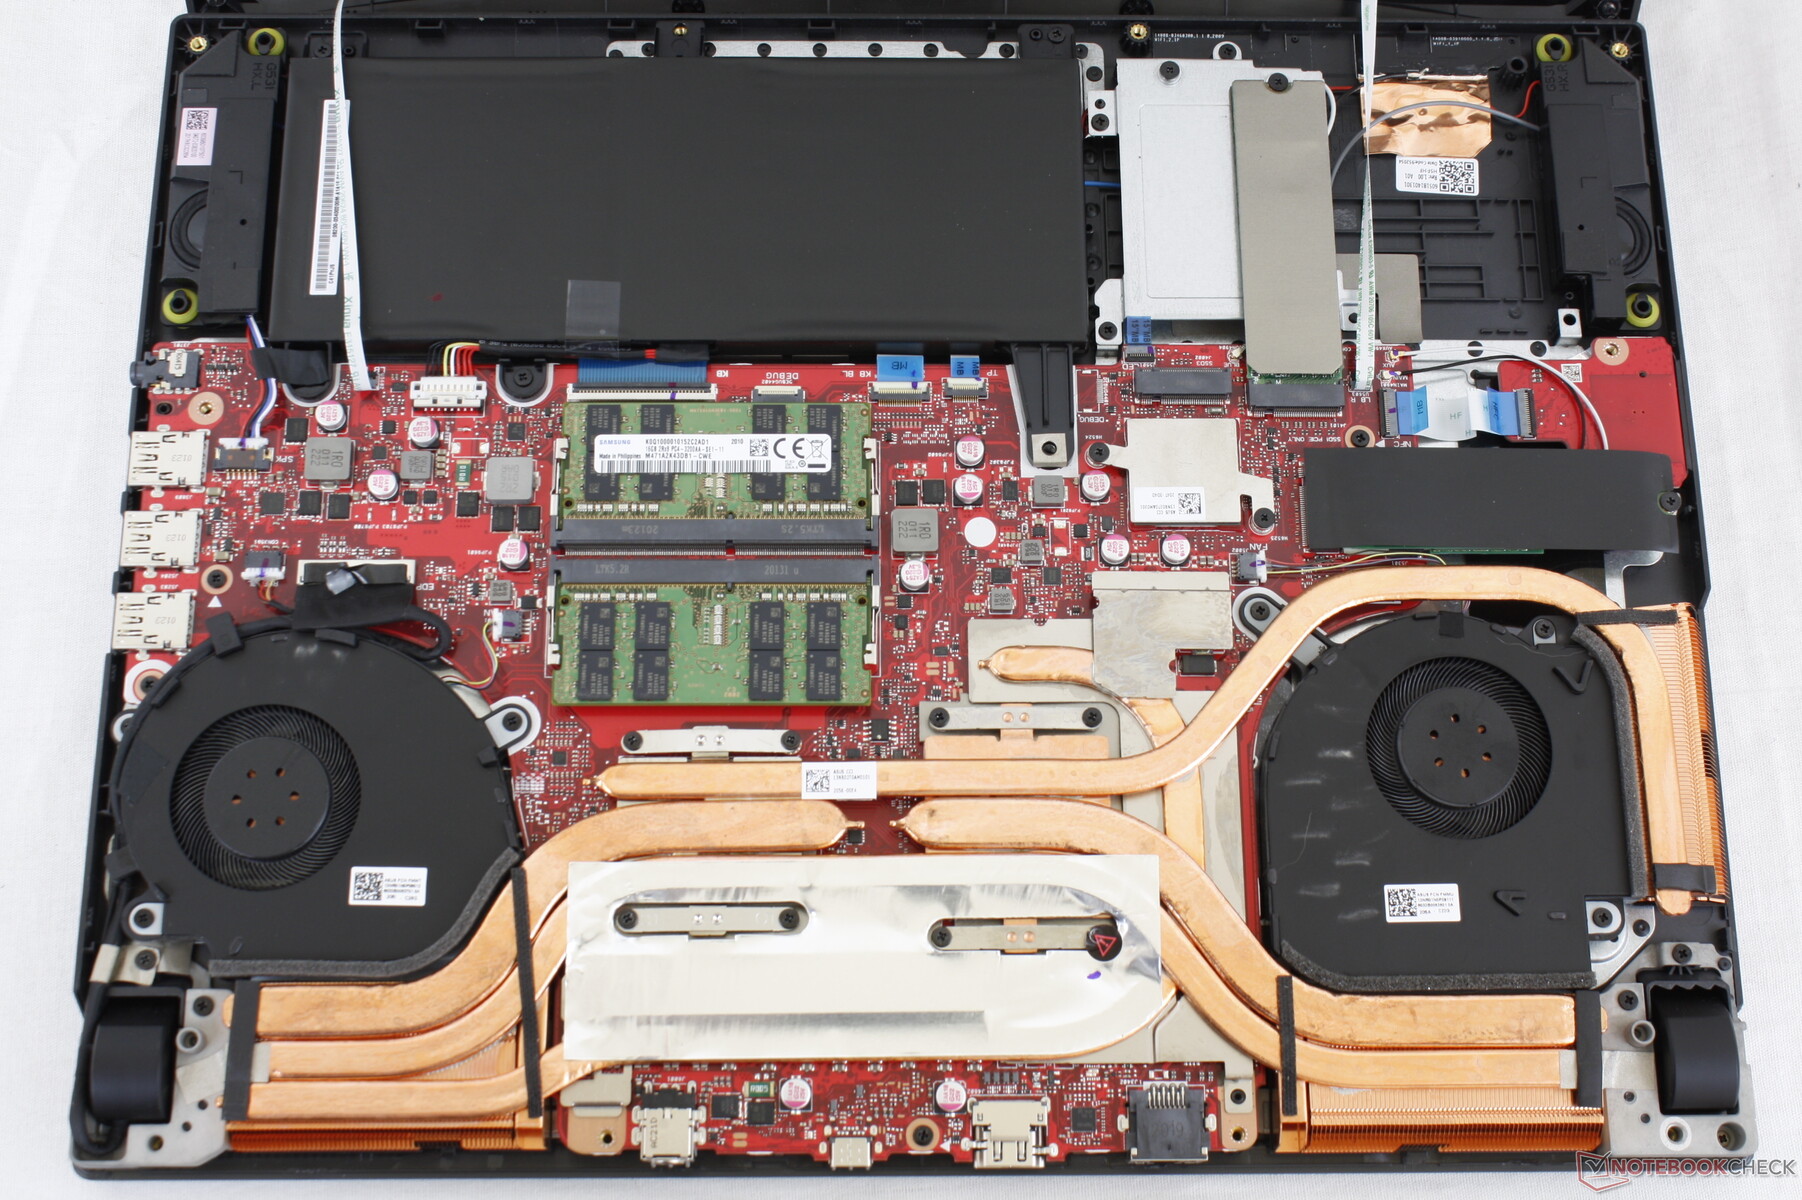
Mantenimiento
El panel inferior es fácilmente desmontable con sólo un destornillador Philips y un borde afilado. Hay que tener en cuenta que el panel inferior está unido a la placa base a través de dos frágiles cintas, a diferencia de lo que ocurre en la mayoría de los otros portátiles, debido a la barra de LEDs RGB a lo largo del borde frontal del chasis.
Accesorios y garantía
La caja de venta al público incluye el Asus Keystone dos placas adicionales con el logotipo de ROG para la esquina trasera del chasis, y la documentación habitual y el adaptador de CA. Se aplica la garantía estándar de un año limitada del fabricante con opciones de extensión si se adquiere en Xotic PC.
Dispositivos de entrada
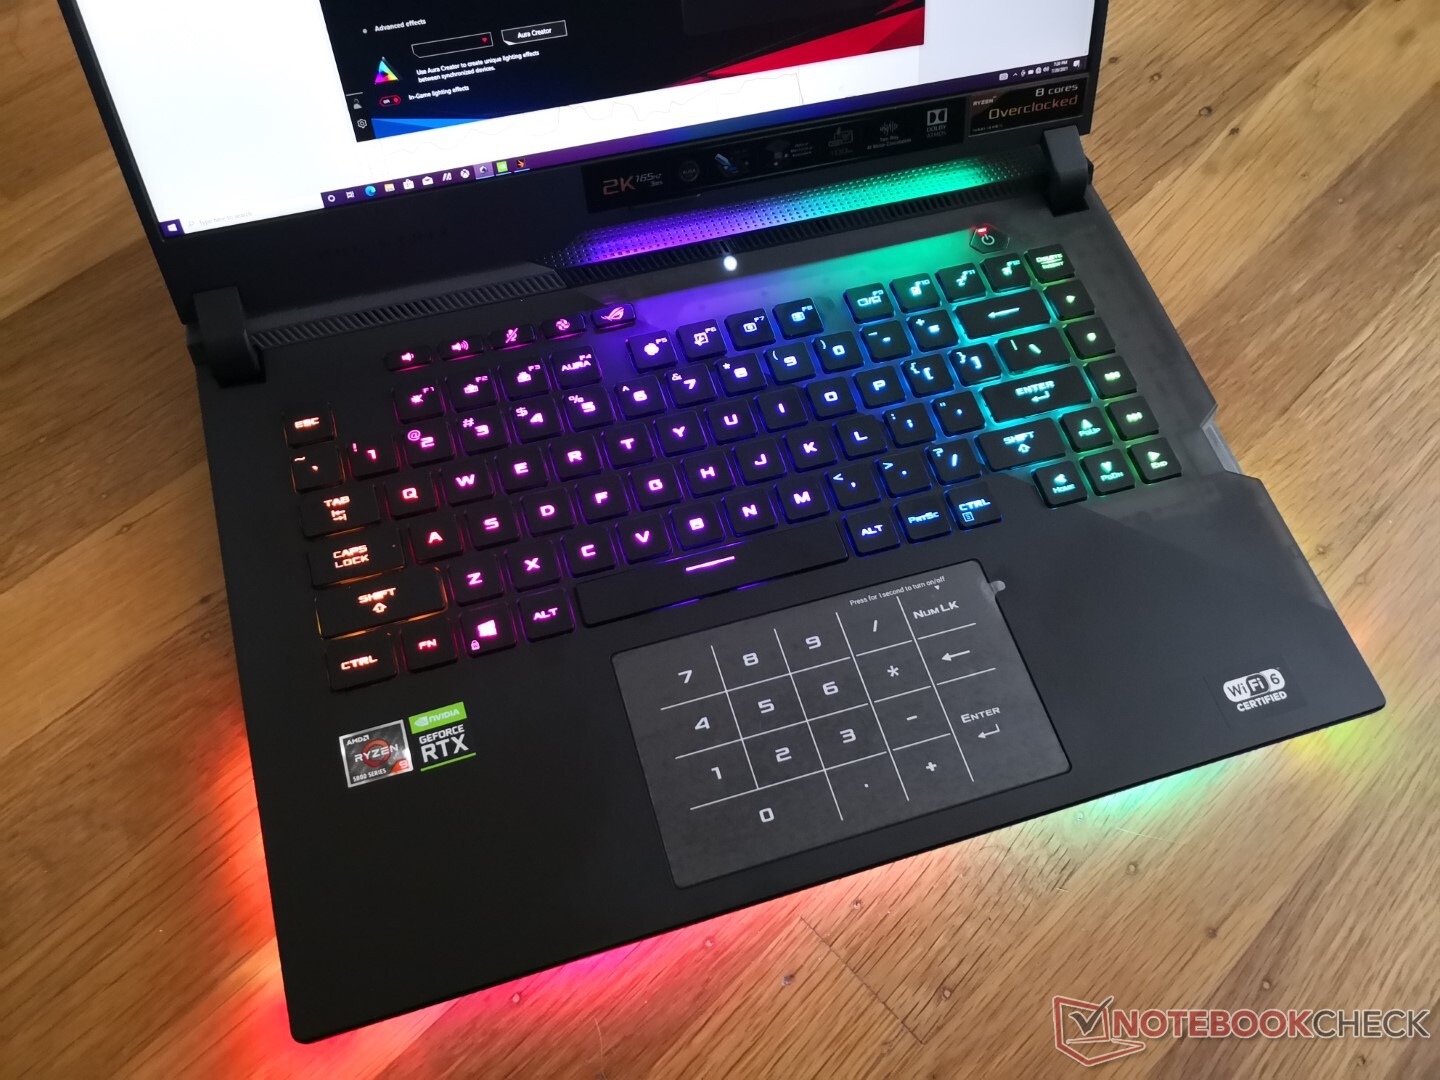
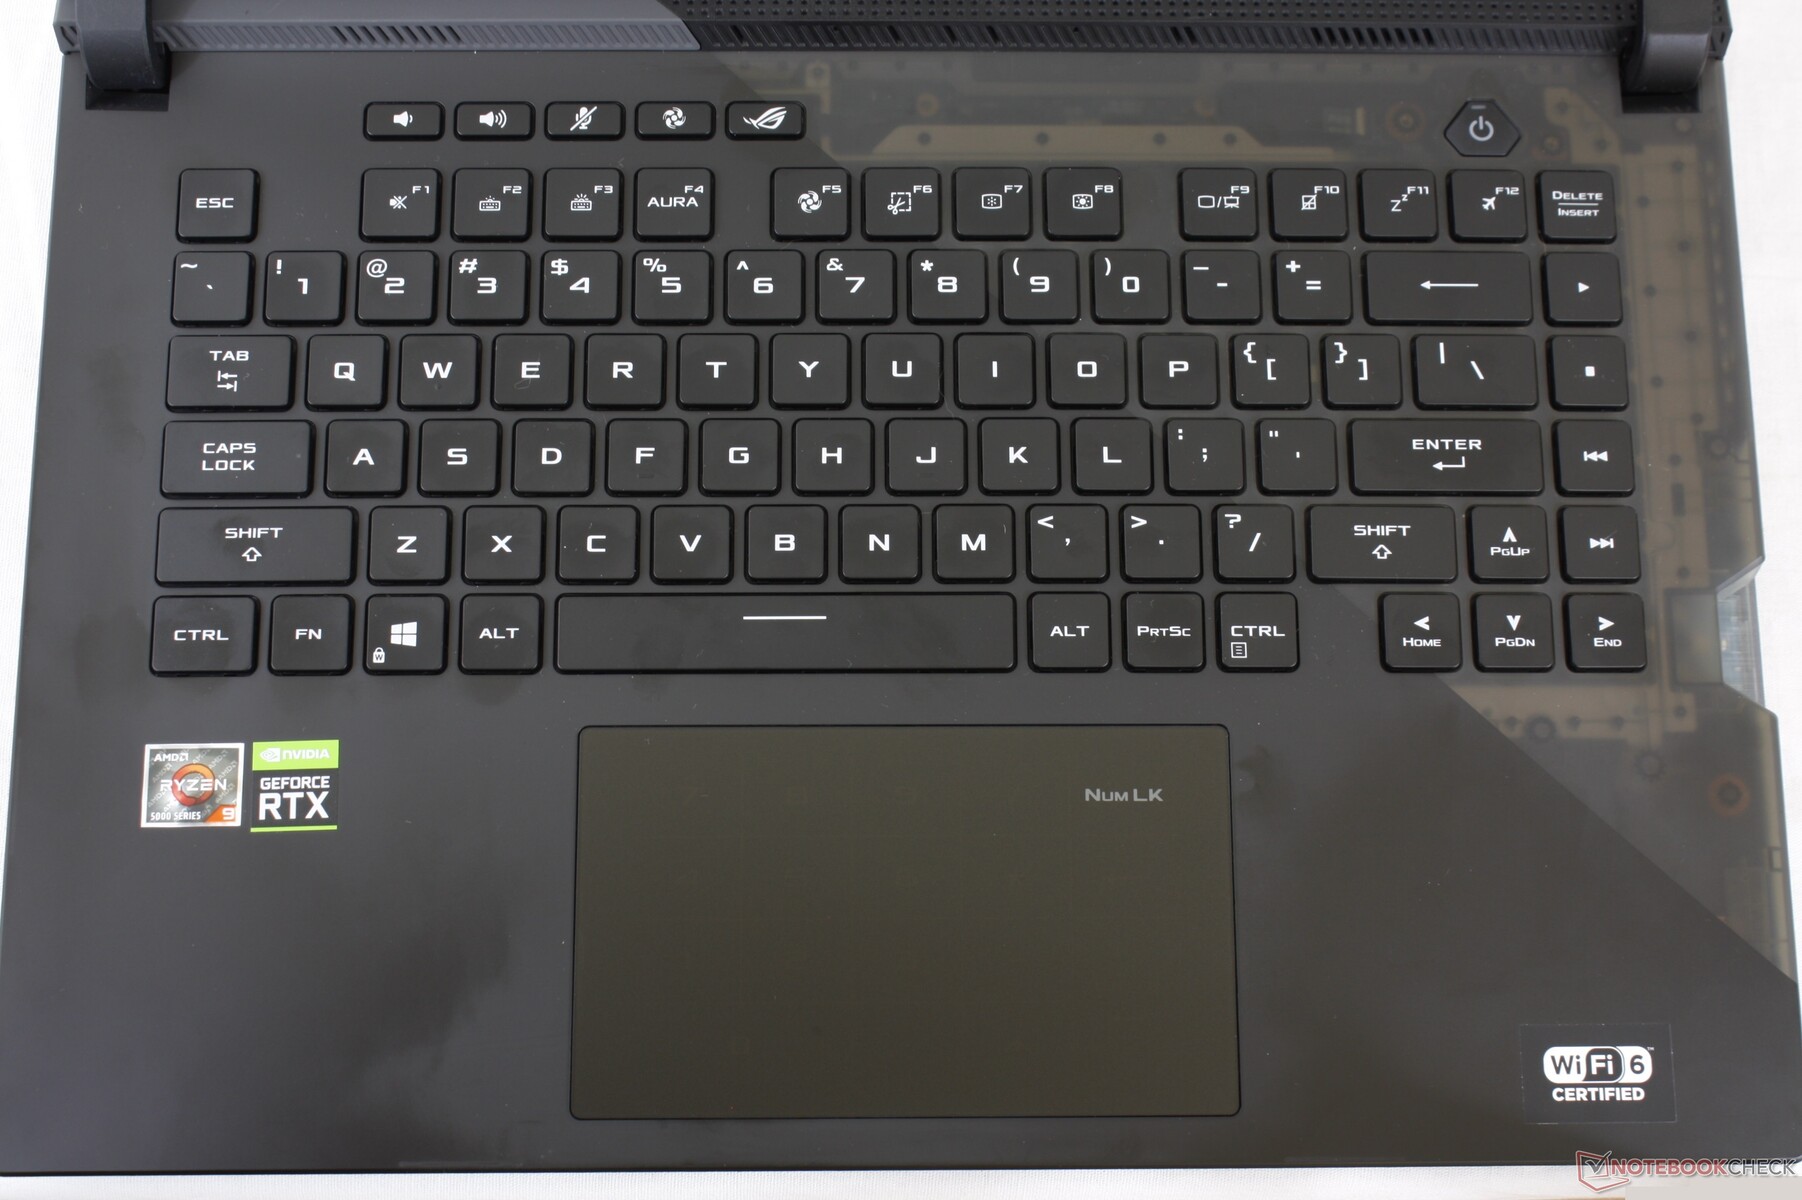
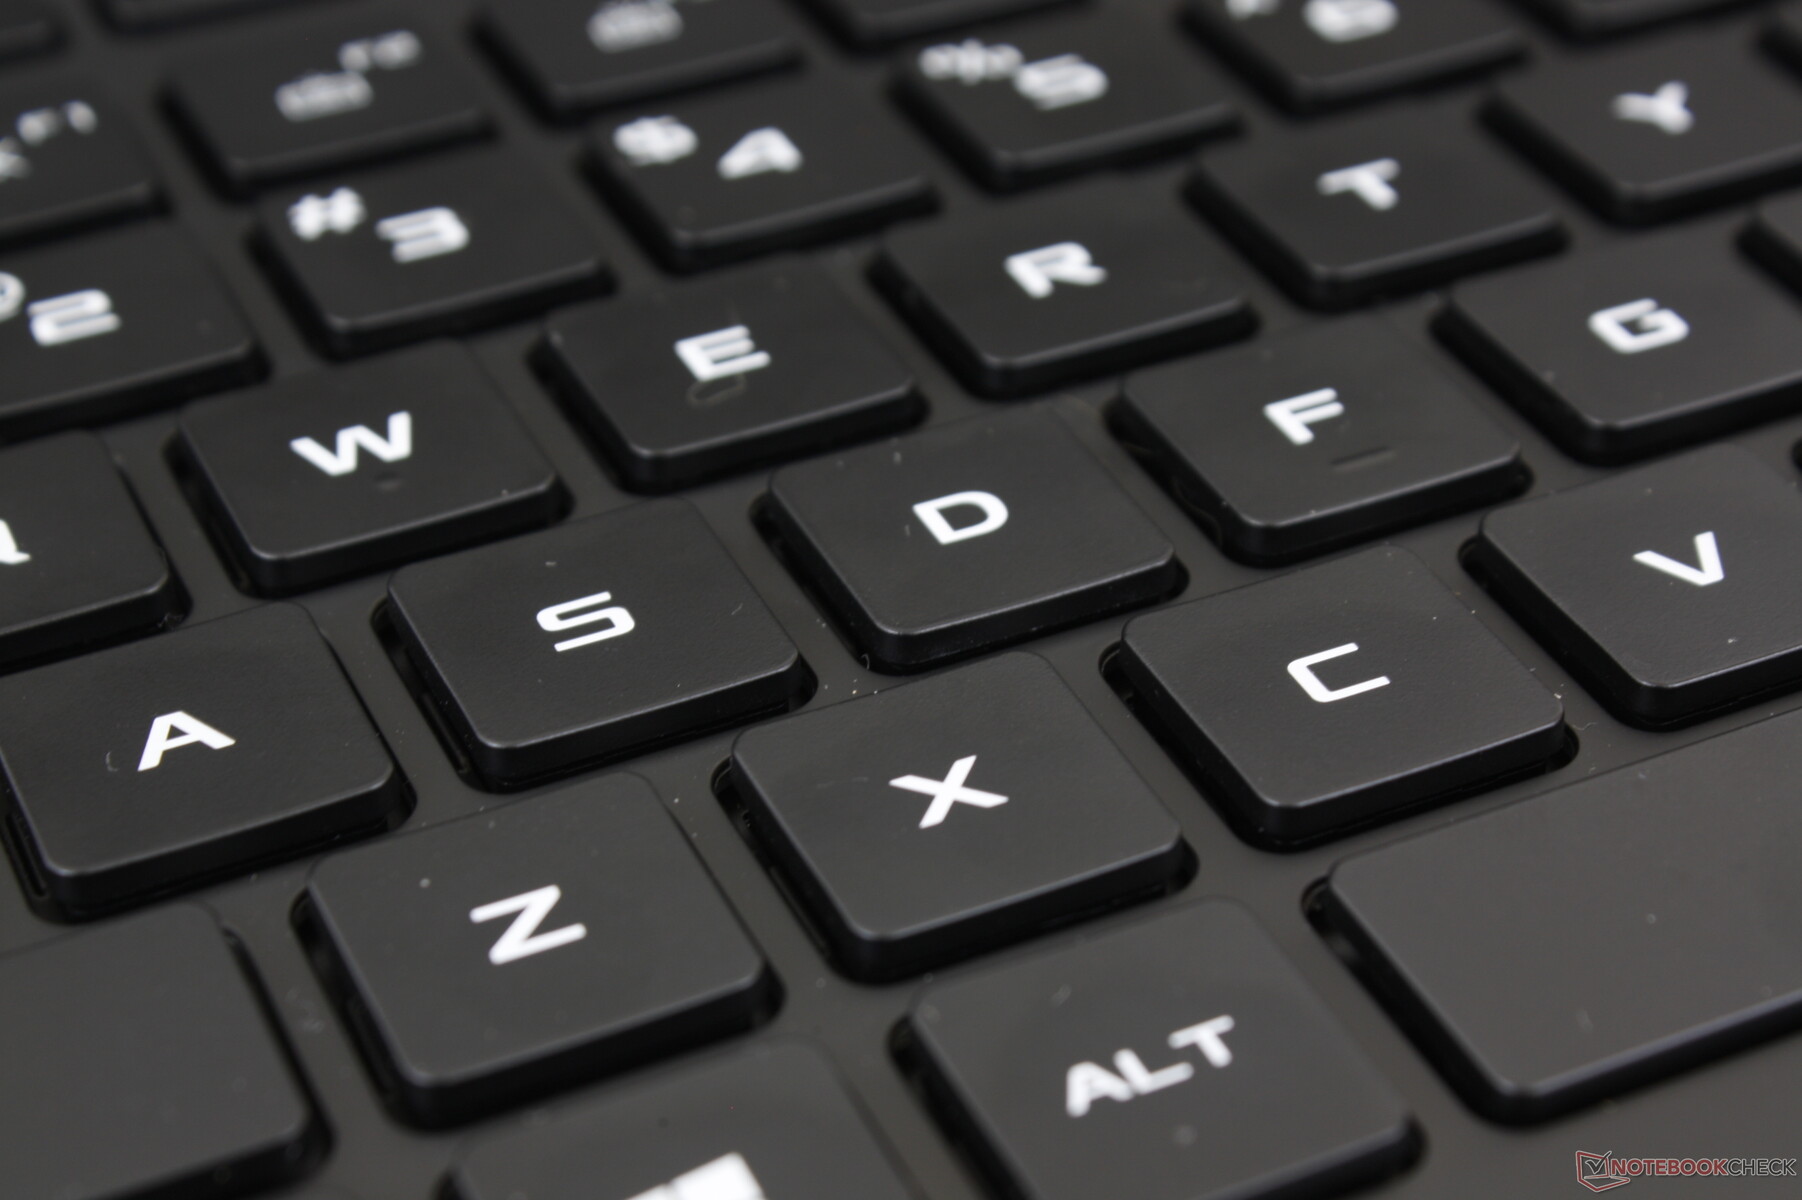
Teclado
Asus ha renovado completamente tanto el teclado como el clickpad del antiguo G532. El teclado RGB por tecla, en particular, es ahora óptico-mecánico con una disposición y un tacto diferentes. Otros fabricantes de equipos originales también han incursionado en interruptores mecánicos similares, como los últimos portátiles Portátiles Alienware. Estas teclas son más ruidosas y más clics, lo que algunos jugadores pueden apreciar, pero este cambio también hace que el portátil sea desfavorable para las aulas, las bibliotecas, los dormitorios y otros entornos donde se prefieren las teclas más silenciosas.
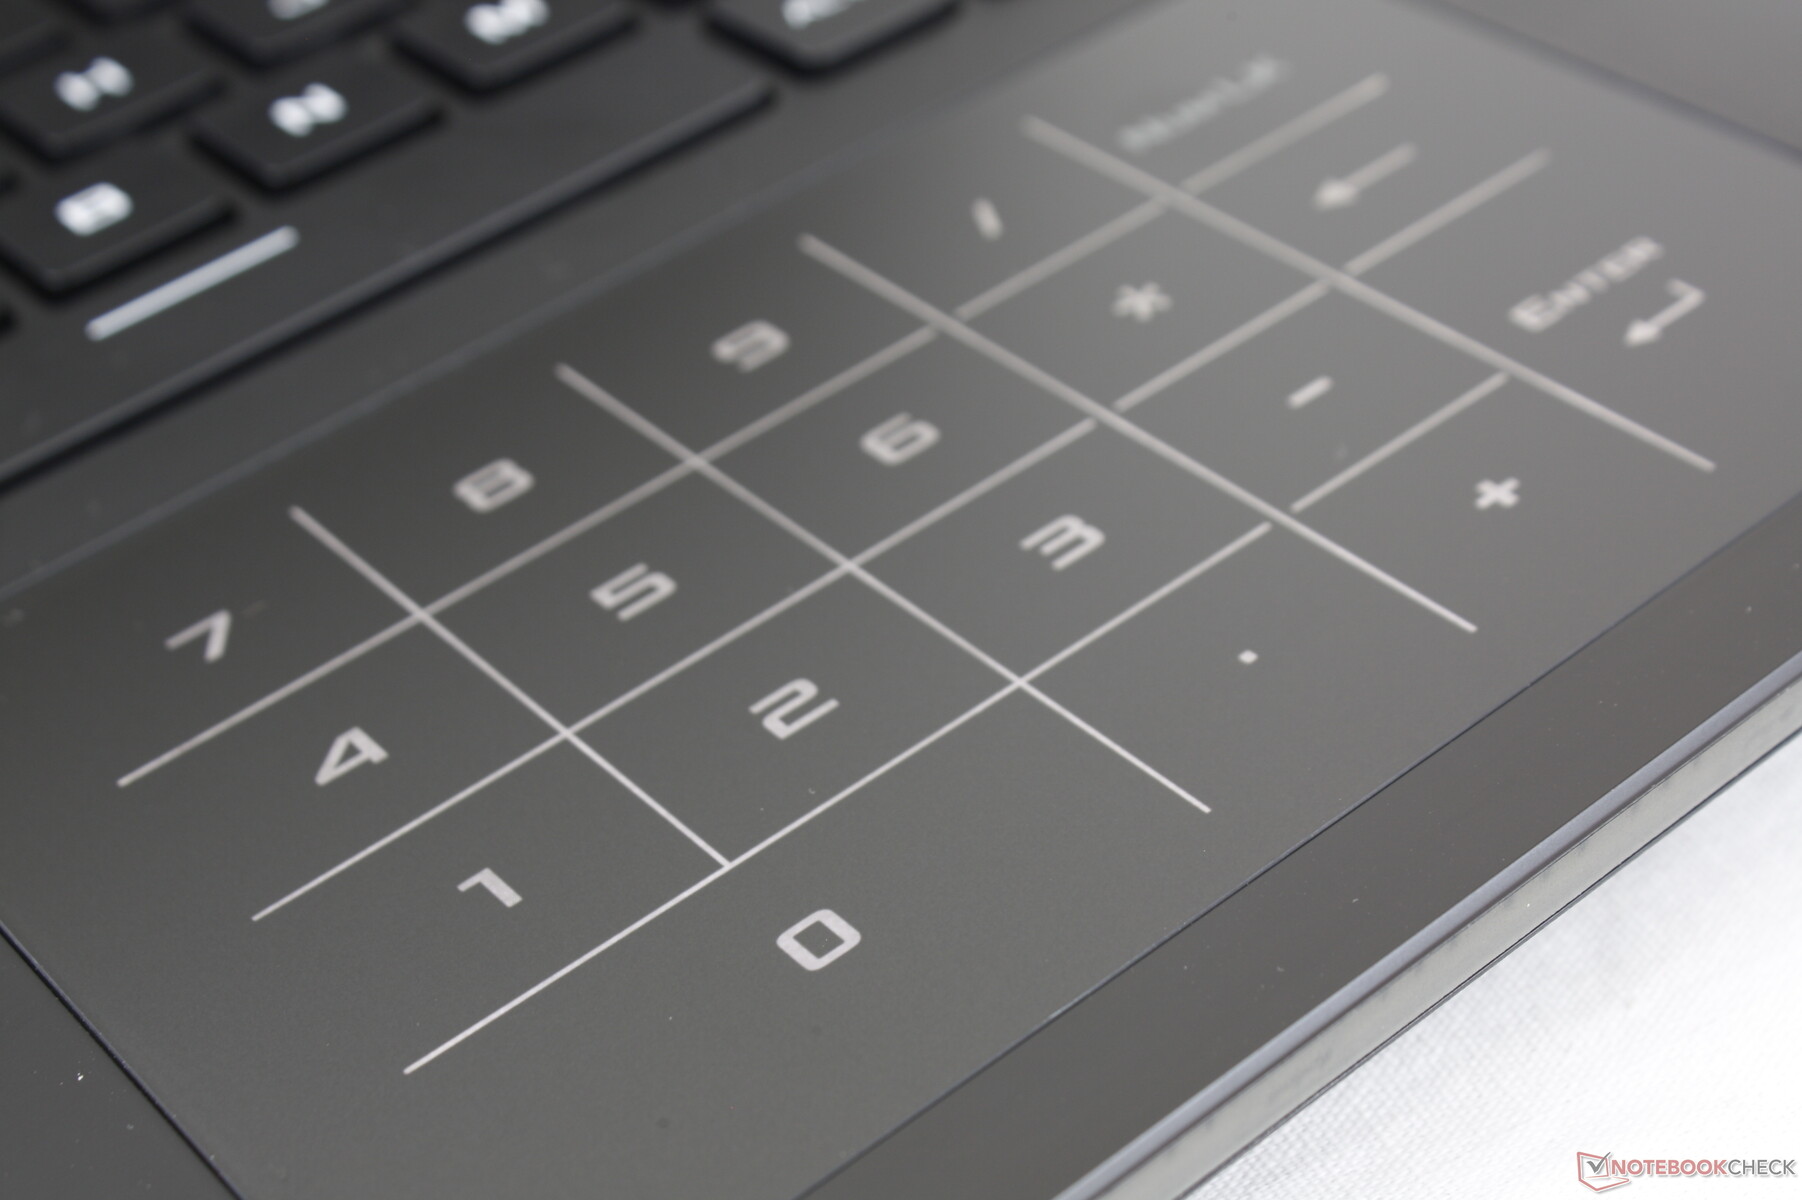
Panel táctil
El nuevo clickpad es más grande que el del G532(13 x 7,7 cm frente a 10,9x 6 cm) ya que Asus ha dejado de lado los botones dedicados del ratón en favor de la mayor superficie. La respuesta es débil debido al escaso recorrido a pesar del clic relativamente fuerte cuando se pulsa. Así, acciones como arrastrar y soltar son más difíciles de realizar esta vez. El control básico del cursor es, por otra parte, más amplio y sensible que antes, debido en parte a la mayor frecuencia de refresco de la pantalla
Mostrar
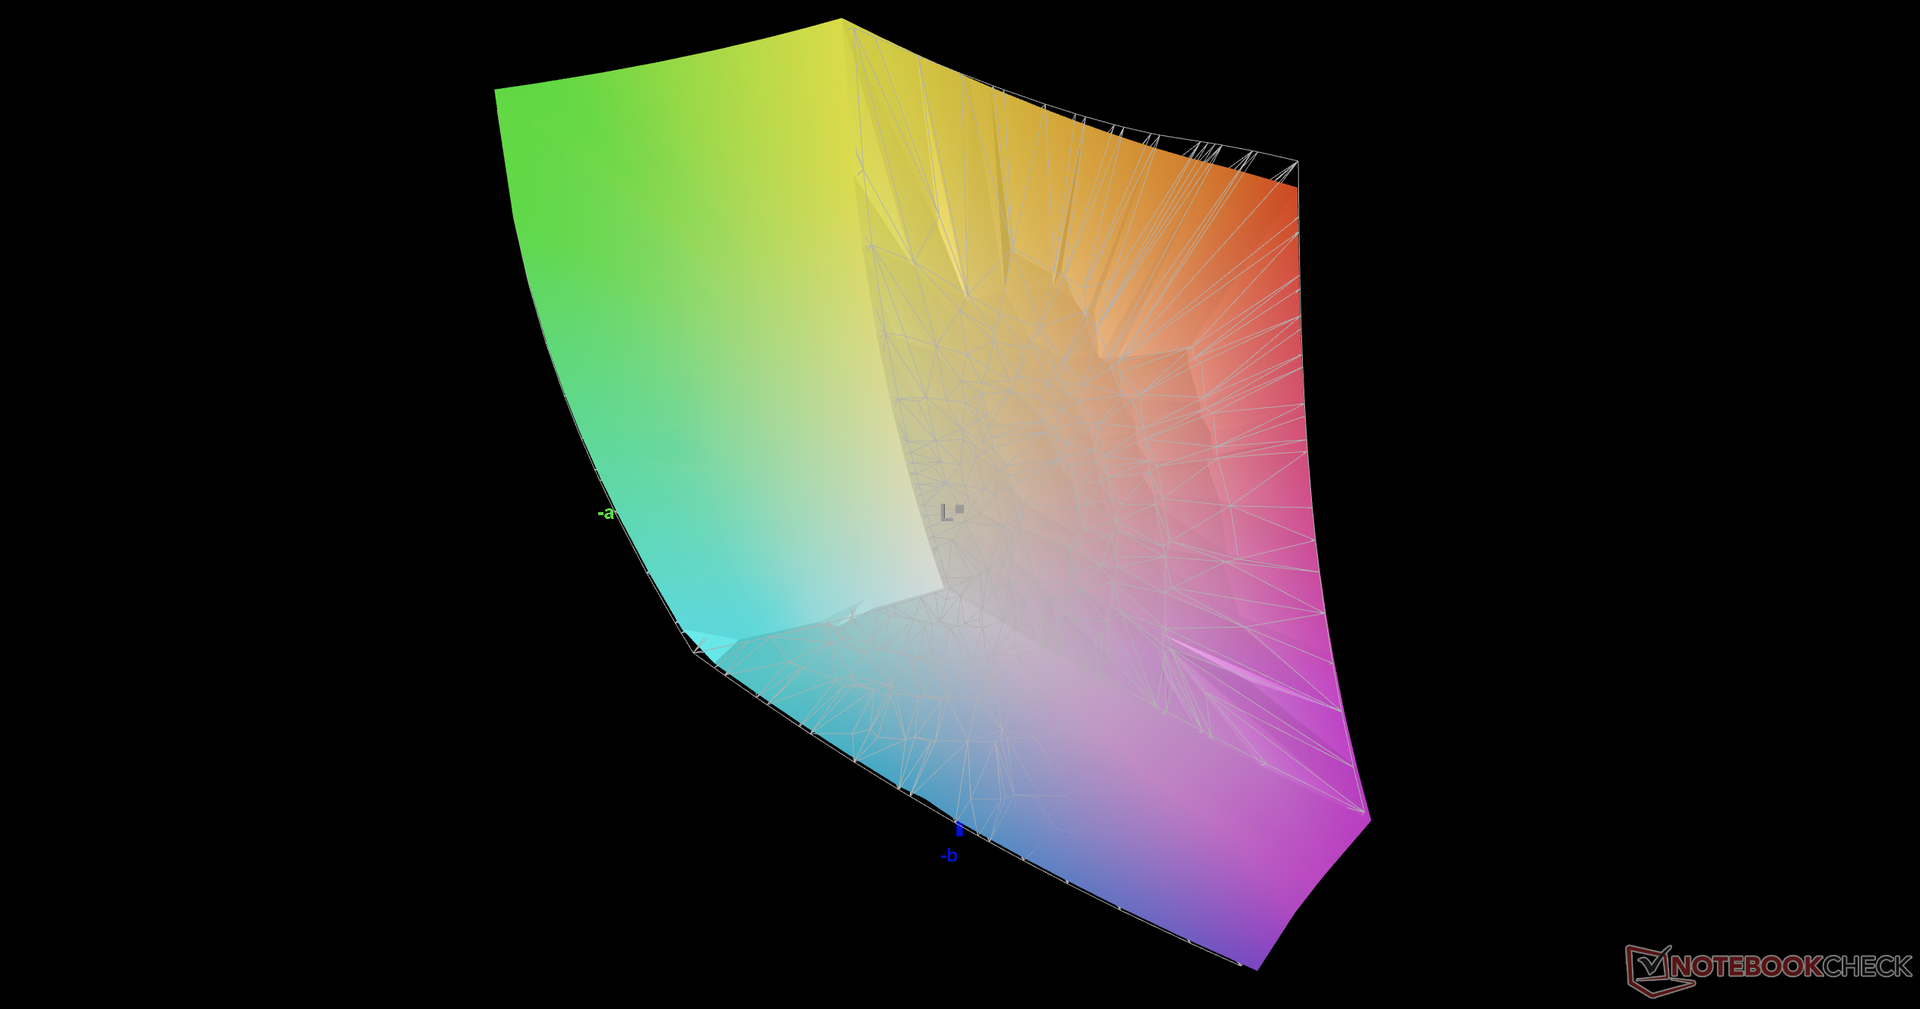
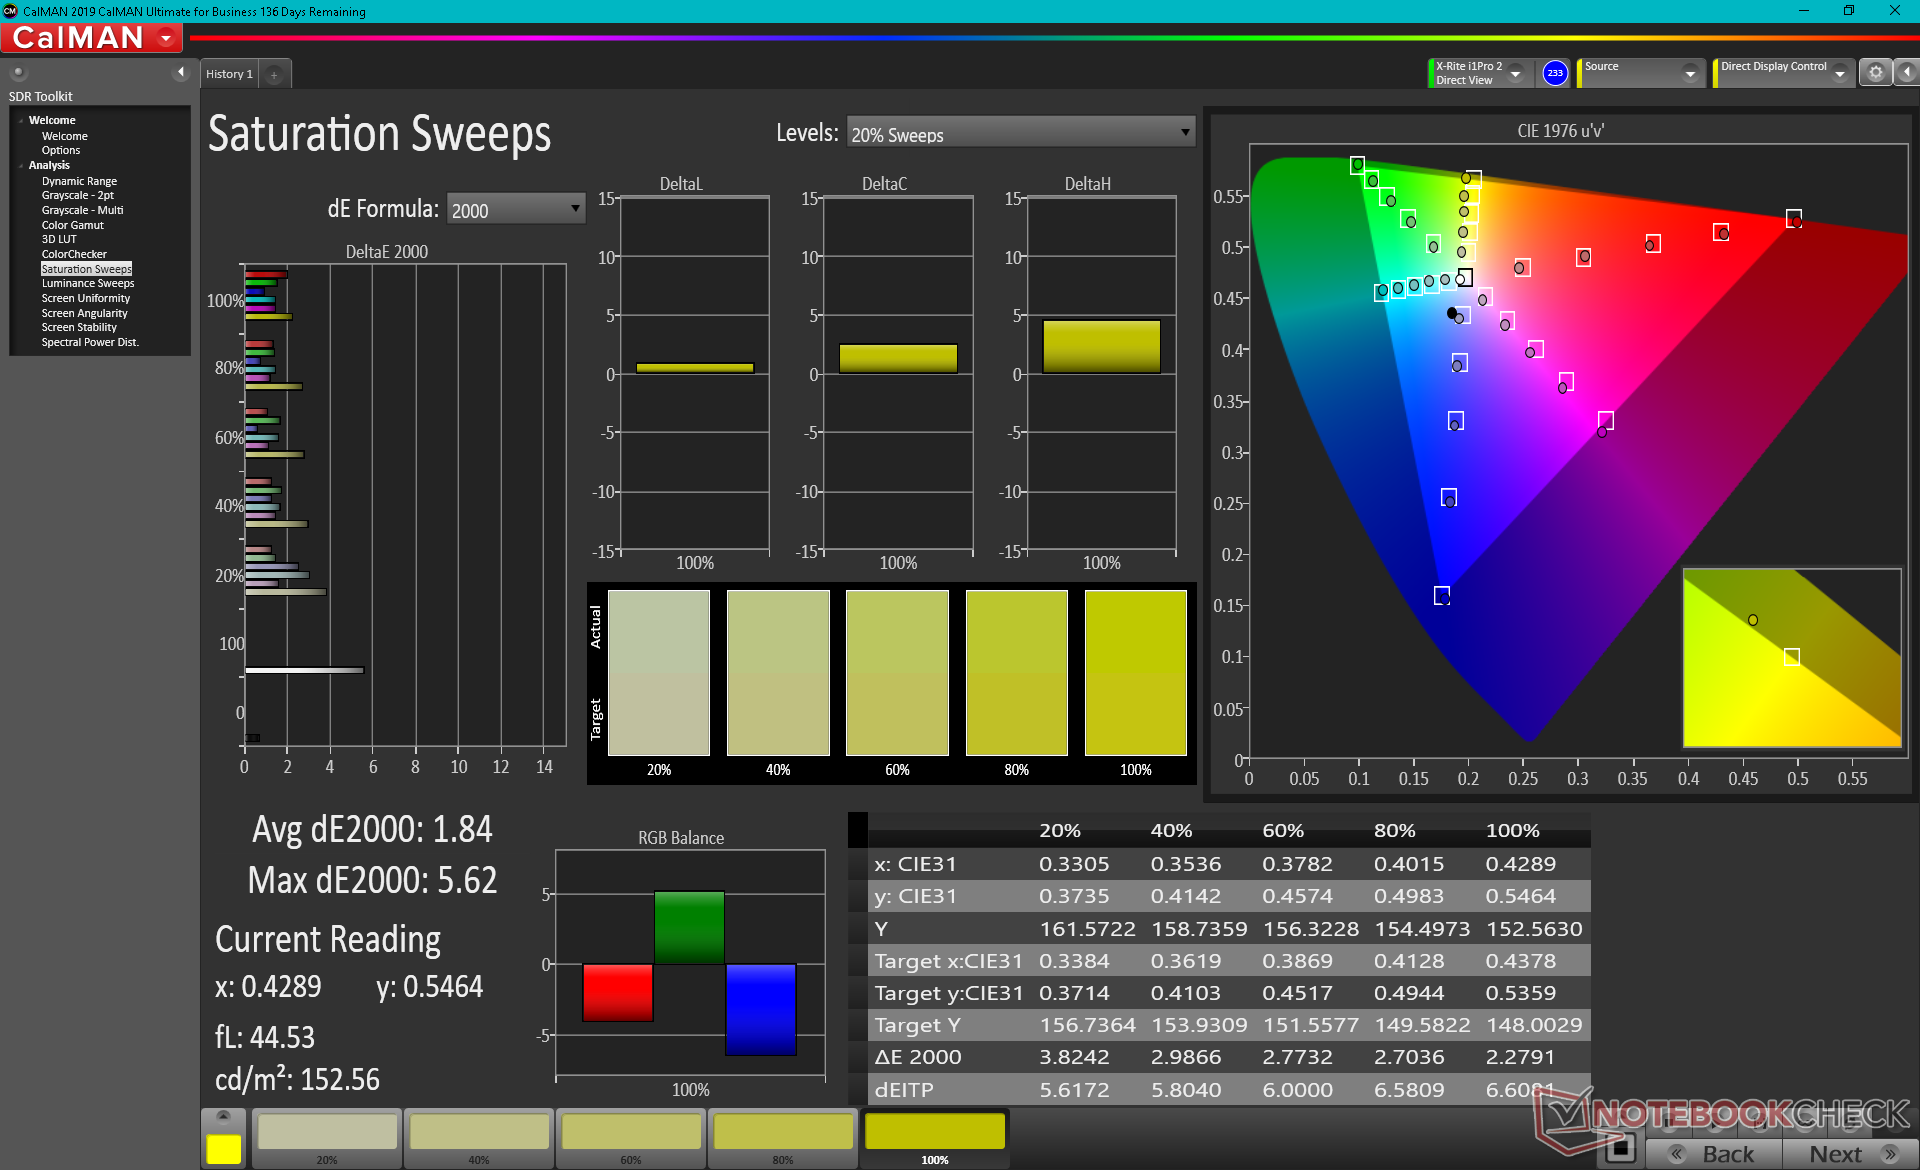
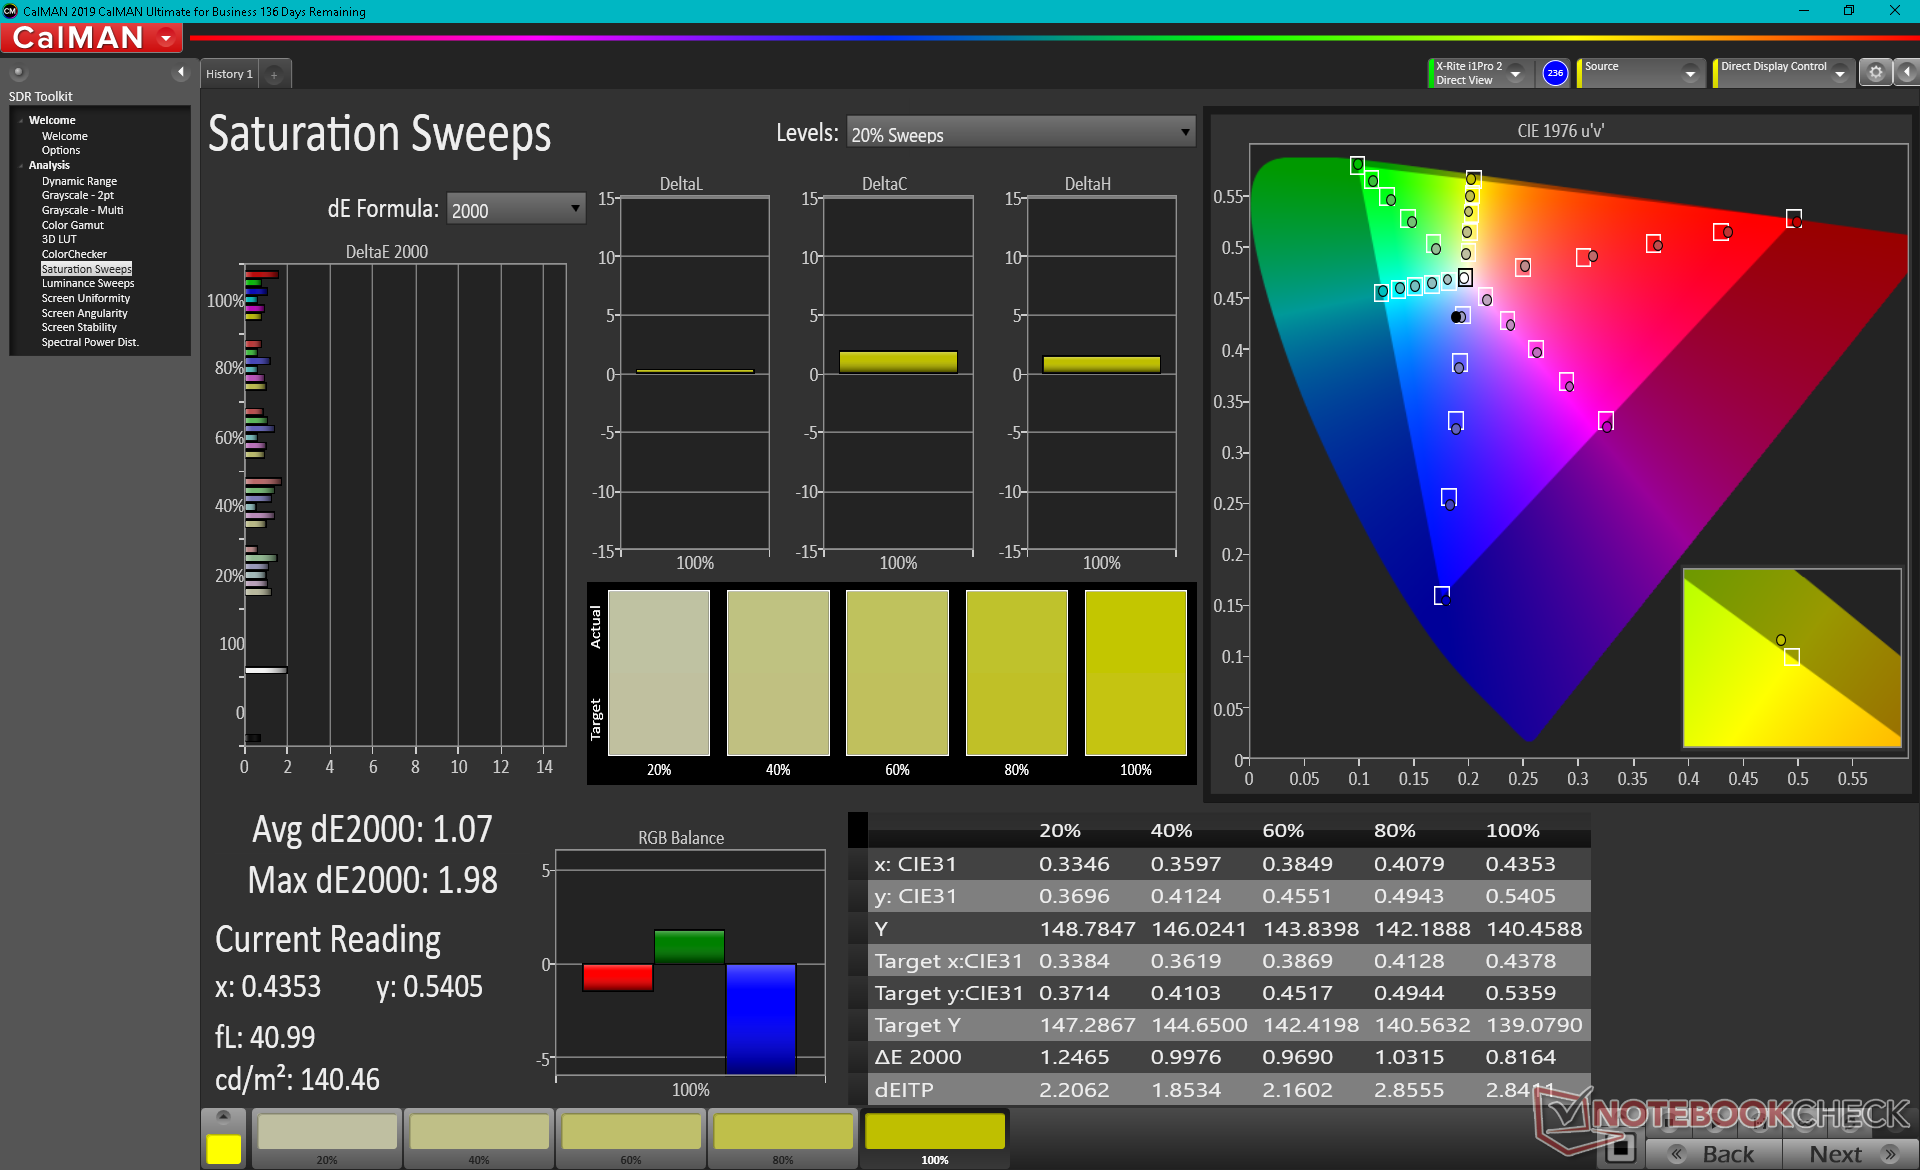
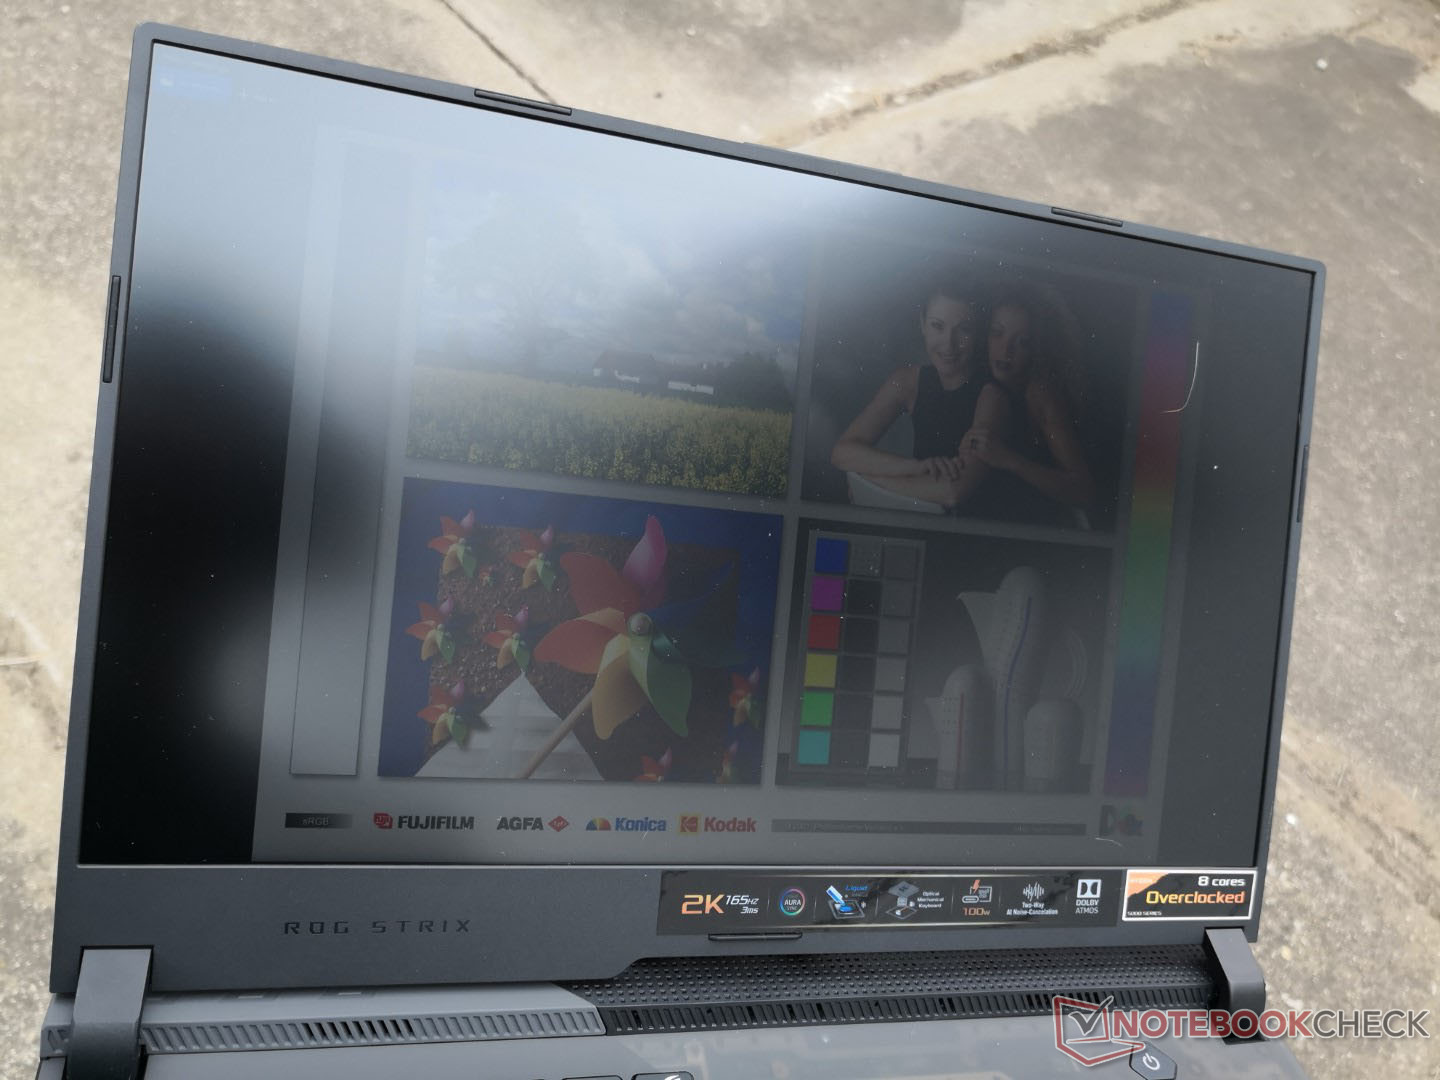
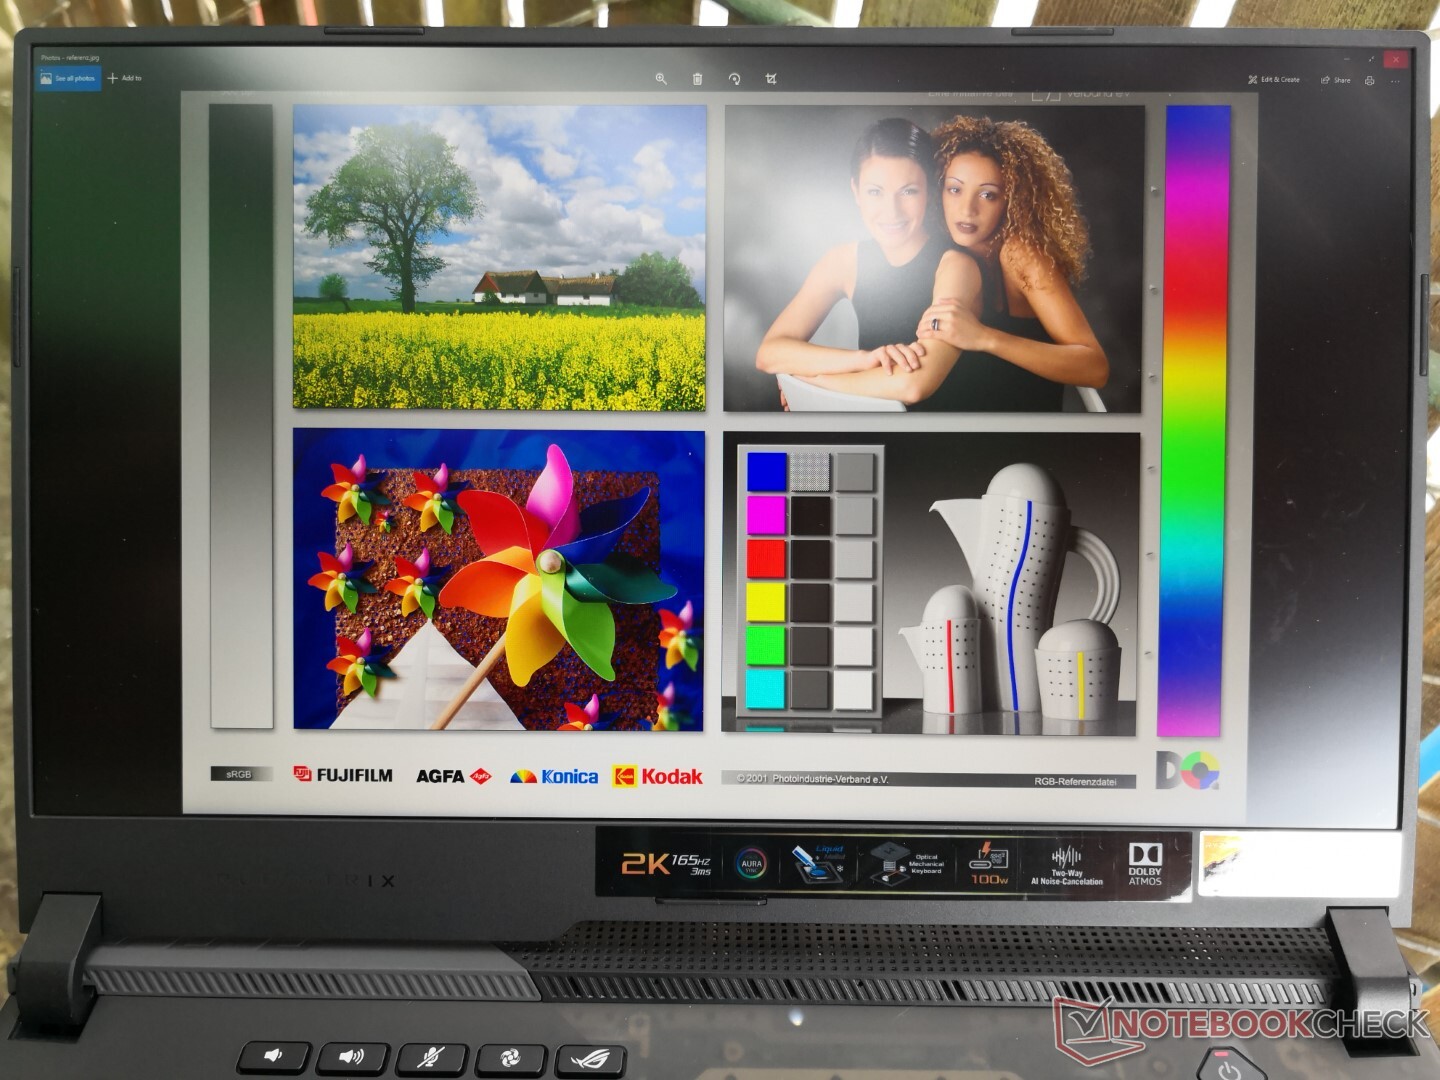
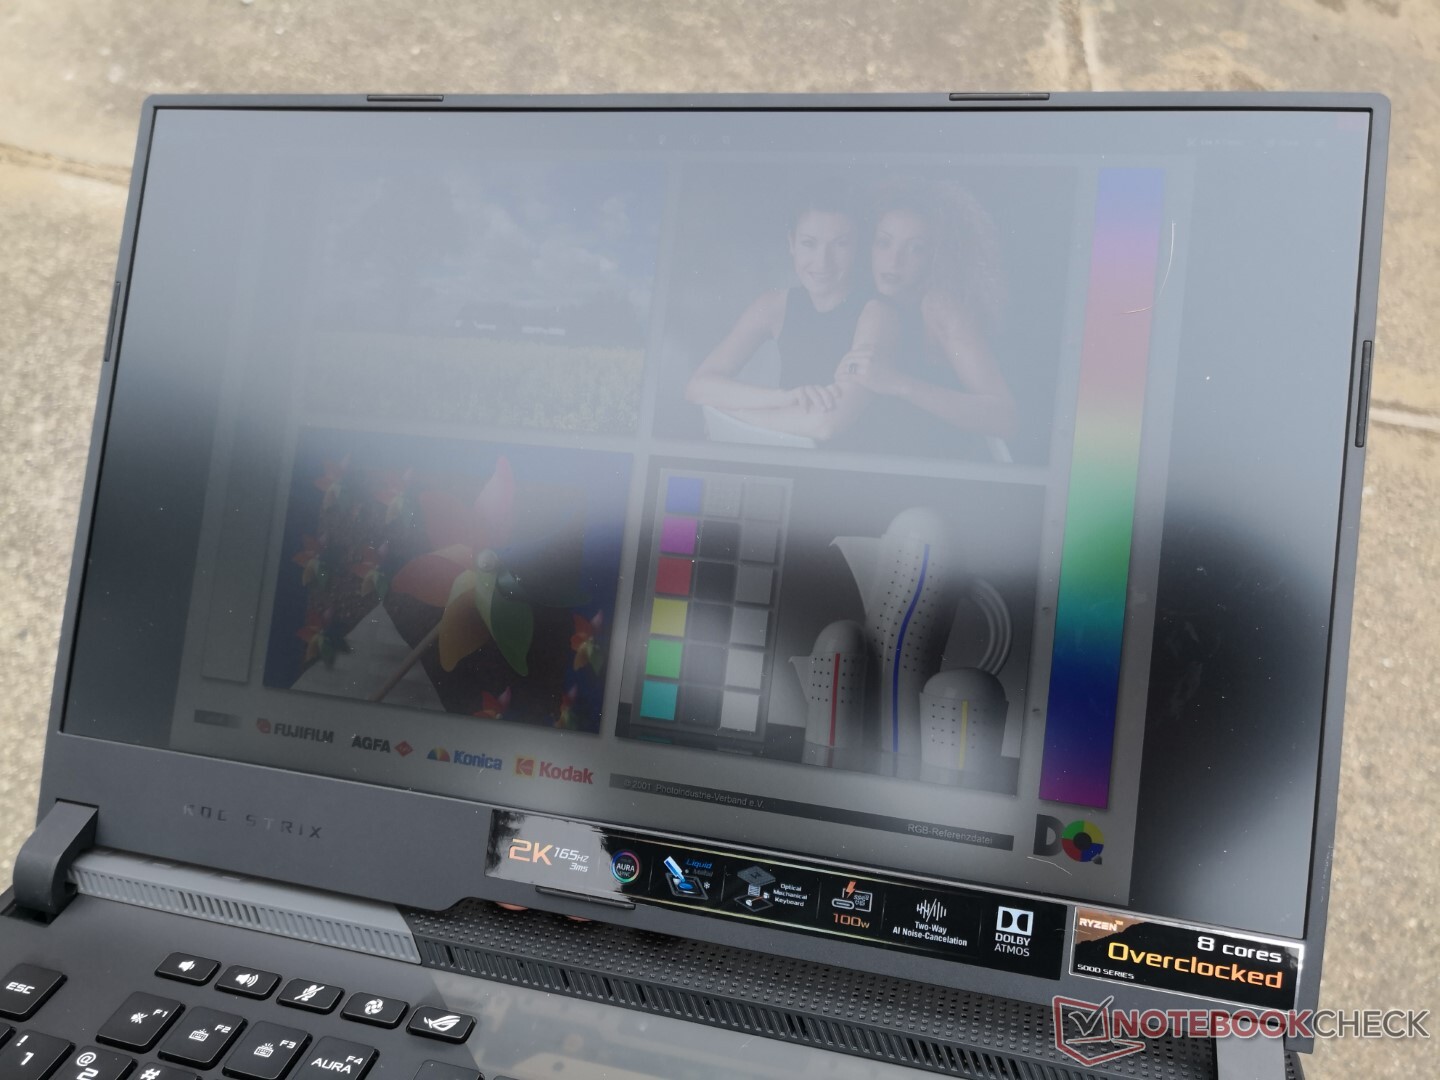
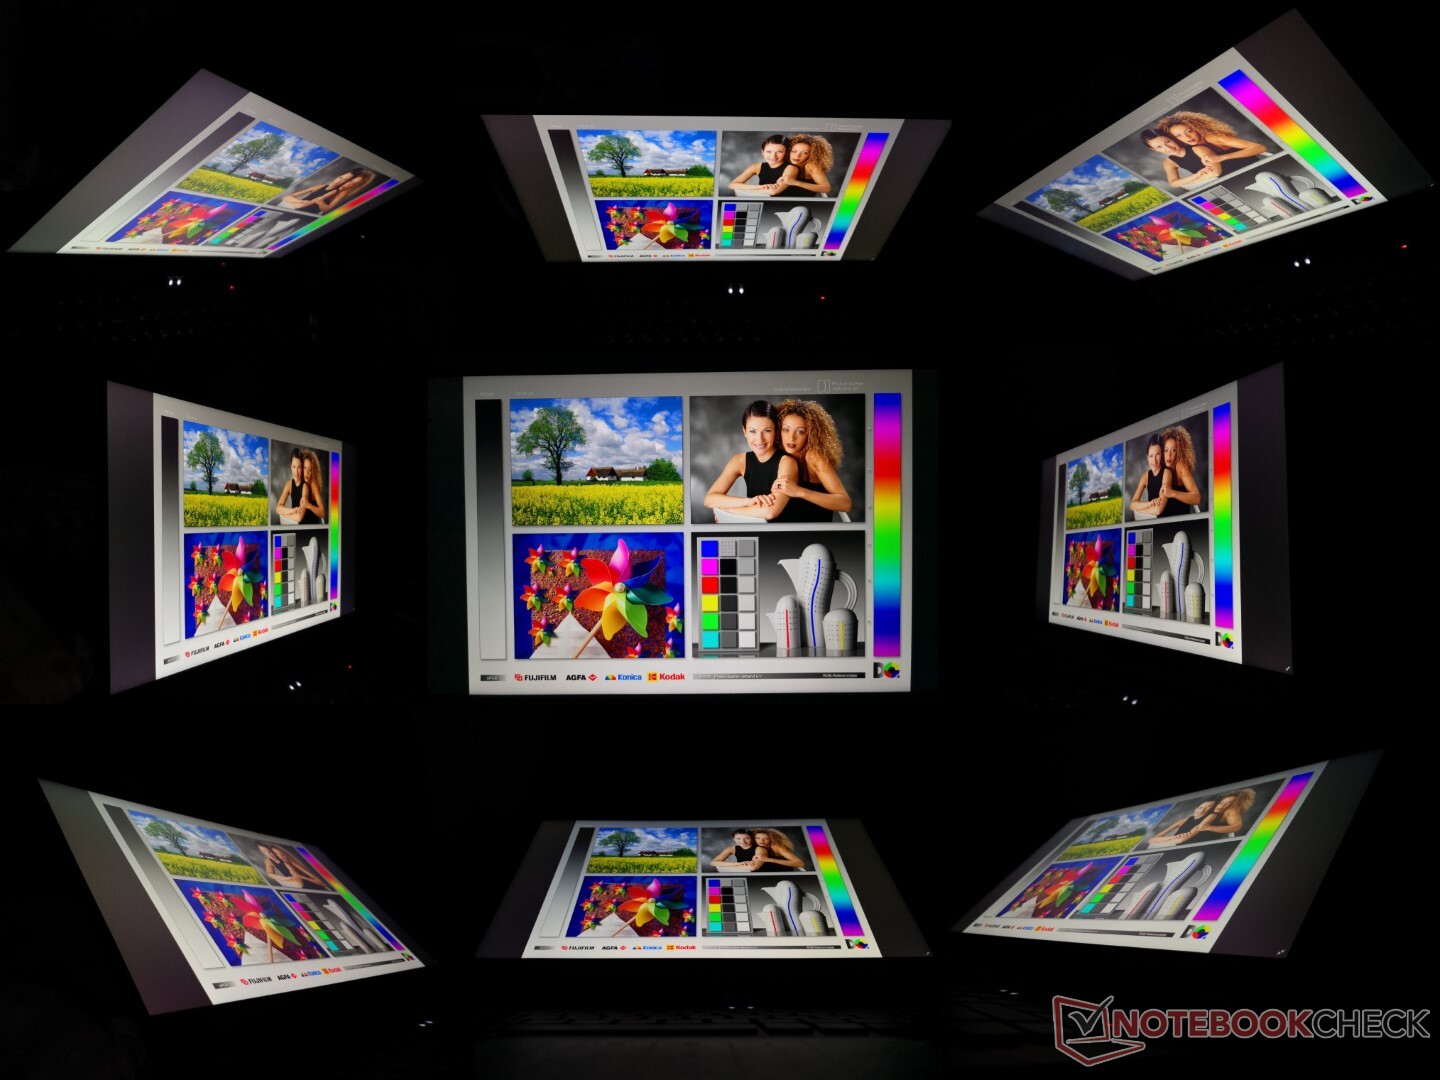
El panel IPS BOE NE156QHM-NY1 que se encuentra en nuestro G533QS es el primero en aparecer en nuestra base de datos. El Schenker XMG Neo 15 viene con el panel NE156QHM-NY2, ligeramente diferente, que tiene la misma resolución nativa de 1440p y una frecuencia de refresco de 165 Hz, pero un espacio de color más estrecho (69 por ciento de P3 en lugar de 98 por ciento). Nuestro panel 1440p parece tenerlo todo, incluyendo tiempos de respuesta rápidos, colores profundos y altas frecuencias de refresco. El contraste, sin embargo, podría ser un poco mejor con "sólo" 900:1.
AMD FreeSync es compatible con el panel principal.

| |||||||||||||||||||||||||
iluminación: 76 %
Brillo con batería: 304.3 cd/m²
Contraste: 922:1 (Negro: 0.33 cd/m²)
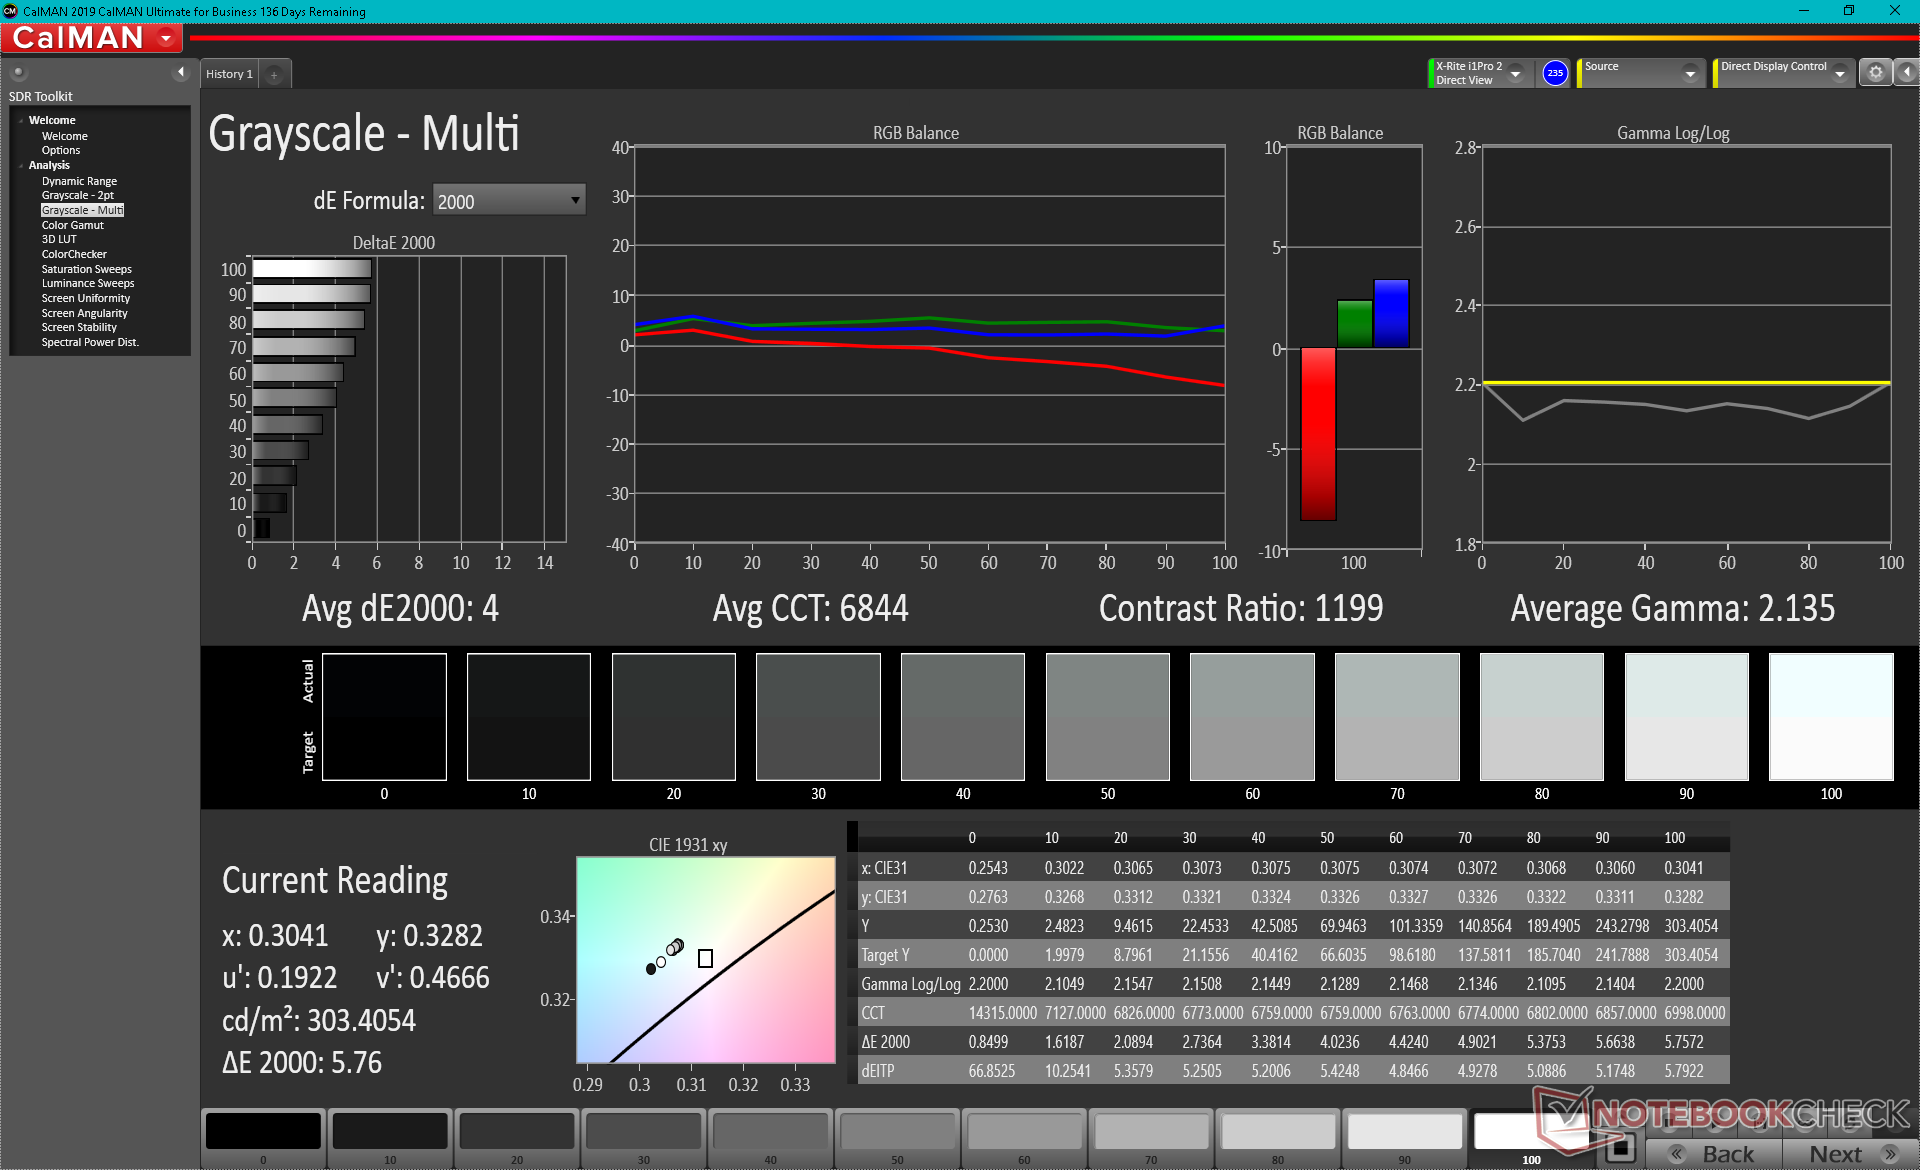
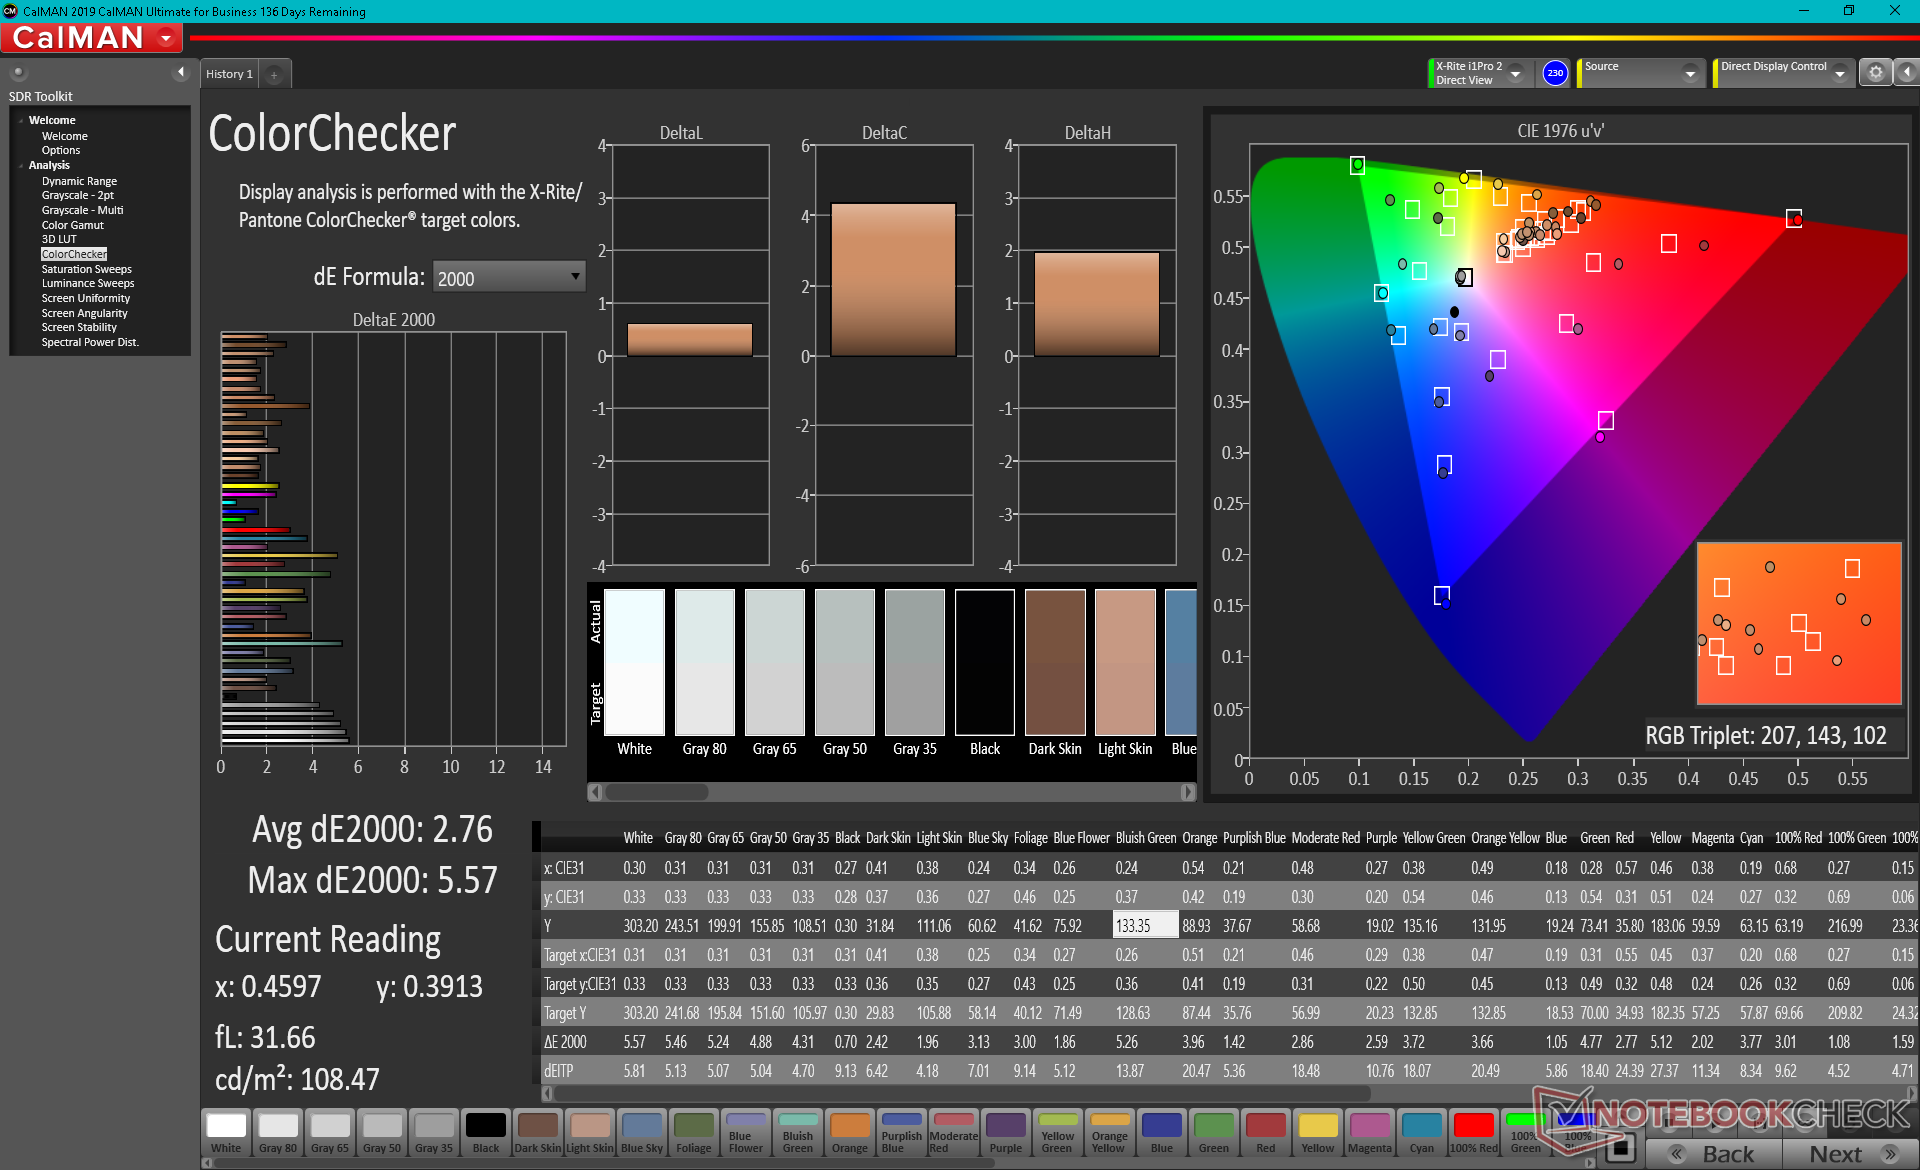
ΔE ColorChecker Calman: 2.76 | ∀{0.5-29.43 Ø4.72}
calibrated: 2.38
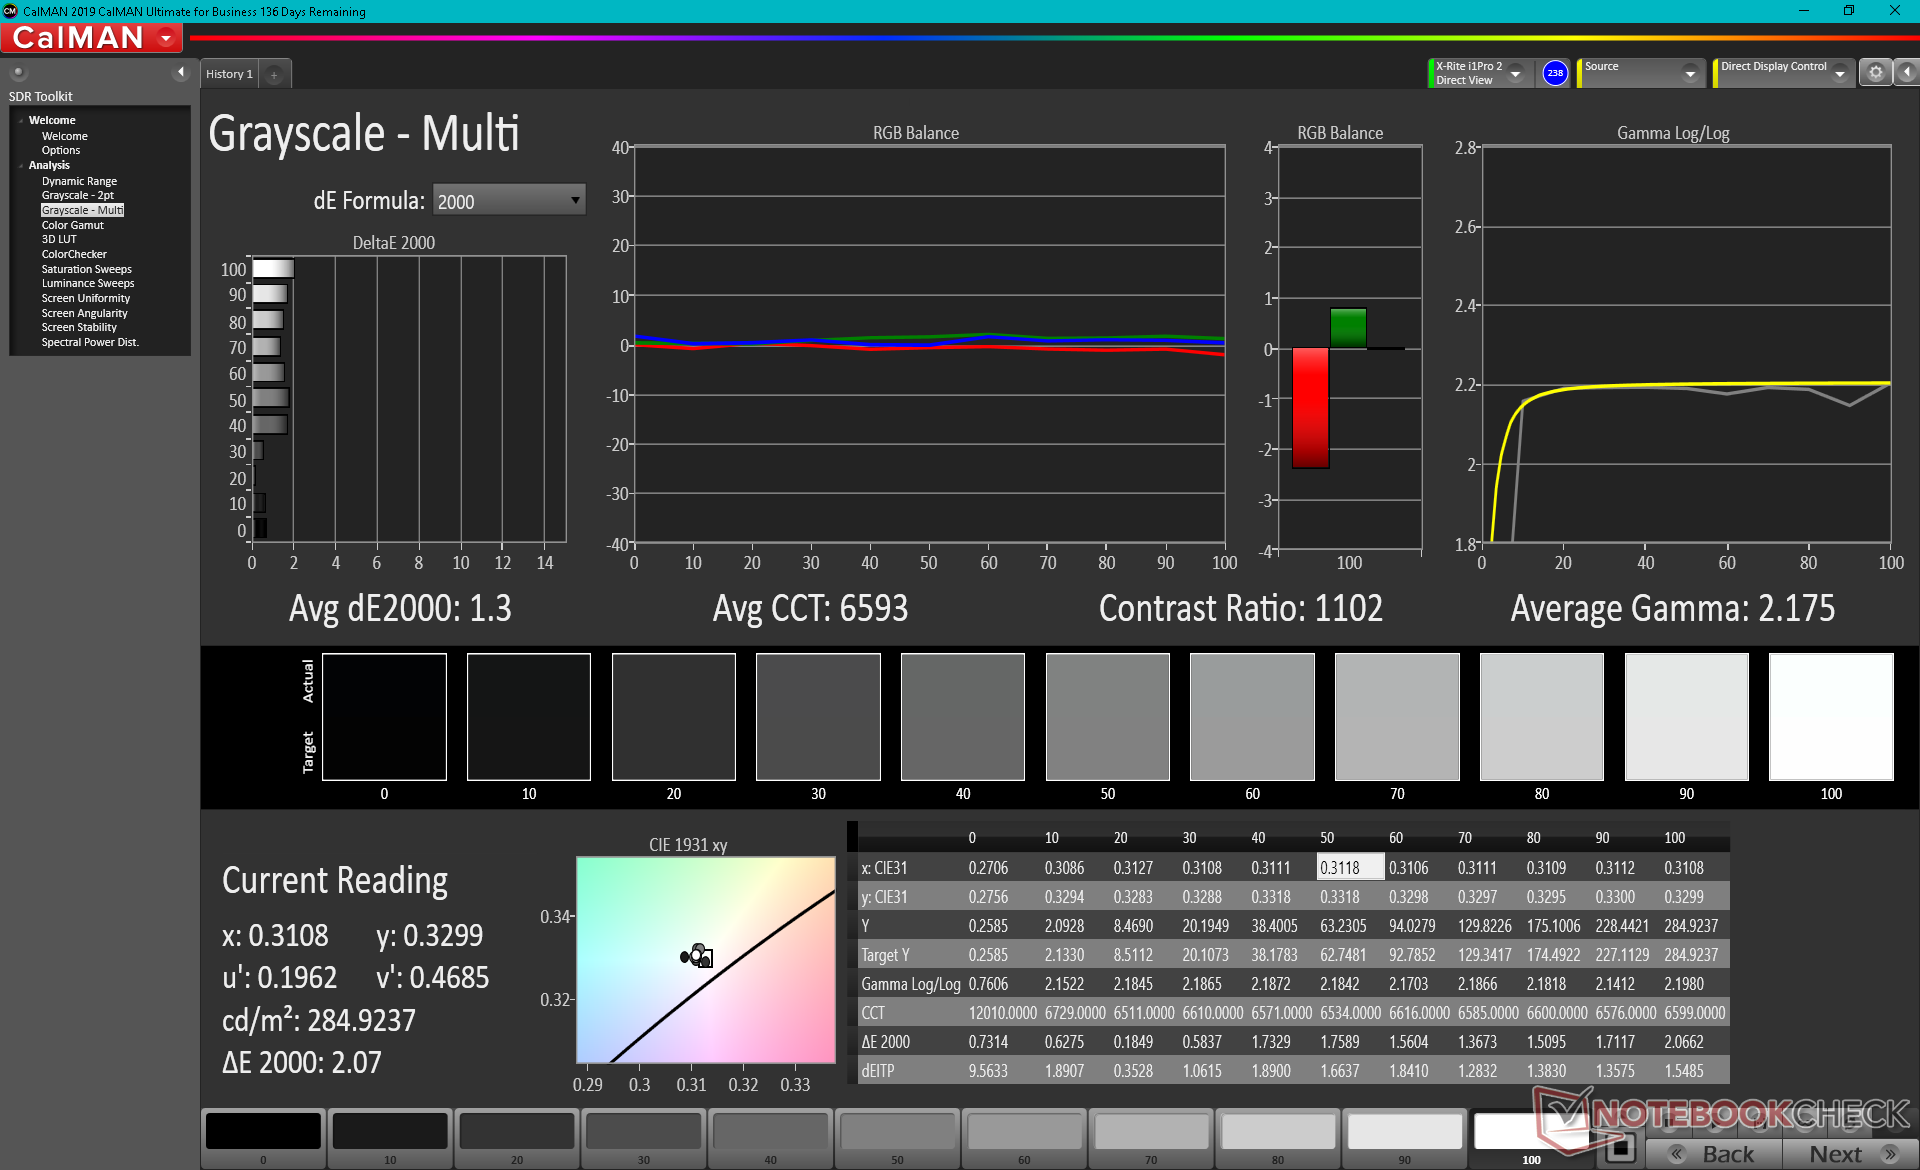
ΔE Greyscale Calman: 4 | ∀{0.09-98 Ø4.97}
85.3% AdobeRGB 1998 (Argyll 3D)
99.9% sRGB (Argyll 3D)
97.6% Display P3 (Argyll 3D)
Gamma: 2.14
CCT: 6844 K
| Asus ROG Strix Scar 15 G533QS BOE CQ NE156QHM-NY1, IPS, 15.6", 2560x1440 | Asus ROG Strix Scar 15 G532LWS AU Optronics B156HAN12.0, IPS, 15.6", 1920x1080 | MSI GE66 Raider 10SFS Sharp LQ156M1JW03 (SHP14C5), IPS-Level, 15.6", 1920x1080 | Razer Blade 15 Advanced (Mid 2021) TL156VDXP02-0, IPS, 15.6", 1920x1080 | Alienware m15 R5 Ryzen Edition B156HAN, IPS, 15.6", 1920x1080 | Lenovo Legion C7 15IMH05 82EH0030GE BOW CQ NV156FHM-NY5, IPS, 15.6", 1920x1080 | |
|---|---|---|---|---|---|---|
| Display | -15% | -16% | -18% | 4% | ||
| Display P3 Coverage (%) | 97.6 | 69.9 -28% | 68 -30% | 66.9 -31% | 91.9 -6% | |
| sRGB Coverage (%) | 99.9 | 99.6 0% | 99 -1% | 97.1 -3% | 99.8 0% | |
| AdobeRGB 1998 Coverage (%) | 85.3 | 71.4 -16% | 69.8 -18% | 69 -19% | 99.5 17% | |
| Response Times | 12% | -1% | 45% | 52% | 38% | |
| Response Time Grey 50% / Grey 80% * (ms) | 14 ? | 14.4 ? -3% | 16.4 ? -17% | 4.2 ? 70% | 4 ? 71% | 14 ? -0% |
| Response Time Black / White * (ms) | 12.4 ? | 9.2 ? 26% | 10.4 ? 16% | 10 ? 19% | 8.4 ? 32% | 3 ? 76% |
| PWM Frequency (Hz) | 23580 ? | |||||
| Screen | 31% | 27% | 20% | 19% | -31% | |
| Brightness middle (cd/m²) | 304.3 | 307.2 1% | 291 -4% | 353.4 16% | 329 8% | 440 45% |
| Brightness (cd/m²) | 286 | 301 5% | 278 -3% | 340 19% | 321 12% | 414 45% |
| Brightness Distribution (%) | 76 | 91 20% | 91 20% | 92 21% | 92 21% | 87 14% |
| Black Level * (cd/m²) | 0.33 | 0.21 36% | 0.25 24% | 0.31 6% | 0.27 18% | 0.42 -27% |
| Contrast (:1) | 922 | 1463 59% | 1164 26% | 1140 24% | 1219 32% | 1048 14% |
| Colorchecker dE 2000 * | 2.76 | 1.85 33% | 1.19 57% | 2.17 21% | 2.78 -1% | 6.32 -129% |
| Colorchecker dE 2000 max. * | 5.57 | 3.92 30% | 3.04 45% | 5.69 -2% | 4.88 12% | 9.96 -79% |
| Colorchecker dE 2000 calibrated * | 2.38 | 1.26 47% | 1.05 56% | 1.63 32% | 4.13 -74% | |
| Greyscale dE 2000 * | 4 | 2 50% | 1.9 52% | 3.4 15% | 2.5 37% | 7.56 -89% |
| Gamma | 2.14 103% | 2.15 102% | 2.216 99% | 2.2 100% | 2.106 104% | 2.64 83% |
| CCT | 6844 95% | 6479 100% | 7018 93% | 6830 95% | 6201 105% | 7681 85% |
| Color Space (Percent of AdobeRGB 1998) (%) | 65 | 70 | 76 | 88 | ||
| Color Space (Percent of sRGB) (%) | 99.7 | 92 | 99 | 100 | ||
| Media total (Programa/Opciones) | 9% /
19% | 3% /
13% | 16% /
15% | 36% /
25% | 4% /
-14% |
* ... más pequeño es mejor
La gama cubre completamente el sRGB y aproximadamente el 98% del DCI-P3 para ser más que suficiente para los juegos. Se trata de uno de los pocos paneles IPS para portátiles con tiempos de respuesta rápidos y colores amplios, aptos tanto para los juegos como para la creación de contenidos.
Las mediciones del colorímetro X-Rite muestran que la temperatura del color es ligeramente demasiado fría, lo que, afortunadamente, puede solucionarse fácilmente con una calibración por parte del usuario. Los valores medios de escala de grises y color DeltaE se situarían en sólo 1,3 y 2,38, respectivamente, tras la calibración.
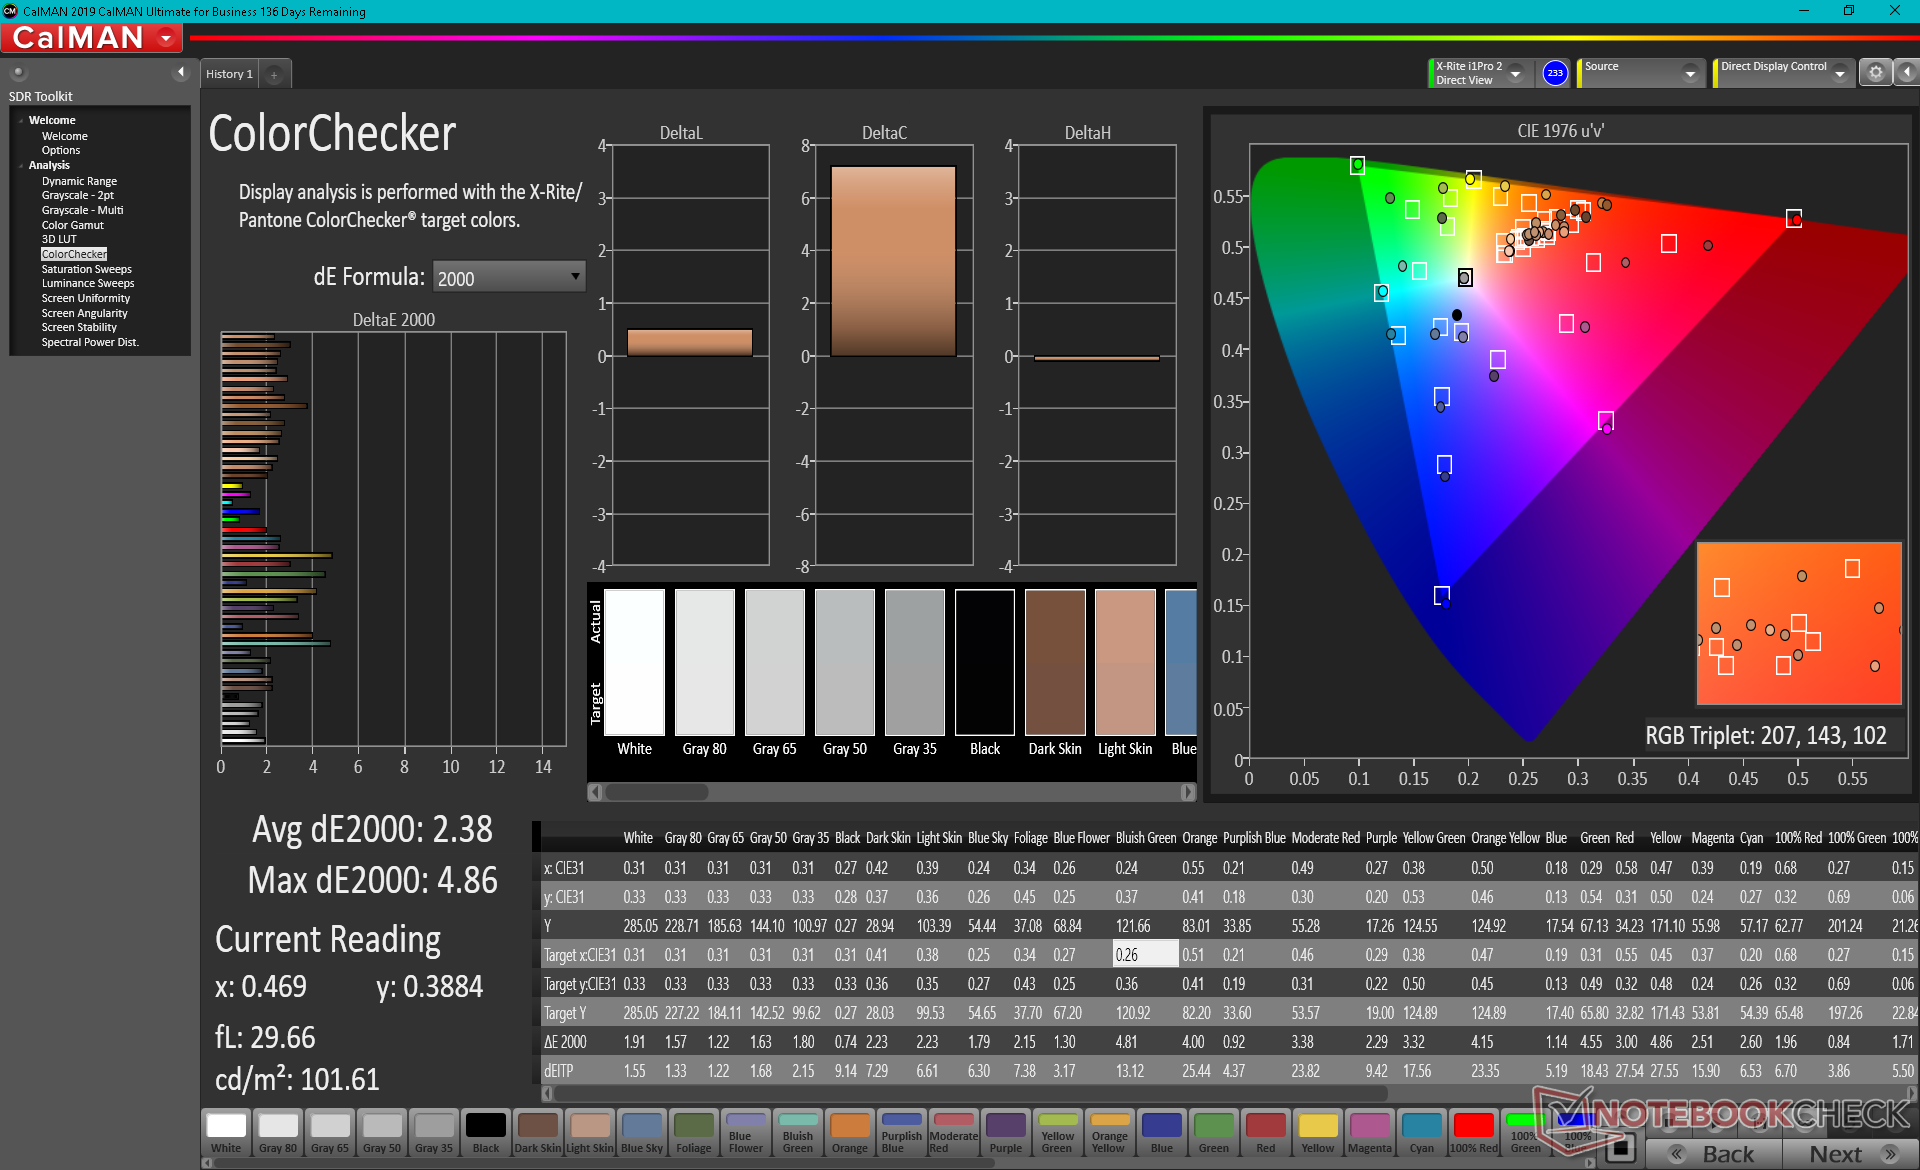
Tiempos de respuesta del display
| ↔ Tiempo de respuesta de Negro a Blanco | ||
|---|---|---|
| 12.4 ms ... subida ↗ y bajada ↘ combinada | ↗ 7.2 ms subida | 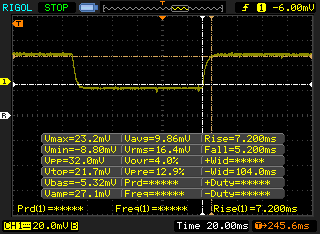 |
| ↘ 5.2 ms bajada | ||
| La pantalla mostró buenos tiempos de respuesta en nuestros tests pero podría ser demasiado lenta para los jugones competitivos. En comparación, todos los dispositivos de prueba van de ##min### (mínimo) a 240 (máximo) ms. » 33 % de todos los dispositivos son mejores. Esto quiere decir que el tiempo de respuesta medido es mejor que la media (19.8 ms) de todos los dispositivos testados. | ||
| ↔ Tiempo de respuesta 50% Gris a 80% Gris | ||
| 14 ms ... subida ↗ y bajada ↘ combinada | ↗ 7.2 ms subida | 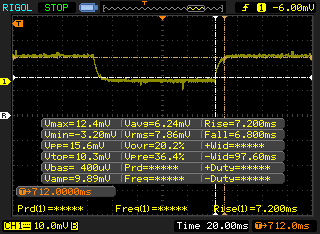 |
| ↘ 6.8 ms bajada | ||
| La pantalla mostró buenos tiempos de respuesta en nuestros tests pero podría ser demasiado lenta para los jugones competitivos. En comparación, todos los dispositivos de prueba van de ##min### (mínimo) a 636 (máximo) ms. » 28 % de todos los dispositivos son mejores. Esto quiere decir que el tiempo de respuesta medido es mejor que la media (31 ms) de todos los dispositivos testados. | ||
Parpadeo de Pantalla / PWM (Pulse-Width Modulation)
| Parpadeo de Pantalla / PWM no detectado |  | ||
Comparación: 52 % de todos los dispositivos testados no usaron PWM para atenuar el display. Si se usó, medimos una media de 7769 (mínimo: 5 - máxmo: 343500) Hz. | |||
La pantalla de 300 nits está en la media de un portátil de juegos, por lo que la visibilidad en exteriores no es particularmente mejor o peor que la de la mayoría de los modelos existentes. Sin embargo, recuerda desactivar AMD Vari-Bright o el brillo máximo caerá automáticamente de 312 nits a sólo 247 nits cuando funcione con batería.
Rendimiento - Sin necesidad de Intel
Asus está apuntando directamente a los jugadores entusiastas, ya que incluso la configuración de gama más baja viene con el potente Ryzen 7 5800H y GeForce RTX 3070. La GPU está clasificada para un TGP de 115 W + 15 W de refuerzo, pero es capaz de funcionar de forma consistente a 130 W cuando se juega en modo Turbo, como mostrará nuestra sección de pruebas de estrés más adelante. Nuestra unidad se puso en modo Turbo antes de ejecutar cualquier prueba de rendimiento para obtener las puntuaciones más altas posibles.
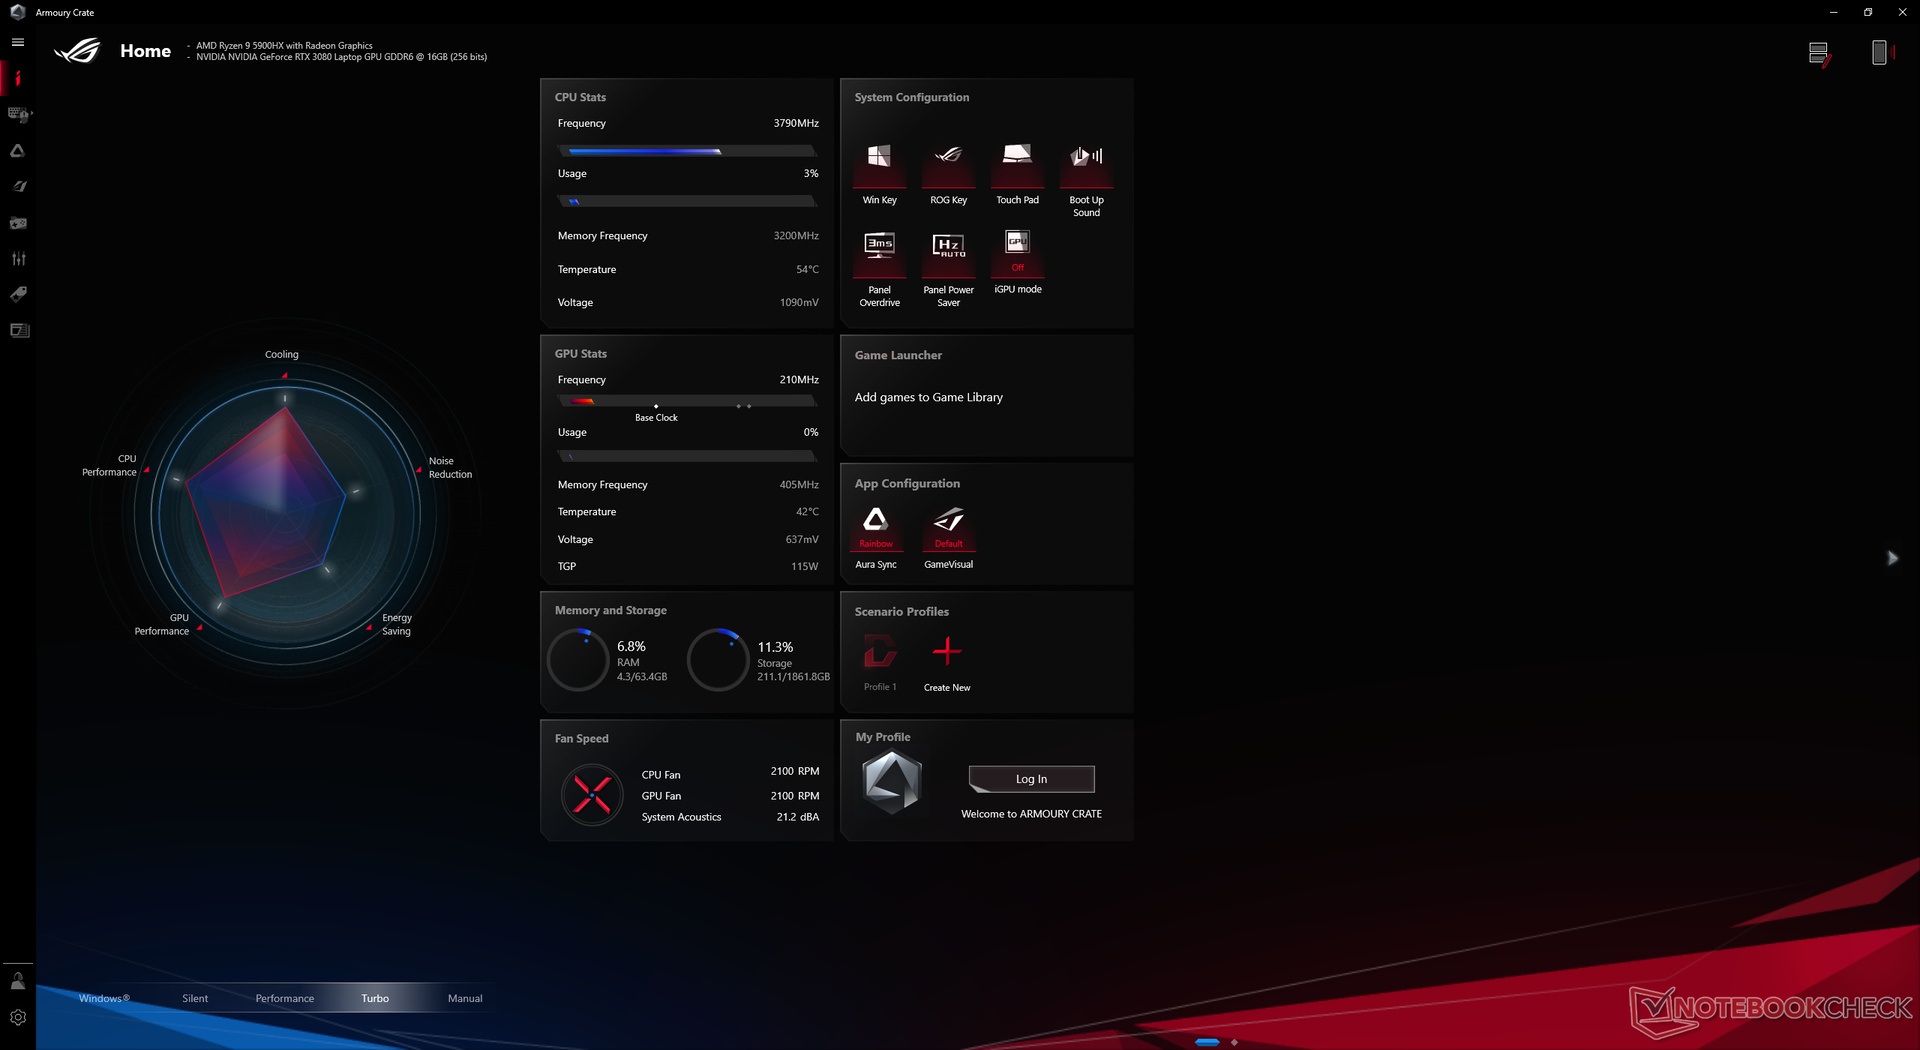
Recomendamos a los propietarios que se familiaricen con el software Asus Armoury Crate, ya que aquí se pueden cambiar importantes ajustes de rendimiento, conmutación de gráficos y LED
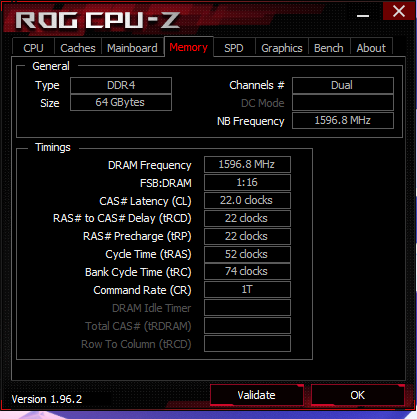
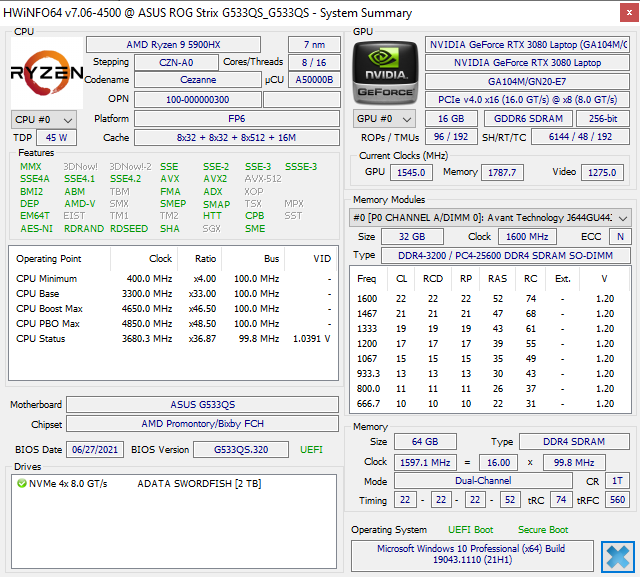
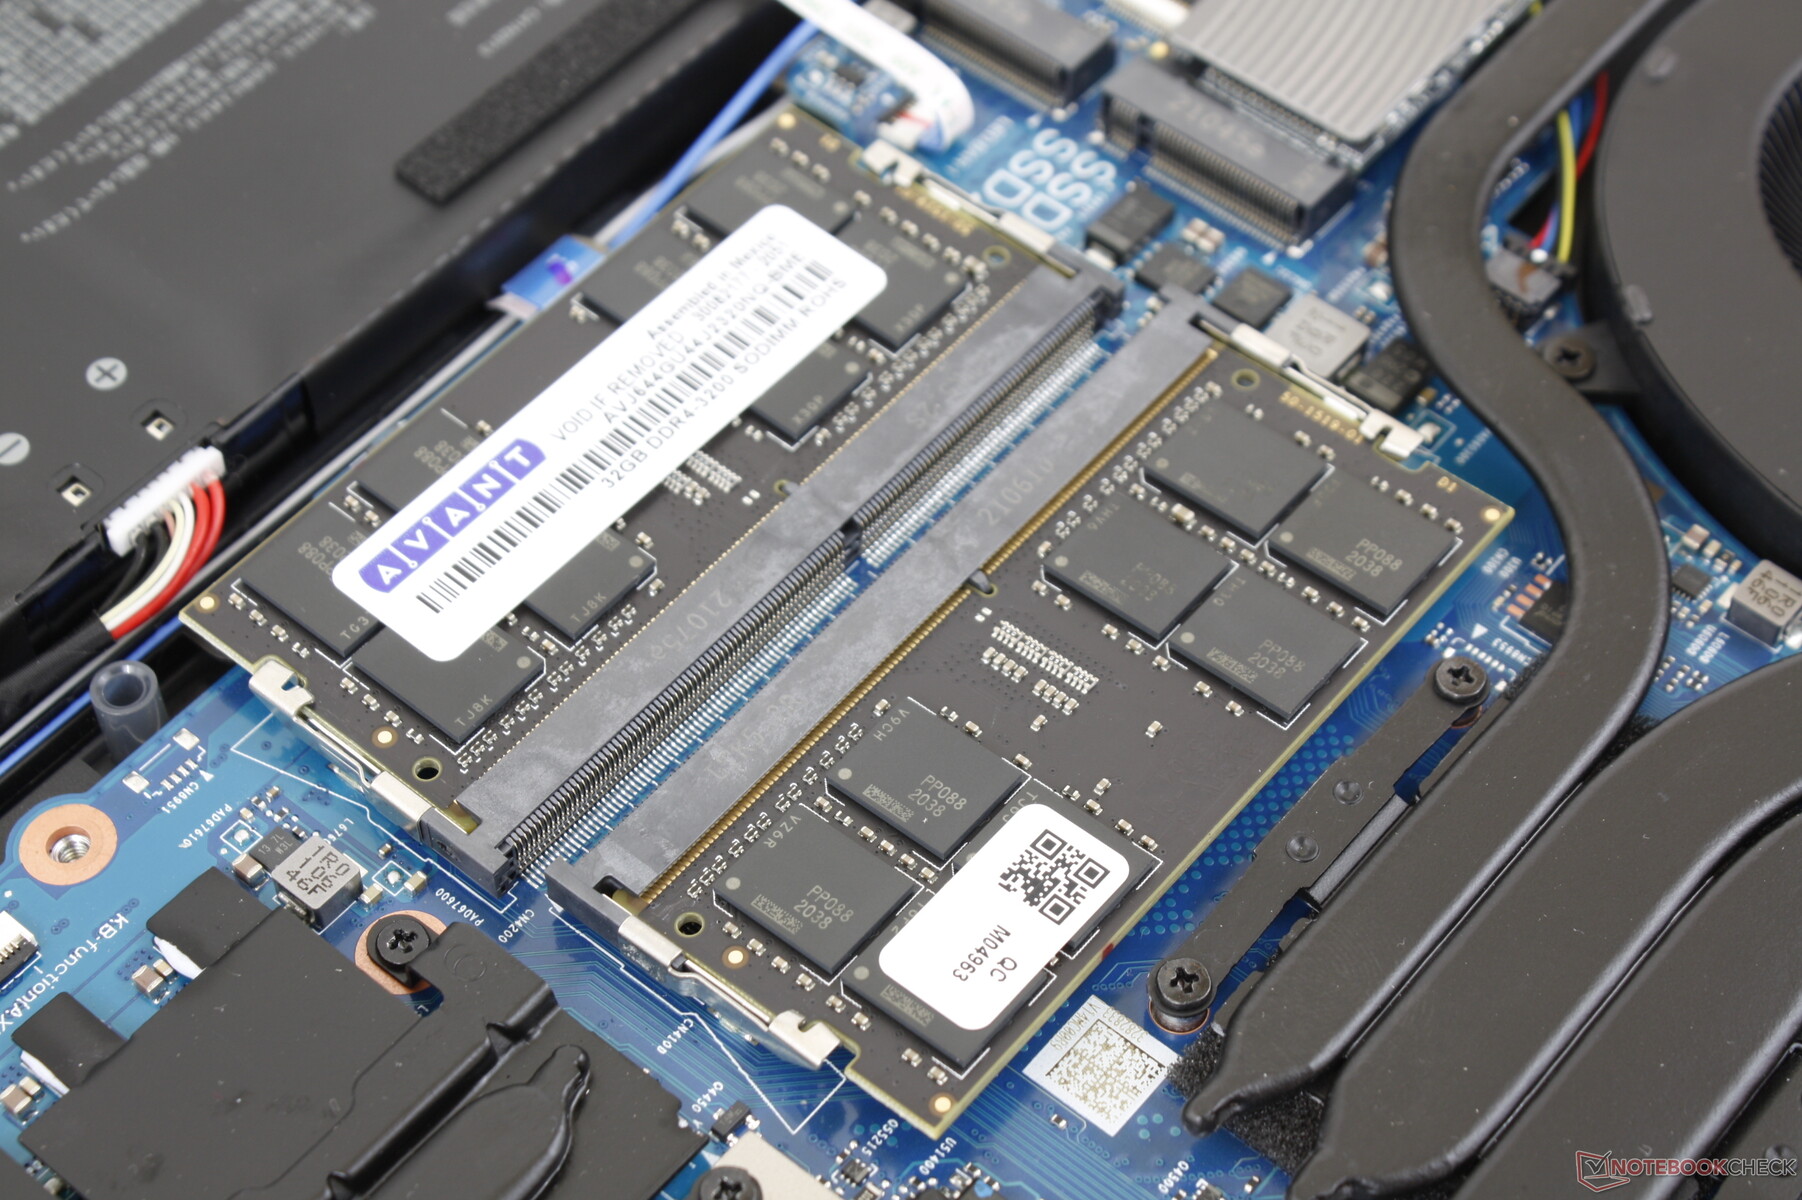
No hay RAM soldada como en la mayoría de los modelos Asus Zephyrus.
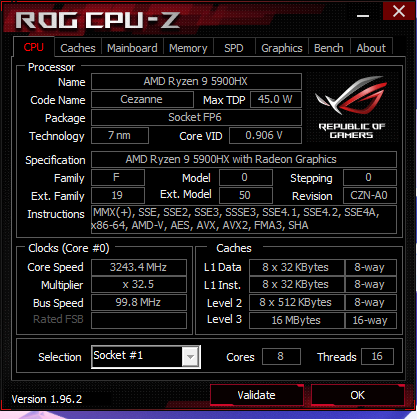
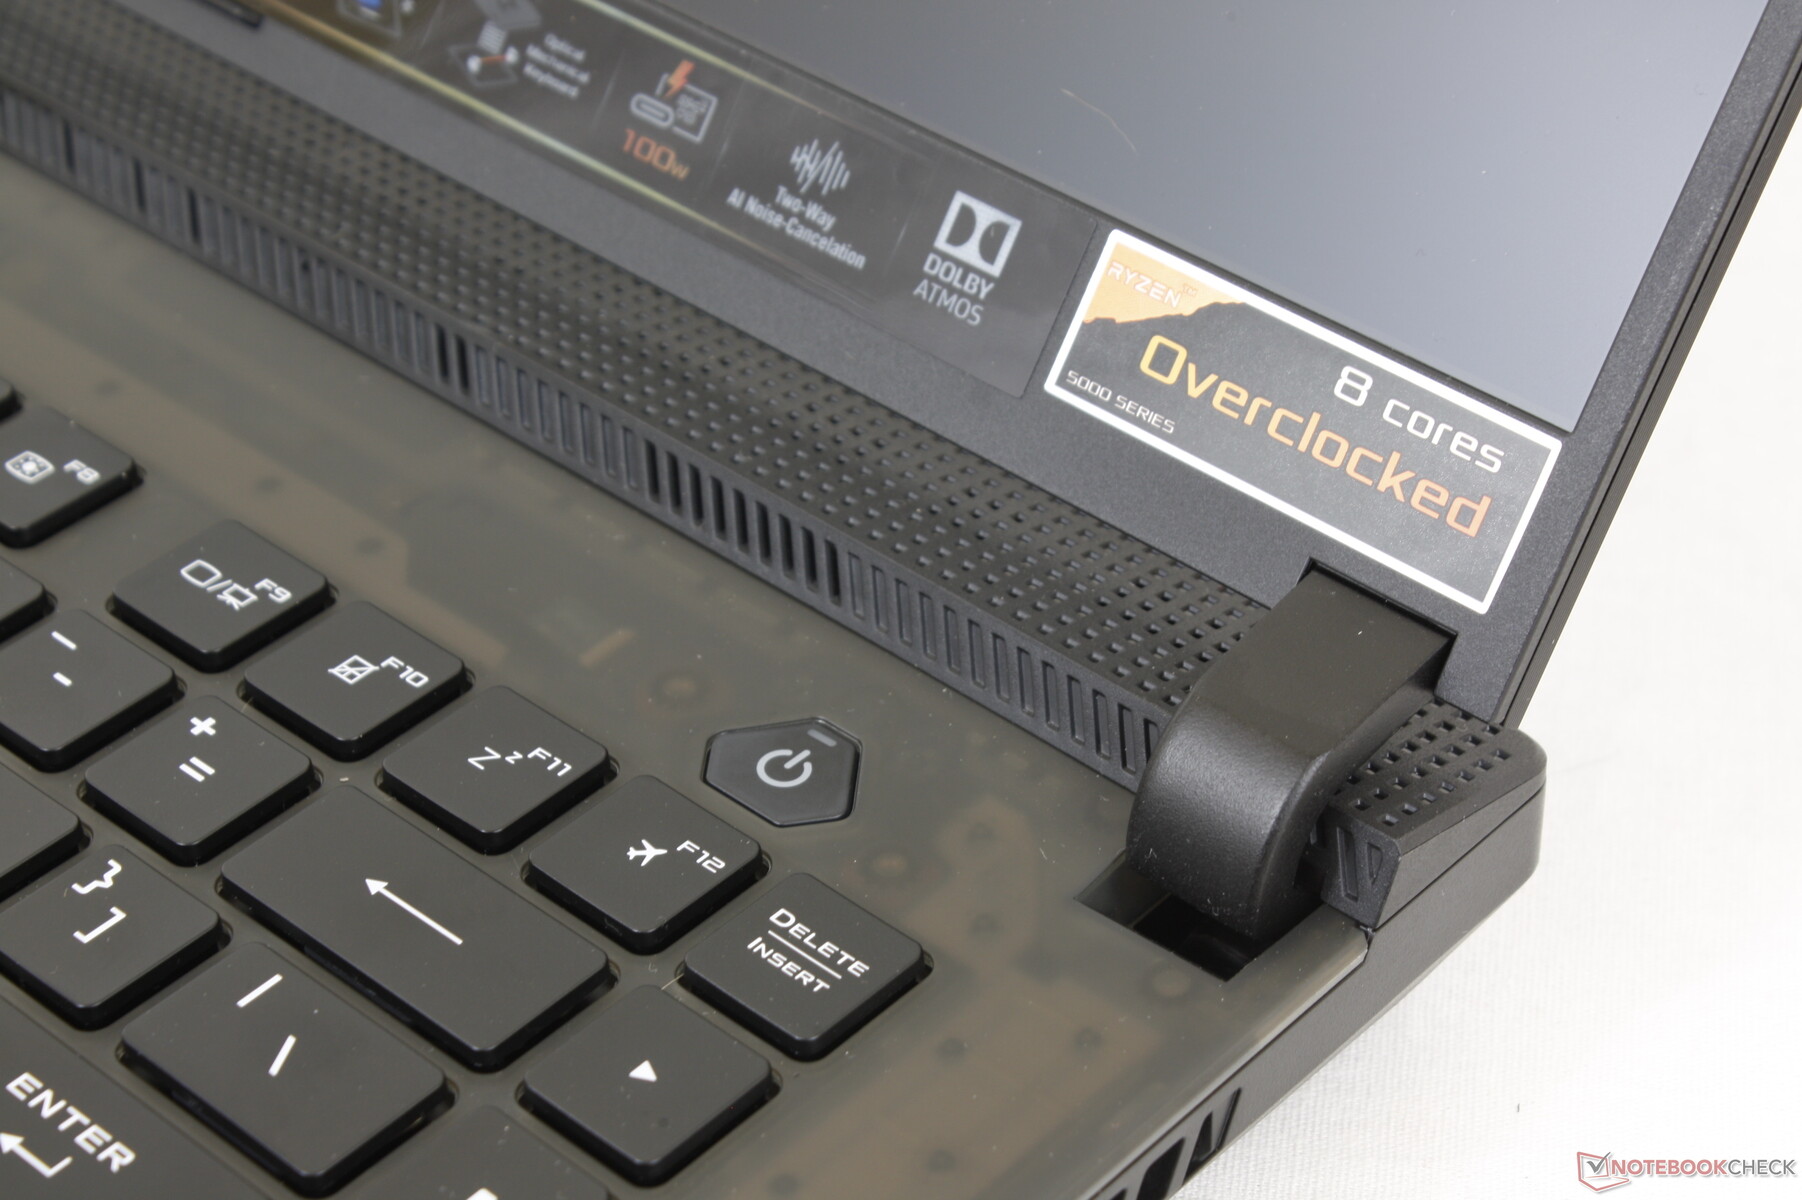
Procesador
El rendimiento está esencialmente a la par con el competidor Core i9-11900H en aplicaciones de un solo hilo y multihilo. Los usuarios que cambien a un Ryzen 7 5800H sólo perderán entre un 10 y un 15 por ciento de rendimiento multihilo
El Ryzen 9 5900HX es casi indistinguible del Ryzen 9 5900HS ya que ambos procesadores estarán más que limitados por la solución de refrigeración del portátil. El más pequeño Razer Blade 14por ejemplo, viene con la misma CPU Ryzen 9 5900HX que nuestro Asus y, sin embargo, puede rendir entre un 6 y un 17 por ciento más lento
La sostenibilidad del rendimiento es excelente con resultados CineBench R15 xT consistentes a lo largo del tiempo.
Cinebench R15 Multi Loop
Cinebench R23: Multi Core | Single Core
Cinebench R15: CPU Multi 64Bit | CPU Single 64Bit
Blender: v2.79 BMW27 CPU
7-Zip 18.03: 7z b 4 -mmt1 | 7z b 4
Geekbench 5.5: Single-Core | Multi-Core
HWBOT x265 Benchmark v2.2: 4k Preset
LibreOffice : 20 Documents To PDF
R Benchmark 2.5: Overall mean
Cinebench R23: Multi Core | Single Core
Cinebench R15: CPU Multi 64Bit | CPU Single 64Bit
Blender: v2.79 BMW27 CPU
7-Zip 18.03: 7z b 4 -mmt1 | 7z b 4
Geekbench 5.5: Single-Core | Multi-Core
HWBOT x265 Benchmark v2.2: 4k Preset
LibreOffice : 20 Documents To PDF
R Benchmark 2.5: Overall mean
* ... más pequeño es mejor
Rendimiento del sistema
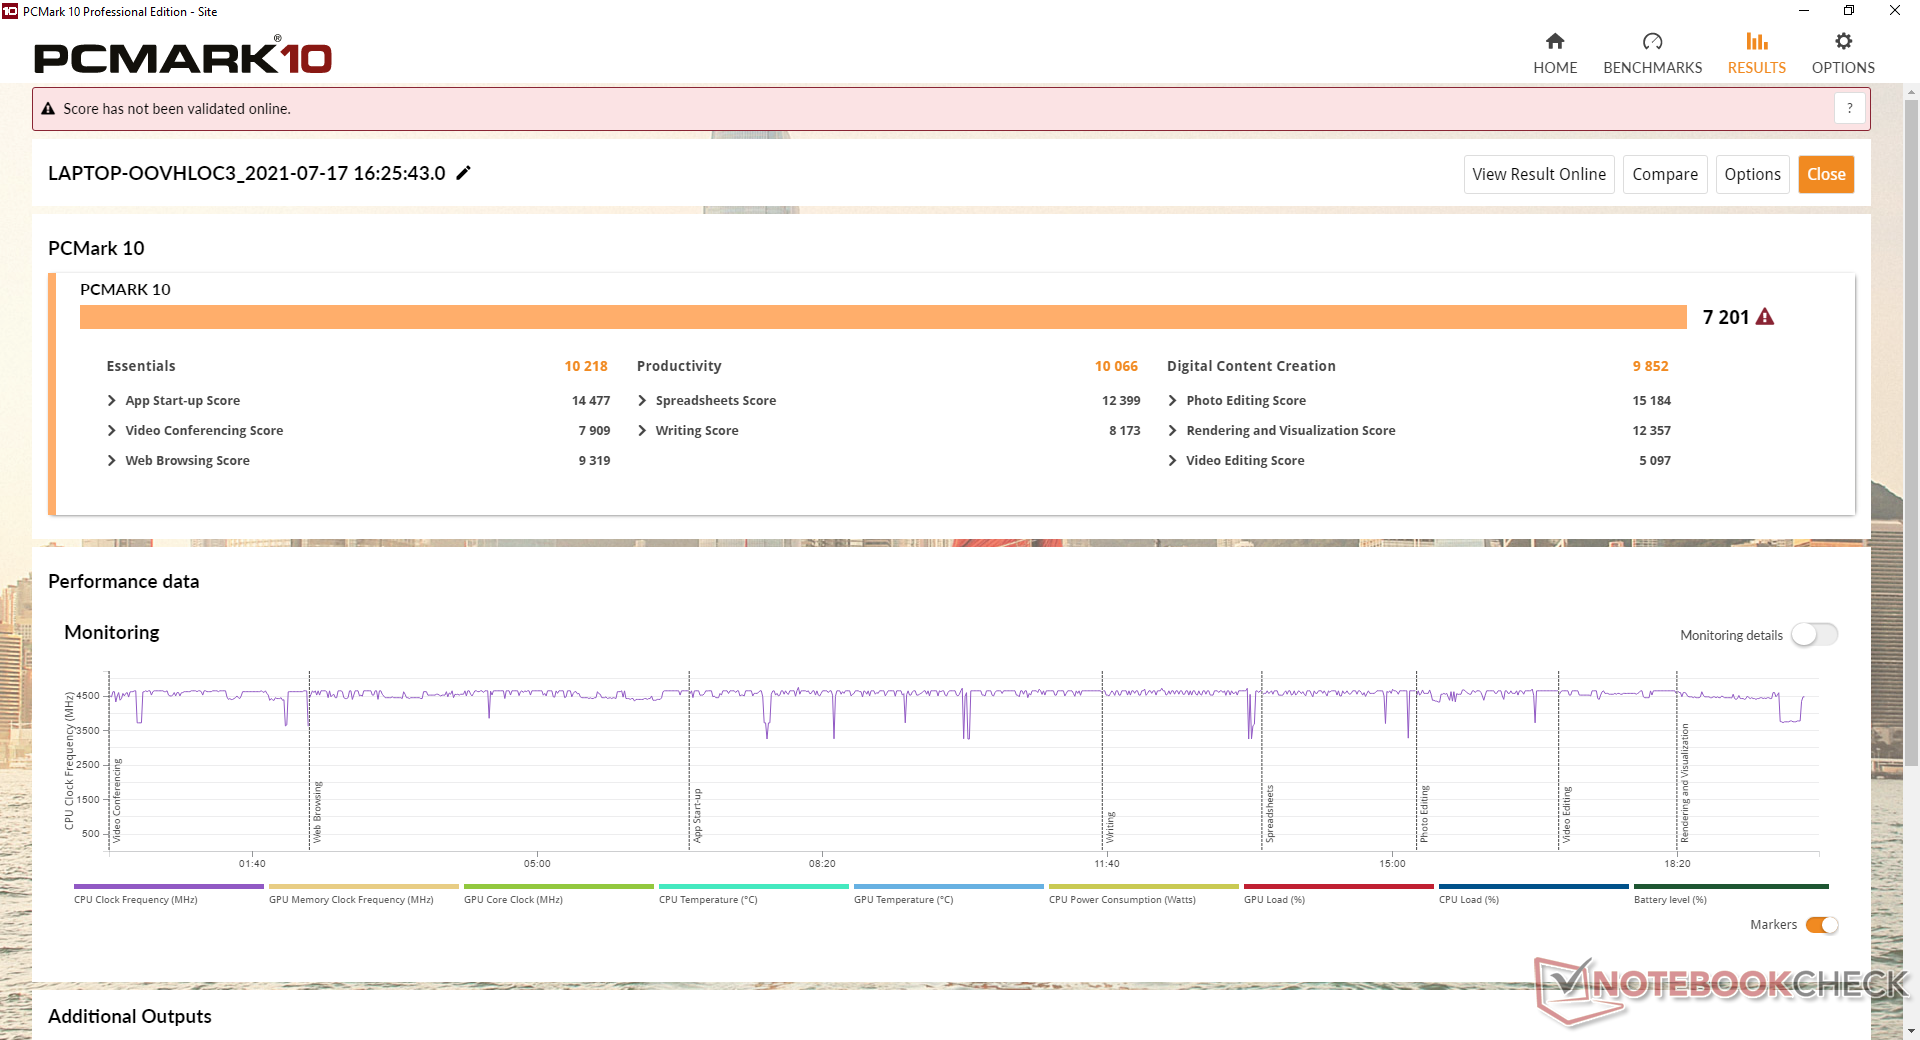
Los resultados de PCMark 10 son consistentemente más altos que en el G532 equipado con Core i9 del año pasado para estar apenas por debajo del último Razer Blade 15. El sistema está diseñado para ejecutar cargas exigentes con aplomo.
| PCMark 10 / Score | |
| Razer Blade 15 Advanced (Mid 2021) | |
| Asus ROG Strix Scar 15 G533QS | |
| Medio AMD Ryzen 9 5900HX, NVIDIA GeForce RTX 3080 Laptop GPU (6807 - 7416, n=6) | |
| Alienware m15 R5 Ryzen Edition | |
| Lenovo Legion C7 15IMH05 82EH0030GE | |
| Asus ROG Strix Scar 15 G532LWS | |
| MSI GE66 Raider 10SFS | |
| PCMark 10 / Essentials | |
| Razer Blade 15 Advanced (Mid 2021) | |
| Medio AMD Ryzen 9 5900HX, NVIDIA GeForce RTX 3080 Laptop GPU (10018 - 10593, n=6) | |
| Asus ROG Strix Scar 15 G533QS | |
| Asus ROG Strix Scar 15 G532LWS | |
| MSI GE66 Raider 10SFS | |
| Alienware m15 R5 Ryzen Edition | |
| Lenovo Legion C7 15IMH05 82EH0030GE | |
| PCMark 10 / Productivity | |
| Asus ROG Strix Scar 15 G533QS | |
| Medio AMD Ryzen 9 5900HX, NVIDIA GeForce RTX 3080 Laptop GPU (8546 - 10066, n=6) | |
| Razer Blade 15 Advanced (Mid 2021) | |
| Alienware m15 R5 Ryzen Edition | |
| Asus ROG Strix Scar 15 G532LWS | |
| Lenovo Legion C7 15IMH05 82EH0030GE | |
| MSI GE66 Raider 10SFS | |
| PCMark 10 / Digital Content Creation | |
| Razer Blade 15 Advanced (Mid 2021) | |
| Medio AMD Ryzen 9 5900HX, NVIDIA GeForce RTX 3080 Laptop GPU (9377 - 10582, n=6) | |
| Asus ROG Strix Scar 15 G533QS | |
| Lenovo Legion C7 15IMH05 82EH0030GE | |
| Alienware m15 R5 Ryzen Edition | |
| MSI GE66 Raider 10SFS | |
| Asus ROG Strix Scar 15 G532LWS | |
| PCMark 10 Score | 7201 puntos | |
ayuda | ||
Latencia del CPD
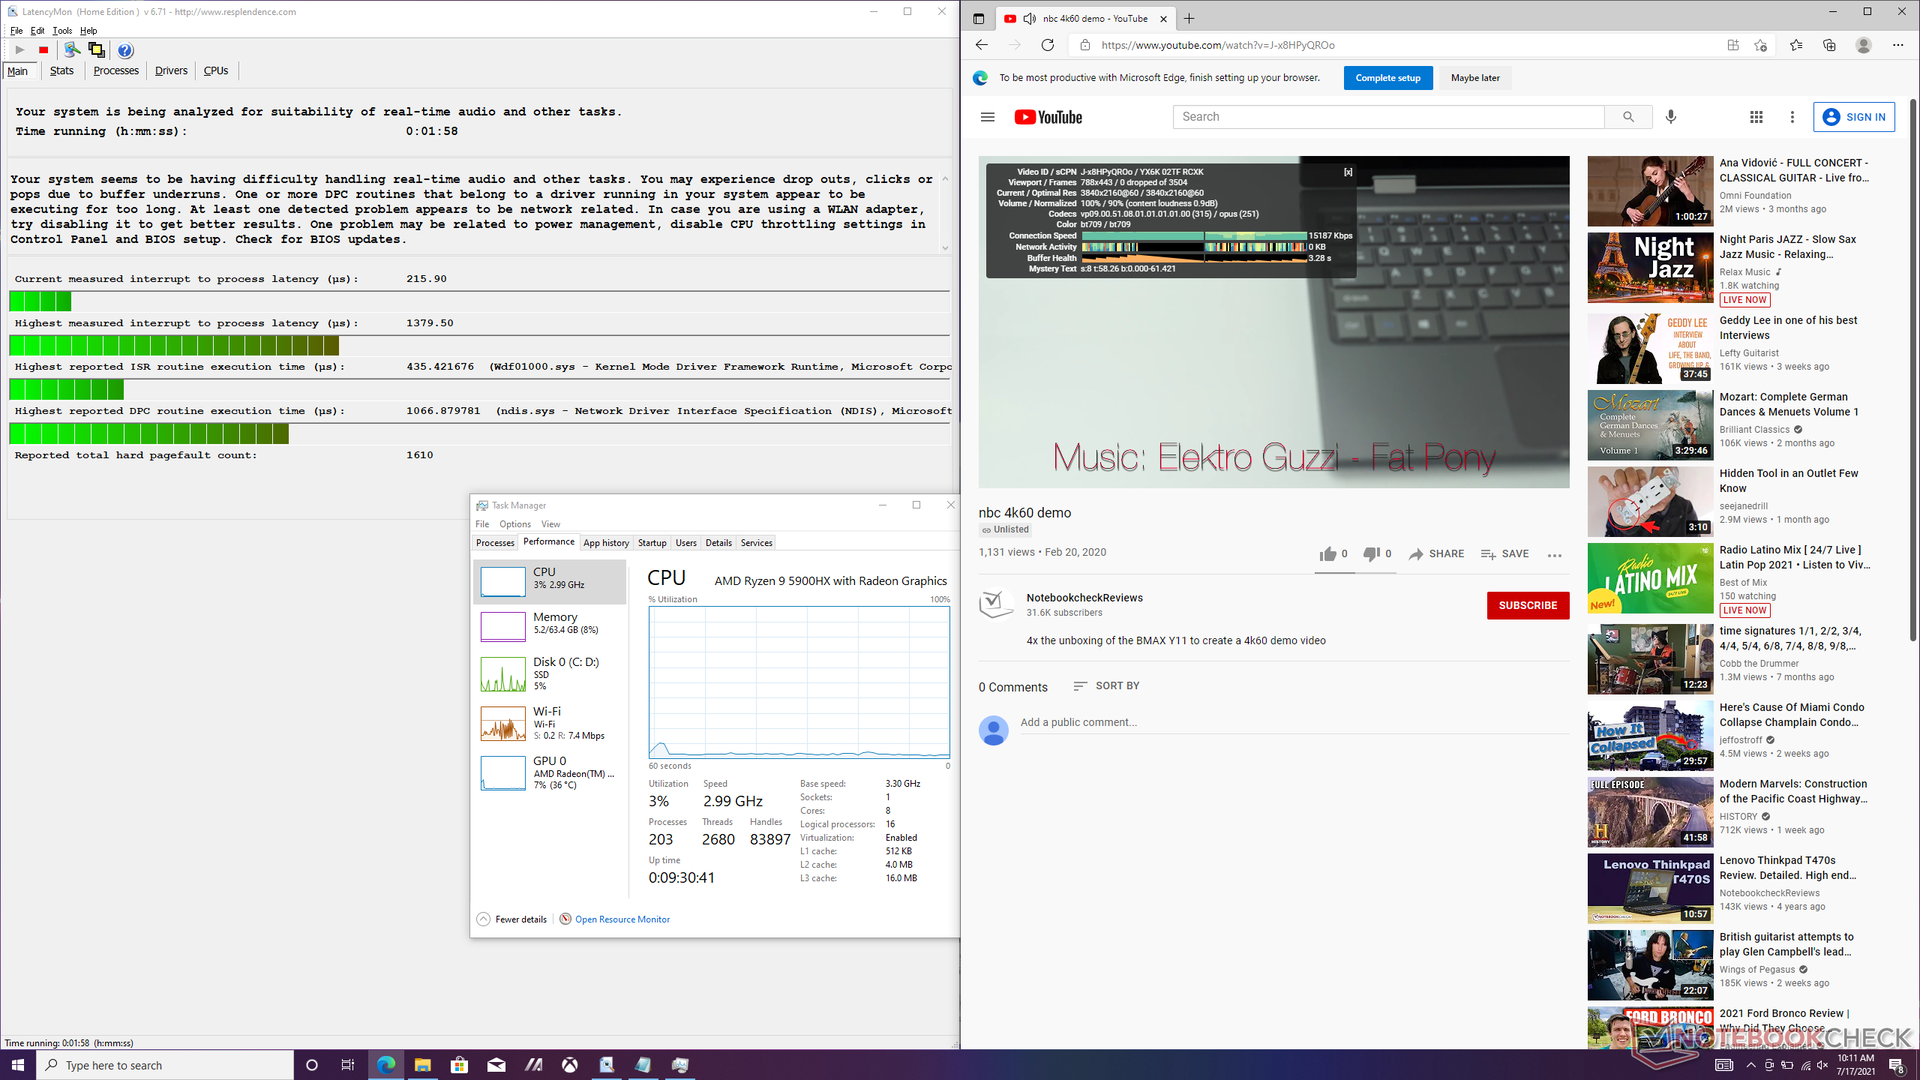
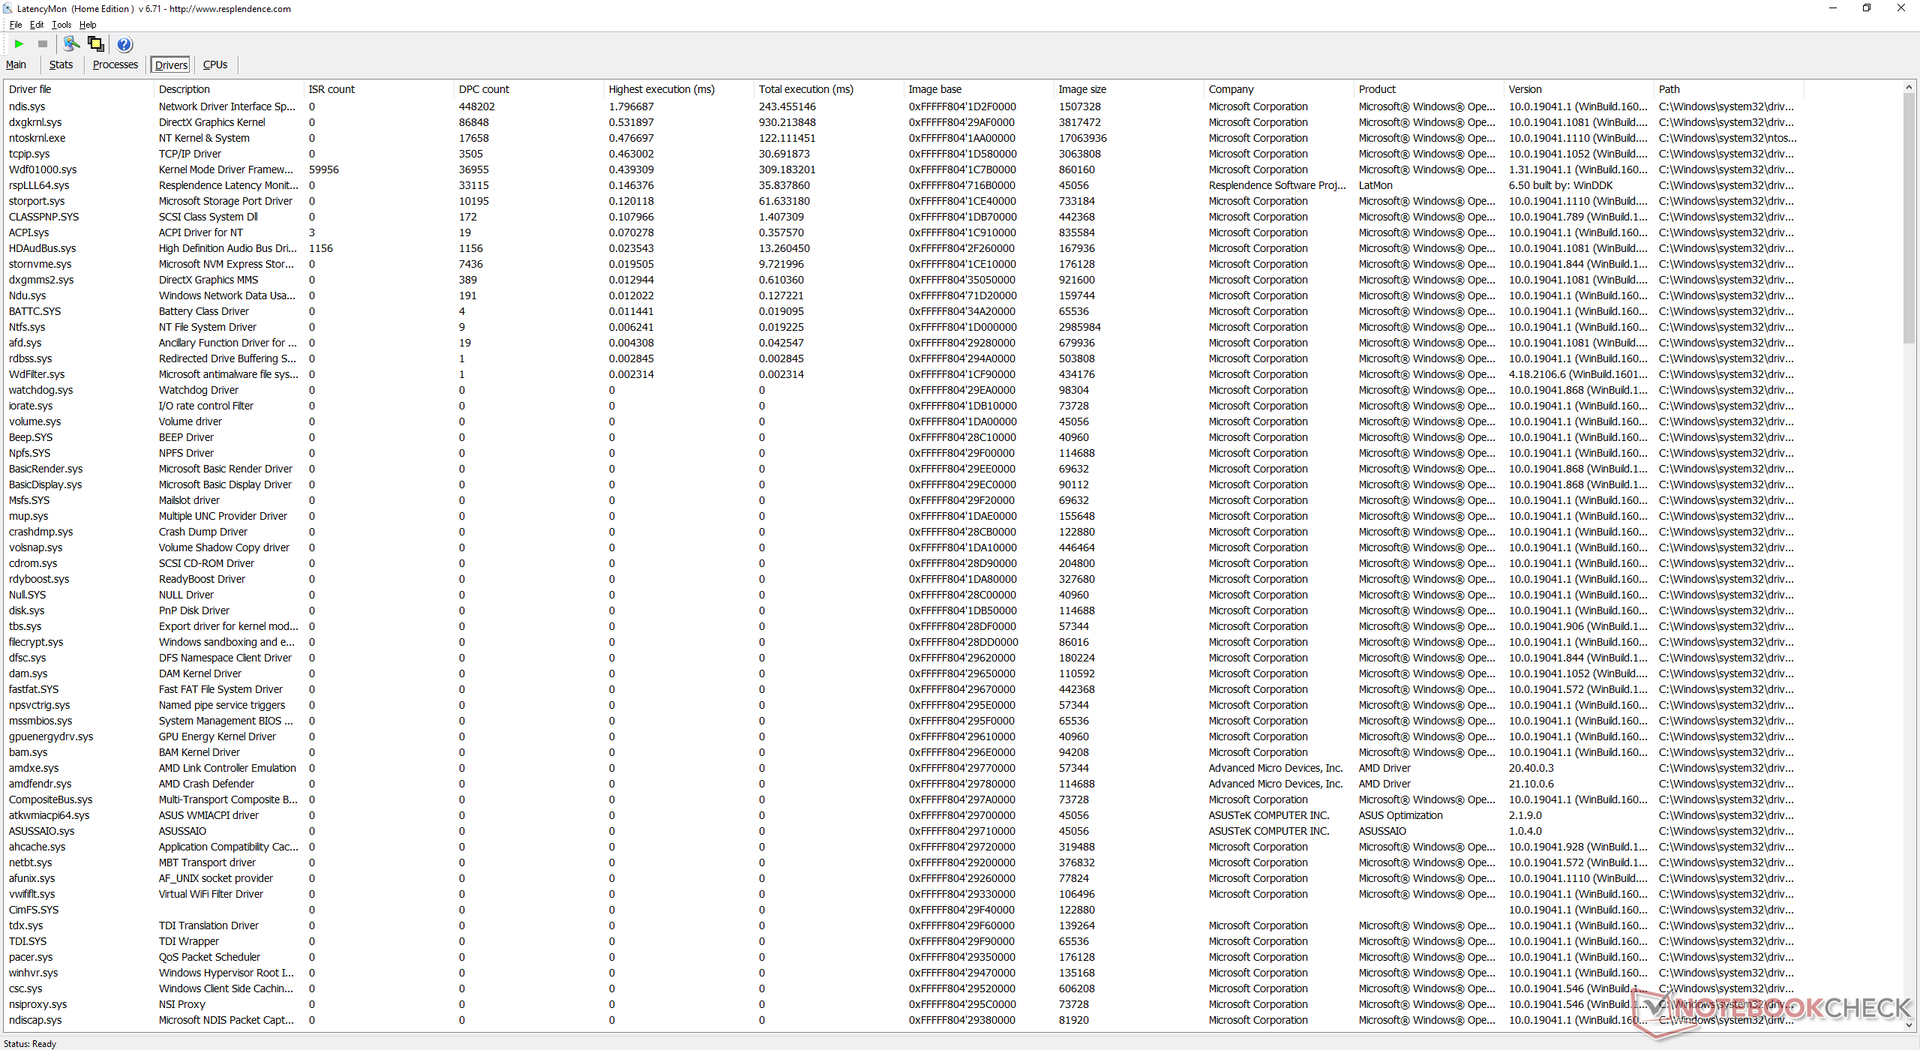
LatencyMon muestra problemas menores de latencia del CPD al abrir varias pestañas del navegador en nuestra página de inicio. La reproducción de vídeo 4K a 60 FPS es, por lo demás, fluida y sin pérdida de fotogramas.
| DPC Latencies / LatencyMon - interrupt to process latency (max), Web, Youtube, Prime95 | |
| Razer Blade 15 Advanced (Mid 2021) | |
| Lenovo Legion C7 15IMH05 82EH0030GE | |
| Asus ROG Strix Scar 15 G532LWS | |
| Asus ROG Strix Scar 15 G533QS | |
| MSI GE66 Raider 10SFS | |
| Alienware m15 R5 Ryzen Edition | |
* ... más pequeño es mejor
Dispositivos de almacenamiento
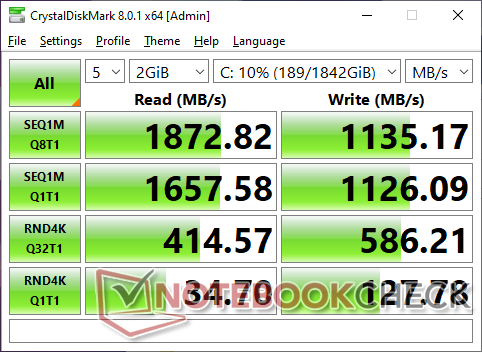
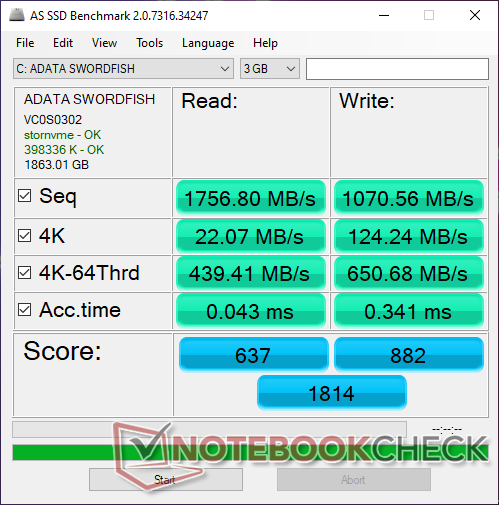
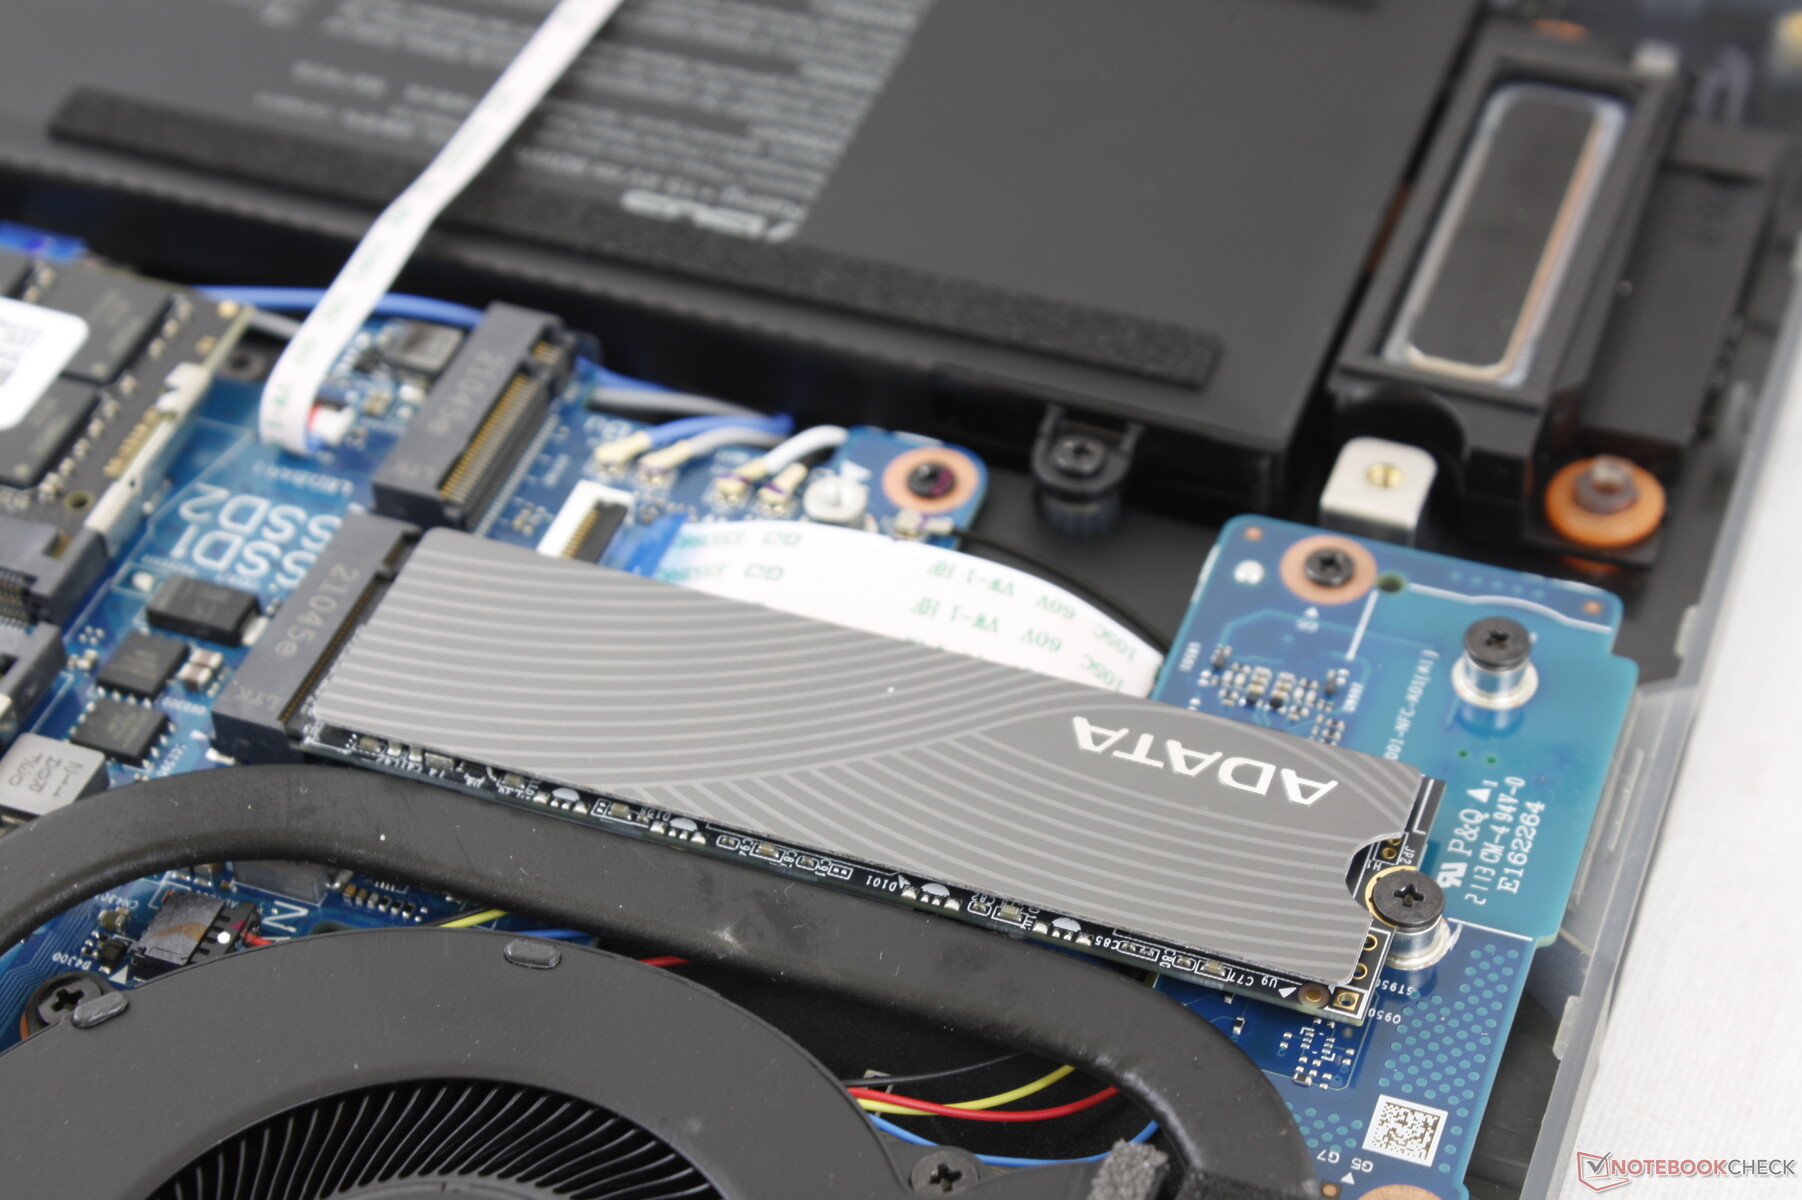
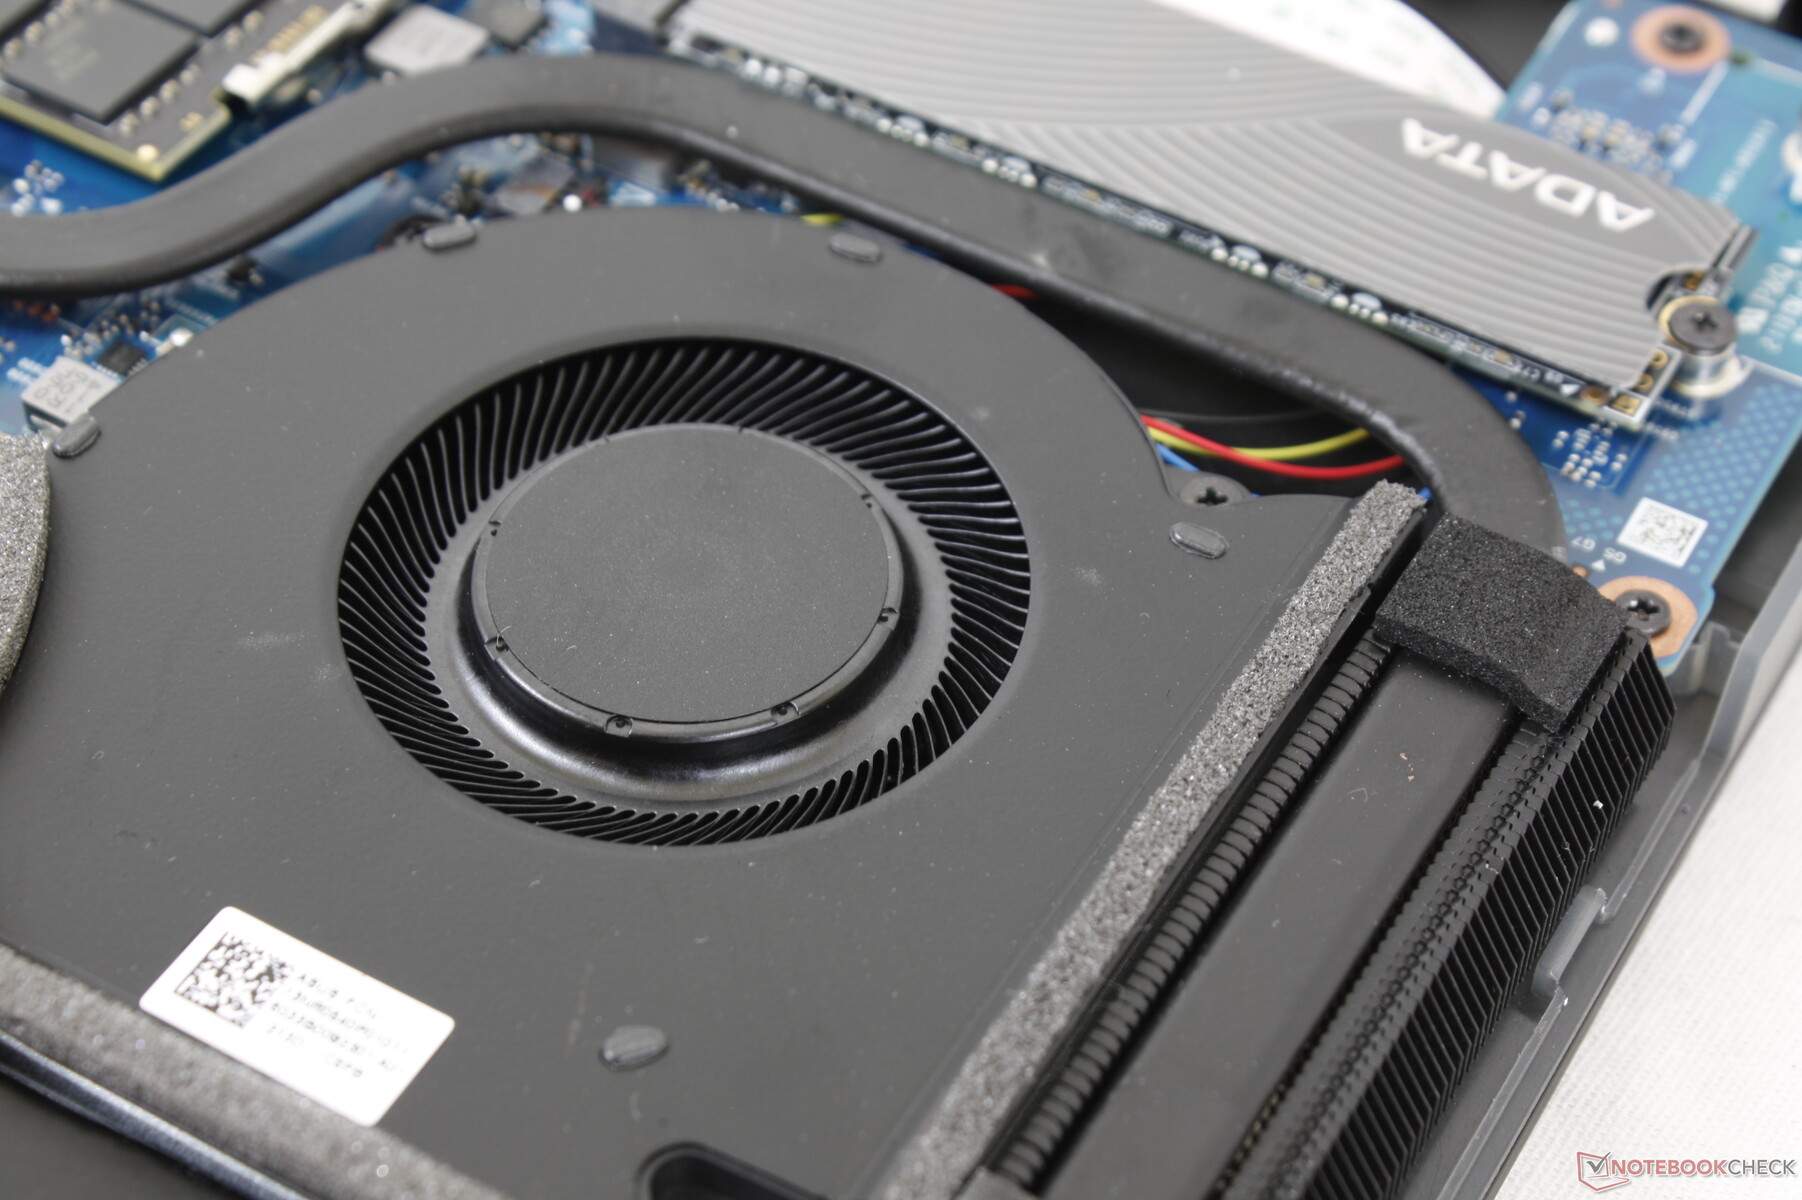
Nuestra unidad viene con un SSD ADATA Swordfish NVMe de 2 TB en contraste con el SSD Intel de nuestra antigua unidad G532. El fabricante anuncia tasas de lectura y escritura secuenciales de 1800 MB/s y 1200 MB/s, respectivamente, lo que pudimos confirmar en nuestras propias pruebas. Esto hace que la unidad sea un SSD NVMe de gama media, ya que unidades más caras como la WDC SN730 o la Samsung PM981a pueden ser de dos a tres veces más rápidas.
| Asus ROG Strix Scar 15 G533QS ADATA Swordfish 2 TB | Asus ROG Strix Scar 15 G532LWS 2x Intel SSD 660p 1TB SSDPEKNW010T8 (RAID 0) | MSI GE66 Raider 10SFS WDC PC SN730 SDBPNTY-1T00 | Razer Blade 15 Advanced (Mid 2021) SSSTC CA6-8D1024 | Alienware m15 R5 Ryzen Edition Toshiba KBG40ZNS512G NVMe | Lenovo Legion C7 15IMH05 82EH0030GE Samsung PM981a MZVLB1T0HBLR | |
|---|---|---|---|---|---|---|
| AS SSD | 55% | 143% | 188% | 20% | 86% | |
| Seq Read (MB/s) | 1757 | 1982 13% | 2979 70% | 5739 227% | 2082 18% | 2804 60% |
| Seq Write (MB/s) | 1071 | 1444 35% | 2581 141% | 4201 292% | 825 -23% | 2765 158% |
| 4K Read (MB/s) | 22.07 | 50.3 128% | 47.33 114% | 53.8 144% | 42.41 92% | 44.96 104% |
| 4K Write (MB/s) | 124.2 | 120.1 -3% | 140 13% | 179.2 44% | 98.3 -21% | 98.3 -21% |
| 4K-64 Read (MB/s) | 439.4 | 1016 131% | 1710 289% | 2959 573% | 1255 186% | 1503 242% |
| 4K-64 Write (MB/s) | 651 | 1351 108% | 2188 236% | 1891 190% | 738 13% | 1845 183% |
| Access Time Read * (ms) | 0.043 | 0.044 -2% | 0.05 -16% | 0.027 37% | 0.109 -153% | 0.058 -35% |
| Access Time Write * (ms) | 0.341 | 0.109 68% | 0.026 92% | 0.154 55% | 0.17 50% | 0.038 89% |
| Score Read (Points) | 637 | 1264 98% | 2055 223% | 3587 463% | 1506 136% | 1828 187% |
| Score Write (Points) | 882 | 1615 83% | 2586 193% | 2490 182% | 918 4% | 2220 152% |
| Score Total (Points) | 1814 | 3510 93% | 5673 213% | 7821 331% | 3136 73% | 4983 175% |
| Copy ISO MB/s (MB/s) | 3220 | 3474 8% | 3027 -6% | 1391 -57% | 1904 -41% | |
| Copy Program MB/s (MB/s) | 675 | 751 11% | 1177 74% | 645 -4% | 567 -16% | |
| Copy Game MB/s (MB/s) | 1684 | 1684 0% | 2170 29% | 1101 -35% | 1112 -34% | |
| CrystalDiskMark 5.2 / 6 | 43% | 56% | 170% | 12% | 55% | |
| Write 4K (MB/s) | 134.7 | 128.4 -5% | 158.2 17% | 295.6 119% | 116.9 -13% | 107.9 -20% |
| Read 4K (MB/s) | 34.46 | 53.7 56% | 50.7 47% | 85.7 149% | 44.56 29% | 48.48 41% |
| Write Seq (MB/s) | 1123 | 1875 67% | 1790 59% | 4149 269% | 1552 38% | 2910 159% |
| Read Seq (MB/s) | 1691 | 2315 37% | 2469 46% | 4203 149% | 1682 -1% | 2015 19% |
| Write 4K Q32T1 (MB/s) | 581 | 427.2 -26% | 503 -13% | 715 23% | 497.8 -14% | 413 -29% |
| Read 4K Q32T1 (MB/s) | 423.6 | 440.7 4% | 579 37% | 709 67% | 436.8 3% | 468.9 11% |
| Write Seq Q32T1 (MB/s) | 1131 | 2793 147% | 3102 174% | 4681 314% | 1461 29% | 3016 167% |
| Read Seq Q32T1 (MB/s) | 1859 | 3101 67% | 3413 84% | 6905 271% | 2364 27% | 3533 90% |
| Media total (Programa/Opciones) | 49% /
51% | 100% /
106% | 179% /
182% | 16% /
17% | 71% /
75% |
* ... más pequeño es mejor

Disk Throttling: DiskSpd Read Loop, Queue Depth 8
Rendimiento de la GPU - 130 W GeForce RTX 3080
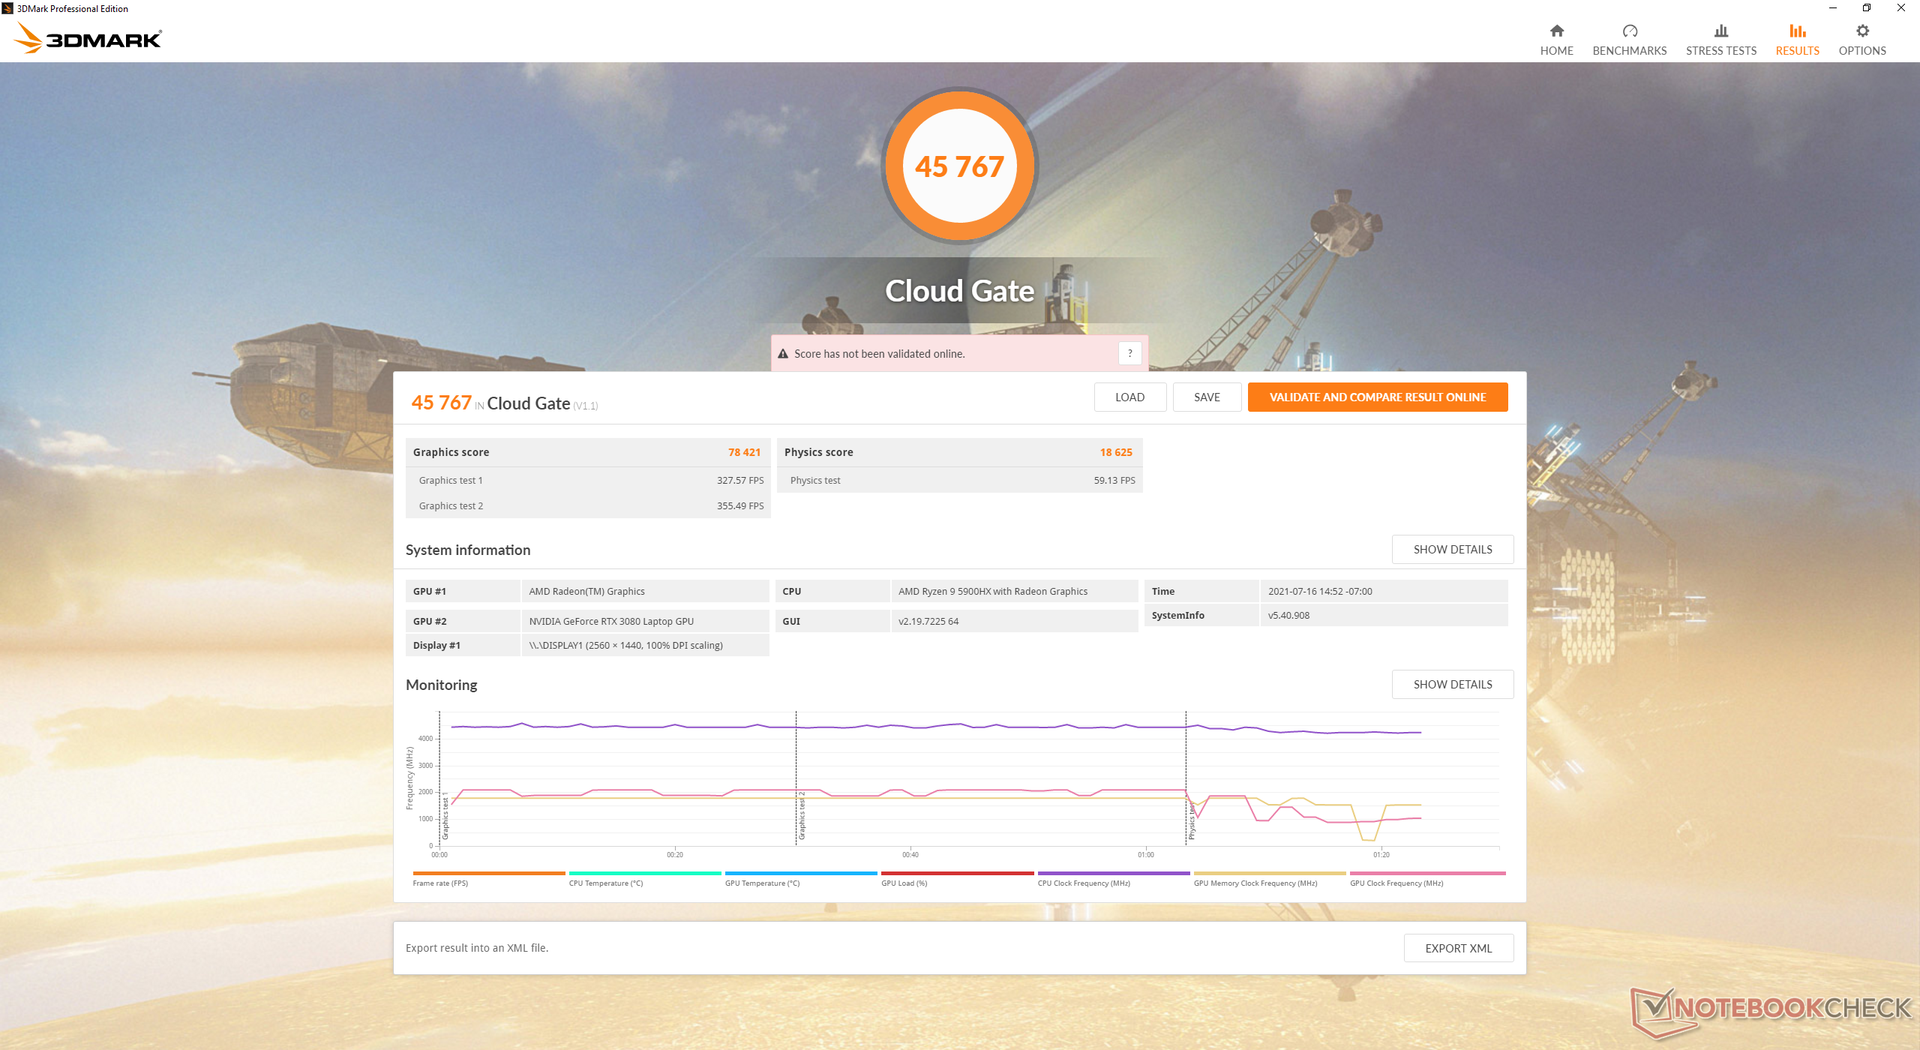
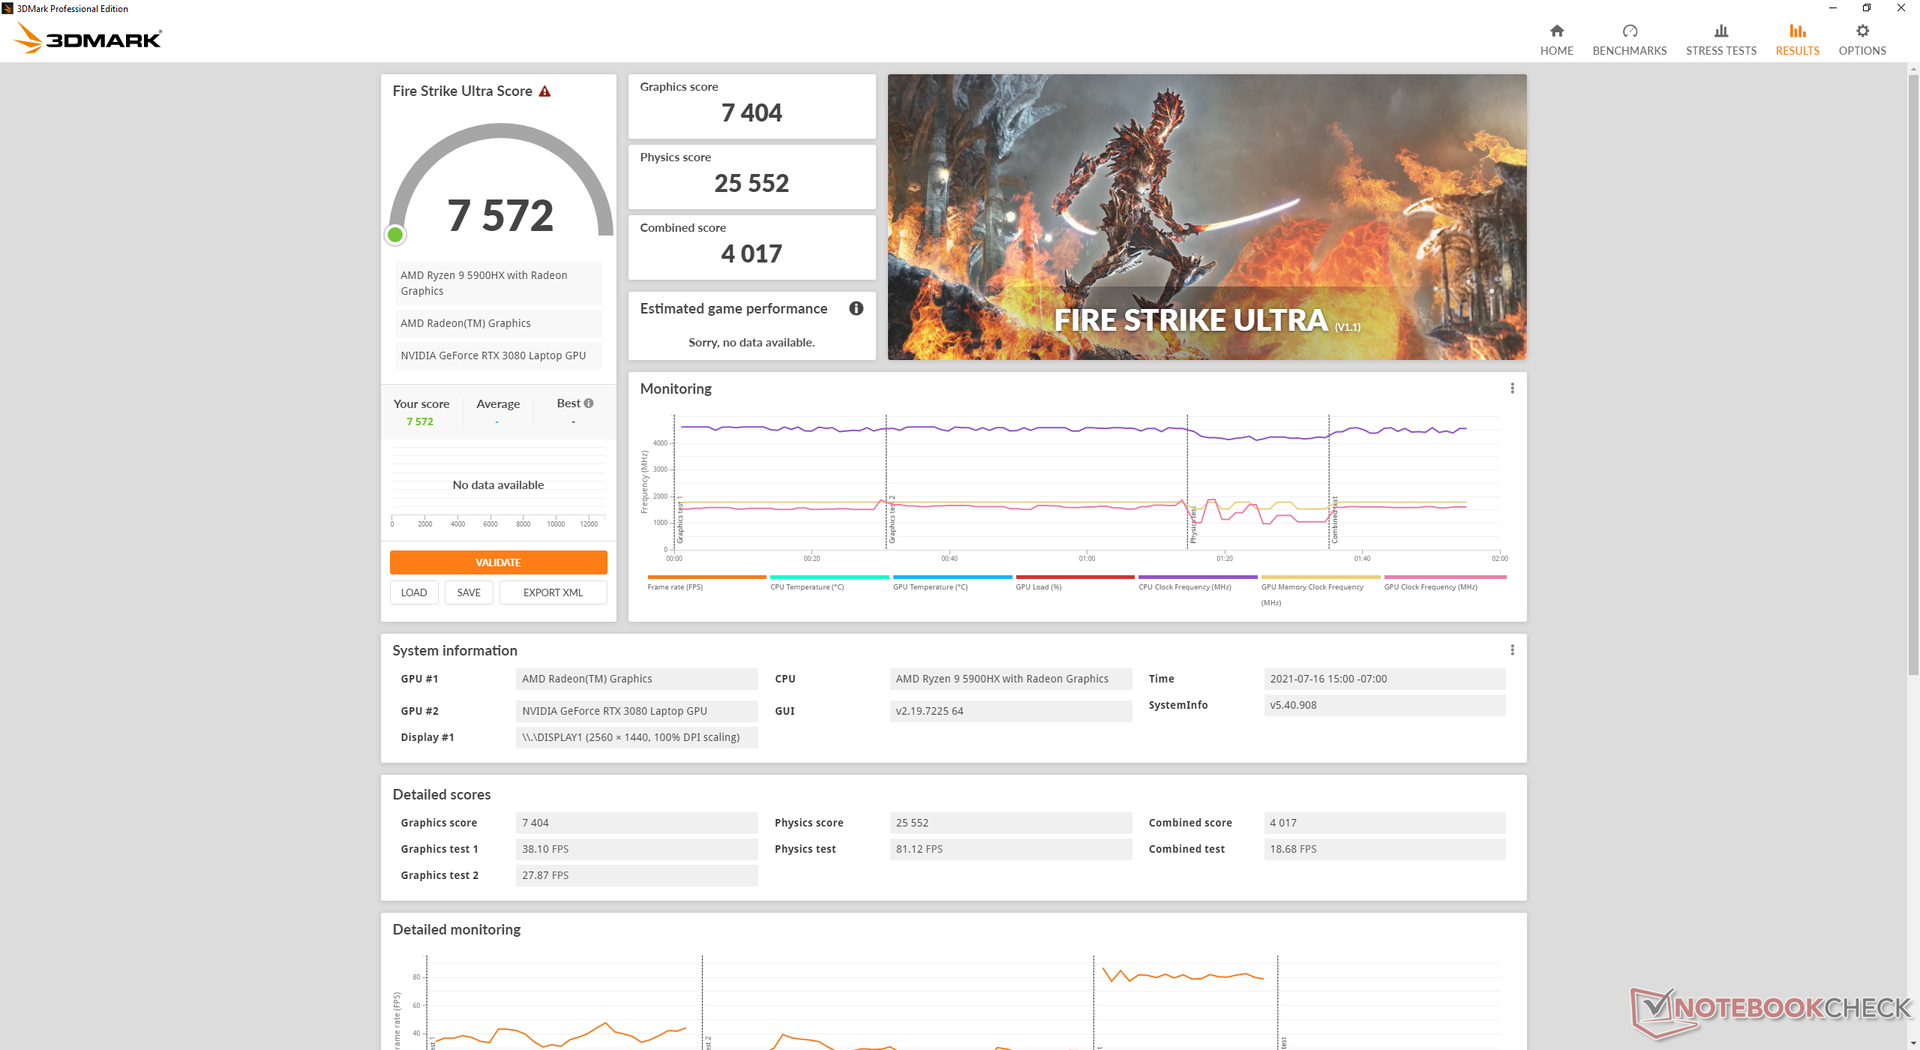
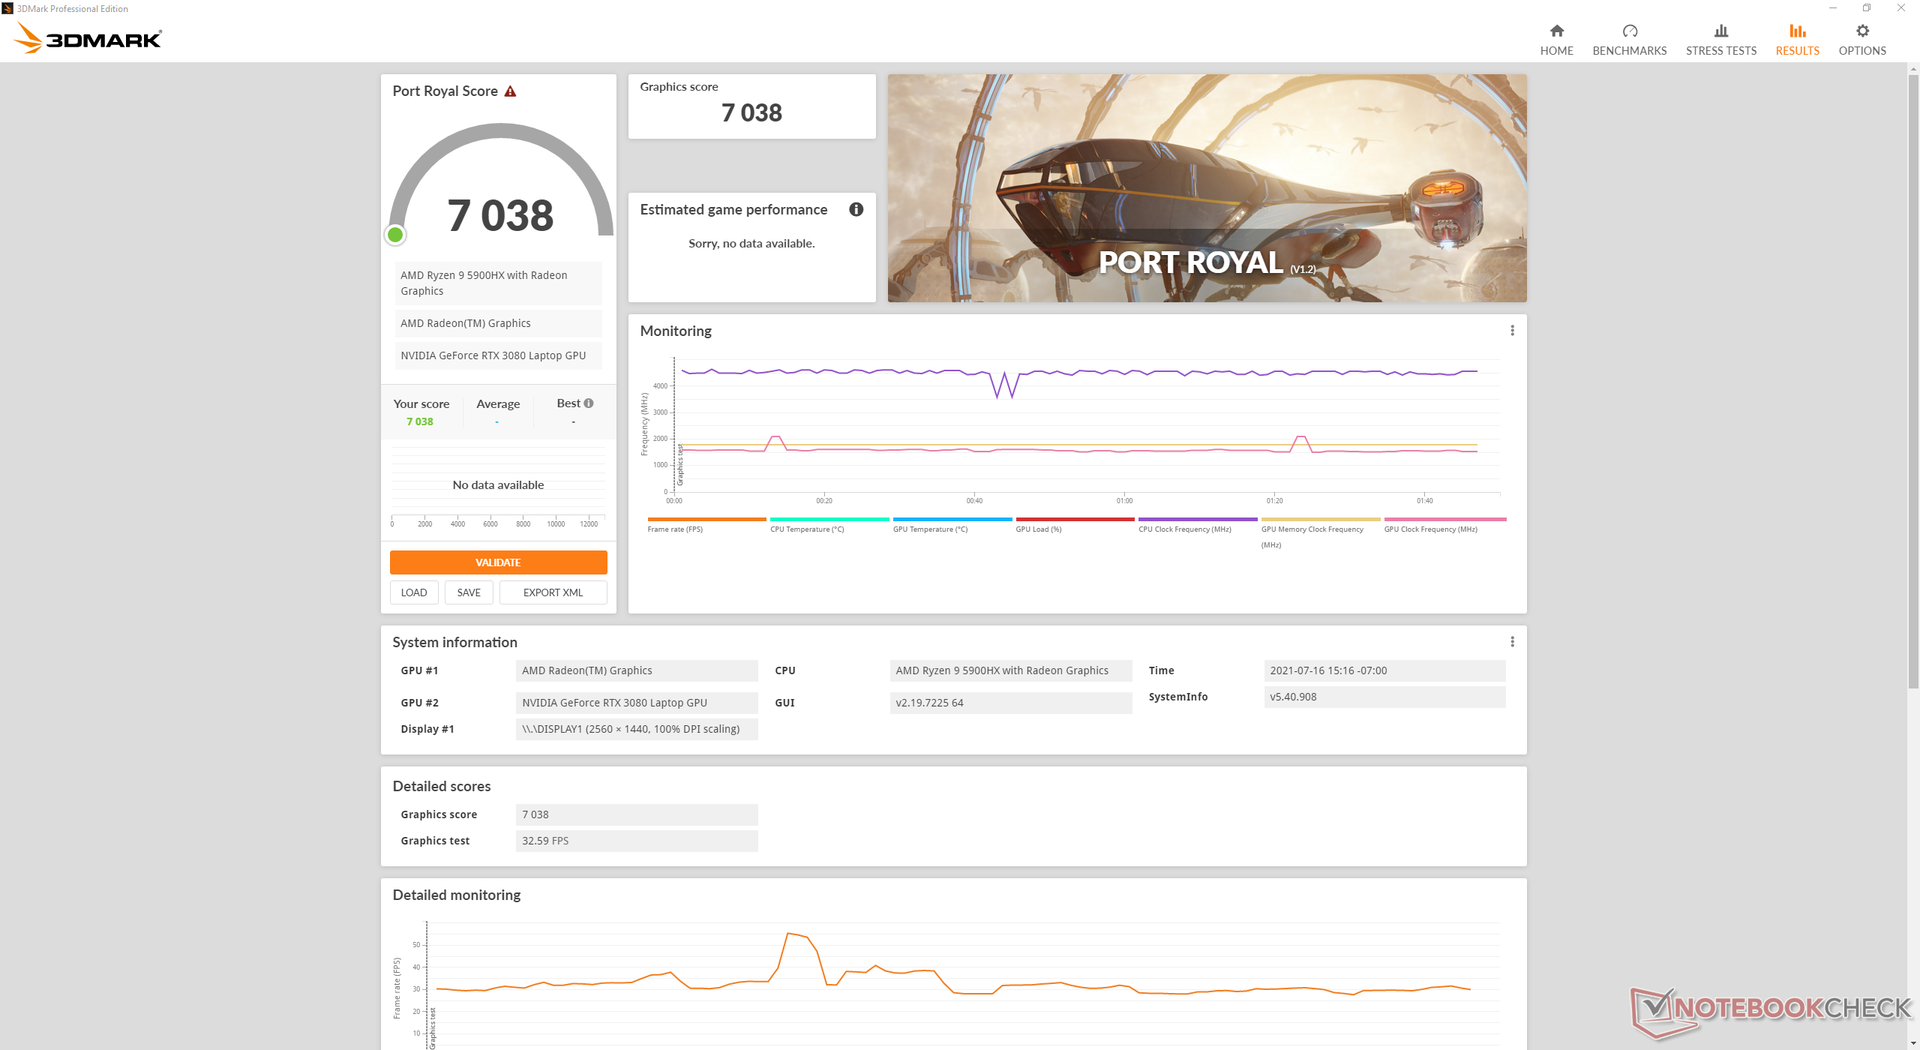
Las puntuaciones de 3DMark están en la media de lo que se espera de un GeForce RTX 3080 portátil que se desempeñe. El más grande Schenker XMG Ultra 17 que viene con una RTX 3080 de 165 W que consume más energía, es capaz de superar a nuestra GPU de 130 W en aproximadamente un 15 por ciento. Los usuarios que se pasen a la RTX 3070 perderán un 15% de rendimiento bruto.
La actualización desde la RTX 2070 Super de la ROG Strix Scar 15 G532LWS del año pasado a nuestra RTX 3080 verán un aumento de rendimiento de entre el 20 y el 40 por ciento. No es suficiente para acercarse a los 165 FPS y aprovechar al máximo la pantalla 1440p de 165 Hz, pero el tearing de la pantalla y los saltos de fotogramas suelen ser menos notables cuando el promedio de FPS es superior a 60 y especialmente cuando se activa FreeSync.
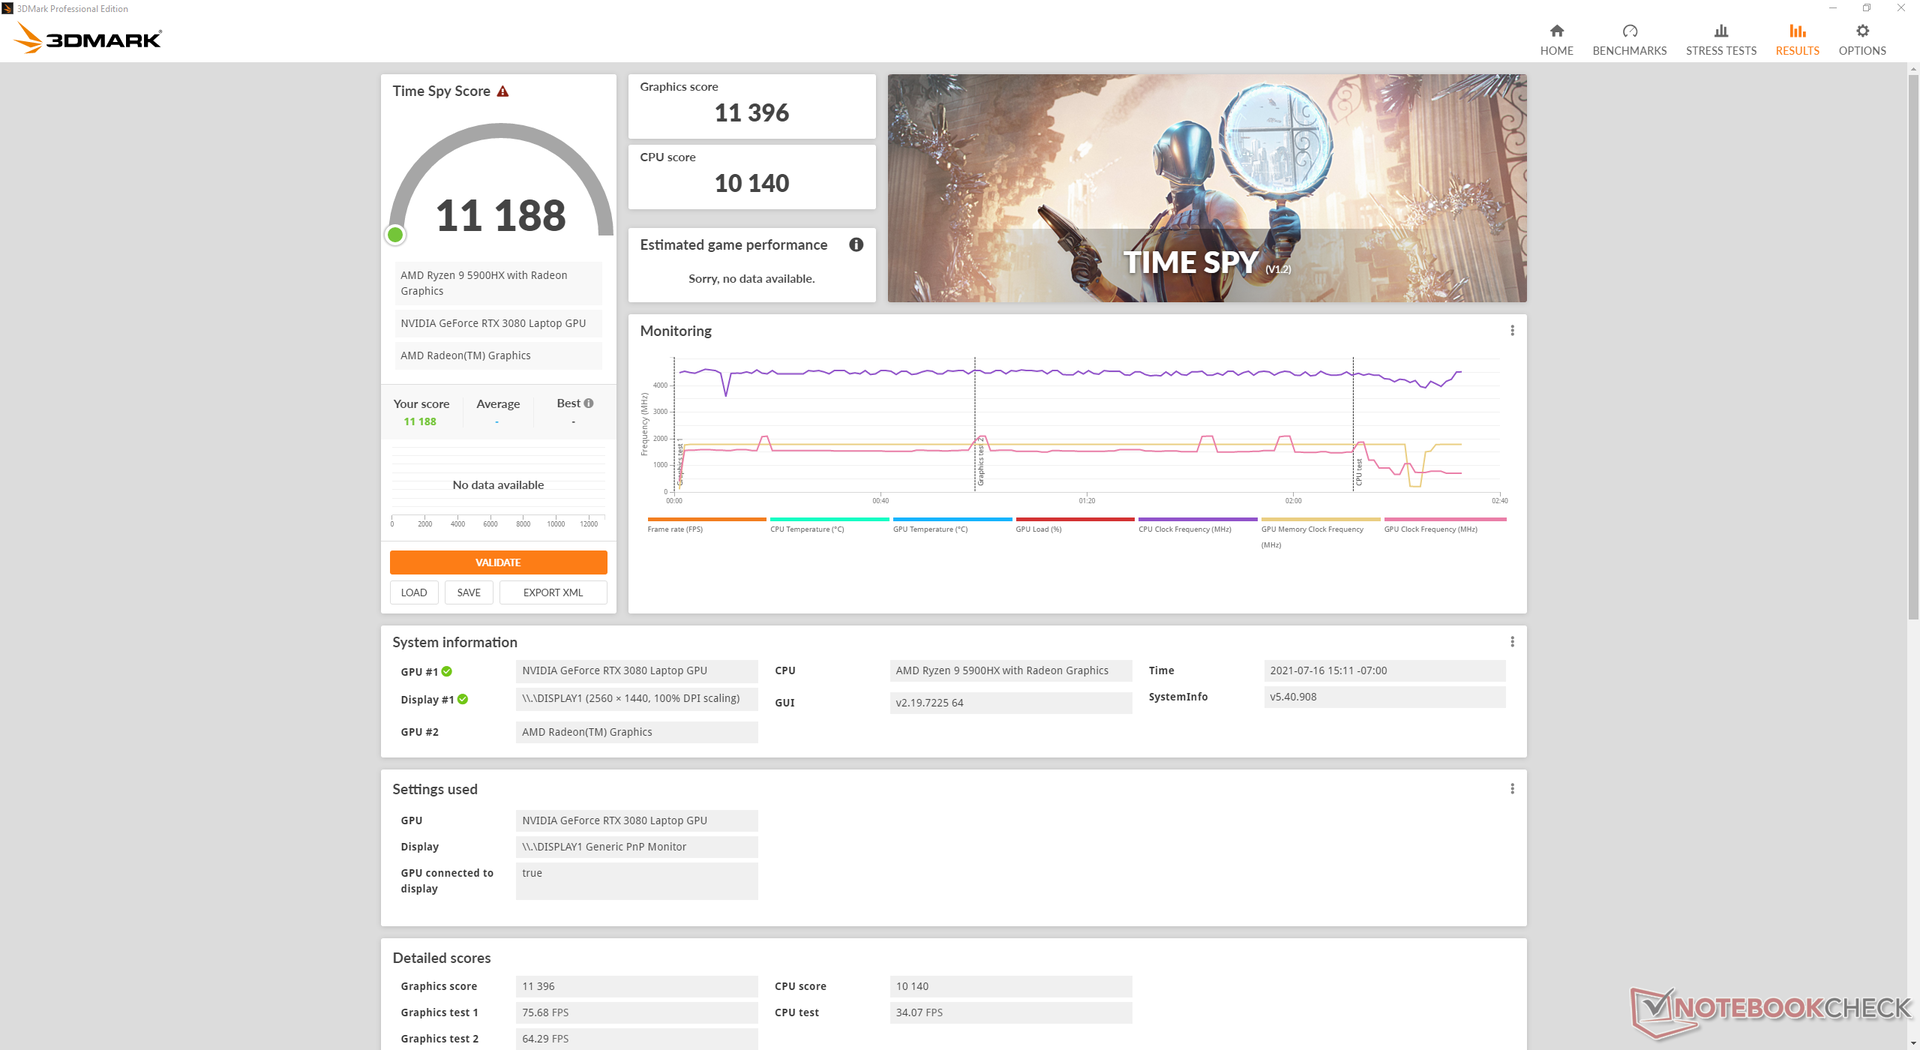
Si se ejecuta Fire Strike en el modo Rendimiento en lugar del modo Turbo, las puntuaciones de Física y Gráficos de Time Spy serán ligeramente inferiores, de 9960 y 10742 puntos, respectivamente, en comparación con los 10140 y 11396 puntos en el modo Turbo.
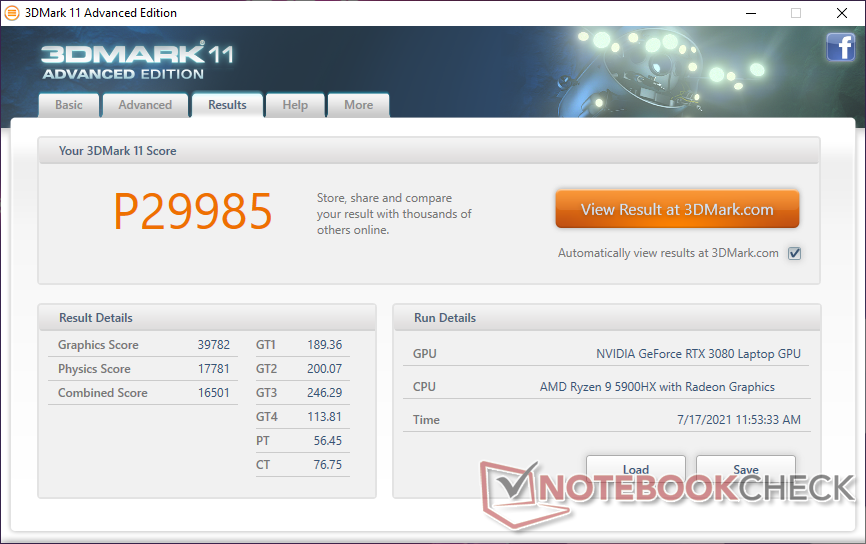
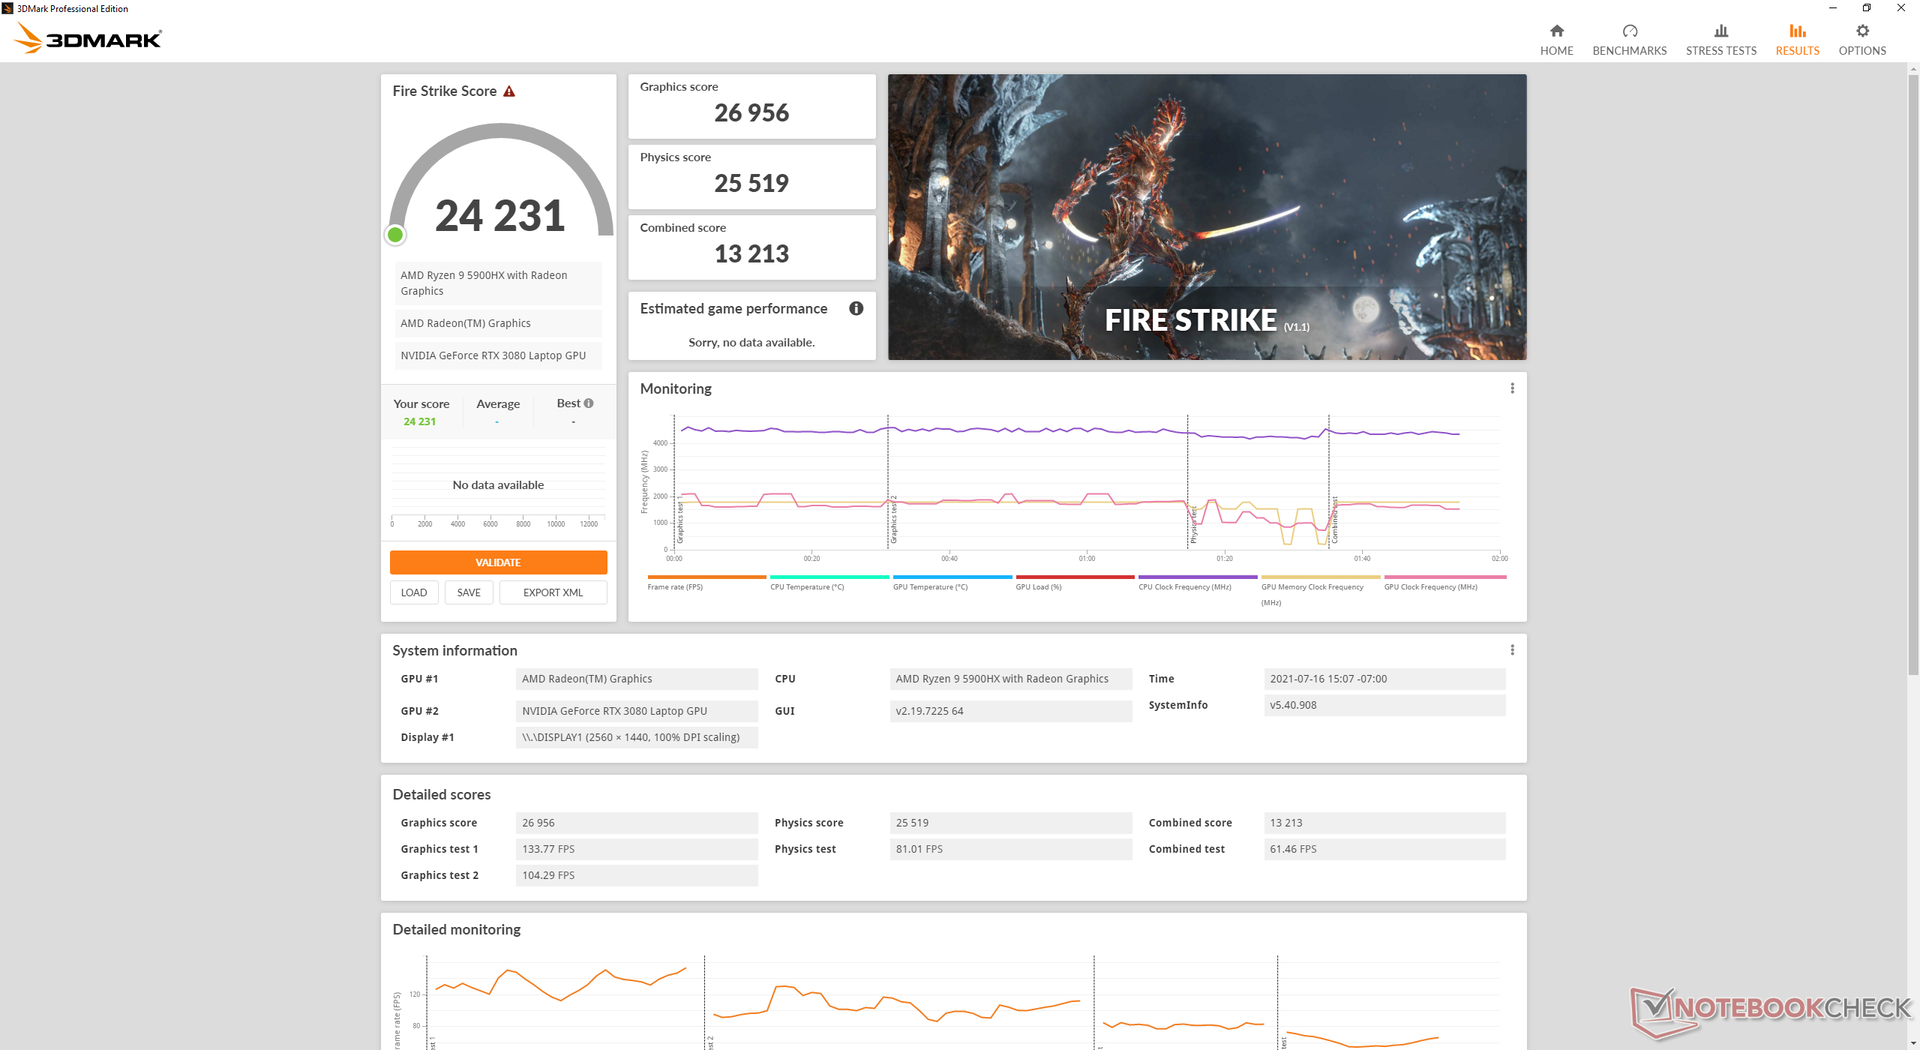
| 3DMark 11 Performance | 29985 puntos | |
| 3DMark Cloud Gate Standard Score | 45767 puntos | |
| 3DMark Fire Strike Score | 24231 puntos | |
| 3DMark Time Spy Score | 11188 puntos | |
ayuda | ||
Witcher 3 FPS Chart
| bajo | medio | alto | ultra | QHD | |
|---|---|---|---|---|---|
| GTA V (2015) | 177 | 171 | 150 | 94.5 | 85.7 |
| The Witcher 3 (2015) | 325 | 270.1 | 189.5 | 105.8 | |
| Dota 2 Reborn (2015) | 147 | 136 | 131 | 119 | |
| Final Fantasy XV Benchmark (2018) | 179 | 139 | 105 | ||
| X-Plane 11.11 (2018) | 103 | 92.3 | 76 | ||
| Strange Brigade (2018) | 337 | 212 | 191 | 174 | 138 |
Emissions
Ruido del sistema: más silencioso que antes
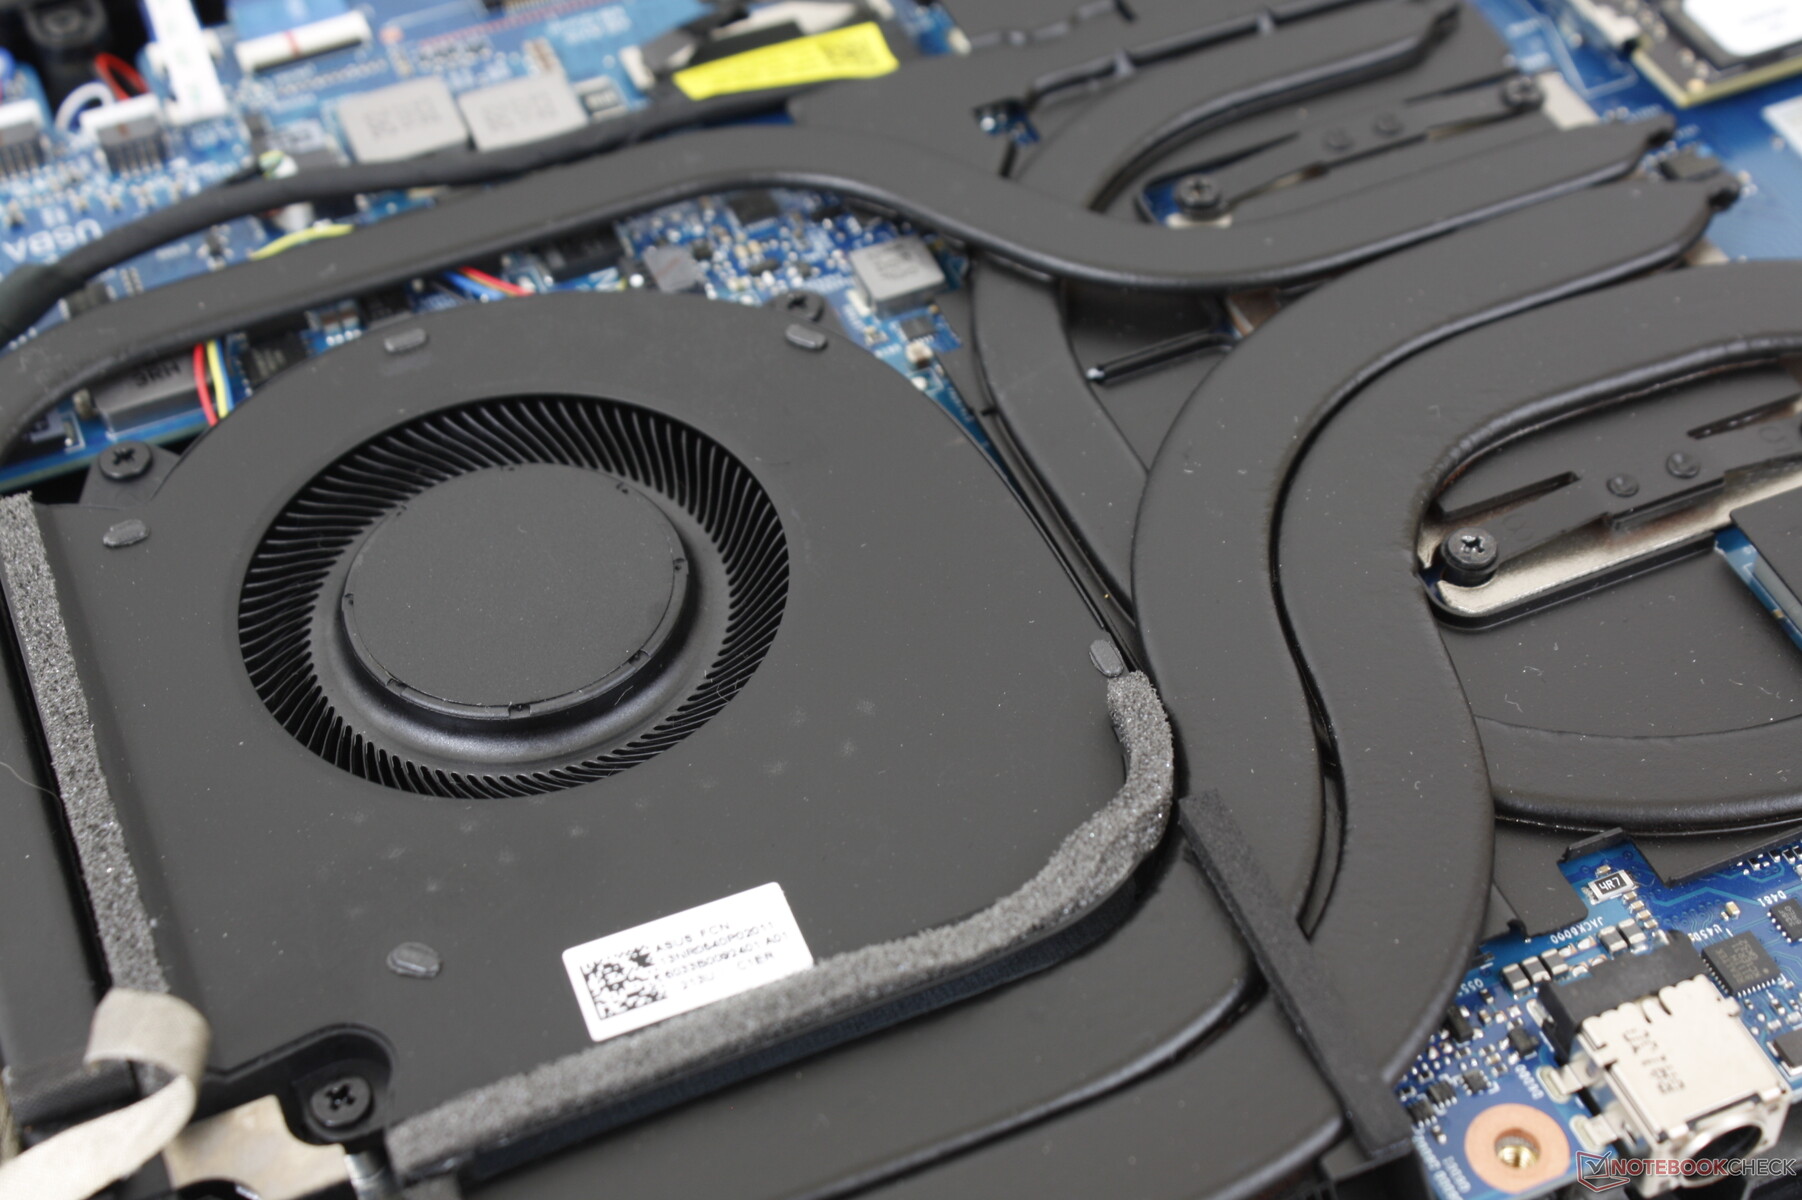
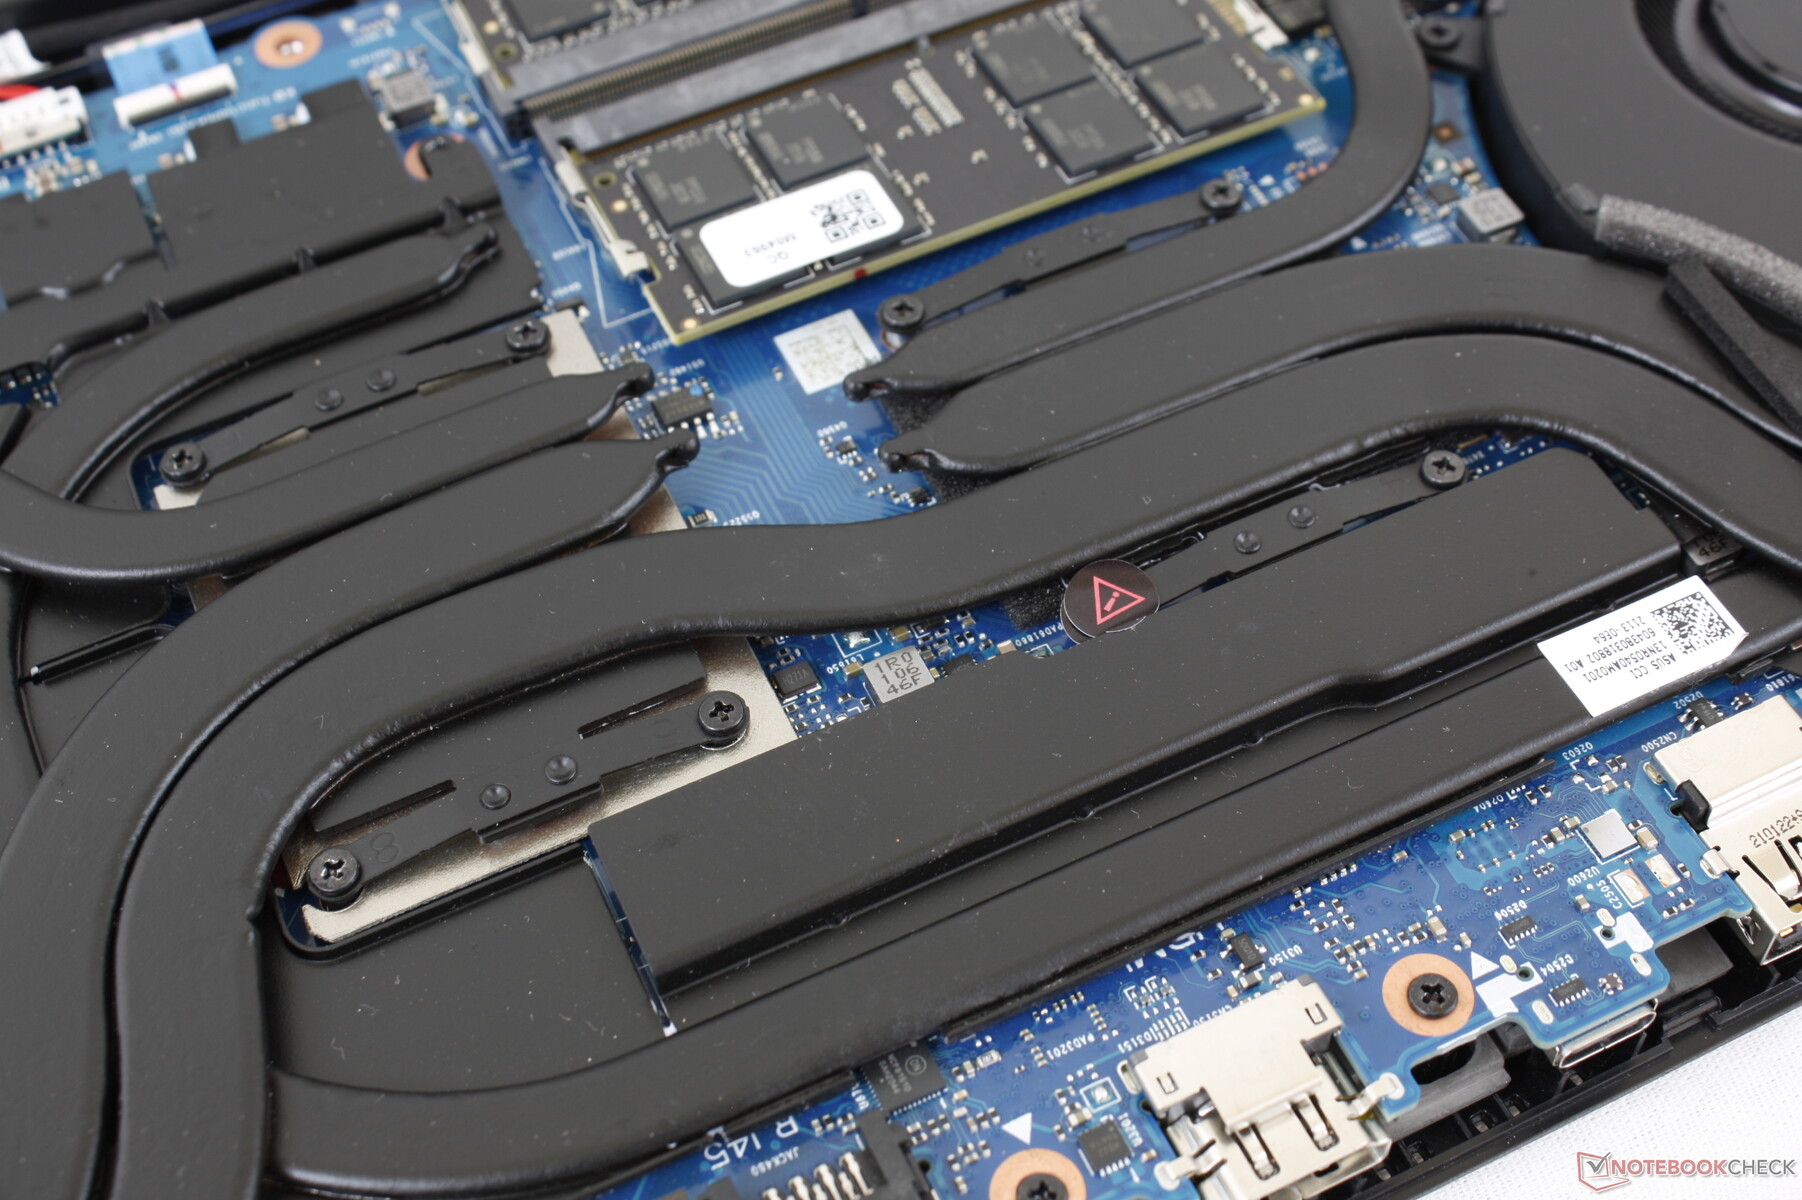
La solución de refrigeración consiste en dos ventiladores de 45 a 50 mm, como en el G532, pero con seis tubos de calor de cobre más grandes y gruesos. La CPU también está refrigerada por líquido, como prometido por el fabricante durante el CES 2021
El ruido de los ventiladores es en general más silencioso que en el G532 y más cercano al del Razer Blade 15. Jugar en modo Turbo inducirá un ruido de ventilador de 50.5 dB(A) mientras que el modo Rendimiento inducirá un ruido de ventilador de 46.8 dB(A). Por lo tanto, los ventiladores deben estar al máximo para exprimir al máximo el rendimiento de la CPU y la GPU, como se ha indicado anteriormente.
Es importante poner el sistema en modo equilibrado o silencioso cuando no se necesite la potencia extra, o los ventiladores pulsarán con frecuencia y sin necesidad hasta 37 dB(A). Los ventiladores generalmente se mantienen en el rango de 30 a 32 dB(A) contra un fondo silencioso de 25.5 dB(A) cuando se navega o se transmite video en modo silencioso.
| Asus ROG Strix Scar 15 G533QS GeForce RTX 3080 Laptop GPU, R9 5900HX, ADATA Swordfish 2 TB | Asus ROG Strix Scar 15 G532LWS GeForce RTX 2070 Super Mobile, i9-10980HK, 2x Intel SSD 660p 1TB SSDPEKNW010T8 (RAID 0) | MSI GE66 Raider 10SFS GeForce RTX 2070 Super Mobile, i9-10980HK, WDC PC SN730 SDBPNTY-1T00 | Razer Blade 15 Advanced (Mid 2021) GeForce RTX 3080 Laptop GPU, i7-11800H, SSSTC CA6-8D1024 | Alienware m15 R5 Ryzen Edition GeForce RTX 3060 Laptop GPU, R7 5800H, Toshiba KBG40ZNS512G NVMe | Lenovo Legion C7 15IMH05 82EH0030GE GeForce RTX 2070 Max-Q, i7-10875H, Samsung PM981a MZVLB1T0HBLR | |
|---|---|---|---|---|---|---|
| Noise | -12% | -20% | 6% | 2% | 10% | |
| apagado / medio ambiente * (dB) | 25.5 | 26.5 -4% | 30 -18% | 25.1 2% | 24 6% | 24.9 2% |
| Idle Minimum * (dB) | 25.5 | 27.1 -6% | 30 -18% | 25.3 1% | 24 6% | 24.9 2% |
| Idle Average * (dB) | 25.5 | 32.2 -26% | 35 -37% | 25.3 1% | 25 2% | 24.9 2% |
| Idle Maximum * (dB) | 37.1 | 34 8% | 44 -19% | 25.3 32% | 35 6% | 24.9 33% |
| Load Average * (dB) | 39.2 | 52.4 -34% | 53 -35% | 42 -7% | 44 -12% | 34.6 12% |
| Witcher 3 ultra * (dB) | 50.5 | 57.5 -14% | 53 -5% | 45.6 10% | 48 5% | |
| Load Maximum * (dB) | 51.8 | 57.5 -11% | 55 -6% | 51.6 -0% | 50 3% | 47.7 8% |
* ... más pequeño es mejor
Ruido
| Ocioso |
| 25.5 / 25.5 / 37.1 dB(A) |
| Carga |
| 39.2 / 51.8 dB(A) |
 | ||
30 dB silencioso 40 dB(A) audible 50 dB(A) ruidosamente alto |
||
min: | ||
Temperatura
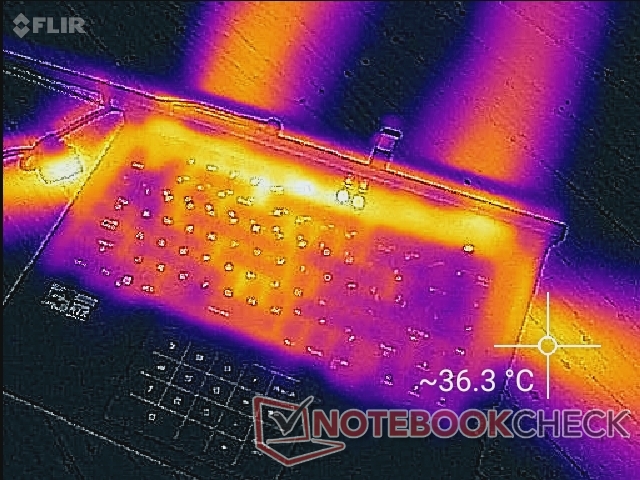
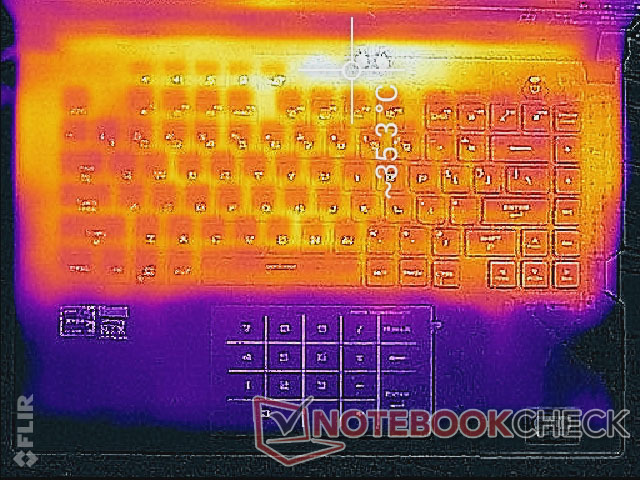
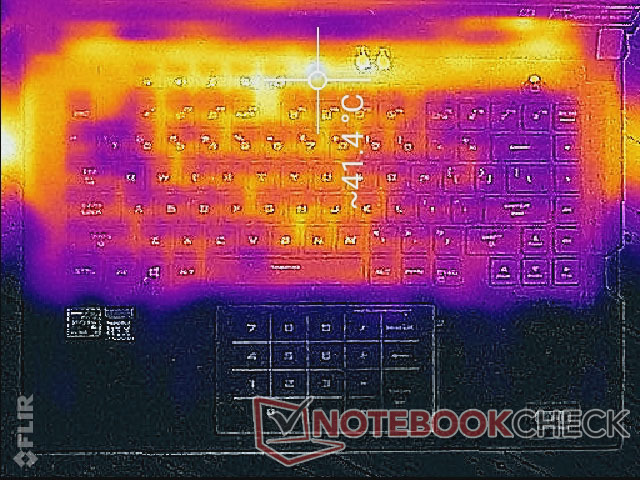
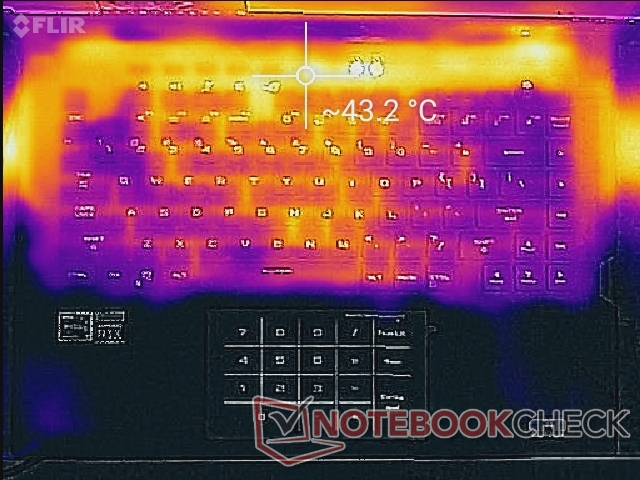
Las temperaturas de la superficie son casi siempre cálidas en las teclas del teclado y el panel inferior, a unos 35 C o más, incluso cuando está en reposo en el escritorio. No es desagradable, sin embargo, y el sistema nunca se siente incómodo para escribir. Si se juega, el centro del teclado puede acercarse a los 40 C mientras que los reposamanos, las teclas WASD y la tecla Enter permanecen mucho más fríos.
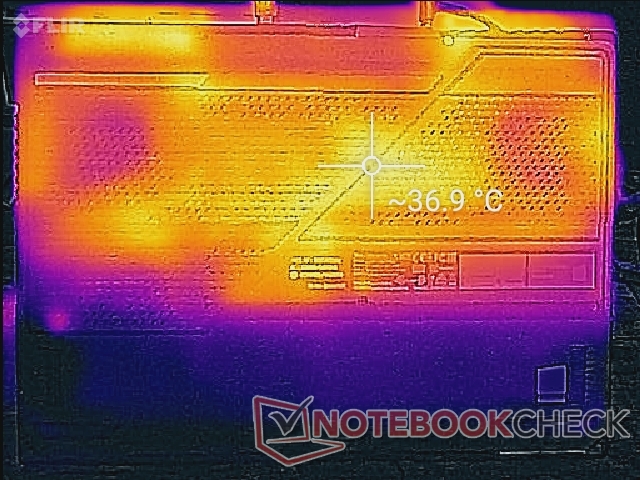
El calor residual sale por cuatro lugares diferentes alrededor de la parte trasera del chasis, en comparación con sólo dos en la mayoría de otros portátiles para juegos.
(±) La temperatura máxima en la parte superior es de 43.4 °C / 110 F, frente a la media de 40.4 °C / 105 F, que oscila entre 21.2 y 68.8 °C para la clase Gaming.
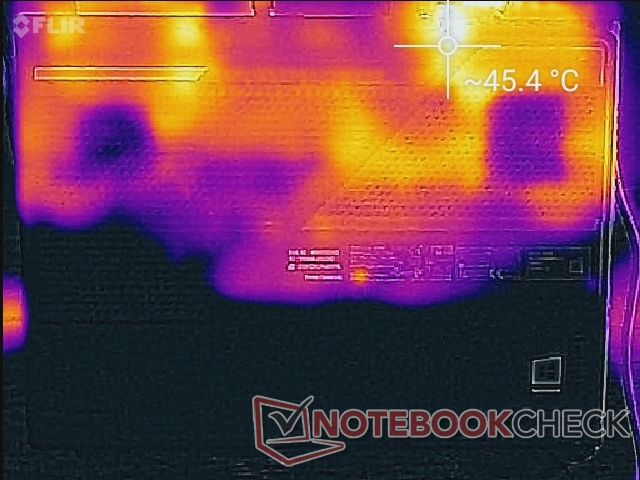
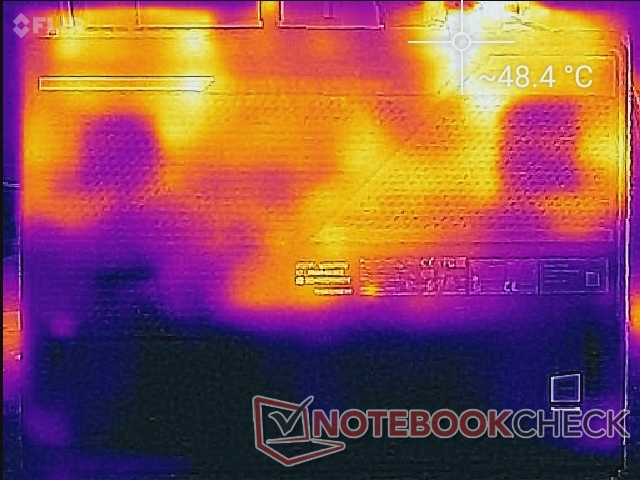
(-) El fondo se calienta hasta un máximo de 48.2 °C / 119 F, frente a la media de 43.2 °C / 110 F
(+) En reposo, la temperatura media de la parte superior es de 28.4 °C / 83# F, frente a la media del dispositivo de 33.9 °C / 93 F.
(+) Jugando a The Witcher 3, la temperatura media de la parte superior es de 29.9 °C / 86 F, frente a la media del dispositivo de 33.9 °C / 93 F.
(+) El reposamanos y el panel táctil están a una temperatura inferior a la de la piel, con un máximo de 25.6 °C / 78.1 F y, por tanto, son fríos al tacto.
(+) La temperatura media de la zona del reposamanos de dispositivos similares fue de 28.8 °C / 83.8 F (+3.2 °C / 5.7 F).
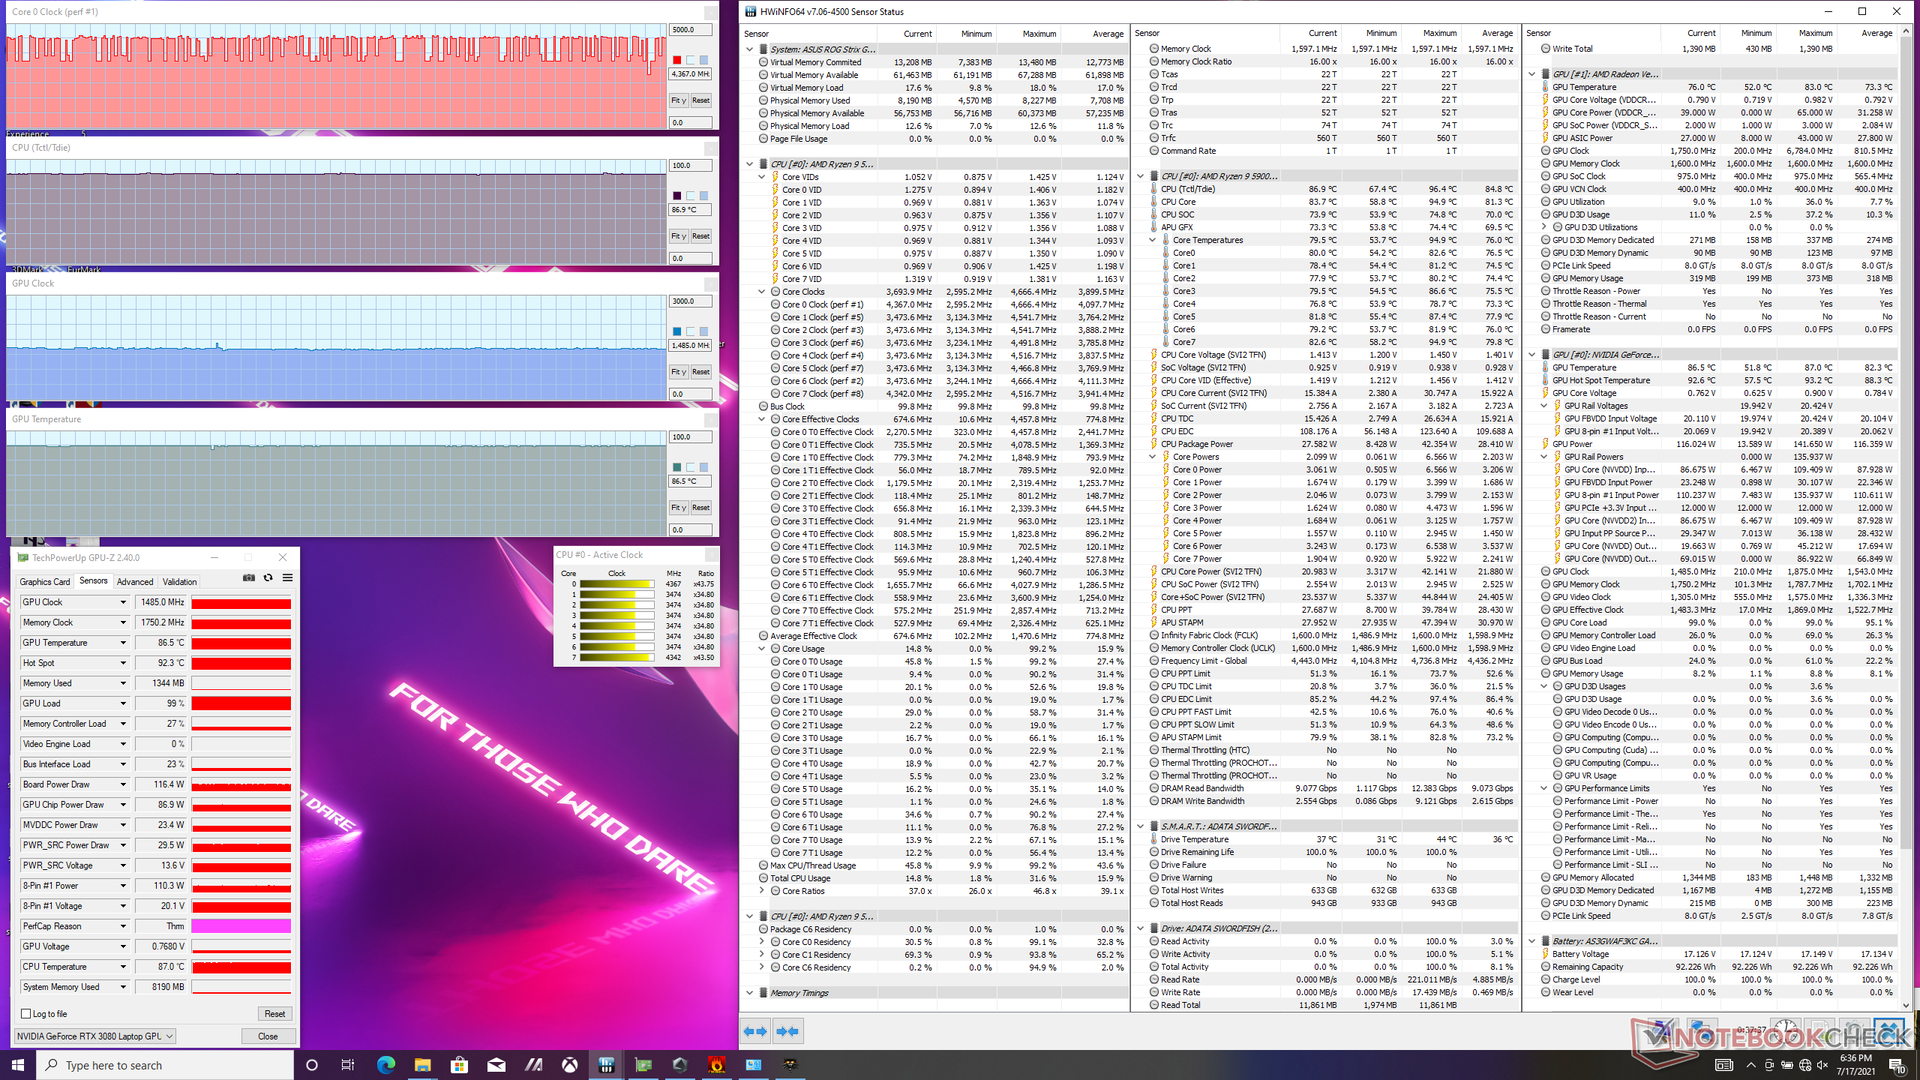
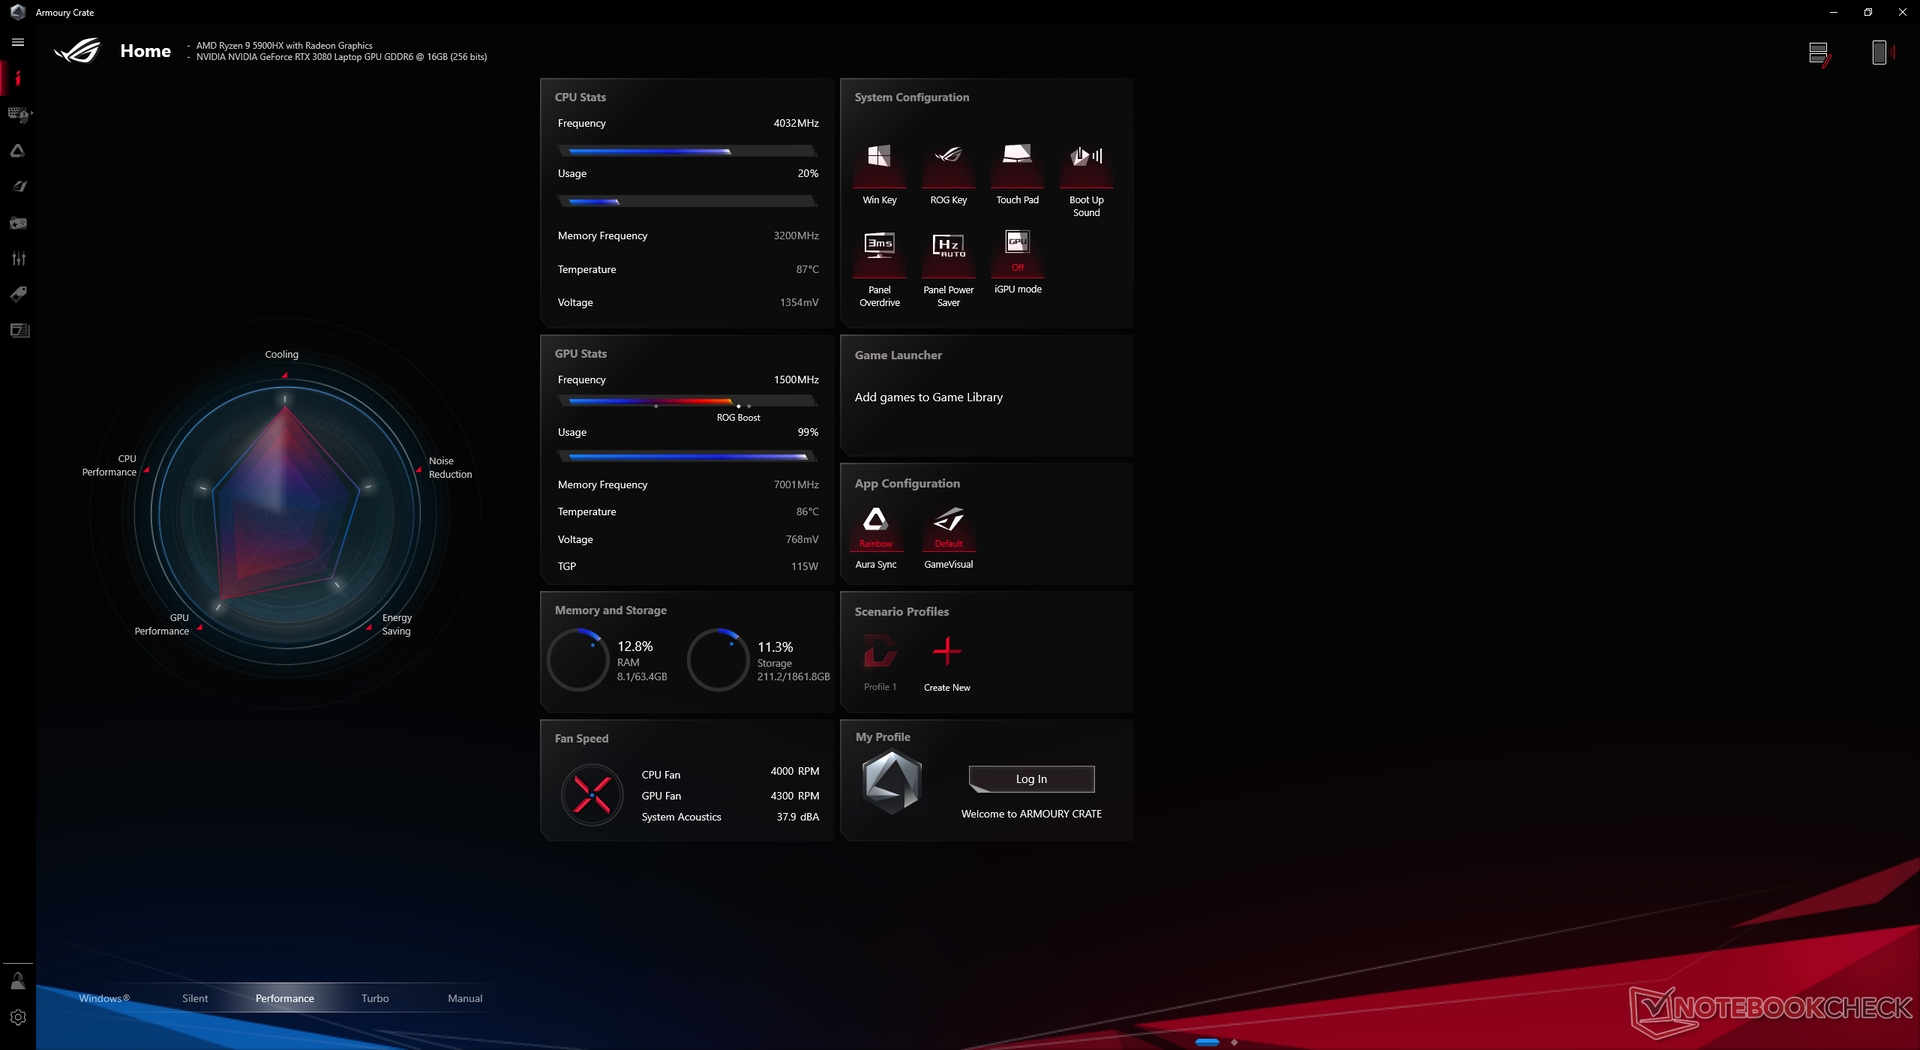
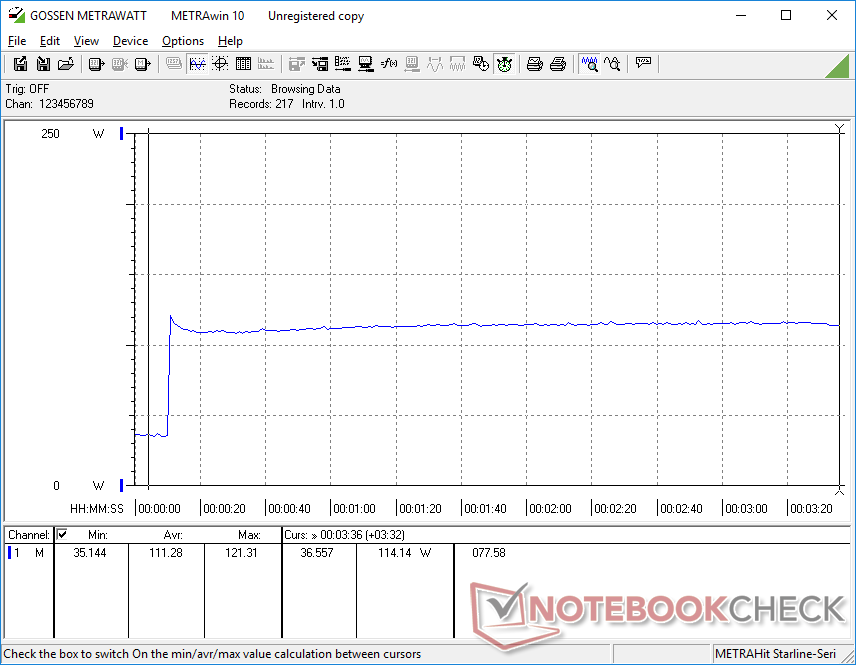
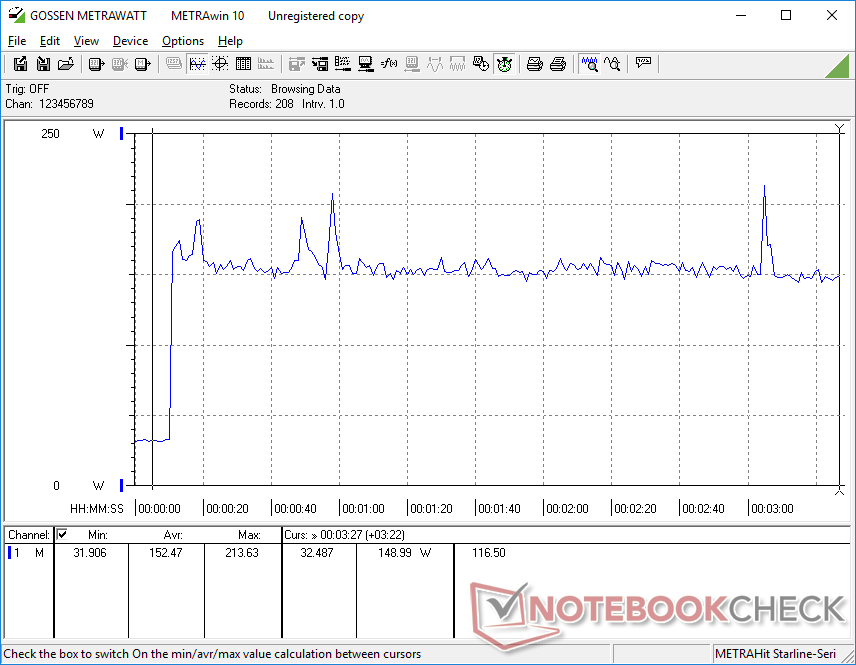
Prueba de esfuerzo
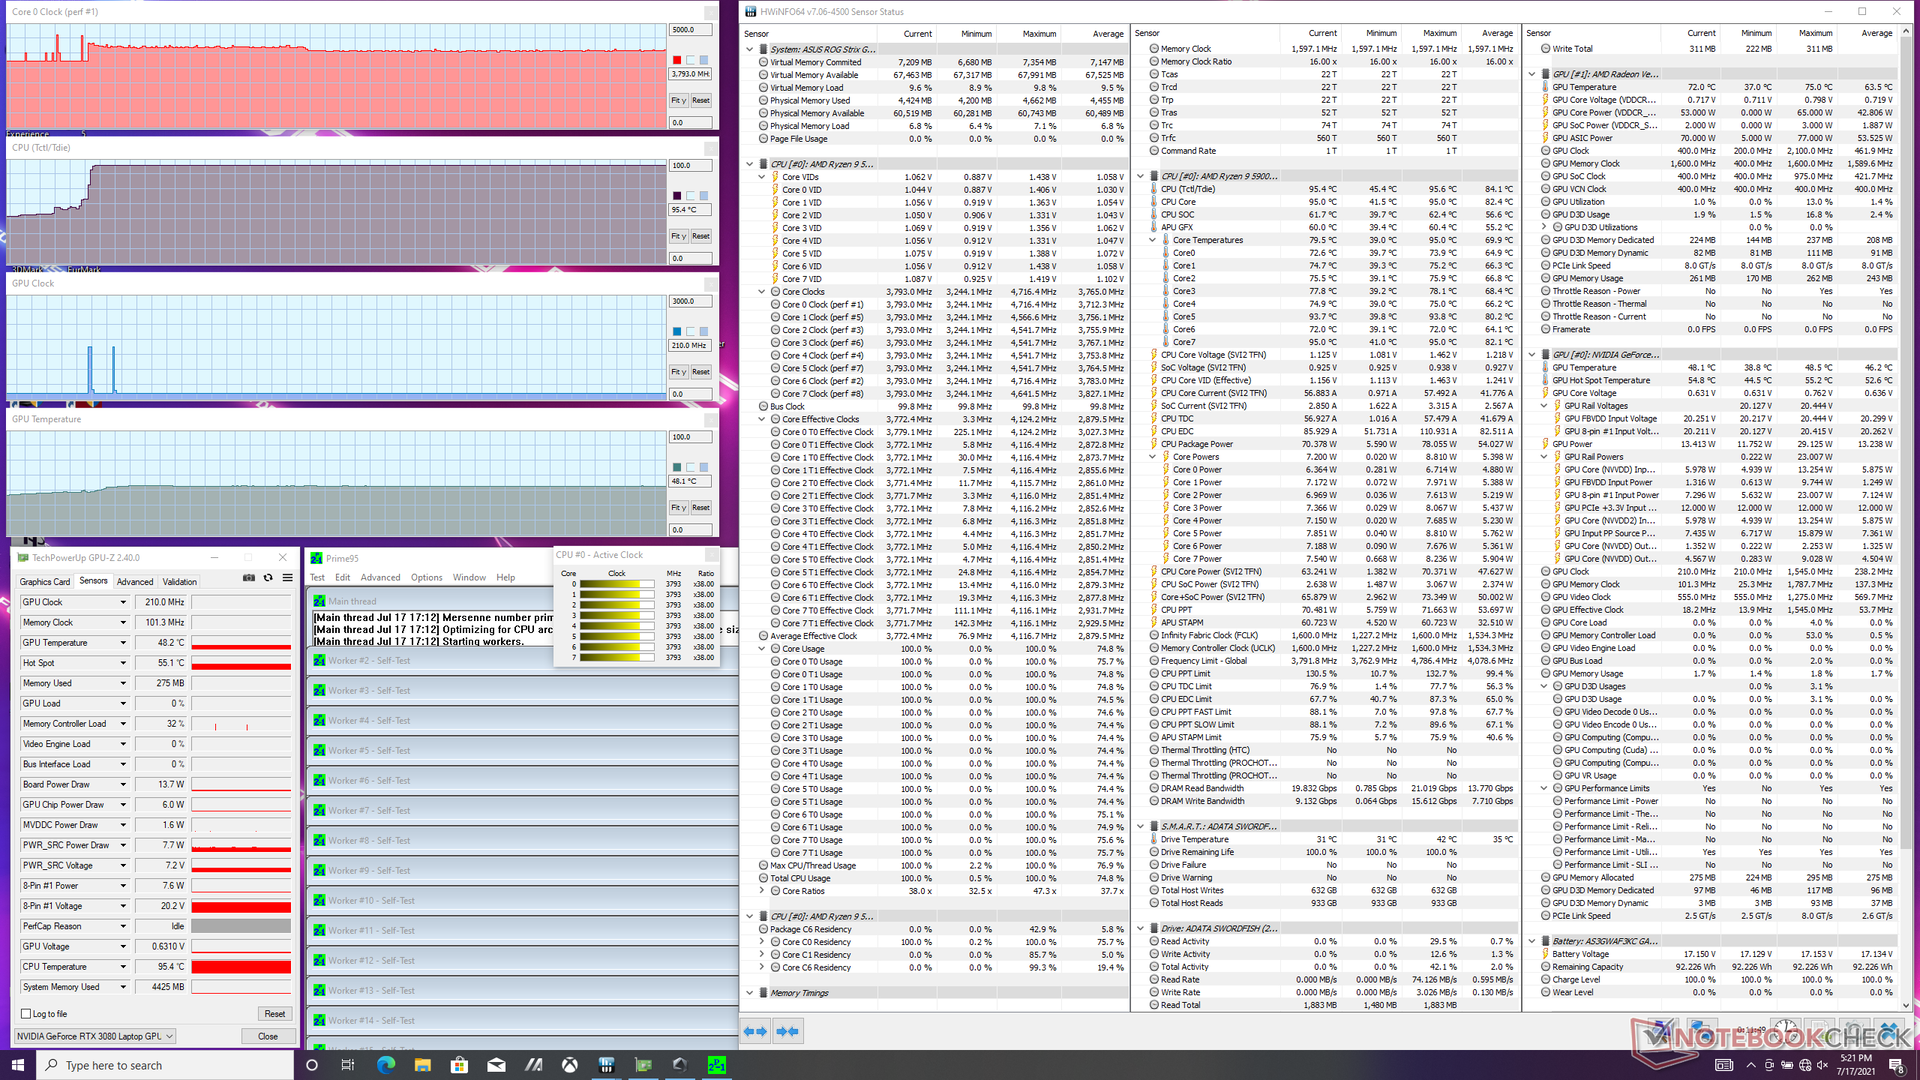
Cuando se estresa con Prime95 en modo Turbo, la CPU sube a 4,1 GHz durante sólo un par de segundos antes de caer ligeramente a unos estables 3,8 GHz y 95 C. Si se ejecuta esta misma prueba en el antiguo G532LWS con el Core i9-10980HK se obtiene una velocidad de reloj de la CPU estable y una temperatura de 3,7 GHz y 90 C, respectivamente. Nuestro G533 con AMD es capaz de ofrecer más rendimiento, aunque con temperaturas de núcleo ligeramente superiores
La CPU y la GPU se estabilizan a 93 C y 84 C, respectivamente, cuando se ejecuta Witcher 3 en modo Turbo, en comparación con los 94 C y 78 C del G532LWS del año pasado. El consumo de energía de la placa GPU también se mantendría relativamente estable en 129,7 W, confirmando la afirmación publicitaria de Asus de una GPU TGP de 130 W. Ejecutar esta misma prueba en modo Rendimiento en vez de en modo Turbo dará como resultado una velocidad de reloj del núcleo ligeramente inferior (1695 MHz frente a 1485 MHz), una velocidad de reloj de la memoria (1787.7 MHz frente a 1750.2 MHz) y un consumo de energía de la GPU (129.7 W frente a 116.4 W)
El uso de la batería reduce el rendimiento. Una prueba de Fire Strike con baterías arrojaría unas puntuaciones de Física y Gráficos de 23802 y 15793 puntos, respectivamente, en comparación con los 25519 y 26956 puntos con la red eléctrica. El modo Turbo se desactiva automáticamente cuando no está conectado a la red eléctrica.
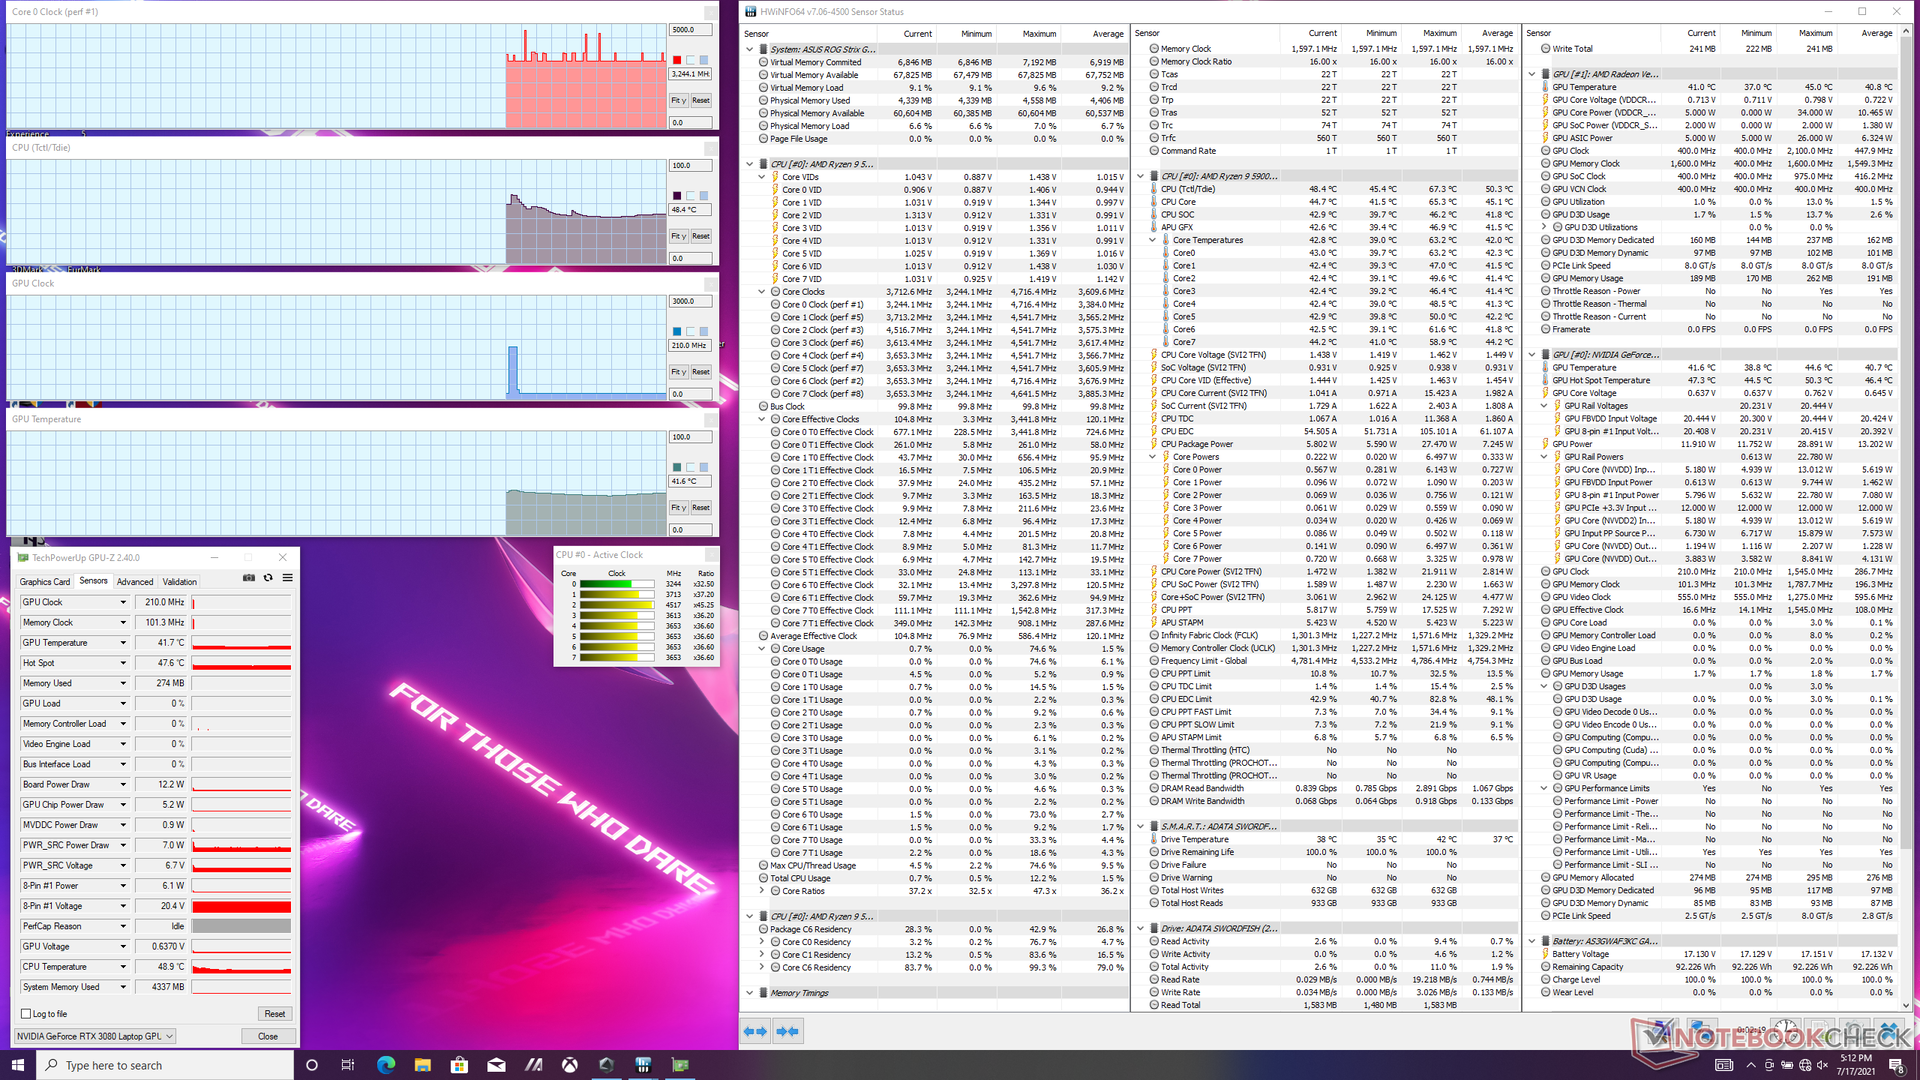
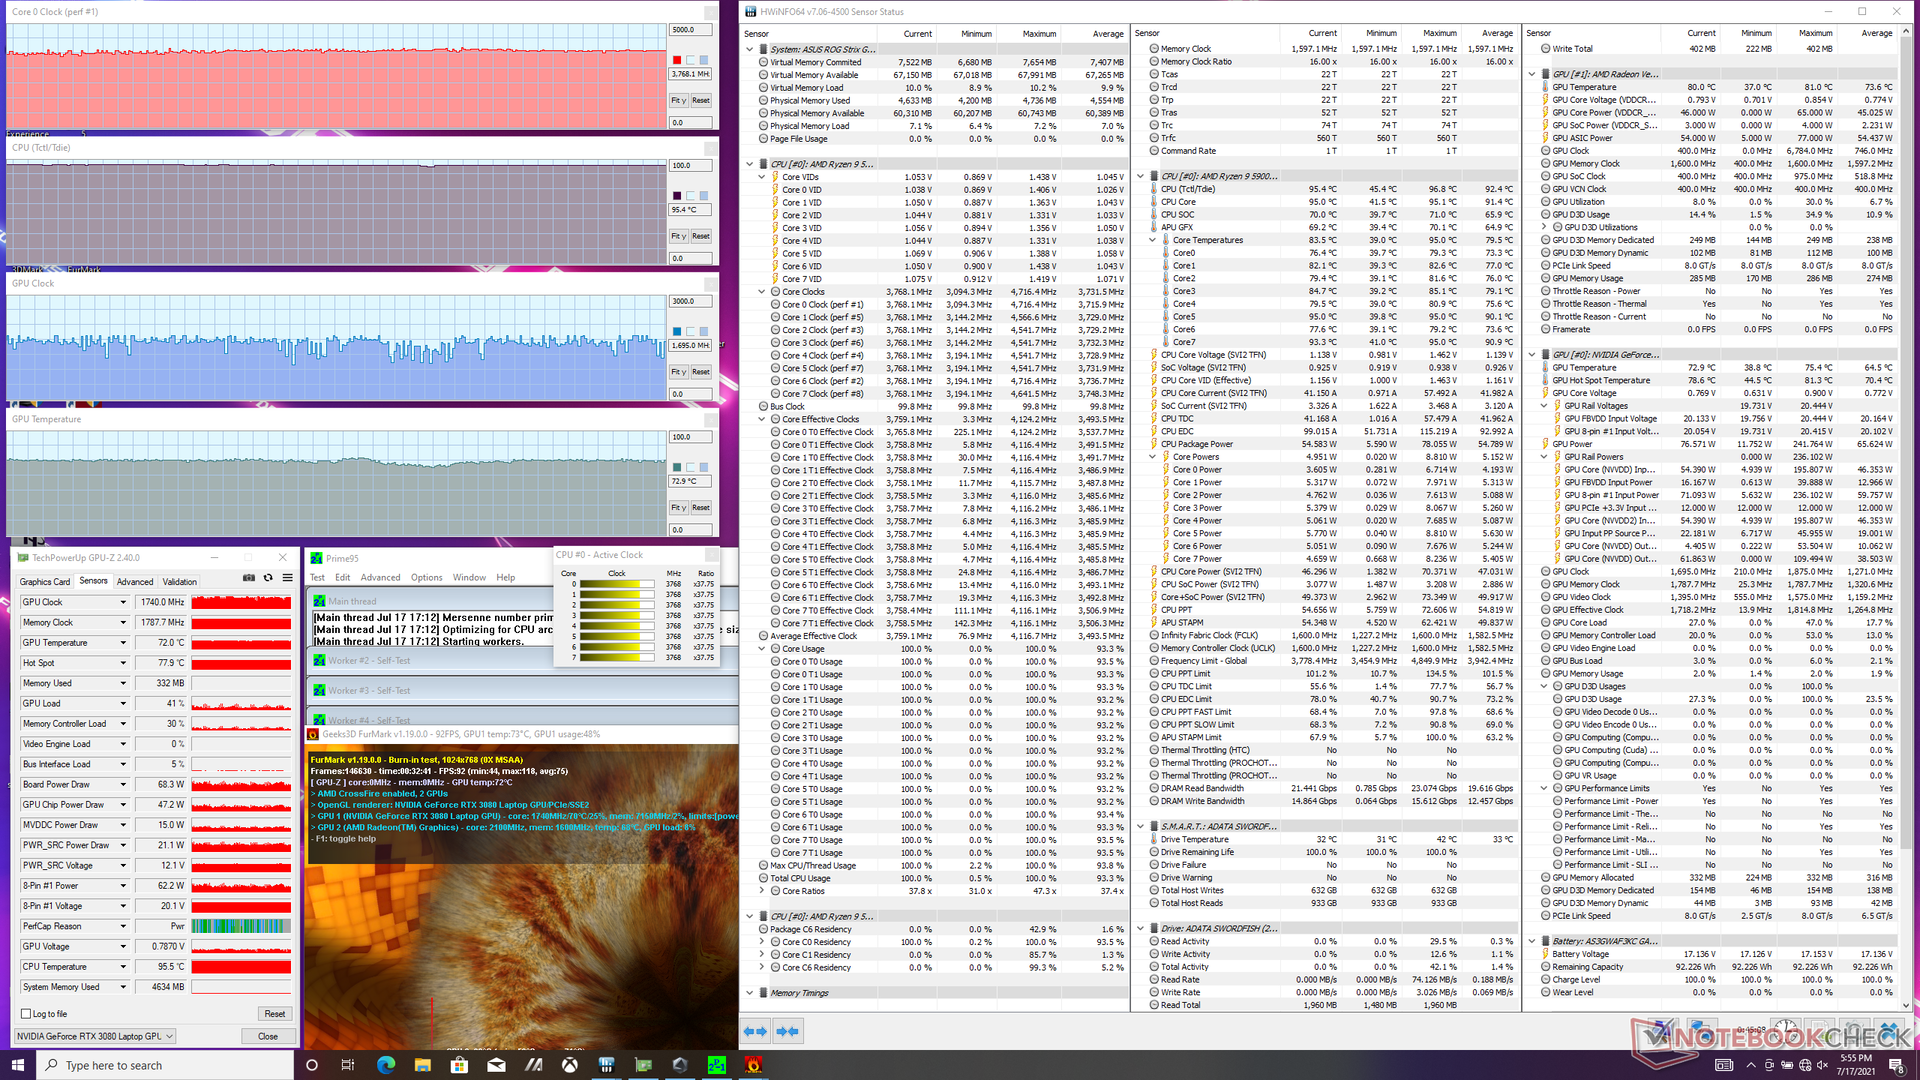

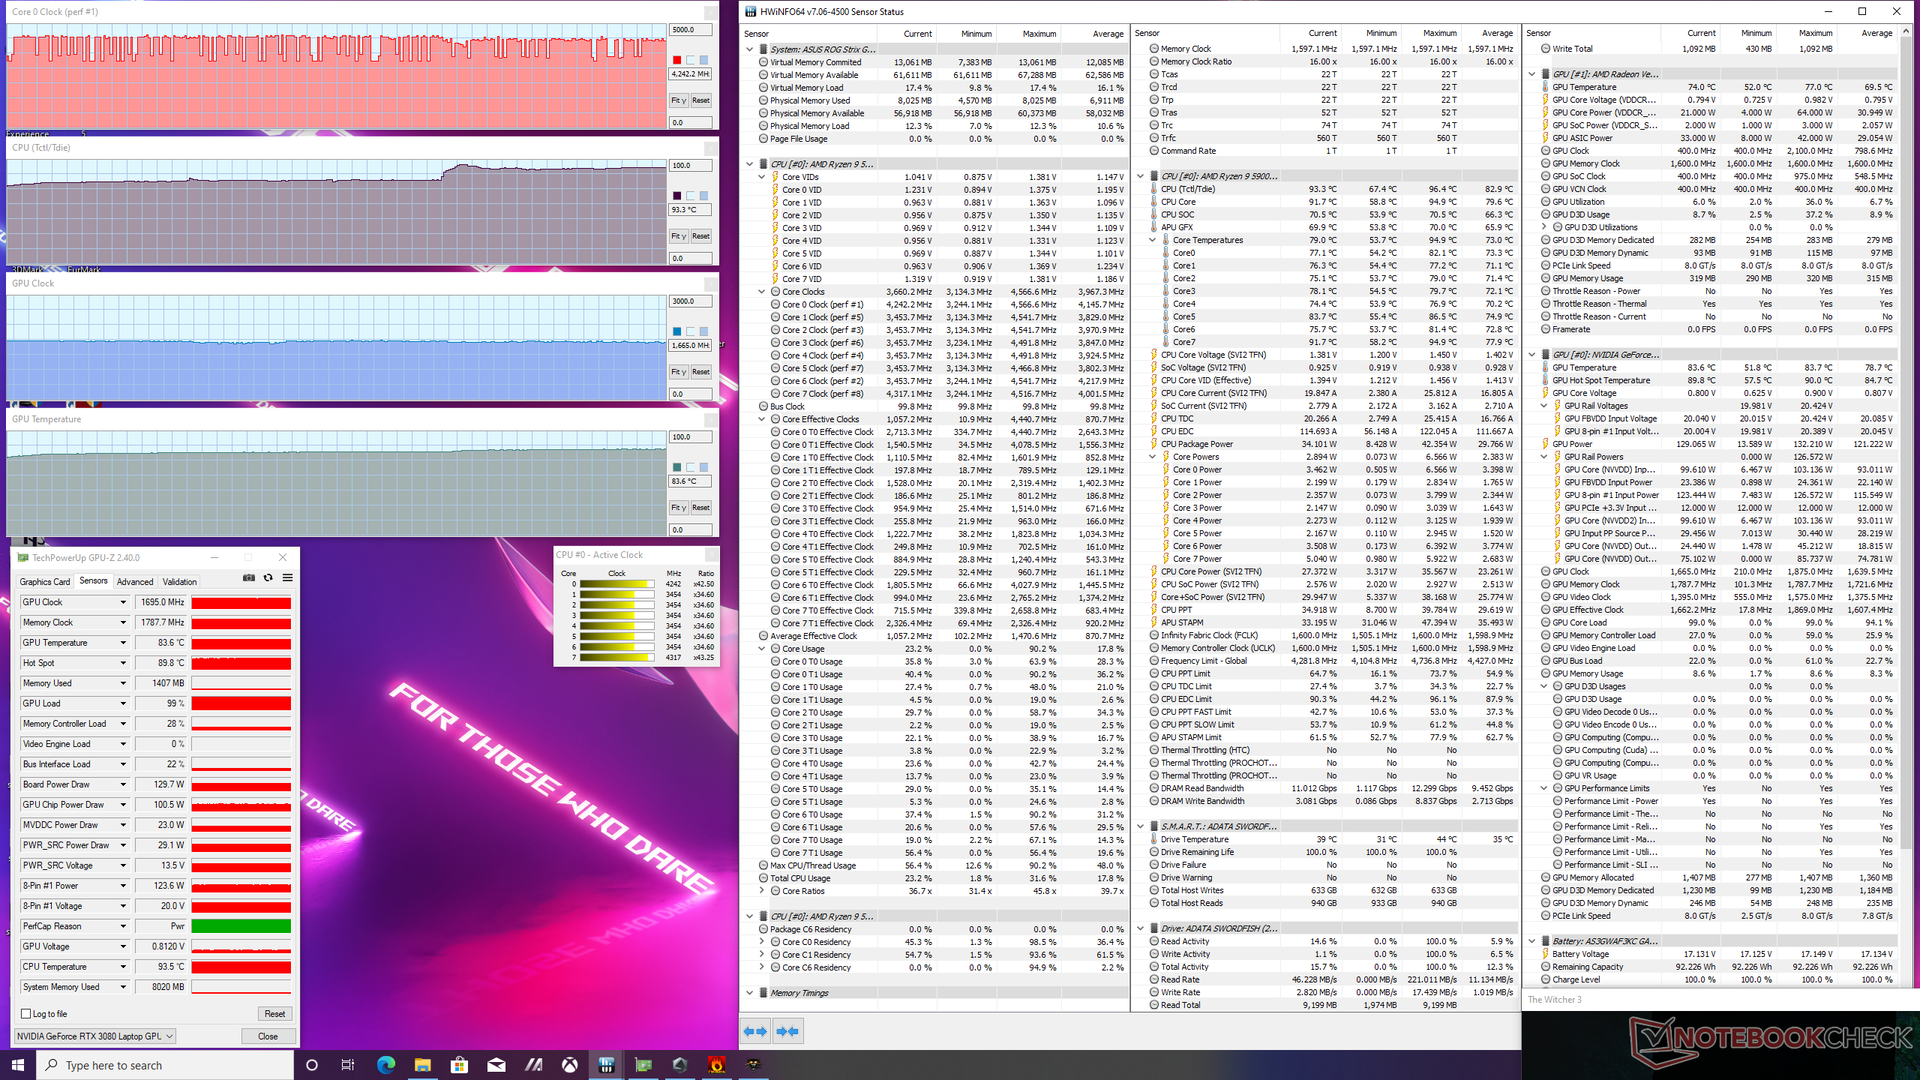
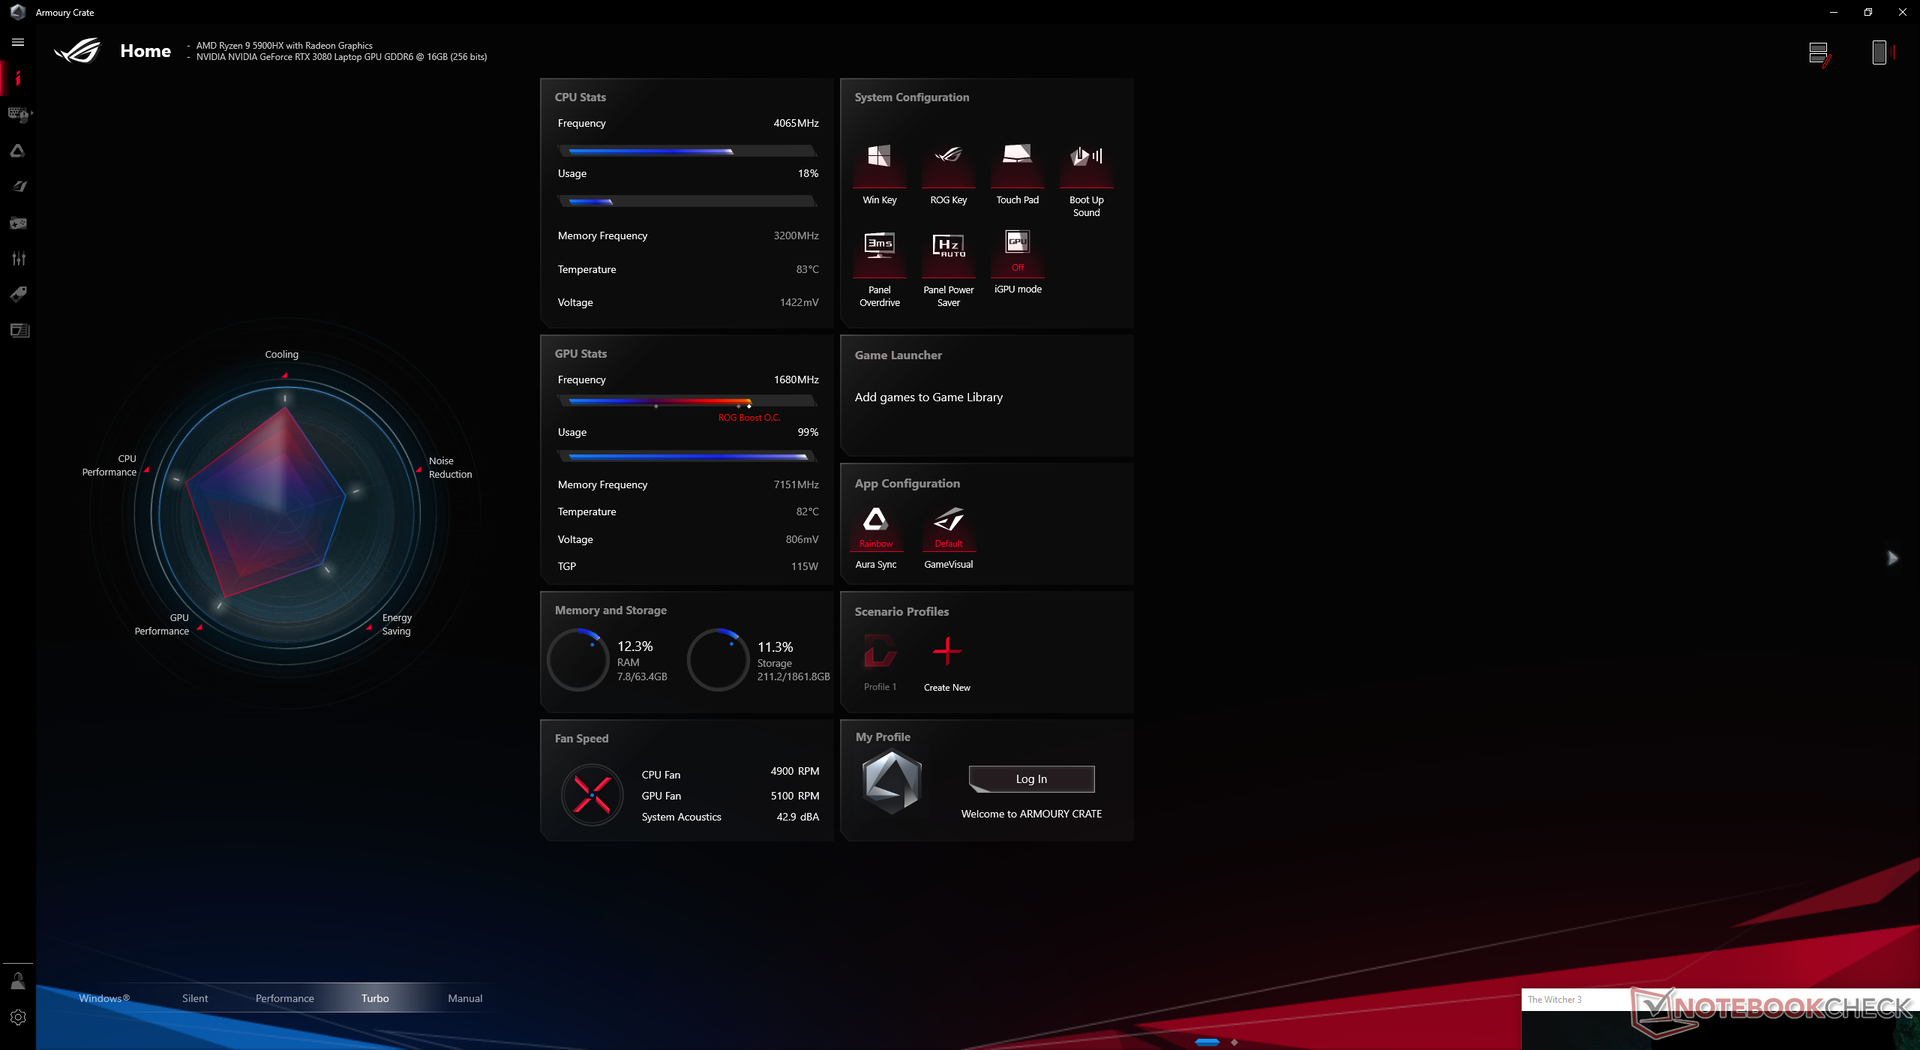
| Relojde la CPU(GHz) | Reloj dela GPU(MHz) | Temperatura media de la CPU (°C) | Temperaturamediade la GPU (°C) | |
| Sistema en reposo | 48 | 42 | ||
| Estrés de Prime95(modo Turbo) | 3.8 | -- | 95 | 48 |
| Estrés Prime95+ FurMark(modo Turbo) | 3.8 | ~1071 - 1740 | 95 | 73 |
| Witcher 3 Estrés (modo Turbo) | 3,5 - 4,3 | 1695 | 93 | 84 |
| Witcher 3 Estrés (modo rendimiento) | 3,5 - 4,3 | 1485 | 87 | 87 |
Altavoces


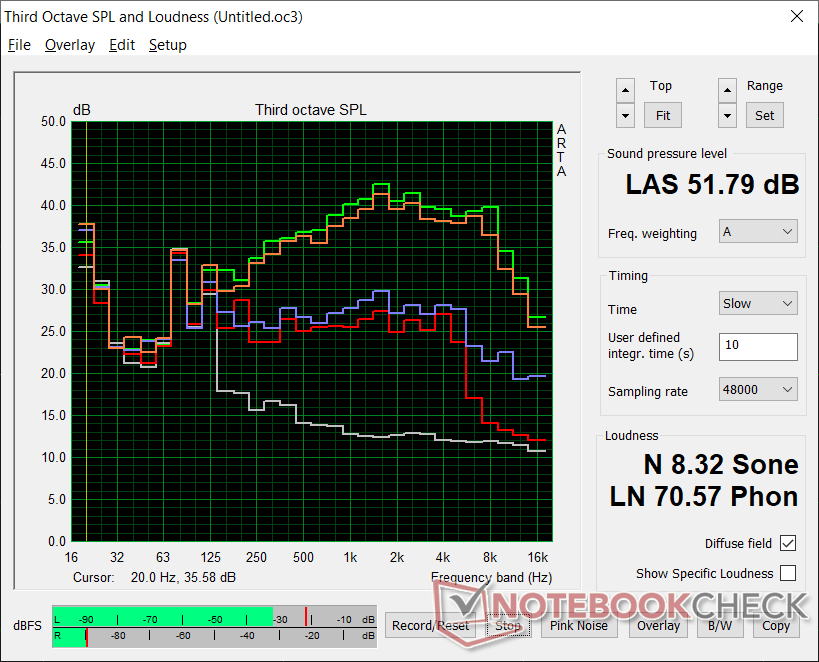
Asus ROG Strix Scar 15 G533QS análisis de audio
(±) | la sonoridad del altavoz es media pero buena (74.9 dB)
Graves 100 - 315 Hz
(+) | buen bajo - sólo 4.5% lejos de la mediana
(±) | la linealidad de los graves es media (8.2% delta a frecuencia anterior)
Medios 400 - 2000 Hz
(+) | medios equilibrados - a sólo 3.6% de la mediana
(±) | la linealidad de los medios es media (8.3% delta respecto a la frecuencia anterior)
Altos 2 - 16 kHz
(+) | máximos equilibrados - a sólo 3.3% de la mediana
(+) | los máximos son lineales (4.7% delta a la frecuencia anterior)
Total 100 - 16.000 Hz
(+) | el sonido global es lineal (13.9% de diferencia con la mediana)
En comparación con la misma clase
» 22% de todos los dispositivos probados de esta clase eran mejores, 7% similares, 71% peores
» El mejor tuvo un delta de 6%, la media fue 18%, el peor fue ###max##%
En comparación con todos los dispositivos probados
» 16% de todos los dispositivos probados eran mejores, 4% similares, 80% peores
» El mejor tuvo un delta de 4%, la media fue 24%, el peor fue ###max##%
Apple MacBook 12 (Early 2016) 1.1 GHz análisis de audio
(+) | los altavoces pueden reproducir a un volumen relativamente alto (#83.6 dB)
Graves 100 - 315 Hz
(±) | lubina reducida - en promedio 11.3% inferior a la mediana
(±) | la linealidad de los graves es media (14.2% delta a frecuencia anterior)
Medios 400 - 2000 Hz
(+) | medios equilibrados - a sólo 2.4% de la mediana
(+) | los medios son lineales (5.5% delta a la frecuencia anterior)
Altos 2 - 16 kHz
(+) | máximos equilibrados - a sólo 2% de la mediana
(+) | los máximos son lineales (4.5% delta a la frecuencia anterior)
Total 100 - 16.000 Hz
(+) | el sonido global es lineal (10.2% de diferencia con la mediana)
En comparación con la misma clase
» 7% de todos los dispositivos probados de esta clase eran mejores, 2% similares, 91% peores
» El mejor tuvo un delta de 5%, la media fue 18%, el peor fue ###max##%
En comparación con todos los dispositivos probados
» 5% de todos los dispositivos probados eran mejores, 1% similares, 94% peores
» El mejor tuvo un delta de 4%, la media fue 24%, el peor fue ###max##%
Energy Management
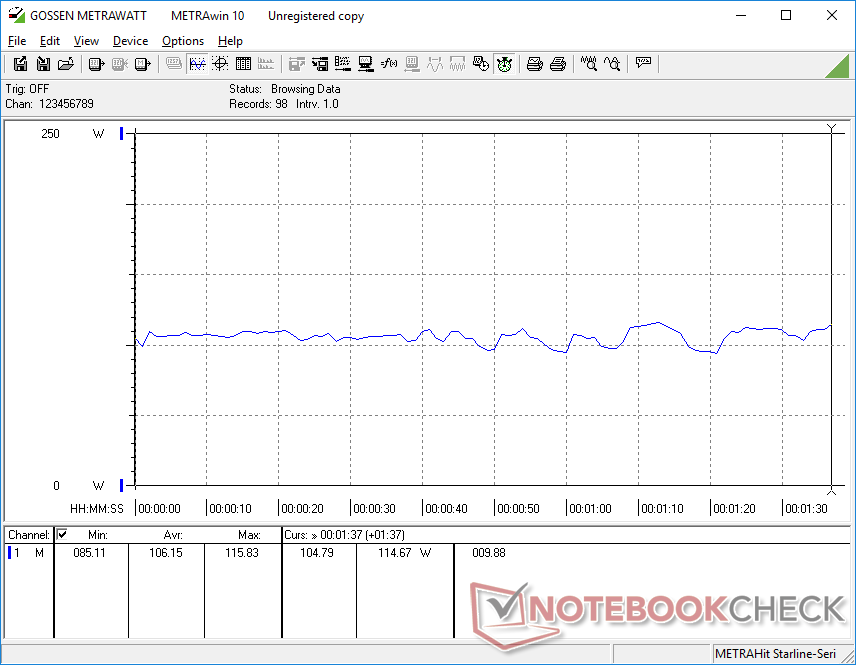
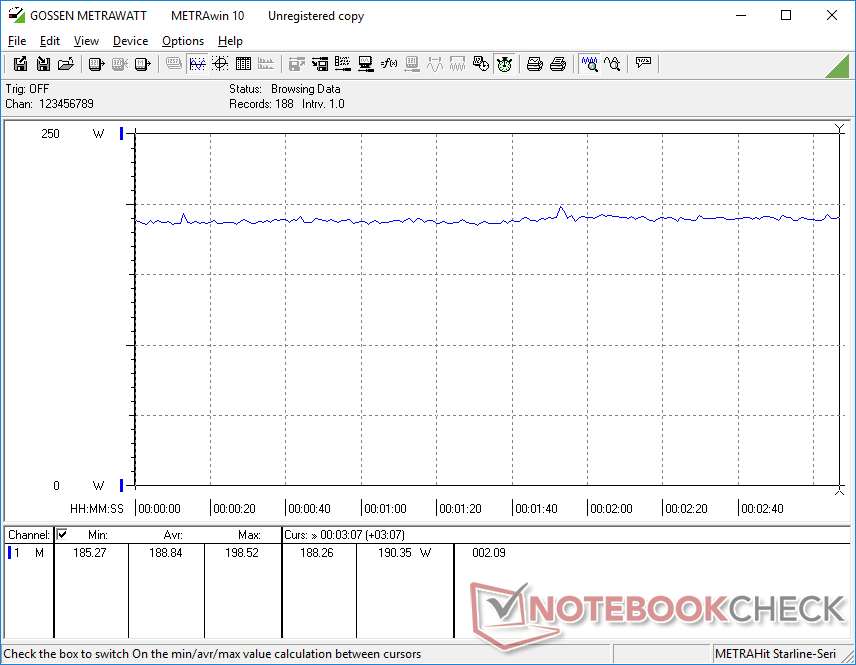
Consumo de energía
Los juegos exigen un poco menos de energía que en el antiguo G532LWS a pesar de la CPU más rápida, la GPU más rápida y la pantalla de mayor resolución para un mayor rendimiento general por vatio. Sin embargo, el consumo de energía en reposo en el escritorio o en la navegación web no es necesariamente menor
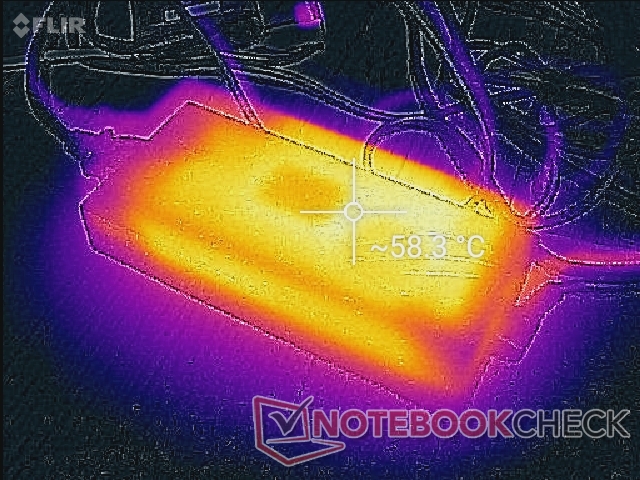
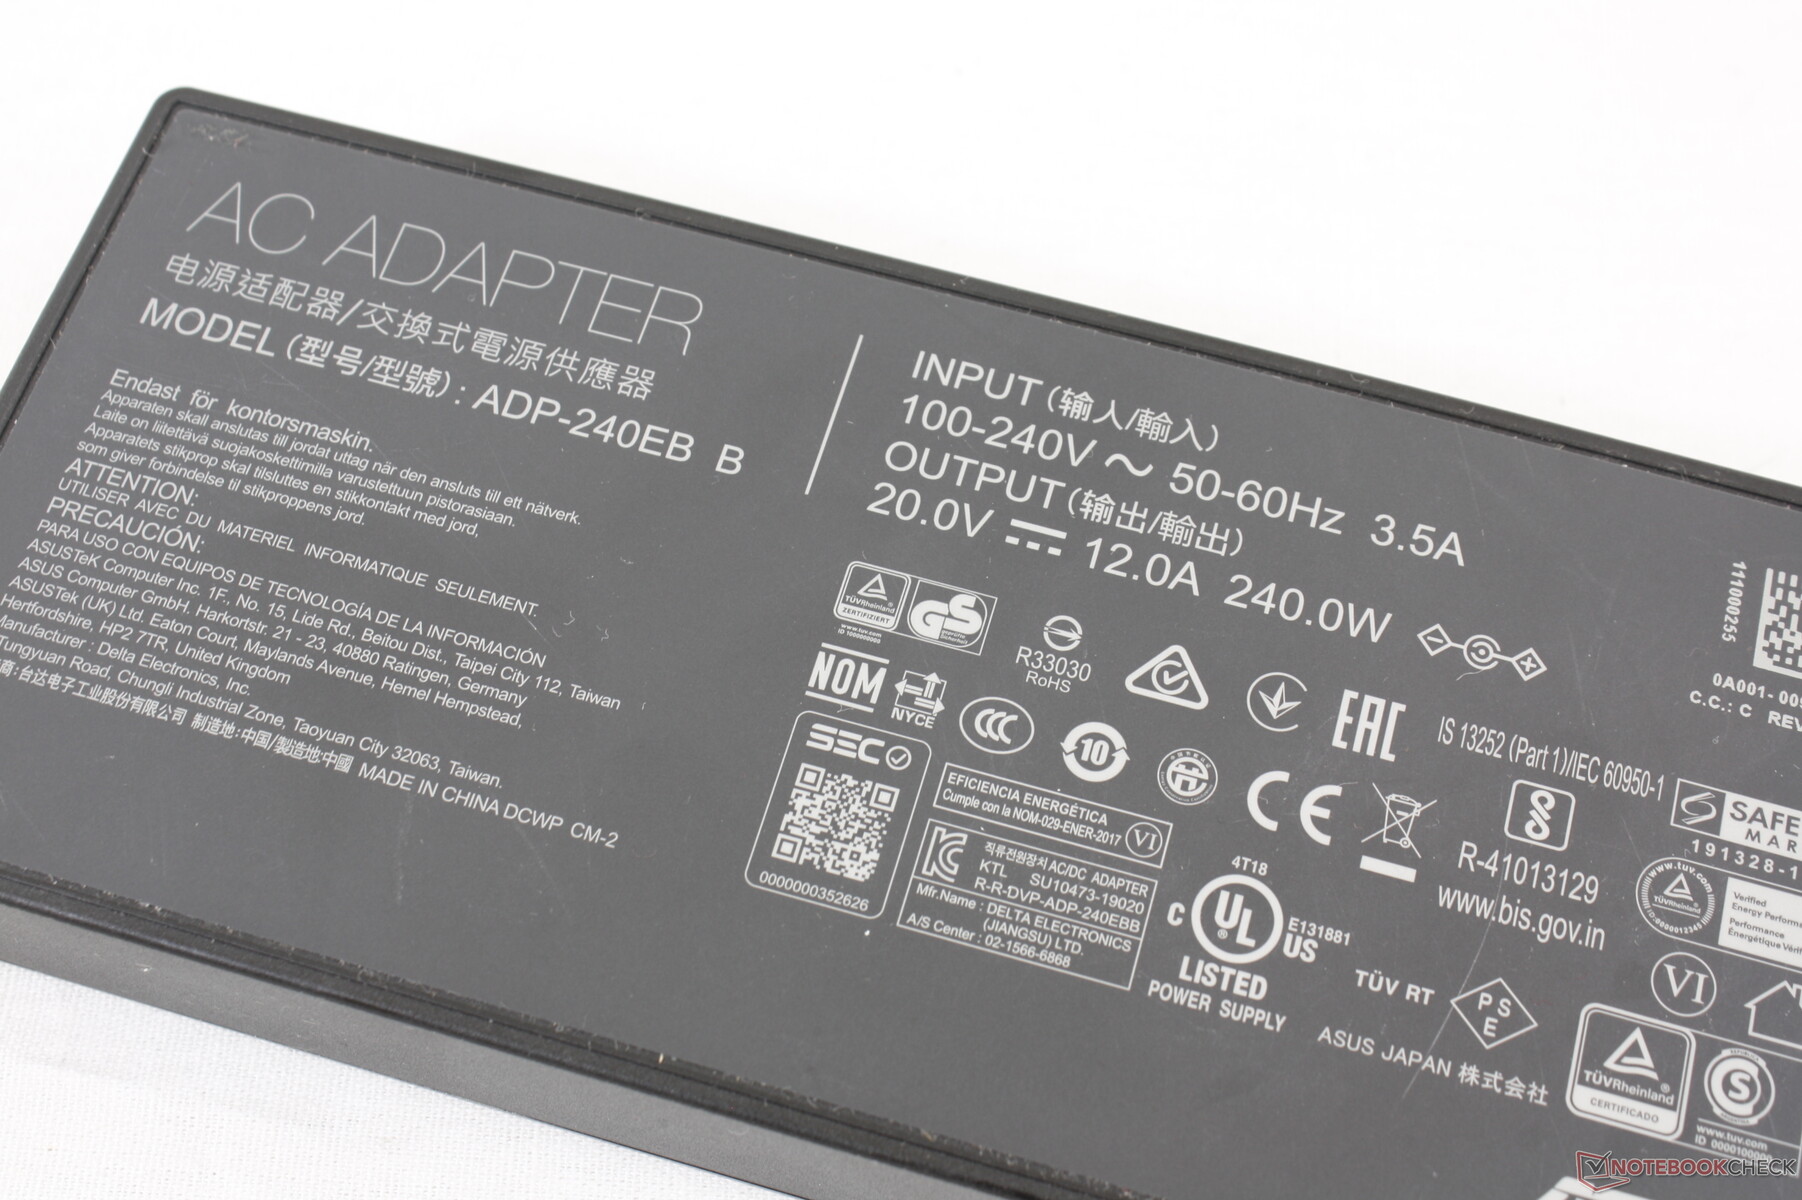
Hemos podido medir un consumo máximo de 214 W desde el adaptador de CA de 240 W. El adaptador también es ligeramente más pequeño que el del modelo del año pasado (16,5 x 7,5 x 2,5 cm frente a 18 x 8,5 x 3,6 cm).
| Off / Standby | |
| Ocioso | |
| Carga |
|
Clave:
min: | |
| Asus ROG Strix Scar 15 G533QS R9 5900HX, GeForce RTX 3080 Laptop GPU, ADATA Swordfish 2 TB, IPS, 2560x1440, 15.6" | Asus ROG Strix Scar 15 G532LWS i9-10980HK, GeForce RTX 2070 Super Mobile, 2x Intel SSD 660p 1TB SSDPEKNW010T8 (RAID 0), IPS, 1920x1080, 15.6" | MSI GE66 Raider 10SFS i9-10980HK, GeForce RTX 2070 Super Mobile, WDC PC SN730 SDBPNTY-1T00, IPS-Level, 1920x1080, 15.6" | Razer Blade 15 Advanced (Mid 2021) i7-11800H, GeForce RTX 3080 Laptop GPU, SSSTC CA6-8D1024, IPS, 1920x1080, 15.6" | Alienware m15 R5 Ryzen Edition R7 5800H, GeForce RTX 3060 Laptop GPU, Toshiba KBG40ZNS512G NVMe, IPS, 1920x1080, 15.6" | Lenovo Legion C7 15IMH05 82EH0030GE i7-10875H, GeForce RTX 2070 Max-Q, Samsung PM981a MZVLB1T0HBLR, IPS, 1920x1080, 15.6" | |
|---|---|---|---|---|---|---|
| Power Consumption | -2% | 7% | -23% | 3% | 25% | |
| Idle Minimum * (Watt) | 11.2 | 8 29% | 6 46% | 19.5 -74% | 11 2% | 7.4 34% |
| Idle Average * (Watt) | 16.4 | 9.8 40% | 14 15% | 23.3 -42% | 14 15% | 10.1 38% |
| Idle Maximum * (Watt) | 29.4 | 25.8 12% | 25 15% | 40.1 -36% | 25 15% | 12.6 57% |
| Load Average * (Watt) | 106.2 | 169 -59% | 108 -2% | 98.9 7% | 123 -16% | 114 -7% |
| Witcher 3 ultra * (Watt) | 189 | 201 -6% | 195 -3% | 174 8% | 176 7% | 144 24% |
| Load Maximum * (Watt) | 213.6 | 271.6 -27% | 280 -31% | 214 -0% | 226 -6% | 201 6% |
* ... más pequeño es mejor
Power Consumption Witcher 3 / Stresstest
Duración de la batería - Batería más grande
La duración es estupenda para un portátil de juegos, con unas 2 horas más de lo que registramos en el modelo anterior G532LWS, probablemente debido a la mayor batería de nuestro nuevo modelo (90 Wh frente a 66 Wh). Sin embargo, los usuarios deben habilitar el modo iGPU a través de Armoury Crate y luego configurar el sistema en Equilibrado o inferior para beneficiarse de la larga duración de la batería.
La carga desde el vacío hasta la capacidad total tarda poco más de 1,5 horas. La batería se carga más lentamente si se juega, pero afortunadamente no se agotará. Se puede cargar por USB-C con adaptadores de terceros.
| Asus ROG Strix Scar 15 G533QS R9 5900HX, GeForce RTX 3080 Laptop GPU, 90 Wh | Asus ROG Strix Scar 15 G532LWS i9-10980HK, GeForce RTX 2070 Super Mobile, 66 Wh | MSI GE66 Raider 10SFS i9-10980HK, GeForce RTX 2070 Super Mobile, 99.99 Wh | Razer Blade 15 Advanced (Mid 2021) i7-11800H, GeForce RTX 3080 Laptop GPU, 80 Wh | Alienware m15 R5 Ryzen Edition R7 5800H, GeForce RTX 3060 Laptop GPU, 86 Wh | Lenovo Legion C7 15IMH05 82EH0030GE i7-10875H, GeForce RTX 2070 Max-Q, 80 Wh | |
|---|---|---|---|---|---|---|
| Duración de Batería | -18% | -6% | -19% | -11% | -2% | |
| Reader / Idle (h) | 11.1 | 8.1 -27% | 7.6 -32% | 14.7 32% | 12.7 14% | |
| WiFi v1.3 (h) | 7.3 | 4.9 -33% | 6.1 -16% | 5.9 -19% | 5.1 -30% | 5.9 -19% |
| Load (h) | 1.4 | 1.5 7% | 1.8 29% | 0.9 -36% | 1.4 0% | |
| Witcher 3 ultra (h) | 1.6 |
Pro
Contra
Veredicto - Otro fuerte competidor de AMD de Asus

El Strix Scar 15 G533QS es una actualización significativa del G532LWS que se lanzó hace apenas un año. El rendimiento de la CPU es un 30 por ciento más rápido, el rendimiento gráfico es un 30 por ciento más rápido, la batería es más grande y duradera, el teclado y el clickpad están completamente renovados, los ventiladores son más silenciosos cuando se juega, y la nueva pantalla de 165 Hz 1440p se combina muy bien con el hardware principal. Es un poco más grueso, sin embargo, pero es un pequeño precio a pagar por la larga lista de beneficios que vienen con el nuevo modelo
El último ROG Strix Scar 15 de 15,6 pulgadas de Asus parece más completo y más fácil de actualizar que la línea Zephyrus, más delgada. Sin embargo, las inevitables teclas mecánicas ruidosas lo convierten en un portátil pobre para entornos sensibles al ruido.
El mayor competidor o alternativa al Asus G533 es el actual MSI GE66 ya que ambos vienen con características similares, incluyendo 2x SODIMM, 2x M.2 SSD, e incluso una barra de luz LED RGB en el borde frontal. El chasis de MSI se siente más fuerte construido, pero las bisagras en el Asus son más grandes y más rígidas para una mejor sensación de longevidad, mientras que sus interruptores de teclas mecánicas no están disponibles en el MSI.
Precio y disponibilidad
Asus ROG Strix Scar 15 G533QS
- 07/23/2021 v7 (old)
Allen Ngo
Price comparison

