Análisis del portátil Razer Blade 14 Ryzen 9: Rendimiento del Blade Pro 17 con la mitad de tamaño
El razer Blade 14 original de 14 pulgadas se lanzó hace casi 10 años con el Core i7-4702HQ y GeForce GTX 765M. El fabricante retiraría el modelo después de unos años para centrarse en el Blade Stealth de 13,3 pulgadas y el Blade 15 de 15,6 pulgadas. Ahora que el Stealth y el Blade 15 están bien establecidos, Razer ha decidido revivir el Blade 14 con un hardware actualizado.
Presentado en el E3 2021el nuevo Blade 14 destaca no solo por su pequeño y atractivo factor de forma, sino también por ser el primer portátil de Razer con una CPU AMD. Sus especificaciones principales podrían pasar fácilmente por un portátil de juegos más grande de 17,3 pulgadas, incluyendo su procesador Ryzen 9 5900HX Zen 3, gráficos GeForce RTX Ampere, 16 GB de RAM, SSD M.2 PCIe 3 NVMe y pantalla FHD de 144 Hz o QHD de 165 Hz con cobertura DCI-P3 y soporte FreeSync. Nuestra unidad de prueba es la opción de gama media alta con la RTX 3070 y la pantalla QHD de 165 Hz por 2200 dólares al por menor, pero otras SKU van desde 1800 hasta 2800 dólares.
Los competidores directos en este espacio están lejos y son pocos porque no hay muchos portátiles de juego de 14 pulgadas de alta potencia como el Blade 14. MSI no ha tenido un portátil de 14 pulgadas para juegos desde hace años dejando el Asus Zephyrus G14 como el único otro gran portátil de 14 pulgadas para juegos con especificaciones similares a las del Razer.
Más análisis de Razer:
potential competitors in comparison
Valoración | Fecha | Modelo | Peso | Altura | Tamaño | Resolución | Precio |
|---|---|---|---|---|---|---|---|
| 87.5 % v7 (old) | 06/2021 | Razer Blade 14 Ryzen 9 RTX 3070 R9 5900HX, GeForce RTX 3070 Laptop GPU | 1.8 kg | 16.8 mm | 14.00" | 2560x1440 | |
| 87.5 % v7 (old) | 05/2021 | Razer Blade 15 Advanced Model Early 2021 i7-10875H, GeForce RTX 3080 Laptop GPU | 2 kg | 16.99 mm | 15.60" | 1920x1080 | |
| 83.6 % v7 (old) | 04/2020 | Asus Zephyrus G14 GA401IV R9 4900HS, GeForce RTX 2060 Max-Q | 1.6 kg | 17.9 mm | 14.00" | 1920x1080 | |
| 84.7 % v7 (old) | 02/2021 | Asus ROG Flow X13 GV301QH R9 5980HS, GeForce GTX 1650 Max-Q | 1.4 kg | 15.8 mm | 13.40" | 3840x2400 | |
| 90.1 % v7 (old) | 06/2020 | Dell XPS 15 9500 Core i7 4K UHD i7-10875H, GeForce GTX 1650 Ti Mobile | 2 kg | 18 mm | 15.60" | 3840x2400 |
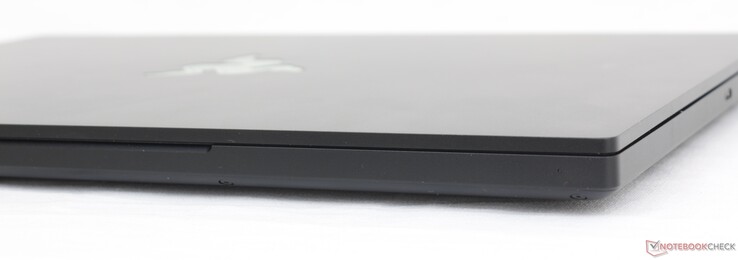
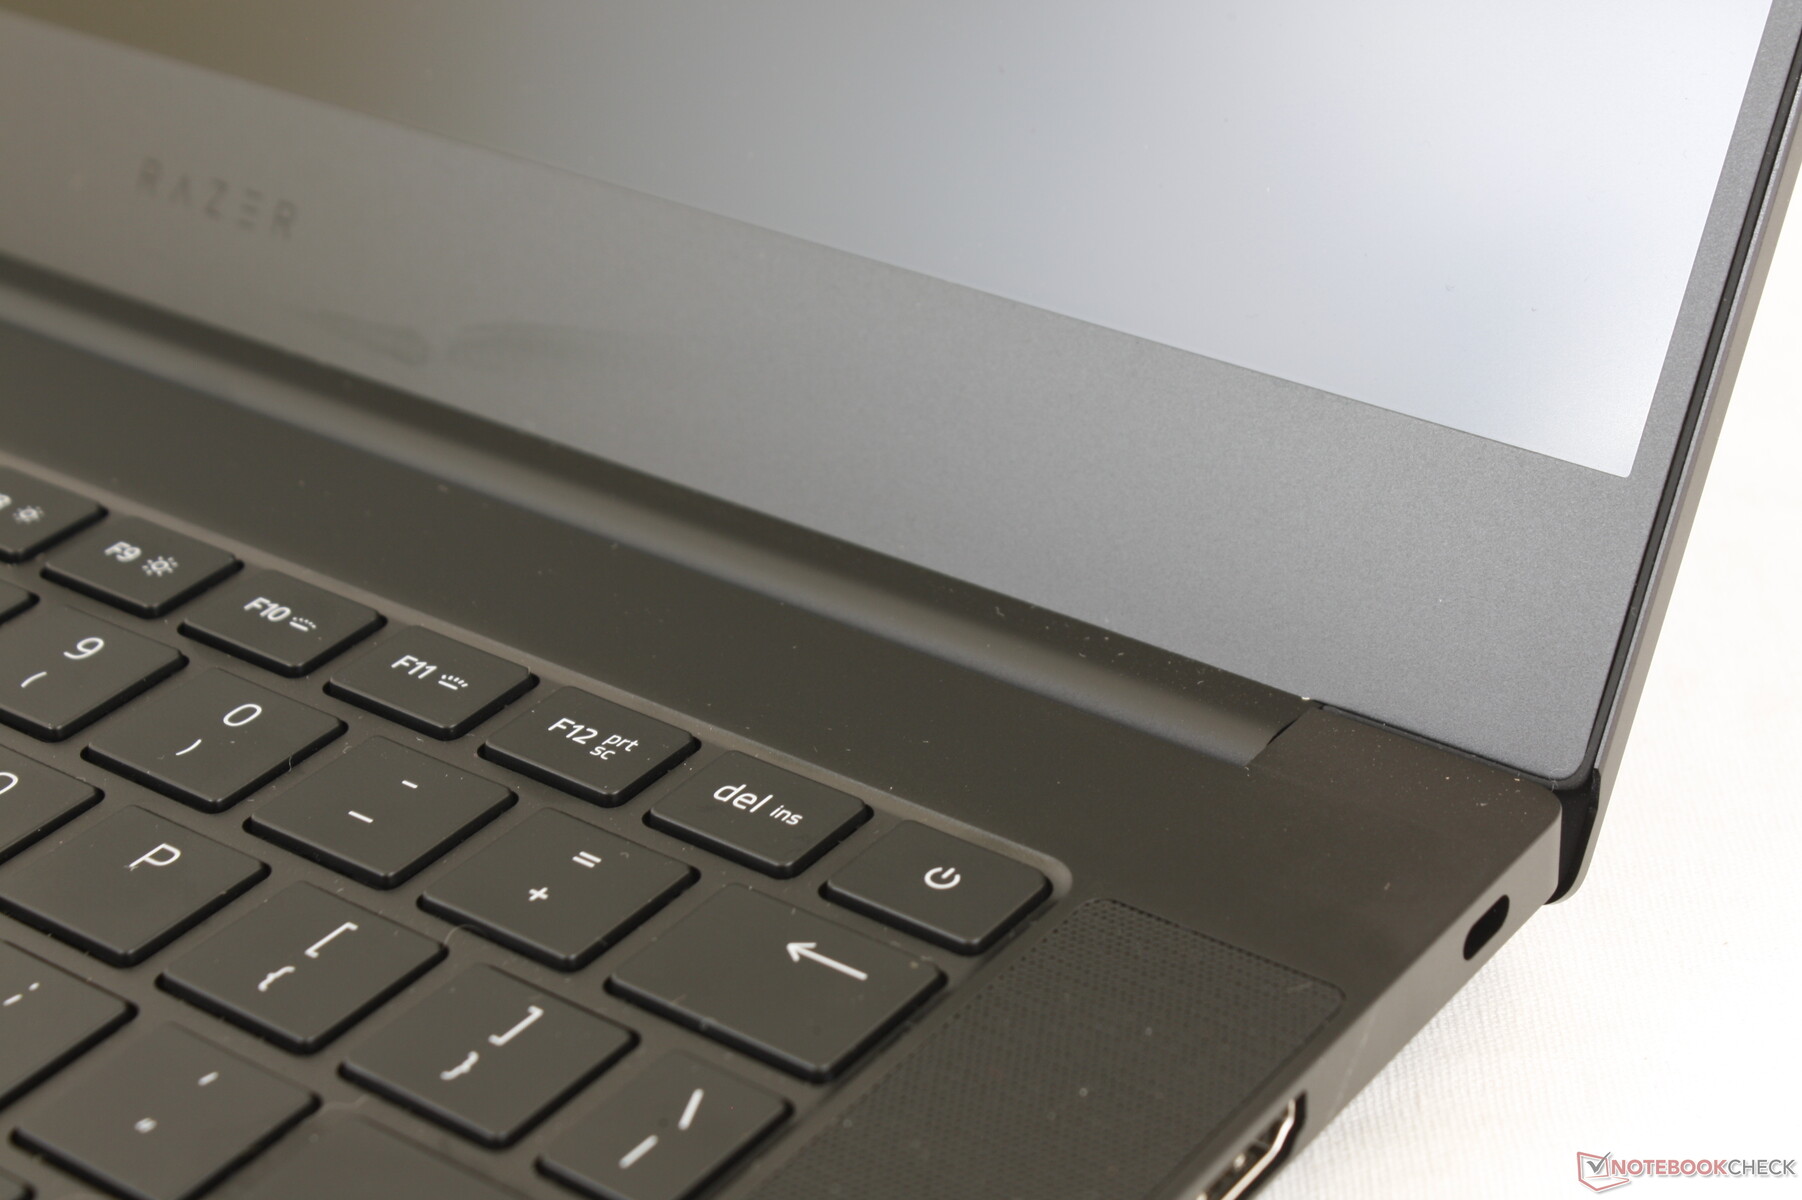
Estuche - Mismo diseño elegante, nuevo tamaño más pequeño
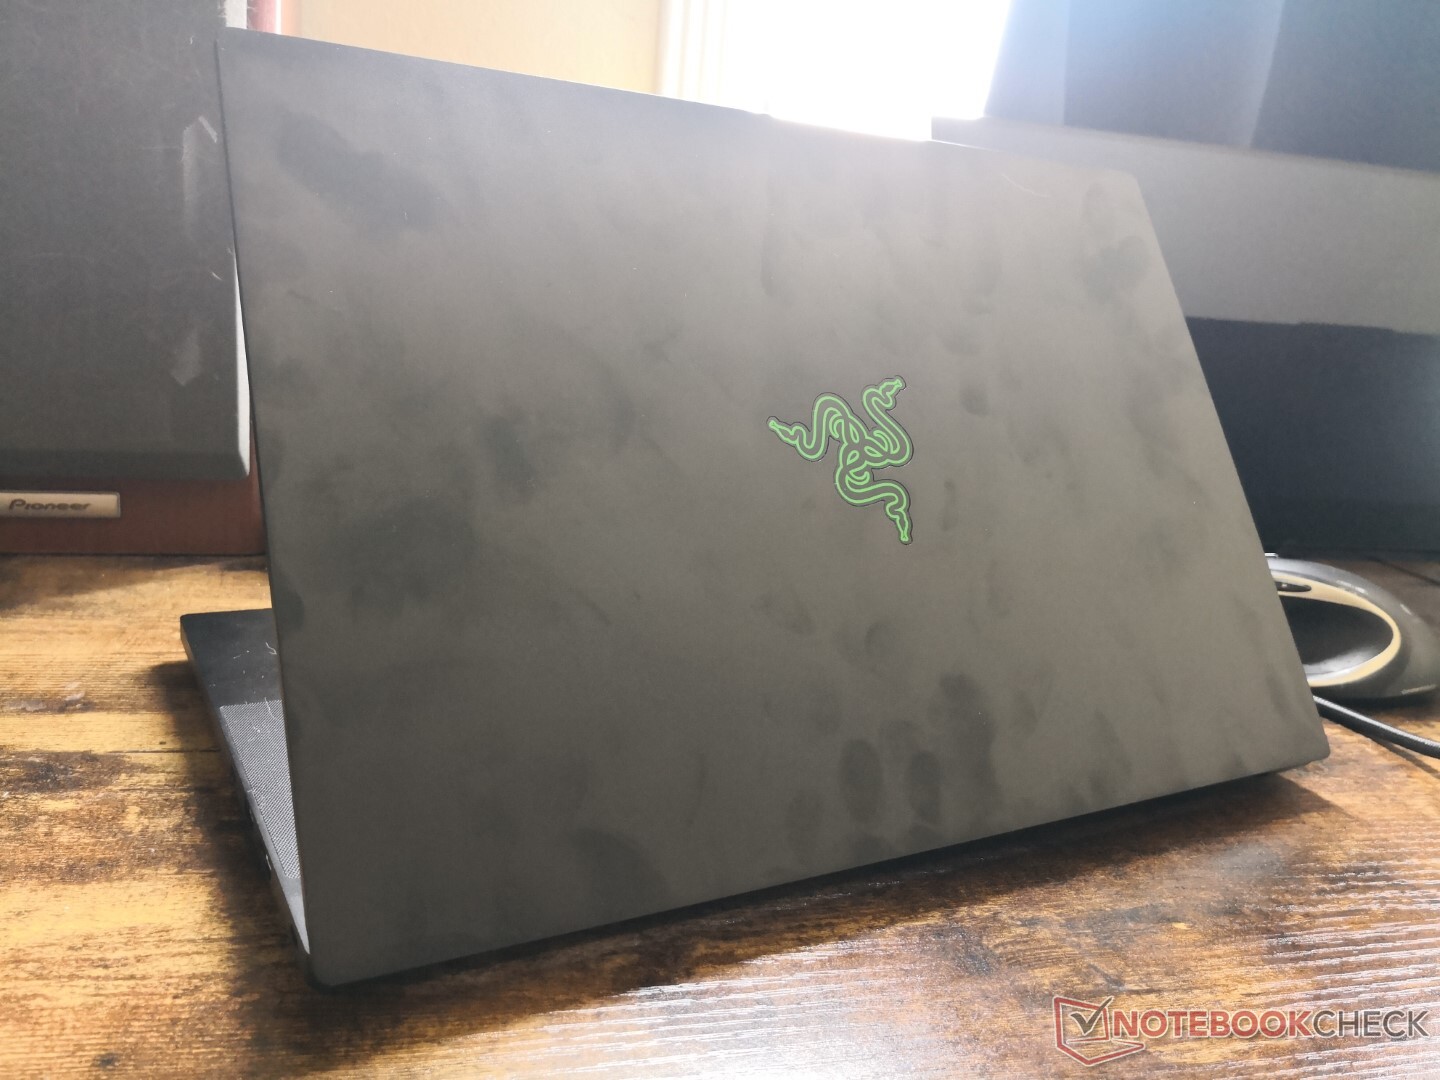
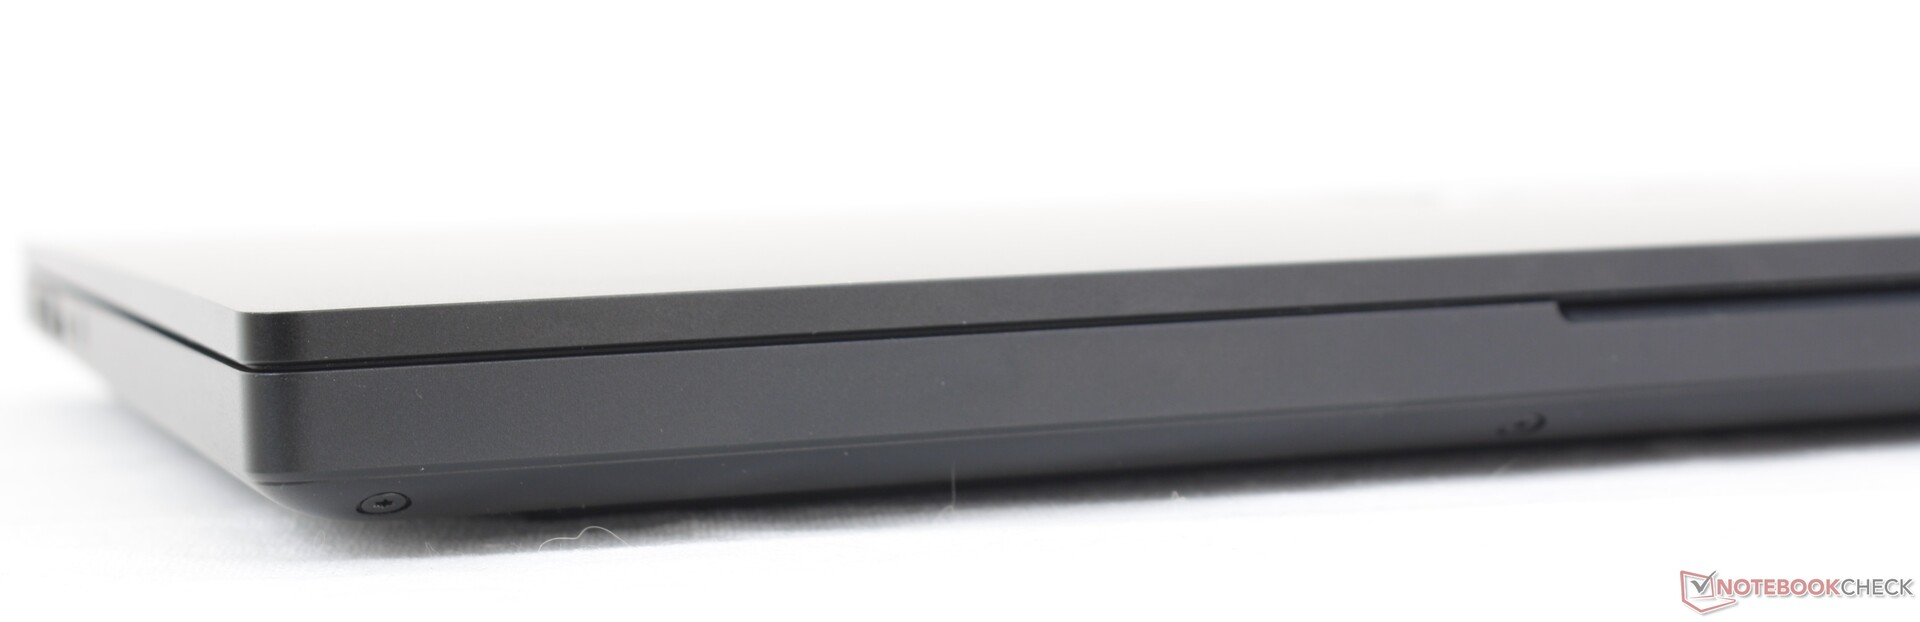
El diseño del chasis y los materiales de aleación de aluminio son similares a los últimos modelos Blade Stealth, Blade 15 y Blade Pro. Si has tenido en tus manos alguno de estos modelos Blade en los últimos años, ya te habrás hecho una idea del aspecto y el tacto del Blade 14. Es un 20% más grande que el Blade Stealth, con la misma base robusta y superficies lisas y mate.
La tapa es notablemente más susceptible de torcerse y deformarse que el resto del portátil. No es malo ni mucho menos, pero nos parece que las tapas del HP Spectre x360 14 o ZenBook Duo 14 sean más rígidas para una mejor sensación de longevidad.
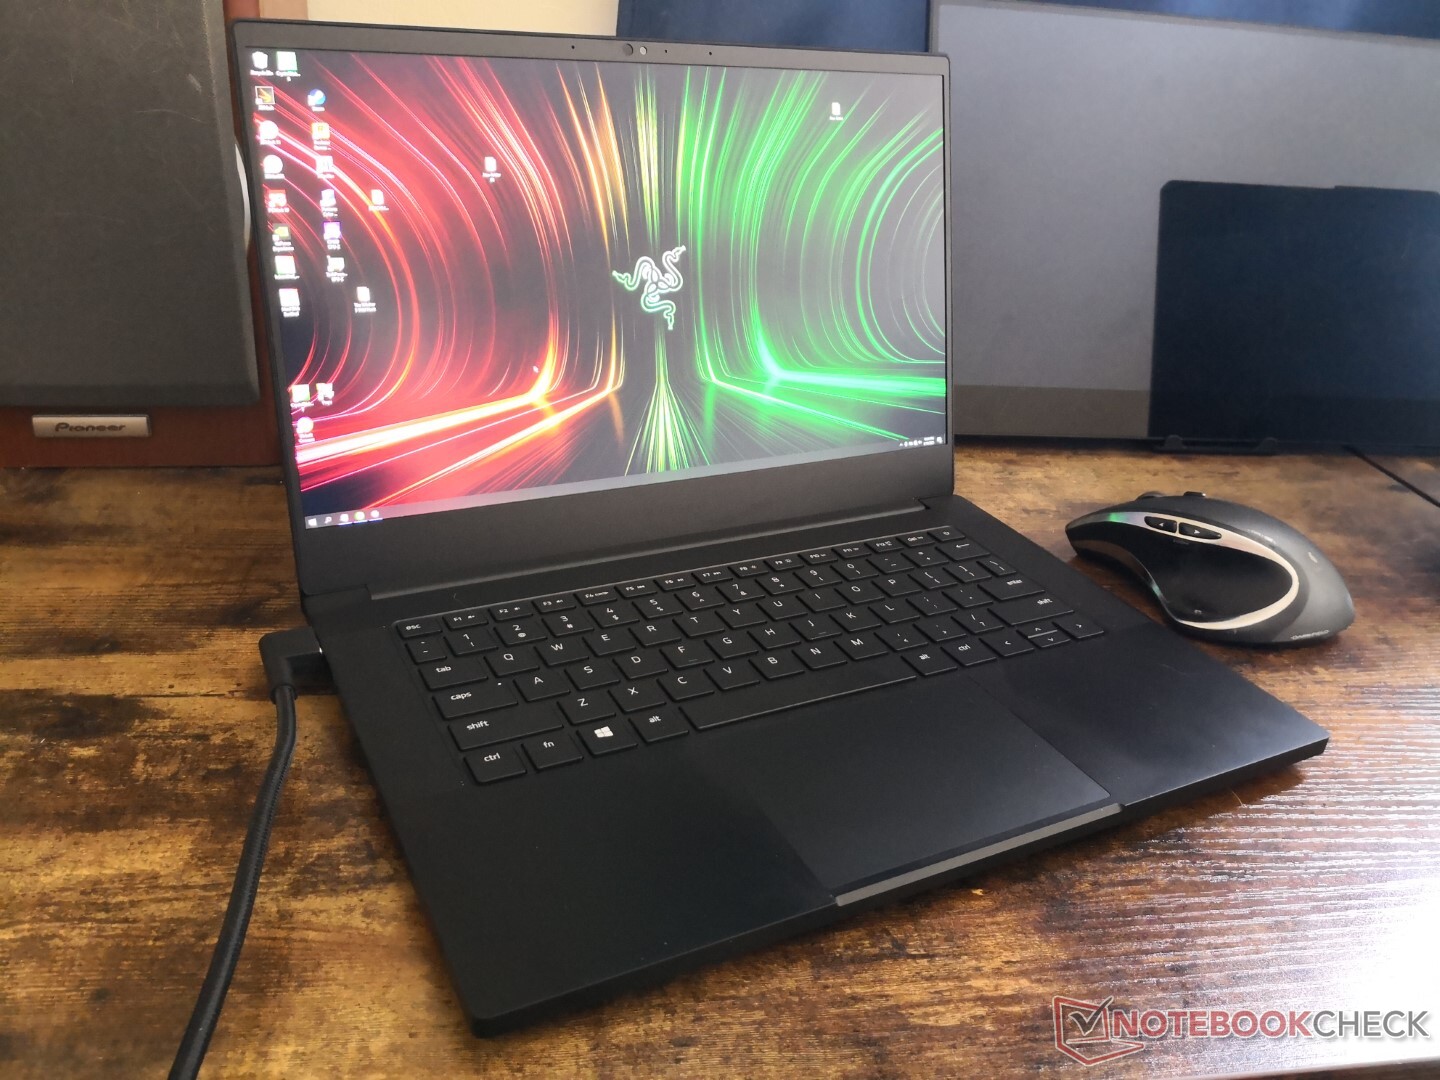
El sistema es ligeramente más pequeño que el Zephyrus G14 en las tres dimensiones, aunque pesa unos 200 g más en el proceso. Es notablemente más denso como resultado, pero el pequeño tamaño lo hace sentir tan portátil como cualquier otro Ultrabook de 14 pulgadas incluyendo la serie Asus ZenBook. El Blade 14 ha recorrido un largo camino desde el modelo original de 2015 que ahora es tan grande como un 2020 de 15,6 pulgadas Dell XPS 15.
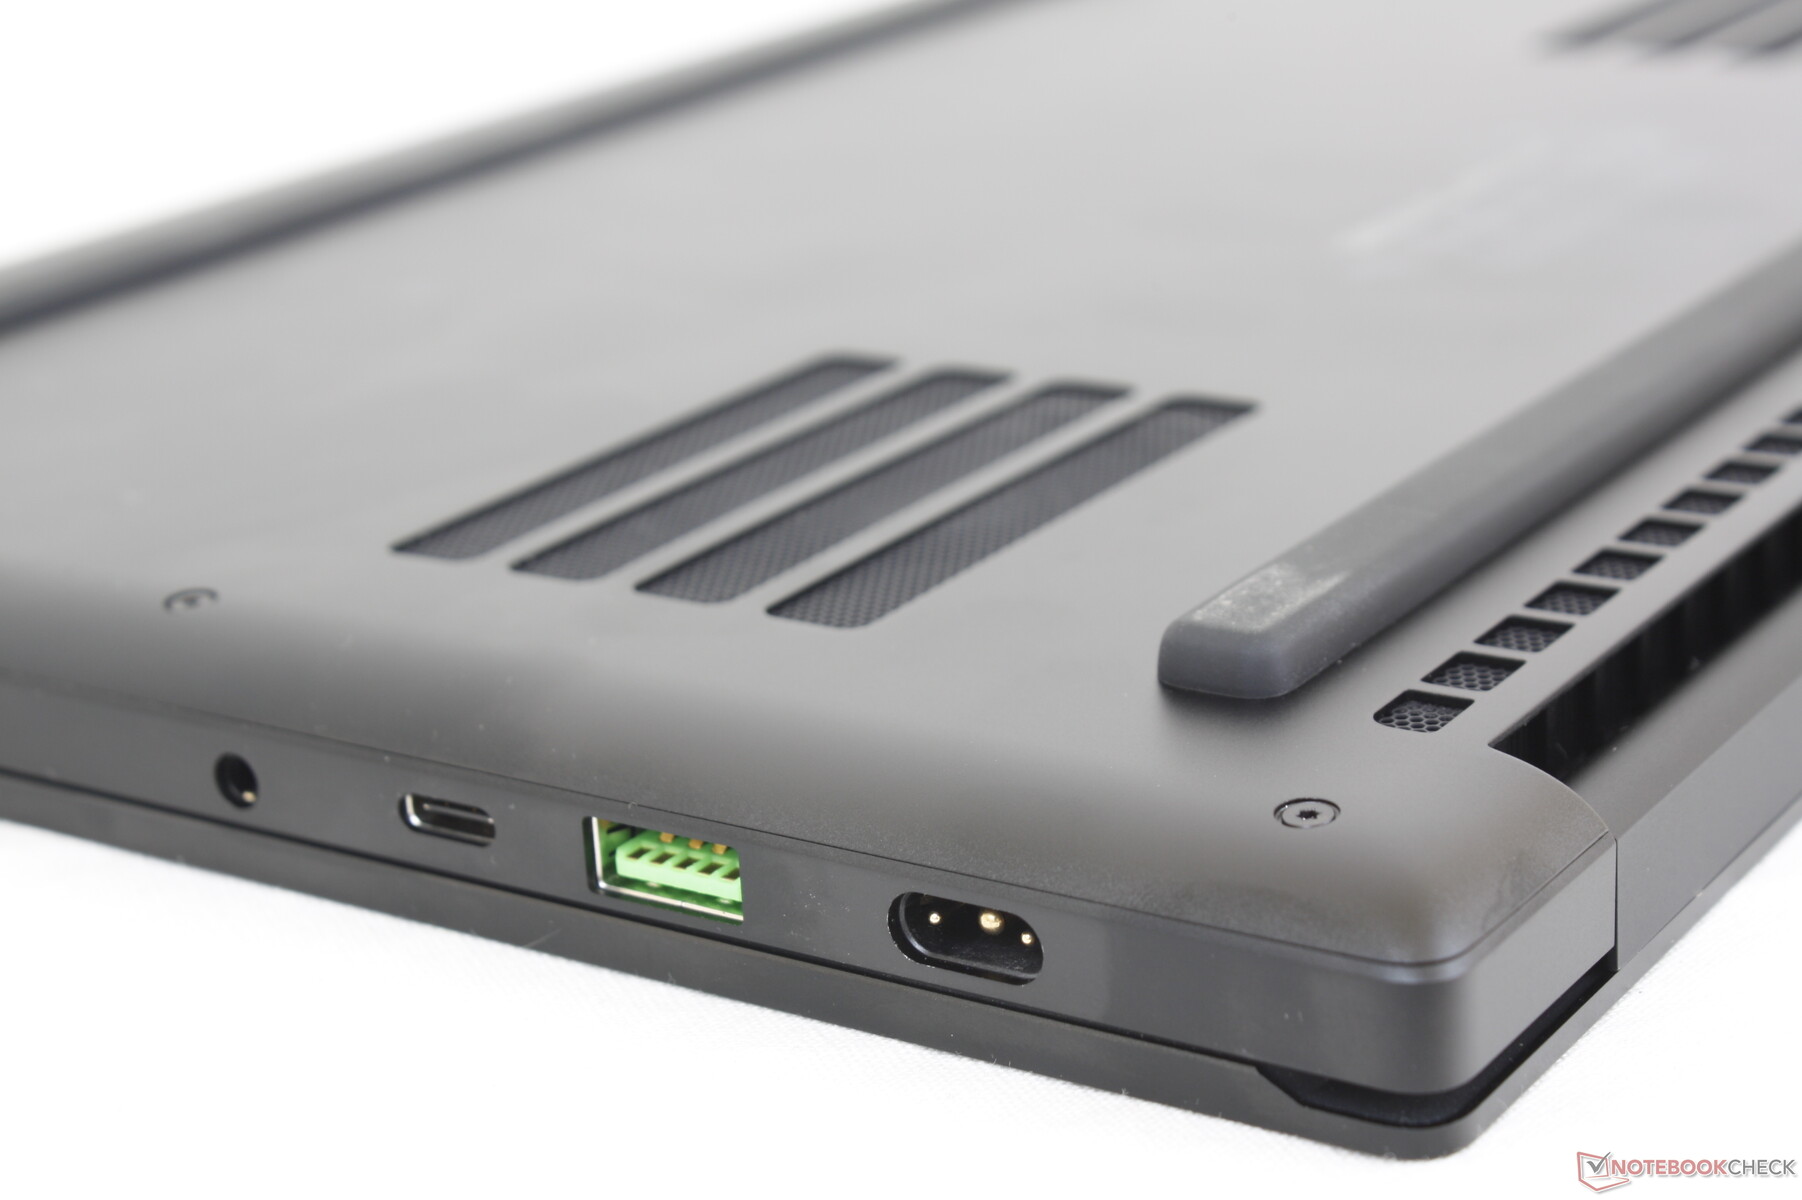
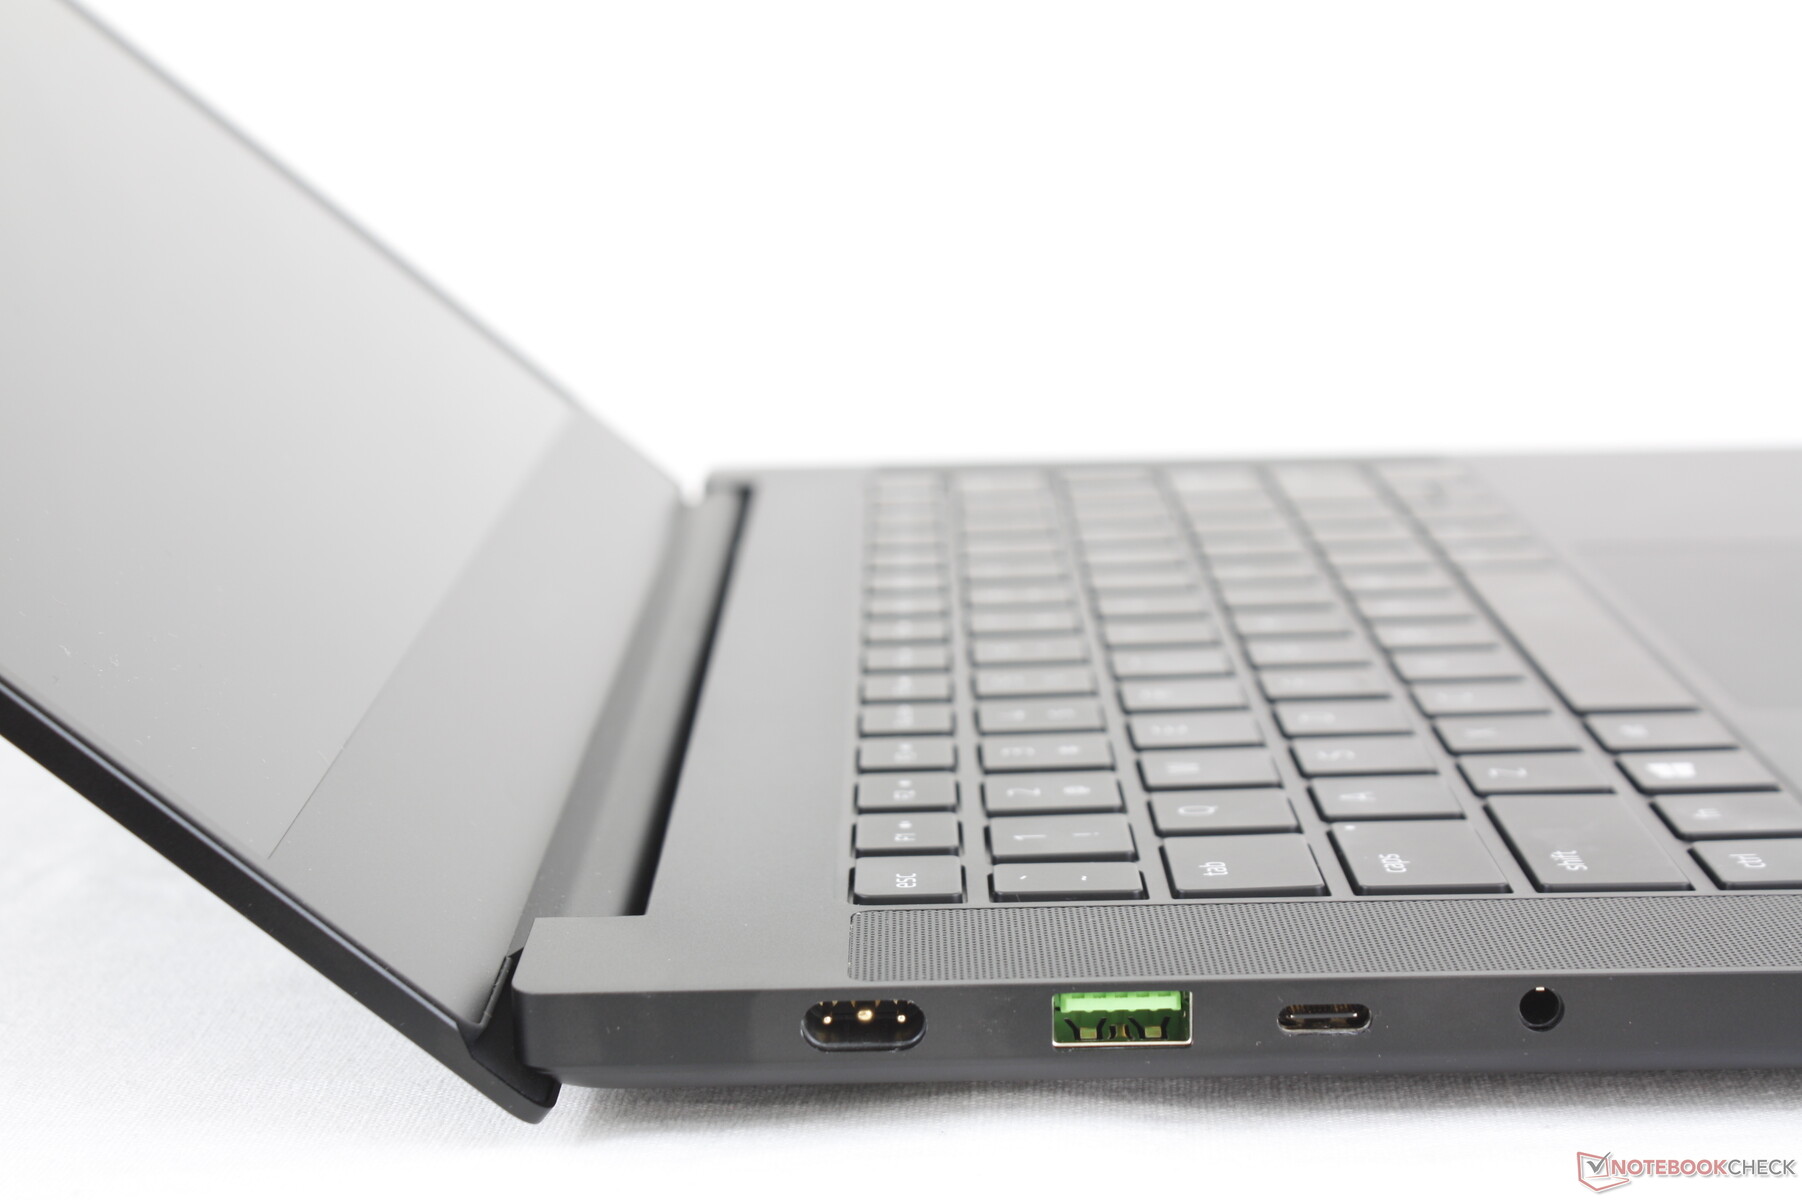
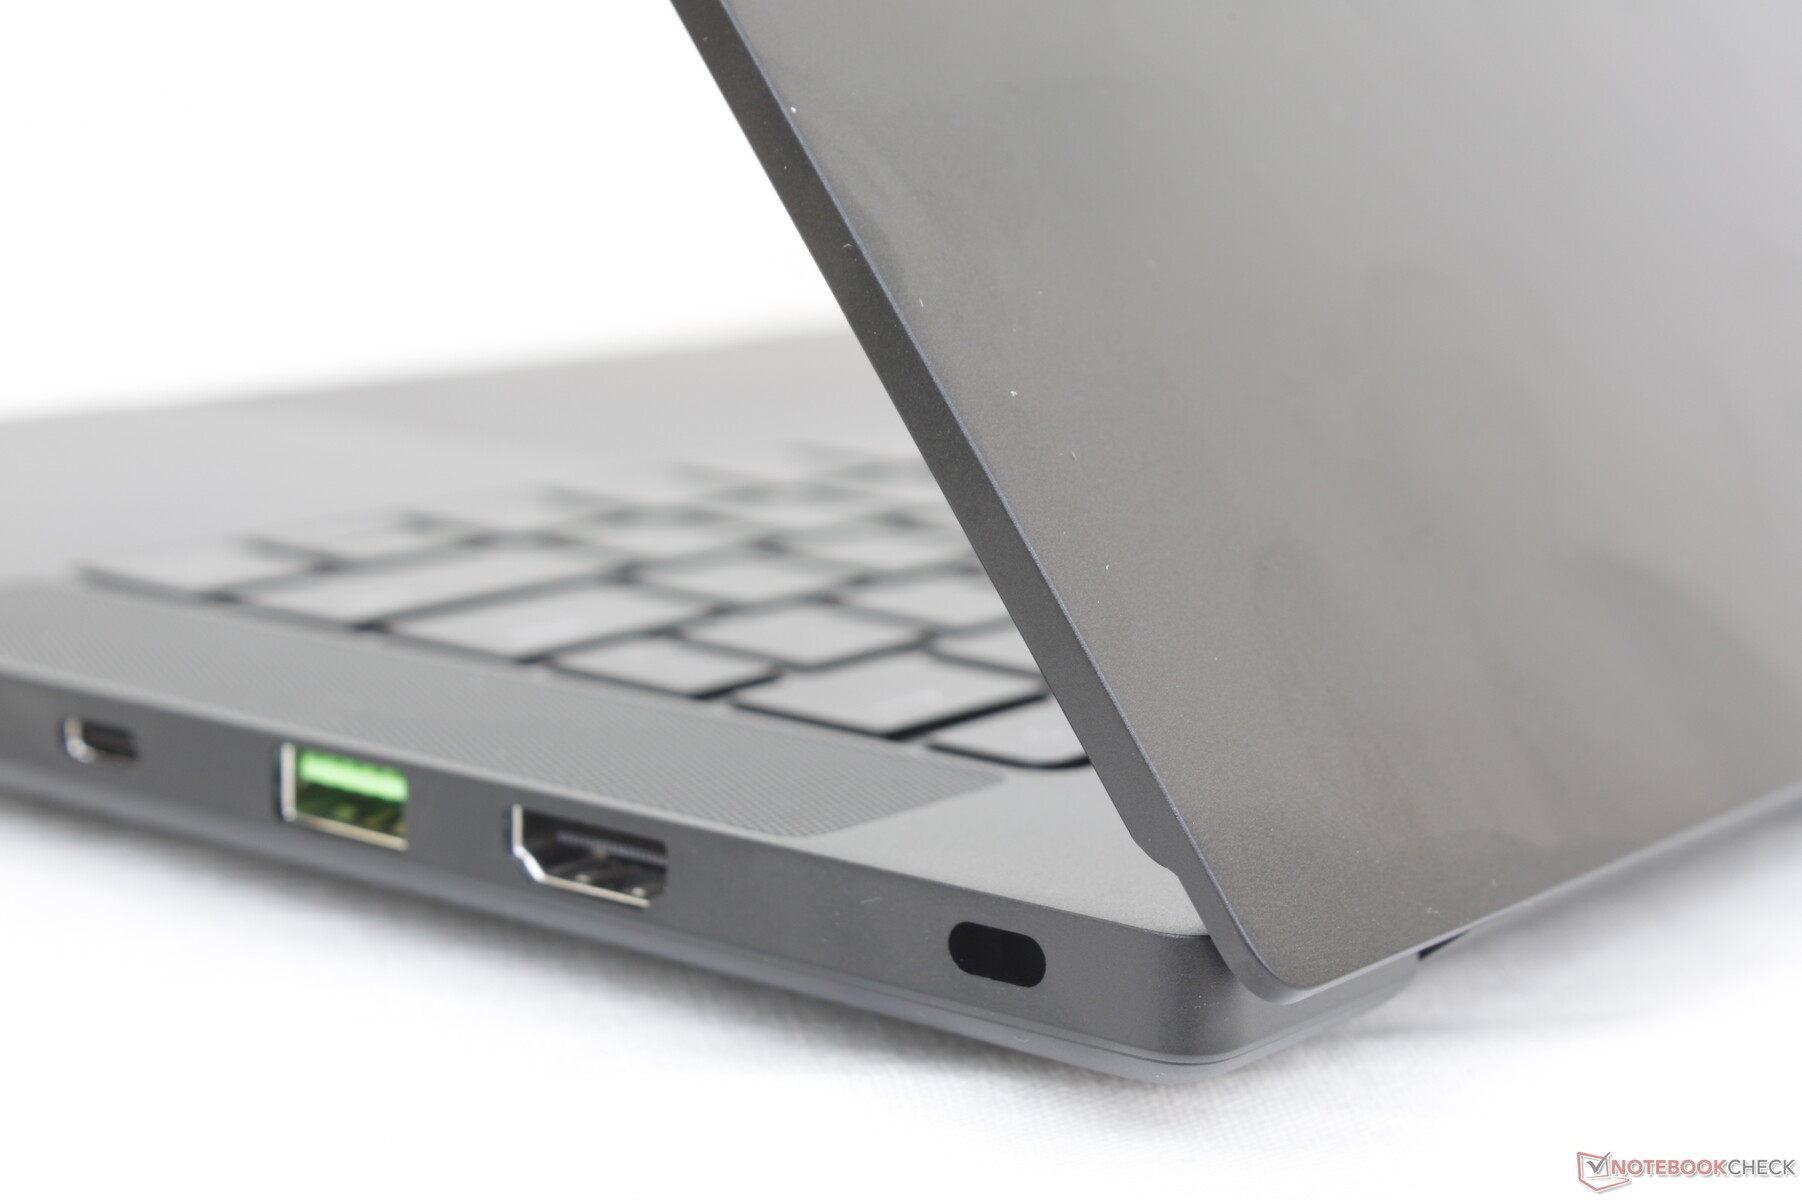
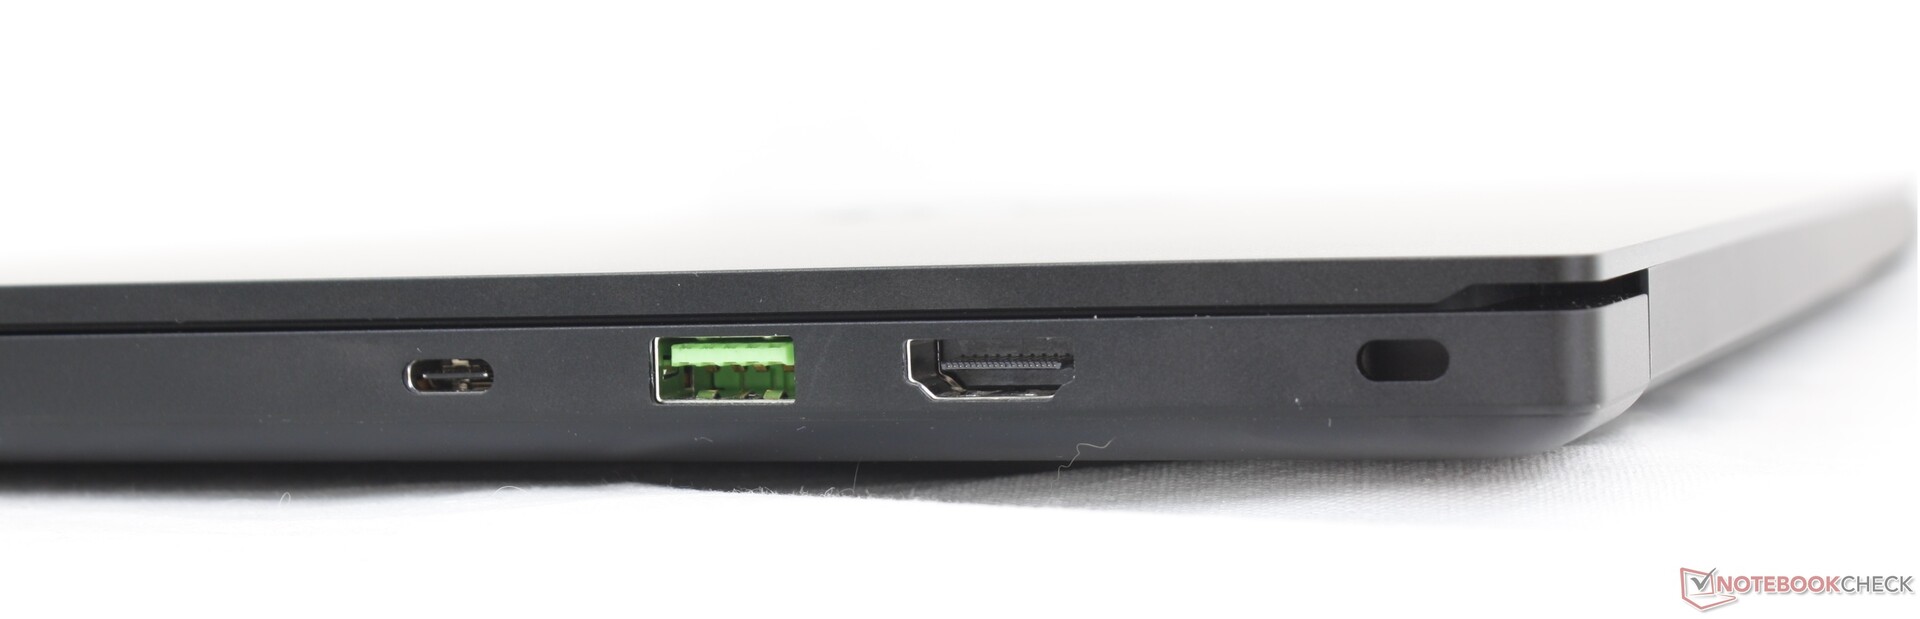
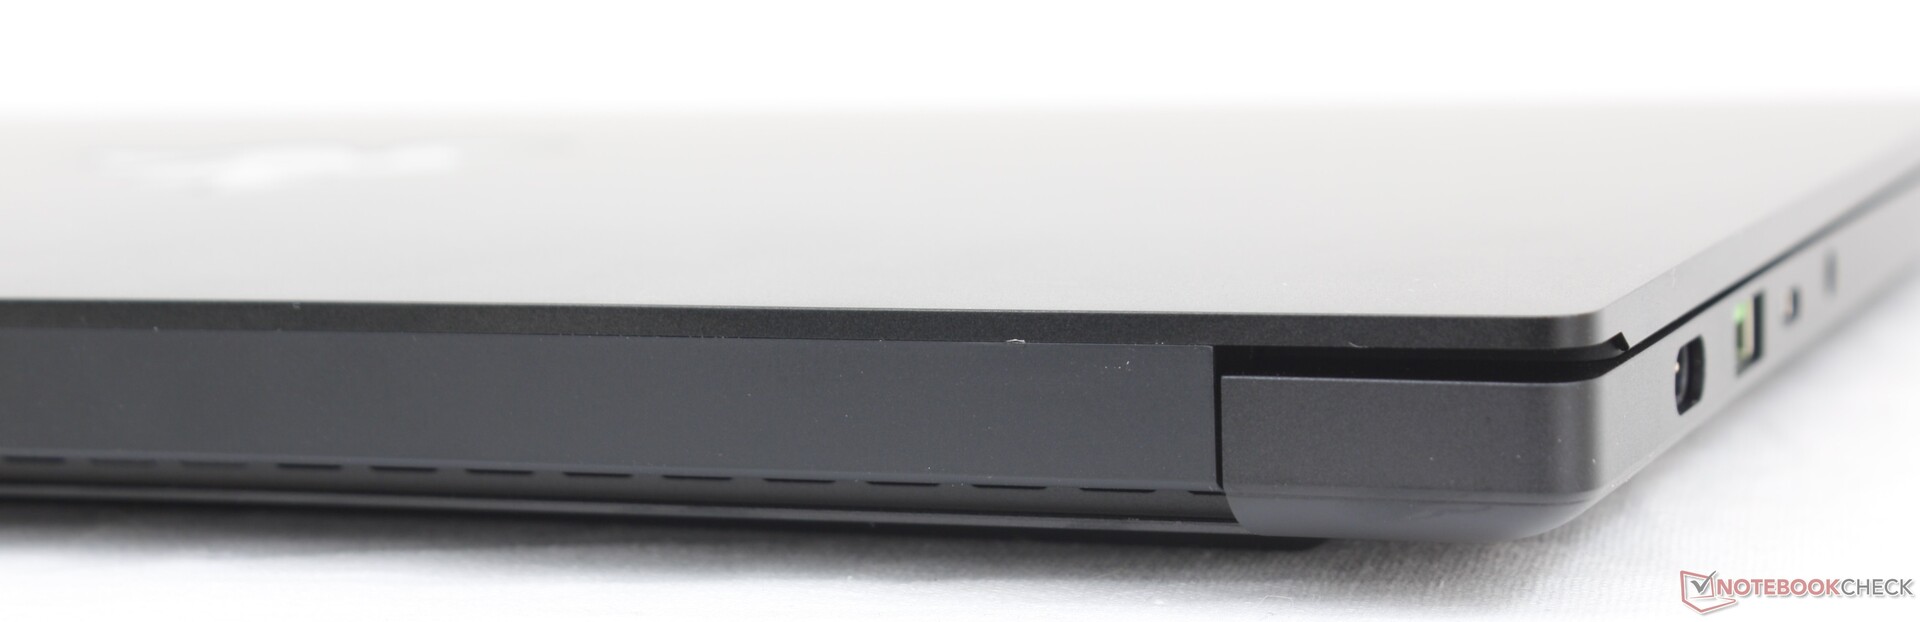
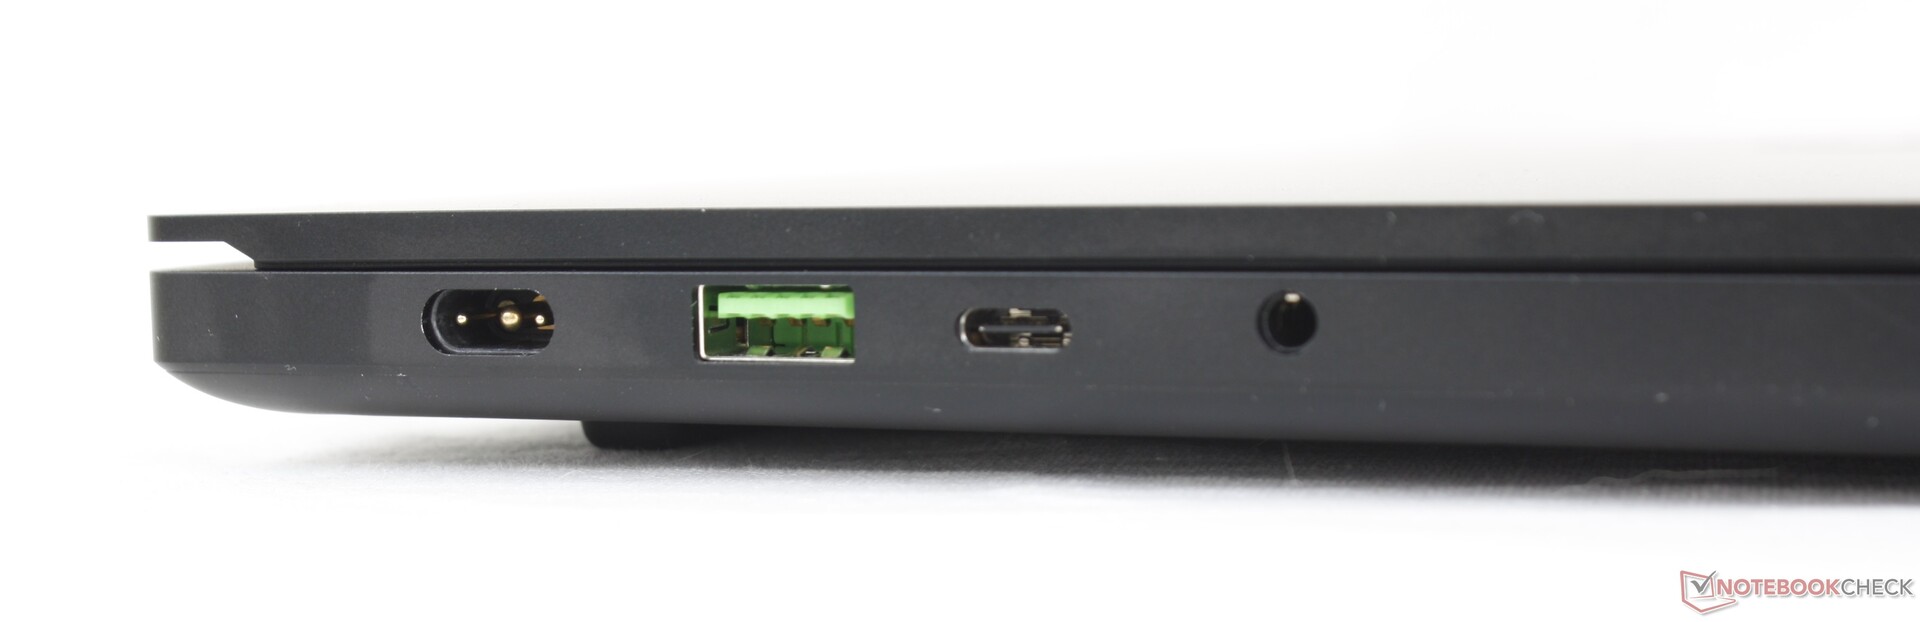
Conectividad - Thunderbolt está fuera
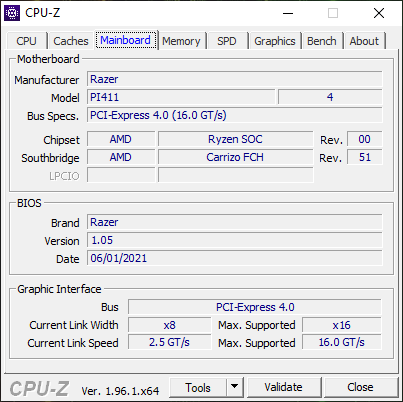
Las opciones de puerto son las mismas que en el Zephyrus G14, aunque reordenadas. Los usuarios pueden conectar hasta tres monitores externos o recargar el portátil por USB-C en lugar del cargador de barril propietario. No hay soporte para Thunderbolt debido a la falta de un controlador integrado en los procesadores AMD, lo que convierte al Blade 14 en el único portátil Blade moderno que no es compatible con la serie Razer Core eGPU. Asus ha solucionado en parte este problema introduciendo su propio conector propietario en el ROG Flow X13 para soportar estaciones de acoplamiento de GPU externas específicas.
Comunicación
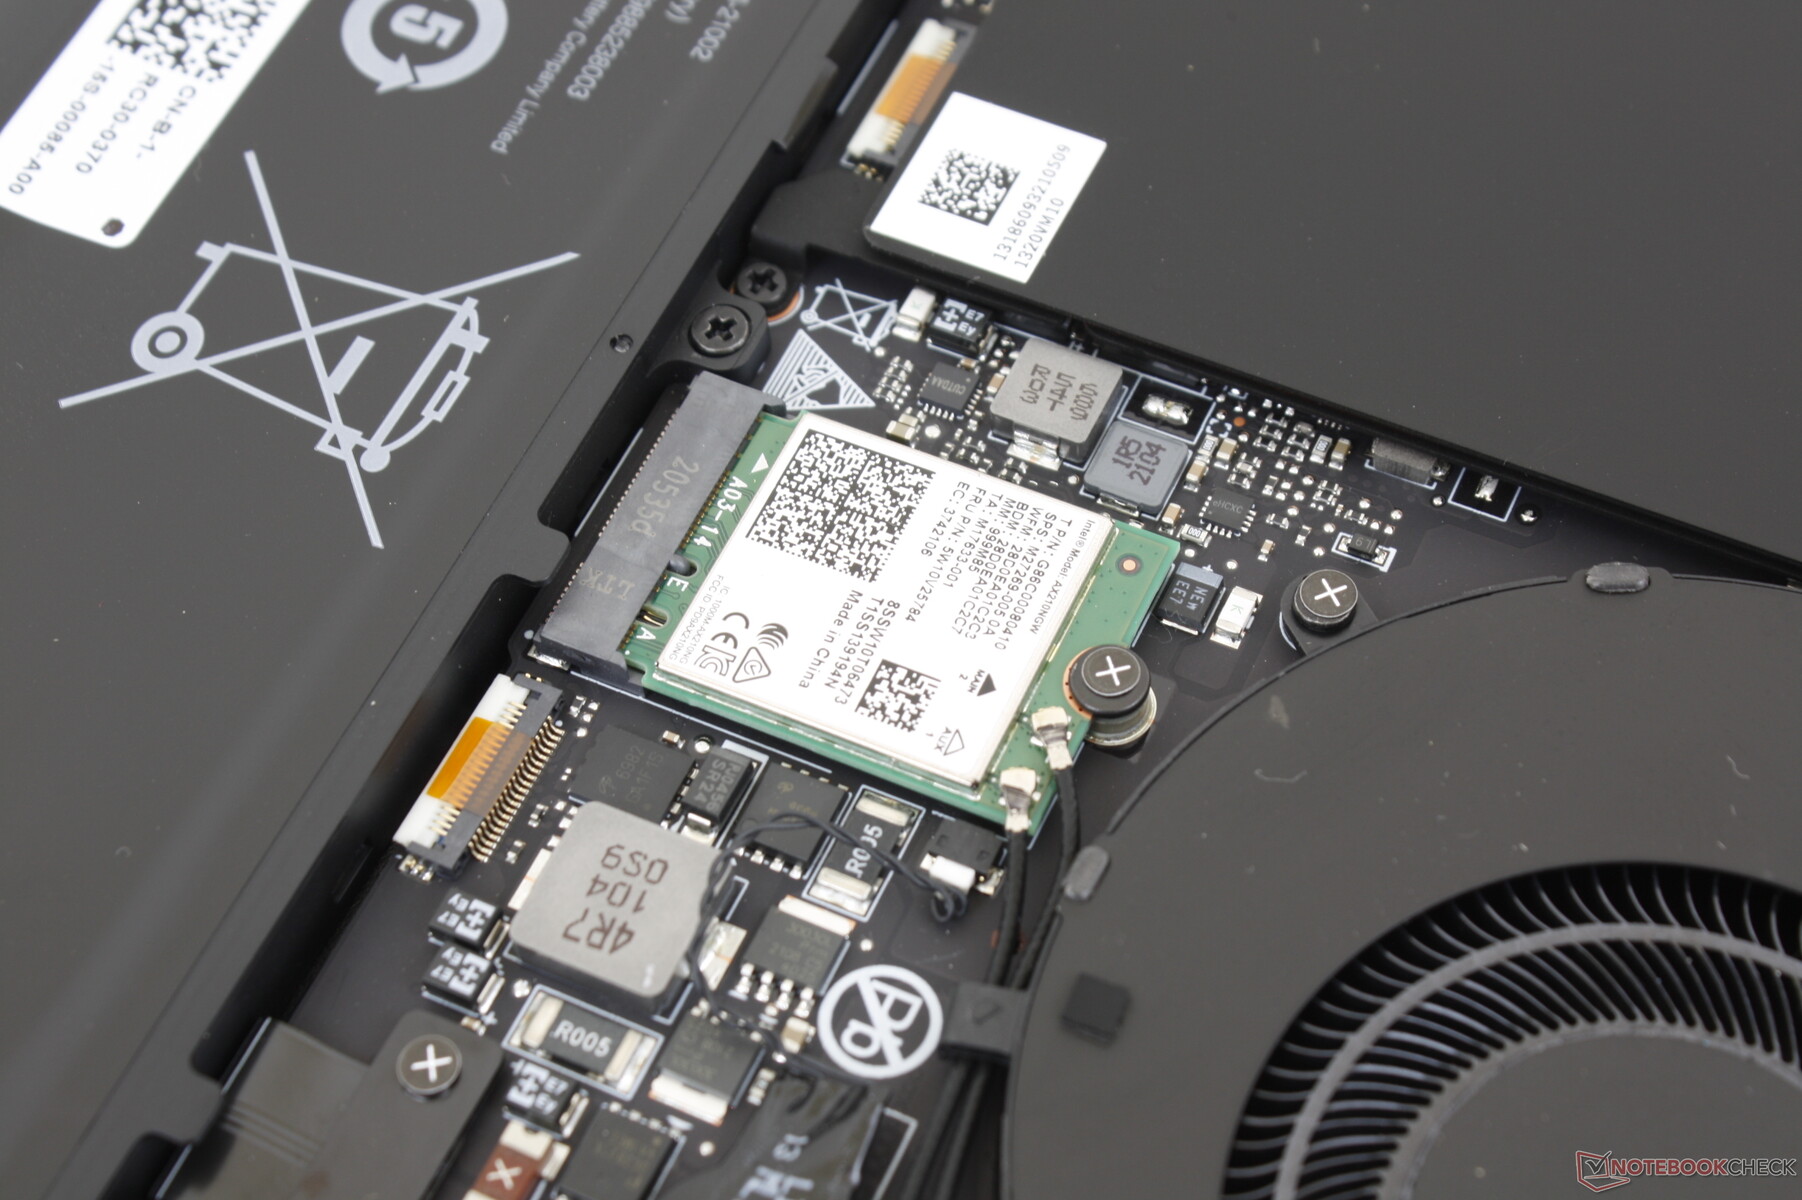
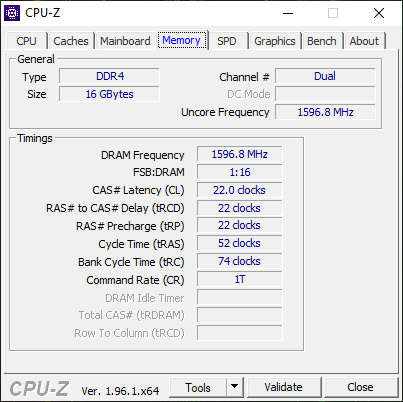
El Intel AX210 viene de serie para la compatibilidad con Wi-Fi 6E y Bluetooth 5.2, mientras que la mayoría de los demás portátiles siguen saliendo con el Intel AX200/201 para la Wi-Fi 6 normal. La mayoría de los usuarios no podrán aprovechar al máximo el Wi-Fi 6E, ya que el estándar requiere otro router diseñado para el Wi-Fi 6E. Esta característica es más una prueba de futuro para el Blade 14 que otra cosa.
Cámara web
La cámara no ha sido mejorada de forma significativa. Los usuarios reciben la misma cámara web de baja calidad de 1 MP que ha sido habitual en los portátiles durante años. Hay un sensor IR para Windows Hello, pero el obturador de la webcam sigue ausente.


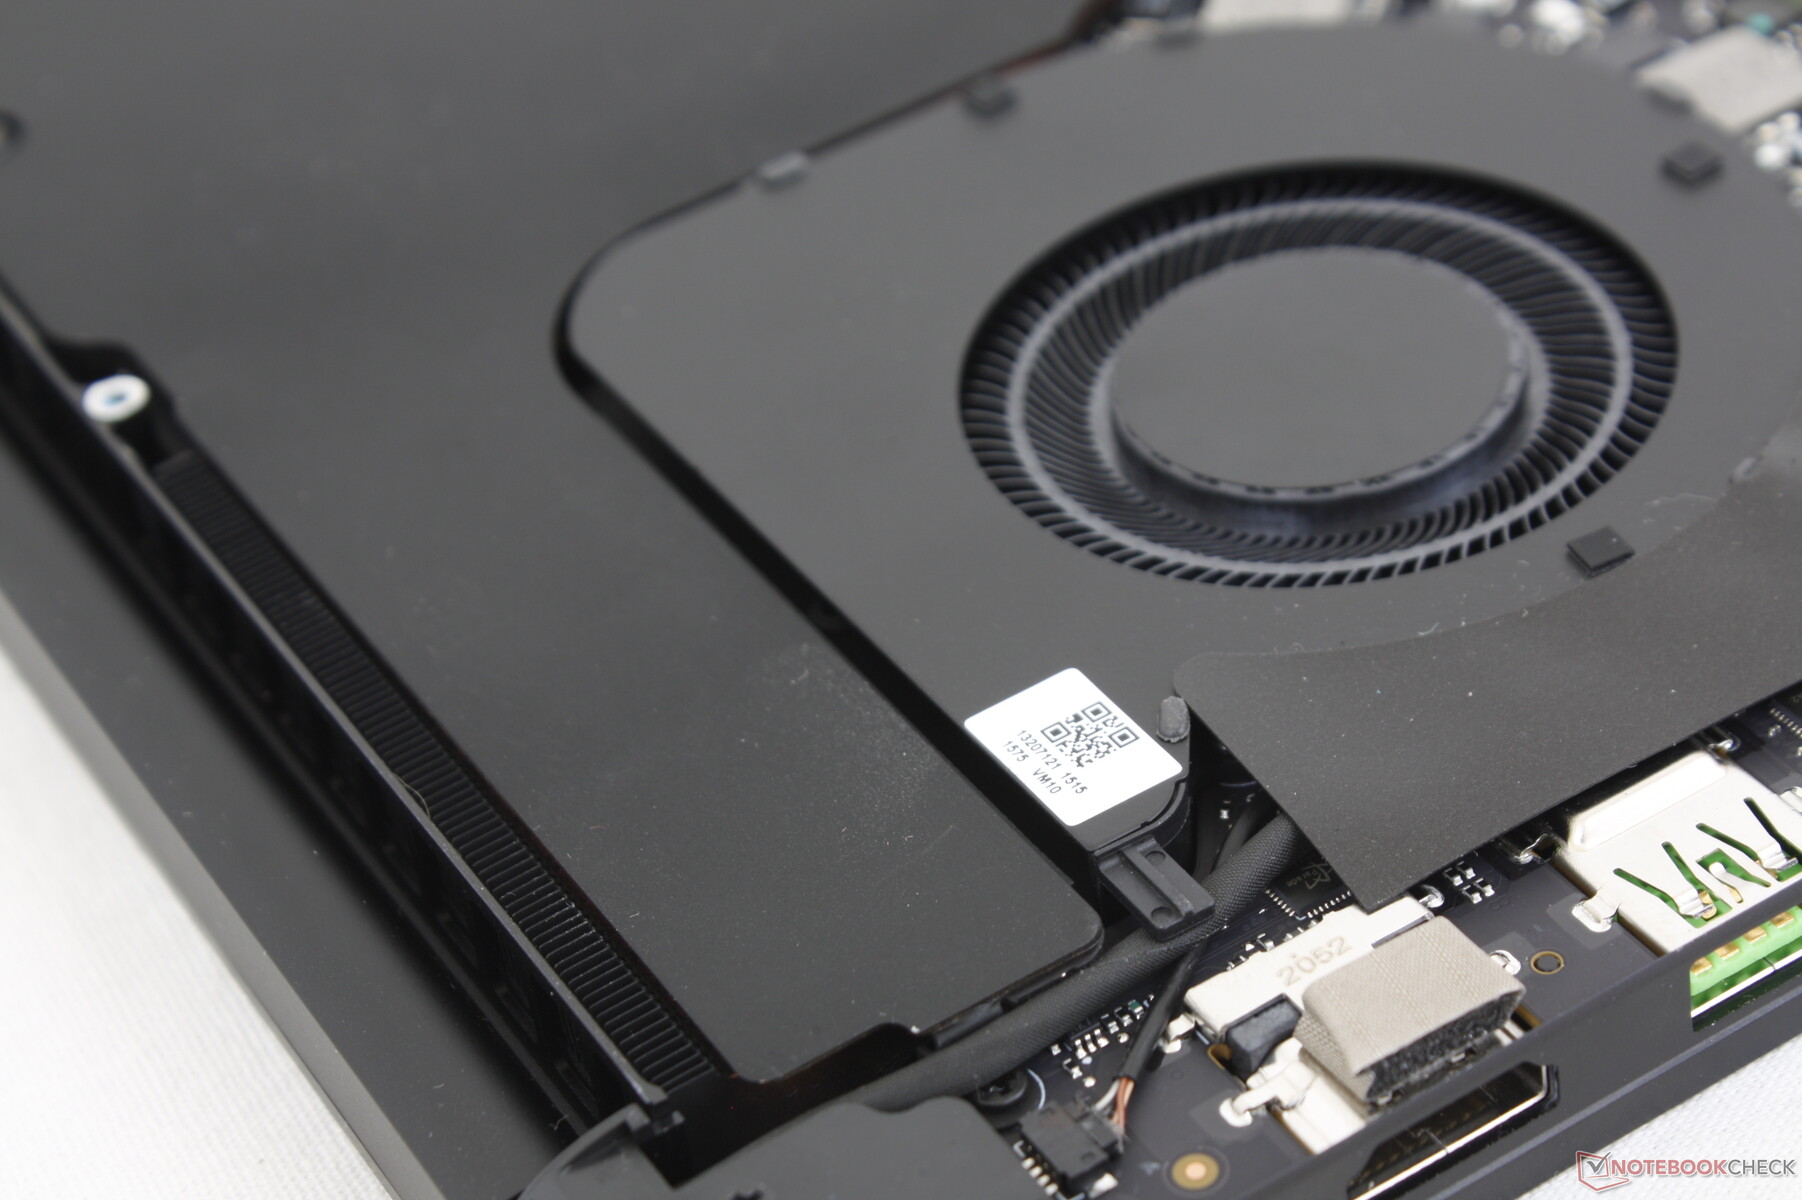
Mantenimiento
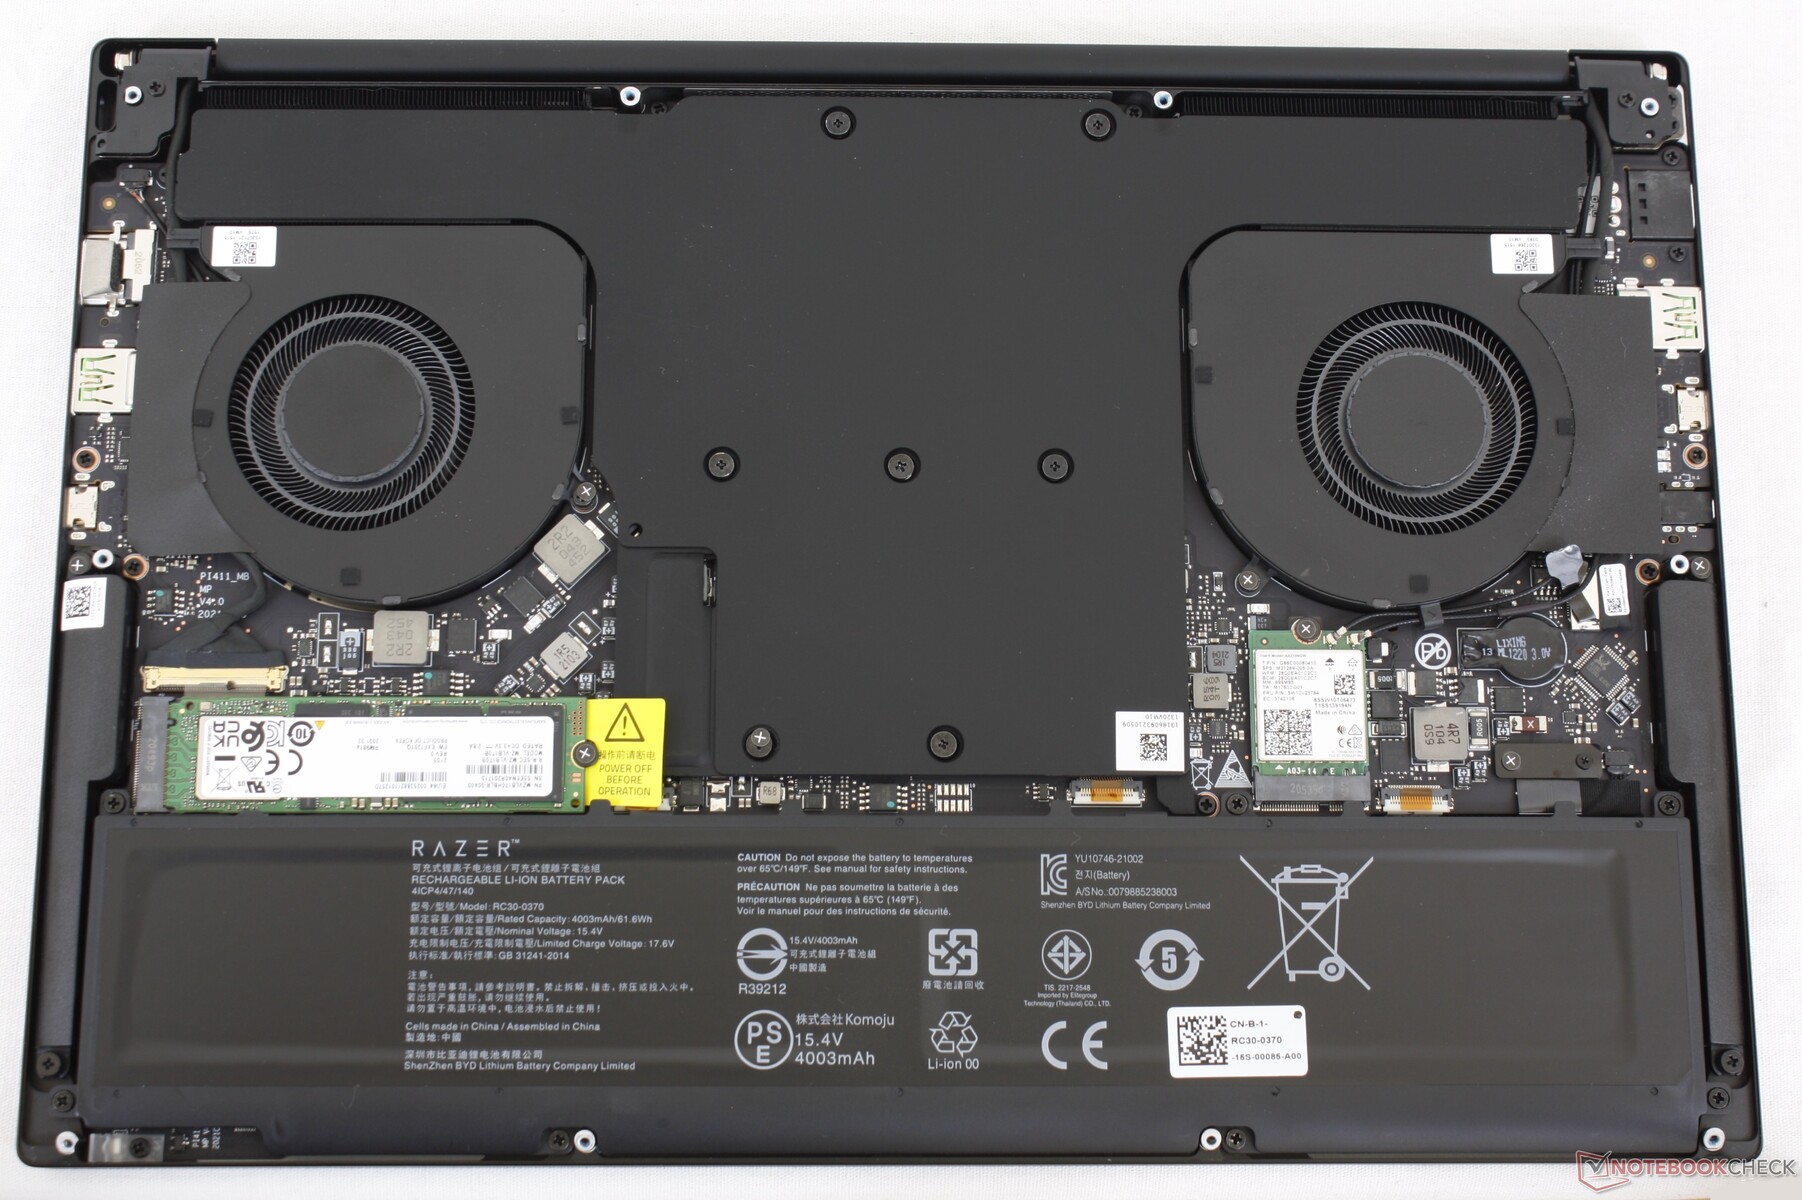
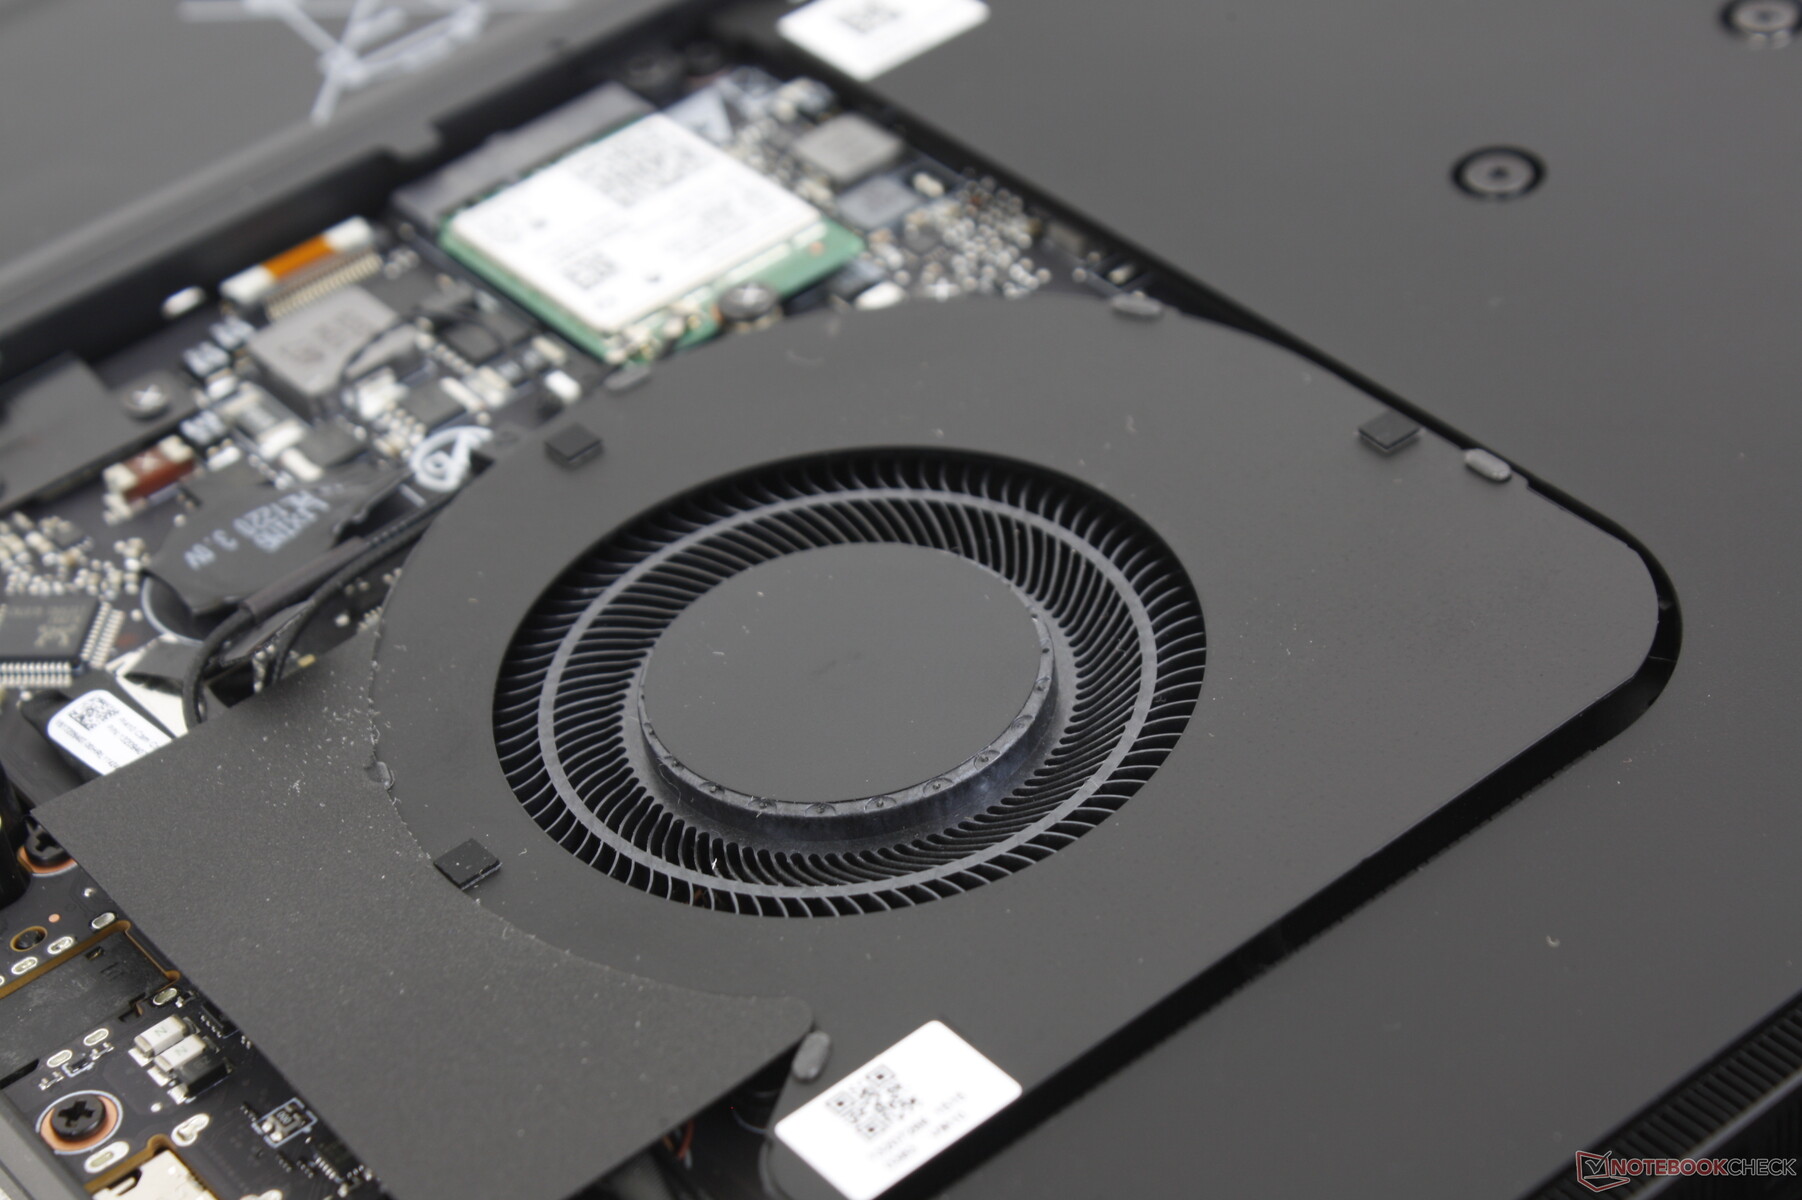
El panel inferior está asegurado por tornillos T5 Torx fácilmente extraíbles, como en otros modelos Blade. Sin embargo, no hay mucho que actualizar, ya que el sistema carece de RAM extraíble y de cualquier ranura M.2 secundaria. Los dos ventiladores y la solución de refrigeración por cámara de vapor cubren casi toda la placa base.
Accesorios y garantía
La caja de venta al público incluye un pequeño paño de terciopelo y algunas pegatinas con el logotipo de Razer. Se aplica la garantía limitada estándar de un año con opciones de extensión.
Dispositivos de entrada - Como un Blade Stealth
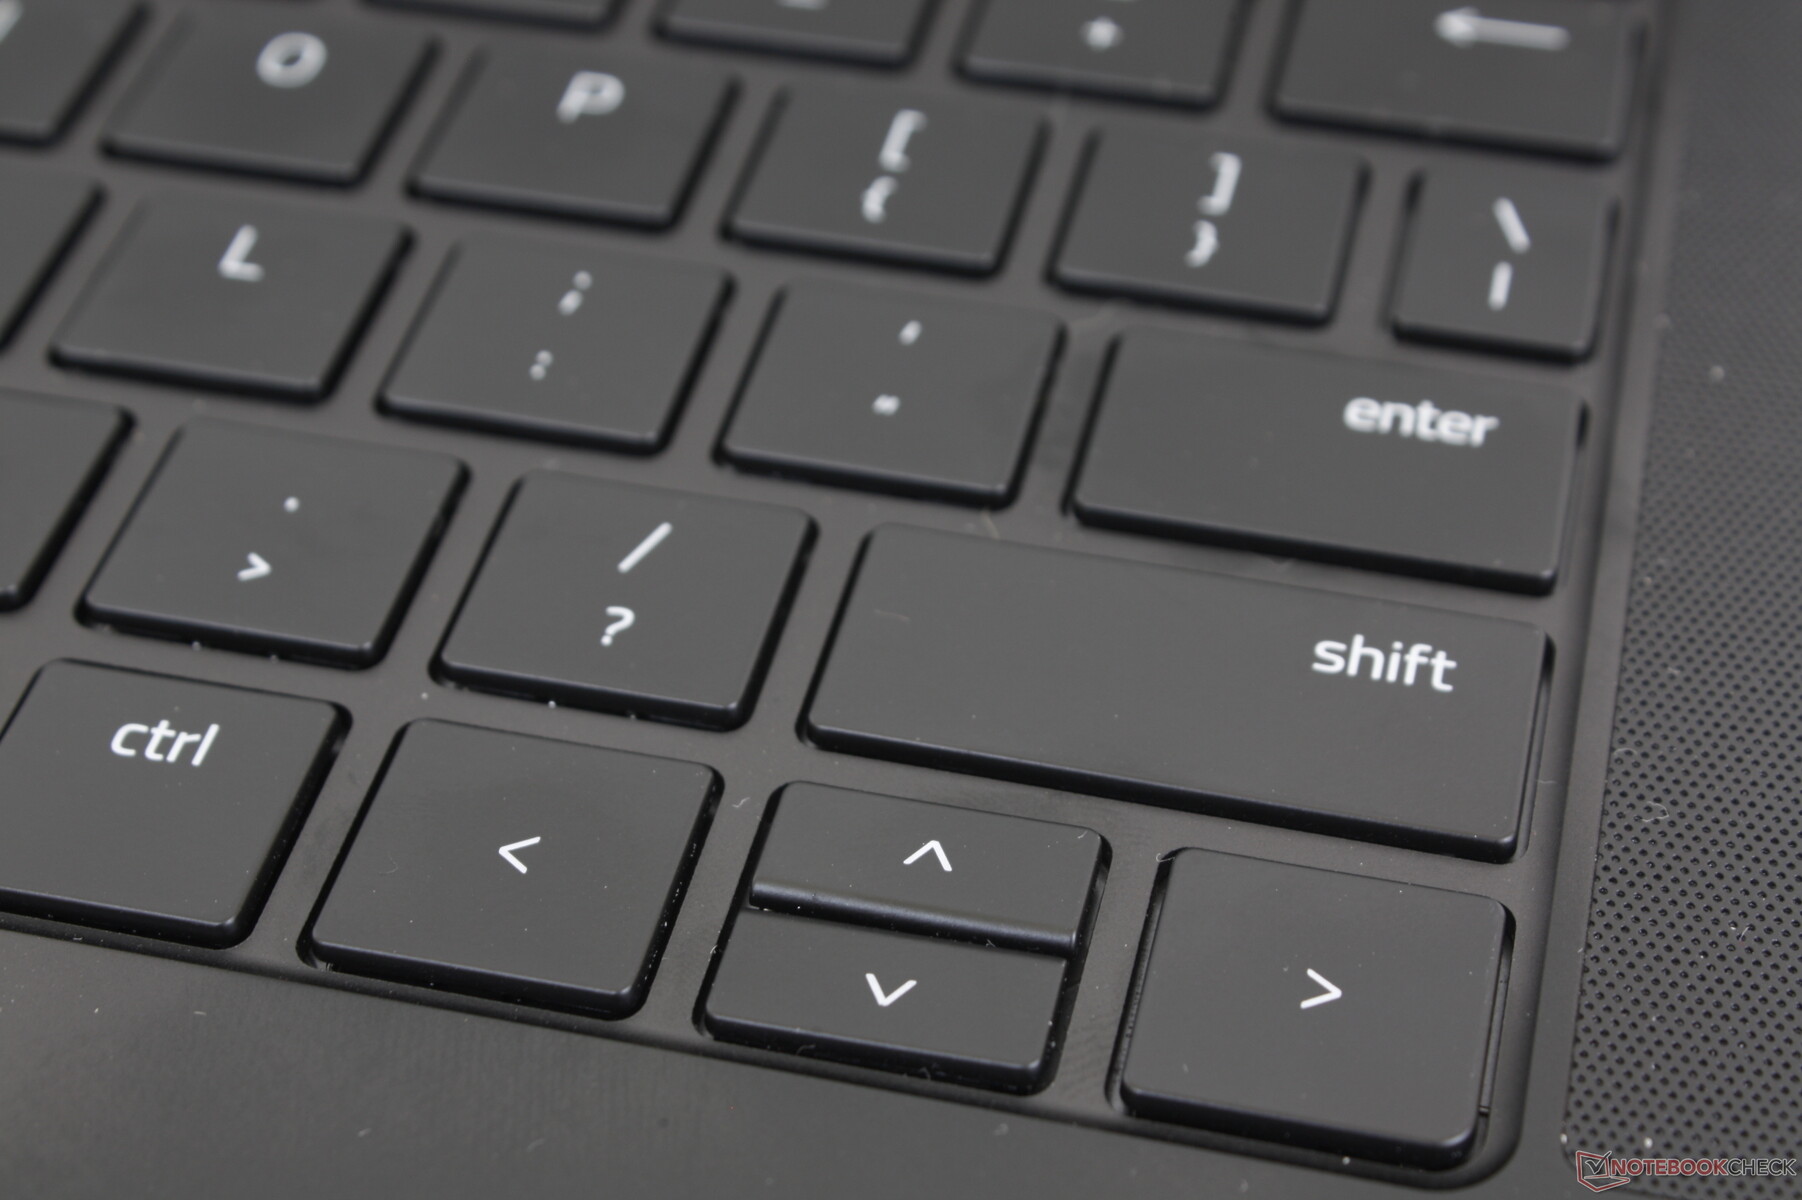
Teclado
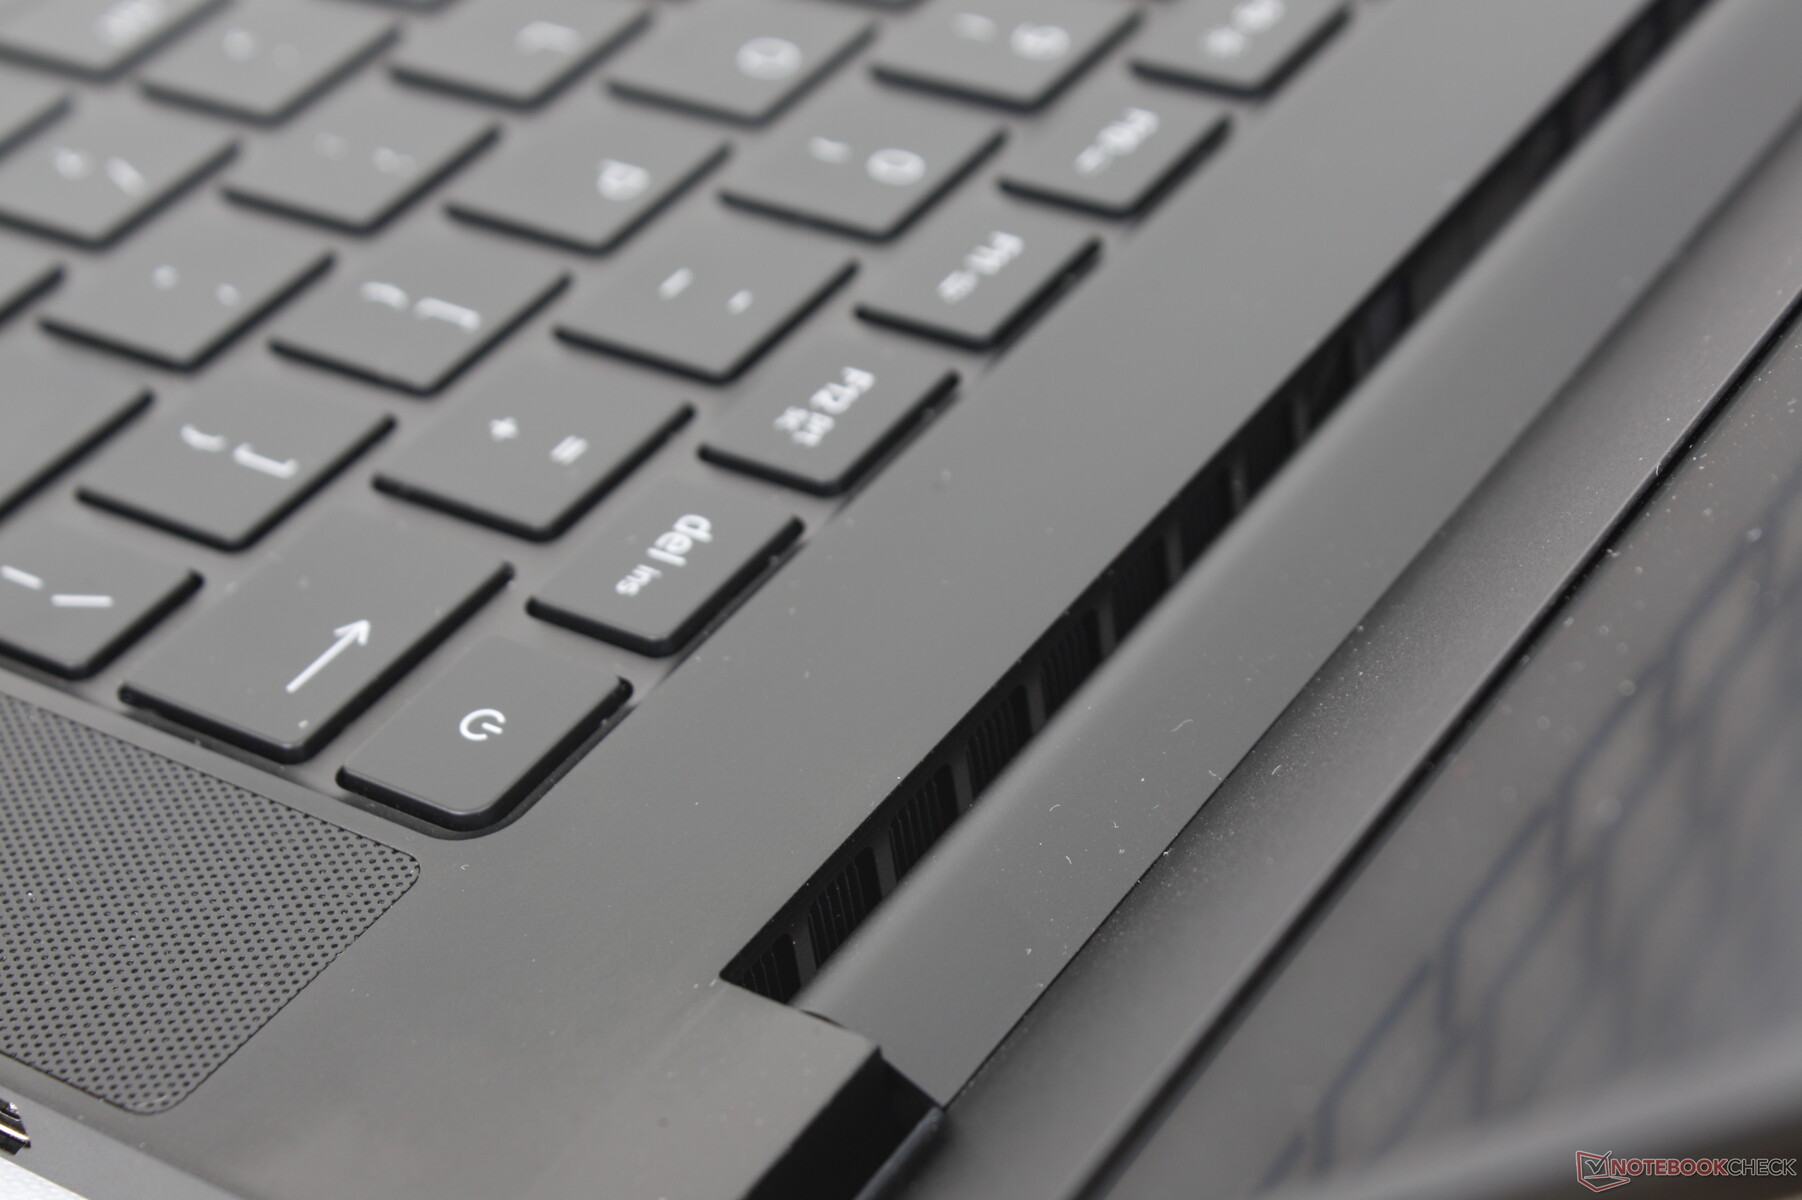
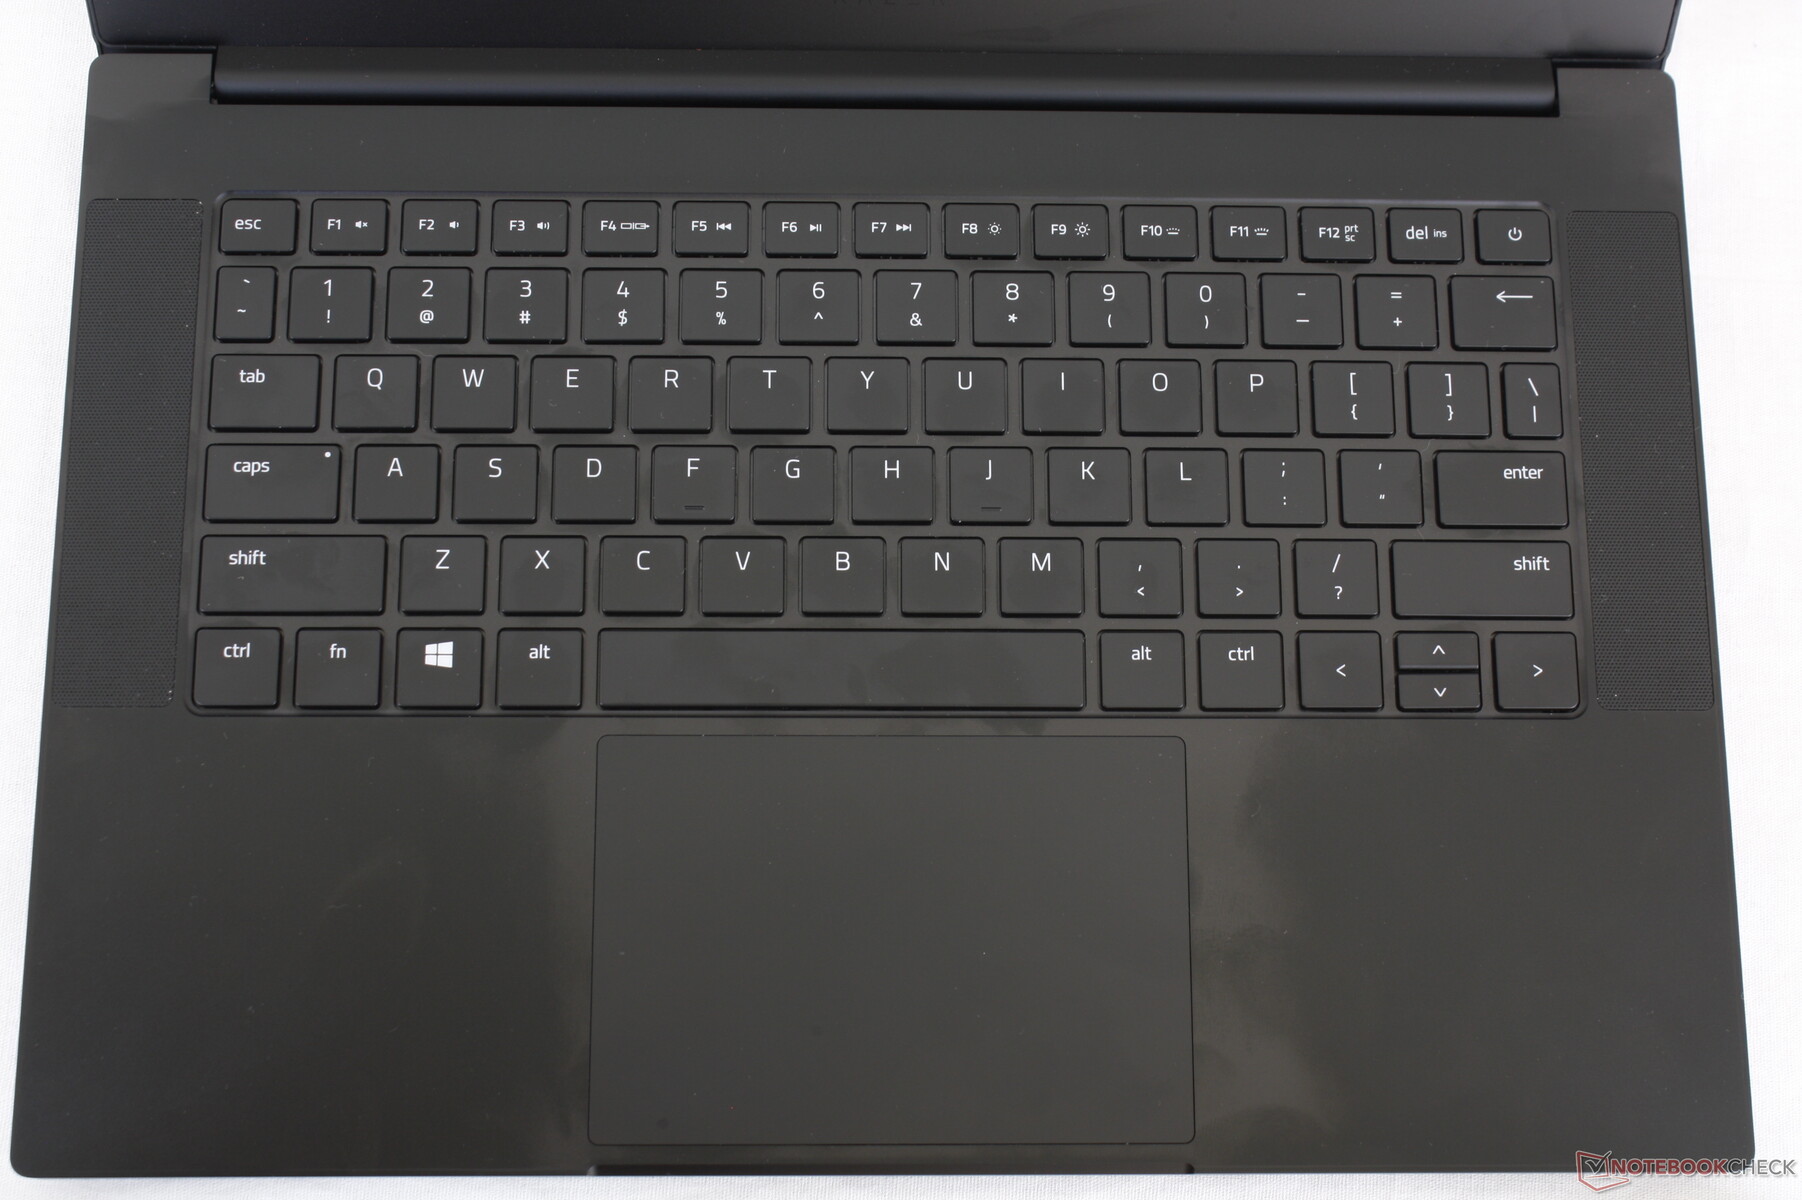
Aparte de la opción de interruptor óptico de corta duración, los teclados y clickpads de los portátiles Razer Blade se han mantenido muy consistentes entre modelos y tamaños. La experiencia de escritura en un Blade Stealth de 13,3 pulgadas de 2018 , por ejemplo, se acercaría a lo que obtendrías en un Blade Pro de 17,3 pulgadas de 2021 para bien o para mal. La respuesta de las teclas sigue siendo más ligera y superficial que en otros portátiles, incluso en el MSI GS66 o el Asus Flow X13. Personalmente, preferimos teclas más profundas y firmes, más cercanas a las que obtendrías en el HP Spectre pero sabrás exactamente qué esperar del Blade 14 si has tecleado en cualquier otro portátil Blade en el pasado.
La impresión de todas las teclas se ilumina cuando la retroiluminación RGB por tecla está activa. Esto puede no ser cierto en los modelos internacionales como en los modelos internos existentes Blade Stealth, 15, o Pro 17. El Zephyrus G14 de la competencia no tiene la opción de iluminación RGB por tecla.
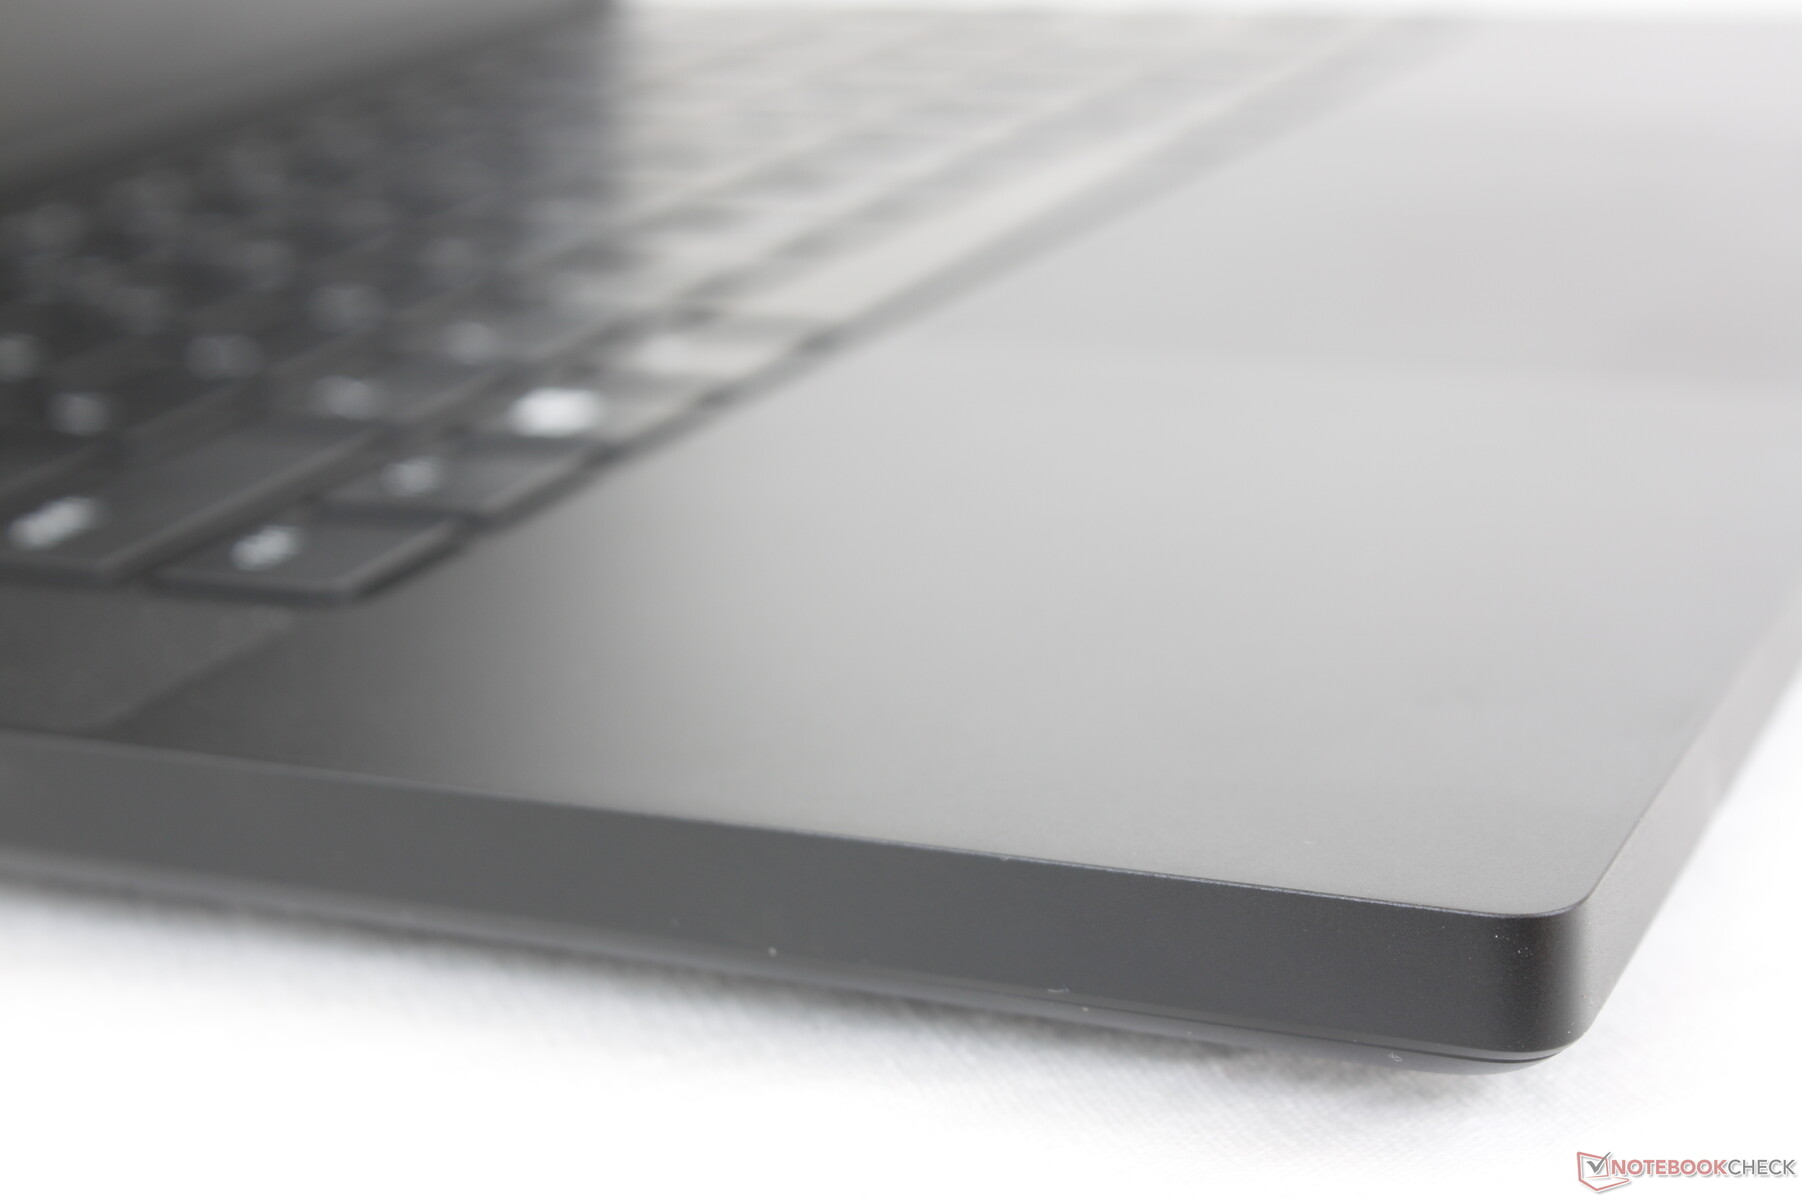
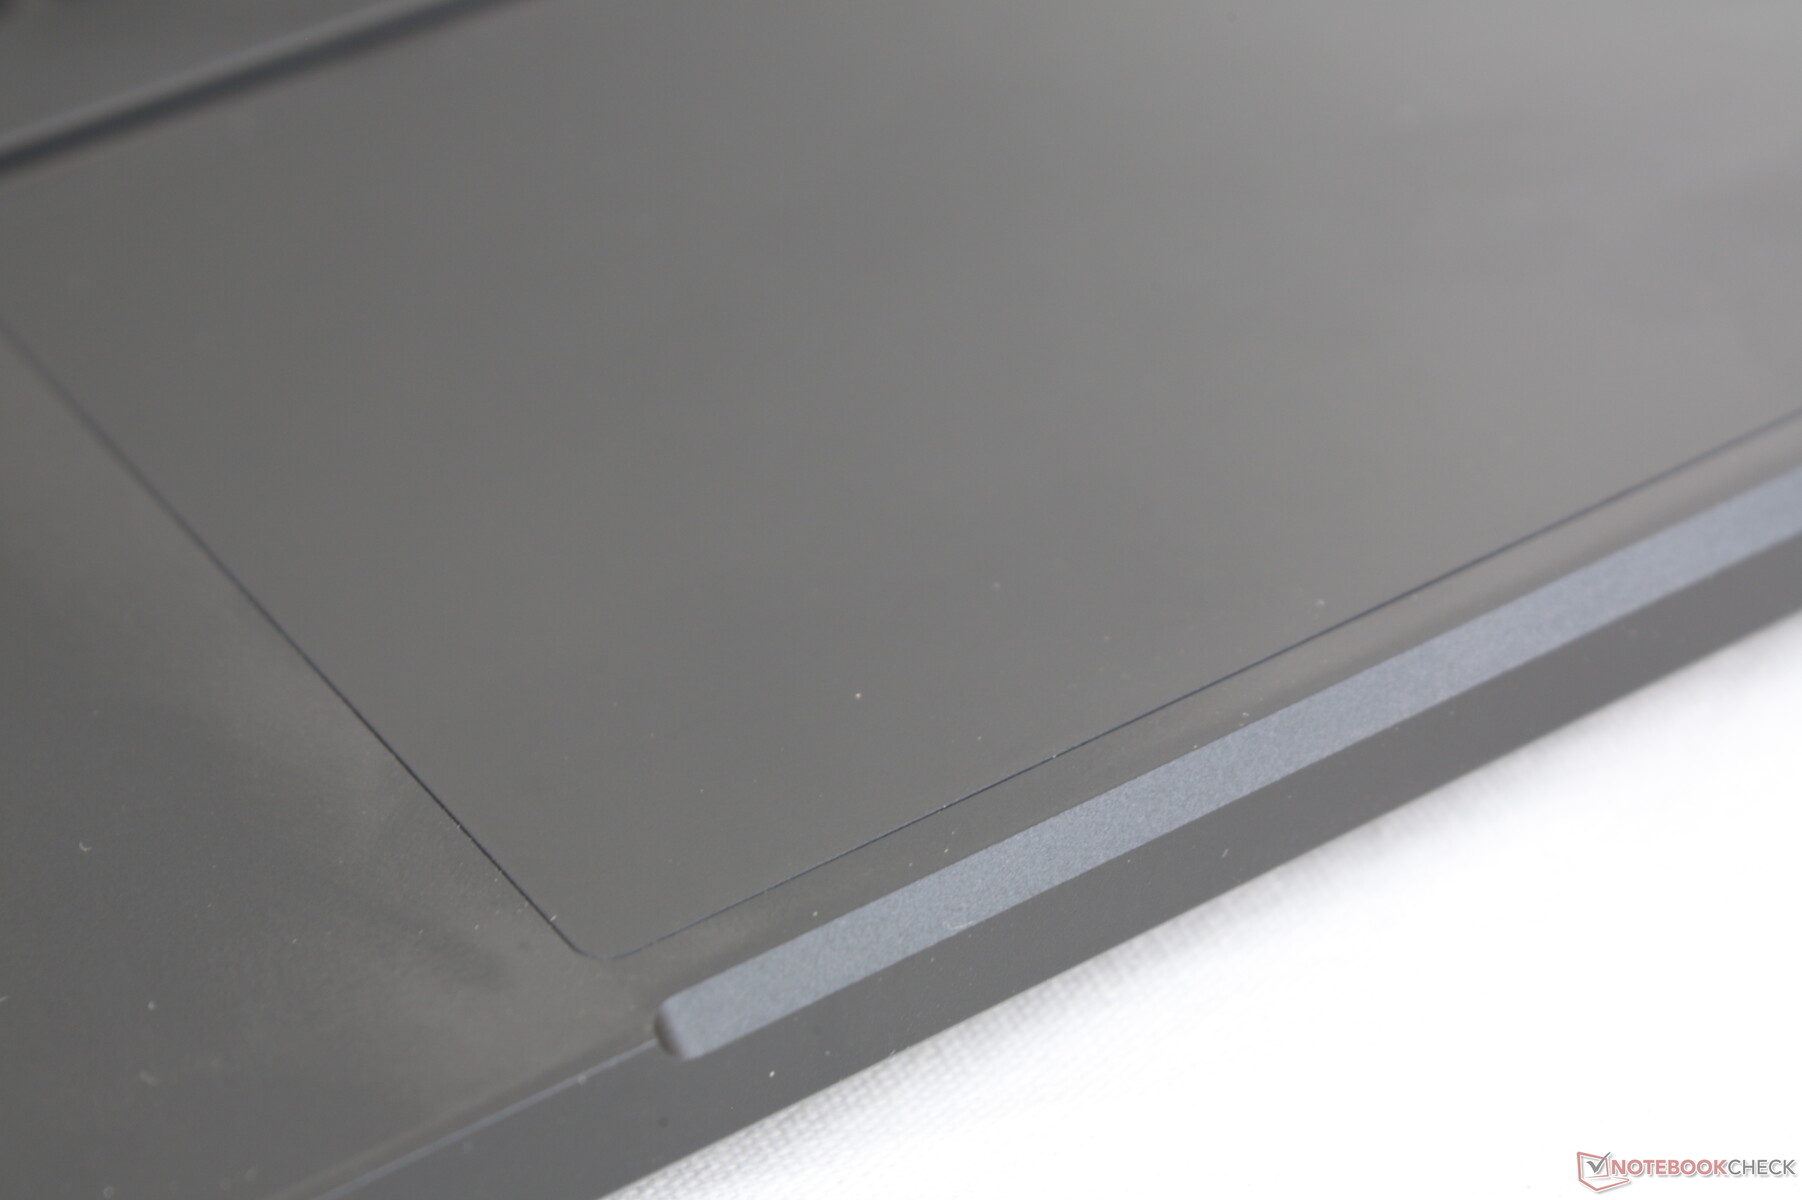
Panel táctil
El clickpad(11,1 x 7,6 cm) esmás pequeño y más grande que los del Blade 15 (13 x 8 cm) y el Zephyrus G14 (10,5 x 6 cm), respectivamente. En realidad es bastante espacioso dado el limitado factor de forma de 14 pulgadas. Sin embargo, aún no somos fans de la respuesta silenciosa y esponjosa, que se siente poco satisfactoria al pulsar.

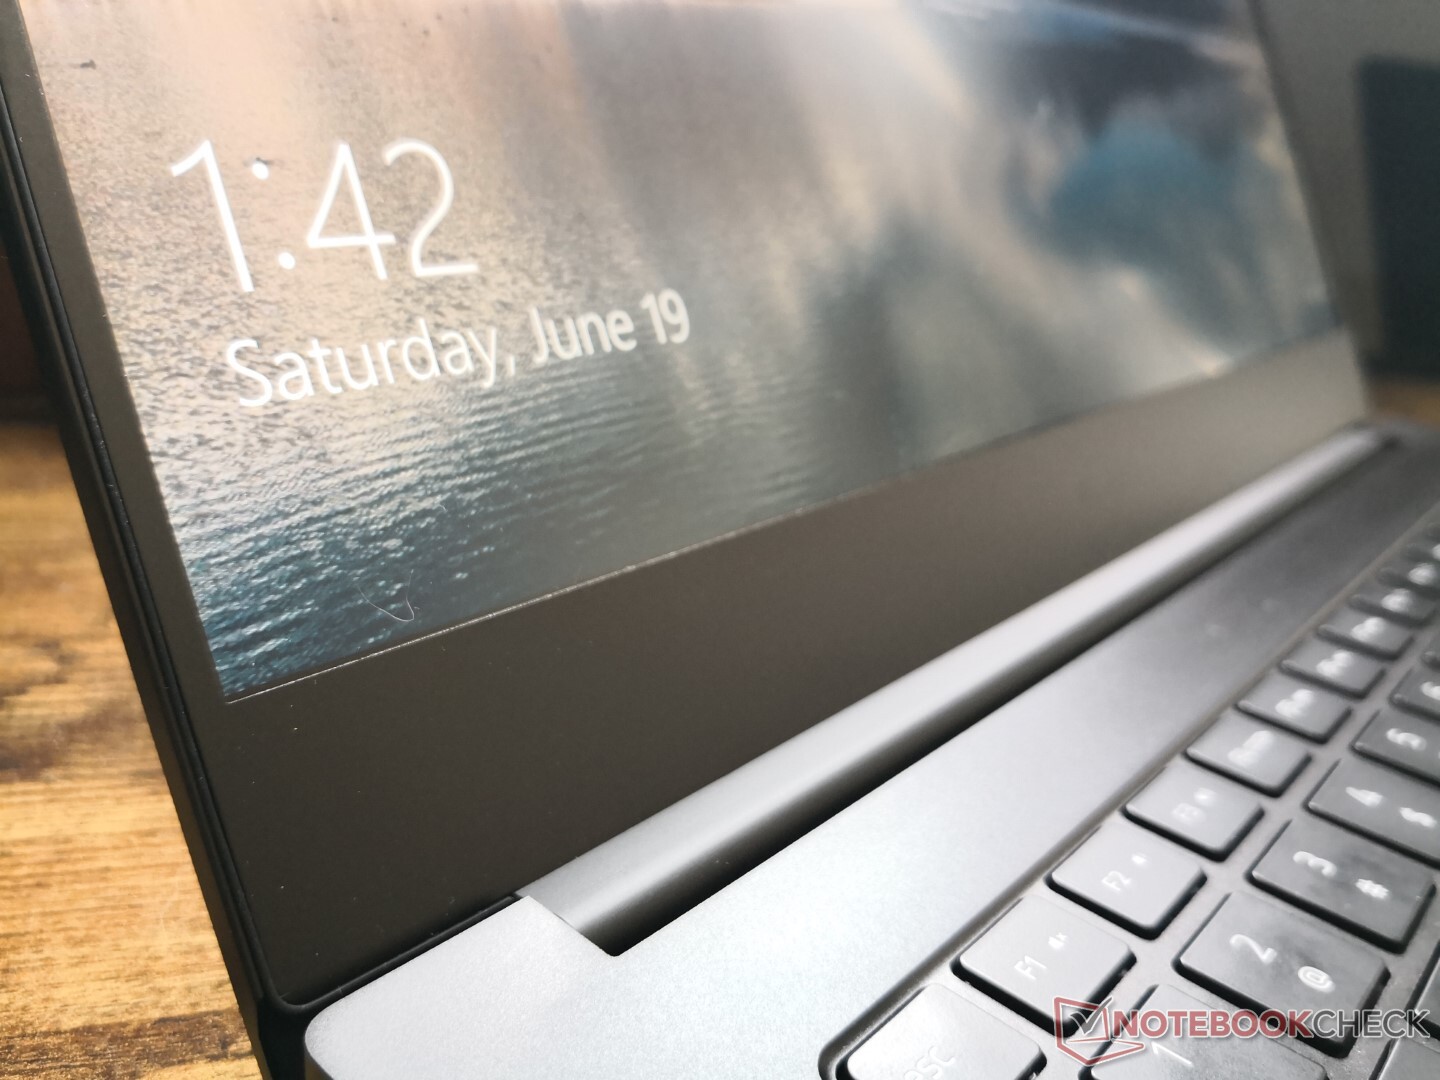
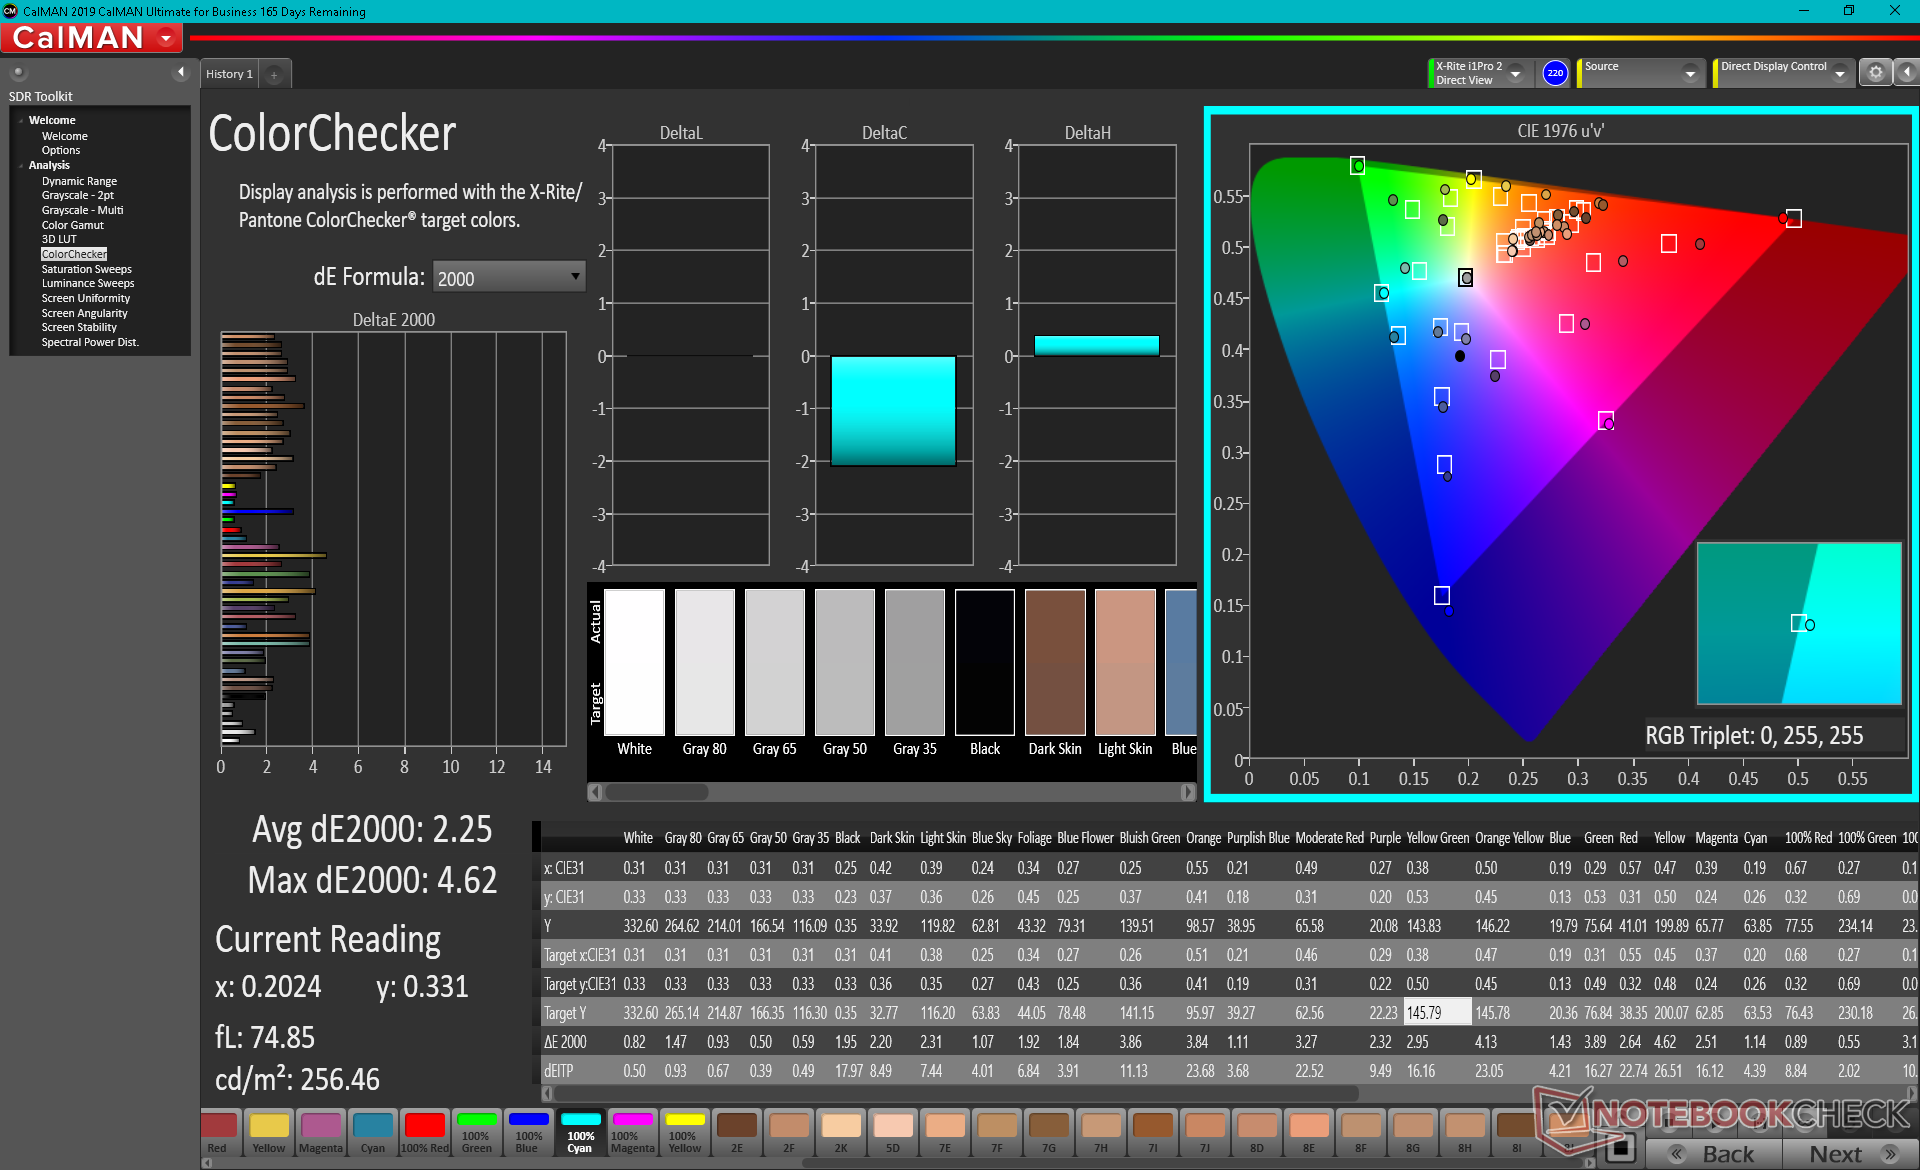
Pantalla - 165 Hz, FreeSync, QHD y DCI-P3 All-in-One
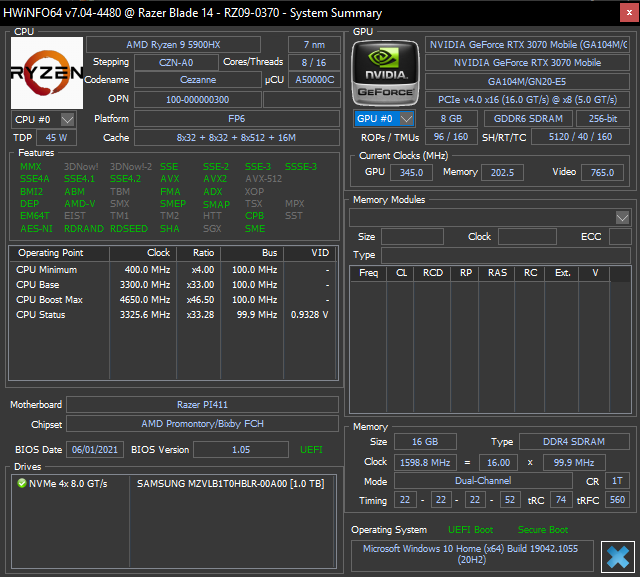
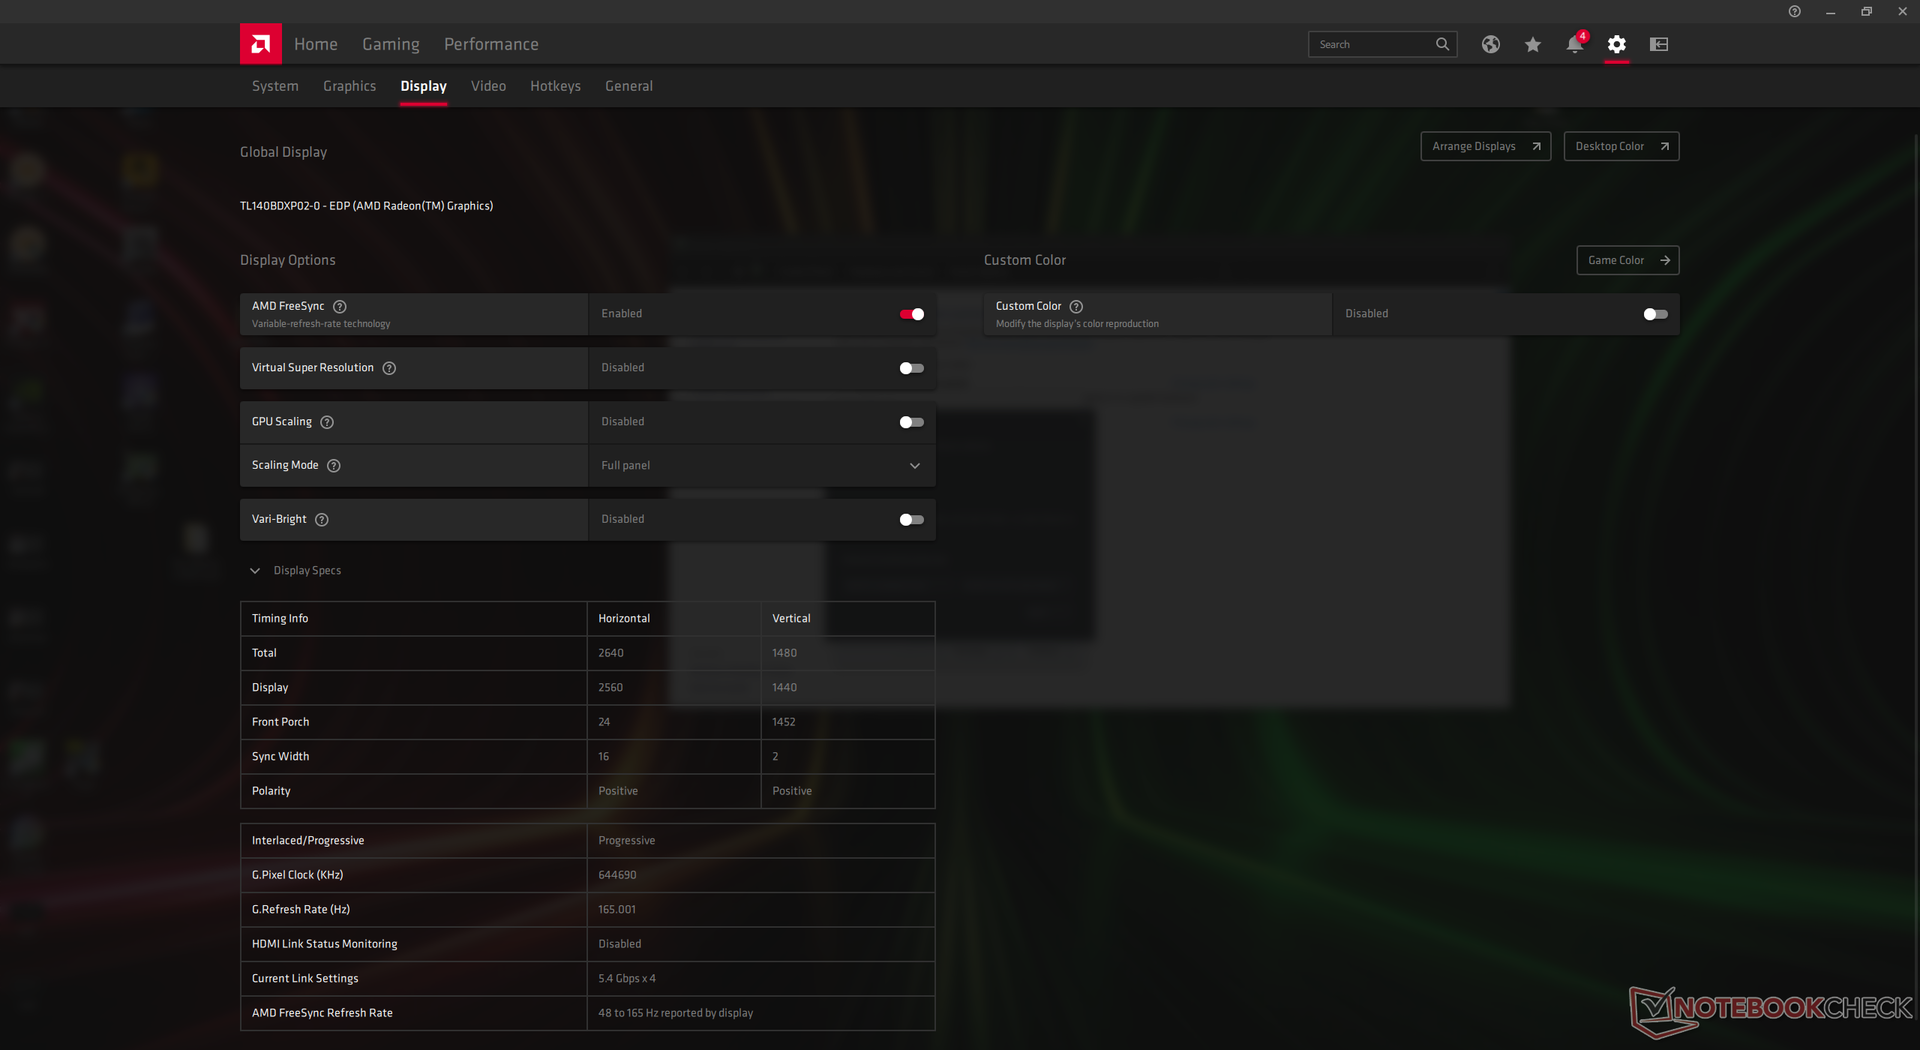
HWiNFO devuelve un nombre de panel TL140BDXP02-2 que parece ser la versión de 14 pulgadas del panel TL156VDXP02-0 de 15,6 pulgadas del Blade 15. Es la primera vez que un panel así aparece en nuestra base de datos, lo que significa que ningún otro portátil disponible en este momento utiliza el mismo panel QHD de 14 pulgadas que el Blade 14.
Todos los aspectos del panel QHD están muy por encima de la media. Los tiempos de respuesta no son tan rápidos como los de OLED o ciertos paneles IPS como el del MSI GS75 o el Blade Pro 17, pero siguen siendo lo suficientemente buenos para los juegos de ritmo rápido. La calidad de la imagen es ligeramente más granulada que en el Blade 15 o Blade Pro 17 brillante debido a la superposición mate.
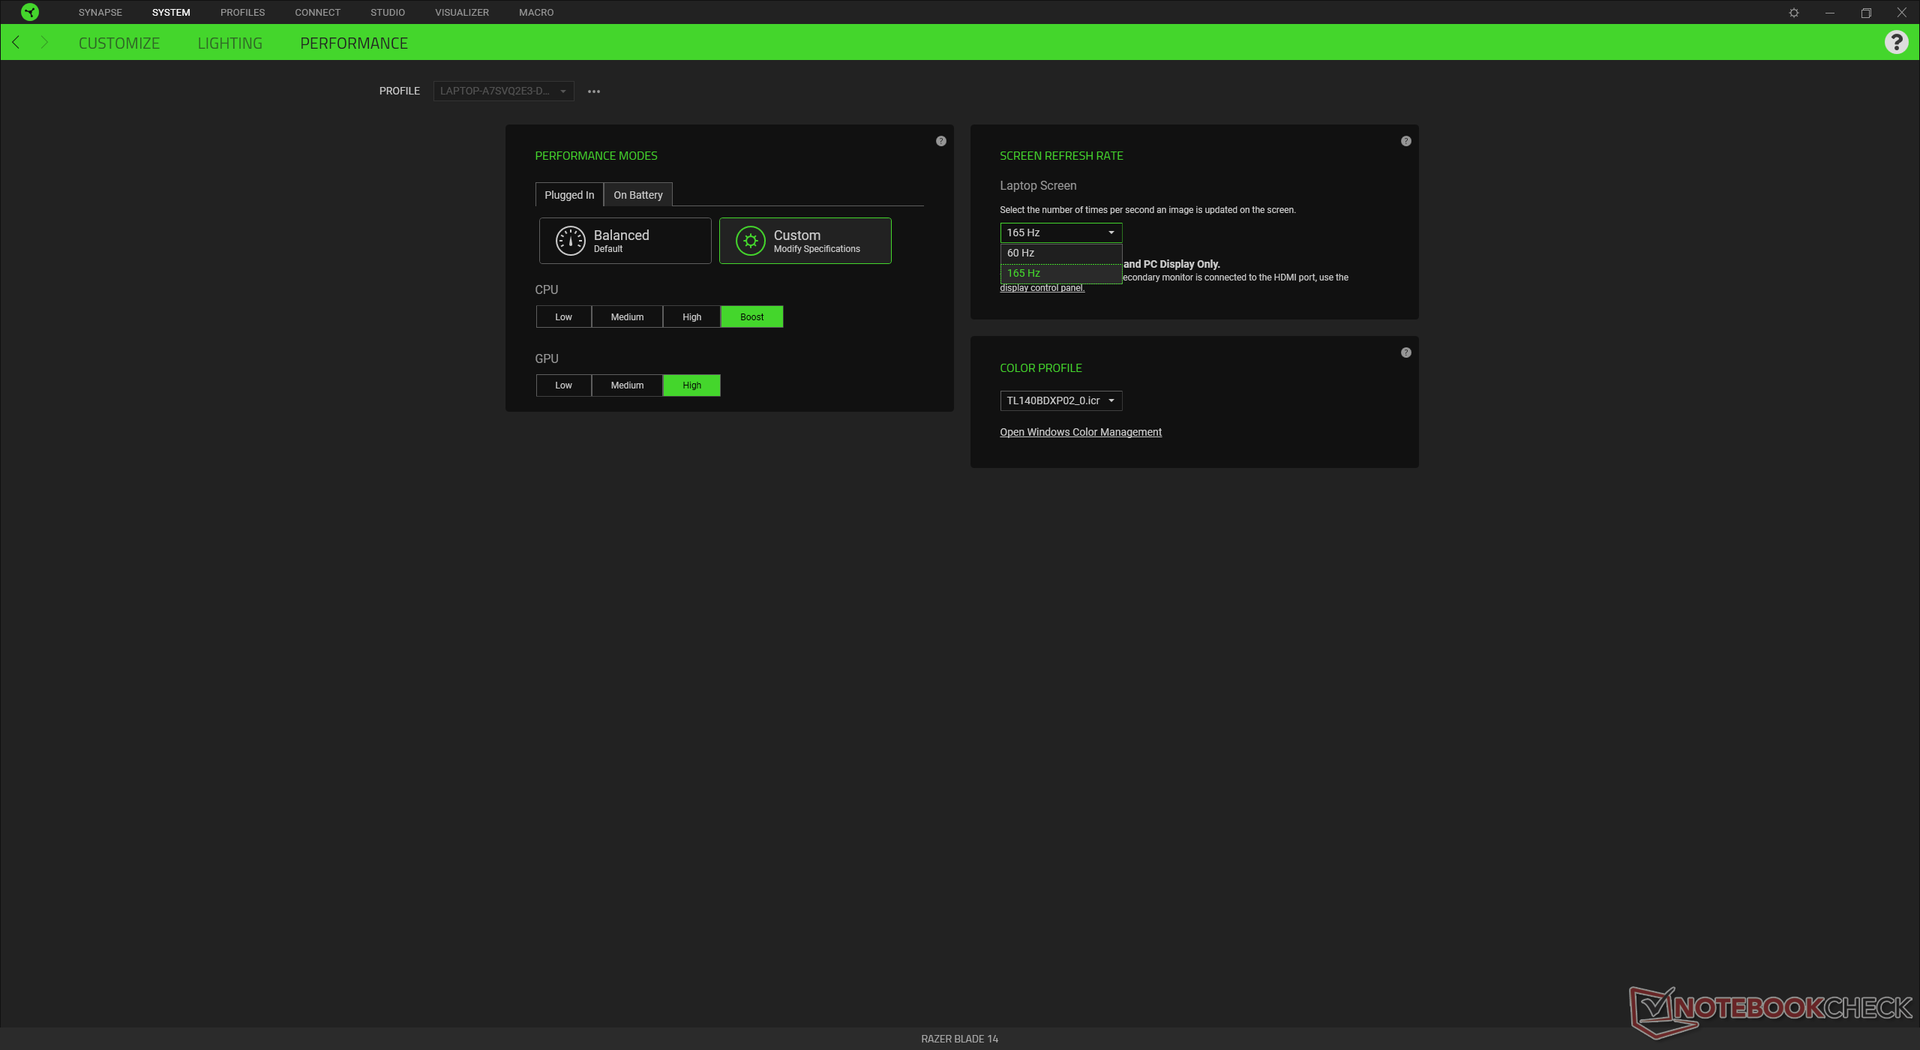
Hay que tener en cuenta que el panel de 165 Hz está limitado a 60 Hz o 165 Hz sin un ajuste "intermedio" de 144 Hz. Soporta AMD FreeSync y se activa automáticamente.

| |||||||||||||||||||||||||
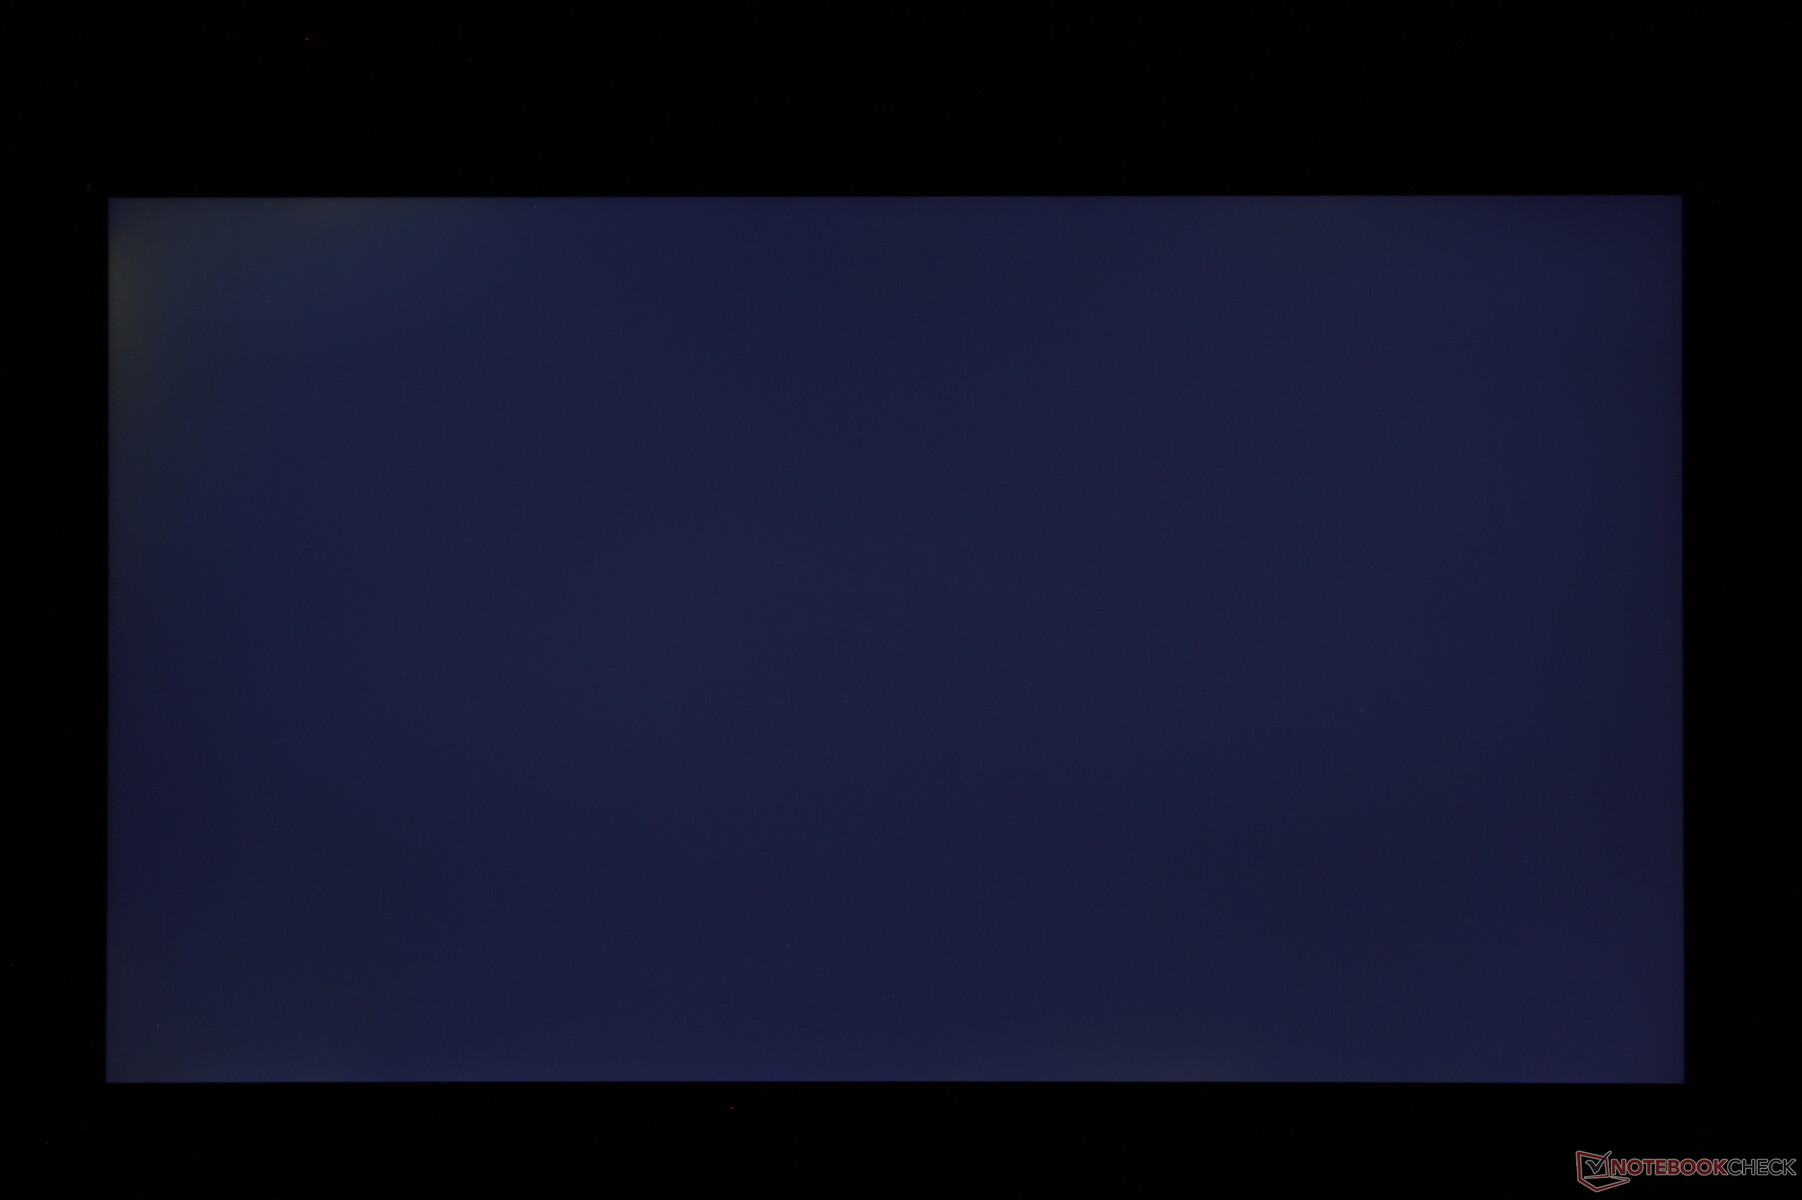
iluminación: 91 %
Brillo con batería: 331.1 cd/m²
Contraste: 920:1 (Negro: 0.36 cd/m²)
ΔE ColorChecker Calman: 2.25 | ∀{0.5-29.43 Ø4.73}
ΔE Greyscale Calman: 1.7 | ∀{0.09-98 Ø4.97}
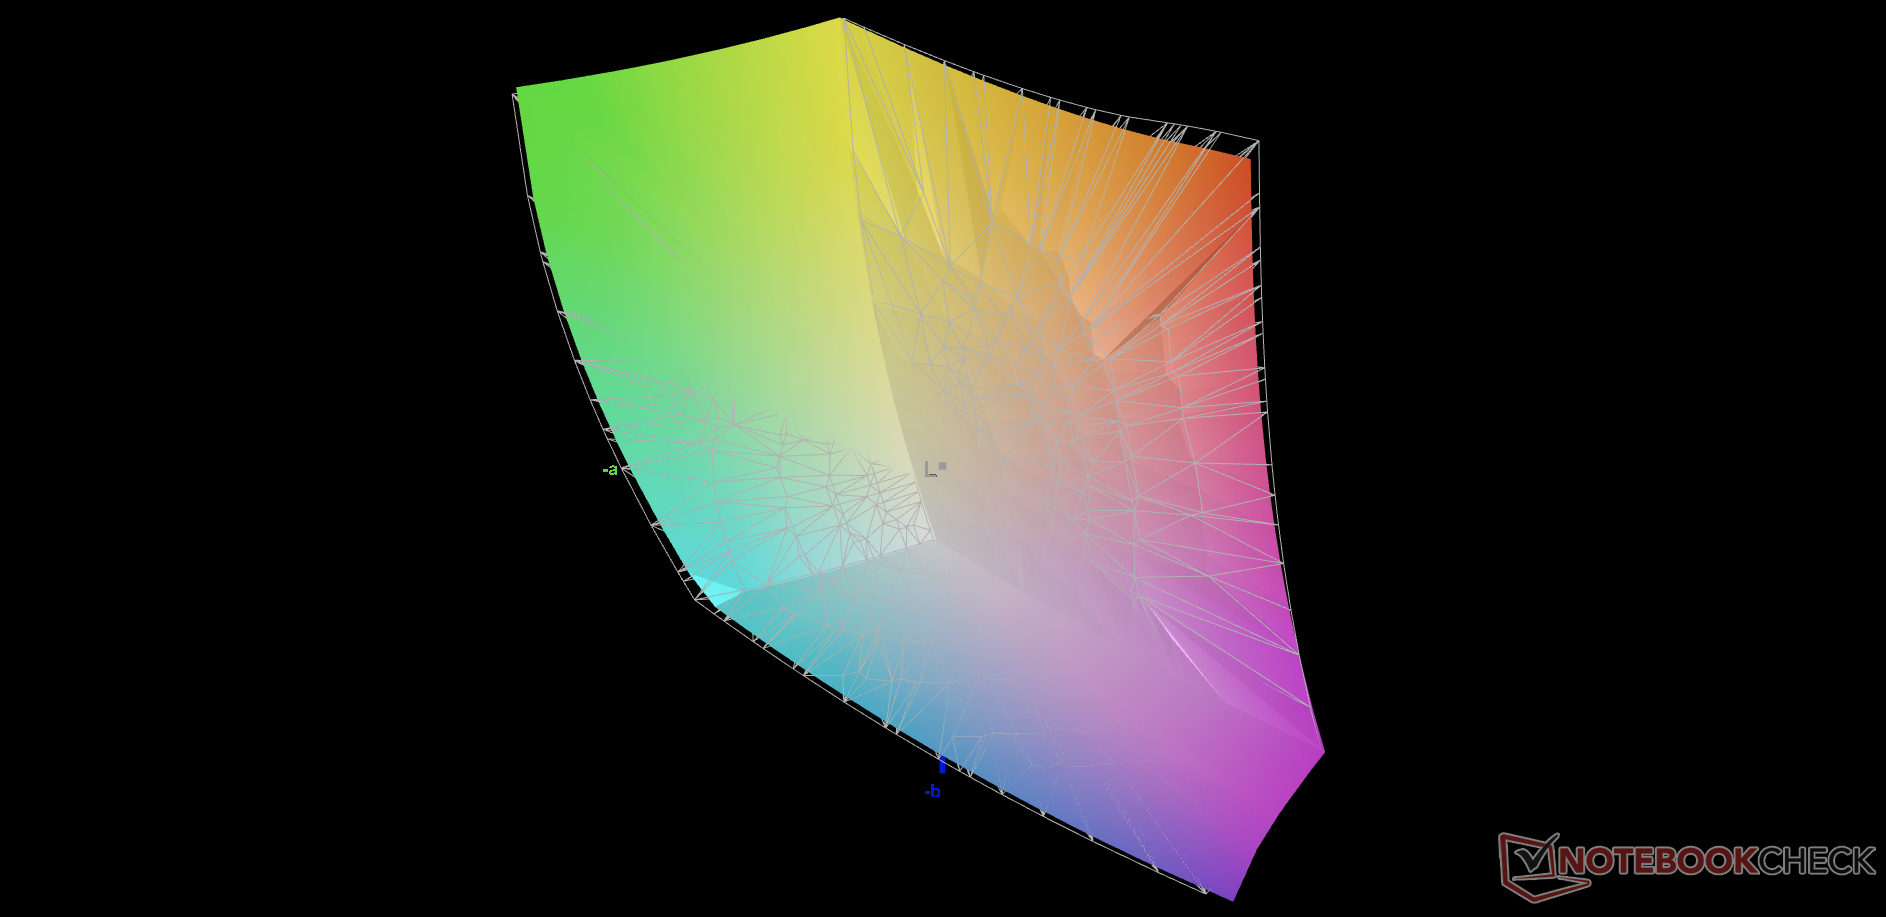
85.4% AdobeRGB 1998 (Argyll 3D)
99.9% sRGB (Argyll 3D)
97.2% Display P3 (Argyll 3D)
Gamma: 2.3
CCT: 6751 K
| Razer Blade 14 Ryzen 9 RTX 3070 TL140BDXP02-2, IPS, 14", 2560x1440 | Razer Blade 15 Advanced Model Early 2021 TL156VDXP02-0, IPS, 15.6", 1920x1080 | Asus Zephyrus G14 GA401IV CEC PA LM140LF-1F01, IPS, 14", 1920x1080 | LG Gram 14Z90P-G.AA79G LG Display LP140WU1-SPA1, IPS, 14", 1920x1200 | MSI GS66 Stealth 10UG AU Optronics B156HAN12.0, IPS, 15.6", 1920x1080 | |
|---|---|---|---|---|---|
| Display | -19% | -20% | 0% | -17% | |
| Display P3 Coverage (%) | 97.2 | 65.9 -32% | 66.5 -32% | 97.6 0% | 67.7 -30% |
| sRGB Coverage (%) | 99.9 | 96.4 -4% | 92 -8% | 99.9 0% | 98.4 -2% |
| AdobeRGB 1998 Coverage (%) | 85.4 | 68 -20% | 67.2 -21% | 85.3 0% | 69.1 -19% |
| Response Times | 3% | -194% | -144% | 3% | |
| Response Time Grey 50% / Grey 80% * (ms) | 16.4 ? | 16 ? 2% | 43.6 ? -166% | 45 ? -174% | 14.4 ? 12% |
| Response Time Black / White * (ms) | 10.8 ? | 10.4 ? 4% | 34.8 ? -222% | 23 ? -113% | 11.6 ? -7% |
| PWM Frequency (Hz) | |||||
| Screen | 21% | -8% | -27% | -4% | |
| Brightness middle (cd/m²) | 331.1 | 338 2% | 322.2 -3% | 352 6% | 259.5 -22% |
| Brightness (cd/m²) | 318 | 334 5% | 302 -5% | 332 4% | 264 -17% |
| Brightness Distribution (%) | 91 | 94 3% | 87 -4% | 91 0% | 90 -1% |
| Black Level * (cd/m²) | 0.36 | 0.24 33% | 0.26 28% | 0.22 39% | 0.25 31% |
| Contrast (:1) | 920 | 1408 53% | 1239 35% | 1600 74% | 1038 13% |
| Colorchecker dE 2000 * | 2.25 | 1.39 38% | 2.43 -8% | 2.89 -28% | 2.52 -12% |
| Colorchecker dE 2000 max. * | 4.62 | 3.31 28% | 5.07 -10% | 4.66 -1% | 5.55 -20% |
| Greyscale dE 2000 * | 1.7 | 1.6 6% | 3.3 -94% | 6.9 -306% | 1.7 -0% |
| Gamma | 2.3 96% | 2.291 96% | 2.22 99% | 2.34 94% | 2.04 108% |
| CCT | 6751 96% | 6626 98% | 6902 94% | 7904 82% | 6414 101% |
| Colorchecker dE 2000 calibrated * | 0.97 | 2.29 | 2.7 | 1.93 | |
| Color Space (Percent of AdobeRGB 1998) (%) | 68 | 60 | 76 | 63.3 | |
| Color Space (Percent of sRGB) (%) | 89 | 91.9 | 100 | 98.8 | |
| Media total (Programa/Opciones) | 2% /
9% | -74% /
-39% | -57% /
-38% | -6% /
-6% |
* ... más pequeño es mejor
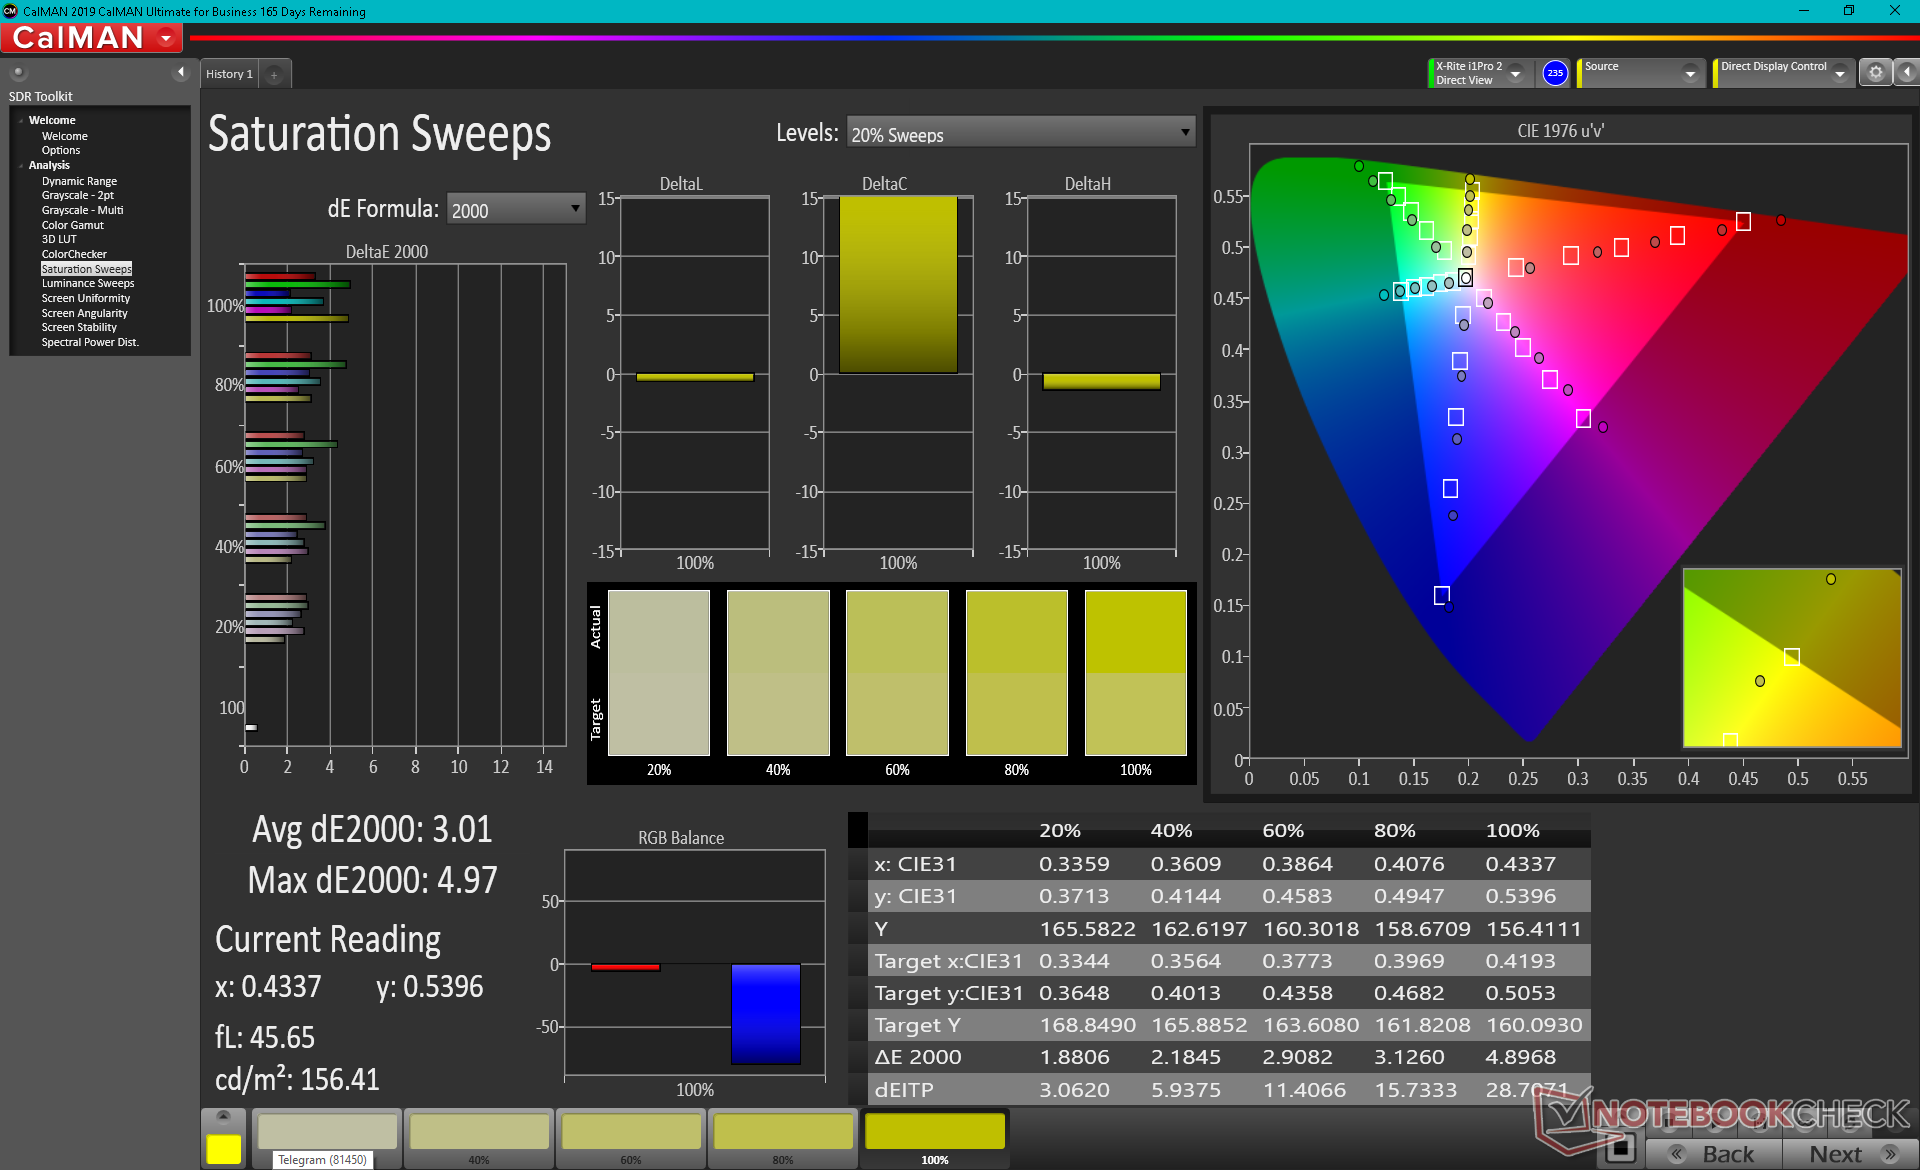
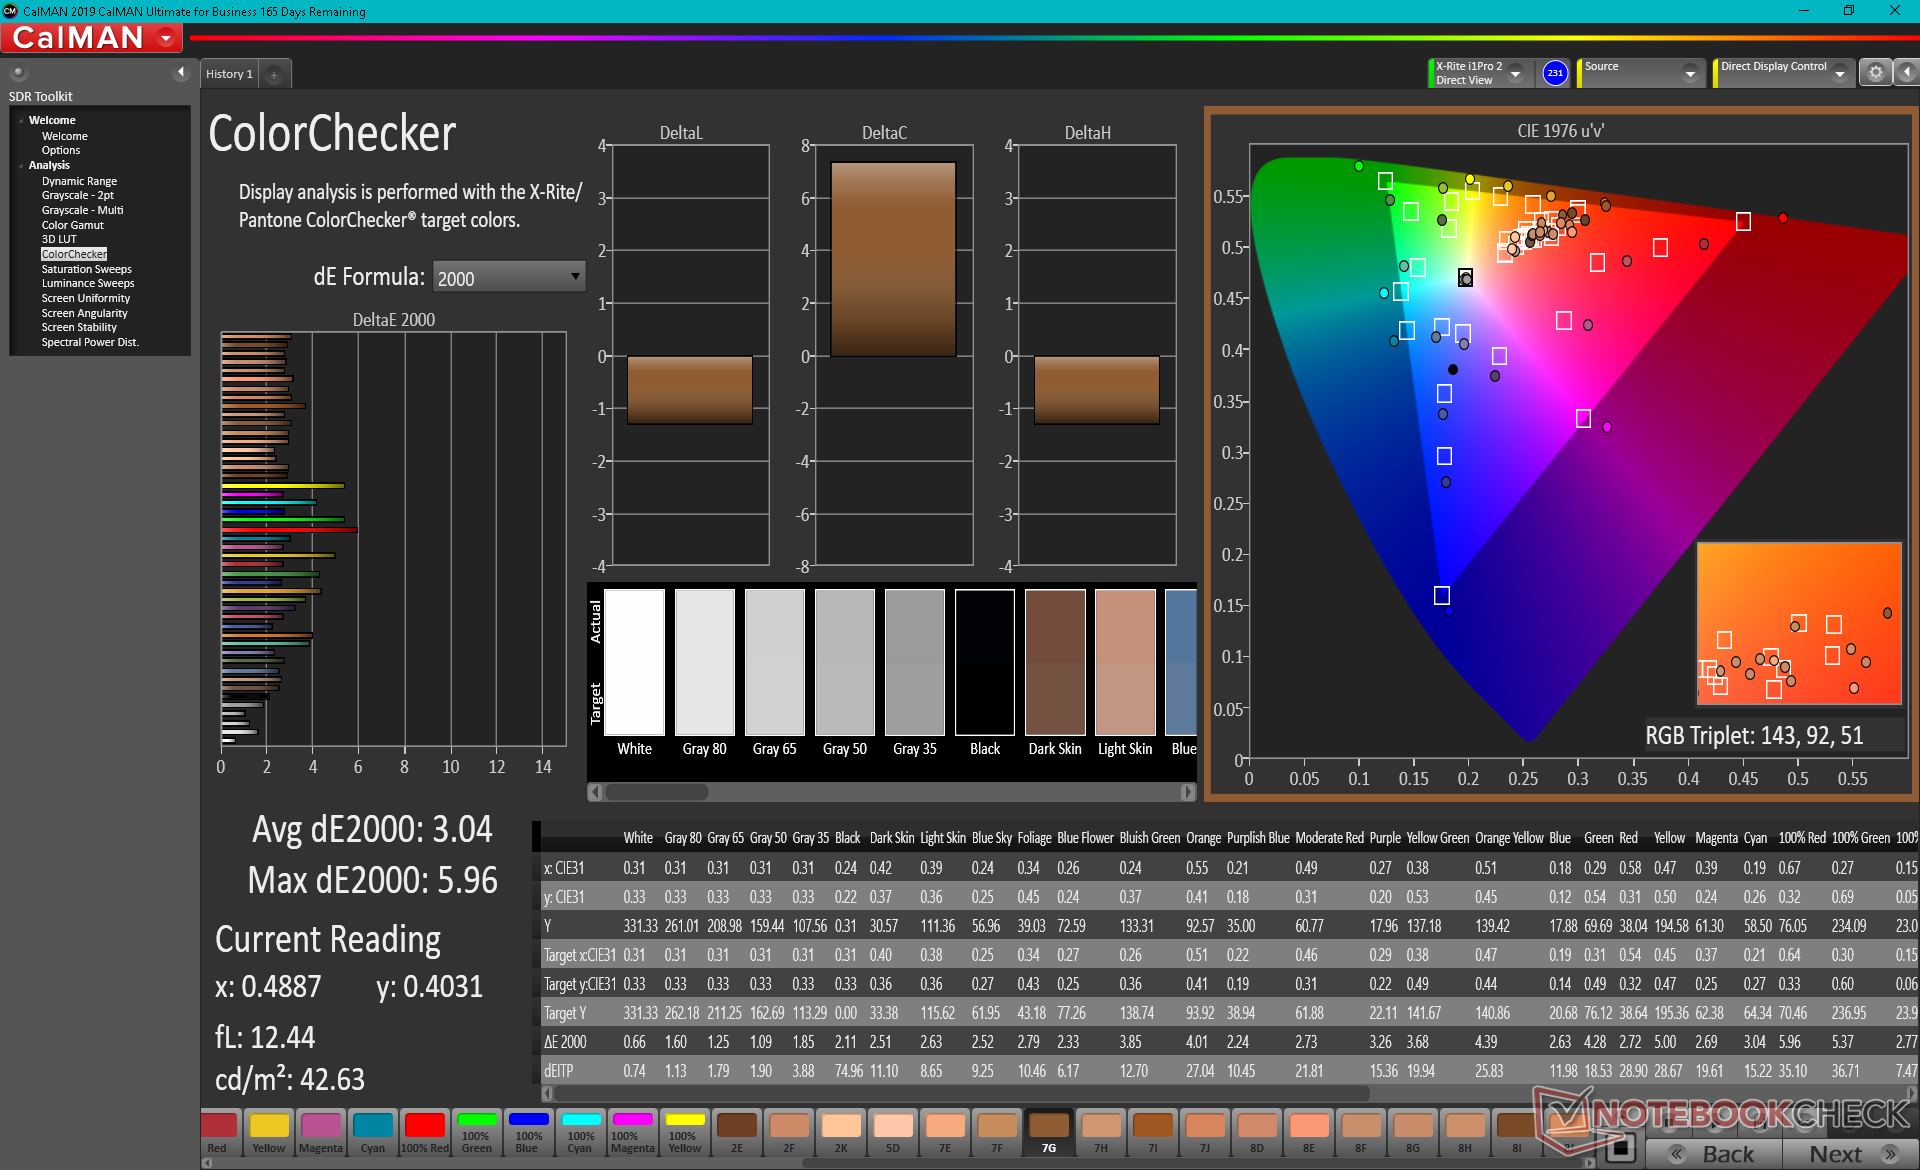
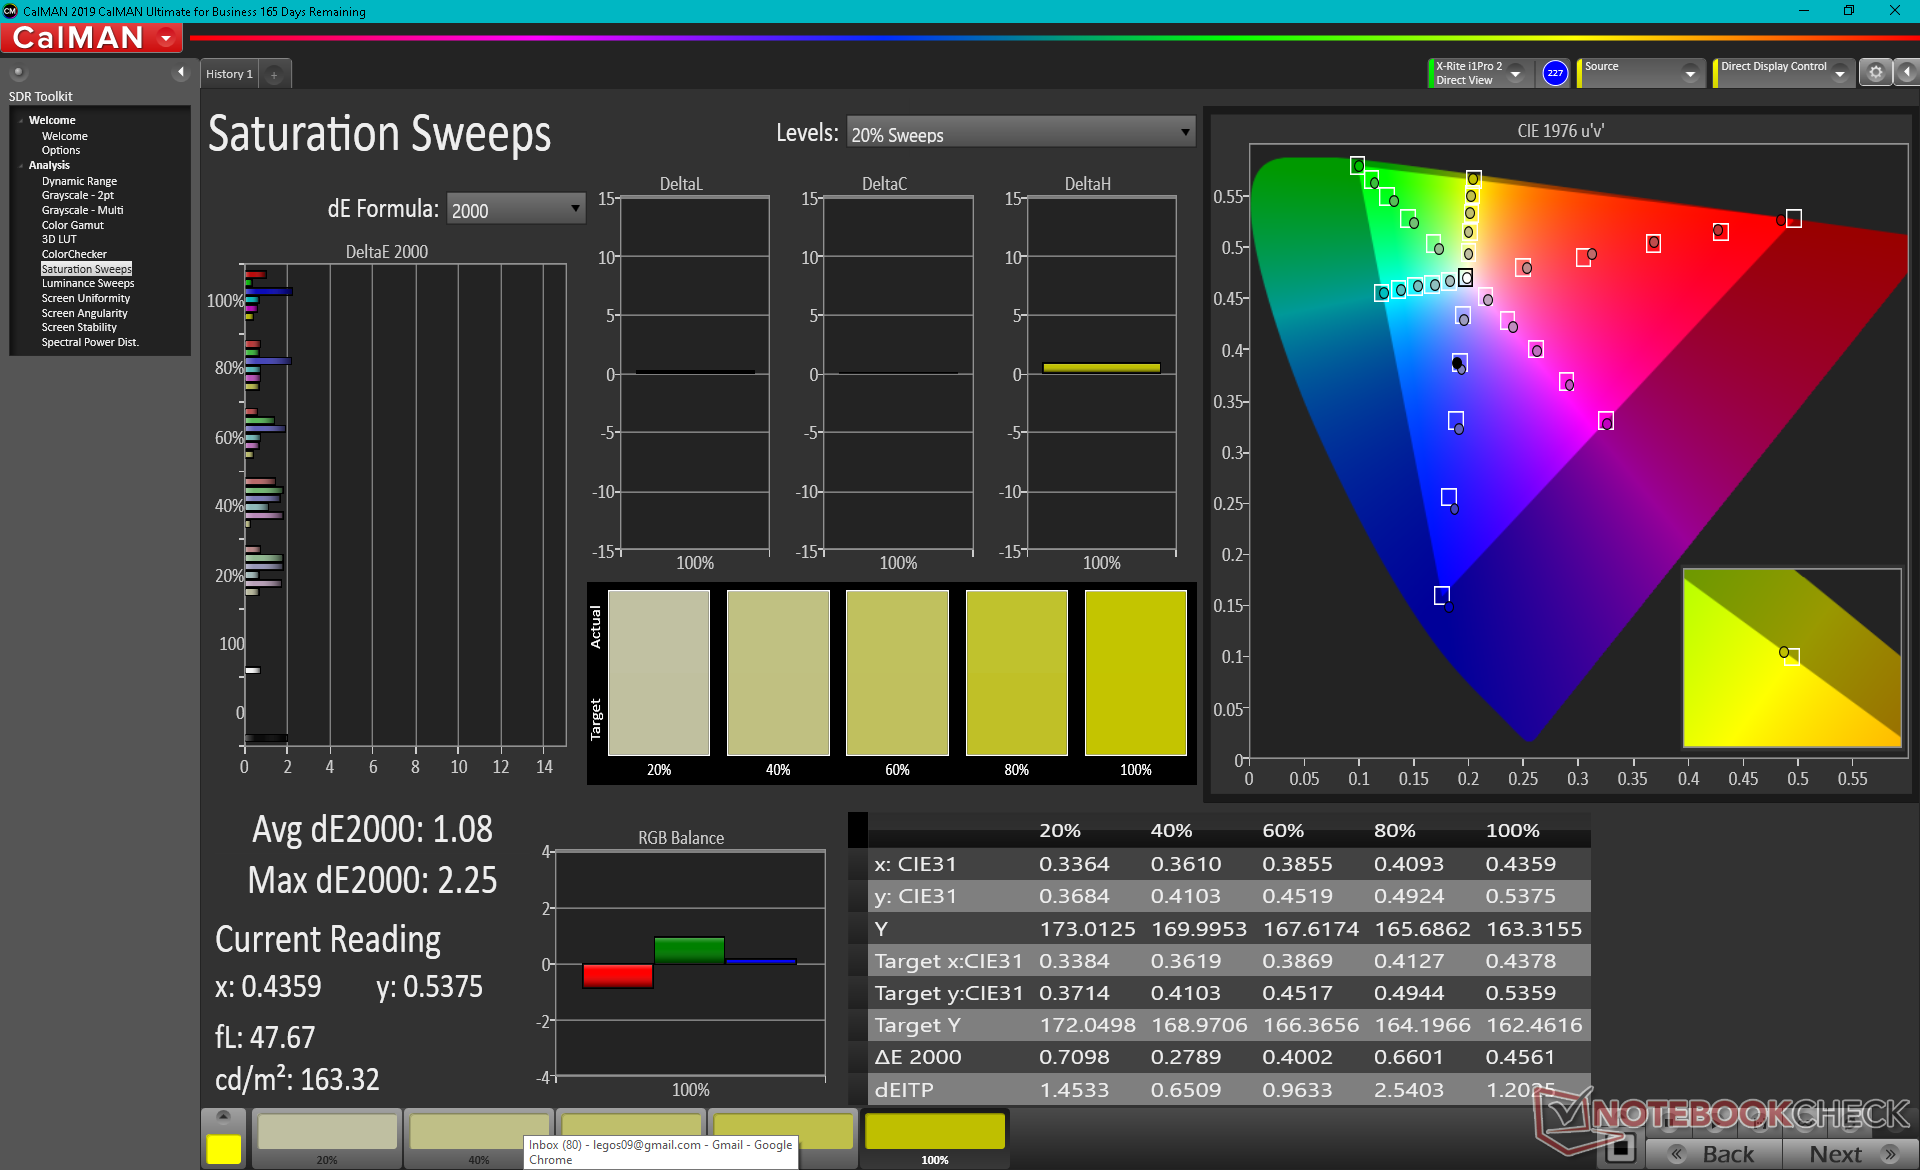
El espacio de color cubre esencialmente todo el sRGB y el DCI-P3, como anuncia el fabricante. La cobertura DCI-P3 sólo se podía conseguir antes en ciertas configuraciones 4K u OLED, por lo que es la primera vez que la vemos en una pantalla IPS QHD de 165 Hz. Los propietarios están obteniendo casi todo aquí sin compromisos, incluyendo tiempos de respuesta rápidos, frecuencias de refresco rápidas y colores profundos, mientras que la mayoría de los otros paneles de portátiles suelen rendir menos en al menos una de estas tres áreas.
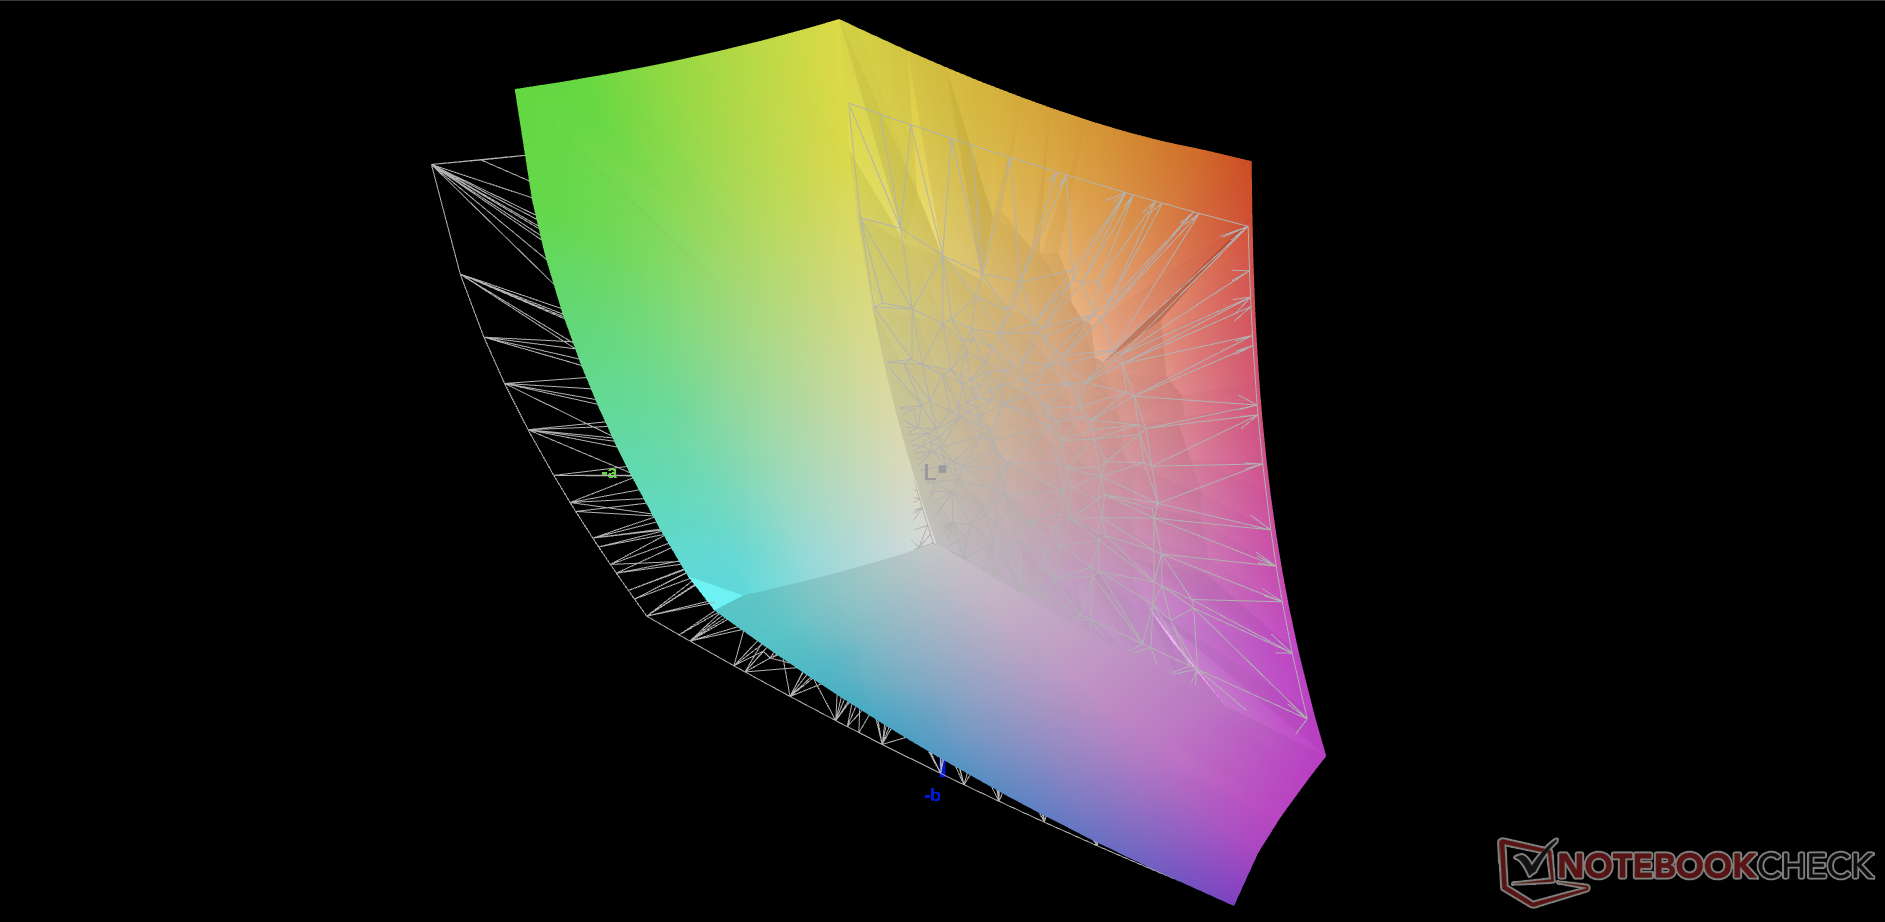
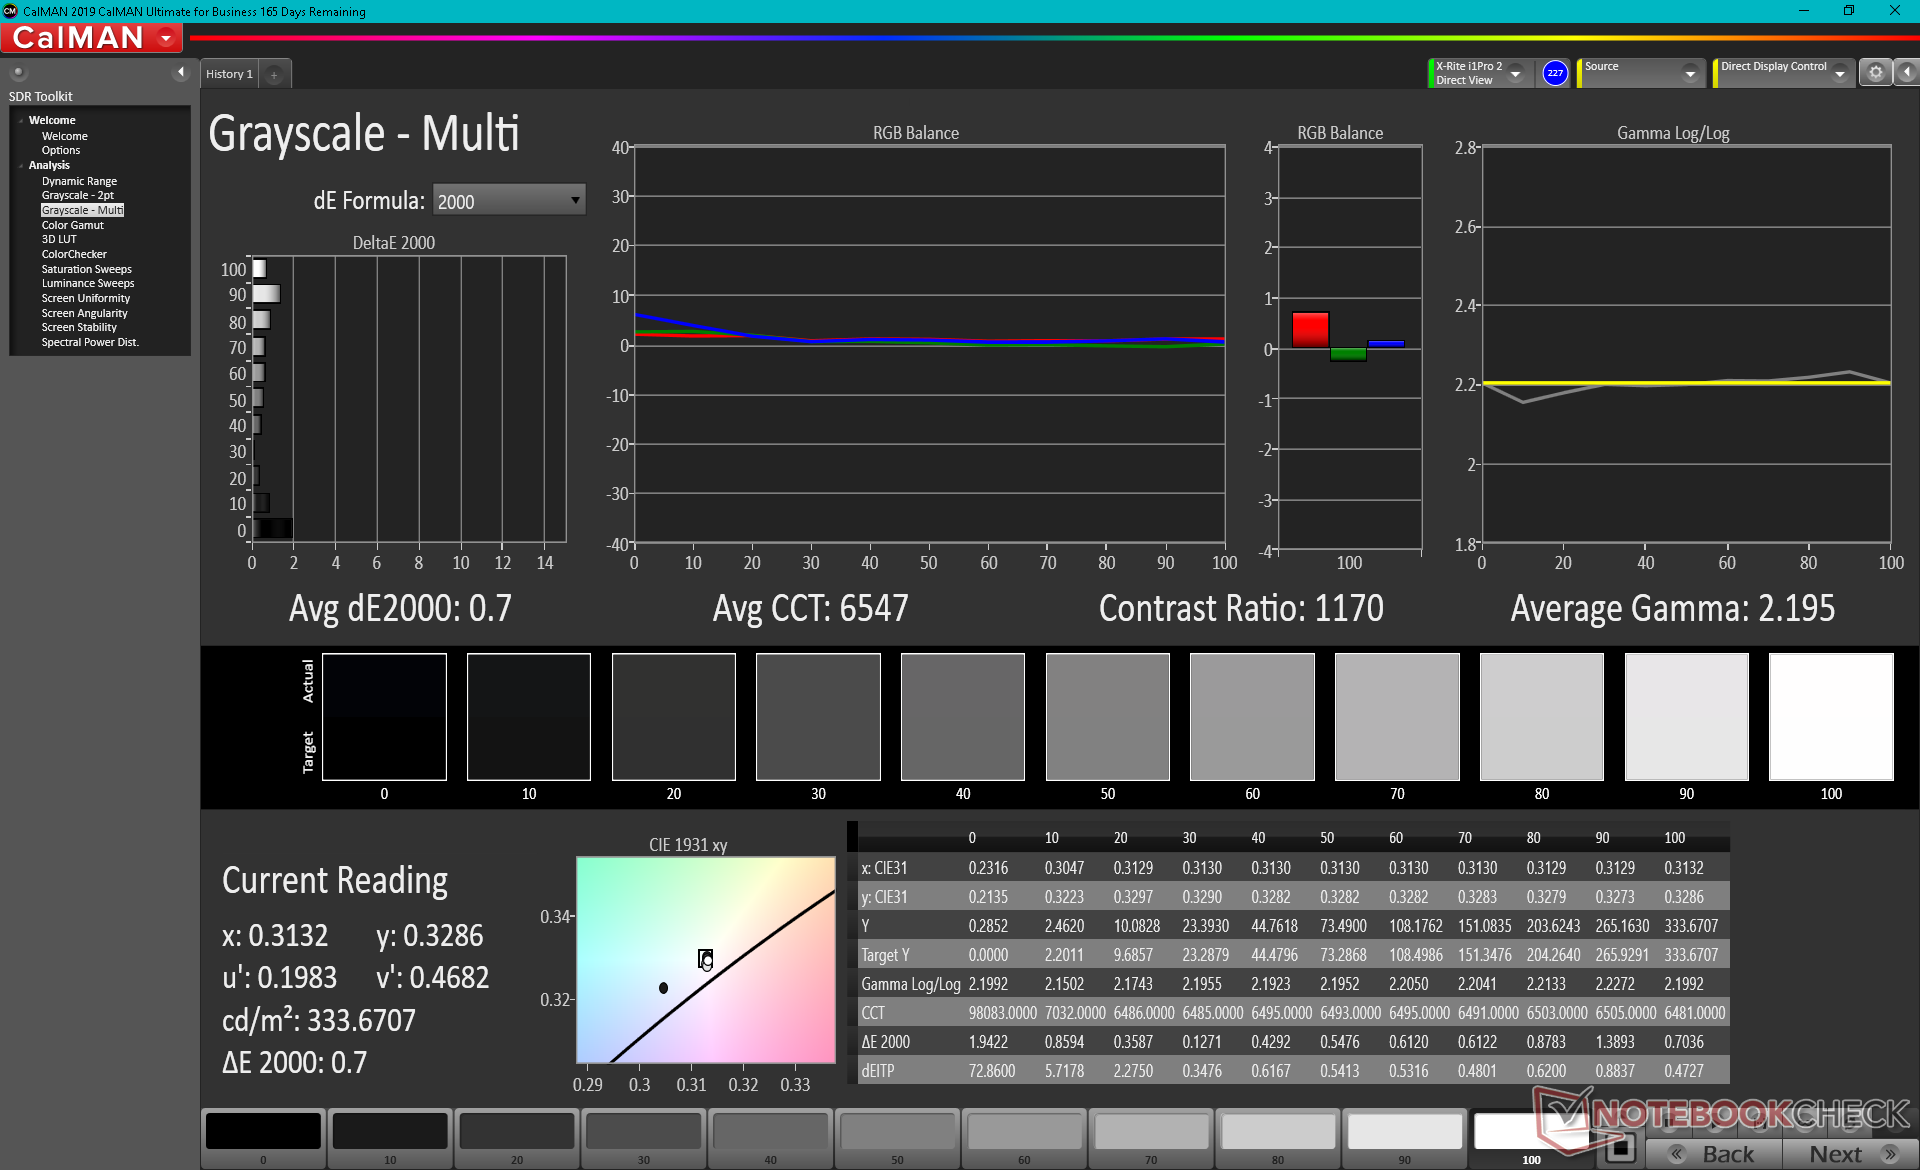
Razer anuncia "pantallas calibradas individualmente para obtener calidad y precisión de color" y, efectivamente, nuestro análisis con el colorímetro X-Rite revela exactamente eso. Los valores medios de escala de grises y deltaE de color se sitúan en sólo 0,7 y 2,25, respectivamente, lo que demuestra que cualquier intento de calibración por parte del usuario final sólo tendrá mejoras menores en el mejor de los casos. Si tenemos que ser puntillosos, los colores naranjas parecen ser ligeramente más imprecisos que los otros colores probados en CalMAN.
Tiempos de respuesta del display
| ↔ Tiempo de respuesta de Negro a Blanco | ||
|---|---|---|
| 10.8 ms ... subida ↗ y bajada ↘ combinada | ↗ 5.6 ms subida | 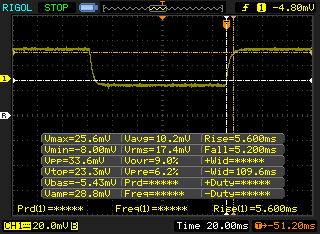 |
| ↘ 5.2 ms bajada | ||
| La pantalla mostró buenos tiempos de respuesta en nuestros tests pero podría ser demasiado lenta para los jugones competitivos. En comparación, todos los dispositivos de prueba van de ##min### (mínimo) a 240 (máximo) ms. » 29 % de todos los dispositivos son mejores. Esto quiere decir que el tiempo de respuesta medido es mejor que la media (19.9 ms) de todos los dispositivos testados. | ||
| ↔ Tiempo de respuesta 50% Gris a 80% Gris | ||
| 16.4 ms ... subida ↗ y bajada ↘ combinada | ↗ 8 ms subida | 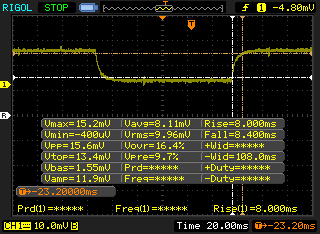 |
| ↘ 8.4 ms bajada | ||
| La pantalla mostró buenos tiempos de respuesta en nuestros tests pero podría ser demasiado lenta para los jugones competitivos. En comparación, todos los dispositivos de prueba van de ##min### (mínimo) a 636 (máximo) ms. » 30 % de todos los dispositivos son mejores. Esto quiere decir que el tiempo de respuesta medido es mejor que la media (31.1 ms) de todos los dispositivos testados. | ||
Parpadeo de Pantalla / PWM (Pulse-Width Modulation)
| Parpadeo de Pantalla / PWM no detectado | 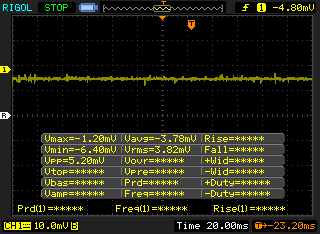 | ||
Comparación: 52 % de todos los dispositivos testados no usaron PWM para atenuar el display. Si se usó, medimos una media de 7784 (mínimo: 5 - máxmo: 343500) Hz. | |||
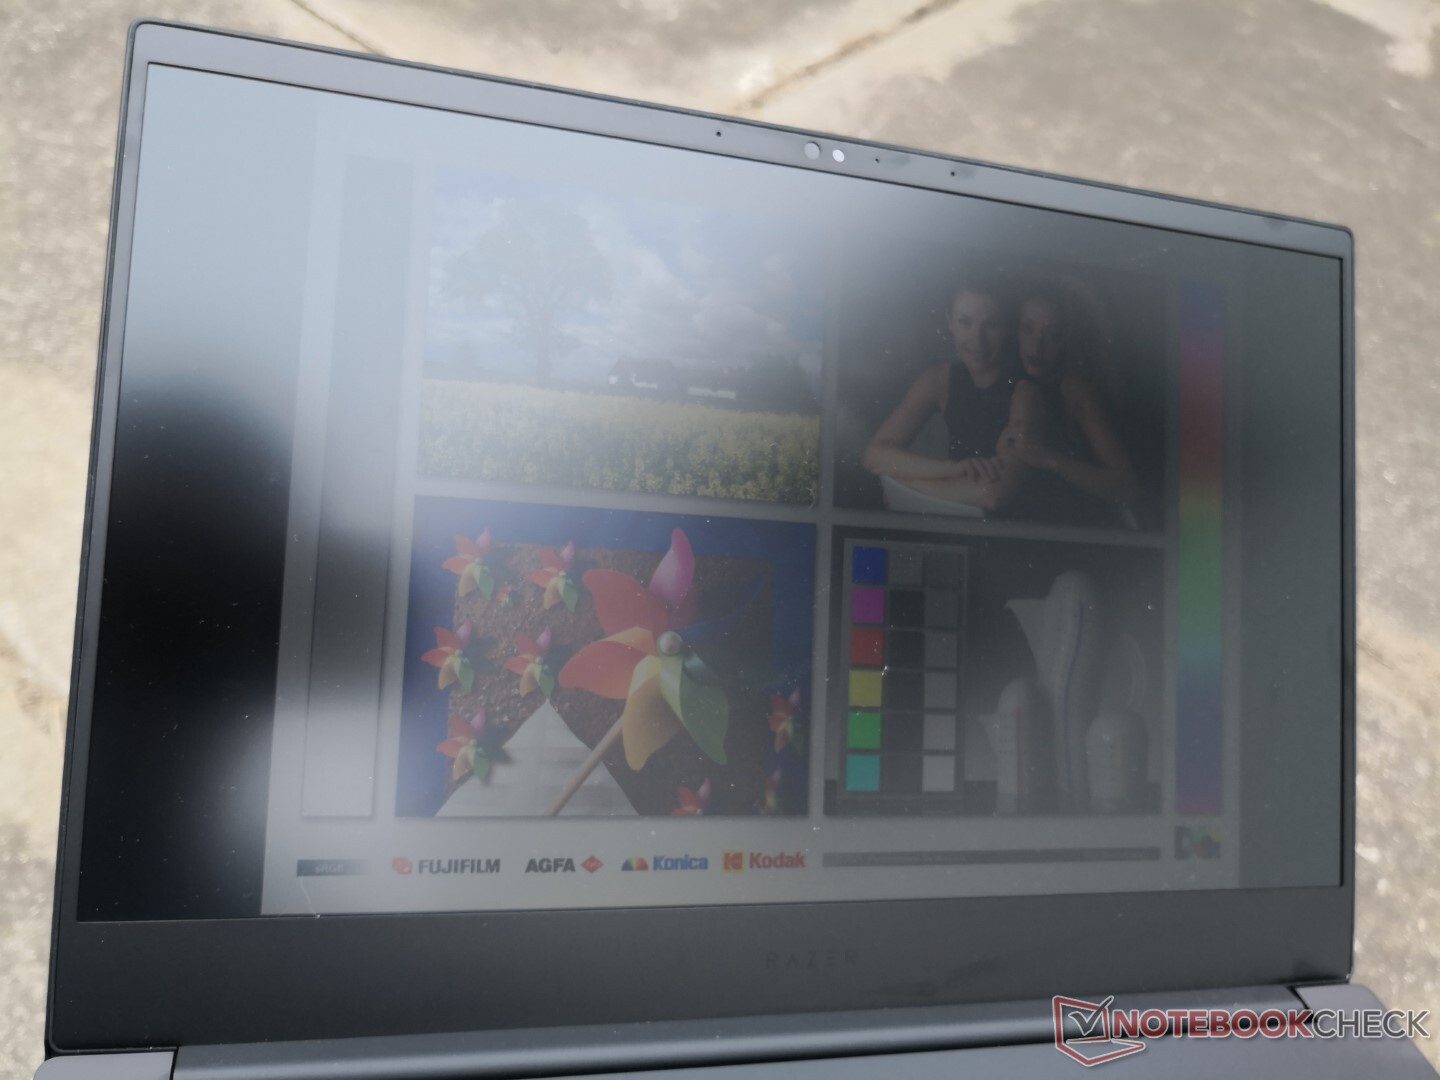
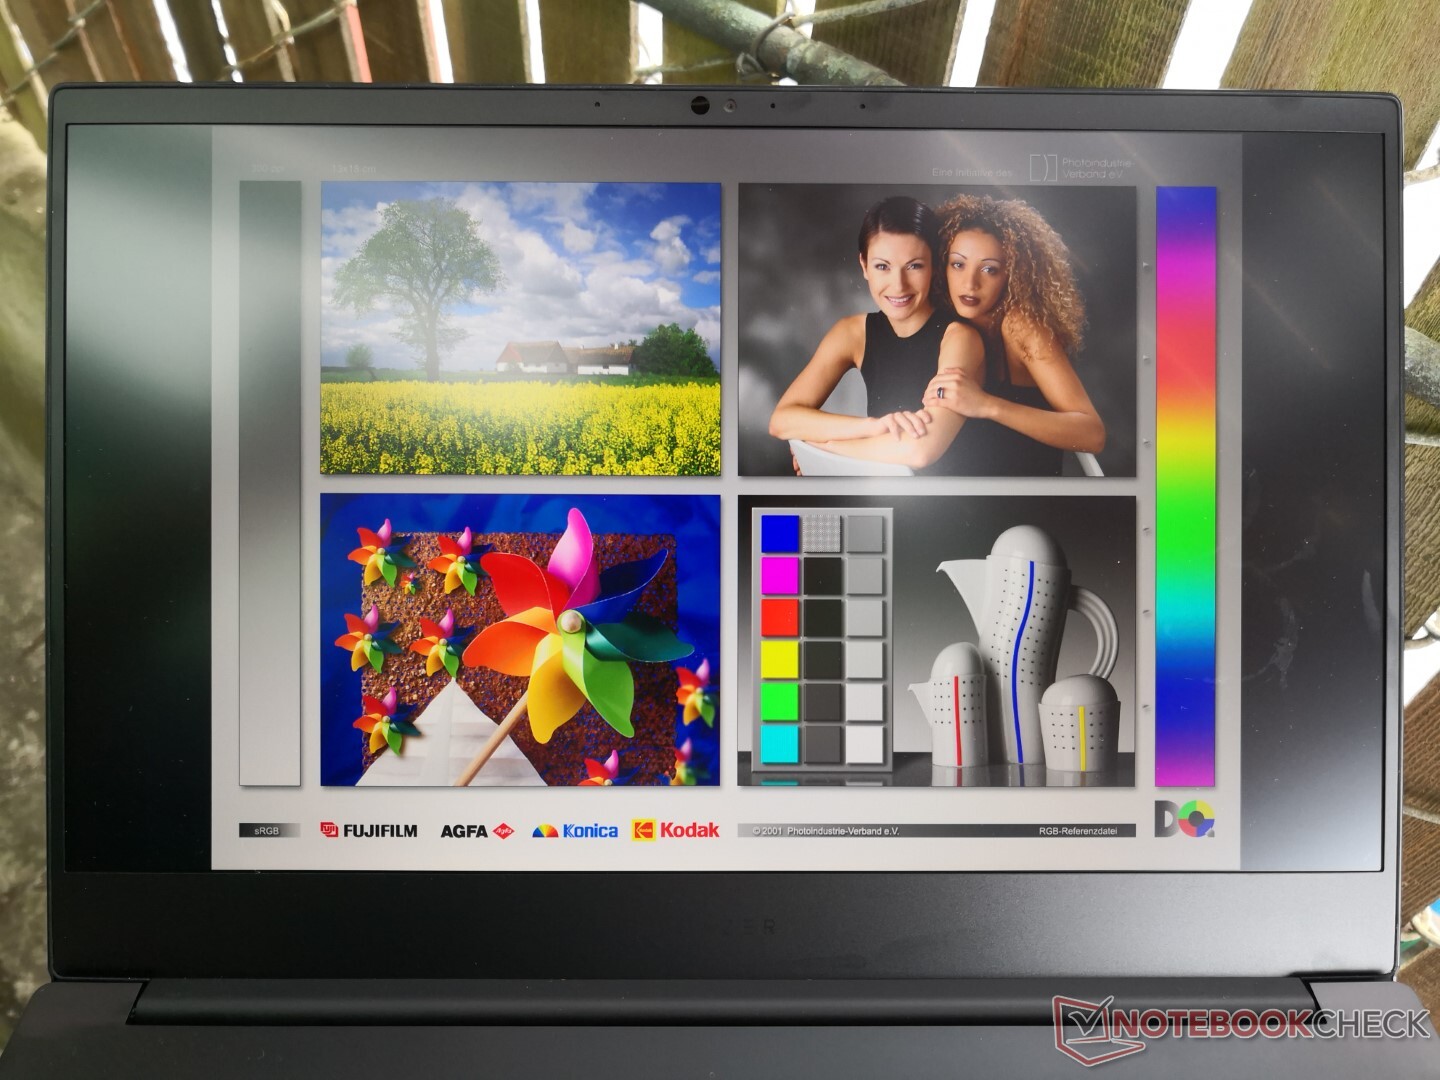
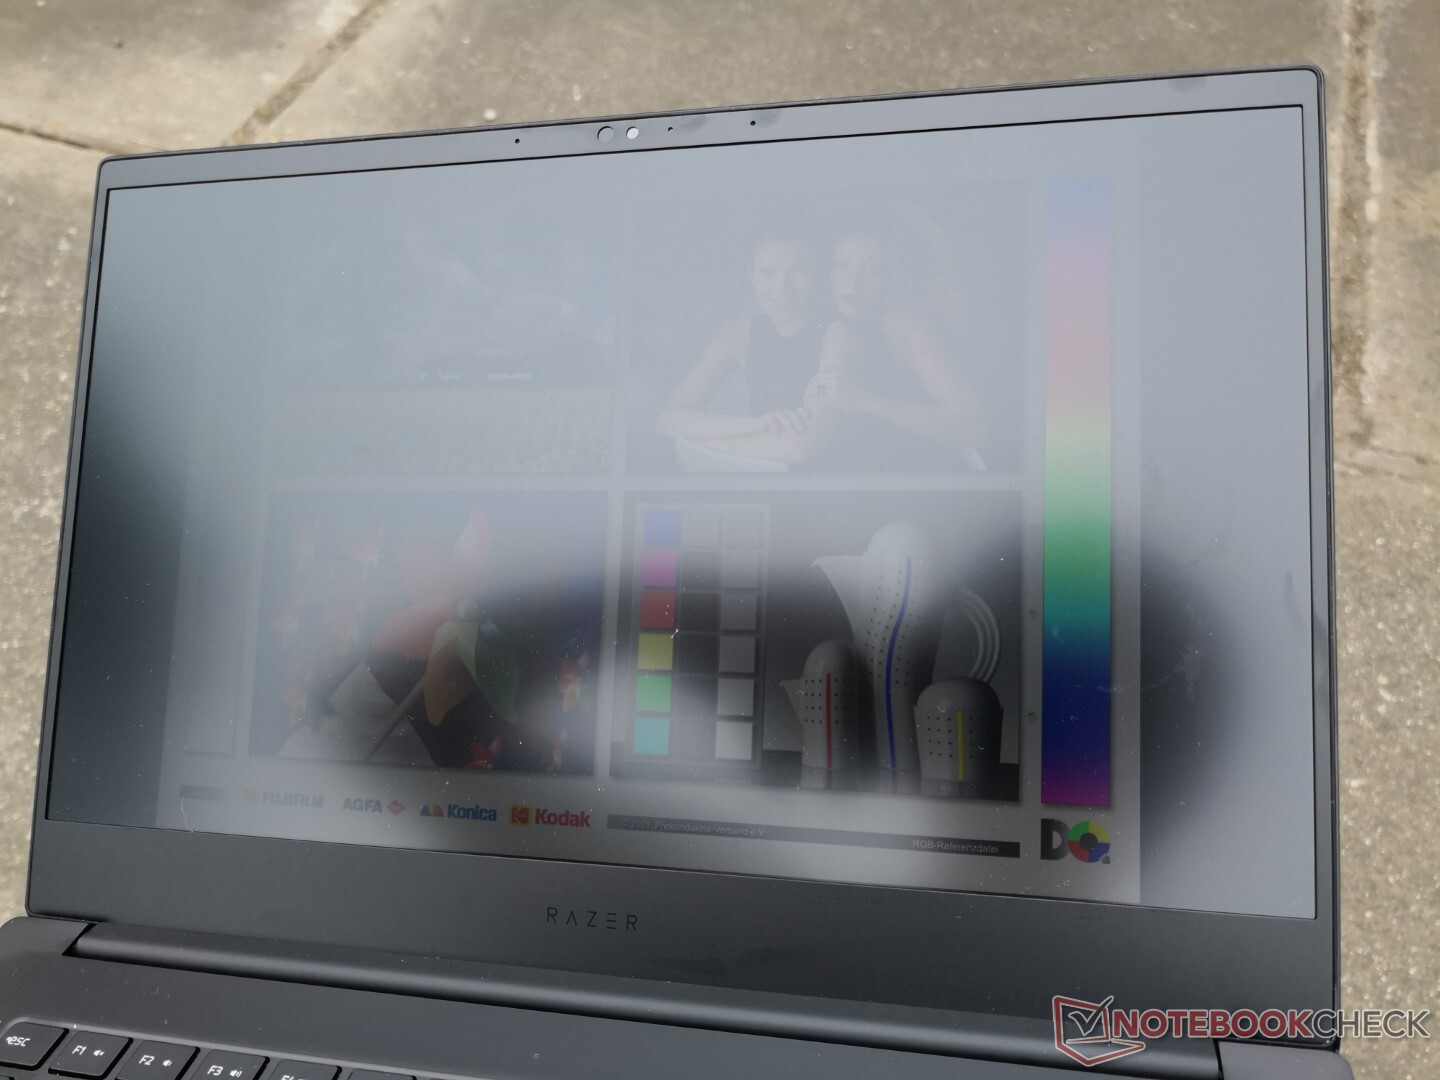
La visibilidad en exteriores es decente sólo cuando está a la sombra. Con algo más de 300 nits, la pantalla del Blade 14 es tan brillante como la pantalla no OLED de Blade Stealth o el Blade 15. Los usuarios pueden querer desactivar AMD Vari-Bright a través de los ajustes de Radeon o si no el brillo máximo puede caer cuando funciona con batería.
Rendimiento: más rápido que la mayoría de los portátiles de 15,6 y 17,3 pulgadas
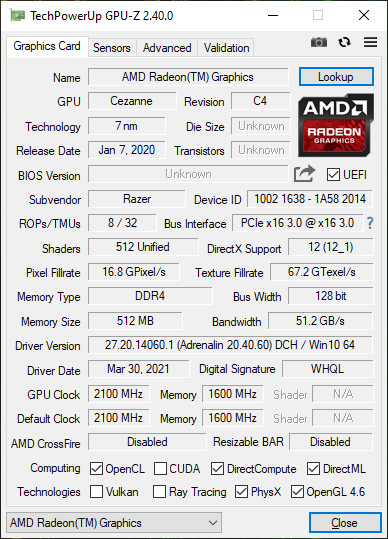
Todos los SKUs actuales vienen con la misma CPU AMD Ryzen 9 5900HX Zen 3 sin ninguna variante de Intel. Este procesador en particular se suele encontrar en portátiles mucho más grandes como el Asus Strix Scar 17 o Lenovo Legion 7 y por eso es poco común verlo aquí en un factor de forma de 14 pulgadas. Asus se adelantó a Razer en el mercado con su propio portátil para juegos de 14 pulgadas con tecnología Zen el año pasado y luego volvió a hacerlo en el CES 2021 con el ROG Flow X13.
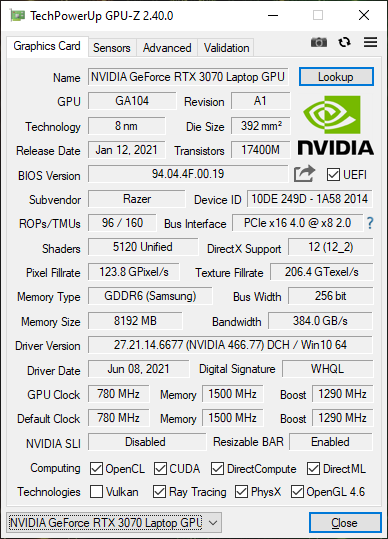
Las opciones de GPU incluyen las GeForce RTX 3060, 3070 y 3080, cada una de ellas con 100 W TGP y con soporte de barra redimensionable. Estas son esencialmente las versiones de GeForce Max-Q como los portátiles más gruesos como elSchenker XMG Ultra 17 vienen con opciones de "plena potencia" de 165 W TGP.
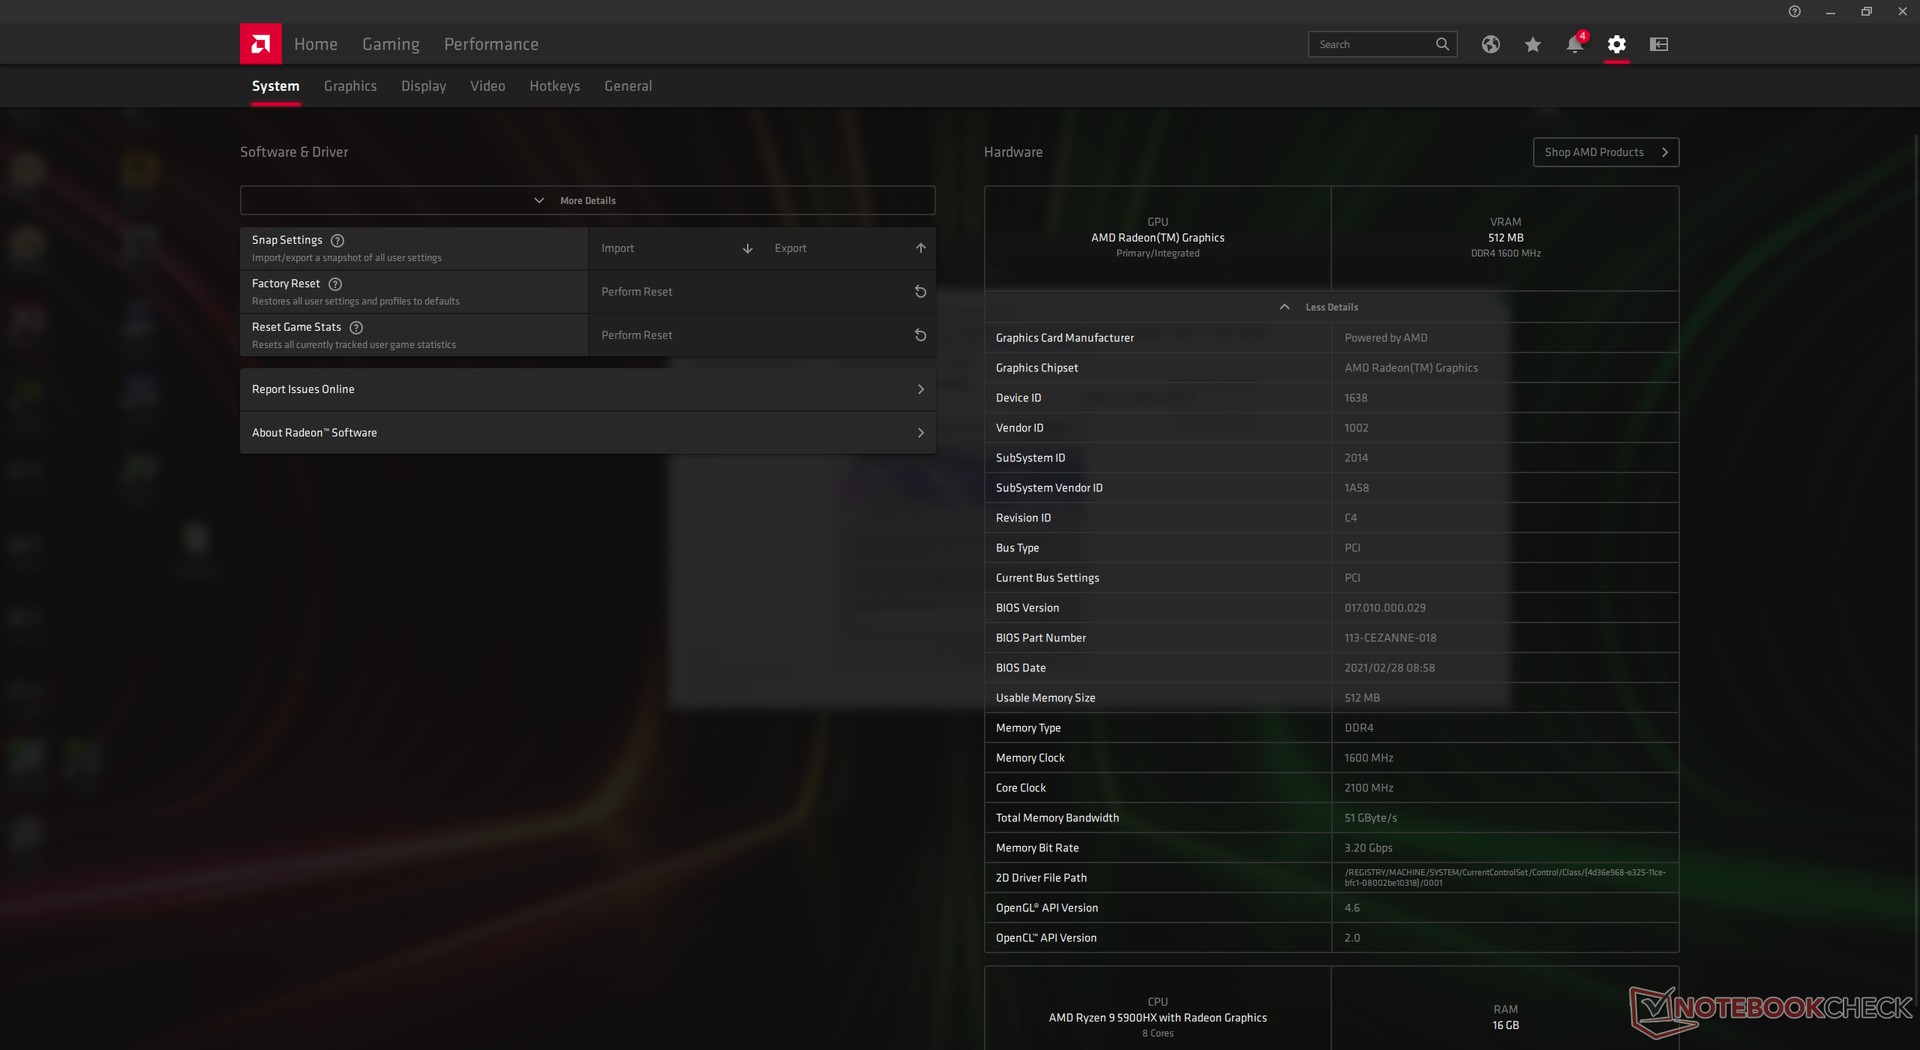
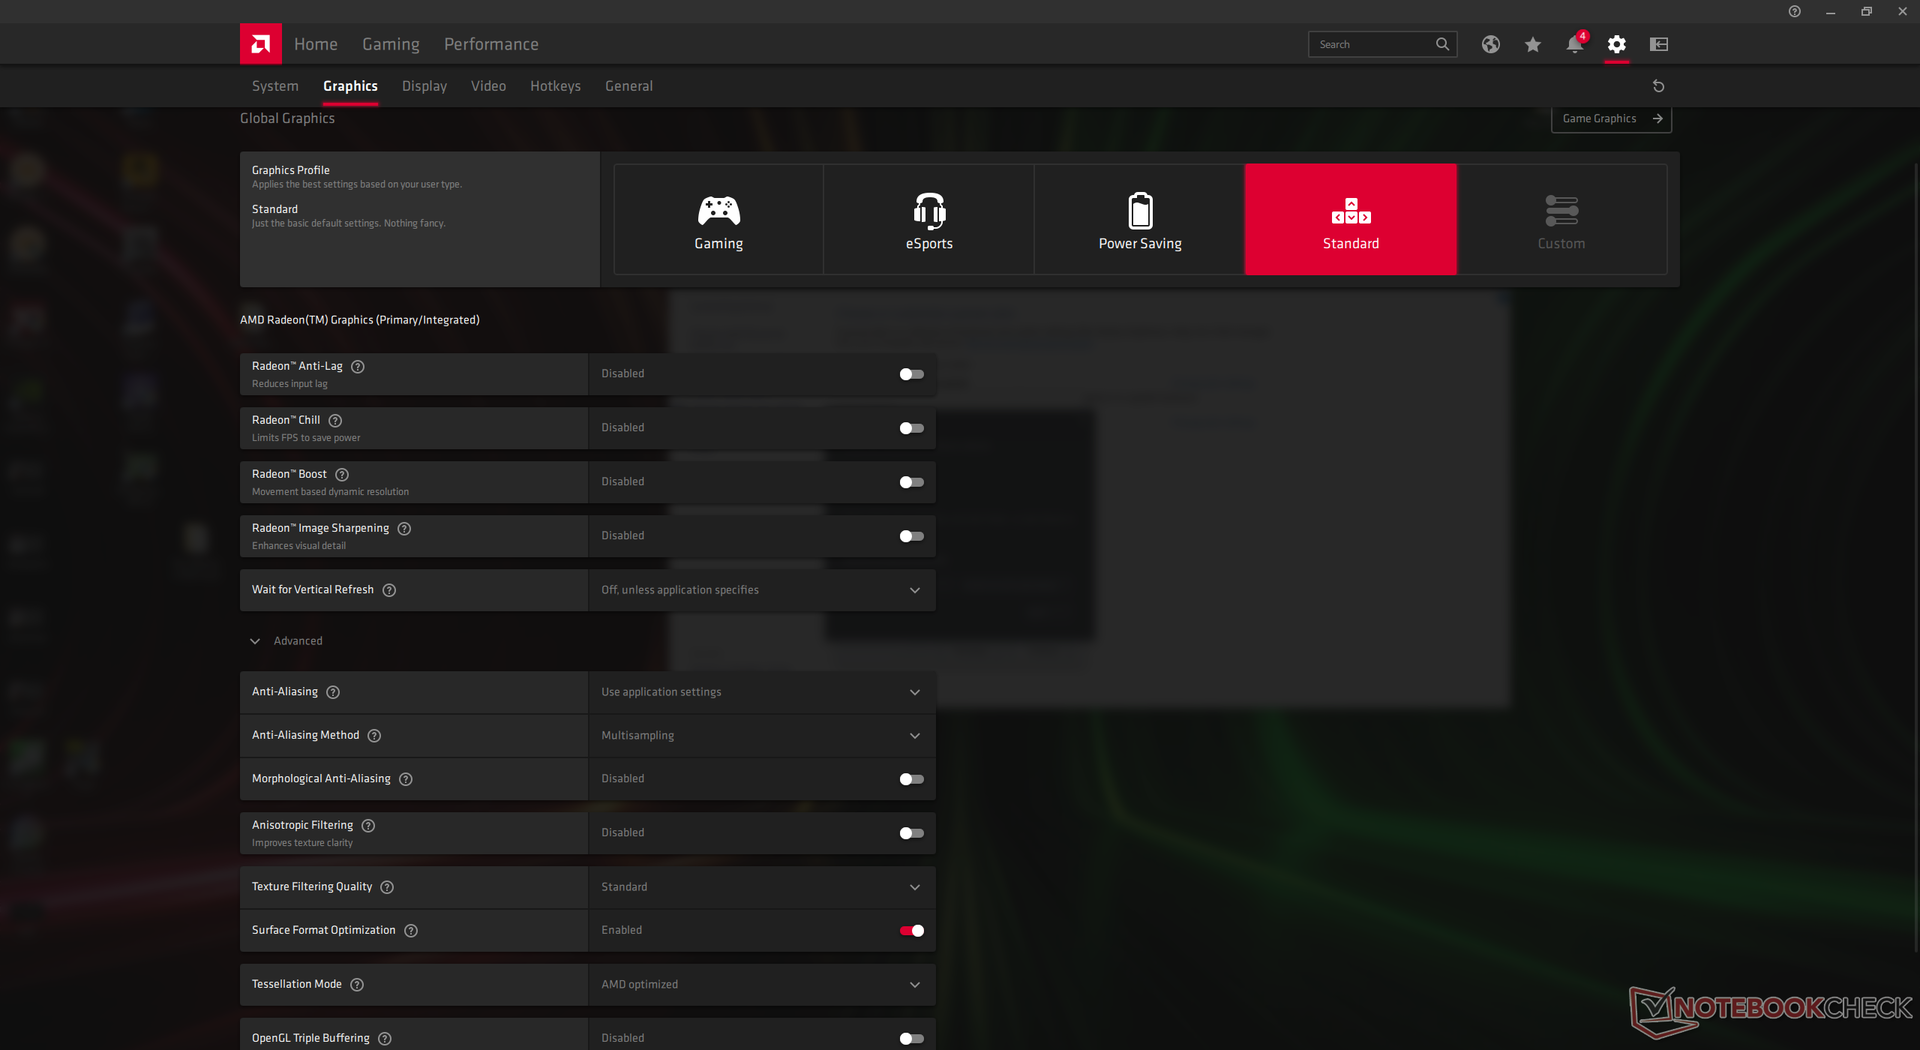
Nuestra unidad de prueba se configuró en modo de rendimiento personalizado con la CPU y la GPU a máxima potencia a través de Razer Synapse. Recomendamos a los propietarios que se familiaricen con Synapse y con las aplicaciones Radeon, ya que las características clave se activan aquí.
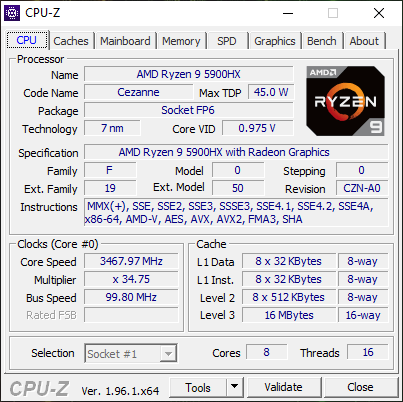
Procesador
¿Puede una CPU octa-core Ryzen 9 rendir en un pequeño portátil de 14 pulgadas? La respuesta es sí, en su mayor parte. De los ocho portátiles diferentes que hemos probado hasta ahora con el mismo Ryzen 9 5900HX Nuestro Blade 14 sólo queda por detrás de él entre un 5 y un 10 por ciento en pruebas multihilo como CineBench. Esta diferencia puede crecer hasta un 15 por ciento en pruebas de un solo hilo como 7-Zip (-mmt1), lo que sugiere que la CPU del Blade 14 se beneficia de un potencial de Turbo Boost más corto que en otros portátiles Ryzen 9.
El competidor de la 11ª generación Tiger Lake-H Intel Core i9-11900H es más rápido que nuestro Ryzen 9 en cargas de trabajo de un solo hilo en un 20 a 30 por ciento, mientras que es ligeramente más lento en cargas de varios hilos en hasta un 10 por ciento. También se puede observar un patrón similar entre las CPUs de la serie U de Ryzen y las de la serie U de Core.
La sostenibilidad general del Turbo Boost sigue siendo muy buena, no obstante. La ejecución de CineBench R15 xT en bucle muestra un rendimiento más consistente durante largos periodos que en el Asus ROG Flow X13 o el Zephyrus G14. Este es fácilmente uno de los portátiles de 14 pulgadas más rápidos que puedes encontrar en términos de rendimiento del procesador multihilo,si no el más rápido.
Cinebench R23: Multi Core | Single Core
Cinebench R15: CPU Multi 64Bit | CPU Single 64Bit
Blender: v2.79 BMW27 CPU
7-Zip 18.03: 7z b 4 -mmt1 | 7z b 4
Geekbench 5.5: Single-Core | Multi-Core
HWBOT x265 Benchmark v2.2: 4k Preset
LibreOffice : 20 Documents To PDF
R Benchmark 2.5: Overall mean
Cinebench R23: Multi Core | Single Core
Cinebench R15: CPU Multi 64Bit | CPU Single 64Bit
Blender: v2.79 BMW27 CPU
7-Zip 18.03: 7z b 4 -mmt1 | 7z b 4
Geekbench 5.5: Single-Core | Multi-Core
HWBOT x265 Benchmark v2.2: 4k Preset
LibreOffice : 20 Documents To PDF
R Benchmark 2.5: Overall mean
* ... más pequeño es mejor
Rendimiento del sistema
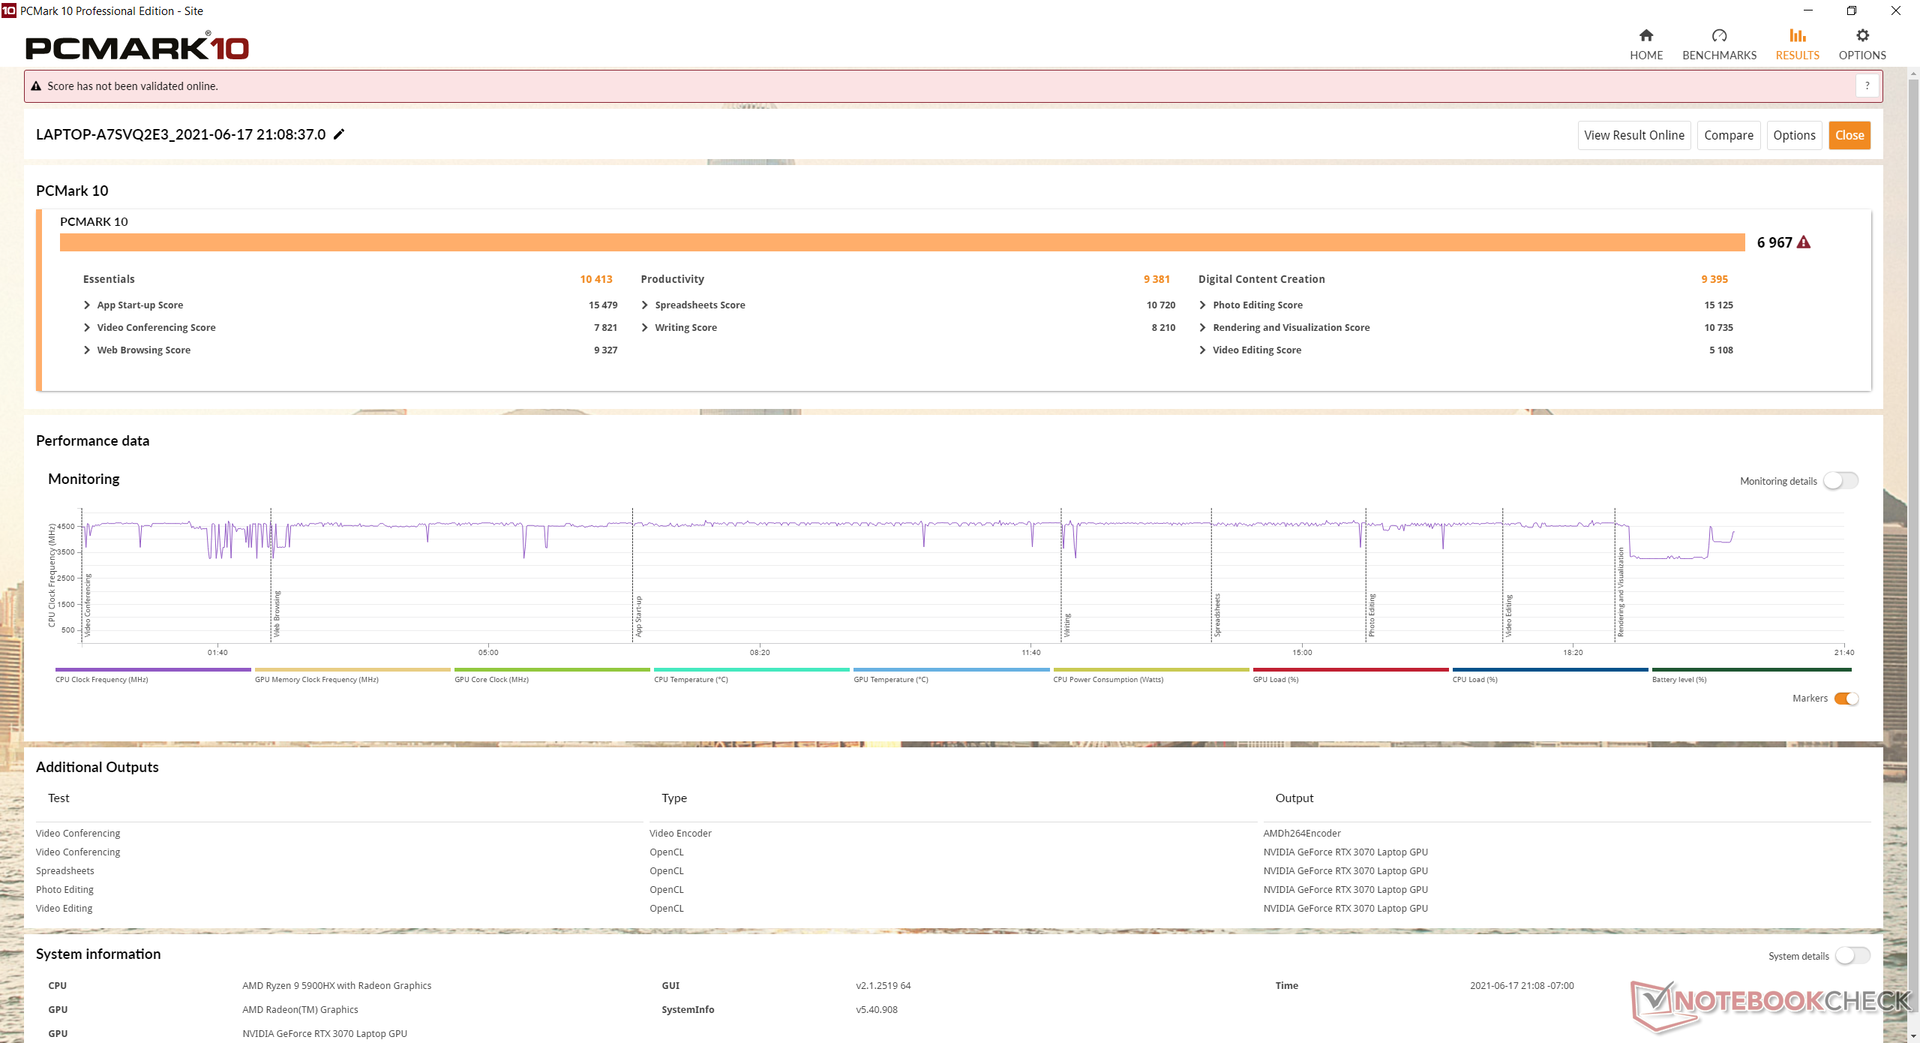
Las puntuaciones de PCMark son sistemáticamente superiores a las de cualquier portátil Blade existente en el mercado, incluido el Razer Blade Pro de 17,3 pulgadas totalmente equipado con gráficos GeForce RTX 3080. El Ryzen 9 5900HX está definitivamente dejando su huella en esta categoría en particular.
| PCMark 10 / Score | |
| Razer Blade 14 Ryzen 9 RTX 3070 | |
| Medio AMD Ryzen 9 5900HX, NVIDIA GeForce RTX 3070 Laptop GPU (6875 - 6967, n=4) | |
| Razer Blade 15 Advanced Model Early 2021 | |
| MSI GS66 Stealth 10UG | |
| Asus ROG Flow X13 GV301QH | |
| Asus Zephyrus G14 GA401IV | |
| Dell XPS 15 9500 Core i7 4K UHD | |
| PCMark 10 / Essentials | |
| Razer Blade 14 Ryzen 9 RTX 3070 | |
| Medio AMD Ryzen 9 5900HX, NVIDIA GeForce RTX 3070 Laptop GPU (9991 - 10413, n=3) | |
| Asus Zephyrus G14 GA401IV | |
| Dell XPS 15 9500 Core i7 4K UHD | |
| Asus ROG Flow X13 GV301QH | |
| MSI GS66 Stealth 10UG | |
| Razer Blade 15 Advanced Model Early 2021 | |
| PCMark 10 / Productivity | |
| Razer Blade 14 Ryzen 9 RTX 3070 | |
| Medio AMD Ryzen 9 5900HX, NVIDIA GeForce RTX 3070 Laptop GPU (9301 - 9381, n=3) | |
| Asus ROG Flow X13 GV301QH | |
| Razer Blade 15 Advanced Model Early 2021 | |
| Dell XPS 15 9500 Core i7 4K UHD | |
| MSI GS66 Stealth 10UG | |
| Asus Zephyrus G14 GA401IV | |
| PCMark 10 / Digital Content Creation | |
| Medio AMD Ryzen 9 5900HX, NVIDIA GeForce RTX 3070 Laptop GPU (9383 - 9561, n=3) | |
| Razer Blade 14 Ryzen 9 RTX 3070 | |
| MSI GS66 Stealth 10UG | |
| Razer Blade 15 Advanced Model Early 2021 | |
| Asus ROG Flow X13 GV301QH | |
| Asus Zephyrus G14 GA401IV | |
| Dell XPS 15 9500 Core i7 4K UHD | |
| PCMark 10 Score | 6967 puntos | |
ayuda | ||
Latencia del CPD
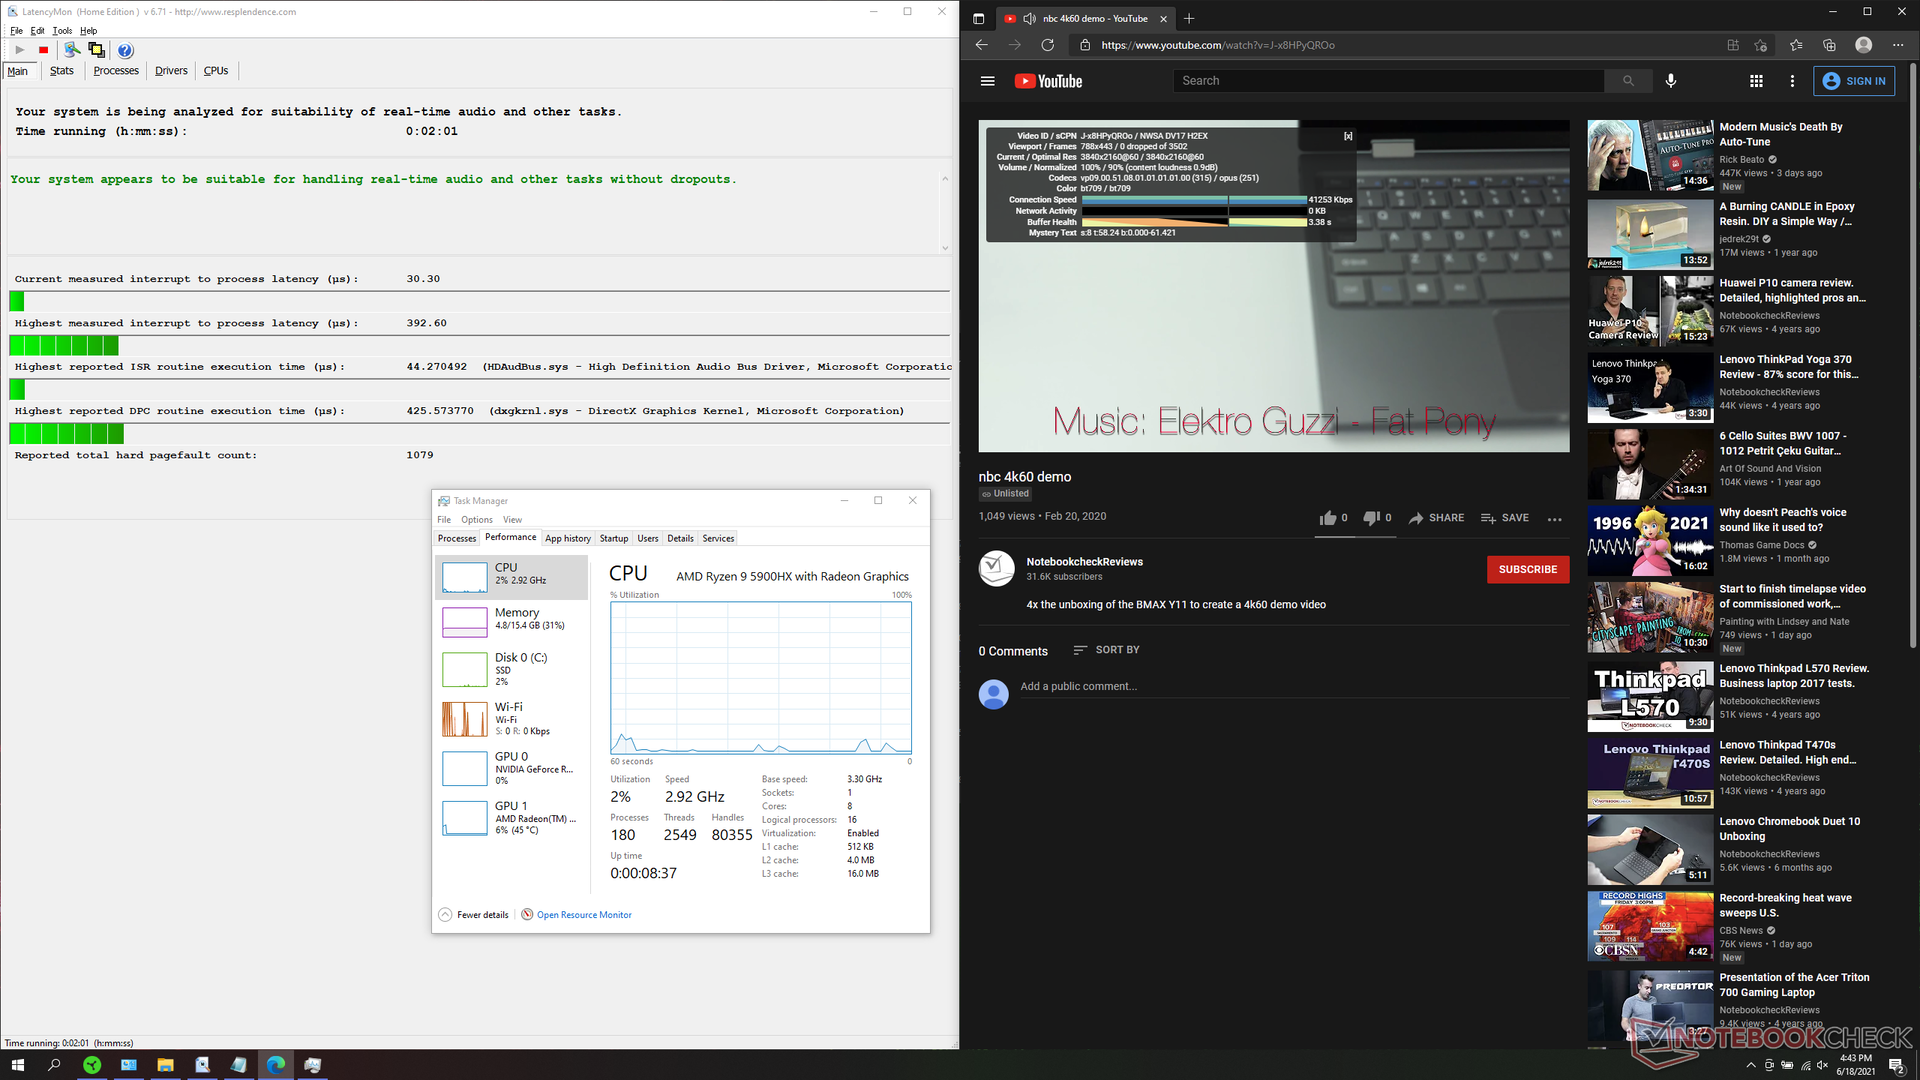
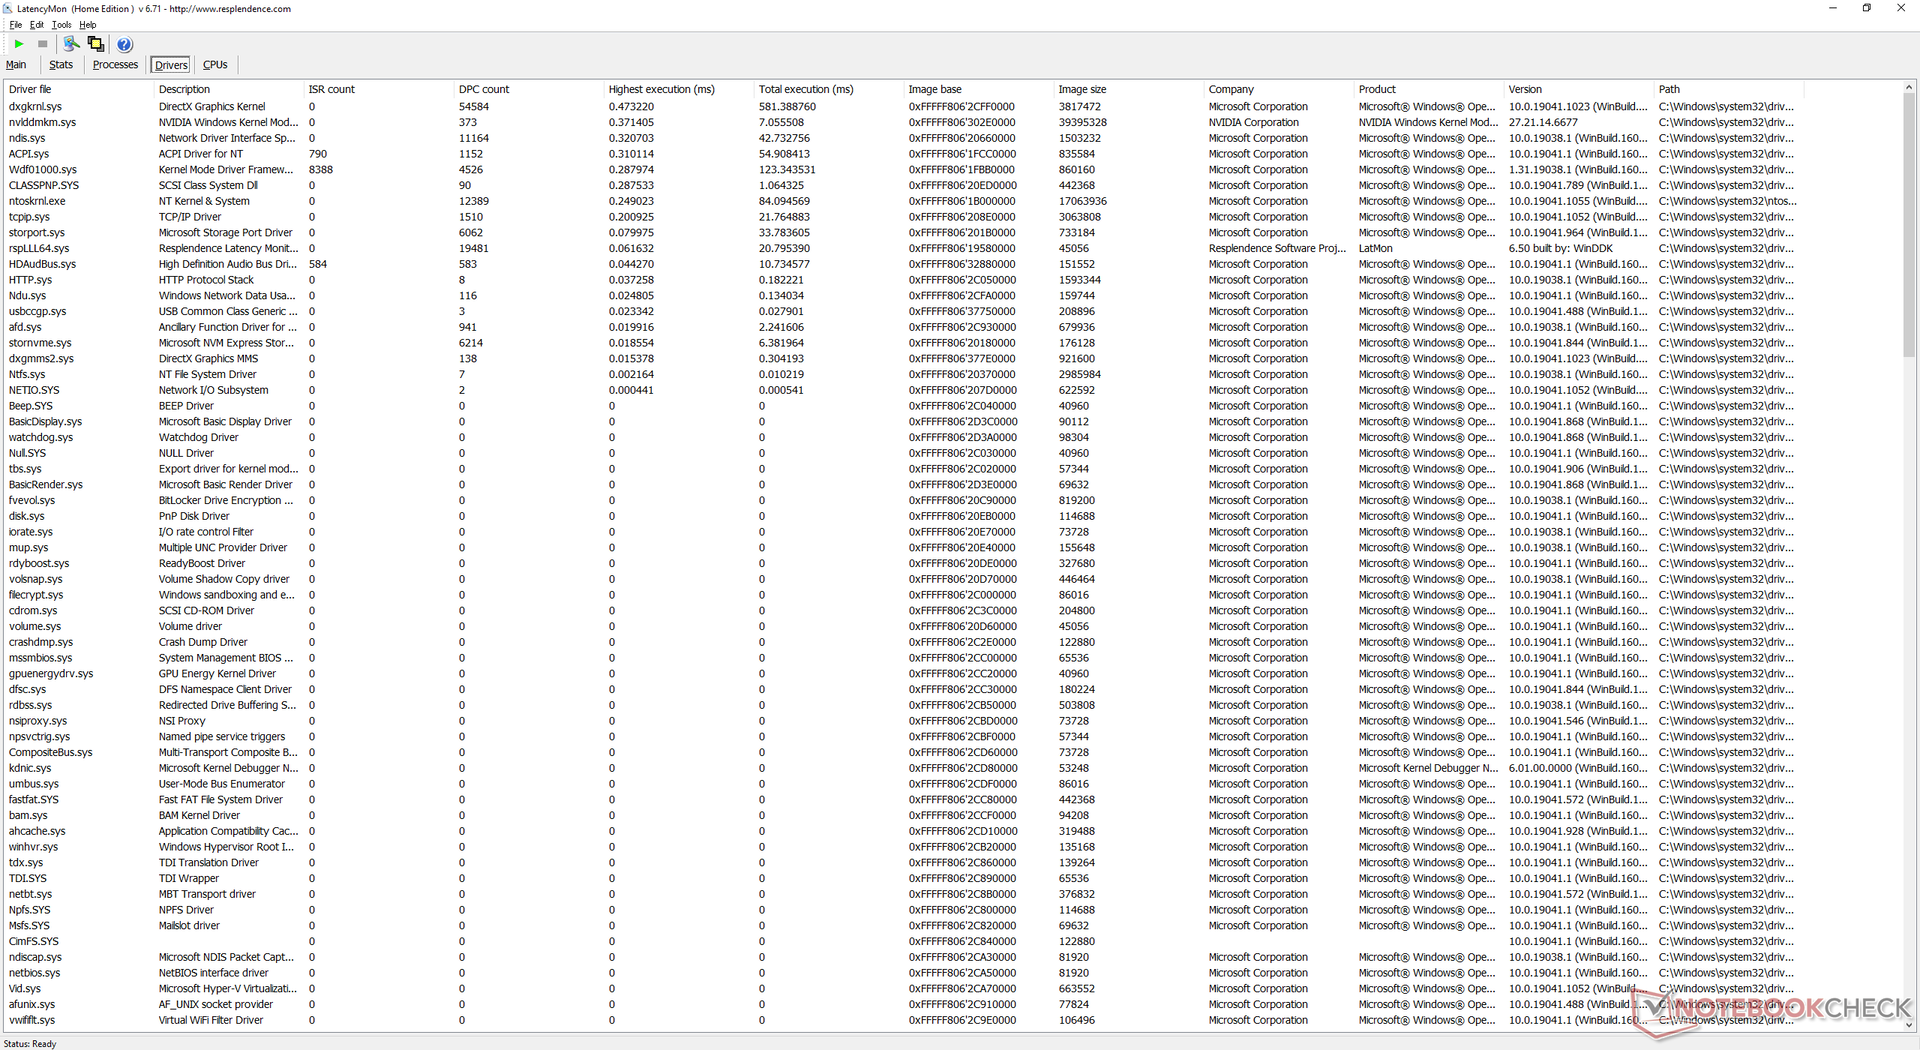
Impresionantemente, LatencyMon no muestra problemas de latencia DPC al navegar por la web y abrir varias pestañas en nuestra página de inicio. La reproducción de vídeo 4K a 60 FPS es fluida y sin caídas de frames. La utilización de la CPU y la iGPU se sitúa en apenas un 2 y un 6 por ciento, respectivamente, en comparación con el 7 y el 31 por ciento de la mayoría de los portátiles Intel con CPU Core i7 Tiger Lake-U.
| DPC Latencies / LatencyMon - interrupt to process latency (max), Web, Youtube, Prime95 | |
| Dell XPS 15 9500 Core i7 4K UHD | |
| Asus ROG Flow X13 GV301QH | |
| Asus Zephyrus G14 GA401IV | |
| MSI GS66 Stealth 10UG | |
| Razer Blade 15 Advanced Model Early 2021 | |
| Razer Blade 14 Ryzen 9 RTX 3070 | |
* ... más pequeño es mejor
Dispositivos de almacenamiento - Sólo una unidad interna
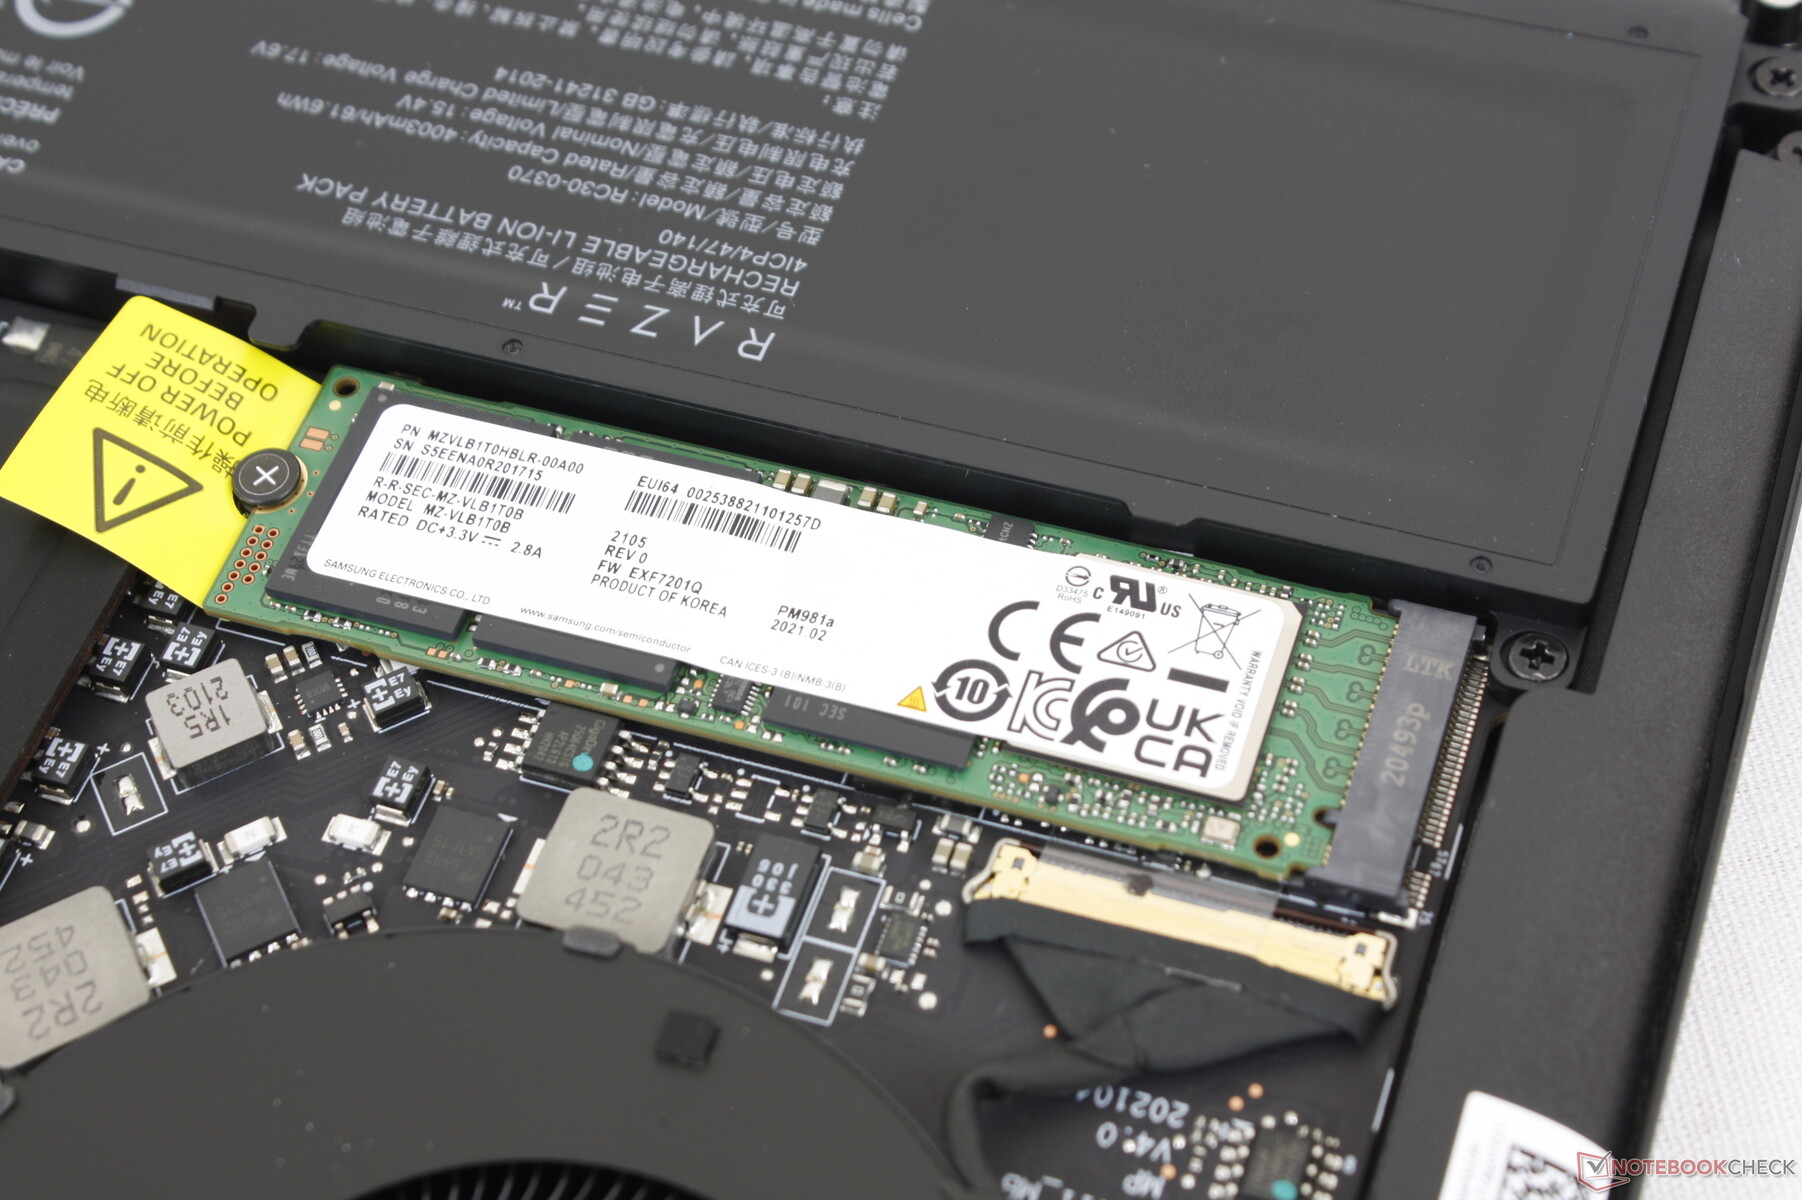
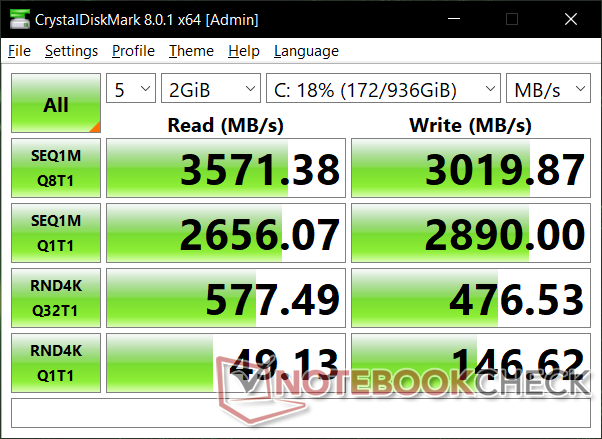
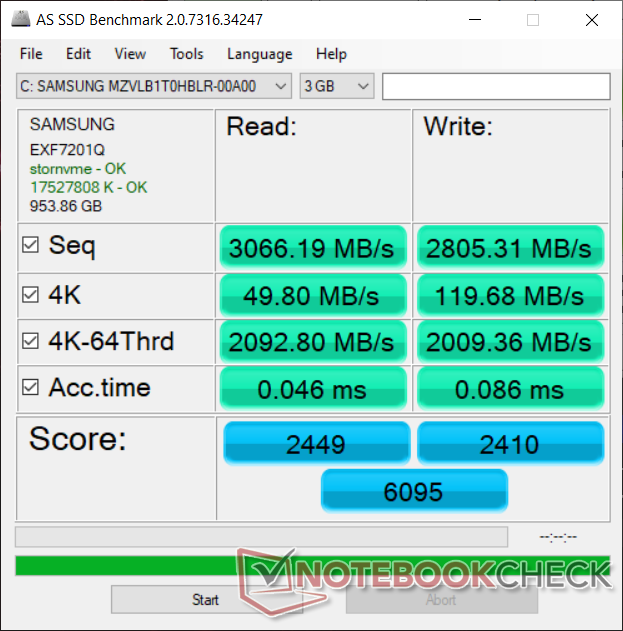
La mayoría de portátiles Razer Blade vienen con SSDs Samsung PM981 A NVMe y el Blade 14 continúa esta tendencia. Sin embargo, es algo decepcionante no ver soporte PCIe 4.0, pero eso puede achacarse en parte a AMD y su arquitectura Zen 3. Un pequeño puñado de Ultrabooks de 14 pulgadas como el Vaio Z ya se comercializan con unidades PCIe 4.0.
| Razer Blade 14 Ryzen 9 RTX 3070 Samsung PM981a MZVLB1T0HBLR | Razer Blade 15 Advanced Model Early 2021 Samsung PM981a MZVLB1T0HBLR | Asus Zephyrus G14 GA401IV Intel SSD 660p 1TB SSDPEKNW010T8 | Asus ROG Flow X13 GV301QH WDC PC SN530 SDBPNPZ-1T00 | Dell XPS 15 9500 Core i7 4K UHD SK Hynix PC611 512GB | |
|---|---|---|---|---|---|
| AS SSD | -8% | -32% | -15% | -32% | |
| Seq Read (MB/s) | 3066 | 2112 -31% | 1278 -58% | 2137 -30% | 2072 -32% |
| Seq Write (MB/s) | 2805 | 2024 -28% | 1624 -42% | 1334 -52% | 1486 -47% |
| 4K Read (MB/s) | 49.8 | 46.53 -7% | 57.8 16% | 45.37 -9% | 47.41 -5% |
| 4K Write (MB/s) | 119.7 | 89.7 -25% | 163 36% | 179.3 50% | 117.6 -2% |
| 4K-64 Read (MB/s) | 2093 | 1747 -17% | 582 -72% | 1016 -51% | 967 -54% |
| 4K-64 Write (MB/s) | 2009 | 1962 -2% | 849 -58% | 1492 -26% | 715 -64% |
| Access Time Read * (ms) | 0.046 | 0.052 -13% | 0.036 22% | 0.033 28% | 0.057 -24% |
| Access Time Write * (ms) | 0.086 | 0.04 53% | 0.112 -30% | 0.043 50% | 0.096 -12% |
| Score Read (Points) | 2449 | 2004 -18% | 768 -69% | 1275 -48% | 1222 -50% |
| Score Write (Points) | 2410 | 2254 -6% | 1174 -51% | 1805 -25% | 981 -59% |
| Score Total (Points) | 6095 | 5280 -13% | 2372 -61% | 3700 -39% | 2809 -54% |
| Copy ISO MB/s (MB/s) | 1799 | 2128 18% | 1660 -8% | 1491 -17% | 1999 11% |
| Copy Program MB/s (MB/s) | 750 | 707 -6% | 443.5 -41% | 608 -19% | 627 -16% |
| Copy Game MB/s (MB/s) | 1830 | 1471 -20% | 1162 -37% | 1428 -22% | 1001 -45% |
* ... más pequeño es mejor

Disk Throttling: DiskSpd Read Loop, Queue Depth 8
Rendimiento de la GPU - 100 W TGP GeForce RTX Graphics
Nuestros 100 W GeForce RTX 3070 es aproximadamente entre un 4 y un 8 por ciento más lenta que la RTX 3070 de 130 W del Asus ROG Strix G15 G513QR. Si tenemos en cuenta que el Blade 14 es sólo una fracción del tamaño del Asus, muchos usuarios pueden encontrar el ligero déficit de rendimiento una píldora fácil de tragar. El rendimiento bruto sigue siendo entre un 9 y un 26 por ciento más rápido que la GeForce RTX 2080 Max-Q que se encuentra en la mayoría de los portátiles de juego más antiguos (y más grandes).
La actualización a la RTX 3080 Supondrá para los usuarios una ganancia relativamente menor del 10 al 13 por ciento en el rendimiento gráfico, mientras que el cambio a la RTX 3060 Reducirá el rendimiento entre un 14 y un 25 por ciento.
El rendimiento de los juegos en el mundo real está a unos pocos puntos porcentuales de media de un típico portátil GeForce RTX 3070. El ralentí en Witcher 3 muestra tasas de fotogramas constantes a lo largo del tiempo sin grandes caídas.
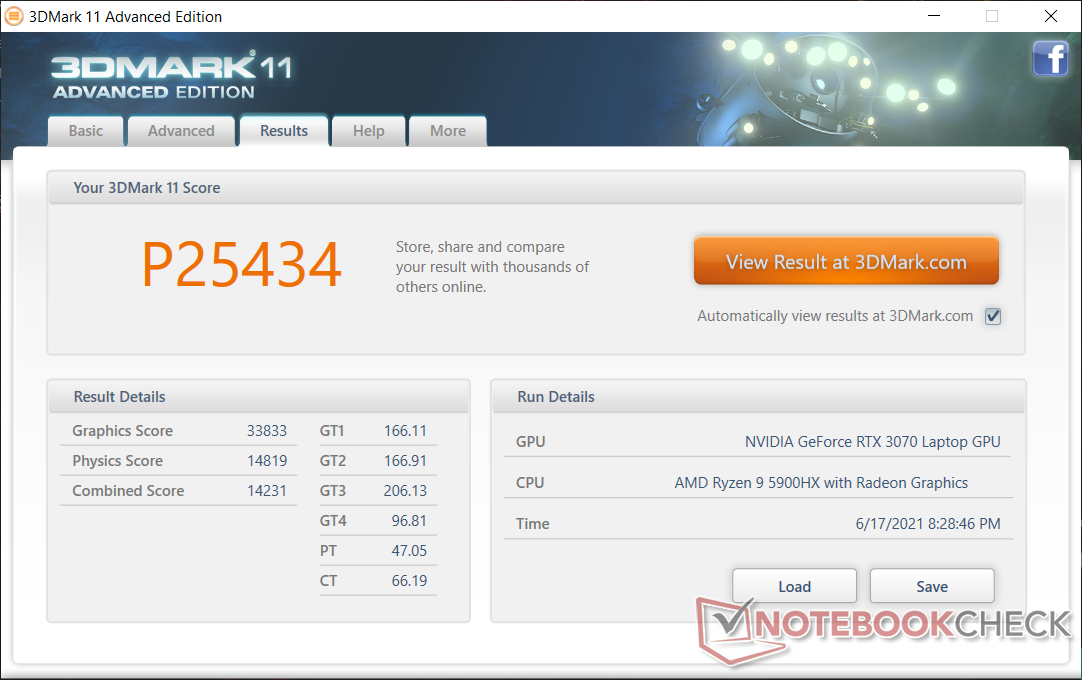
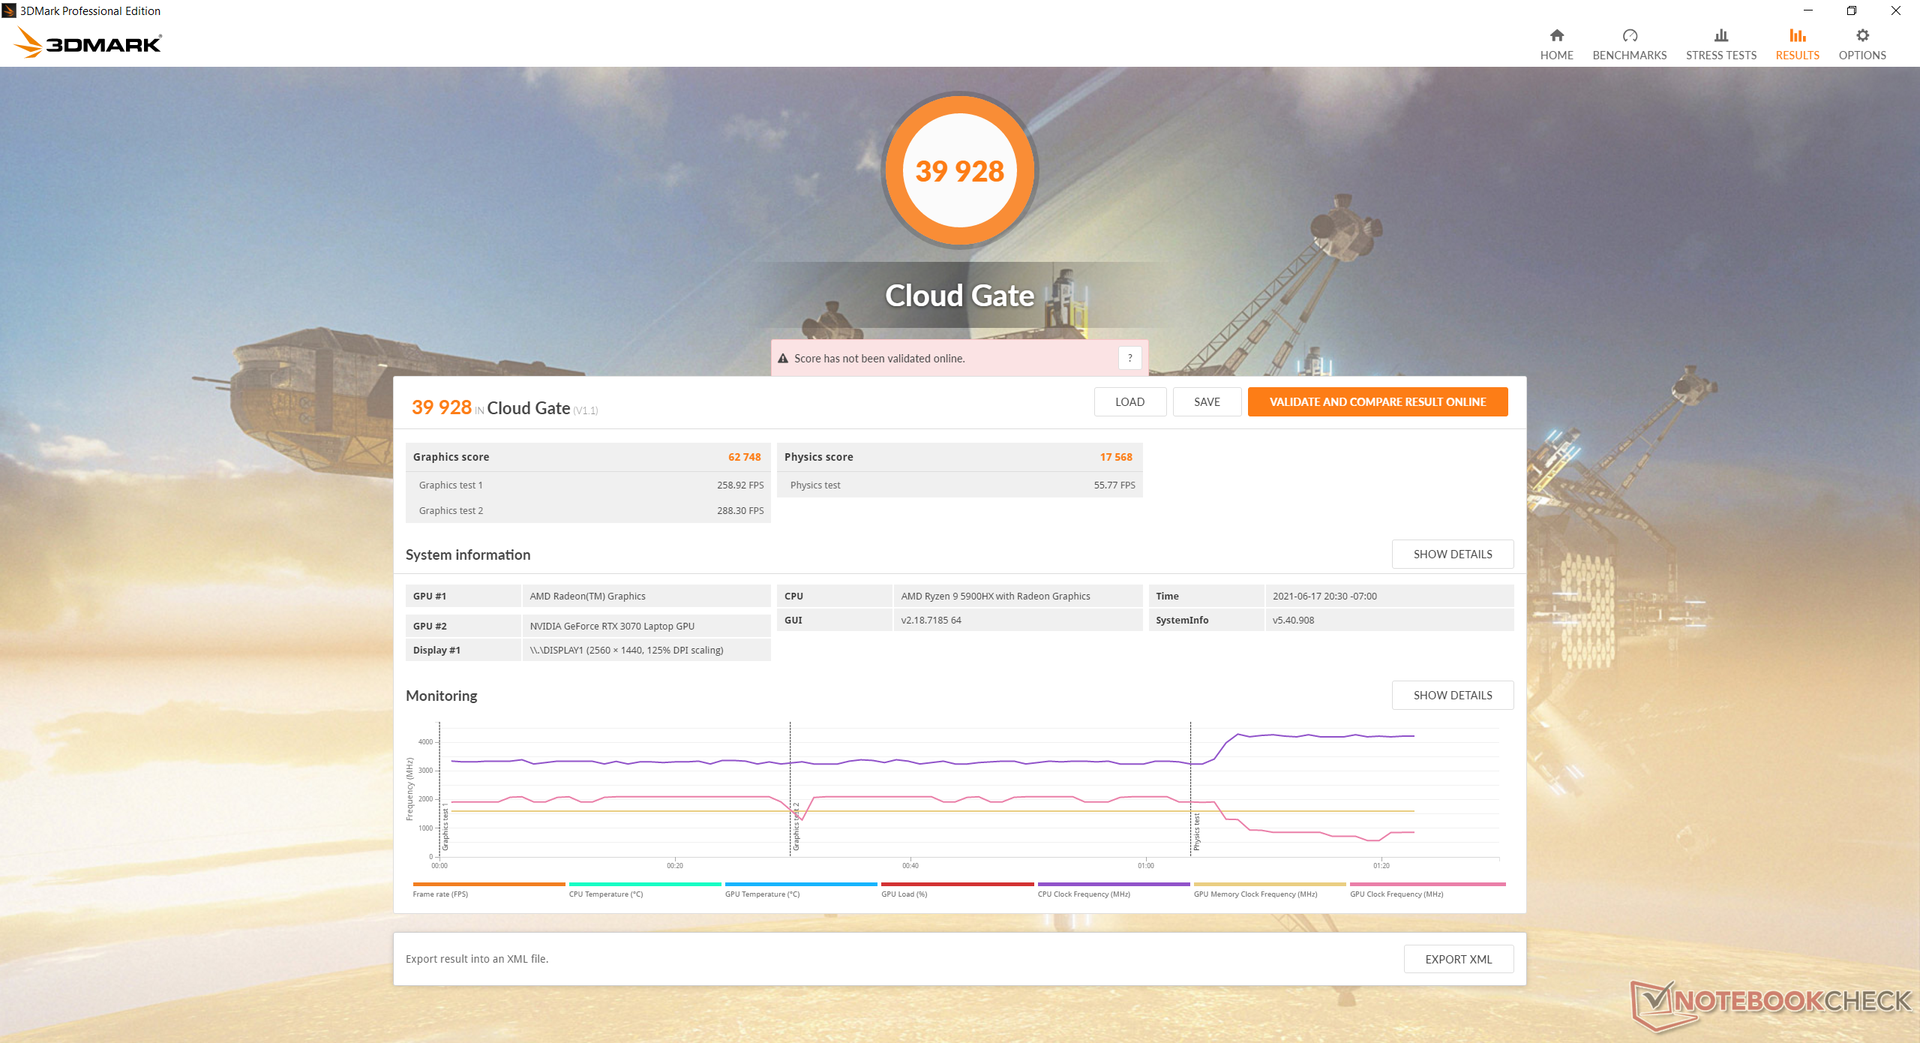
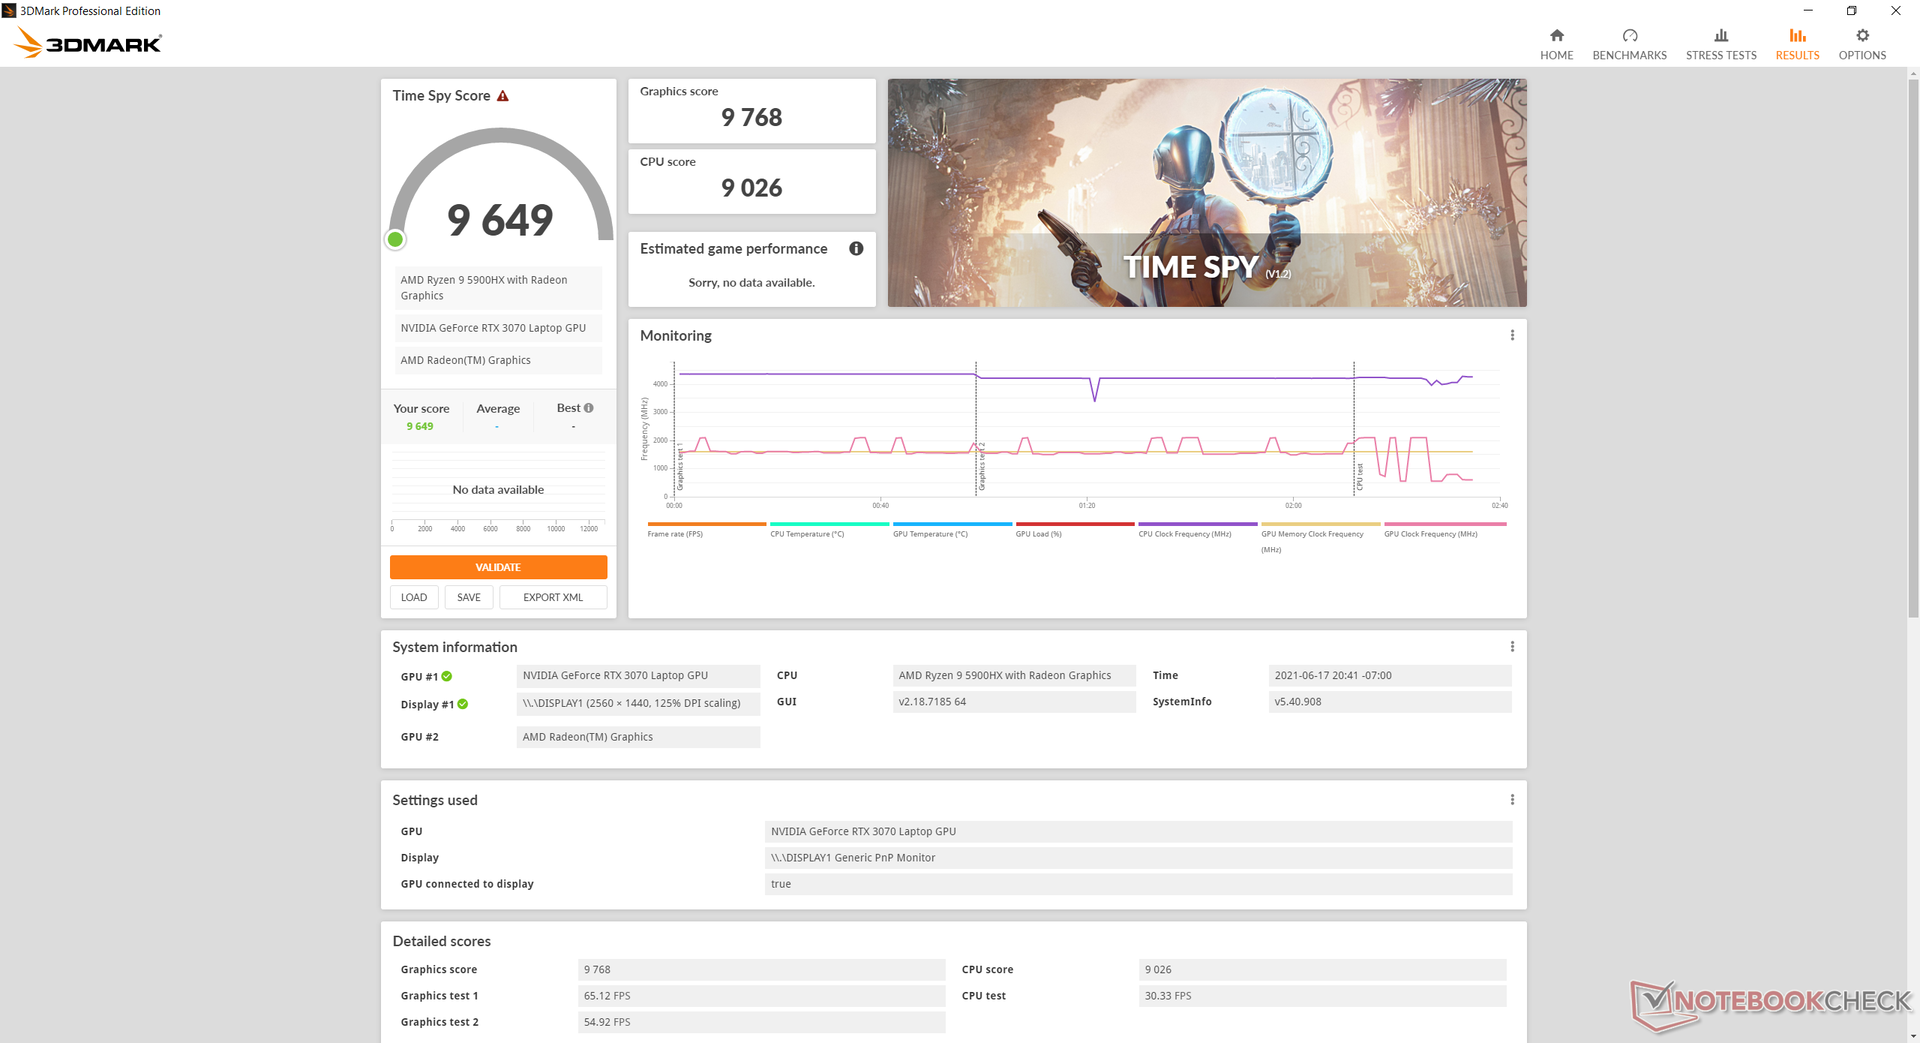
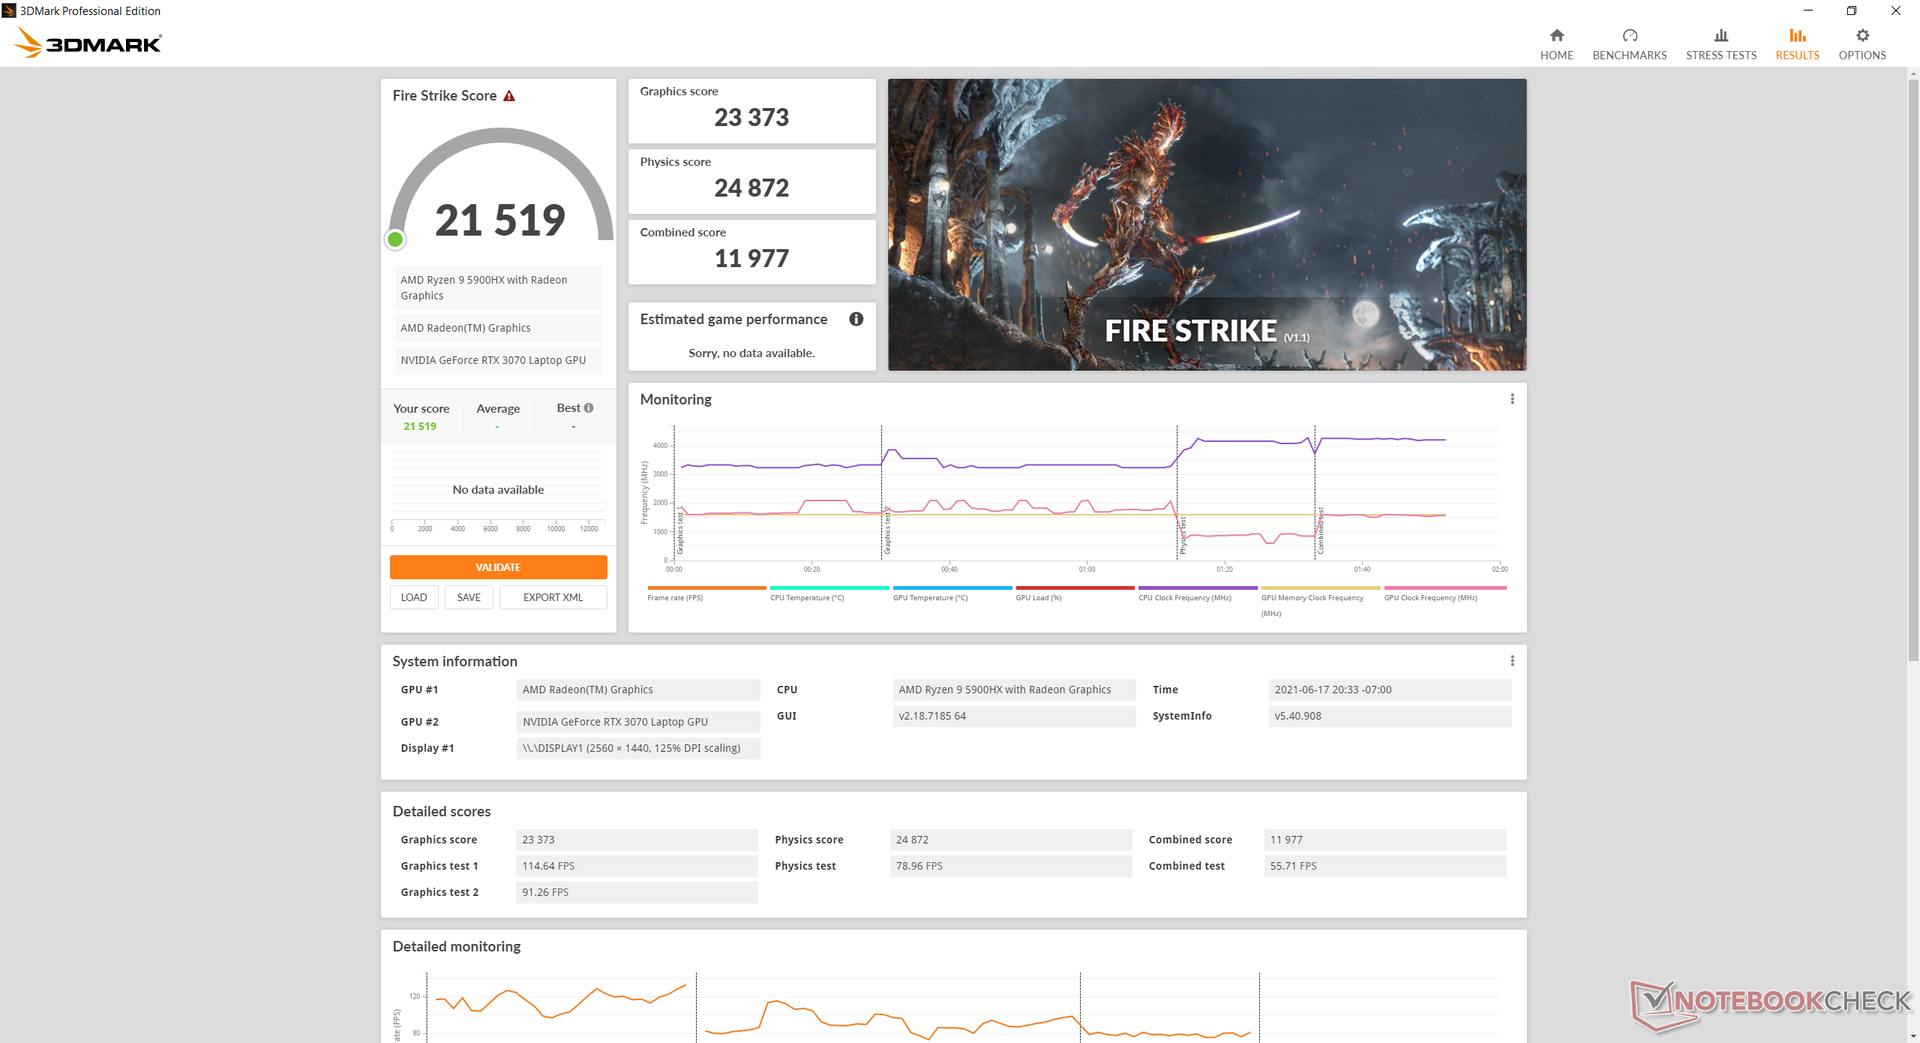
| 3DMark 11 Performance | 25434 puntos | |
| 3DMark Cloud Gate Standard Score | 39928 puntos | |
| 3DMark Fire Strike Score | 21519 puntos | |
| 3DMark Time Spy Score | 9649 puntos | |
ayuda | ||
Witcher 3 FPS Chart
| bajo | medio | alto | ultra | QHD | |
|---|---|---|---|---|---|
| GTA V (2015) | 169 | 132 | 79.6 | 72.7 | |
| The Witcher 3 (2015) | 288.3 | 164.2 | 88.6 | ||
| Dota 2 Reborn (2015) | 127 | 126 | 112 | 107 | |
| Final Fantasy XV Benchmark (2018) | 139 | 114 | 88 | 70.3 | |
| X-Plane 11.11 (2018) | 85 | 75.4 | 62.7 | ||
| Far Cry 5 (2018) | 133 | 110 | 105 | 99 | 86 |
| Strange Brigade (2018) | 285 | 178 | 163 | 154 | 119 |
| Assassin´s Creed Valhalla (2020) | 112 | 86 | 75 | 67 | 53 |
| Cyberpunk 2077 1.6 (2022) | 111.4 | 99.8 | 84.2 | 84 | 45.3 |
Emissions — Quiet When It Needs To Be
Ruido del sistema
El ruido de los ventiladores está estrechamente ligado a los ajustes de rendimiento de Razer Synapse. Cuando está en modo de ahorro de energía, los ventiladores suelen establecerse en torno a los 31 dB(A) o menos durante tareas sencillas como la navegación o el streaming para que sean audibles pero no distraigan. Los ventiladores pueden incluso estar inactivos durante cargas muy bajas como el procesamiento de textos para una experiencia silenciosa. Estos modos de bajo ruido permiten utilizar el Blade 14 en entornos sensibles como aulas o conferencias, como cualquier otro Ultrabook.
Jugar en el modo de alto rendimiento aumenta el ruido del ventilador muy rápidamente. Podemos registrar un ruido constante de 44 dB(A) cuando se ejecuta Witcher 3 hasta casi 52 dB(A) cuando la CPU y la GPU se estresan aún más. Estos rangos de ruido son similares a los de la mayoría de portátiles de juego más grandes, sin embargo, por lo que el Blade 14 no es necesariamente más ruidoso que muchos de sus compañeros más grandes - en cambio, sus ventiladores aumentan antes y de forma más brusca.
Razer no utiliza refrigeración por metal líquido para su CPU, a diferencia de lo que ocurre en todos los 2021 portátiles ROG de Asus que hay actualmente en el mercado. No podemos evitar preguntarnos cómo la tecnología podría haber cambiado las temperaturas o el ruido del ventilador del Blade 14 respecto a la habitual pasta térmica basada en silicona.
| Razer Blade 14 Ryzen 9 RTX 3070 GeForce RTX 3070 Laptop GPU, R9 5900HX, Samsung PM981a MZVLB1T0HBLR | Razer Blade 15 Advanced Model Early 2021 GeForce RTX 3080 Laptop GPU, i7-10875H, Samsung PM981a MZVLB1T0HBLR | Asus Zephyrus G14 GA401IV GeForce RTX 2060 Max-Q, R9 4900HS, Intel SSD 660p 1TB SSDPEKNW010T8 | Asus ROG Flow X13 GV301QH GeForce GTX 1650 Max-Q, R9 5980HS, WDC PC SN530 SDBPNPZ-1T00 | Dell XPS 15 9500 Core i7 4K UHD GeForce GTX 1650 Ti Mobile, i7-10875H, SK Hynix PC611 512GB | MSI GS66 Stealth 10UG GeForce RTX 3070 Laptop GPU, i7-10870H, WDC PC SN730 SDBPNTY-1T00 | |
|---|---|---|---|---|---|---|
| Noise | -14% | -18% | -15% | -12% | -26% | |
| apagado / medio ambiente * (dB) | 25.1 | 24 4% | 28.1 -12% | 30.5 -22% | 28.4 -13% | 26.2 -4% |
| Idle Minimum * (dB) | 25.2 | 26 -3% | 30.4 -21% | 30.5 -21% | 28.4 -13% | 34 -35% |
| Idle Average * (dB) | 25.2 | 28 -11% | 31.5 -25% | 30.5 -21% | 28.4 -13% | 34 -35% |
| Idle Maximum * (dB) | 25.2 | 40 -59% | 33.7 -34% | 32.1 -27% | 28.4 -13% | 34 -35% |
| Load Average * (dB) | 31 | 45 -45% | 34.3 -11% | 43 -39% | 46 -48% | 47.2 -52% |
| Witcher 3 ultra * (dB) | 44 | 43 2% | 53.5 -22% | 42.8 3% | 42 5% | 46.3 -5% |
| Load Maximum * (dB) | 51.7 | 45 13% | 53.5 -3% | 41.3 20% | 47.1 9% | 58.2 -13% |
* ... más pequeño es mejor
Ruido
| Ocioso |
| 25.2 / 25.2 / 25.2 dB(A) |
| Carga |
| 31 / 51.7 dB(A) |
 | ||
30 dB silencioso 40 dB(A) audible 50 dB(A) ruidosamente alto |
||
min: | ||
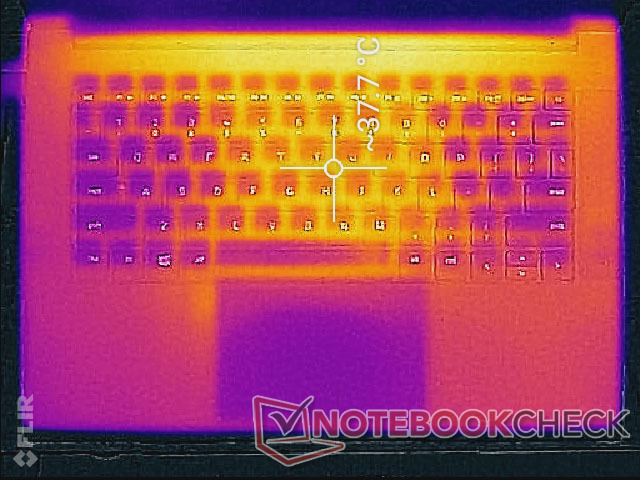
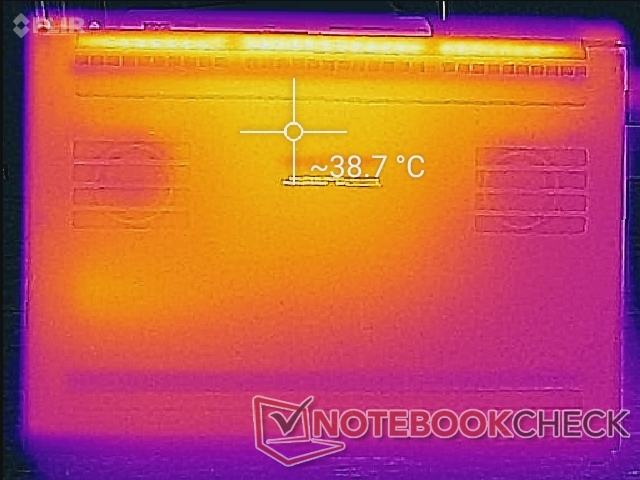
Temperatura - Caliente casi todo el tiempo
Las temperaturas de la superficie son más cálidas de lo esperado cuando está en ralentí en el escritorio porque los ventiladores tienden a estar en ralentí como se ha mencionado anteriormente. De hecho, la temperatura media de la superficie cuando está en reposo es 10 C más cálida que la que registramos en el Asus Zephyrus G14 en condiciones similares.
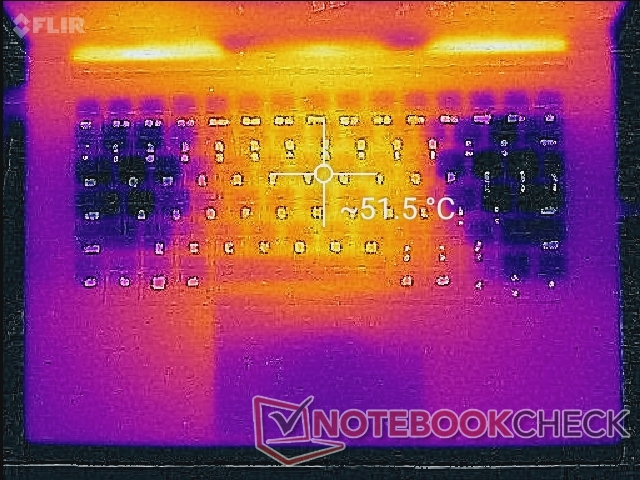
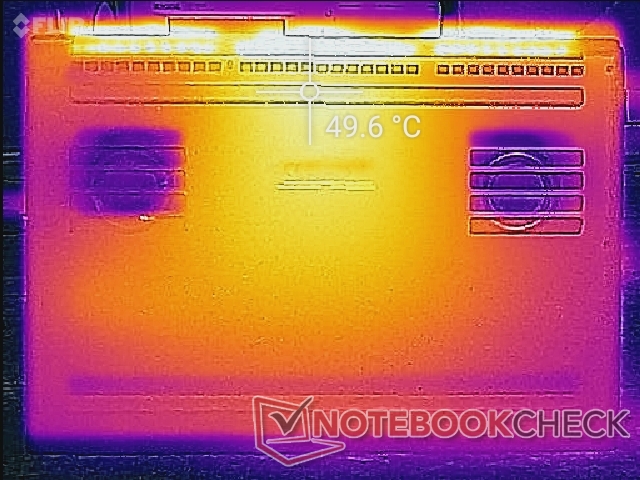
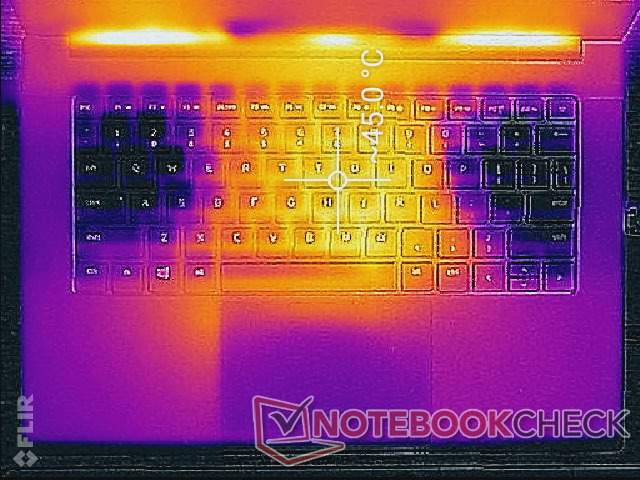
Cuando se ejecutan cargas más altas, como los juegos, los dos ventiladores extraen aire fresco a través de las teclas WASD y Enter, como se muestra a continuación, para enfriar los dedos. Sin embargo, los reposamanos se calientan mucho más a casi 40 C. Definitivamente se siente un poco raro tener los dedos fríos en las teclas WASD mientras el resto de la mano está mucho más caliente. Las temperaturas medias de la superficie son más cálidas que las que encontrarás en otros portátiles para juegos, incluyendo el Zephyrus G14 o el MSI GS66 debido en parte al diseño metálico unibody más denso del Razer.
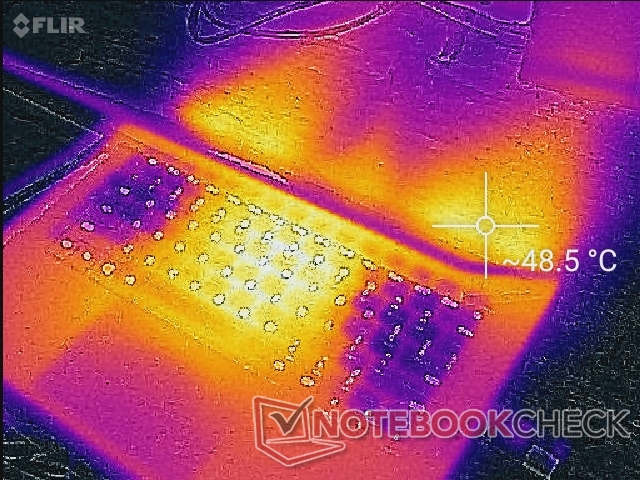
(±) La temperatura máxima en la parte superior es de 45 °C / 113 F, frente a la media de 40.4 °C / 105 F, que oscila entre 21.2 y 68.8 °C para la clase Gaming.
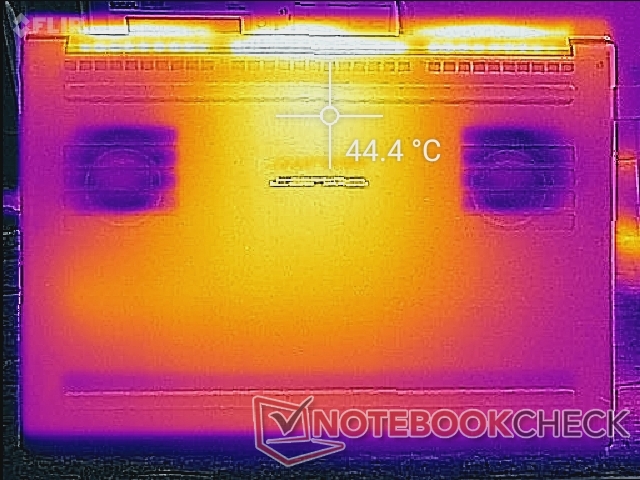
(±) El fondo se calienta hasta un máximo de 44.4 °C / 112 F, frente a la media de 43.2 °C / 110 F
(±) En reposo, la temperatura media de la parte superior es de 35.4 °C / 96# F, frente a la media del dispositivo de 33.9 °C / 93 F.
(-) Jugando a The Witcher 3, la temperatura media de la parte superior es de 41.2 °C / 106 F, frente a la media del dispositivo de 33.9 °C / 93 F.
(±) El reposamanos y el touchpad pueden calentarse mucho al tacto con un máximo de 39.4 °C / 102.9 F.
(-) La temperatura media de la zona del reposamanos de dispositivos similares fue de 28.8 °C / 83.8 F (-10.6 °C / -19.1 F).
Prueba de esfuerzo
Cuando se ejecuta Prime95 para estresar la CPU, se pueden observar velocidades de reloj que aumentan y se estabilizan en 4,3 GHz. La temperatura del núcleo también se mantiene estable en torno a los 83 C. Si el núcleo llega a los 100 C, la velocidad de reloj baja temporalmente a 3,8 GHz antes de volver a subir a 4,3 GHz, como muestra la siguiente captura de pantalla. La temperatura estable más alta de la CPU que podemos registrar es de 90 C cuando se ejecuta Prime95 y FurMark simultáneamente en la máquina.
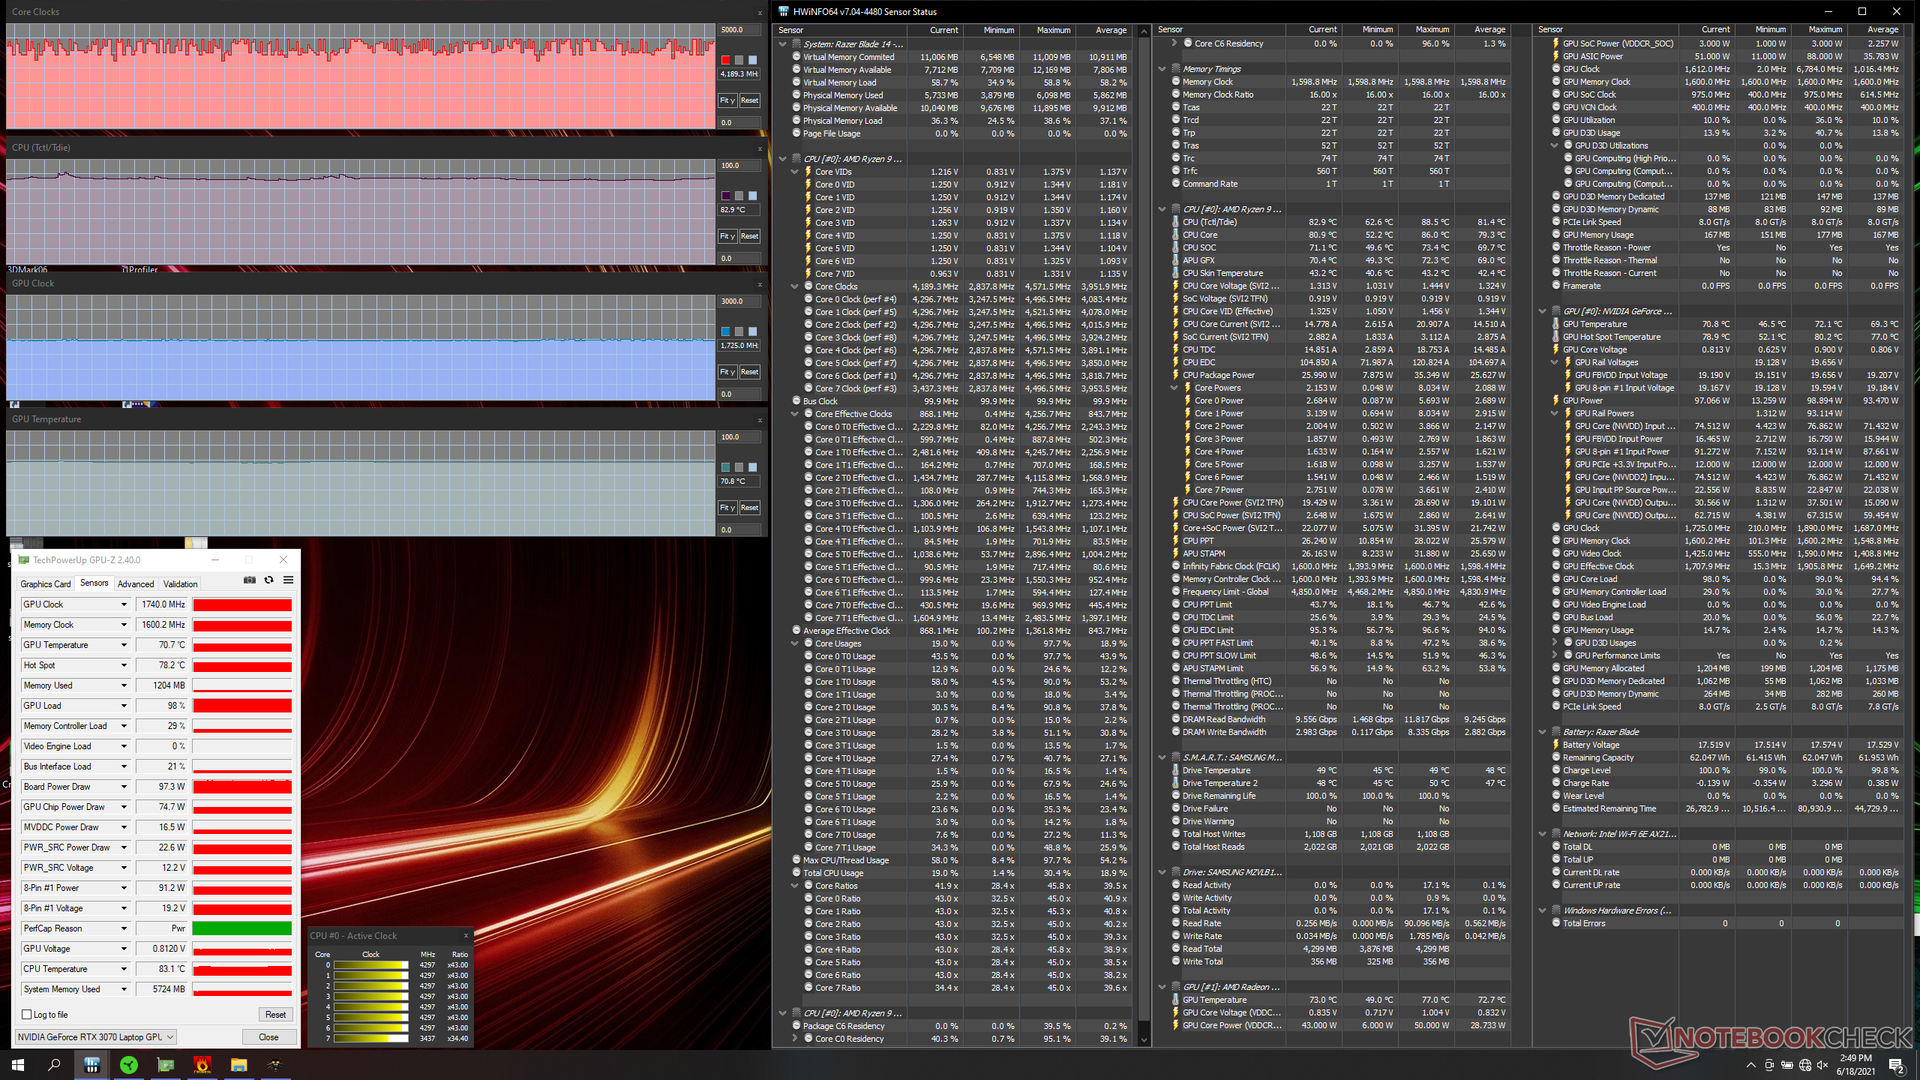
La ejecución de Witcher 3 es más representativo de las cargas de juego del mundo real. La CPU y la GPU se estabilizan a 83 C y 71 C, respectivamente, en comparación con los 79 C y 66 C del Zephyrus G14 o los 67 C y 75 C del Blade 15 en condiciones de juego similares. La CPU está definitivamente funcionando un poco más caliente en el Blade 14 comparado con lo que hemos visto en la mayoría de otros portátiles de juego.
El consumo de la placa de la GPU también rondaría los 97 W cuando se ejecuta Witcher 3 lo que confirma la afirmación de Razer de una TGP RTX 3070 de 100 W. El 15.6-inch Zephyrus Duo 15 SE es capaz de albergar GPUs TGP más potentes de 130 W mientras ofrece exactamente la misma CPU que nuestro Blade 14.
El funcionamiento con batería limita el rendimiento. Una prueba de 3DMark 11 con baterías arrojaría unas puntuaciones de Física y Gráficos de 11372 y 13071 puntos, respectivamente, en comparación con los 14819 y 33833 puntos con la red eléctrica.
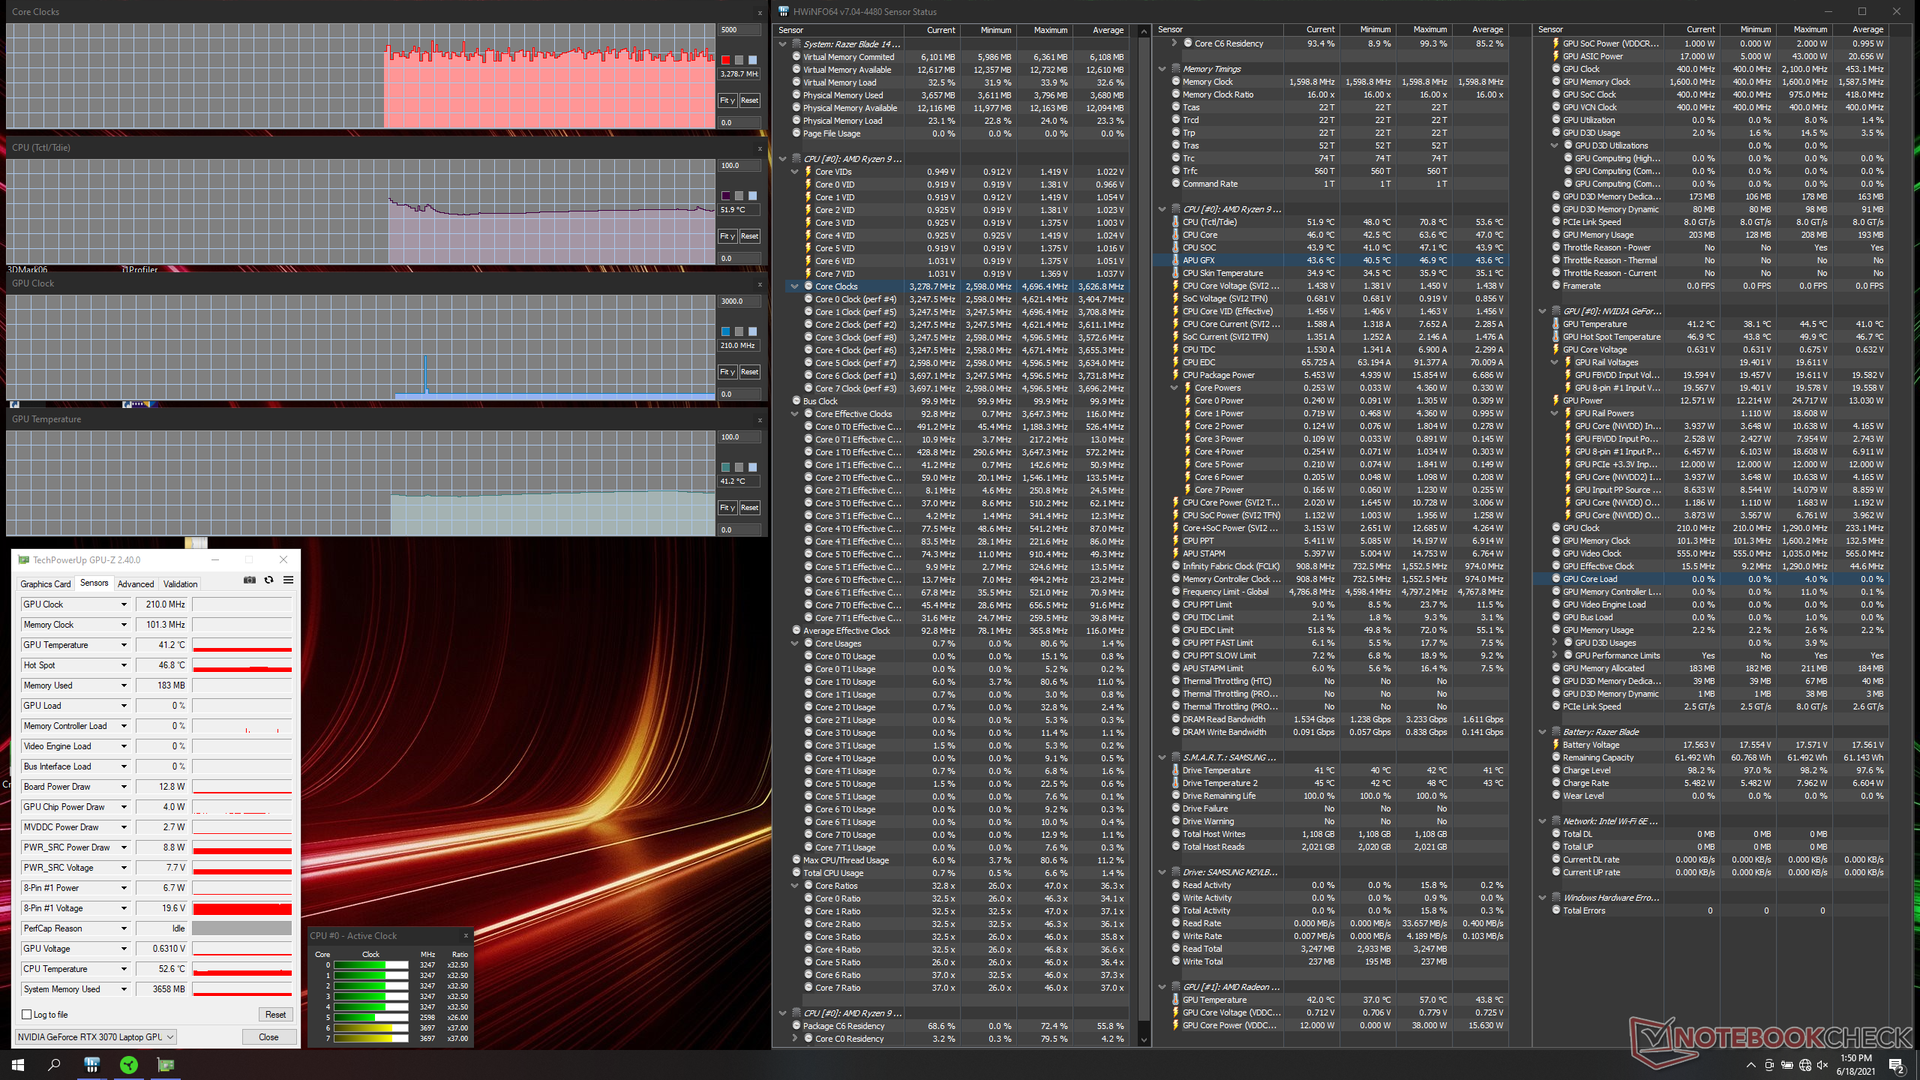
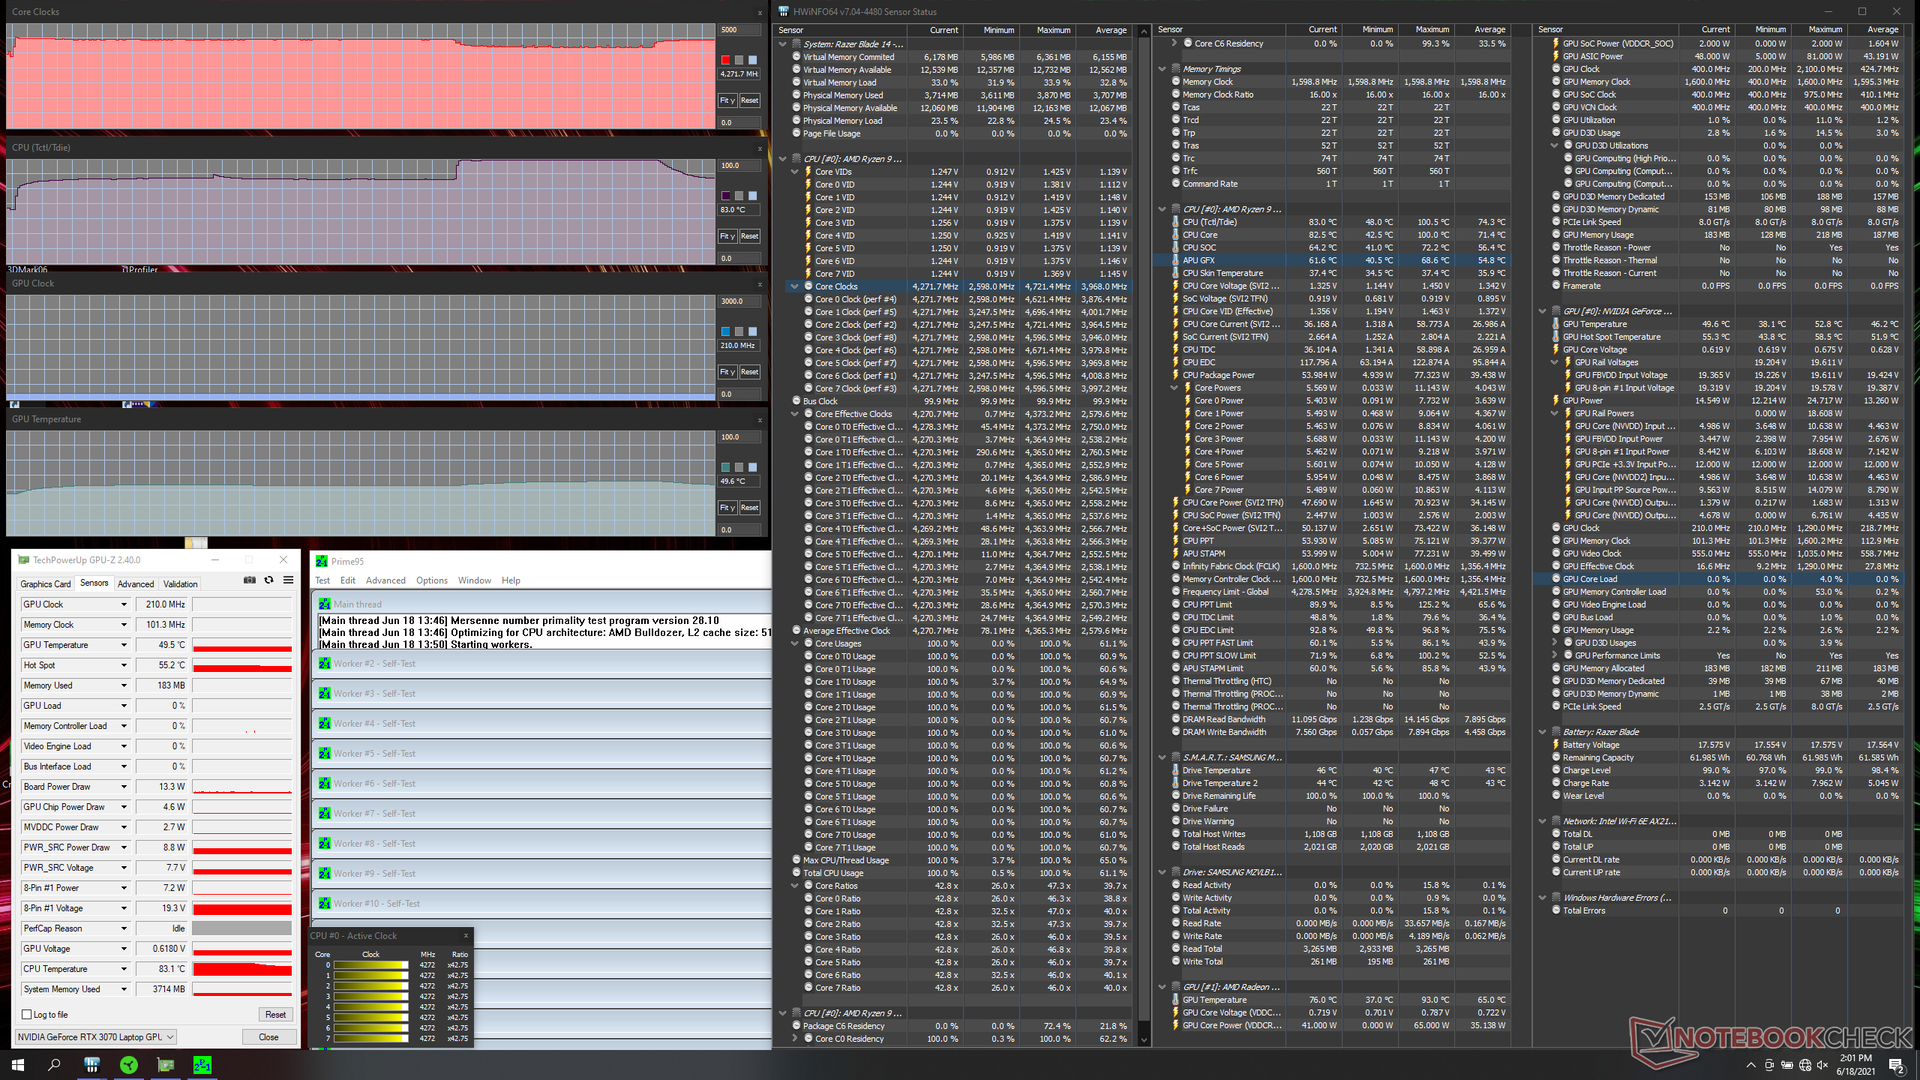
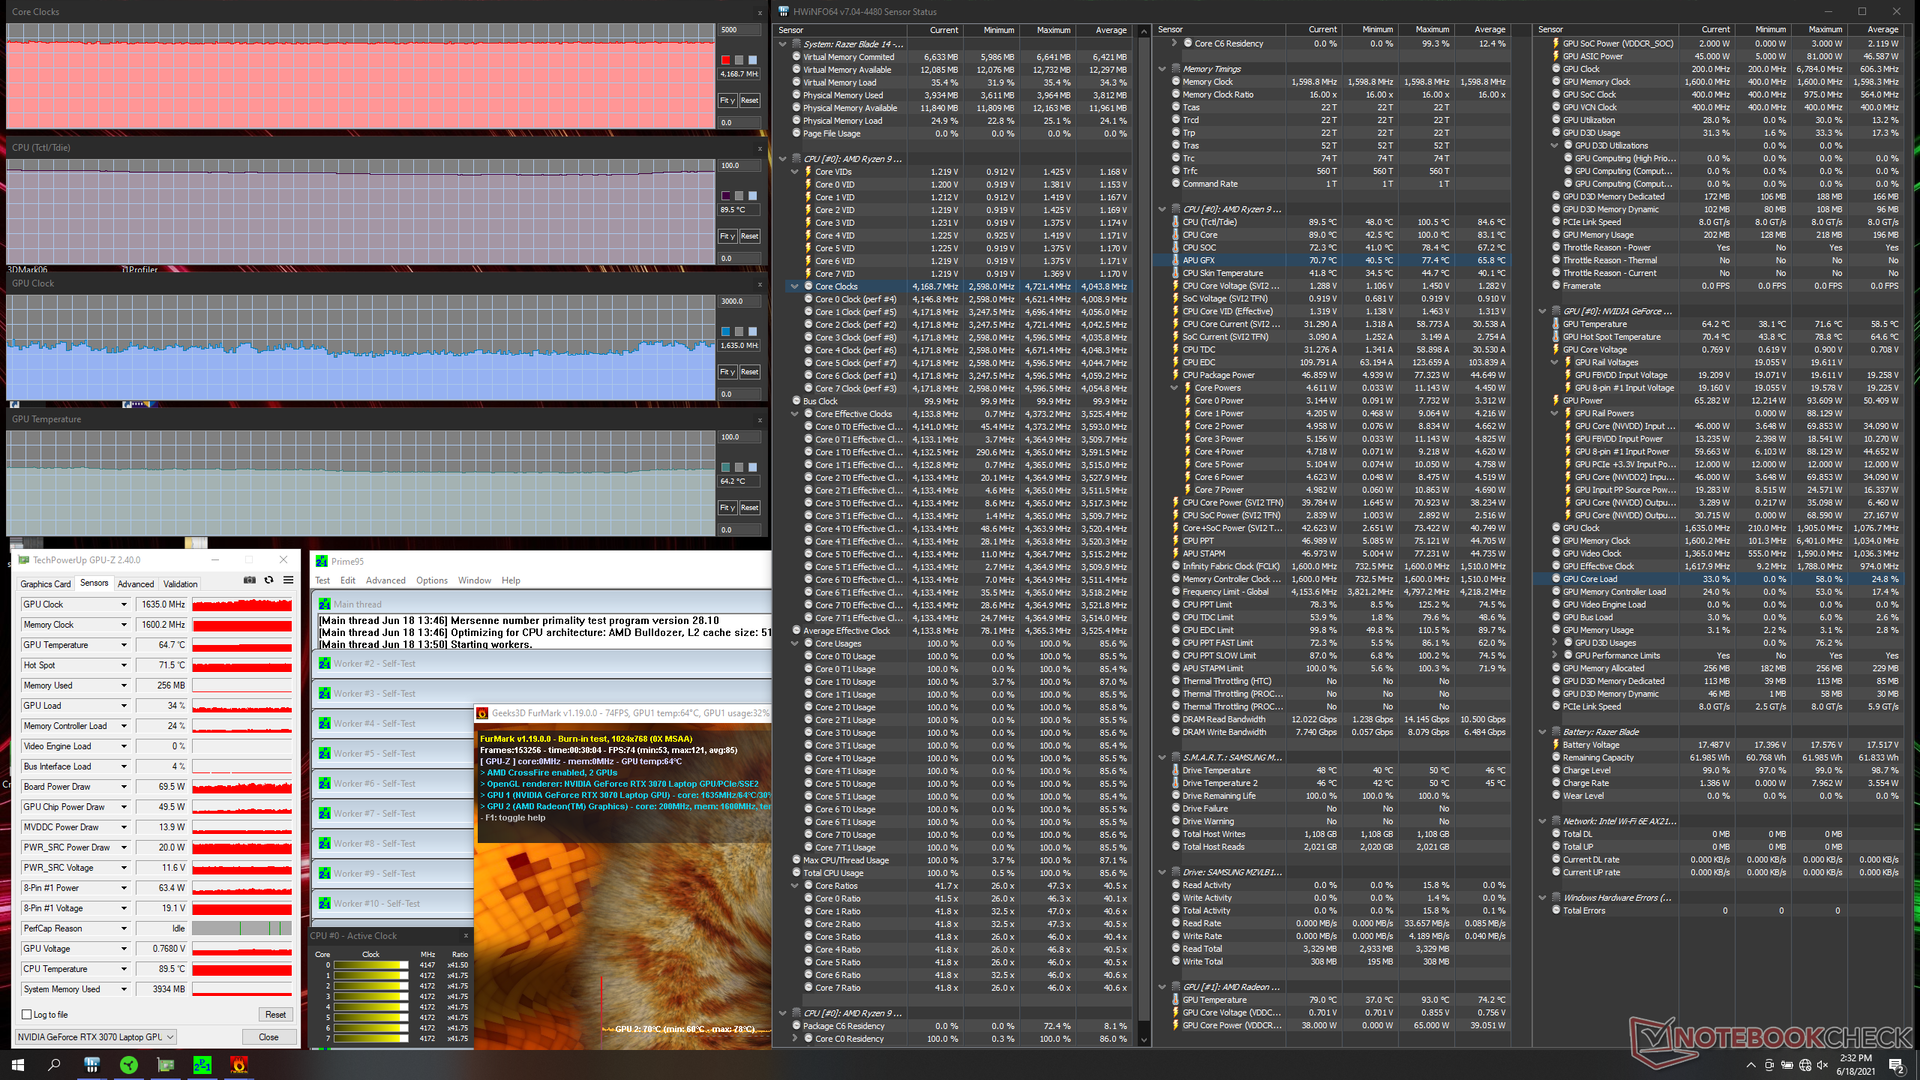
| Relojde la CPU(GHz) | Reloj dela GPU(MHz) | Temperatura media de la CPU (°C) | Temperaturamediade la GPU (°C) | |
| Sistema en reposo | 52 | 41 | ||
| EstrésPrime95 | 3,9 - 4,3 | -- | 83 - 100 | 50 |
| Estrés Prime95+ FurMark | 4,2 | ~1635 | 90 | 65 |
| Witcher 3 Estrés | ~3,5 - 4,2 | 1740 | 83 | 71 |
Altavoces
Los altavoces estéreo son medios y nada especiales en relación con el emocionante hardware que los rodea. Podrían pasar fácilmente en un Ultrabook normal que vale menos de la mitad del precio de nuestro Razer. De todos modos, es probable que quieras un buen par de auriculares para ahogar el ruido del ventilador cuando juegues.
Las rejillas de los altavoces están a lo largo de los lados del teclado, como en el Blade 15, a pesar de que la disposición del teclado es idéntica a la de Blade Stealth.
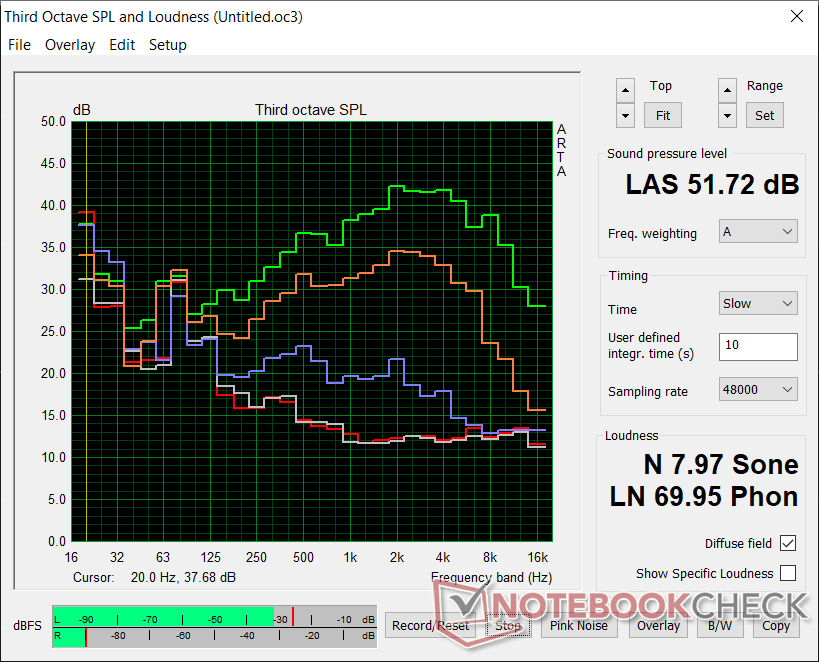
Razer Blade 14 Ryzen 9 RTX 3070 análisis de audio
(±) | la sonoridad del altavoz es media pero buena (78.1 dB)
Graves 100 - 315 Hz
(±) | lubina reducida - en promedio 14.2% inferior a la mediana
(±) | la linealidad de los graves es media (13.5% delta a frecuencia anterior)
Medios 400 - 2000 Hz
(±) | medias más altas - de media 5.5% más altas que la mediana
(+) | los medios son lineales (6.6% delta a la frecuencia anterior)
Altos 2 - 16 kHz
(+) | máximos equilibrados - a sólo 4.8% de la mediana
(±) | la linealidad de los máximos es media (8.9% delta a frecuencia anterior)
Total 100 - 16.000 Hz
(±) | la linealidad del sonido global es media (18.6% de diferencia con la mediana)
En comparación con la misma clase
» 60% de todos los dispositivos probados de esta clase eran mejores, 9% similares, 31% peores
» El mejor tuvo un delta de 6%, la media fue 18%, el peor fue ###max##%
En comparación con todos los dispositivos probados
» 42% de todos los dispositivos probados eran mejores, 8% similares, 50% peores
» El mejor tuvo un delta de 4%, la media fue 24%, el peor fue ###max##%
Apple MacBook 12 (Early 2016) 1.1 GHz análisis de audio
(+) | los altavoces pueden reproducir a un volumen relativamente alto (#83.6 dB)
Graves 100 - 315 Hz
(±) | lubina reducida - en promedio 11.3% inferior a la mediana
(±) | la linealidad de los graves es media (14.2% delta a frecuencia anterior)
Medios 400 - 2000 Hz
(+) | medios equilibrados - a sólo 2.4% de la mediana
(+) | los medios son lineales (5.5% delta a la frecuencia anterior)
Altos 2 - 16 kHz
(+) | máximos equilibrados - a sólo 2% de la mediana
(+) | los máximos son lineales (4.5% delta a la frecuencia anterior)
Total 100 - 16.000 Hz
(+) | el sonido global es lineal (10.2% de diferencia con la mediana)
En comparación con la misma clase
» 7% de todos los dispositivos probados de esta clase eran mejores, 2% similares, 91% peores
» El mejor tuvo un delta de 5%, la media fue 18%, el peor fue ###max##%
En comparación con todos los dispositivos probados
» 5% de todos los dispositivos probados eran mejores, 1% similares, 94% peores
» El mejor tuvo un delta de 4%, la media fue 24%, el peor fue ###max##%
Energy Management
Consumo de energía - Alto rendimiento de la CPU por vatio
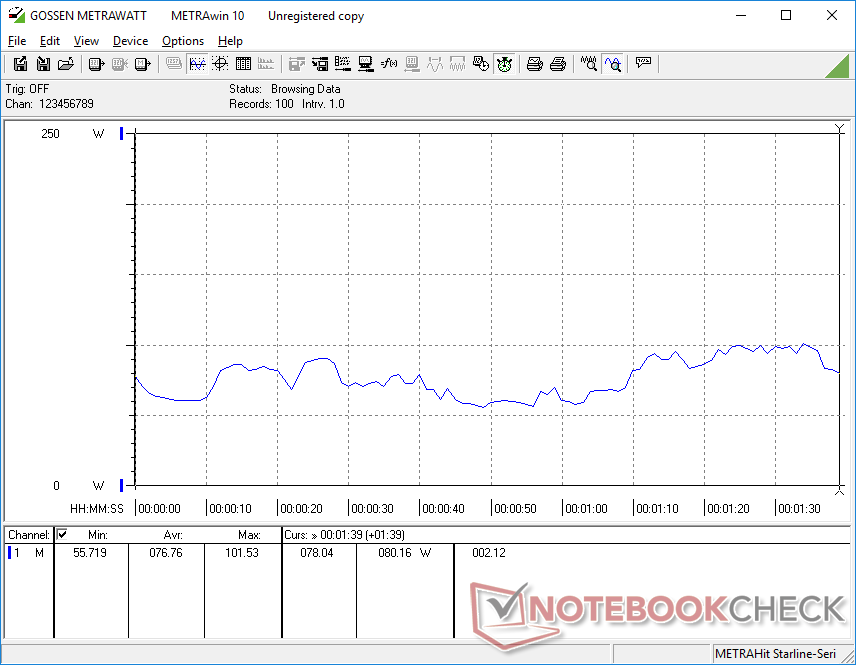
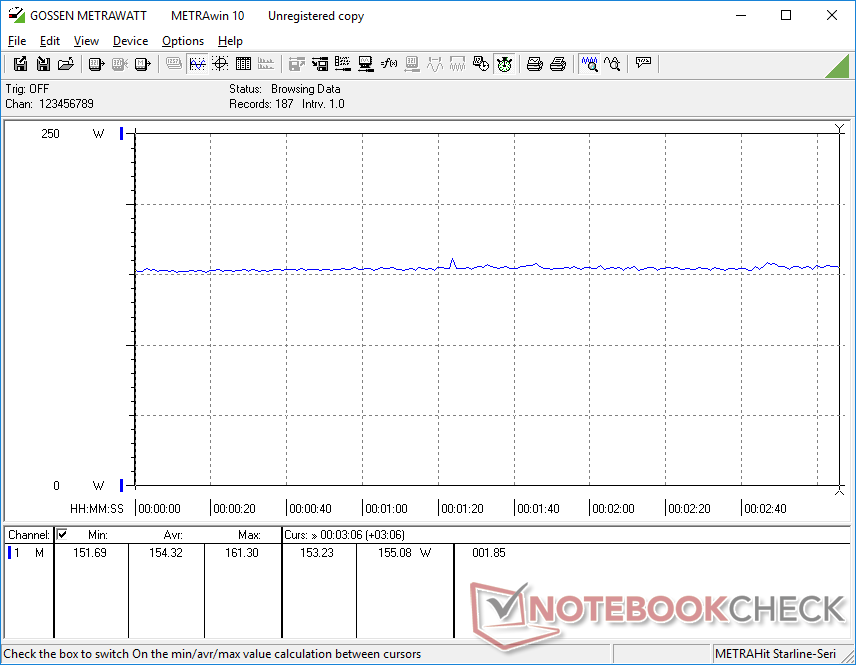
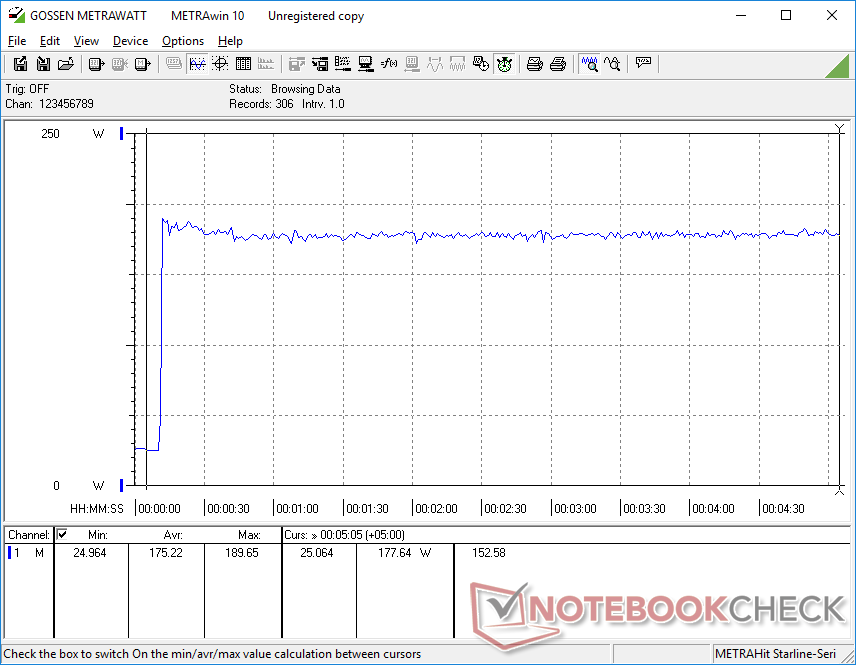
El consumo de energía cuando se juega es mayor que el que registramos en el 2021 Blade 15 en un 22%. El Asus ROG Strix G15 G513QR con la misma CPU y GPU que nuestro Blade 14, sin embargo, consumiría entre 20 y 40 W más bajo las mismas cargas de juego. La RTX 3070 de 130 W más exigente del Asus es al menos parcialmente responsable de esta diferencia.
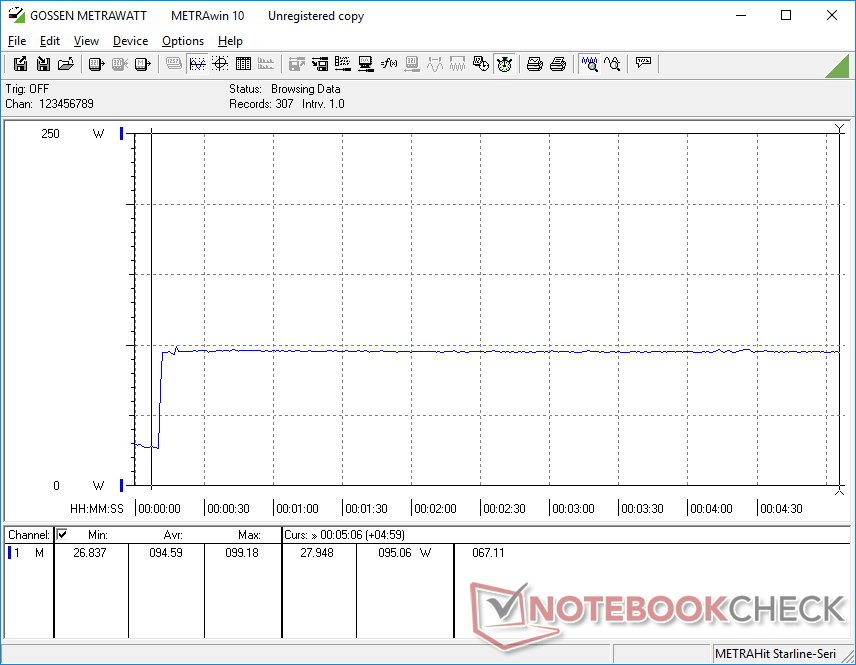
Ejecutar Prime95 consumiría unos 96 W frente a los 122 W del Blade Pro con el más débil Core i7-10875H. Por lo tanto, el Blade 14 es capaz de ofrecer un rendimiento multihilo casi un 40 por ciento más rápido que el Core i7-10875H, a la vez que consume un 20 por ciento menos de energía en el proceso.
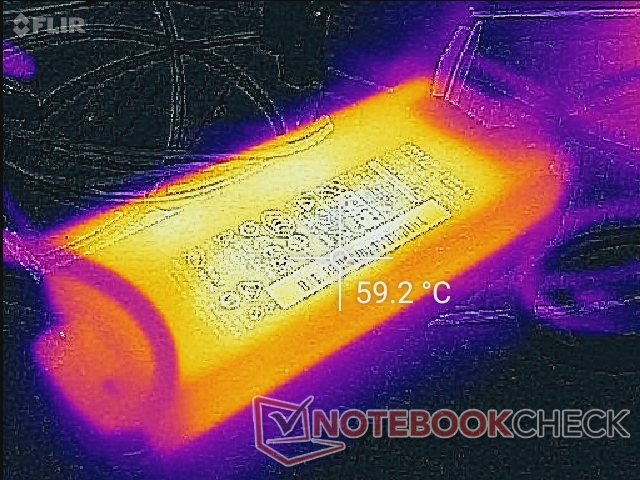
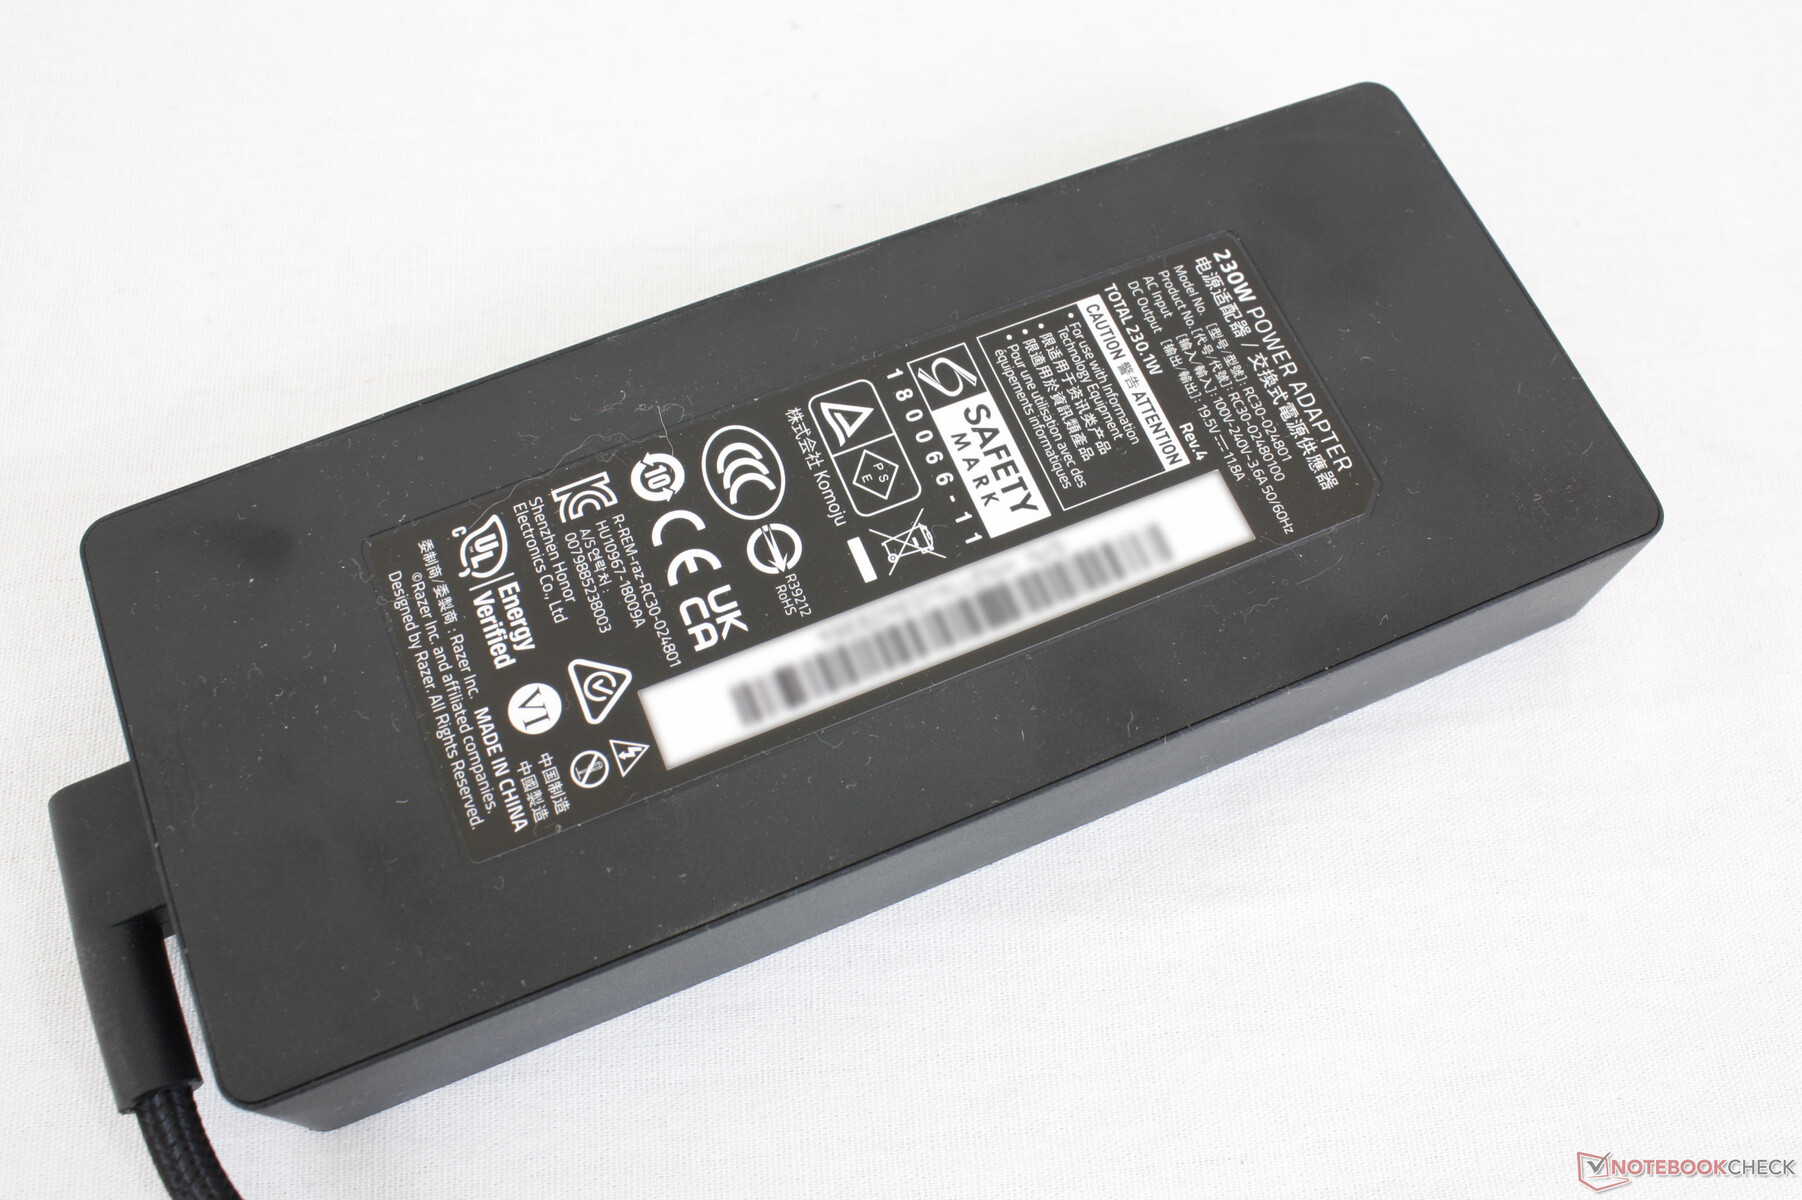
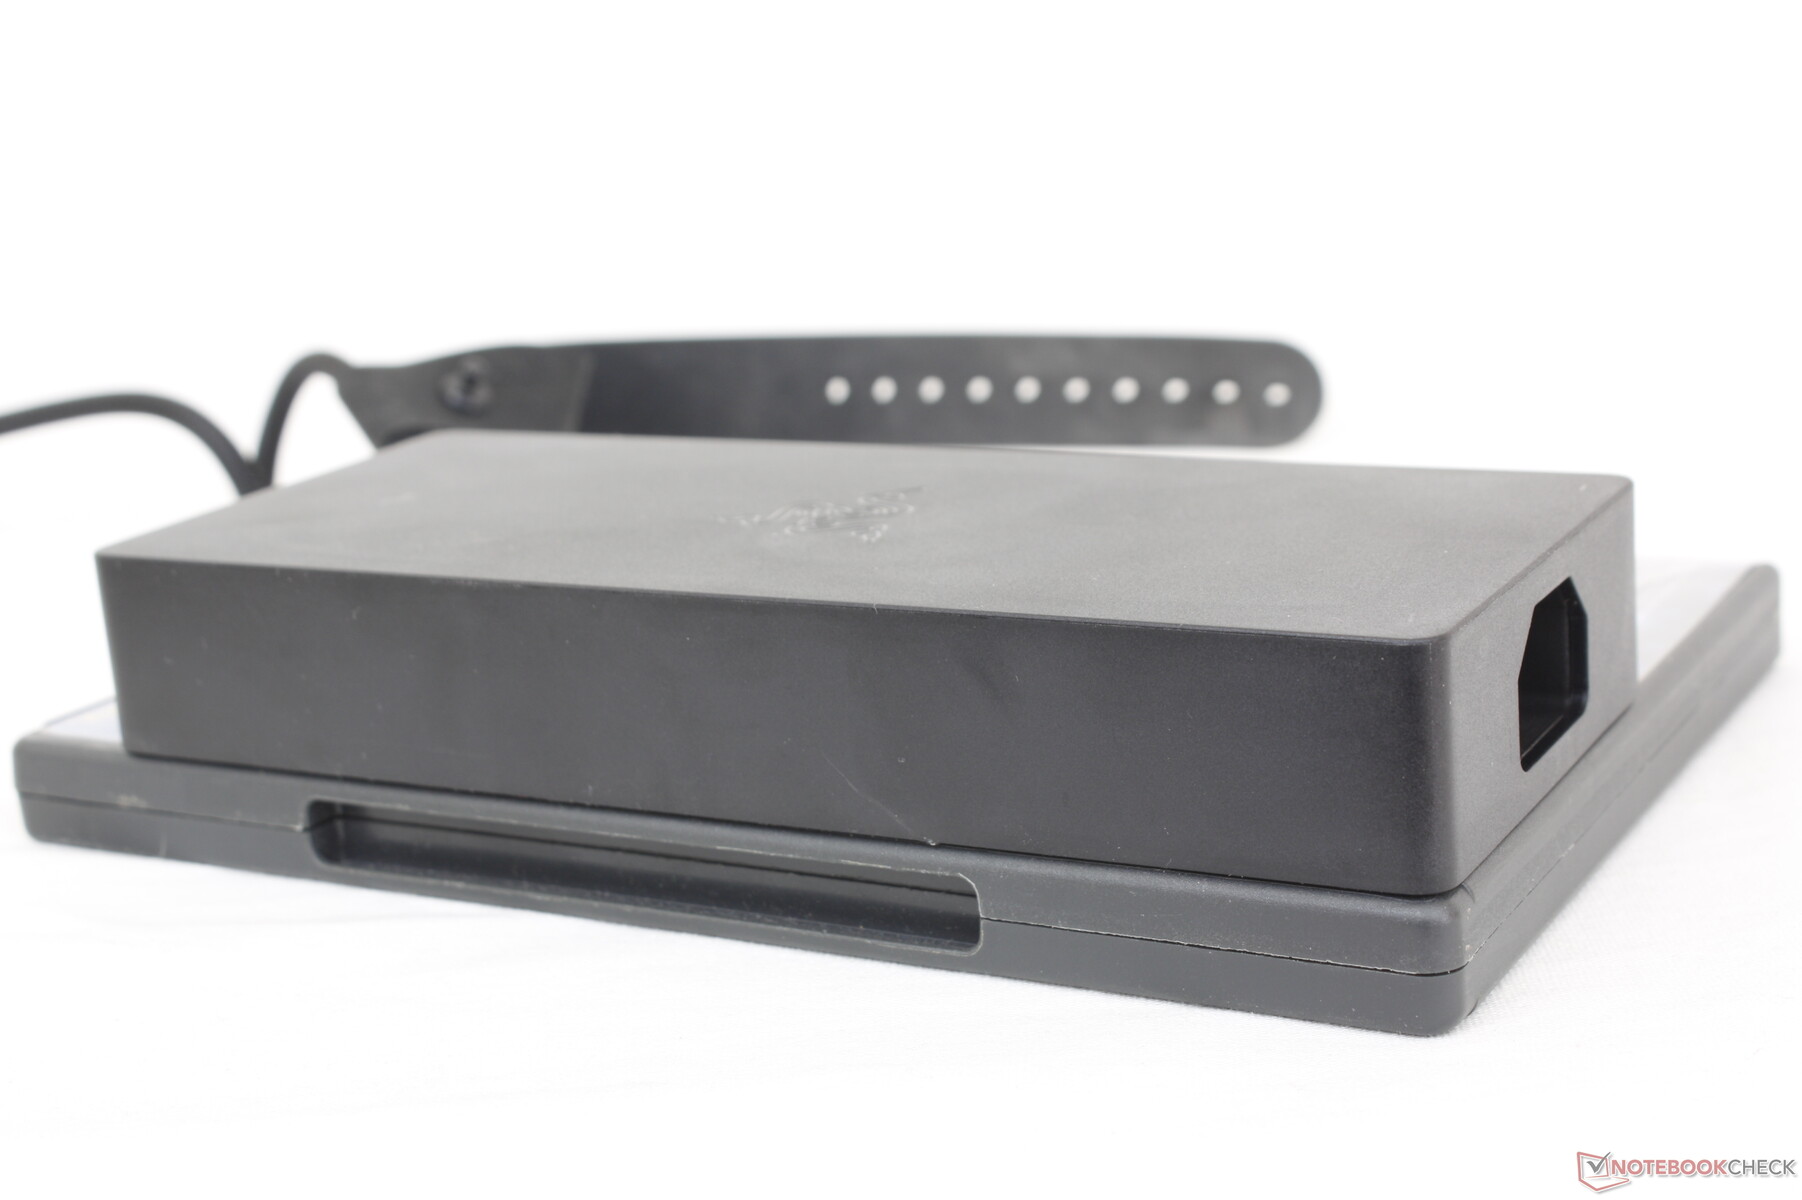
Ejecutar Prime95 y FurMark simultáneamente extrae un máximo de 190 W del adaptador de CA de 230 W de tamaño medio (~17 x 7 x 2,5 cm). Apreciamos el hecho de que todos los modelos Blade más recientes (excepto el Blade Stealth) compartan el mismo cargador de barril de CA para poder intercambiarlo y sustituirlo fácilmente si es necesario.
| Off / Standby | |
| Ocioso | |
| Carga |
|
Clave:
min: | |
| Razer Blade 14 Ryzen 9 RTX 3070 R9 5900HX, GeForce RTX 3070 Laptop GPU, Samsung PM981a MZVLB1T0HBLR, IPS, 2560x1440, 14" | Razer Blade 15 Advanced Model Early 2021 i7-10875H, GeForce RTX 3080 Laptop GPU, Samsung PM981a MZVLB1T0HBLR, IPS, 1920x1080, 15.6" | Asus Zephyrus G14 GA401IV R9 4900HS, GeForce RTX 2060 Max-Q, Intel SSD 660p 1TB SSDPEKNW010T8, IPS, 1920x1080, 14" | Asus ROG Flow X13 GV301QH R9 5980HS, GeForce GTX 1650 Max-Q, WDC PC SN530 SDBPNPZ-1T00, IPS, 3840x2400, 13.4" | MSI GS66 Stealth 10UG i7-10870H, GeForce RTX 3070 Laptop GPU, WDC PC SN730 SDBPNTY-1T00, IPS, 1920x1080, 15.6" | |
|---|---|---|---|---|---|
| Power Consumption | -4% | 23% | 32% | -17% | |
| Idle Minimum * (Watt) | 9.4 | 13 -38% | 5.5 41% | 7.4 21% | 12.9 -37% |
| Idle Average * (Watt) | 15.8 | 15 5% | 9.3 41% | 10.3 35% | 15.4 3% |
| Idle Maximum * (Watt) | 24.1 | 22 9% | 15.8 34% | 13.4 44% | 27.1 -12% |
| Load Average * (Watt) | 76.8 | 98 -28% | 92.2 -20% | 75.9 1% | 98.2 -28% |
| Witcher 3 ultra * (Watt) | 154 | 126 18% | 112.4 27% | 164.9 -7% | |
| Load Maximum * (Watt) | 189.7 | 165 13% | 156.6 17% | 78 59% | 232.9 -23% |
* ... más pequeño es mejor
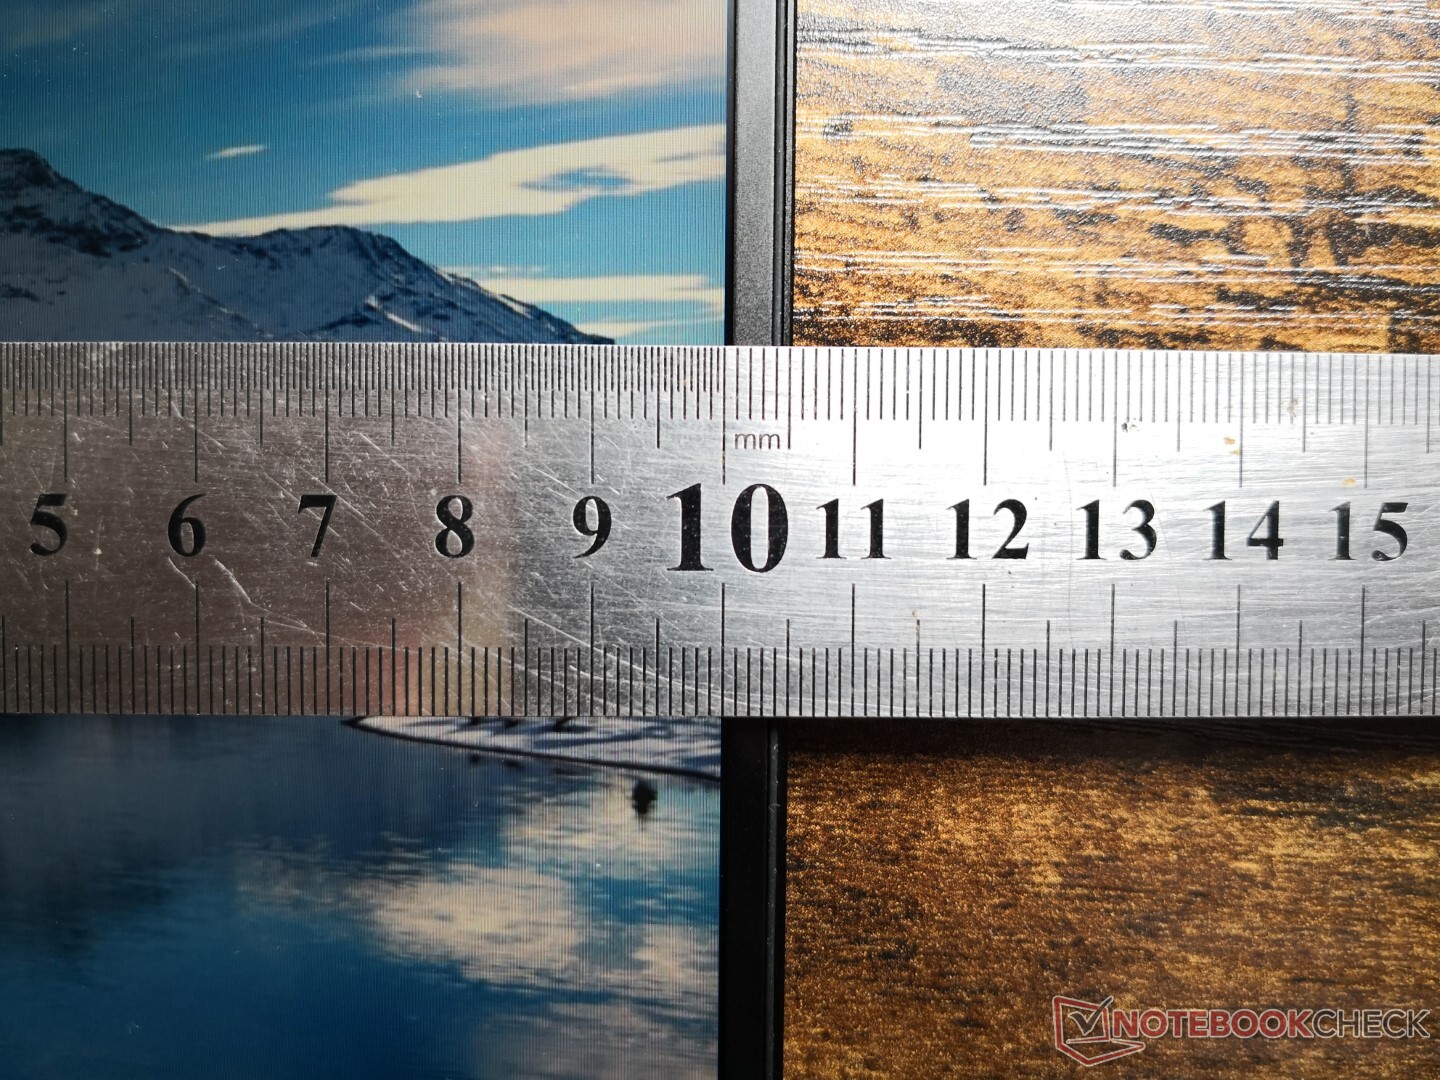
Duración de la batería - Larga duración
La capacidad de la batería (62 Wh) está entre la de la Blade Stealth (53 Wh) y la del Blade 15 (80 Wh). La duración total, sin embargo, es inferior a la de cualquiera de los dos modelos en casi dos horas. La autonomía de 7 horas en el mundo real de la WLAN sigue siendo respetable y probablemente más que suficiente para la mayoría de los usuarios.
La carga desde el vacío hasta la capacidad total es rápida, con poco más de 1,5 horas. La capacidad de la batería no se agotará con el tiempo si se juega y se carga simultáneamente, a diferencia de algunos modelos de modelos más antiguos de Blade Stealth . La velocidad de carga, sin embargo, será mucho más lenta.
| Razer Blade 14 Ryzen 9 RTX 3070 R9 5900HX, GeForce RTX 3070 Laptop GPU, 62 Wh | Razer Blade 15 Advanced Model Early 2021 i7-10875H, GeForce RTX 3080 Laptop GPU, 80 Wh | Asus Zephyrus G14 GA401IV R9 4900HS, GeForce RTX 2060 Max-Q, 76 Wh | Asus ROG Flow X13 GV301QH R9 5980HS, GeForce GTX 1650 Max-Q, 62 Wh | Dell XPS 15 9500 Core i7 4K UHD i7-10875H, GeForce GTX 1650 Ti Mobile, 86 Wh | MSI GS66 Stealth 10UG i7-10870H, GeForce RTX 3070 Laptop GPU, 99.9 Wh | Razer Blade Stealth i7-1165G7 GTX 1650 Ti Max-Q i7-1165G7, GeForce GTX 1650 Ti Max-Q, 53.1 Wh | |
|---|---|---|---|---|---|---|---|
| Duración de Batería | 27% | 36% | -3% | 49% | 15% | 36% | |
| Reader / Idle (h) | 13.8 | 14.4 4% | 19 38% | 10.4 -25% | 23 67% | 10.8 -22% | 20.6 49% |
| WiFi v1.3 (h) | 7.3 | 9 23% | 9.6 32% | 5.8 -21% | 9.1 25% | 7.1 -3% | 9 23% |
| Load (h) | 1.3 | 2 54% | 1.8 38% | 1.8 38% | 2 54% | 2.2 69% |
Pro
Contra
Veredicto: está a la altura de todas las afirmaciones
Cada vez que vemos un portátil superdelgado que promete un rendimiento del nivel de Core i9 con gráficos del nivel GeForce RTX 80, siempre nos preguntamos qué compromisos se han hecho a espaldas de los usuarios. No se puede simplemente meter un hardware diseñado para factores de forma gruesos de 17,3 pulgadas en un pequeño portátil de 14 pulgadas sin cortar algunas esquinas
En el caso de Razer, los contratiempos del Blade 14 son notablemente menores en relación con el ahorro de tamaño y peso. El más grande de 15,6 pulgadas Asus ROG Strix G15 G513QRque viene con el mismo Ryzen 9 5900HX Y la misma RTX 3070 Que nuestra unidad de pruebas Razer, es sólo unos pocos puntos porcentuales más rápido en las pruebas brutas a pesar de ser un 111 por ciento (!) más grande en volumen y un 28 por ciento más pesado. Ni siquiera la duración de la batería es necesariamente mayor en el modelo Asus más grande. El Blade 14 puede ser un poco más lento, pero las tremendas ganancias en portabilidad y versatilidad probablemente compensen el pequeño déficit de rendimiento entre ellos para el público objetivo de los jugadores que viajan o los estudiantes ávidos de energía.
El Razer Blade 14 no es solo apariencia, ya que tiene el rendimiento en el mundo real para respaldar todas esas impresionantes especificaciones sobre el papel.
Si el rendimiento es comparable al de los modelos más grandes de 15,6 o 17,3 pulgadas, entonces el Blade 14 debe ser más ruidoso y cálido, ¿no? En términos de ruido, el sistema está generalmente a la par con muchas de sus alternativas más grandes cuando se ejecutan juegos debido a su solución de refrigeración sobredimensionada. La temperatura es el único aspecto en el que el Blade 14 podría mejorar. Si puedes lidiar con el cálido reposamanos y la falta de soporte Thunderbolt, verás que el Blade 14 puede cumplir con todos los frentes de rendimiento.
Precio y disponibilidad
El Razer Blade 14 2021 ya está disponible en las principales tiendas, incluida la propia tienda online de Razer tienda onlineWalmart, Best Buyy Amazon tienen nuestra configuración GeForce RTX 3070 por 2199 dólares.
Razer Blade 14 Ryzen 9 RTX 3070
- 06/22/2021 v7 (old)
Allen Ngo
Price comparison

