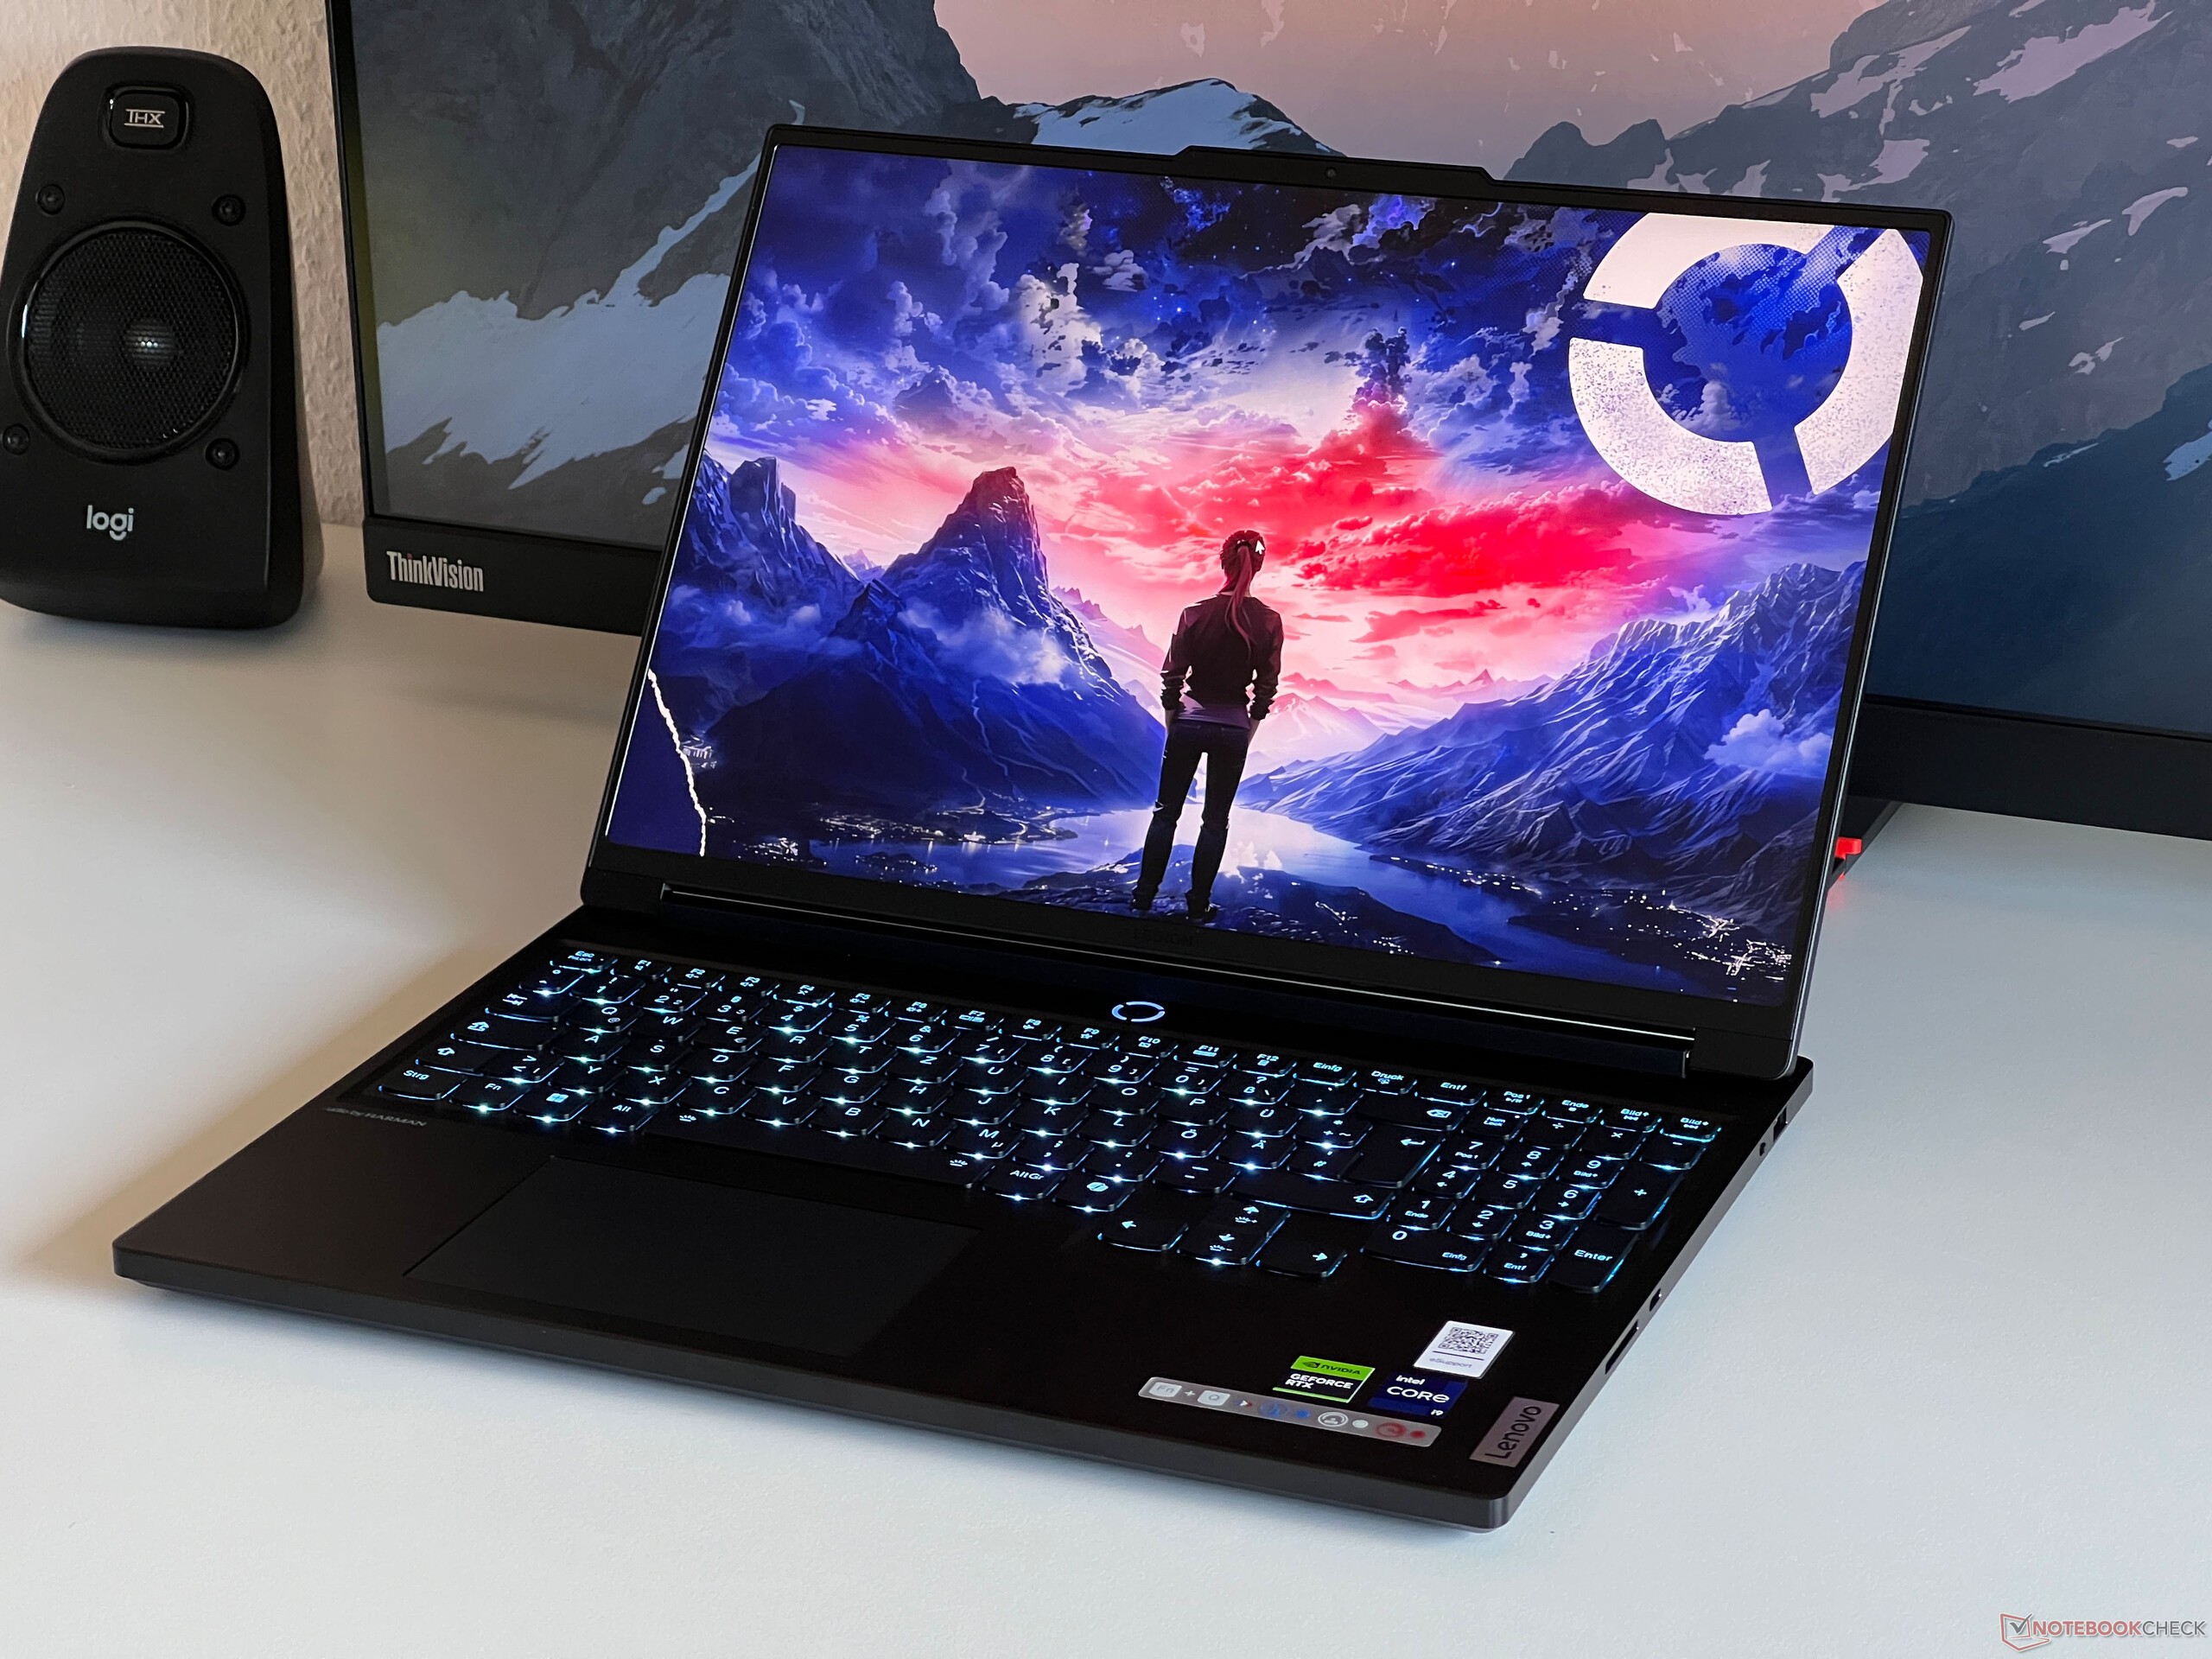
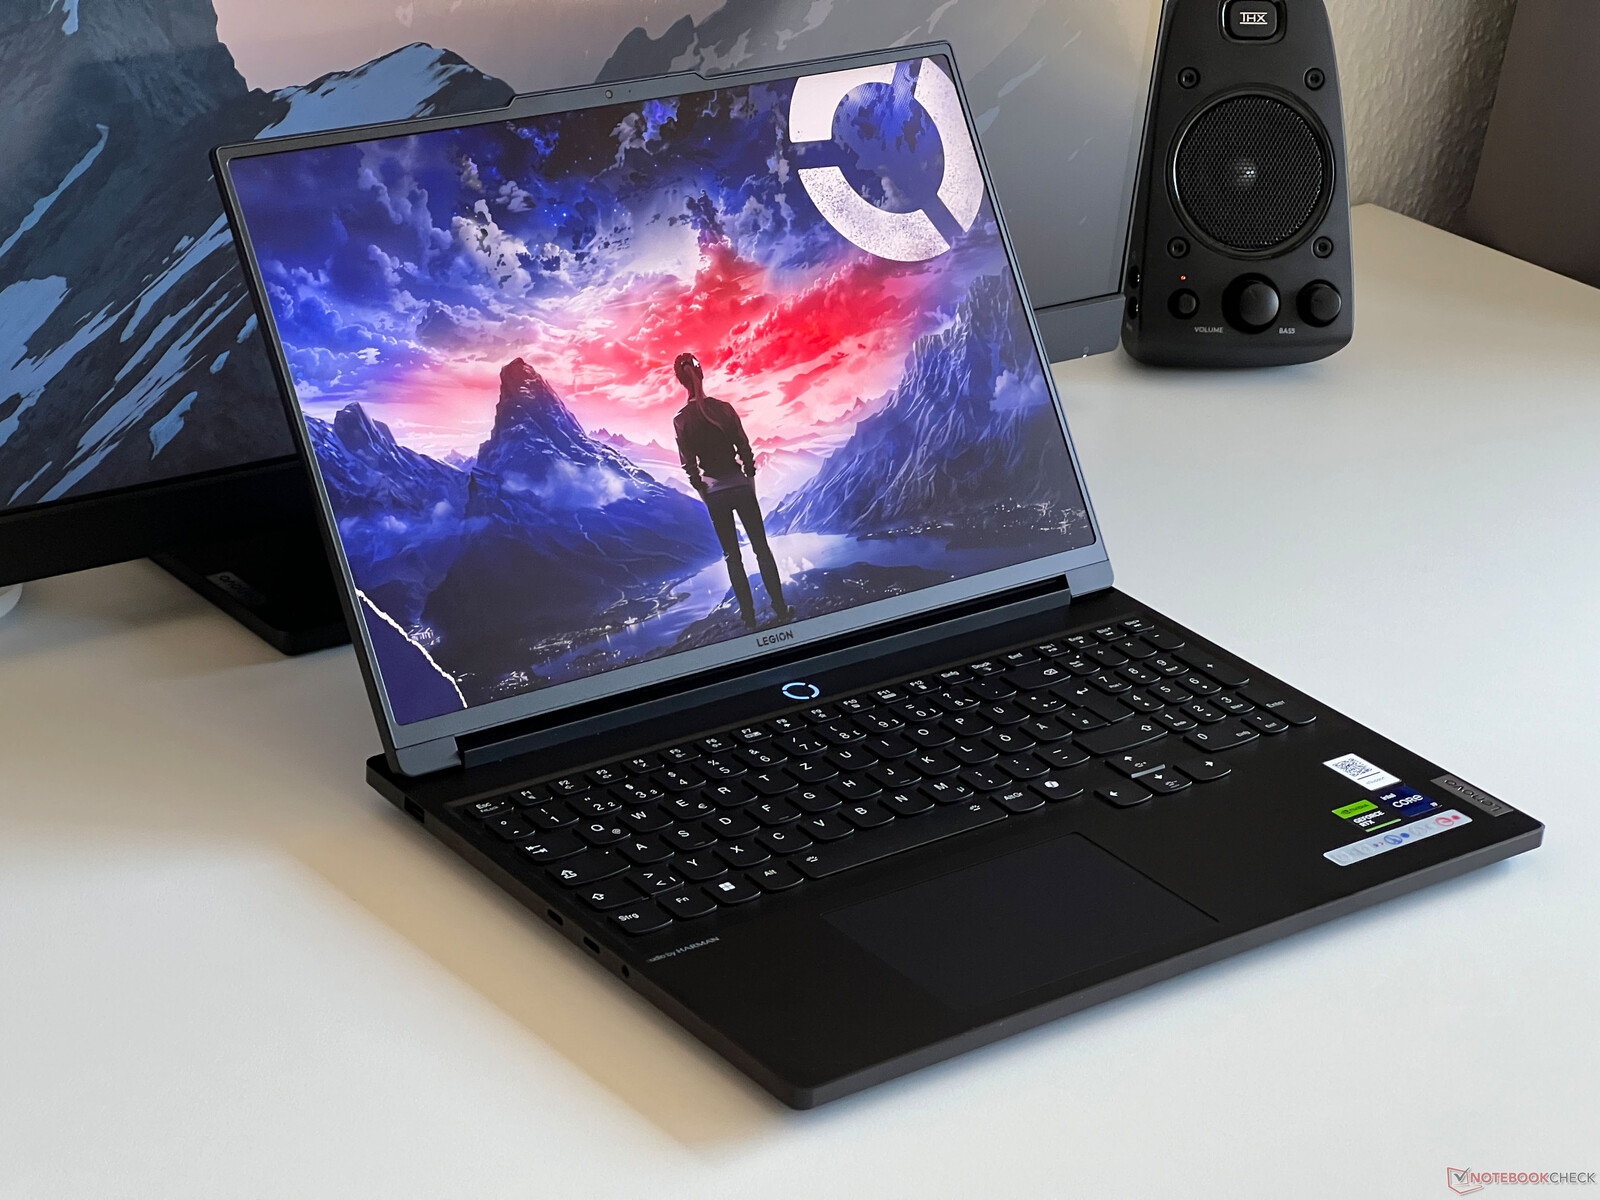
Análisis del portátil Lenovo Legion 7 16 G9 - Un equipo para juegos con pantalla 3.2K, CPU HX y una RTX 4070 overclockeada
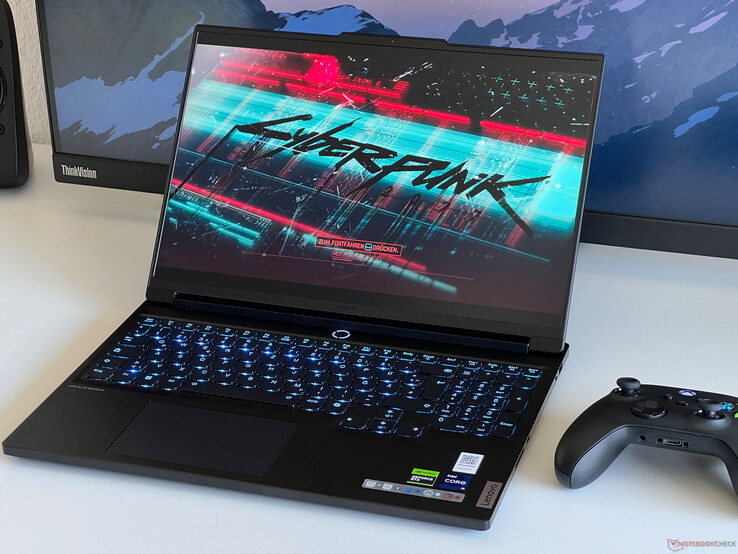
El Legion 7 16 es el Legion Pro 7 16 hermano más barato y más delgado que acabamos de revisar recientemente. Existen diferencias, especialmente en lo que se refiere a las tarjetas gráficas, ya que la GPU máxima disponible del Legion 7 normal es la RTX 4070 del portátil. Sin embargo, en cuanto al procesador, se utilizan los mismos chips Intel HX y, además de los paneles WQHD, existe un panel IPS opcional de alta resolución y 165 Hz 3,2K.
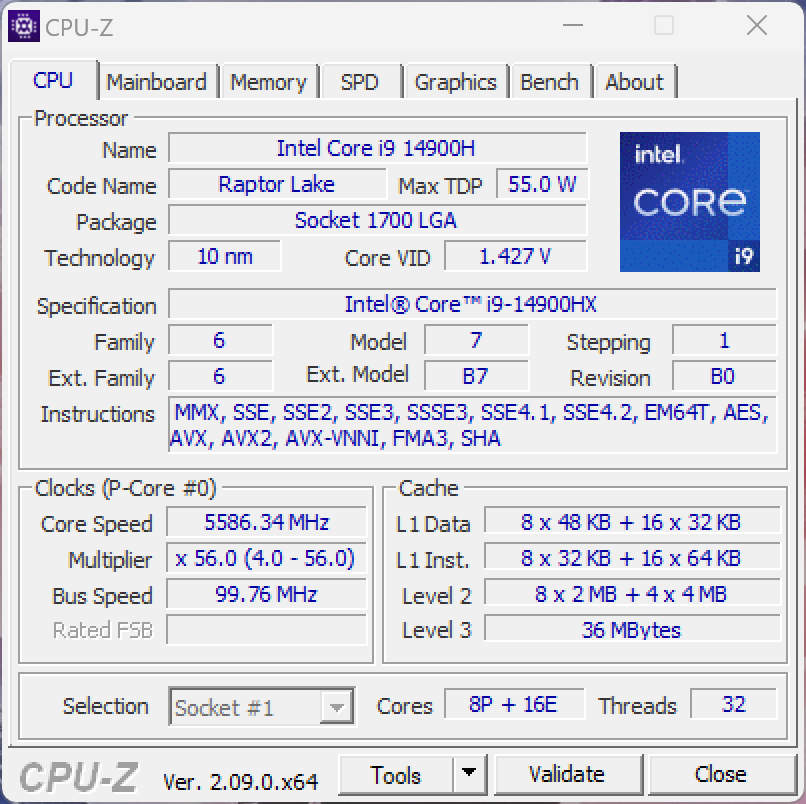
Nuestro dispositivo de revisión es la variante Campus de 2.249 dólares que viene con un Core i9-14900HXGeForce RTX 4070, 32 GB de RAM, una unidad SSD de 1 TB, así como un panel 3,2K. Actualmente, aún no hay variantes correspondientes para clientes normales, pero el precio debería ser unos 250-300 dólares más alto.
Posibles contendientes en la comparación
Valoración | Fecha | Modelo | Peso | Altura | Tamaño | Resolución | Precio |
|---|---|---|---|---|---|---|---|
| 90.8 % v7 (old) | 04/2024 | Lenovo Legion 7 16 IRX G9 i9-14900HX, GeForce RTX 4070 Laptop GPU | 2.3 kg | 19.8 mm | 16.00" | 3200x2000 | |
| 89.3 % v7 (old) | 04/2024 | Lenovo Legion Pro 5 16IRX9 i9-14900HX, GeForce RTX 4070 Laptop GPU | 2.5 kg | 26.95 mm | 16.00" | 2560x1600 | |
| 87.4 % v7 (old) | 04/2024 | Aorus 16X 2024 i9-14900HX, GeForce RTX 4070 Laptop GPU | 2.3 kg | 20 mm | 16.00" | 2560x1600 | |
| 88.4 % v7 (old) | 02/2024 | HP Omen Transcend 16-u1095ng i9-14900HX, GeForce RTX 4070 Laptop GPU | 2.3 kg | 20 mm | 16.00" | 2560x1600 | |
| 90.2 % v7 (old) | 03/2024 | Alienware m16 R2 Ultra 7 155H, GeForce RTX 4070 Laptop GPU | 2.5 kg | 23.5 mm | 16.00" | 2560x1600 | |
| 89.2 % v7 (old) | 10/2023 | Schenker XMG CORE 16 (L23) R7 7840HS, GeForce RTX 4070 Laptop GPU | 2.4 kg | 26.1 mm | 16.00" | 2560x1600 | |
| 89.5 % v7 (old) | 03/2024 | Lenovo Legion Pro 7 16IRX9H i9-14900HX, GeForce RTX 4080 Laptop GPU | 2.7 kg | 21.95 mm | 16.00" | 2560x1600 |
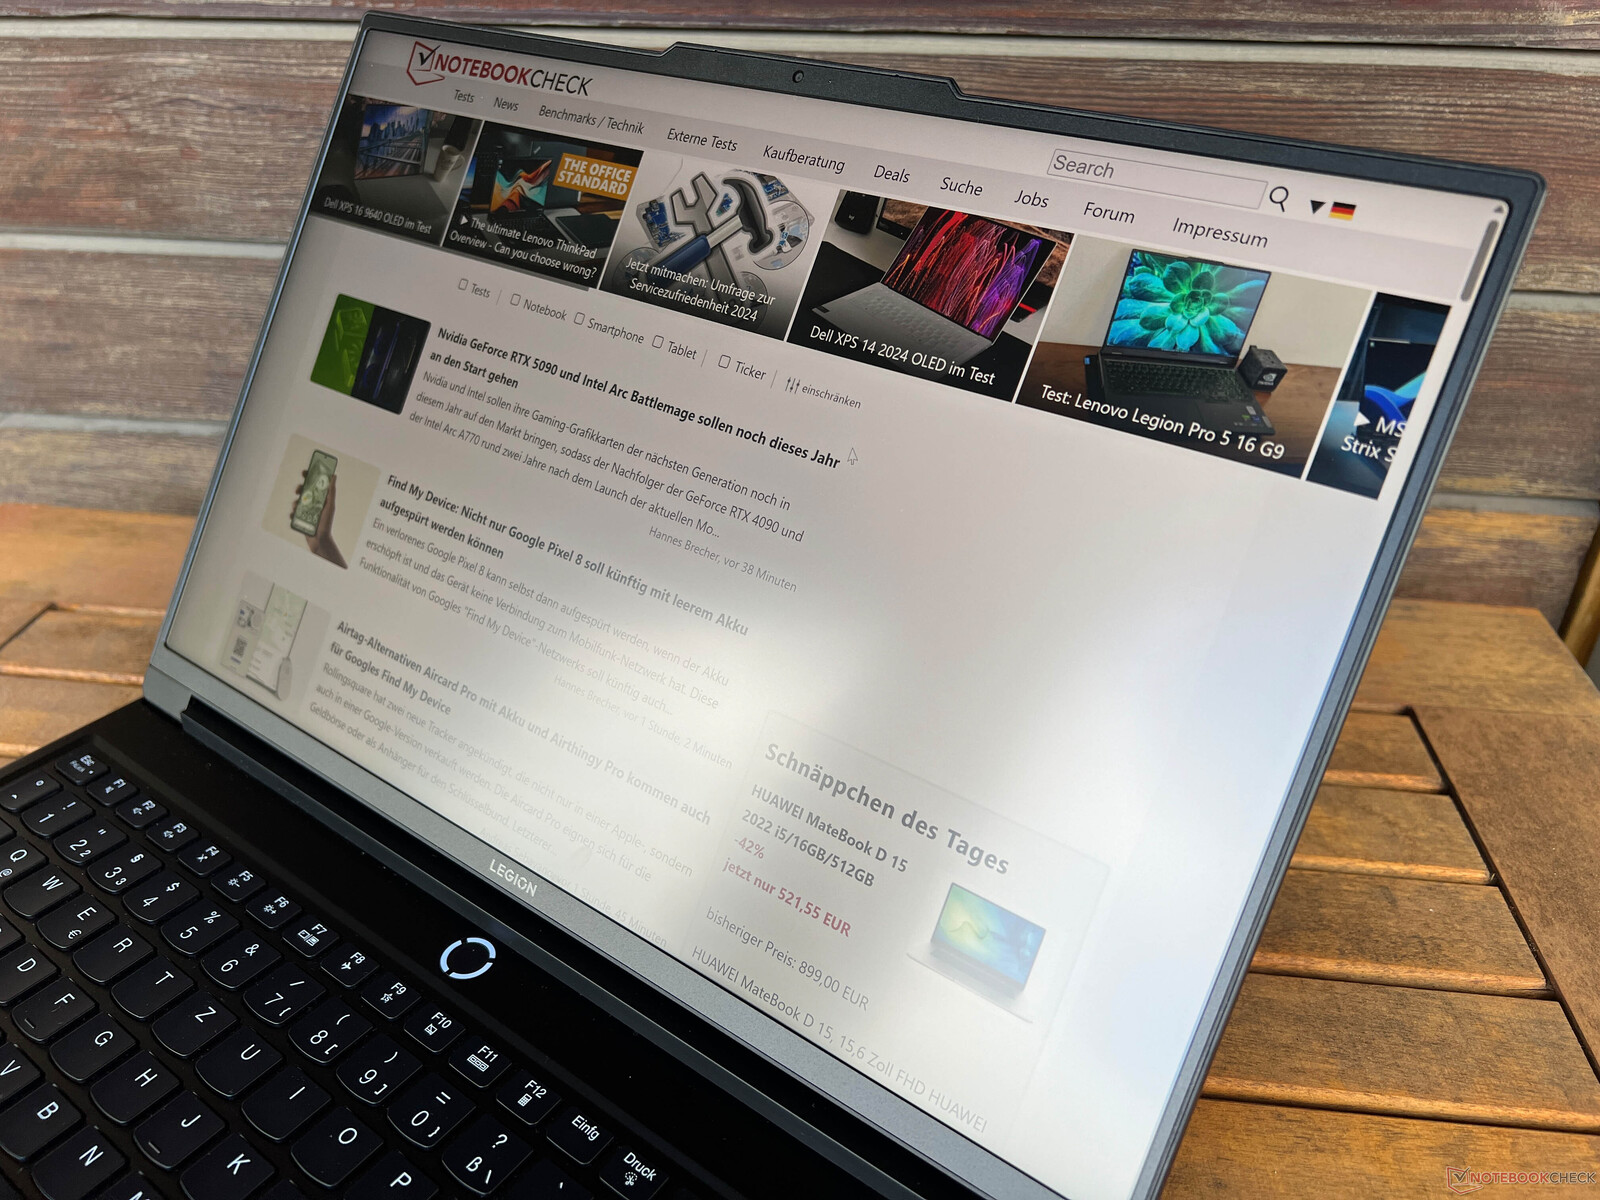
Caja - Un imán de aluminio negro para las huellas dactilares
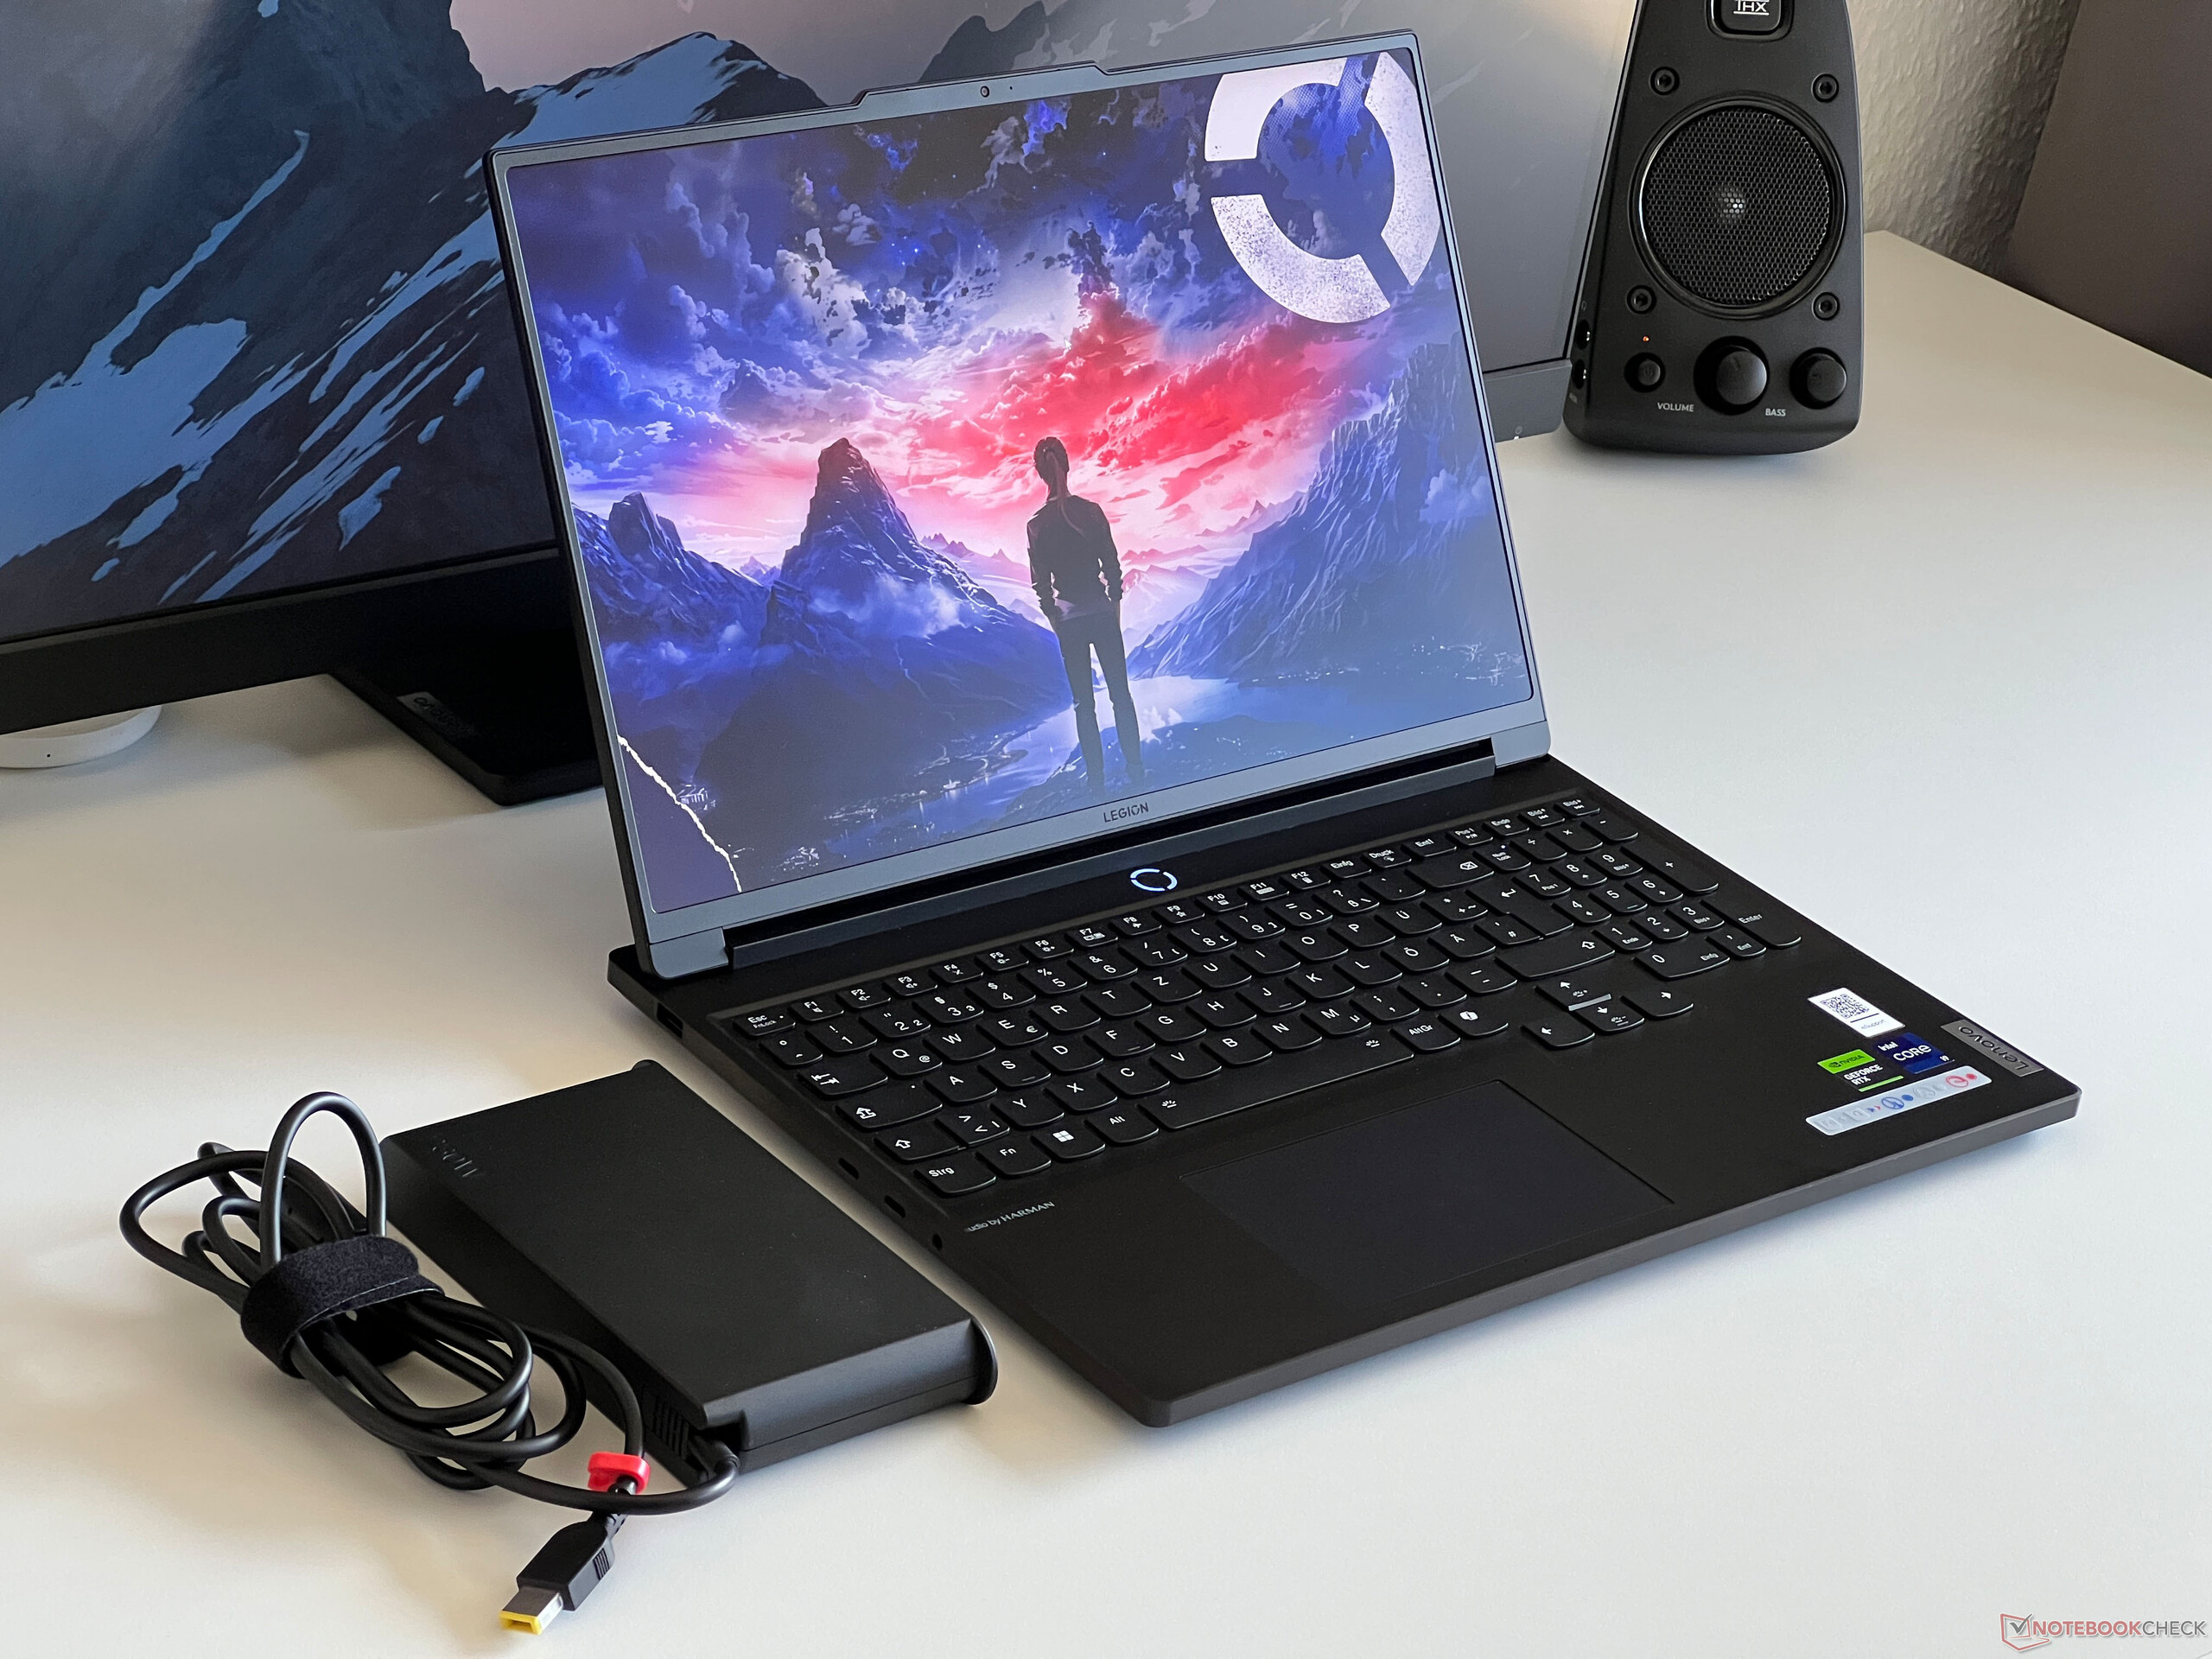
El Legion 7 16 es un portátil para juegos comparativamente delgado que también es muy discreto gracias a su carcasa de aluminio negro. A diferencia del Legion Pro 7, no hay elementos de refrigeración salientes en los laterales del dispositivo. Visualmente, la carcasa tiene muy buen aspecto, pero sólo durante poco tiempo, ya que las superficies lisas atraen mágicamente las huellas dactilares. Por este motivo, debe tener siempre a mano un paño para limpiar la carcasa. Los biseles de la pantalla son muy finos y sólo la protuberancia de la cámara estropea el aspecto, aunque esto facilita la apertura de la funda.
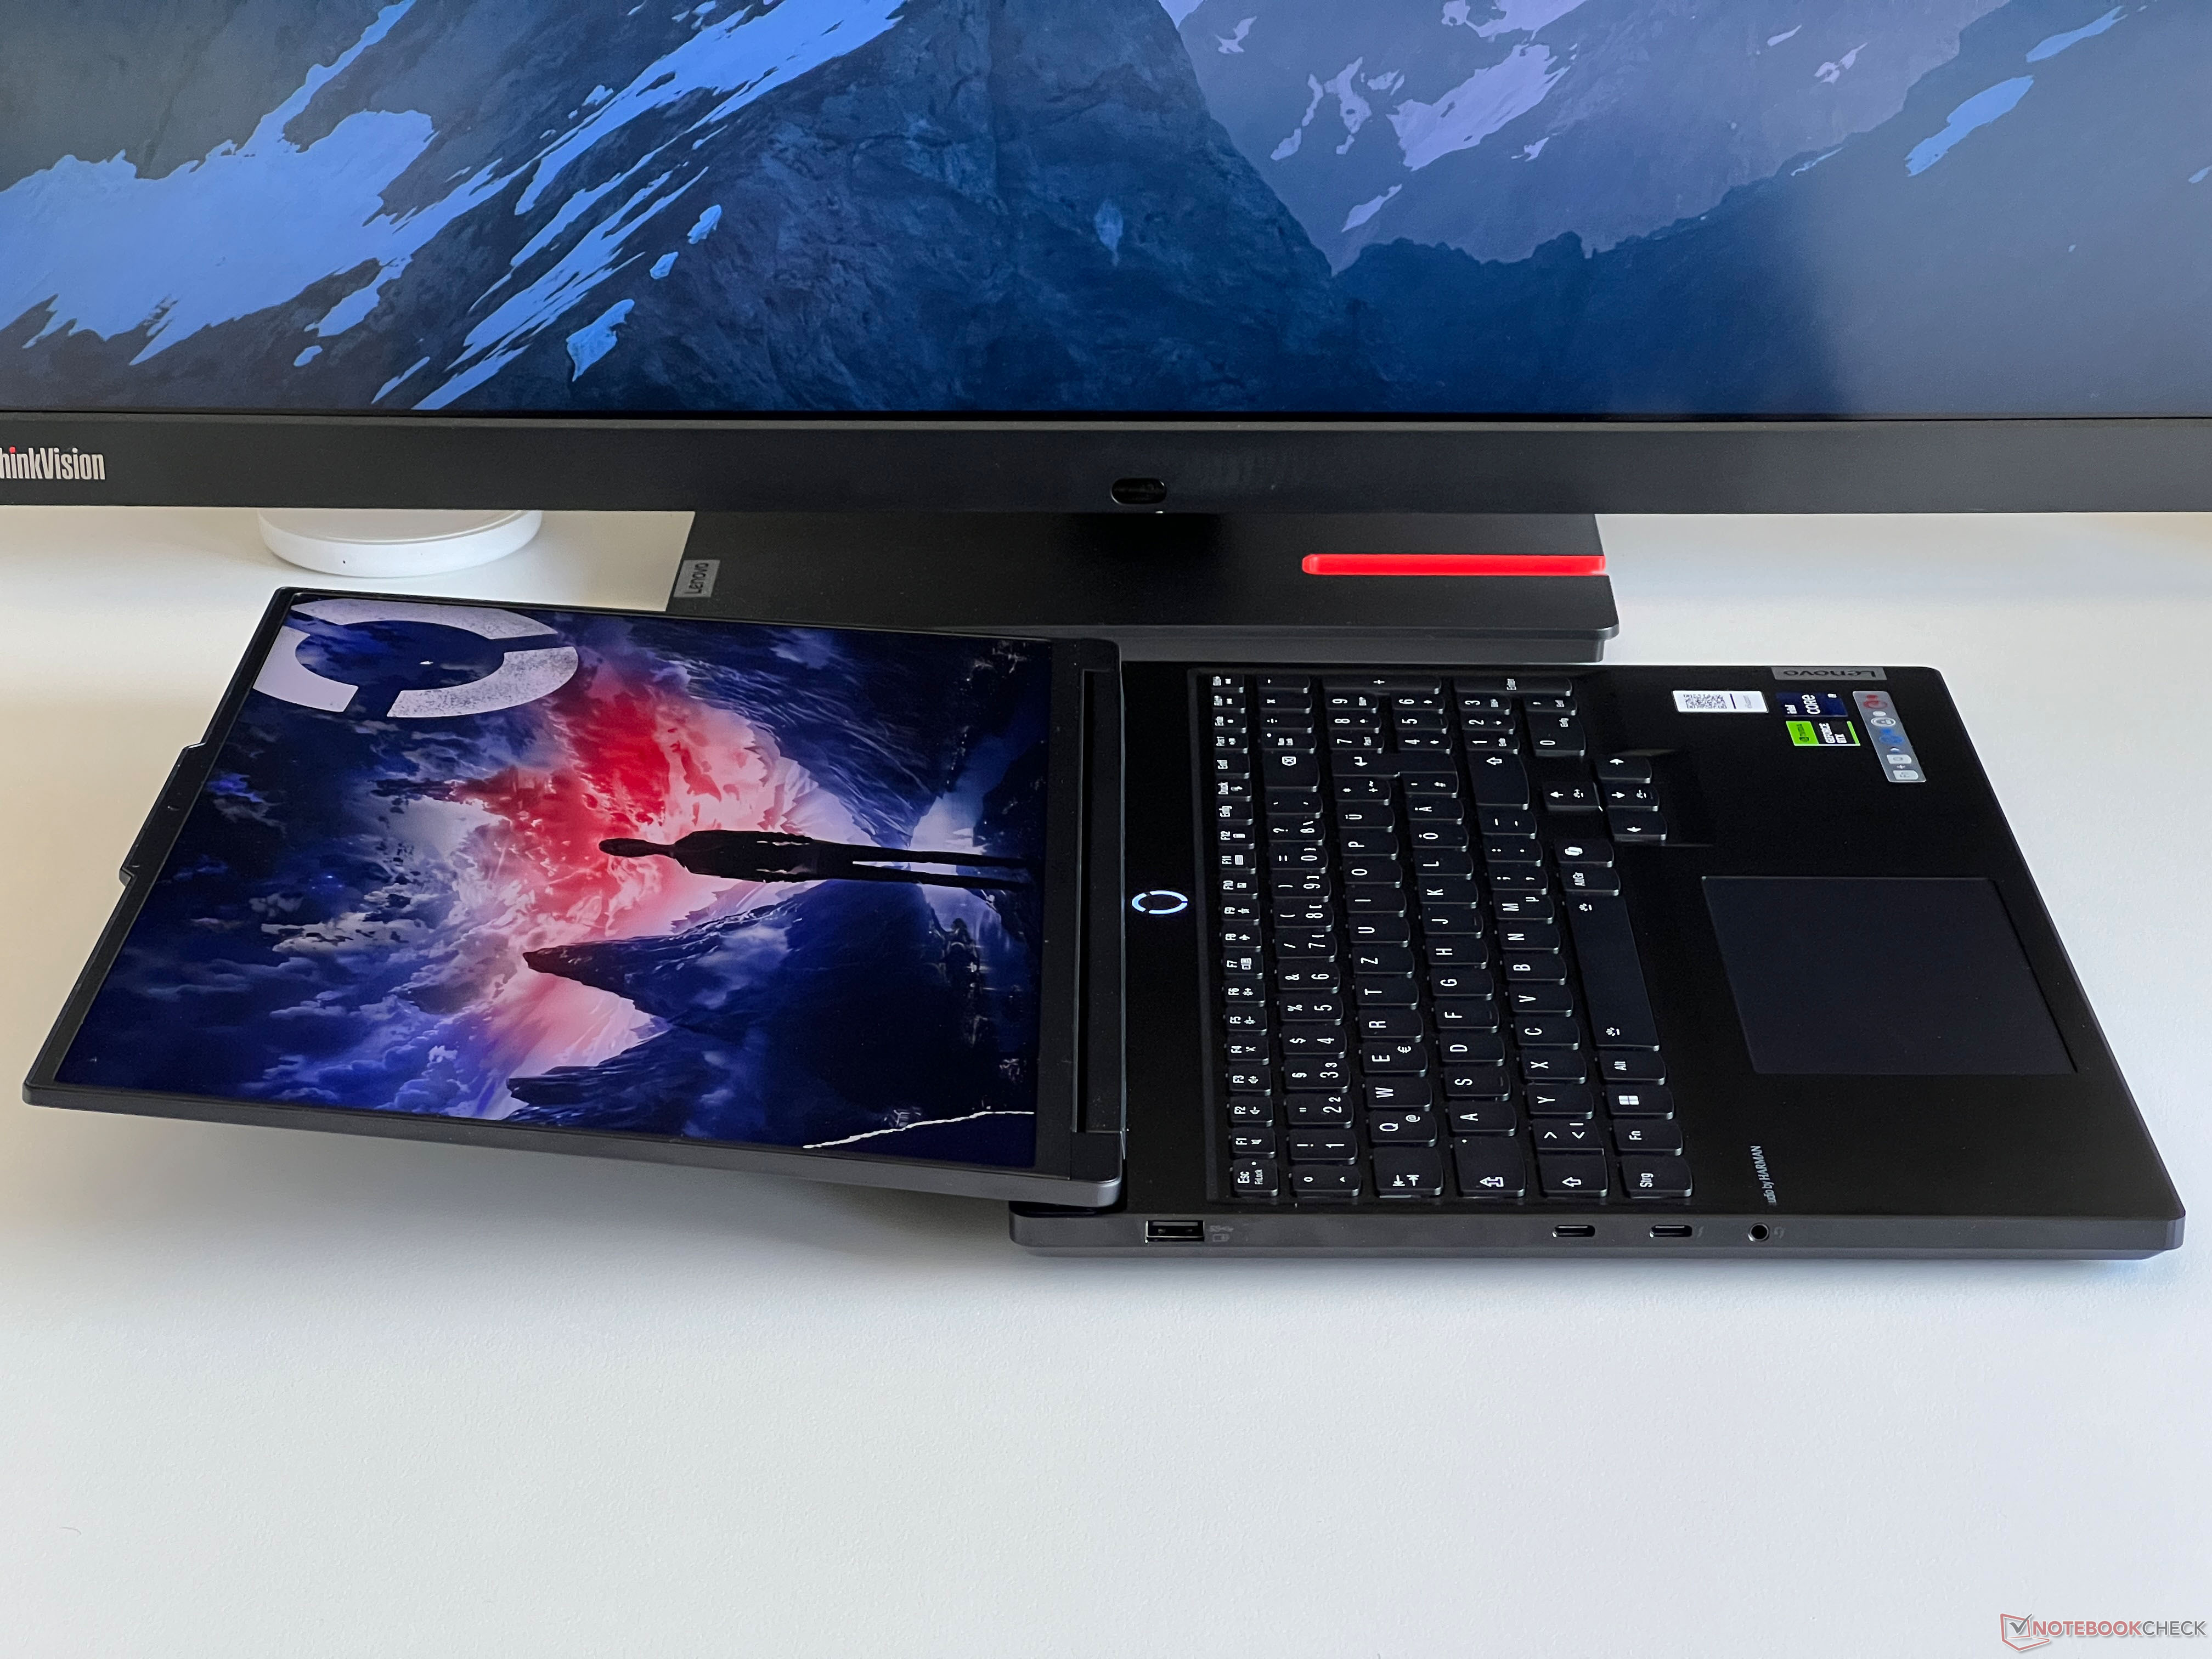
Tanto la estabilidad como la calidad de construcción de la funda son muy buenas y no pudimos provocar crujidos de ningún tipo. Además, es prácticamente imposible flexionar el teclado cuando se aplica presión. La delgada tapa de la pantalla es un poco más flexible, pero también es un área en la que no pudimos provocar ninguna distorsión de la imagen. Para nuestro gusto, las bisagras podrían ser un poco más firmes porque se produce un visible movimiento de balanceo al ajustar el ángulo de apertura (máximo ~170 grados).
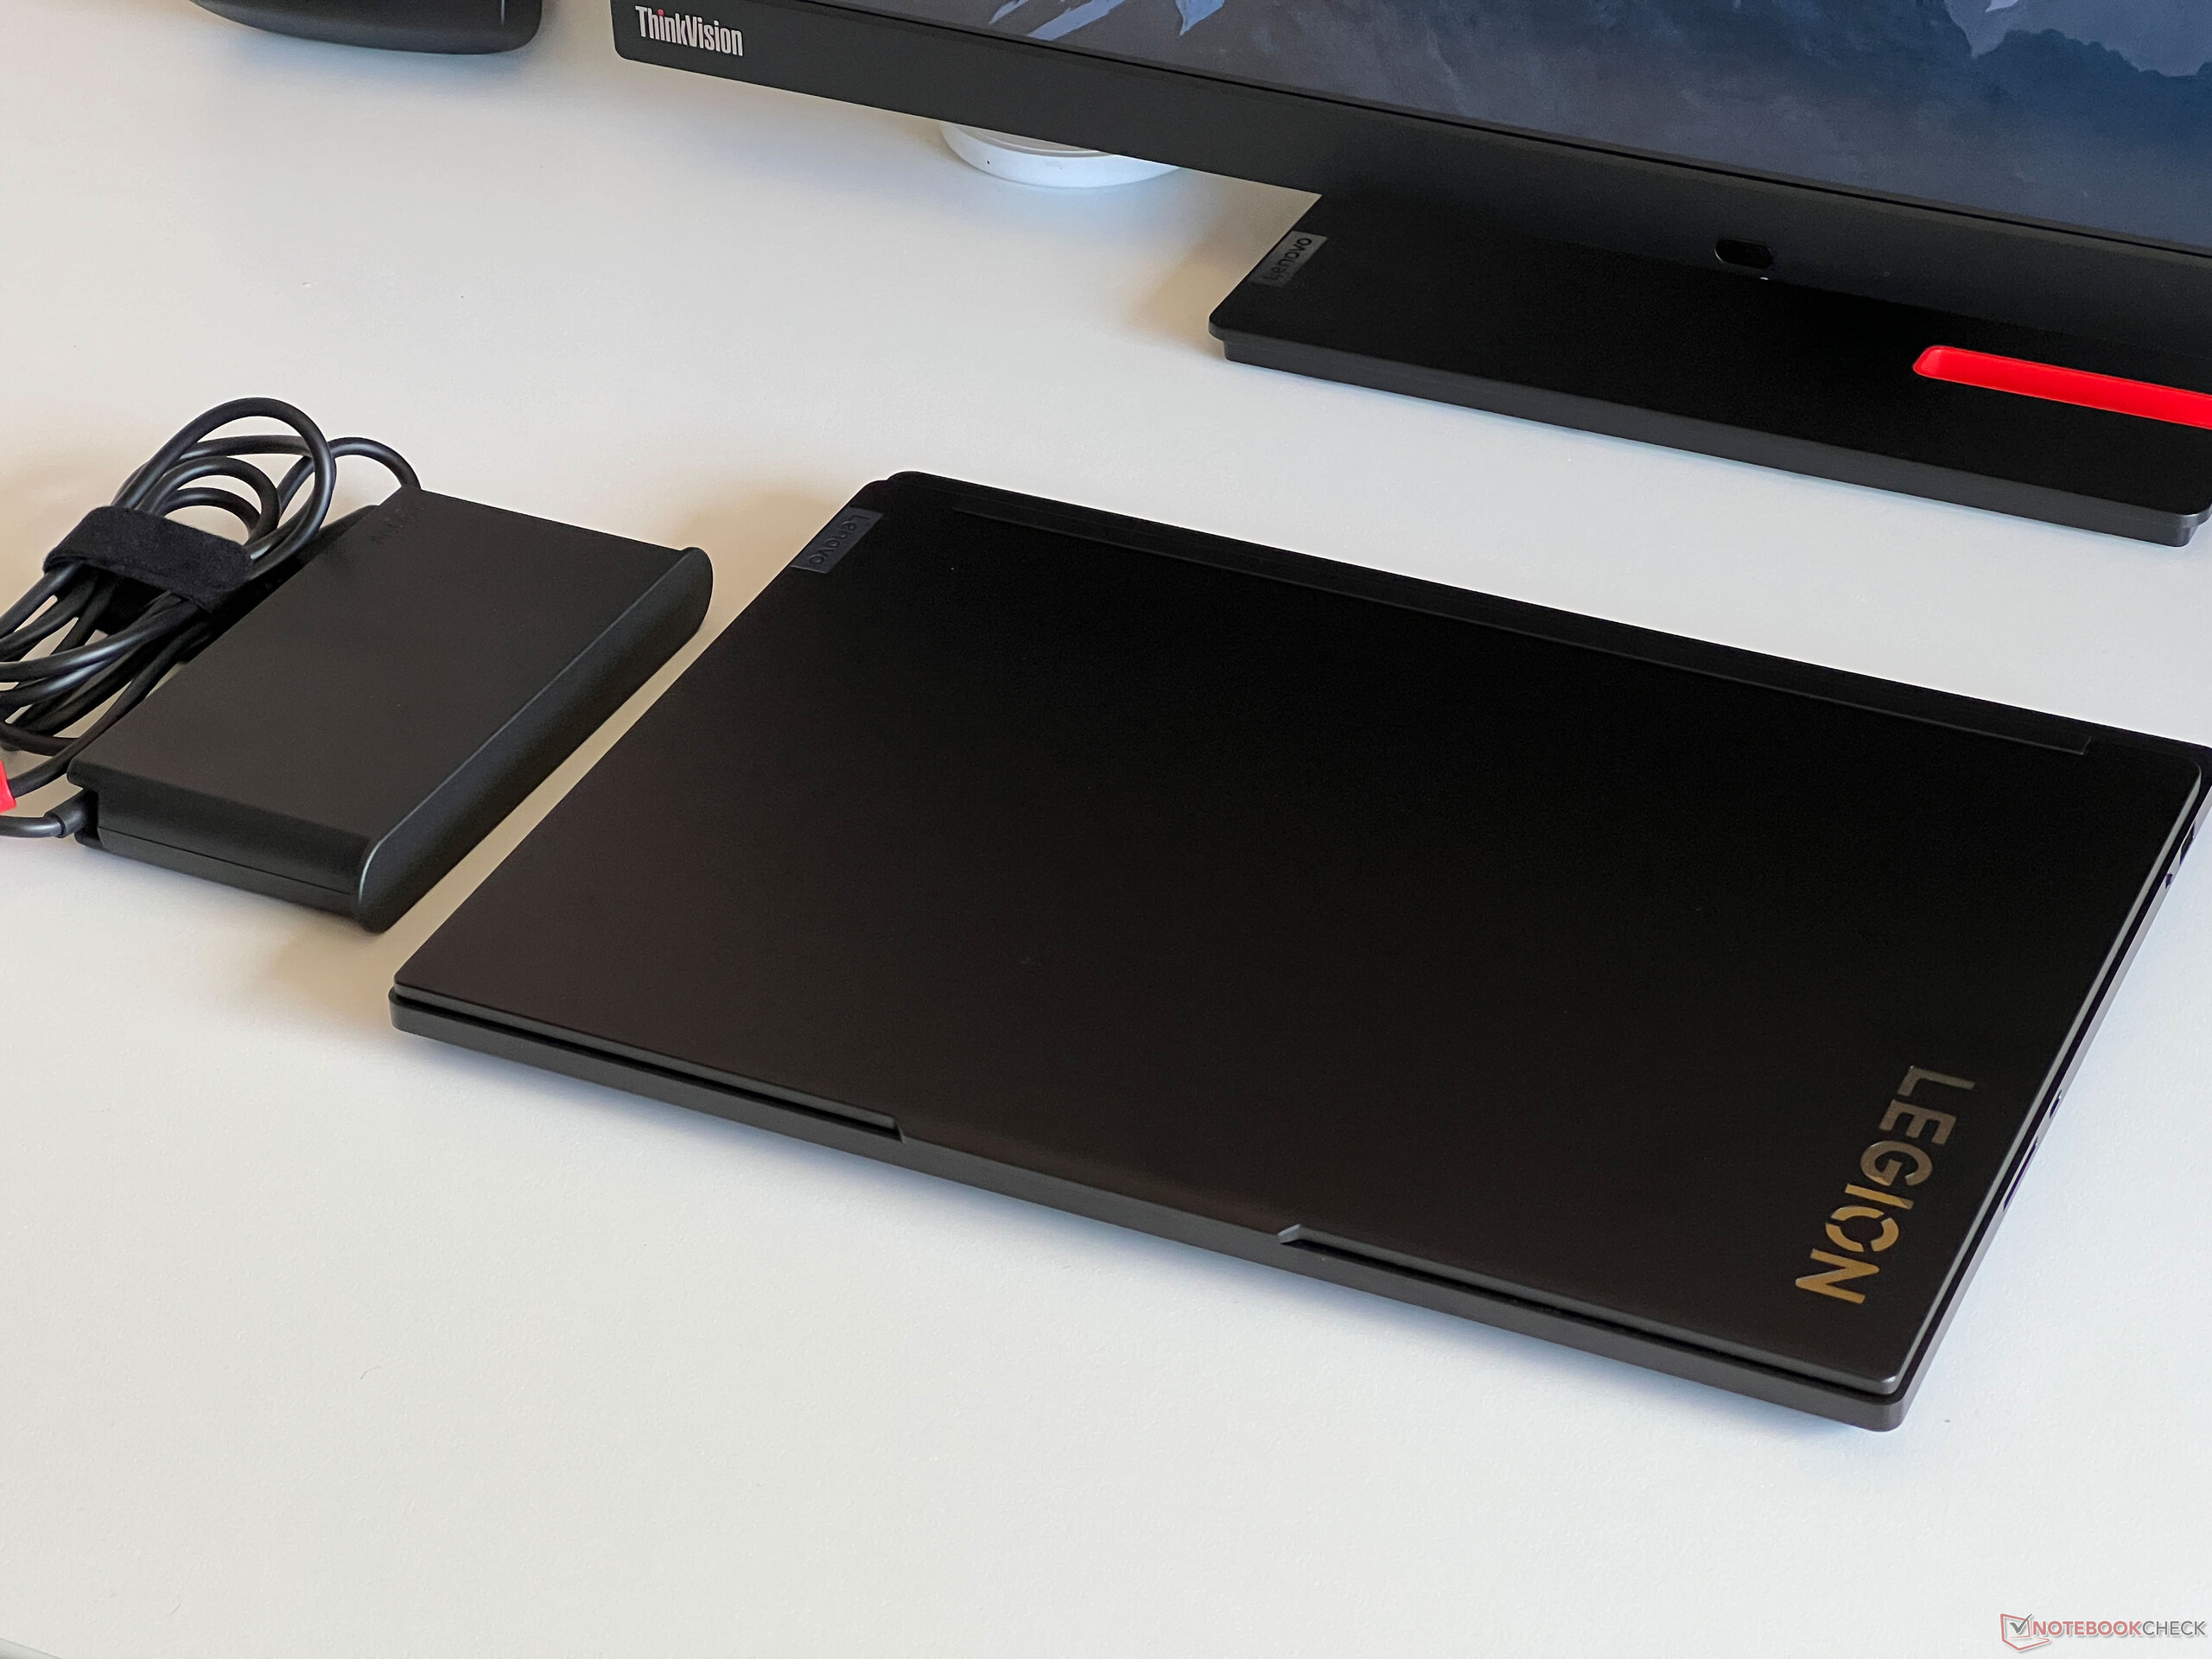
El Legion 7 16 es uno de los dispositivos más delgados de nuestro grupo de comparación, sin embargo, en términos de peso y huella general, no hay grandes diferencias. La fuente de alimentación de 230 vatios inclina la balanza hasta los 948 gramos.
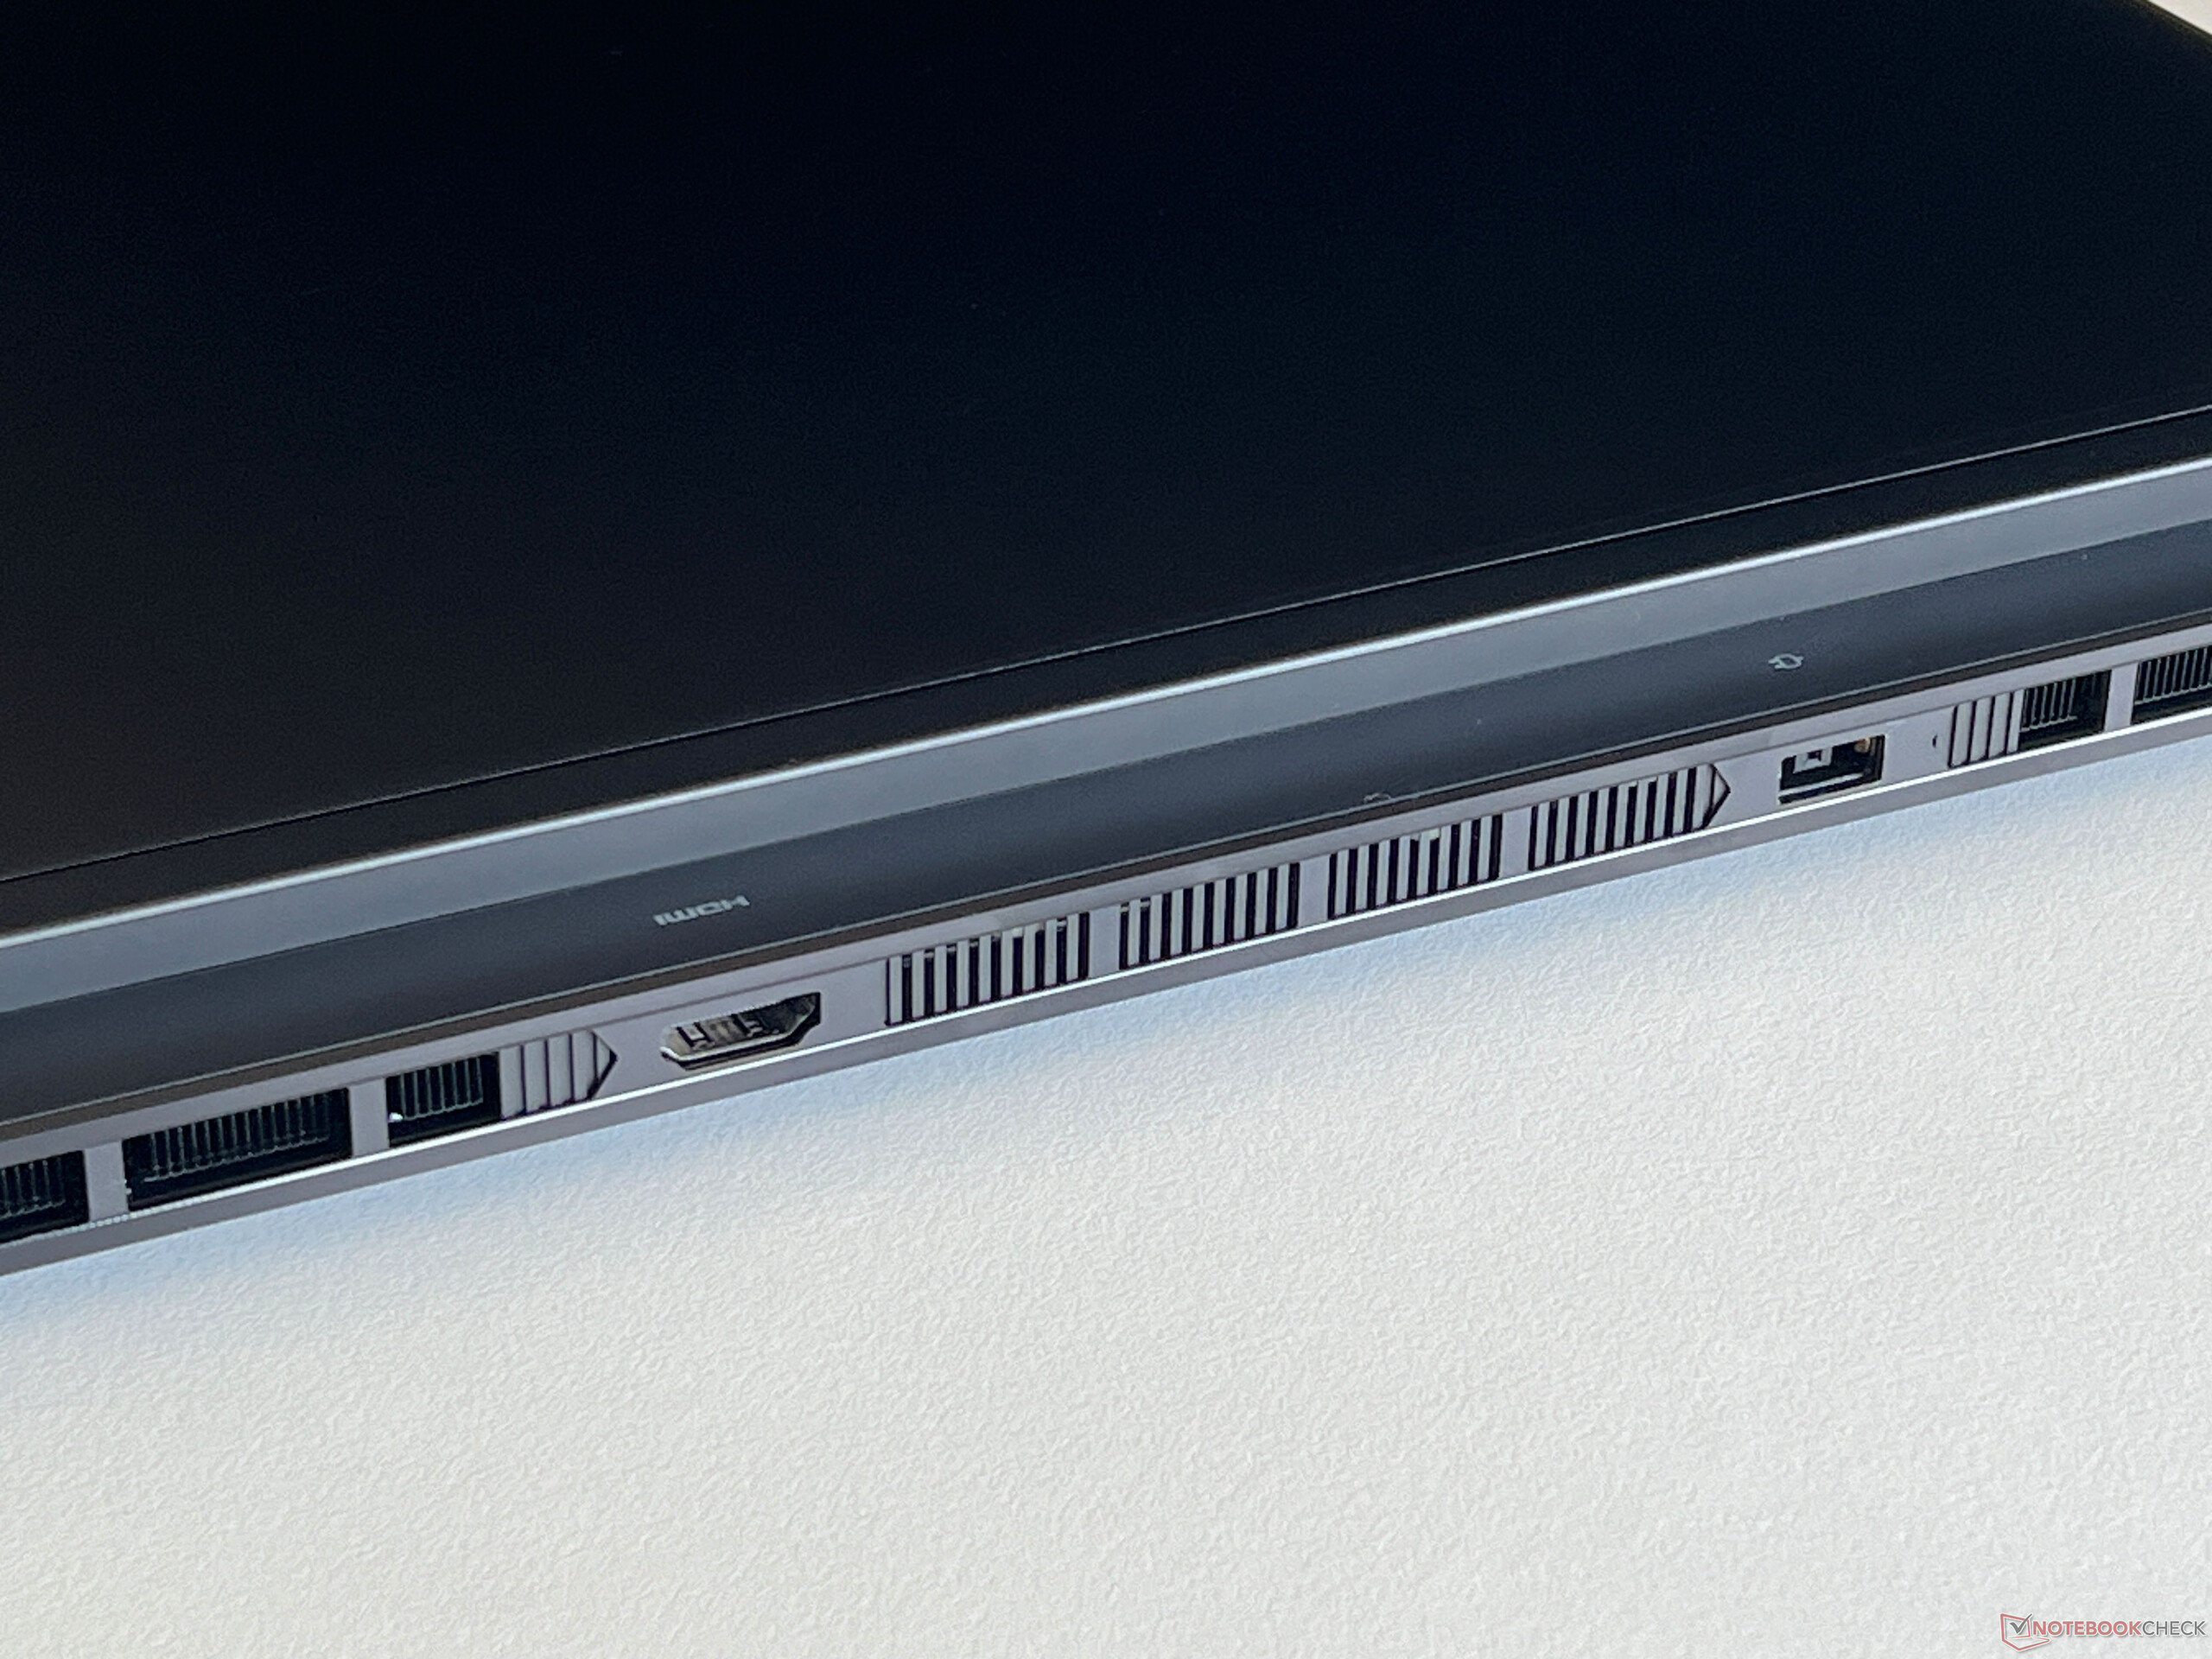
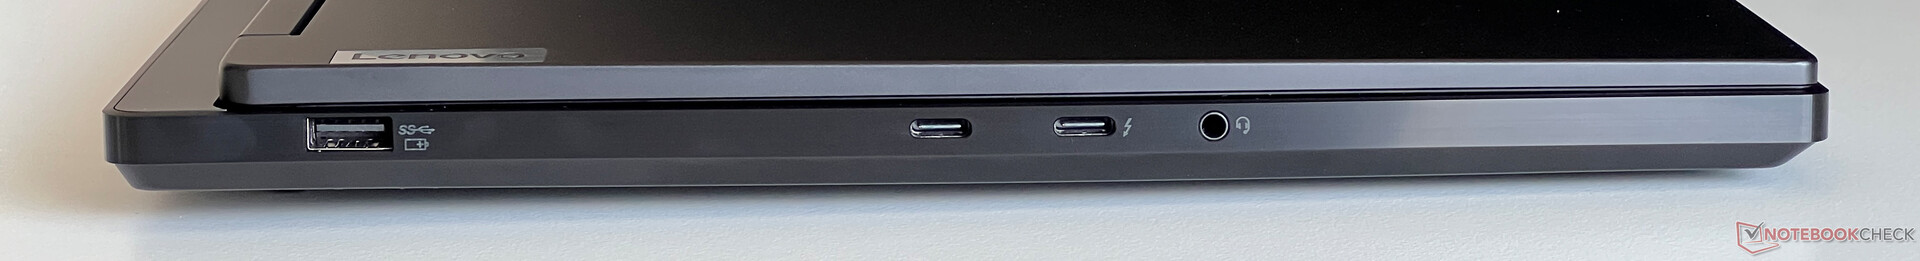
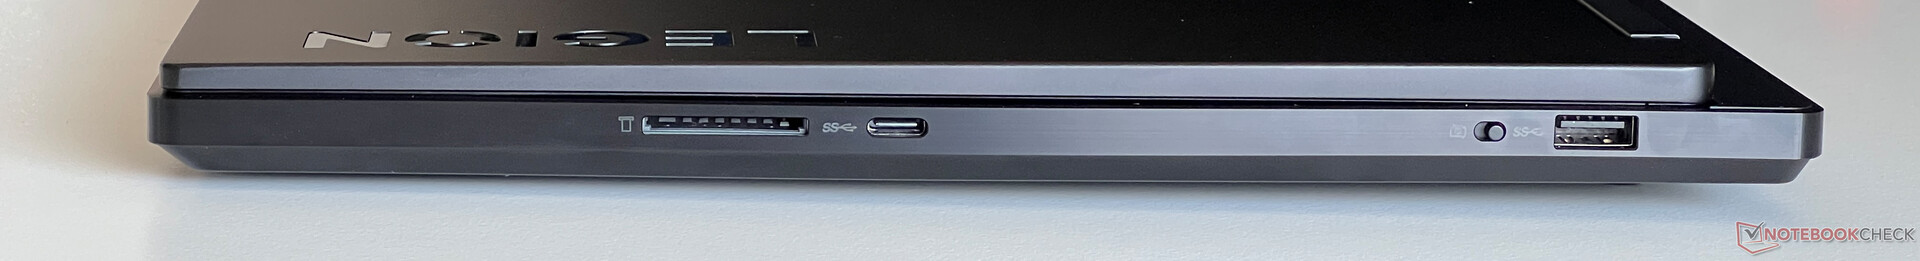
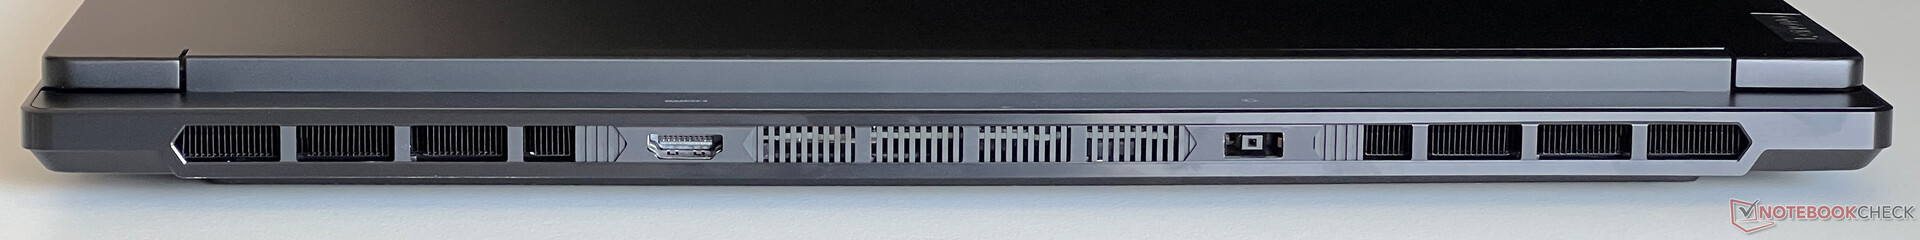
Características - Thunderbolt pero sin Ethernet
Los puertos están distribuidos tanto en los laterales como en la parte trasera del portátil. En este aspecto, el Legion 7 normal sale algo mejor parado que el Legion Pro 7 más caro, ya que las rejillas de refrigeración sólo se encuentran en la parte trasera. Todos los estándares importantes están aquí, aparte del puerto Ethernet, lo que no es ideal para los jugadores. El puerto Thunderbolt se conecta a través de la iGPU y esto significa que cuando se conecta una pantalla externa, la GPU Nvidia no siempre tiene que estar activa. Todas las demás salidas de vídeo funcionan directamente a través de la dGPU.
Lector de tarjetas SD
Emparejado con nuestra tarjeta de referencia (Angelbird AV Pro V60), el lector de tarjetas del lado derecho puede alcanzar velocidades medias de transferencia de 75-90 MB/s. Sin embargo, las tarjetas insertadas sobresalen claramente de la carcasa.
| SD Card Reader | |
| average JPG Copy Test (av. of 3 runs) | |
| Aorus 16X 2024 (AV PRO microSD 128 GB V60) | |
| Media de la clase Gaming (20.9 - 210, n=54, últimos 2 años) | |
| Lenovo Legion 7 16 IRX G9 (Angelbird AV Pro V60) | |
| Alienware m16 R2 (AV PRO microSD 128 GB V60) | |
| Schenker XMG CORE 16 (L23) | |
| maximum AS SSD Seq Read Test (1GB) | |
| Alienware m16 R2 (AV PRO microSD 128 GB V60) | |
| Aorus 16X 2024 (AV PRO microSD 128 GB V60) | |
| Media de la clase Gaming (25.5 - 261, n=51, últimos 2 años) | |
| Lenovo Legion 7 16 IRX G9 (Angelbird AV Pro V60) | |
| Schenker XMG CORE 16 (L23) | |
Comunicación
En el interior de Legion hay instalado un módulo Realtek Wi-Fi 6E. Su rendimiento es bueno y, combinado con nuestro router de referencia Asus, consiguió velocidades de transferencia altas y estables. Soporta Bluetooth 5.1 pero el portátil no ofrece puerto Ethernet.
| Networking | |
| Lenovo Legion 7 16 IRX G9 | |
| iperf3 transmit AXE11000 | |
| iperf3 receive AXE11000 | |
| Lenovo Legion Pro 5 16IRX9 | |
| iperf3 transmit AXE11000 | |
| iperf3 receive AXE11000 | |
| iperf3 transmit AXE11000 6GHz | |
| iperf3 receive AXE11000 6GHz | |
| Aorus 16X 2024 | |
| iperf3 transmit AXE11000 | |
| iperf3 receive AXE11000 | |
| HP Omen Transcend 16-u1095ng | |
| iperf3 transmit AXE11000 | |
| iperf3 receive AXE11000 | |
| Alienware m16 R2 | |
| iperf3 transmit AXE11000 | |
| iperf3 receive AXE11000 | |
| iperf3 transmit AXE11000 6GHz | |
| iperf3 receive AXE11000 6GHz | |
| Schenker XMG CORE 16 (L23) | |
| iperf3 transmit AXE11000 | |
| iperf3 receive AXE11000 | |
| Lenovo Legion Pro 7 16IRX9H | |
| iperf3 transmit AXE11000 | |
| iperf3 receive AXE11000 | |
Cámara web
La webcam 1080p está alojada dentro del bisel superior de la pantalla y ofrece un obturador electrónico (el interruptor está en el lado derecho) pero, incluso en buenas condiciones de iluminación, sólo captura imágenes medias. La webcam no es compatible con Windows Studio Effects, a diferencia de los dispositivos Meteor Lake actuales.


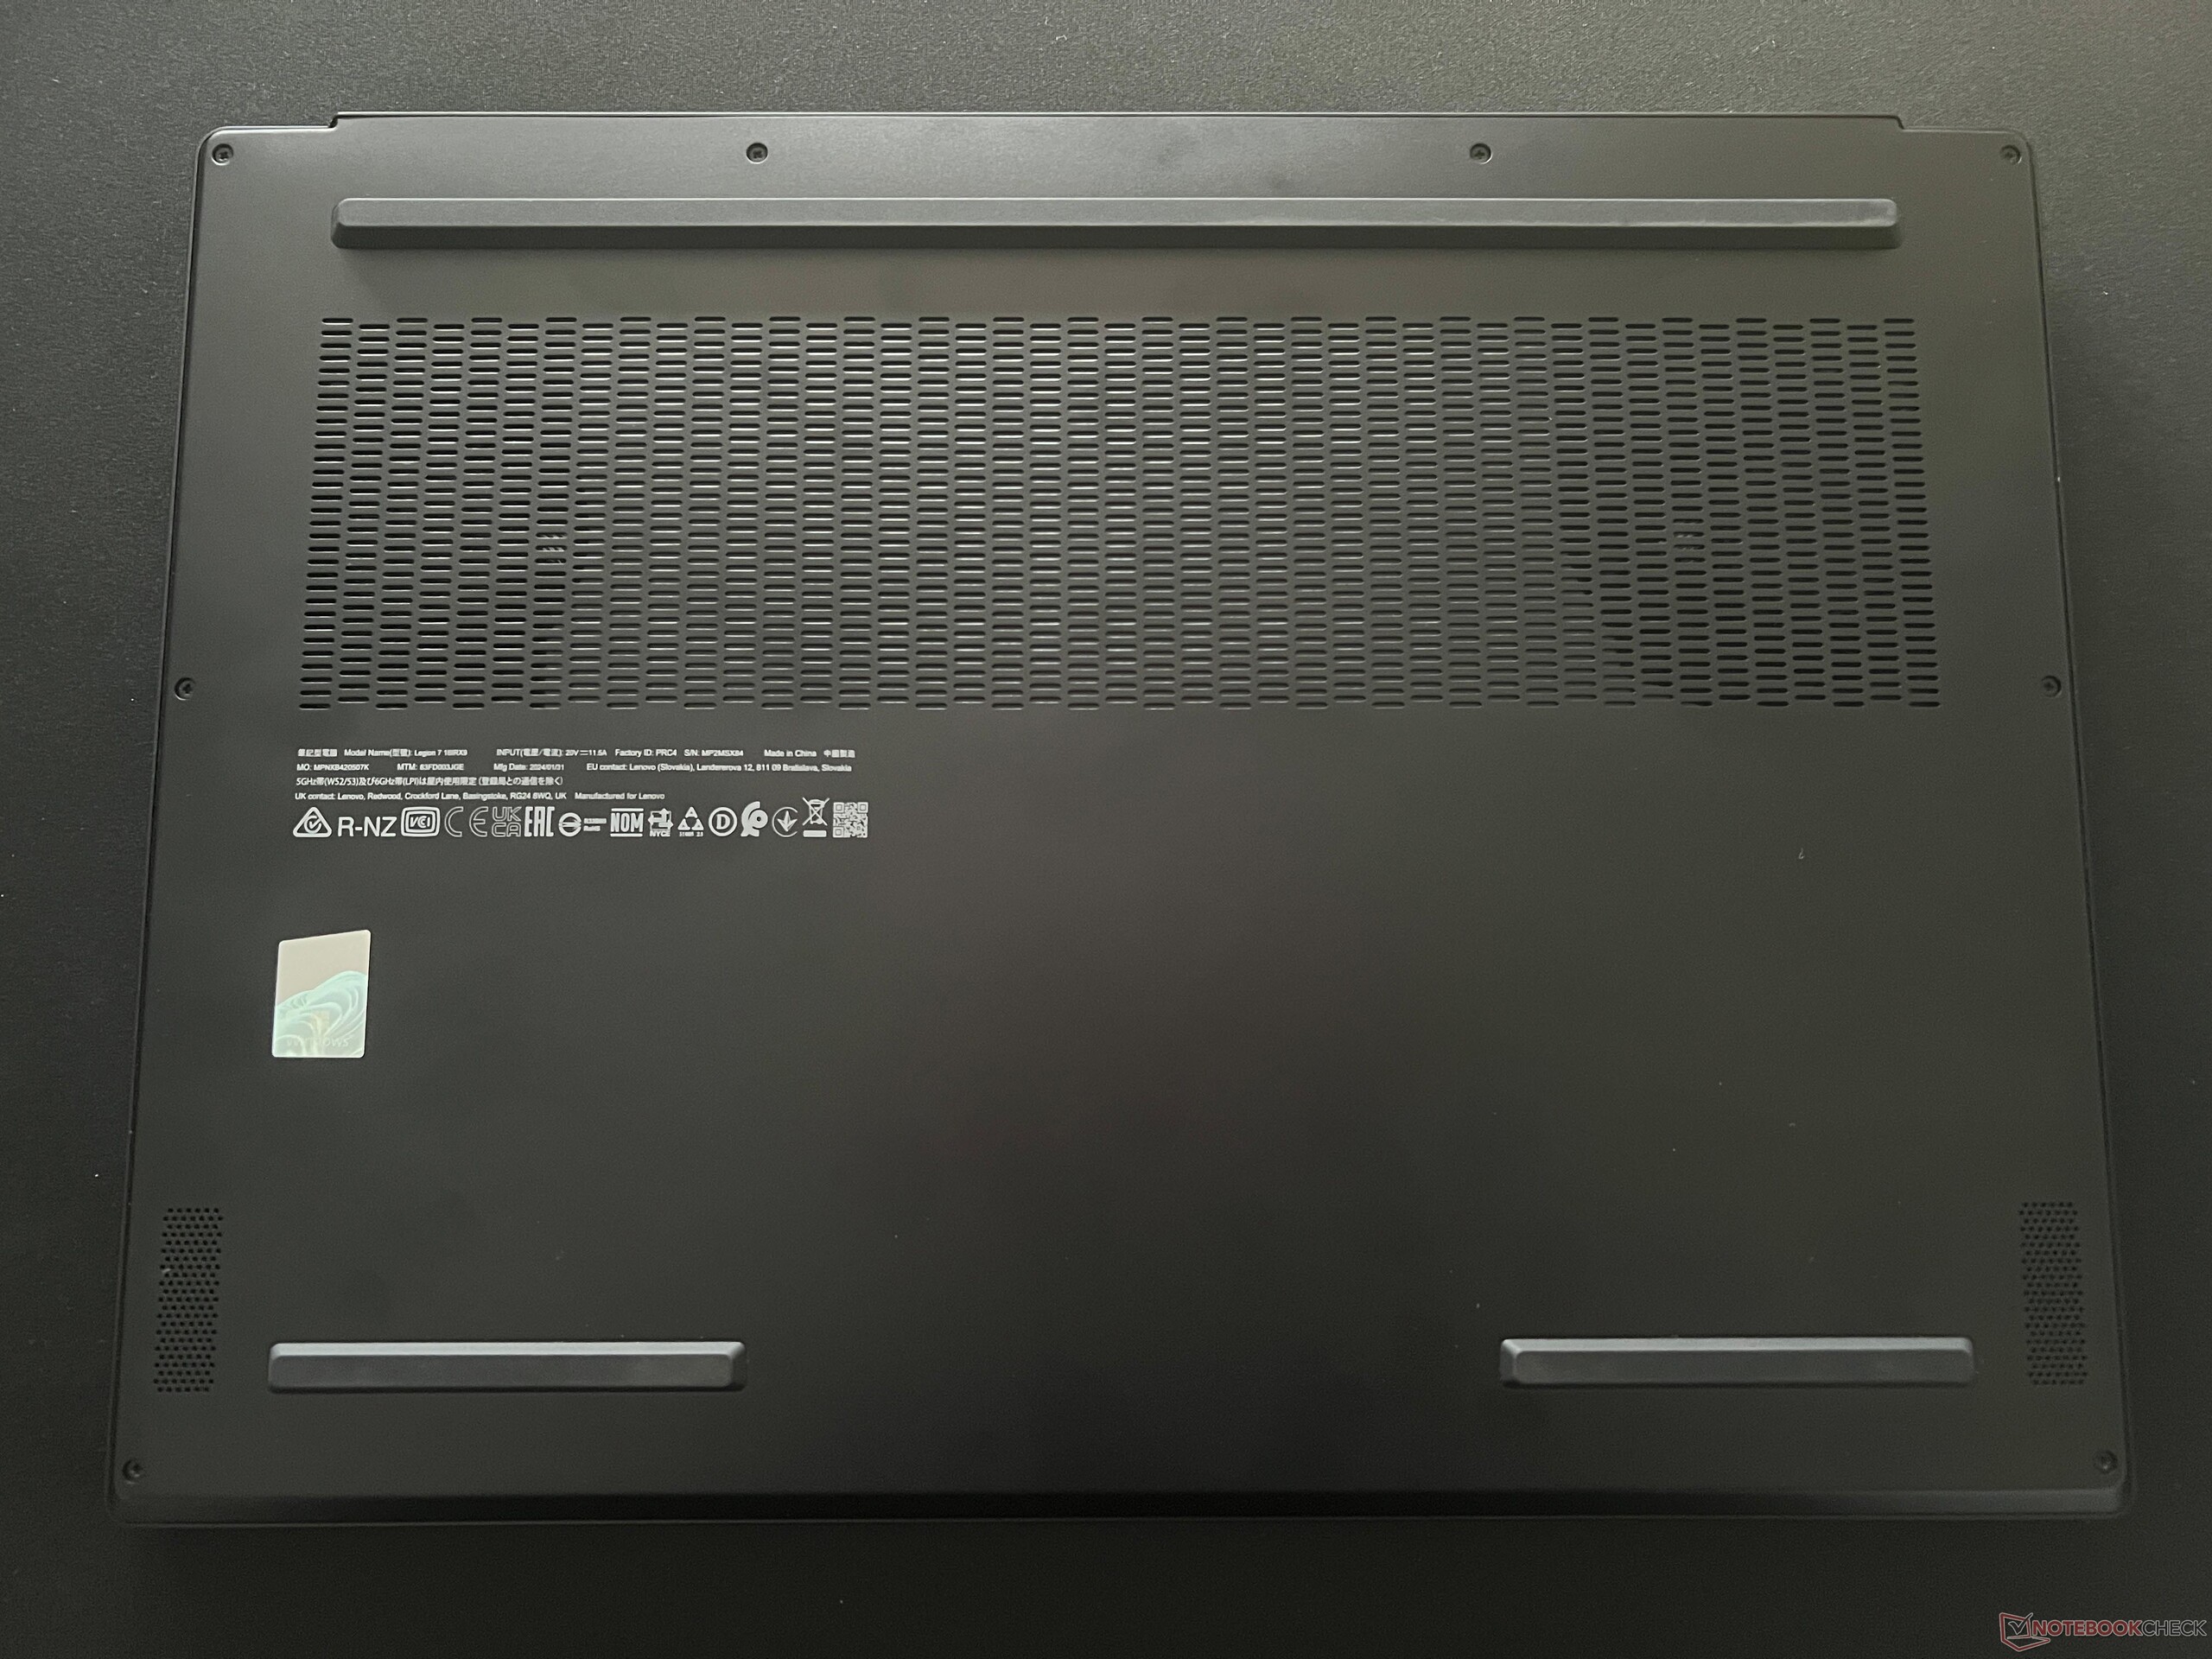
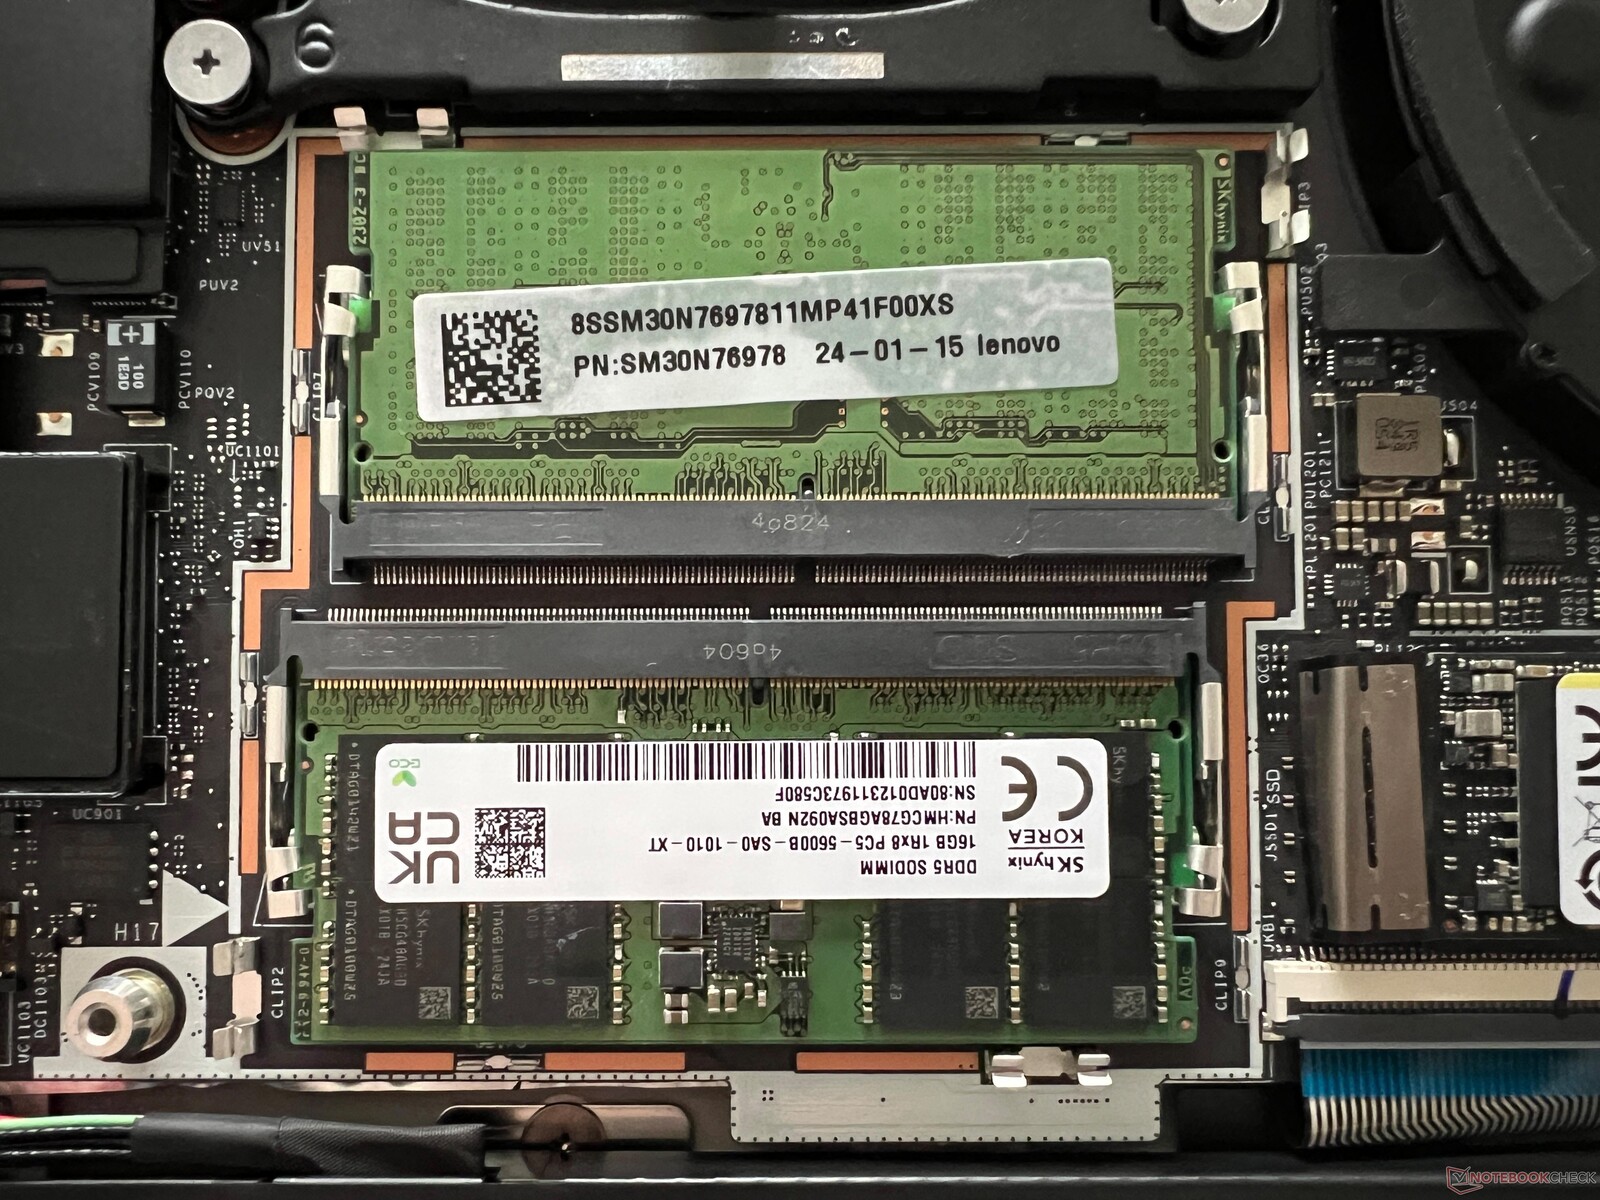
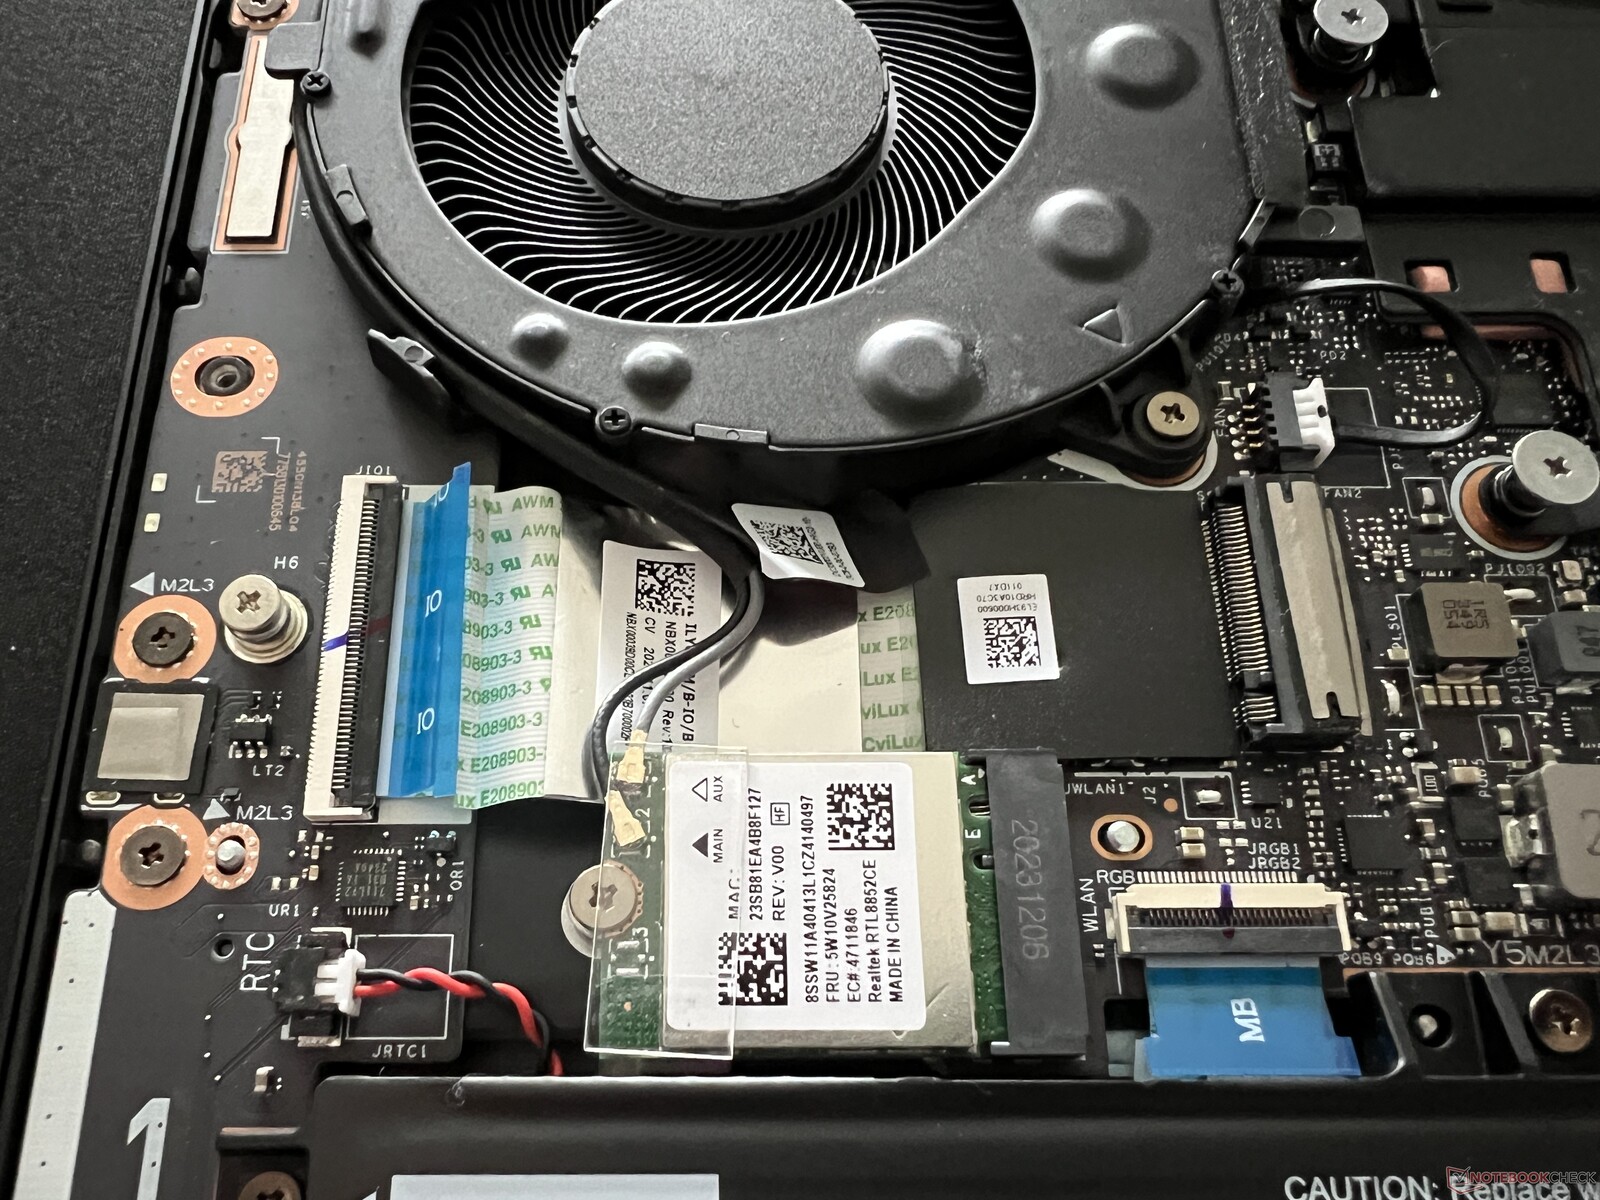
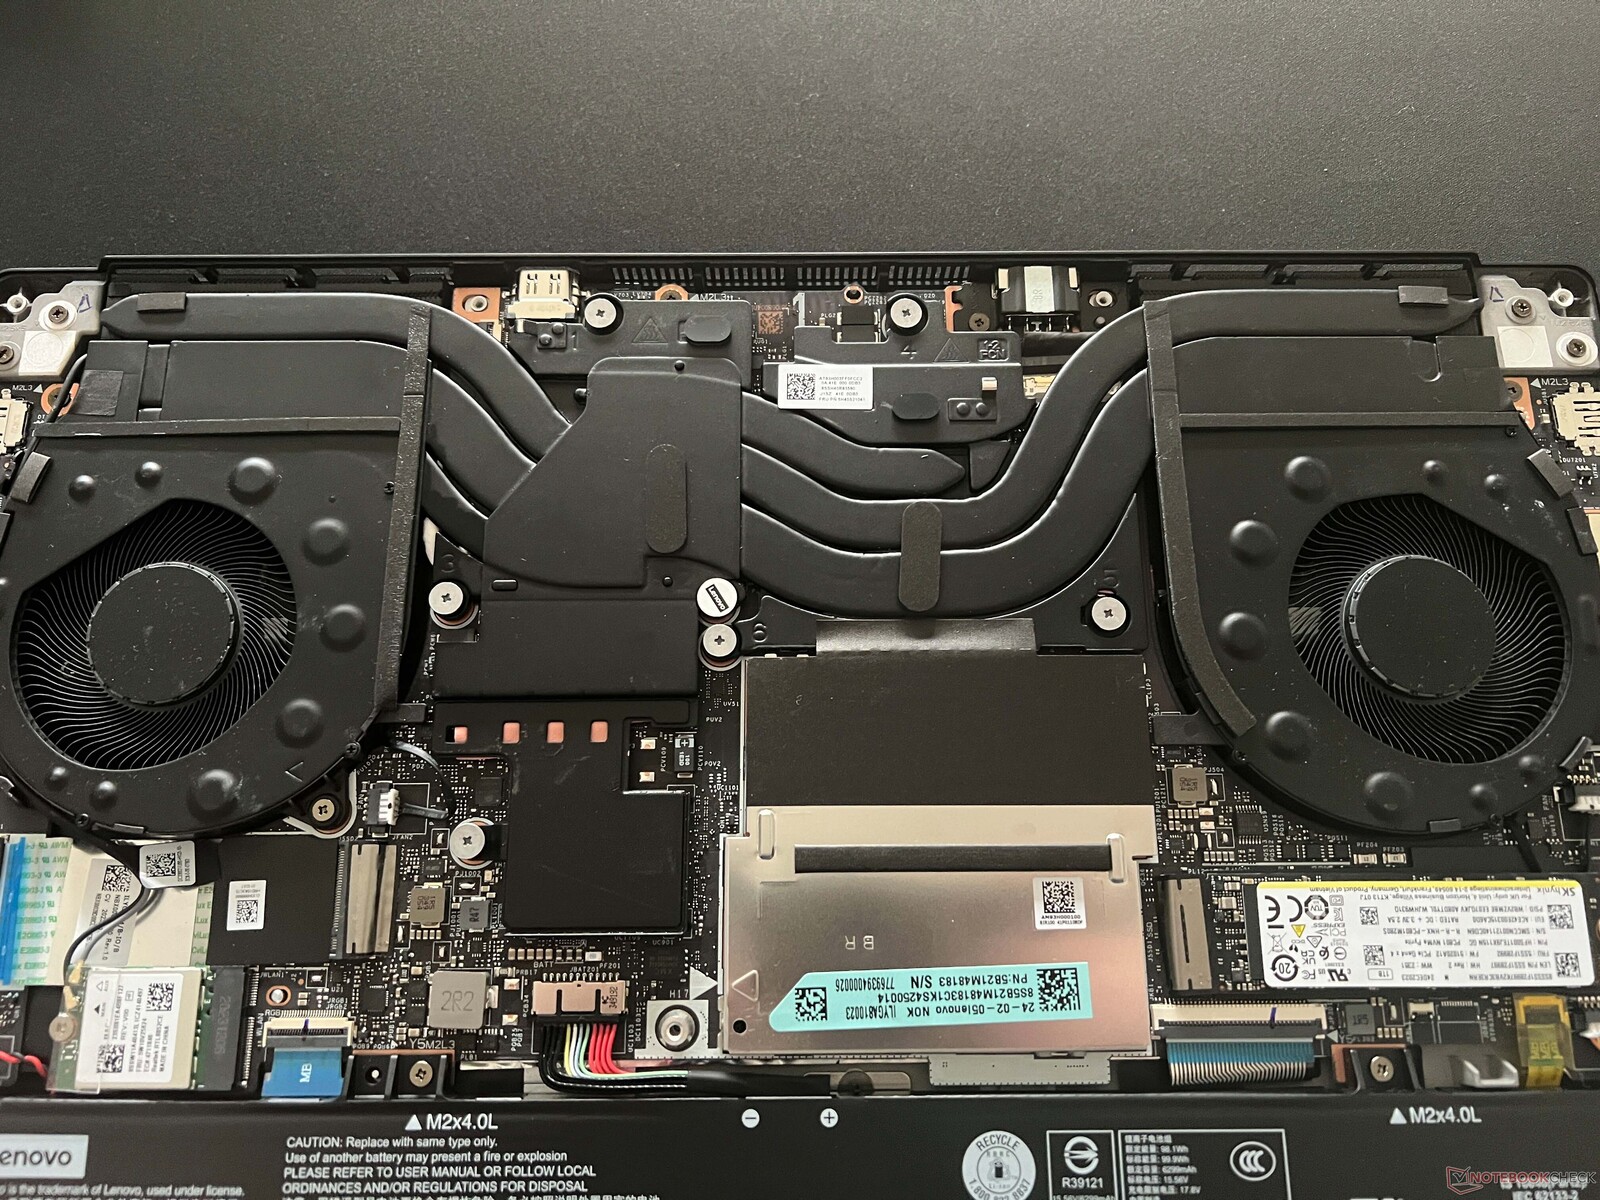
Mantenimiento
La cubierta de la base está asegurada por tornillos de estrella normales y es muy fácil de quitar. Además de los dos módulos de RAM, también hay dos ranuras M.2 2280 aunque el acceso a la segunda ranura está algo obstaculizado por el cable Wi-Fi. Asimismo, tanto el módulo Wi-Fi como la batería pueden sustituirse.

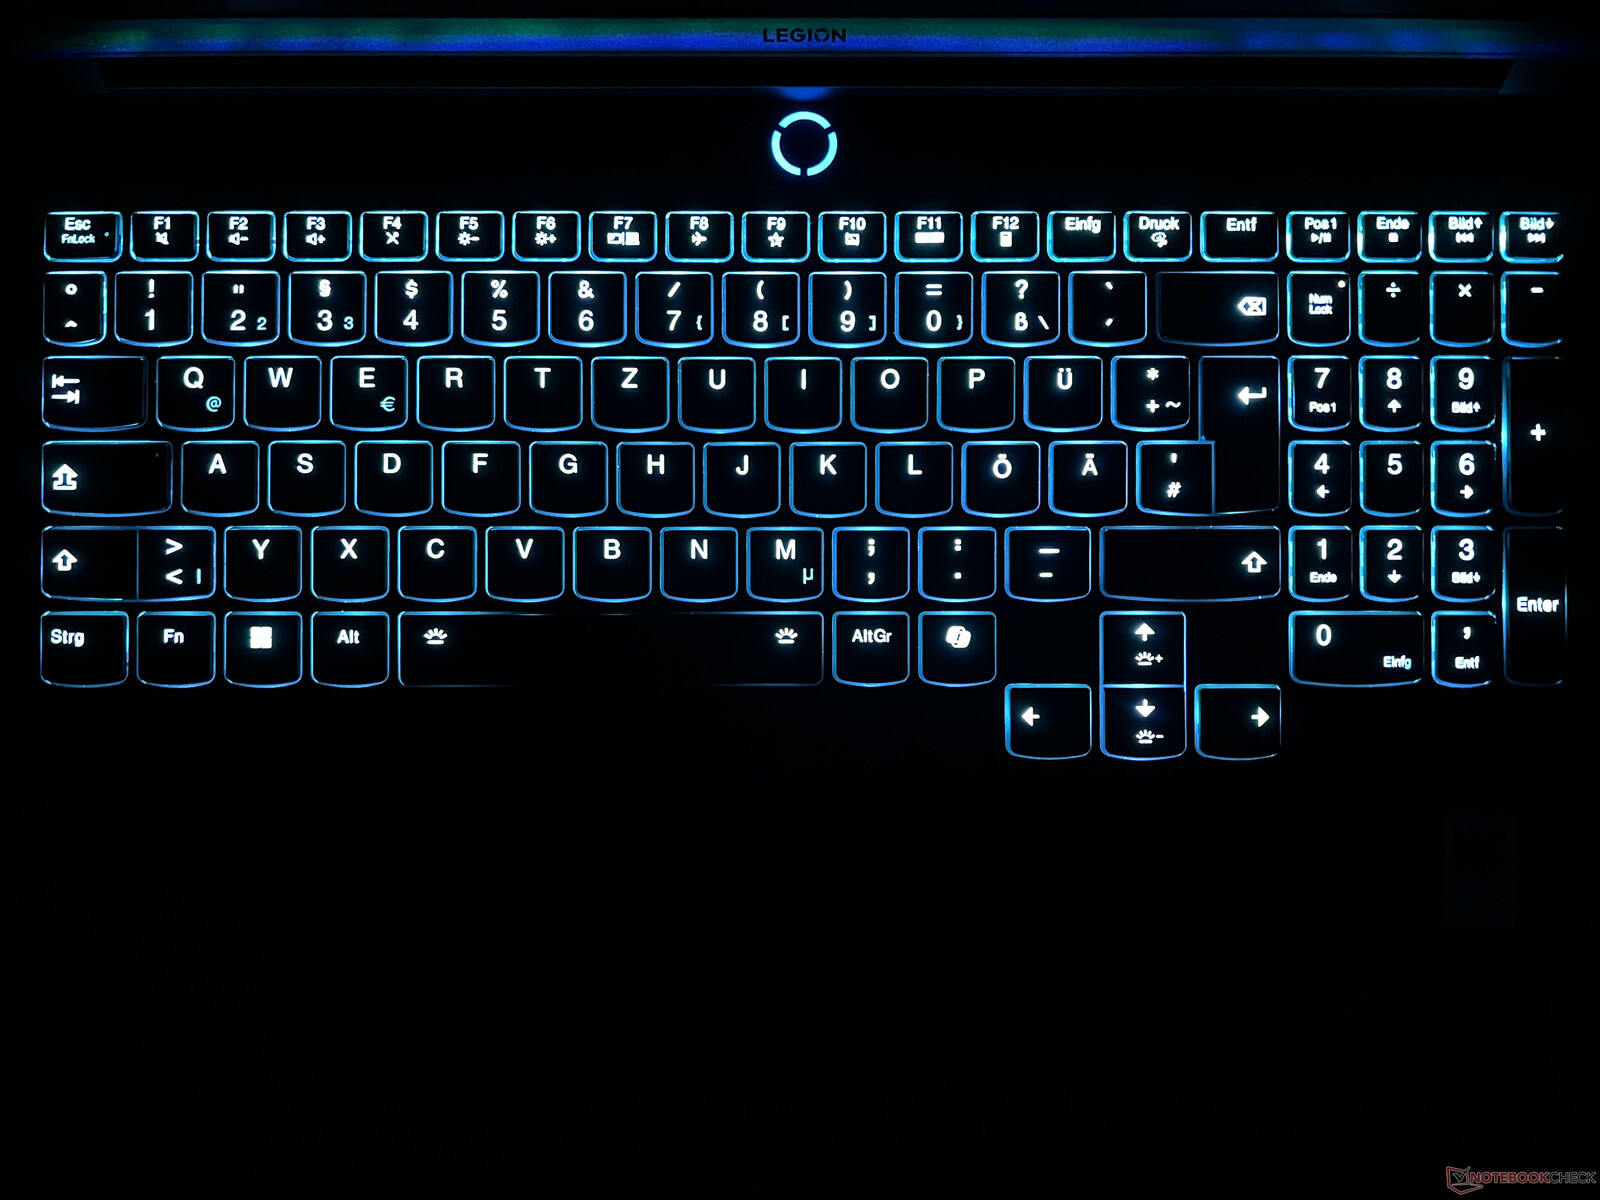
Dispositivos de entrada - Teclado numérico e iluminación de teclas individuales
Lenovo ha dotado al Legion 7 16 de un teclado de membrana muy cómodo que se completa con un teclado numérico dedicado e iluminación individual de las teclas. En general, la pulsación precisa y agradablemente silenciosa de las teclas no da motivos de queja. Incluso los textos más largos pueden teclearse sin esfuerzo. Las teclas del teclado numérico son un poco más estrechas, pero eso no presenta ningún problema en situaciones reales. Las teclas de flecha son agradablemente grandes y el escáner de huellas dactilares está integrado en el botón de encendido.
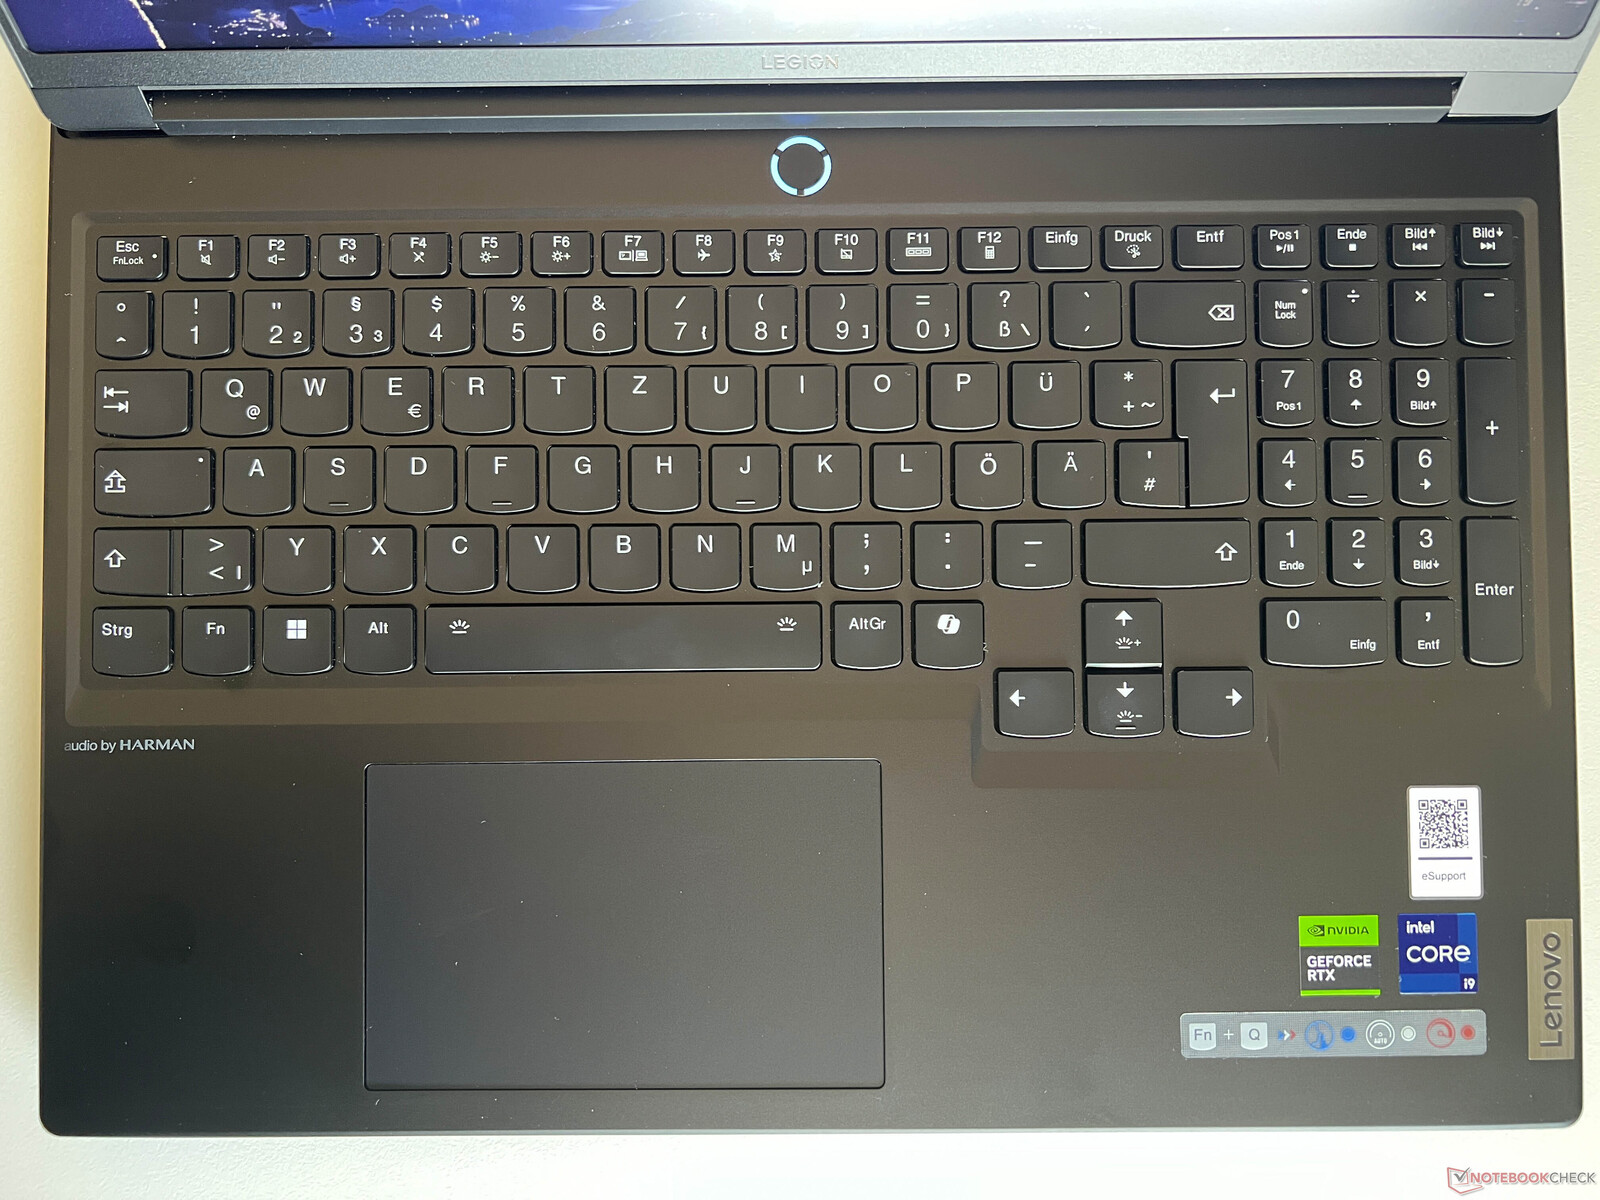
El clickpad está situado ligeramente a la izquierda del centro y, con unas dimensiones de 12 x 7,5 cm, está bien proporcionado. Las acciones de deslizamiento se traducen muy bien y se puede pulsar la zona inferior del pad, aunque de forma bastante ruidosa. Por este motivo, sólo debe tocar ligeramente la almohadilla. También se incluye el Legion Speed Mouse Mad M.
Pantalla - Un panel IPS de 3,2K, 165 Hz y G-Sync
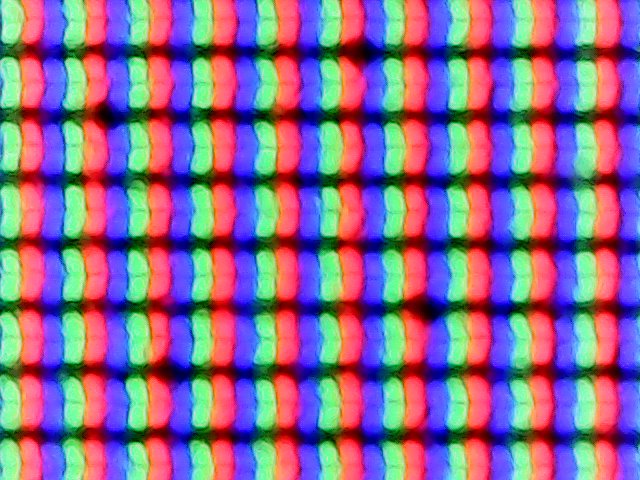
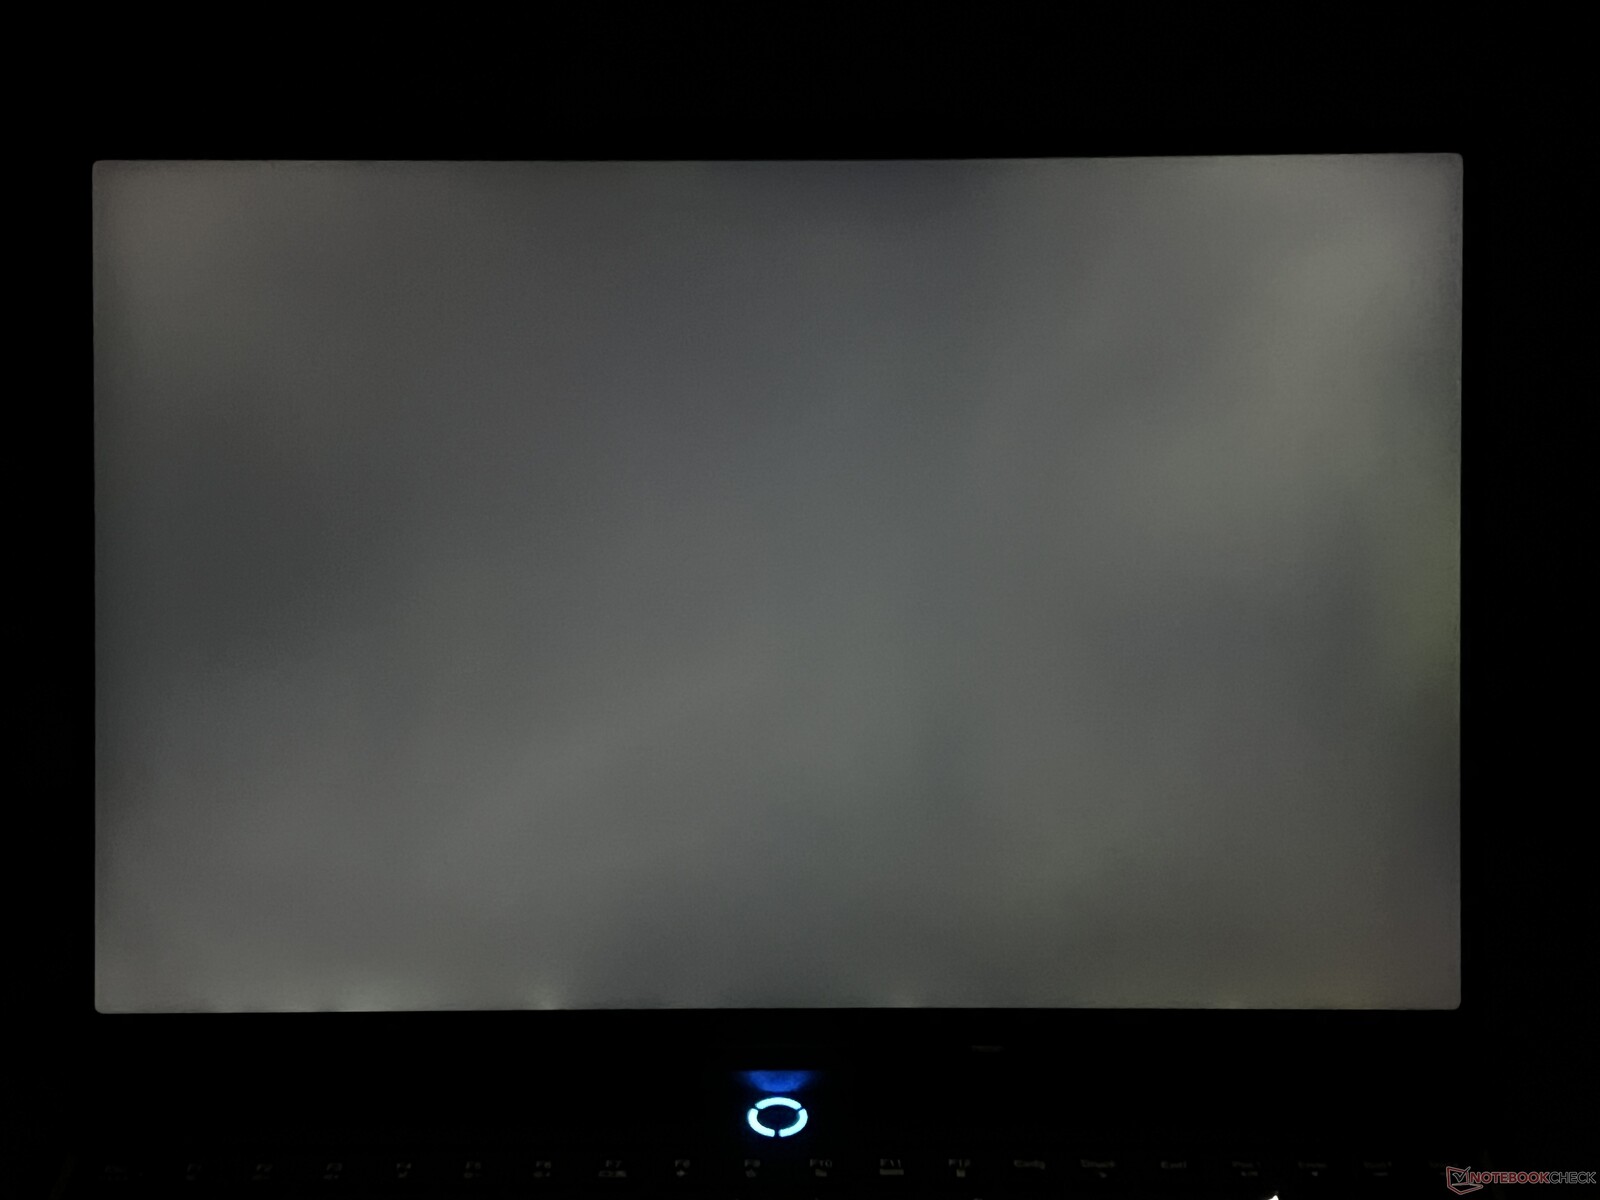
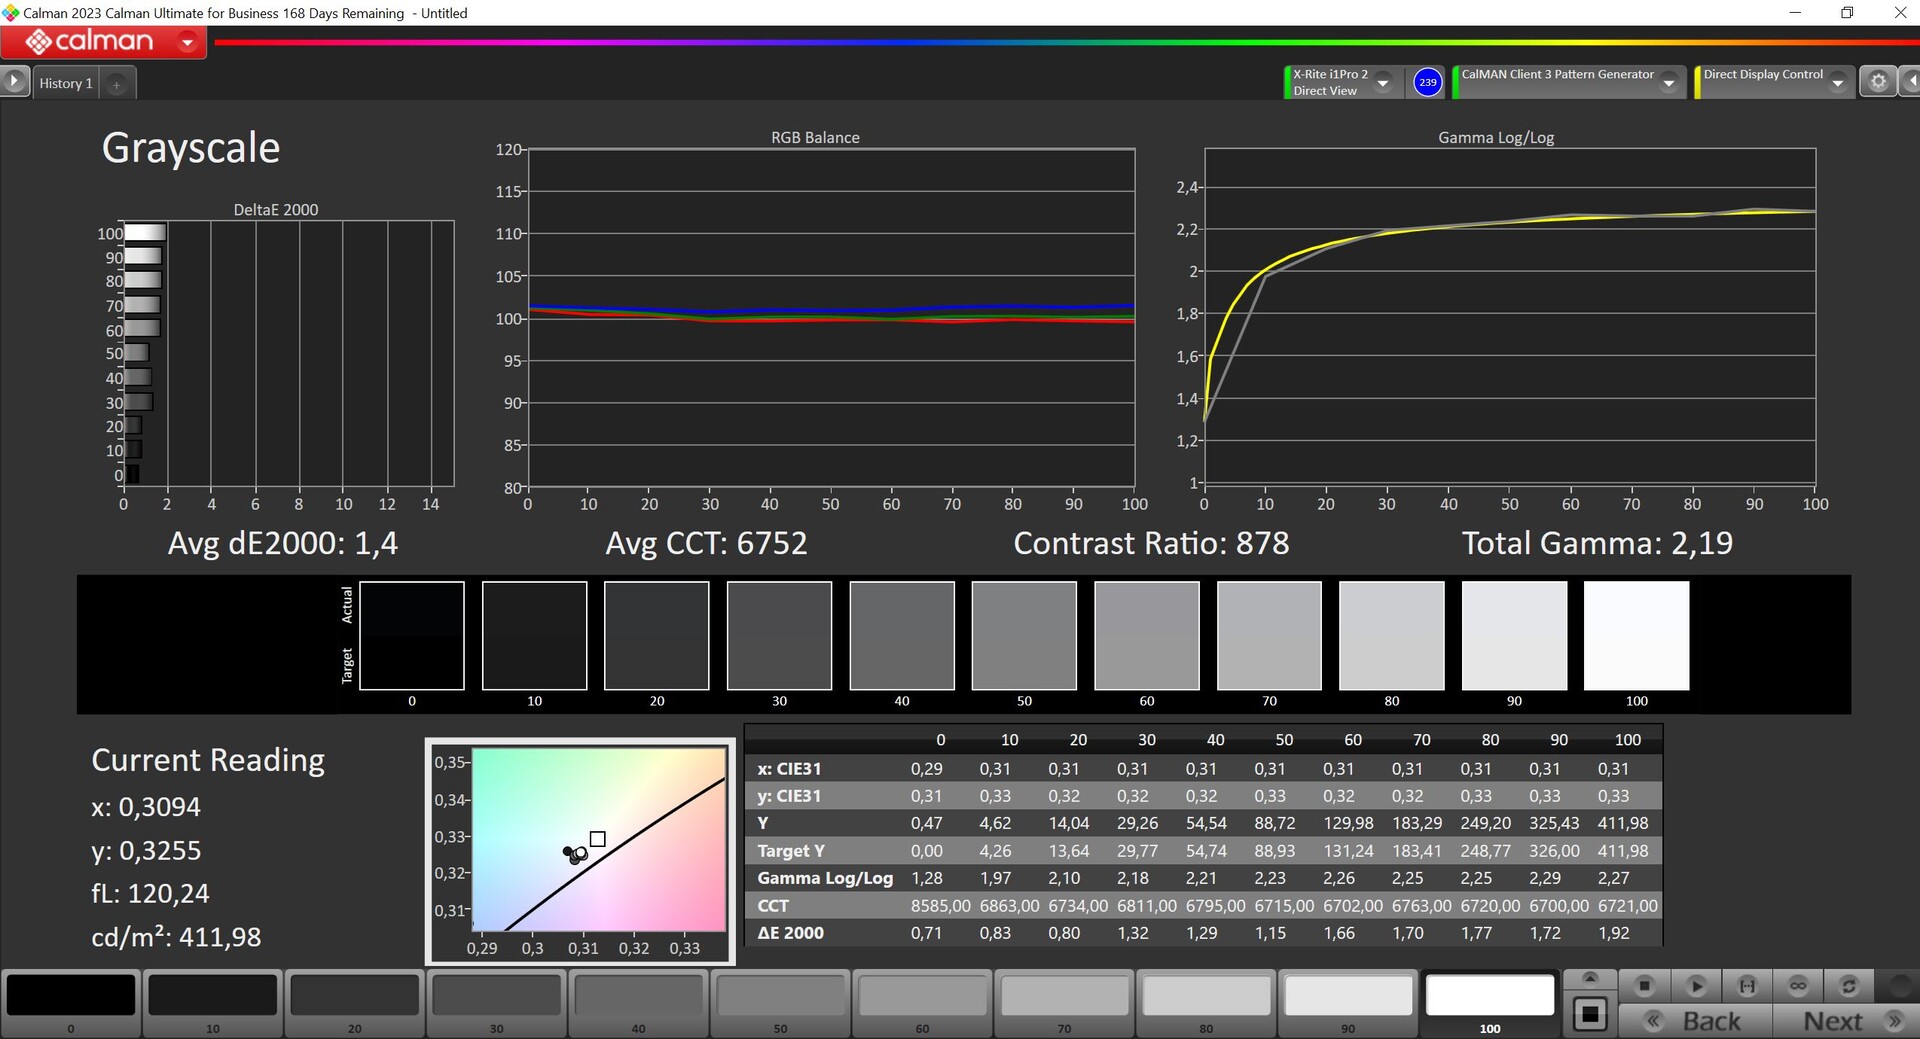
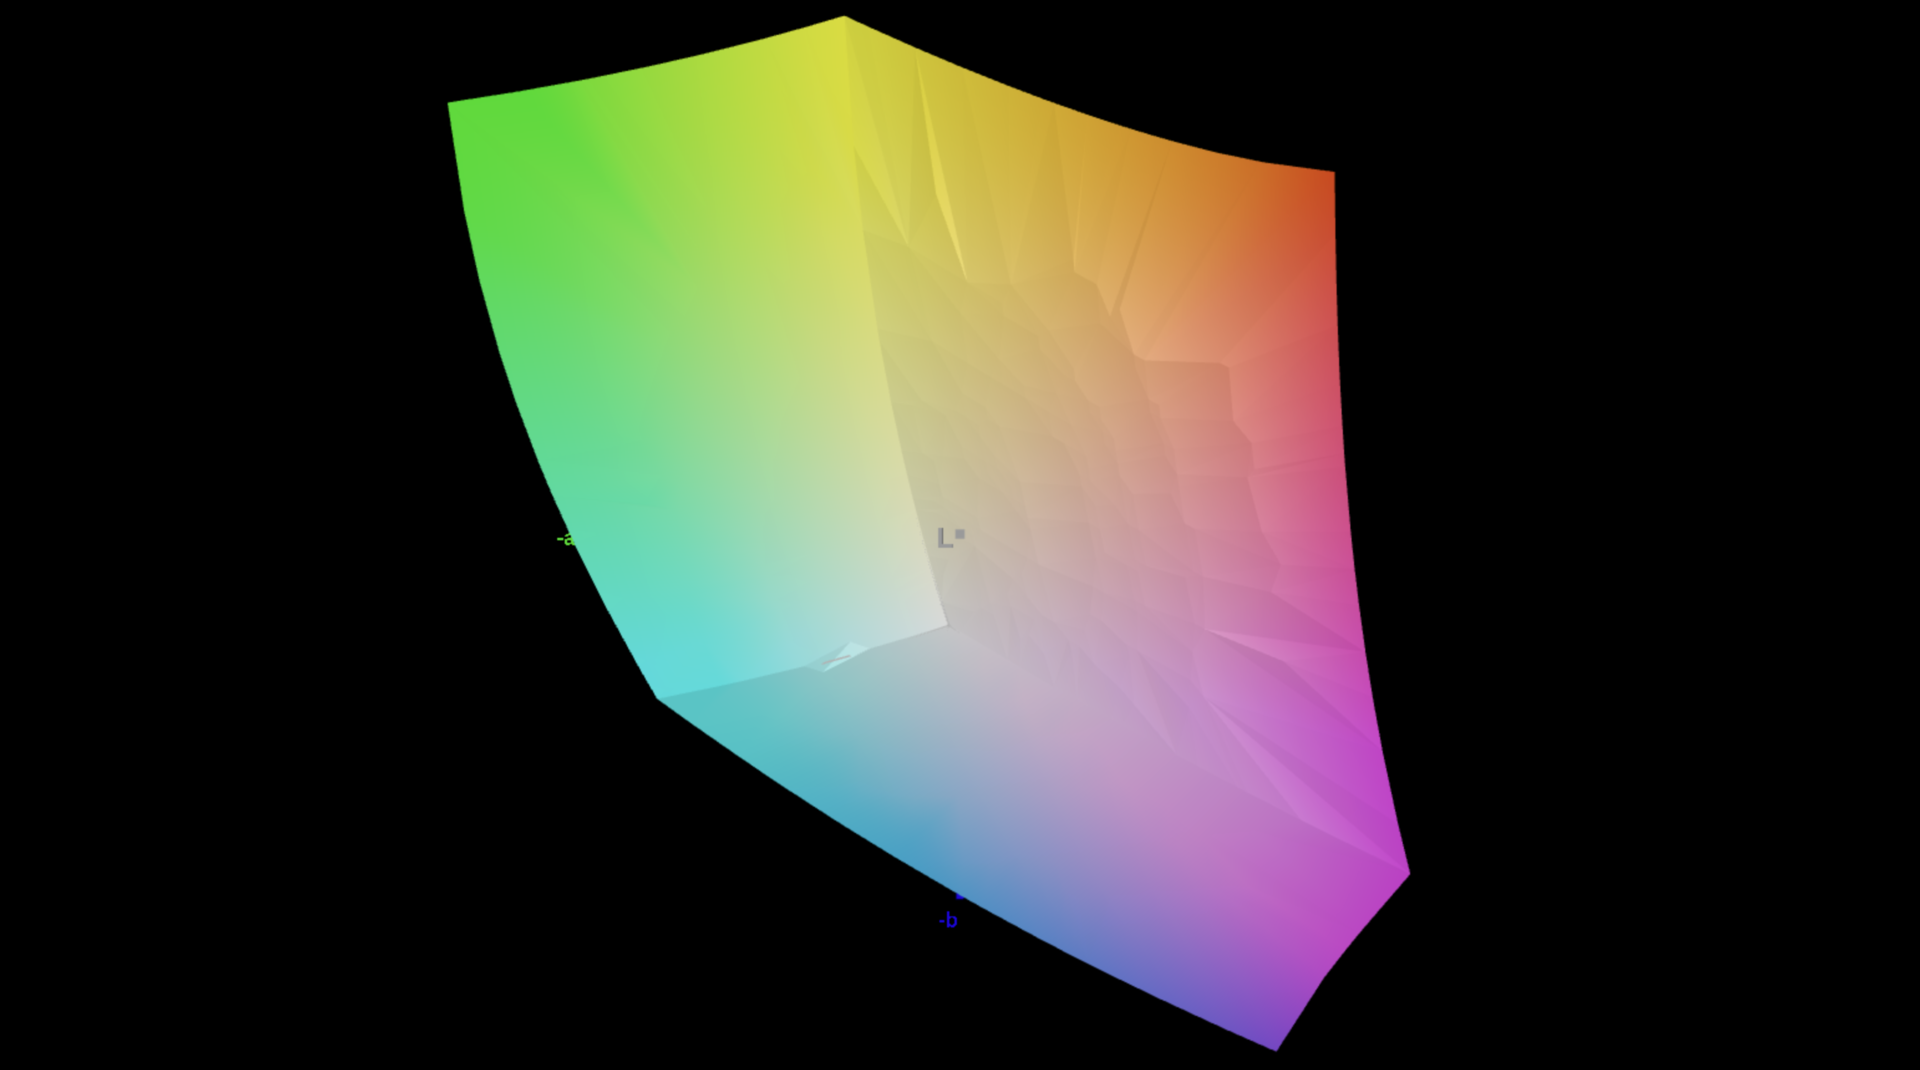
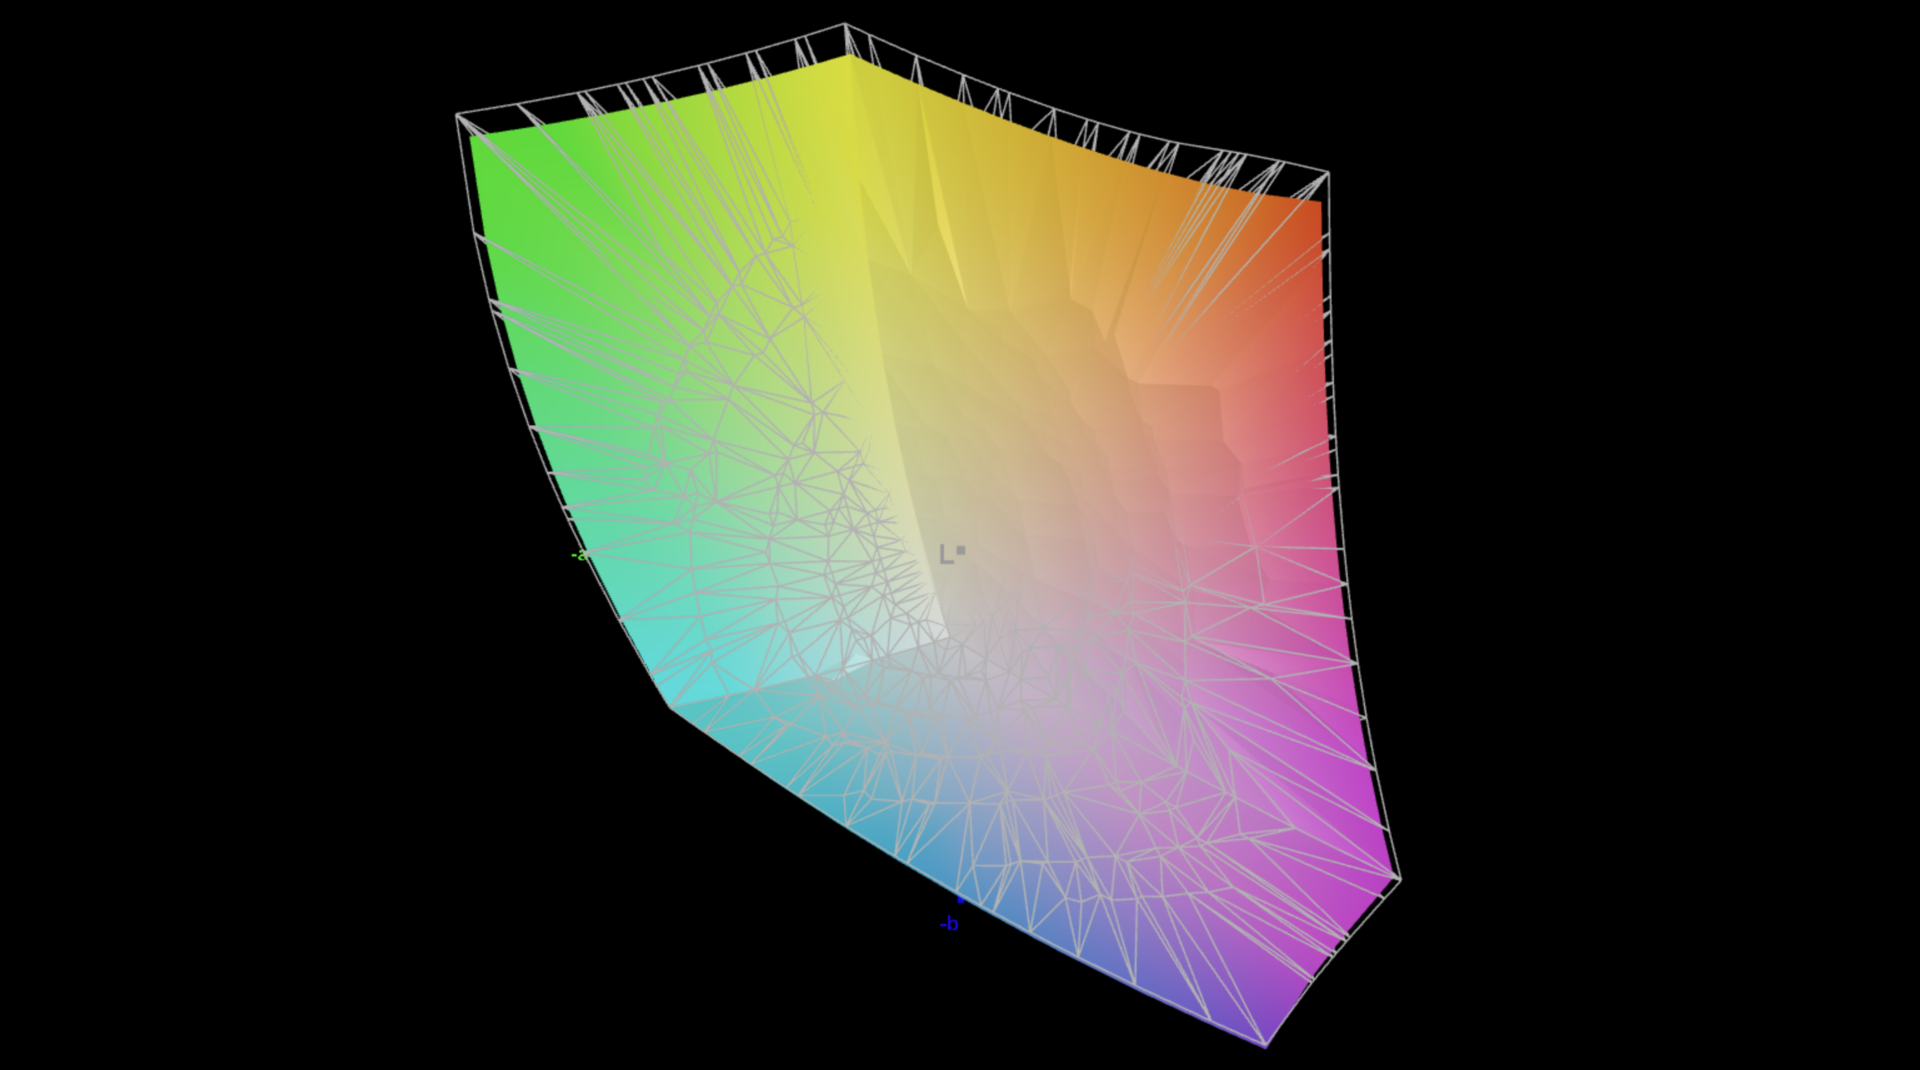
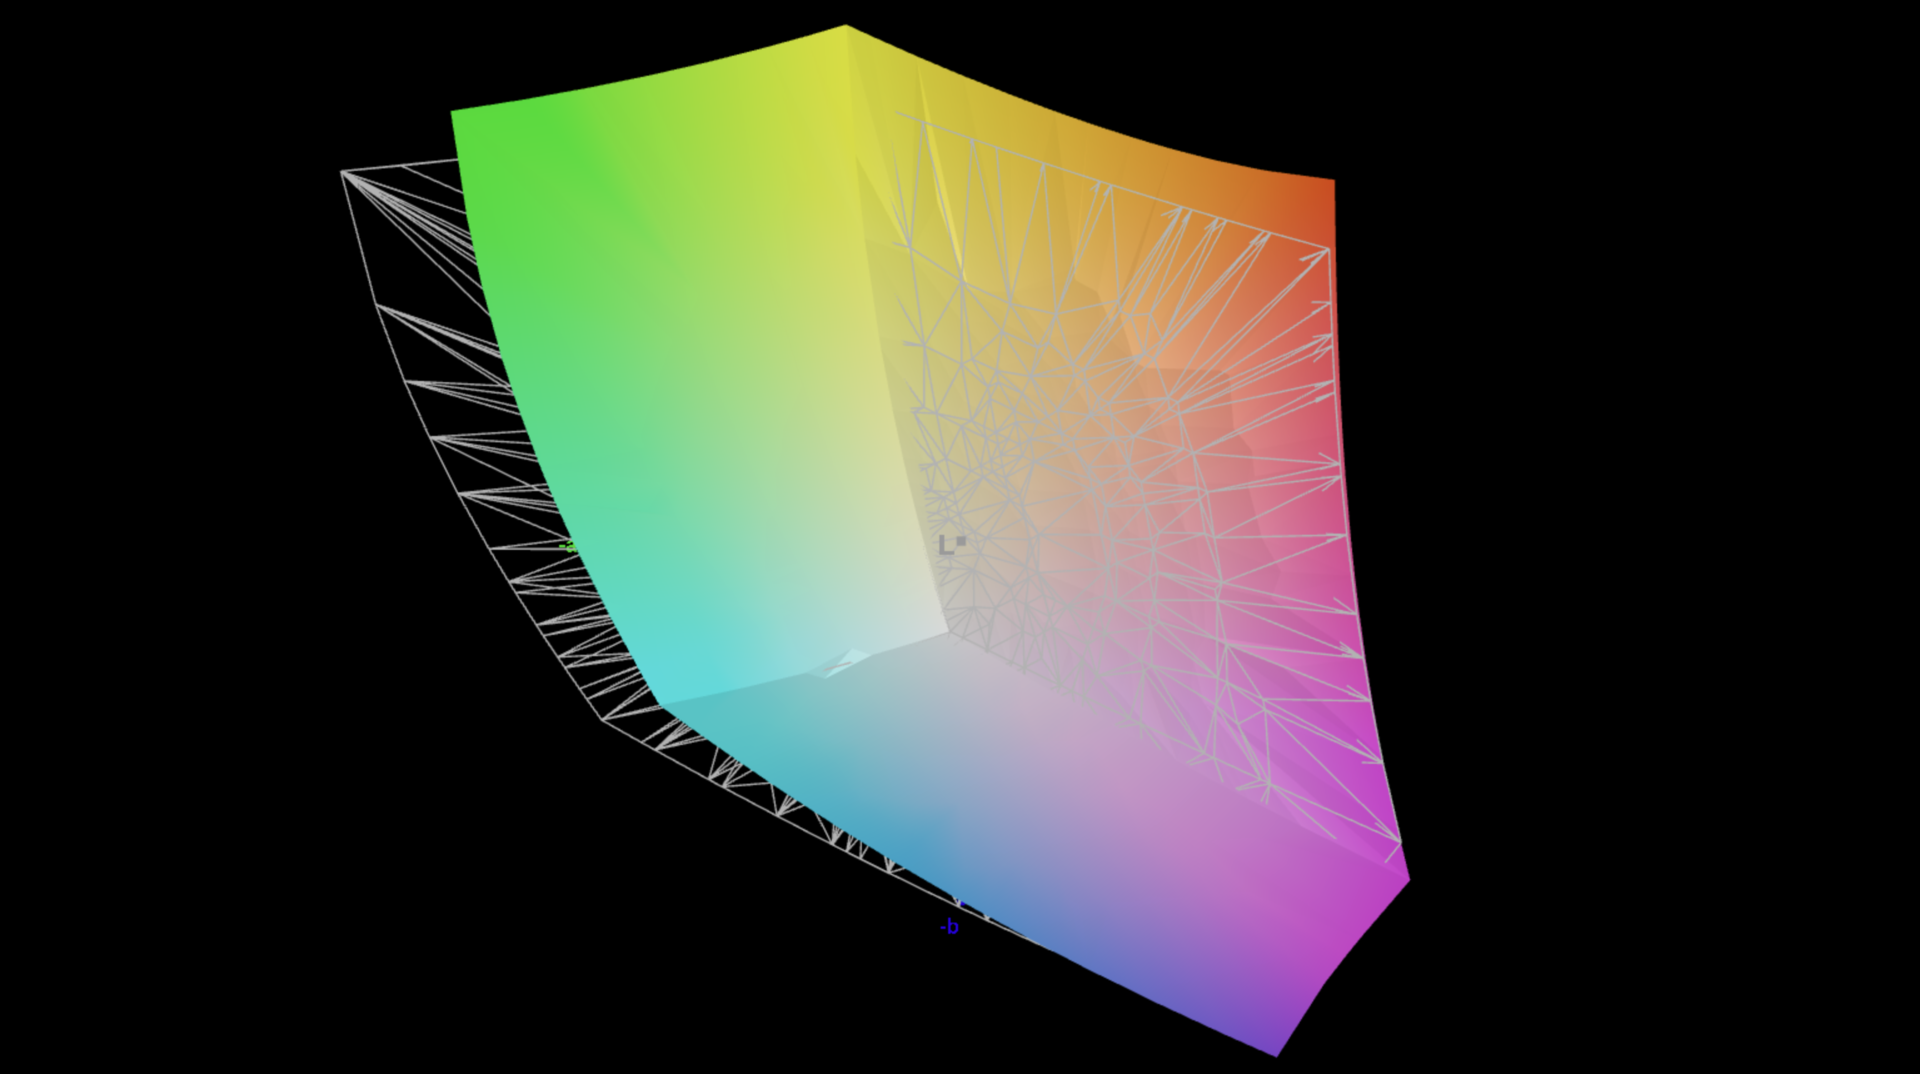
Nuestro dispositivo de análisis Legion 7 16 está equipado con una pantalla IPS de alta resolución y relación de aspecto 16:10 (3.200 x 2.000 píxeles). La calidad de imagen subjetiva es buena, con contenidos que aparecen muy nítidos gracias a la alta resolución de la pantalla. Asimismo, los colores también son vibrantes, pero los paneles OLED actuales ofrecen imágenes más vivas. Cuando se trata de contenidos más brillantes, las superficies aparecen ligeramente granuladas, sin embargo, Lenovo consigue evitar ese problema en la mayoría de los casos utilizando el modo oscuro de Windows de serie. Los movimientos son muy suaves gracias a la frecuencia de actualización de 165 Hz y los tiempos de respuesta son rápidos. No se utiliza el parpadeo PWM.
El brillo medio se sitúa en torno a 400 cd/m², pero, con 0,43 cd/m², el valor de negro es bastante alto y explica por qué la relación de contraste máxima apenas llega a 1.000:1. Además, a pleno brillo y con contenidos oscuros, hay sangrado de luz visible.
| |||||||||||||||||||||||||
iluminación: 89 %
Brillo con batería: 412 cd/m²
Contraste: 958:1 (Negro: 0.43 cd/m²)
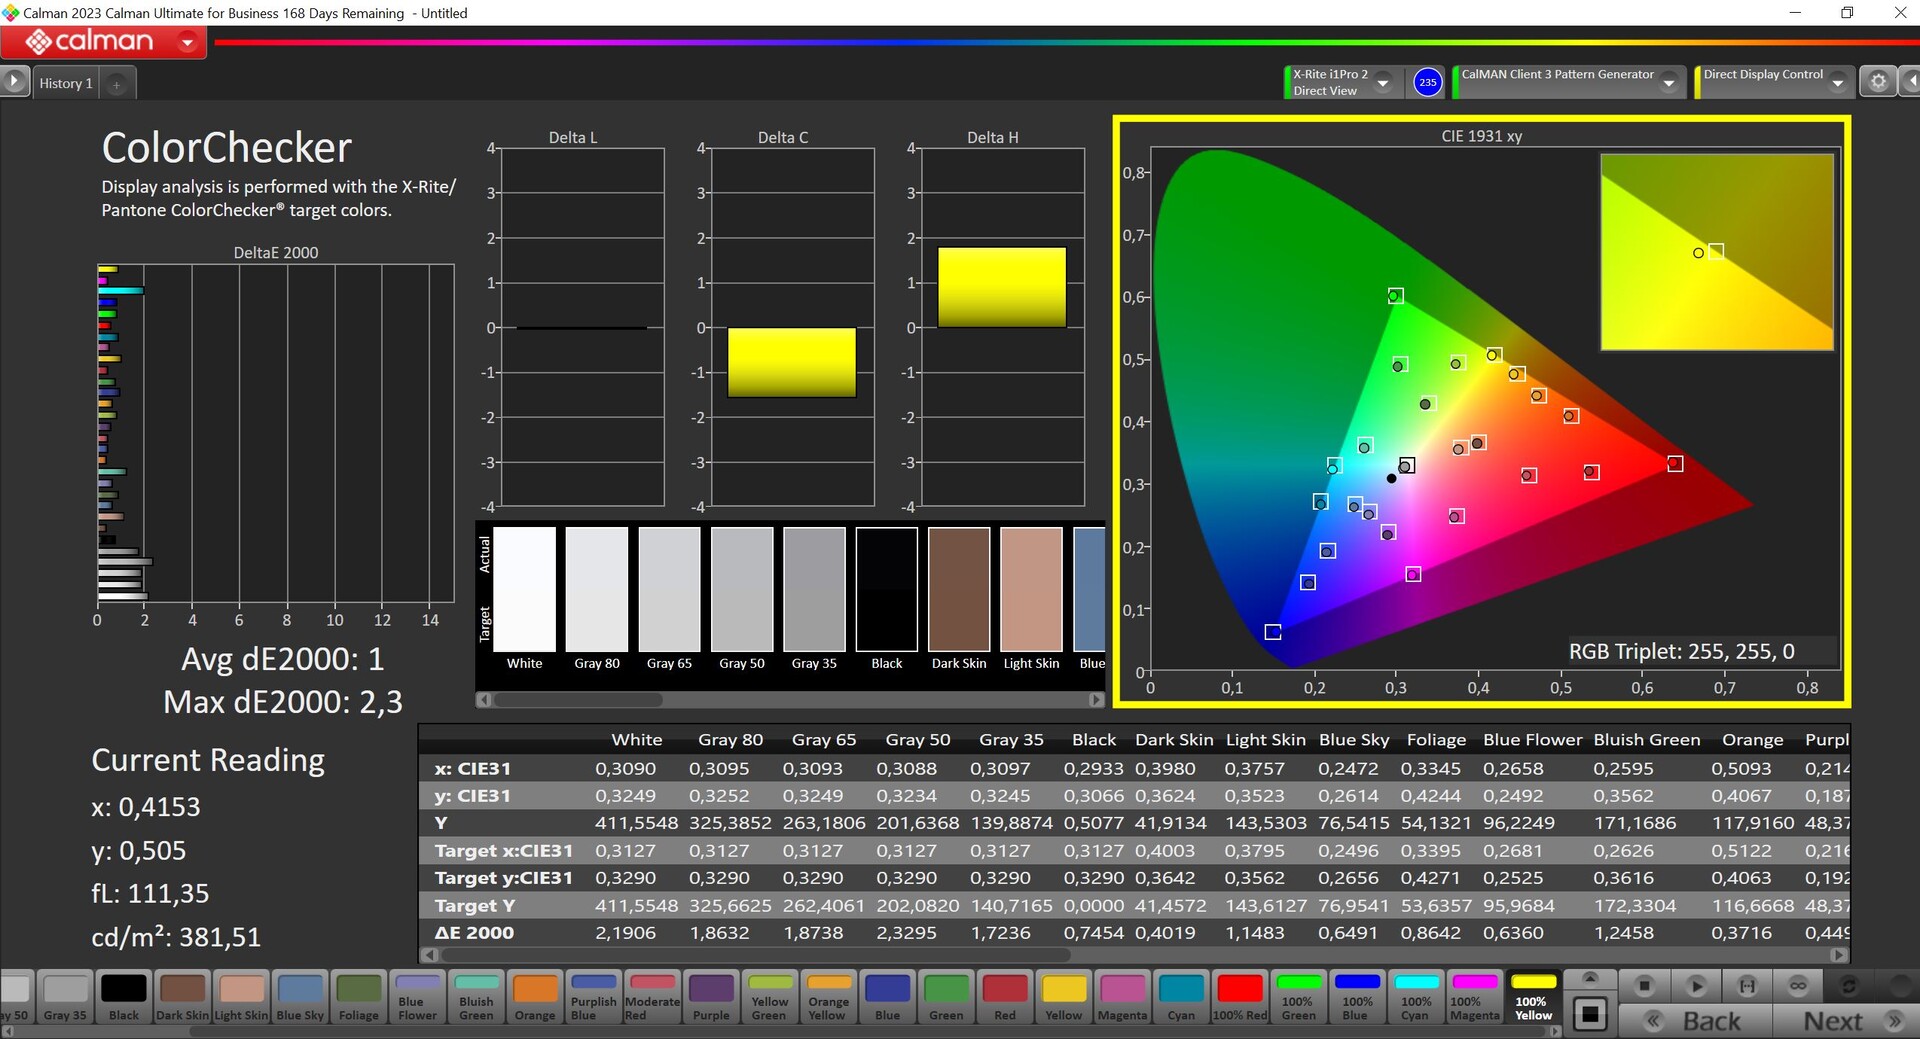
ΔE ColorChecker Calman: 0.9 | ∀{0.5-29.43 Ø4.71}
calibrated: 0.6
ΔE Greyscale Calman: 1.4 | ∀{0.09-98 Ø4.96}
87.2% AdobeRGB 1998 (Argyll 3D)
100% sRGB (Argyll 3D)
95% Display P3 (Argyll 3D)
Gamma: 2.23
CCT: 6731 K
| Lenovo Legion 7 16 IRX G9 MNG007ZA1-2, IPS, 3200x2000, 16" | Lenovo Legion Pro 7 16IRX9H BOE CQ NE16QDM-NZB, IPS, 2560x1600, 16" | Lenovo Legion Pro 5 16IRX9 BOE NE160QDM-NYC, IPS, 2560x1600, 16" | Aorus 16X 2024 BOE CQ NE160QDM-NY1, IPS, 2560x1600, 16" | HP Omen Transcend 16-u1095ng ATNA60DL02-0 (SDC41A4), OLED, 2560x1600, 16" | Alienware m16 R2 BOE NE16NYH, IPS, 2560x1600, 16" | Schenker XMG CORE 16 (L23) BOE0AF0 (), IPS, 2560x1600, 16" | |
|---|---|---|---|---|---|---|---|
| Display | 1% | -16% | -18% | 5% | -14% | -16% | |
| Display P3 Coverage (%) | 95 | 98.5 4% | 69.3 -27% | 67.2 -29% | 99.8 5% | 71 -25% | 68.3 -28% |
| sRGB Coverage (%) | 100 | 99.9 0% | 99.4 -1% | 96.7 -3% | 100 0% | 100 0% | 98.6 -1% |
| AdobeRGB 1998 Coverage (%) | 87.2 | 86.7 -1% | 70.1 -20% | 69.3 -21% | 97 11% | 71.4 -18% | 69.6 -20% |
| Response Times | 16% | -4% | 37% | 98% | 20% | 8% | |
| Response Time Grey 50% / Grey 80% * (ms) | 14.4 ? | 12.6 ? 12% | 11.9 ? 17% | 7.5 ? 48% | 0.2 ? 99% | 5.7 ? 60% | 13.2 ? 8% |
| Response Time Black / White * (ms) | 7.2 ? | 5.8 ? 19% | 8.9 ? -24% | 5.4 ? 25% | 0.2 ? 97% | 8.7 ? -21% | 6.6 ? 8% |
| PWM Frequency (Hz) | 120 ? | ||||||
| Screen | 3% | -11% | -58% | 133% | -26% | -69% | |
| Brightness middle (cd/m²) | 412 | 487 18% | 384 -7% | 542 32% | 390 -5% | 345.8 -16% | 376 -9% |
| Brightness (cd/m²) | 396 | 460 16% | 366 -8% | 504 27% | 392 -1% | 337 -15% | 358 -10% |
| Brightness Distribution (%) | 89 | 88 -1% | 91 2% | 86 -3% | 98 10% | 87 -2% | 88 -1% |
| Black Level * (cd/m²) | 0.43 | 0.42 2% | 0.35 19% | 0.45 -5% | 0.02 95% | 0.3 30% | 0.33 23% |
| Contrast (:1) | 958 | 1160 21% | 1097 15% | 1204 26% | 19500 1935% | 1153 20% | 1139 19% |
| Colorchecker dE 2000 * | 0.9 | 1.12 -24% | 0.97 -8% | 2.73 -203% | 1.94 -116% | 1.99 -121% | 2.74 -204% |
| Colorchecker dE 2000 max. * | 2 | 2.26 -13% | 3.57 -79% | 5.29 -165% | 4.26 -113% | 3.52 -76% | 6.78 -239% |
| Colorchecker dE 2000 calibrated * | 0.6 | 0.54 10% | 0.77 -28% | 1.32 -120% | 4.21 -602% | 0.62 -3% | 0.88 -47% |
| Greyscale dE 2000 * | 1.4 | 1.4 -0% | 1.5 -7% | 2.9 -107% | 1.5 -7% | 2.1 -50% | 3.57 -155% |
| Gamma | 2.23 99% | 2.242 98% | 2.24 98% | 2.192 100% | 2.221 99% | 2.32 95% | 2.4 92% |
| CCT | 6731 97% | 6809 95% | 6709 97% | 6173 105% | 6395 102% | 6369 102% | 7246 90% |
| Media total (Programa/Opciones) | 7% /
5% | -10% /
-11% | -13% /
-36% | 79% /
101% | -7% /
-17% | -26% /
-47% |
* ... más pequeño es mejor


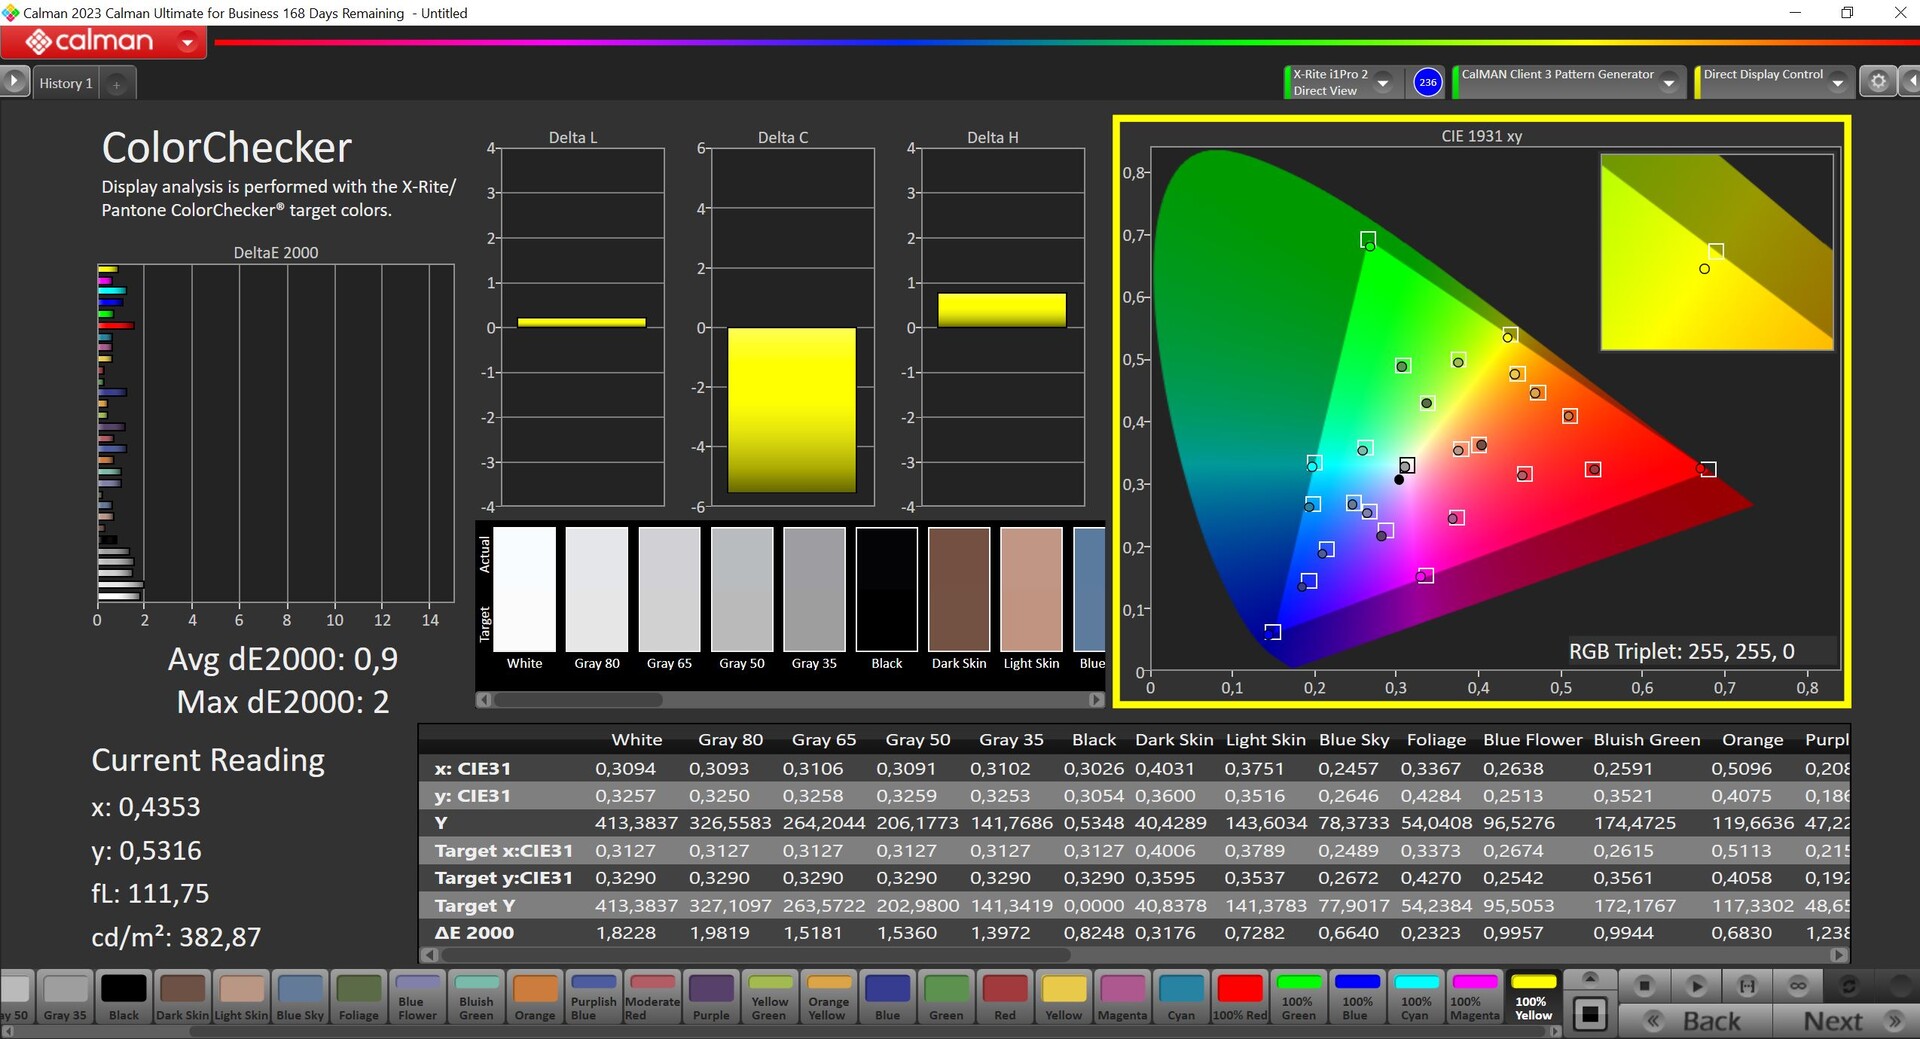
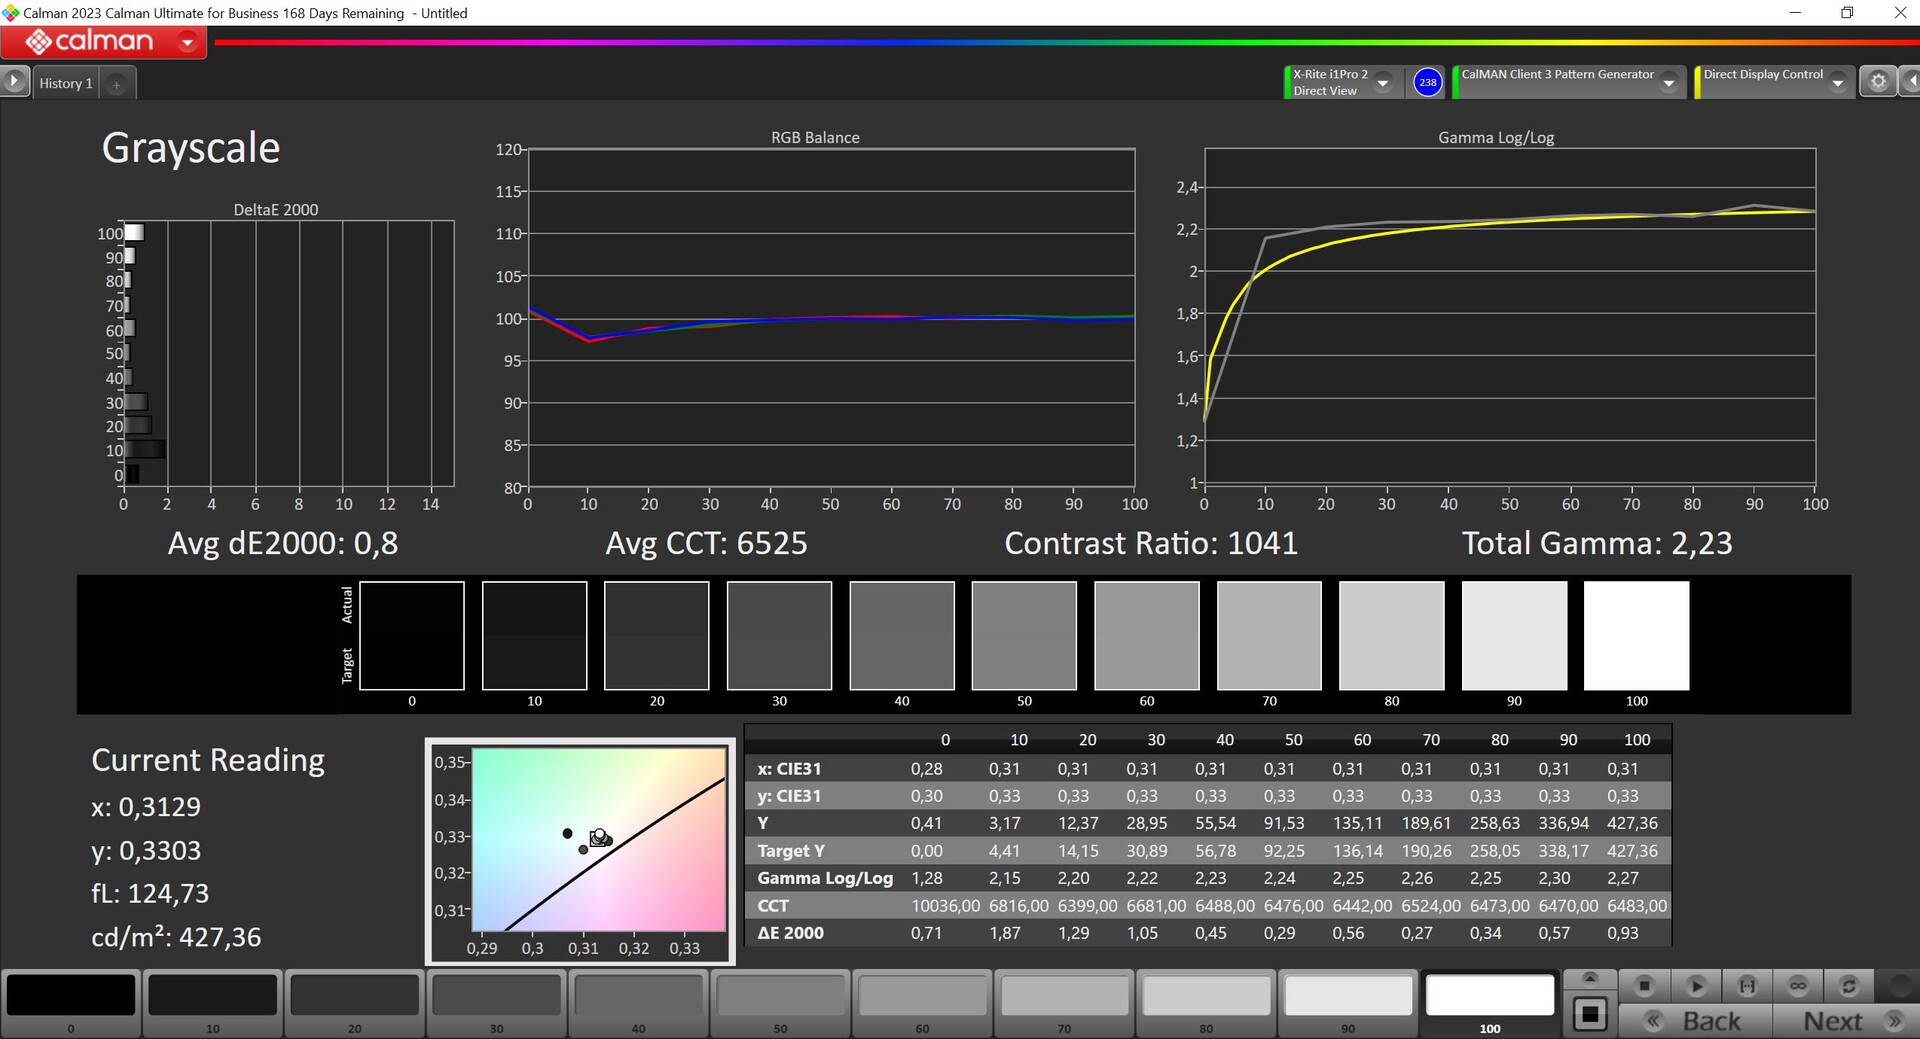
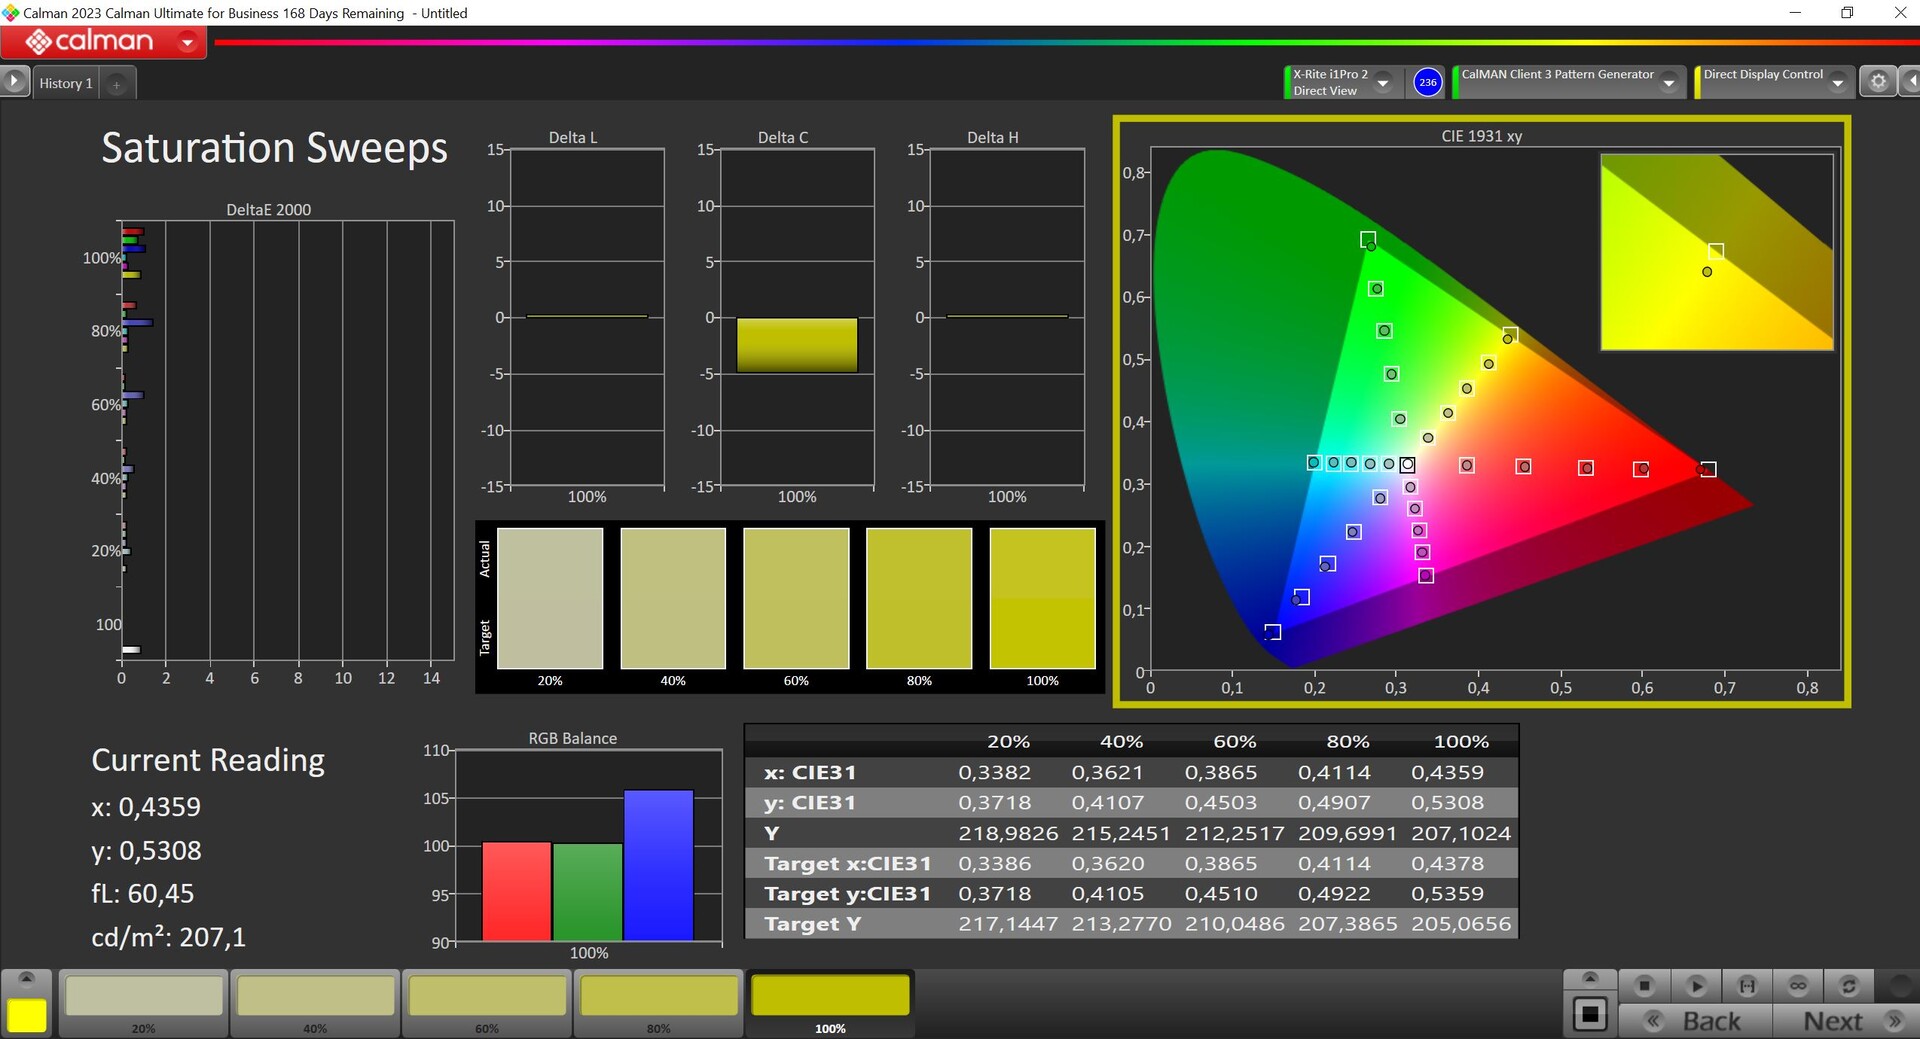
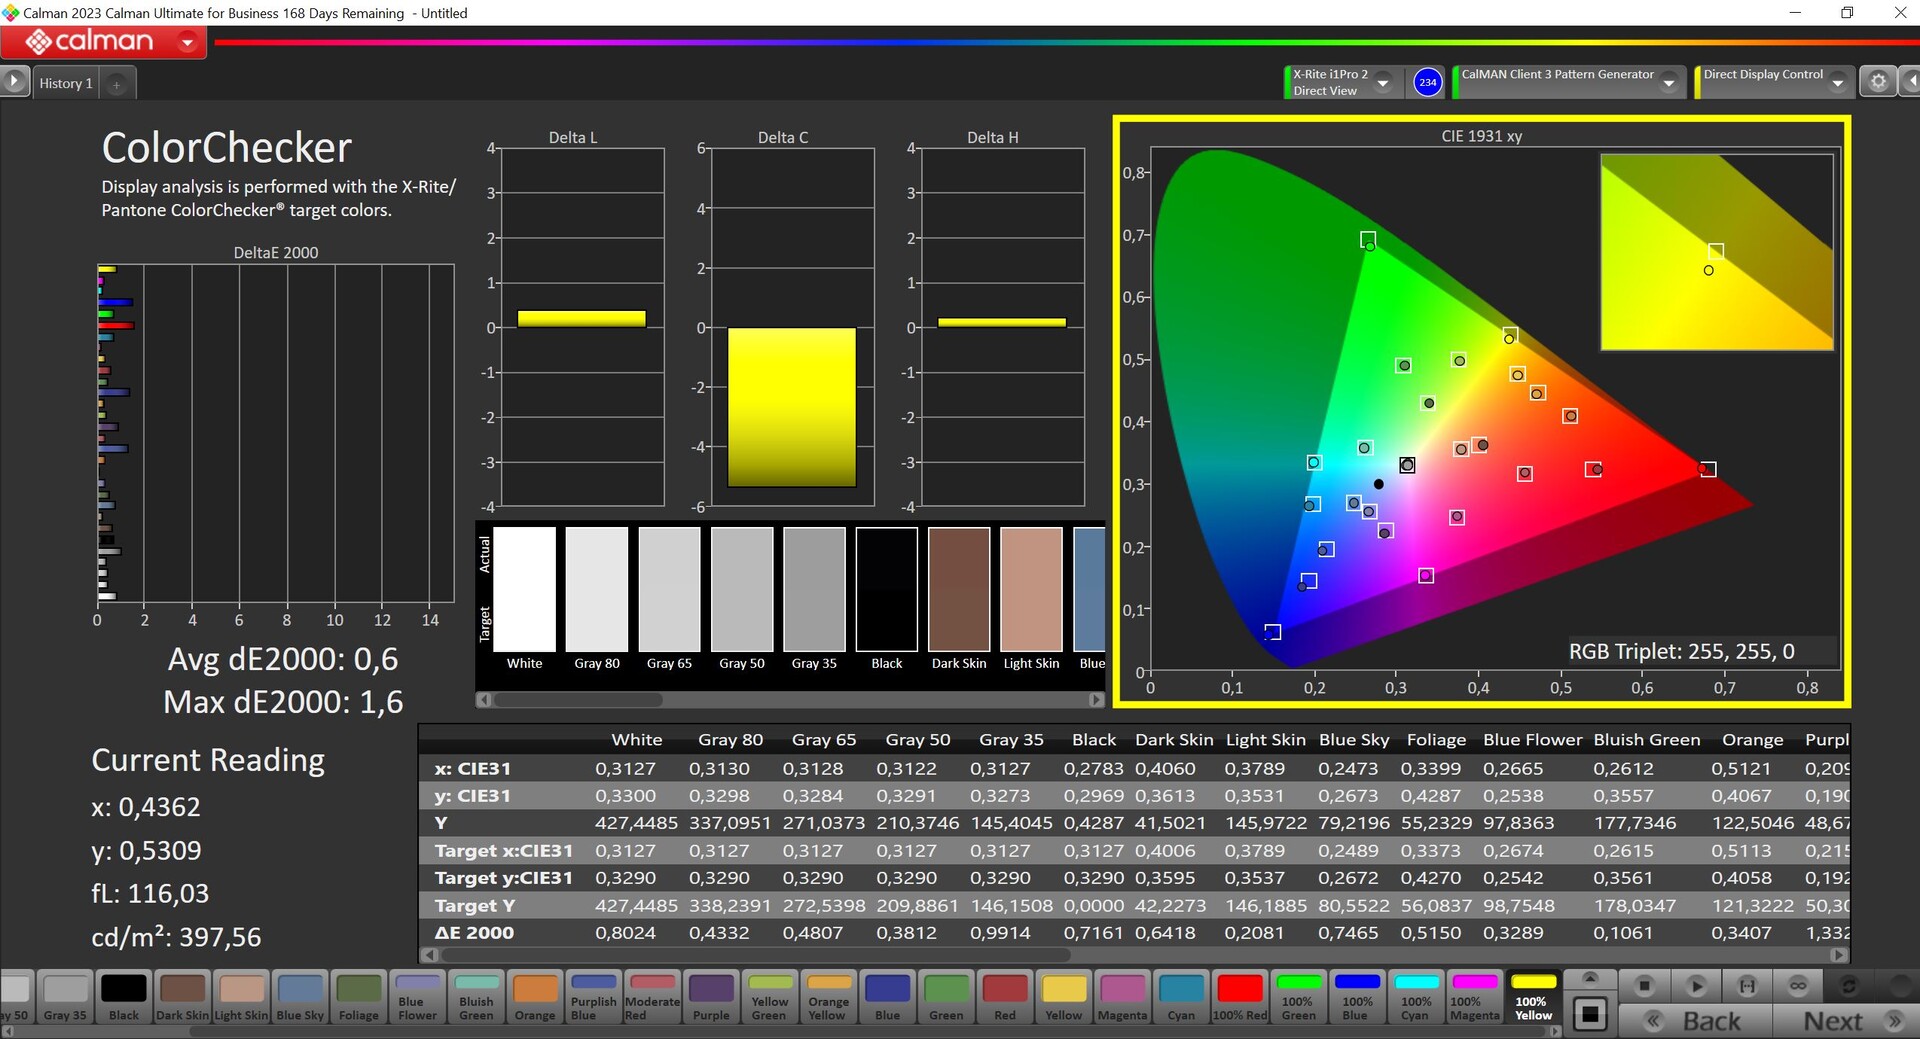
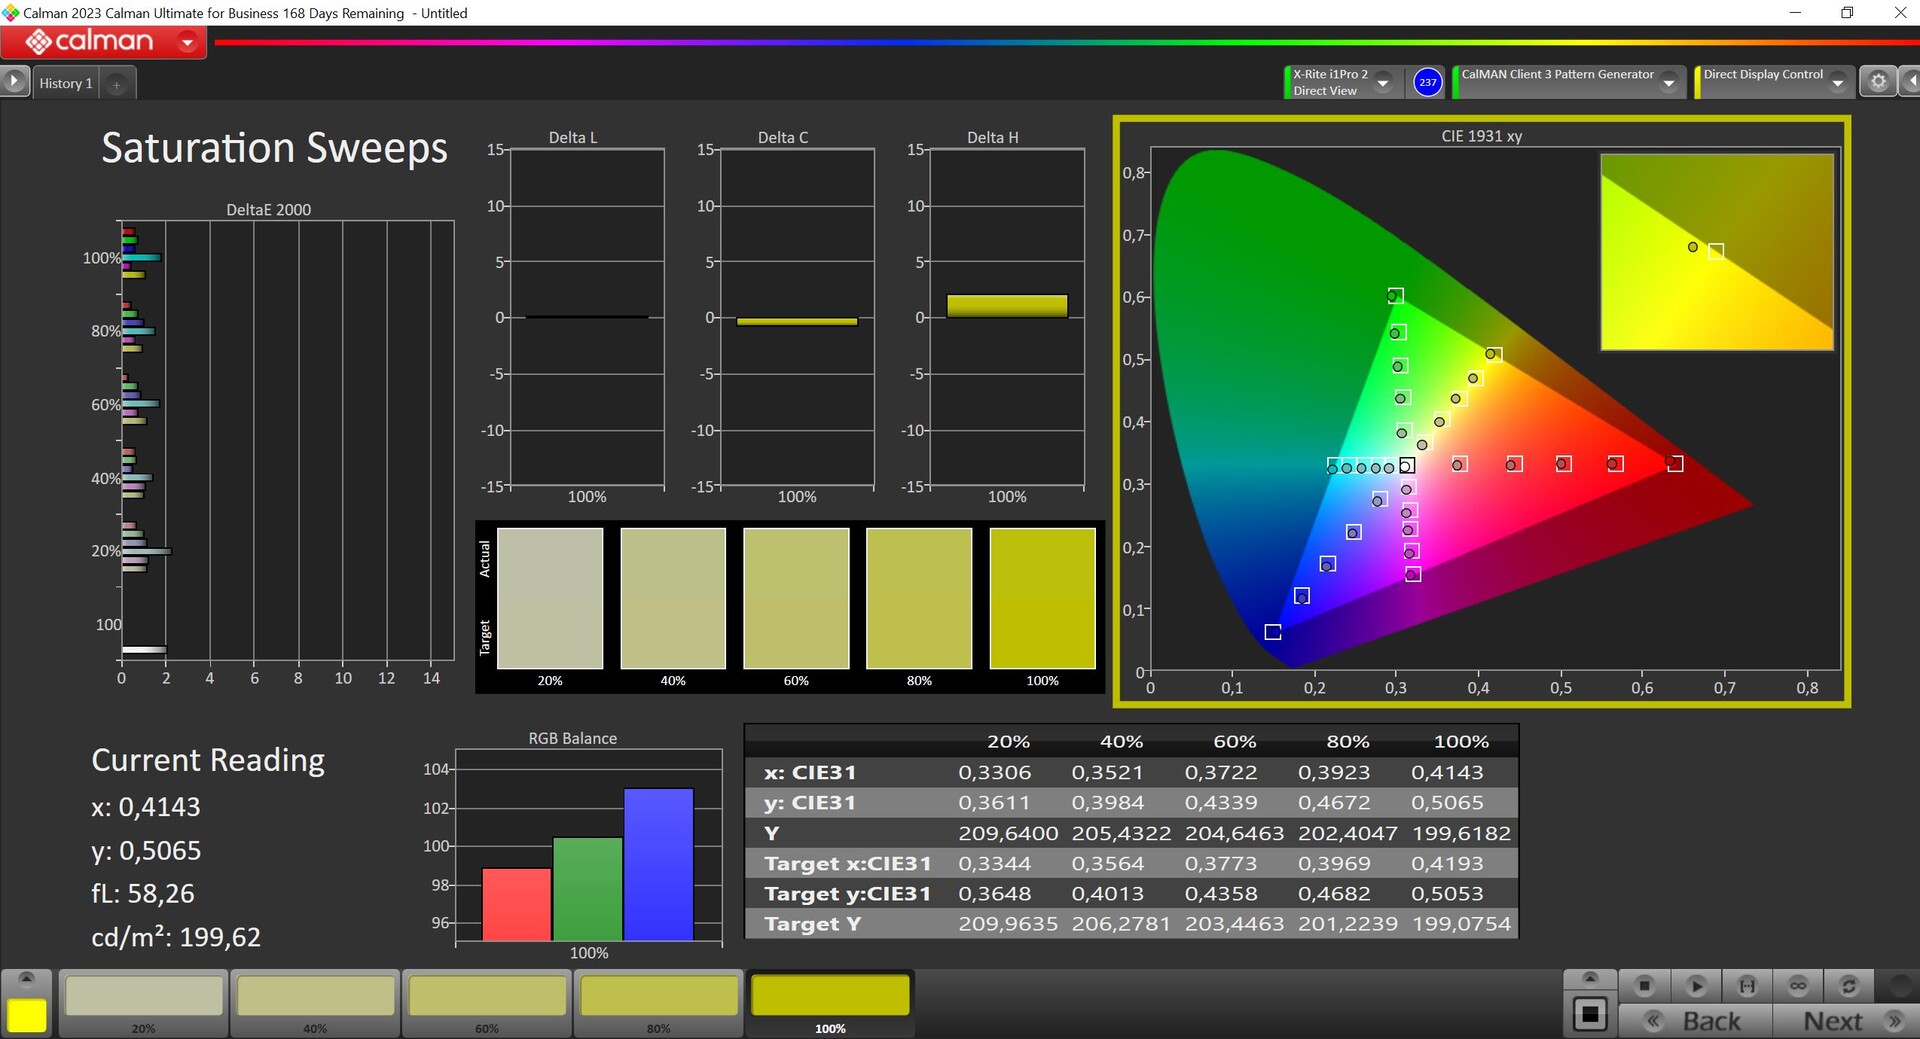
Analizamos el panel utilizando el software profesional CalMAN (X-Rite i1 Pro 2). Lenovo ofrece varios perfiles y, fuera de la caja, el perfil predeterminado ofrece imágenes precisas. Opcionalmente, también hay un perfil nativo con un brillo máximo más alto (~455 cd/m²) pero también una temperatura de color demasiado cálida y con mayores desviaciones de color. Con nuestra calibración, pudimos mejorar aún más las imágenes y más arriba encontrará una descarga gratuita del perfil correspondiente. Asimismo, Lenovo ofrece un modo sRGB muy preciso que resulta especialmente importante para la edición de imágenes. El espacio de color sRGB está cubierto por completo; P3 al 95 %.
Tiempos de respuesta del display
| ↔ Tiempo de respuesta de Negro a Blanco | ||
|---|---|---|
| 7.2 ms ... subida ↗ y bajada ↘ combinada | ↗ 2.9 ms subida | 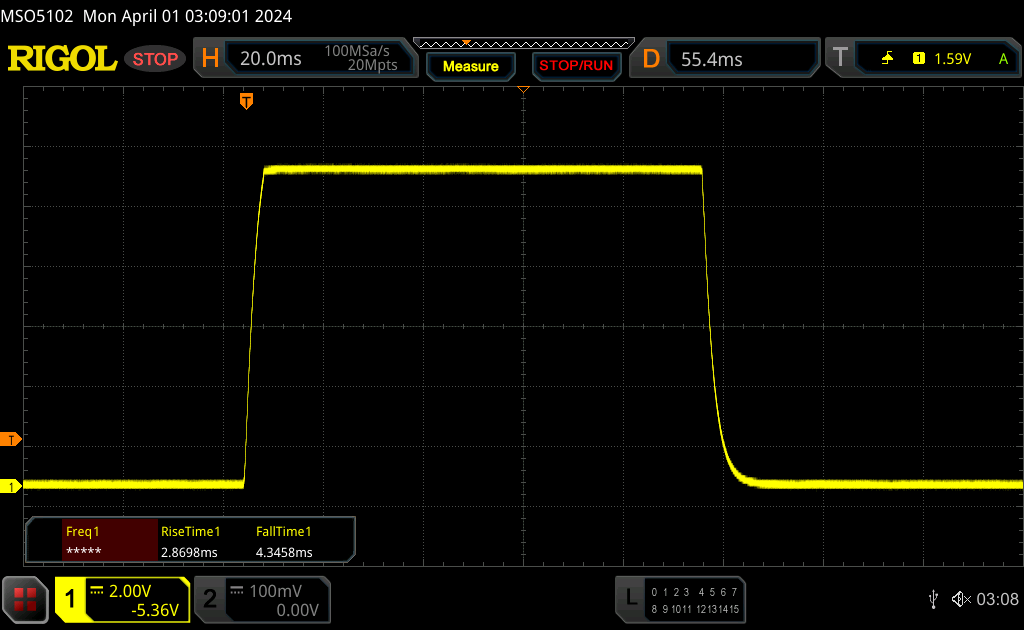 |
| ↘ 4.3 ms bajada | ||
| La pantalla mostró tiempos de respuesta muy rápidos en nuestros tests y debería ser adecuada para juegos frenéticos. En comparación, todos los dispositivos de prueba van de ##min### (mínimo) a 240 (máximo) ms. » 21 % de todos los dispositivos son mejores. Esto quiere decir que el tiempo de respuesta medido es mejor que la media (19.8 ms) de todos los dispositivos testados. | ||
| ↔ Tiempo de respuesta 50% Gris a 80% Gris | ||
| 14.4 ms ... subida ↗ y bajada ↘ combinada | ↗ 6.9 ms subida | 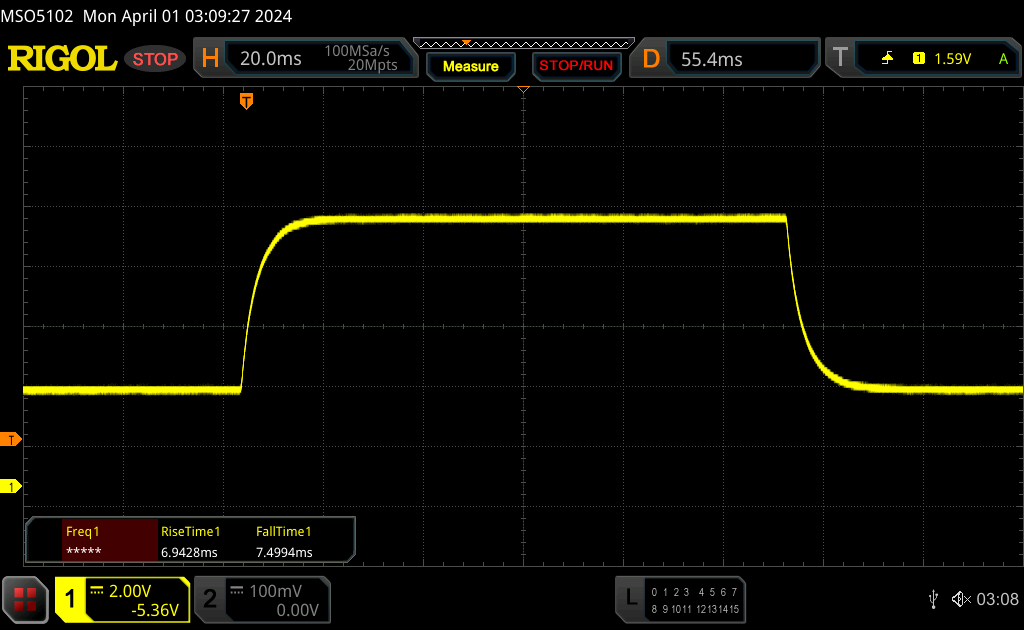 |
| ↘ 7.5 ms bajada | ||
| La pantalla mostró buenos tiempos de respuesta en nuestros tests pero podría ser demasiado lenta para los jugones competitivos. En comparación, todos los dispositivos de prueba van de ##min### (mínimo) a 636 (máximo) ms. » 28 % de todos los dispositivos son mejores. Esto quiere decir que el tiempo de respuesta medido es mejor que la media (31 ms) de todos los dispositivos testados. | ||
Parpadeo de Pantalla / PWM (Pulse-Width Modulation)
| Parpadeo de Pantalla / PWM no detectado |  | ||
Comparación: 52 % de todos los dispositivos testados no usaron PWM para atenuar el display. Si se usó, medimos una media de 7757 (mínimo: 5 - máxmo: 343500) Hz. | |||


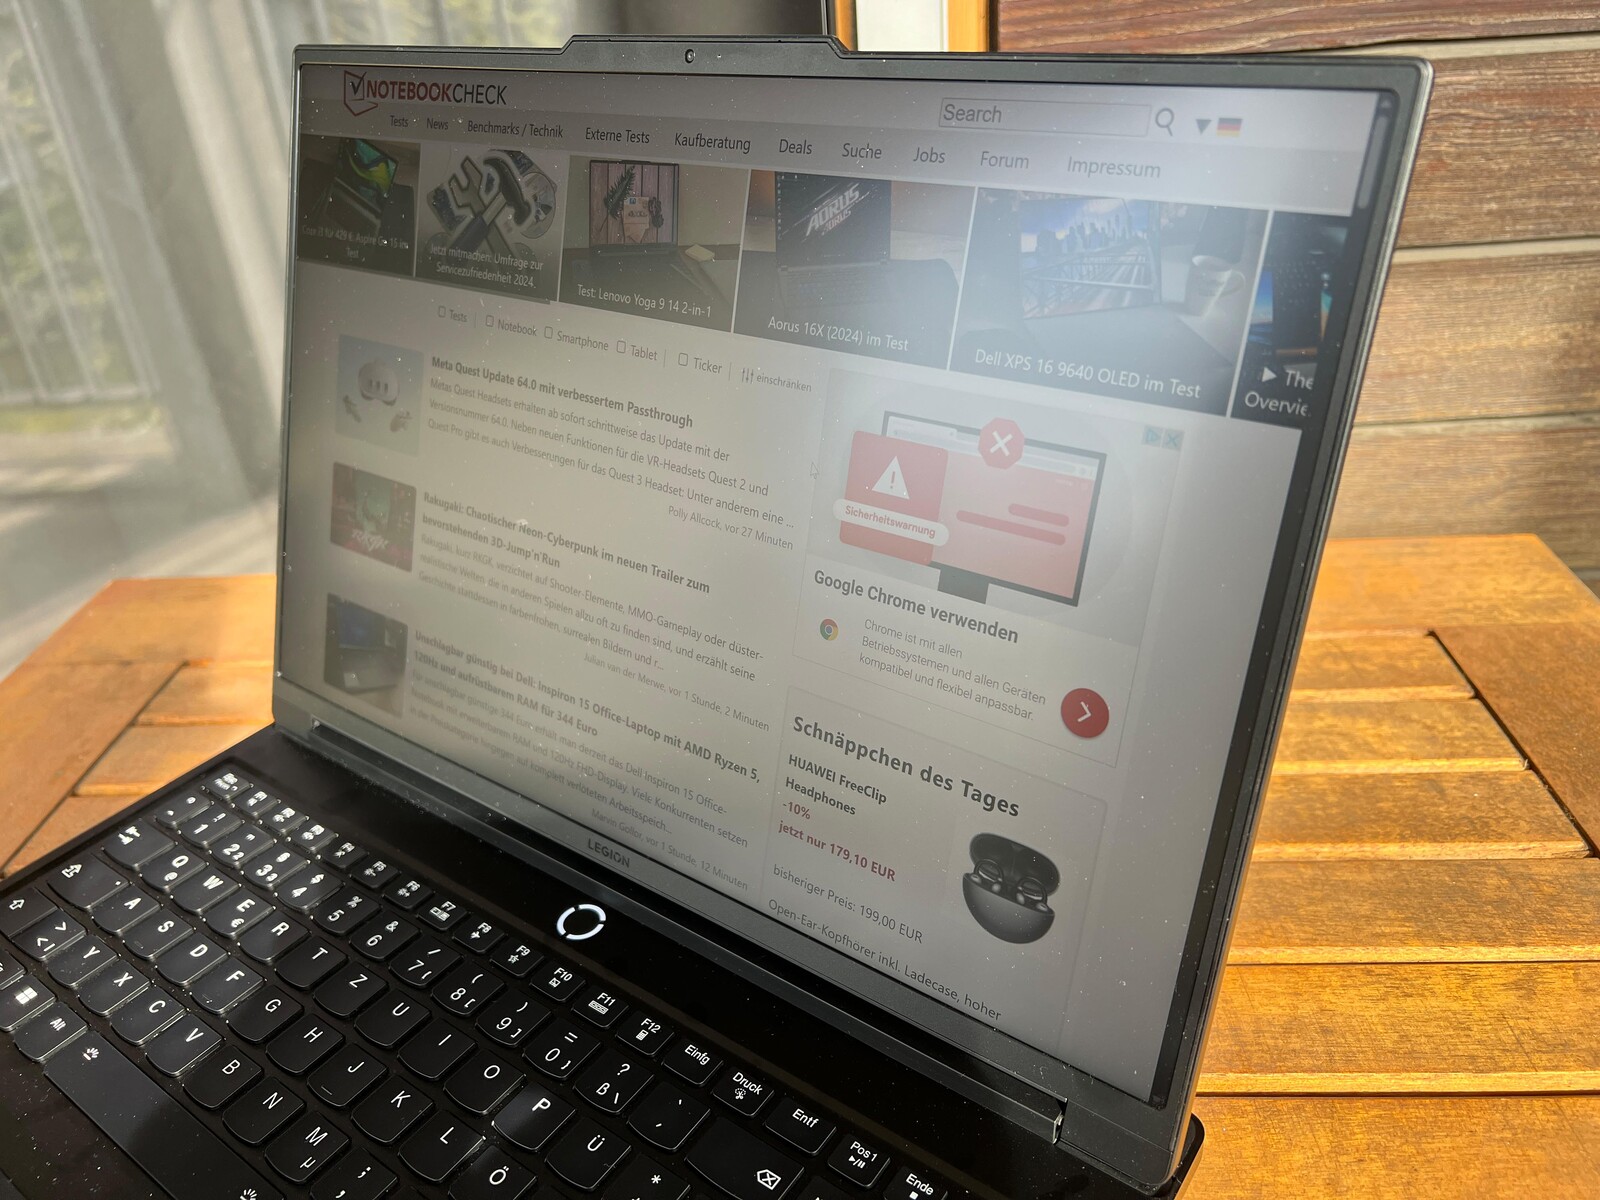
Gracias a la pantalla mate, el panel también puede utilizarse en exteriores pero, en días luminosos, el brillo podría ser aún mayor. La estabilidad del ángulo de visión del panel IPS es muy buena.

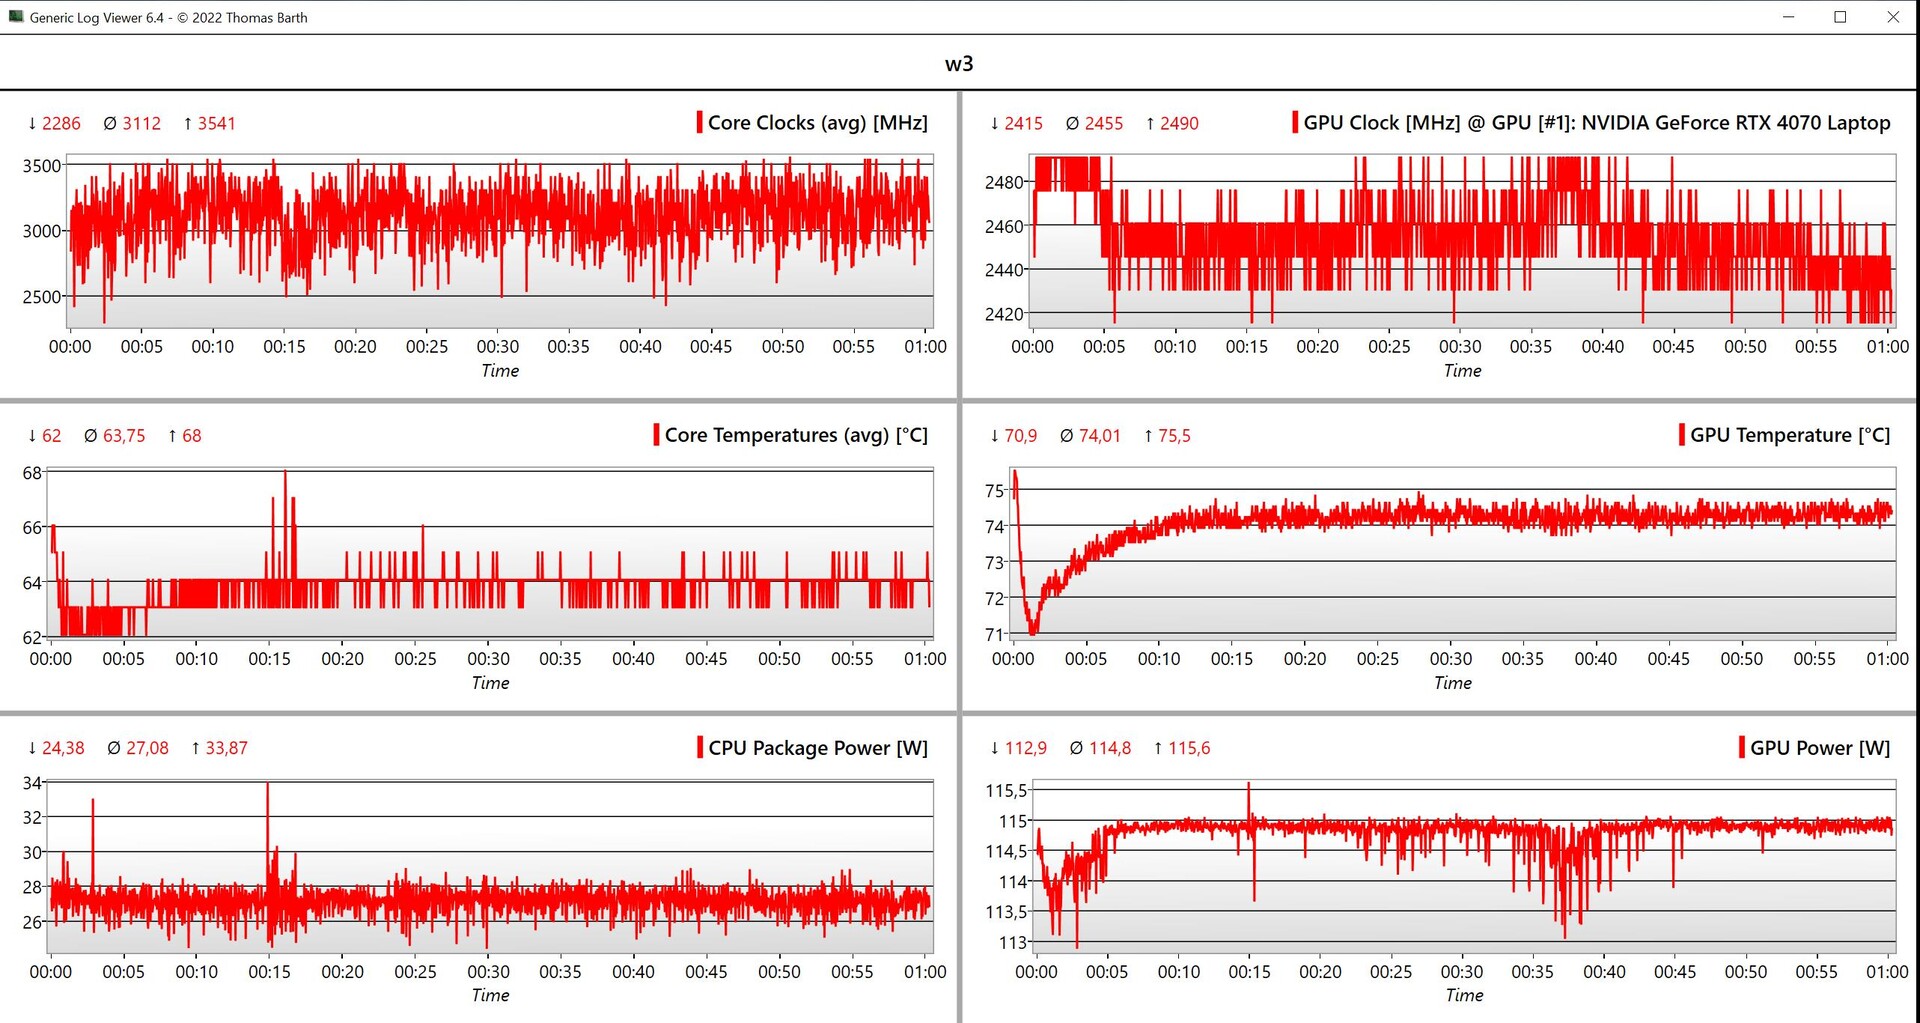
Rendimiento - Raptor Lake HX y un portátil RTX 4070 overclockeado
Condiciones de la prueba
Como es habitual, Lenovo ofrece varios perfiles de energía y hemos recopilado una lista resumida de los datos de rendimiento correspondientes en la siguiente tabla. El perfil actual también se muestra a través del LED del botón de encendido. Llevamos a cabo los puntos de referencia y las mediciones en el modo de rendimiento en el que la GPU se overclockea ligeramente de forma automática (+100 MHz núcleo, +200 MHz VRAM). El modo de rendimiento no está disponible en el modo de batería.
| Perfil energético | Carga de la CPU | CB R23 Multi | Carga de la GPU | Time Spy Gráficos | Cyberpunk 2077 QHD Ultra |
volumen faan máximo |
|---|---|---|---|---|---|---|
| Modo silencioso | 65 -> 54 vatios | 20.203 puntos | 65 vatios | 8.239 puntos | 35 FPS | 38,4 dB(A) |
| Equilibrado | 120 -> 85 vatios | 24.142 puntos | 95 vatios | 9.853 puntos | 41,5 FPS | 50,7 dB(A) |
| Modo rendimiento | 154 -> 90 vatios | 31.127 puntos | 115 vatios | 12.174 puntos | 51,4 FPS | 54,1 dB(A) |
Nota: Intentamos sin éxito actualizar los controladores Nvidia. El controlador oficial finalizó la instalación con un problema de compatibilidad. Hasta ahora, la propia Lenovo sólo ha puesto a disposición el controlador 537.70 preinstalado y éste es el que utilizamos inevitablemente.
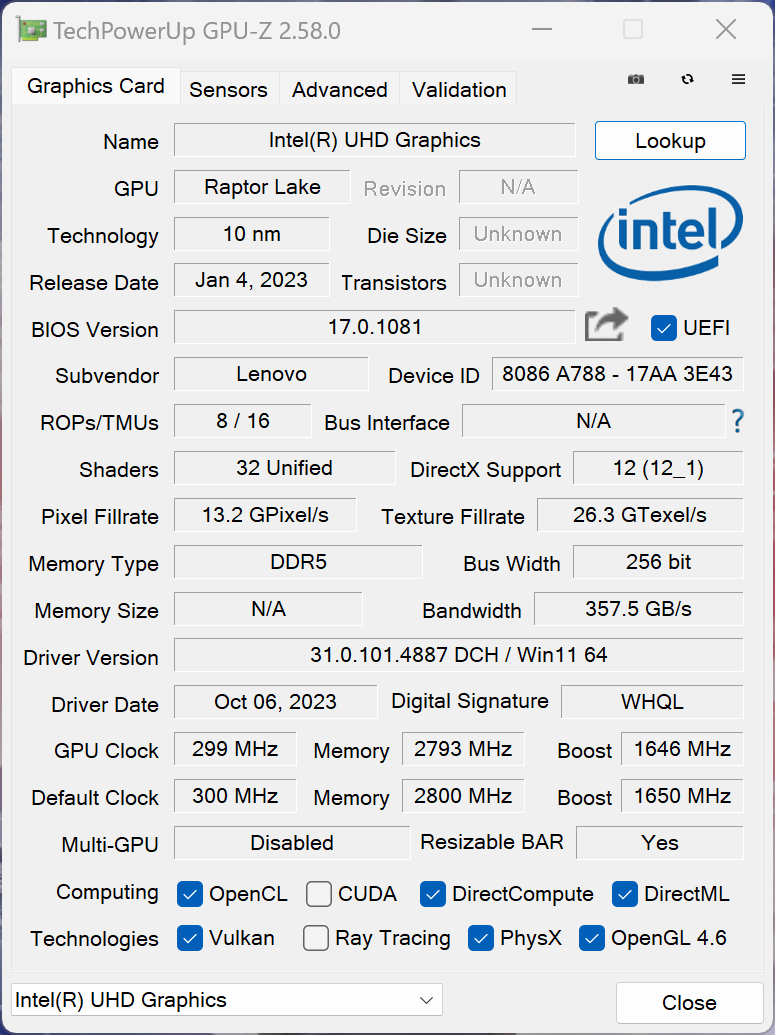
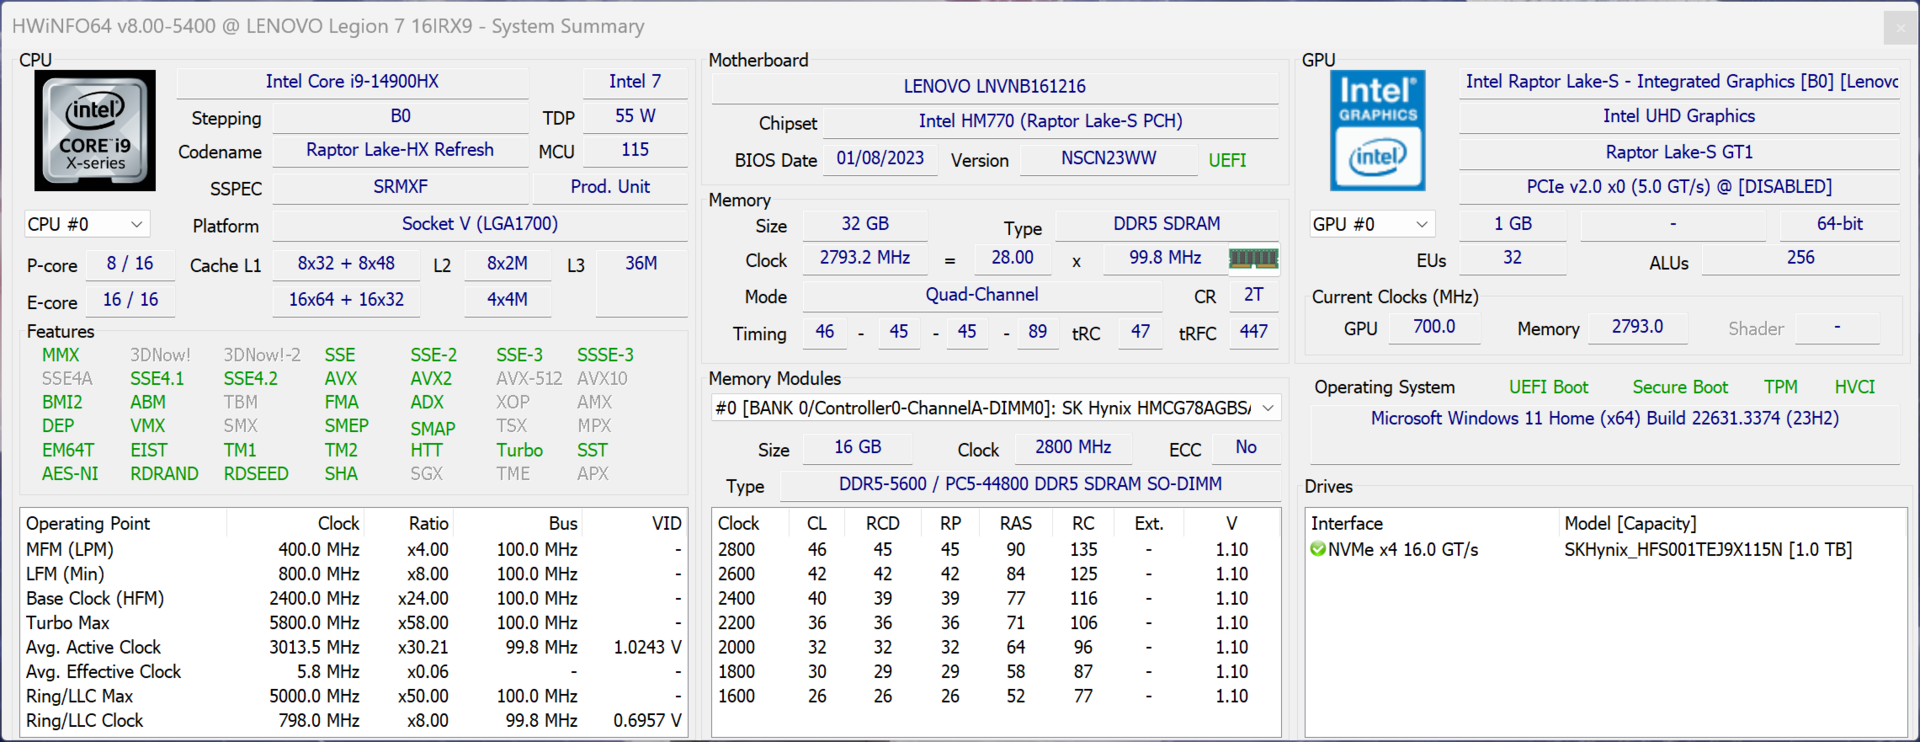
Procesador - Core i9-14900HX
Lenovo también ha equipado la Legion 7 16 normal con el Core i9-14900HXel procesador móvil Raptor Lake más rápido que también se puede encontrar en el más caro Legion Pro 7. En comparación con los dos modelos Legion Pro 7/5 16 más gruesos, la carcasa más delgada tiene un impacto cuando se trata de los límites de potencia, bajando a 90 vatios después de haber alcanzado brevemente los 154 vatios. En general, el rendimiento fue maravilloso tanto en las pruebas multinúcleo como en las de un solo núcleo. En modo batería, el procesador puede consumir un máximo de 60 vatios, por lo que el rendimiento multinúcleo es aquí un 40 % inferior. Puede encontrar más pruebas de rendimiento de la CPU en nuestra sección de tecnología.
Cinebench R15 Multi Continuous Test
Cinebench R23: Multi Core | Single Core
Cinebench R20: CPU (Multi Core) | CPU (Single Core)
Cinebench R15: CPU Multi 64Bit | CPU Single 64Bit
Blender: v2.79 BMW27 CPU
7-Zip 18.03: 7z b 4 | 7z b 4 -mmt1
Geekbench 6.7: Multi-Core | Single-Core
Geekbench 5.5: Multi-Core | Single-Core
HWBOT x265 Benchmark v2.2: 4k Preset
LibreOffice : 20 Documents To PDF
R Benchmark 2.5: Overall mean
| CPU Performance rating | |
| Lenovo Legion Pro 7 16IRX9H | |
| Lenovo Legion 7 16 IRX G9 | |
| Lenovo Legion Pro 5 16IRX9 | |
| Aorus 16X 2024 | |
| Medio Intel Core i9-14900HX | |
| Media de la clase Gaming | |
| HP Omen Transcend 16-u1095ng | |
| Alienware m16 R2 -1! | |
| Schenker XMG CORE 16 (L23) | |
| Cinebench R23 / Multi Core | |
| Lenovo Legion Pro 7 16IRX9H | |
| Lenovo Legion 7 16 IRX G9 | |
| Lenovo Legion Pro 5 16IRX9 | |
| Medio Intel Core i9-14900HX (17078 - 36249, n=37) | |
| Aorus 16X 2024 | |
| Media de la clase Gaming (10488 - 42661, n=107, últimos 2 años) | |
| HP Omen Transcend 16-u1095ng | |
| Alienware m16 R2 | |
| Schenker XMG CORE 16 (L23) | |
| Cinebench R23 / Single Core | |
| Lenovo Legion Pro 7 16IRX9H | |
| Lenovo Legion 7 16 IRX G9 | |
| Aorus 16X 2024 | |
| HP Omen Transcend 16-u1095ng | |
| Medio Intel Core i9-14900HX (1720 - 2245, n=37) | |
| Lenovo Legion Pro 5 16IRX9 | |
| Media de la clase Gaming (1166 - 2415, n=107, últimos 2 años) | |
| Schenker XMG CORE 16 (L23) | |
| Alienware m16 R2 | |
| Cinebench R20 / CPU (Multi Core) | |
| Lenovo Legion Pro 7 16IRX9H | |
| Lenovo Legion 7 16 IRX G9 | |
| Lenovo Legion Pro 5 16IRX9 | |
| Medio Intel Core i9-14900HX (6579 - 13832, n=37) | |
| Aorus 16X 2024 | |
| Media de la clase Gaming (4029 - 16433, n=106, últimos 2 años) | |
| HP Omen Transcend 16-u1095ng | |
| Alienware m16 R2 | |
| Schenker XMG CORE 16 (L23) | |
| Cinebench R20 / CPU (Single Core) | |
| Lenovo Legion 7 16 IRX G9 | |
| Aorus 16X 2024 | |
| HP Omen Transcend 16-u1095ng | |
| Lenovo Legion Pro 7 16IRX9H | |
| Medio Intel Core i9-14900HX (657 - 859, n=37) | |
| Lenovo Legion Pro 5 16IRX9 | |
| Media de la clase Gaming (442 - 913, n=106, últimos 2 años) | |
| Schenker XMG CORE 16 (L23) | |
| Alienware m16 R2 | |
| Cinebench R15 / CPU Multi 64Bit | |
| Lenovo Legion Pro 7 16IRX9H | |
| Lenovo Legion 7 16 IRX G9 | |
| Lenovo Legion Pro 5 16IRX9 | |
| Medio Intel Core i9-14900HX (3263 - 5589, n=38) | |
| Aorus 16X 2024 | |
| Media de la clase Gaming (1578 - 6330, n=105, últimos 2 años) | |
| HP Omen Transcend 16-u1095ng | |
| Alienware m16 R2 | |
| Schenker XMG CORE 16 (L23) | |
| Cinebench R15 / CPU Single 64Bit | |
| Lenovo Legion Pro 7 16IRX9H | |
| Aorus 16X 2024 | |
| Lenovo Legion 7 16 IRX G9 | |
| Medio Intel Core i9-14900HX (247 - 323, n=37) | |
| Lenovo Legion Pro 5 16IRX9 | |
| HP Omen Transcend 16-u1095ng | |
| Media de la clase Gaming (188.8 - 350, n=106, últimos 2 años) | |
| Schenker XMG CORE 16 (L23) | |
| Alienware m16 R2 | |
| Blender / v2.79 BMW27 CPU | |
| Schenker XMG CORE 16 (L23) | |
| HP Omen Transcend 16-u1095ng | |
| Media de la clase Gaming (79 - 330, n=104, últimos 2 años) | |
| Aorus 16X 2024 | |
| Lenovo Legion 7 16 IRX G9 | |
| Medio Intel Core i9-14900HX (91 - 206, n=37) | |
| Lenovo Legion Pro 5 16IRX9 | |
| Lenovo Legion Pro 7 16IRX9H | |
| 7-Zip 18.03 / 7z b 4 | |
| Lenovo Legion Pro 7 16IRX9H | |
| Lenovo Legion Pro 5 16IRX9 | |
| Medio Intel Core i9-14900HX (66769 - 136645, n=37) | |
| Lenovo Legion 7 16 IRX G9 | |
| Aorus 16X 2024 | |
| Media de la clase Gaming (33491 - 148086, n=105, últimos 2 años) | |
| HP Omen Transcend 16-u1095ng | |
| Schenker XMG CORE 16 (L23) | |
| Alienware m16 R2 | |
| 7-Zip 18.03 / 7z b 4 -mmt1 | |
| Lenovo Legion Pro 7 16IRX9H | |
| Aorus 16X 2024 | |
| Lenovo Legion 7 16 IRX G9 | |
| HP Omen Transcend 16-u1095ng | |
| Medio Intel Core i9-14900HX (5452 - 7545, n=37) | |
| Lenovo Legion Pro 5 16IRX9 | |
| Schenker XMG CORE 16 (L23) | |
| Media de la clase Gaming (4199 - 7436, n=105, últimos 2 años) | |
| Alienware m16 R2 | |
| Geekbench 6.7 / Multi-Core | |
| Lenovo Legion Pro 7 16IRX9H | |
| Lenovo Legion Pro 5 16IRX9 | |
| Lenovo Legion 7 16 IRX G9 | |
| Aorus 16X 2024 | |
| Medio Intel Core i9-14900HX (13158 - 19665, n=37) | |
| HP Omen Transcend 16-u1095ng | |
| Media de la clase Gaming (6625 - 22850, n=106, últimos 2 años) | |
| Schenker XMG CORE 16 (L23) | |
| Alienware m16 R2 | |
| Geekbench 6.7 / Single-Core | |
| Aorus 16X 2024 | |
| Lenovo Legion Pro 7 16IRX9H | |
| Lenovo Legion 7 16 IRX G9 | |
| Medio Intel Core i9-14900HX (2419 - 3129, n=37) | |
| Lenovo Legion Pro 5 16IRX9 | |
| Media de la clase Gaming (1490 - 3259, n=106, últimos 2 años) | |
| HP Omen Transcend 16-u1095ng | |
| Schenker XMG CORE 16 (L23) | |
| Alienware m16 R2 | |
| Geekbench 5.5 / Multi-Core | |
| Lenovo Legion Pro 5 16IRX9 | |
| Lenovo Legion Pro 7 16IRX9H | |
| Lenovo Legion 7 16 IRX G9 | |
| Aorus 16X 2024 | |
| Medio Intel Core i9-14900HX (8618 - 23194, n=37) | |
| HP Omen Transcend 16-u1095ng | |
| Media de la clase Gaming (6460 - 28263, n=105, últimos 2 años) | |
| Alienware m16 R2 | |
| Schenker XMG CORE 16 (L23) | |
| Geekbench 5.5 / Single-Core | |
| Aorus 16X 2024 | |
| Lenovo Legion Pro 7 16IRX9H | |
| Lenovo Legion 7 16 IRX G9 | |
| Medio Intel Core i9-14900HX (1669 - 2210, n=37) | |
| Media de la clase Gaming (986 - 2474, n=105, últimos 2 años) | |
| HP Omen Transcend 16-u1095ng | |
| Lenovo Legion Pro 5 16IRX9 | |
| Schenker XMG CORE 16 (L23) | |
| Alienware m16 R2 | |
| HWBOT x265 Benchmark v2.2 / 4k Preset | |
| Lenovo Legion Pro 7 16IRX9H | |
| Lenovo Legion Pro 5 16IRX9 | |
| Medio Intel Core i9-14900HX (16.8 - 38.9, n=37) | |
| Lenovo Legion 7 16 IRX G9 | |
| Media de la clase Gaming (11.5 - 44.4, n=105, últimos 2 años) | |
| Aorus 16X 2024 | |
| HP Omen Transcend 16-u1095ng | |
| Schenker XMG CORE 16 (L23) | |
| Alienware m16 R2 | |
| LibreOffice / 20 Documents To PDF | |
| Schenker XMG CORE 16 (L23) | |
| HP Omen Transcend 16-u1095ng | |
| Alienware m16 R2 | |
| Media de la clase Gaming (33.2 - 88.8, n=105, últimos 2 años) | |
| Lenovo Legion 7 16 IRX G9 | |
| Medio Intel Core i9-14900HX (19 - 85.1, n=37) | |
| Lenovo Legion Pro 5 16IRX9 | |
| Aorus 16X 2024 | |
| Lenovo Legion Pro 7 16IRX9H | |
| R Benchmark 2.5 / Overall mean | |
| Alienware m16 R2 | |
| Schenker XMG CORE 16 (L23) | |
| Media de la clase Gaming (0.3439 - 0.759, n=106, últimos 2 años) | |
| HP Omen Transcend 16-u1095ng | |
| Lenovo Legion 7 16 IRX G9 | |
| Lenovo Legion Pro 5 16IRX9 | |
| Lenovo Legion Pro 7 16IRX9H | |
| Medio Intel Core i9-14900HX (0.3604 - 0.4859, n=37) | |
| Aorus 16X 2024 | |
* ... más pequeño es mejor
AIDA64: FP32 Ray-Trace | FPU Julia | CPU SHA3 | CPU Queen | FPU SinJulia | FPU Mandel | CPU AES | CPU ZLib | FP64 Ray-Trace | CPU PhotoWorxx
| Performance rating | |
| Lenovo Legion Pro 7 16IRX9H | |
| Media de la clase Gaming | |
| Lenovo Legion Pro 5 16IRX9 | |
| Medio Intel Core i9-14900HX | |
| Aorus 16X 2024 | |
| Lenovo Legion 7 16 IRX G9 | |
| Schenker XMG CORE 16 (L23) | |
| HP Omen Transcend 16-u1095ng | |
| Alienware m16 R2 | |
| AIDA64 / FP32 Ray-Trace | |
| Media de la clase Gaming (10227 - 85542, n=105, últimos 2 años) | |
| Lenovo Legion Pro 7 16IRX9H | |
| Schenker XMG CORE 16 (L23) | |
| Lenovo Legion 7 16 IRX G9 | |
| Lenovo Legion Pro 5 16IRX9 | |
| Medio Intel Core i9-14900HX (13098 - 33474, n=36) | |
| Aorus 16X 2024 | |
| Alienware m16 R2 | |
| HP Omen Transcend 16-u1095ng | |
| AIDA64 / FPU Julia | |
| Media de la clase Gaming (51376 - 238426, n=105, últimos 2 años) | |
| Lenovo Legion Pro 7 16IRX9H | |
| Lenovo Legion Pro 5 16IRX9 | |
| Medio Intel Core i9-14900HX (67573 - 166040, n=36) | |
| Schenker XMG CORE 16 (L23) | |
| Lenovo Legion 7 16 IRX G9 | |
| Aorus 16X 2024 | |
| Alienware m16 R2 | |
| HP Omen Transcend 16-u1095ng | |
| AIDA64 / CPU SHA3 | |
| Lenovo Legion Pro 7 16IRX9H | |
| Media de la clase Gaming (2180 - 10115, n=105, últimos 2 años) | |
| Lenovo Legion Pro 5 16IRX9 | |
| Medio Intel Core i9-14900HX (3589 - 7979, n=36) | |
| Aorus 16X 2024 | |
| Lenovo Legion 7 16 IRX G9 | |
| Schenker XMG CORE 16 (L23) | |
| HP Omen Transcend 16-u1095ng | |
| Alienware m16 R2 | |
| AIDA64 / CPU Queen | |
| Lenovo Legion Pro 7 16IRX9H | |
| Lenovo Legion Pro 5 16IRX9 | |
| Lenovo Legion 7 16 IRX G9 | |
| Aorus 16X 2024 | |
| Medio Intel Core i9-14900HX (118405 - 148966, n=36) | |
| HP Omen Transcend 16-u1095ng | |
| Media de la clase Gaming (49785 - 173351, n=90, últimos 2 años) | |
| Schenker XMG CORE 16 (L23) | |
| Alienware m16 R2 | |
| AIDA64 / FPU SinJulia | |
| Lenovo Legion Pro 7 16IRX9H | |
| Lenovo Legion Pro 5 16IRX9 | |
| Medio Intel Core i9-14900HX (10475 - 18517, n=36) | |
| Schenker XMG CORE 16 (L23) | |
| Aorus 16X 2024 | |
| Media de la clase Gaming (4424 - 33636, n=105, últimos 2 años) | |
| Lenovo Legion 7 16 IRX G9 | |
| HP Omen Transcend 16-u1095ng | |
| Alienware m16 R2 | |
| AIDA64 / FPU Mandel | |
| Media de la clase Gaming (25115 - 128721, n=105, últimos 2 años) | |
| Lenovo Legion Pro 7 16IRX9H | |
| Schenker XMG CORE 16 (L23) | |
| Lenovo Legion Pro 5 16IRX9 | |
| Medio Intel Core i9-14900HX (32543 - 83662, n=36) | |
| Aorus 16X 2024 | |
| Alienware m16 R2 | |
| Lenovo Legion 7 16 IRX G9 | |
| HP Omen Transcend 16-u1095ng | |
| AIDA64 / CPU AES | |
| Medio Intel Core i9-14900HX (86964 - 241777, n=36) | |
| Lenovo Legion Pro 7 16IRX9H | |
| Lenovo Legion Pro 5 16IRX9 | |
| Aorus 16X 2024 | |
| Lenovo Legion 7 16 IRX G9 | |
| Media de la clase Gaming (39258 - 247074, n=105, últimos 2 años) | |
| Schenker XMG CORE 16 (L23) | |
| HP Omen Transcend 16-u1095ng | |
| Alienware m16 R2 | |
| AIDA64 / CPU ZLib | |
| Lenovo Legion Pro 7 16IRX9H | |
| Lenovo Legion Pro 5 16IRX9 | |
| Medio Intel Core i9-14900HX (1054 - 2292, n=36) | |
| Aorus 16X 2024 | |
| Lenovo Legion 7 16 IRX G9 | |
| Media de la clase Gaming (574 - 2531, n=105, últimos 2 años) | |
| HP Omen Transcend 16-u1095ng | |
| Alienware m16 R2 | |
| Schenker XMG CORE 16 (L23) | |
| AIDA64 / FP64 Ray-Trace | |
| Media de la clase Gaming (5509 - 45446, n=105, últimos 2 años) | |
| Lenovo Legion Pro 7 16IRX9H | |
| Schenker XMG CORE 16 (L23) | |
| Lenovo Legion Pro 5 16IRX9 | |
| Medio Intel Core i9-14900HX (6809 - 18349, n=36) | |
| Lenovo Legion 7 16 IRX G9 | |
| Aorus 16X 2024 | |
| Alienware m16 R2 | |
| HP Omen Transcend 16-u1095ng | |
| AIDA64 / CPU PhotoWorxx | |
| Lenovo Legion Pro 5 16IRX9 | |
| HP Omen Transcend 16-u1095ng | |
| Aorus 16X 2024 | |
| Lenovo Legion 7 16 IRX G9 | |
| Lenovo Legion Pro 7 16IRX9H | |
| Medio Intel Core i9-14900HX (23903 - 54702, n=36) | |
| Media de la clase Gaming (12271 - 89891, n=105, últimos 2 años) | |
| Schenker XMG CORE 16 (L23) | |
| Alienware m16 R2 | |
Rendimiento del sistema
La impresión subjetiva de rendimiento es excelente y los puntos de referencia tampoco pusieron de manifiesto ningún problema. Sólo se produjeron tartamudeos ocasionales al cambiar entre modos gráficos, por ejemplo, cuando se iniciaba un juego. Esto es bastante habitual en los portátiles que utilizan Advanced Optimus.
CrossMark: Overall | Productivity | Creativity | Responsiveness
WebXPRT 3: Overall
WebXPRT 4: Overall
Mozilla Kraken 1.1: Total
| PCMark 10 / Score | |
| Lenovo Legion Pro 7 16IRX9H | |
| Lenovo Legion Pro 5 16IRX9 | |
| Media de la clase Gaming (5828 - 12414, n=93, últimos 2 años) | |
| Aorus 16X 2024 | |
| Medio Intel Core i9-14900HX, NVIDIA GeForce RTX 4070 Laptop GPU (7768 - 8550, n=8) | |
| Schenker XMG CORE 16 (L23) | |
| Lenovo Legion 7 16 IRX G9 | |
| HP Omen Transcend 16-u1095ng | |
| Alienware m16 R2 | |
| PCMark 10 / Essentials | |
| Lenovo Legion Pro 7 16IRX9H | |
| Lenovo Legion Pro 5 16IRX9 | |
| Aorus 16X 2024 | |
| Lenovo Legion 7 16 IRX G9 | |
| Schenker XMG CORE 16 (L23) | |
| Medio Intel Core i9-14900HX, NVIDIA GeForce RTX 4070 Laptop GPU (10104 - 11815, n=8) | |
| Media de la clase Gaming (8810 - 11935, n=97, últimos 2 años) | |
| HP Omen Transcend 16-u1095ng | |
| Alienware m16 R2 | |
| PCMark 10 / Productivity | |
| Lenovo Legion Pro 7 16IRX9H | |
| Media de la clase Gaming (6845 - 25323, n=95, últimos 2 años) | |
| Aorus 16X 2024 | |
| Schenker XMG CORE 16 (L23) | |
| Medio Intel Core i9-14900HX, NVIDIA GeForce RTX 4070 Laptop GPU (9577 - 11103, n=8) | |
| HP Omen Transcend 16-u1095ng | |
| Lenovo Legion Pro 5 16IRX9 | |
| Lenovo Legion 7 16 IRX G9 | |
| Alienware m16 R2 | |
| PCMark 10 / Digital Content Creation | |
| Lenovo Legion Pro 5 16IRX9 | |
| Lenovo Legion Pro 7 16IRX9H | |
| Media de la clase Gaming (7602 - 19954, n=95, últimos 2 años) | |
| Lenovo Legion 7 16 IRX G9 | |
| Medio Intel Core i9-14900HX, NVIDIA GeForce RTX 4070 Laptop GPU (12114 - 14827, n=8) | |
| Aorus 16X 2024 | |
| Alienware m16 R2 | |
| Schenker XMG CORE 16 (L23) | |
| HP Omen Transcend 16-u1095ng | |
| CrossMark / Overall | |
| Lenovo Legion Pro 7 16IRX9H | |
| Aorus 16X 2024 | |
| Lenovo Legion 7 16 IRX G9 | |
| Medio Intel Core i9-14900HX, NVIDIA GeForce RTX 4070 Laptop GPU (2002 - 2312, n=7) | |
| Lenovo Legion Pro 5 16IRX9 | |
| Media de la clase Gaming (1366 - 2409, n=94, últimos 2 años) | |
| Alienware m16 R2 | |
| Schenker XMG CORE 16 (L23) | |
| CrossMark / Productivity | |
| Lenovo Legion Pro 7 16IRX9H | |
| Aorus 16X 2024 | |
| Lenovo Legion 7 16 IRX G9 | |
| Medio Intel Core i9-14900HX, NVIDIA GeForce RTX 4070 Laptop GPU (1827 - 2191, n=7) | |
| Media de la clase Gaming (1386 - 2254, n=94, últimos 2 años) | |
| Lenovo Legion Pro 5 16IRX9 | |
| Alienware m16 R2 | |
| Schenker XMG CORE 16 (L23) | |
| CrossMark / Creativity | |
| Lenovo Legion Pro 7 16IRX9H | |
| Aorus 16X 2024 | |
| Lenovo Legion 7 16 IRX G9 | |
| Medio Intel Core i9-14900HX, NVIDIA GeForce RTX 4070 Laptop GPU (2258 - 2458, n=7) | |
| Lenovo Legion Pro 5 16IRX9 | |
| Media de la clase Gaming (1343 - 2786, n=94, últimos 2 años) | |
| Alienware m16 R2 | |
| Schenker XMG CORE 16 (L23) | |
| CrossMark / Responsiveness | |
| Lenovo Legion 7 16 IRX G9 | |
| Aorus 16X 2024 | |
| Lenovo Legion Pro 7 16IRX9H | |
| Medio Intel Core i9-14900HX, NVIDIA GeForce RTX 4070 Laptop GPU (1734 - 2330, n=7) | |
| Lenovo Legion Pro 5 16IRX9 | |
| Media de la clase Gaming (1226 - 2334, n=94, últimos 2 años) | |
| Alienware m16 R2 | |
| Schenker XMG CORE 16 (L23) | |
| WebXPRT 3 / Overall | |
| Lenovo Legion Pro 7 16IRX9H | |
| HP Omen Transcend 16-u1095ng | |
| Lenovo Legion 7 16 IRX G9 | |
| Aorus 16X 2024 | |
| Lenovo Legion Pro 5 16IRX9 | |
| Medio Intel Core i9-14900HX, NVIDIA GeForce RTX 4070 Laptop GPU (269 - 342, n=8) | |
| Media de la clase Gaming (220 - 532, n=98, últimos 2 años) | |
| Alienware m16 R2 | |
| Schenker XMG CORE 16 (L23) | |
| WebXPRT 4 / Overall | |
| Lenovo Legion Pro 7 16IRX9H | |
| Medio Intel Core i9-14900HX, NVIDIA GeForce RTX 4070 Laptop GPU (291 - 304, n=6) | |
| Lenovo Legion 7 16 IRX G9 | |
| Lenovo Legion Pro 5 16IRX9 | |
| Media de la clase Gaming (165 - 354, n=98, últimos 2 años) | |
| Alienware m16 R2 | |
| Mozilla Kraken 1.1 / Total | |
| Alienware m16 R2 | |
| Schenker XMG CORE 16 (L23) | |
| Media de la clase Gaming (391 - 590, n=100, últimos 2 años) | |
| Lenovo Legion Pro 5 16IRX9 | |
| Medio Intel Core i9-14900HX, NVIDIA GeForce RTX 4070 Laptop GPU (431 - 469, n=8) | |
| Lenovo Legion 7 16 IRX G9 | |
| Lenovo Legion Pro 7 16IRX9H | |
| HP Omen Transcend 16-u1095ng | |
| Aorus 16X 2024 | |
* ... más pequeño es mejor
| PCMark 10 Score | 8023 puntos | |
ayuda | ||
| AIDA64 / Memory Copy | |
| Lenovo Legion Pro 5 16IRX9 | |
| Lenovo Legion 7 16 IRX G9 | |
| Aorus 16X 2024 | |
| Lenovo Legion Pro 7 16IRX9H | |
| HP Omen Transcend 16-u1095ng | |
| Medio Intel Core i9-14900HX (38028 - 83392, n=36) | |
| Media de la clase Gaming (21750 - 129946, n=105, últimos 2 años) | |
| Schenker XMG CORE 16 (L23) | |
| Alienware m16 R2 | |
| AIDA64 / Memory Read | |
| Aorus 16X 2024 | |
| Lenovo Legion Pro 5 16IRX9 | |
| Lenovo Legion Pro 7 16IRX9H | |
| Lenovo Legion 7 16 IRX G9 | |
| HP Omen Transcend 16-u1095ng | |
| Medio Intel Core i9-14900HX (43306 - 87568, n=36) | |
| Alienware m16 R2 | |
| Media de la clase Gaming (22956 - 118858, n=105, últimos 2 años) | |
| Schenker XMG CORE 16 (L23) | |
| AIDA64 / Memory Write | |
| Schenker XMG CORE 16 (L23) | |
| HP Omen Transcend 16-u1095ng | |
| Aorus 16X 2024 | |
| Lenovo Legion Pro 5 16IRX9 | |
| Media de la clase Gaming (22297 - 135096, n=105, últimos 2 años) | |
| Lenovo Legion 7 16 IRX G9 | |
| Medio Intel Core i9-14900HX (37146 - 80589, n=36) | |
| Lenovo Legion Pro 7 16IRX9H | |
| Alienware m16 R2 | |
| AIDA64 / Memory Latency | |
| Alienware m16 R2 | |
| Media de la clase Gaming (75.3 - 259, n=105, últimos 2 años) | |
| Schenker XMG CORE 16 (L23) | |
| HP Omen Transcend 16-u1095ng | |
| Medio Intel Core i9-14900HX (76.1 - 105, n=36) | |
| Lenovo Legion 7 16 IRX G9 | |
| Lenovo Legion Pro 5 16IRX9 | |
| Aorus 16X 2024 | |
| Lenovo Legion Pro 7 16IRX9H | |
* ... más pequeño es mejor
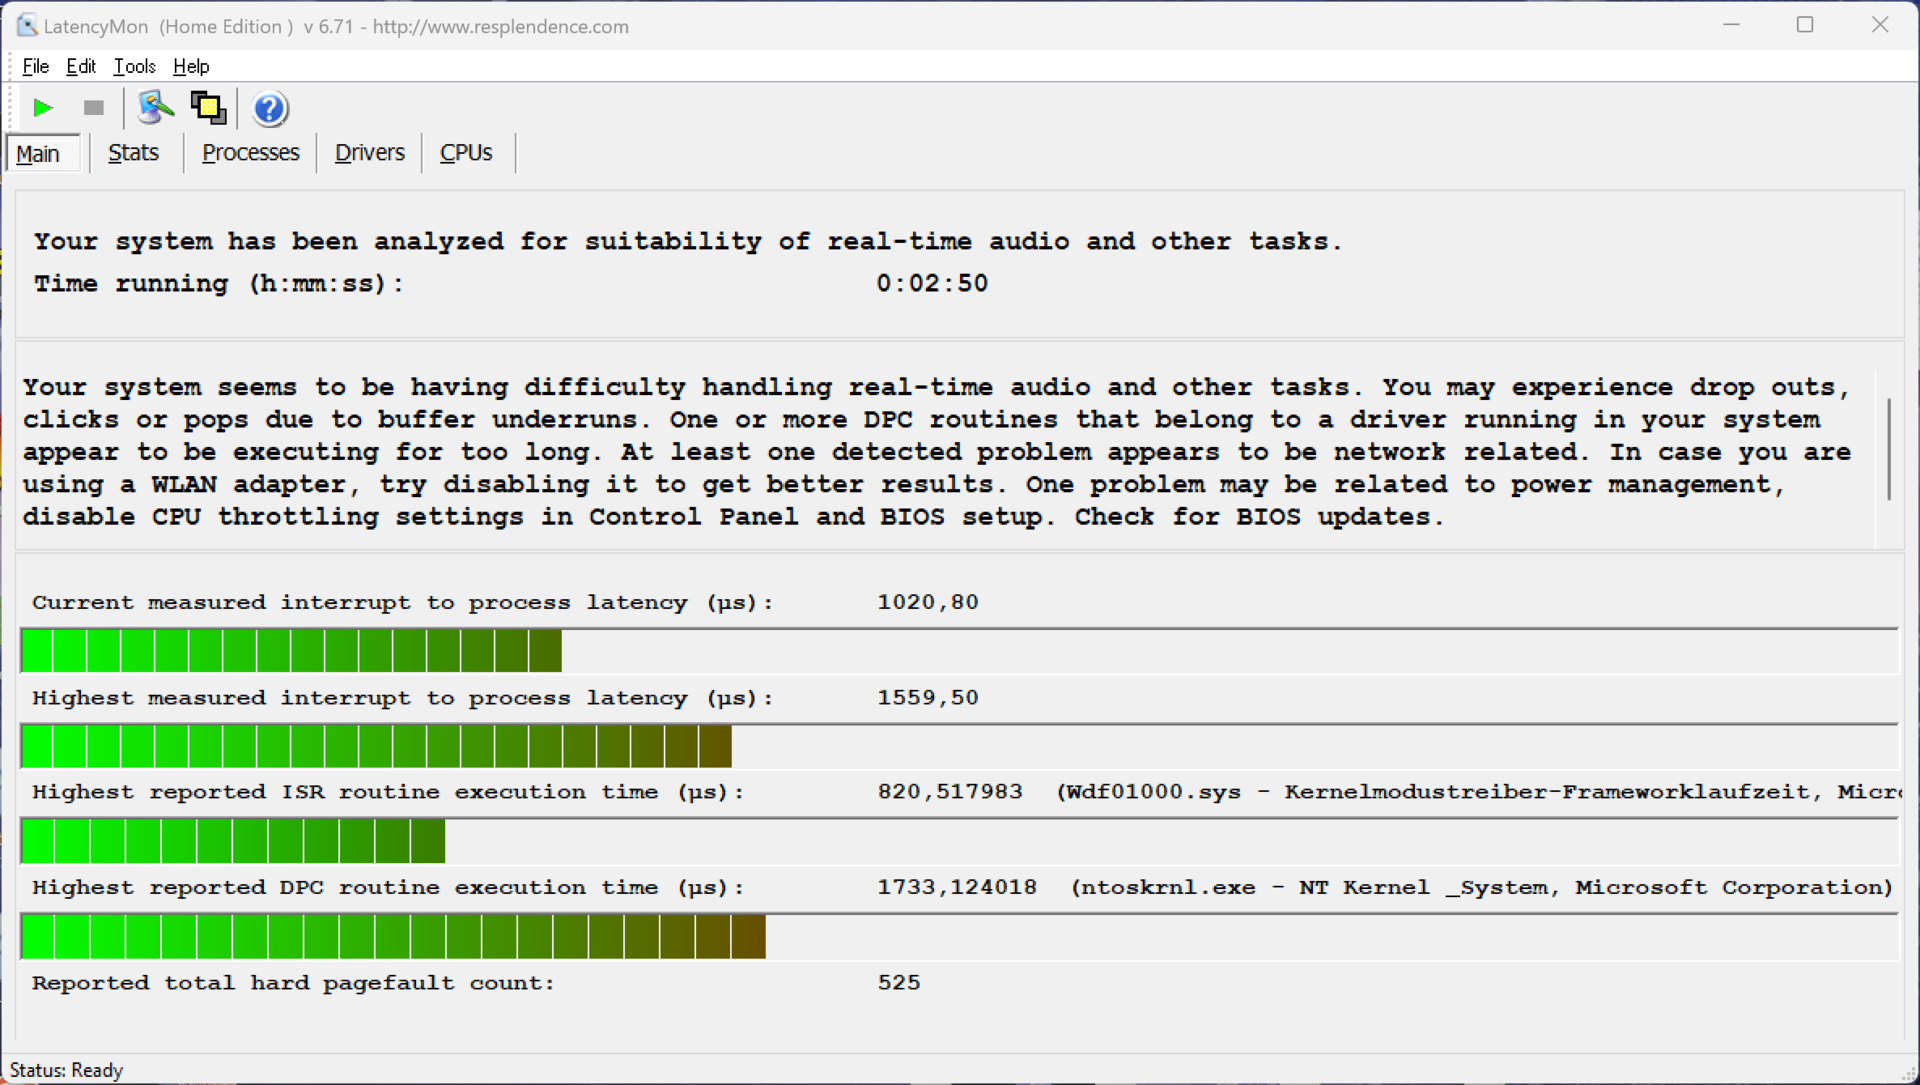
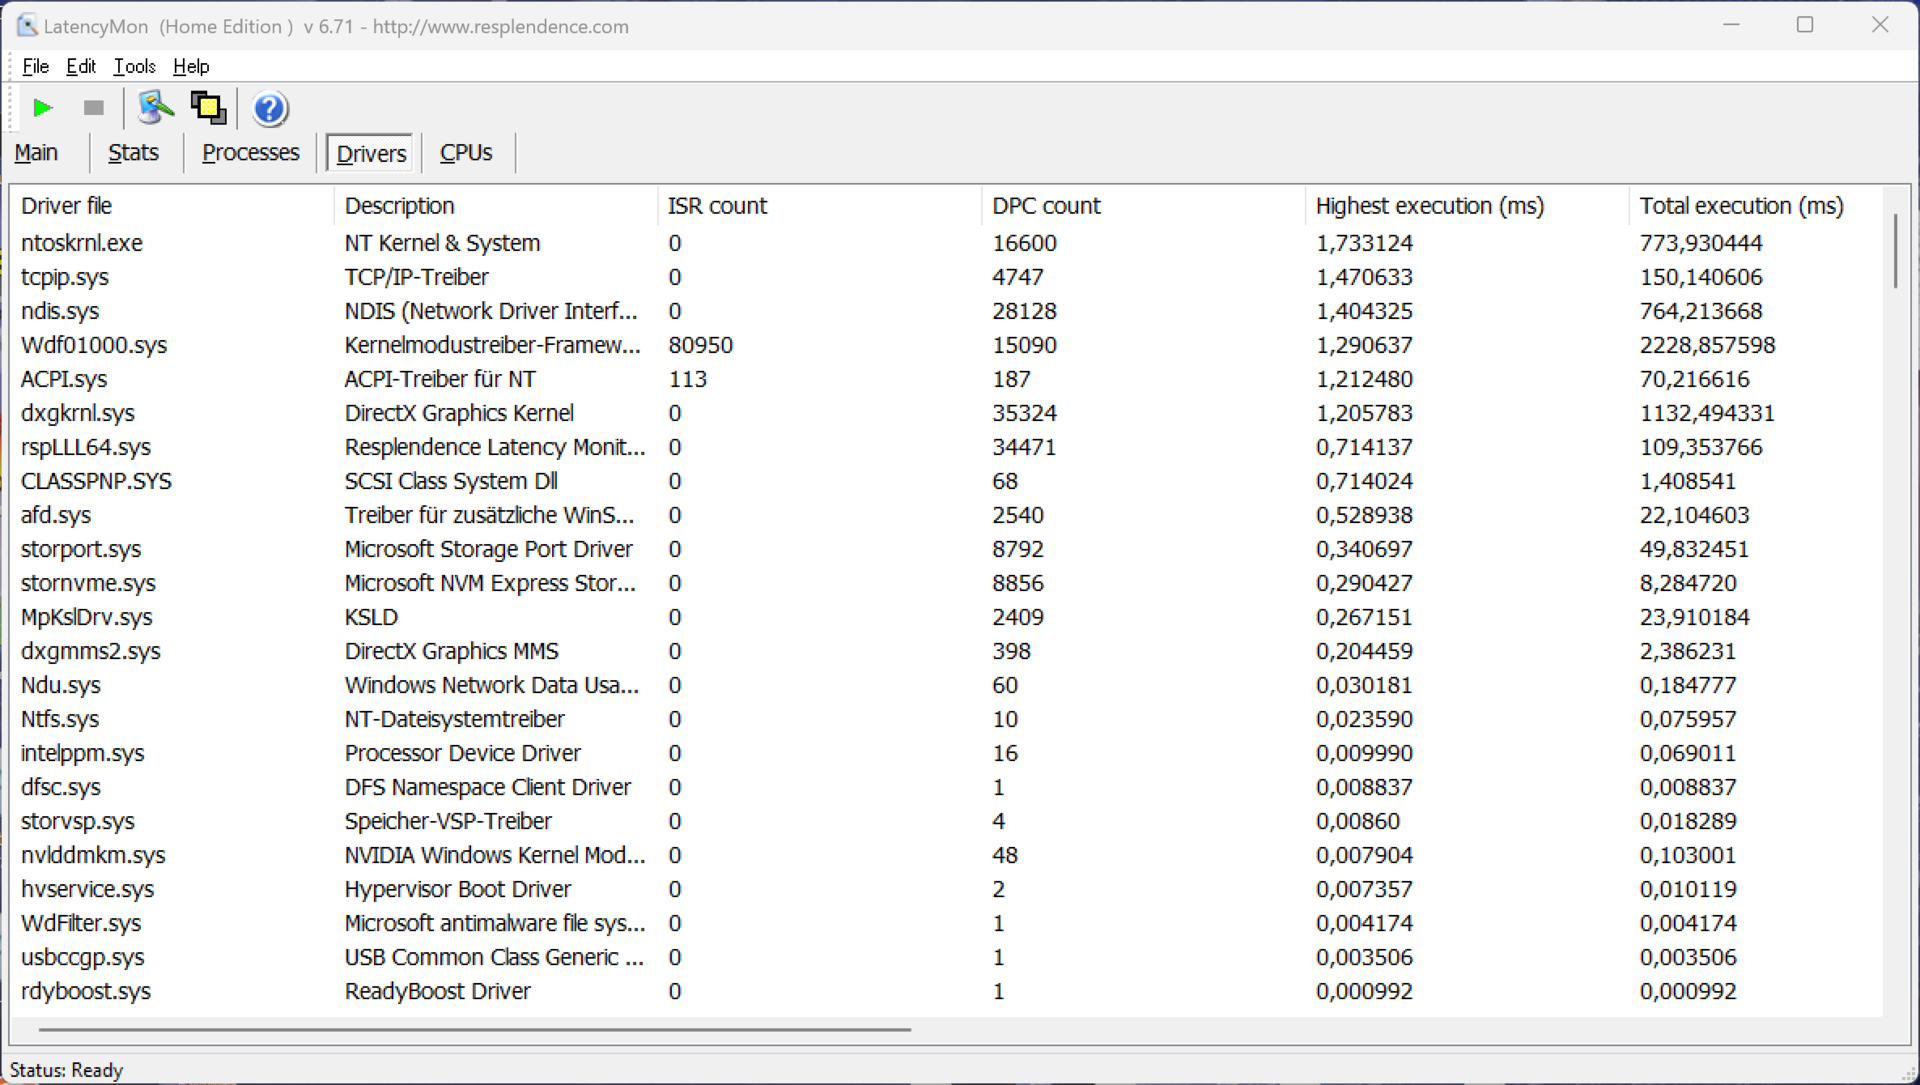
Latencias del CPD
En nuestra prueba de latencia estandarizada (navegación por Internet, reproducción 4K de YouTube, carga de la CPU) utilizando la versión actual de la BIOS, el dispositivo de revisión mostró algunas limitaciones a la hora de utilizar aplicaciones de audio en tiempo real.
| DPC Latencies / LatencyMon - interrupt to process latency (max), Web, Youtube, Prime95 | |
| Alienware m16 R2 | |
| HP Omen Transcend 16-u1095ng | |
| Lenovo Legion 7 16 IRX G9 | |
| Lenovo Legion Pro 7 16IRX9H | |
| Aorus 16X 2024 | |
| Lenovo Legion Pro 5 16IRX9 | |
| Schenker XMG CORE 16 (L23) | |
* ... más pequeño es mejor
Almacenamiento masivo
En el dispositivo de análisis, Lenovo ha instalado una SSD PCIe 4.0 de 1 TB de SK Hynix, pero, tras el primer arranque, el usuario dispone de 877 GB. Con hasta 7 GB/s, las velocidades de transferencia son muy altas y, en general, la SSD es un poco más rápida que la competencia. Sin embargo, aunque el rendimiento no siempre se mantiene estable bajo carga sostenida, no es algo que se note en situaciones cotidianas. Los puntos de referencia adicionales de la SSD se enumerados aquí.

* ... más pequeño es mejor
Continuous Performance Read: DiskSpd Read Loop, Queue Depth 8
Tarjeta gráfica - GeForce RTX 4070 portátil
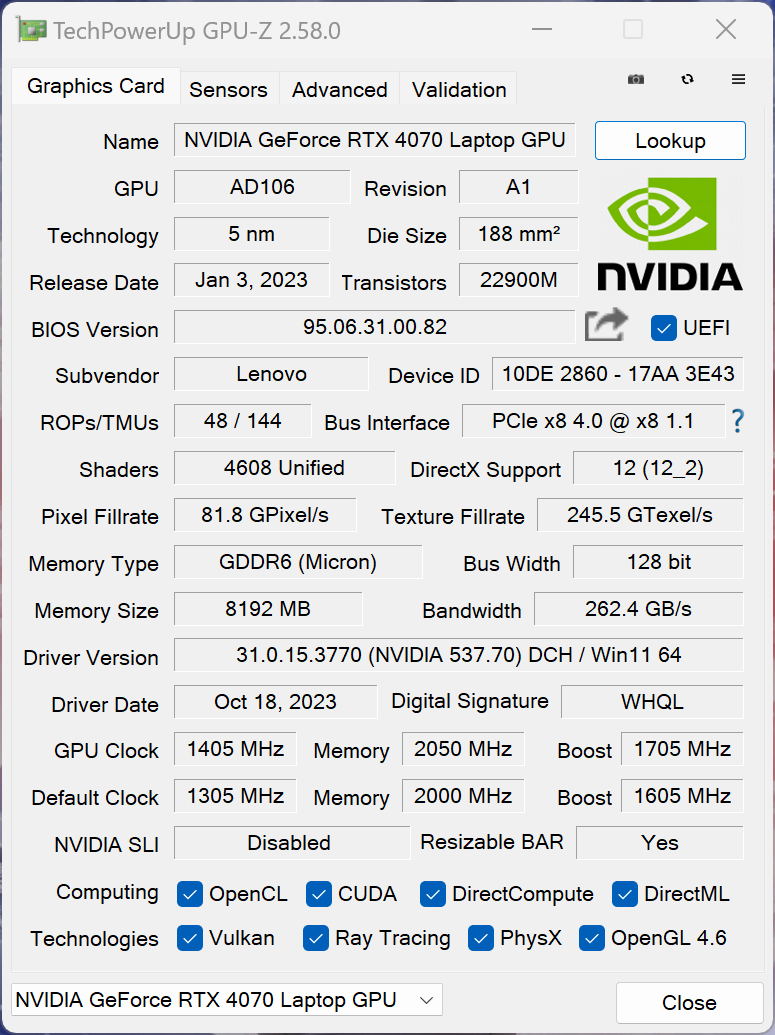
Nuestro dispositivo de revisión viene con la Portátil RTX 4070 aunque en realidad se trata de la versión de 115 vatios. Además, en el modo de rendimiento, la GPU está ligeramente overclockeada. En las pruebas comparativas sintéticas, equipado con su variante de 140 vatios, el Legion 7 16 queda un poco por detrás de la competencia. Sin embargo, como estamos a punto de ver, esto no es relevante para los puntos de referencia de juegos, ya que el portátil RTX 4070 es incapaz de consumir los 140 vatios completos de todos modos. El Legion es compatible con el conmutador gráfico Advanced Optimus.
Bajo carga sostenida, la GPU permanece completamente estable y, en modo batería, el consumo se limita a 50 vatios. Por ello, el rendimiento aquí es alrededor de un 35 % inferior. Otras pruebas de rendimiento de la GPU enumerados aquí.
| 3DMark 11 Performance | 35070 puntos | |
| 3DMark Fire Strike Score | 25692 puntos | |
| 3DMark Time Spy Score | 12844 puntos | |
ayuda | ||
| Blender / v3.3 Classroom OPTIX/RTX | |
| HP Omen Transcend 16-u1095ng | |
| Medio NVIDIA GeForce RTX 4070 Laptop GPU (18 - 30, n=68) | |
| Schenker XMG CORE 16 (L23) | |
| Alienware m16 R2 | |
| Aorus 16X 2024 | |
| Lenovo Legion 7 16 IRX G9 | |
| Lenovo Legion Pro 5 16IRX9 | |
| Media de la clase Gaming (9 - 32, n=106, últimos 2 años) | |
| Lenovo Legion Pro 7 16IRX9H | |
| Blender / v3.3 Classroom CUDA | |
| HP Omen Transcend 16-u1095ng | |
| Medio NVIDIA GeForce RTX 4070 Laptop GPU (32 - 50, n=67) | |
| Alienware m16 R2 | |
| Media de la clase Gaming (15 - 228, n=106, últimos 2 años) | |
| Schenker XMG CORE 16 (L23) | |
| Lenovo Legion Pro 5 16IRX9 | |
| Aorus 16X 2024 | |
| Lenovo Legion 7 16 IRX G9 | |
| Lenovo Legion Pro 7 16IRX9H | |
| Blender / v3.3 Classroom CPU | |
| Schenker XMG CORE 16 (L23) | |
| HP Omen Transcend 16-u1095ng | |
| Alienware m16 R2 | |
| Medio NVIDIA GeForce RTX 4070 Laptop GPU (158 - 440, n=67) | |
| Media de la clase Gaming (122 - 565, n=102, últimos 2 años) | |
| Aorus 16X 2024 | |
| Lenovo Legion 7 16 IRX G9 | |
| Lenovo Legion Pro 5 16IRX9 | |
| Lenovo Legion Pro 7 16IRX9H | |
* ... más pequeño es mejor
Rendimiento en juegos
El rendimiento de la Legion 7 16 en juegos es muy bueno y todos los títulos modernos pueden jugarse sin problemas a resolución QHD y con los máximos detalles. Incluso en resolución nativa, el rendimiento debería ser suficiente y, si se desea, se puede activar el reescalado DLSS. En la comparación de pruebas de juegos, el dispositivo de análisis obtuvo una puntuación un poco mejor que en las pruebas sintéticas y el rendimiento se mantuvo totalmente estable incluso durante las sesiones de juego más largas. Puede encontrar más pruebas comparativas de juegos aquí.
| The Witcher 3 - 1920x1080 Ultra Graphics & Postprocessing (HBAO+) | |
| Media de la clase Gaming (104.7 - 240, n=7, últimos 2 años) | |
| Lenovo Legion Pro 7 16IRX9H | |
| Lenovo Legion Pro 5 16IRX9 | |
| Aorus 16X 2024 | |
| Alienware m16 R2 | |
| Schenker XMG CORE 16 (L23) | |
| HP Omen Transcend 16-u1095ng | |
| Lenovo Legion 7 16 IRX G9 | |
| GTA V - 1920x1080 Highest AA:4xMSAA + FX AF:16x | |
| Lenovo Legion Pro 7 16IRX9H | |
| Media de la clase Gaming (48.3 - 186.9, n=94, últimos 2 años) | |
| Lenovo Legion Pro 5 16IRX9 | |
| Lenovo Legion 7 16 IRX G9 | |
| Schenker XMG CORE 16 (L23) | |
| HP Omen Transcend 16-u1095ng | |
| Aorus 16X 2024 | |
| Final Fantasy XV Benchmark - 1920x1080 High Quality | |
| Lenovo Legion Pro 7 16IRX9H | |
| Media de la clase Gaming (41 - 215, n=95, últimos 2 años) | |
| Lenovo Legion Pro 5 16IRX9 | |
| Schenker XMG CORE 16 (L23) | |
| Lenovo Legion 7 16 IRX G9 | |
| Alienware m16 R2 | |
| Aorus 16X 2024 | |
| HP Omen Transcend 16-u1095ng | |
| Horizon Forbidden West | |
| 1920x1080 Very High Preset AA:T | |
| Lenovo Legion Pro 7 16IRX9H | |
| Media de la clase Gaming (14.7 - 140.3, n=12, últimos 2 años) | |
| Aorus 16X 2024 | |
| Lenovo Legion 7 16 IRX G9 | |
| Medio NVIDIA GeForce RTX 4070 Laptop GPU (53.2 - 76.7, n=10) | |
| 2560x1440 Very High Preset AA:T | |
| Lenovo Legion Pro 7 16IRX9H | |
| Media de la clase Gaming (45.7 - 100.9, n=9, últimos 2 años) | |
| Aorus 16X 2024 | |
| Medio NVIDIA GeForce RTX 4070 Laptop GPU (40.3 - 59.1, n=9) | |
| Lenovo Legion 7 16 IRX G9 | |
Witcher 3 FPS diagram
| bajo | medio | alto | ultra | QHD | |
|---|---|---|---|---|---|
| GTA V (2015) | 182.4 | 124.1 | 94.2 | ||
| The Witcher 3 (2015) | 246 | 113.1 | 92 | ||
| Dota 2 Reborn (2015) | 230 | 205 | 193.4 | 179.5 | |
| Final Fantasy XV Benchmark (2018) | 223 | 166.8 | 119.8 | 89.1 | |
| X-Plane 11.11 (2018) | 198 | 180.6 | 138.2 | ||
| Far Cry 5 (2018) | 193 | 166 | 157 | 146 | 115 |
| Strange Brigade (2018) | 436 | 311 | 250 | 220 | 143 |
| F1 23 (2023) | 287 | 284 | 222 | 70.1 | 43.9 |
| Baldur's Gate 3 (2023) | 155.6 | 127.9 | 115.7 | 115 | 71.9 |
| Cyberpunk 2077 (2023) | 129.7 | 117.1 | 99.6 | 85.2 | 51.4 |
| Horizon Forbidden West (2024) | 107.1 | 103.4 | 73.2 | 64.4 | 49.9 |
Emisiones - Refrigeración ruidosa pero eficaz
Emisiones sonoras
Cuando se trata de tareas sencillas, la refrigeración de la Legion 7 16 suele permanecer desactivada, incluso en el modo de rendimiento, y en las situaciones cotidianas puede recurrir con toda confianza al modo silencioso para minimizar el ruido del ventilador. Con un máximo de 38,4 dB(A) en modo silencioso, también es posible jugar sin auriculares, sin embargo, en los otros dos modos, 50 y 54 dB(A) son demasiado altos. A pesar de ello, tanto el Legion Pro 5 como el Legion Pro 7 son incluso un poco más ruidosos. Tras periodos de carga, los ventiladores también reducen rápidamente su velocidad. Ningún otro ruido electrónico estaba presente en el dispositivo de revisión.
Ruido
| Ocioso |
| 24.5 / 24.5 / 24.5 dB(A) |
| Carga |
| 34.8 / 54.1 dB(A) |
 | ||
30 dB silencioso 40 dB(A) audible 50 dB(A) ruidosamente alto |
||
min: | ||
| Lenovo Legion 7 16 IRX G9 GeForce RTX 4070 Laptop GPU, i9-14900HX, SK Hynix HFS001TEJ9X115N | Lenovo Legion Pro 5 16IRX9 GeForce RTX 4070 Laptop GPU, i9-14900HX, Samsung PM9A1 MZVL21T0HCLR | Aorus 16X 2024 GeForce RTX 4070 Laptop GPU, i9-14900HX, Gigabyte AG450E1024-SI | HP Omen Transcend 16-u1095ng GeForce RTX 4070 Laptop GPU, i9-14900HX, Kioxia XG8 KXG80ZNV1T02 | Alienware m16 R2 GeForce RTX 4070 Laptop GPU, Ultra 7 155H, Samsung PM9A1 MZVL21T0HCLR | Schenker XMG CORE 16 (L23) GeForce RTX 4070 Laptop GPU, R7 7840HS, Samsung 990 Pro 1 TB | Lenovo Legion Pro 7 16IRX9H GeForce RTX 4080 Laptop GPU, i9-14900HX, SK Hynix HFS001TEJ9X115N | |
|---|---|---|---|---|---|---|---|
| Noise | -6% | -21% | -9% | -2% | -1% | -22% | |
| apagado / medio ambiente * (dB) | 24.5 | 23.9 2% | 26 -6% | 24 2% | 24.7 -1% | 23 6% | 24 2% |
| Idle Minimum * (dB) | 24.5 | 24.3 1% | 26 -6% | 29 -18% | 25.3 -3% | 23 6% | 25 -2% |
| Idle Average * (dB) | 24.5 | 24.3 1% | 32 -31% | 30 -22% | 25.3 -3% | 28.48 -16% | 30 -22% |
| Idle Maximum * (dB) | 24.5 | 28.9 -18% | 38 -55% | 31 -27% | 25.3 -3% | 28.48 -16% | 45 -84% |
| Load Average * (dB) | 34.8 | 45.8 -32% | 54 -55% | 45 -29% | 31.7 9% | 30 14% | 50 -44% |
| Witcher 3 ultra * (dB) | 54.1 | 51 6% | 50 8% | 44 19% | 53.8 1% | 54.12 -0% | 54 -0% |
| Load Maximum * (dB) | 54.1 | 56.6 -5% | 55 -2% | 47 13% | 62 -15% | 54.12 -0% | 56 -4% |
* ... más pequeño es mejor
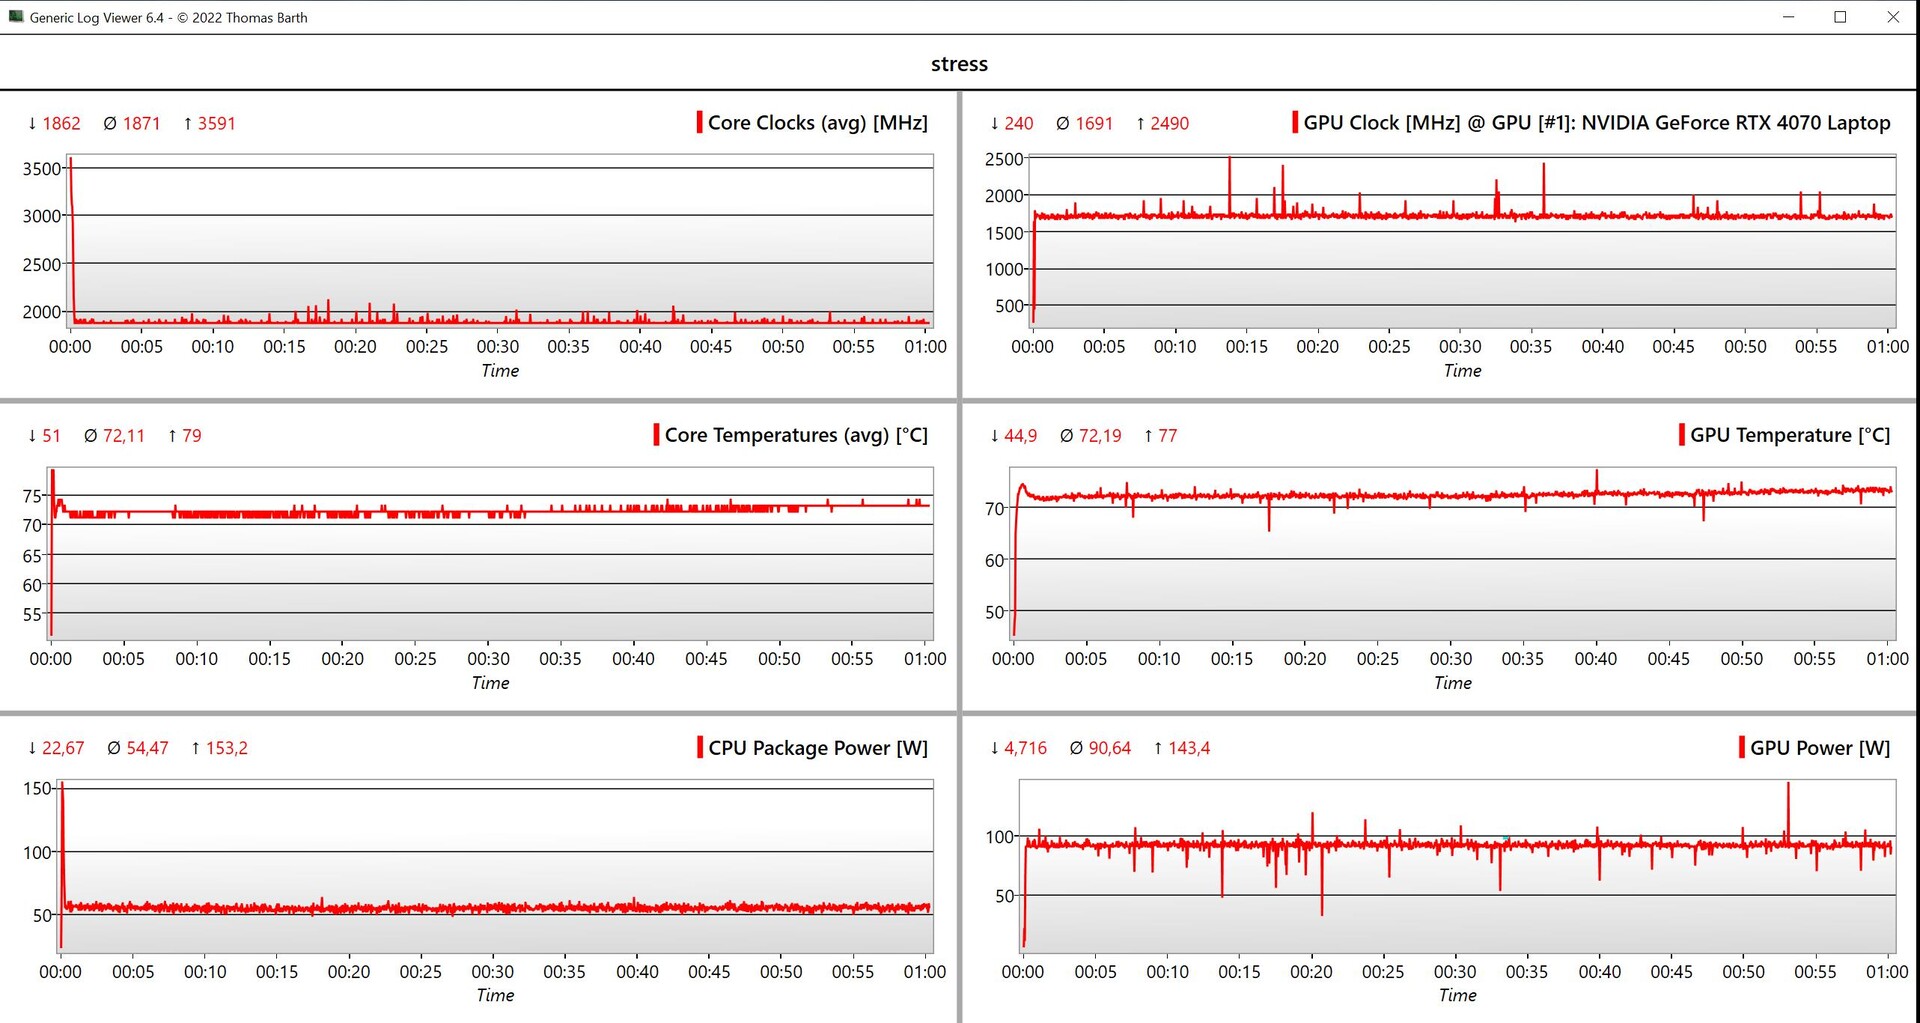
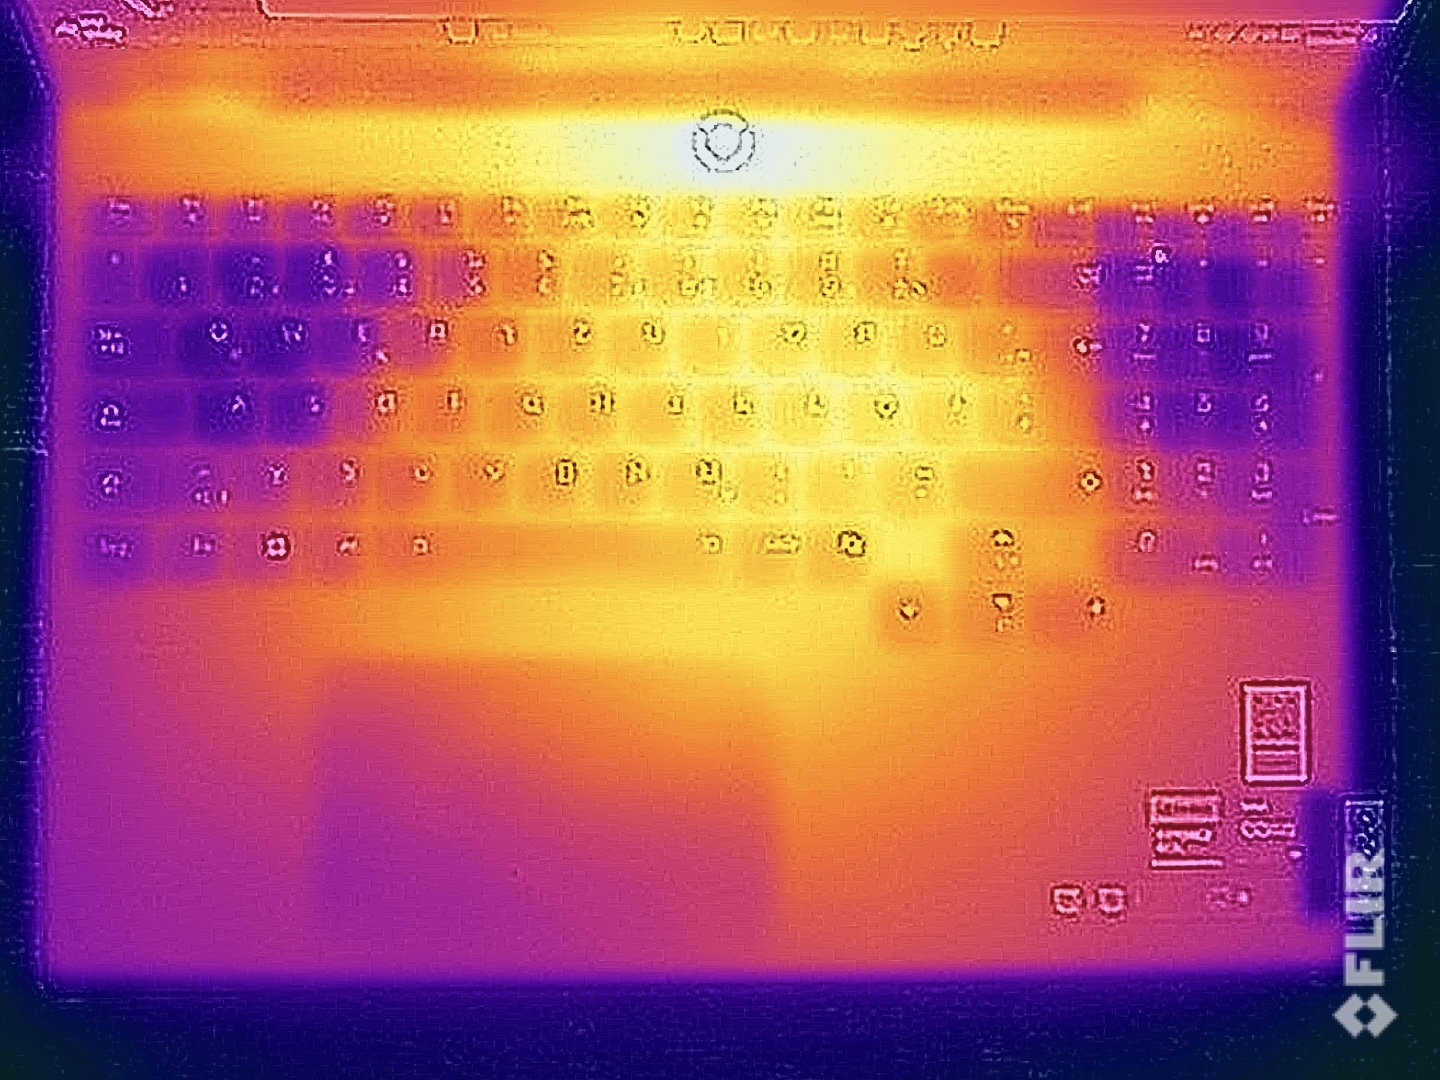
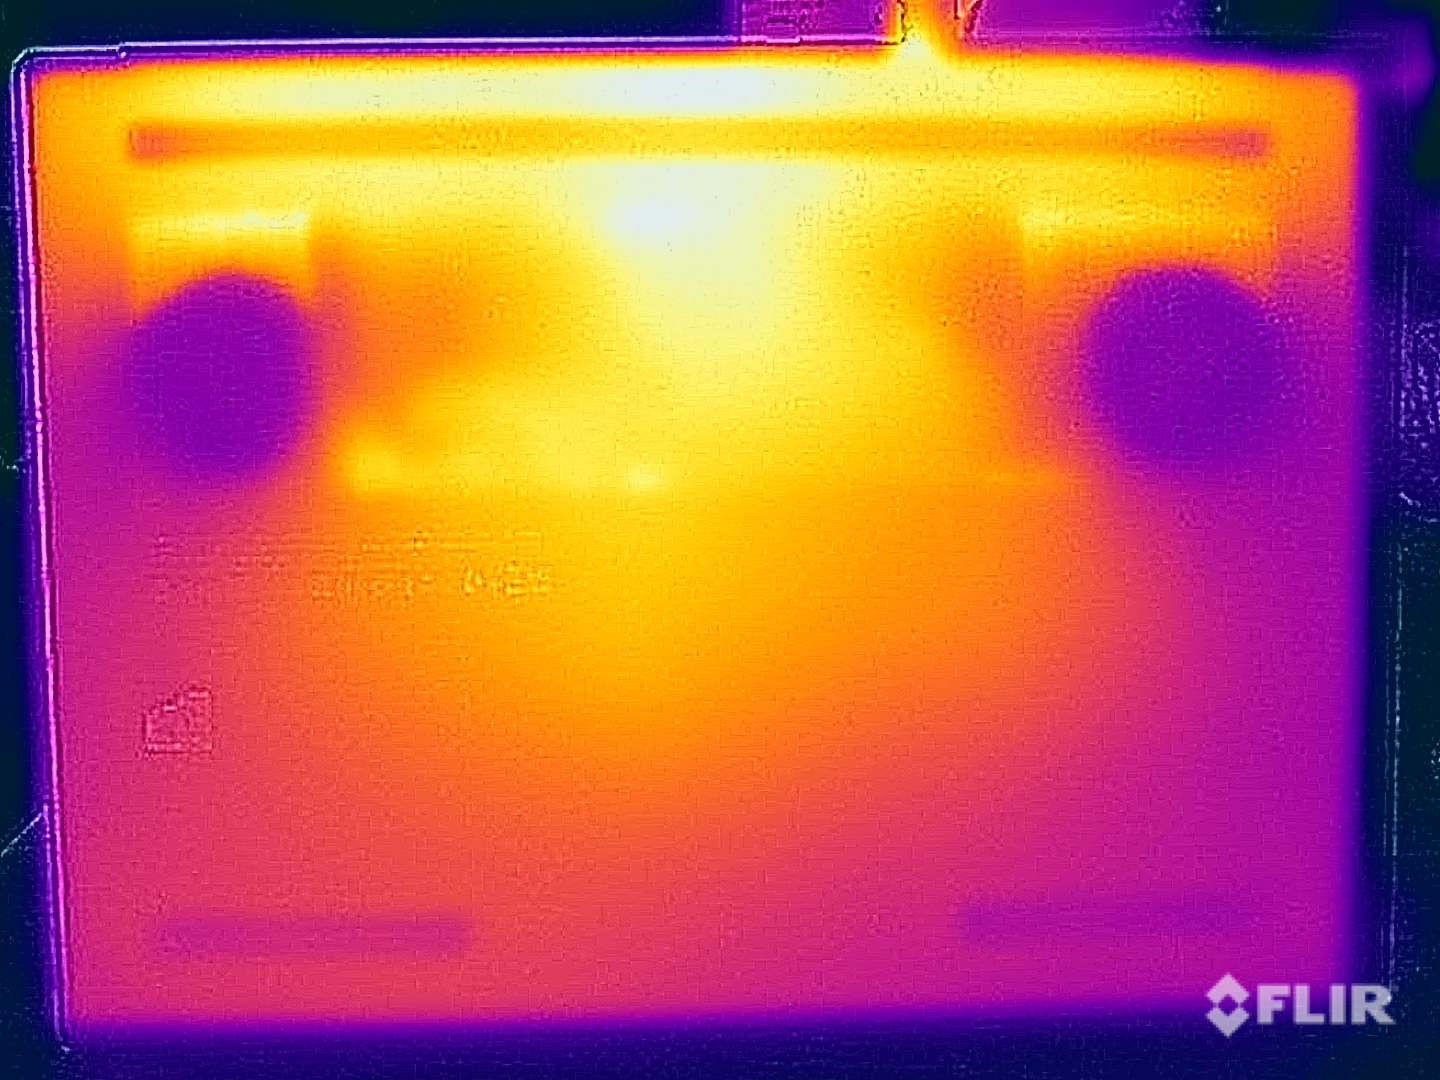
Temperatura
En ralentí y con poca carga, la carcasa de aluminio se mantiene agradablemente fría e incluso cuando se juega rinde mejor de lo esperado. En algunos lugares, medimos valores que oscilaban entre los 42 y los 43 °C y, aunque esto es algo que también se nota al utilizar el teclado, no resulta en una experiencia de usuario restringida y, una vez más, la Legion 7 rinde mejor que los dos modelos pro de la competencia a pesar de su unidad base más delgada. En la prueba de estrés con carga combinada de CPU y GPU, la GPU funciona a 90 vatios y la CPU a unos 54 vatios.
(±) La temperatura máxima en la parte superior es de 43.7 °C / 111 F, frente a la media de 40.4 °C / 105 F, que oscila entre 21.2 y 68.8 °C para la clase Gaming.
(±) El fondo se calienta hasta un máximo de 42.9 °C / 109 F, frente a la media de 43.2 °C / 110 F
(+) En reposo, la temperatura media de la parte superior es de 27 °C / 81# F, frente a la media del dispositivo de 33.9 °C / 93 F.
(±) Jugando a The Witcher 3, la temperatura media de la parte superior es de 37.2 °C / 99 F, frente a la media del dispositivo de 33.9 °C / 93 F.
(±) El reposamanos y el touchpad pueden calentarse mucho al tacto con un máximo de 38.7 °C / 101.7 F.
(-) La temperatura media de la zona del reposamanos de dispositivos similares fue de 28.8 °C / 83.8 F (-9.9 °C / -17.9 F).
| Lenovo Legion 7 16 IRX G9 Intel Core i9-14900HX, NVIDIA GeForce RTX 4070 Laptop GPU | Lenovo Legion Pro 5 16IRX9 Intel Core i9-14900HX, NVIDIA GeForce RTX 4070 Laptop GPU | Aorus 16X 2024 Intel Core i9-14900HX, NVIDIA GeForce RTX 4070 Laptop GPU | HP Omen Transcend 16-u1095ng Intel Core i9-14900HX, NVIDIA GeForce RTX 4070 Laptop GPU | Alienware m16 R2 Intel Core Ultra 7 155H, NVIDIA GeForce RTX 4070 Laptop GPU | Schenker XMG CORE 16 (L23) AMD Ryzen 7 7840HS, NVIDIA GeForce RTX 4070 Laptop GPU | Lenovo Legion Pro 7 16IRX9H Intel Core i9-14900HX, NVIDIA GeForce RTX 4080 Laptop GPU | |
|---|---|---|---|---|---|---|---|
| Heat | -15% | -10% | -14% | -20% | -7% | -18% | |
| Maximum Upper Side * (°C) | 43.7 | 43.8 -0% | 41 6% | 49 -12% | 44.8 -3% | 46 -5% | 46 -5% |
| Maximum Bottom * (°C) | 42.9 | 55.4 -29% | 41 4% | 63 -47% | 48 -12% | 44 -3% | 49 -14% |
| Idle Upper Side * (°C) | 29.1 | 32.8 -13% | 37 -27% | 30 -3% | 37.2 -28% | 32 -10% | 38 -31% |
| Idle Bottom * (°C) | 30.6 | 36 -18% | 38 -24% | 29 5% | 42 -37% | 33 -8% | 37 -21% |
* ... más pequeño es mejor
Altavoces
Ambos altavoces estéreo hacen un trabajo decente pero hay una diferencia notable entre ellos y los más caros Legion Pro 7 16. Sin embargo, son lo suficientemente buenos para películas/series ocasionales o música de fondo. A la hora de jugar, recomendaríamos utilizar unos auriculares debido a los ruidosos ventiladores.
Lenovo Legion 7 16 IRX G9 análisis de audio
(+) | los altavoces pueden reproducir a un volumen relativamente alto (#82.1 dB)
Graves 100 - 315 Hz
(±) | lubina reducida - en promedio 13.1% inferior a la mediana
(±) | la linealidad de los graves es media (9.7% delta a frecuencia anterior)
Medios 400 - 2000 Hz
(+) | medios equilibrados - a sólo 2.8% de la mediana
(+) | los medios son lineales (3.7% delta a la frecuencia anterior)
Altos 2 - 16 kHz
(+) | máximos equilibrados - a sólo 4.7% de la mediana
(±) | la linealidad de los máximos es media (7% delta a frecuencia anterior)
Total 100 - 16.000 Hz
(+) | el sonido global es lineal (12.6% de diferencia con la mediana)
En comparación con la misma clase
» 16% de todos los dispositivos probados de esta clase eran mejores, 4% similares, 81% peores
» El mejor tuvo un delta de 6%, la media fue 18%, el peor fue ###max##%
En comparación con todos los dispositivos probados
» 11% de todos los dispositivos probados eran mejores, 3% similares, 86% peores
» El mejor tuvo un delta de 4%, la media fue 23%, el peor fue ###max##%
Lenovo Legion Pro 7 16IRX9H análisis de audio
(+) | los altavoces pueden reproducir a un volumen relativamente alto (#84 dB)
Graves 100 - 315 Hz
(±) | lubina reducida - en promedio 8.9% inferior a la mediana
(±) | la linealidad de los graves es media (7.4% delta a frecuencia anterior)
Medios 400 - 2000 Hz
(+) | medios equilibrados - a sólo 2.8% de la mediana
(+) | los medios son lineales (4% delta a la frecuencia anterior)
Altos 2 - 16 kHz
(+) | máximos equilibrados - a sólo 3% de la mediana
(+) | los máximos son lineales (5% delta a la frecuencia anterior)
Total 100 - 16.000 Hz
(+) | el sonido global es lineal (8.4% de diferencia con la mediana)
En comparación con la misma clase
» 2% de todos los dispositivos probados de esta clase eran mejores, 1% similares, 97% peores
» El mejor tuvo un delta de 6%, la media fue 18%, el peor fue ###max##%
En comparación con todos los dispositivos probados
» 2% de todos los dispositivos probados eran mejores, 1% similares, 97% peores
» El mejor tuvo un delta de 4%, la media fue 23%, el peor fue ###max##%
Gestión de la energía - Duración media de las baterías
Consumo de energía
En las mediciones de consumo, el dispositivo de revisión no nos sorprendió y, en uso en reposo, registramos un máximo de casi 22 vatios. En modo de rendimiento, la fuente de alimentación de 230 vatios es brevemente el factor limitante, pero se estabilizó rápidamente y el consumo se estabilizó rápidamente en 200 vatios. En general, la PSU de 230 vatios está bien dimensionada. No obstante, Lenovo podría mejorar el consumo en modo de espera de más de 1,1 vatios.
| Off / Standby | |
| Ocioso | |
| Carga |
|
Clave:
min: | |
| Lenovo Legion 7 16 IRX G9 i9-14900HX, GeForce RTX 4070 Laptop GPU, SK Hynix HFS001TEJ9X115N, IPS, 3200x2000, 16" | Aorus 16X 2024 i9-14900HX, GeForce RTX 4070 Laptop GPU, Gigabyte AG450E1024-SI, IPS, 2560x1600, 16" | HP Omen Transcend 16-u1095ng i9-14900HX, GeForce RTX 4070 Laptop GPU, Kioxia XG8 KXG80ZNV1T02, OLED, 2560x1600, 16" | Alienware m16 R2 Ultra 7 155H, GeForce RTX 4070 Laptop GPU, Samsung PM9A1 MZVL21T0HCLR, IPS, 2560x1600, 16" | Schenker XMG CORE 16 (L23) R7 7840HS, GeForce RTX 4070 Laptop GPU, Samsung 990 Pro 1 TB, IPS, 2560x1600, 16" | Lenovo Legion Pro 7 16IRX9H i9-14900HX, GeForce RTX 4080 Laptop GPU, SK Hynix HFS001TEJ9X115N, IPS, 2560x1600, 16" | Medio NVIDIA GeForce RTX 4070 Laptop GPU | Media de la clase Gaming | |
|---|---|---|---|---|---|---|---|---|
| Power Consumption | -4% | 4% | 6% | 20% | -27% | 10% | 5% | |
| Idle Minimum * (Watt) | 15.4 | 13 16% | 10 35% | 8.1 47% | 11 29% | 16 -4% | 13.2 ? 14% | 13 ? 16% |
| Idle Average * (Watt) | 21.2 | 18 15% | 18 15% | 13 39% | 15.2 28% | 21 1% | 18.2 ? 14% | 18.7 ? 12% |
| Idle Maximum * (Watt) | 21.9 | 35 -60% | 32 -46% | 40.3 -84% | 16 27% | 36 -64% | 24.6 ? -12% | 24.3 ? -11% |
| Load Average * (Watt) | 128.5 | 138 -7% | 128 -0% | 79 39% | 64 50% | 132 -3% | 97 ? 25% | 110.2 ? 14% |
| Witcher 3 ultra * (Watt) | 188.4 | 172.6 8% | 148.4 21% | 188.1 -0% | 179 5% | 267 -42% | ||
| Load Maximum * (Watt) | 239.1 | 222 7% | 242 -1% | 254.9 -7% | 280 -17% | 360 -51% | 221 ? 8% | 258 ? -8% |
* ... más pequeño es mejor
Power consumption Witcher 3 / stress test
Power consumption with an external monitor
Duración de las pilas
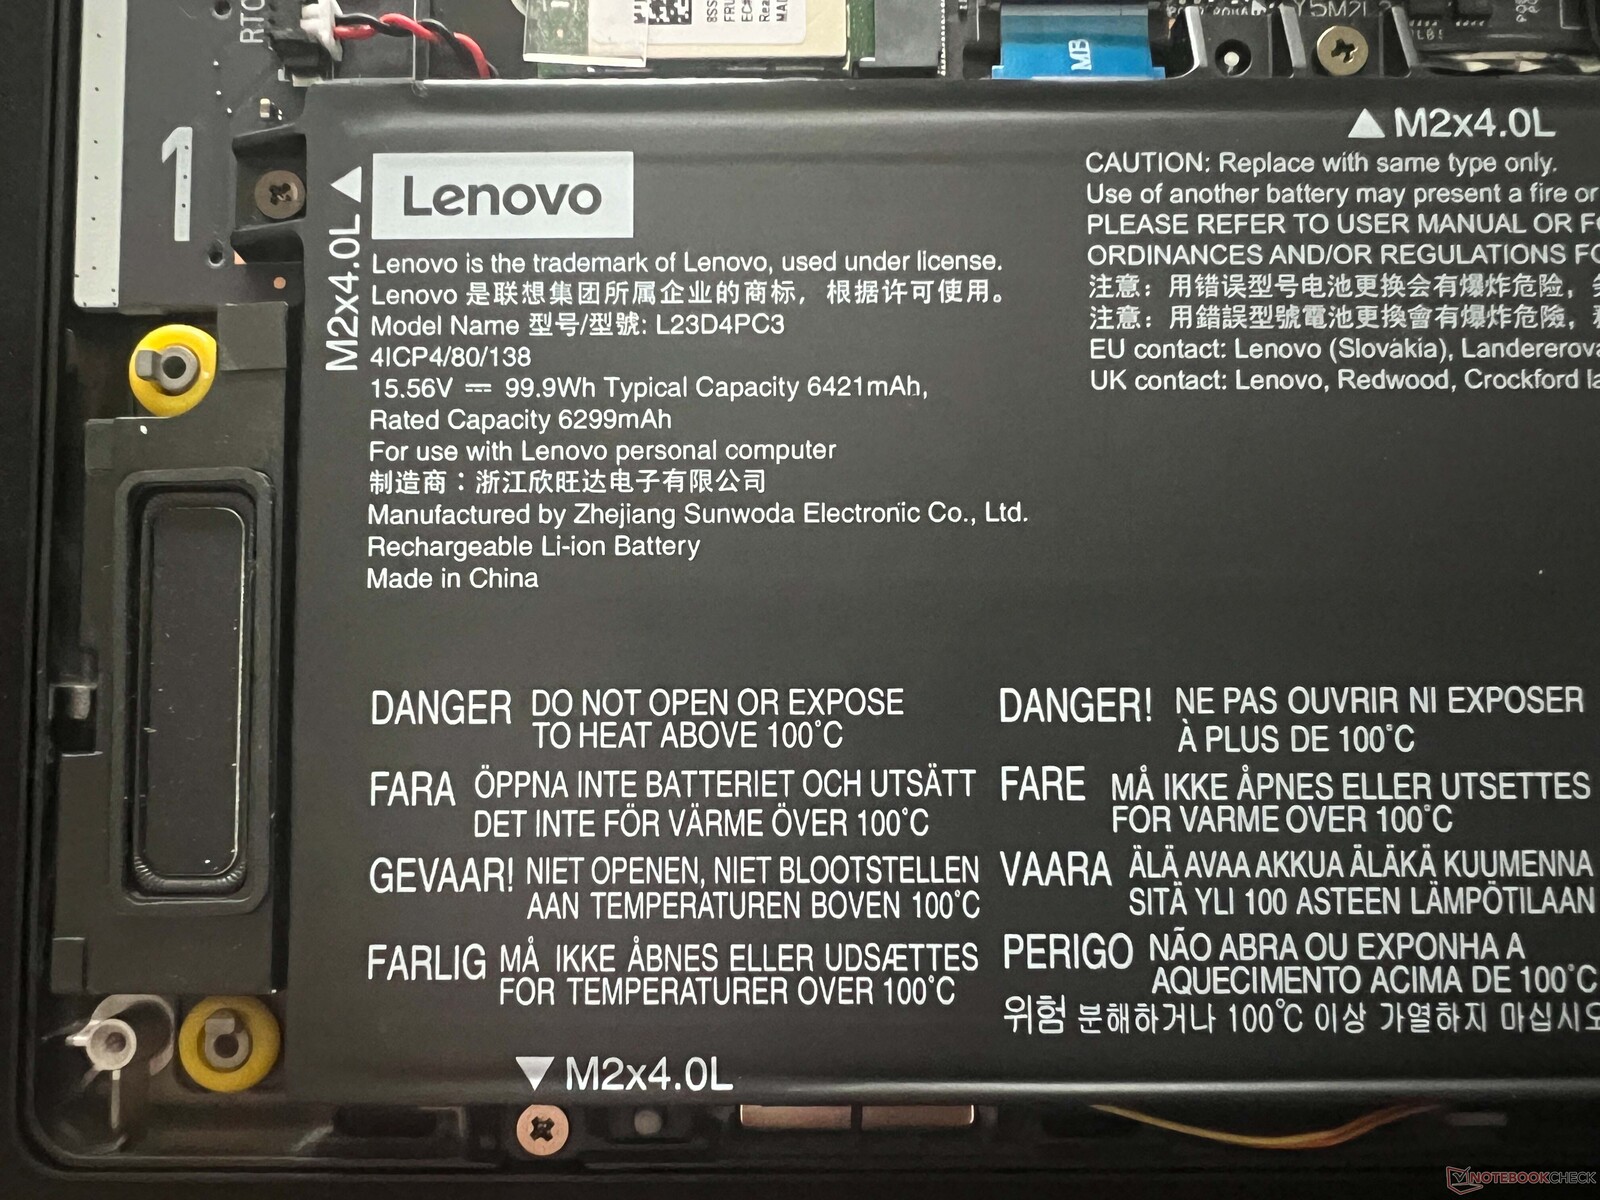
Lenovo ha instalado una batería de 99,9 Wh en su Legion 7 16 y, en general, los tiempos de ejecución pueden considerarse bastante medios. A 150 cd/m² (lo que representa el 63 % del brillo máximo del dispositivo de revisión) y 60 Hz, nuestra prueba Wi-Fi duró más de 7 horas (~6,5 horas a 165 Hz) y alrededor de 5,5 horas a brillo máximo y 60 Hz (~5 horas a 165 Hz). En la prueba de vídeo a 150 cd/m², registramos algo más de 10 horas, y bajo carga, en el peor de los casos, las luces se apagan a los 50 minutos.
La Legion ofrece dos modos de carga, con un ciclo de carga completo que tarda 97 minutos (80 % tras ~64 minutos) utilizando el modo normal. Con el modo exprés, tarda 79 minutos (80 % tras sólo 34 minutos).
| Lenovo Legion 7 16 IRX G9 i9-14900HX, GeForce RTX 4070 Laptop GPU, 99.9 Wh | Lenovo Legion Pro 5 16IRX9 i9-14900HX, GeForce RTX 4070 Laptop GPU, 80 Wh | Aorus 16X 2024 i9-14900HX, GeForce RTX 4070 Laptop GPU, 99 Wh | HP Omen Transcend 16-u1095ng i9-14900HX, GeForce RTX 4070 Laptop GPU, 97 Wh | Alienware m16 R2 Ultra 7 155H, GeForce RTX 4070 Laptop GPU, 90 Wh | Schenker XMG CORE 16 (L23) R7 7840HS, GeForce RTX 4070 Laptop GPU, 99 Wh | Lenovo Legion Pro 7 16IRX9H i9-14900HX, GeForce RTX 4080 Laptop GPU, 99.9 Wh | Media de la clase Gaming | |
|---|---|---|---|---|---|---|---|---|
| Duración de Batería | 3% | 37% | -32% | 19% | 72% | -14% | 23% | |
| H.264 (h) | 10.3 | 9 -13% | 10.2 -1% | 8.32 ? -19% | ||||
| WiFi v1.3 (h) | 7.2 | 4.8 -33% | 8 11% | 4.9 -32% | 8.1 13% | 8.4 17% | 6.2 -14% | 7.11 ? -1% |
| Load (h) | 0.8 | 1.1 38% | 1.7 113% | 1 25% | 2.4 200% | 1.502 ? 88% | ||
| Reader / Idle (h) | 6.7 | 12.6 | 12.6 | 8.16 ? |
Pro
Contra
Veredicto - Un portátil para juegos discreto y de alto rendimiento

Con el nuevo Legion 7i 16 G9, Lenovo ofrece un portátil para juegos comparativamente delgado que no reveló ninguna debilidad evidente durante las pruebas. En comparación con el más caro Legion Pro 7hay que aceptar limitaciones en lo que se refiere al rendimiento de la CPU durante largos periodos de tiempo, así como de la GPU equipada (el Legion 7 alcanza como máximo el portátil RTX 4070) pero, en comparación con el Pro, la carcasa de aluminio se mantiene más fresca y, en general, la refrigeración hace un muy buen trabajo. Los ventiladores siguen siendo problemáticos porque necesitará unos auriculares cuando juegue, utilizando cualquiera de los modos de energía rápida. Sin embargo, eso también se aplica a la competencia y, utilizando el modo silencioso, es posible tener niveles de sonido tolerables a expensas de algo de rendimiento.
Además, la carcasa más delgada destaca mucho menos que la del Legion Pro. Quien busque amplias opciones de iluminación se sentirá decepcionado pero, por otro lado, esto también hace que la Legion 7 16 sea adecuada para otros grupos objetivo. Lo único molesto son las superficies sensibles a las huellas dactilares. Aparte del puerto Ethernet que falta, todos los conectores importantes están a bordo y no hay problemas cuando se trata de los dispositivos de entrada.
El nuevo Lenovo Legion 7i 16 G9 es un llamativo portátil para juegos con bolsas de rendimiento y un buen conjunto de características. La pantalla IPS de alta resolución también es adecuada para ver y editar imágenes y no implementa PWM.
En general, la pantalla IPS opcional y su resolución de 3.200 x 2.000 píxeles hacen un buen trabajo, aunque la impresión subjetiva de la imagen y los tiempos de respuesta no pueden seguir el ritmo de los paneles OLED. La parte positiva es la falta de PWM y los molestos reflejos también están ausentes. Del mismo modo, la autonomía de la batería es sólo la media, ya que la plataforma y su procesador HX simplemente requieren demasiada energía.
El nuevo Legion 7 16 también rinde bien cuando se le compara con sus compañeros. En particular, el Legion Pro 7 es adecuado si desea una GPU más rápida que la RTX 4070 del portátil. Con una potencia comparable, la Legion Pro 5 es, por el contrario, significativamente más voluminoso y también ofrece una pantalla más pobre. El HP Omen Transcend viene con una OLED de 240 Hz pero también ofrece un rendimiento algo inferior y un precio más elevado.
Precio y disponibilidad
La Legion 7i 16 G9 puede comprarse directamente a Lenovo por unos 2.099 dólares.
Lenovo Legion 7 16 IRX G9
- 04/13/2024 v7 (old)
Andreas Osthoff
Transparencia
La selección de los dispositivos que se van a reseñar corre a cargo de nuestro equipo editorial. La muestra de prueba fue proporcionada al autor en calidad de préstamo por el fabricante o el minorista a los efectos de esta reseña. El prestamista no tuvo ninguna influencia en esta reseña, ni el fabricante recibió una copia de la misma antes de su publicación. No había ninguna obligación de publicar esta reseña. Como empresa de medios independiente, Notebookcheck no está sujeta a la autoridad de fabricantes, minoristas o editores.
Así es como prueba Notebookcheck
Cada año, Notebookcheck revisa de forma independiente cientos de portátiles y smartphones utilizando procedimientos estandarizados para asegurar que todos los resultados son comparables. Hemos desarrollado continuamente nuestros métodos de prueba durante unos 20 años y hemos establecido los estándares de la industria en el proceso. En nuestros laboratorios de pruebas, técnicos y editores experimentados utilizan equipos de medición de alta calidad. Estas pruebas implican un proceso de validación en varias fases. Nuestro complejo sistema de clasificación se basa en cientos de mediciones y puntos de referencia bien fundamentados, lo que mantiene la objetividad.Price comparison

