Veredicto - Lenovo Legion 7a 16 es más ligero, pero también más lento que antes
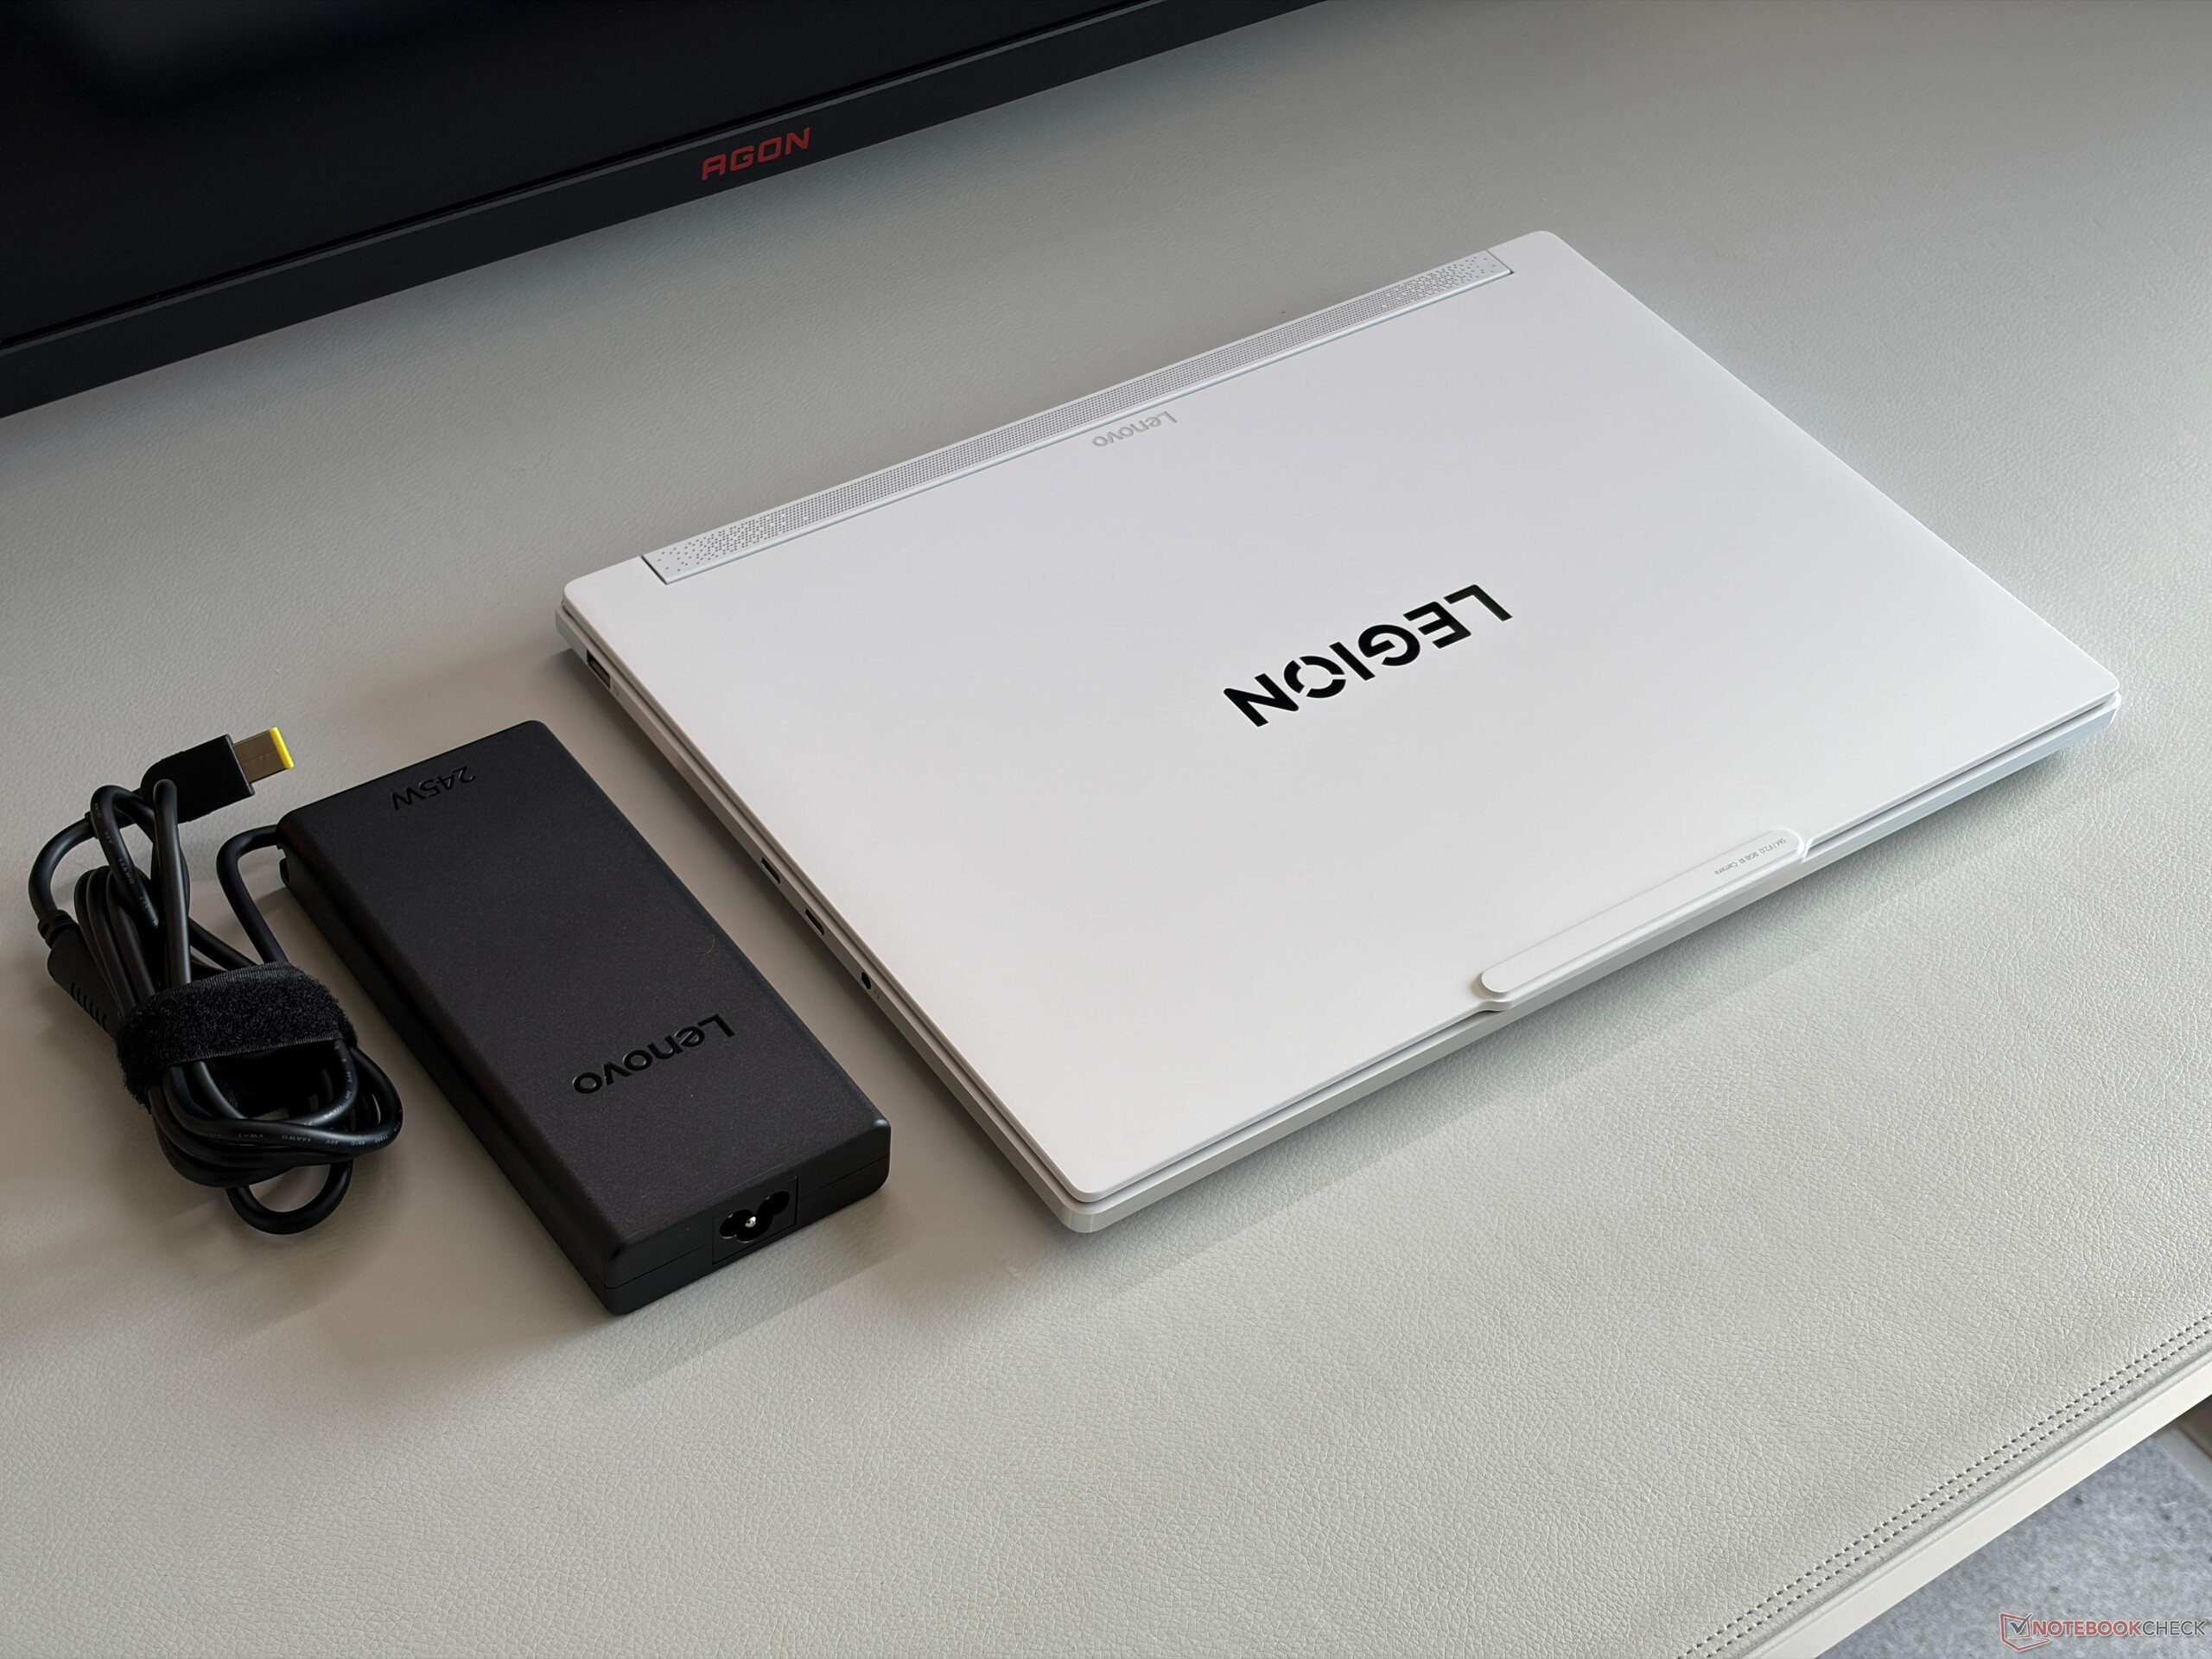
El nuevo Legion 7a 16 Gen 11 de Lenovo es un portátil para juegos de 16 pulgadas elegante y sorprendentemente ligero con una magnífica pantalla OLED (240 Hz, VRR, G-Sync). El chasis de aluminio es muy robusto y tiene buen aspecto y, aunque puede instalar dos SSD, la RAM está desgraciadamente soldada. También dispone de un número suficiente de puertos, un teclado muy cómodo y unos altavoces decentes.
El problema es que el menor peso también afecta al rendimiento porque Lenovo solo utiliza la Ryzen AI 9 HX470, que no puede seguir el ritmo de la antigua Intel Core Ultra 7 255HX y la GeForce RTX 5060 móvil solo funciona hasta 95 W en modo Rendimiento ahora en lugar de 115 W. Puede utilizar el modo manual y ajustar el TGP a 115 vatios, pero esto es poco práctico y el modo manual sólo se puede seleccionar en la aplicación.
Si busca un portátil de 16 pulgadas elegante y móvil, el nuevo Legion 7a 16 es una buena opción, pero tiene que hacer algunas concesiones en términos de rendimiento. Ahora mismo, la mejor opción es probablemente la antigua generación G10 del Legion 7 16, que es un poco más potente, ofrece RAM ampliable y es menos cara, pero carece de Advanced Optimus.
Pro
Contra
- $2,249.99Lenovo Legion 7a Gen 11 16" Gaming Laptop with AMD Ryzen AI 9 HX 470 Processor, NVIDIA GeForce RTX 5060, OLED WQXGA 240Hz Non-Touch Display, 32GB LPDDR5X-8533MT RAM, 1TB SSD, and Windows 11 Home
- $3,450.00Lenovo Legion Pro 7 16IAX10H OLED 16" 240Hz Glossy Display, Gaming Laptop, Intel Core Ultra 9 275HX 2.1GHz; NVIDIA GeForce RTX 5070 Ti 12GB GDDR7; 32GB DDR5-6400 RAM; 2X 1TB SSD
- $3,649.99Lenovo Legion Pro 7i Gen 10 16" Gaming Laptop (2025 Model) Intel Core Ultra 9 275HX 24C, NVIDIA GeForce RTX 5080 16GB, 32GB RAM, 1TB Gen 5 NVMe SSD, 16.0" WQXGA OLED 500 nits 240Hz, Windows 11 Pro
Índice
- Veredicto - Lenovo Legion 7a 16 es más ligero, pero también más lento que antes
- Especificaciones
- Caso
- Dispositivos de entrada - Teclado RGB con recorrido de 1,6 mm
- Pantalla - Impresionante OLED con 240 Hz y VRR
- Rendimiento - Ryzen 400 y Blackwell
- Emisiones
- Gestión de la energía
- Valoración de Notebookcheck
- Competidores potenciales en comparación
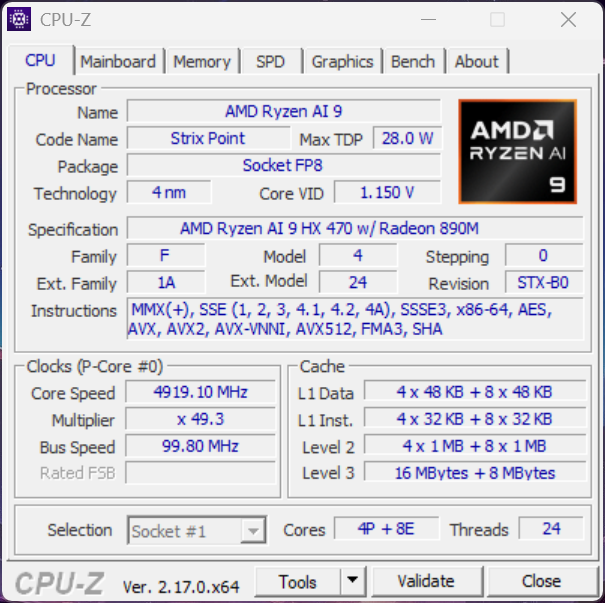
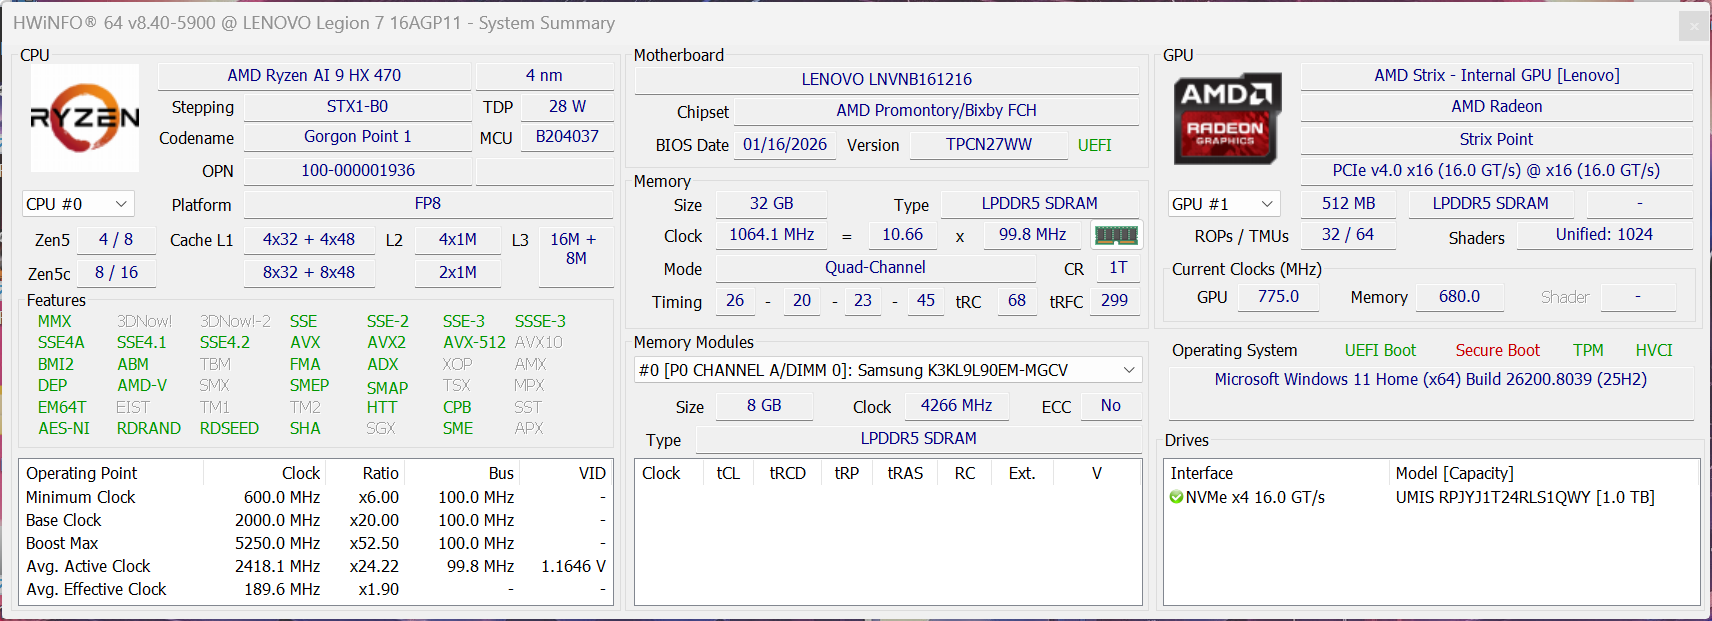
Lenovo lanza una nueva versión de su portátil para juegos de 16 pulgadas Legion 7 y el nuevo modelo Legion 7a G11 utiliza procesadores AMD Ryzen 400. Las opciones de GPU se limitan a la versión móvil de la Nvidia GeForce RTX 5060, que ahora es compatible con la conmutación de gráficos Advanced Optimus. El precio de partida es de 2079 dólares, mientras que nuestra unidad de revisión con la CPU Ryzen AI 9 HX 470 más rápida cuesta 2279 dólares.
Especificaciones
Caso
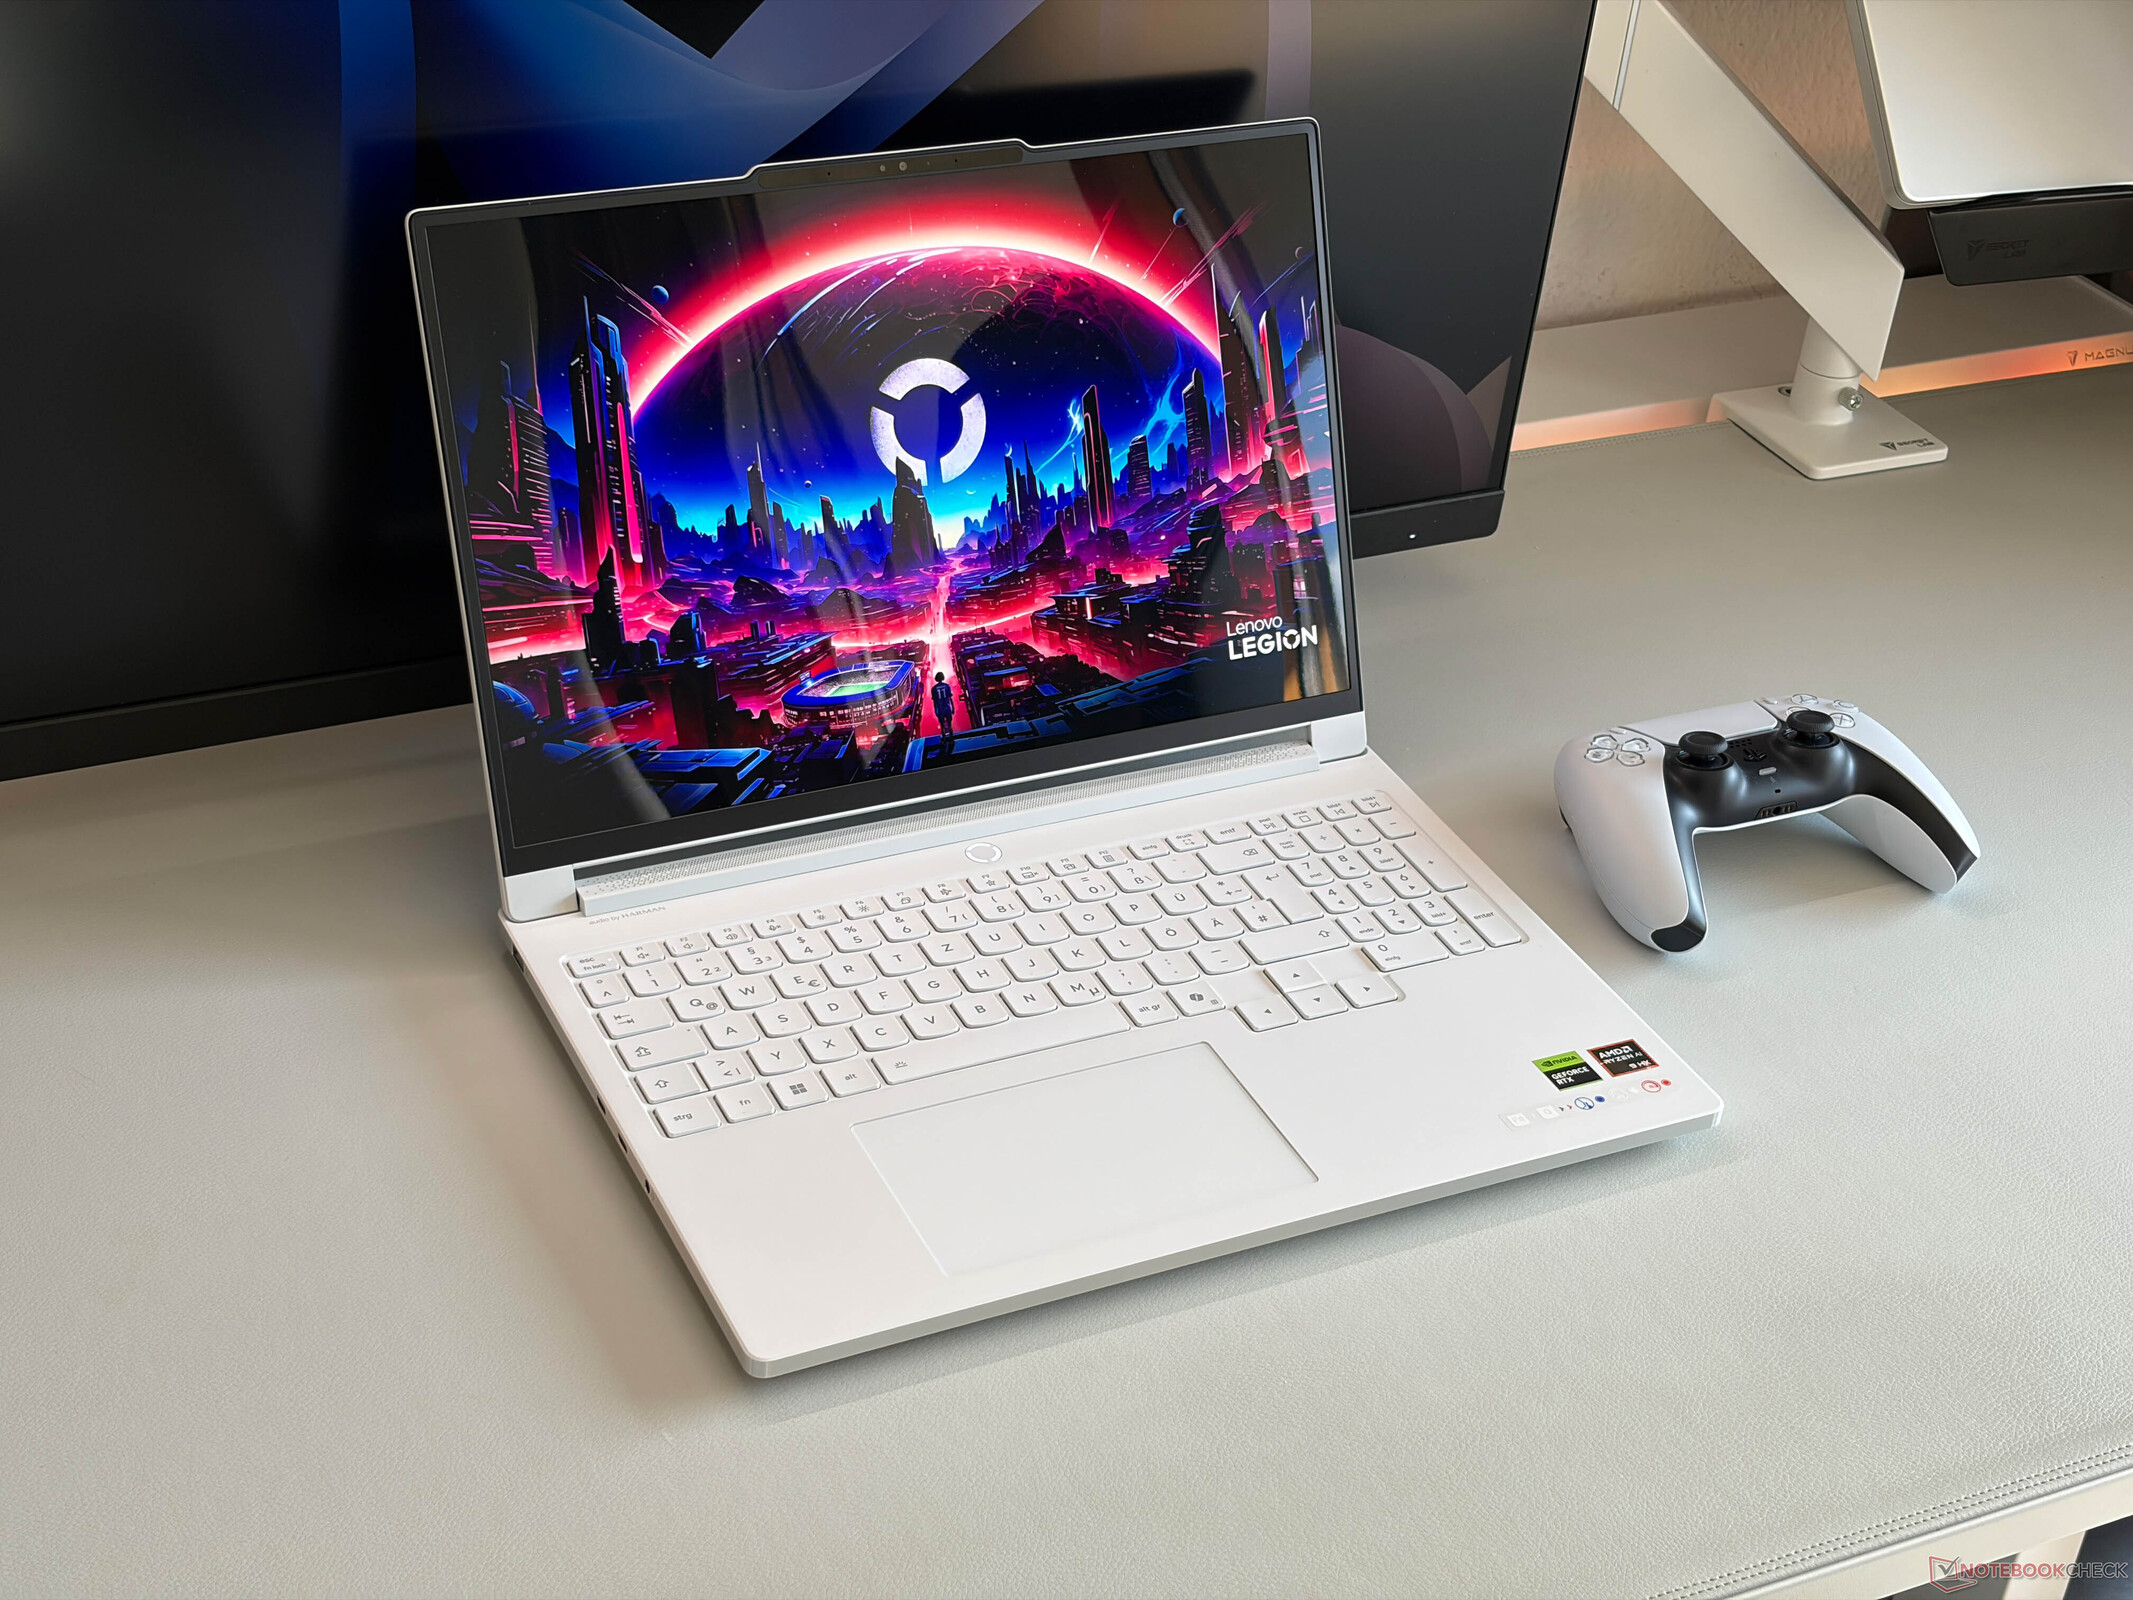
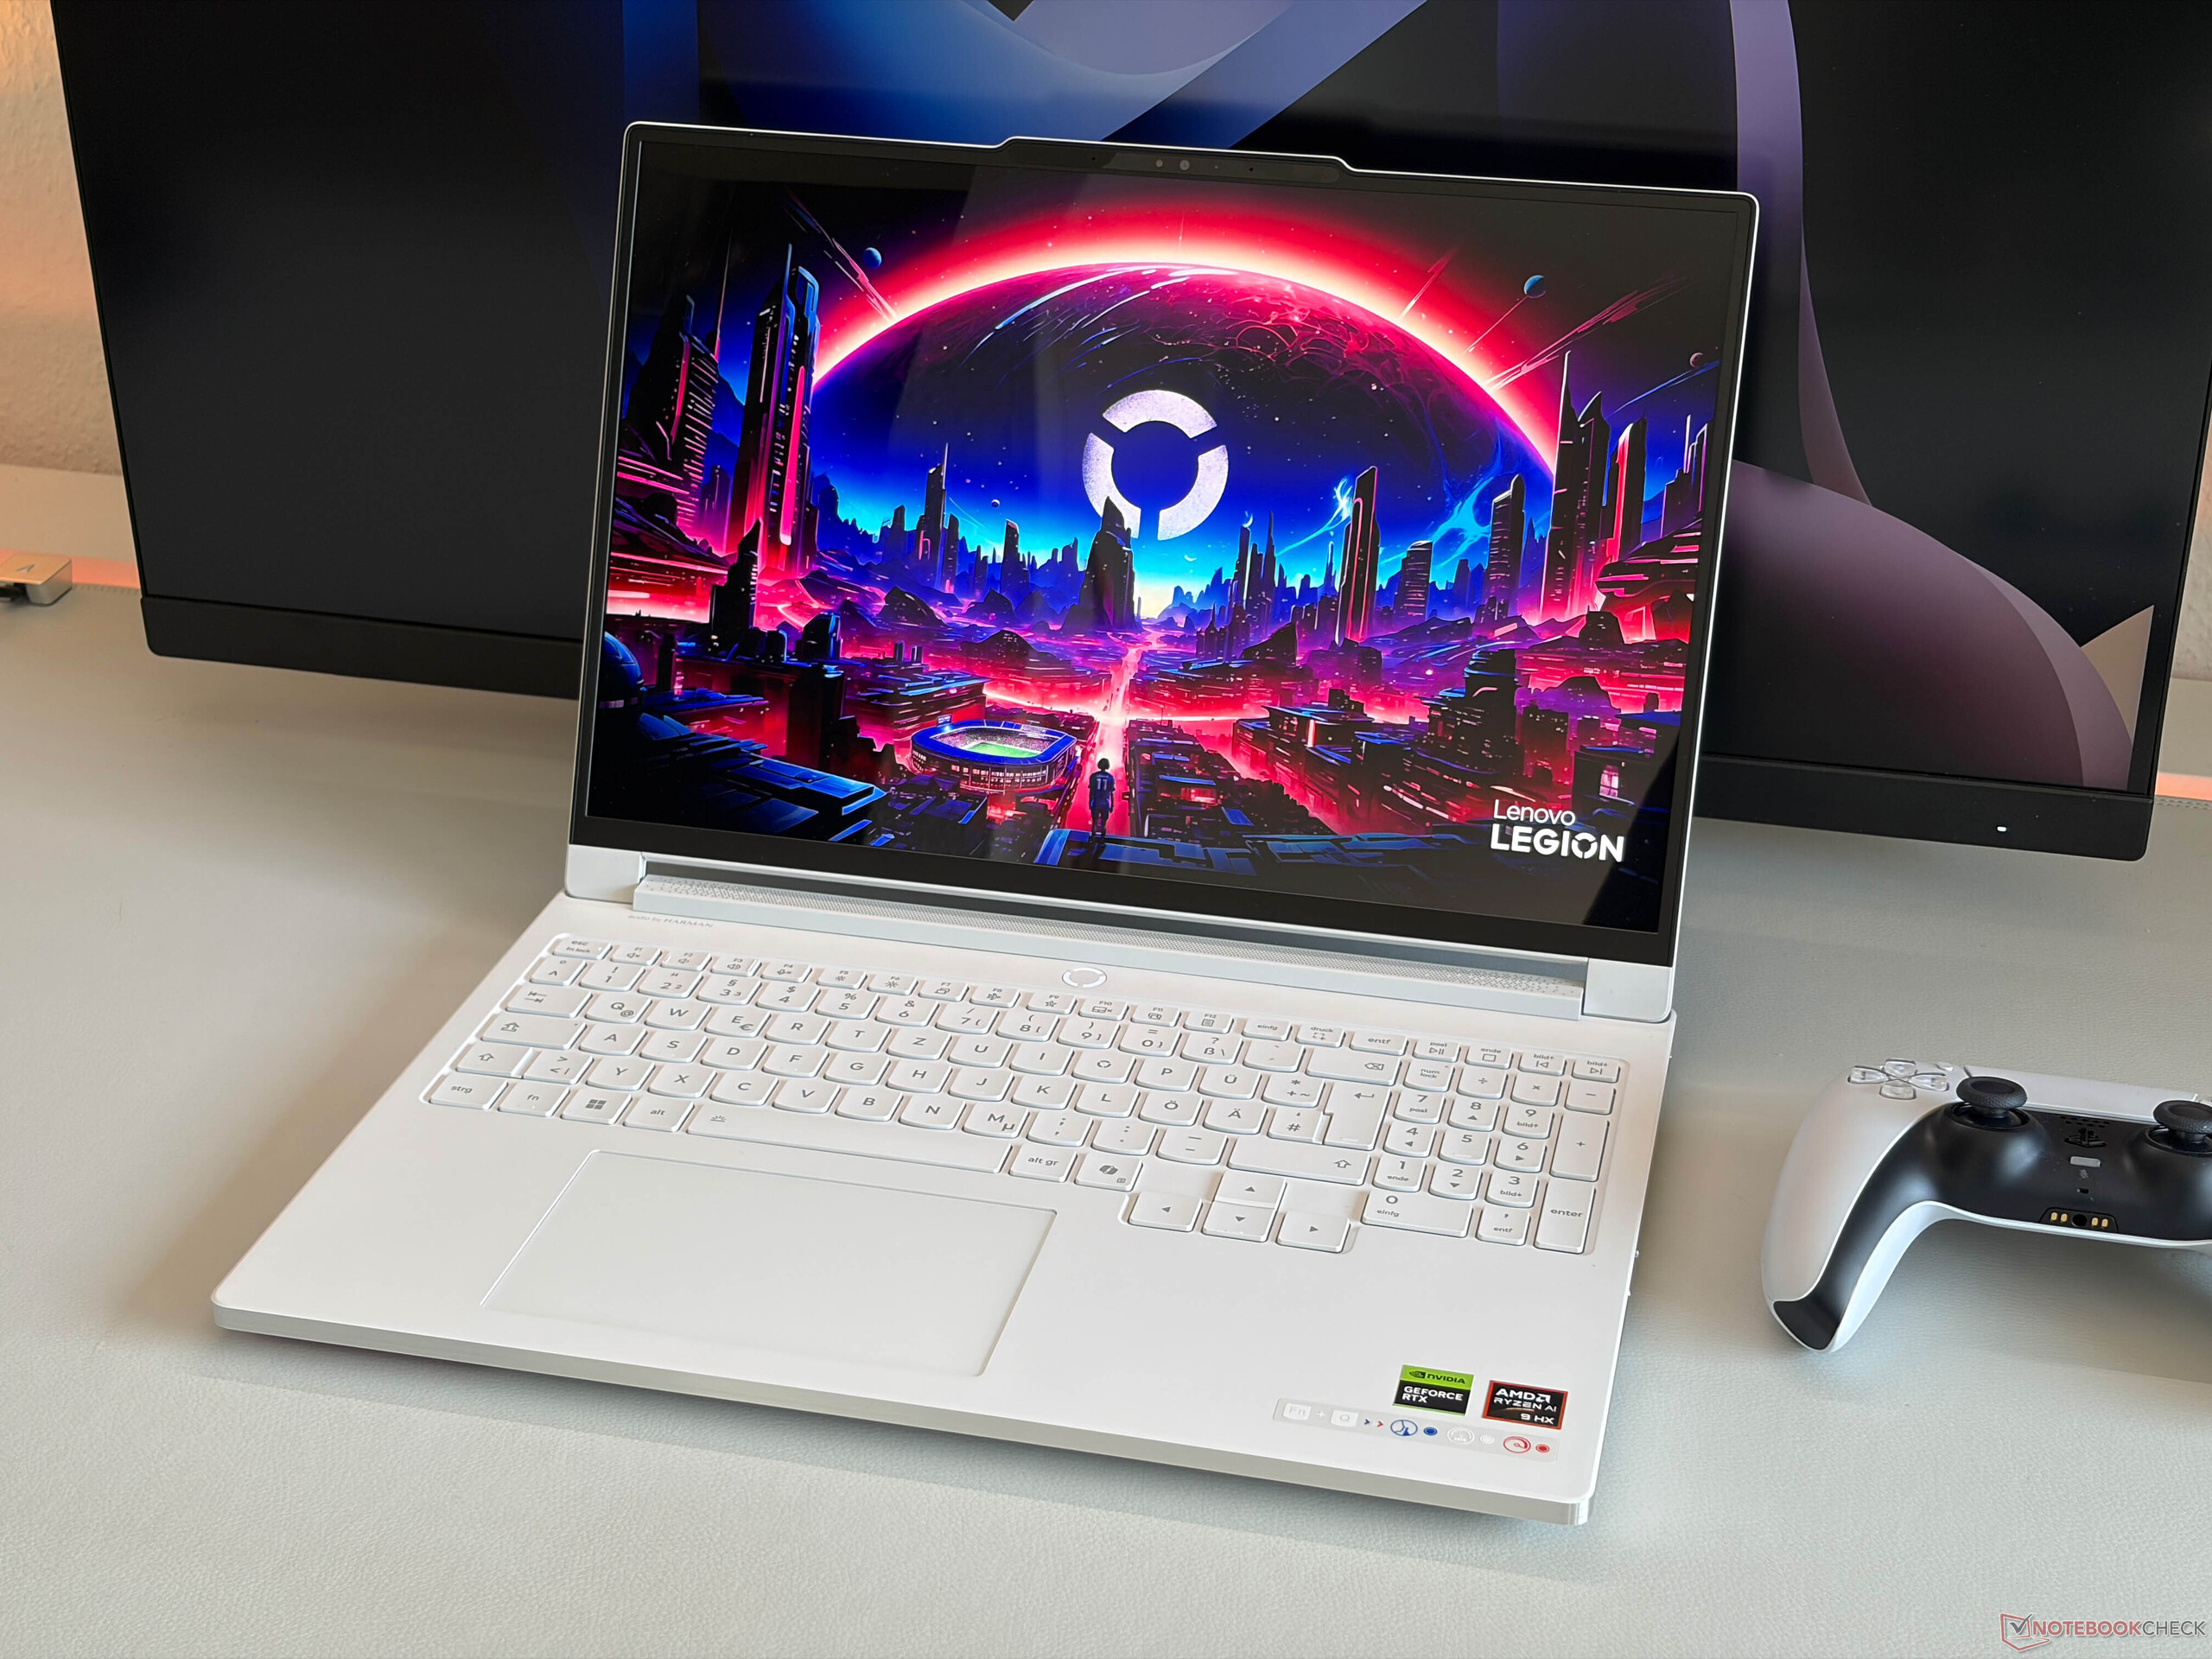
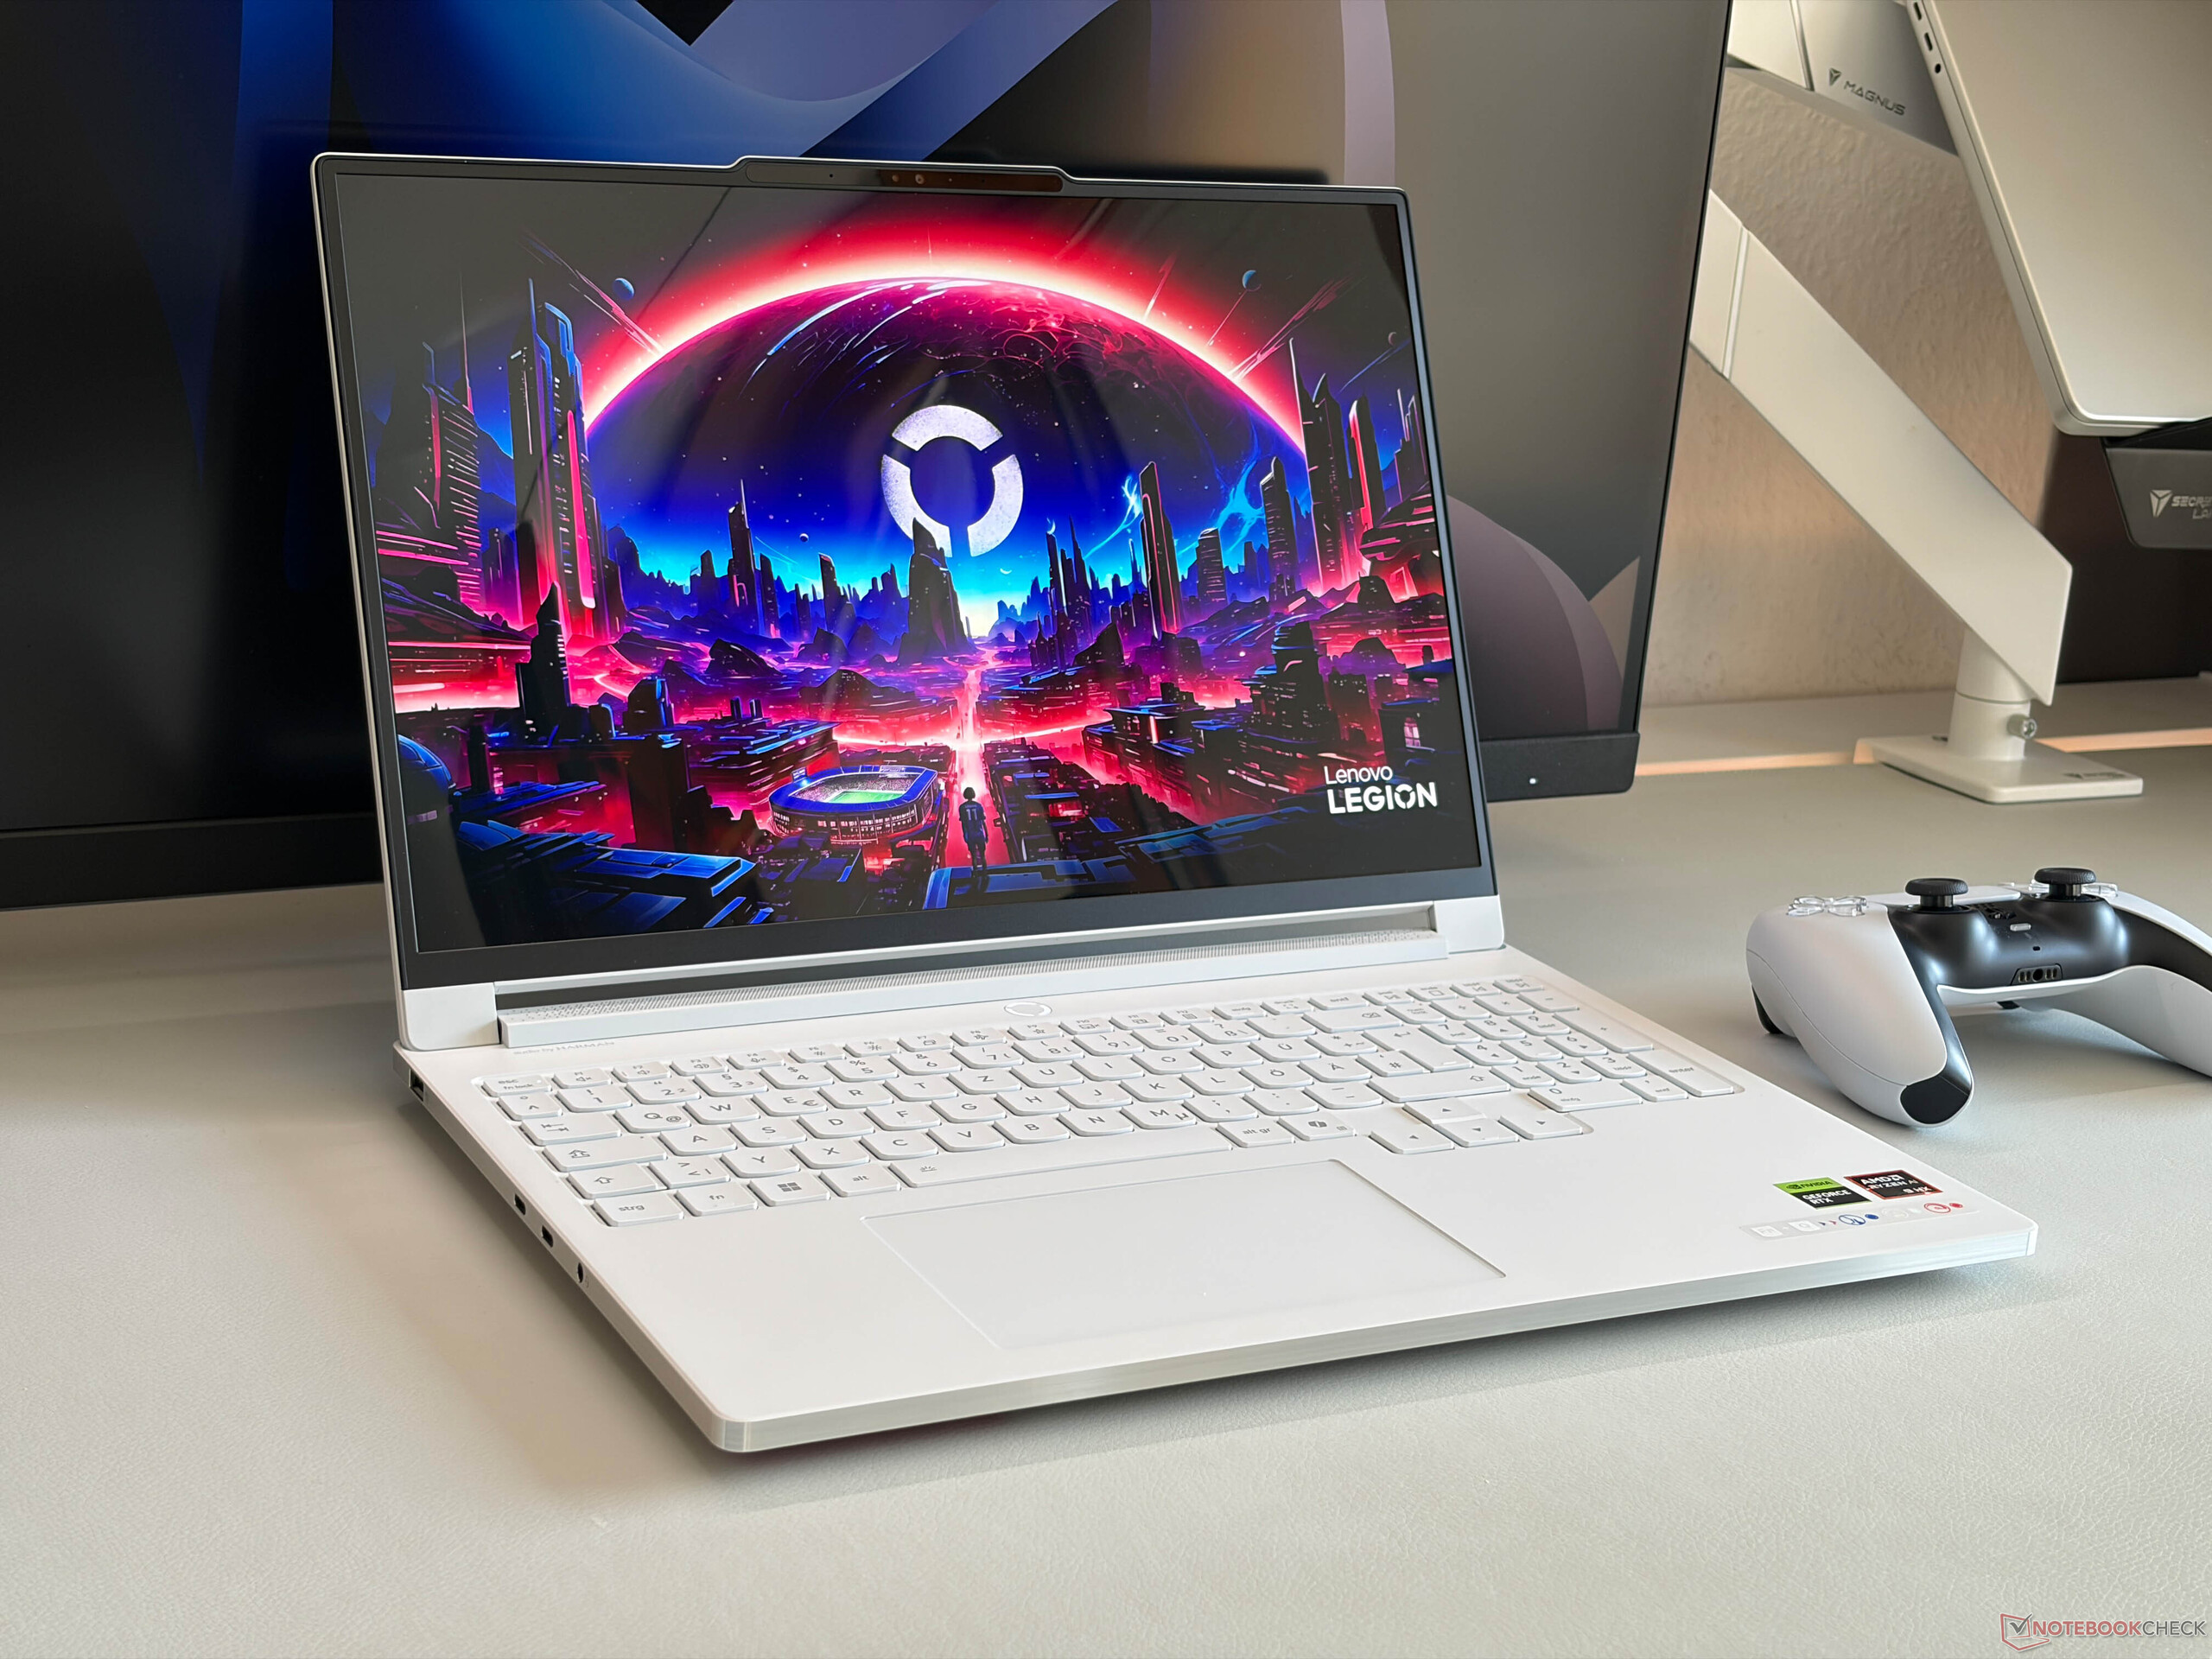
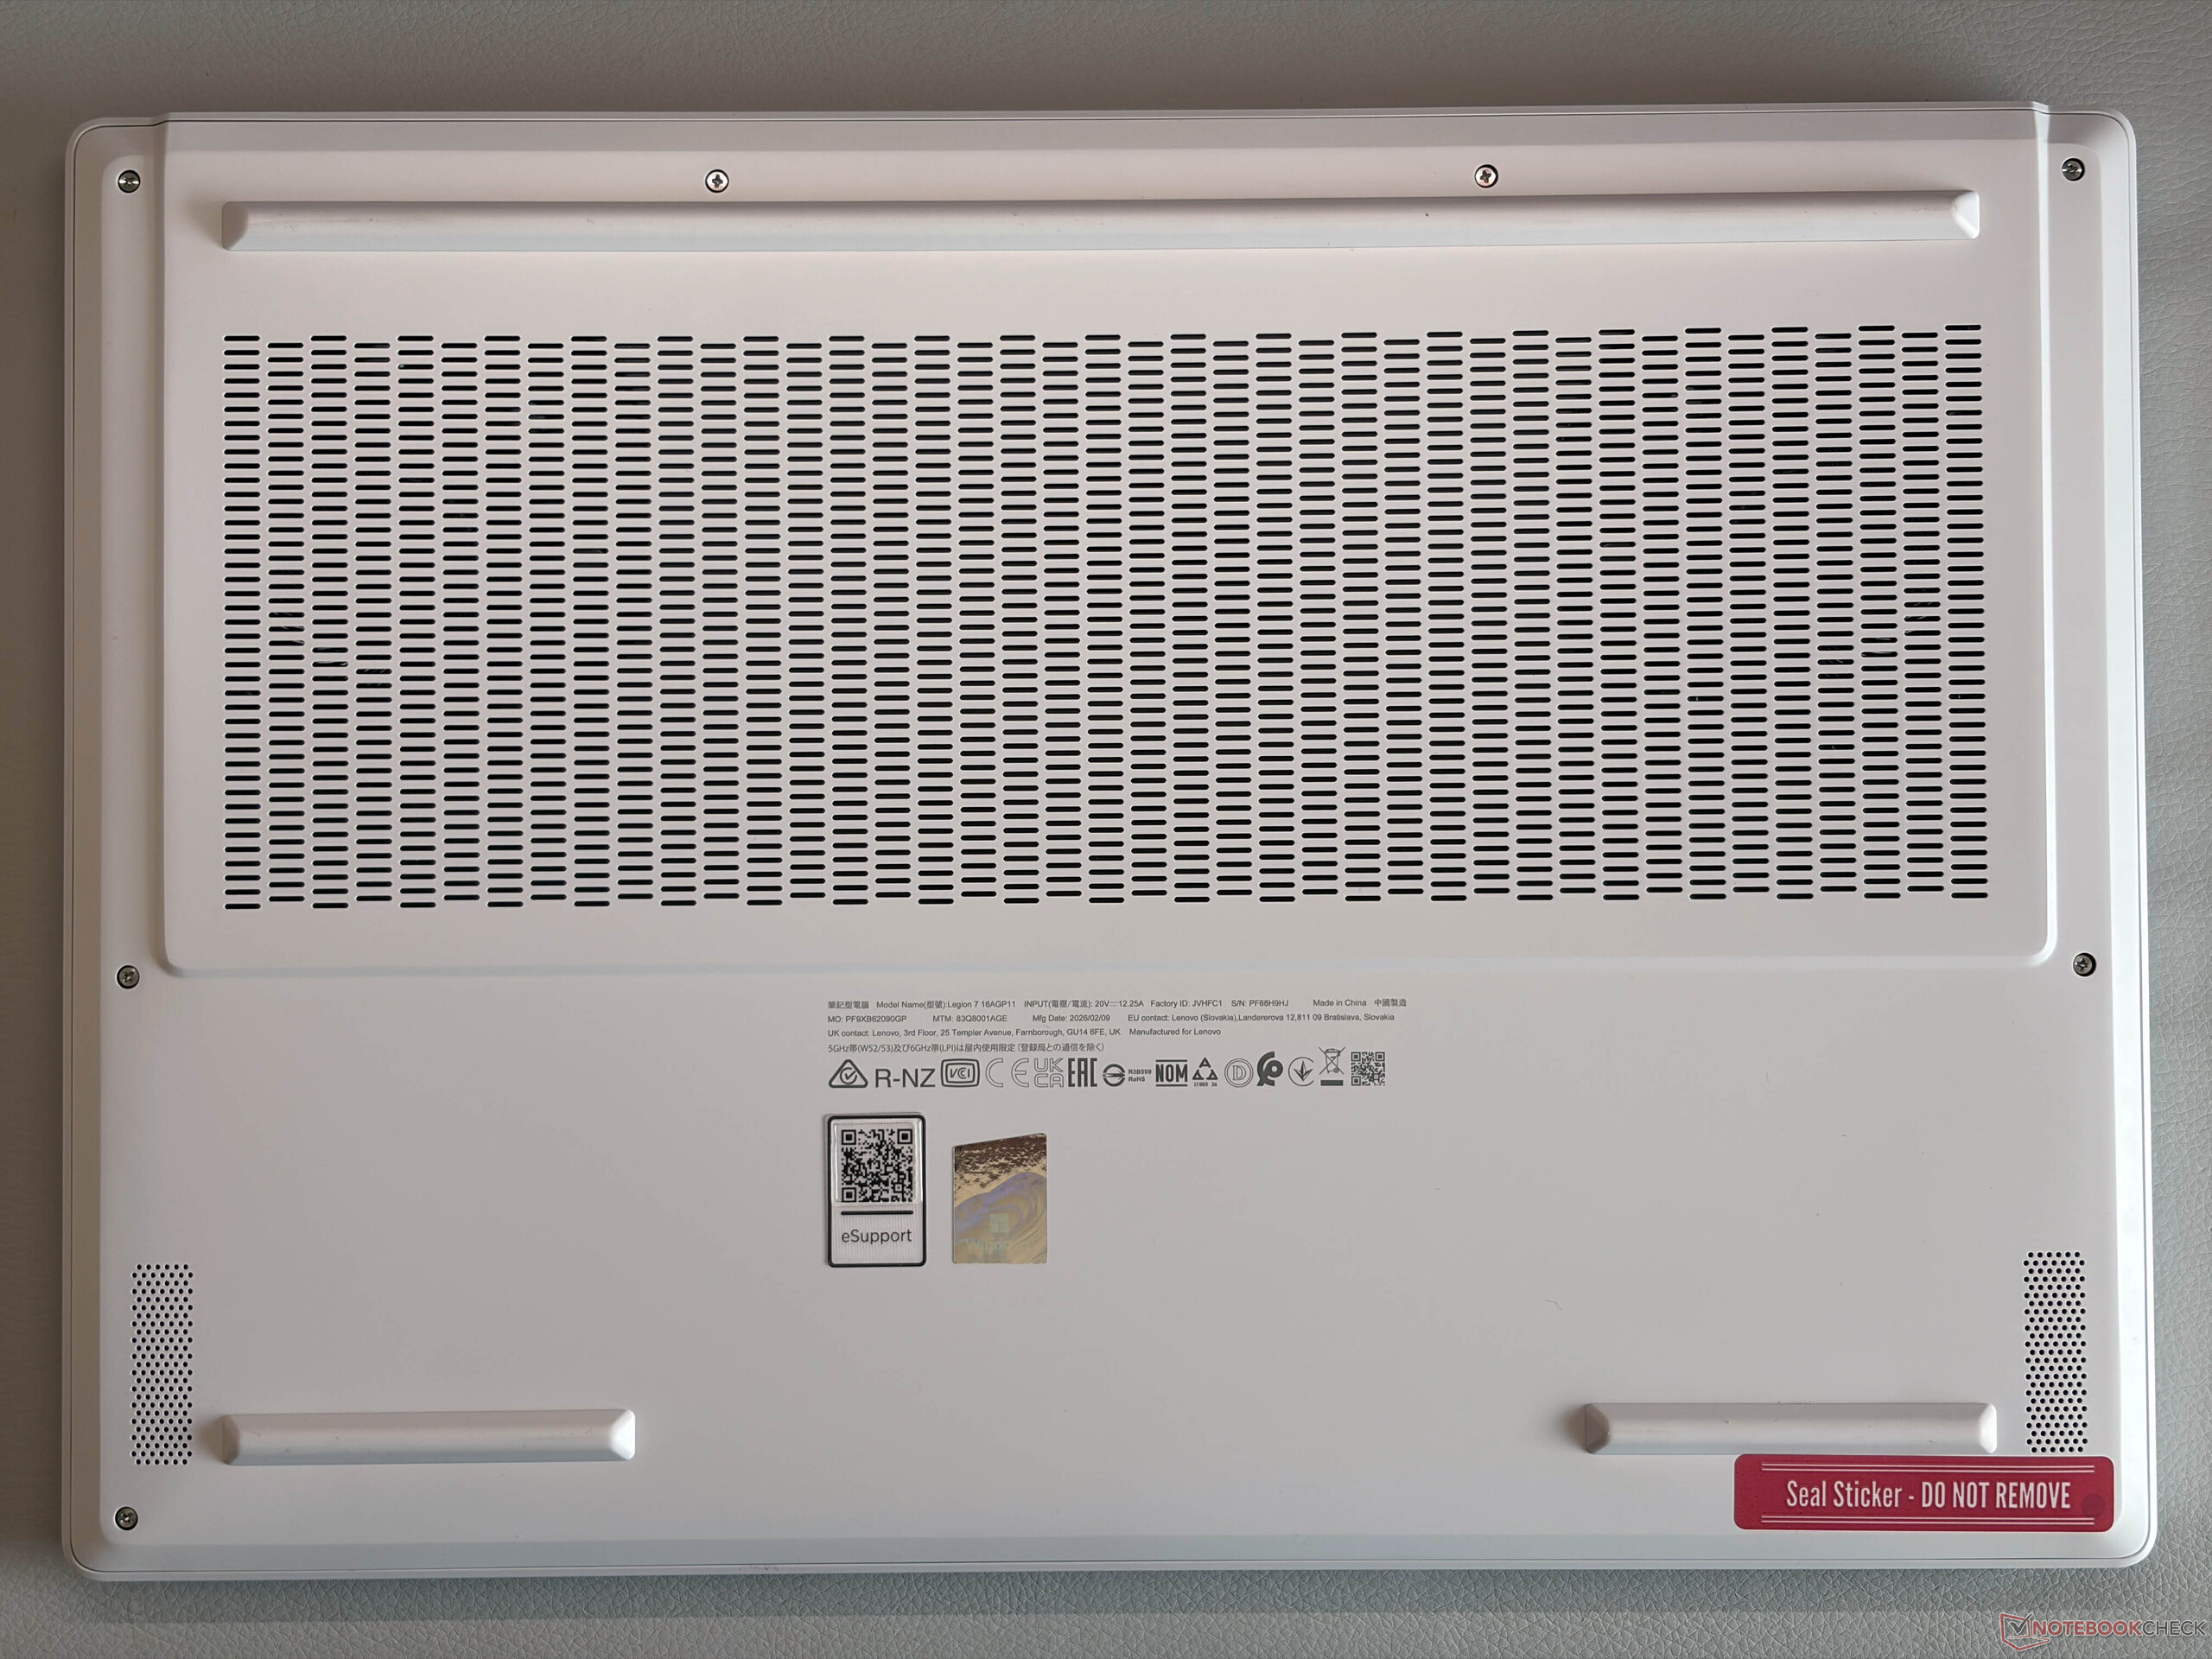
El diseño de la nueva Legion 7a 16 es prácticamente idéntico al de la versión anterior y, una vez más, puede elegir entre el blanco glaciar o el azul nebulosa. Sin embargo, mientras que el Legion 7i 16 G10 ya era bastante ligero con 1,978 kg, el nuevo Legion 7a 16 es incluso 200 gramos más ligero (1,78 kg) y, por tanto, también es claramente el aparato más ligero dentro de nuestro grupo de comparación.
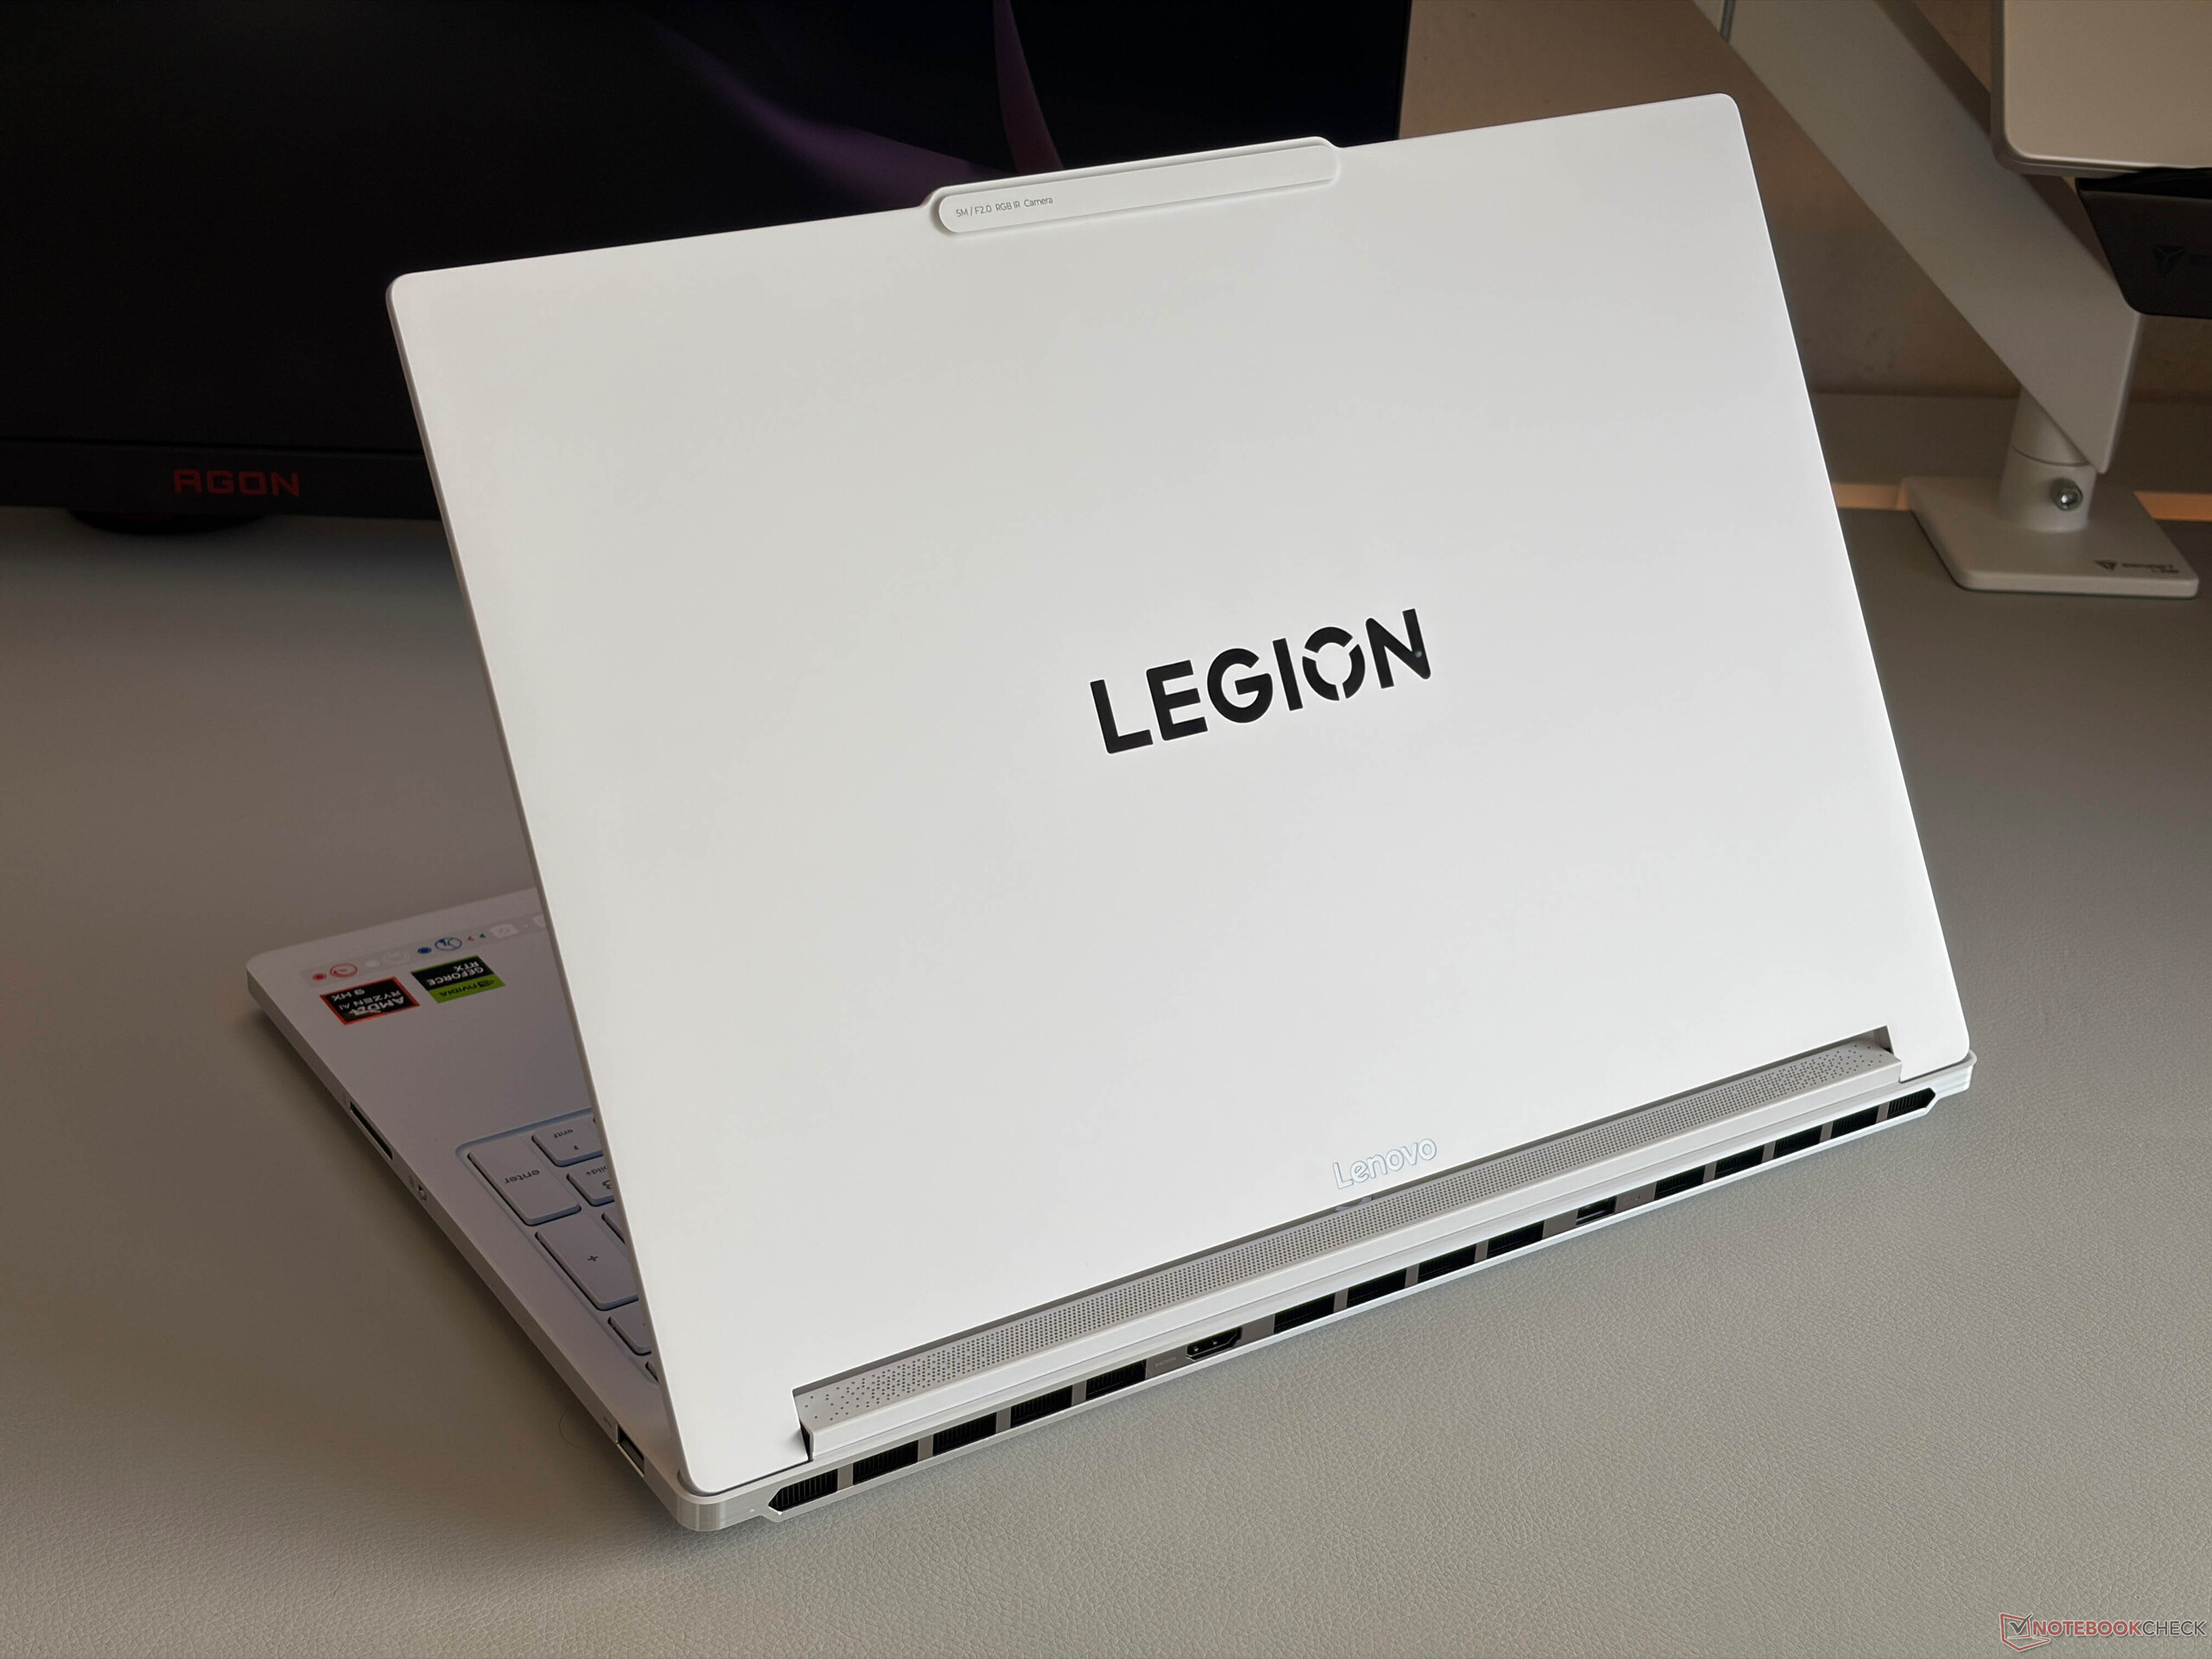
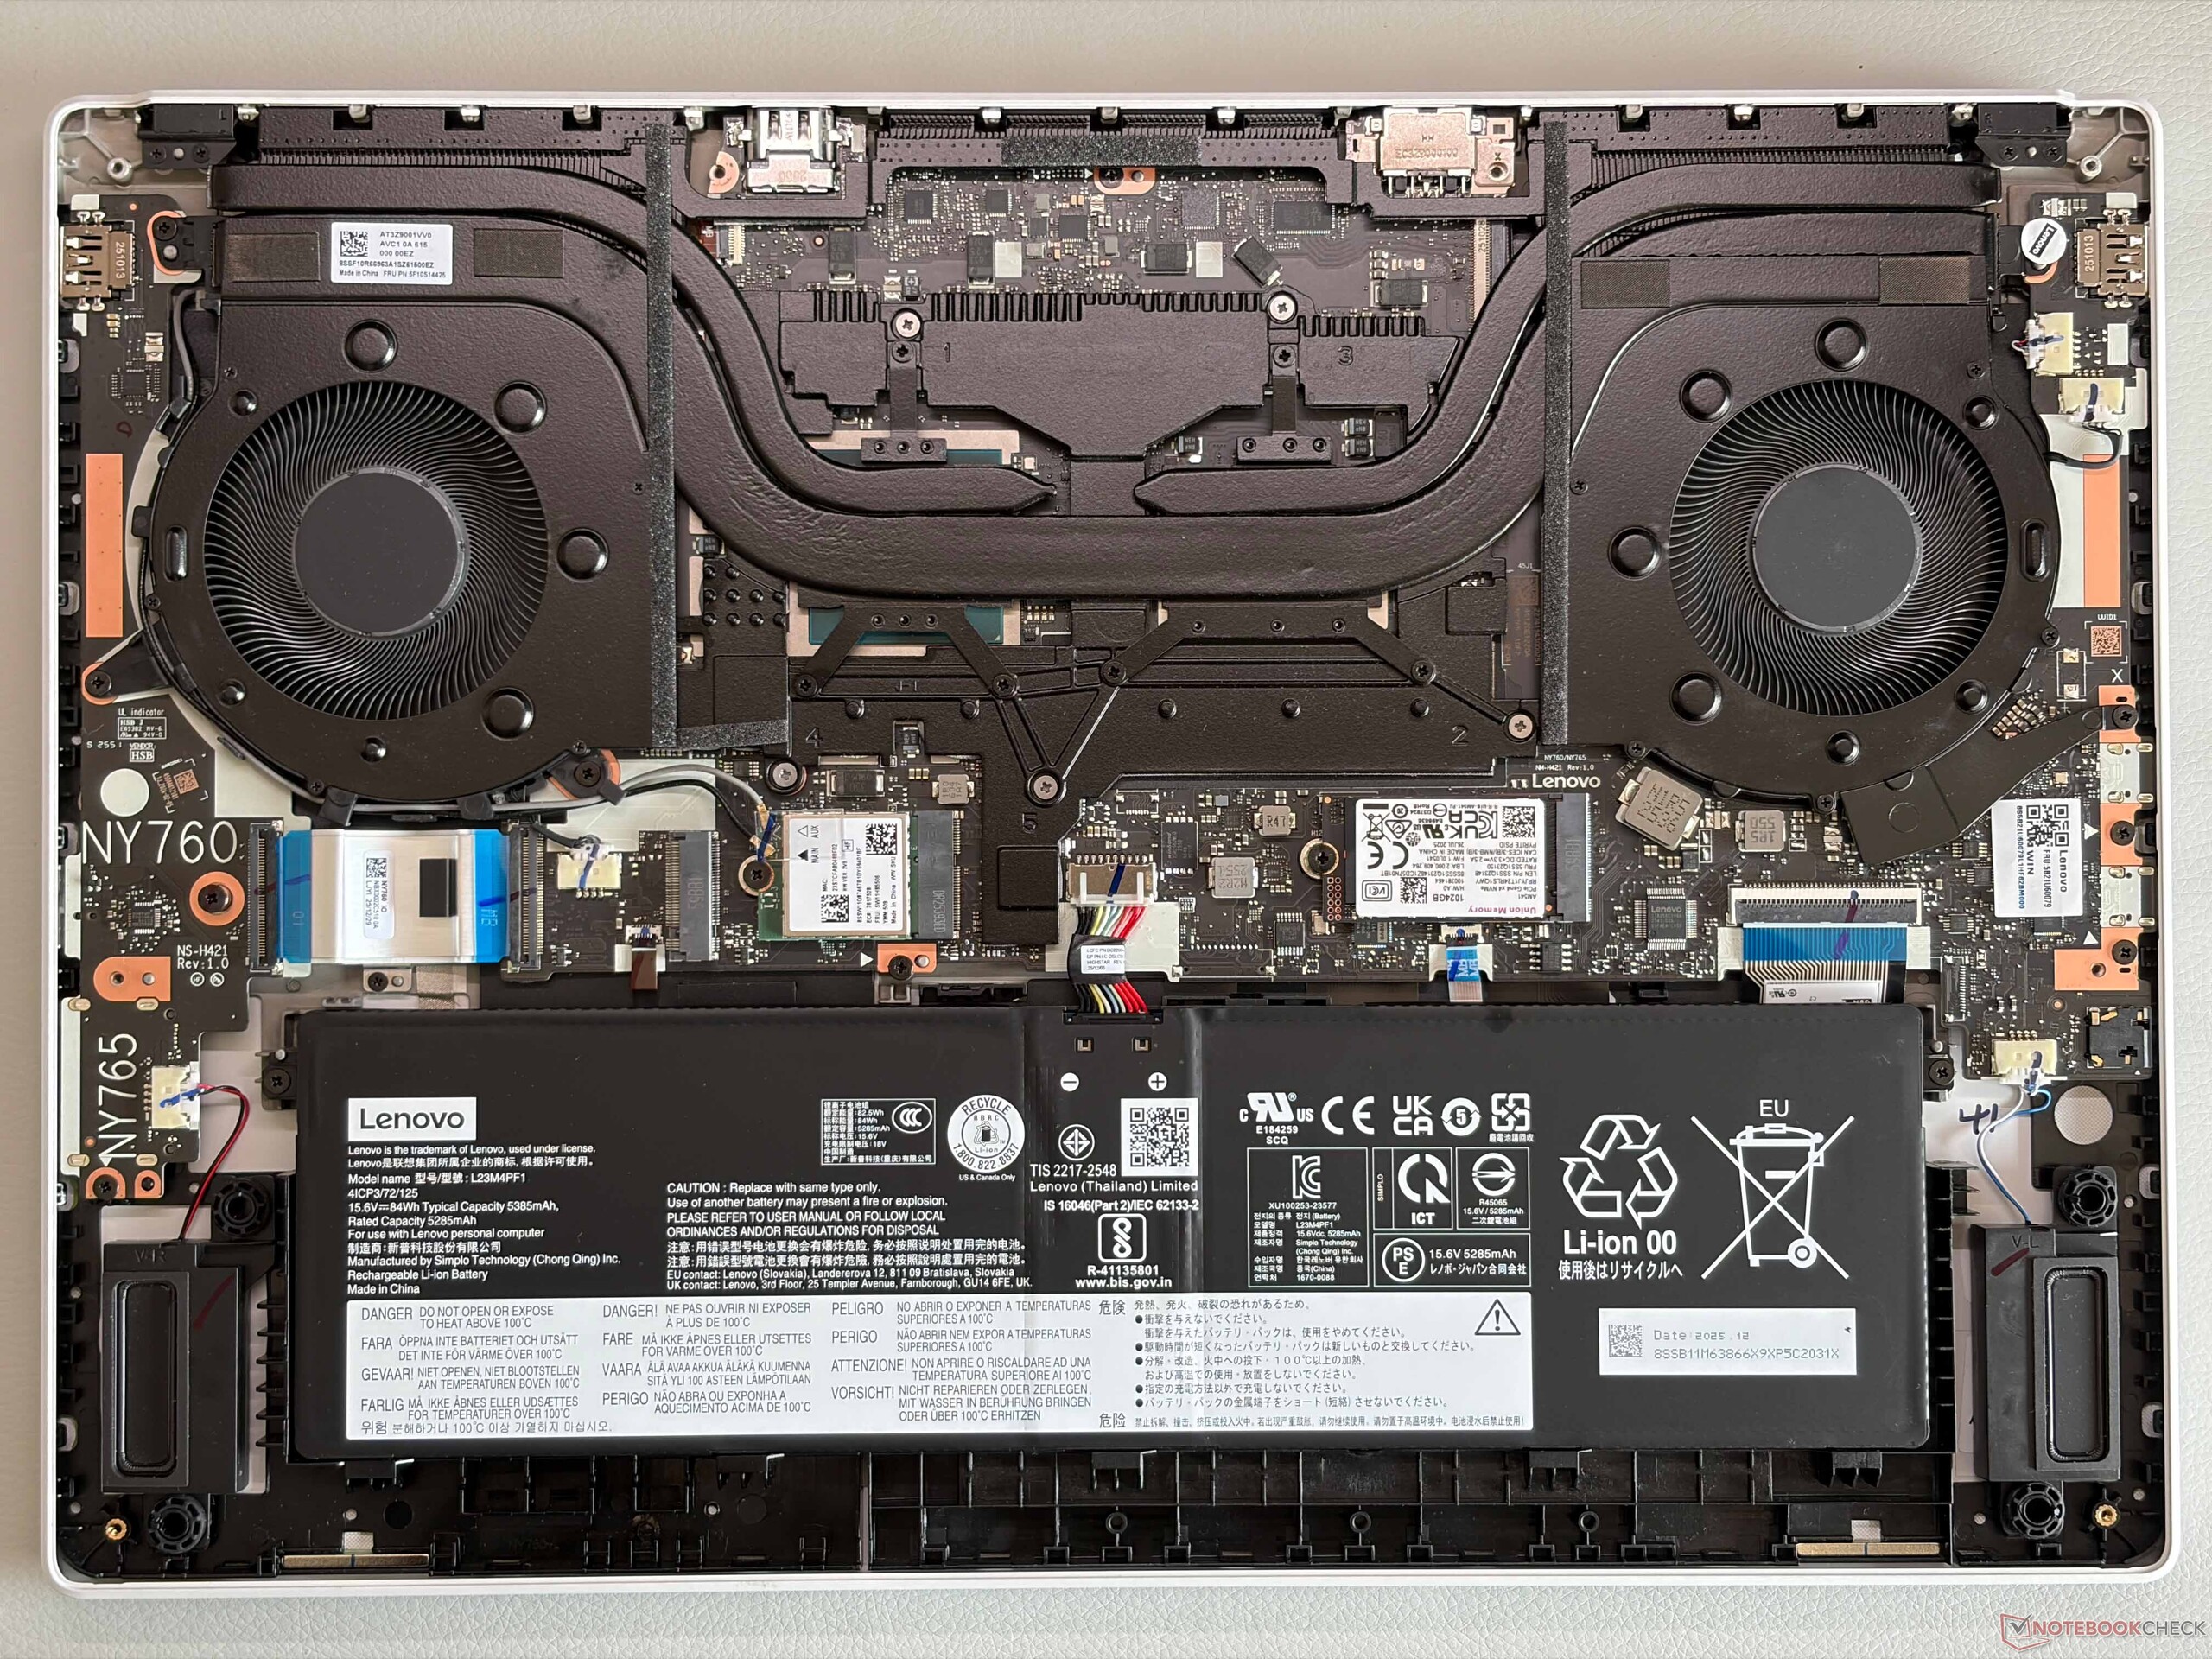
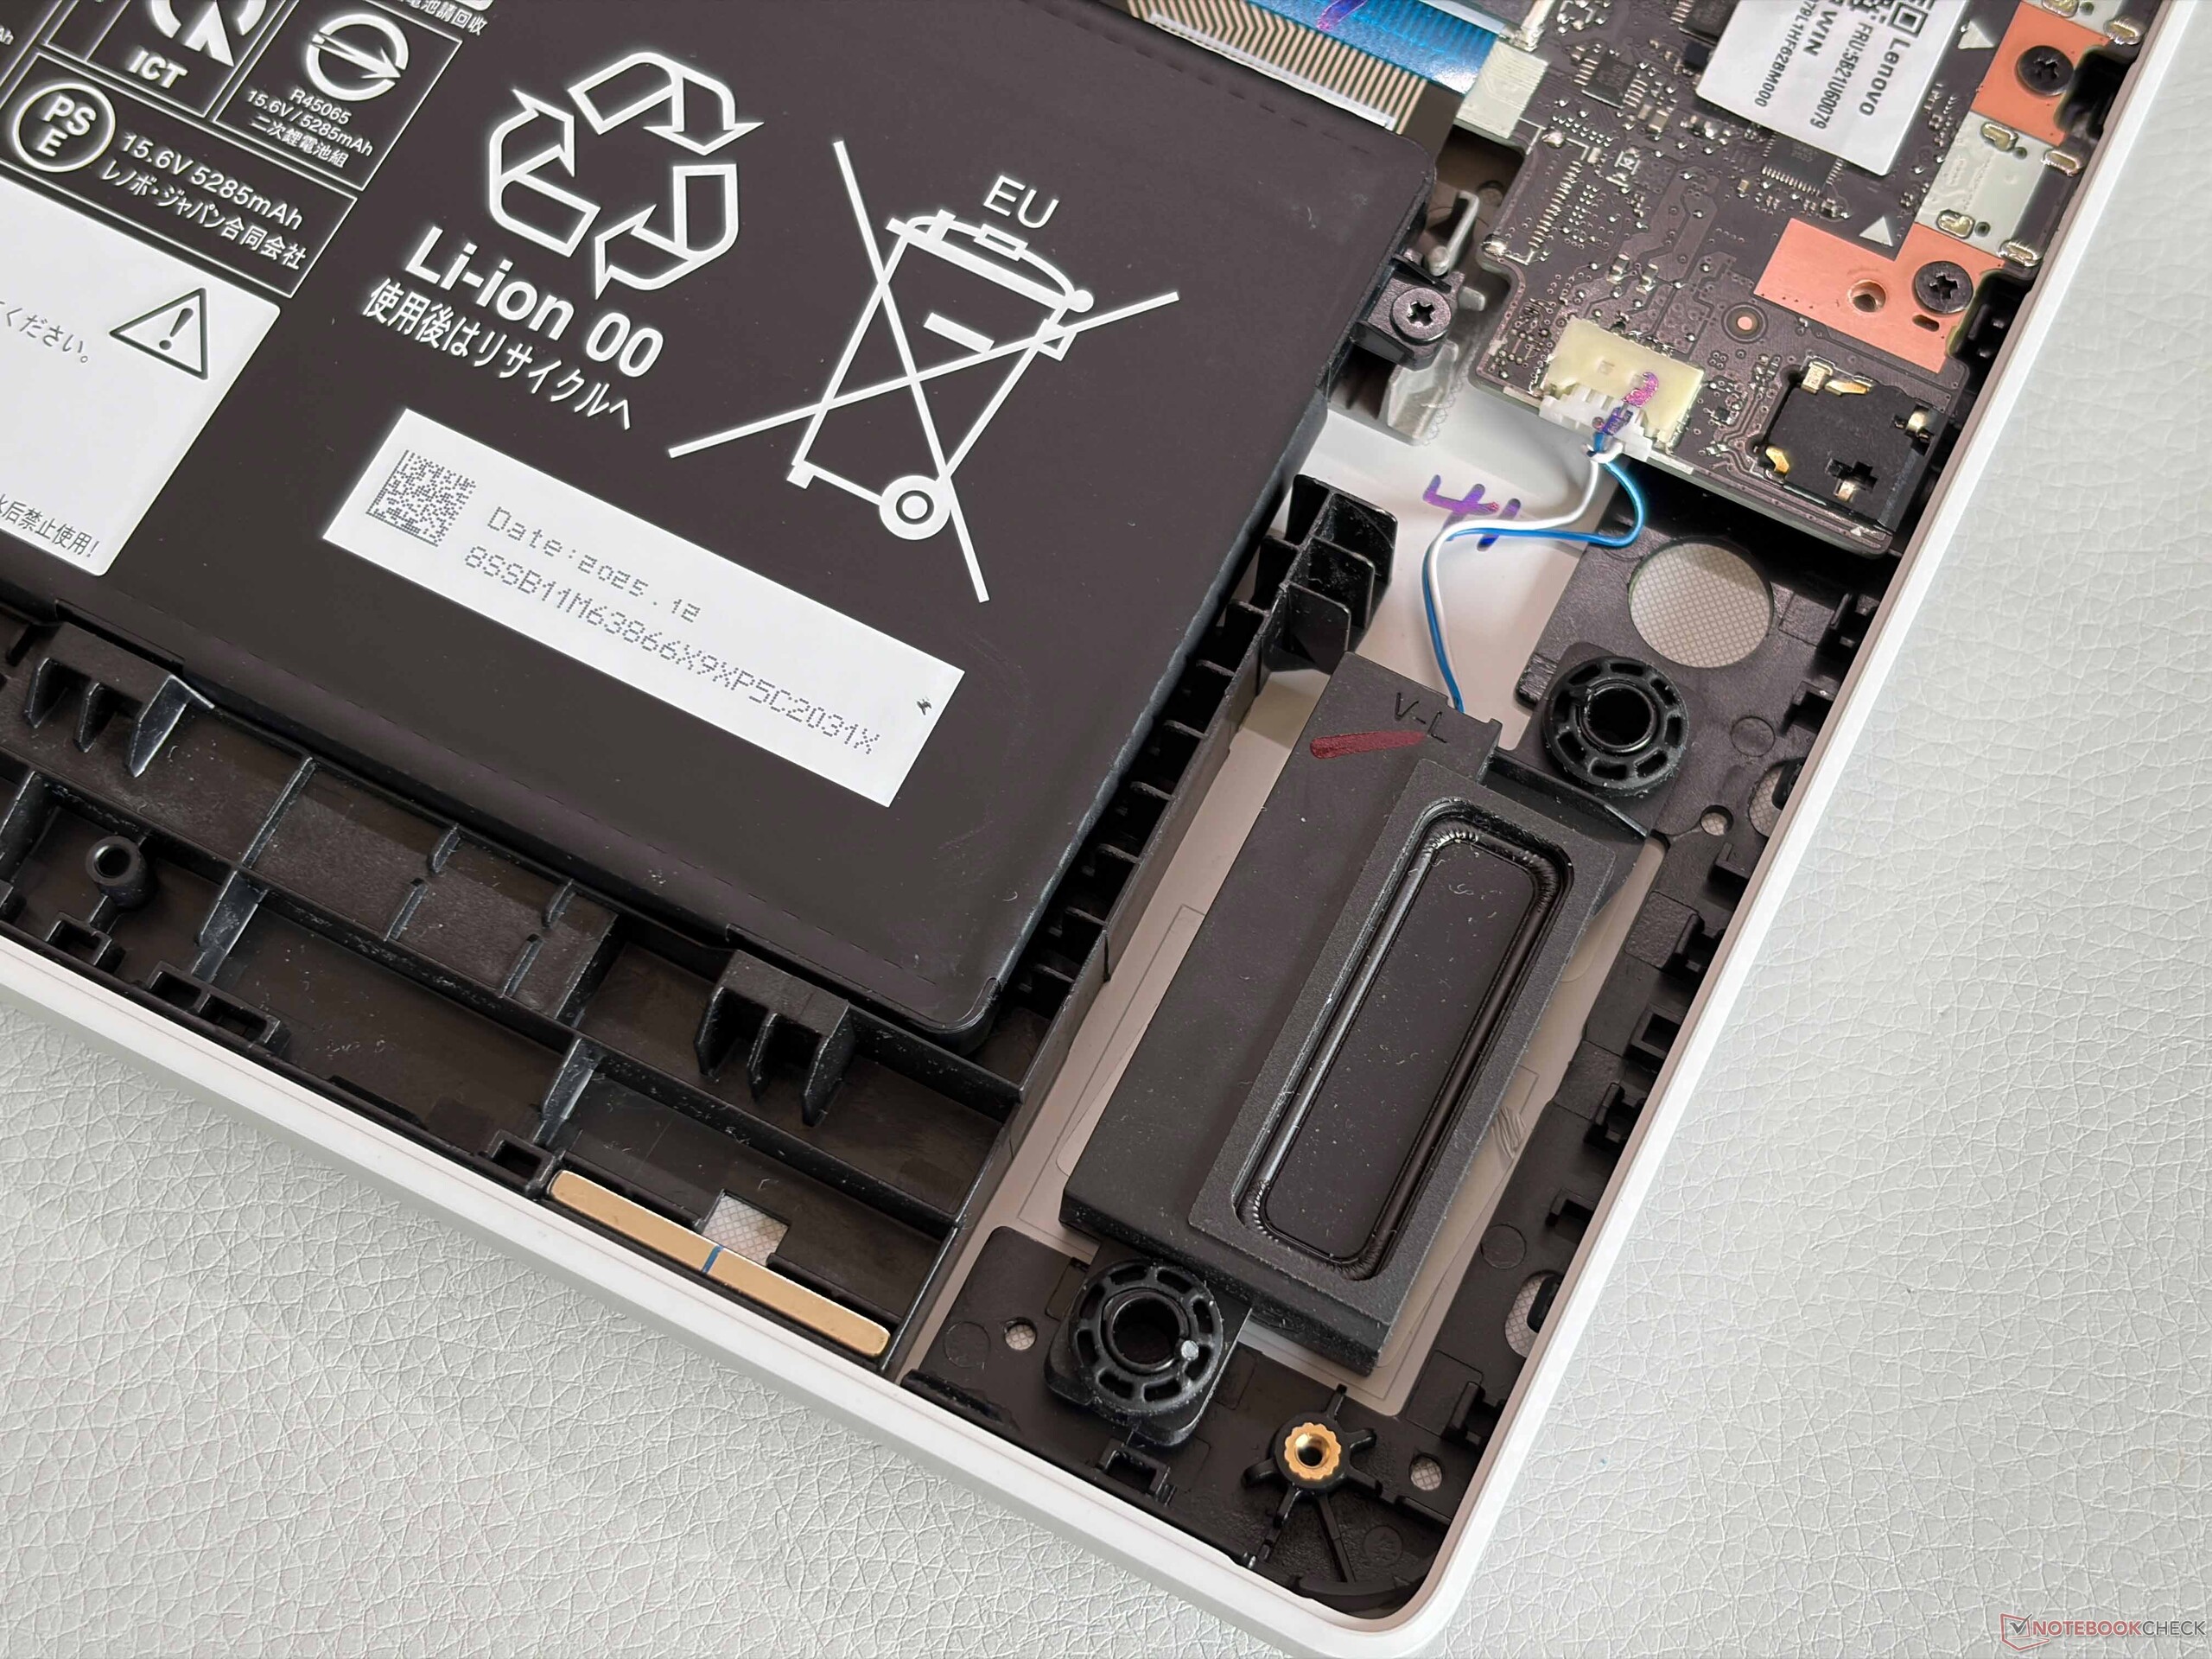
Nuestra unidad de pruebas blanca tiene un aspecto muy agradable y las superficies de aluminio no atraen realmente las huellas dactilares ni la suciedad, por lo que es muy fácil mantenerla limpia. Los elementos de iluminación se mantienen al mínimo. El menor peso no afecta a la estabilidad y el nuevo modelo de AMD es tan robusto como antes. Las bisagras (ángulo máximo de apertura de 180 grados) también están bien ajustadas y mantienen los rebotes al mínimo. Las opciones de mantenimiento se limitan a la SSD M.2-2242, una ranura M.2-2280 libre, el módulo Wi-Fi así como la limpieza de los ventiladores, mientras que la RAM está soldada.
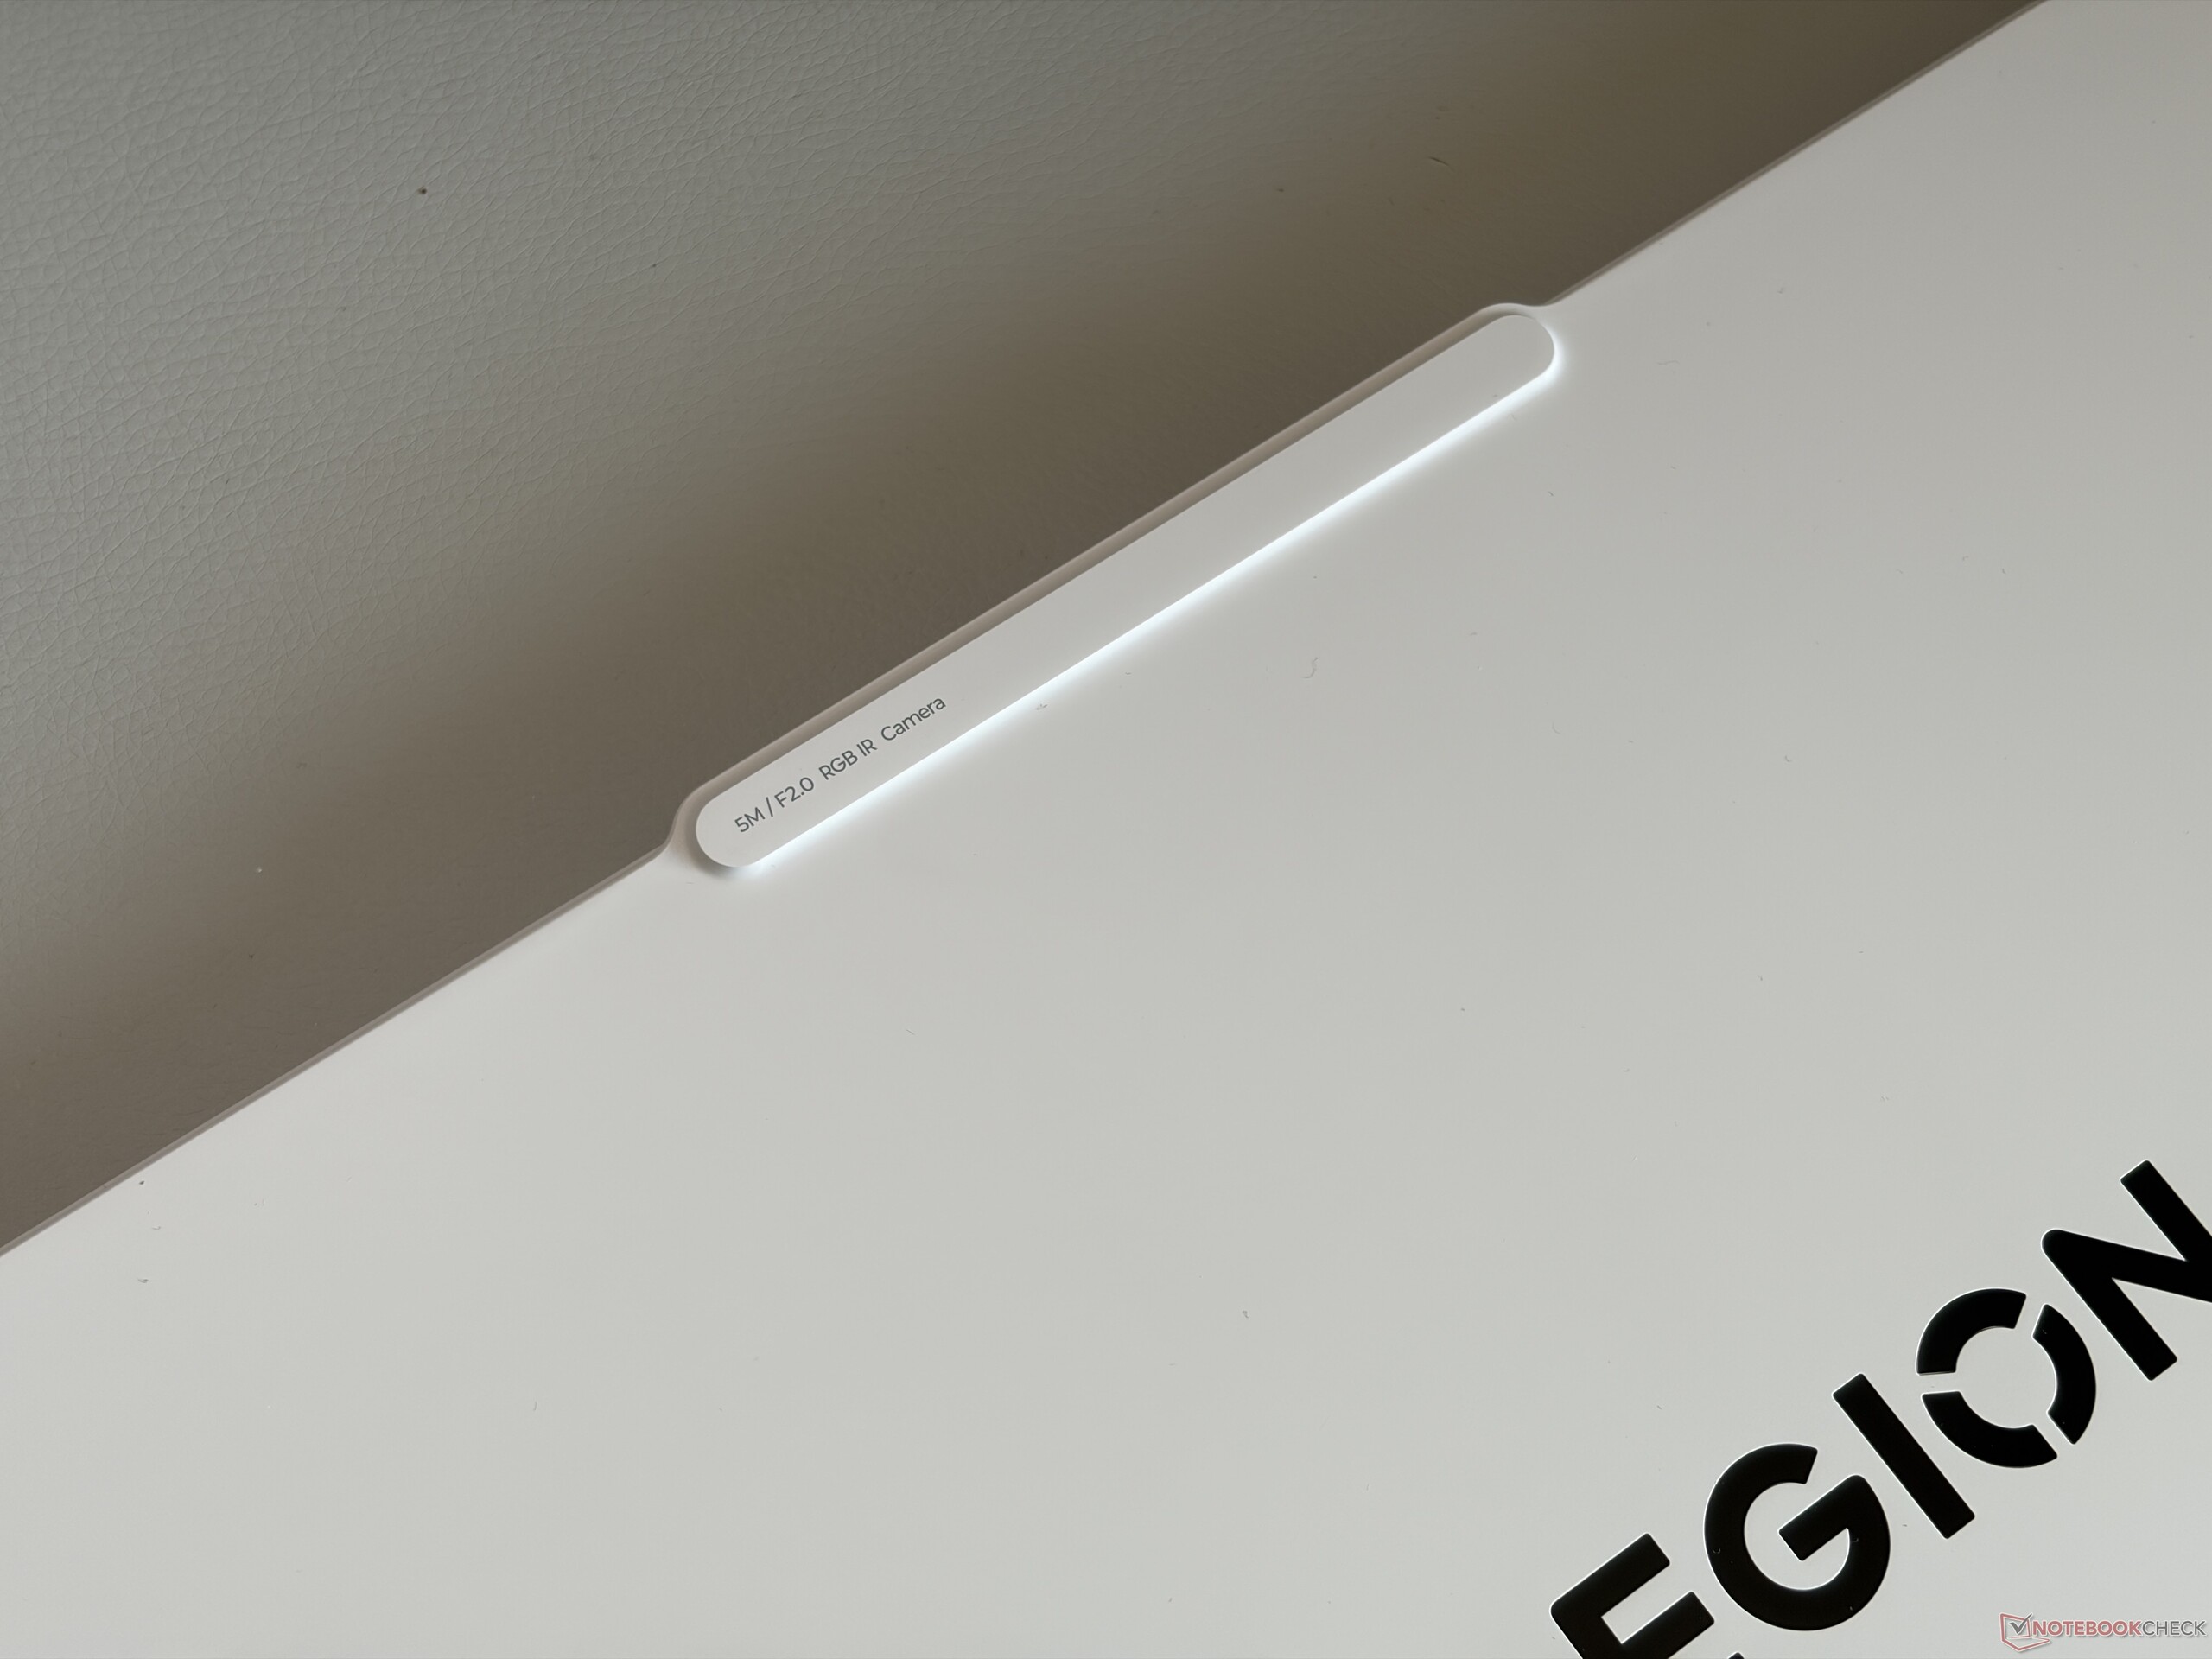
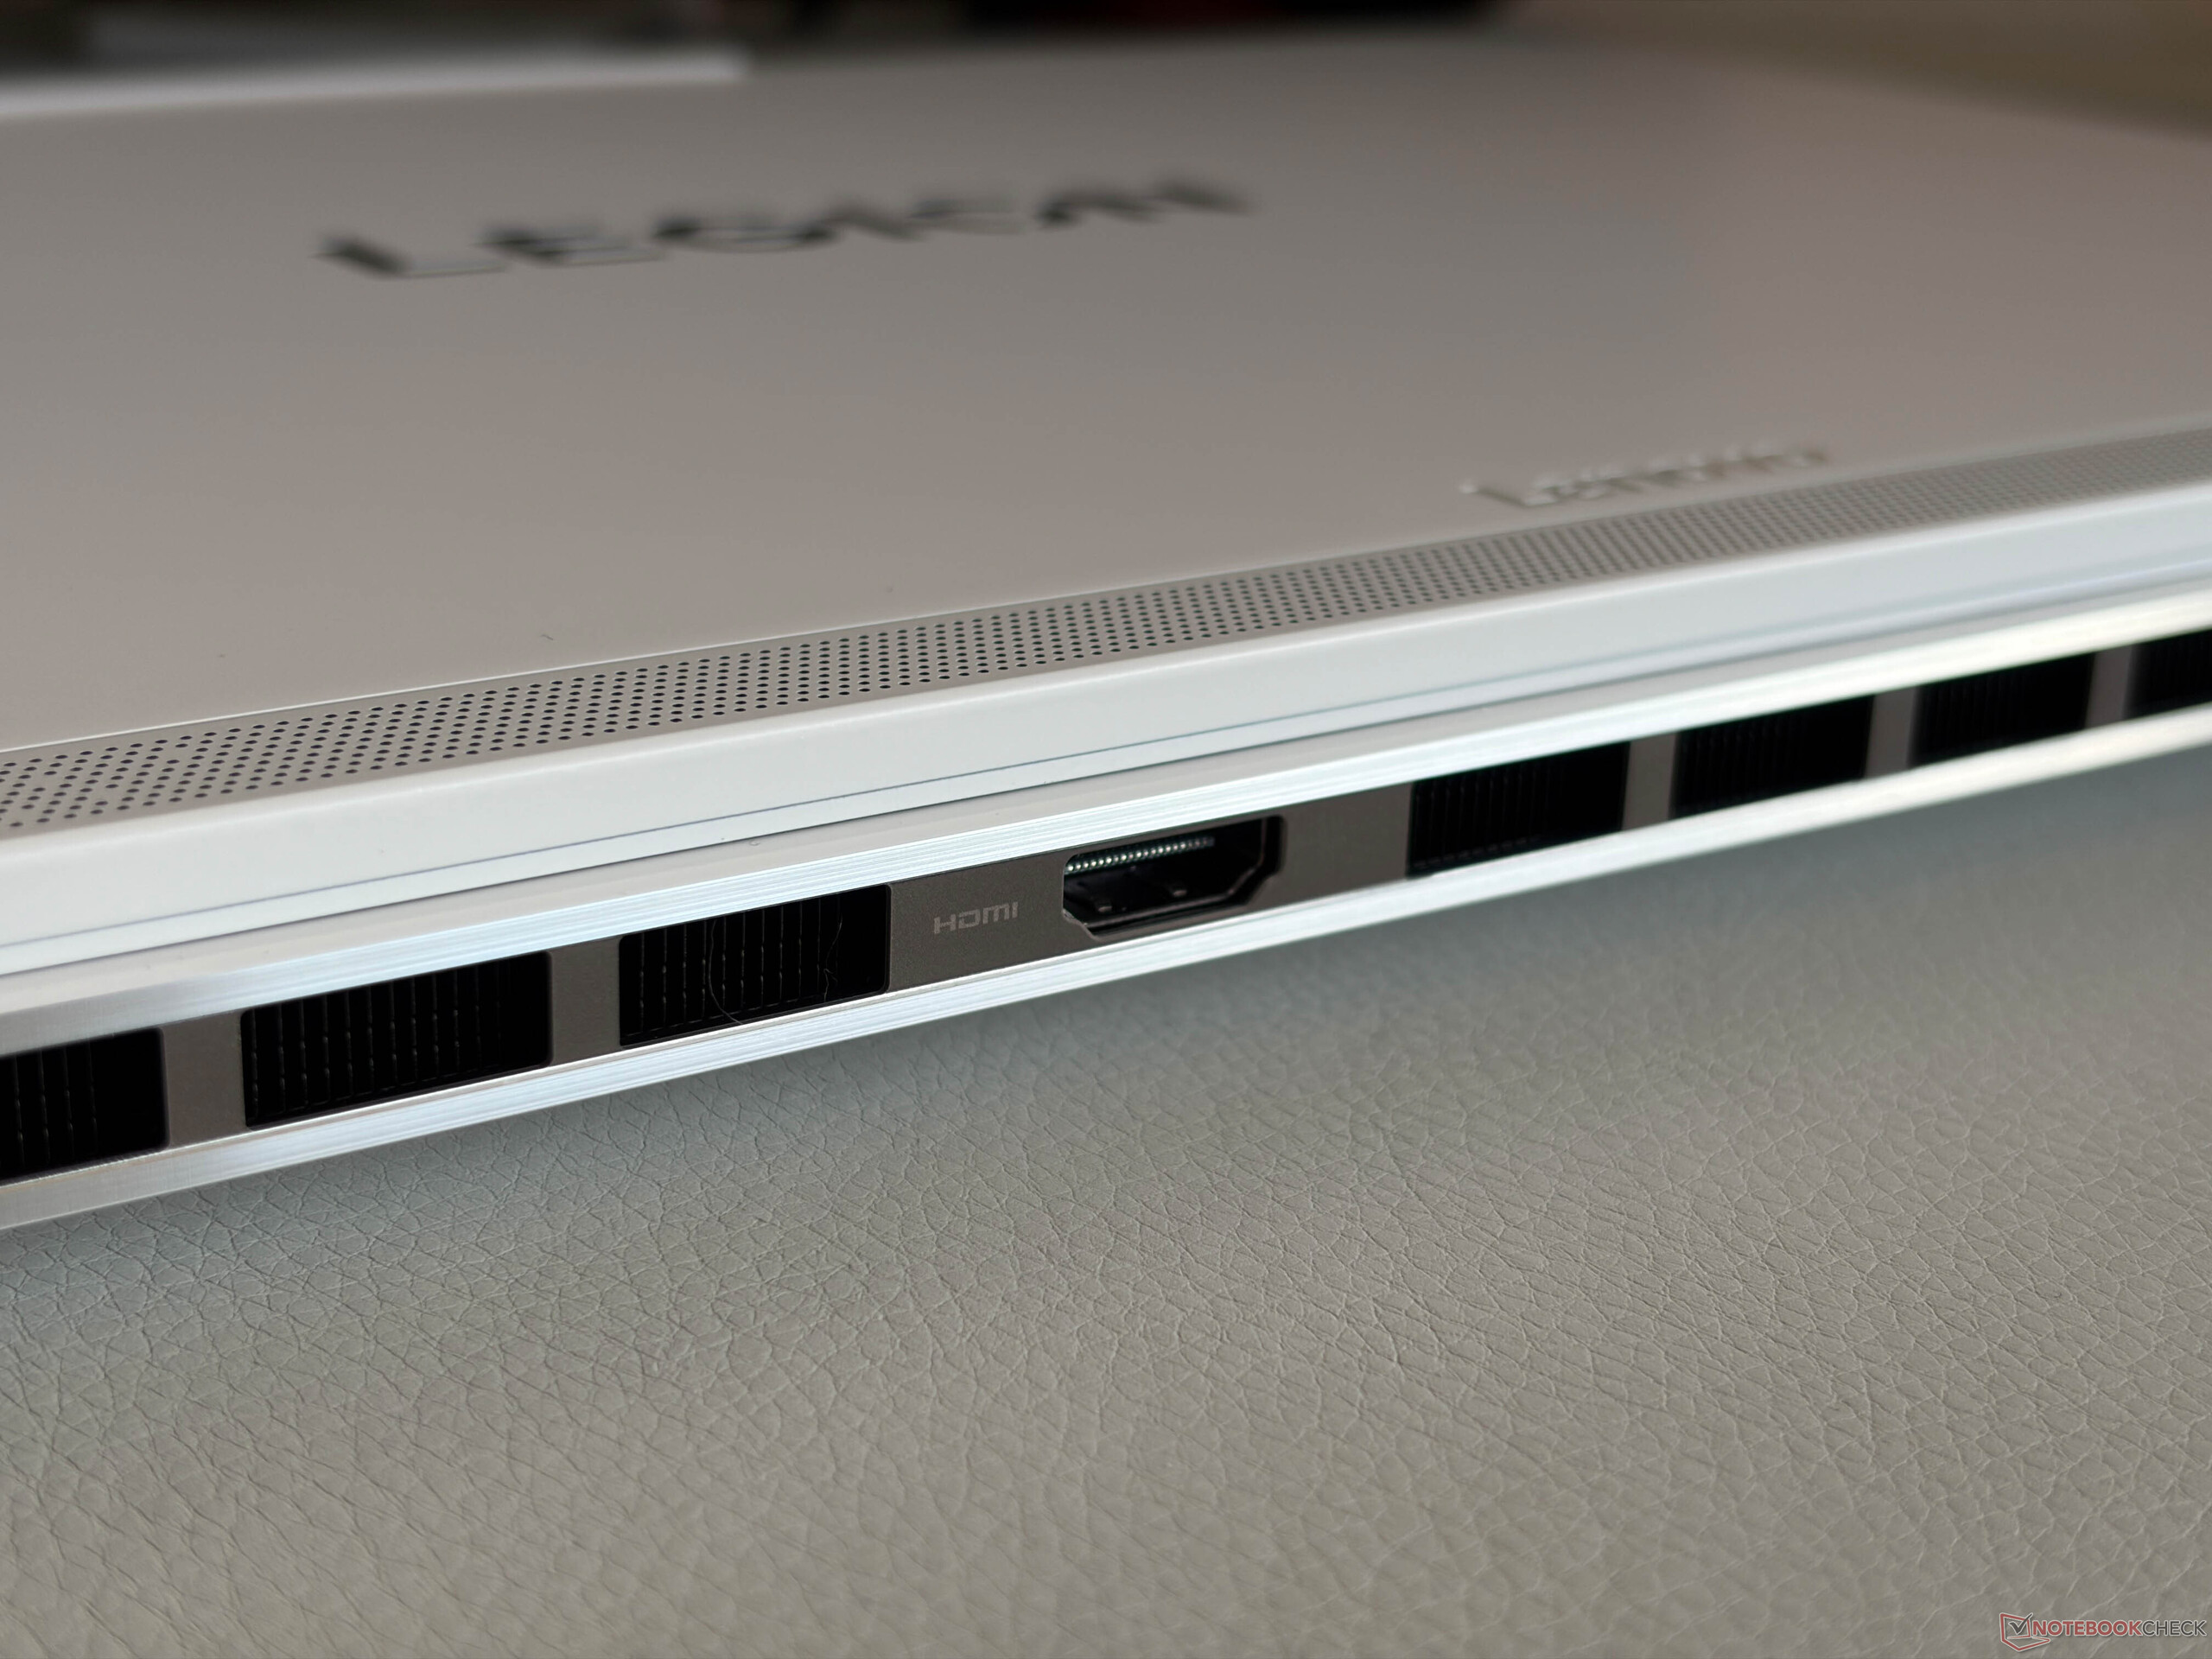
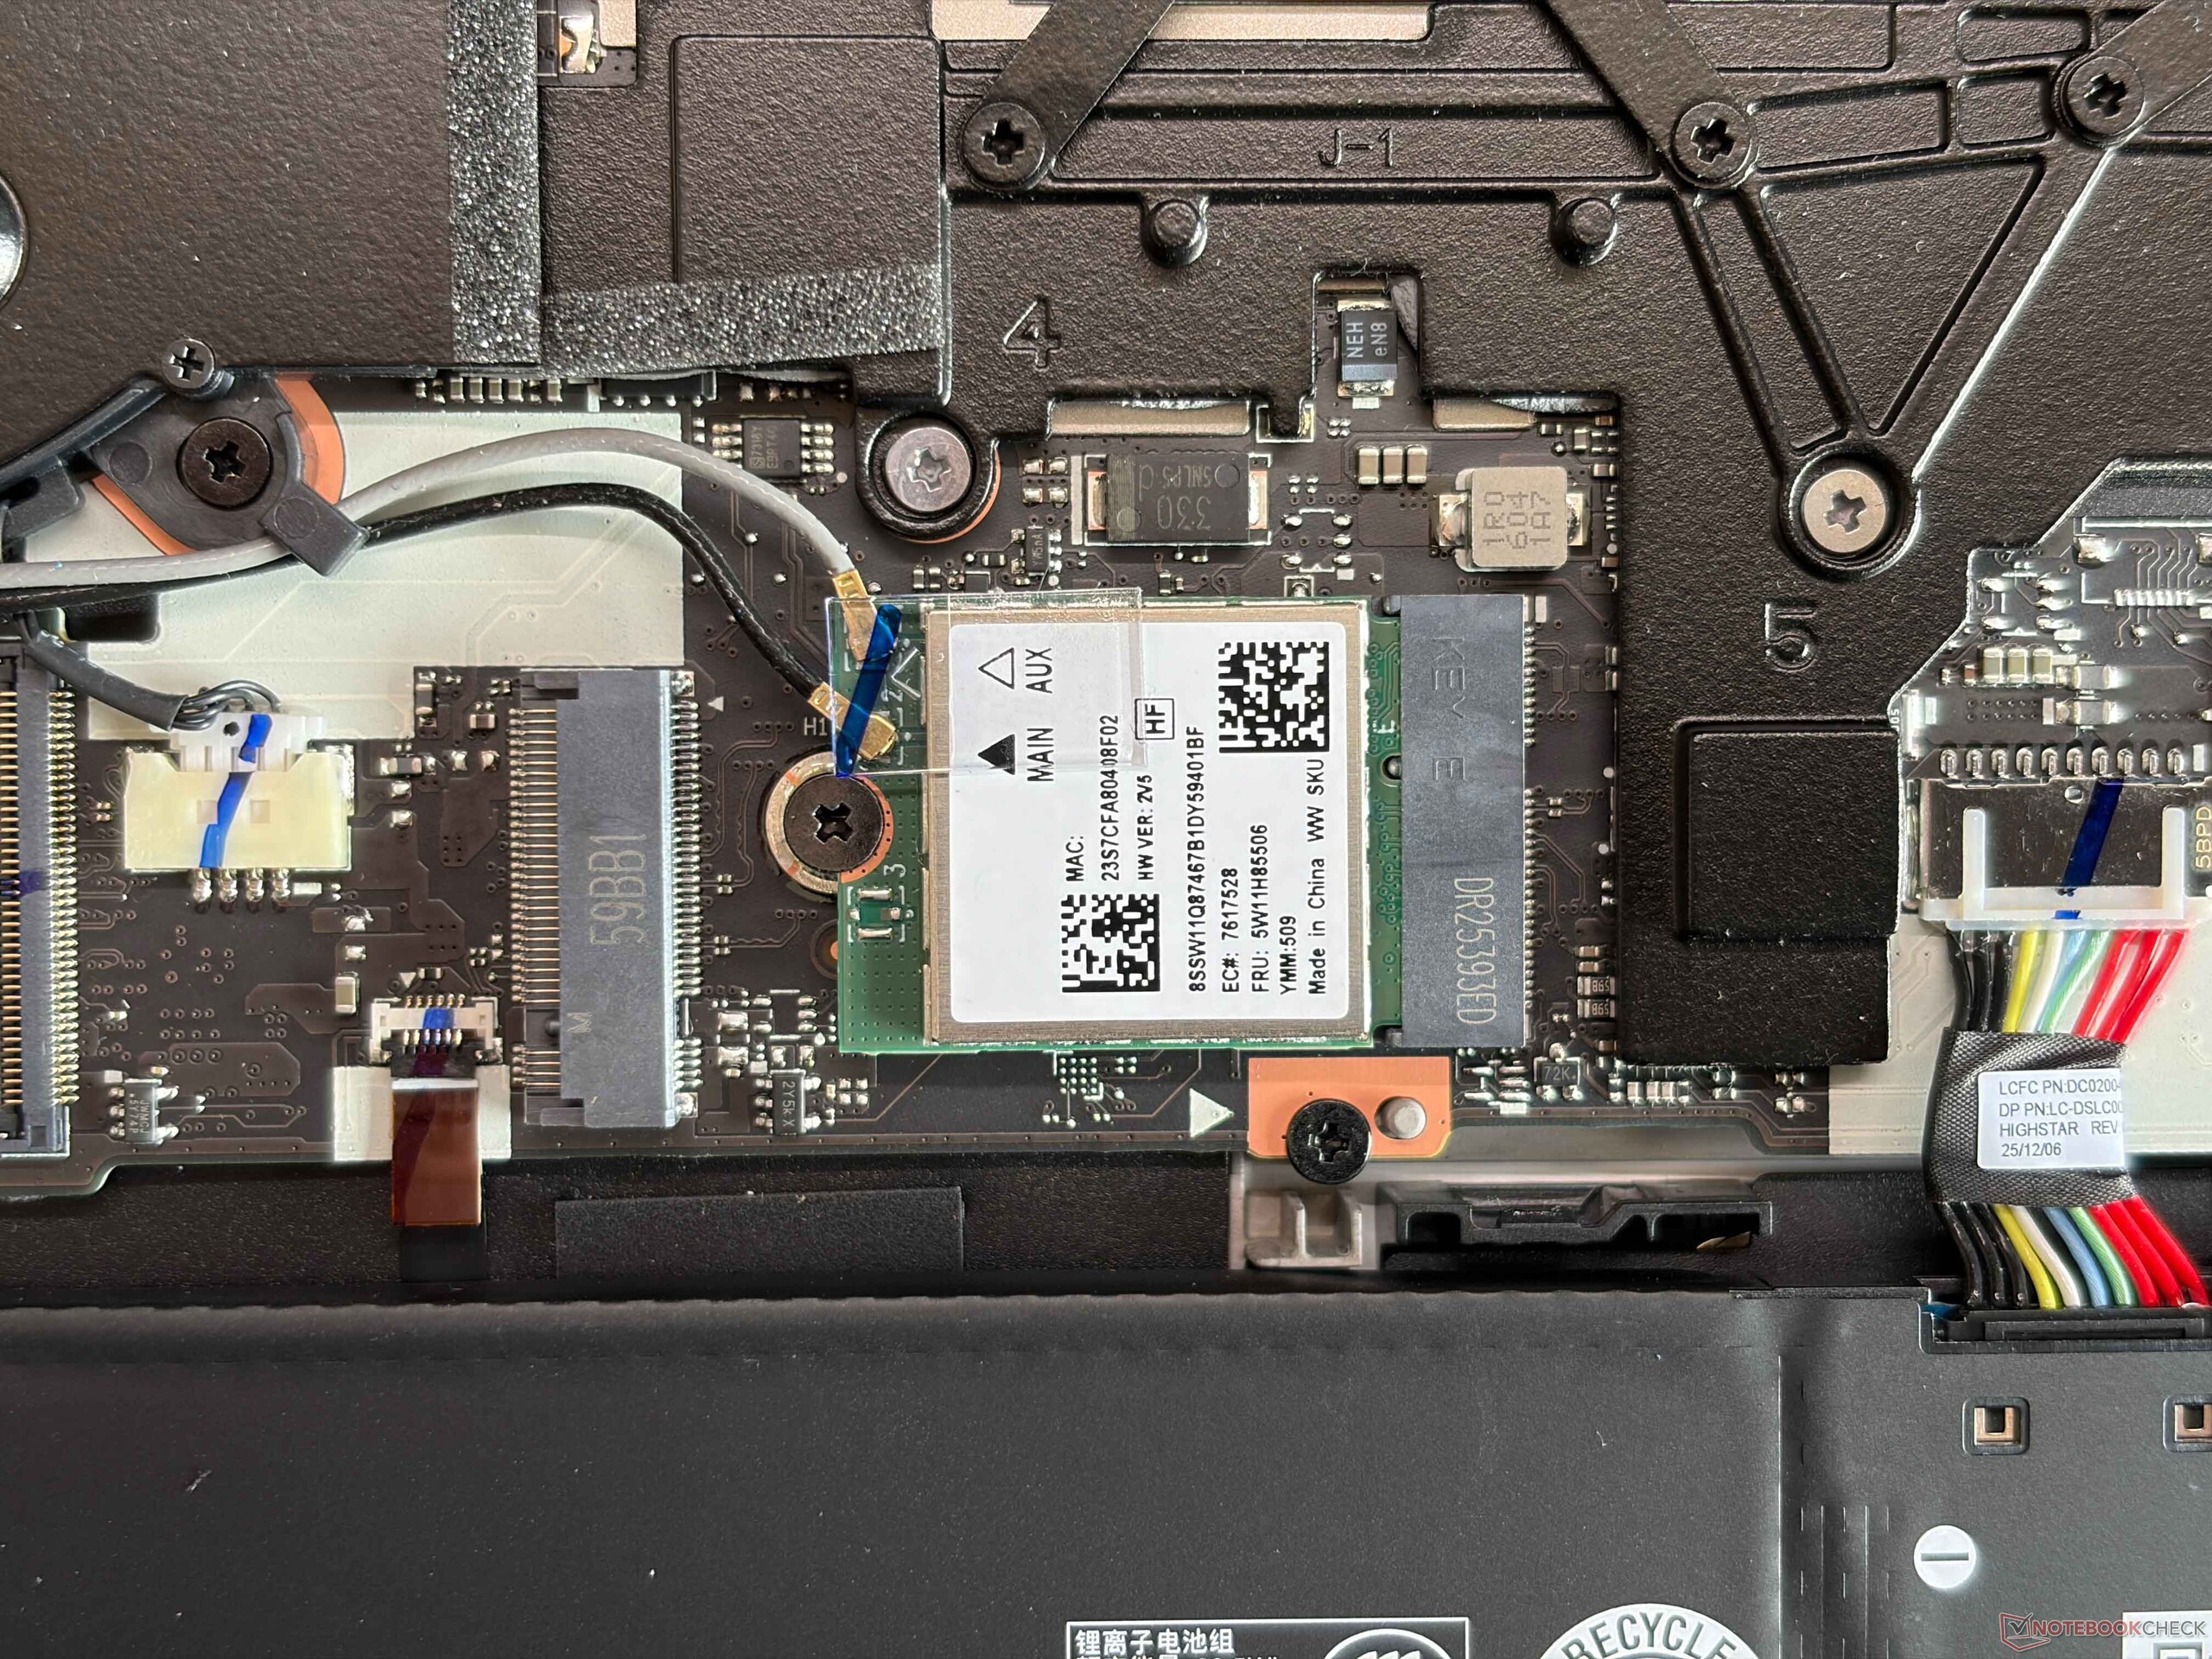
La conectividad es sólida con dos puertos USB-C, HDMI así como dos puertos USB-A normales. También dispone de un rápido lector de tarjetas SD, aunque no es compatible con el estándar SD Express. El Legion también es compatible con el último estándar Wi-Fi 7, pero las velocidades de transferencia del módulo RealTek 8922AE son sólo aceptables. Aún así, no experimentamos ningún problema de conectividad durante nuestro periodo de revisión. No dispone de conector Ethernet. La cámara de 5 MP (e-shutter) toma imágenes decentes.


| SD Card Reader | |
| average JPG Copy Test (av. of 3 runs) | |
| Schenker XMG Core 16 VE M25 (AV PRO microSD 128 GB V60) | |
| Lenovo Legion 7 16 AGP11 (Angelbird AV Pro V60) | |
| Media de la clase Gaming (20.9 - 210, n=54, últimos 2 años) | |
| Lenovo Legion 7 16IAX10 (Toshiba Exceria Pro SDXC 64 GB UHS-II) | |
| Schenker XMG FUSION 16 (M25) (Angelbird AV Pro V60) | |
| maximum AS SSD Seq Read Test (1GB) | |
| Lenovo Legion 7 16IAX10 (Toshiba Exceria Pro SDXC 64 GB UHS-II) | |
| Lenovo Legion 7 16 AGP11 (Angelbird AV Pro V60) | |
| Media de la clase Gaming (25.5 - 261, n=51, últimos 2 años) | |
| Schenker XMG FUSION 16 (M25) (Angelbird AV Pro V60) | |
| Networking | |
| Lenovo Legion 7 16 AGP11 | |
| iperf3 transmit RT-BE96U WiFi7 | |
| iperf3 receive RT-BE96U WiFi7 | |
| Schenker XMG Core 16 VE M25 | |
| iperf3 transmit AXE11000 | |
| iperf3 receive AXE11000 | |
| Schenker XMG FUSION 16 (M25) | |
| iperf3 transmit AXE11000 | |
| iperf3 receive AXE11000 | |
| HP Omen 16-ap0091ng | |
| iperf3 transmit AXE11000 | |
| iperf3 receive AXE11000 | |
| Asus TUF Gaming A16 FA608UP | |
| iperf3 transmit AXE11000 | |
| iperf3 receive AXE11000 | |
| Lenovo Legion 7 16IAX10 | |
| iperf3 transmit AXE11000 | |
| iperf3 receive AXE11000 | |
| iperf3 transmit AXE11000 6GHz | |
| iperf3 receive AXE11000 6GHz | |
| Lenovo Legion 5 15AHP G10 | |
| iperf3 transmit AXE11000 | |
| iperf3 receive AXE11000 | |


Dispositivos de entrada - Teclado RGB con recorrido de 1,6 mm
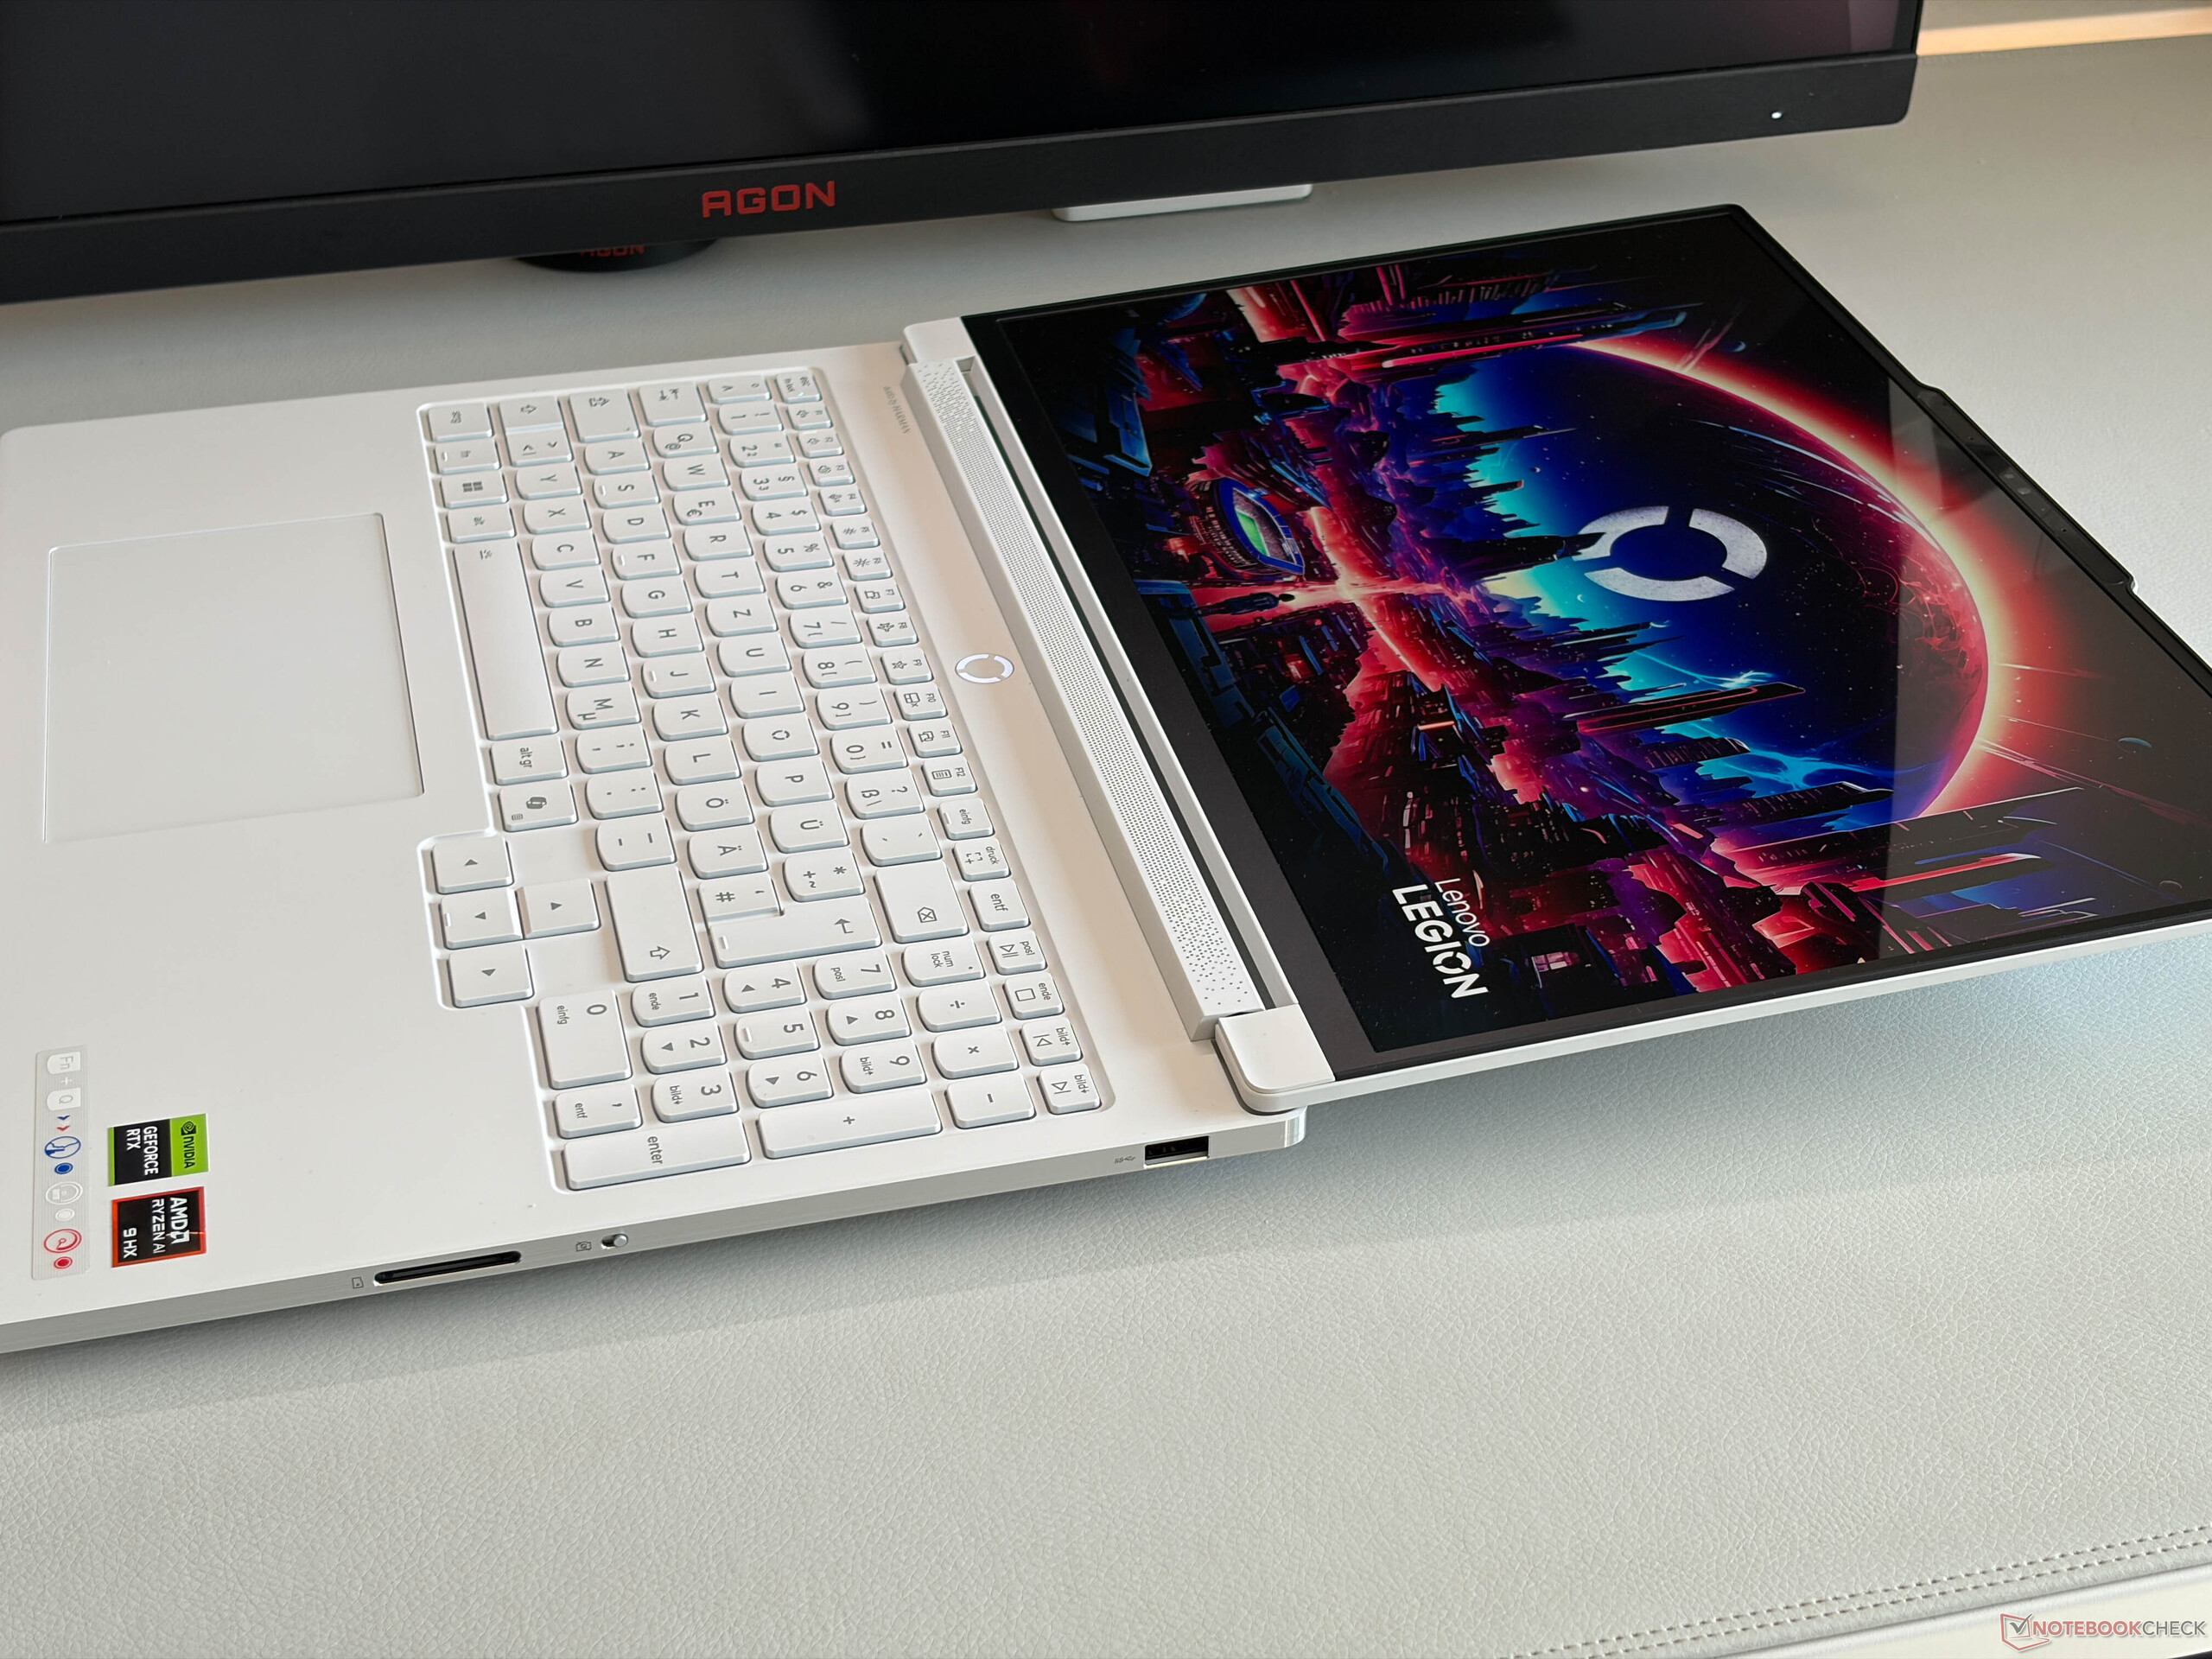
Lenovo implementa un teclado muy cómodo con un recorrido de tecla de 1,6 mm, así como retroiluminación RGB (24 zonas). También dispone de teclas de flecha grandes, así como de un teclado numérico dedicado, aunque estas teclas son ligeramente más estrechas. El teclado es ideal tanto para juegos como para actividades cotidianas. El clickpad está ligeramente desplazado hacia el lado izquierdo y ofrece una buena capacidad de deslizamiento. No traquetea, pero los clics mecánicos de la mitad inferior son bastante sonoros.


Pantalla - Impresionante OLED con 240 Hz y VRR
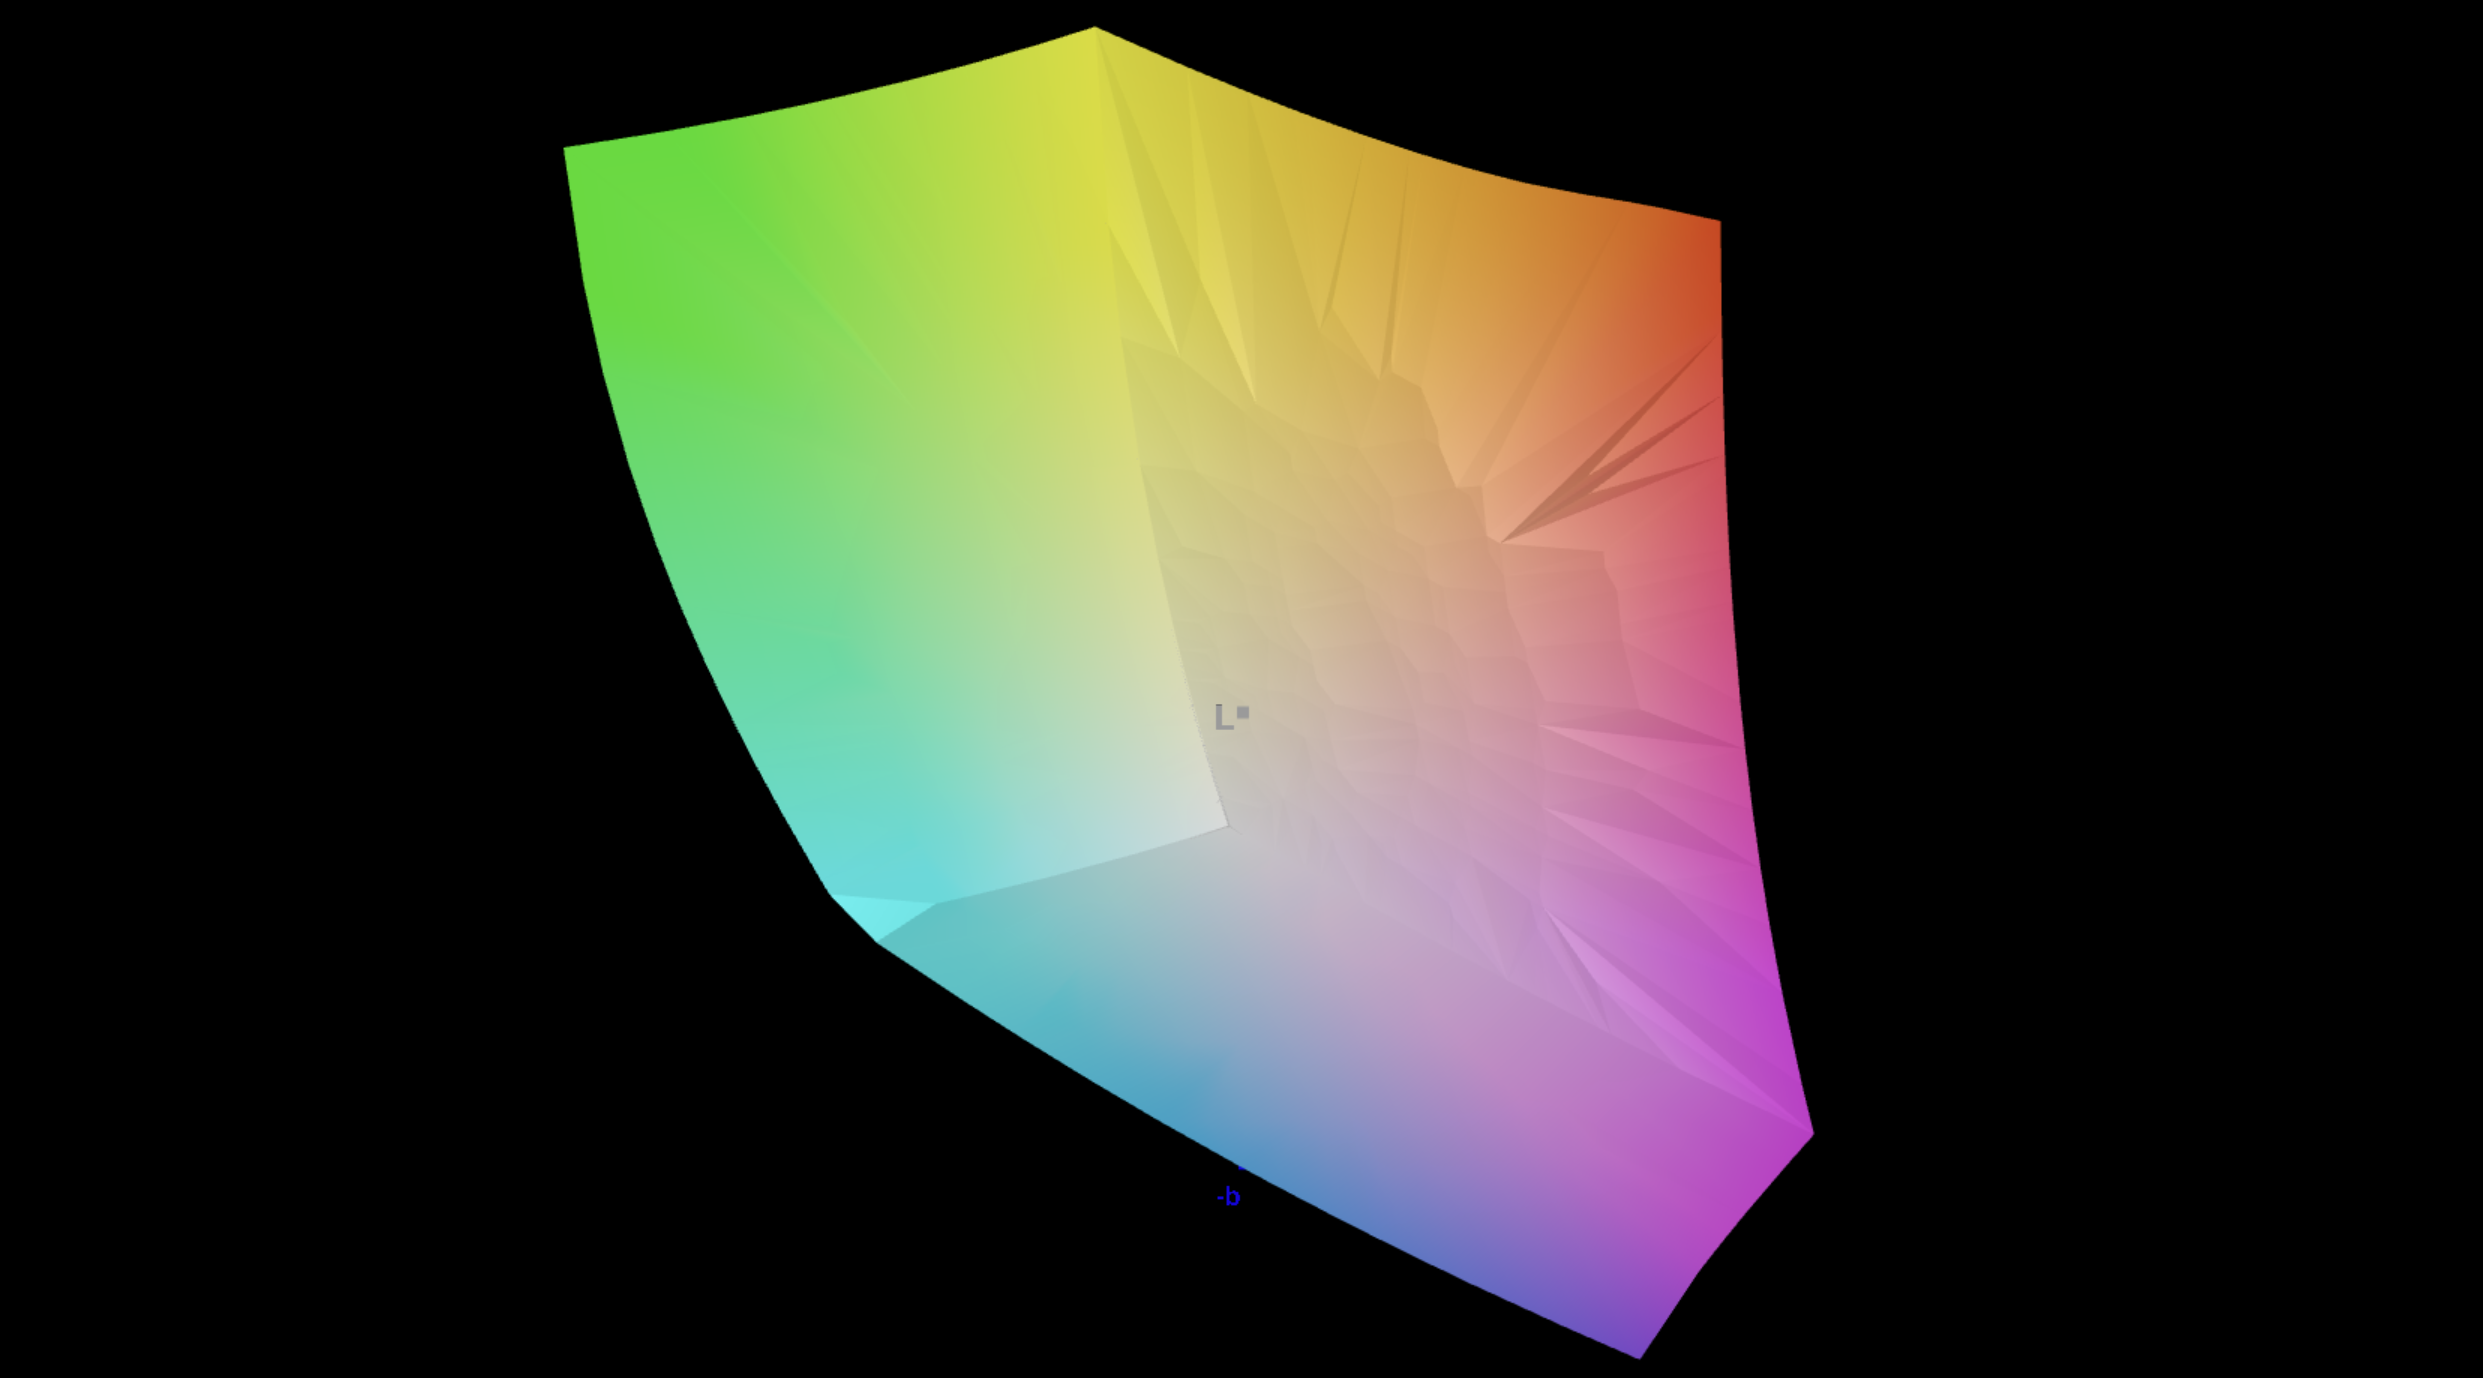
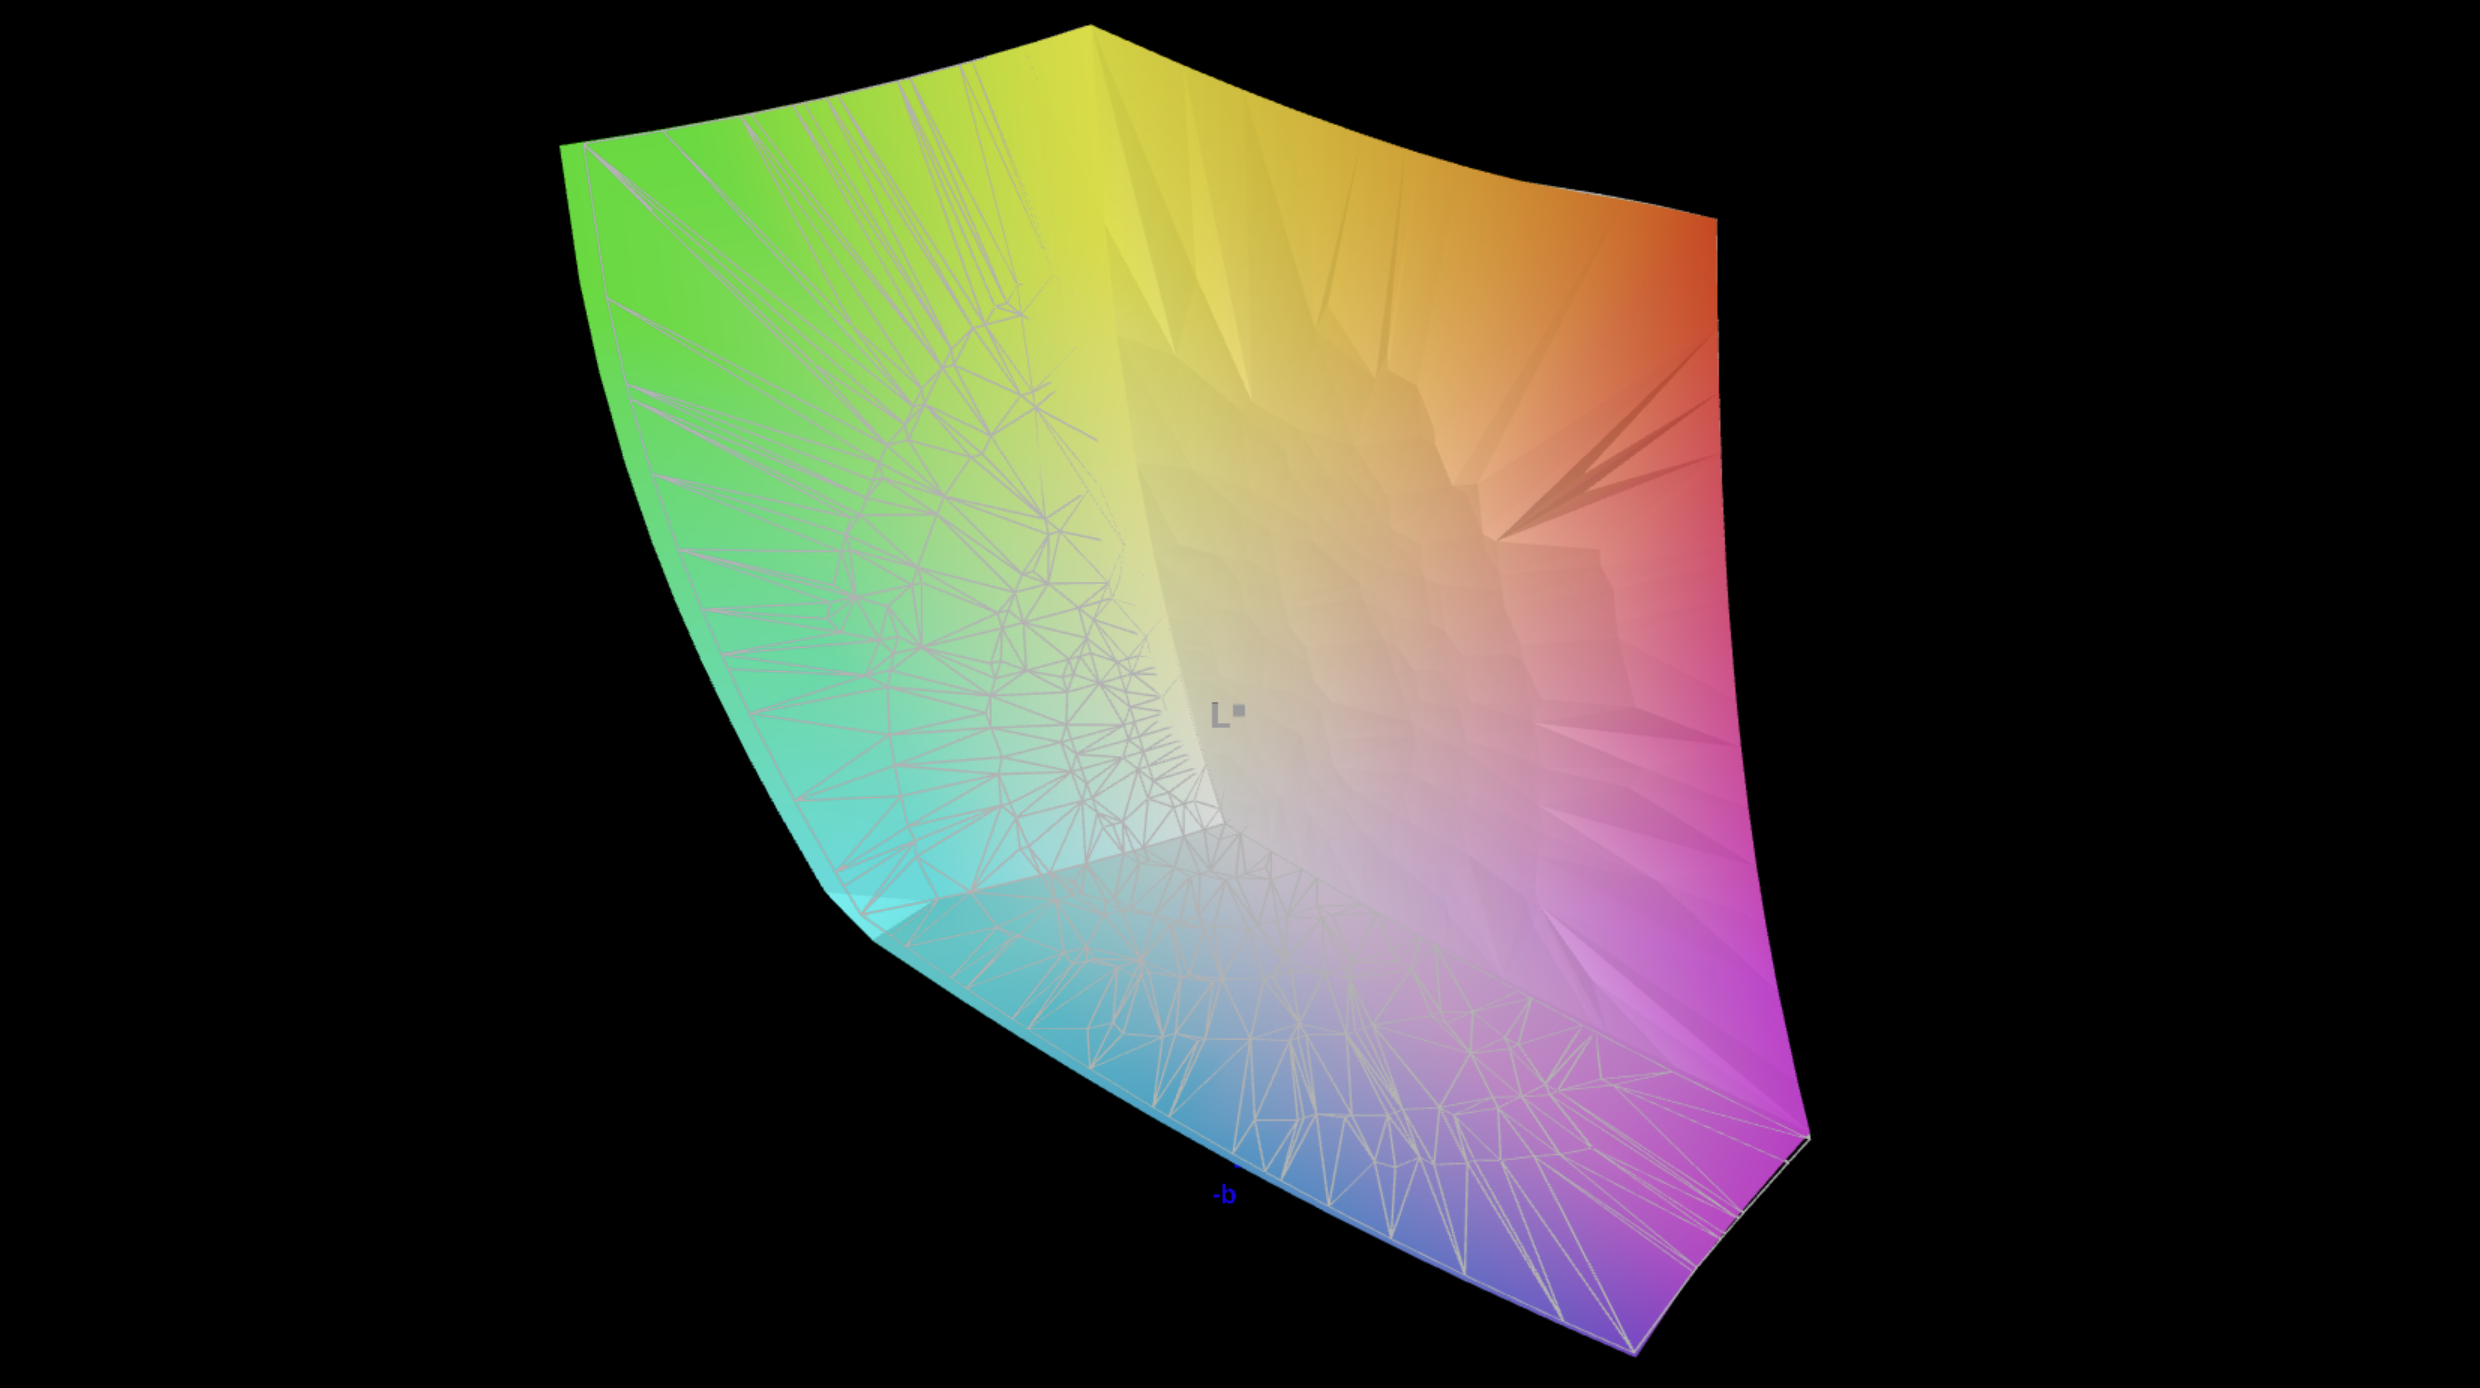
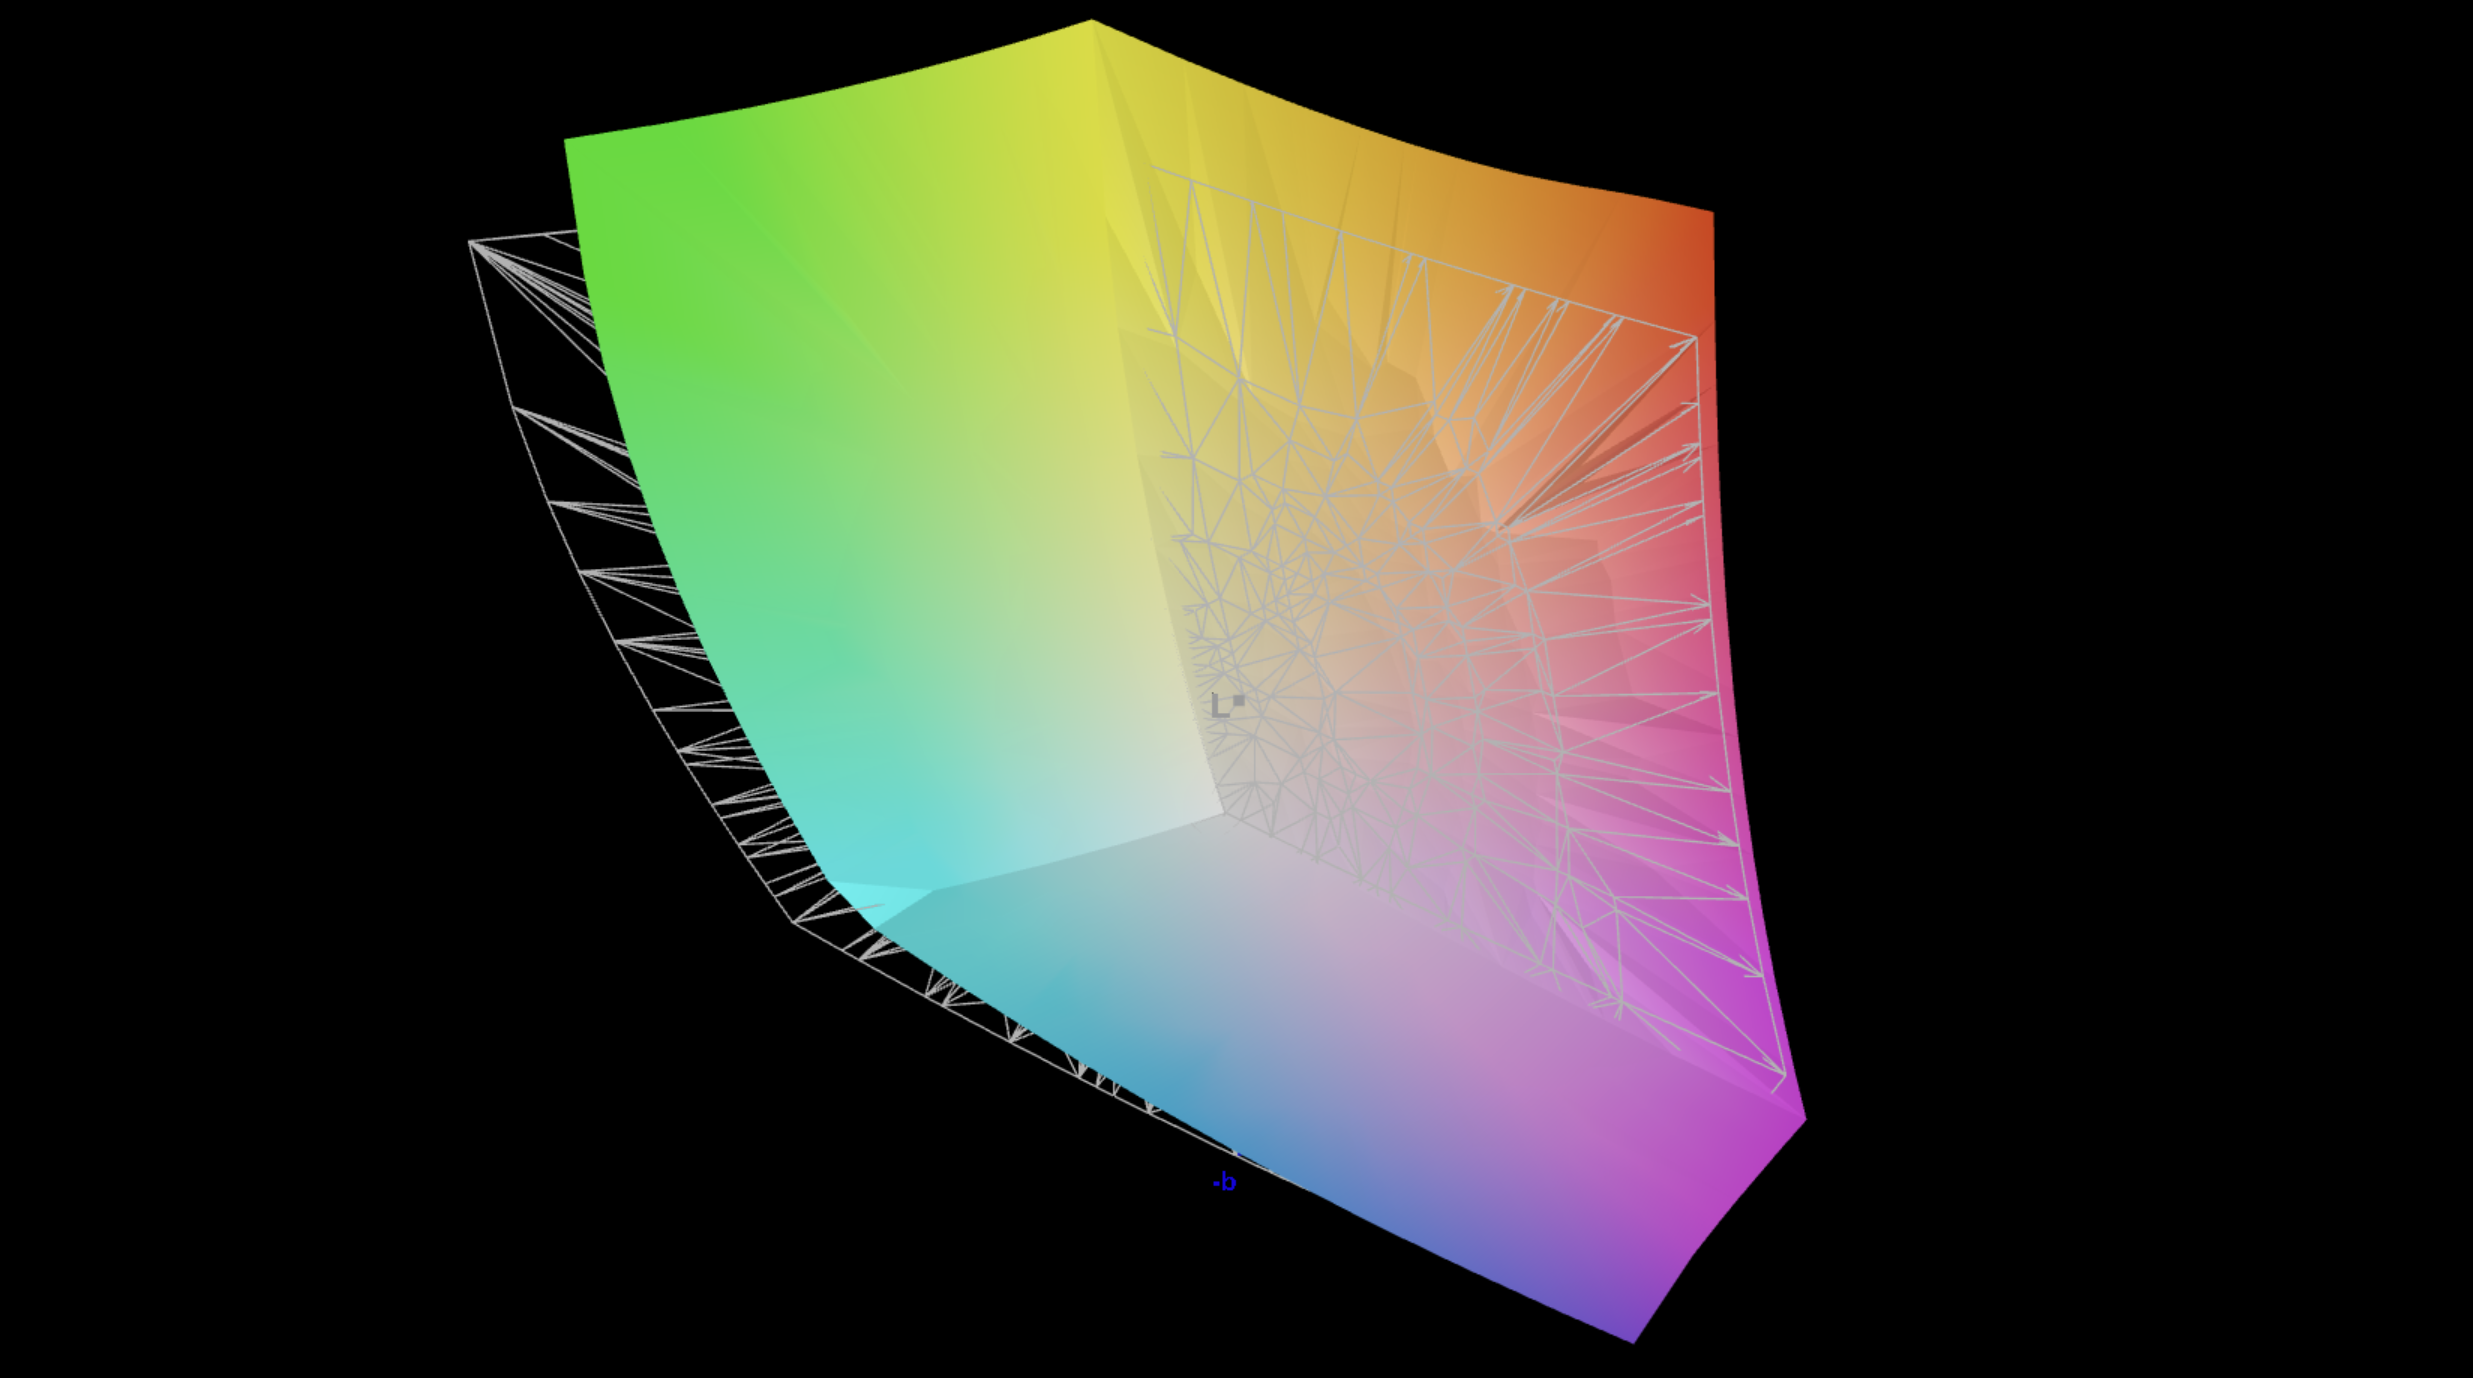
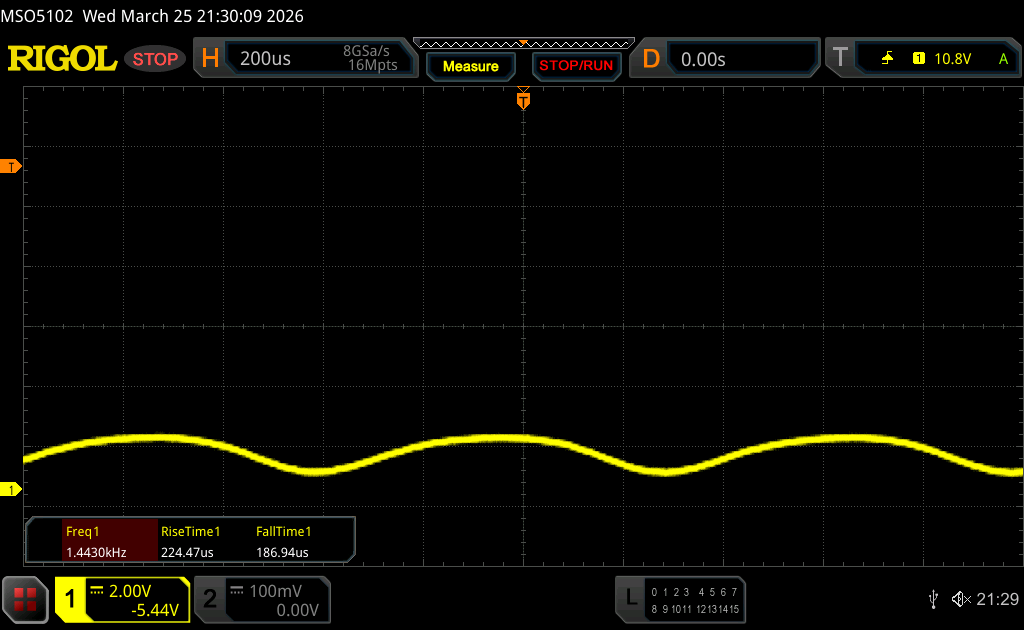
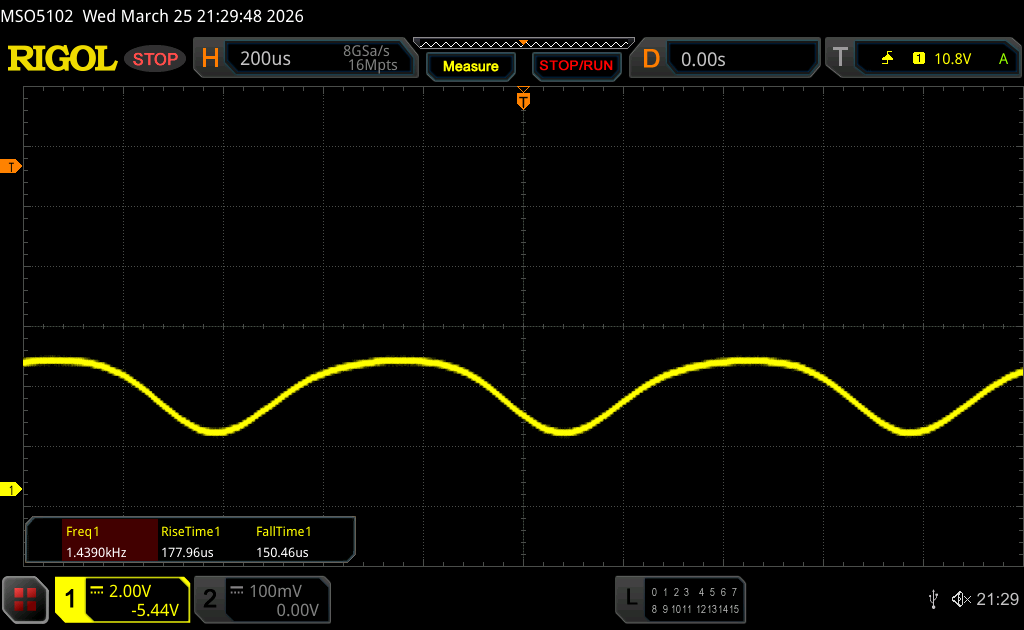
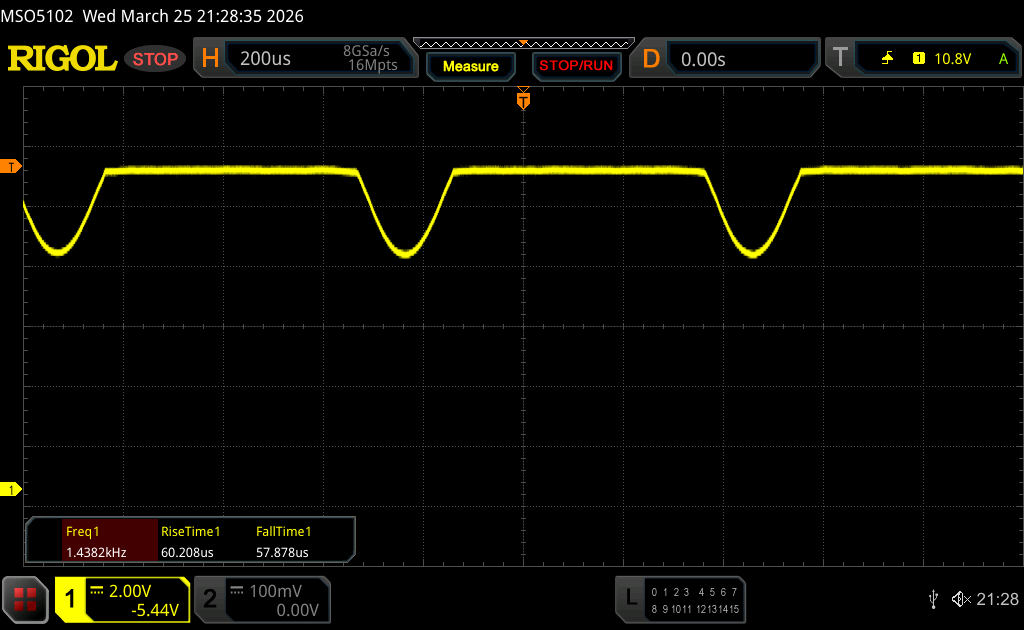
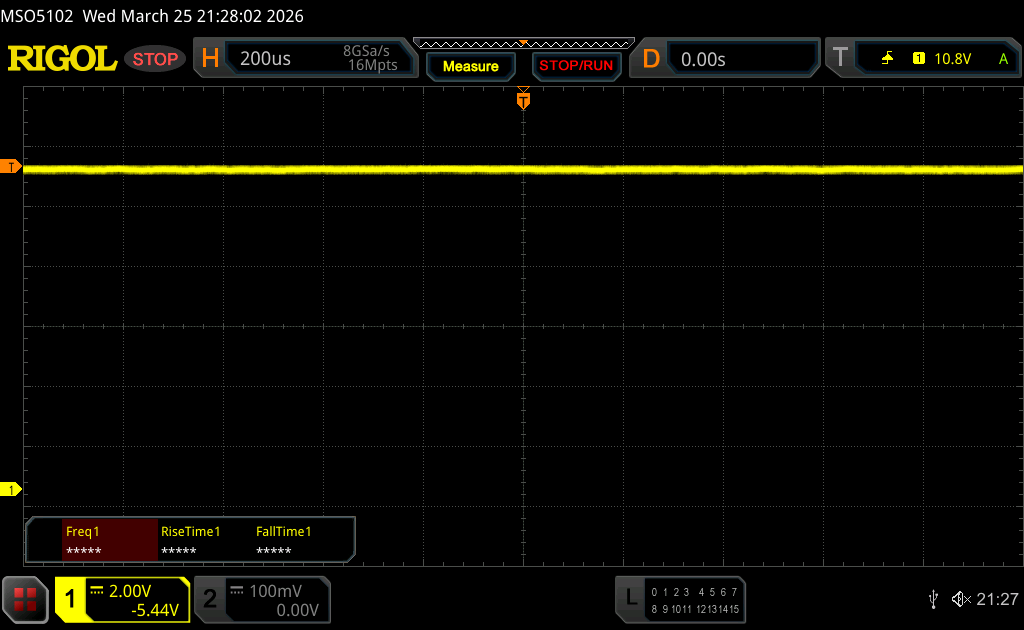
Lenovo utiliza un panel OLED brillante de Samsung (2560 x 1600) y la calidad de imagen es sencillamente sobresaliente: colores impresionantes, negro perfecto, movimientos suaves con 240 Hz, así como tiempos de respuesta rápidos, VRR y G-Sync. Hay parpadeo PWM, pero la frecuencia es alta, de 1,4 kHz. Los juegos se ven sencillamente impresionantes, tanto en SDR como en HDR, donde el panel también alcanza hasta 1100 nits. El brillo SDR también es bueno con 500 nits y Lenovo ofrece perfiles de color precisos desde el primer momento, por lo que también puede editar imágenes/vídeos (P3 y sRGB). Nuestra propia calibración no mejoró más la calidad de imagen.
| |||||||||||||||||||||||||
iluminación: 98 %
Brillo con batería: 499 cd/m²
Contraste: 24950:1 (Negro: 0.02 cd/m²)
ΔE ColorChecker Calman: 2.5 | ∀{0.5-29.43 Ø4.71}
ΔE Greyscale Calman: 4.7 | ∀{0.09-98 Ø4.96}
90.2% AdobeRGB 1998 (Argyll 3D)
100% sRGB (Argyll 3D)
99.2% Display P3 (Argyll 3D)
Gamma: 2.21
CCT: 6715 K
| Lenovo Legion 7 16 AGP11 ATNA60HU02-0, OLED, 2560x1600, 16", 240 Hz | Lenovo Legion 7 16IAX10 Samsung ATNA60HS01-0, OLED, 2560x1600, 16", 165 Hz | Schenker XMG Core 16 VE M25 MNG007DA5-4, IPS, 2560x1600, 16", 180 Hz | Schenker XMG FUSION 16 (M25) ATNA60CL10_0, OLED, 2880x1800, 16", 120 Hz | HP Omen 16-ap0091ng AUODBB2, IPS, 1920x1200, 16", 144 Hz | Asus TUF Gaming A16 FA608UP MNG007DA5-3, IPS, 2560x1600, 16", 165 Hz | no name Hz | Lenovo Legion 5 15AHP G10 LEN151WQXGA, OLED, 2560x1600, 15.1", 165 Hz | |
|---|---|---|---|---|---|---|---|---|
| Display | 1% | -17% | 1% | -53% | -18% | 3% | ||
| Display P3 Coverage (%) | 99.2 | 99.6 0% | 69 -30% | 99.9 1% | 40 -60% | 69.4 -30% | 99.9 1% | |
| sRGB Coverage (%) | 100 | 100 0% | 98.7 -1% | 100 0% | 58.1 -42% | 97.2 -3% | 100 0% | |
| AdobeRGB 1998 Coverage (%) | 90.2 | 93.5 4% | 71.4 -21% | 93.3 3% | 38.7 -57% | 71.9 -20% | 98.3 9% | |
| Response Times | -38% | -1329% | -10% | -4759% | -1084% | 28% | ||
| Response Time Grey 50% / Grey 80% * (ms) | 1.41 ? | 0.6 ? 57% | 12.1 ? -758% | 0.56 ? 60% | 27.6 ? -1857% | 6.3 ? -347% | 0.42 ? 70% | |
| Response Time Black / White * (ms) | 0.25 ? | 0.8 ? -220% | 5 ? -1900% | 0.58 ? -132% | 19.4 ? -7660% | 4.8 ? -1820% | 0.4 ? -60% | |
| PWM Frequency (Hz) | 1440 ? | 1317 ? | 480 ? | 1152 ? | ||||
| PWM Amplitude * (%) | 44 | 23 48% | 26 41% | 11 75% | ||||
| Screen | 12% | -245% | 3% | -191% | -179% | -152% | 35% | |
| Brightness middle (cd/m²) | 499 | 477.6 -4% | 490 -2% | 434 -13% | 328 -34% | 480 -4% | 345.3 -31% | 492 -1% |
| Brightness (cd/m²) | 502 | 483 -4% | 488 -3% | 433 -14% | 313 -38% | 456 -9% | 324 -35% | 495 -1% |
| Brightness Distribution (%) | 98 | 95 -3% | 95 -3% | 99 1% | 91 -7% | 91 -7% | 88 -10% | 92 -6% |
| Black Level * (cd/m²) | 0.02 | 0.42 -2000% | 0.26 -1200% | 0.32 -1500% | 0.23 -1050% | |||
| Contrast (:1) | 24950 | 1167 -95% | 1262 -95% | 1500 -94% | 1501 -94% | |||
| Colorchecker dE 2000 * | 2.5 | 3.11 -24% | 1.45 42% | 3 -20% | 4.73 -89% | 1.4 44% | 3.22 -29% | 0.9 64% |
| Colorchecker dE 2000 max. * | 7.8 | 5.99 23% | 4.19 46% | 5.1 35% | 17.47 -124% | 2.5 68% | 5.68 27% | 1.8 77% |
| Greyscale dE 2000 * | 4.7 | 0.9 81% | 2 57% | 3.4 28% | 2.05 56% | 1.2 74% | 4.5 4% | 1.2 74% |
| Gamma | 2.21 100% | 2.18 101% | 2.172 101% | 2.47 89% | 2.63 84% | 2.16 102% | 2.1 105% | 2.16 102% |
| CCT | 6715 97% | 6405 101% | 6738 96% | 6452 101% | 6718 97% | 6620 98% | 7041 92% | 6291 103% |
| Colorchecker dE 2000 calibrated * | 0.79 | 0.98 | 1.4 | 4.22 | 1.3 | 0.93 | ||
| Media total (Programa/Opciones) | -8% /
-4% | -530% /
-359% | -2% /
-1% | -1668% /
-862% | -427% /
-281% | -152% /
-152% | 22% /
25% |
* ... más pequeño es mejor


Tiempos de respuesta del display
| ↔ Tiempo de respuesta de Negro a Blanco | ||
|---|---|---|
| 0.25 ms ... subida ↗ y bajada ↘ combinada | ↗ 0.13 ms subida | 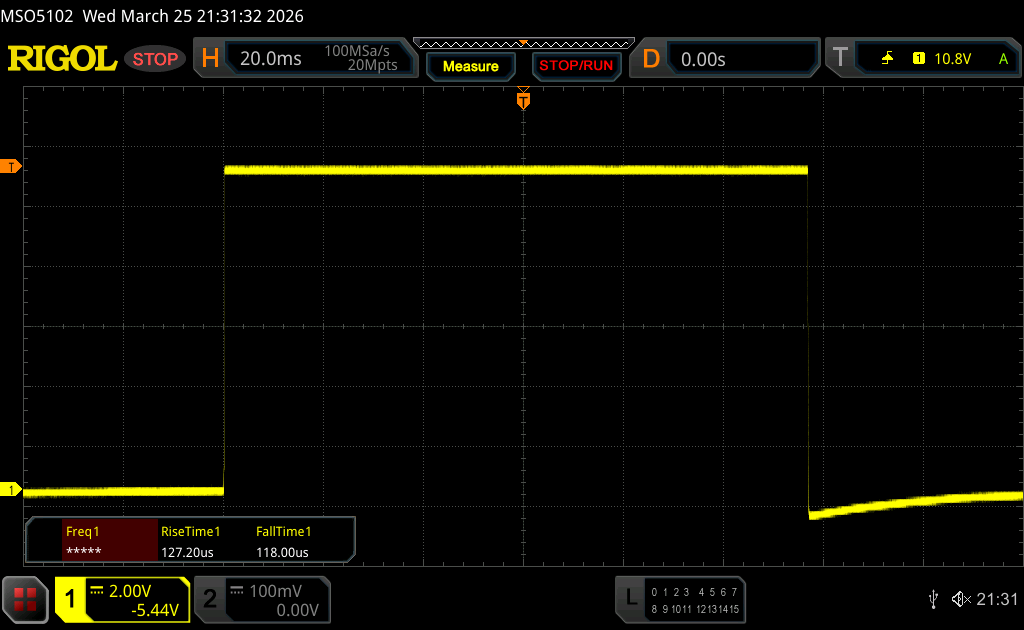 |
| ↘ 0.12 ms bajada | ||
| La pantalla mostró tiempos de respuesta muy rápidos en nuestros tests y debería ser adecuada para juegos frenéticos. En comparación, todos los dispositivos de prueba van de ##min### (mínimo) a 240 (máximo) ms. » 0 % de todos los dispositivos son mejores. Esto quiere decir que el tiempo de respuesta medido es mejor que la media (19.8 ms) de todos los dispositivos testados. | ||
| ↔ Tiempo de respuesta 50% Gris a 80% Gris | ||
| 1.41 ms ... subida ↗ y bajada ↘ combinada | ↗ 0.7 ms subida | 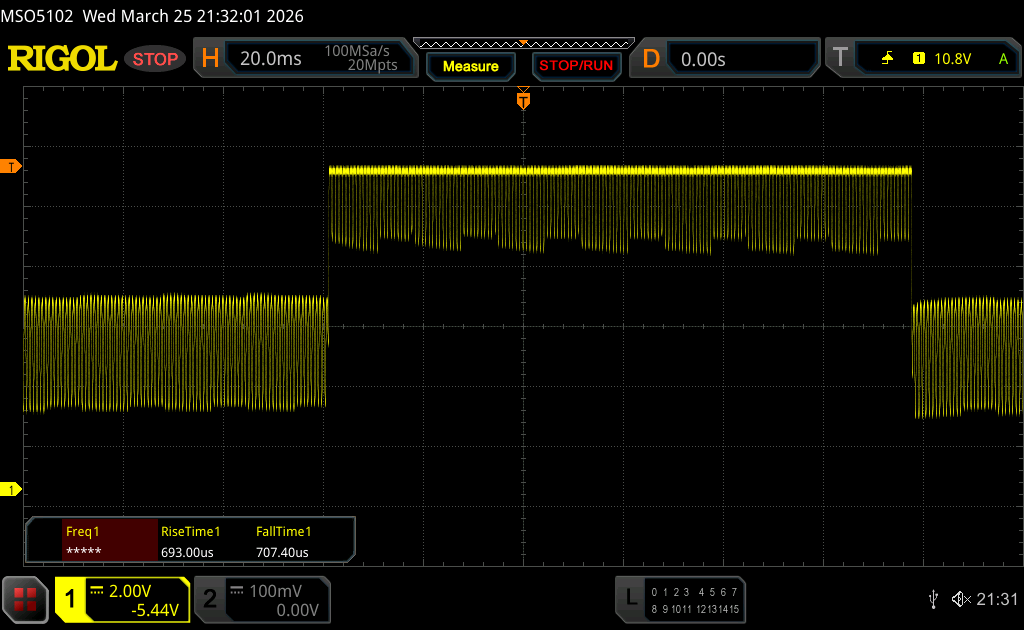 |
| ↘ 0.71 ms bajada | ||
| La pantalla mostró tiempos de respuesta muy rápidos en nuestros tests y debería ser adecuada para juegos frenéticos. En comparación, todos los dispositivos de prueba van de ##min### (mínimo) a 636 (máximo) ms. » 7 % de todos los dispositivos son mejores. Esto quiere decir que el tiempo de respuesta medido es mejor que la media (31 ms) de todos los dispositivos testados. | ||
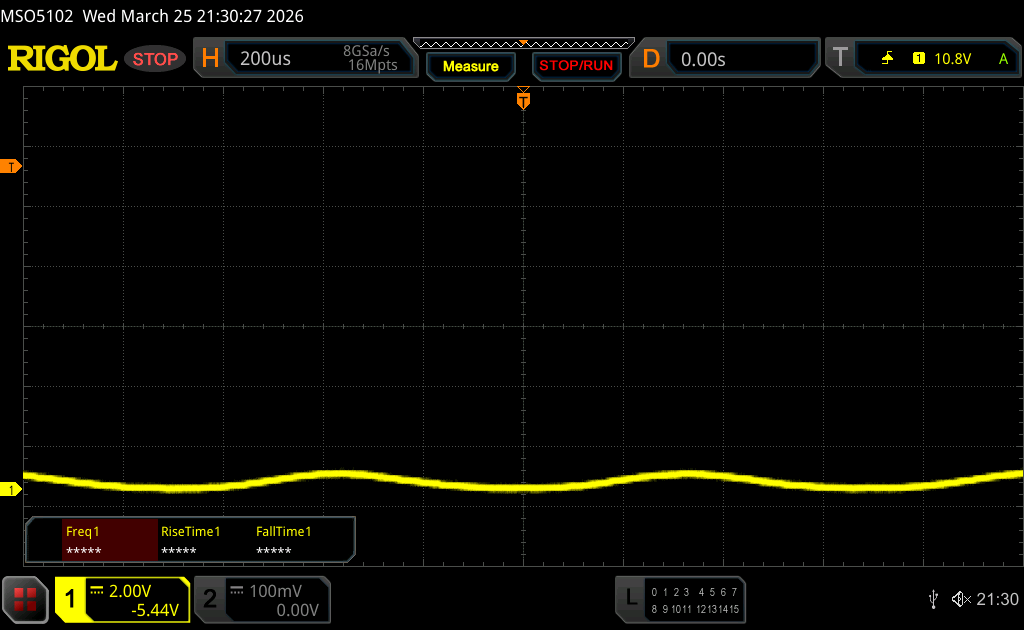
Parpadeo de Pantalla / PWM (Pulse-Width Modulation)
| Parpadeo de Pantalla / PWM detectado | 1440 Hz Amplitude: 44 % | ≤ 90 % de brillo | 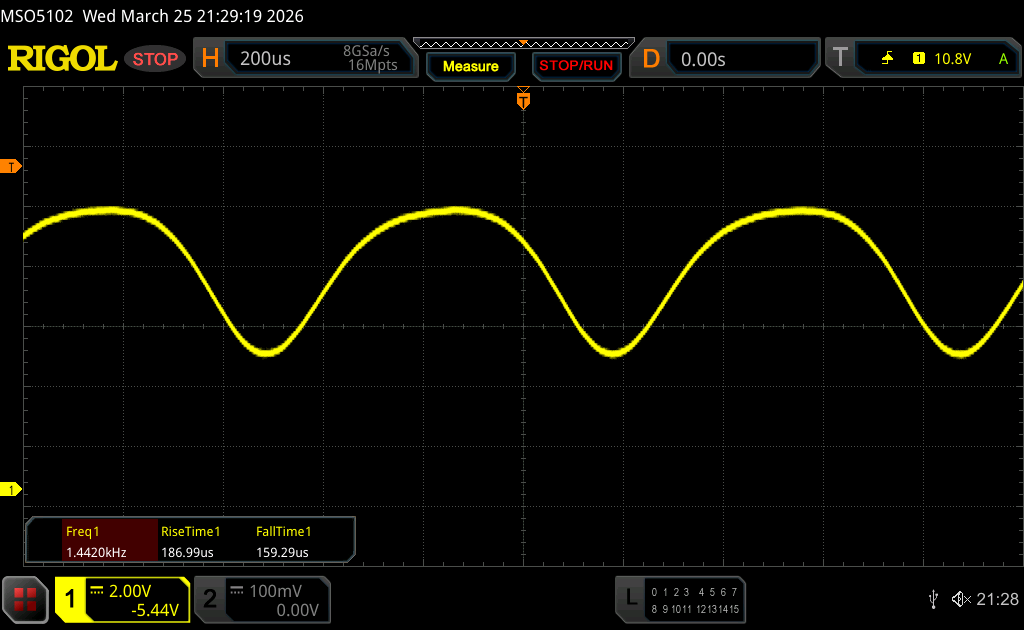 |
La retroiluminación del display parpadea a 1440 Hz (seguramente usa PWM - Pulse-Width Modulation) a un brillo del 90 % e inferior. Sobre este nivel de brillo no debería darse parpadeo / PWM. La frecuencia de 1440 Hz es bastante alta, por lo que la mayoría de gente sensible al parpadeo no debería ver parpadeo o tener fatiga visual. Comparación: 52 % de todos los dispositivos testados no usaron PWM para atenuar el display. Si se usó, medimos una media de 7747 (mínimo: 5 - máxmo: 343500) Hz. | |||


Rendimiento - Ryzen 400 y Blackwell
Condiciones de prueba
Lenovo ofrece diferentes perfiles de energía (vinculados a la configuración de Windows) y tiene que utilizar el modo Rendimiento para obtener el máximo rendimiento de la GPU. Para cargas de trabajo ligeras, sin embargo, puede utilizar fácilmente el modo Silencio . Hemos realizado nuestros benchmarks en modo Rendimiento . Puede utilizar el modo Manual para aumentar el TGP de la GPU a 115 vatios, pero tiene que ajustarlo manualmente y no puede utilizar el acceso directo (Fn+Q) para acceder al modo Manual , lo que resulta muy poco práctico.
| Perfil energético | CPU TDP | CB24 Multi | GPU TGP | Time Spy Gráficos | Cyberpunk 2077 QHD Ultra | ruido máx. del ventilador |
|---|---|---|---|---|---|---|
| Silencioso | 45 W | 1127 pts | 60 W | 9688 pts | 45,9 fps | 41,3 dB(A) |
| Auto | 80 W | 1220 pts | 75 W | 10747 pts | 50,9 fps | 46,5 dB(A) |
| Rendimiento | 90/85 W | 1241 pts | 95 W | 12071 pts | 56,2 fps | 53 dB(A) |
| Batería (Auto) | 45 W | 1088 pts | 55 W | 9071 pts | 42,1 fps | 45,9 dB(A) |
Procesador
El AMD Ryzen AI 9 HX470 ofrece un rendimiento de CPU bueno y estable, pero también es mucho más lento en comparación con el procesador Intel HX del anterior Legion 7 16 G10. Nuestra tabla con los diferentes modos de potencia también muestra que la CPU no se beneficia realmente mucho de los límites de potencia más altos, ya que las ganancias de rendimiento de 45 a 80-90W son muy pequeñas (10 %).
Bucle múltiple Cinebench R15
Cinebench 2024: CPU Multi Core | CPU Single Core
Cinebench R23: Multi Core | Single Core
Cinebench R20: CPU (Multi Core) | CPU (Single Core)
Cinebench R15: CPU Multi 64Bit | CPU Single 64Bit
Blender: v2.79 BMW27 CPU
7-Zip 18.03: 7z b 4 | 7z b 4 -mmt1
Geekbench 6.7: Multi-Core | Single-Core
Geekbench 5.5: Multi-Core | Single-Core
HWBOT x265 Benchmark v2.2: 4k Preset
LibreOffice : 20 Documents To PDF
R Benchmark 2.5: Overall mean
| CPU Performance rating | |
| Schenker XMG FUSION 16 (M25) | |
| Lenovo Legion 7 16IAX10 | |
| Media de la clase Gaming | |
| HP Omen 16-ap0091ng -2! | |
| Lenovo Legion 7 16 AGP11 | |
| Medio AMD Ryzen AI 9 HX 470 | |
| Lenovo Legion 5 15AHP G10 | |
| Schenker XMG Core 16 VE M25 | |
| Asus TUF Gaming A16 FA608UP | |
| Cinebench 2024 / CPU Multi Core | |
| Schenker XMG FUSION 16 (M25) | |
| Lenovo Legion 7 16IAX10 | |
| Media de la clase Gaming (486 - 2327, n=89, últimos 2 años) | |
| Lenovo Legion 7 16 AGP11 | |
| Medio AMD Ryzen AI 9 HX 470 (1087 - 1247, n=5) | |
| Lenovo Legion 5 15AHP G10 | |
| Asus TUF Gaming A16 FA608UP | |
| Schenker XMG Core 16 VE M25 | |
| Cinebench 2024 / CPU Single Core | |
| Schenker XMG FUSION 16 (M25) | |
| Lenovo Legion 7 16IAX10 | |
| Media de la clase Gaming (95 - 141, n=89, últimos 2 años) | |
| Medio AMD Ryzen AI 9 HX 470 (119 - 122, n=5) | |
| Lenovo Legion 7 16 AGP11 | |
| Lenovo Legion 5 15AHP G10 | |
| Asus TUF Gaming A16 FA608UP | |
| Schenker XMG Core 16 VE M25 | |
| Cinebench R23 / Multi Core | |
| Schenker XMG FUSION 16 (M25) | |
| Lenovo Legion 7 16IAX10 | |
| HP Omen 16-ap0091ng | |
| Media de la clase Gaming (10488 - 42661, n=107, últimos 2 años) | |
| Lenovo Legion 7 16 AGP11 | |
| Medio AMD Ryzen AI 9 HX 470 (22589 - 23997, n=5) | |
| Lenovo Legion 5 15AHP G10 | |
| Schenker XMG Core 16 VE M25 | |
| Asus TUF Gaming A16 FA608UP | |
| Cinebench R23 / Single Core | |
| Schenker XMG FUSION 16 (M25) | |
| Lenovo Legion 7 16IAX10 | |
| Medio AMD Ryzen AI 9 HX 470 (2061 - 2091, n=5) | |
| Lenovo Legion 7 16 AGP11 | |
| Media de la clase Gaming (1166 - 2415, n=107, últimos 2 años) | |
| HP Omen 16-ap0091ng | |
| Lenovo Legion 5 15AHP G10 | |
| Asus TUF Gaming A16 FA608UP | |
| Schenker XMG Core 16 VE M25 | |
| Cinebench R20 / CPU (Multi Core) | |
| Schenker XMG FUSION 16 (M25) | |
| Lenovo Legion 7 16IAX10 | |
| HP Omen 16-ap0091ng | |
| Media de la clase Gaming (4029 - 16433, n=106, últimos 2 años) | |
| Lenovo Legion 7 16 AGP11 | |
| Medio AMD Ryzen AI 9 HX 470 (8746 - 9354, n=5) | |
| Lenovo Legion 5 15AHP G10 | |
| Schenker XMG Core 16 VE M25 | |
| Asus TUF Gaming A16 FA608UP | |
| Cinebench R20 / CPU (Single Core) | |
| Schenker XMG FUSION 16 (M25) | |
| Lenovo Legion 7 16IAX10 | |
| Medio AMD Ryzen AI 9 HX 470 (806 - 822, n=5) | |
| Lenovo Legion 7 16 AGP11 | |
| Media de la clase Gaming (442 - 913, n=106, últimos 2 años) | |
| HP Omen 16-ap0091ng | |
| Lenovo Legion 5 15AHP G10 | |
| Asus TUF Gaming A16 FA608UP | |
| Schenker XMG Core 16 VE M25 | |
| Cinebench R15 / CPU Multi 64Bit | |
| Schenker XMG FUSION 16 (M25) | |
| Lenovo Legion 7 16IAX10 | |
| HP Omen 16-ap0091ng | |
| Media de la clase Gaming (1578 - 6330, n=105, últimos 2 años) | |
| Lenovo Legion 7 16 AGP11 | |
| Medio AMD Ryzen AI 9 HX 470 (3372 - 3607, n=5) | |
| Schenker XMG Core 16 VE M25 | |
| Lenovo Legion 5 15AHP G10 | |
| Asus TUF Gaming A16 FA608UP | |
| Cinebench R15 / CPU Single 64Bit | |
| Schenker XMG FUSION 16 (M25) | |
| Lenovo Legion 7 16IAX10 | |
| Media de la clase Gaming (188.8 - 350, n=106, últimos 2 años) | |
| Medio AMD Ryzen AI 9 HX 470 (192.7 - 322, n=5) | |
| HP Omen 16-ap0091ng | |
| Lenovo Legion 5 15AHP G10 | |
| Schenker XMG Core 16 VE M25 | |
| Asus TUF Gaming A16 FA608UP | |
| Lenovo Legion 7 16 AGP11 | |
| Blender / v2.79 BMW27 CPU | |
| Schenker XMG Core 16 VE M25 | |
| Lenovo Legion 5 15AHP G10 | |
| Asus TUF Gaming A16 FA608UP | |
| Media de la clase Gaming (79 - 330, n=104, últimos 2 años) | |
| Medio AMD Ryzen AI 9 HX 470 (140 - 149, n=5) | |
| Lenovo Legion 7 16 AGP11 | |
| HP Omen 16-ap0091ng | |
| Lenovo Legion 7 16IAX10 | |
| Schenker XMG FUSION 16 (M25) | |
| 7-Zip 18.03 / 7z b 4 | |
| Schenker XMG FUSION 16 (M25) | |
| HP Omen 16-ap0091ng | |
| Lenovo Legion 7 16IAX10 | |
| Media de la clase Gaming (33491 - 148086, n=105, últimos 2 años) | |
| Lenovo Legion 7 16 AGP11 | |
| Medio AMD Ryzen AI 9 HX 470 (73258 - 84545, n=5) | |
| Schenker XMG Core 16 VE M25 | |
| Lenovo Legion 5 15AHP G10 | |
| Asus TUF Gaming A16 FA608UP | |
| 7-Zip 18.03 / 7z b 4 -mmt1 | |
| HP Omen 16-ap0091ng | |
| Schenker XMG FUSION 16 (M25) | |
| Schenker XMG Core 16 VE M25 | |
| Lenovo Legion 7 16IAX10 | |
| Lenovo Legion 5 15AHP G10 | |
| Medio AMD Ryzen AI 9 HX 470 (6244 - 6562, n=5) | |
| Media de la clase Gaming (4199 - 7436, n=105, últimos 2 años) | |
| Lenovo Legion 7 16 AGP11 | |
| Asus TUF Gaming A16 FA608UP | |
| Geekbench 6.7 / Multi-Core | |
| Schenker XMG FUSION 16 (M25) | |
| Lenovo Legion 7 16IAX10 | |
| Lenovo Legion 7 16 AGP11 | |
| Media de la clase Gaming (6625 - 22850, n=106, últimos 2 años) | |
| Medio AMD Ryzen AI 9 HX 470 (11437 - 16116, n=7) | |
| Schenker XMG Core 16 VE M25 | |
| Lenovo Legion 5 15AHP G10 | |
| Asus TUF Gaming A16 FA608UP | |
| HP Omen 16-ap0091ng | |
| Geekbench 6.7 / Single-Core | |
| Schenker XMG FUSION 16 (M25) | |
| Lenovo Legion 7 16 AGP11 | |
| Medio AMD Ryzen AI 9 HX 470 (2872 - 3000, n=7) | |
| Lenovo Legion 7 16IAX10 | |
| Media de la clase Gaming (1490 - 3259, n=106, últimos 2 años) | |
| HP Omen 16-ap0091ng | |
| Lenovo Legion 5 15AHP G10 | |
| Asus TUF Gaming A16 FA608UP | |
| Schenker XMG Core 16 VE M25 | |
| Geekbench 5.5 / Multi-Core | |
| Schenker XMG FUSION 16 (M25) | |
| Lenovo Legion 7 16IAX10 | |
| Media de la clase Gaming (6460 - 28263, n=105, últimos 2 años) | |
| Lenovo Legion 7 16 AGP11 | |
| Medio AMD Ryzen AI 9 HX 470 (12418 - 16002, n=5) | |
| HP Omen 16-ap0091ng | |
| Schenker XMG Core 16 VE M25 | |
| Lenovo Legion 5 15AHP G10 | |
| Asus TUF Gaming A16 FA608UP | |
| Geekbench 5.5 / Single-Core | |
| Schenker XMG FUSION 16 (M25) | |
| Lenovo Legion 7 16 AGP11 | |
| Lenovo Legion 7 16IAX10 | |
| Medio AMD Ryzen AI 9 HX 470 (1950 - 2193, n=5) | |
| Media de la clase Gaming (986 - 2474, n=105, últimos 2 años) | |
| Lenovo Legion 5 15AHP G10 | |
| HP Omen 16-ap0091ng | |
| Asus TUF Gaming A16 FA608UP | |
| Schenker XMG Core 16 VE M25 | |
| HWBOT x265 Benchmark v2.2 / 4k Preset | |
| Schenker XMG FUSION 16 (M25) | |
| Lenovo Legion 7 16IAX10 | |
| Media de la clase Gaming (11.5 - 44.4, n=105, últimos 2 años) | |
| Lenovo Legion 7 16 AGP11 | |
| Medio AMD Ryzen AI 9 HX 470 (24.9 - 28.5, n=5) | |
| HP Omen 16-ap0091ng | |
| Lenovo Legion 5 15AHP G10 | |
| Schenker XMG Core 16 VE M25 | |
| Asus TUF Gaming A16 FA608UP | |
| LibreOffice / 20 Documents To PDF | |
| Medio AMD Ryzen AI 9 HX 470 (53.8 - 59.9, n=5) | |
| Schenker XMG Core 16 VE M25 | |
| Asus TUF Gaming A16 FA608UP | |
| Lenovo Legion 7 16 AGP11 | |
| Schenker XMG FUSION 16 (M25) | |
| Media de la clase Gaming (33.2 - 88.8, n=105, últimos 2 años) | |
| Lenovo Legion 5 15AHP G10 | |
| HP Omen 16-ap0091ng | |
| Lenovo Legion 7 16IAX10 | |
| R Benchmark 2.5 / Overall mean | |
| Schenker XMG Core 16 VE M25 | |
| Asus TUF Gaming A16 FA608UP | |
| Lenovo Legion 5 15AHP G10 | |
| Lenovo Legion 7 16IAX10 | |
| Media de la clase Gaming (0.3439 - 0.759, n=106, últimos 2 años) | |
| HP Omen 16-ap0091ng | |
| Lenovo Legion 7 16 AGP11 | |
| Schenker XMG FUSION 16 (M25) | |
| Medio AMD Ryzen AI 9 HX 470 (0.3848 - 0.4157, n=5) | |
* ... más pequeño es mejor
AIDA64: FP32 Ray-Trace | FPU Julia | CPU SHA3 | CPU Queen | FPU SinJulia | FPU Mandel | CPU AES | CPU ZLib | FP64 Ray-Trace | CPU PhotoWorxx | CPU CheckMate
| Performance rating | |
| HP Omen 16-ap0091ng -1! | |
| Schenker XMG FUSION 16 (M25) -1! | |
| Lenovo Legion 7 16 AGP11 -1! | |
| Lenovo Legion 7 16IAX10 -1! | |
| Media de la clase Gaming | |
| Medio AMD Ryzen AI 9 HX 470 | |
| Schenker XMG Core 16 VE M25 -1! | |
| Lenovo Legion 5 15AHP G10 -1! | |
| Asus TUF Gaming A16 FA608UP -1! | |
| AIDA64 / FP32 Ray-Trace | |
| HP Omen 16-ap0091ng (v6.92.6600) | |
| Lenovo Legion 7 16 AGP11 (v8.20.8100) | |
| Medio AMD Ryzen AI 9 HX 470 (31969 - 38491, n=8) | |
| Schenker XMG FUSION 16 (M25) (v6.92.6600) | |
| Media de la clase Gaming (10227 - 85542, n=105, últimos 2 años) | |
| Lenovo Legion 5 15AHP G10 (v6.92.6600) | |
| Lenovo Legion 7 16IAX10 (v6.92.6600) | |
| Asus TUF Gaming A16 FA608UP (v6.92.6600) | |
| Schenker XMG Core 16 VE M25 (v6.92.6600) | |
| AIDA64 / FPU Julia | |
| Schenker XMG FUSION 16 (M25) (v6.92.6600) | |
| HP Omen 16-ap0091ng (v6.92.6600) | |
| Lenovo Legion 7 16IAX10 (v6.92.6600) | |
| Lenovo Legion 7 16 AGP11 (v8.20.8100) | |
| Media de la clase Gaming (51376 - 238426, n=105, últimos 2 años) | |
| Medio AMD Ryzen AI 9 HX 470 (117908 - 152422, n=8) | |
| Lenovo Legion 5 15AHP G10 (v6.92.6600) | |
| Asus TUF Gaming A16 FA608UP (v6.92.6600) | |
| Schenker XMG Core 16 VE M25 (v6.92.6600) | |
| AIDA64 / CPU SHA3 | |
| Schenker XMG FUSION 16 (M25) (v6.92.6600) | |
| HP Omen 16-ap0091ng (v6.92.6600) | |
| Lenovo Legion 7 16IAX10 (v6.92.6600) | |
| Media de la clase Gaming (2180 - 10115, n=105, últimos 2 años) | |
| Lenovo Legion 7 16 AGP11 (v8.20.8100) | |
| Medio AMD Ryzen AI 9 HX 470 (5074 - 5821, n=8) | |
| Schenker XMG Core 16 VE M25 (v6.92.6600) | |
| Asus TUF Gaming A16 FA608UP (v6.92.6600) | |
| Lenovo Legion 5 15AHP G10 (v6.92.6600) | |
| AIDA64 / CPU Queen | |
| HP Omen 16-ap0091ng (v6.92.6600) | |
| Lenovo Legion 7 16IAX10 (v6.92.6600) | |
| Schenker XMG FUSION 16 (M25) (v6.92.6600) | |
| Schenker XMG Core 16 VE M25 (v6.92.6600) | |
| Lenovo Legion 5 15AHP G10 (v6.92.6600) | |
| Asus TUF Gaming A16 FA608UP (v6.92.6600) | |
| Media de la clase Gaming (49785 - 173351, n=90, últimos 2 años) | |
| Medio AMD Ryzen AI 9 HX 470 (89114 - 100242, n=3) | |
| AIDA64 / FPU SinJulia | |
| HP Omen 16-ap0091ng (v6.92.6600) | |
| Lenovo Legion 7 16 AGP11 (v8.20.8100) | |
| Medio AMD Ryzen AI 9 HX 470 (17747 - 19320, n=8) | |
| Schenker XMG Core 16 VE M25 (v6.92.6600) | |
| Lenovo Legion 5 15AHP G10 (v6.92.6600) | |
| Asus TUF Gaming A16 FA608UP (v6.92.6600) | |
| Media de la clase Gaming (4424 - 33636, n=105, últimos 2 años) | |
| Schenker XMG FUSION 16 (M25) (v6.92.6600) | |
| Lenovo Legion 7 16IAX10 (v6.92.6600) | |
| AIDA64 / FPU Mandel | |
| HP Omen 16-ap0091ng (v6.92.6600) | |
| Schenker XMG FUSION 16 (M25) (v6.92.6600) | |
| Lenovo Legion 7 16IAX10 (v6.92.6600) | |
| Lenovo Legion 7 16 AGP11 (v8.20.8100) | |
| Media de la clase Gaming (25115 - 128721, n=105, últimos 2 años) | |
| Medio AMD Ryzen AI 9 HX 470 (66324 - 78045, n=8) | |
| Lenovo Legion 5 15AHP G10 (v6.92.6600) | |
| Asus TUF Gaming A16 FA608UP (v6.92.6600) | |
| Schenker XMG Core 16 VE M25 (v6.92.6600) | |
| AIDA64 / CPU AES | |
| HP Omen 16-ap0091ng (v6.92.6600) | |
| Schenker XMG FUSION 16 (M25) (v6.92.6600) | |
| Lenovo Legion 7 16 AGP11 (v8.20.8100) | |
| Lenovo Legion 7 16IAX10 (v6.92.6600) | |
| Media de la clase Gaming (39258 - 247074, n=105, últimos 2 años) | |
| Schenker XMG Core 16 VE M25 (v6.92.6600) | |
| Asus TUF Gaming A16 FA608UP (v6.92.6600) | |
| Medio AMD Ryzen AI 9 HX 470 (78626 - 117375, n=8) | |
| Lenovo Legion 5 15AHP G10 (v6.92.6600) | |
| AIDA64 / CPU ZLib | |
| Schenker XMG FUSION 16 (M25) (v6.92.6600) | |
| Lenovo Legion 7 16IAX10 (v6.92.6600) | |
| HP Omen 16-ap0091ng (v6.92.6600) | |
| Media de la clase Gaming (574 - 2531, n=105, últimos 2 años) | |
| Lenovo Legion 7 16 AGP11 (v8.20.8100) | |
| Medio AMD Ryzen AI 9 HX 470 (1434 - 1549, n=8) | |
| Schenker XMG Core 16 VE M25 (v6.92.6600) | |
| Lenovo Legion 5 15AHP G10 (v6.92.6600) | |
| Asus TUF Gaming A16 FA608UP (v6.92.6600) | |
| AIDA64 / FP64 Ray-Trace | |
| HP Omen 16-ap0091ng (v6.92.6600) | |
| Lenovo Legion 7 16 AGP11 (v8.20.8100) | |
| Medio AMD Ryzen AI 9 HX 470 (16687 - 20313, n=8) | |
| Schenker XMG FUSION 16 (M25) (v6.92.6600) | |
| Media de la clase Gaming (5509 - 45446, n=105, últimos 2 años) | |
| Lenovo Legion 7 16IAX10 (v6.92.6600) | |
| Lenovo Legion 5 15AHP G10 (v6.92.6600) | |
| Asus TUF Gaming A16 FA608UP (v6.92.6600) | |
| Schenker XMG Core 16 VE M25 (v6.92.6600) | |
| AIDA64 / CPU PhotoWorxx | |
| Lenovo Legion 7 16 AGP11 (v8.20.8100) | |
| Schenker XMG FUSION 16 (M25) (v6.92.6600) | |
| Lenovo Legion 7 16IAX10 (v6.92.6600) | |
| Schenker XMG Core 16 VE M25 (v6.92.6600) | |
| Media de la clase Gaming (12271 - 89891, n=105, últimos 2 años) | |
| Lenovo Legion 5 15AHP G10 (v6.92.6600) | |
| Asus TUF Gaming A16 FA608UP (v6.92.6600) | |
| Medio AMD Ryzen AI 9 HX 470 (23851 - 54302, n=8) | |
| HP Omen 16-ap0091ng (v6.92.6600) | |
| AIDA64 / CPU CheckMate | |
| Lenovo Legion 7 16 AGP11 (v8.20.8100) | |
| Medio AMD Ryzen AI 9 HX 470 (7688 - 8080, n=5) | |
| Media de la clase Gaming (2930 - 11788, n=14, últimos 2 años) | |
Rendimiento del sistema
El rendimiento general del sistema es excelente y no encontramos ningún problema de estabilidad.
PCMark 10: Score | Essentials | Productivity | Digital Content Creation
CrossMark: Overall | Productivity | Creativity | Responsiveness
WebXPRT 3: Overall
WebXPRT 4: Overall
Mozilla Kraken 1.1: Total
| Performance rating | |
| Schenker XMG FUSION 16 (M25) | |
| Media de la clase Gaming | |
| Lenovo Legion 7 16IAX10 | |
| Medio AMD Ryzen AI 9 HX 470, NVIDIA GeForce RTX 5060 Laptop | |
| Lenovo Legion 7 16 AGP11 | |
| Schenker XMG Core 16 VE M25 | |
| HP Omen 16-ap0091ng | |
| Lenovo Legion 5 15AHP G10 | |
| Asus TUF Gaming A16 FA608UP -4! | |
| PCMark 10 / Score | |
| Schenker XMG FUSION 16 (M25) | |
| Lenovo Legion 7 16 AGP11 | |
| Medio AMD Ryzen AI 9 HX 470, NVIDIA GeForce RTX 5060 Laptop (n=1) | |
| Media de la clase Gaming (5828 - 12414, n=93, últimos 2 años) | |
| Lenovo Legion 5 15AHP G10 | |
| Schenker XMG Core 16 VE M25 | |
| HP Omen 16-ap0091ng | |
| Lenovo Legion 7 16IAX10 | |
| PCMark 10 / Essentials | |
| Lenovo Legion 7 16IAX10 | |
| Lenovo Legion 5 15AHP G10 | |
| HP Omen 16-ap0091ng | |
| Media de la clase Gaming (8810 - 11935, n=97, últimos 2 años) | |
| Lenovo Legion 7 16 AGP11 | |
| Medio AMD Ryzen AI 9 HX 470, NVIDIA GeForce RTX 5060 Laptop (n=1) | |
| Schenker XMG FUSION 16 (M25) | |
| Schenker XMG Core 16 VE M25 | |
| PCMark 10 / Productivity | |
| Schenker XMG FUSION 16 (M25) | |
| Lenovo Legion 7 16 AGP11 | |
| Medio AMD Ryzen AI 9 HX 470, NVIDIA GeForce RTX 5060 Laptop (n=1) | |
| Schenker XMG Core 16 VE M25 | |
| Media de la clase Gaming (6845 - 25323, n=95, últimos 2 años) | |
| Lenovo Legion 7 16IAX10 | |
| Lenovo Legion 5 15AHP G10 | |
| HP Omen 16-ap0091ng | |
| PCMark 10 / Digital Content Creation | |
| Schenker XMG FUSION 16 (M25) | |
| Lenovo Legion 7 16 AGP11 | |
| Medio AMD Ryzen AI 9 HX 470, NVIDIA GeForce RTX 5060 Laptop (n=1) | |
| Media de la clase Gaming (7602 - 19954, n=95, últimos 2 años) | |
| Lenovo Legion 5 15AHP G10 | |
| HP Omen 16-ap0091ng | |
| Schenker XMG Core 16 VE M25 | |
| Lenovo Legion 7 16IAX10 | |
| CrossMark / Overall | |
| Schenker XMG FUSION 16 (M25) | |
| Lenovo Legion 7 16IAX10 | |
| Media de la clase Gaming (1366 - 2409, n=94, últimos 2 años) | |
| Schenker XMG Core 16 VE M25 | |
| HP Omen 16-ap0091ng | |
| Lenovo Legion 5 15AHP G10 | |
| Asus TUF Gaming A16 FA608UP | |
| Lenovo Legion 7 16 AGP11 | |
| Medio AMD Ryzen AI 9 HX 470, NVIDIA GeForce RTX 5060 Laptop (n=1) | |
| CrossMark / Productivity | |
| Lenovo Legion 7 16IAX10 | |
| Schenker XMG FUSION 16 (M25) | |
| Media de la clase Gaming (1386 - 2254, n=94, últimos 2 años) | |
| HP Omen 16-ap0091ng | |
| Schenker XMG Core 16 VE M25 | |
| Lenovo Legion 5 15AHP G10 | |
| Asus TUF Gaming A16 FA608UP | |
| Lenovo Legion 7 16 AGP11 | |
| Medio AMD Ryzen AI 9 HX 470, NVIDIA GeForce RTX 5060 Laptop (n=1) | |
| CrossMark / Creativity | |
| Schenker XMG FUSION 16 (M25) | |
| Lenovo Legion 7 16IAX10 | |
| Media de la clase Gaming (1343 - 2786, n=94, últimos 2 años) | |
| HP Omen 16-ap0091ng | |
| Schenker XMG Core 16 VE M25 | |
| Lenovo Legion 5 15AHP G10 | |
| Asus TUF Gaming A16 FA608UP | |
| Lenovo Legion 7 16 AGP11 | |
| Medio AMD Ryzen AI 9 HX 470, NVIDIA GeForce RTX 5060 Laptop (n=1) | |
| CrossMark / Responsiveness | |
| Lenovo Legion 7 16IAX10 | |
| Schenker XMG FUSION 16 (M25) | |
| Media de la clase Gaming (1226 - 2334, n=94, últimos 2 años) | |
| Schenker XMG Core 16 VE M25 | |
| Lenovo Legion 5 15AHP G10 | |
| HP Omen 16-ap0091ng | |
| Lenovo Legion 7 16 AGP11 | |
| Medio AMD Ryzen AI 9 HX 470, NVIDIA GeForce RTX 5060 Laptop (n=1) | |
| Asus TUF Gaming A16 FA608UP | |
| WebXPRT 3 / Overall | |
| Lenovo Legion 7 16IAX10 | |
| Schenker XMG FUSION 16 (M25) | |
| Lenovo Legion 7 16 AGP11 | |
| Medio AMD Ryzen AI 9 HX 470, NVIDIA GeForce RTX 5060 Laptop (n=1) | |
| HP Omen 16-ap0091ng | |
| Media de la clase Gaming (220 - 532, n=98, últimos 2 años) | |
| Lenovo Legion 5 15AHP G10 | |
| Asus TUF Gaming A16 FA608UP | |
| Schenker XMG Core 16 VE M25 | |
| WebXPRT 4 / Overall | |
| Lenovo Legion 7 16IAX10 | |
| Schenker XMG FUSION 16 (M25) | |
| Media de la clase Gaming (165 - 354, n=98, últimos 2 años) | |
| Medio AMD Ryzen AI 9 HX 470, NVIDIA GeForce RTX 5060 Laptop (n=1) | |
| Lenovo Legion 7 16 AGP11 | |
| Schenker XMG Core 16 VE M25 | |
| Lenovo Legion 5 15AHP G10 | |
| HP Omen 16-ap0091ng | |
| Asus TUF Gaming A16 FA608UP | |
| Mozilla Kraken 1.1 / Total | |
| Asus TUF Gaming A16 FA608UP | |
| HP Omen 16-ap0091ng | |
| Schenker XMG Core 16 VE M25 | |
| Lenovo Legion 5 15AHP G10 | |
| Media de la clase Gaming (391 - 590, n=100, últimos 2 años) | |
| Lenovo Legion 7 16IAX10 | |
| Schenker XMG FUSION 16 (M25) | |
| Lenovo Legion 7 16 AGP11 | |
| Medio AMD Ryzen AI 9 HX 470, NVIDIA GeForce RTX 5060 Laptop (n=1) | |
* ... más pequeño es mejor
| PCMark 10 Score | 9485 puntos | |
ayuda | ||
| AIDA64 / Memory Copy | |
| Lenovo Legion 7 16IAX10 | |
| Lenovo Legion 7 16 AGP11 | |
| Schenker XMG FUSION 16 (M25) | |
| Media de la clase Gaming (21750 - 129946, n=105, últimos 2 años) | |
| Lenovo Legion 5 15AHP G10 | |
| Schenker XMG Core 16 VE M25 | |
| Asus TUF Gaming A16 FA608UP | |
| Medio AMD Ryzen AI 9 HX 470 (38489 - 86767, n=8) | |
| HP Omen 16-ap0091ng | |
| AIDA64 / Memory Read | |
| Lenovo Legion 7 16 AGP11 | |
| Schenker XMG FUSION 16 (M25) | |
| Lenovo Legion 7 16IAX10 | |
| Media de la clase Gaming (22956 - 118858, n=105, últimos 2 años) | |
| Medio AMD Ryzen AI 9 HX 470 (39901 - 93860, n=8) | |
| Asus TUF Gaming A16 FA608UP | |
| Lenovo Legion 5 15AHP G10 | |
| Schenker XMG Core 16 VE M25 | |
| HP Omen 16-ap0091ng | |
| AIDA64 / Memory Write | |
| Lenovo Legion 7 16 AGP11 | |
| Lenovo Legion 5 15AHP G10 | |
| Asus TUF Gaming A16 FA608UP | |
| Schenker XMG Core 16 VE M25 | |
| Schenker XMG FUSION 16 (M25) | |
| Lenovo Legion 7 16IAX10 | |
| Media de la clase Gaming (22297 - 135096, n=105, últimos 2 años) | |
| Medio AMD Ryzen AI 9 HX 470 (40283 - 118364, n=8) | |
| HP Omen 16-ap0091ng | |
| AIDA64 / Memory Latency | |
| Schenker XMG FUSION 16 (M25) | |
| Media de la clase Gaming (75.3 - 259, n=105, últimos 2 años) | |
| Lenovo Legion 7 16IAX10 | |
| Lenovo Legion 7 16 AGP11 | |
| Medio AMD Ryzen AI 9 HX 470 (88.1 - 104.5, n=8) | |
| Asus TUF Gaming A16 FA608UP | |
| Lenovo Legion 5 15AHP G10 | |
| Schenker XMG Core 16 VE M25 | |
| HP Omen 16-ap0091ng | |
* ... más pequeño es mejor
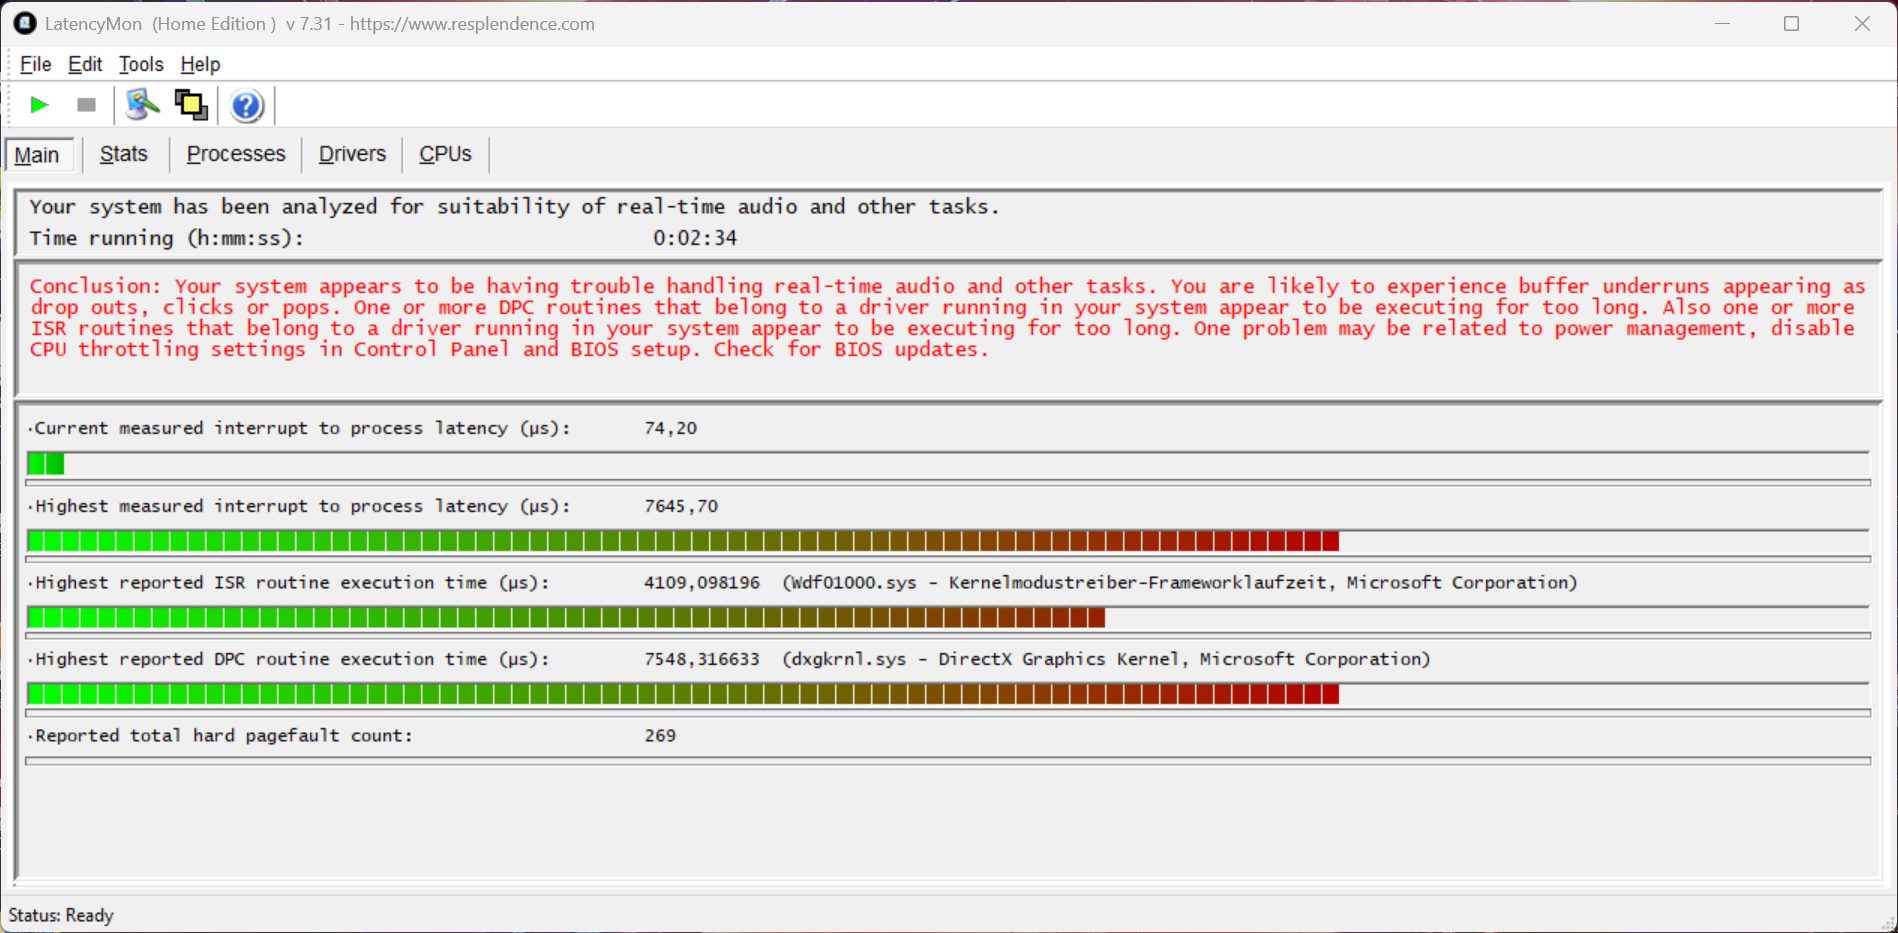
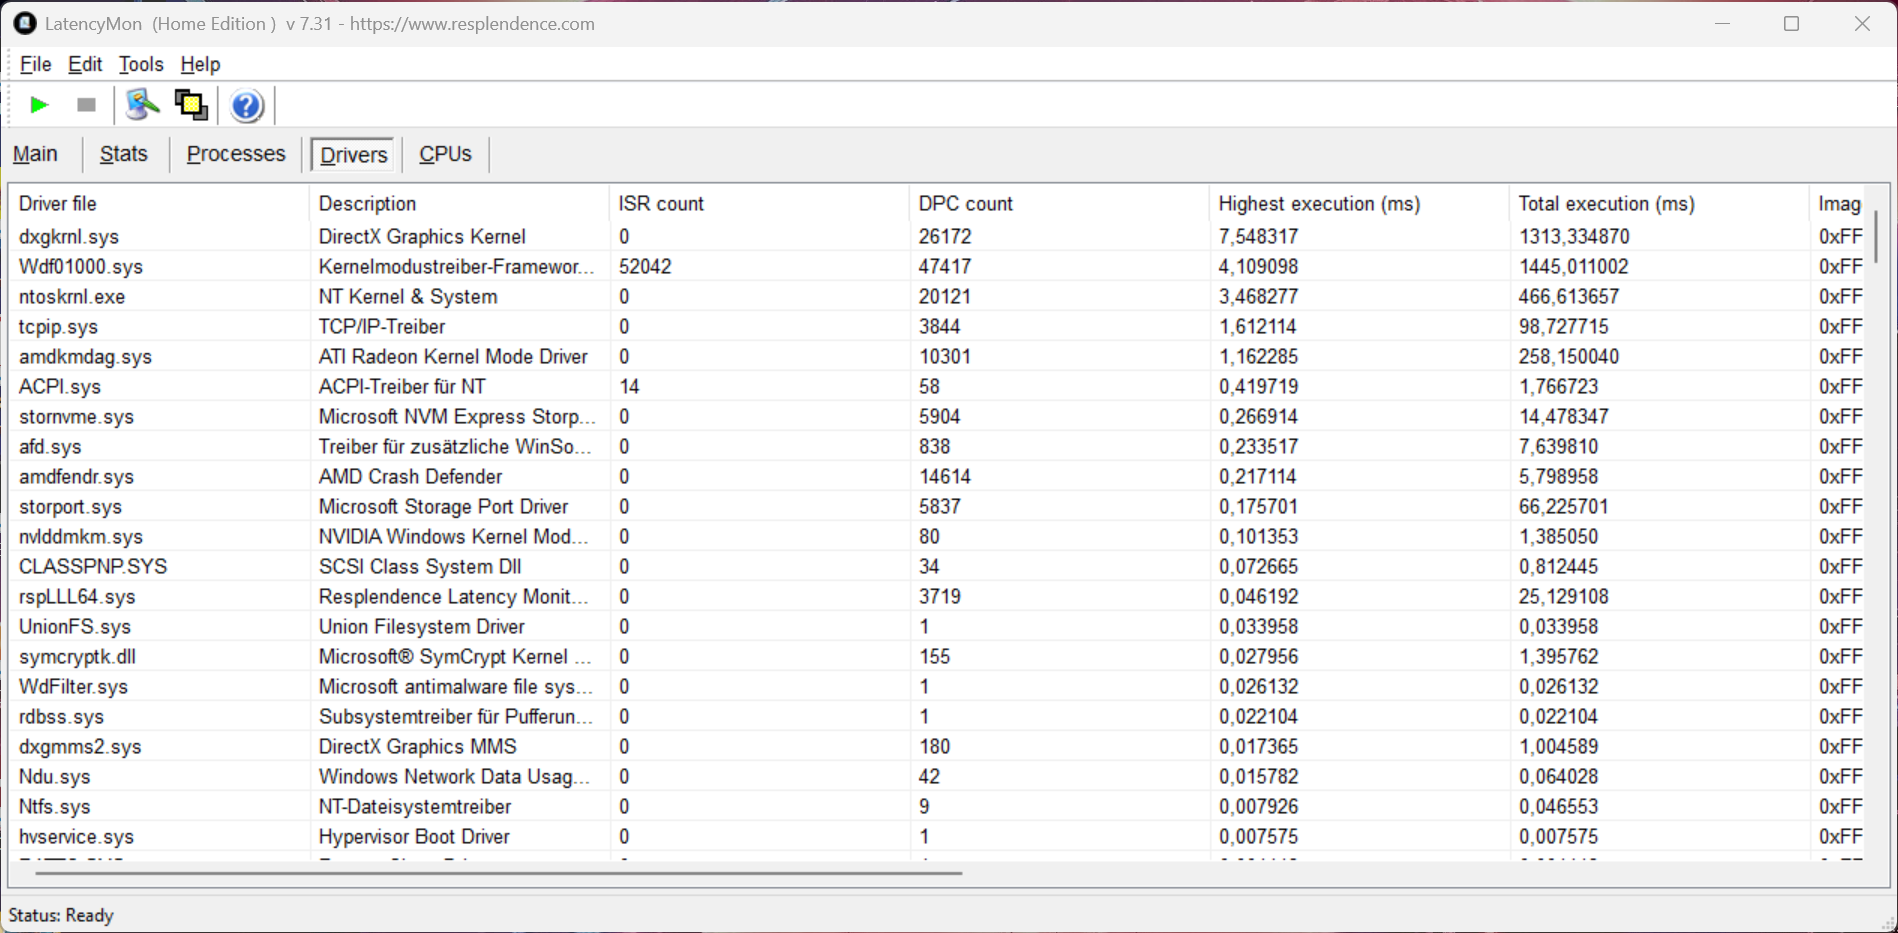
Latencia del CPD
Nuestra prueba de latencia estandarizada muestra problemas para la unidad de revisión con la versión actual de la BIOS, por lo que no es ideal para aplicaciones de audio en tiempo real.
| DPC Latencies / LatencyMon - interrupt to process latency (max), Web, Youtube, Prime95 | |
| Lenovo Legion 7 16 AGP11 | |
| Lenovo Legion 5 15AHP G10 | |
| HP Omen 16-ap0091ng | |
| Schenker XMG Core 16 VE M25 | |
| Lenovo Legion 7 16IAX10 | |
| Schenker XMG FUSION 16 (M25) | |
| Asus TUF Gaming A16 FA608UP | |
* ... más pequeño es mejor
Dispositivos de almacenamiento
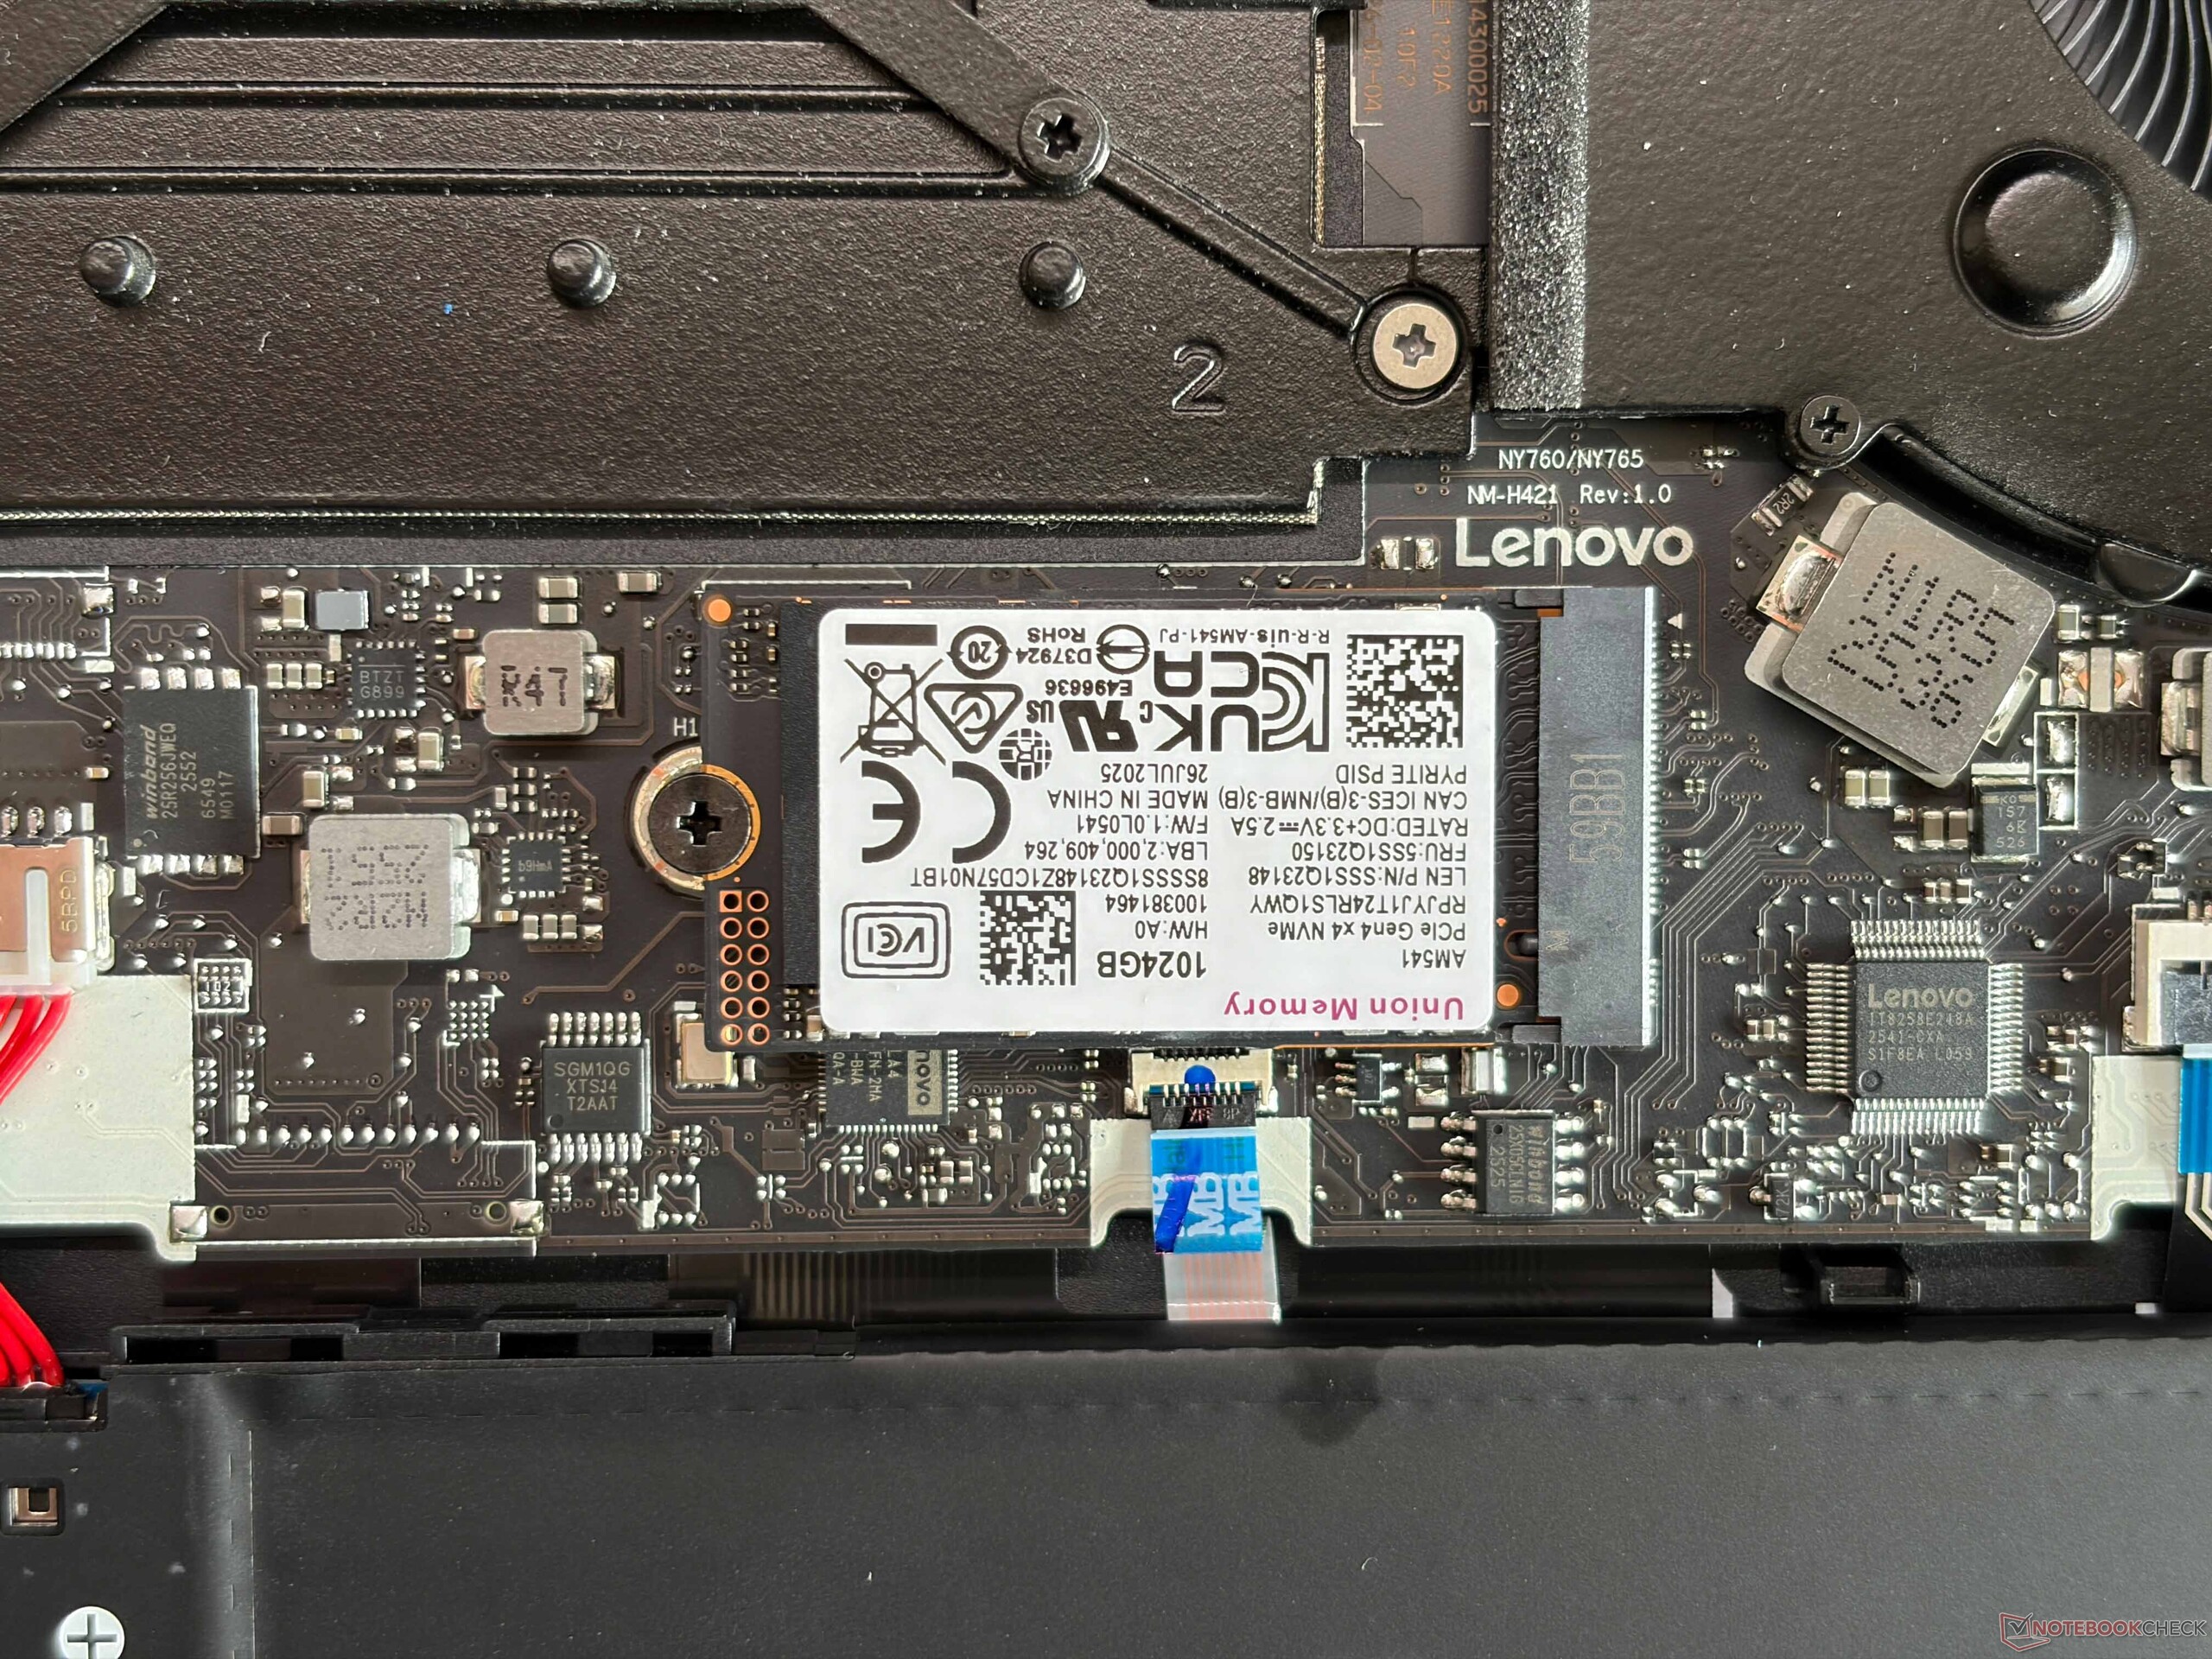
Nuestra unidad de pruebas está equipada con la unidad UMIS AM541 de 1 TB PCIe 4.0 propia de Lenovo (870 GB libres) y las tasas de transferencia de la M.2-2242 compacta están bien, pero no son consistentes bajo cargas de trabajo sostenidas. También hay una ranura M.2-2280 libre para otra unidad SSD, pero está limitada a PCIe 4.0 x2, por lo que las velocidades de transferencia están limitadas a unos 3,5-4 GB/s.

* ... más pequeño es mejor
Estrangulamiento de disco: Bucle de lectura DiskSpd, profundidad de cola 8
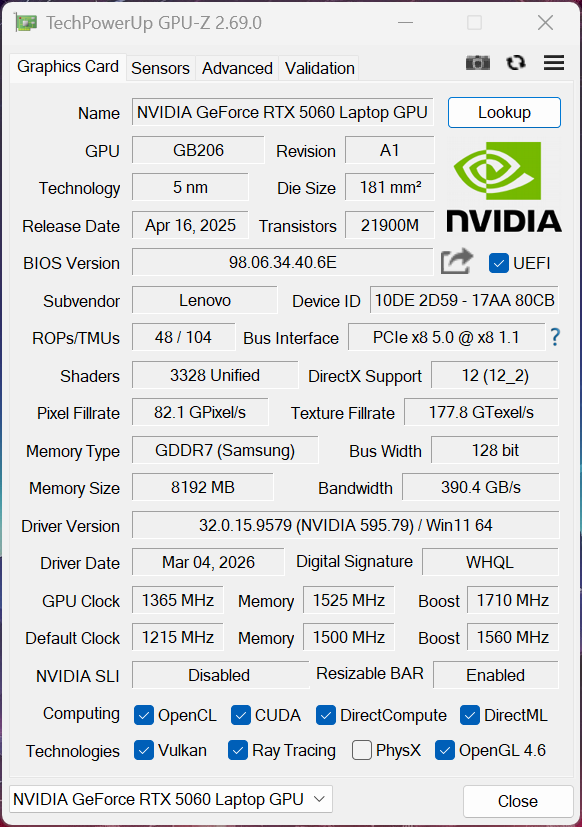
Rendimiento de la GPU
Lenovo vuelve a utilizar la GeForce RTX 5060 móvil, pero esta vez con soporte Advanced Optimus. Sin embargo, en comparación con el anterior Legion 7 16 G10, el TGP ha bajado de 115 a 95 vatios, por lo que el rendimiento de la GPU también es ligeramente inferior. El rendimiento en juegos también se ve afectado, y la CPU AMD más lenta tampoco ayuda. En nuestras pruebas comparativas estandarizadas para juegos, el nuevo Legion 7a 16 G11 es aproximadamente un 10 % más lento que el modelo antiguo, lo que es simplemente el precio que hay que pagar por el diseño más ligero y delgado.
| 3DMark 11 Performance | 34353 puntos | |
| 3DMark Fire Strike Score | 28519 puntos | |
| 3DMark Time Spy Score | 11735 puntos | |
| 3DMark Steel Nomad Score | 2605 puntos | |
| 3DMark Steel Nomad Light Score | 12141 puntos | |
ayuda | ||
| Blender / v3.3 Classroom OPTIX/RTX | |
| Medio NVIDIA GeForce RTX 5060 Laptop (20 - 28, n=18) | |
| Lenovo Legion 5 15AHP G10 | |
| Lenovo Legion 7 16IAX10 | |
| HP Omen 16-ap0091ng | |
| Schenker XMG Core 16 VE M25 | |
| Lenovo Legion 7 16 AGP11 | |
| Asus TUF Gaming A16 FA608UP | |
| Schenker XMG FUSION 16 (M25) | |
| Media de la clase Gaming (9 - 32, n=106, últimos 2 años) | |
| Blender / v3.3 Classroom CUDA | |
| Medio NVIDIA GeForce RTX 5060 Laptop (38 - 186, n=19) | |
| Lenovo Legion 7 16 AGP11 | |
| Schenker XMG Core 16 VE M25 | |
| Lenovo Legion 5 15AHP G10 | |
| Lenovo Legion 7 16IAX10 | |
| HP Omen 16-ap0091ng | |
| Schenker XMG FUSION 16 (M25) | |
| Asus TUF Gaming A16 FA608UP | |
| Media de la clase Gaming (15 - 228, n=106, últimos 2 años) | |
| Blender / v3.3 Classroom CPU | |
| Schenker XMG Core 16 VE M25 | |
| Asus TUF Gaming A16 FA608UP | |
| Lenovo Legion 5 15AHP G10 | |
| Medio NVIDIA GeForce RTX 5060 Laptop (133 - 511, n=18) | |
| Media de la clase Gaming (122 - 565, n=102, últimos 2 años) | |
| Lenovo Legion 7 16 AGP11 | |
| HP Omen 16-ap0091ng | |
| Lenovo Legion 7 16IAX10 | |
| Schenker XMG FUSION 16 (M25) | |
* ... más pequeño es mejor
| GTA V - 1920x1080 Highest AA:4xMSAA + FX AF:16x | |
| Schenker XMG FUSION 16 (M25) | |
| Lenovo Legion 7 16IAX10 | |
| Media de la clase Gaming (48.3 - 186.9, n=93, últimos 2 años) | |
| Lenovo Legion 7 16 AGP11 | |
| HP Omen 16-ap0091ng | |
| Asus TUF Gaming A16 FA608UP | |
| Lenovo Legion 5 15AHP G10 | |
| Strange Brigade - 1920x1080 ultra AA:ultra AF:16 | |
| Media de la clase Gaming (76.3 - 456, n=86, últimos 2 años) | |
| Schenker XMG FUSION 16 (M25) | |
| Lenovo Legion 7 16IAX10 | |
| Lenovo Legion 5 15AHP G10 | |
| Lenovo Legion 7 16 AGP11 | |
| Asus TUF Gaming A16 FA608UP | |
| HP Omen 16-ap0091ng | |

Cyberpunk 2077 ultra FPS Gráfico
| bajo | medio | alto | ultra | QHD DLSS | QHD | |
|---|---|---|---|---|---|---|
| GTA V (2015) | 129.7 | 108.1 | ||||
| Dota 2 Reborn (2015) | 190.6 | 164.3 | 156.5 | 147.8 | ||
| Final Fantasy XV Benchmark (2018) | 197.3 | 162.6 | 121.7 | 89.2 | ||
| X-Plane 11.11 (2018) | 105.8 | 98.8 | 78.4 | |||
| Strange Brigade (2018) | 436 | 321 | 264 | 223 | 155.2 | |
| Baldur's Gate 3 (2023) | 162 | 132 | 115 | 112.2 | 76.4 | |
| Cyberpunk 2077 (2023) | 129.8 | 116.1 | 100.3 | 90.5 | 66.7 | 56.2 |
| F1 24 (2024) | 223 | 208 | 74.3 | 74.5 | 47.2 | |
| F1 25 (2025) | 176.8 | 180.8 | 160.9 | 26.6 | 26.5 | 9.78 |
Emisiones
Ruido del sistema

El Legion es un compañero diario muy silencioso y el ruido del ventilador bajo carga depende mucho del modo de alimentación. En el modo Rendimiento , podemos medir hasta 53 dB(A) mientras juega, por lo que necesitará unos auriculares. Los otros modos son más silenciosos(Auto: 46,5, Silencioso: 41,3 dB(A)), pero el rendimiento en juegos será menor. No notamos ningún quejido de la bobina en nuestra unidad.
Ruido
| Ocioso |
| 24.5 / 24.5 / 27.1 dB(A) |
| Carga |
| 34.6 / 53 dB(A) |
 | ||
30 dB silencioso 40 dB(A) audible 50 dB(A) ruidosamente alto |
||
min: | ||
| Lenovo Legion 7 16 AGP11 Ryzen AI 9 HX 470, GeForce RTX 5060 Laptop | Schenker XMG Core 16 VE M25 Ryzen 7 255, GeForce RTX 5060 Laptop | Schenker XMG FUSION 16 (M25) Ultra 9 275HX, GeForce RTX 5070 Laptop | HP Omen 16-ap0091ng R9 8940HX, GeForce RTX 5060 Laptop | Asus TUF Gaming A16 FA608UP R7 260, GeForce RTX 5070 Laptop | no name | Lenovo Legion 7 16IAX10 Ultra 7 255HX, GeForce RTX 5060 Laptop | Lenovo Legion 5 15AHP G10 R7 260, GeForce RTX 5060 Laptop | |
|---|---|---|---|---|---|---|---|---|
| Noise | -4% | -3% | -3% | -15% | -3% | -3% | -0% | |
| apagado / medio ambiente * (dB) | 24.5 | 24 2% | 25.7 -5% | 23 6% | 25.1 -2% | 22.9 7% | 23.9 2% | 25.5 -4% |
| Idle Minimum * (dB) | 24.5 | 24 2% | 25.7 -5% | 23 6% | 32.2 -31% | 24 2% | 24 2% | 25.5 -4% |
| Idle Average * (dB) | 24.5 | 27 -10% | 25.7 -5% | 23 6% | 32.2 -31% | 25.6 -4% | 26 -6% | 25.5 -4% |
| Idle Maximum * (dB) | 27.1 | 32 -18% | 28 -3% | 27.64 -2% | 32.2 -19% | 25.6 6% | 29.4 -8% | 26.9 1% |
| Load Average * (dB) | 34.6 | 41 -18% | 38.9 -12% | 49.5 -43% | 38.1 -10% | 46.8 -35% | 35.4 -2% | 34.6 -0% |
| Cyberpunk 2077 ultra * (dB) | 53 | 49 8% | 49.7 6% | 49.5 7% | 53.9 -2% | 49.9 6% | 54.6 -3% | 50.1 5% |
| Load Maximum * (dB) | 53 | 50 6% | 49.7 6% | 52.73 1% | 57.1 -8% | 55.6 -5% | 54.7 -3% | 50.1 5% |
* ... más pequeño es mejor
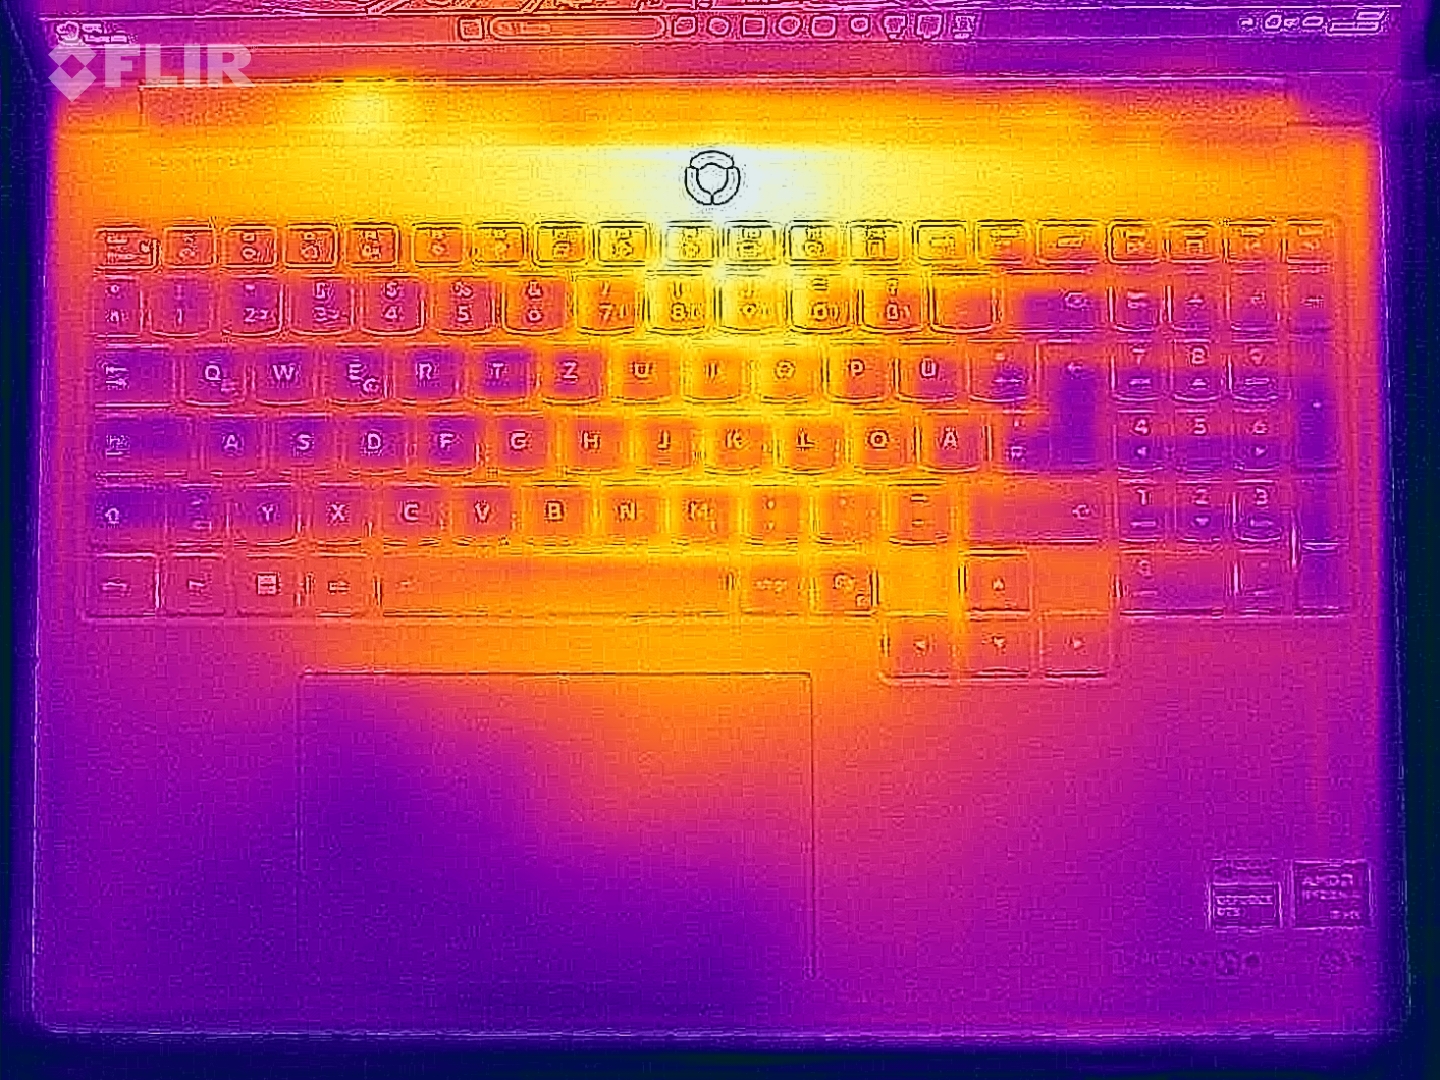
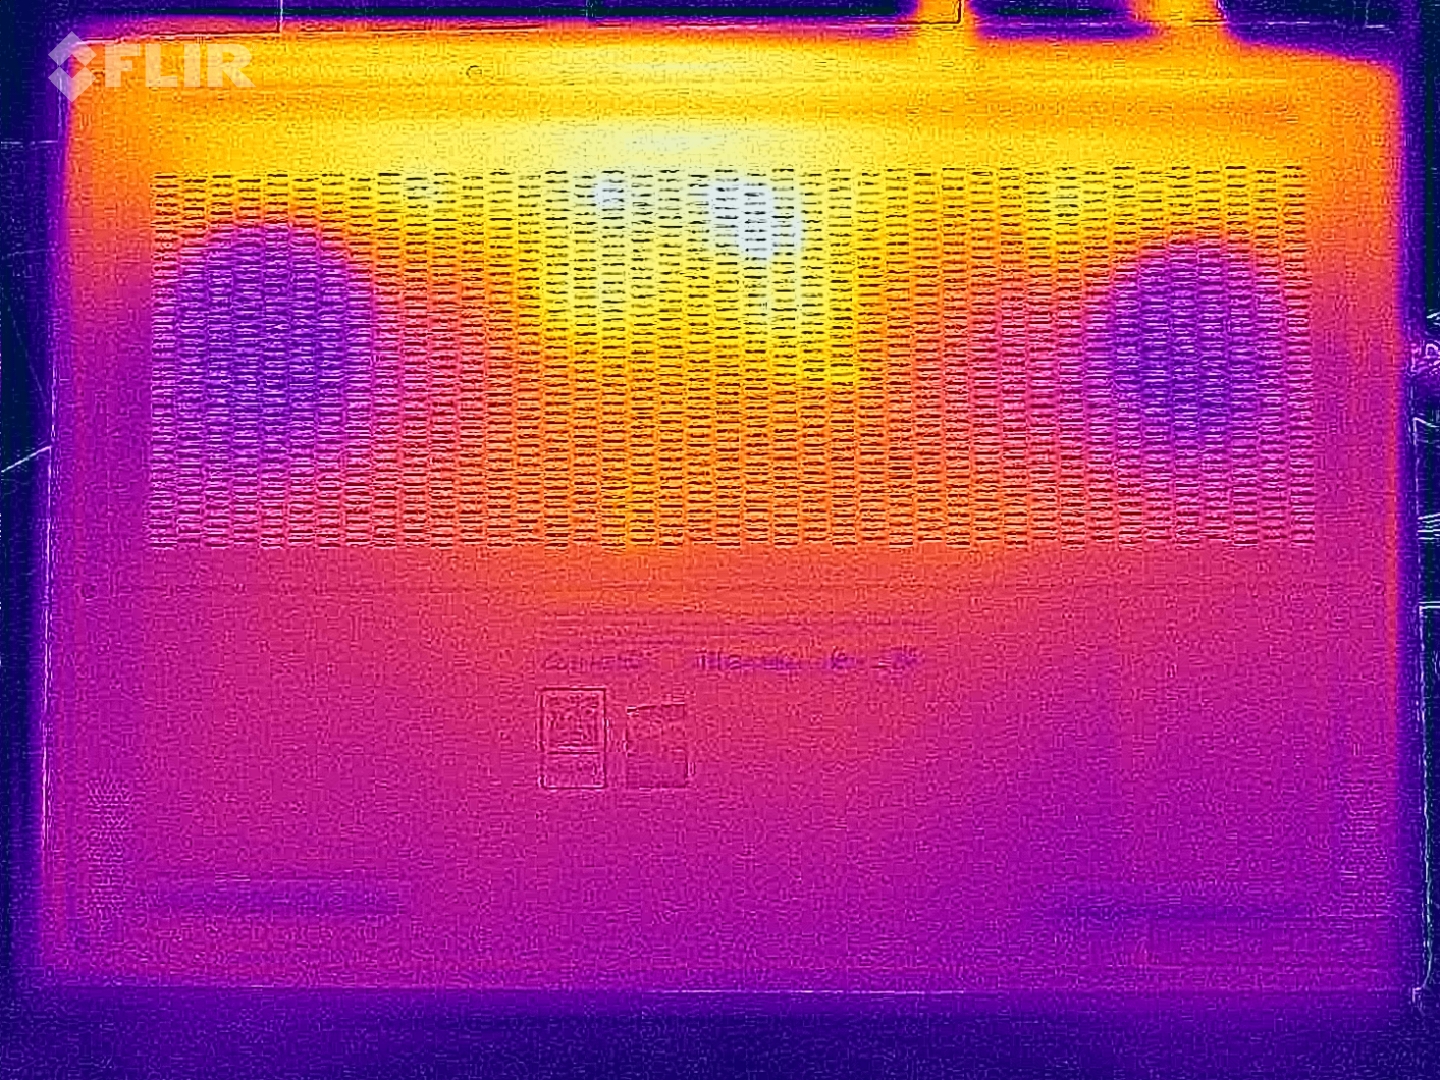
Temperatura
Las temperaturas superficiales son bajas en situaciones cotidianas, pero podemos medir hasta 50 °C en la parte inferior trasera cuando se estresa realmente el portátil, por lo que no debería utilizarlo sobre el regazo en este caso. Durante la prueba de estrés, la CPU se nivela a 45 vatios (76 °C) y la GPU a 80 vatios (76 °C).

(±) La temperatura máxima en la parte superior es de 44.9 °C / 113 F, frente a la media de 40.4 °C / 105 F, que oscila entre 21.2 y 68.8 °C para la clase Gaming.
(-) El fondo se calienta hasta un máximo de 50.5 °C / 123 F, frente a la media de 43.2 °C / 110 F
(+) En reposo, la temperatura media de la parte superior es de 25.8 °C / 78# F, frente a la media del dispositivo de 33.9 °C / 93 F.
(±) 3: The average temperature for the upper side is 37.2 °C / 99 F, compared to the average of 33.9 °C / 93 F for the class Gaming.
(±) El reposamanos y el touchpad pueden calentarse mucho al tacto con un máximo de 37.4 °C / 99.3 F.
(-) La temperatura media de la zona del reposamanos de dispositivos similares fue de 28.8 °C / 83.8 F (-8.6 °C / -15.5 F).
| Lenovo Legion 7 16 AGP11 Ryzen AI 9 HX 470, GeForce RTX 5060 Laptop | Schenker XMG Core 16 VE M25 Ryzen 7 255, GeForce RTX 5060 Laptop | Schenker XMG FUSION 16 (M25) Ultra 9 275HX, GeForce RTX 5070 Laptop | HP Omen 16-ap0091ng R9 8940HX, GeForce RTX 5060 Laptop | Asus TUF Gaming A16 FA608UP R7 260, GeForce RTX 5070 Laptop | no name | Lenovo Legion 7 16IAX10 Ultra 7 255HX, GeForce RTX 5060 Laptop | Lenovo Legion 5 15AHP G10 R7 260, GeForce RTX 5060 Laptop | |
|---|---|---|---|---|---|---|---|---|
| Heat | -9% | 3% | 5% | 9% | -13% | -2% | ||
| Maximum Upper Side * (°C) | 44.9 | 46 -2% | 43.2 4% | 36 20% | 39.5 12% | 47 -5% | 42.2 6% | |
| Maximum Bottom * (°C) | 50.5 | 57 -13% | 48 5% | 37 27% | 45.1 11% | 44 13% | 51.7 -2% | |
| Idle Upper Side * (°C) | 27.3 | 29 -6% | 26.6 3% | 30 -10% | 25.7 6% | 35.6 -30% | 28.5 -4% | |
| Idle Bottom * (°C) | 27.5 | 31 -13% | 27.6 -0% | 32 -16% | 25.5 7% | 35.2 -28% | 29.2 -6% |
* ... más pequeño es mejor
Altavoces
El sistema de sonido utiliza cuatro módulos (de 2 W cada uno) y proporciona una buena calidad de audio.
Lenovo Legion 7 16 AGP11 análisis de audio
(±) | la sonoridad del altavoz es media pero buena (79 dB)
Graves 100 - 315 Hz
(±) | lubina reducida - en promedio 11.4% inferior a la mediana
(±) | la linealidad de los graves es media (8.7% delta a frecuencia anterior)
Medios 400 - 2000 Hz
(+) | medios equilibrados - a sólo 3.1% de la mediana
(+) | los medios son lineales (2.4% delta a la frecuencia anterior)
Altos 2 - 16 kHz
(+) | máximos equilibrados - a sólo 2.1% de la mediana
(+) | los máximos son lineales (5% delta a la frecuencia anterior)
Total 100 - 16.000 Hz
(+) | el sonido global es lineal (11.7% de diferencia con la mediana)
En comparación con la misma clase
» 11% de todos los dispositivos probados de esta clase eran mejores, 4% similares, 85% peores
» El mejor tuvo un delta de 6%, la media fue 18%, el peor fue ###max##%
En comparación con todos los dispositivos probados
» 8% de todos los dispositivos probados eran mejores, 3% similares, 89% peores
» El mejor tuvo un delta de 4%, la media fue 23%, el peor fue ###max##%
Schenker XMG Core 16 VE M25 análisis de audio
(±) | la sonoridad del altavoz es media pero buena (76 dB)
Graves 100 - 315 Hz
(-) | casi sin bajos - de media 19.1% inferior a la mediana
(±) | la linealidad de los graves es media (10.5% delta a frecuencia anterior)
Medios 400 - 2000 Hz
(±) | medias más altas - de media 6.3% más altas que la mediana
(±) | la linealidad de los medios es media (7.2% delta respecto a la frecuencia anterior)
Altos 2 - 16 kHz
(+) | máximos equilibrados - a sólo 1.8% de la mediana
(+) | los máximos son lineales (6% delta a la frecuencia anterior)
Total 100 - 16.000 Hz
(±) | la linealidad del sonido global es media (18.7% de diferencia con la mediana)
En comparación con la misma clase
» 62% de todos los dispositivos probados de esta clase eran mejores, 8% similares, 30% peores
» El mejor tuvo un delta de 6%, la media fue 18%, el peor fue ###max##%
En comparación con todos los dispositivos probados
» 43% de todos los dispositivos probados eran mejores, 8% similares, 50% peores
» El mejor tuvo un delta de 4%, la media fue 23%, el peor fue ###max##%
Schenker XMG FUSION 16 (M25) análisis de audio
(+) | los altavoces pueden reproducir a un volumen relativamente alto (#85.1 dB)
Graves 100 - 315 Hz
(-) | casi sin bajos - de media 17.9% inferior a la mediana
(±) | la linealidad de los graves es media (10.5% delta a frecuencia anterior)
Medios 400 - 2000 Hz
(±) | medias más altas - de media 5.7% más altas que la mediana
(+) | los medios son lineales (4.6% delta a la frecuencia anterior)
Altos 2 - 16 kHz
(+) | máximos equilibrados - a sólo 3.1% de la mediana
(+) | los máximos son lineales (4.8% delta a la frecuencia anterior)
Total 100 - 16.000 Hz
(+) | el sonido global es lineal (14.8% de diferencia con la mediana)
En comparación con la misma clase
» 30% de todos los dispositivos probados de esta clase eran mejores, 7% similares, 63% peores
» El mejor tuvo un delta de 6%, la media fue 18%, el peor fue ###max##%
En comparación con todos los dispositivos probados
» 20% de todos los dispositivos probados eran mejores, 4% similares, 76% peores
» El mejor tuvo un delta de 4%, la media fue 23%, el peor fue ###max##%
HP Omen 16-ap0091ng análisis de audio
(±) | la sonoridad del altavoz es media pero buena (79.91 dB)
Graves 100 - 315 Hz
(-) | casi sin bajos - de media 18% inferior a la mediana
(±) | la linealidad de los graves es media (11.1% delta a frecuencia anterior)
Medios 400 - 2000 Hz
(±) | medias más altas - de media 6.9% más altas que la mediana
(±) | la linealidad de los medios es media (7.5% delta respecto a la frecuencia anterior)
Altos 2 - 16 kHz
(+) | máximos equilibrados - a sólo 2.1% de la mediana
(±) | la linealidad de los máximos es media (7.5% delta a frecuencia anterior)
Total 100 - 16.000 Hz
(±) | la linealidad del sonido global es media (17.8% de diferencia con la mediana)
En comparación con la misma clase
» 53% de todos los dispositivos probados de esta clase eran mejores, 10% similares, 37% peores
» El mejor tuvo un delta de 6%, la media fue 18%, el peor fue ###max##%
En comparación con todos los dispositivos probados
» 36% de todos los dispositivos probados eran mejores, 8% similares, 56% peores
» El mejor tuvo un delta de 4%, la media fue 23%, el peor fue ###max##%
Asus TUF Gaming A16 FA608UP análisis de audio
(±) | la sonoridad del altavoz es media pero buena (80.2 dB)
Graves 100 - 315 Hz
(±) | lubina reducida - en promedio 11.8% inferior a la mediana
(±) | la linealidad de los graves es media (8.7% delta a frecuencia anterior)
Medios 400 - 2000 Hz
(+) | medios equilibrados - a sólo 3% de la mediana
(+) | los medios son lineales (3% delta a la frecuencia anterior)
Altos 2 - 16 kHz
(+) | máximos equilibrados - a sólo 4.4% de la mediana
(±) | la linealidad de los máximos es media (7.4% delta a frecuencia anterior)
Total 100 - 16.000 Hz
(+) | el sonido global es lineal (12.6% de diferencia con la mediana)
En comparación con la misma clase
» 16% de todos los dispositivos probados de esta clase eran mejores, 4% similares, 81% peores
» El mejor tuvo un delta de 6%, la media fue 18%, el peor fue ###max##%
En comparación con todos los dispositivos probados
» 11% de todos los dispositivos probados eran mejores, 3% similares, 86% peores
» El mejor tuvo un delta de 4%, la media fue 23%, el peor fue ###max##%
Lenovo Legion 7 16IAX10 análisis de audio
(±) | la sonoridad del altavoz es media pero buena (77.6 dB)
Graves 100 - 315 Hz
(±) | lubina reducida - en promedio 9.5% inferior a la mediana
(±) | la linealidad de los graves es media (9.8% delta a frecuencia anterior)
Medios 400 - 2000 Hz
(+) | medios equilibrados - a sólo 1.5% de la mediana
(+) | los medios son lineales (4% delta a la frecuencia anterior)
Altos 2 - 16 kHz
(+) | máximos equilibrados - a sólo 3% de la mediana
(+) | los máximos son lineales (4.9% delta a la frecuencia anterior)
Total 100 - 16.000 Hz
(+) | el sonido global es lineal (11.5% de diferencia con la mediana)
En comparación con la misma clase
» 10% de todos los dispositivos probados de esta clase eran mejores, 3% similares, 87% peores
» El mejor tuvo un delta de 6%, la media fue 18%, el peor fue ###max##%
En comparación con todos los dispositivos probados
» 8% de todos los dispositivos probados eran mejores, 2% similares, 90% peores
» El mejor tuvo un delta de 4%, la media fue 23%, el peor fue ###max##%
Lenovo Legion 5 15AHP G10 análisis de audio
(±) | la sonoridad del altavoz es media pero buena (81.5 dB)
Graves 100 - 315 Hz
(-) | casi sin bajos - de media 21% inferior a la mediana
(±) | la linealidad de los graves es media (8.2% delta a frecuencia anterior)
Medios 400 - 2000 Hz
(+) | medios equilibrados - a sólo 4.7% de la mediana
(+) | los medios son lineales (5.4% delta a la frecuencia anterior)
Altos 2 - 16 kHz
(+) | máximos equilibrados - a sólo 3.1% de la mediana
(+) | los máximos son lineales (6.4% delta a la frecuencia anterior)
Total 100 - 16.000 Hz
(±) | la linealidad del sonido global es media (16.7% de diferencia con la mediana)
En comparación con la misma clase
» 43% de todos los dispositivos probados de esta clase eran mejores, 10% similares, 47% peores
» El mejor tuvo un delta de 6%, la media fue 18%, el peor fue ###max##%
En comparación con todos los dispositivos probados
» 29% de todos los dispositivos probados eran mejores, 7% similares, 64% peores
» El mejor tuvo un delta de 4%, la media fue 23%, el peor fue ###max##%
Gestión de la energía
Consumo de energía

La Legion es bastante eficiente en ralentí y las cifras de carga también son inferiores en comparación con el modelo anterior. Durante la prueba de estrés vemos hasta 235 vatios, pero este valor se asienta rápidamente en torno a los 170 vatios, por lo que la fuente de alimentación de 245 vatios es suficiente.
| Off / Standby | |
| Ocioso | |
| Carga |
|
Clave:
min: | |
| Lenovo Legion 7 16 AGP11 Ryzen AI 9 HX 470, GeForce RTX 5060 Laptop, Lenovo UMIS AM541 1TB, OLED, 2560x1600, 16" | Schenker XMG Core 16 VE M25 Ryzen 7 255, GeForce RTX 5060 Laptop, Samsung 990 Pro 2 TB MZVL72T0HDLB, IPS, 2560x1600, 16" | Schenker XMG FUSION 16 (M25) Ultra 9 275HX, GeForce RTX 5070 Laptop, Samsung 9100 Pro 2 TB, OLED, 2880x1800, 16" | HP Omen 16-ap0091ng R9 8940HX, GeForce RTX 5060 Laptop, Samsung PM9C1b MZVL81T0HFLB-00BH1, IPS, 1920x1200, 16" | Asus TUF Gaming A16 FA608UP R7 260, GeForce RTX 5070 Laptop, Western Digital PC SN5000S SDEQNSJ-1T00, IPS, 2560x1600, 16" | no name | Lenovo Legion 7 16IAX10 Ultra 7 255HX, GeForce RTX 5060 Laptop, WD PC SN7100S SDFPMSL-1T00-1101, OLED, 2560x1600, 16" | Lenovo Legion 5 15AHP G10 R7 260, GeForce RTX 5060 Laptop, SK hynix PVC10 HFS001TEM4X182N, OLED, 2560x1600, 15.1" | Medio NVIDIA GeForce RTX 5060 Laptop | Media de la clase Gaming | |
|---|---|---|---|---|---|---|---|---|---|---|
| Power Consumption | -46% | -56% | -32% | -6% | -16% | -64% | -7% | -40% | -89% | |
| Idle Minimum * (Watt) | 5.7 | 10.5 -84% | 15.3 -168% | 7.8 -37% | 4.6 19% | 4.4 23% | 9.4 -65% | 6.9 -21% | 8.97 ? -57% | 13 ? -128% |
| Idle Average * (Watt) | 8.7 | 13 -49% | 16.8 -93% | 8.8 -1% | 9.8 -13% | 18 -107% | 10.6 -22% | 10.7 -23% | 12.9 ? -48% | 18.7 ? -115% |
| Idle Maximum * (Watt) | 9.1 | 18.8 -107% | 17.3 -90% | 21.5 -136% | 10.2 -12% | 18.2 -100% | 36.4 -300% | 11.3 -24% | 18.3 ? -101% | 24.3 ? -167% |
| Load Average * (Watt) | 88.7 | 94.7 -7% | 119 -34% | 76.1 14% | 87.1 2% | 107.7 -21% | 69.7 21% | 92 ? -4% | 110.2 ? -24% | |
| Cyberpunk 2077 ultra external monitor * (Watt) | 156.9 | 181.1 -15% | 180.9 -15% | 164.5 -5% | 198.1 -26% | 120.6 23% | 187.5 -20% | 165 -5% | ||
| Cyberpunk 2077 ultra * (Watt) | 160.3 | 182.5 -14% | 185.3 -16% | 192 -20% | 198.9 -24% | 123 23% | 188 -17% | 162.6 -1% | ||
| Load Maximum * (Watt) | 234.9 | 246 -5% | 242.7 -3% | 208 11% | 235.2 -0% | 183 22% | 247 -5% | 233.6 1% | 213 ? 9% | 258 ? -10% |
* ... más pequeño es mejor
Consumo de energía Cyberpunk / Prueba de estrés
Consumo de energía Monitor externo
Duración de las pilas
La autonomía con la batería de 83 Wh es simplemente media. Registramos una autonomía Wi-Fi de unas 9 horas a 150 nits y de casi 6 horas a brillo máximo.

Valoración de Notebookcheck
Lenovo Legion 7 16 AGP11
- 04/25/2026 v8
Andreas Osthoff
 Total Sustainability Score:
 Competidores potenciales en comparación
Imagen | Modelo | Precio | Peso | Altura | Pantalla |
|---|---|---|---|---|---|
1. 86.4%  | Lenovo Legion 7 16 AGP11 AMD Ryzen AI 9 HX 470 ⎘ NVIDIA GeForce RTX 5060 Laptop ⎘ 32 GB Memoría, 1024 GB SSD | Amazon: Precio de catálogo: 2500€ | 1.8 kg | 16.9 mm | 16.00" 2560x1600 189 PPI OLED |
2. 83.9%  | Schenker XMG Core 16 VE M25 AMD Ryzen 7 255 ⎘ NVIDIA GeForce RTX 5060 Laptop ⎘ 64 GB Memoría, 2048 GB SSD | Amazon: Precio de catálogo: 1935 EUR | 2.1 kg | 23 mm | 16.00" 2560x1600 189 PPI IPS |
3. 87.5%  | Schenker XMG FUSION 16 (M25) Intel Core Ultra 9 275HX ⎘ NVIDIA GeForce RTX 5070 Laptop ⎘ 64 GB Memoría, 2048 GB SSD | Amazon: Precio de catálogo: 2700€ | 2.1 kg | 23 mm | 16.00" 2880x1800 212 PPI OLED |
4. 82.5%  | HP Omen 16-ap0091ng AMD Ryzen 9 8940HX ⎘ NVIDIA GeForce RTX 5060 Laptop ⎘ 16 GB Memoría, 1000 GB SSD | Amazon: Precio de catálogo: 1500 Euro | 2.4 kg | 23.7 mm | 16.00" 1920x1200 162 PPI IPS |
5. 83.8% 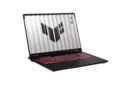 | Asus TUF Gaming A16 FA608UP AMD Ryzen 7 260 ⎘ NVIDIA GeForce RTX 5070 Laptop ⎘ 32 GB Memoría, 1024 GB SSD | Amazon: Precio de catálogo: 2199€ | 2.2 kg | 25.7 mm | 16.00" 2560x1600 189 PPI IPS |
| no name ⎘ ⎘ | Amazon: 1. $23.19 No Name 2. No Name 3. $12.99 The Paper with No Name! | ||||
7. 86.6%  | Lenovo Legion 7 16IAX10 Intel Core Ultra 7 255HX ⎘ NVIDIA GeForce RTX 5060 Laptop ⎘ 32 GB Memoría, 1024 GB SSD | Amazon: Precio de catálogo: 1650 USD | 2 kg | 17.9 mm | 16.00" 2560x1600 189 PPI OLED |
8. 87.2%  | Lenovo Legion 5 15AHP G10 AMD Ryzen 7 260 ⎘ NVIDIA GeForce RTX 5060 Laptop ⎘ 32 GB Memoría, 1024 GB SSD | Amazon: Precio de catálogo: 1449€ | 1.9 kg | 21.5 mm | 15.10" 2560x1600 200 PPI OLED |
Transparencia
La selección de los dispositivos que se van a reseñar corre a cargo de nuestro equipo editorial. La muestra de prueba fue proporcionada al autor en calidad de préstamo por el fabricante o el minorista a los efectos de esta reseña. El prestamista no tuvo ninguna influencia en esta reseña, ni el fabricante recibió una copia de la misma antes de su publicación. No había ninguna obligación de publicar esta reseña. Como empresa de medios independiente, Notebookcheck no está sujeta a la autoridad de fabricantes, minoristas o editores.
Así es como prueba Notebookcheck
Cada año, Notebookcheck revisa de forma independiente cientos de portátiles y smartphones utilizando procedimientos estandarizados para asegurar que todos los resultados son comparables. Hemos desarrollado continuamente nuestros métodos de prueba durante unos 20 años y hemos establecido los estándares de la industria en el proceso. En nuestros laboratorios de pruebas, técnicos y editores experimentados utilizan equipos de medición de alta calidad. Estas pruebas implican un proceso de validación en varias fases. Nuestro complejo sistema de clasificación se basa en cientos de mediciones y puntos de referencia bien fundamentados, lo que mantiene la objetividad.
