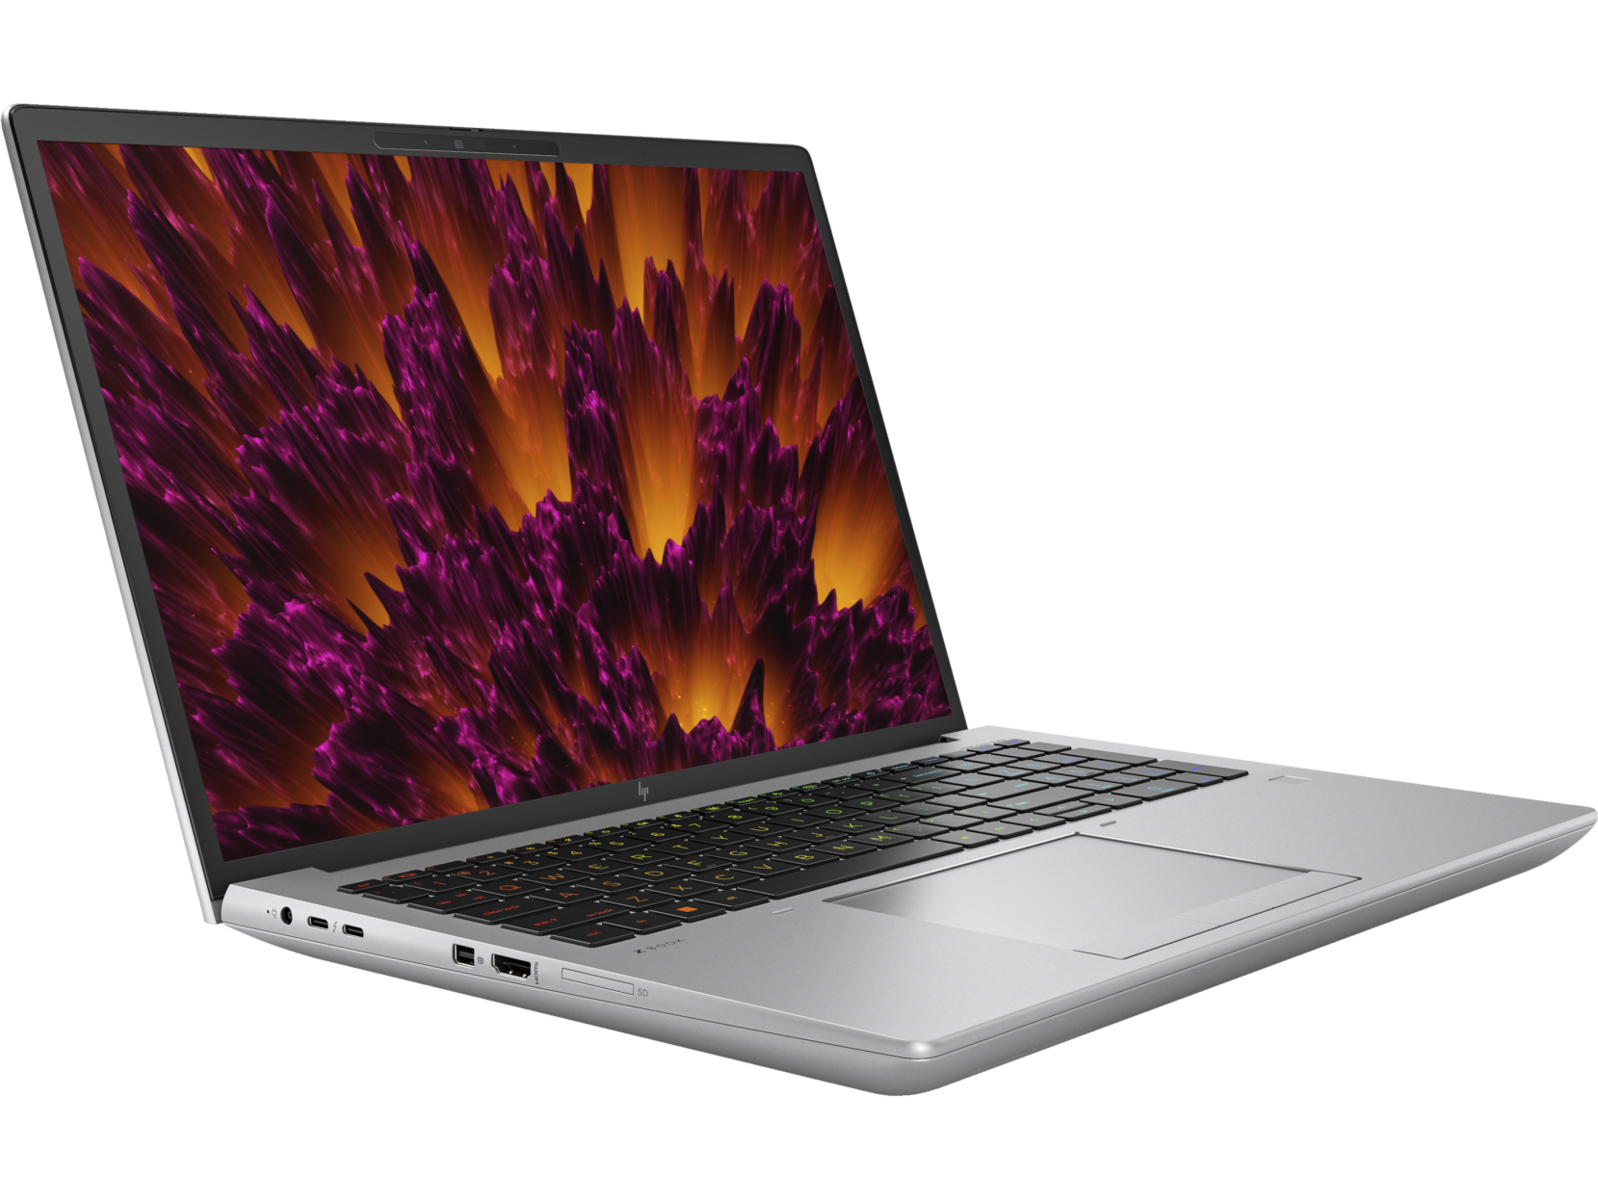
Análisis de la estación de trabajo móvil HP ZBook Fury 16 G10: nvidia RTX 5000 Ada de 100 W

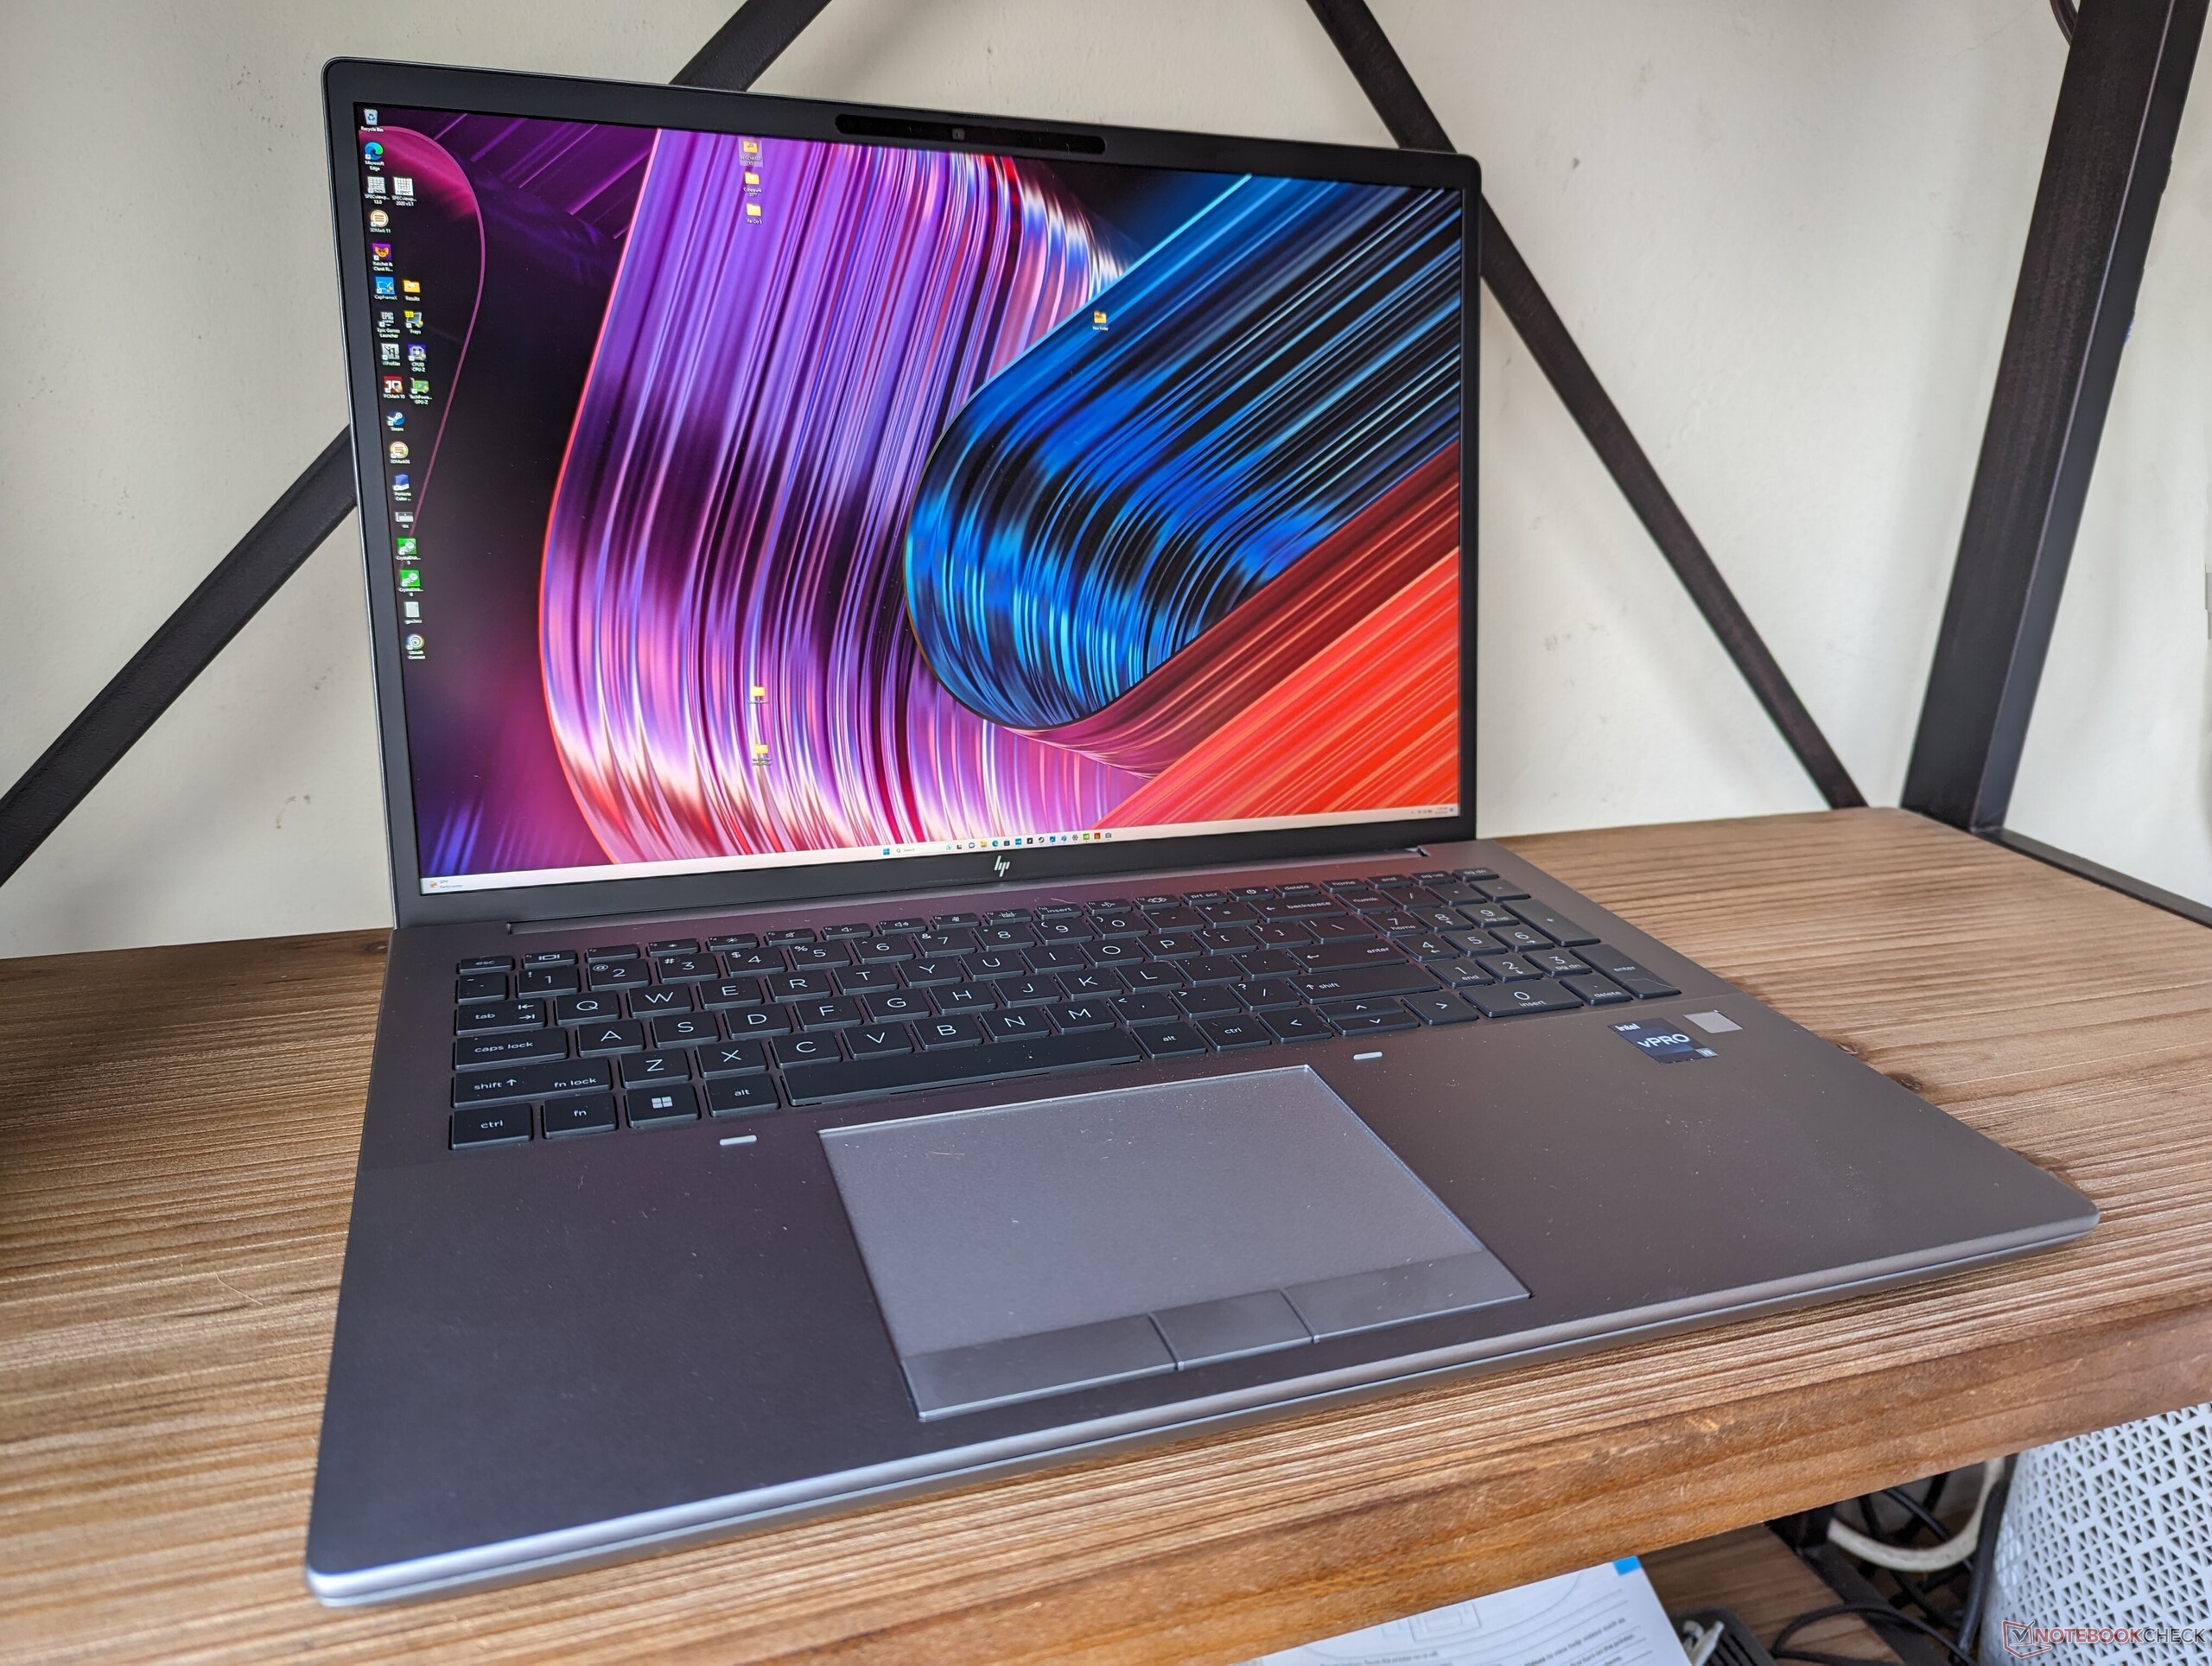
El ZBook Fury 16 G10 sucede directamente al ZBook Fury 16 G9 del año pasado con nuevas opciones de CPU Raptor Lake-HX de 13ª generación y GPU Nvidia RTX Ada para sustituir a los antiguos procesadores Alder Lake y RTX Ampere de 12ª generación, respectivamente. Por lo demás, el nuevo modelo es visualmente idéntico al Fury 16 G9, por lo que recomendamos ponerse al día con nuestro análisis del modelo del año pasado para saber más sobre las características físicas de la Fury 16 G10.
Nuestra unidad de análisis específica es una configuración de gama alta con Core i9-13950HX, Nvidia RTX 5000 Ada y pantalla IPS de 2400p por aproximadamente $5300 USD al por menor. Hay disponibles configuraciones inferiores por precios de salida más bajos, como se detalla en la lista oficial de especificaciones HP de https://www8.hp.com/h20195/v2/GetDocument.aspx?docname=c08558392.
Las alternativas a la Fury 16 G10 incluyen otras estaciones de trabajo móviles de 16 pulgadas como la Dell Precision 5680, Lenovo ThinkPad P16 G1,MSI CreatorPro Z16Po elAsus ProArt StudioBook 16.
Más opiniones sobre HP:
Posibles contendientes en la comparación
Valoración | Fecha | Modelo | Peso | Altura | Tamaño | Resolución | Precio |
|---|---|---|---|---|---|---|---|
| 92.3 % v7 (old) | 09/2023 | HP ZBook Fury 16 G10 i9-13950HX, RTX 5000 Ada Generation Laptop | 2.6 kg | 28.5 mm | 16.00" | 3840x2400 | |
| 91 % v7 (old) | 06/2023 | HP ZBook Fury 16 G9 i9-12950HX, RTX A5500 Laptop GPU | 2.6 kg | 28.5 mm | 16.00" | 3840x2400 | |
| 89 % v7 (old) | 08/2023 | Dell Precision 5000 5680 i9-13900H, RTX 5000 Ada Generation Laptop | 2.3 kg | 22.17 mm | 16.00" | 3840x2400 | |
| 91 % v7 (old) | 02/2023 | Lenovo ThinkPad P16 G1 RTX A5500 i9-12950HX, RTX A5500 Laptop GPU | 3 kg | 30.23 mm | 16.00" | 3840x2400 | |
| 84.3 % v7 (old) | 11/2022 | MSI CreatorPro Z16P B12UKST i7-12700H, RTX A3000 Laptop GPU | 2.4 kg | 19 mm | 16.00" | 2560x1600 | |
v (old) | 12/2021 | Asus ProArt StudioBook 16 W7600H5A-2BL2 W-11955M, RTX A5000 Laptop GPU | 2.4 kg | 21.4 mm | 16.00" | 3840x2400 |
Carcasa - Diseño familiar de la ZBook Fury 16 G9
Lector de tarjetas SD
| SD Card Reader | |
| average JPG Copy Test (av. of 3 runs) | |
| Dell Precision 5000 5680 (Toshiba Exceria Pro SDXC 64 GB UHS-II) | |
| MSI CreatorPro Z16P B12UKST (AV Pro V60) | |
| HP ZBook Fury 16 G10 (Toshiba Exceria Pro SDXC 64 GB UHS-II) | |
| HP ZBook Fury 16 G9 (PNY EliteX-PRO60) | |
| Lenovo ThinkPad P16 G1 RTX A5500 (Toshiba Exceria Pro SDXC 64 GB UHS-II) | |
| Asus ProArt StudioBook 16 W7600H5A-2BL2 (AV Pro SD microSD 128 GB V60) | |
| maximum AS SSD Seq Read Test (1GB) | |
| Dell Precision 5000 5680 (Toshiba Exceria Pro SDXC 64 GB UHS-II) | |
| HP ZBook Fury 16 G10 (Toshiba Exceria Pro SDXC 64 GB UHS-II) | |
| Asus ProArt StudioBook 16 W7600H5A-2BL2 (AV Pro SD microSD 128 GB V60) | |
| HP ZBook Fury 16 G9 (PNY EliteX-PRO60) | |
| MSI CreatorPro Z16P B12UKST (AV Pro V60) | |
| Lenovo ThinkPad P16 G1 RTX A5500 (Toshiba Exceria Pro SDXC 64 GB UHS-II) | |
Comunicación
| Networking | |
| iperf3 transmit AX12 | |
| Asus ProArt StudioBook 16 W7600H5A-2BL2 | |
| iperf3 receive AX12 | |
| Asus ProArt StudioBook 16 W7600H5A-2BL2 | |
| iperf3 transmit AXE11000 | |
| HP ZBook Fury 16 G10 | |
| Lenovo ThinkPad P16 G1 RTX A5500 | |
| Dell Precision 5000 5680 | |
| HP ZBook Fury 16 G9 | |
| iperf3 receive AXE11000 | |
| HP ZBook Fury 16 G9 | |
| HP ZBook Fury 16 G10 | |
| Lenovo ThinkPad P16 G1 RTX A5500 | |
| Dell Precision 5000 5680 | |
| iperf3 transmit AXE11000 6GHz | |
| MSI CreatorPro Z16P B12UKST | |
| Lenovo ThinkPad P16 G1 RTX A5500 | |
| HP ZBook Fury 16 G10 | |
| Dell Precision 5000 5680 | |
| iperf3 receive AXE11000 6GHz | |
| MSI CreatorPro Z16P B12UKST | |
| HP ZBook Fury 16 G10 | |
| Lenovo ThinkPad P16 G1 RTX A5500 | |
| Dell Precision 5000 5680 | |
Cámara web
Los portátiles HP siguen teniendo algunas de las webcams de mayor resolución del mercado. El sensor de 5 MP de la Fury 16 G10 ofrece una imagen mucho más limpia que la webcam de 2 MP de la Precision 5680.


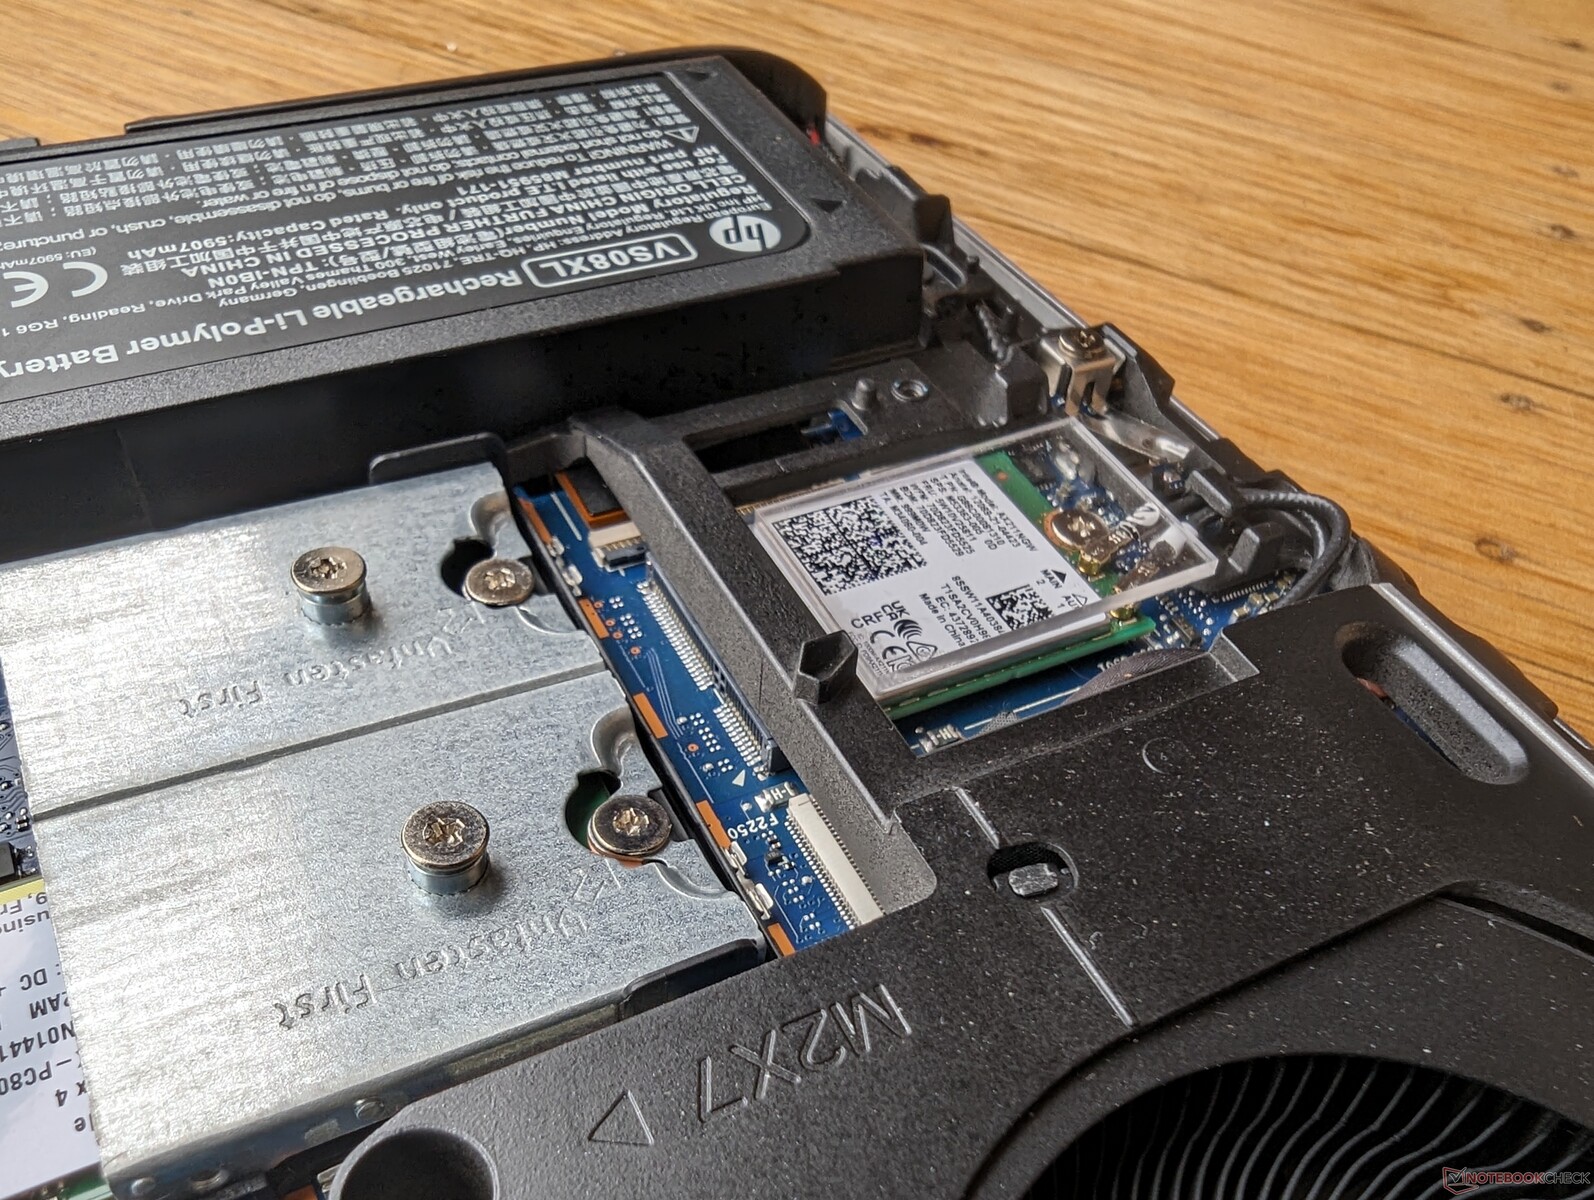
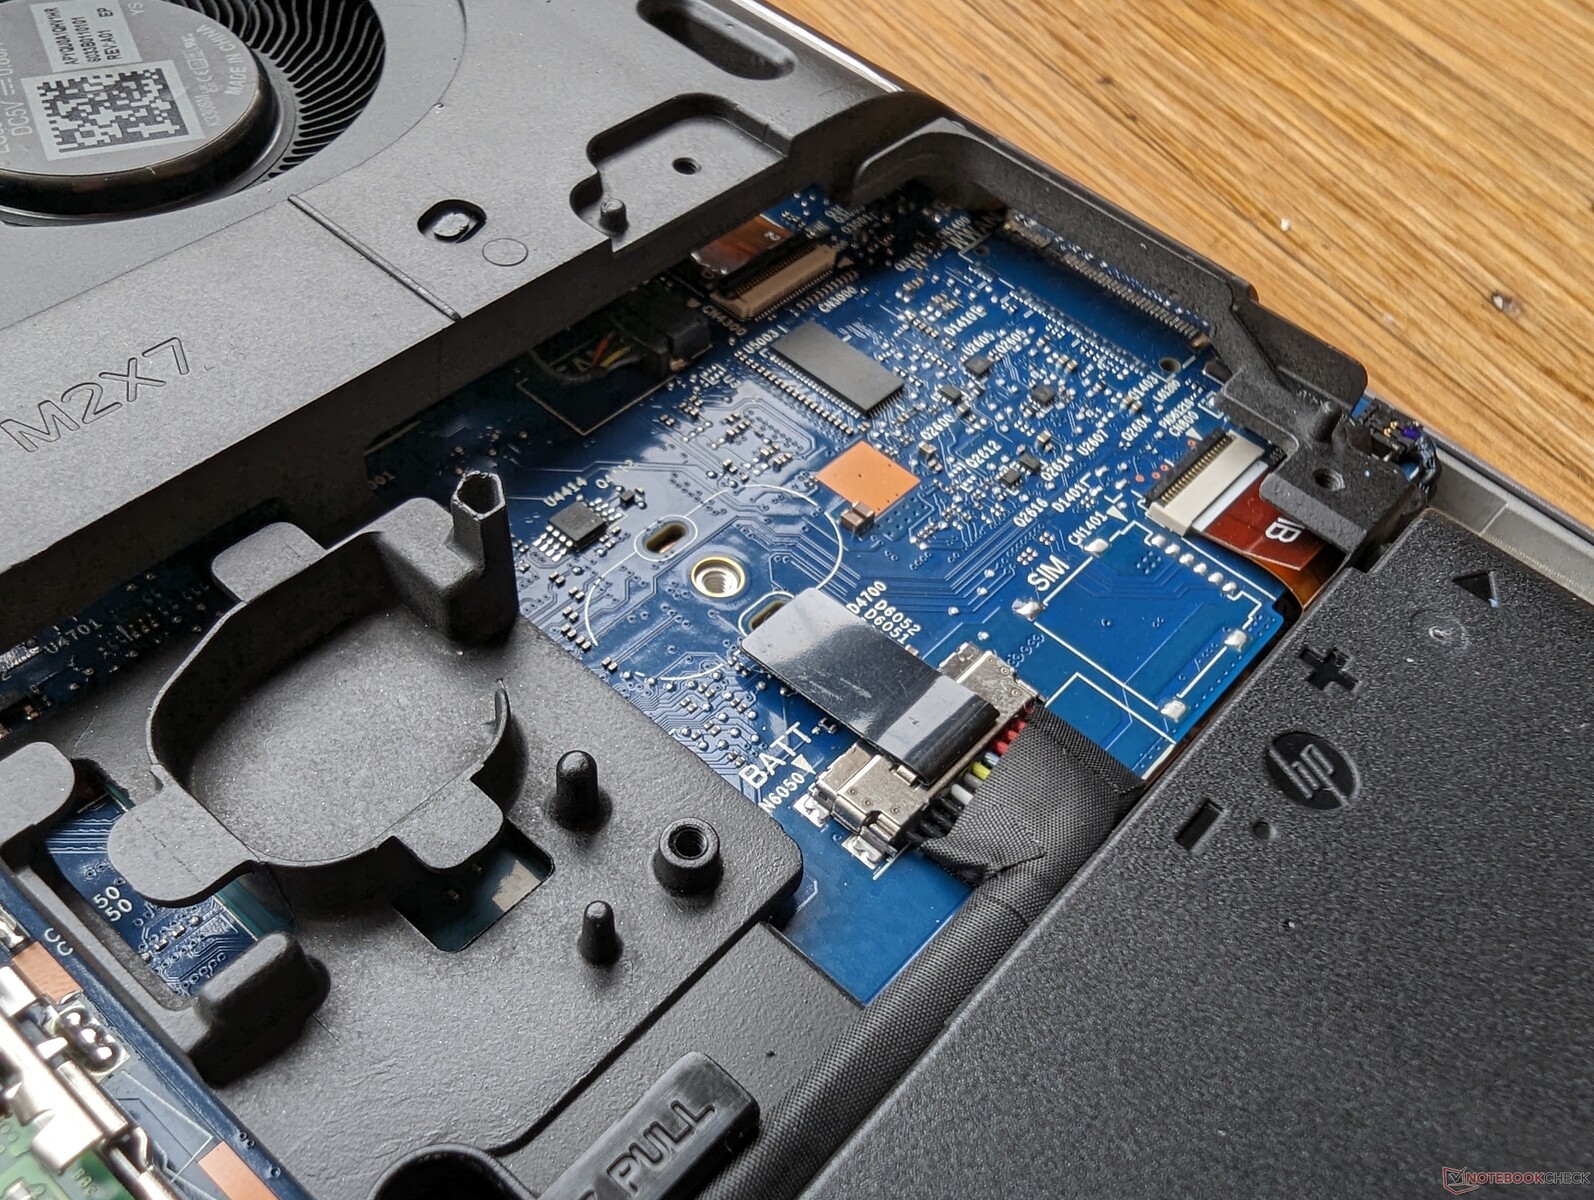
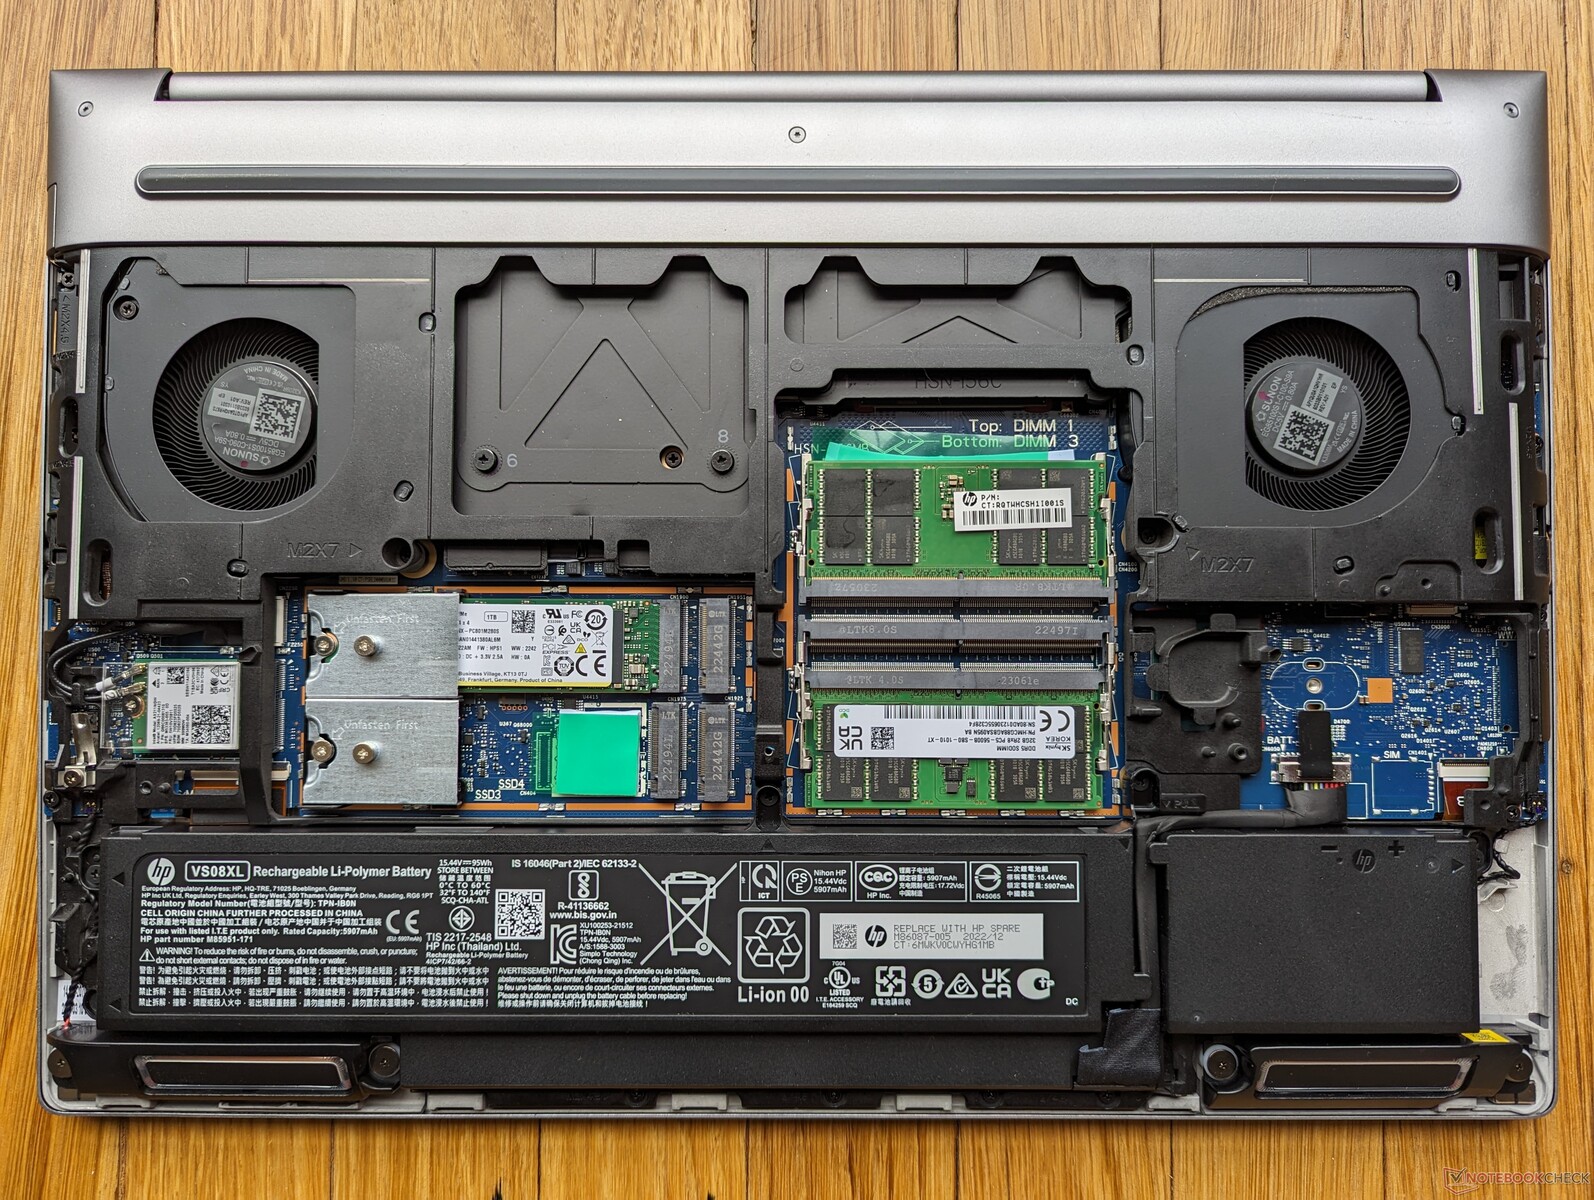
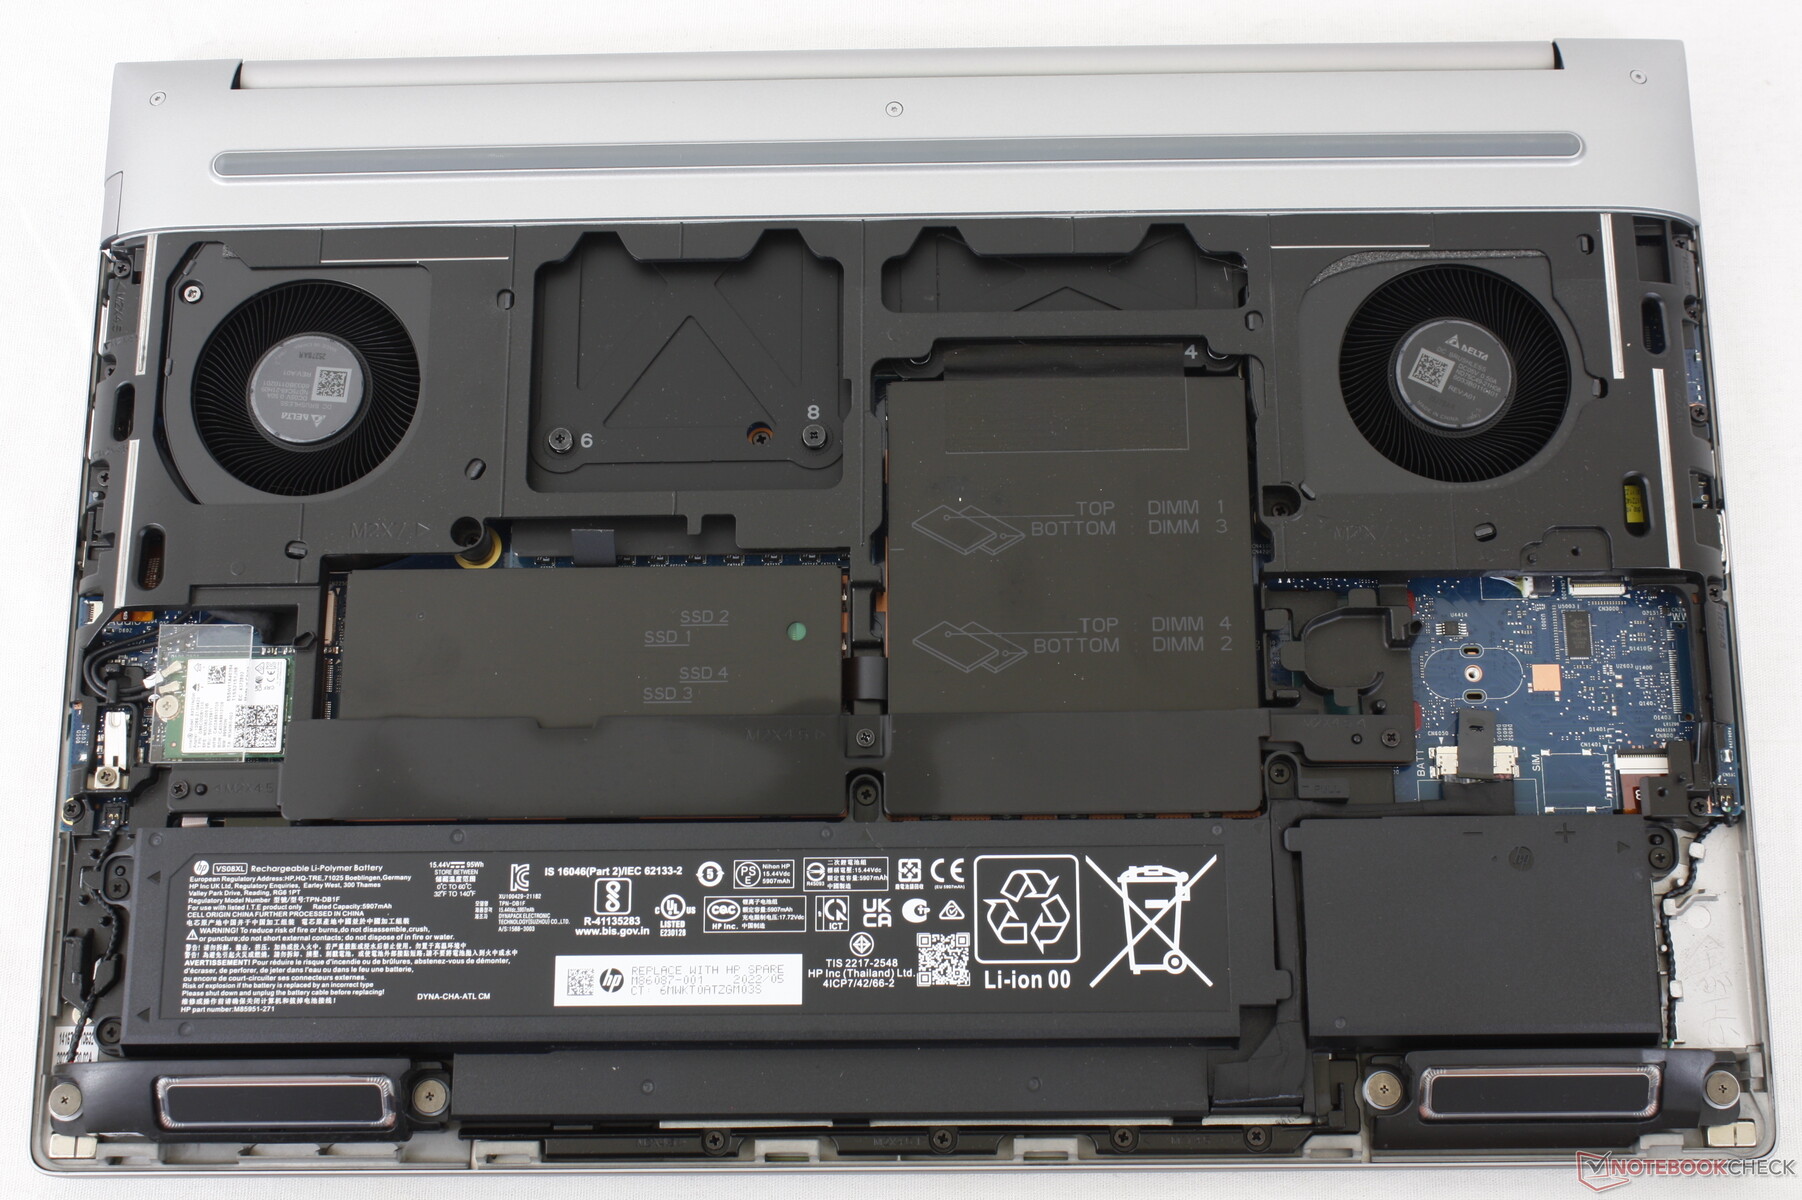
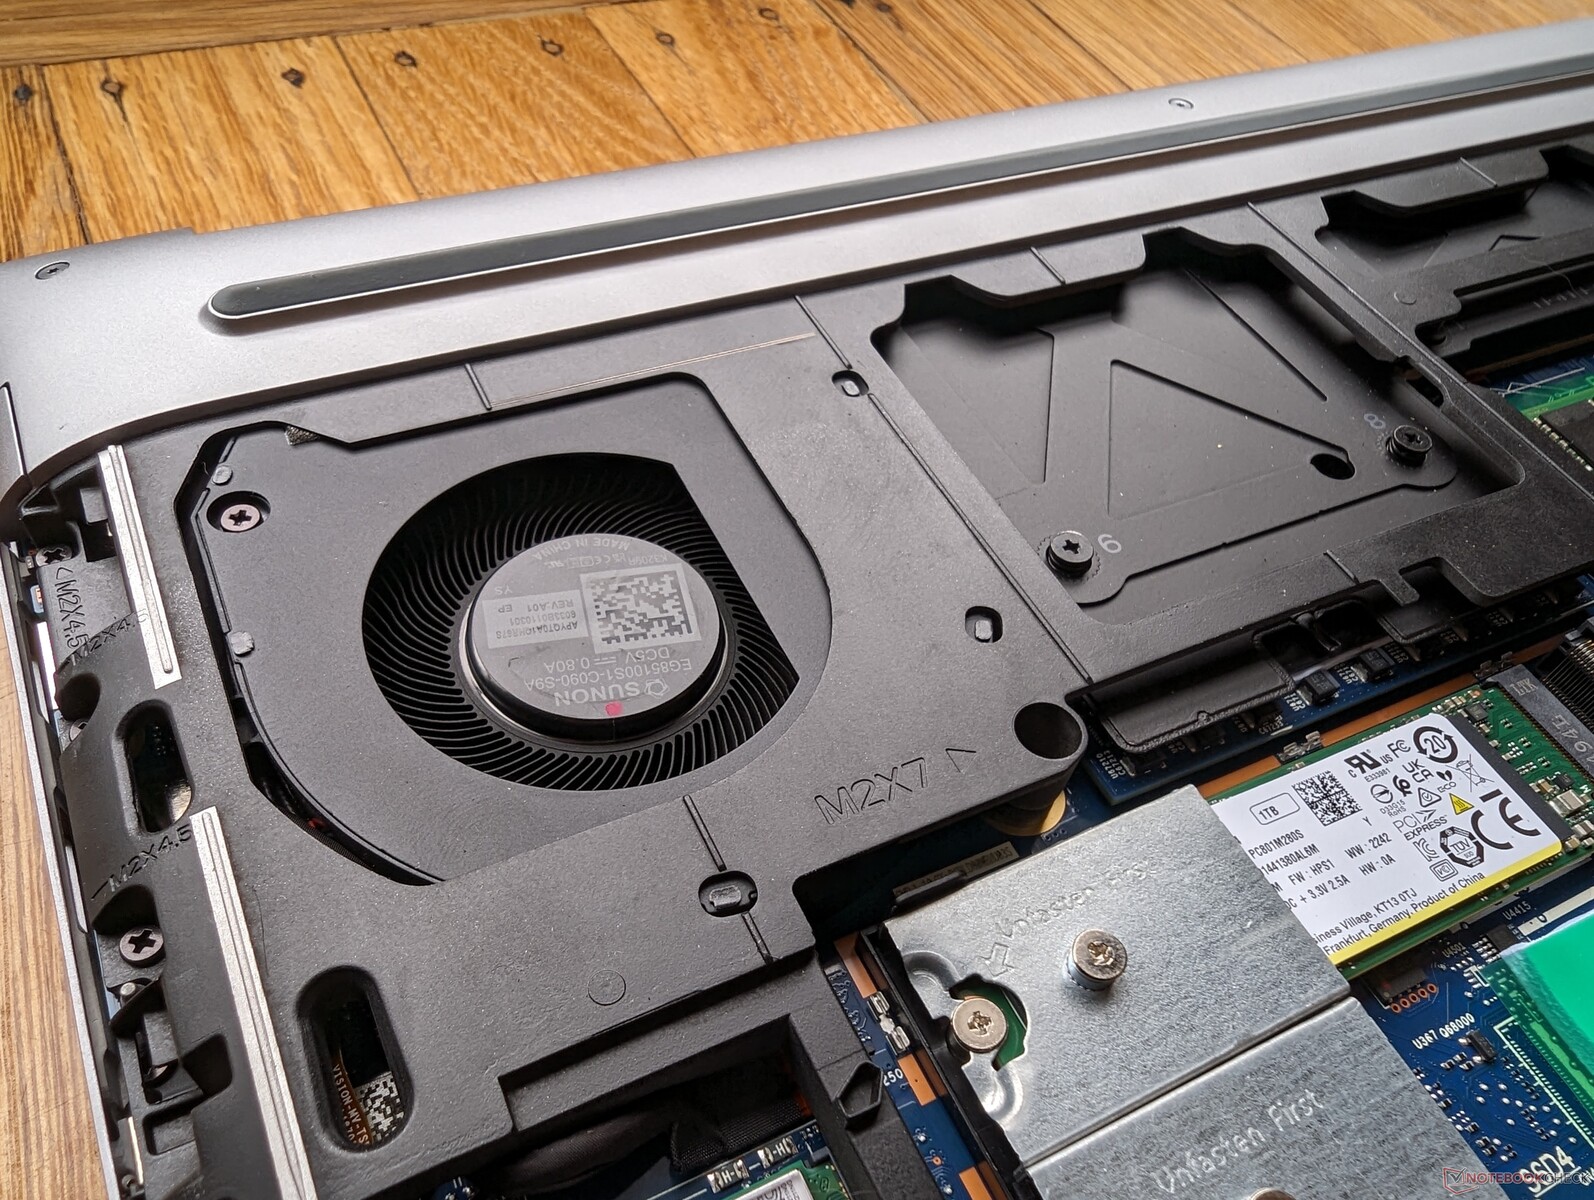
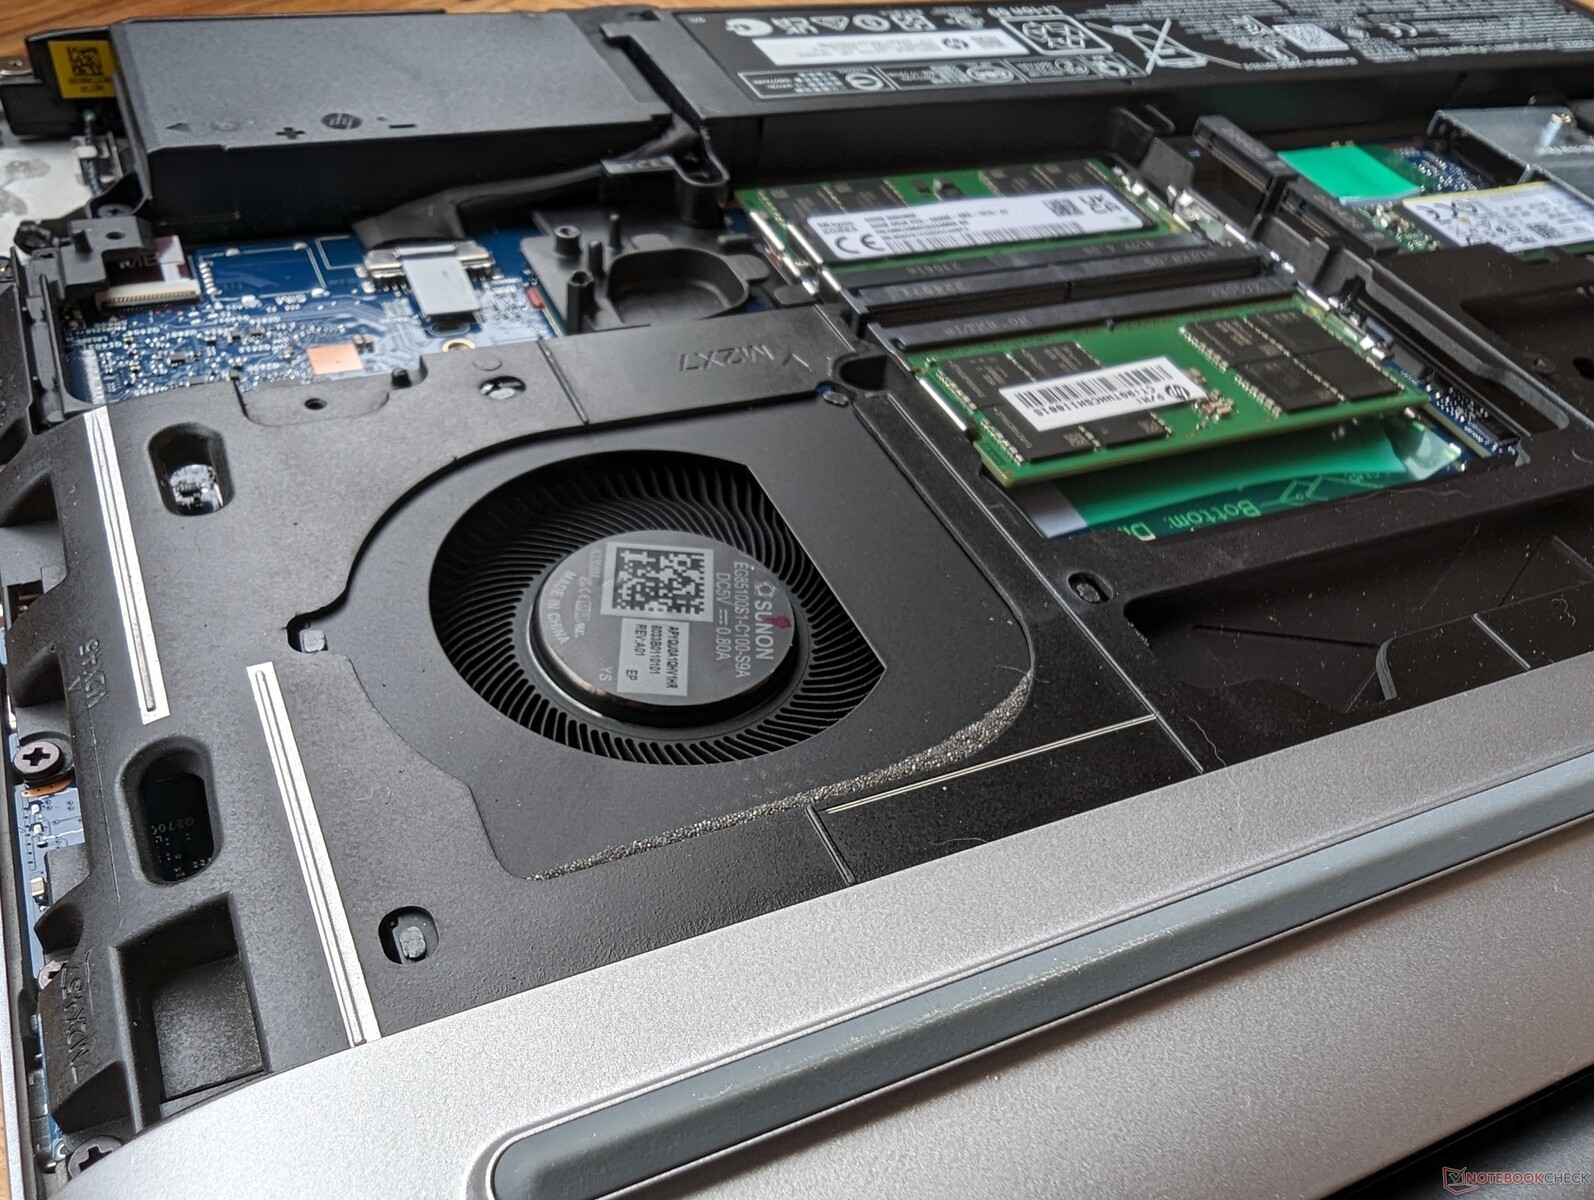
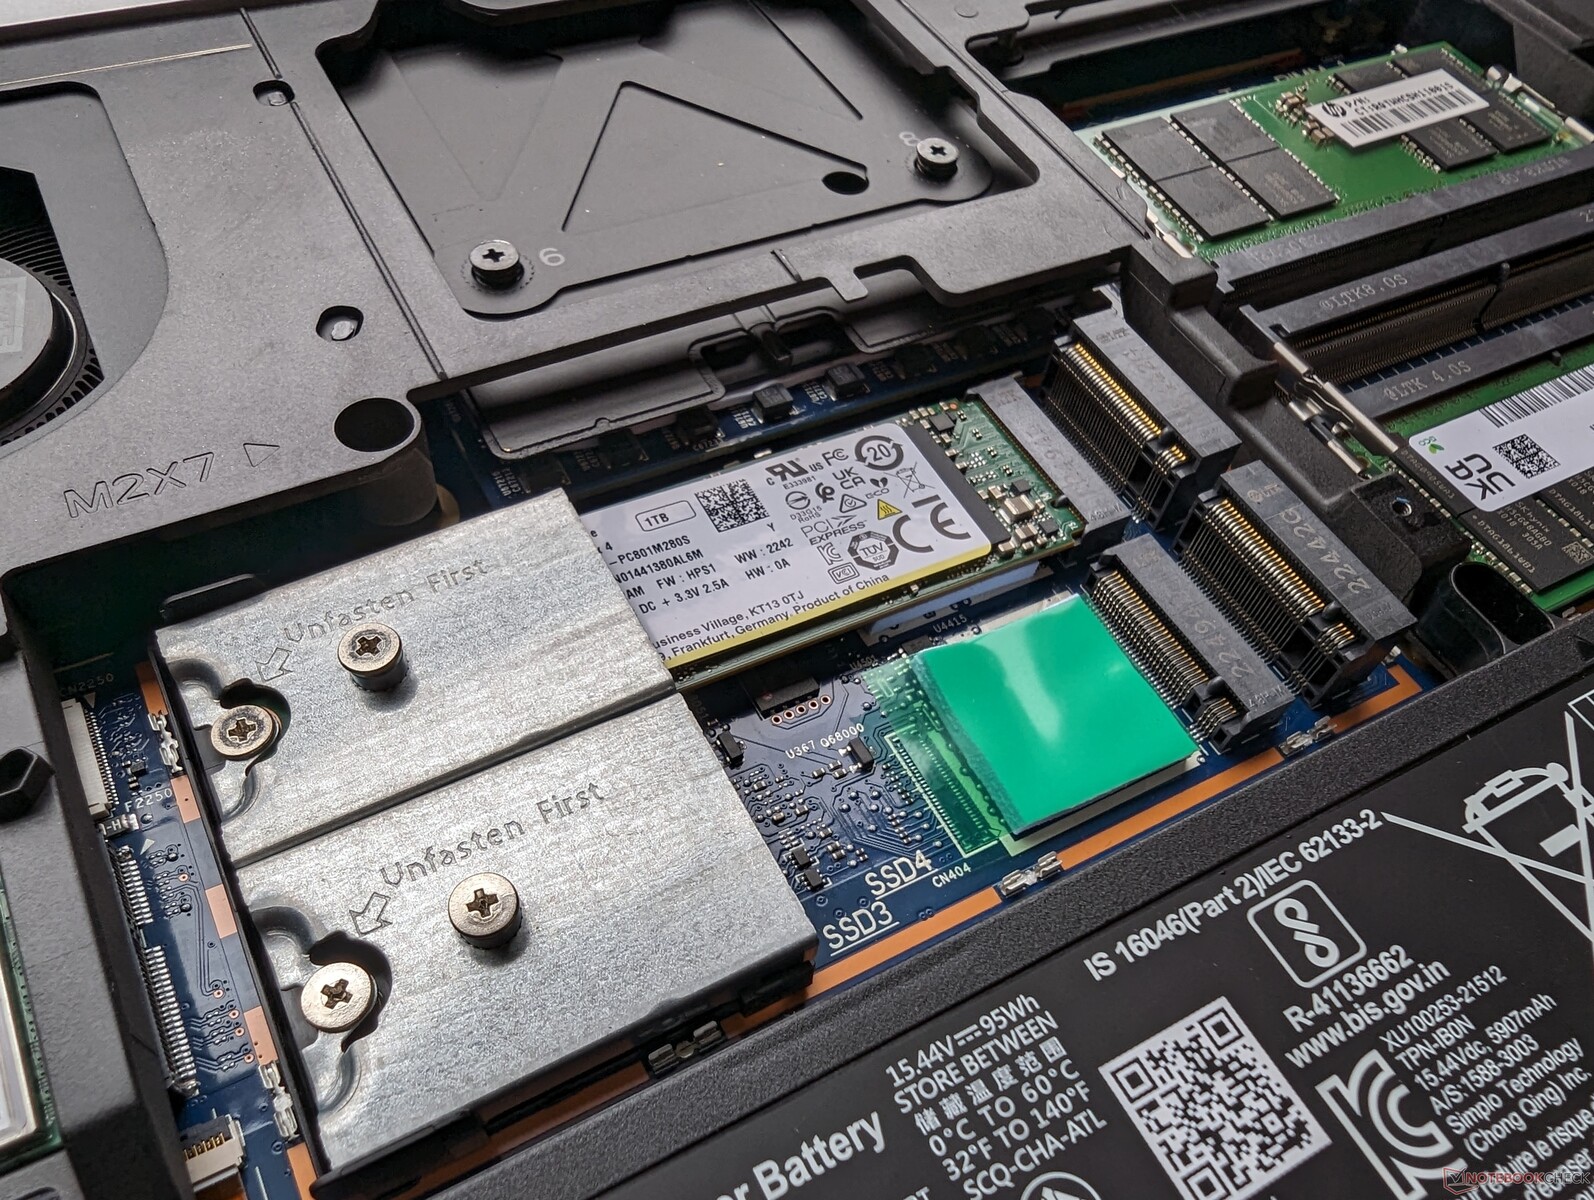
Mantenimiento
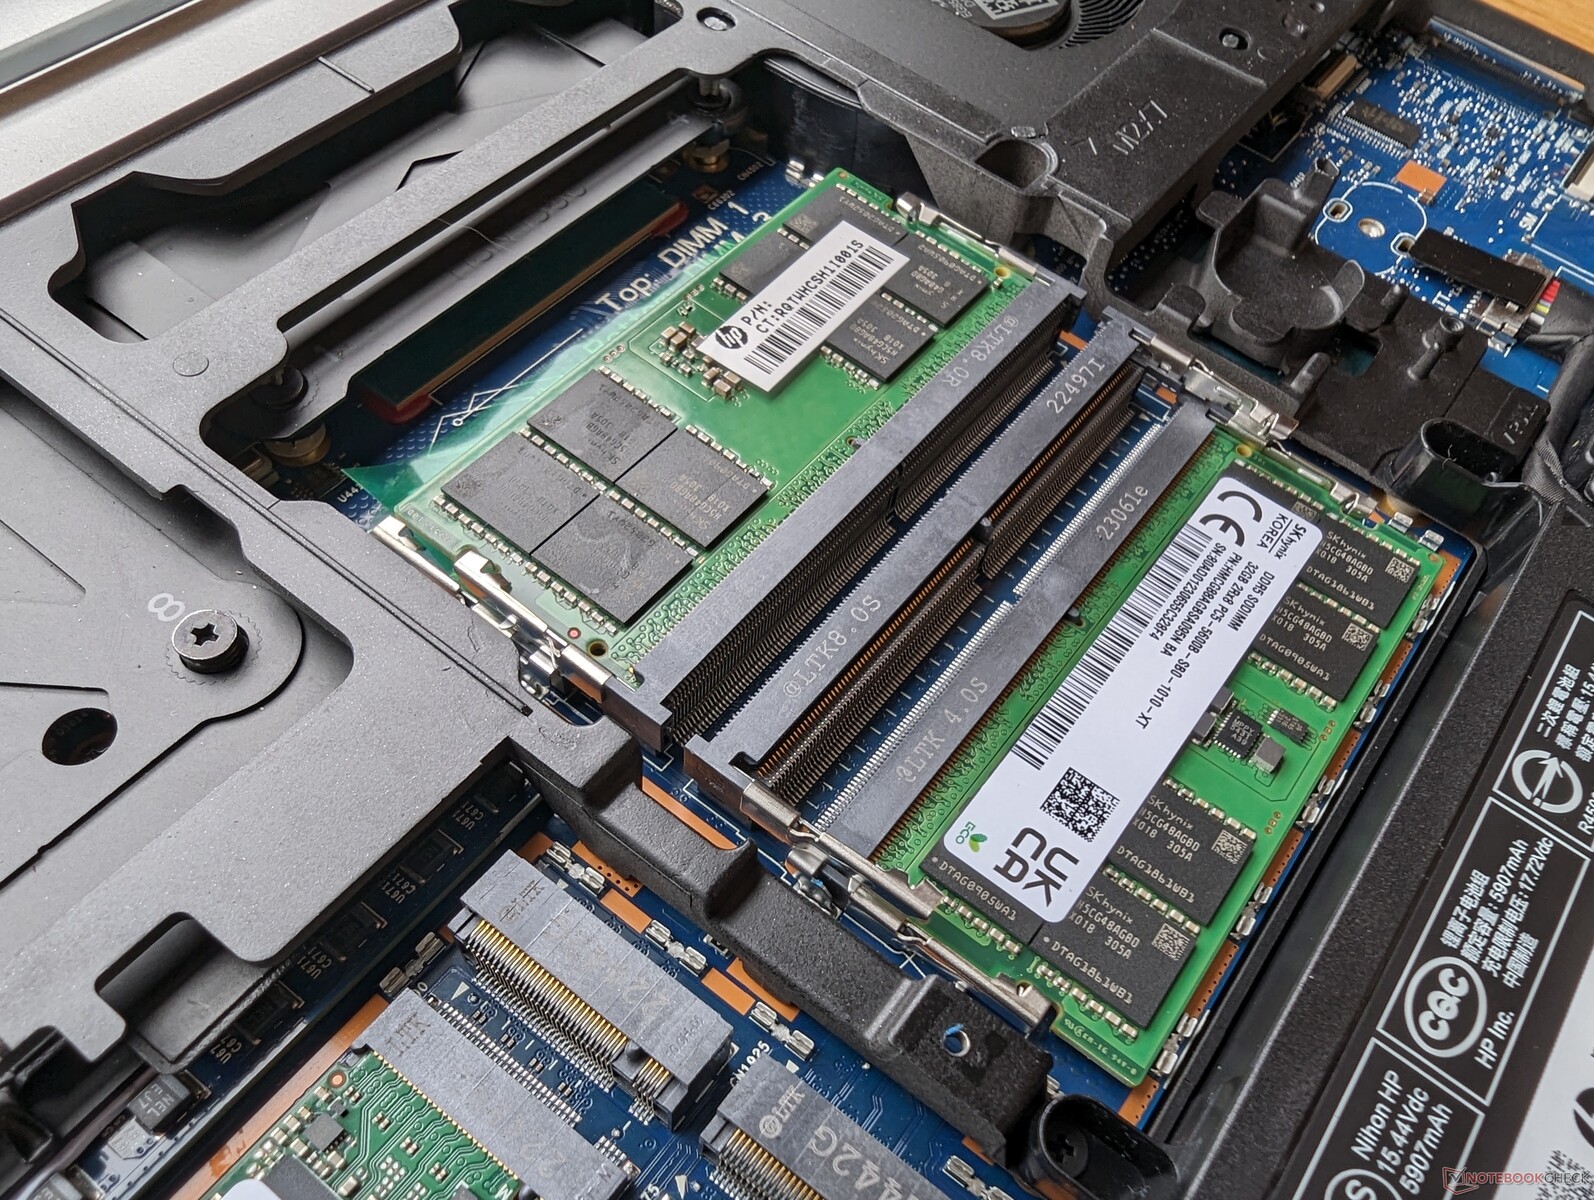
El mantenimiento se realiza "sin herramientas", en el sentido de que el panel inferior puede retirarse sin necesidad de herramientas. Una vez dentro, sin embargo, se necesitará un destornillador para retirar la placa metálica que protege los cuatro SSD y los cuatro módulos de RAM. Por lo tanto, seguirá necesitando un destornillador para cualquier actualización significativa.
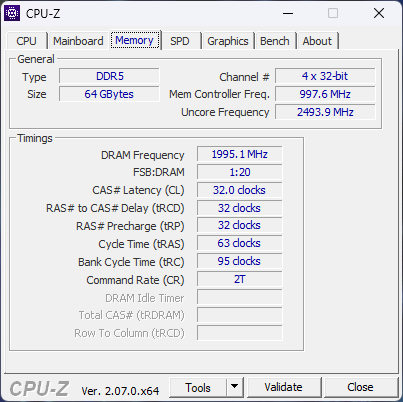
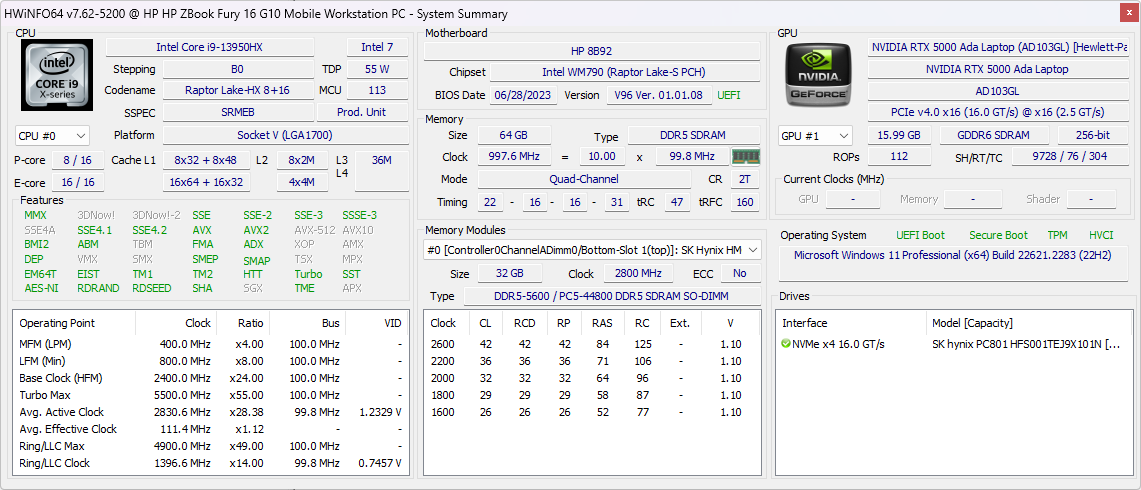
Soporta hasta 128 GB de RAM, aunque sólo hasta 4000 MT/s.
Accesorios y garantía
En la caja no hay más extras que el adaptador de CA y la documentación. HP ofrece tres años de garantía limitada de serie.
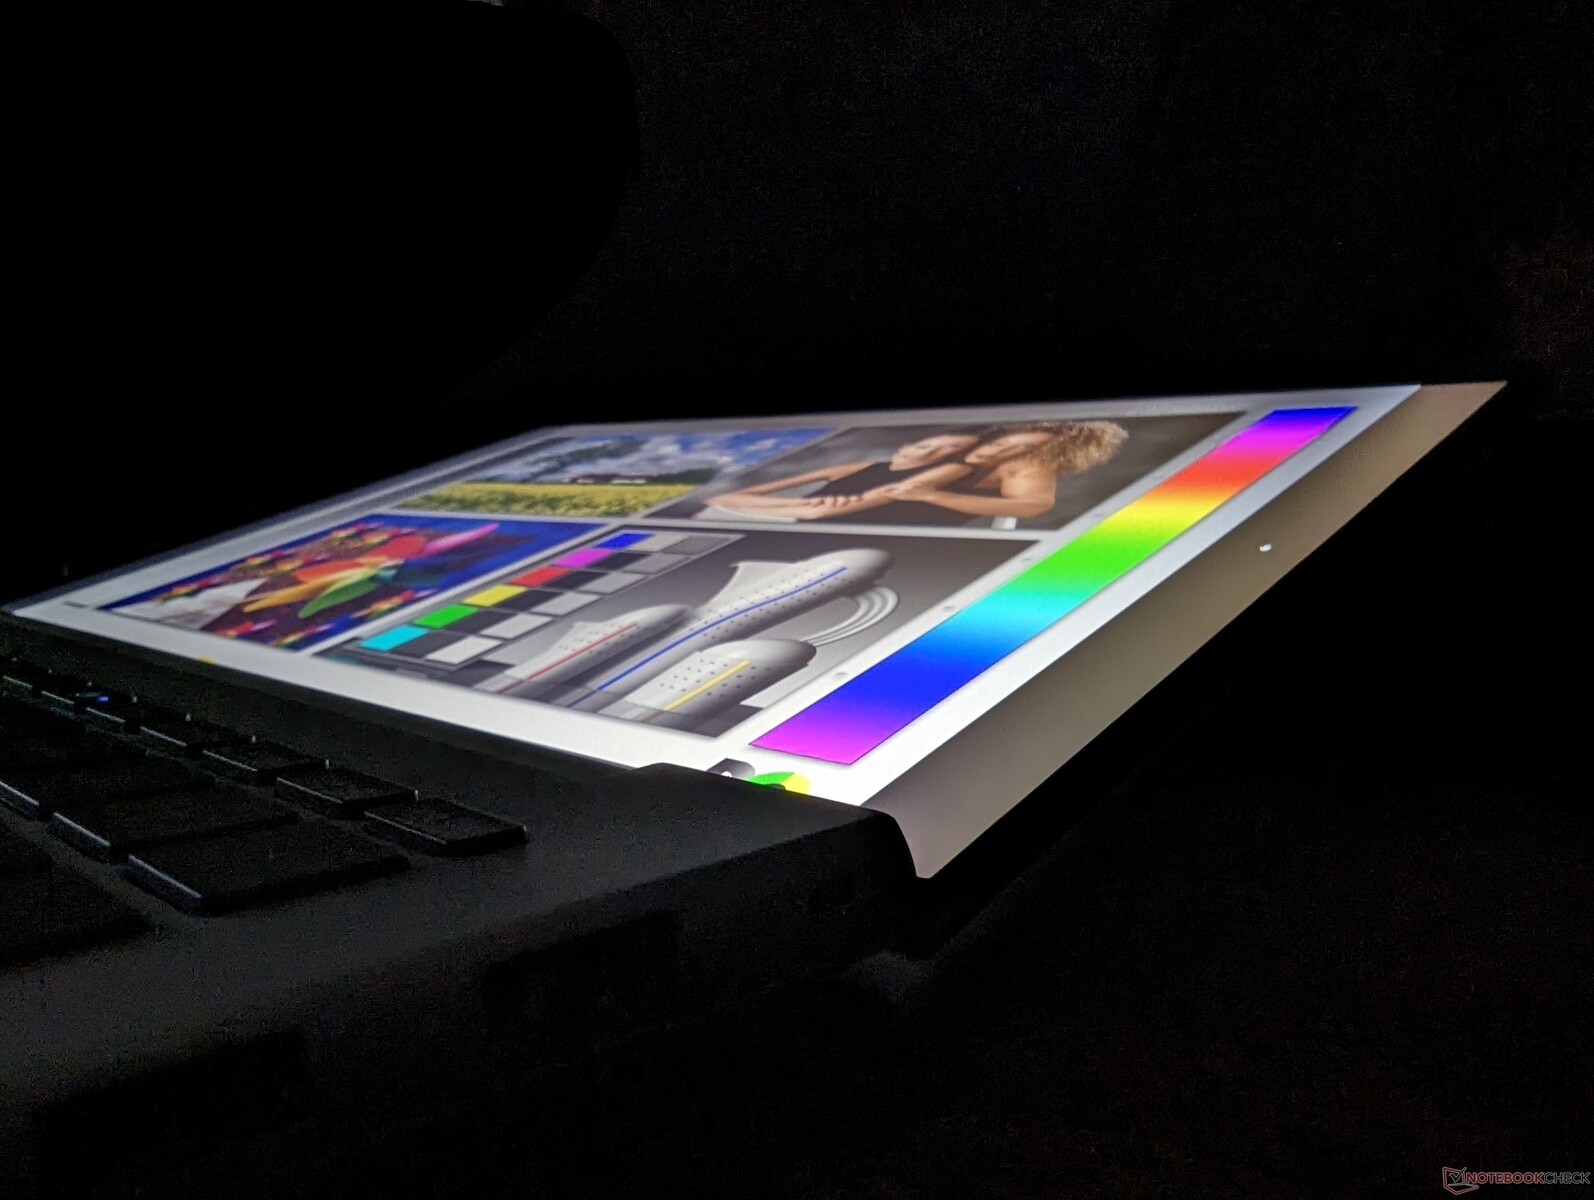
Mostrar
Las siguientes tres opciones de pantalla eDP+PSR (Panel Self Refresh) están disponibles para el Fury 16 G10 de 16 pulgadas. Nuestra unidad de pruebas específica se ha configurado con la opción en negrita:
- 3840 x 2400, 60 Hz, OLED, pantalla táctil, 400 nits, 100% DCI-P3, brillante
- 3840 x 2400, 120 Hz, IPS, no táctil, 500 nits, 100% DCI-P3, mate
- 1920 x 1200, 60 Hz, IPS, no táctil, 1000 nits, 100% sRGB, mate
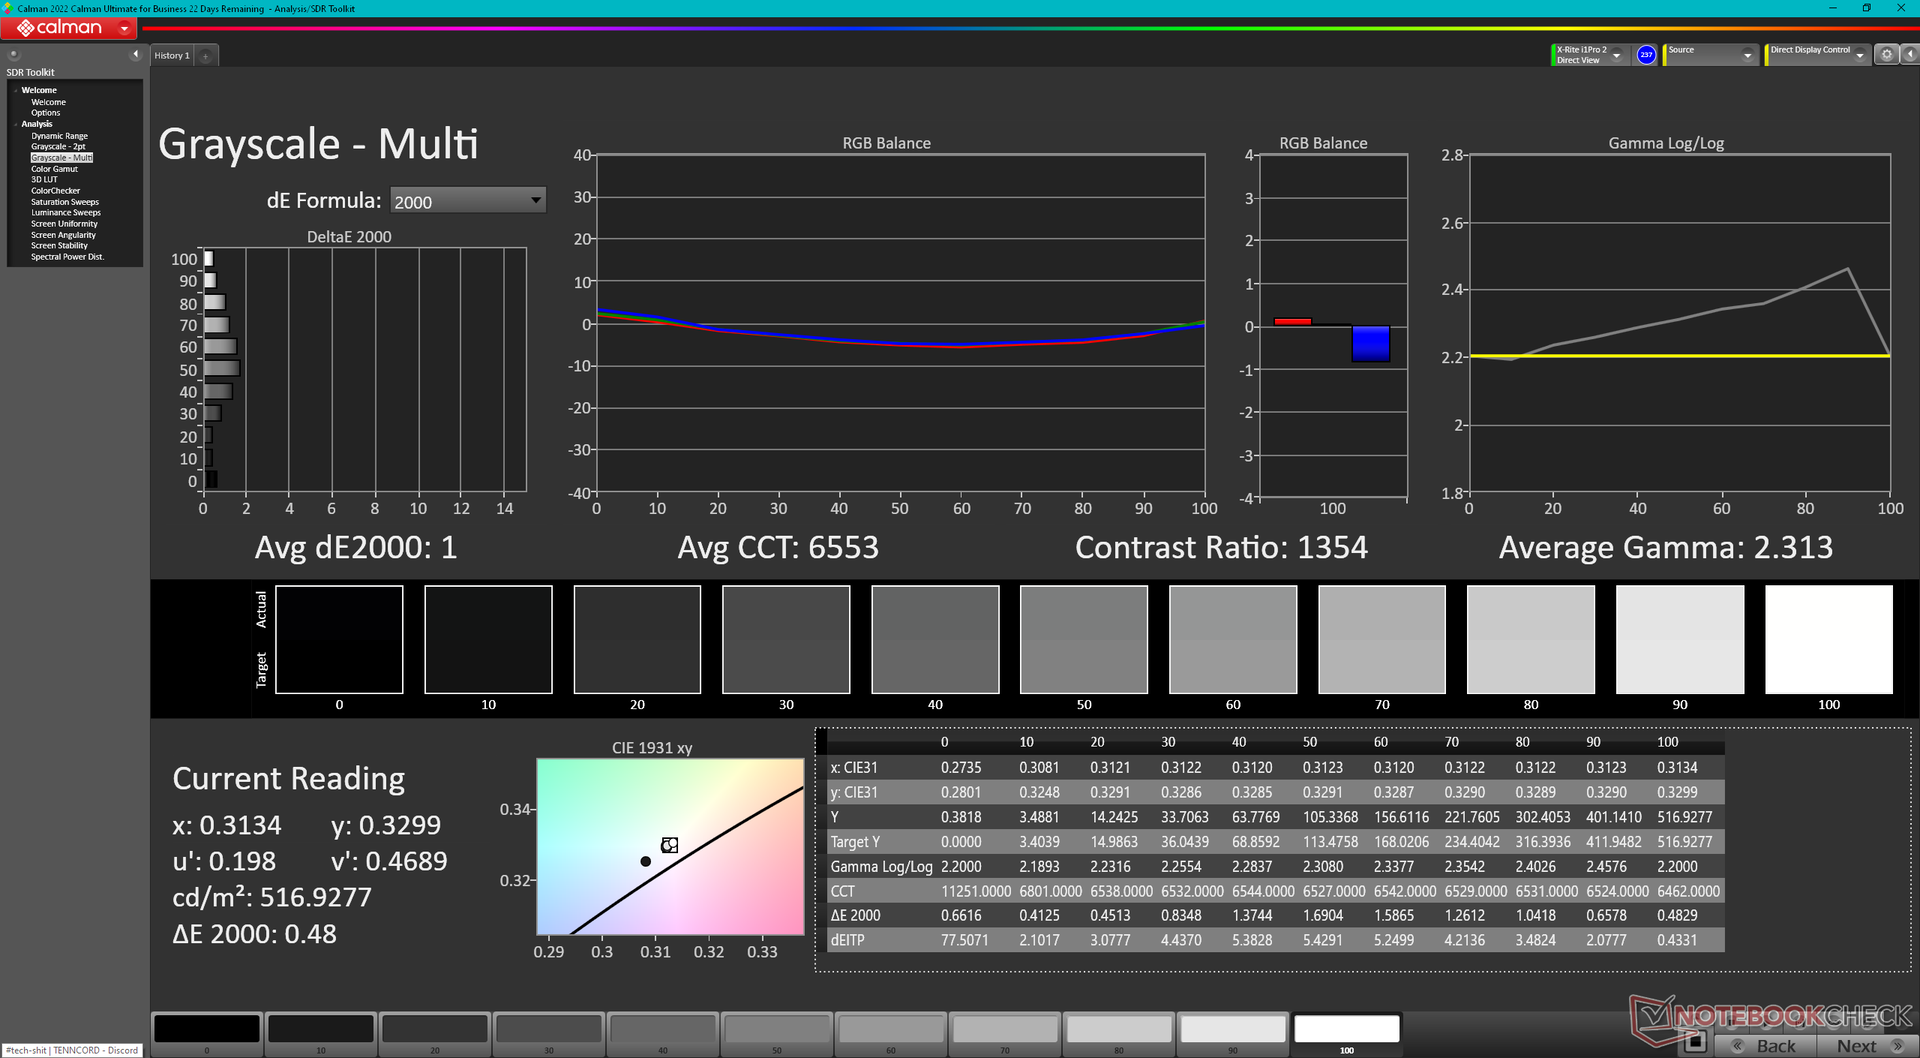
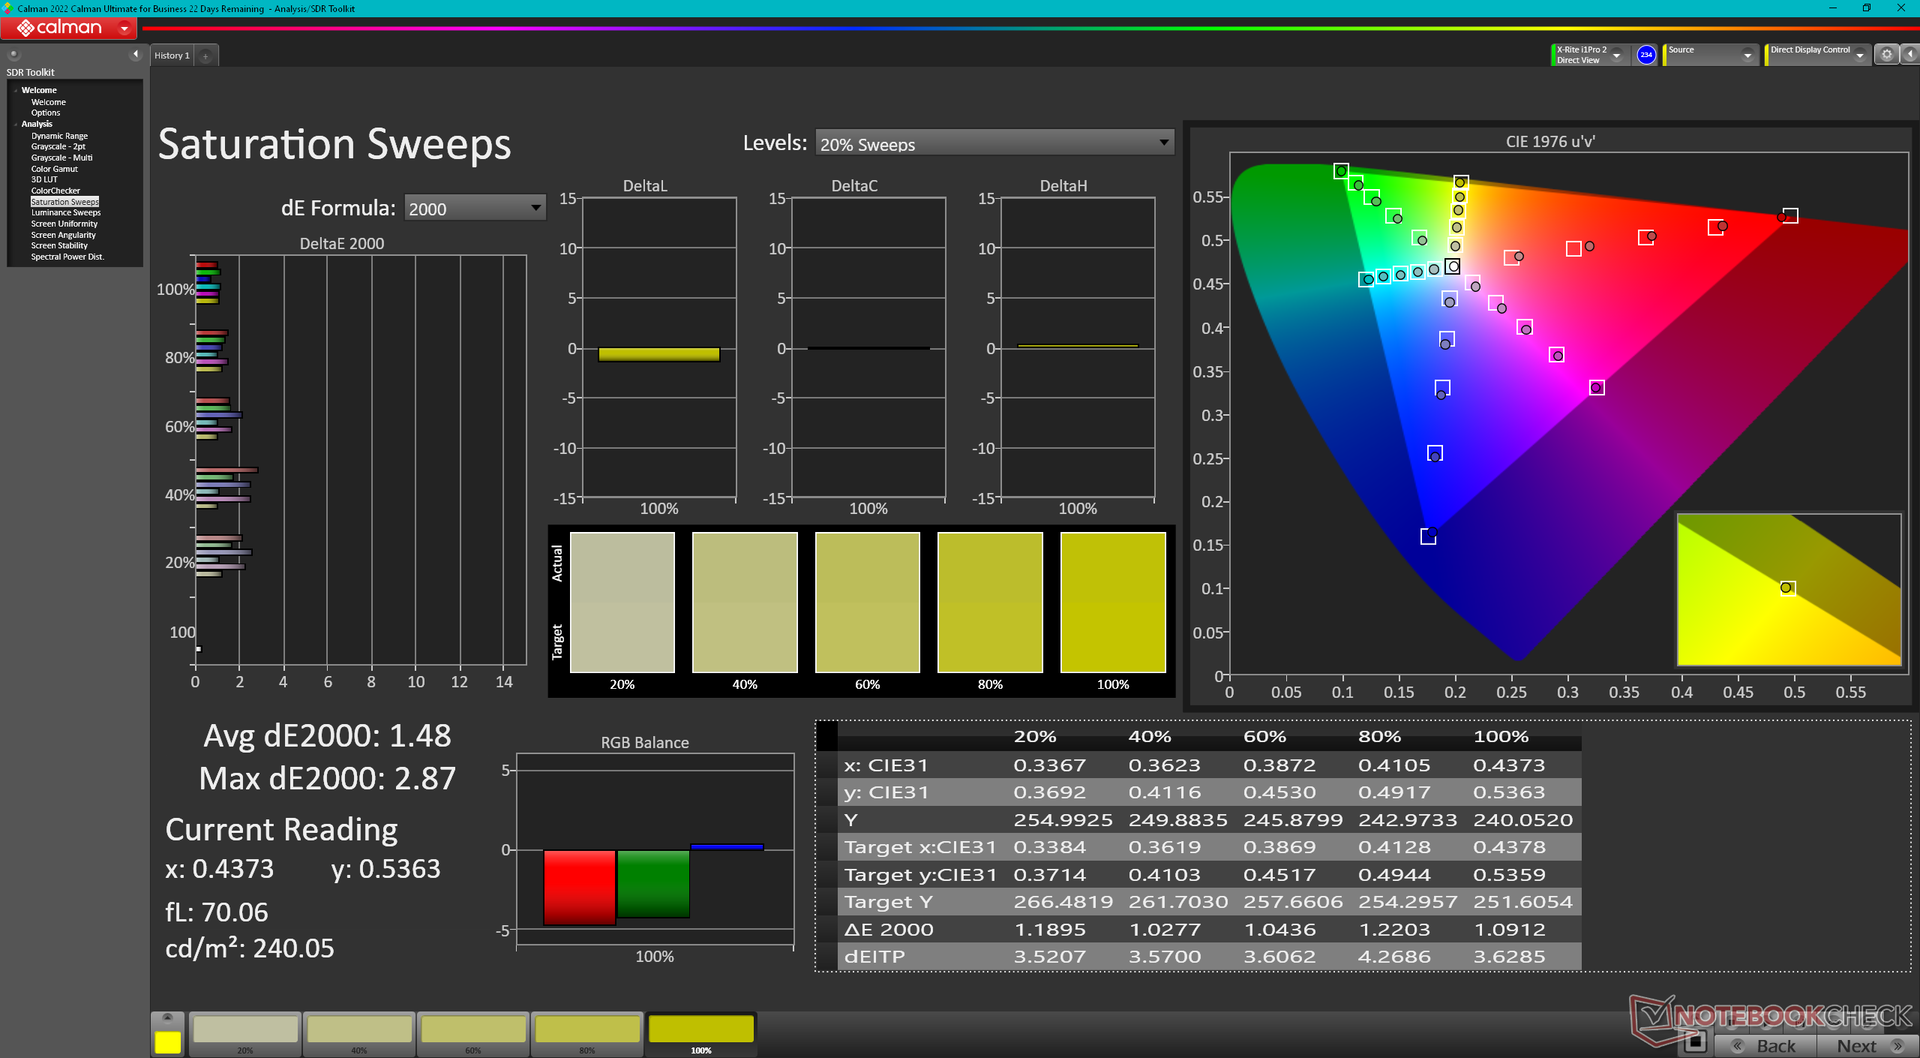
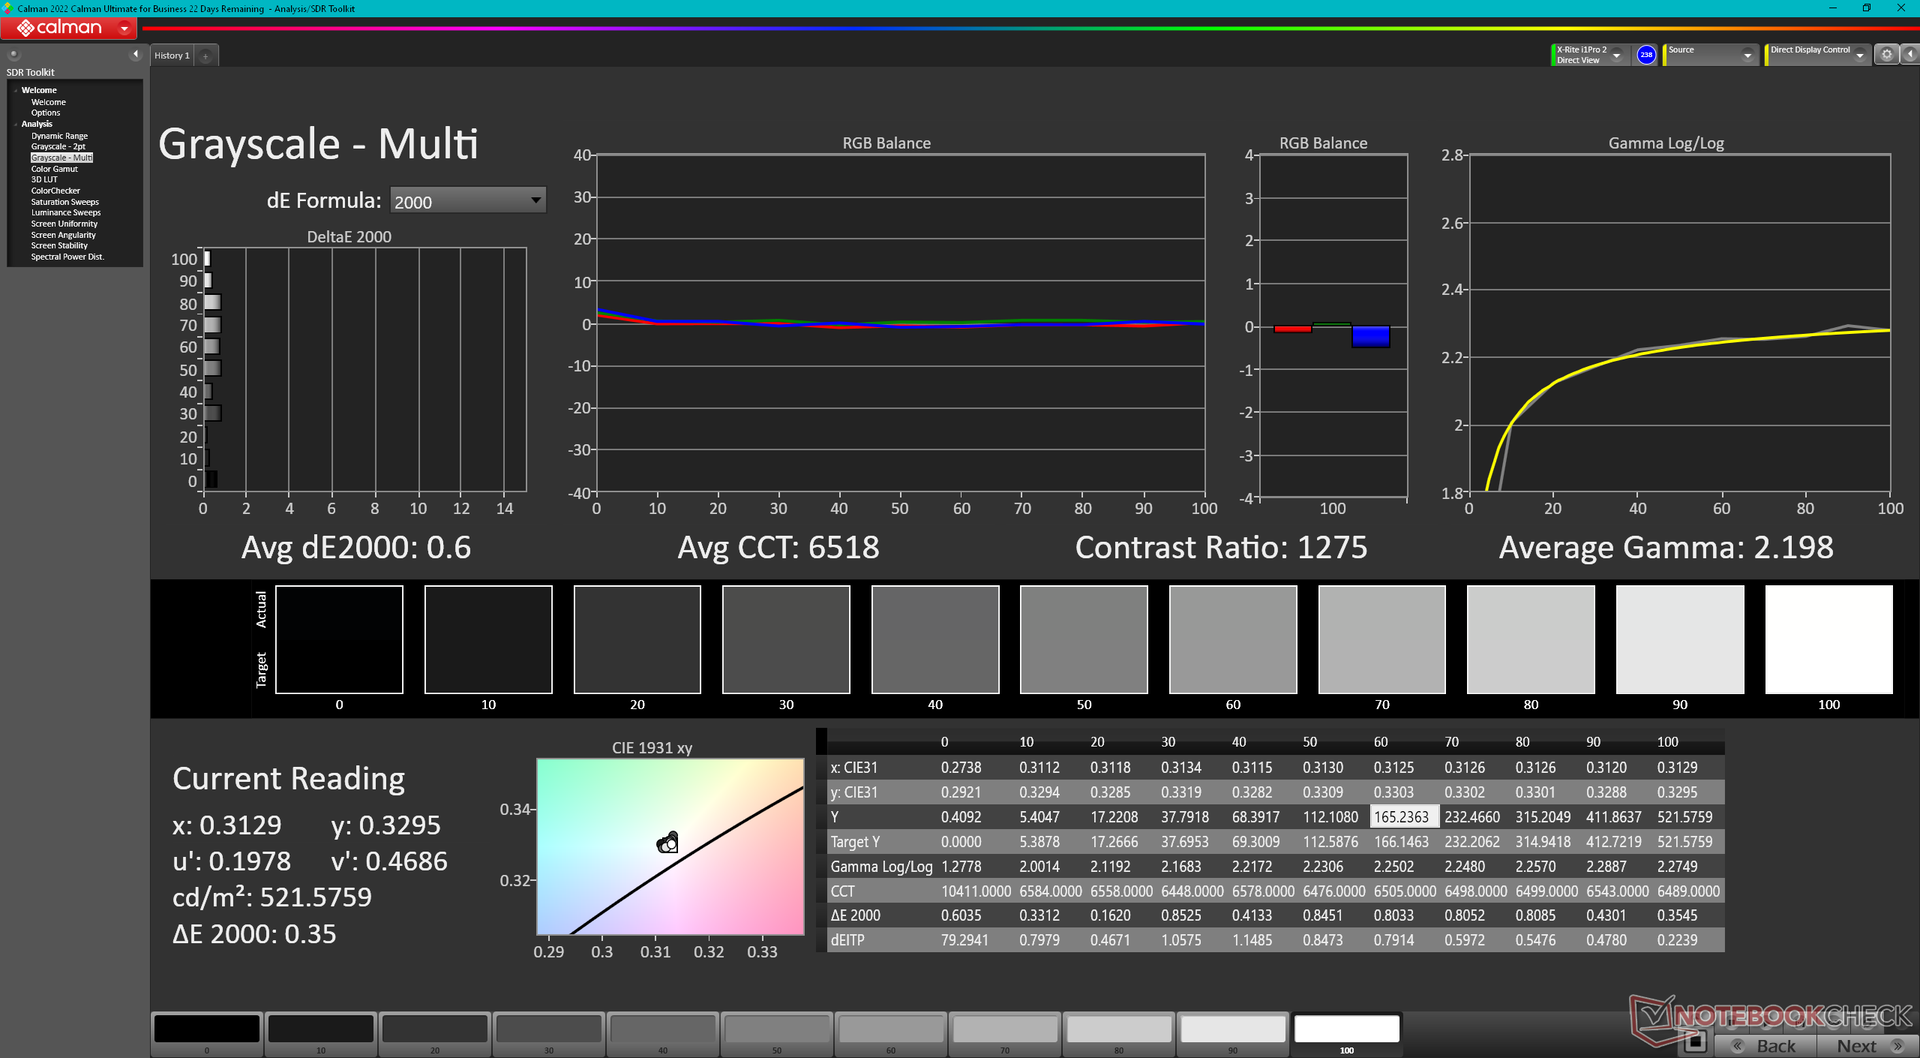
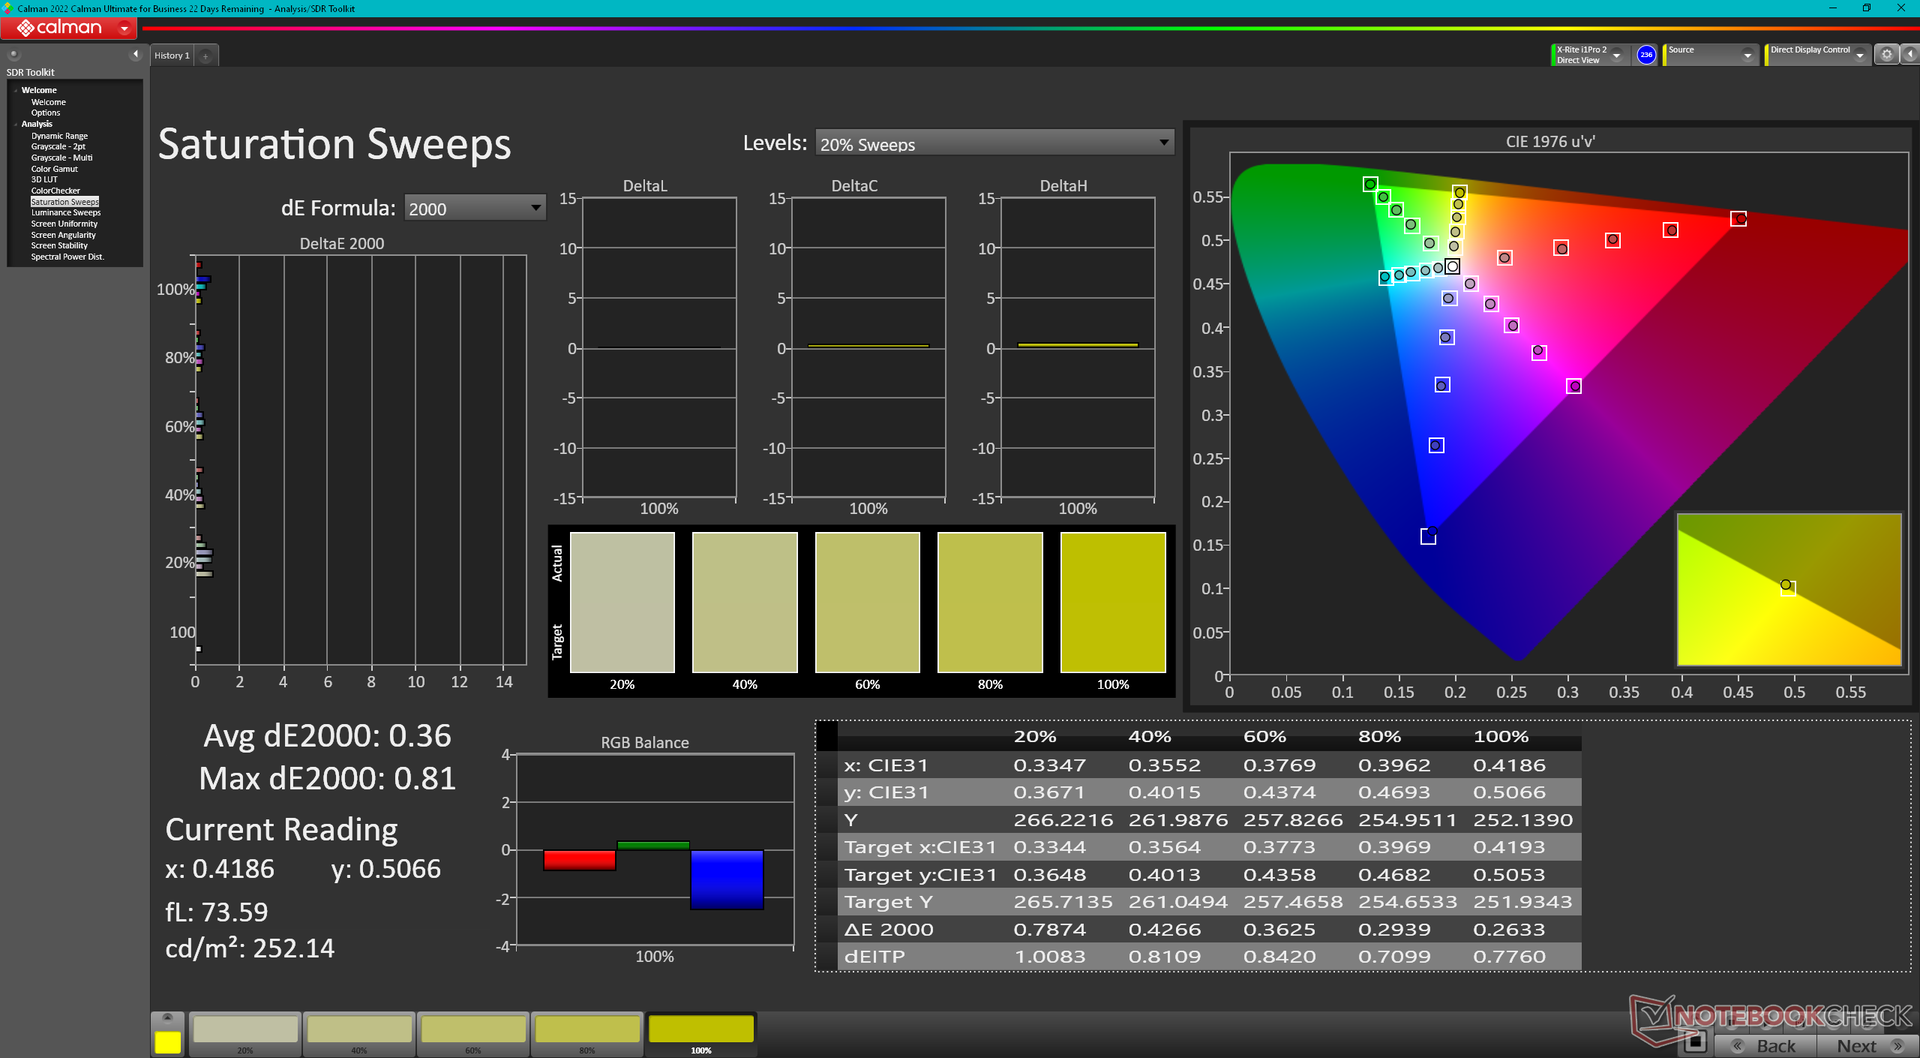
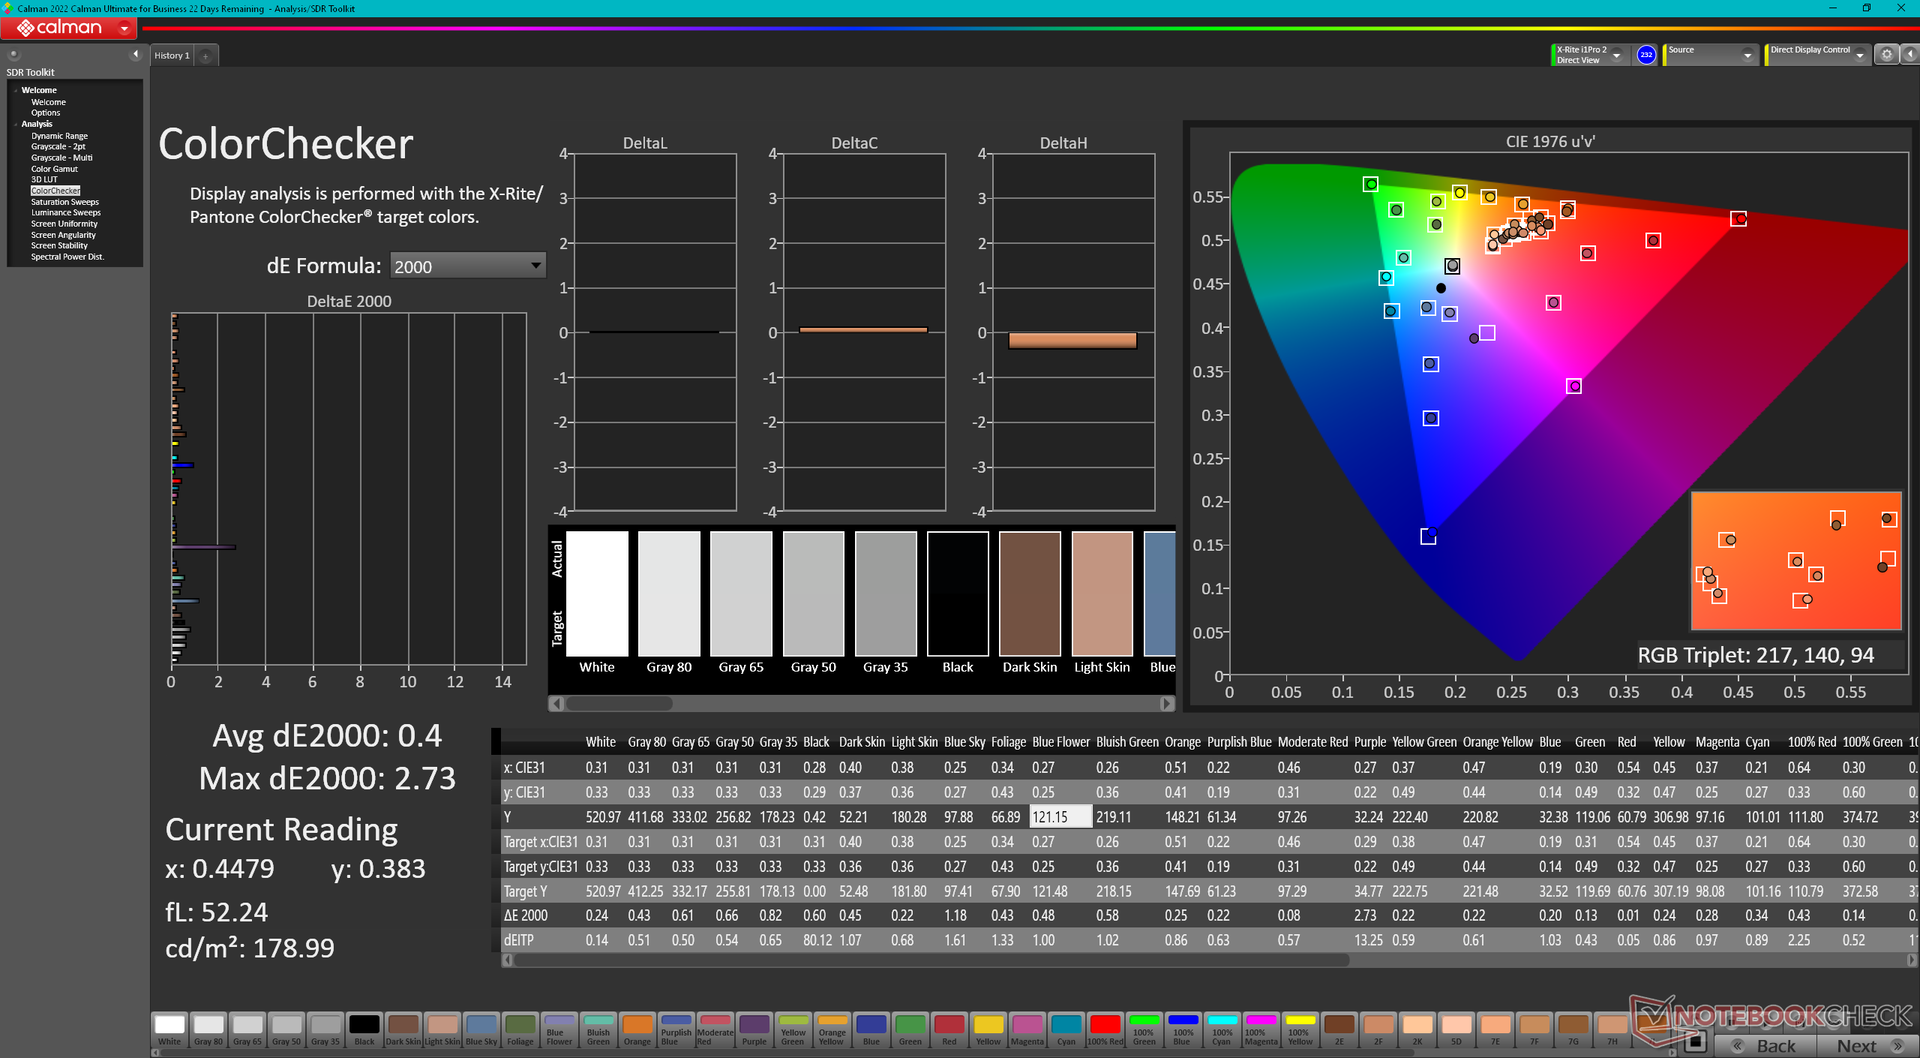
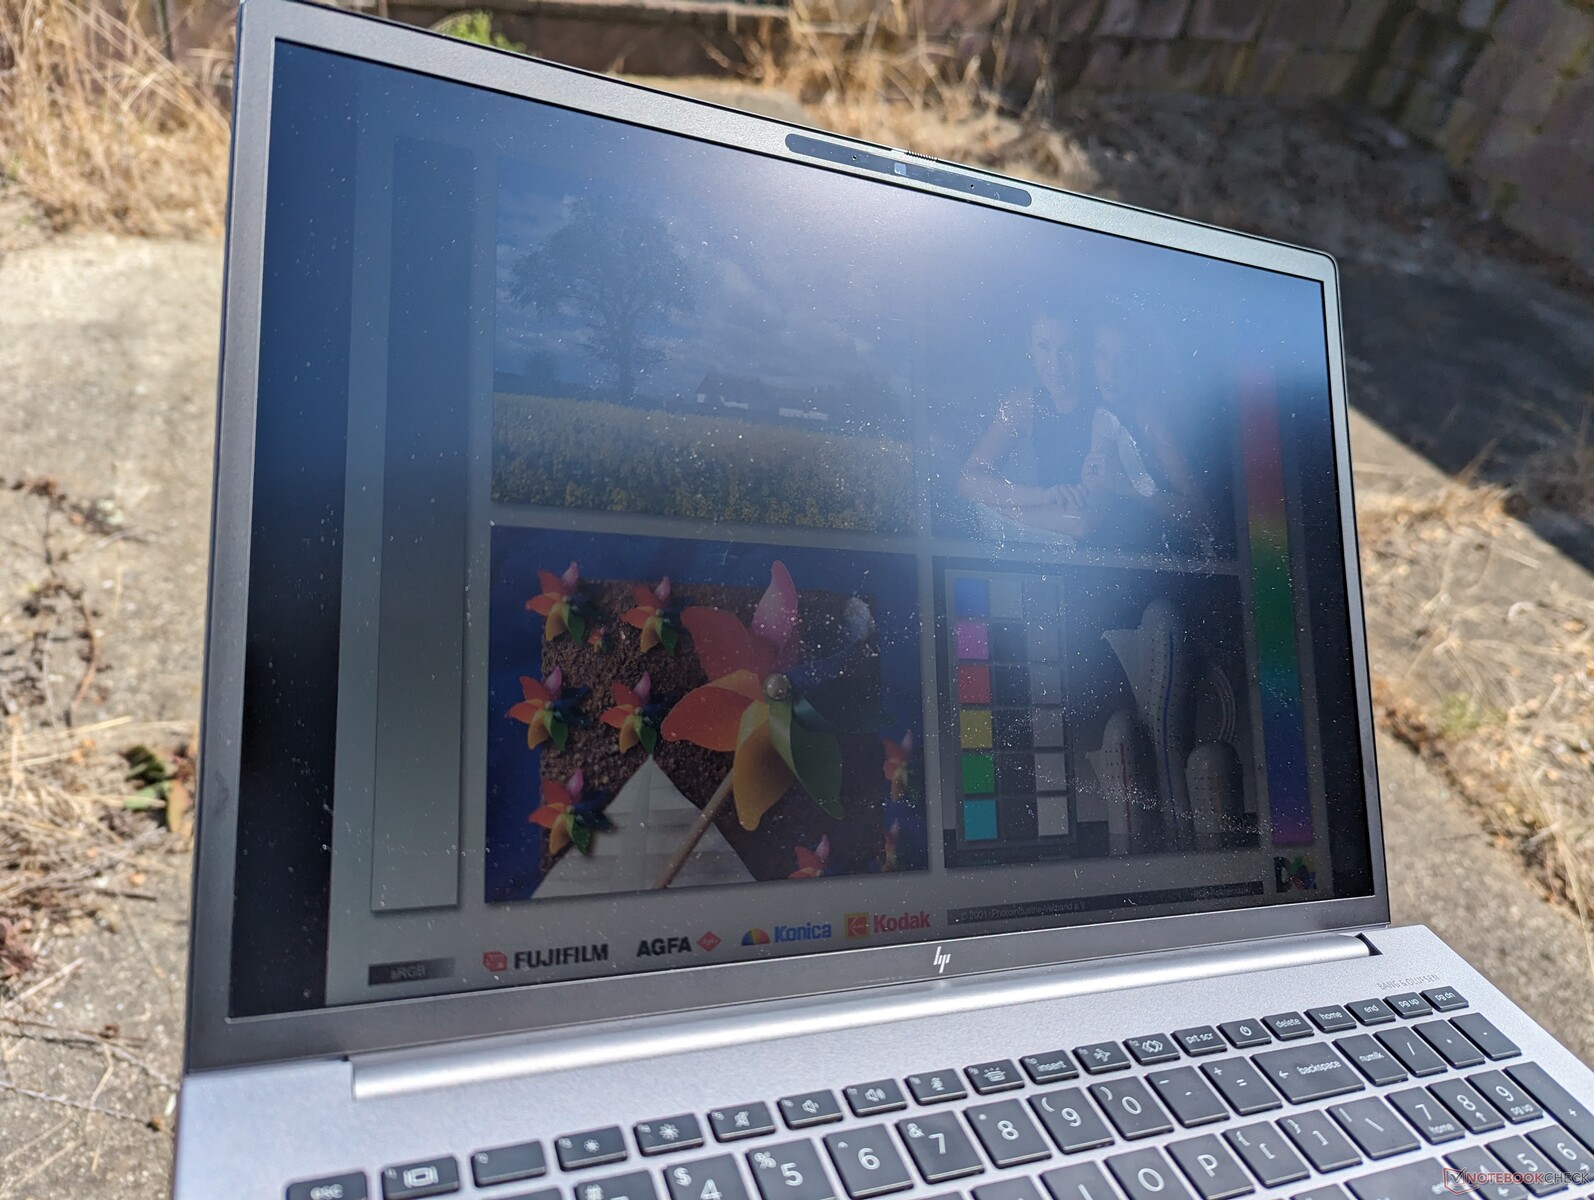
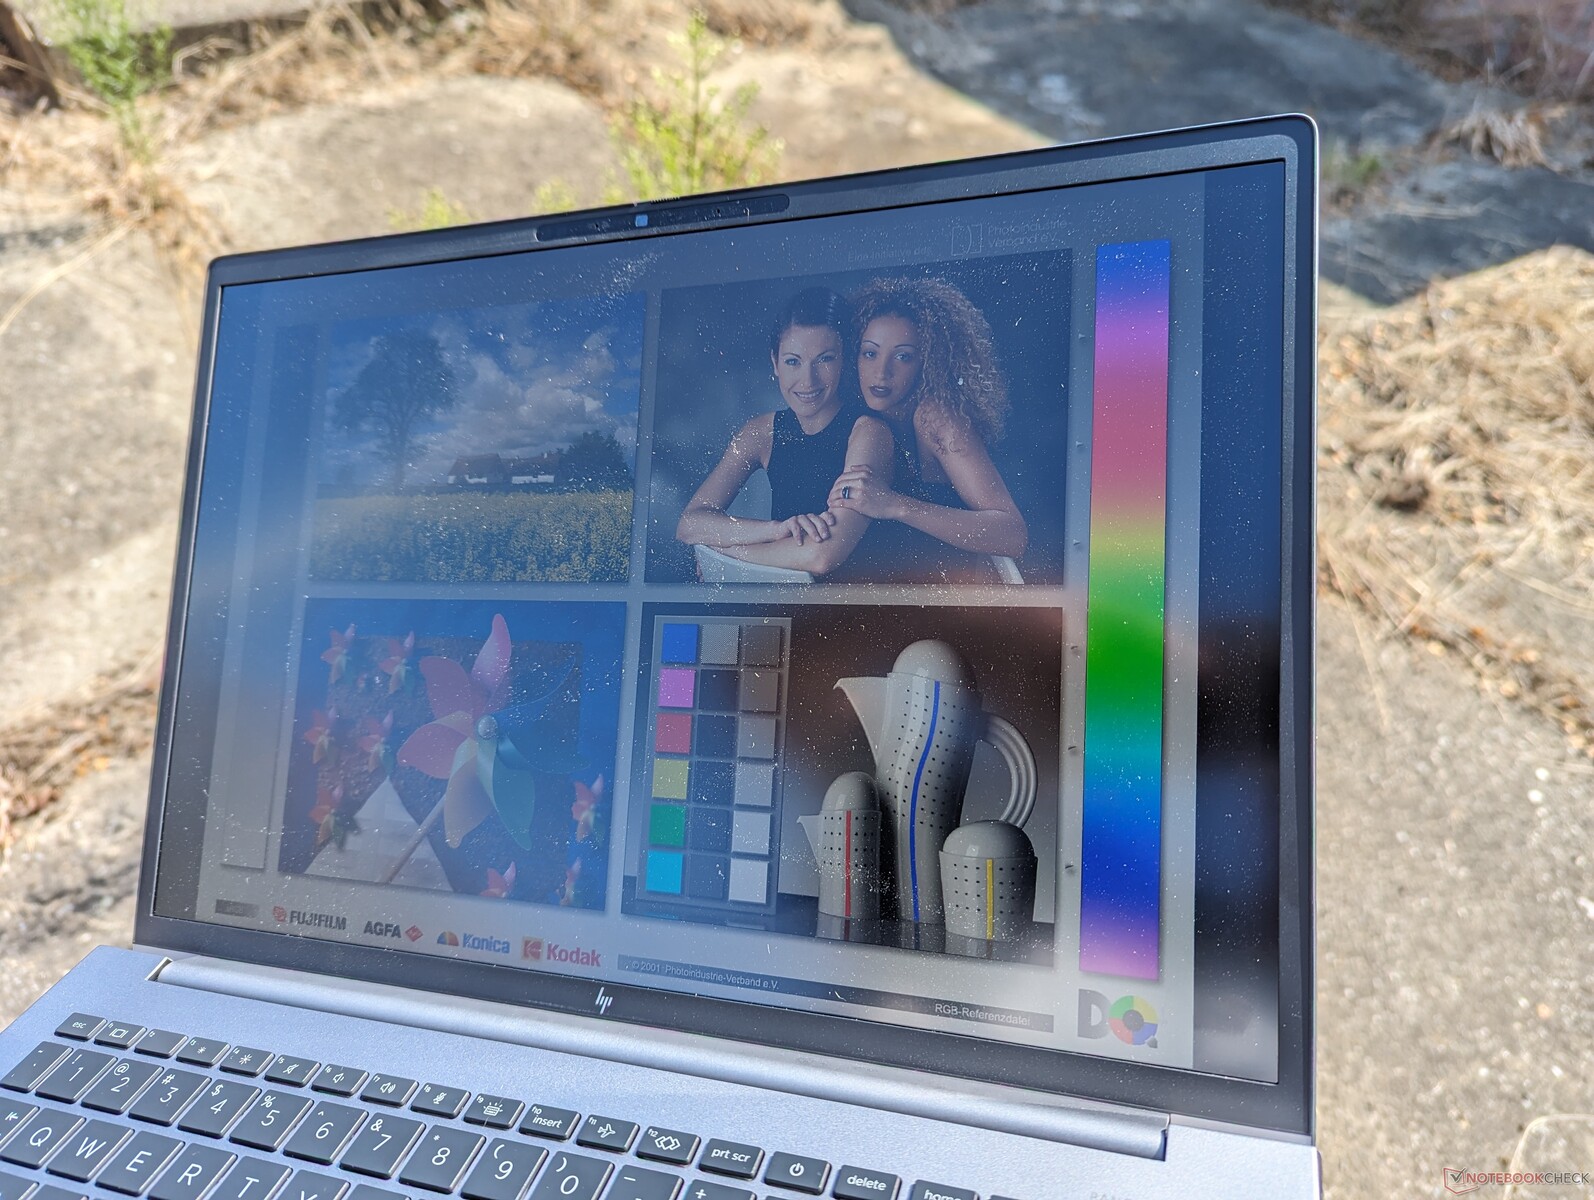
Nuestras mediciones independientes con un colorímetro X-Rite confirman tanto la cobertura P3 completa como el brillo máximo de 500 nits, tal como se anuncia. La frecuencia de refresco de 120 Hz es también una mejora notable con respecto al panel de 60 Hz del Fury 16 G9 del año pasado. Es una de las pocas estaciones de trabajo del mercado que ofrece un panel IPS 4K con colores P3 y una rápida frecuencia de 120 Hz.

| |||||||||||||||||||||||||
iluminación: 90 %
Brillo con batería: 514.6 cd/m²
Contraste: 1119:1 (Negro: 0.46 cd/m²)
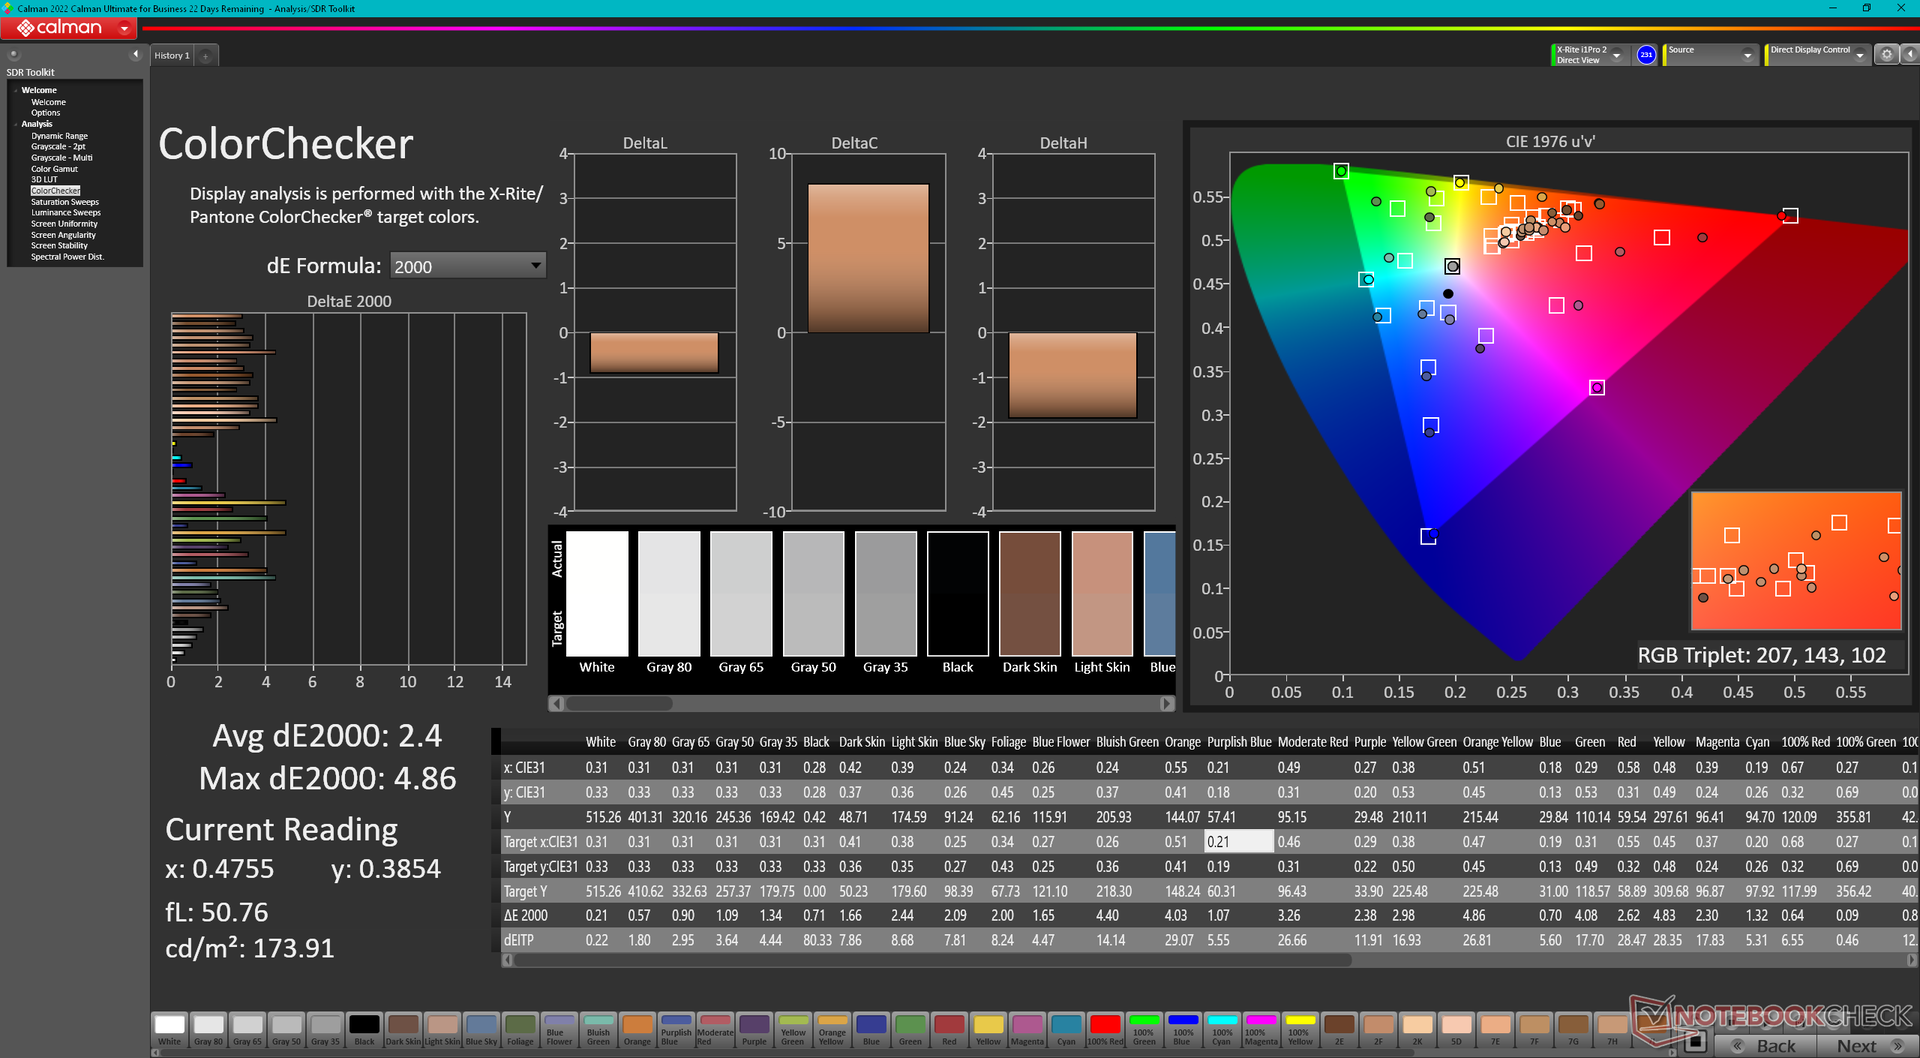
ΔE ColorChecker Calman: 2.4 | ∀{0.5-29.43 Ø4.72}
calibrated: 0.4
ΔE Greyscale Calman: 1 | ∀{0.09-98 Ø4.97}
86.2% AdobeRGB 1998 (Argyll 3D)
99.9% sRGB (Argyll 3D)
98% Display P3 (Argyll 3D)
Gamma: 2.3
CCT: 6553 K
| HP ZBook Fury 16 G10 AUO87A8, IPS, 3840x2400, 16" | HP ZBook Fury 16 G9 BOE0A52, IPS, 3840x2400, 16" | Dell Precision 5000 5680 Samsung 160YV03, OLED, 3840x2400, 16" | Lenovo ThinkPad P16 G1 RTX A5500 LP160UQ1-SPB1, IPS, 3840x2400, 16" | MSI CreatorPro Z16P B12UKST B160QAN02.N, IPS, 2560x1600, 16" | Asus ProArt StudioBook 16 W7600H5A-2BL2 ATNA60YV02-0, OLED, 3840x2400, 16" | |
|---|---|---|---|---|---|---|
| Display | -0% | 5% | -2% | 0% | 5% | |
| Display P3 Coverage (%) | 98 | 97.4 -1% | 99.9 2% | 82.9 -15% | 97.6 0% | 99.9 2% |
| sRGB Coverage (%) | 99.9 | 99.9 0% | 100 0% | 98.9 -1% | 99.9 0% | 100 0% |
| AdobeRGB 1998 Coverage (%) | 86.2 | 86.3 0% | 97.5 13% | 95.9 11% | 87.4 1% | 98.6 14% |
| Response Times | -3% | 84% | -283% | 8% | 81% | |
| Response Time Grey 50% / Grey 80% * (ms) | 11.9 ? | 13.7 ? -15% | 1.68 ? 86% | 45.6 ? -283% | 12.8 ? -8% | 2 ? 83% |
| Response Time Black / White * (ms) | 9.6 ? | 8.6 ? 10% | 1.77 ? 82% | 36.8 ? -283% | 7.4 ? 23% | 2 ? 79% |
| PWM Frequency (Hz) | 60 ? | 240 ? | ||||
| Screen | -141% | -72% | -16% | -12% | -102% | |
| Brightness middle (cd/m²) | 514.6 | 530.5 3% | 345.7 -33% | 601.9 17% | 407 -21% | 353 -31% |
| Brightness (cd/m²) | 495 | 476 -4% | 349 -29% | 569 15% | 388 -22% | 360 -27% |
| Brightness Distribution (%) | 90 | 83 -8% | 98 9% | 77 -14% | 88 -2% | 96 7% |
| Black Level * (cd/m²) | 0.46 | 0.57 -24% | 0.47 -2% | 0.36 22% | ||
| Contrast (:1) | 1119 | 931 -17% | 1281 14% | 1131 1% | ||
| Colorchecker dE 2000 * | 2.4 | 2.26 6% | 3.59 -50% | 2.45 -2% | 1.3 46% | 2.45 -2% |
| Colorchecker dE 2000 max. * | 4.86 | 7.02 -44% | 4.46 8% | 2.5 49% | 3.75 23% | |
| Colorchecker dE 2000 calibrated * | 0.4 | 4.73 -1083% | 0.99 -147% | 0.7 -75% | 2.77 -593% | |
| Greyscale dE 2000 * | 1 | 1 -0% | 3.1 -210% | 2.6 -160% | 2.1 -110% | 1.88 -88% |
| Gamma | 2.3 96% | 2.28 96% | 2.13 103% | 2.3 96% | 2.26 97% | 2.31 95% |
| CCT | 6553 99% | 6543 99% | 6448 101% | 6805 96% | 6437 101% | 6441 101% |
| Media total (Programa/Opciones) | -48% /
-87% | 6% /
-27% | -100% /
-53% | -1% /
-7% | -5% /
-44% |
* ... más pequeño es mejor
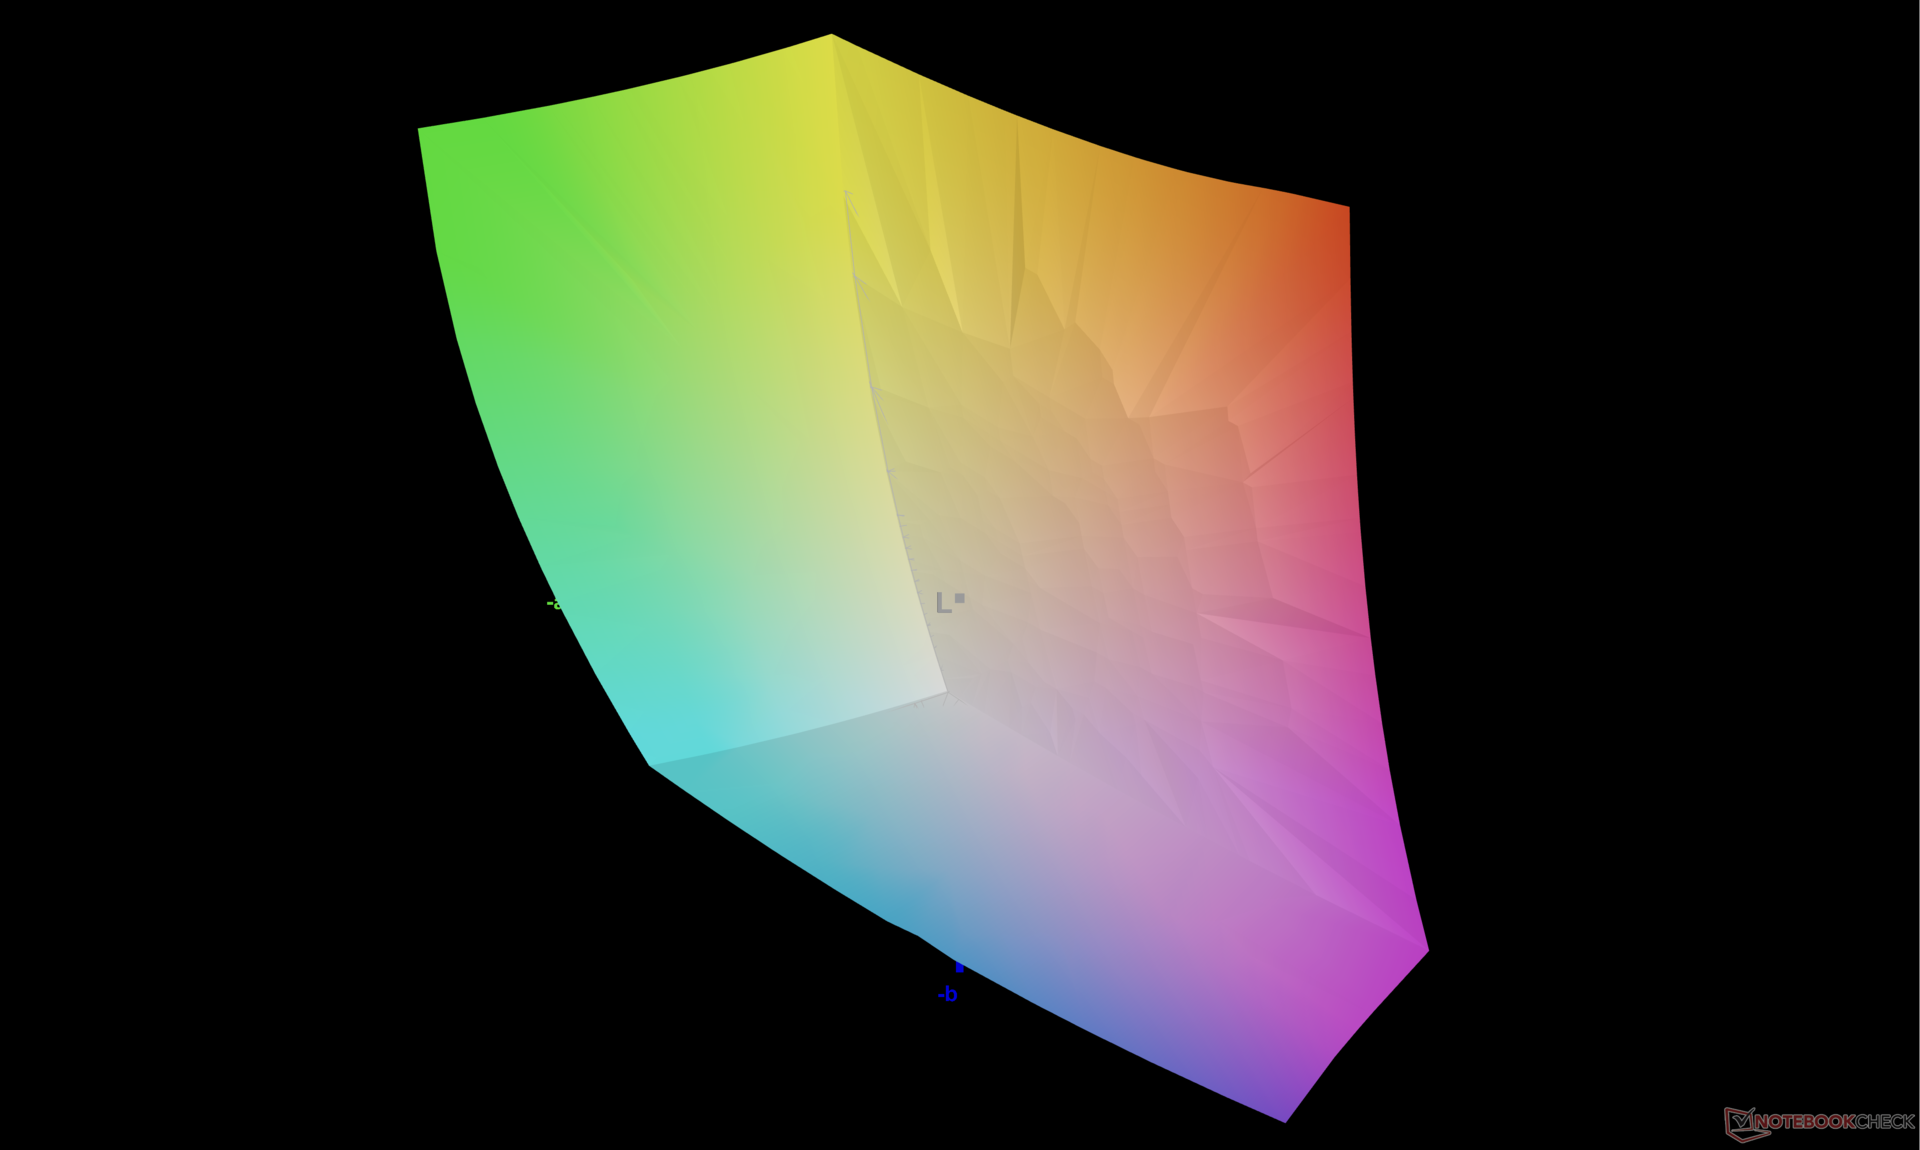
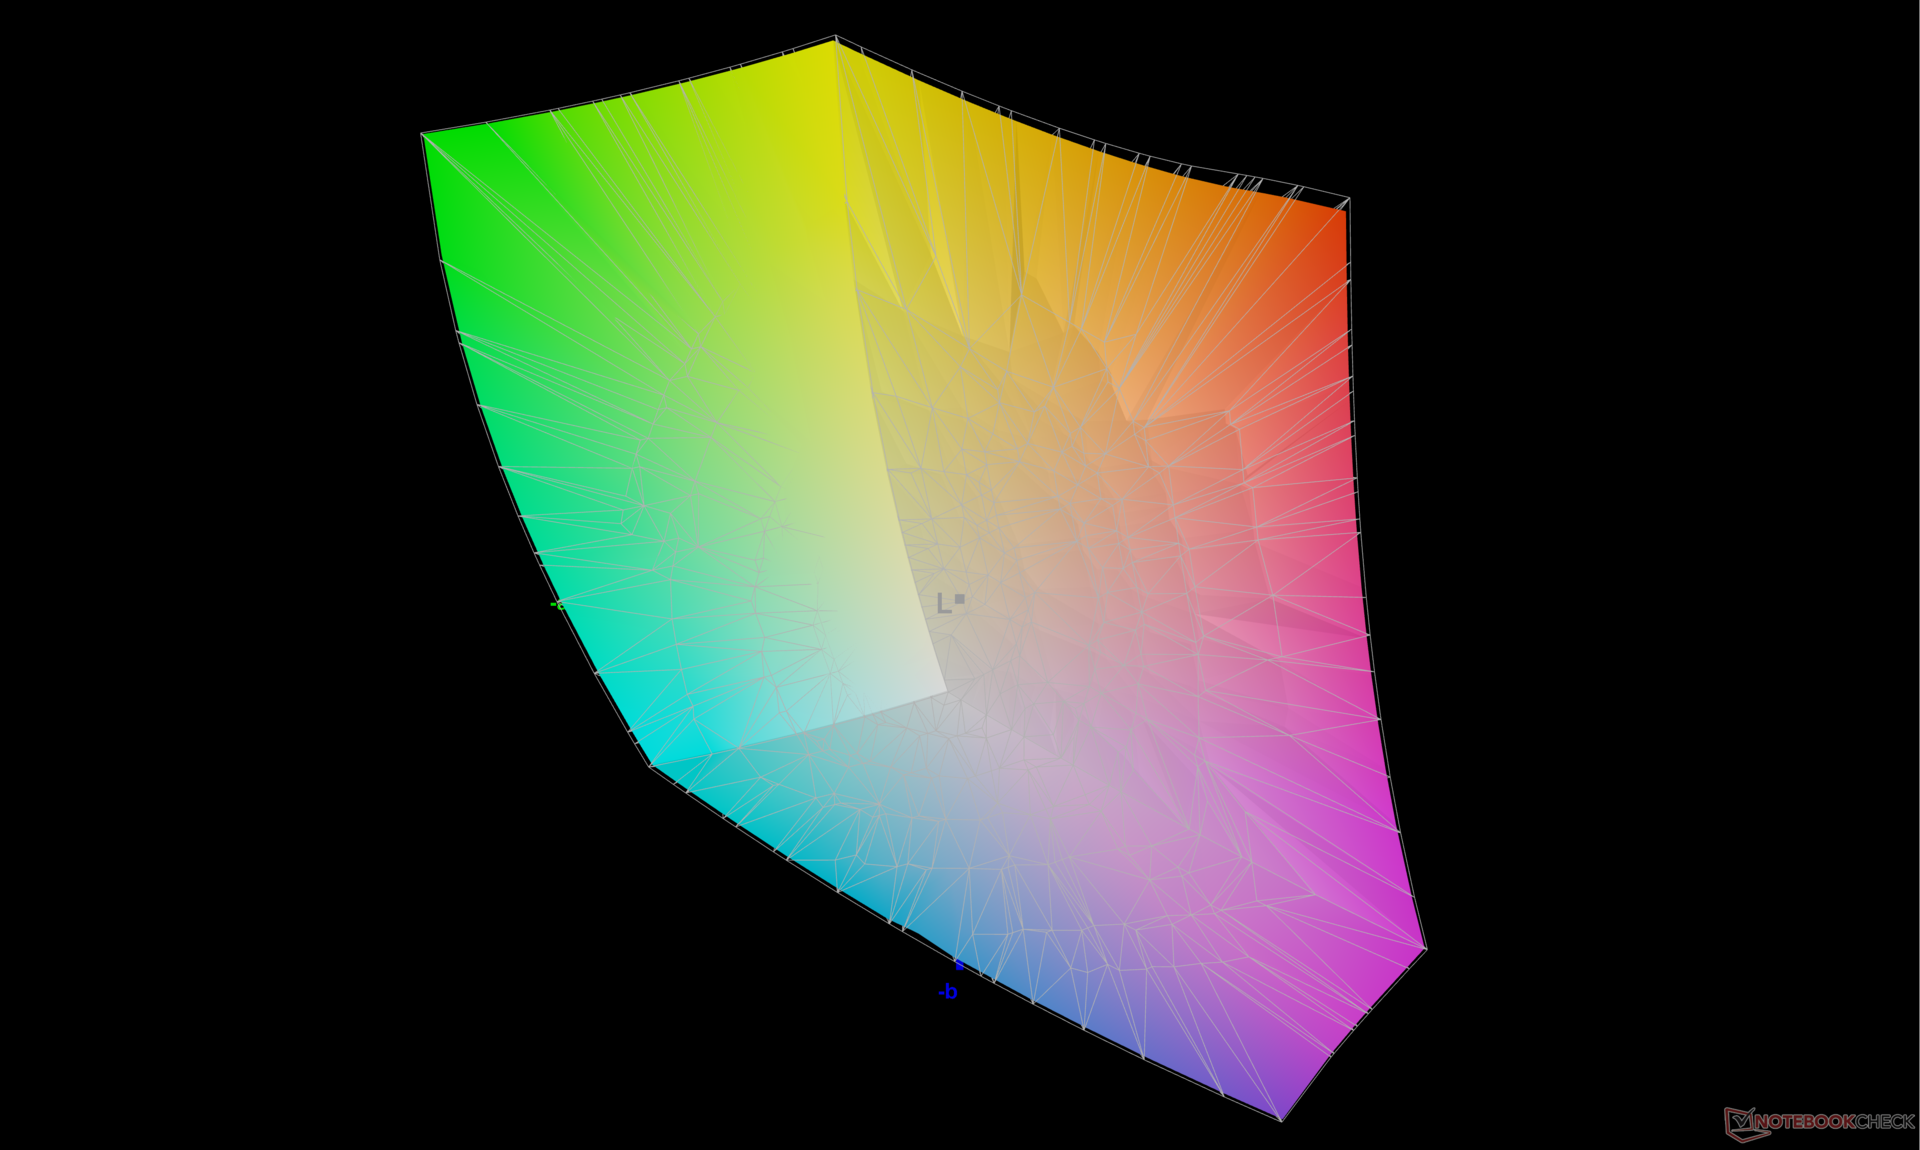
La pantalla viene bien calibrada de fábrica con la norma P3, por lo que no es necesaria una calibración por parte del usuario final.
Tiempos de respuesta del display
| ↔ Tiempo de respuesta de Negro a Blanco | ||
|---|---|---|
| 9.6 ms ... subida ↗ y bajada ↘ combinada | ↗ 5.1 ms subida | 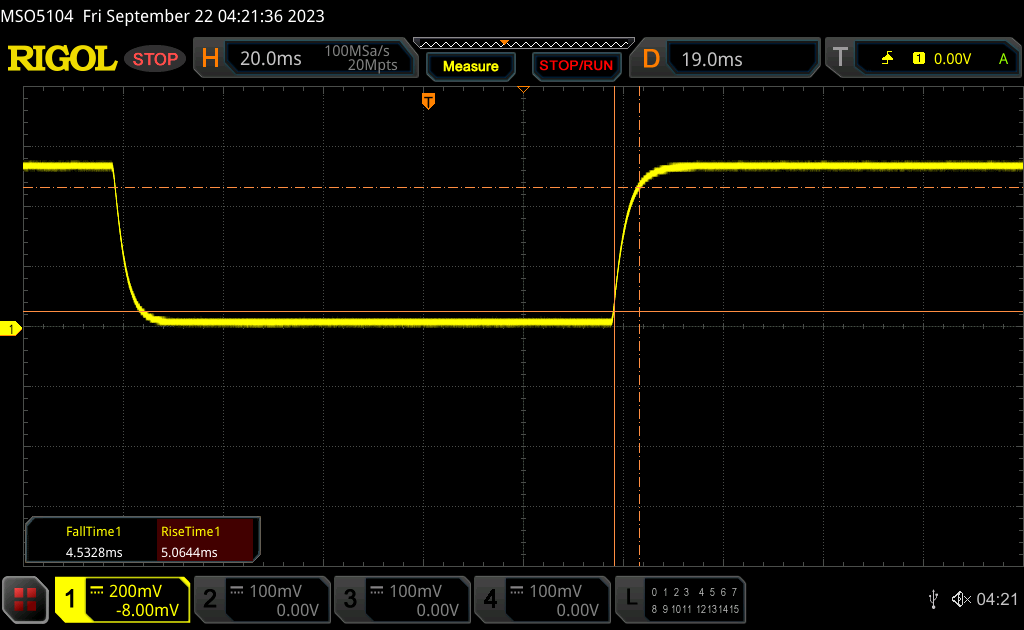 |
| ↘ 4.5 ms bajada | ||
| La pantalla mostró tiempos de respuesta rápidos en nuestros tests y debería ser adecuada para juegos. En comparación, todos los dispositivos de prueba van de ##min### (mínimo) a 240 (máximo) ms. » 26 % de todos los dispositivos son mejores. Esto quiere decir que el tiempo de respuesta medido es mejor que la media (19.8 ms) de todos los dispositivos testados. | ||
| ↔ Tiempo de respuesta 50% Gris a 80% Gris | ||
| 11.9 ms ... subida ↗ y bajada ↘ combinada | ↗ 5.9 ms subida | 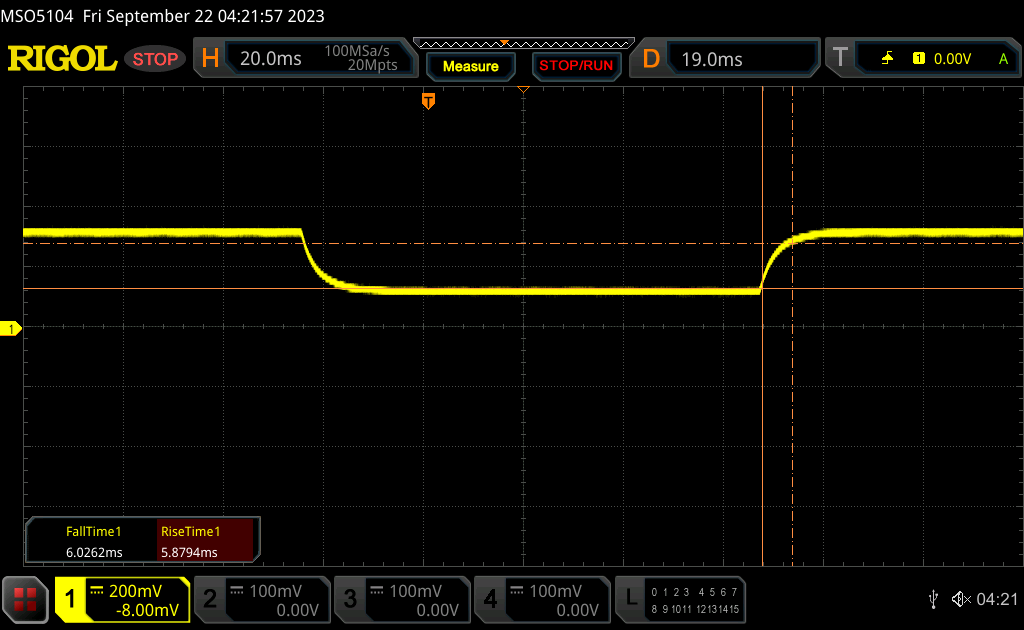 |
| ↘ 6 ms bajada | ||
| La pantalla mostró buenos tiempos de respuesta en nuestros tests pero podría ser demasiado lenta para los jugones competitivos. En comparación, todos los dispositivos de prueba van de ##min### (mínimo) a 636 (máximo) ms. » 25 % de todos los dispositivos son mejores. Esto quiere decir que el tiempo de respuesta medido es mejor que la media (31 ms) de todos los dispositivos testados. | ||
Parpadeo de Pantalla / PWM (Pulse-Width Modulation)
| Parpadeo de Pantalla / PWM no detectado | 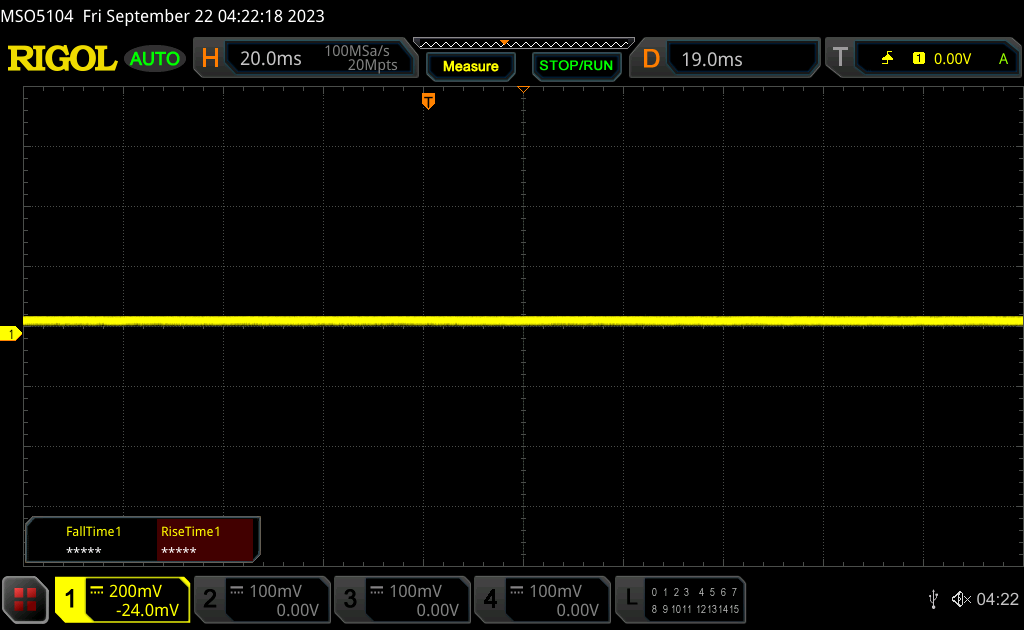 | ||
Comparación: 52 % de todos los dispositivos testados no usaron PWM para atenuar el display. Si se usó, medimos una media de 7769 (mínimo: 5 - máxmo: 343500) Hz. | |||


Rendimiento

Condiciones de ensayo
Configuramos Windows en modo Rendimiento antes de ejecutar las siguientes pruebas.
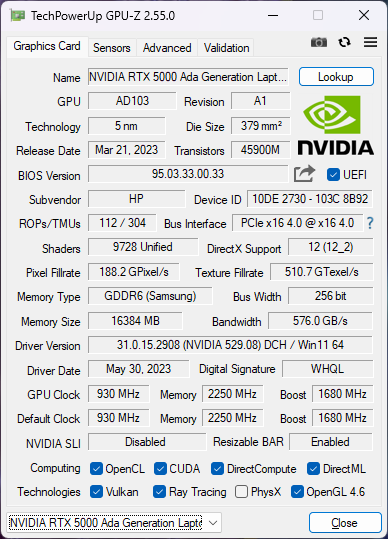
Las CPUs Advanced Optimus, MUX e Intel Xeon no son compatibles. Sin embargo, vale la pena señalar que el modelo soporta oficialmente DDR5 ECC RAM a pesar de la falta de opciones Xeon que es una característica que no se encuentra en la mayoría de las estaciones de trabajo móviles.
El modo ECC VRAM puede activarse o desactivarse como en otras GPU Ada Lovelace diseñadas para estaciones de trabajo. Al activarlo, la VRAM máxima utilizable se reduce de 16 GB a 15 GB.
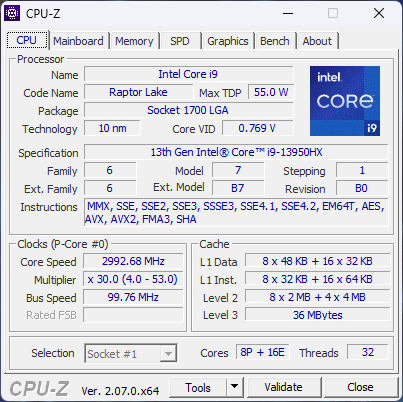
Procesador
El rendimiento de la CPU es desigual. Por un lado, el rendimiento multihilo es entre un 25 y un 30 por ciento más rápido que el del Core i9-12950HX del Fury 16 G9 del año pasado. Por otro lado, el rendimiento es en promedio un 15 por ciento más lento que en otros portátiles con el mismoCore i9-13950HX que nuestro HP. Exactamente la misma CPU en elRazer Blade 18 y MSI GE78HXpor ejemplo, funcionan sistemáticamente más rápido que nuestro HP. Esto no quiere decir que el Fury 16 G10 sea lento, pero muestra que la CPU es ligeramente más lenta de lo esperado.
Cinebench R15 Multi Loop
Cinebench R23: Multi Core | Single Core
Cinebench R20: CPU (Multi Core) | CPU (Single Core)
Cinebench R15: CPU Multi 64Bit | CPU Single 64Bit
Blender: v2.79 BMW27 CPU
7-Zip 18.03: 7z b 4 | 7z b 4 -mmt1
Geekbench 5.5: Multi-Core | Single-Core
HWBOT x265 Benchmark v2.2: 4k Preset
LibreOffice : 20 Documents To PDF
R Benchmark 2.5: Overall mean
| CPU Performance rating | |
| Medio Intel Core i9-13950HX | |
| HP ZBook Fury 16 G10 | |
| Lenovo ThinkPad P16 G1 RTX A5500 | |
| Dell Precision 5000 5680 | |
| HP ZBook Fury 16 G9 | |
| Lenovo ThinkPad P16 G1 21D6001DMB | |
| HP ZBook Studio 16 G9 62U04EA | |
| MSI CreatorPro Z16P B12UKST | |
| Asus ProArt StudioBook 16 W7600H5A-2BL2 | |
| Lenovo ThinkPad P1 G4-20Y4Z9DVUS | |
| Cinebench R23 / Multi Core | |
| Medio Intel Core i9-13950HX (24560 - 33277, n=7) | |
| HP ZBook Fury 16 G10 | |
| Lenovo ThinkPad P16 G1 RTX A5500 | |
| HP ZBook Fury 16 G9 | |
| Dell Precision 5000 5680 | |
| Lenovo ThinkPad P16 G1 21D6001DMB | |
| MSI CreatorPro Z16P B12UKST | |
| HP ZBook Studio 16 G9 62U04EA | |
| Lenovo ThinkPad P1 G4-20Y4Z9DVUS | |
| Asus ProArt StudioBook 16 W7600H5A-2BL2 | |
| Cinebench R23 / Single Core | |
| HP ZBook Fury 16 G10 | |
| Medio Intel Core i9-13950HX (1952 - 2113, n=7) | |
| Dell Precision 5000 5680 | |
| HP ZBook Fury 16 G9 | |
| Lenovo ThinkPad P16 G1 RTX A5500 | |
| HP ZBook Studio 16 G9 62U04EA | |
| Lenovo ThinkPad P16 G1 21D6001DMB | |
| MSI CreatorPro Z16P B12UKST | |
| Lenovo ThinkPad P1 G4-20Y4Z9DVUS | |
| Asus ProArt StudioBook 16 W7600H5A-2BL2 | |
| Cinebench R20 / CPU (Multi Core) | |
| Medio Intel Core i9-13950HX (8697 - 12648, n=7) | |
| HP ZBook Fury 16 G10 | |
| Lenovo ThinkPad P16 G1 RTX A5500 | |
| HP ZBook Fury 16 G9 | |
| Dell Precision 5000 5680 | |
| Lenovo ThinkPad P16 G1 21D6001DMB | |
| MSI CreatorPro Z16P B12UKST | |
| HP ZBook Studio 16 G9 62U04EA | |
| Lenovo ThinkPad P1 G4-20Y4Z9DVUS | |
| Asus ProArt StudioBook 16 W7600H5A-2BL2 | |
| Cinebench R20 / CPU (Single Core) | |
| HP ZBook Fury 16 G10 | |
| Medio Intel Core i9-13950HX (742 - 816, n=7) | |
| Dell Precision 5000 5680 | |
| HP ZBook Fury 16 G9 | |
| Lenovo ThinkPad P16 G1 RTX A5500 | |
| HP ZBook Studio 16 G9 62U04EA | |
| Lenovo ThinkPad P16 G1 21D6001DMB | |
| MSI CreatorPro Z16P B12UKST | |
| Lenovo ThinkPad P1 G4-20Y4Z9DVUS | |
| Asus ProArt StudioBook 16 W7600H5A-2BL2 | |
| Cinebench R15 / CPU Multi 64Bit | |
| Medio Intel Core i9-13950HX (3625 - 5227, n=7) | |
| HP ZBook Fury 16 G10 | |
| Lenovo ThinkPad P16 G1 RTX A5500 | |
| Lenovo ThinkPad P16 G1 21D6001DMB | |
| HP ZBook Studio 16 G9 62U04EA | |
| HP ZBook Fury 16 G9 | |
| Dell Precision 5000 5680 | |
| MSI CreatorPro Z16P B12UKST | |
| Lenovo ThinkPad P1 G4-20Y4Z9DVUS | |
| Asus ProArt StudioBook 16 W7600H5A-2BL2 | |
| Cinebench R15 / CPU Single 64Bit | |
| HP ZBook Fury 16 G10 | |
| Medio Intel Core i9-13950HX (274 - 303, n=7) | |
| Dell Precision 5000 5680 | |
| Lenovo ThinkPad P16 G1 RTX A5500 | |
| HP ZBook Studio 16 G9 62U04EA | |
| Lenovo ThinkPad P16 G1 21D6001DMB | |
| MSI CreatorPro Z16P B12UKST | |
| Lenovo ThinkPad P1 G4-20Y4Z9DVUS | |
| Asus ProArt StudioBook 16 W7600H5A-2BL2 | |
| HP ZBook Fury 16 G9 | |
| Blender / v2.79 BMW27 CPU | |
| Asus ProArt StudioBook 16 W7600H5A-2BL2 | |
| Lenovo ThinkPad P1 G4-20Y4Z9DVUS | |
| MSI CreatorPro Z16P B12UKST | |
| Dell Precision 5000 5680 | |
| HP ZBook Studio 16 G9 62U04EA | |
| Lenovo ThinkPad P16 G1 21D6001DMB | |
| HP ZBook Fury 16 G9 | |
| Lenovo ThinkPad P16 G1 RTX A5500 | |
| HP ZBook Fury 16 G10 | |
| Medio Intel Core i9-13950HX (100 - 137, n=7) | |
| 7-Zip 18.03 / 7z b 4 | |
| Medio Intel Core i9-13950HX (99351 - 127295, n=7) | |
| HP ZBook Fury 16 G10 | |
| Lenovo ThinkPad P16 G1 RTX A5500 | |
| HP ZBook Fury 16 G9 | |
| Dell Precision 5000 5680 | |
| Lenovo ThinkPad P16 G1 21D6001DMB | |
| HP ZBook Studio 16 G9 62U04EA | |
| MSI CreatorPro Z16P B12UKST | |
| Lenovo ThinkPad P1 G4-20Y4Z9DVUS | |
| Asus ProArt StudioBook 16 W7600H5A-2BL2 | |
| 7-Zip 18.03 / 7z b 4 -mmt1 | |
| Medio Intel Core i9-13950HX (6445 - 7064, n=7) | |
| HP ZBook Fury 16 G10 | |
| Dell Precision 5000 5680 | |
| Lenovo ThinkPad P16 G1 RTX A5500 | |
| HP ZBook Fury 16 G9 | |
| HP ZBook Studio 16 G9 62U04EA | |
| Lenovo ThinkPad P16 G1 21D6001DMB | |
| MSI CreatorPro Z16P B12UKST | |
| Lenovo ThinkPad P1 G4-20Y4Z9DVUS | |
| Asus ProArt StudioBook 16 W7600H5A-2BL2 | |
| Geekbench 5.5 / Multi-Core | |
| Medio Intel Core i9-13950HX (16776 - 21853, n=7) | |
| HP ZBook Fury 16 G10 | |
| Lenovo ThinkPad P16 G1 RTX A5500 | |
| Dell Precision 5000 5680 | |
| HP ZBook Fury 16 G9 | |
| Lenovo ThinkPad P16 G1 21D6001DMB | |
| HP ZBook Studio 16 G9 62U04EA | |
| MSI CreatorPro Z16P B12UKST | |
| Asus ProArt StudioBook 16 W7600H5A-2BL2 | |
| Lenovo ThinkPad P1 G4-20Y4Z9DVUS | |
| Geekbench 5.5 / Single-Core | |
| HP ZBook Fury 16 G10 | |
| Dell Precision 5000 5680 | |
| Medio Intel Core i9-13950HX (1805 - 2097, n=7) | |
| HP ZBook Fury 16 G9 | |
| Lenovo ThinkPad P16 G1 RTX A5500 | |
| HP ZBook Studio 16 G9 62U04EA | |
| MSI CreatorPro Z16P B12UKST | |
| Lenovo ThinkPad P16 G1 21D6001DMB | |
| Lenovo ThinkPad P1 G4-20Y4Z9DVUS | |
| Asus ProArt StudioBook 16 W7600H5A-2BL2 | |
| HWBOT x265 Benchmark v2.2 / 4k Preset | |
| Medio Intel Core i9-13950HX (26 - 34.5, n=7) | |
| HP ZBook Fury 16 G10 | |
| Lenovo ThinkPad P16 G1 RTX A5500 | |
| Dell Precision 5000 5680 | |
| HP ZBook Fury 16 G9 | |
| HP ZBook Studio 16 G9 62U04EA | |
| MSI CreatorPro Z16P B12UKST | |
| Lenovo ThinkPad P16 G1 21D6001DMB | |
| Lenovo ThinkPad P1 G4-20Y4Z9DVUS | |
| Asus ProArt StudioBook 16 W7600H5A-2BL2 | |
| LibreOffice / 20 Documents To PDF | |
| Lenovo ThinkPad P1 G4-20Y4Z9DVUS | |
| Lenovo ThinkPad P16 G1 21D6001DMB | |
| Medio Intel Core i9-13950HX (32.8 - 52.1, n=7) | |
| HP ZBook Fury 16 G10 | |
| HP ZBook Studio 16 G9 62U04EA | |
| Dell Precision 5000 5680 | |
| Lenovo ThinkPad P16 G1 RTX A5500 | |
| MSI CreatorPro Z16P B12UKST | |
| HP ZBook Fury 16 G9 | |
| Asus ProArt StudioBook 16 W7600H5A-2BL2 | |
| R Benchmark 2.5 / Overall mean | |
| Asus ProArt StudioBook 16 W7600H5A-2BL2 | |
| Lenovo ThinkPad P1 G4-20Y4Z9DVUS | |
| MSI CreatorPro Z16P B12UKST | |
| Lenovo ThinkPad P16 G1 21D6001DMB | |
| HP ZBook Studio 16 G9 62U04EA | |
| Lenovo ThinkPad P16 G1 RTX A5500 | |
| HP ZBook Fury 16 G9 | |
| Dell Precision 5000 5680 | |
| Medio Intel Core i9-13950HX (0.3823 - 0.4121, n=7) | |
| HP ZBook Fury 16 G10 | |
* ... más pequeño es mejor
AIDA64: FP32 Ray-Trace | FPU Julia | CPU SHA3 | CPU Queen | FPU SinJulia | FPU Mandel | CPU AES | CPU ZLib | FP64 Ray-Trace | CPU PhotoWorxx
| Performance rating | |
| Medio Intel Core i9-13950HX | |
| HP ZBook Fury 16 G10 | |
| Lenovo ThinkPad P16 G1 RTX A5500 | |
| HP ZBook Fury 16 G9 | |
| Dell Precision 5000 5680 | |
| MSI CreatorPro Z16P B12UKST | |
| AIDA64 / FP32 Ray-Trace | |
| Medio Intel Core i9-13950HX (17993 - 28957, n=9) | |
| HP ZBook Fury 16 G10 | |
| Lenovo ThinkPad P16 G1 RTX A5500 | |
| HP ZBook Fury 16 G9 | |
| Dell Precision 5000 5680 | |
| MSI CreatorPro Z16P B12UKST | |
| AIDA64 / FPU Julia | |
| Medio Intel Core i9-13950HX (89362 - 144303, n=9) | |
| HP ZBook Fury 16 G10 | |
| HP ZBook Fury 16 G9 | |
| Lenovo ThinkPad P16 G1 RTX A5500 | |
| Dell Precision 5000 5680 | |
| MSI CreatorPro Z16P B12UKST | |
| AIDA64 / CPU SHA3 | |
| Medio Intel Core i9-13950HX (4518 - 7093, n=9) | |
| HP ZBook Fury 16 G10 | |
| Lenovo ThinkPad P16 G1 RTX A5500 | |
| HP ZBook Fury 16 G9 | |
| MSI CreatorPro Z16P B12UKST | |
| Dell Precision 5000 5680 | |
| AIDA64 / CPU Queen | |
| Medio Intel Core i9-13950HX (131931 - 140103, n=8) | |
| HP ZBook Fury 16 G10 | |
| Dell Precision 5000 5680 | |
| Lenovo ThinkPad P16 G1 RTX A5500 | |
| HP ZBook Fury 16 G9 | |
| MSI CreatorPro Z16P B12UKST | |
| AIDA64 / FPU SinJulia | |
| Medio Intel Core i9-13950HX (12318 - 17057, n=9) | |
| HP ZBook Fury 16 G10 | |
| Lenovo ThinkPad P16 G1 RTX A5500 | |
| HP ZBook Fury 16 G9 | |
| Dell Precision 5000 5680 | |
| MSI CreatorPro Z16P B12UKST | |
| AIDA64 / FPU Mandel | |
| Medio Intel Core i9-13950HX (44372 - 71038, n=9) | |
| HP ZBook Fury 16 G10 | |
| HP ZBook Fury 16 G9 | |
| Lenovo ThinkPad P16 G1 RTX A5500 | |
| Dell Precision 5000 5680 | |
| MSI CreatorPro Z16P B12UKST | |
| AIDA64 / CPU AES | |
| Medio Intel Core i9-13950HX (99981 - 204491, n=9) | |
| MSI CreatorPro Z16P B12UKST | |
| HP ZBook Fury 16 G10 | |
| HP ZBook Fury 16 G9 | |
| Lenovo ThinkPad P16 G1 RTX A5500 | |
| Dell Precision 5000 5680 | |
| AIDA64 / CPU ZLib | |
| Medio Intel Core i9-13950HX (1263 - 2069, n=9) | |
| HP ZBook Fury 16 G10 | |
| Lenovo ThinkPad P16 G1 RTX A5500 | |
| HP ZBook Fury 16 G9 | |
| MSI CreatorPro Z16P B12UKST | |
| Dell Precision 5000 5680 | |
| AIDA64 / FP64 Ray-Trace | |
| Medio Intel Core i9-13950HX (9649 - 15573, n=9) | |
| HP ZBook Fury 16 G10 | |
| Lenovo ThinkPad P16 G1 RTX A5500 | |
| HP ZBook Fury 16 G9 | |
| Dell Precision 5000 5680 | |
| MSI CreatorPro Z16P B12UKST | |
| AIDA64 / CPU PhotoWorxx | |
| Dell Precision 5000 5680 | |
| Medio Intel Core i9-13950HX (40233 - 50864, n=9) | |
| MSI CreatorPro Z16P B12UKST | |
| Lenovo ThinkPad P16 G1 RTX A5500 | |
| HP ZBook Fury 16 G10 | |
| HP ZBook Fury 16 G9 | |
Rendimiento del sistema
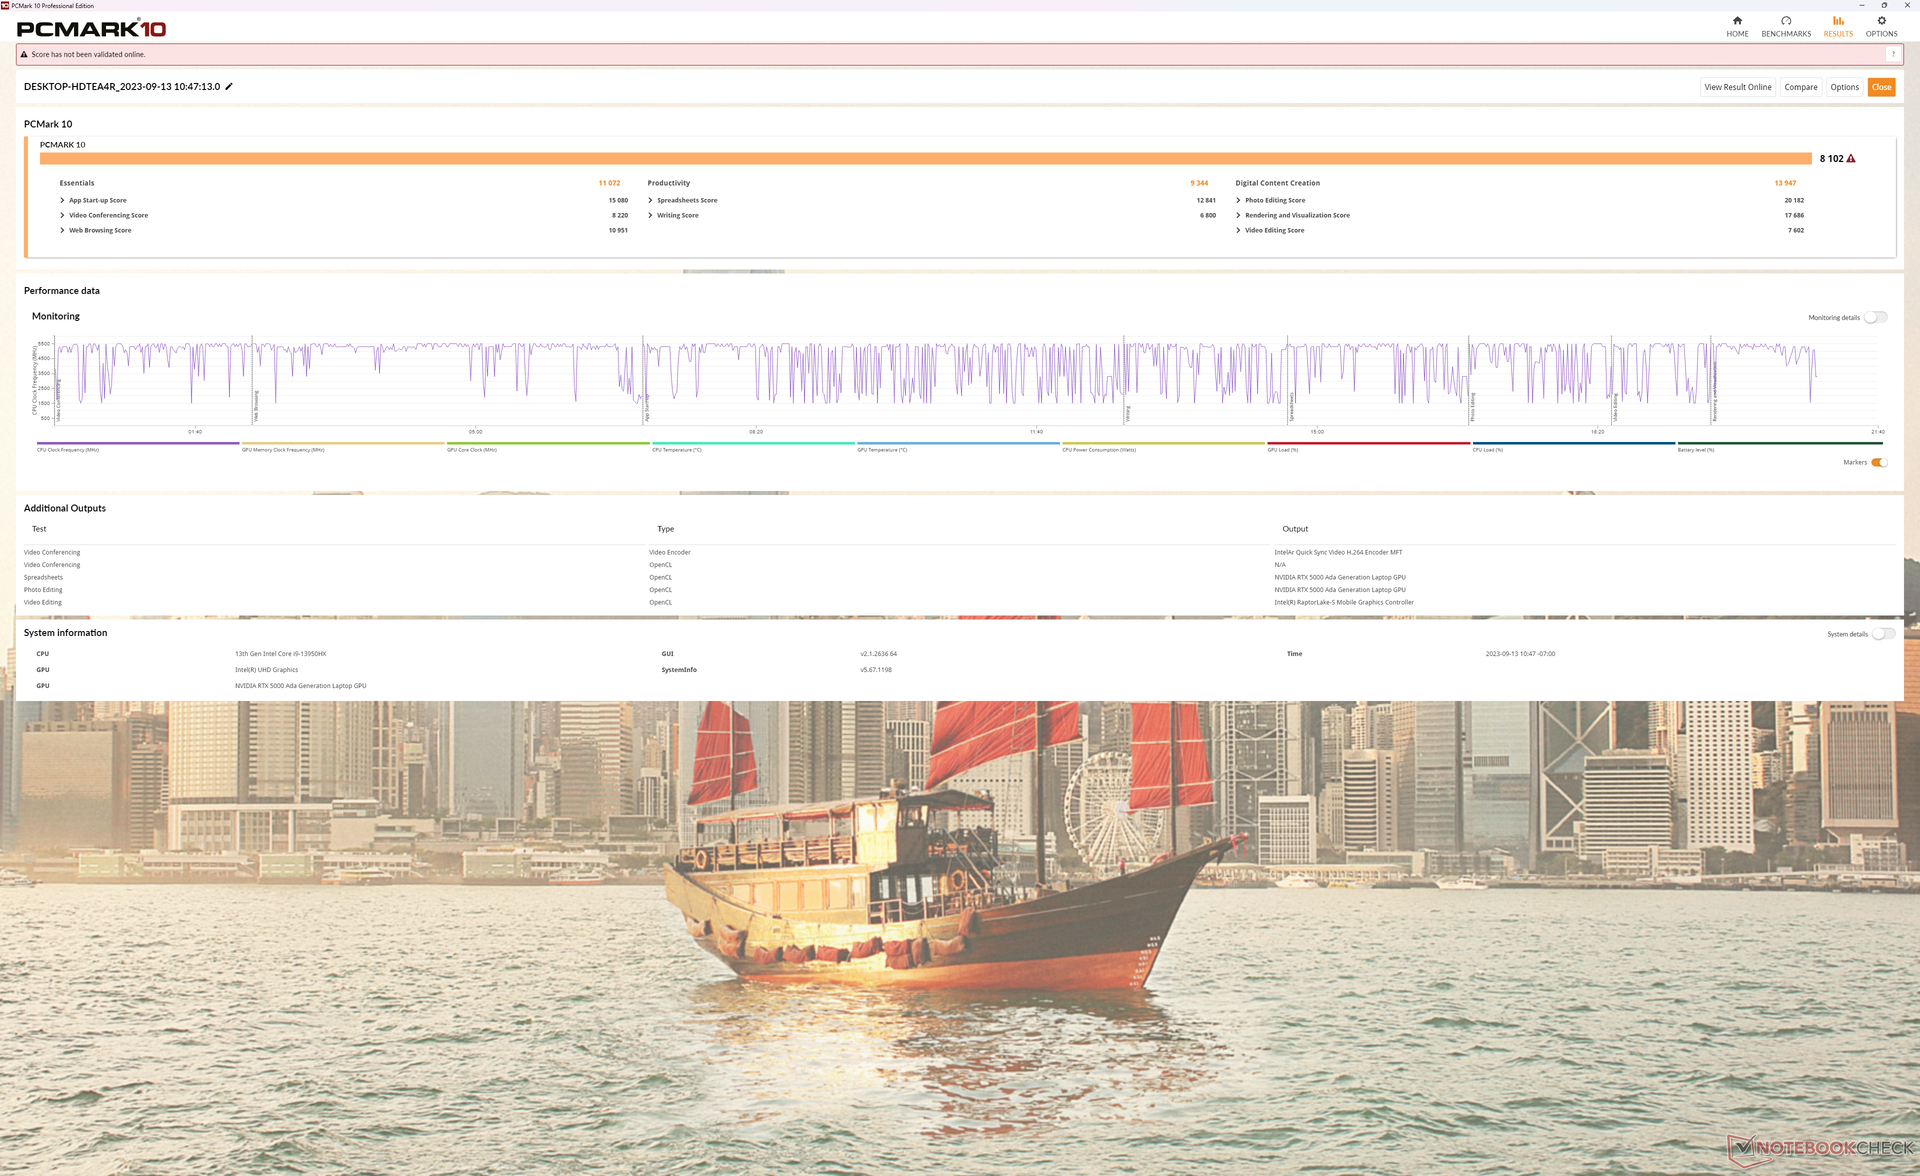
Las puntuaciones en PCMark superan a las de la Fury 16 G9 del año pasado, especialmente en la subprueba de creación de contenidos digitales, debido al significativo salto en el rendimiento de la GPU. Mientras tanto, la Precision 5680 obtiene mejores resultados en Productividad gracias a sus SSD RAID 0. Por supuesto, nuestro HP también puede configurarse con RAID si se desea.
CrossMark: Overall | Productivity | Creativity | Responsiveness
| PCMark 10 / Score | |
| Dell Precision 5000 5680 | |
| HP ZBook Fury 16 G10 | |
| Medio Intel Core i9-13950HX, NVIDIA RTX 5000 Ada Generation Laptop (n=1) | |
| Lenovo ThinkPad P16 G1 RTX A5500 | |
| MSI CreatorPro Z16P B12UKST | |
| Asus ProArt StudioBook 16 W7600H5A-2BL2 | |
| HP ZBook Fury 16 G9 | |
| PCMark 10 / Essentials | |
| Dell Precision 5000 5680 | |
| HP ZBook Fury 16 G10 | |
| Medio Intel Core i9-13950HX, NVIDIA RTX 5000 Ada Generation Laptop (n=1) | |
| HP ZBook Fury 16 G9 | |
| Lenovo ThinkPad P16 G1 RTX A5500 | |
| MSI CreatorPro Z16P B12UKST | |
| Asus ProArt StudioBook 16 W7600H5A-2BL2 | |
| PCMark 10 / Productivity | |
| Dell Precision 5000 5680 | |
| Lenovo ThinkPad P16 G1 RTX A5500 | |
| MSI CreatorPro Z16P B12UKST | |
| HP ZBook Fury 16 G10 | |
| Medio Intel Core i9-13950HX, NVIDIA RTX 5000 Ada Generation Laptop (n=1) | |
| Asus ProArt StudioBook 16 W7600H5A-2BL2 | |
| HP ZBook Fury 16 G9 | |
| PCMark 10 / Digital Content Creation | |
| HP ZBook Fury 16 G10 | |
| Medio Intel Core i9-13950HX, NVIDIA RTX 5000 Ada Generation Laptop (n=1) | |
| Dell Precision 5000 5680 | |
| Asus ProArt StudioBook 16 W7600H5A-2BL2 | |
| Lenovo ThinkPad P16 G1 RTX A5500 | |
| MSI CreatorPro Z16P B12UKST | |
| HP ZBook Fury 16 G9 | |
| CrossMark / Overall | |
| MSI CreatorPro Z16P B12UKST | |
| Dell Precision 5000 5680 | |
| HP ZBook Fury 16 G10 | |
| Medio Intel Core i9-13950HX, NVIDIA RTX 5000 Ada Generation Laptop (n=1) | |
| HP ZBook Fury 16 G9 | |
| Lenovo ThinkPad P16 G1 RTX A5500 | |
| CrossMark / Productivity | |
| HP ZBook Fury 16 G10 | |
| Medio Intel Core i9-13950HX, NVIDIA RTX 5000 Ada Generation Laptop (n=1) | |
| MSI CreatorPro Z16P B12UKST | |
| Dell Precision 5000 5680 | |
| HP ZBook Fury 16 G9 | |
| Lenovo ThinkPad P16 G1 RTX A5500 | |
| CrossMark / Creativity | |
| Lenovo ThinkPad P16 G1 RTX A5500 | |
| Dell Precision 5000 5680 | |
| HP ZBook Fury 16 G9 | |
| HP ZBook Fury 16 G10 | |
| Medio Intel Core i9-13950HX, NVIDIA RTX 5000 Ada Generation Laptop (n=1) | |
| MSI CreatorPro Z16P B12UKST | |
| CrossMark / Responsiveness | |
| MSI CreatorPro Z16P B12UKST | |
| HP ZBook Fury 16 G10 | |
| Medio Intel Core i9-13950HX, NVIDIA RTX 5000 Ada Generation Laptop (n=1) | |
| HP ZBook Fury 16 G9 | |
| Dell Precision 5000 5680 | |
| Lenovo ThinkPad P16 G1 RTX A5500 | |
| PCMark 10 Score | 8102 puntos | |
ayuda | ||
| AIDA64 / Memory Copy | |
| Dell Precision 5000 5680 | |
| Lenovo ThinkPad P16 G1 RTX A5500 | |
| MSI CreatorPro Z16P B12UKST | |
| HP ZBook Fury 16 G10 | |
| HP ZBook Fury 16 G9 | |
| AIDA64 / Memory Read | |
| Dell Precision 5000 5680 | |
| MSI CreatorPro Z16P B12UKST | |
| Lenovo ThinkPad P16 G1 RTX A5500 | |
| HP ZBook Fury 16 G10 | |
| HP ZBook Fury 16 G9 | |
| AIDA64 / Memory Write | |
| Dell Precision 5000 5680 | |
| MSI CreatorPro Z16P B12UKST | |
| Lenovo ThinkPad P16 G1 RTX A5500 | |
| HP ZBook Fury 16 G10 | |
| HP ZBook Fury 16 G9 | |
* ... más pequeño es mejor
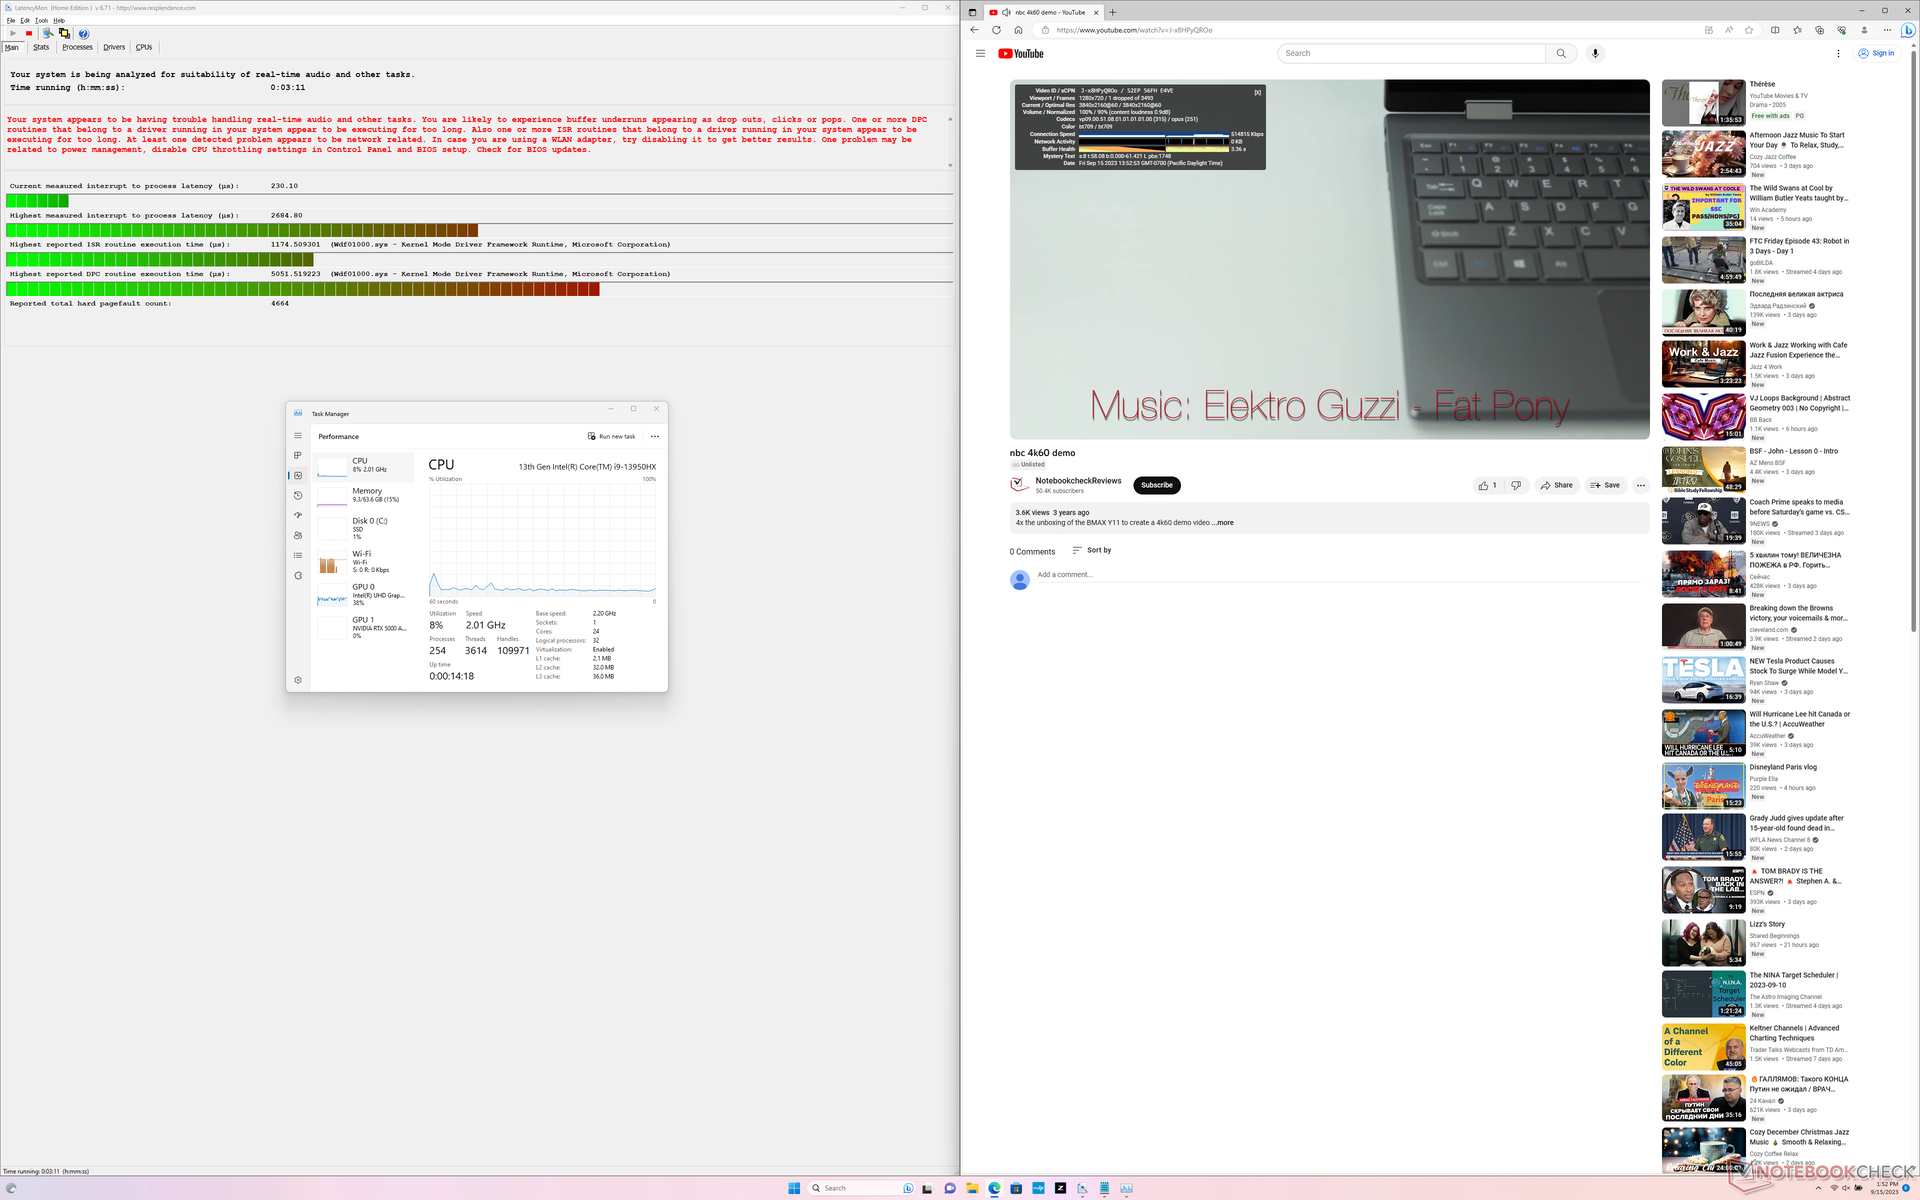
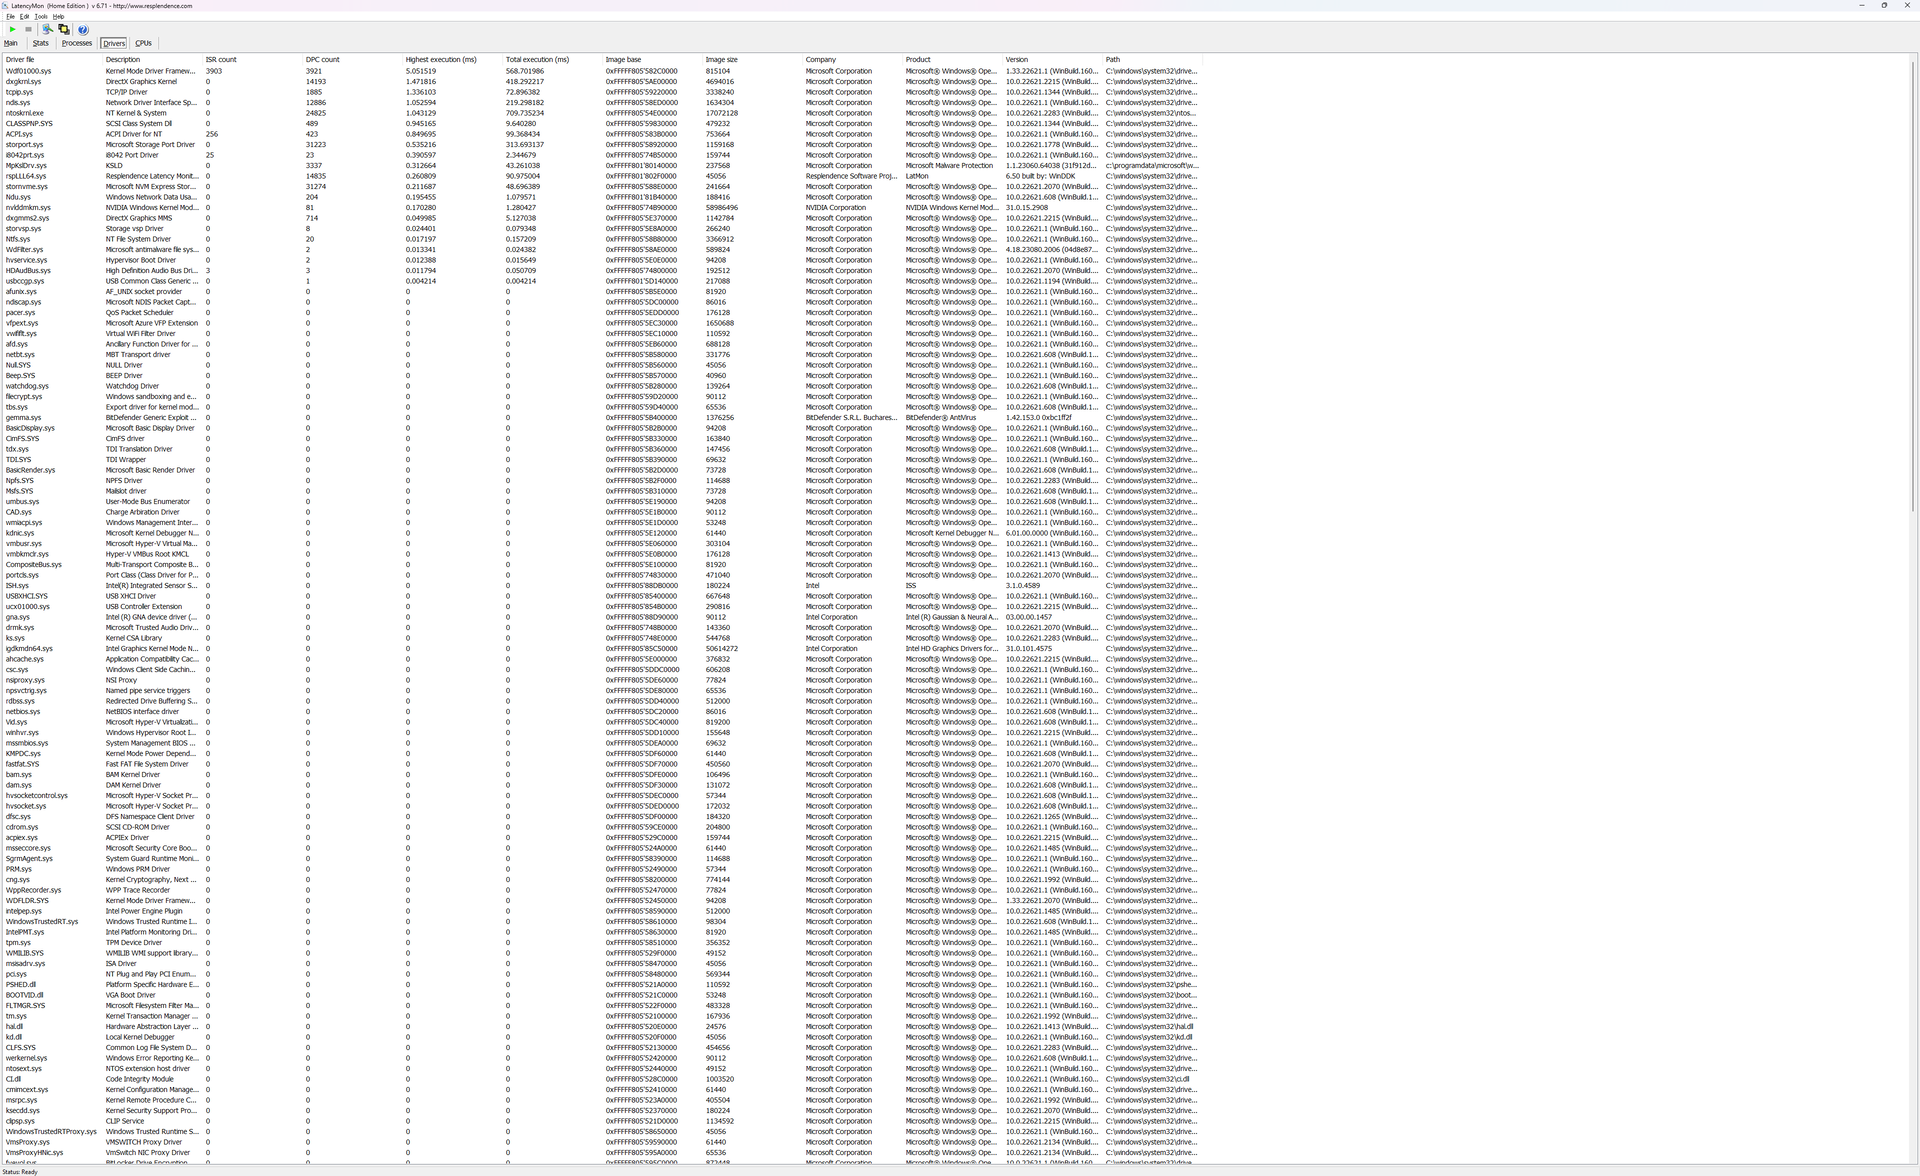
Latencia del CPD
LatencyMon revela problemas de CPD al abrir varias pestañas de nuestra página de inicio. la reproducción de vídeo 4K a 60 FPS es casi perfecta, con un solo fotograma caído en un intervalo de 60 segundos.
| DPC Latencies / LatencyMon - interrupt to process latency (max), Web, Youtube, Prime95 | |
| HP ZBook Fury 16 G10 | |
| HP ZBook Fury 16 G9 | |
| Dell Precision 5000 5680 | |
| Lenovo ThinkPad P16 G1 RTX A5500 | |
| Asus ProArt StudioBook 16 W7600H5A-2BL2 | |
| MSI CreatorPro Z16P B12UKST | |
* ... más pequeño es mejor
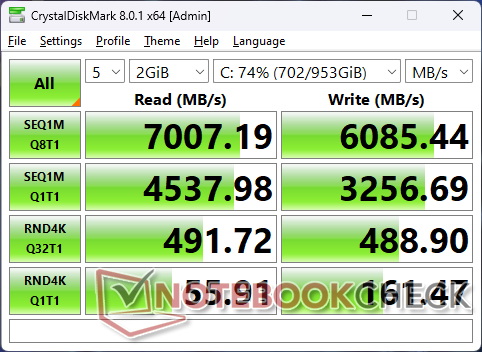
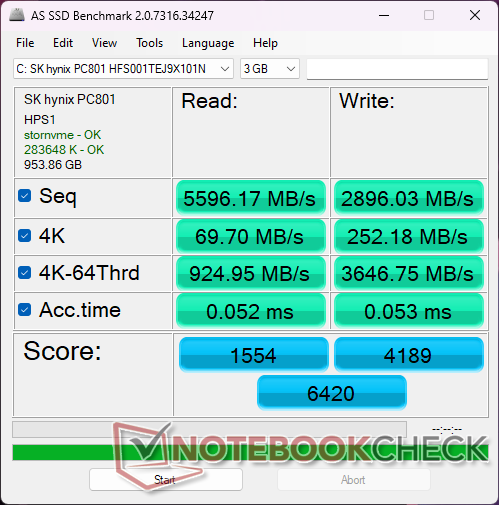
Dispositivos de almacenamiento
Nuestra unidad de prueba se suministra con un SK hynix PC801 PCIe4 x4 NVMe SSD mientras que nuestra unidad Fury G16 G9 más antigua se envía con un Micron 3400. Desgraciadamente, el rendimiento seguía bajando hasta los 3400 MB/s después de aproximadamente un minuto en nuestra prueba de estrés, como se muestra en el siguiente gráfico. Está claro que a las cuatro ranuras M.2 SSD les vendría bien algo más de refrigeración para mejorar la consistencia del rendimiento.

* ... más pequeño es mejor
Disk Throttling: DiskSpd Read Loop, Queue Depth 8
Rendimiento de la GPU - Mobile Monster
El sitio RTX 5000 Ada en nuestro sistema HP es entre un 10 y un 20 por ciento más rápida que la misma GPU en el Dell Precision 5680. Sus ligeras pero constantes ventajas de rendimiento pueden atribuirse al mayor techo de TGP, mientras que la GPU en el Dell antes mencionado funcionaría a una potencia inferior. La sección de pruebas de estrés detalla nuestras observaciones.
El rendimiento general es muy superior al de laRTX A5500 de la Fury 16 G9 del año pasado en hasta un 40% o incluso un 80% dependiendo de la aplicación.
| 3DMark Performance rating - Percent | |
| HP ZBook Fury 16 G10 | |
| Medio NVIDIA RTX 5000 Ada Generation Laptop | |
| Dell Precision 5000 5680 | |
| Lenovo ThinkPad P16 G1 RTX A5500 | |
| Asus ProArt StudioBook 16 W7600H5A-2BL2 -20! | |
| HP ZBook Fury 16 G9 | |
| Dell Precision 5480 -2! | |
| MSI CreatorPro Z16P B12UKST -17! | |
| HP ZBook Studio 16 G9 62U04EA -10! | |
| Lenovo ThinkPad P16 G1 21D6001DMB -18! | |
| Lenovo ThinkPad P1 G4-20Y4Z9DVUS -18! | |
| 3DMark 11 - 1280x720 Performance GPU | |
| HP ZBook Fury 16 G10 | |
| Medio NVIDIA RTX 5000 Ada Generation Laptop (49833 - 54334, n=3) | |
| Dell Precision 5000 5680 | |
| Lenovo ThinkPad P16 G1 RTX A5500 | |
| HP ZBook Fury 16 G9 | |
| Dell Precision 5480 | |
| MSI CreatorPro Z16P B12UKST | |
| HP ZBook Studio 16 G9 62U04EA | |
| Lenovo ThinkPad P16 G1 21D6001DMB | |
| Lenovo ThinkPad P1 G4-20Y4Z9DVUS | |
| 3DMark 11 Performance | 39530 puntos | |
| 3DMark Fire Strike Score | 28837 puntos | |
| 3DMark Time Spy Score | 15989 puntos | |
ayuda | ||
* ... más pequeño es mejor
Witcher 3 FPS Chart
| bajo | medio | alto | ultra | QHD | 4K | |
|---|---|---|---|---|---|---|
| The Witcher 3 (2015) | 510.5 | 430.3 | 298.1 | 156.5 | 105.2 | |
| Dota 2 Reborn (2015) | 211 | 191.7 | 188.2 | 166.7 | 157.3 | |
| Final Fantasy XV Benchmark (2018) | 196.9 | 179.9 | 149.1 | 120 | 68.7 | |
| X-Plane 11.11 (2018) | 175.5 | 153.9 | 122.4 | 102.6 | ||
| Far Cry 5 (2018) | 158 | 144 | 138 | 131 | 129 | |
| Strange Brigade (2018) | 411 | 337 | 306 | 283 | 216 | 105.1 |
| Cyberpunk 2077 1.6 (2022) | 110.5 | 106.8 | 104.9 | 103.8 | 74.7 | 37 |
| Tiny Tina's Wonderlands (2022) | 267.5 | 227.7 | 171.7 | 139.4 | 99.4 | 53.9 |
| F1 22 (2022) | 249 | 246 | 211 | 86.2 | 64.4 | 33.4 |
| Ratchet & Clank Rift Apart (2023) | 118 | 93.9 | 69.4 | 54.5 | 43.4 | 33.3 |
Emisiones
Ruido del sistema
Características del ventilador en uso típico, ruido en diferentes escenarios de carga según las mediciones, ruidos molestos (de, por ejemplo, transistores) y otras irregularidades (HDD que gira rápidamente, ODD, ventilador inestable,...)
Analizar las características del ruido: ¿alguna anomalía? Breve reseña:Breve análisis de las emisiones de ruido, comparación con la competencia.Máx. 500 caracteres
Ruido
| Ocioso |
| 22.9 / 22.9 / 28.5 dB(A) |
| Carga |
| 40.6 / 45.8 dB(A) |
 | ||
30 dB silencioso 40 dB(A) audible 50 dB(A) ruidosamente alto |
||
min: | ||
| HP ZBook Fury 16 G10 RTX 5000 Ada Generation Laptop, i9-13950HX, SK hynix PC801 HFS001TEJ9X101N | HP ZBook Fury 16 G9 RTX A5500 Laptop GPU, i9-12950HX, Micron 3400 1TB MTFDKBA1T0TFH | Dell Precision 5000 5680 RTX 5000 Ada Generation Laptop, i9-13900H, 2x SK hynix PC801 HFS512GEJ9X101N RAID 0 | Lenovo ThinkPad P16 G1 RTX A5500 RTX A5500 Laptop GPU, i9-12950HX, WDC PC SN810 2TB | MSI CreatorPro Z16P B12UKST RTX A3000 Laptop GPU, i7-12700H, Samsung PM9A1 MZVL21T0HCLR | Asus ProArt StudioBook 16 W7600H5A-2BL2 RTX A5000 Laptop GPU, W-11955M, 2x Micron 2300 2TB MTFDHBA2T0TDV (RAID 0) | |
|---|---|---|---|---|---|---|
| Noise | -1% | 0% | 2% | -6% | -5% | |
| apagado / medio ambiente * (dB) | 22.9 | 22.6 1% | 22.8 -0% | 23.1 -1% | 24.1 -5% | 26 -14% |
| Idle Minimum * (dB) | 22.9 | 22.7 1% | 23 -0% | 23.1 -1% | 27.1 -18% | 26 -14% |
| Idle Average * (dB) | 22.9 | 22.7 1% | 23 -0% | 23.1 -1% | 27.1 -18% | 26 -14% |
| Idle Maximum * (dB) | 28.5 | 28.8 -1% | 23 19% | 23.1 19% | 27.1 5% | 26.5 7% |
| Load Average * (dB) | 40.6 | 36.2 11% | 37.2 8% | 28.9 29% | 42.9 -6% | 42 -3% |
| Witcher 3 ultra * (dB) | 44.1 | 49.5 -12% | 51 -16% | 51.6 -17% | 44 -0% | |
| Load Maximum * (dB) | 45.8 | 49.3 -8% | 51 -11% | 51.4 -12% | 47 -3% | 43 6% |
* ... más pequeño es mejor
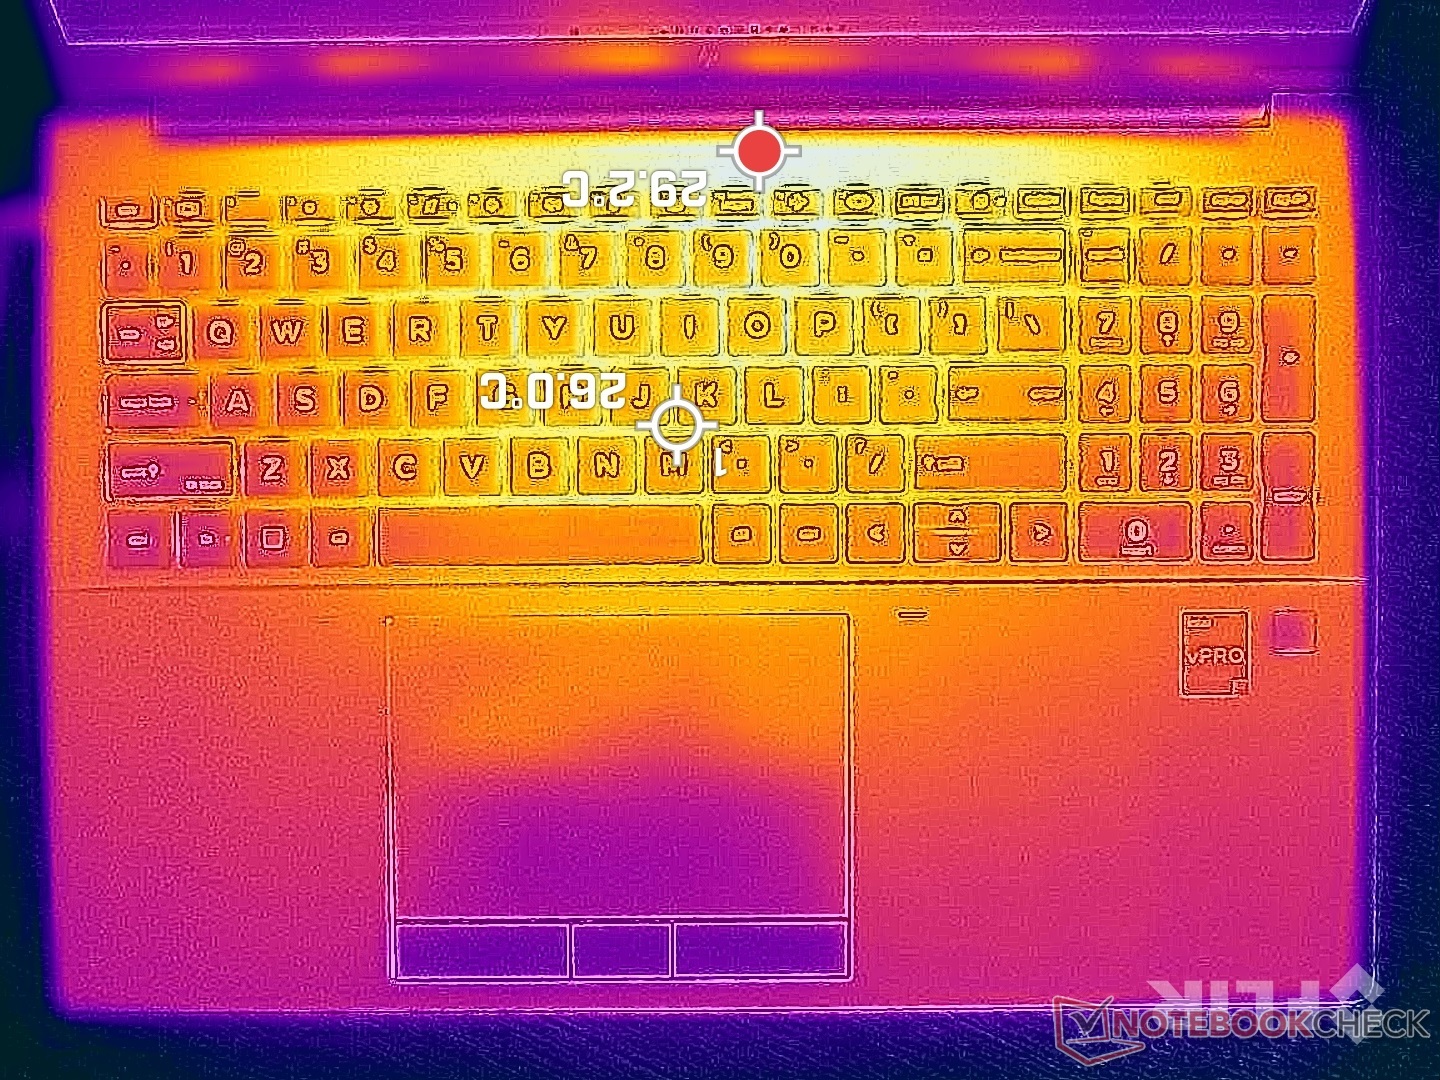
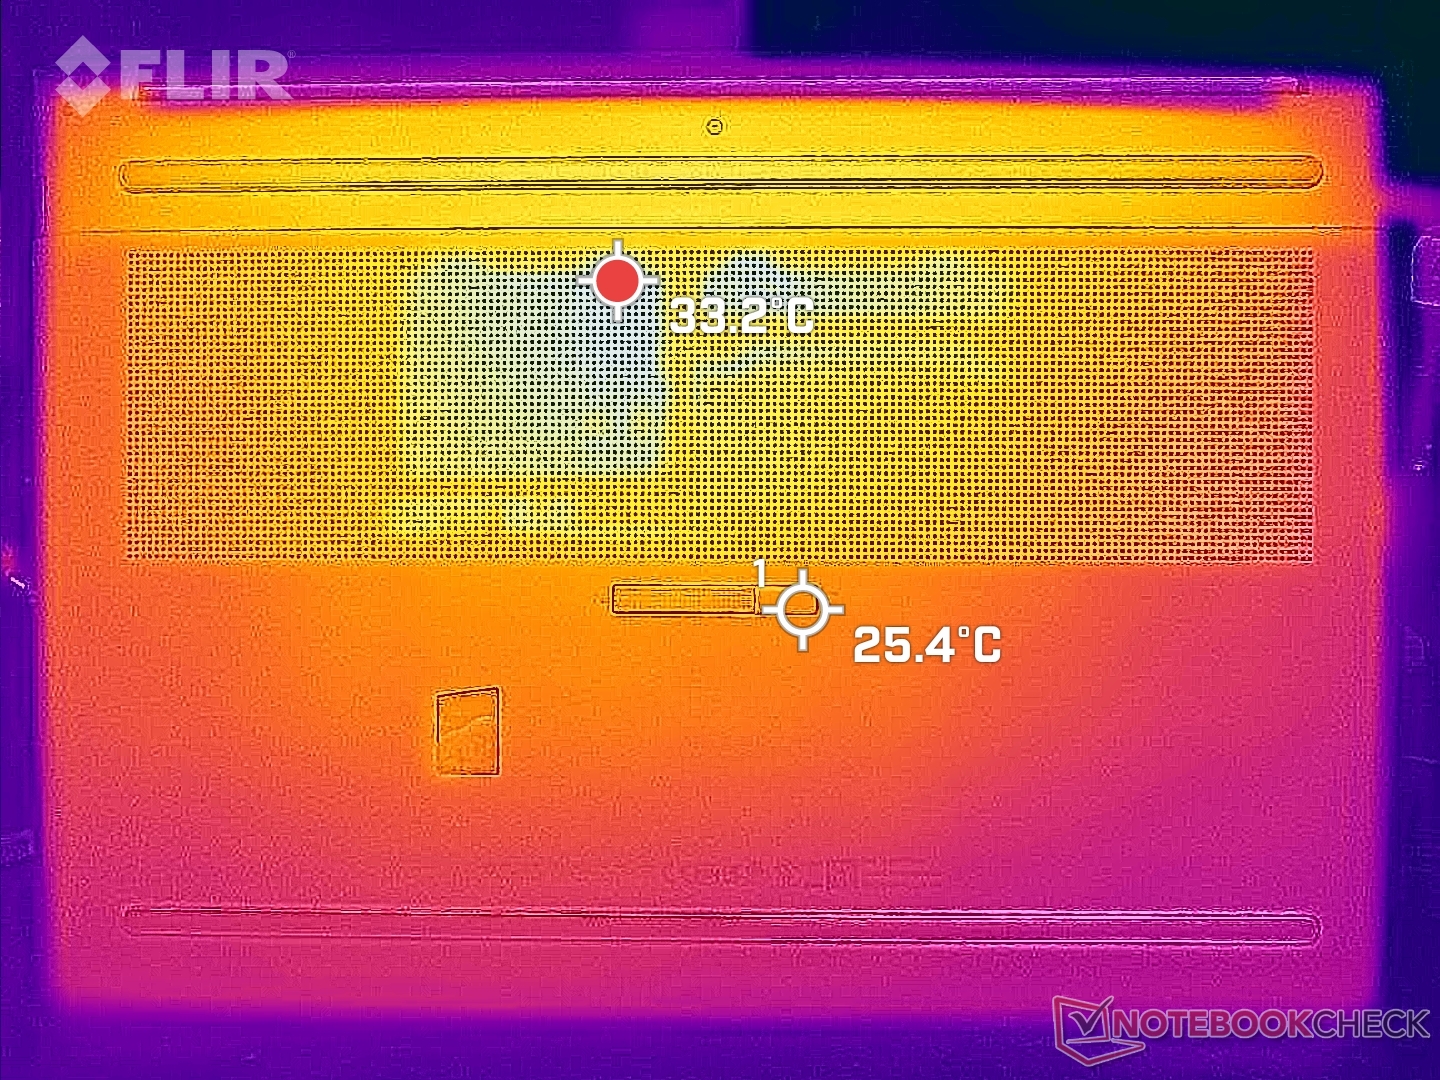
Temperatura
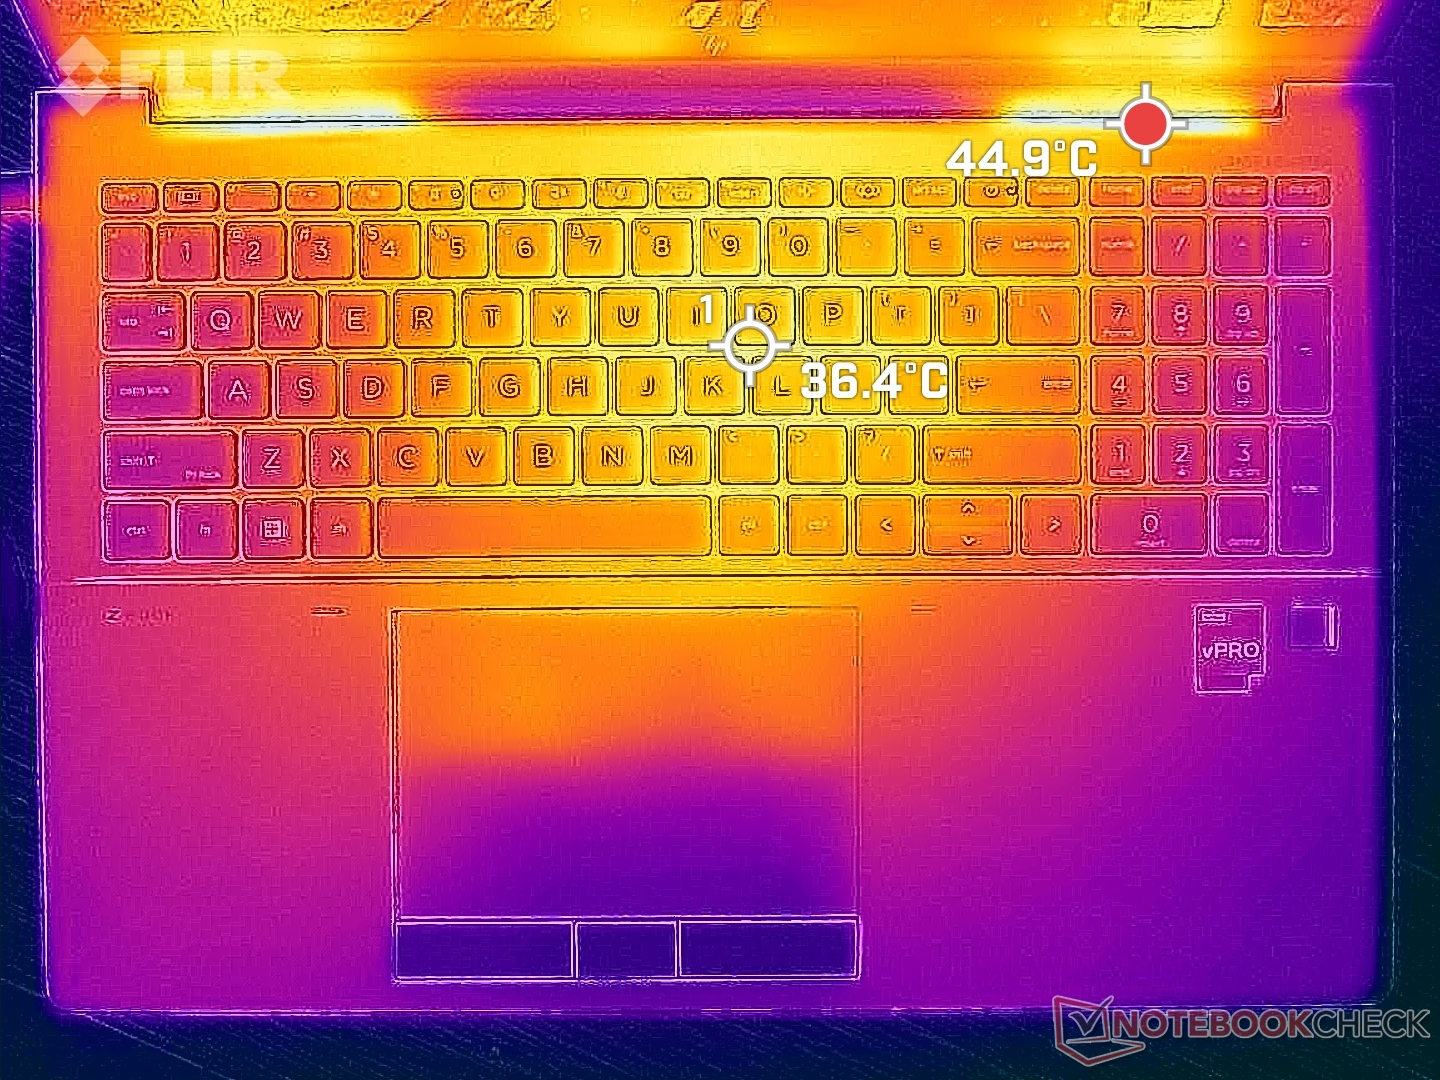
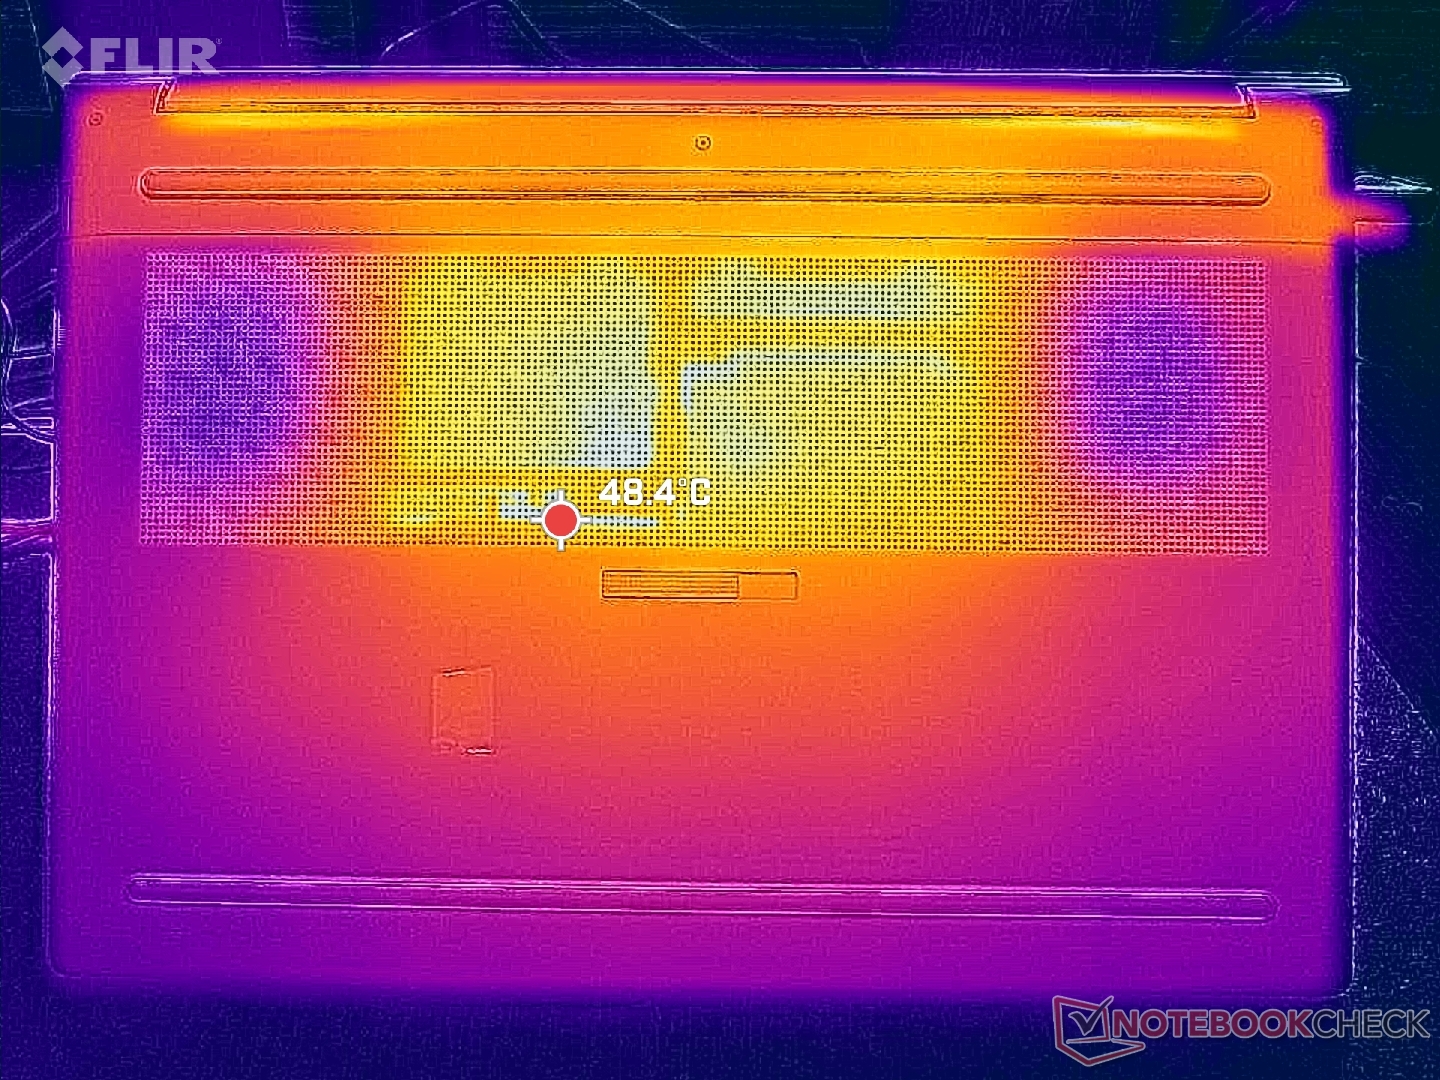
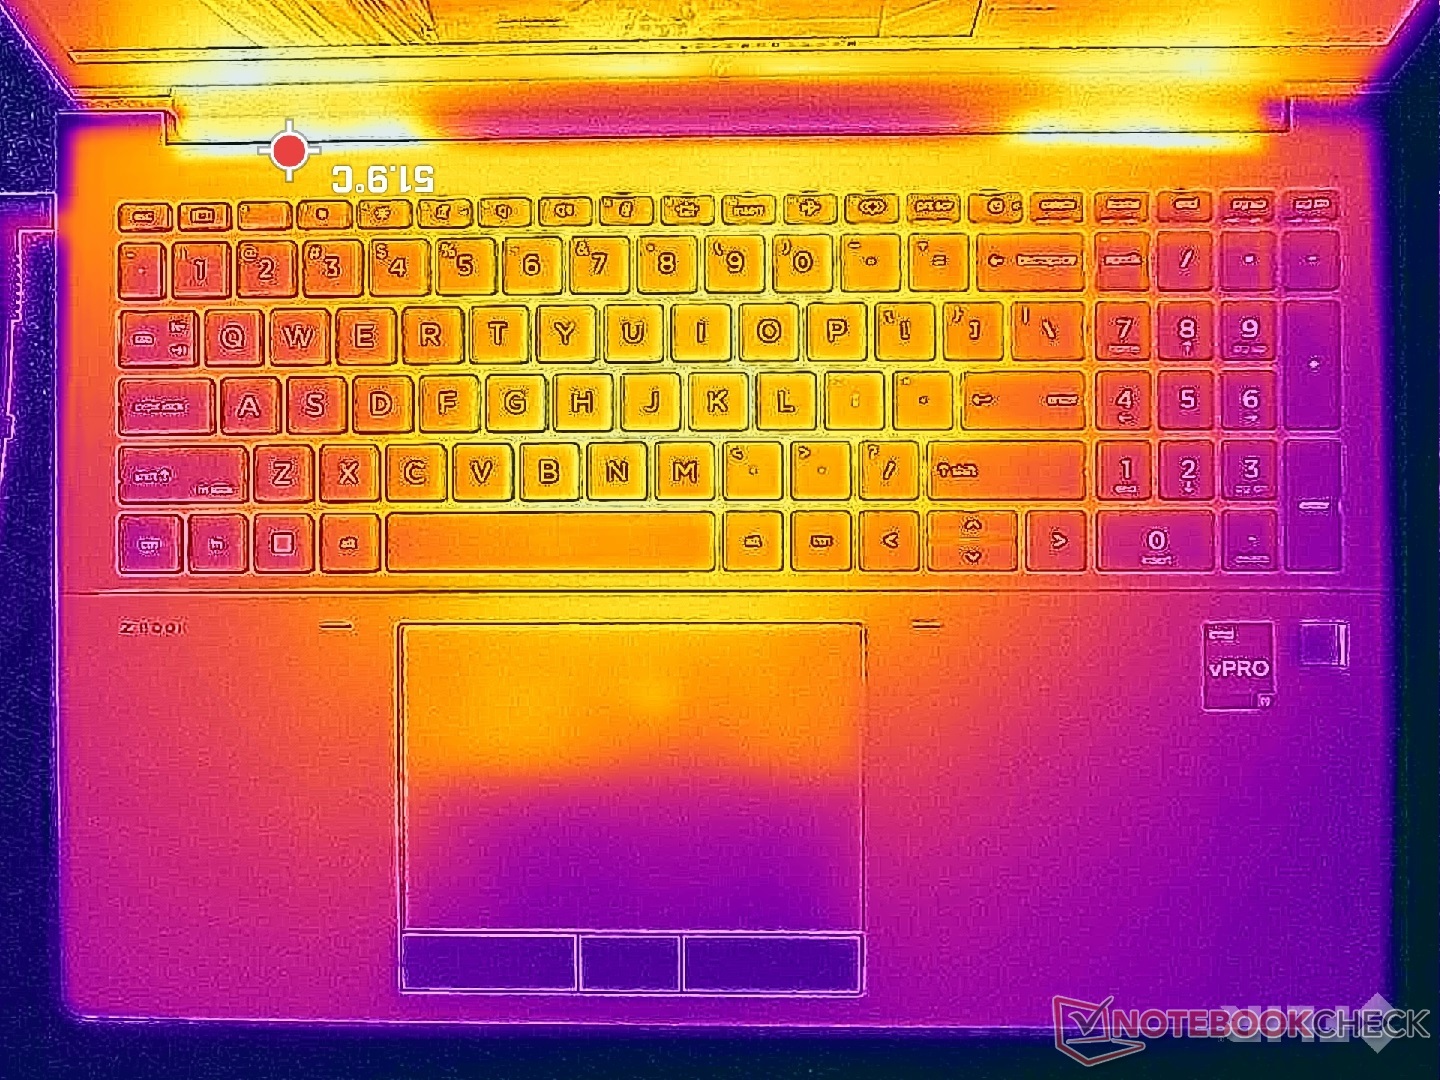
Las temperaturas superficiales pueden alcanzar más de 36 C en el centro del teclado o 45 C en la parte trasera cuando se ejecutan cargas elevadas. Curiosamente, el sistema es más frío que el Precision 5680 en el teclado pero lo contrario es cierto para sus superficies inferiores.
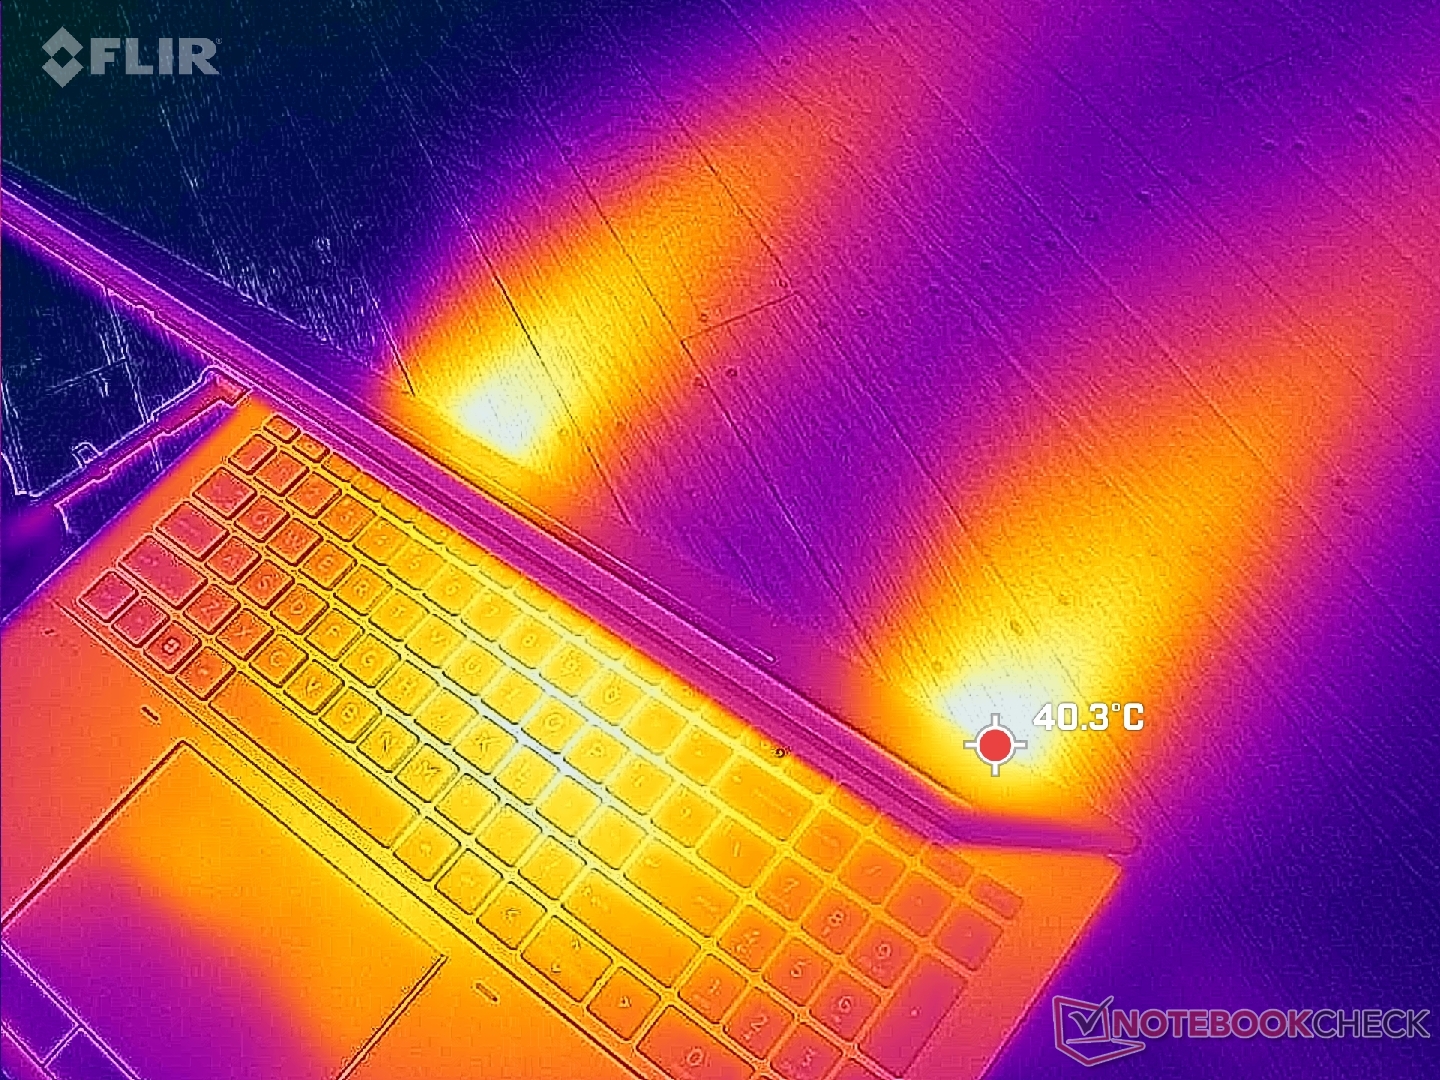
(±) La temperatura máxima en la parte superior es de 44.8 °C / 113 F, frente a la media de 38.2 °C / 101 F, que oscila entre 22.2 y 69.8 °C para la clase Workstation.
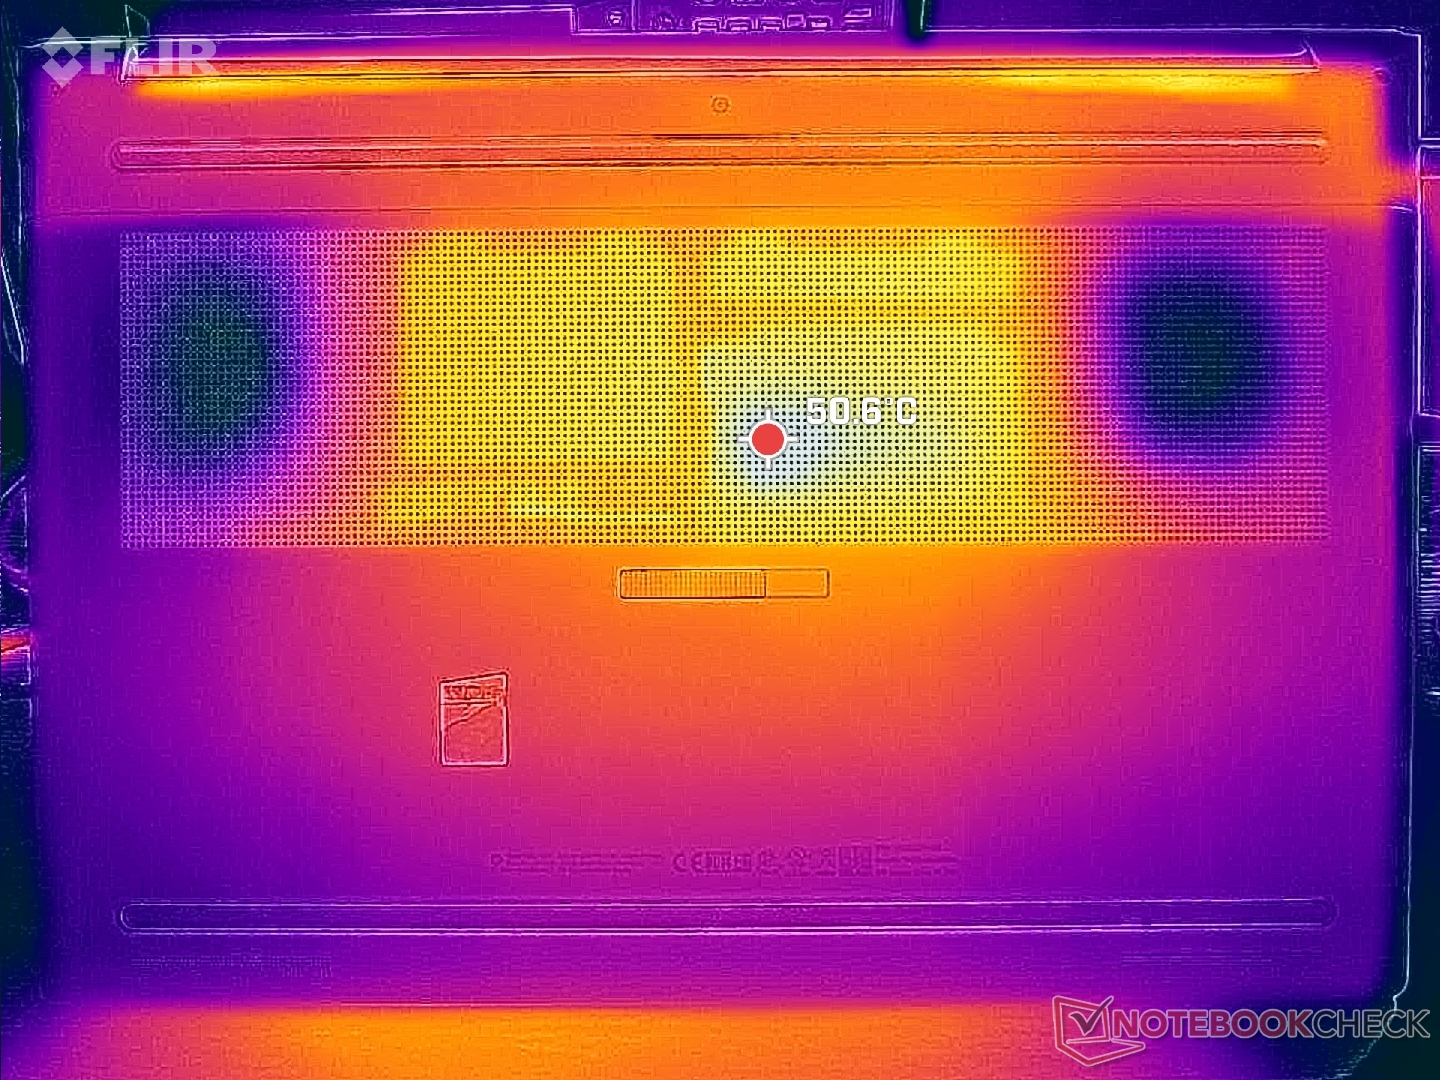
(-) El fondo se calienta hasta un máximo de 50 °C / 122 F, frente a la media de 41.1 °C / 106 F
(+) En reposo, la temperatura media de la parte superior es de 30.6 °C / 87# F, frente a la media del dispositivo de 32 °C / 90 F.
(±) Jugando a The Witcher 3, la temperatura media de la parte superior es de 34.7 °C / 94 F, frente a la media del dispositivo de 32 °C / 90 F.
(±) El reposamanos y el touchpad pueden calentarse mucho al tacto con un máximo de 39.2 °C / 102.6 F.
(-) La temperatura media de la zona del reposamanos de dispositivos similares fue de 27.8 °C / 82 F (-11.4 °C / -20.6 F).
| HP ZBook Fury 16 G10 Intel Core i9-13950HX, NVIDIA RTX 5000 Ada Generation Laptop | HP ZBook Fury 16 G9 Intel Core i9-12950HX, NVIDIA RTX A5500 Laptop GPU | Dell Precision 5000 5680 Intel Core i9-13900H, NVIDIA RTX 5000 Ada Generation Laptop | Lenovo ThinkPad P16 G1 RTX A5500 Intel Core i9-12950HX, NVIDIA RTX A5500 Laptop GPU | MSI CreatorPro Z16P B12UKST Intel Core i7-12700H, NVIDIA RTX A3000 Laptop GPU | Asus ProArt StudioBook 16 W7600H5A-2BL2 Intel Xeon W-11955M, NVIDIA RTX A5000 Laptop GPU | |
|---|---|---|---|---|---|---|
| Heat | 8% | 4% | -3% | -4% | -3% | |
| Maximum Upper Side * (°C) | 44.8 | 43.2 4% | 50.2 -12% | 44.8 -0% | 56.3 -26% | 45.7 -2% |
| Maximum Bottom * (°C) | 50 | 50.4 -1% | 32 36% | 49.8 -0% | 68.3 -37% | 48.3 3% |
| Idle Upper Side * (°C) | 34.4 | 28.6 17% | 37.4 -9% | 30.6 11% | 25.2 27% | 35.3 -3% |
| Idle Bottom * (°C) | 31.8 | 28.2 11% | 31.2 2% | 38.6 -21% | 25.9 19% | 34.4 -8% |
* ... más pequeño es mejor
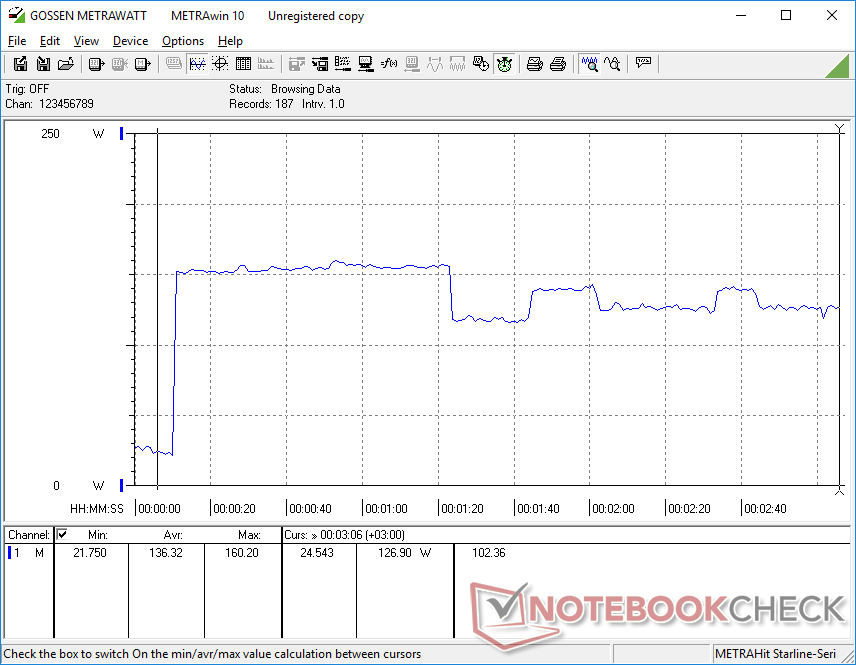
Prueba de resistencia
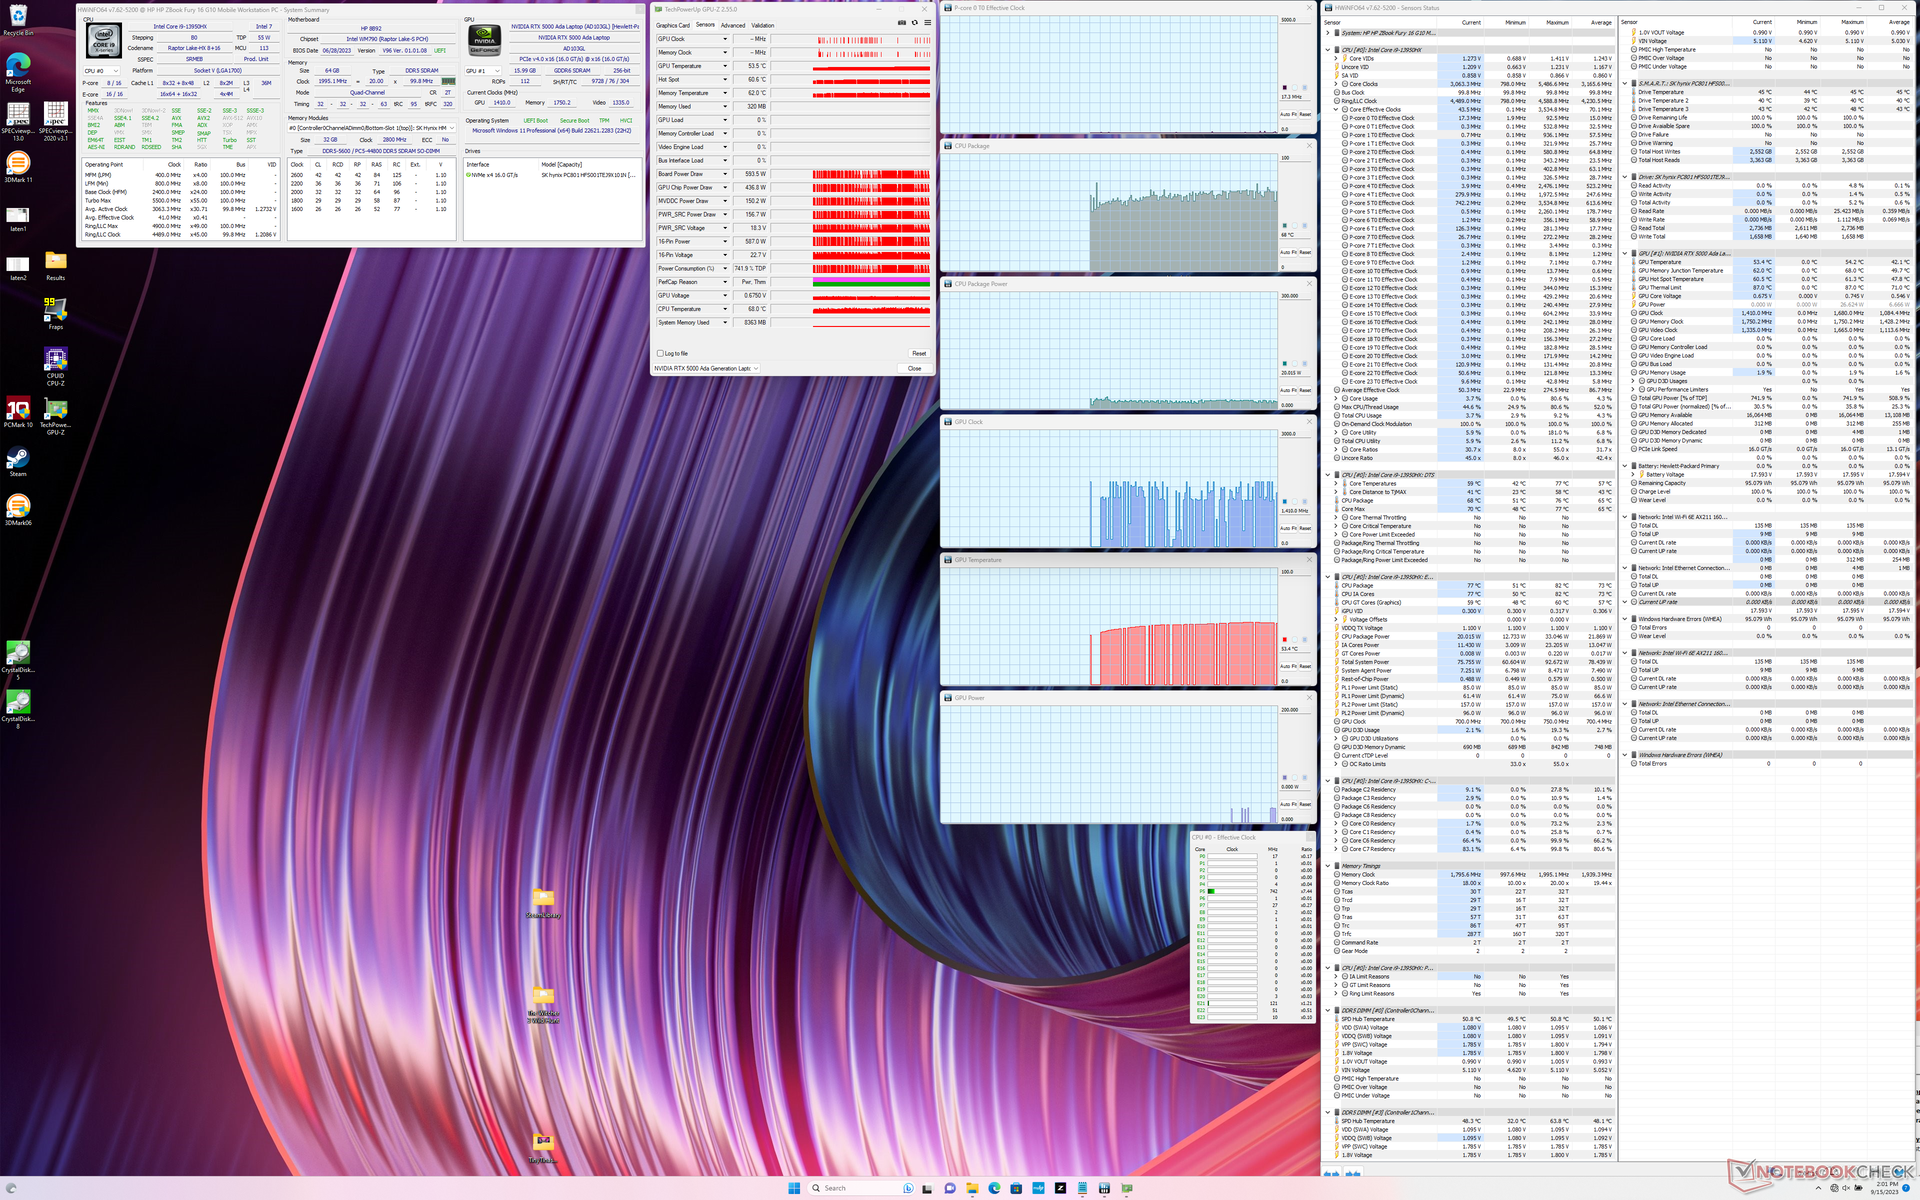
La velocidad media de reloj de la CPU y el consumo de la placa al ejecutar Prime95 se estabilizarían en 1,5 GHz y 48 W, respectivamente, frente a los 2,9 GHz y 115 W del Razer Blade 18 equipado con la misma CPU Core i9-13950HX. La temperatura del núcleo sería unos 8 C más fría en el HP, lo que sugiere que el Fury 16 G10 prioriza el control de la temperatura sobre un rendimiento más rápido.
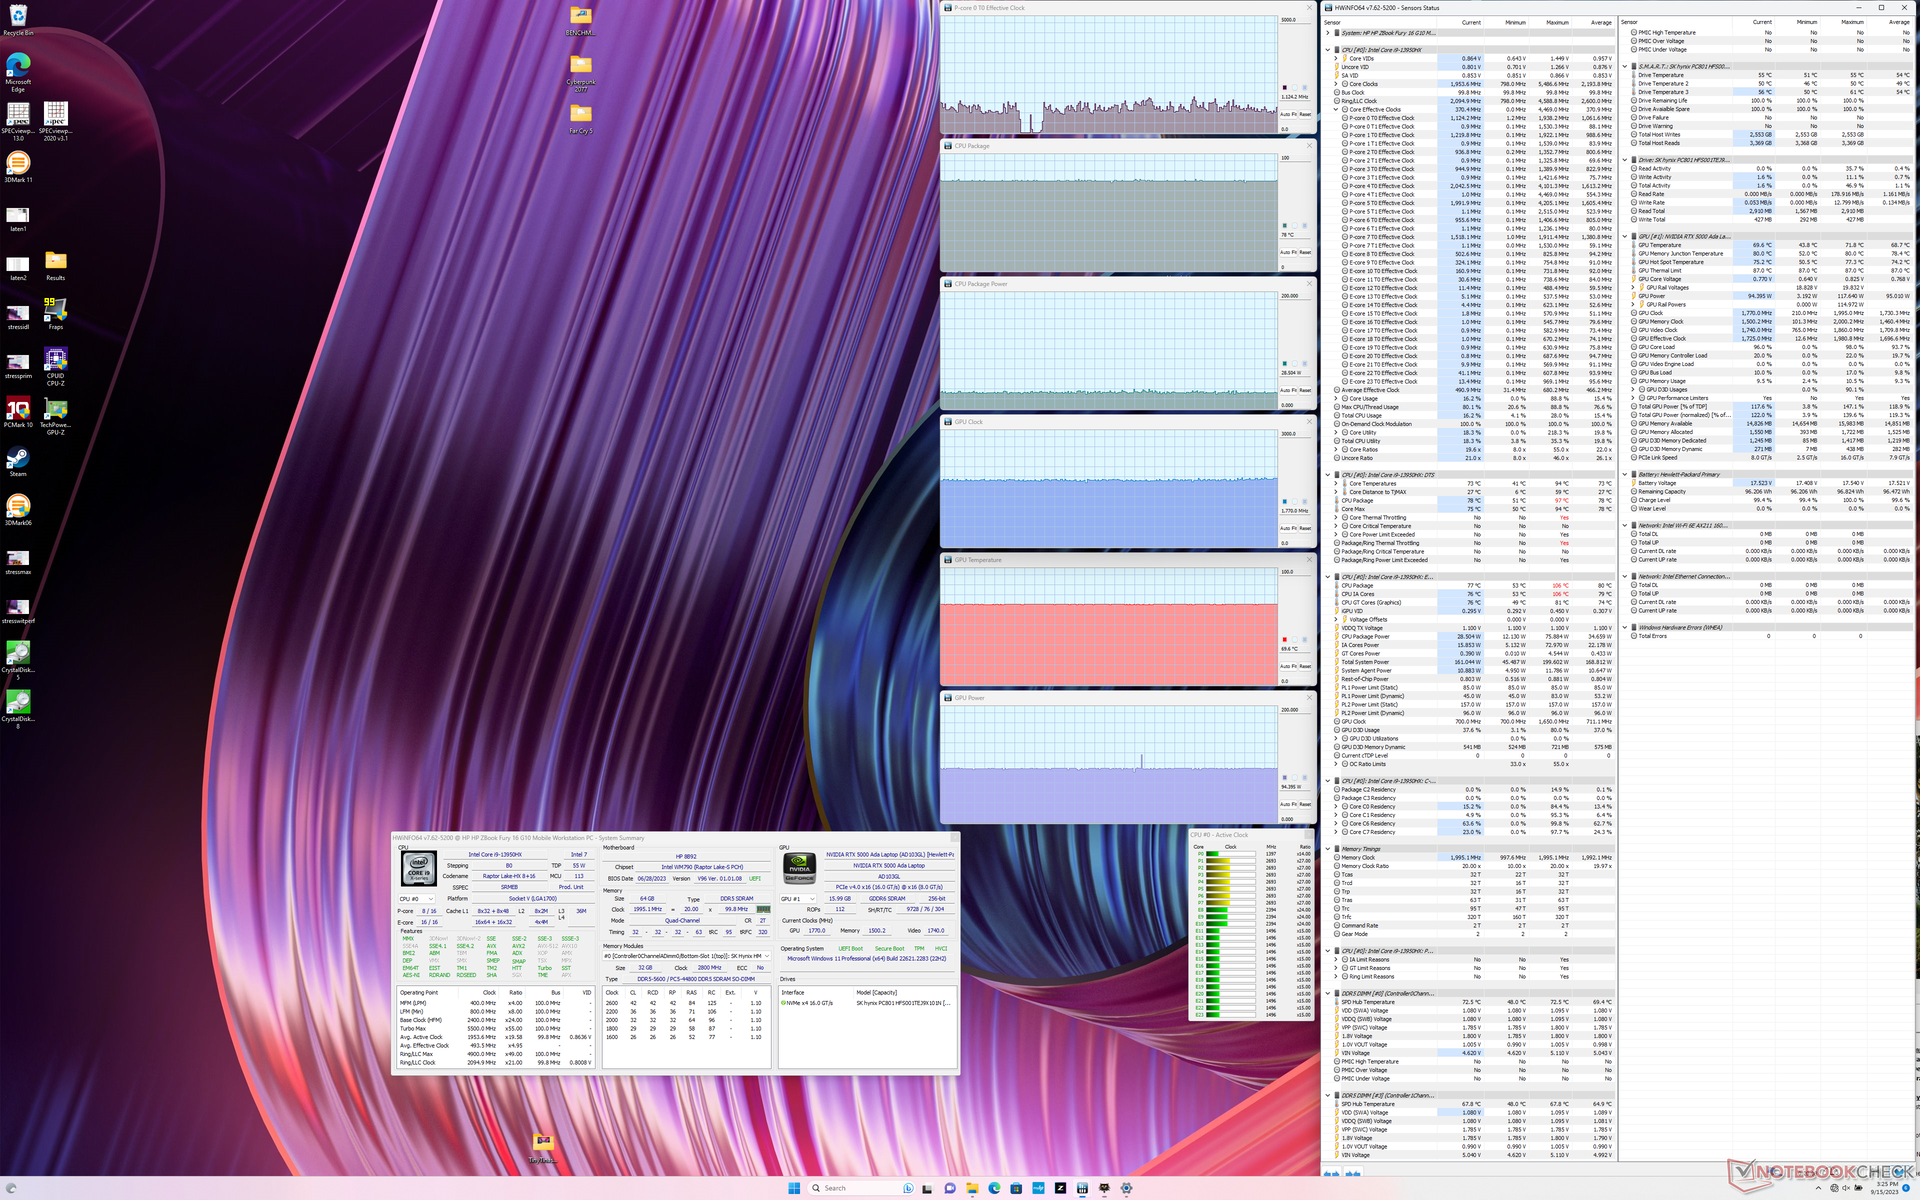
El modo equilibrado reduce el rendimiento gráfico. Por ejemplo, las frecuencias de reloj de la GPU y el consumo de energía cuando se ejecuta Witcher 3 se estabilizarían en 1845 MHz y 102 W, respectivamente, en comparación con 1770 MHz y 94 W cuando se ejecuta en modo equilibrado. En cualquier caso, el sistema HP alcanza valores de TGP en el mundo real superiores a los de la misma GPU en el modelo Precision 5680 donde sólo alcanza 72 W.
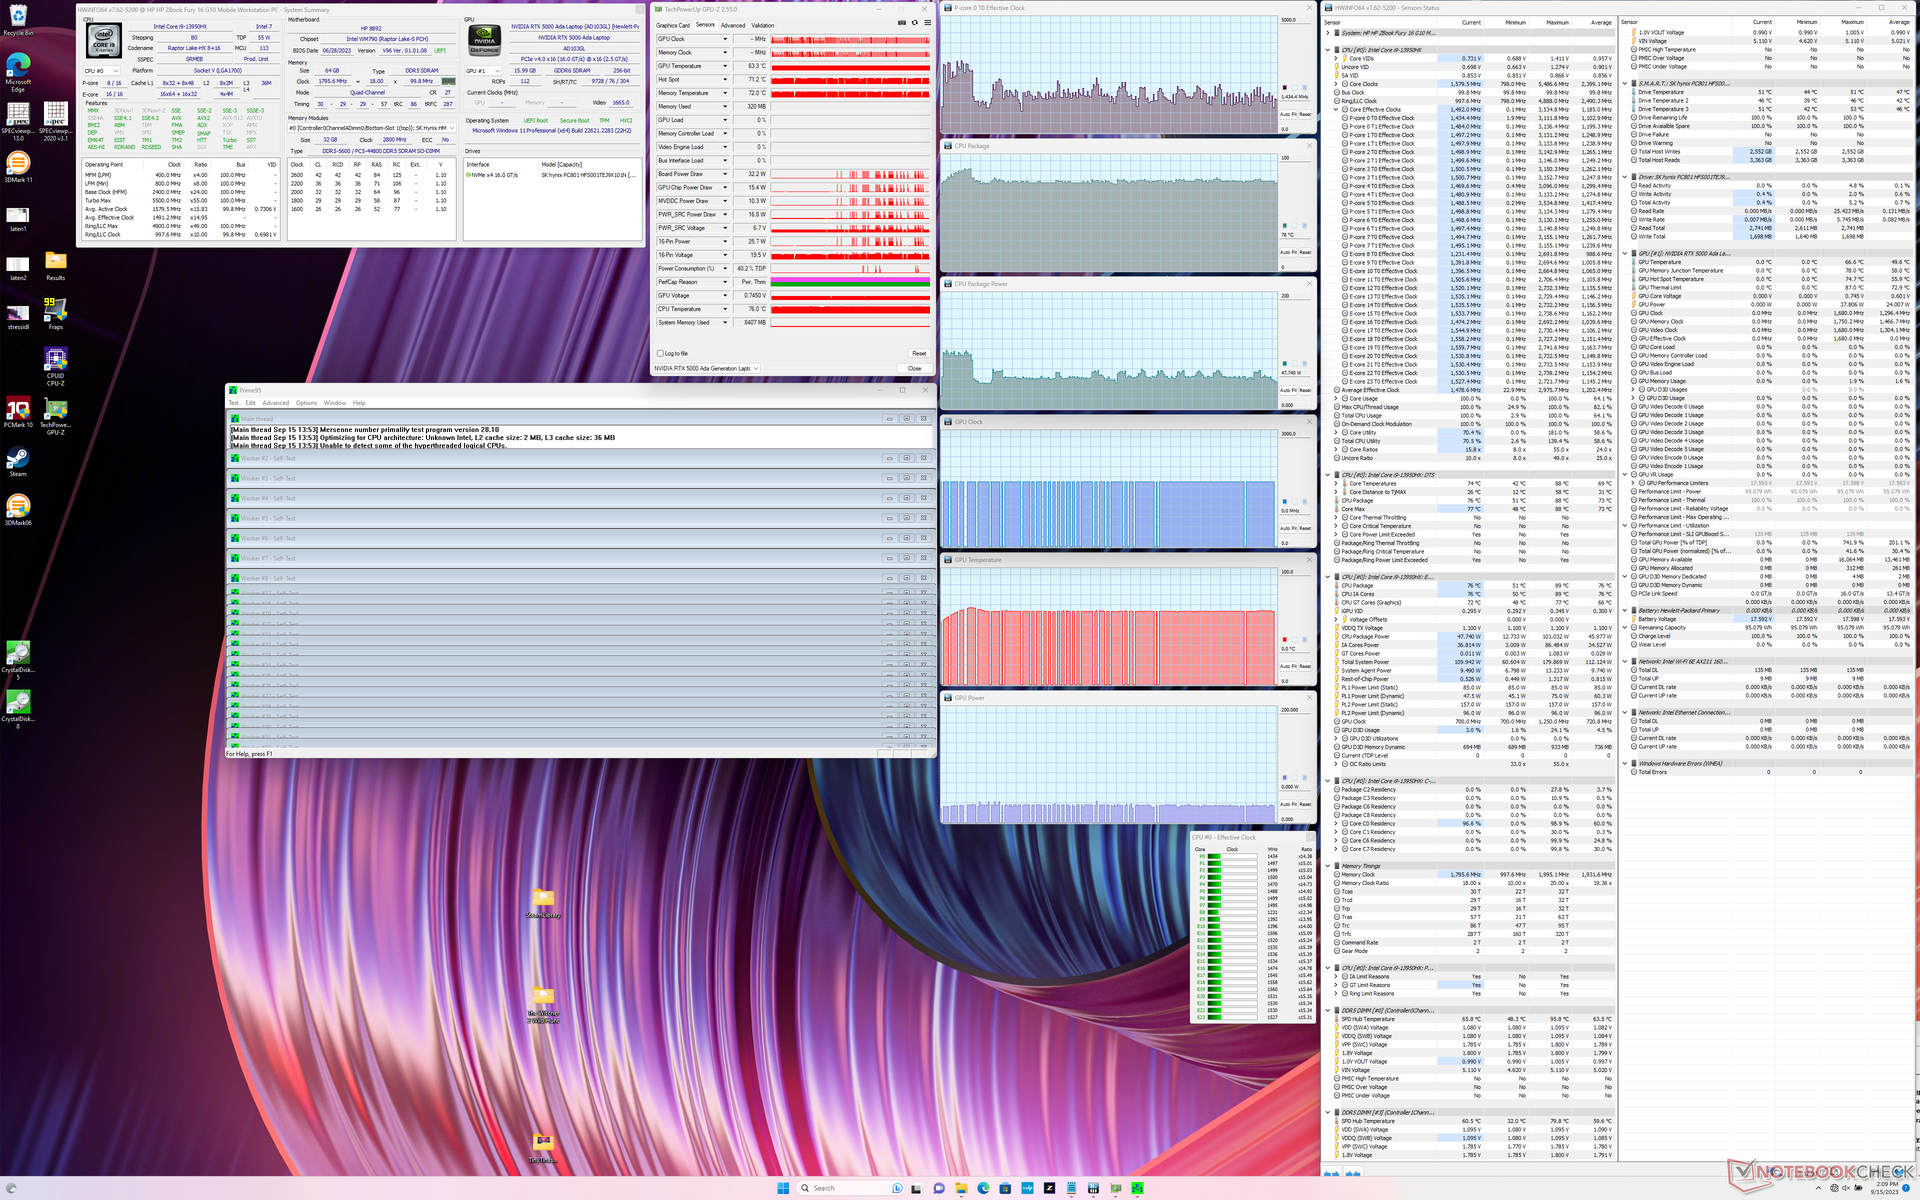
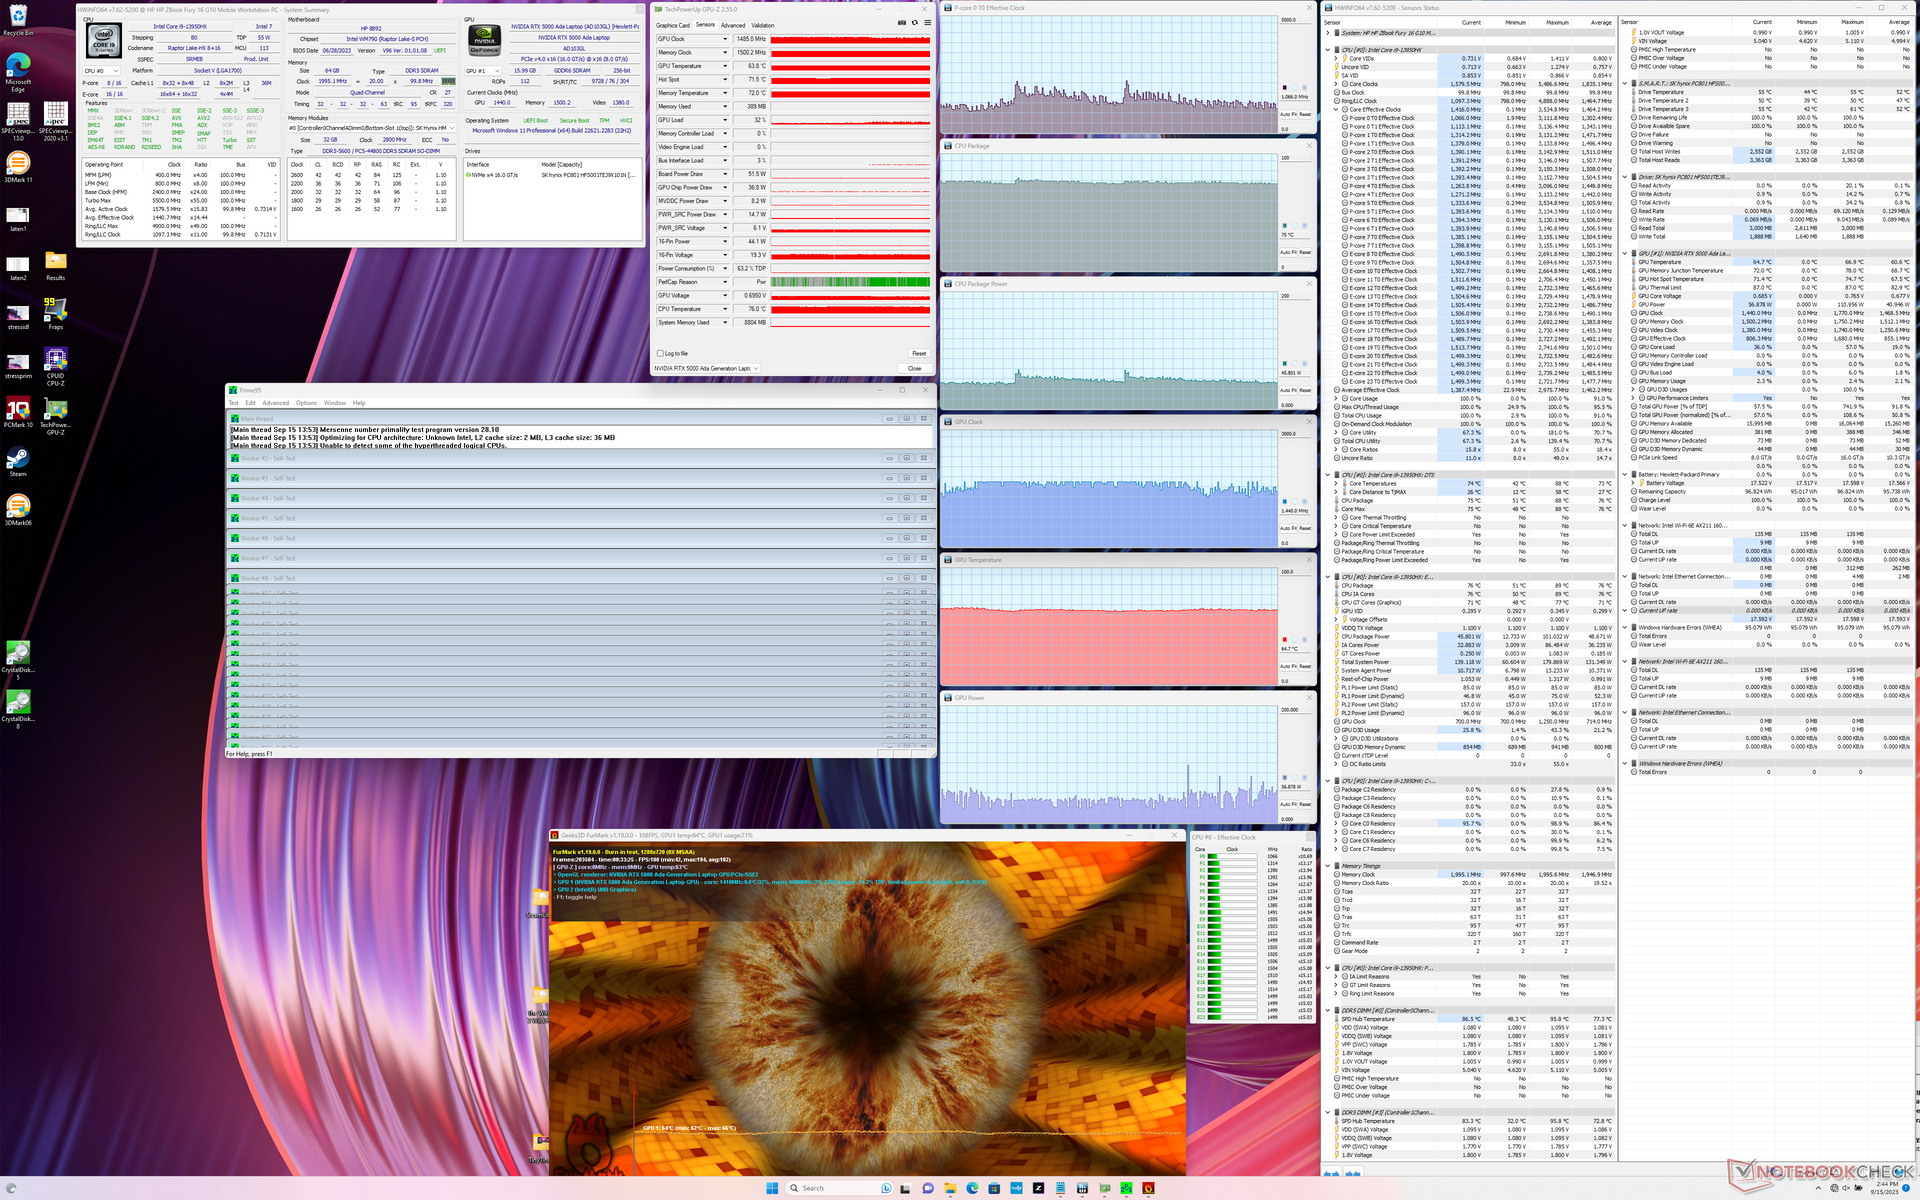

| RelojCPU (GHz) | Reloj GPU (MHz) | Temperatura mediaCPU (°C) | Temperatura media GPU (°C) | |
| Sistema en reposo | -- | -- | 68 | 54 |
| Prime95 Stress | ~1,7 | -- | 76 | 63 |
| Prime95+ FurMark Stress | ~1,1 | 1440 | 75 | 65 |
| Witcher 3 Estrés (modoequilibrado) | ~1,1 | 1770 | 78 | 70 |
| Witcher 3 Estrés (modoRendimiento) | ~1,1 | 1845 | 79 | 70 |
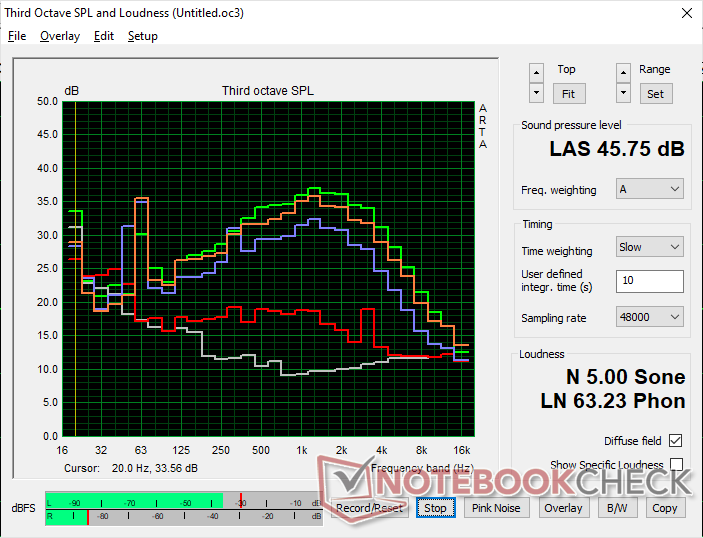
Altavoces
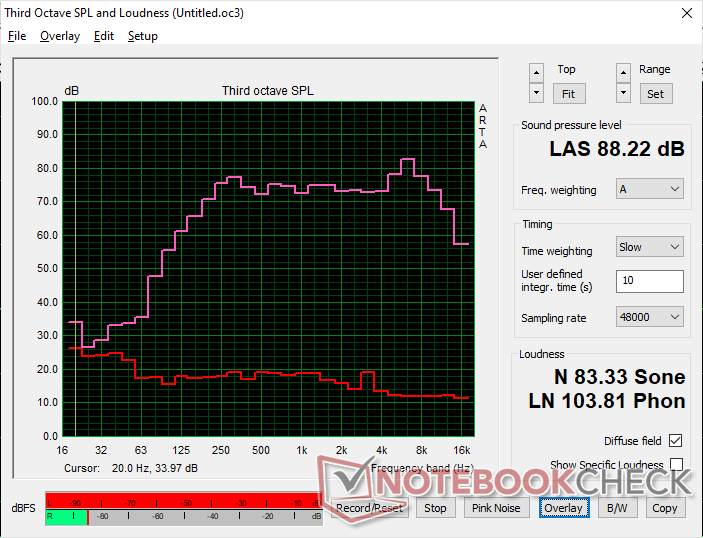
HP ZBook Fury 16 G10 análisis de audio
(+) | los altavoces pueden reproducir a un volumen relativamente alto (#88.2 dB)
Graves 100 - 315 Hz
(±) | lubina reducida - en promedio 7.7% inferior a la mediana
(±) | la linealidad de los graves es media (8.7% delta a frecuencia anterior)
Medios 400 - 2000 Hz
(+) | medios equilibrados - a sólo 1.2% de la mediana
(+) | los medios son lineales (3.3% delta a la frecuencia anterior)
Altos 2 - 16 kHz
(+) | máximos equilibrados - a sólo 2.8% de la mediana
(+) | los máximos son lineales (5.2% delta a la frecuencia anterior)
Total 100 - 16.000 Hz
(+) | el sonido global es lineal (8.6% de diferencia con la mediana)
En comparación con la misma clase
» 2% de todos los dispositivos probados de esta clase eran mejores, 1% similares, 96% peores
» El mejor tuvo un delta de 7%, la media fue 17%, el peor fue ###max##%
En comparación con todos los dispositivos probados
» 2% de todos los dispositivos probados eran mejores, 1% similares, 97% peores
» El mejor tuvo un delta de 4%, la media fue 24%, el peor fue ###max##%
Apple MacBook Pro 16 2021 M1 Pro análisis de audio
(+) | los altavoces pueden reproducir a un volumen relativamente alto (#84.7 dB)
Graves 100 - 315 Hz
(+) | buen bajo - sólo 3.8% lejos de la mediana
(+) | el bajo es lineal (5.2% delta a la frecuencia anterior)
Medios 400 - 2000 Hz
(+) | medios equilibrados - a sólo 1.3% de la mediana
(+) | los medios son lineales (2.1% delta a la frecuencia anterior)
Altos 2 - 16 kHz
(+) | máximos equilibrados - a sólo 1.9% de la mediana
(+) | los máximos son lineales (2.7% delta a la frecuencia anterior)
Total 100 - 16.000 Hz
(+) | el sonido global es lineal (4.6% de diferencia con la mediana)
En comparación con la misma clase
» 0% de todos los dispositivos probados de esta clase eran mejores, 0% similares, 100% peores
» El mejor tuvo un delta de 5%, la media fue 17%, el peor fue ###max##%
En comparación con todos los dispositivos probados
» 0% de todos los dispositivos probados eran mejores, 0% similares, 100% peores
» El mejor tuvo un delta de 4%, la media fue 24%, el peor fue ###max##%
Gestión de la energía
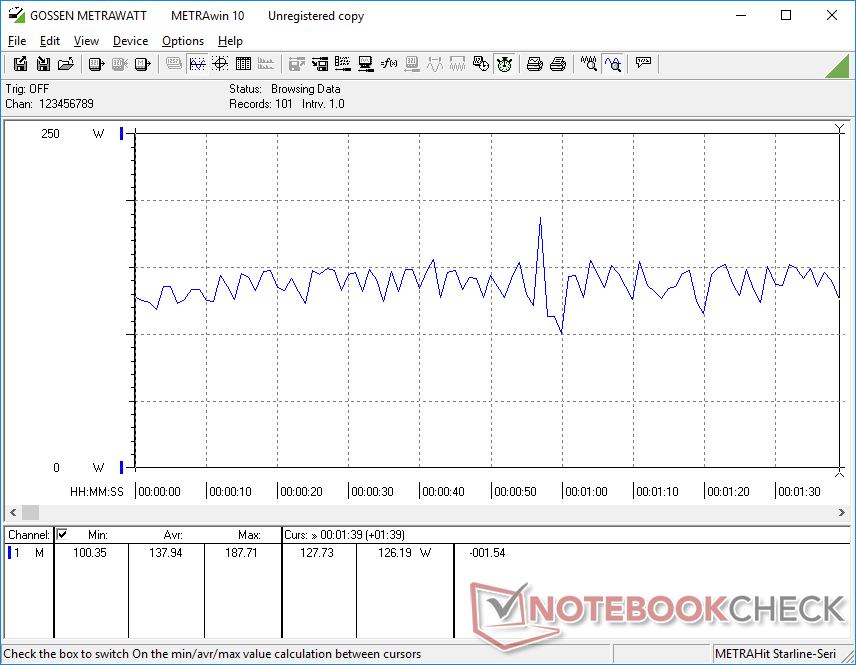
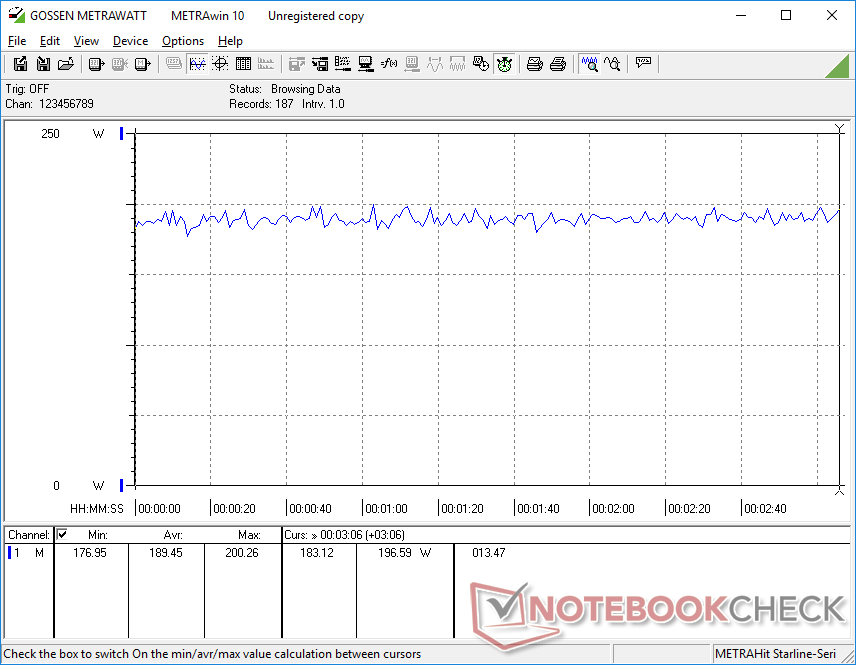
Consumo de energía
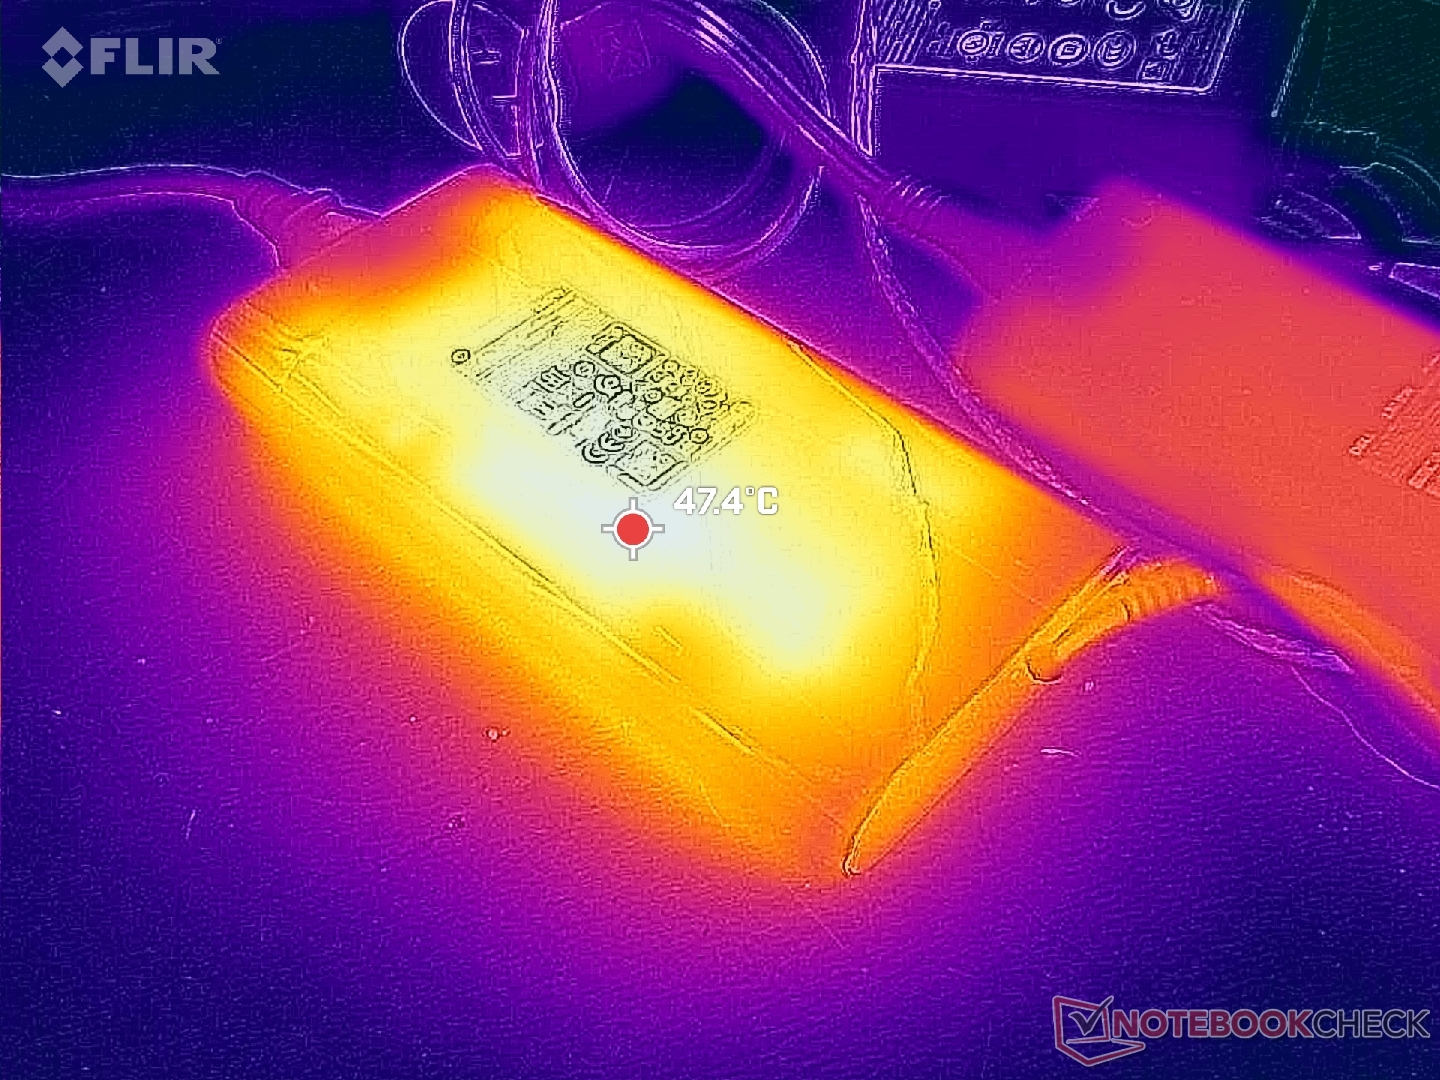
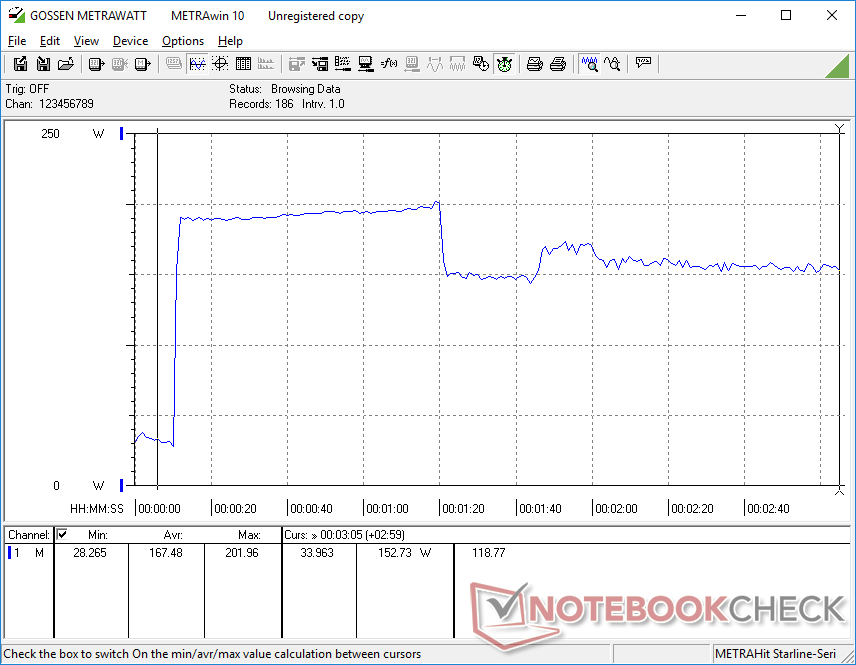
El consumo de energía bajo carga sigue siendo más o menos el mismo que en el modelo del año pasado a pesar de las mejoras de la CPU y la GPU para un rendimiento por vatio mucho mayor. En general, también es mayor que en el Precision 5680 debido a los objetivos TGP más elevados del modelo de HP.
Ten en cuenta que nuestra Fury 16 G10 consume mucha más energía que la Precision 5680 de configuración similar cuando se ejecutan cargas elevadas, como juegos, debido sobre todo a los objetivos de consumo más elevados de la HP. El HP trae un adaptador de corriente de 230 W, mientras que el Dell trae un adaptador USB-C de 165 W.
| Off / Standby | |
| Ocioso | |
| Carga |
|
Clave:
min: | |
| HP ZBook Fury 16 G10 i9-13950HX, RTX 5000 Ada Generation Laptop, SK hynix PC801 HFS001TEJ9X101N, IPS, 3840x2400, 16" | HP ZBook Fury 16 G9 i9-12950HX, RTX A5500 Laptop GPU, Micron 3400 1TB MTFDKBA1T0TFH, IPS, 3840x2400, 16" | Dell Precision 5000 5680 i9-13900H, RTX 5000 Ada Generation Laptop, 2x SK hynix PC801 HFS512GEJ9X101N RAID 0, OLED, 3840x2400, 16" | Lenovo ThinkPad P16 G1 RTX A5500 i9-12950HX, RTX A5500 Laptop GPU, WDC PC SN810 2TB, IPS, 3840x2400, 16" | MSI CreatorPro Z16P B12UKST i7-12700H, RTX A3000 Laptop GPU, Samsung PM9A1 MZVL21T0HCLR, IPS, 2560x1600, 16" | Asus ProArt StudioBook 16 W7600H5A-2BL2 W-11955M, RTX A5000 Laptop GPU, 2x Micron 2300 2TB MTFDHBA2T0TDV (RAID 0), OLED, 3840x2400, 16" | |
|---|---|---|---|---|---|---|
| Power Consumption | -24% | 28% | -9% | 22% | 18% | |
| Idle Minimum * (Watt) | 15.3 | 19.5 -27% | 8 48% | 7.5 51% | 10.8 29% | 12.4 19% |
| Idle Average * (Watt) | 18.2 | 29 -59% | 10.4 43% | 20.1 -10% | 16.3 10% | 16.5 9% |
| Idle Maximum * (Watt) | 28 | 40.7 -45% | 30.5 -9% | 40 -43% | 16.9 40% | 25 11% |
| Load Average * (Watt) | 137.9 | 142.1 -3% | 75.4 45% | 137 1% | 111.7 19% | 132 4% |
| Witcher 3 ultra * (Watt) | 189.4 | 188.6 -0% | 134 29% | 208 -10% | 152.1 20% | 132 30% |
| Load Maximum * (Watt) | 202 | 224.4 -11% | 175 13% | 285.9 -42% | 177.4 12% | 134 34% |
* ... más pequeño es mejor
Power Consumption Witcher 3 / Stresstest
Power Consumption external Monitor
Duración de la batería
La duración general no es inferior a la del modelo del año pasado a pesar de los aumentos de rendimiento CPU, GPU y frecuencia de refresco de pantalla. Hemos podido grabar algo más de 7 horas de navegación WLAN en modo equilibrado o casi una hora más que en el Fury 16 G9 del año pasado.
La carga desde vacío hasta plena capacidad con el adaptador de CA incluido tarda algo menos de 90 minutos. El sistema también se puede cargar mediante adaptadores USB-C de terceros, aunque más lentamente.
| HP ZBook Fury 16 G10 i9-13950HX, RTX 5000 Ada Generation Laptop, 95 Wh | HP ZBook Fury 16 G9 i9-12950HX, RTX A5500 Laptop GPU, 95 Wh | Dell Precision 5000 5680 i9-13900H, RTX 5000 Ada Generation Laptop, 98 Wh | Lenovo ThinkPad P16 G1 RTX A5500 i9-12950HX, RTX A5500 Laptop GPU, 94 Wh | MSI CreatorPro Z16P B12UKST i7-12700H, RTX A3000 Laptop GPU, 90 Wh | Asus ProArt StudioBook 16 W7600H5A-2BL2 W-11955M, RTX A5000 Laptop GPU, 90 Wh | |
|---|---|---|---|---|---|---|
| Duración de Batería | -18% | 36% | -21% | -21% | -32% | |
| WiFi v1.3 (h) | 7.3 | 6 -18% | 9.9 36% | 5.8 -21% | 5.8 -21% | 5 -32% |
| Reader / Idle (h) | 5.3 | 17.9 | ||||
| Load (h) | 1.2 | 1.7 | ||||
| H.264 (h) | 1.8 | |||||
| Witcher 3 ultra (h) | 1.6 |
Pro
Contra
Veredicto - La estación de trabajo HP que deben adquirir los cazadores de gráficos
A veces, las actualizaciones interanuales de los procesadores pueden ser relativamente menores. Otras veces, sin embargo, pueden ser bastante significativas. El ZBook Fury 16 G10 entra en esta última categoría, ya que su CPU de 13ª generación y las opciones de GPU Nvidia RTX Ada pueden ofrecer considerables aumentos de rendimiento con respecto al ZBook Fury 16 G9, especialmente en lo que respecta a los gráficos. Si valoras la RAM ECC y maximizar la potencia de la GPU con límites TGP más altos, entonces merece la pena considerar la Fury 16 G10 por encima de cualquier otra estación de trabajo de 16 pulgadas del momento, incluyendo la Precision 5680 que viene con las mismas opciones de GPU pero con objetivos de TGP más bajos.
La ZBook Fury 16 G10 maximiza la potencia de la GPU para convertirse en una de las estaciones de trabajo portátiles más rápidas en lo que a gráficos se refiere. Sin embargo, esto parece venir a costa del rendimiento de la SSD y la CPU.
Un par de problemas impiden que el HP sea "perfecto". El SSD sigue ralentizándose y la CPU es más lenta de lo esperado incluso en modo Rendimiento. Esto sería más fácil de perdonar en estaciones de trabajo más delgadas o pequeñas, pero el Fury 16 G10 es cualquier cosa menos delgado y ligero.
Precio y disponibilidad
HP ya está distribuyendo su ZBook Fury 16 G10 desde 2700 USD para la configuración base hasta más de 4200 USD cuando está totalmente configurada con Core i9 y RTX 5000 Ada.
HP ZBook Fury 16 G10
- 09/23/2023 v7 (old)
Allen Ngo
Transparencia
La selección de los dispositivos que se van a reseñar corre a cargo de nuestro equipo editorial. La muestra de prueba fue proporcionada al autor en calidad de préstamo por el fabricante o el minorista a los efectos de esta reseña. El prestamista no tuvo ninguna influencia en esta reseña, ni el fabricante recibió una copia de la misma antes de su publicación. No había ninguna obligación de publicar esta reseña. Como empresa de medios independiente, Notebookcheck no está sujeta a la autoridad de fabricantes, minoristas o editores.
Así es como prueba Notebookcheck
Cada año, Notebookcheck revisa de forma independiente cientos de portátiles y smartphones utilizando procedimientos estandarizados para asegurar que todos los resultados son comparables. Hemos desarrollado continuamente nuestros métodos de prueba durante unos 20 años y hemos establecido los estándares de la industria en el proceso. En nuestros laboratorios de pruebas, técnicos y editores experimentados utilizan equipos de medición de alta calidad. Estas pruebas implican un proceso de validación en varias fases. Nuestro complejo sistema de clasificación se basa en cientos de mediciones y puntos de referencia bien fundamentados, lo que mantiene la objetividad.Price comparison

