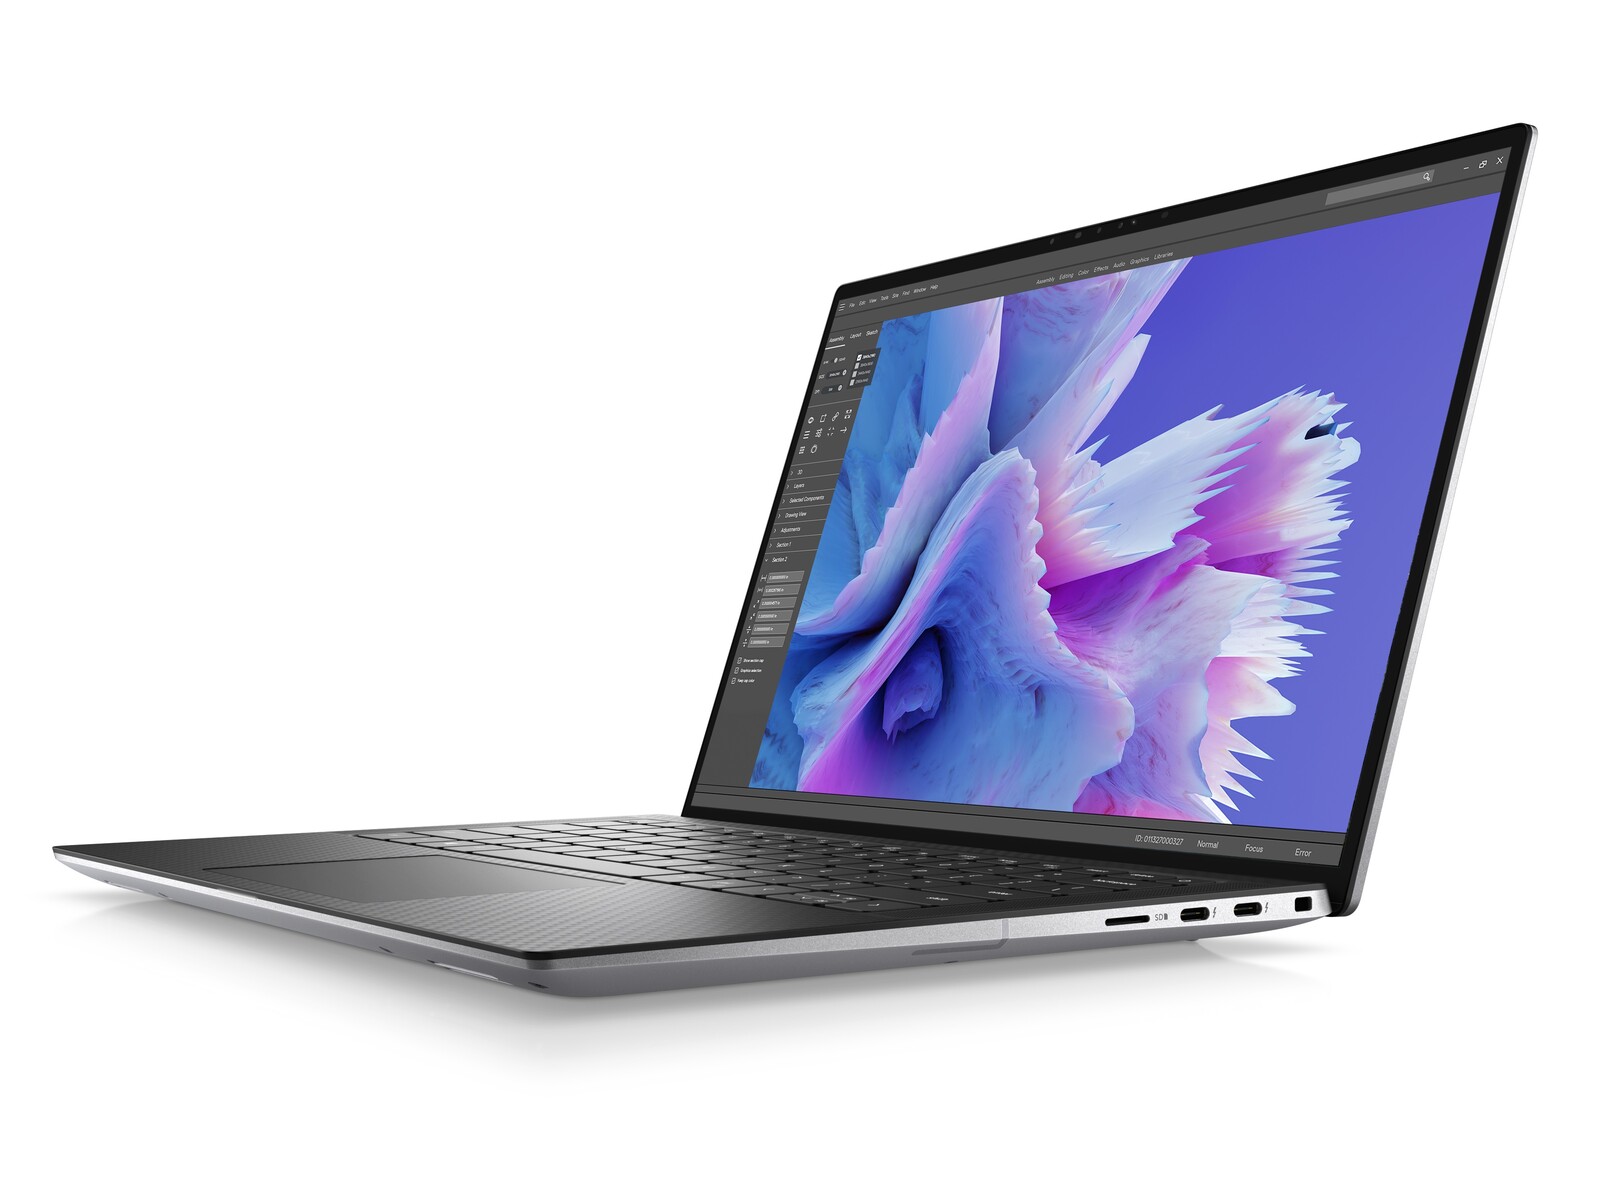
Debut de rendimiento de Nvidia RTX 3000 Ada: Análisis de la estación de trabajo Dell Precision 5480

El Precision 5480 sucede directamente al Precision 5470 del año pasado al actualizar la CPU Alder Lake-H de 12ª generación y la GPU Nvidia Ampere con opciones Raptor Lake-H de 13ª generación y Ada Lovelace, respectivamente. También resulta ser una de las primeras estaciones de trabajo móviles en llevar la RTX 3000 Ada. Por lo demás, el chasis o esqueleto sigue siendo el mismo que en el Precision 5470, por lo que recomendamos echar un vistazo a nuestro análisis del modelo del año pasado para saber más sobre las características físicas del Precision 5480.
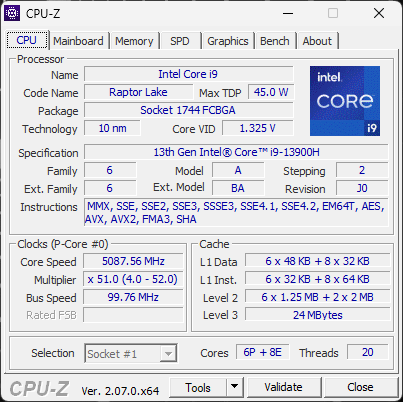
Nuestra unidad de pruebas específica es una configuración de gama alta con CPU Core i9-13900H, GPU RTX 3000 Ada y pantalla táctil QHD+ por unos 4400 dólares. SKUs inferiores con el Core i5-13500H, gráficos Iris Xe integrados, y pantalla FHD+ no táctil también están disponibles a partir de $2300.
El espacio de los subportátiles de 14 pulgadas para estaciones de trabajo es relativamente pequeño, pero todavía hay algunas alternativas, como elLenovo ThinkPad P14s y HP ZBook Firefly serie 14.
Más opiniones sobre Dell:
Posibles contendientes en la comparación
Valoración | Fecha | Modelo | Peso | Altura | Tamaño | Resolución | Precio |
|---|---|---|---|---|---|---|---|
| 89.6 % v7 (old) | 09/2023 | Dell Precision 5480 i9-13900H, RTX 3000 Ada Generation Laptop | 1.6 kg | 18.95 mm | 14.00" | 2560x1600 | |
| 87.6 % v7 (old) | 09/2022 | Dell Precision 5000 5470 i9-12900H, RTX A1000 Laptop GPU | 1.6 kg | 18.95 mm | 14.00" | 2560x1600 | |
| 88.3 % v7 (old) | 10/2021 | Dell Precision 5000 5560 i7-11850H, RTX A2000 Laptop GPU | 2 kg | 18 mm | 15.60" | 3840x2400 | |
| 86.9 % v7 (old) | 04/2023 | Lenovo ThinkPad P14s G3 AMD 21J6S05000 R7 PRO 6850U, Radeon 680M | 1.5 kg | 17.9 mm | 14.00" | 1920x1200 | |
| 87.4 % v7 (old) | HP ZBook Firefly 14 G9-6B8A2EA i7-1265U, T550 Laptop GPU | 1.5 kg | 19.9 mm | 14.00" | 1920x1200 | ||
| 87.8 % v7 (old) | 04/2023 | Lenovo ThinkPad P15v G3 21EM001AGE R7 PRO 6850H, RTX A2000 Laptop GPU | 2.2 kg | 22.7 mm | 15.60" | 3840x2160 |
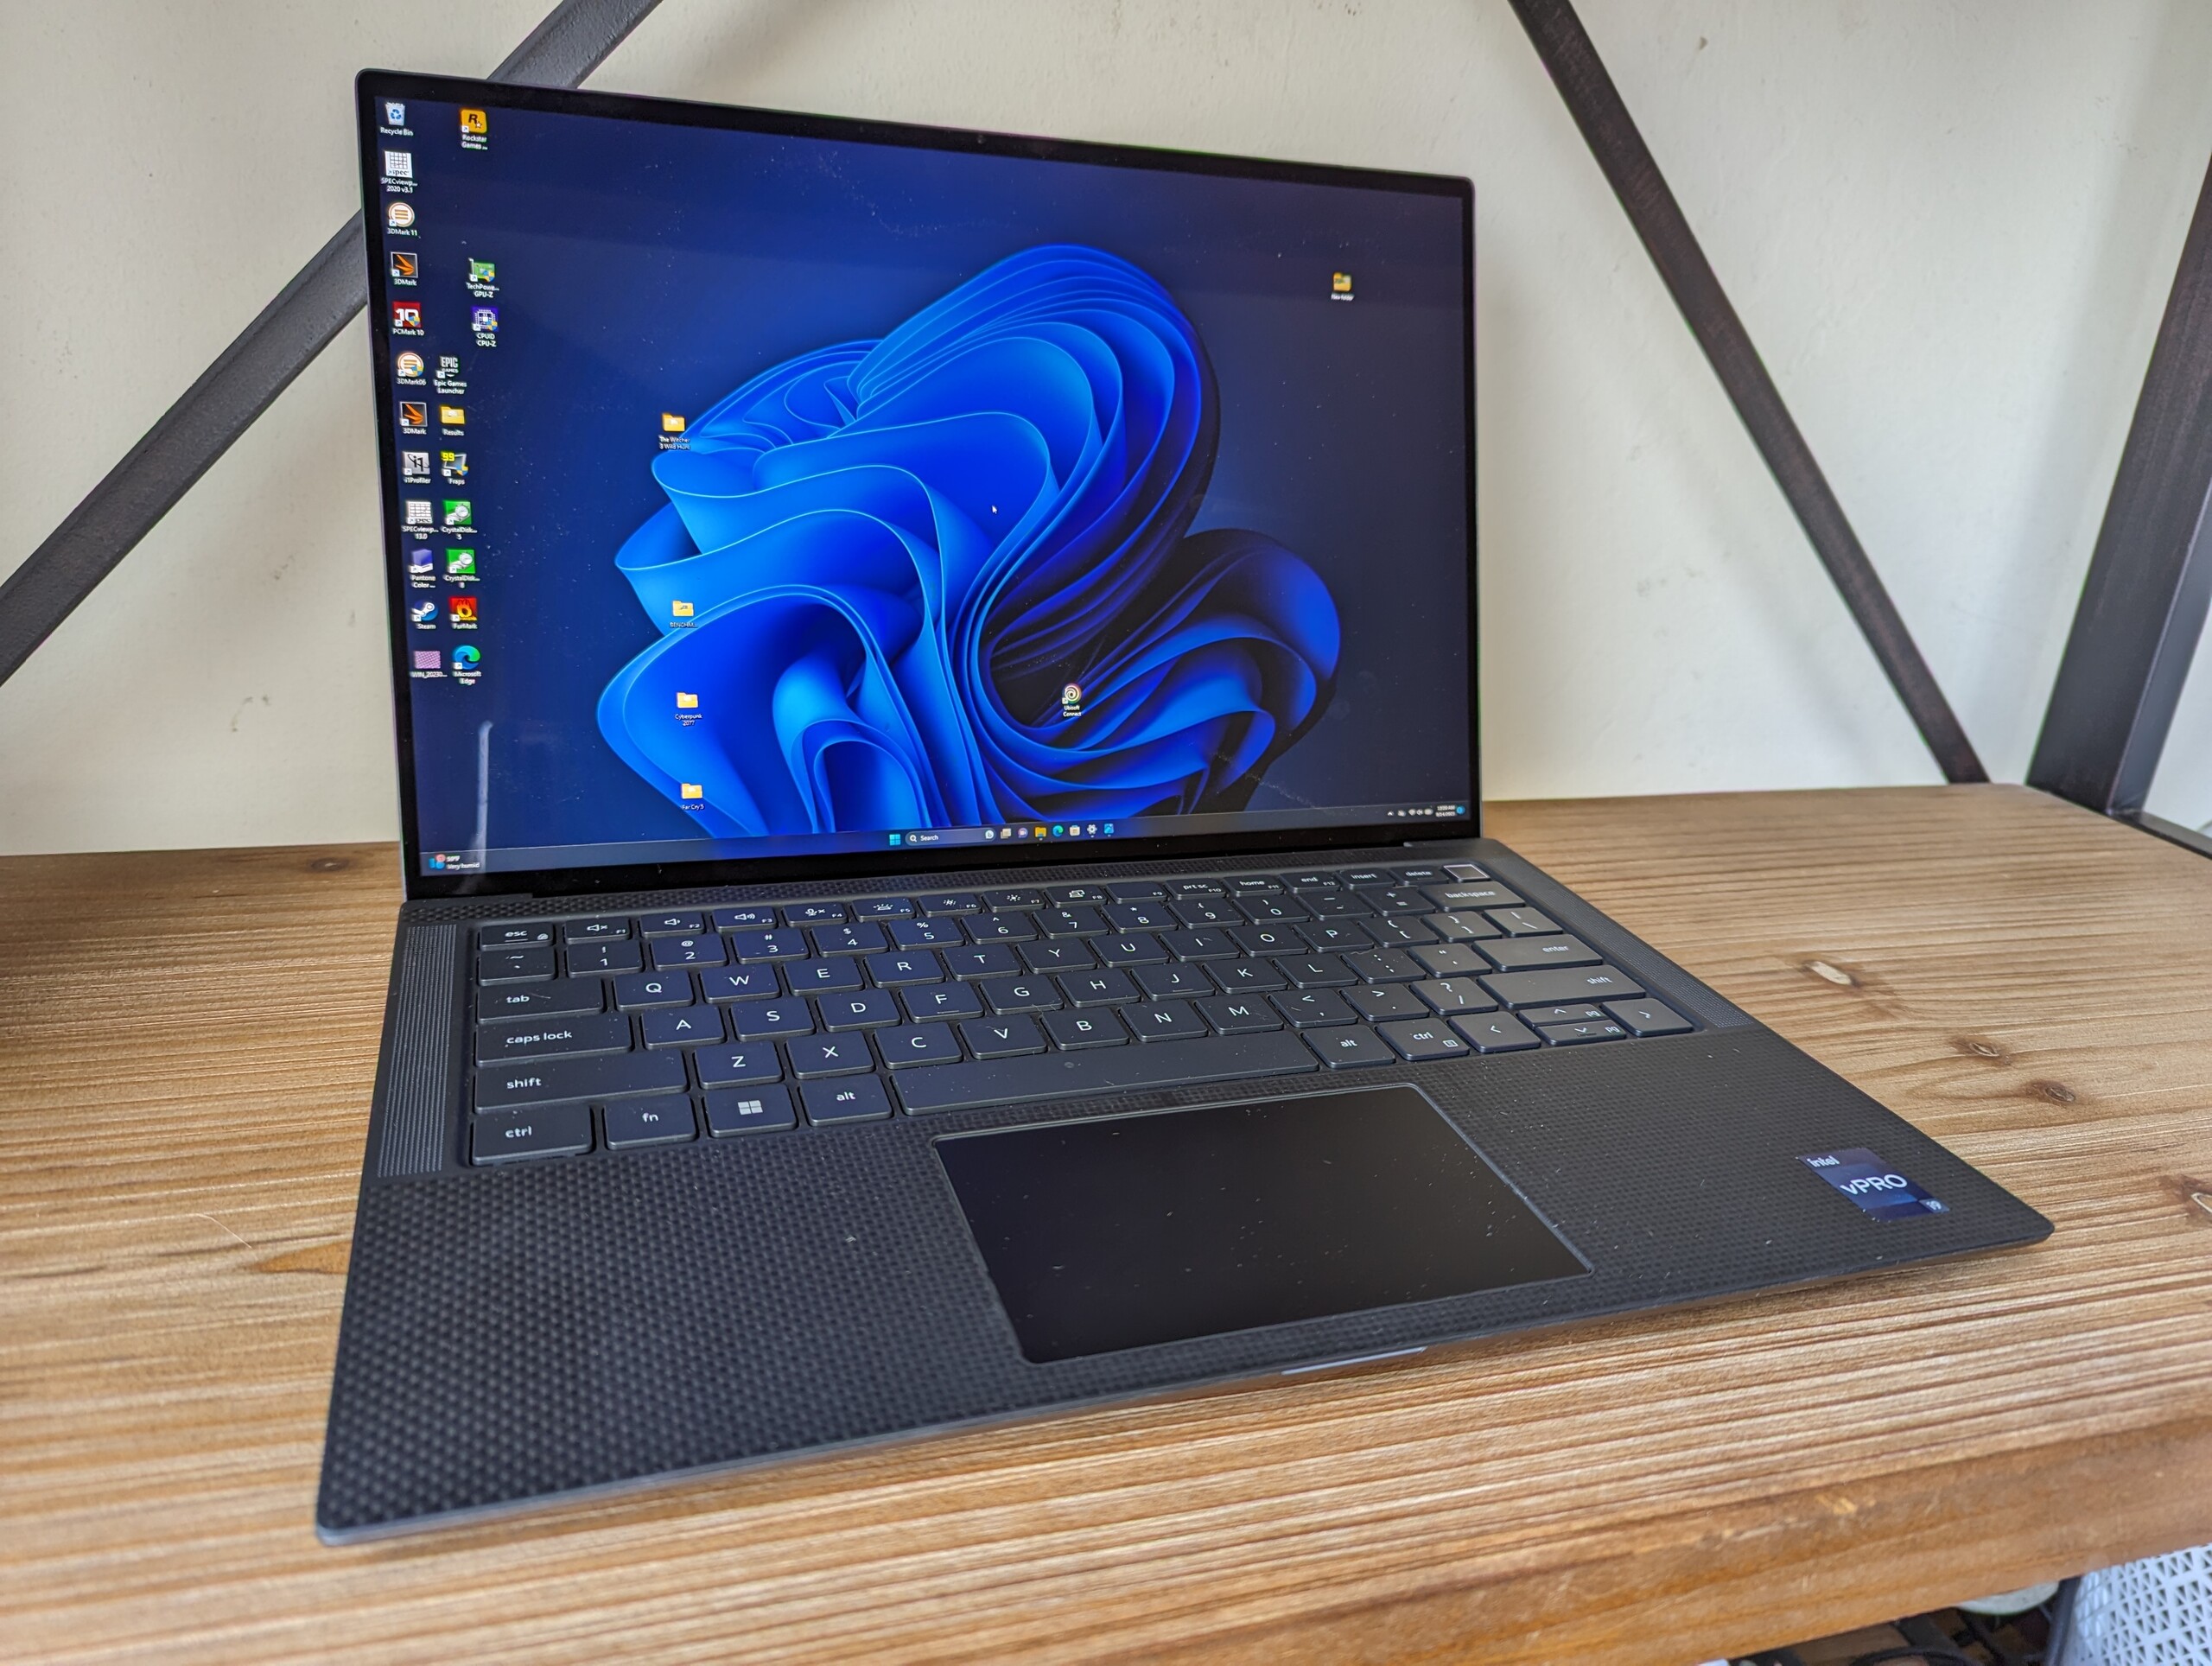
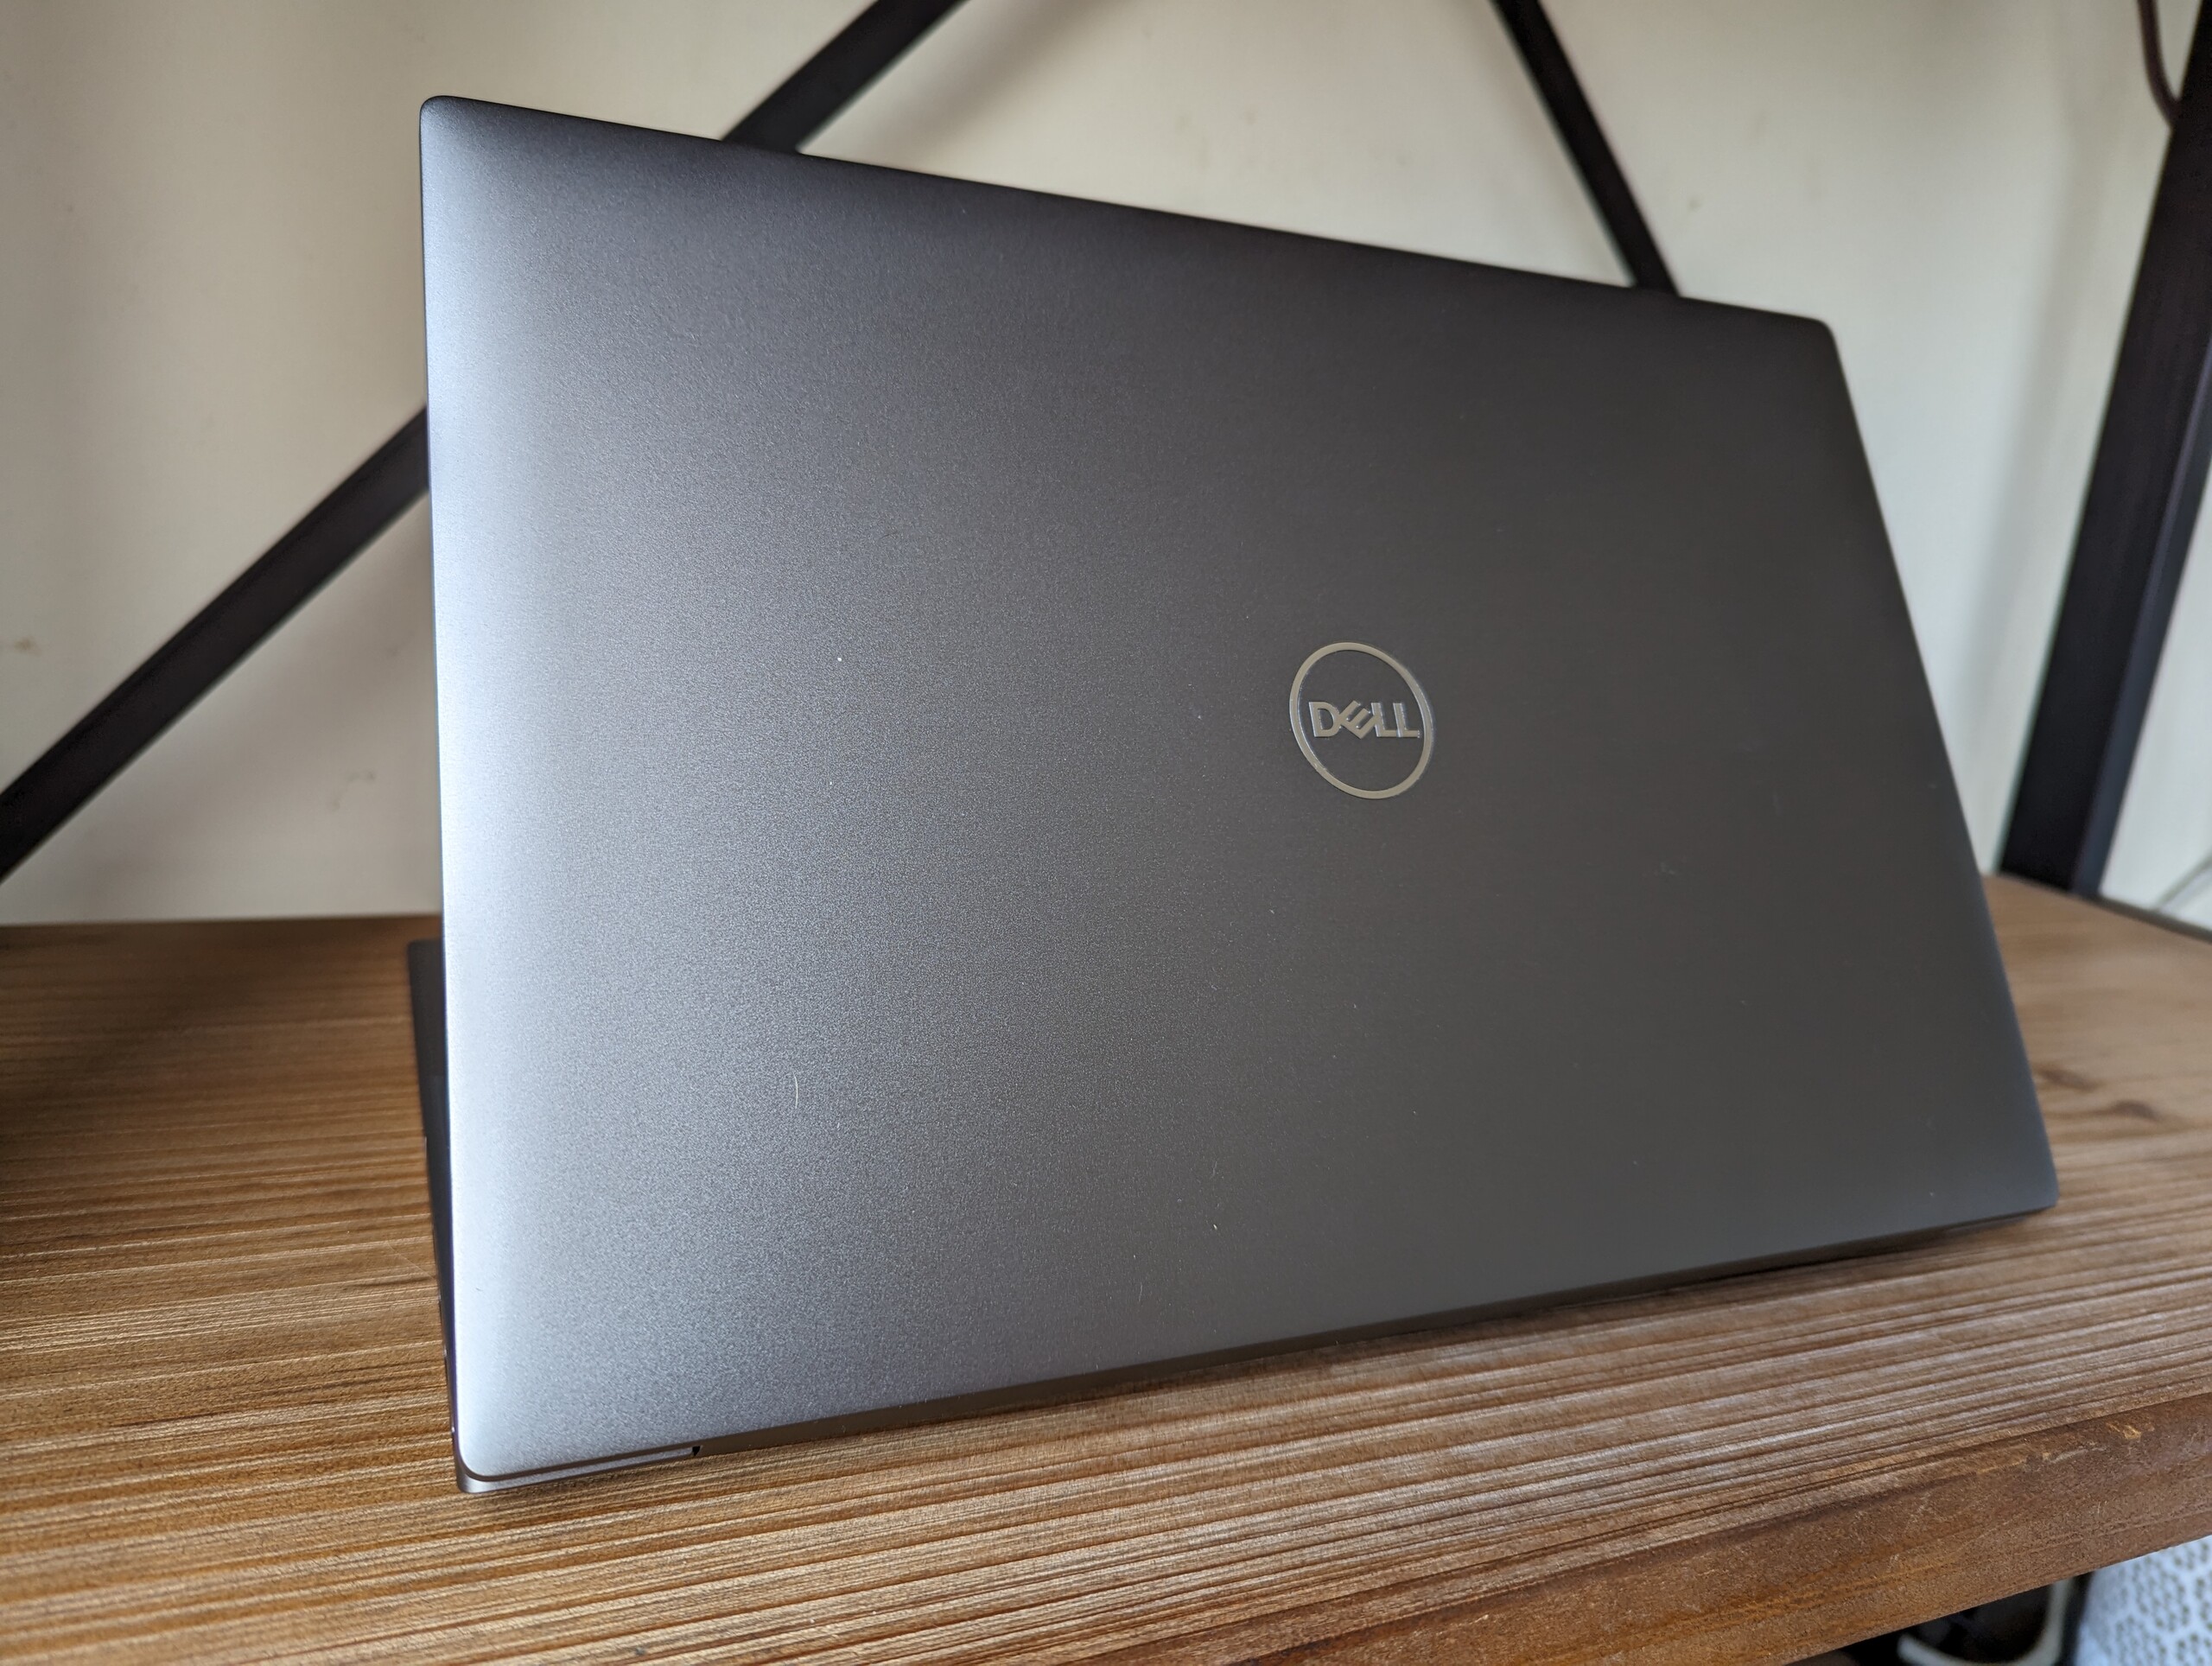
Maletín - Inspirado en el XPS
Lector de tarjetas SD
| SD Card Reader | |
| average JPG Copy Test (av. of 3 runs) | |
| Dell Precision 5000 5560 (AV Pro V60) | |
| Lenovo ThinkPad P15v G3 21EM001AGE (AV Pro V60) | |
| Dell Precision 5000 5470 (AV Pro V60) | |
| Dell Precision 5480 (AV Pro V60) | |
| maximum AS SSD Seq Read Test (1GB) | |
| Dell Precision 5000 5470 (AV Pro V60) | |
| Lenovo ThinkPad P15v G3 21EM001AGE (AV Pro V60) | |
| Dell Precision 5000 5560 (AV Pro V60) | |
| Dell Precision 5480 (AV Pro V60) | |
Comunicación
| Networking | |
| iperf3 transmit AX12 | |
| Dell Precision 5000 5560 | |
| iperf3 receive AX12 | |
| Dell Precision 5000 5560 | |
| iperf3 transmit AXE11000 | |
| Dell Precision 5480 | |
| Lenovo ThinkPad P14s G3 AMD 21J6S05000 | |
| Lenovo ThinkPad P15v G3 21EM001AGE | |
| iperf3 receive AXE11000 | |
| Lenovo ThinkPad P14s G3 AMD 21J6S05000 | |
| Lenovo ThinkPad P15v G3 21EM001AGE | |
| Dell Precision 5480 | |
| iperf3 transmit AXE11000 6GHz | |
| Dell Precision 5480 | |
| Lenovo ThinkPad P14s G3 AMD 21J6S05000 | |
| Dell Precision 5000 5470 | |
| Lenovo ThinkPad P15v G3 21EM001AGE | |
| iperf3 receive AXE11000 6GHz | |
| Lenovo ThinkPad P14s G3 AMD 21J6S05000 | |
| Lenovo ThinkPad P15v G3 21EM001AGE | |
| Dell Precision 5480 | |
| Dell Precision 5000 5470 | |
Cámara web
Dell sigue ofreciendo cámaras web de 720p en muchos de sus productos estrella, como la serie XPS y los portátiles Precision basados en el diseño XPS. Otros fabricantes ya han cambiado a sensores de 2 o 5 MP y esperamos que Dell haga lo mismo con sus futuros rediseños.


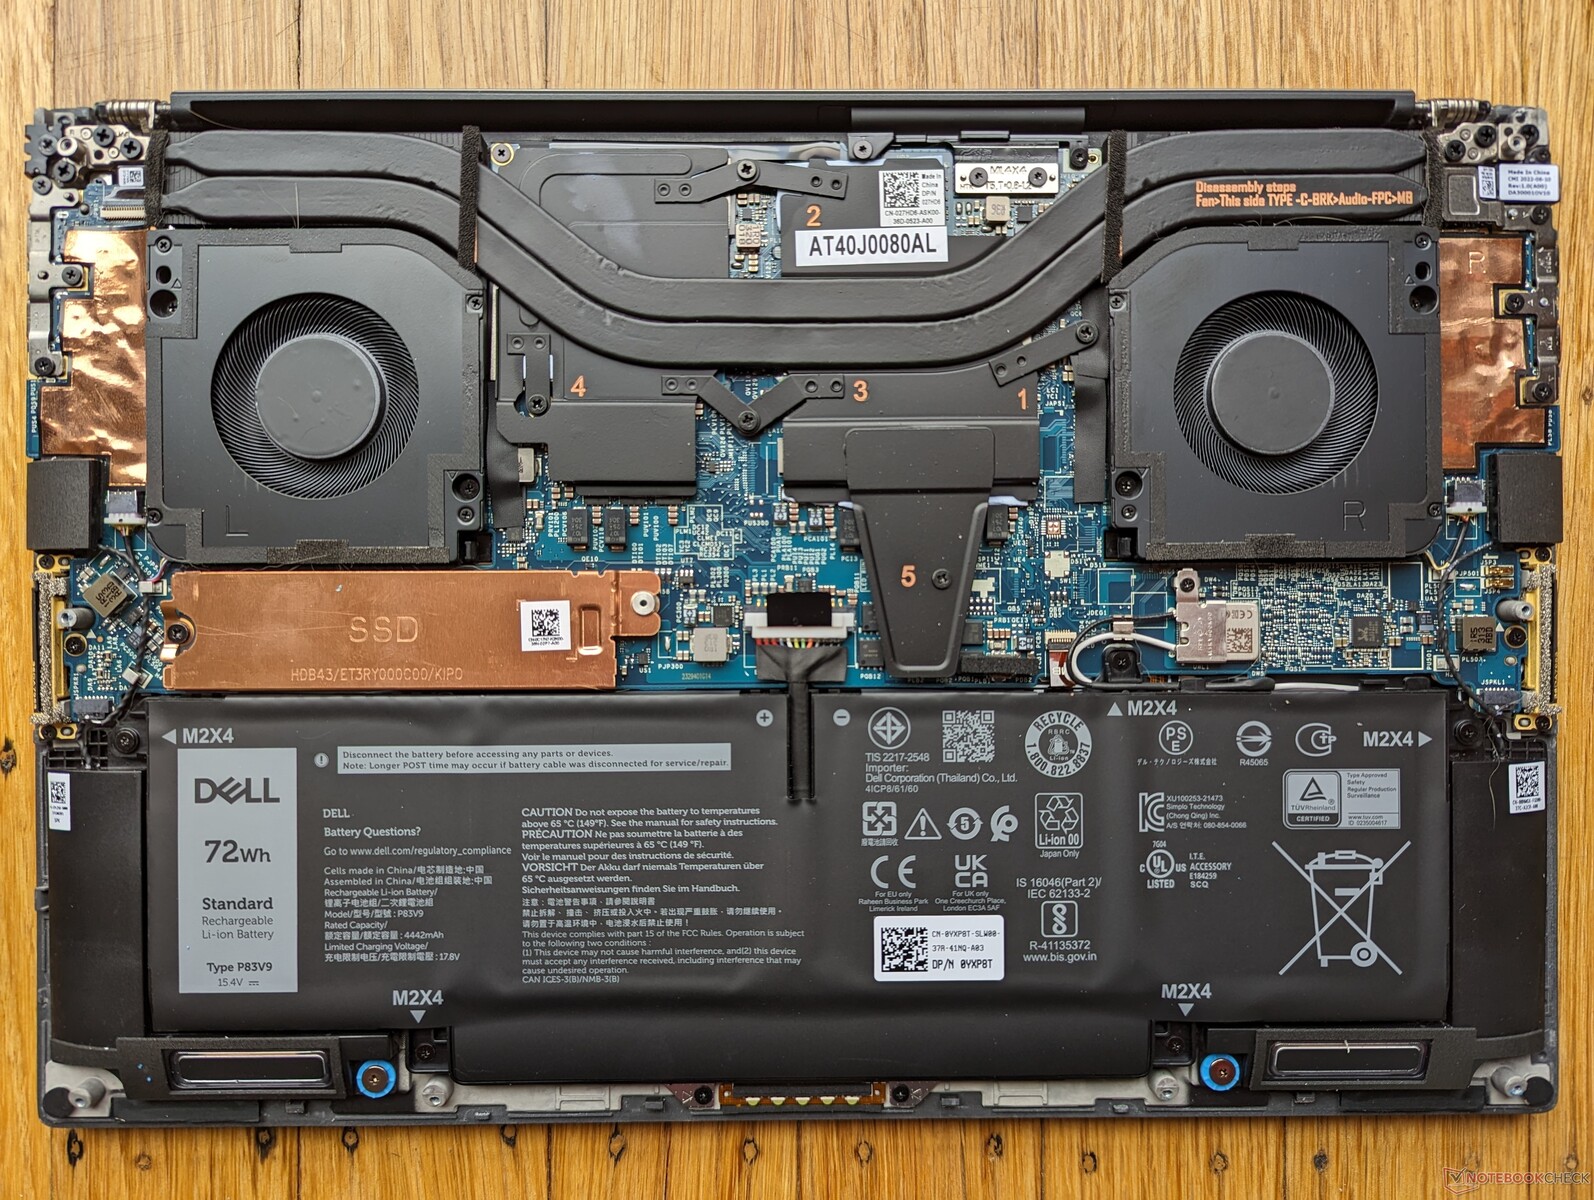
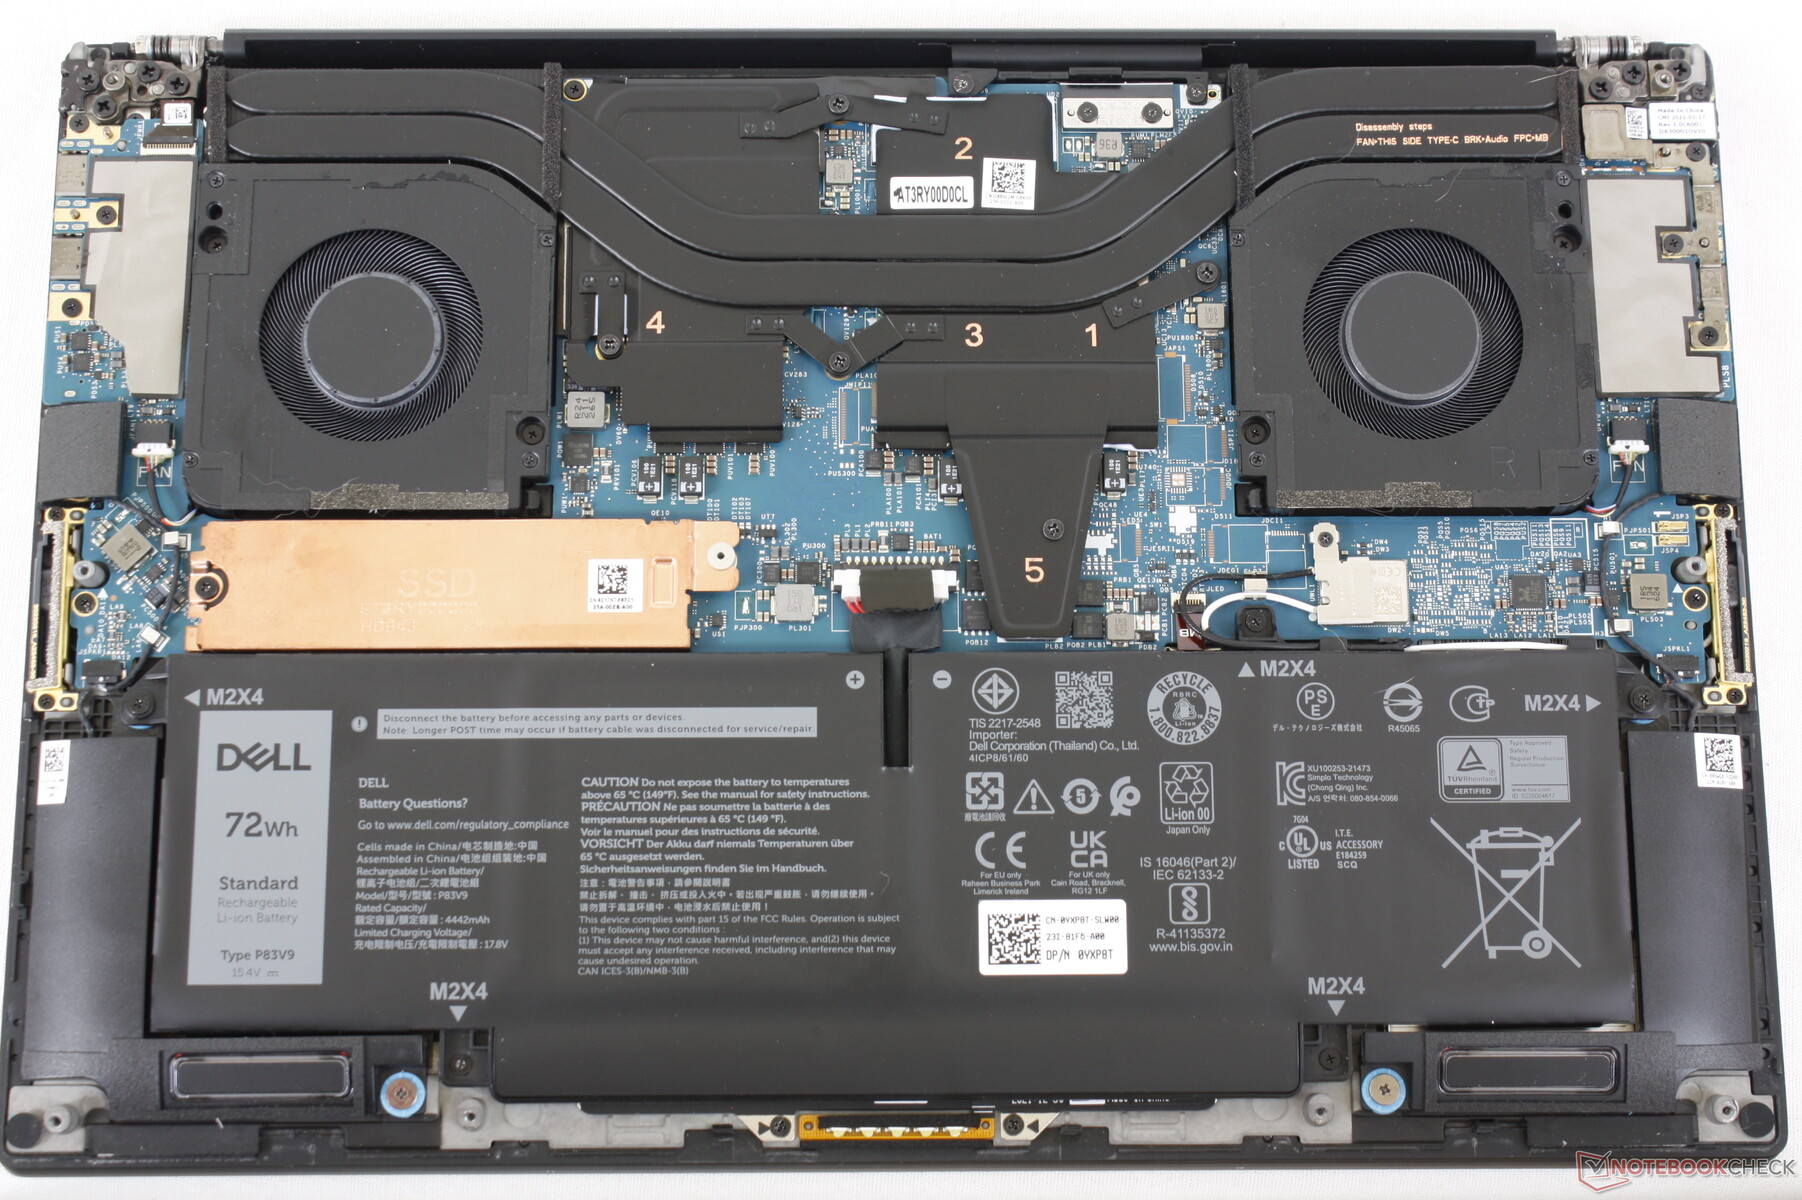
Mantenimiento
Accesorios y garantía
La caja incluye el mismo adaptador USB-C a HDMI y USB-A del modelo del año pasado además de la documentación y el adaptador de corriente USB-C de 130 W. Dell también ofrece un adaptador USB-C AC más pequeño de 100 W que debería bastar para configuraciones sin gráfica Nvidia discreta.
Una garantía de tres años viene de serie si se compra a Dell en EE.UU. similar a la serie Precision 7000.
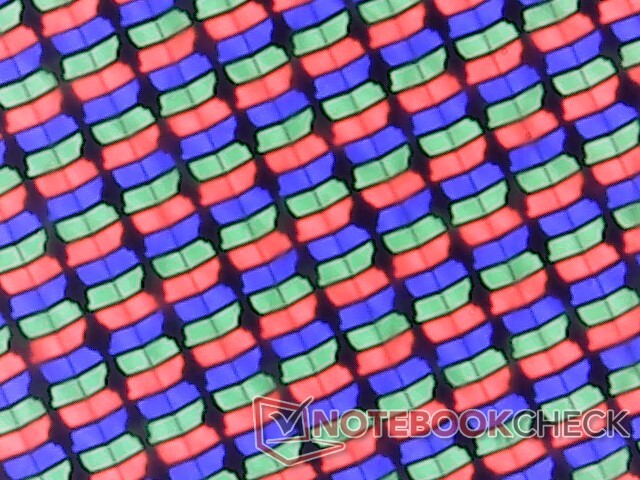
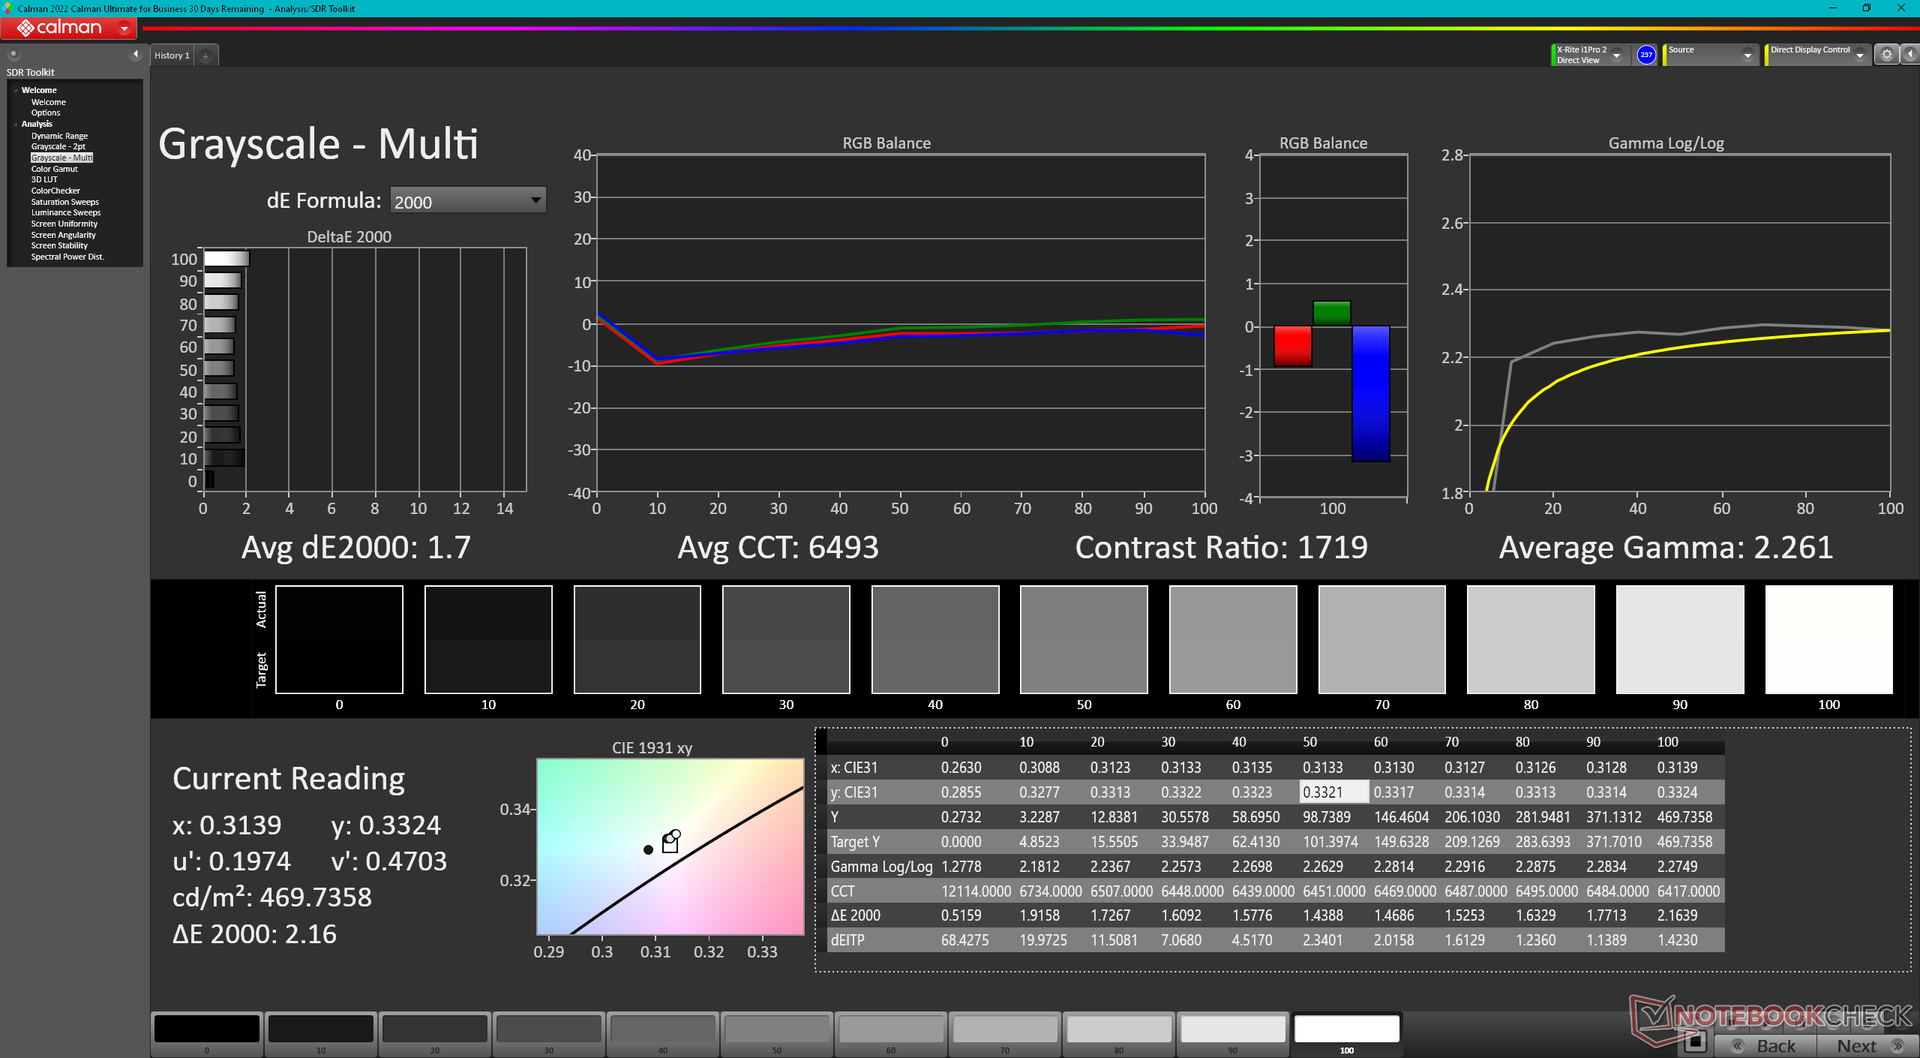
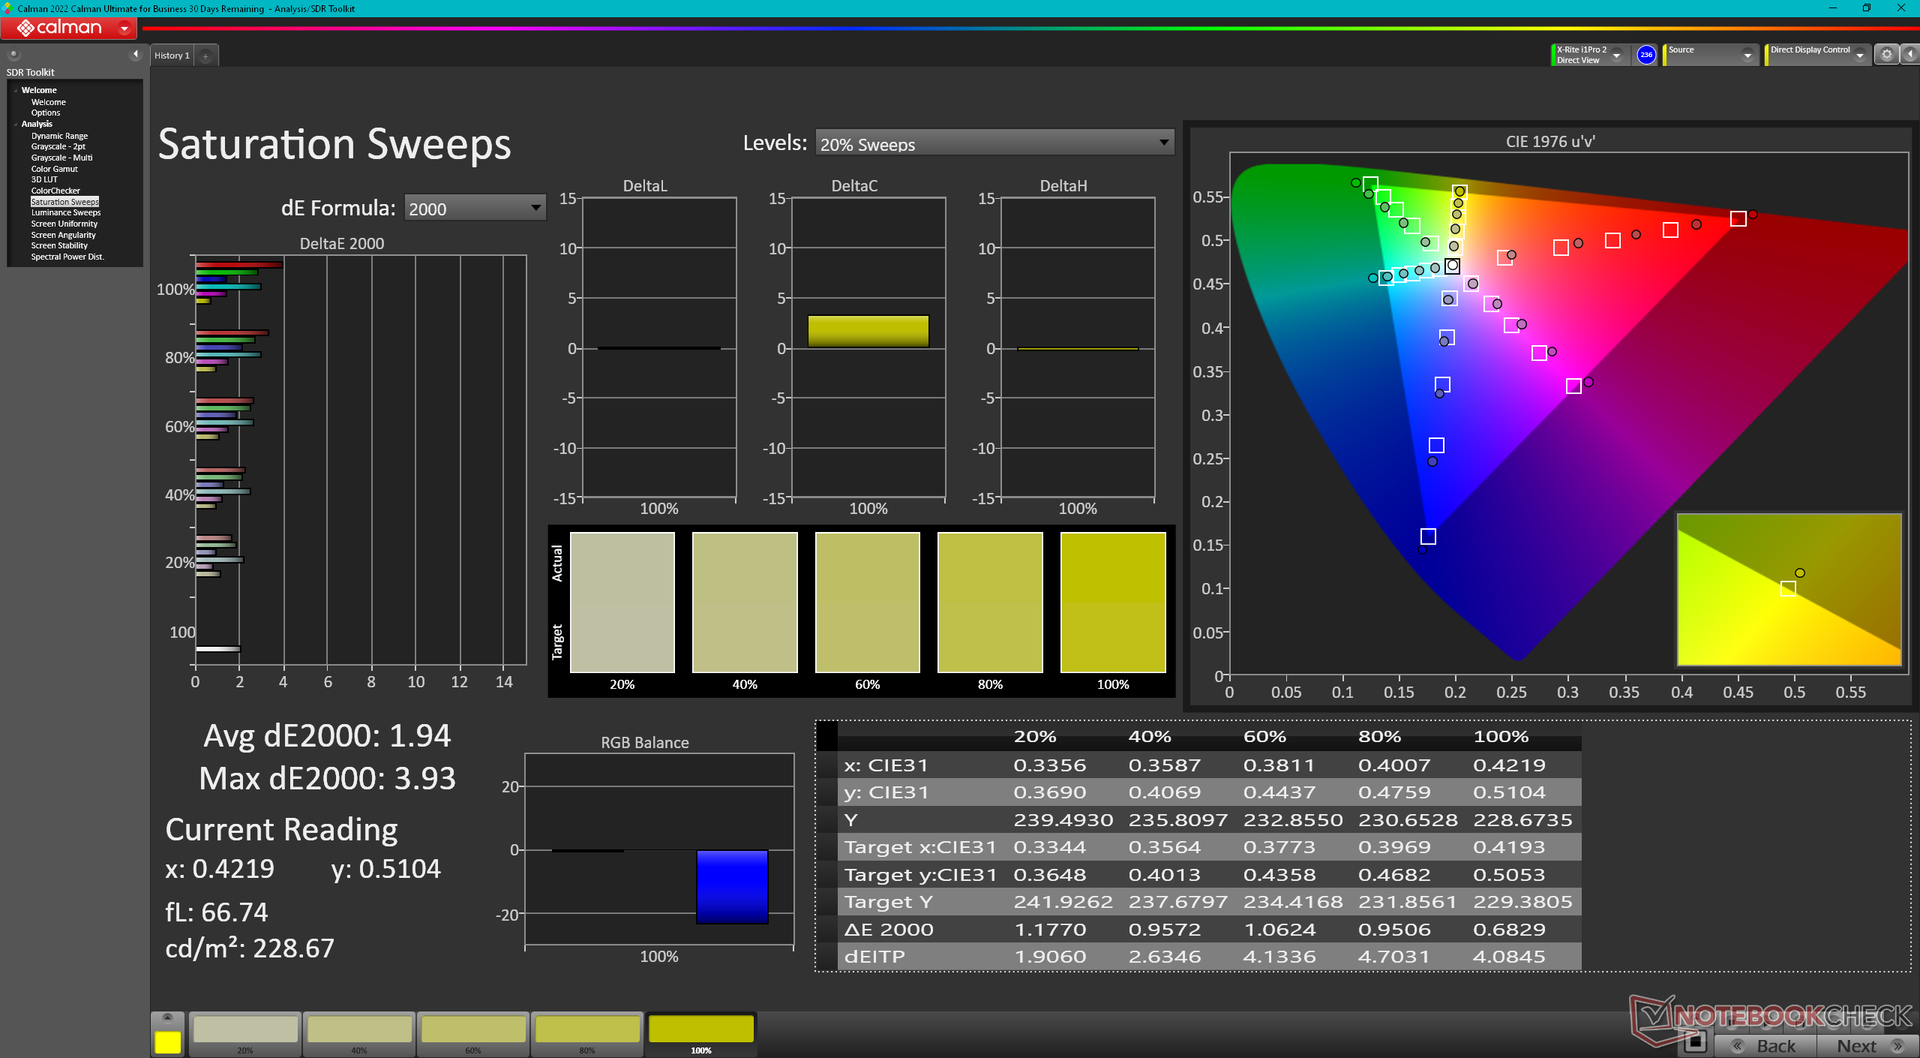
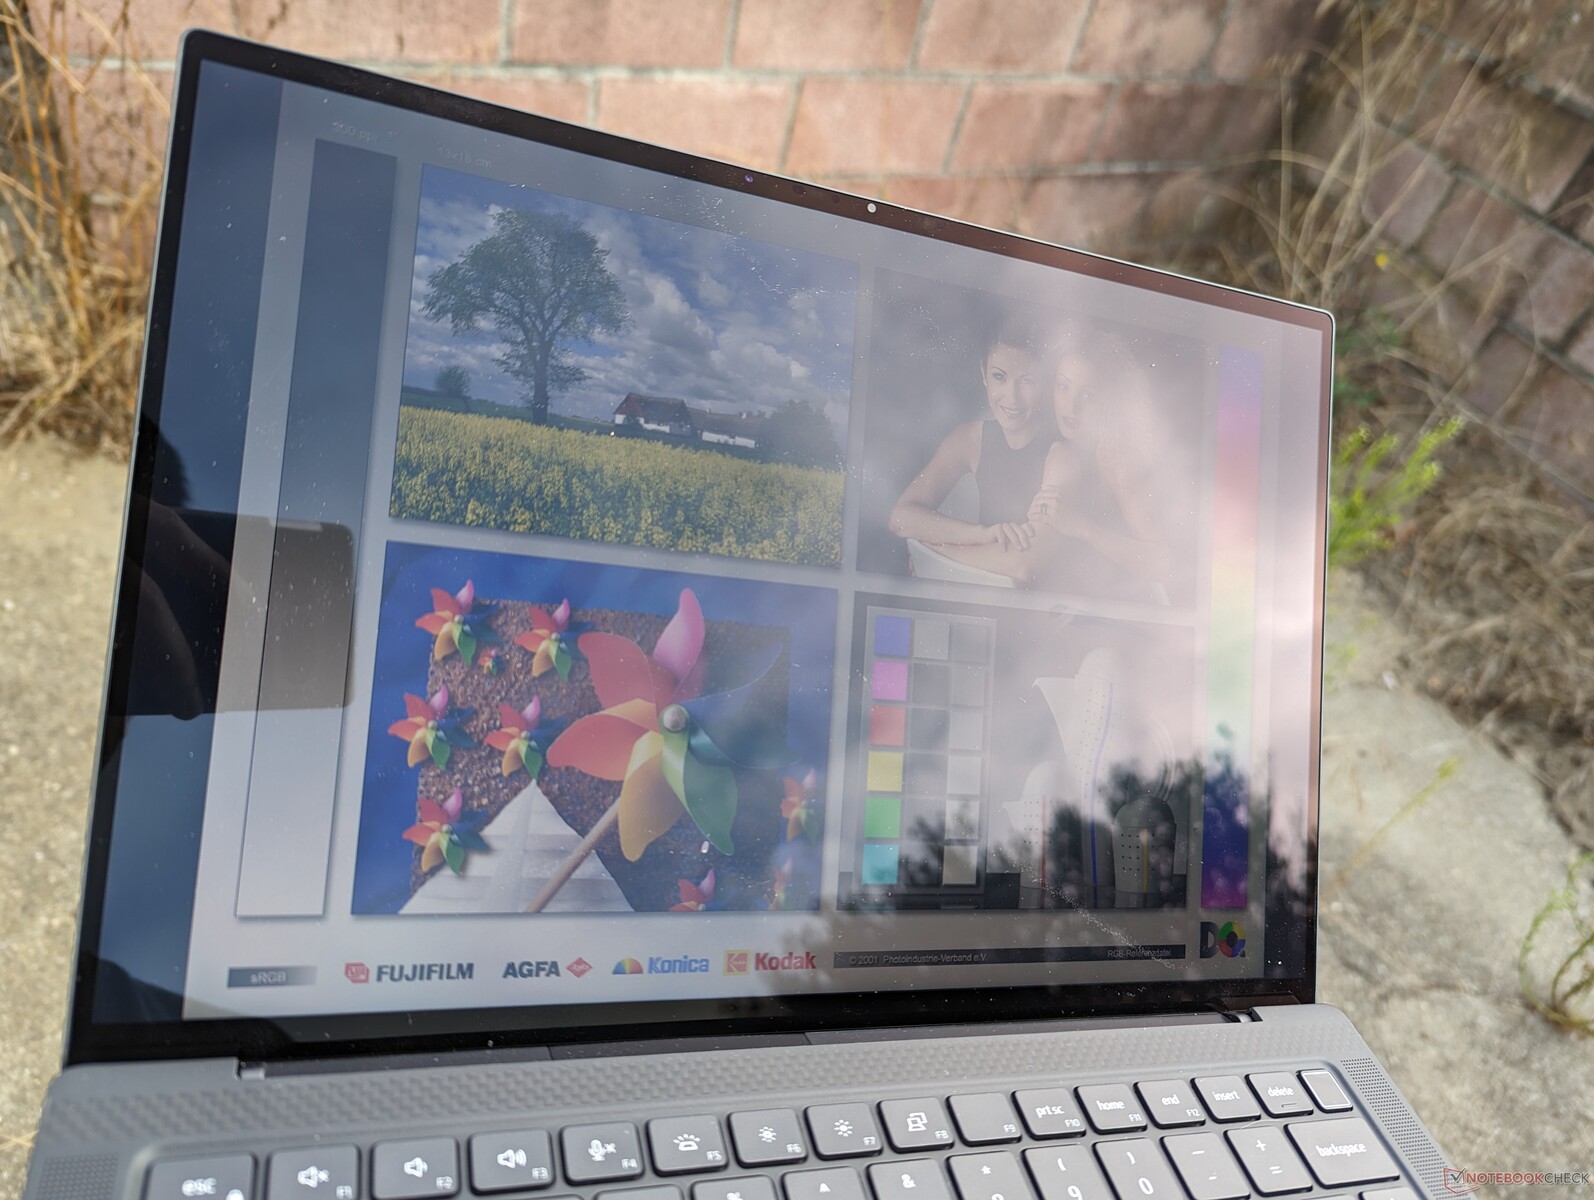
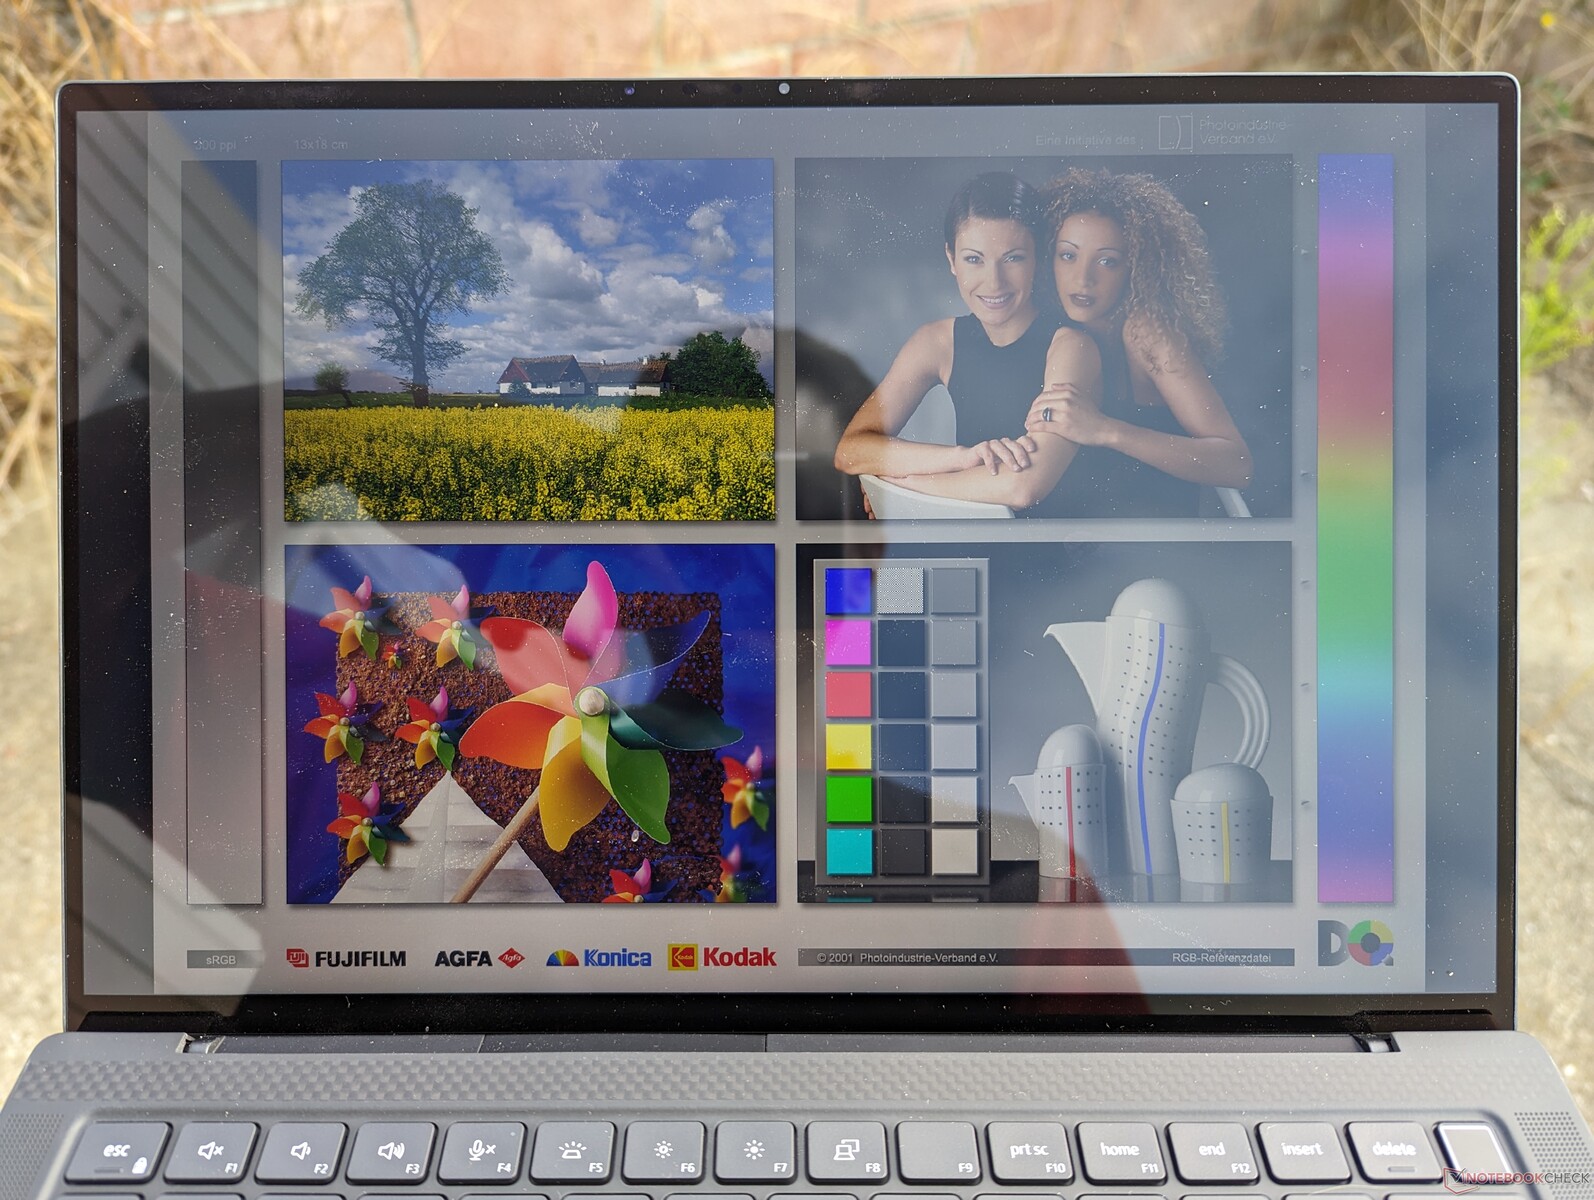
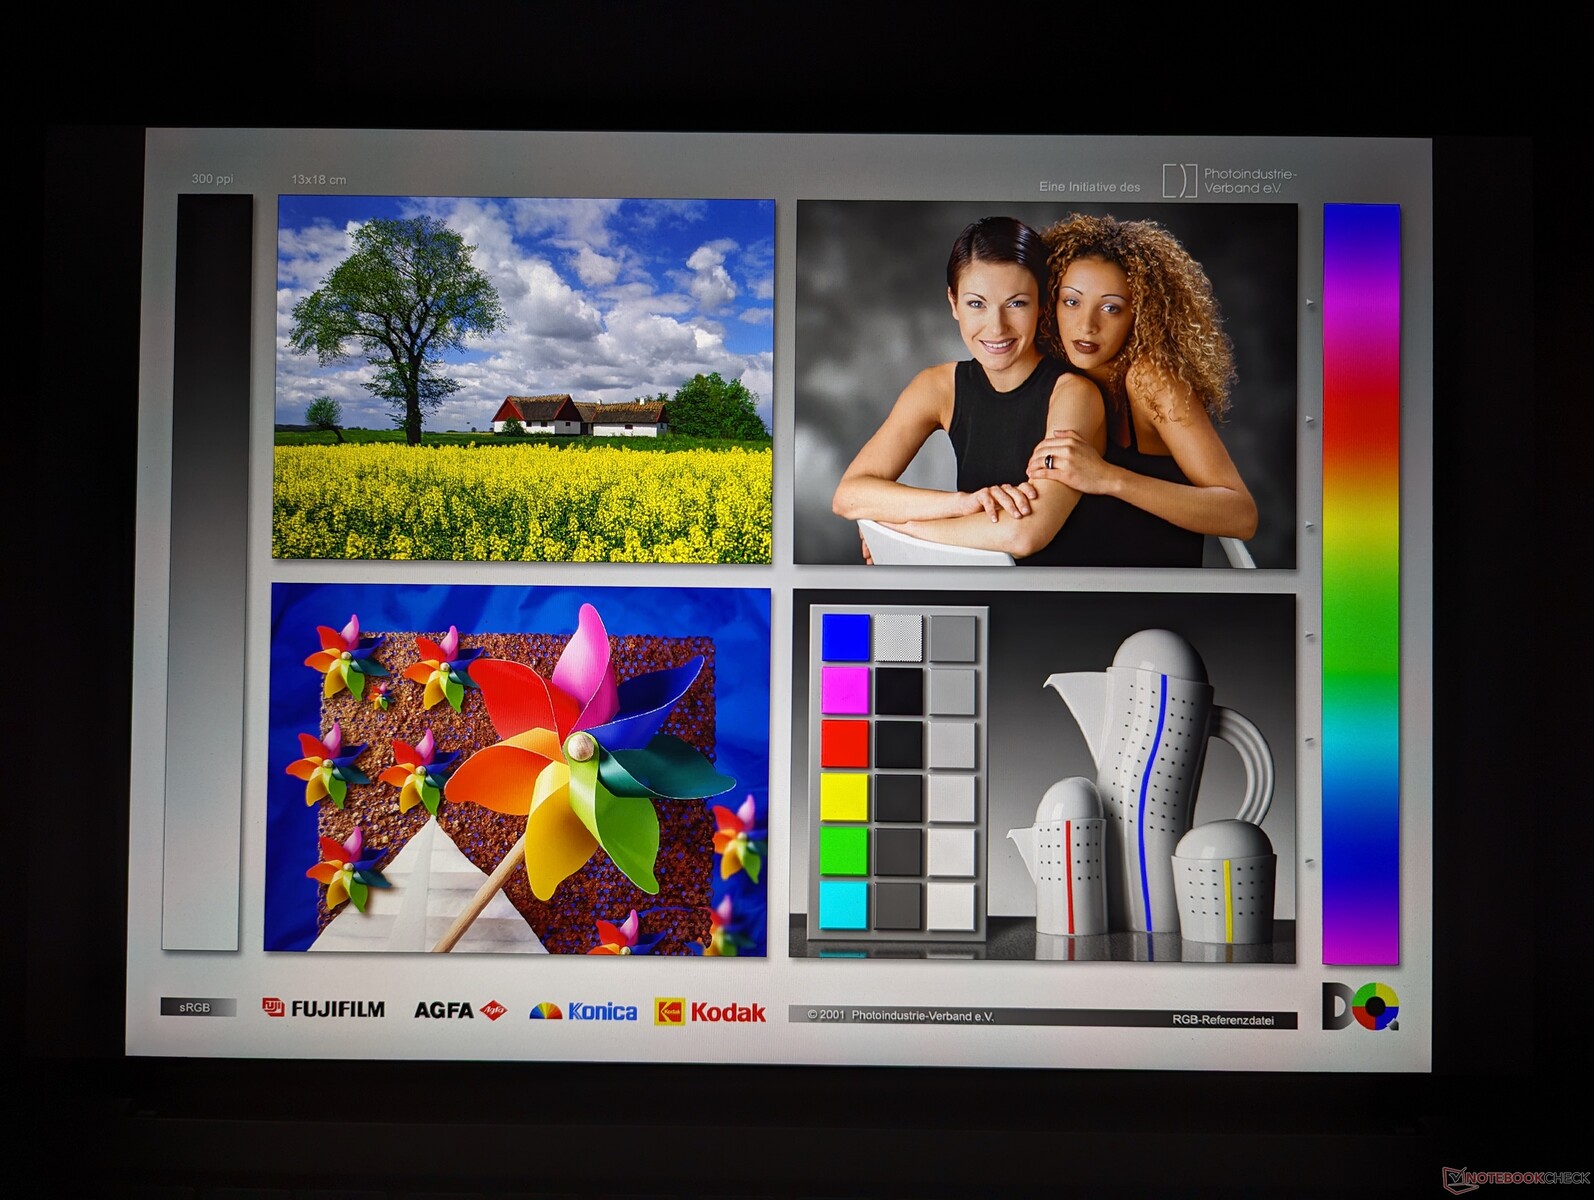
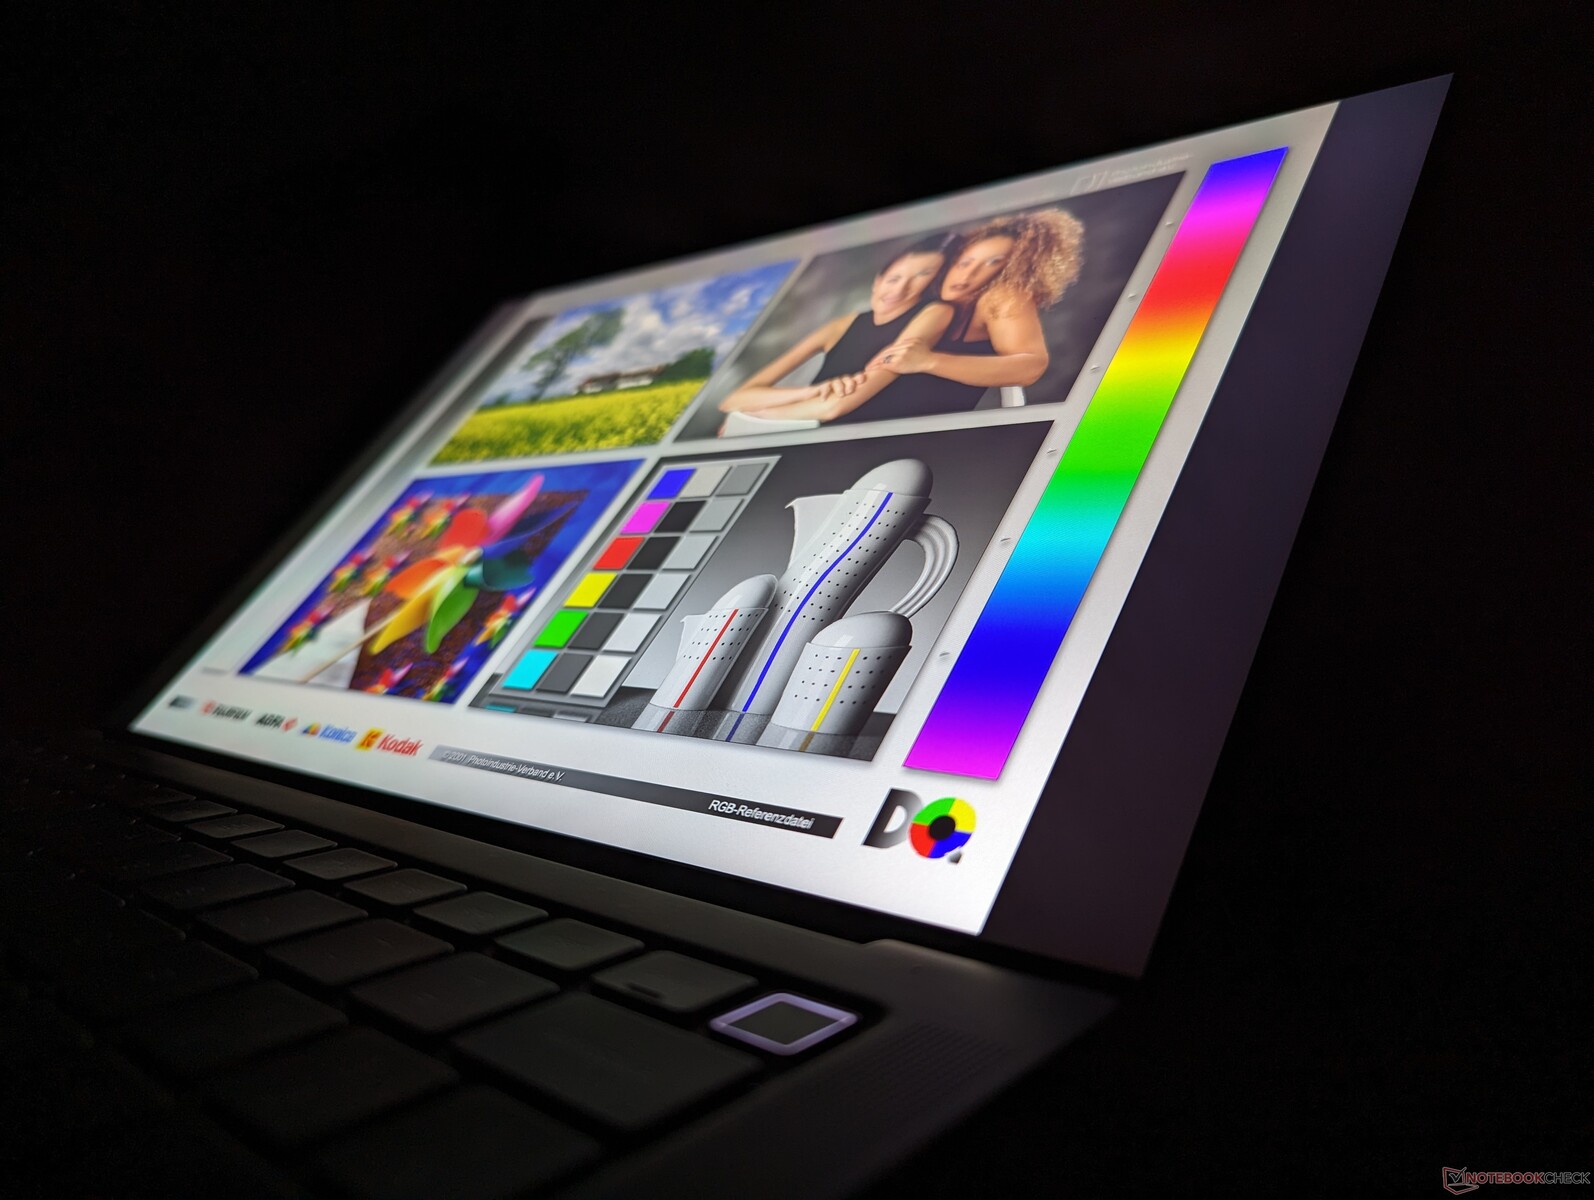
Pantalla - QHD+ con todos los colores sRGB
Nuestra unidad de pruebas viene con el mismo panel IPS AU Optronics B140QAN del modelo del año pasado. Dell no ofrece nuevas opciones de panel para la renovación de este año, lo que significa que los colores DCi-P3 o OLED siguen fuera de nuestro alcance.
| |||||||||||||||||||||||||
iluminación: 87 %
Brillo con batería: 472.8 cd/m²
Contraste: 1351:1 (Negro: 0.35 cd/m²)
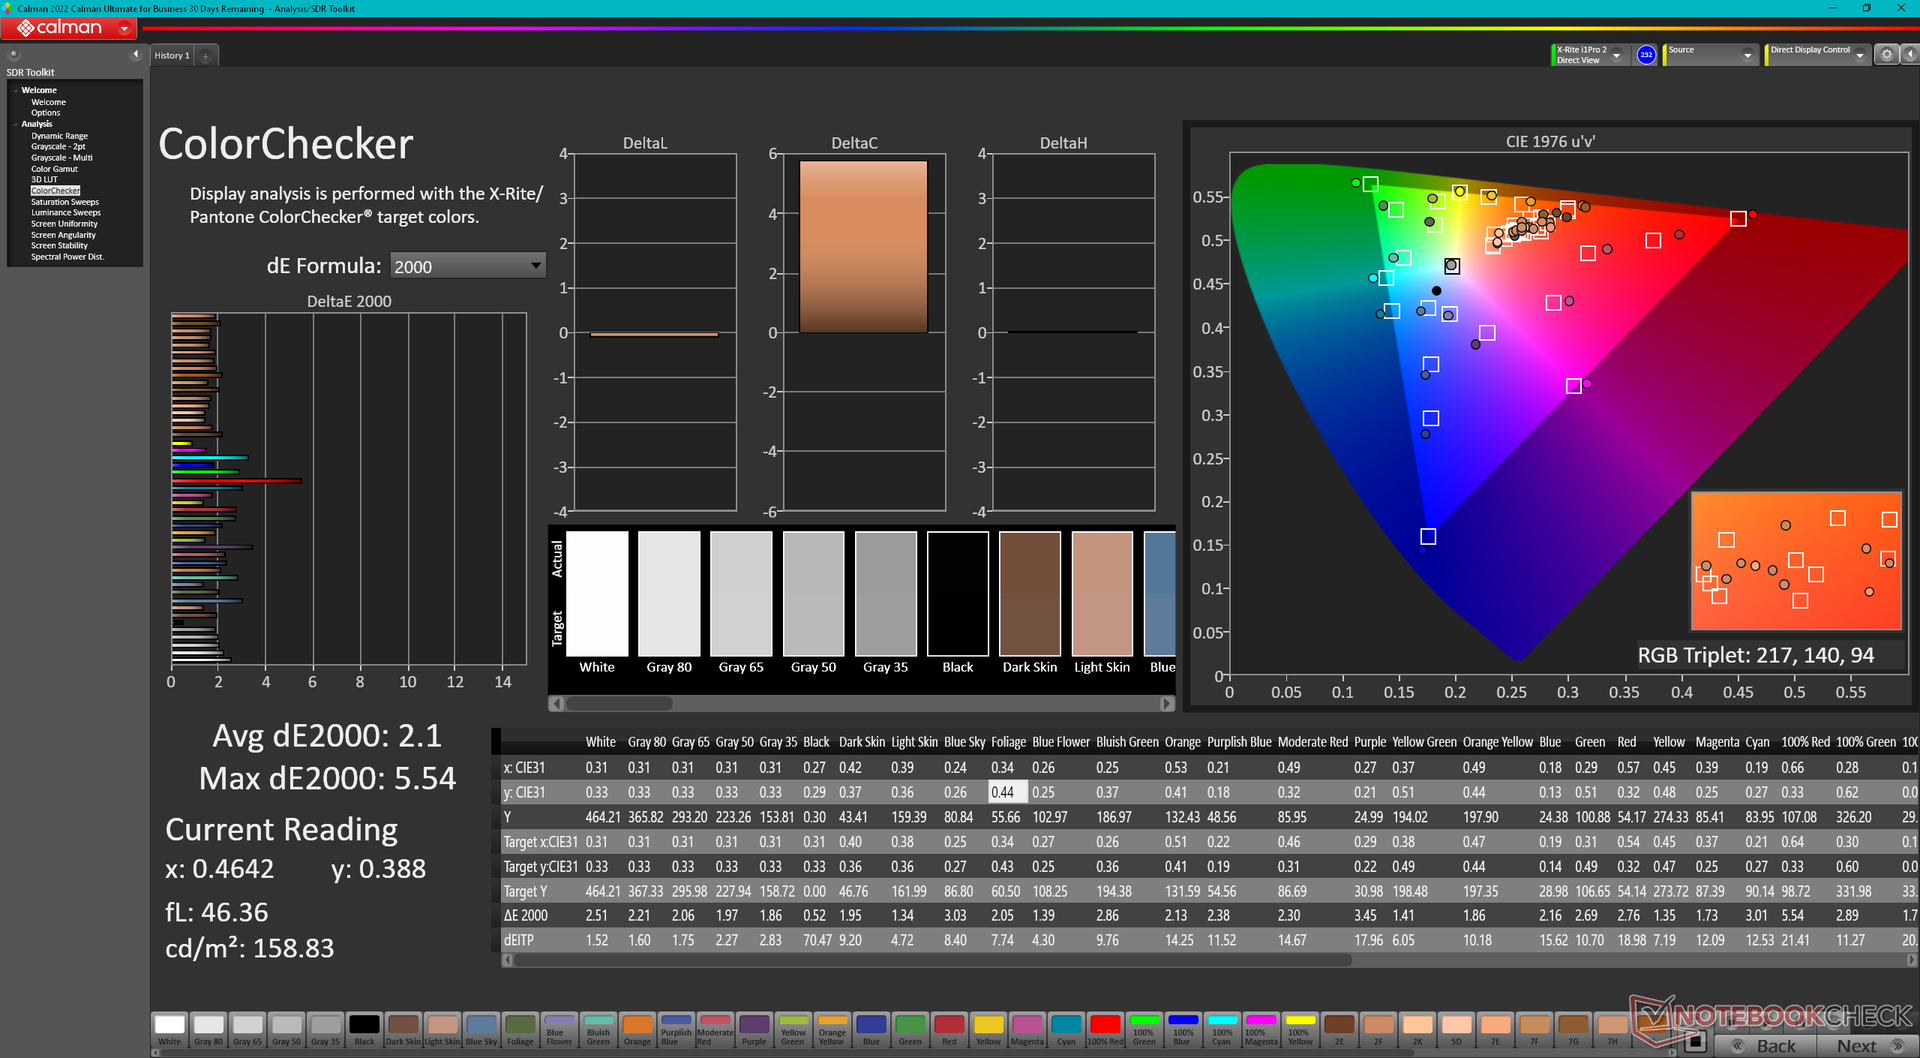
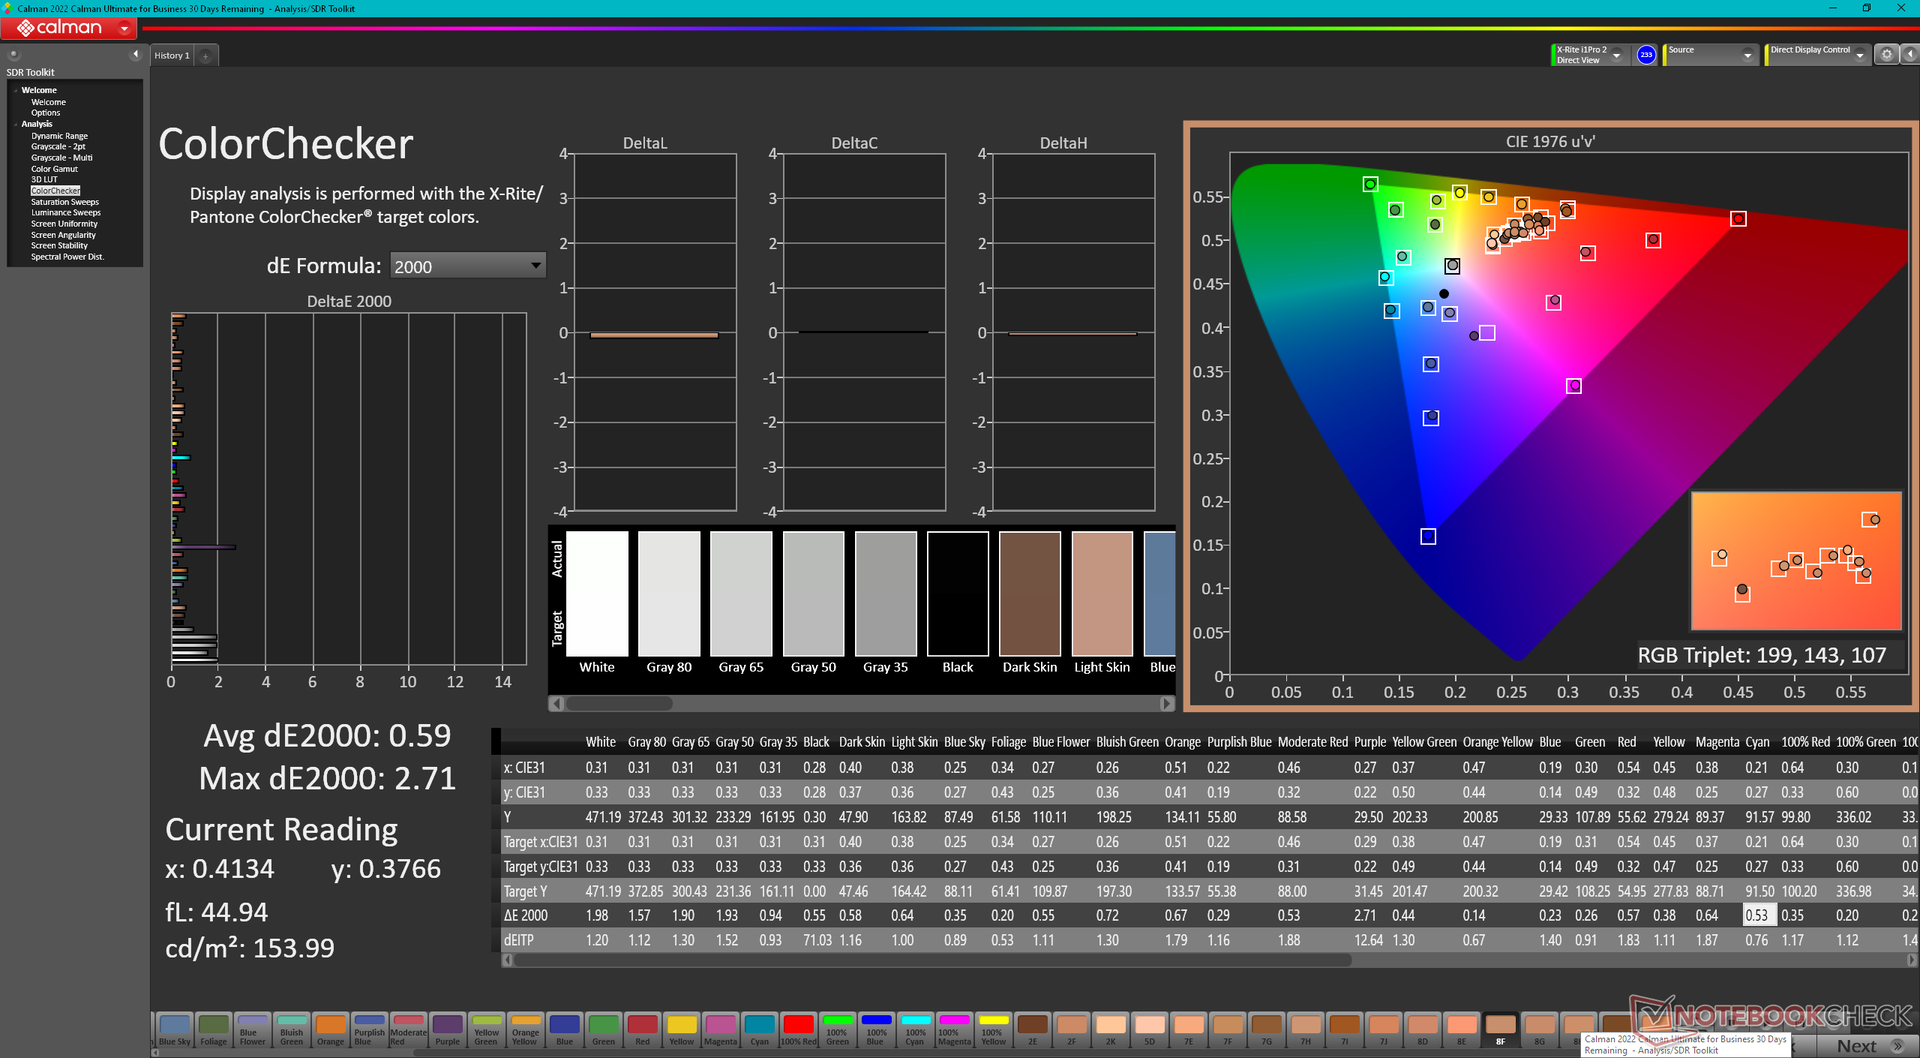
ΔE ColorChecker Calman: 2.1 | ∀{0.5-29.43 Ø4.71}
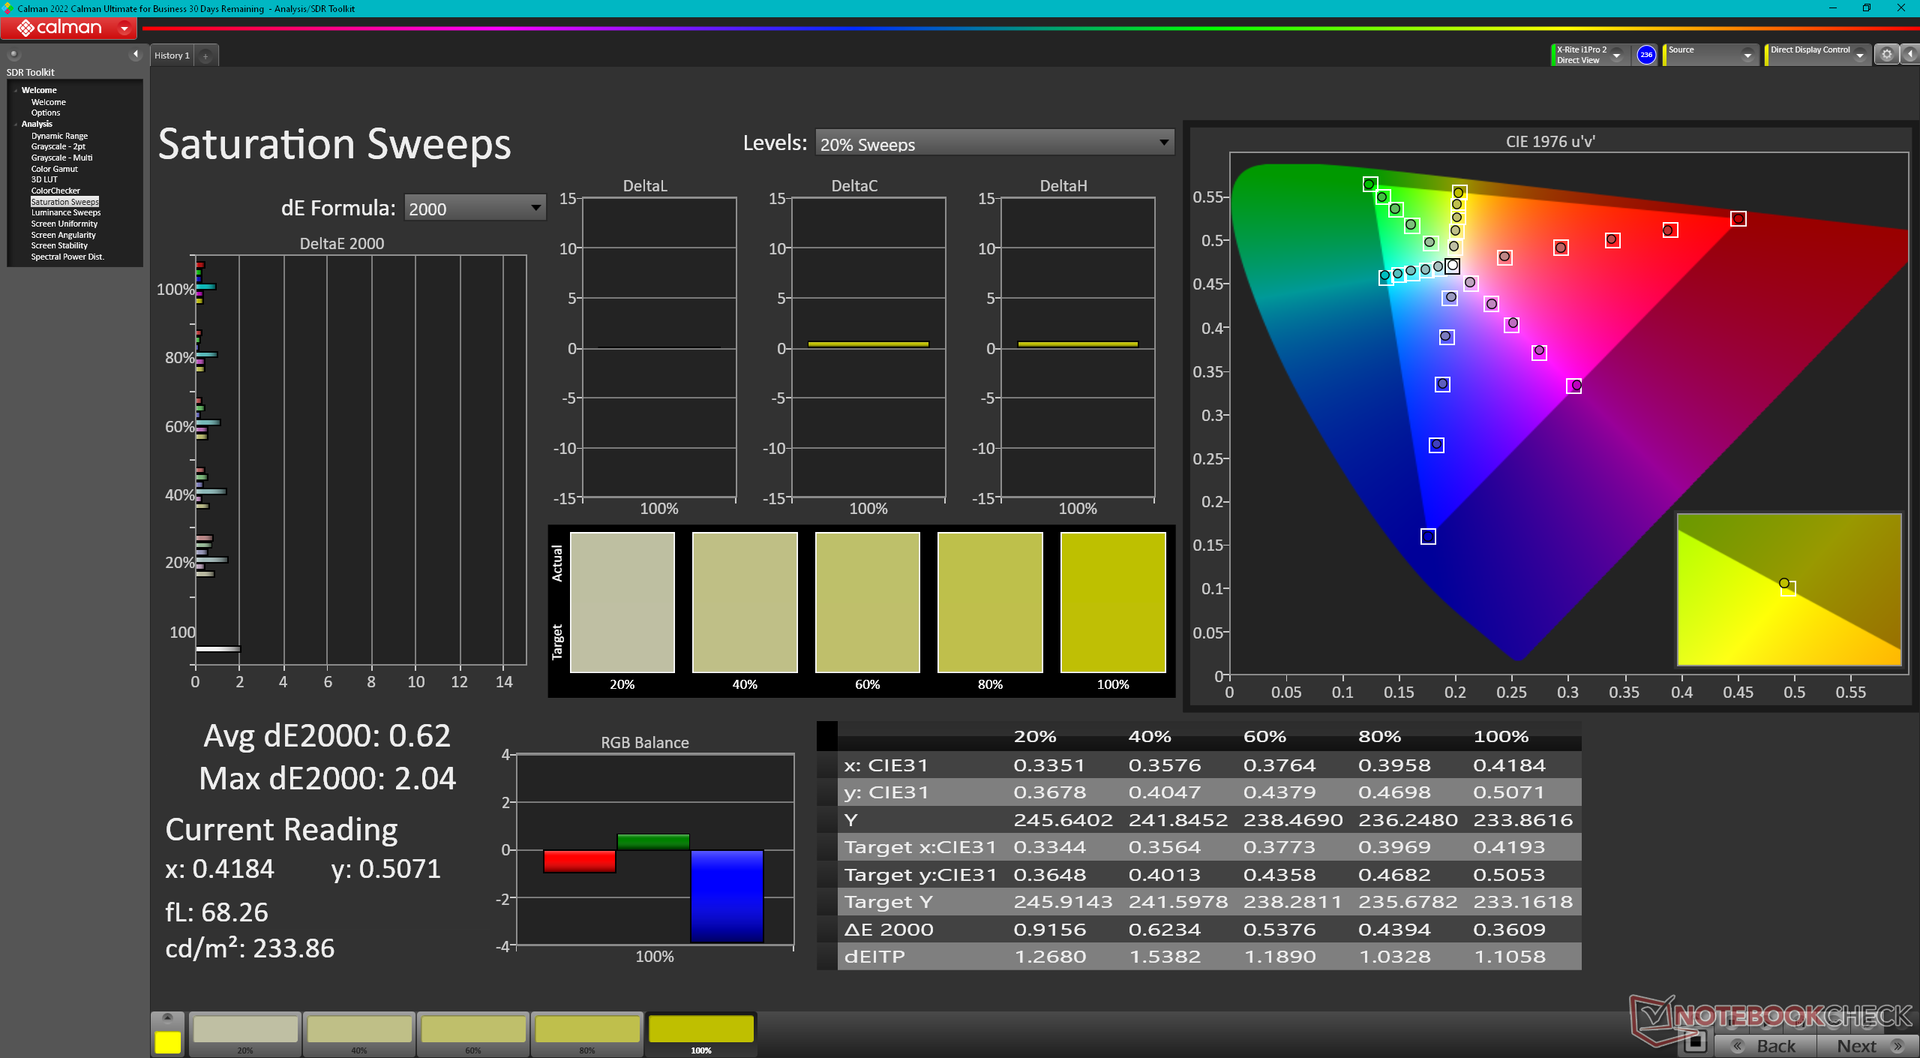
calibrated: 0.59
ΔE Greyscale Calman: 1.7 | ∀{0.09-98 Ø4.96}
78% AdobeRGB 1998 (Argyll 3D)
99.8% sRGB (Argyll 3D)
77.6% Display P3 (Argyll 3D)
Gamma: 2.26
CCT: 6493 K
| Dell Precision 5480 AU Optronics B140QAN, IPS, 2560x1600, 14" | Dell Precision 5000 5470 AU Optronics B140QAN, IPS, 2560x1600, 14" | Dell Precision 5000 5560 Sharp LQ156R1, IPS, 3840x2400, 15.6" | Lenovo ThinkPad P14s G3 AMD 21J6S05000 LP140WU1-SPB2, IPS LED, 1920x1200, 14" | Lenovo ThinkPad P15v G3 21EM001AGE NE156QUM-N6C, IPS LED, 3840x2160, 15.6" | HP ZBook Firefly 14 G9-6B8A2EA CMN1435, IPS, 1920x1200, 14" | |
|---|---|---|---|---|---|---|
| Display | 1% | 17% | -11% | 15% | -6% | |
| Display P3 Coverage (%) | 77.6 | 79.3 2% | 94.9 22% | 65.9 -15% | 89.9 16% | 69.6 -10% |
| sRGB Coverage (%) | 99.8 | 100 0% | 100 0% | 94.3 -6% | 100 0% | 99.9 0% |
| AdobeRGB 1998 Coverage (%) | 78 | 78.7 1% | 100 28% | 68.2 -13% | 99.9 28% | 71.1 -9% |
| Response Times | -24% | -14% | 13% | -7% | -16% | |
| Response Time Grey 50% / Grey 80% * (ms) | 43.9 ? | 52.4 ? -19% | 47.2 ? -8% | 33.5 ? 24% | 46.7 ? -6% | 56.3 ? -28% |
| Response Time Black / White * (ms) | 25.3 ? | 32.4 ? -28% | 30.4 ? -20% | 24.9 ? 2% | 27.3 ? -8% | 26.2 ? -4% |
| PWM Frequency (Hz) | ||||||
| Screen | -8% | -35% | -13% | -55% | -26% | |
| Brightness middle (cd/m²) | 472.8 | 537 14% | 501.5 6% | 448 -5% | 588 24% | 432 -9% |
| Brightness (cd/m²) | 469 | 518 10% | 467 0% | 422 -10% | 536 14% | 407 -13% |
| Brightness Distribution (%) | 87 | 94 8% | 83 -5% | 85 -2% | 83 -5% | 91 5% |
| Black Level * (cd/m²) | 0.35 | 0.33 6% | 0.44 -26% | 0.23 34% | 0.38 -9% | 0.28 20% |
| Contrast (:1) | 1351 | 1627 20% | 1140 -16% | 1948 44% | 1547 15% | 1543 14% |
| Colorchecker dE 2000 * | 2.1 | 2.97 -41% | 4.73 -125% | 2.5 -19% | 3.9 -86% | 3.1 -48% |
| Colorchecker dE 2000 max. * | 5.54 | 5.33 4% | 8.45 -53% | 3.7 33% | 8.8 -59% | 5.6 -1% |
| Colorchecker dE 2000 calibrated * | 0.59 | 0.88 -49% | 0.51 14% | 1.3 -120% | 1 -69% | 0.8 -36% |
| Greyscale dE 2000 * | 1.7 | 2.4 -41% | 3.6 -112% | 2.9 -71% | 7.1 -318% | 4.5 -165% |
| Gamma | 2.26 97% | 2.06 107% | 2.08 106% | 2.03 108% | 2.12 104% | 2 110% |
| CCT | 6493 100% | 6668 97% | 6447 101% | 6840 95% | 7268 89% | 6528 100% |
| Media total (Programa/Opciones) | -10% /
-8% | -11% /
-21% | -4% /
-9% | -16% /
-33% | -16% /
-20% |
* ... más pequeño es mejor
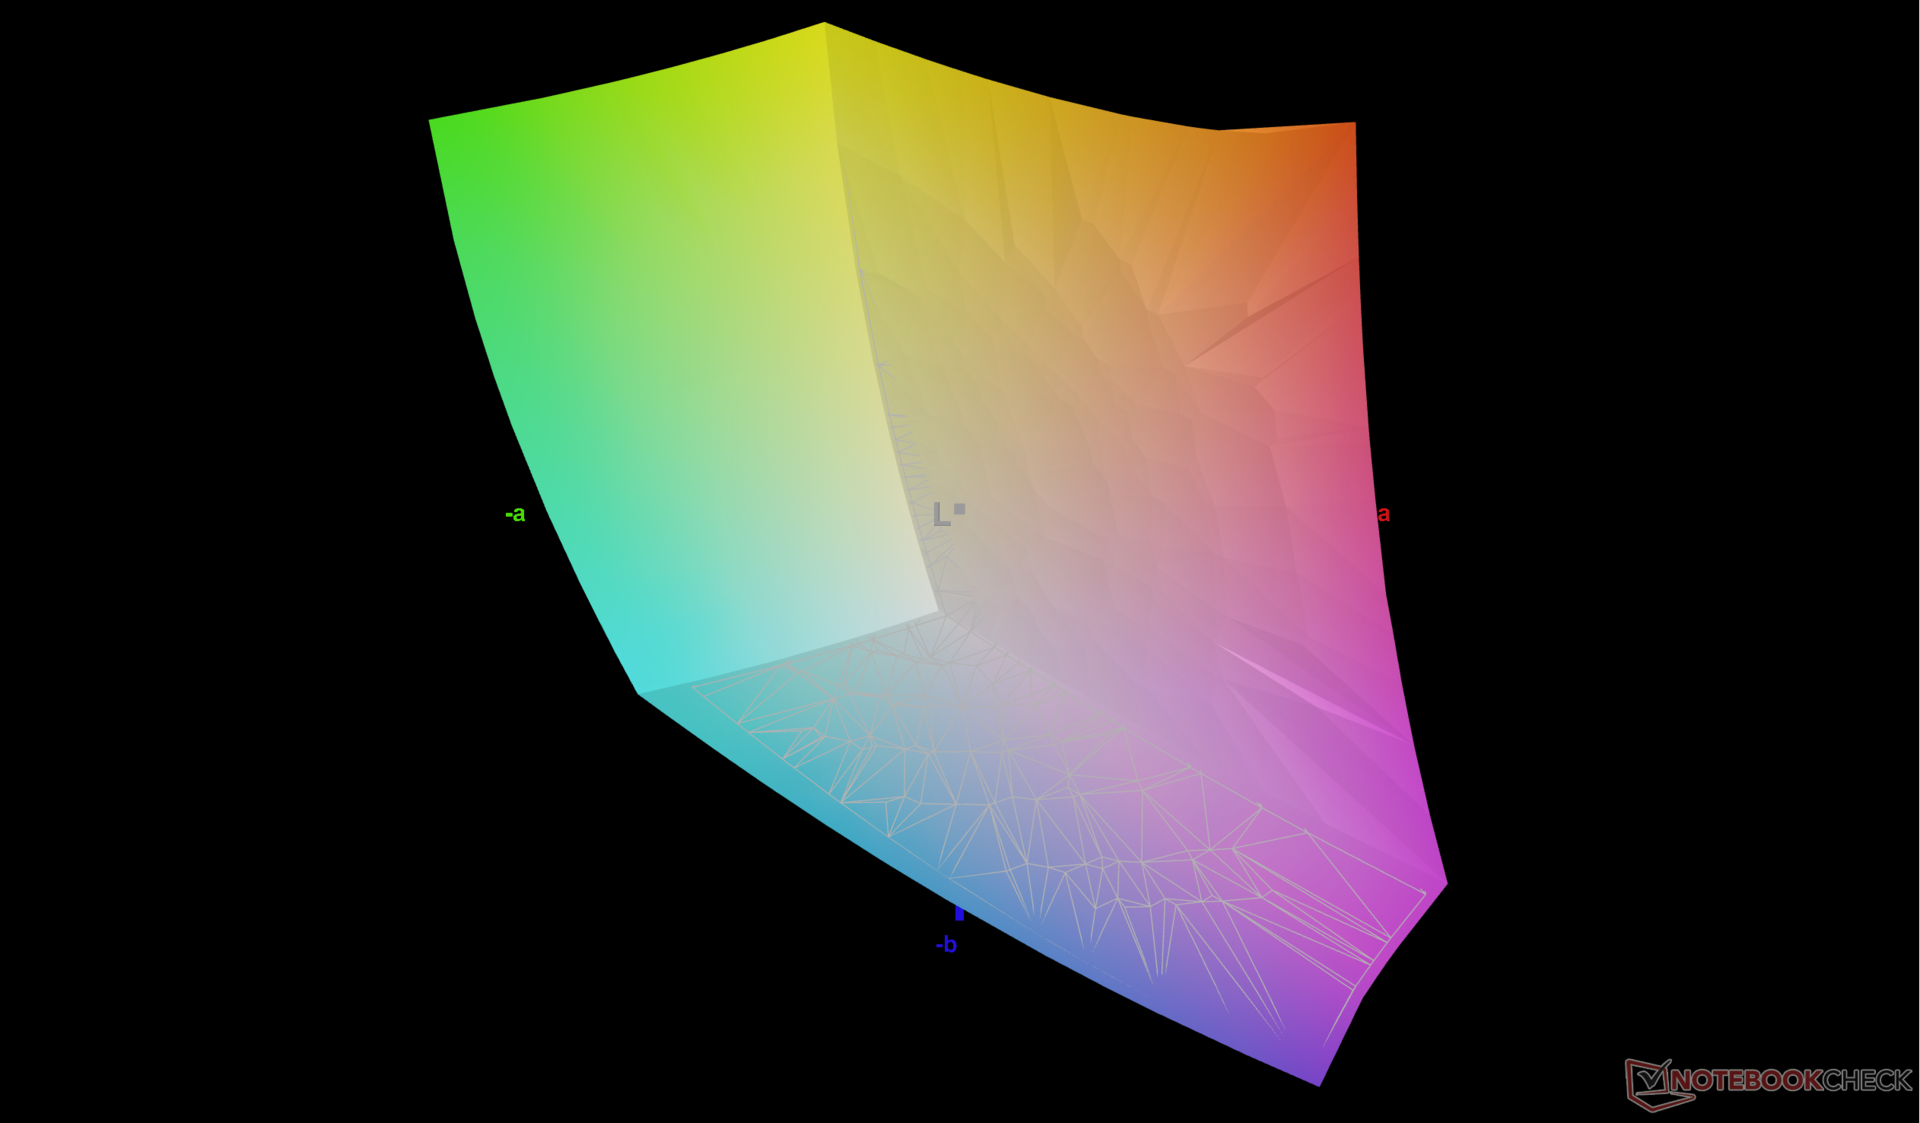
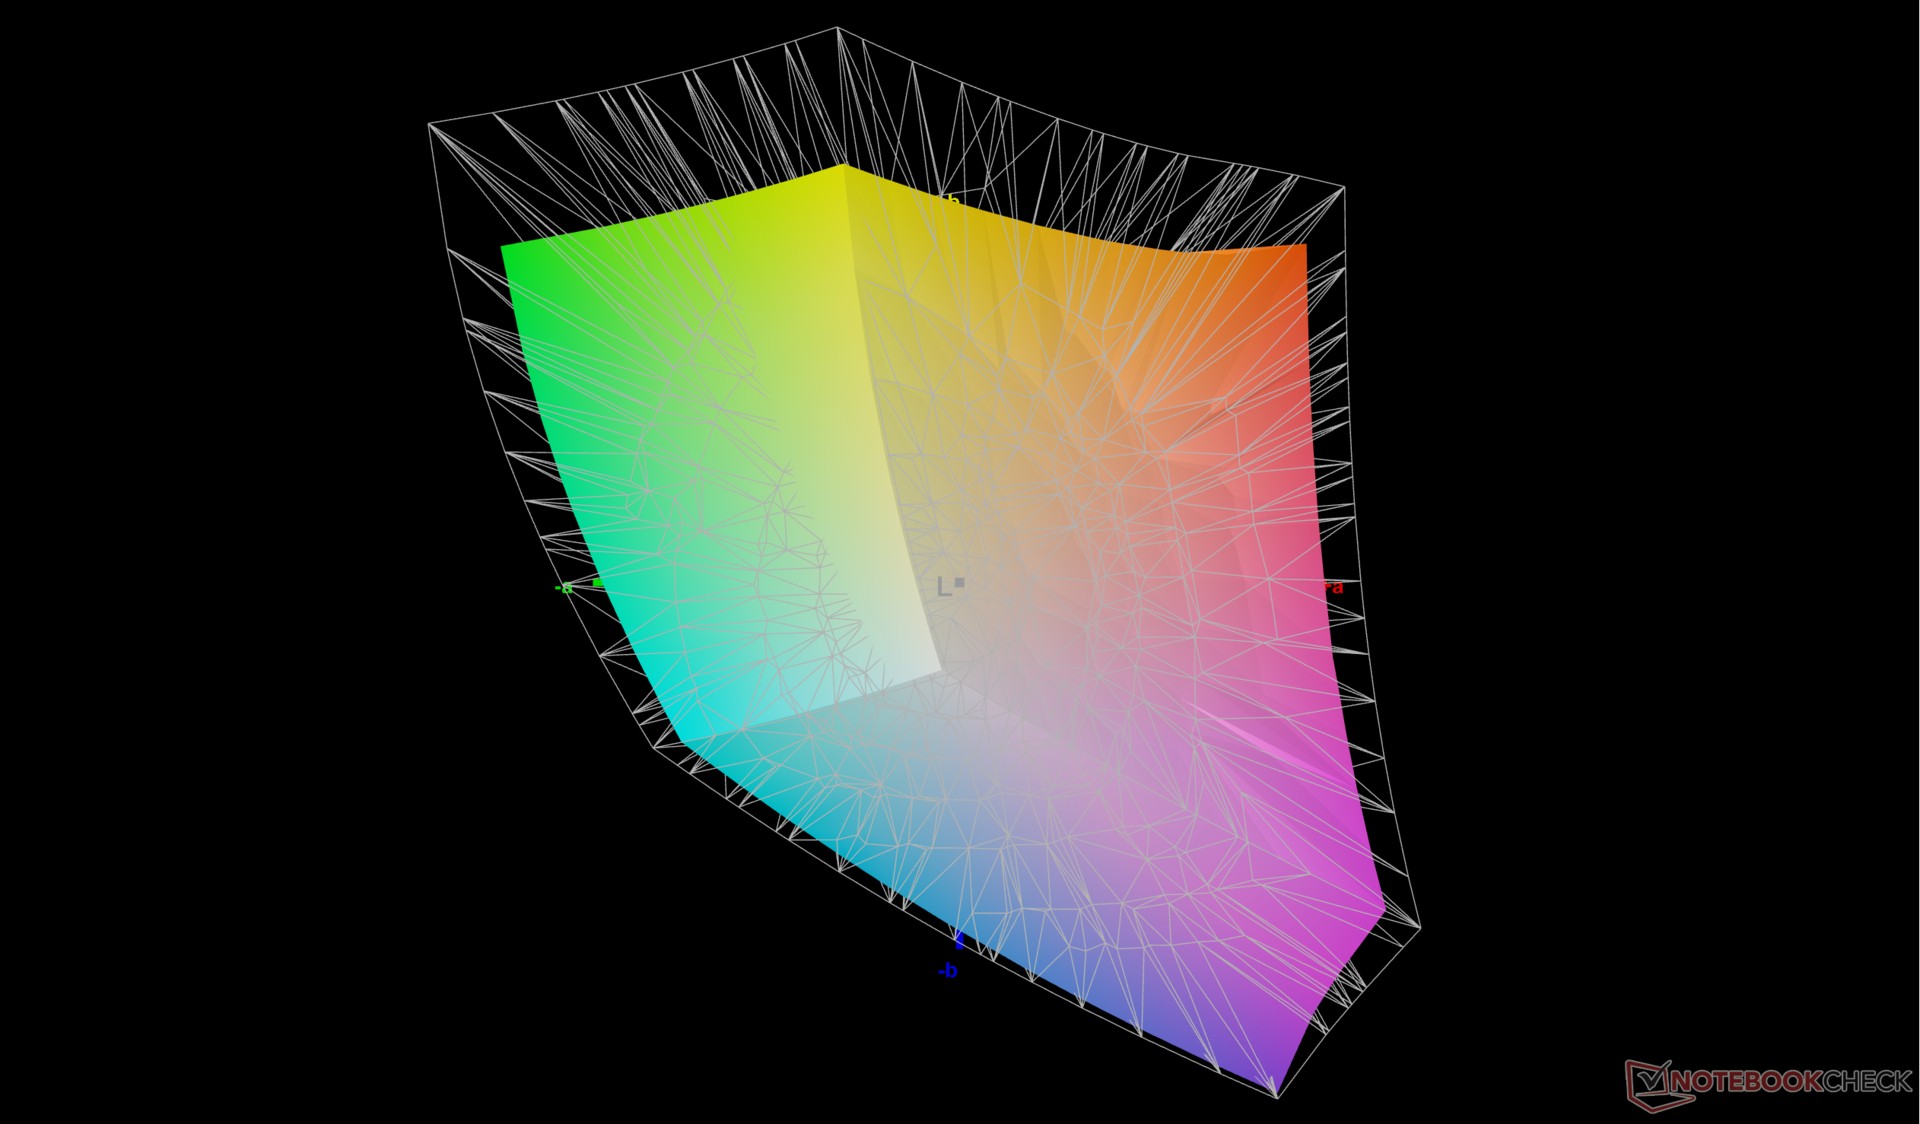
La pantalla viene bien calibrada de fábrica, con valores deltaE medios de escala de grises y color de sólo 1,7 y 2,1, respectivamente. El usuario final puede calibrarla, pero no es necesario.

Tiempos de respuesta del display
| ↔ Tiempo de respuesta de Negro a Blanco | ||
|---|---|---|
| 25.3 ms ... subida ↗ y bajada ↘ combinada | ↗ 12.6 ms subida | 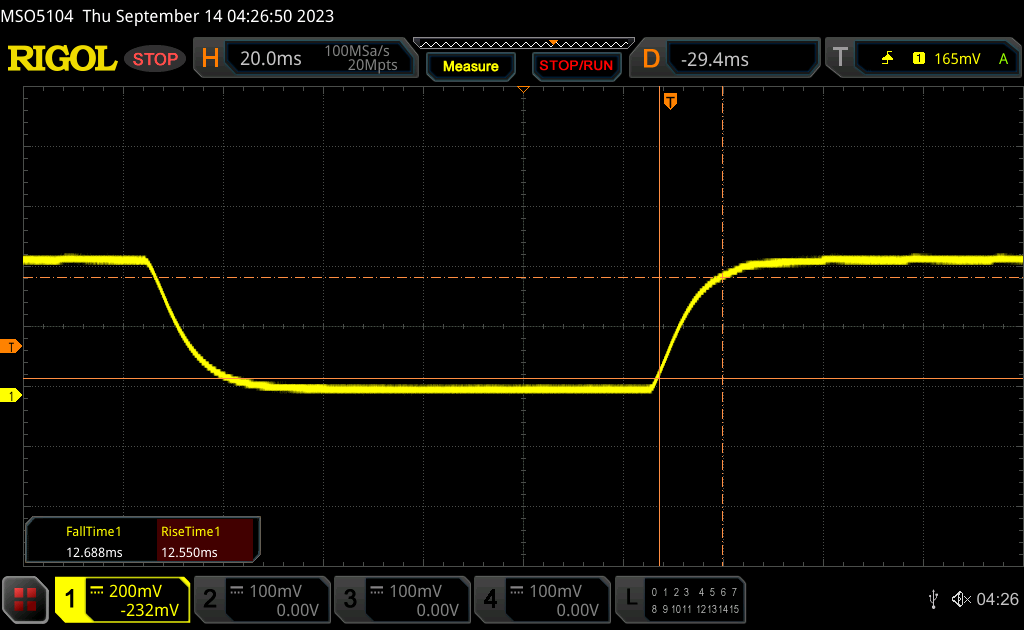 |
| ↘ 12.7 ms bajada | ||
| La pantalla mostró tiempos de respuesta relativamente lentos en nuestros tests pero podría ser demasiado lenta para los jugones. En comparación, todos los dispositivos de prueba van de ##min### (mínimo) a 240 (máximo) ms. » 61 % de todos los dispositivos son mejores. Eso quiere decir que el tiempo de respuesta es peor que la media (19.8 ms) de todos los dispositivos testados. | ||
| ↔ Tiempo de respuesta 50% Gris a 80% Gris | ||
| 43.9 ms ... subida ↗ y bajada ↘ combinada | ↗ 19.2 ms subida | 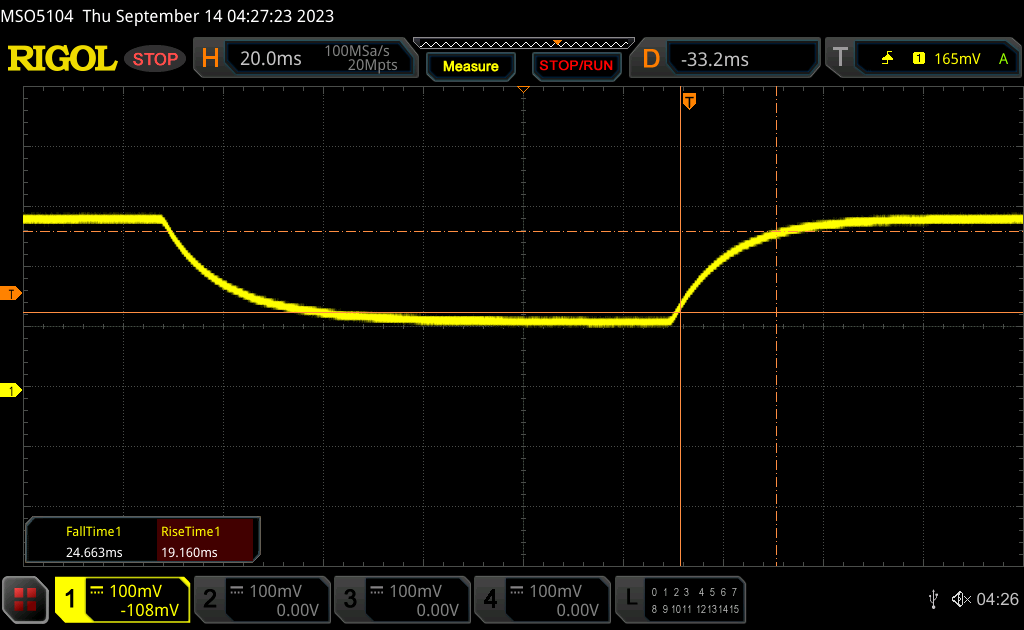 |
| ↘ 24.7 ms bajada | ||
| La pantalla mostró tiempos de respuesta lentos en nuestros tests y podría ser demasiado lenta para los jugones. En comparación, todos los dispositivos de prueba van de ##min### (mínimo) a 636 (máximo) ms. » 73 % de todos los dispositivos son mejores. Eso quiere decir que el tiempo de respuesta es peor que la media (31 ms) de todos los dispositivos testados. | ||
Parpadeo de Pantalla / PWM (Pulse-Width Modulation)
| Parpadeo de Pantalla / PWM no detectado | 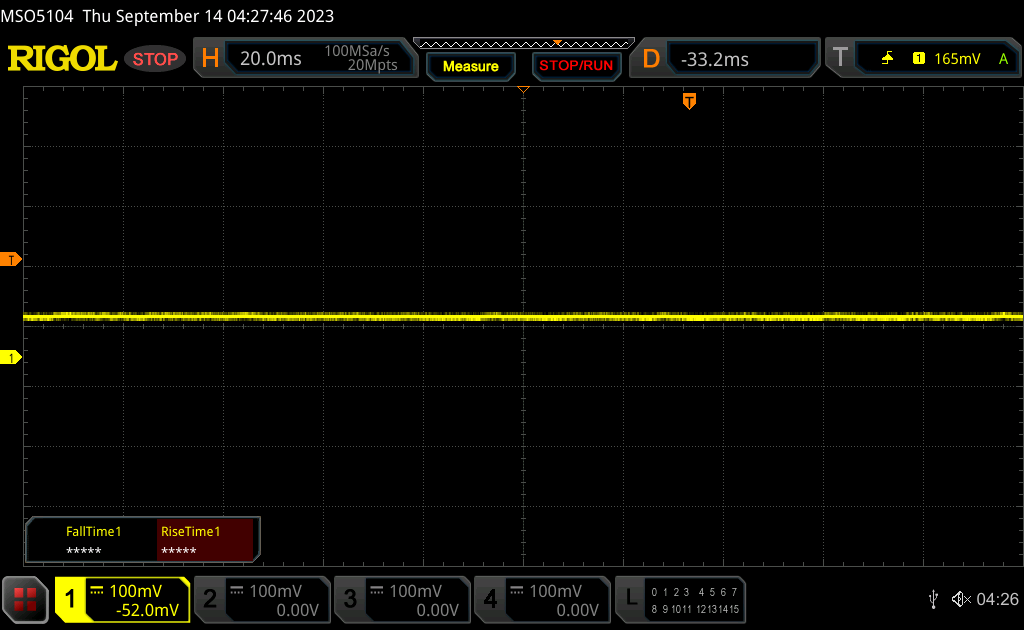 | ||
Comparación: 52 % de todos los dispositivos testados no usaron PWM para atenuar el display. Si se usó, medimos una media de 7747 (mínimo: 5 - máxmo: 343500) Hz. | |||
Rendimiento - 13ª generación Raptor Lake-H
Condiciones de ensayo
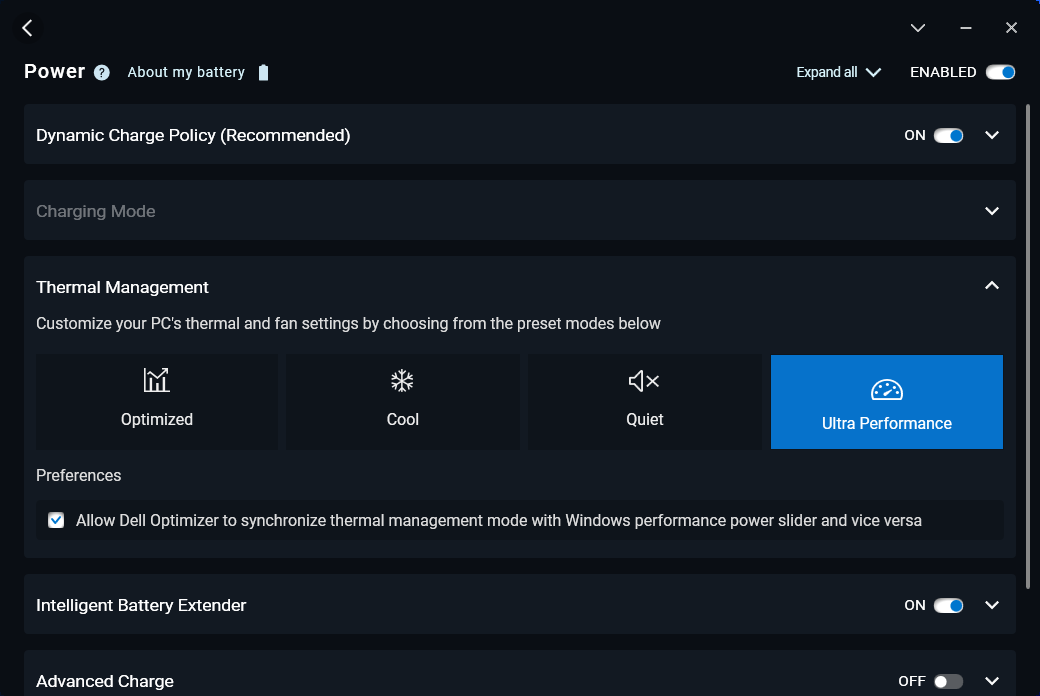
Configuramos nuestra unidad en modo Ultra Performance a través de Dell Optimizer antes de ejecutar los benchmarks que se muestran a continuación. Los perfiles de energía de Optimizer pueden sincronizarse con los perfiles de energía de Windows, a diferencia de la mayoría de portátiles.
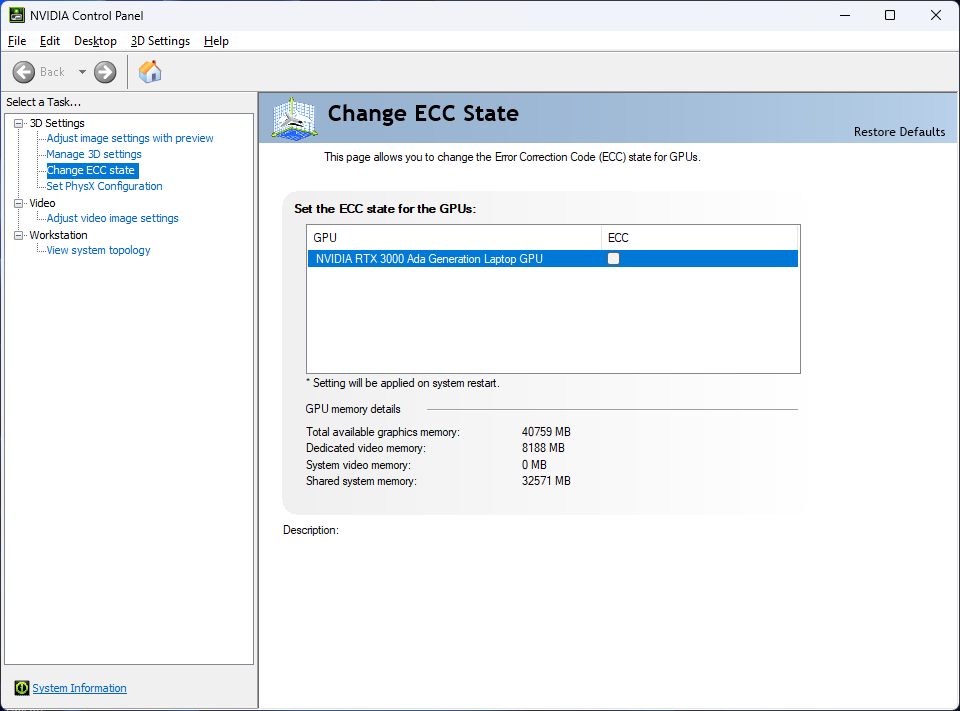
Advanced Optimus, MUX y G-Sync no son compatibles con la pantalla interna. El modo VRAM ECC puede activarse o desactivarse a través del panel de control de Nvidia, al igual que en otras GPU RTX para estaciones de trabajo de la generación Ada Lovelace.
Procesador
Nuestro Core i9-13900H ofrece un rendimiento multihilo entre un 25 y un 35 por ciento más rápido que el Core i9-12900H del Precision 5470 del año pasado. El notable aumento puede atribuirse al rendimiento Turbo Boost más estable del Precision 5480 en comparación con el Precision 5470, como muestran nuestros resultados de la prueba de bucle CineBench R15 xT a continuación.
El rendimiento medio sigue siendo más lento de lo esperado para un portátil con Core i9-13900H, probablemente debido al pequeño tamaño del Precision 5480. El mayor Precision 5680de mayor tamaño, por ejemplo, lleva la misma CPU y, sin embargo, rinde un 15 por ciento más rápido.
Cinebench R15 Multi Loop
Cinebench R23: Multi Core | Single Core
Cinebench R20: CPU (Multi Core) | CPU (Single Core)
Cinebench R15: CPU Multi 64Bit | CPU Single 64Bit
Blender: v2.79 BMW27 CPU
7-Zip 18.03: 7z b 4 | 7z b 4 -mmt1
Geekbench 5.5: Multi-Core | Single-Core
HWBOT x265 Benchmark v2.2: 4k Preset
LibreOffice : 20 Documents To PDF
R Benchmark 2.5: Overall mean
| CPU Performance rating | |
| Asus ExpertBook B6 Flip B6602FC2 | |
| Dell Precision 5000 5680 | |
| HP ZBook Fury 16 G9 | |
| Dell Precision 5480 | |
| Medio Intel Core i9-13900H | |
| Dell Precision 5000 5470 | |
| Lenovo ThinkPad P1 G4-20Y4Z9DVUS | |
| Lenovo ThinkPad P14s G3 AMD 21J6S05000 | |
| HP ZBook Firefly 14 G9-6B8A2EA | |
| Dell Precision 5000 5560 -2! | |
| Lenovo ThinkPad P15v G3 21EM001AGE | |
| Lenovo ThinkPad P15v G2 21A9000XGE -1! | |
| Cinebench R23 / Multi Core | |
| Asus ExpertBook B6 Flip B6602FC2 | |
| HP ZBook Fury 16 G9 | |
| Dell Precision 5000 5680 | |
| Medio Intel Core i9-13900H (11997 - 20385, n=28) | |
| Dell Precision 5480 | |
| Dell Precision 5000 5470 | |
| Lenovo ThinkPad P15v G3 21EM001AGE | |
| Lenovo ThinkPad P1 G4-20Y4Z9DVUS | |
| Lenovo ThinkPad P14s G3 AMD 21J6S05000 | |
| Lenovo ThinkPad P15v G2 21A9000XGE | |
| Dell Precision 5000 5560 | |
| HP ZBook Firefly 14 G9-6B8A2EA | |
| Cinebench R23 / Single Core | |
| Dell Precision 5000 5680 | |
| Dell Precision 5480 | |
| HP ZBook Fury 16 G9 | |
| Medio Intel Core i9-13900H (1297 - 2054, n=26) | |
| Asus ExpertBook B6 Flip B6602FC2 | |
| Dell Precision 5000 5470 | |
| HP ZBook Firefly 14 G9-6B8A2EA | |
| Lenovo ThinkPad P14s G3 AMD 21J6S05000 | |
| Dell Precision 5000 5560 | |
| Lenovo ThinkPad P1 G4-20Y4Z9DVUS | |
| Lenovo ThinkPad P15v G3 21EM001AGE | |
| Cinebench R20 / CPU (Multi Core) | |
| Asus ExpertBook B6 Flip B6602FC2 | |
| HP ZBook Fury 16 G9 | |
| Dell Precision 5000 5680 | |
| Medio Intel Core i9-13900H (4935 - 7716, n=25) | |
| Dell Precision 5480 | |
| Lenovo ThinkPad P15v G3 21EM001AGE | |
| Lenovo ThinkPad P15v G3 21EM001AGE | |
| Lenovo ThinkPad P1 G4-20Y4Z9DVUS | |
| Dell Precision 5000 5470 | |
| Lenovo ThinkPad P14s G3 AMD 21J6S05000 | |
| Dell Precision 5000 5560 | |
| Lenovo ThinkPad P15v G2 21A9000XGE | |
| HP ZBook Firefly 14 G9-6B8A2EA | |
| Cinebench R20 / CPU (Single Core) | |
| Dell Precision 5000 5680 | |
| Dell Precision 5480 | |
| HP ZBook Fury 16 G9 | |
| Asus ExpertBook B6 Flip B6602FC2 | |
| Medio Intel Core i9-13900H (428 - 792, n=25) | |
| Dell Precision 5000 5470 | |
| HP ZBook Firefly 14 G9-6B8A2EA | |
| Lenovo ThinkPad P14s G3 AMD 21J6S05000 | |
| Lenovo ThinkPad P1 G4-20Y4Z9DVUS | |
| Dell Precision 5000 5560 | |
| Lenovo ThinkPad P15v G3 21EM001AGE | |
| Lenovo ThinkPad P15v G3 21EM001AGE | |
| Lenovo ThinkPad P15v G2 21A9000XGE | |
| Cinebench R15 / CPU Multi 64Bit | |
| Asus ExpertBook B6 Flip B6602FC2 | |
| Medio Intel Core i9-13900H (2061 - 3100, n=26) | |
| HP ZBook Fury 16 G9 | |
| Dell Precision 5480 | |
| Dell Precision 5000 5680 | |
| Dell Precision 5000 5470 | |
| Lenovo ThinkPad P1 G4-20Y4Z9DVUS | |
| Lenovo ThinkPad P15v G3 21EM001AGE | |
| Lenovo ThinkPad P14s G3 AMD 21J6S05000 | |
| Lenovo ThinkPad P15v G2 21A9000XGE | |
| Dell Precision 5000 5560 | |
| HP ZBook Firefly 14 G9-6B8A2EA | |
| Cinebench R15 / CPU Single 64Bit | |
| Dell Precision 5000 5680 | |
| Dell Precision 5480 | |
| Asus ExpertBook B6 Flip B6602FC2 | |
| Medio Intel Core i9-13900H (211 - 297, n=26) | |
| HP ZBook Firefly 14 G9-6B8A2EA | |
| Dell Precision 5000 5470 | |
| Lenovo ThinkPad P14s G3 AMD 21J6S05000 | |
| Dell Precision 5000 5560 | |
| Lenovo ThinkPad P1 G4-20Y4Z9DVUS | |
| Lenovo ThinkPad P15v G2 21A9000XGE | |
| HP ZBook Fury 16 G9 | |
| Lenovo ThinkPad P15v G3 21EM001AGE | |
| Blender / v2.79 BMW27 CPU | |
| HP ZBook Firefly 14 G9-6B8A2EA | |
| Lenovo ThinkPad P15v G2 21A9000XGE | |
| Dell Precision 5000 5560 | |
| Lenovo ThinkPad P14s G3 AMD 21J6S05000 | |
| Lenovo ThinkPad P1 G4-20Y4Z9DVUS | |
| Dell Precision 5000 5470 | |
| Lenovo ThinkPad P15v G3 21EM001AGE | |
| Dell Precision 5480 | |
| Medio Intel Core i9-13900H (166 - 268, n=24) | |
| Dell Precision 5000 5680 | |
| Asus ExpertBook B6 Flip B6602FC2 | |
| HP ZBook Fury 16 G9 | |
| 7-Zip 18.03 / 7z b 4 | |
| HP ZBook Fury 16 G9 | |
| Asus ExpertBook B6 Flip B6602FC2 | |
| Dell Precision 5000 5680 | |
| Medio Intel Core i9-13900H (45045 - 79032, n=25) | |
| Dell Precision 5480 | |
| Lenovo ThinkPad P15v G3 21EM001AGE | |
| Dell Precision 5000 5470 | |
| Lenovo ThinkPad P1 G4-20Y4Z9DVUS | |
| Lenovo ThinkPad P14s G3 AMD 21J6S05000 | |
| Dell Precision 5000 5560 | |
| Lenovo ThinkPad P15v G2 21A9000XGE | |
| HP ZBook Firefly 14 G9-6B8A2EA | |
| 7-Zip 18.03 / 7z b 4 -mmt1 | |
| Asus ExpertBook B6 Flip B6602FC2 | |
| Dell Precision 5000 5680 | |
| Dell Precision 5480 | |
| Medio Intel Core i9-13900H (3665 - 6600, n=25) | |
| HP ZBook Fury 16 G9 | |
| Dell Precision 5000 5560 | |
| HP ZBook Firefly 14 G9-6B8A2EA | |
| Lenovo ThinkPad P1 G4-20Y4Z9DVUS | |
| Dell Precision 5000 5470 | |
| Lenovo ThinkPad P15v G3 21EM001AGE | |
| Lenovo ThinkPad P15v G2 21A9000XGE | |
| Lenovo ThinkPad P14s G3 AMD 21J6S05000 | |
| Geekbench 5.5 / Multi-Core | |
| Asus ExpertBook B6 Flip B6602FC2 | |
| Dell Precision 5000 5680 | |
| HP ZBook Fury 16 G9 | |
| Dell Precision 5480 | |
| Medio Intel Core i9-13900H (9094 - 15410, n=26) | |
| Dell Precision 5000 5470 | |
| HP ZBook Firefly 14 G9-6B8A2EA | |
| Lenovo ThinkPad P1 G4-20Y4Z9DVUS | |
| Lenovo ThinkPad P15v G3 21EM001AGE | |
| Lenovo ThinkPad P14s G3 AMD 21J6S05000 | |
| Lenovo ThinkPad P15v G2 21A9000XGE | |
| Geekbench 5.5 / Single-Core | |
| Dell Precision 5000 5680 | |
| HP ZBook Fury 16 G9 | |
| Dell Precision 5480 | |
| Medio Intel Core i9-13900H (1140 - 2043, n=26) | |
| Asus ExpertBook B6 Flip B6602FC2 | |
| Dell Precision 5000 5470 | |
| HP ZBook Firefly 14 G9-6B8A2EA | |
| Lenovo ThinkPad P1 G4-20Y4Z9DVUS | |
| Lenovo ThinkPad P14s G3 AMD 21J6S05000 | |
| Lenovo ThinkPad P15v G2 21A9000XGE | |
| Lenovo ThinkPad P15v G3 21EM001AGE | |
| HWBOT x265 Benchmark v2.2 / 4k Preset | |
| Asus ExpertBook B6 Flip B6602FC2 | |
| Dell Precision 5000 5680 | |
| HP ZBook Fury 16 G9 | |
| Medio Intel Core i9-13900H (14.1 - 22.3, n=25) | |
| Dell Precision 5480 | |
| Lenovo ThinkPad P1 G4-20Y4Z9DVUS | |
| Dell Precision 5000 5470 | |
| Lenovo ThinkPad P14s G3 AMD 21J6S05000 | |
| Lenovo ThinkPad P15v G3 21EM001AGE | |
| Dell Precision 5000 5560 | |
| Lenovo ThinkPad P15v G2 21A9000XGE | |
| HP ZBook Firefly 14 G9-6B8A2EA | |
| LibreOffice / 20 Documents To PDF | |
| Lenovo ThinkPad P15v G3 21EM001AGE | |
| Lenovo ThinkPad P14s G3 AMD 21J6S05000 | |
| Lenovo ThinkPad P15v G2 21A9000XGE | |
| Lenovo ThinkPad P1 G4-20Y4Z9DVUS | |
| Dell Precision 5000 5560 | |
| Medio Intel Core i9-13900H (34.4 - 82.8, n=25) | |
| Dell Precision 5000 5470 | |
| Dell Precision 5480 | |
| HP ZBook Firefly 14 G9-6B8A2EA | |
| Asus ExpertBook B6 Flip B6602FC2 | |
| Dell Precision 5000 5680 | |
| HP ZBook Fury 16 G9 | |
| R Benchmark 2.5 / Overall mean | |
| Lenovo ThinkPad P15v G2 21A9000XGE | |
| Lenovo ThinkPad P1 G4-20Y4Z9DVUS | |
| Dell Precision 5000 5560 | |
| Lenovo ThinkPad P14s G3 AMD 21J6S05000 | |
| Lenovo ThinkPad P15v G3 21EM001AGE | |
| HP ZBook Firefly 14 G9-6B8A2EA | |
| Dell Precision 5000 5470 | |
| Dell Precision 5480 | |
| Asus ExpertBook B6 Flip B6602FC2 | |
| Medio Intel Core i9-13900H (0.4052 - 0.723, n=25) | |
| HP ZBook Fury 16 G9 | |
| Dell Precision 5000 5680 | |
* ... más pequeño es mejor
AIDA64: FP32 Ray-Trace | FPU Julia | CPU SHA3 | CPU Queen | FPU SinJulia | FPU Mandel | CPU AES | CPU ZLib | FP64 Ray-Trace | CPU PhotoWorxx
| Performance rating | |
| Lenovo ThinkPad P15v G3 21EM001AGE | |
| Dell Precision 5480 | |
| Medio Intel Core i9-13900H | |
| Lenovo ThinkPad P14s G3 AMD 21J6S05000 | |
| Dell Precision 5000 5470 | |
| HP ZBook Firefly 14 G9-6B8A2EA | |
| AIDA64 / FP32 Ray-Trace | |
| Dell Precision 5480 | |
| Medio Intel Core i9-13900H (6788 - 19557, n=25) | |
| Lenovo ThinkPad P15v G3 21EM001AGE | |
| Dell Precision 5000 5470 | |
| Lenovo ThinkPad P14s G3 AMD 21J6S05000 | |
| HP ZBook Firefly 14 G9-6B8A2EA | |
| AIDA64 / FPU Julia | |
| Lenovo ThinkPad P15v G3 21EM001AGE | |
| Lenovo ThinkPad P14s G3 AMD 21J6S05000 | |
| Dell Precision 5480 | |
| Medio Intel Core i9-13900H (22551 - 95579, n=25) | |
| Dell Precision 5000 5470 | |
| HP ZBook Firefly 14 G9-6B8A2EA | |
| AIDA64 / CPU SHA3 | |
| Medio Intel Core i9-13900H (2491 - 4270, n=25) | |
| Dell Precision 5480 | |
| Lenovo ThinkPad P15v G3 21EM001AGE | |
| Dell Precision 5000 5470 | |
| Lenovo ThinkPad P14s G3 AMD 21J6S05000 | |
| HP ZBook Firefly 14 G9-6B8A2EA | |
| AIDA64 / CPU Queen | |
| Dell Precision 5480 | |
| Dell Precision 5000 5470 | |
| Medio Intel Core i9-13900H (65121 - 120936, n=25) | |
| Lenovo ThinkPad P15v G3 21EM001AGE | |
| Lenovo ThinkPad P14s G3 AMD 21J6S05000 | |
| HP ZBook Firefly 14 G9-6B8A2EA | |
| AIDA64 / FPU SinJulia | |
| Lenovo ThinkPad P15v G3 21EM001AGE | |
| Lenovo ThinkPad P14s G3 AMD 21J6S05000 | |
| Dell Precision 5480 | |
| Medio Intel Core i9-13900H (6108 - 11631, n=25) | |
| Dell Precision 5000 5470 | |
| HP ZBook Firefly 14 G9-6B8A2EA | |
| AIDA64 / FPU Mandel | |
| Lenovo ThinkPad P15v G3 21EM001AGE | |
| Lenovo ThinkPad P14s G3 AMD 21J6S05000 | |
| Dell Precision 5480 | |
| Medio Intel Core i9-13900H (11283 - 48474, n=25) | |
| Dell Precision 5000 5470 | |
| HP ZBook Firefly 14 G9-6B8A2EA | |
| AIDA64 / CPU AES | |
| Lenovo ThinkPad P15v G3 21EM001AGE | |
| Medio Intel Core i9-13900H (3691 - 149377, n=25) | |
| Dell Precision 5480 | |
| Lenovo ThinkPad P14s G3 AMD 21J6S05000 | |
| HP ZBook Firefly 14 G9-6B8A2EA | |
| Dell Precision 5000 5470 | |
| AIDA64 / CPU ZLib | |
| Medio Intel Core i9-13900H (789 - 1254, n=25) | |
| Dell Precision 5480 | |
| Lenovo ThinkPad P15v G3 21EM001AGE | |
| Lenovo ThinkPad P14s G3 AMD 21J6S05000 | |
| HP ZBook Firefly 14 G9-6B8A2EA | |
| Dell Precision 5000 5470 | |
| AIDA64 / FP64 Ray-Trace | |
| Medio Intel Core i9-13900H (3655 - 10716, n=25) | |
| Dell Precision 5480 | |
| Lenovo ThinkPad P15v G3 21EM001AGE | |
| Dell Precision 5000 5470 | |
| Lenovo ThinkPad P14s G3 AMD 21J6S05000 | |
| HP ZBook Firefly 14 G9-6B8A2EA | |
| AIDA64 / CPU PhotoWorxx | |
| Dell Precision 5480 | |
| Dell Precision 5000 5470 | |
| HP ZBook Firefly 14 G9-6B8A2EA | |
| Medio Intel Core i9-13900H (10871 - 50488, n=25) | |
| Lenovo ThinkPad P14s G3 AMD 21J6S05000 | |
| Lenovo ThinkPad P15v G3 21EM001AGE | |
Rendimiento del sistema
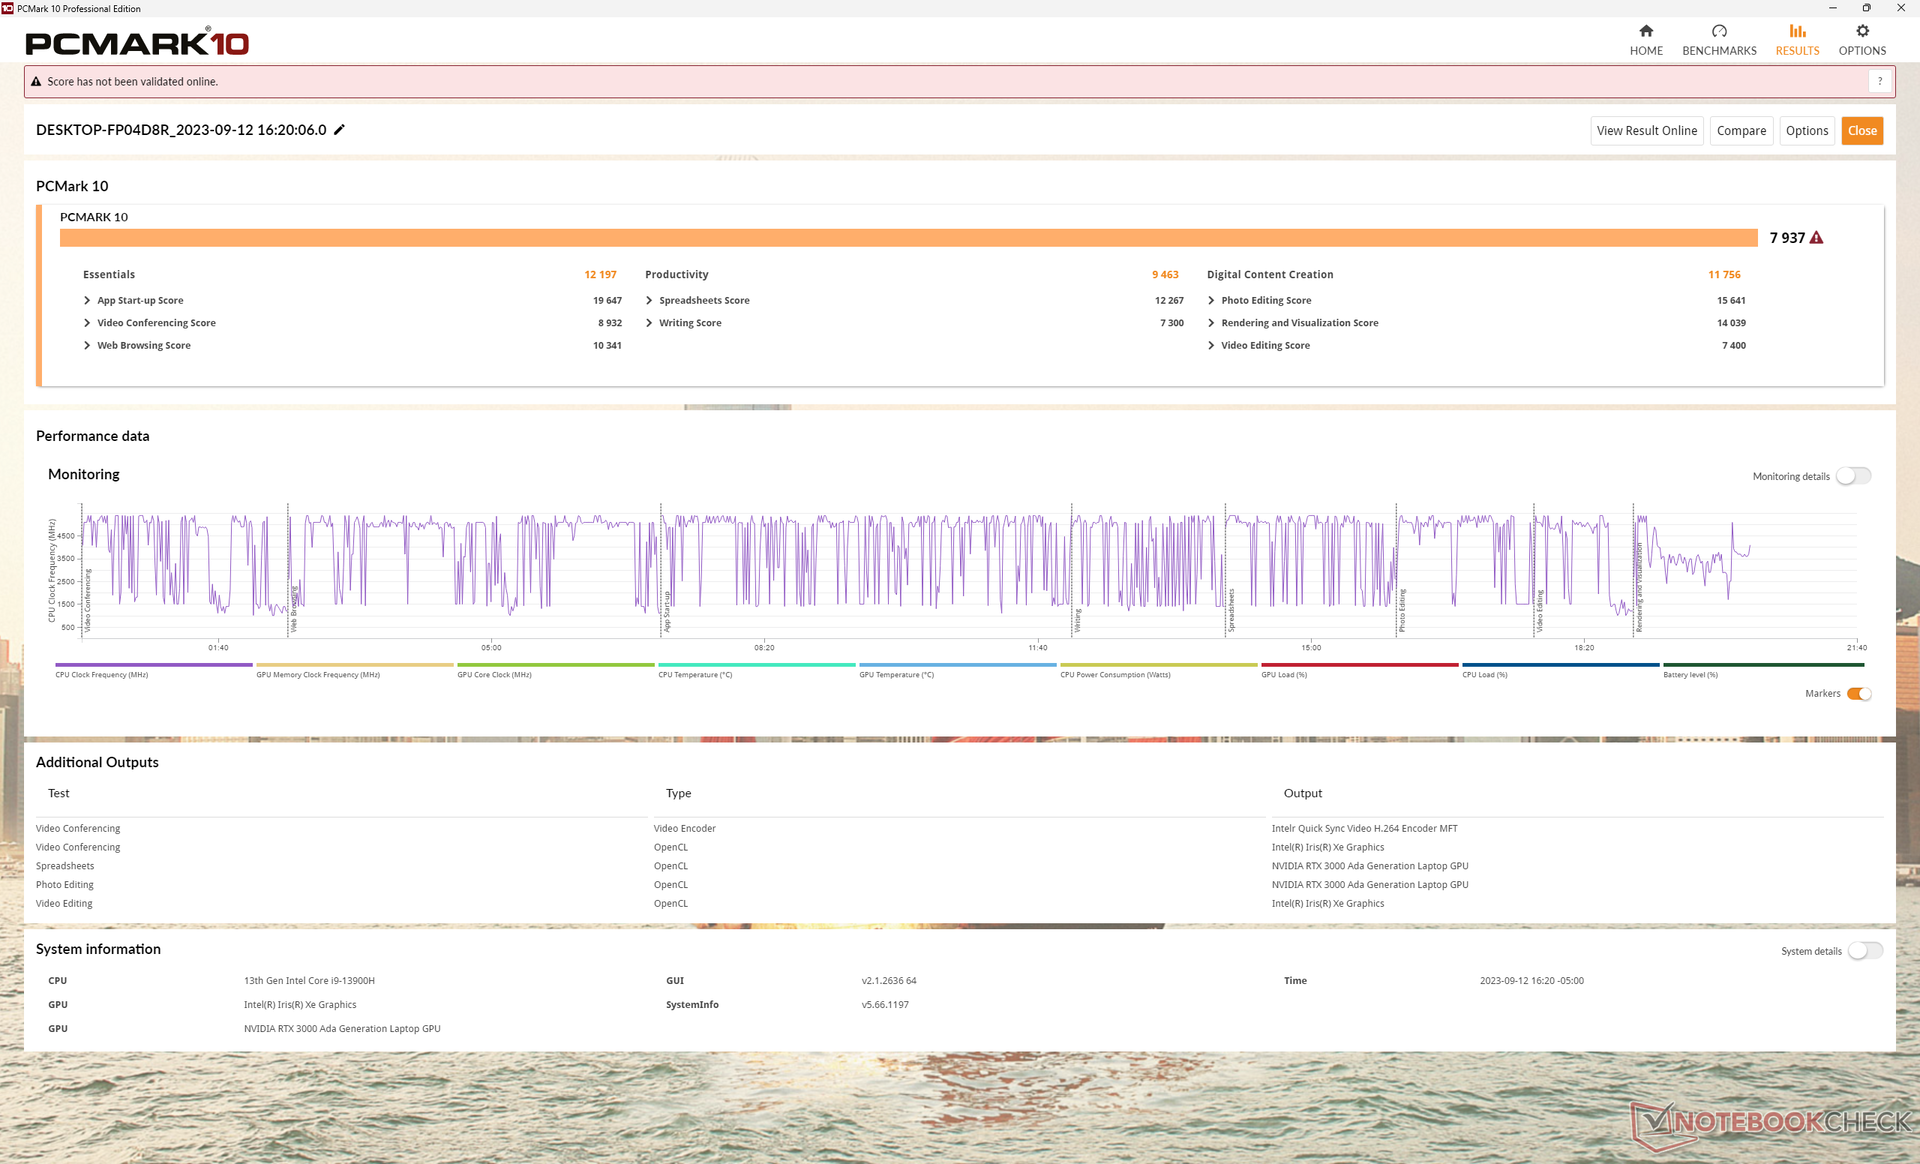
Las puntuaciones PCMark son superiores a las de otras estaciones de trabajo de 14 pulgadas que hemos probado hasta ahora. Gran parte de la ganancia puede atribuirse a la nueva GPU RTX 3000 Ada, que ofrece importantes ventajas de rendimiento respecto a las opciones Ampere del año pasado, como mostrará nuestra sección Rendimiento GPU más adelante.
CrossMark: Overall | Productivity | Creativity | Responsiveness
| PCMark 10 / Score | |
| Dell Precision 5480 | |
| Dell Precision 5000 5470 | |
| Dell Precision 5000 5560 | |
| Lenovo ThinkPad P15 G2-20YQ001JGE | |
| Lenovo ThinkPad P15v G3 21EM001AGE | |
| HP ZBook Firefly 14 G9-6B8A2EA | |
| Lenovo ThinkPad P14s G3 AMD 21J6S05000 | |
| PCMark 10 / Essentials | |
| Dell Precision 5480 | |
| Dell Precision 5000 5470 | |
| Dell Precision 5000 5560 | |
| Lenovo ThinkPad P15 G2-20YQ001JGE | |
| HP ZBook Firefly 14 G9-6B8A2EA | |
| Lenovo ThinkPad P15v G3 21EM001AGE | |
| Lenovo ThinkPad P14s G3 AMD 21J6S05000 | |
| PCMark 10 / Productivity | |
| HP ZBook Firefly 14 G9-6B8A2EA | |
| Dell Precision 5480 | |
| Dell Precision 5000 5560 | |
| Lenovo ThinkPad P15v G3 21EM001AGE | |
| Dell Precision 5000 5470 | |
| Lenovo ThinkPad P14s G3 AMD 21J6S05000 | |
| Lenovo ThinkPad P15 G2-20YQ001JGE | |
| PCMark 10 / Digital Content Creation | |
| Dell Precision 5480 | |
| Dell Precision 5000 5470 | |
| Lenovo ThinkPad P15 G2-20YQ001JGE | |
| Lenovo ThinkPad P15v G3 21EM001AGE | |
| Dell Precision 5000 5560 | |
| Lenovo ThinkPad P14s G3 AMD 21J6S05000 | |
| HP ZBook Firefly 14 G9-6B8A2EA | |
| CrossMark / Overall | |
| Dell Precision 5480 | |
| Dell Precision 5000 5470 | |
| HP ZBook Firefly 14 G9-6B8A2EA | |
| Lenovo ThinkPad P15v G3 21EM001AGE | |
| Lenovo ThinkPad P14s G3 AMD 21J6S05000 | |
| CrossMark / Productivity | |
| Dell Precision 5480 | |
| Dell Precision 5000 5470 | |
| HP ZBook Firefly 14 G9-6B8A2EA | |
| Lenovo ThinkPad P15v G3 21EM001AGE | |
| Lenovo ThinkPad P14s G3 AMD 21J6S05000 | |
| CrossMark / Creativity | |
| Dell Precision 5480 | |
| Dell Precision 5000 5470 | |
| HP ZBook Firefly 14 G9-6B8A2EA | |
| Lenovo ThinkPad P15v G3 21EM001AGE | |
| Lenovo ThinkPad P14s G3 AMD 21J6S05000 | |
| CrossMark / Responsiveness | |
| Dell Precision 5480 | |
| Dell Precision 5000 5470 | |
| HP ZBook Firefly 14 G9-6B8A2EA | |
| Lenovo ThinkPad P15v G3 21EM001AGE | |
| Lenovo ThinkPad P14s G3 AMD 21J6S05000 | |
| PCMark 10 Score | 7937 puntos | |
ayuda | ||
| AIDA64 / Memory Copy | |
| Dell Precision 5480 | |
| Dell Precision 5000 5470 | |
| Medio Intel Core i9-13900H (37448 - 74486, n=25) | |
| HP ZBook Firefly 14 G9-6B8A2EA | |
| Lenovo ThinkPad P14s G3 AMD 21J6S05000 | |
| Lenovo ThinkPad P15v G3 21EM001AGE | |
| AIDA64 / Memory Read | |
| Dell Precision 5000 5470 | |
| Dell Precision 5480 | |
| HP ZBook Firefly 14 G9-6B8A2EA | |
| Medio Intel Core i9-13900H (41599 - 75433, n=25) | |
| Lenovo ThinkPad P14s G3 AMD 21J6S05000 | |
| Lenovo ThinkPad P15v G3 21EM001AGE | |
| AIDA64 / Memory Write | |
| Dell Precision 5480 | |
| Medio Intel Core i9-13900H (36152 - 88505, n=25) | |
| HP ZBook Firefly 14 G9-6B8A2EA | |
| Dell Precision 5000 5470 | |
| Lenovo ThinkPad P14s G3 AMD 21J6S05000 | |
| Lenovo ThinkPad P15v G3 21EM001AGE | |
| AIDA64 / Memory Latency | |
| Lenovo ThinkPad P14s G3 AMD 21J6S05000 | |
| Dell Precision 5000 5470 | |
| Lenovo ThinkPad P15v G3 21EM001AGE | |
| Dell Precision 5480 | |
| Medio Intel Core i9-13900H (75.8 - 102.3, n=25) | |
| HP ZBook Firefly 14 G9-6B8A2EA | |
* ... más pequeño es mejor
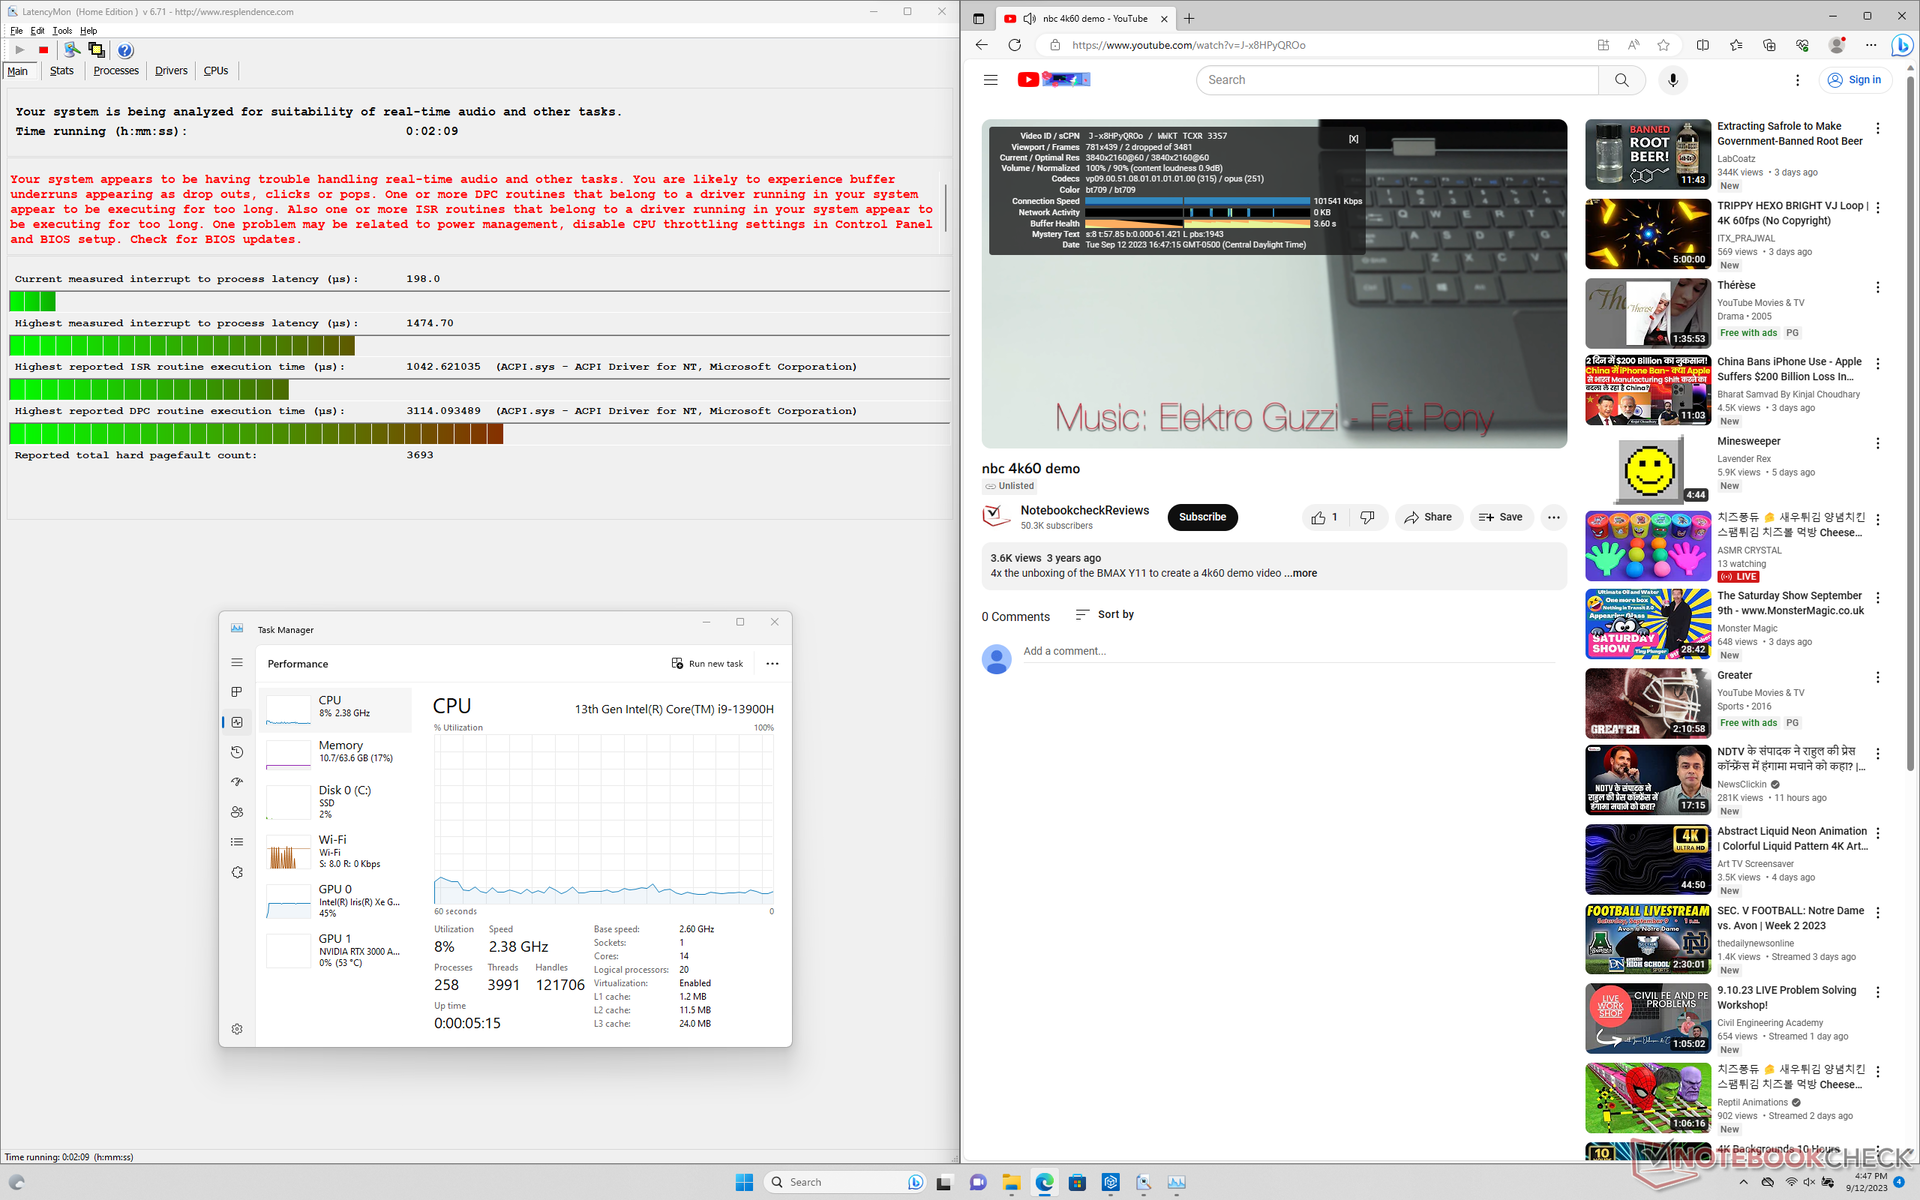
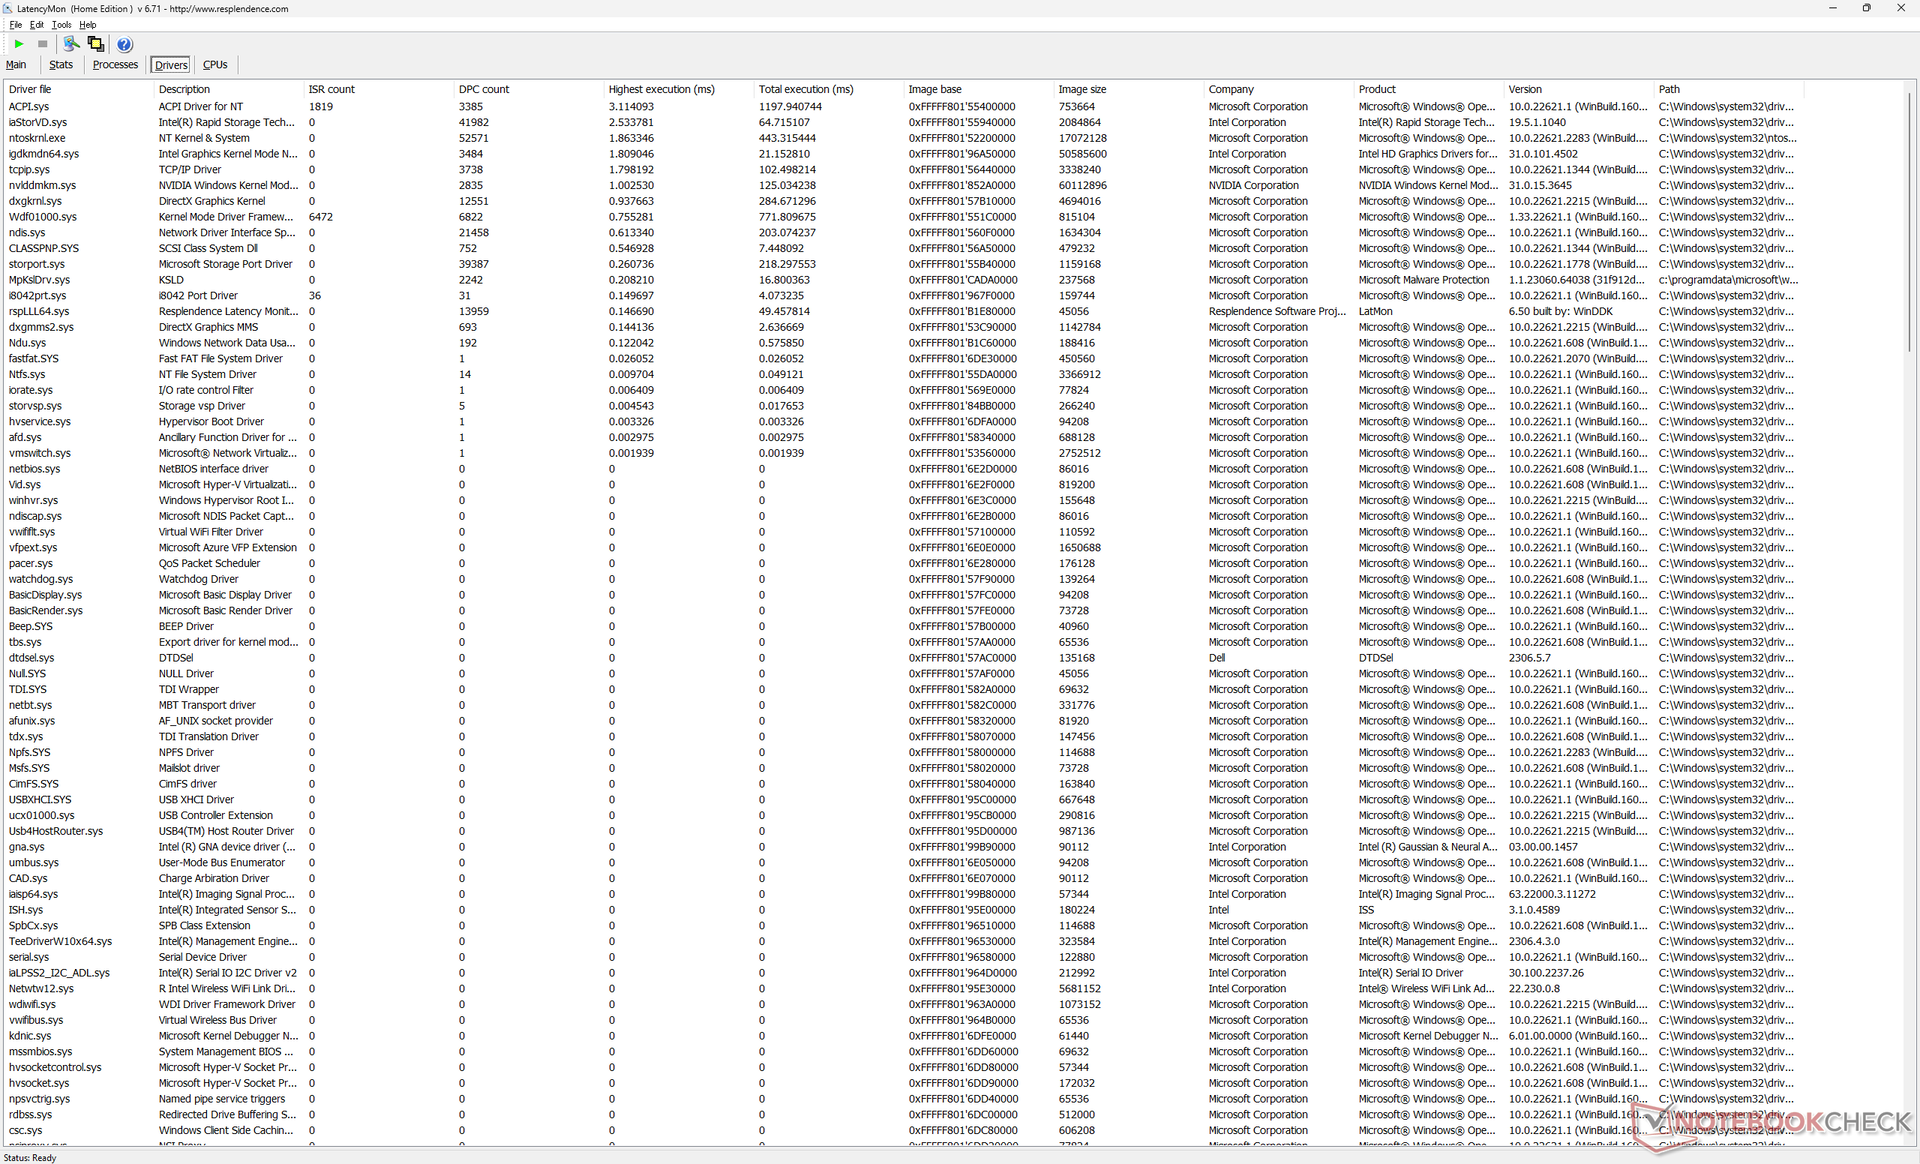
Latencia del CPD
LatencyMon revela problemas de CPD al abrir varias pestañas de nuestra página de inicio. También pudimos grabar dos fotogramas perdidos durante un vídeo 4K60 de un minuto de duración, algo lamentable de ver en una estación de trabajo móvil.
| DPC Latencies / LatencyMon - interrupt to process latency (max), Web, Youtube, Prime95 | |
| Dell Precision 5480 | |
| Dell Precision 5000 5470 | |
| Lenovo ThinkPad P14s G3 AMD 21J6S05000 | |
| Dell Precision 5000 5560 | |
| Lenovo ThinkPad P15v G3 21EM001AGE | |
* ... más pequeño es mejor
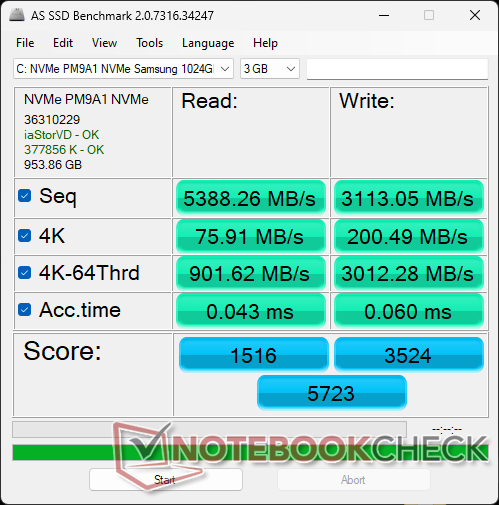
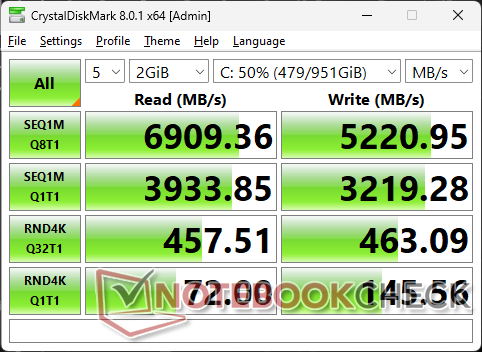
Dispositivos de almacenamiento
Dell parece estar utilizando Samsung PM9A1 SSDs para la mayoría de sus modelos Precision incluyendo los Precision 5470 y 5560. Las tasas de transferencia máximas son estables en torno a los 6900 MB/s sin problemas de ralentización.
Las unidades con autocifrado son opcionales en Dell, pero el modelo sólo admite un SSD interno.

| Drive Performance rating - Percent | |
| Lenovo ThinkPad P14s G3 AMD 21J6S05000 | |
| Medio Samsung PM9A1 MZVL21T0HCLR | |
| Dell Precision 5000 5560 | |
| Dell Precision 5480 | |
| Lenovo ThinkPad P15v G3 21EM001AGE | |
| Dell Precision 5000 5470 | |
| HP ZBook Firefly 14 G9-6B8A2EA -11! | |
* ... más pequeño es mejor
Disk Throttling: DiskSpd Read Loop, Queue Depth 8
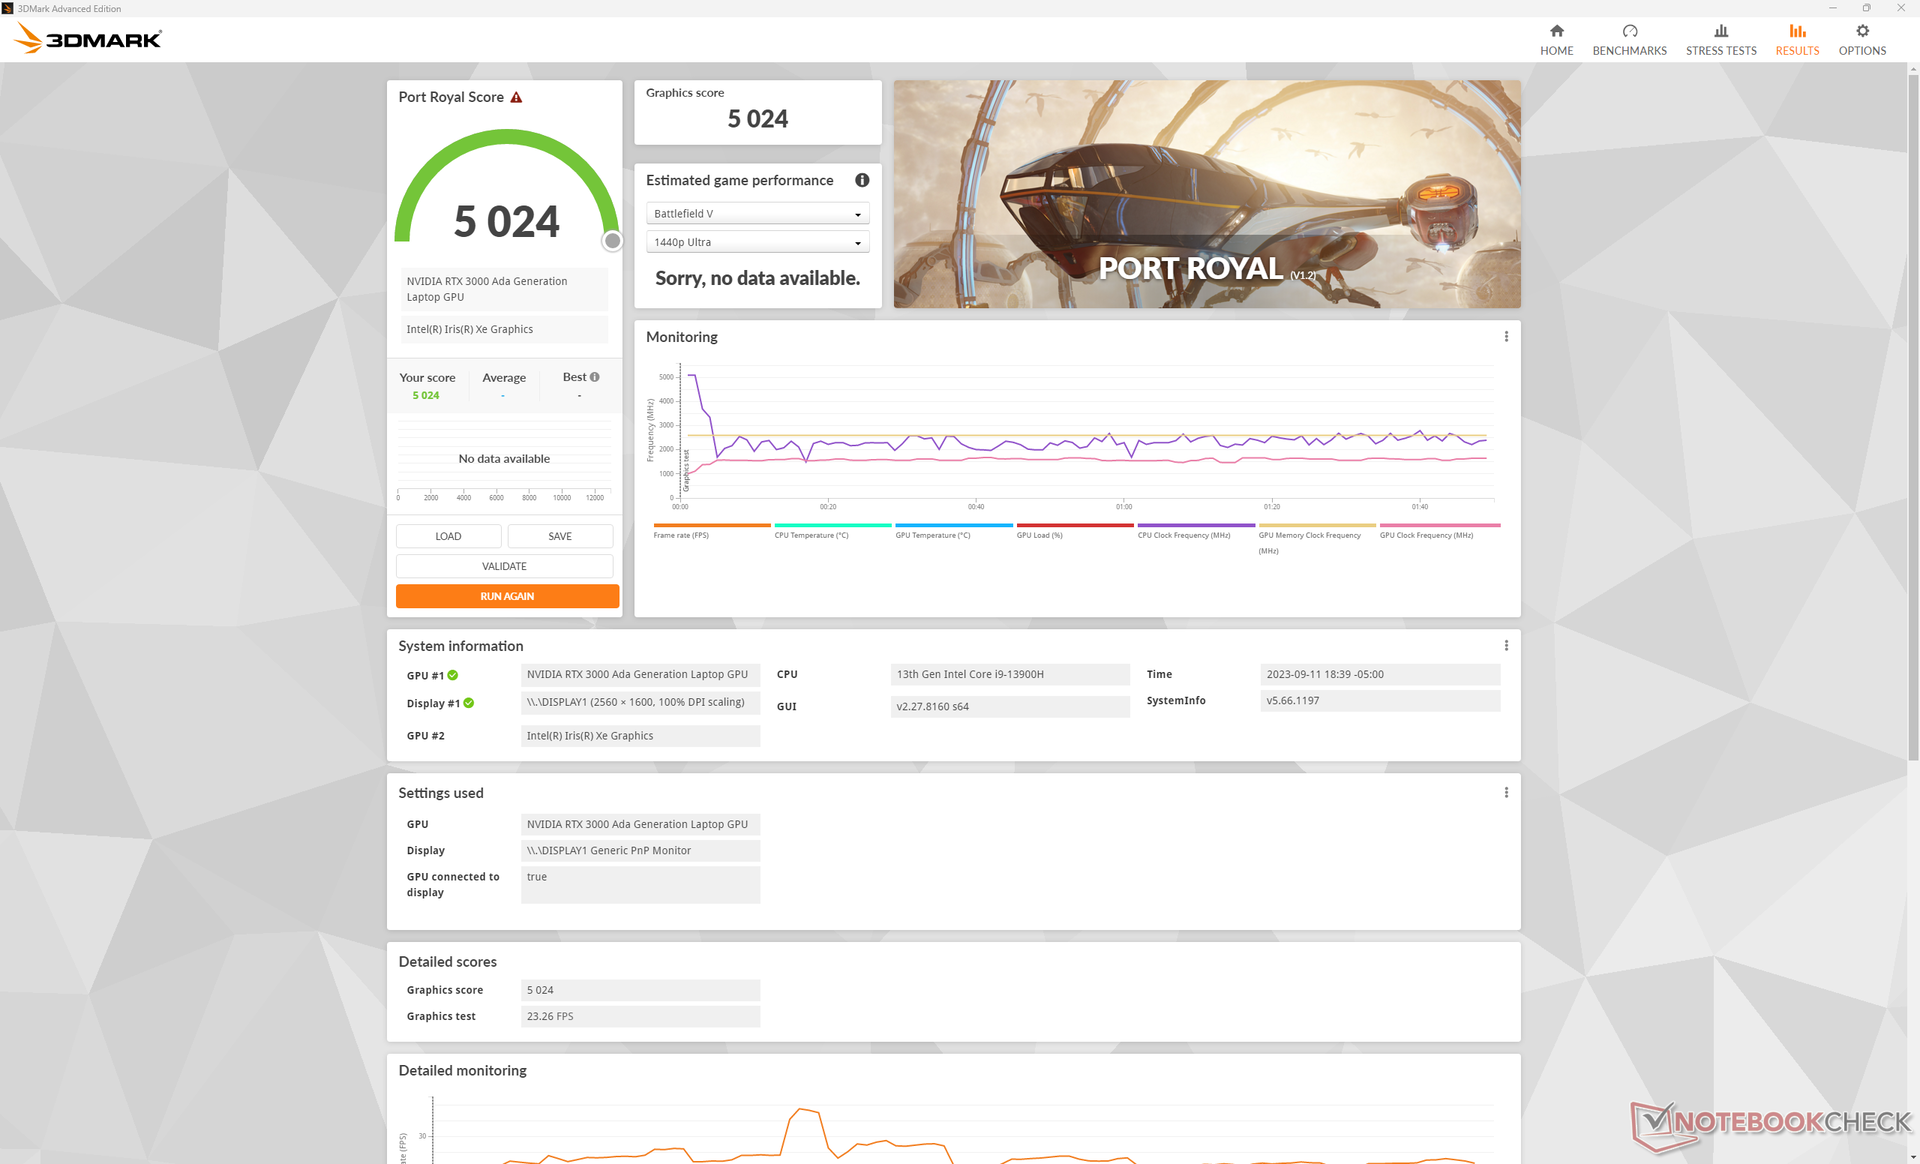
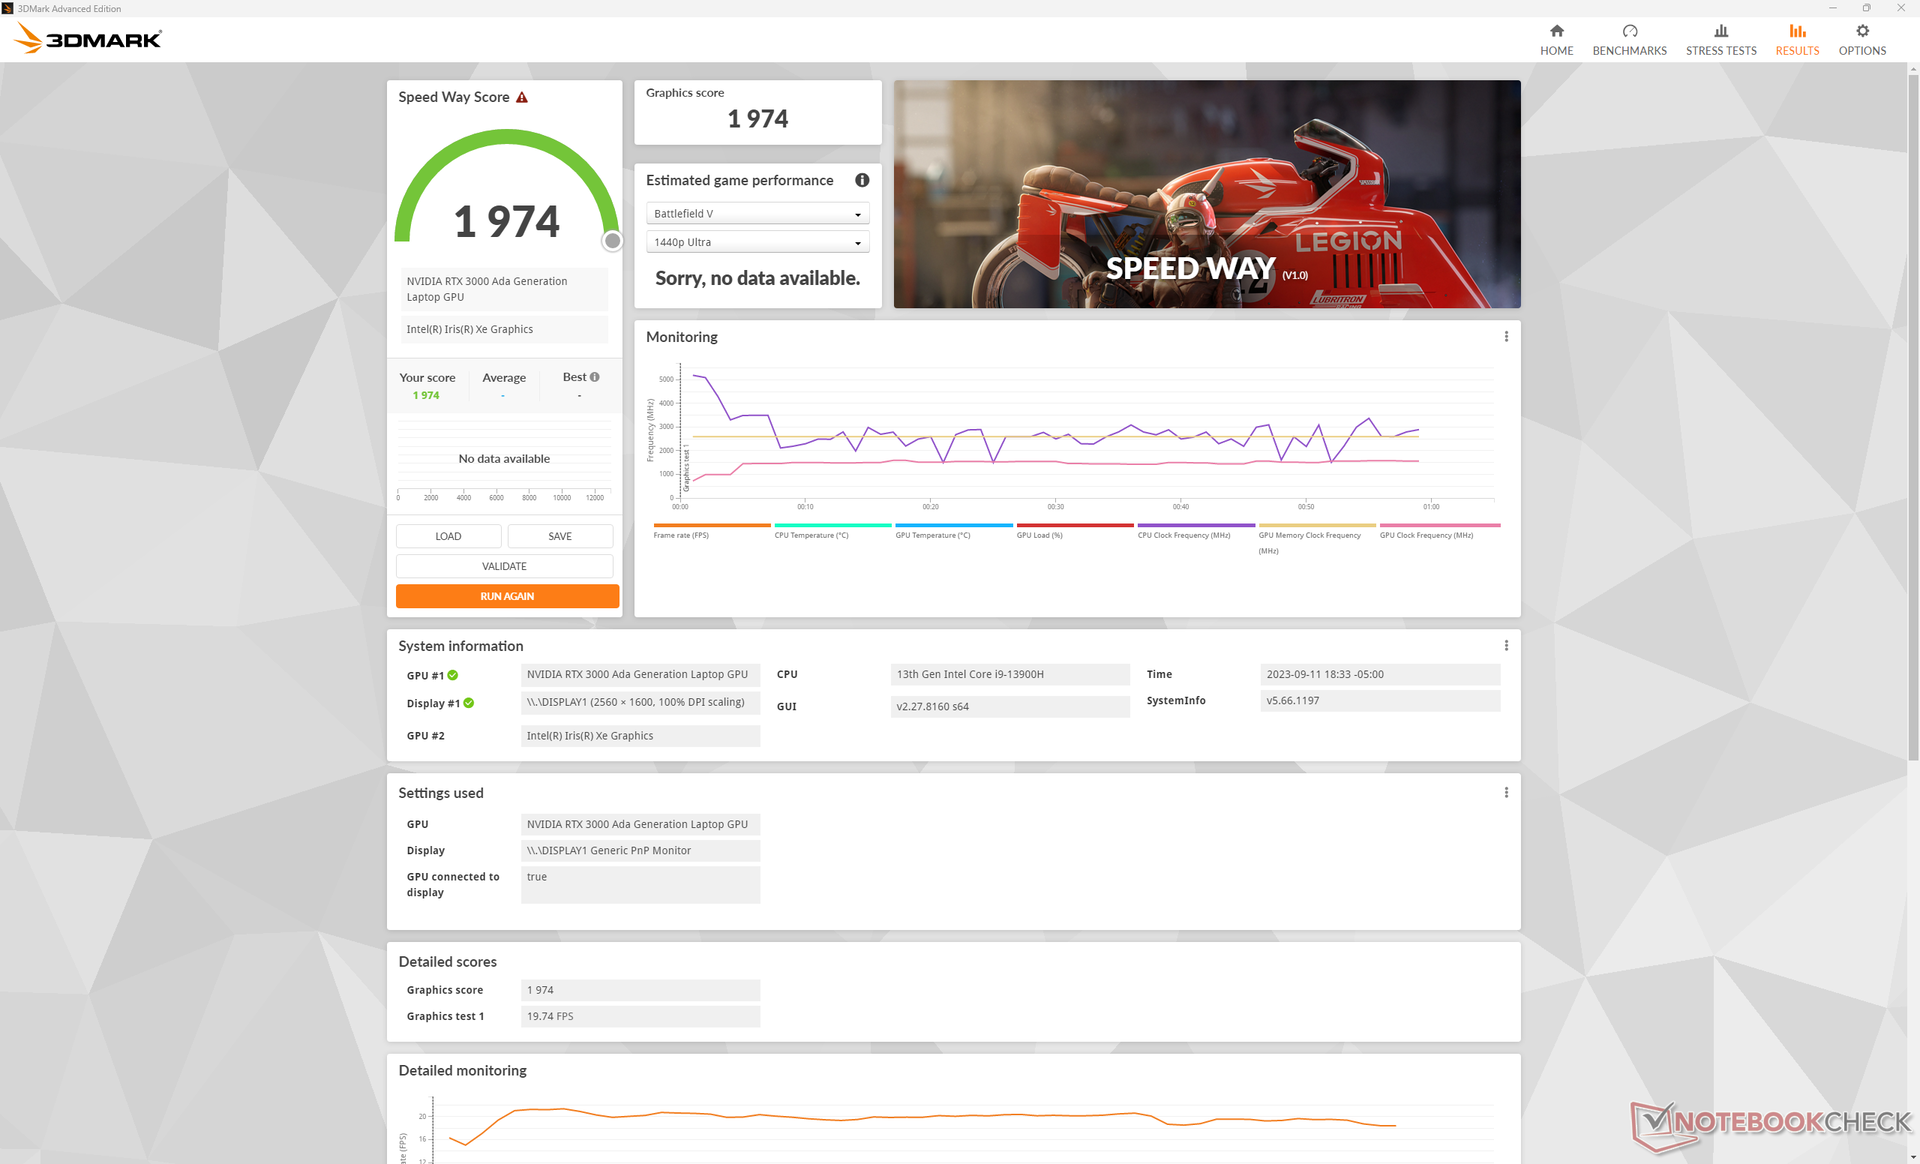
Rendimiento de la GPU
El sitio RTX 3000 Ada es entre un 60 y un 80 por ciento más rápido que el RTX A1000 de la Precision 5470 del año pasado o entre un 10 y un 15 por ciento más rápida que la RTX A3000 a la que sustituye directamente. La nueva GPU alcanza un TGP ligeramente superior de 50 W, mientras que la GPU de la Precision 5470 estaba limitada a 40 W.
La RTX A1000 de la generación anterior sigue siendo configurable en la Precision 5480, pero la RTX 3000 Ada es muy recomendable por sus importantes mejoras de rendimiento. La nueva GPU Ada está sólo un poco por detrás de la antigua amperio RTX A5500 que se encuentran en estaciones de trabajo mucho más grandes como laHP ZBook Fury 16 G9.
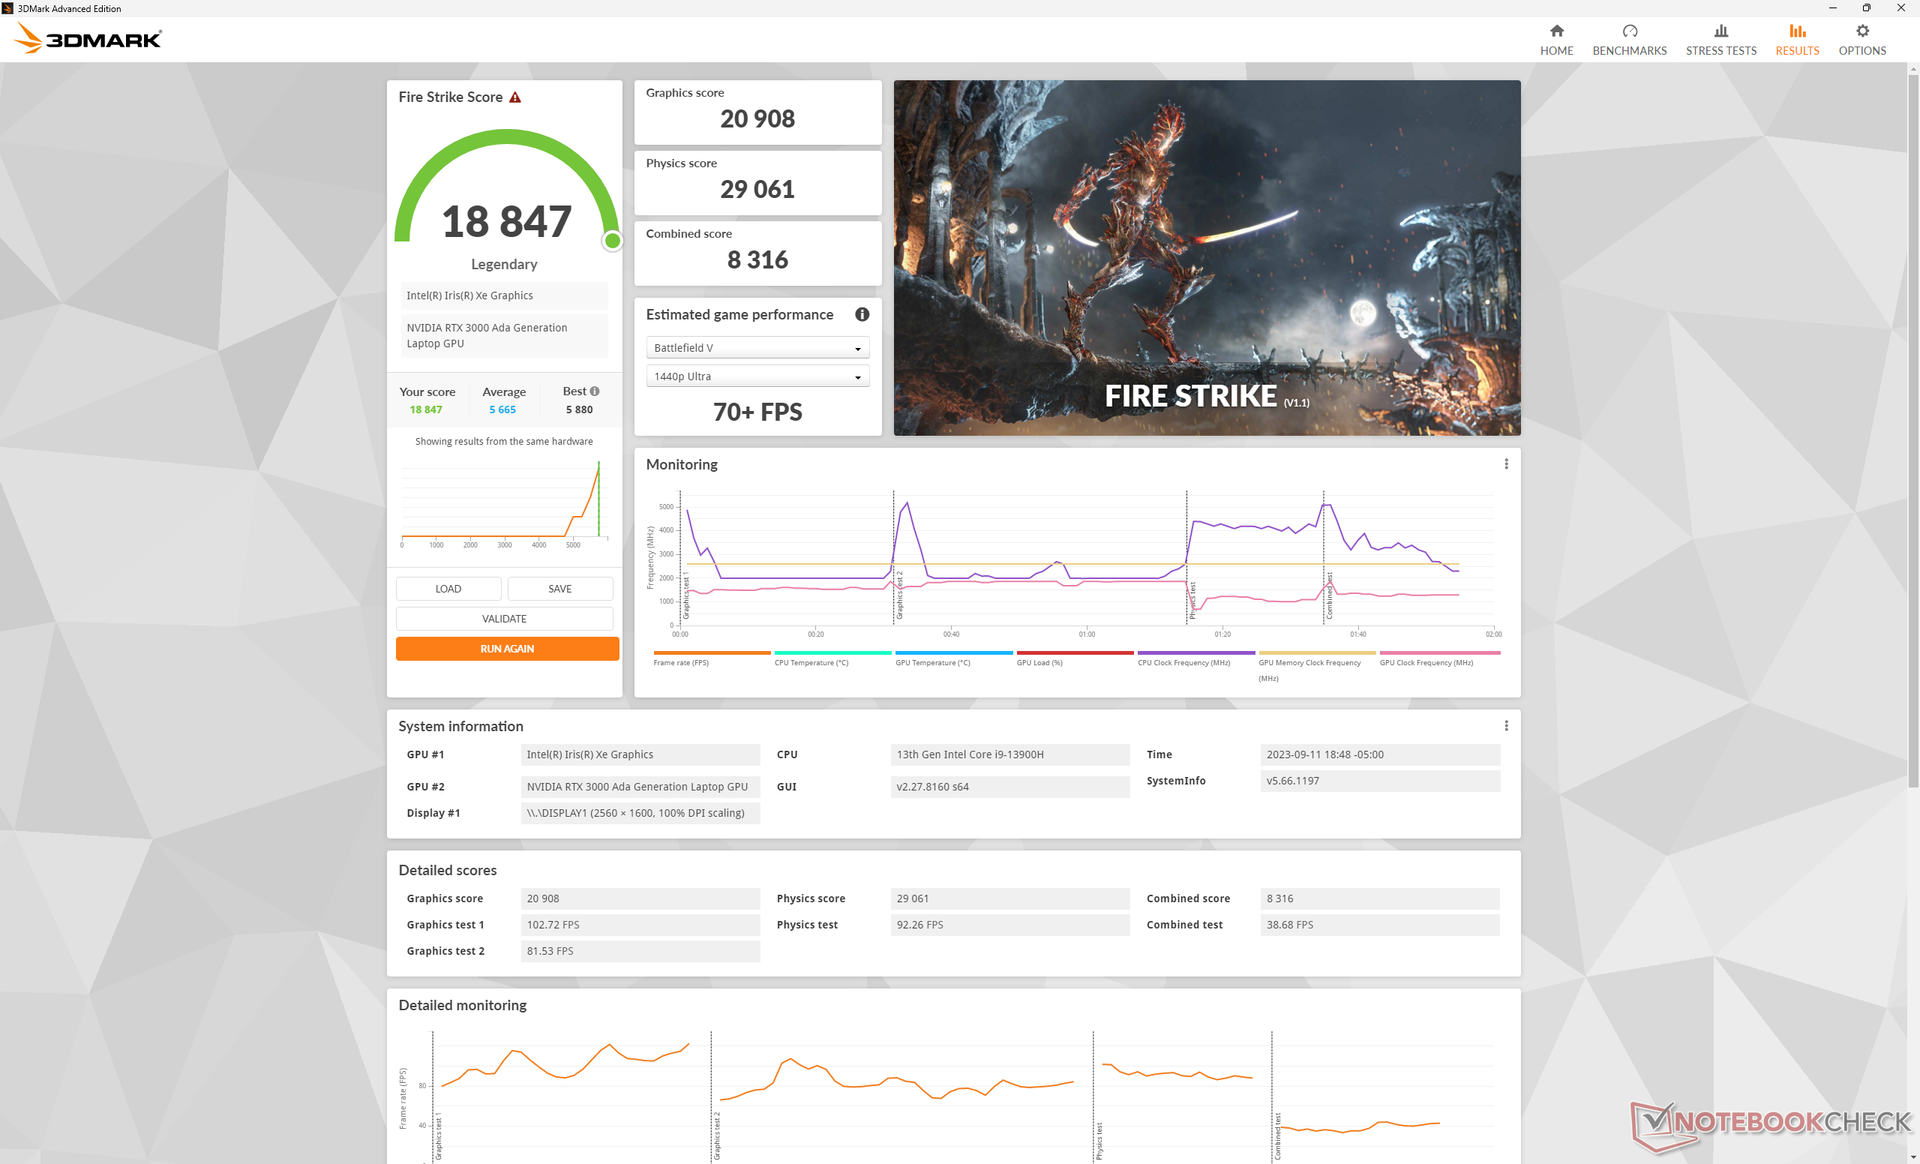
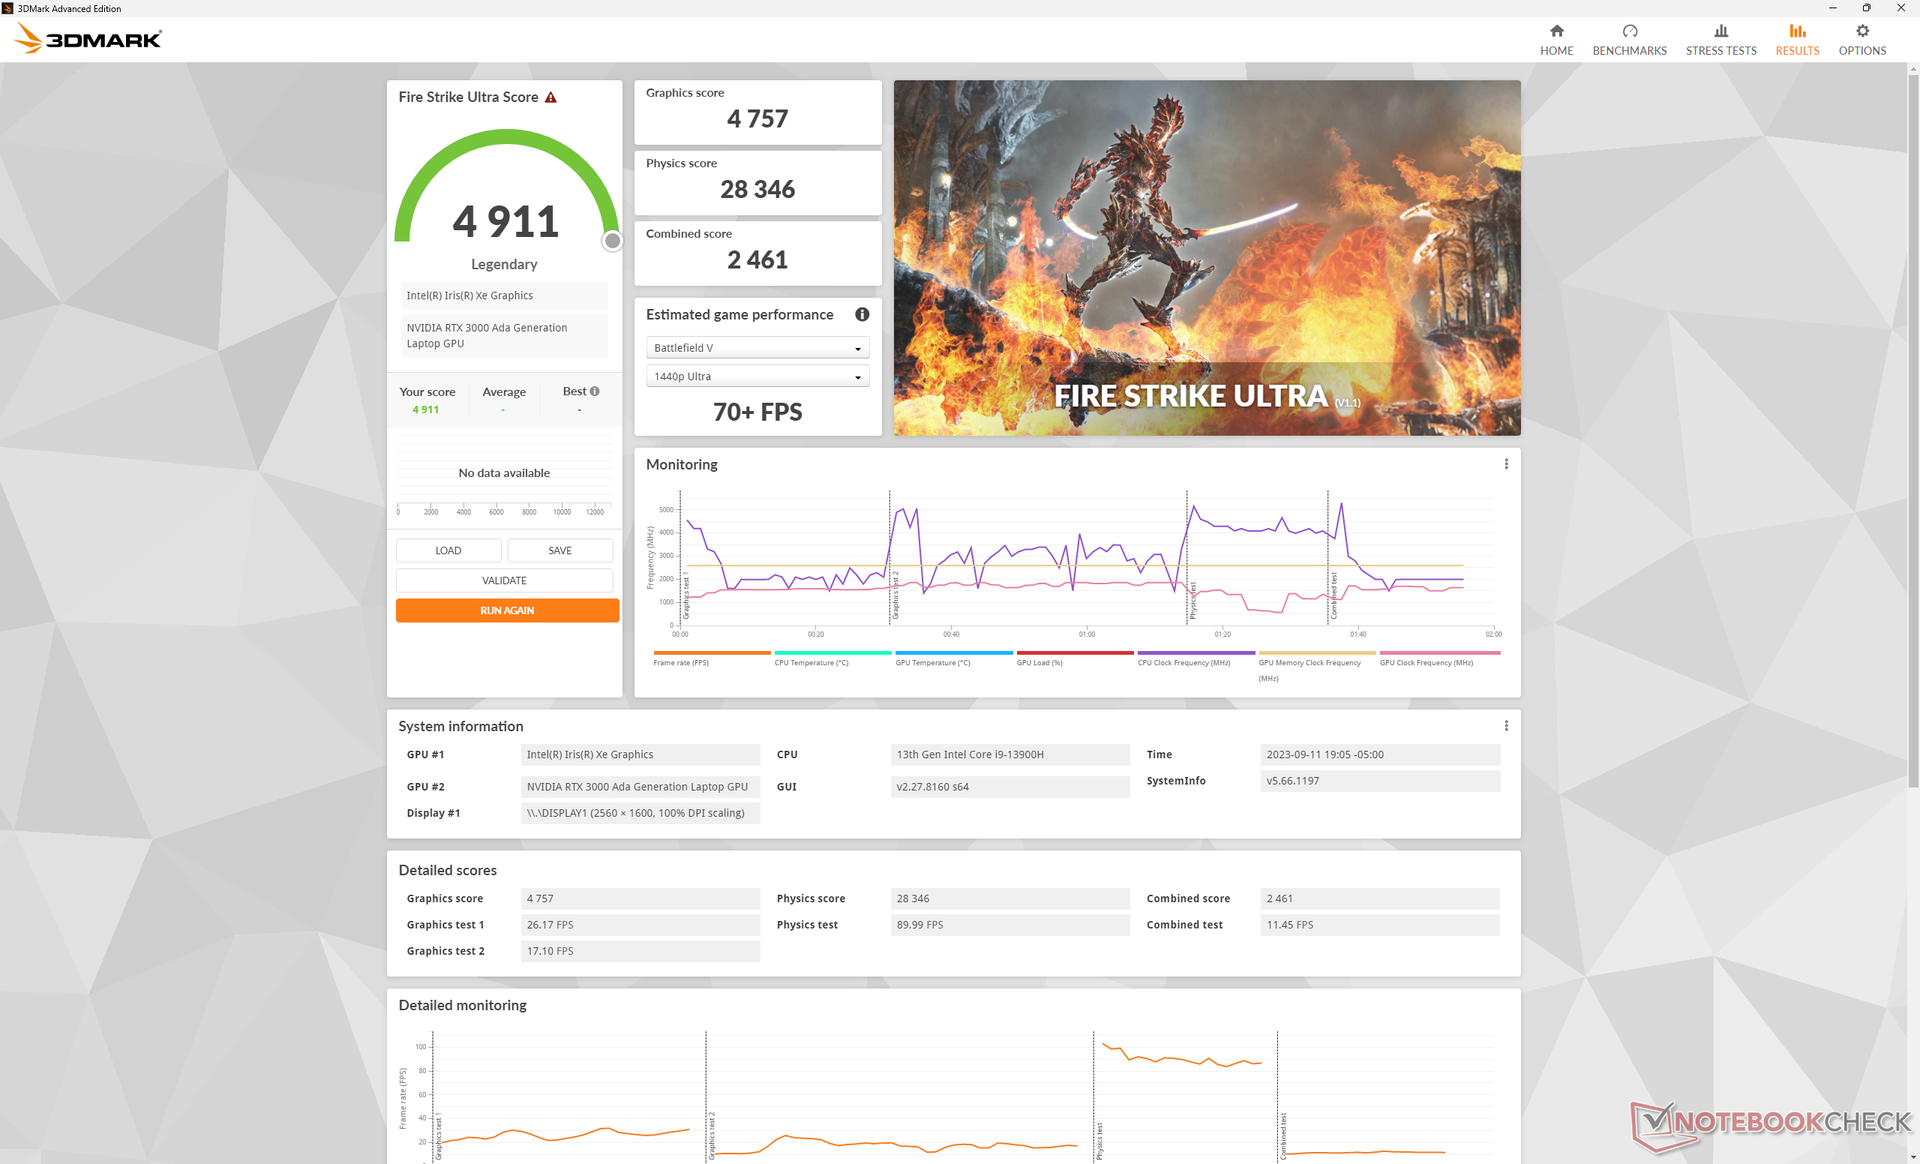
Ejecutar en modo equilibrado afecta más al rendimiento de la CPU que al de la GPU, como muestran nuestros resultados de Fire Strike en la tabla siguiente. Los déficits son relativamente menores y se sitúan en puntos porcentuales de un solo dígito incluso si se ejecuta en modo batería.
Curiosamente, dos subpruebas de SpecViewPerf 12 (energía y medicina) siempre se bloqueaban en nuestra unidad, por lo que estas puntuaciones se han omitido de los gráficos siguientes.
| Perfil de energía | Puntuación física | Puntuación de gráficos | Puntuación combinada |
| Modo Rendimiento | 29061 | 20908 | 8316 |
| Modo equilibrado | 26880 (-8%) | 20411 (-2%) | 7633 (-8%) |
| Modo batería | 27852 (-4%) | 19755 (-6%) | 7569 (-9%) |
| 3DMark 11 - 1280x720 Performance GPU | |
| Dell Precision 5000 5680 | |
| HP ZBook Fury 16 G9 | |
| Medio NVIDIA RTX 3000 Ada Generation Laptop (28283 - 33802, n=3) | |
| Dell Precision 5480 | |
| Lenovo ThinkPad P15 G2-20YQ001JGE | |
| Asus ExpertBook B6 Flip B6602FC2 | |
| Dell Precision 5000 5560 | |
| Lenovo ThinkPad P15v G3 21EM001AGE | |
| Dell Precision 5000 5470 | |
| Lenovo ThinkPad P1 G4-20Y4Z9DVUS | |
| Lenovo ThinkPad P15v G2 21A9000XGE | |
| Lenovo ThinkPad P14s G3 AMD 21J6S05000 | |
| HP ZBook Firefly 14 G9-6B8A2EA | |
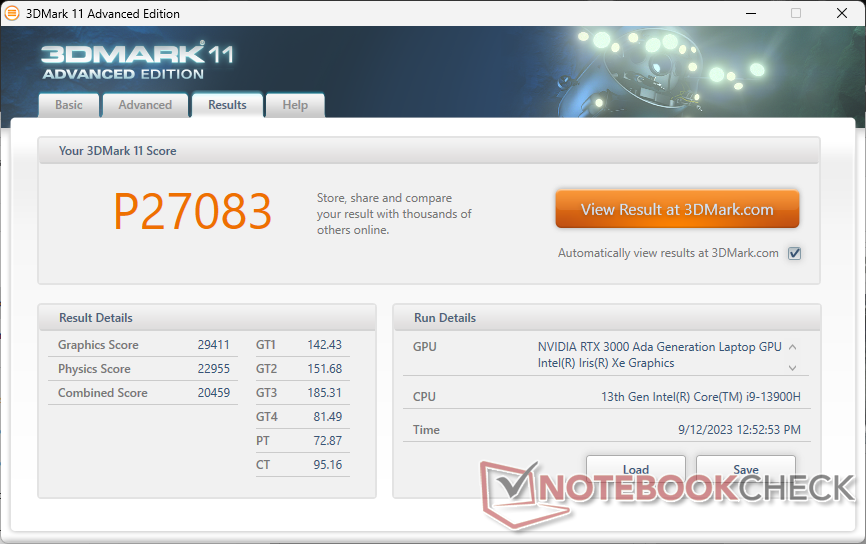
| 3DMark 11 Performance | 27083 puntos | |
| 3DMark Fire Strike Score | 18847 puntos | |
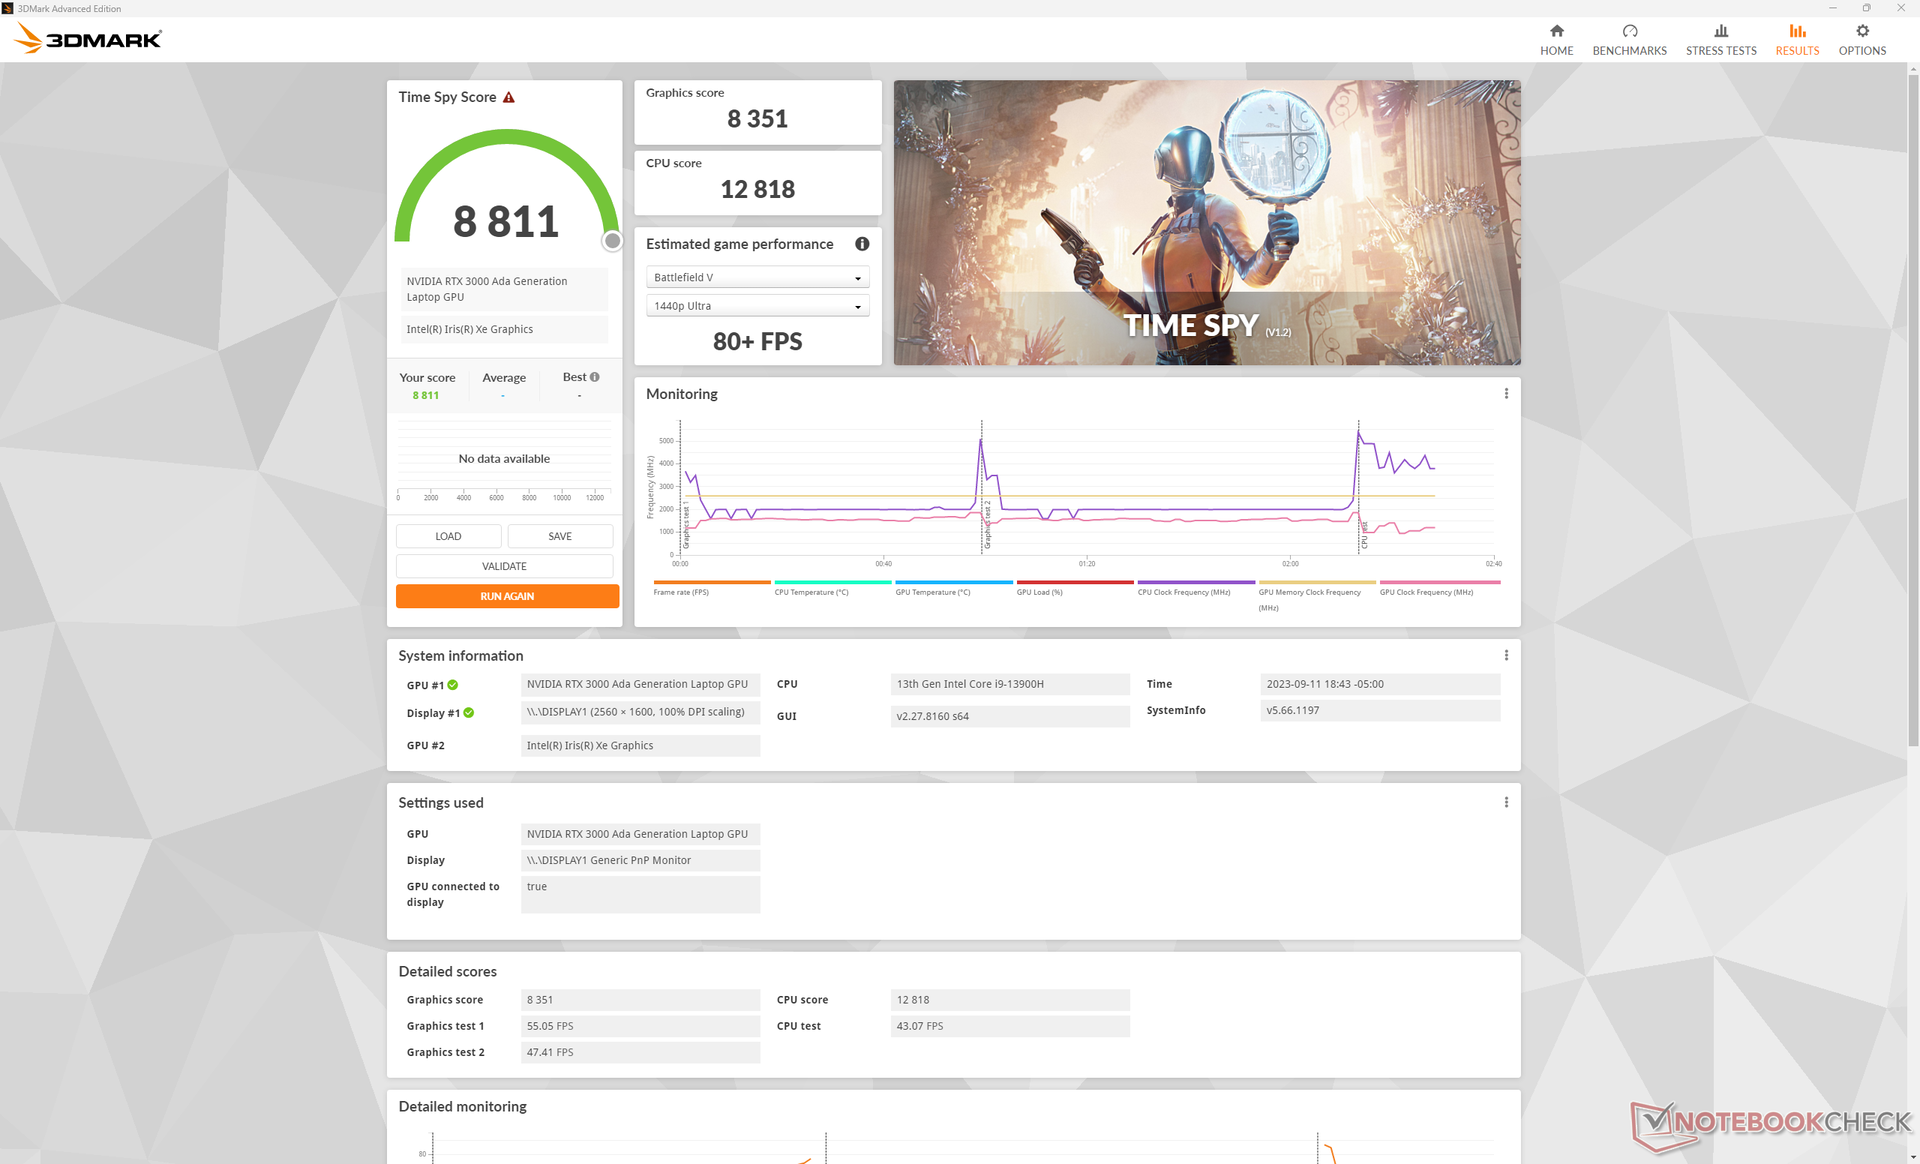
| 3DMark Time Spy Score | 8811 puntos | |
ayuda | ||
| Blender | |
| v3.3 Classroom HIP/AMD | |
| Lenovo ThinkPad P15v G3 21EM001AGE | |
| Lenovo ThinkPad P14s G3 AMD 21J6S05000 | |
| Lenovo ThinkPad P14s G3 AMD 21J6S05000 | |
| v3.3 Classroom OPTIX/RTX | |
| HP ZBook Firefly 14 G9-6B8A2EA | |
| Dell Precision 5000 5470 | |
| Lenovo ThinkPad P15v G3 21EM001AGE | |
| Asus ExpertBook B6 Flip B6602FC2 | |
| Dell Precision 5480 | |
| Medio NVIDIA RTX 3000 Ada Generation Laptop (23 - 28, n=3) | |
| HP ZBook Fury 16 G9 | |
| Dell Precision 5000 5680 | |
| v3.3 Classroom CUDA | |
| HP ZBook Firefly 14 G9-6B8A2EA | |
| Dell Precision 5000 5470 | |
| Lenovo ThinkPad P15v G3 21EM001AGE | |
| Asus ExpertBook B6 Flip B6602FC2 | |
| Dell Precision 5480 | |
| Medio NVIDIA RTX 3000 Ada Generation Laptop (40 - 48, n=3) | |
| HP ZBook Fury 16 G9 | |
| Dell Precision 5000 5680 | |
| v3.3 Classroom CPU | |
| HP ZBook Firefly 14 G9-6B8A2EA | |
| Lenovo ThinkPad P14s G3 AMD 21J6S05000 | |
| Dell Precision 5000 5470 | |
| Lenovo ThinkPad P15v G3 21EM001AGE | |
| Dell Precision 5480 | |
| Dell Precision 5000 5680 | |
| Medio NVIDIA RTX 3000 Ada Generation Laptop (312 - 363, n=3) | |
| Asus ExpertBook B6 Flip B6602FC2 | |
| HP ZBook Fury 16 G9 | |
* ... más pequeño es mejor
Rendimiento en juegos
El rendimiento en juegos es muy similar al de los portátiles con GeForce RTX 4060, como el reciente Inspiron 16 Plus 7630. Nuestra estación de trabajo es capaz de ejecutar títulos exigentes como Cyberpunk 2077 a 1080p muy bien mientras que QHD+ nativo requerirá ajustes más bajos o DLSS para mantener a flote las velocidades de fotogramas.
Witcher 3 FPS Chart
| bajo | medio | alto | ultra | |
|---|---|---|---|---|
| GTA V (2015) | 183.2 | 177 | 164.1 | 88.2 |
| The Witcher 3 (2015) | 364.1 | 242.5 | 150.1 | 78.7 |
| Dota 2 Reborn (2015) | 175.7 | 160.8 | 151.5 | 142.9 |
| Final Fantasy XV Benchmark (2018) | 155.1 | 108 | 78.9 | |
| X-Plane 11.11 (2018) | 152 | 126.8 | 102 | |
| Far Cry 5 (2018) | 155 | 116 | 106 | 101 |
| Strange Brigade (2018) | 400 | 191.3 | 160.1 | 140.7 |
| Cyberpunk 2077 1.6 (2022) | 92.3 | 72.4 | 61.2 | 56.2 |
| Tiny Tina's Wonderlands (2022) | 156 | 131.4 | 88 | 69 |
| F1 22 (2022) | 162.7 | 159.6 | 133.4 | 51.1 |
Emisiones
Ruido del sistema
El ruido del ventilador y su comportamiento no han cambiado realmente respecto al modelo del año pasado. Cargas más altas equivalentes a juegos inducirían un ruido de ventilador de algo más de 50 dB(A) para ser una de las estaciones de trabajo de 14 pulgadas más ruidosas del mercado. Curiosamente, este máximo sigue siendo el mismo entre los modos Equilibrado y Rendimiento, por lo que hay poco o ningún beneficio de funcionar en modo Equilibrado en términos de ruido.
Ruido
| Ocioso |
| 23.5 / 23.5 / 23.5 dB(A) |
| Carga |
| 39.9 / 51 dB(A) |
 | ||
30 dB silencioso 40 dB(A) audible 50 dB(A) ruidosamente alto |
||
min: | ||
| Dell Precision 5480 RTX 3000 Ada Generation Laptop, i9-13900H, Samsung PM9A1 MZVL21T0HCLR | Dell Precision 5000 5470 RTX A1000 Laptop GPU, i9-12900H, Samsung PM9A1 MZVL21T0HCLR | Dell Precision 5000 5560 RTX A2000 Laptop GPU, i7-11850H, Samsung PM9A1 MZVL22T0HBLB | Lenovo ThinkPad P14s G3 AMD 21J6S05000 Radeon 680M, R7 PRO 6850U, Samsung PM9A1 MZVL21T0HCLR | HP ZBook Firefly 14 G9-6B8A2EA T550 Laptop GPU, i7-1265U, Micron 3400 1TB MTFDKBA1T0TFH | Lenovo ThinkPad P15v G3 21EM001AGE RTX A2000 Laptop GPU, R7 PRO 6850H, SK Hynix PC711 1TB HFS001TDE9X081N | |
|---|---|---|---|---|---|---|
| Noise | -2% | 11% | 11% | 4% | 9% | |
| apagado / medio ambiente * (dB) | 23.5 | 23 2% | 23.4 -0% | 22.9 3% | 23.6 -0% | 23.2 1% |
| Idle Minimum * (dB) | 23.5 | 23.3 1% | 23.6 -0% | 22.9 3% | 23.6 -0% | 23.2 1% |
| Idle Average * (dB) | 23.5 | 23.3 1% | 23.6 -0% | 22.9 3% | 23.6 -0% | 23.2 1% |
| Idle Maximum * (dB) | 23.5 | 23.3 1% | 23.6 -0% | 22.9 3% | 23.6 -0% | 23.2 1% |
| Load Average * (dB) | 39.9 | 48.5 -22% | 25.8 35% | 30.8 23% | 42.5 -7% | 35 12% |
| Witcher 3 ultra * (dB) | 50.1 | 48.6 3% | 40.1 20% | 39.4 21% | 42.5 15% | 37.9 24% |
| Load Maximum * (dB) | 51 | 50.4 1% | 41.4 19% | 39.5 23% | 42.5 17% | 37.5 26% |
* ... más pequeño es mejor
Temperatura
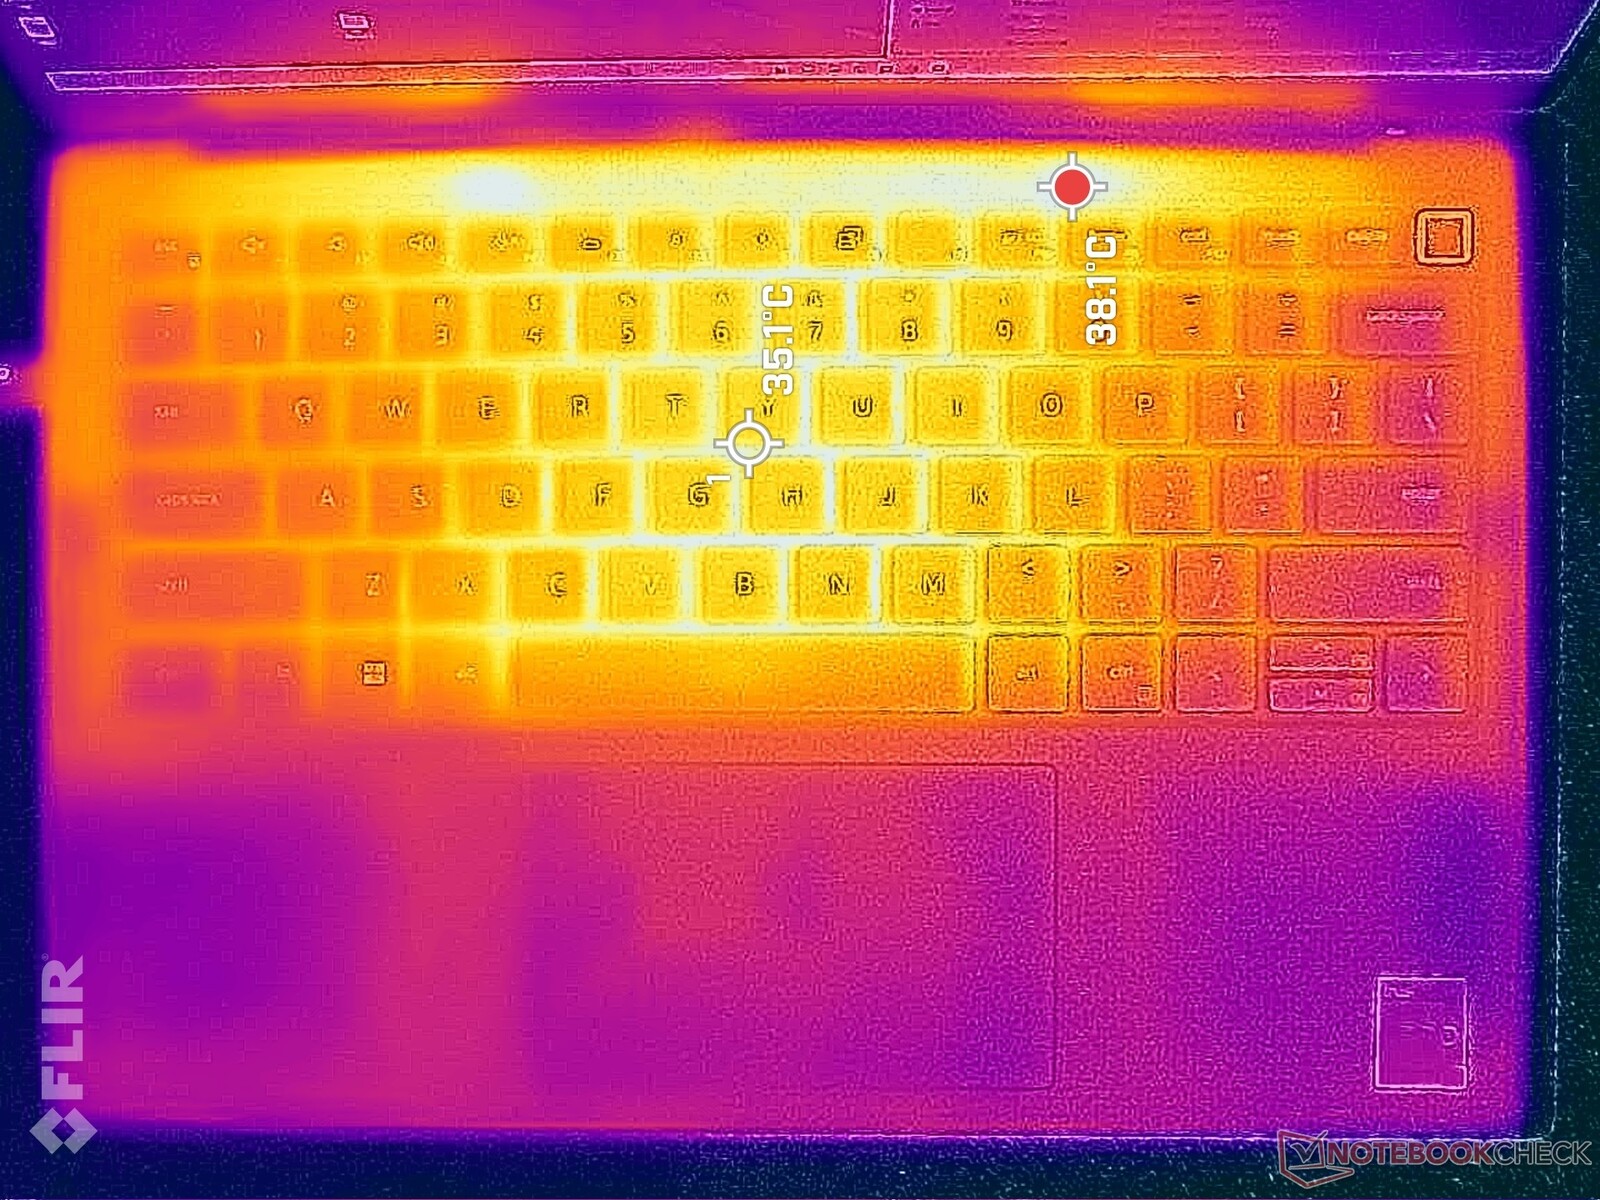
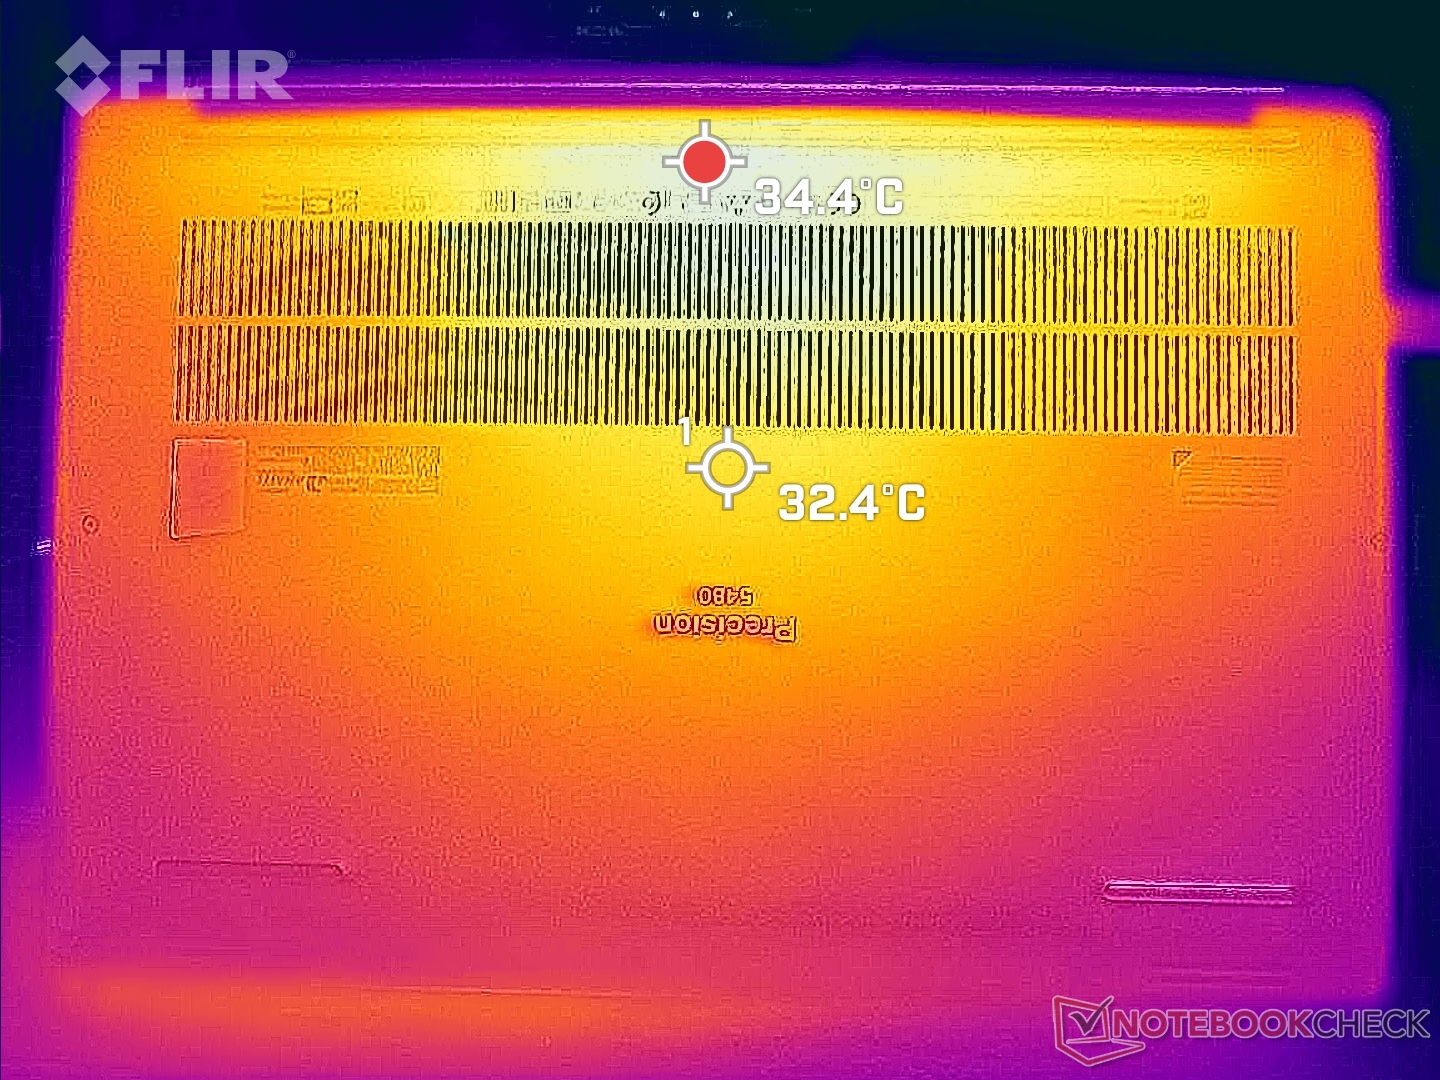
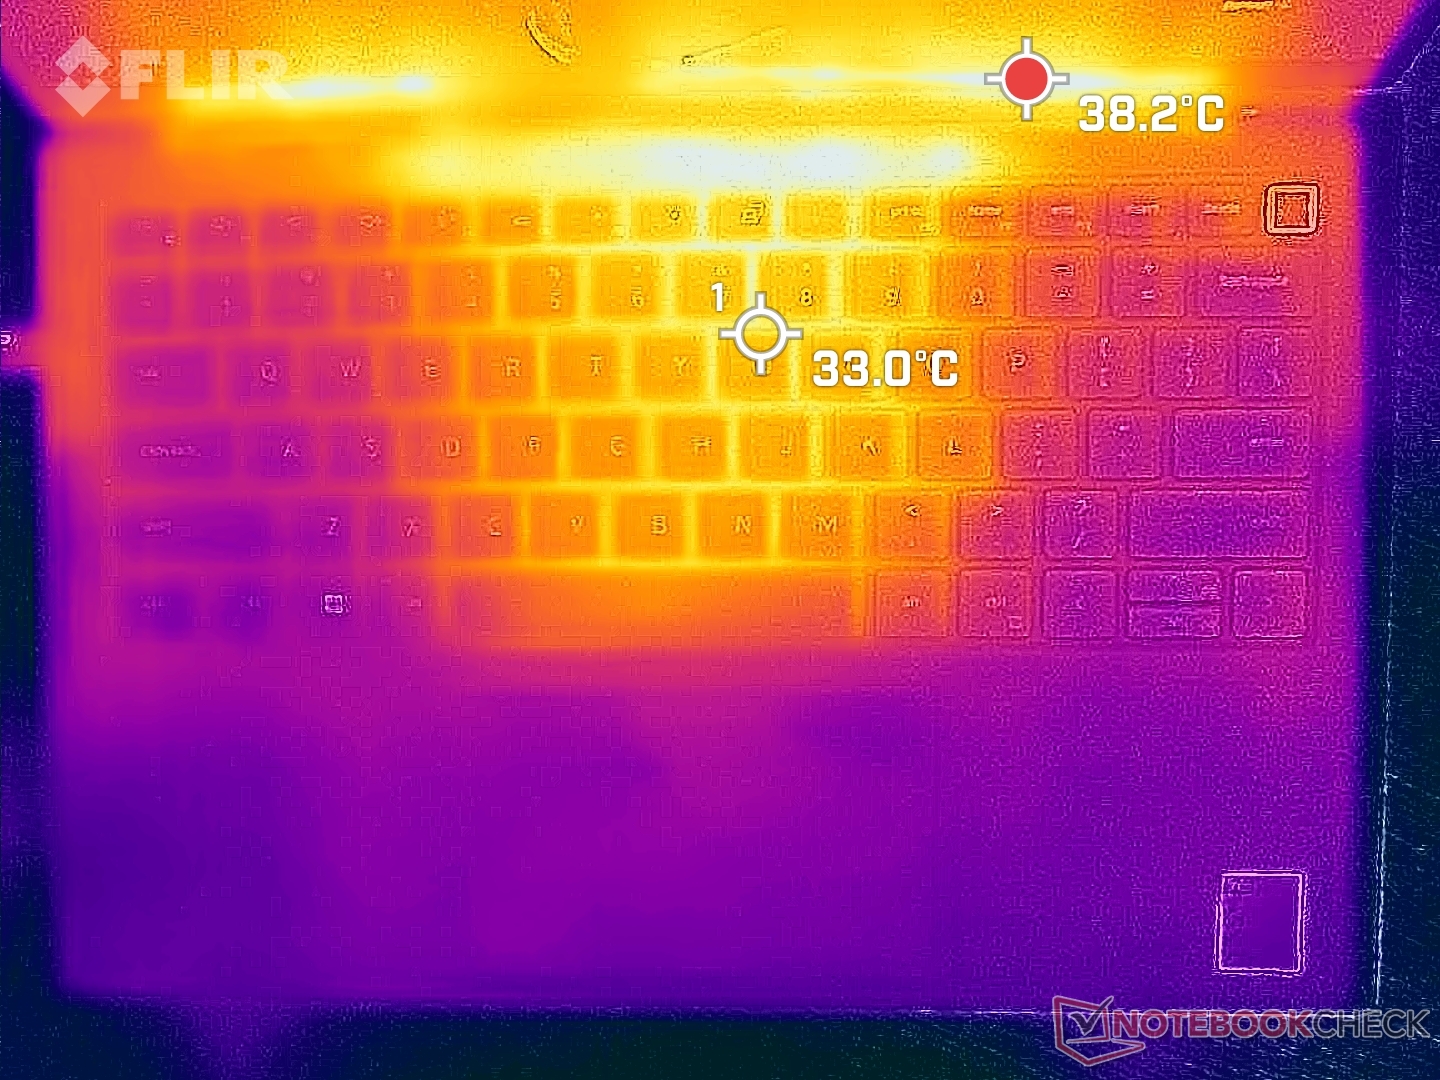
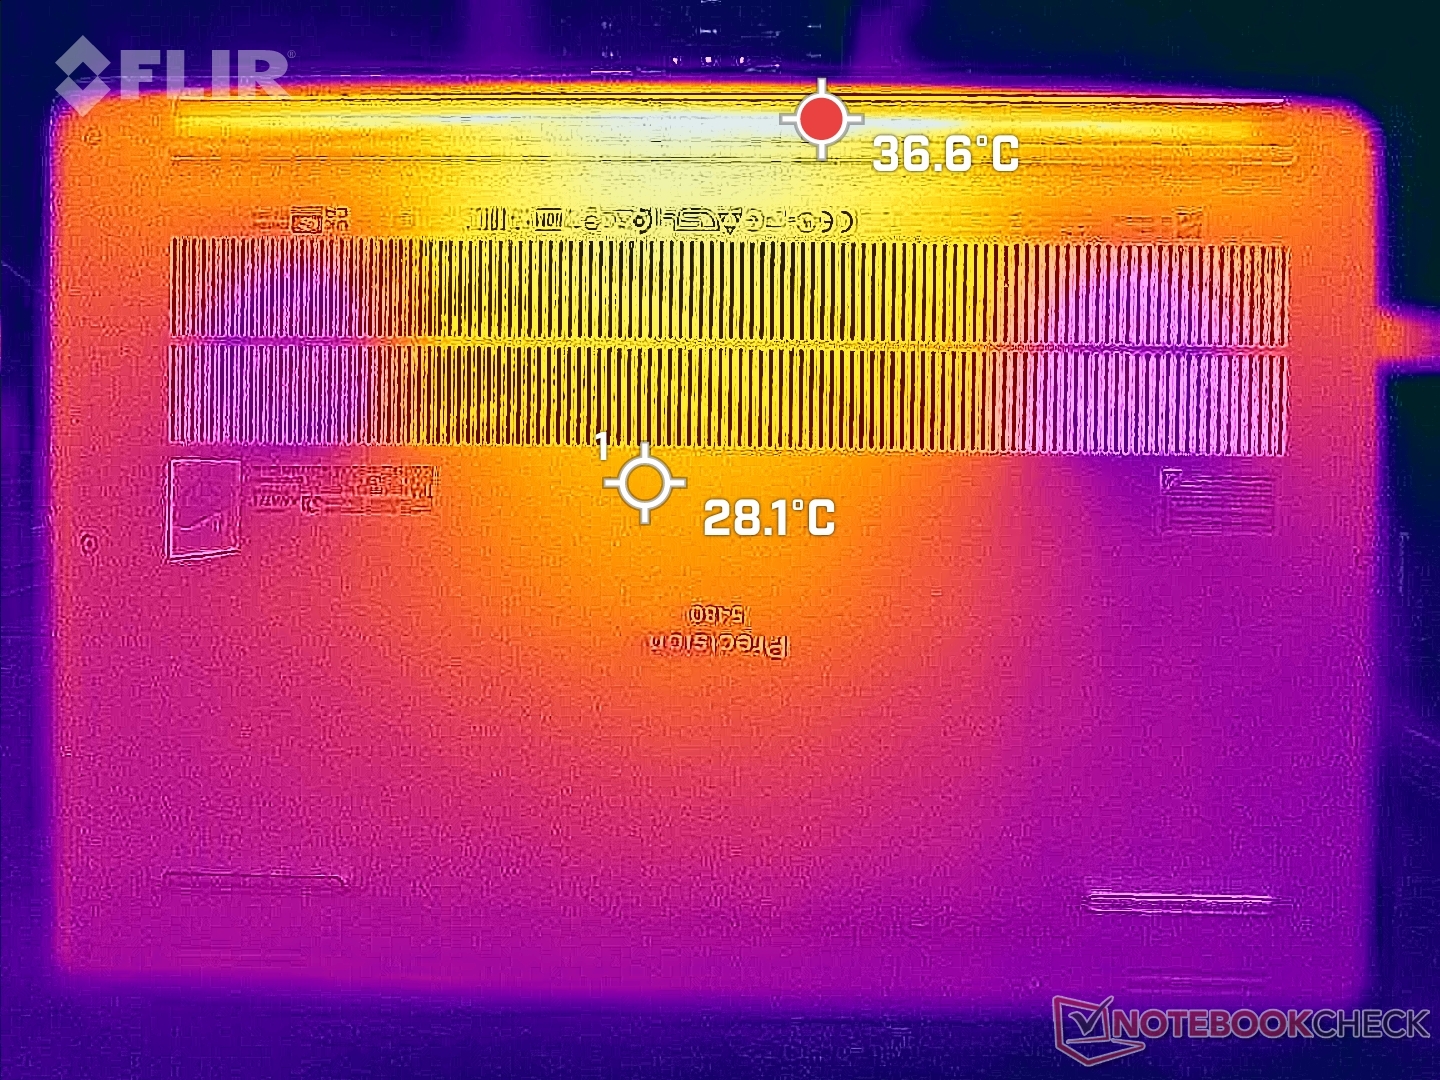
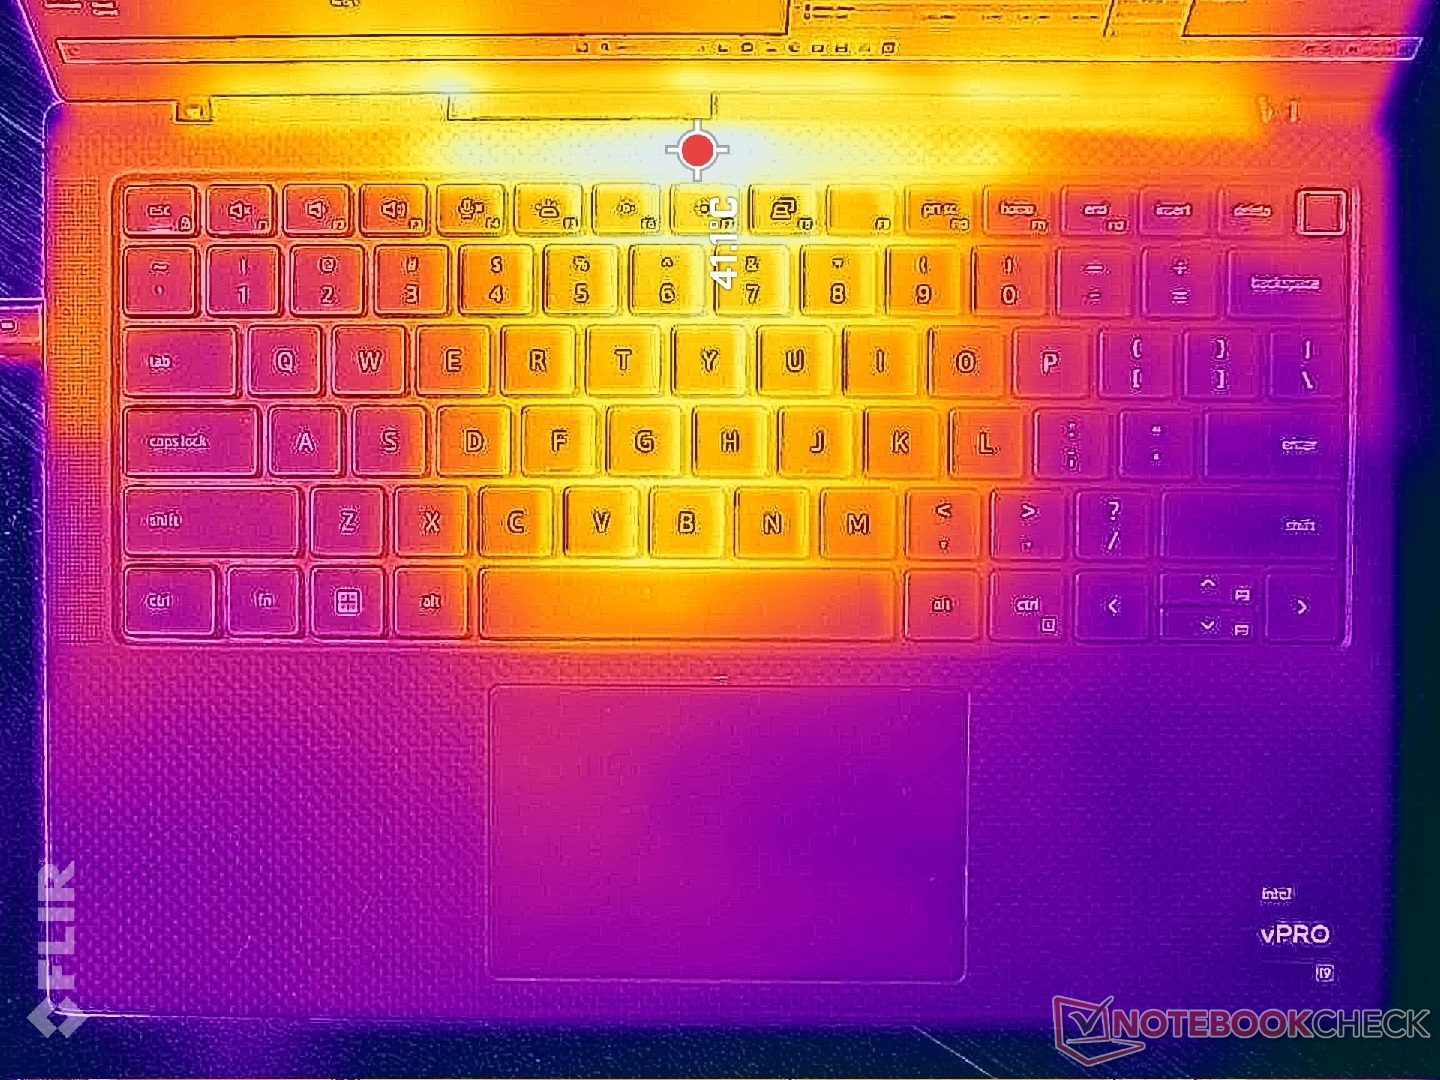
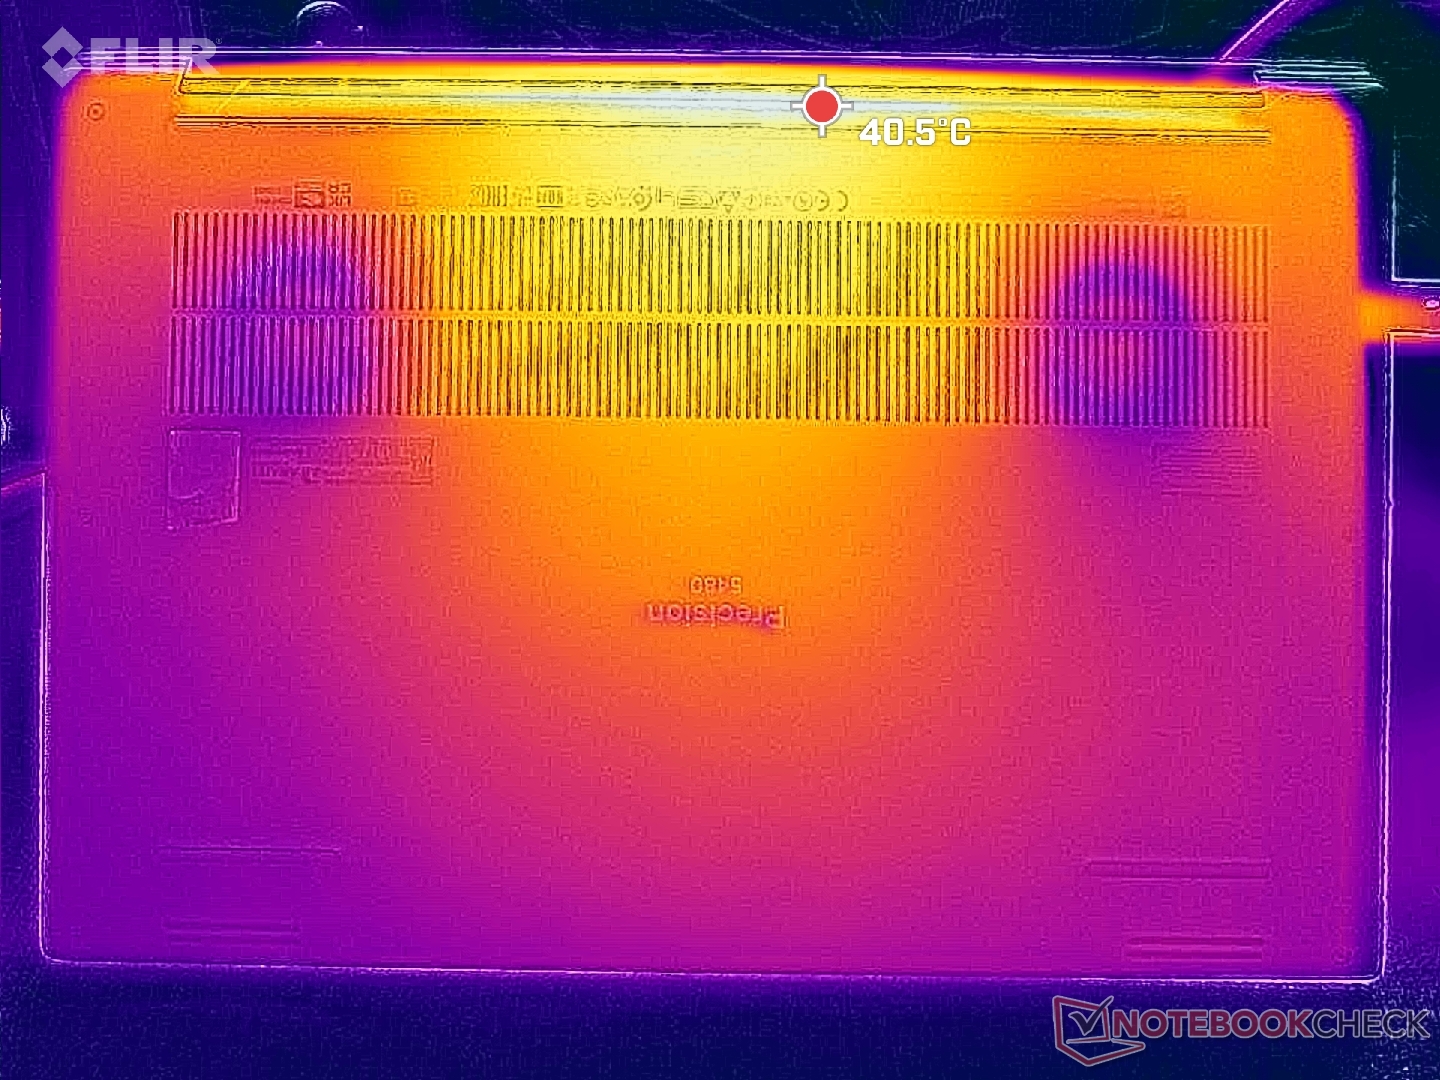
Las temperaturas superficiales son más cálidas de lo habitual cerca del centro de la unidad cuando está en reposo sobre el escritorio debido a los ventiladores inertes. Así, el coste del silencio cuando se ejecutan cargas poco exigentes son las cálidas temperaturas de la superficie, que pueden o no molestar a algunos usuarios.
Los puntos calientes pueden alcanzar más de 40 C en los lados superior e inferior del chasis cuando se ejecutan Prime95 y FurMark simultáneamente. Se concentran cerca de la parte trasera de la unidad, por lo que los reposamanos de fibra de carbono siguen siendo cómodos al tacto, pero la mayor parte de la parte inferior metálica estará muy caliente.
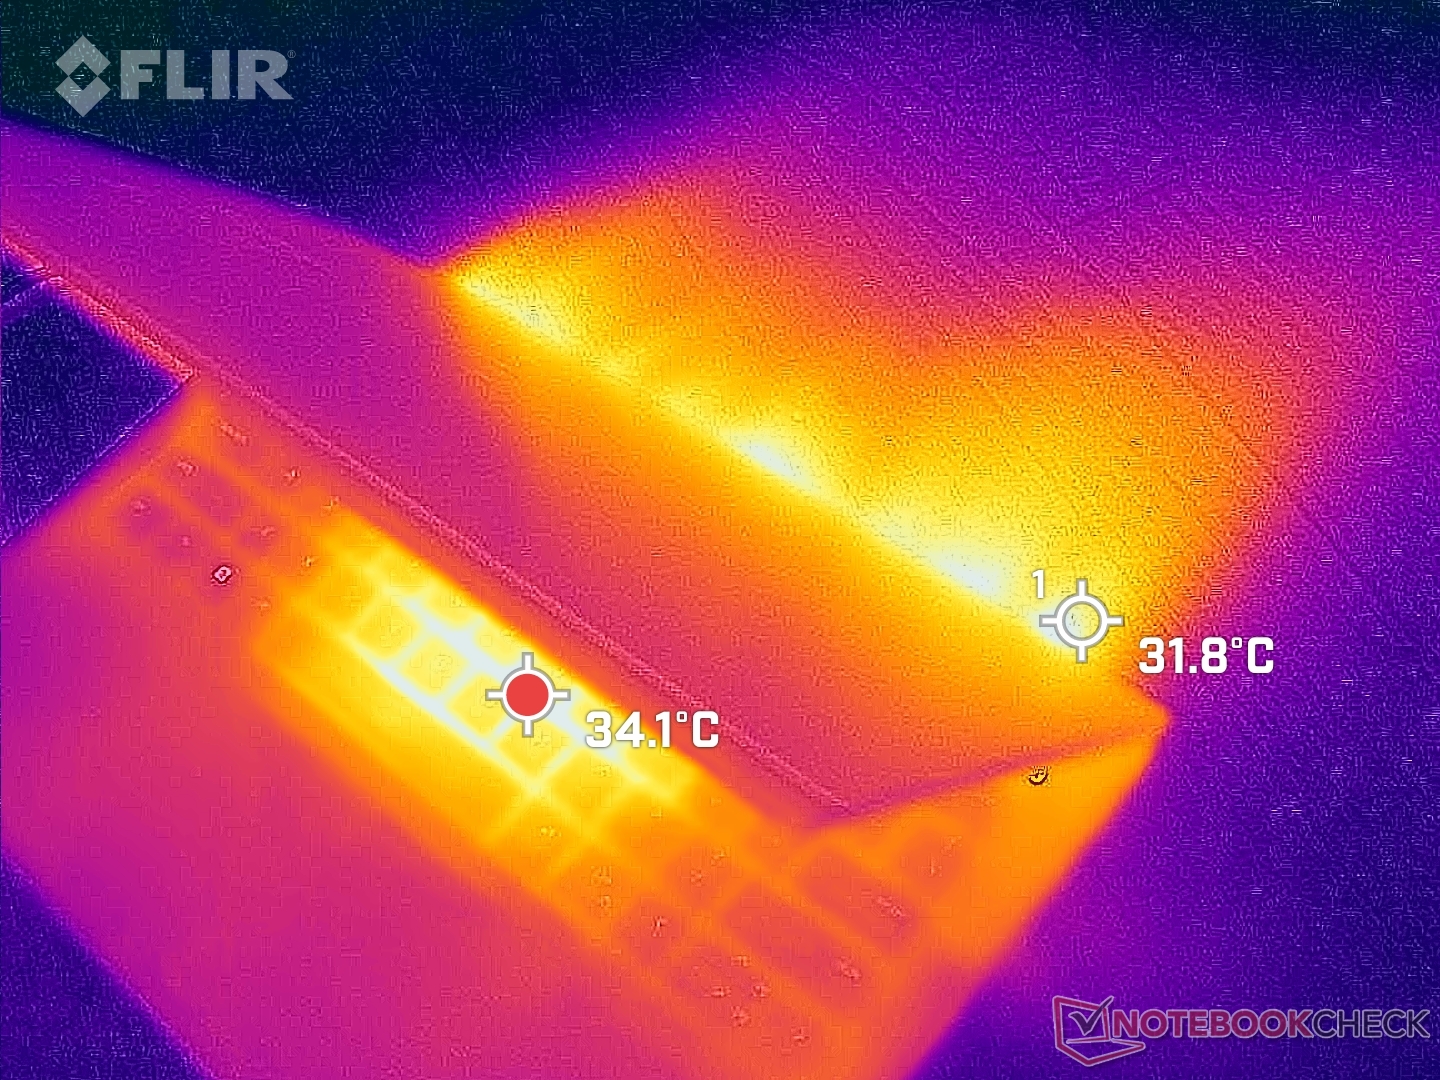
(±) La temperatura máxima en la parte superior es de 44 °C / 111 F, frente a la media de 38.2 °C / 101 F, que oscila entre 22.2 y 69.8 °C para la clase Workstation.
(+) El fondo se calienta hasta un máximo de 38.2 °C / 101 F, frente a la media de 41.1 °C / 106 F
(±) En reposo, la temperatura media de la parte superior es de 34.2 °C / 94# F, frente a la media del dispositivo de 32 °C / 90 F.
(±) Jugando a The Witcher 3, la temperatura media de la parte superior es de 32 °C / 90 F, frente a la media del dispositivo de 32 °C / 90 F.
(+) El reposamanos y el panel táctil están a una temperatura inferior a la de la piel, con un máximo de 29.6 °C / 85.3 F y, por tanto, son fríos al tacto.
(±) La temperatura media de la zona del reposamanos de dispositivos similares fue de 27.8 °C / 82 F (-1.8 °C / -3.3 F).
| Dell Precision 5480 Intel Core i9-13900H, NVIDIA RTX 3000 Ada Generation Laptop | Dell Precision 5000 5470 Intel Core i9-12900H, NVIDIA RTX A1000 Laptop GPU | Dell Precision 5000 5560 Intel Core i7-11850H, NVIDIA RTX A2000 Laptop GPU | Lenovo ThinkPad P14s G3 AMD 21J6S05000 AMD Ryzen 7 PRO 6850U, AMD Radeon 680M | Lenovo ThinkPad P15v G3 21EM001AGE AMD Ryzen 7 PRO 6850H, NVIDIA RTX A2000 Laptop GPU | HP ZBook Firefly 14 G9-6B8A2EA Intel Core i7-1265U, NVIDIA T550 Laptop GPU | |
|---|---|---|---|---|---|---|
| Heat | 9% | -1% | 14% | 7% | 11% | |
| Maximum Upper Side * (°C) | 44 | 41.8 5% | 48.2 -10% | 42.7 3% | 48.7 -11% | 41.2 6% |
| Maximum Bottom * (°C) | 38.2 | 36 6% | 42.6 -12% | 43.1 -13% | 50.5 -32% | 47.9 -25% |
| Idle Upper Side * (°C) | 38.8 | 34.6 11% | 34.8 10% | 25.7 34% | 25 36% | 26.5 32% |
| Idle Bottom * (°C) | 38.6 | 33.6 13% | 35.2 9% | 26.4 32% | 25.4 34% | 27 30% |
* ... más pequeño es mejor
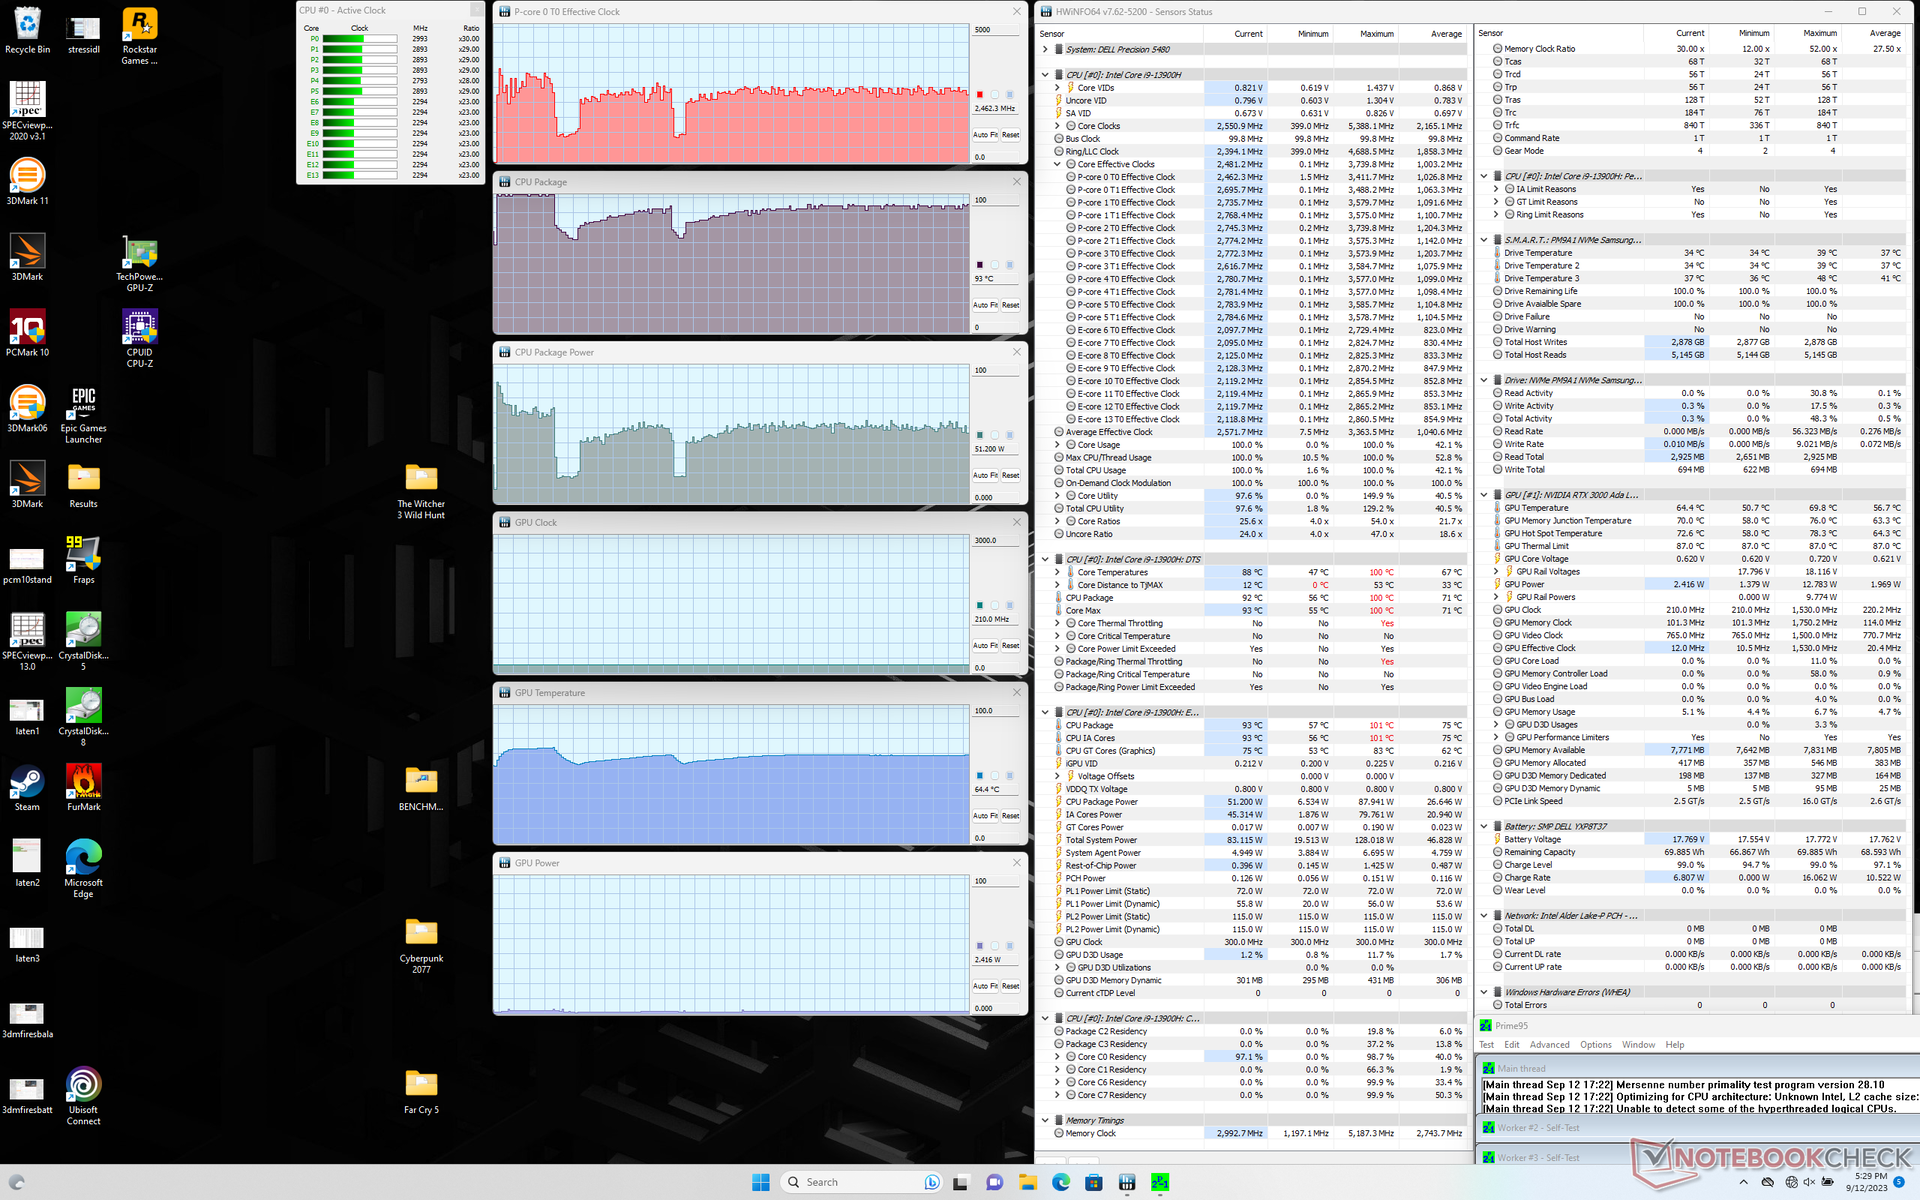
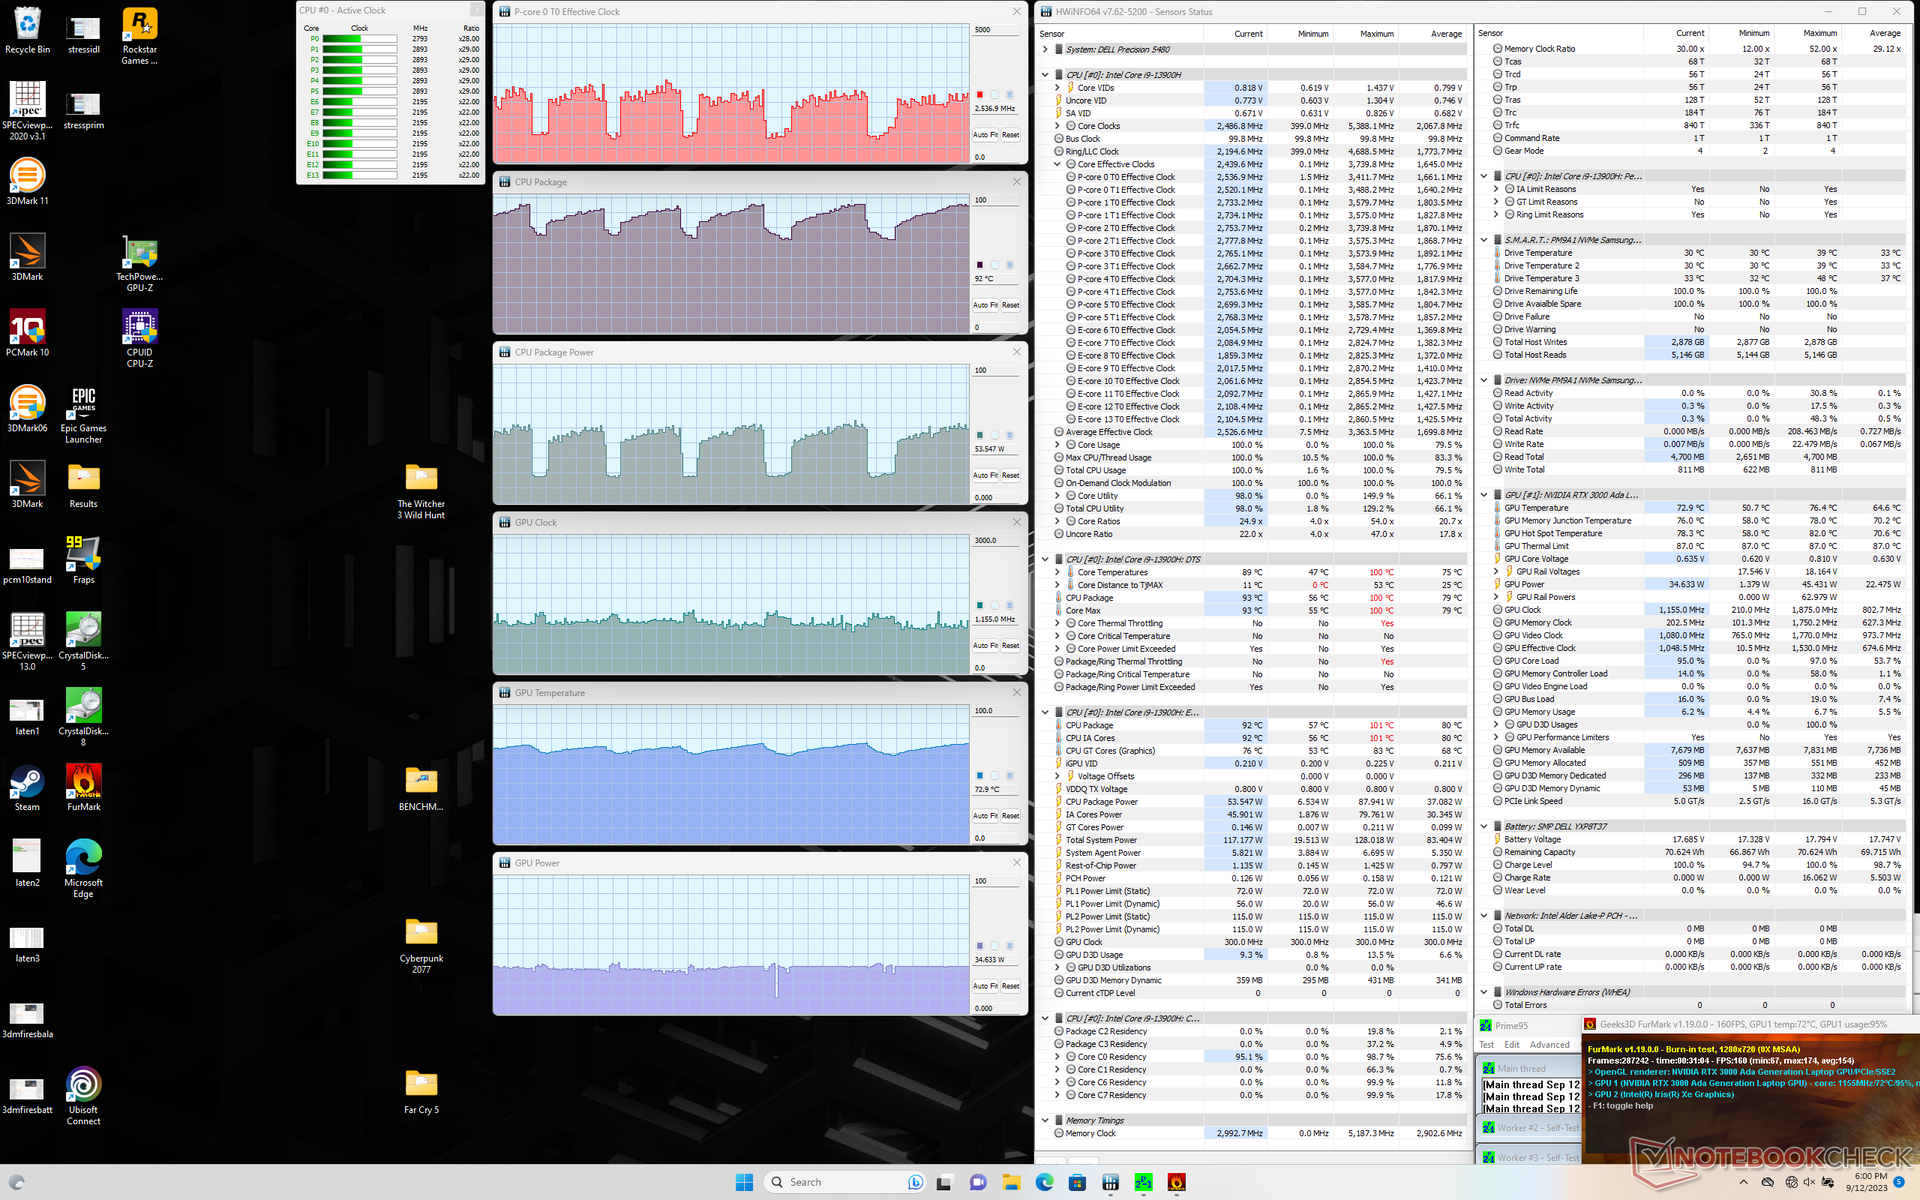
Prueba de resistencia
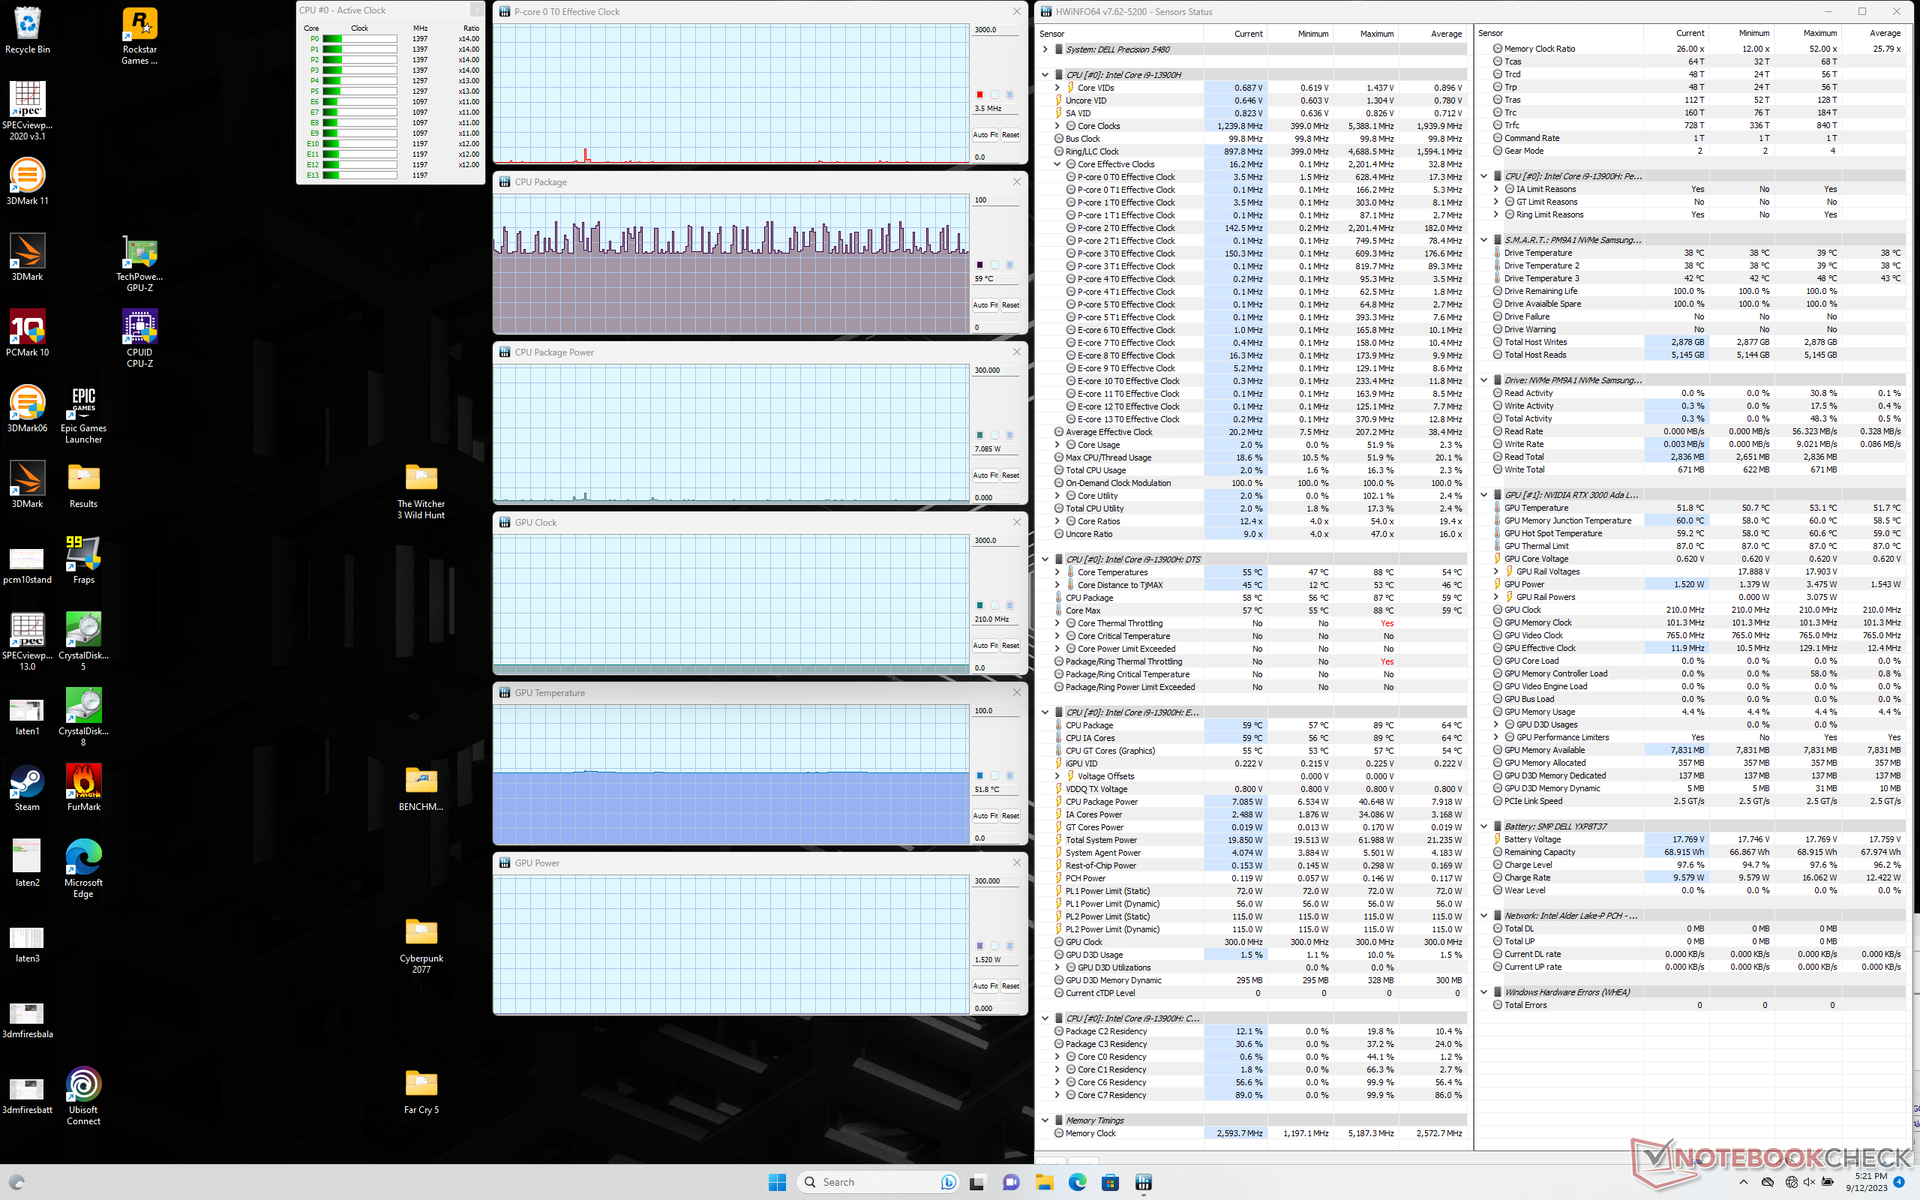
Cuando se ejecuta Prime95, la CPU alcanza los 3,4 GHz, 88 W y 100 C durante sólo un par de minutos. Al final se estabiliza en torno a los 2,4 GHz y 51 W para mantener una temperatura del núcleo ligeramente más fría pero manejable de 93 C. Por tanto, el Turbo Boost máximo no es indefinido, pero sigue siendo bastante bueno teniendo en cuenta el pequeño factor de forma de 14 pulgadas.
La CPU y la GPU se estabilizarían en torno a los 64 C cada una al ejecutar Witcher 3 para representar cargas altas. Curiosamente, esto no cambia al cambiar entre los modos Equilibrado y Rendimiento, lo que sugiere que el modo Equilibrado debería ser suficiente para la mayoría de cargas de trabajo. Hay que tener en cuenta que el consumo de energía de la GPU es mayor, entre 45 y 50 W, frente a los 36 W de la GPU Precision 5470. No obstante, las temperaturas del núcleo seguirán siendo más bajas que en el modelo del año pasado con cargas de juego similares.
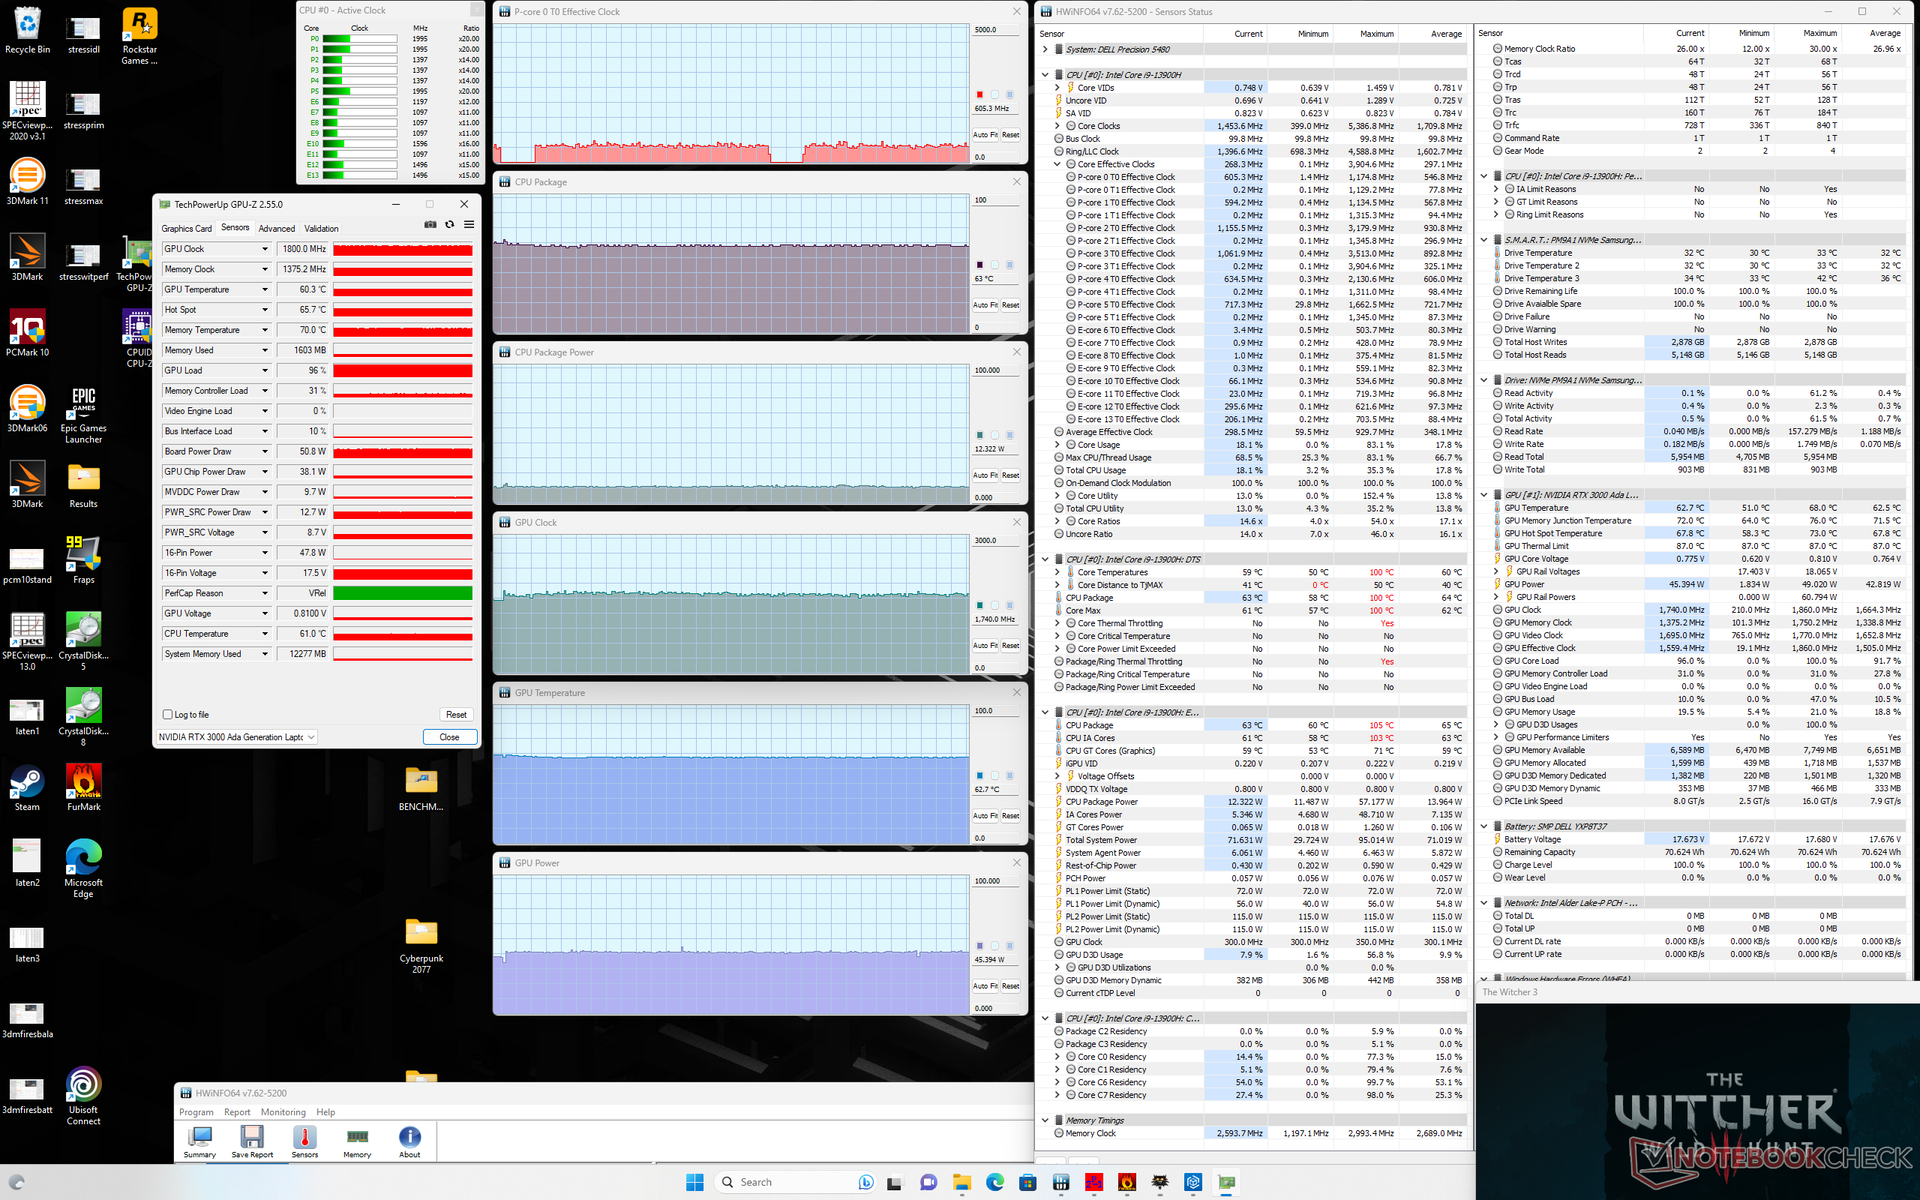
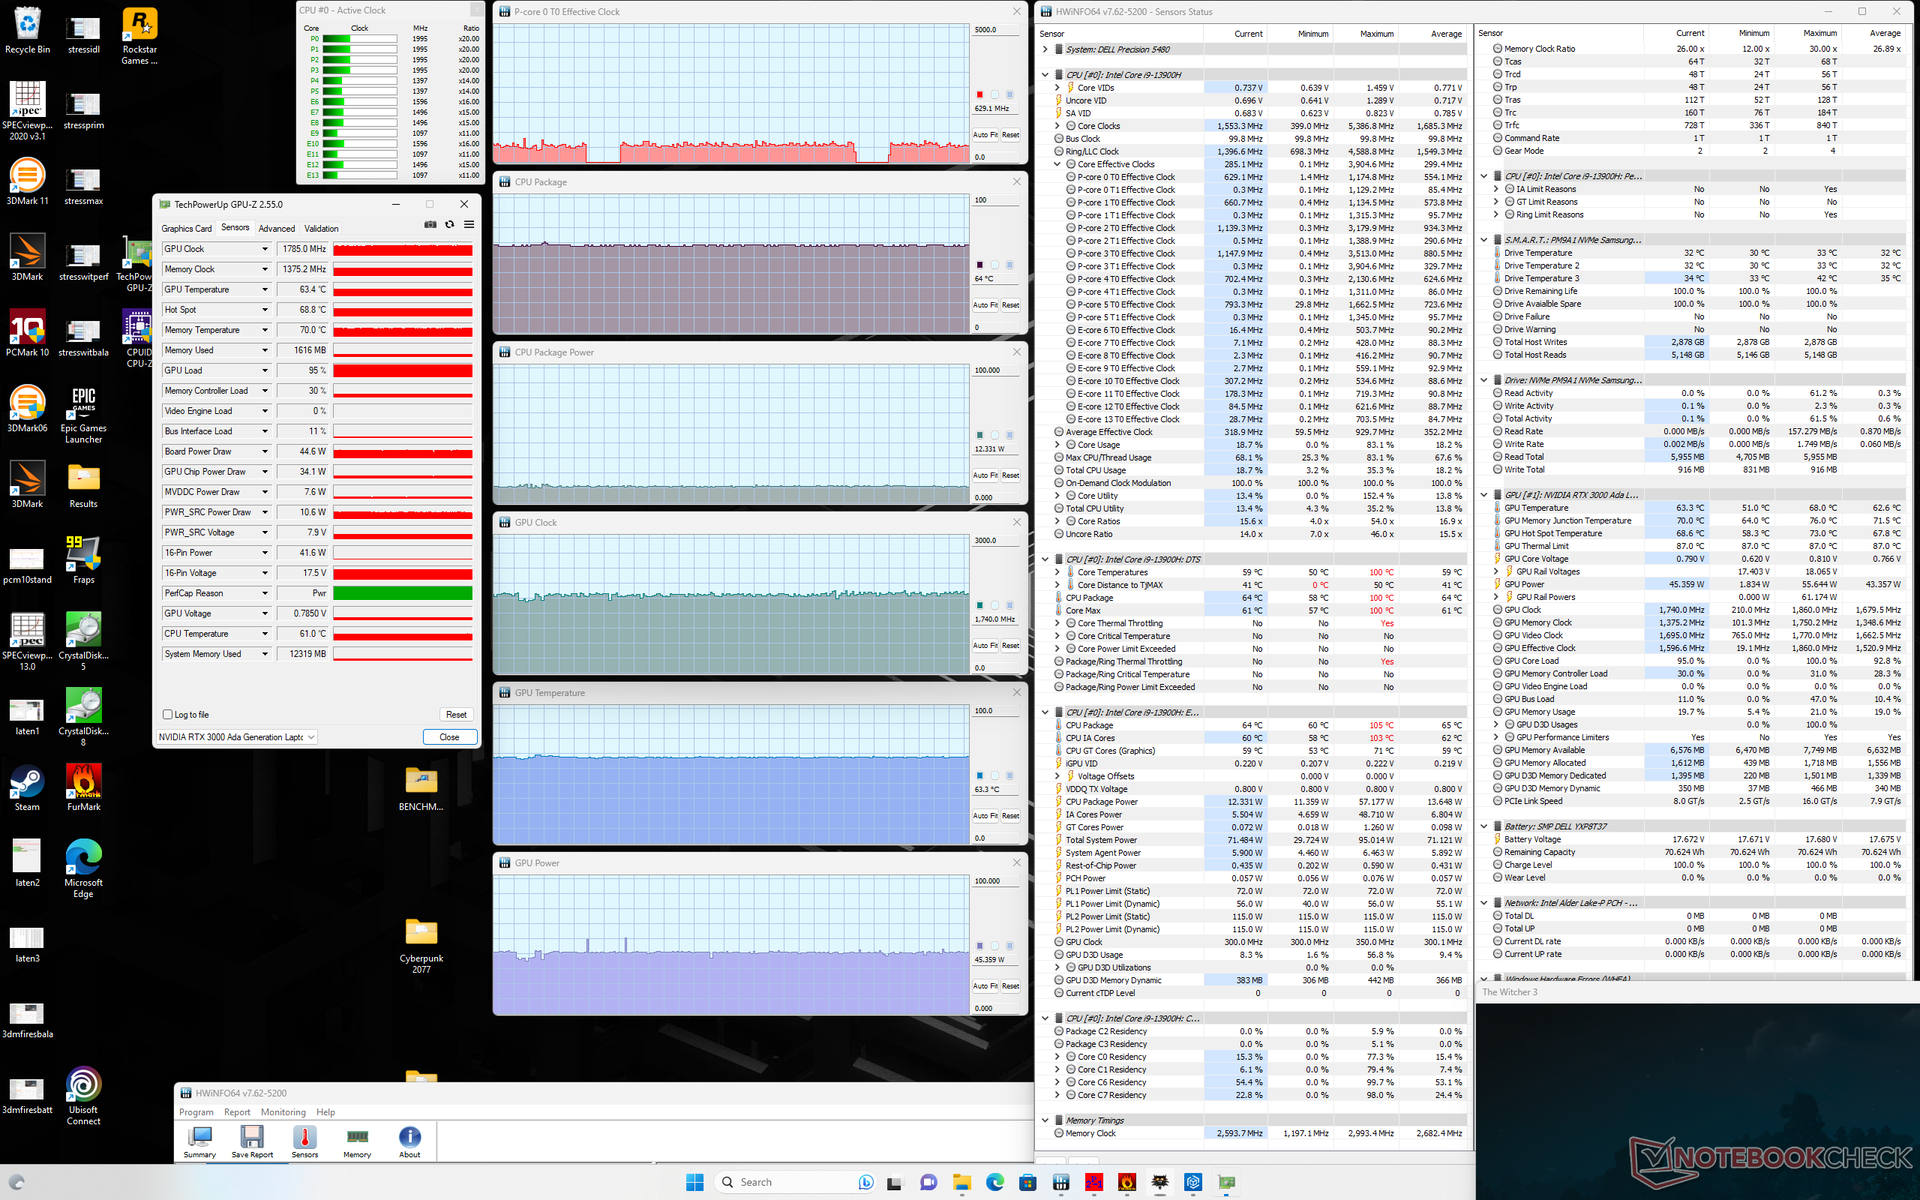
| RelojCPU (GHz) | Reloj GPU (MHz) | Temperatura mediaCPU (°C) | Temperatura media GPU (°C) | |
| Sistema en reposo | -- | -- | 59 | 52 |
| Prime95Stress | 2,5 | -- | 93 | 65 |
| Prime95+ FurMark Stress | 1,0 - 2,6 | 1155 | 69 - 92 | 66 - 73 |
| Witcher 3 Tensión (modoequilibrado) | 0,6 | 1740 | 63 | 63 |
| Witcher 3 Estrés (modoRendimiento) | 0,6 | 1740 | 64 | 63 |
Altavoces
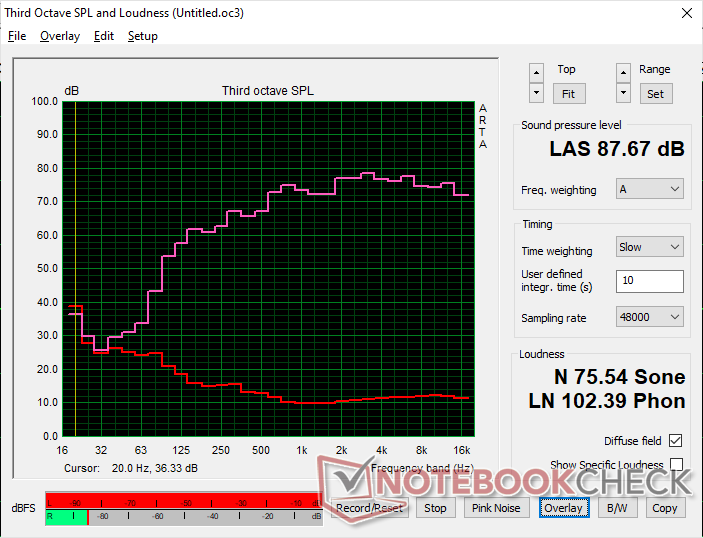
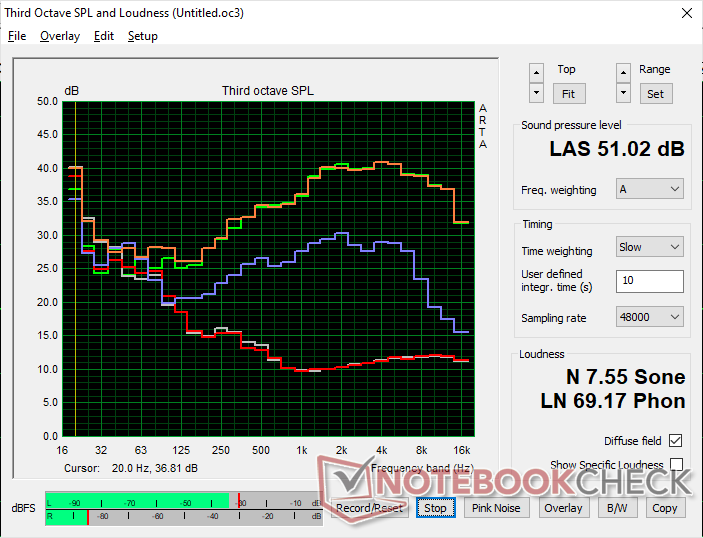
Dell Precision 5480 análisis de audio
(+) | los altavoces pueden reproducir a un volumen relativamente alto (#87.7 dB)
Graves 100 - 315 Hz
(±) | lubina reducida - en promedio 12.9% inferior a la mediana
(±) | la linealidad de los graves es media (7% delta a frecuencia anterior)
Medios 400 - 2000 Hz
(+) | medios equilibrados - a sólo 2.8% de la mediana
(+) | los medios son lineales (3.6% delta a la frecuencia anterior)
Altos 2 - 16 kHz
(+) | máximos equilibrados - a sólo 2.9% de la mediana
(+) | los máximos son lineales (2% delta a la frecuencia anterior)
Total 100 - 16.000 Hz
(+) | el sonido global es lineal (9% de diferencia con la mediana)
En comparación con la misma clase
» 4% de todos los dispositivos probados de esta clase eran mejores, 2% similares, 94% peores
» El mejor tuvo un delta de 7%, la media fue 17%, el peor fue ###max##%
En comparación con todos los dispositivos probados
» 3% de todos los dispositivos probados eran mejores, 1% similares, 96% peores
» El mejor tuvo un delta de 4%, la media fue 23%, el peor fue ###max##%
Apple MacBook Pro 16 2021 M1 Pro análisis de audio
(+) | los altavoces pueden reproducir a un volumen relativamente alto (#84.7 dB)
Graves 100 - 315 Hz
(+) | buen bajo - sólo 3.8% lejos de la mediana
(+) | el bajo es lineal (5.2% delta a la frecuencia anterior)
Medios 400 - 2000 Hz
(+) | medios equilibrados - a sólo 1.3% de la mediana
(+) | los medios son lineales (2.1% delta a la frecuencia anterior)
Altos 2 - 16 kHz
(+) | máximos equilibrados - a sólo 1.9% de la mediana
(+) | los máximos son lineales (2.7% delta a la frecuencia anterior)
Total 100 - 16.000 Hz
(+) | el sonido global es lineal (4.6% de diferencia con la mediana)
En comparación con la misma clase
» 0% de todos los dispositivos probados de esta clase eran mejores, 0% similares, 100% peores
» El mejor tuvo un delta de 5%, la media fue 17%, el peor fue ###max##%
En comparación con todos los dispositivos probados
» 0% de todos los dispositivos probados eran mejores, 0% similares, 100% peores
» El mejor tuvo un delta de 4%, la media fue 23%, el peor fue ###max##%
Gestión de la energía
Consumo de energía
El Precision 5480 es más exigente que el Precision 5470 saliente cuando se ejecutan cargas exigentes. Witcher 3 así, por ejemplo, consumiría unos 90 W frente a los 83 W del modelo del año pasado, pero el ligero aumento del consumo queda empequeñecido por el significativo salto en el rendimiento, como ya se ha señalado.
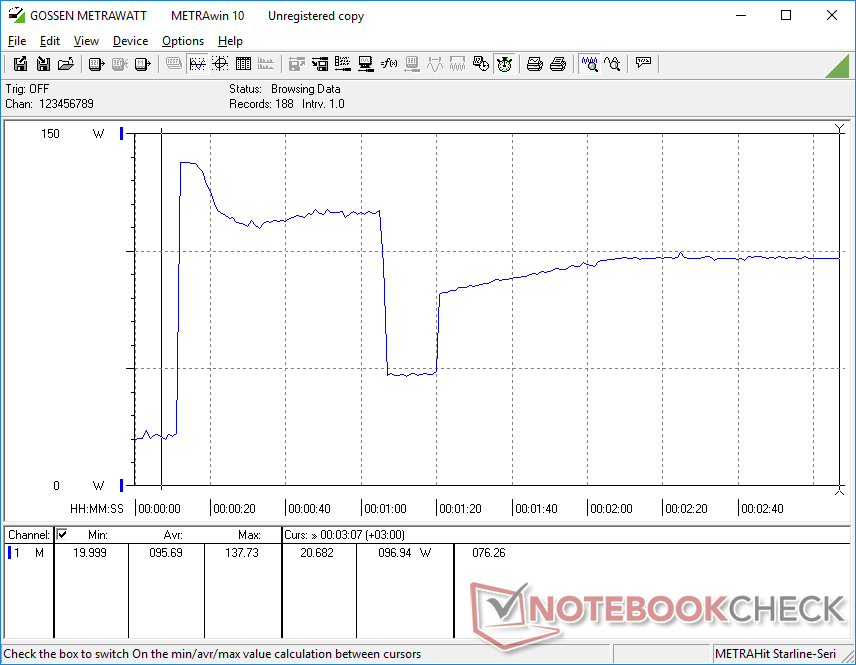
Curiosamente, el consumo de energía al ejecutar Prime95 sería más del doble que en el modelo del año pasado (98 W frente a 42 W) después de tener en cuenta cualquier estrangulamiento del rendimiento, como se muestra en los gráficos siguientes. Por tanto, el aumento interanual del rendimiento del procesador tiene un precio mucho más elevado que el aumento del rendimiento gráfico.
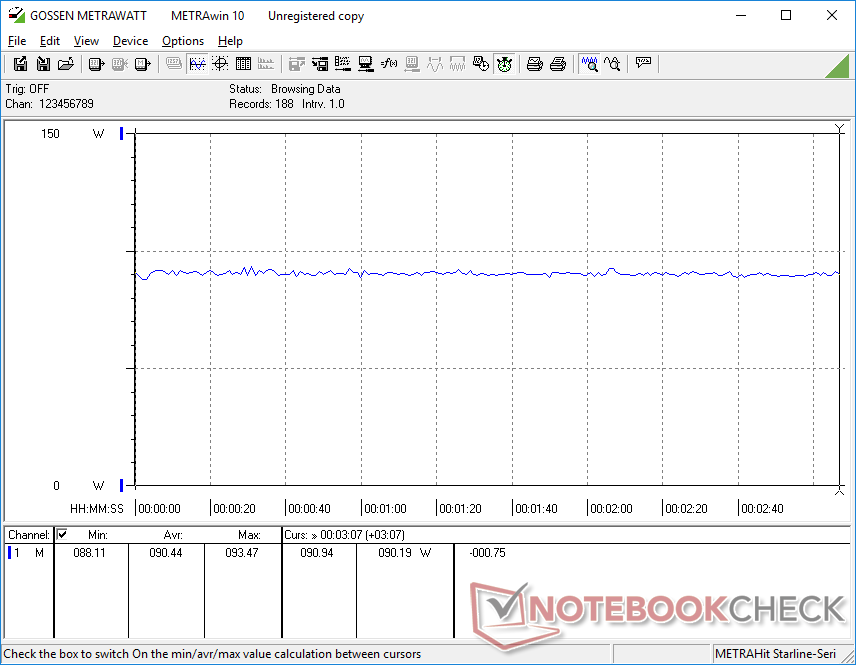
También vale la pena mencionar que nuestra unidad consumía más energía de lo esperado cuando simplemente estaba en reposo en el escritorio sin aplicaciones en ejecución, lo que puede ser en parte responsable de las temperaturas de superficie generalmente más cálidas como se señaló anteriormente.
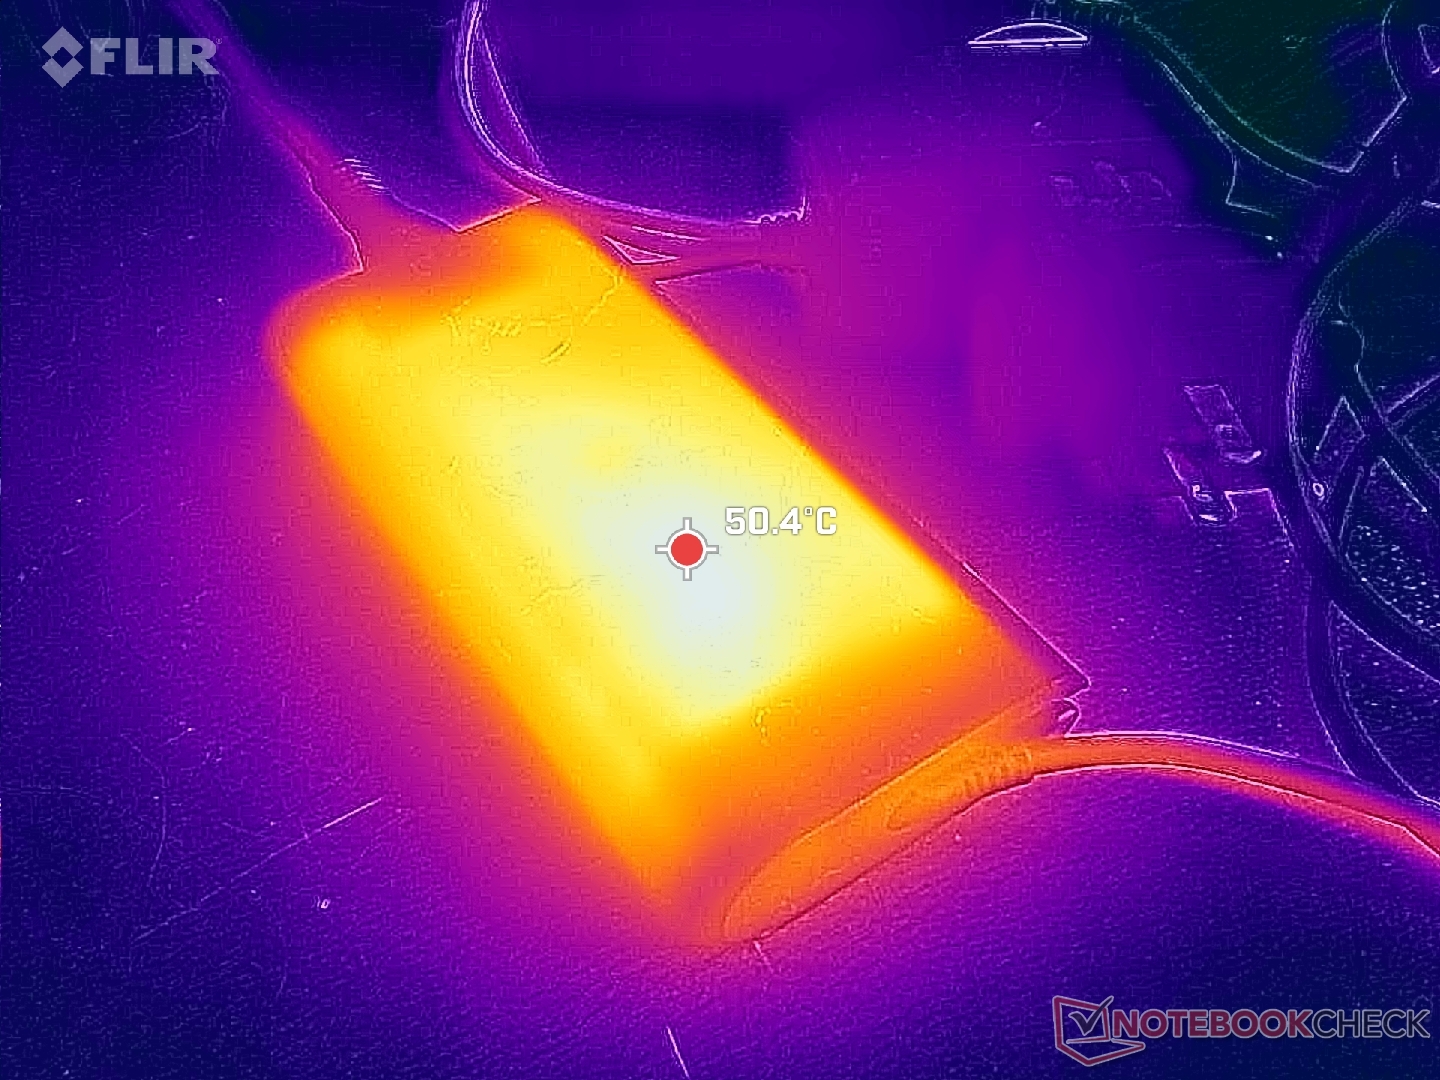
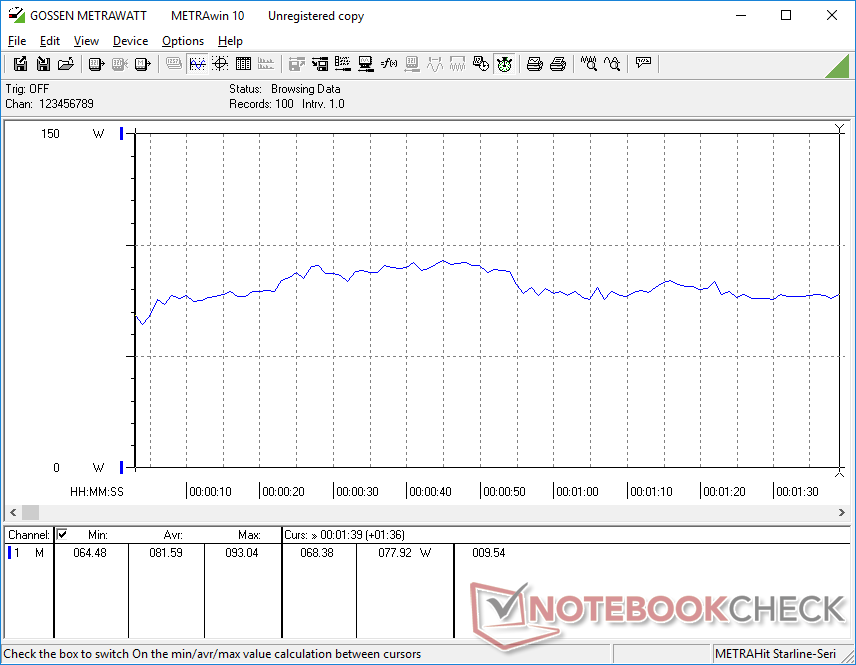
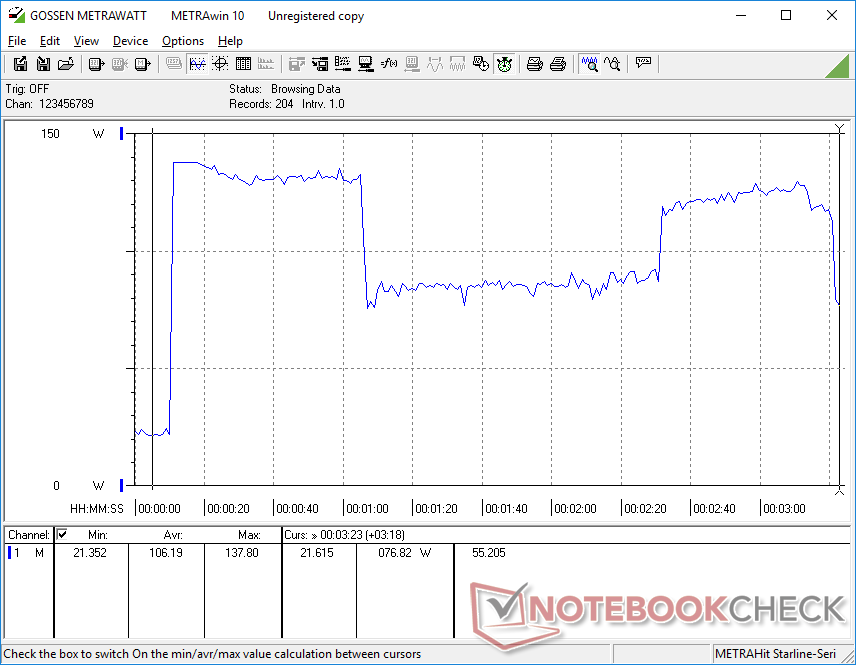
Pudimos medir un consumo máximo temporal de 138 W del adaptador USB-C AC pequeño-mediano (~14.3 x 6.5 x 2.1 cm) de 130 W cuando la CPU y la GPU están a pleno rendimiento. Esta elevada tasa de consumo no es consistente, ya que oscilaría entre 76 W y 138 W cada minuto más o menos, como muestra el siguiente gráfico que se correlaciona con las tasas de reloj cíclicas.
| Off / Standby | |
| Ocioso | |
| Carga |
|
Clave:
min: | |
| Dell Precision 5480 i9-13900H, RTX 3000 Ada Generation Laptop, Samsung PM9A1 MZVL21T0HCLR, IPS, 2560x1600, 14" | Dell Precision 5000 5470 i9-12900H, RTX A1000 Laptop GPU, Samsung PM9A1 MZVL21T0HCLR, IPS, 2560x1600, 14" | Dell Precision 5000 5560 i7-11850H, RTX A2000 Laptop GPU, Samsung PM9A1 MZVL22T0HBLB, IPS, 3840x2400, 15.6" | Lenovo ThinkPad P14s G3 AMD 21J6S05000 R7 PRO 6850U, Radeon 680M, Samsung PM9A1 MZVL21T0HCLR, IPS LED, 1920x1200, 14" | Lenovo ThinkPad P15v G3 21EM001AGE R7 PRO 6850H, RTX A2000 Laptop GPU, SK Hynix PC711 1TB HFS001TDE9X081N, IPS LED, 3840x2160, 15.6" | HP ZBook Firefly 14 G9-6B8A2EA i7-1265U, T550 Laptop GPU, Micron 3400 1TB MTFDKBA1T0TFH, IPS, 1920x1200, 14" | |
|---|---|---|---|---|---|---|
| Power Consumption | 25% | 15% | 63% | 24% | 60% | |
| Idle Minimum * (Watt) | 14.9 | 4.3 71% | 6.2 58% | 2.6 83% | 6.3 58% | 4.2 72% |
| Idle Average * (Watt) | 19.5 | 8.9 54% | 13.9 29% | 5 74% | 13.9 29% | 6.5 67% |
| Idle Maximum * (Watt) | 27.2 | 18.9 31% | 23.8 12% | 5.6 79% | 14.5 47% | 7.2 74% |
| Load Average * (Watt) | 81.6 | 94 -15% | 95.7 -17% | 49.7 39% | 82.8 -1% | 47.7 42% |
| Witcher 3 ultra * (Watt) | 90.4 | 83.2 8% | 87 4% | 50.6 44% | 88.8 2% | 42.9 53% |
| Load Maximum * (Watt) | 137.8 | 137.5 -0% | 132.6 4% | 61.1 56% | 124.8 9% | 68.2 51% |
* ... más pequeño es mejor
Power Consumption Witcher 3 / Stresstest
Power Consumption external Monitor
Duración de la batería
La autonomía WLAN es ligeramente superior a la del modelo del año pasado en 1 ó 2 horas, lo que está muy bien teniendo en cuenta las ventajas de rendimiento de un año a otro. Mientras tanto, la carga de vacío a plena capacidad tarda algo más de 2 horas.
| Dell Precision 5480 i9-13900H, RTX 3000 Ada Generation Laptop, 72 Wh | Dell Precision 5000 5470 i9-12900H, RTX A1000 Laptop GPU, 72 Wh | Dell Precision 5000 5560 i7-11850H, RTX A2000 Laptop GPU, 86 Wh | Lenovo ThinkPad P14s G3 AMD 21J6S05000 R7 PRO 6850U, Radeon 680M, 52.5 Wh | Lenovo ThinkPad P15v G3 21EM001AGE R7 PRO 6850H, RTX A2000 Laptop GPU, 68 Wh | HP ZBook Firefly 14 G9-6B8A2EA i7-1265U, T550 Laptop GPU, 51 Wh | |
|---|---|---|---|---|---|---|
| Duración de Batería | 5% | 29% | 17% | 32% | -19% | |
| WiFi v1.3 (h) | 10.9 | 9.6 -12% | 6.3 -42% | 12.2 12% | 6.9 -37% | 8.8 -19% |
| Load (h) | 0.9 | 1.1 22% | 1.8 100% | 1.1 22% | 1.8 100% | |
| Reader / Idle (h) | 14.7 | 12 | ||||
| H.264 (h) | 12 | 10.7 |
Pro
Contra
Veredicto - RTX 3000 Ada impresiona
El Precision 5480 es un perfeccionamiento interno del Precision 5470 del año pasado. El rendimiento de la CPU es más rápido y estable que antes, mientras que la GPU Ada es la verdadera estrella del espectáculo y la mayor razón para comprar el Precision 5480 en lugar del antiguo Precision 5470. El consumo de energía puede ser un poco mayor, pero la duración de la batería no ha cambiado significativamente y el aumento de rendimiento merecerá la pena para los usuarios exigentes.
Quizá el mayor inconveniente del sistema sea lo ruidoso que puede llegar a ser cuando se pisa el acelerador a fondo. Aunque el rendimiento por volumen es muy alto, toda esa potencia en un paquete tan pequeño y portátil tiene el precio del ruido del ventilador. Otras estaciones de trabajo de 14 pulgadas como el
Lenovo ThinkPad P14s oHP ZBook Firefly 14 G9 son mucho más silenciosas, pero tendrás que sacrificar una gran parte del rendimiento gráfico.El Precision 5480 de 14 pulgadas es para usuarios avanzados que saben que pueden explotar al máximo la rápida GPU RTX 3000 Ada. Por lo demás, las alternativas de Lenovo y HP tienden a funcionar de forma mucho más silenciosa y discreta.
Precio y disponibilidad
Dell ya comercializa su estación de trabajo Precision 5480 a partir de 2070 USD para la configuración básica Core i5 sin gráficos discretos hasta más de 4400 USD para nuestra configuración Core i7 RTX 3000 Ada.
Dell Precision 5480
- 09/15/2023 v7 (old)
Allen Ngo
Transparencia
La selección de los dispositivos que se van a reseñar corre a cargo de nuestro equipo editorial. La muestra de prueba fue proporcionada al autor en calidad de préstamo por el fabricante o el minorista a los efectos de esta reseña. El prestamista no tuvo ninguna influencia en esta reseña, ni el fabricante recibió una copia de la misma antes de su publicación. No había ninguna obligación de publicar esta reseña. Como empresa de medios independiente, Notebookcheck no está sujeta a la autoridad de fabricantes, minoristas o editores.
Así es como prueba Notebookcheck
Cada año, Notebookcheck revisa de forma independiente cientos de portátiles y smartphones utilizando procedimientos estandarizados para asegurar que todos los resultados son comparables. Hemos desarrollado continuamente nuestros métodos de prueba durante unos 20 años y hemos establecido los estándares de la industria en el proceso. En nuestros laboratorios de pruebas, técnicos y editores experimentados utilizan equipos de medición de alta calidad. Estas pruebas implican un proceso de validación en varias fases. Nuestro complejo sistema de clasificación se basa en cientos de mediciones y puntos de referencia bien fundamentados, lo que mantiene la objetividad.Price comparison

