Análisis del Lenovo ThinkPad P1 G6: 80 W GeForce RTX 4080 para una estación de trabajo ultradelgada

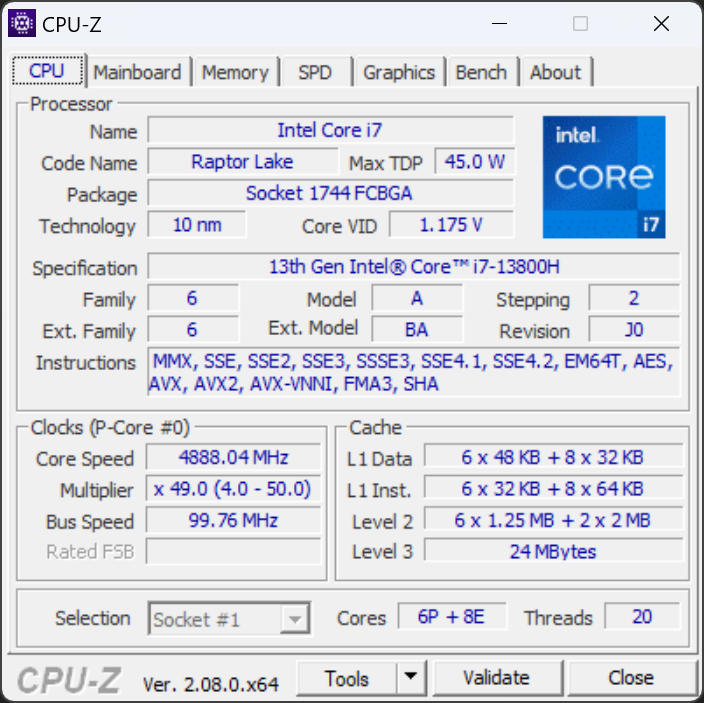
Recientemente hemos revisado el ThinkPad P1 G6 con la CPU Core i9-13900H, la GPU RTX 2000 y la pantalla IPS de 1600p y nos pareció una estación de trabajo de 16 pulgadas muy competitiva. En esta ocasión, nos disponemos a examinar una segunda configuración con el Core i7-13800H, la GPU GeForce RTX 4080 y la pantalla OLED de 2400p para ver cómo las diferentes especificaciones podrían afectar al rendimiento, la duración de la batería, el hardware interno y mucho más.
Tenga en cuenta que la serie ThinkPad P1 16 no debe confundirse con la ThinkPad serie P16 que consta de modelos más grandes y pesados con opciones Core serie HX más rápidas.
Más opiniones sobre Lenovo:
Posibles contendientes en la comparación
Valoración | Fecha | Modelo | Peso | Altura | Tamaño | Resolución | Precio |
|---|---|---|---|---|---|---|---|
| 90.1 % v7 (old) | 12/2023 | Lenovo ThinkPad P1 G6 21FV001KUS i7-13800H, GeForce RTX 4080 Laptop GPU | 1.9 kg | 17.5 mm | 16.00" | 3480x2400 | |
| 91.7 % v7 (old) | 10/2023 | Lenovo ThinkPad P1 G6-21FV000DGE i9-13900H, RTX 2000 Ada Generation Laptop | 1.9 kg | 17.5 mm | 16.00" | 2560x1600 | |
| 89.8 % v7 (old) | 11/2021 | Lenovo ThinkPad P1 G4-20Y4S0KS00 i7-11850H, GeForce RTX 3070 Laptop GPU | 2 kg | 17.7 mm | 16.00" | 3840x2400 | |
| 91 % v7 (old) | 02/2023 | Lenovo ThinkPad P16 G1 RTX A5500 i9-12950HX, RTX A5500 Laptop GPU | 3 kg | 30.23 mm | 16.00" | 3840x2400 | |
| 89 % v7 (old) | 08/2023 | Dell Precision 5000 5680 i9-13900H, RTX 5000 Ada Generation Laptop | 2.3 kg | 22.17 mm | 16.00" | 3840x2400 | |
| 92.3 % v7 (old) | 09/2023 | HP ZBook Fury 16 G10 i9-13950HX, RTX 5000 Ada Generation Laptop | 2.6 kg | 28.5 mm | 16.00" | 3840x2400 |
Lector de tarjetas SD
| SD Card Reader | |
| average JPG Copy Test (av. of 3 runs) | |
| Dell Precision 5000 5680 (Toshiba Exceria Pro SDXC 64 GB UHS-II) | |
| Lenovo ThinkPad P1 G6 21FV001KUS (Toshiba Exceria Pro SDXC 64 GB UHS-II) | |
| HP ZBook Fury 16 G10 (Toshiba Exceria Pro SDXC 64 GB UHS-II) | |
| Lenovo ThinkPad P1 G6-21FV000DGE (Angelbird AV Pro V60) | |
| Lenovo ThinkPad P16 G1 RTX A5500 (Toshiba Exceria Pro SDXC 64 GB UHS-II) | |
| maximum AS SSD Seq Read Test (1GB) | |
| Dell Precision 5000 5680 (Toshiba Exceria Pro SDXC 64 GB UHS-II) | |
| Lenovo ThinkPad P1 G6 21FV001KUS (Toshiba Exceria Pro SDXC 64 GB UHS-II) | |
| HP ZBook Fury 16 G10 (Toshiba Exceria Pro SDXC 64 GB UHS-II) | |
| Lenovo ThinkPad P1 G6-21FV000DGE (Angelbird AV Pro V60) | |
| Lenovo ThinkPad P16 G1 RTX A5500 (Toshiba Exceria Pro SDXC 64 GB UHS-II) | |
Comunicación
Mientras que las velocidades de recepción son estables, las de transmisión tienden a ser más lentas y con más fluctuaciones de lo esperado, incluso después de repetir las pruebas.
Cámara web
La unidad se ha configurado con una cámara web de 5 MP y 1440p en comparación con la cámara web de 2 MP y 1080p de nuestra revisión original potenciada por RTX 2000 para obtener una imagen más nítida.
IR y un obturador físico vienen de serie.


Mantenimiento
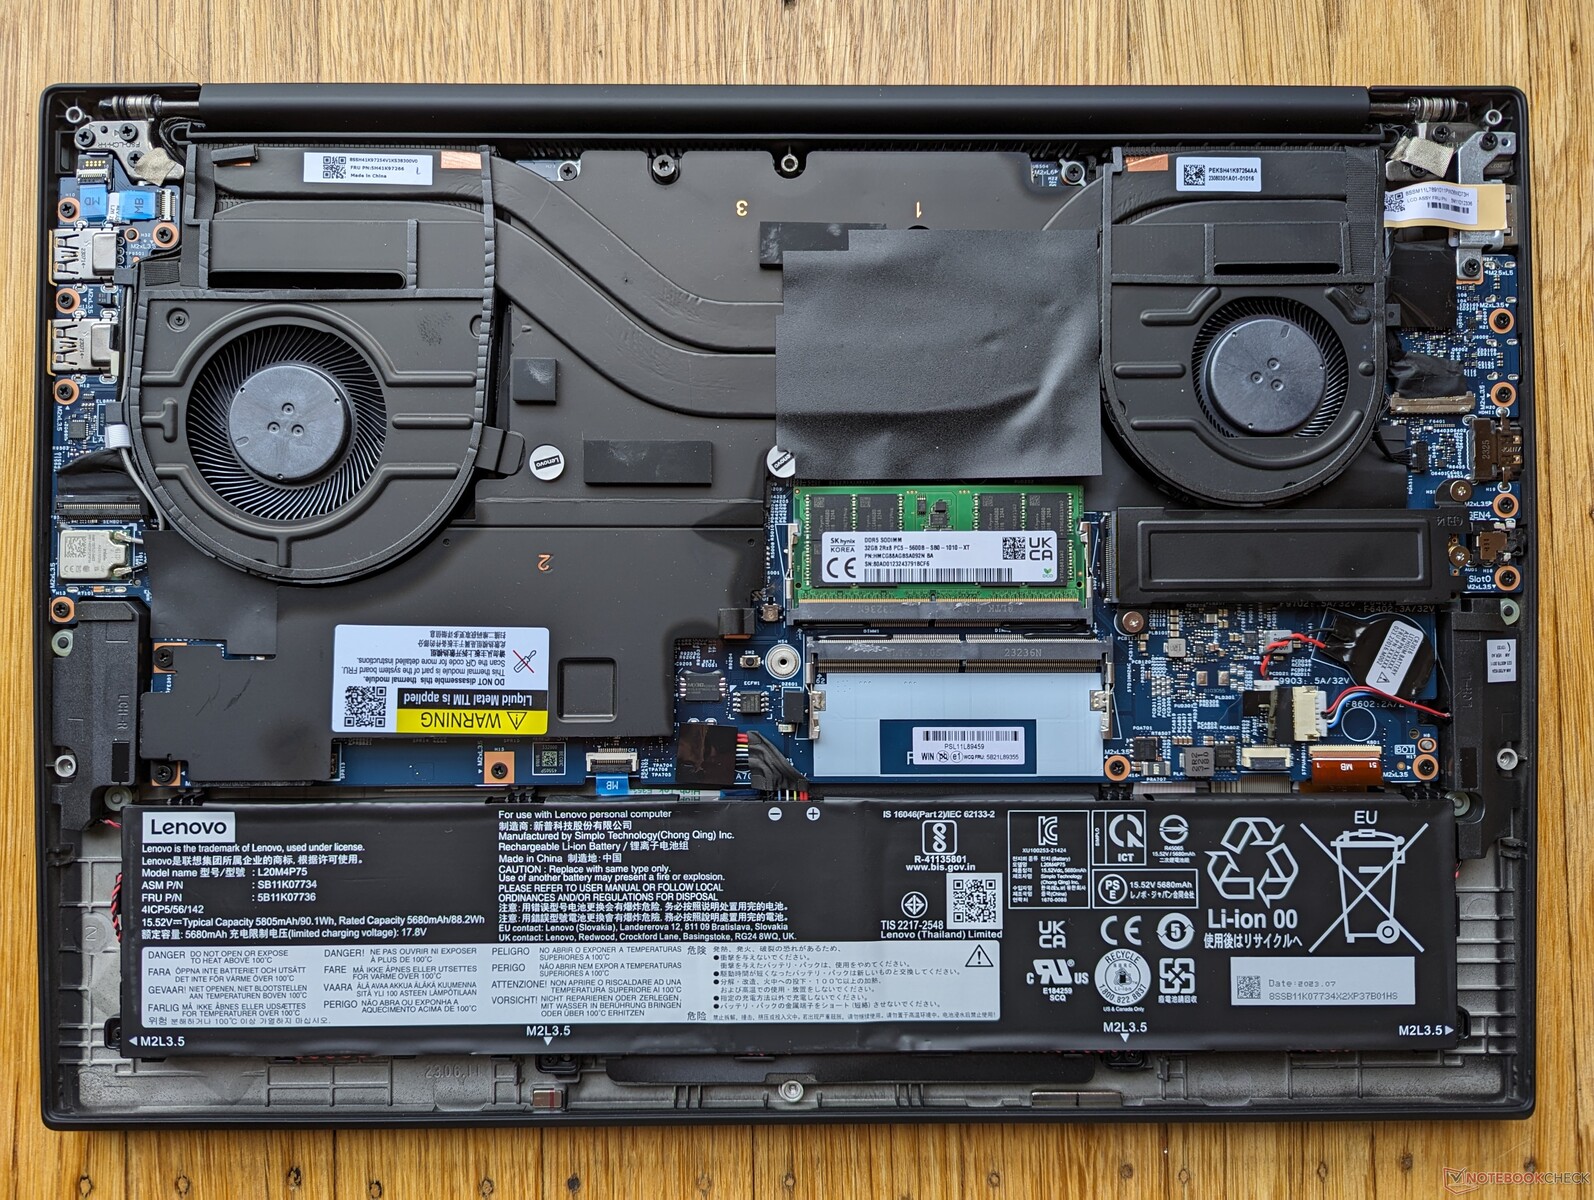
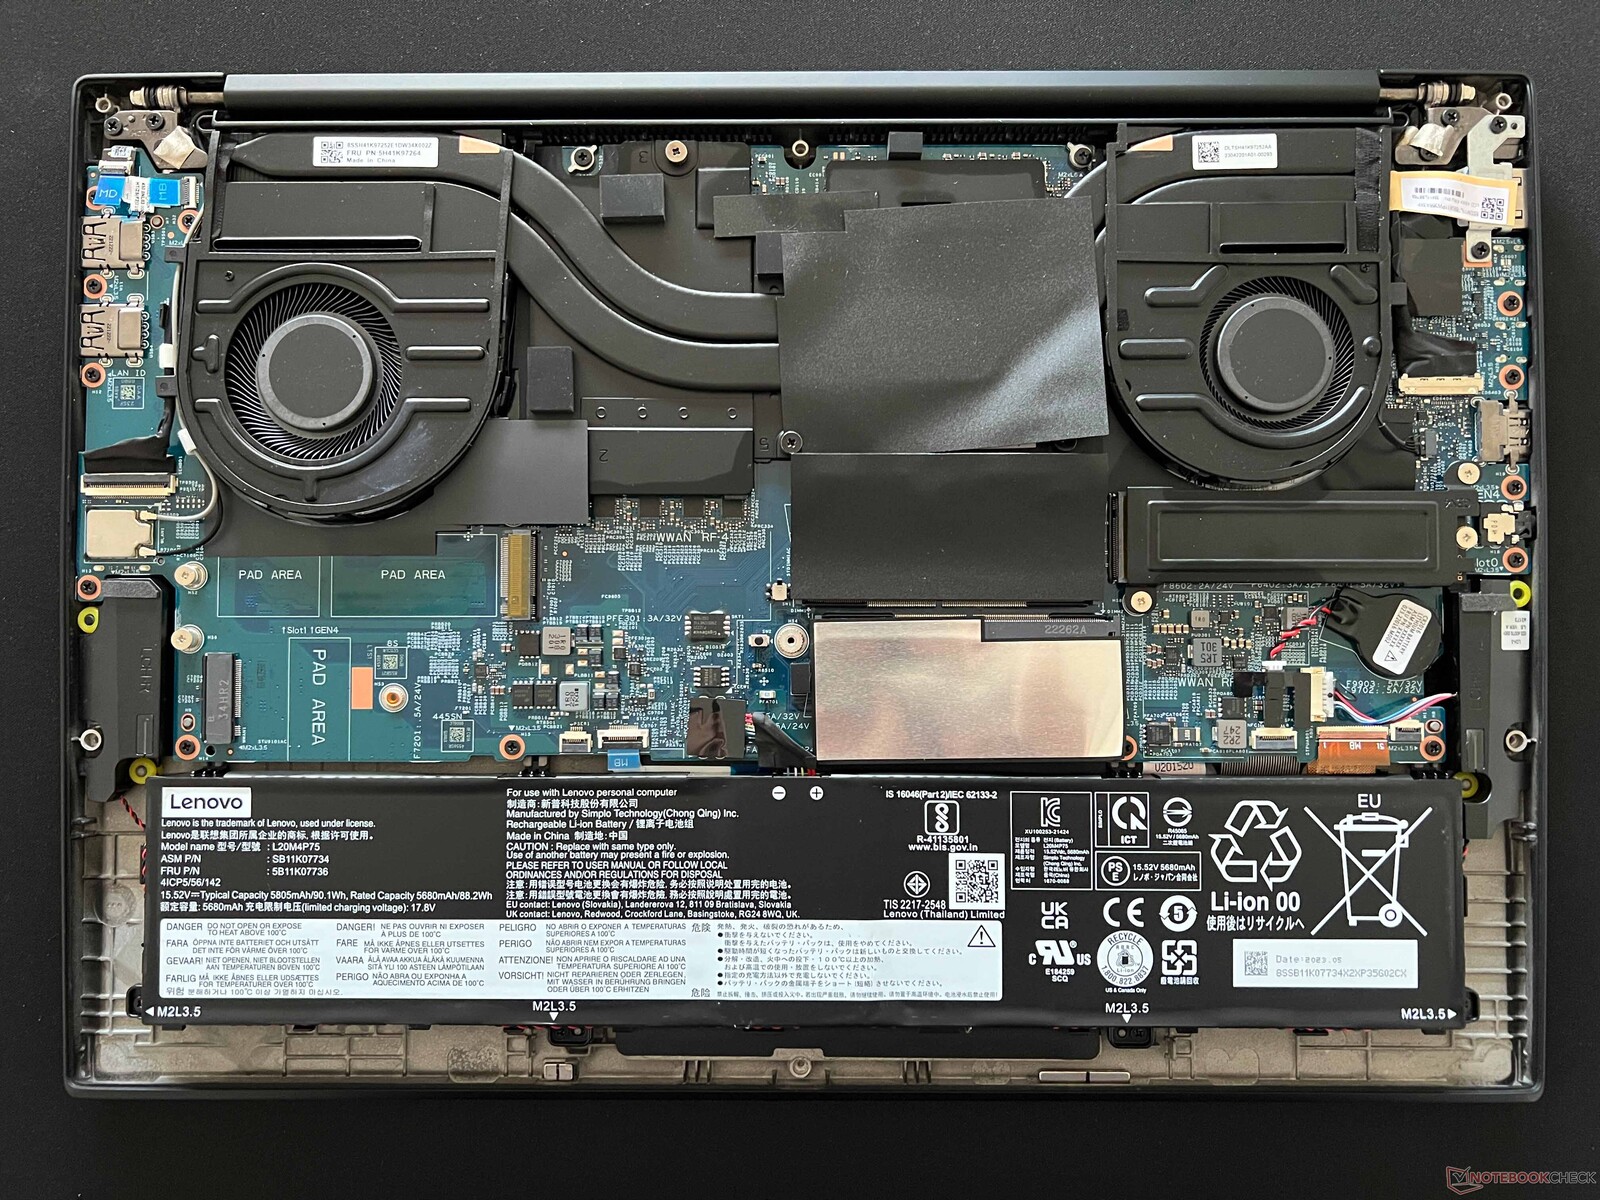
En comparación con la configuración de la ThinkPad P1 G6 RTX 2000, la configuración RTX 4080 integra una solución de refrigeración ampliada con un ventilador de mayor tamaño para dar cabida a la GPU más exigente. Desafortunadamente, esto se produce a costa de dos ranuras de expansión, como se muestra en las imágenes de comparación a continuación.
Accesorios y garantía
No hay extras incluidos en la caja aparte del habitual adaptador de CA y el papeleo. Resulta decepcionante que la garantía limitada estándar sea de sólo 12 meses si se adquiere en EE.UU., frente a los 36 meses de muchos modelos Dell Precision.
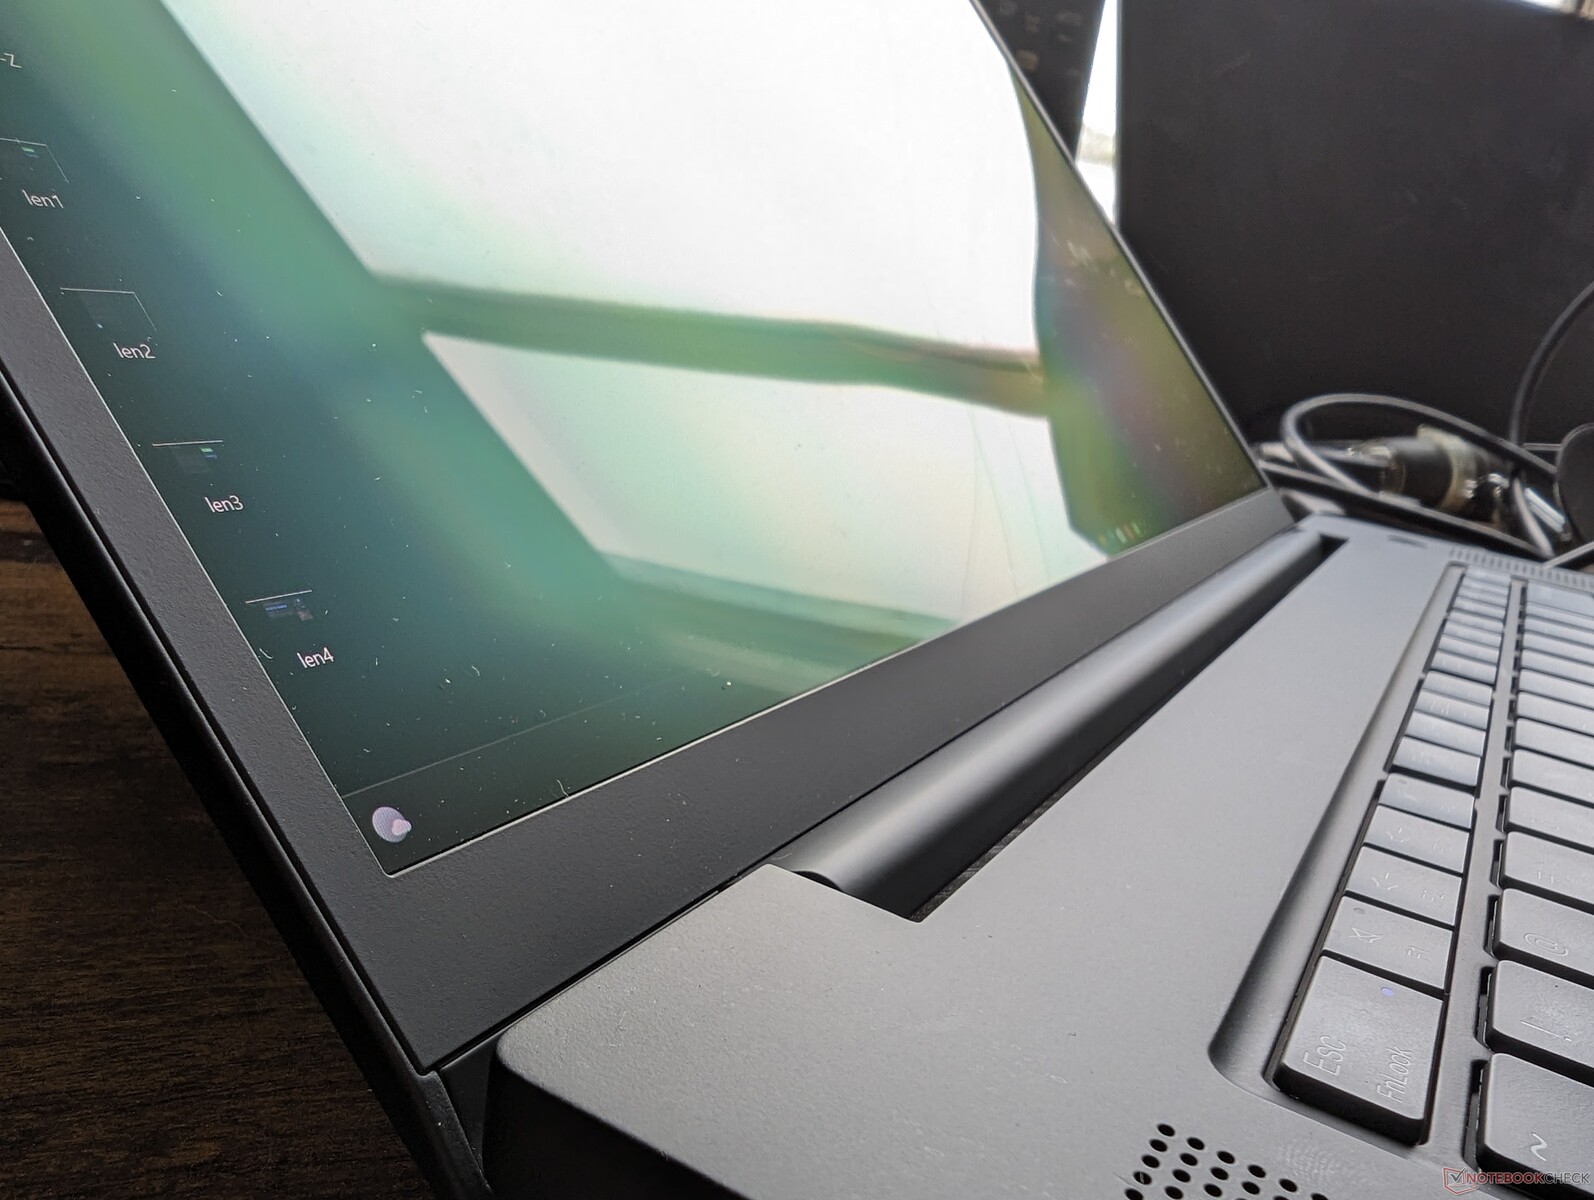
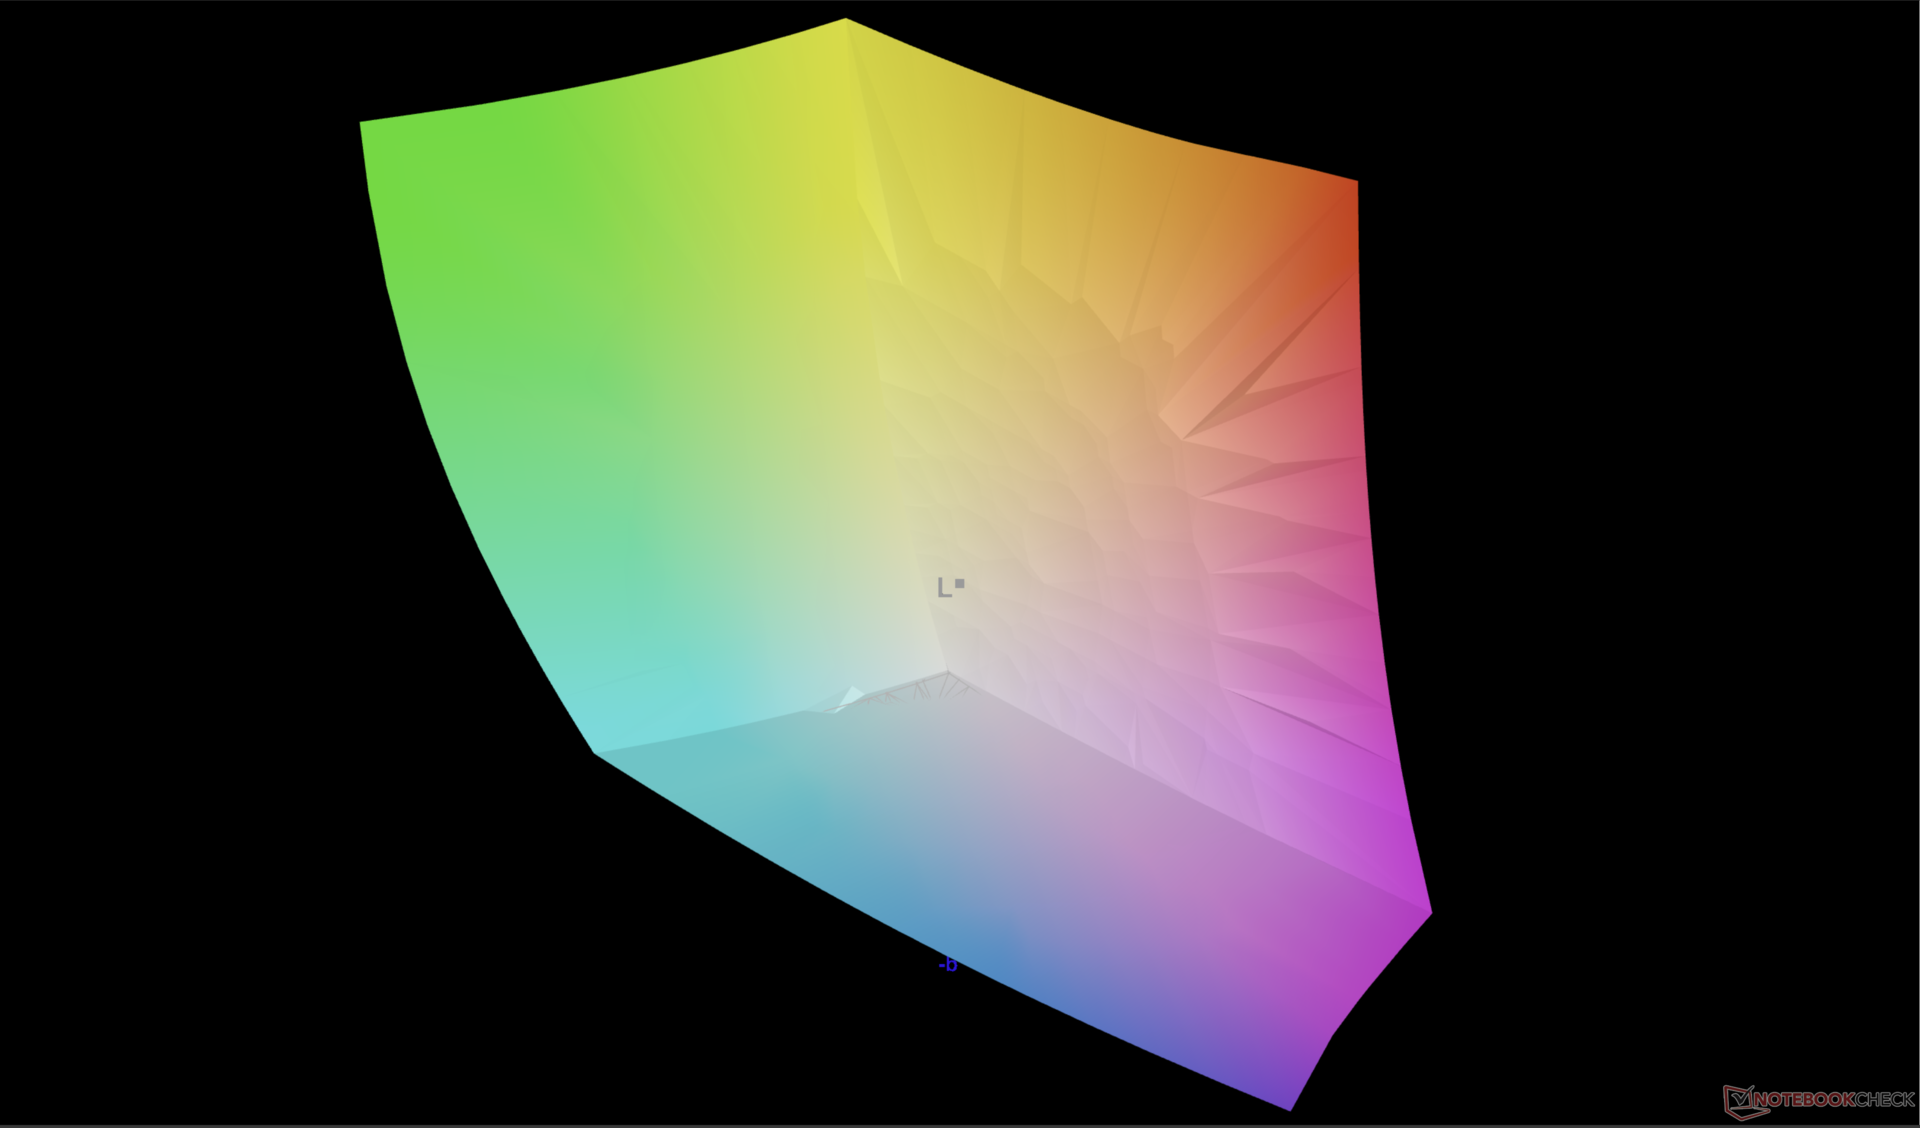
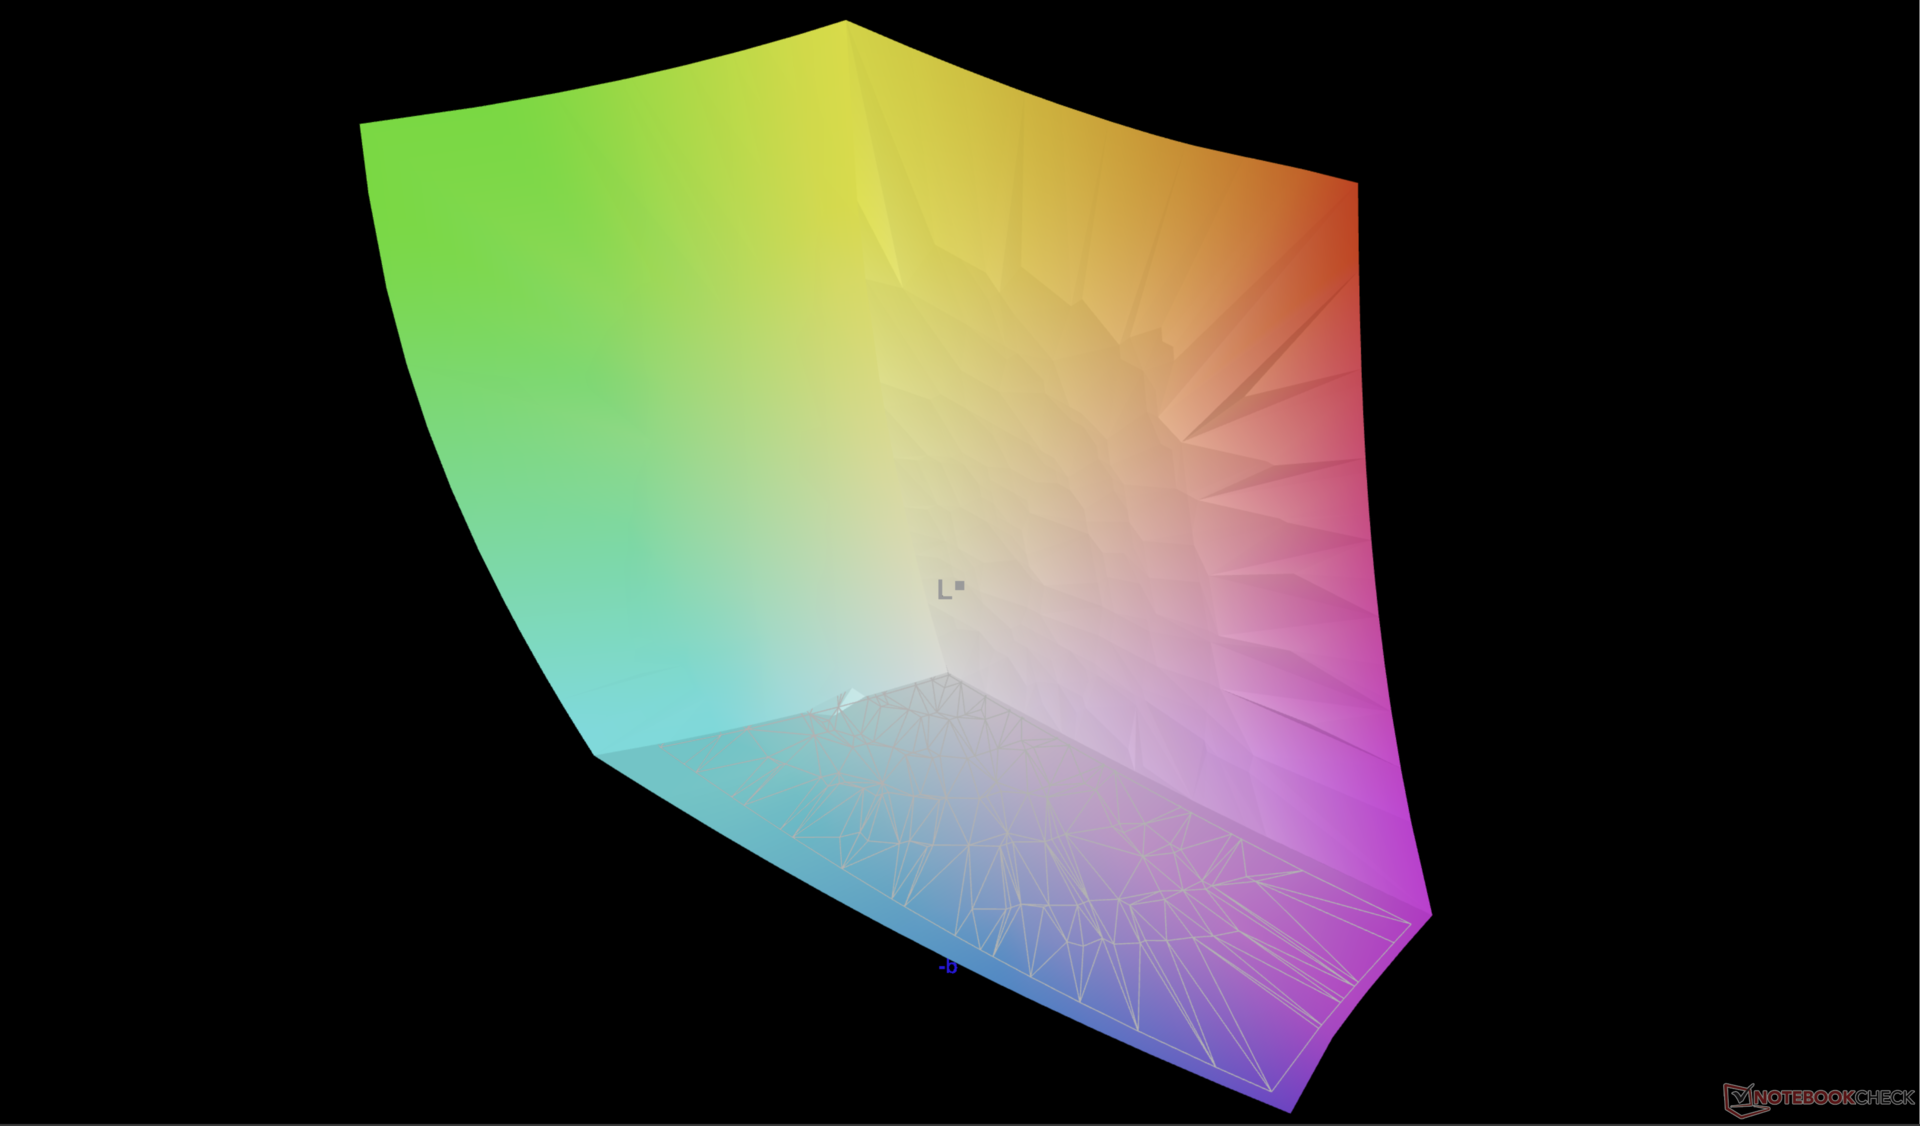
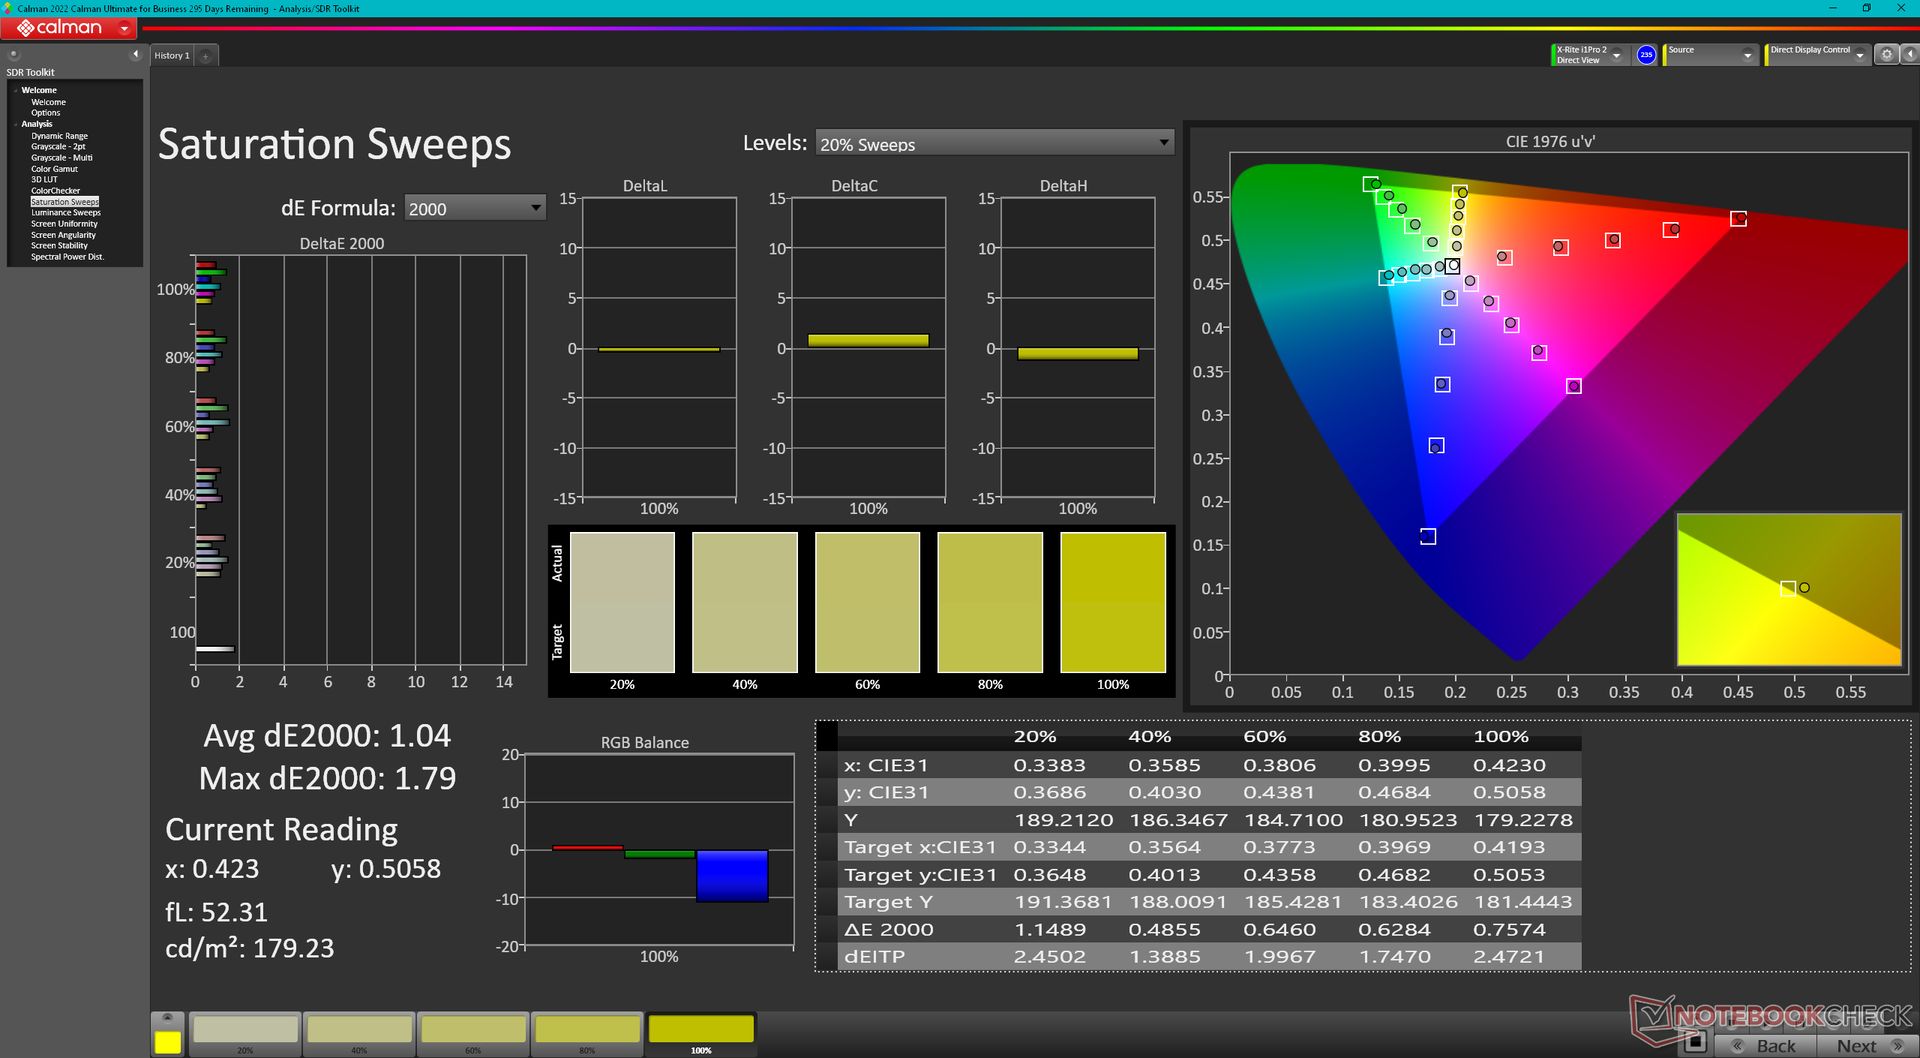
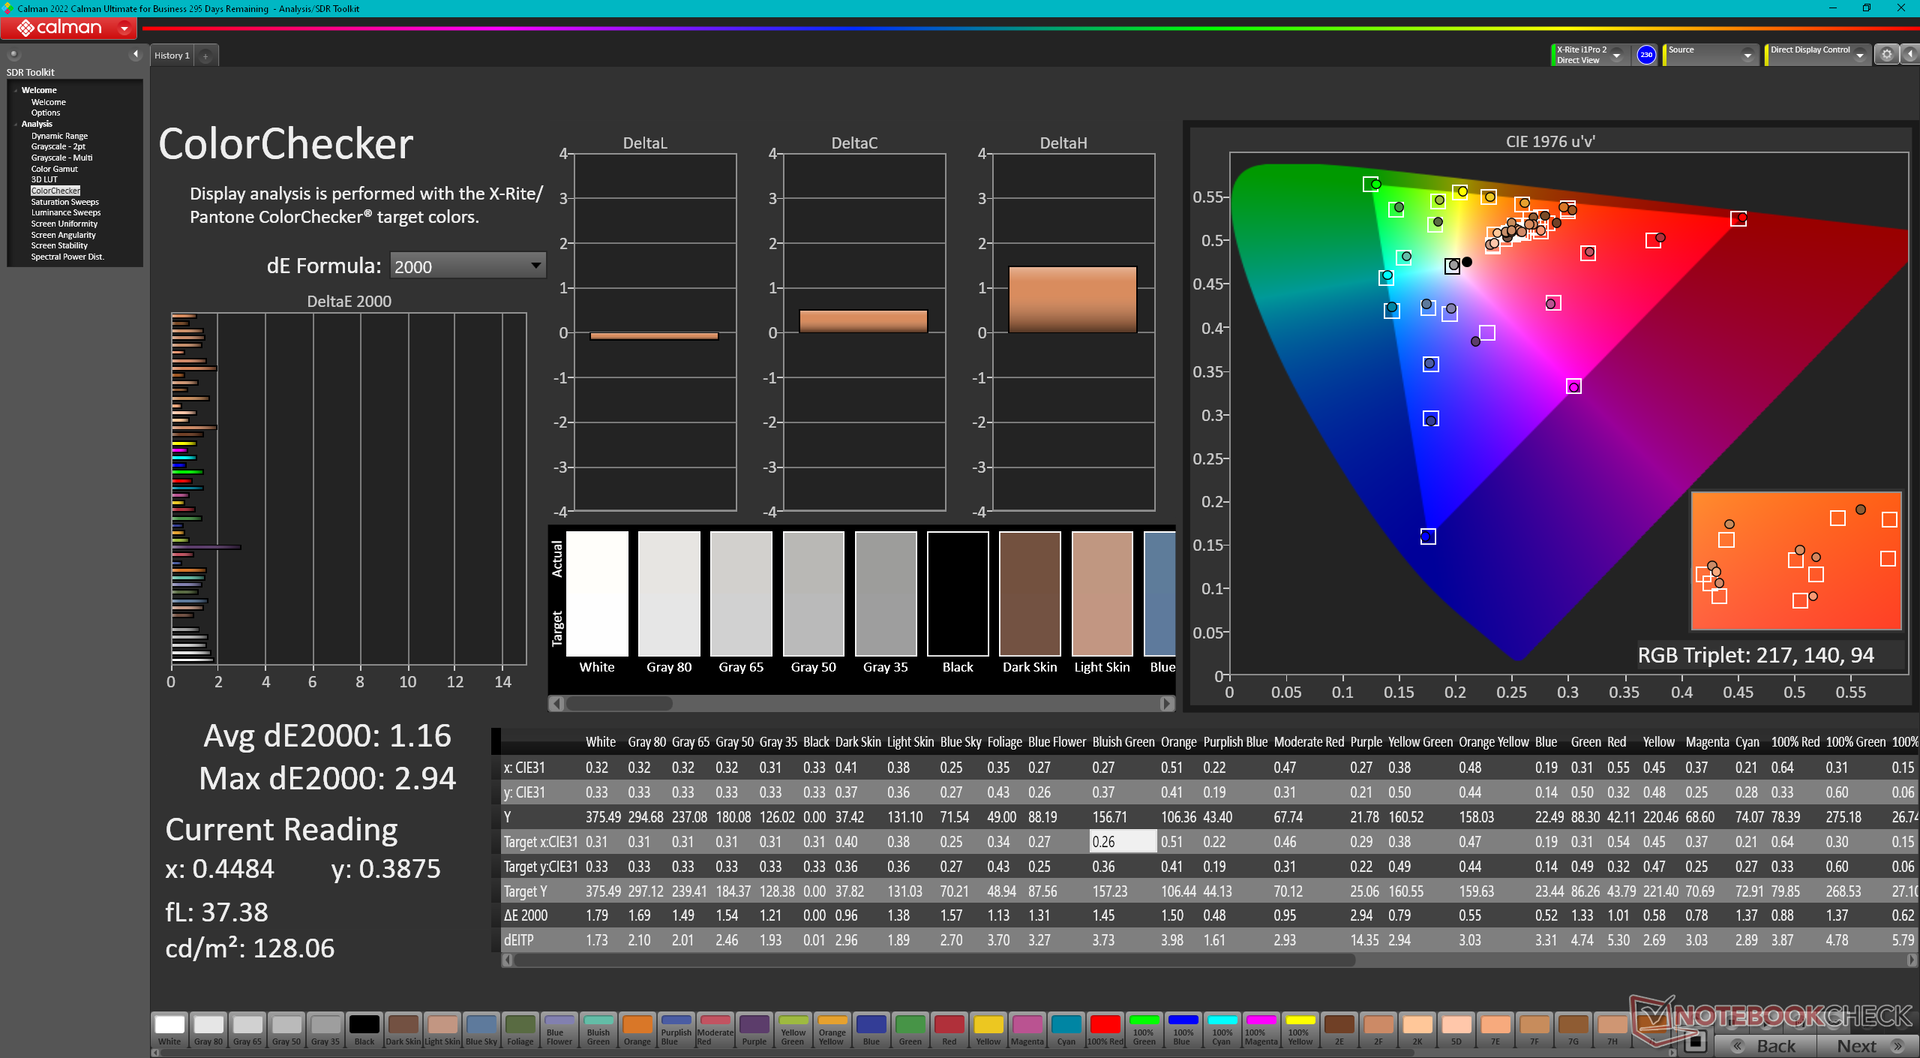
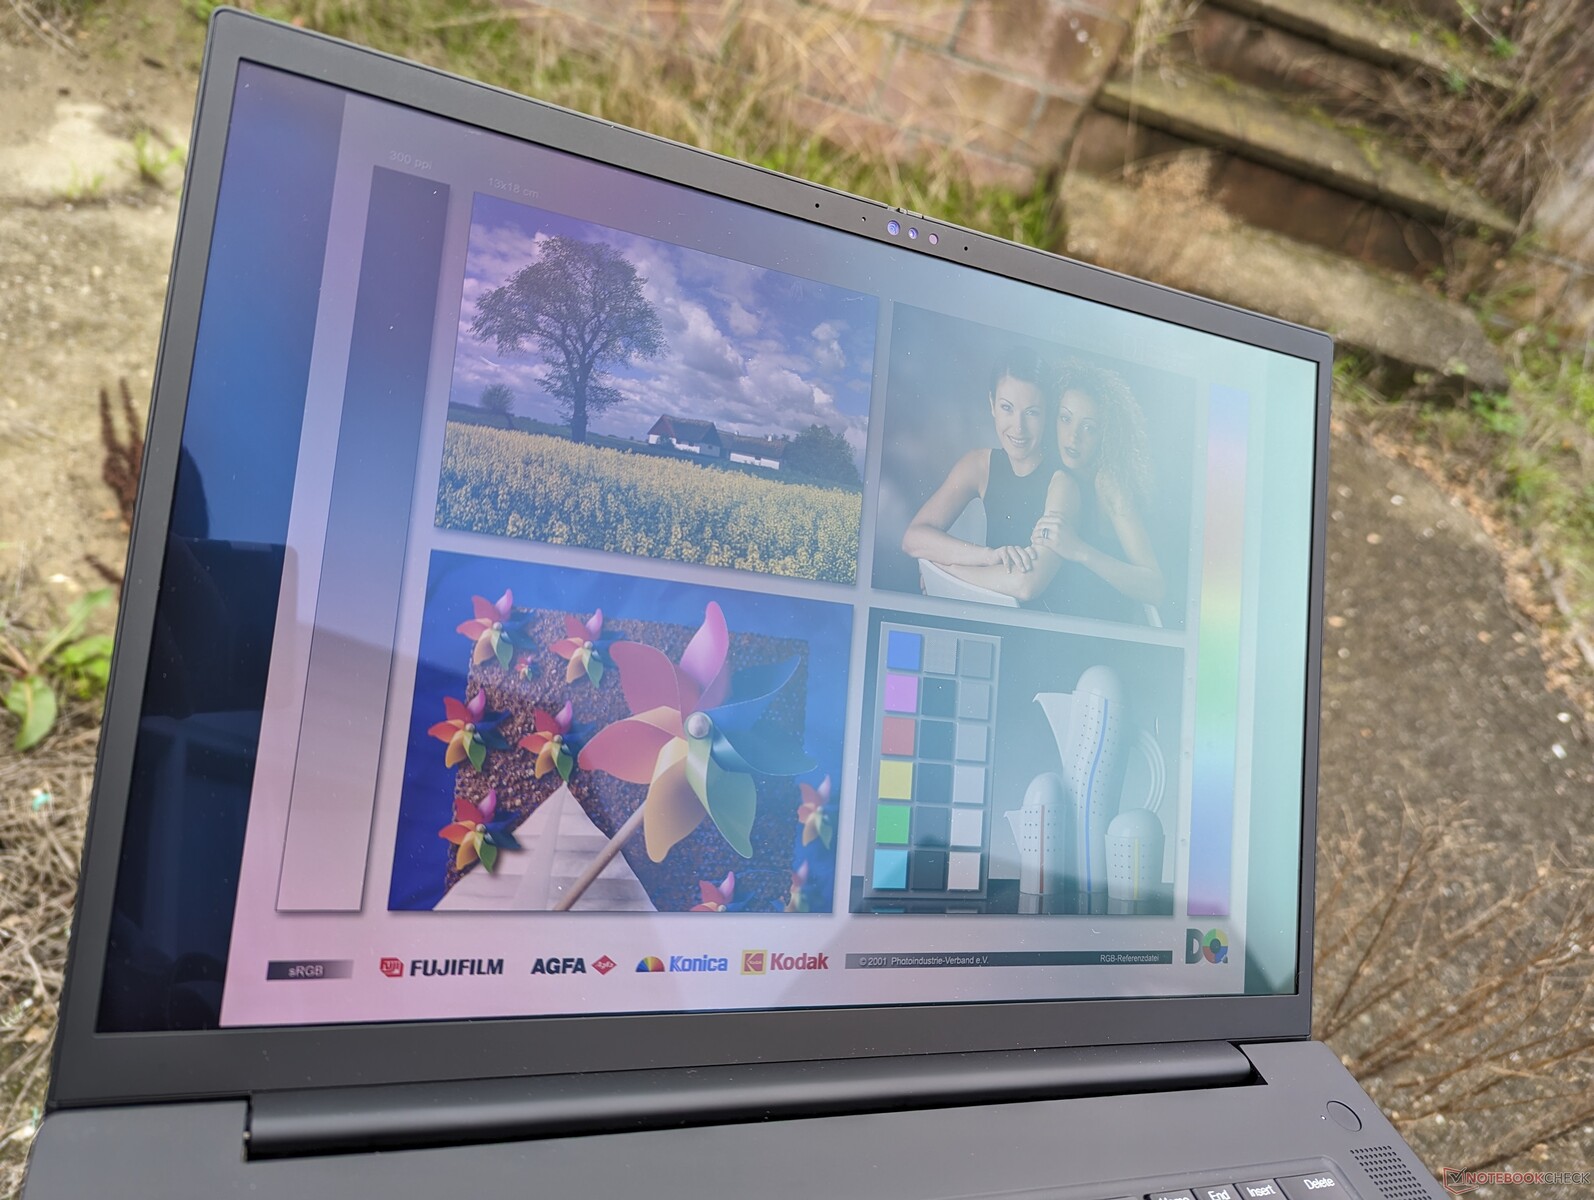
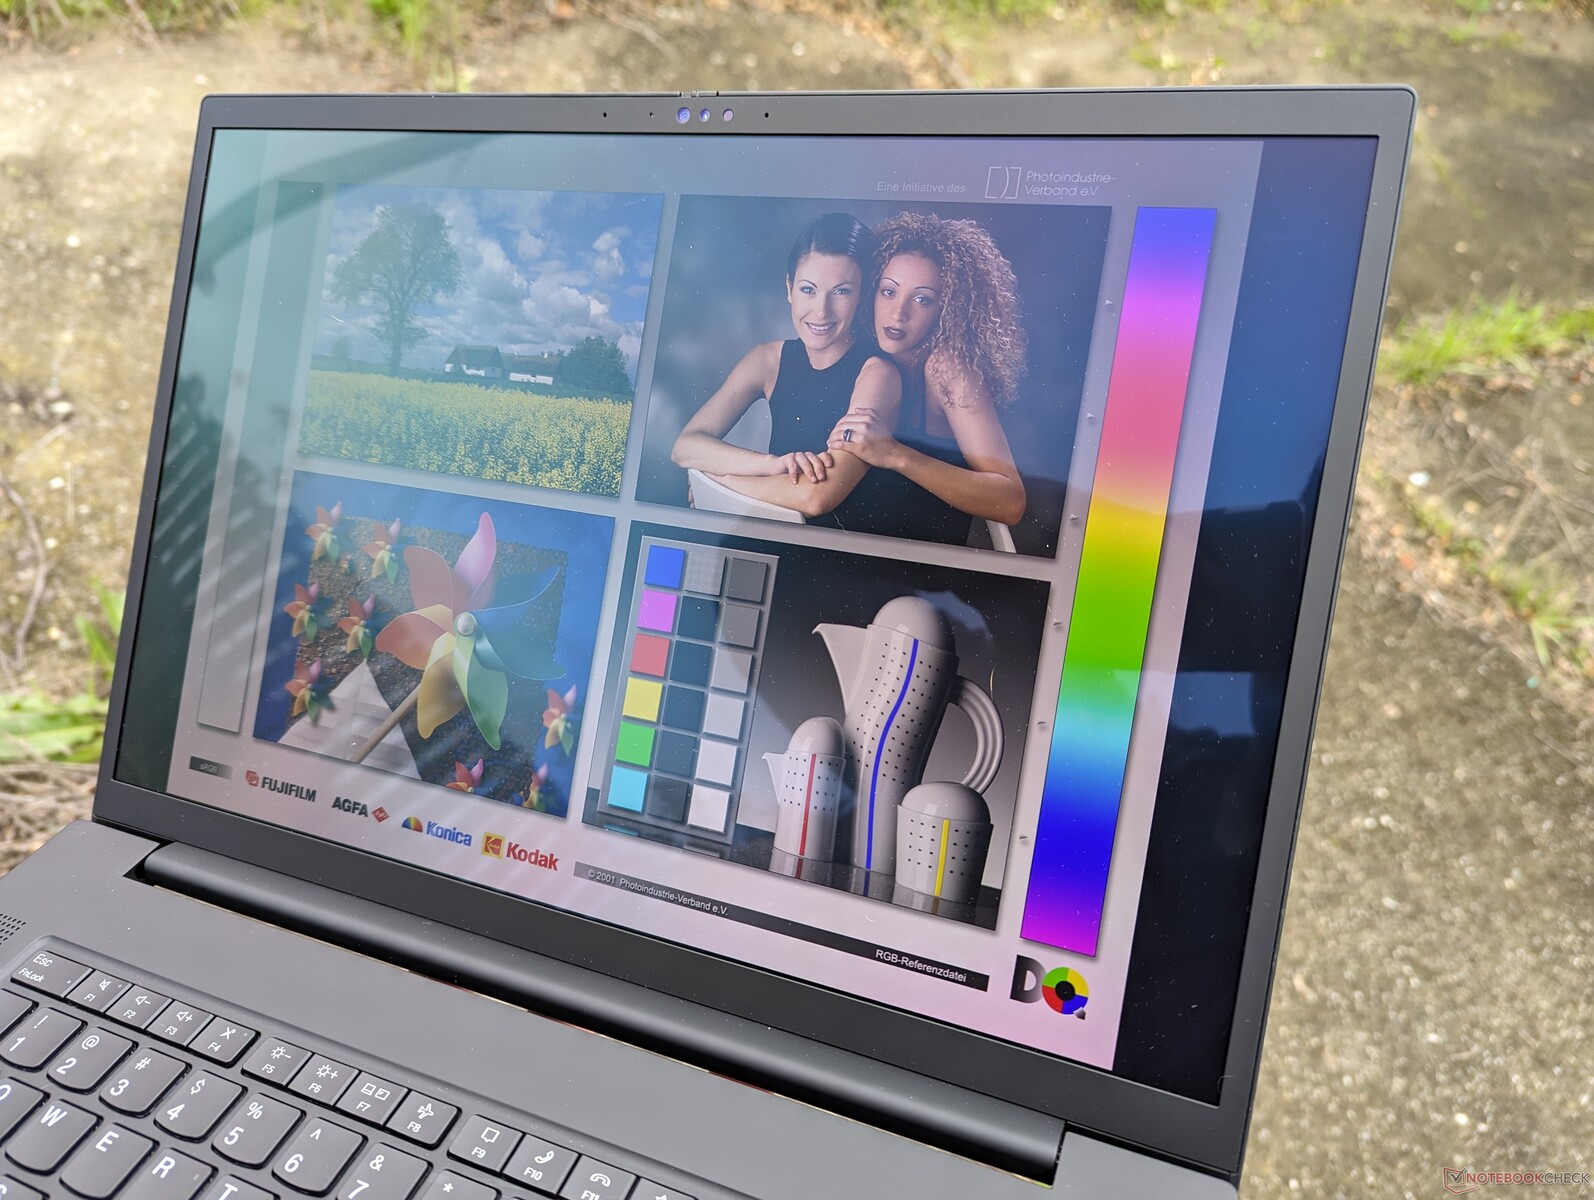
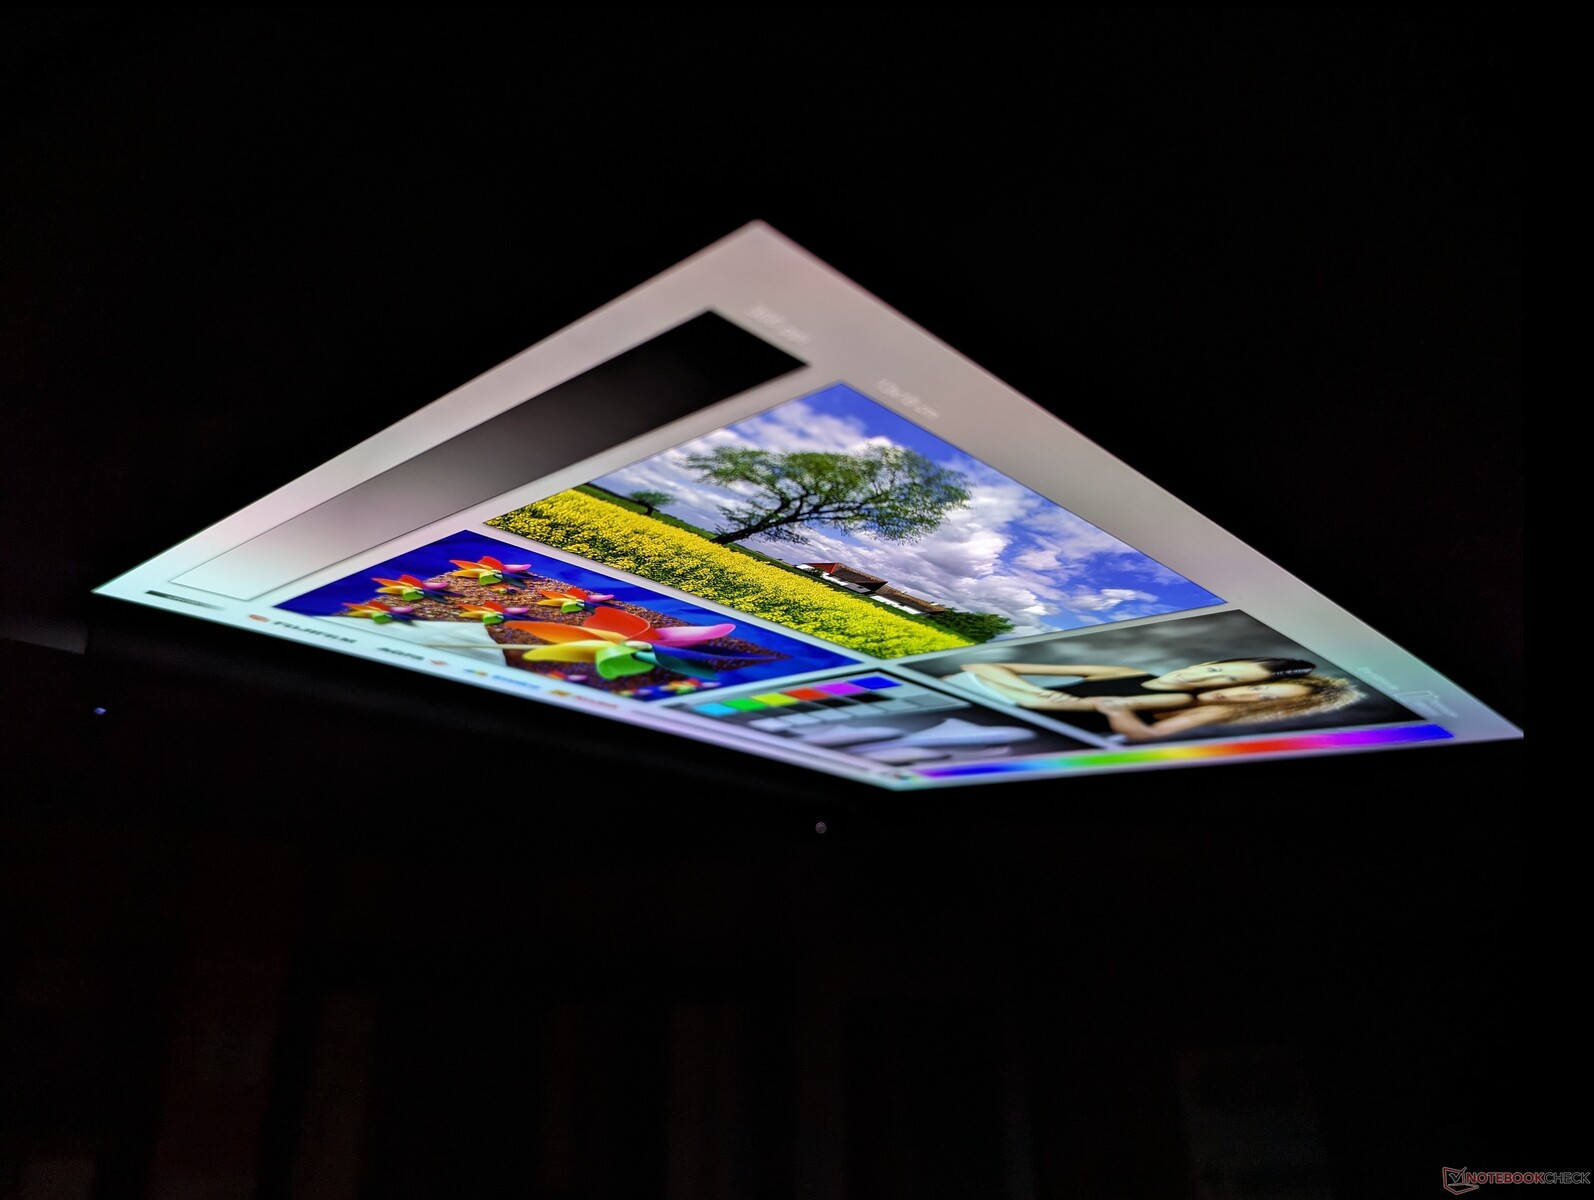
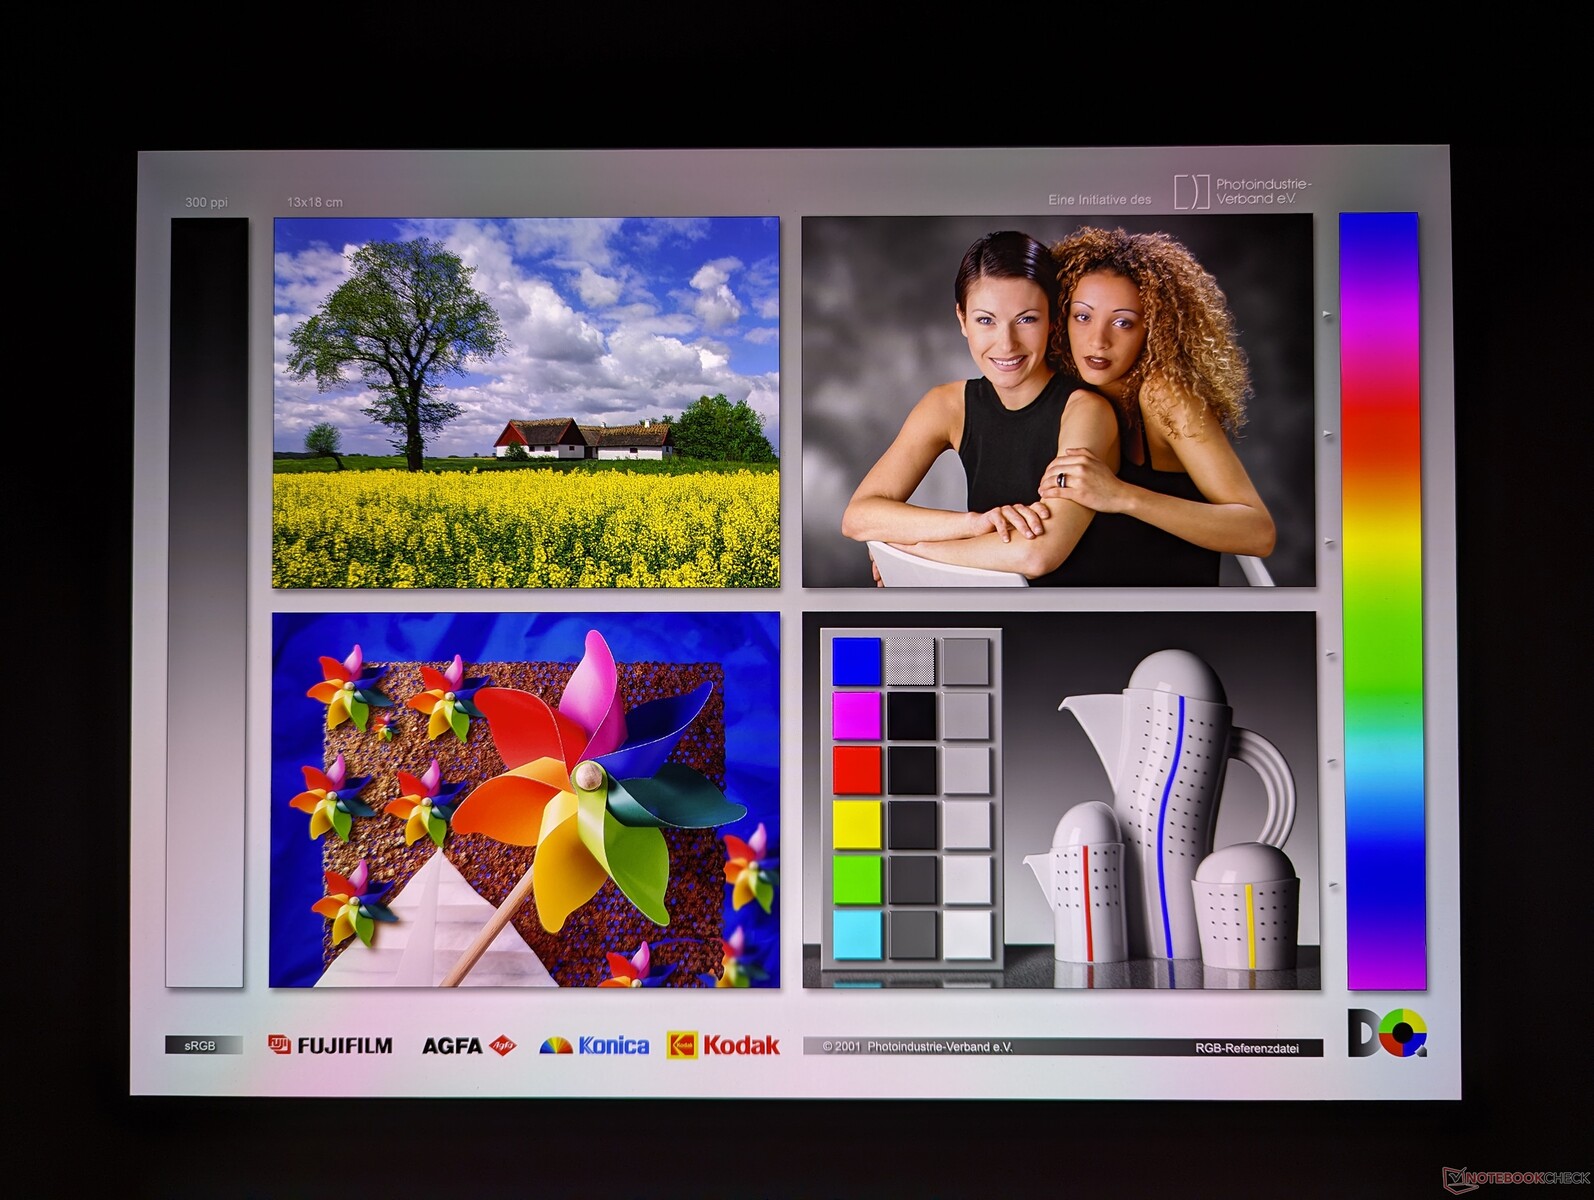
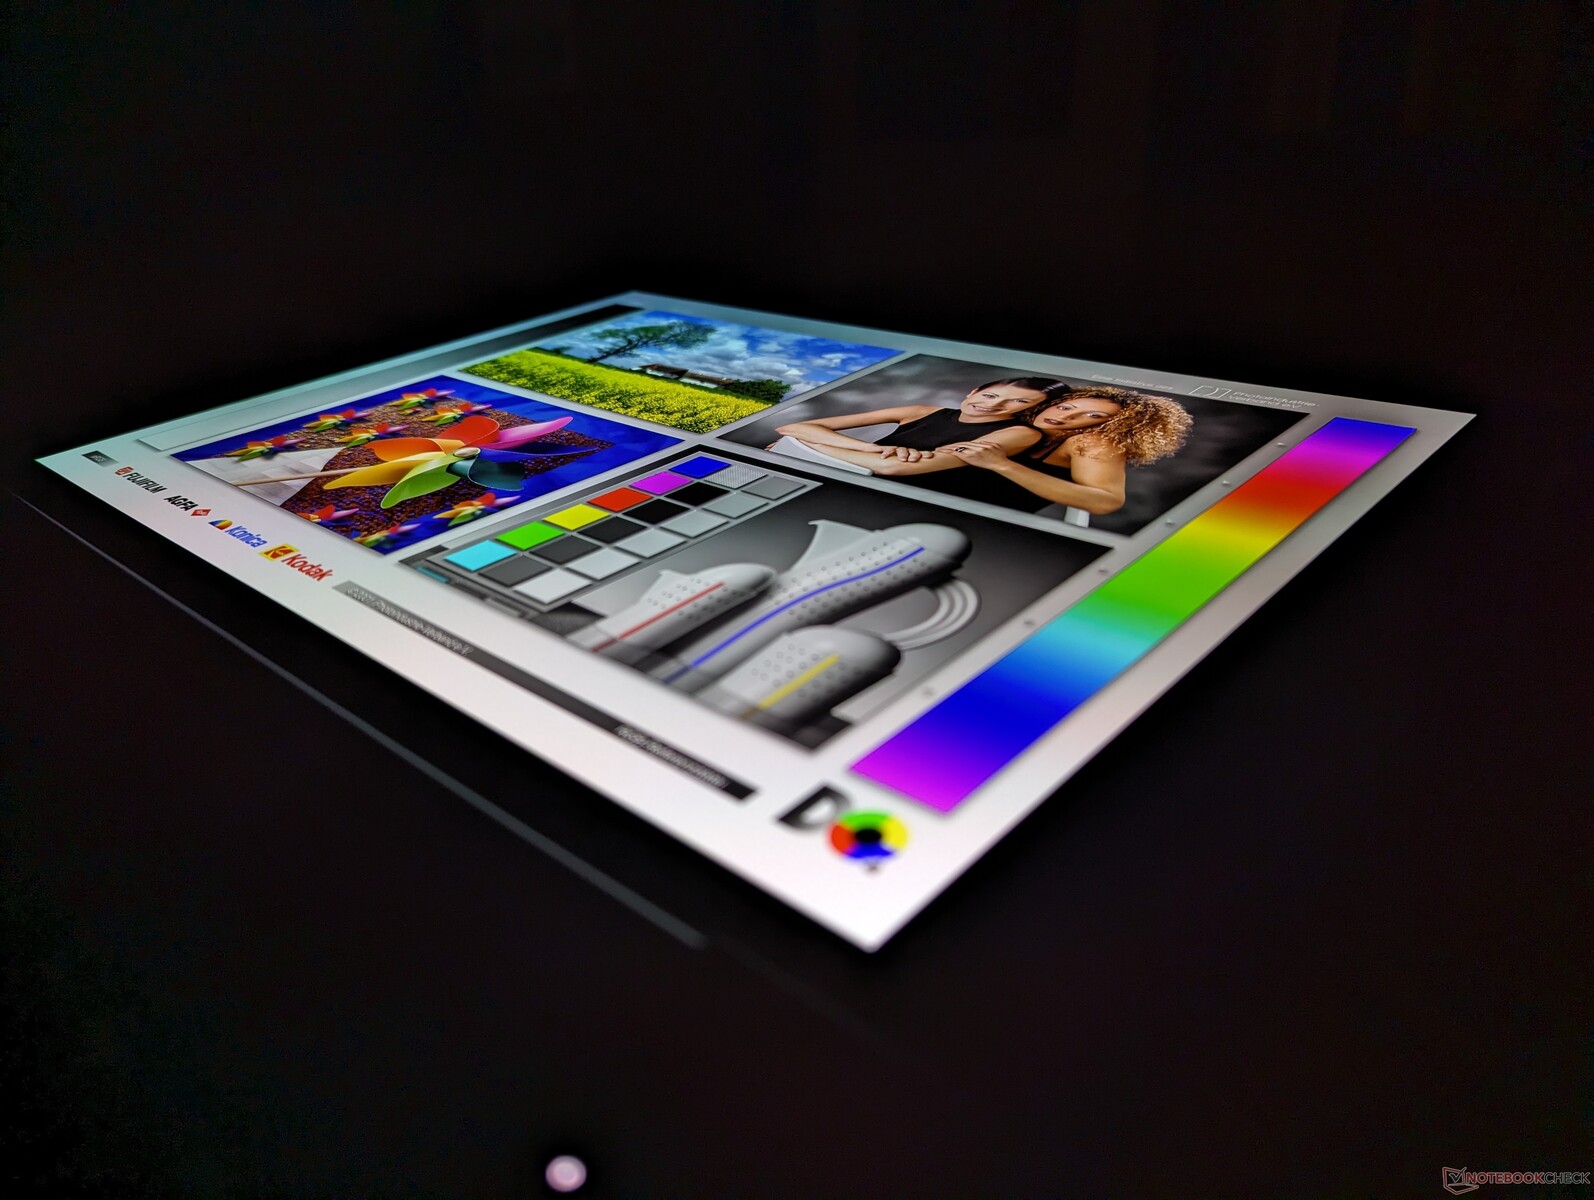
Pantalla - HDR400 con colores DCI-P3
El panel OLED 4K ofrece colores superiores, tiempos de respuesta más rápidos, funcionalidad de pantalla táctil y una resolución nativa más densa que el panel IPS 2K de nuestra anterior configuración potenciada con RTX 2000. Sin embargo, estos beneficios vienen a costa de una frecuencia de actualización nativa más lenta de sólo 60 Hz y un brillo máximo más tenue como se muestra en nuestra tabla a continuación. Por lo tanto, el panel IPS podría ser preferible dependiendo de su aplicación. Es una pena que Lenovo no ofrezca opciones OLED de 120 Hz a la Vivobook Pro 16X.
| |||||||||||||||||||||||||
iluminación: 98 %
Brillo con batería: 375.1 cd/m²
Contraste: ∞:1 (Negro: 0 cd/m²)
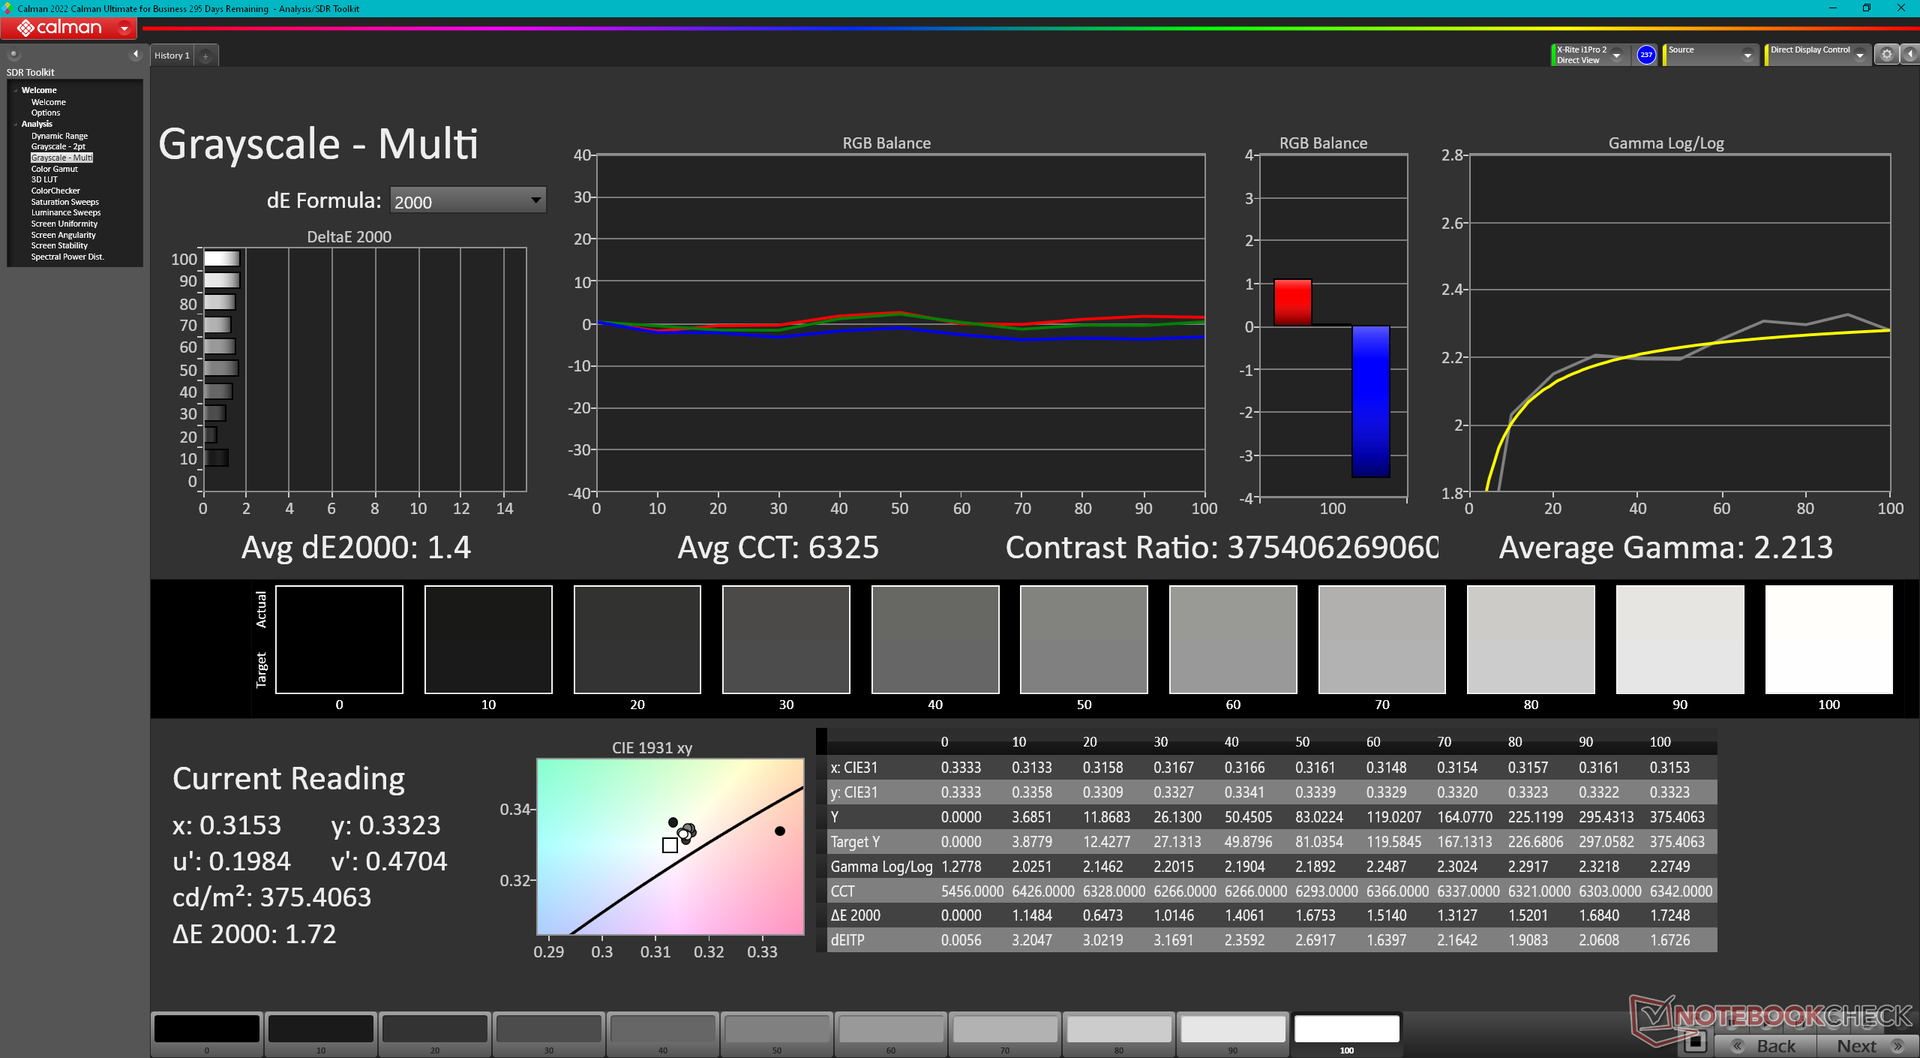
ΔE ColorChecker Calman: 1.16 | ∀{0.5-29.43 Ø4.73}
ΔE Greyscale Calman: 1.4 | ∀{0.09-98 Ø4.97}
97.9% AdobeRGB 1998 (Argyll 3D)
100% sRGB (Argyll 3D)
99.8% Display P3 (Argyll 3D)
Gamma: 2.2
CCT: 6325 K
| Lenovo ThinkPad P1 G6 21FV001KUS Samsung ATNA60YV04-0, OLED, 3480x2400, 16" | Lenovo ThinkPad P1 G6-21FV000DGE NE160QDM-NY1, IPS, 2560x1600, 16" | Lenovo ThinkPad P1 G4-20Y4S0KS00 LP160UQ1-SPB1, IPS LED, 3840x2400, 16" | Lenovo ThinkPad P16 G1 RTX A5500 LP160UQ1-SPB1, IPS, 3840x2400, 16" | Dell Precision 5000 5680 Samsung 160YV03, OLED, 3840x2400, 16" | HP ZBook Fury 16 G10 AUO87A8, IPS, 3840x2400, 16" | |
|---|---|---|---|---|---|---|
| Display | -21% | -5% | -7% | 0% | -5% | |
| Display P3 Coverage (%) | 99.8 | 68.1 -32% | 85.7 -14% | 82.9 -17% | 99.9 0% | 98 -2% |
| sRGB Coverage (%) | 100 | 97.5 -2% | 99.4 -1% | 98.9 -1% | 100 0% | 99.9 0% |
| AdobeRGB 1998 Coverage (%) | 97.9 | 70.2 -28% | 98.9 1% | 95.9 -2% | 97.5 0% | 86.2 -12% |
| Response Times | -583% | -2435% | -2313% | -1% | -530% | |
| Response Time Grey 50% / Grey 80% * (ms) | 1.69 ? | 13.7 ? -711% | 55.2 ? -3166% | 45.6 ? -2598% | 1.68 ? 1% | 11.9 ? -604% |
| Response Time Black / White * (ms) | 1.73 ? | 9.6 ? -455% | 31.2 ? -1703% | 36.8 ? -2027% | 1.77 ? -2% | 9.6 ? -455% |
| PWM Frequency (Hz) | 60 ? | 60 ? | ||||
| Screen | 12% | -22% | -27% | -81% | -14% | |
| Brightness middle (cd/m²) | 375.1 | 521 39% | 630 68% | 601.9 60% | 345.7 -8% | 514.6 37% |
| Brightness (cd/m²) | 379 | 484 28% | 622 64% | 569 50% | 349 -8% | 495 31% |
| Brightness Distribution (%) | 98 | 89 -9% | 90 -8% | 77 -21% | 98 0% | 90 -8% |
| Black Level * (cd/m²) | 0.36 | 0.41 | 0.47 | 0.46 | ||
| Colorchecker dE 2000 * | 1.16 | 1.2 -3% | 2.2 -90% | 2.45 -111% | 3.59 -209% | 2.4 -107% |
| Colorchecker dE 2000 max. * | 2.94 | 2.5 15% | 5 -70% | 4.46 -52% | 7.02 -139% | 4.86 -65% |
| Greyscale dE 2000 * | 1.4 | 1.4 -0% | 2.7 -93% | 2.6 -86% | 3.1 -121% | 1 29% |
| Gamma | 2.2 100% | 2.25 98% | 2.26 97% | 2.3 96% | 2.13 103% | 2.3 96% |
| CCT | 6325 103% | 6682 97% | 6886 94% | 6805 96% | 6448 101% | 6553 99% |
| Contrast (:1) | 1447 | 1537 | 1281 | 1119 | ||
| Colorchecker dE 2000 calibrated * | 1 | 1 | 0.99 | 0.4 | ||
| Media total (Programa/Opciones) | -197% /
-105% | -821% /
-456% | -782% /
-437% | -27% /
-44% | -183% /
-105% |
* ... más pequeño es mejor
La pantalla viene precalibrada con unos valores medios deltaE en escala de grises y color de sólo 1,4 y 1,16, respectivamente. Por lo tanto, no es necesaria una calibración adicional para la mayoría de los usuarios.
Tiempos de respuesta del display
| ↔ Tiempo de respuesta de Negro a Blanco | ||
|---|---|---|
| 1.73 ms ... subida ↗ y bajada ↘ combinada | ↗ 0.77 ms subida | 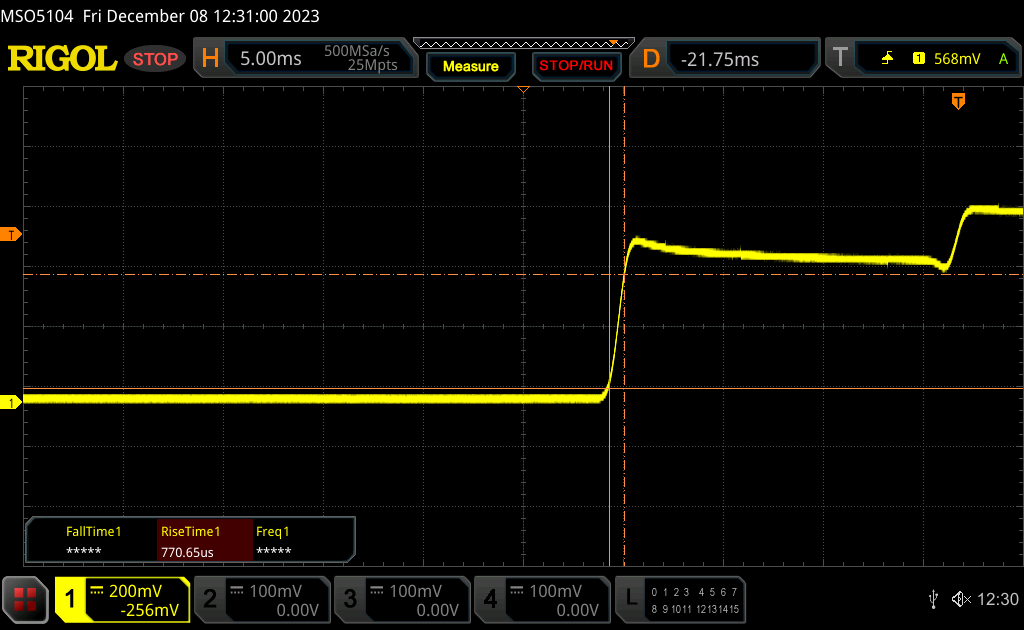 |
| ↘ 0.96 ms bajada | ||
| La pantalla mostró tiempos de respuesta muy rápidos en nuestros tests y debería ser adecuada para juegos frenéticos. En comparación, todos los dispositivos de prueba van de ##min### (mínimo) a 240 (máximo) ms. » 10 % de todos los dispositivos son mejores. Esto quiere decir que el tiempo de respuesta medido es mejor que la media (19.9 ms) de todos los dispositivos testados. | ||
| ↔ Tiempo de respuesta 50% Gris a 80% Gris | ||
| 1.69 ms ... subida ↗ y bajada ↘ combinada | ↗ 0.89 ms subida | 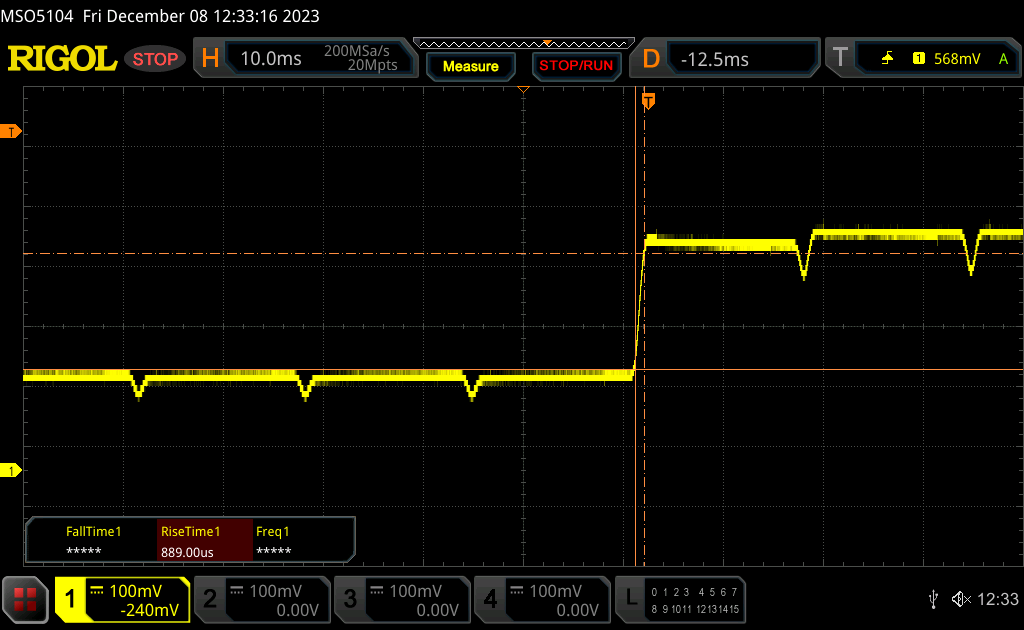 |
| ↘ 0.8 ms bajada | ||
| La pantalla mostró tiempos de respuesta muy rápidos en nuestros tests y debería ser adecuada para juegos frenéticos. En comparación, todos los dispositivos de prueba van de ##min### (mínimo) a 636 (máximo) ms. » 8 % de todos los dispositivos son mejores. Esto quiere decir que el tiempo de respuesta medido es mejor que la media (31.1 ms) de todos los dispositivos testados. | ||
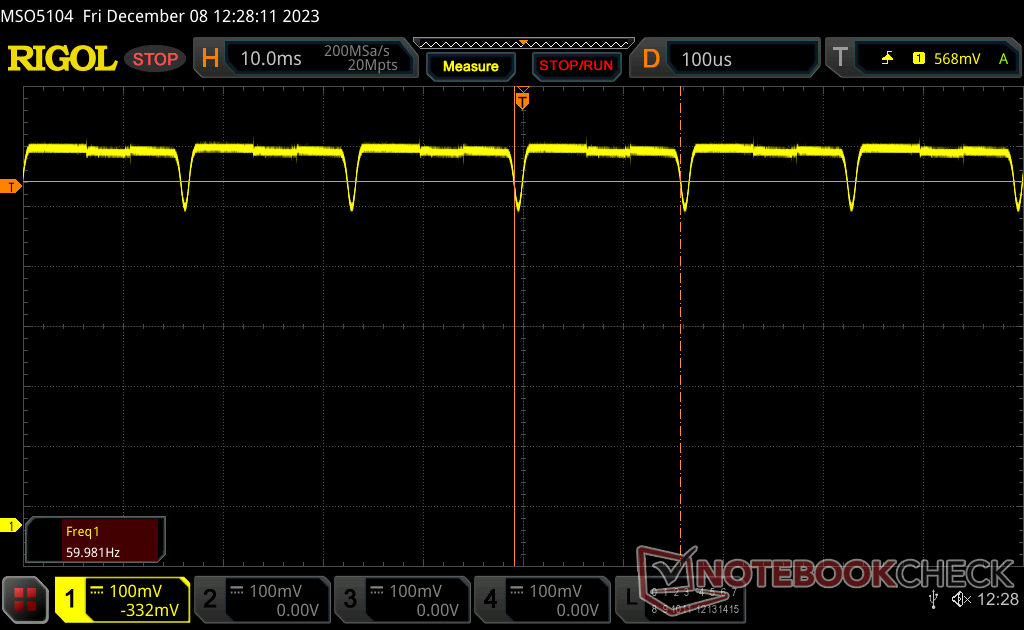
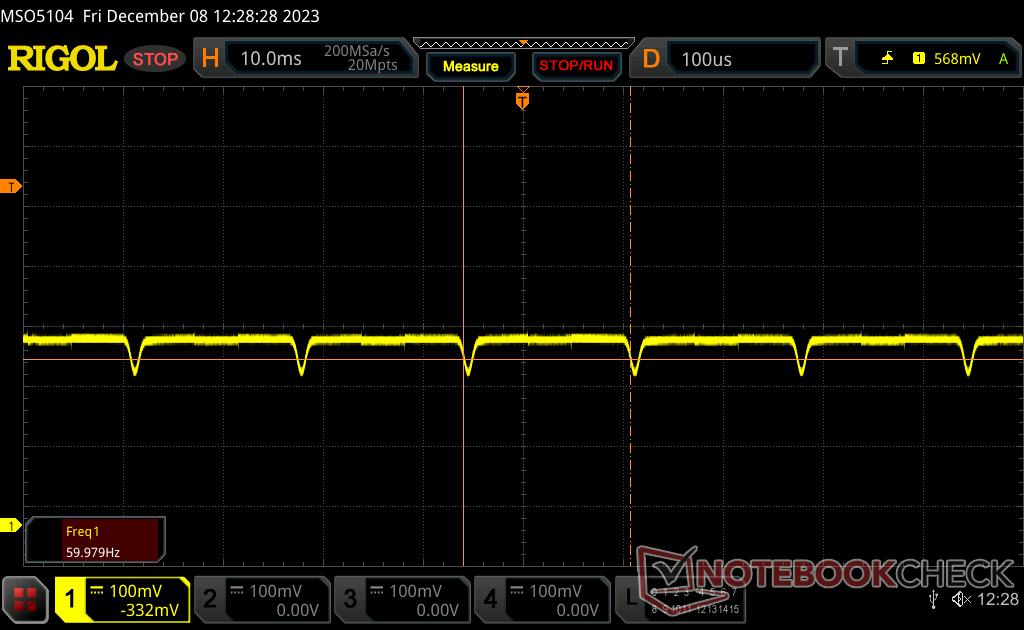
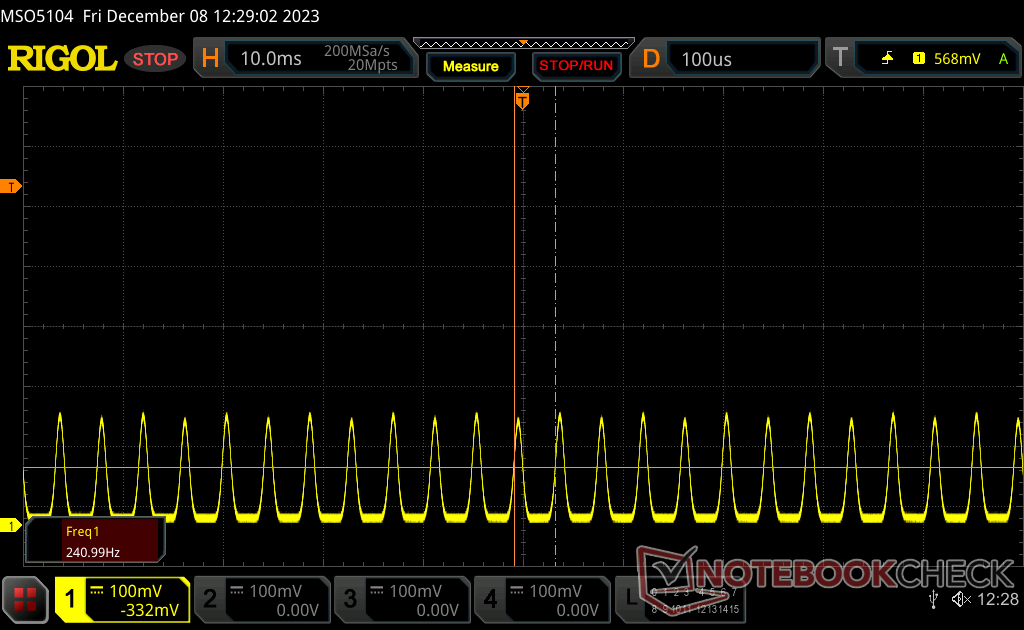
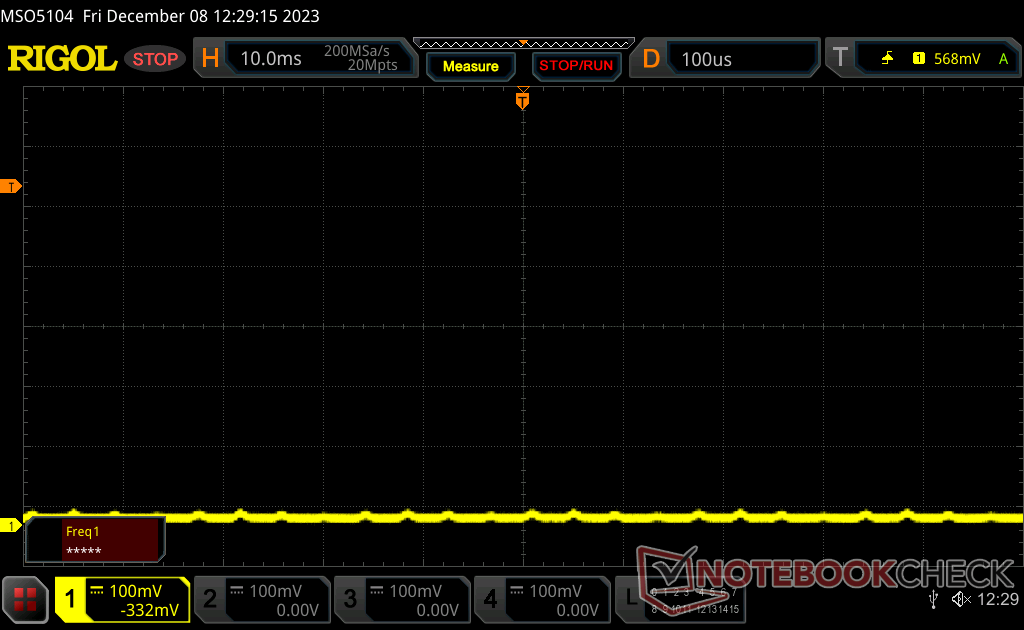
Parpadeo de Pantalla / PWM (Pulse-Width Modulation)
| Parpadeo de Pantalla / PWM detectado | 60 Hz | ≤ 100 % de brillo | 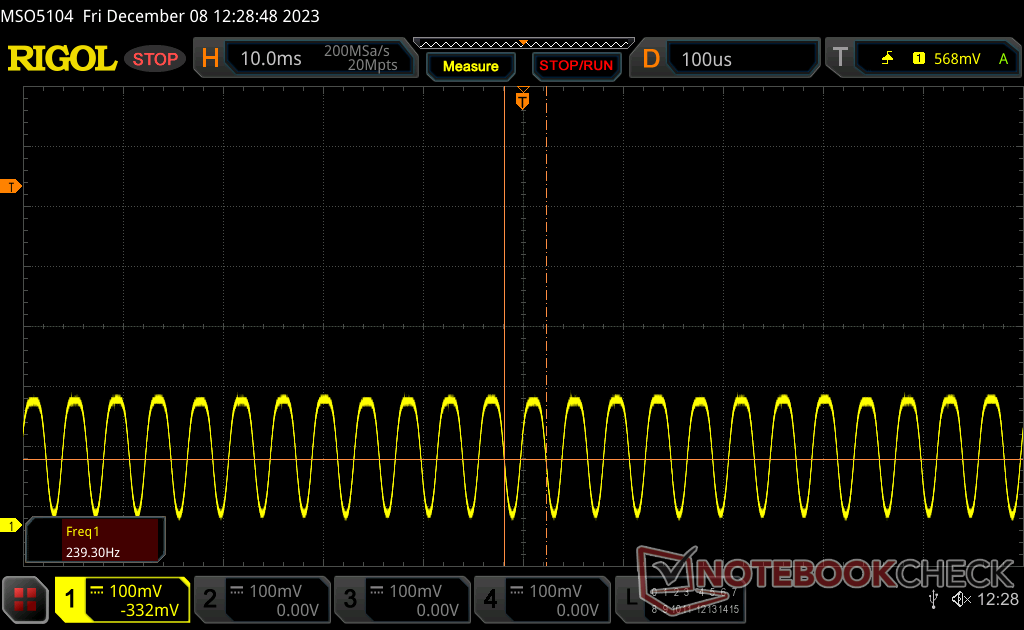 |
La retroiluminación del display parpadea a 60 Hz (seguramente usa PWM - Pulse-Width Modulation) a un brillo del 100 % e inferior. Sobre este nivel de brillo no debería darse parpadeo / PWM. La frecuencia de 60 Hz es bajísima, por lo que el parpadeo puede causar fatiga visual y cefaleas cuando se usa mucho tiempo. Comparación: 52 % de todos los dispositivos testados no usaron PWM para atenuar el display. Si se usó, medimos una media de 7794 (mínimo: 5 - máxmo: 343500) Hz. | |||
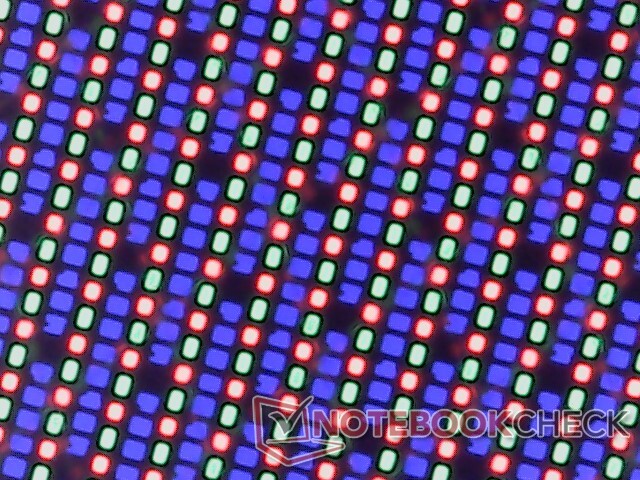
La modulación por ancho de pulso está presente en todos los niveles de brillo, como cabe esperar de un panel OLED. Somos capaces de detectar una frecuencia de 239 Hz de 0 a 57 por ciento de brillo y de 60 Hz de 58 a 100 por ciento de brillo.

Rendimiento
Condiciones de prueba
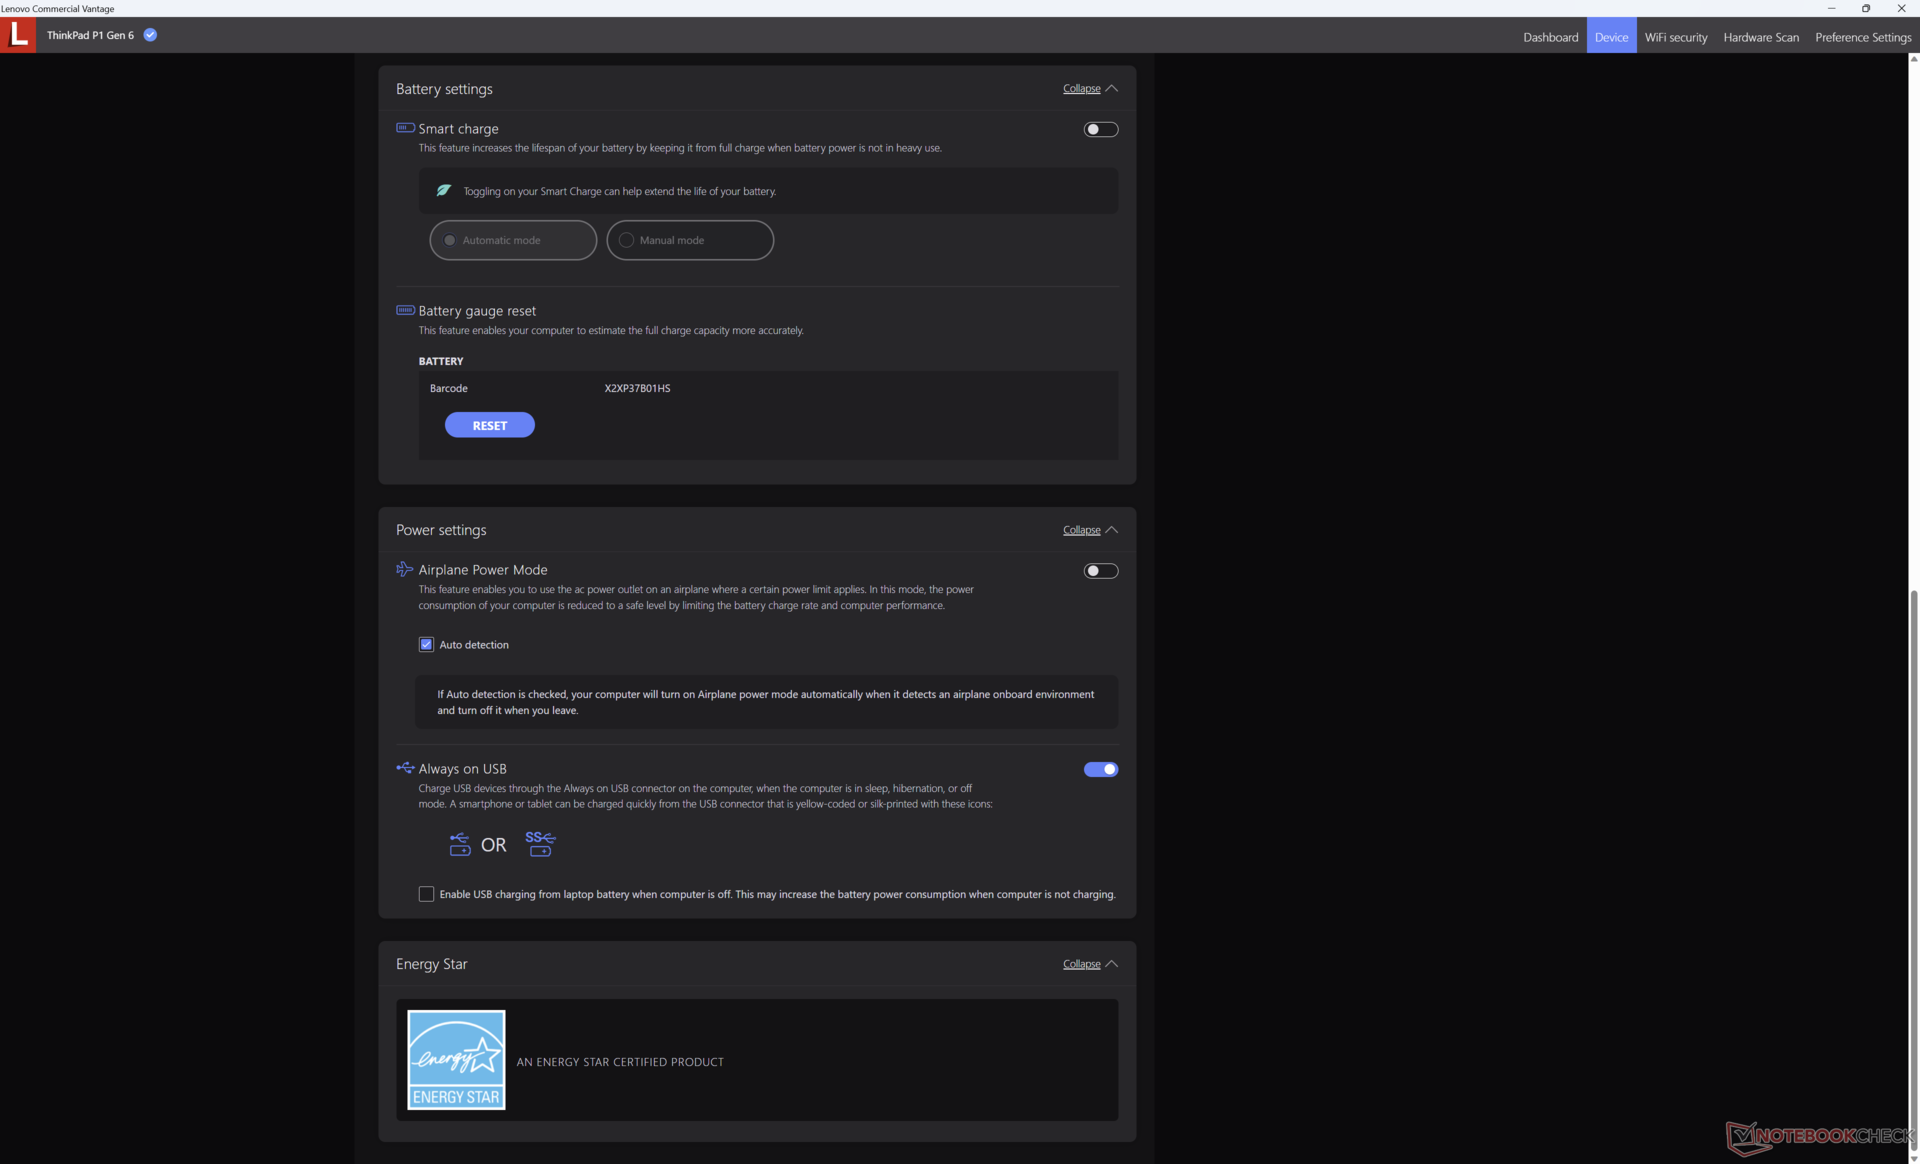
Pusimos Windows en modo Rendimiento antes de ejecutar los puntos de referencia que se muestran a continuación. Lenovo Vantage no incluye ningún perfil de energía especializado para mantener las cosas sencillas.
Sólo es compatible con Optimus 1.0 sin opciones de Optimus Avanzado o MUX, lo que es un poco decepcionante teniendo en cuenta la GPU RTX 4080 de gama alta.
Procesador
El Core i7-13800H en nuestra unidad es sólo entre un 3 y un 5 por ciento más lento que el Core i9-13900H incluso después de tener en cuenta cualquier comportamiento de estrangulamiento. Esta diferencia es esencialmente insignificante para la gran mayoría de usuarios. Los compradores que busquen aumentos de rendimiento más tangibles deberían considerar en su lugar la serie ThinkPad P16, que se suministra con CPU de la serie Core HX.
Cinebench R15 Multi Loop
Cinebench R23: Multi Core | Single Core
Cinebench R20: CPU (Multi Core) | CPU (Single Core)
Cinebench R15: CPU Multi 64Bit | CPU Single 64Bit
Blender: v2.79 BMW27 CPU
7-Zip 18.03: 7z b 4 | 7z b 4 -mmt1
Geekbench 5.5: Multi-Core | Single-Core
HWBOT x265 Benchmark v2.2: 4k Preset
LibreOffice : 20 Documents To PDF
R Benchmark 2.5: Overall mean
| Cinebench R20 / CPU (Multi Core) | |
| Asus ProArt Studiobook 16 OLED H7604 | |
| HP ZBook Fury 16 G10 | |
| MSI Raider GE68 HX 13VG, i7-13700HX | |
| Lenovo ThinkPad P16 G1 RTX A5500 | |
| Dell Precision 5000 5680 | |
| Lenovo ThinkPad P1 G6-21FV000DGE | |
| Gigabyte Aero 16 YE5 | |
| Lenovo ThinkPad P1 G6 21FV001KUS | |
| Medio Intel Core i7-13800H (n=1) | |
| Lenovo ThinkPad X1 Extreme G4-20Y5CTO1WW (3050 Ti) | |
| Lenovo ThinkPad P1 G4-20Y4S0KS00 | |
| LG Gram 2in1 16 16T90R - G.AA78G | |
| Lenovo ThinkPad E16 G1-21JUS08X00 | |
| Lenovo ThinkPad E16 G1 Core i5-1335U | |
| Cinebench R20 / CPU (Single Core) | |
| HP ZBook Fury 16 G10 | |
| Asus ProArt Studiobook 16 OLED H7604 | |
| Lenovo ThinkPad P1 G6-21FV000DGE | |
| Dell Precision 5000 5680 | |
| Lenovo ThinkPad P1 G6 21FV001KUS | |
| Medio Intel Core i7-13800H (n=1) | |
| Lenovo ThinkPad P16 G1 RTX A5500 | |
| MSI Raider GE68 HX 13VG, i7-13700HX | |
| Gigabyte Aero 16 YE5 | |
| Lenovo ThinkPad E16 G1 Core i5-1335U | |
| LG Gram 2in1 16 16T90R - G.AA78G | |
| Lenovo ThinkPad P1 G4-20Y4S0KS00 | |
| Lenovo ThinkPad X1 Extreme G4-20Y5CTO1WW (3050 Ti) | |
| Lenovo ThinkPad E16 G1-21JUS08X00 | |
| Cinebench R15 / CPU Single 64Bit | |
| Asus ProArt Studiobook 16 OLED H7604 | |
| HP ZBook Fury 16 G10 | |
| Dell Precision 5000 5680 | |
| Lenovo ThinkPad P1 G6-21FV000DGE | |
| Lenovo ThinkPad P1 G6 21FV001KUS | |
| Medio Intel Core i7-13800H (n=1) | |
| Gigabyte Aero 16 YE5 | |
| Lenovo ThinkPad P16 G1 RTX A5500 | |
| MSI Raider GE68 HX 13VG, i7-13700HX | |
| LG Gram 2in1 16 16T90R - G.AA78G | |
| Lenovo ThinkPad E16 G1 Core i5-1335U | |
| Lenovo ThinkPad P1 G4-20Y4S0KS00 | |
| Lenovo ThinkPad E16 G1-21JUS08X00 | |
| Lenovo ThinkPad X1 Extreme G4-20Y5CTO1WW (3050 Ti) | |
| HWBOT x265 Benchmark v2.2 / 4k Preset | |
| Asus ProArt Studiobook 16 OLED H7604 | |
| HP ZBook Fury 16 G10 | |
| MSI Raider GE68 HX 13VG, i7-13700HX | |
| Lenovo ThinkPad P16 G1 RTX A5500 | |
| Dell Precision 5000 5680 | |
| Lenovo ThinkPad P1 G6 21FV001KUS | |
| Medio Intel Core i7-13800H (n=1) | |
| Lenovo ThinkPad P1 G6-21FV000DGE | |
| Gigabyte Aero 16 YE5 | |
| Lenovo ThinkPad P1 G4-20Y4S0KS00 | |
| Lenovo ThinkPad X1 Extreme G4-20Y5CTO1WW (3050 Ti) | |
| Lenovo ThinkPad E16 G1-21JUS08X00 | |
| LG Gram 2in1 16 16T90R - G.AA78G | |
| Lenovo ThinkPad E16 G1 Core i5-1335U | |
| LibreOffice / 20 Documents To PDF | |
| LG Gram 2in1 16 16T90R - G.AA78G | |
| MSI Raider GE68 HX 13VG, i7-13700HX | |
| Lenovo ThinkPad E16 G1 Core i5-1335U | |
| Lenovo ThinkPad E16 G1-21JUS08X00 | |
| Lenovo ThinkPad P1 G6-21FV000DGE | |
| Lenovo ThinkPad P1 G4-20Y4S0KS00 | |
| Lenovo ThinkPad P1 G6 21FV001KUS | |
| Medio Intel Core i7-13800H (n=1) | |
| Asus ProArt Studiobook 16 OLED H7604 | |
| HP ZBook Fury 16 G10 | |
| Lenovo ThinkPad X1 Extreme G4-20Y5CTO1WW (3050 Ti) | |
| Dell Precision 5000 5680 | |
| Lenovo ThinkPad P16 G1 RTX A5500 | |
| Gigabyte Aero 16 YE5 | |
| R Benchmark 2.5 / Overall mean | |
| LG Gram 2in1 16 16T90R - G.AA78G | |
| Lenovo ThinkPad X1 Extreme G4-20Y5CTO1WW (3050 Ti) | |
| Lenovo ThinkPad P1 G4-20Y4S0KS00 | |
| Lenovo ThinkPad E16 G1-21JUS08X00 | |
| Lenovo ThinkPad P16 G1 RTX A5500 | |
| MSI Raider GE68 HX 13VG, i7-13700HX | |
| Lenovo ThinkPad P1 G6-21FV000DGE | |
| Gigabyte Aero 16 YE5 | |
| Dell Precision 5000 5680 | |
| Lenovo ThinkPad P1 G6 21FV001KUS | |
| Medio Intel Core i7-13800H (n=1) | |
| HP ZBook Fury 16 G10 | |
| Asus ProArt Studiobook 16 OLED H7604 | |
Cinebench R23: Multi Core | Single Core
Cinebench R20: CPU (Multi Core) | CPU (Single Core)
Cinebench R15: CPU Multi 64Bit | CPU Single 64Bit
Blender: v2.79 BMW27 CPU
7-Zip 18.03: 7z b 4 | 7z b 4 -mmt1
Geekbench 5.5: Multi-Core | Single-Core
HWBOT x265 Benchmark v2.2: 4k Preset
LibreOffice : 20 Documents To PDF
R Benchmark 2.5: Overall mean
* ... más pequeño es mejor
AIDA64: FP32 Ray-Trace | FPU Julia | CPU SHA3 | CPU Queen | FPU SinJulia | FPU Mandel | CPU AES | CPU ZLib | FP64 Ray-Trace | CPU PhotoWorxx
| Performance rating | |
| HP ZBook Fury 16 G10 | |
| Lenovo ThinkPad P16 G1 RTX A5500 | |
| Lenovo ThinkPad P1 G6 21FV001KUS | |
| Medio Intel Core i7-13800H | |
| Dell Precision 5000 5680 | |
| Lenovo ThinkPad P1 G6-21FV000DGE | |
| Lenovo ThinkPad P1 G4-20Y4S0KS00 -9! | |
| AIDA64 / FP32 Ray-Trace | |
| HP ZBook Fury 16 G10 | |
| Lenovo ThinkPad P16 G1 RTX A5500 | |
| Lenovo ThinkPad P1 G6 21FV001KUS | |
| Medio Intel Core i7-13800H (n=1) | |
| Lenovo ThinkPad P1 G6-21FV000DGE | |
| Dell Precision 5000 5680 | |
| AIDA64 / FPU Julia | |
| HP ZBook Fury 16 G10 | |
| Lenovo ThinkPad P16 G1 RTX A5500 | |
| Lenovo ThinkPad P1 G6 21FV001KUS | |
| Medio Intel Core i7-13800H (n=1) | |
| Lenovo ThinkPad P1 G6-21FV000DGE | |
| Dell Precision 5000 5680 | |
| AIDA64 / CPU SHA3 | |
| HP ZBook Fury 16 G10 | |
| Lenovo ThinkPad P16 G1 RTX A5500 | |
| Lenovo ThinkPad P1 G6 21FV001KUS | |
| Medio Intel Core i7-13800H (n=1) | |
| Lenovo ThinkPad P1 G6-21FV000DGE | |
| Dell Precision 5000 5680 | |
| AIDA64 / CPU Queen | |
| HP ZBook Fury 16 G10 | |
| Dell Precision 5000 5680 | |
| Lenovo ThinkPad P1 G6-21FV000DGE | |
| Lenovo ThinkPad P1 G6 21FV001KUS | |
| Medio Intel Core i7-13800H (n=1) | |
| Lenovo ThinkPad P16 G1 RTX A5500 | |
| AIDA64 / FPU SinJulia | |
| HP ZBook Fury 16 G10 | |
| Lenovo ThinkPad P16 G1 RTX A5500 | |
| Lenovo ThinkPad P1 G6 21FV001KUS | |
| Medio Intel Core i7-13800H (n=1) | |
| Lenovo ThinkPad P1 G6-21FV000DGE | |
| Dell Precision 5000 5680 | |
| AIDA64 / FPU Mandel | |
| HP ZBook Fury 16 G10 | |
| Lenovo ThinkPad P16 G1 RTX A5500 | |
| Lenovo ThinkPad P1 G6 21FV001KUS | |
| Medio Intel Core i7-13800H (n=1) | |
| Lenovo ThinkPad P1 G6-21FV000DGE | |
| Dell Precision 5000 5680 | |
| AIDA64 / CPU AES | |
| HP ZBook Fury 16 G10 | |
| Lenovo ThinkPad P16 G1 RTX A5500 | |
| Lenovo ThinkPad P1 G6 21FV001KUS | |
| Medio Intel Core i7-13800H (n=1) | |
| Lenovo ThinkPad P1 G6-21FV000DGE | |
| Dell Precision 5000 5680 | |
| AIDA64 / CPU ZLib | |
| HP ZBook Fury 16 G10 | |
| Lenovo ThinkPad P16 G1 RTX A5500 | |
| Lenovo ThinkPad P1 G6 21FV001KUS | |
| Medio Intel Core i7-13800H (n=1) | |
| Lenovo ThinkPad P1 G6-21FV000DGE | |
| Dell Precision 5000 5680 | |
| Lenovo ThinkPad P1 G4-20Y4S0KS00 | |
| AIDA64 / FP64 Ray-Trace | |
| HP ZBook Fury 16 G10 | |
| Lenovo ThinkPad P16 G1 RTX A5500 | |
| Lenovo ThinkPad P1 G6 21FV001KUS | |
| Medio Intel Core i7-13800H (n=1) | |
| Lenovo ThinkPad P1 G6-21FV000DGE | |
| Dell Precision 5000 5680 | |
| AIDA64 / CPU PhotoWorxx | |
| Dell Precision 5000 5680 | |
| Lenovo ThinkPad P16 G1 RTX A5500 | |
| HP ZBook Fury 16 G10 | |
| Lenovo ThinkPad P1 G6-21FV000DGE | |
| Lenovo ThinkPad P1 G6 21FV001KUS | |
| Medio Intel Core i7-13800H (n=1) | |
Rendimiento del sistema
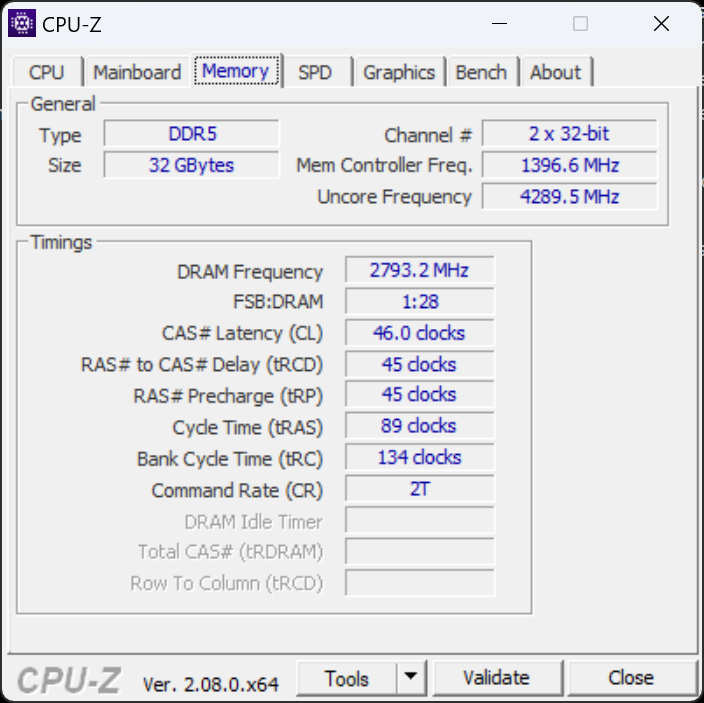
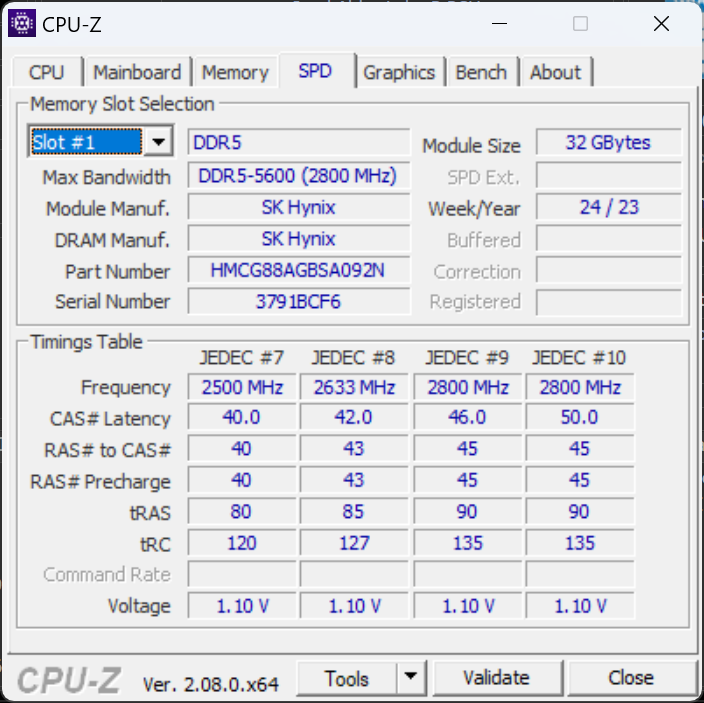
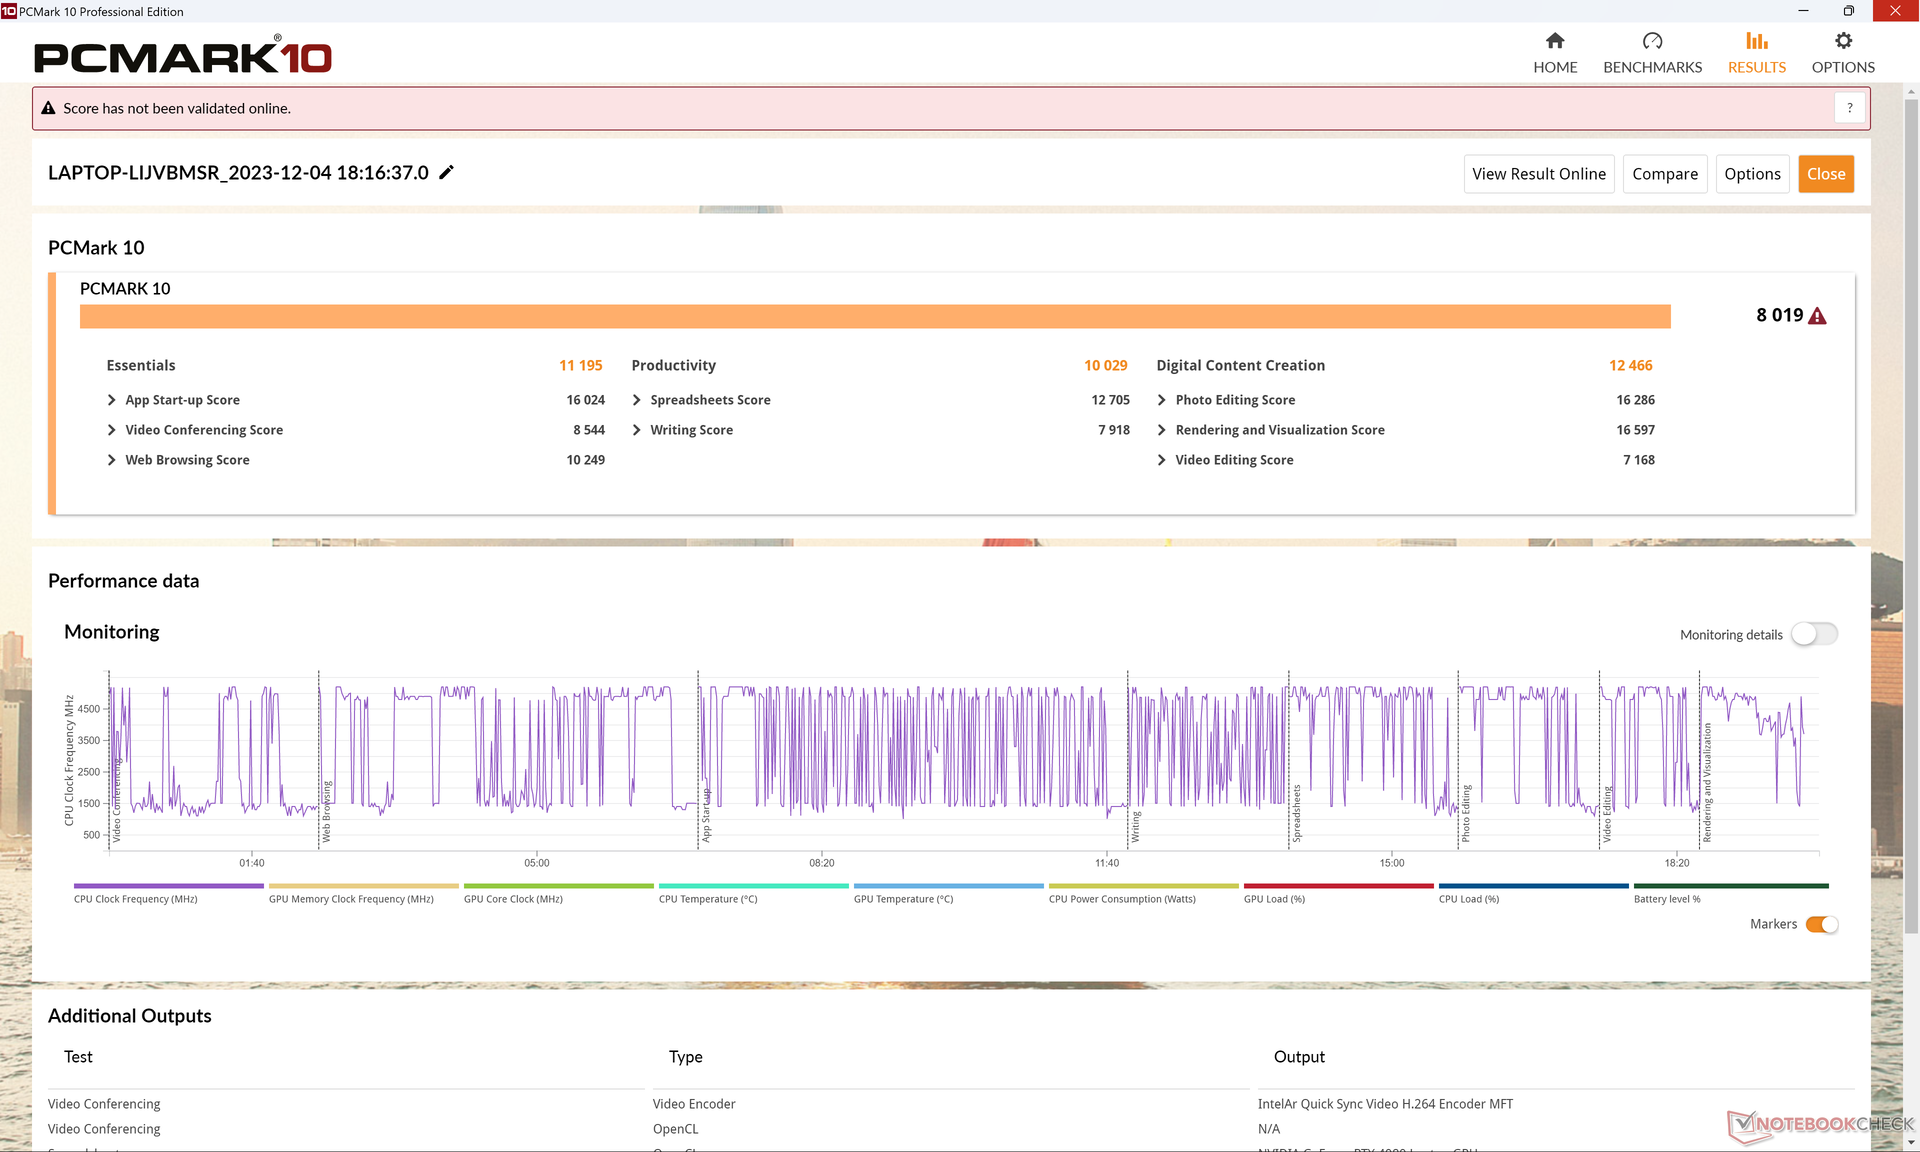
Las puntuaciones de PCMark son comparables, si no ligeramente más rápidas, que las de la configuración ThinkPad P1 G6 con RTX 2000 debido principalmente a la GPU RTX 4080 más rápida. Tenga en cuenta que el rendimiento de la memoria es lento ya que nuestra unidad se ha configurado con un solo módulo de RAM en modo de canal único en lugar de dos.
CrossMark: Overall | Productivity | Creativity | Responsiveness
WebXPRT 3: Overall
WebXPRT 4: Overall
Mozilla Kraken 1.1: Total
| PCMark 10 / Score | |
| Dell Precision 5000 5680 | |
| HP ZBook Fury 16 G10 | |
| Lenovo ThinkPad P1 G6 21FV001KUS | |
| Medio Intel Core i7-13800H, NVIDIA GeForce RTX 4080 Laptop GPU (n=1) | |
| Lenovo ThinkPad P1 G6-21FV000DGE | |
| Lenovo ThinkPad P16 G1 RTX A5500 | |
| Lenovo ThinkPad P1 G4-20Y4S0KS00 | |
| PCMark 10 / Essentials | |
| Dell Precision 5000 5680 | |
| Lenovo ThinkPad P1 G6 21FV001KUS | |
| Medio Intel Core i7-13800H, NVIDIA GeForce RTX 4080 Laptop GPU (n=1) | |
| Lenovo ThinkPad P1 G6-21FV000DGE | |
| HP ZBook Fury 16 G10 | |
| Lenovo ThinkPad P16 G1 RTX A5500 | |
| Lenovo ThinkPad P1 G4-20Y4S0KS00 | |
| PCMark 10 / Productivity | |
| Dell Precision 5000 5680 | |
| Lenovo ThinkPad P1 G6 21FV001KUS | |
| Medio Intel Core i7-13800H, NVIDIA GeForce RTX 4080 Laptop GPU (n=1) | |
| Lenovo ThinkPad P1 G6-21FV000DGE | |
| Lenovo ThinkPad P16 G1 RTX A5500 | |
| HP ZBook Fury 16 G10 | |
| Lenovo ThinkPad P1 G4-20Y4S0KS00 | |
| PCMark 10 / Digital Content Creation | |
| HP ZBook Fury 16 G10 | |
| Dell Precision 5000 5680 | |
| Lenovo ThinkPad P1 G6 21FV001KUS | |
| Medio Intel Core i7-13800H, NVIDIA GeForce RTX 4080 Laptop GPU (n=1) | |
| Lenovo ThinkPad P1 G6-21FV000DGE | |
| Lenovo ThinkPad P1 G4-20Y4S0KS00 | |
| Lenovo ThinkPad P16 G1 RTX A5500 | |
| CrossMark / Overall | |
| Dell Precision 5000 5680 | |
| HP ZBook Fury 16 G10 | |
| Lenovo ThinkPad P16 G1 RTX A5500 | |
| Lenovo ThinkPad P1 G6-21FV000DGE | |
| Lenovo ThinkPad P1 G6 21FV001KUS | |
| Medio Intel Core i7-13800H, NVIDIA GeForce RTX 4080 Laptop GPU (n=1) | |
| Lenovo ThinkPad P1 G4-20Y4S0KS00 | |
| CrossMark / Productivity | |
| HP ZBook Fury 16 G10 | |
| Dell Precision 5000 5680 | |
| Lenovo ThinkPad P1 G6-21FV000DGE | |
| Lenovo ThinkPad P16 G1 RTX A5500 | |
| Lenovo ThinkPad P1 G6 21FV001KUS | |
| Medio Intel Core i7-13800H, NVIDIA GeForce RTX 4080 Laptop GPU (n=1) | |
| Lenovo ThinkPad P1 G4-20Y4S0KS00 | |
| CrossMark / Creativity | |
| Lenovo ThinkPad P16 G1 RTX A5500 | |
| Dell Precision 5000 5680 | |
| HP ZBook Fury 16 G10 | |
| Lenovo ThinkPad P1 G6 21FV001KUS | |
| Medio Intel Core i7-13800H, NVIDIA GeForce RTX 4080 Laptop GPU (n=1) | |
| Lenovo ThinkPad P1 G6-21FV000DGE | |
| Lenovo ThinkPad P1 G4-20Y4S0KS00 | |
| CrossMark / Responsiveness | |
| HP ZBook Fury 16 G10 | |
| Lenovo ThinkPad P1 G6-21FV000DGE | |
| Dell Precision 5000 5680 | |
| Lenovo ThinkPad P1 G6 21FV001KUS | |
| Medio Intel Core i7-13800H, NVIDIA GeForce RTX 4080 Laptop GPU (n=1) | |
| Lenovo ThinkPad P1 G4-20Y4S0KS00 | |
| Lenovo ThinkPad P16 G1 RTX A5500 | |
| WebXPRT 3 / Overall | |
| Dell Precision 5000 5680 | |
| HP ZBook Fury 16 G10 | |
| Lenovo ThinkPad P1 G6-21FV000DGE | |
| Lenovo ThinkPad P16 G1 RTX A5500 | |
| Lenovo ThinkPad P1 G6 21FV001KUS | |
| Medio Intel Core i7-13800H, NVIDIA GeForce RTX 4080 Laptop GPU (n=1) | |
| Lenovo ThinkPad P1 G4-20Y4S0KS00 | |
| WebXPRT 4 / Overall | |
| Lenovo ThinkPad P1 G6-21FV000DGE | |
| HP ZBook Fury 16 G10 | |
| Dell Precision 5000 5680 | |
| Lenovo ThinkPad P1 G6 21FV001KUS | |
| Medio Intel Core i7-13800H, NVIDIA GeForce RTX 4080 Laptop GPU (n=1) | |
| Lenovo ThinkPad P16 G1 RTX A5500 | |
| Mozilla Kraken 1.1 / Total | |
| Lenovo ThinkPad P1 G4-20Y4S0KS00 | |
| Lenovo ThinkPad P16 G1 RTX A5500 | |
| Lenovo ThinkPad P1 G6 21FV001KUS | |
| Medio Intel Core i7-13800H, NVIDIA GeForce RTX 4080 Laptop GPU (n=1) | |
| Dell Precision 5000 5680 | |
| Lenovo ThinkPad P1 G6-21FV000DGE | |
| HP ZBook Fury 16 G10 | |
* ... más pequeño es mejor
| PCMark 10 Score | 8019 puntos | |
ayuda | ||
| AIDA64 / Memory Copy | |
| Dell Precision 5000 5680 | |
| Lenovo ThinkPad P16 G1 RTX A5500 | |
| HP ZBook Fury 16 G10 | |
| Lenovo ThinkPad P1 G6-21FV000DGE | |
| Lenovo ThinkPad P1 G6 21FV001KUS | |
| Medio Intel Core i7-13800H (n=1) | |
| AIDA64 / Memory Read | |
| Dell Precision 5000 5680 | |
| Lenovo ThinkPad P16 G1 RTX A5500 | |
| HP ZBook Fury 16 G10 | |
| Lenovo ThinkPad P1 G6 21FV001KUS | |
| Medio Intel Core i7-13800H (n=1) | |
| Lenovo ThinkPad P1 G6-21FV000DGE | |
| AIDA64 / Memory Write | |
| Dell Precision 5000 5680 | |
| Lenovo ThinkPad P16 G1 RTX A5500 | |
| HP ZBook Fury 16 G10 | |
| Lenovo ThinkPad P1 G6 21FV001KUS | |
| Medio Intel Core i7-13800H (n=1) | |
| Lenovo ThinkPad P1 G6-21FV000DGE | |
| AIDA64 / Memory Latency | |
| HP ZBook Fury 16 G10 | |
| Dell Precision 5000 5680 | |
| Lenovo ThinkPad P16 G1 RTX A5500 | |
| Lenovo ThinkPad P1 G6 21FV001KUS | |
| Medio Intel Core i7-13800H (n=1) | |
| Lenovo ThinkPad P1 G6-21FV000DGE | |
| Lenovo ThinkPad P1 G4-20Y4S0KS00 | |
* ... más pequeño es mejor
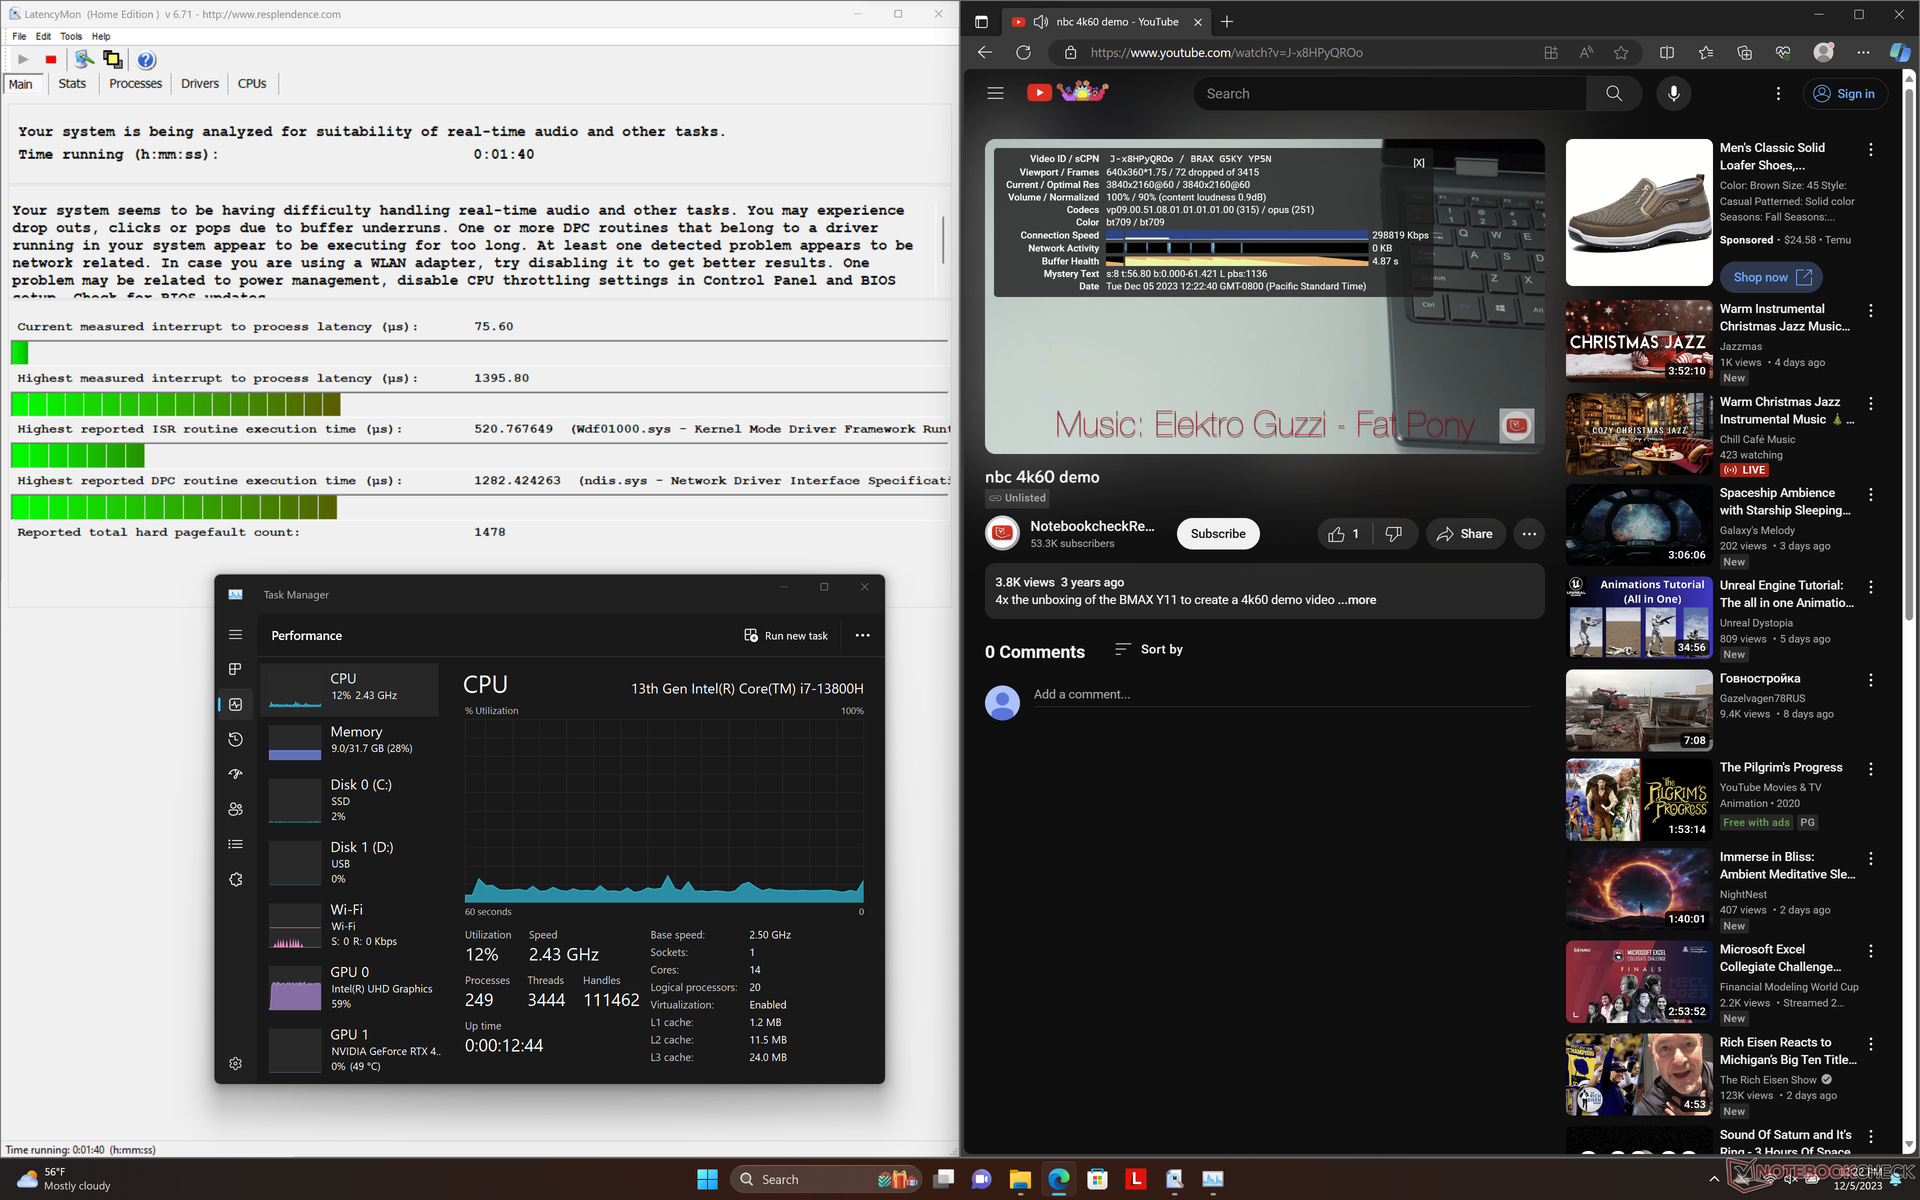
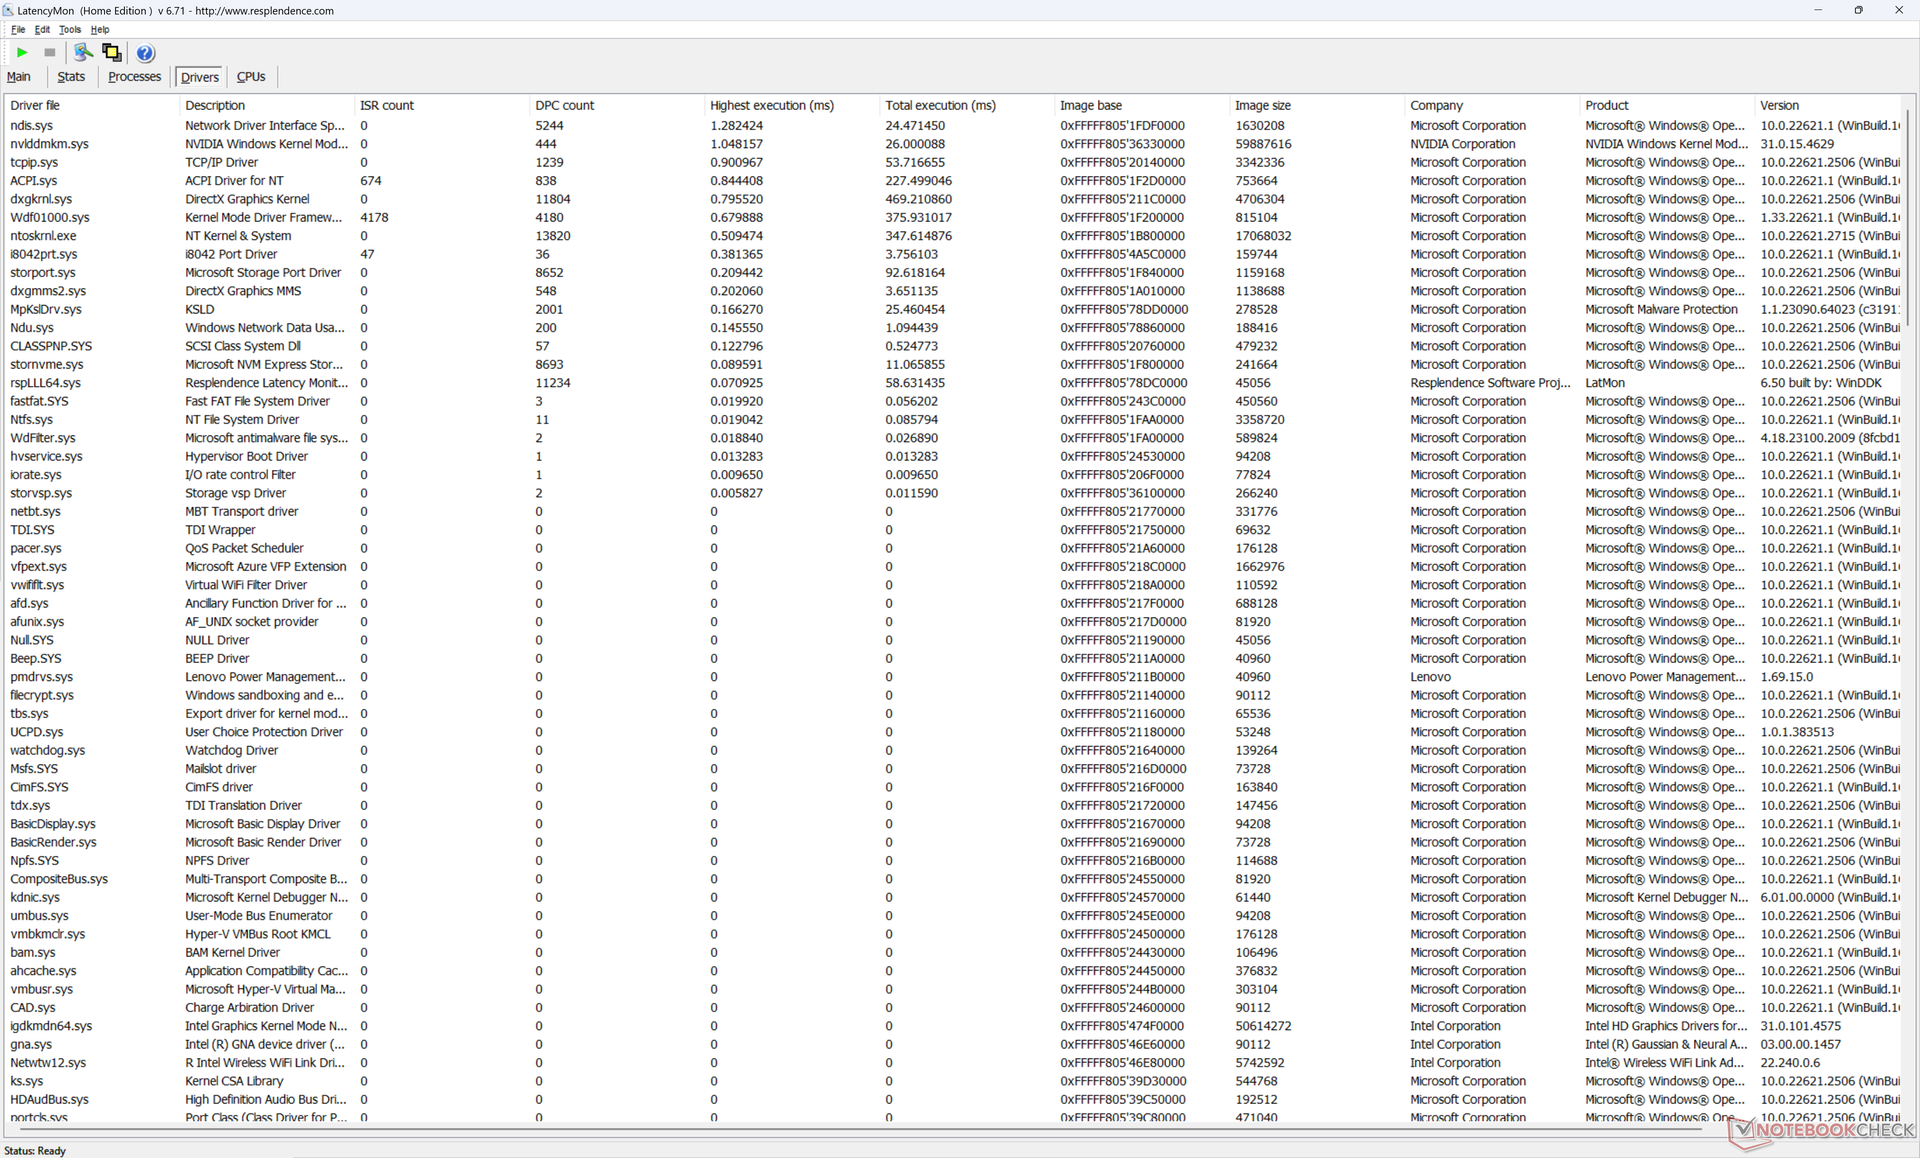
Latencia del CPD
LatencyMon revela problemas de CPD al abrir varias pestañas del navegador de nuestra página de inicio y 75 fotogramas caídos al reproducir un vídeo 4K60 de un minuto de duración. Esto último es especialmente decepcionante dado el precio y el aspecto profesional del modelo. También sugiere problemas con los controladores o una mala gestión de las aplicaciones en segundo plano que podrían interrumpir la ventana enfocada.
| DPC Latencies / LatencyMon - interrupt to process latency (max), Web, Youtube, Prime95 | |
| HP ZBook Fury 16 G10 | |
| Lenovo ThinkPad P1 G6-21FV000DGE | |
| Dell Precision 5000 5680 | |
| Lenovo ThinkPad P16 G1 RTX A5500 | |
| Lenovo ThinkPad P1 G6 21FV001KUS | |
| Lenovo ThinkPad P1 G4-20Y4S0KS00 | |
* ... más pequeño es mejor
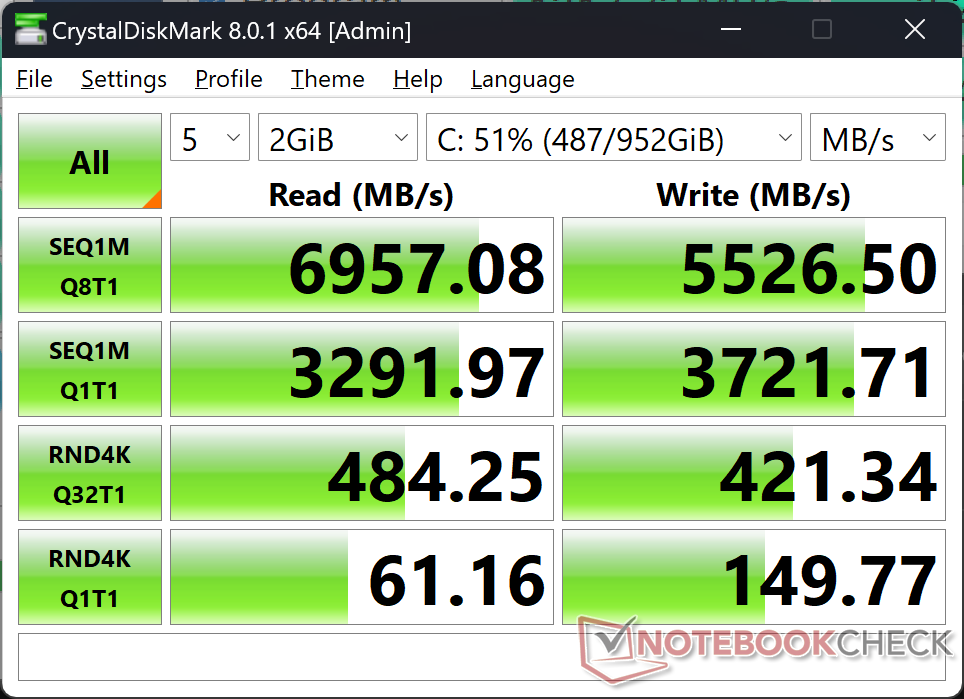
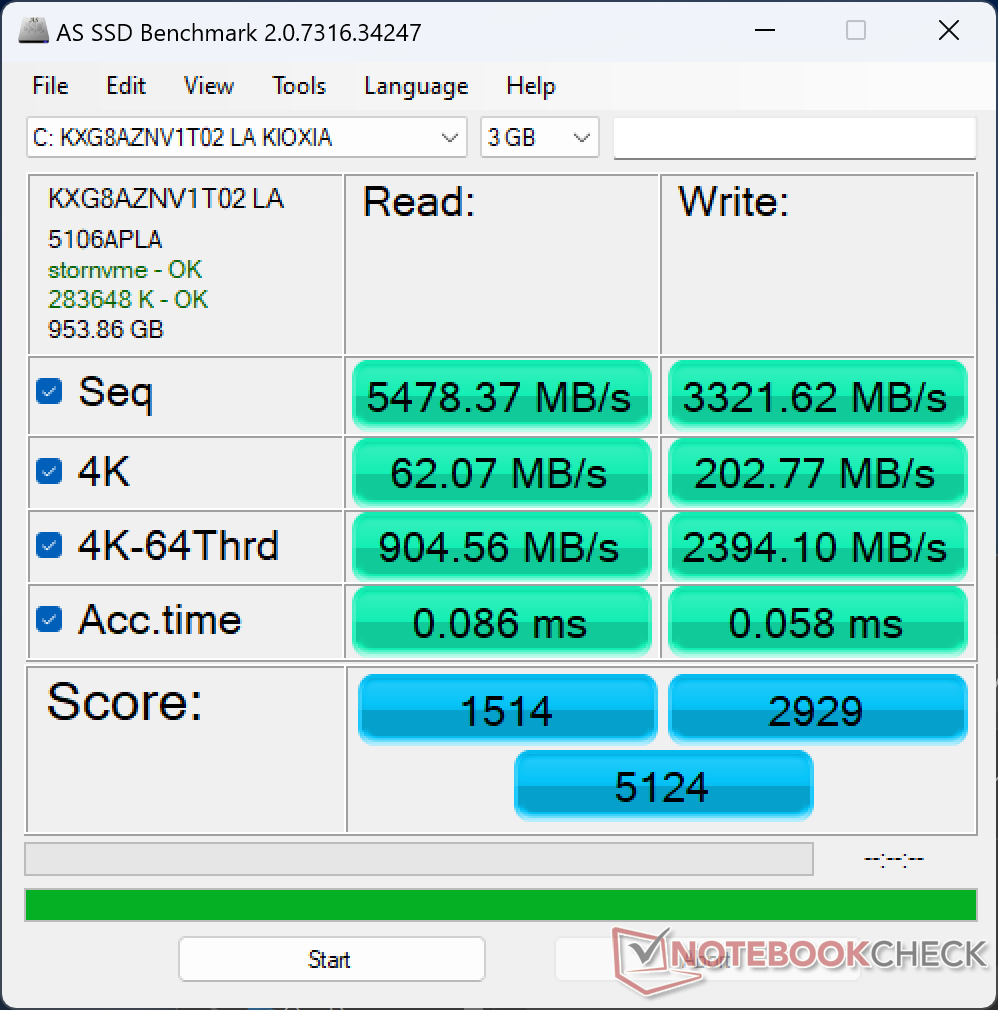
Dispositivos de almacenamiento
Nuestra unidad de prueba se entrega con el Kioxia XG8 KXG8AZNV1T02 en lugar del SK Hynix PC711 de nuestro ThinkPad P1 G6 original. En general, el rendimiento es más lento, sobre todo al escribir datos, pero las velocidades de lectura son, no obstante, excelentes, con una ligera ralentización después de unos 3 minutos de esfuerzo.
Tenga en cuenta que determinadas configuraciones de la ThinkPad P1 G6 pueden admitir más de una unidad SSD M.2 interna. Sin embargo, esta configuración de prueba en particular sólo admite una unidad.

* ... más pequeño es mejor
Disk Throttling: DiskSpd Read Loop, Queue Depth 8
Rendimiento de la GPU
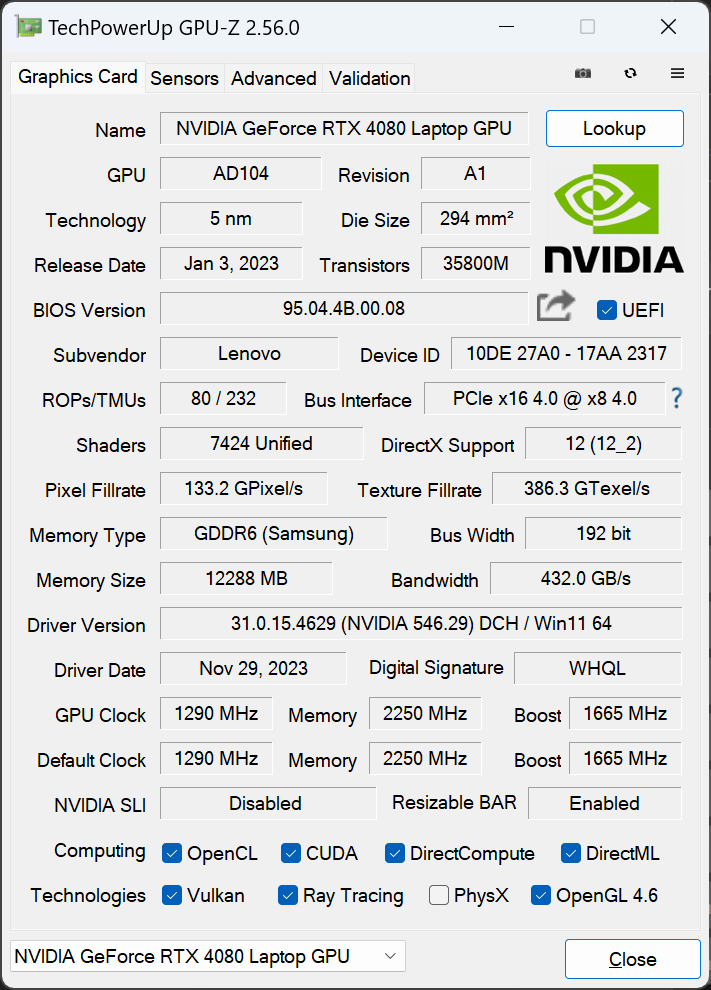
El panel de control de Nvidia enumera una potencia gráfica máxima de 105 W. En realidad, sin embargo, sólo somos capaces de alcanzar un máximo de 80 W según GPU-Z. Posteriormente, el rendimiento general es entre un 15 y un 20 por ciento más lento que el de la media de portátiles de nuestra base de datos con la misma GPU móvil GeForce RTX 4080, ya que esta GPU en concreto suele funcionar con techos de potencia más elevados.
A pesar de ello, el rendimiento gráfico sigue estando muy por delante de la RTX 2000 en la mayoría de las pruebas de rendimiento, salvo en las pruebas Specviewperf Siemens NX y Medical. Para un rendimiento más rápido, Lenovo ofrece la RTX 5000 en la configuración de gama más alta.
Ejecutarla en modo Equilibrado en lugar de en modo Rendimiento repercute en el rendimiento de la GPU, mientras que la CPU permanece prácticamente inalterada, como muestran nuestros Fire Strike resultados en la tabla siguiente.
| Perfil de potencia | Puntuación Física | Puntuación de gráficos | Puntuación combinada |
| Modo Rendimiento | 29543 | 33402 | 12423 |
| Modo equilibrado | 30978 (-0%) | 25806 (-23%) | 9616 (-23%) |
| Batería | 21163 (-28%) | 18870 (-44%) | 4960 (-60%) |
| 3DMark Performance rating - Percent | |
| Razer Blade 16 Early 2023 RTX 4090 -34! | |
| HP ZBook Fury 16 G10 -1! | |
| Lenovo ThinkPad P16 G1 RTX A5500 -1! | |
| Medio NVIDIA GeForce RTX 4080 Laptop GPU -1! | |
| Lenovo ThinkPad P1 G6 21FV001KUS -1! | |
| Lenovo ThinkPad P1 G6-21FV000DGE -17! | |
| Asus ProArt Studiobook 16 OLED H7604 -17! | |
| Gigabyte Aero 16 YE5 -2! | |
| Lenovo ThinkPad P1 G4-20Y4S0KS00 -11! | |
| Lenovo ThinkPad X1 Extreme G4-20Y5CTO1WW (3050 Ti) -36! | |
| LG Gram 2in1 16 16T90R - G.AA78G -36! | |
| 3DMark 11 Performance | 38087 puntos | |
| 3DMark Fire Strike Score | 28105 puntos | |
| 3DMark Time Spy Score | 13863 puntos | |
ayuda | ||
* ... más pequeño es mejor
| F1 22 | |
| 1920x1080 Ultra High Preset AA:T AF:16x | |
| Medio NVIDIA GeForce RTX 4080 Laptop GPU (72.3 - 124.2, n=15) | |
| HP ZBook Fury 16 G10 | |
| Lenovo ThinkPad P1 G6 21FV001KUS | |
| Asus ProArt Studiobook 16 OLED H7604 | |
| Lenovo ThinkPad P1 G6-21FV000DGE | |
| 2560x1440 Ultra High Preset AA:T AF:16x | |
| Medio NVIDIA GeForce RTX 4080 Laptop GPU (55.4 - 79, n=13) | |
| HP ZBook Fury 16 G10 | |
| Lenovo ThinkPad P1 G6 21FV001KUS | |
| Asus ProArt Studiobook 16 OLED H7604 | |
| Lenovo ThinkPad P1 G6-21FV000DGE | |
| 3840x2160 Ultra High Preset AA:T AF:16x | |
| Medio NVIDIA GeForce RTX 4080 Laptop GPU (25.8 - 39.8, n=10) | |
| HP ZBook Fury 16 G10 | |
| Lenovo ThinkPad P1 G6 21FV001KUS | |
| Tiny Tina's Wonderlands | |
| 1920x1080 Badass Preset (DX12) | |
| Medio NVIDIA GeForce RTX 4080 Laptop GPU (112.9 - 167.1, n=9) | |
| HP ZBook Fury 16 G10 | |
| Lenovo ThinkPad P1 G6 21FV001KUS | |
| 2560x1440 Badass Preset (DX12) | |
| Medio NVIDIA GeForce RTX 4080 Laptop GPU (85 - 114.8, n=9) | |
| HP ZBook Fury 16 G10 | |
| Lenovo ThinkPad P1 G6 21FV001KUS | |
| 3840x2160 Badass Preset (DX12) | |
| Medio NVIDIA GeForce RTX 4080 Laptop GPU (46.4 - 60.9, n=9) | |
| HP ZBook Fury 16 G10 | |
| Lenovo ThinkPad P1 G6 21FV001KUS | |
| Baldur's Gate 3 | |
| 1920x1080 Ultra Preset AA:T | |
| Medio NVIDIA GeForce RTX 4080 Laptop GPU (111.8 - 181.2, n=7) | |
| Lenovo ThinkPad P1 G6 21FV001KUS | |
| Apple MacBook Pro 16 2023 M3 Pro | |
| 2560x1440 Ultra Preset AA:T | |
| Medio NVIDIA GeForce RTX 4080 Laptop GPU (88.3 - 129.3, n=7) | |
| Lenovo ThinkPad P1 G6 21FV001KUS | |
| 3840x2160 Ultra Preset AA:T | |
| Medio NVIDIA GeForce RTX 4080 Laptop GPU (48.8 - 68.4, n=5) | |
| Lenovo ThinkPad P1 G6 21FV001KUS | |
| Cyberpunk 2077 | |
| 1920x1080 Ultra Preset (FSR off) | |
| Medio NVIDIA GeForce RTX 4080 Laptop GPU (83.9 - 127.1, n=15) | |
| Lenovo ThinkPad P1 G6 21FV001KUS | |
| Apple MacBook Pro 16 2023 M3 Pro | |
| LG Gram 2in1 16 16T90R - G.AA78G | |
| 2560x1440 Ultra Preset (FSR off) | |
| Medio NVIDIA GeForce RTX 4080 Laptop GPU (56.2 - 86.3, n=15) | |
| Lenovo ThinkPad P1 G6 21FV001KUS | |
| 3840x2160 Ultra Preset (FSR off) | |
| Medio NVIDIA GeForce RTX 4080 Laptop GPU (25.8 - 39.8, n=8) | |
| Lenovo ThinkPad P1 G6 21FV001KUS | |
| 3840x2160 Ray Tracing Ultra Preset + DLSS3 Quality + FG | |
| Medio NVIDIA GeForce RTX 4080 Laptop GPU (48.4 - 58.5, n=4) | |
| Lenovo ThinkPad P1 G6 21FV001KUS | |
Las frecuencias de cuadro en ralentí en Witcher 3 se mantuvieron estables en todo momento, salvo en un caso en el que el rendimiento cayó hasta el rango de los 90 FPS, como muestra el gráfico siguiente. La caída repentina se debe probablemente a una mala gestión de las aplicaciones en segundo plano.
Witcher 3 FPS Chart
| bajo | medio | alto | ultra | QHD | 4K | |
|---|---|---|---|---|---|---|
| GTA V (2015) | 120.3 | 106.4 | 120.3 | |||
| The Witcher 3 (2015) | 130.4 | 78.5 | ||||
| Dota 2 Reborn (2015) | 191.8 | 169 | 155.8 | 147.3 | 144.6 | |
| Final Fantasy XV Benchmark (2018) | 135.3 | 102.6 | 61.5 | |||
| X-Plane 11.11 (2018) | 171.1 | 150.8 | 118.6 | 103 | ||
| Far Cry 5 (2018) | 149 | 126 | 71 | |||
| Tiny Tina's Wonderlands (2022) | 118.6 | 85 | 46.4 | |||
| F1 22 (2022) | 202 | 81.5 | 55.4 | 29.7 | ||
| Baldur's Gate 3 (2023) | 124.8 | 88.7 | 48.8 | |||
| Cyberpunk 2077 (2023) | 103.8 | 90.9 | 59.9 | 25.8 |
Emisiones
Ruido del sistema
El ruido del ventilador es más alto que en la configuración potenciada con RTX 2000 cuando se ejecutan cargas exigentes. Cuando se ejecuta Witcher 3, por ejemplo, el ruido del ventilador oscila entre 47 y 55 dB(A) frente a sólo 41 a 48 dB(A) en la configuración de menor potencia. Por lo demás, el sistema hace un excelente trabajo al permanecer silencioso durante largos periodos cuando ejecuta procesos más sencillos como navegadores o streaming de vídeo.
Ruido
| Ocioso |
| 22.5 / 22.5 / 22.5 dB(A) |
| Carga |
| 28.7 / 54.4 dB(A) |
 | ||
30 dB silencioso 40 dB(A) audible 50 dB(A) ruidosamente alto |
||
min: | ||
| Lenovo ThinkPad P1 G6 21FV001KUS GeForce RTX 4080 Laptop GPU, i7-13800H, Kioxia XG8 KXG8AZNV1T02 | Lenovo ThinkPad P1 G6-21FV000DGE RTX 2000 Ada Generation Laptop, i9-13900H, SK Hynix PC711 1TB HFS001TDE9X084N | Lenovo ThinkPad P1 G4-20Y4S0KS00 GeForce RTX 3070 Laptop GPU, i7-11850H, Samsung PM9A1 MZVL21T0HCLR | Lenovo ThinkPad P16 G1 RTX A5500 RTX A5500 Laptop GPU, i9-12950HX, WDC PC SN810 2TB | Dell Precision 5000 5680 RTX 5000 Ada Generation Laptop, i9-13900H, 2x SK hynix PC801 HFS512GEJ9X101N RAID 0 | HP ZBook Fury 16 G10 RTX 5000 Ada Generation Laptop, i9-13950HX, SK hynix PC801 HFS001TEJ9X101N | |
|---|---|---|---|---|---|---|
| Noise | -11% | -9% | -2% | -5% | -7% | |
| apagado / medio ambiente * (dB) | 22.5 | 24.5 -9% | 23.8 -6% | 23.1 -3% | 22.8 -1% | 22.9 -2% |
| Idle Minimum * (dB) | 22.5 | 24.5 -9% | 23.8 -6% | 23.1 -3% | 23 -2% | 22.9 -2% |
| Idle Average * (dB) | 22.5 | 24.5 -9% | 23.8 -6% | 23.1 -3% | 23 -2% | 22.9 -2% |
| Idle Maximum * (dB) | 22.5 | 24.5 -9% | 28.3 -26% | 23.1 -3% | 23 -2% | 28.5 -27% |
| Load Average * (dB) | 28.7 | 48 -67% | 38.6 -34% | 28.9 -1% | 37.2 -30% | 40.6 -41% |
| Witcher 3 ultra * (dB) | 47.5 | 40.7 14% | 47.4 -0% | 51.6 -9% | 51 -7% | 44.1 7% |
| Load Maximum * (dB) | 54.4 | 48 12% | 47.4 13% | 51.4 6% | 51 6% | 45.8 16% |
* ... más pequeño es mejor
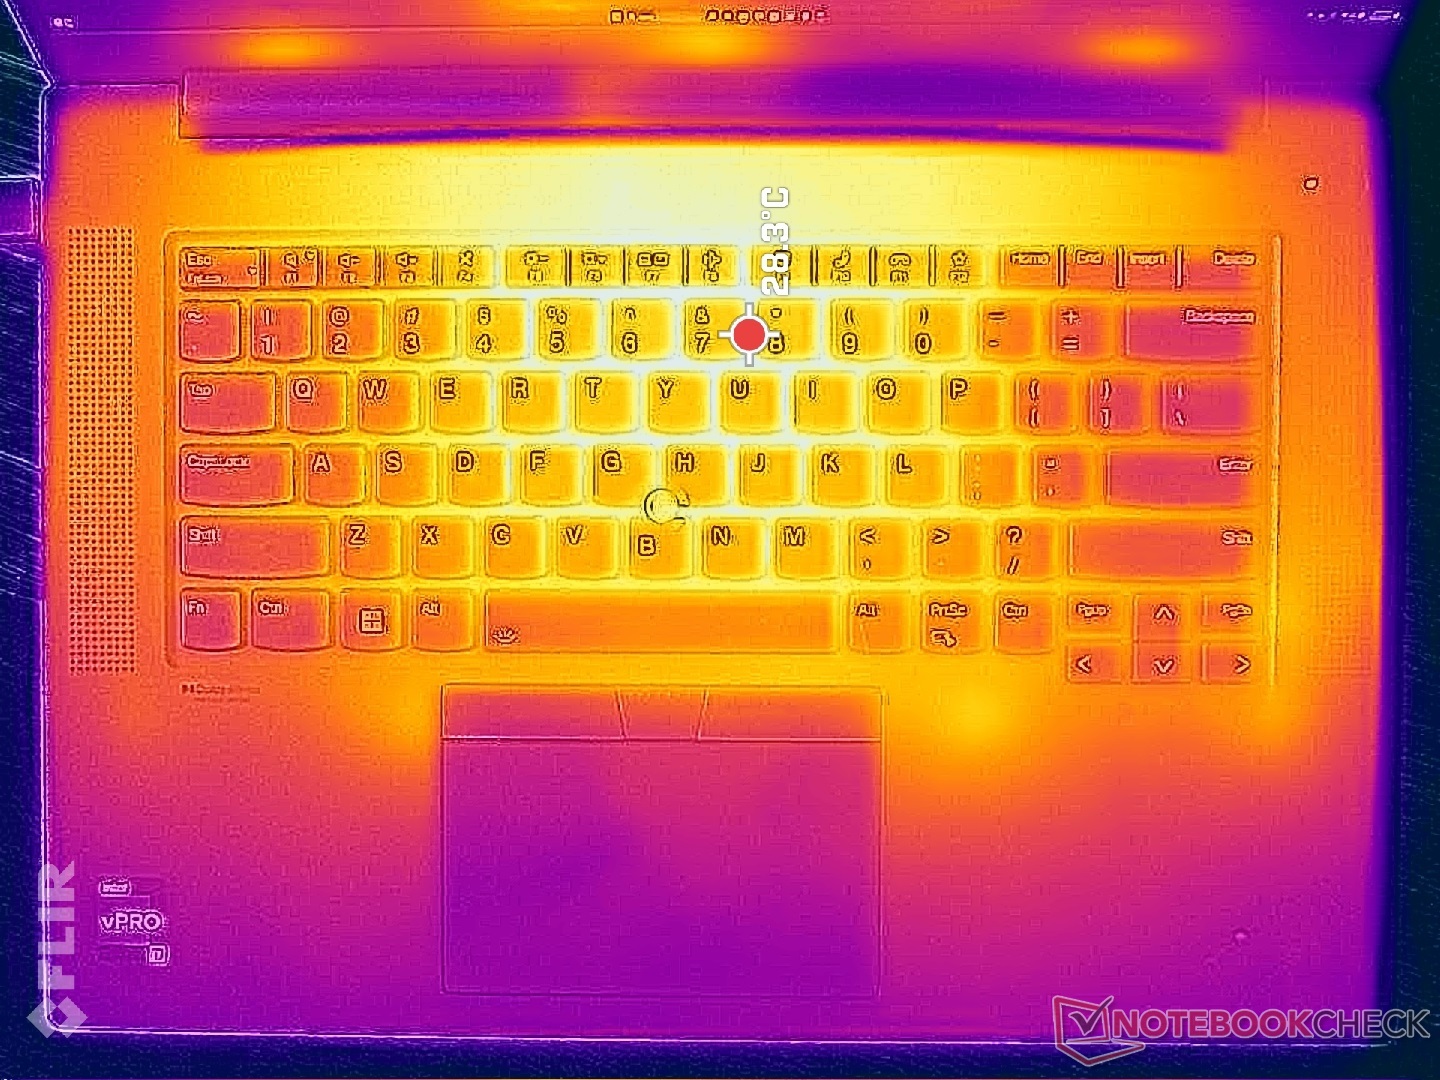
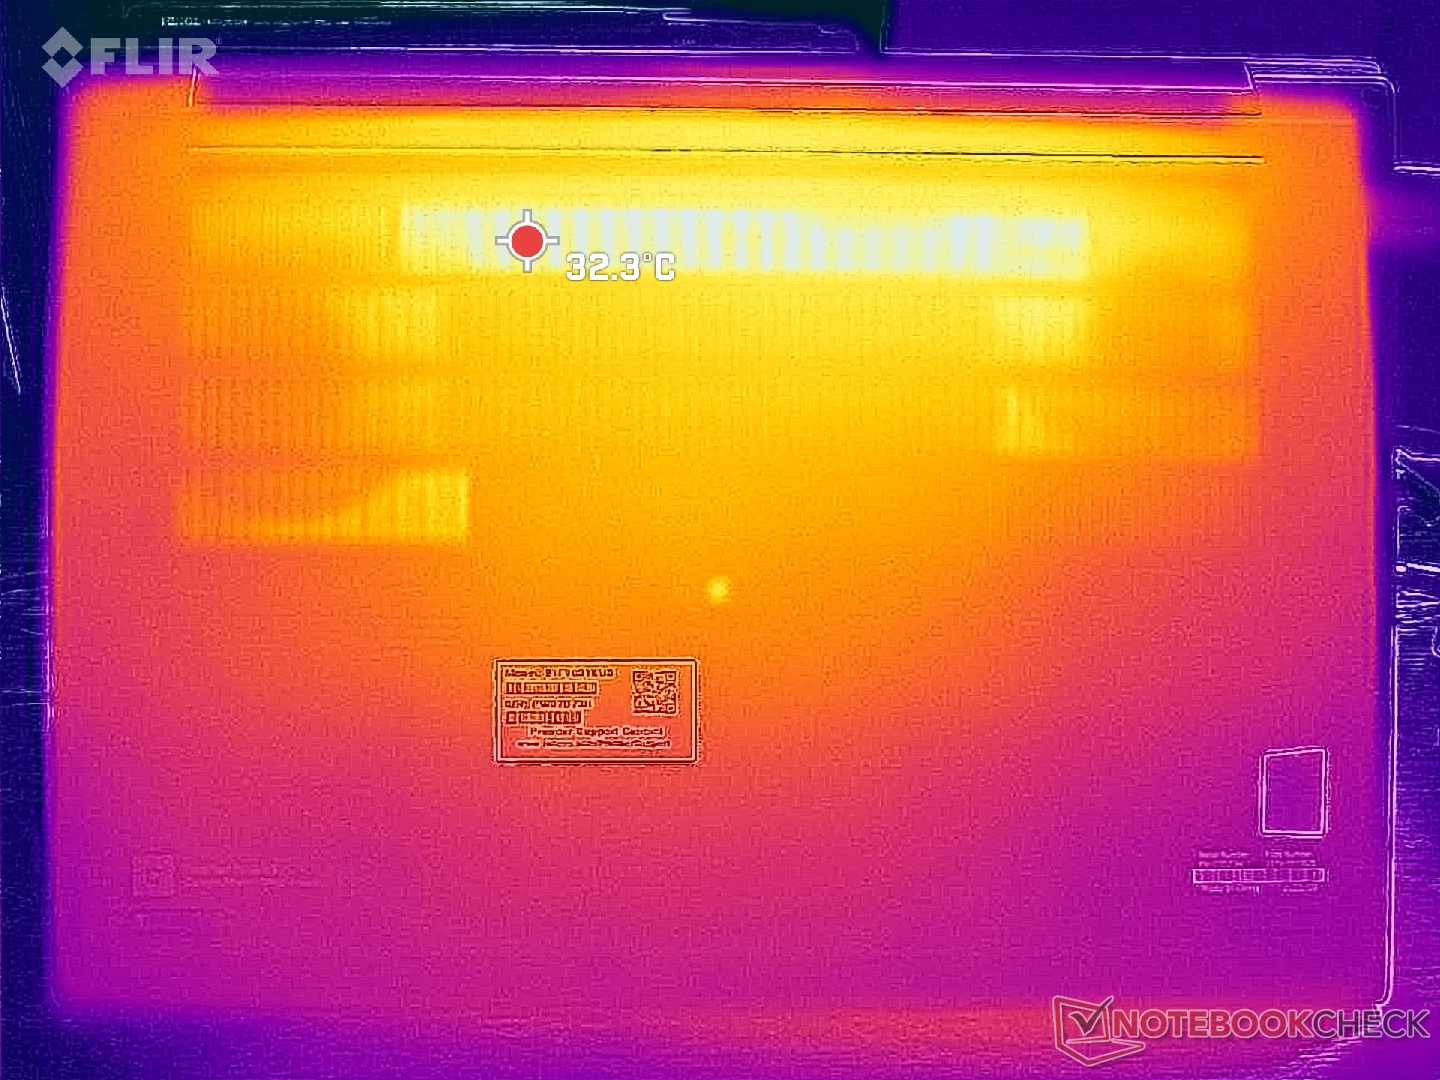
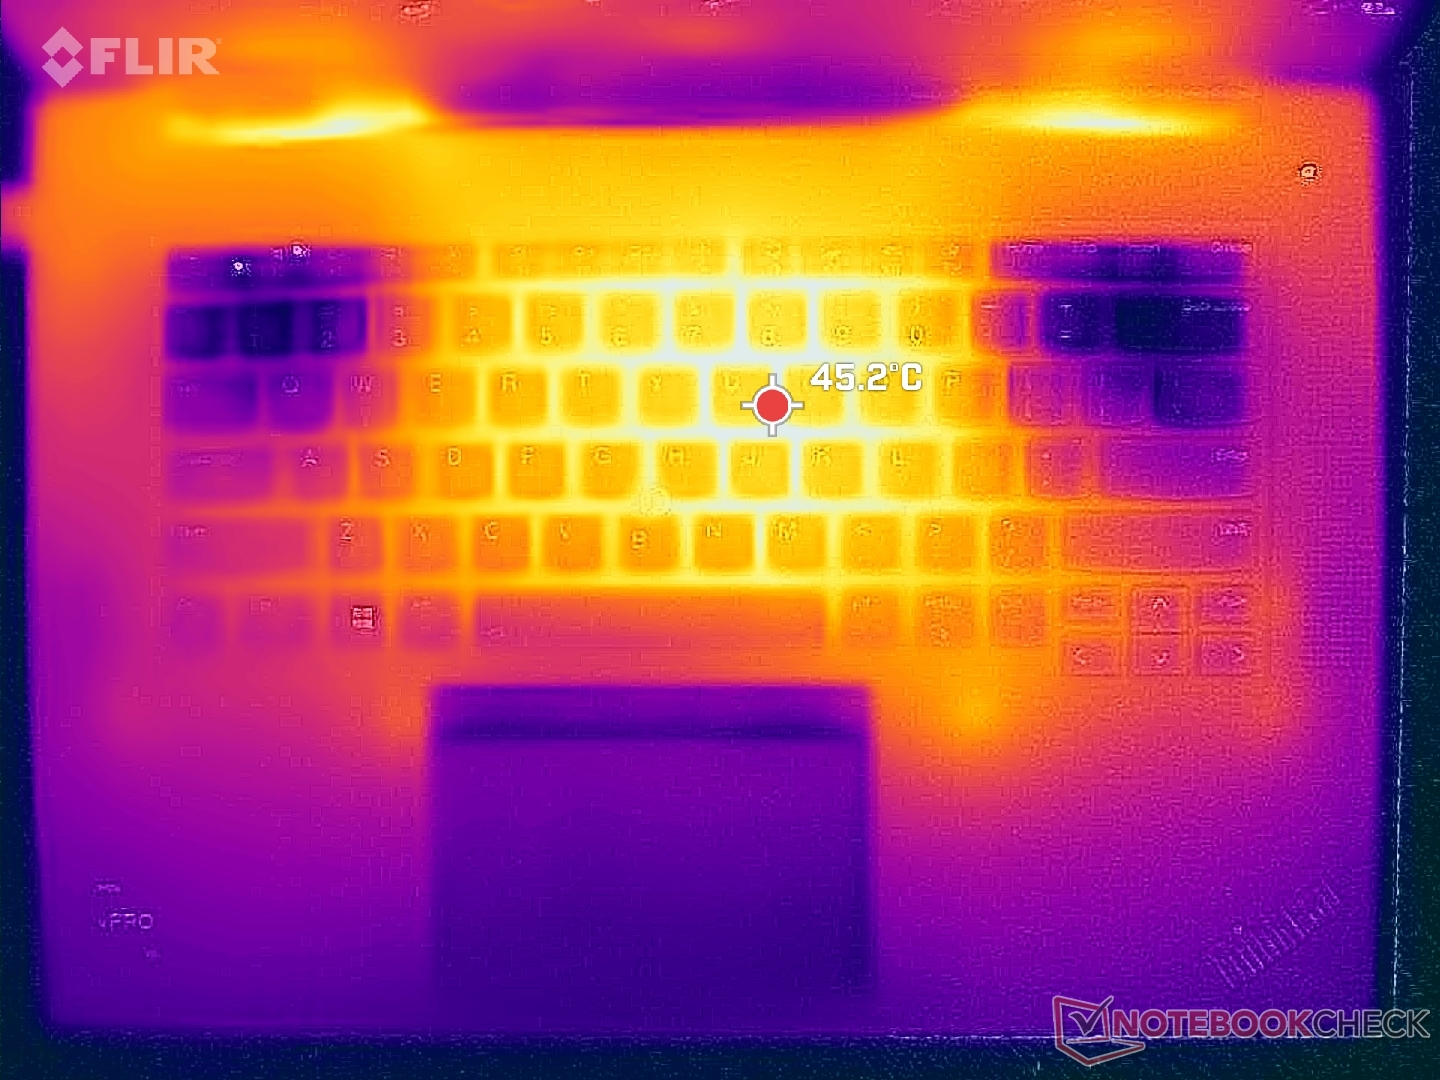
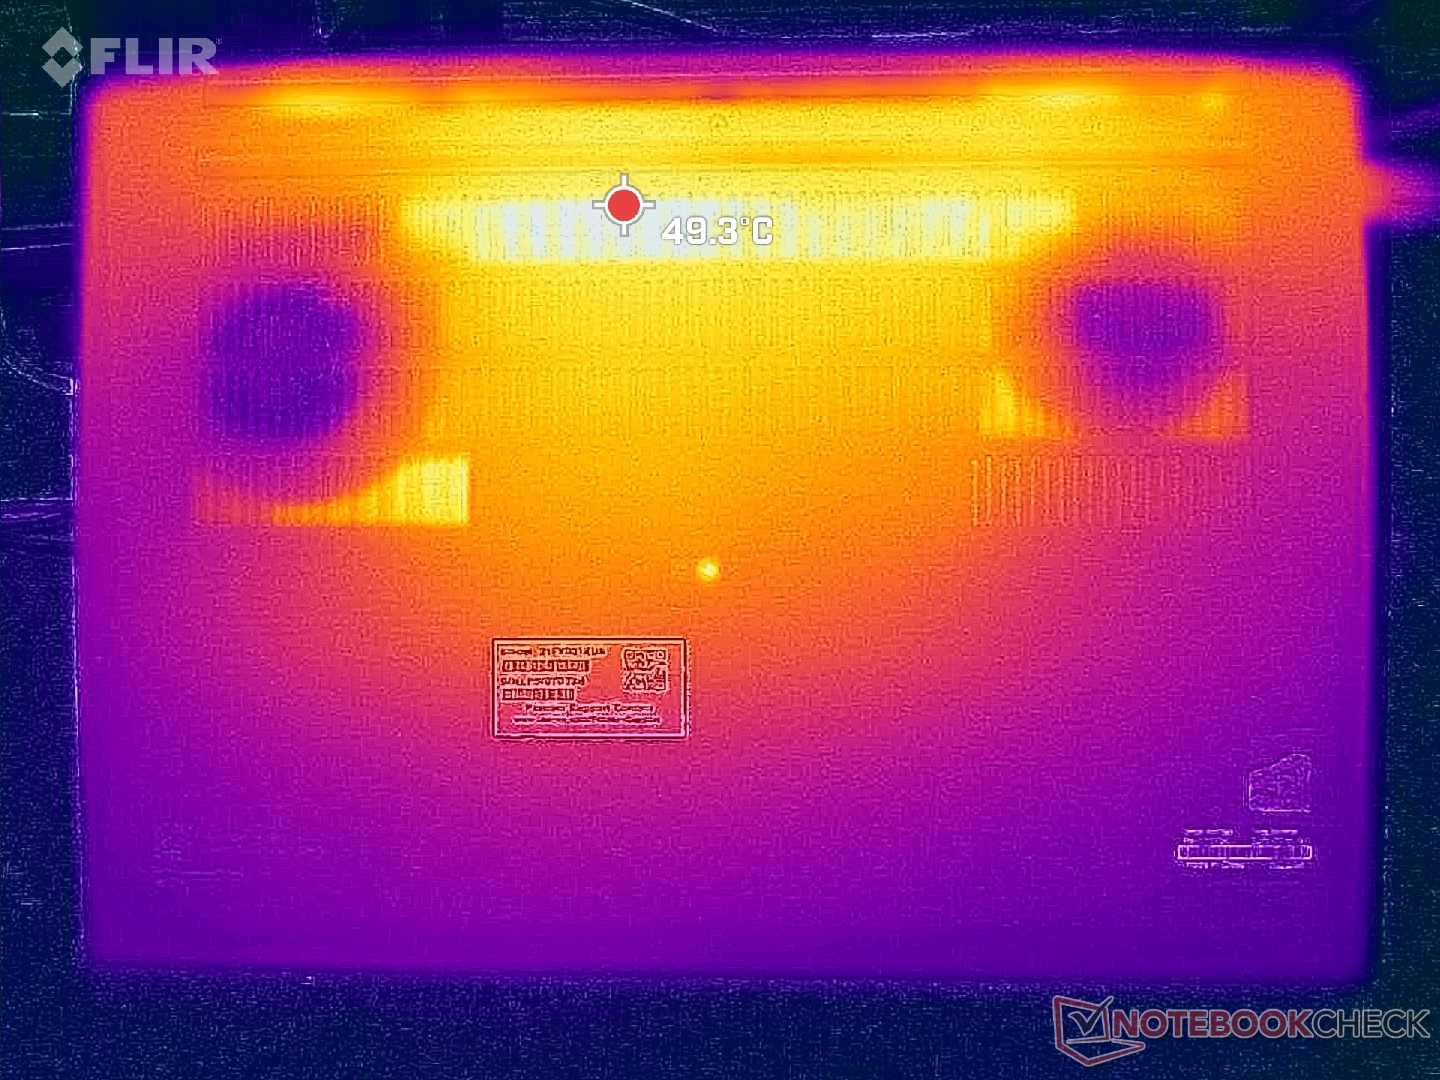
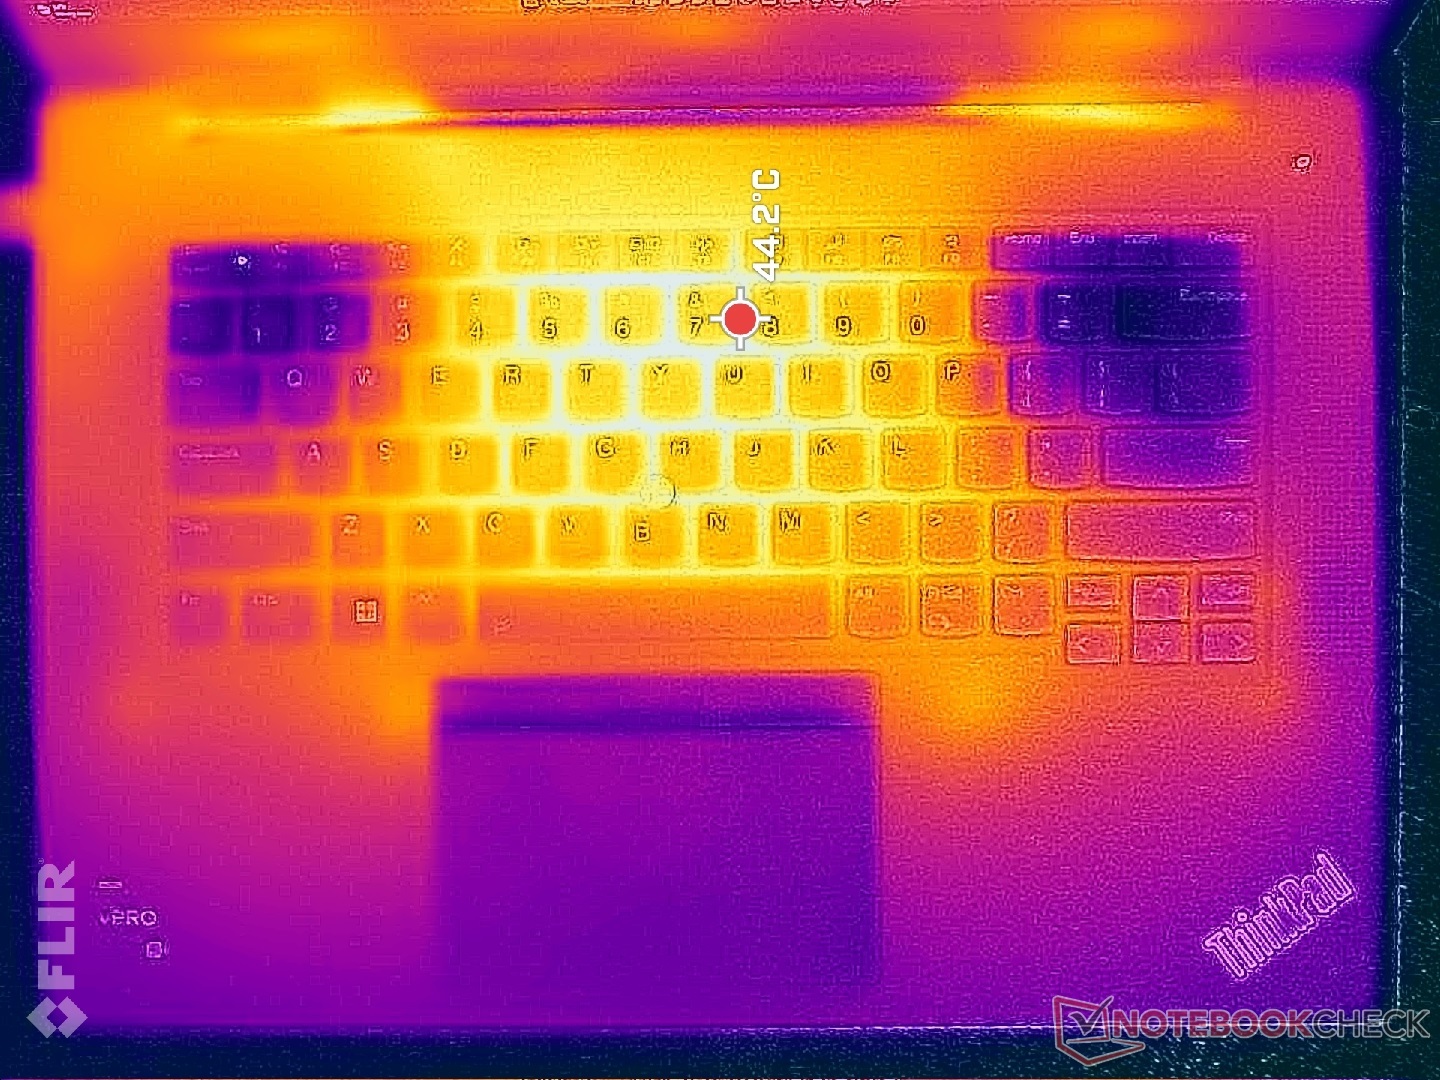
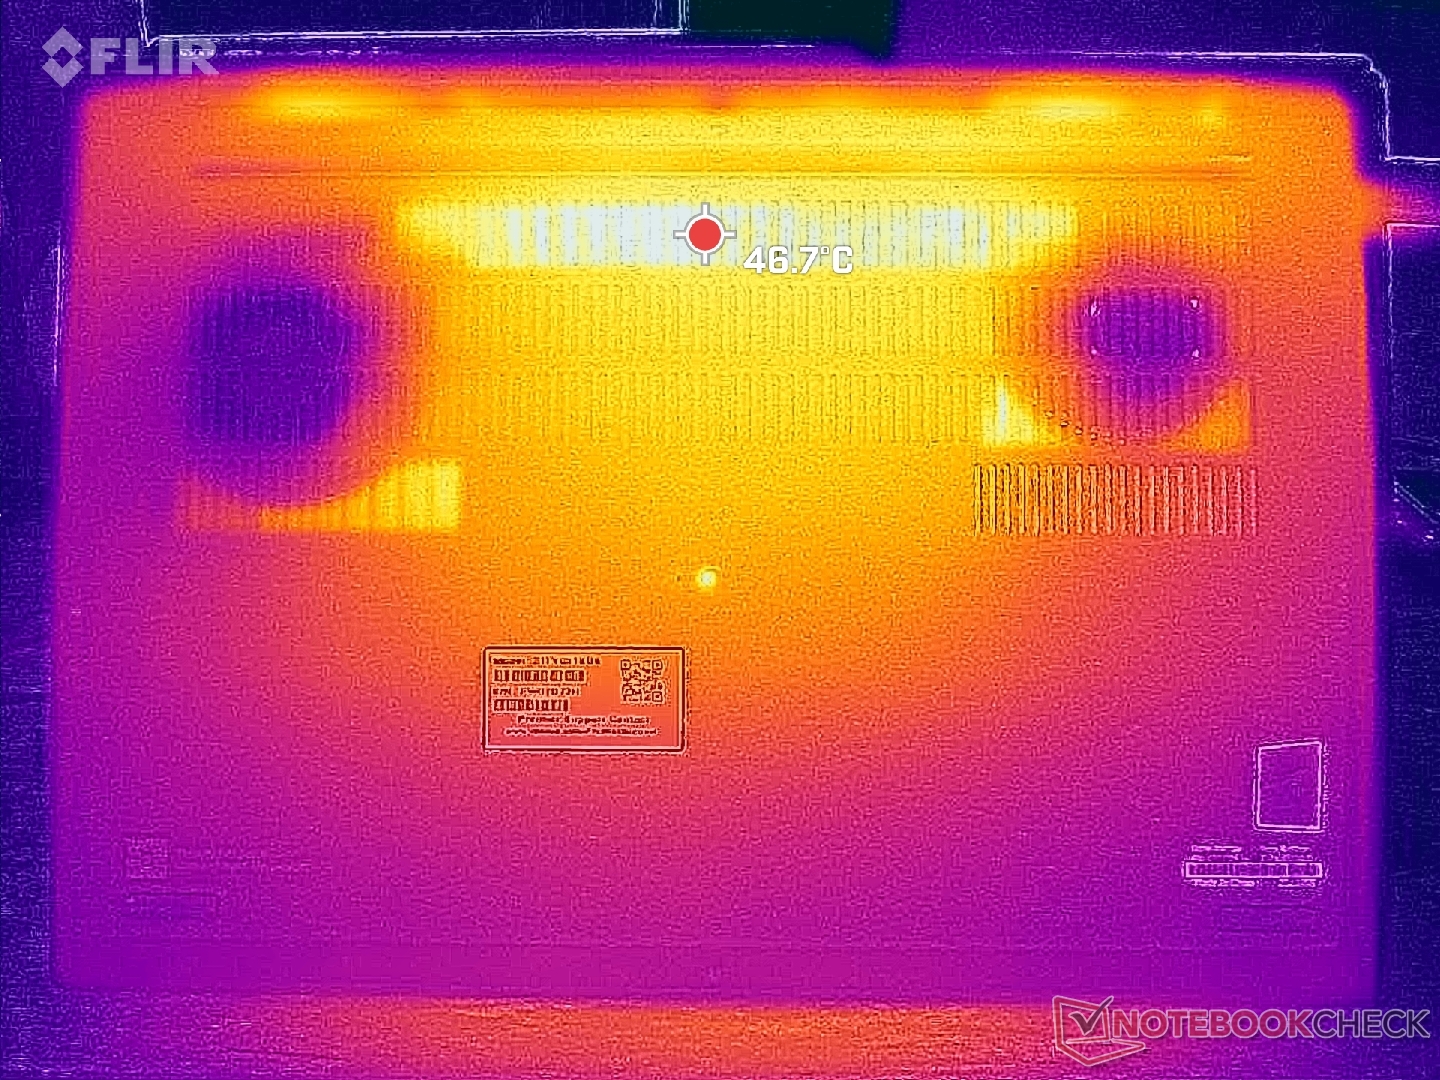
Temperatura
Las temperaturas de la superficie pueden ser bastante cálidas incluso en reposo sobre el escritorio, ya que los ventiladores tienden a ser letárgicos hasta que se introducen cargas mucho mayores. Los puntos calientes de las superficies del teclado y de la parte inferior pueden alcanzar los 45 C y 49 C, respectivamente, en comparación con los 51 C y 32 C del modelo de la competencia Dell Precision 5680.
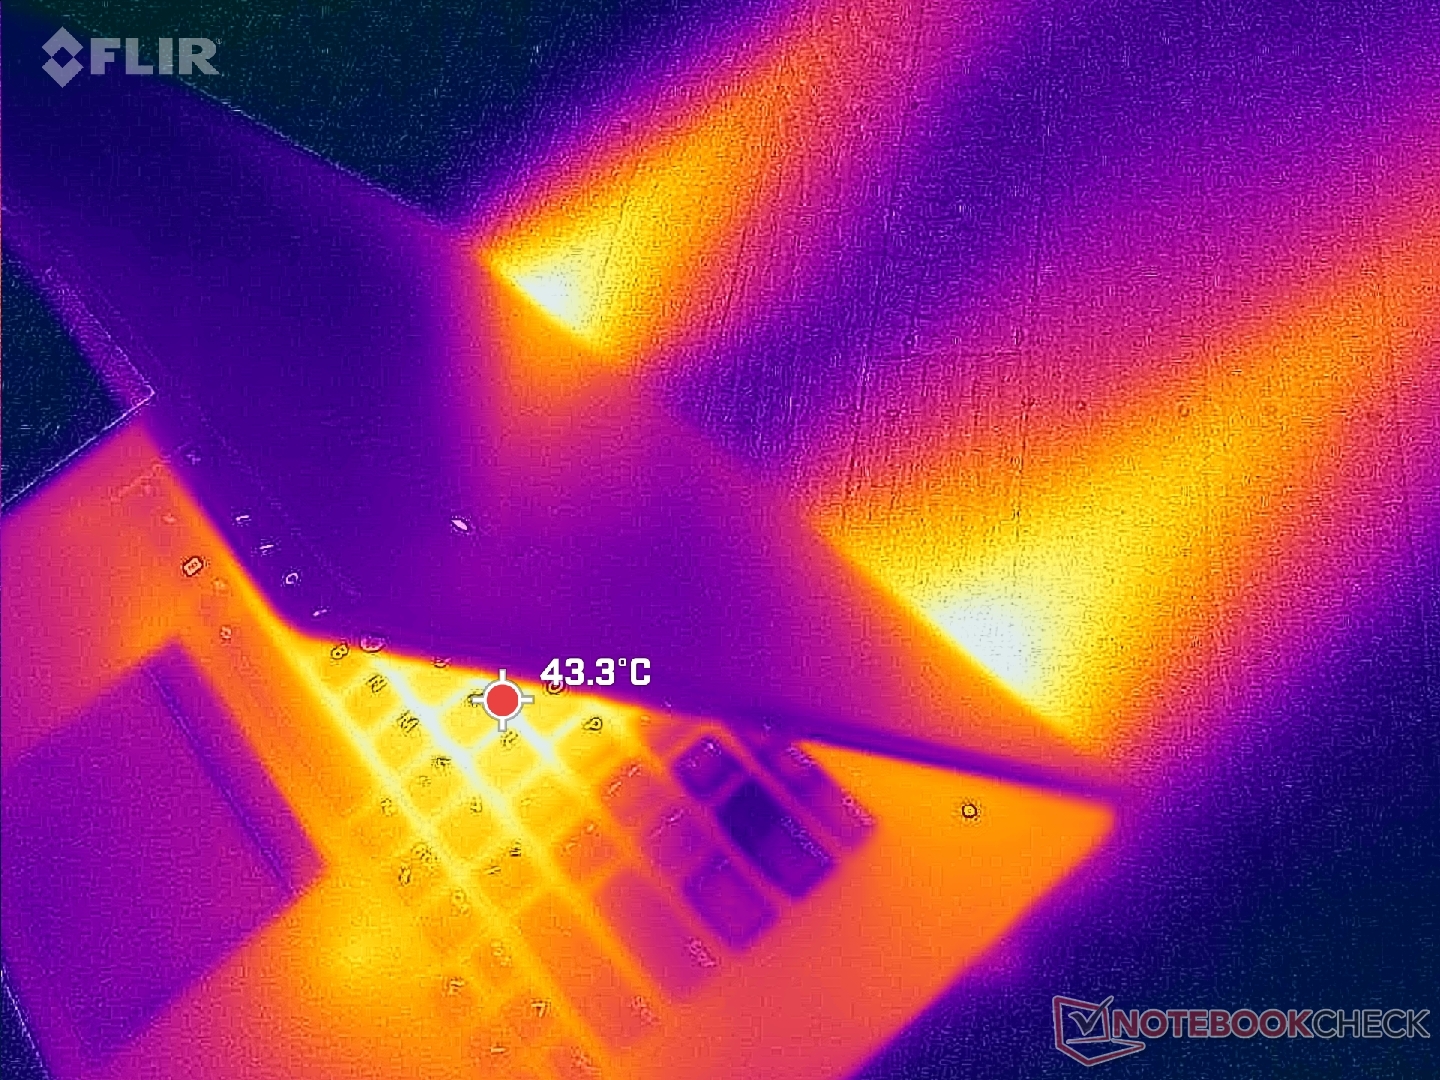
(±) La temperatura máxima en la parte superior es de 42 °C / 108 F, frente a la media de 38.2 °C / 101 F, que oscila entre 22.2 y 69.8 °C para la clase Workstation.
(-) El fondo se calienta hasta un máximo de 45.2 °C / 113 F, frente a la media de 41.1 °C / 106 F
(+) En reposo, la temperatura media de la parte superior es de 29 °C / 84# F, frente a la media del dispositivo de 32 °C / 90 F.
(±) Jugando a The Witcher 3, la temperatura media de la parte superior es de 36.1 °C / 97 F, frente a la media del dispositivo de 32 °C / 90 F.
(+) El reposamanos y el panel táctil están a una temperatura inferior a la de la piel, con un máximo de 30.8 °C / 87.4 F y, por tanto, son fríos al tacto.
(-) La temperatura media de la zona del reposamanos de dispositivos similares fue de 27.8 °C / 82 F (-3 °C / -5.4 F).
| Lenovo ThinkPad P1 G6 21FV001KUS Intel Core i7-13800H, NVIDIA GeForce RTX 4080 Laptop GPU | Lenovo ThinkPad P1 G6-21FV000DGE Intel Core i9-13900H, NVIDIA RTX 2000 Ada Generation Laptop | Lenovo ThinkPad P1 G4-20Y4S0KS00 Intel Core i7-11850H, NVIDIA GeForce RTX 3070 Laptop GPU | Lenovo ThinkPad P16 G1 RTX A5500 Intel Core i9-12950HX, NVIDIA RTX A5500 Laptop GPU | Dell Precision 5000 5680 Intel Core i9-13900H, NVIDIA RTX 5000 Ada Generation Laptop | HP ZBook Fury 16 G10 Intel Core i9-13950HX, NVIDIA RTX 5000 Ada Generation Laptop | |
|---|---|---|---|---|---|---|
| Heat | 1% | -1% | -4% | 3% | -2% | |
| Maximum Upper Side * (°C) | 42 | 47.1 -12% | 51 -21% | 44.8 -7% | 50.2 -20% | 44.8 -7% |
| Maximum Bottom * (°C) | 45.2 | 56.5 -25% | 53.5 -18% | 49.8 -10% | 32 29% | 50 -11% |
| Idle Upper Side * (°C) | 33 | 28.1 15% | 28.8 13% | 30.6 7% | 37.4 -13% | 34.4 -4% |
| Idle Bottom * (°C) | 37 | 27.6 25% | 29.3 21% | 38.6 -4% | 31.2 16% | 31.8 14% |
* ... más pequeño es mejor
Prueba de estrés
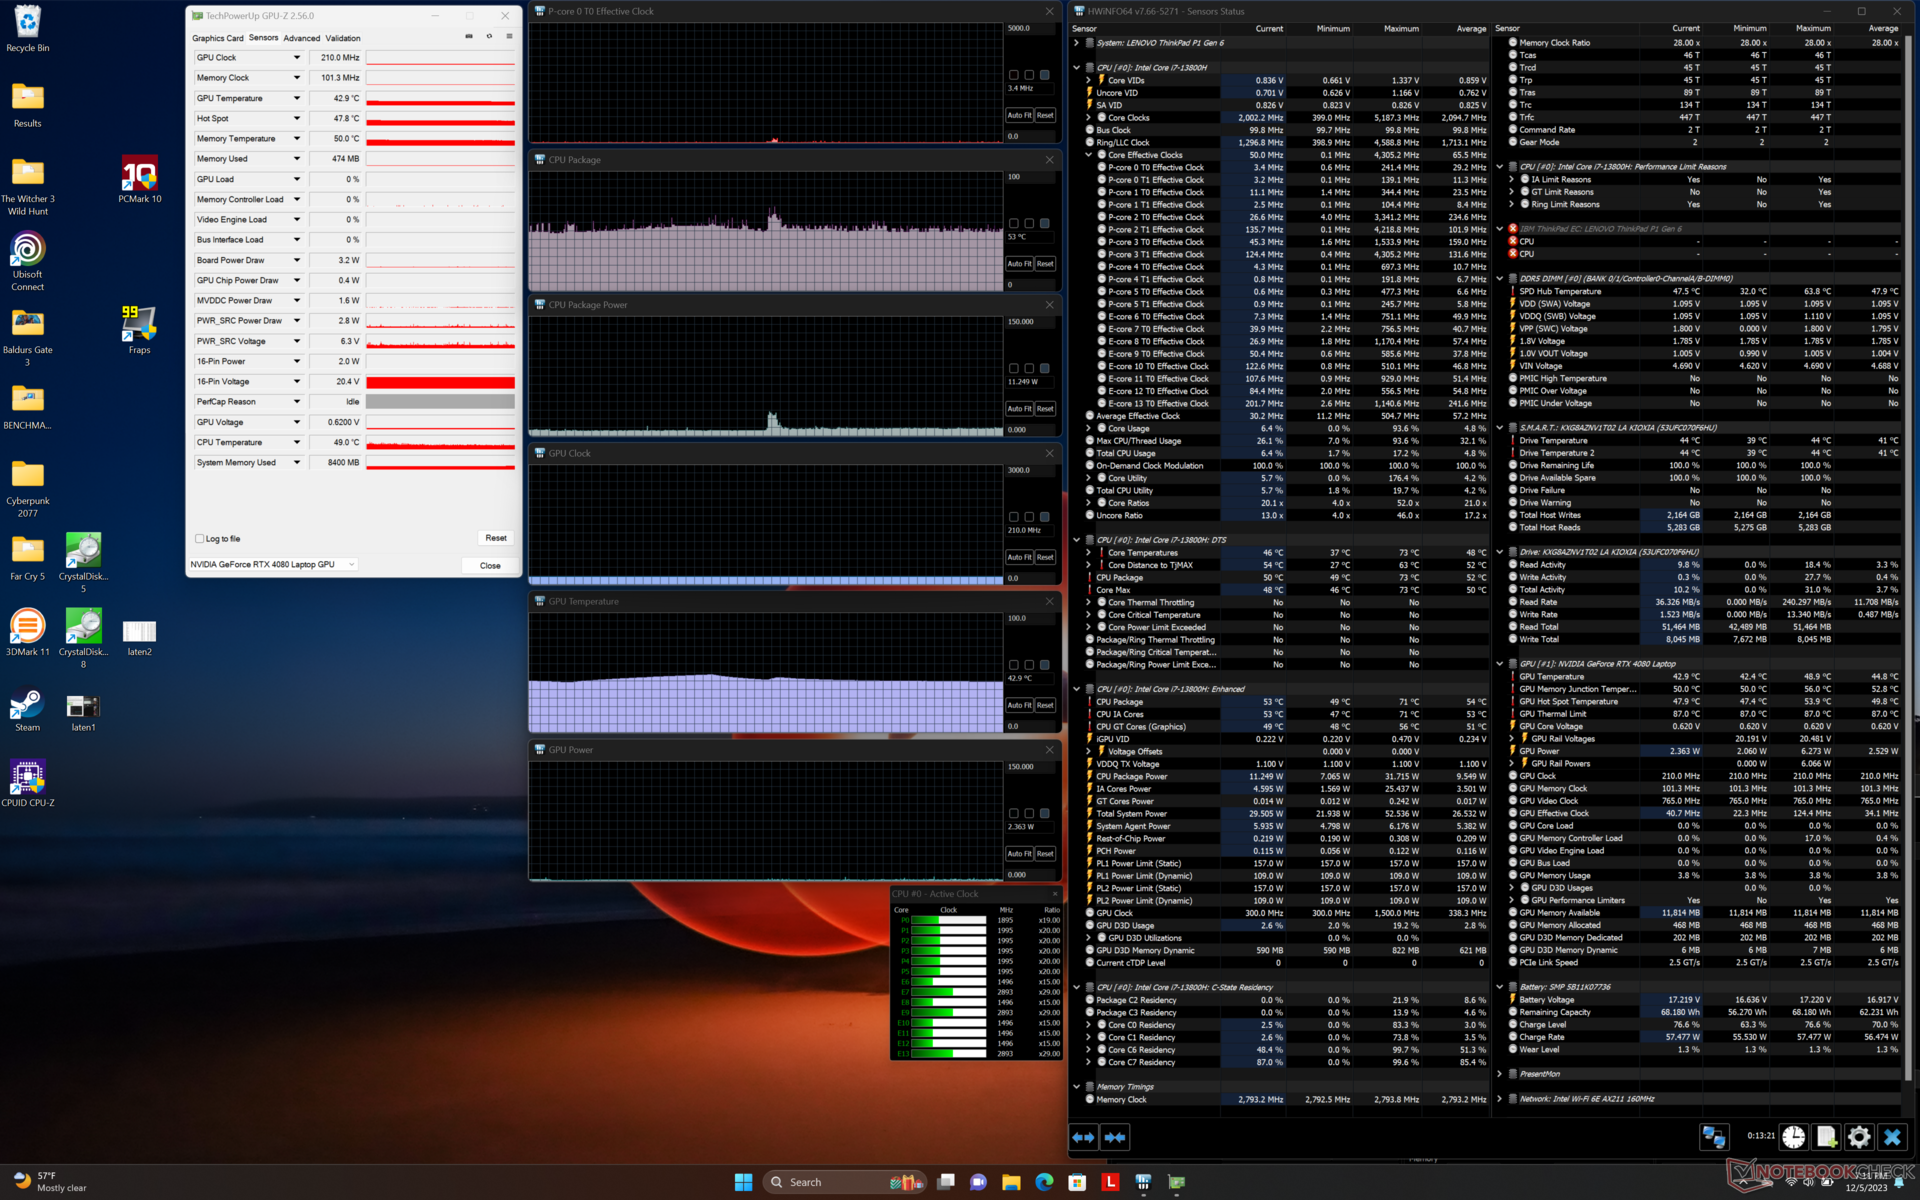
Bajo el estrés de Prime95, la CPU aumentaría a 4,1 GHz y 111 W sólo durante el primer par de segundos antes de caer y estabilizarse en 75 W y el rango de 2,5 a 3,1 GHz. Lo más notable es que la temperatura del núcleo se estabilizaría en unos muy cálidos 97 C, lo que sugiere que el procesador está llevando al límite la solución de refrigeración para maximizar el potencial de Turbo Boost.
El rendimiento gráfico se reduce si se ejecuta en modo Equilibrado en lugar de en modo Rendimiento, como se ha mencionado anteriormente. Por ejemplo, la GPU se estabilizaría en 1890 MHz, 79 W y 77 C cuando se ejecuta Witcher 3 en modo Rendimiento en comparación con sólo 1470 MHz, 52 W y 67 C cuando está en modo Equilibrado.
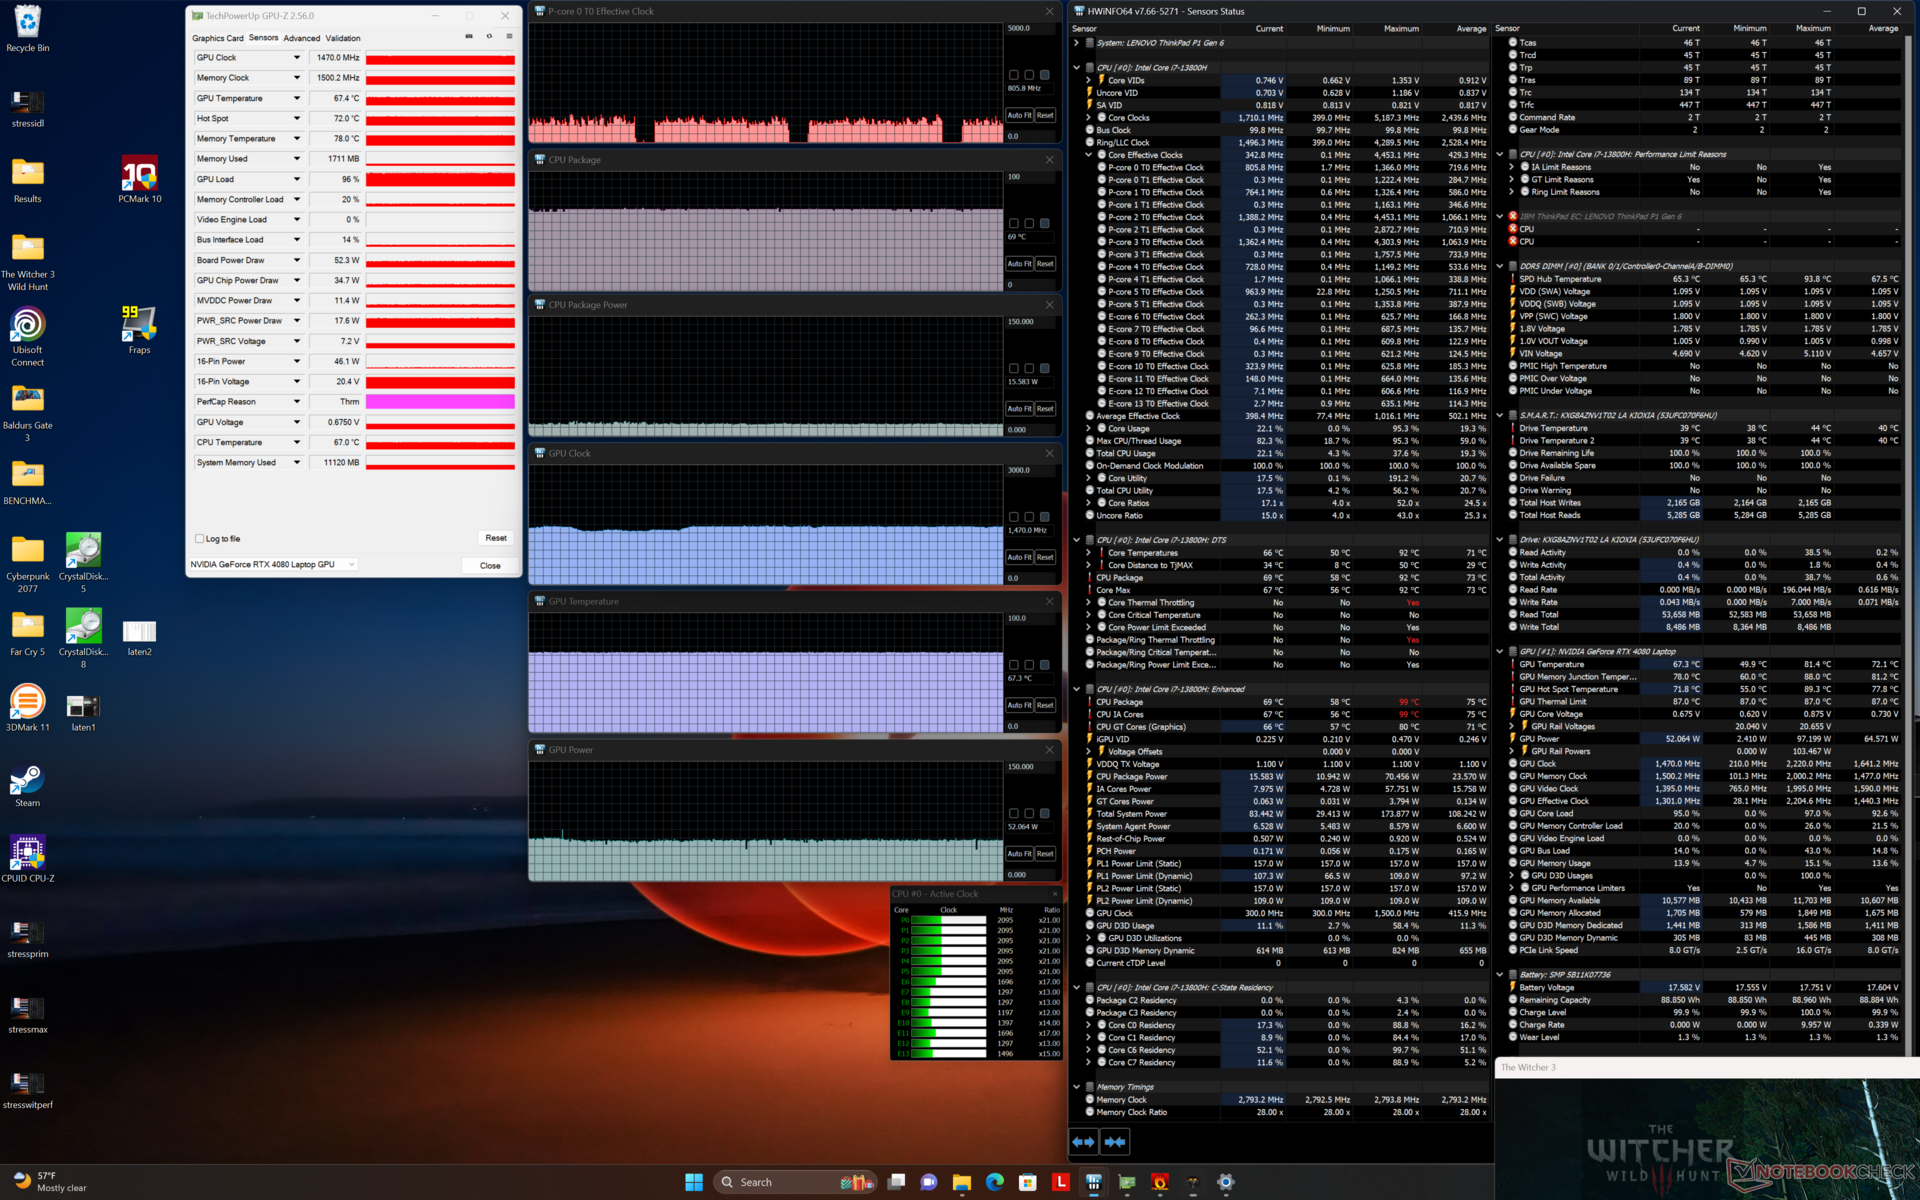
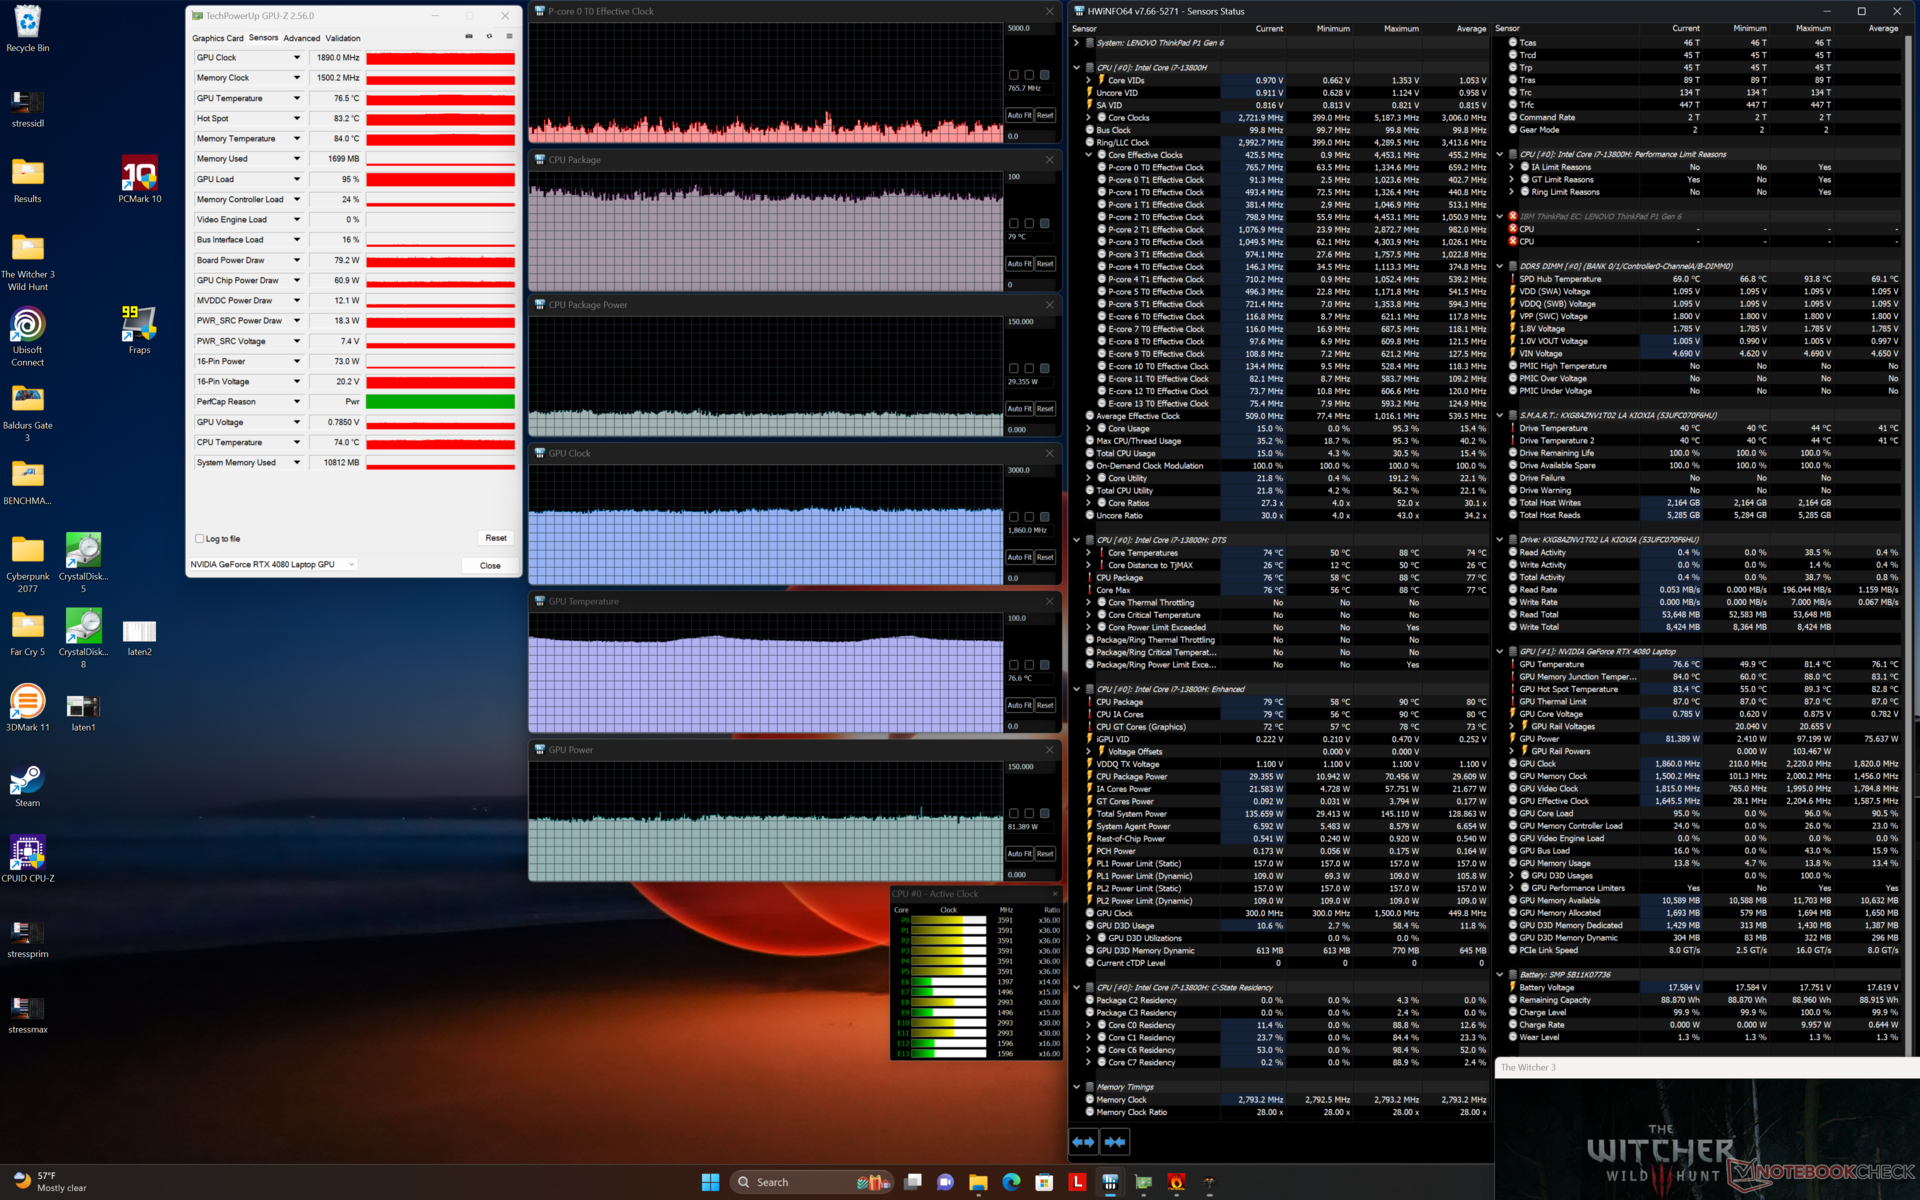
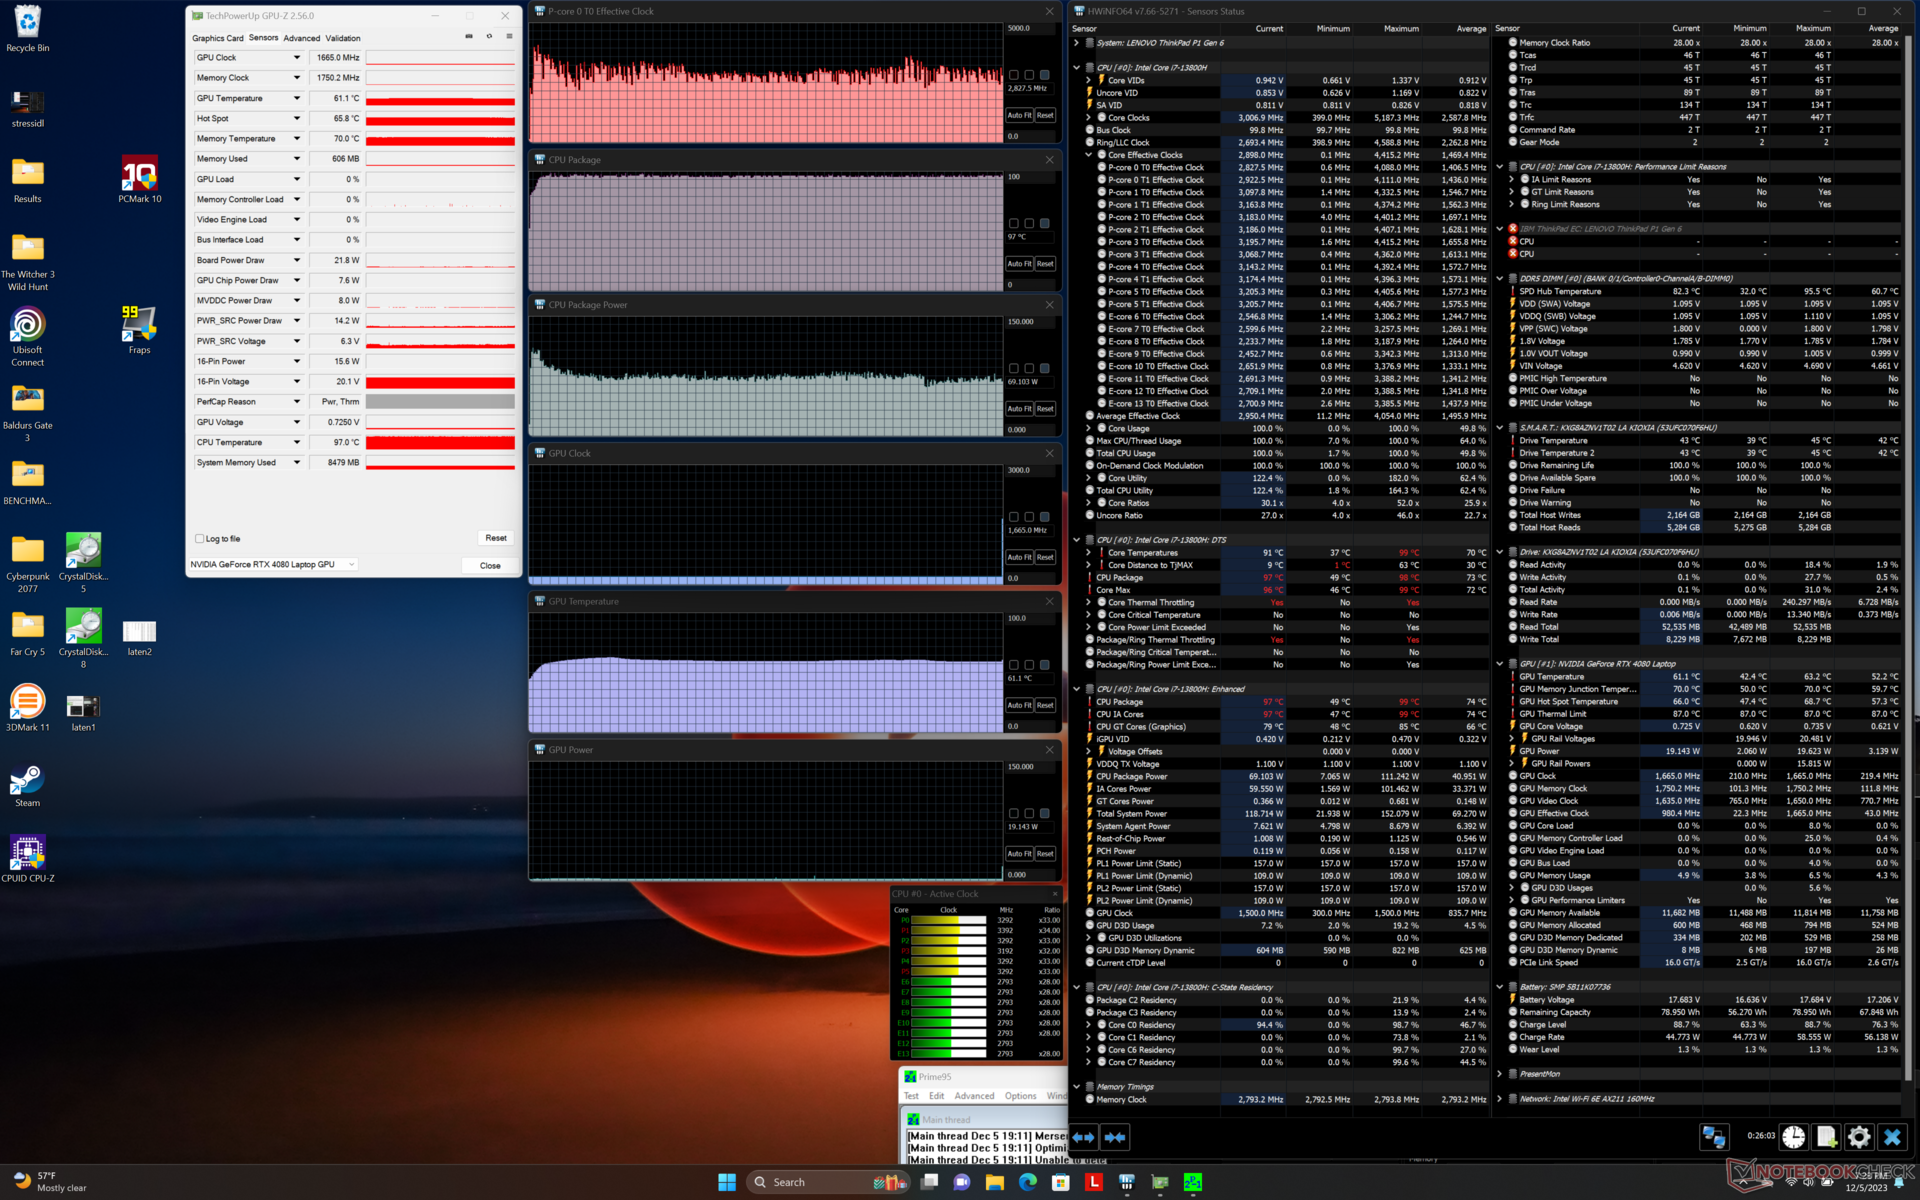
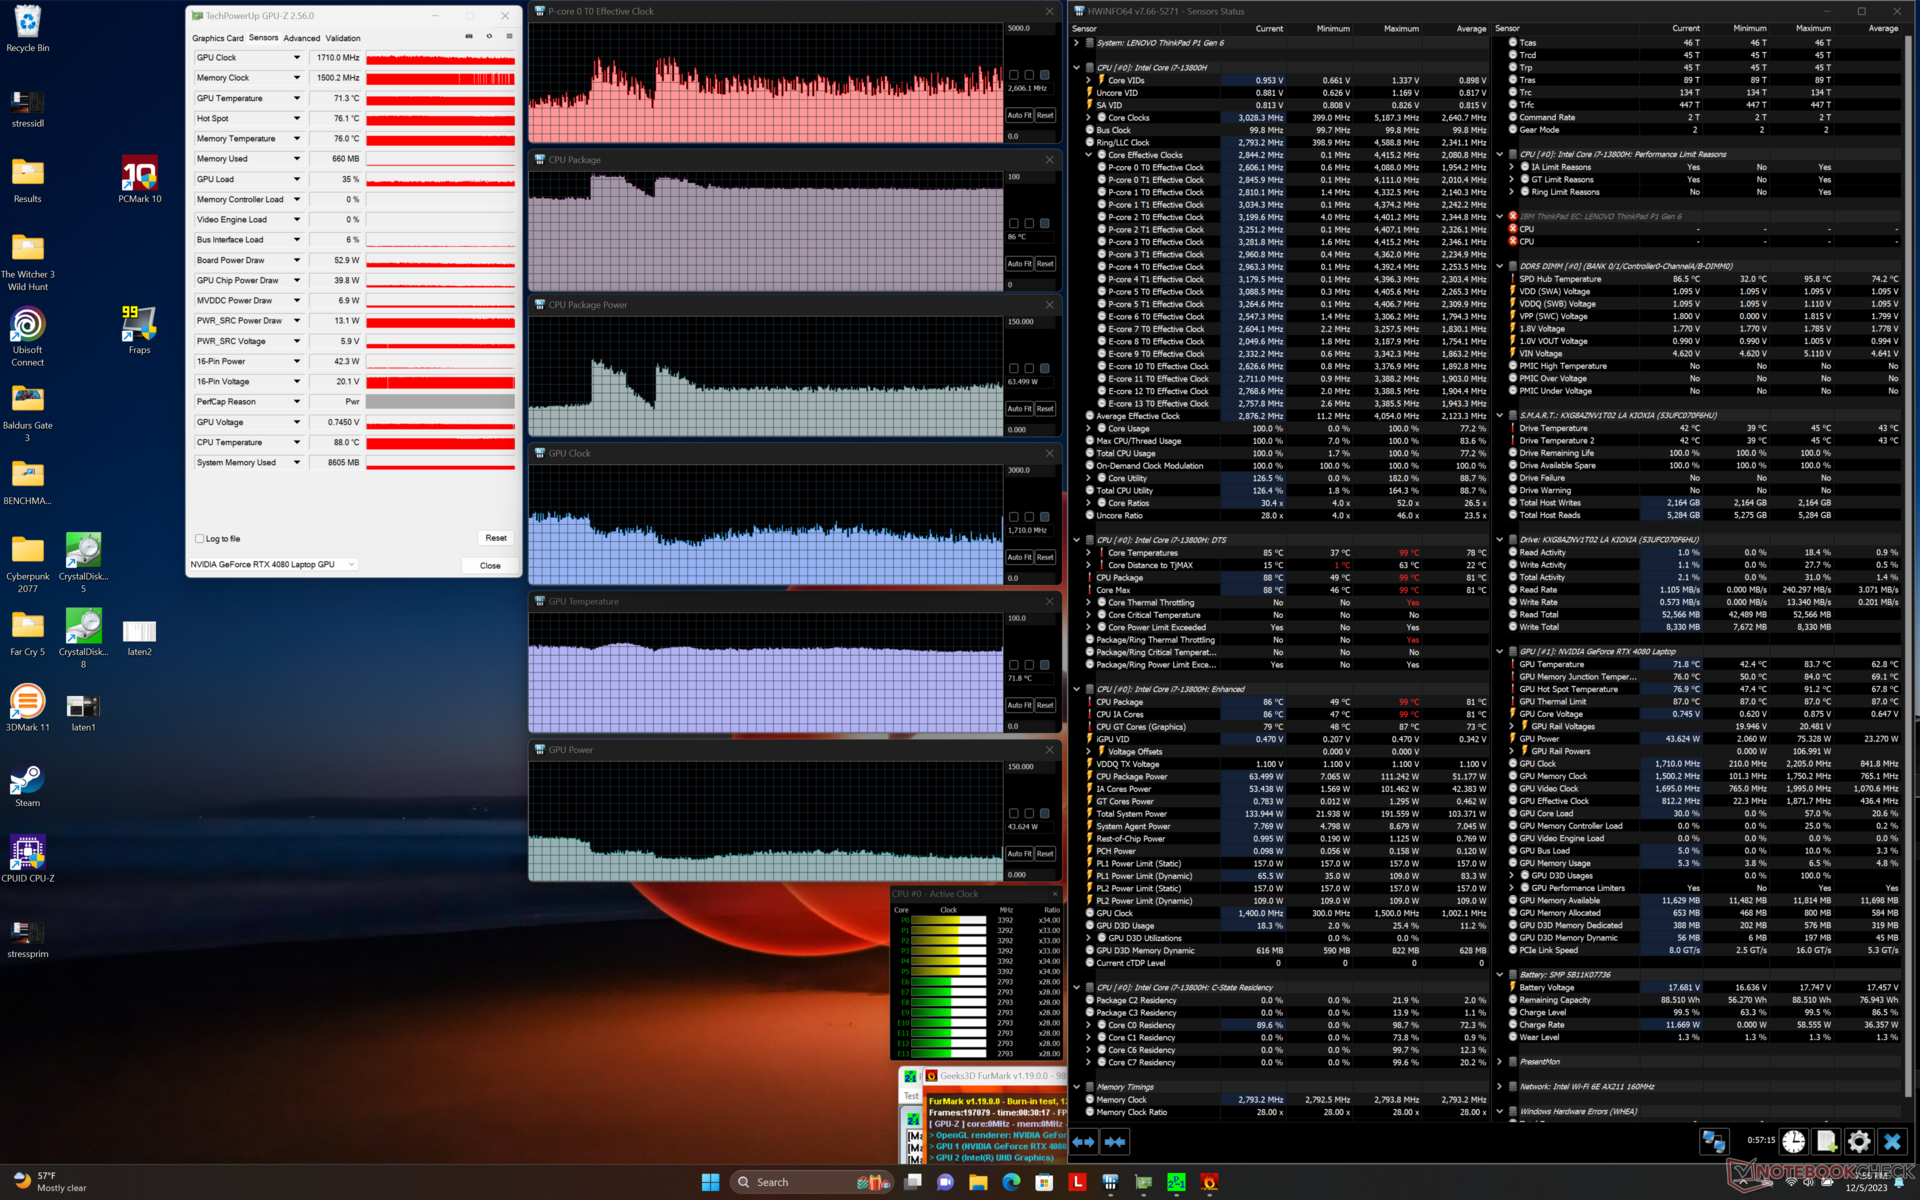
| Reloj dela CPU (GHz) | Reloj de la GPU (MHz) | Temperatura media dela CPU (°C) | Temperatura media de la GPU (°C) | |
| Sistema en reposo | -- | -- | 53 | 43 |
| EstrésPrime95 | -- | -- | 2,5 - 3,1 | 97 |
| Estrés Prime95+ FurMark | ~2,1 - 3,1 | ~1071 | 86 | 72 |
| Witcher 3 Estrés (modoequilibrado) | 0,8 | 1470 | 69 | 67 |
| Witcher 3 Estrés (modoRendimiento) | ~0,8 | 1890 | 79 | 77 |
Altavoces
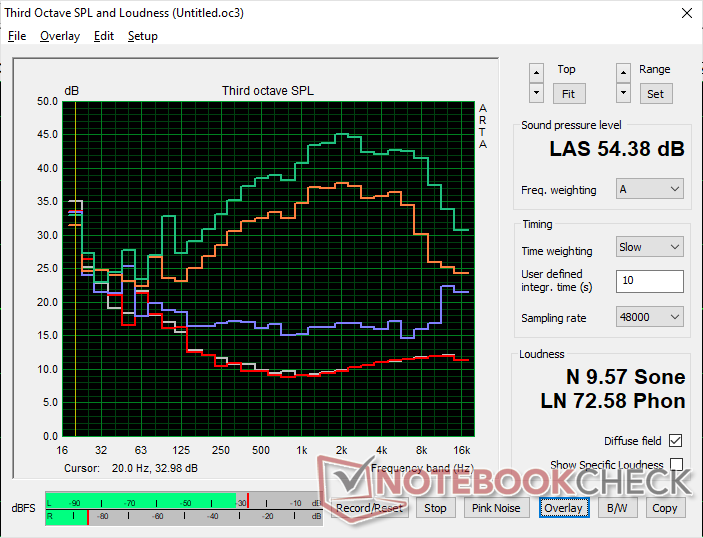
Lenovo ThinkPad P1 G6 21FV001KUS análisis de audio
(+) | los altavoces pueden reproducir a un volumen relativamente alto (#85.2 dB)
Graves 100 - 315 Hz
(±) | lubina reducida - en promedio 8% inferior a la mediana
(±) | la linealidad de los graves es media (10.2% delta a frecuencia anterior)
Medios 400 - 2000 Hz
(±) | medias más altas - de media 7.7% más altas que la mediana
(+) | los medios son lineales (4.7% delta a la frecuencia anterior)
Altos 2 - 16 kHz
(+) | máximos equilibrados - a sólo 4.2% de la mediana
(+) | los máximos son lineales (6.2% delta a la frecuencia anterior)
Total 100 - 16.000 Hz
(+) | el sonido global es lineal (13.2% de diferencia con la mediana)
En comparación con la misma clase
» 23% de todos los dispositivos probados de esta clase eran mejores, 6% similares, 71% peores
» El mejor tuvo un delta de 7%, la media fue 17%, el peor fue ###max##%
En comparación con todos los dispositivos probados
» 13% de todos los dispositivos probados eran mejores, 3% similares, 84% peores
» El mejor tuvo un delta de 4%, la media fue 24%, el peor fue ###max##%
Apple MacBook Pro 16 2021 M1 Pro análisis de audio
(+) | los altavoces pueden reproducir a un volumen relativamente alto (#84.7 dB)
Graves 100 - 315 Hz
(+) | buen bajo - sólo 3.8% lejos de la mediana
(+) | el bajo es lineal (5.2% delta a la frecuencia anterior)
Medios 400 - 2000 Hz
(+) | medios equilibrados - a sólo 1.3% de la mediana
(+) | los medios son lineales (2.1% delta a la frecuencia anterior)
Altos 2 - 16 kHz
(+) | máximos equilibrados - a sólo 1.9% de la mediana
(+) | los máximos son lineales (2.7% delta a la frecuencia anterior)
Total 100 - 16.000 Hz
(+) | el sonido global es lineal (4.6% de diferencia con la mediana)
En comparación con la misma clase
» 0% de todos los dispositivos probados de esta clase eran mejores, 0% similares, 100% peores
» El mejor tuvo un delta de 5%, la media fue 17%, el peor fue ###max##%
En comparación con todos los dispositivos probados
» 0% de todos los dispositivos probados eran mejores, 0% similares, 100% peores
» El mejor tuvo un delta de 4%, la media fue 24%, el peor fue ###max##%
Gestión de la energía
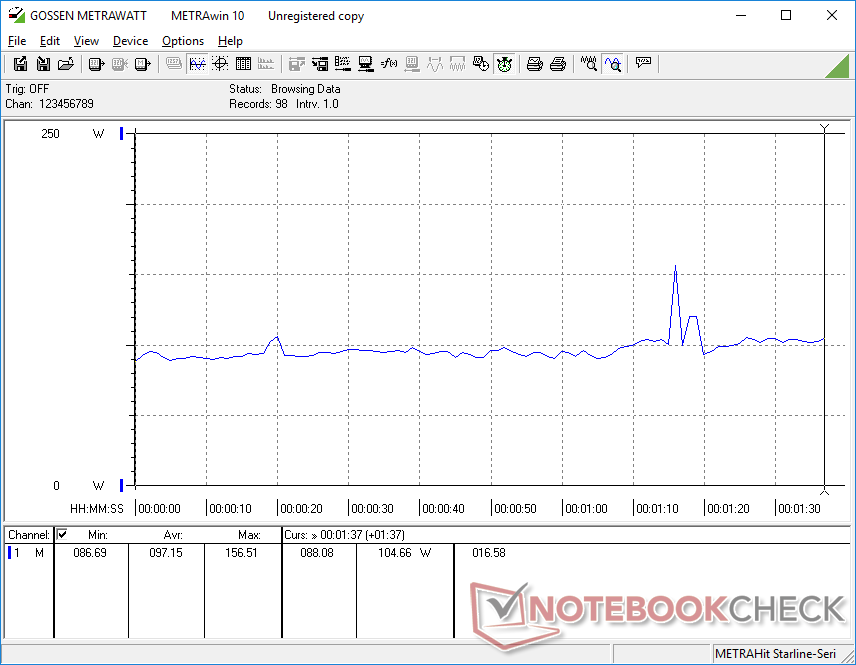
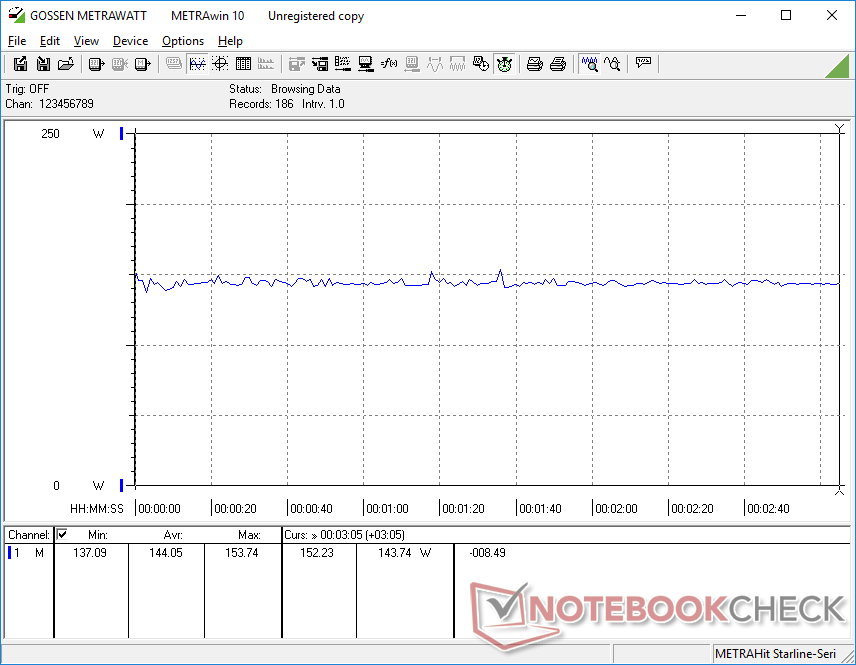
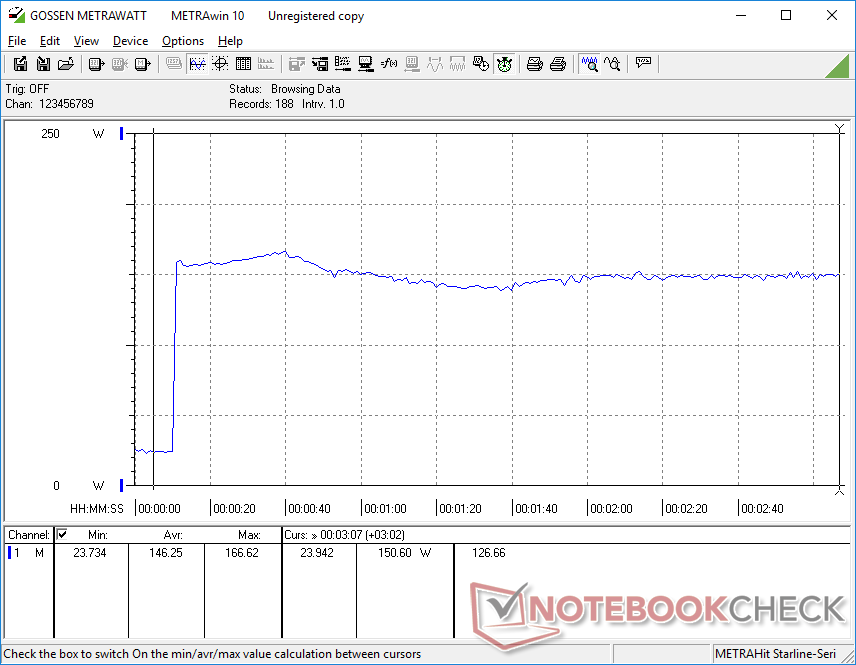
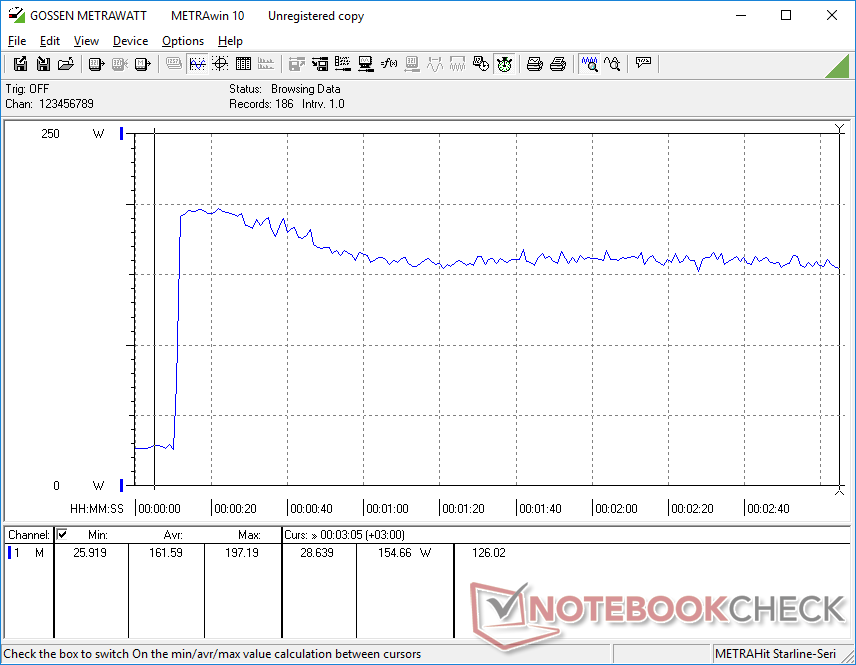
Consumo de energía
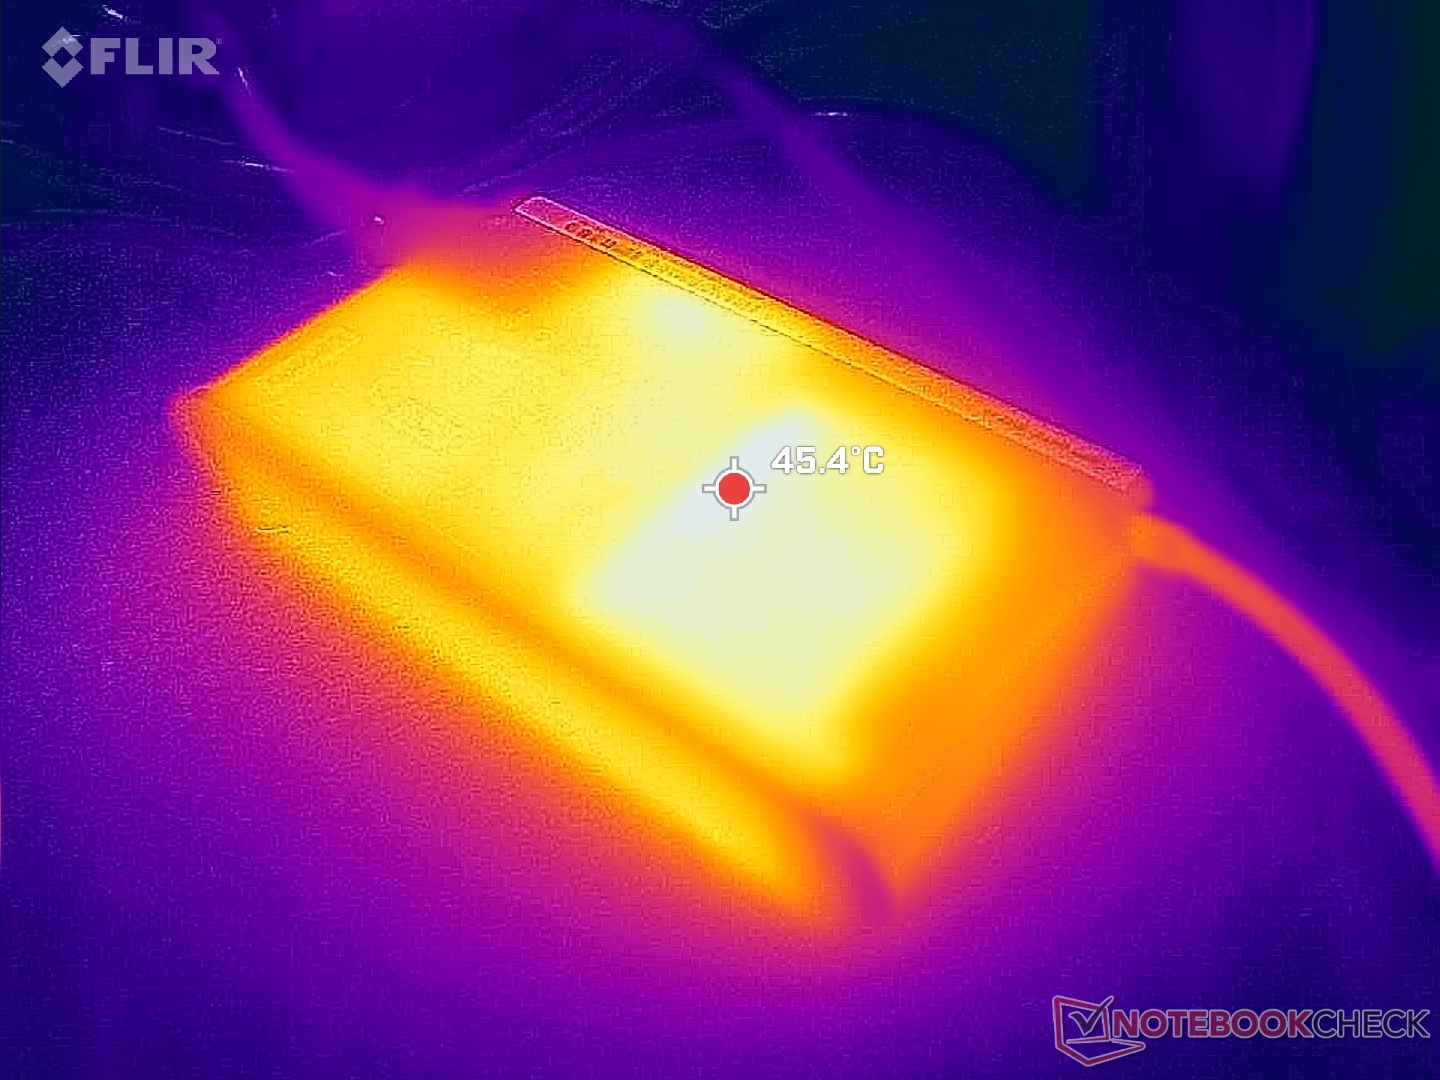
Nuestra unidad de pruebas es, en general, más exigente que la configuración de menor potencia RTX 2000, lo que explica la menor duración de la batería en nuestra siguiente sección. La ejecución de Witcher 3 para representar cargas exigentes, por ejemplo, consumiría un 37% más de energía.
Somos capaces de registrar un consumo máximo de 197 W desde el adaptador de CA de 230 W de tamaño medio (~17 x 8,8 x 2,5 cm) cuando la CPU y la GPU están cada una al 100 por ciento de utilización.
| Off / Standby | |
| Ocioso | |
| Carga |
|
Clave:
min: | |
| Lenovo ThinkPad P1 G6 21FV001KUS i7-13800H, GeForce RTX 4080 Laptop GPU, Kioxia XG8 KXG8AZNV1T02, OLED, 3480x2400, 16" | Lenovo ThinkPad P1 G6-21FV000DGE i9-13900H, RTX 2000 Ada Generation Laptop, SK Hynix PC711 1TB HFS001TDE9X084N, IPS, 2560x1600, 16" | Lenovo ThinkPad P1 G4-20Y4S0KS00 i7-11850H, GeForce RTX 3070 Laptop GPU, Samsung PM9A1 MZVL21T0HCLR, IPS LED, 3840x2400, 16" | Lenovo ThinkPad P16 G1 RTX A5500 i9-12950HX, RTX A5500 Laptop GPU, WDC PC SN810 2TB, IPS, 3840x2400, 16" | Dell Precision 5000 5680 i9-13900H, RTX 5000 Ada Generation Laptop, 2x SK hynix PC801 HFS512GEJ9X101N RAID 0, OLED, 3840x2400, 16" | HP ZBook Fury 16 G10 i9-13950HX, RTX 5000 Ada Generation Laptop, SK hynix PC801 HFS001TEJ9X101N, IPS, 3840x2400, 16" | |
|---|---|---|---|---|---|---|
| Power Consumption | 5% | -15% | -51% | 0% | -46% | |
| Idle Minimum * (Watt) | 8 | 8.3 -4% | 8.1 -1% | 7.5 6% | 8 -0% | 15.3 -91% |
| Idle Average * (Watt) | 9.5 | 14.5 -53% | 20.2 -113% | 20.1 -112% | 10.4 -9% | 18.2 -92% |
| Idle Maximum * (Watt) | 23.7 | 15.3 35% | 21.9 8% | 40 -69% | 30.5 -29% | 28 -18% |
| Load Average * (Watt) | 97.2 | 91.8 6% | 88.2 9% | 137 -41% | 75.4 22% | 137.9 -42% |
| Witcher 3 ultra * (Watt) | 144 | 104.7 27% | 149 -3% | 208 -44% | 134 7% | 189.4 -32% |
| Load Maximum * (Watt) | 197.2 | 164.5 17% | 170.6 13% | 285.9 -45% | 175 11% | 202 -2% |
* ... más pequeño es mejor
Power Consumption Witcher 3 / Stresstest
Power Consumption external Monitor
Duración de las pilas
Los tiempos de ejecución son significativamente más cortos que en la configuración potenciada con RTX 2000, más de la mitad, debido a la pantalla OLED más exigente y a la GPU más rápida. Solo pudimos registrar algo más de 4 horas de navegación real por WLAN incluso con el perfil de energía equilibrado.
| Lenovo ThinkPad P1 G6 21FV001KUS i7-13800H, GeForce RTX 4080 Laptop GPU, 90 Wh | Lenovo ThinkPad P1 G6-21FV000DGE i9-13900H, RTX 2000 Ada Generation Laptop, 90 Wh | Lenovo ThinkPad P1 G4-20Y4S0KS00 i7-11850H, GeForce RTX 3070 Laptop GPU, 90 Wh | Lenovo ThinkPad P16 G1 RTX A5500 i9-12950HX, RTX A5500 Laptop GPU, 94 Wh | Dell Precision 5000 5680 i9-13900H, RTX 5000 Ada Generation Laptop, 98 Wh | HP ZBook Fury 16 G10 i9-13950HX, RTX 5000 Ada Generation Laptop, 95 Wh | |
|---|---|---|---|---|---|---|
| Duración de Batería | 126% | 67% | 38% | 136% | 74% | |
| WiFi v1.3 (h) | 4.2 | 9.5 126% | 7 67% | 5.8 38% | 9.9 136% | 7.3 74% |
| H.264 (h) | 11.2 | 7.2 | ||||
| Load (h) | 1.1 | 1.2 | 1.7 | |||
| Reader / Idle (h) | 17.9 |
Pro
Contra
Veredicto - Mayor rendimiento a costa de la duración de la batería
El ThinkPad P1 G6 ofrece una amplia gama de niveles de configuración que incluyen IPS, OLED, Core i7, Core i9 y opciones de GPU GeForce RTX o RTX Ada. Basado en nuestro tiempo con dos configuraciones muy diferentes, las dos opciones de procesador (Core i7-13800H vs. Core i9-13900H) tienen diferencias mínimas entre ellos lo que significa que sería prudente ir con el Core i7 más barato y luego gastar los dólares adicionales en otros lugares.
En cuanto a la pantalla, es un cara o cruz entre 1600p IPS y 2400p OLED. La primera ofrece una frecuencia de actualización nativa más rápida y un brillo máximo mayor, mientras que la segunda ofrece pantalla táctil, colores DCI-P3, mínimo efecto fantasma y compatibilidad con HDR400. Es posible que futuros modelos incorporen paneles OLED de 120 Hz, cada vez más comunes en modelos como el Asus VivoBook.
El ThinkPad P1 G6 ofrece un alto rendimiento por volumen aunque a costa de la duración de la batería, ventiladores más ruidosos y actualizaciones limitadas en comparación con sus configuraciones inferiores.
Configurar opciones de GPU más rápidas como la RTX 5000 o nuestra RTX 4080 en lugar de la RTX 2000 conlleva algunas desventajas. Las actualizaciones de almacenamiento interno se vuelven más limitadas, el ruido del ventilador se hace más fuerte bajo carga y la duración de la batería recibe un golpe notable. También tenemos que mencionar los tartamudeos de la velocidad de fotogramas al transmitir vídeo y el techo relativamente bajo de 80 W TGP. Aun así, el ThinkPad P1 G6 es una de las estaciones de trabajo portátiles más rápidas de su tamaño y peso. Para algo razonablemente más rápido, tendría que considerar la más voluminosa Serie ThinkPad P16 en su lugar.
Precio y disponibilidad
Lenovo ya está distribuyendo el ThinkPad P1 G6 en múltiples configuraciones que comienzan en $1680 USD para la configuración base Core i7/RTX A1000/1200p IPS hasta $2700 y más si se configura con la RTX 4080.
Lenovo ThinkPad P1 G6 21FV001KUS
- 12/08/2023 v7 (old)
Allen Ngo
Transparencia
La selección de los dispositivos que se van a reseñar corre a cargo de nuestro equipo editorial. La muestra de prueba fue proporcionada al autor en calidad de préstamo por el fabricante o el minorista a los efectos de esta reseña. El prestamista no tuvo ninguna influencia en esta reseña, ni el fabricante recibió una copia de la misma antes de su publicación. No había ninguna obligación de publicar esta reseña. Como empresa de medios independiente, Notebookcheck no está sujeta a la autoridad de fabricantes, minoristas o editores.
Así es como prueba Notebookcheck
Cada año, Notebookcheck revisa de forma independiente cientos de portátiles y smartphones utilizando procedimientos estandarizados para asegurar que todos los resultados son comparables. Hemos desarrollado continuamente nuestros métodos de prueba durante unos 20 años y hemos establecido los estándares de la industria en el proceso. En nuestros laboratorios de pruebas, técnicos y editores experimentados utilizan equipos de medición de alta calidad. Estas pruebas implican un proceso de validación en varias fases. Nuestro complejo sistema de clasificación se basa en cientos de mediciones y puntos de referencia bien fundamentados, lo que mantiene la objetividad.Price comparison

