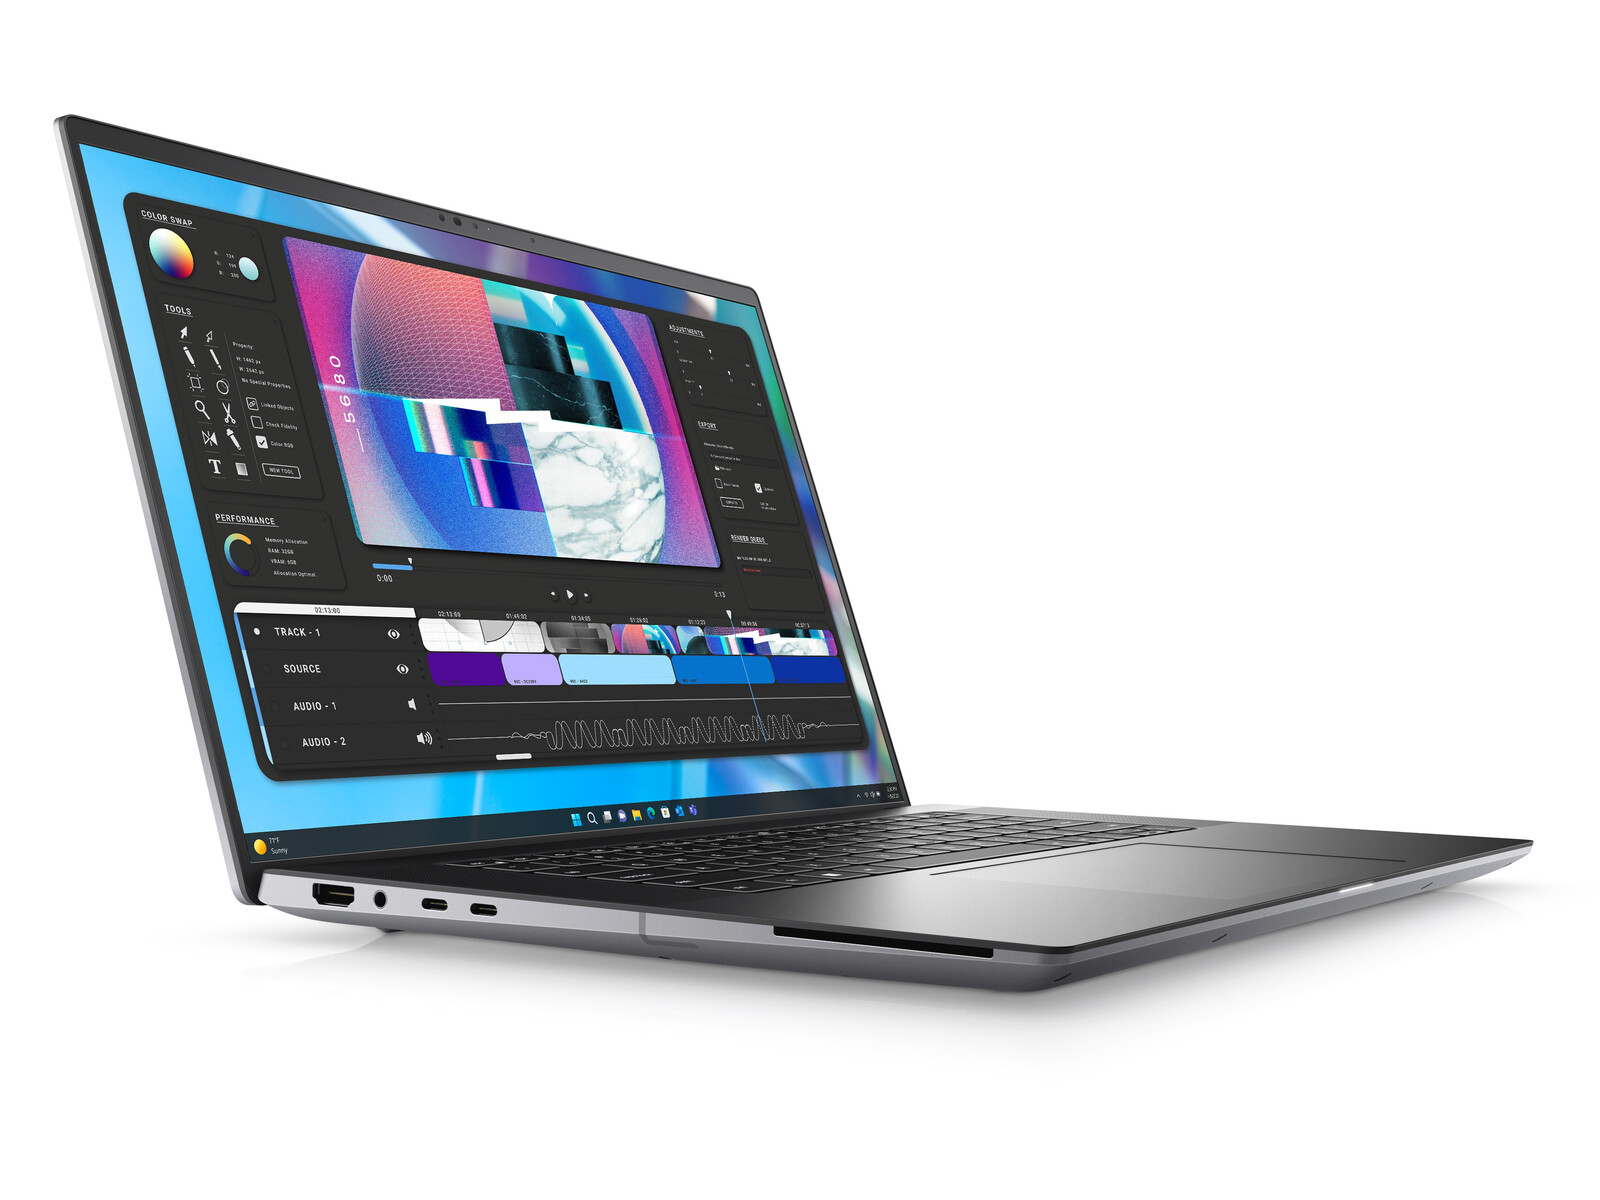
Análisis de Dell Precision 5680: Ada Lovelace domina las estaciones de trabajo

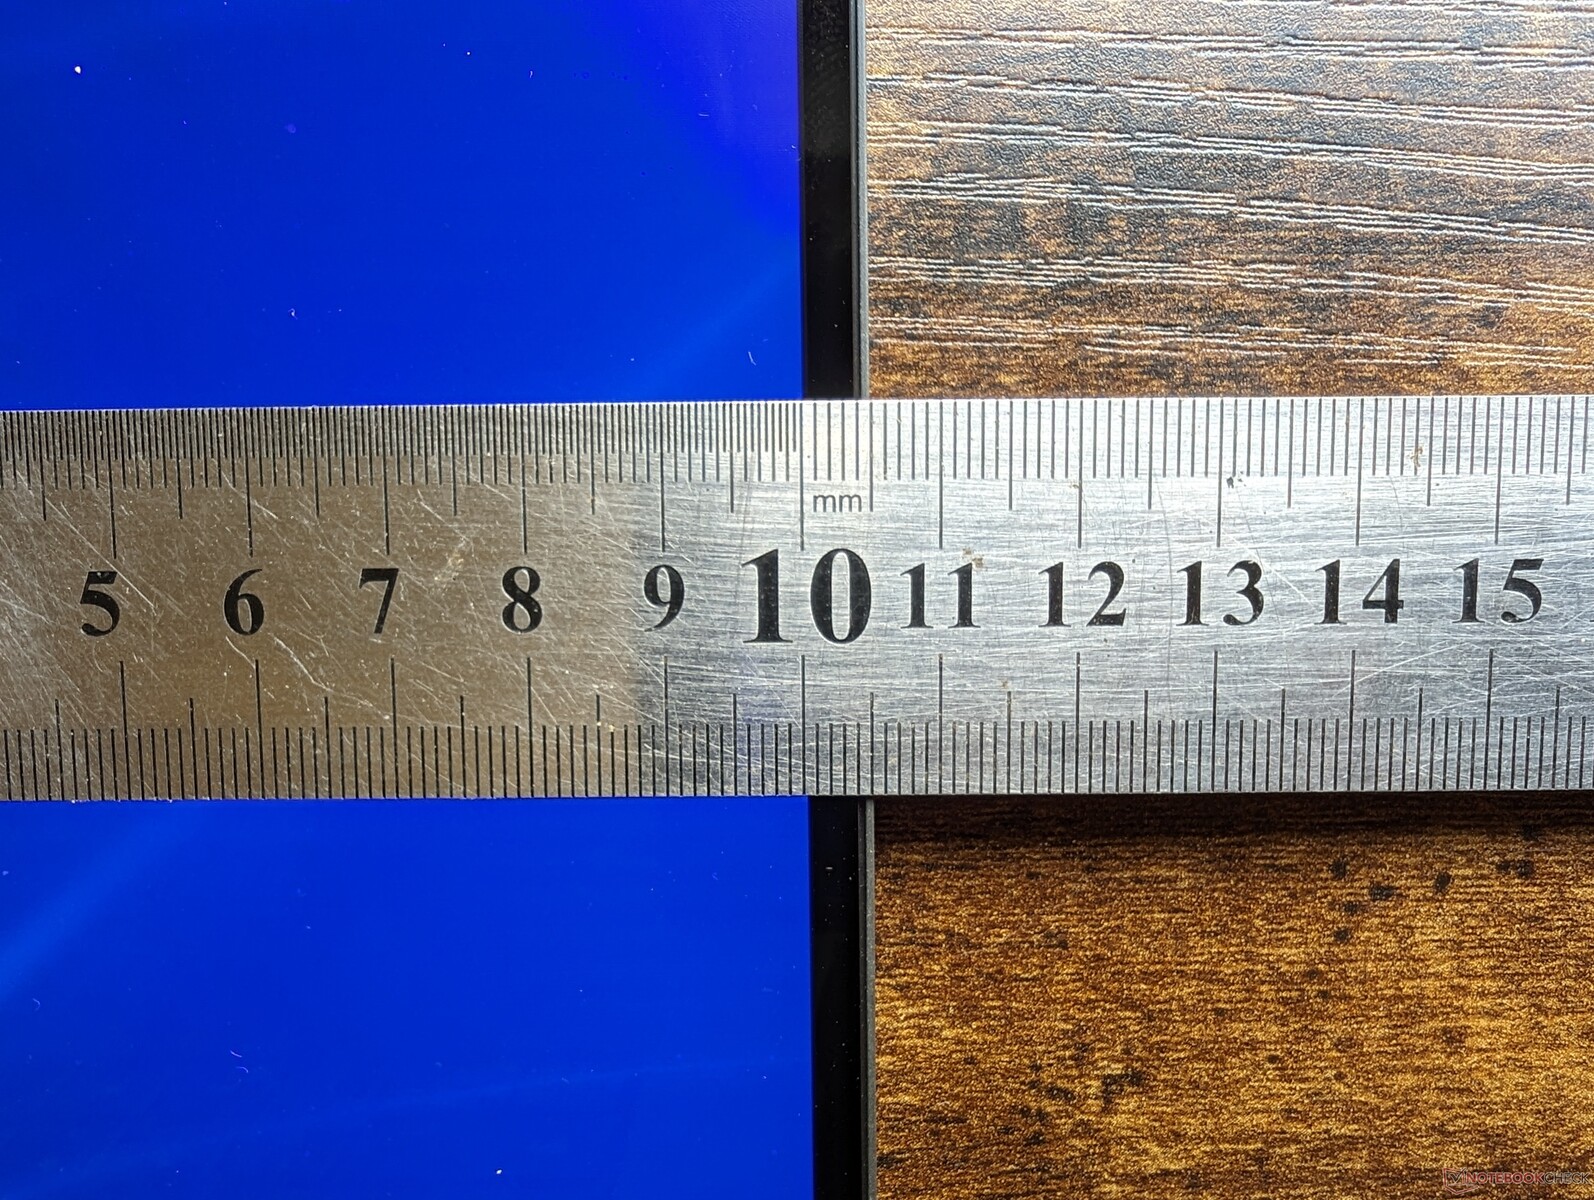
El Precision 5680 es el primer modelo de 16 pulgadas de la serie Precision 5000 que complementa al existente de 14 pulgadas Precision 5470y 15 pulgadas Precision 5560y 17 pulgadas Precision 5750. Es una estación de trabajo móvil de gama alta más delgada y ligera que un modelo Precision modelo 7000 aunque con menos funciones auxiliares integradas.
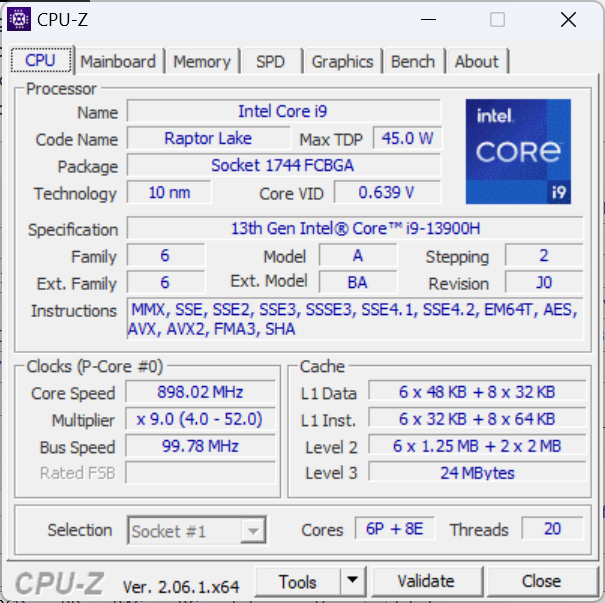
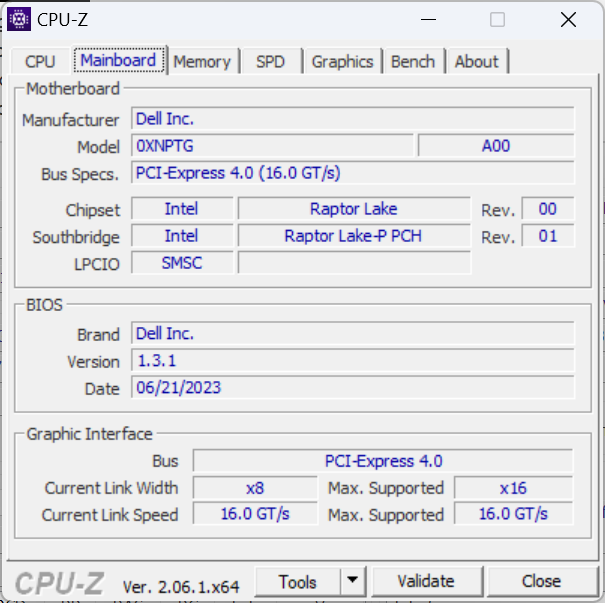
Nuestra unidad de prueba es una configuración de gama alta con la CPU Raptor Lake-H Core i9-13900H de 13ª generación, GPU Nvidia RTX 5000 de 75 W y pantalla táctil OLED de 2400p por unos 6500 dólares. Hay SKU inferiores con el Core i5-13600H, sin GPU discreta y pantalla IPS de 1200p por un precio inicial más bajo de unos 2490 $.
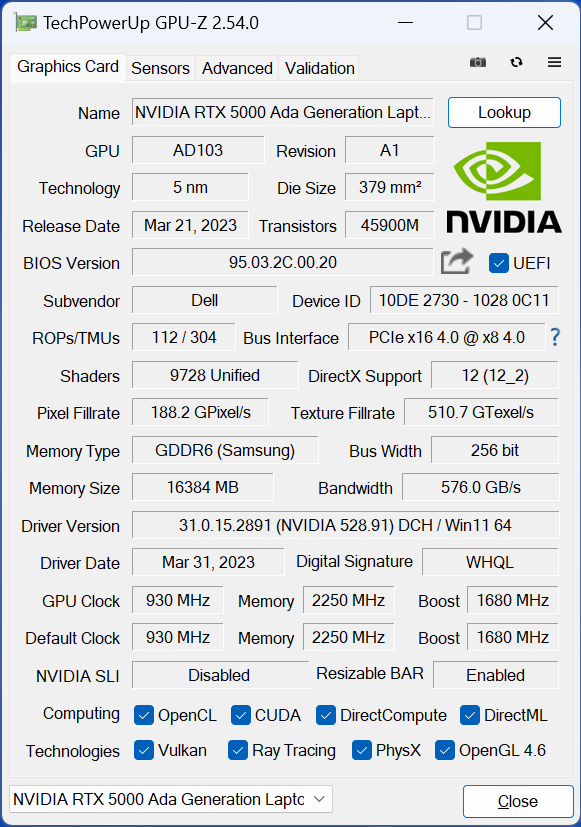
Esta también es una de las primeras estaciones de trabajo en incluir la GPU móvil RTX 5000 Ada Lovelace, que no debe confundirse con la GPU basada en Turing Quadro RTX 5000 o la basada en Ampere RTX A5000.
Los competidores en este espacio incluyen otras estaciones de trabajo de 16 pulgadas como elHP ZBook Fury 16 G9,Lenovo ThinkPad P16 G1,MSI CreatorPro Z16Po el Asus ProArt StudioBook serie 16.
Más opiniones sobre Dell:
Posibles contendientes en la comparación
Valoración | Fecha | Modelo | Peso | Altura | Tamaño | Resolución | Precio |
|---|---|---|---|---|---|---|---|
| 89 % v7 (old) | 08/2023 | Dell Precision 5000 5680 i9-13900H, RTX 5000 Ada Generation Laptop | 2.3 kg | 22.17 mm | 16.00" | 3840x2400 | |
| 89.1 % v7 (old) | 12/2022 | Dell Precision 7000 7670 Performance i9-12950HX, RTX A5500 Laptop GPU | 2.8 kg | 25.95 mm | 16.00" | 3840x2400 | |
| 91 % v7 (old) | 06/2023 | HP ZBook Fury 16 G9 i9-12950HX, RTX A5500 Laptop GPU | 2.6 kg | 28.5 mm | 16.00" | 3840x2400 | |
| 91 % v7 (old) | 02/2023 | Lenovo ThinkPad P16 G1 RTX A5500 i9-12950HX, RTX A5500 Laptop GPU | 3 kg | 30.23 mm | 16.00" | 3840x2400 | |
| 84.3 % v7 (old) | 11/2022 | MSI CreatorPro Z16P B12UKST i7-12700H, RTX A3000 Laptop GPU | 2.4 kg | 19 mm | 16.00" | 2560x1600 | |
| 89.6 % v7 (old) | 01/2023 | Asus ExpertBook B6 Flip B6602FC2 i9-12950HX, RTX A2000 Laptop GPU | 2.8 kg | 27.2 mm | 16.00" | 2560x1600 |
Funda - XPS Roots
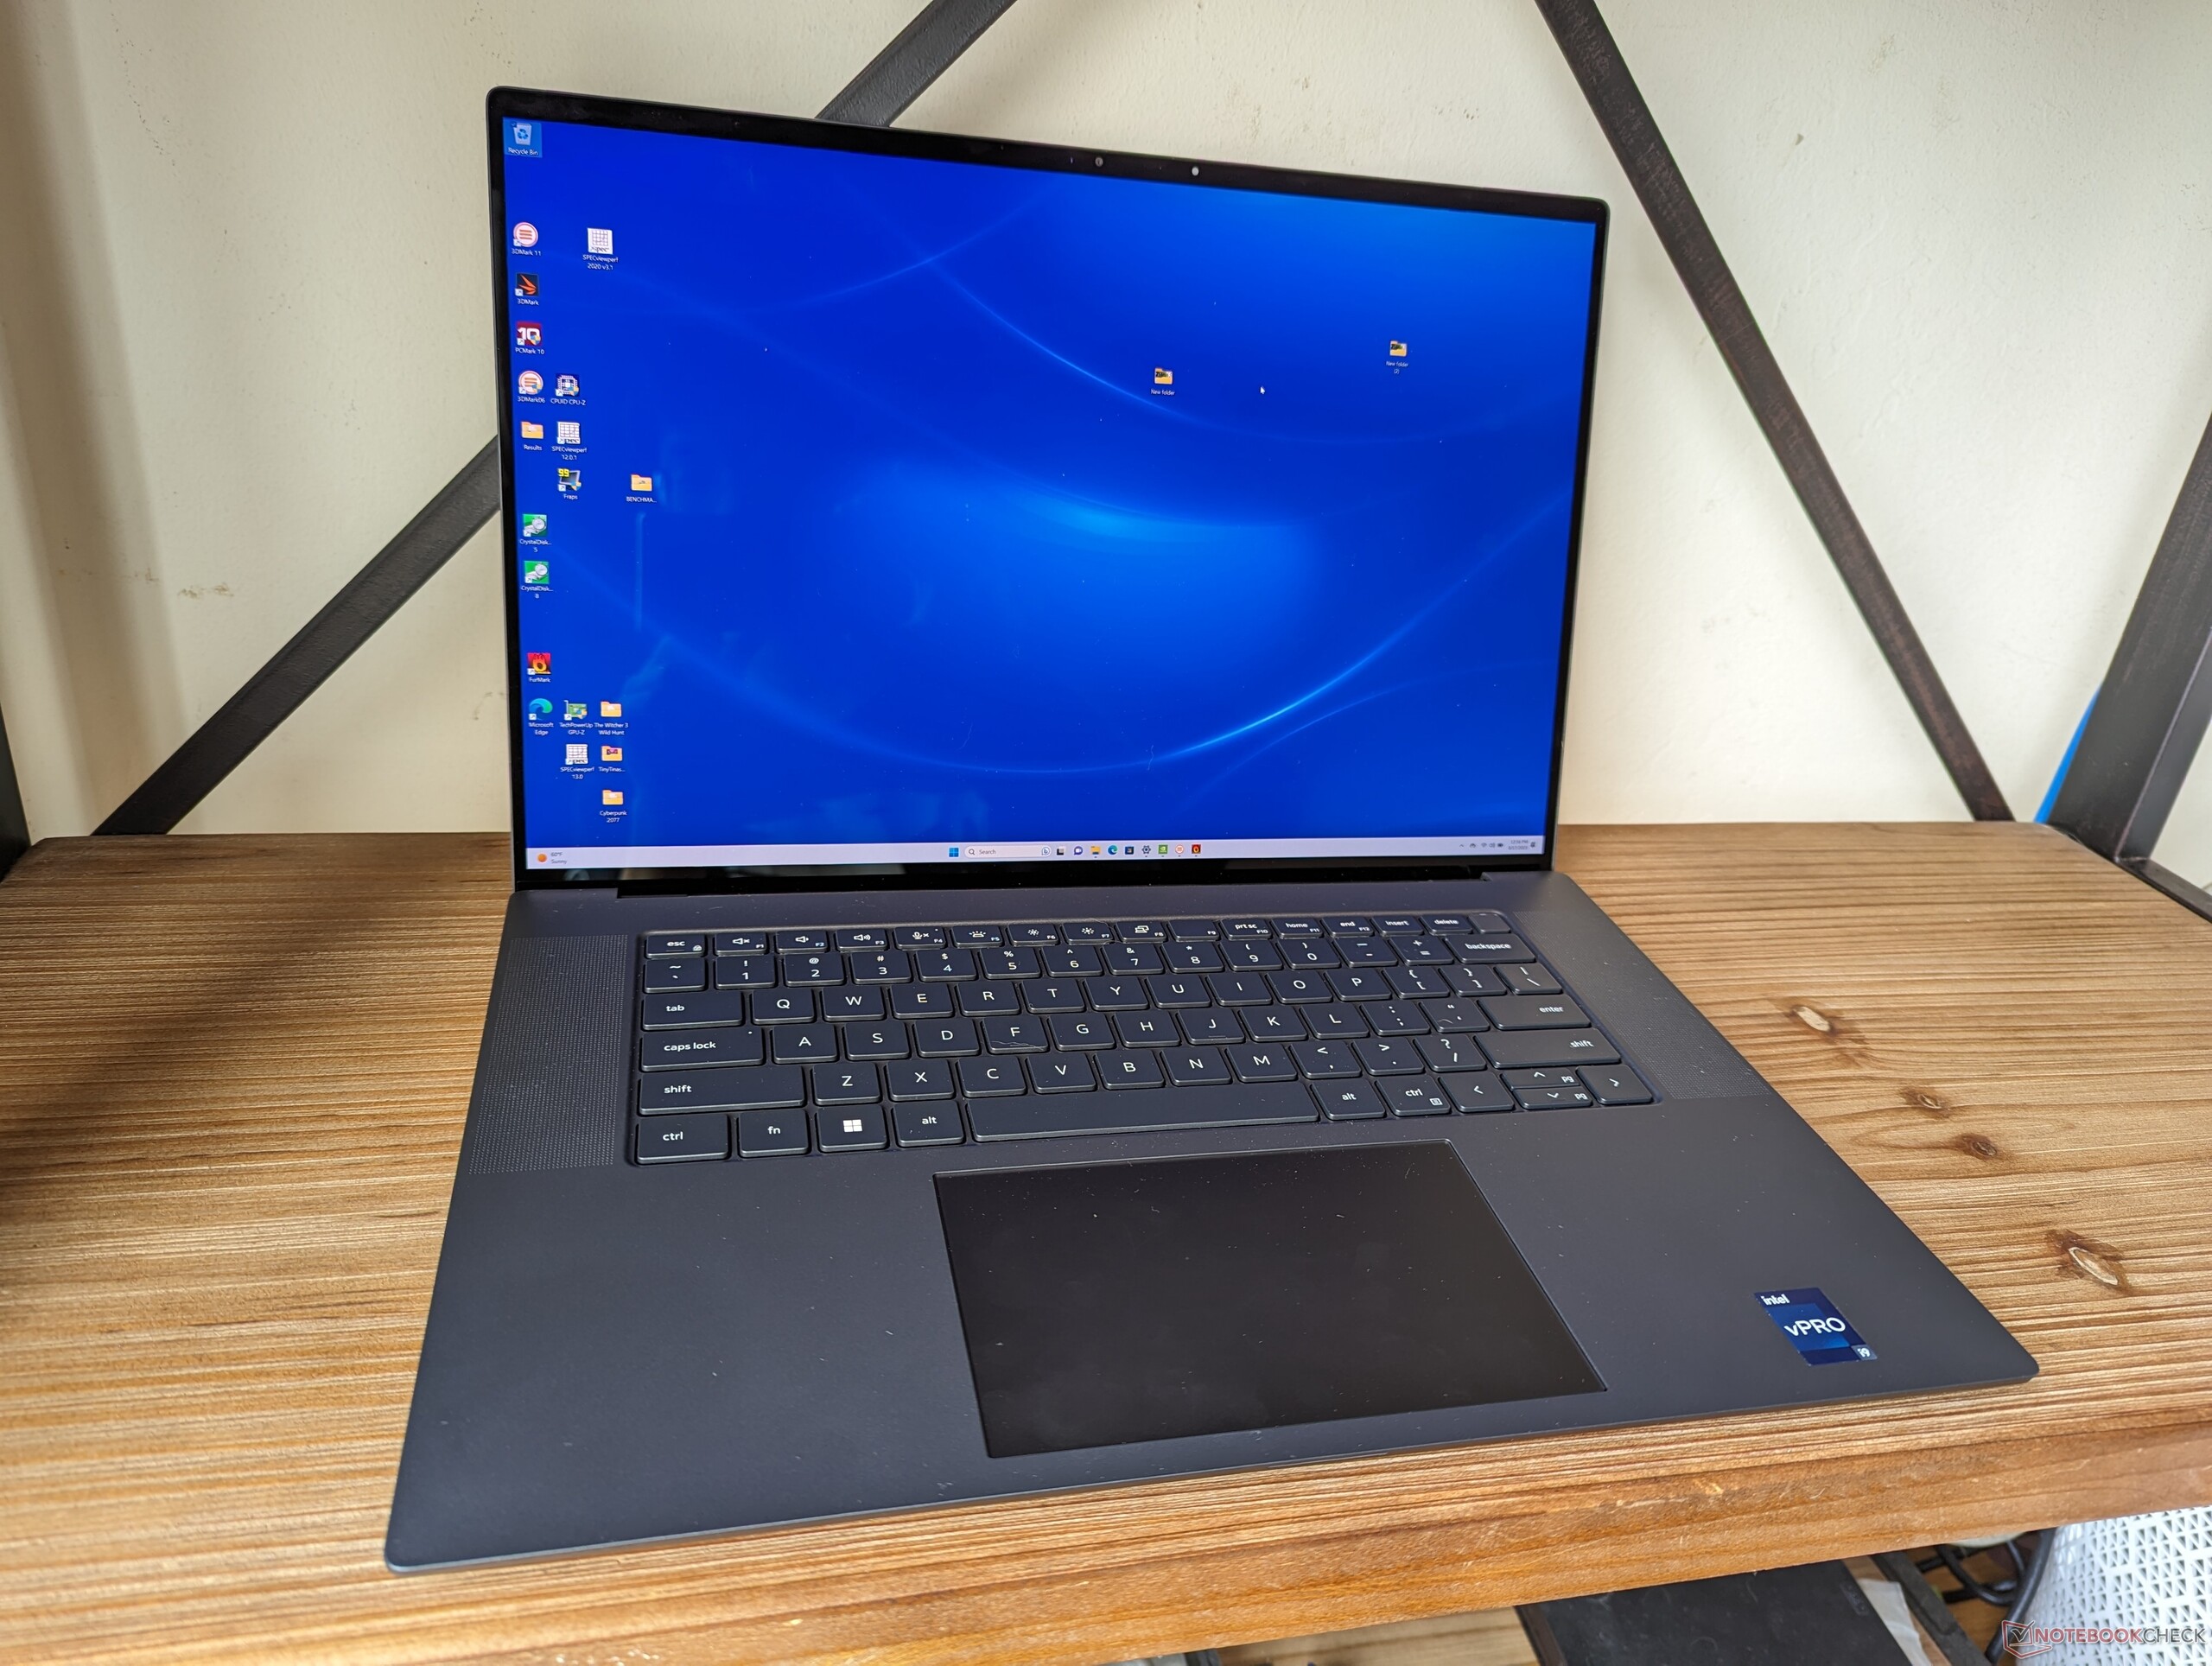
La inspiración para el diseño de Precision 5680 es obvia, ya que es esencialmente la versión de 16 pulgadas del XPS 15 y de 17 pulgadas XPS 17. Si ya has tenido experiencia con un modelo XPS, entonces el Precision 5680 debería resultarte familiar al instante. Parece preceder a un hipotético "XPS 16" y no nos sorprendería ver un modelo de este tipo en un futuro próximo con un chasis basado en el Precision 5680.
La calidad de construcción se compara favorablemente con alternativas como el ZBook Fury 16 G9 o elCreatorPro Z16P que también se componen principalmente de aleaciones de metal para una primera impresión fuerte.
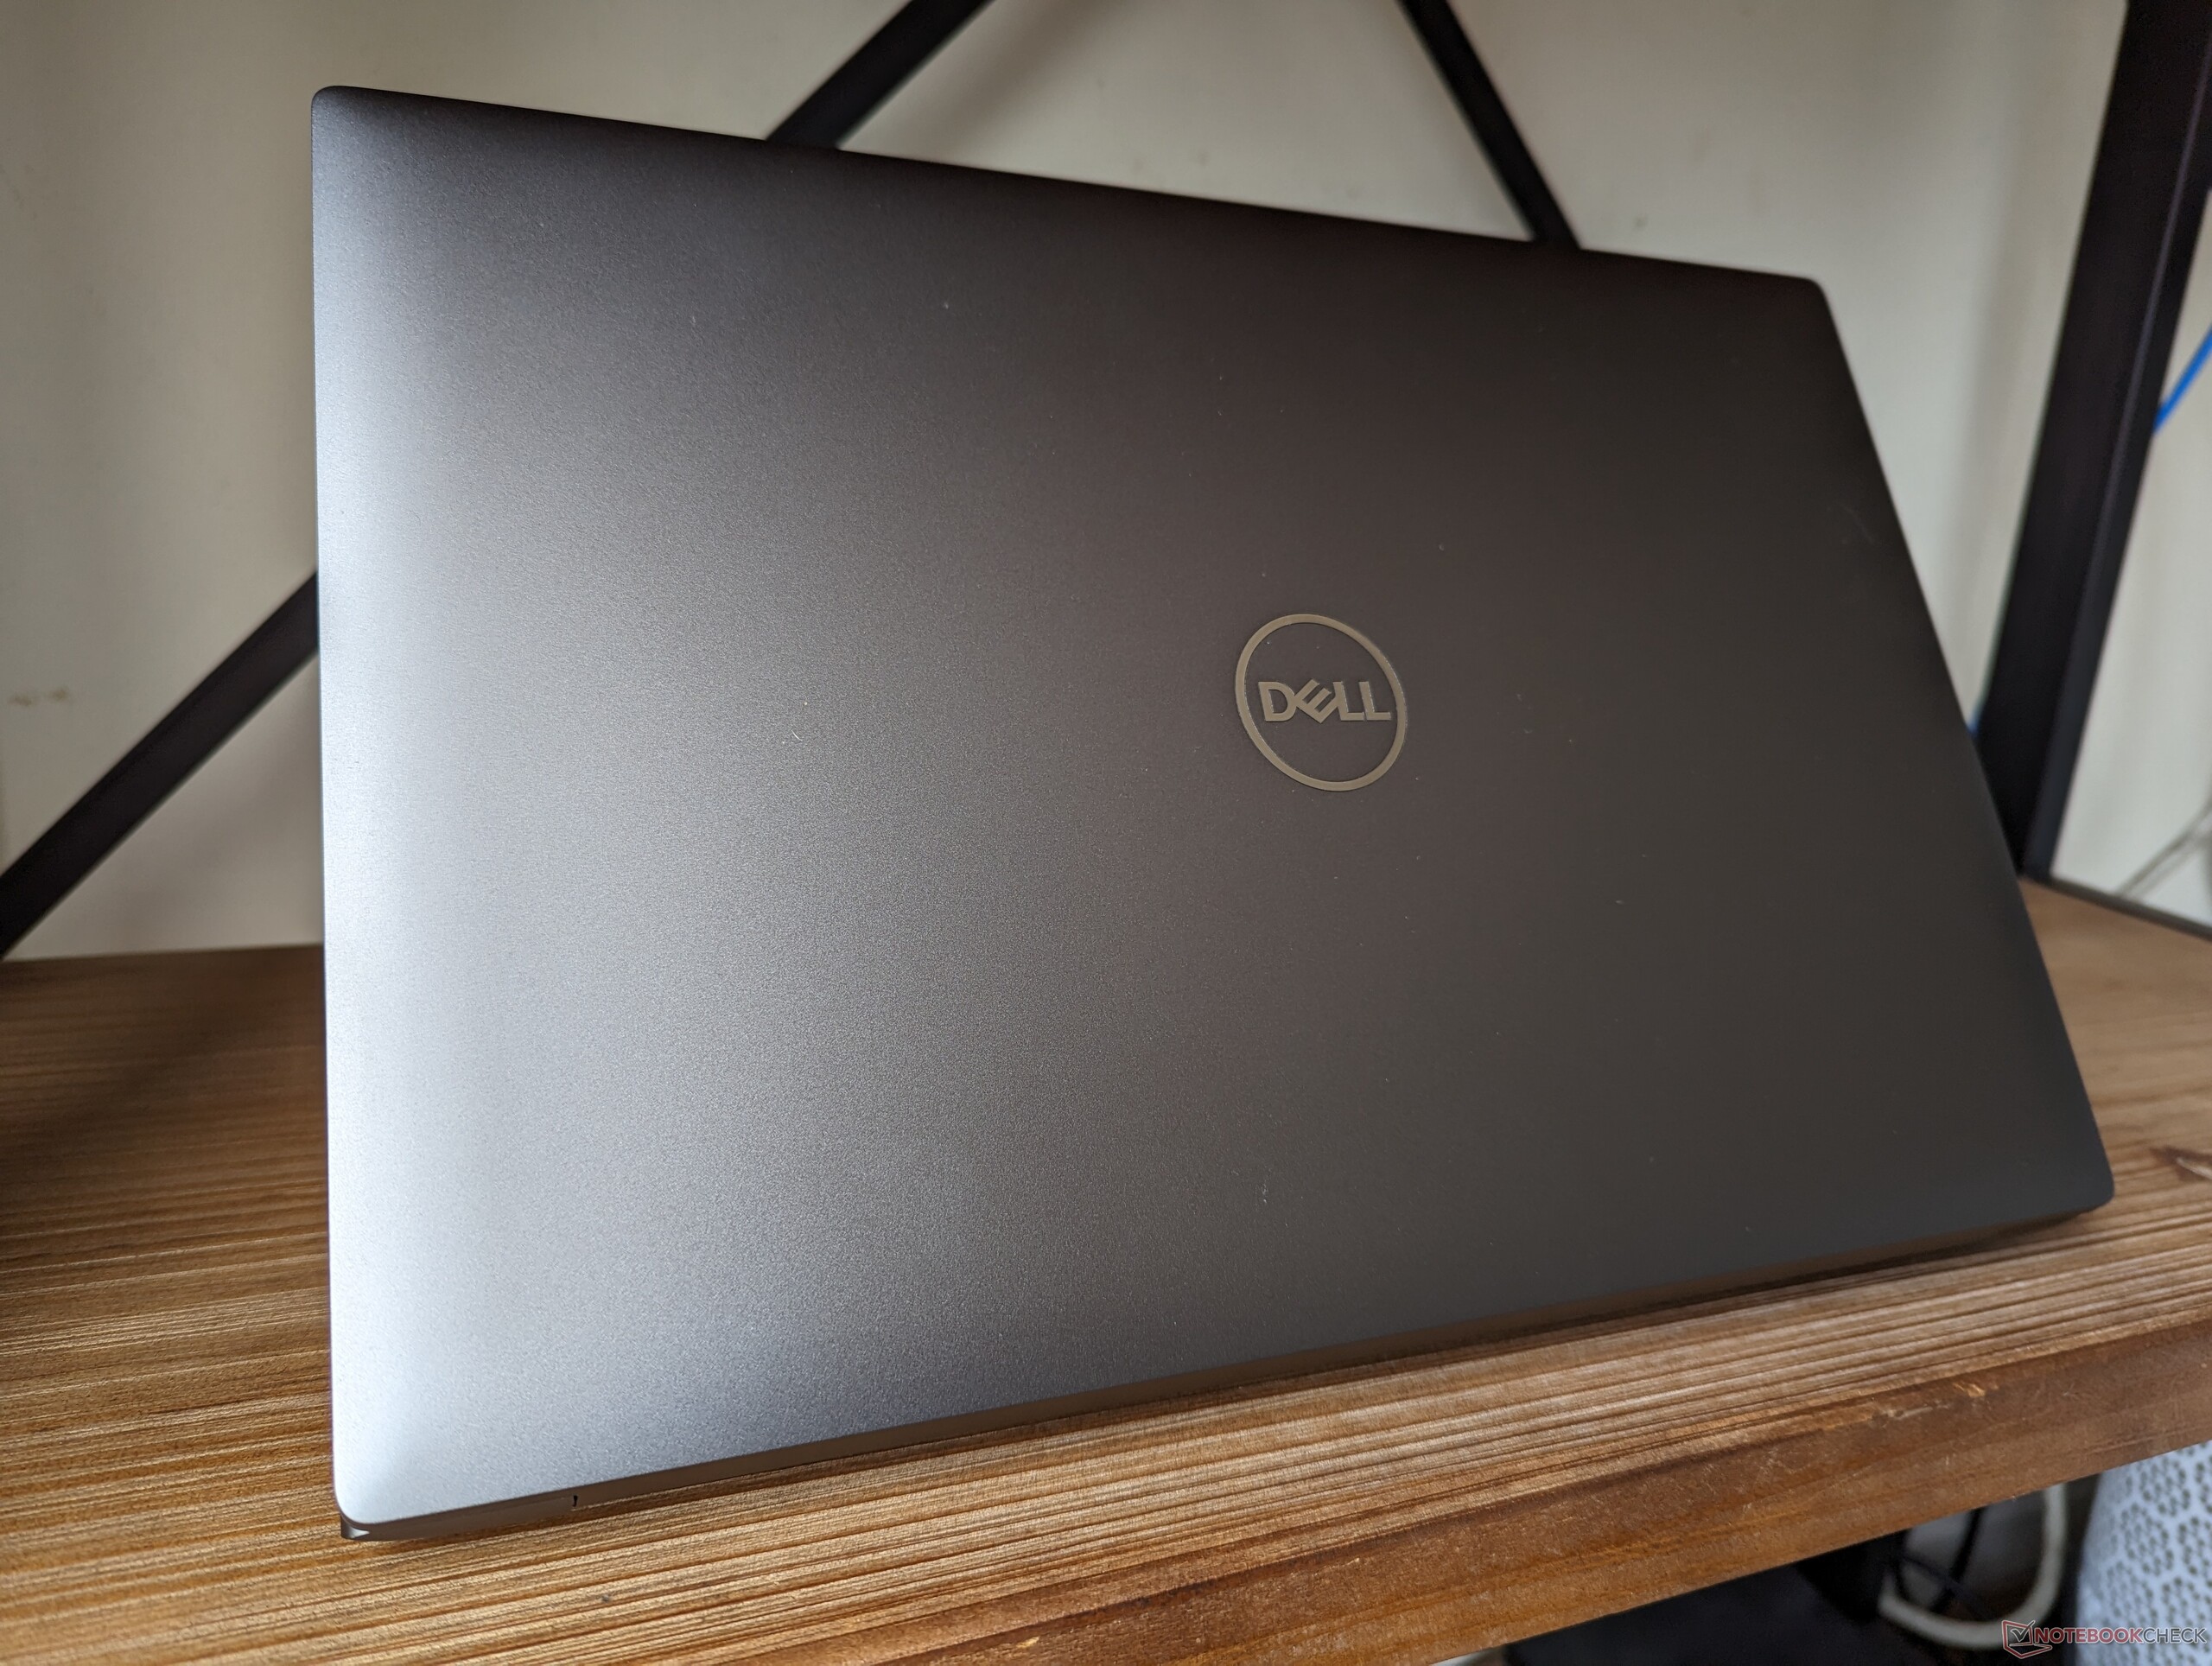
Con sólo 2,3 kg, Precision 5680 es una de las estaciones de trabajo de 16 pulgadas más ligeras del mercado. La CreatorPro Z16P y laHP ZBook Fury 16 G9por ejemplo, pesan unos 100 g y 300 g más, respectivamente, y ocupan más espacio que nuestro Dell. El Precision 5680 es sorprendentemente portátil teniendo en cuenta su rendimiento.
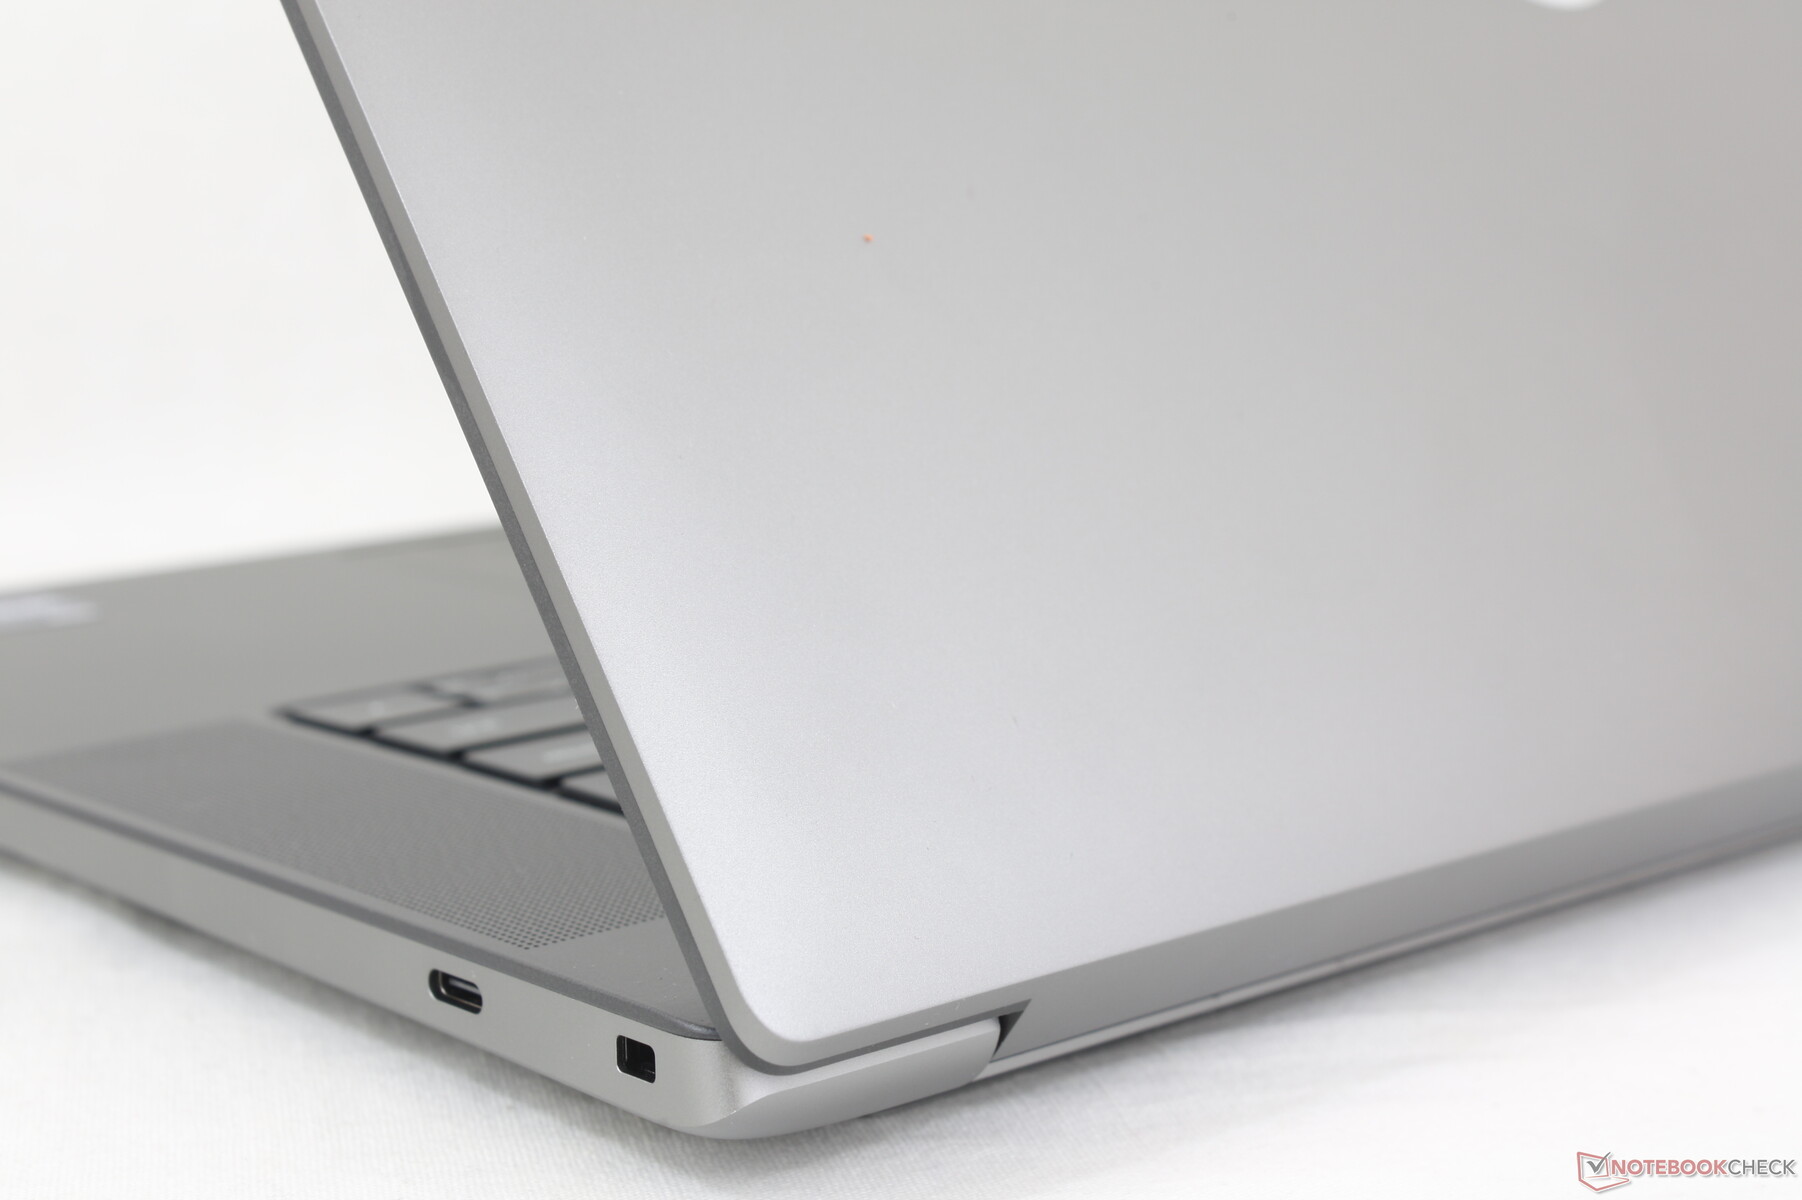
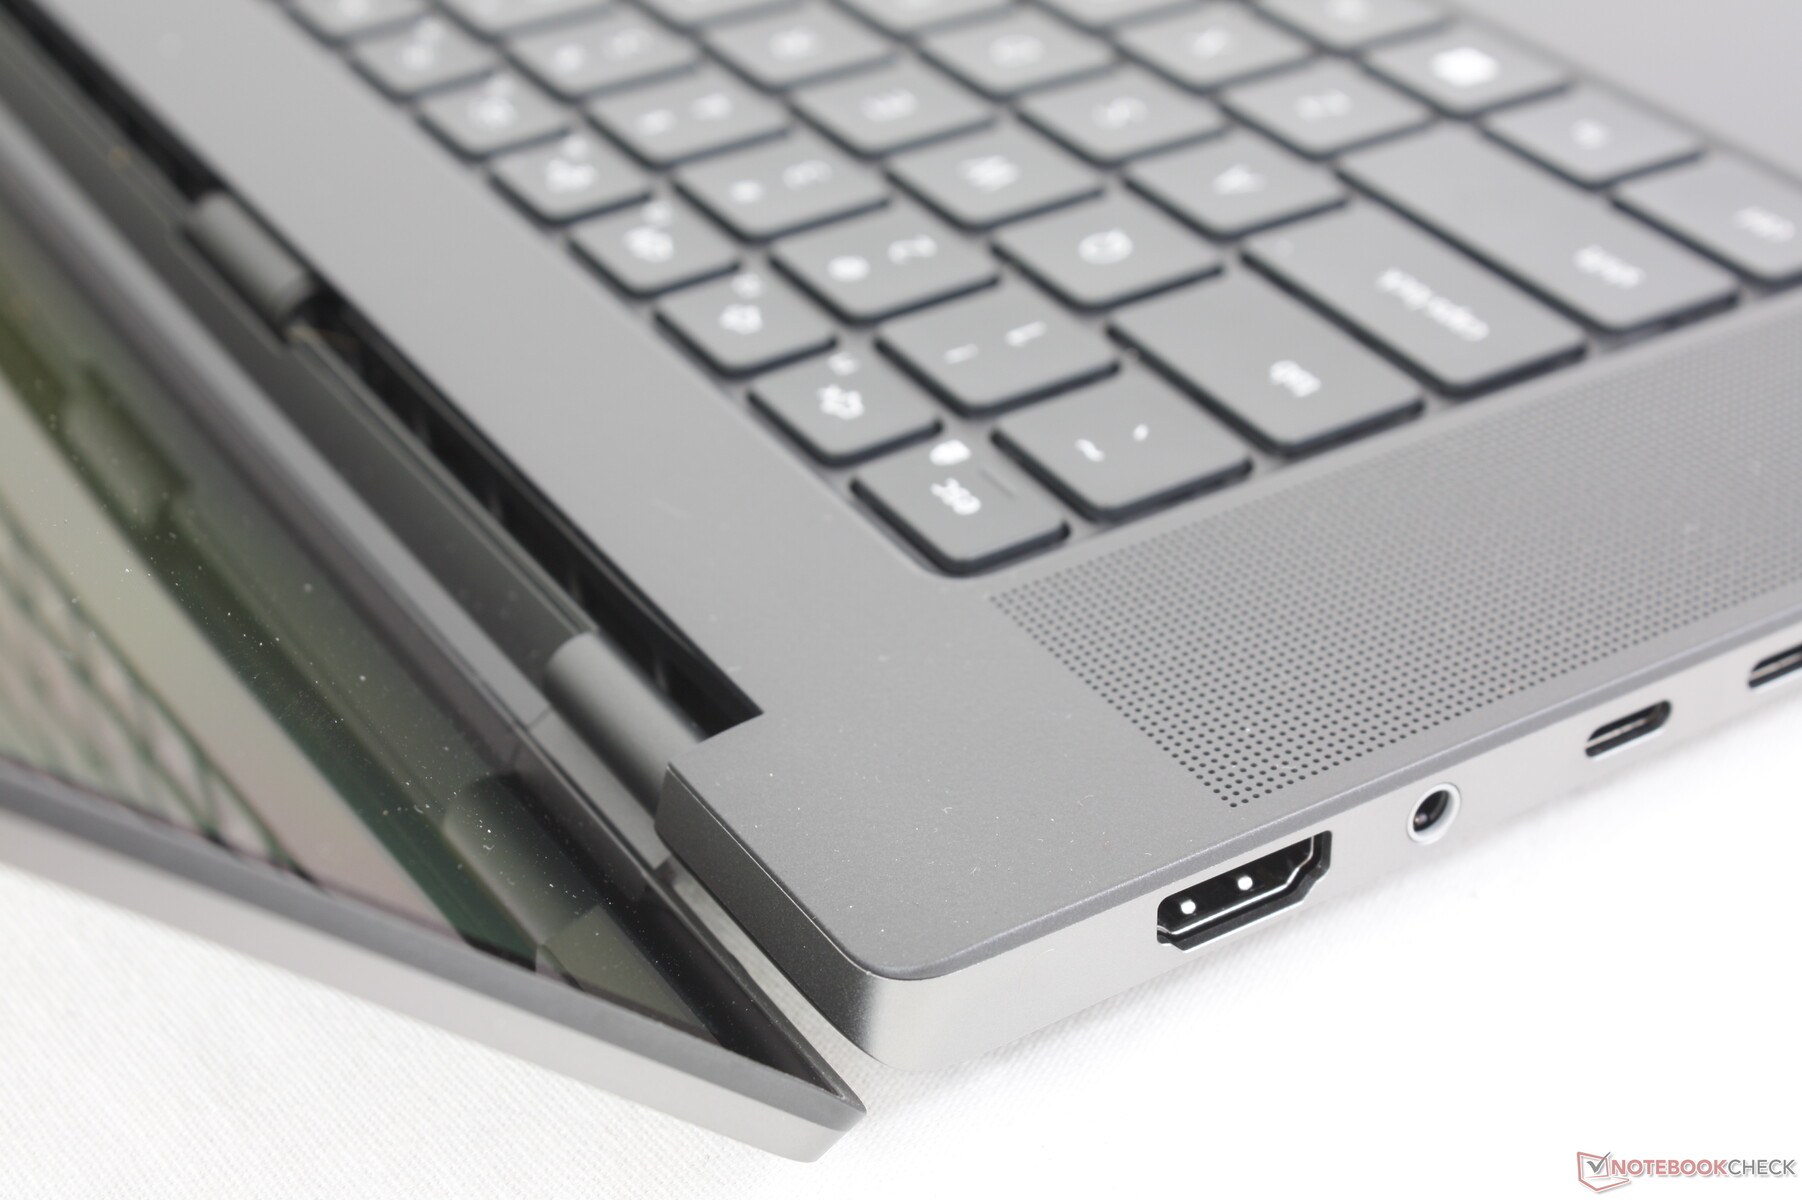
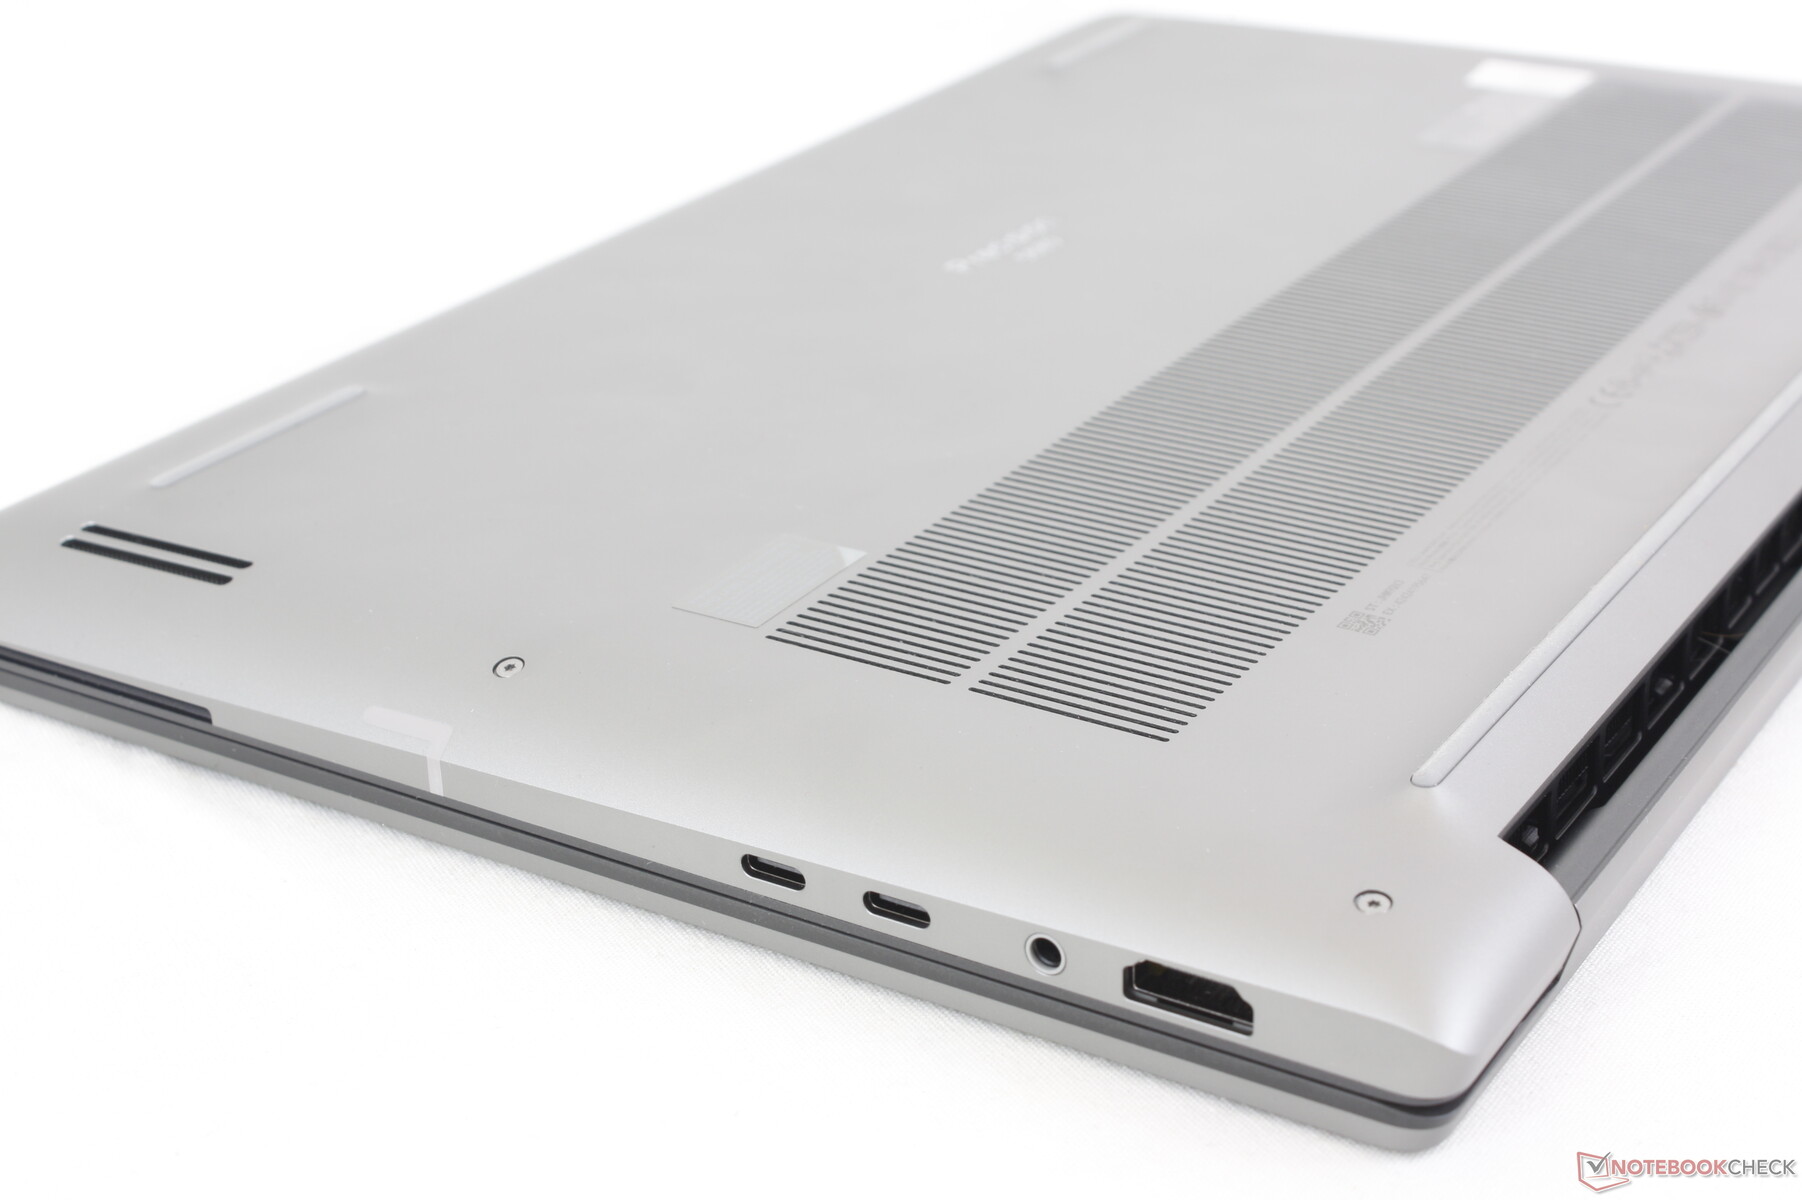
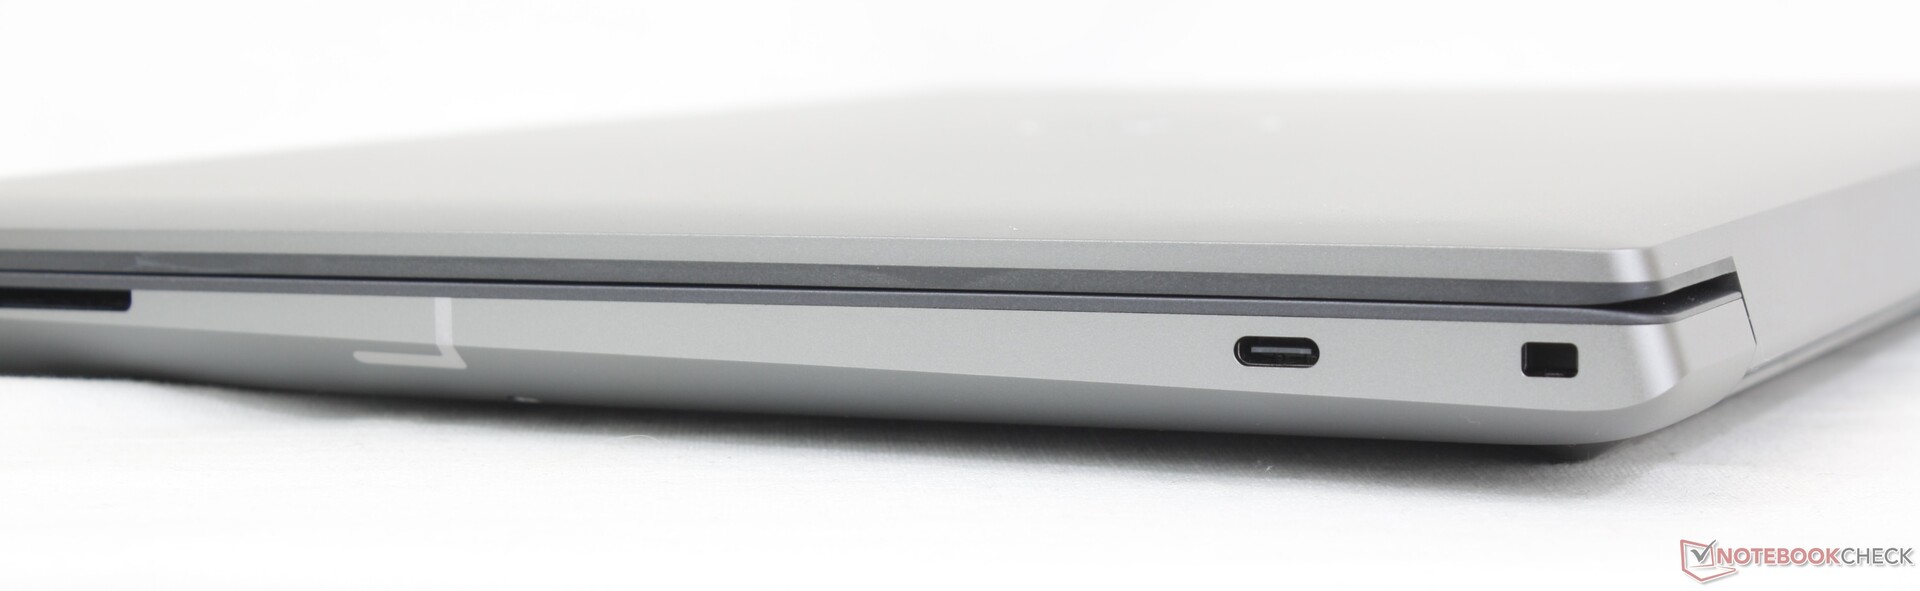
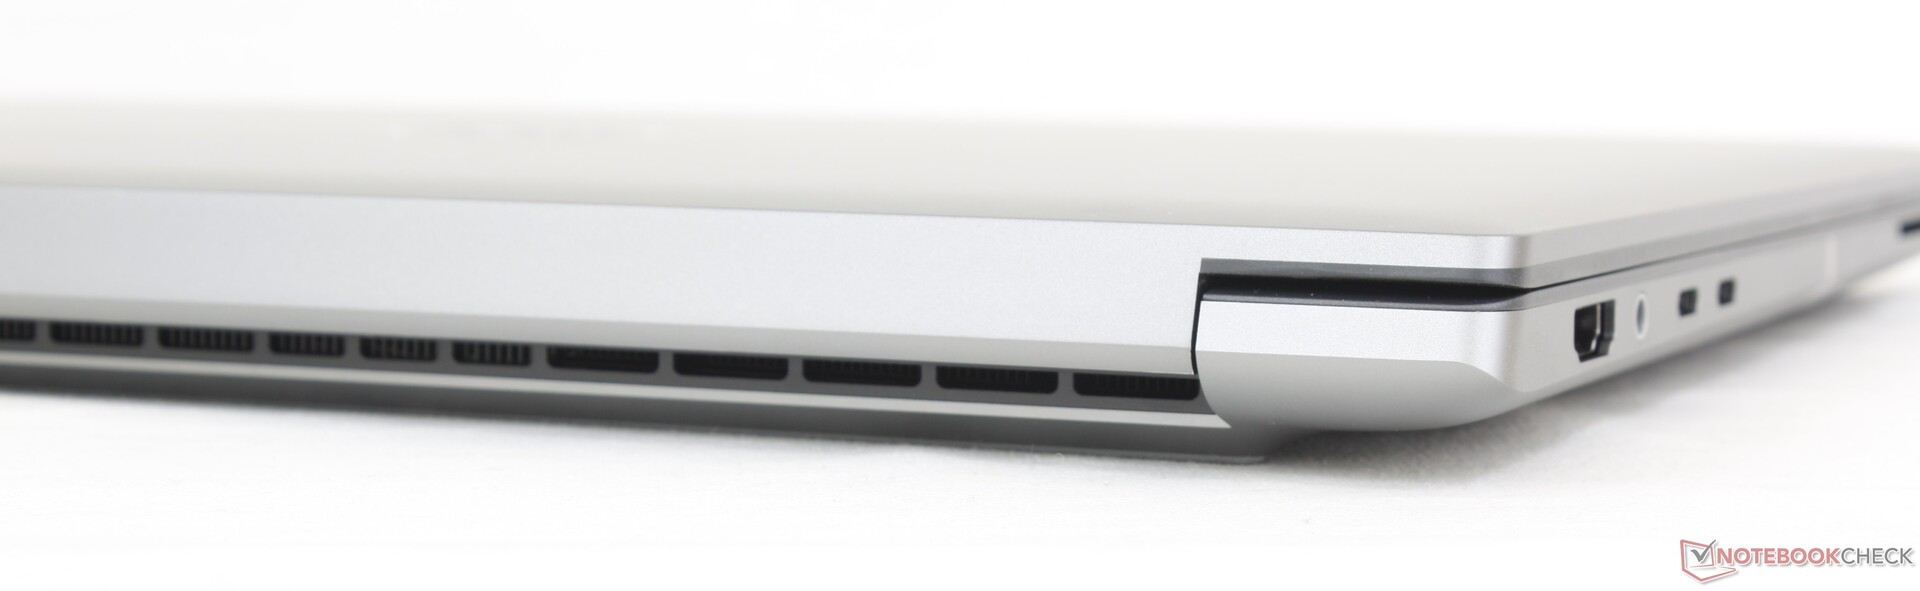
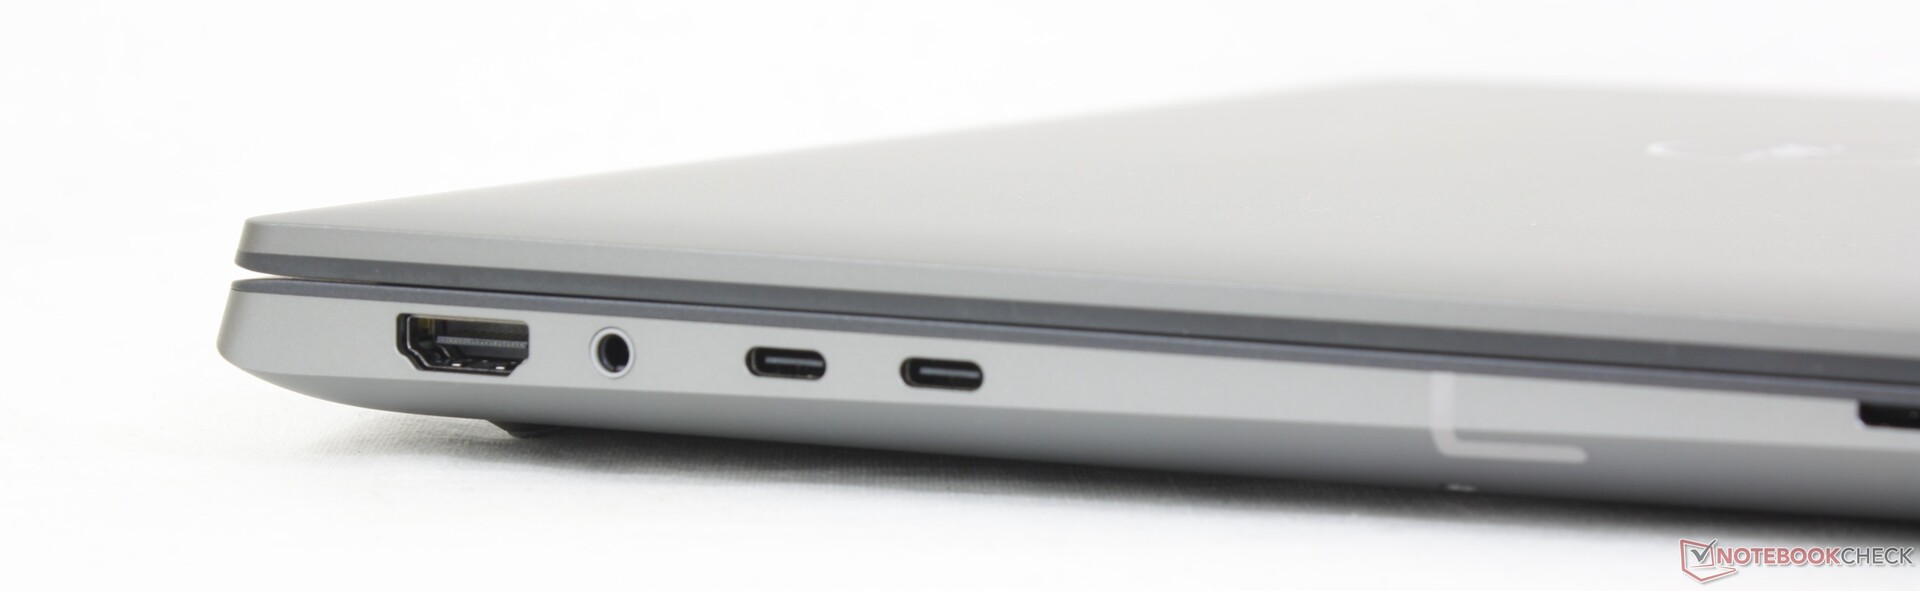
Conectividad: poca para una estación de trabajo
Las opciones de puertos están pensadas para el futuro, para bien o para mal. Es mejor en el sentido de que cada puerto es muy versátil cuando se trata de adaptadores y periféricos, pero también es peor en el sentido de que no hay puertos básicos como USB de tamaño completo o RJ-45. Alternativas como el ThinkPad P1 G4 o el ExpertBook B6 Flip ofrecen una mayor variedad de puertos que nuestro Dell. Prepárate para depender de adaptadores o estaciones de acoplamiento cuando uses el Precision 5680 como resultado.
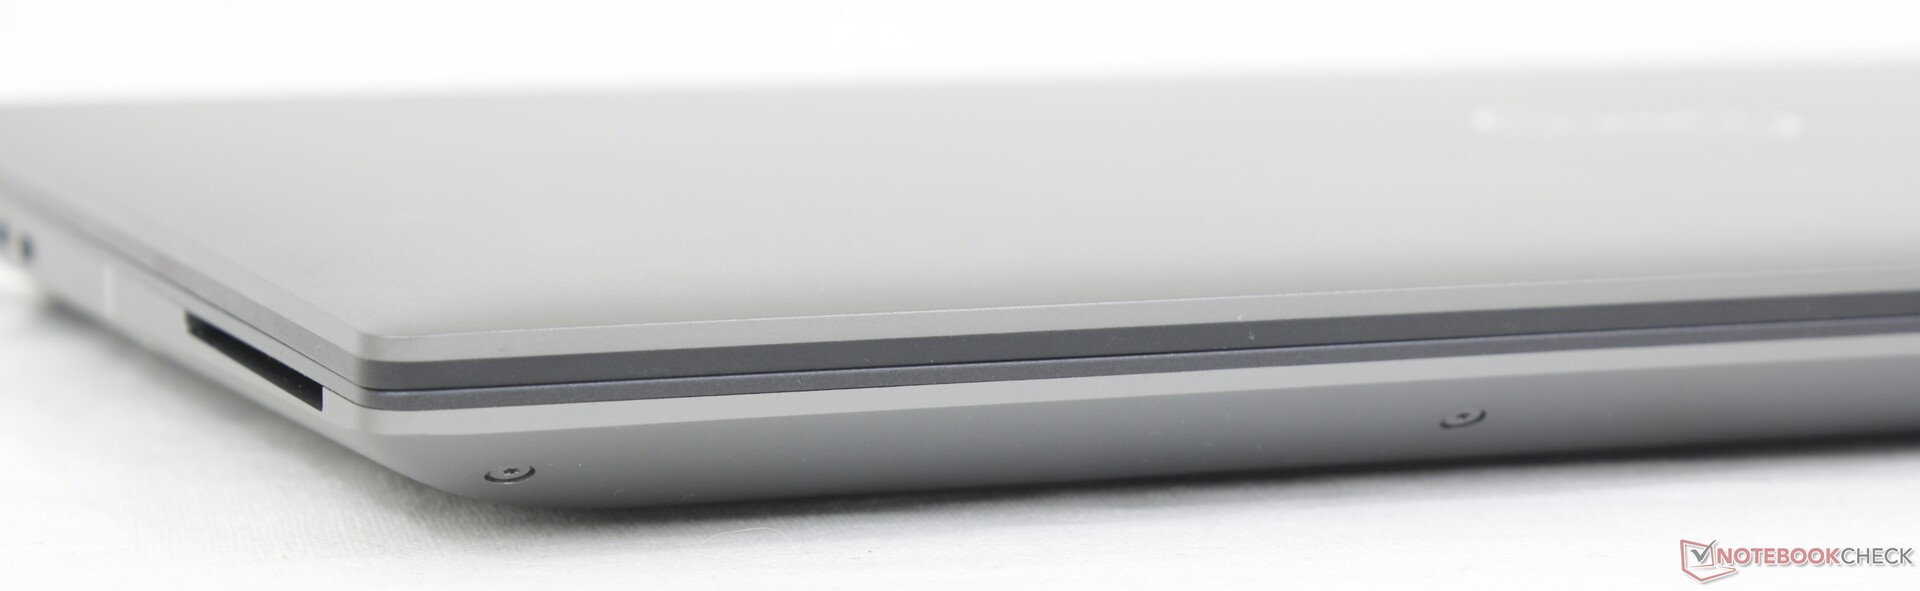
Lector de tarjetas SD
Los modelos XPS y Precision tienen algunos de los lectores de tarjetas SD integrados más rápidos y esto sigue siendo cierto en nuestro Precision 5680. Las velocidades de lectura son más del doble de rápidas que en el ZBook Fury 16 G9 o el ThinkPad P16 G1, por lo que sólo se tardan entre 5 y 6 segundos en transferir 1 GB de datos desde nuestra tarjeta de prueba UHS-II al sobremesa.
| SD Card Reader | |
| average JPG Copy Test (av. of 3 runs) | |
| Dell Precision 5000 5680 (Toshiba Exceria Pro SDXC 64 GB UHS-II) | |
| Dell Precision 7000 7670 Performance (Toshiba Exceria Pro SDXC 64 GB UHS-II) | |
| MSI CreatorPro Z16P B12UKST (AV Pro V60) | |
| HP ZBook Fury 16 G9 (PNY EliteX-PRO60) | |
| Lenovo ThinkPad P16 G1 RTX A5500 (Toshiba Exceria Pro SDXC 64 GB UHS-II) | |
| maximum AS SSD Seq Read Test (1GB) | |
| Dell Precision 7000 7670 Performance (Toshiba Exceria Pro SDXC 64 GB UHS-II) | |
| Dell Precision 5000 5680 (Toshiba Exceria Pro SDXC 64 GB UHS-II) | |
| HP ZBook Fury 16 G9 (PNY EliteX-PRO60) | |
| MSI CreatorPro Z16P B12UKST (AV Pro V60) | |
| Lenovo ThinkPad P16 G1 RTX A5500 (Toshiba Exceria Pro SDXC 64 GB UHS-II) | |
Comunicación
Un Intel AX211 viene de serie para la conectividad Wi-Fi 6E y Bluetooth 5.3. Las tasas de transferencia fueron estables cuando se emparejó a nuestra red Asus AXE11000 6GHz.
Las opciones WAN por desgracia no están soportadas como en el ZBook Fury 16 G9 de la competencia.
Cámara web
Dell ha aumentado la webcam de 1 MP en el Precision 5550 a 2 MP en nuestro Precision 5680. Aún así, sigue sin tener un obturador de privacidad integrado.


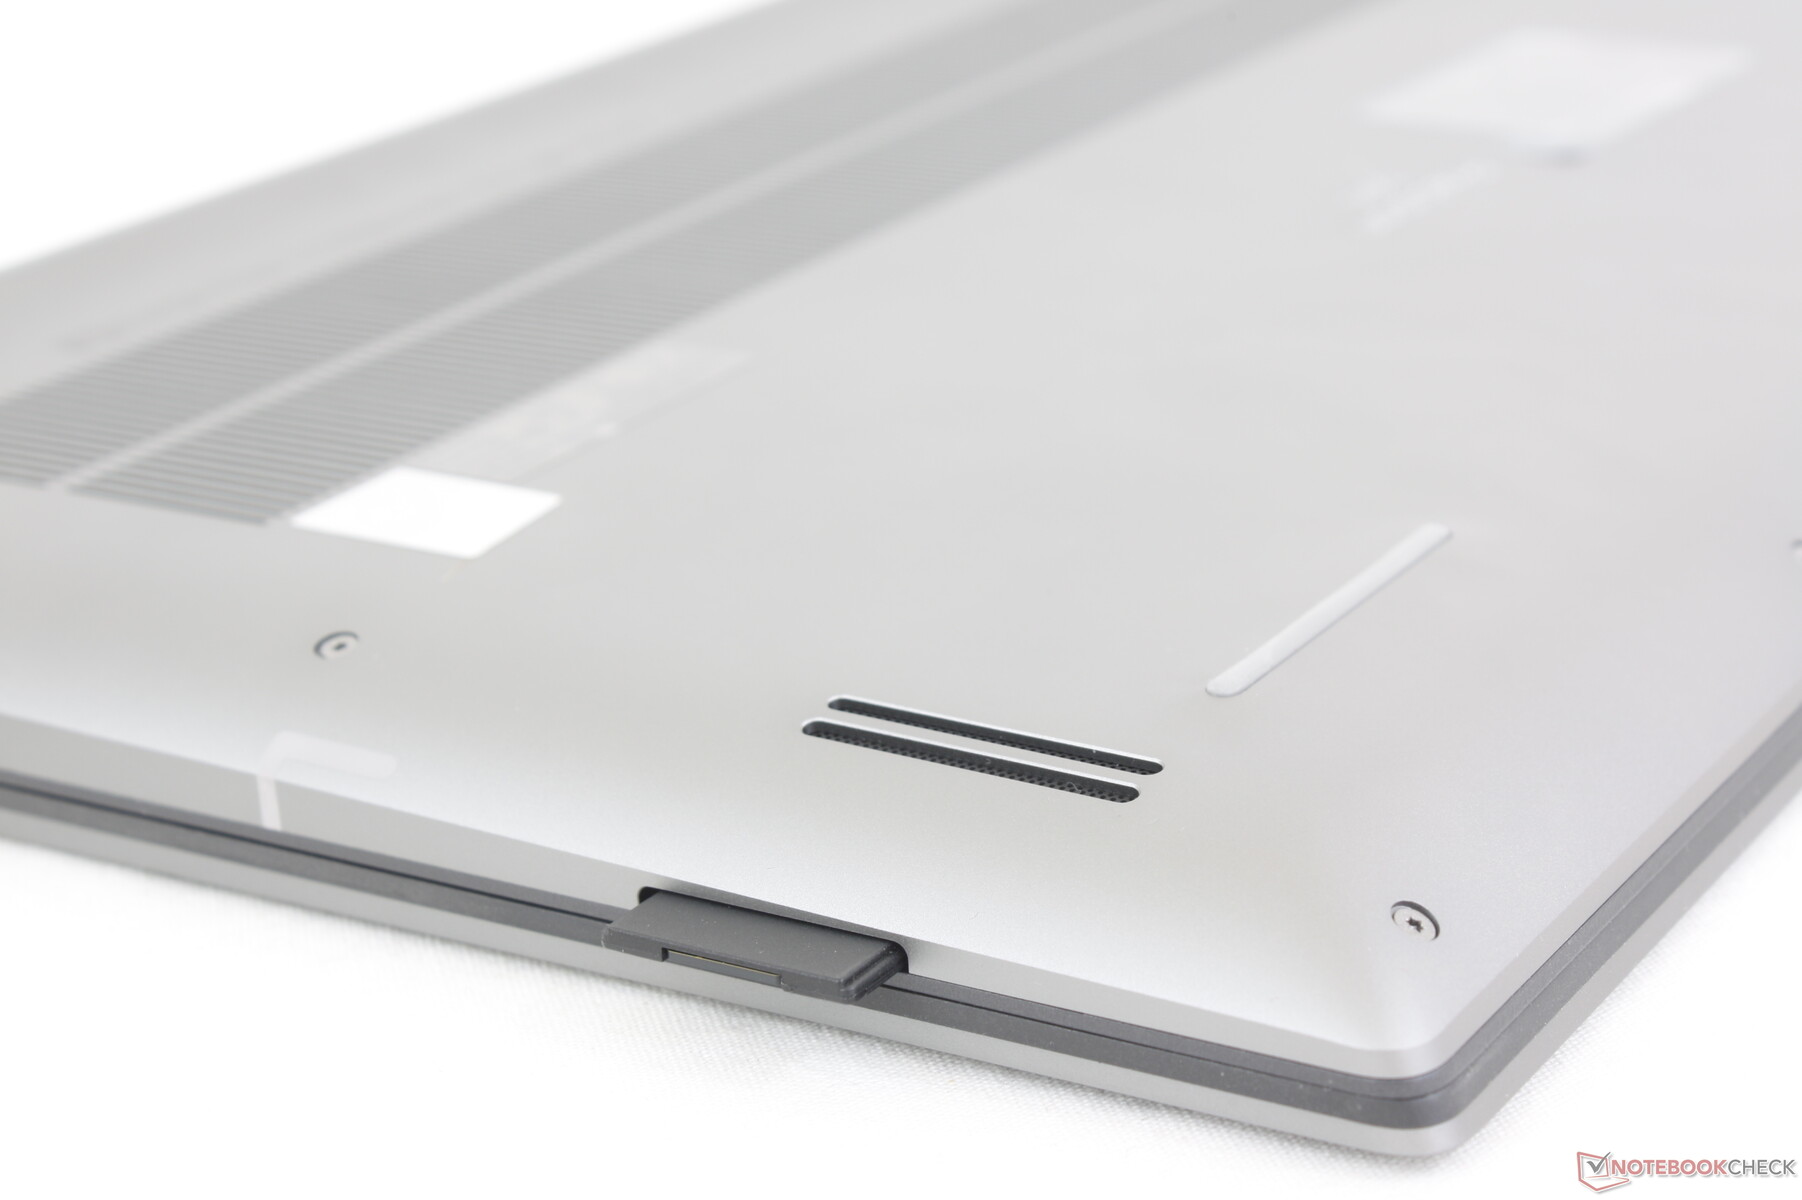
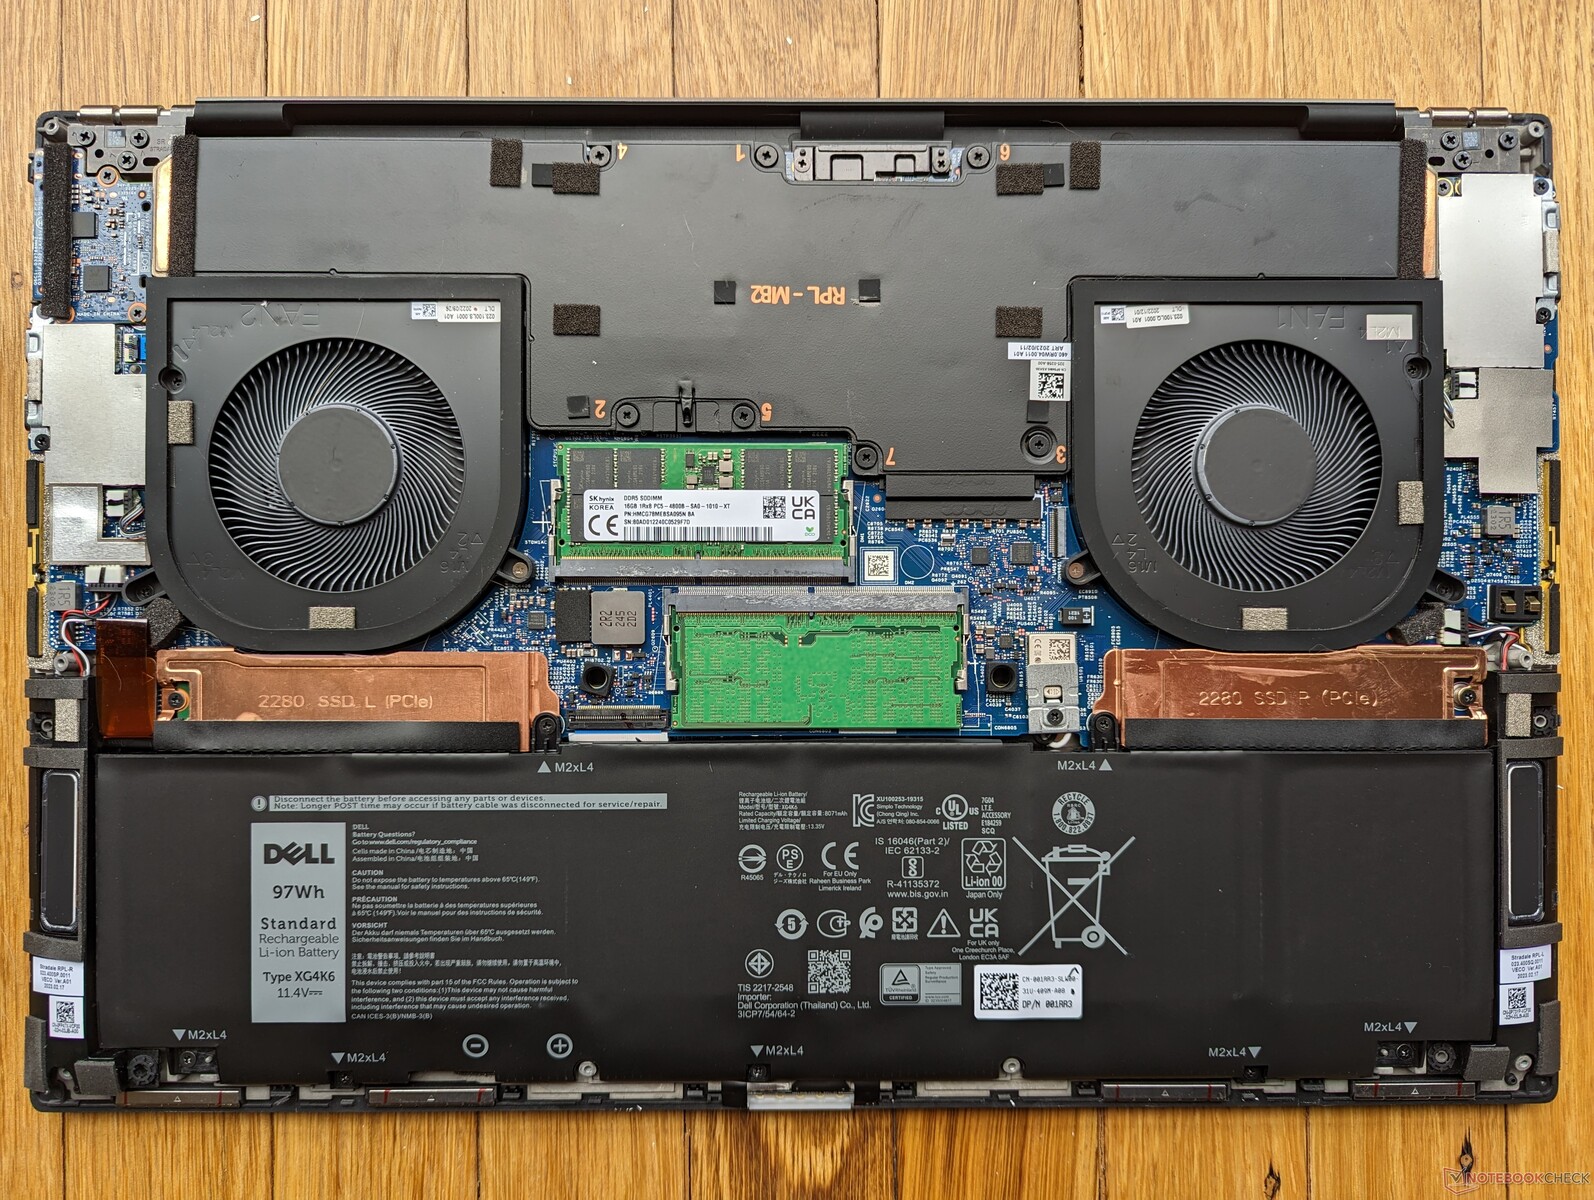
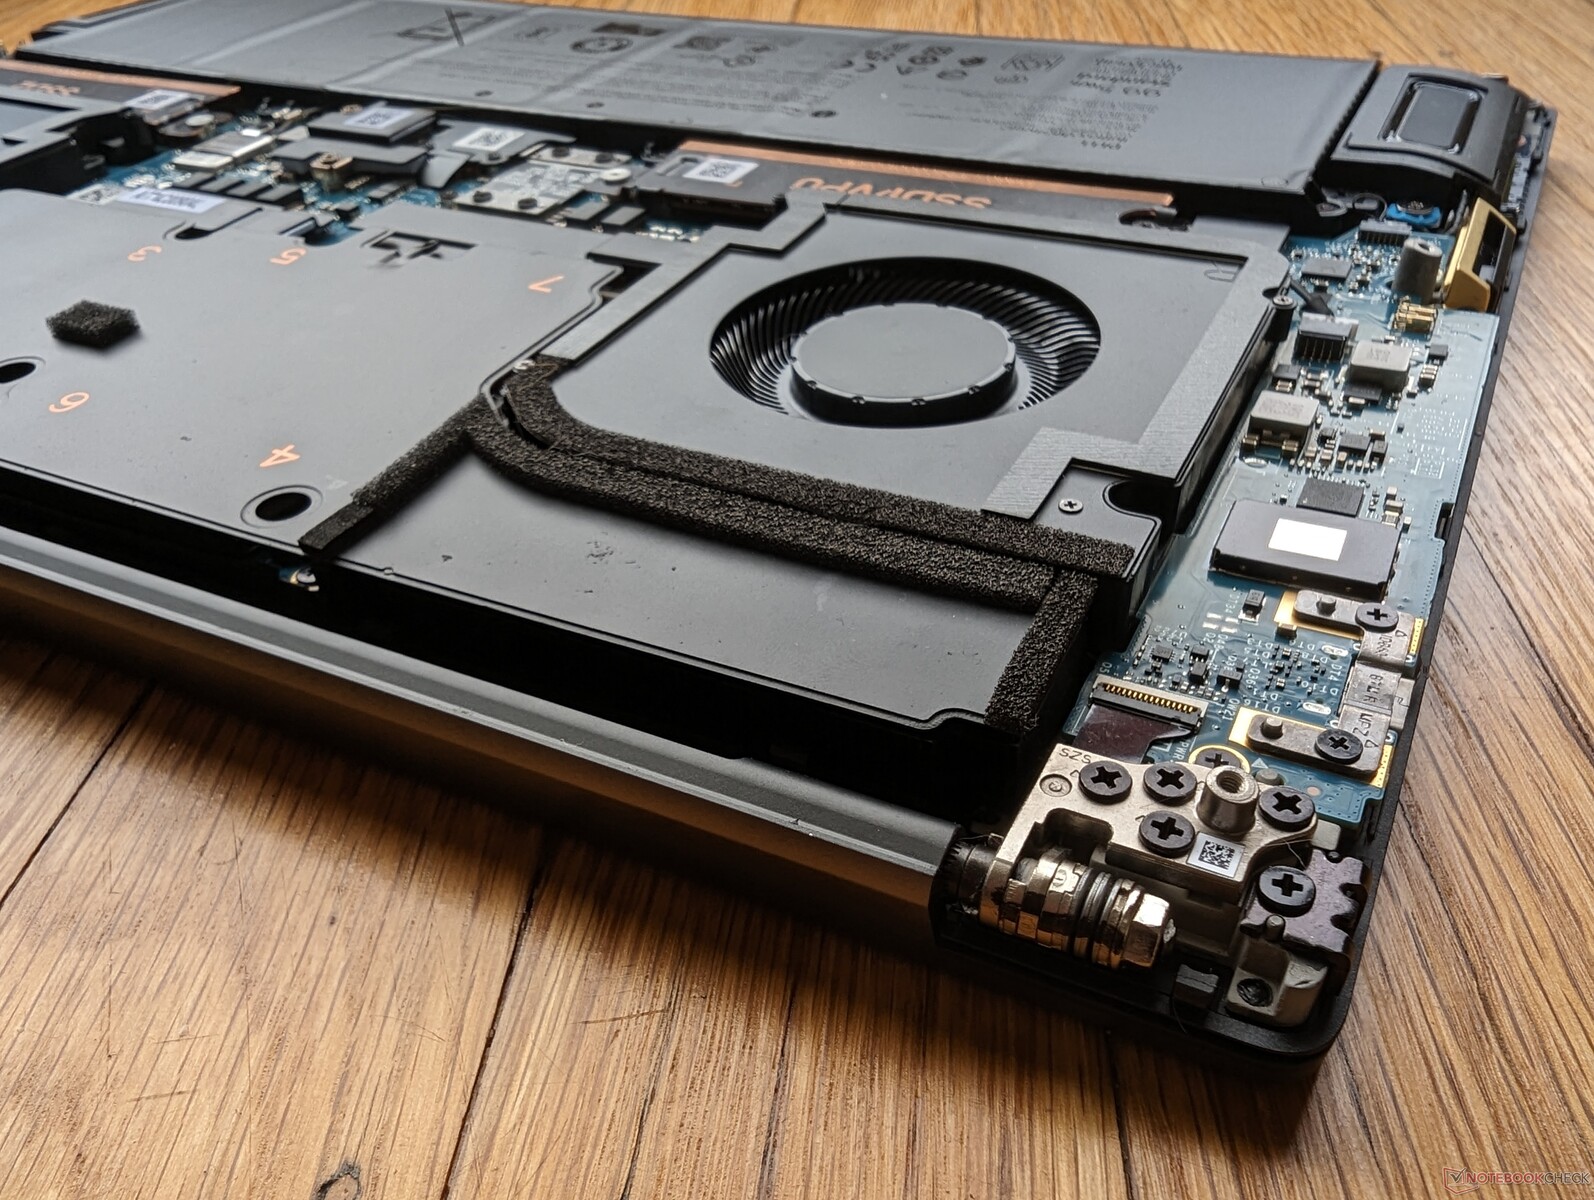
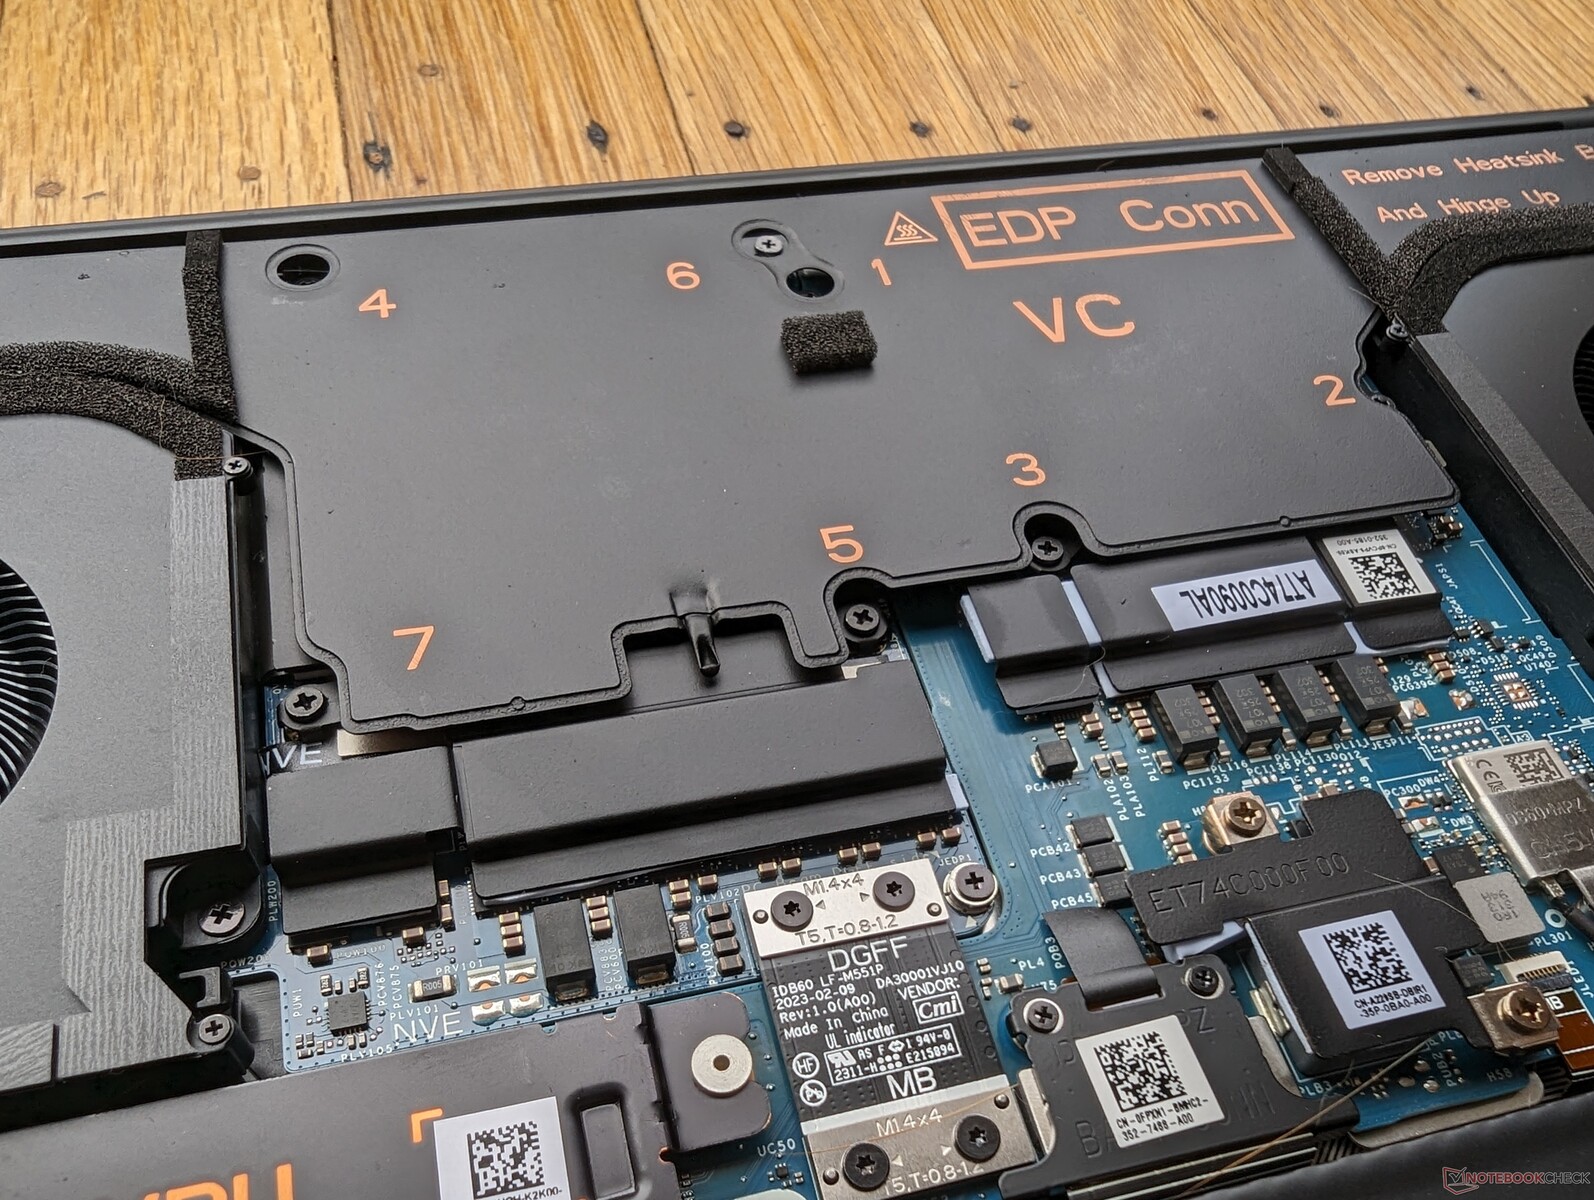
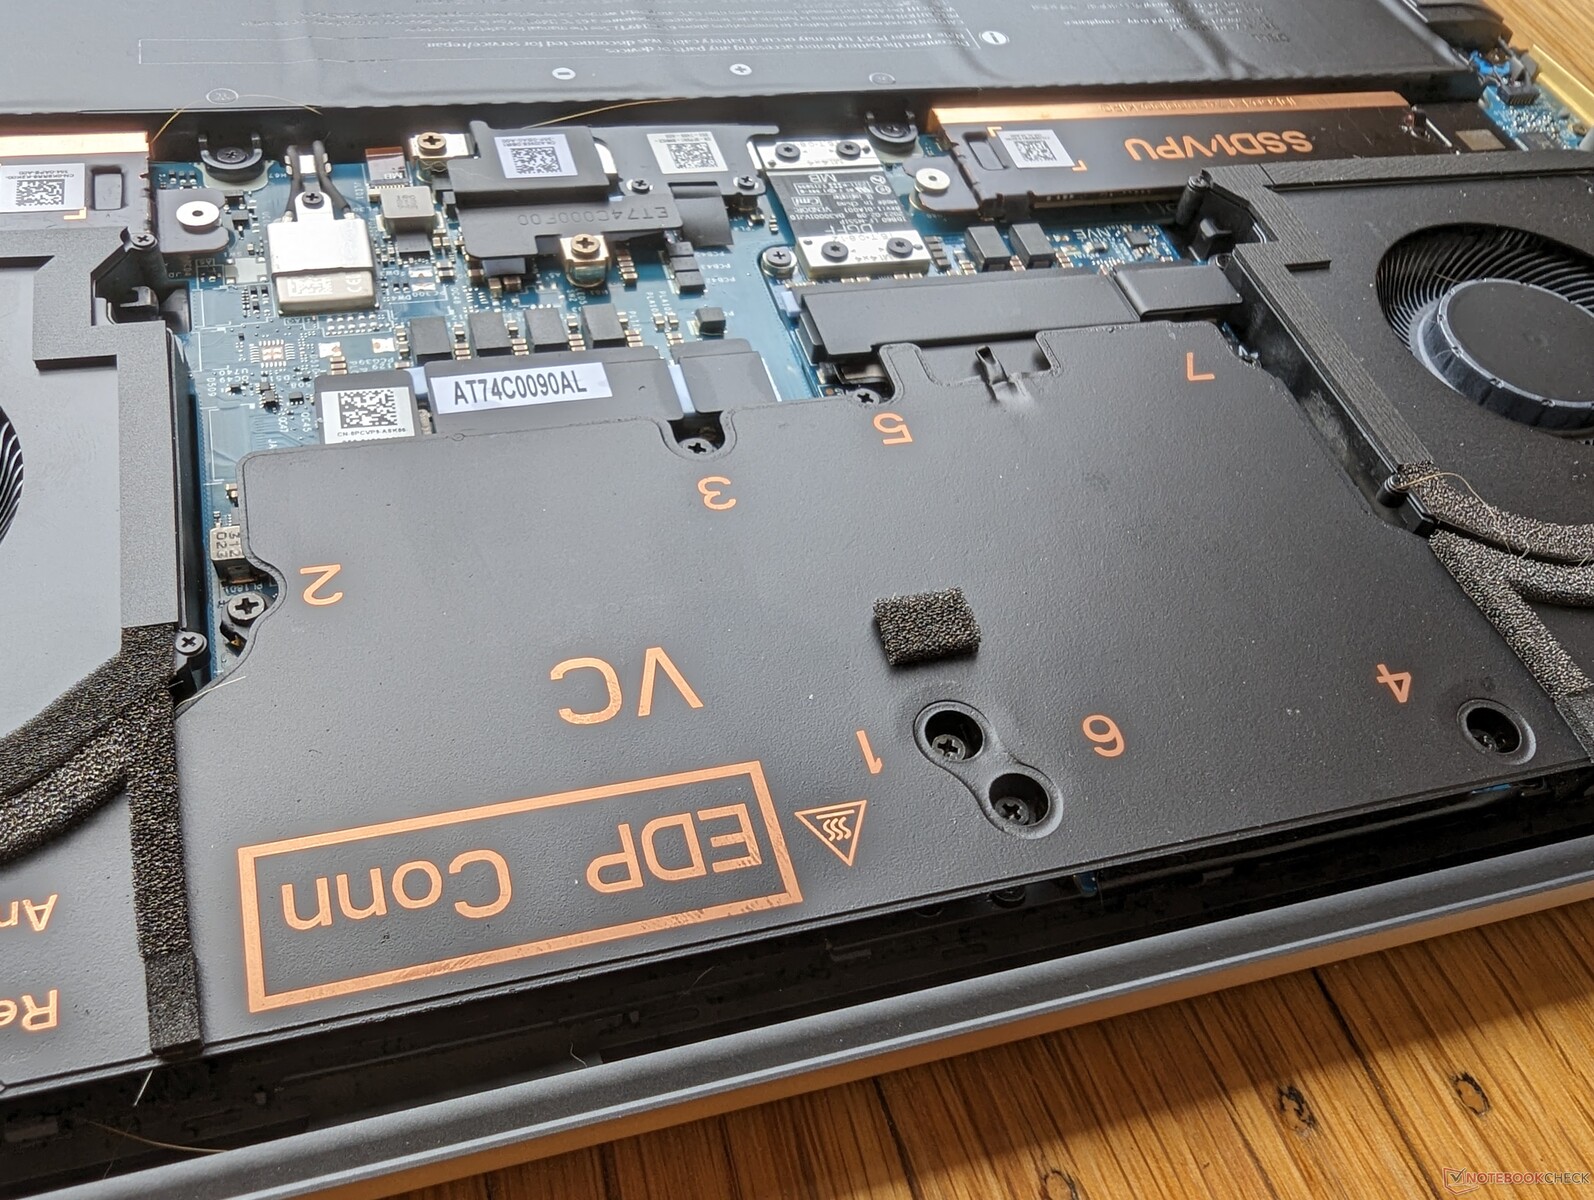
Mantenimiento
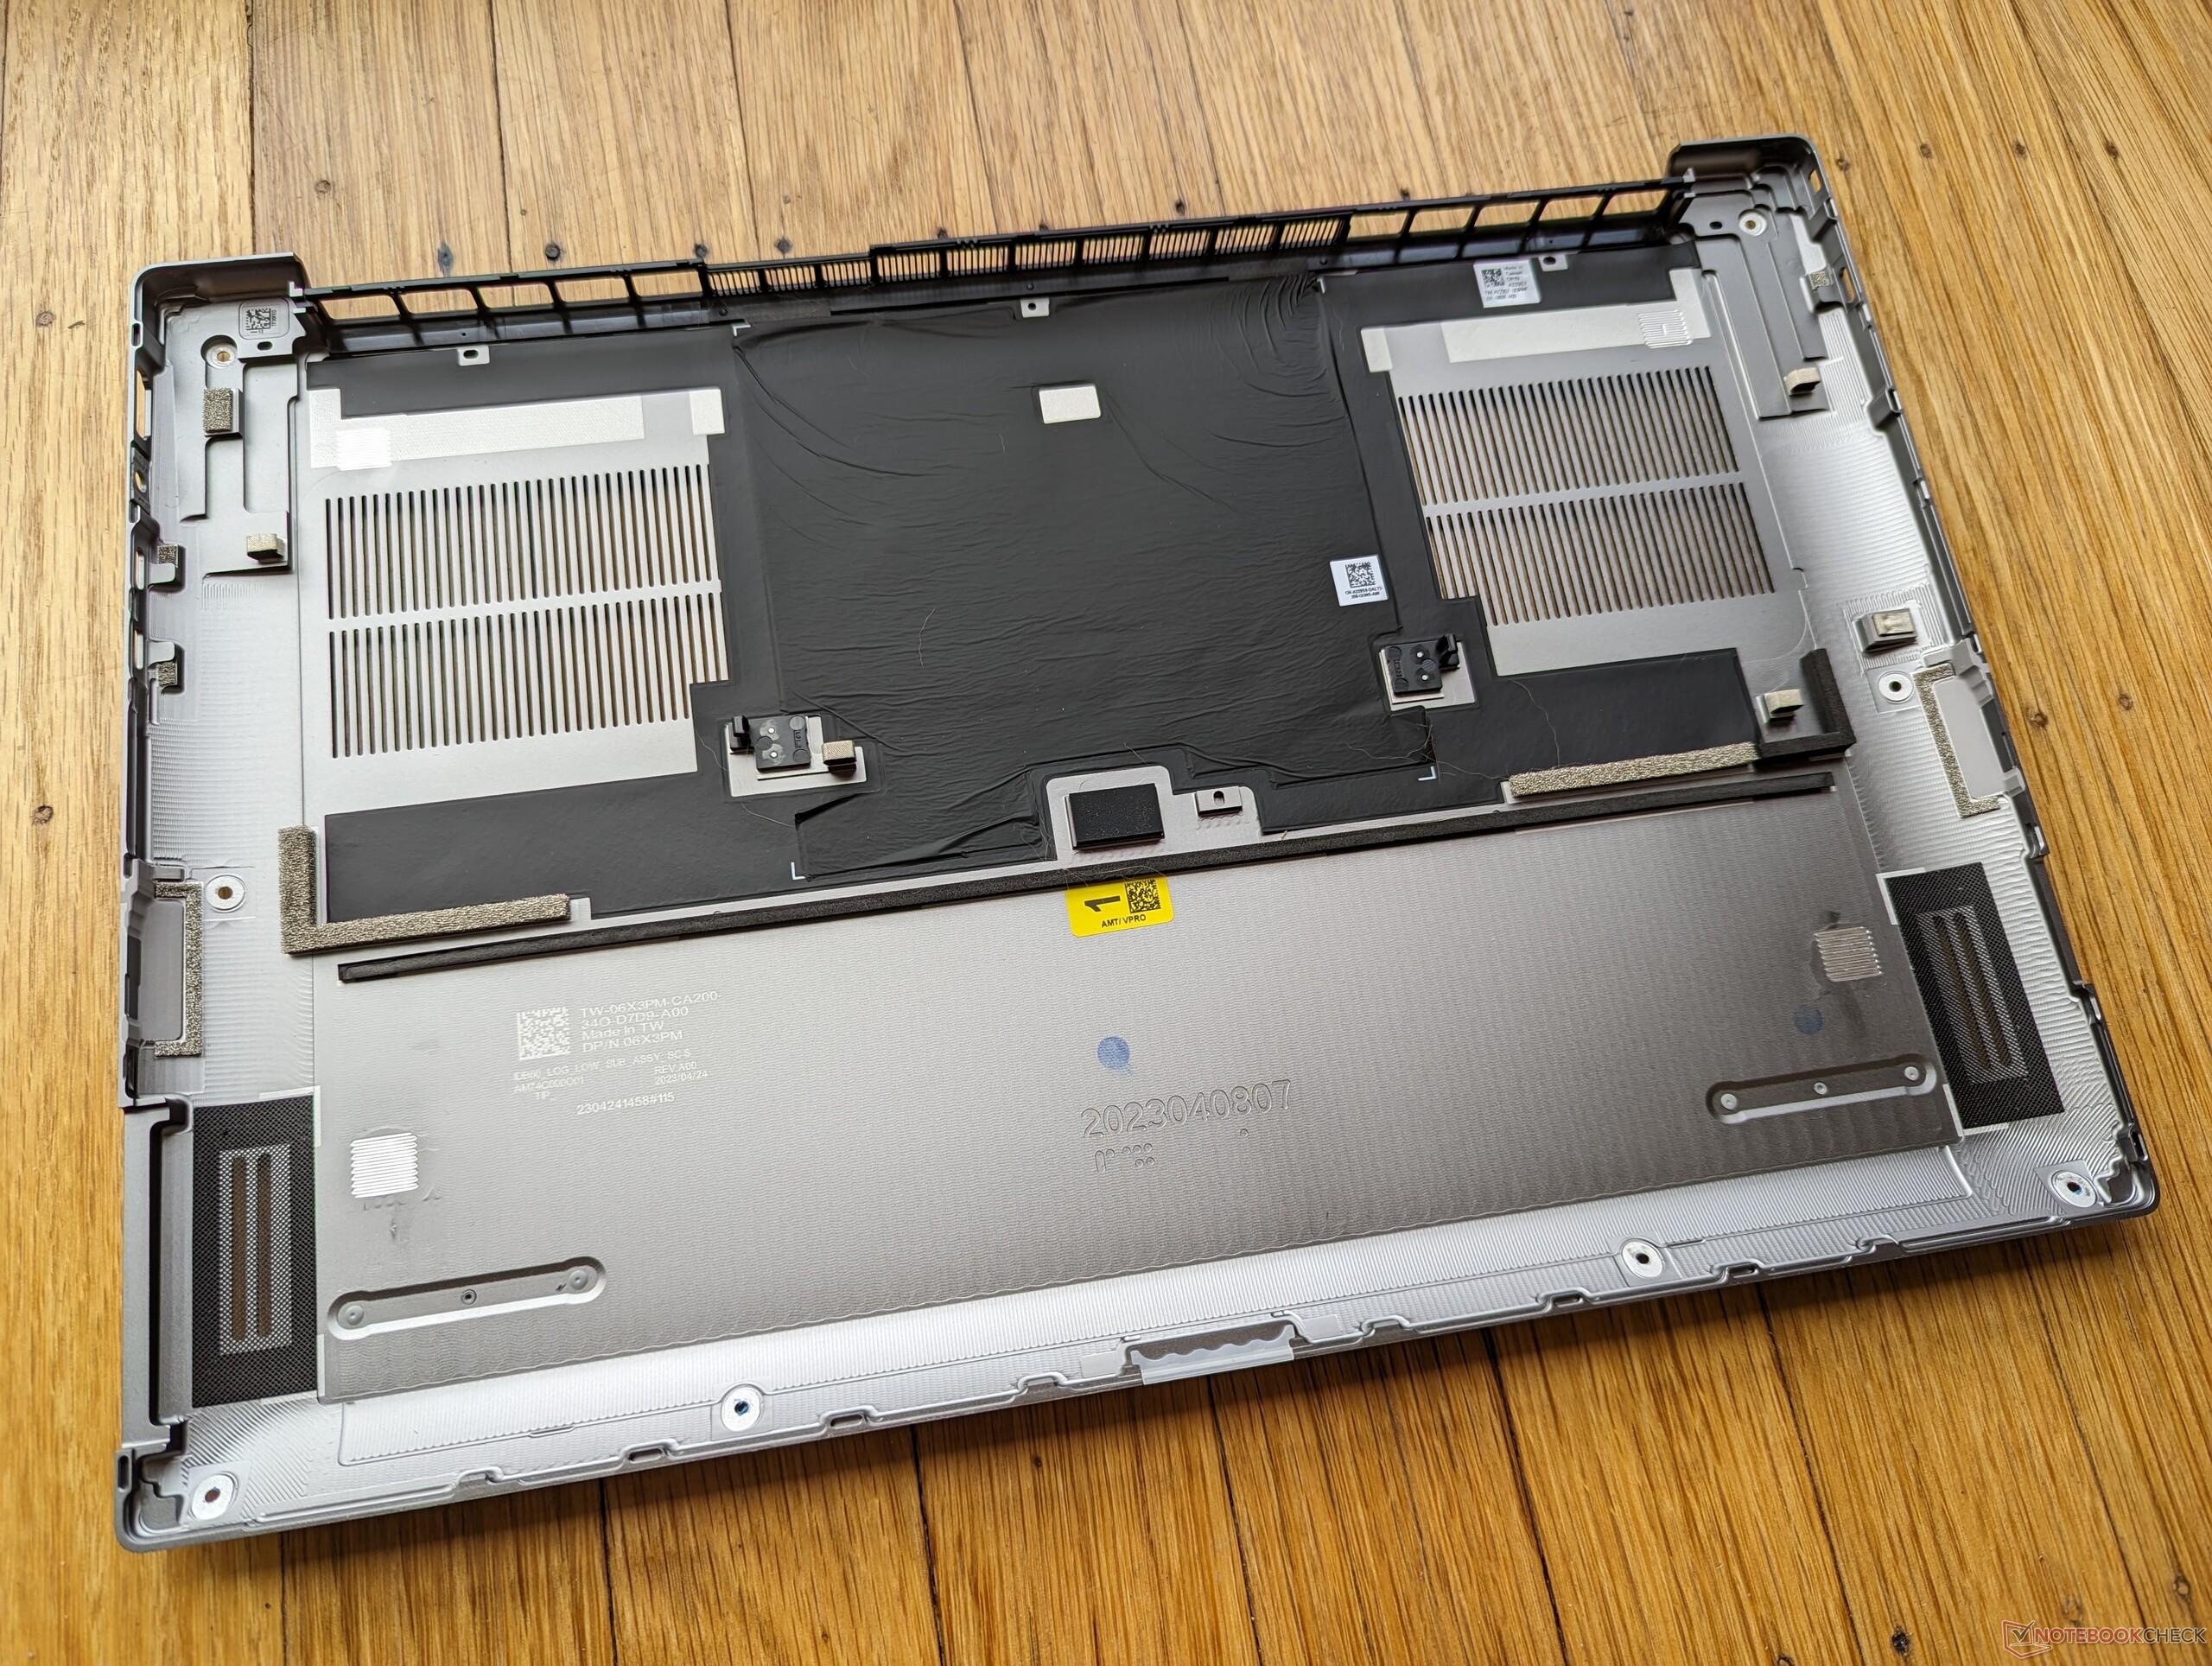
El panel inferior es un poco más difícil de quitar de lo esperado ya que los bordes de la placa de metal son afilados y están firmemente cerrados como en el XPS 15 o XPS 17. Se recomienda un tornillo Torx y un borde plano para reparar el sistema.
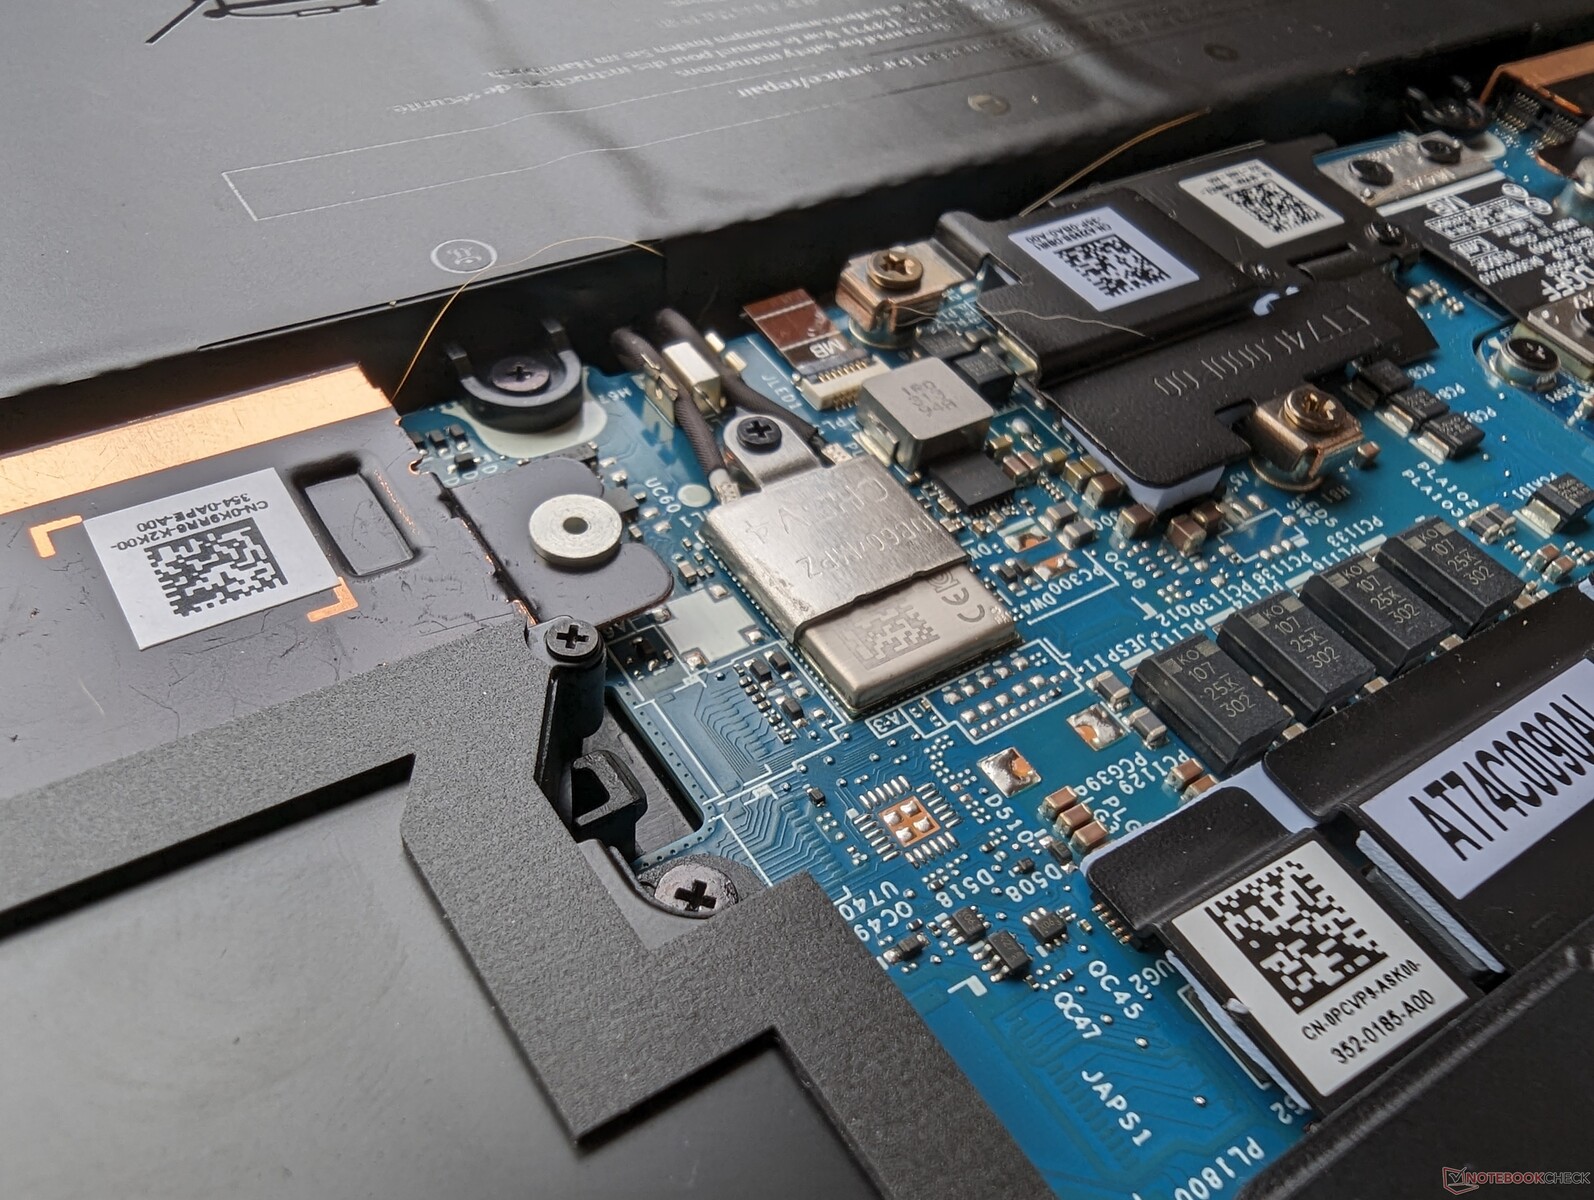
Tanto los módulos WLAN como RAM están soldados a diferencia de la mayoría de estaciones de trabajo de este tamaño de pantalla. Tanto los módulos altamente integrados como las limitadas opciones de puerto son posibles inconvenientes para el por lo demás elegante diseño y relativamente bajo peso.
Accesorios y garantía
La caja incluye un pequeño adaptador de USB-C a USB-A para compensar la ausencia de puertos USB de tamaño completo en el sistema.
Si se adquiere en EE.UU., se aplica una garantía limitada del fabricante de tres años con reparación in situ.
Dispositivos de entrada - Ligeramente diferente a XPS
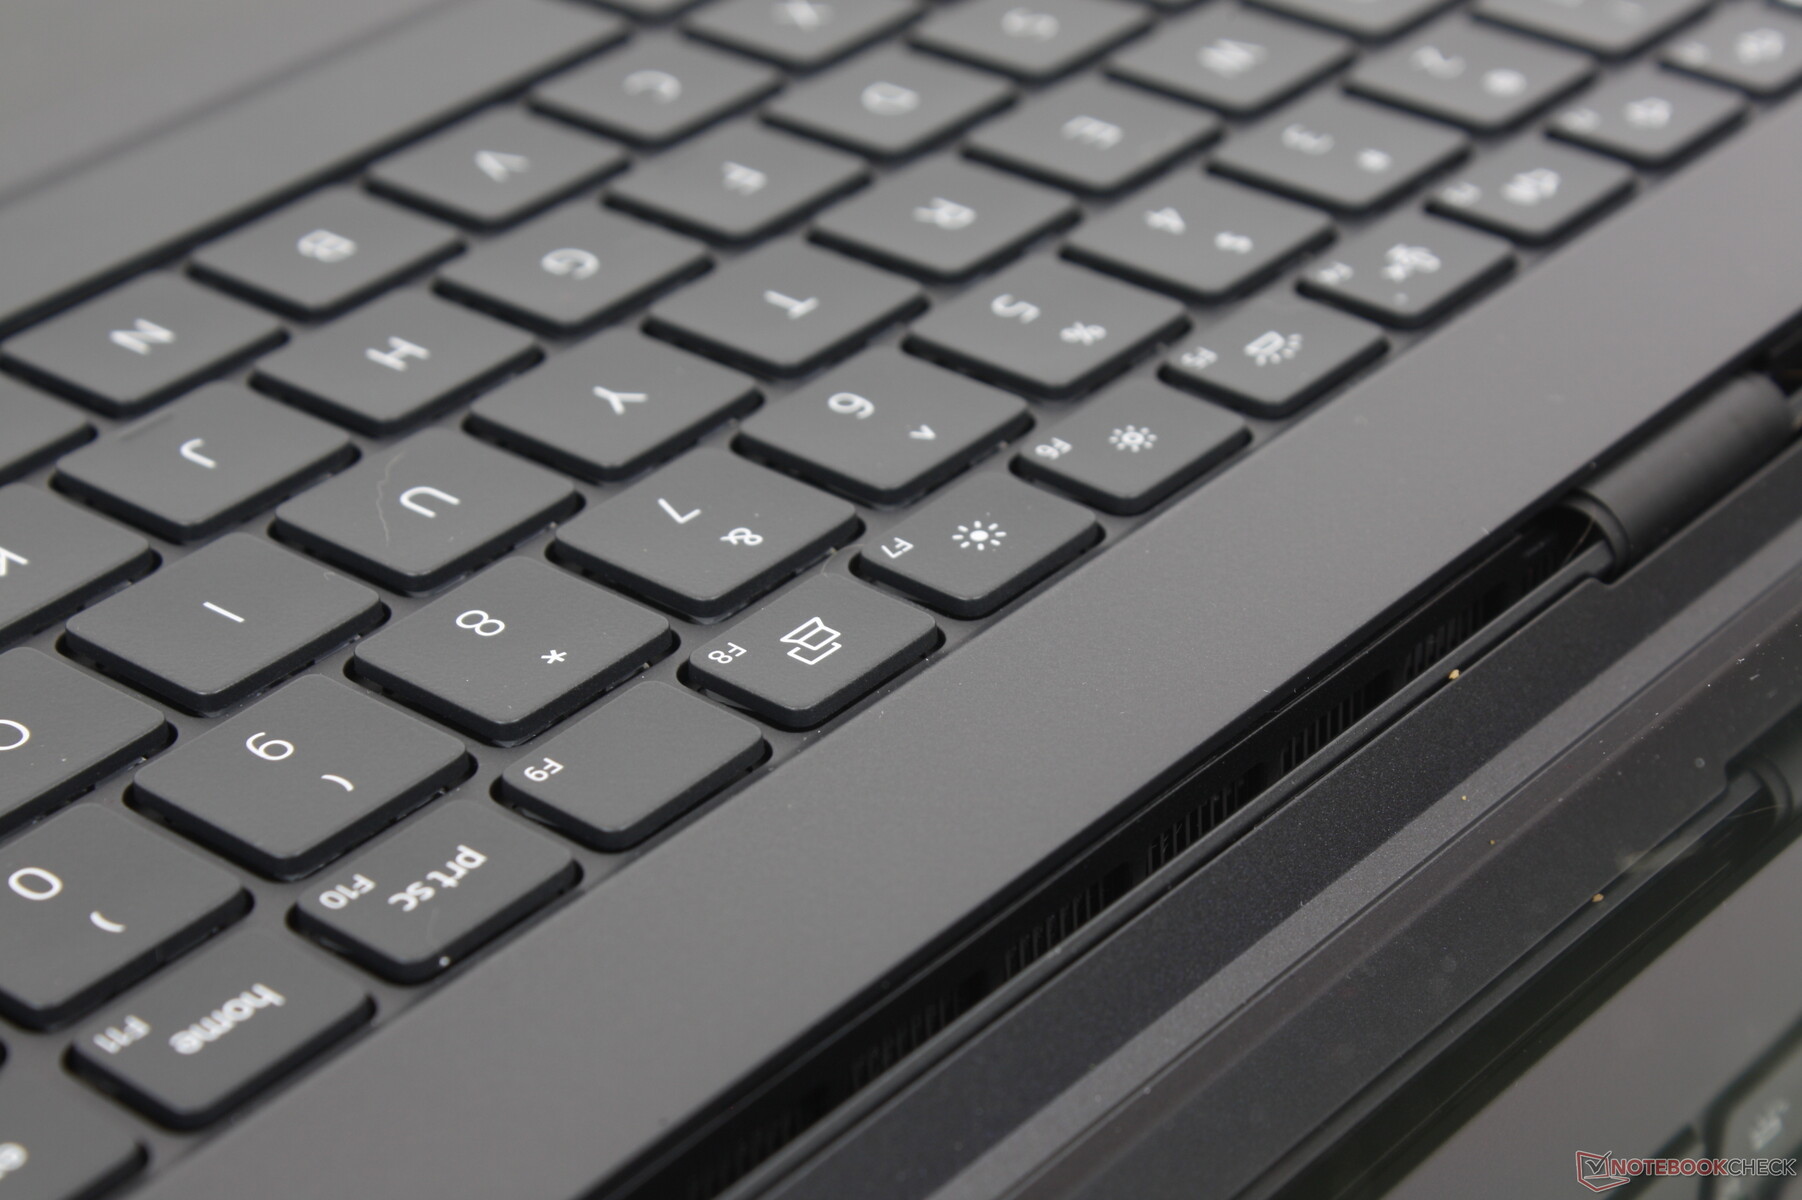
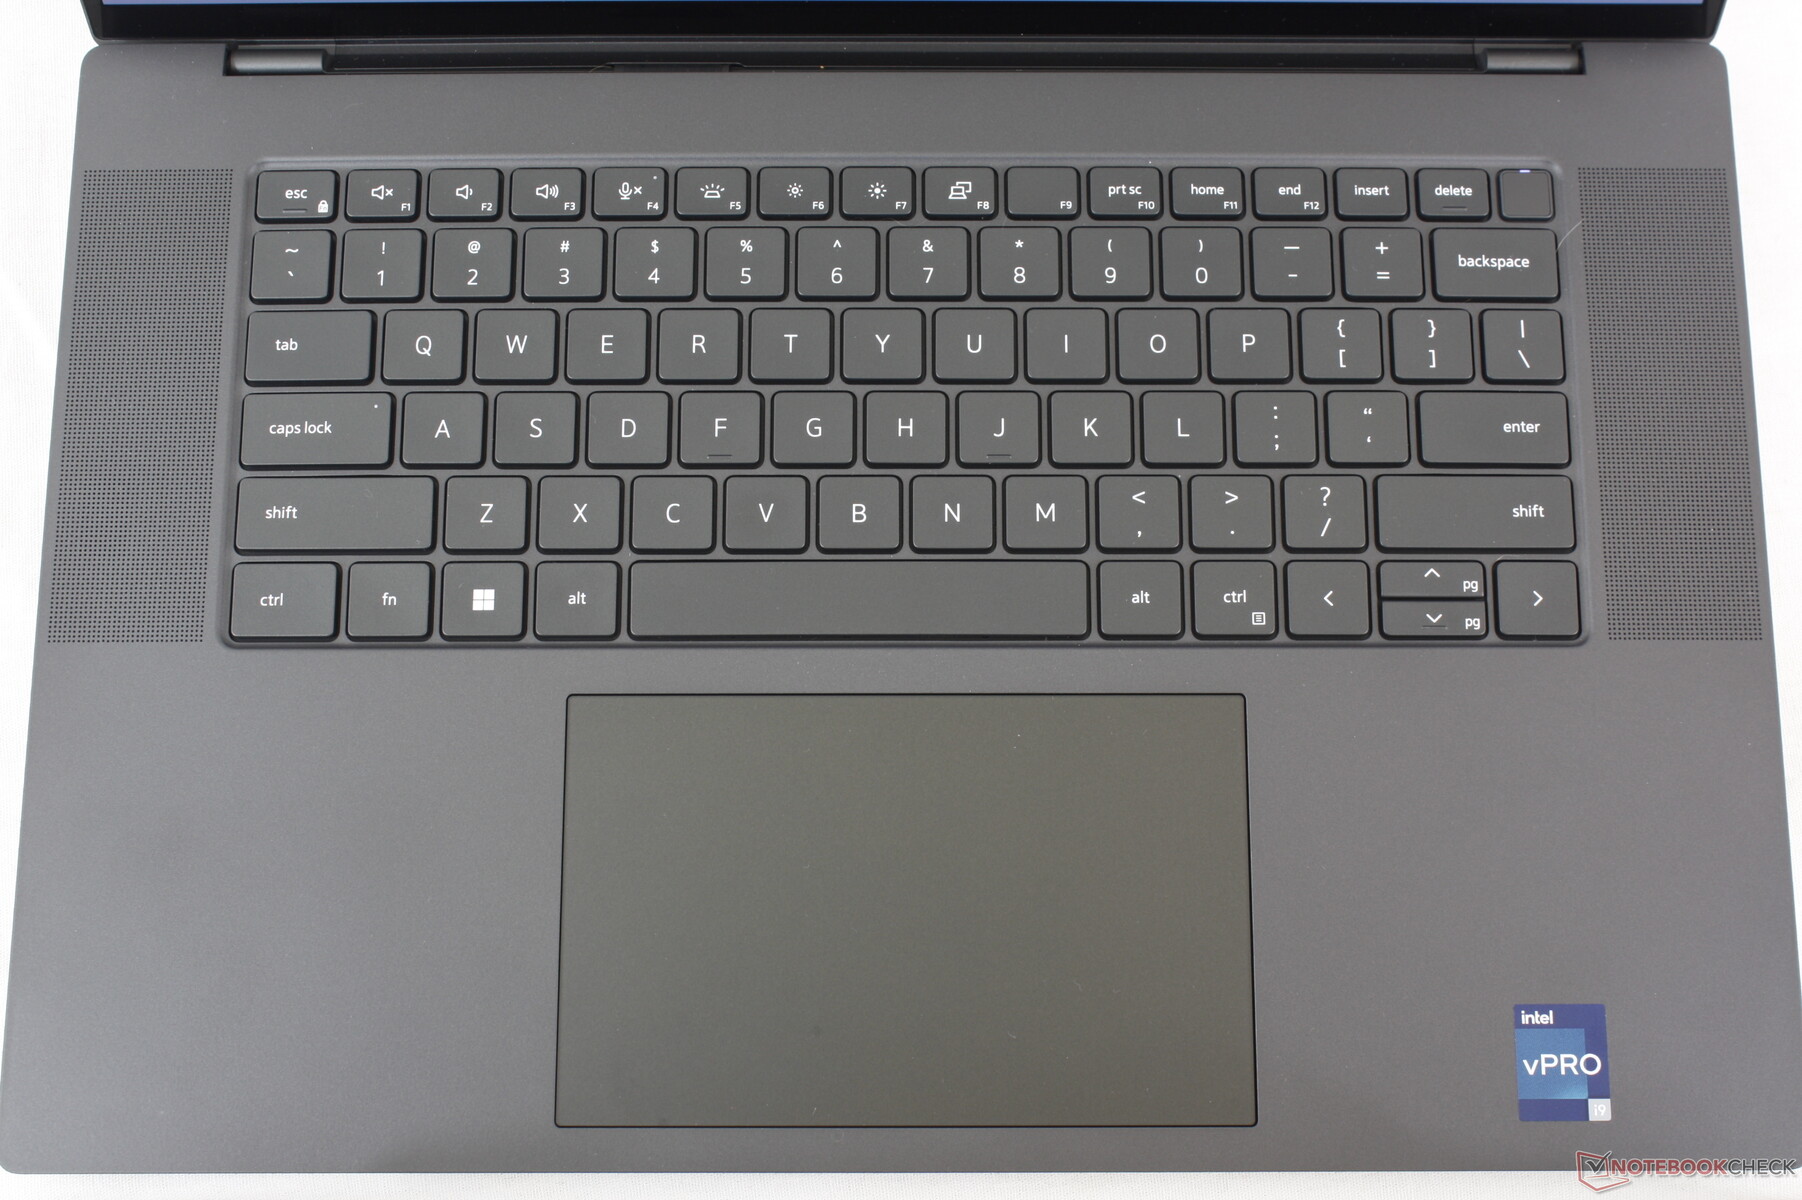
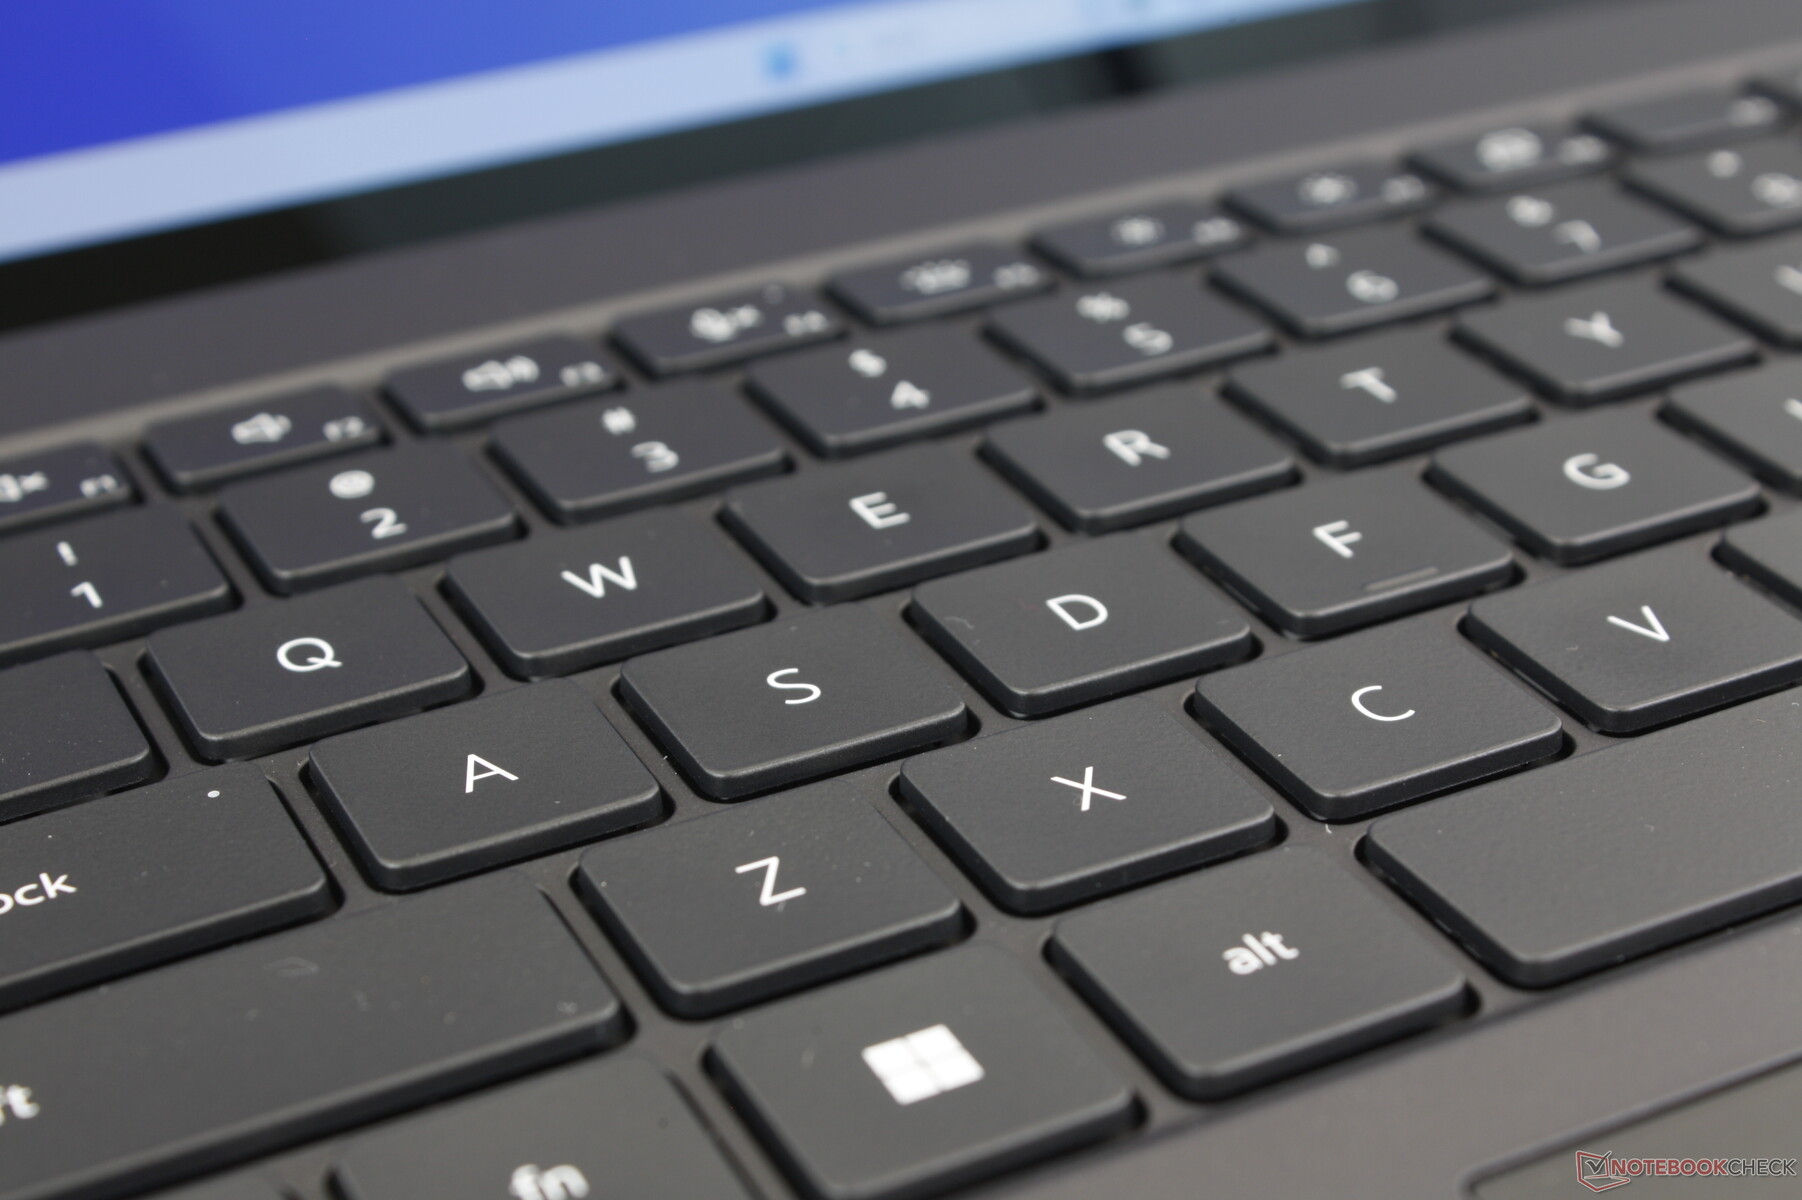
Teclado
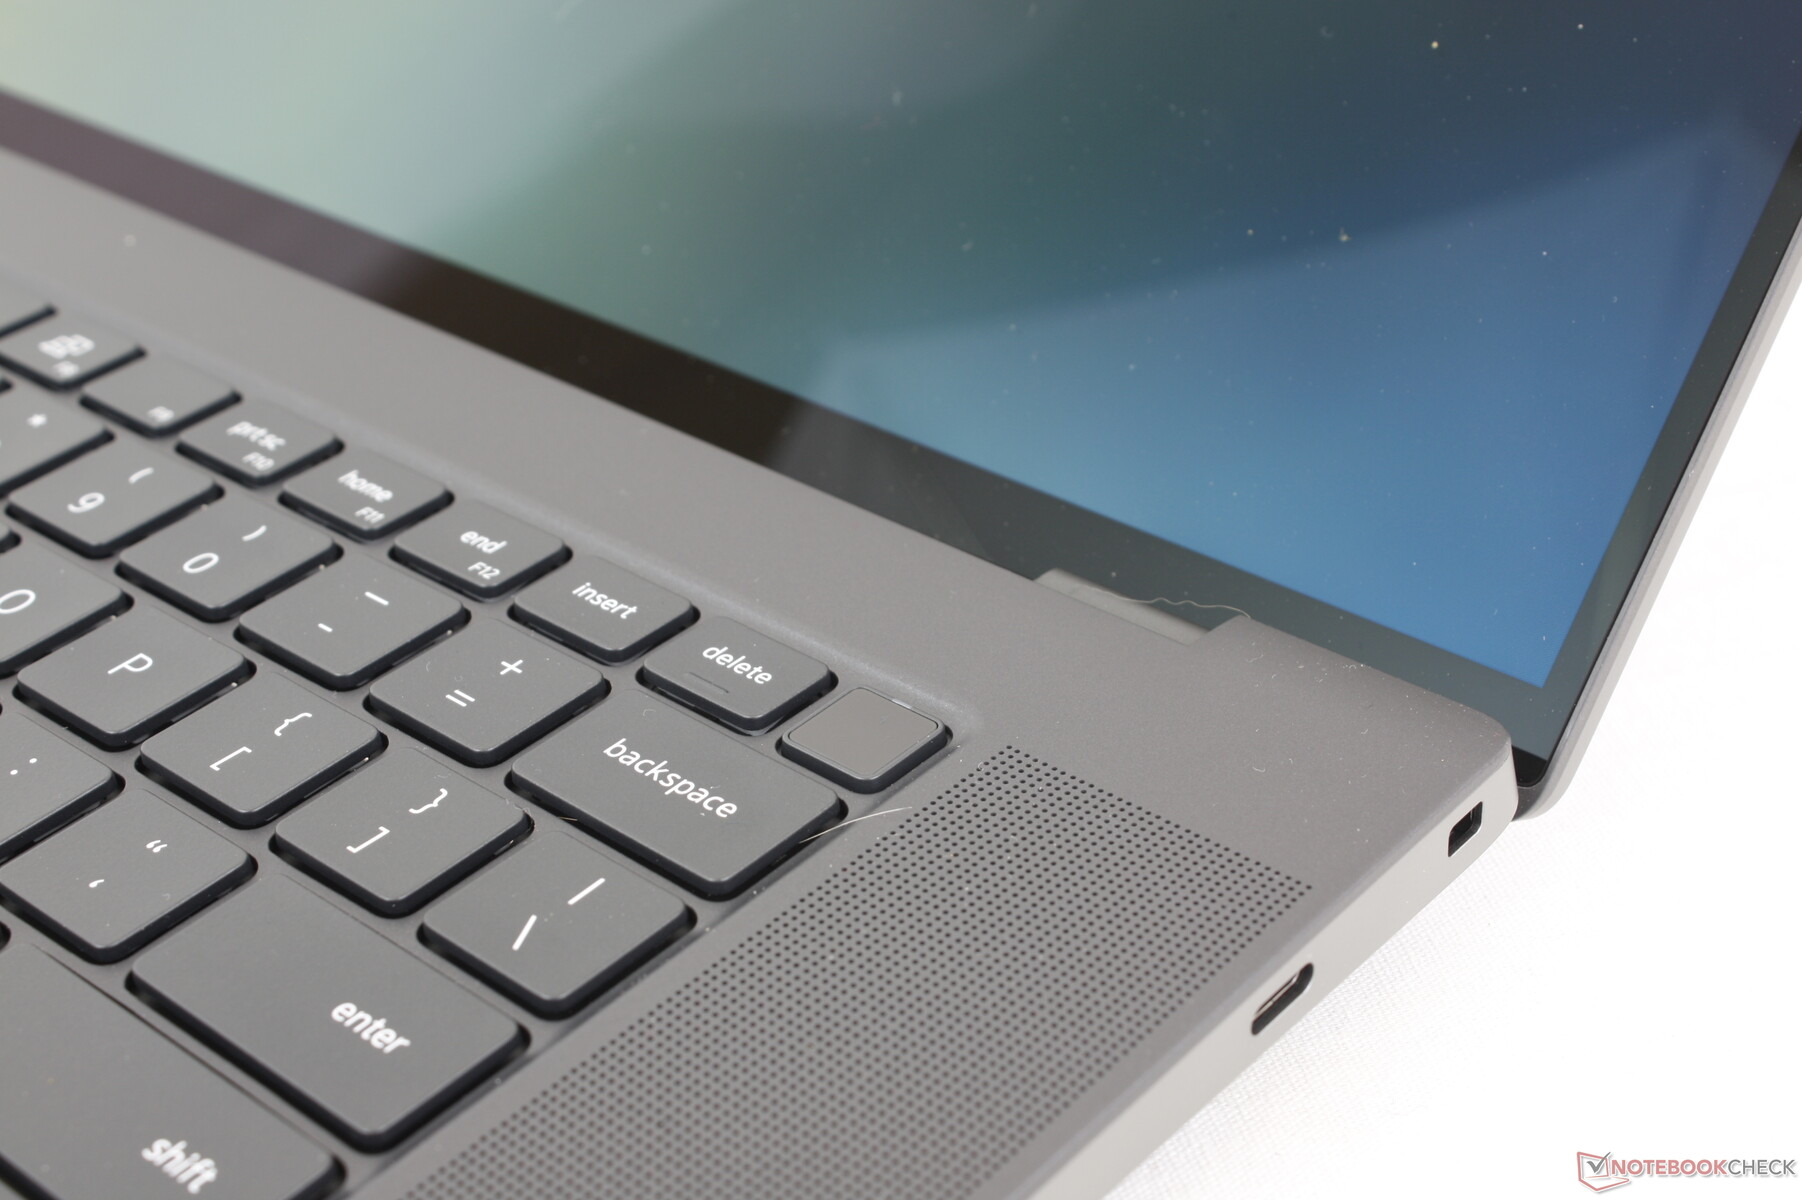
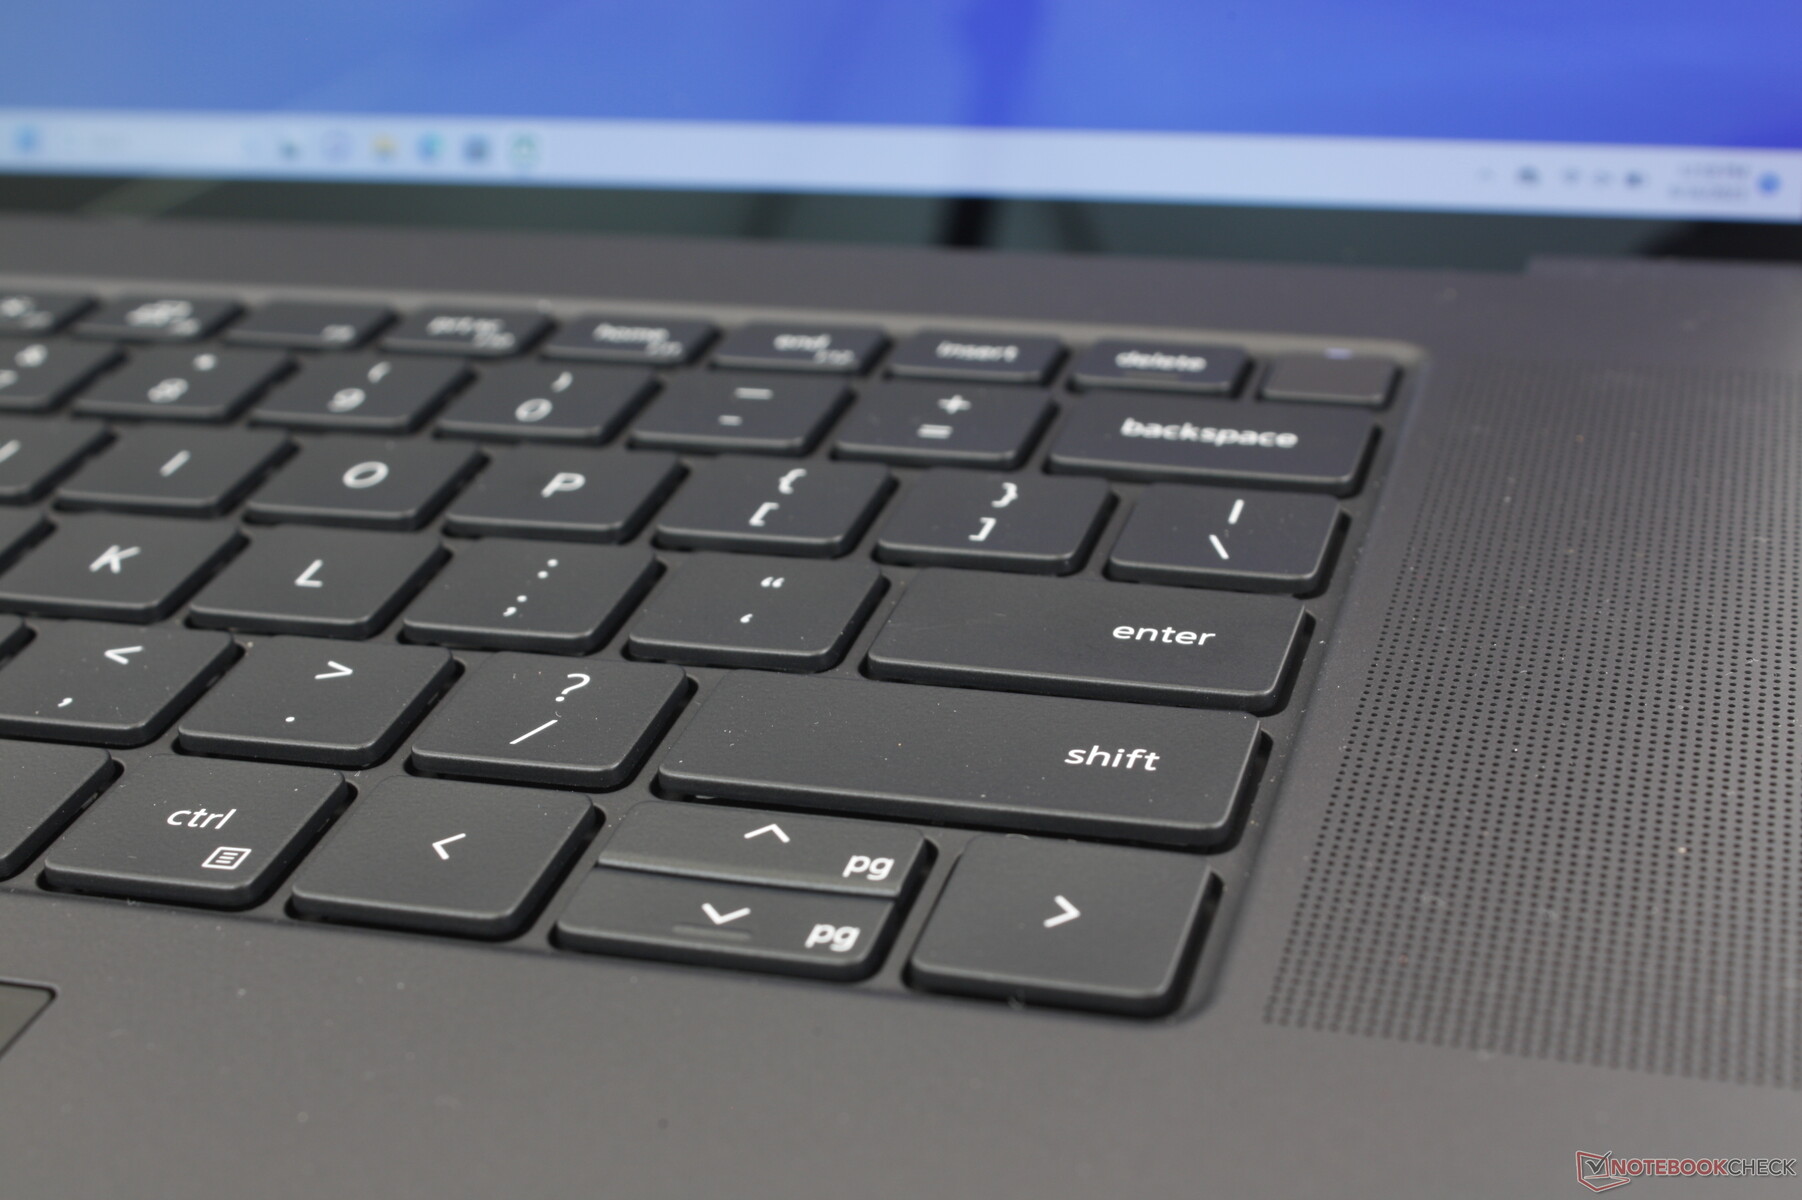
El teclado puede parecer idéntico a los teclados del XPS 15 o Precision 5550 a primera vista, pero hay un par de cambios importantes. En primer lugar, la fila superior de teclas de función es ahora más grande, ya que algunos propietarios del XPS 15 se han quejado de que son demasiado estrechas. Y en segundo lugar, algunas de las teclas de los bordes son ahora ligeramente más cortas, incluyendo las teclas Retroceso, Intro, Mayúsculas, Tabulador, Ctrl y Mayúsculas. Por lo demás, la experiencia de tecleo sigue siendo la misma para una sensación XPS familiar.
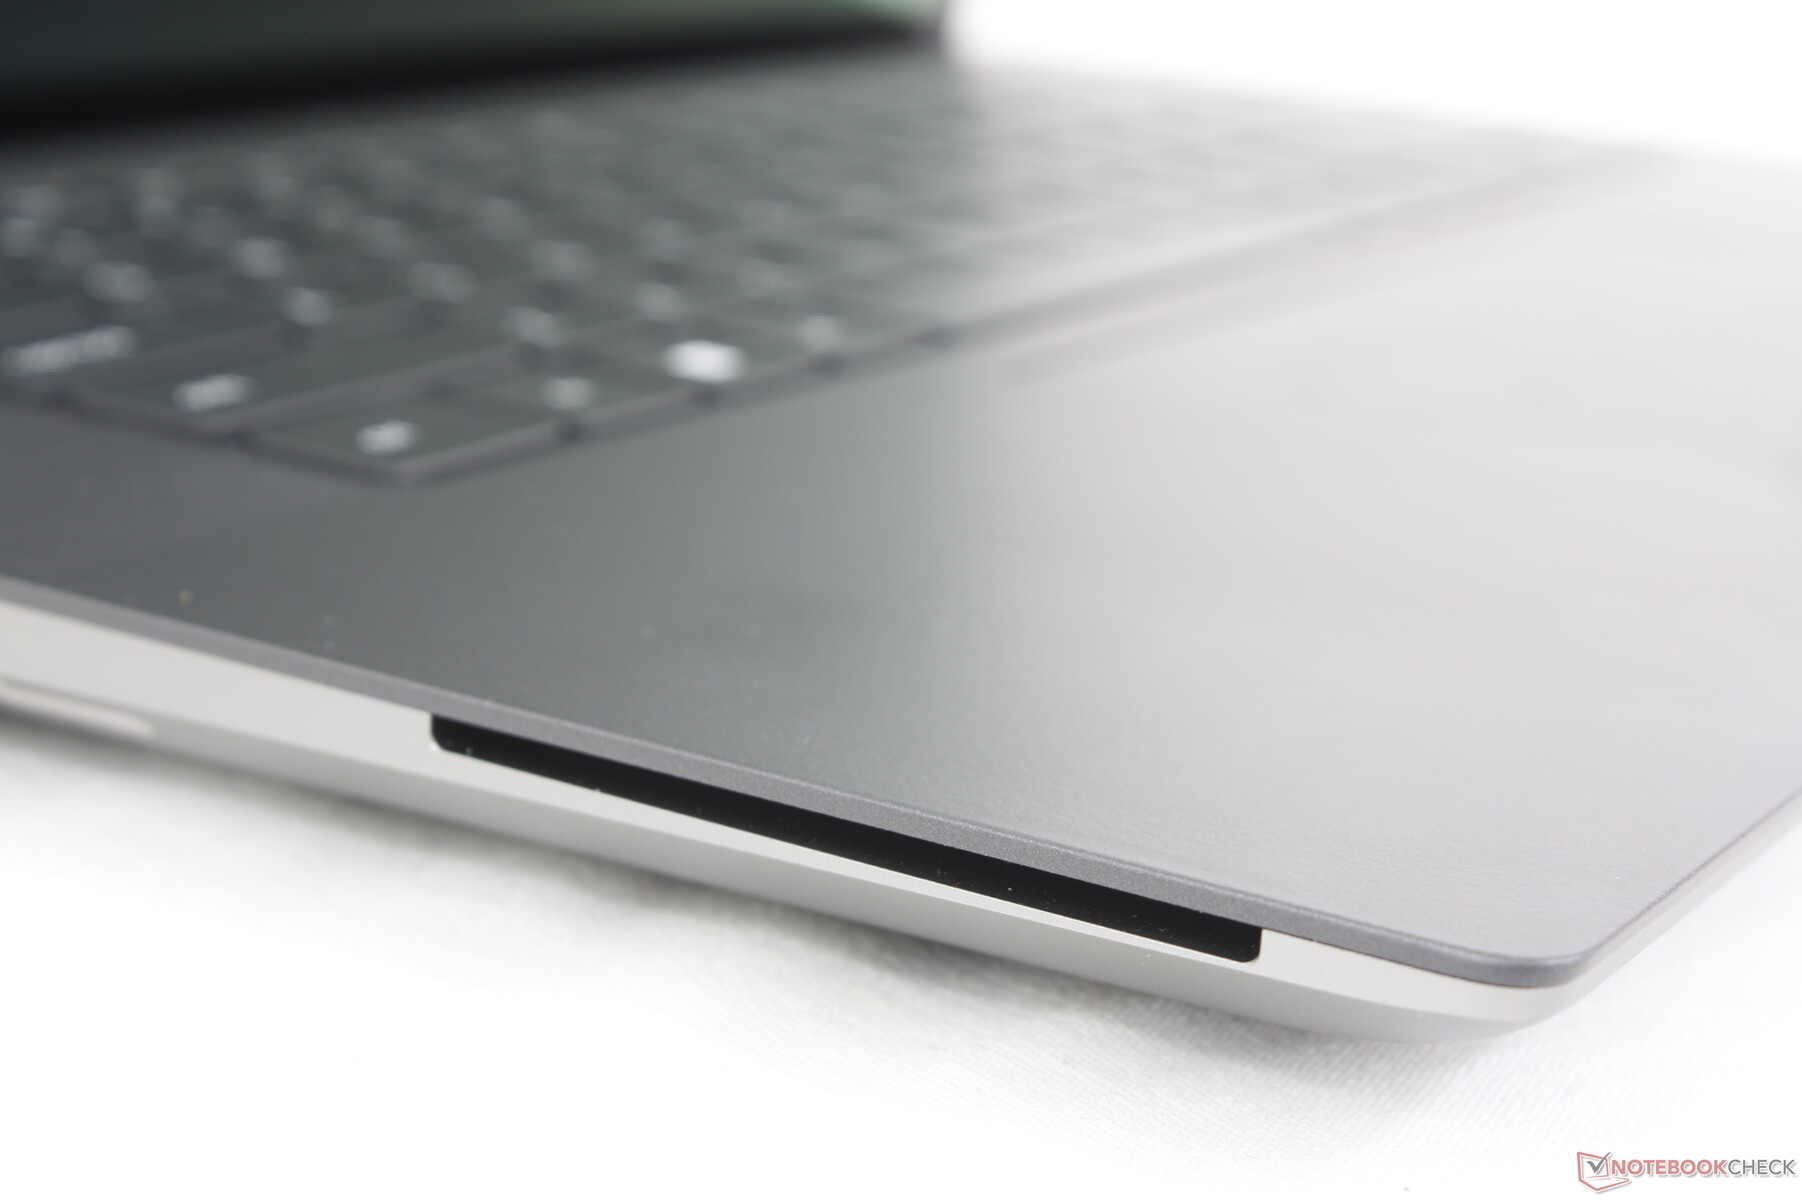
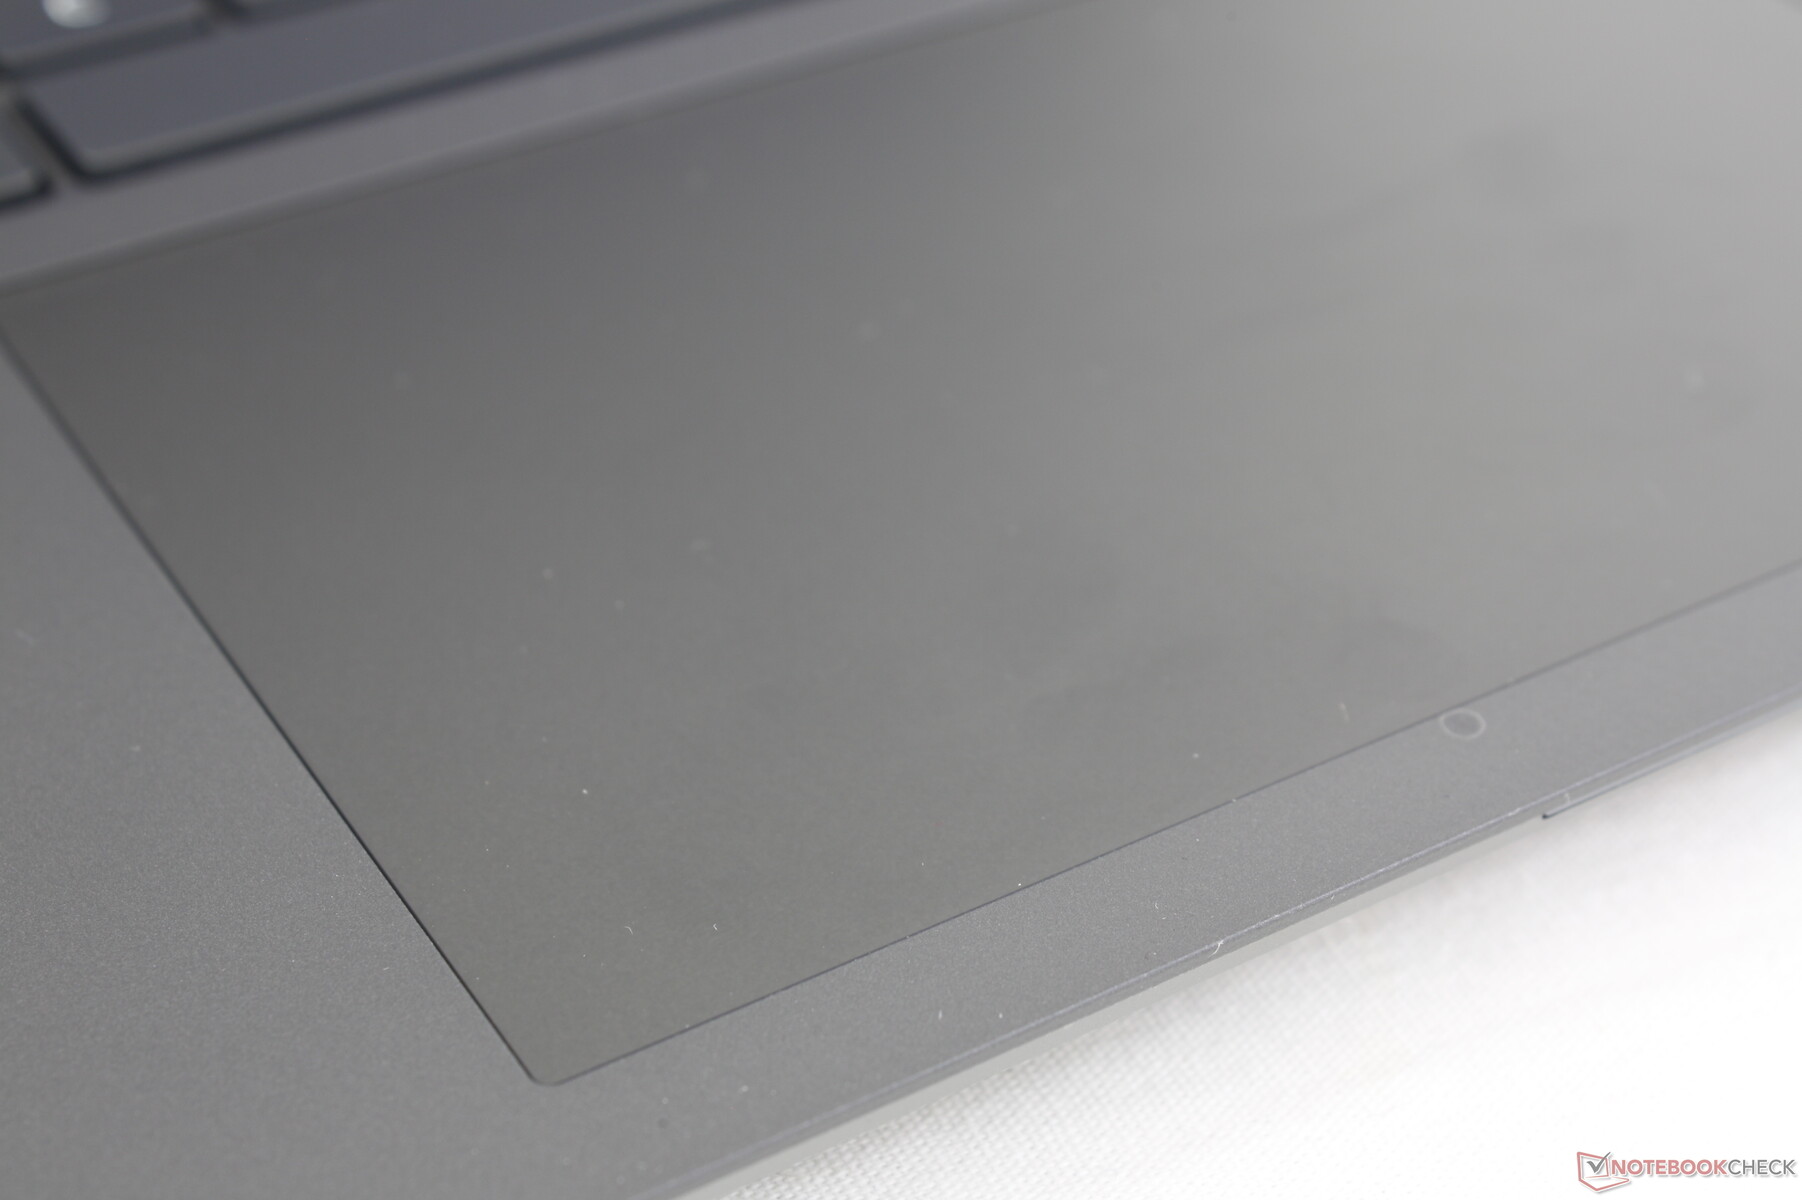
Panel táctil
El clickpad es en realidad más pequeño que el del Precision 5550 de 15 pulgadas (13,7 x 8,5 cm frente a 15,1 x 9 cm) a pesar de nuestro mayor tamaño de pantalla. Aún así, sigue pareciendo espacioso con propiedades de deslizamiento suaves y fiables como en un XPS 15.
Por desgracia, la respuesta al hacer clic en el clickpad háptico es casi inexistente. De hecho, casi no hay desplazamiento o retroalimentación audible en absoluto. Se recomienda encarecidamente un ratón para acciones de arrastrar y soltar más precisas.
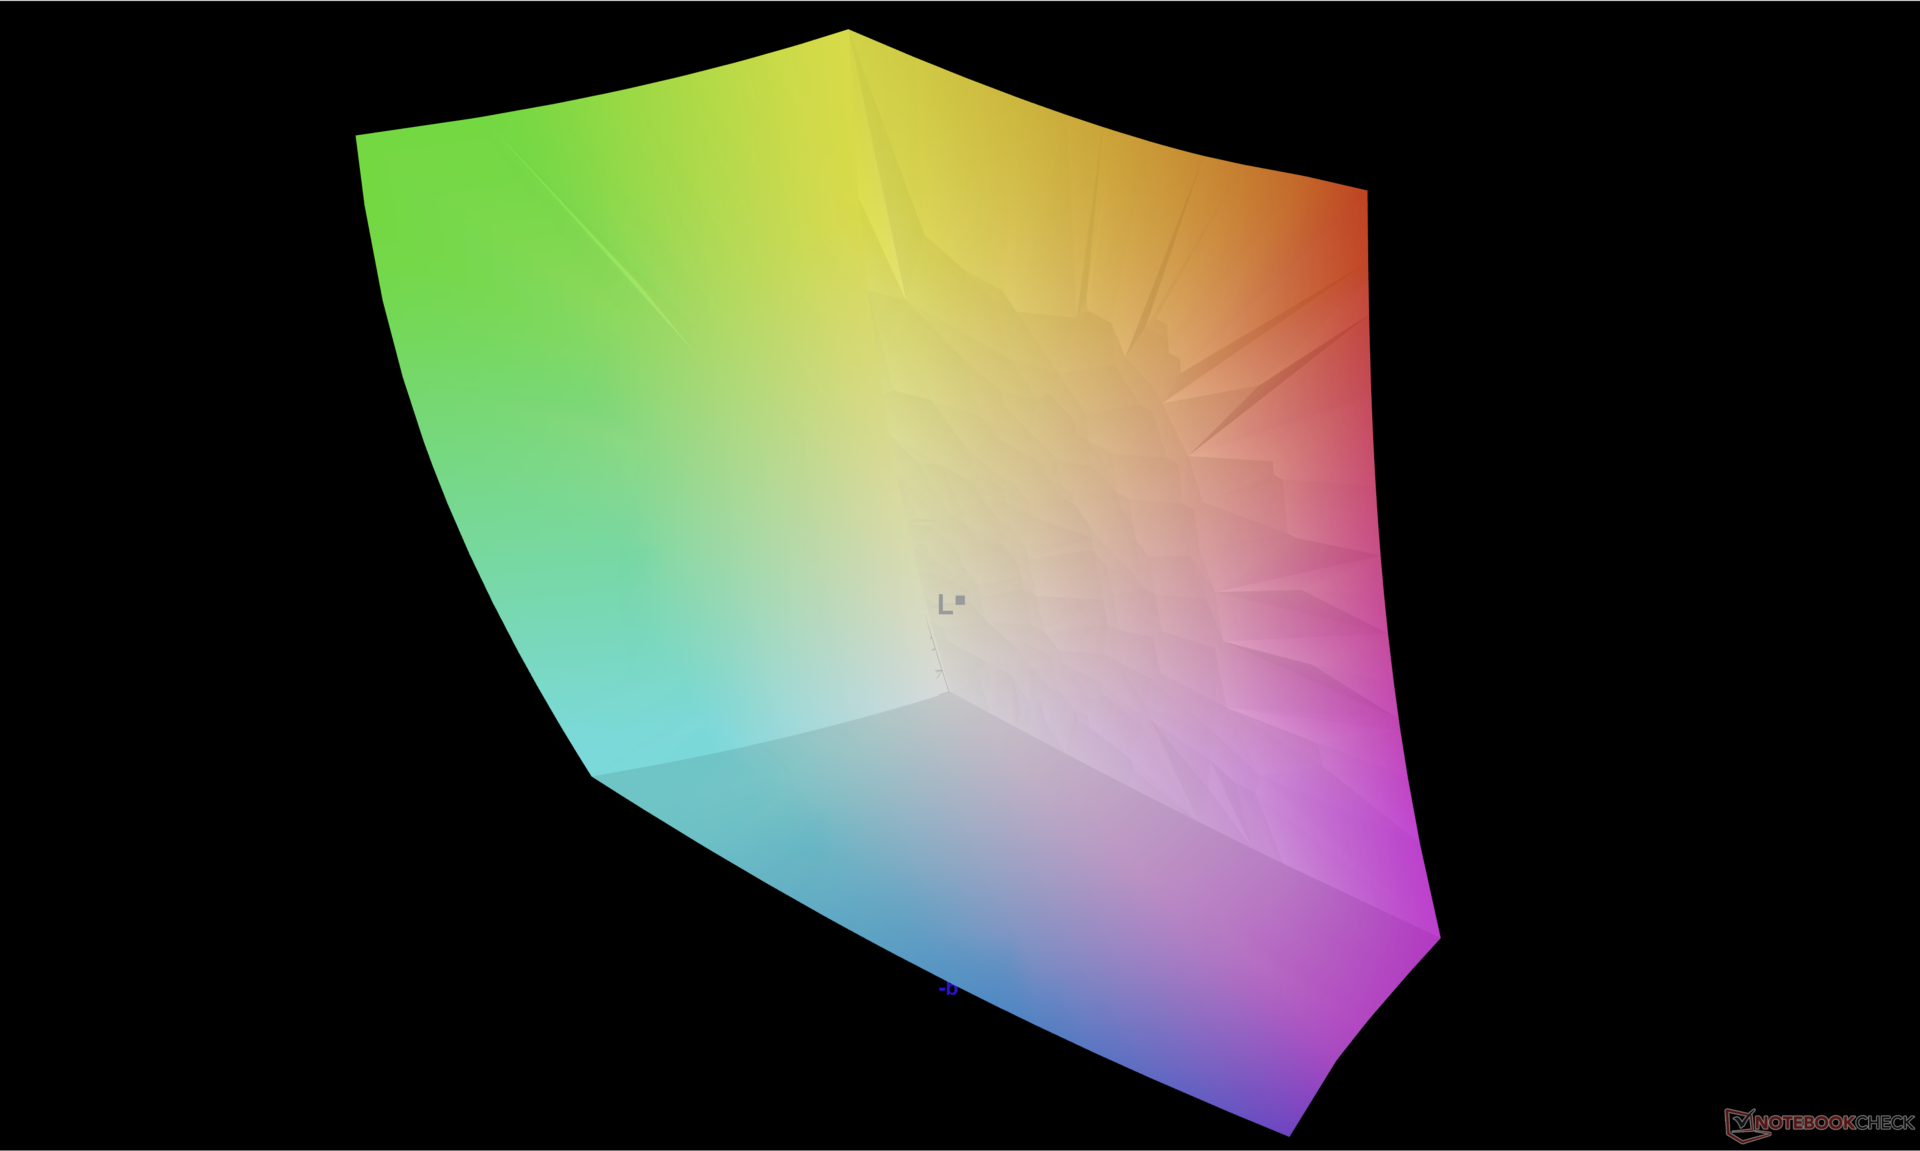
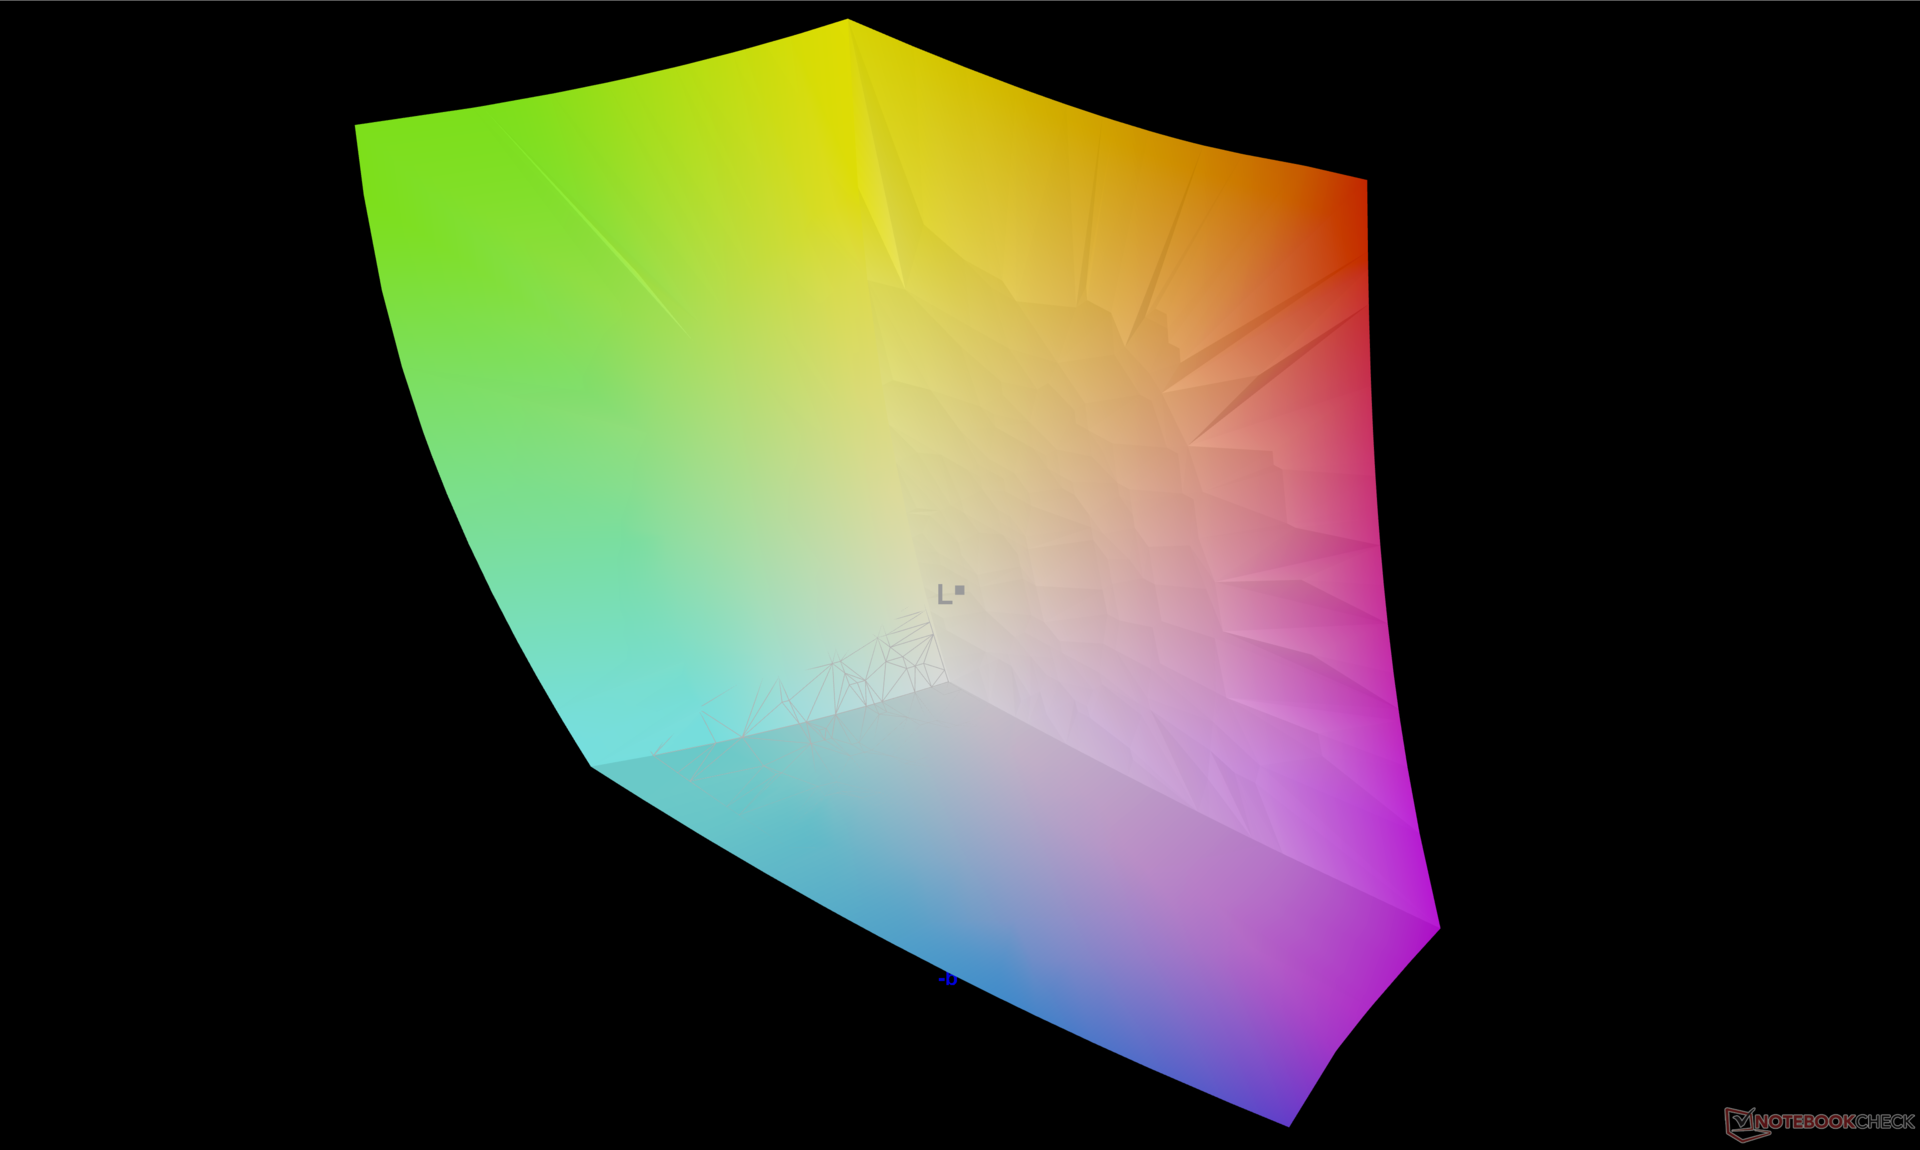
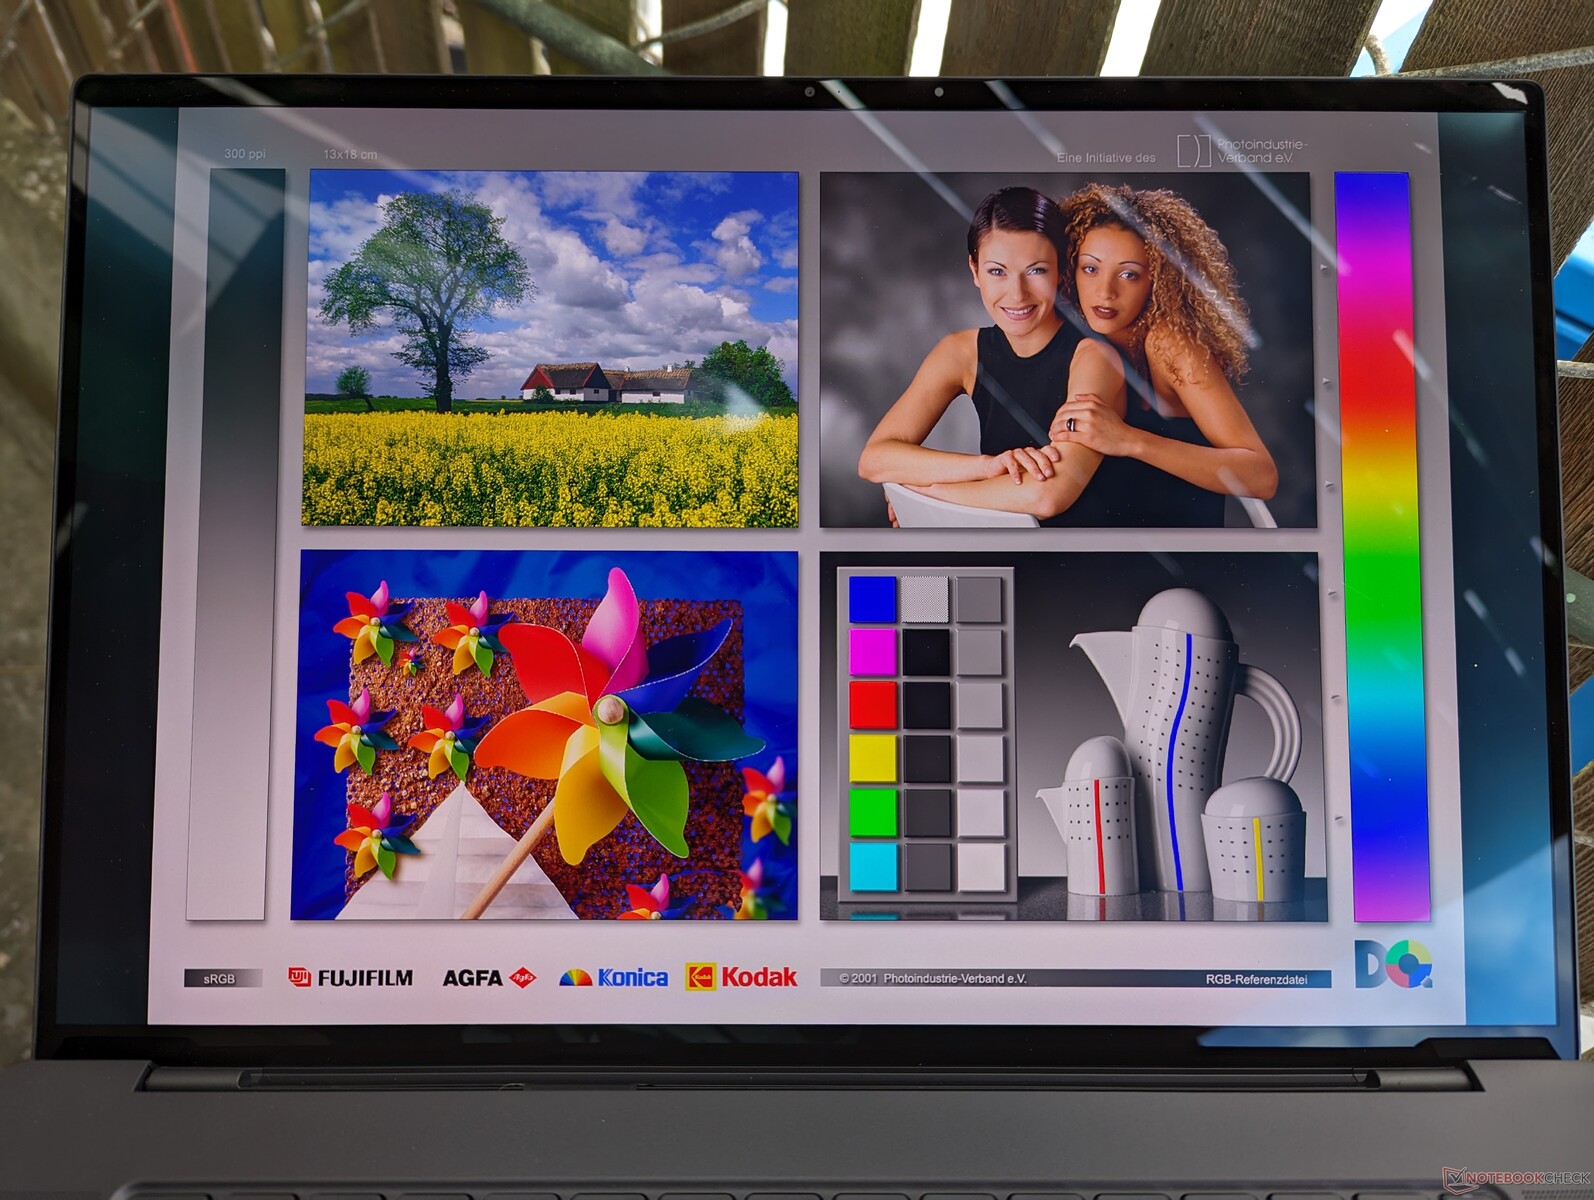
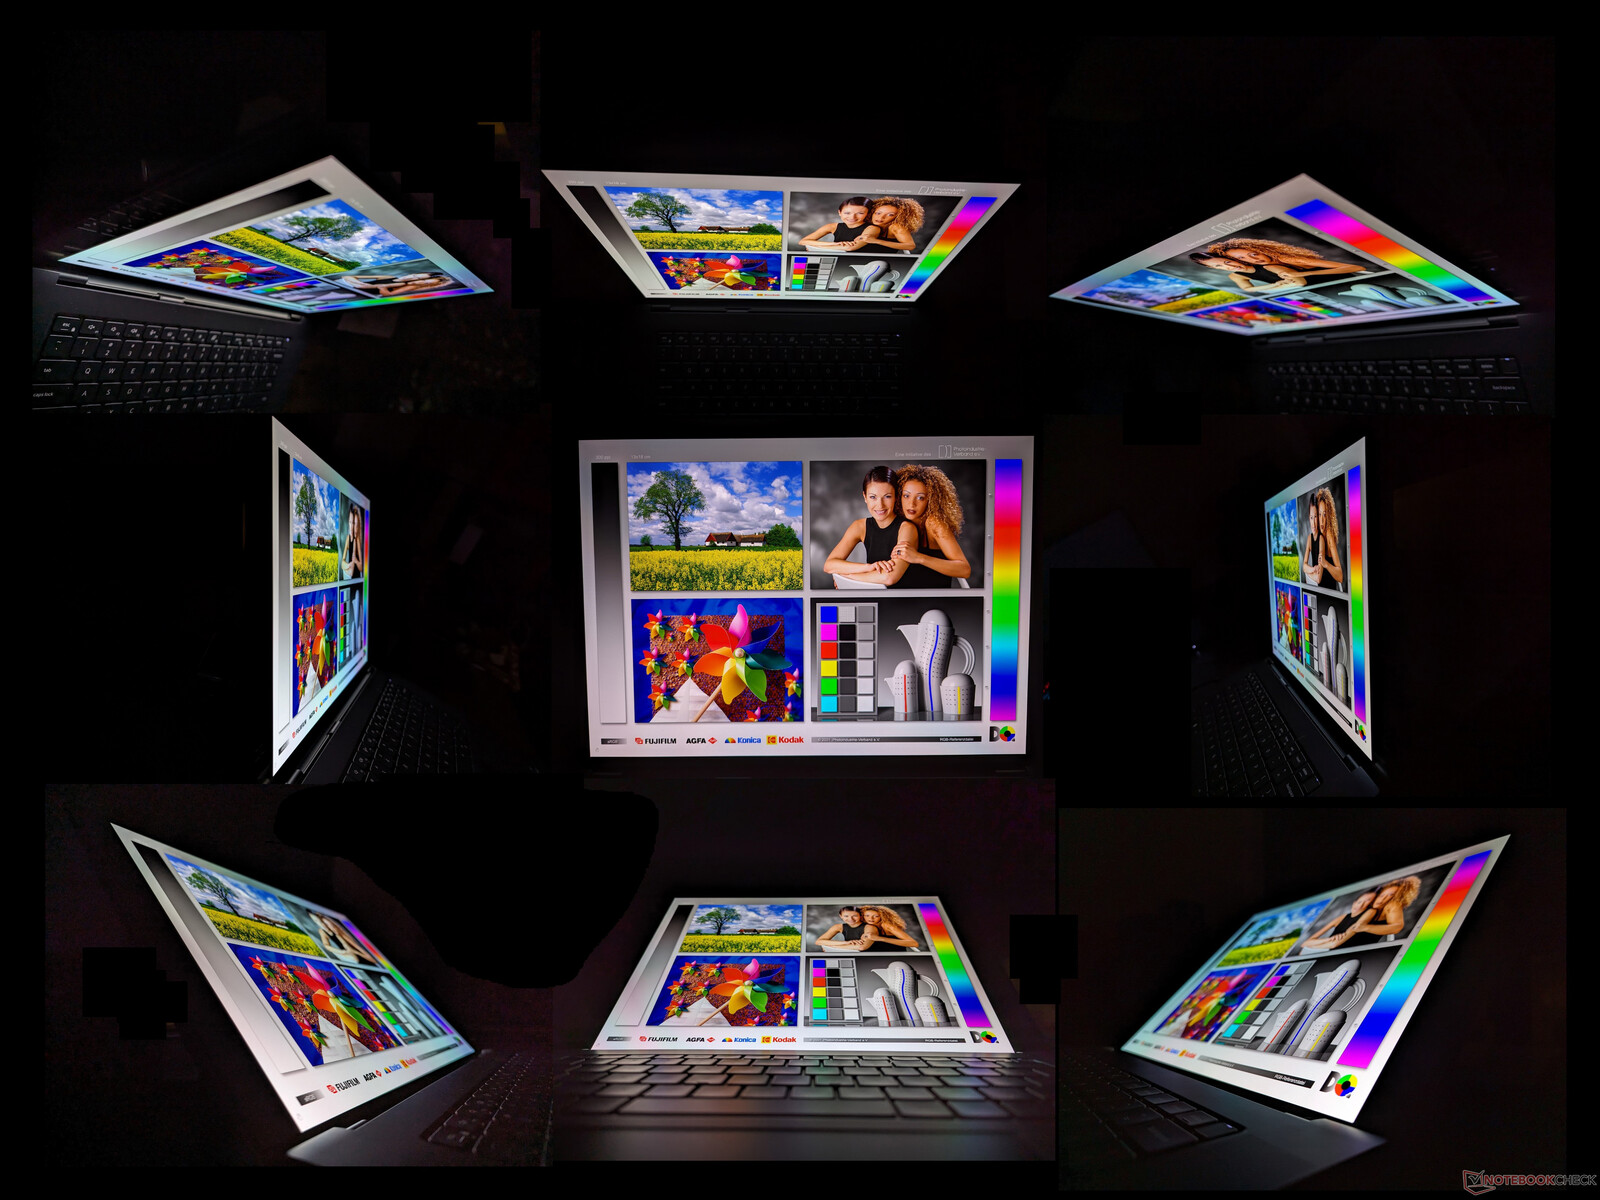
Mostrar
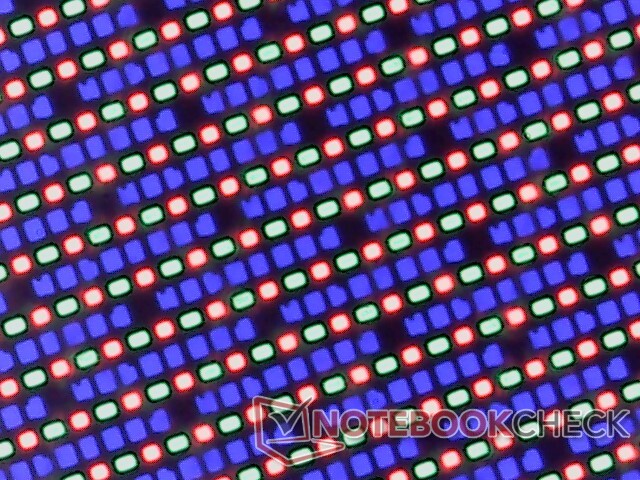
Dell emplea el mismo panel OLED Samsung 160YV03 para sus modelos de 16 pulgadas Precision 5680 y 16 pulgadas Precision 7670. Así, ambos modelos ofrecen la misma experiencia visual gracias a sus tiempos de respuesta similares, colores DCI-P3 completos e incluso niveles de brillo, como muestra la siguiente tabla comparativa. Esperemos que en un futuro próximo podamos ver algunas opciones con mayor frecuencia de refresco.
| |||||||||||||||||||||||||
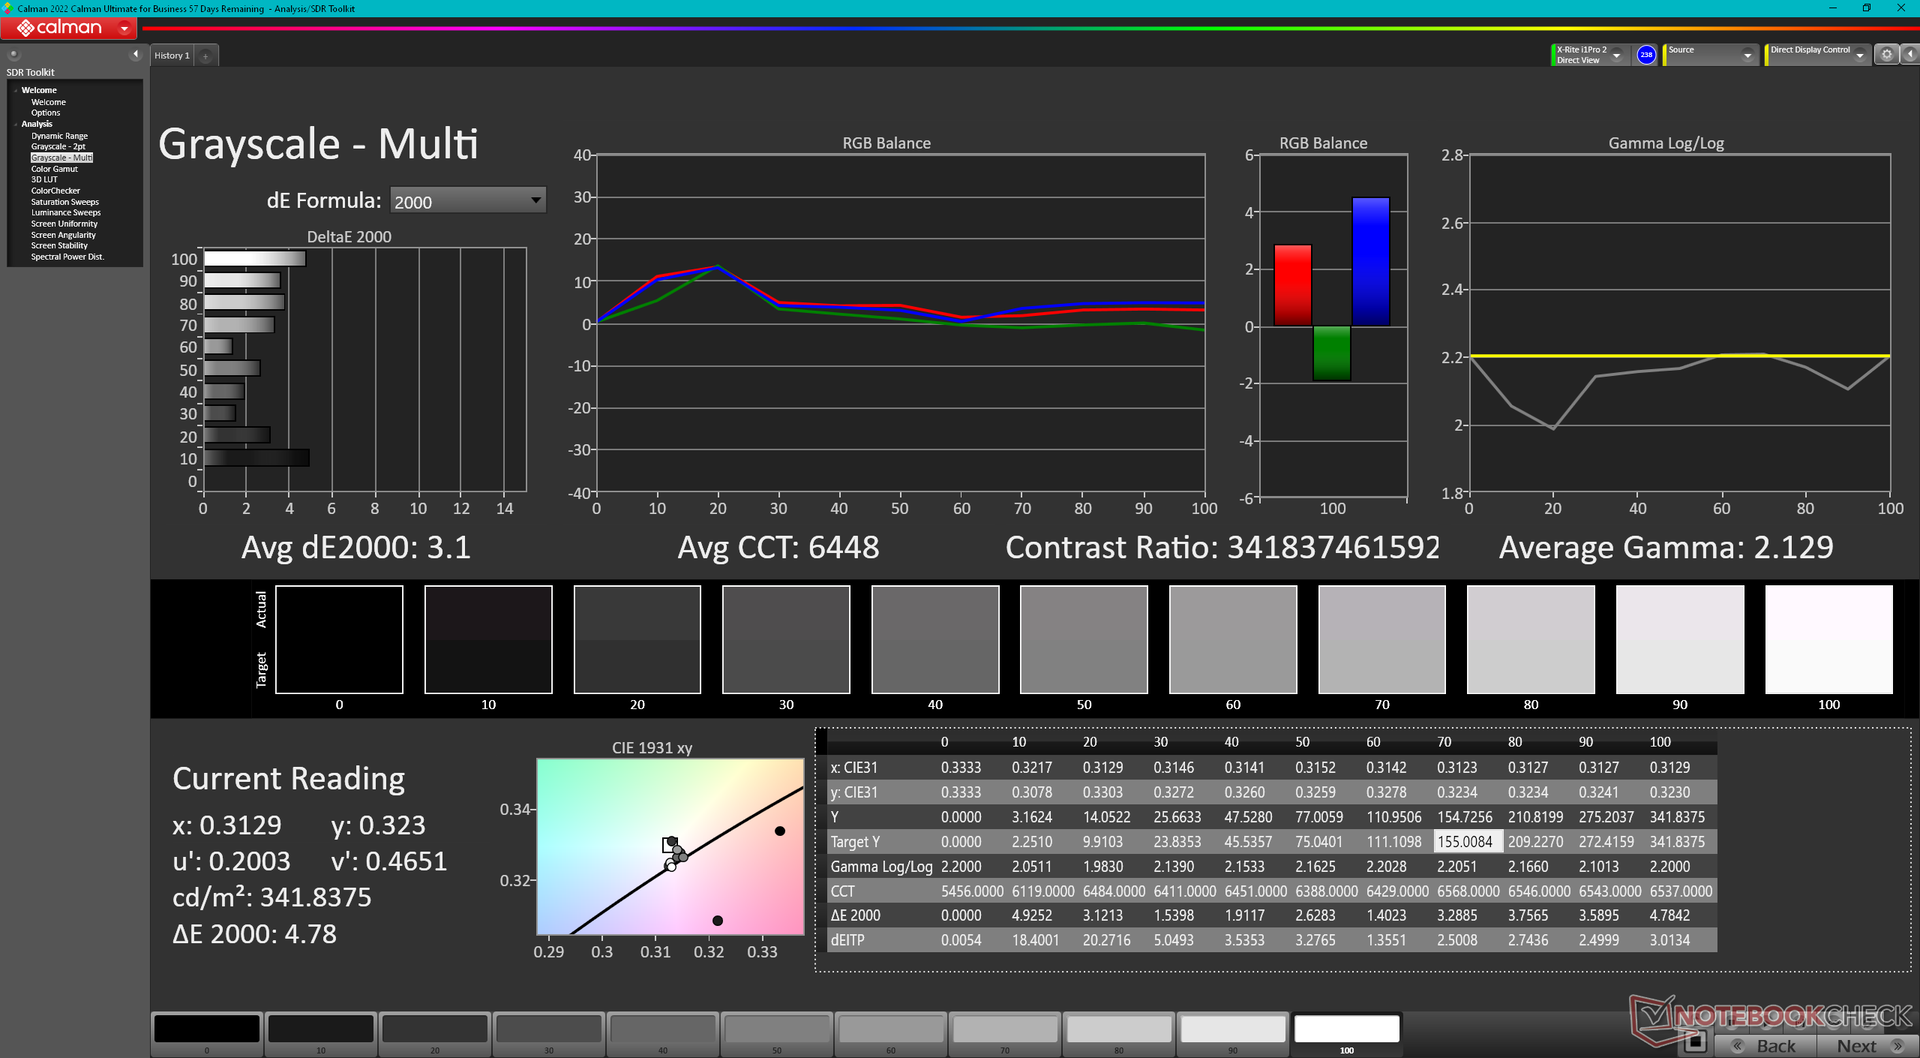
iluminación: 98 %
Brillo con batería: 345.7 cd/m²
Contraste: ∞:1 (Negro: 0 cd/m²)
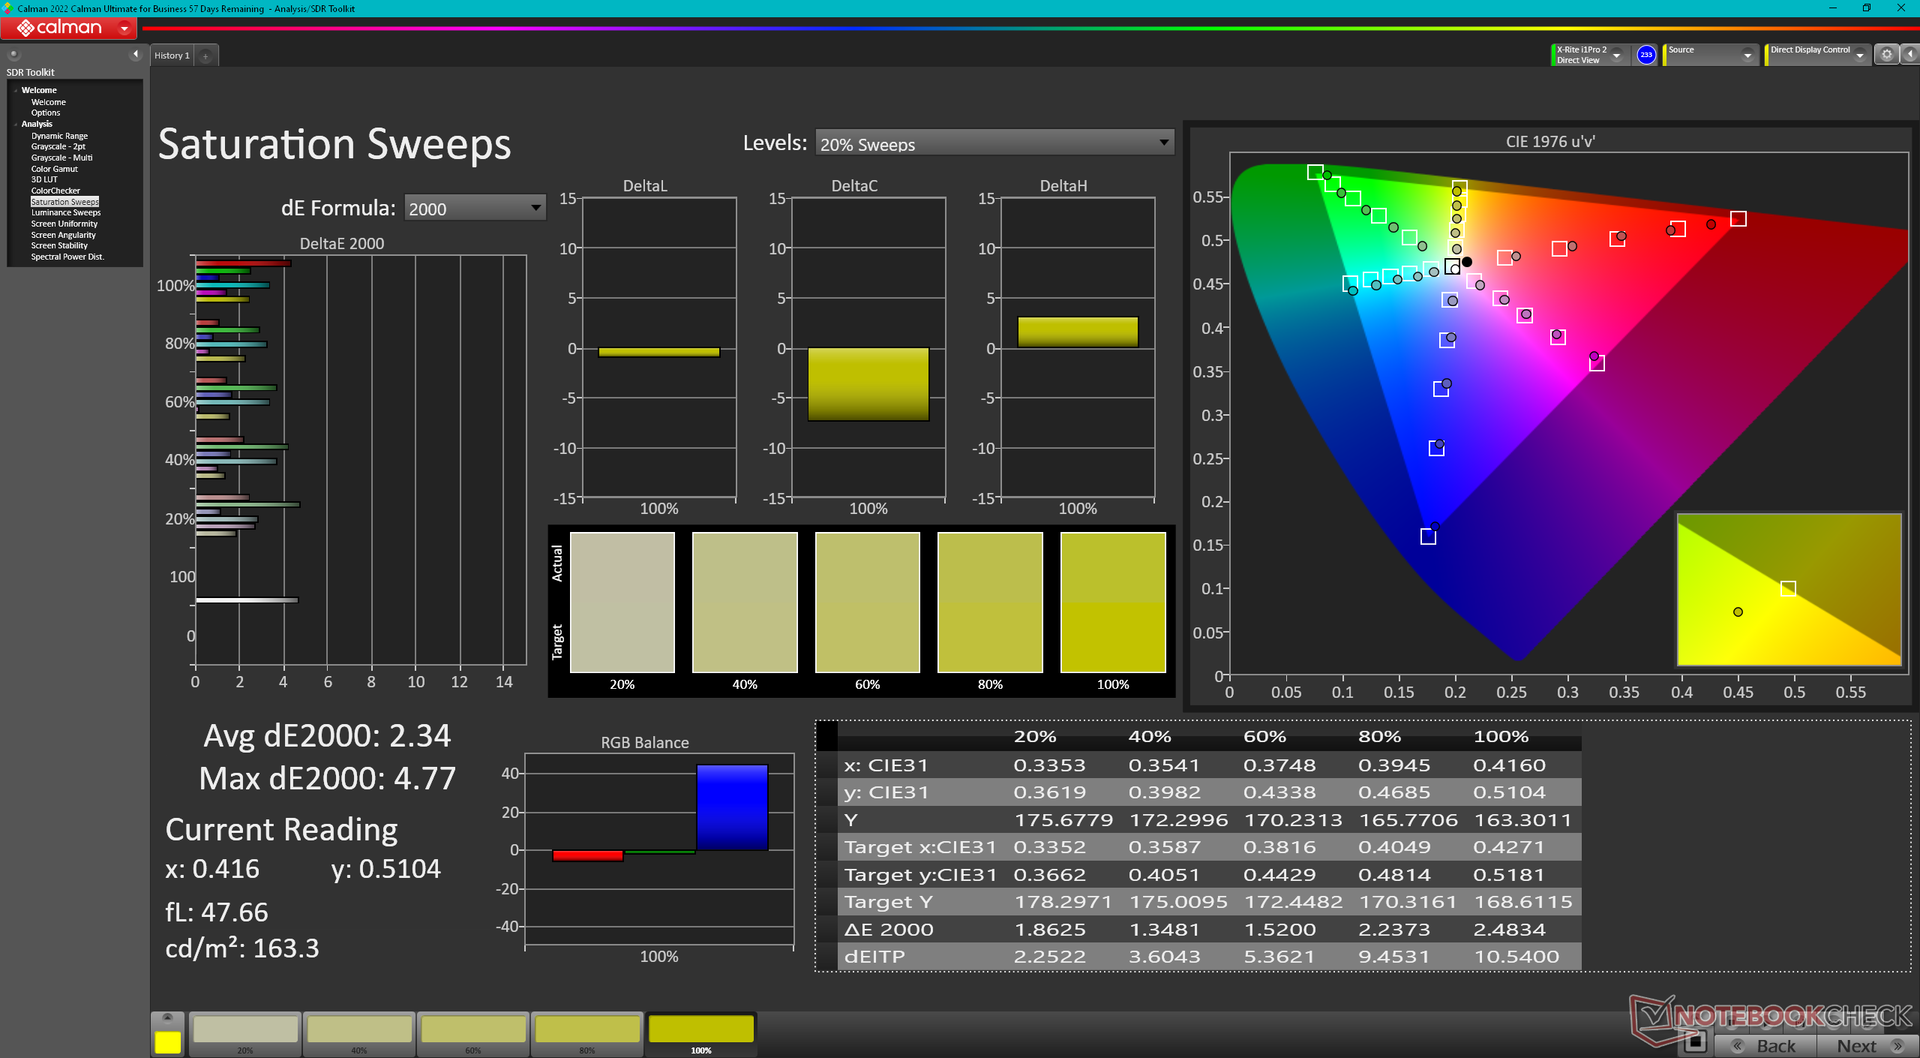
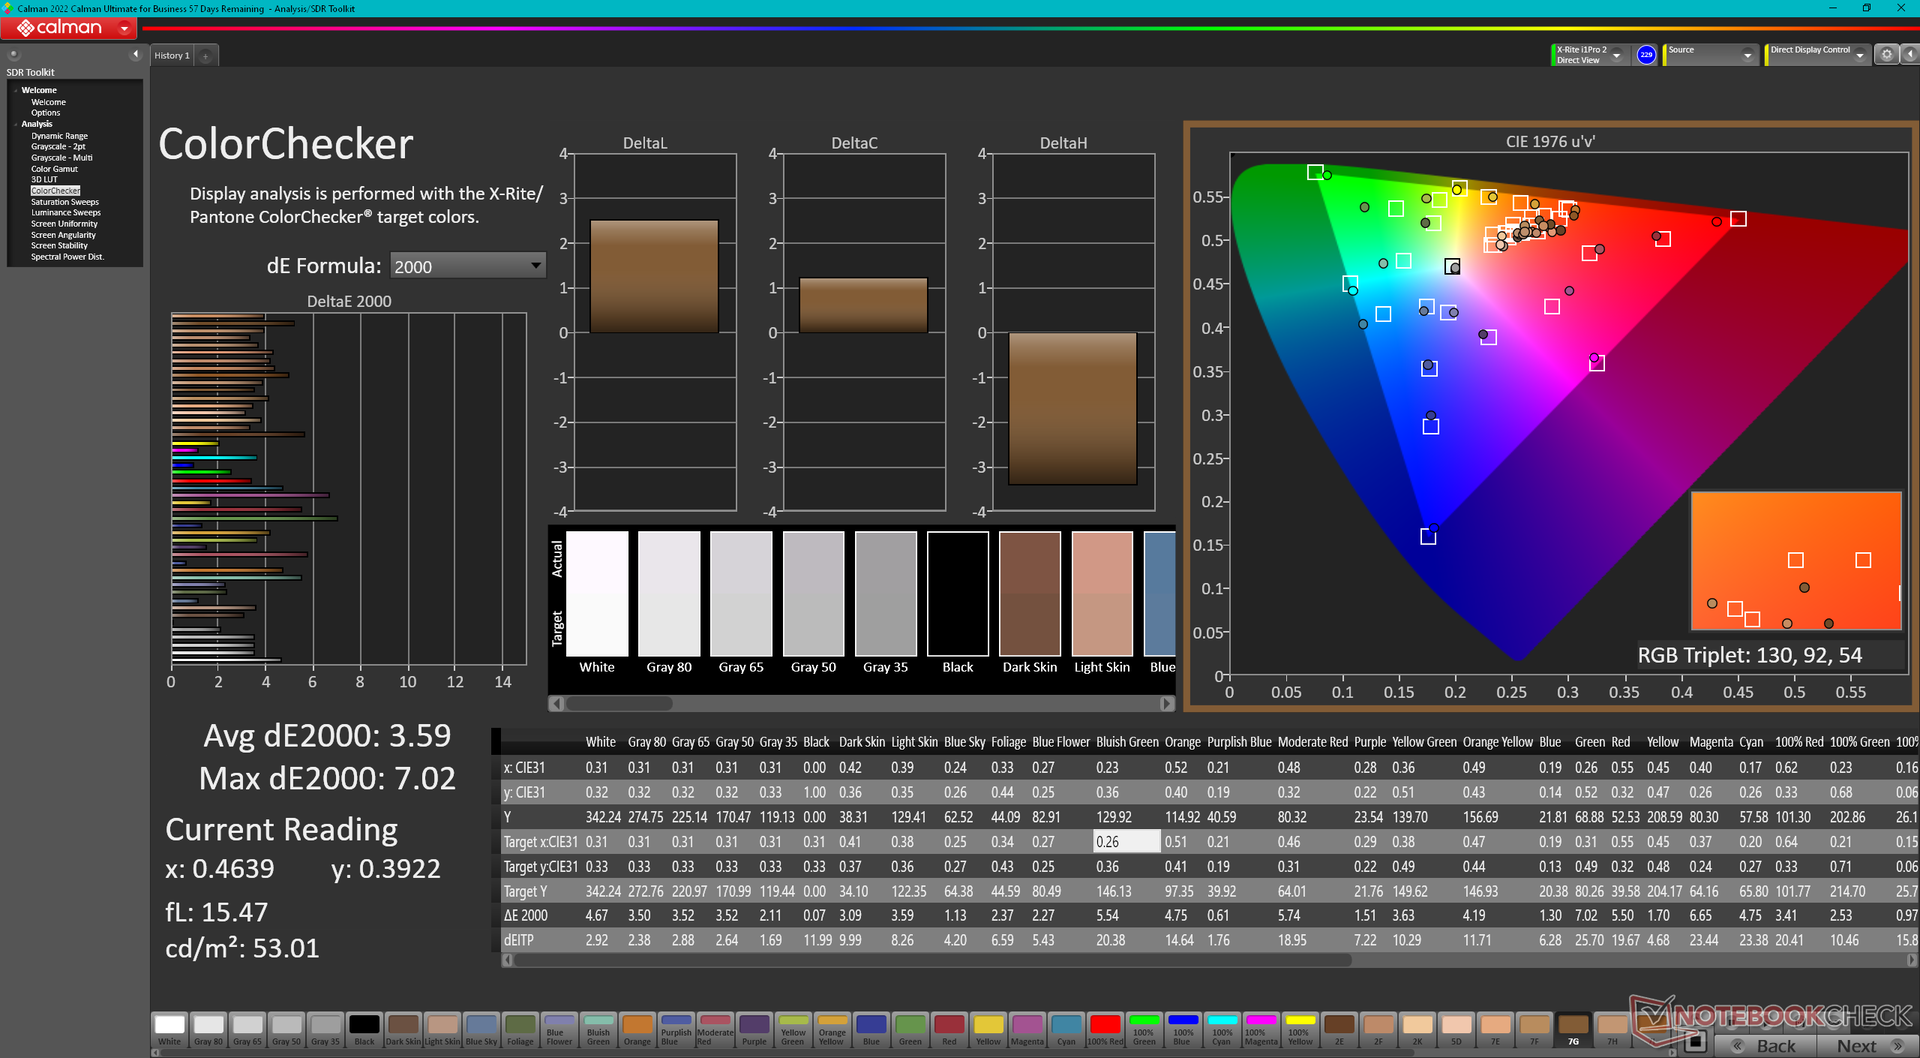
ΔE ColorChecker Calman: 3.59 | ∀{0.5-29.43 Ø4.73}
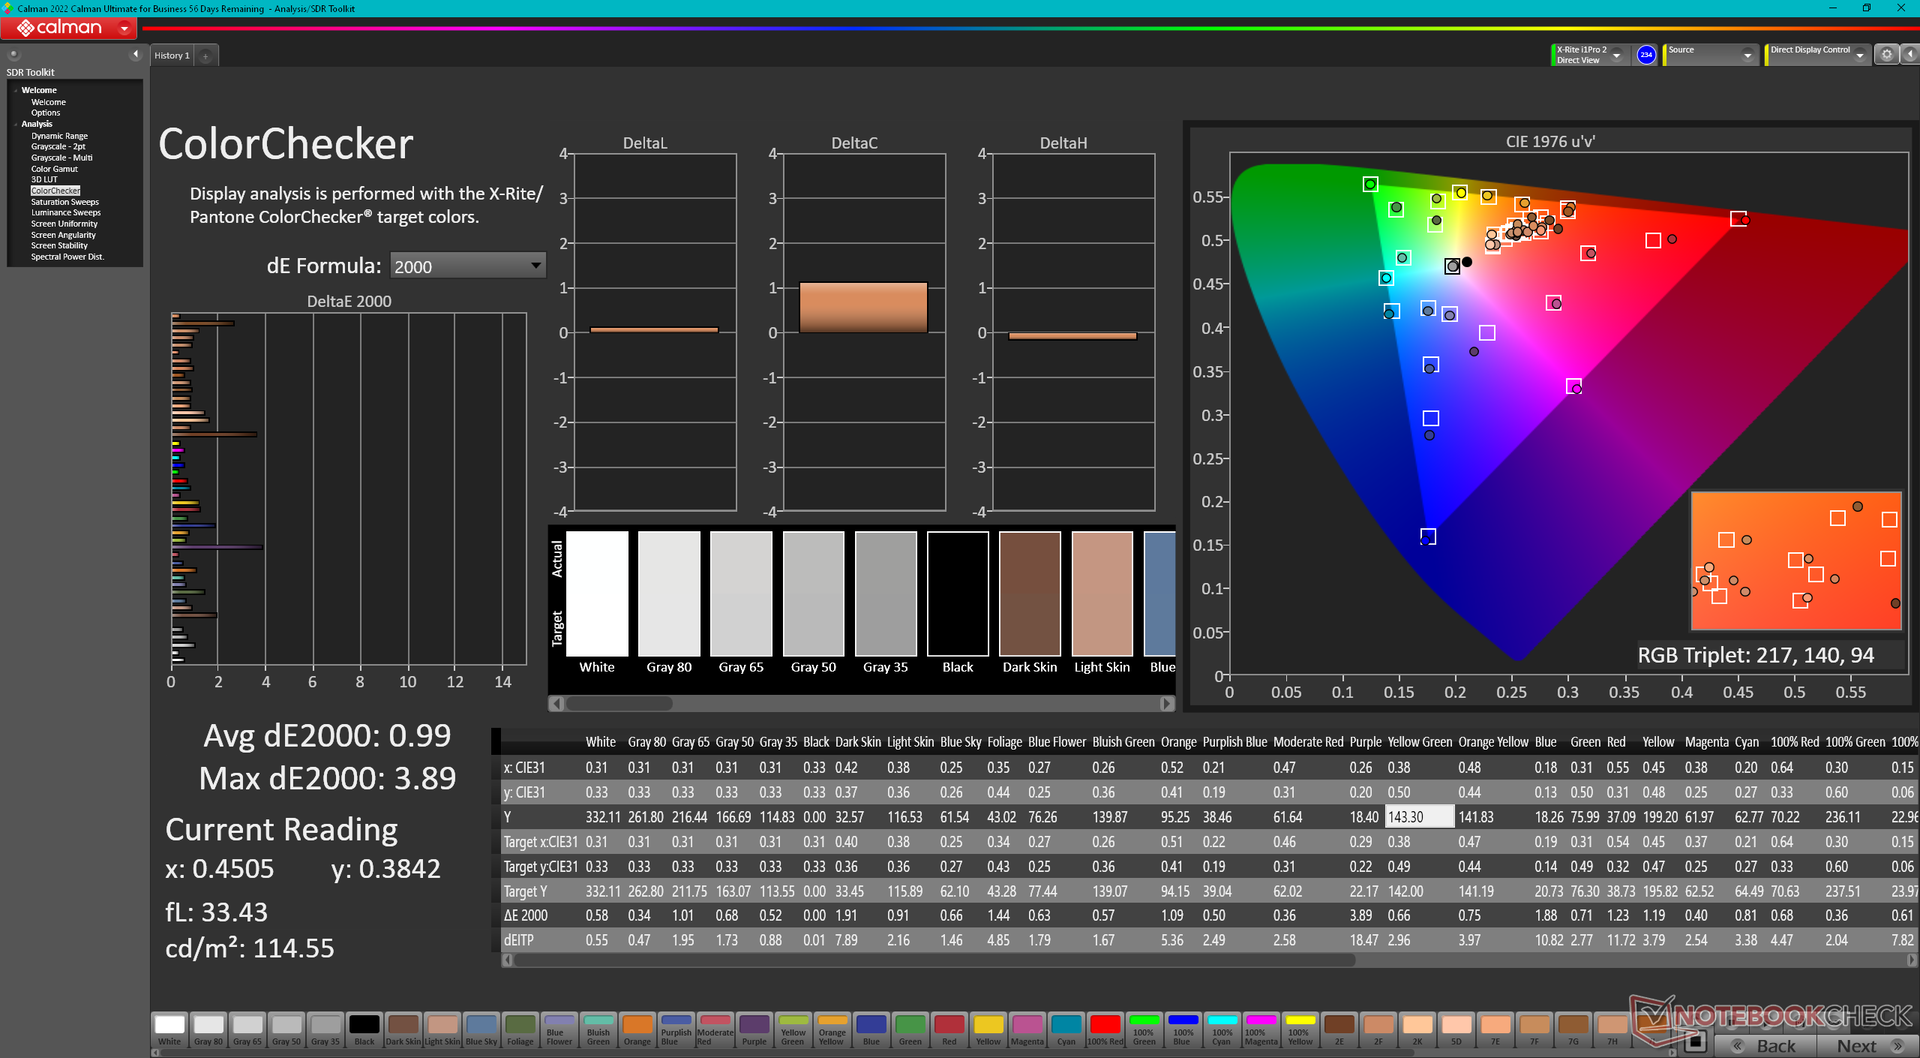
calibrated: 0.99
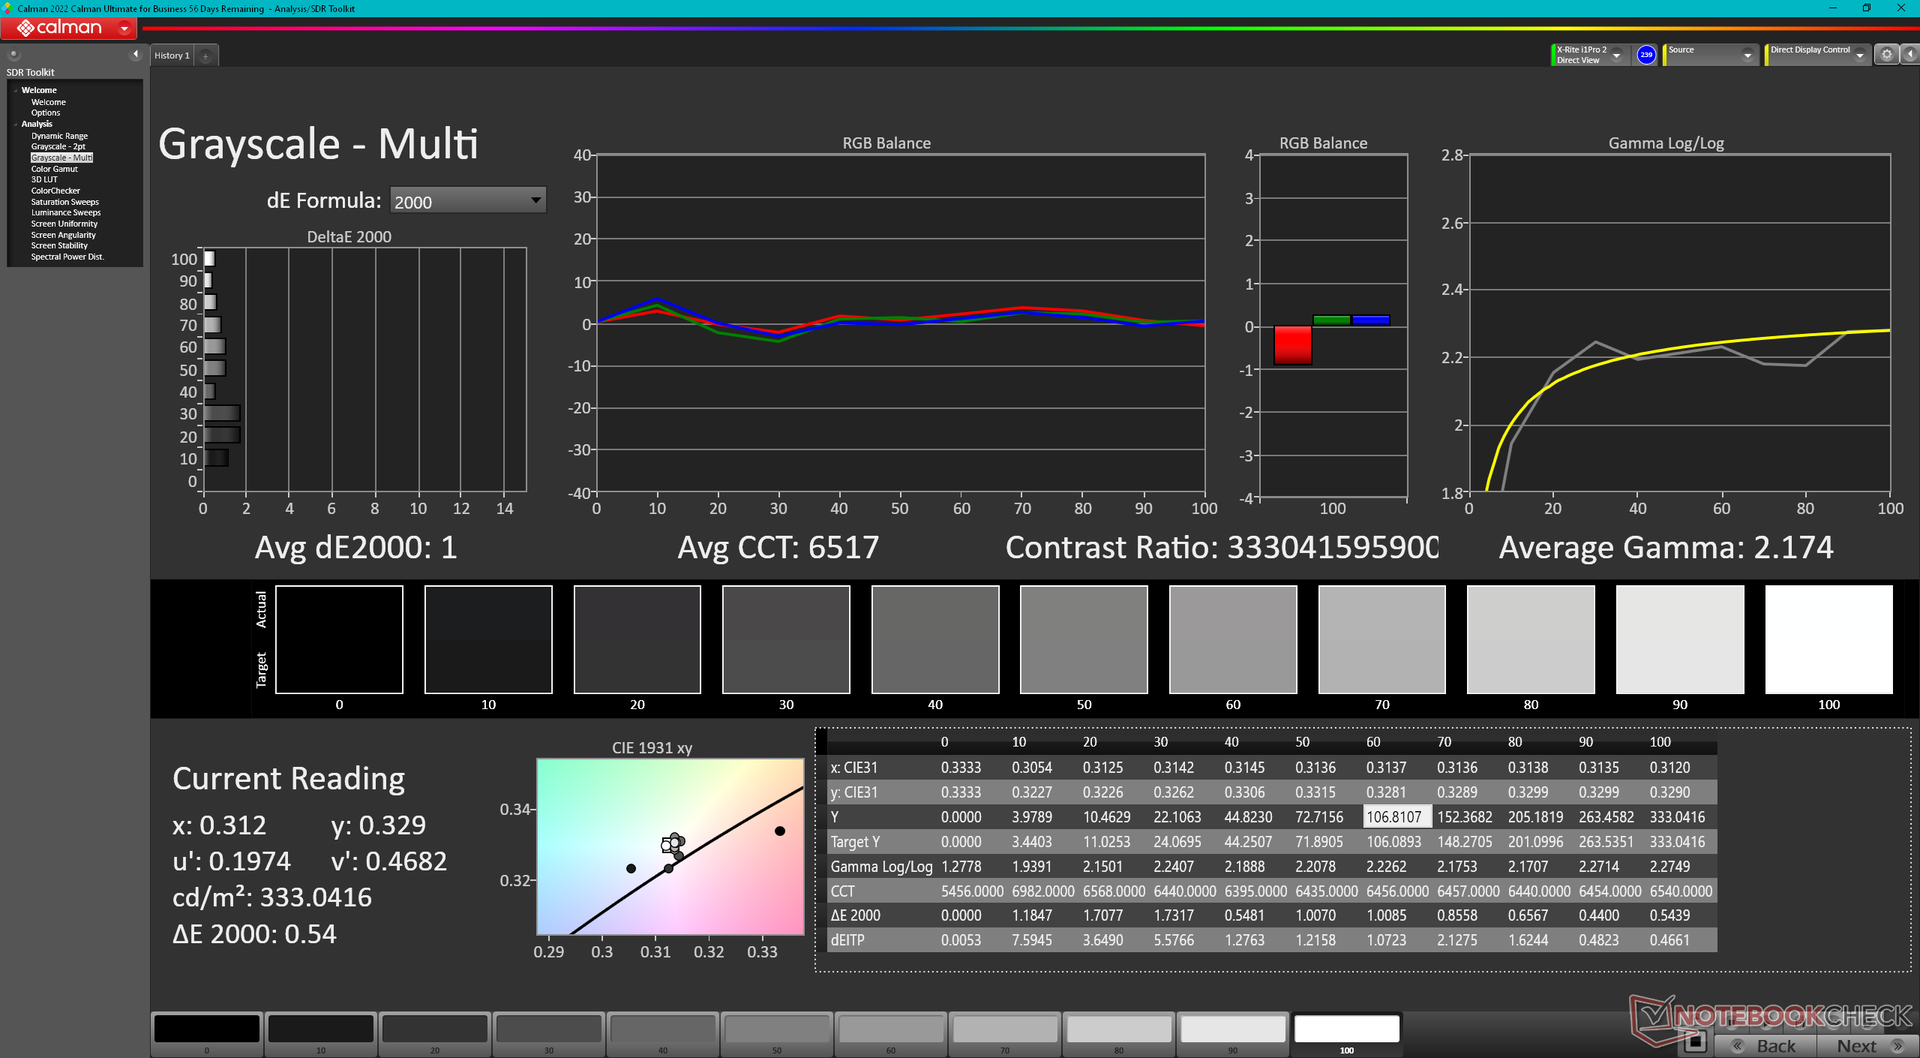
ΔE Greyscale Calman: 3.1 | ∀{0.09-98 Ø4.97}
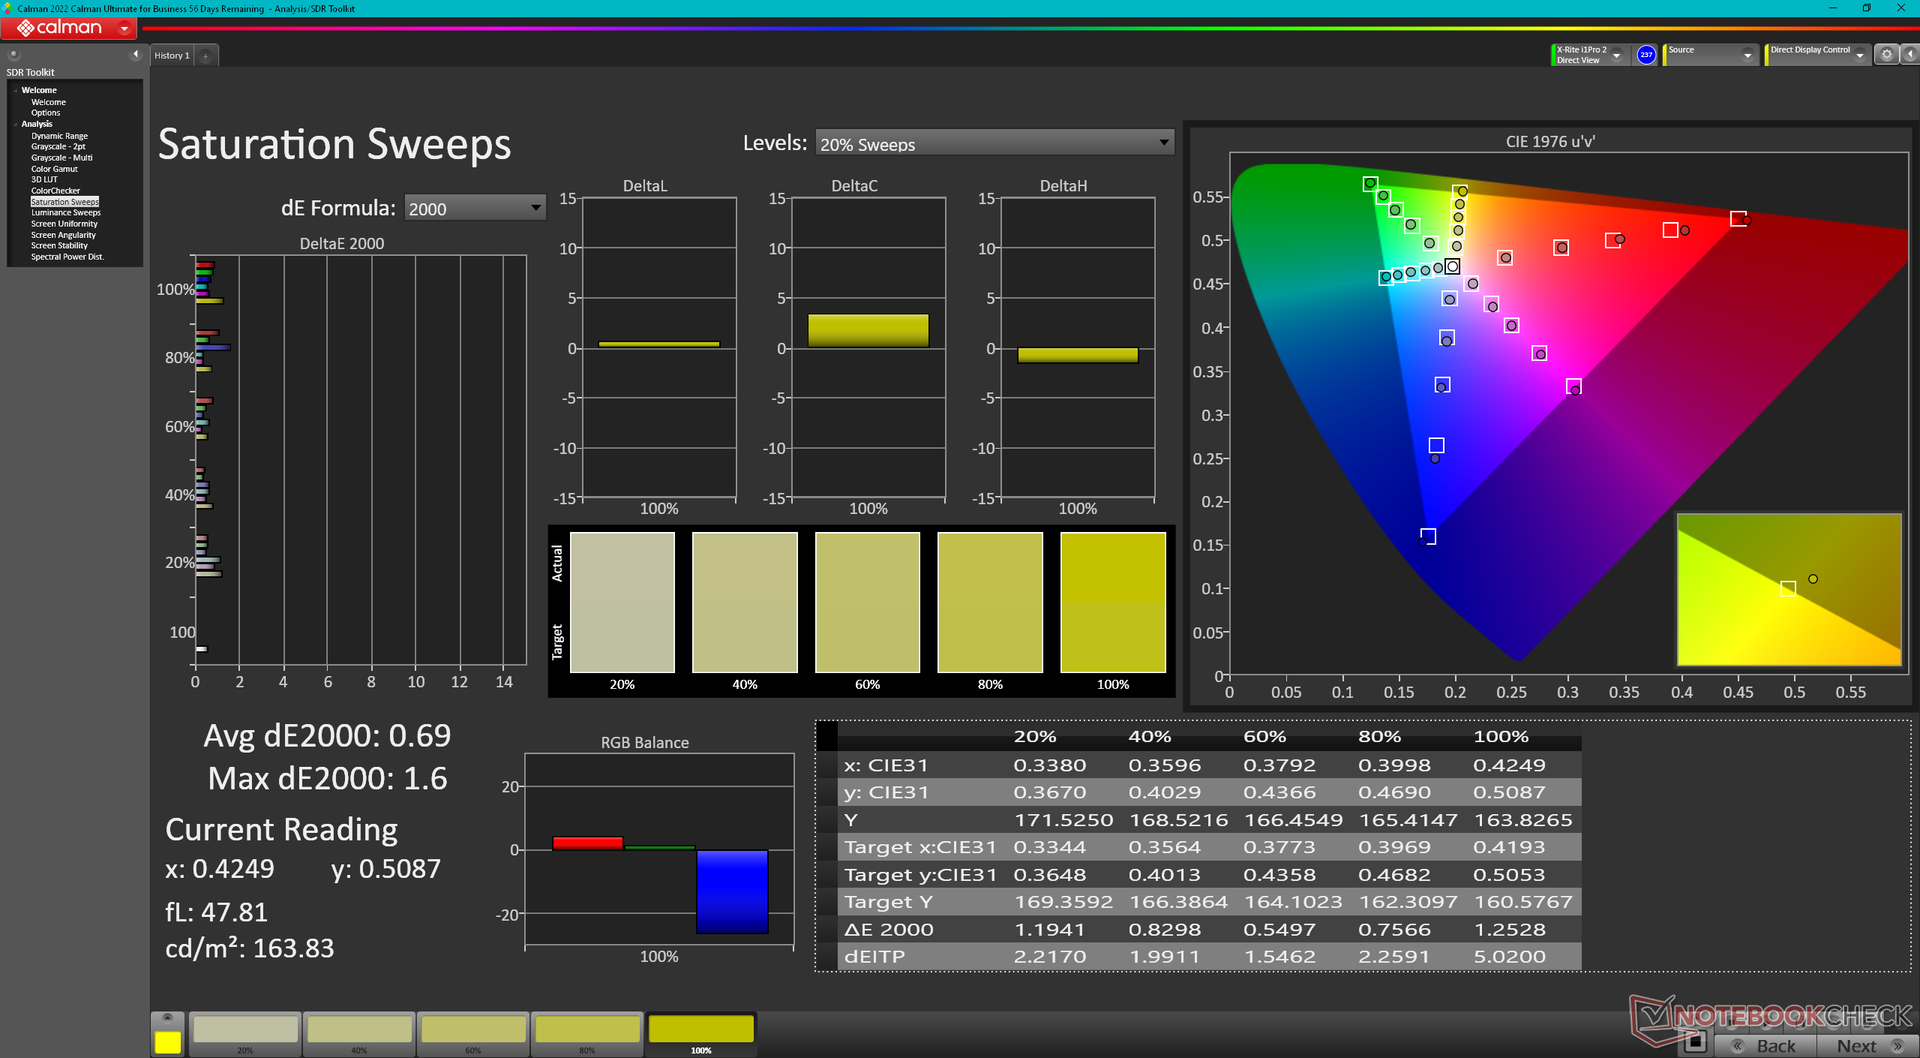
97.5% AdobeRGB 1998 (Argyll 3D)
100% sRGB (Argyll 3D)
99.9% Display P3 (Argyll 3D)
Gamma: 2.13
CCT: 6448 K
| Dell Precision 5000 5680 Samsung 160YV03, OLED, 3840x2400, 16" | Dell Precision 7000 7670 Performance Samsung 160YV03, OLED, 3840x2400, 16" | HP ZBook Fury 16 G9 BOE0A52, IPS, 3840x2400, 16" | Lenovo ThinkPad P16 G1 RTX A5500 LP160UQ1-SPB1, IPS, 3840x2400, 16" | MSI CreatorPro Z16P B12UKST B160QAN02.N, IPS, 2560x1600, 16" | Asus ExpertBook B6 Flip B6602FC2 AU Optronics Model: AUOE495, IPS, 2560x1600, 16" | |
|---|---|---|---|---|---|---|
| Display | 0% | -5% | -7% | -4% | -5% | |
| Display P3 Coverage (%) | 99.9 | 99.9 0% | 97.4 -3% | 82.9 -17% | 97.6 -2% | 97.9 -2% |
| sRGB Coverage (%) | 100 | 100 0% | 99.9 0% | 98.9 -1% | 99.9 0% | 99.89 0% |
| AdobeRGB 1998 Coverage (%) | 97.5 | 98.1 1% | 86.3 -11% | 95.9 -2% | 87.4 -10% | 85.52 -12% |
| Response Times | -9% | -551% | -2297% | -490% | -1452% | |
| Response Time Grey 50% / Grey 80% * (ms) | 1.68 ? | 1.84 ? -10% | 13.7 ? -715% | 45.6 ? -2614% | 12.8 ? -662% | 36 ? -2043% |
| Response Time Black / White * (ms) | 1.77 ? | 1.92 ? -8% | 8.6 ? -386% | 36.8 ? -1979% | 7.4 ? -318% | 17 ? -860% |
| PWM Frequency (Hz) | 60 ? | 59.52 ? | ||||
| Screen | -5% | -33% | 33% | 30% | -6% | |
| Brightness middle (cd/m²) | 345.7 | 325.2 -6% | 530.5 53% | 601.9 74% | 407 18% | 440 27% |
| Brightness (cd/m²) | 349 | 328 -6% | 476 36% | 569 63% | 388 11% | 418 20% |
| Brightness Distribution (%) | 98 | 97 -1% | 83 -15% | 77 -21% | 88 -10% | 82 -16% |
| Black Level * (cd/m²) | 0.57 | 0.47 | 0.36 | 0.3 | ||
| Colorchecker dE 2000 * | 3.59 | 4.59 -28% | 2.26 37% | 2.45 32% | 1.3 64% | 2.81 22% |
| Colorchecker dE 2000 max. * | 7.02 | 7.65 -9% | 4.46 36% | 2.5 64% | 4.62 34% | |
| Colorchecker dE 2000 calibrated * | 0.99 | 4.73 -378% | 0.7 29% | 2.99 -202% | ||
| Greyscale dE 2000 * | 3.1 | 2.5 19% | 1 68% | 2.6 16% | 2.1 32% | 0.91 71% |
| Gamma | 2.13 103% | 2.1 105% | 2.28 96% | 2.3 96% | 2.26 97% | 2.2 100% |
| CCT | 6448 101% | 6541 99% | 6543 99% | 6805 96% | 6437 101% | 6600 98% |
| Contrast (:1) | 931 | 1281 | 1131 | 1467 | ||
| Media total (Programa/Opciones) | -5% /
-4% | -196% /
-119% | -757% /
-401% | -155% /
-65% | -488% /
-247% |
* ... más pequeño es mejor
La pantalla está bien calibrada desde el primer momento, con valores deltaE medios de entre 3 y 4. Puedes descargar gratuitamente nuestro perfil ICM calibrado.
Tiempos de respuesta del display
| ↔ Tiempo de respuesta de Negro a Blanco | ||
|---|---|---|
| 1.77 ms ... subida ↗ y bajada ↘ combinada | ↗ 0.8 ms subida | 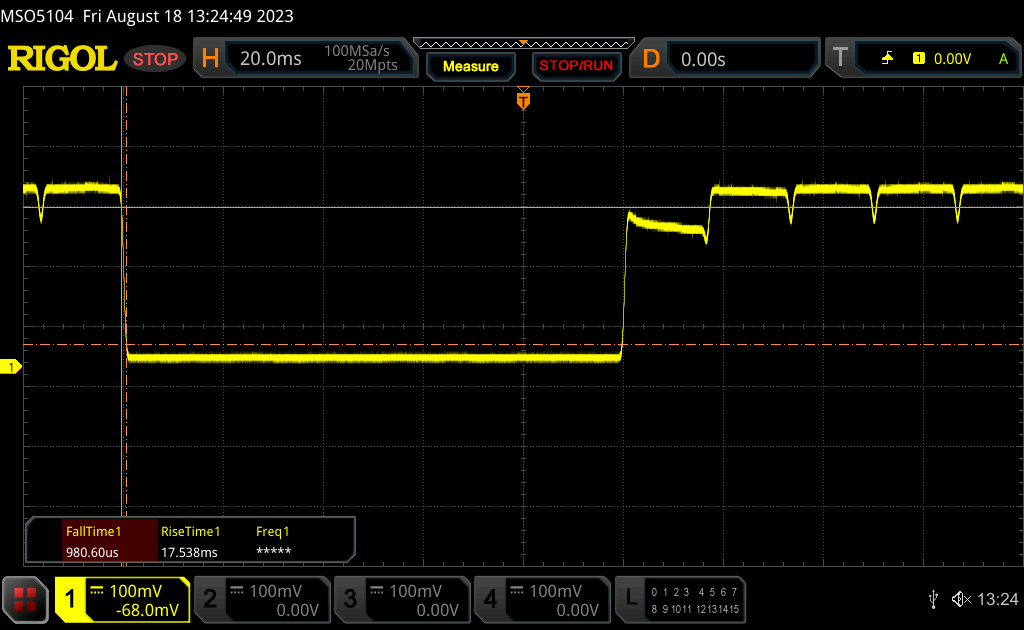 |
| ↘ 0.97 ms bajada | ||
| La pantalla mostró tiempos de respuesta muy rápidos en nuestros tests y debería ser adecuada para juegos frenéticos. En comparación, todos los dispositivos de prueba van de ##min### (mínimo) a 240 (máximo) ms. » 10 % de todos los dispositivos son mejores. Esto quiere decir que el tiempo de respuesta medido es mejor que la media (19.9 ms) de todos los dispositivos testados. | ||
| ↔ Tiempo de respuesta 50% Gris a 80% Gris | ||
| 1.68 ms ... subida ↗ y bajada ↘ combinada | ↗ 0.97 ms subida | 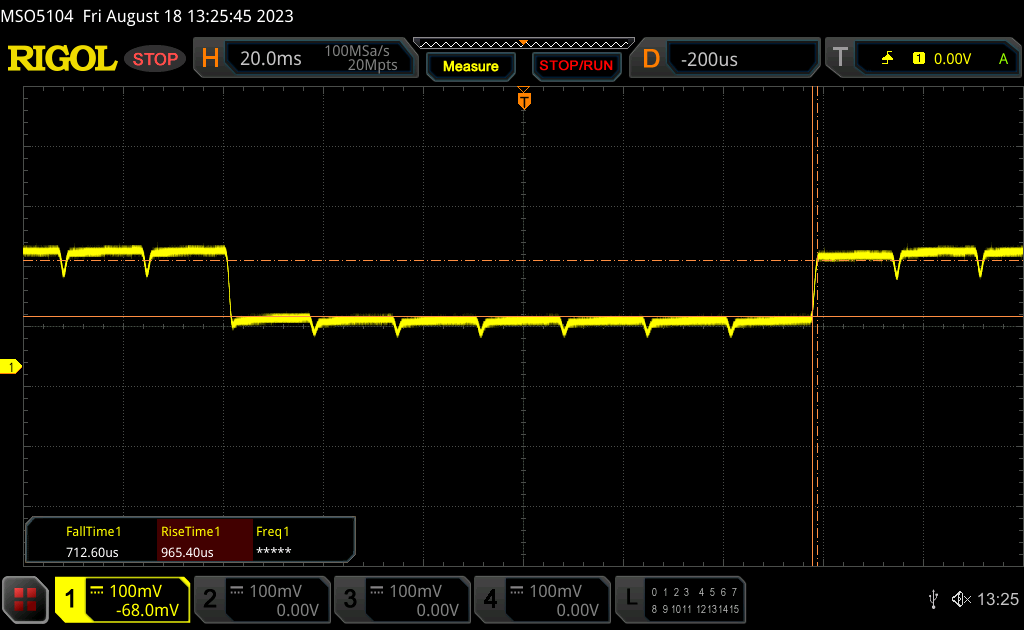 |
| ↘ 0.71 ms bajada | ||
| La pantalla mostró tiempos de respuesta muy rápidos en nuestros tests y debería ser adecuada para juegos frenéticos. En comparación, todos los dispositivos de prueba van de ##min### (mínimo) a 636 (máximo) ms. » 8 % de todos los dispositivos son mejores. Esto quiere decir que el tiempo de respuesta medido es mejor que la media (31.1 ms) de todos los dispositivos testados. | ||
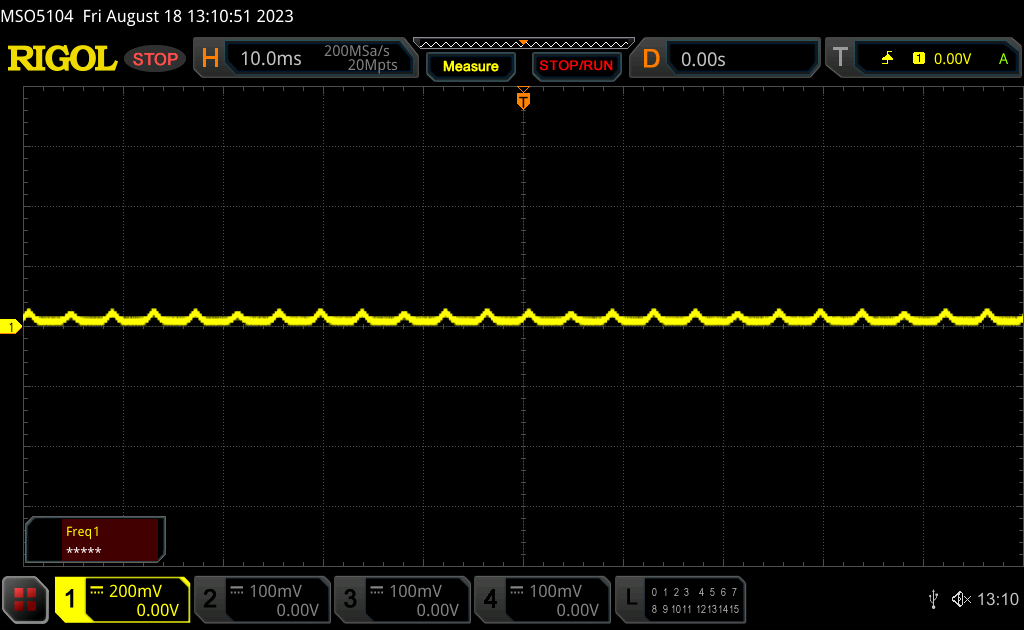
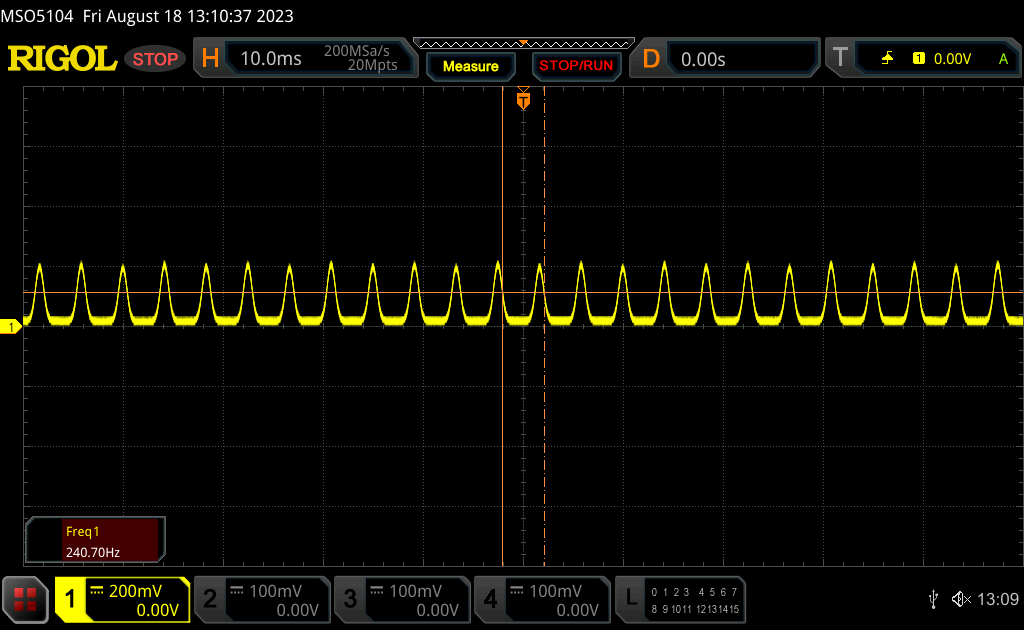
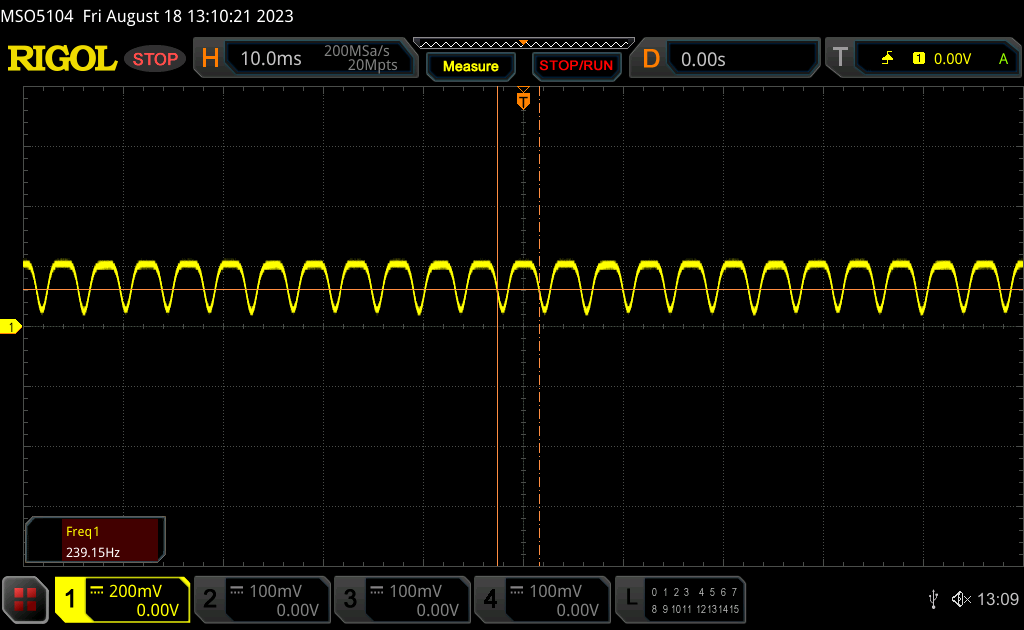
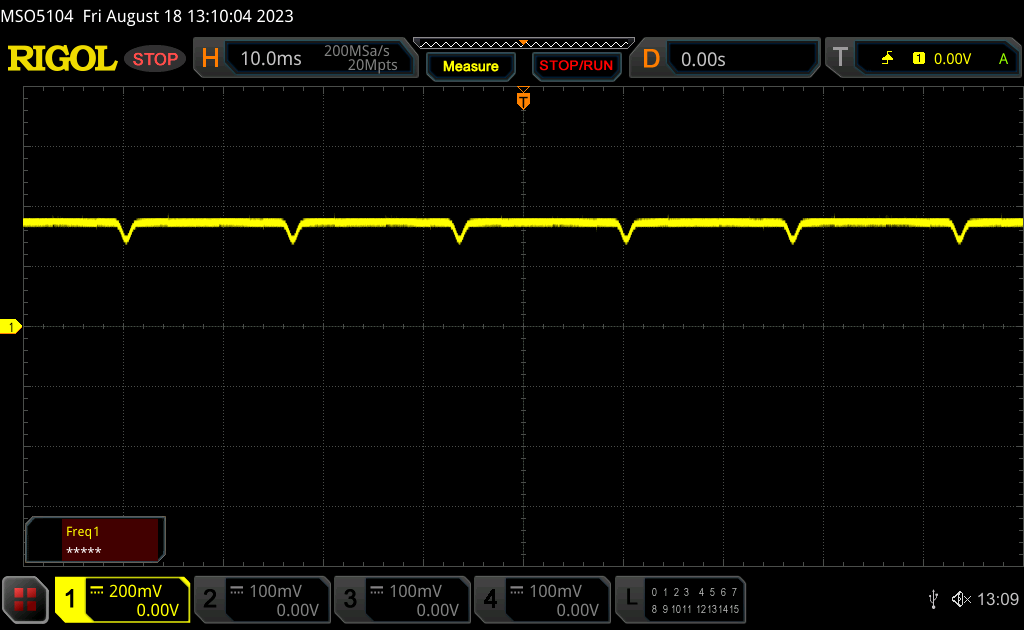
Parpadeo de Pantalla / PWM (Pulse-Width Modulation)
| Parpadeo de Pantalla / PWM detectado | 60 Hz | ≤ 100 % de brillo | 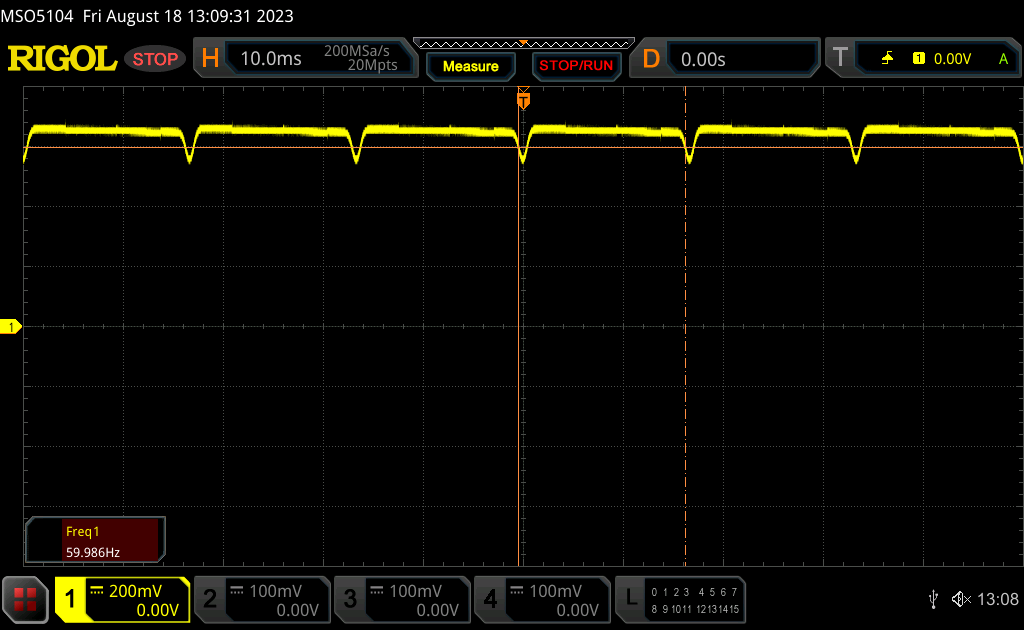 |
La retroiluminación del display parpadea a 60 Hz (seguramente usa PWM - Pulse-Width Modulation) a un brillo del 100 % e inferior. Sobre este nivel de brillo no debería darse parpadeo / PWM. La frecuencia de 60 Hz es bajísima, por lo que el parpadeo puede causar fatiga visual y cefaleas cuando se usa mucho tiempo. Comparación: 52 % de todos los dispositivos testados no usaron PWM para atenuar el display. Si se usó, medimos una media de 7784 (mínimo: 5 - máxmo: 343500) Hz. | |||
El parpadeo está presente en todos los niveles de brillo, similar al de los smartphones y otros portátiles equipados con paneles OLED. La frecuencia sería estable a 239 Hz de 0 a 54 por ciento de brillo y a 60 Hz de 55 a 100 por ciento de brillo.
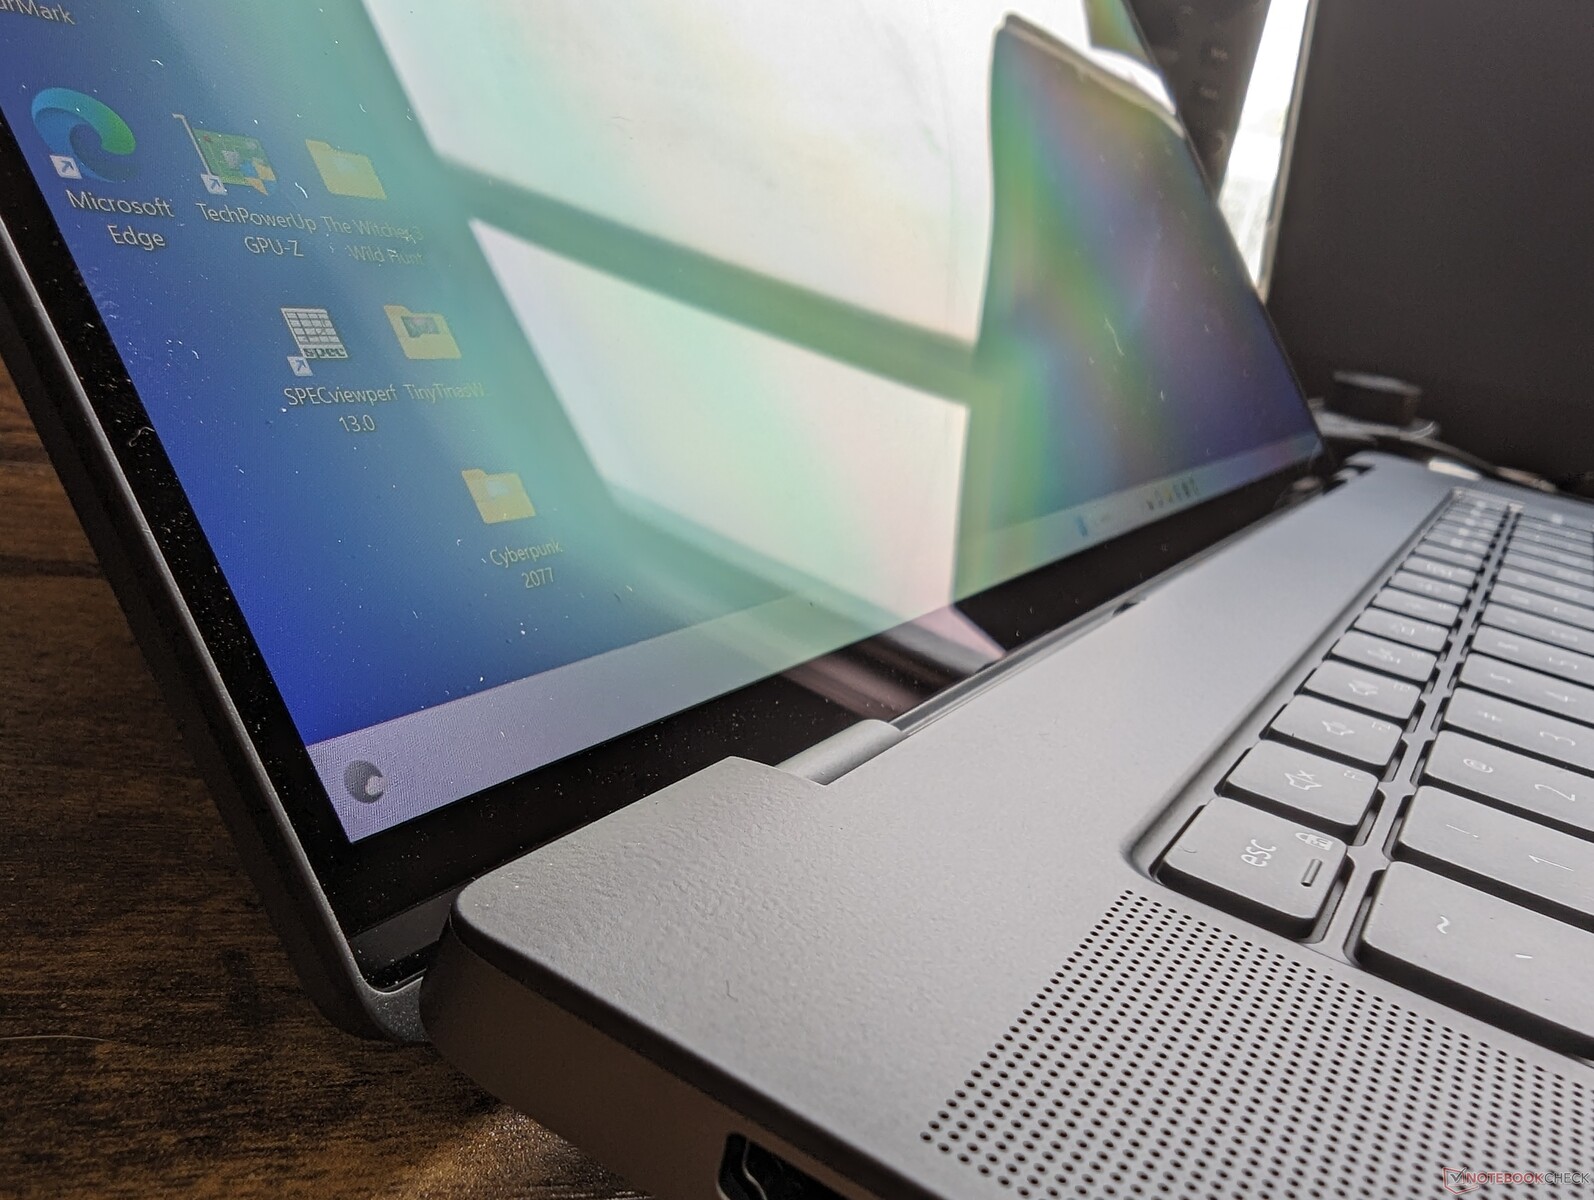
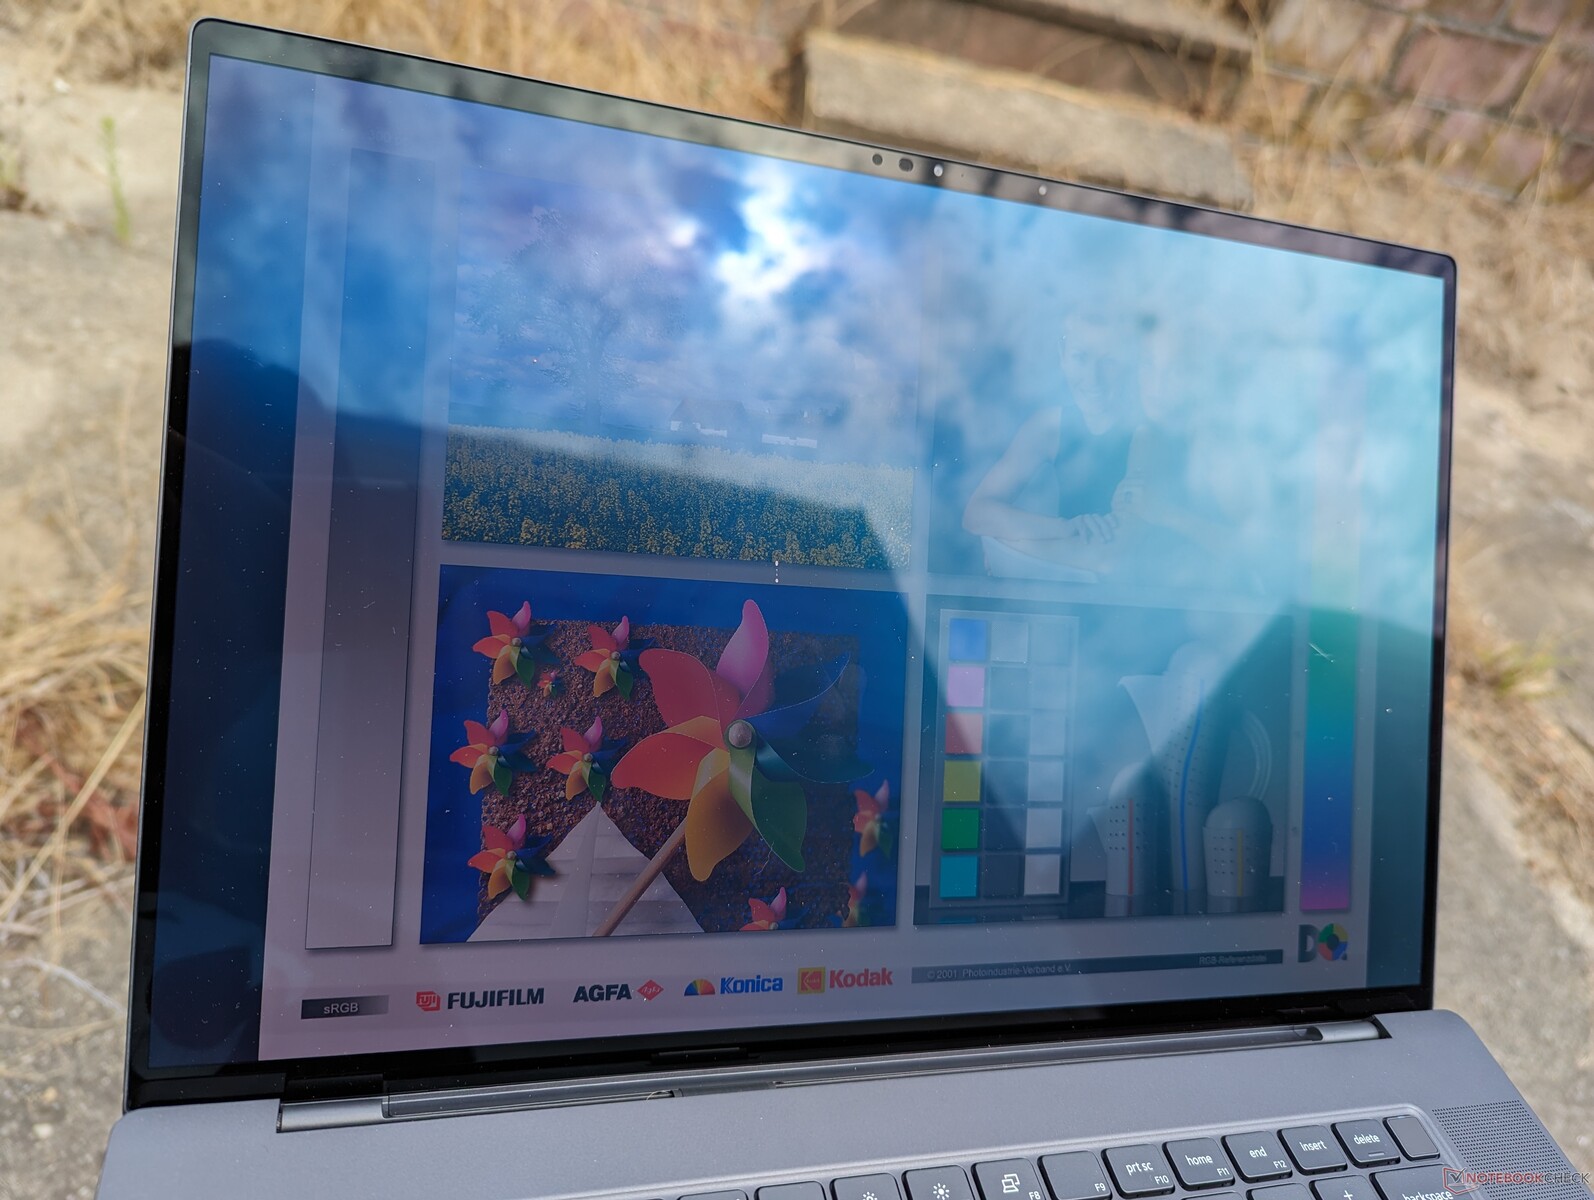
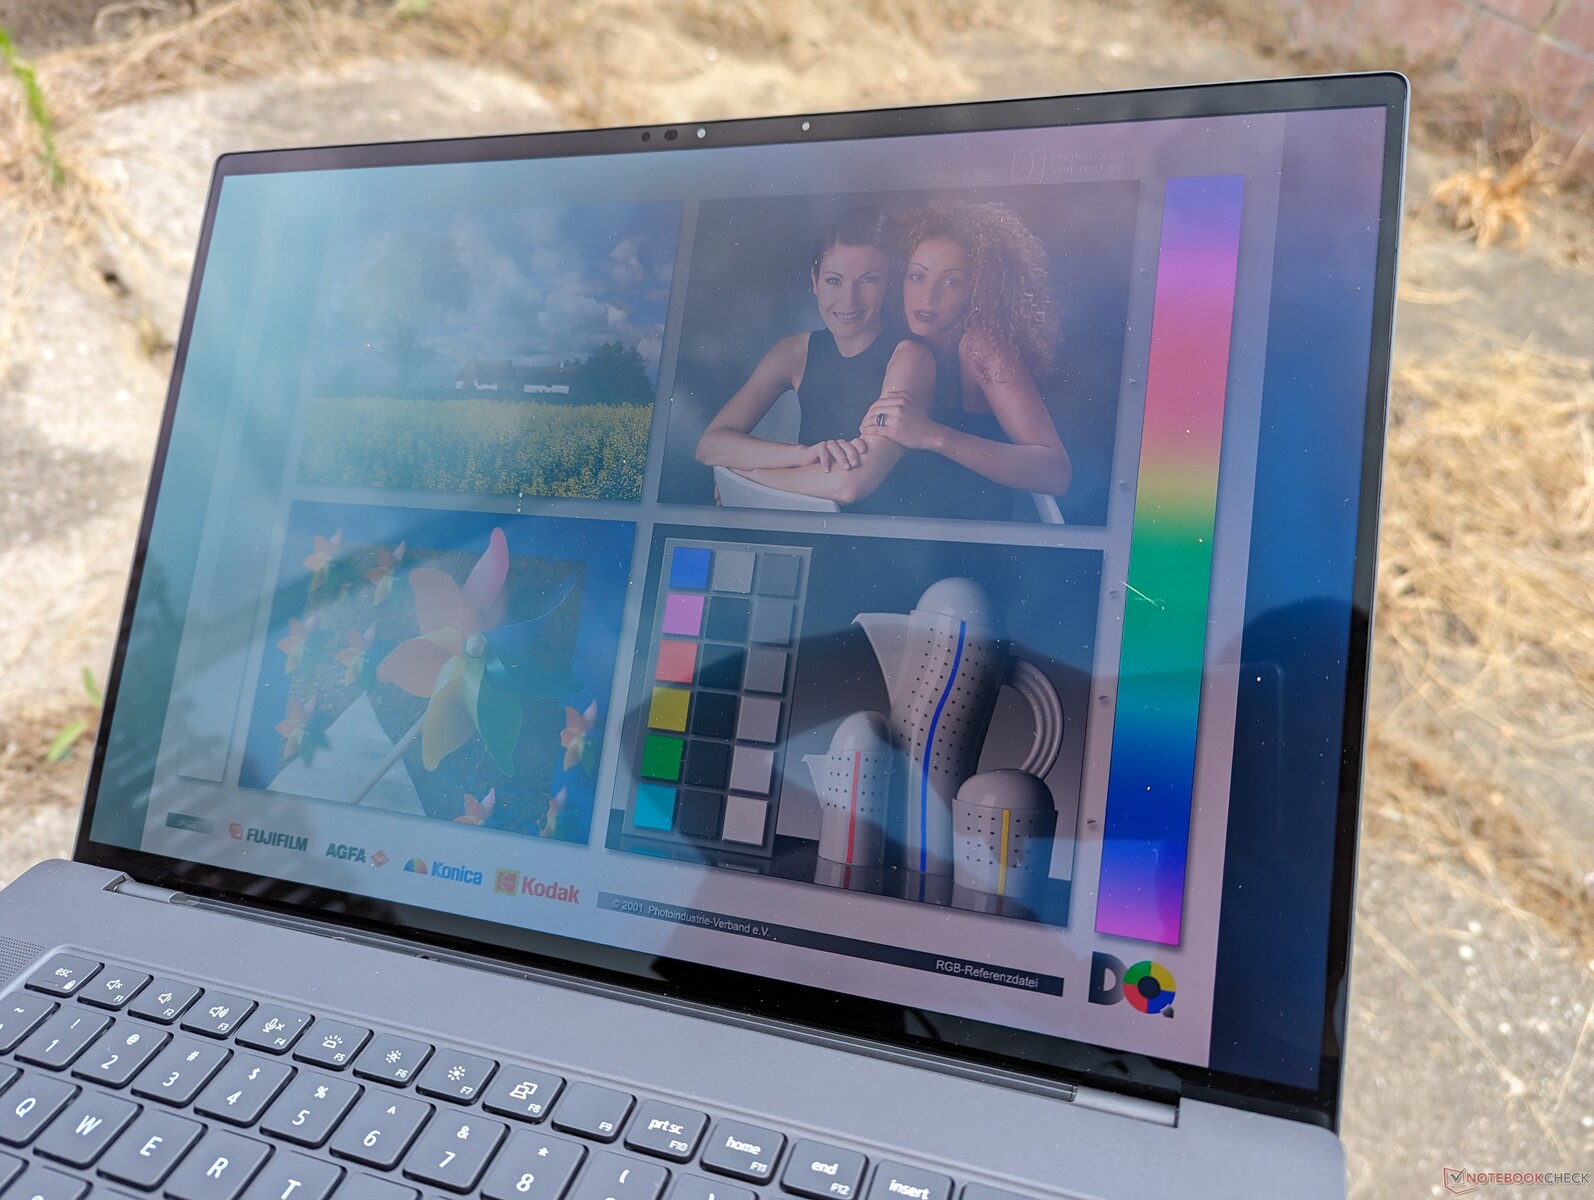
La visibilidad en exteriores es media en el mejor de los casos, ya que la pantalla táctil OLED brillante de 350 nits no es tan brillante como las pantallas IPS del ZBook Fury 16 G9 o el ThinkPad P16 G1 que pueden acercarse a los 500 o 600 nits.
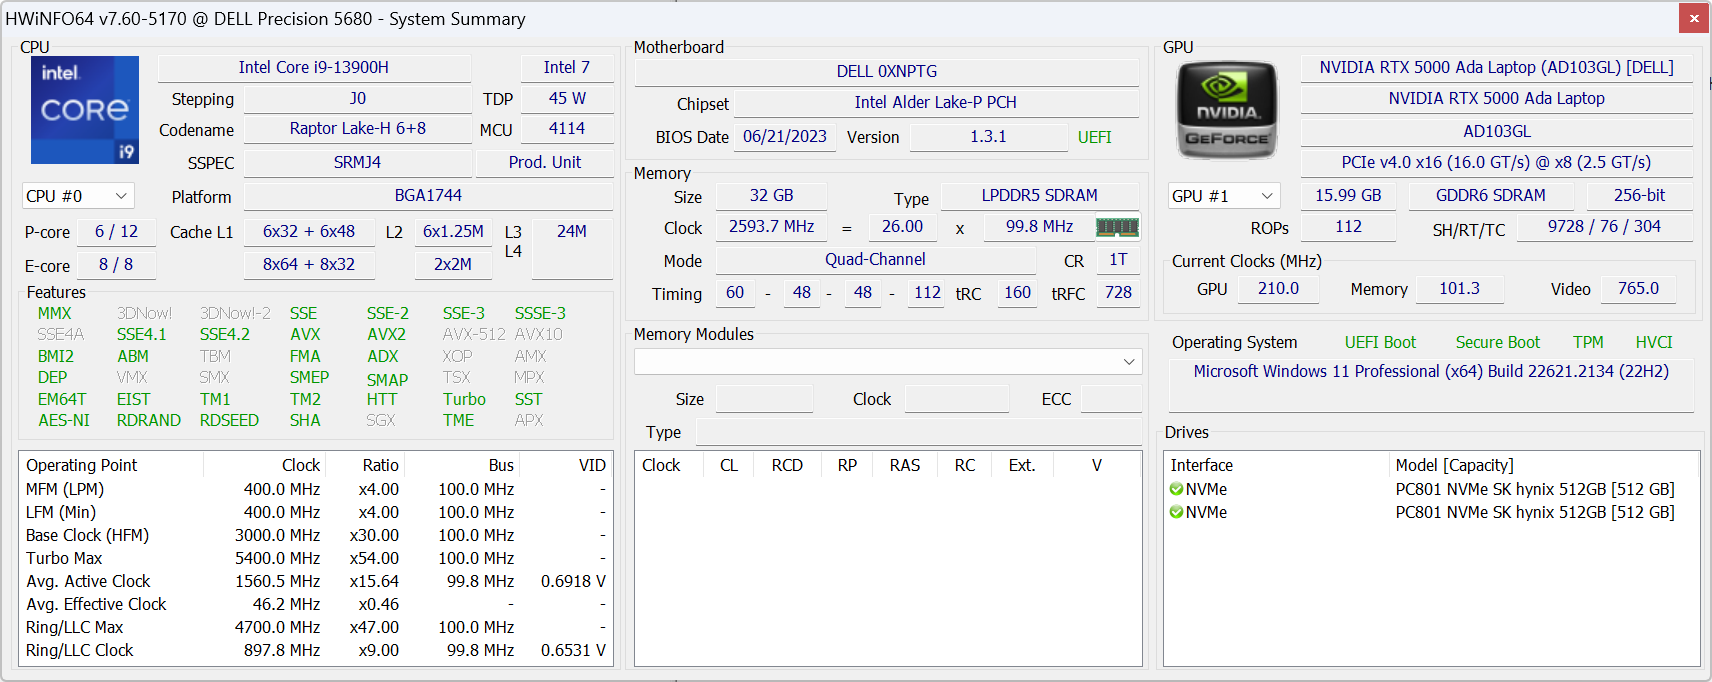
Rendimiento - Intel Raptor Lake-H de 13ª generación
Condiciones de ensayo
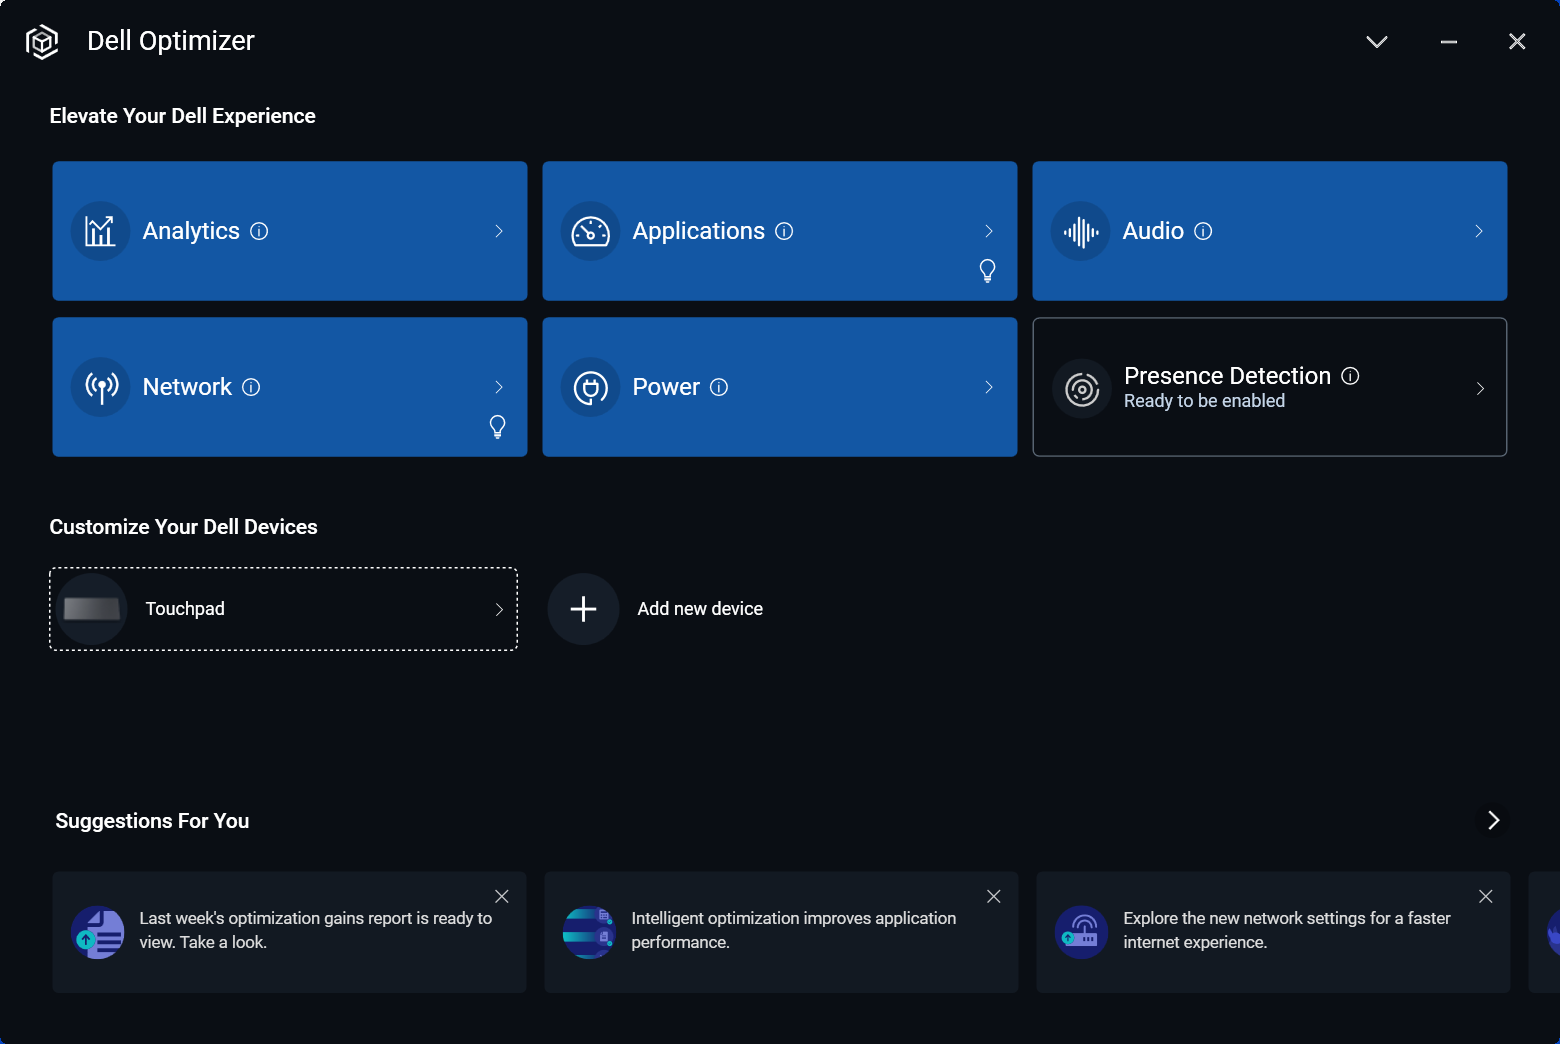
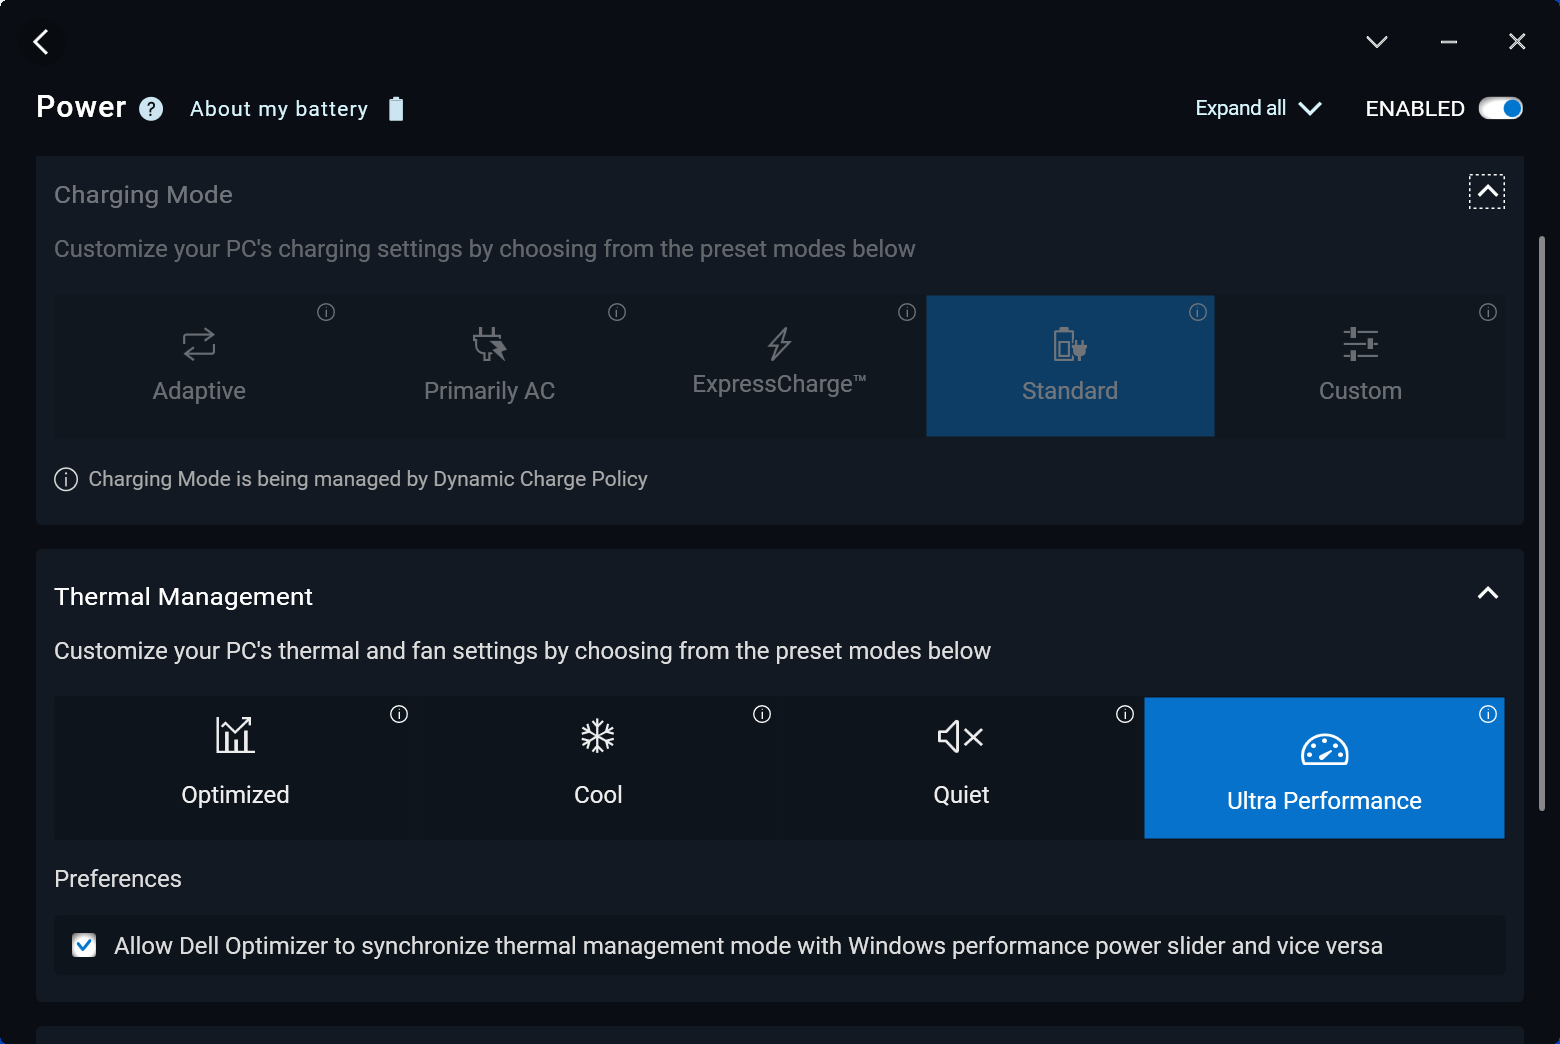
Configuramos nuestra unidad en modo Ultra Performance a través del software Dell Optimizer antes de ejecutar los benchmarks que se muestran a continuación. Los perfiles de energía de Optimizer pueden sincronizarse convenientemente con los perfiles de energía de Windows, a diferencia de los perfiles de energía especializados de la mayoría de los demás fabricantes.
Advanced Optimus u Optimus 2.0 no es compatible. Sin embargo, una novedad en las GPU para estaciones de trabajo Ada Lovelace es el modo ECC VRAM, que puede activarse o desactivarse a través del panel de control de Nvidia. Es necesario reiniciar el sistema para activar esta función.
Procesador
La 13ª generación Core i9-13900H es decepcionante en el sentido de que no es un salto notable hacia adelante sobre la 12 ª generación del año pasado Core i9-12900H. El rendimiento, por ejemplo, sería esencialmente idéntico al delAsus ProArt StudioBook 16 con el antiguo Core i9-12900H, salvo por un pequeño aumento del 5 al 10 por ciento en las operaciones de un solo subproceso. Es una pena que el Precision 5680 no ofrezca un Core i9-13900HX que habría proporcionado un aumento mucho más significativo en el rendimiento sobre cualquier procesador móvil Alder Lake-H.
Ten en cuenta que tampoco hay opciones de procesador Xeon o clase W, lo que significa que no hay soporte para RAM ECC en la serie Precision 5680.
Cambiar al Core i7-13700H desde nuestro i9-13900H se espera que reduzca el rendimiento multihilo en aproximadamente un 20 por ciento basado en nuestro tiempo con elSchenker Vision 16 Pro.
Cinebench R15 Multi Loop
Cinebench R23: Multi Core | Single Core
Cinebench R20: CPU (Multi Core) | CPU (Single Core)
Cinebench R15: CPU Multi 64Bit | CPU Single 64Bit
Blender: v2.79 BMW27 CPU
7-Zip 18.03: 7z b 4 | 7z b 4 -mmt1
Geekbench 5.5: Multi-Core | Single-Core
HWBOT x265 Benchmark v2.2: 4k Preset
LibreOffice : 20 Documents To PDF
R Benchmark 2.5: Overall mean
* ... más pequeño es mejor
AIDA64: FP32 Ray-Trace | FPU Julia | CPU SHA3 | CPU Queen | FPU SinJulia | FPU Mandel | CPU AES | CPU ZLib | FP64 Ray-Trace | CPU PhotoWorxx
| Performance rating | |
| Lenovo ThinkPad P16 G1 RTX A5500 | |
| HP ZBook Fury 16 G9 | |
| Dell Precision 5000 5680 | |
| MSI CreatorPro Z16P B12UKST | |
| Asus ExpertBook B6 Flip B6602FC2 | |
| Medio Intel Core i9-13900H | |
| Dell Precision 7000 7670 Performance | |
| AIDA64 / FP32 Ray-Trace | |
| Lenovo ThinkPad P16 G1 RTX A5500 | |
| HP ZBook Fury 16 G9 | |
| Asus ExpertBook B6 Flip B6602FC2 | |
| Dell Precision 5000 5680 | |
| Dell Precision 7000 7670 Performance | |
| Medio Intel Core i9-13900H (6788 - 19557, n=25) | |
| MSI CreatorPro Z16P B12UKST | |
| AIDA64 / FPU Julia | |
| HP ZBook Fury 16 G9 | |
| Lenovo ThinkPad P16 G1 RTX A5500 | |
| Asus ExpertBook B6 Flip B6602FC2 | |
| Dell Precision 5000 5680 | |
| Dell Precision 7000 7670 Performance | |
| Medio Intel Core i9-13900H (22551 - 95579, n=25) | |
| MSI CreatorPro Z16P B12UKST | |
| AIDA64 / CPU SHA3 | |
| Lenovo ThinkPad P16 G1 RTX A5500 | |
| HP ZBook Fury 16 G9 | |
| MSI CreatorPro Z16P B12UKST | |
| Medio Intel Core i9-13900H (2491 - 4270, n=25) | |
| Dell Precision 5000 5680 | |
| Asus ExpertBook B6 Flip B6602FC2 | |
| Dell Precision 7000 7670 Performance | |
| AIDA64 / CPU Queen | |
| Dell Precision 5000 5680 | |
| Medio Intel Core i9-13900H (65121 - 120936, n=25) | |
| Lenovo ThinkPad P16 G1 RTX A5500 | |
| Dell Precision 7000 7670 Performance | |
| Asus ExpertBook B6 Flip B6602FC2 | |
| HP ZBook Fury 16 G9 | |
| MSI CreatorPro Z16P B12UKST | |
| AIDA64 / FPU SinJulia | |
| Lenovo ThinkPad P16 G1 RTX A5500 | |
| HP ZBook Fury 16 G9 | |
| Asus ExpertBook B6 Flip B6602FC2 | |
| Dell Precision 7000 7670 Performance | |
| Dell Precision 5000 5680 | |
| Medio Intel Core i9-13900H (6108 - 11631, n=25) | |
| MSI CreatorPro Z16P B12UKST | |
| AIDA64 / FPU Mandel | |
| HP ZBook Fury 16 G9 | |
| Lenovo ThinkPad P16 G1 RTX A5500 | |
| Asus ExpertBook B6 Flip B6602FC2 | |
| Dell Precision 5000 5680 | |
| Medio Intel Core i9-13900H (11283 - 48474, n=25) | |
| Dell Precision 7000 7670 Performance | |
| MSI CreatorPro Z16P B12UKST | |
| AIDA64 / CPU ZLib | |
| Lenovo ThinkPad P16 G1 RTX A5500 | |
| HP ZBook Fury 16 G9 | |
| Medio Intel Core i9-13900H (789 - 1254, n=25) | |
| Asus ExpertBook B6 Flip B6602FC2 | |
| MSI CreatorPro Z16P B12UKST | |
| Dell Precision 5000 5680 | |
| Dell Precision 7000 7670 Performance | |
| AIDA64 / FP64 Ray-Trace | |
| Lenovo ThinkPad P16 G1 RTX A5500 | |
| HP ZBook Fury 16 G9 | |
| Asus ExpertBook B6 Flip B6602FC2 | |
| Dell Precision 5000 5680 | |
| Dell Precision 7000 7670 Performance | |
| Medio Intel Core i9-13900H (3655 - 10716, n=25) | |
| MSI CreatorPro Z16P B12UKST | |
| AIDA64 / CPU PhotoWorxx | |
| Dell Precision 5000 5680 | |
| MSI CreatorPro Z16P B12UKST | |
| Dell Precision 7000 7670 Performance | |
| Lenovo ThinkPad P16 G1 RTX A5500 | |
| Medio Intel Core i9-13900H (10871 - 50488, n=25) | |
| HP ZBook Fury 16 G9 | |
| Asus ExpertBook B6 Flip B6602FC2 | |
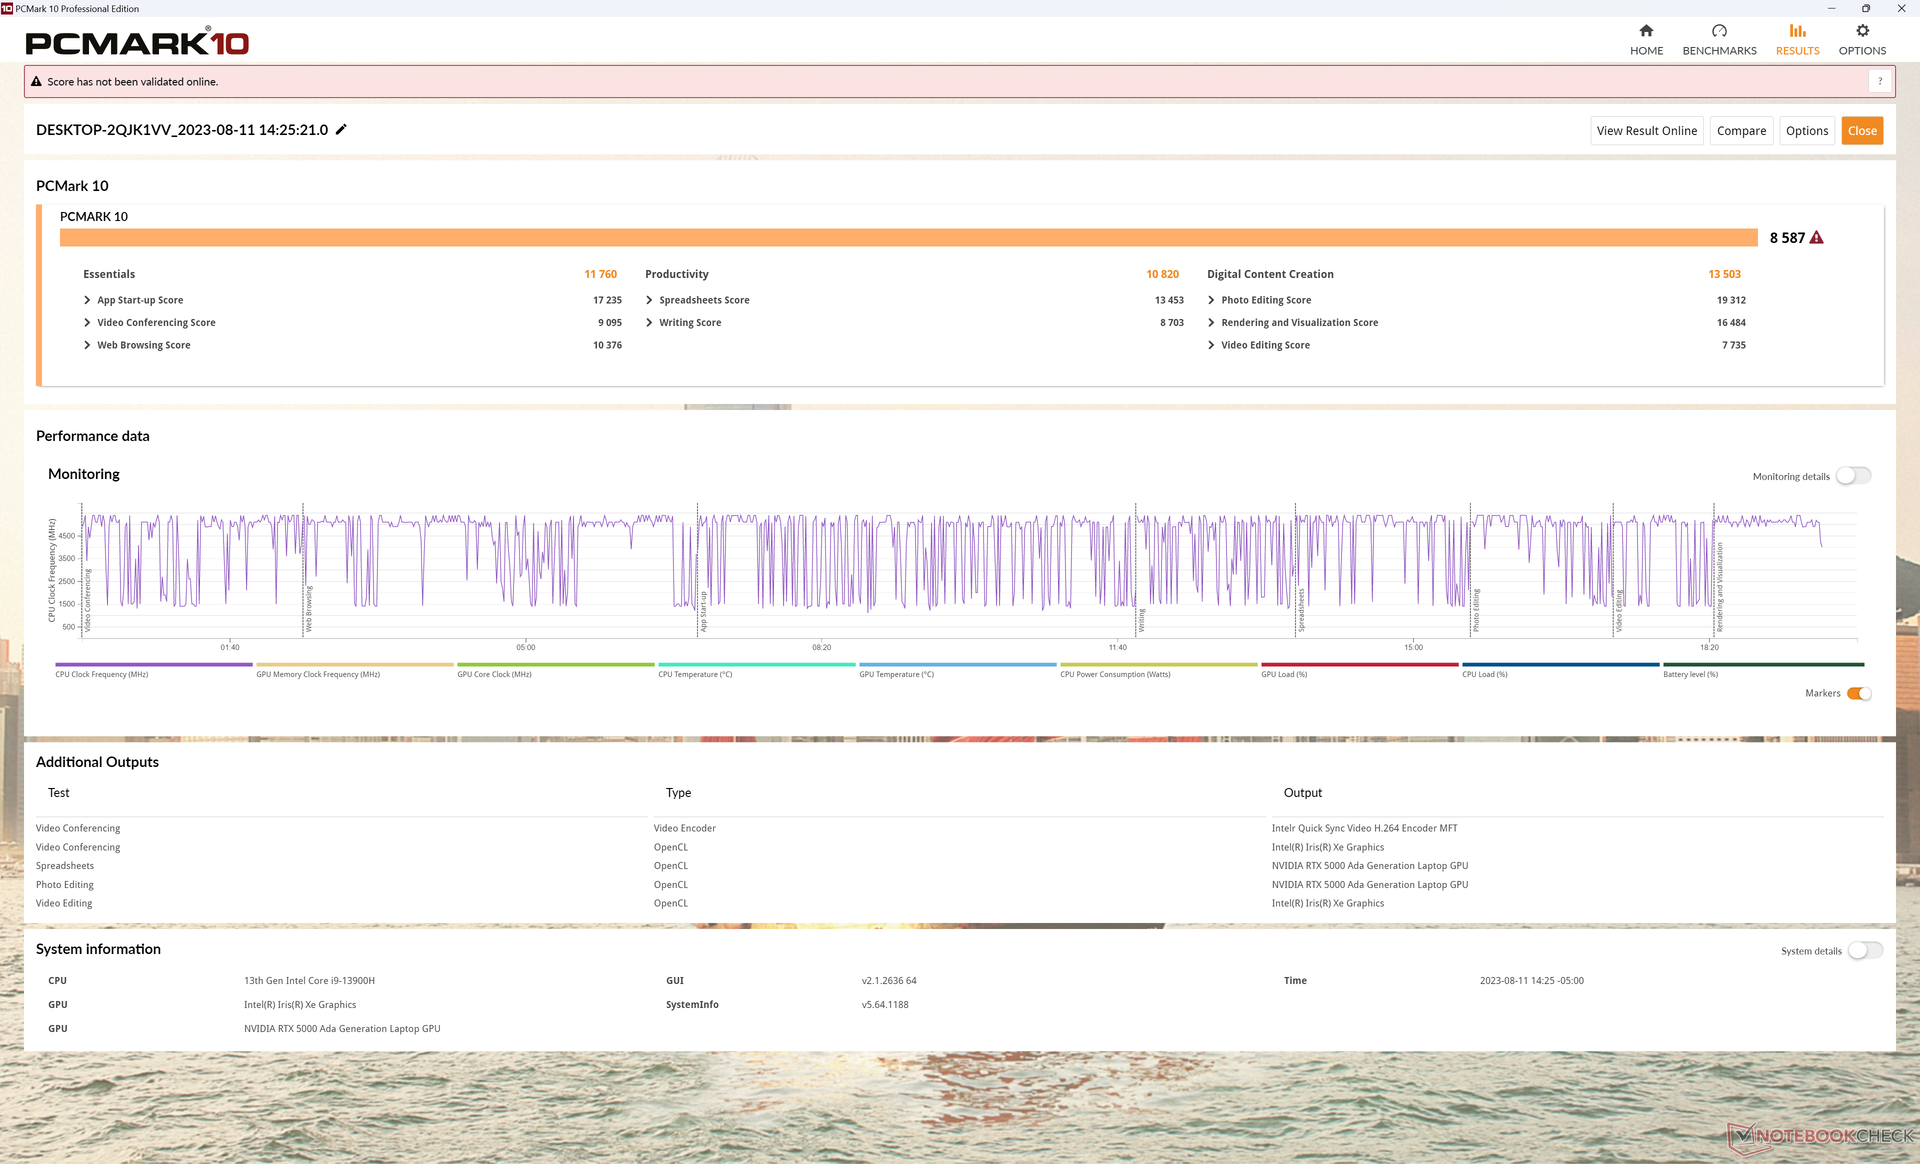
Rendimiento del sistema
Las puntuaciones en PCMark son superiores a las de la mayoría de estaciones de trabajo por márgenes relativamente amplios, incluyendo incluso algunas potentes como la HP ZBook Fury 16 G9 o laPrecision 7670 Rendimiento. Esto puede atribuirse a nuestra configuración de SSD RAID 0 y GPU RTX 5000, mientras que la mayoría de las demás estaciones de trabajo funcionan con un solo SSD y GPU de generaciones anteriores.
CrossMark: Overall | Productivity | Creativity | Responsiveness
| PCMark 10 / Score | |
| Dell Precision 5000 5680 | |
| Medio Intel Core i9-13900H, NVIDIA RTX 5000 Ada Generation Laptop (n=1) | |
| Asus ExpertBook B6 Flip B6602FC2 | |
| Lenovo ThinkPad P16 G1 RTX A5500 | |
| MSI CreatorPro Z16P B12UKST | |
| HP ZBook Fury 16 G9 | |
| Dell Precision 7000 7670 Performance | |
| PCMark 10 / Essentials | |
| Dell Precision 5000 5680 | |
| Medio Intel Core i9-13900H, NVIDIA RTX 5000 Ada Generation Laptop (n=1) | |
| Dell Precision 7000 7670 Performance | |
| HP ZBook Fury 16 G9 | |
| Lenovo ThinkPad P16 G1 RTX A5500 | |
| Asus ExpertBook B6 Flip B6602FC2 | |
| MSI CreatorPro Z16P B12UKST | |
| PCMark 10 / Productivity | |
| Dell Precision 5000 5680 | |
| Medio Intel Core i9-13900H, NVIDIA RTX 5000 Ada Generation Laptop (n=1) | |
| Asus ExpertBook B6 Flip B6602FC2 | |
| Lenovo ThinkPad P16 G1 RTX A5500 | |
| MSI CreatorPro Z16P B12UKST | |
| HP ZBook Fury 16 G9 | |
| Dell Precision 7000 7670 Performance | |
| PCMark 10 / Digital Content Creation | |
| Dell Precision 5000 5680 | |
| Medio Intel Core i9-13900H, NVIDIA RTX 5000 Ada Generation Laptop (n=1) | |
| Lenovo ThinkPad P16 G1 RTX A5500 | |
| MSI CreatorPro Z16P B12UKST | |
| Dell Precision 7000 7670 Performance | |
| HP ZBook Fury 16 G9 | |
| Asus ExpertBook B6 Flip B6602FC2 | |
| CrossMark / Overall | |
| Asus ExpertBook B6 Flip B6602FC2 | |
| MSI CreatorPro Z16P B12UKST | |
| Dell Precision 5000 5680 | |
| Medio Intel Core i9-13900H, NVIDIA RTX 5000 Ada Generation Laptop (n=1) | |
| HP ZBook Fury 16 G9 | |
| Lenovo ThinkPad P16 G1 RTX A5500 | |
| Dell Precision 7000 7670 Performance | |
| CrossMark / Productivity | |
| Asus ExpertBook B6 Flip B6602FC2 | |
| MSI CreatorPro Z16P B12UKST | |
| Dell Precision 5000 5680 | |
| Medio Intel Core i9-13900H, NVIDIA RTX 5000 Ada Generation Laptop (n=1) | |
| HP ZBook Fury 16 G9 | |
| Lenovo ThinkPad P16 G1 RTX A5500 | |
| Dell Precision 7000 7670 Performance | |
| CrossMark / Creativity | |
| Lenovo ThinkPad P16 G1 RTX A5500 | |
| Dell Precision 5000 5680 | |
| Medio Intel Core i9-13900H, NVIDIA RTX 5000 Ada Generation Laptop (n=1) | |
| Asus ExpertBook B6 Flip B6602FC2 | |
| HP ZBook Fury 16 G9 | |
| MSI CreatorPro Z16P B12UKST | |
| Dell Precision 7000 7670 Performance | |
| CrossMark / Responsiveness | |
| MSI CreatorPro Z16P B12UKST | |
| Asus ExpertBook B6 Flip B6602FC2 | |
| HP ZBook Fury 16 G9 | |
| Dell Precision 5000 5680 | |
| Medio Intel Core i9-13900H, NVIDIA RTX 5000 Ada Generation Laptop (n=1) | |
| Dell Precision 7000 7670 Performance | |
| Lenovo ThinkPad P16 G1 RTX A5500 | |
| PCMark 10 Score | 8587 puntos | |
ayuda | ||
| AIDA64 / Memory Copy | |
| Dell Precision 5000 5680 | |
| Dell Precision 7000 7670 Performance | |
| Lenovo ThinkPad P16 G1 RTX A5500 | |
| MSI CreatorPro Z16P B12UKST | |
| Medio Intel Core i9-13900H (37448 - 74486, n=25) | |
| HP ZBook Fury 16 G9 | |
| Asus ExpertBook B6 Flip B6602FC2 | |
| AIDA64 / Memory Read | |
| Dell Precision 7000 7670 Performance | |
| Dell Precision 5000 5680 | |
| MSI CreatorPro Z16P B12UKST | |
| Lenovo ThinkPad P16 G1 RTX A5500 | |
| Medio Intel Core i9-13900H (41599 - 75433, n=25) | |
| Asus ExpertBook B6 Flip B6602FC2 | |
| HP ZBook Fury 16 G9 | |
| AIDA64 / Memory Write | |
| Dell Precision 5000 5680 | |
| MSI CreatorPro Z16P B12UKST | |
| Dell Precision 7000 7670 Performance | |
| Medio Intel Core i9-13900H (36152 - 88505, n=25) | |
| Lenovo ThinkPad P16 G1 RTX A5500 | |
| Asus ExpertBook B6 Flip B6602FC2 | |
| HP ZBook Fury 16 G9 | |
| AIDA64 / Memory Latency | |
| MSI CreatorPro Z16P B12UKST | |
| Asus ExpertBook B6 Flip B6602FC2 | |
| Dell Precision 5000 5680 | |
| HP ZBook Fury 16 G9 | |
| Lenovo ThinkPad P16 G1 RTX A5500 | |
| Medio Intel Core i9-13900H (75.8 - 102.3, n=25) | |
| Dell Precision 7000 7670 Performance | |
* ... más pequeño es mejor
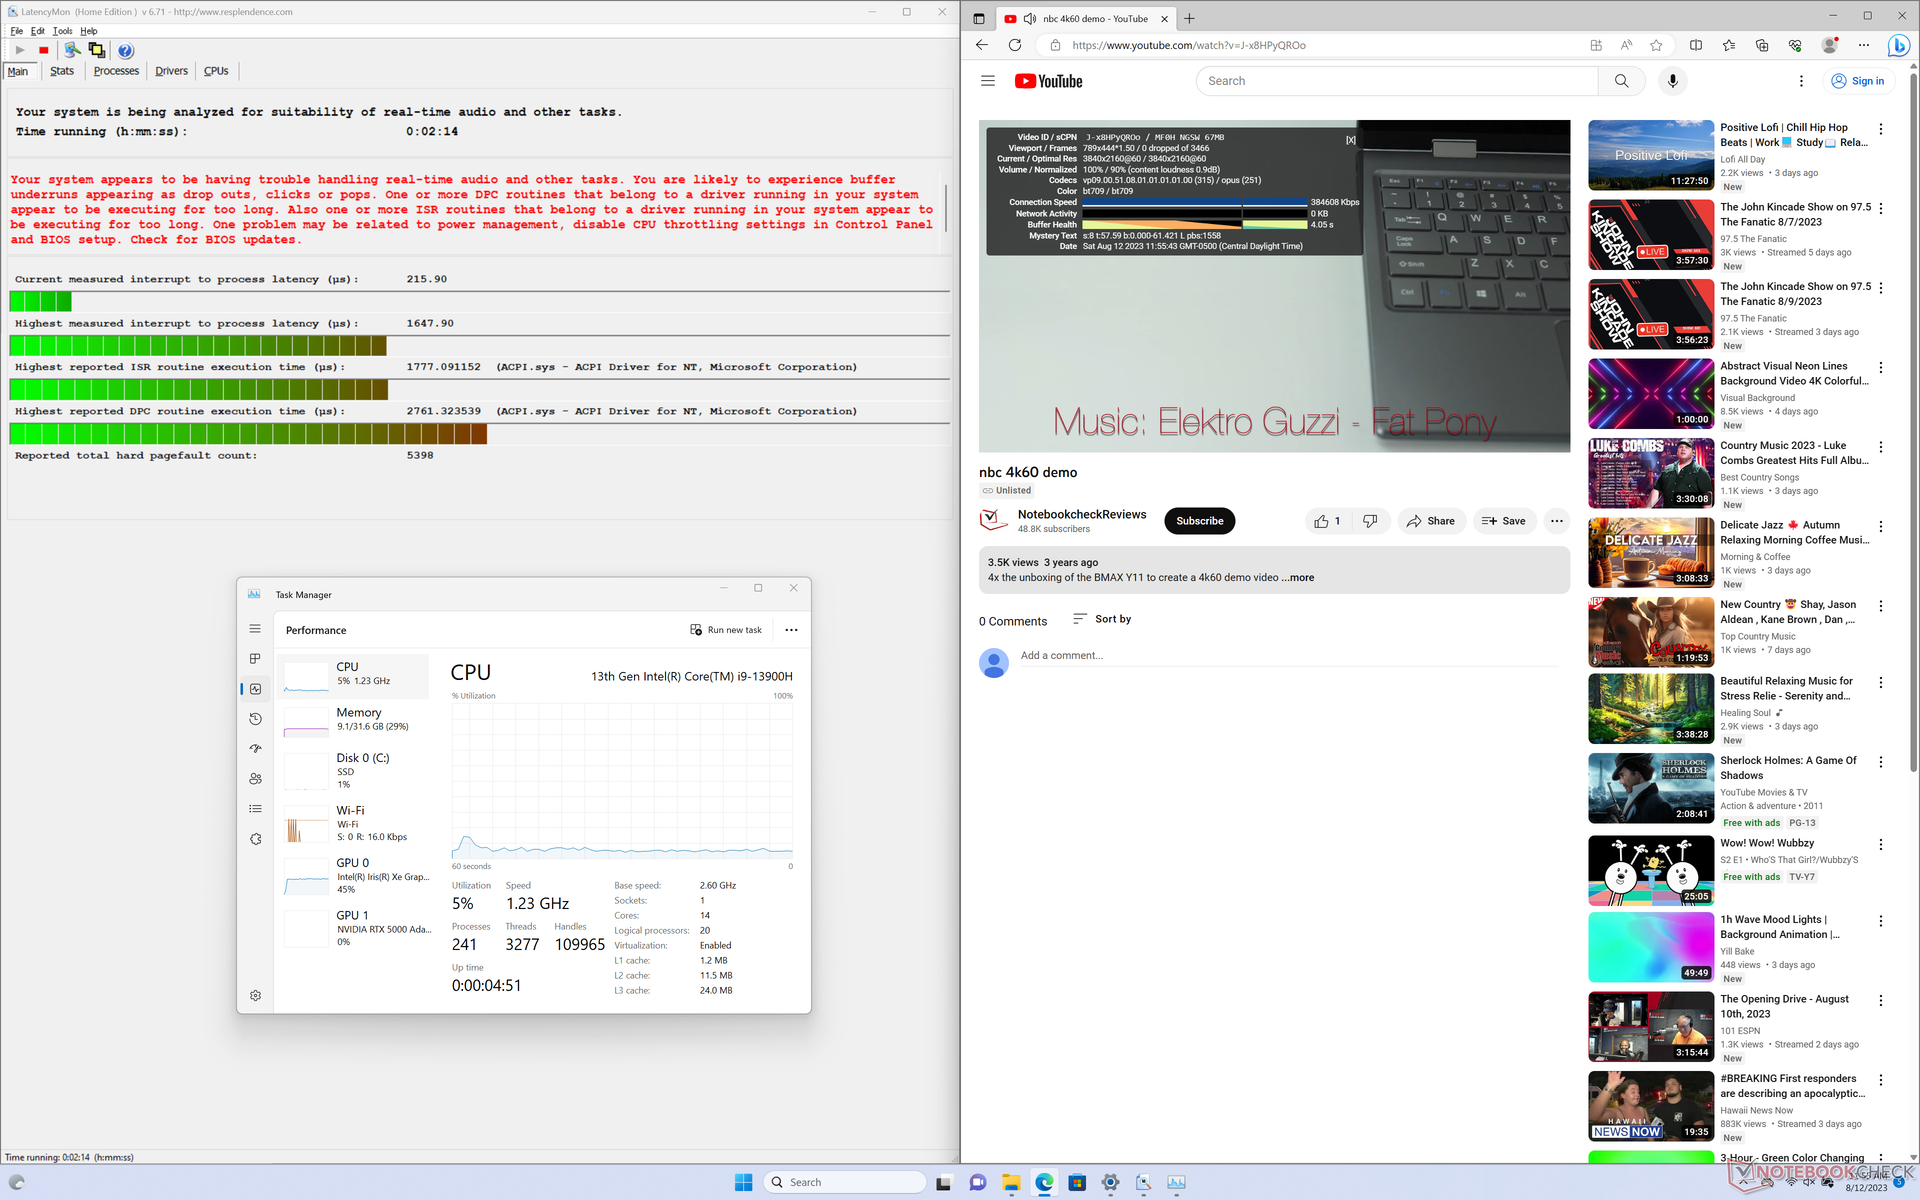
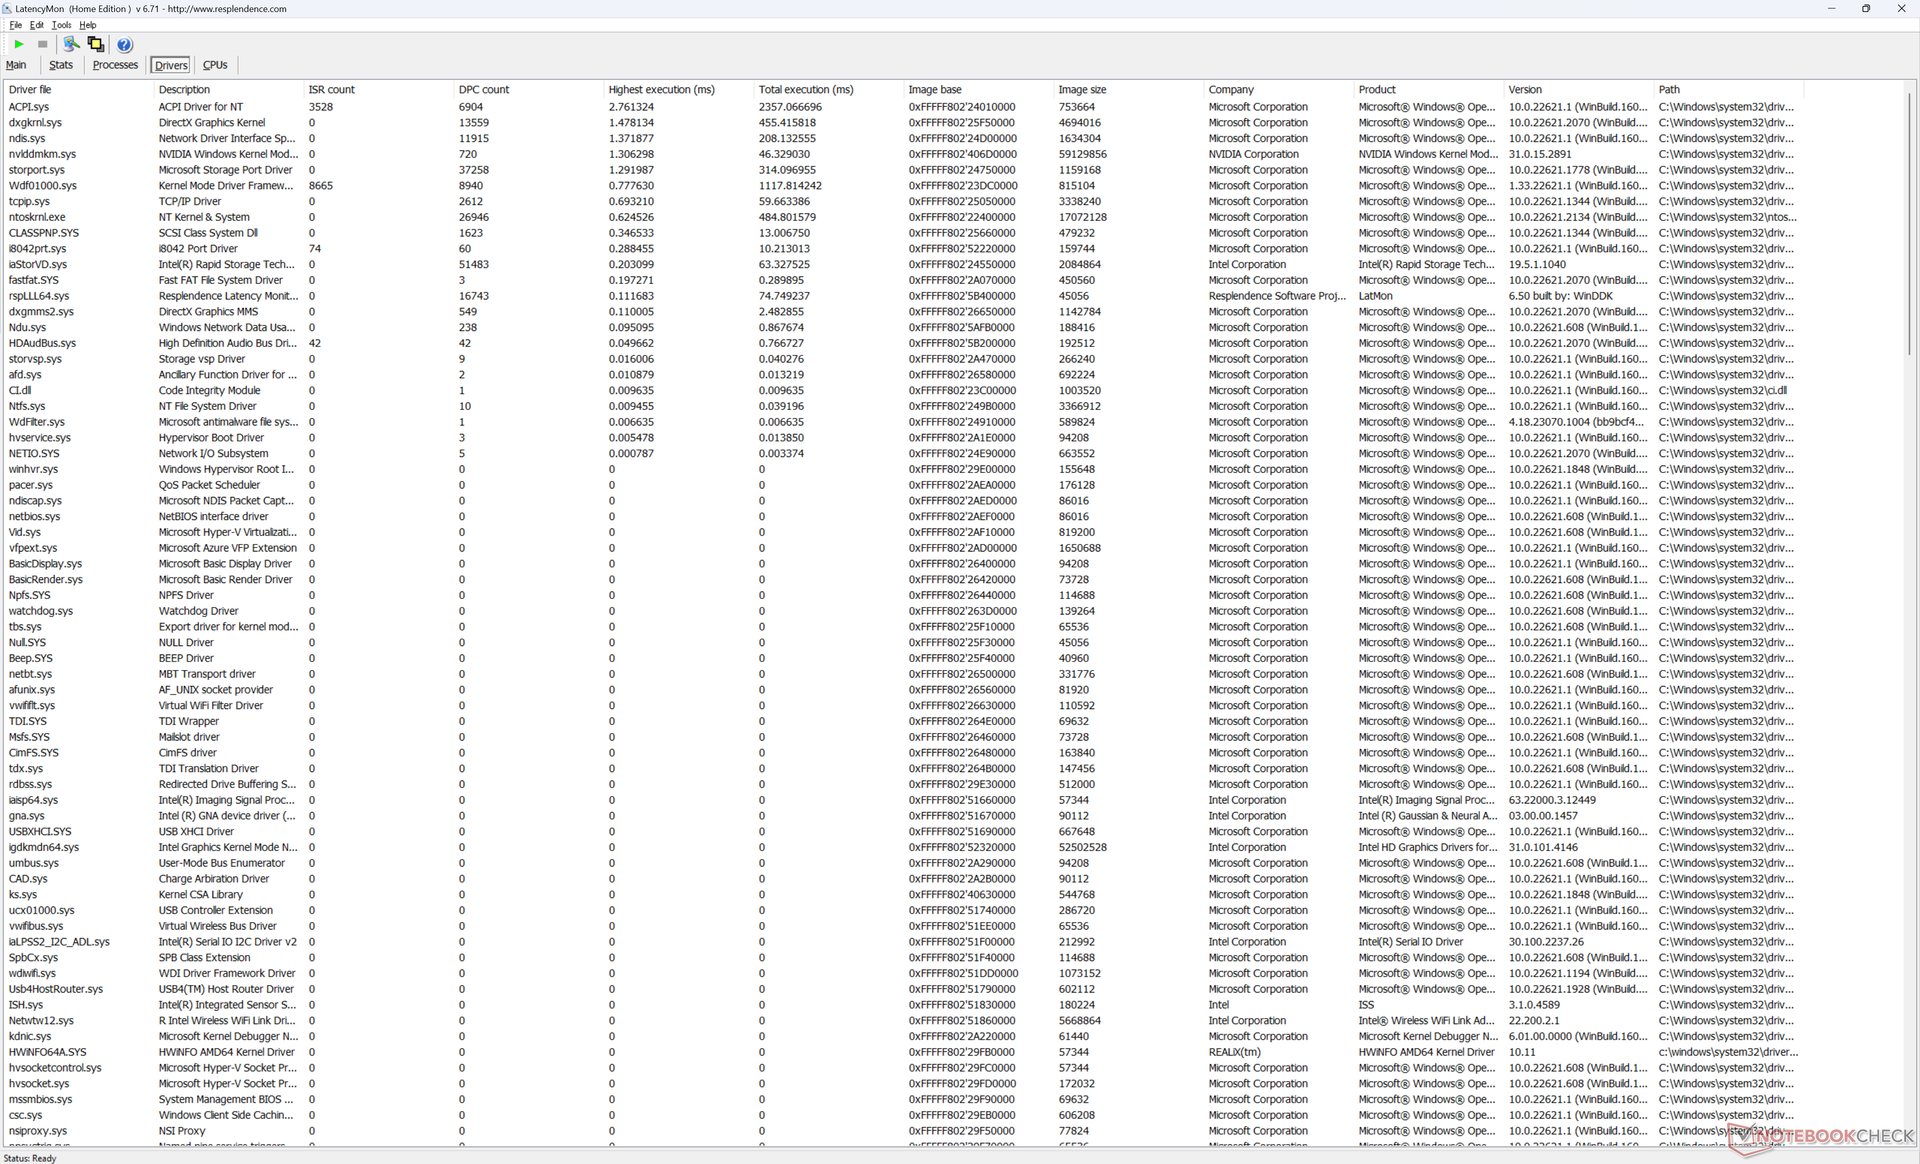
Latencia del CPD
LatencyMon revela ligeros problemas de CPD al abrir múltiples pestañas de navegador de nuestra página de inicio, parecido a lo que observamos en el Precision 7670. por lo demás, la reproducción de vídeo 4K a 60 FPS es perfecta y no se registran caídas de frames.
| DPC Latencies / LatencyMon - interrupt to process latency (max), Web, Youtube, Prime95 | |
| HP ZBook Fury 16 G9 | |
| Asus ExpertBook B6 Flip B6602FC2 | |
| Dell Precision 7000 7670 Performance | |
| Dell Precision 5000 5680 | |
| Lenovo ThinkPad P16 G1 RTX A5500 | |
| MSI CreatorPro Z16P B12UKST | |
* ... más pequeño es mejor
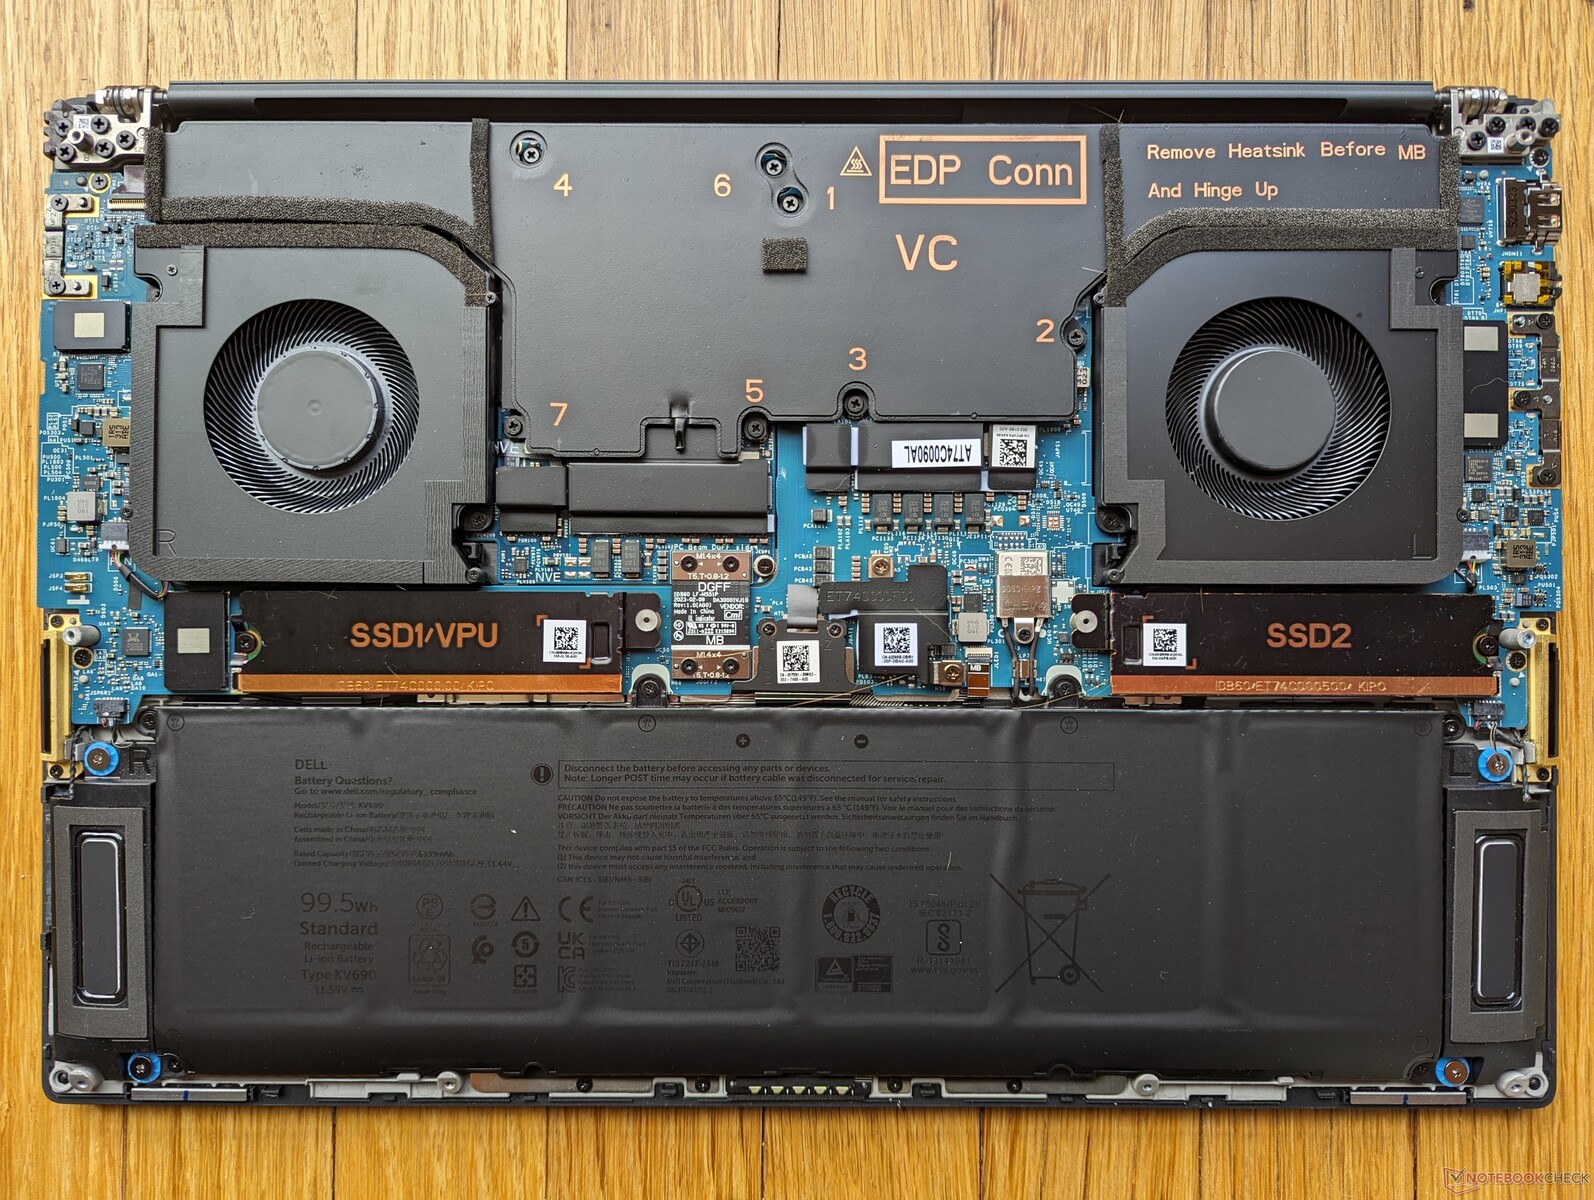
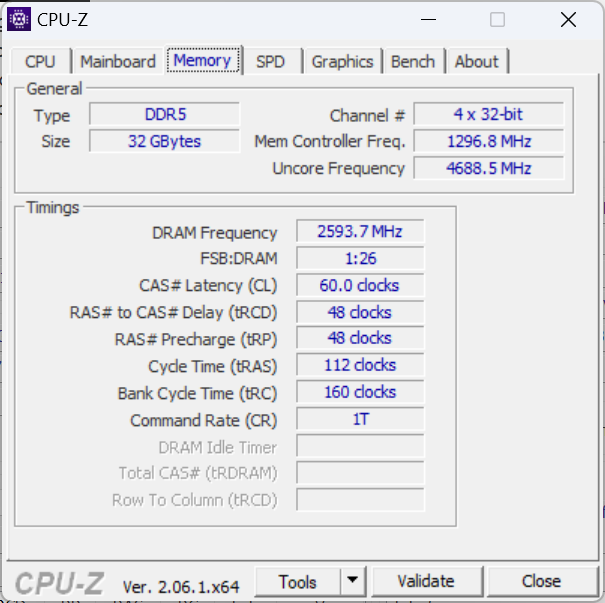
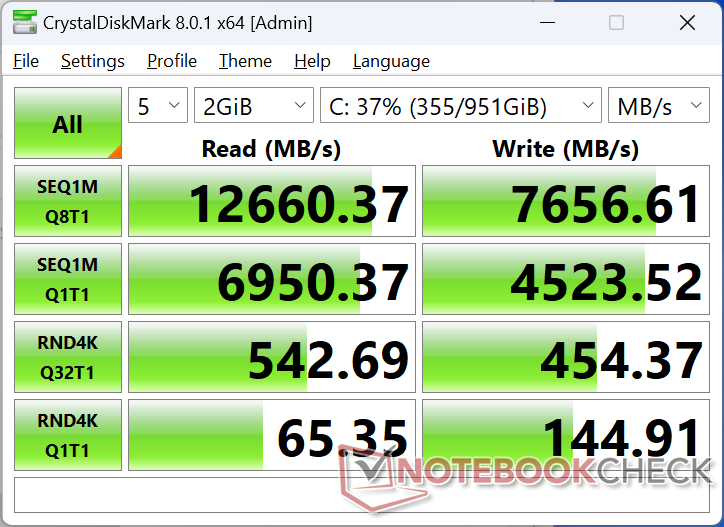
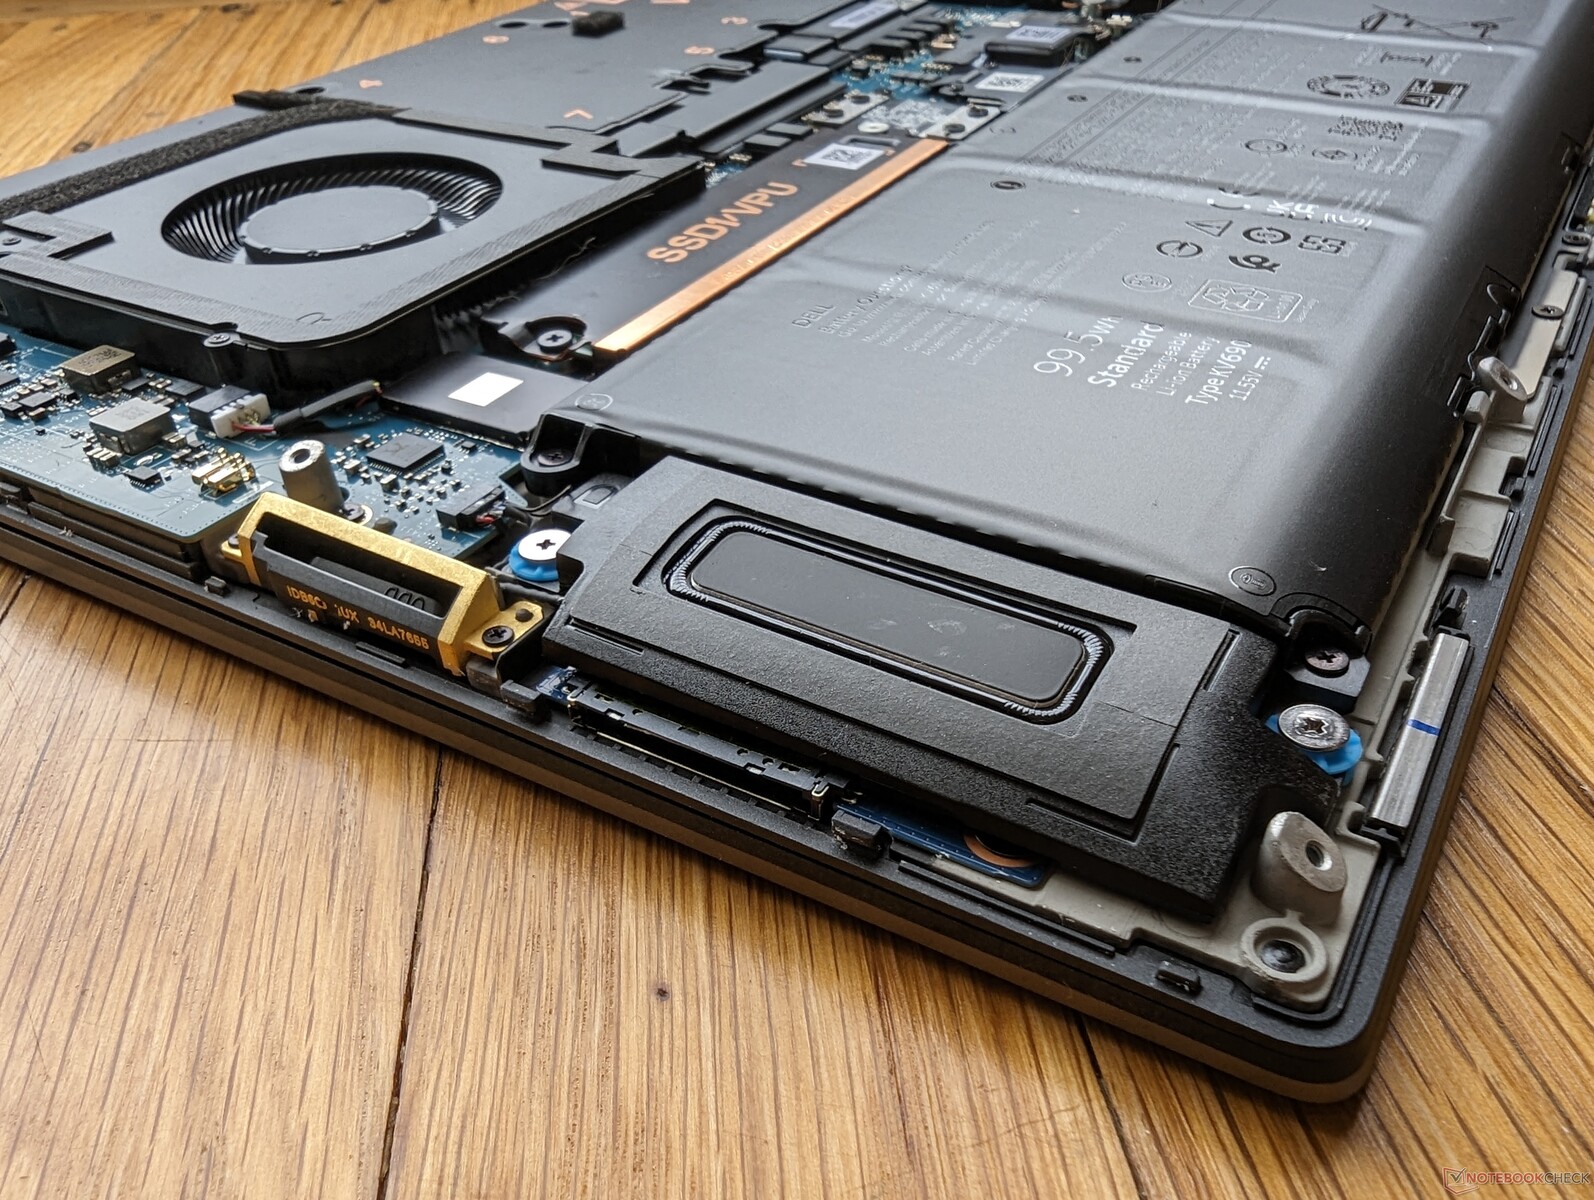
Dispositivos de almacenamiento: hasta dos SSD PCIe4 x4 NVMe
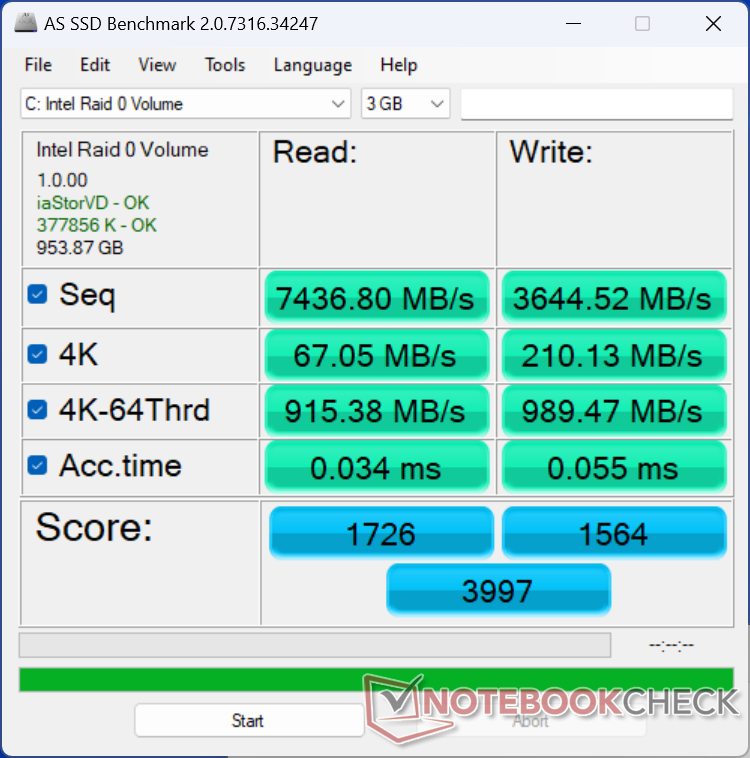
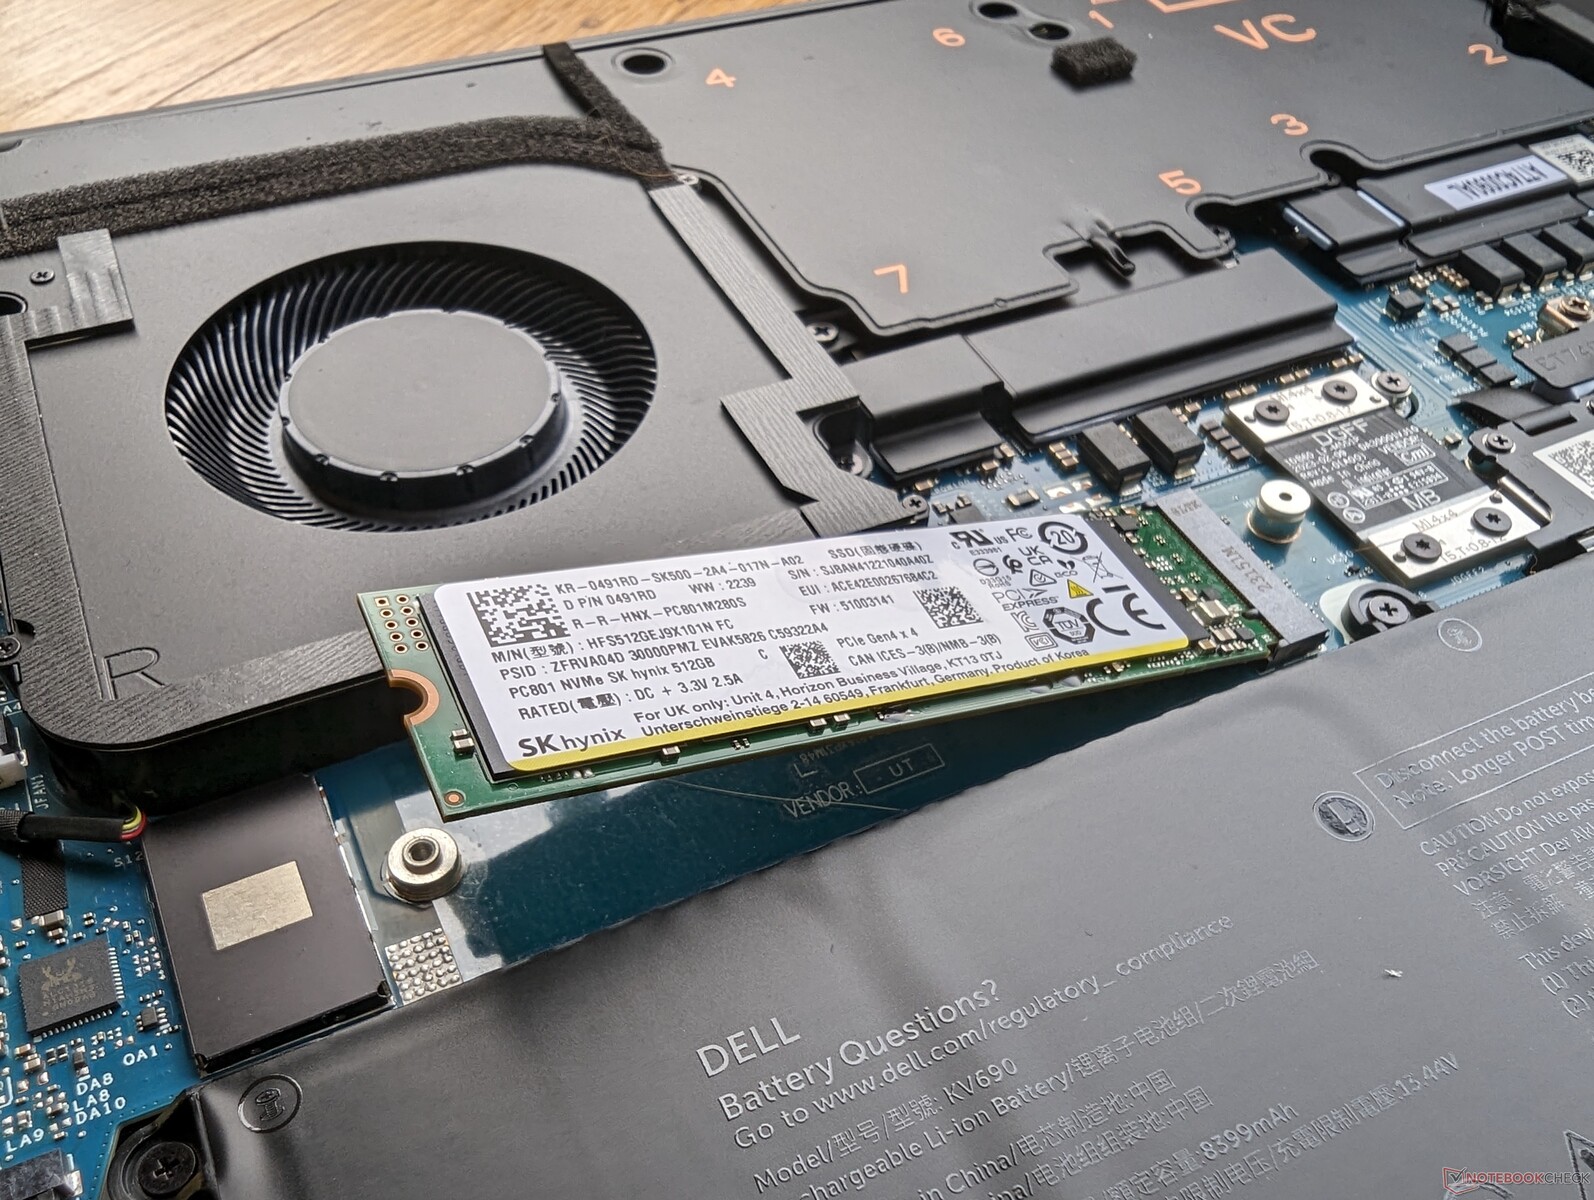
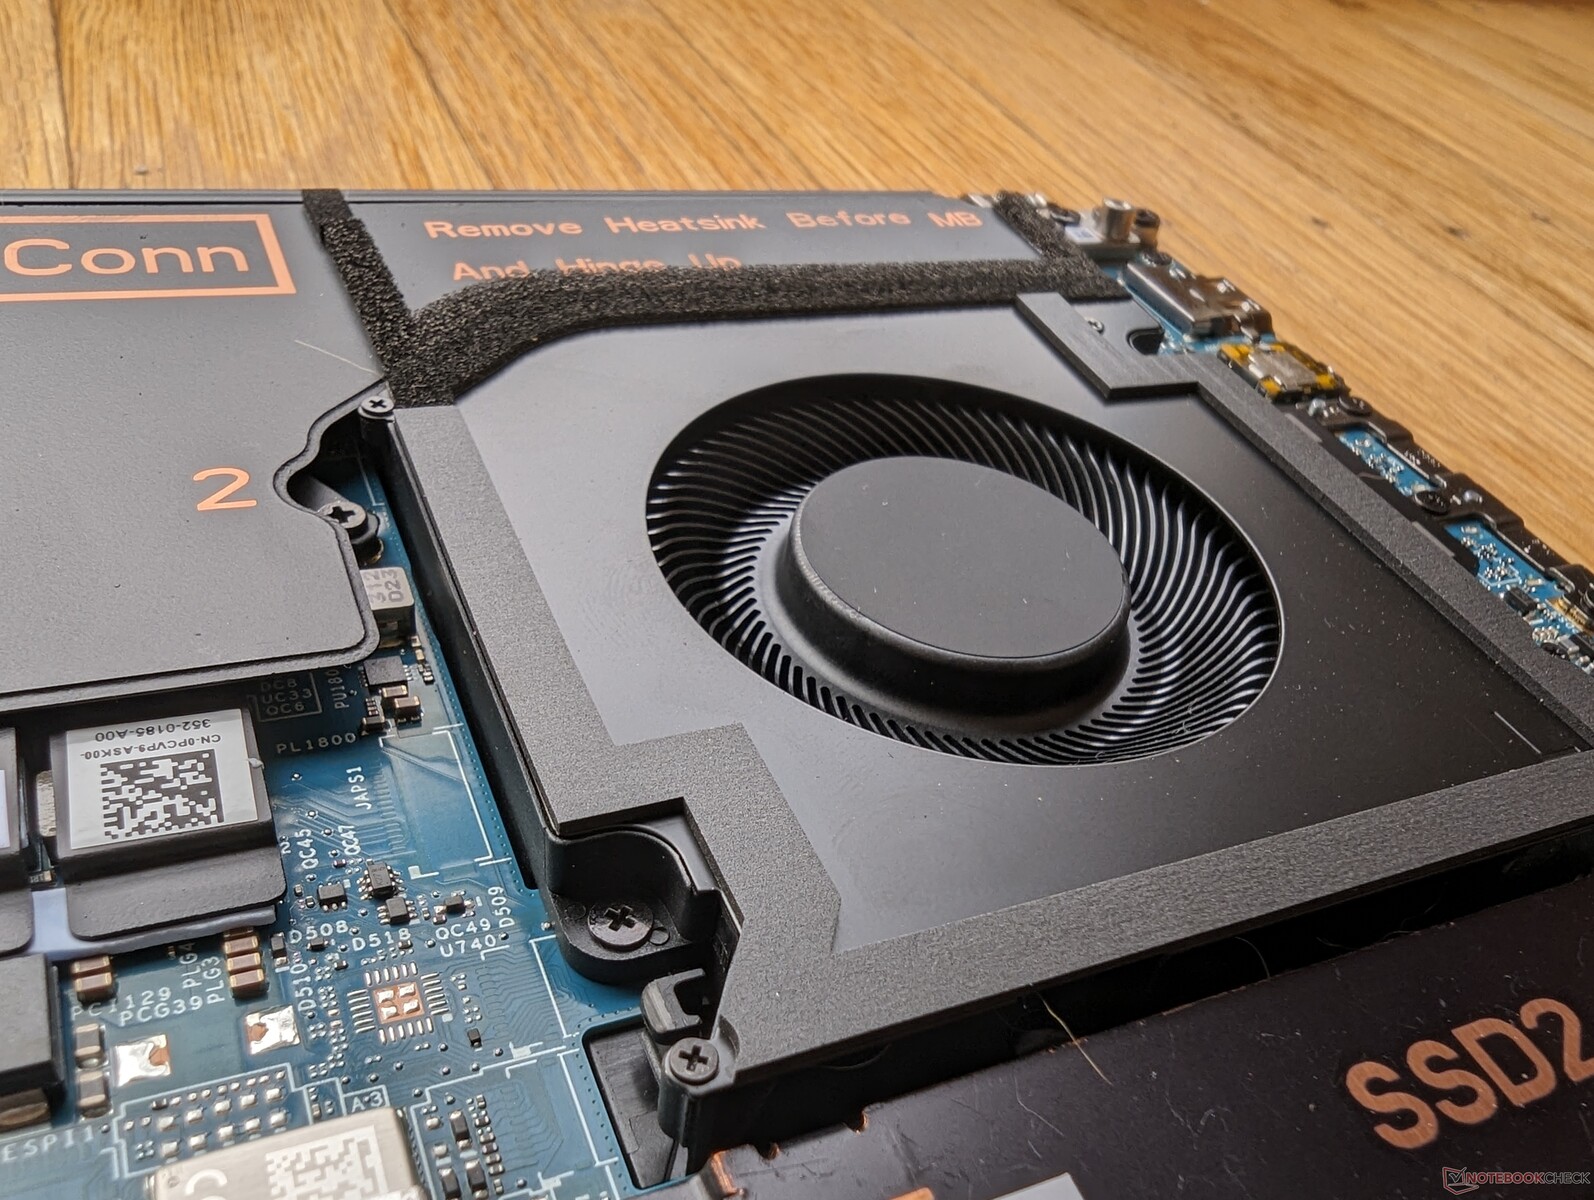
Nuestra unidad de prueba se entrega con el mismo SK hynix PC801 PCIe4 x4 NVMe SSD en configuración RAID 0 que se encuentran en la serie Precision 7670. Aunque la compatibilidad con PCIe5, como en ciertos portátiles para juegos habría sido agradable de ver, no es una característica importante en este momento dado lo raros que siguen siendo los SSD PCIe5. Dell ofrece opciones de SSD con autocifrado para mayor seguridad.
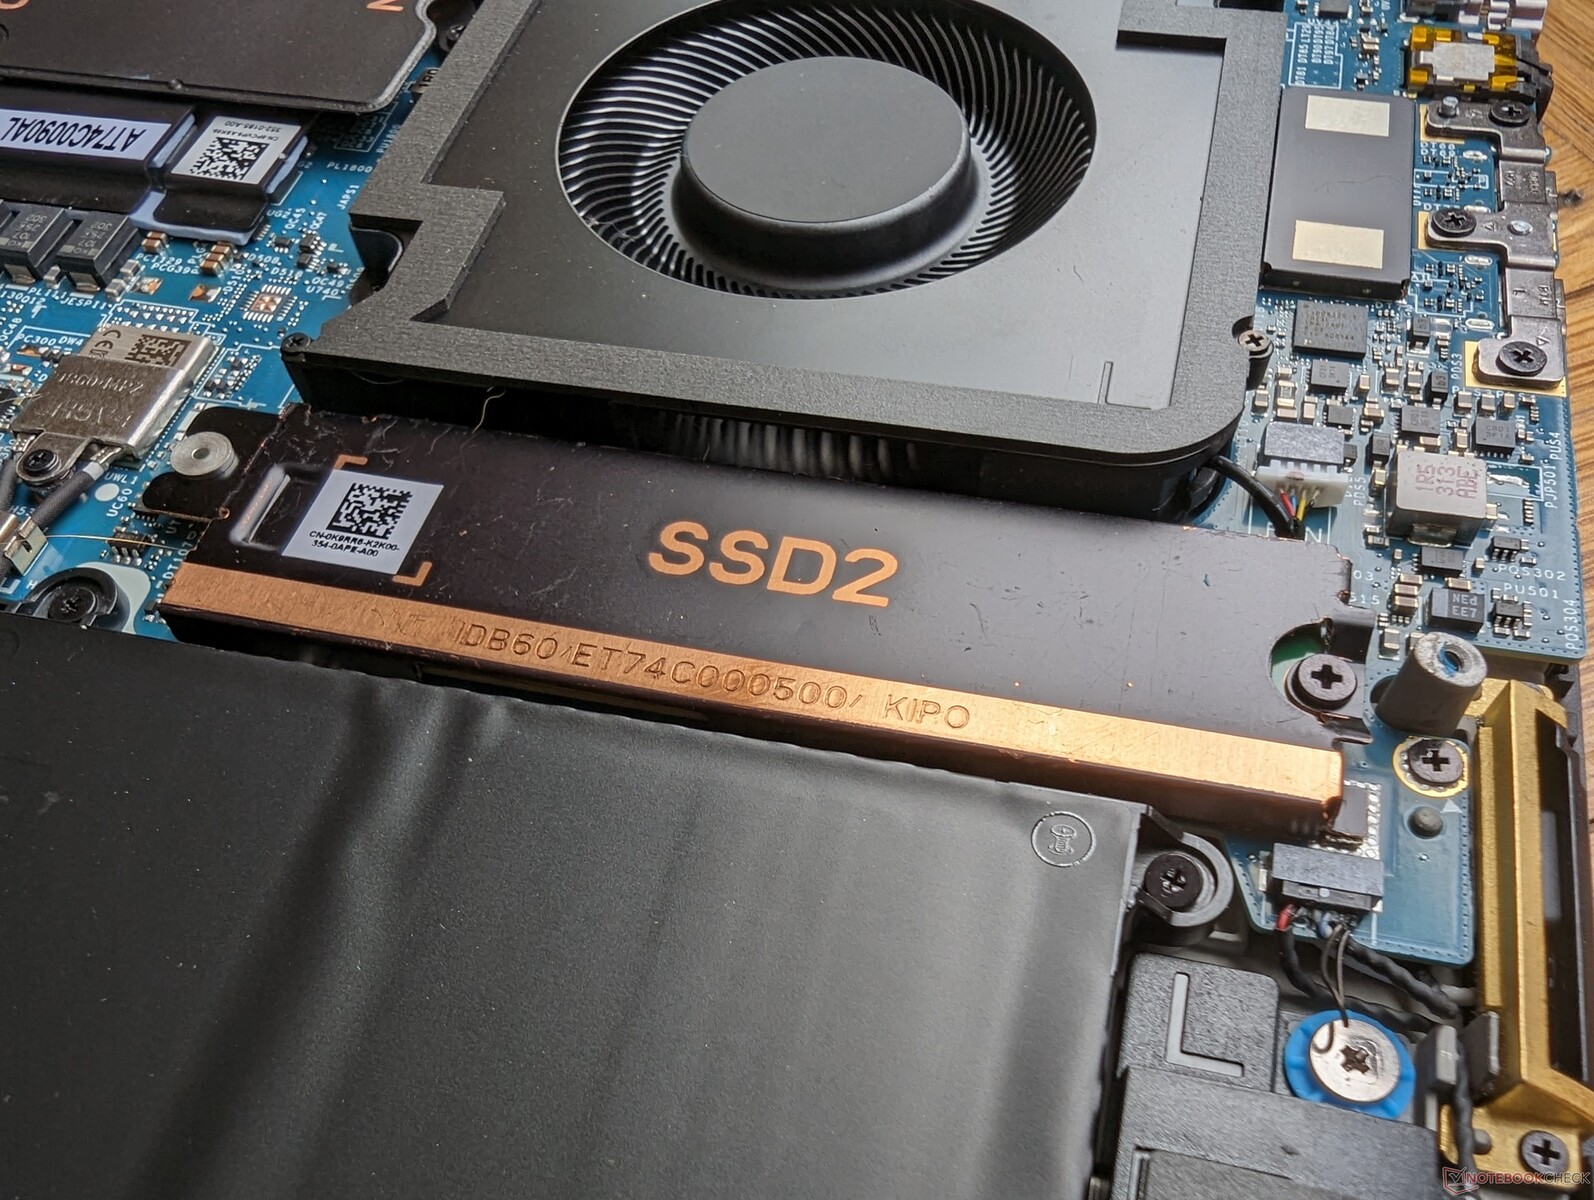
Cada ranura M.2 SSD viene con un disipador de calor de cobre como se muestra a continuación para ayudar en la refrigeración. Cada unidad de nuestra unidad no tuvo problemas para mantener altas tasas de transferencia de ~5400 MB/s durante largos periodos para no mostrar problemas de ralentización importantes.

* ... más pequeño es mejor
Disk Throttling: DiskSpd Read Loop, Queue Depth 8
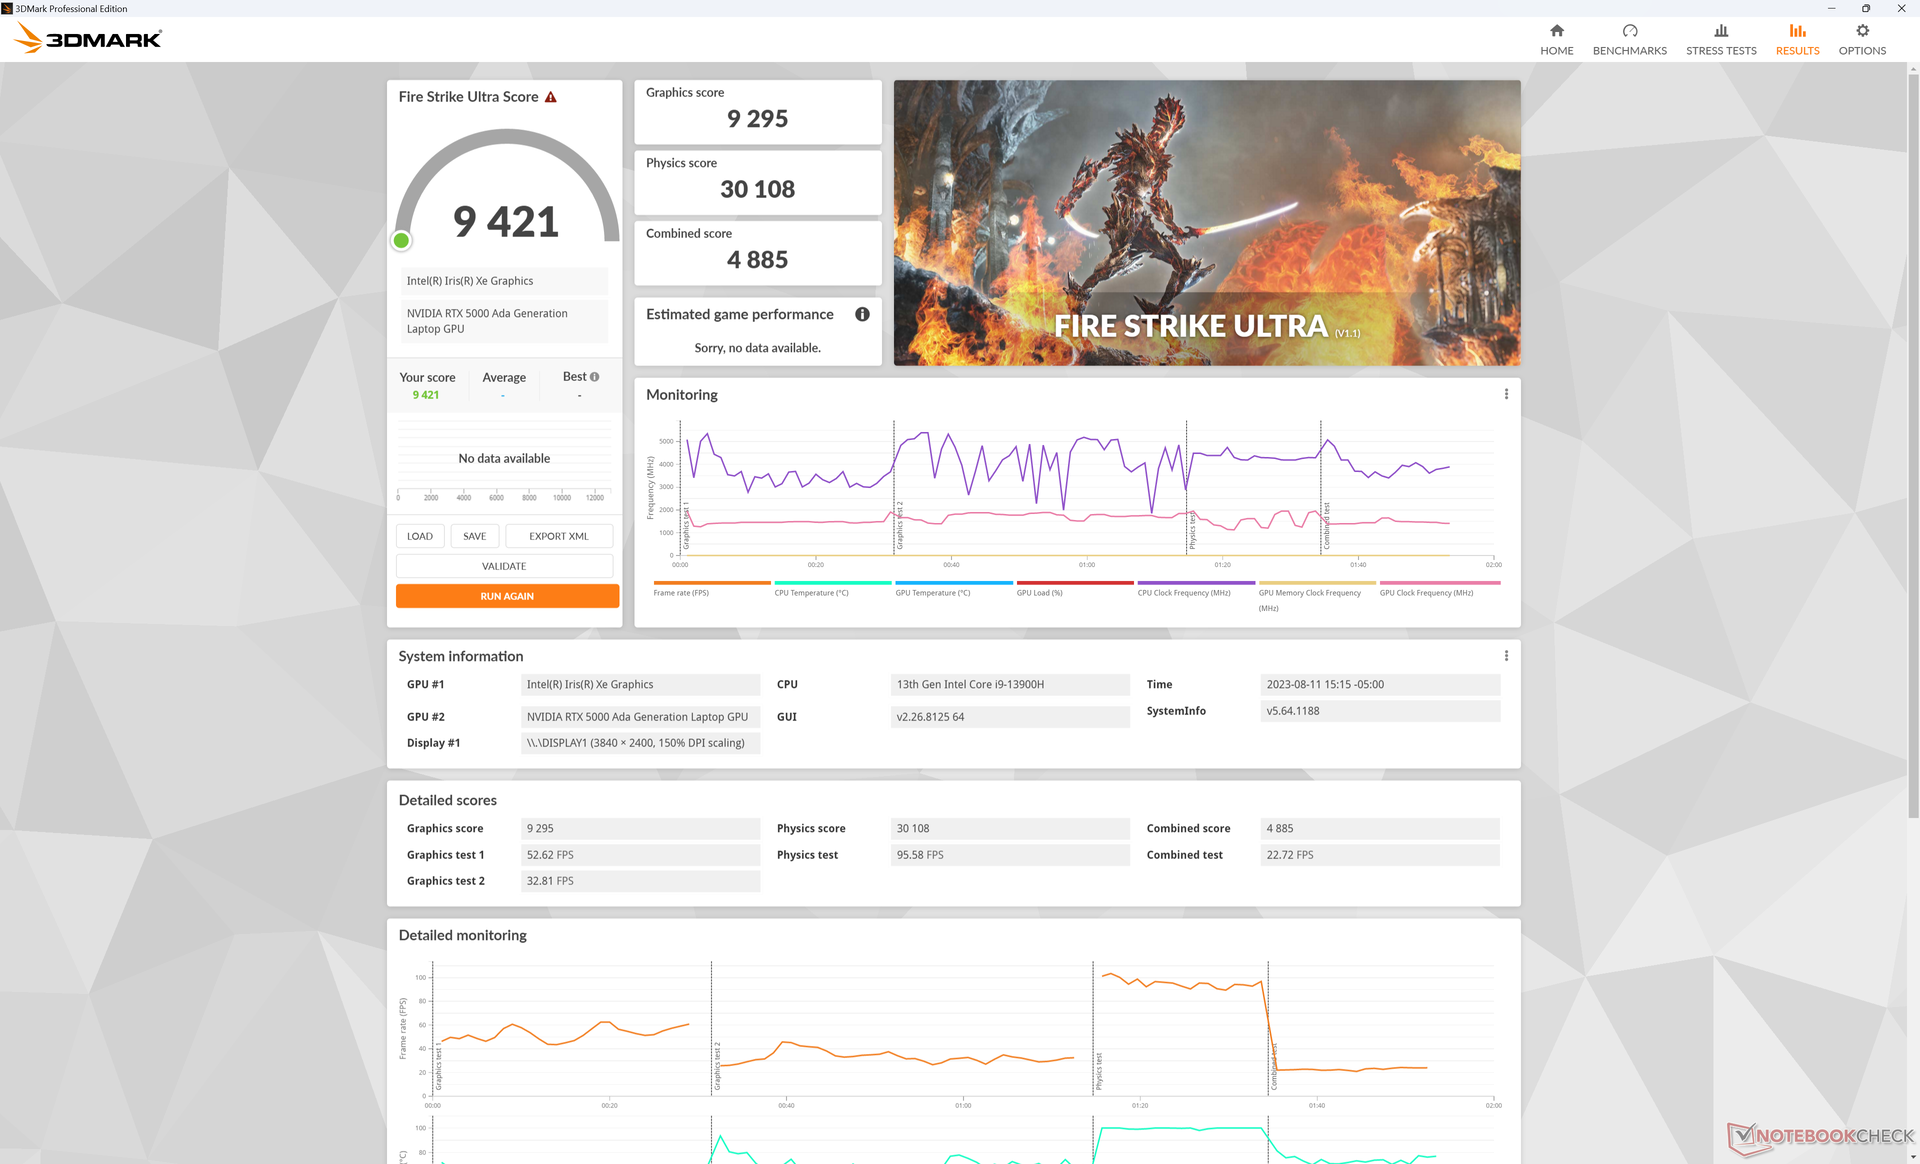
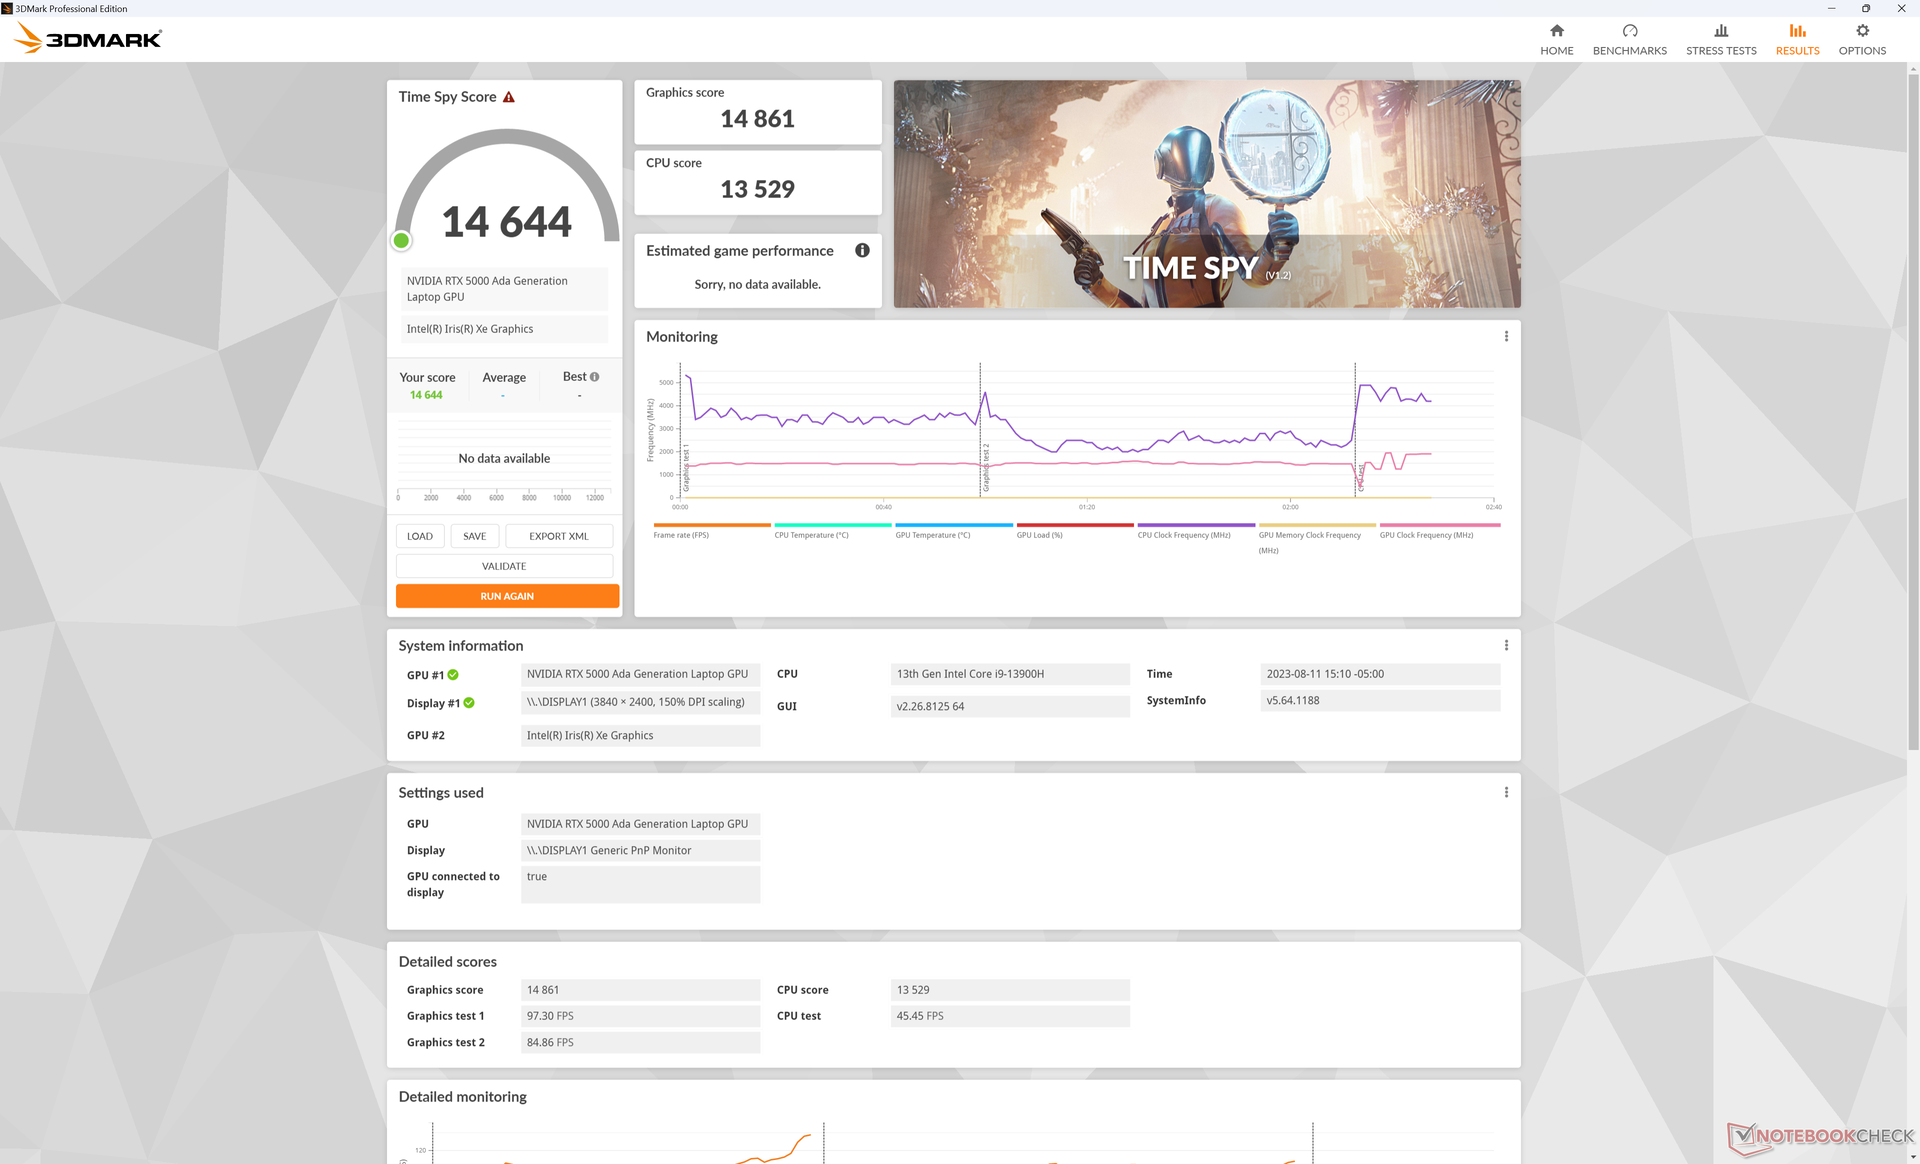
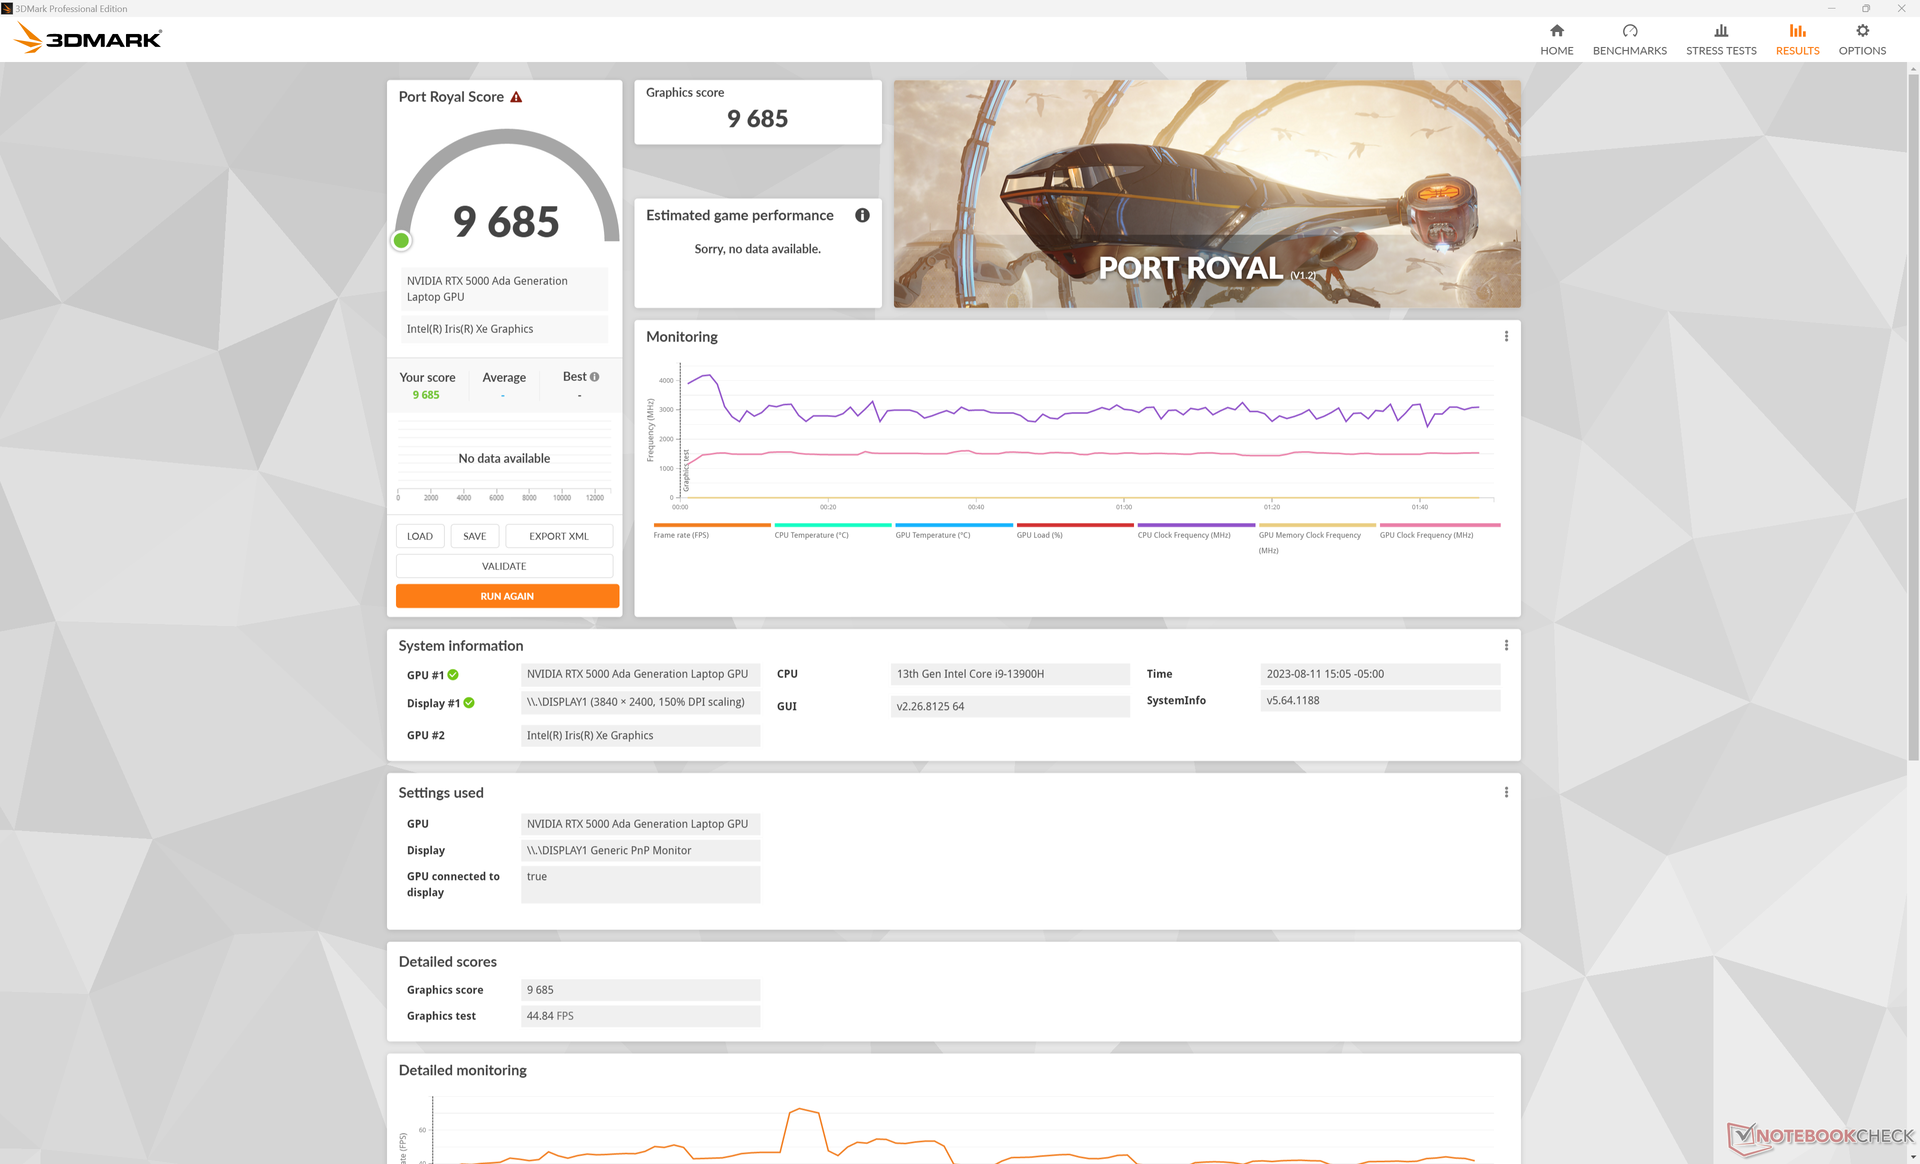
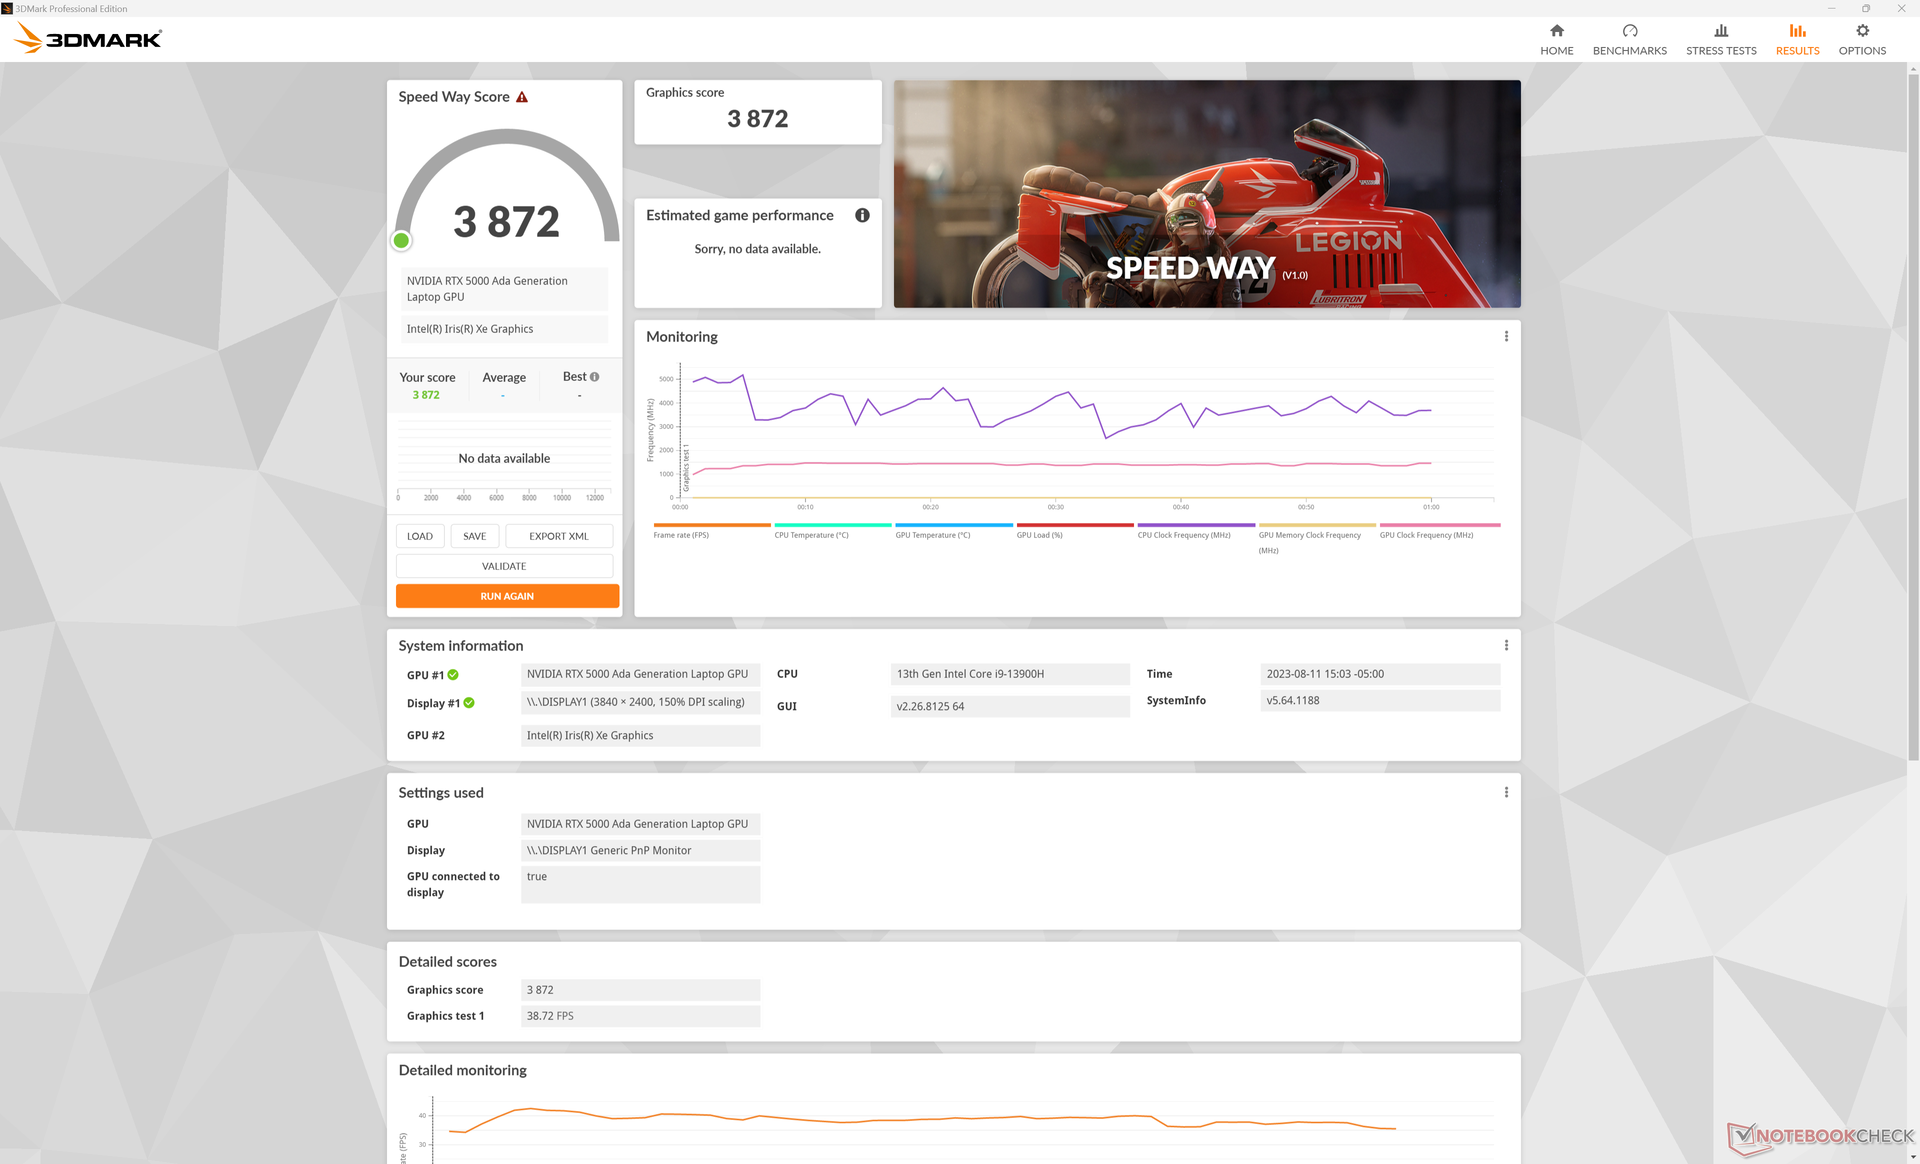
Rendimiento de la GPU - 70 W Nvidia Ada Lovelace
La nueva RTX 5000 ofrece notables ventajas de rendimiento respecto a la del año pasado RTX A5000 y A5500 especialmente en aplicaciones DX12 y aceleración CUDA de Blender. Time Spy la RTX 5000, por ejemplo, obtendría entre un 30 y un 40 por ciento más de puntuación en nuestro Precision que en elMSI WE76 o el Lenovo ThinkPad P16 G1, ambos con GPU Ampere más antiguas. Las ventajas se extienden también a la mayoría de las subpruebas de Specviewperf.
La activación del modo VRAM ECC no parece afectar a la velocidad de reloj de la memoria, pero la VRAM máxima disponible disminuiría de 16384 MB a 15360 MB según GPU-Z.
Nótese que no hay un impacto importante en el rendimiento de la GPU al pasar del modo Performance al modo Balanced, como se muestra en los resultados de Fire Strike a continuación. En cambio, el rendimiento de la CPU se vería notablemente afectado.
| Perfil de potencia | Puntuación física | Puntuación de gráficos | Puntuación combinada |
| Batería | 20938 (-31%) | 27514 (-10%) | 8910 (-31%) |
| Modo equilibrado | 24828 (-18%) | 30588 (-0%) | 11365 (-12%) |
| Modo Rendimiento | 30237 | 30422 | 12907 |
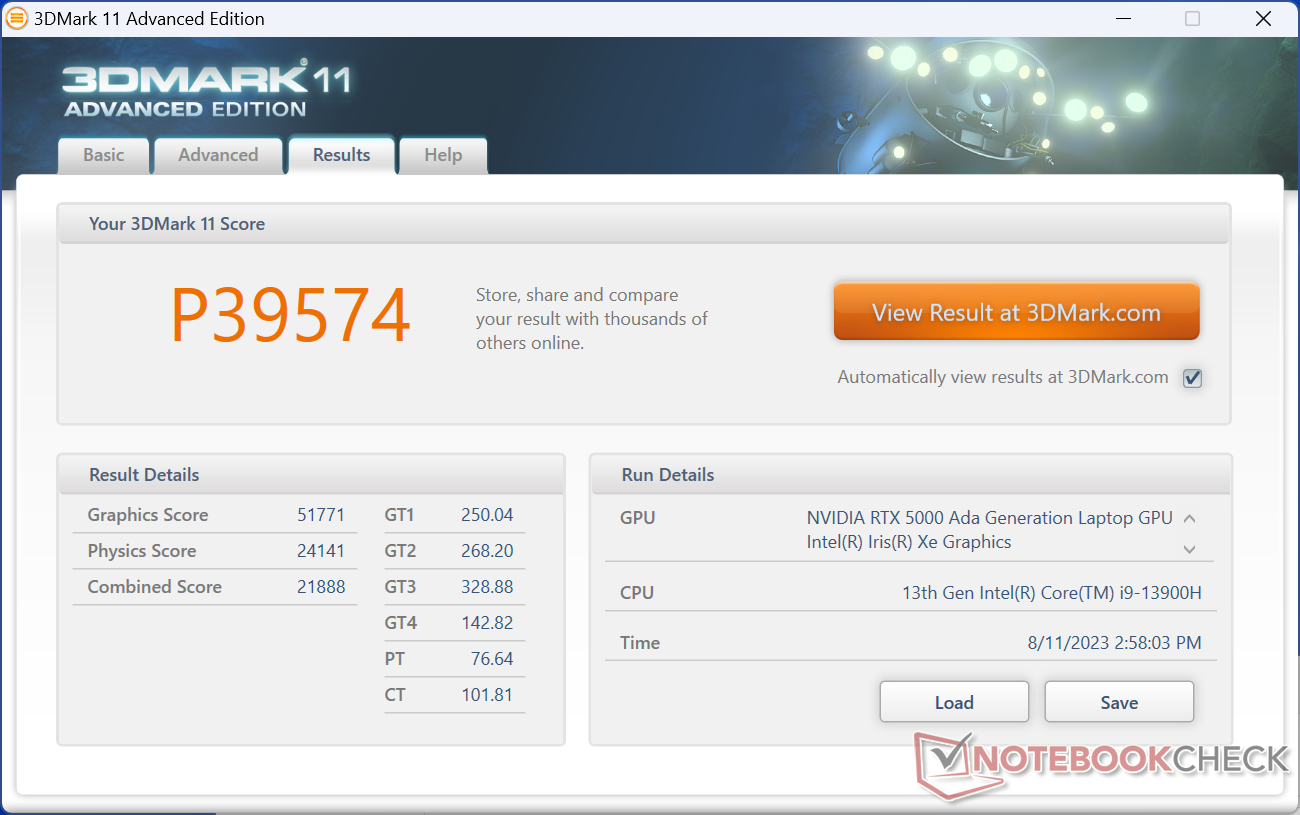
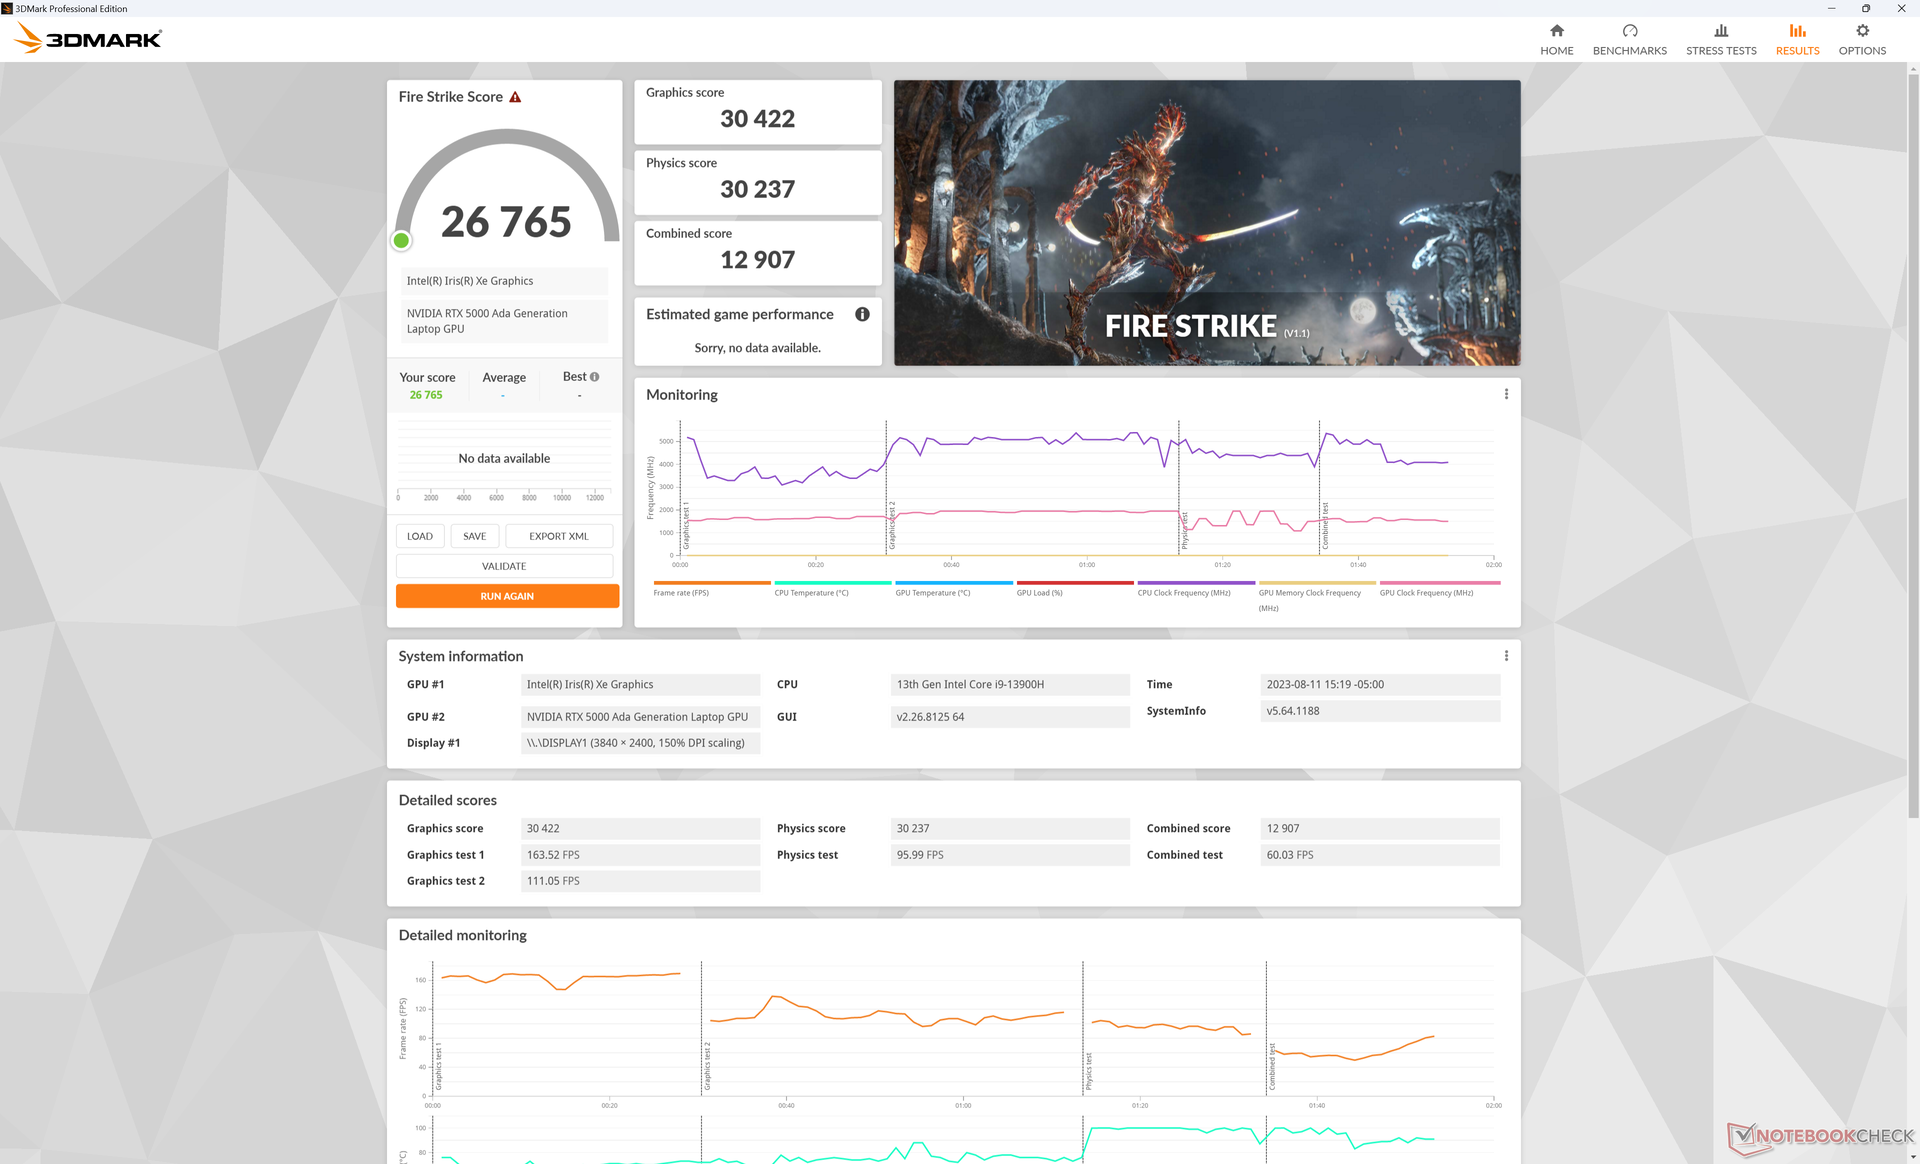
| 3DMark 11 Performance | 39574 puntos | |
| 3DMark Fire Strike Score | 26765 puntos | |
| 3DMark Time Spy Score | 14644 puntos | |
ayuda | ||
* ... más pequeño es mejor
Rendimiento en juegos
Aunque no es un portátil para juegos, el Precision 5680 sigue siendo totalmente capaz de jugar a los últimos títulos exigentes sin problemas de compatibilidad durante las pruebas. El rendimiento general en juegos se sitúa entre la GeForce RTX 4060 móvil y la rTX 4070 móvil que se encuentran en portátiles dedicados a juegos como el HP Omen Transcend 16.
Witcher 3 FPS Chart
| bajo | medio | alto | ultra | QHD | 4K | |
|---|---|---|---|---|---|---|
| GTA V (2015) | 185.4 | 179.7 | 175.3 | 117.1 | 106.6 | 108 |
| The Witcher 3 (2015) | 412.7 | 329.6 | 256 | 137 | 97 | |
| Dota 2 Reborn (2015) | 178 | 161.7 | 154 | 144 | 142.5 | |
| Final Fantasy XV Benchmark (2018) | 196.3 | 165.6 | 127.4 | 100.8 | 60.4 | |
| X-Plane 11.11 (2018) | 155.3 | 133 | 102.4 | 86.2 | ||
| Far Cry 5 (2018) | 145 | 132 | 129 | 132 | 114 | 70 |
| Cyberpunk 2077 1.6 (2022) | 124.9 | 122.7 | 107.7 | 100 | 66.2 | 32.2 |
| Tiny Tina's Wonderlands (2022) | 220 | 202.3 | 152.6 | 125 | 90.1 | 50.9 |
| F1 22 (2022) | 232 | 218 | 202 | 84.5 | 56.1 | 28.8 |
| Returnal (2023) | 98 | 94 | 90 | 81 | 60 | 34 |
Emisiones: silenciosas la mayor parte del tiempo
Ruido del sistema
Los niveles de ruido son muy similares a los delPrecision 5550 aunque nuestro Precision 5680 lleva una GPU significativamente más rápida. Los ventiladores tienden a rondar los 20 dB(A) cuando se ejecutan cargas poco exigentes como navegadores web, mientras que las cargas más exigentes inducen un ruido constante de 51 dB(A).
Curiosamente, el nivel máximo de ruido del ventilador en el modo Equilibrado es el mismo que en el modo Rendimiento.
Ruido
| Ocioso |
| 23 / 23 / 23 dB(A) |
| Carga |
| 37.2 / 51 dB(A) |
 | ||
30 dB silencioso 40 dB(A) audible 50 dB(A) ruidosamente alto |
||
min: | ||
| Dell Precision 5000 5680 RTX 5000 Ada Generation Laptop, i9-13900H, 2x SK hynix PC801 HFS512GEJ9X101N RAID 0 | Dell Precision 7000 7670 Performance RTX A5500 Laptop GPU, i9-12950HX | HP ZBook Fury 16 G9 RTX A5500 Laptop GPU, i9-12950HX, Micron 3400 1TB MTFDKBA1T0TFH | Lenovo ThinkPad P16 G1 RTX A5500 RTX A5500 Laptop GPU, i9-12950HX, WDC PC SN810 2TB | MSI CreatorPro Z16P B12UKST RTX A3000 Laptop GPU, i7-12700H, Samsung PM9A1 MZVL21T0HCLR | Asus ExpertBook B6 Flip B6602FC2 RTX A2000 Laptop GPU, i9-12950HX, Samsung PM9A1 MZVL21T0HCLR | |
|---|---|---|---|---|---|---|
| Noise | -11% | -2% | 3% | -8% | -30% | |
| apagado / medio ambiente * (dB) | 22.8 | 23.9 -5% | 22.6 1% | 23.1 -1% | 24.1 -6% | 26 -14% |
| Idle Minimum * (dB) | 23 | 24 -4% | 22.7 1% | 23.1 -0% | 27.1 -18% | 32.4 -41% |
| Idle Average * (dB) | 23 | 24 -4% | 22.7 1% | 23.1 -0% | 27.1 -18% | 32.4 -41% |
| Idle Maximum * (dB) | 23 | 38 -65% | 28.8 -25% | 23.1 -0% | 27.1 -18% | 32.4 -41% |
| Load Average * (dB) | 37.2 | 46.3 -24% | 36.2 3% | 28.9 22% | 42.9 -15% | 51.9 -40% |
| Witcher 3 ultra * (dB) | 51 | 41.9 18% | 49.5 3% | 51.6 -1% | 44 14% | |
| Load Maximum * (dB) | 51 | 47.9 6% | 49.3 3% | 51.4 -1% | 47 8% | 52.1 -2% |
* ... más pequeño es mejor
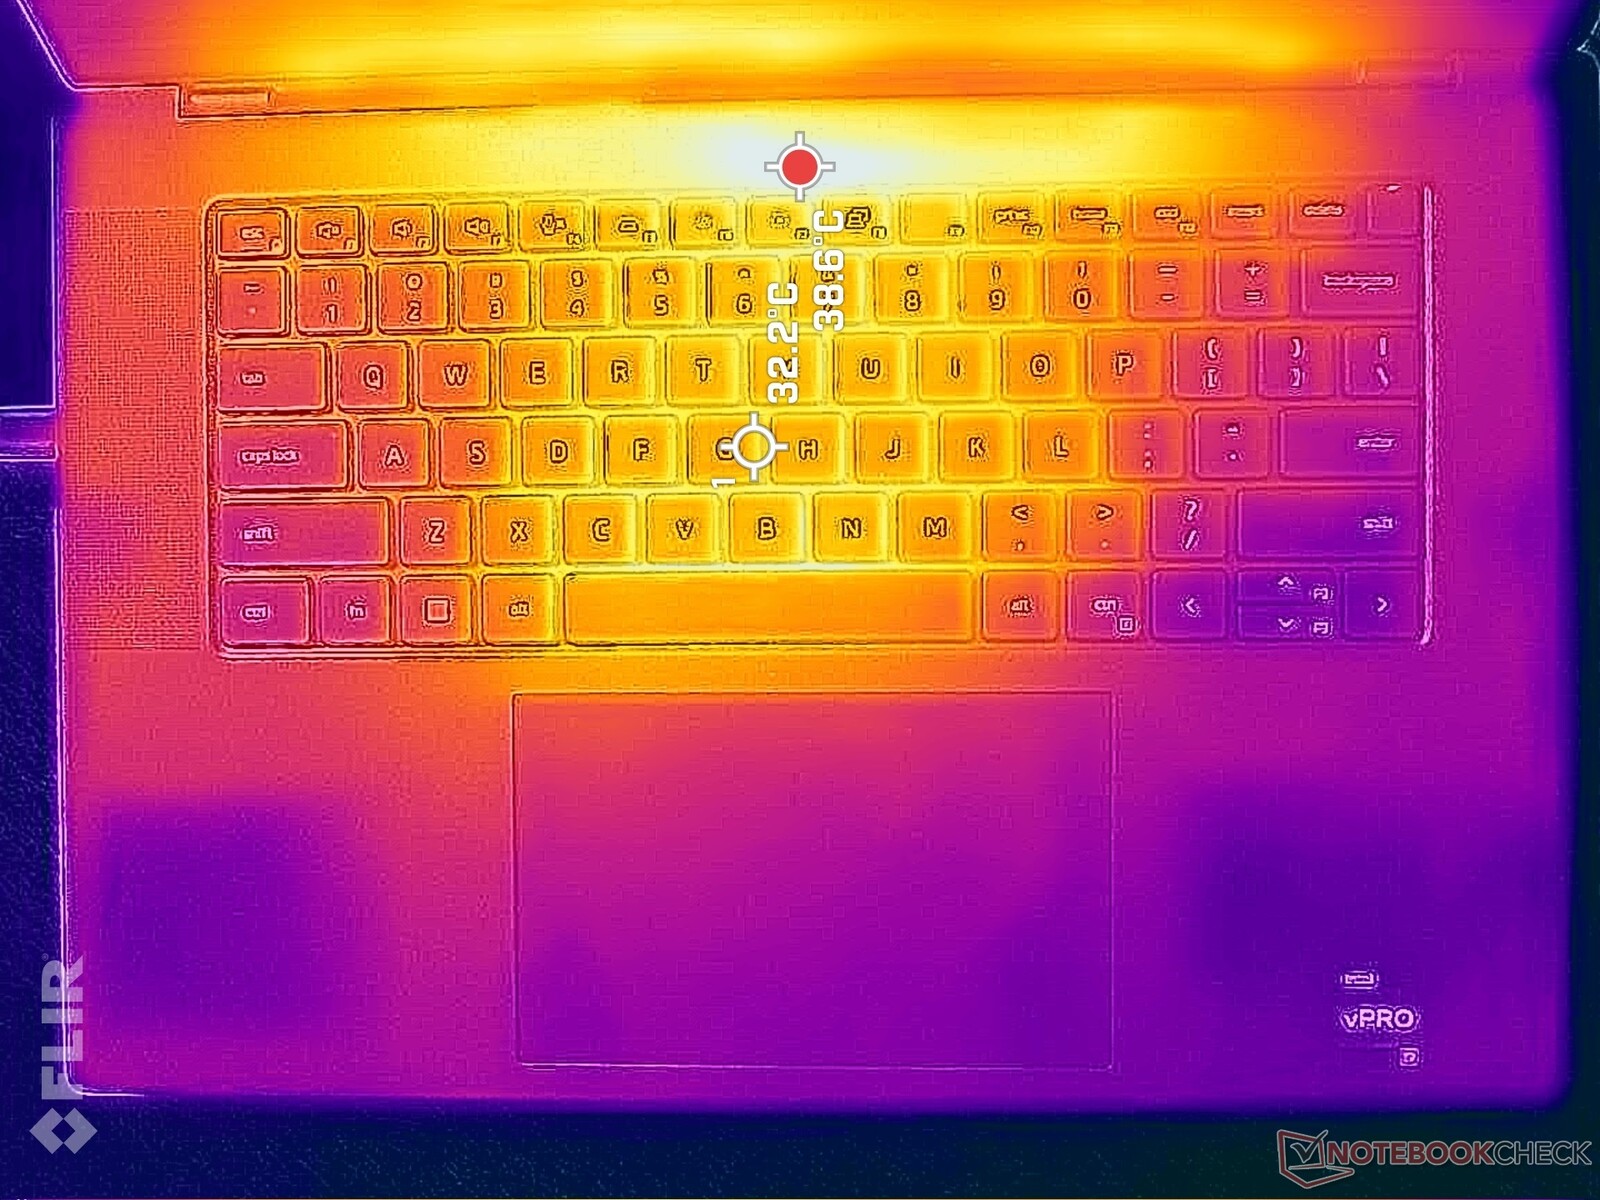
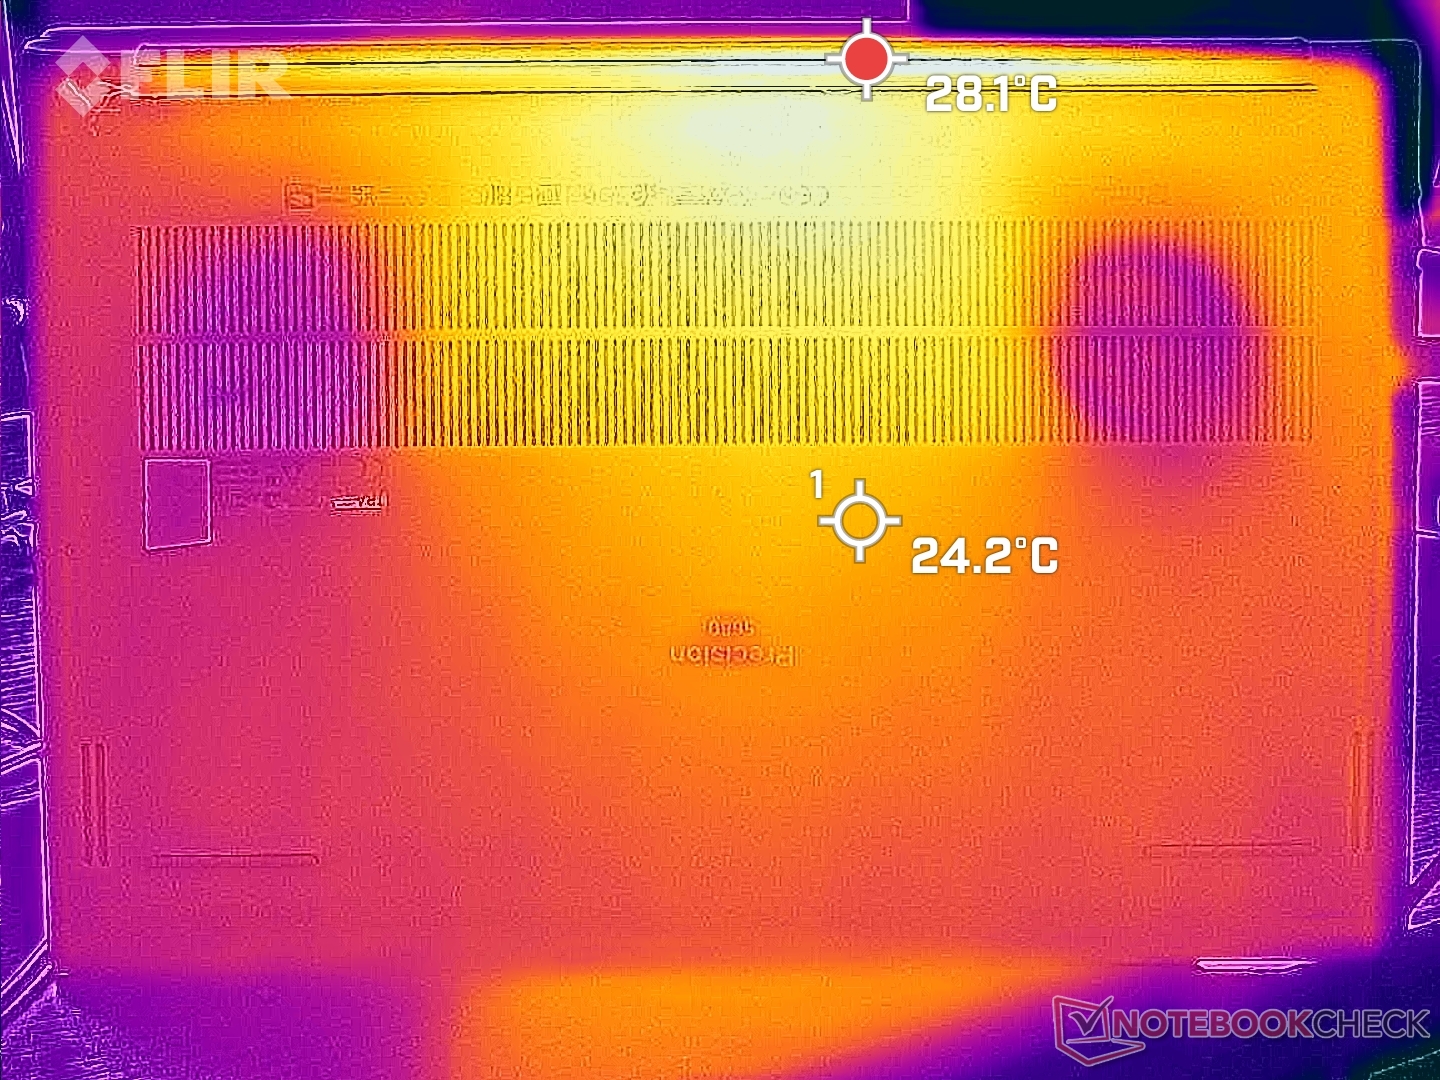
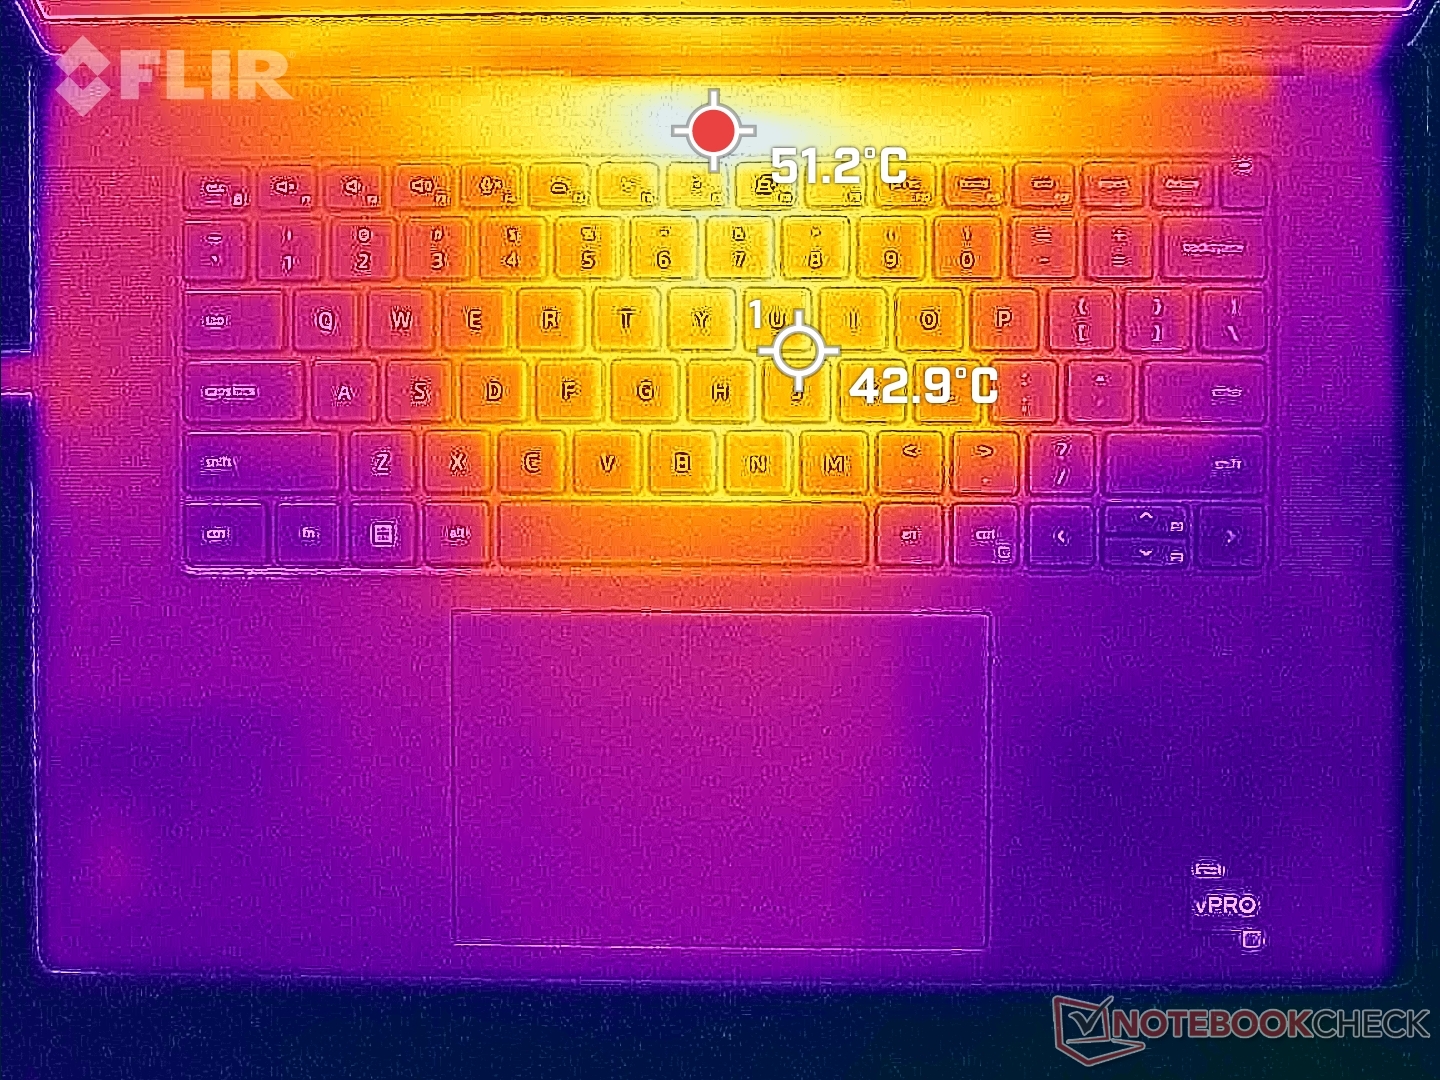
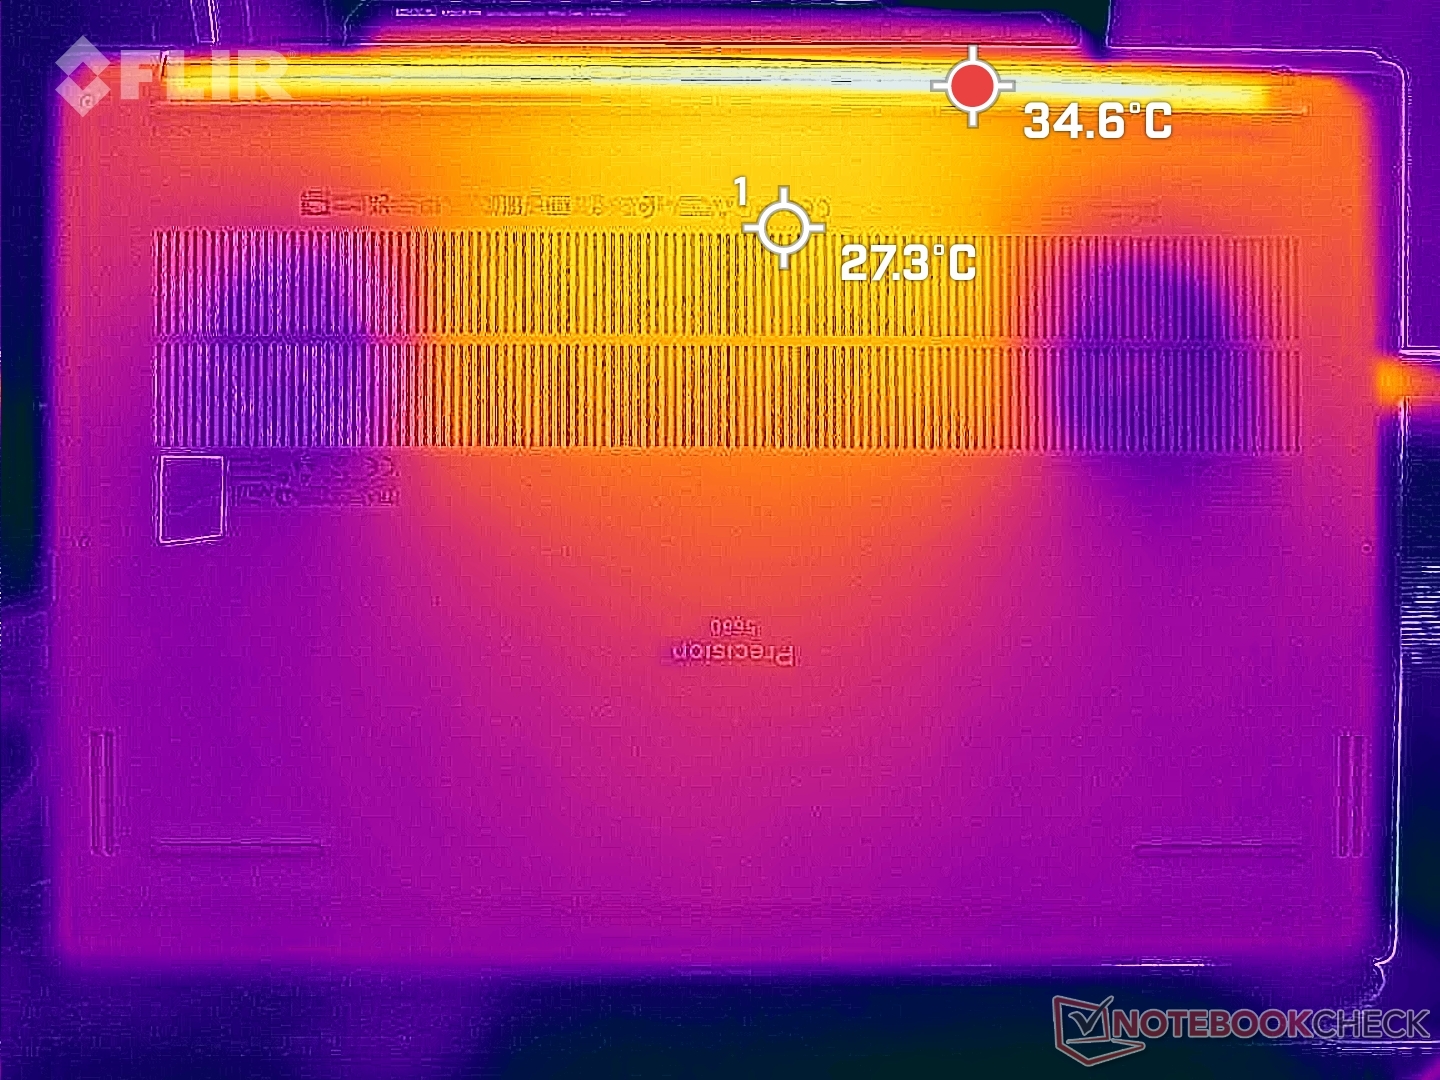
Temperatura
Las temperaturas superficiales al ralentí son más cálidas de lo esperado, ya que los ventiladores tienden a permanecer inactivos hasta que es necesario. Los puntos calientes pueden alcanzar los 37 C y 32 C en la parte superior e inferior, respectivamente, en comparación con los 30 C de la parte inferior.ExpertBook B6 Flip.
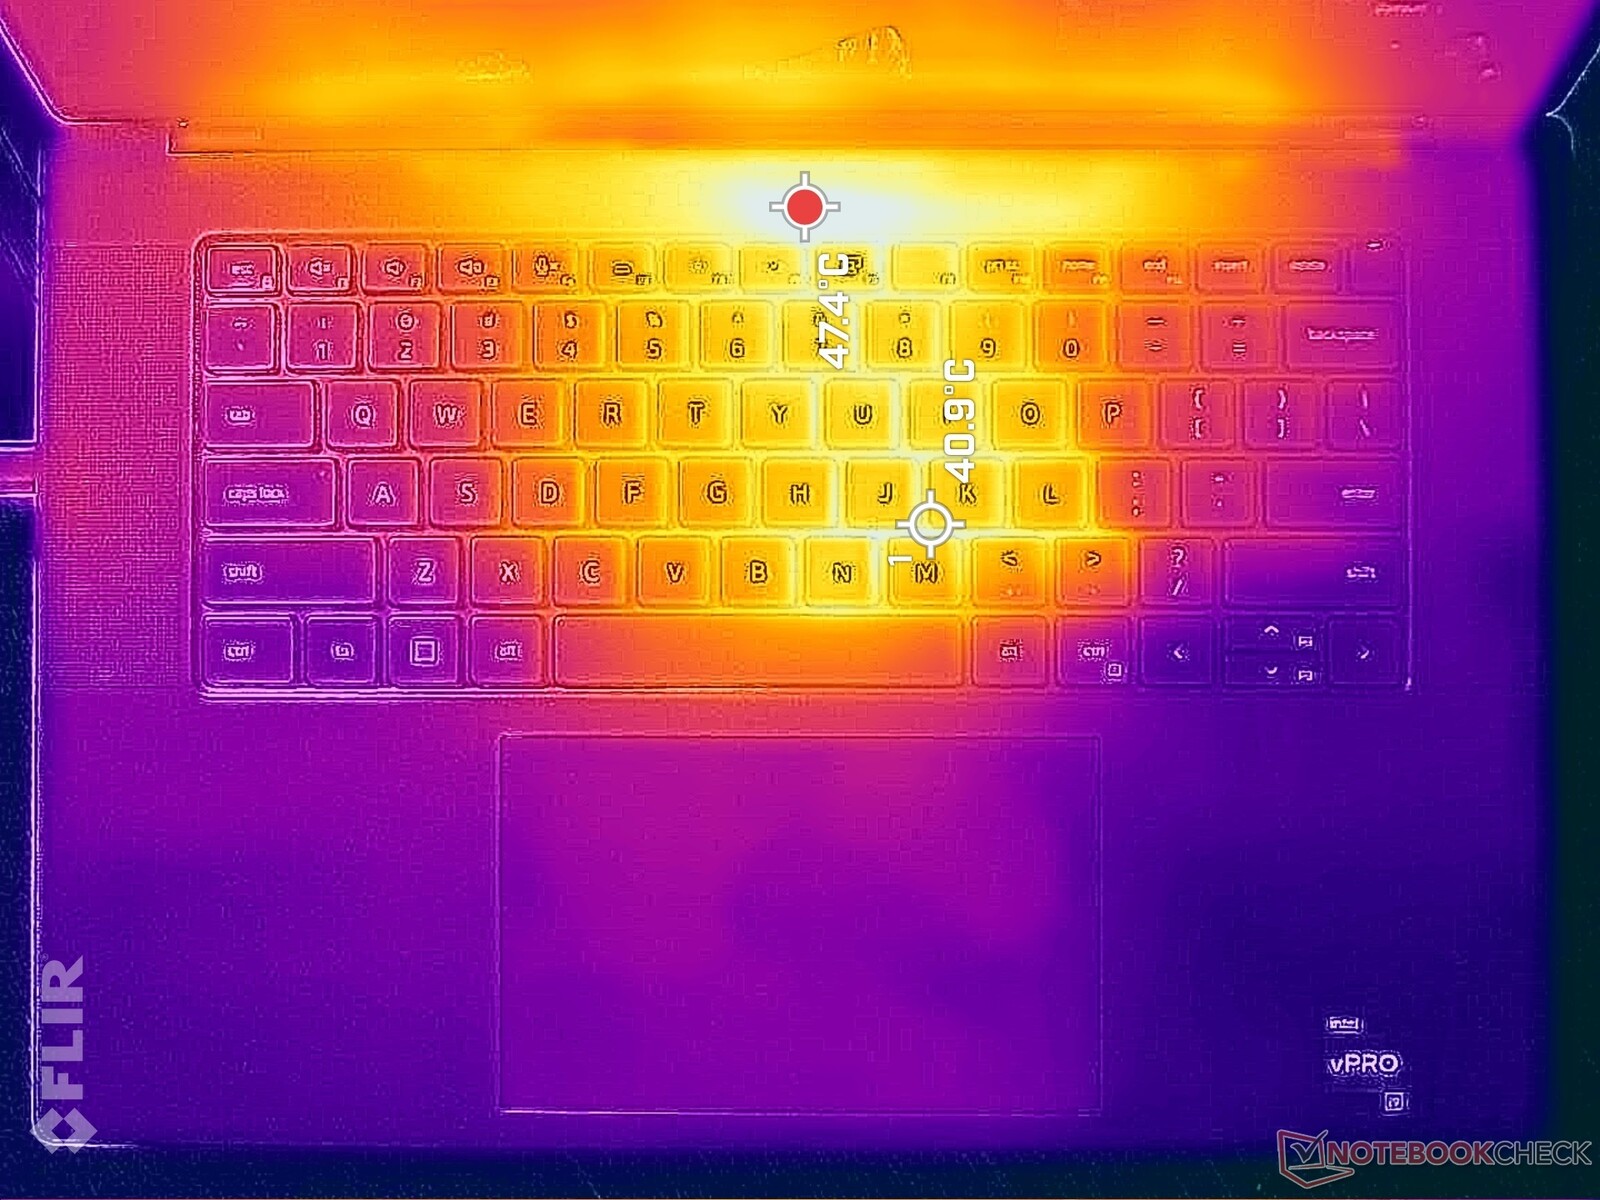
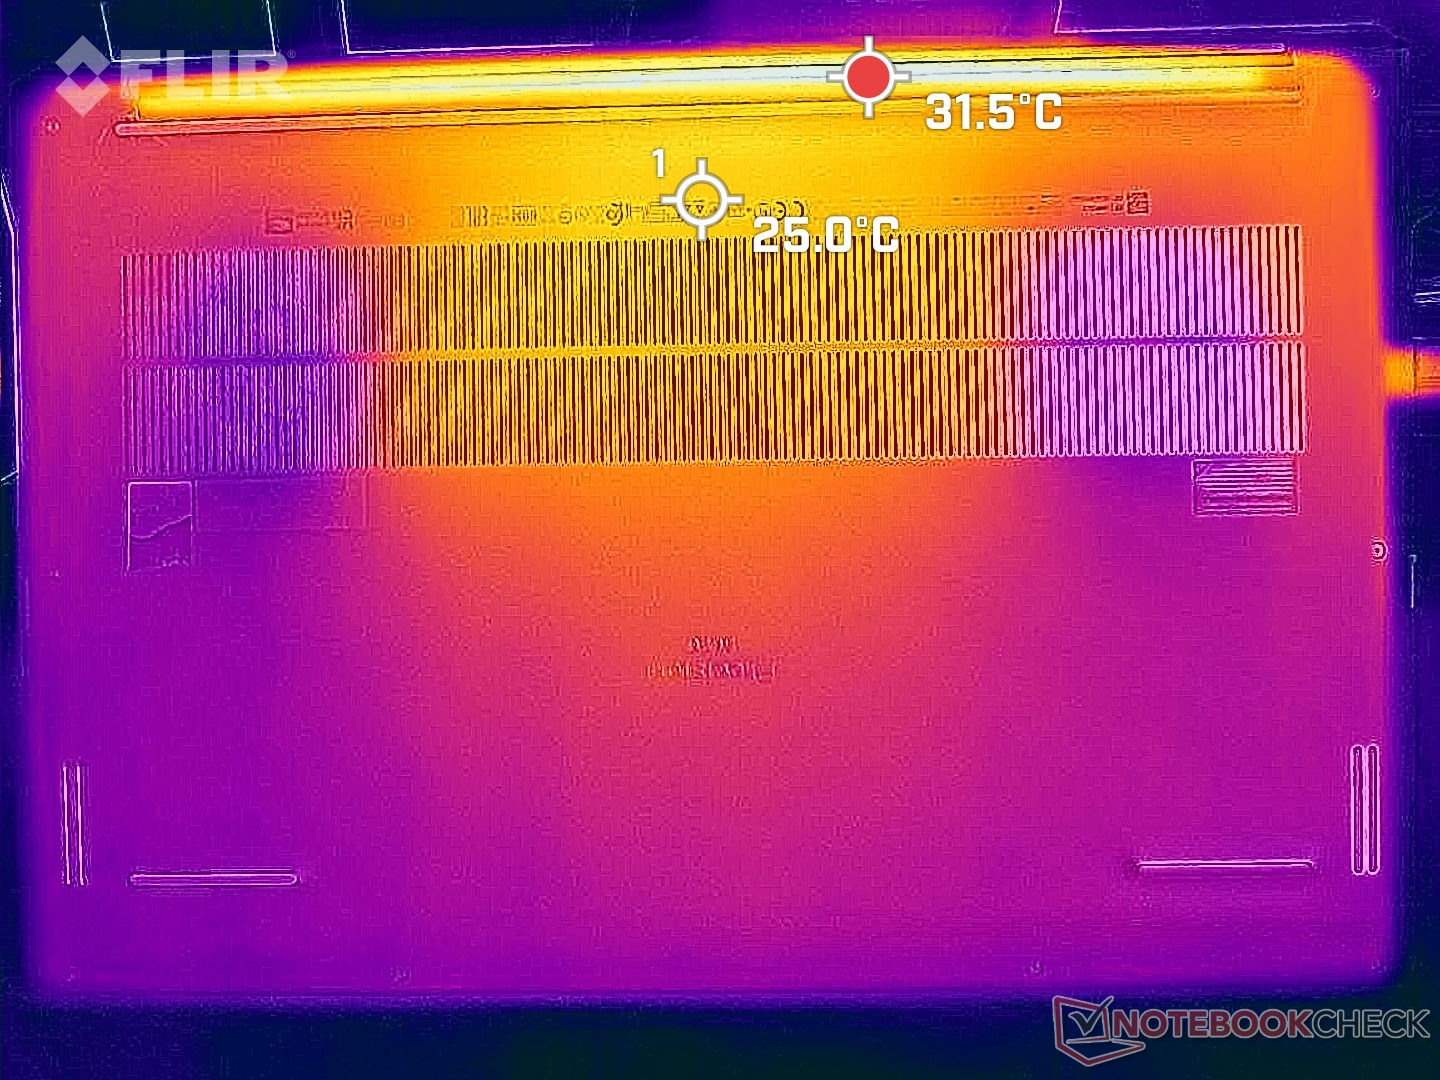
Cuando se ejecutan cargas más exigentes, el centro del teclado puede alcanzar más de 50 C mientras que la superficie inferior apenas se calentaría debido en parte a los aislantes Gore. Los dedos y las palmas sólo tocan el centro del teclado con poca frecuencia, por lo que los puntos calientes no suelen afectar a la comodidad.
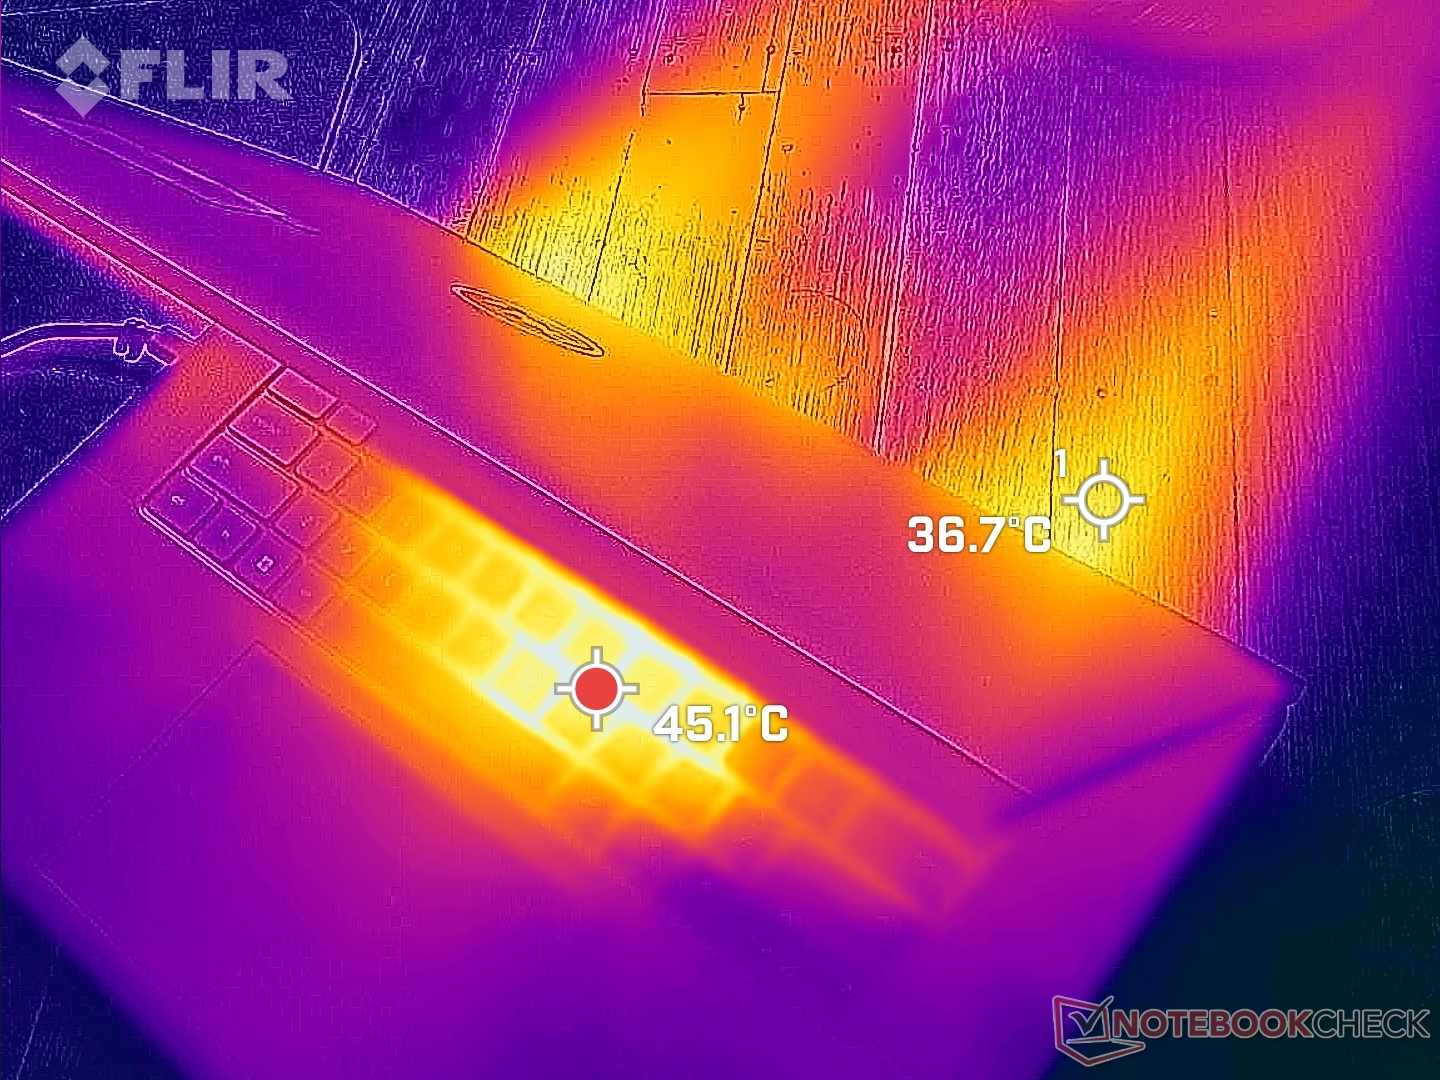
(-) La temperatura máxima en la parte superior es de 50.2 °C / 122 F, frente a la media de 38.2 °C / 101 F, que oscila entre 22.2 y 69.8 °C para la clase Workstation.
(+) El fondo se calienta hasta un máximo de 32 °C / 90 F, frente a la media de 41.1 °C / 106 F
(+) En reposo, la temperatura media de la parte superior es de 30.1 °C / 86# F, frente a la media del dispositivo de 32 °C / 90 F.
(±) Jugando a The Witcher 3, la temperatura media de la parte superior es de 34.6 °C / 94 F, frente a la media del dispositivo de 32 °C / 90 F.
(+) El reposamanos y el panel táctil están a una temperatura inferior a la de la piel, con un máximo de 27.6 °C / 81.7 F y, por tanto, son fríos al tacto.
(±) La temperatura media de la zona del reposamanos de dispositivos similares fue de 27.8 °C / 82 F (+0.2 °C / 0.3 F).
| Dell Precision 5000 5680 Intel Core i9-13900H, NVIDIA RTX 5000 Ada Generation Laptop | Dell Precision 7000 7670 Performance Intel Core i9-12950HX, NVIDIA RTX A5500 Laptop GPU | HP ZBook Fury 16 G9 Intel Core i9-12950HX, NVIDIA RTX A5500 Laptop GPU | Lenovo ThinkPad P16 G1 RTX A5500 Intel Core i9-12950HX, NVIDIA RTX A5500 Laptop GPU | MSI CreatorPro Z16P B12UKST Intel Core i7-12700H, NVIDIA RTX A3000 Laptop GPU | Asus ExpertBook B6 Flip B6602FC2 Intel Core i9-12950HX, NVIDIA RTX A2000 Laptop GPU | |
|---|---|---|---|---|---|---|
| Heat | -12% | -3% | -13% | -19% | -8% | |
| Maximum Upper Side * (°C) | 50.2 | 53 -6% | 43.2 14% | 44.8 11% | 56.3 -12% | 48.4 4% |
| Maximum Bottom * (°C) | 32 | 43.2 -35% | 50.4 -58% | 49.8 -56% | 68.3 -113% | 52.3 -63% |
| Idle Upper Side * (°C) | 37.4 | 36.8 2% | 28.6 24% | 30.6 18% | 25.2 33% | 27.8 26% |
| Idle Bottom * (°C) | 31.2 | 33.8 -8% | 28.2 10% | 38.6 -24% | 25.9 17% | 30.3 3% |
* ... más pequeño es mejor
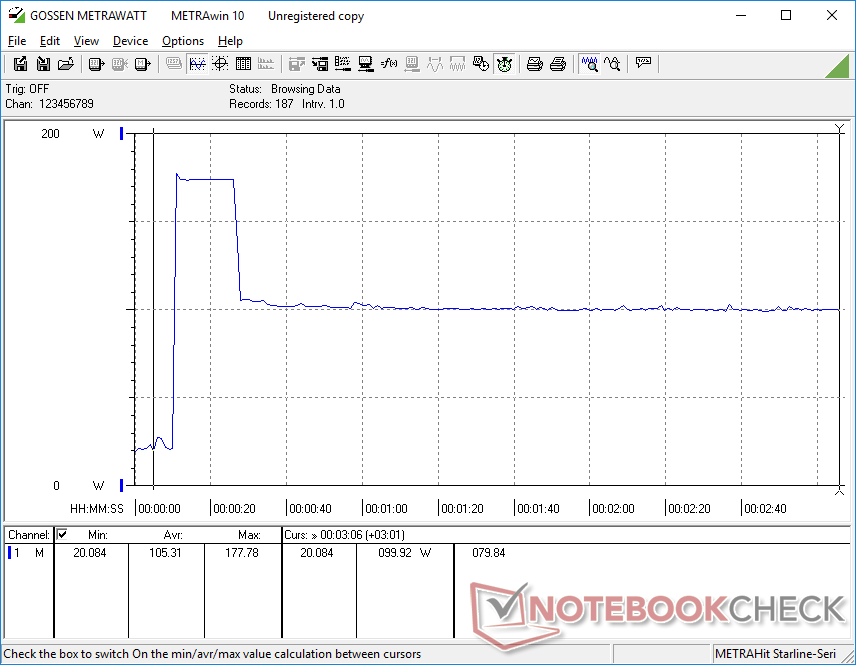
Prueba de resistencia
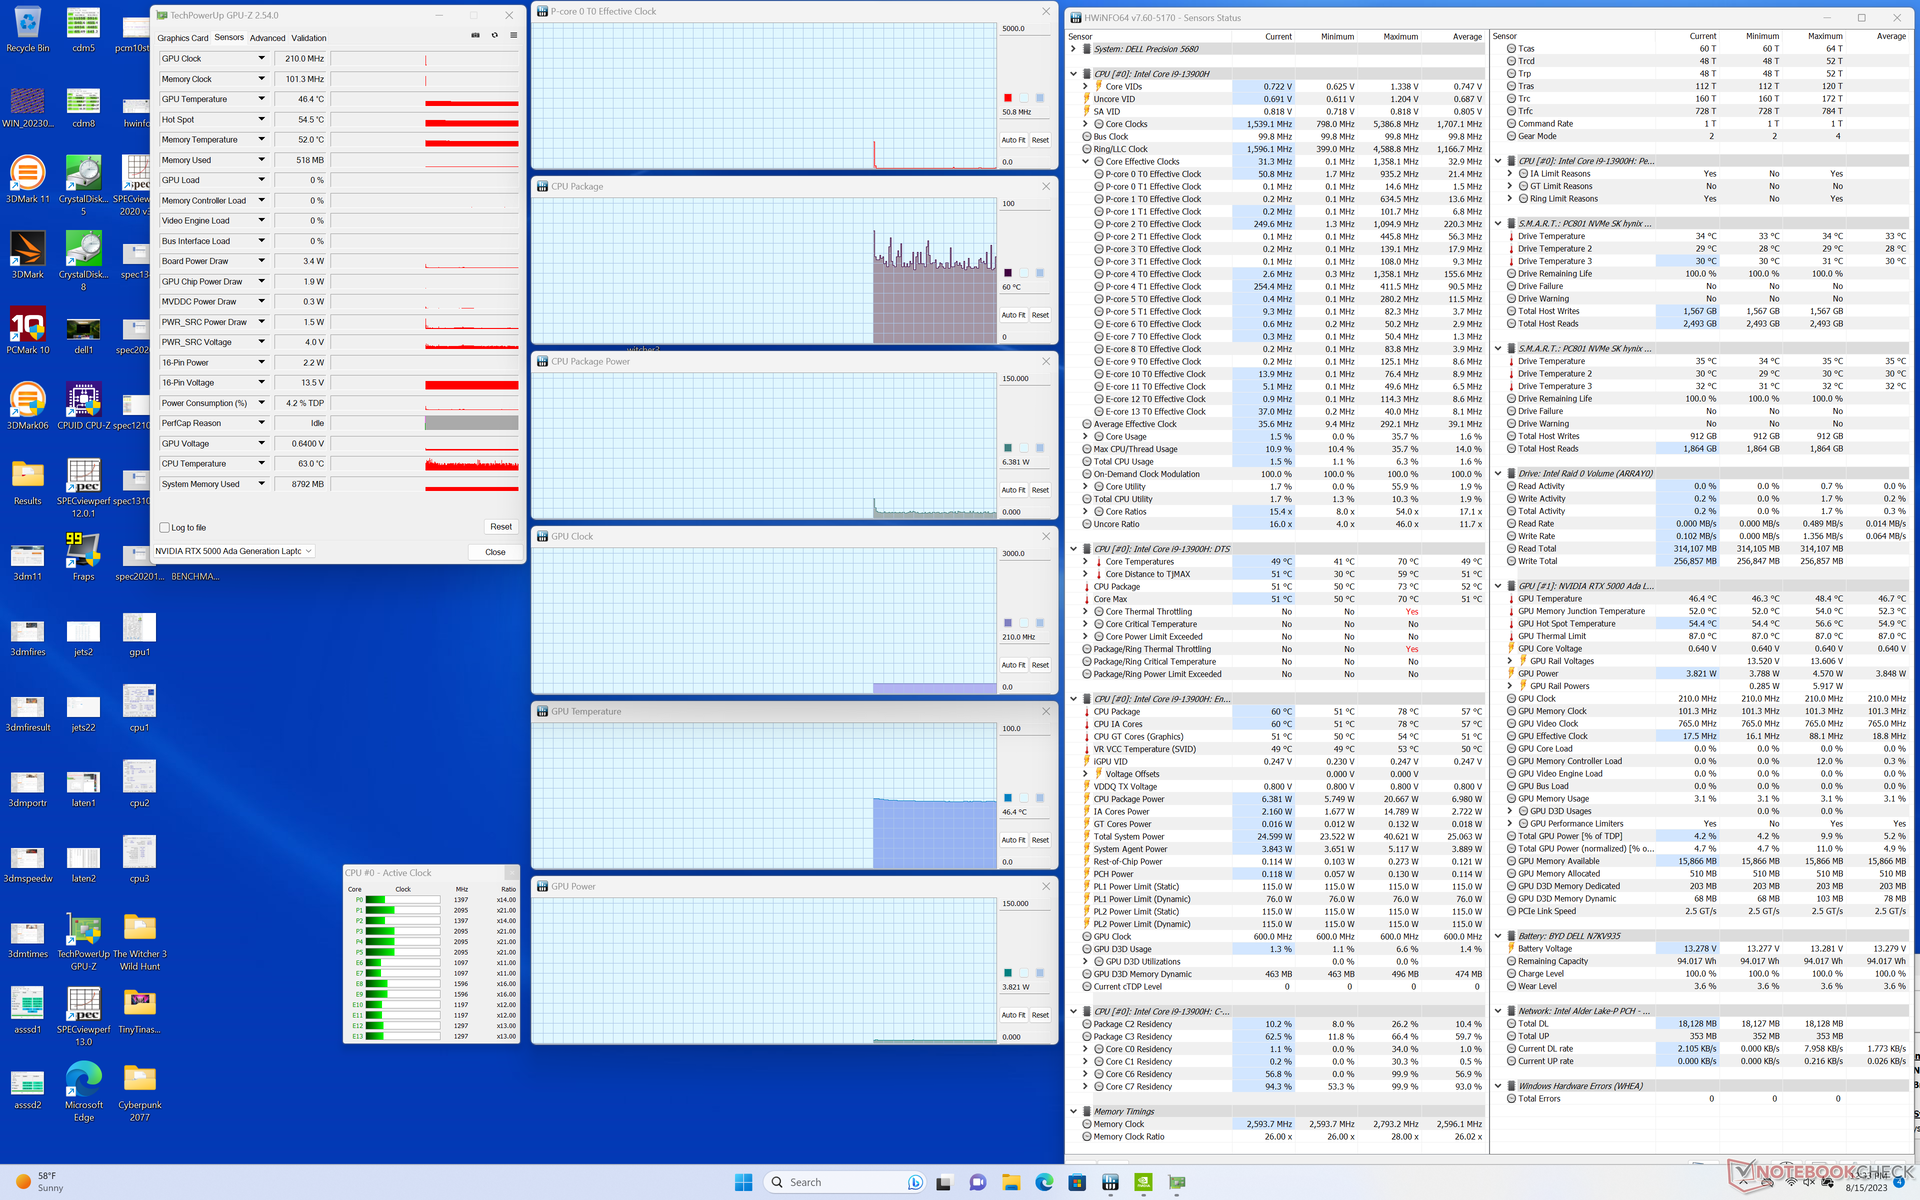
Cuando se ejecuta Prime95, la CPU alcanza los 3,9 GHz, 117 W y 100 C durante sólo 15 segundos. A partir de entonces, el potencial de Turbo Boost disminuye y se estabiliza en torno a los 2,8 GHz y 56 W, con una temperatura del núcleo más razonable de 75 C. Por tanto, el Turbo Boost máximo no es sostenible en la Precision 5680 ni siquiera en el modo Rendimiento.
Utilizar el modo Equilibrado en lugar del modo Rendimiento no afecta negativamente al rendimiento de la GPU, como ya se ha mencionado. El reloj, la temperatura y el consumo de energía de la GPU en modo Witcher 3 en modo Performance se estabilizan en 1560 MHz, 72 C y 63 W, respectivamente, frente a 1665 MHz, 65 C y 69 W en modo Balanced. La mayor diferencia entre los modos Equilibrado y Rendimiento parece ser la temperatura de la CPU, que puede llegar a los 100+ C en modo Rendimiento para un mayor potencial Turbo Boost comparado con los ~80 C en modo Equilibrado.
Nótese que sólo somos capaces de alcanzar un consumo máximo de la GPU de 75 W a pesar de que el TGP objetivo es de 95 W según el Panel de Control de Nvidia.
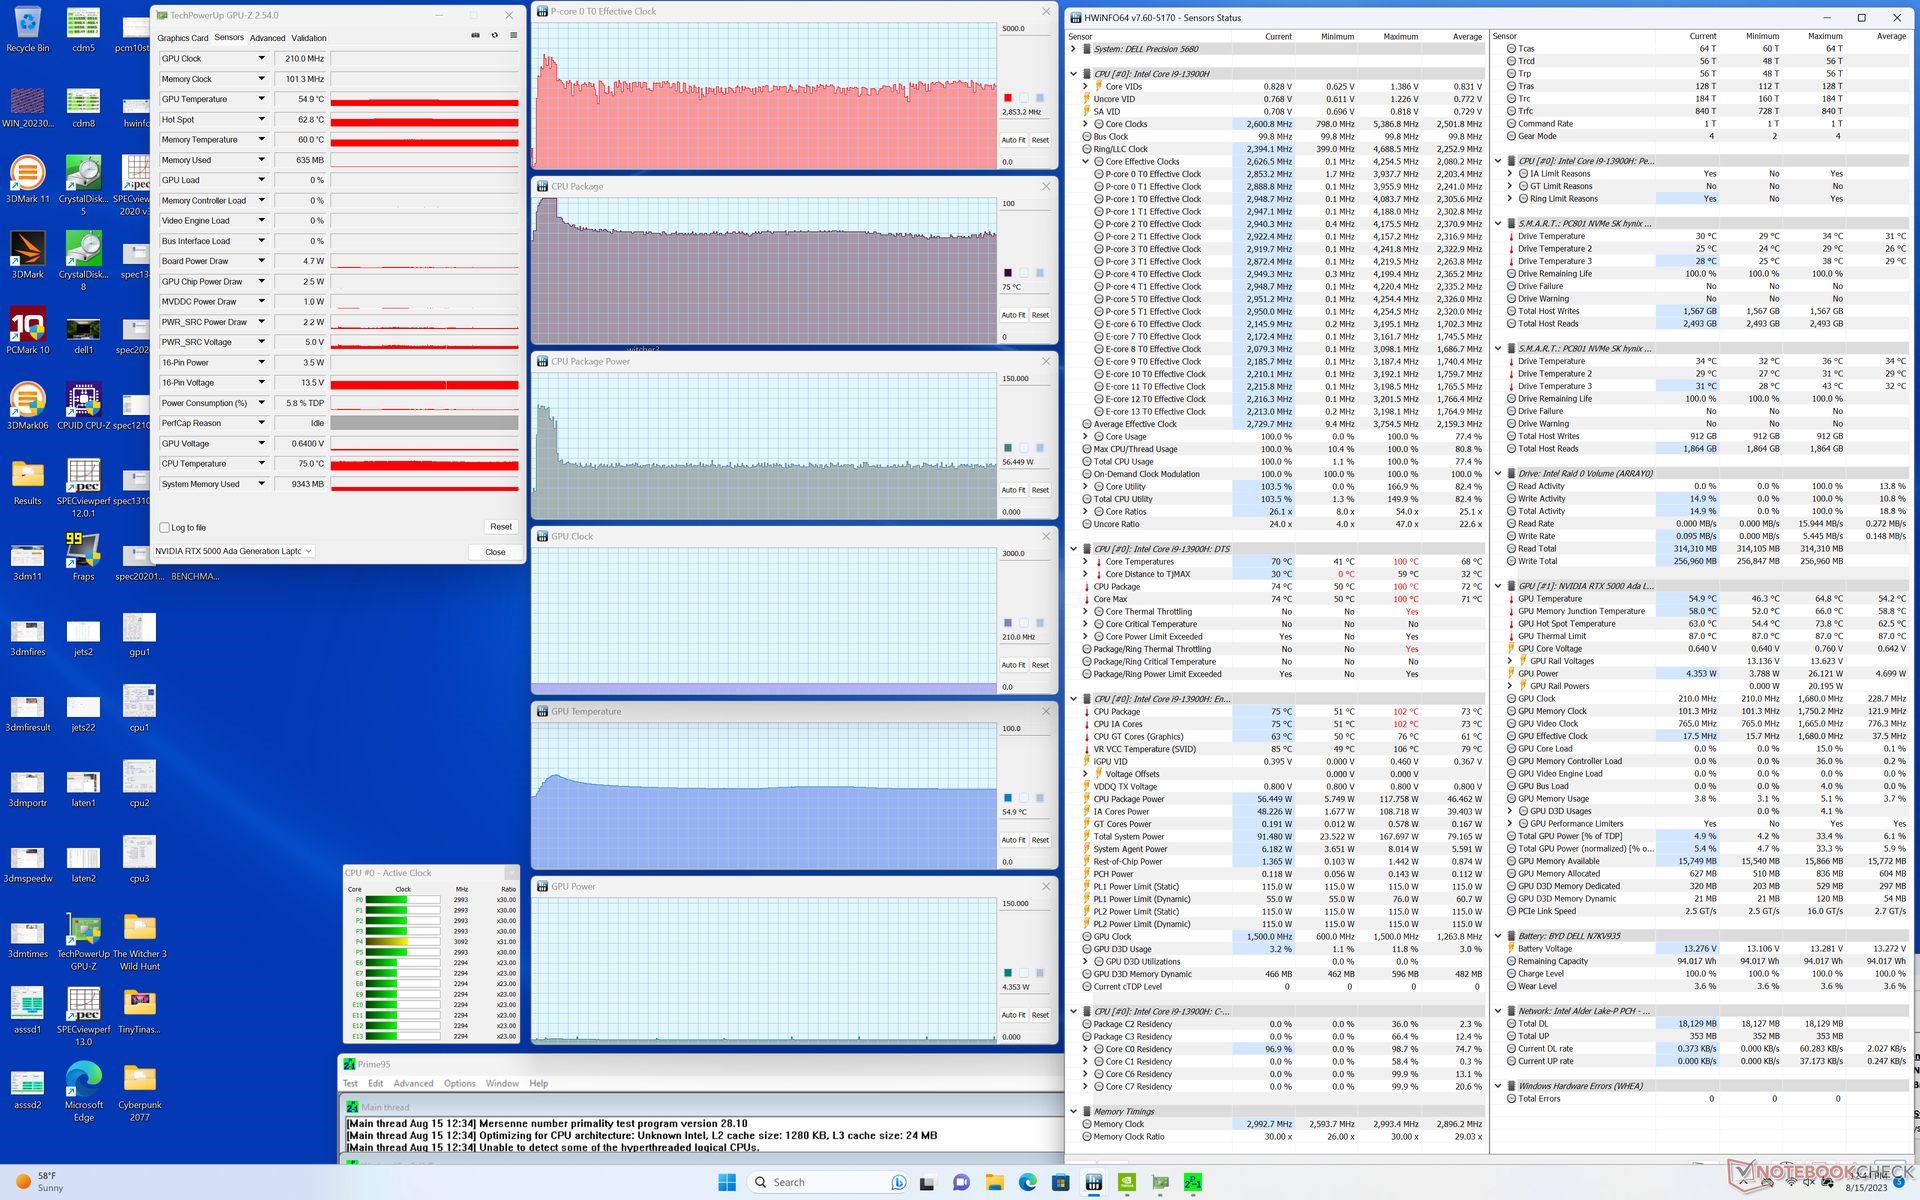
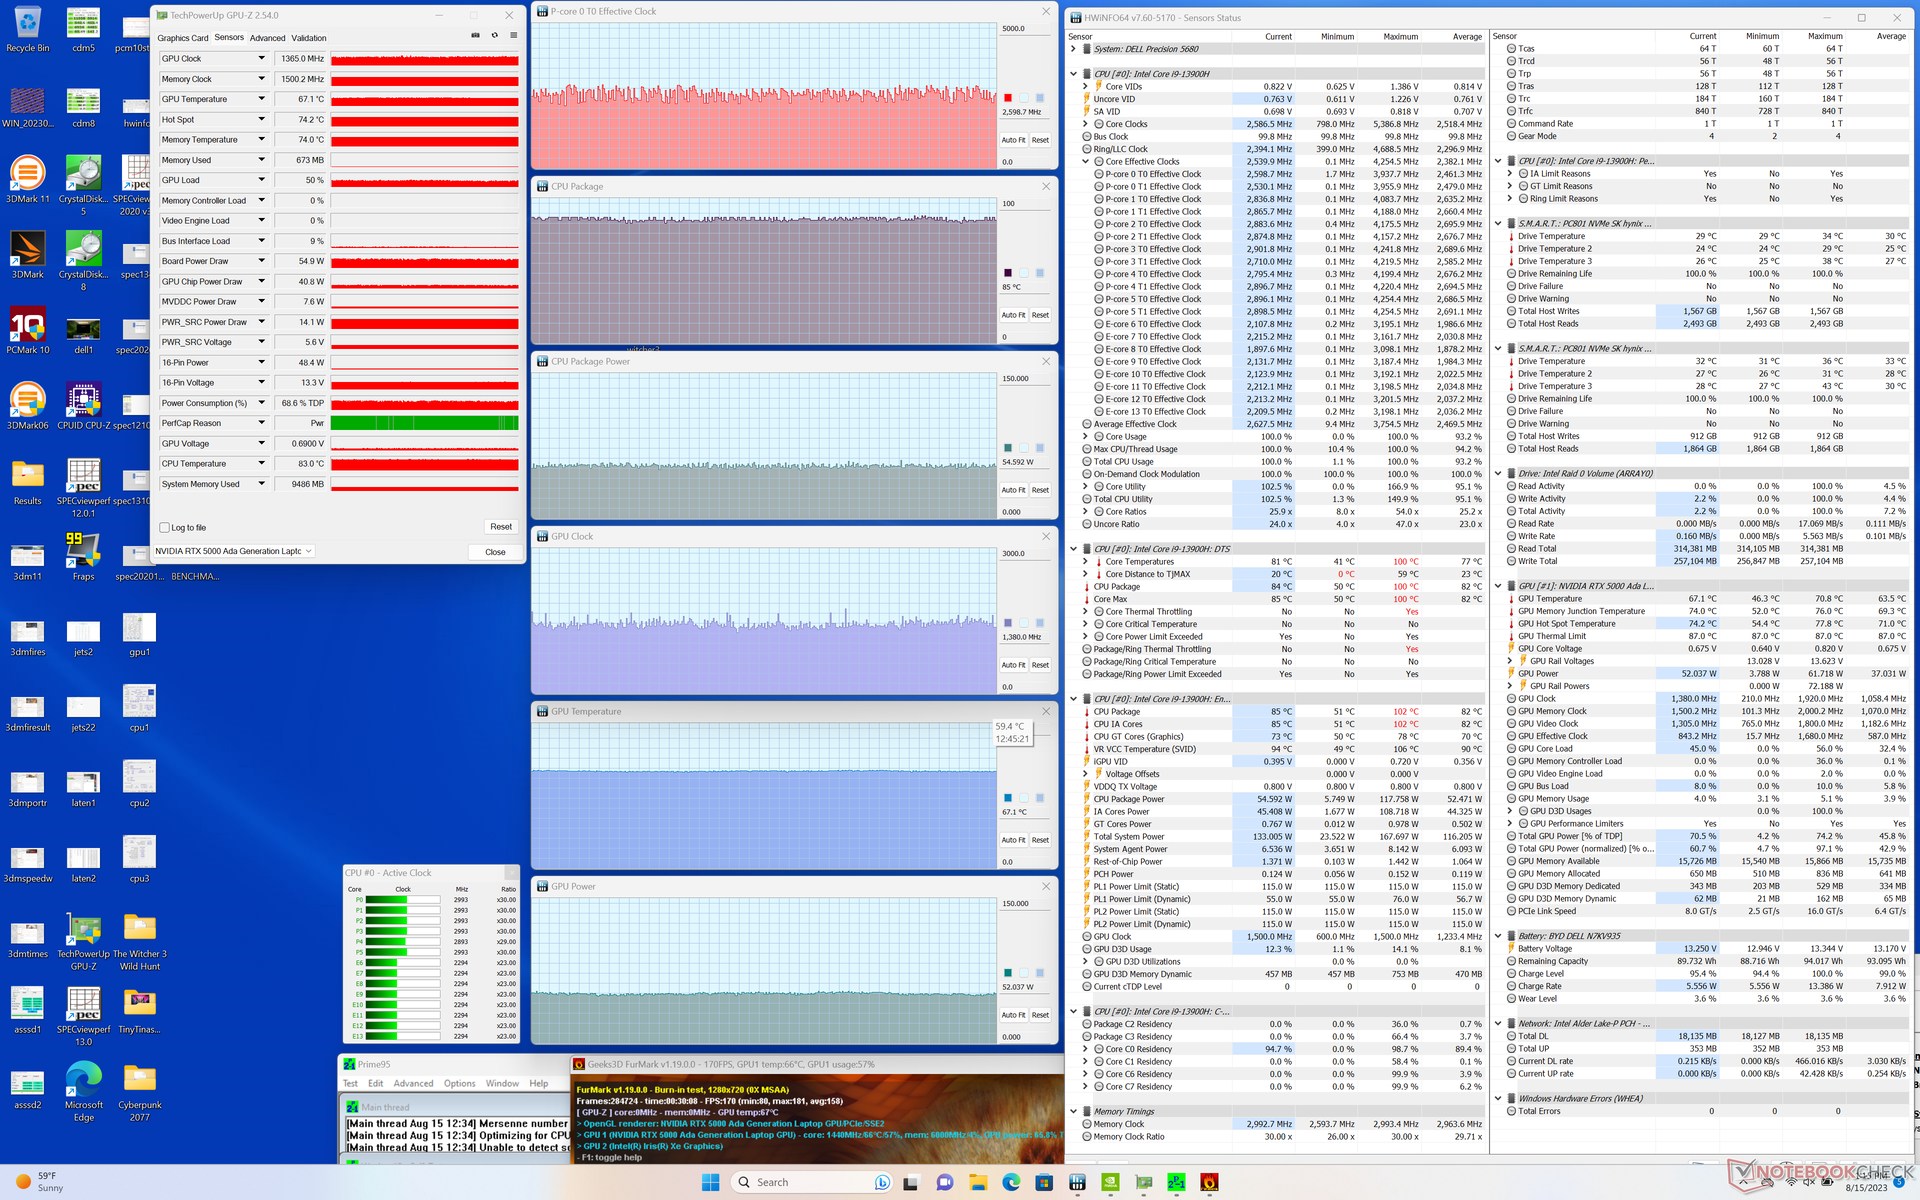
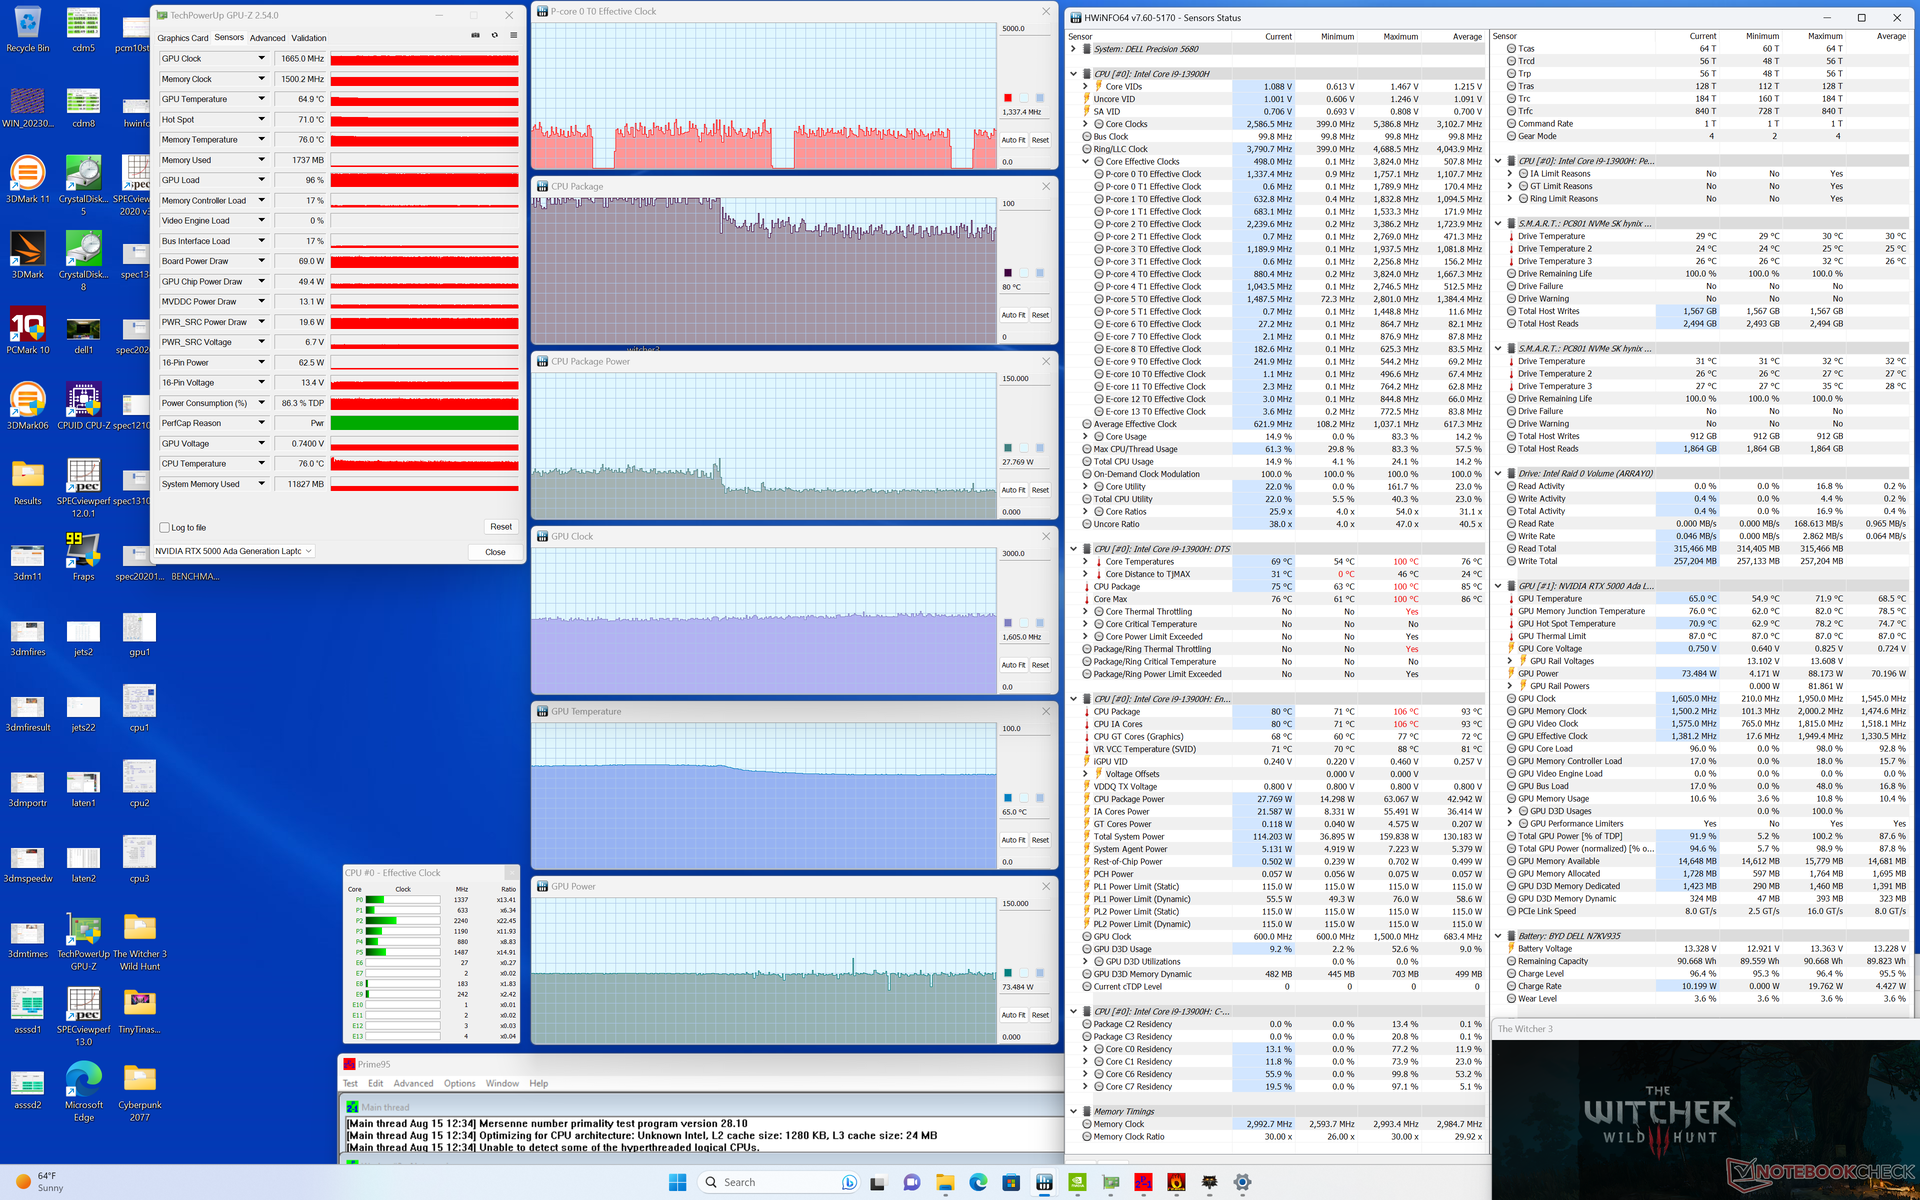
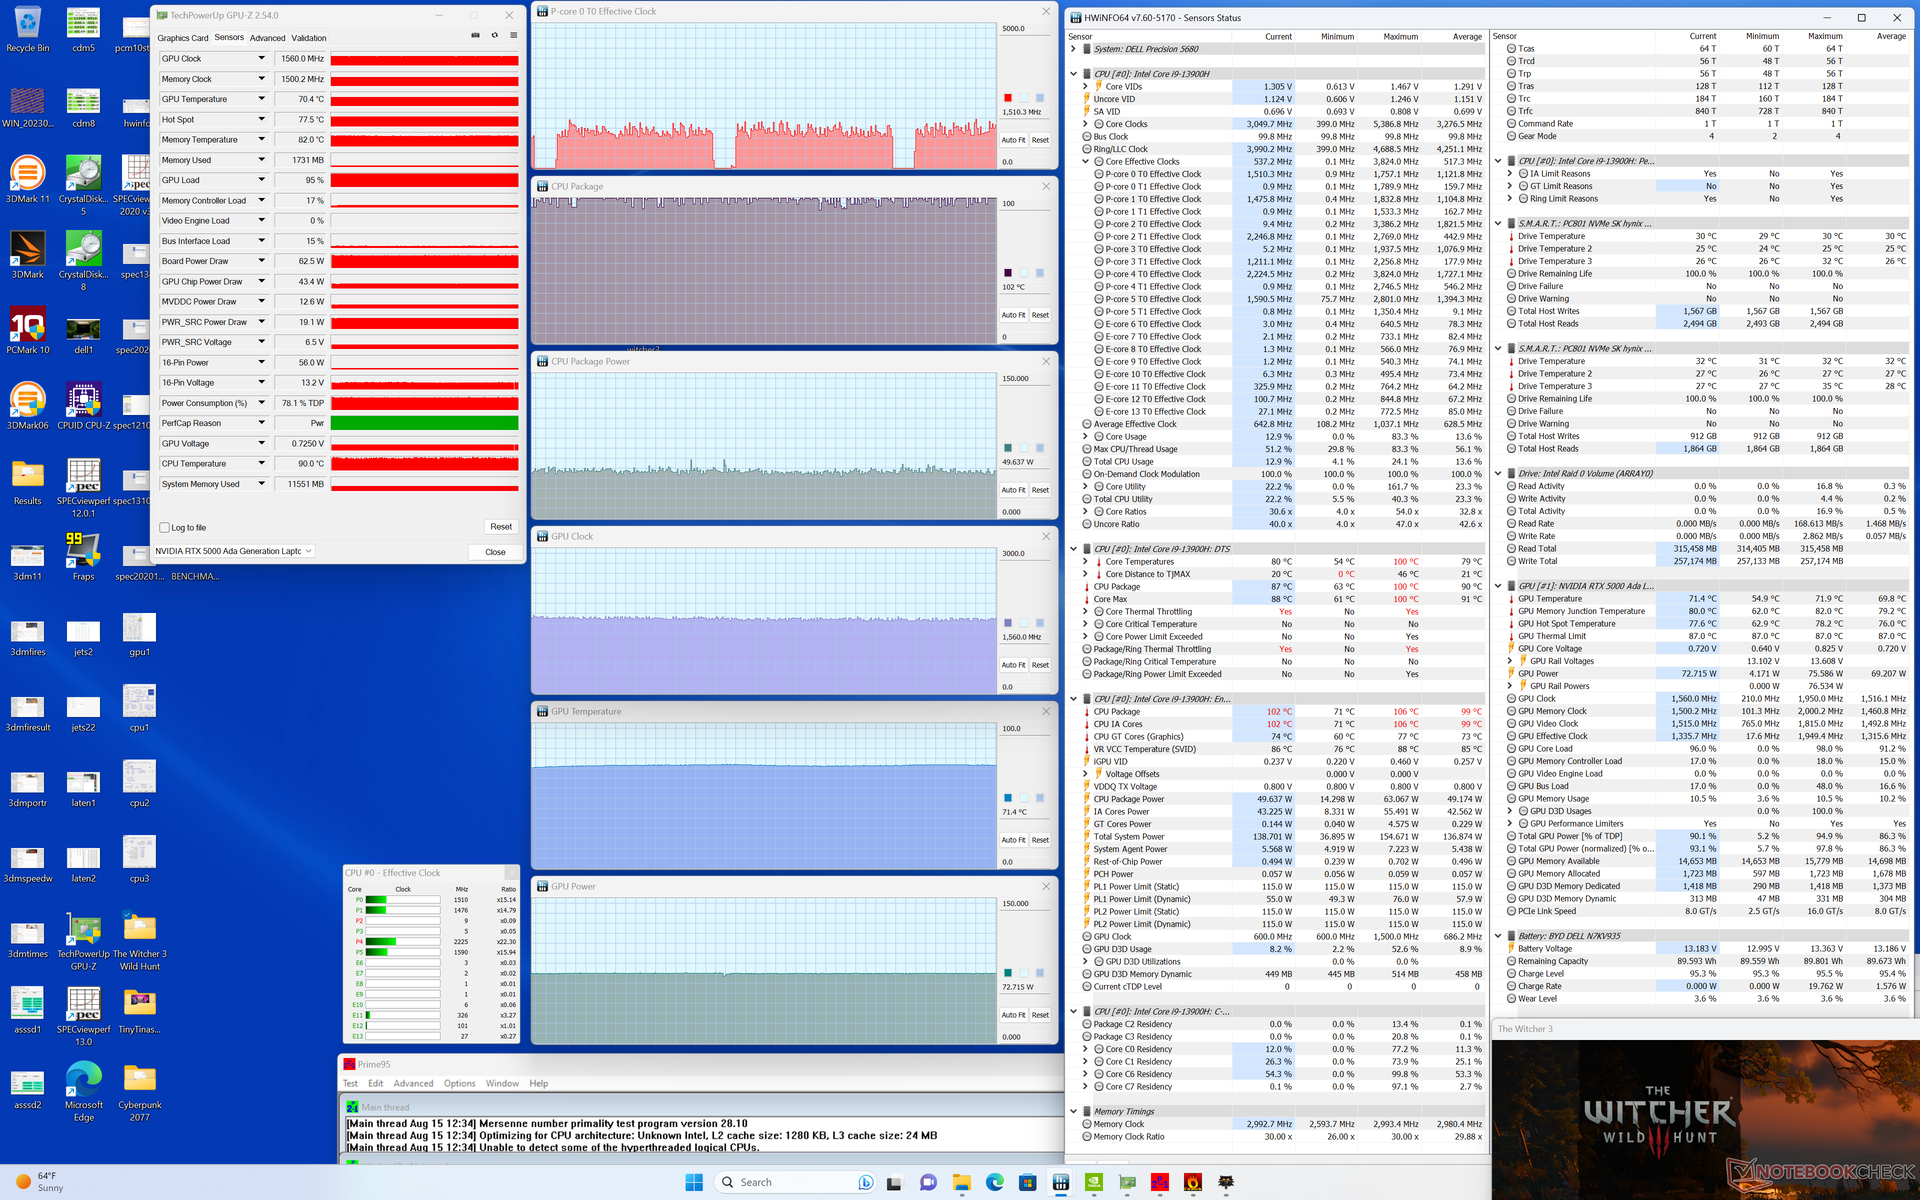
| RelojCPU (GHz) | Reloj GPU (MHz) | Temperatura mediaCPU (°C) | Temperatura media GPU (°C) | |
| Sistema en reposo | -- | -- | 60 | 46 |
| Prime95 Stress | ~2,8 | -- | 75 | 55 |
| Estrés Prime95+ FurMark | ~2,6 | 1365 | 85 | 67 |
| Witcher 3 Estrés (modoRendimiento) | ~1,5 | 1560 | 100 | 72 |
| Witcher 3 Estrés (modoequilibrado) | ~1,3 | 1665 | 80 | 65 |
Altavoces
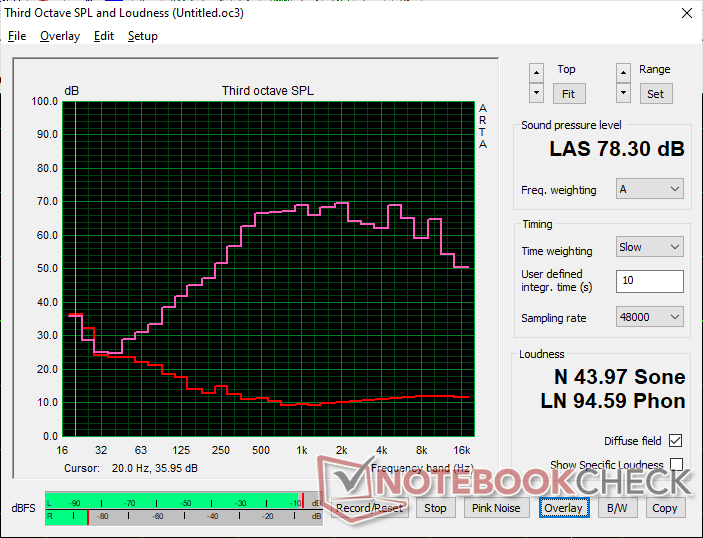
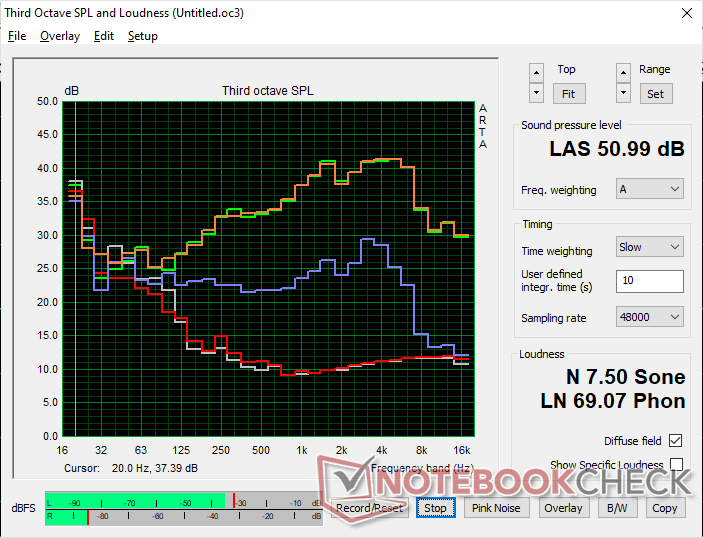
Dell Precision 5000 5680 análisis de audio
(±) | la sonoridad del altavoz es media pero buena (78.3 dB)
Graves 100 - 315 Hz
(-) | casi sin bajos - de media 16.4% inferior a la mediana
(±) | la linealidad de los graves es media (7.5% delta a frecuencia anterior)
Medios 400 - 2000 Hz
(+) | medios equilibrados - a sólo 3.9% de la mediana
(+) | los medios son lineales (4.5% delta a la frecuencia anterior)
Altos 2 - 16 kHz
(+) | máximos equilibrados - a sólo 2.2% de la mediana
(±) | la linealidad de los máximos es media (8.3% delta a frecuencia anterior)
Total 100 - 16.000 Hz
(±) | la linealidad del sonido global es media (15.5% de diferencia con la mediana)
En comparación con la misma clase
» 35% de todos los dispositivos probados de esta clase eran mejores, 10% similares, 55% peores
» El mejor tuvo un delta de 7%, la media fue 17%, el peor fue ###max##%
En comparación con todos los dispositivos probados
» 23% de todos los dispositivos probados eran mejores, 4% similares, 73% peores
» El mejor tuvo un delta de 4%, la media fue 24%, el peor fue ###max##%
Apple MacBook Pro 16 2021 M1 Pro análisis de audio
(+) | los altavoces pueden reproducir a un volumen relativamente alto (#84.7 dB)
Graves 100 - 315 Hz
(+) | buen bajo - sólo 3.8% lejos de la mediana
(+) | el bajo es lineal (5.2% delta a la frecuencia anterior)
Medios 400 - 2000 Hz
(+) | medios equilibrados - a sólo 1.3% de la mediana
(+) | los medios son lineales (2.1% delta a la frecuencia anterior)
Altos 2 - 16 kHz
(+) | máximos equilibrados - a sólo 1.9% de la mediana
(+) | los máximos son lineales (2.7% delta a la frecuencia anterior)
Total 100 - 16.000 Hz
(+) | el sonido global es lineal (4.6% de diferencia con la mediana)
En comparación con la misma clase
» 0% de todos los dispositivos probados de esta clase eran mejores, 0% similares, 100% peores
» El mejor tuvo un delta de 5%, la media fue 17%, el peor fue ###max##%
En comparación con todos los dispositivos probados
» 0% de todos los dispositivos probados eran mejores, 0% similares, 100% peores
» El mejor tuvo un delta de 4%, la media fue 24%, el peor fue ###max##%
Gestión de la energía - Ada Lovelace brilla
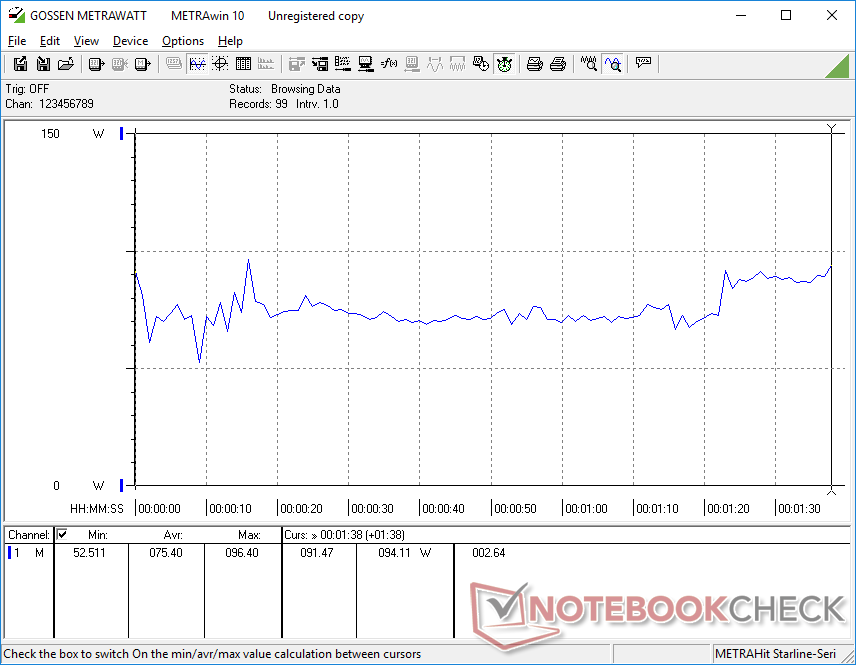
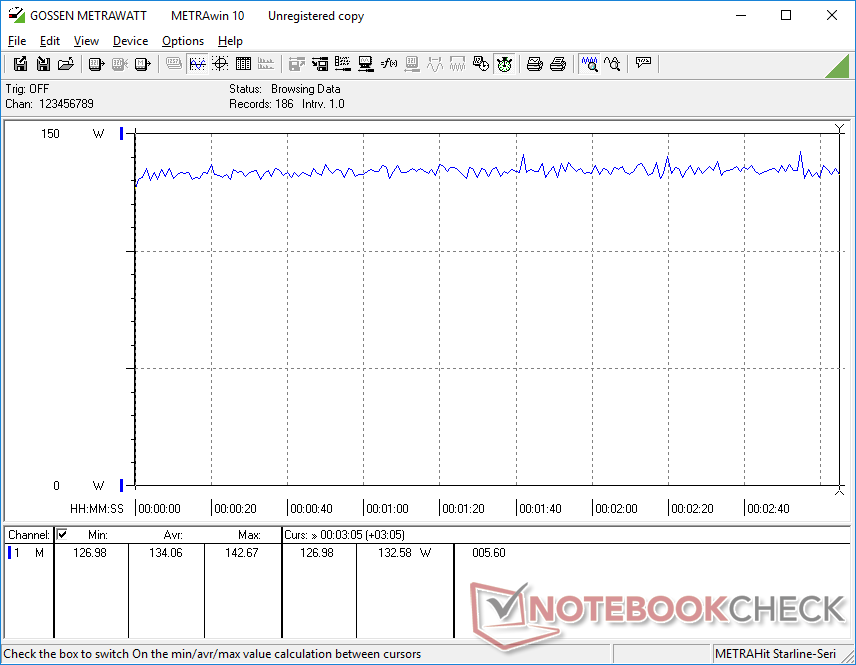
Consumo de energía
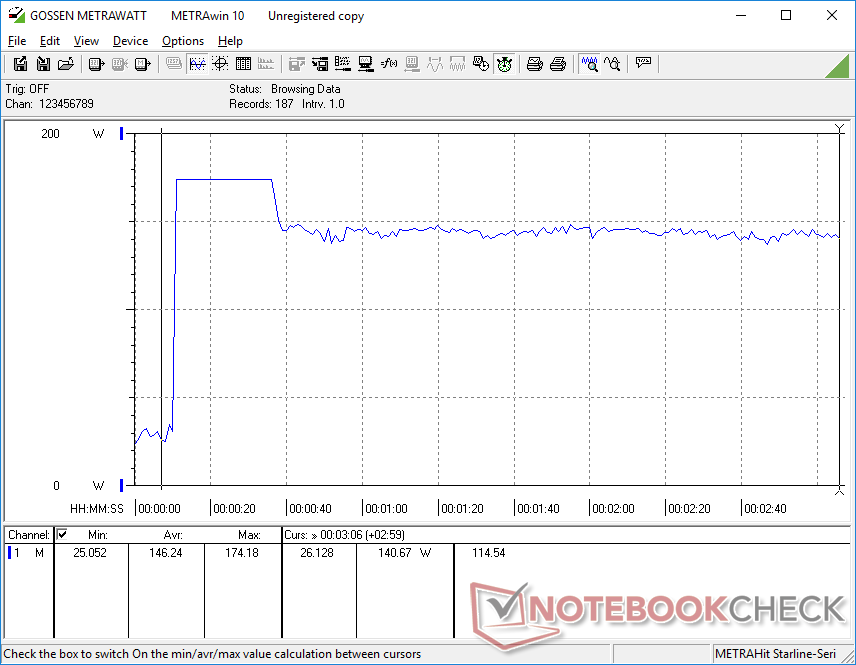
El rendimiento por vatio es significativamente superior al de la mayoría de estaciones de trabajo, ya que nuestra Precision utiliza una GPU Ada Lovelace de última generación. La ejecución de Witcher 3por ejemplo, consumiría sólo 134 W en nuestro sistema, frente a los 159 W y 189 W de la GPU Precision 7670 Rendimiento y HP ZBook Fury 16 G9, respectivamente, a pesar de que nuestra GPU RTX 5000 superaría a sus GPU RTX A5500, como ya se ha indicado.
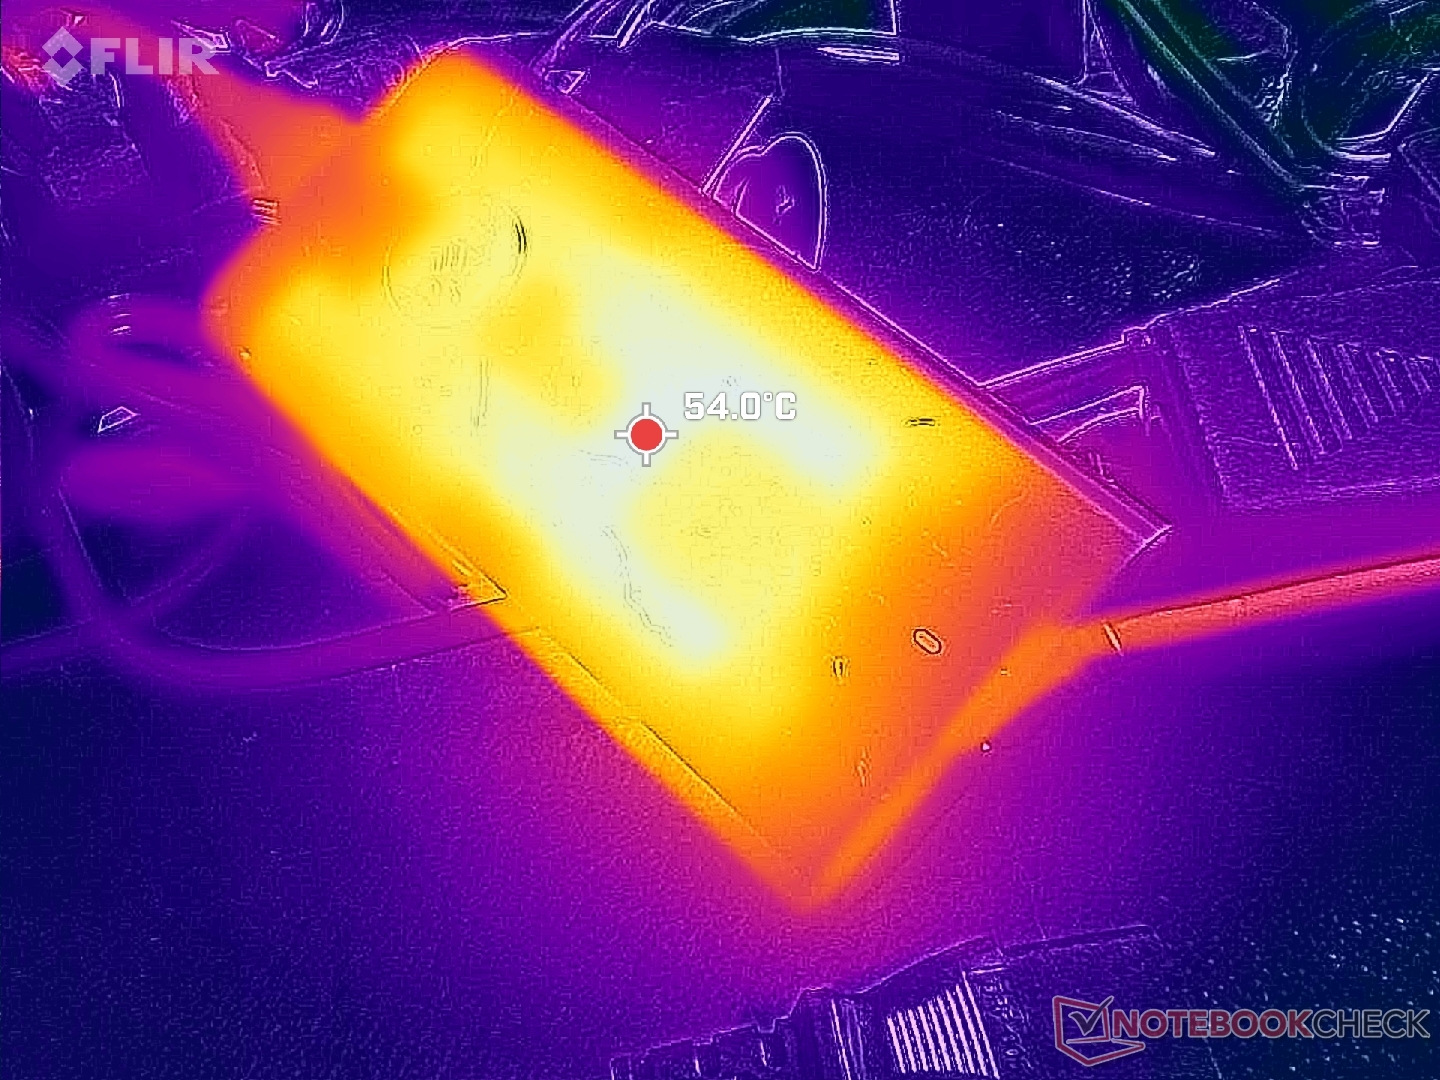
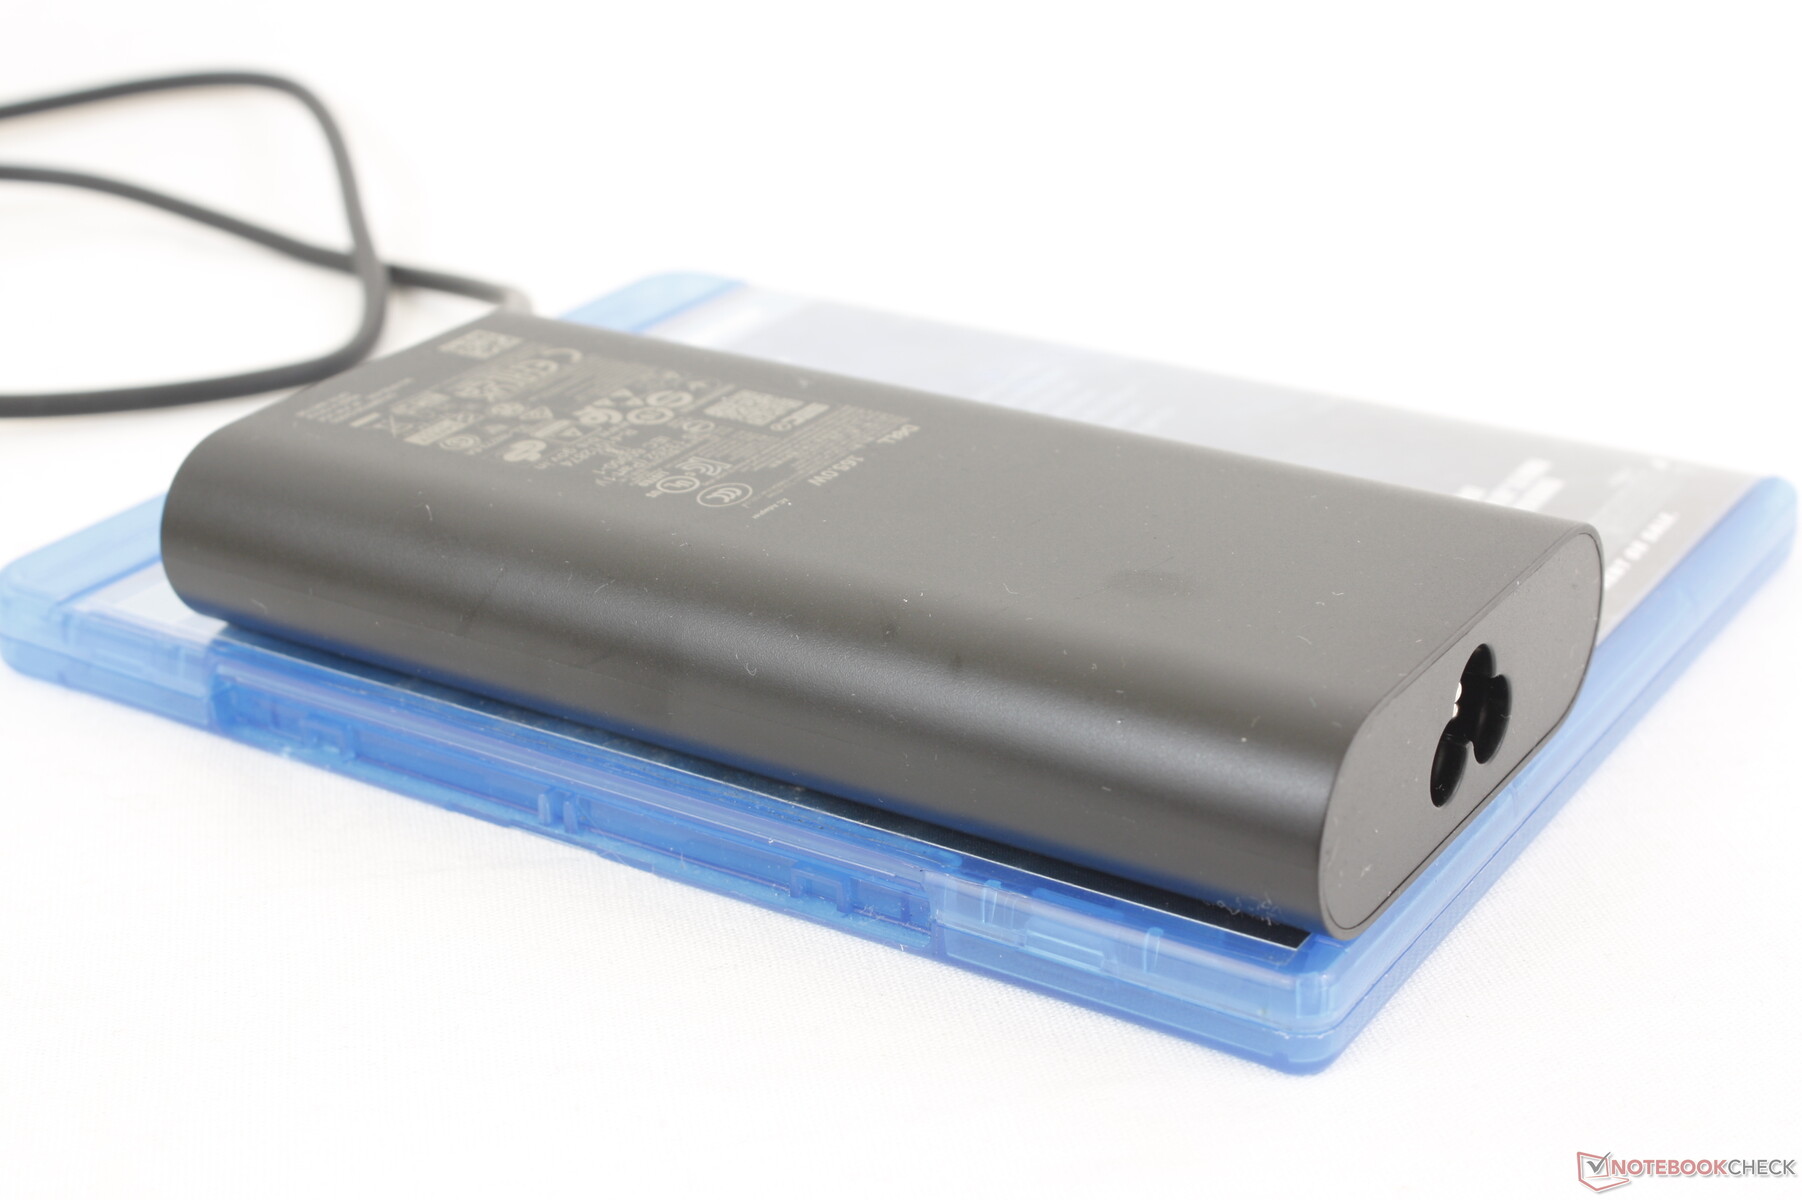
El relativamente pequeño (~13,5 x 6,5 x 2,2 cm) adaptador USB-C AC de 165 W merece una mención también por su alta potencia de salida. La mayoría de los adaptadores USB-C existentes están limitados a solo 100 W a 140 W como máximo, lo que convierte a nuestro adaptador de 165 W en uno de los más versátiles. Este nuevo adaptador resuelve directamente los problemas de carga de la batería que experimentamos en el modelo anterior Precision 7000, que venía con un adaptador USB-C de 130 W menos capaz.
| Off / Standby | |
| Ocioso | |
| Carga |
|
Clave:
min: | |
| Dell Precision 5000 5680 i9-13900H, RTX 5000 Ada Generation Laptop, 2x SK hynix PC801 HFS512GEJ9X101N RAID 0, OLED, 3840x2400, 16" | Dell Precision 7000 7670 Performance i9-12950HX, RTX A5500 Laptop GPU, , OLED, 3840x2400, 16" | HP ZBook Fury 16 G9 i9-12950HX, RTX A5500 Laptop GPU, Micron 3400 1TB MTFDKBA1T0TFH, IPS, 3840x2400, 16" | Lenovo ThinkPad P16 G1 RTX A5500 i9-12950HX, RTX A5500 Laptop GPU, WDC PC SN810 2TB, IPS, 3840x2400, 16" | MSI CreatorPro Z16P B12UKST i7-12700H, RTX A3000 Laptop GPU, Samsung PM9A1 MZVL21T0HCLR, IPS, 2560x1600, 16" | Asus ExpertBook B6 Flip B6602FC2 i9-12950HX, RTX A2000 Laptop GPU, Samsung PM9A1 MZVL21T0HCLR, IPS, 2560x1600, 16" | |
|---|---|---|---|---|---|---|
| Power Consumption | -99% | -86% | -53% | -18% | -35% | |
| Idle Minimum * (Watt) | 8 | 16.4 -105% | 19.5 -144% | 7.5 6% | 10.8 -35% | 10.5 -31% |
| Idle Average * (Watt) | 10.4 | 35.9 -245% | 29 -179% | 20.1 -93% | 16.3 -57% | 11.9 -14% |
| Idle Maximum * (Watt) | 30.5 | 47 -54% | 40.7 -33% | 40 -31% | 16.9 45% | 18 41% |
| Load Average * (Watt) | 75.4 | 147.1 -95% | 142.1 -88% | 137 -82% | 111.7 -48% | 182 -141% |
| Witcher 3 ultra * (Watt) | 134 | 158.8 -19% | 188.6 -41% | 208 -55% | 152.1 -14% | 177.5 -32% |
| Load Maximum * (Watt) | 175 | 311 -78% | 224.4 -28% | 285.9 -63% | 177.4 -1% | 229 -31% |
* ... más pequeño es mejor
Power Consumption Witcher 3 / Stresstest
Power Consumption external Monitor
Duración de la batería
La duración de la batería es excelente teniendo en cuenta el alto rendimiento y el exigente panel OLED 4K. Pudimos registrar casi 10 horas de navegación WLAN real en el perfil Equilibrado con la iGPU activa comparado con casi la mitad en alternativas como el Lenovo ThinkPad P16 G1 o elMSI CreatorPro Z16P.
La carga de vacío a plena capacidad tarda unas 2 horas con el adaptador de CA de 165 W incluido. Nuestro adaptador USB-C de 65 W también puede recargar el sistema, aunque a menor velocidad.
| Dell Precision 5000 5680 i9-13900H, RTX 5000 Ada Generation Laptop, 98 Wh | Dell Precision 7000 7670 Performance i9-12950HX, RTX A5500 Laptop GPU, 93 Wh | HP ZBook Fury 16 G9 i9-12950HX, RTX A5500 Laptop GPU, 95 Wh | Lenovo ThinkPad P16 G1 RTX A5500 i9-12950HX, RTX A5500 Laptop GPU, 94 Wh | MSI CreatorPro Z16P B12UKST i7-12700H, RTX A3000 Laptop GPU, 90 Wh | Asus ExpertBook B6 Flip B6602FC2 i9-12950HX, RTX A2000 Laptop GPU, 90 Wh | |
|---|---|---|---|---|---|---|
| Duración de Batería | -53% | -46% | -41% | -41% | -14% | |
| Reader / Idle (h) | 17.9 | 5.3 -70% | 12.5 -30% | |||
| WiFi v1.3 (h) | 9.9 | 4.7 -53% | 6 -39% | 5.8 -41% | 5.8 -41% | 8.7 -12% |
| Load (h) | 1.7 | 1.2 -29% | 1.7 0% | |||
| H.264 (h) | 5.8 |
Pro
Contra
Veredicto - Más potente de lo que parece
El Precision 5680 es una de las estaciones de trabajo móviles más ligeras y rápidas de toda la gama Dell. El diseño portátil, el adaptador USB-C de 165 W, el excelente display OLED 4K y la potente GPU RTX 5000 son las características más fuertes del modelo. Esta última, en particular, es responsable de gran parte de los aumentos de rendimiento y las ventajas de duración de la batería con respecto a la mayoría de estaciones de trabajo gracias a su arquitectura Ada Lovelace y su altísimo rendimiento por vatio.
La Precision 5680 ofrece uno de los mayores rendimientos por vatio en la creciente categoría de estaciones de trabajo ligeras y delgadas.
Los usuarios empedernidos de estaciones de trabajo pueden seguir prefiriendo modelos más grandes y gruesos como el HP ZBook Fury 16 o Precision 7670 ya que el delgado diseño de Precision 5680 renuncia a algunas características clave como RAM ampliable, WAN, RAM ECC y opciones de puerto más amplias. Su terrible clickpad no es ni de lejos tan preciso como los touchpads de los HP o ThinkPad P16 de Lenovo que tienen botones de ratón reales para un mejor control.
Precio y disponibilidad
Dell ya está distribuyendo el Precision 5680 desde $2490 USD hasta más de $6500 según lo revisado.
Dell Precision 5000 5680
- 08/18/2023 v7 (old)
Allen Ngo
Transparencia
La selección de los dispositivos que se van a reseñar corre a cargo de nuestro equipo editorial. La muestra de prueba fue proporcionada al autor en calidad de préstamo por el fabricante o el minorista a los efectos de esta reseña. El prestamista no tuvo ninguna influencia en esta reseña, ni el fabricante recibió una copia de la misma antes de su publicación. No había ninguna obligación de publicar esta reseña. Como empresa de medios independiente, Notebookcheck no está sujeta a la autoridad de fabricantes, minoristas o editores.
Así es como prueba Notebookcheck
Cada año, Notebookcheck revisa de forma independiente cientos de portátiles y smartphones utilizando procedimientos estandarizados para asegurar que todos los resultados son comparables. Hemos desarrollado continuamente nuestros métodos de prueba durante unos 20 años y hemos establecido los estándares de la industria en el proceso. En nuestros laboratorios de pruebas, técnicos y editores experimentados utilizan equipos de medición de alta calidad. Estas pruebas implican un proceso de validación en varias fases. Nuestro complejo sistema de clasificación se basa en cientos de mediciones y puntos de referencia bien fundamentados, lo que mantiene la objetividad.Price comparison

