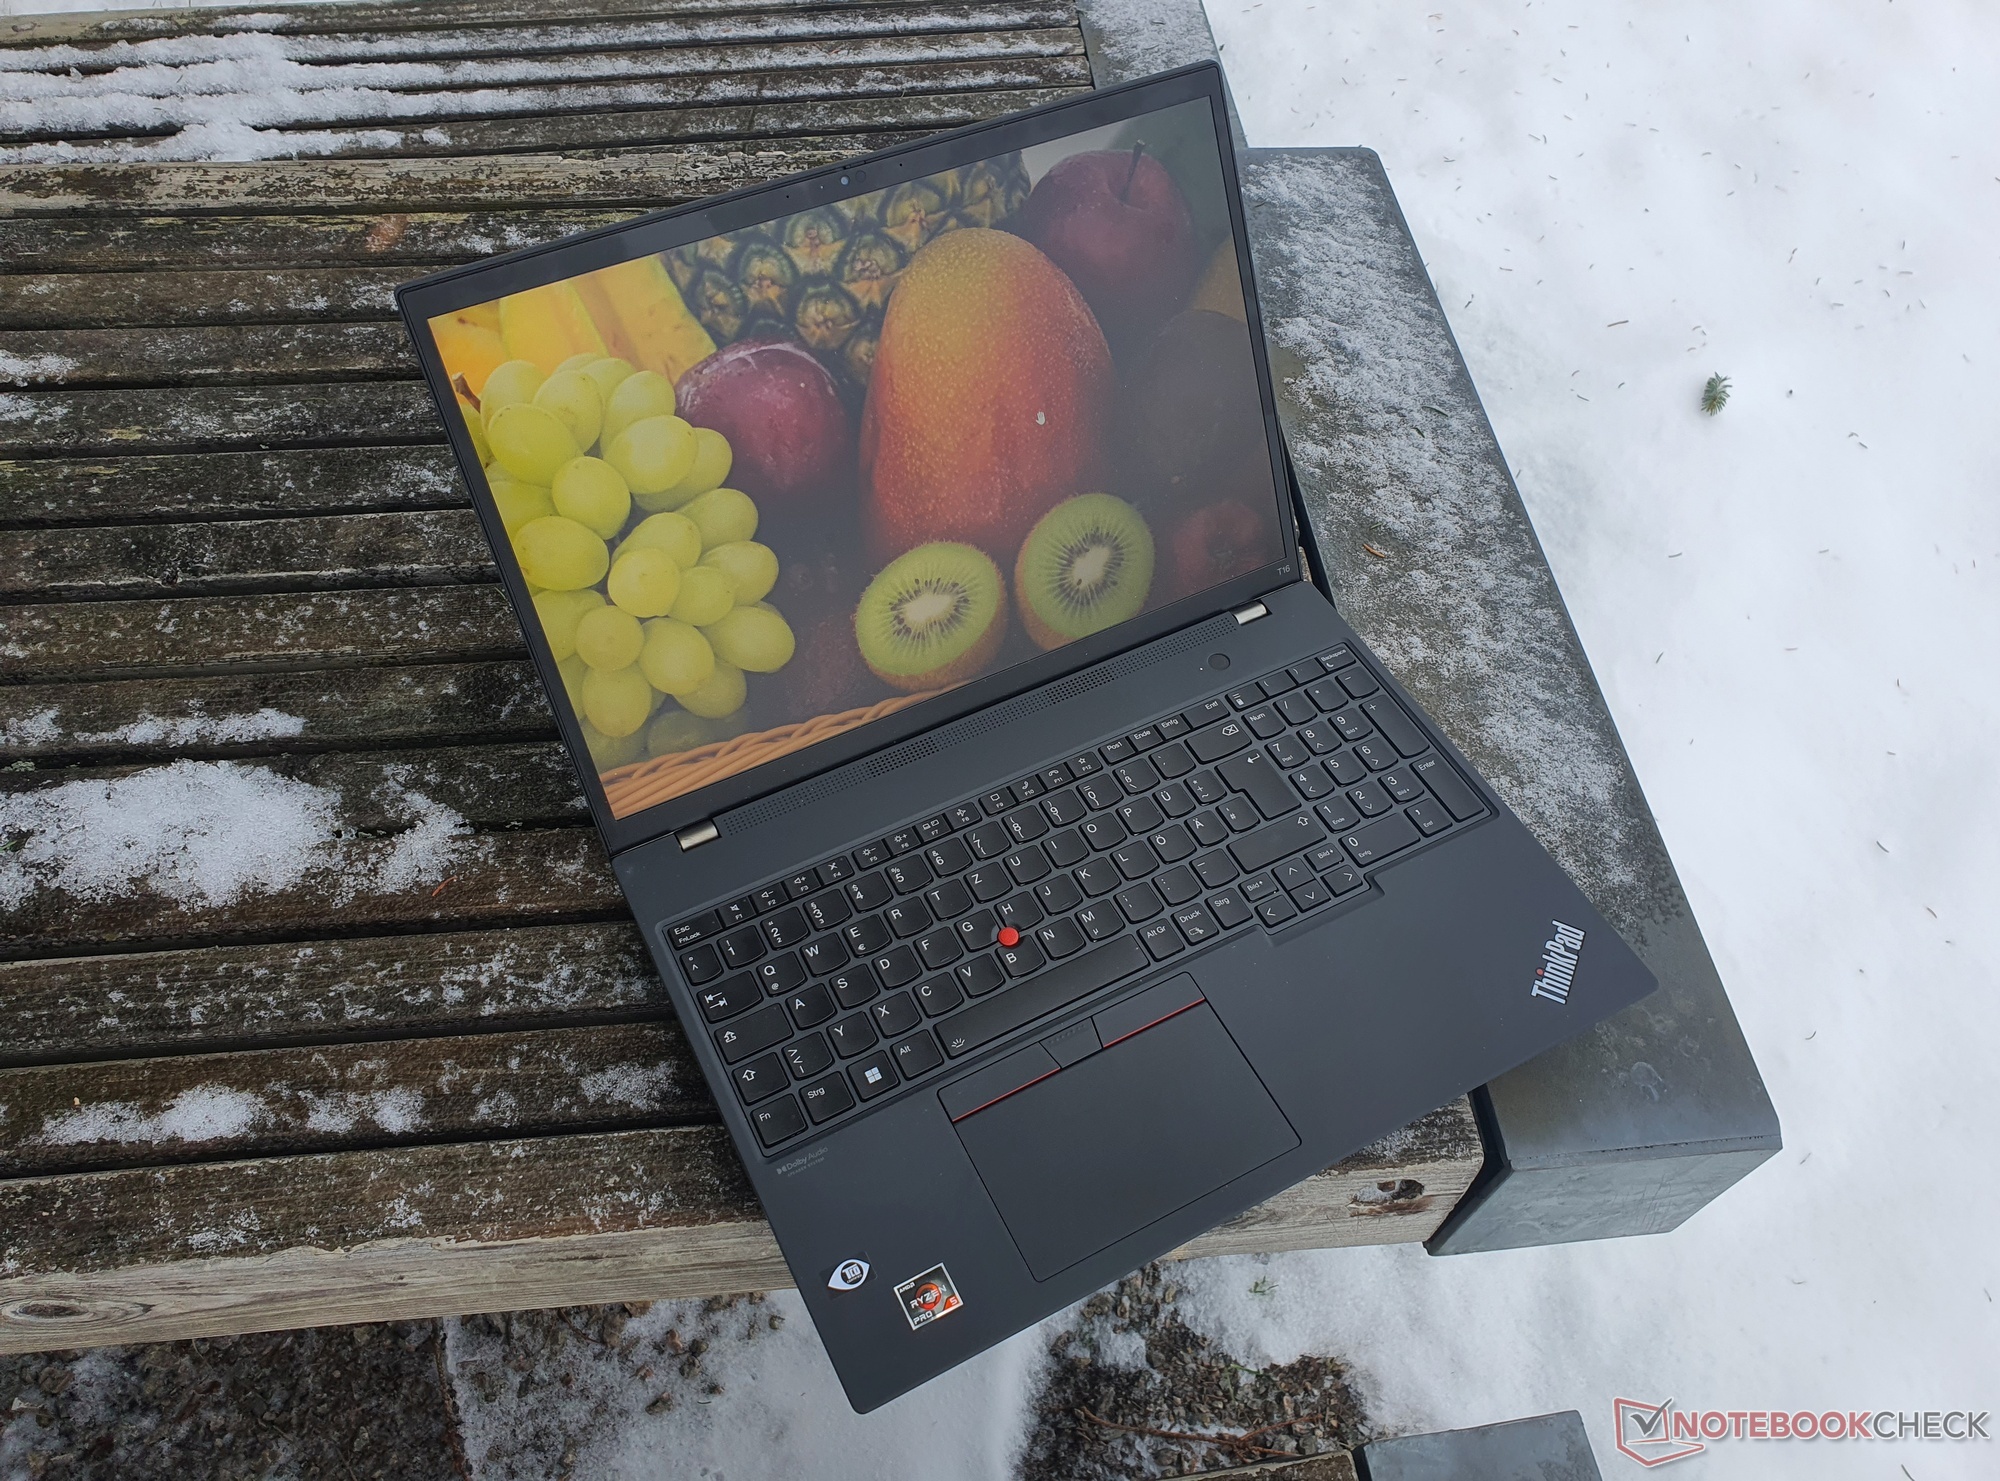
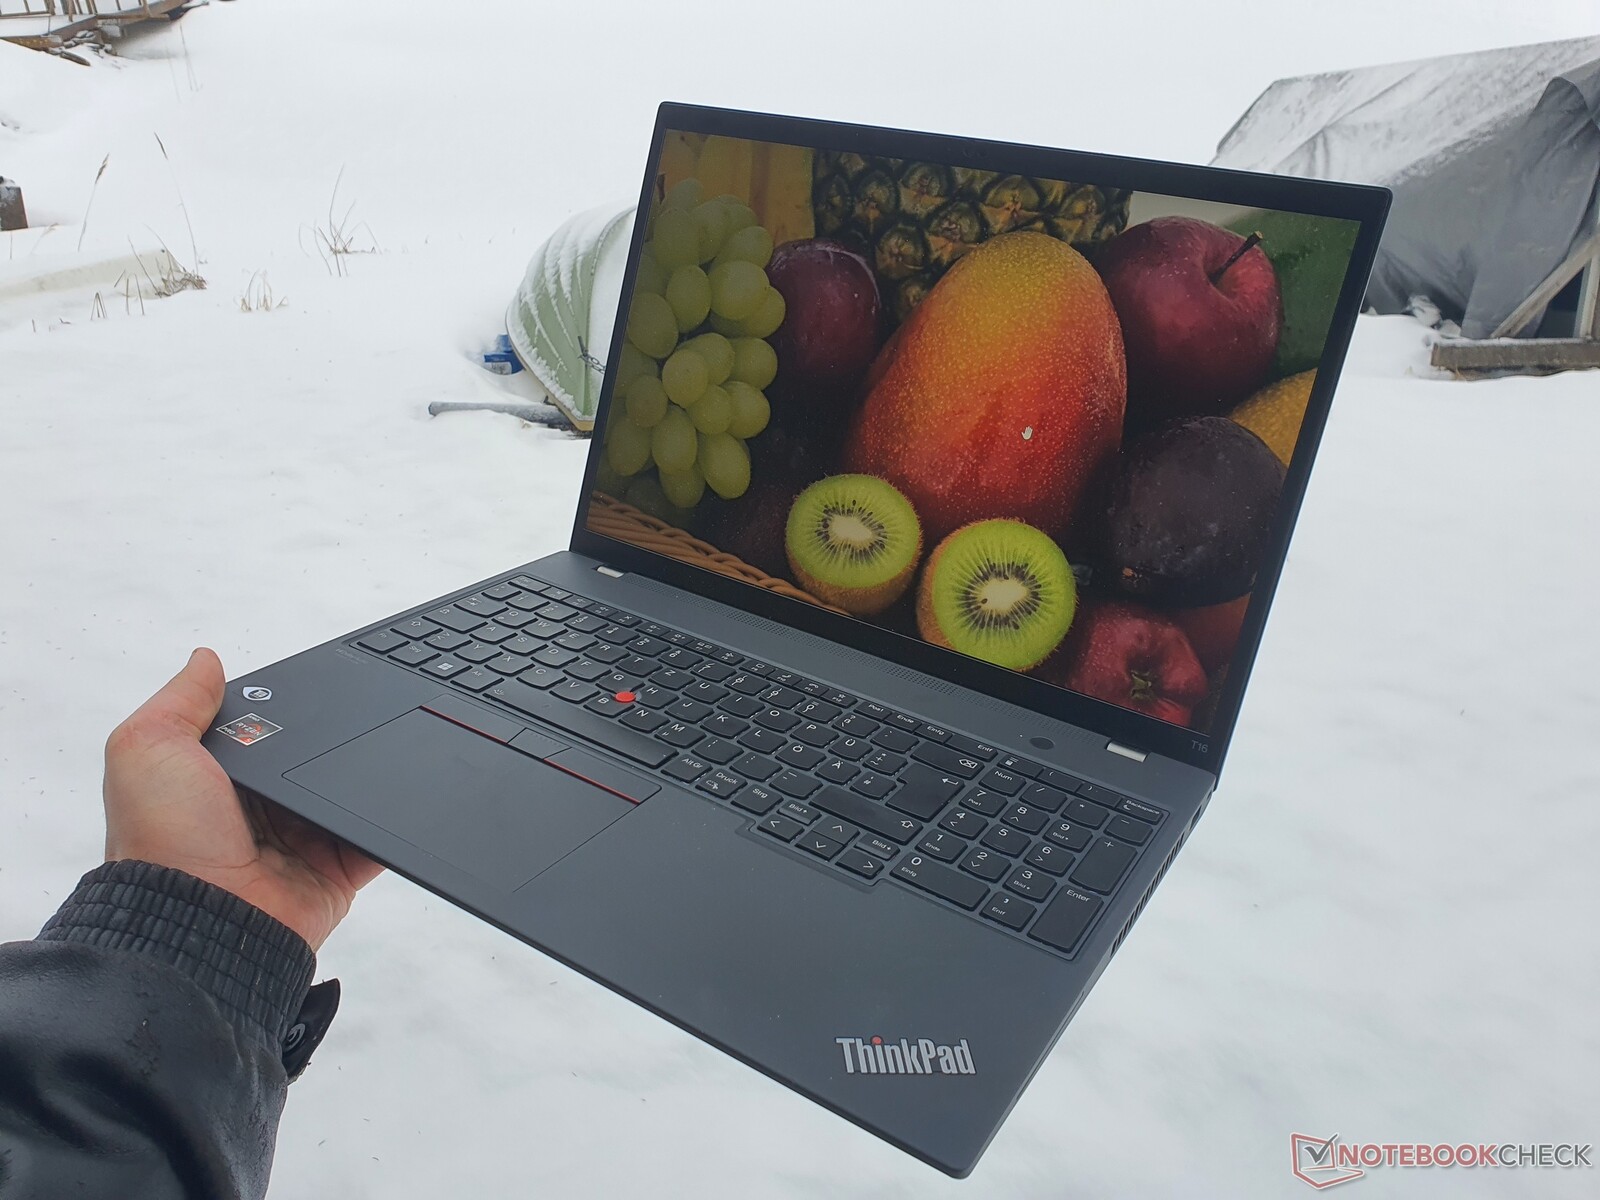
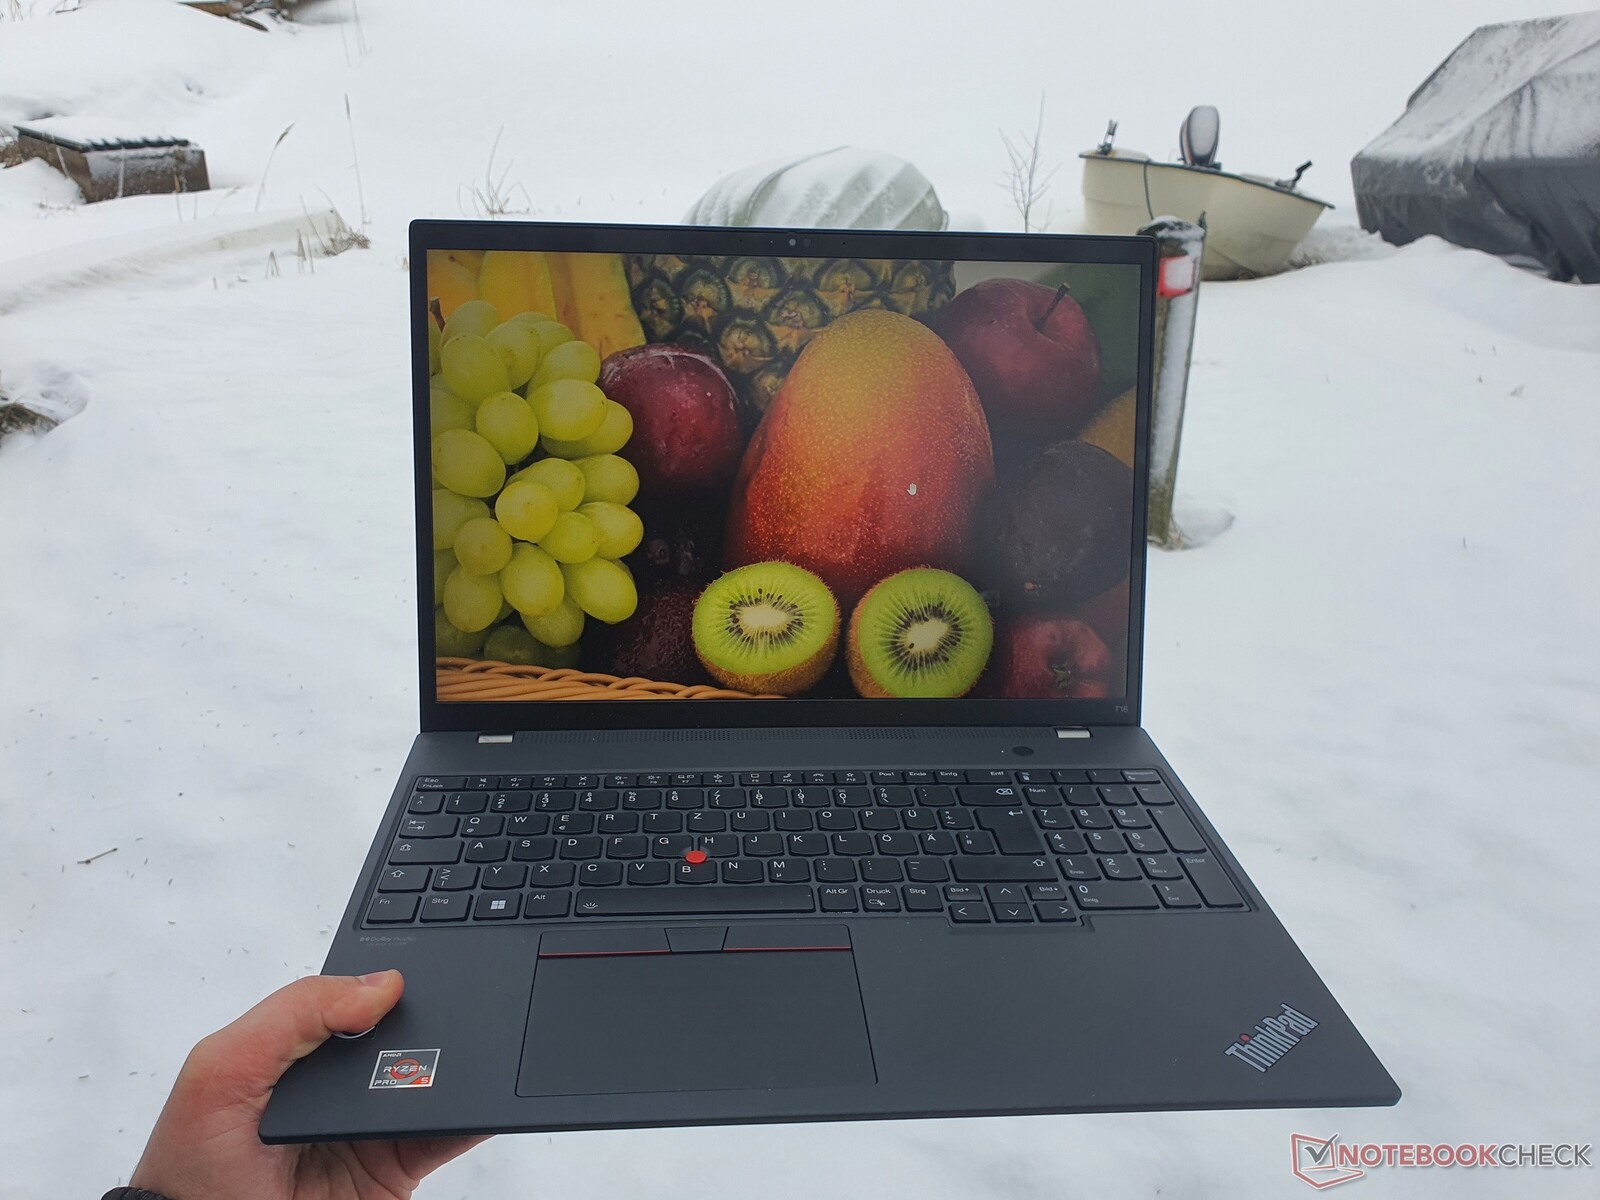
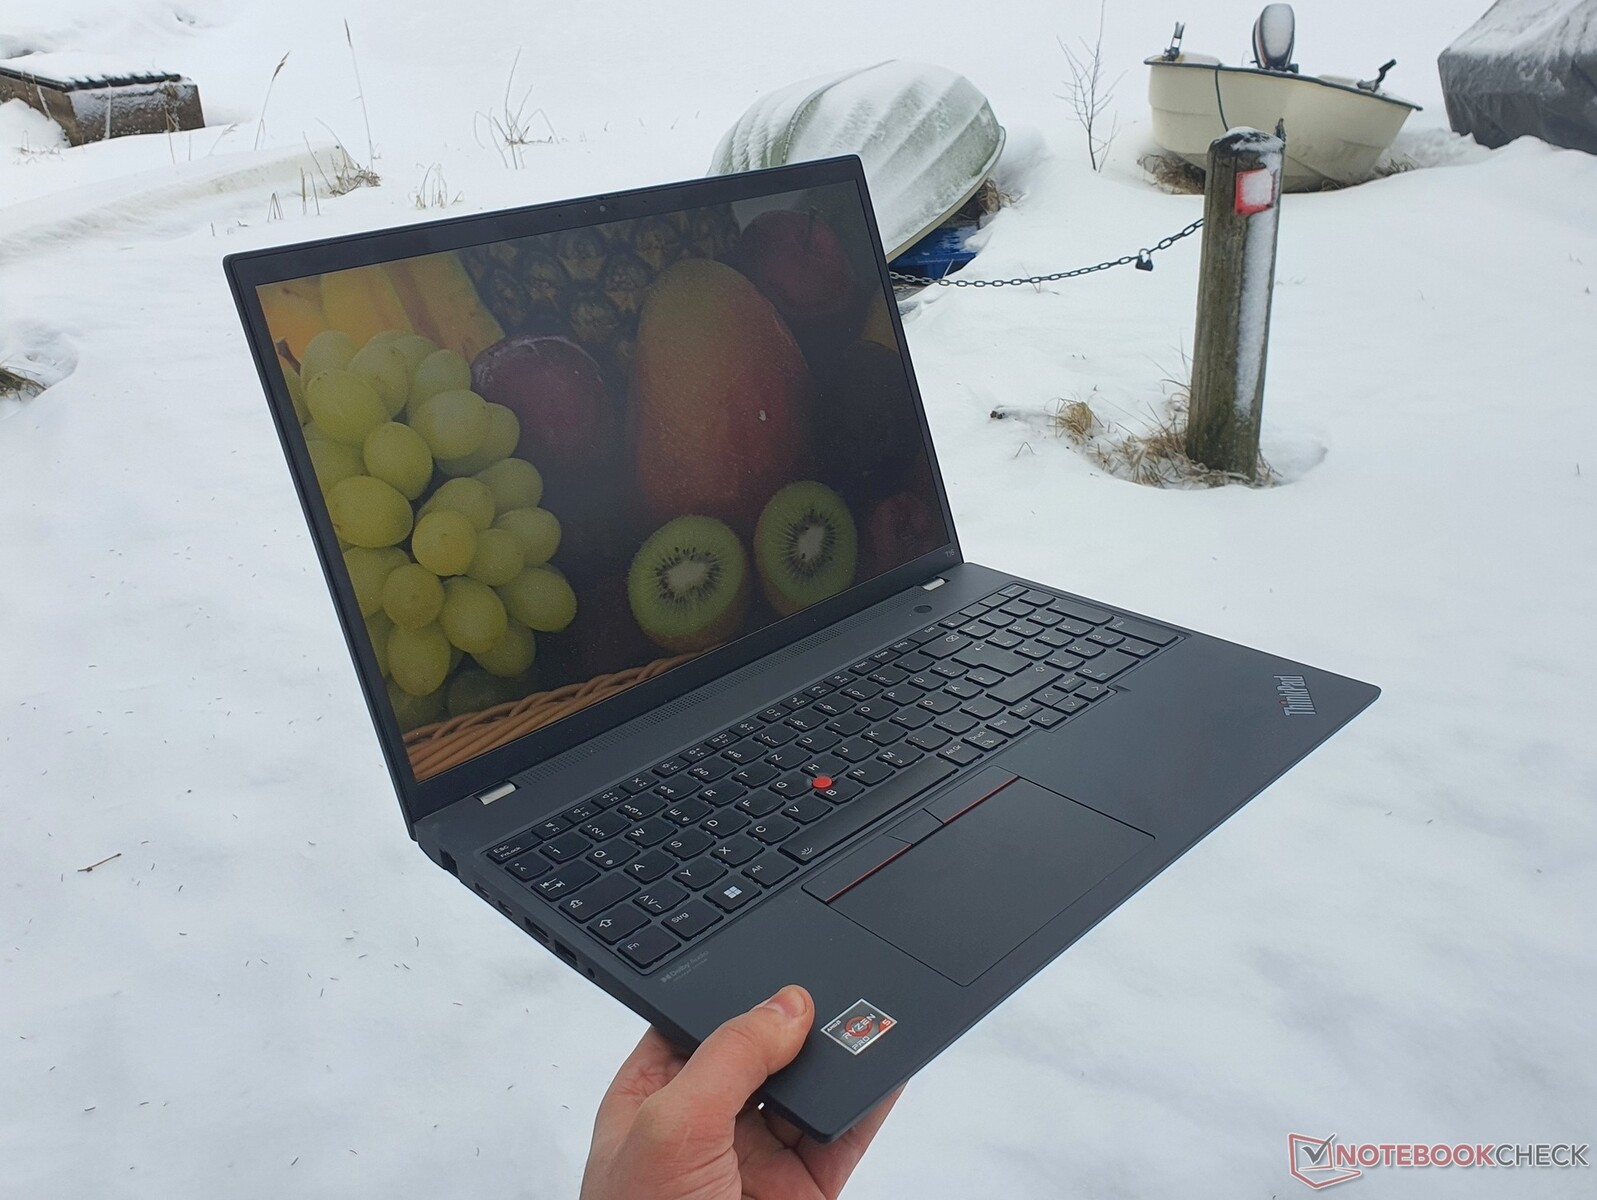
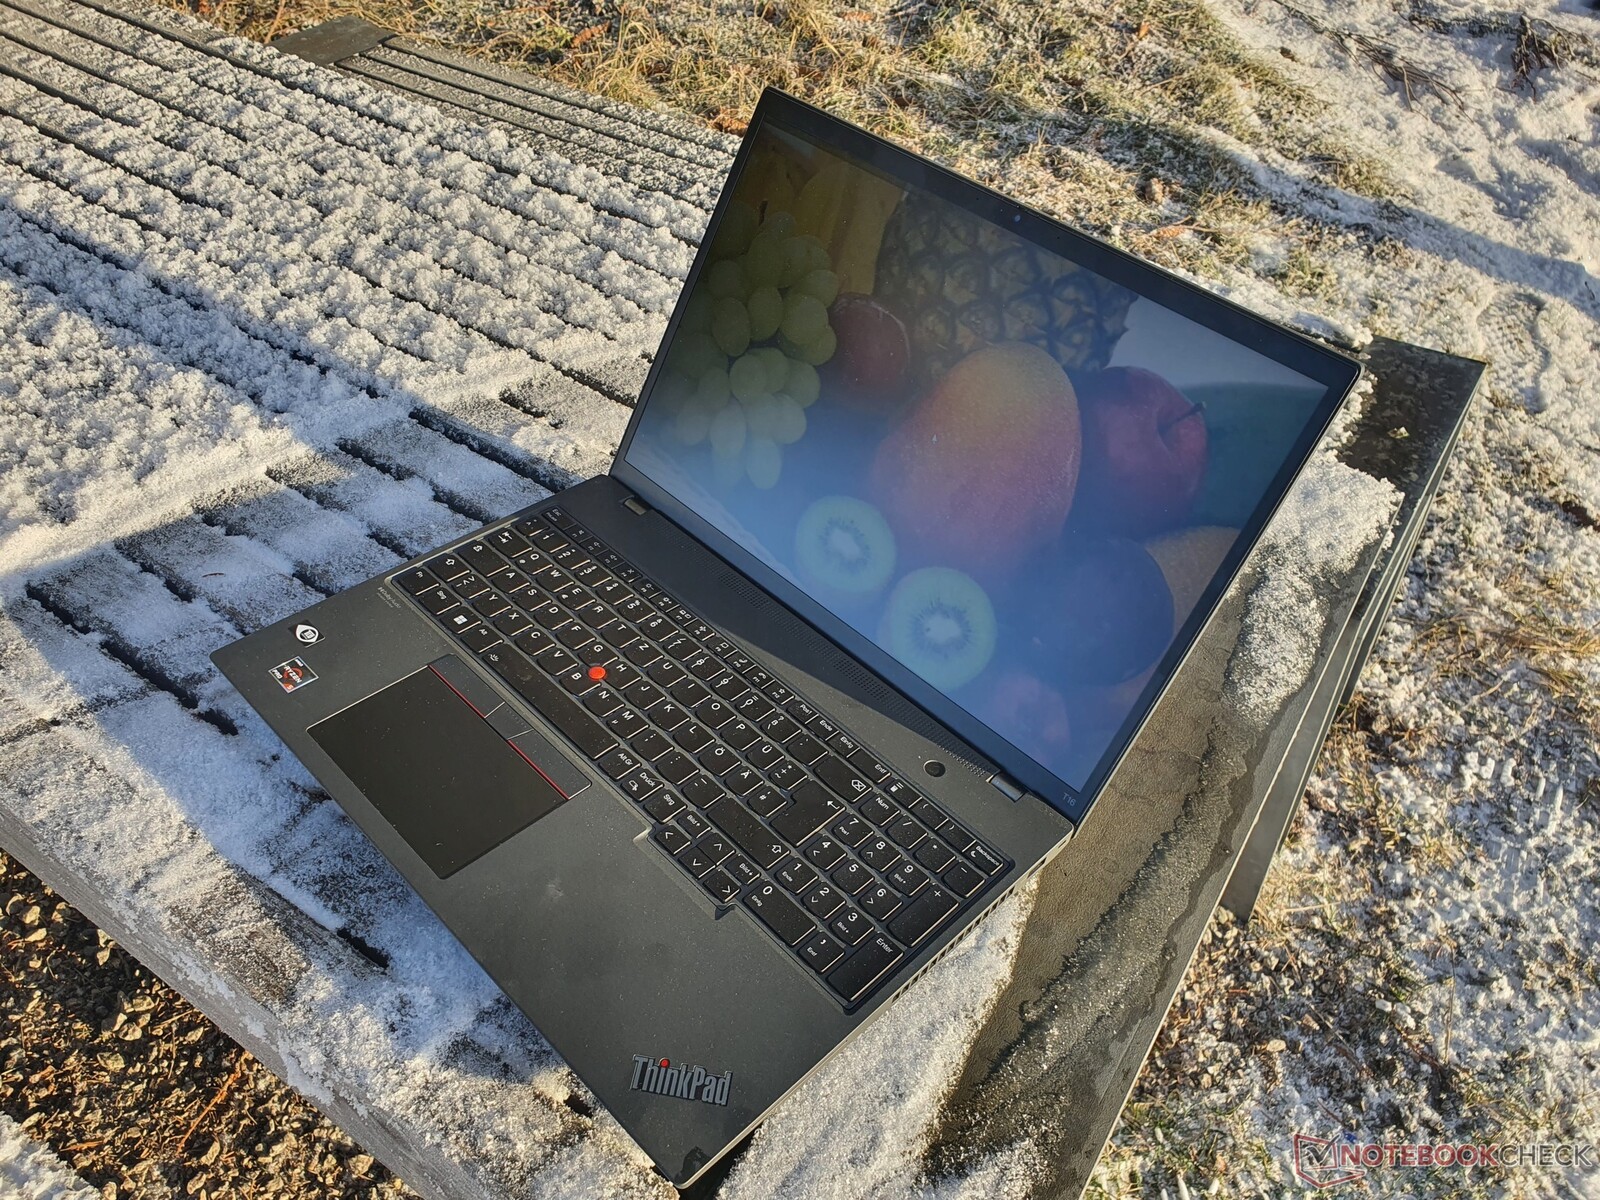
Análisis del portátil Lenovo ThinkPad T16 G1 AMD: Eficiente y más rápido que Intel
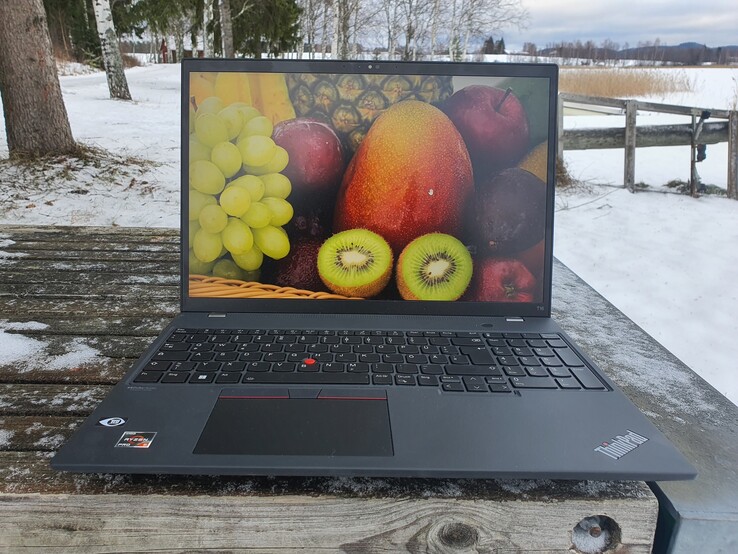
En este análisis, echamos un vistazo a la versión AMD del Lenovo ThinkPad T16, después de que ya hayamos probado la versión Intely vimos muchos aspectos positivos en ella. Sin embargo, seguimos decepcionados con su rendimiento, lo que nos lleva a esperar más de las actuales CPUs Ryzen en el mayor ThinkPad de la serie T. También queremos ver si el longevo T16 G1 será aún más eficiente con un procesador AMD.
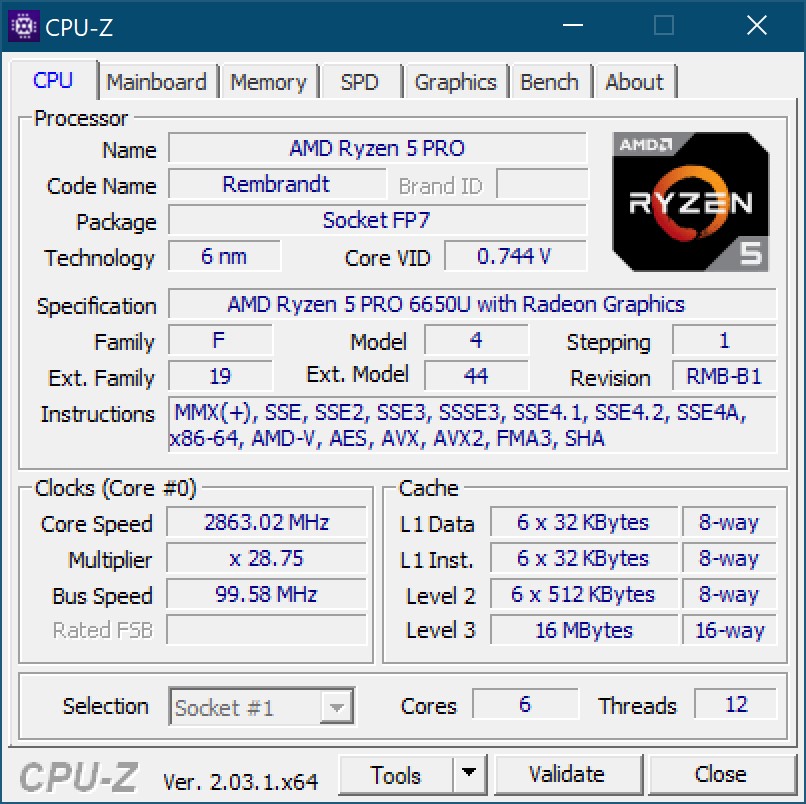
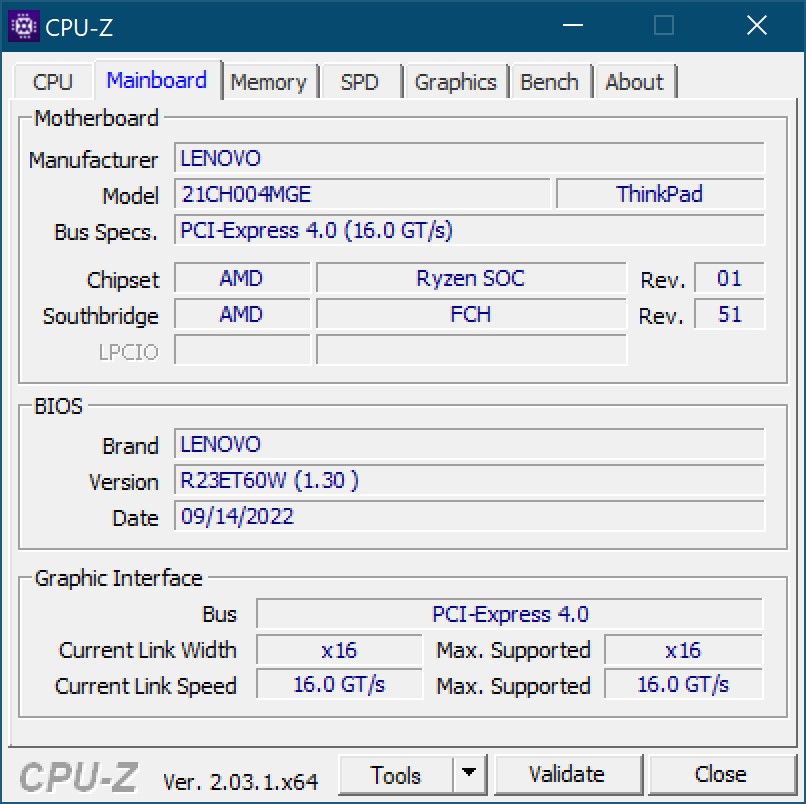
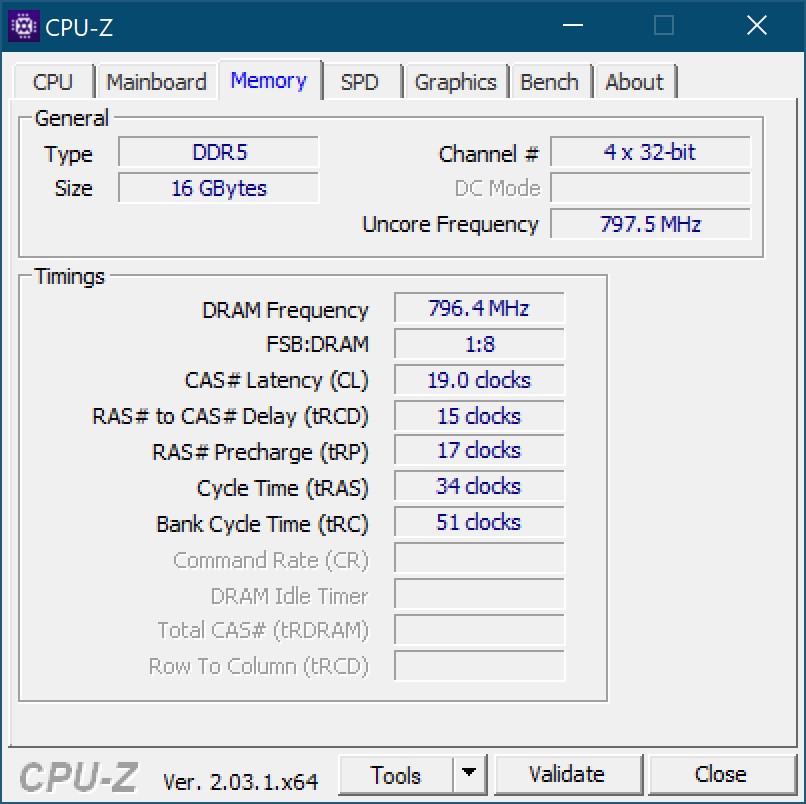
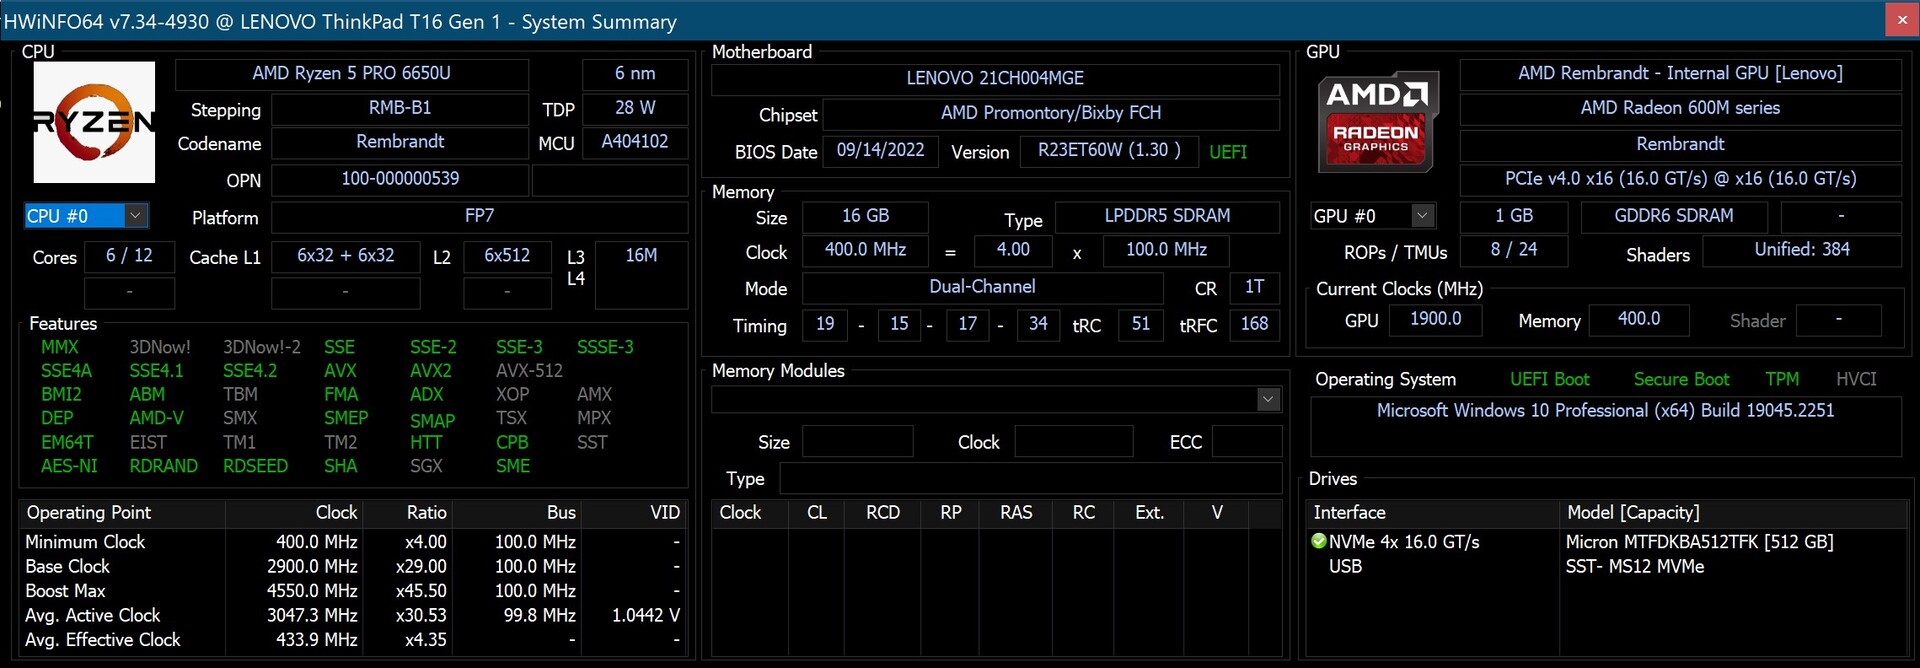
Probamos una versión del modelo con la batería más pequeña de 52,5 Wh, pantalla WQXGA de alta resolución y el hexa-core de AMD Ryzen 5 PRO 6650U de AMD. Además, hay 16 GB de LPDDR5-RAM, que está completamente soldada con los AMD ThinkPads T16 y T14y un SSD PCIe 4.0 de 512 GB. La tarjeta integrada Radeon 660Mse encarga de las operaciones gráficas.
Entre los competidores destaca el HP EliteBook 865 G9pero la comparación con otros ThinkPads de 16 pulgadas como el ThinkPad Z16 o incluso el ThinkPad X1 Extremetambién incluimos varios resultados de pruebas de un modelo T16 adicional con un Ryzen 7 PRO 6850Uy por lo demás idéntico equipamiento.
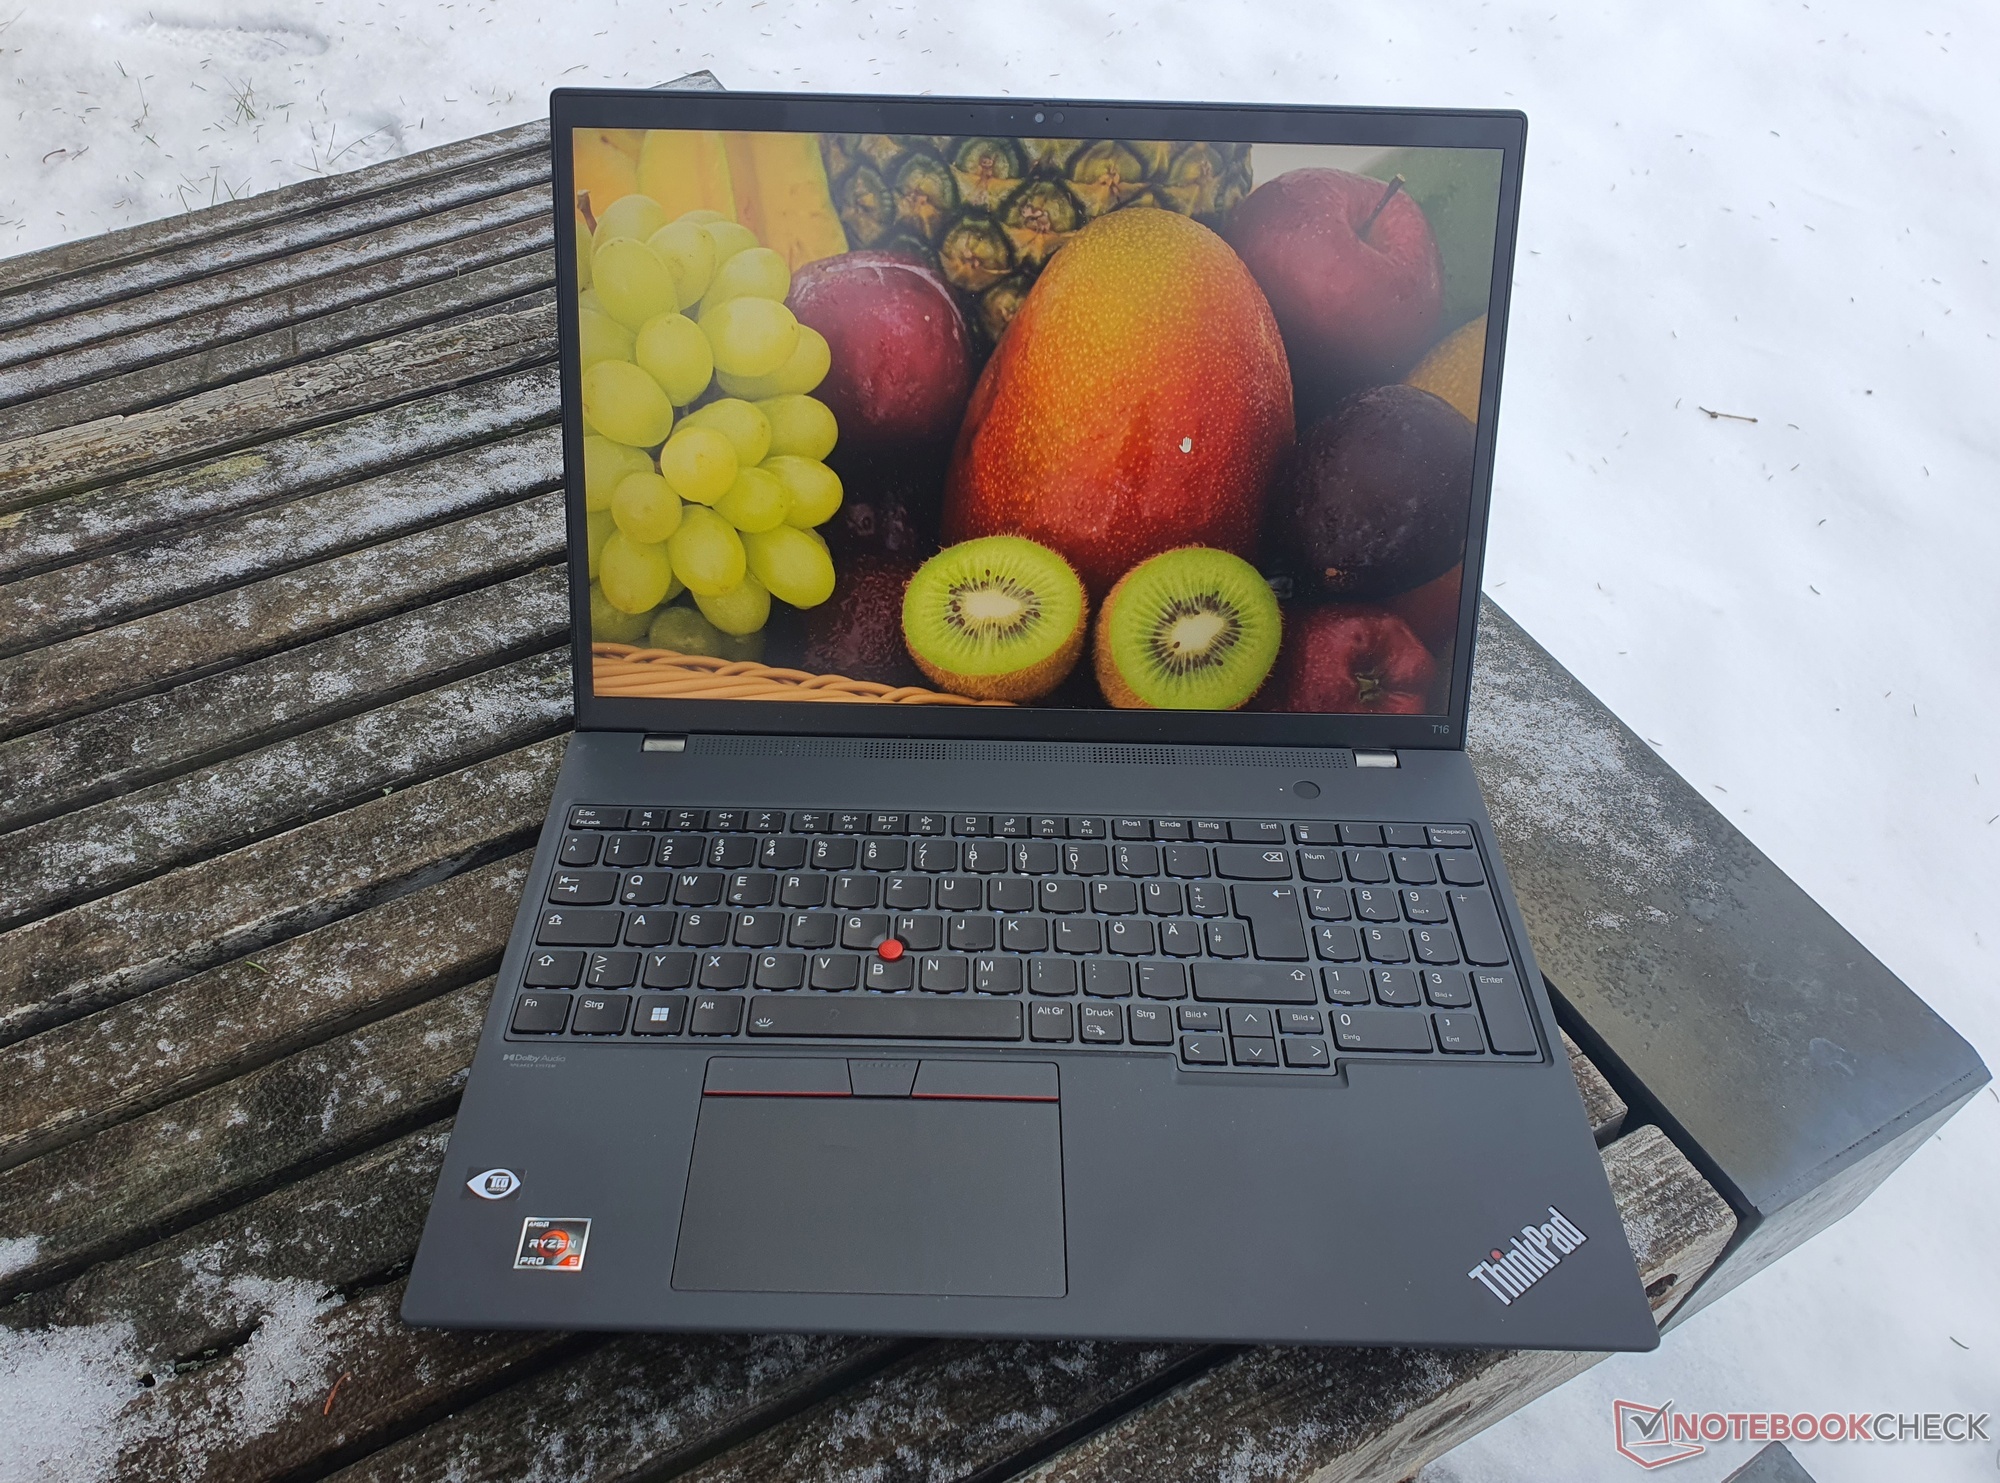
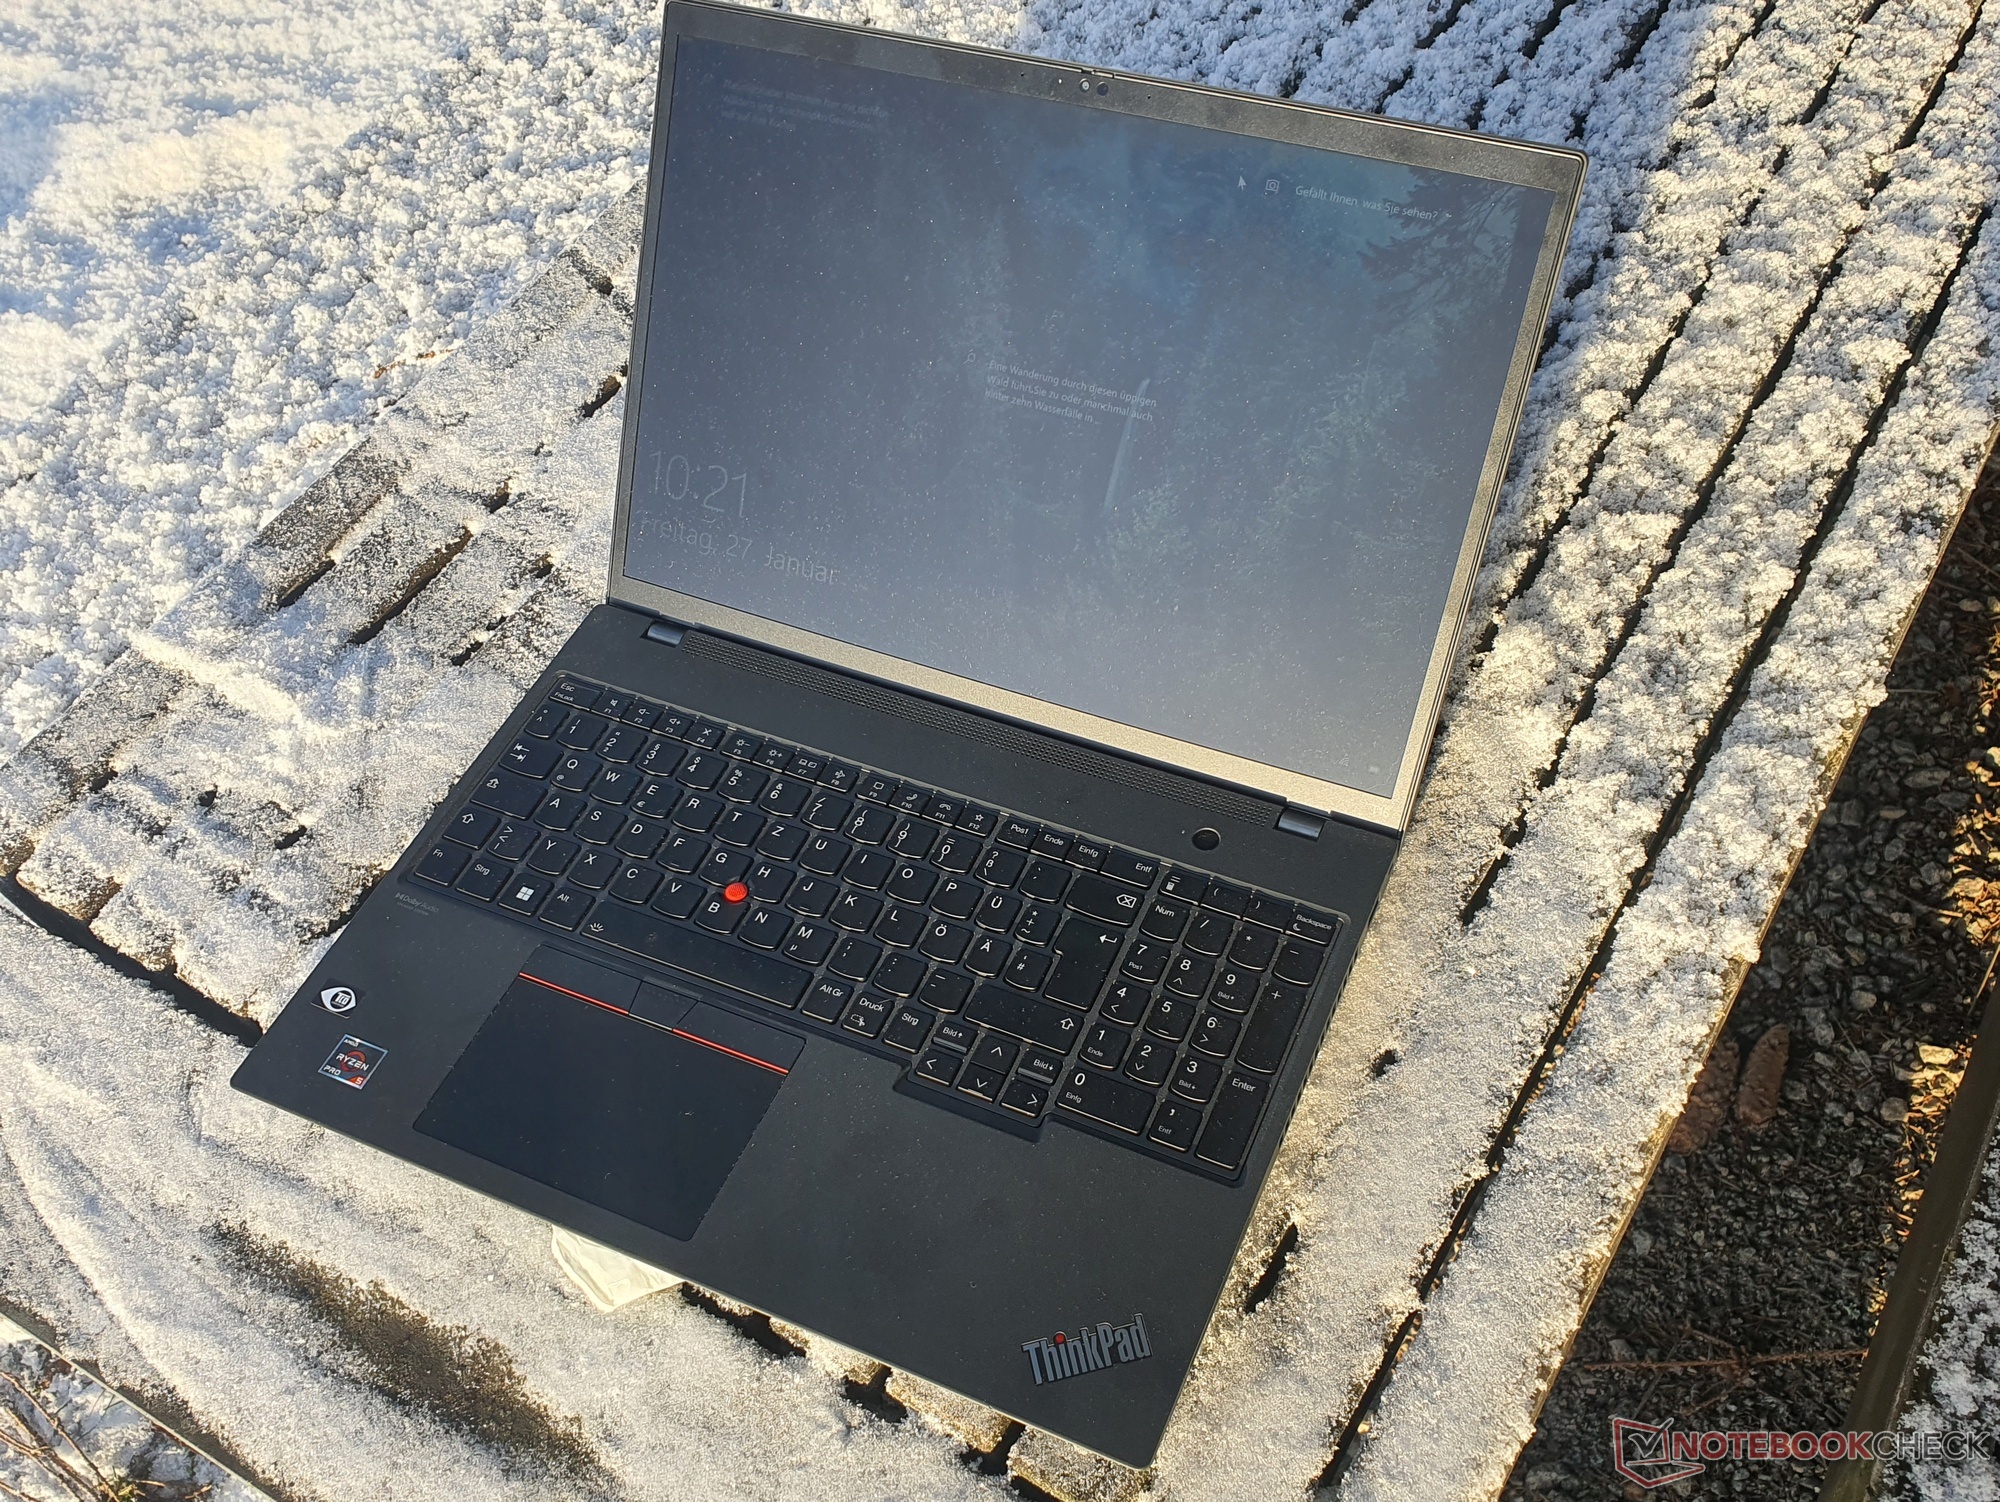
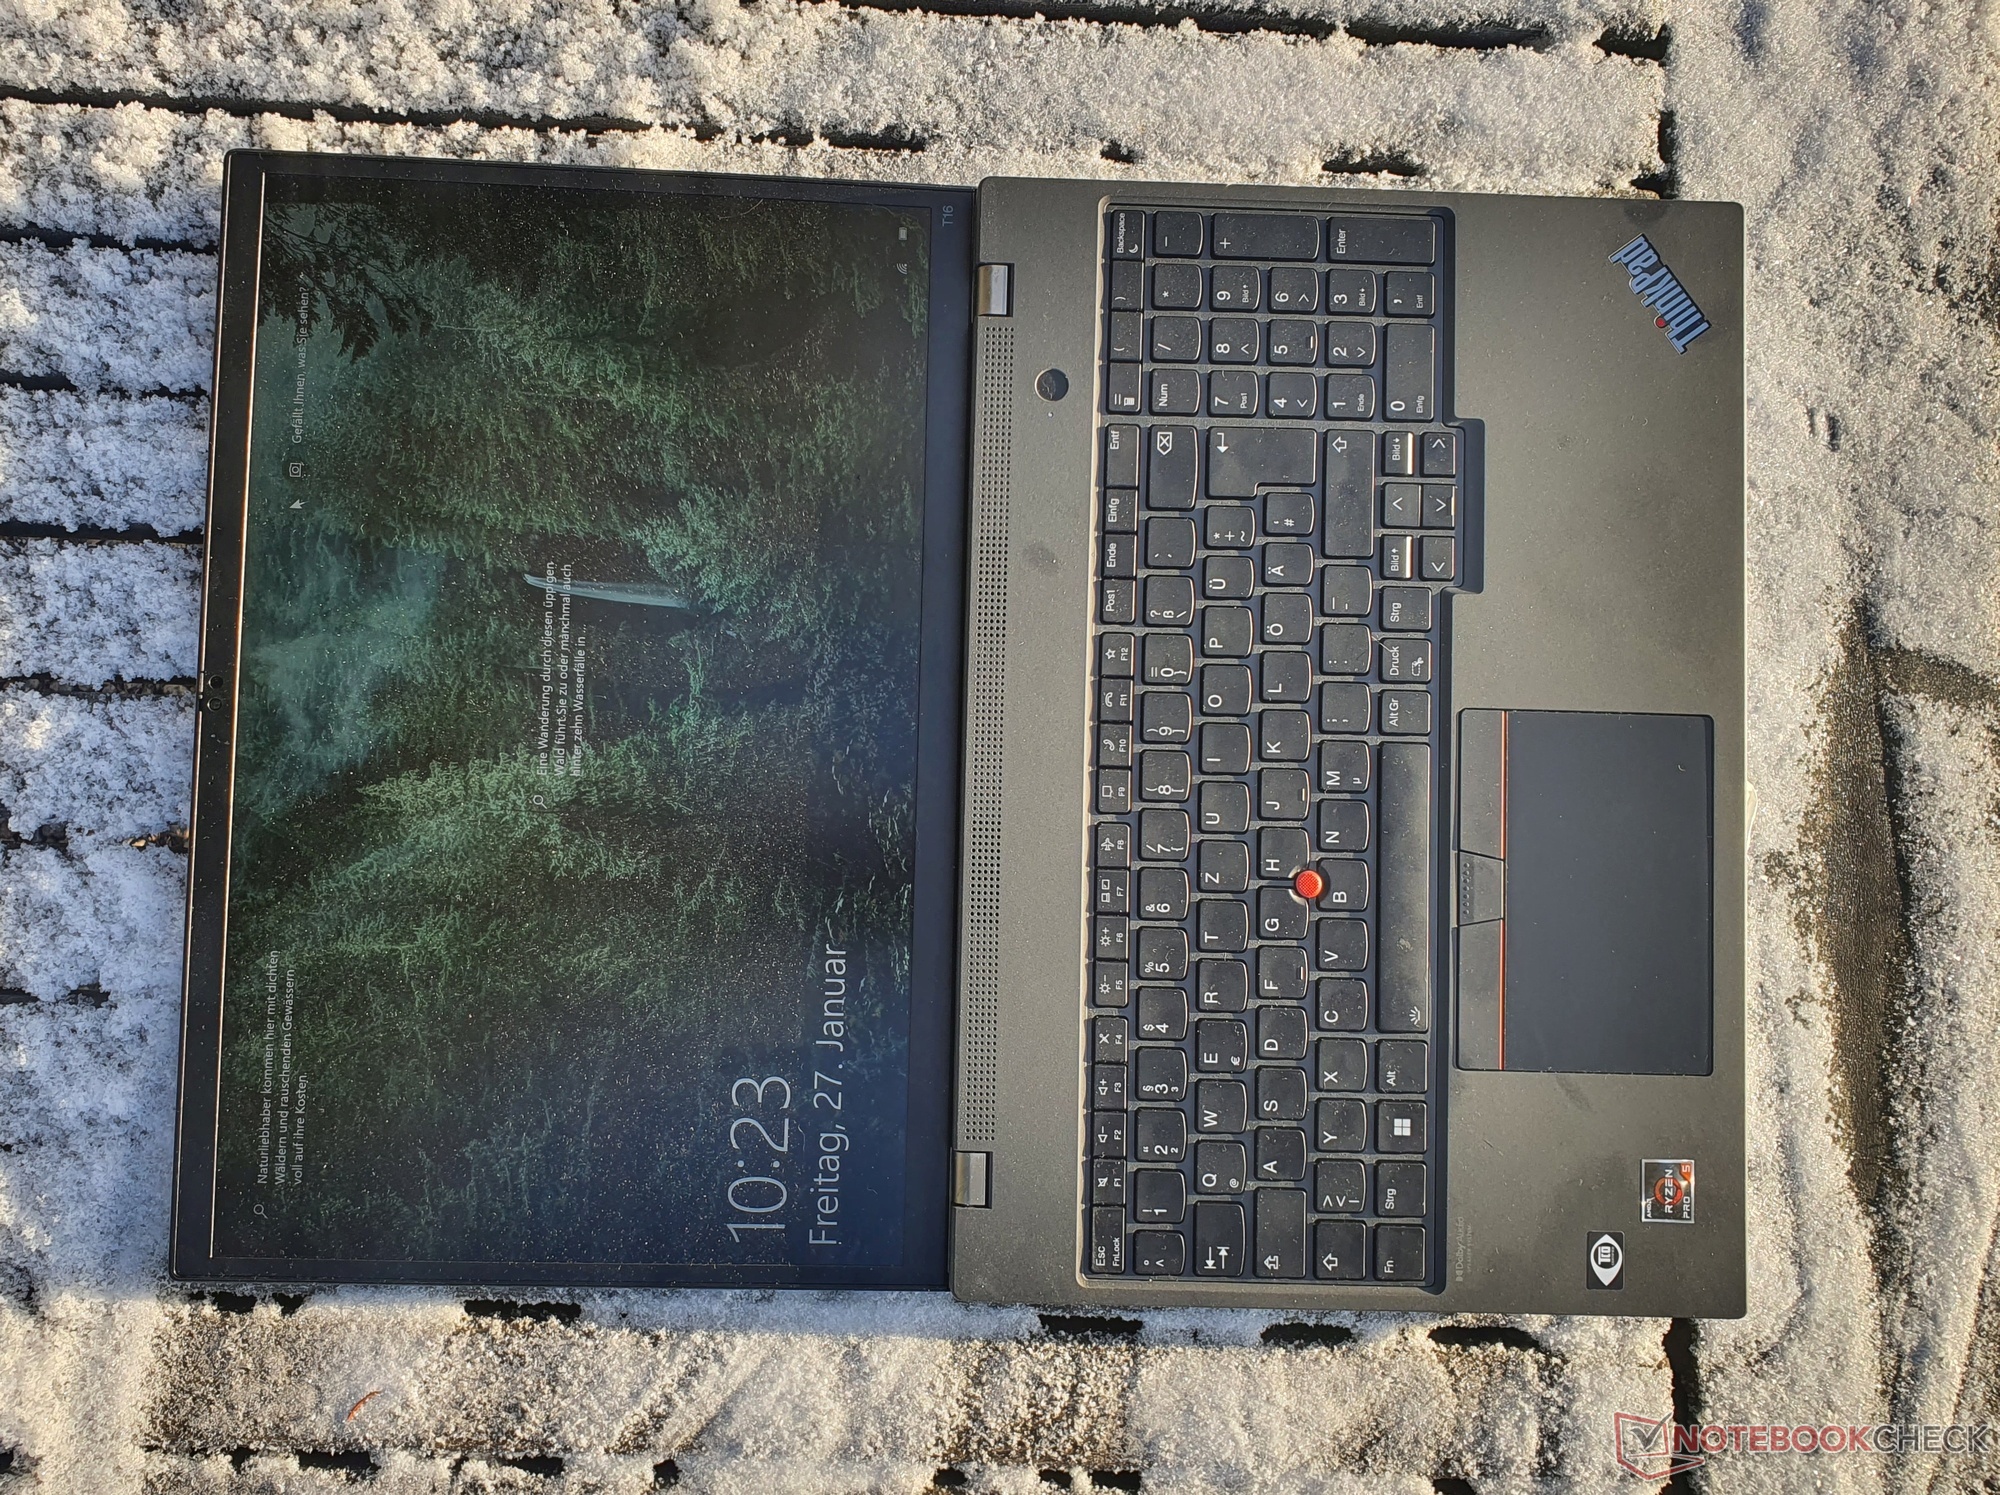
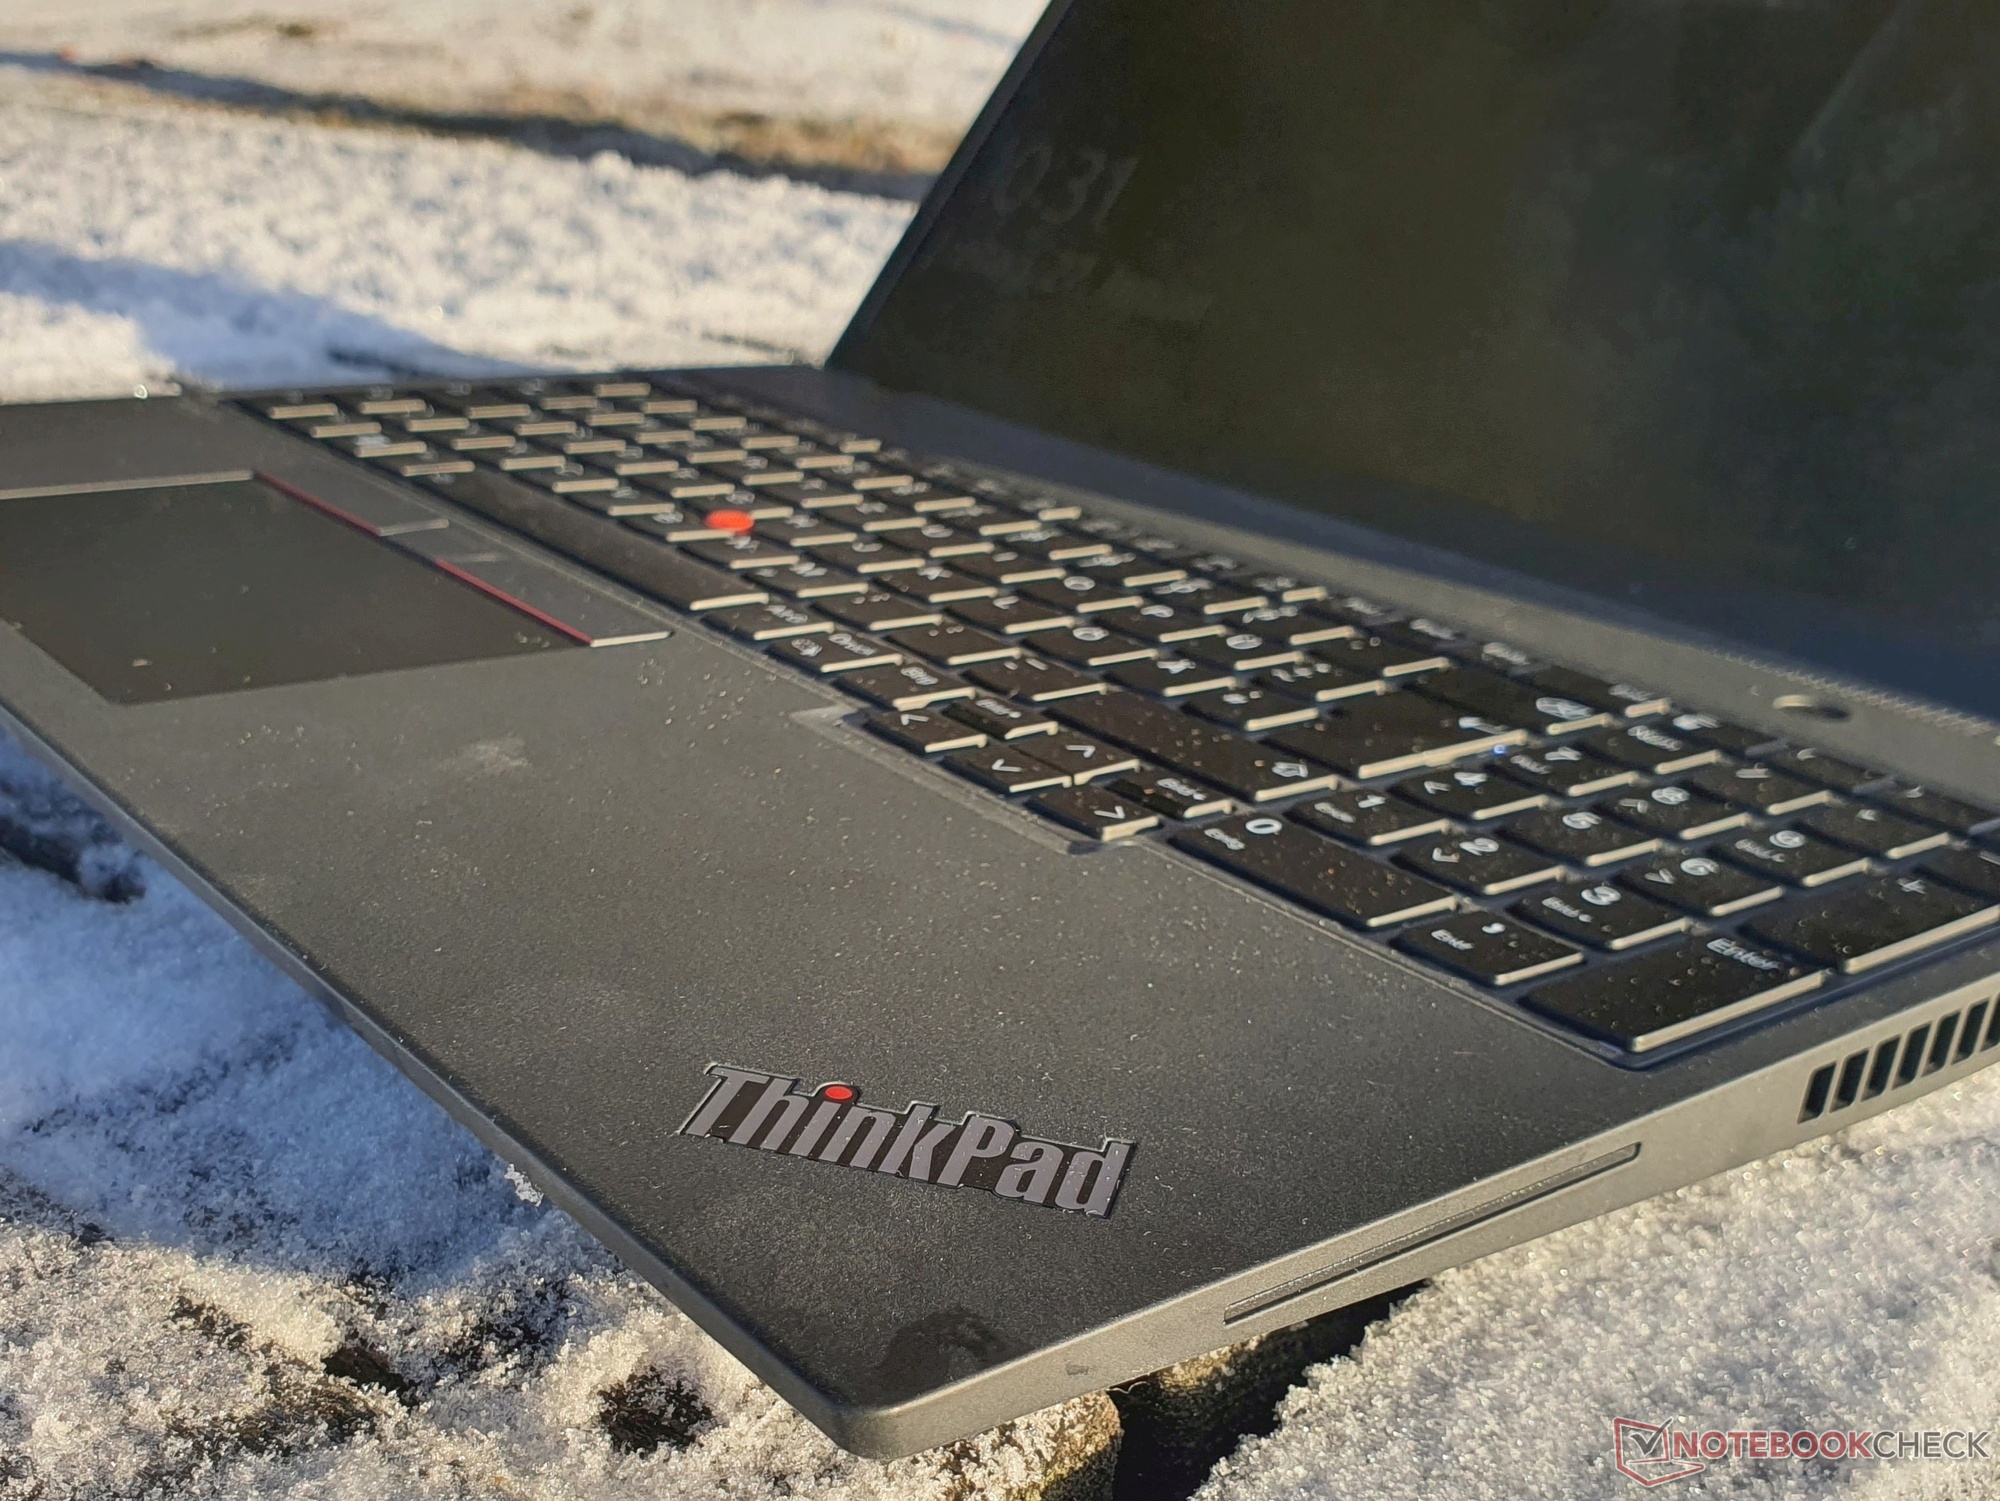
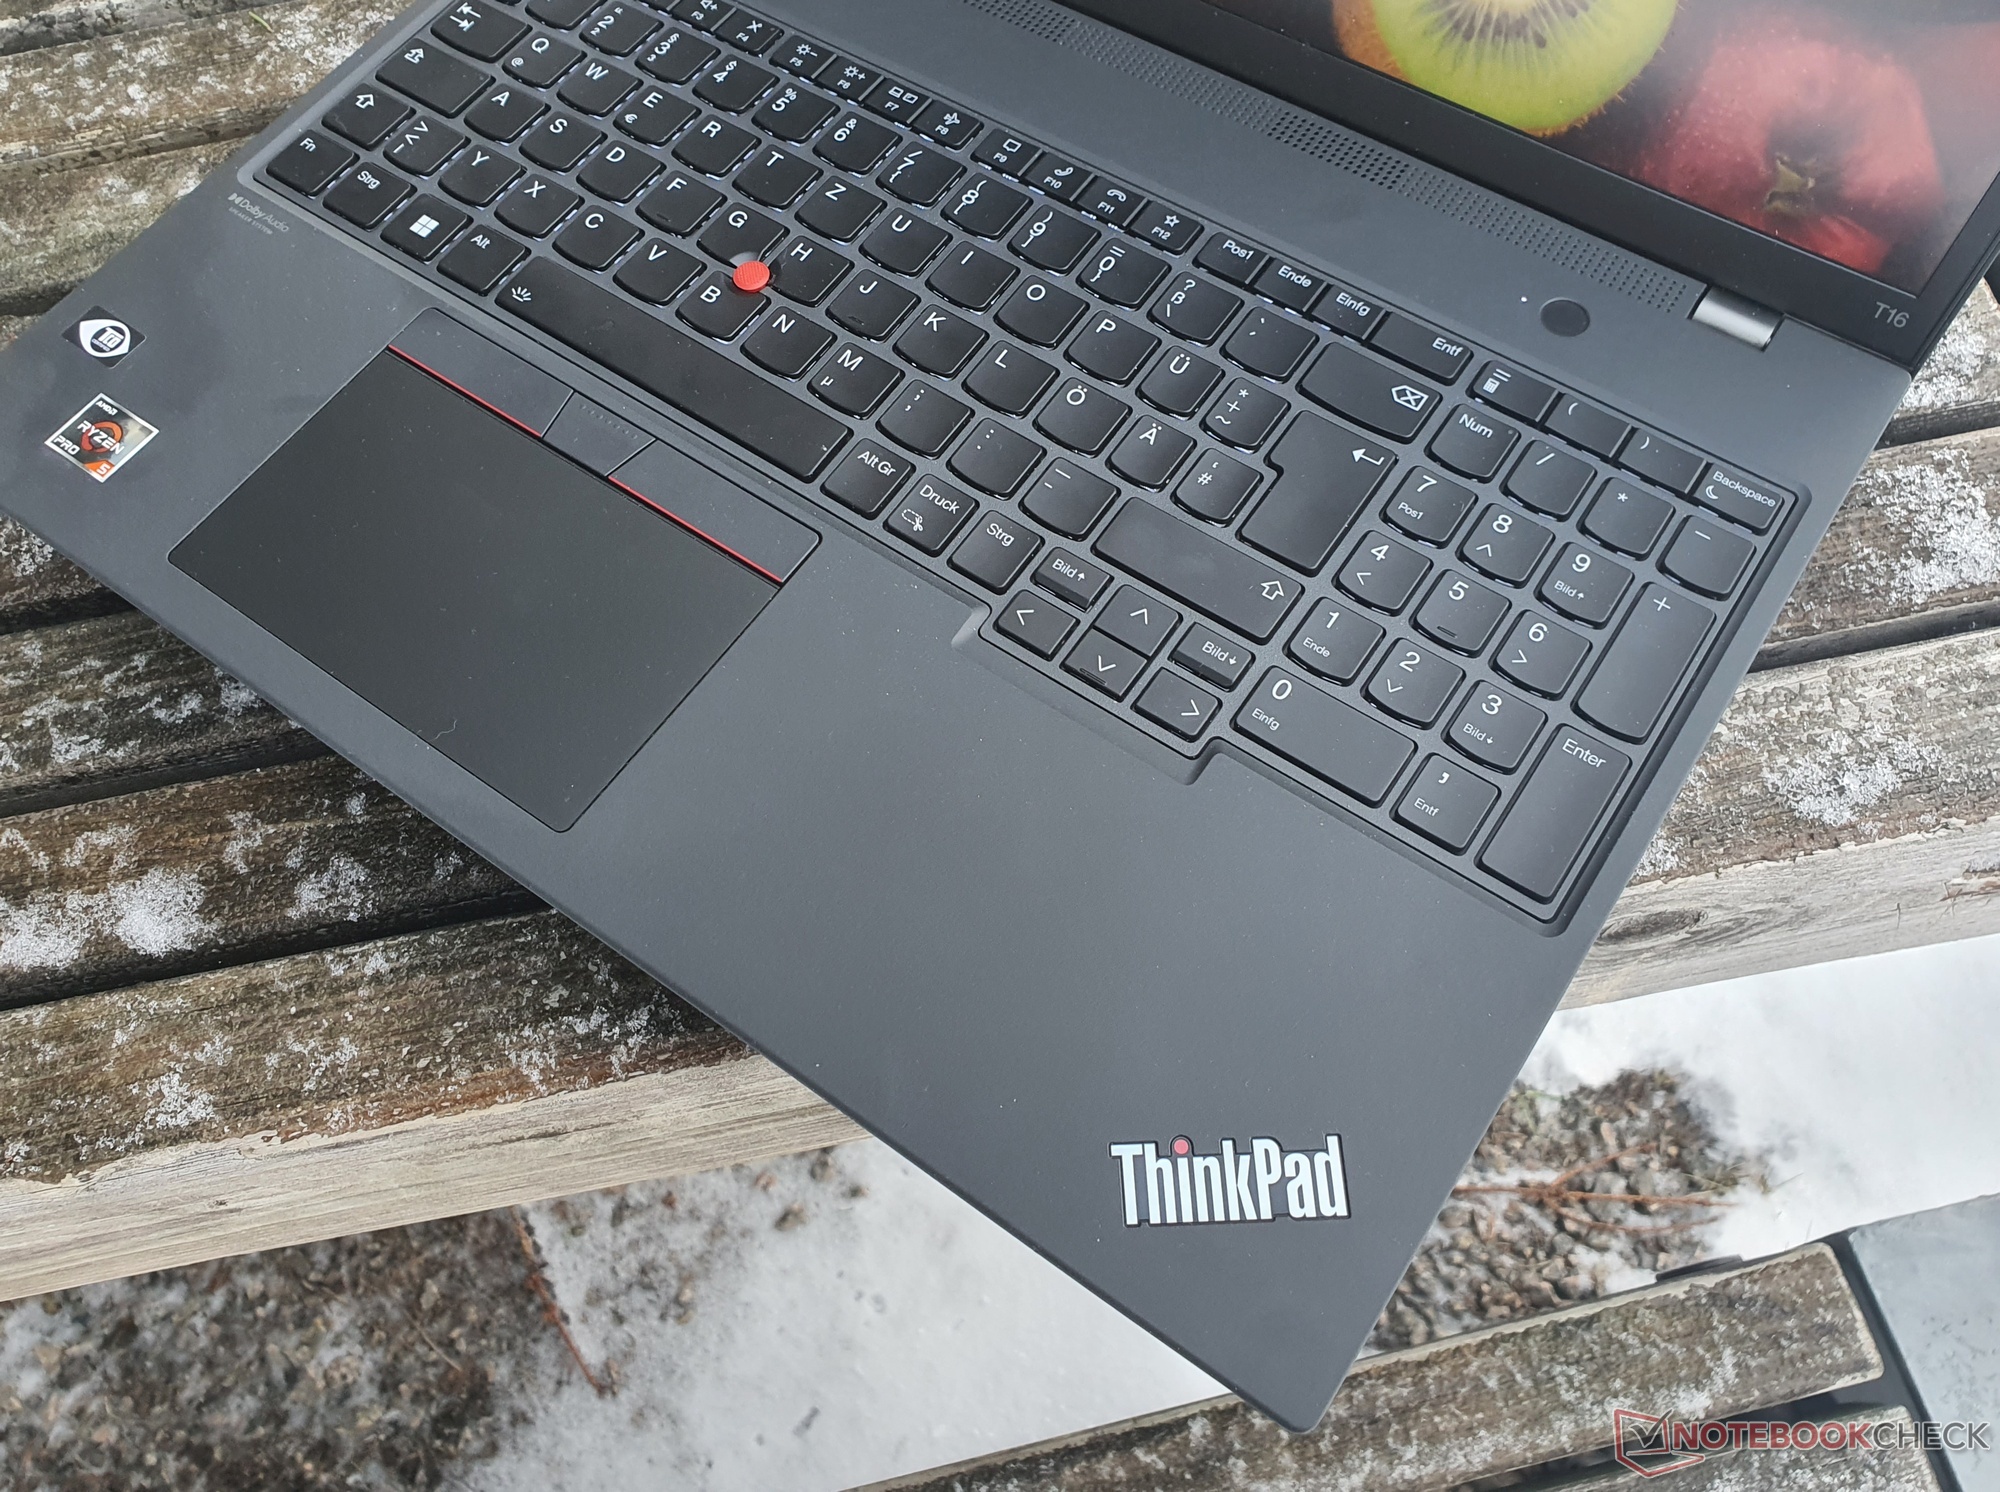
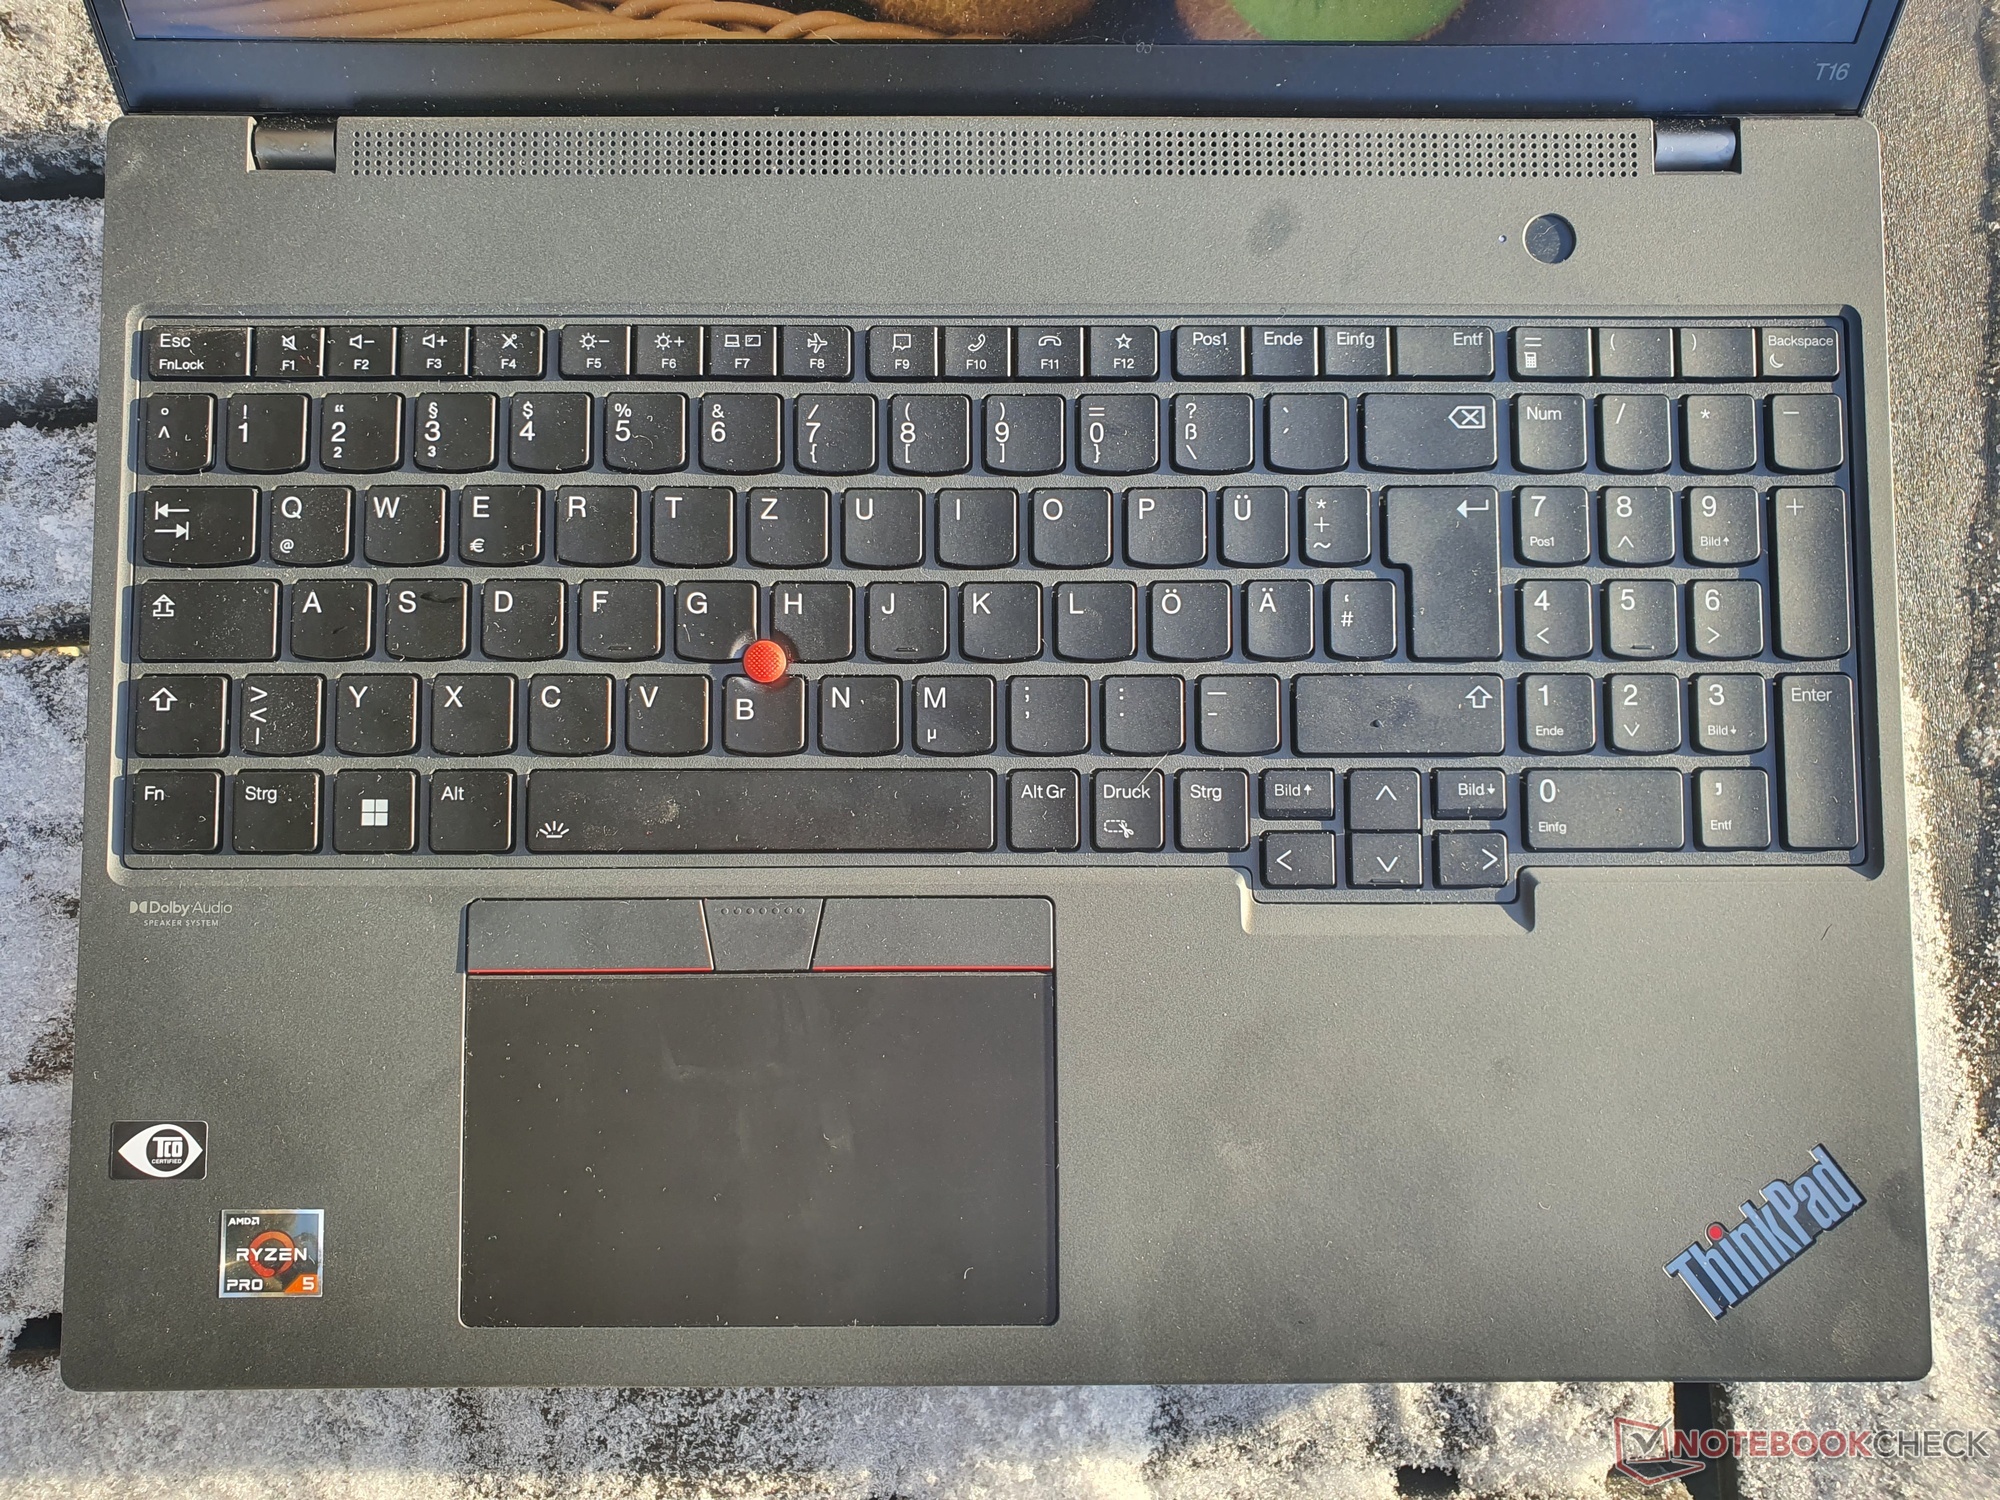
Dado que la carcasa, el equipo de conexión y los dispositivos de entrada son básicamente los mismos, puedes encontrar información detallada al respecto en nuestro análisis del ThinkPad T16 G1 Intel.
Revisiones adicionales de ThinkPad de Lenovo:
ThinkPad P16 G1
ThinkPad T14s G3 AMD
ThinkPad T14s G3 Intel
ThinkPad X1 Carbon G10
ThinkPad X13 G3 Intel
ThinkPad X13s G1
ThinkPad Z13 G1 OLED
Comparaison avec les concurrents potentiels
Valoración | Fecha | Modelo | Peso | Altura | Tamaño | Resolución | Precio |
|---|---|---|---|---|---|---|---|
| 90.2 % v7 (old) | 02/2023 | Lenovo ThinkPad T16 G1 21CH004MGE R5 PRO 6650U, Radeon 660M | 1.8 kg | 20.5 mm | 16.00" | 2560x1600 | |
| 89.3 % v7 (old) | 09/2022 | Lenovo ThinkPad T16 G1 21BWS00200 i5-1240P, Iris Xe G7 80EUs | 1.9 kg | 20.5 mm | 16.00" | 1920x1200 | |
| 87.2 % v7 (old) | 12/2022 | HP EliteBook 865 G9 R7 PRO 6850U, Radeon 680M | 1.9 kg | 19 mm | 16.00" | 1920x1200 | |
| 87.3 % v7 (old) | 10/2022 | Lenovo ThinkPad Z16 G1 21D5S00T00 R7 PRO 6850H, Radeon RX 6500M | 1.9 kg | 15.8 mm | 16.00" | 1920x1200 | |
| 88.7 % v7 (old) | 12/2022 | Lenovo ThinkPad X1 Extreme G5-21DE003RGE i7-12700H, GeForce RTX 3060 Laptop GPU | 2.1 kg | 17.9 mm | 16.00" | 3840x2400 | |
| 86.2 % v7 (old) | 06/2022 | Lenovo ThinkPad P15v G2 21A9000XGE i7-11800H, T1200 Laptop GPU | 2.3 kg | 22.7 mm | 15.60" | 1920x1080 | |
| 87.4 % v7 (old) | 01/2023 | HP ZBook Power 15 G9 6B8C4EA i7-12700H, RTX A2000 Laptop GPU | 2 kg | 22.8 mm | 15.60" | 3840x2160 |

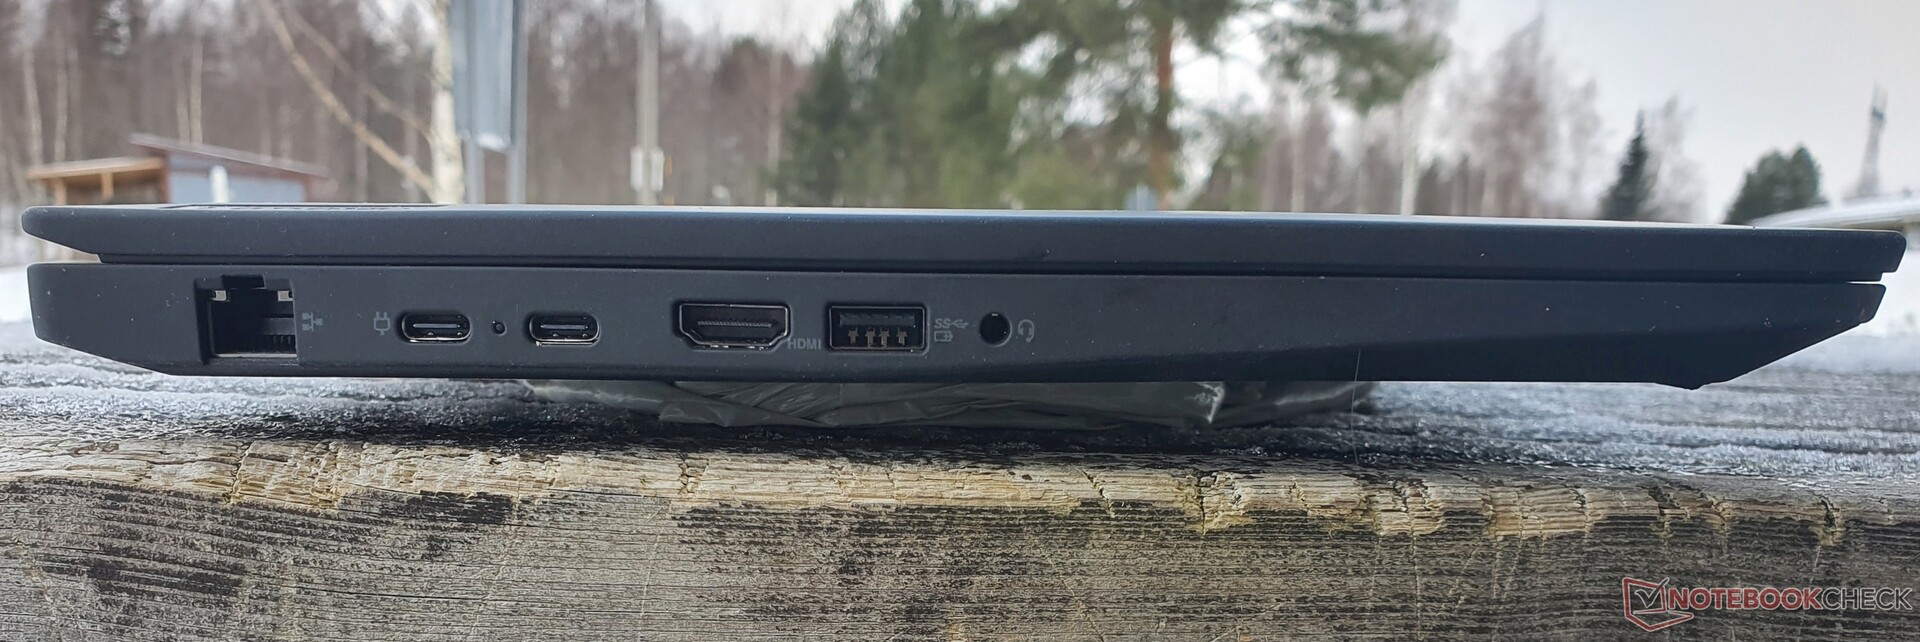
Conexiones
Las conexiones son básicamente las mismas que en el Modelo Intelcon la única diferencia de carecer de Thunderbolt 4 y USB 4.
Comunicación
Como en el ThinkPad T14 AMDy ThinkPad Z16también se usa aquí el módulo WCN685x Wi-Fi 6E de Qualcomm que incluye Bluetooth 5.2, lo que lleva a velocidades de transferencia muy rápidas. En nuestro campo de comparación, todos los dispositivos son igual de rápidos en este aspecto. Aunque nuestra unidad de pruebas no tiene módulo WWAN, sigue incluyendo las antenas necesarias.
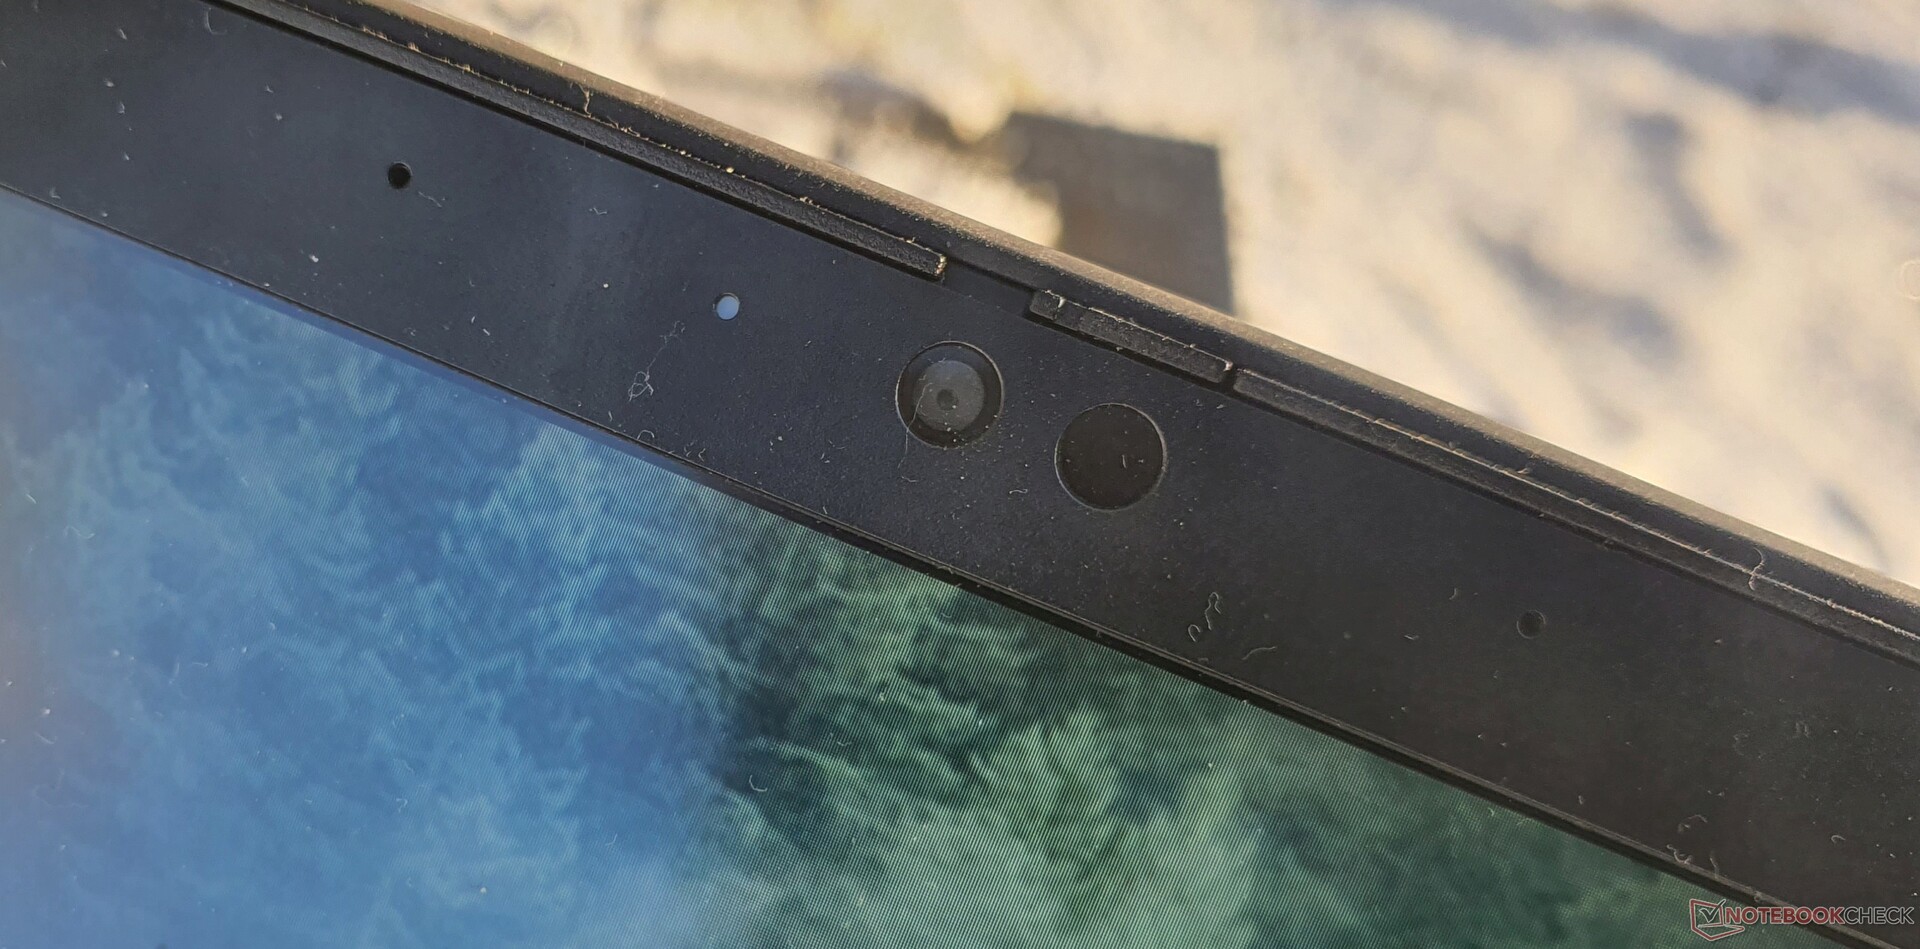
Cámara web
La cámara web de 1.080p es idéntica a la del ThinkPad T16 Intel.


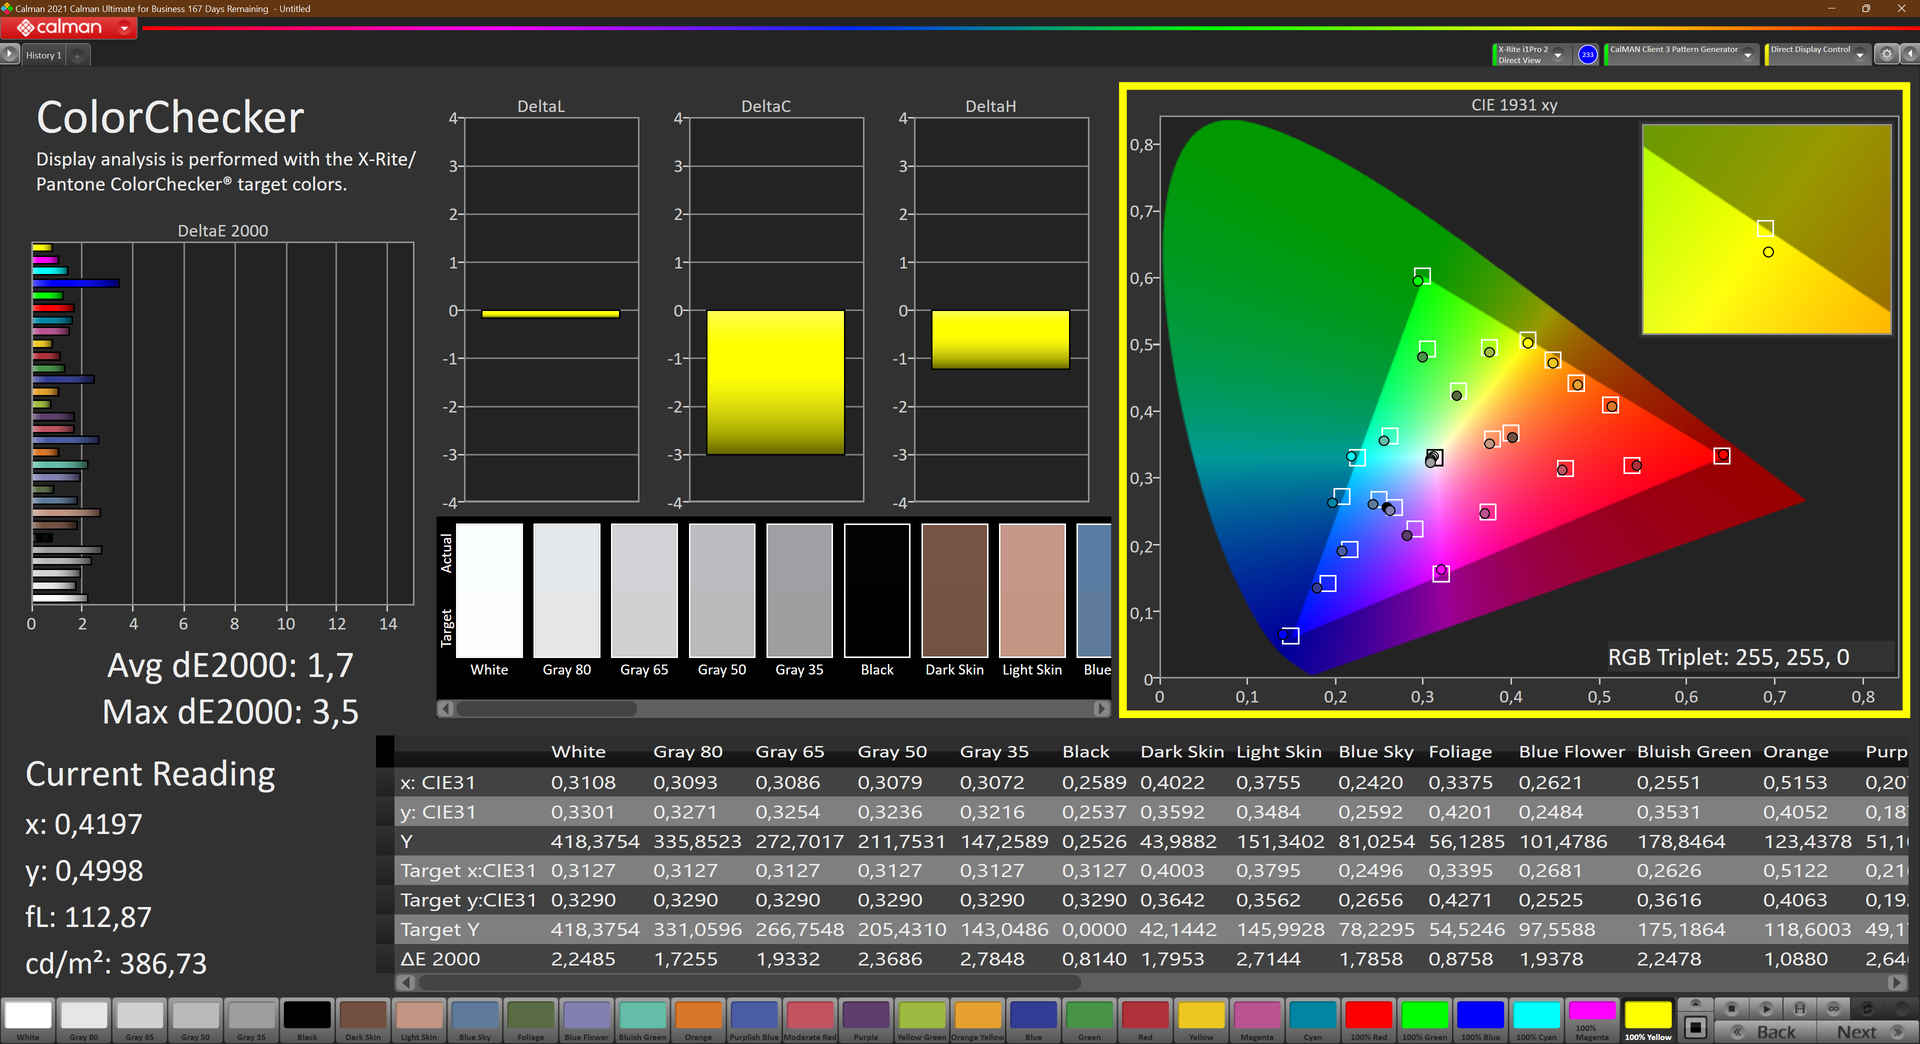
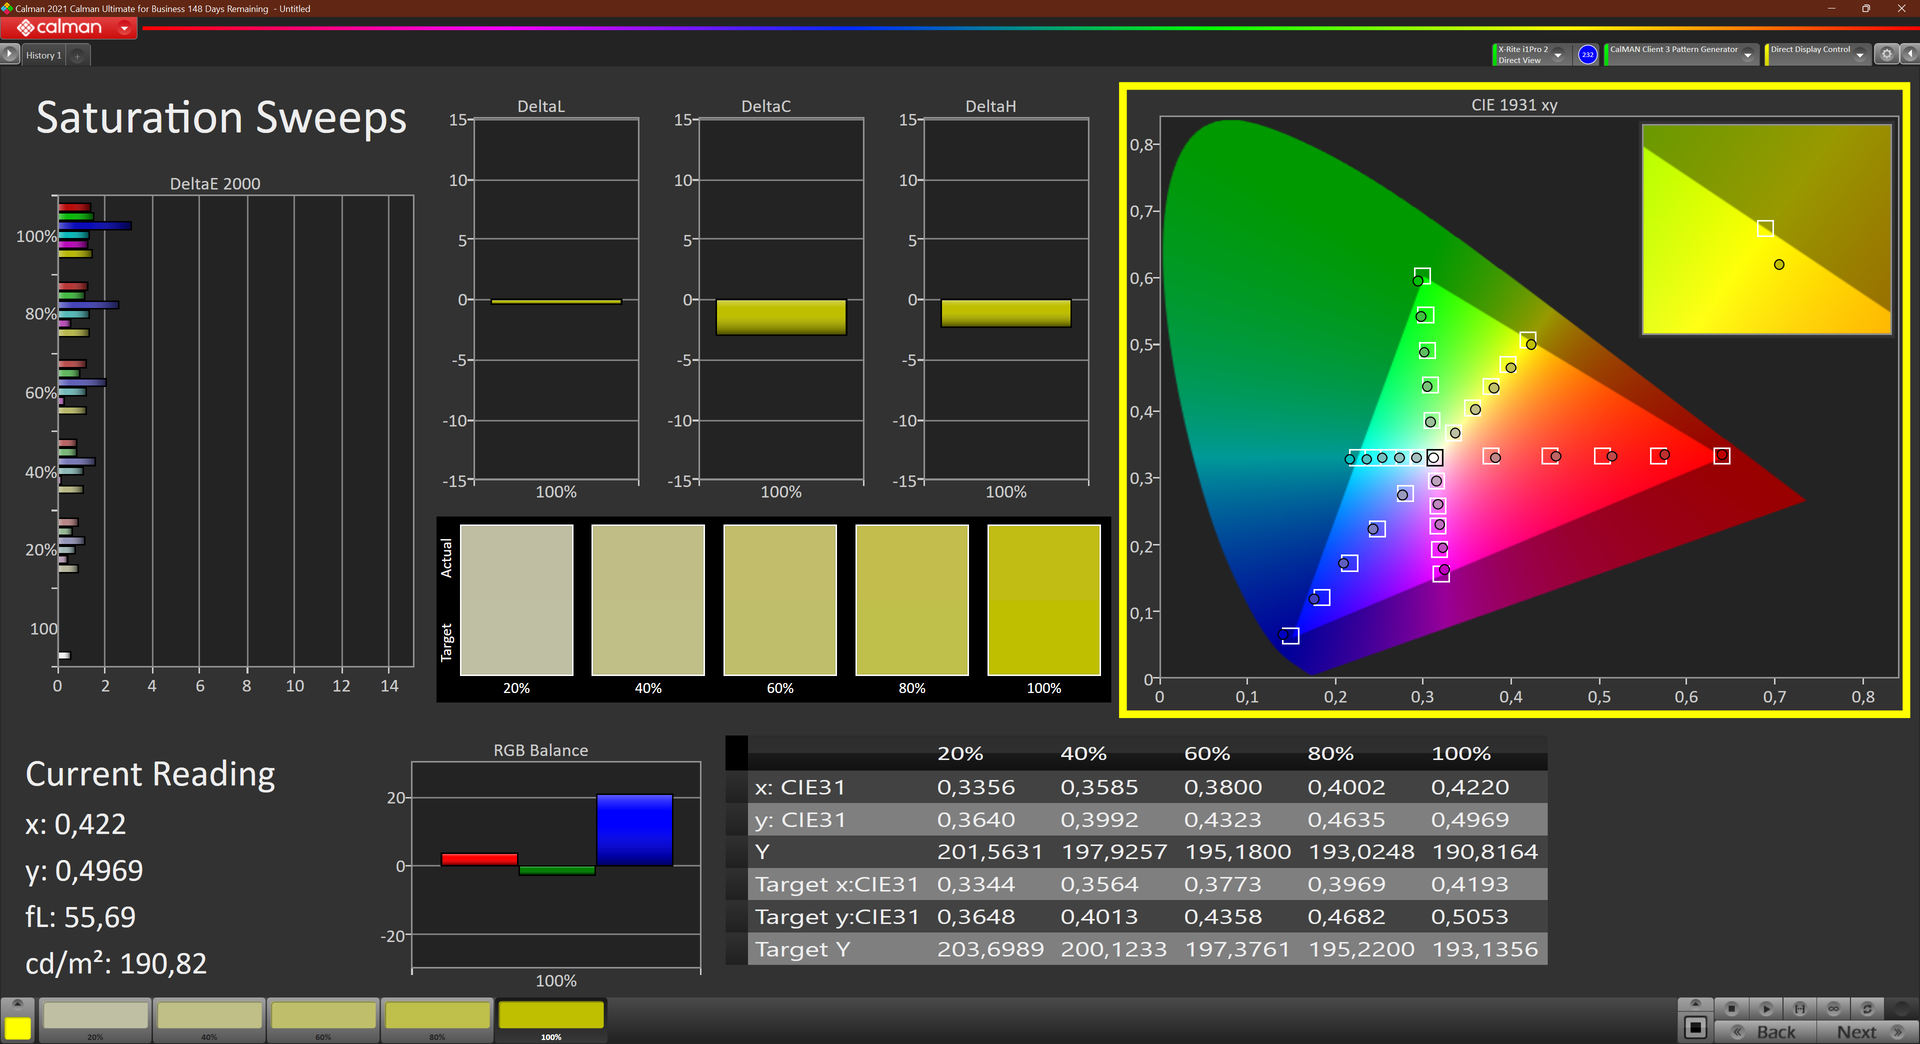
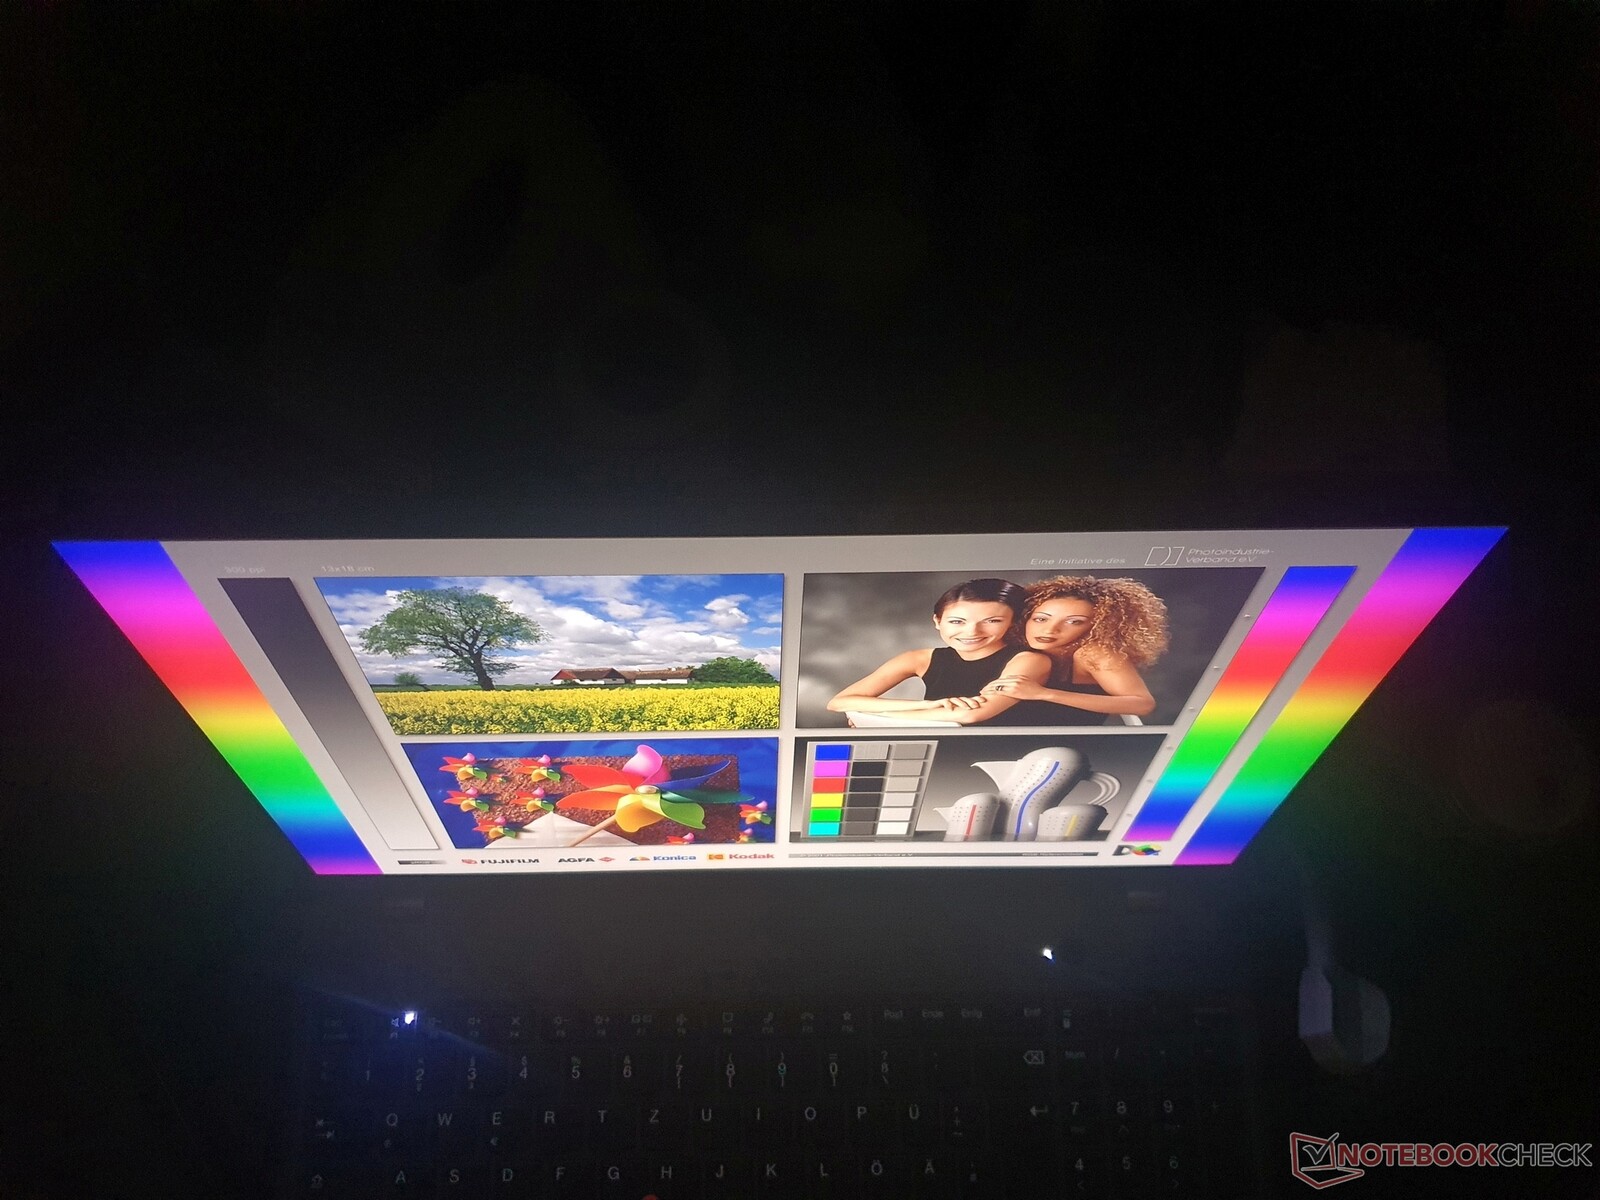
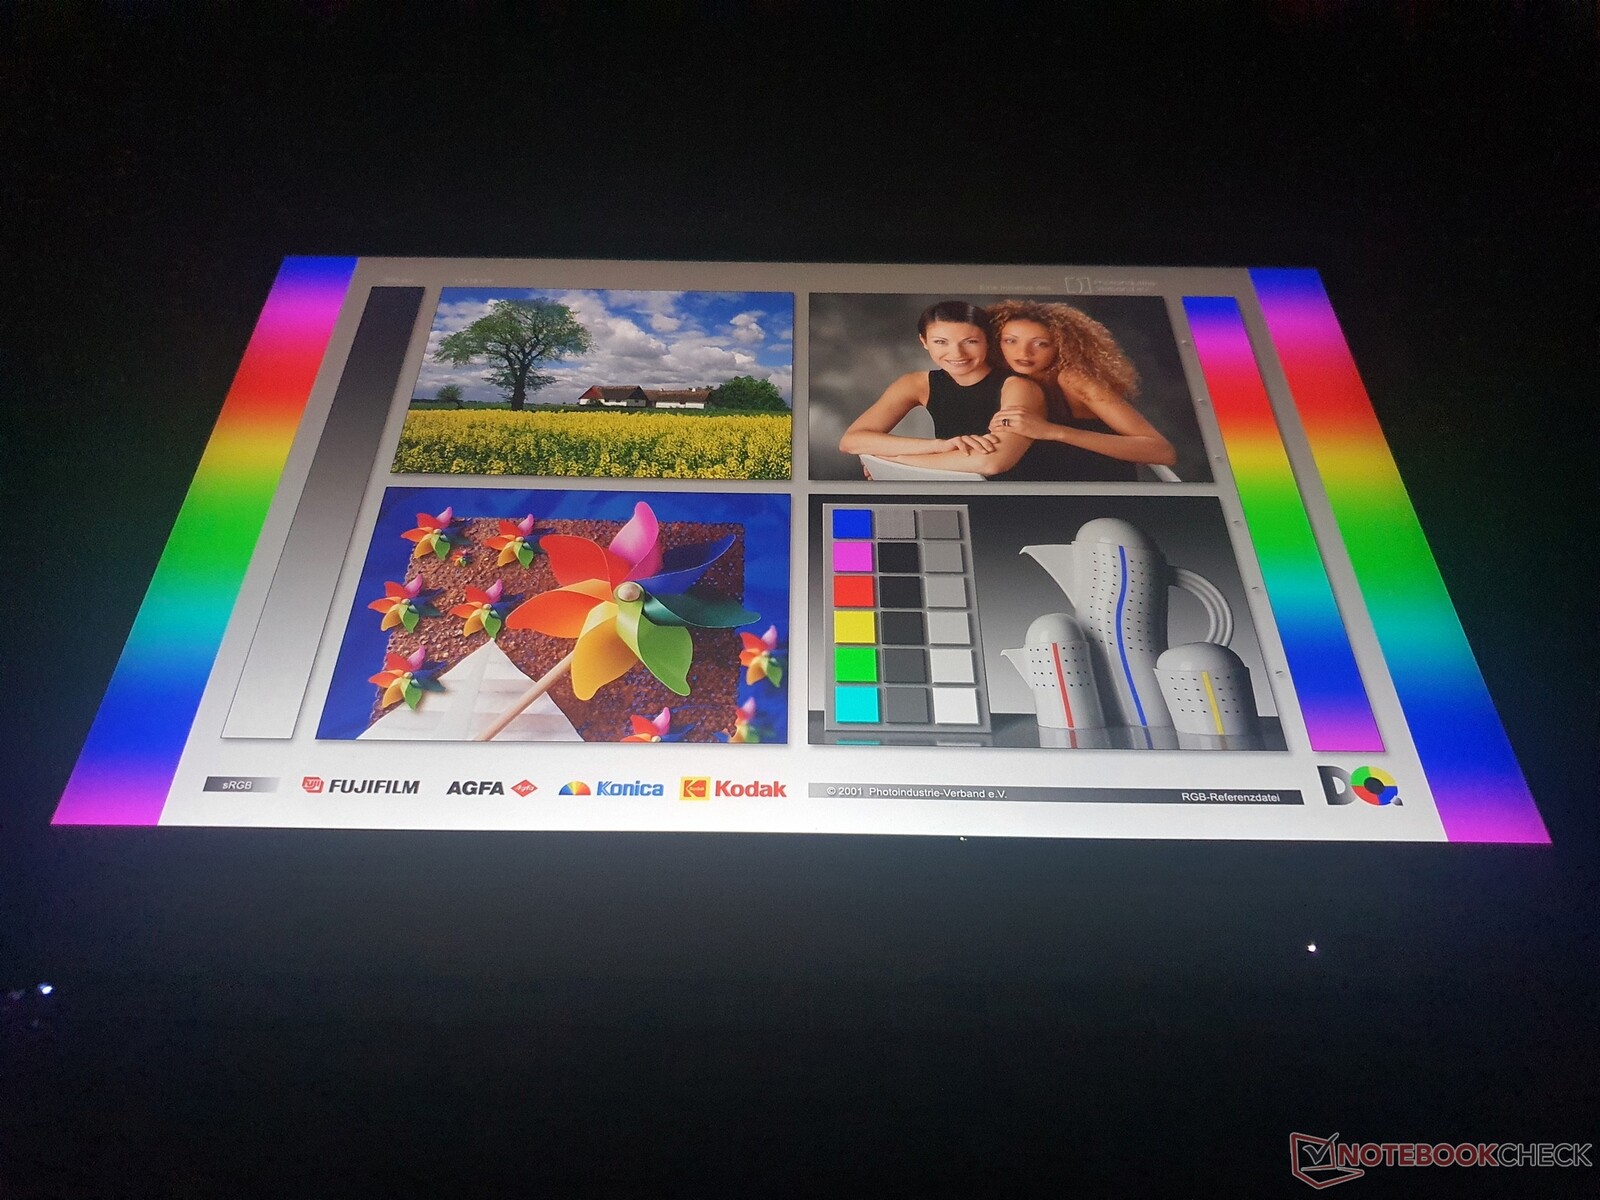
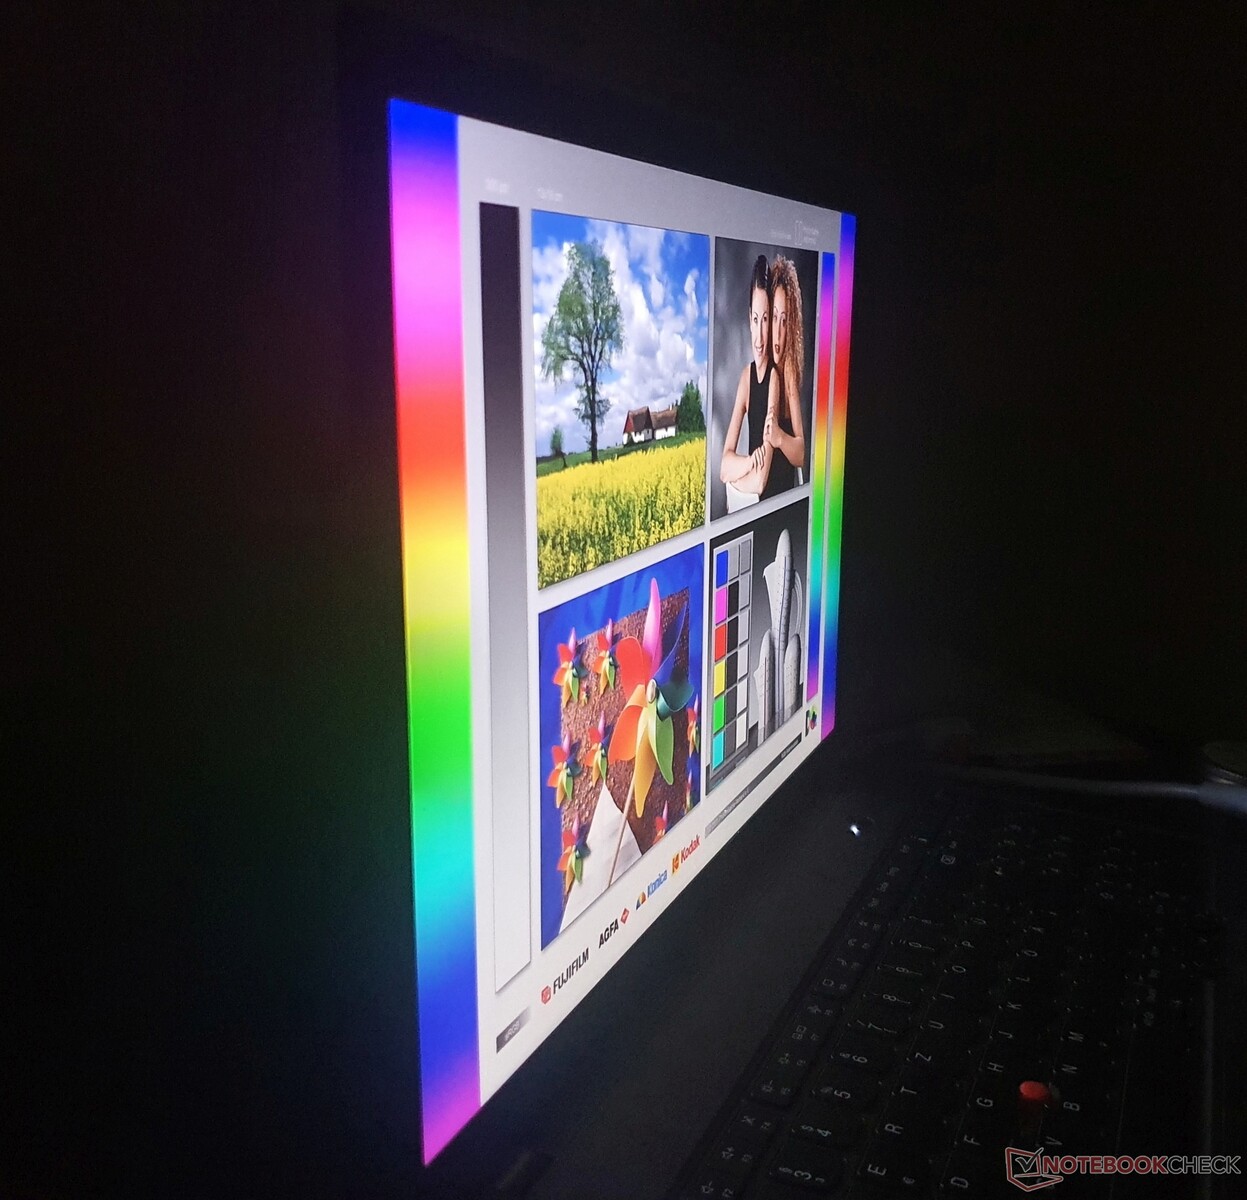
Pantalla: Rica en contraste, brillante y de alta resolución en el ThinkPad T16

Lenovo ha equipado nuestra unidad de pruebas del ThinkPad T16 AMD con un panel IPS mate de 16 pulgadas de CSOT con una resolución de 2.560 x 1.600 píxeles en formato 16:10.
En contraste con el panel WUXGA del ThinkPad T16 Intel, esta pantalla no es una de las llamadas "LCD de bajo consumo" Los valores medidos de ambos paneles son bastante similares, destacando principalmente la mejor calibración del panel WQXGA en el estado de entrega, pero también notamos la cobertura ligeramente inferior del espacio de color.
El brillo también es el mismo con 388 cd/m², pero el contraste que medimos es superior con 1738:1, y el valor de negro ligeramente inferior con unos buenos 0,24 cd/m². Esto hace que el negro parezca muy saturado, mientras que la calidad de imagen parece muy buena en general, y la diferencia subjetiva con el panel FHD+ de bajo consumo no parece muy pronunciada.
| |||||||||||||||||||||||||
iluminación: 81 %
Brillo con batería: 417 cd/m²
Contraste: 1738:1 (Negro: 0.24 cd/m²)
ΔE ColorChecker Calman: 1.7 | ∀{0.5-29.43 Ø4.71}
calibrated: 1.4
ΔE Greyscale Calman: 2.4 | ∀{0.09-98 Ø4.96}
69.1% AdobeRGB 1998 (Argyll 3D)
95.7% sRGB (Argyll 3D)
66.7% Display P3 (Argyll 3D)
Gamma: 2.16
CCT: 6924 K
| Lenovo ThinkPad T16 G1 21CH004MGE MNG007DA1-C, IPS-LED, 2560x1600, 16" | Lenovo ThinkPad T16 G1 21BWS00200 B160UAN01.K, IPS, 1920x1200, 16" | HP EliteBook 865 G9 X160NV42, IPS, 1920x1200, 16" | Lenovo ThinkPad Z16 G1 21D5S00T00 NE160WUM-N62 , IPS LED, 1920x1200, 16" | Lenovo ThinkPad X1 Extreme G5-21DE003RGE LP160UQ1-SPB1, IPS, 3840x2400, 16" | Lenovo ThinkPad P15v G2 21A9000XGE N156HCA-EAC, IPS LED, 1920x1080, 15.6" | HP ZBook Power 15 G9 6B8C4EA LGD073F, IPS, 3840x2160, 15.6" | |
|---|---|---|---|---|---|---|---|
| Display | 13% | 6% | 4% | 24% | -33% | 2% | |
| Display P3 Coverage (%) | 66.7 | 80.1 20% | 71.4 7% | 70 5% | 84.6 27% | 43.7 -34% | 69.1 4% |
| sRGB Coverage (%) | 95.7 | 100 4% | 99.3 4% | 99.7 4% | 99.2 4% | 65.1 -32% | 97.7 2% |
| AdobeRGB 1998 Coverage (%) | 69.1 | 80.5 16% | 73.2 6% | 72.1 4% | 97.7 41% | 45.3 -34% | 69.6 1% |
| Response Times | 13% | -18% | -29% | -23% | -49% | -47% | |
| Response Time Grey 50% / Grey 80% * (ms) | 32.1 ? | 27 ? 16% | 35.5 ? -11% | 40 ? -25% | 46 ? -43% | 48 ? -50% | 45.8 ? -43% |
| Response Time Black / White * (ms) | 18.9 ? | 17 ? 10% | 23.5 ? -24% | 25 ? -32% | 19.2 ? -2% | 28 ? -48% | 28.6 ? -51% |
| PWM Frequency (Hz) | 56.7 | ||||||
| Screen | -51% | 7% | 5% | -7% | -132% | -21% | |
| Brightness middle (cd/m²) | 417 | 404 -3% | 865 107% | 487 17% | 476 14% | 305 -27% | 392 -6% |
| Brightness (cd/m²) | 388 | 391 1% | 771 99% | 446 15% | 470 21% | 281 -28% | 388 0% |
| Brightness Distribution (%) | 81 | 80 -1% | 72 -11% | 83 2% | 90 11% | 88 9% | 88 9% |
| Black Level * (cd/m²) | 0.24 | 0.29 -21% | 0.3 -25% | 0.31 -29% | 0.35 -46% | 0.32 -33% | 0.15 37% |
| Contrast (:1) | 1738 | 1393 -20% | 2883 66% | 1571 -10% | 1360 -22% | 953 -45% | 2613 50% |
| Colorchecker dE 2000 * | 1.7 | 3.9 -129% | 2.4 -41% | 1.8 -6% | 1.9 -12% | 5.9 -247% | 3.2 -88% |
| Colorchecker dE 2000 max. * | 3.5 | 8.5 -143% | 5.8 -66% | 3.3 6% | 4.7 -34% | 20.1 -474% | 7 -100% |
| Colorchecker dE 2000 calibrated * | 1.4 | 1.7 -21% | 1.5 -7% | 0.8 43% | 1.3 7% | 4.5 -221% | 1.2 14% |
| Greyscale dE 2000 * | 2.4 | 5.4 -125% | 3.8 -58% | 2.3 4% | 2.4 -0% | 5.3 -121% | 4.9 -104% |
| Gamma | 2.16 102% | 2.21 100% | 2.36 93% | 2.16 102% | 2.24 98% | 2.1 105% | 2.13 103% |
| CCT | 6924 94% | 6242 104% | 6922 94% | 6867 95% | 6377 102% | 6307 103% | 5982 109% |
| Media total (Programa/Opciones) | -8% /
-28% | -2% /
3% | -7% /
-0% | -2% /
-2% | -71% /
-99% | -22% /
-20% |
* ... más pequeño es mejor
El espacio de color sRGB está suficientemente cubierto con un 95,7%, lo que debería permitir un procesamiento profesional de las imágenes en el área digital. Sin embargo, incluso después de nuestra calibración, el color azul sigue desviándose del objetivo con un valor DeltaE 2000 de 3,5, aunque pudimos remediar el tinte azul. Como siempre, puedes descargar nuestro perfil de color calibrado desde el enlace anterior, a la derecha del gráfico de distribución de brillo.
Tiempos de respuesta del display
| ↔ Tiempo de respuesta de Negro a Blanco | ||
|---|---|---|
| 18.9 ms ... subida ↗ y bajada ↘ combinada | ↗ 9.4 ms subida |  |
| ↘ 9.5 ms bajada | ||
| La pantalla mostró buenos tiempos de respuesta en nuestros tests pero podría ser demasiado lenta para los jugones competitivos. En comparación, todos los dispositivos de prueba van de ##min### (mínimo) a 240 (máximo) ms. » 42 % de todos los dispositivos son mejores. Eso quiere decir que el tiempo de respuesta es similar al dispositivo testado medio (19.8 ms). | ||
| ↔ Tiempo de respuesta 50% Gris a 80% Gris | ||
| 32.1 ms ... subida ↗ y bajada ↘ combinada | ↗ 15.6 ms subida |  |
| ↘ 16.5 ms bajada | ||
| La pantalla mostró tiempos de respuesta lentos en nuestros tests y podría ser demasiado lenta para los jugones. En comparación, todos los dispositivos de prueba van de ##min### (mínimo) a 636 (máximo) ms. » 44 % de todos los dispositivos son mejores. Eso quiere decir que el tiempo de respuesta es similar al dispositivo testado medio (31 ms). | ||
Parpadeo de Pantalla / PWM (Pulse-Width Modulation)
| Parpadeo de Pantalla / PWM no detectado |  | ||
Comparación: 52 % de todos los dispositivos testados no usaron PWM para atenuar el display. Si se usó, medimos una media de 7754 (mínimo: 5 - máxmo: 343500) Hz. | |||
Gracias al brillo bastante alto de ~390 cd/m², el contenido de la pantalla mate sigue siendo fácilmente legible en exteriores, siempre que evites la luz solar directa.
Rendimiento: El hexa-core de AMD ya es más rápido que el T16 de Intel
Nuestra unidad de pruebas del ThinkPad T16 AMD viene con 16 GB de RAM LPDDR5-6400 soldada, mientras que el modelo Intel ofrece una ranura RAM para un módulo DDR4-3200. El máximo disponible para la versión AMD es de 32 GB, y para la versión Intel es de 48 GB.
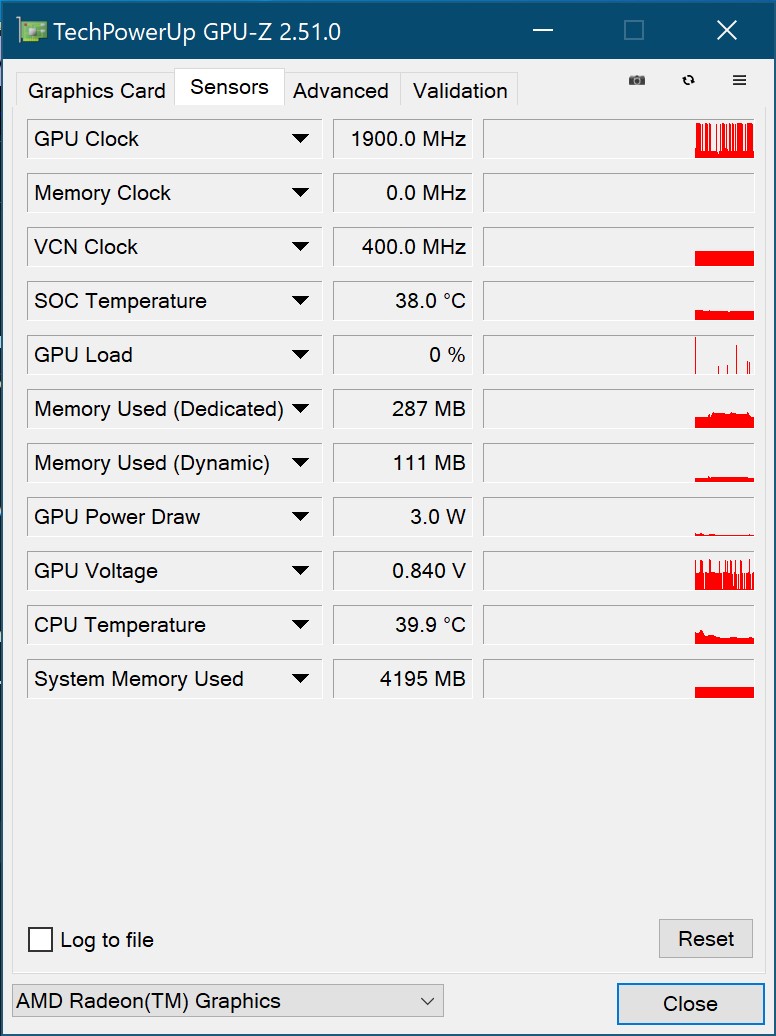
El corazón del dispositivo es el AMD Ryzen 5 PRO 6650Ucon sus seis núcleos, y también tenemos un T16 con un octa-core Ryzen 7 PRO 6850Udisponible para varios benchmarks. Con un SSD PCIe 4.0 de 512 GB y únicamente la solución gráfica integrada (Radeon 660M o Radeon 680M), el uso objetivo está claramente en el área ofimática.

Condiciones de la prueba
Lenovo no ofrece sus propios controles de los modos de rendimiento con sus ThinkPads, pero están integrados en los ajustes de energía de Windows. Esto te permite elegir entre tres perfiles con diferentes límites de potencia para el Turbo de corta duración (PL2) y el Boost de larga duración (PL1):
- Máxima eficiencia energética: 20 W (PL2) / 18 W (PL1)
- Equilibrado: 32 W (PL2) / 27 W (PL1)
- Mejor rendimiento: 37 W (PL2) / 32 W (PL1)
Ejecutamos todas nuestras pruebas de rendimiento con el modo "Mejor rendimiento" activado. La duración de la batería Wi-Fi y de vídeo se determinó usando el modo "Equilibrado".
Procesador
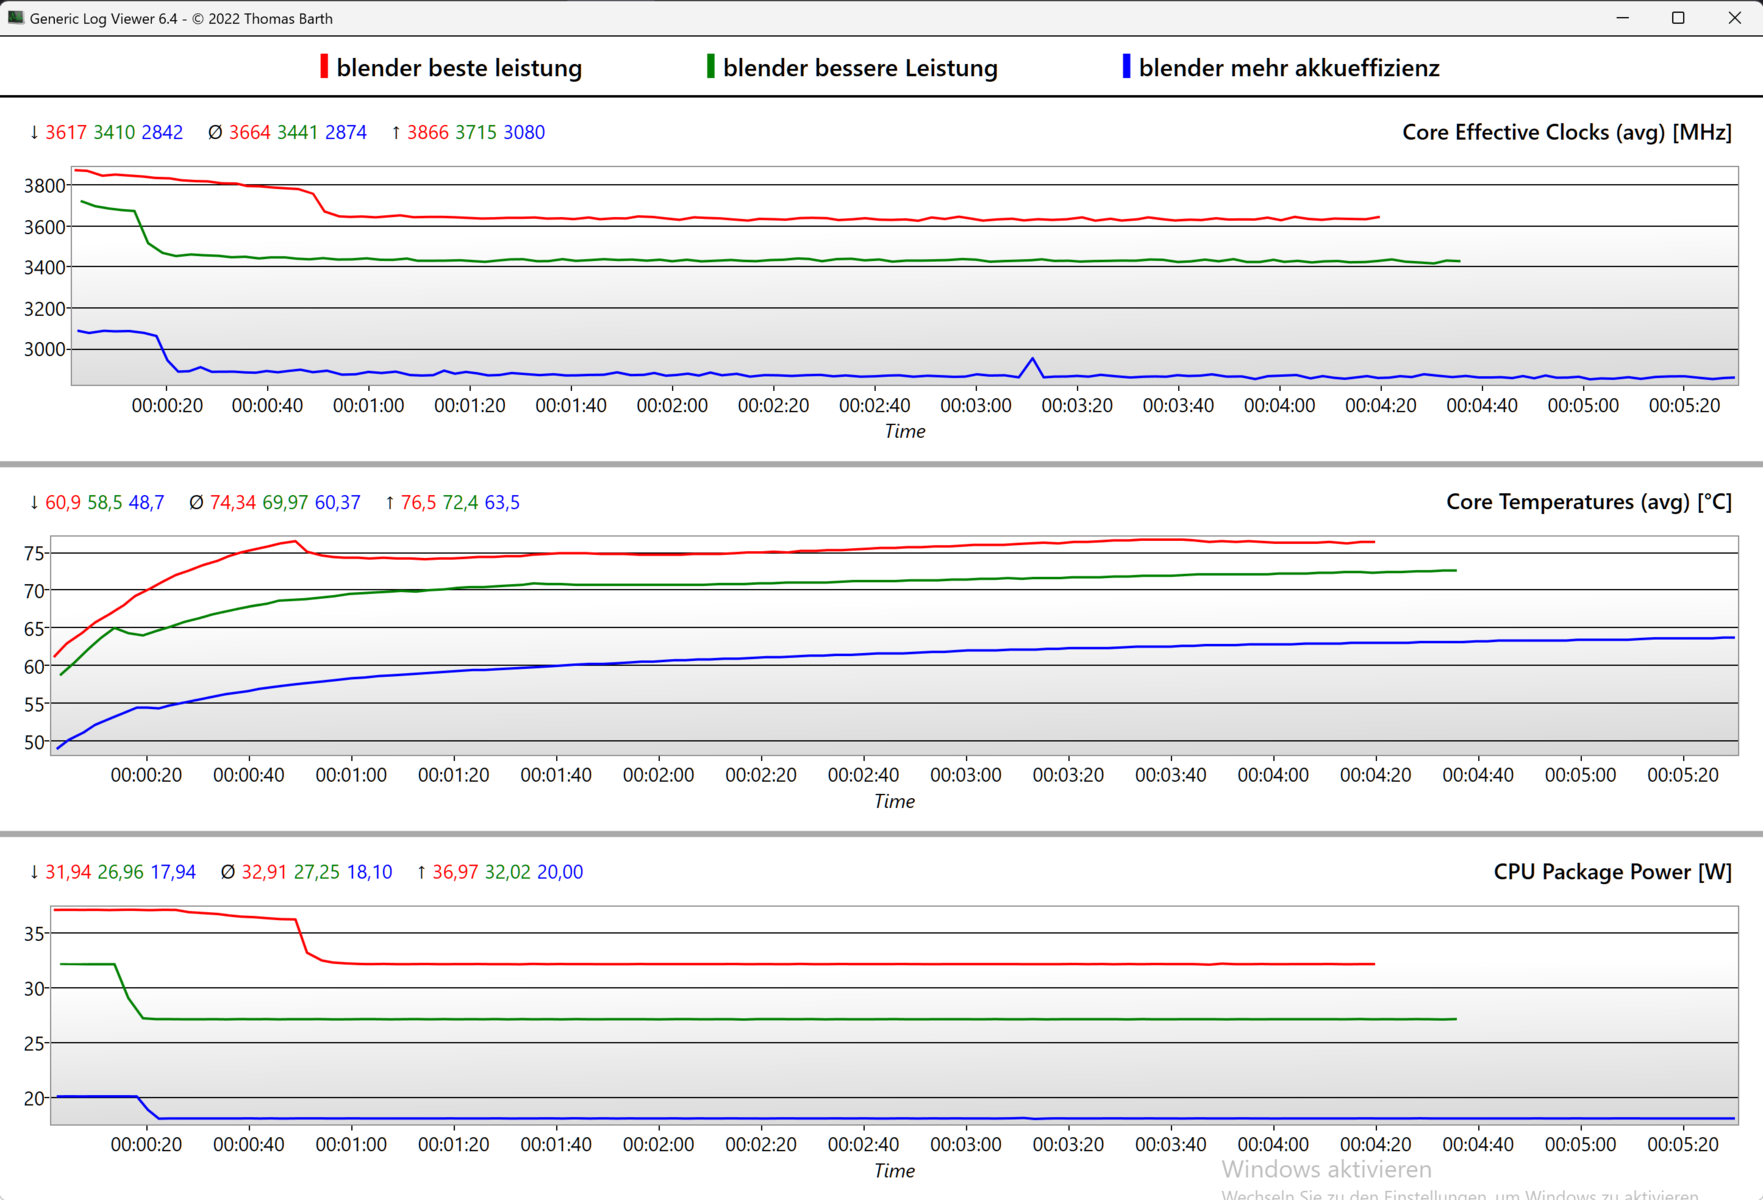
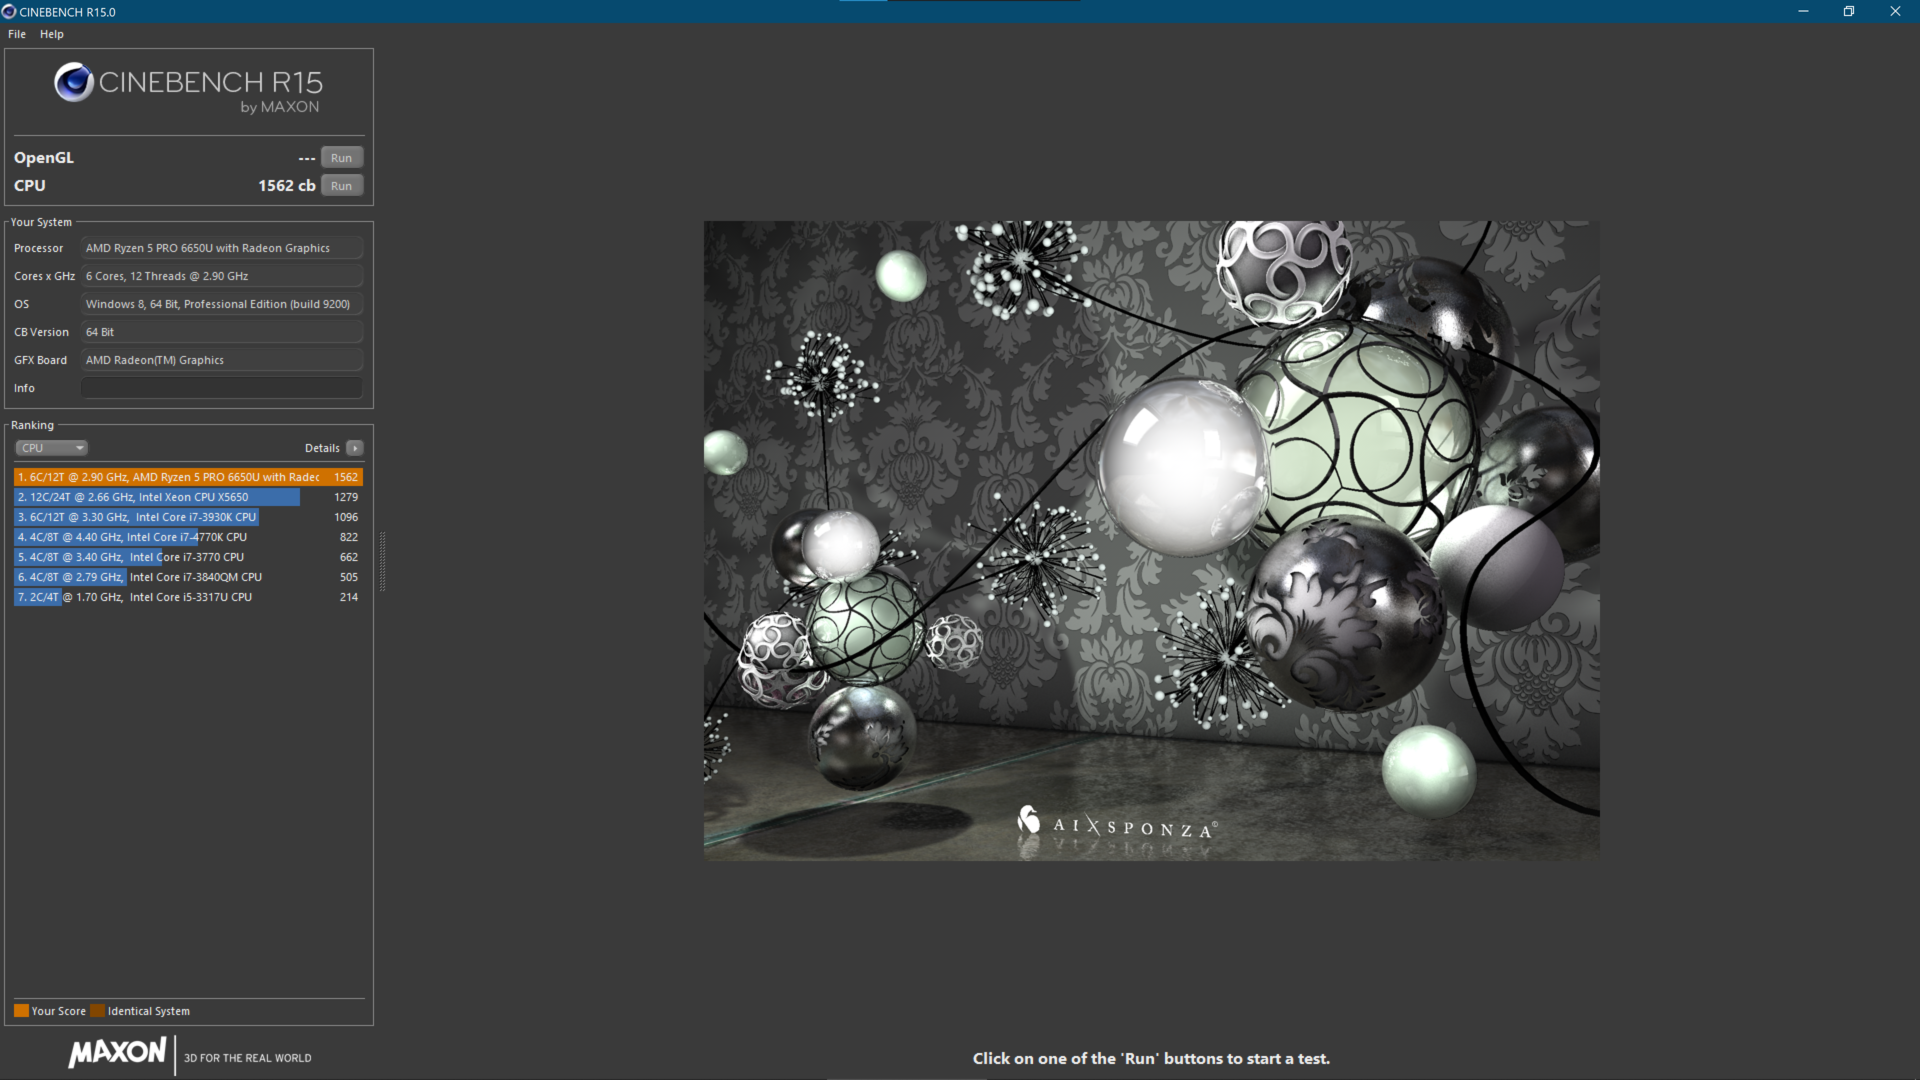
El AMD Ryzen 5 Pro 6650U es un procesador hexa-core. Es capaz de mantener su velocidad máxima de 3.8 GHz en todos los núcleos durante unos 45 segundos en el ThinkPad T16 G1, antes de nivelarse después apenas por debajo de los 3.65 GHz.
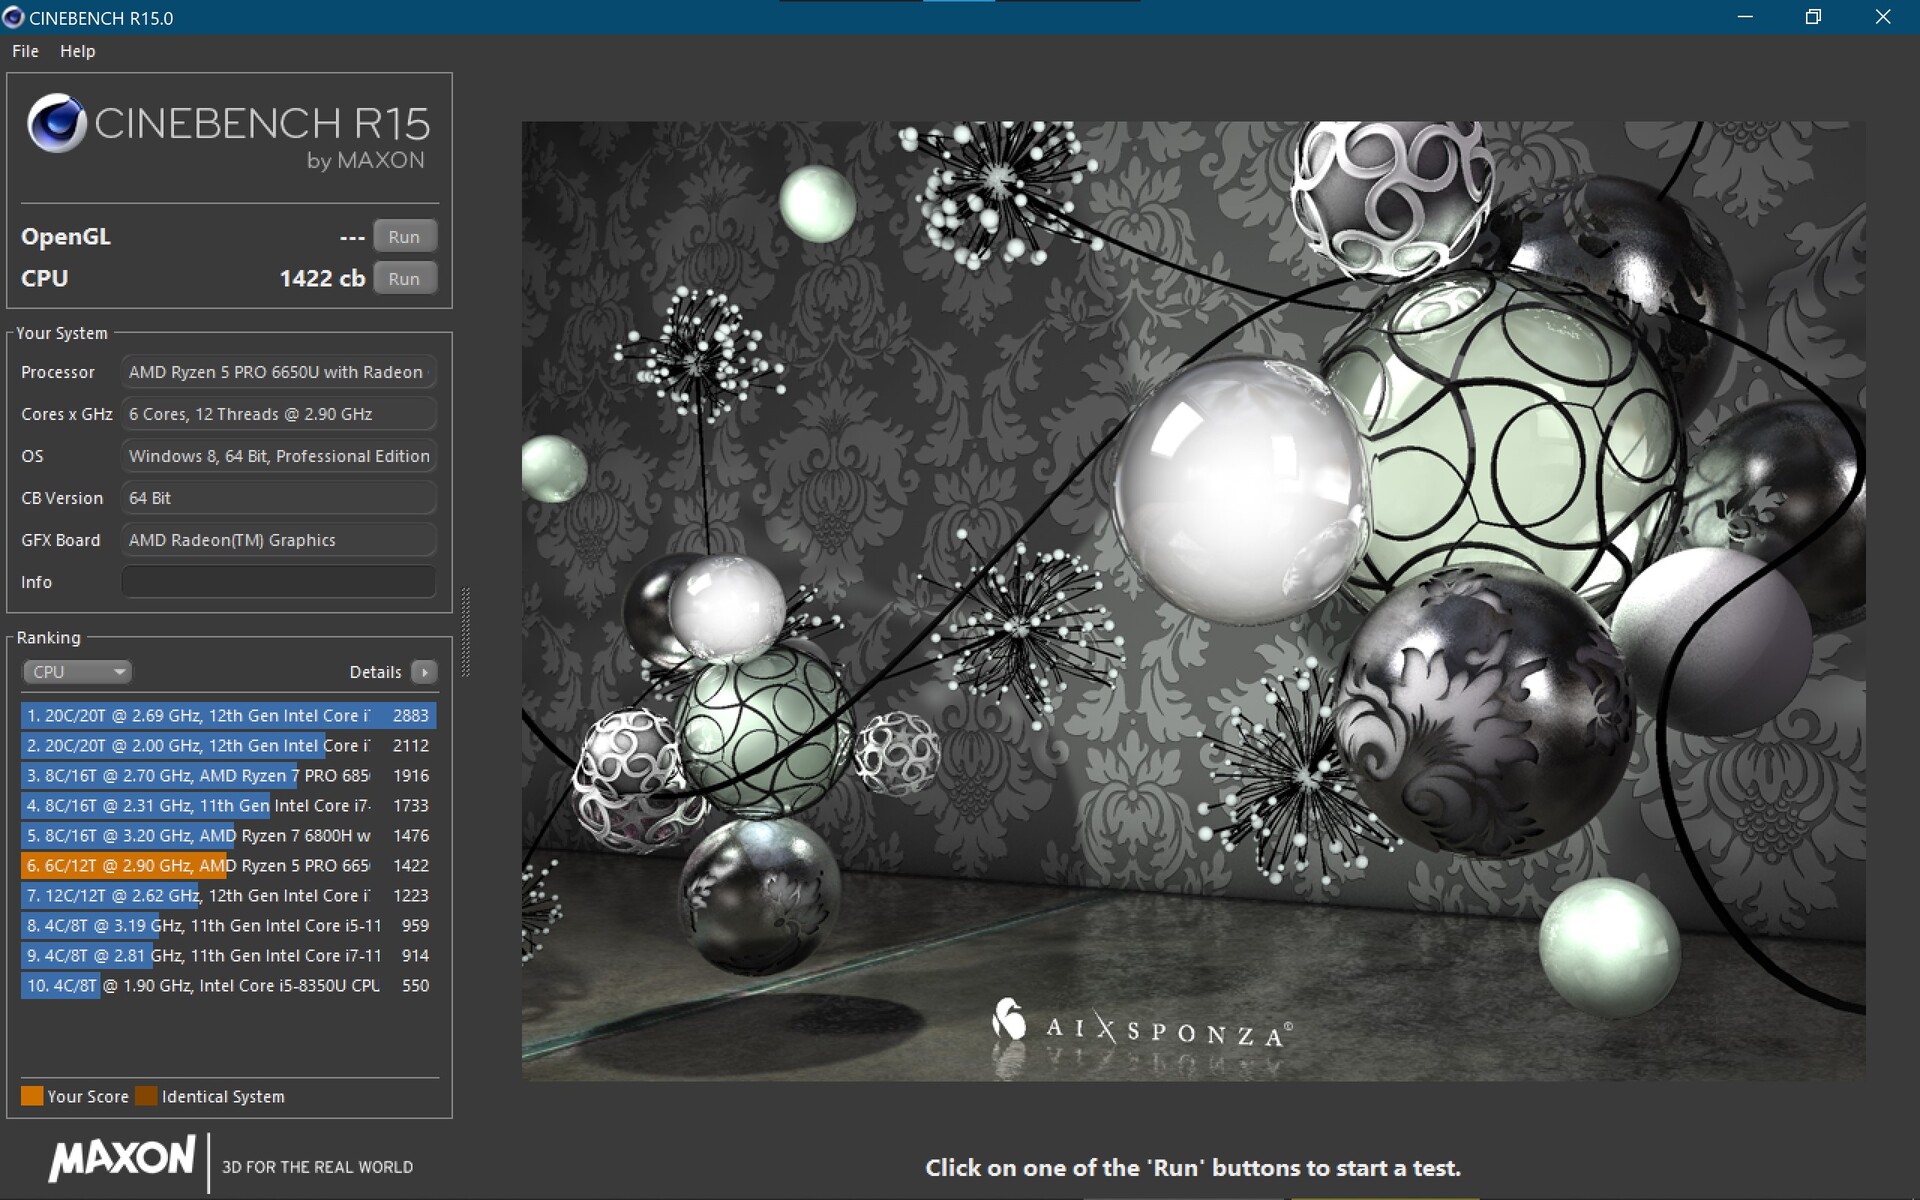
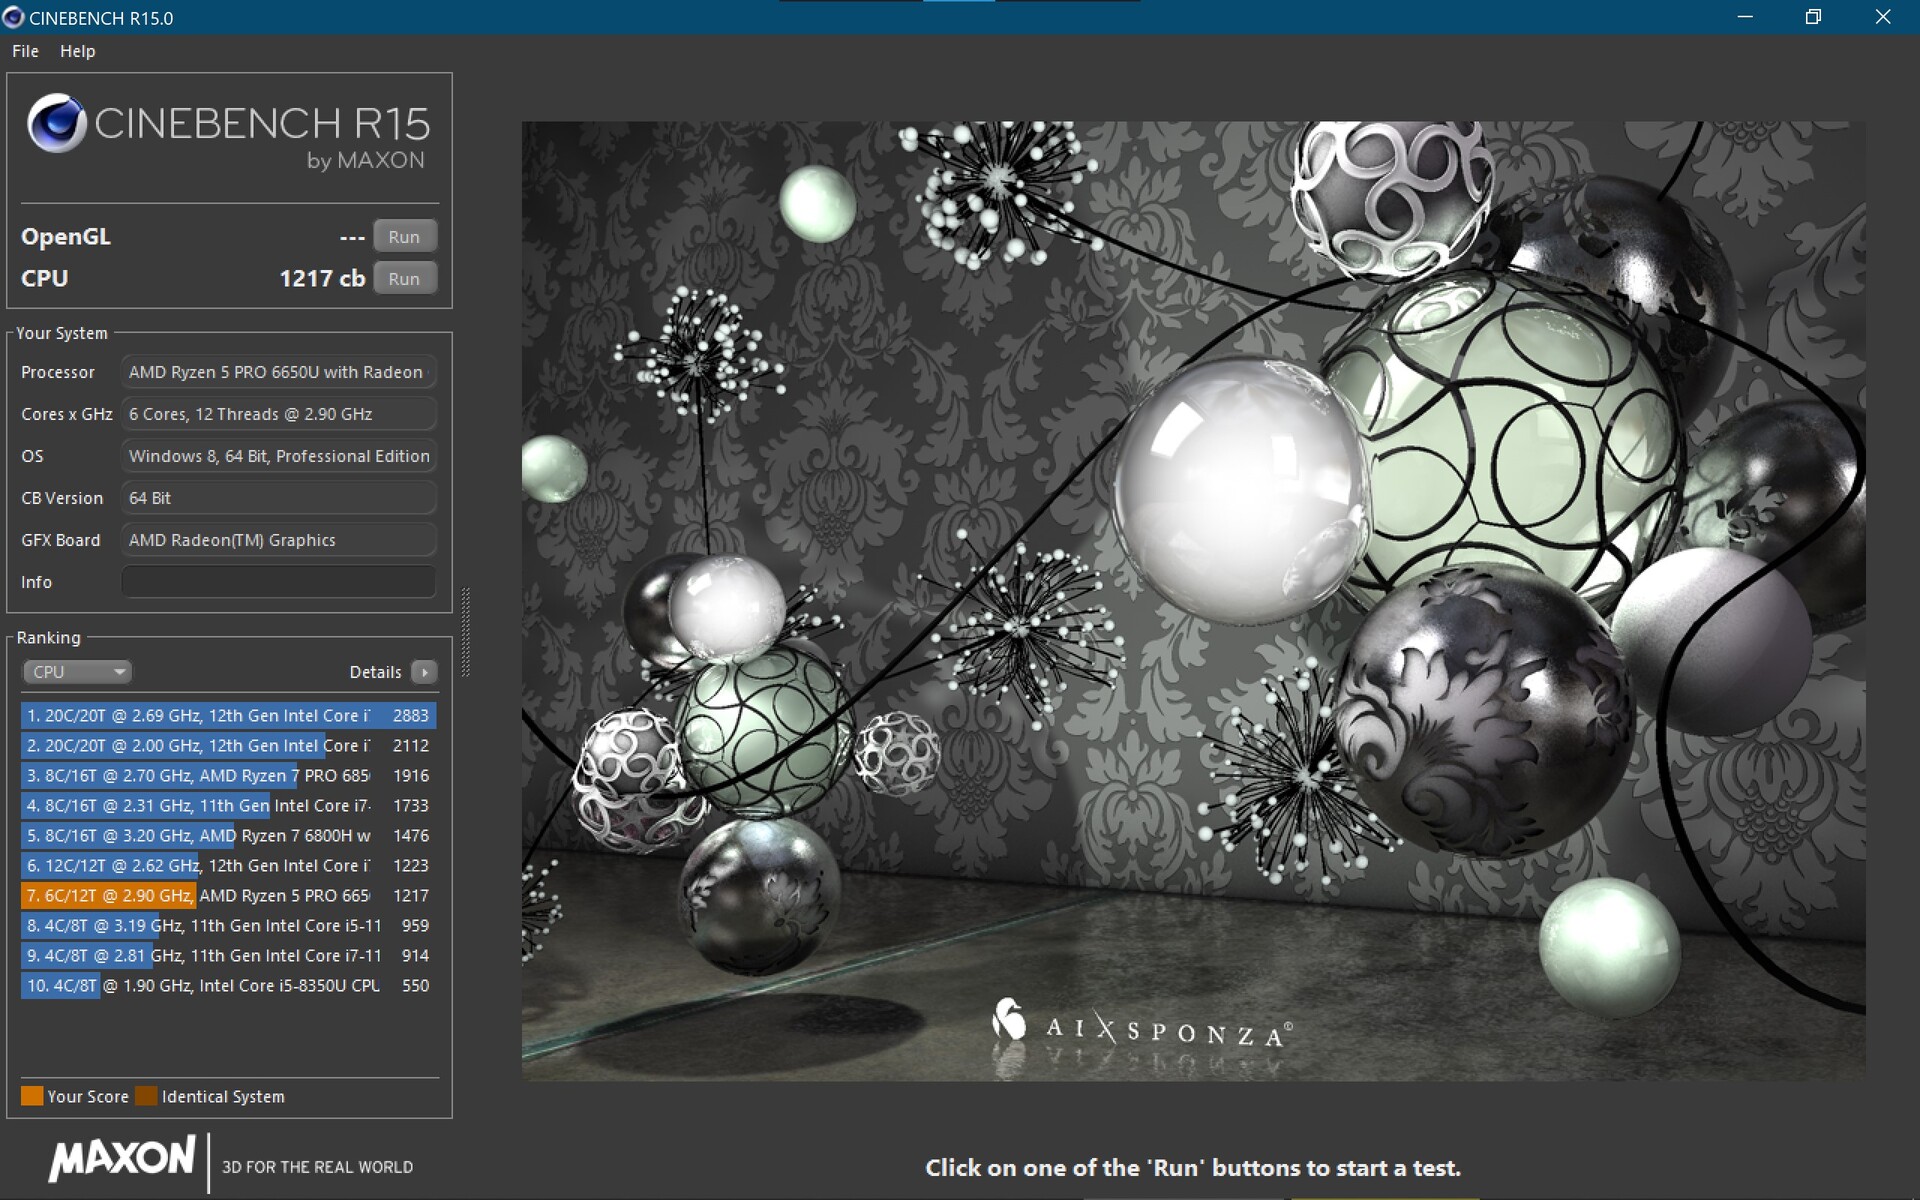
Esto da como resultado unos valores de rendimiento significativamente superiores a los delModelo Intelque Lenovo limita a 20 vatios. En nuestro bucle Cinebench R15, medimos resultados que son un 50% superiores de media que con el correspondiente Intel Core i5-1240Pque al menos está por delante durante la primera ejecución.
Nuestra segunda unidad de pruebas T16 con un Ryzen 7 Pro 6850U ofrece un 20% más de rendimiento en esta prueba. Por otro lado, el EliteBook 865 G9con el mismo chip octa-core está al mismo nivel que el T16 peor equipado con su R5 6650U. El Intel Core i7-12700H delThinkPad X1 Extreme G5fue casi el doble de rápido en las pruebas multinúcleo que el Ryzen 5 Pro 6650Uy en la prueba mononúcleo rindió un 23% más.
En funcionamiento en batería, el rendimiento no disminuye. Sin embargo, en el T16 con el procesador octa-core más potente, observamos una caída de rendimiento del 20%.

Cinebench R15 Multi Constant Load Test
Cinebench R23: Multi Core | Single Core
Cinebench R20: CPU (Multi Core) | CPU (Single Core)
Cinebench R15: CPU Multi 64Bit | CPU Single 64Bit
Blender: v2.79 BMW27 CPU
7-Zip 18.03: 7z b 4 | 7z b 4 -mmt1
Geekbench 5.5: Multi-Core | Single-Core
HWBOT x265 Benchmark v2.2: 4k Preset
LibreOffice : 20 Documents To PDF
R Benchmark 2.5: Overall mean
| CPU Performance rating | |
| Lenovo ThinkPad X1 Extreme G5-21DE003RGE | |
| HP ZBook Power 15 G9 6B8C4EA | |
| Lenovo ThinkPad Z16 G1 21D5S00T00 | |
| Media de la clase Office | |
| Lenovo ThinkPad T16 G1 21CHCTO1WW | |
| HP EliteBook 865 G9 | |
| Lenovo ThinkPad T16 G1 21CH004MGE | |
| Lenovo ThinkPad T16 G1 21BWS00200 | |
| Medio AMD Ryzen 5 PRO 6650U | |
| Cinebench R23 / Multi Core | |
| Lenovo ThinkPad X1 Extreme G5-21DE003RGE | |
| HP ZBook Power 15 G9 6B8C4EA | |
| Lenovo ThinkPad Z16 G1 21D5S00T00 | |
| Media de la clase Office (1673 - 22808, n=76, últimos 2 años) | |
| Lenovo ThinkPad T16 G1 21CHCTO1WW | |
| HP EliteBook 865 G9 | |
| Lenovo ThinkPad T16 G1 21CH004MGE | |
| Medio AMD Ryzen 5 PRO 6650U (7805 - 9534, n=4) | |
| Lenovo ThinkPad T16 G1 21BWS00200 | |
| Cinebench R23 / Single Core | |
| Lenovo ThinkPad X1 Extreme G5-21DE003RGE | |
| HP ZBook Power 15 G9 6B8C4EA | |
| Media de la clase Office (708 - 2130, n=76, últimos 2 años) | |
| Lenovo ThinkPad T16 G1 21BWS00200 | |
| Lenovo ThinkPad T16 G1 21CHCTO1WW | |
| Lenovo ThinkPad Z16 G1 21D5S00T00 | |
| Lenovo ThinkPad T16 G1 21CH004MGE | |
| Medio AMD Ryzen 5 PRO 6650U (1439 - 1476, n=4) | |
| HP EliteBook 865 G9 | |
| Cinebench R20 / CPU (Multi Core) | |
| Lenovo ThinkPad X1 Extreme G5-21DE003RGE | |
| HP ZBook Power 15 G9 6B8C4EA | |
| Lenovo ThinkPad Z16 G1 21D5S00T00 | |
| Media de la clase Office (648 - 8840, n=75, últimos 2 años) | |
| Lenovo ThinkPad T16 G1 21CHCTO1WW | |
| HP EliteBook 865 G9 | |
| Lenovo ThinkPad T16 G1 21CH004MGE | |
| Medio AMD Ryzen 5 PRO 6650U (3057 - 3684, n=4) | |
| Lenovo ThinkPad T16 G1 21BWS00200 | |
| Cinebench R20 / CPU (Single Core) | |
| Lenovo ThinkPad X1 Extreme G5-21DE003RGE | |
| HP ZBook Power 15 G9 6B8C4EA | |
| Media de la clase Office (345 - 816, n=75, últimos 2 años) | |
| Lenovo ThinkPad T16 G1 21CHCTO1WW | |
| HP EliteBook 865 G9 | |
| Lenovo ThinkPad Z16 G1 21D5S00T00 | |
| Lenovo ThinkPad T16 G1 21BWS00200 | |
| Lenovo ThinkPad T16 G1 21CH004MGE | |
| Medio AMD Ryzen 5 PRO 6650U (548 - 578, n=4) | |
| Cinebench R15 / CPU Multi 64Bit | |
| Lenovo ThinkPad X1 Extreme G5-21DE003RGE | |
| Lenovo ThinkPad Z16 G1 21D5S00T00 | |
| HP ZBook Power 15 G9 6B8C4EA | |
| Lenovo ThinkPad T16 G1 21CHCTO1WW | |
| Media de la clase Office (250 - 3380, n=77, últimos 2 años) | |
| Lenovo ThinkPad T16 G1 21BWS00200 | |
| Lenovo ThinkPad T16 G1 21BWS00200 | |
| HP EliteBook 865 G9 | |
| Lenovo ThinkPad T16 G1 21CH004MGE | |
| Medio AMD Ryzen 5 PRO 6650U (1299 - 1555, n=4) | |
| Cinebench R15 / CPU Single 64Bit | |
| Lenovo ThinkPad X1 Extreme G5-21DE003RGE | |
| HP ZBook Power 15 G9 6B8C4EA | |
| Media de la clase Office (99.5 - 316, n=77, últimos 2 años) | |
| Lenovo ThinkPad Z16 G1 21D5S00T00 | |
| Lenovo ThinkPad T16 G1 21CHCTO1WW | |
| Lenovo ThinkPad T16 G1 21CH004MGE | |
| HP EliteBook 865 G9 | |
| Medio AMD Ryzen 5 PRO 6650U (230 - 234, n=4) | |
| Lenovo ThinkPad T16 G1 21BWS00200 | |
| Blender / v2.79 BMW27 CPU | |
| Lenovo ThinkPad T16 G1 21BWS00200 | |
| Medio AMD Ryzen 5 PRO 6650U (328 - 548, n=5) | |
| Media de la clase Office (158 - 1940, n=76, últimos 2 años) | |
| Lenovo ThinkPad T16 G1 21CH004MGE | |
| HP EliteBook 865 G9 | |
| Lenovo ThinkPad T16 G1 21CHCTO1WW | |
| Lenovo ThinkPad Z16 G1 21D5S00T00 | |
| HP ZBook Power 15 G9 6B8C4EA | |
| Lenovo ThinkPad X1 Extreme G5-21DE003RGE | |
| 7-Zip 18.03 / 7z b 4 | |
| Lenovo ThinkPad X1 Extreme G5-21DE003RGE | |
| HP ZBook Power 15 G9 6B8C4EA | |
| Lenovo ThinkPad Z16 G1 21D5S00T00 | |
| Lenovo ThinkPad T16 G1 21CHCTO1WW | |
| HP EliteBook 865 G9 | |
| Media de la clase Office (7098 - 76886, n=77, últimos 2 años) | |
| Lenovo ThinkPad T16 G1 21CH004MGE | |
| Medio AMD Ryzen 5 PRO 6650U (32613 - 41530, n=4) | |
| Lenovo ThinkPad T16 G1 21BWS00200 | |
| 7-Zip 18.03 / 7z b 4 -mmt1 | |
| Lenovo ThinkPad X1 Extreme G5-21DE003RGE | |
| HP ZBook Power 15 G9 6B8C4EA | |
| HP EliteBook 865 G9 | |
| Media de la clase Office (3387 - 6469, n=77, últimos 2 años) | |
| Lenovo ThinkPad Z16 G1 21D5S00T00 | |
| Lenovo ThinkPad T16 G1 21CHCTO1WW | |
| Lenovo ThinkPad T16 G1 21CH004MGE | |
| Medio AMD Ryzen 5 PRO 6650U (5175 - 5427, n=4) | |
| Lenovo ThinkPad T16 G1 21BWS00200 | |
| Geekbench 5.5 / Multi-Core | |
| Lenovo ThinkPad X1 Extreme G5-21DE003RGE | |
| HP ZBook Power 15 G9 6B8C4EA | |
| Media de la clase Office (1483 - 16999, n=73, últimos 2 años) | |
| Lenovo ThinkPad Z16 G1 21D5S00T00 | |
| Lenovo ThinkPad T16 G1 21CHCTO1WW | |
| Lenovo ThinkPad T16 G1 21CH004MGE | |
| Lenovo ThinkPad T16 G1 21BWS00200 | |
| HP EliteBook 865 G9 | |
| Medio AMD Ryzen 5 PRO 6650U (6171 - 7227, n=4) | |
| Geekbench 5.5 / Single-Core | |
| Lenovo ThinkPad X1 Extreme G5-21DE003RGE | |
| Media de la clase Office (811 - 2175, n=73, últimos 2 años) | |
| HP ZBook Power 15 G9 6B8C4EA | |
| Lenovo ThinkPad T16 G1 21BWS00200 | |
| Lenovo ThinkPad T16 G1 21CH004MGE | |
| Lenovo ThinkPad Z16 G1 21D5S00T00 | |
| Lenovo ThinkPad T16 G1 21CHCTO1WW | |
| Medio AMD Ryzen 5 PRO 6650U (1433 - 1487, n=4) | |
| HP EliteBook 865 G9 | |
| HWBOT x265 Benchmark v2.2 / 4k Preset | |
| Lenovo ThinkPad X1 Extreme G5-21DE003RGE | |
| HP ZBook Power 15 G9 6B8C4EA | |
| Lenovo ThinkPad Z16 G1 21D5S00T00 | |
| Lenovo ThinkPad T16 G1 21CHCTO1WW | |
| Media de la clase Office (2.21 - 26, n=76, últimos 2 años) | |
| Lenovo ThinkPad T16 G1 21CH004MGE | |
| HP EliteBook 865 G9 | |
| Medio AMD Ryzen 5 PRO 6650U (8.71 - 11.8, n=4) | |
| Lenovo ThinkPad T16 G1 21BWS00200 | |
| LibreOffice / 20 Documents To PDF | |
| Medio AMD Ryzen 5 PRO 6650U (50.3 - 63.2, n=4) | |
| Media de la clase Office (39.9 - 102.3, n=76, últimos 2 años) | |
| HP EliteBook 865 G9 | |
| Lenovo ThinkPad Z16 G1 21D5S00T00 | |
| Lenovo ThinkPad T16 G1 21CH004MGE | |
| Lenovo ThinkPad T16 G1 21BWS00200 | |
| Lenovo ThinkPad T16 G1 21CHCTO1WW | |
| HP ZBook Power 15 G9 6B8C4EA | |
| Lenovo ThinkPad X1 Extreme G5-21DE003RGE | |
| R Benchmark 2.5 / Overall mean | |
| Medio AMD Ryzen 5 PRO 6650U (0.521 - 0.59, n=4) | |
| Lenovo ThinkPad T16 G1 21CHCTO1WW | |
| Lenovo ThinkPad T16 G1 21CH004MGE | |
| Lenovo ThinkPad T16 G1 21BWS00200 | |
| Media de la clase Office (0.393 - 0.888, n=76, últimos 2 años) | |
| HP EliteBook 865 G9 | |
| Lenovo ThinkPad Z16 G1 21D5S00T00 | |
| HP ZBook Power 15 G9 6B8C4EA | |
| Lenovo ThinkPad X1 Extreme G5-21DE003RGE | |
* ... más pequeño es mejor
AIDA64: FP32 Ray-Trace | FPU Julia | CPU SHA3 | CPU Queen | FPU SinJulia | FPU Mandel | CPU AES | CPU ZLib | FP64 Ray-Trace | CPU PhotoWorxx
| Performance rating | |
| Lenovo ThinkPad X1 Extreme G5-21DE003RGE | |
| Lenovo ThinkPad Z16 G1 21D5S00T00 | |
| HP ZBook Power 15 G9 6B8C4EA | |
| Lenovo ThinkPad T16 G1 21CHCTO1WW | |
| Media de la clase Office | |
| Lenovo ThinkPad T16 G1 21CH004MGE | |
| HP EliteBook 865 G9 | |
| Lenovo ThinkPad P15v G2 21A9000XGE | |
| Medio AMD Ryzen 5 PRO 6650U | |
| Lenovo ThinkPad T16 G1 21BWS00200 | |
| AIDA64 / FP32 Ray-Trace | |
| Lenovo ThinkPad X1 Extreme G5-21DE003RGE | |
| Lenovo ThinkPad Z16 G1 21D5S00T00 | |
| Media de la clase Office (2083 - 31245, n=83, últimos 2 años) | |
| HP ZBook Power 15 G9 6B8C4EA | |
| Lenovo ThinkPad T16 G1 21CHCTO1WW | |
| Lenovo ThinkPad P15v G2 21A9000XGE | |
| HP EliteBook 865 G9 | |
| Lenovo ThinkPad T16 G1 21CH004MGE | |
| Medio AMD Ryzen 5 PRO 6650U (8854 - 10630, n=4) | |
| Lenovo ThinkPad T16 G1 21BWS00200 | |
| AIDA64 / FPU Julia | |
| Lenovo ThinkPad Z16 G1 21D5S00T00 | |
| Lenovo ThinkPad X1 Extreme G5-21DE003RGE | |
| Lenovo ThinkPad T16 G1 21CHCTO1WW | |
| HP EliteBook 865 G9 | |
| Lenovo ThinkPad T16 G1 21CH004MGE | |
| HP ZBook Power 15 G9 6B8C4EA | |
| Media de la clase Office (8191 - 125394, n=83, últimos 2 años) | |
| Medio AMD Ryzen 5 PRO 6650U (56214 - 68106, n=4) | |
| Lenovo ThinkPad P15v G2 21A9000XGE | |
| Lenovo ThinkPad T16 G1 21BWS00200 | |
| AIDA64 / CPU SHA3 | |
| Lenovo ThinkPad X1 Extreme G5-21DE003RGE | |
| Lenovo ThinkPad P15v G2 21A9000XGE | |
| HP ZBook Power 15 G9 6B8C4EA | |
| Lenovo ThinkPad Z16 G1 21D5S00T00 | |
| Media de la clase Office (433 - 5755, n=83, últimos 2 años) | |
| Lenovo ThinkPad T16 G1 21CHCTO1WW | |
| HP EliteBook 865 G9 | |
| Lenovo ThinkPad T16 G1 21CH004MGE | |
| Medio AMD Ryzen 5 PRO 6650U (1881 - 2326, n=4) | |
| Lenovo ThinkPad T16 G1 21BWS00200 | |
| AIDA64 / CPU Queen | |
| Lenovo ThinkPad Z16 G1 21D5S00T00 | |
| Lenovo ThinkPad X1 Extreme G5-21DE003RGE | |
| HP ZBook Power 15 G9 6B8C4EA | |
| Lenovo ThinkPad P15v G2 21A9000XGE | |
| Lenovo ThinkPad T16 G1 21CHCTO1WW | |
| HP EliteBook 865 G9 | |
| Lenovo ThinkPad T16 G1 21CH004MGE | |
| Lenovo ThinkPad T16 G1 21BWS00200 | |
| Medio AMD Ryzen 5 PRO 6650U (69023 - 78797, n=4) | |
| Media de la clase Office (22784 - 115197, n=67, últimos 2 años) | |
| AIDA64 / FPU SinJulia | |
| Lenovo ThinkPad Z16 G1 21D5S00T00 | |
| Lenovo ThinkPad T16 G1 21CHCTO1WW | |
| HP EliteBook 865 G9 | |
| Lenovo ThinkPad X1 Extreme G5-21DE003RGE | |
| Lenovo ThinkPad T16 G1 21CH004MGE | |
| Medio AMD Ryzen 5 PRO 6650U (8320 - 9488, n=4) | |
| Lenovo ThinkPad P15v G2 21A9000XGE | |
| HP ZBook Power 15 G9 6B8C4EA | |
| Media de la clase Office (1378 - 18321, n=83, últimos 2 años) | |
| Lenovo ThinkPad T16 G1 21BWS00200 | |
| AIDA64 / FPU Mandel | |
| Lenovo ThinkPad Z16 G1 21D5S00T00 | |
| Lenovo ThinkPad T16 G1 21CHCTO1WW | |
| HP EliteBook 865 G9 | |
| Lenovo ThinkPad X1 Extreme G5-21DE003RGE | |
| Lenovo ThinkPad T16 G1 21CH004MGE | |
| Medio AMD Ryzen 5 PRO 6650U (30969 - 37461, n=4) | |
| Media de la clase Office (4601 - 66922, n=83, últimos 2 años) | |
| HP ZBook Power 15 G9 6B8C4EA | |
| Lenovo ThinkPad P15v G2 21A9000XGE | |
| Lenovo ThinkPad T16 G1 21BWS00200 | |
| AIDA64 / CPU AES | |
| Lenovo ThinkPad T16 G1 21CH004MGE | |
| Lenovo ThinkPad X1 Extreme G5-21DE003RGE | |
| Lenovo ThinkPad P15v G2 21A9000XGE | |
| HP ZBook Power 15 G9 6B8C4EA | |
| Lenovo ThinkPad Z16 G1 21D5S00T00 | |
| Medio AMD Ryzen 5 PRO 6650U (37259 - 93914, n=4) | |
| Media de la clase Office (4854 - 155900, n=83, últimos 2 años) | |
| HP EliteBook 865 G9 | |
| Lenovo ThinkPad T16 G1 21CHCTO1WW | |
| Lenovo ThinkPad T16 G1 21BWS00200 | |
| AIDA64 / CPU ZLib | |
| Lenovo ThinkPad X1 Extreme G5-21DE003RGE | |
| HP ZBook Power 15 G9 6B8C4EA | |
| Lenovo ThinkPad Z16 G1 21D5S00T00 | |
| Media de la clase Office (114.6 - 1366, n=83, últimos 2 años) | |
| Lenovo ThinkPad T16 G1 21CHCTO1WW | |
| Lenovo ThinkPad P15v G2 21A9000XGE | |
| HP EliteBook 865 G9 | |
| Lenovo ThinkPad T16 G1 21BWS00200 | |
| Lenovo ThinkPad T16 G1 21CH004MGE | |
| Medio AMD Ryzen 5 PRO 6650U (504 - 602, n=4) | |
| AIDA64 / FP64 Ray-Trace | |
| Lenovo ThinkPad X1 Extreme G5-21DE003RGE | |
| Lenovo ThinkPad Z16 G1 21D5S00T00 | |
| Media de la clase Office (1109 - 17834, n=83, últimos 2 años) | |
| HP ZBook Power 15 G9 6B8C4EA | |
| Lenovo ThinkPad P15v G2 21A9000XGE | |
| Lenovo ThinkPad T16 G1 21CHCTO1WW | |
| HP EliteBook 865 G9 | |
| Lenovo ThinkPad T16 G1 21CH004MGE | |
| Medio AMD Ryzen 5 PRO 6650U (4620 - 5468, n=4) | |
| Lenovo ThinkPad T16 G1 21BWS00200 | |
| AIDA64 / CPU PhotoWorxx | |
| HP ZBook Power 15 G9 6B8C4EA | |
| Media de la clase Office (11090 - 65229, n=83, últimos 2 años) | |
| Lenovo ThinkPad Z16 G1 21D5S00T00 | |
| Lenovo ThinkPad T16 G1 21CH004MGE | |
| Lenovo ThinkPad T16 G1 21CHCTO1WW | |
| Medio AMD Ryzen 5 PRO 6650U (19643 - 26137, n=4) | |
| Lenovo ThinkPad X1 Extreme G5-21DE003RGE | |
| HP EliteBook 865 G9 | |
| Lenovo ThinkPad T16 G1 21BWS00200 | |
| Lenovo ThinkPad P15v G2 21A9000XGE | |
Rendimiento del sistema
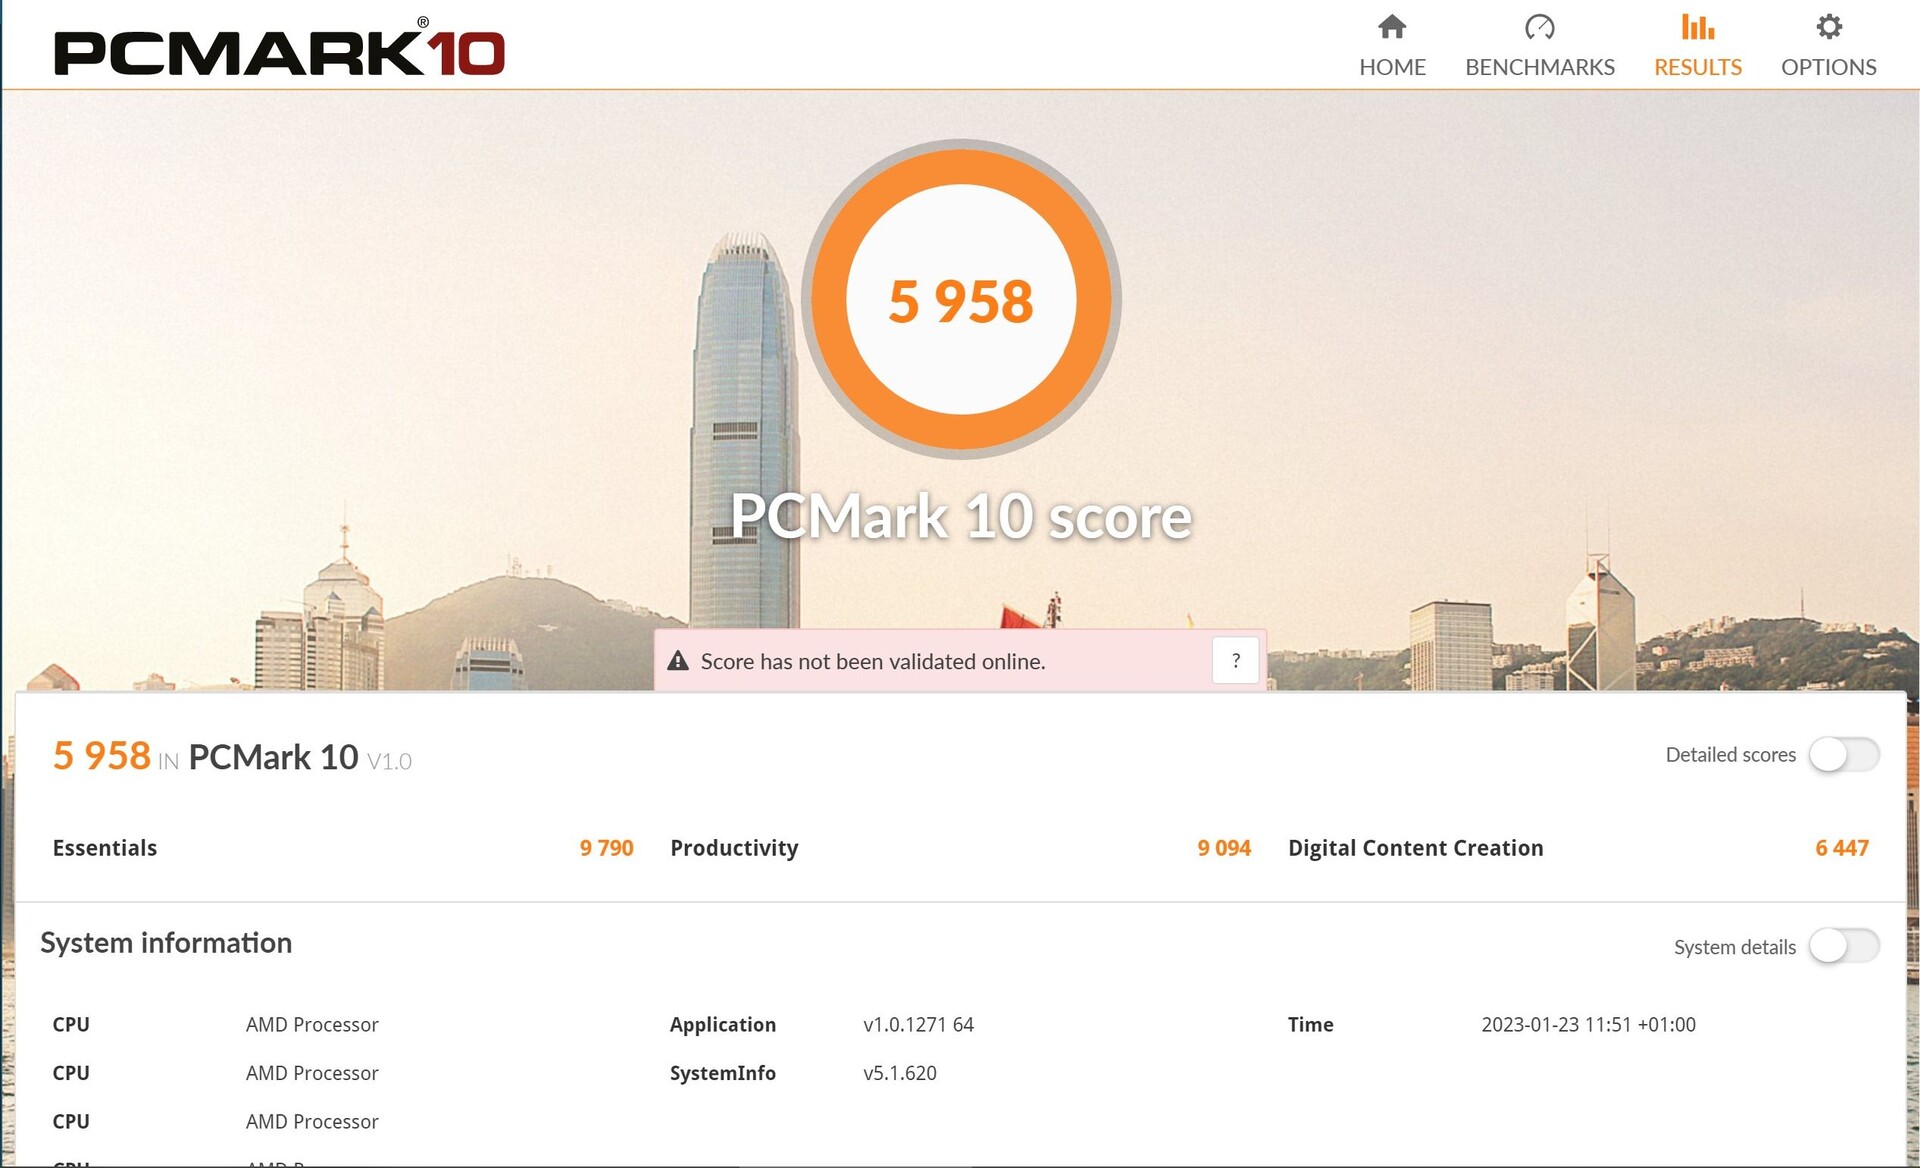
La navegación web fluida con varias pestañas y la reproducción simultánea de vídeos 4K de YouTube no suponen ningún problema para el ThinkPad T16 AMD. Sin embargo, gracias a su Turbo más potente, elT16 Intelsigue manteniendo una ligera ventaja en pruebas de navegador como Mozilla Kraken u Octane v2. Por otro lado, la versión Intel se ve fuertemente ralentizada por su configuración RAM monocanal en las pruebas PCMark y Crossmark.
CrossMark: Overall | Productivity | Creativity | Responsiveness
Mozilla Kraken 1.1: Total
Speedometer 2.0: Result 2.0
Octane V2: Total Score
Jetstream 2: 2.0 Total
WebXPRT 3: Overall
WebXPRT 4: Overall
| PCMark 10 / Score | |
| Lenovo ThinkPad X1 Extreme G5-21DE003RGE | |
| Media de la clase Office (2601 - 9298, n=68, últimos 2 años) | |
| Lenovo ThinkPad Z16 G1 21D5S00T00 | |
| HP ZBook Power 15 G9 6B8C4EA | |
| Lenovo ThinkPad T16 G1 21CHCTO1WW | |
| Lenovo ThinkPad T16 G1 21CH004MGE | |
| Lenovo ThinkPad P15v G2 21A9000XGE | |
| HP EliteBook 865 G9 | |
| Medio AMD Ryzen 5 PRO 6650U, AMD Radeon 660M (5513 - 5958, n=4) | |
| Lenovo ThinkPad T16 G1 21BWS00200 | |
| PCMark 10 / Essentials | |
| Lenovo ThinkPad X1 Extreme G5-21DE003RGE | |
| Lenovo ThinkPad T16 G1 21CHCTO1WW | |
| Lenovo ThinkPad Z16 G1 21D5S00T00 | |
| Media de la clase Office (3245 - 11594, n=68, últimos 2 años) | |
| HP ZBook Power 15 G9 6B8C4EA | |
| Lenovo ThinkPad T16 G1 21CH004MGE | |
| Lenovo ThinkPad P15v G2 21A9000XGE | |
| Medio AMD Ryzen 5 PRO 6650U, AMD Radeon 660M (9578 - 9982, n=4) | |
| Lenovo ThinkPad T16 G1 21BWS00200 | |
| HP EliteBook 865 G9 | |
| PCMark 10 / Productivity | |
| Media de la clase Office (5336 - 17243, n=68, últimos 2 años) | |
| Lenovo ThinkPad X1 Extreme G5-21DE003RGE | |
| Lenovo ThinkPad T16 G1 21CH004MGE | |
| Lenovo ThinkPad T16 G1 21CHCTO1WW | |
| HP EliteBook 865 G9 | |
| Medio AMD Ryzen 5 PRO 6650U, AMD Radeon 660M (7848 - 9094, n=4) | |
| Lenovo ThinkPad Z16 G1 21D5S00T00 | |
| Lenovo ThinkPad P15v G2 21A9000XGE | |
| HP ZBook Power 15 G9 6B8C4EA | |
| Lenovo ThinkPad T16 G1 21BWS00200 | |
| PCMark 10 / Digital Content Creation | |
| Lenovo ThinkPad X1 Extreme G5-21DE003RGE | |
| Lenovo ThinkPad Z16 G1 21D5S00T00 | |
| HP ZBook Power 15 G9 6B8C4EA | |
| Media de la clase Office (2049 - 13541, n=68, últimos 2 años) | |
| HP EliteBook 865 G9 | |
| Lenovo ThinkPad P15v G2 21A9000XGE | |
| Lenovo ThinkPad T16 G1 21CHCTO1WW | |
| Lenovo ThinkPad T16 G1 21CH004MGE | |
| Medio AMD Ryzen 5 PRO 6650U, AMD Radeon 660M (5837 - 6447, n=4) | |
| Lenovo ThinkPad T16 G1 21BWS00200 | |
| CrossMark / Overall | |
| Lenovo ThinkPad X1 Extreme G5-21DE003RGE | |
| HP ZBook Power 15 G9 6B8C4EA | |
| Media de la clase Office (381 - 2010, n=75, últimos 2 años) | |
| Lenovo ThinkPad Z16 G1 21D5S00T00 | |
| Lenovo ThinkPad T16 G1 21CH004MGE | |
| Medio AMD Ryzen 5 PRO 6650U, AMD Radeon 660M (1338 - 1432, n=3) | |
| Lenovo ThinkPad T16 G1 21BWS00200 | |
| Lenovo ThinkPad P15v G2 21A9000XGE | |
| Lenovo ThinkPad T16 G1 21CHCTO1WW | |
| HP EliteBook 865 G9 | |
| CrossMark / Productivity | |
| Lenovo ThinkPad X1 Extreme G5-21DE003RGE | |
| HP ZBook Power 15 G9 6B8C4EA | |
| Lenovo ThinkPad Z16 G1 21D5S00T00 | |
| Media de la clase Office (464 - 1880, n=75, últimos 2 años) | |
| Lenovo ThinkPad T16 G1 21CH004MGE | |
| Medio AMD Ryzen 5 PRO 6650U, AMD Radeon 660M (1366 - 1440, n=3) | |
| Lenovo ThinkPad T16 G1 21BWS00200 | |
| Lenovo ThinkPad P15v G2 21A9000XGE | |
| HP EliteBook 865 G9 | |
| Lenovo ThinkPad T16 G1 21CHCTO1WW | |
| CrossMark / Creativity | |
| HP ZBook Power 15 G9 6B8C4EA | |
| Lenovo ThinkPad X1 Extreme G5-21DE003RGE | |
| Media de la clase Office (319 - 2361, n=75, últimos 2 años) | |
| Lenovo ThinkPad Z16 G1 21D5S00T00 | |
| Lenovo ThinkPad T16 G1 21CH004MGE | |
| Medio AMD Ryzen 5 PRO 6650U, AMD Radeon 660M (1397 - 1517, n=3) | |
| Lenovo ThinkPad T16 G1 21CHCTO1WW | |
| Lenovo ThinkPad P15v G2 21A9000XGE | |
| Lenovo ThinkPad T16 G1 21BWS00200 | |
| HP EliteBook 865 G9 | |
| CrossMark / Responsiveness | |
| Lenovo ThinkPad X1 Extreme G5-21DE003RGE | |
| HP ZBook Power 15 G9 6B8C4EA | |
| Lenovo ThinkPad T16 G1 21BWS00200 | |
| Media de la clase Office (360 - 1820, n=75, últimos 2 años) | |
| Lenovo ThinkPad Z16 G1 21D5S00T00 | |
| Lenovo ThinkPad T16 G1 21CH004MGE | |
| Medio AMD Ryzen 5 PRO 6650U, AMD Radeon 660M (1106 - 1229, n=3) | |
| Lenovo ThinkPad P15v G2 21A9000XGE | |
| HP EliteBook 865 G9 | |
| Lenovo ThinkPad T16 G1 21CHCTO1WW | |
| Mozilla Kraken 1.1 / Total | |
| Lenovo ThinkPad T16 G1 21CHCTO1WW | |
| Medio AMD Ryzen 5 PRO 6650U, AMD Radeon 660M (615 - 707, n=4) | |
| Lenovo ThinkPad P15v G2 21A9000XGE | |
| Lenovo ThinkPad T16 G1 21CH004MGE | |
| HP EliteBook 865 G9 | |
| Lenovo ThinkPad T16 G1 21BWS00200 | |
| Lenovo ThinkPad Z16 G1 21D5S00T00 | |
| Media de la clase Office (391 - 1297, n=78, últimos 2 años) | |
| HP ZBook Power 15 G9 6B8C4EA | |
| Lenovo ThinkPad X1 Extreme G5-21DE003RGE | |
| Speedometer 2.0 / Result 2.0 | |
| Media de la clase Office (173 - 640, n=18, últimos 2 años) | |
| HP ZBook Power 15 G9 6B8C4EA | |
| Lenovo ThinkPad X1 Extreme G5-21DE003RGE | |
| Lenovo ThinkPad T16 G1 21BWS00200 | |
| HP EliteBook 865 G9 | |
| Lenovo ThinkPad T16 G1 21CH004MGE | |
| Medio AMD Ryzen 5 PRO 6650U, AMD Radeon 660M (n=1) | |
| Octane V2 / Total Score | |
| Media de la clase Office (49011 - 126830, n=20, últimos 2 años) | |
| Lenovo ThinkPad X1 Extreme G5-21DE003RGE | |
| HP ZBook Power 15 G9 6B8C4EA | |
| Lenovo ThinkPad T16 G1 21BWS00200 | |
| Lenovo ThinkPad T16 G1 21CH004MGE | |
| Medio AMD Ryzen 5 PRO 6650U, AMD Radeon 660M (n=1) | |
| HP EliteBook 865 G9 | |
| Jetstream 2 / 2.0 Total | |
| Media de la clase Office (126.6 - 483, n=21, últimos 2 años) | |
| HP ZBook Power 15 G9 6B8C4EA | |
| Lenovo ThinkPad T16 G1 21BWS00200 | |
| Lenovo ThinkPad X1 Extreme G5-21DE003RGE | |
| Medio AMD Ryzen 5 PRO 6650U, AMD Radeon 660M (n=1) | |
| Lenovo ThinkPad T16 G1 21CH004MGE | |
| HP EliteBook 865 G9 | |
| WebXPRT 3 / Overall | |
| HP ZBook Power 15 G9 6B8C4EA | |
| Media de la clase Office (129.9 - 444, n=77, últimos 2 años) | |
| Lenovo ThinkPad X1 Extreme G5-21DE003RGE | |
| HP EliteBook 865 G9 | |
| Lenovo ThinkPad T16 G1 21BWS00200 | |
| Lenovo ThinkPad P15v G2 21A9000XGE | |
| Lenovo ThinkPad Z16 G1 21D5S00T00 | |
| Lenovo ThinkPad T16 G1 21CH004MGE | |
| Medio AMD Ryzen 5 PRO 6650U, AMD Radeon 660M (225 - 242, n=4) | |
| Lenovo ThinkPad T16 G1 21CHCTO1WW | |
| WebXPRT 4 / Overall | |
| HP ZBook Power 15 G9 6B8C4EA | |
| Media de la clase Office (104.2 - 313, n=77, últimos 2 años) | |
| Lenovo ThinkPad X1 Extreme G5-21DE003RGE | |
| Lenovo ThinkPad T16 G1 21BWS00200 | |
| HP EliteBook 865 G9 | |
| Lenovo ThinkPad T16 G1 21CH004MGE | |
| Lenovo ThinkPad Z16 G1 21D5S00T00 | |
| Medio AMD Ryzen 5 PRO 6650U, AMD Radeon 660M (176.4 - 206, n=4) | |
| Lenovo ThinkPad T16 G1 21CHCTO1WW | |
* ... más pequeño es mejor
| PCMark 10 Score | 5958 puntos | |
ayuda | ||
| AIDA64 / Memory Copy | |
| Media de la clase Office (20075 - 110930, n=80, últimos 2 años) | |
| HP ZBook Power 15 G9 6B8C4EA | |
| Lenovo ThinkPad Z16 G1 21D5S00T00 | |
| Lenovo ThinkPad T16 G1 21CHCTO1WW | |
| Lenovo ThinkPad T16 G1 21CH004MGE | |
| Medio AMD Ryzen 5 PRO 6650U (31014 - 48558, n=4) | |
| Lenovo ThinkPad X1 Extreme G5-21DE003RGE | |
| HP EliteBook 865 G9 | |
| Lenovo ThinkPad P15v G2 21A9000XGE | |
| Lenovo ThinkPad T16 G1 21BWS00200 | |
| AIDA64 / Memory Read | |
| HP ZBook Power 15 G9 6B8C4EA | |
| Media de la clase Office (10084 - 128030, n=81, últimos 2 años) | |
| Lenovo ThinkPad Z16 G1 21D5S00T00 | |
| Lenovo ThinkPad T16 G1 21CHCTO1WW | |
| Lenovo ThinkPad T16 G1 21CH004MGE | |
| Medio AMD Ryzen 5 PRO 6650U (34690 - 39833, n=4) | |
| Lenovo ThinkPad X1 Extreme G5-21DE003RGE | |
| HP EliteBook 865 G9 | |
| Lenovo ThinkPad P15v G2 21A9000XGE | |
| Lenovo ThinkPad T16 G1 21BWS00200 | |
| AIDA64 / Memory Write | |
| Media de la clase Office (20073 - 119858, n=81, últimos 2 años) | |
| HP ZBook Power 15 G9 6B8C4EA | |
| Lenovo ThinkPad Z16 G1 21D5S00T00 | |
| Lenovo ThinkPad T16 G1 21CH004MGE | |
| Lenovo ThinkPad T16 G1 21CHCTO1WW | |
| Medio AMD Ryzen 5 PRO 6650U (34563 - 51117, n=4) | |
| HP EliteBook 865 G9 | |
| Lenovo ThinkPad X1 Extreme G5-21DE003RGE | |
| Lenovo ThinkPad T16 G1 21BWS00200 | |
| Lenovo ThinkPad P15v G2 21A9000XGE | |
| AIDA64 / Memory Latency | |
| Lenovo ThinkPad T16 G1 21CHCTO1WW | |
| Lenovo ThinkPad Z16 G1 21D5S00T00 | |
| Lenovo ThinkPad T16 G1 21CH004MGE | |
| Medio AMD Ryzen 5 PRO 6650U (91.6 - 126.5, n=4) | |
| Media de la clase Office (7.6 - 162.9, n=76, últimos 2 años) | |
| Lenovo ThinkPad P15v G2 21A9000XGE | |
| Lenovo ThinkPad T16 G1 21BWS00200 | |
| HP EliteBook 865 G9 | |
| HP ZBook Power 15 G9 6B8C4EA | |
| Lenovo ThinkPad X1 Extreme G5-21DE003RGE | |
* ... más pequeño es mejor
Latencias del CPD
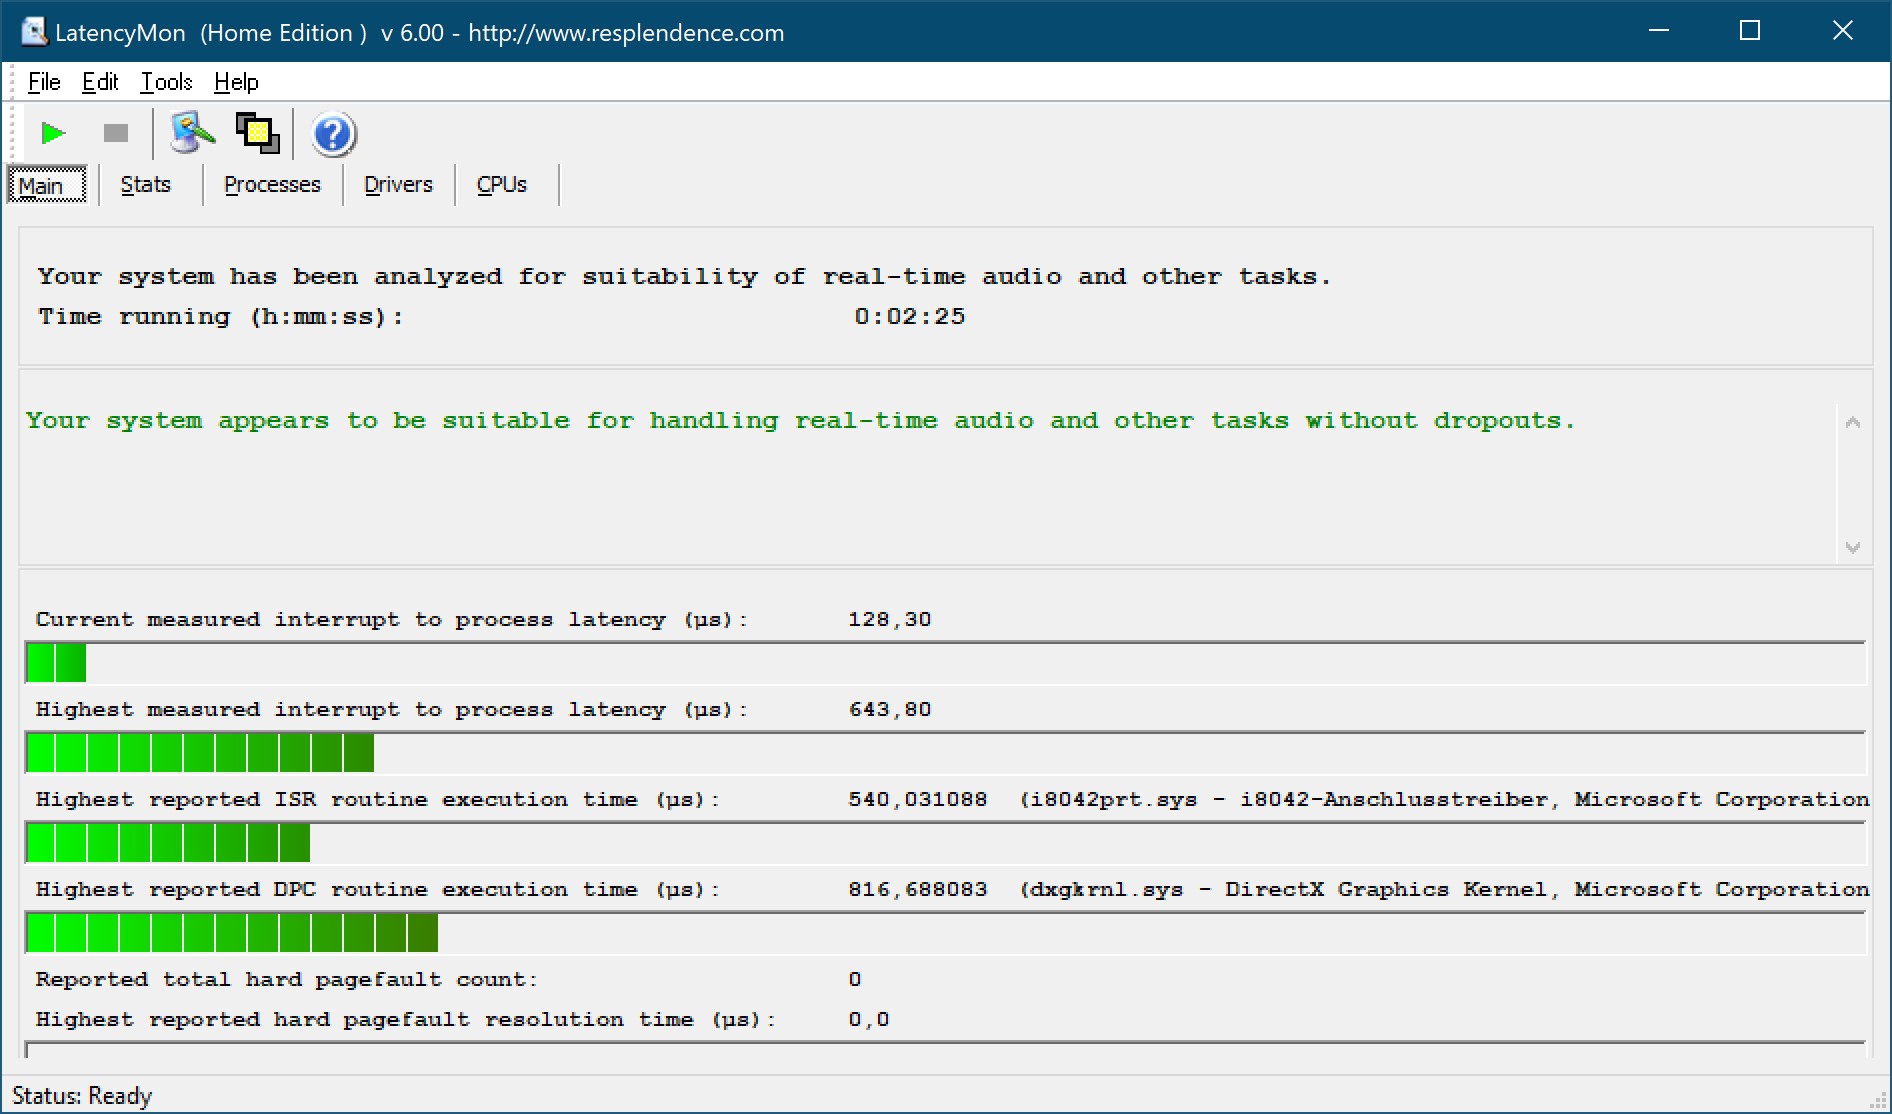
| DPC Latencies / LatencyMon - interrupt to process latency (max), Web, Youtube, Prime95 | |
| Lenovo ThinkPad T16 G1 21BWS00200 | |
| Lenovo ThinkPad X1 Extreme G5-21DE003RGE | |
| HP ZBook Power 15 G9 6B8C4EA | |
| Lenovo ThinkPad T16 G1 21CH004MGE | |
| Lenovo ThinkPad Z16 G1 21D5S00T00 | |
| HP EliteBook 865 G9 | |
* ... más pequeño es mejor
Solución de almacenamiento
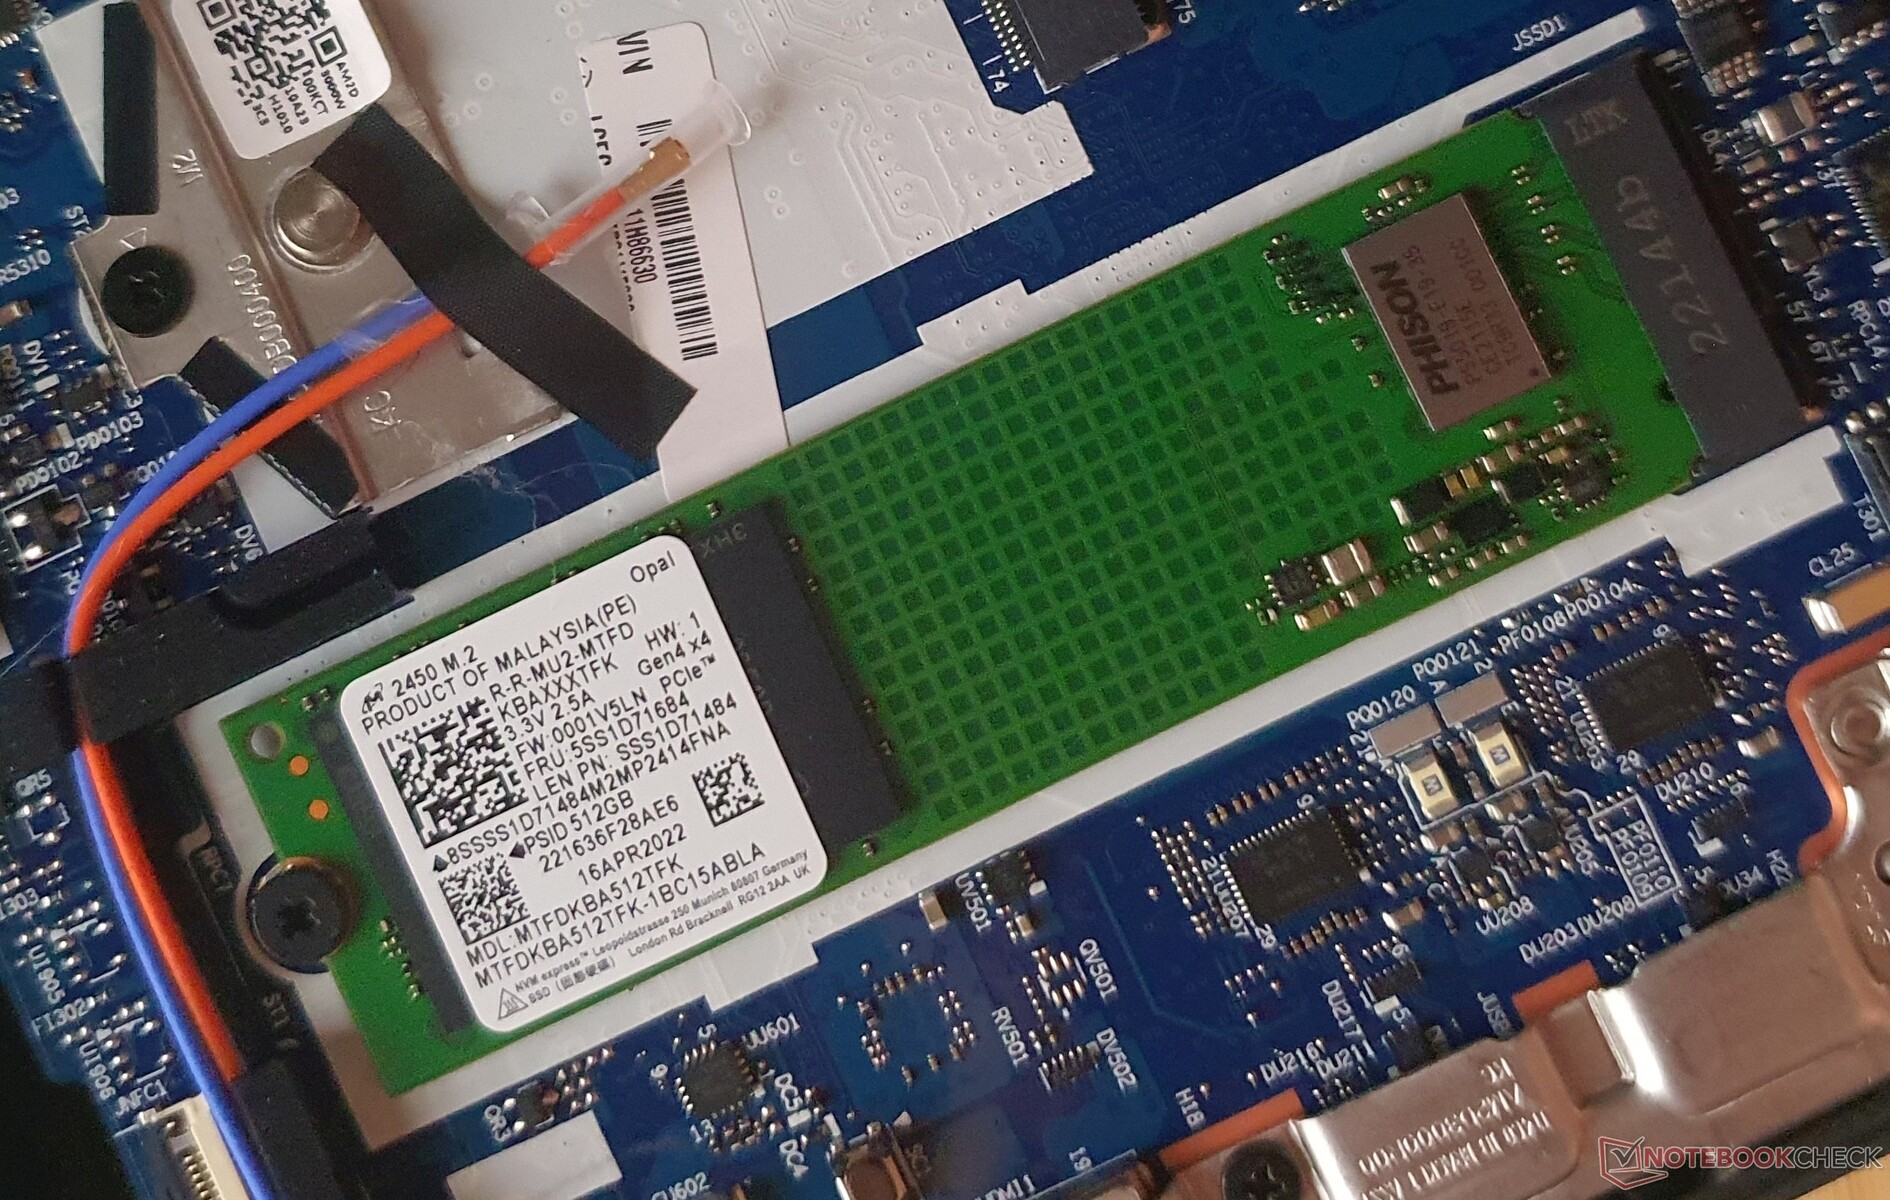
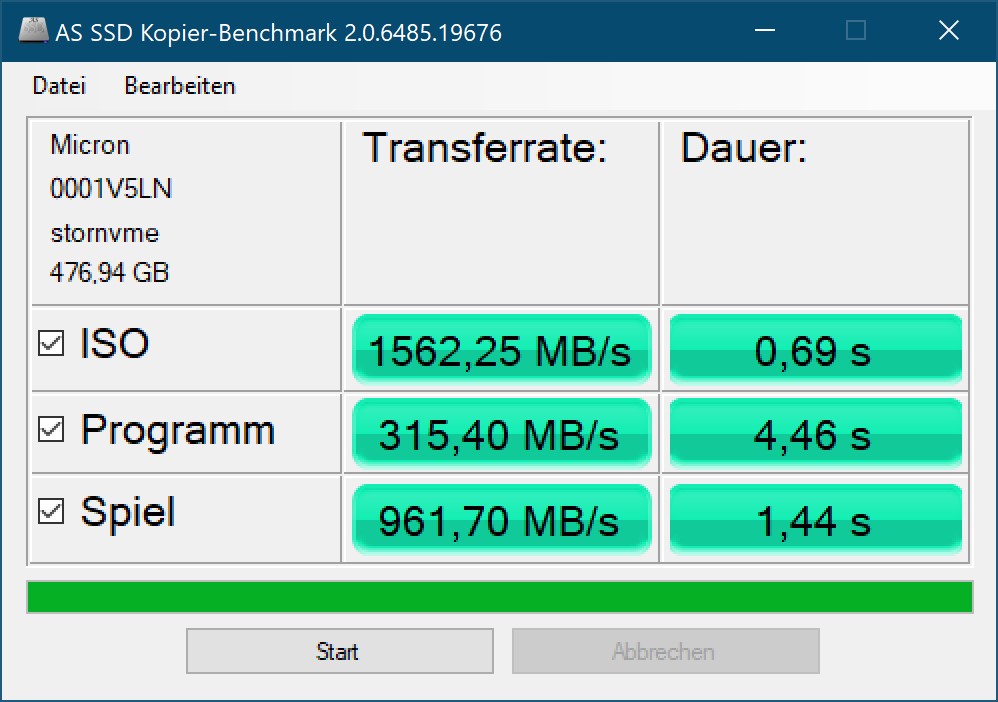
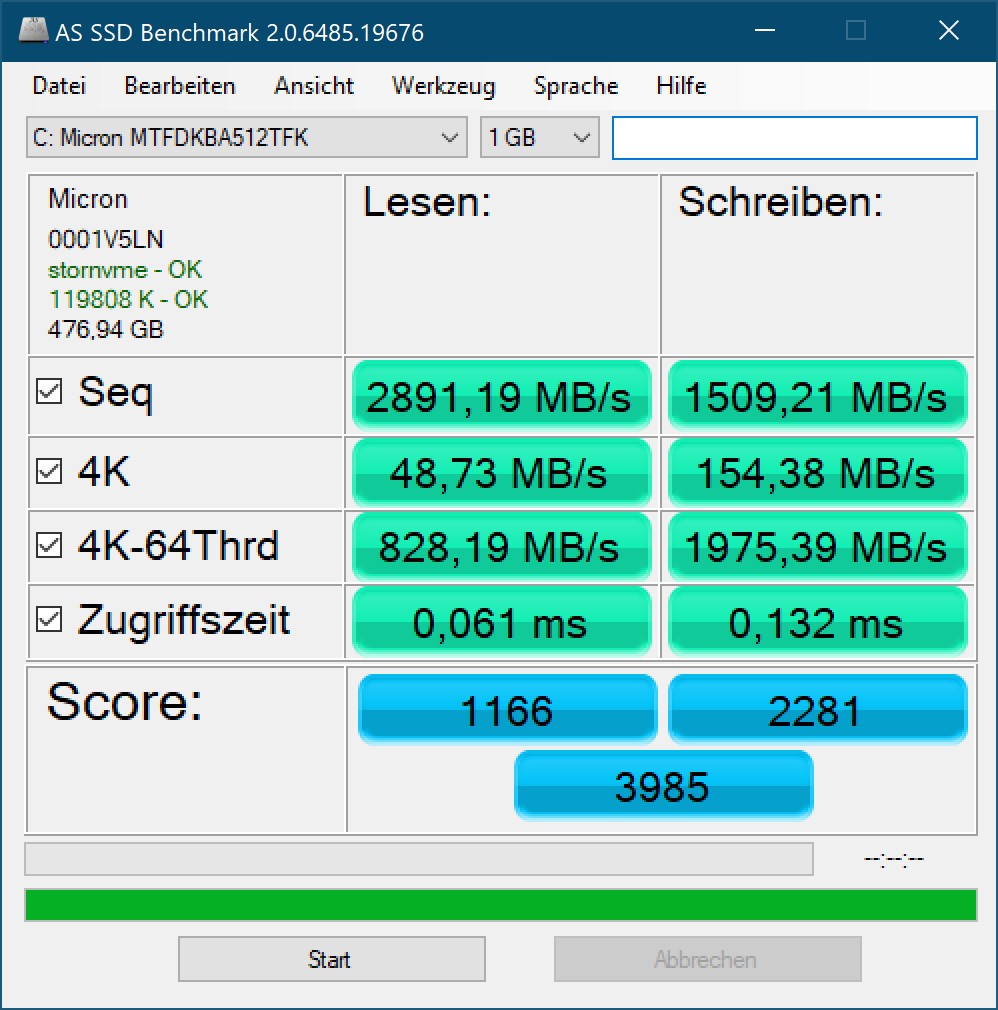
Los 512 GB Micron 2450 PCIe 4.0 SSD lee y escribe datos a velocidades que corresponden más al estándar PCIe 3.0. ElSamsung PM9A1 en el modeloModelo Intel del T16lee más rápido pero cae a un nivel similar al de la SSD Micron en nuestra prueba de lectura constante.
| Lenovo ThinkPad T16 G1 21CH004MGE Micron 2450 512GB MTFDKBA512TFK | Lenovo ThinkPad T16 G1 21BWS00200 Samsung PM9A1 MZVL2512HCJQ | Lenovo ThinkPad T16 G1 21CHCTO1WW Micron 2450 512GB MTFDKBA512TFK | HP EliteBook 865 G9 Samsung PM991 MZVLQ512HBLU | Lenovo ThinkPad Z16 G1 21D5S00T00 Samsung PM9A1 MZVL21T0HCLR | Lenovo ThinkPad X1 Extreme G5-21DE003RGE Micron 3400 1TB MTFDKBA1T0TFH | Lenovo ThinkPad P15v G2 21A9000XGE Toshiba XG6 KXG6AZNV512G | HP ZBook Power 15 G9 6B8C4EA Samsung PM9A1 MZVL21T0HCLR | |
|---|---|---|---|---|---|---|---|---|
| AS SSD | 16% | 20% | 2% | 32% | 38% | -8% | 50% | |
| Seq Read (MB/s) | 2891 | 3225 12% | 3107 7% | 2485 -14% | 4572.06 58% | 4766 65% | 2684 -7% | 5081 76% |
| Seq Write (MB/s) | 1509 | 1567 4% | 2965 96% | 1119 -26% | 2339.86 55% | 2159 43% | 1352 -10% | 1785 18% |
| 4K Read (MB/s) | 48.73 | 69.7 43% | 70 44% | 43.99 -10% | 63.1 29% | 44.61 -8% | 43.68 -10% | 76.86 58% |
| 4K Write (MB/s) | 154.38 | 170.9 11% | 166 8% | 117.89 -24% | 138.07 -11% | 141.69 -8% | 105.56 -32% | 197.01 28% |
| 4K-64 Read (MB/s) | 828 | 720 -13% | 1339 62% | 760.82 -8% | 863.66 4% | 877.37 6% | 976.92 18% | 912.6 10% |
| 4K-64 Write (MB/s) | 1975 | 2682 36% | 2101 6% | 1041.52 -47% | 2682.07 36% | 2594.6 31% | 1452.09 -26% | 3010.2 52% |
| Access Time Read * (ms) | 0.061 | 0.059 3% | 0.024 61% | 0.049 20% | 0.045 26% | 0.03 51% | 0.124 -103% | 0.02 67% |
| Access Time Write * (ms) | 0.132 | 0.024 82% | 0.171 -30% | 0.033 75% | 0.028 79% | 0.025 81% | 0.038 71% | 0.02 85% |
| Score Read (Points) | 1166 | 1112 -5% | 1719 47% | 1053 -10% | 1384 19% | 1399 20% | 1289 11% | 1498 28% |
| Score Write (Points) | 2281 | 3010 32% | 2563 12% | 1271 -44% | 3054 34% | 2952 29% | 1693 -26% | 3386 48% |
| Score Total (Points) | 3985 | 4630 16% | 5170 30% | 2805 -30% | 5050 27% | 4942 24% | 3582 -10% | 5506 38% |
| Copy ISO MB/s (MB/s) | 1562 | 1639 5% | 651 -58% | 1450.27 -7% | 2156.8 38% | 3591.64 130% | 1760.5 13% | 3596.51 130% |
| Copy Program MB/s (MB/s) | 315 | 326.8 4% | 408 30% | 681.41 116% | 426.1 35% | 422.46 34% | 355 13% | 418.84 33% |
| Copy Game MB/s (MB/s) | 962 | 942.7 -2% | 596 -38% | 1251.03 30% | 1157.07 20% | 1239.49 29% | 849 -12% | 1249.83 30% |
| DiskSpd | 22% | 57% | -24% | 32% | 21% | -13% | 37% | |
| seq read (MB/s) | 2012 | 3645 81% | 2309 15% | 1772 -12% | 3695 84% | 3210 60% | 2260 12% | 3945 96% |
| seq write (MB/s) | 2458 | 2809 14% | 3301 34% | 1535 -38% | 3294 34% | 2889 18% | 1837 -25% | 3039 24% |
| seq q8 t1 read (MB/s) | 3507 | 6524 86% | 3589 2% | 2741 -22% | 6628 89% | 6553 87% | 3290 -6% | 6481 85% |
| seq q8 t1 write (MB/s) | 3339 | 4812 44% | 3351 0% | 1606 -52% | 4957 48% | 4703 41% | 2902 -13% | 4914 47% |
| 4k q1 t1 read (MB/s) | 52.1 | 68.2 31% | 58.5 12% | 44.5 -15% | 65.4 26% | 48.7 -7% | 44.3 -15% | 78 50% |
| 4k q1 t1 write (MB/s) | 169.6 | 134.8 -21% | 66.6 -61% | 118 -30% | 134.8 -21% | 148.8 -12% | 113.3 -33% | 162.3 -4% |
| 4k q32 t16 read (MB/s) | 1066 | 683 -36% | 1445 36% | 814 -24% | 898 -16% | 883 -17% | 890 -17% | 866 -19% |
| 4k q32 t16 write (MB/s) | 365 | 293 -20% | 1877 414% | 361 -1% | 399 9% | 370 1% | 332 -9% | 426 17% |
| Media total (Programa/Opciones) | 19% /
19% | 39% /
33% | -11% /
-8% | 32% /
32% | 30% /
32% | -11% /
-10% | 44% /
45% |
* ... más pequeño es mejor
* ... más pequeño es mejor
Disk Throttling: DiskSpd Read Loop, Queue Depth 8
Tarjeta gráfica
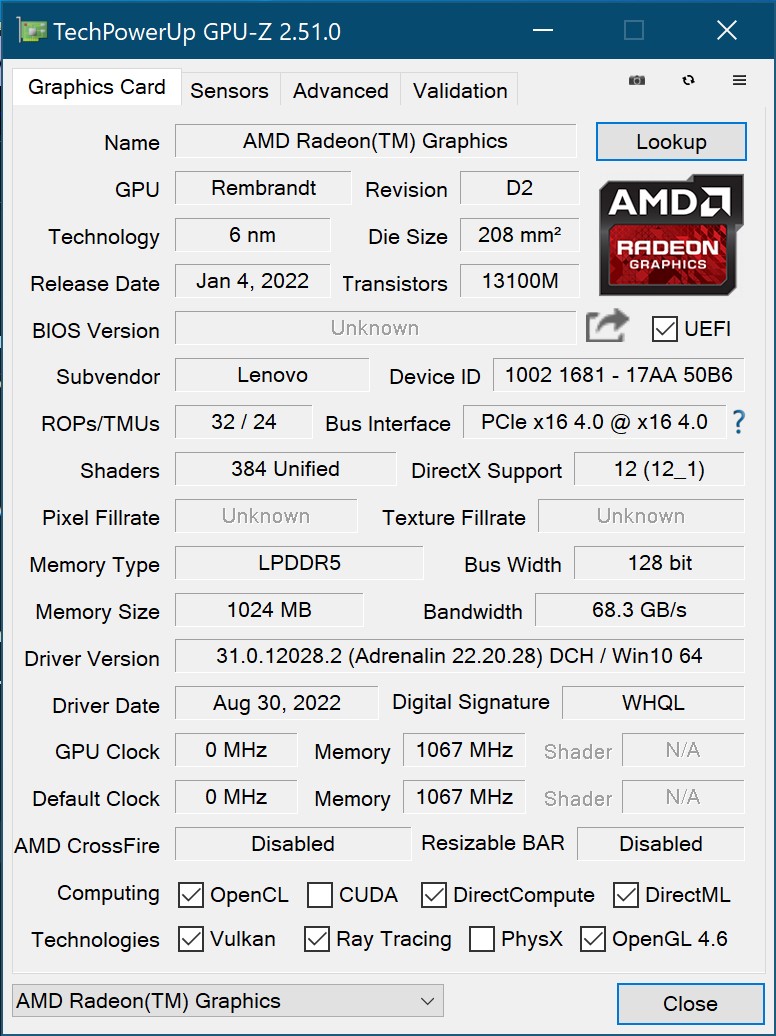

La AMD Radeon 660Mdel Ryzen 5 PRO usado aquí es la más débil de las dos soluciones gráficas integradas del ThinkPad T16 AMD únicamente disponibles. Mientras que los juegos más antiguos pueden jugarse con detalles medios o altos, los nuevos apenas pueden jugarse con ajustes bajos, ya que el T16 no está diseñado para jugar.
Durante los juegos, unIntel Xe7 (96EUs)se queda un 20% por detrás, mientras que la Radeon 680Mcomputa un 45% más rápido. En funcionamiento en batería, todo el rendimiento gráfico está disponible.


| 3DMark 11 Performance | 7403 puntos | |
| 3DMark Cloud Gate Standard Score | 24538 puntos | |
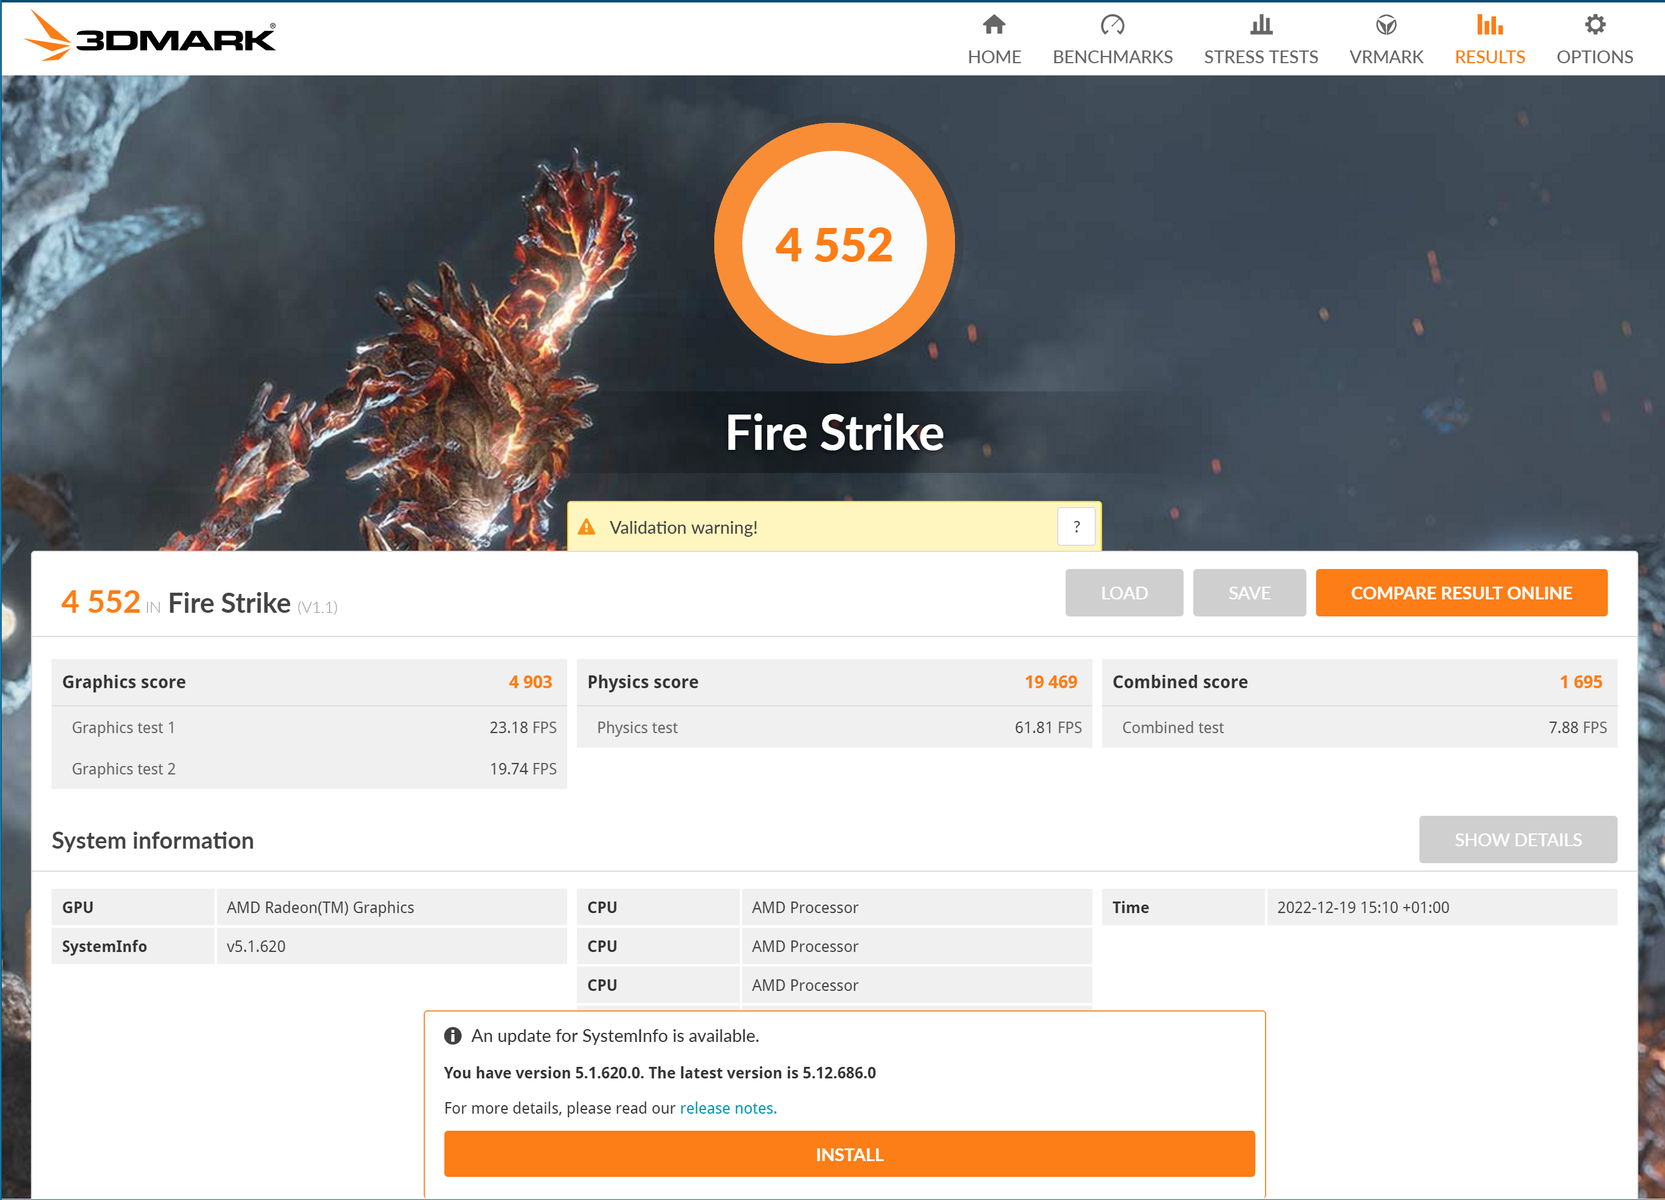
| 3DMark Fire Strike Score | 4552 puntos | |
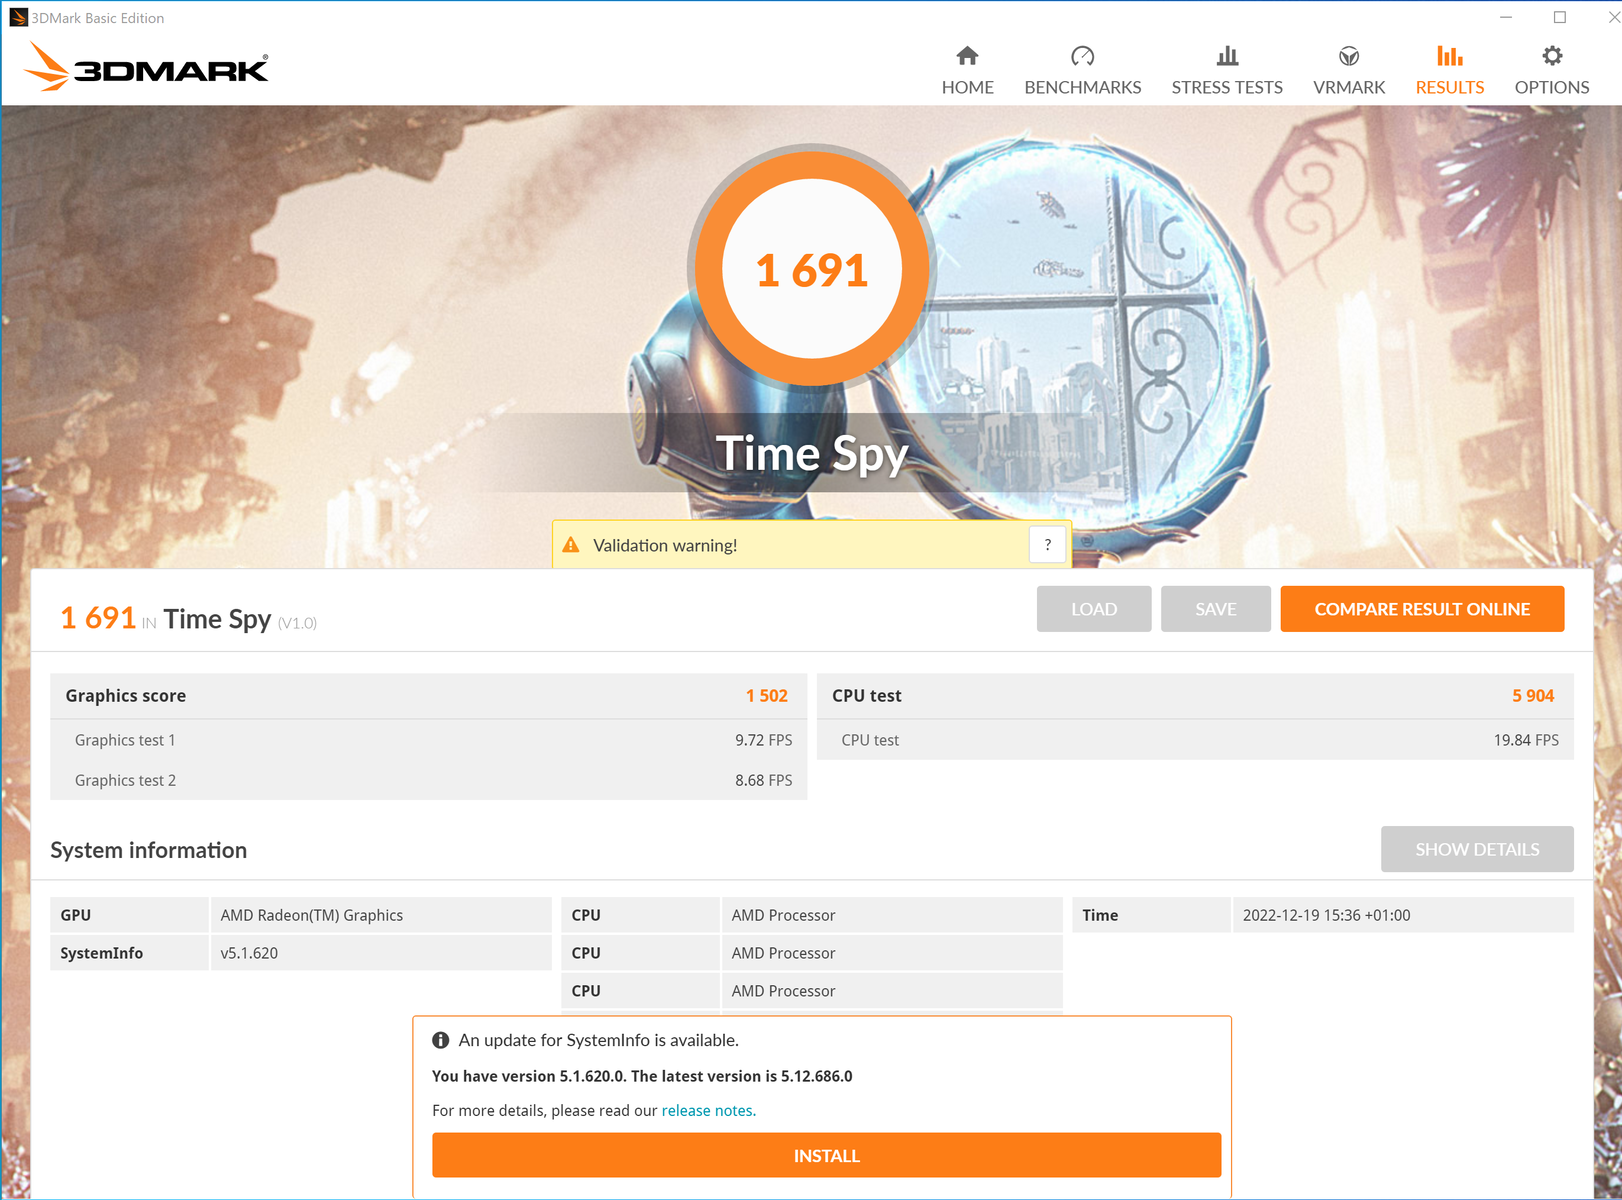
| 3DMark Time Spy Score | 1691 puntos | |
ayuda | ||
| Blender | |
| v3.3 Classroom HIP/AMD | |
| Lenovo ThinkPad T16 G1 21CH004MGE | |
| HP EliteBook 865 G9 | |
| Medio AMD Radeon 660M (438 - 755, n=8) | |
| Lenovo ThinkPad T16 G1 21CHCTO1WW | |
| Media de la clase Office (296 - 507, n=5, últimos 2 años) | |
| Lenovo ThinkPad T14 G3-21CF004NGE | |
| Lenovo ThinkPad Z16 G1 21D5S00T00 | |
| v3.3 Classroom OPTIX/RTX | |
| Media de la clase Office (29 - 242, n=2, últimos 2 años) | |
| HP ZBook Power 15 G9 6B8C4EA | |
| v3.3 Classroom CPU | |
| Lenovo ThinkPad T16 G1 21BWS00200 | |
| Lenovo ThinkPad T16 Gen 1 Core i7-1270P | |
| Medio AMD Radeon 660M (323 - 968, n=13) | |
| Media de la clase Office (245 - 3219, n=75, últimos 2 años) | |
| Lenovo ThinkPad T16 G1 21CH004MGE | |
| Lenovo ThinkPad Z16 G1 21D5S00T00 | |
| Lenovo ThinkPad T14 G3-21CF004NGE | |
| HP EliteBook 865 G9 | |
| Lenovo ThinkPad T16 G1 21CHCTO1WW | |
| HP ZBook Power 15 G9 6B8C4EA | |
* ... más pequeño es mejor
The Witcher 3 FPS Chart
| bajo | medio | alto | ultra | |
|---|---|---|---|---|
| GTA V (2015) | 132.5 | 120 | 40.7 | 18 |
| The Witcher 3 (2015) | 90.5 | 52.5 | 27.1 | 17.9 |
| Dota 2 Reborn (2015) | 109.3 | 99.3 | 61 | 52.9 |
| Final Fantasy XV Benchmark (2018) | 51.6 | 24.3 | 17.4 | |
| X-Plane 11.11 (2018) | 49.1 | 33.7 | 29.3 | |
| Far Cry 5 (2018) | 61 | 31 | 26 | 25 |
| Strange Brigade (2018) | 120.7 | 44.5 | 35.3 | 29.7 |
| Shadow of the Tomb Raider (2018) | 77 | 29 | 27 | 23 |
| God of War (2022) | 23.9 | 18.9 | 16.1 | 10.8 |
Emisiones: La mayor parte del tiempo ThinkPad T16 AMD permanece en silencio
Niveles de ruido
Durante el funcionamiento en reposo y al realizar tareas sencillas como navegar por Internet, iniciar aplicaciones y trabajos de oficina, el ventilador permanece casi siempre apagado o apenas se oye. Sólo bajo carga constante o combinada (juegos), el ventilador se acelera después de varios minutos. Aunque entonces ya no será silencioso con un máximo de 39 dB(A), produce una baja frecuencia de sonido confortable.
Por otro lado, nuestra segunda unidad de prueba ThinkPad T16 AMD tiene un ventilador de frecuencia muy alta, que también es mencionado por otros usuarios del T16/T14 y P16s/P14s.
Ruido
| Ocioso |
| 23.1 / 23.1 / 23.1 dB(A) |
| Carga |
| 25.4 / 39.1 dB(A) |
 | ||
30 dB silencioso 40 dB(A) audible 50 dB(A) ruidosamente alto |
||
min: | ||
| Lenovo ThinkPad T16 G1 21CH004MGE Radeon 660M, R5 PRO 6650U, Micron 2450 512GB MTFDKBA512TFK | Lenovo ThinkPad T16 G1 21BWS00200 Iris Xe G7 80EUs, i5-1240P, Samsung PM9A1 MZVL2512HCJQ | HP EliteBook 865 G9 Radeon 680M, R7 PRO 6850U, Samsung PM991 MZVLQ512HBLU | Lenovo ThinkPad Z16 G1 21D5S00T00 Radeon RX 6500M, R7 PRO 6850H, Samsung PM9A1 MZVL21T0HCLR | Lenovo ThinkPad T14 G3-21CF004NGE Radeon 680M, R7 PRO 6850U, Kioxia BG5 KBG5AZNV512G | Lenovo ThinkPad P15v G2 21A9000XGE T1200 Laptop GPU, i7-11800H, Toshiba XG6 KXG6AZNV512G | HP ZBook Power 15 G9 6B8C4EA RTX A2000 Laptop GPU, i7-12700H, Samsung PM9A1 MZVL21T0HCLR | |
|---|---|---|---|---|---|---|---|
| Noise | 3% | 3% | -9% | -7% | -15% | -18% | |
| apagado / medio ambiente * (dB) | 23.1 | 23.3 -1% | 23 -0% | 23.7 -3% | 24.2 -5% | 25.21 -9% | 23.8 -3% |
| Idle Minimum * (dB) | 23.1 | 23.3 -1% | 23 -0% | 23.7 -3% | 24.2 -5% | 25.21 -9% | 23.8 -3% |
| Idle Average * (dB) | 23.1 | 23.3 -1% | 23 -0% | 23.7 -3% | 24.2 -5% | 25.21 -9% | 23.8 -3% |
| Idle Maximum * (dB) | 23.1 | 23.3 -1% | 23 -0% | 23.7 -3% | 25.8 -12% | 25.21 -9% | 23.8 -3% |
| Load Average * (dB) | 25.4 | 25.1 1% | 29.1 -15% | 25.9 -2% | 32.2 -27% | 39.09 -54% | 42.9 -69% |
| Witcher 3 ultra * (dB) | 35.93 | 32.1 11% | 29.1 19% | 46.9 -31% | 34.1 5% | 36.6 -2% | 44.5 -24% |
| Load Maximum * (dB) | 39.1 | 34 13% | 32.9 16% | 46.9 -20% | 38.8 1% | 43.53 -11% | 47.9 -23% |
* ... más pequeño es mejor
Temperaturas
En todo momento, las temperaturas del Lenovo ThinkPad T16 G1 AMD se mantienen extraordinariamente bajas. Durante la carga más alta, medimos un máximo de 41.5 °C en una zona de la parte inferior de la carcasa. A 34.6 °C durante el escenario de carga, la parte superior de la carcasa permanece significativamente más fría que la del modelo Modelo Intel con 45 °C (113 °F).
(+) La temperatura máxima en la parte superior es de 34.6 °C / 94 F, frente a la media de 34.3 °C / 94 F, que oscila entre 21.2 y 62.5 °C para la clase Office.
(±) El fondo se calienta hasta un máximo de 41.5 °C / 107 F, frente a la media de 36.8 °C / 98 F
(+) En reposo, la temperatura media de la parte superior es de 21.9 °C / 71# F, frente a la media del dispositivo de 29.5 °C / 85 F.
(+) Jugando a The Witcher 3, la temperatura media de la parte superior es de 29.6 °C / 85 F, frente a la media del dispositivo de 29.5 °C / 85 F.
(+) El reposamanos y el panel táctil están a una temperatura inferior a la de la piel, con un máximo de 29 °C / 84.2 F y, por tanto, son fríos al tacto.
(±) La temperatura media de la zona del reposamanos de dispositivos similares fue de 27.5 °C / 81.5 F (-1.5 °C / -2.7 F).
| Lenovo ThinkPad T16 G1 21CH004MGE AMD Ryzen 5 PRO 6650U, AMD Radeon 660M | Lenovo ThinkPad T16 G1 21BWS00200 Intel Core i5-1240P, Intel Iris Xe Graphics G7 80EUs | HP EliteBook 865 G9 AMD Ryzen 7 PRO 6850U, AMD Radeon 680M | Lenovo ThinkPad Z16 G1 21D5S00T00 AMD Ryzen 7 PRO 6850H, AMD Radeon RX 6500M | Lenovo ThinkPad T14 G3-21CF004NGE AMD Ryzen 7 PRO 6850U, AMD Radeon 680M | Lenovo ThinkPad P15v G2 21A9000XGE Intel Core i7-11800H, NVIDIA T1200 Laptop GPU | HP ZBook Power 15 G9 6B8C4EA Intel Core i7-12700H, NVIDIA RTX A2000 Laptop GPU | |
|---|---|---|---|---|---|---|---|
| Heat | -29% | -8% | -34% | -19% | -29% | -9% | |
| Maximum Upper Side * (°C) | 34.6 | 45 -30% | 39.4 -14% | 56.8 -64% | 48.2 -39% | 53.8 -55% | 40.3 -16% |
| Maximum Bottom * (°C) | 41.5 | 42.8 -3% | 47.6 -15% | 53.3 -28% | 52.8 -27% | 52.1 -26% | 48.3 -16% |
| Idle Upper Side * (°C) | 22.6 | 33 -46% | 23.6 -4% | 28.2 -25% | 24.4 -8% | 27.6 -22% | 23.7 -5% |
| Idle Bottom * (°C) | 24.5 | 33.6 -37% | 24.1 2% | 29.4 -20% | 24.5 -0% | 27.7 -13% | 23.8 3% |
* ... más pequeño es mejor
Prueba de resistencia
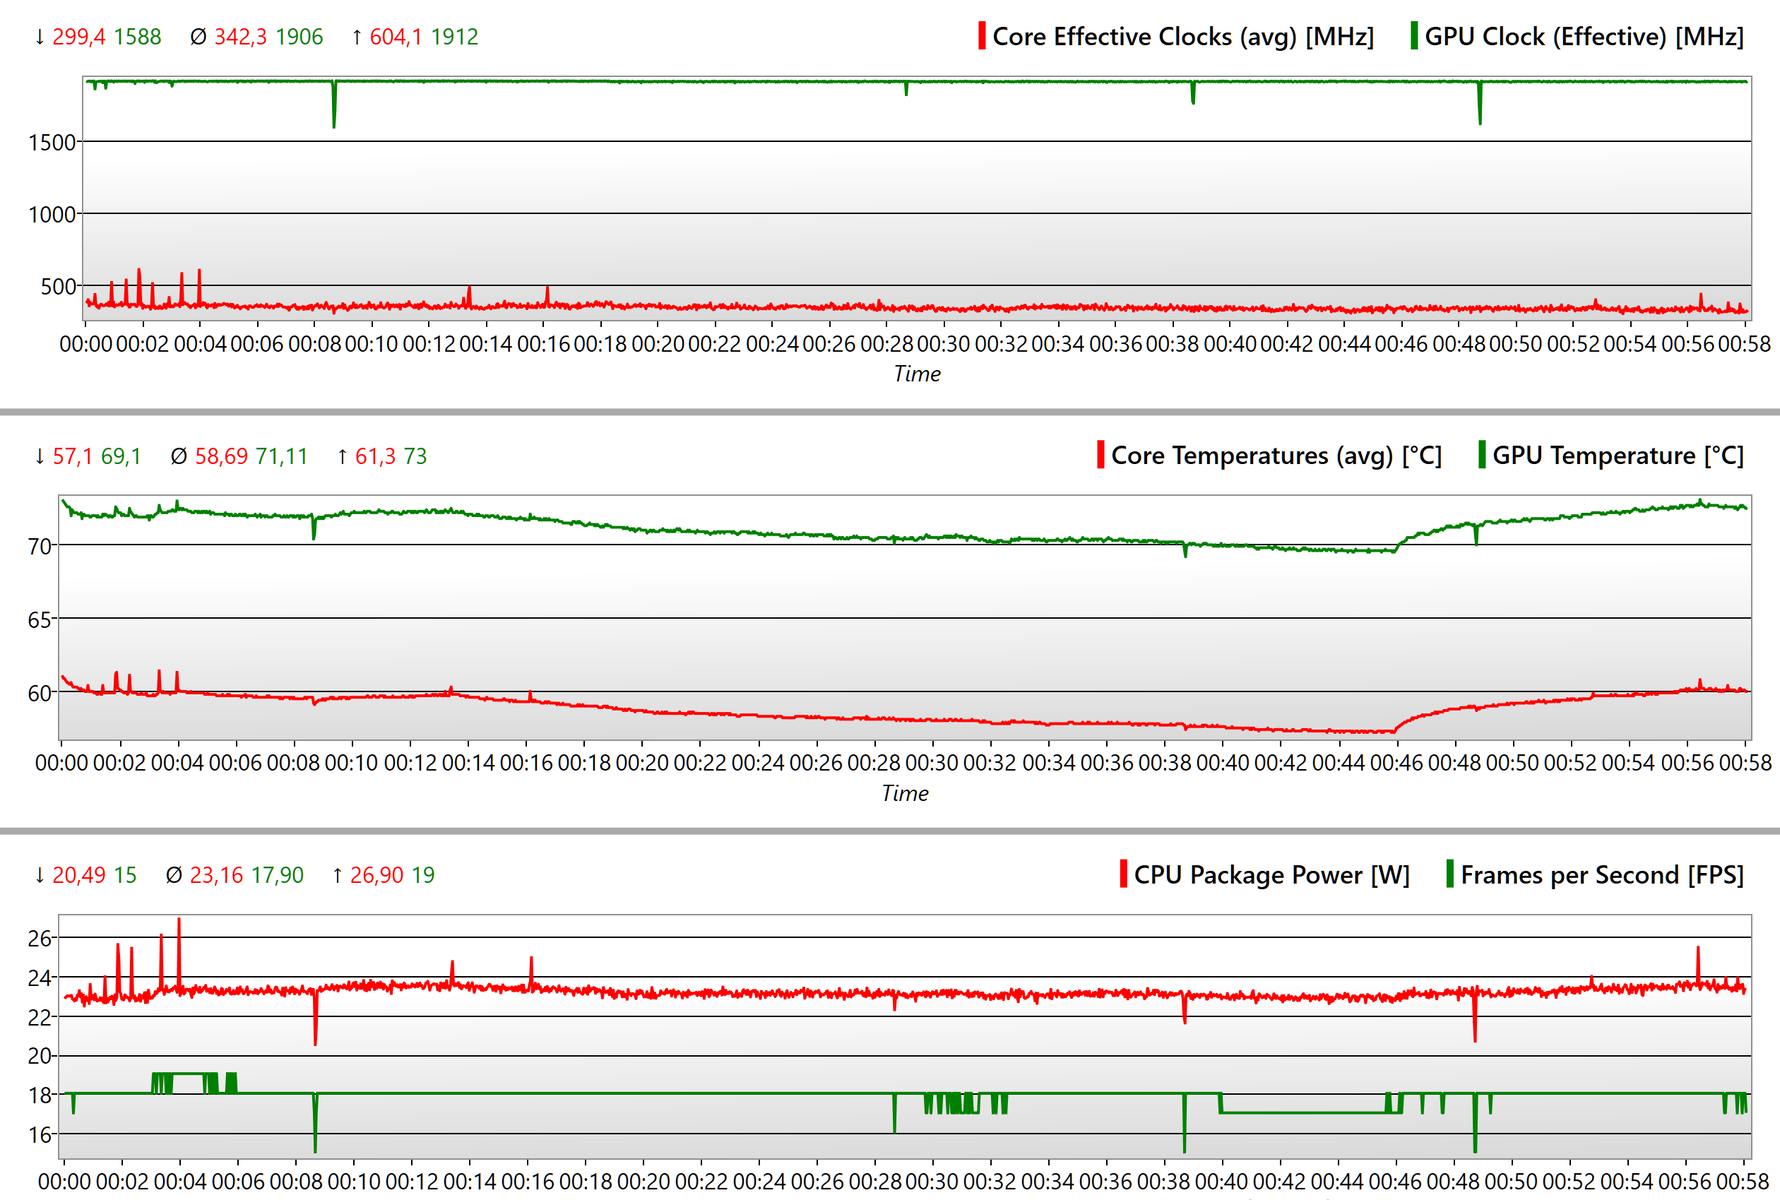
A 2,65 GHz bajo carga combinada (Prime95 + FurMark), la velocidad de la CPU cae ligeramente por debajo de la velocidad de reloj básica de 2,9 GHz, y las temperaturas del núcleo sólo alcanzan los 77 °C (171 °F). En ese momento, la iGPU sólo funciona a la mitad de su velocidad máxima, alcanzando una temperatura de 79 °C (174 °F).
Durante el estrés puro de la CPU, la velocidad de reloj básica se supera en 200 MHz, y durante el estrés puro de la GPU, la iGPU Radeon funciona a su velocidad máxima de ~1.900 MHz.
| RelojCPU (GHz) | Reloj GPU (MHz) | Temperatura mediaCPU (°C) | Temperatura media GPU (°C) | |
| Sistema en reposo | 0,15 | 18 | 35 | 35 |
| Prime95+ FurMark Stress | 2,65 | 930 | 77 | 77 |
| Prime95 Stress | 3,12 | 10 | 79 | 72 |
| FurMark-Stress | 0,23 | 1,866 | 63 | 79 |
| El Witcher 3 Stress | 0,34 | 1,906 | 59 | 71 |
Altavoces
Los altavoces estéreo orientados hacia arriba del ThinkPad de 16 pulgadas son mediocres en general. Les faltan graves, y las frecuencias altas son demasiado altas. Tampoco puedes esperar un volumen alto.
Lenovo ThinkPad T16 G1 21CH004MGE análisis de audio
(-) | altavoces no muy altos (#71.8 dB)
Graves 100 - 315 Hz
(-) | casi sin bajos - de media 18.5% inferior a la mediana
(±) | la linealidad de los graves es media (12.3% delta a frecuencia anterior)
Medios 400 - 2000 Hz
(+) | medios equilibrados - a sólo 4.5% de la mediana
(±) | la linealidad de los medios es media (7.8% delta respecto a la frecuencia anterior)
Altos 2 - 16 kHz
(±) | máximos más altos - de media 5.3% más altos que la mediana
(±) | la linealidad de los máximos es media (7.5% delta a frecuencia anterior)
Total 100 - 16.000 Hz
(±) | la linealidad del sonido global es media (22.5% de diferencia con la mediana)
En comparación con la misma clase
» 60% de todos los dispositivos probados de esta clase eran mejores, 8% similares, 32% peores
» El mejor tuvo un delta de 7%, la media fue 21%, el peor fue ###max##%
En comparación con todos los dispositivos probados
» 66% de todos los dispositivos probados eran mejores, 6% similares, 28% peores
» El mejor tuvo un delta de 4%, la media fue 23%, el peor fue ###max##%
HP EliteBook 865 G9 análisis de audio
(+) | los altavoces pueden reproducir a un volumen relativamente alto (#82.5 dB)
Graves 100 - 315 Hz
(-) | casi sin bajos - de media 19.6% inferior a la mediana
(±) | la linealidad de los graves es media (10.9% delta a frecuencia anterior)
Medios 400 - 2000 Hz
(+) | medios equilibrados - a sólo 1.2% de la mediana
(+) | los medios son lineales (2.2% delta a la frecuencia anterior)
Altos 2 - 16 kHz
(+) | máximos equilibrados - a sólo 3.5% de la mediana
(+) | los máximos son lineales (4% delta a la frecuencia anterior)
Total 100 - 16.000 Hz
(+) | el sonido global es lineal (13.8% de diferencia con la mediana)
En comparación con la misma clase
» 9% de todos los dispositivos probados de esta clase eran mejores, 4% similares, 87% peores
» El mejor tuvo un delta de 7%, la media fue 21%, el peor fue ###max##%
En comparación con todos los dispositivos probados
» 15% de todos los dispositivos probados eran mejores, 4% similares, 81% peores
» El mejor tuvo un delta de 4%, la media fue 23%, el peor fue ###max##%
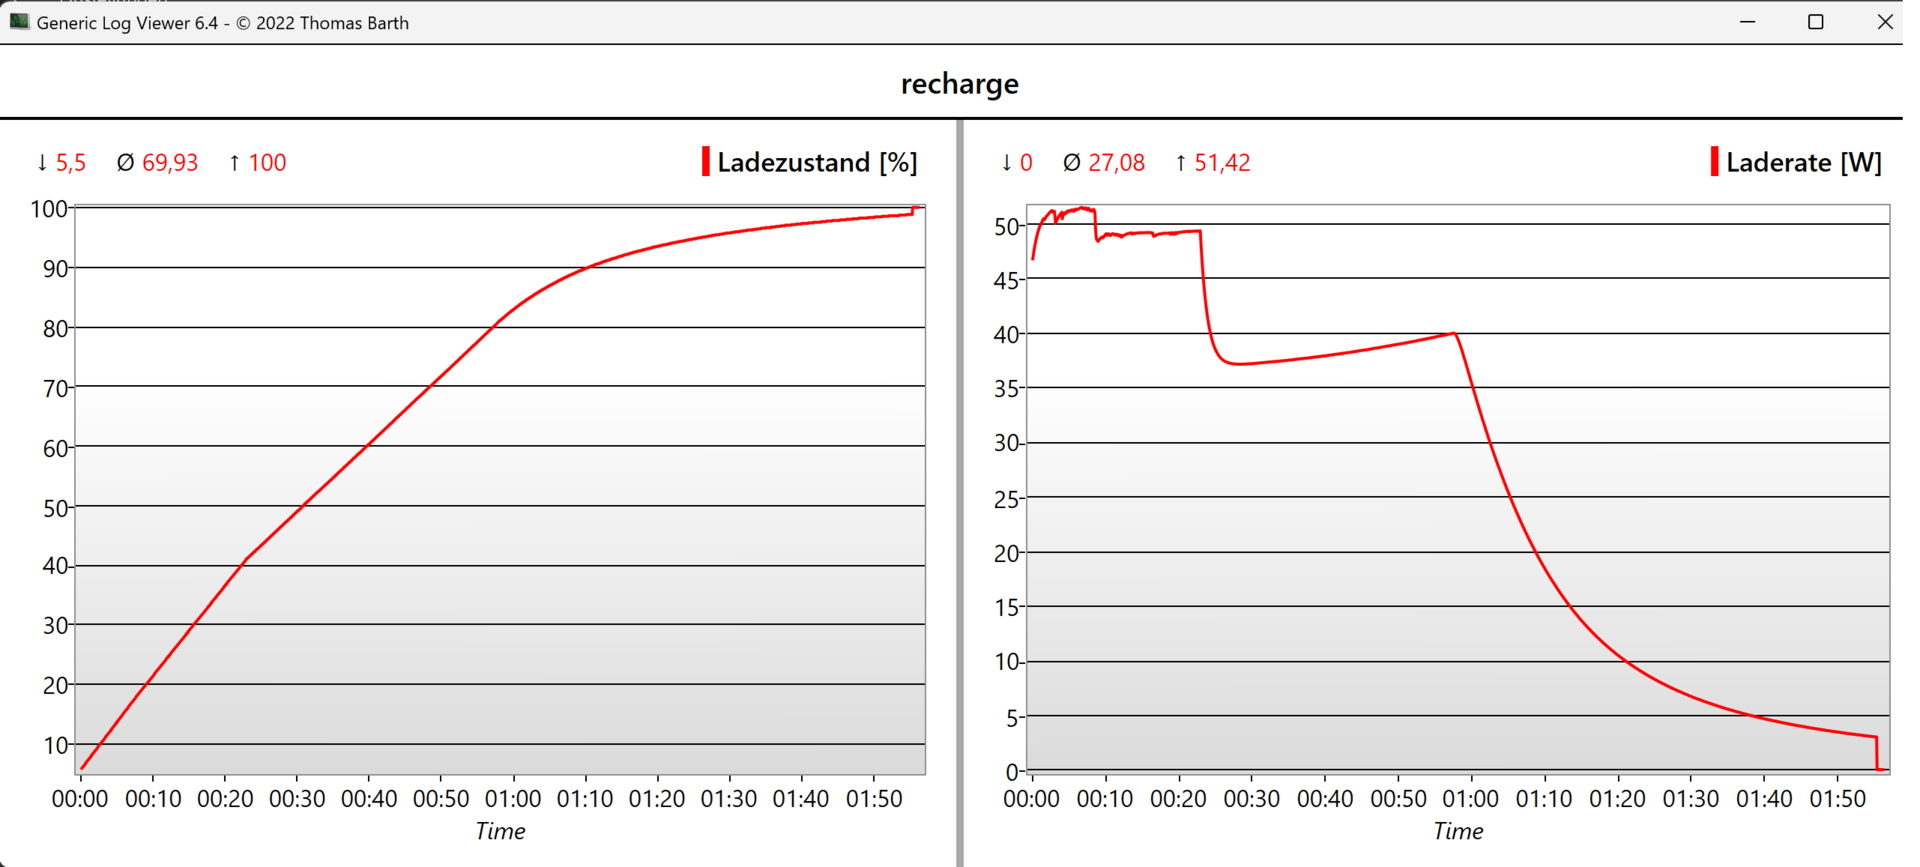
Gestión de la energía: T16 con una gran autonomía a pesar de la pequeña batería
Consumo de energía
Durante el funcionamiento en reposo y bajo carga, el consumo de energía del ThinkPad T16 AMD se mantiene por debajo del del modelo de Modelo Intely delThinkPad T14 G3 AMDcon la misma placa base.
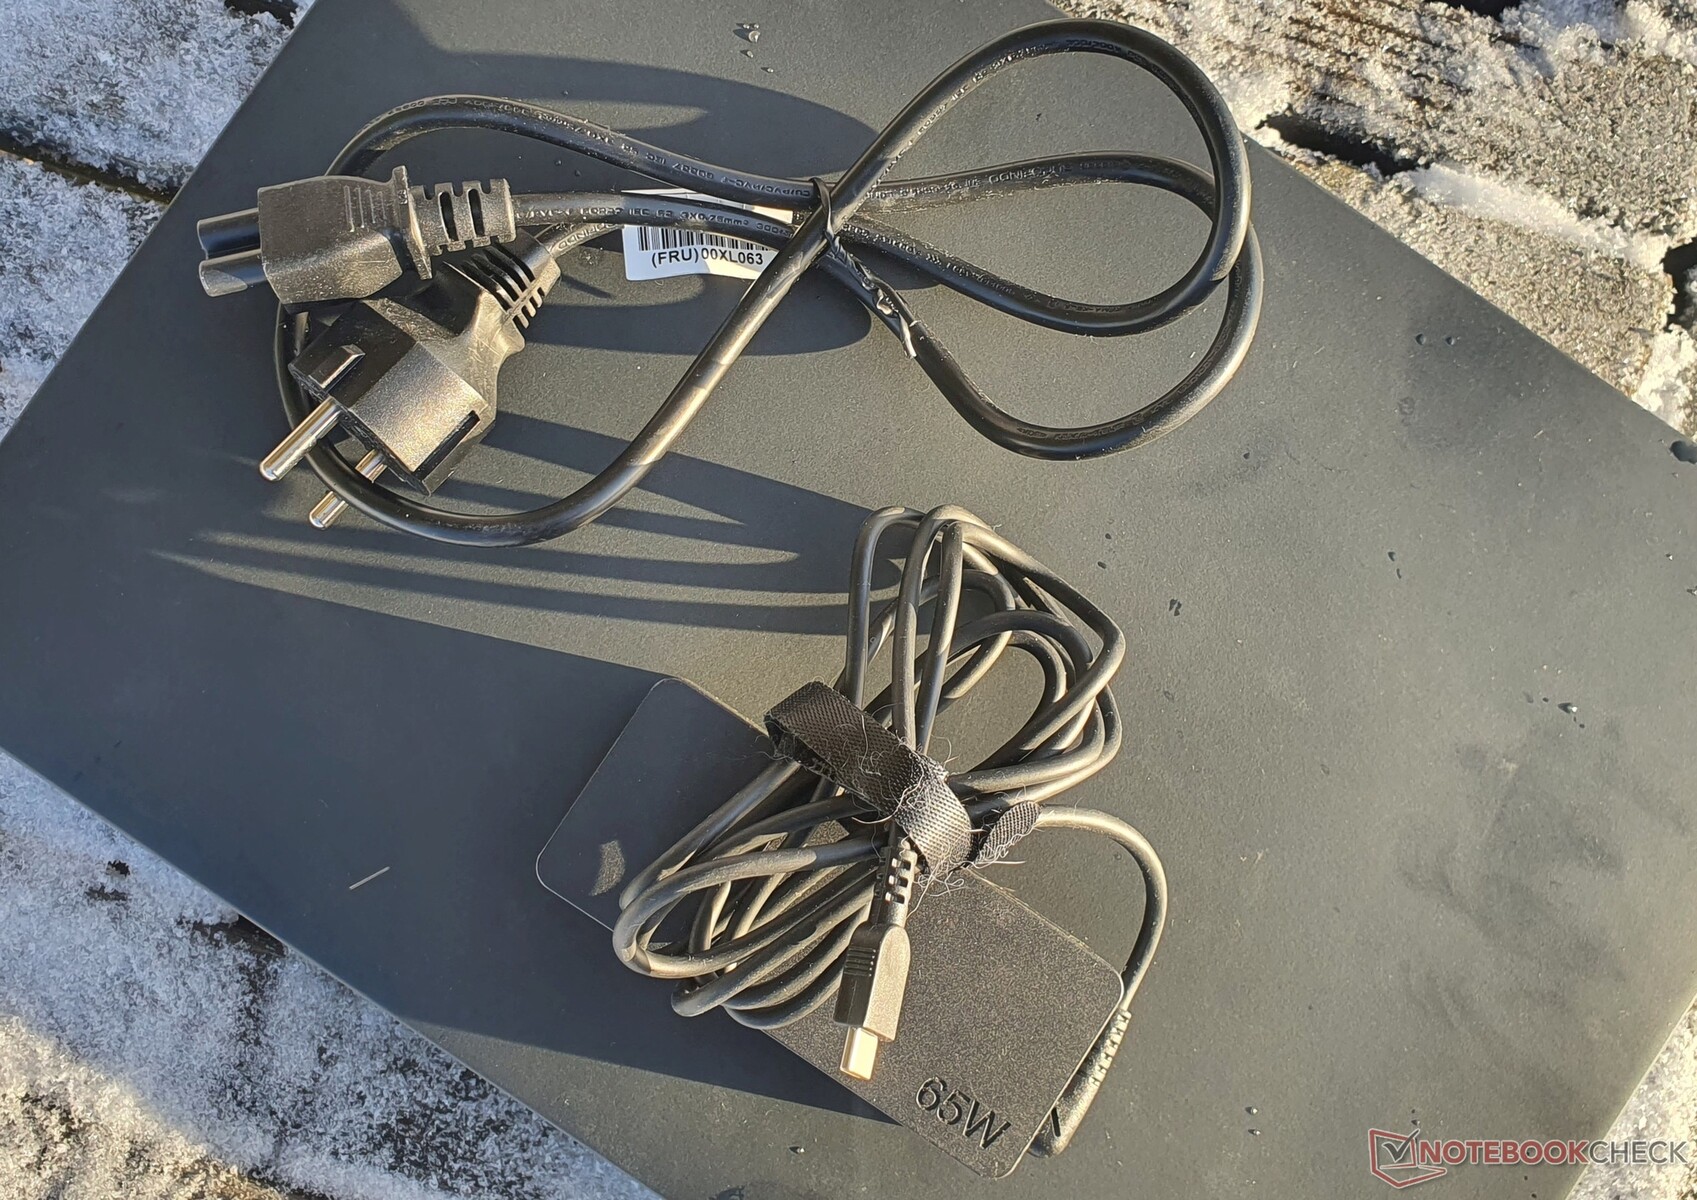
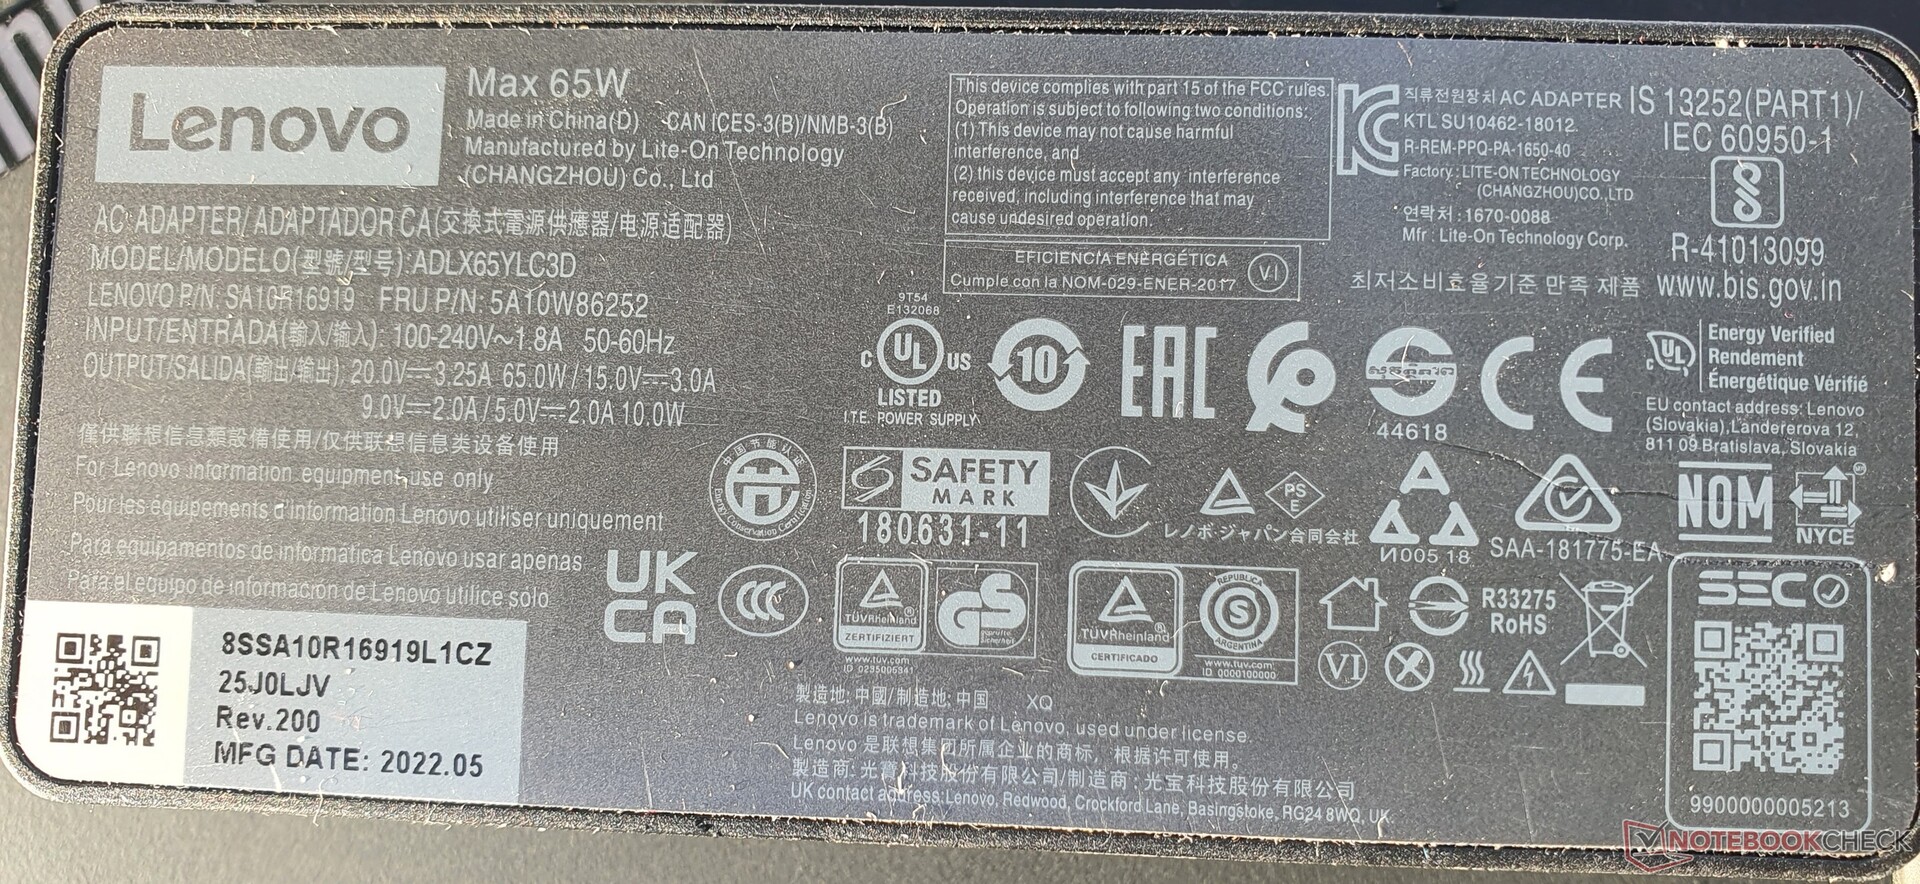
Las razones de esto se pueden encontrar en la pantalla de mayor resolución sin características de bajo consumo y los límites de rendimiento de la CPU más altos. Dado que el Turbo de corta duración de la CPU AMD resulta significativamente menor, el dispositivo consume un máximo de sólo 59 vatios, lo que significa que el cargador de 65 vatios es suficiente.
| Off / Standby | |
| Ocioso | |
| Carga |
|
Clave:
min: | |
| Lenovo ThinkPad T16 G1 21CH004MGE R5 PRO 6650U, Radeon 660M, Micron 2450 512GB MTFDKBA512TFK, IPS-LED, 2560x1600, 16" | Lenovo ThinkPad T16 G1 21BWS00200 i5-1240P, Iris Xe G7 80EUs, Samsung PM9A1 MZVL2512HCJQ, IPS, 1920x1200, 16" | Lenovo ThinkPad T14 G3-21CF004NGE R7 PRO 6850U, Radeon 680M, Kioxia BG5 KBG5AZNV512G, IPS, 1920x1200, 14" | HP EliteBook 865 G9 R7 PRO 6850U, Radeon 680M, Samsung PM991 MZVLQ512HBLU, IPS, 1920x1200, 16" | Lenovo ThinkPad Z16 G1 21D5S00T00 R7 PRO 6850H, Radeon RX 6500M, Samsung PM9A1 MZVL21T0HCLR, IPS LED, 1920x1200, 16" | Lenovo ThinkPad P15v G2 21A9000XGE i7-11800H, T1200 Laptop GPU, Toshiba XG6 KXG6AZNV512G, IPS LED, 1920x1080, 15.6" | HP ZBook Power 15 G9 6B8C4EA i7-12700H, RTX A2000 Laptop GPU, Samsung PM9A1 MZVL21T0HCLR, IPS, 3840x2160, 15.6" | Medio AMD Radeon 660M | Media de la clase Office | |
|---|---|---|---|---|---|---|---|---|---|
| Power Consumption | 9% | 19% | -35% | -64% | -77% | -59% | -8% | -5% | |
| Idle Minimum * (Watt) | 3.2 | 2.9 9% | 2.4 25% | 5.3 -66% | 5.3 -66% | 5.96 -86% | 3.9 -22% | 4.68 ? -46% | 4.26 ? -33% |
| Idle Average * (Watt) | 8.1 | 6 26% | 5.3 35% | 12.8 -58% | 8.6 -6% | 8.37 -3% | 7.2 11% | 7.08 ? 13% | 7.31 ? 10% |
| Idle Maximum * (Watt) | 8.6 | 6.9 20% | 5.6 35% | 14.1 -64% | 9.5 -10% | 9.05 -5% | 8.5 1% | 9.12 ? -6% | 8.55 ? 1% |
| Load Average * (Watt) | 45.4 | 27.3 40% | 39.7 13% | 48.5 -7% | 65.2 -44% | 91.82 -102% | 87.2 -92% | 44.2 ? 3% | 43.8 ? 4% |
| Witcher 3 ultra * (Watt) | 40 | 42.6 -7% | 42.8 -7% | 48.7 -22% | 93.6 -134% | 102 -155% | 86.8 -117% | ||
| Load Maximum * (Watt) | 59.6 | 81.53 -37% | 50.6 15% | 56.6 5% | 133.81 -125% | 126.38 -112% | 139 -133% | 62.4 ? -5% | 64.5 ? -8% |
* ... más pequeño es mejor
Power Consumption The Witcher 3 / Stress Test
Power Consumption With External Monitor
Duración de la batería
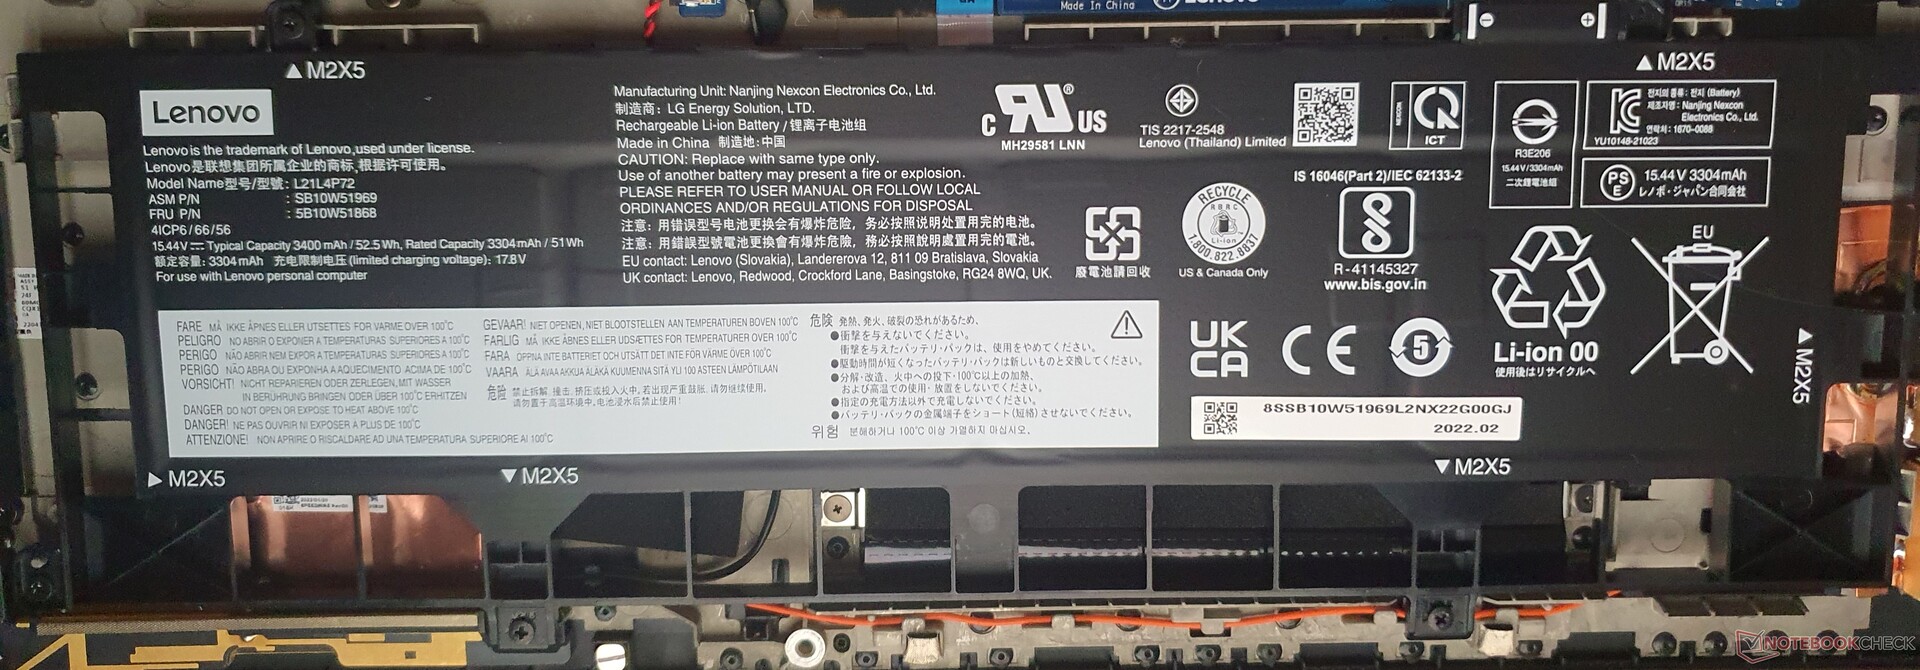
A pesar de que en nuestra unidad de pruebas se utiliza la batería significativamente más pequeña de 52,5 Wh, se puede navegar durante 10:35 horas en la web. El Modelo Intelcon la batería de 86-Wh y pantalla de bajo consumo alcanza las 14 horas. Por tanto, para una larga duración de la batería, deberías hacerte con la batería más grande y la pantalla de bajo consumo.
A juzgar por elThinkPad T14 G3 AMDcon la misma placa base y pantalla de bajo consumo, podrías calcular una duración de batería de hasta 20 horas para el T16 AMD con esto. Sin embargo, debido a la falta de mediciones reales, no podemos confirmarlo.
| Lenovo ThinkPad T16 G1 21CH004MGE R5 PRO 6650U, Radeon 660M, 52.5 Wh | Lenovo ThinkPad T16 G1 21BWS00200 i5-1240P, Iris Xe G7 80EUs, 86 Wh | Lenovo ThinkPad T14 G3-21CF004NGE R7 PRO 6850U, Radeon 680M, 52.5 Wh | HP EliteBook 865 G9 R7 PRO 6850U, Radeon 680M, 76 Wh | Lenovo ThinkPad Z16 G1 21D5S00T00 R7 PRO 6850H, Radeon RX 6500M, 72 Wh | Lenovo ThinkPad P15v G2 21A9000XGE i7-11800H, T1200 Laptop GPU, 68 Wh | HP ZBook Power 15 G9 6B8C4EA i7-12700H, RTX A2000 Laptop GPU, 83 Wh | Lenovo ThinkPad X1 Extreme G5-21DE003RGE i7-12700H, GeForce RTX 3060 Laptop GPU, 90 Wh | |
|---|---|---|---|---|---|---|---|---|
| Duración de Batería | 82% | 30% | 59% | 31% | -25% | -6% | -5% | |
| H.264 (h) | 10.9 | 10.4 -5% | 16.4 50% | 18.5 70% | 11.9 9% | 8 -27% | 7.3 -33% | |
| WiFi v1.3 (h) | 10.6 | 14.1 33% | 12.9 22% | 15 42% | 9.9 -7% | 7.5 -29% | 10 -6% | 6.7 -37% |
| Load (h) | 1.1 | 3.5 218% | 1.3 18% | 1.8 64% | 2.1 91% | 0.9 -18% | 1.7 55% |
Pro
Contra
Veredicto: El ThinkPad T16 AMD es potente, fresco y silencioso

Con una APU AMD, el Lenovo ThinkPad T16 es aún mejor. No sólo se obtiene una CPU muy potente con límites de potencia más altos que en el T16 Intelsino que la GPU Radeon integrada también es más convincente que una iGPU de Intel. Con esto, el portátil de negocios también está preparado para tareas exigentes y pesadas para la CPU.
Recomendamos elegir la batería más grande y la pantalla de bajo consumo para una máxima duración de la batería. Sin embargo, los que busquen una verdadera estación de trabajo básica deberían elegir el ThinkPad P15v o el HP Zbook Power 15 G9. Por otro lado, el ThinkPad X1 Extreme G5y ThinkPad Z16representan un buen compromiso entre delgadez y potencia.
Además del buen equipamiento, el robusto ThinkPad T16 AMD también se beneficia de ser muy silencioso y fresco, tener buenos dispositivos de entrada y la brillante pantalla de 16 pulgadas con colores vibrantes.
El HP EliteBook 865 G9cuyas ventajas particulares frente al T16 AMD de 1499 euros son la RAM ampliable y el USB4, representa una alternativa real.
El control de calidad de la serie T de 2022 tampoco parece ser óptimo: Nuestra segunda unidad de pruebas no sólo sufría de un ventilador de muy alta frecuencia, sino que también producía claros crujidos en la zona del reposamanos, y la tecla TrackPoint izquierda a menudo no se disparaba. Además, el potente olor químico sigue presente incluso después de una semana, y las bisagras ya se han aflojado ligeramente. Por otro lado, el modelo que probamos más a fondo no muestra ninguno de estos problemas que han mencionado con frecuencia los usuarios.
Precio y disponibilidad
Lenovo vende varias configuraciones del ThinkPad T16 AMD a partir de 969,50 dólares, y Amazon también ofrece varias versiones a partir de 990 dólares.
Lenovo ThinkPad T16 G1 21CH004MGE
- 01/31/2023 v7 (old)
Marvin Gollor
Transparencia
La selección de los dispositivos que se van a reseñar corre a cargo de nuestro equipo editorial. La muestra de prueba fue proporcionada al autor en calidad de préstamo por el fabricante o el minorista a los efectos de esta reseña. El prestamista no tuvo ninguna influencia en esta reseña, ni el fabricante recibió una copia de la misma antes de su publicación. No había ninguna obligación de publicar esta reseña. Como empresa de medios independiente, Notebookcheck no está sujeta a la autoridad de fabricantes, minoristas o editores.
Así es como prueba Notebookcheck
Cada año, Notebookcheck revisa de forma independiente cientos de portátiles y smartphones utilizando procedimientos estandarizados para asegurar que todos los resultados son comparables. Hemos desarrollado continuamente nuestros métodos de prueba durante unos 20 años y hemos establecido los estándares de la industria en el proceso. En nuestros laboratorios de pruebas, técnicos y editores experimentados utilizan equipos de medición de alta calidad. Estas pruebas implican un proceso de validación en varias fases. Nuestro complejo sistema de clasificación se basa en cientos de mediciones y puntos de referencia bien fundamentados, lo que mantiene la objetividad.Price comparison

