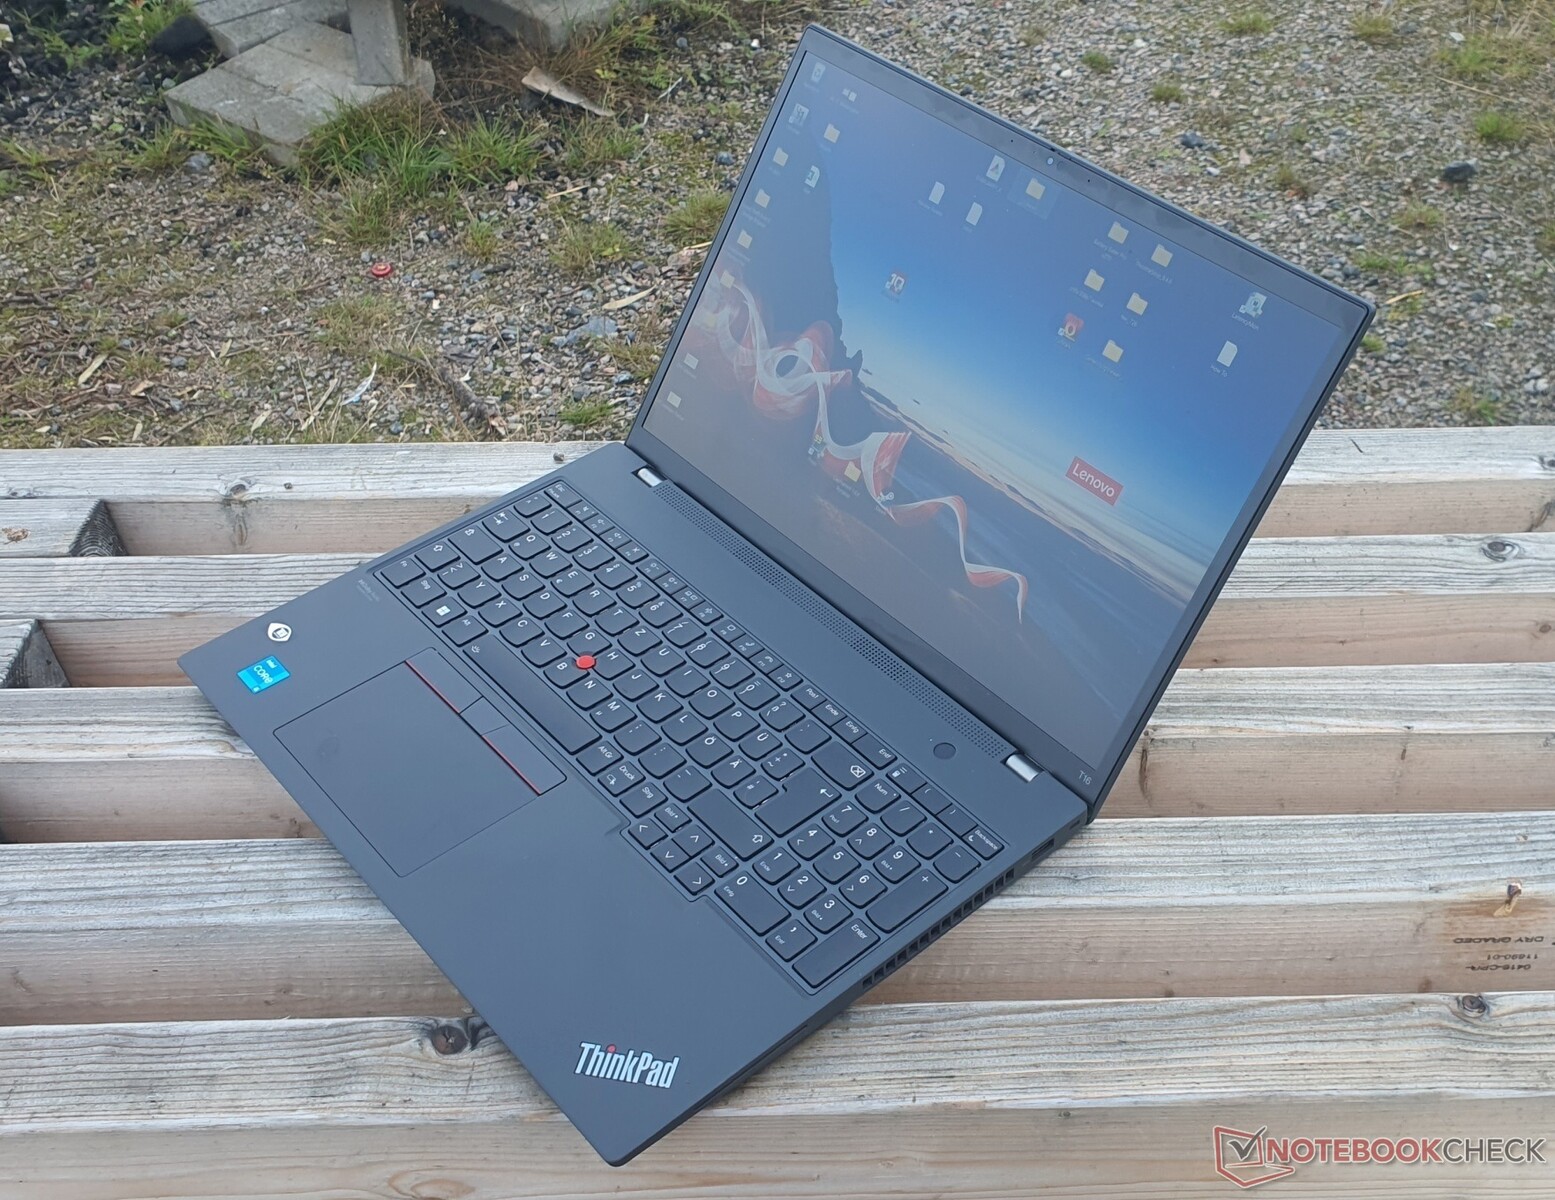
Análisis del portátil Lenovo ThinkPad T16 G1 Intel: un maratonista de 16 pulgadas
Por último, los ThinkPad de Lenovo de la serie T clásica también reciben un rediseño. La pantalla 16:10 del ThinkPad T16 G1, que se ha ampliado a 16 pulgadas, es probablemente lo primero que llama la atención. La opción de una batería significativamente más grande aumenta la esperanza de una larga duración de la misma, al igual que la pantalla opcional de bajo consumo. A lo largo de este análisis se explicarán otros cambios, así como los posibles inconvenientes en comparación concon el predecesor.
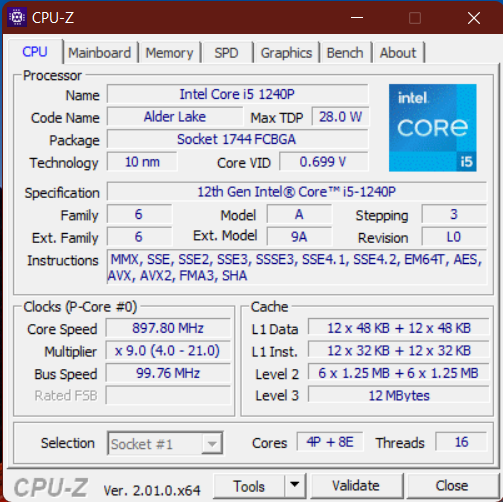
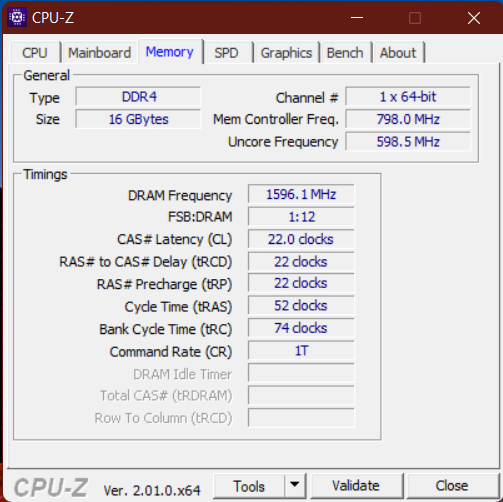
Nuestro modelo viene con un Intel Core i5-1240P, 16 GB de RAM DDR4-3200, un SSD PCIe 4.0 de 512 GB, un display de bajo consumo FHD+ y una gran batería de 86 Wh. Las CPUs Intel U opcionales parecen ser un poco más económicas según nuestros análisis hasta ahora. También está disponible un panel de 2,5K, pero la opción 4K UHD del predecesor con 100% DCI-P3 ya no está disponible. El de NvidiaGeForce MX550 también es opcional.
La competencia del ThinkPad T16 como dispositivo empresarial de gama alta entre los portátiles de 15/16 pulgadas incluye principalmente el Latitude 15 5531 de Dell y el EliteBook 865 G9 de HP. Pero la comparación con los portátiles de gama media es ciertamente interesante, incluyendo los híbridos de oficina multimedia como el MateBook D 16 de Huawei y el Vivobook Pro 16X de Asus.
Posibles contendientes en la comparación
Valoración | Fecha | Modelo | Peso | Altura | Tamaño | Resolución | Precio |
|---|---|---|---|---|---|---|---|
| 89.3 % v7 (old) | 09/2022 | Lenovo ThinkPad T16 G1 21BWS00200 i5-1240P, Iris Xe G7 80EUs | 1.9 kg | 20.5 mm | 16.00" | 1920x1200 | |
| 87.1 % v7 (old) | 05/2021 | Lenovo ThinkPad T15 Gen2-20W5S00100 i7-1165G7, GeForce MX450 | 1.9 kg | 19.1 mm | 15.60" | 1920x1080 | |
| 85.5 % v7 (old) | 08/2021 | Lenovo ThinkPad E15 G3-20YG003UGE R7 5700U, Vega 8 | 1.8 kg | 18.9 mm | 15.60" | 1920x1080 | |
| 85.1 % v7 (old) | 07/2021 | Lenovo ThinkPad L15 G2 AMD R5 5600U, Vega 7 | 1.9 kg | 21 mm | 15.60" | 1920x1080 | |
| 85 % v7 (old) | 08/2022 | HP ProBook 450 G9 6A180EA i7-1255U, Iris Xe G7 96EUs | 1.7 kg | 19.9 mm | 15.60" | 1920x1080 | |
| 87.7 % v7 (old) | 07/2022 | HP ZBook Power 15 G8 313S5EA i7-11800H, T600 Laptop GPU | 2 kg | 22.8 mm | 15.60" | 1920x1080 | |
v (old) | 09/2022 | Dell Latitude 15 5531, i5-12600H MX550 i5-12600H, GeForce MX550 | 1.8 kg | 24.05 mm | 15.60" | 1920x1080 | |
| 87.4 % v7 (old) | 08/2022 | Dell Inspiron 16 Plus 7620 i7-12700H, GeForce RTX 3050 Ti Laptop GPU | 2.1 kg | 18.99 mm | 16.00" | 3072x1920 | |
| 83.6 % v7 (old) | 07/2022 | Huawei MateBook D 16 2022 i7-12700H, Iris Xe G7 96EUs | 1.7 kg | 18.4 mm | 16.00" | 1920x1200 | |
v (old) | 12/2021 | Asus Vivobook Pro 16X-M7600QE R9 5900HX, GeForce RTX 3050 Ti Laptop GPU | 1.9 kg | 19 mm | 16.10" | 3840x2400 |
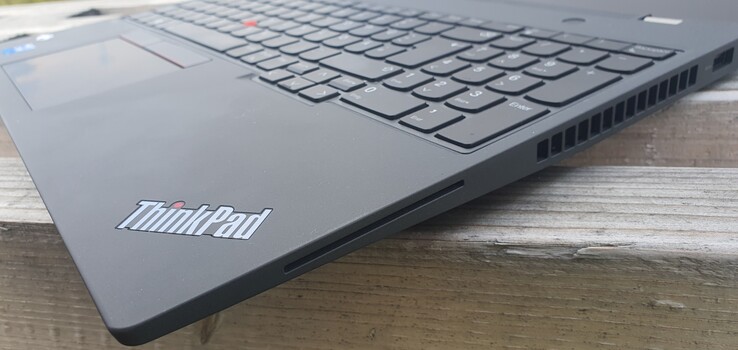
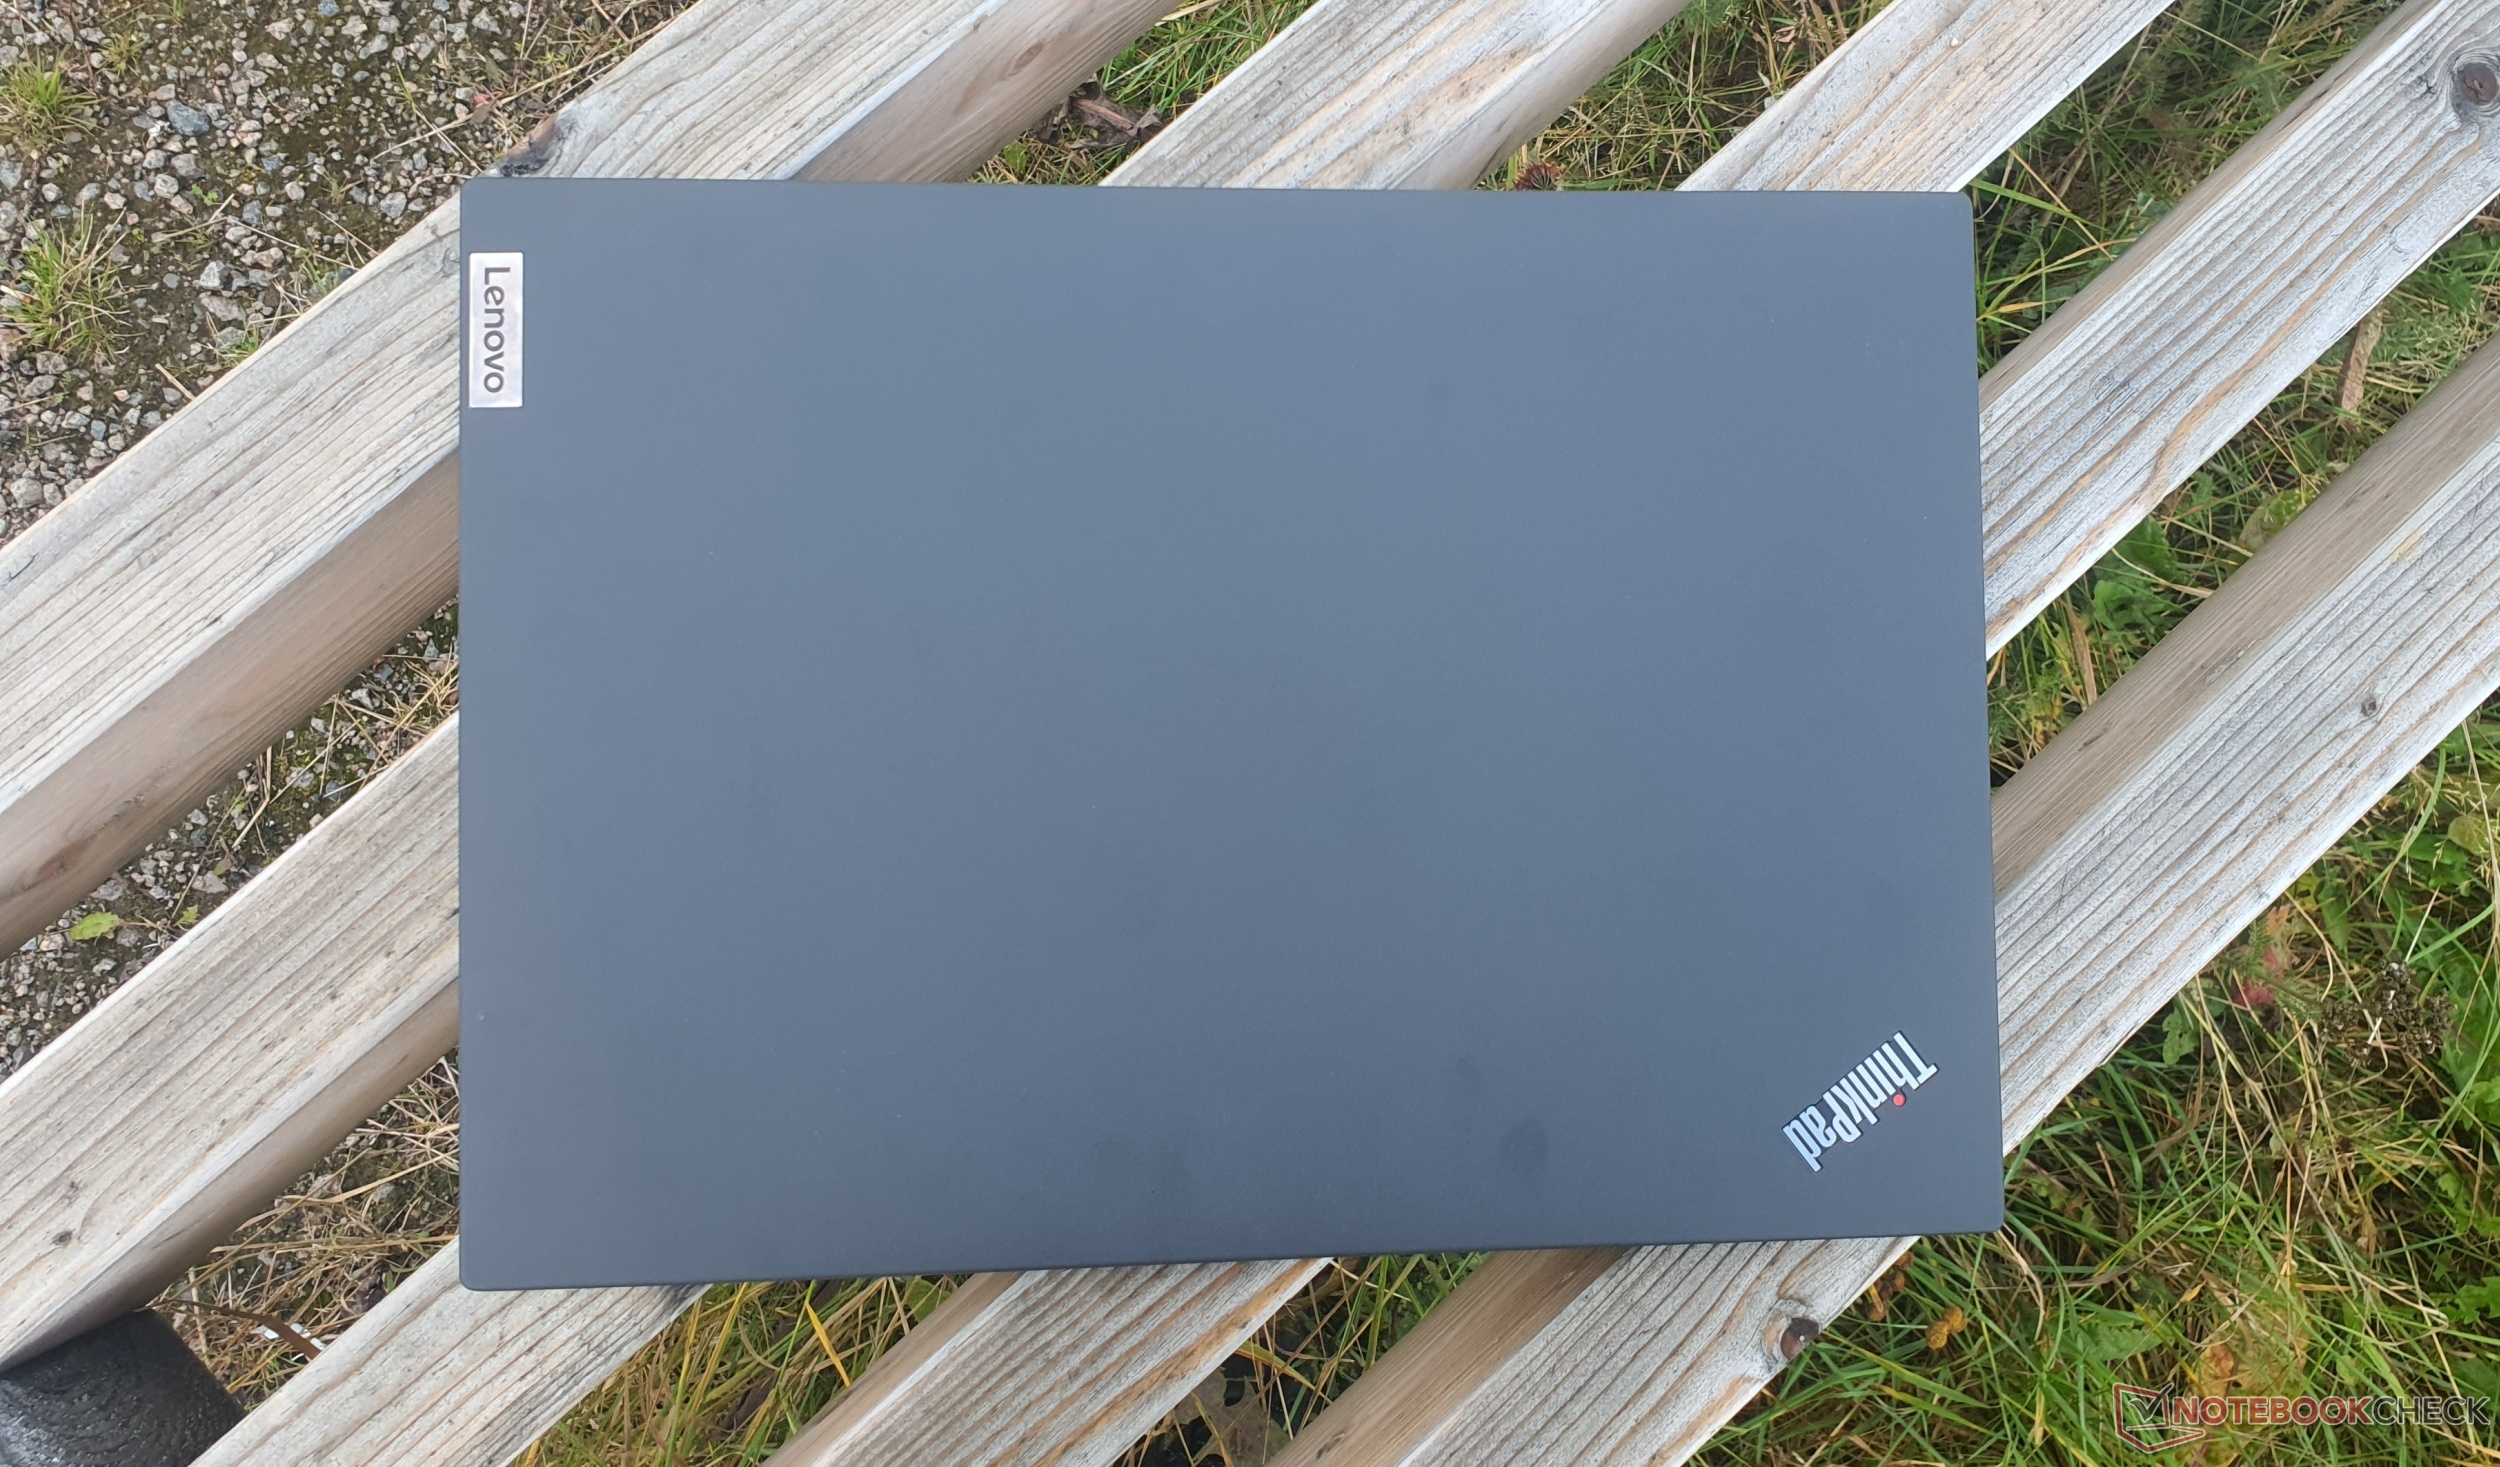
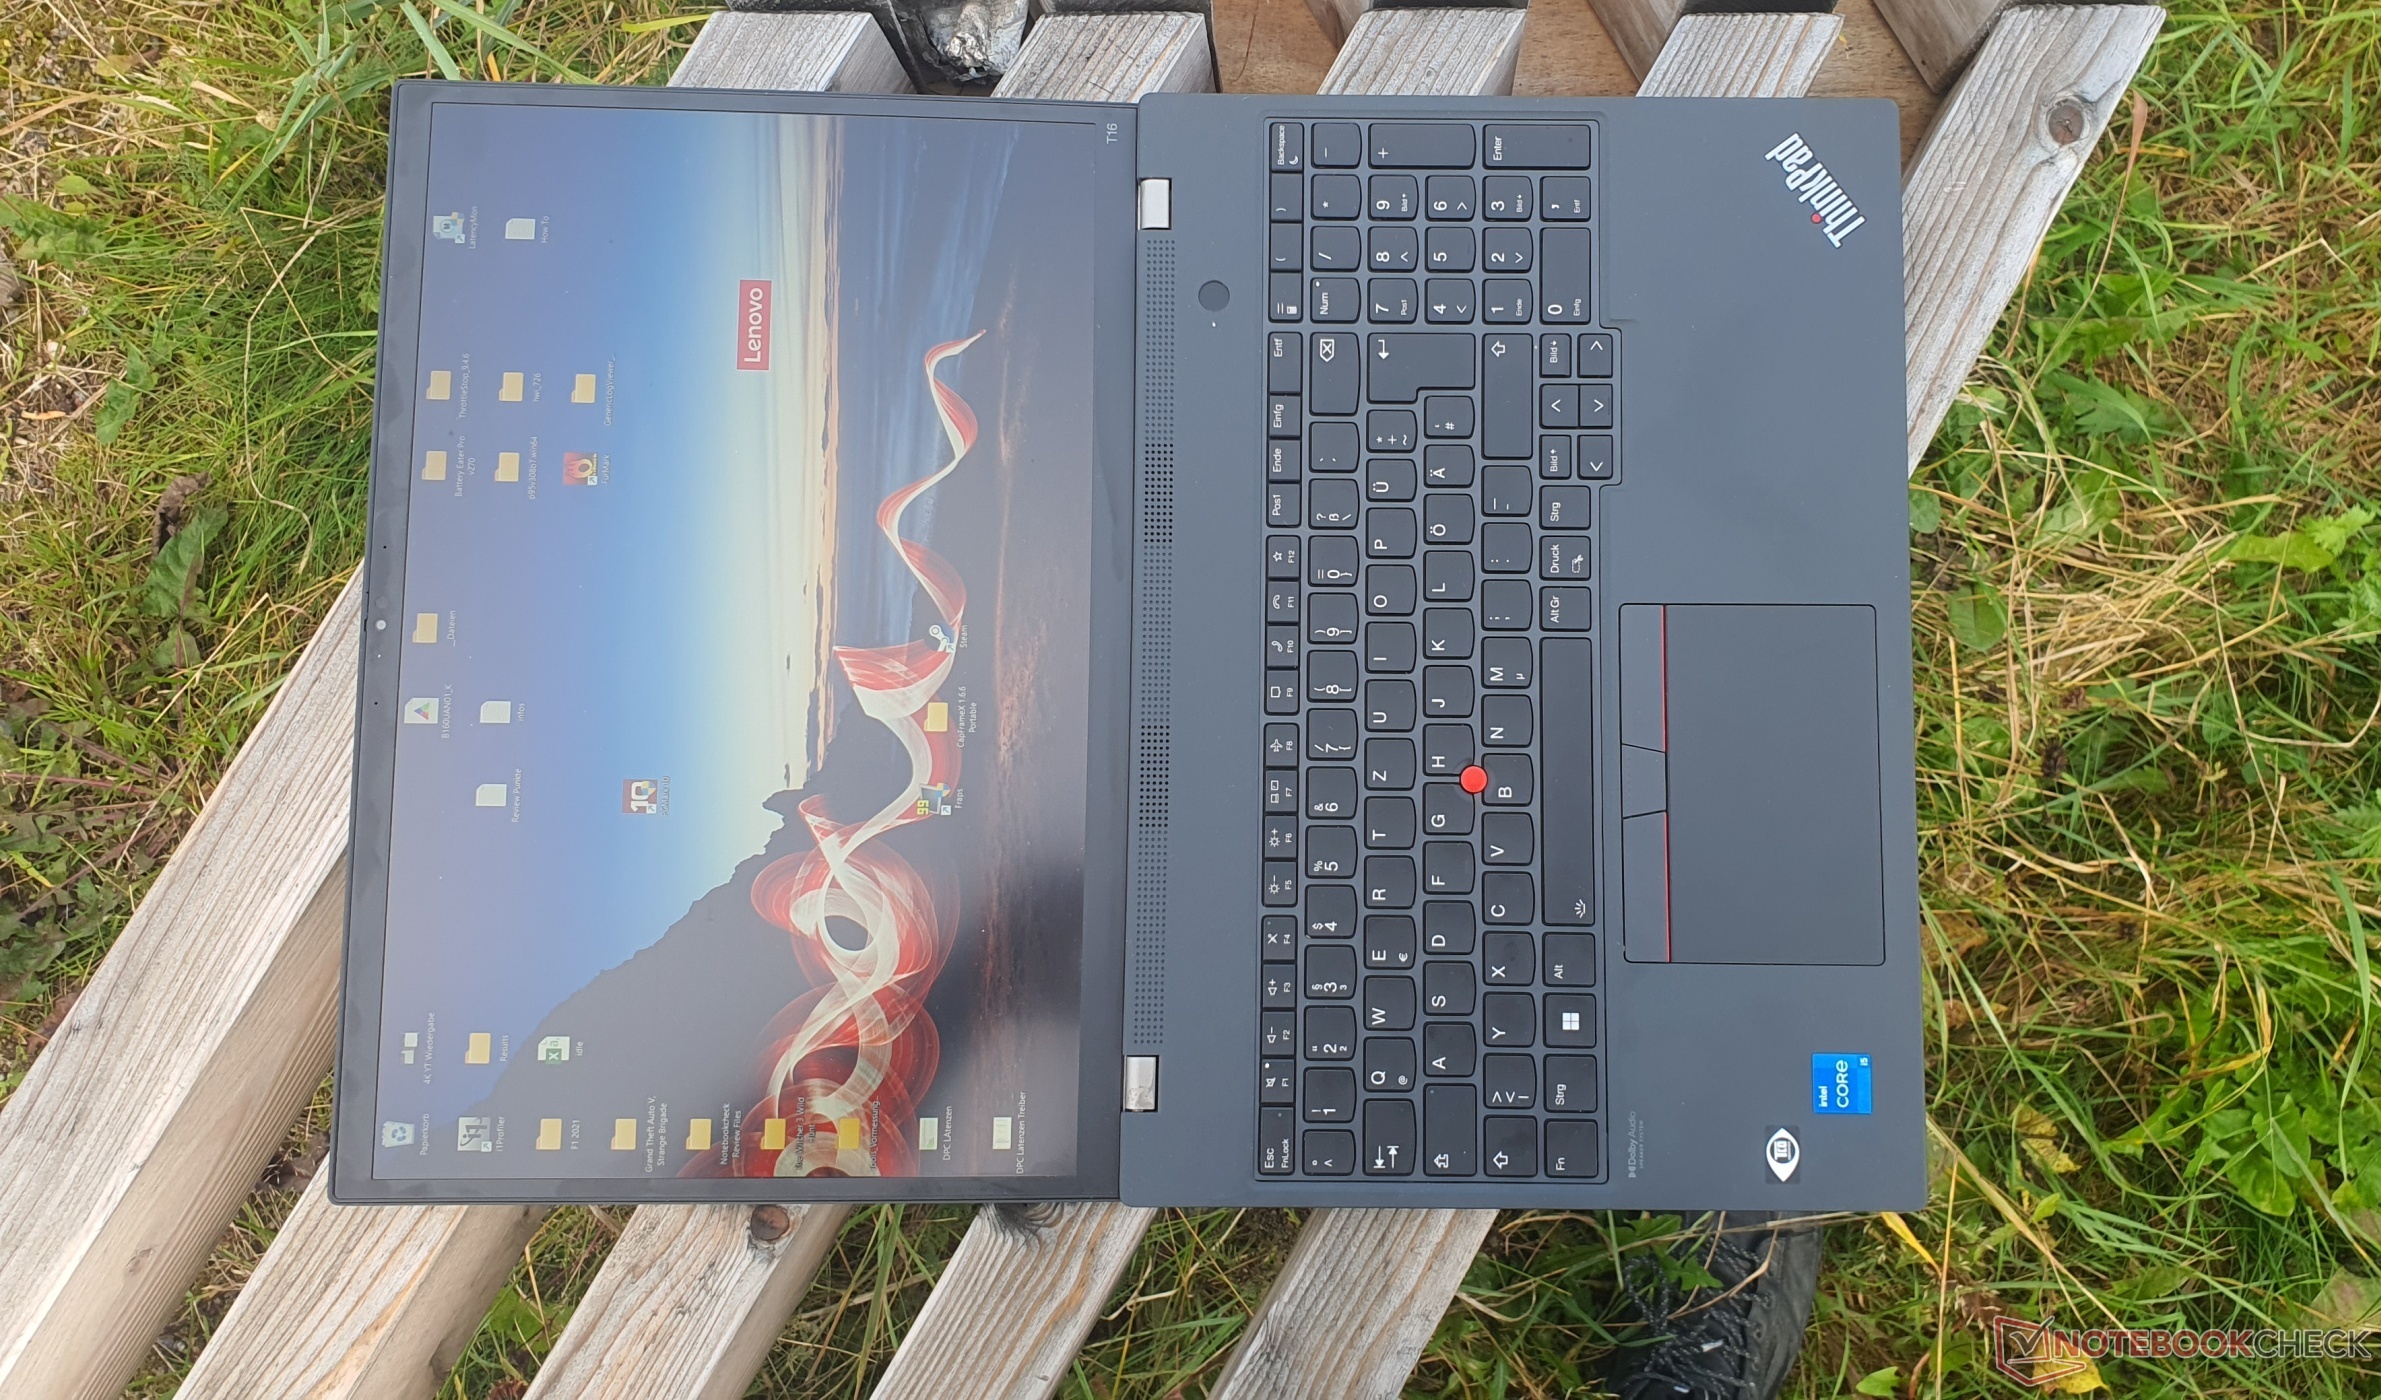
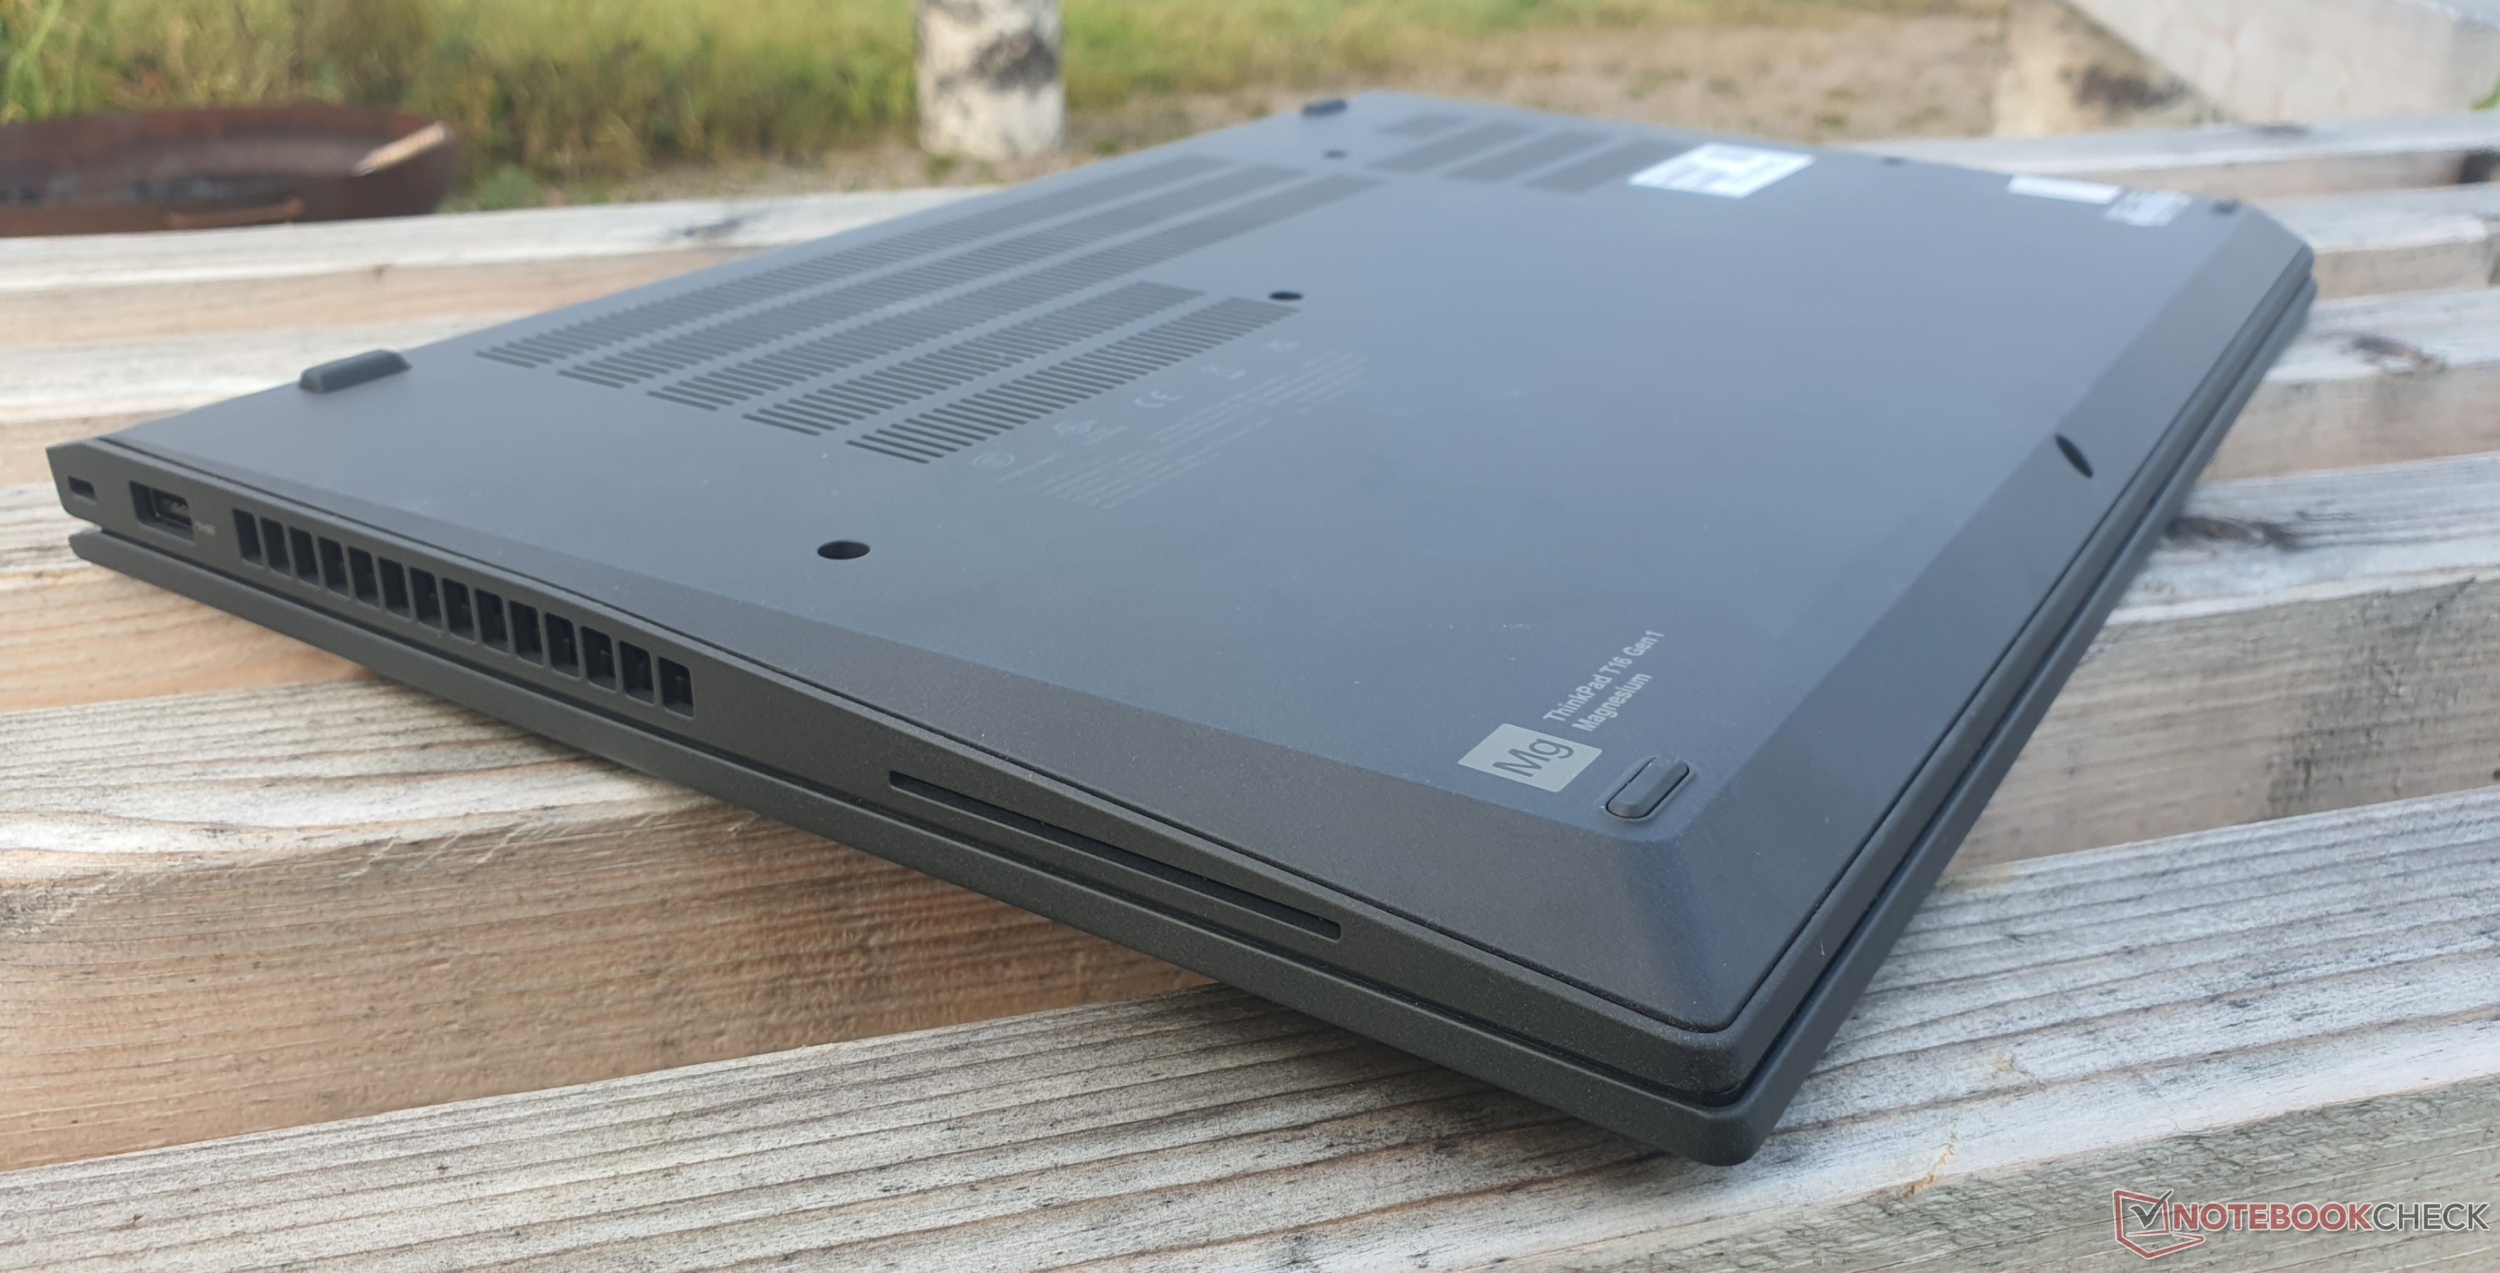
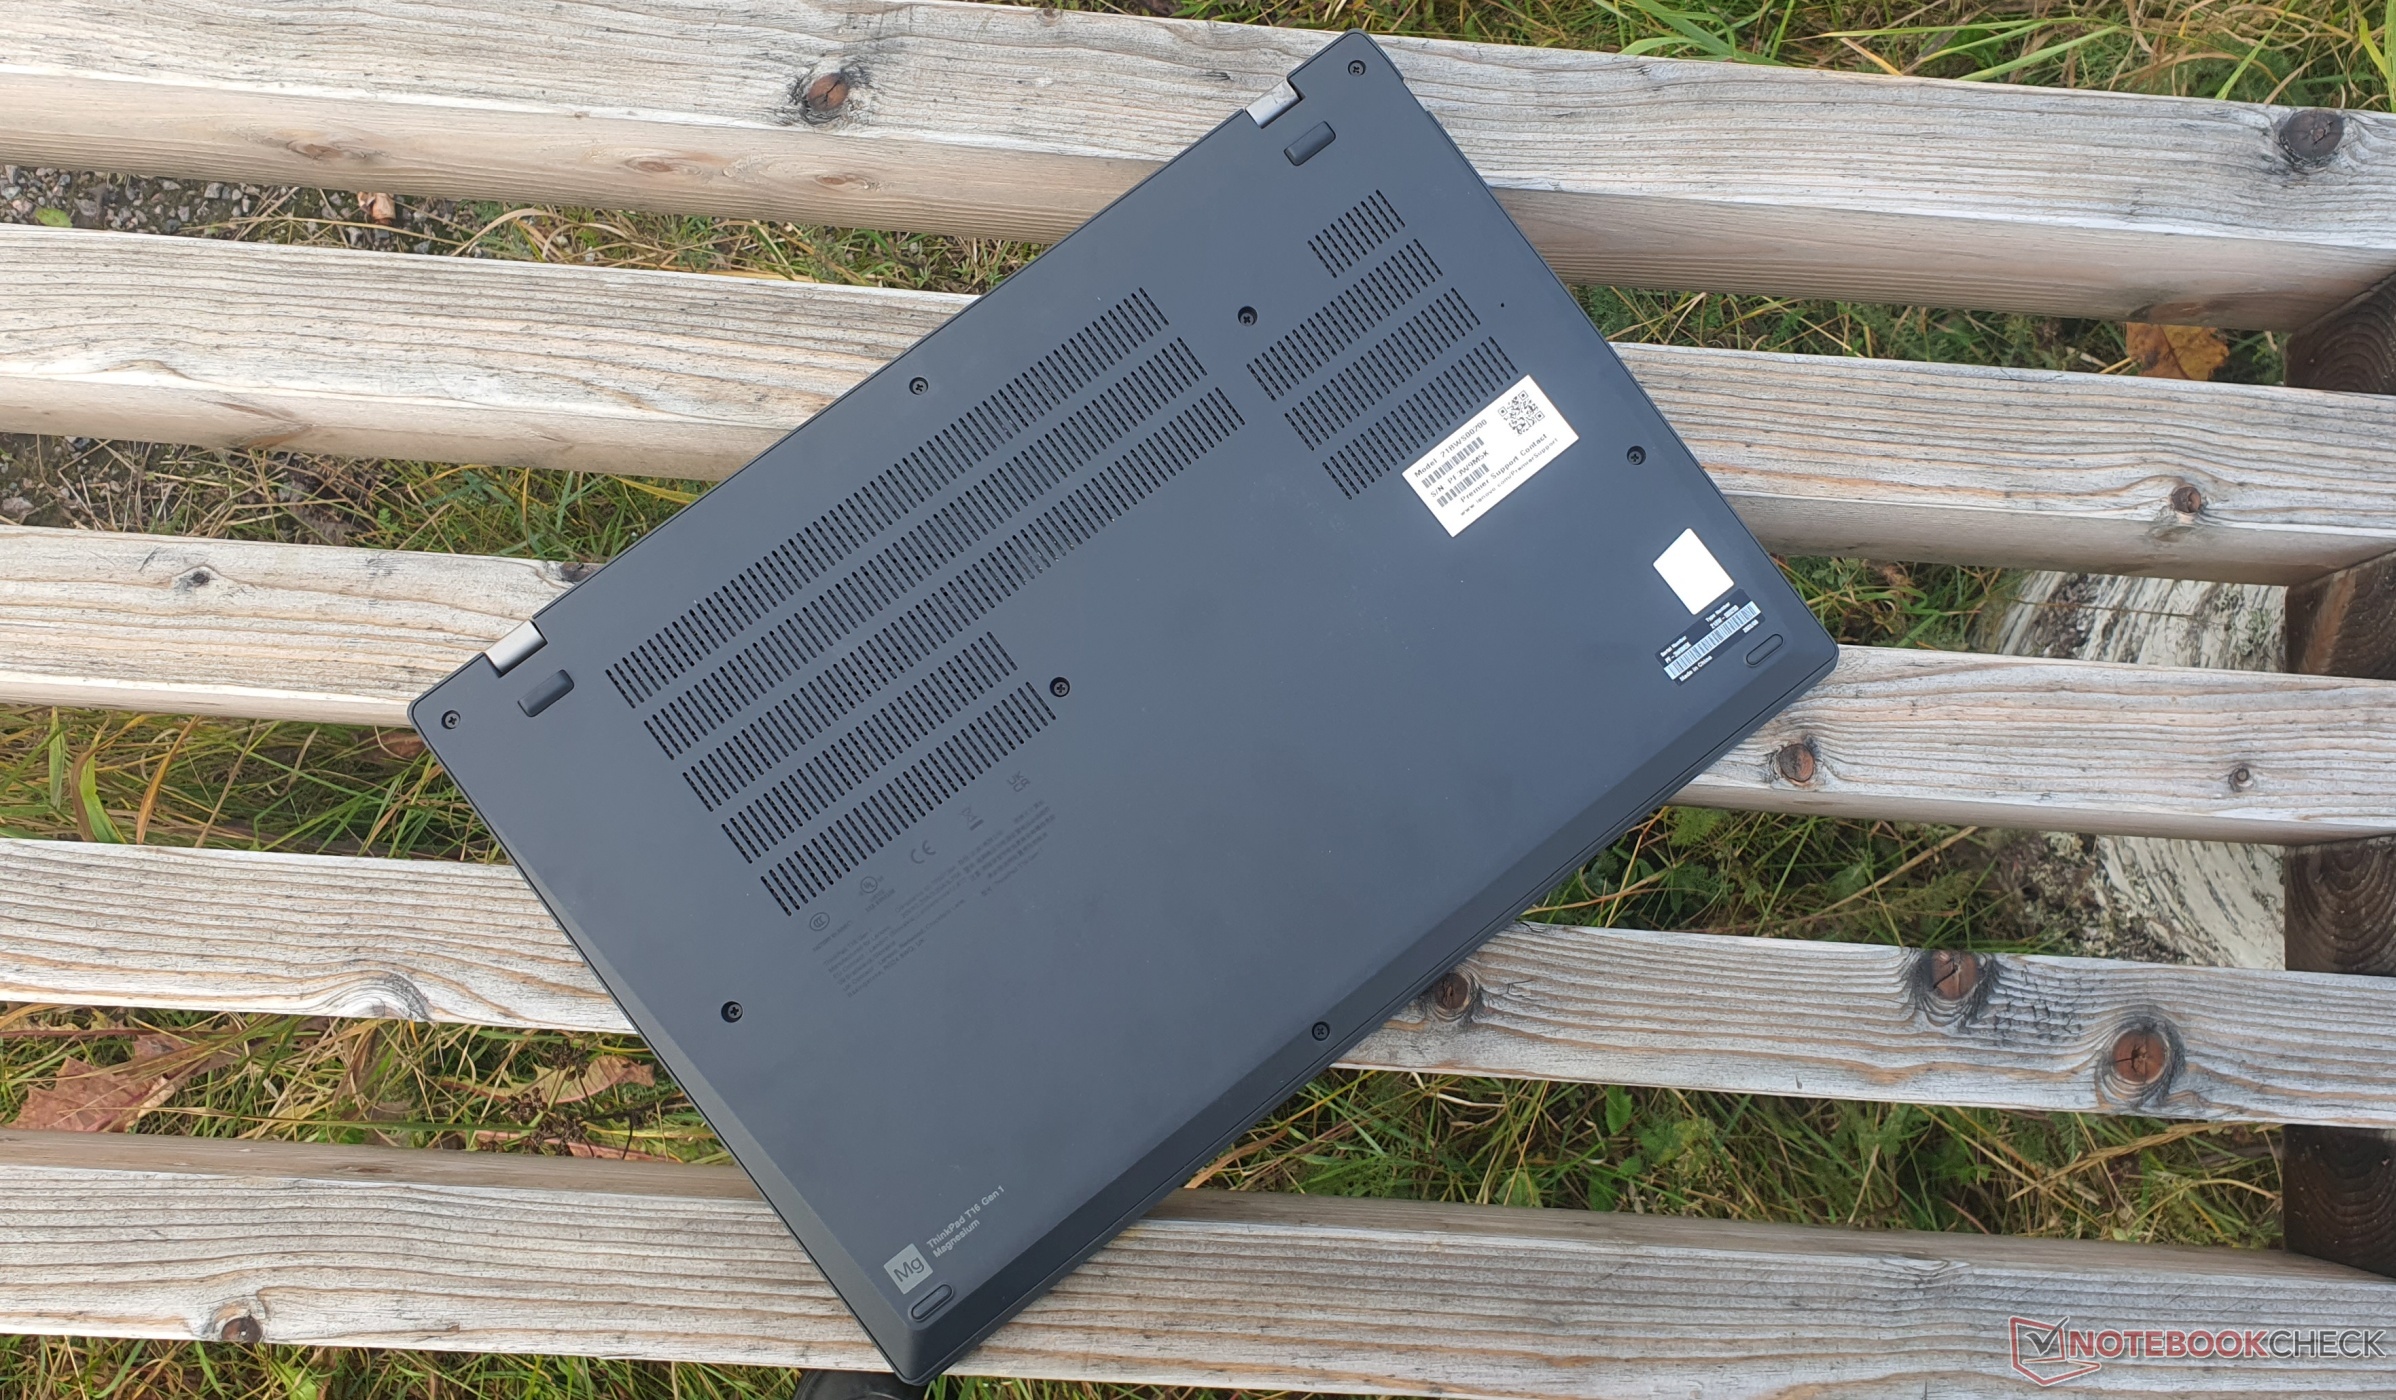
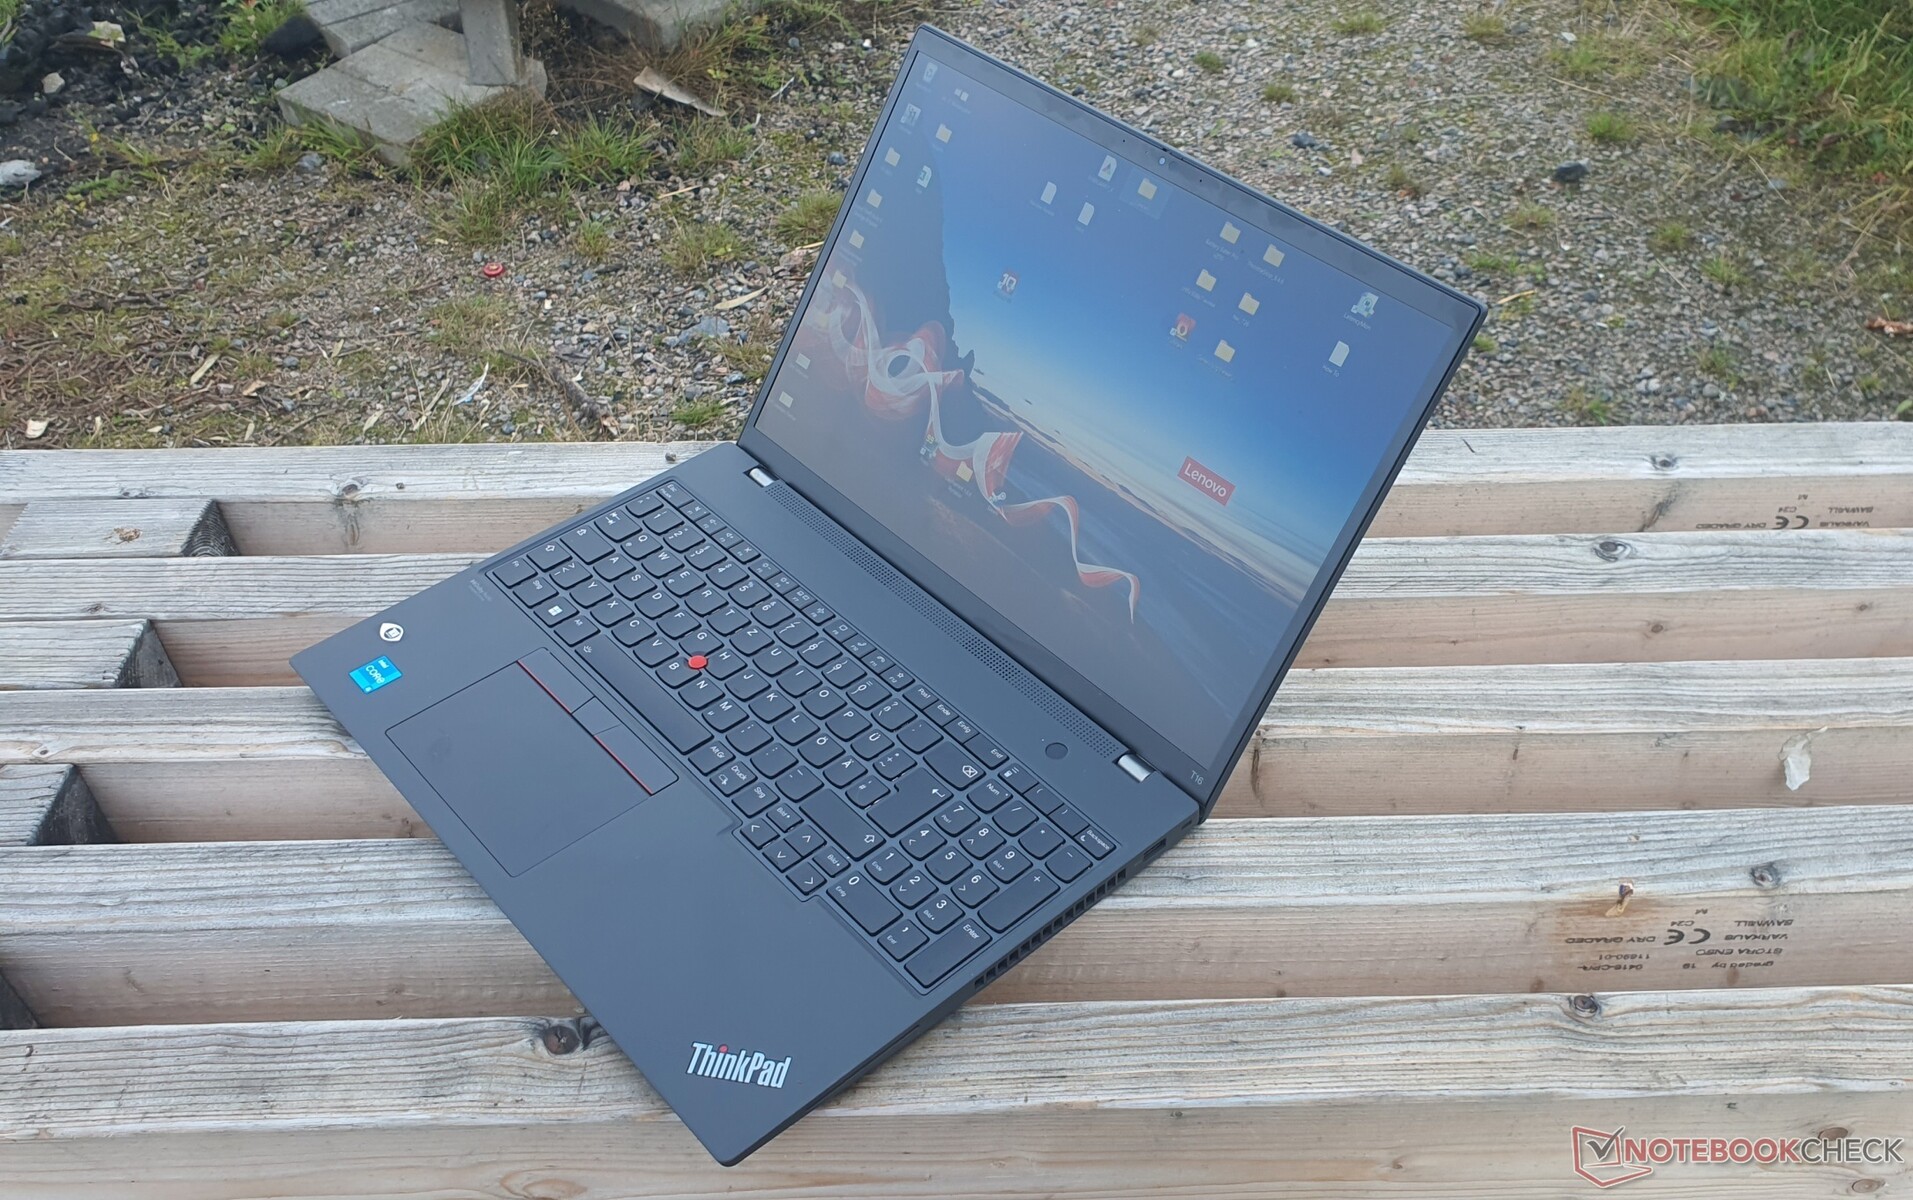
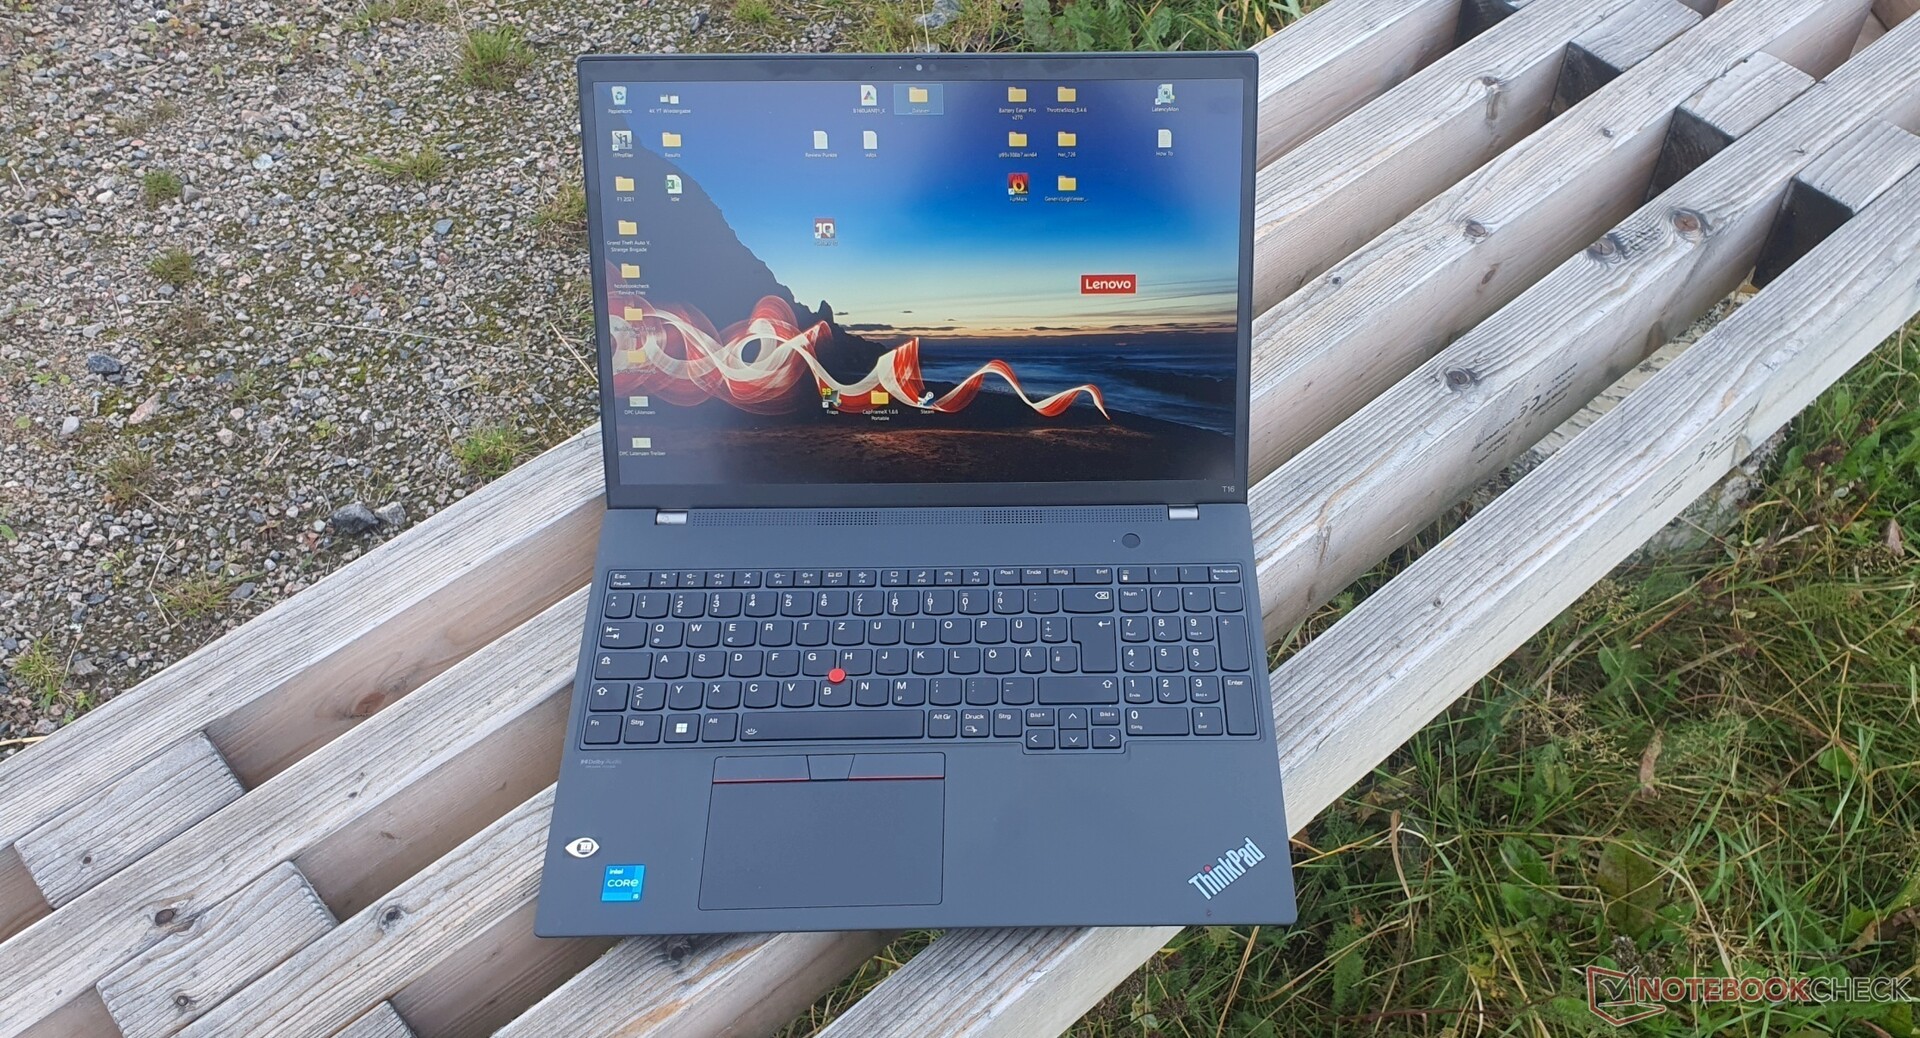
Carcasa: fibra de carbono utilizada por primera vez en el robusto ThinkPad T16
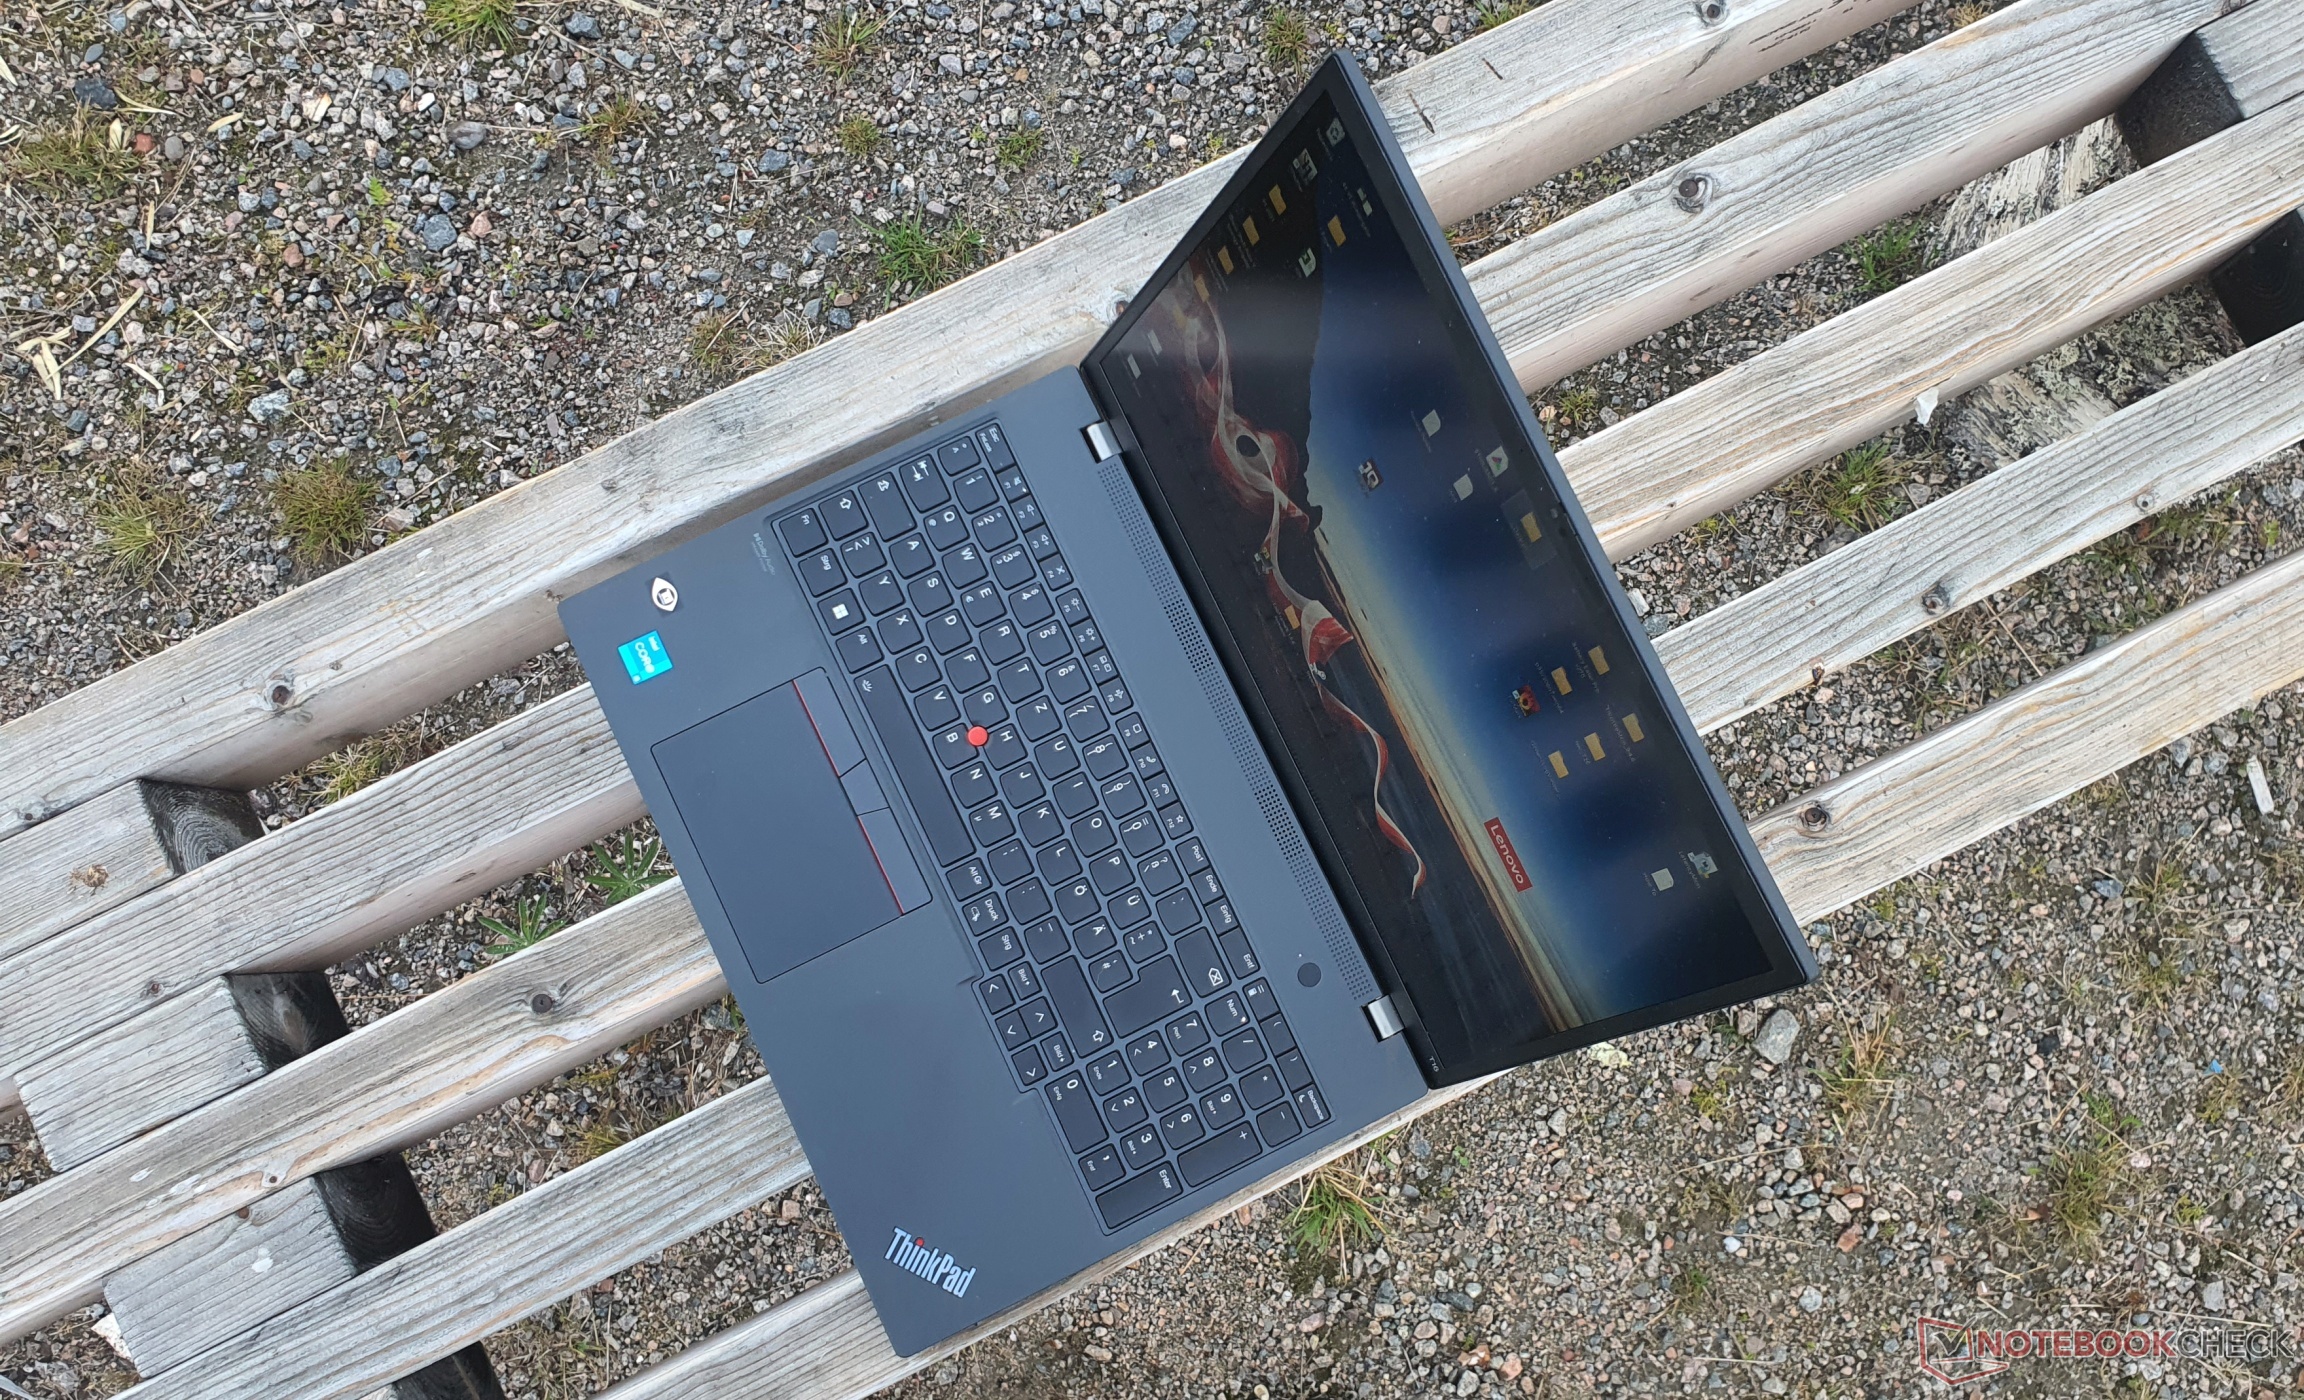
El ThinkPad T16 es de color antracita, similar alT14s G2las superficies ligeramente rugosas y engomadas también son las mismas y tienen un tacto de gran calidad.
Las huellas dactilares son visibles, pero mucho menos que antes. Los bordes de la pantalla son más estrechos debido al formato 16:10, mientras que el resto del diseño sigue siendo más o menos el mismo. Sin embargo, el dispositivo es 1,4 mm más grueso, un poco más corto, pero también un poco más profundo. Nuestro modelo pesa 1,95 kg, lo que se debe sobre todo a la capacidad de la batería seleccionada.
La fabricación, sin huecos, es sobresaliente, al igual que la estabilidad. La tapa apenas se puede torcer, y la presión dirigida a la tapa trasera no provoca ninguna distorsión de la imagen. No es de extrañar, ya que la tapa está hecha de una mezcla de fibra de carbono, fibra de vidrio y plástico. La fibra de carbono estaba reservada antes y exclusivamente para los modelos más caros de con el s-suffix
El reposamanos está hecho de una combinación de plástico, fibra de vidrio, magnesio y aluminio. Así, la base resulta muy resistente a los esfuerzos de torsión. La parte inferior está hecha completamente de termoplástico. Las robustas bisagras están ajustadas, pero es posible abrirlas con una sola mano hasta 180°.

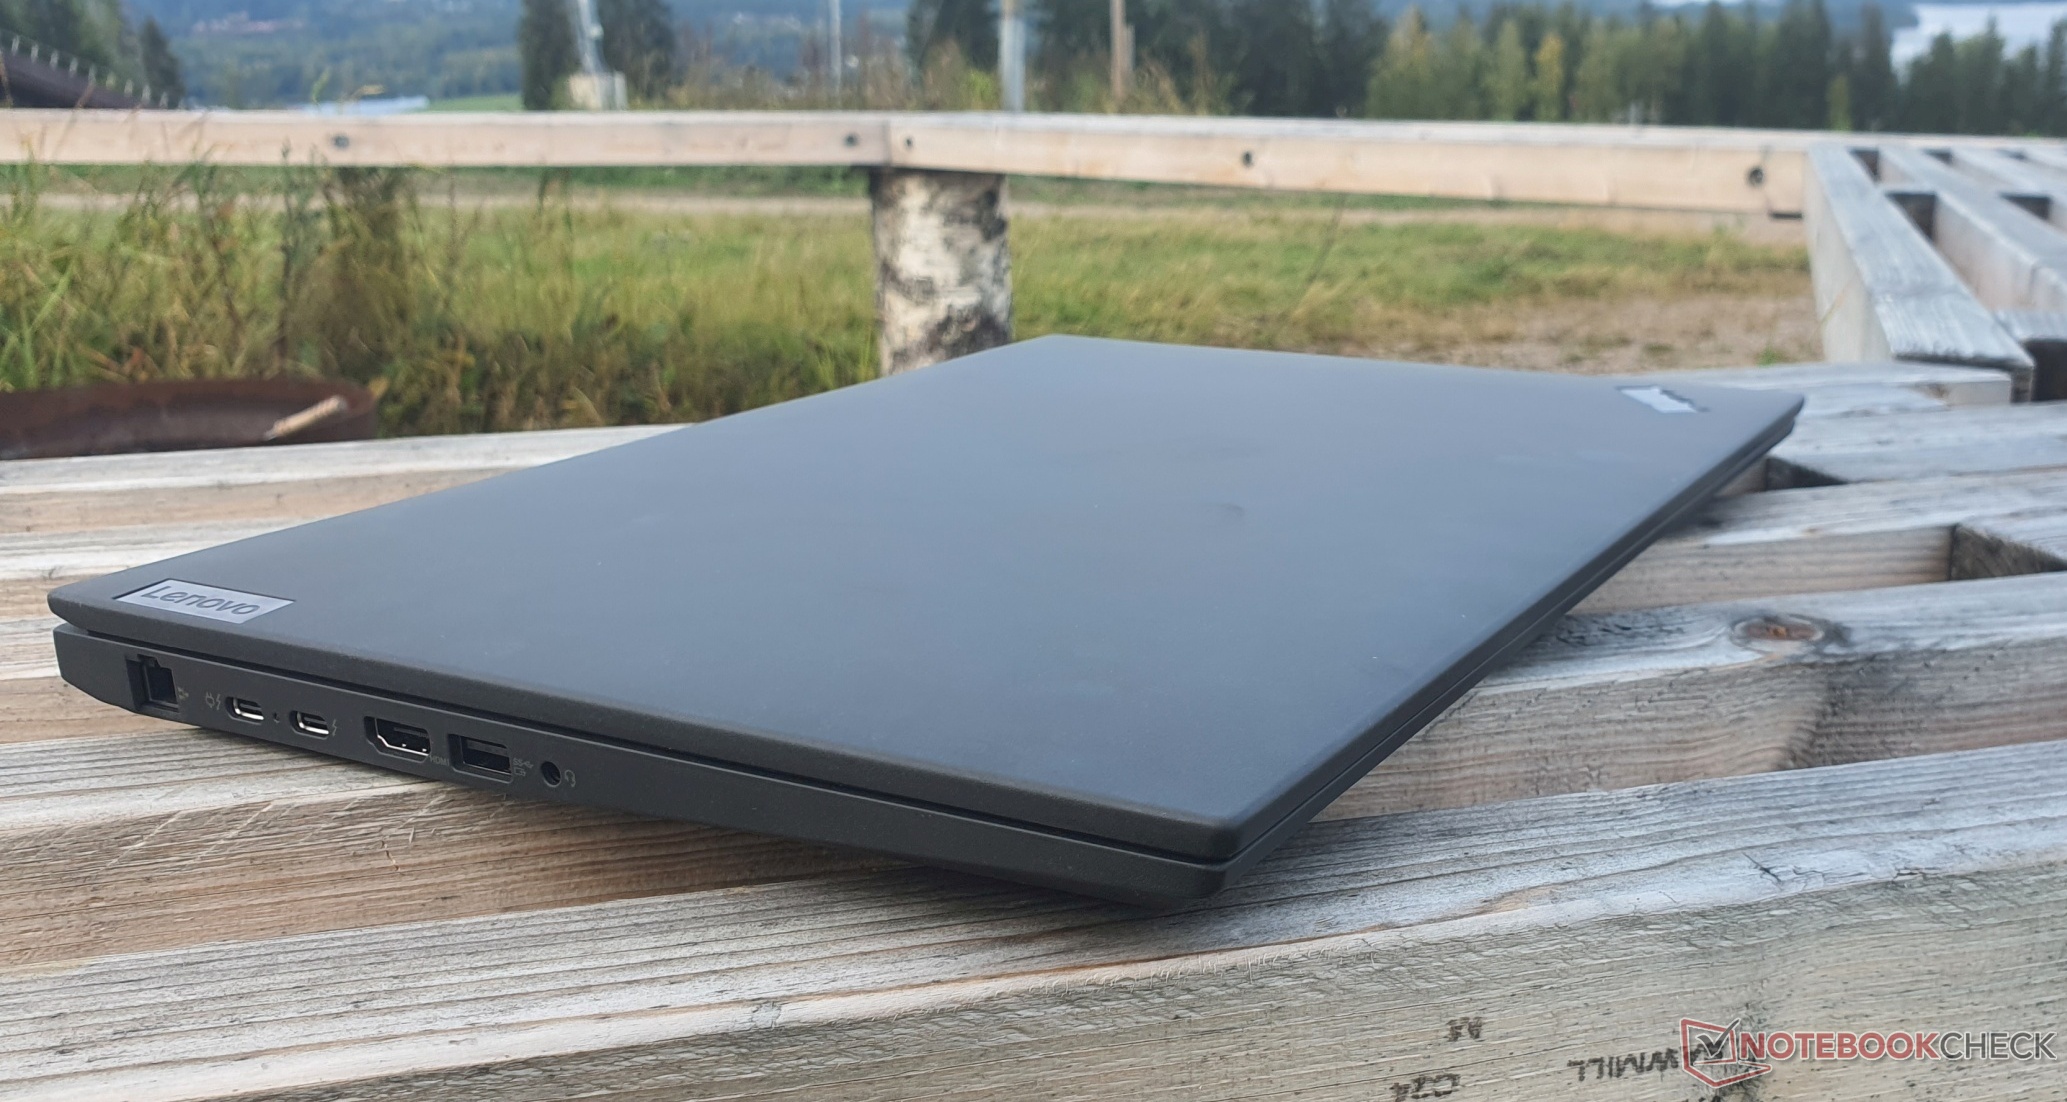
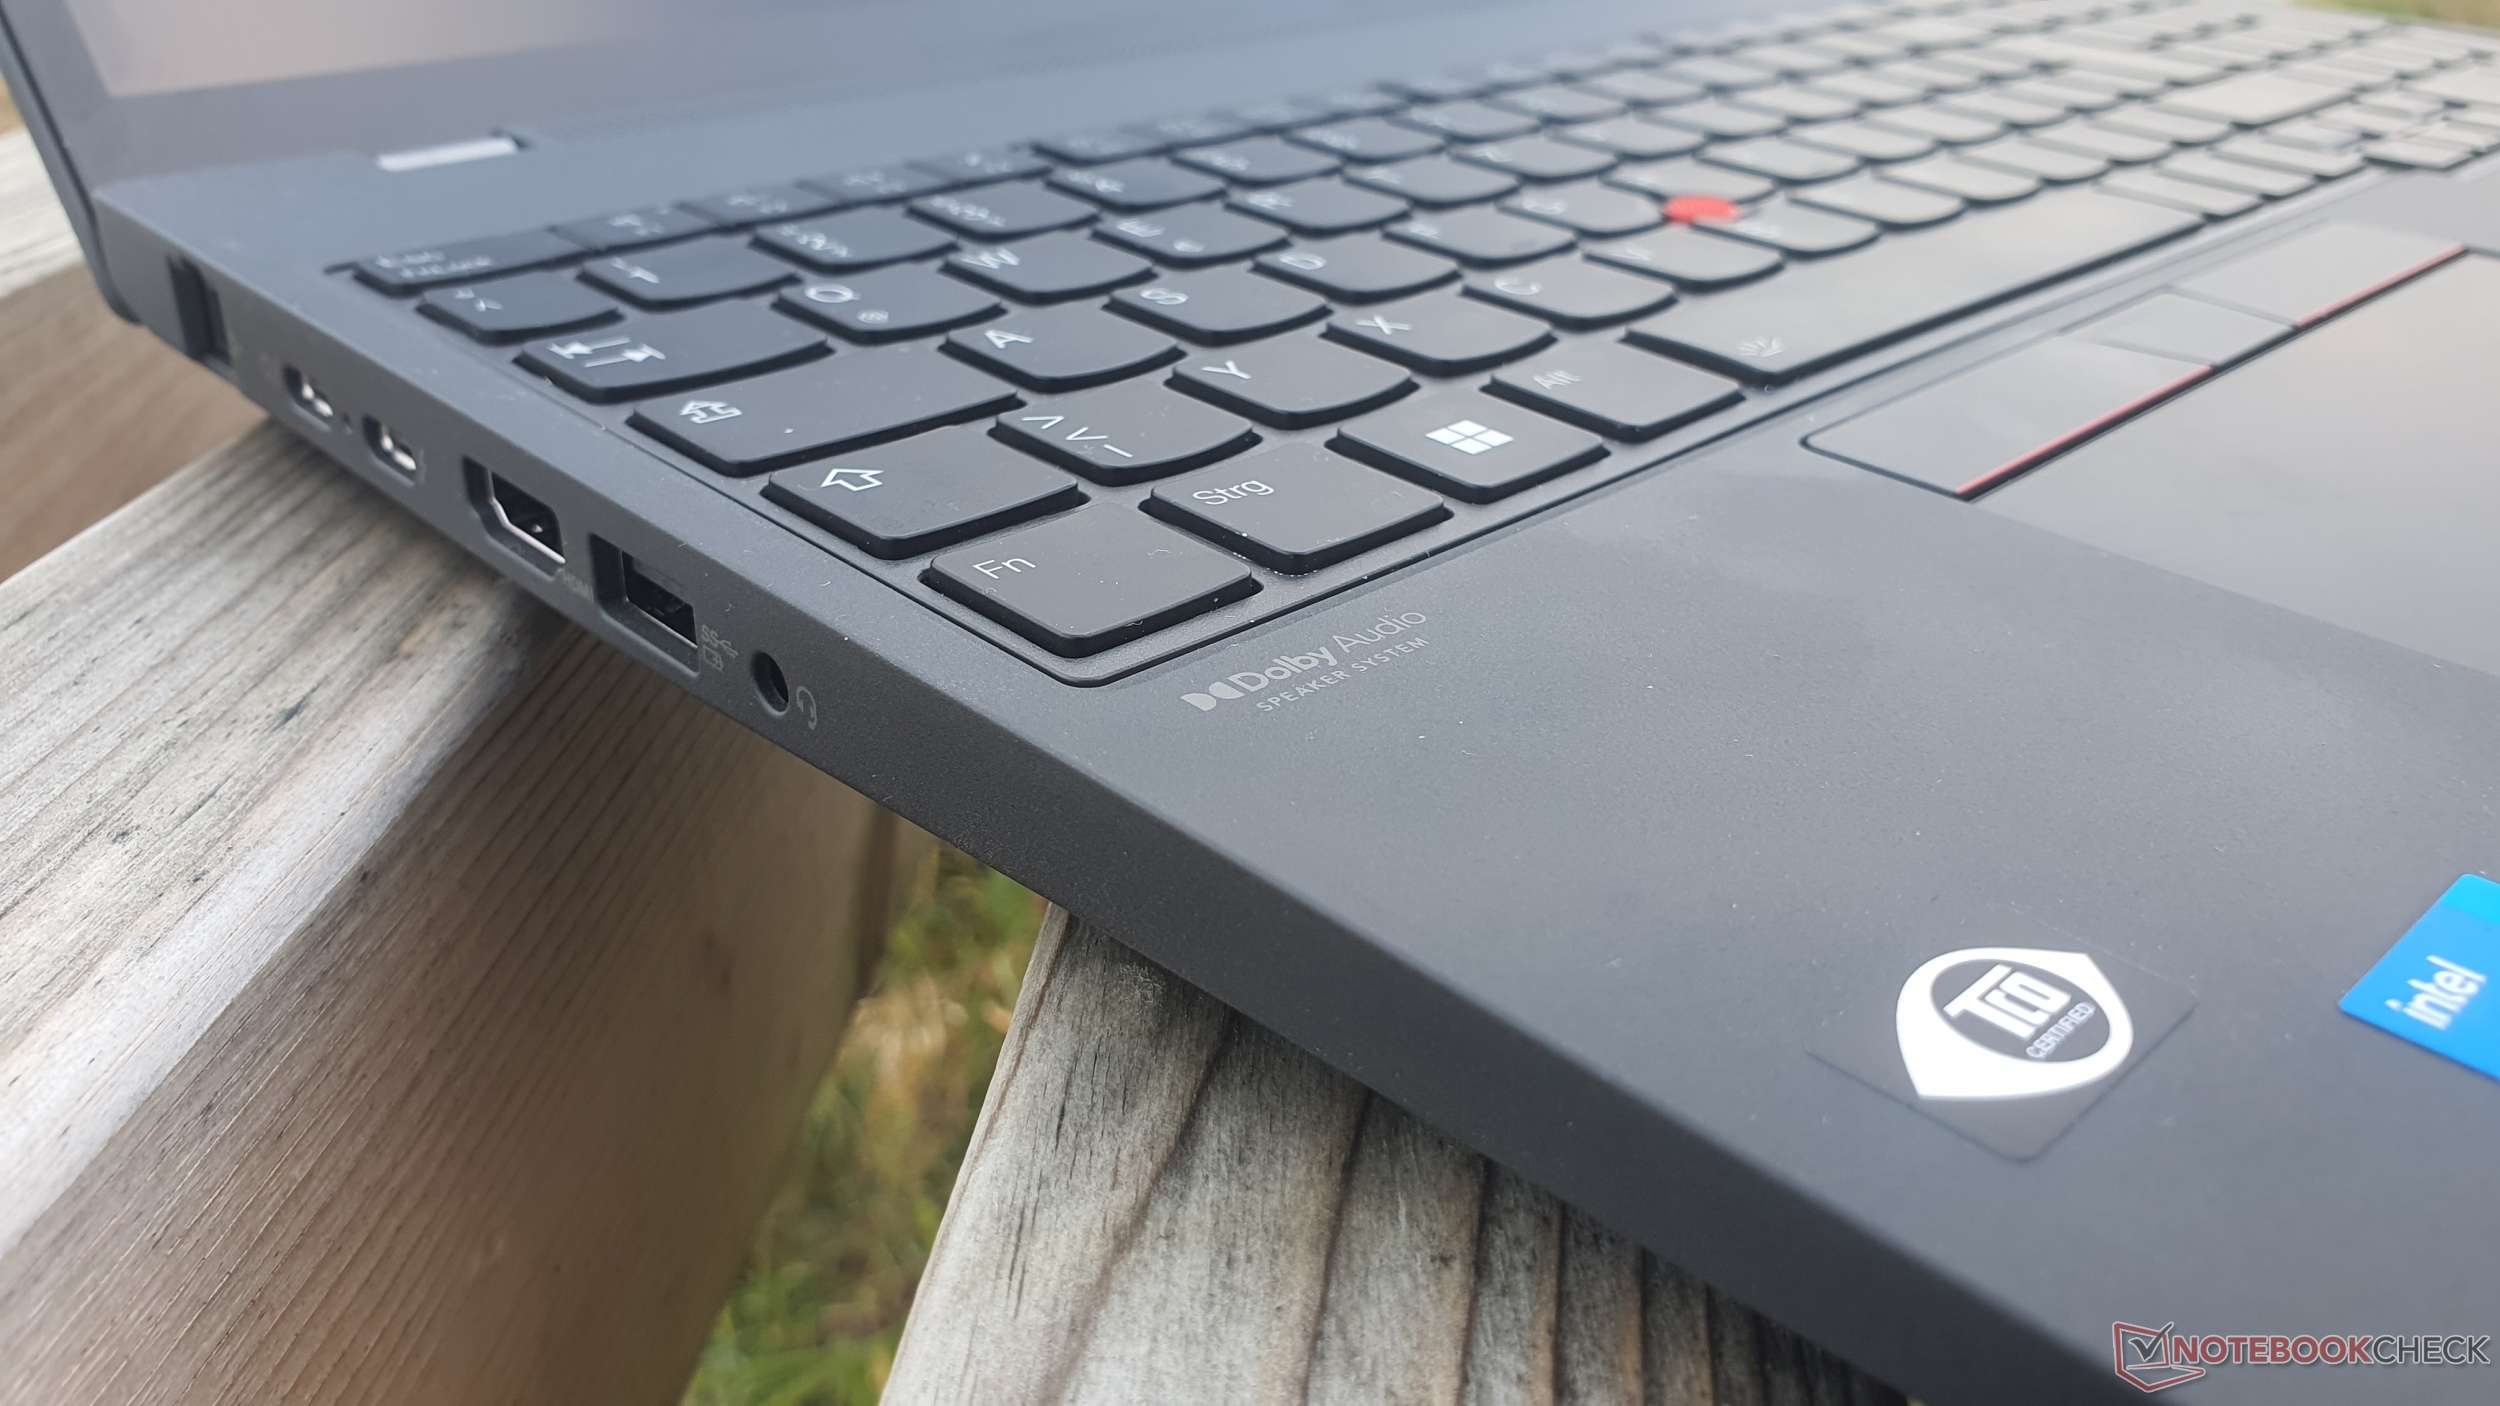
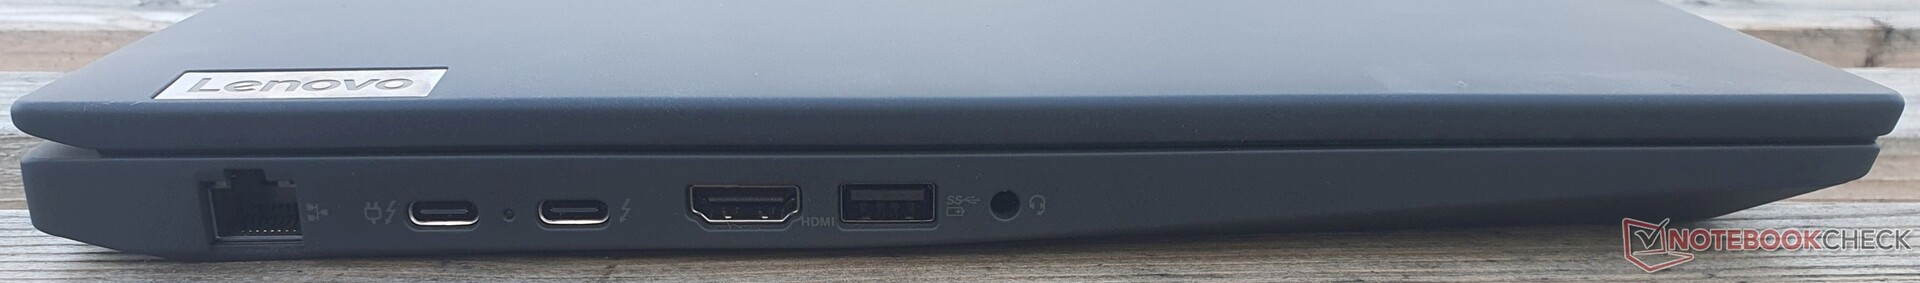
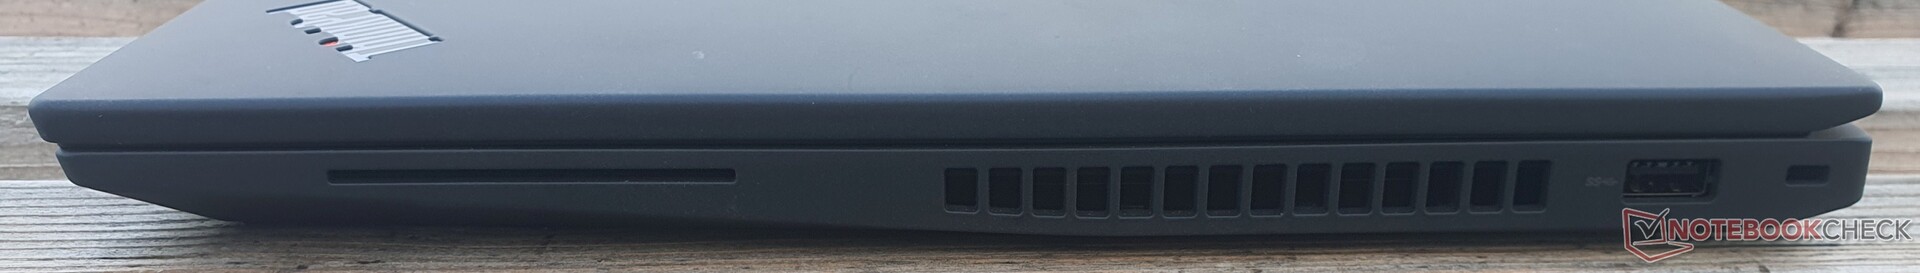
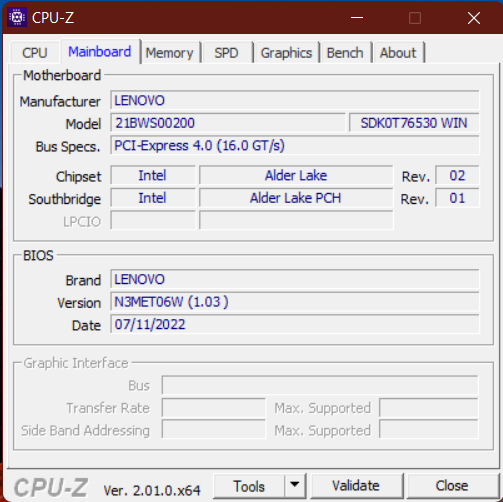
Equipo - RJ45, TB4, Wi-Fi 6E soldado y cámara 1080p
El uso continuado de un puerto LAN GBit es agradable, pero la omisión del lector de tarjetas microSD en la serie T lo es menos. Por lo demás, el ThinkPad ofrece todo lo necesario con 2x USB-A 3.2 Gen 1, HDMI 2.0b y 2x Thunderbolt 4, incluyendo carga de 100 vatios y DisplayPort 1.4. Esto significa que se pueden conectar hasta tres monitores adicionales: 2x 5K60 @TB4 + 1x 4K60 @HDMI.
Comunicación
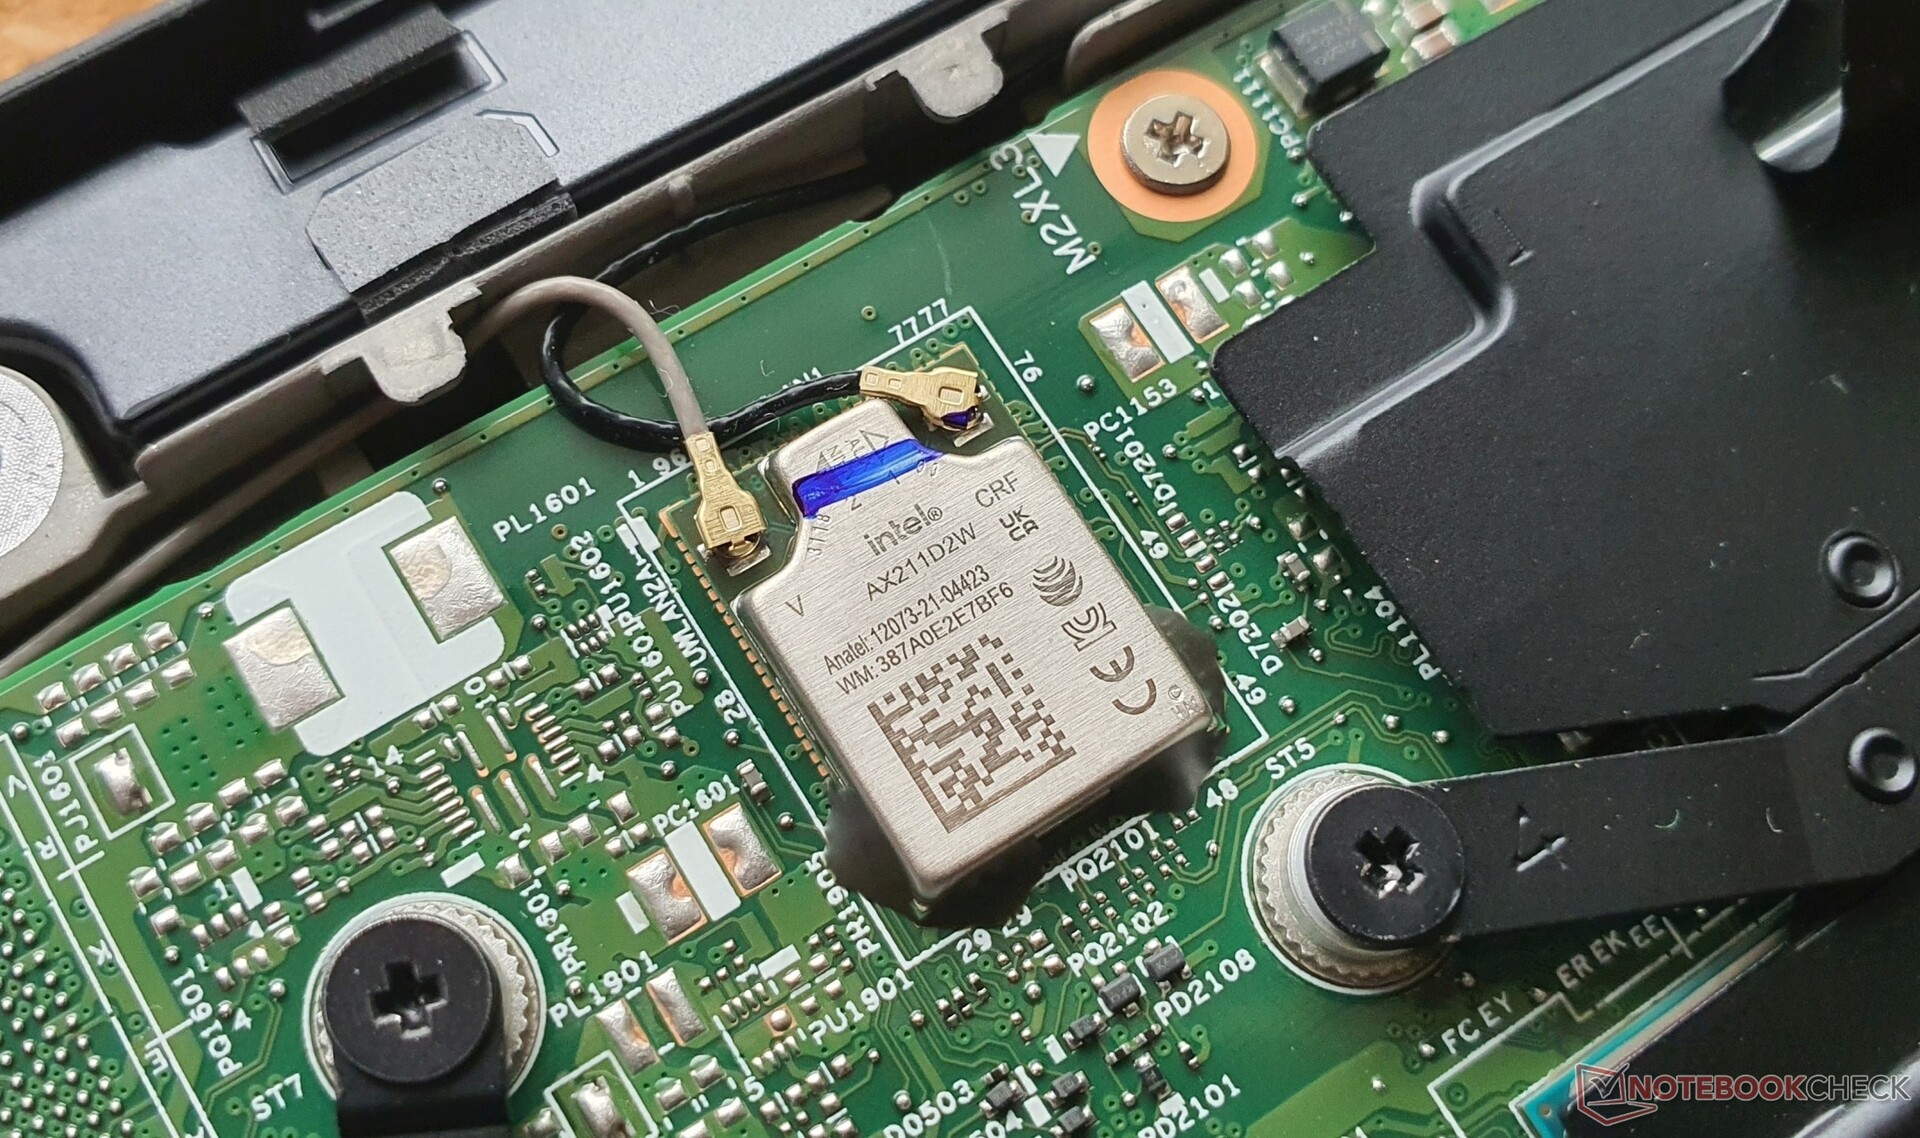
El AX211 soldado de Intel es el responsable del Wi-Fi 6E. Registramos velocidades ejemplares de más de 1.6 GBit/s en ambas direcciones, por lo que nuestro campo de comparación queda fácilmente liderado por el Lenovo ThinkPad T16 G1.
También hay Bluetooth 5.2 y WWAN opcional con 4G. En nuestro modelo de pruebas, hay una ranura M.2 2242 libre, y las antenas pueden mejorarse. NFC es opcional.
| Networking | |
| Lenovo ThinkPad T16 G1 21BWS00200 | |
| iperf3 transmit AXE11000 6GHz | |
| iperf3 receive AXE11000 6GHz | |
| Huawei MateBook D 16 2022 | |
| iperf3 receive AXE11000 | |
| iperf3 transmit AXE11000 | |
| Lenovo ThinkPad T15 Gen2-20W5S00100 | |
| iperf3 transmit AX12 | |
| iperf3 receive AX12 | |
| HP ZBook Power 15 G8 313S5EA | |
| iperf3 transmit AX12 | |
| iperf3 receive AX12 | |
| HP ProBook 450 G9 6A180EA | |
| iperf3 transmit AXE11000 6GHz | |
| iperf3 receive AXE11000 6GHz | |
| Lenovo ThinkPad X1 Extreme G4-20Y5CTO1WW (3050 Ti) | |
| iperf3 transmit AX12 | |
| iperf3 receive AX12 | |
| Dell Inspiron 16 Plus 7620 | |
| iperf3 transmit AXE11000 6GHz | |
| iperf3 receive AXE11000 6GHz | |
| Lenovo ThinkPad E15 G3-20YG003UGE | |
| iperf3 transmit AX12 | |
| iperf3 receive AX12 | |
| Lenovo ThinkPad L15 G2 AMD | |
| iperf3 transmit AX12 | |
| iperf3 receive AX12 | |
Cámara web
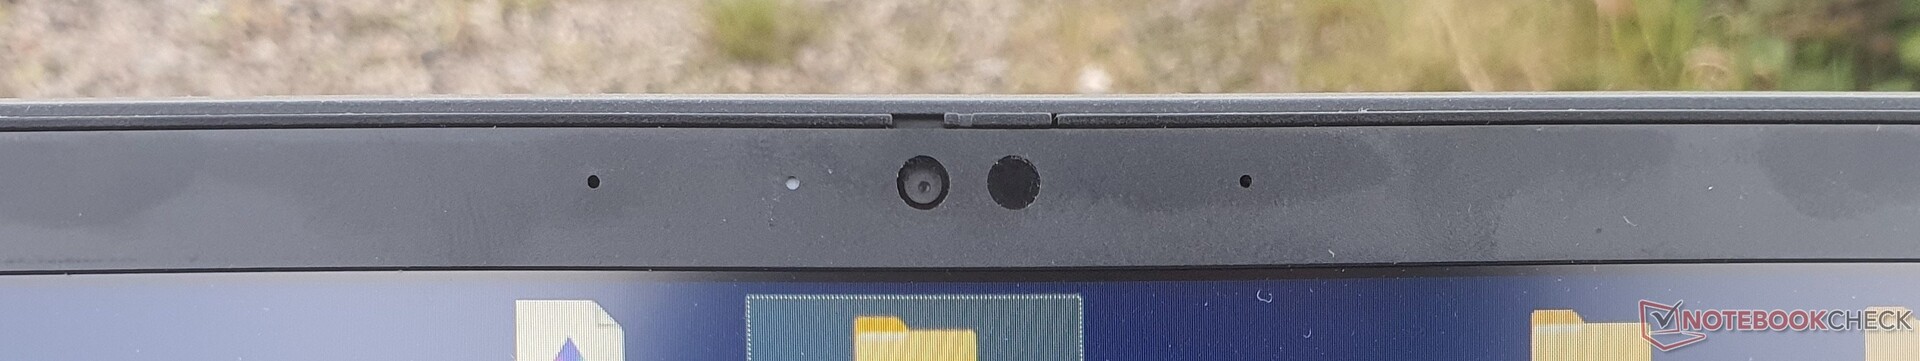
La webcam de 1080p sigue sin impresionar, pero es mucho menos ruidosa y lavada. Además, hay dos micrófonos de doble matriz con buena calidad de grabación, así como IR para Windows Hello.


Seguridad
Para la seguridad, Lenovo ofrece un lector de tarjetas inteligentes opcional, IR para Windows Hello y una apertura de cámara física en el ThinkPad T16 Gen. 1. Otras características de seguridad incluyen TPM 2.0, un bloqueo Kensington y el escáner de huellas dactilares opcional. La detección de presencia humana y Mirametrix Glance se utilizan para el software.
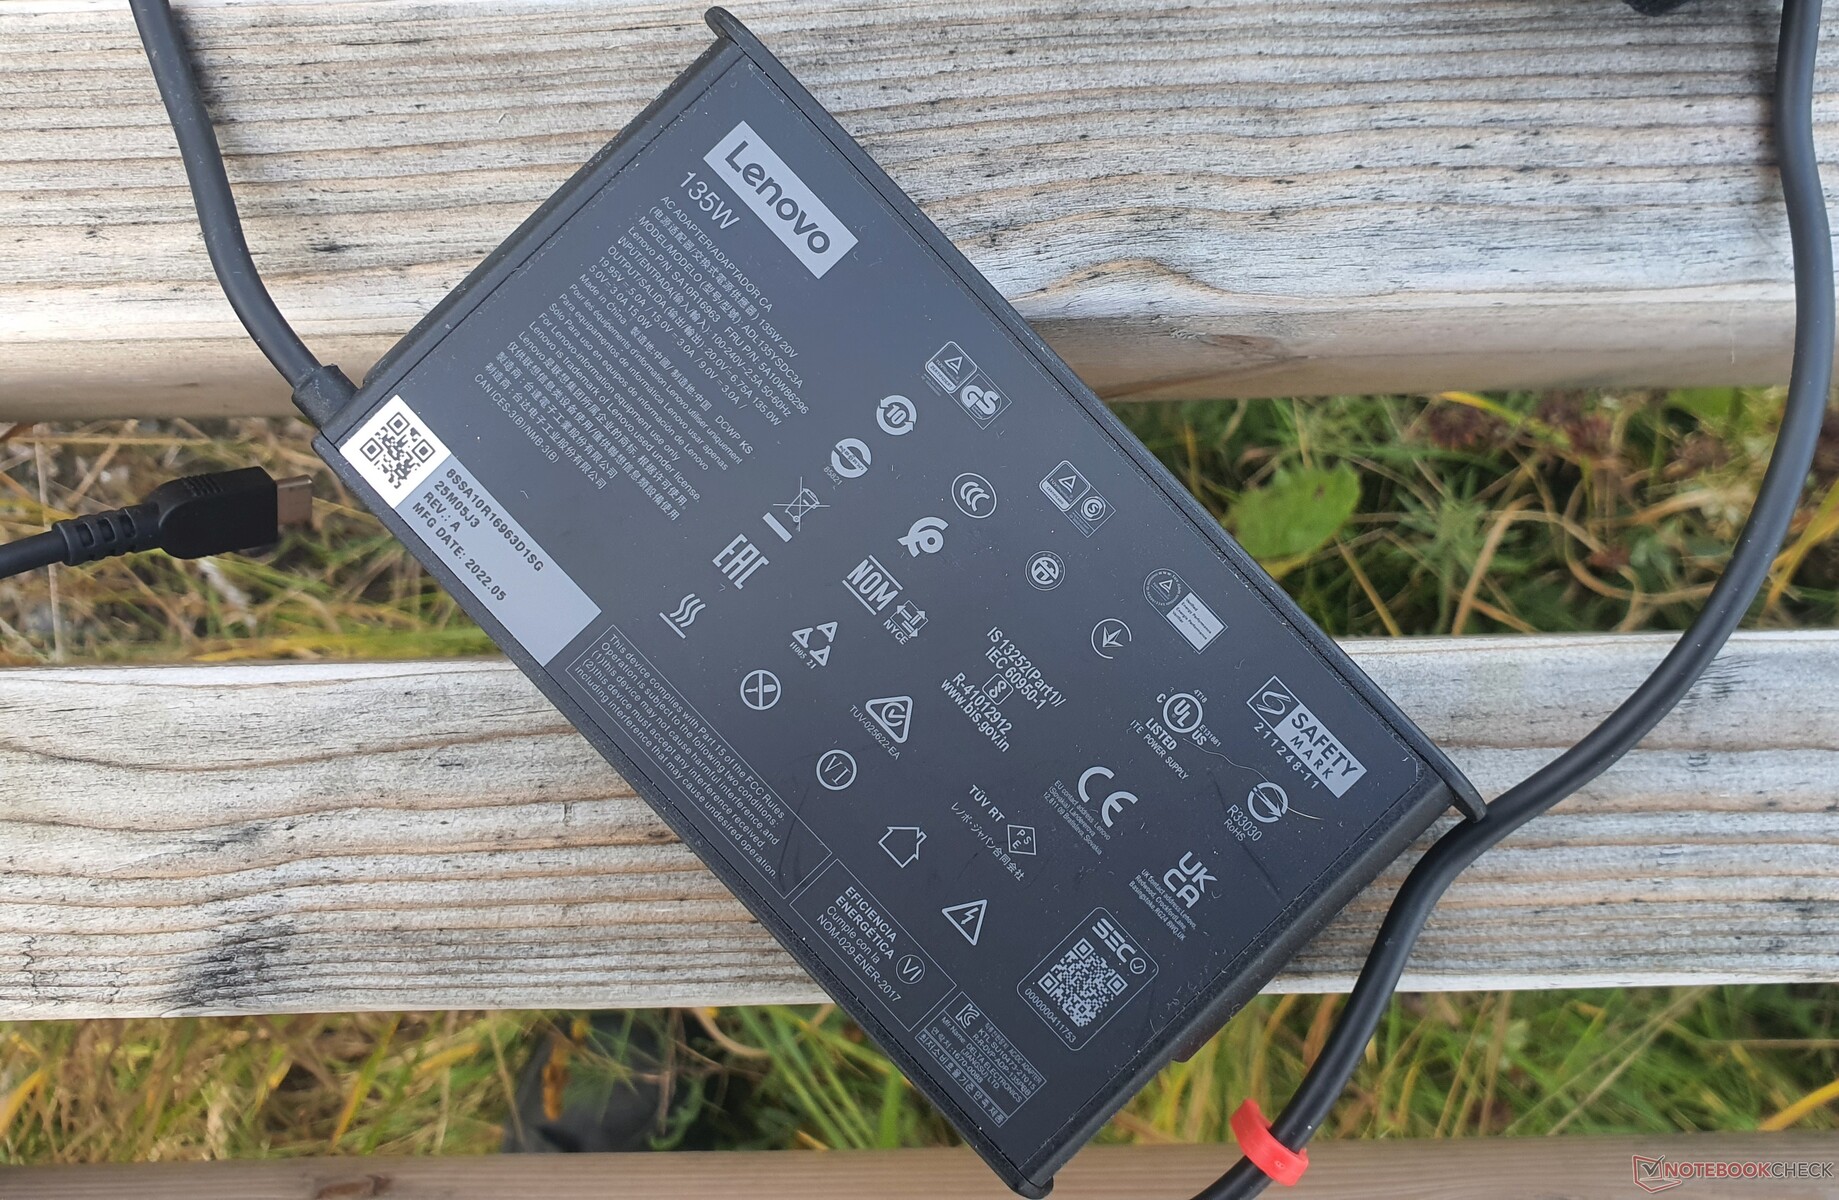
Accesorios
No hay puerto de acoplamiento, pero se pueden utilizar bases USB-C. El volumen de suministro sólo incluye un cargador USB-C Slim de 135 vatios. Los modelos con CPUs de la serie U tienen que conformarse con 65 vatios. Por otro lado, también es posible utilizar un cargador propio de 45 vatios. El embalaje es 90% reciclado o hecho de madera sostenible.
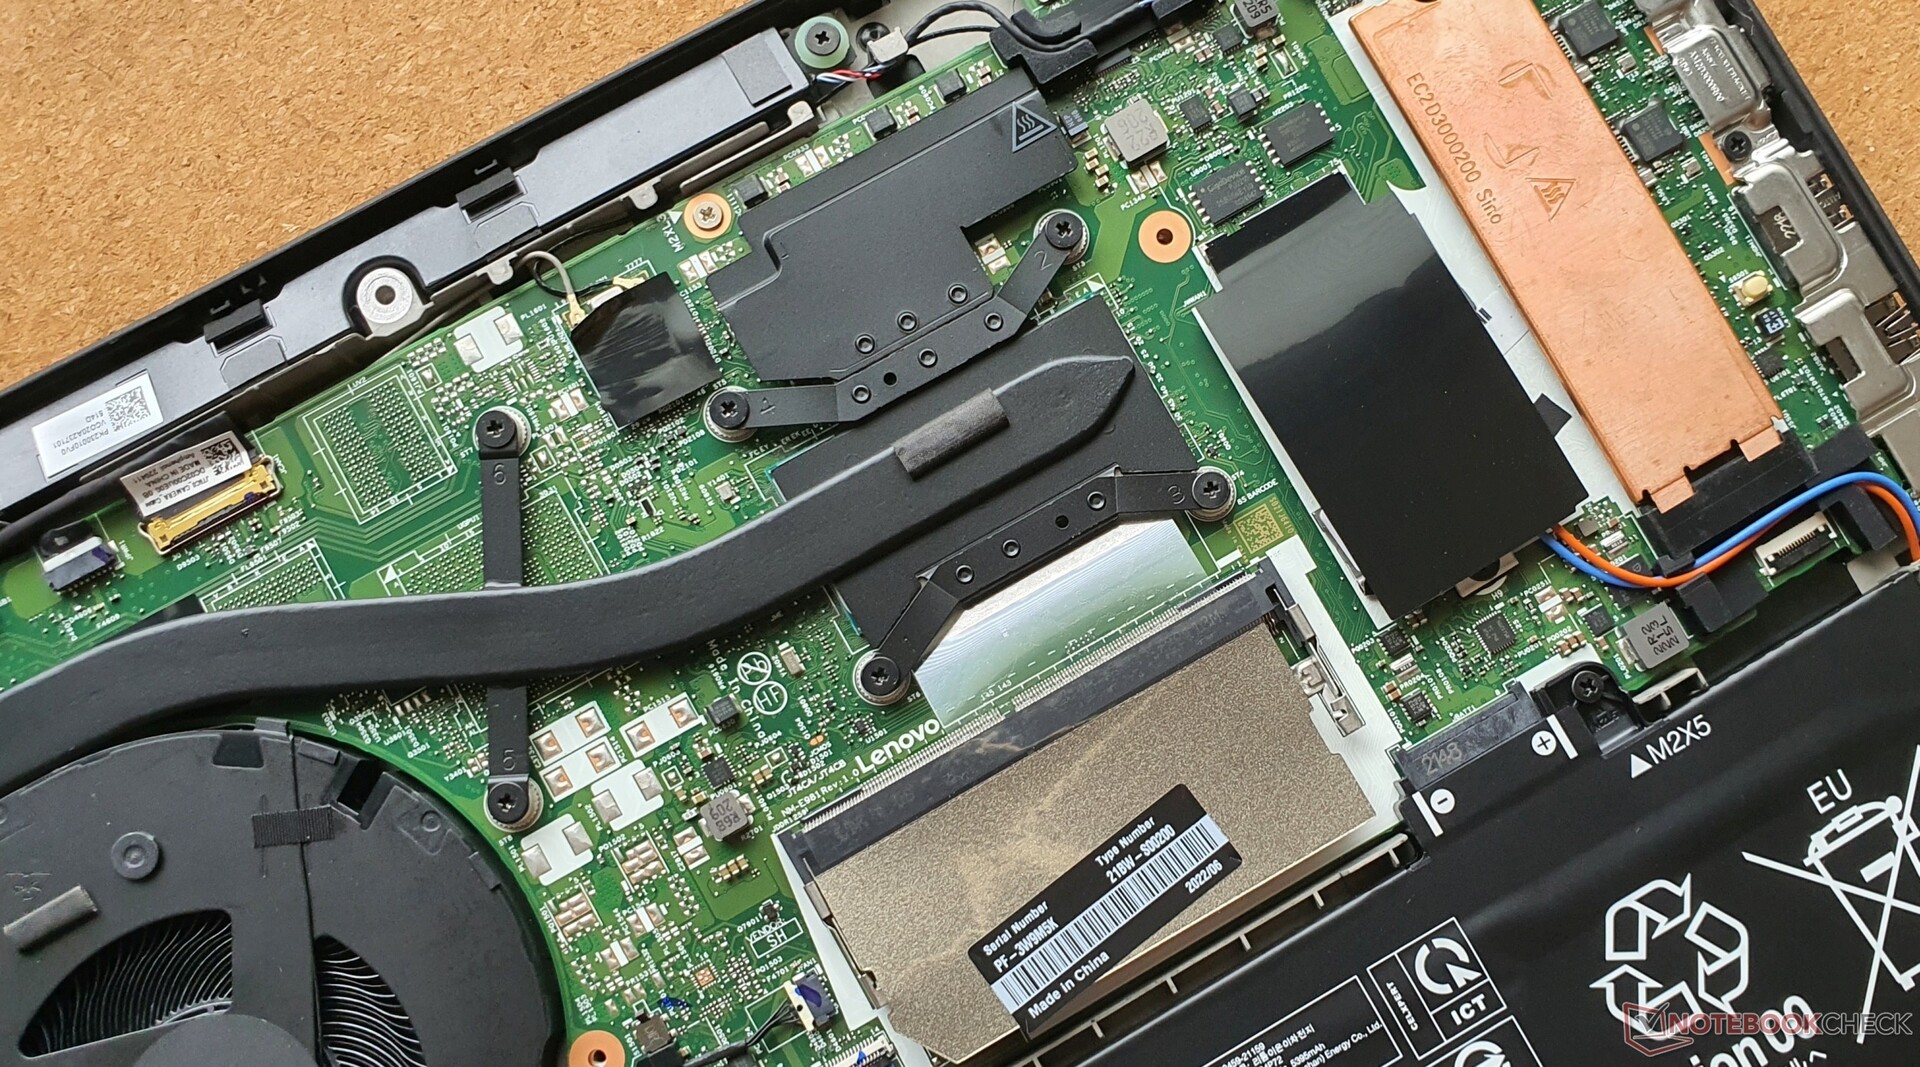
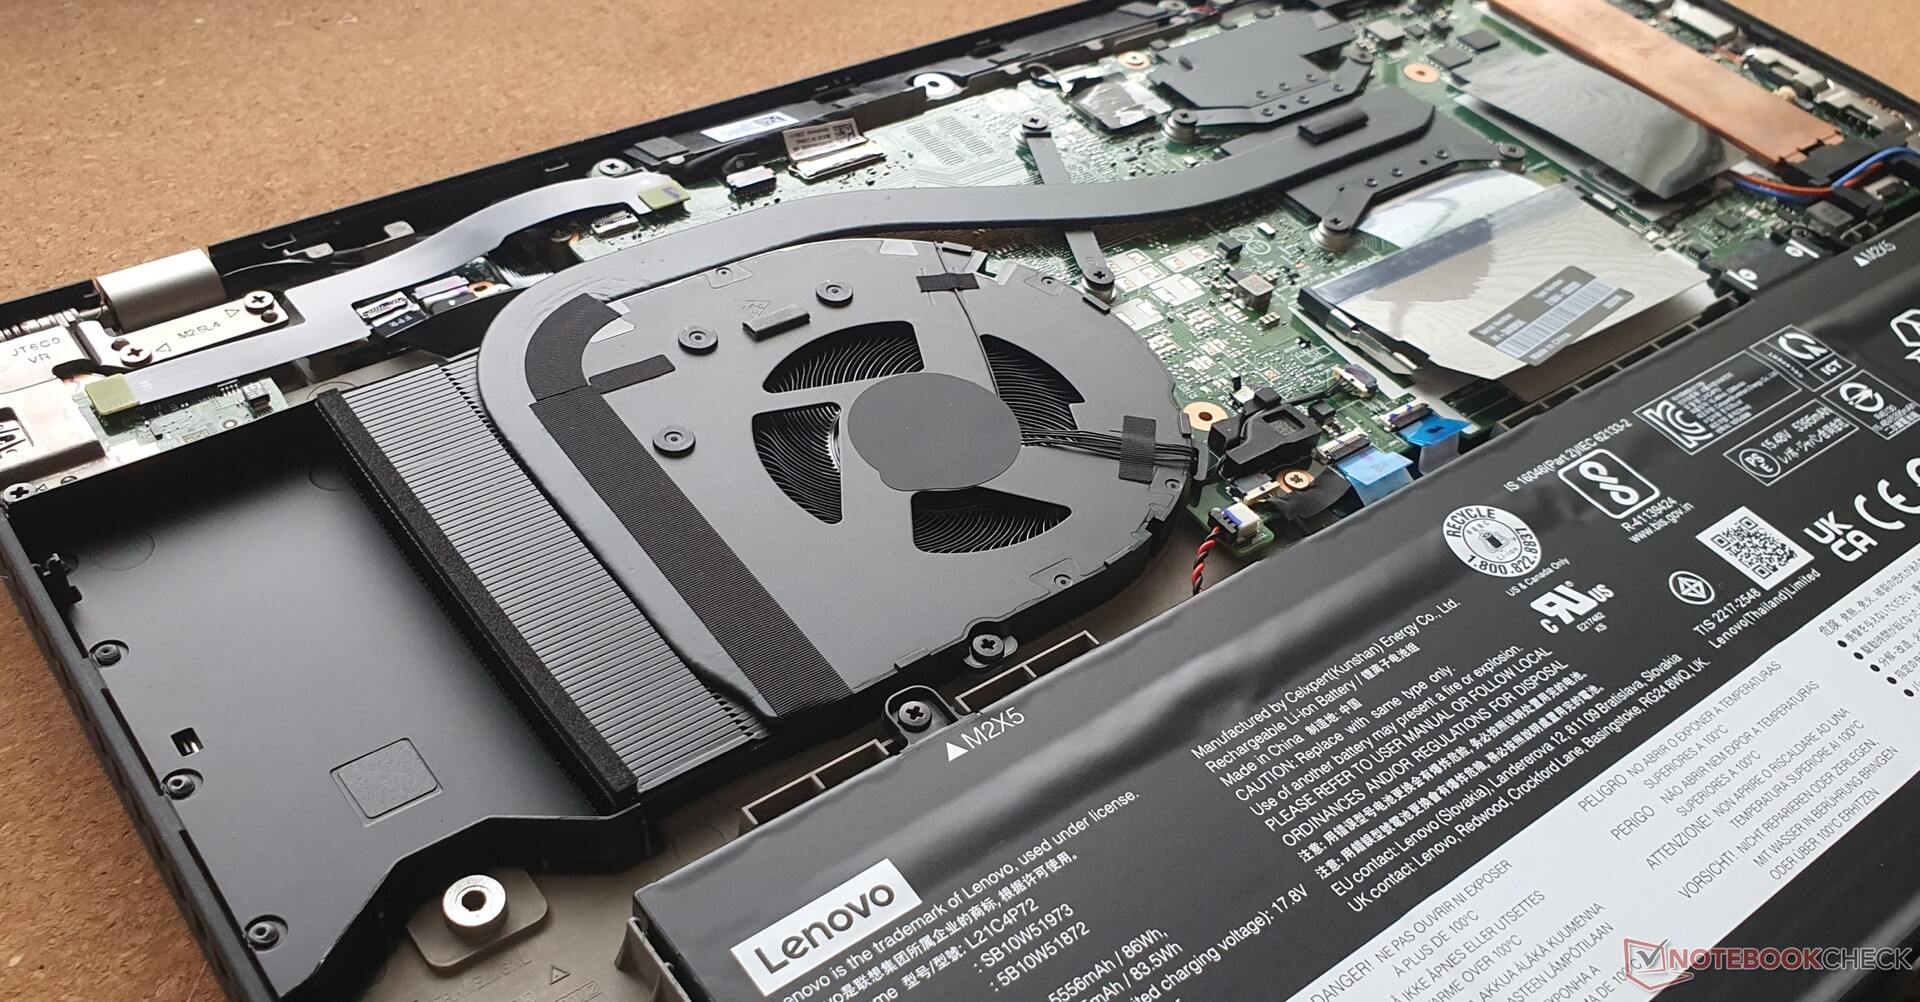
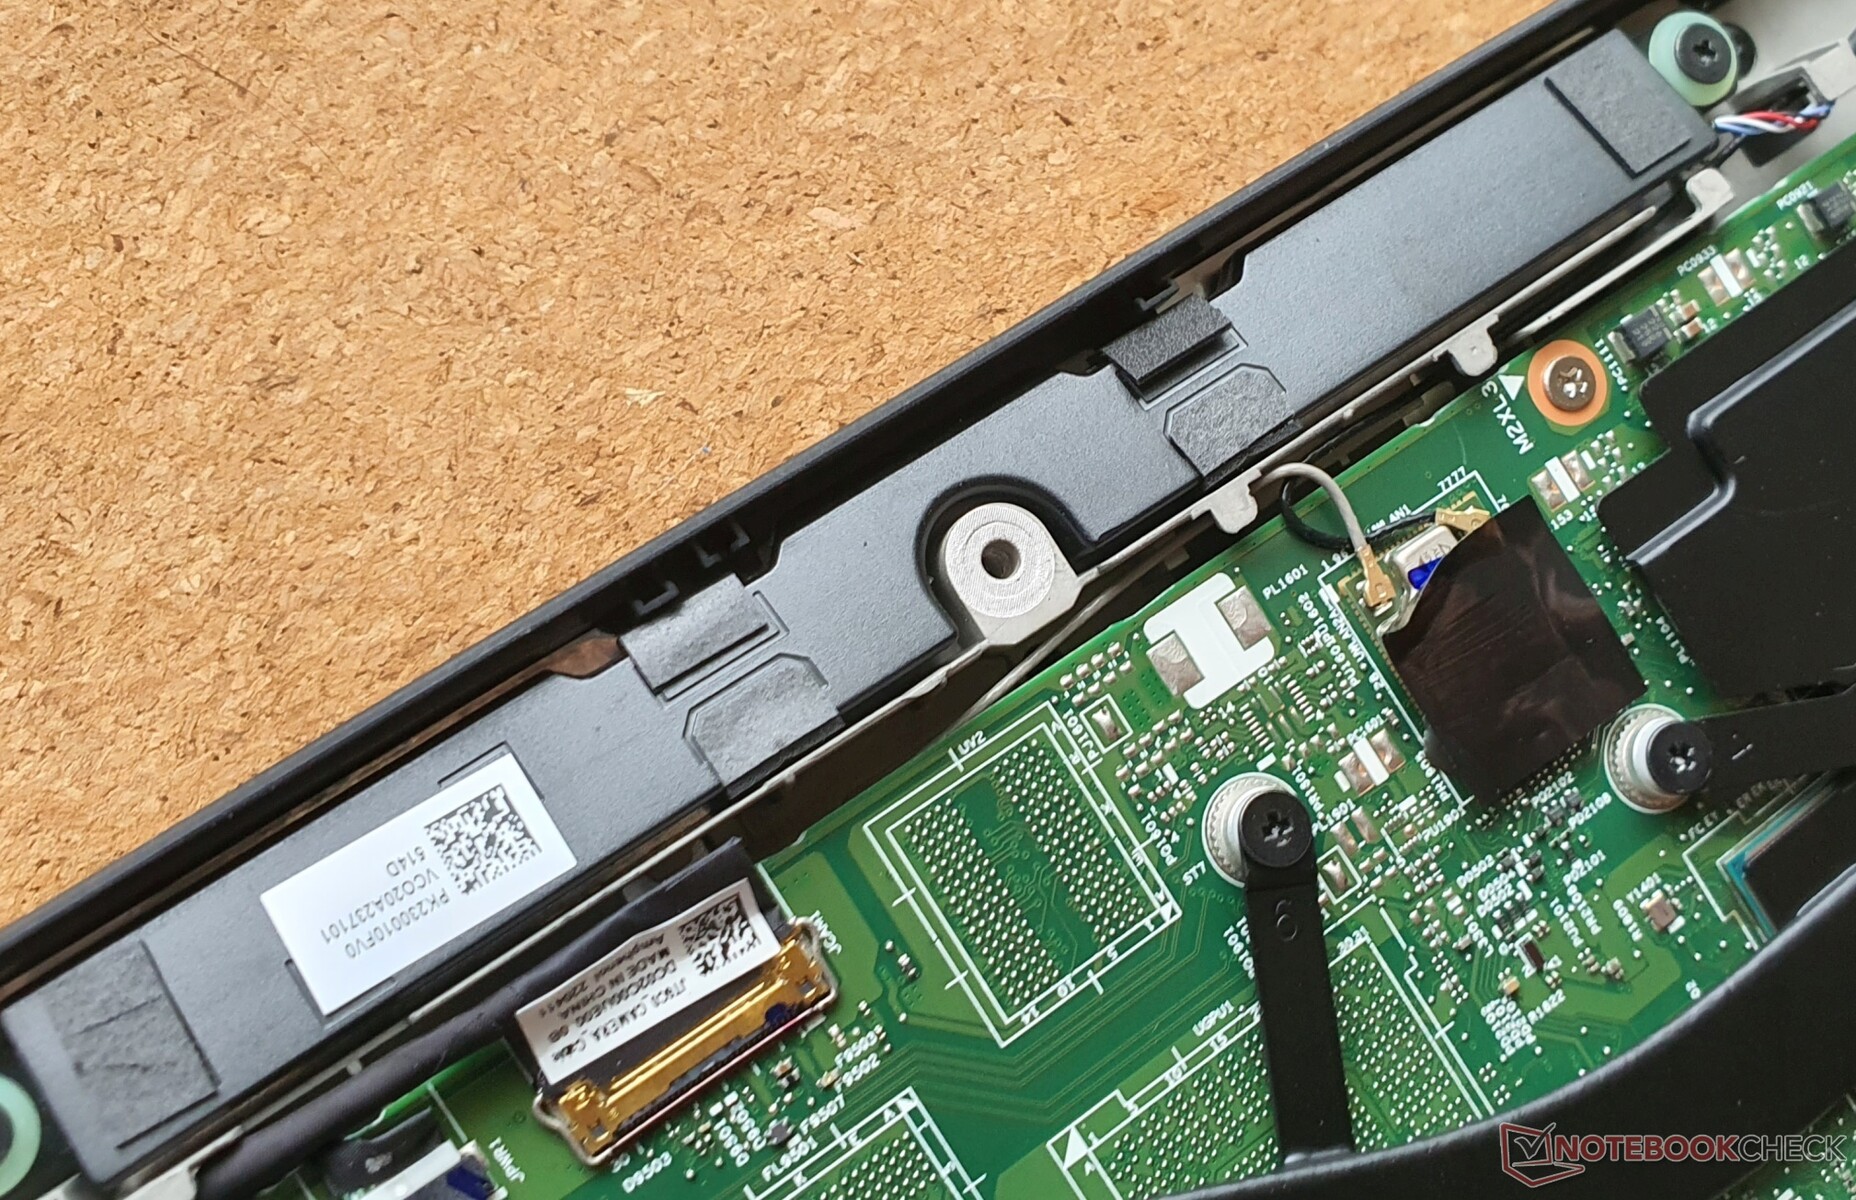
Mantenimiento
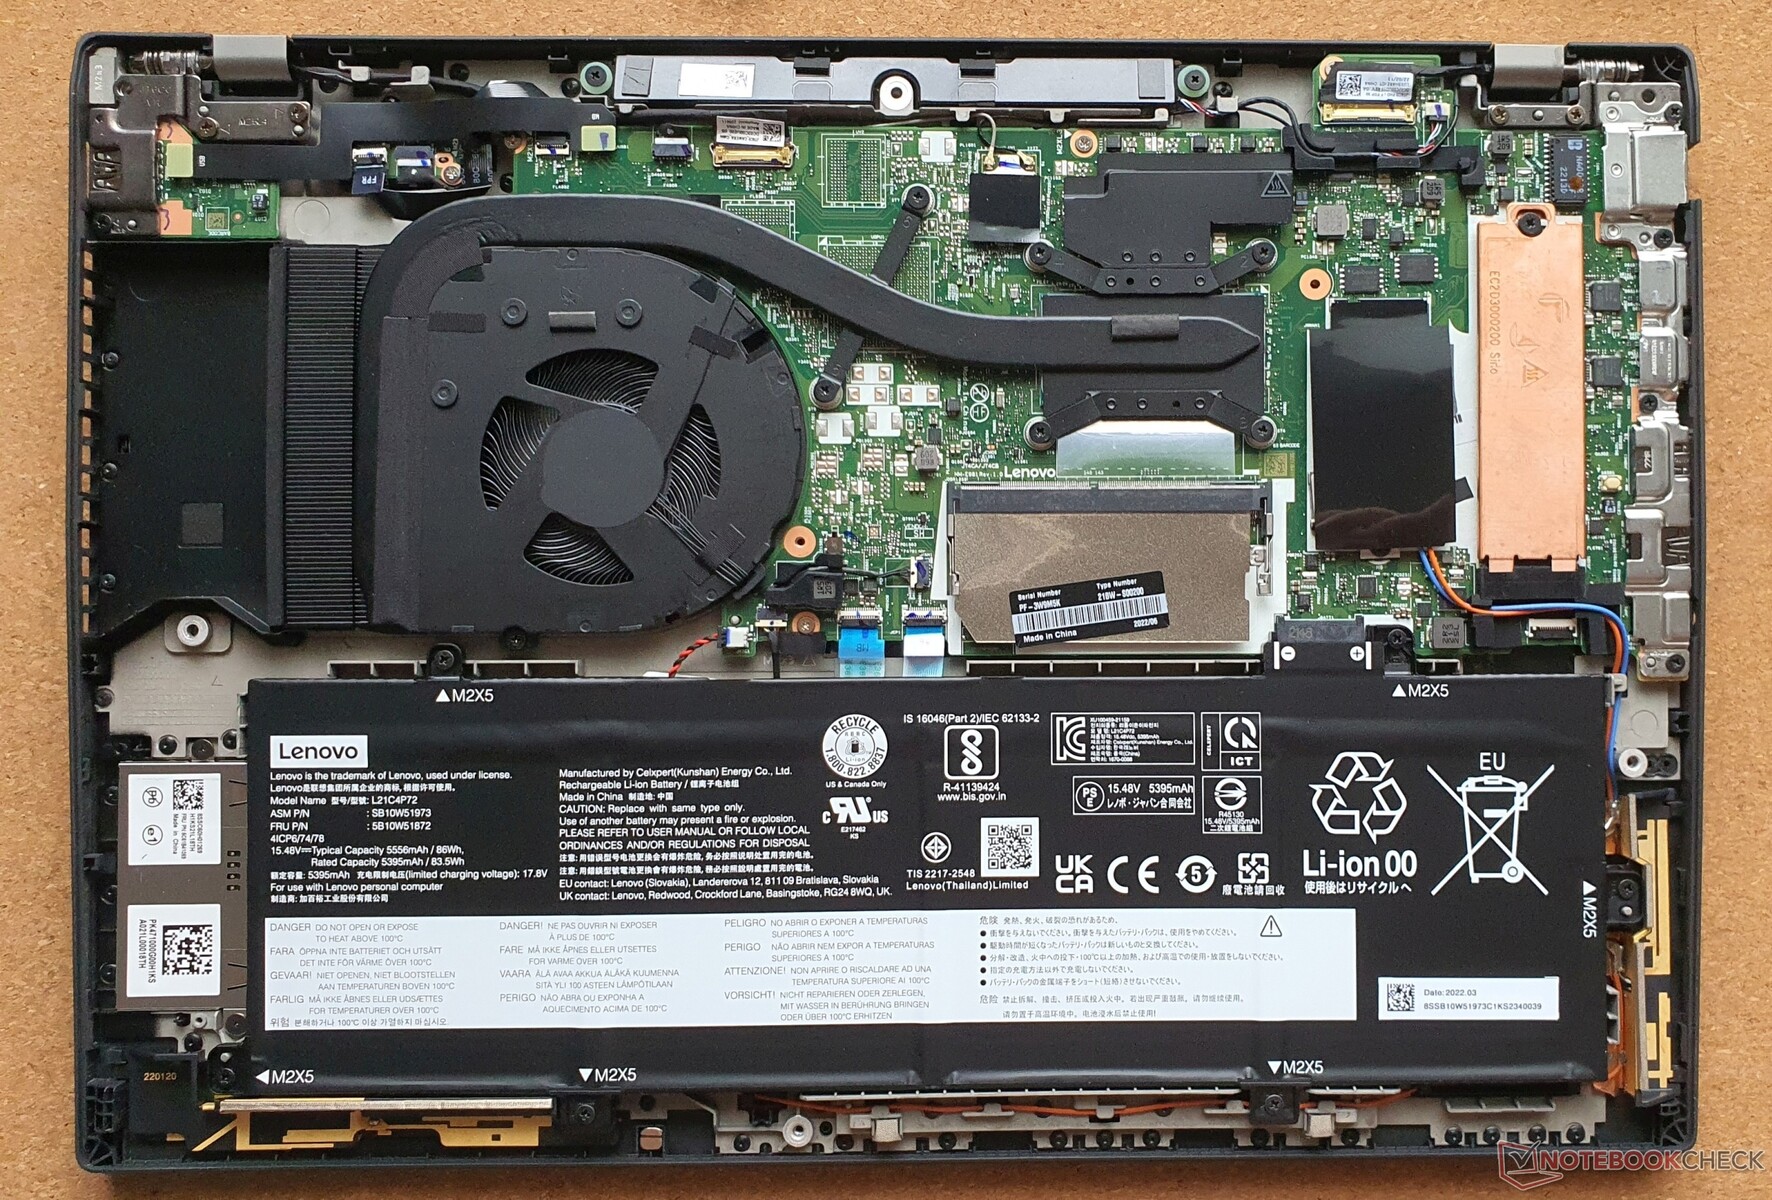
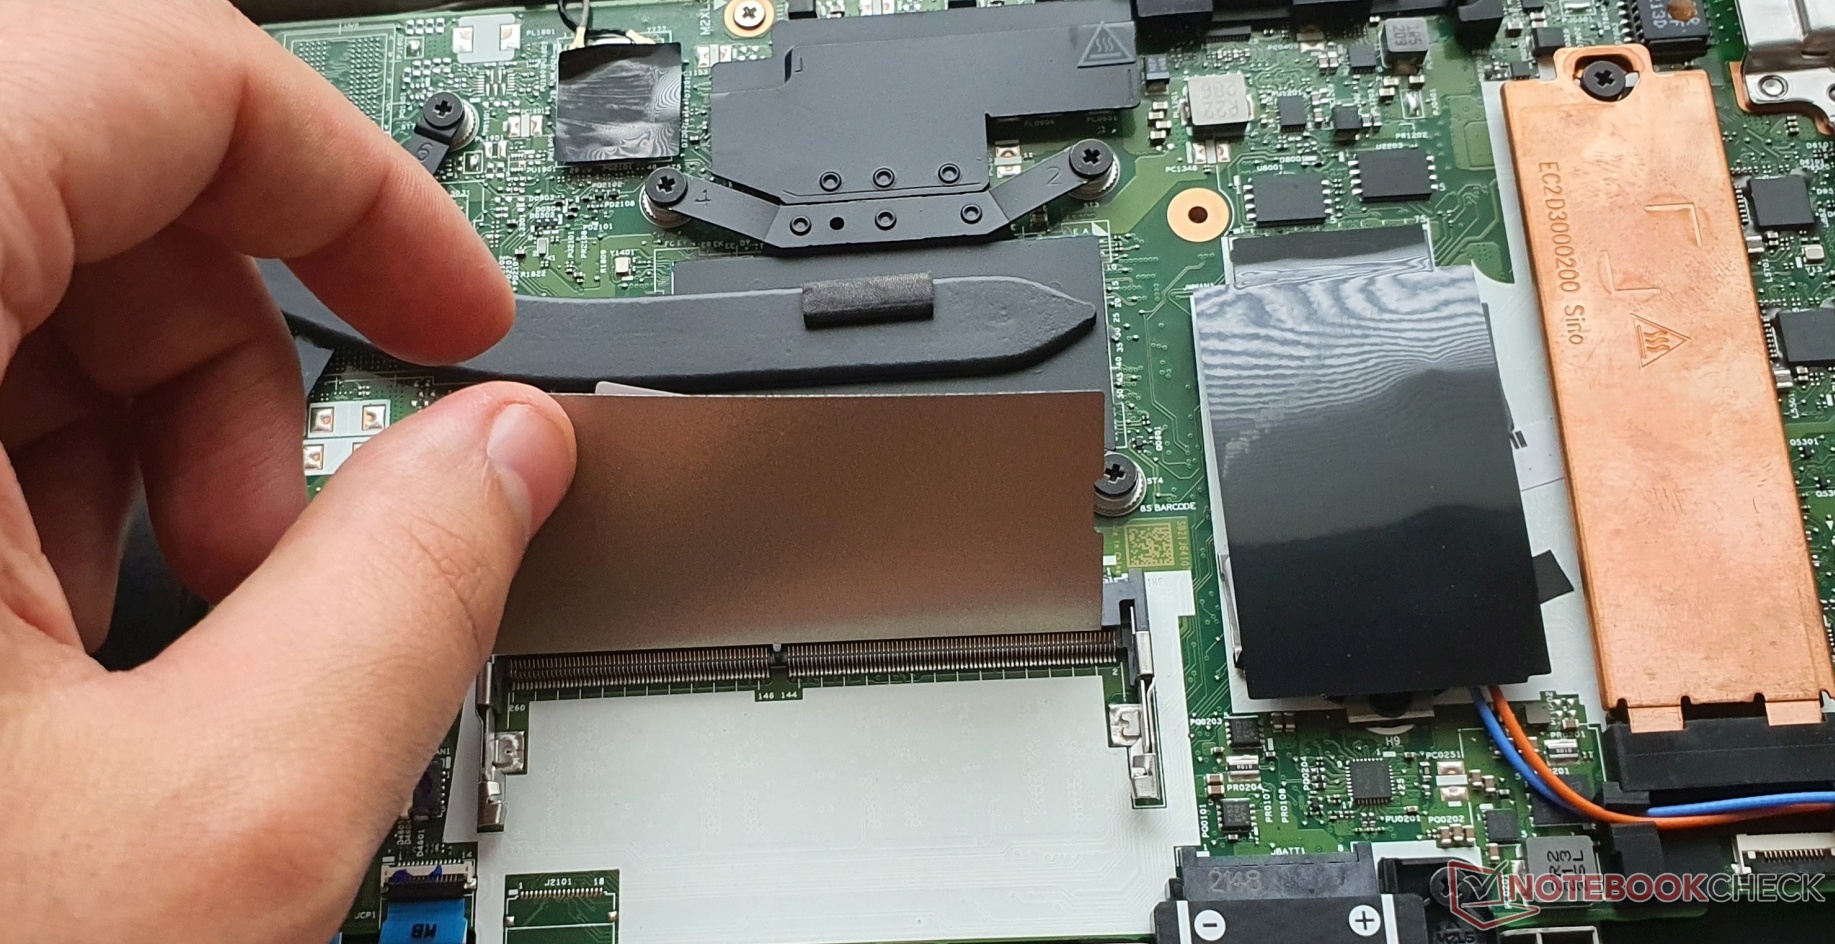
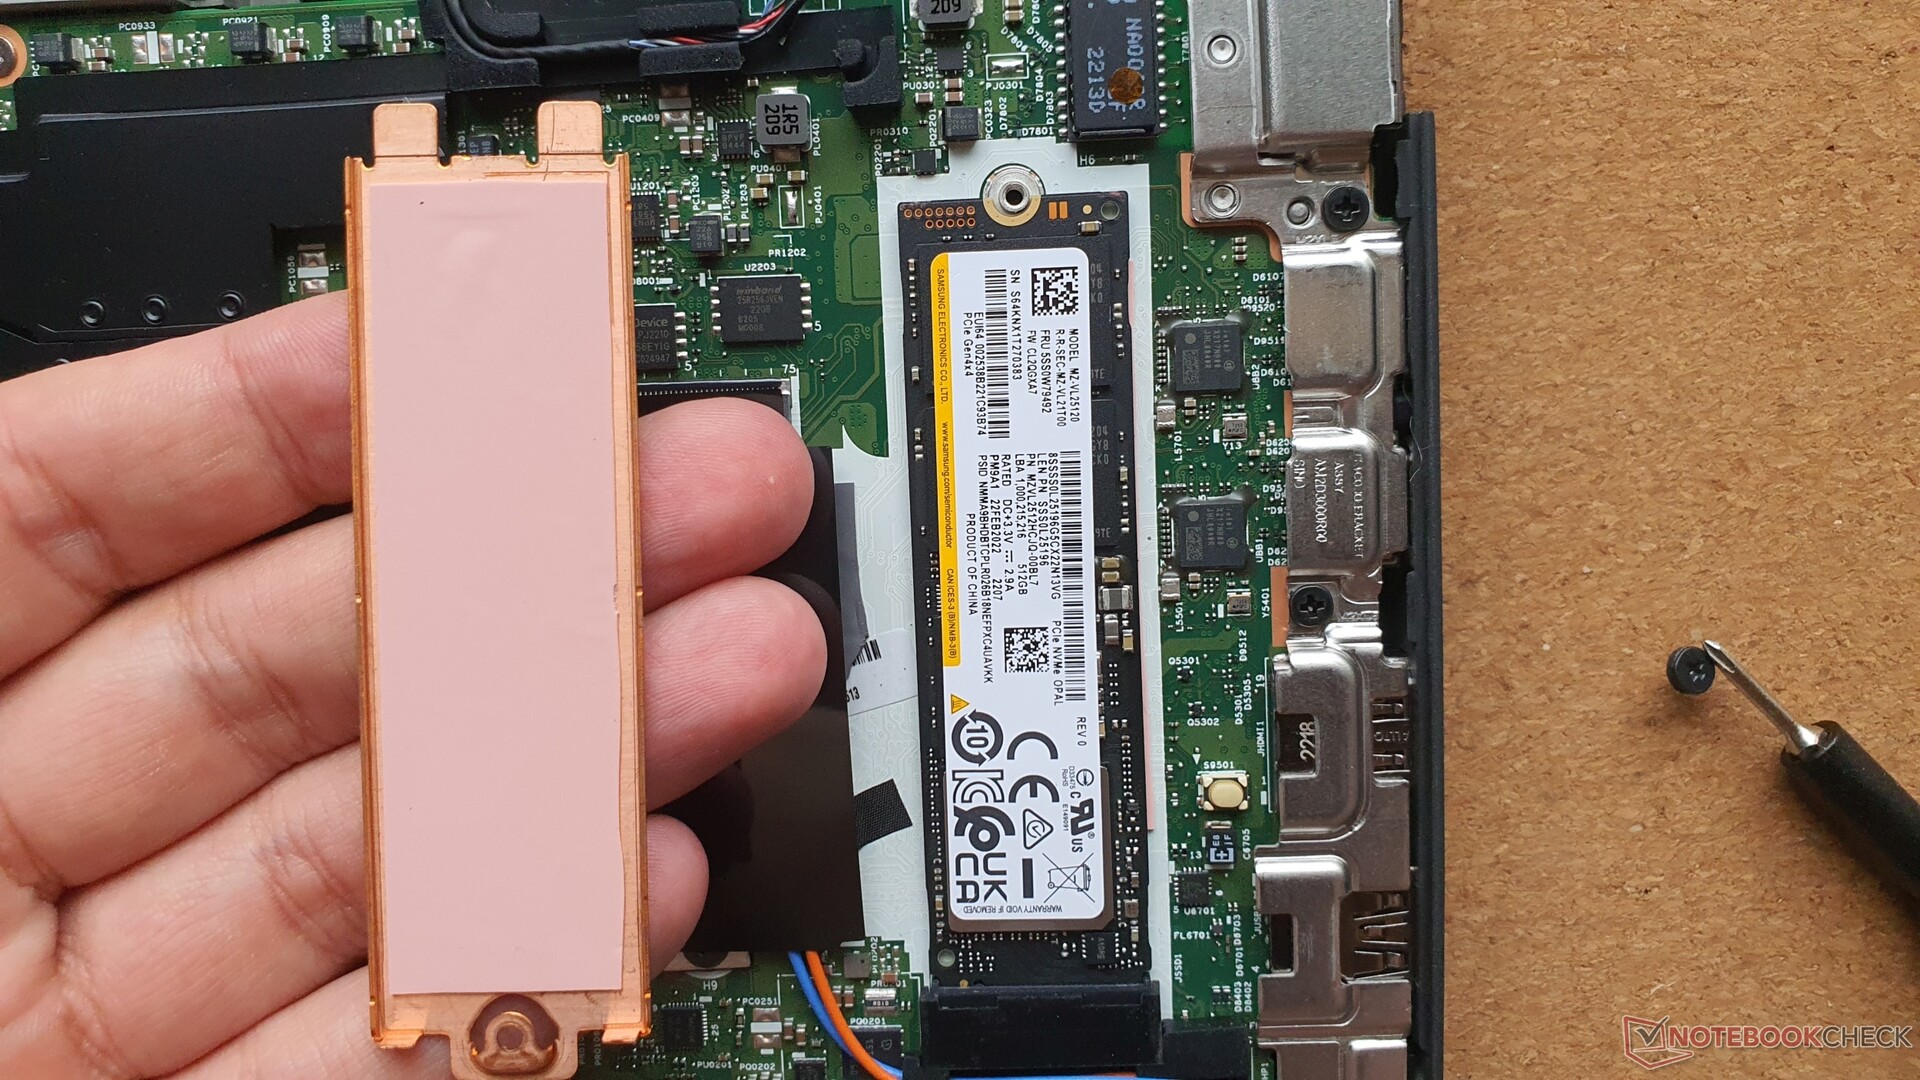
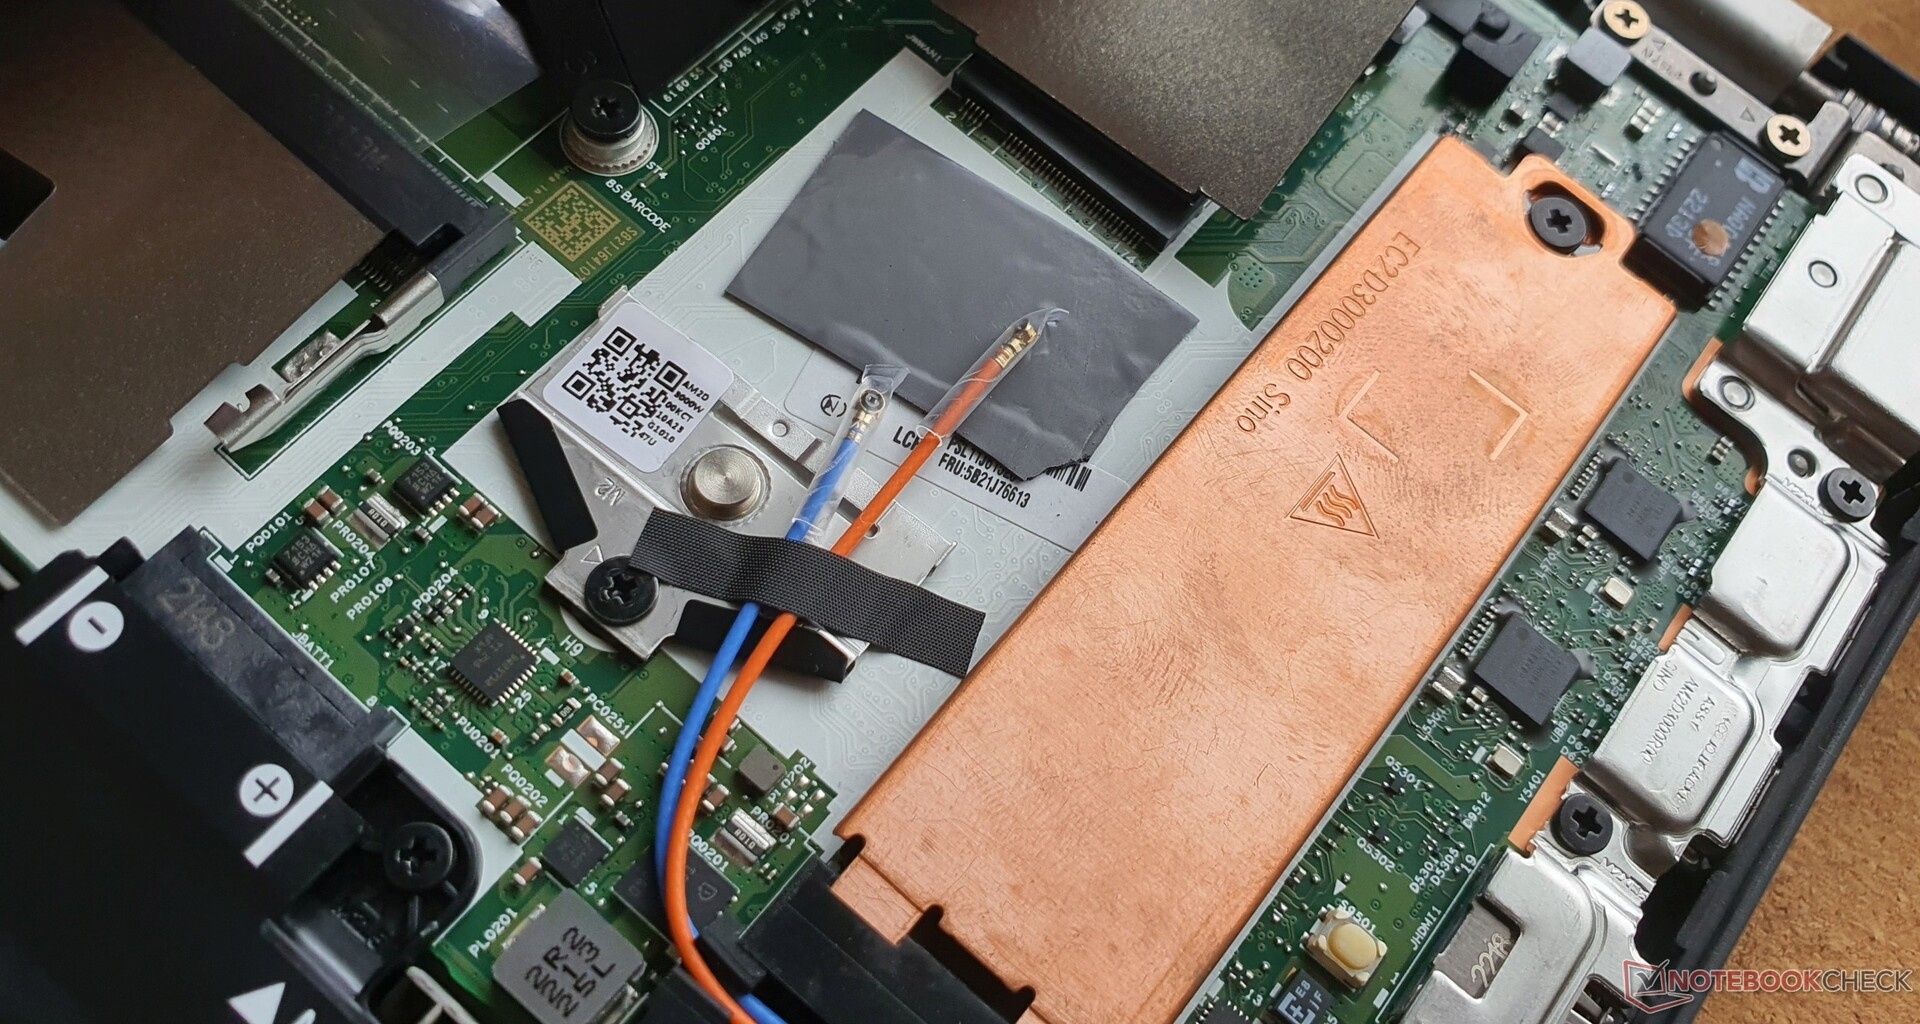
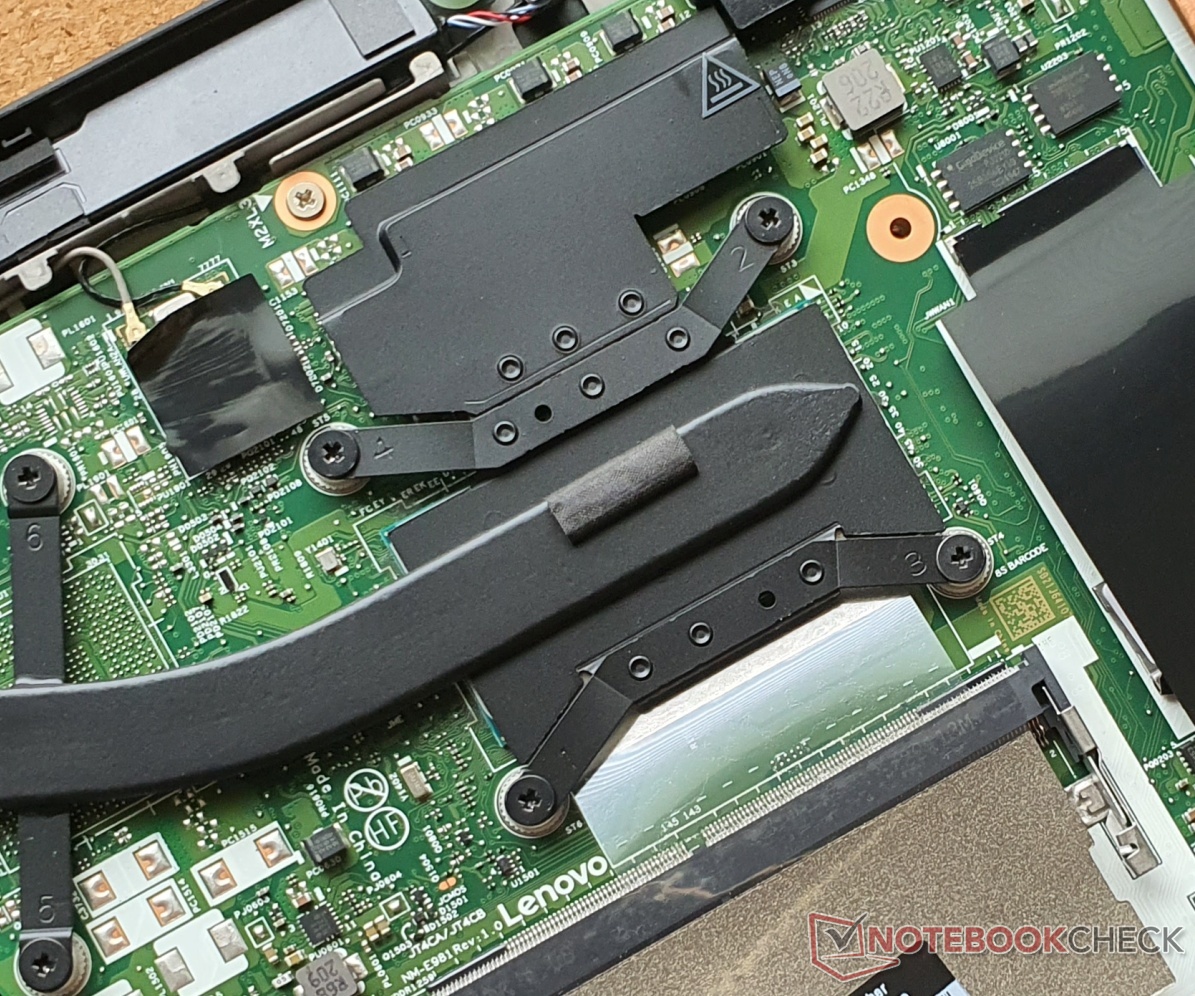
Antes de abrir el dispositivo, debe desactivar la batería interna en la BIOS. Después de aflojar 8 tornillos Phillips, todavía hay que aflojar algunos pestillos con un spudger. Después, tienes acceso al SSD M.2-2280 insertado (PCIe 4.0), una ranura de RAM (libre), una ranura WWAN, la batería de 86 Wh atornillada y el sistema de refrigeración, que puede limpiarse.
No es posible insertar un SSD en la ranura WWAN.
Garantía
En Alemania, Lenovo ofrece una garantía de 3 años (1 año para la batería). Nuestro modelo viene con soporte Premier, que incluye servicio in situ. Sin embargo, el estándar es el servicio de mensajería o de transporte. Es posible una extensión de hasta 5 años: 223 Euros (~US$ 223) para el primero y 521 Euros (~US$ 521) para dos años adicionales.
Estas condiciones de garantía pueden diferir en otros países, así que asegúrese de consultar con su proveedor antes de comprar.
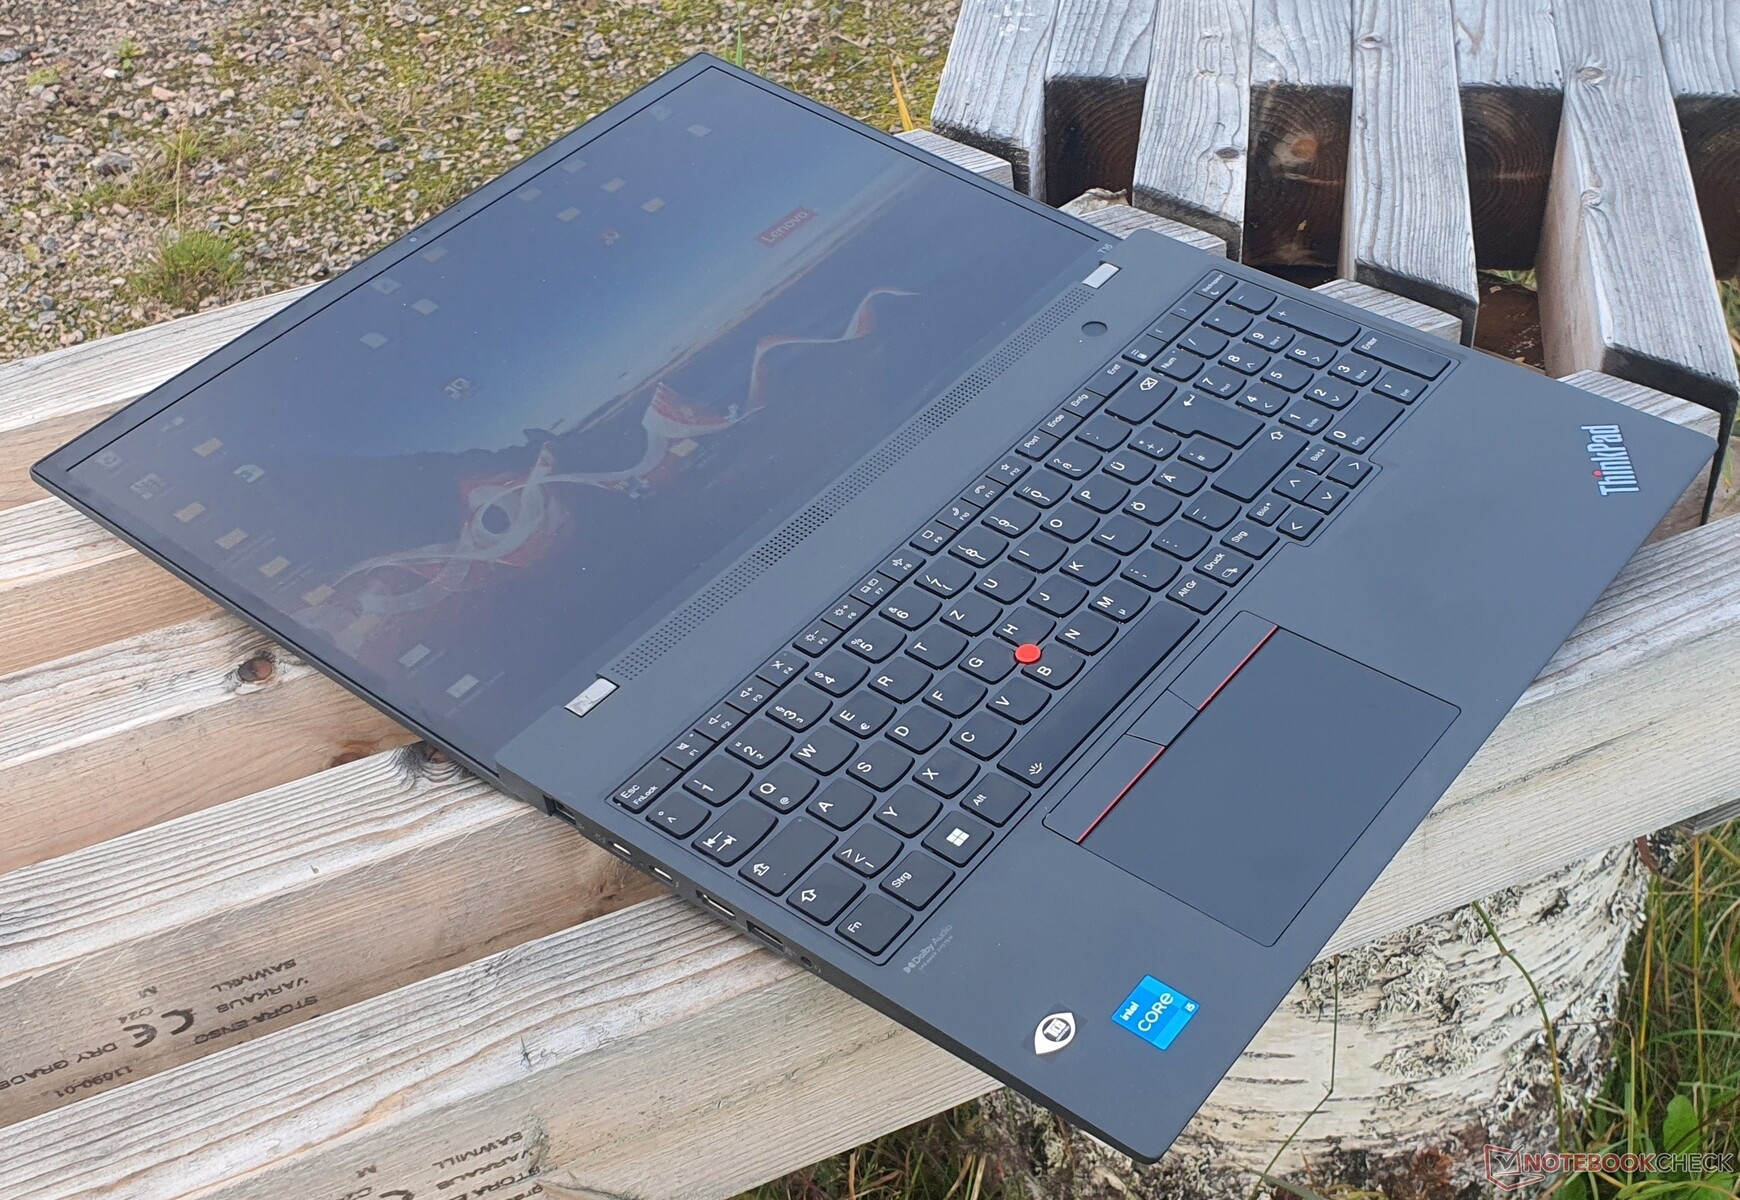
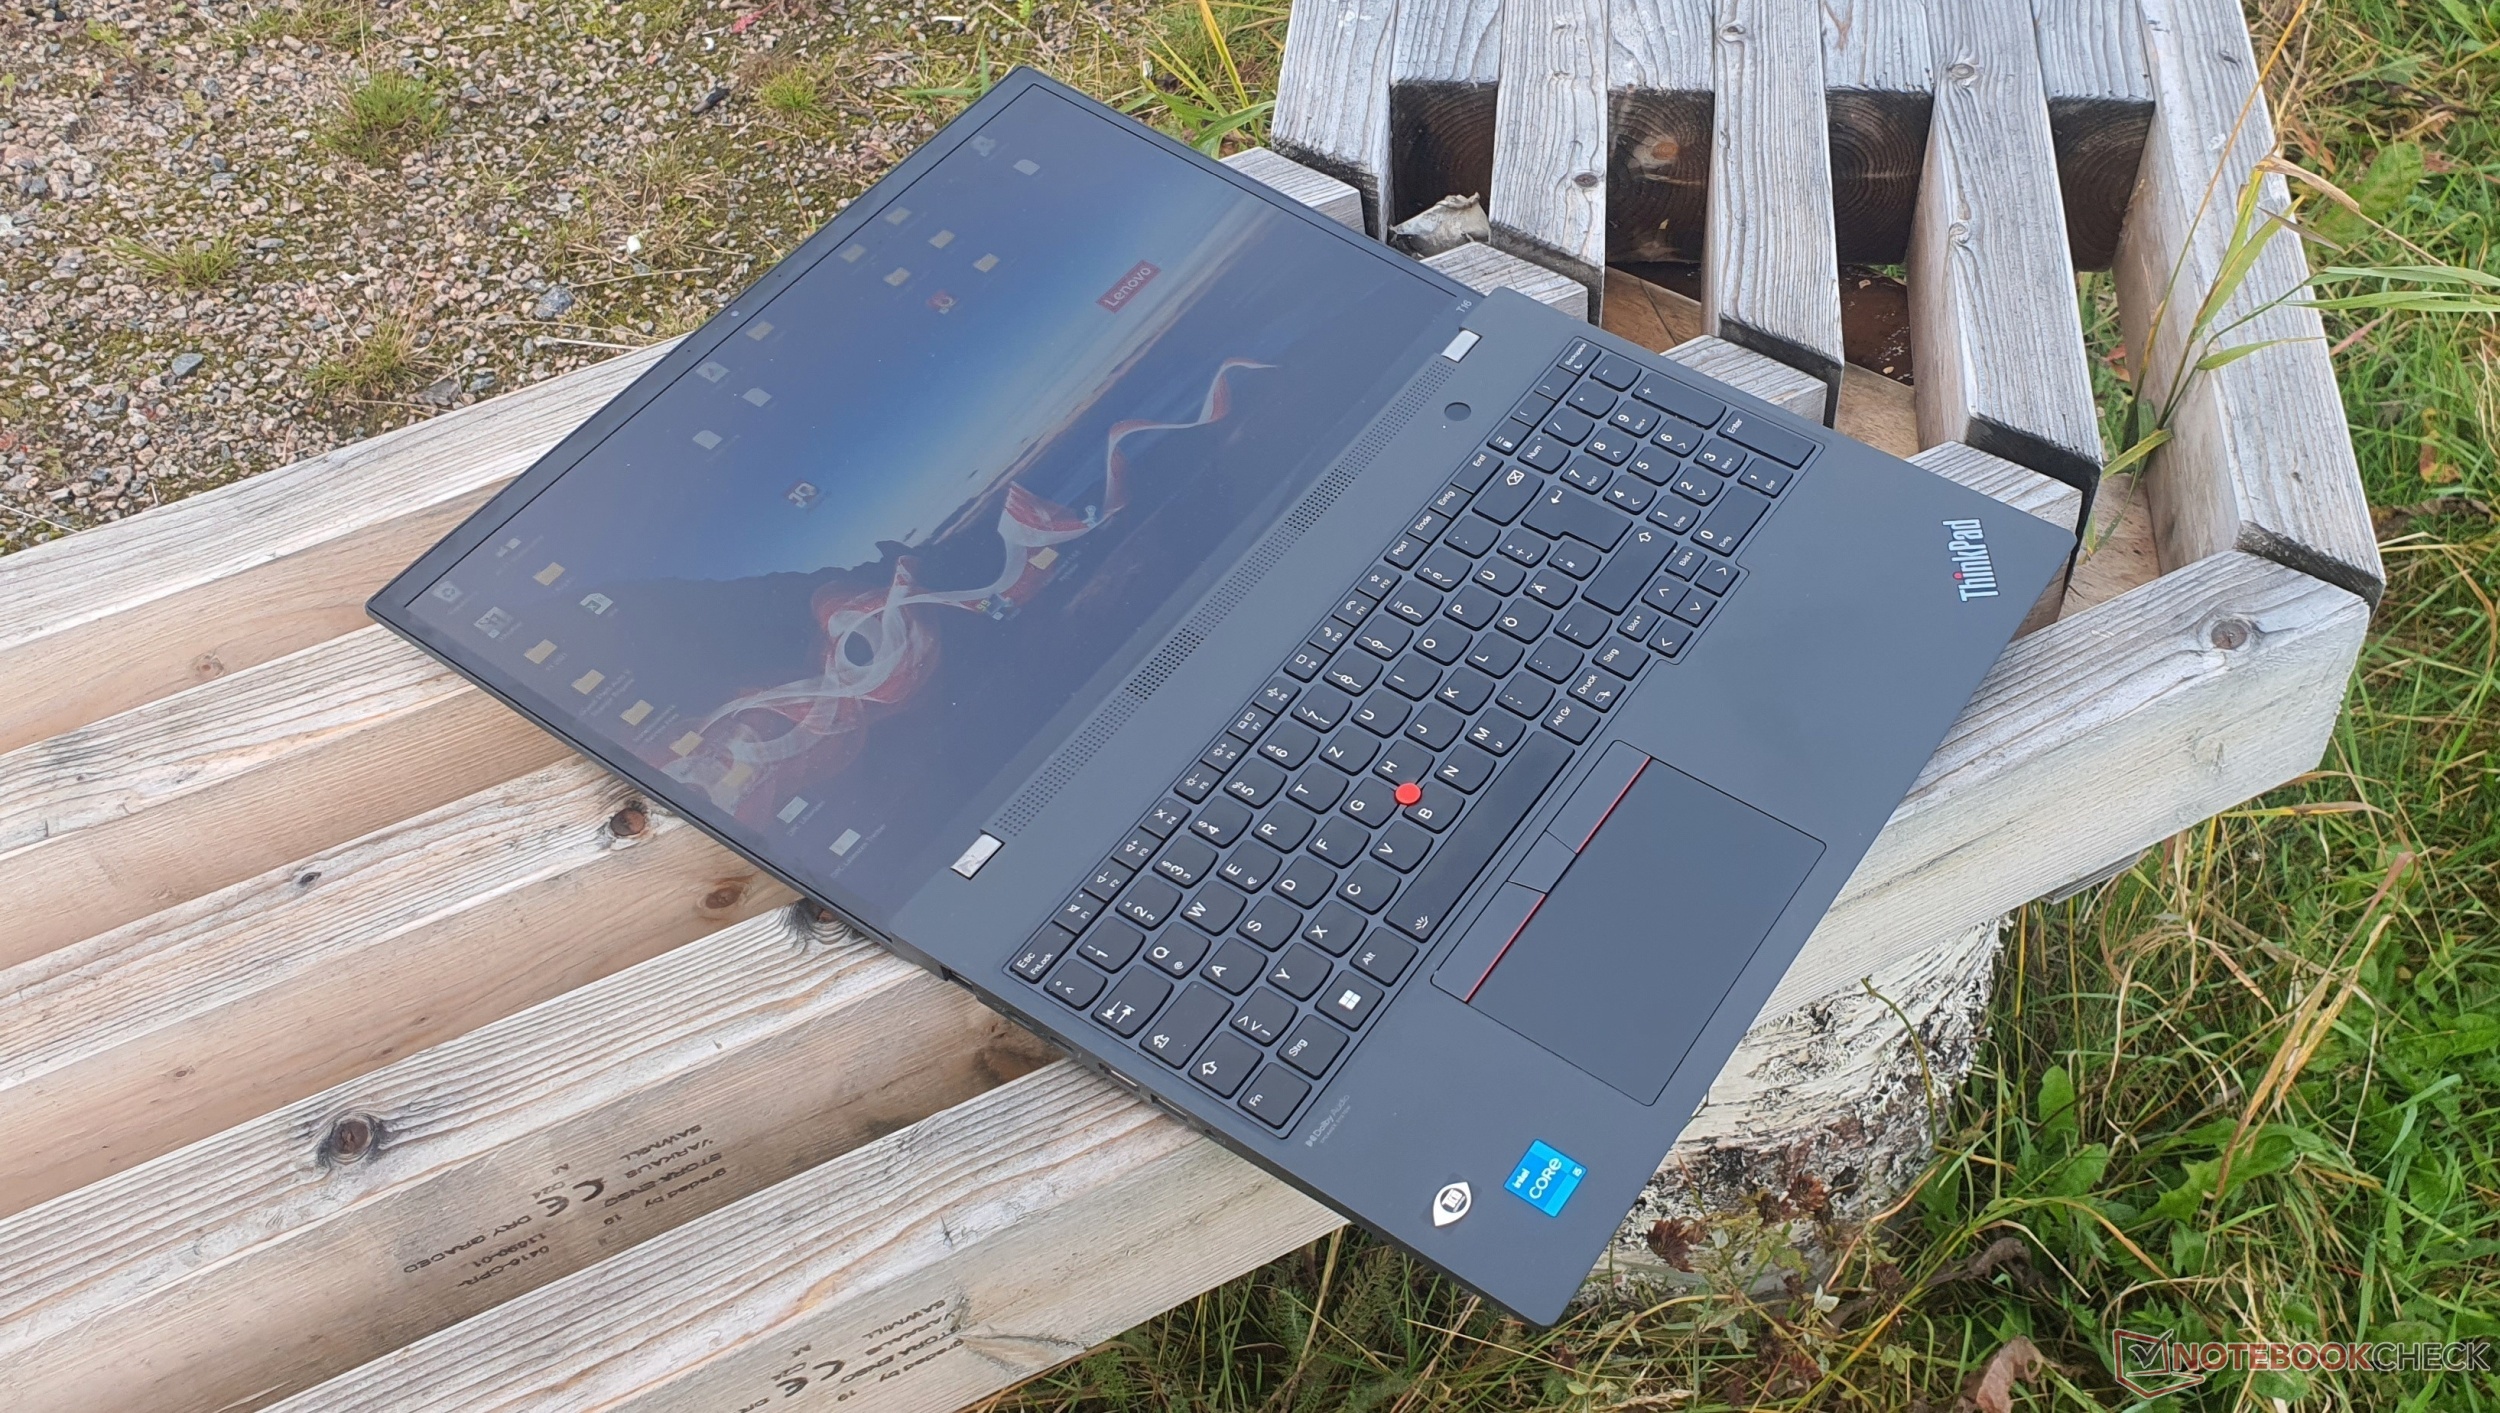
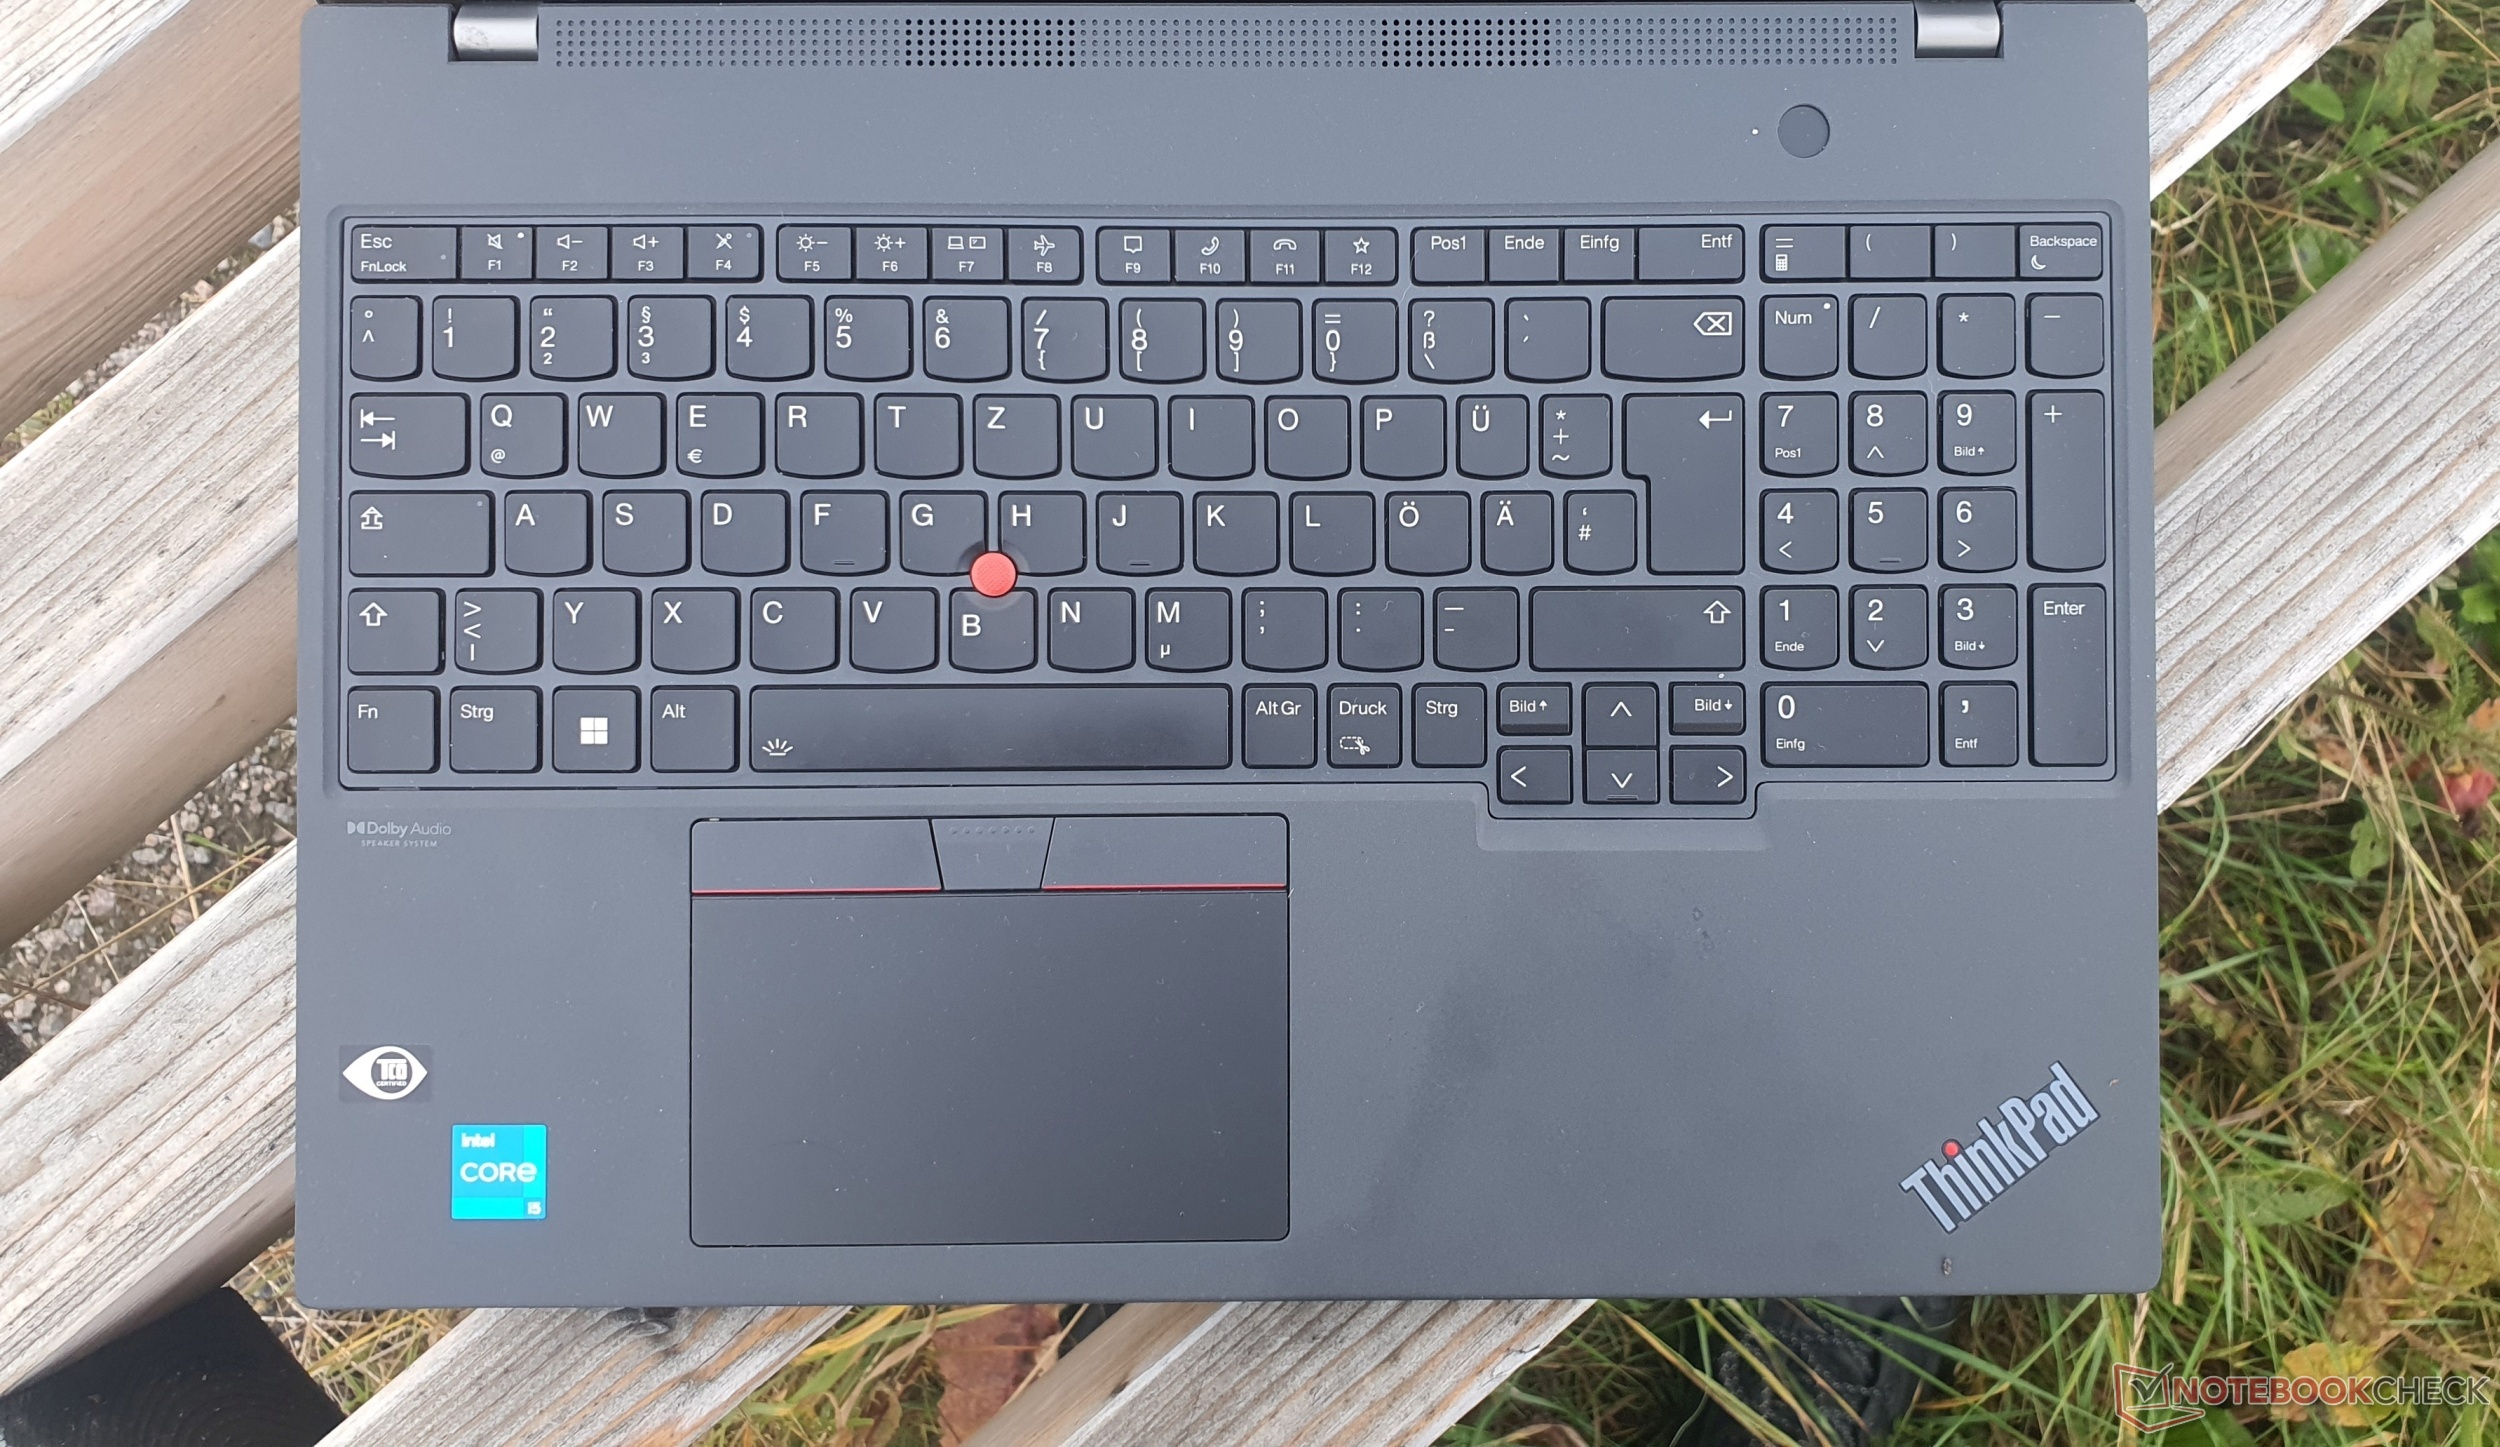
Dispositivos de entrada: desplazamiento de 1,5 mm con teclado ThinkPad reemplazable
Teclado
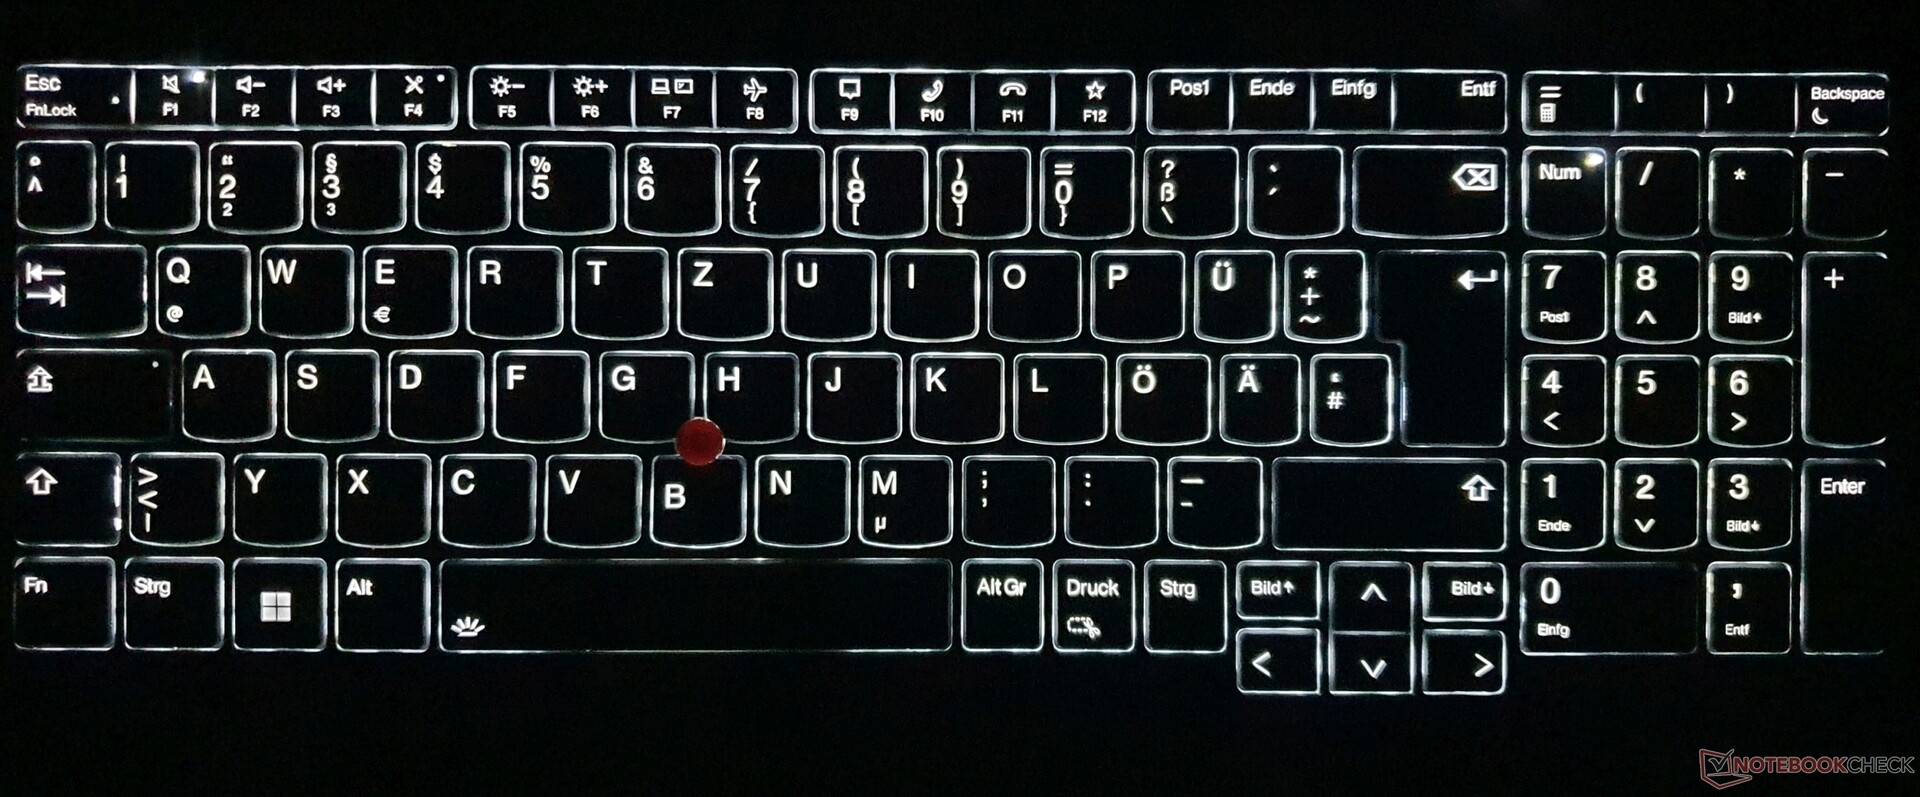
El teclado chiclet de 6 filas, a prueba de salpicaduras, viene con teclas de 16x16 mm. La fila inferior y las teclas de desplazamiento son ahora cuadradas. Algunas teclas se han reducido de tamaño, como el NumPad y las teclas de dirección, pero no se han reducido a la mitad (como en otros modelos). Todas las teclas importantes también están dedicadas.
El recorrido de las teclas, que se ha acortado a 1,5 mm, ha llegado este año a la serie T sin el sufijo s. Como el punto de presión es muy conciso y la resistencia de las teclas está bien implementada, esto garantiza una escritura más rápida, más precisa y también más silenciosa que la de casi cualquier otro teclado. Además, el teclado se puede sustituir en caso de desgaste o daño. La base del teclado cede sólo un poco bajo presión dirigida, lo que no ocurre al escribir.

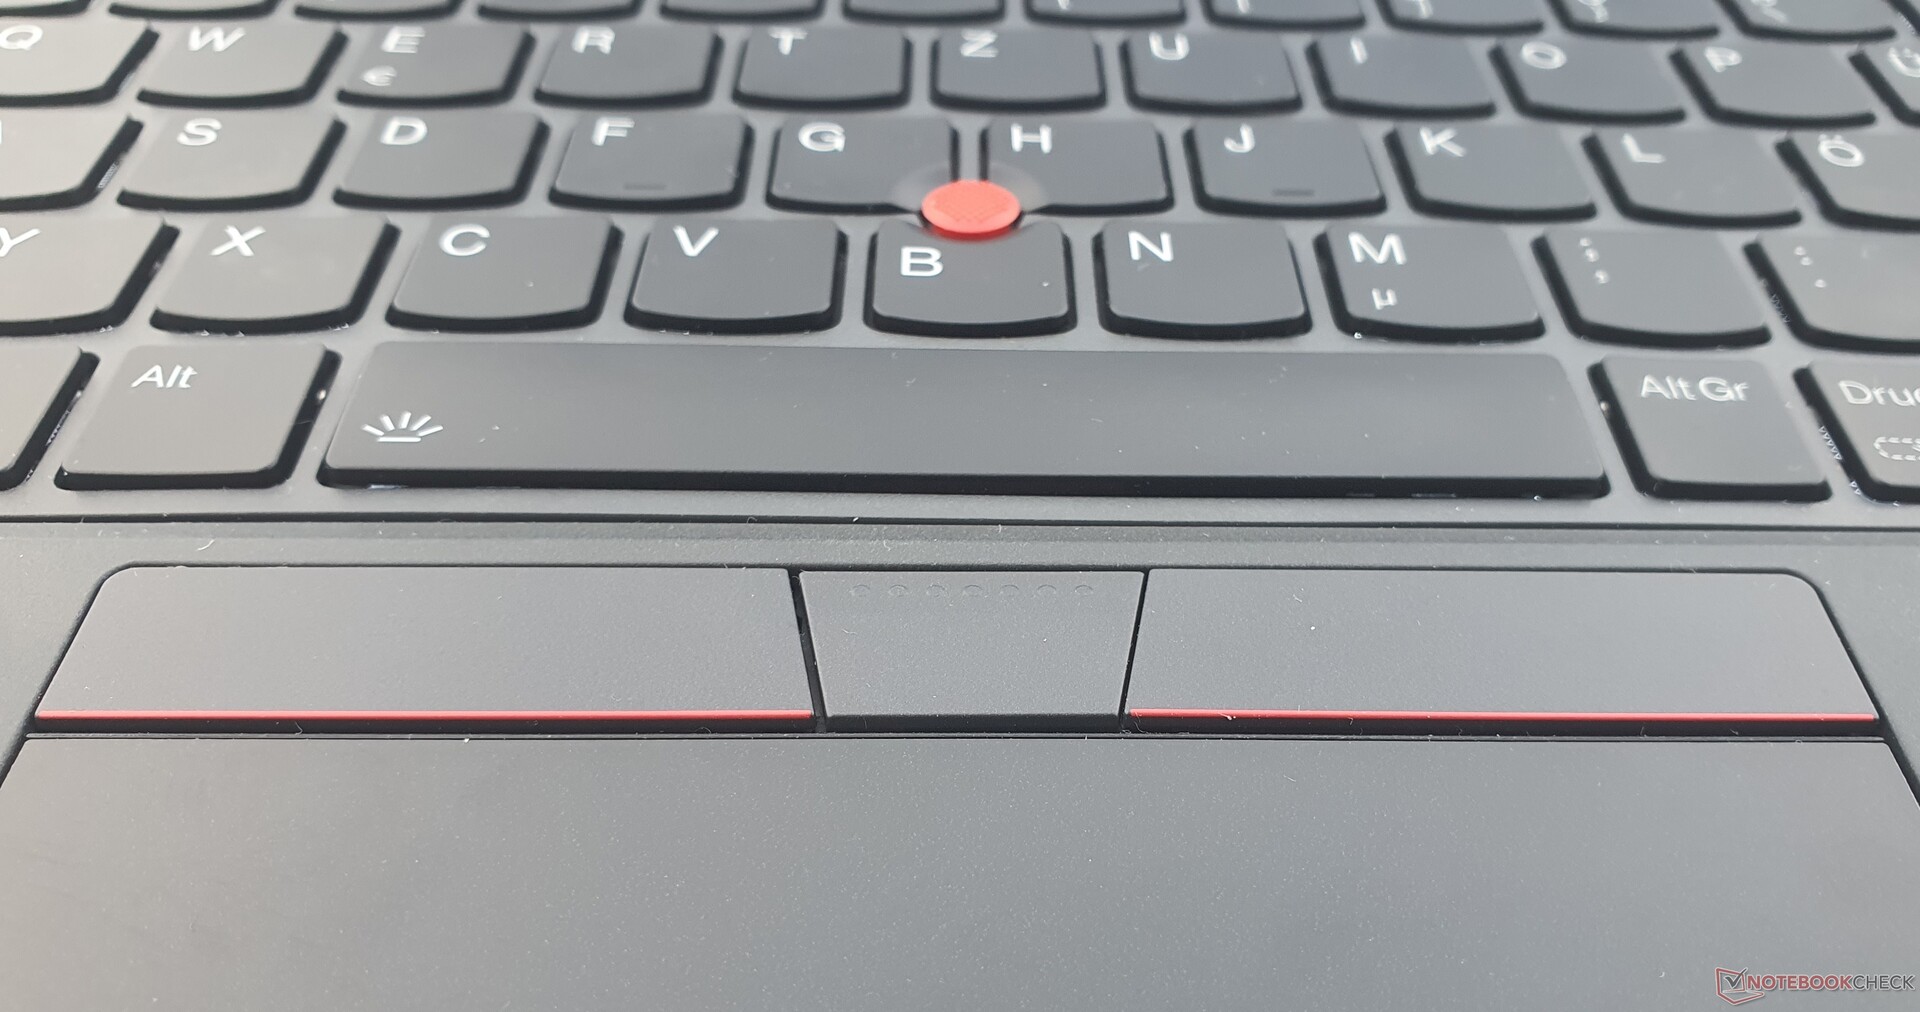
Touchpad y TrackPoint
El panel táctil, que se ha ampliado a 11,5x6,7 cm con una superficie de Mylar mejorada, está un paso por encima en cuanto a capacidad de respuesta, se desliza con más suavidad y se siente más como un cristal liso. La función de pellizcar para hacer zoom y la de arrastrar y soltar funcionan de maravilla. Las entradas se implementan con precisión. Las teclas de clic integradas ofrecen un recorrido corto, pero una respuesta rica y clara.
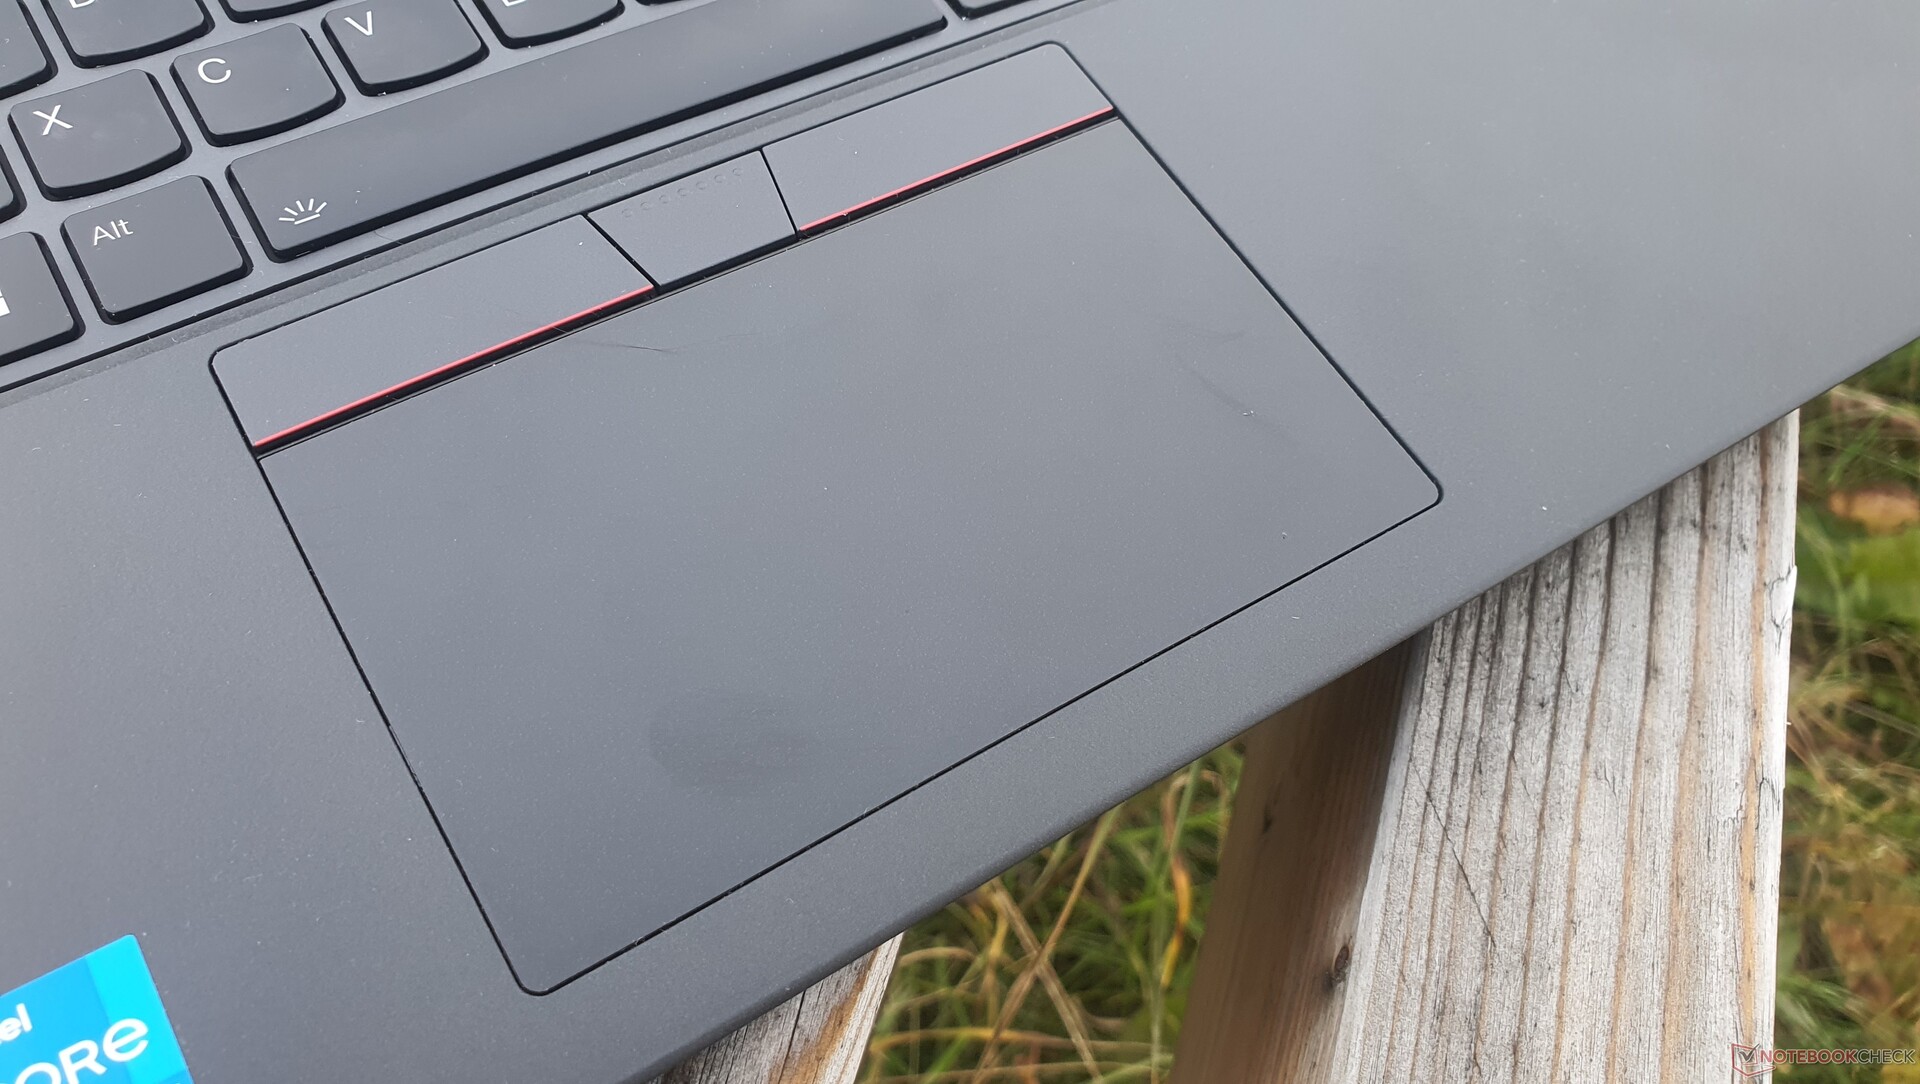
Los aficionados al TrackPoint pueden seguir haciendo uso del ventajoso método para el control del ratón, que hace innecesario retirar la mano del teclado. Sin embargo, las tres teclas asociadas sobre el touchpad son ahora completamente planas, con menos retroalimentación y recorrido. Puede costar un poco acostumbrarse a esto. No obstante, siguen funcionando con precisión y fiabilidad.
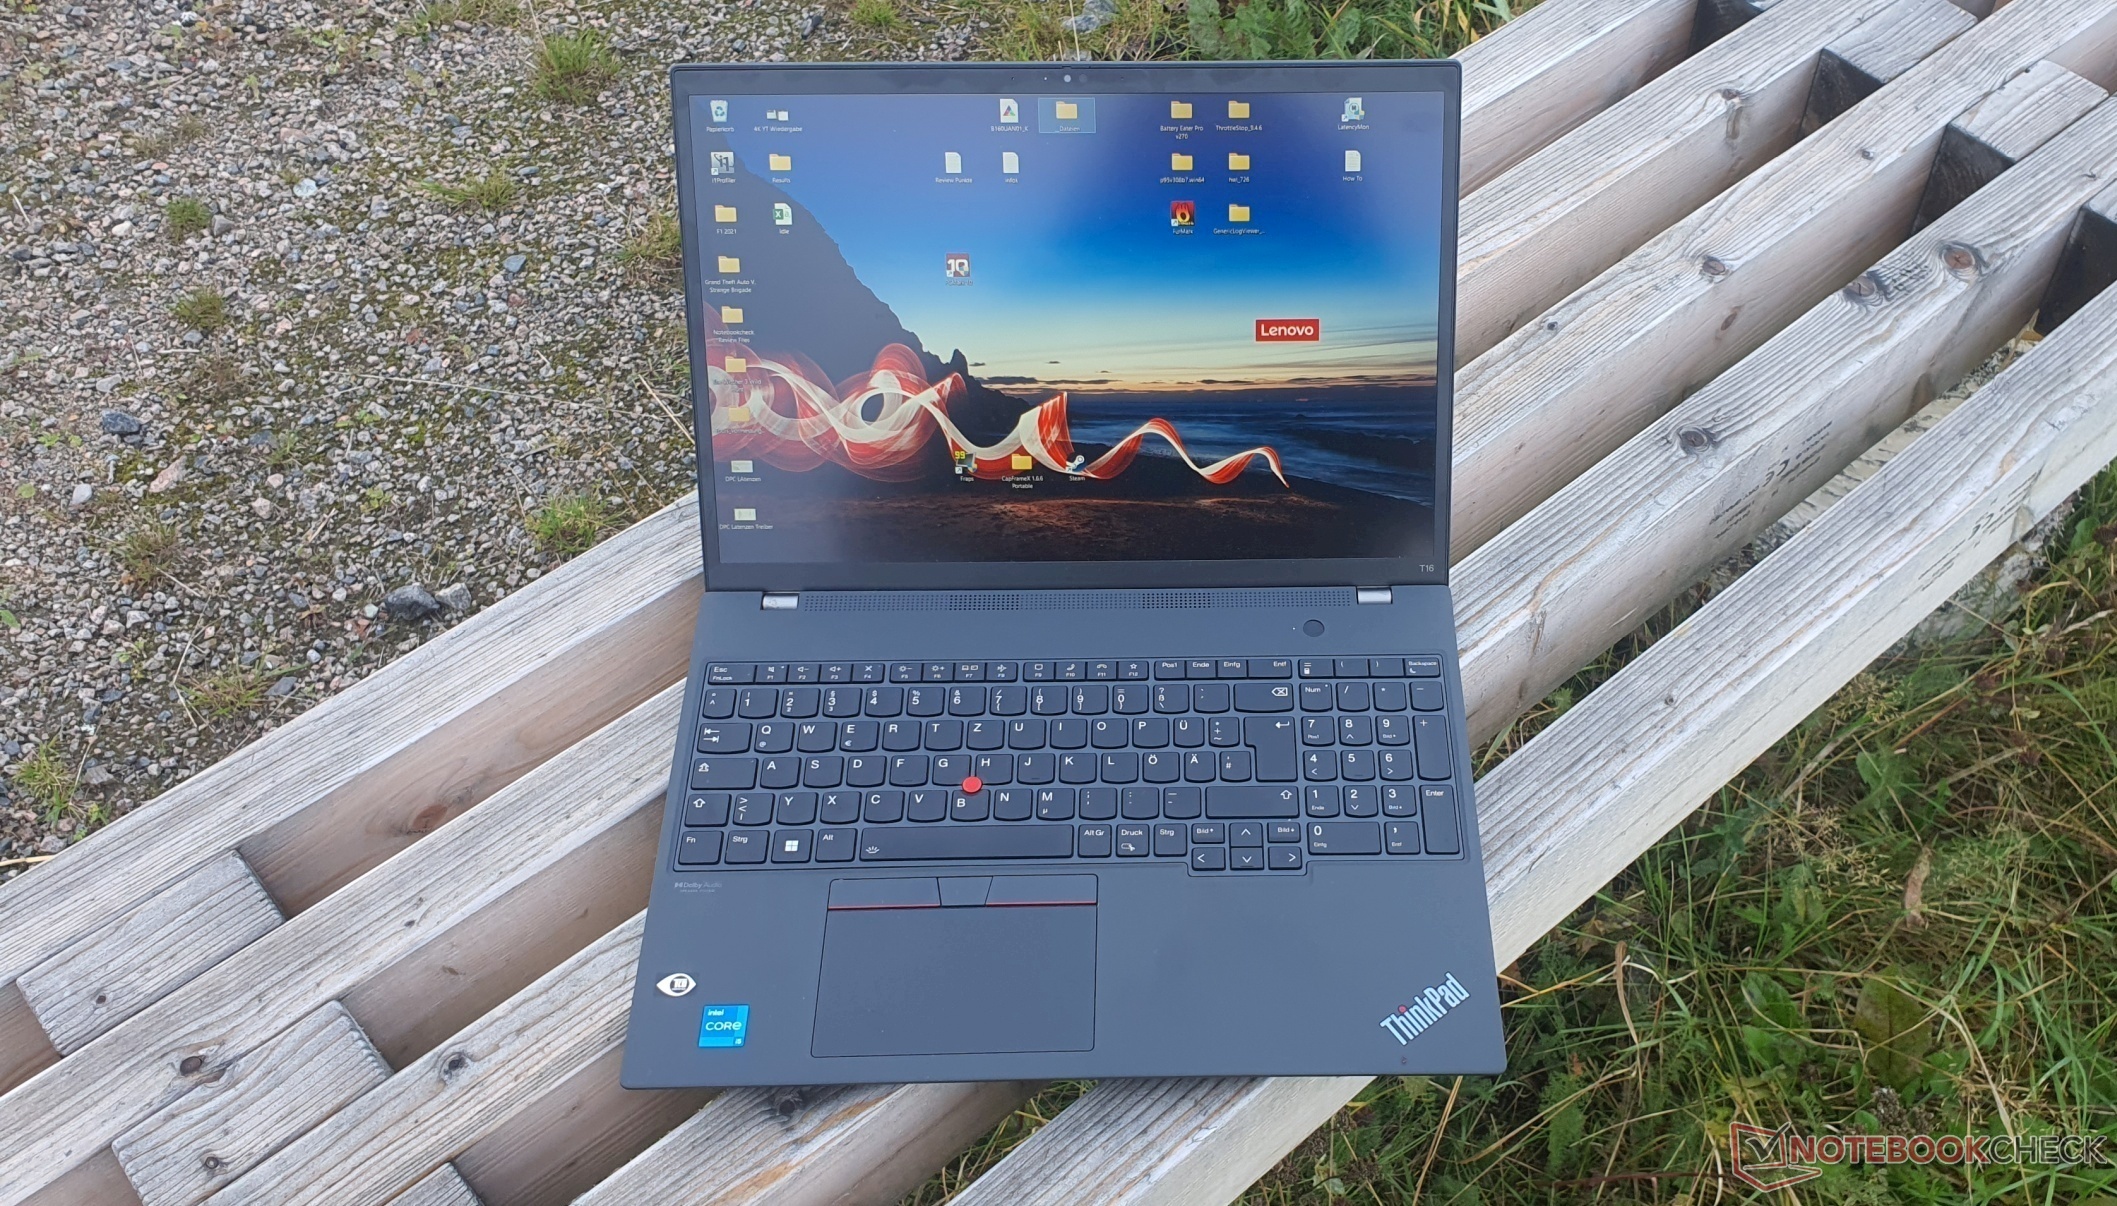
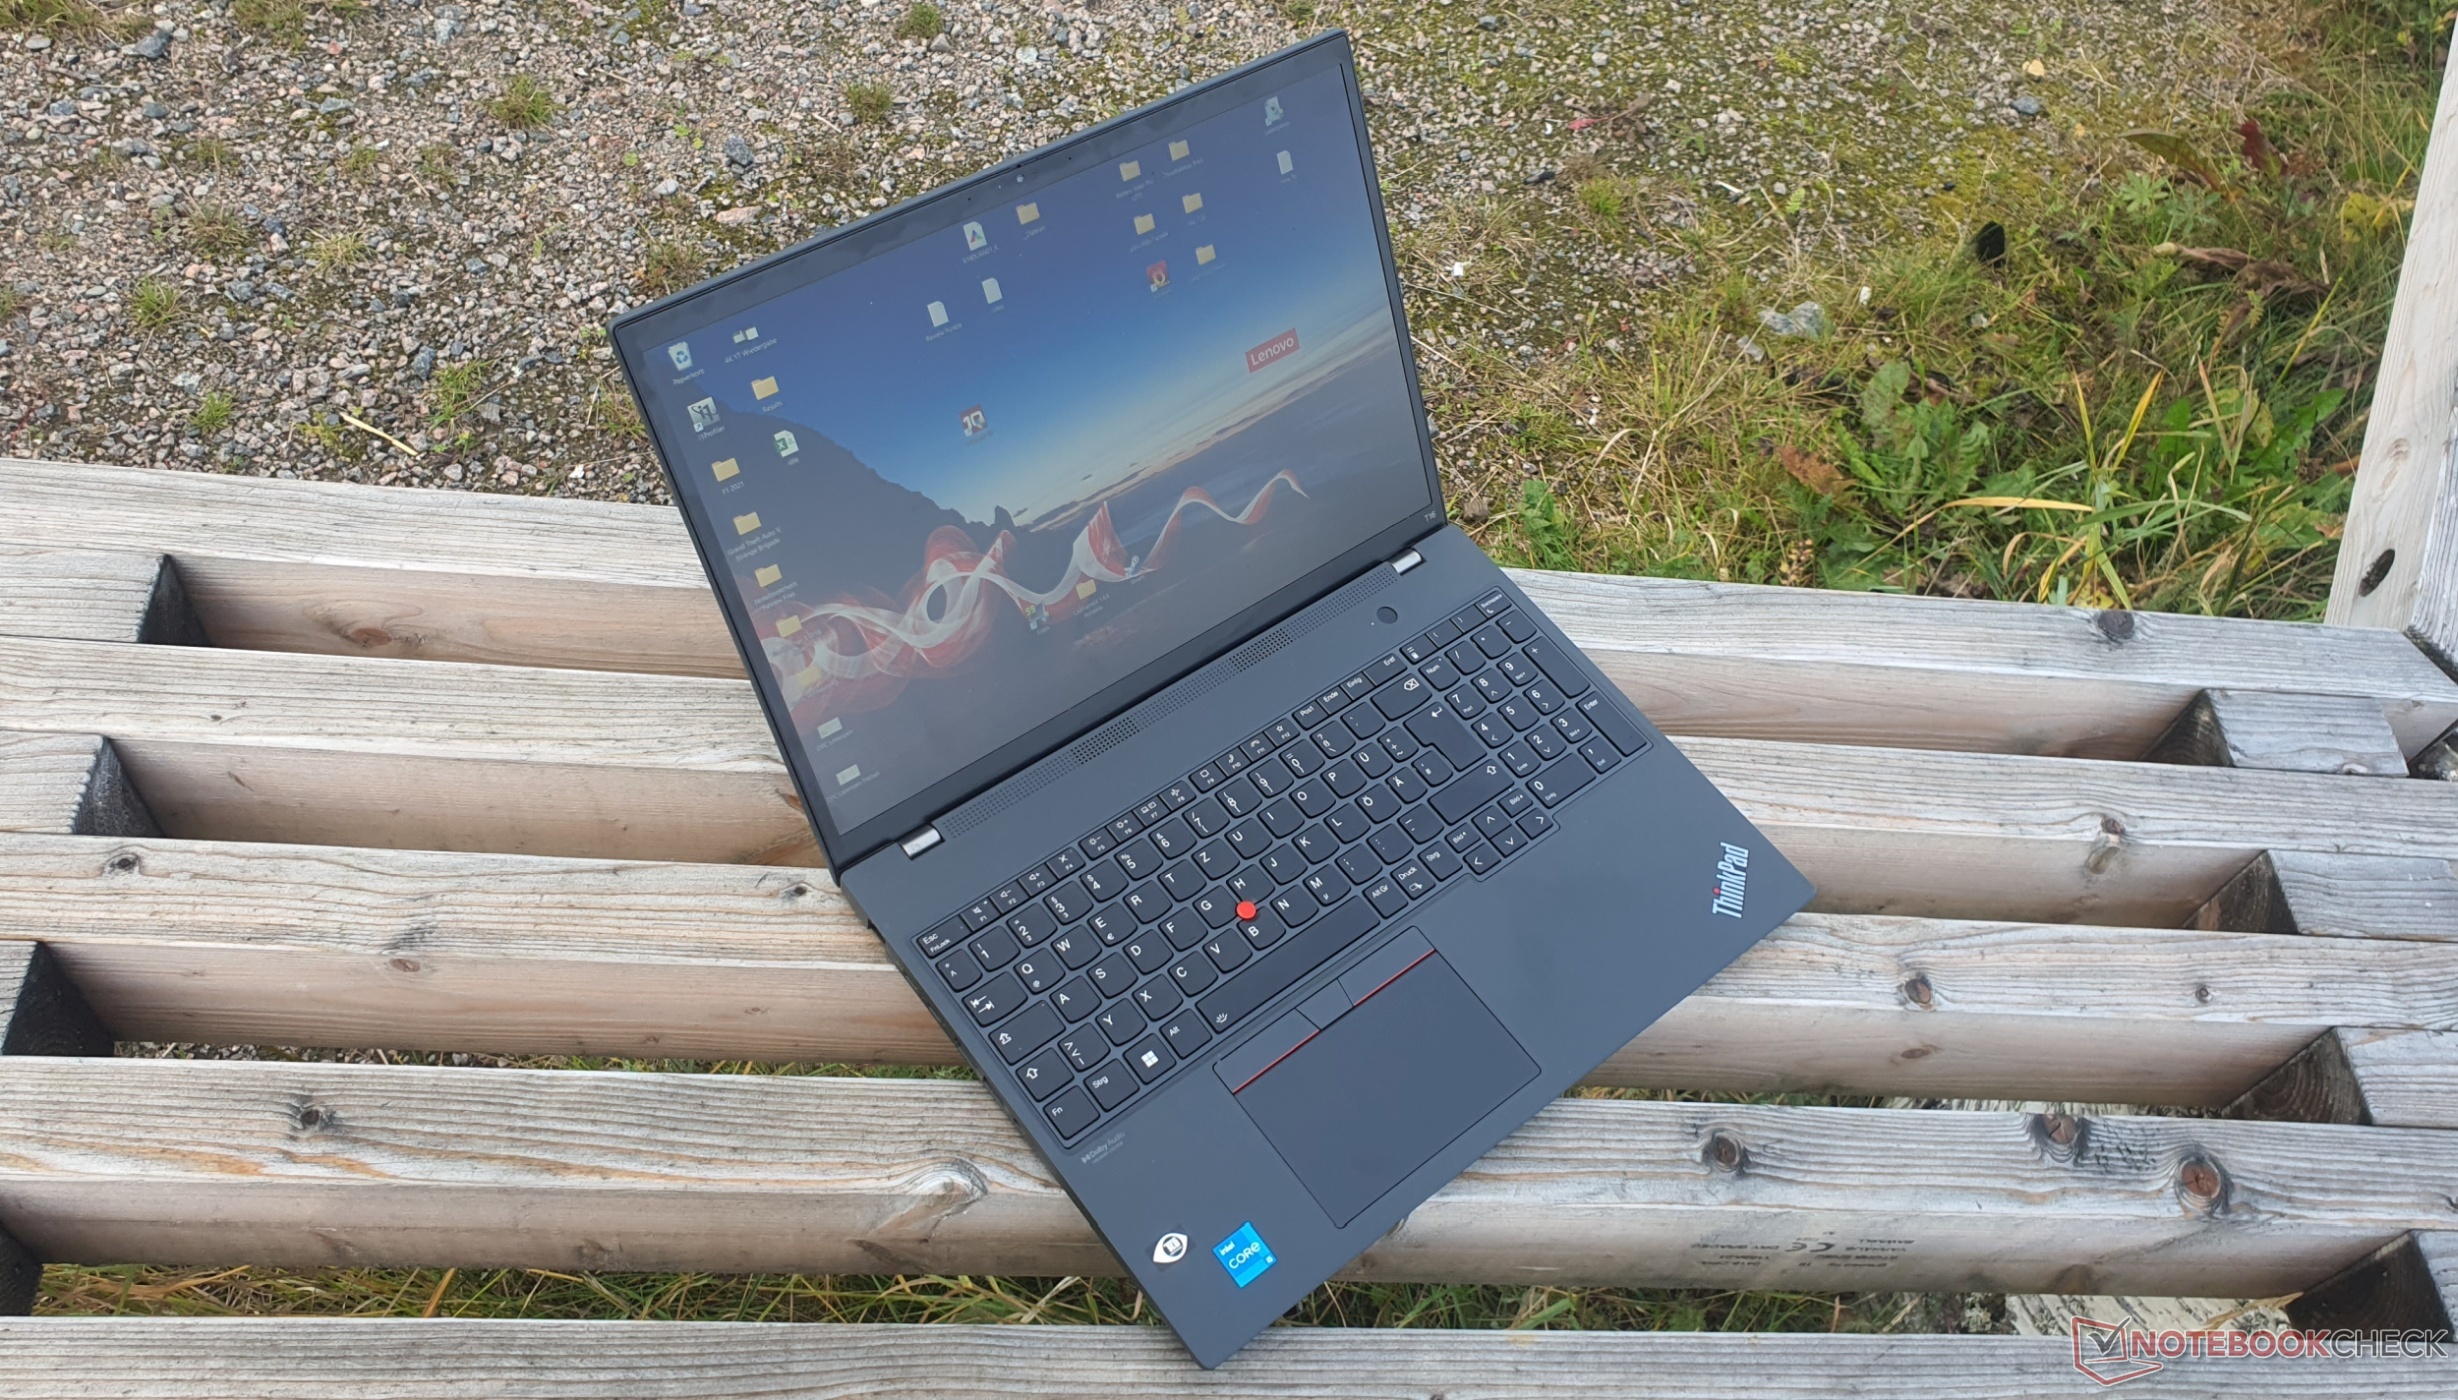
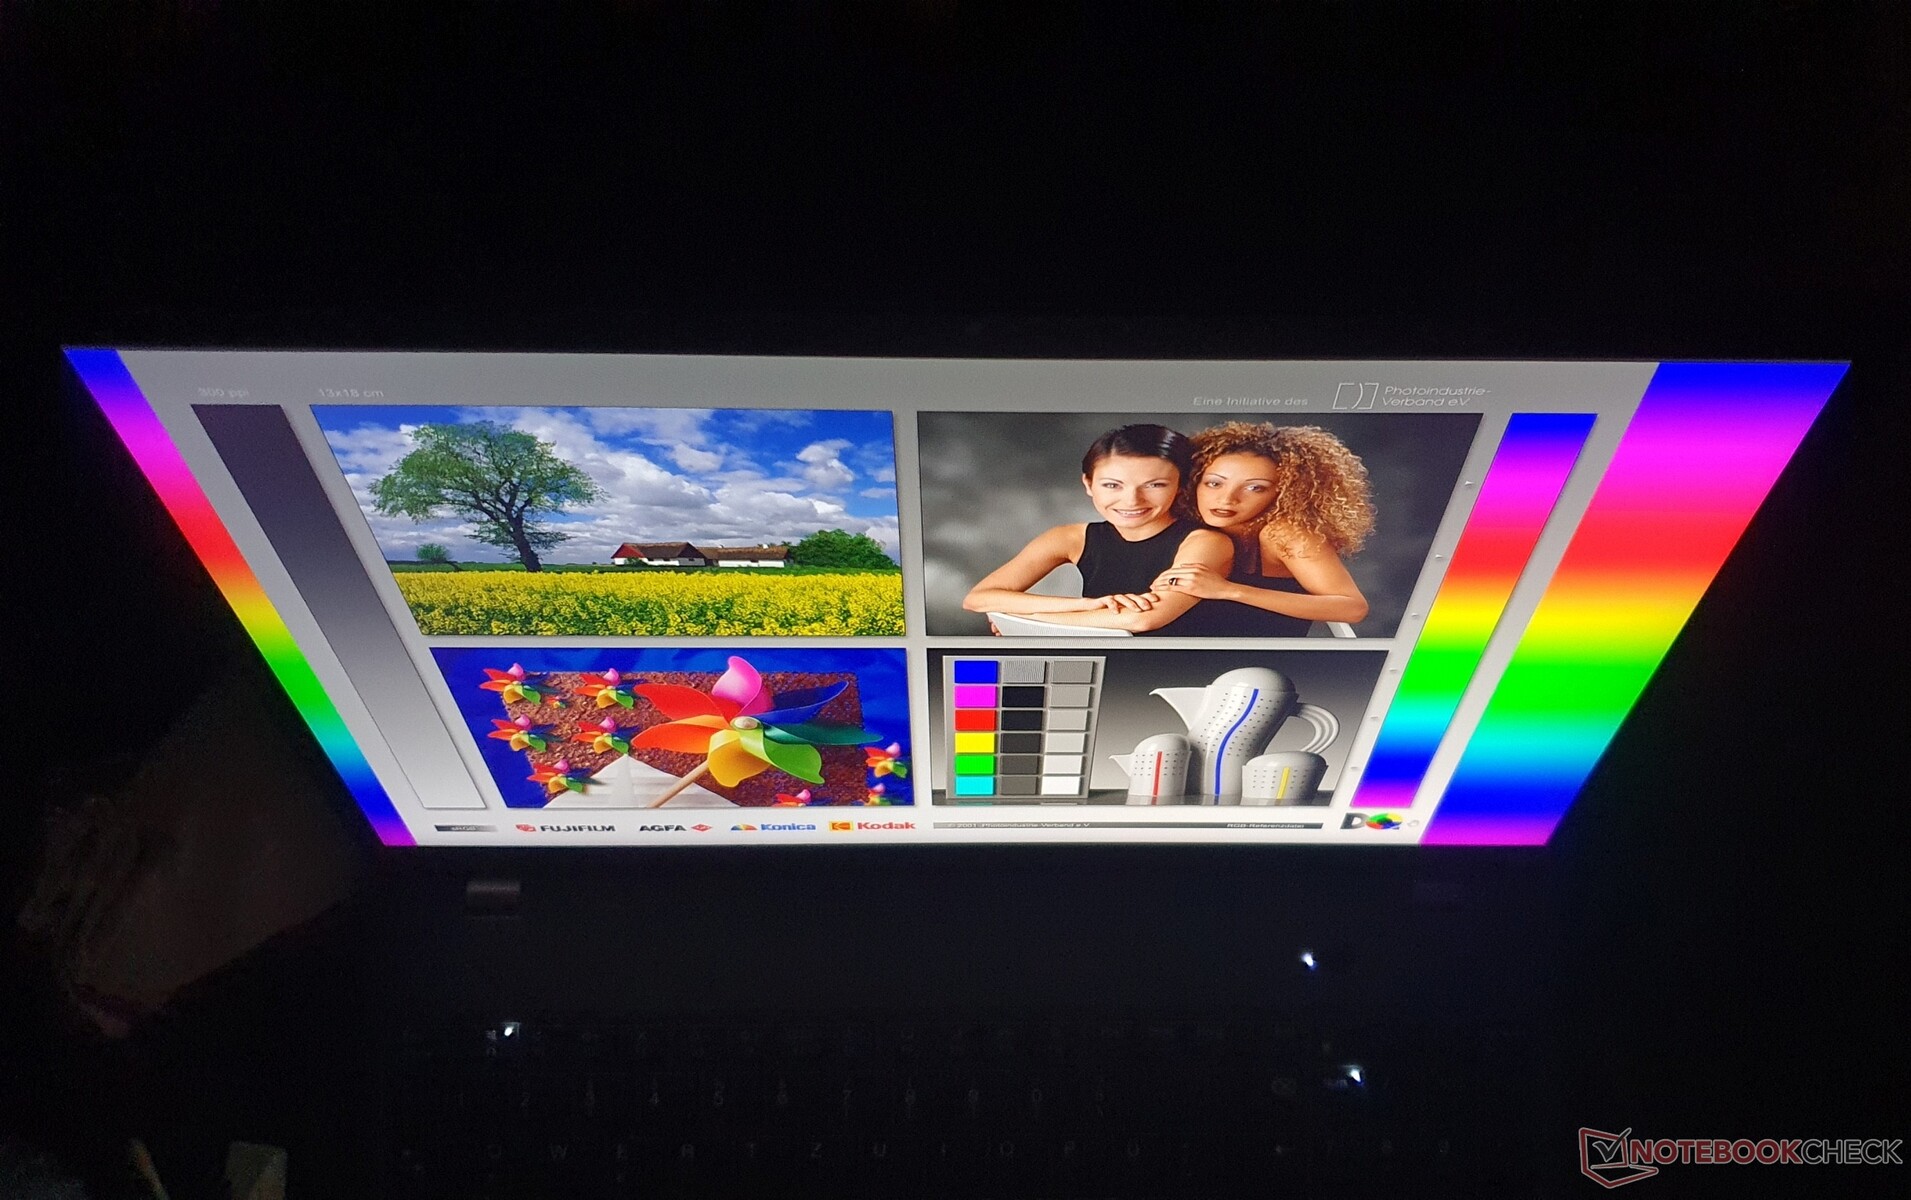
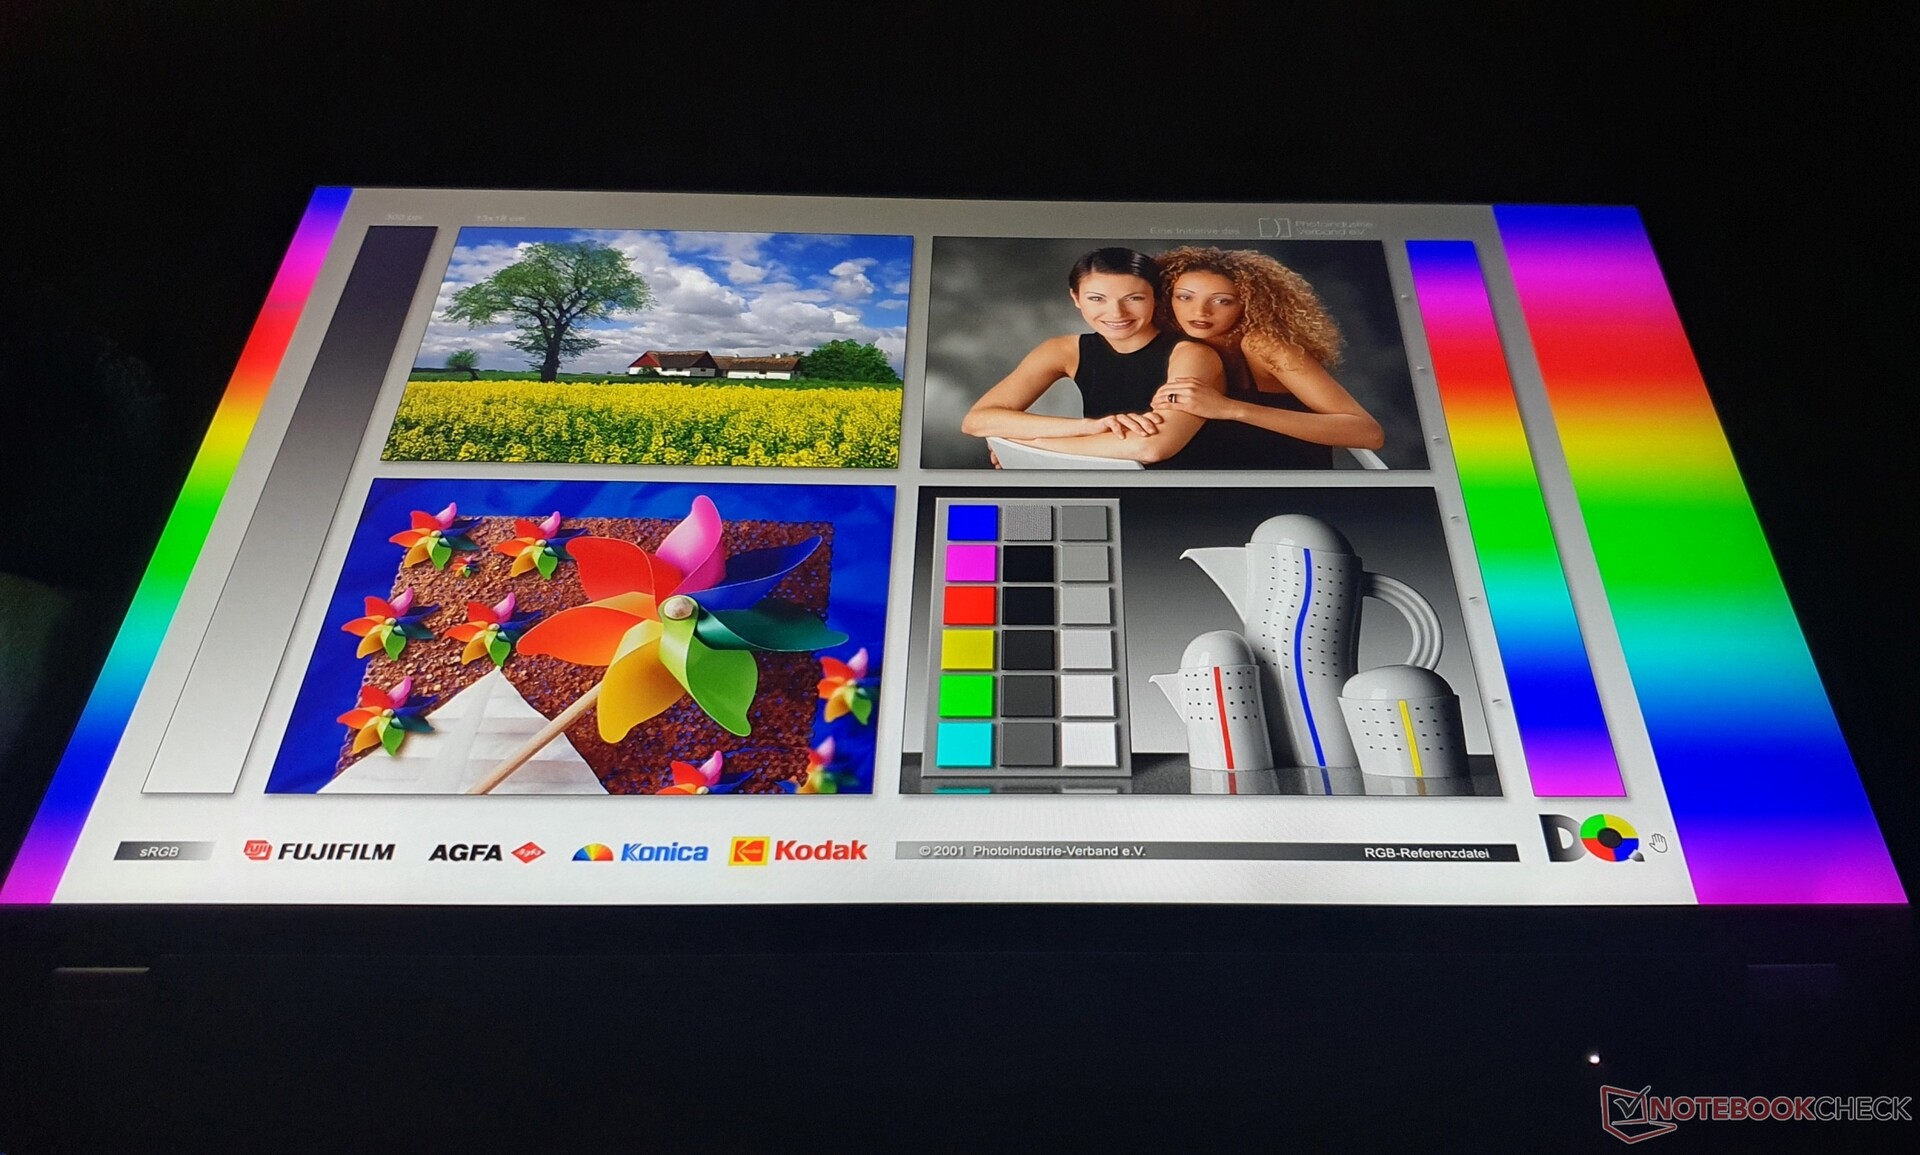
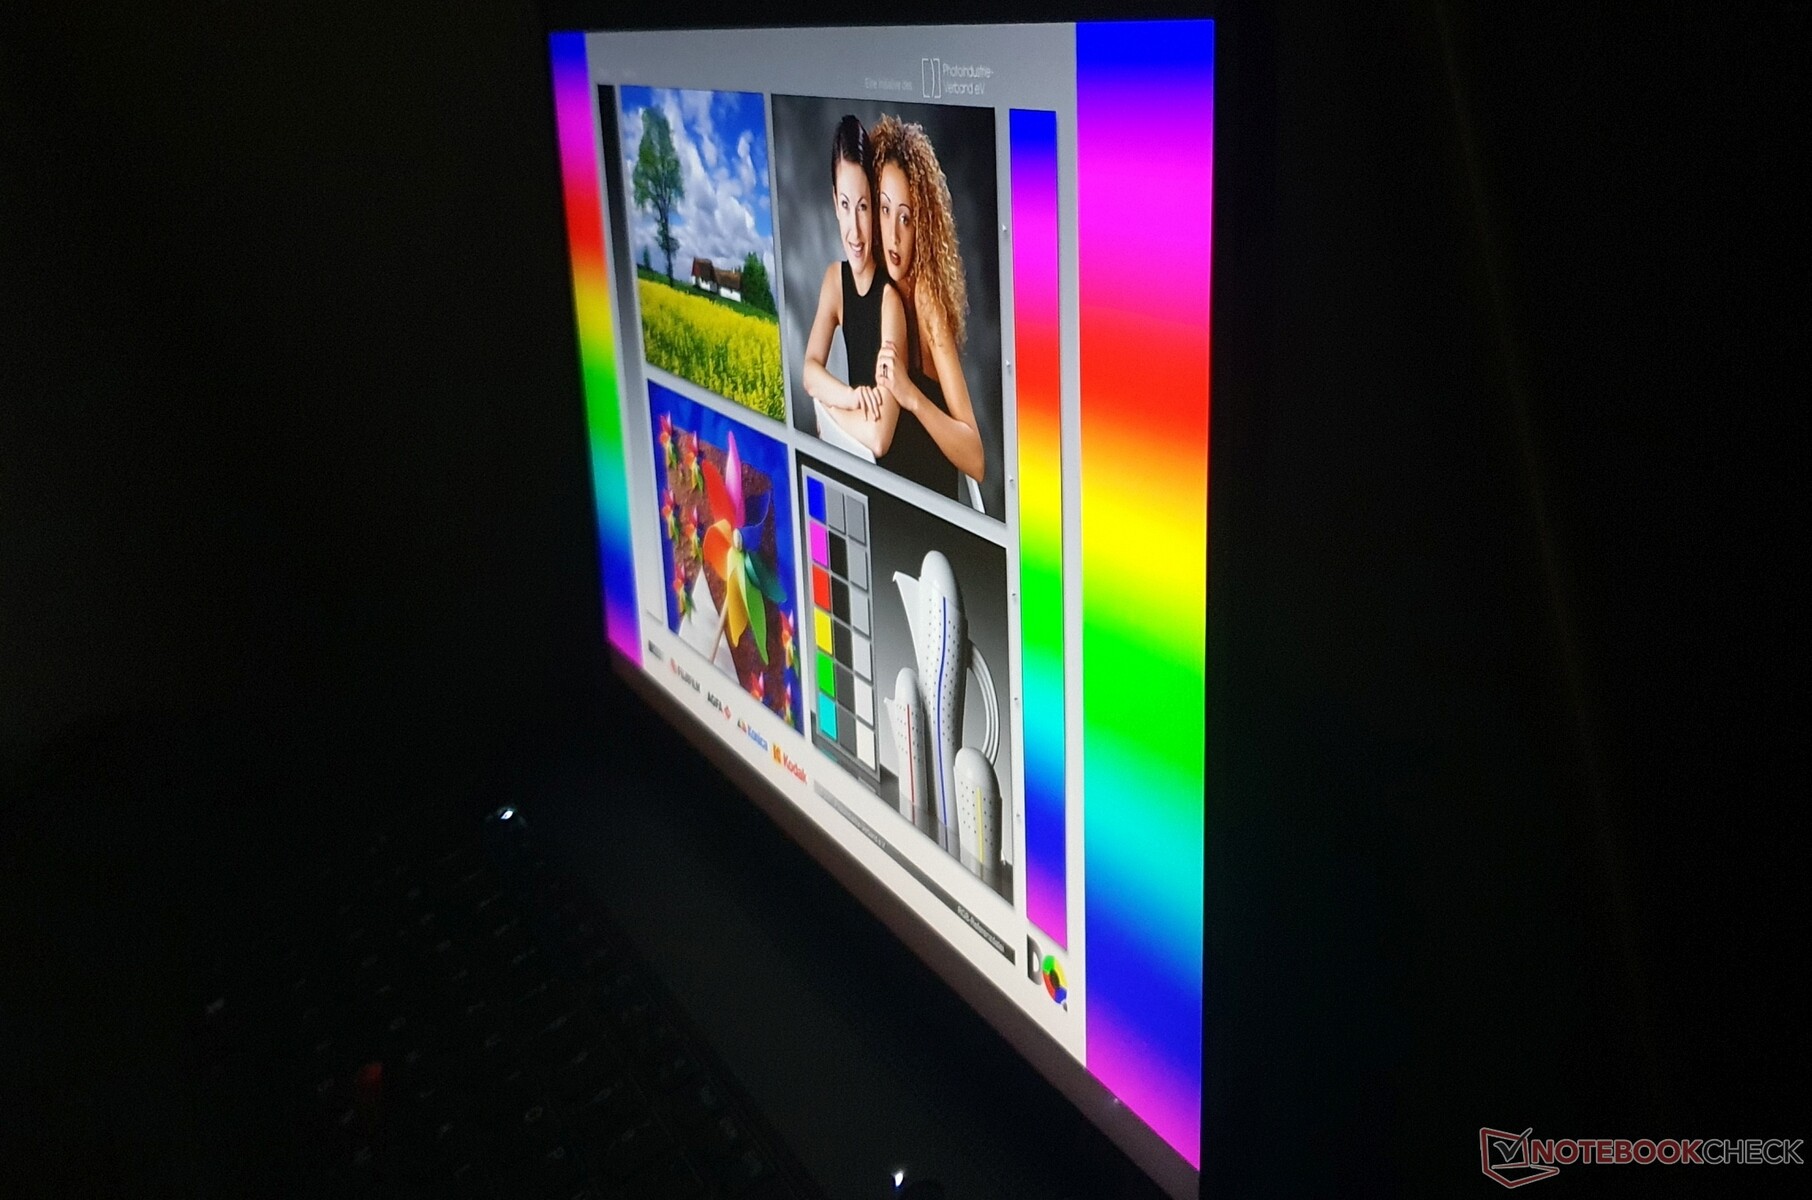
Pantalla: pantalla Sharp FHD+ de bajo consumo en el ThinkPad T16

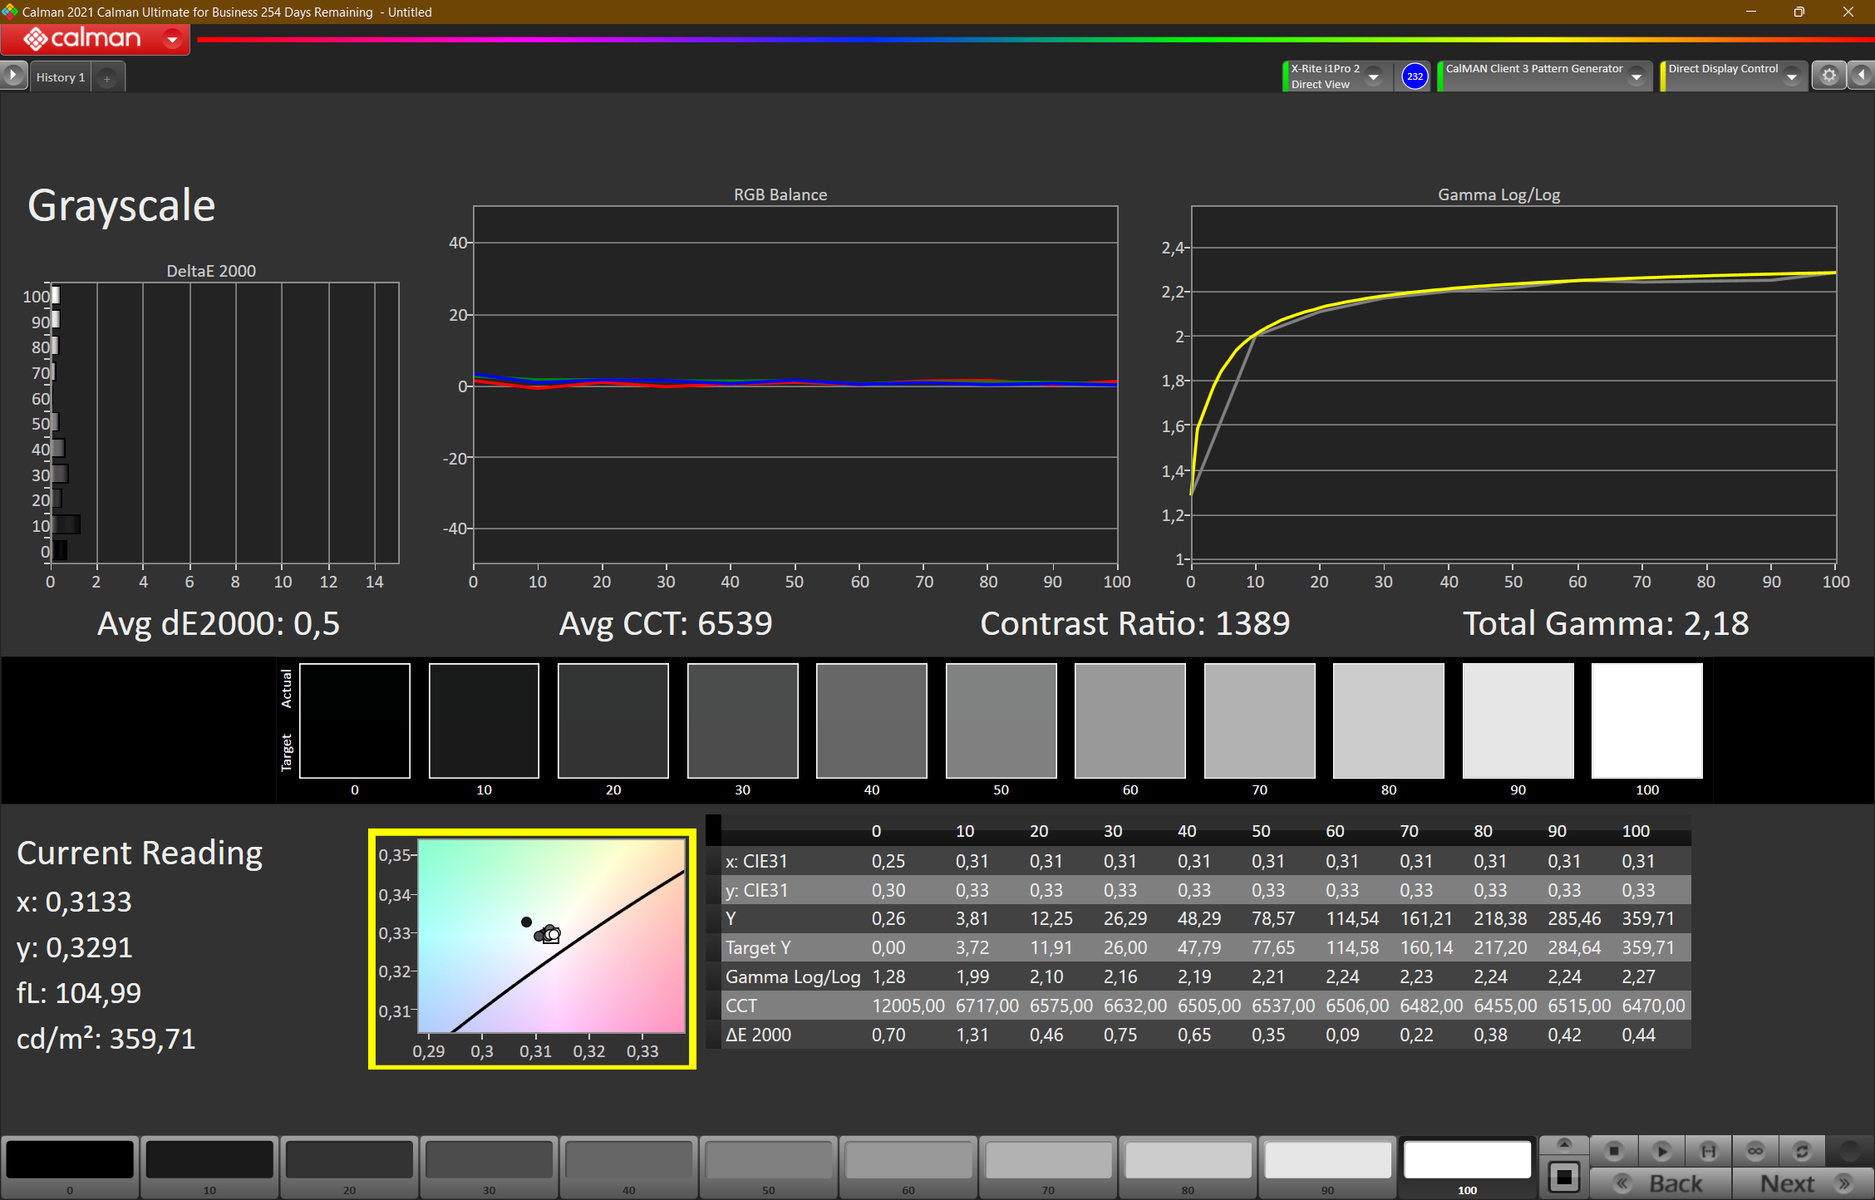
La pantalla mate de bajo consumo en formato 16:10 instalada en nuestro modelo de pruebas tiene una resolución de 1920x1200 (WUXGA/FHD+) y ofrece una buena nitidez en 16 pulgadas. El brillo de unos buenos 390 nits es casi el especificado (400 nits). La relación de contraste (1393:1) y el valor de negro (0,29 nits) también están a un alto nivel. El contenido de la imagen en negro parece rico y profundo como resultado.
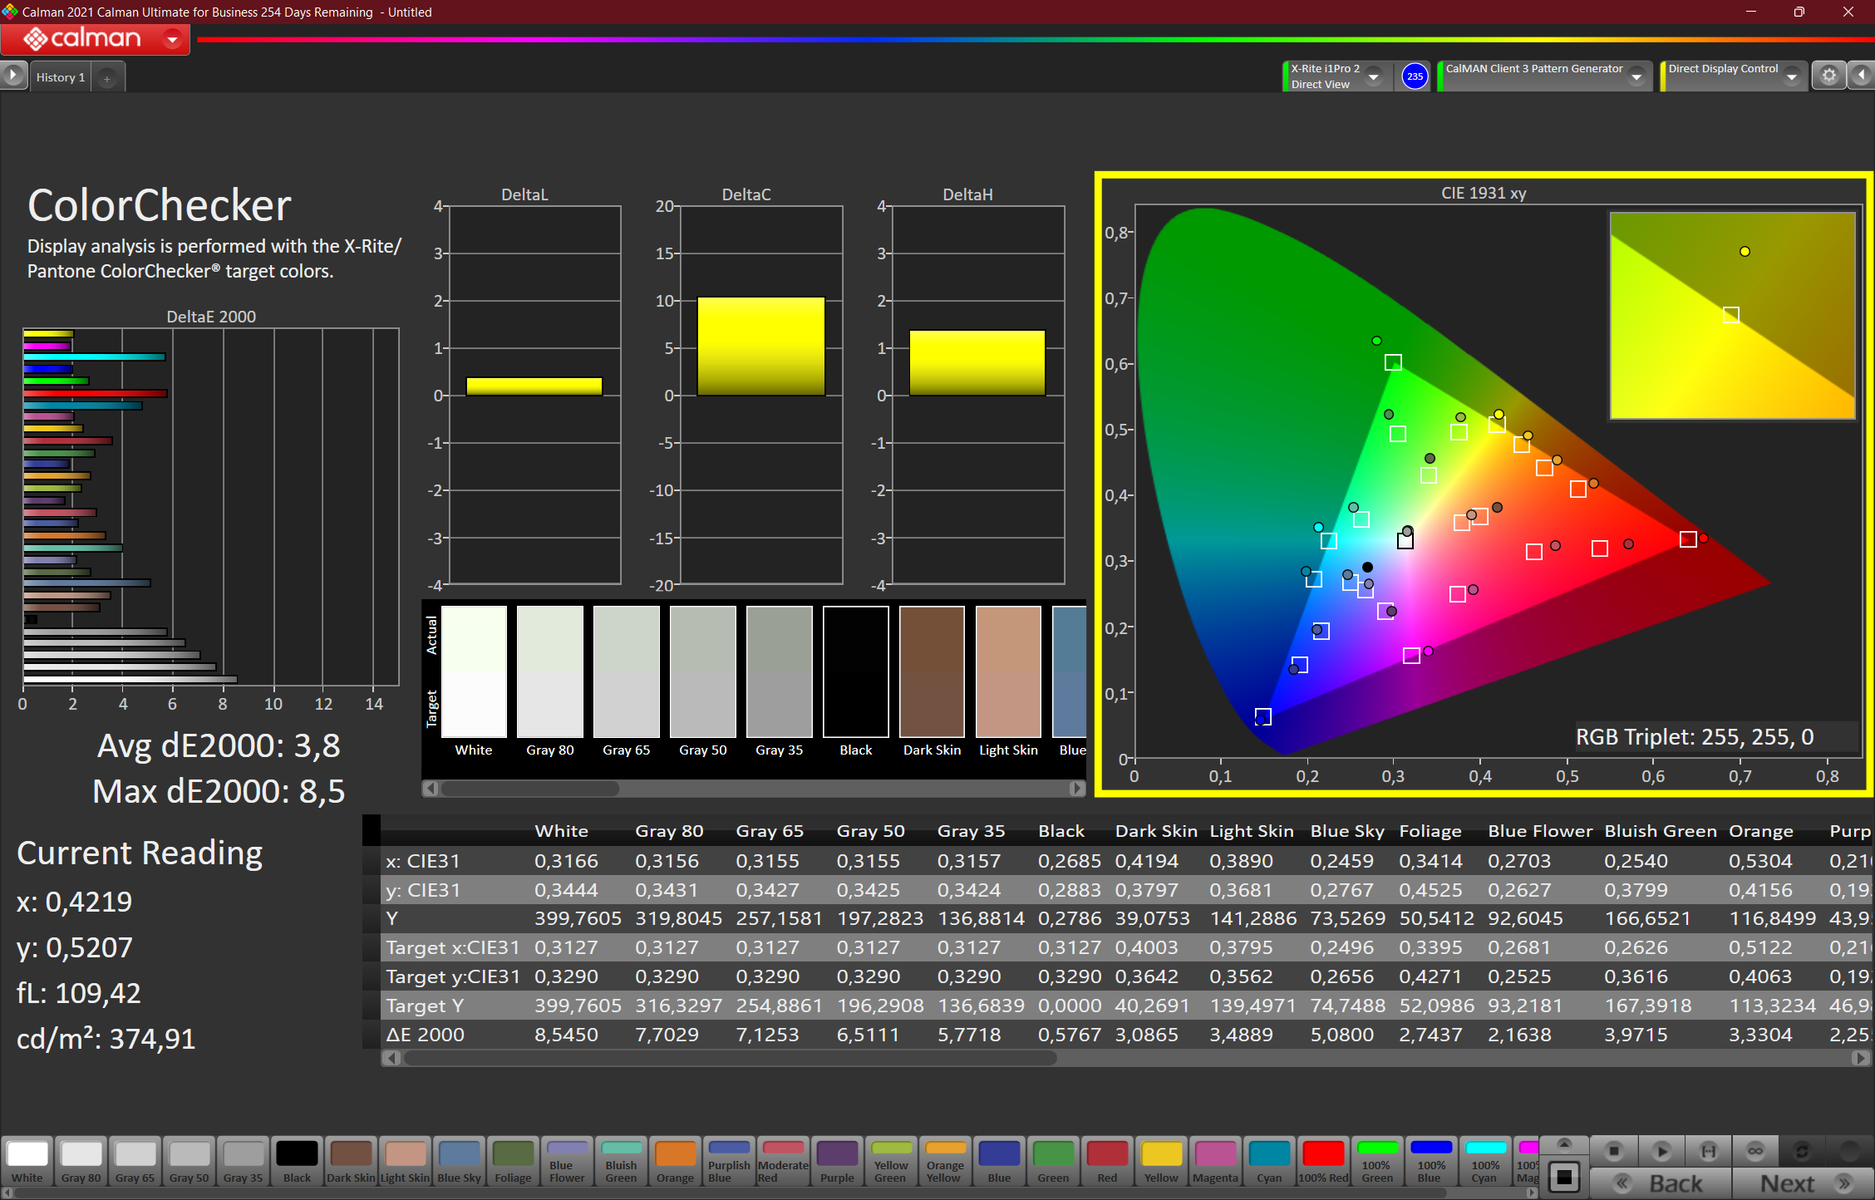
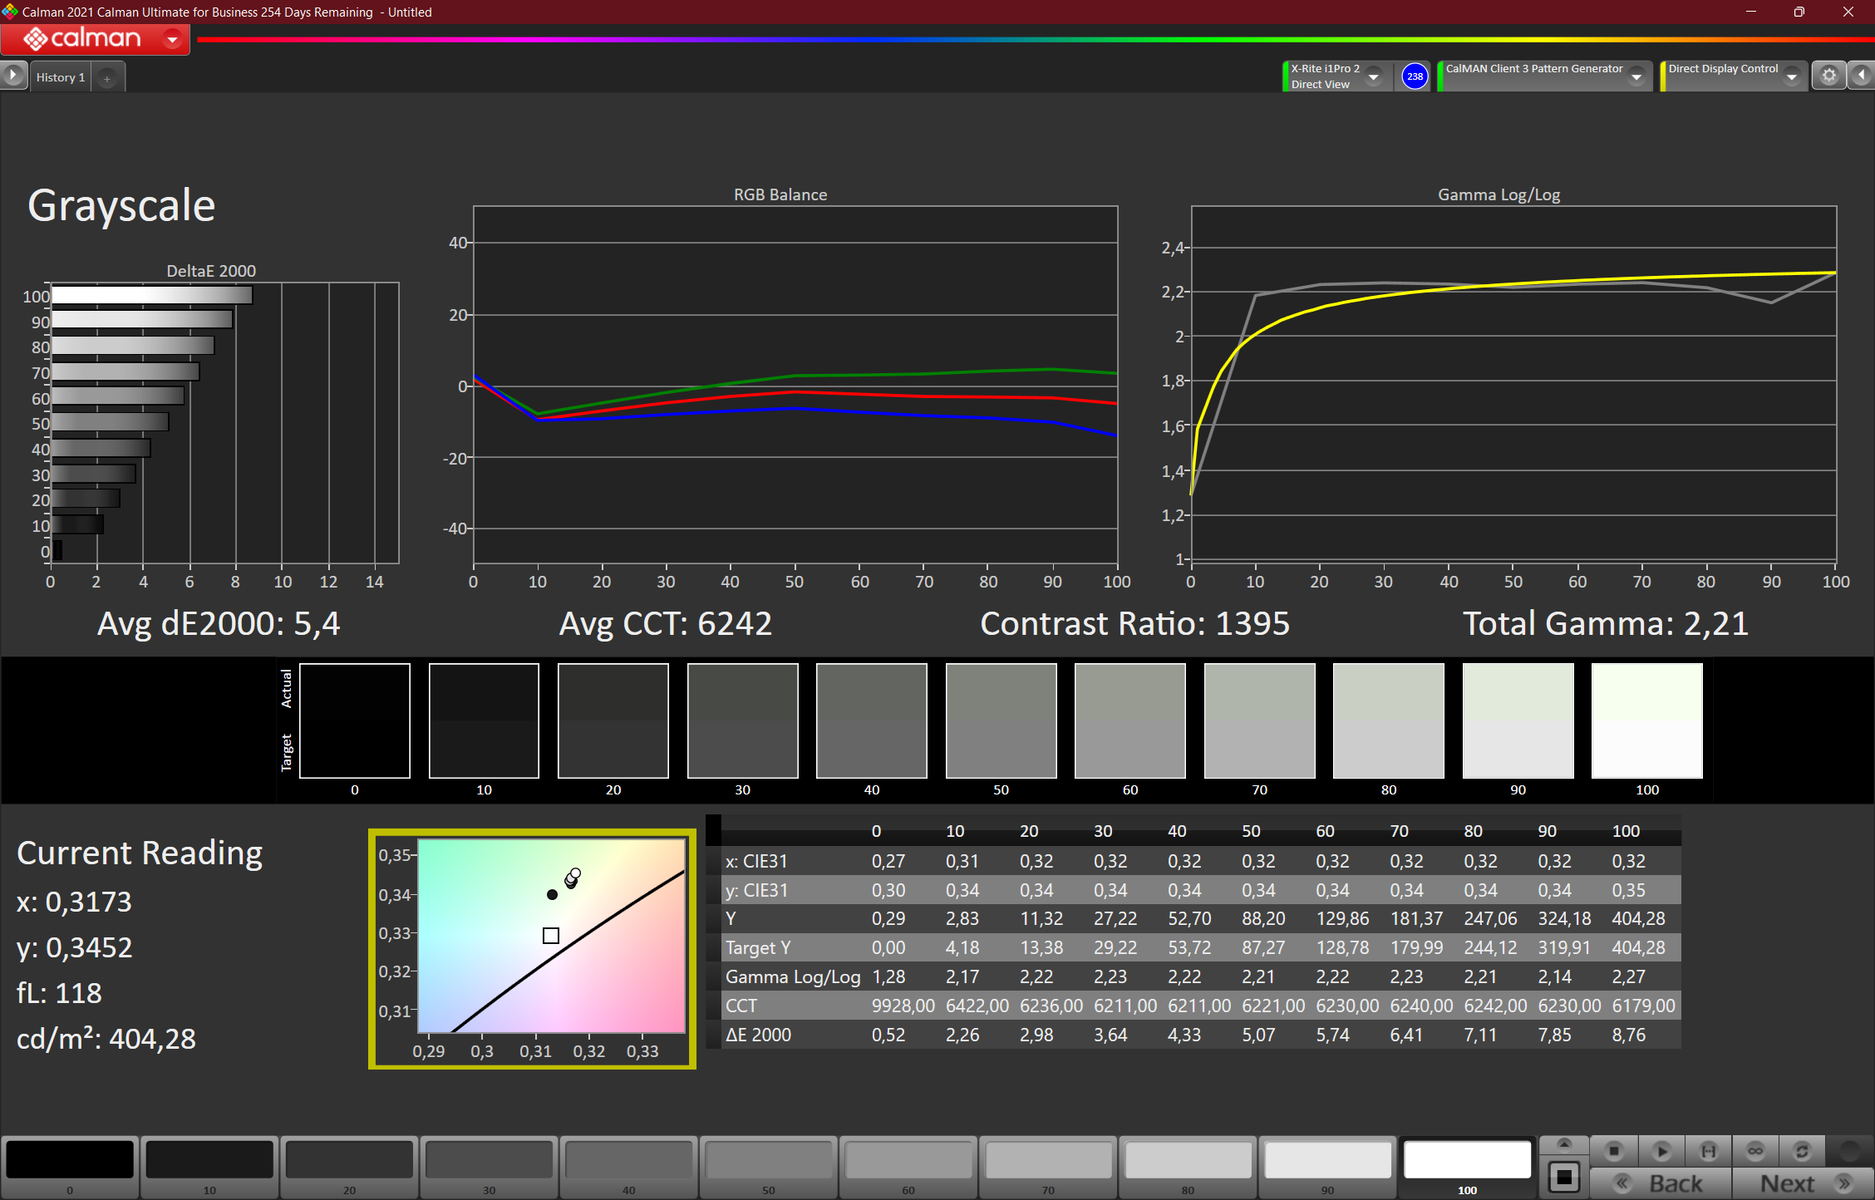
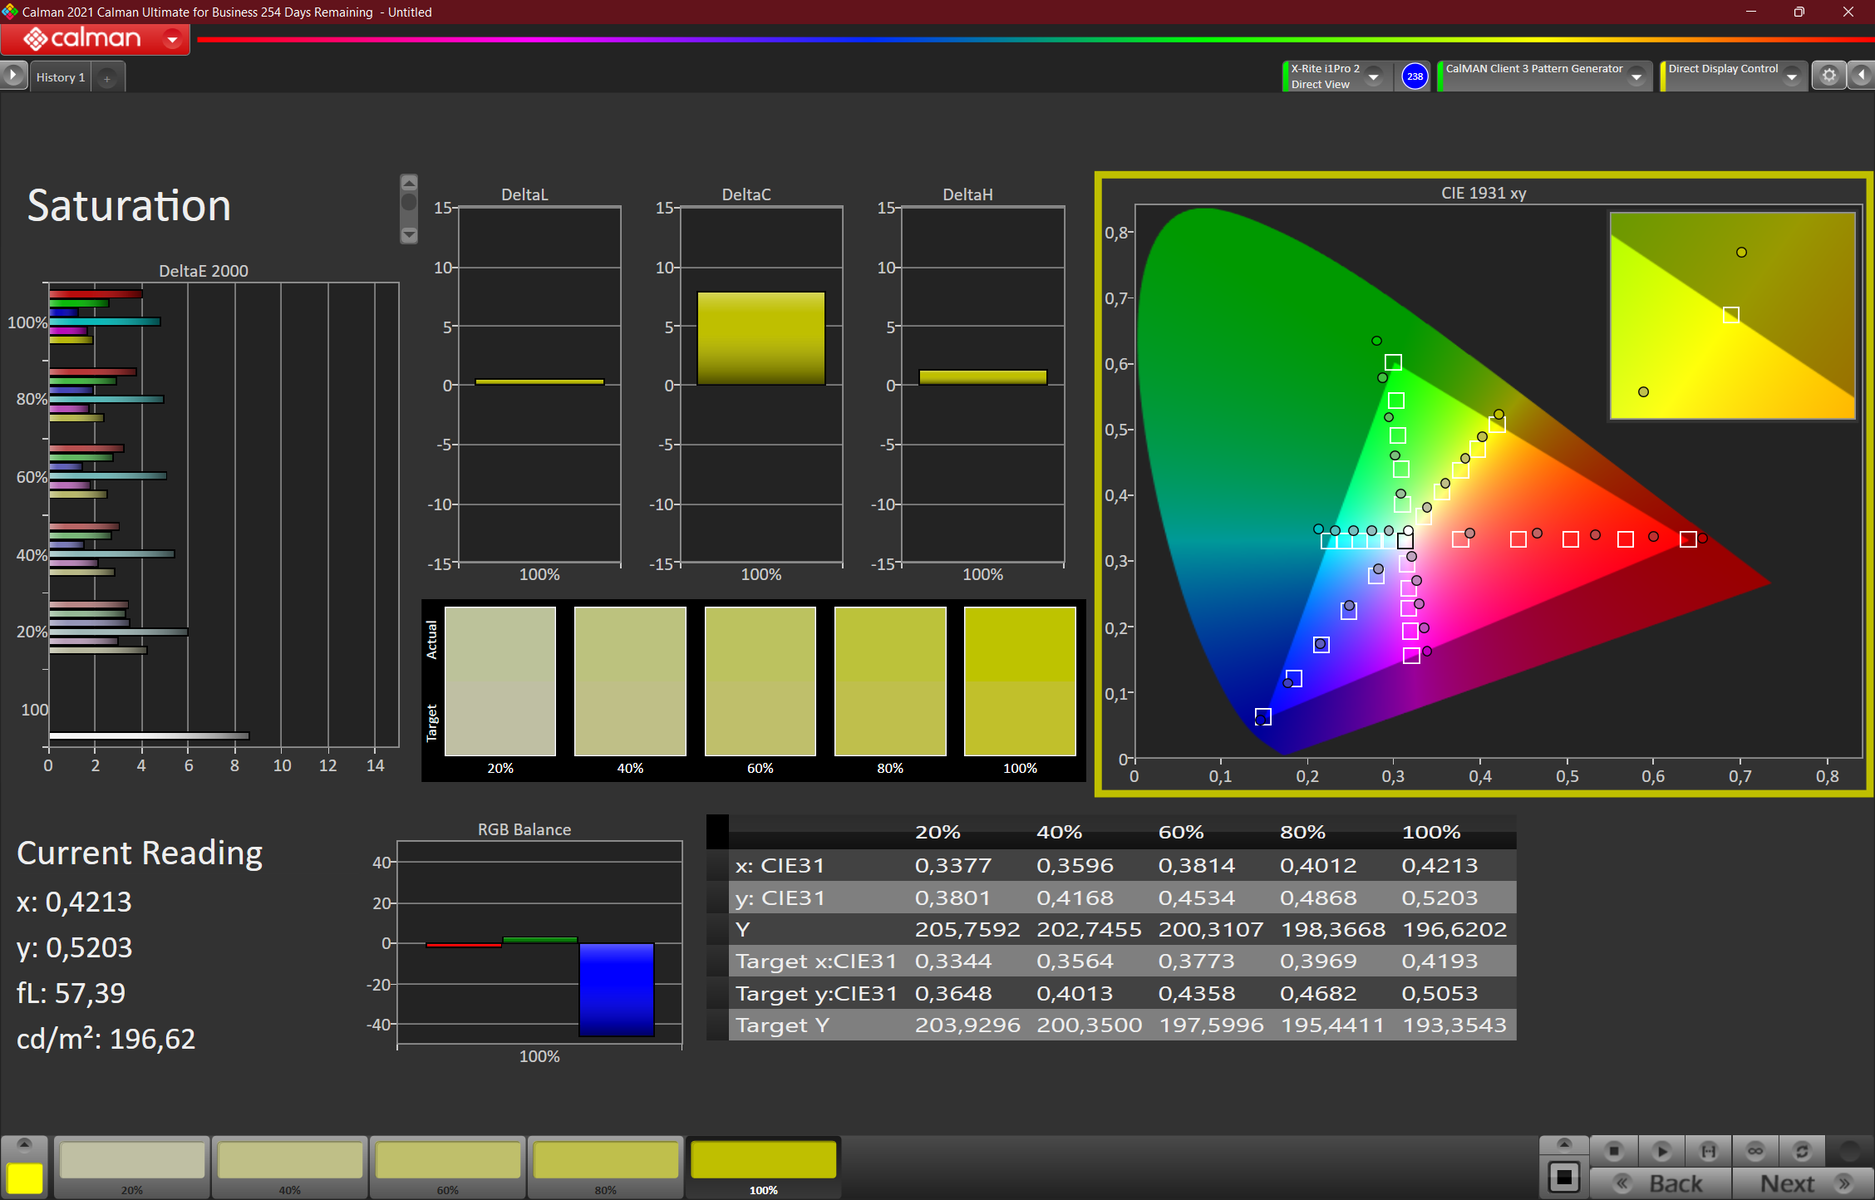
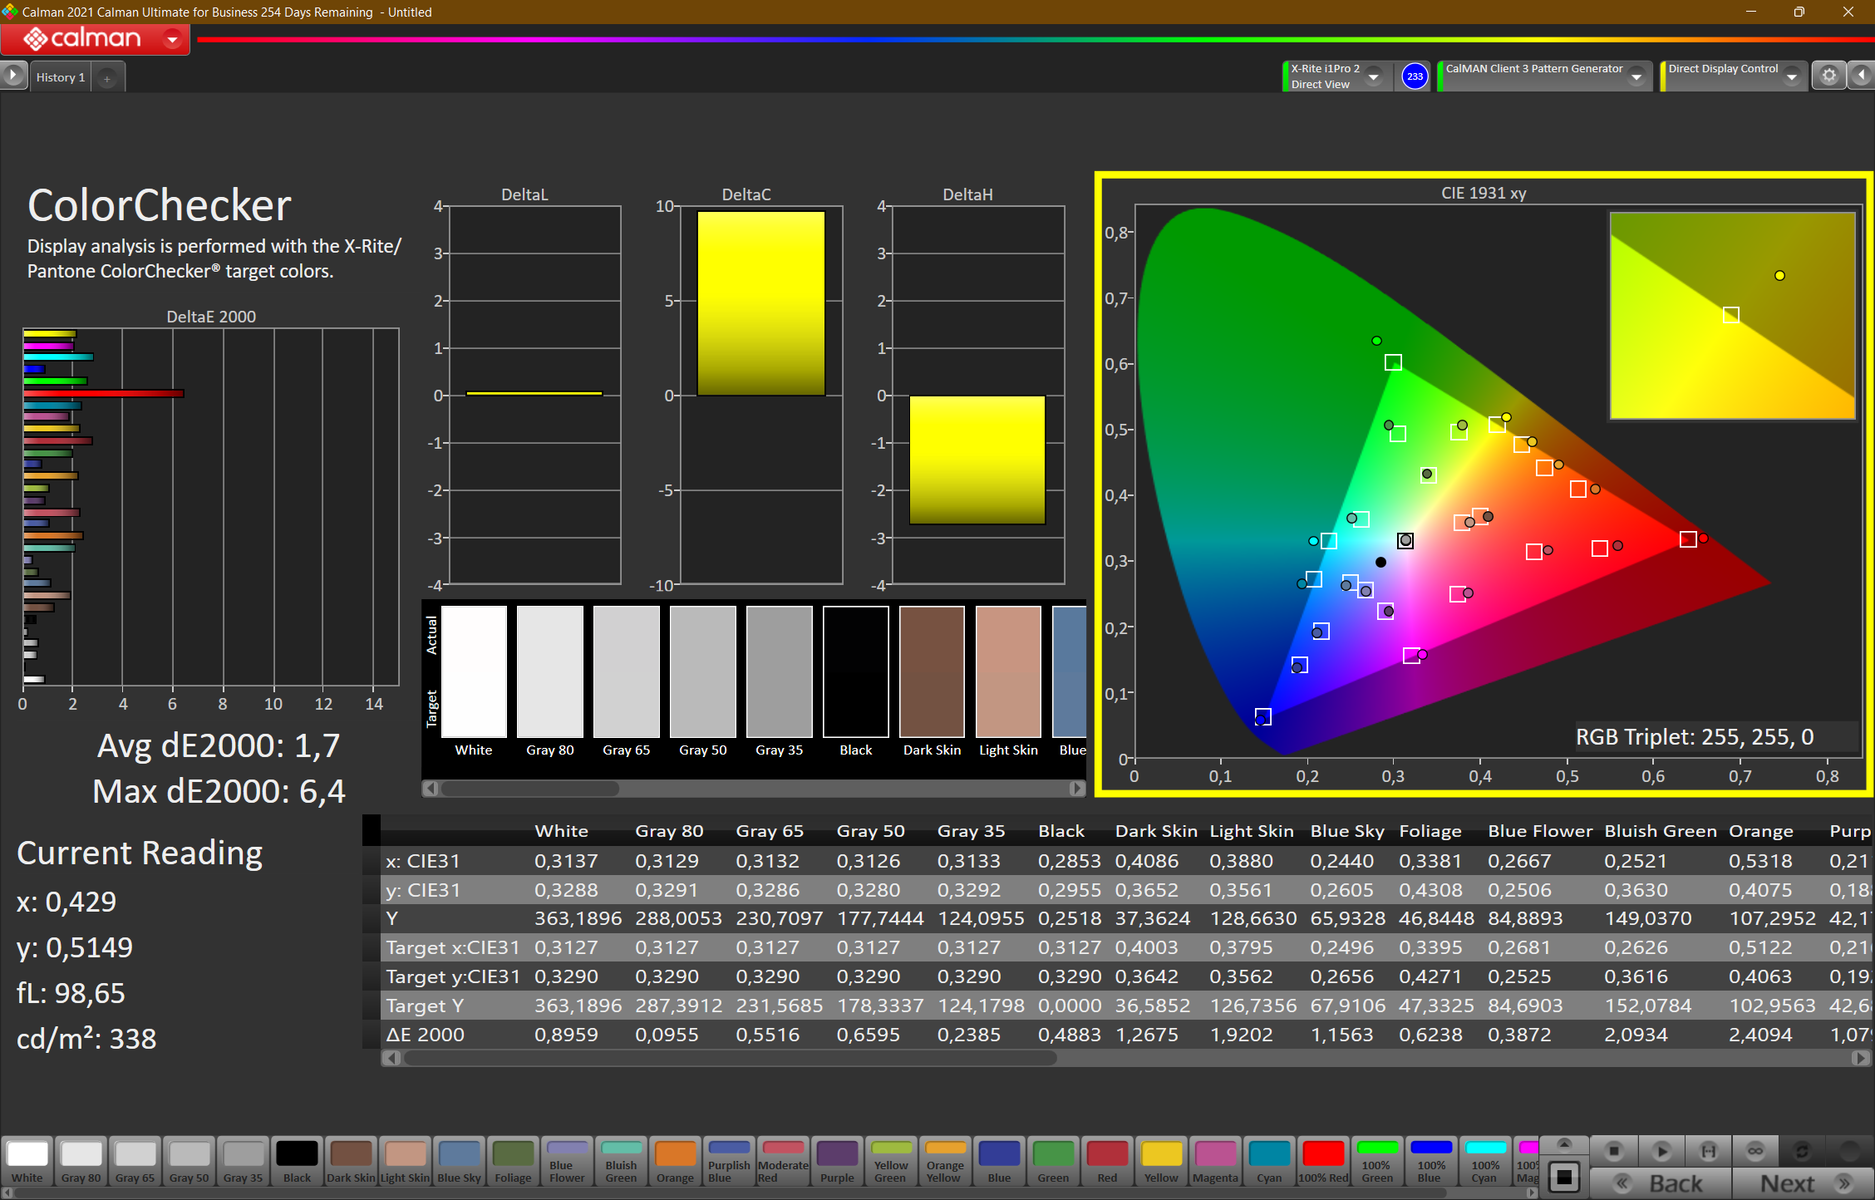
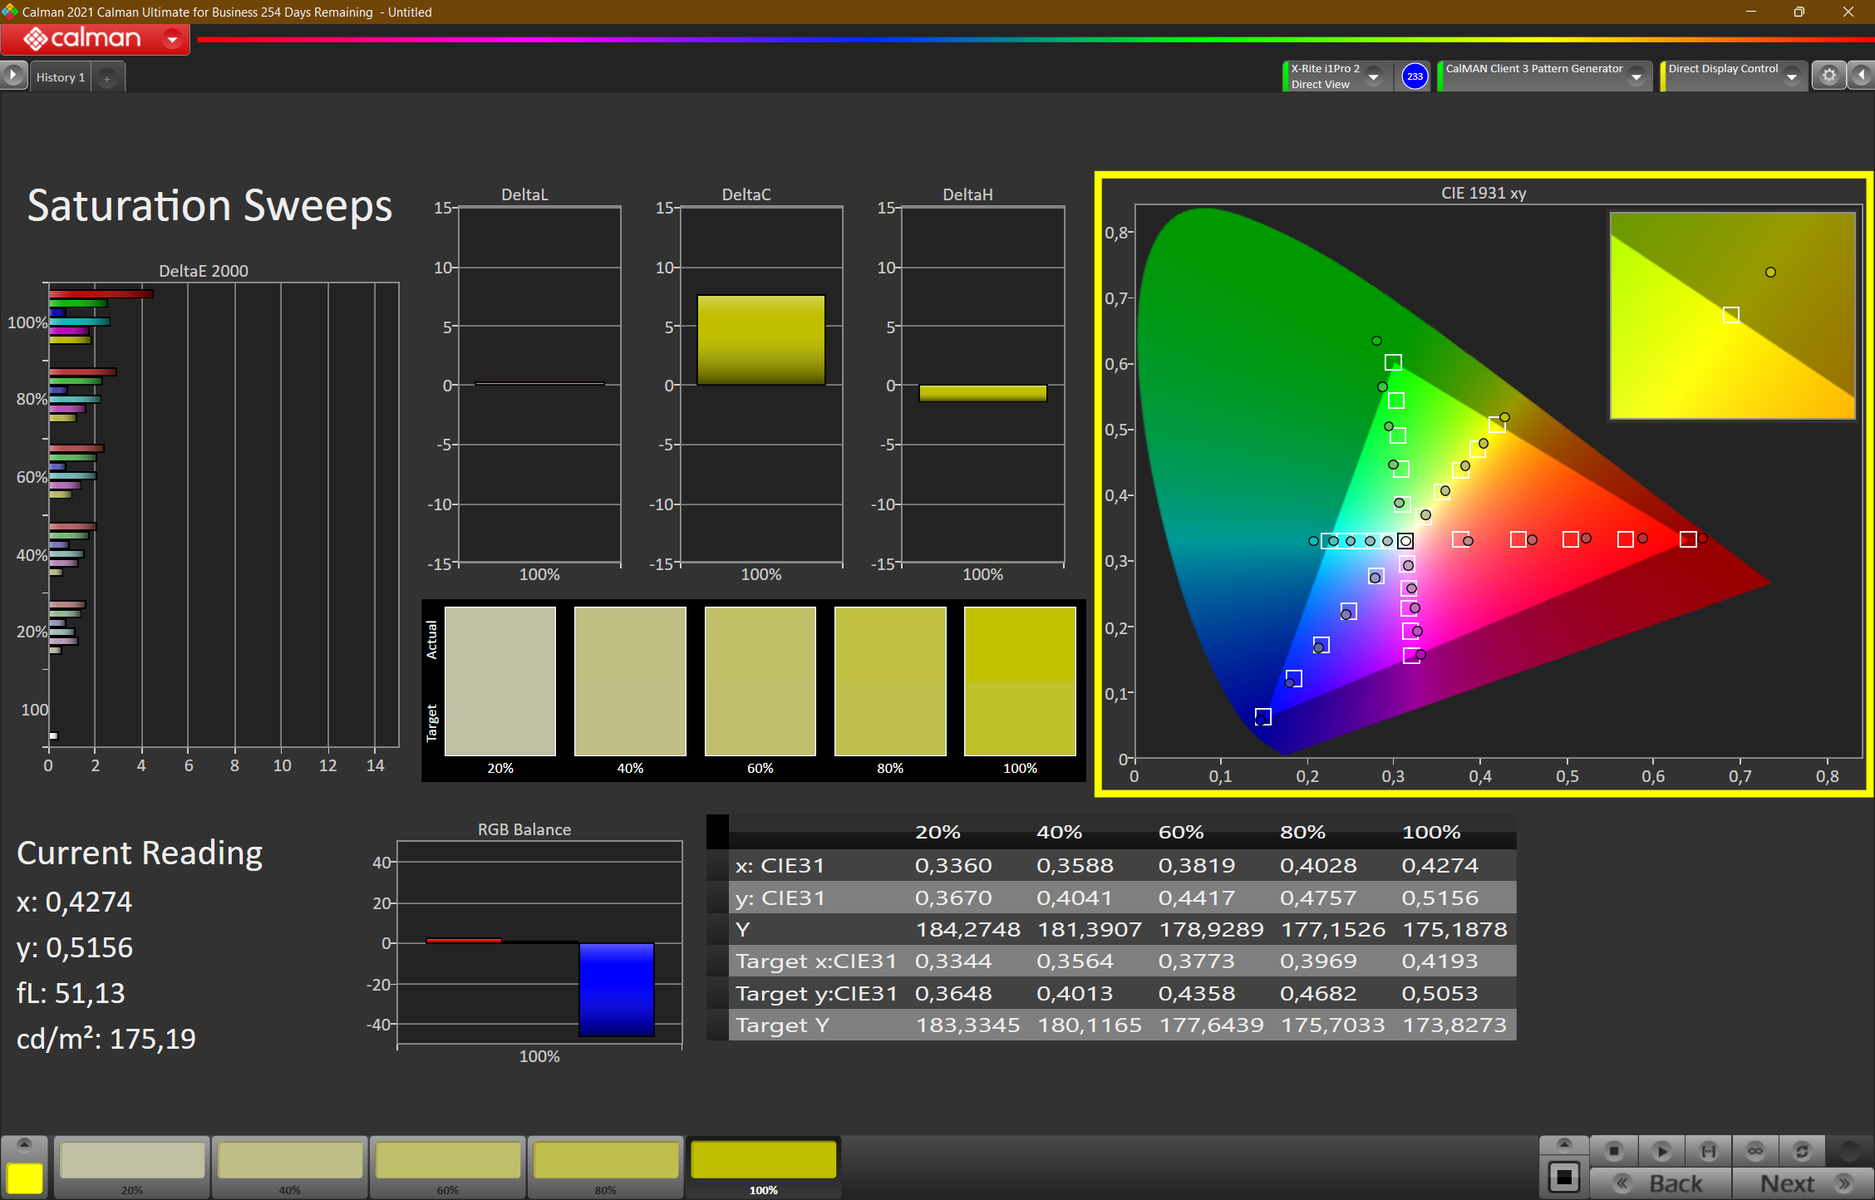
Con 6.300K, el punto blanco se acerca al óptimo de 6.500K. Los colores también son relativamente vivos y, según nuestra calibración, bastante equilibrados. El DeltaE-2000 disminuye de 3,9 a un muy buen 1,7 como resultado, aunque el rojo todavía se desvía mucho.
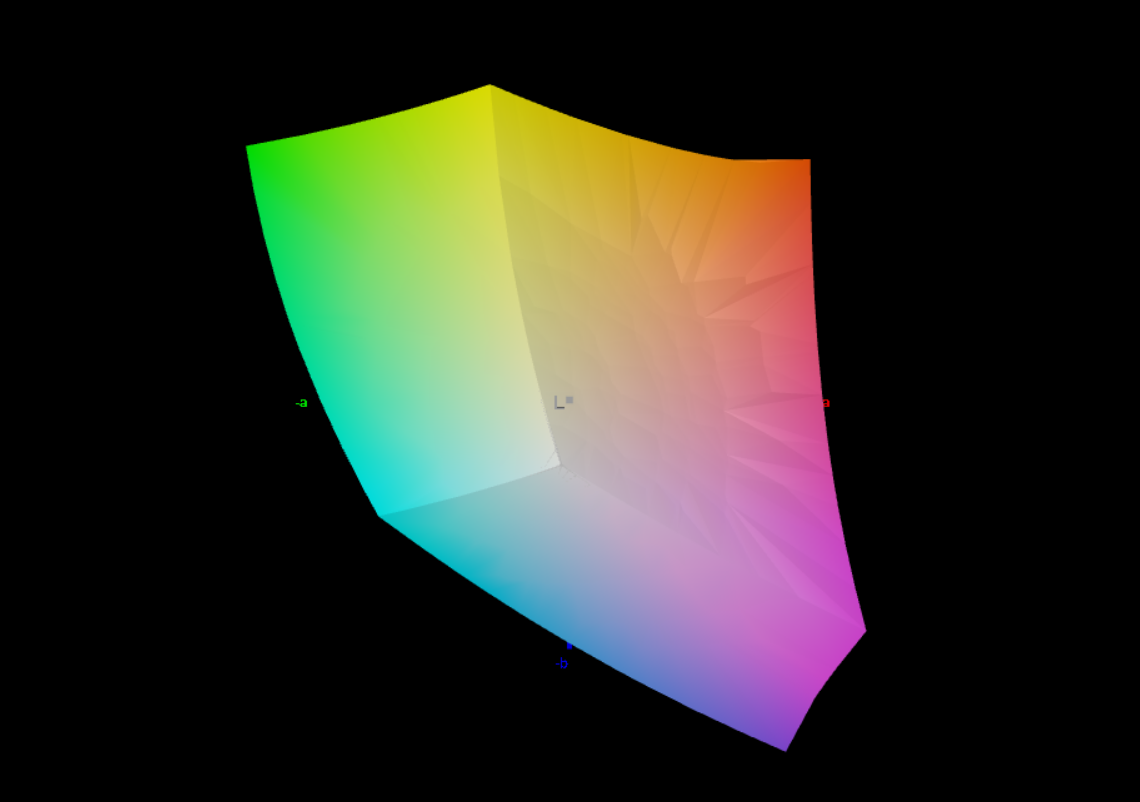
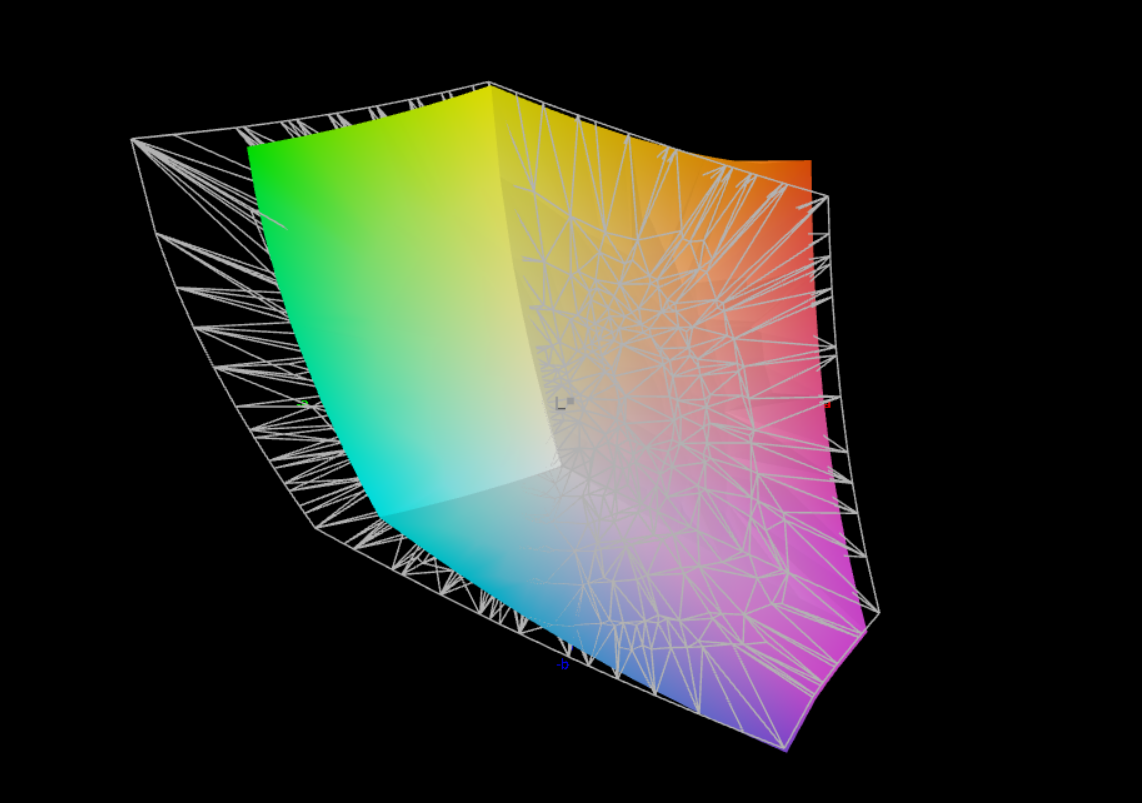
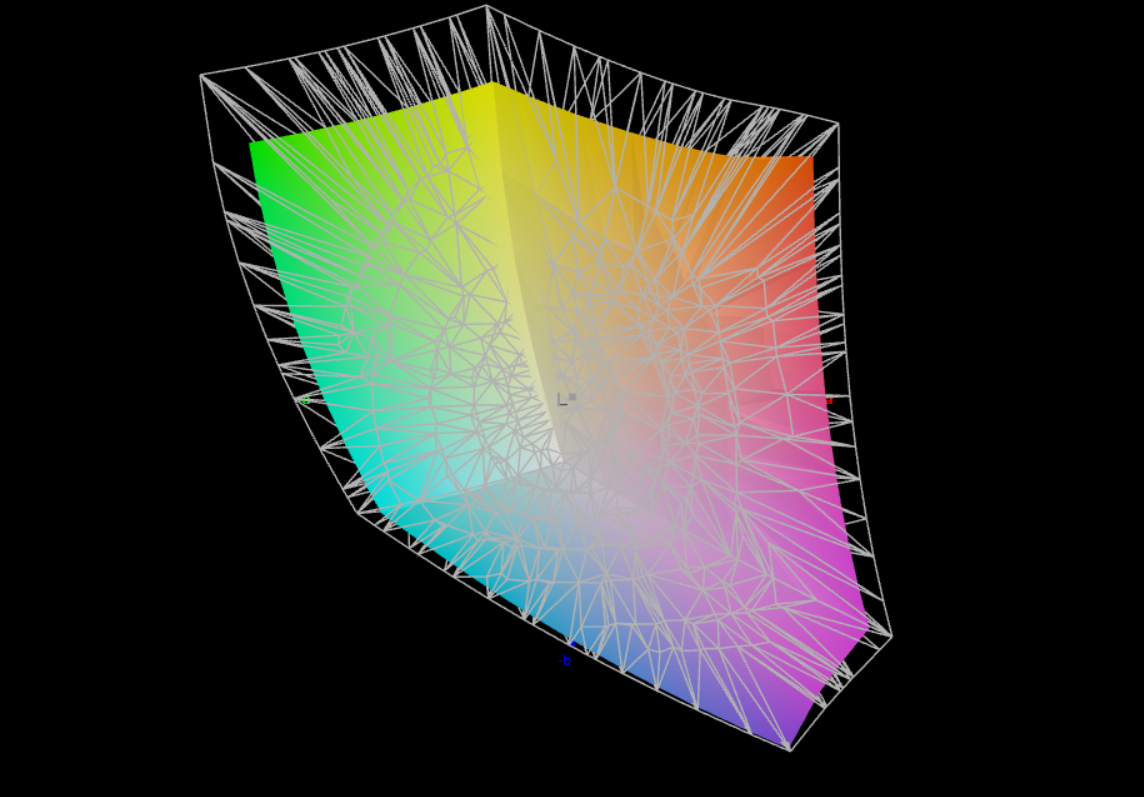
El espacio de color sRGB está cubierto al 100%, lo que es suficiente para la edición de imágenes menos exigente. No se detectó ningún parpadeo PWM. Como siempre, nuestro perfil de color puede descargarse a la derecha del gráfico de iluminación. Se ofrecen tres pantallas alternativas, con el panel de 2,5K como novedad. Desgraciadamente, la opción 4K UHD con 100% DCI-P3 ya no está disponible. En nuestro campo de comparación, el panel FHD+ LP es el que mejor se comporta.
- WUXGA (1920x1200) IPS, táctil, mate, 300 cd/m², 45% NTSC
- WUXGA (1920x1200) IPS, bajo consumo, mate, 400 cd/m², 100% sRGB, baja luz azul
- WUXGA (1920x1200) IPS, mate, táctil, PrivacyGuard, 500 cd/m², 100% sRGB
- WQXGA (2.560x1.600) IPS, mate, bajo consumo, 400 cd/m², 100% sRGB, baja luz azul
| |||||||||||||||||||||||||
iluminación: 80 %
Brillo con batería: 404 cd/m²
Contraste: 1393:1 (Negro: 0.29 cd/m²)
ΔE ColorChecker Calman: 3.9 | ∀{0.5-29.43 Ø4.71}
calibrated: 1.7
ΔE Greyscale Calman: 5.4 | ∀{0.09-98 Ø4.96}
80.5% AdobeRGB 1998 (Argyll 3D)
100% sRGB (Argyll 3D)
80.1% Display P3 (Argyll 3D)
Gamma: 2.21
CCT: 6242 K
| Lenovo ThinkPad T16 G1 21BWS00200 B160UAN01.K, IPS, 1920x1200, 16" | Lenovo ThinkPad T15 Gen2-20W5S00100 B156HAN02.1, IPS, 1920x1080, 15.6" | Huawei MateBook D 16 2022 BOE NV160WUM-NH0, IPS, 1920x1200, 16" | Dell Inspiron 16 Plus 7620 BOE NE16N41, IPS, 3072x1920, 16" | HP ZBook Power 15 G8 313S5EA AUOA08B, IPS LED, 1920x1080, 15.6" | HP ProBook 450 G9 6A180EA Chi Mei CMN1512, , 1920x1080, 15.6" | Lenovo ThinkPad E15 G3-20YG003UGE B156HAN02.1, IPS, 1920x1080, 15.6" | Lenovo ThinkPad L15 G2 AMD N156HCA-EAB, IPS LED, 1920x1080, 15.6" | |
|---|---|---|---|---|---|---|---|---|
| Display | -46% | -12% | -7% | -8% | -43% | -46% | -41% | |
| Display P3 Coverage (%) | 80.1 | 40.18 -50% | 66.2 -17% | 70.8 -12% | 70.5 -12% | 42.76 -47% | 40.3 -50% | 43.8 -45% |
| sRGB Coverage (%) | 100 | 60.2 -40% | 96.4 -4% | 99.5 0% | 99 -1% | 63.9 -36% | 60.2 -40% | 65.7 -34% |
| AdobeRGB 1998 Coverage (%) | 80.5 | 41.55 -48% | 68.3 -15% | 73.2 -9% | 71.3 -11% | 44.2 -45% | 41.6 -48% | 45.3 -44% |
| Response Times | -85% | -12% | -53% | -125% | -11% | -71% | -62% | |
| Response Time Grey 50% / Grey 80% * (ms) | 27 ? | 48.8 ? -81% | 30.5 ? -13% | 38 ? -41% | 61 -126% | 28 ? -4% | 44 ? -63% | 40 -48% |
| Response Time Black / White * (ms) | 17 ? | 32 ? -88% | 18.7 ? -10% | 28 ? -65% | 38 ? -124% | 20 ? -18% | 30.4 ? -79% | 30 -76% |
| PWM Frequency (Hz) | ||||||||
| Screen | -39% | 7% | 22% | 25% | -34% | -27% | -18% | |
| Brightness middle (cd/m²) | 404 | 353 -13% | 319 -21% | 288.9 -28% | 393 -3% | 234 -42% | 347 -14% | 298 -26% |
| Brightness (cd/m²) | 391 | 348 -11% | 317 -19% | 276 -29% | 385 -2% | 218 -44% | 329 -16% | 276 -29% |
| Brightness Distribution (%) | 80 | 95 19% | 90 13% | 92 15% | 78 -2% | 85 6% | 93 16% | 86 8% |
| Black Level * (cd/m²) | 0.29 | 0.2 31% | 0.23 21% | 0.26 10% | 0.25 14% | 0.17 41% | 0.25 14% | 0.26 10% |
| Contrast (:1) | 1393 | 1765 27% | 1387 0% | 1111 -20% | 1572 13% | 1376 -1% | 1388 0% | 1146 -18% |
| Colorchecker dE 2000 * | 3.9 | 6.1 -56% | 3.4 13% | 1.88 52% | 1.5 62% | 5.04 -29% | 4.7 -21% | 3.7 5% |
| Colorchecker dE 2000 max. * | 8.5 | 23.5 -176% | 8.1 5% | 4.37 49% | 4.3 49% | 18.04 -112% | 19.4 -128% | 15 -76% |
| Colorchecker dE 2000 calibrated * | 1.7 | 4.9 -188% | 0.8 53% | 0.42 75% | 1.4 18% | 4.13 -143% | 4.4 -159% | 3.5 -106% |
| Greyscale dE 2000 * | 5.4 | 4.6 15% | 5.7 -6% | 1.4 74% | 1.3 76% | 4.43 18% | 1.7 69% | 1.7 69% |
| Gamma | 2.21 100% | 2.26 97% | 2.1 105% | 2.3 96% | 2.26 97% | 2.41 91% | 2.2 100% | 2.21 100% |
| CCT | 6242 104% | 6732 97% | 7433 87% | 6634 98% | 6435 101% | 6350 102% | 6475 100% | 6588 99% |
| Color Space (Percent of AdobeRGB 1998) (%) | 38.2 | |||||||
| Color Space (Percent of sRGB) (%) | 59.8 | |||||||
| Media total (Programa/Opciones) | -57% /
-47% | -6% /
0% | -13% /
5% | -36% /
-4% | -29% /
-33% | -48% /
-37% | -40% /
-29% |
* ... más pequeño es mejor
Tiempos de respuesta del display
| ↔ Tiempo de respuesta de Negro a Blanco | ||
|---|---|---|
| 17 ms ... subida ↗ y bajada ↘ combinada | ↗ 8 ms subida | 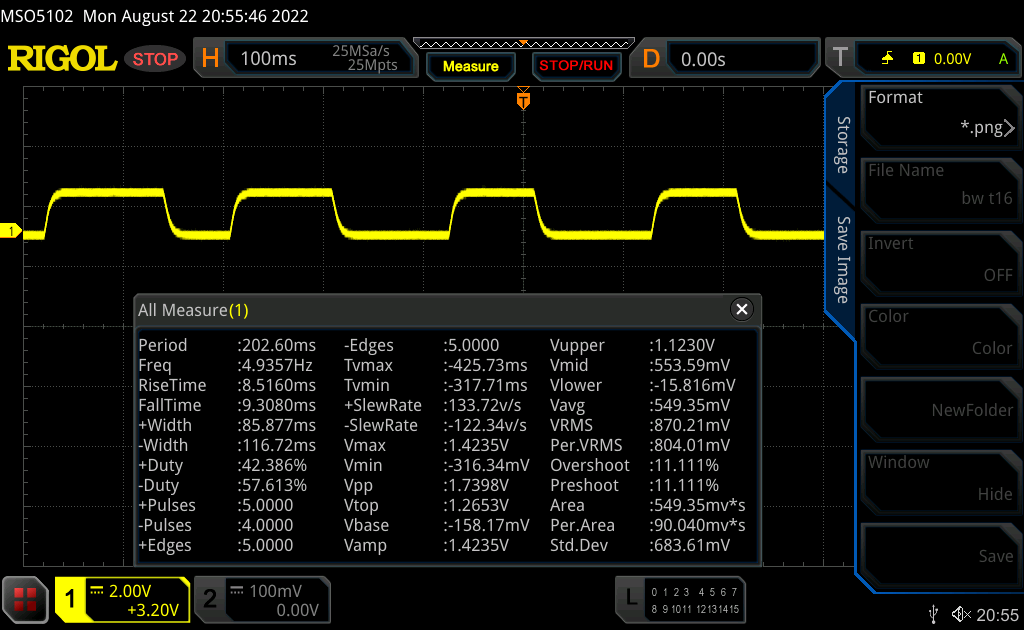 |
| ↘ 9 ms bajada | ||
| La pantalla mostró buenos tiempos de respuesta en nuestros tests pero podría ser demasiado lenta para los jugones competitivos. En comparación, todos los dispositivos de prueba van de ##min### (mínimo) a 240 (máximo) ms. » 39 % de todos los dispositivos son mejores. Esto quiere decir que el tiempo de respuesta medido es mejor que la media (19.8 ms) de todos los dispositivos testados. | ||
| ↔ Tiempo de respuesta 50% Gris a 80% Gris | ||
| 27 ms ... subida ↗ y bajada ↘ combinada | ↗ 12 ms subida | 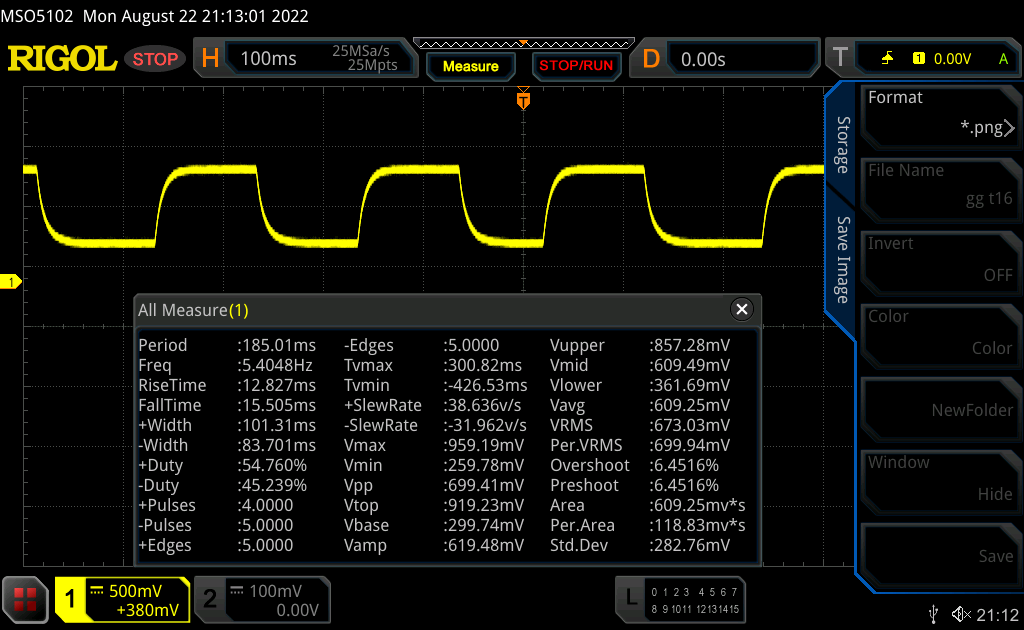 |
| ↘ 15 ms bajada | ||
| La pantalla mostró tiempos de respuesta relativamente lentos en nuestros tests pero podría ser demasiado lenta para los jugones. En comparación, todos los dispositivos de prueba van de ##min### (mínimo) a 636 (máximo) ms. » 37 % de todos los dispositivos son mejores. Esto quiere decir que el tiempo de respuesta medido es mejor que la media (31 ms) de todos los dispositivos testados. | ||
Parpadeo de Pantalla / PWM (Pulse-Width Modulation)
| Parpadeo de Pantalla / PWM no detectado | 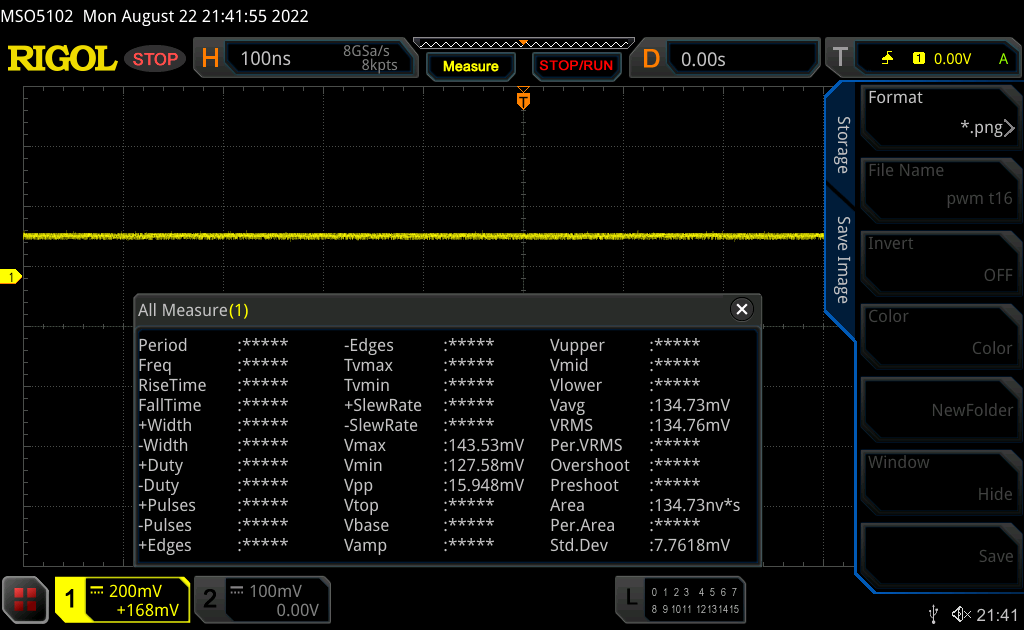 | ||
Comparación: 52 % de todos los dispositivos testados no usaron PWM para atenuar el display. Si se usó, medimos una media de 7757 (mínimo: 5 - máxmo: 343500) Hz. | |||
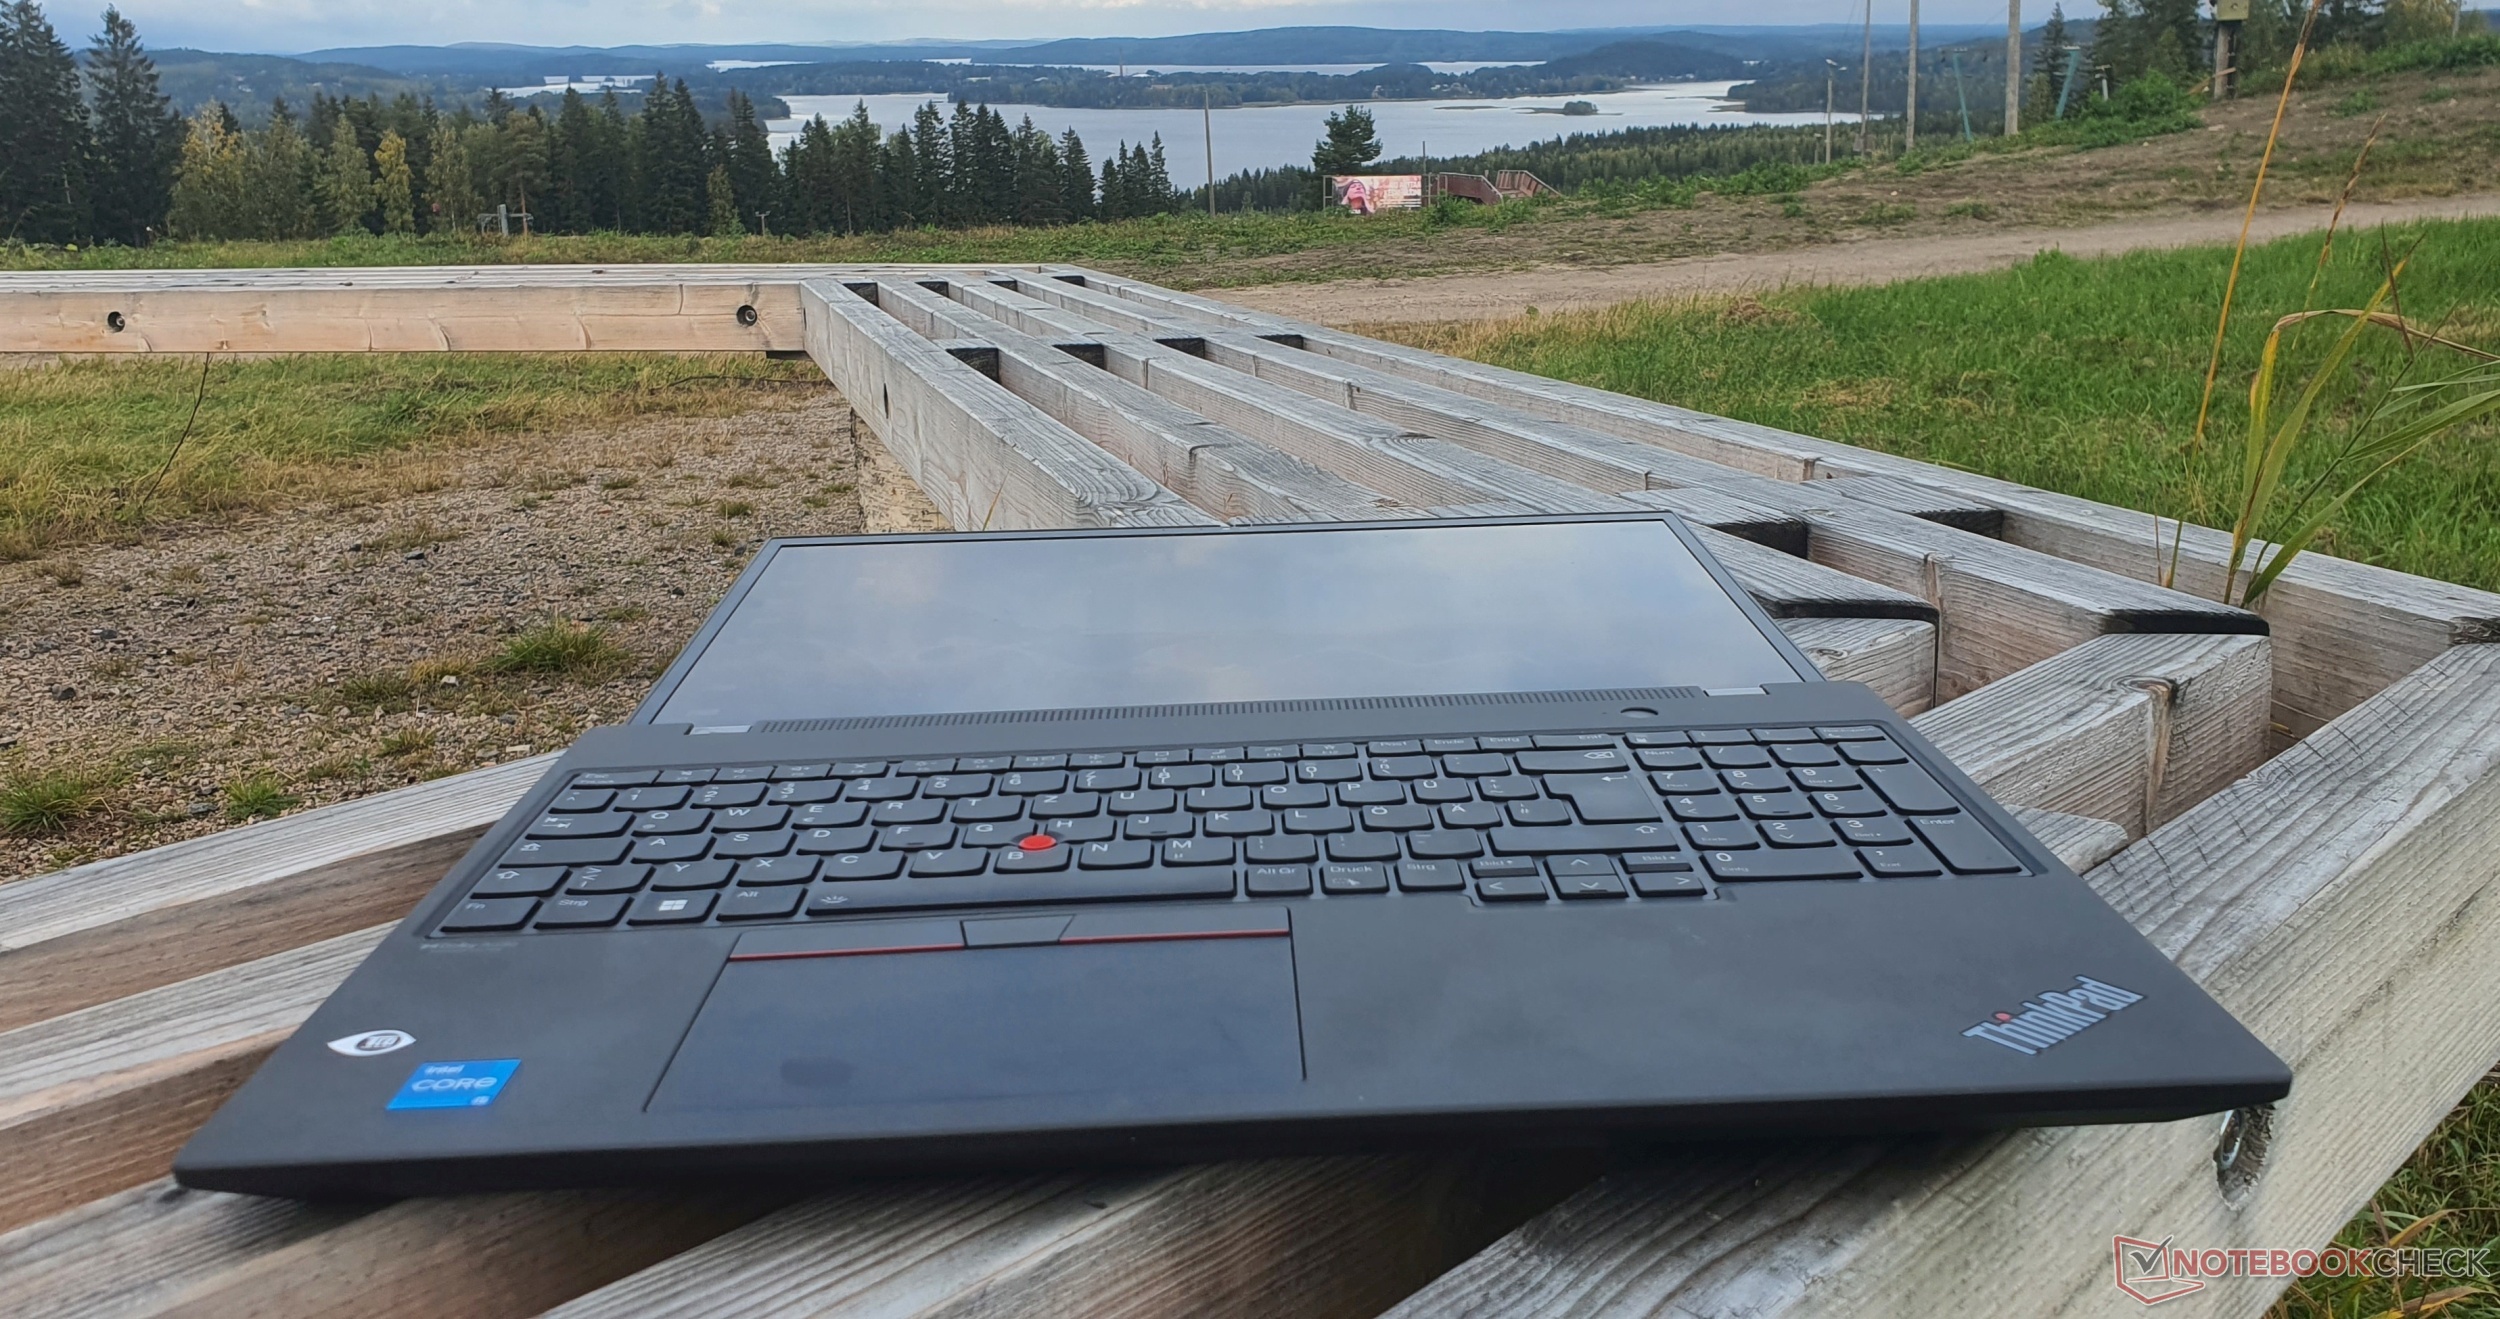
En exteriores, la pantalla mate es fácil de leer con una media de 390 nits. Sin embargo, debes evitar la luz solar directa.

Rendimiento - Lenovo limita con un estrangulamiento artificial
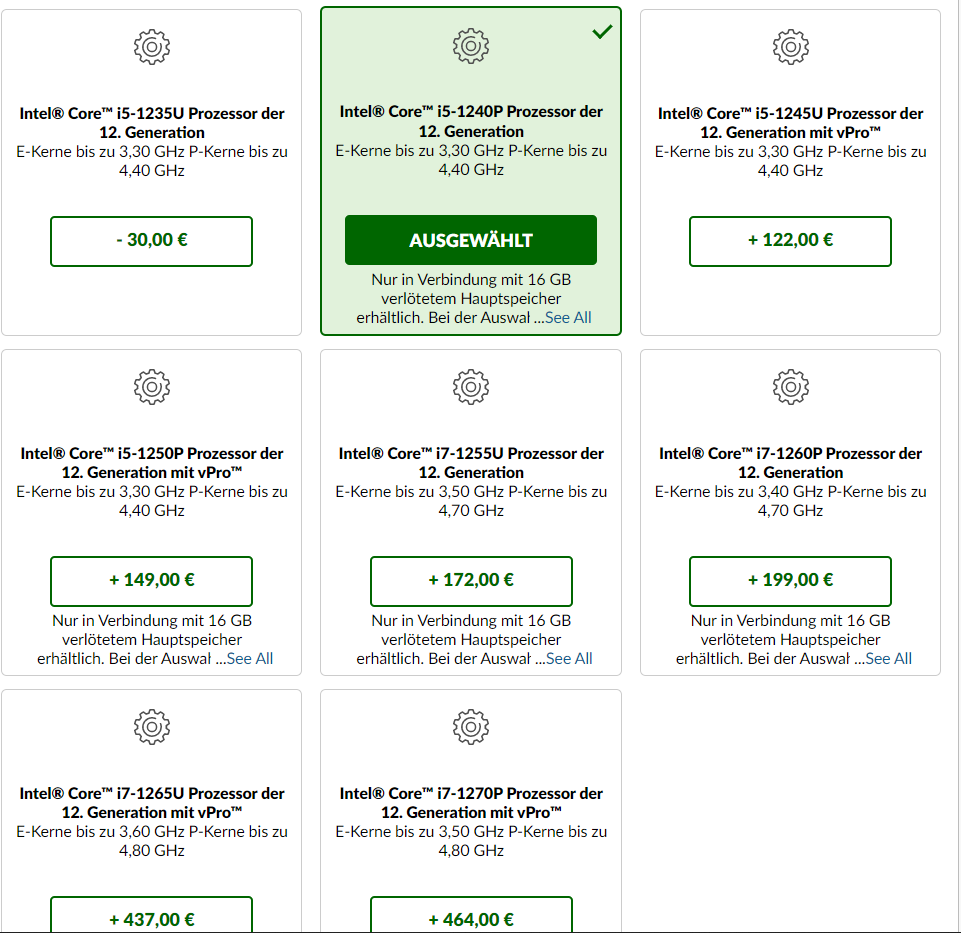
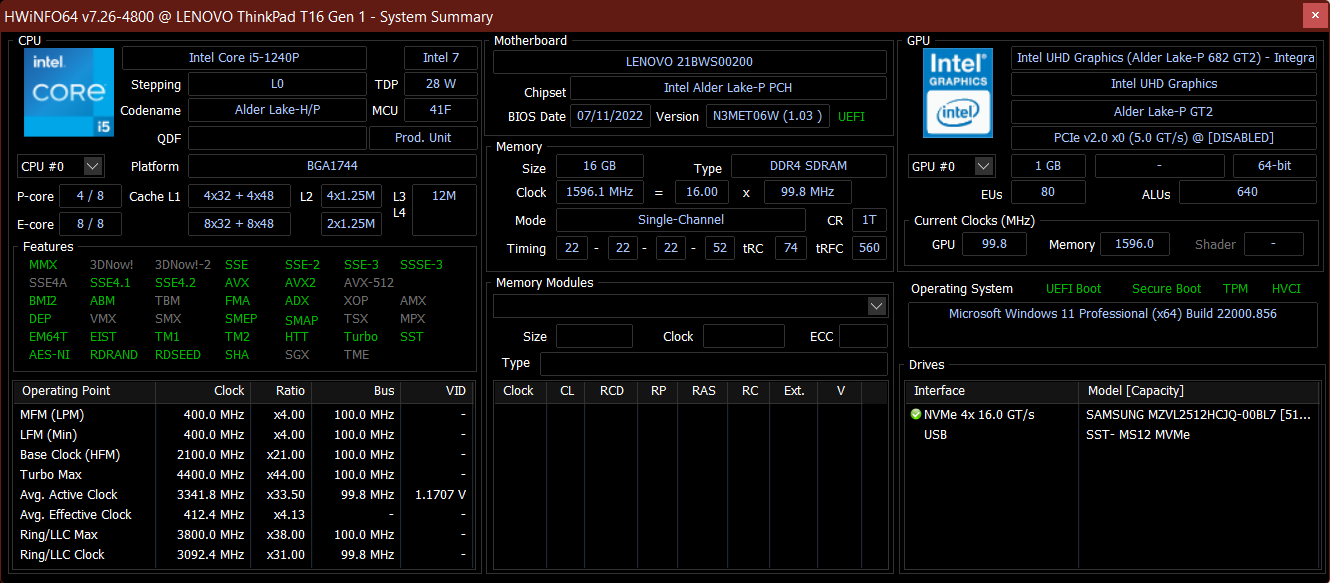
Nuestro modelo está equipado con 16 GB de memoria RAM DDR4-3200 soldada (un solo canal) y está alimentado por el Core i5-1240Pcon una unidad gráfica integrada. Además, hay un SSD de 512 GB en el estándar PCIe 4.0. El sistema está pensado para tareas de oficina y otras tareas empresariales típicas.
No está pensado para la edición de vídeo y los juegos y sólo está disponible en configuraciones alternativas con el GeForce MX550más memoria RAM (en SODIMM libre) y posiblemente una CPU más potente (i7-1280P). Dado que este año también hay modelos con AMD, vale la pena considerar esta opción. Intentaremos revisar tal modelo también.
Condiciones de la prueba
Lenovo no ofrece sus propios perfiles de energía para sus ThinkPads, sino que los integra en la configuración de energía de Windows. El modo automático de "refrigeración inteligente" puede desactivarse con "Fn+T". Las pruebas de rendimiento se llevaron a cabo bajo el perfil de máximo rendimiento con el modo automático desactivado
Procesador
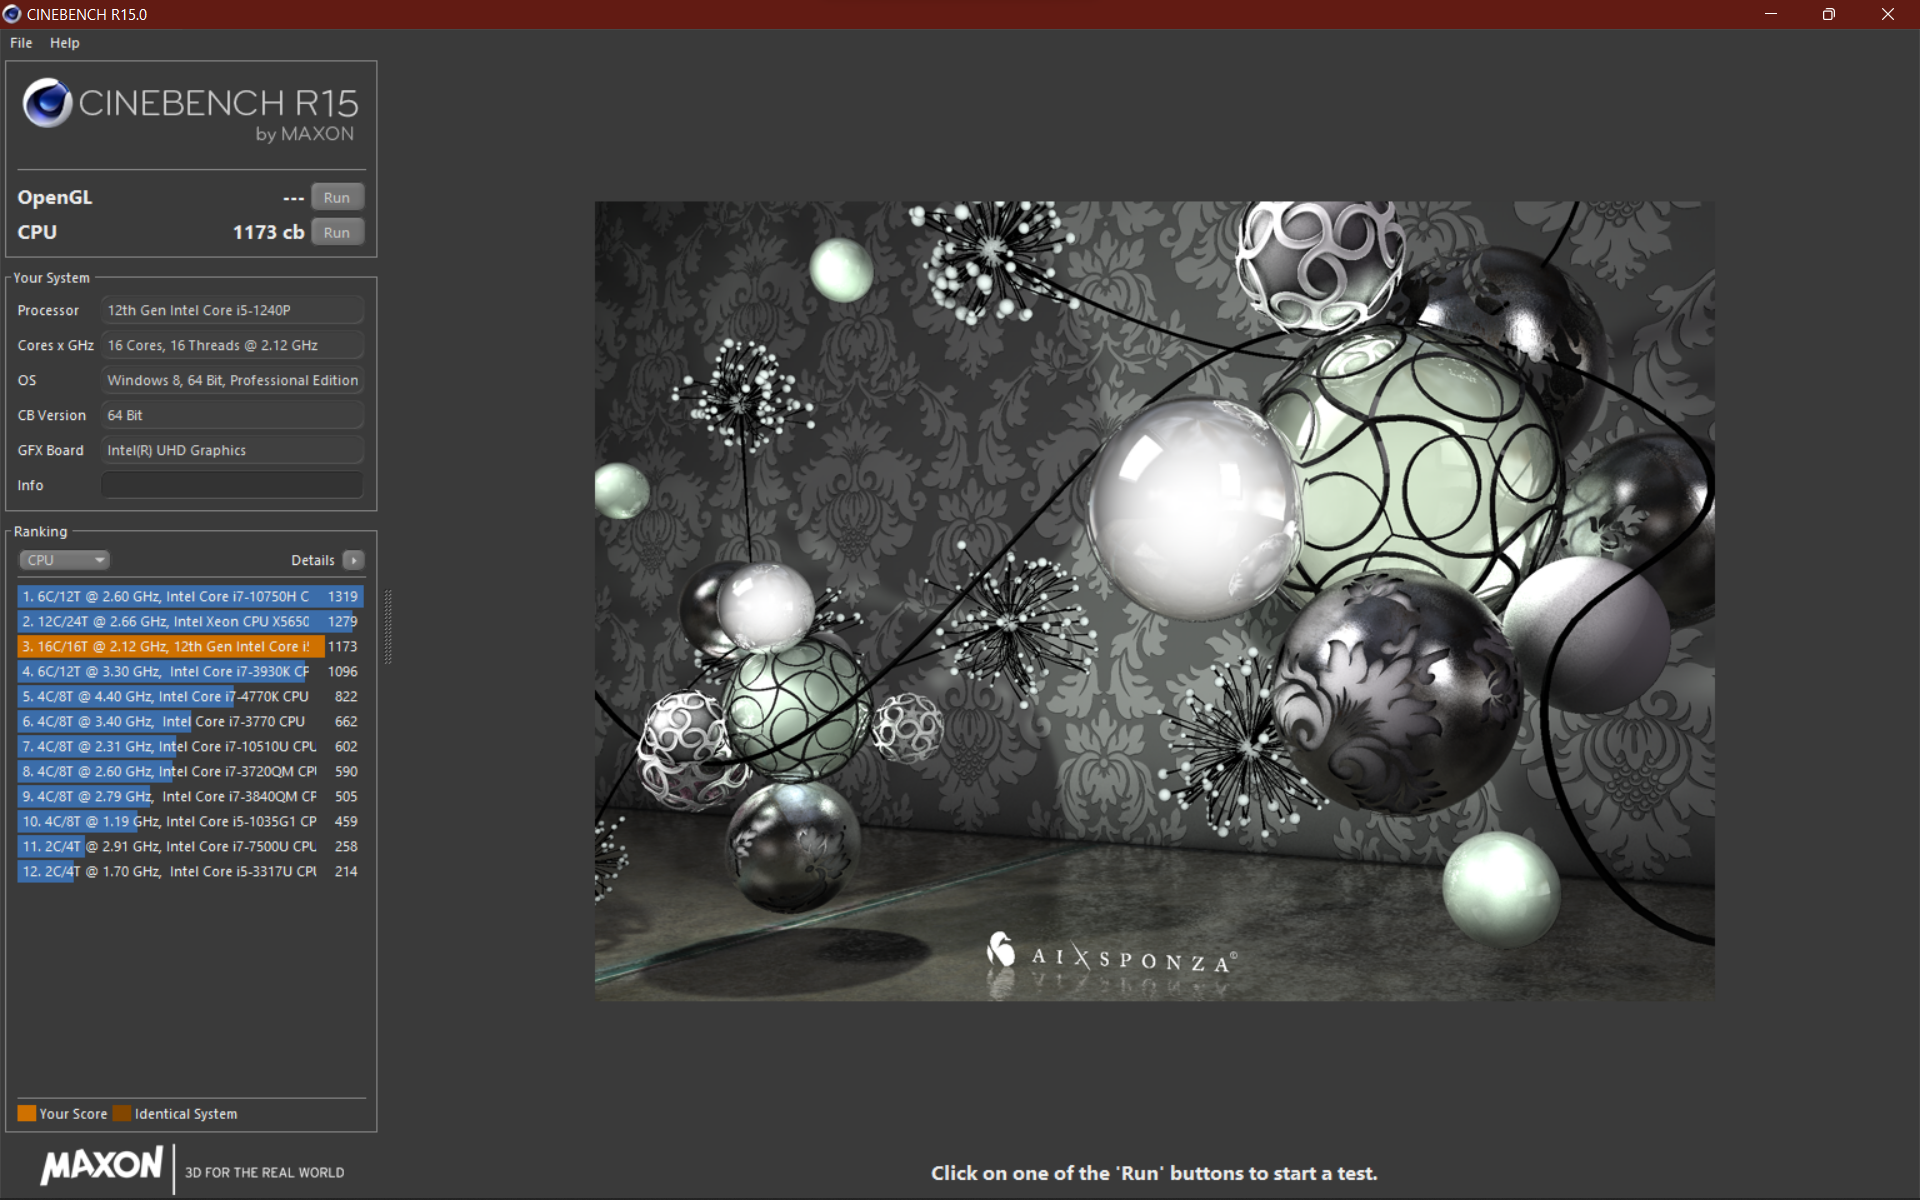
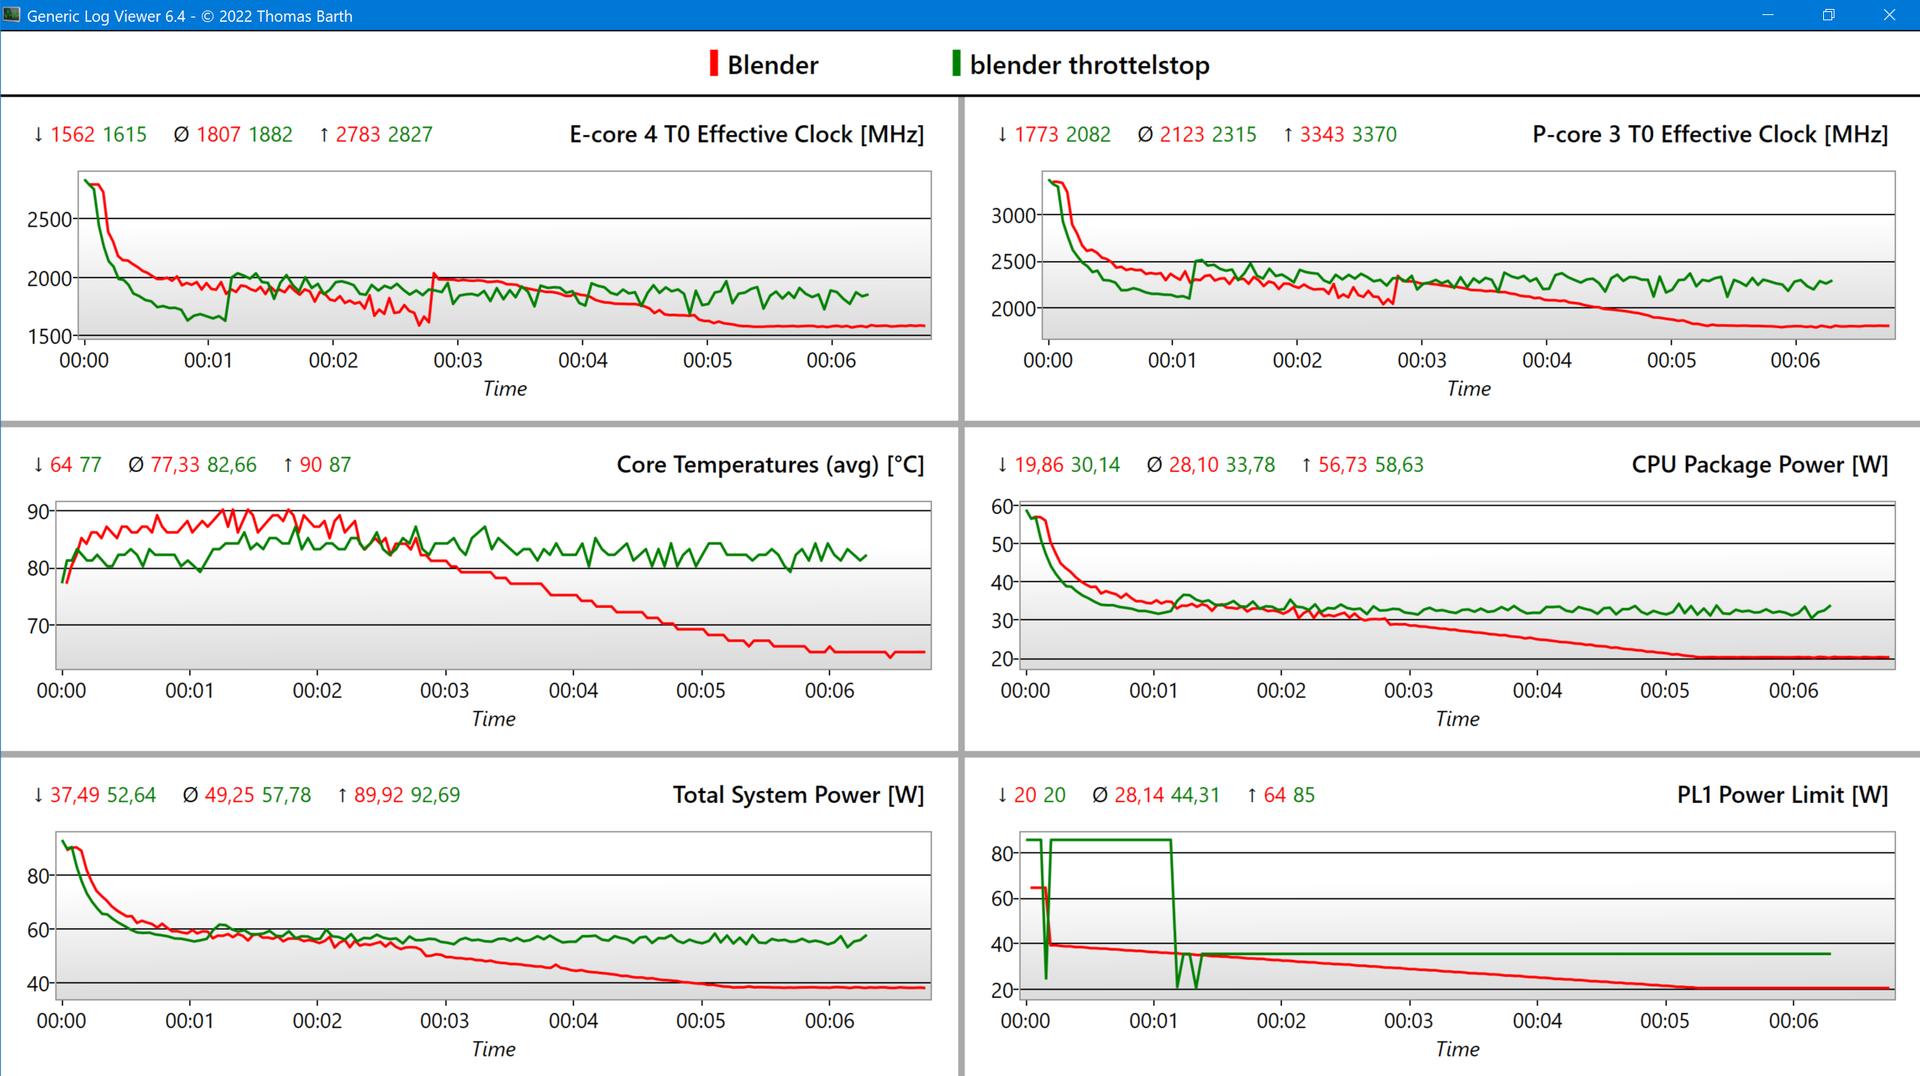
El Intel Core i5-1240P es una CPU de 12 núcleos con 4 núcleos de rendimiento y 8 de eficiencia. El TDP de 28 W se usa por primera vez en la serie T de Lenovo. Sin embargo, nuestras pruebas revelan que Lenovo limita el PL1 a 20 vatios, mientras que el turbo corto de 12 segundos (PL2) es de 59 vatios.
Las bajísimas temperaturas de 63 °C demuestran que este enfoque restringe innecesariamente el rendimiento y que sólo es suficiente para alcanzar el reloj base de 1.7 GHz. Esto es incomprensible, ya que el predecesor funciona constantemente a 35 vatios. En consecuencia, esto se traduce en un rendimiento sostenido de sólo un 15% por encima delpredecesormientras que el ThinkPad E15 con el Ryzen del año pasado computa alrededor de un 50% más rápido. Por otro lado, el T16 es muy rápido en tareas que requieren breves impulsos.
Si la ralentización, que ha sido confirmada por muchas fuentes como también ocurre en el T14 G3(misma placa base), no se arregla mediante una actualización de la BIOS en el futuro, AMD sería probablemente la mejor opción aquí, ya que los Ryzen pueden ofrecer resultados mucho mejores con poca potencia.
En el modo de batería, la potencia se limita aún más a 10 vatios, pero el "Rendimiento máximo en batería" se puede configurar en el BIOS, de modo que el resultado es más o menos el mismo de nuevo. Se puede mantener un total de 30 vatios con la herramienta "ThrottleStop", pero no se recomienda anular los ajustes elegidos por el fabricante.

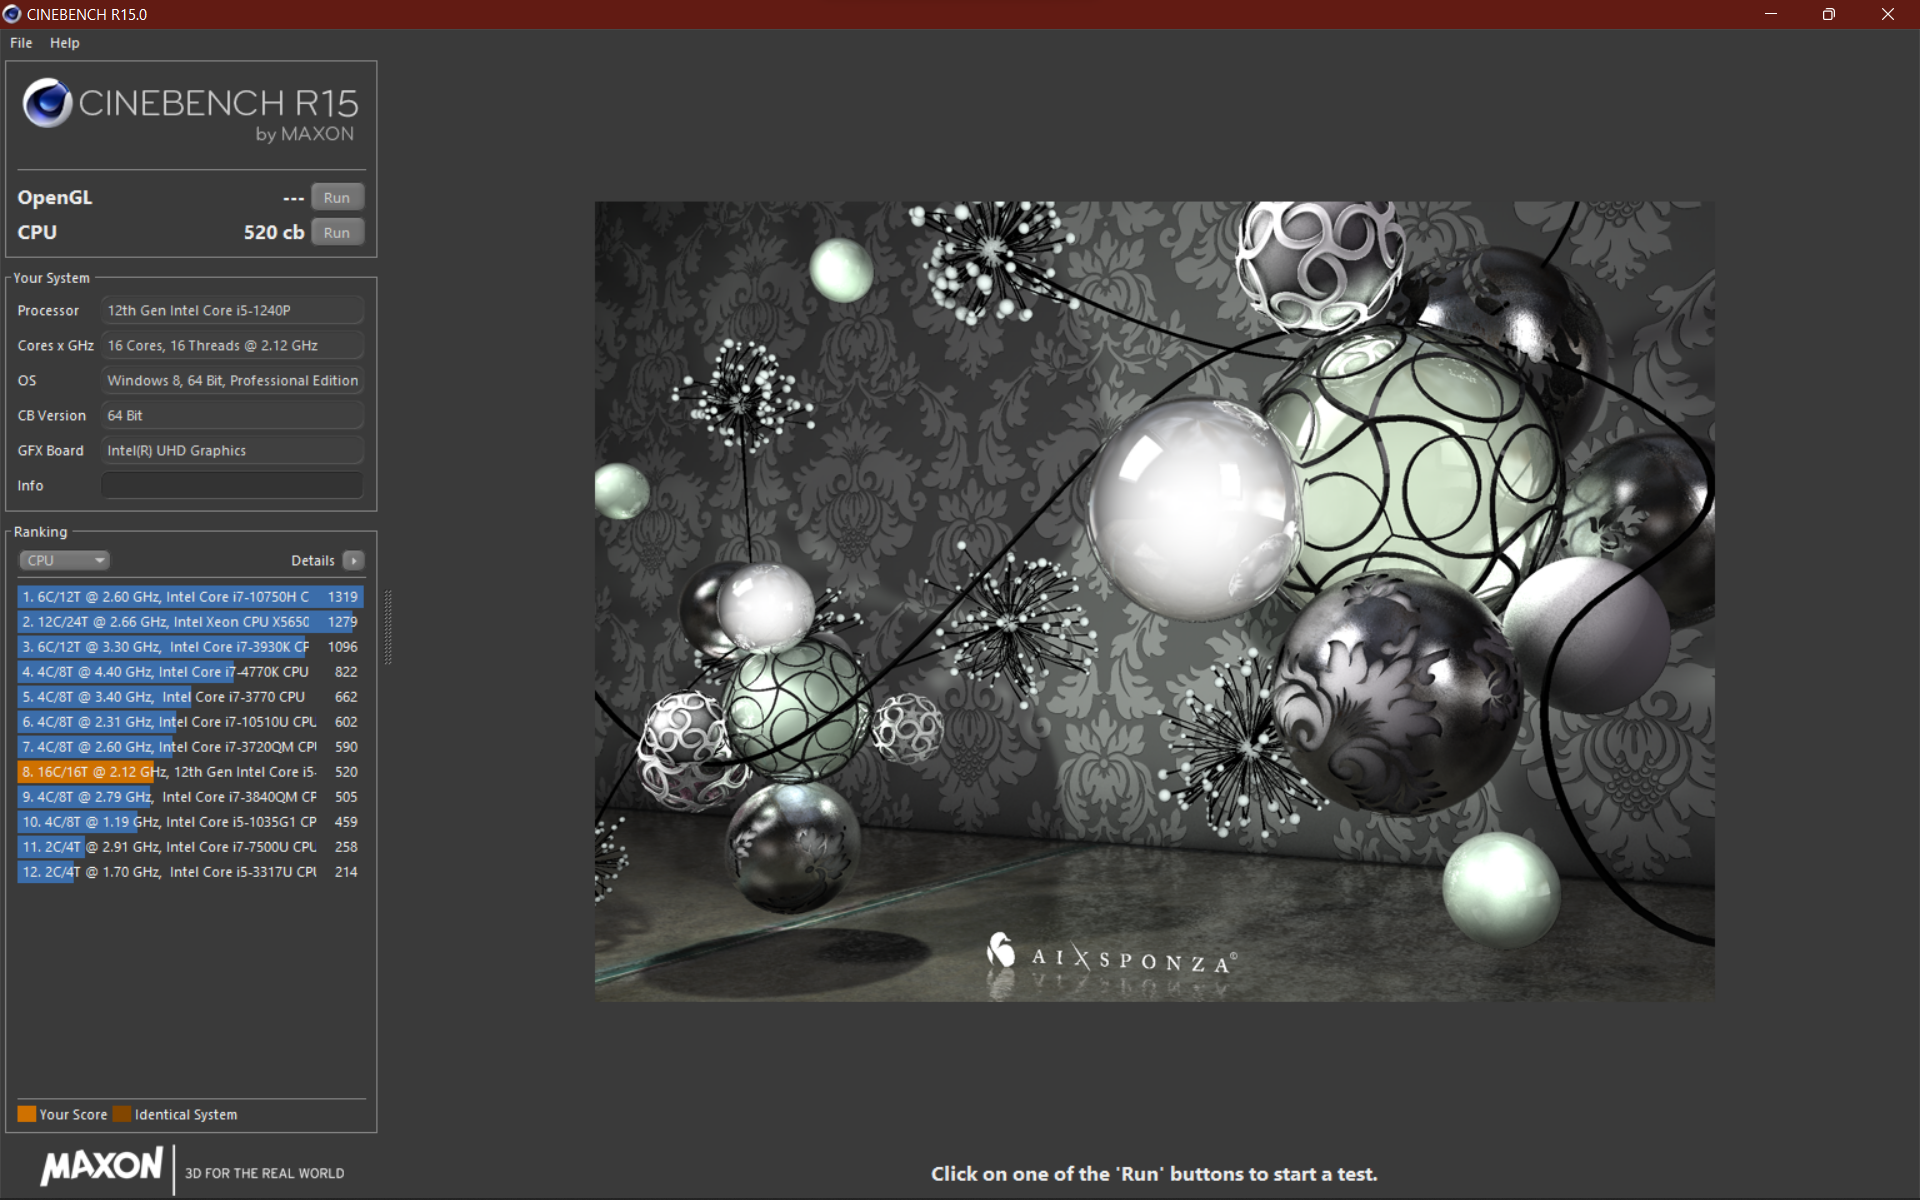
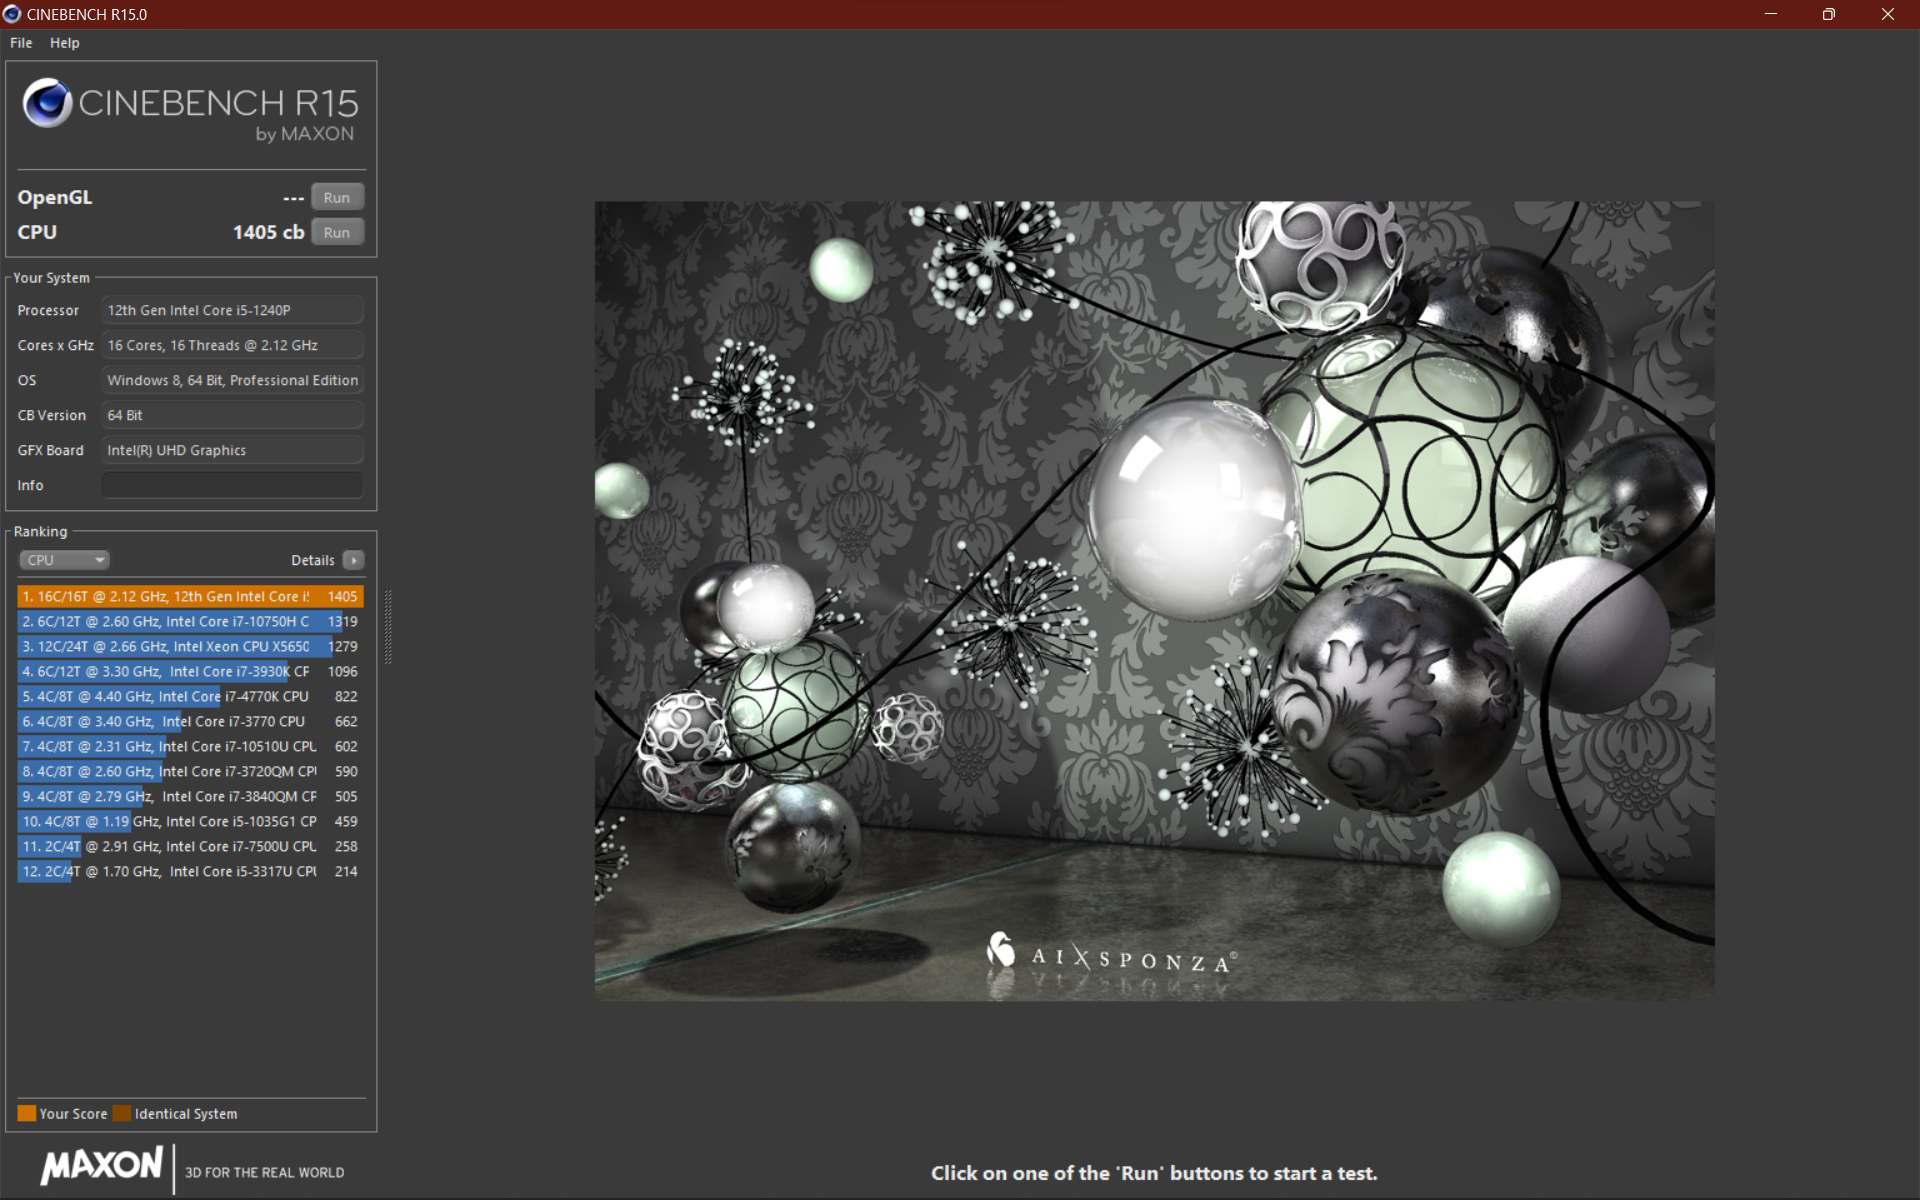
Cinebench R15 Multi Sustained Load
Cinebench R23: Multi Core | Single Core
Cinebench R20: CPU (Multi Core) | CPU (Single Core)
Cinebench R15: CPU Multi 64Bit | CPU Single 64Bit
Blender: v2.79 BMW27 CPU | v3.3 Classroom CPU
7-Zip 18.03: 7z b 4 | 7z b 4 -mmt1
Geekbench 5.5: Multi-Core | Single-Core
HWBOT x265 Benchmark v2.2: 4k Preset
LibreOffice : 20 Documents To PDF
R Benchmark 2.5: Overall mean
V-Ray 5 Benchmark: CPU
V-Ray Benchmark Next 4.10: CPU
| CPU Performance rating | |
| Dell Inspiron 16 Plus 7620 -1! | |
| Huawei MateBook D 16 2022 -1! | |
| Asus Vivobook Pro 16X-M7600QE -2! | |
| Lenovo ThinkPad X1 Extreme G4-20Y5CTO1WW (3050 Ti) -2! | |
| HP ZBook Power 15 G8 313S5EA -2! | |
| Media de la clase Office | |
| Lenovo ThinkPad T16 G1 21BWS00200 | |
| Lenovo ThinkPad E15 G3-20YG003UGE -2! | |
| Lenovo ThinkPad L15 G2 AMD -1! | |
| Medio Intel Core i5-1240P | |
| Lenovo ThinkPad T15 Gen2-20W5S00100 -4! | |
| HP ProBook 450 G9 6A180EA | |
| Blender / v3.3 Classroom CPU | |
| HP ProBook 450 G9 6A180EA | |
| Medio Intel Core i5-1240P (552 - 3047, n=12) | |
| Lenovo ThinkPad T16 G1 21BWS00200 | |
| Media de la clase Office (245 - 3219, n=74, últimos 2 años) | |
| Huawei MateBook D 16 2022 | |
| Dell Inspiron 16 Plus 7620 | |
| V-Ray 5 Benchmark / CPU | |
| Dell Inspiron 16 Plus 7620 | |
| Media de la clase Office (5027 - 13919, n=21, últimos 2 años) | |
| Lenovo ThinkPad L15 G2 AMD | |
| Lenovo ThinkPad T16 G1 21BWS00200 | |
| Medio Intel Core i5-1240P (1334 - 7321, n=6) | |
| HP ProBook 450 G9 6A180EA | |
* ... más pequeño es mejor
AIDA64: FP32 Ray-Trace | FPU Julia | CPU SHA3 | CPU Queen | FPU SinJulia | FPU Mandel | CPU AES | CPU ZLib | FP64 Ray-Trace | CPU PhotoWorxx
| Performance rating | |
| Lenovo ThinkPad X1 Extreme G4-20Y5CTO1WW (3050 Ti) | |
| HP ZBook Power 15 G8 313S5EA | |
| Dell Inspiron 16 Plus 7620 | |
| Media de la clase Office | |
| Huawei MateBook D 16 2022 | |
| Lenovo ThinkPad E15 G3-20YG003UGE | |
| Lenovo ThinkPad L15 G2 AMD | |
| Lenovo ThinkPad T16 G1 21BWS00200 | |
| Medio Intel Core i5-1240P | |
| HP ProBook 450 G9 6A180EA | |
| AIDA64 / FP32 Ray-Trace | |
| HP ZBook Power 15 G8 313S5EA | |
| Lenovo ThinkPad X1 Extreme G4-20Y5CTO1WW (3050 Ti) | |
| Media de la clase Office (2083 - 31245, n=82, últimos 2 años) | |
| Dell Inspiron 16 Plus 7620 | |
| Huawei MateBook D 16 2022 | |
| Lenovo ThinkPad E15 G3-20YG003UGE | |
| Lenovo ThinkPad L15 G2 AMD | |
| Lenovo ThinkPad T16 G1 21BWS00200 | |
| Medio Intel Core i5-1240P (2405 - 9694, n=16) | |
| HP ProBook 450 G9 6A180EA | |
| AIDA64 / FPU SinJulia | |
| Lenovo ThinkPad E15 G3-20YG003UGE | |
| HP ZBook Power 15 G8 313S5EA | |
| Lenovo ThinkPad X1 Extreme G4-20Y5CTO1WW (3050 Ti) | |
| Dell Inspiron 16 Plus 7620 | |
| Lenovo ThinkPad L15 G2 AMD | |
| Media de la clase Office (1378 - 18321, n=82, últimos 2 años) | |
| Huawei MateBook D 16 2022 | |
| Lenovo ThinkPad T16 G1 21BWS00200 | |
| Medio Intel Core i5-1240P (2135 - 6540, n=16) | |
| HP ProBook 450 G9 6A180EA | |
| AIDA64 / FPU Mandel | |
| HP ZBook Power 15 G8 313S5EA | |
| Lenovo ThinkPad X1 Extreme G4-20Y5CTO1WW (3050 Ti) | |
| Media de la clase Office (4601 - 66922, n=82, últimos 2 años) | |
| Lenovo ThinkPad E15 G3-20YG003UGE | |
| Dell Inspiron 16 Plus 7620 | |
| Lenovo ThinkPad L15 G2 AMD | |
| Huawei MateBook D 16 2022 | |
| Lenovo ThinkPad T16 G1 21BWS00200 | |
| Medio Intel Core i5-1240P (5113 - 23992, n=16) | |
| HP ProBook 450 G9 6A180EA | |
| AIDA64 / FP64 Ray-Trace | |
| HP ZBook Power 15 G8 313S5EA | |
| Lenovo ThinkPad X1 Extreme G4-20Y5CTO1WW (3050 Ti) | |
| Media de la clase Office (1109 - 17834, n=82, últimos 2 años) | |
| Dell Inspiron 16 Plus 7620 | |
| Lenovo ThinkPad E15 G3-20YG003UGE | |
| Huawei MateBook D 16 2022 | |
| Lenovo ThinkPad L15 G2 AMD | |
| Lenovo ThinkPad T16 G1 21BWS00200 | |
| Medio Intel Core i5-1240P (1154 - 5258, n=16) | |
| HP ProBook 450 G9 6A180EA | |
| AIDA64 / CPU PhotoWorxx | |
| Huawei MateBook D 16 2022 | |
| Media de la clase Office (11090 - 65229, n=82, últimos 2 años) | |
| Dell Inspiron 16 Plus 7620 | |
| Medio Intel Core i5-1240P (11873 - 43661, n=16) | |
| Lenovo ThinkPad E15 G3-20YG003UGE | |
| Lenovo ThinkPad X1 Extreme G4-20Y5CTO1WW (3050 Ti) | |
| HP ProBook 450 G9 6A180EA | |
| Lenovo ThinkPad T16 G1 21BWS00200 | |
| HP ZBook Power 15 G8 313S5EA | |
| Lenovo ThinkPad L15 G2 AMD | |
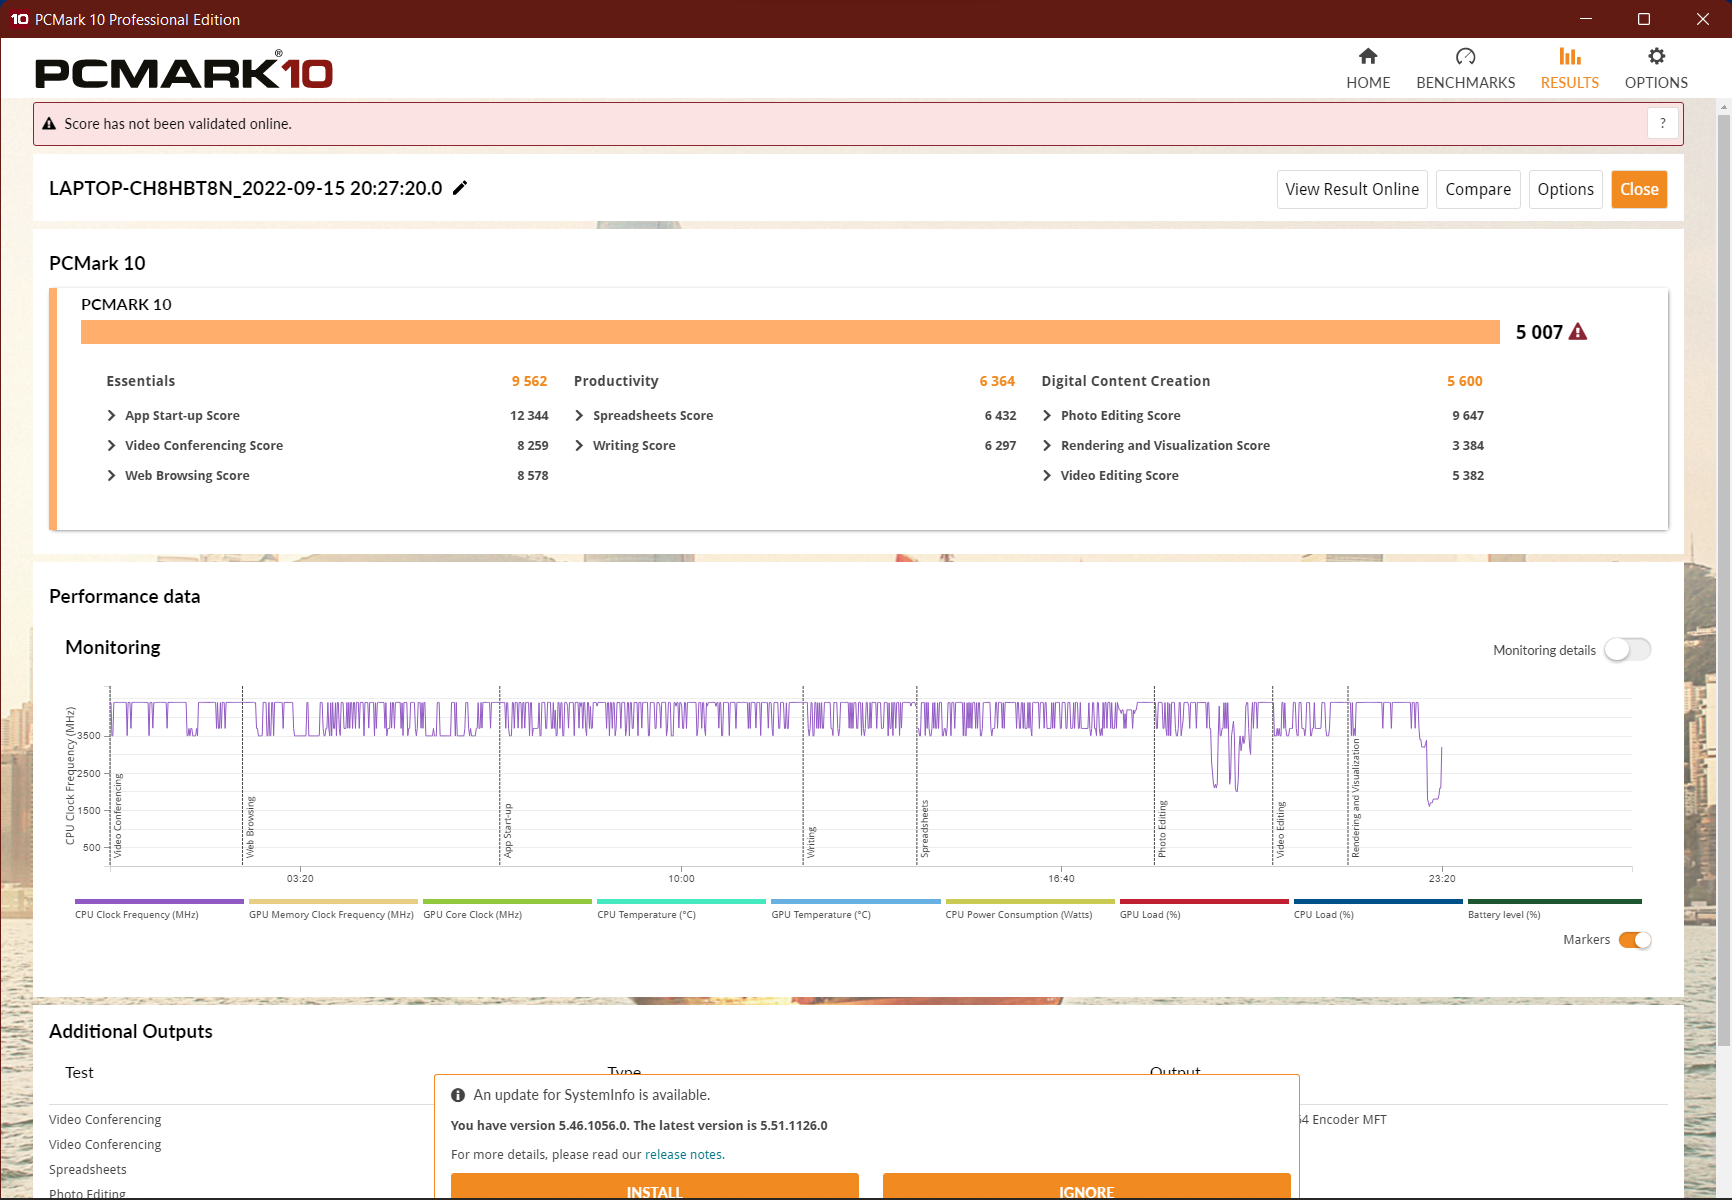
Rendimiento del sistema
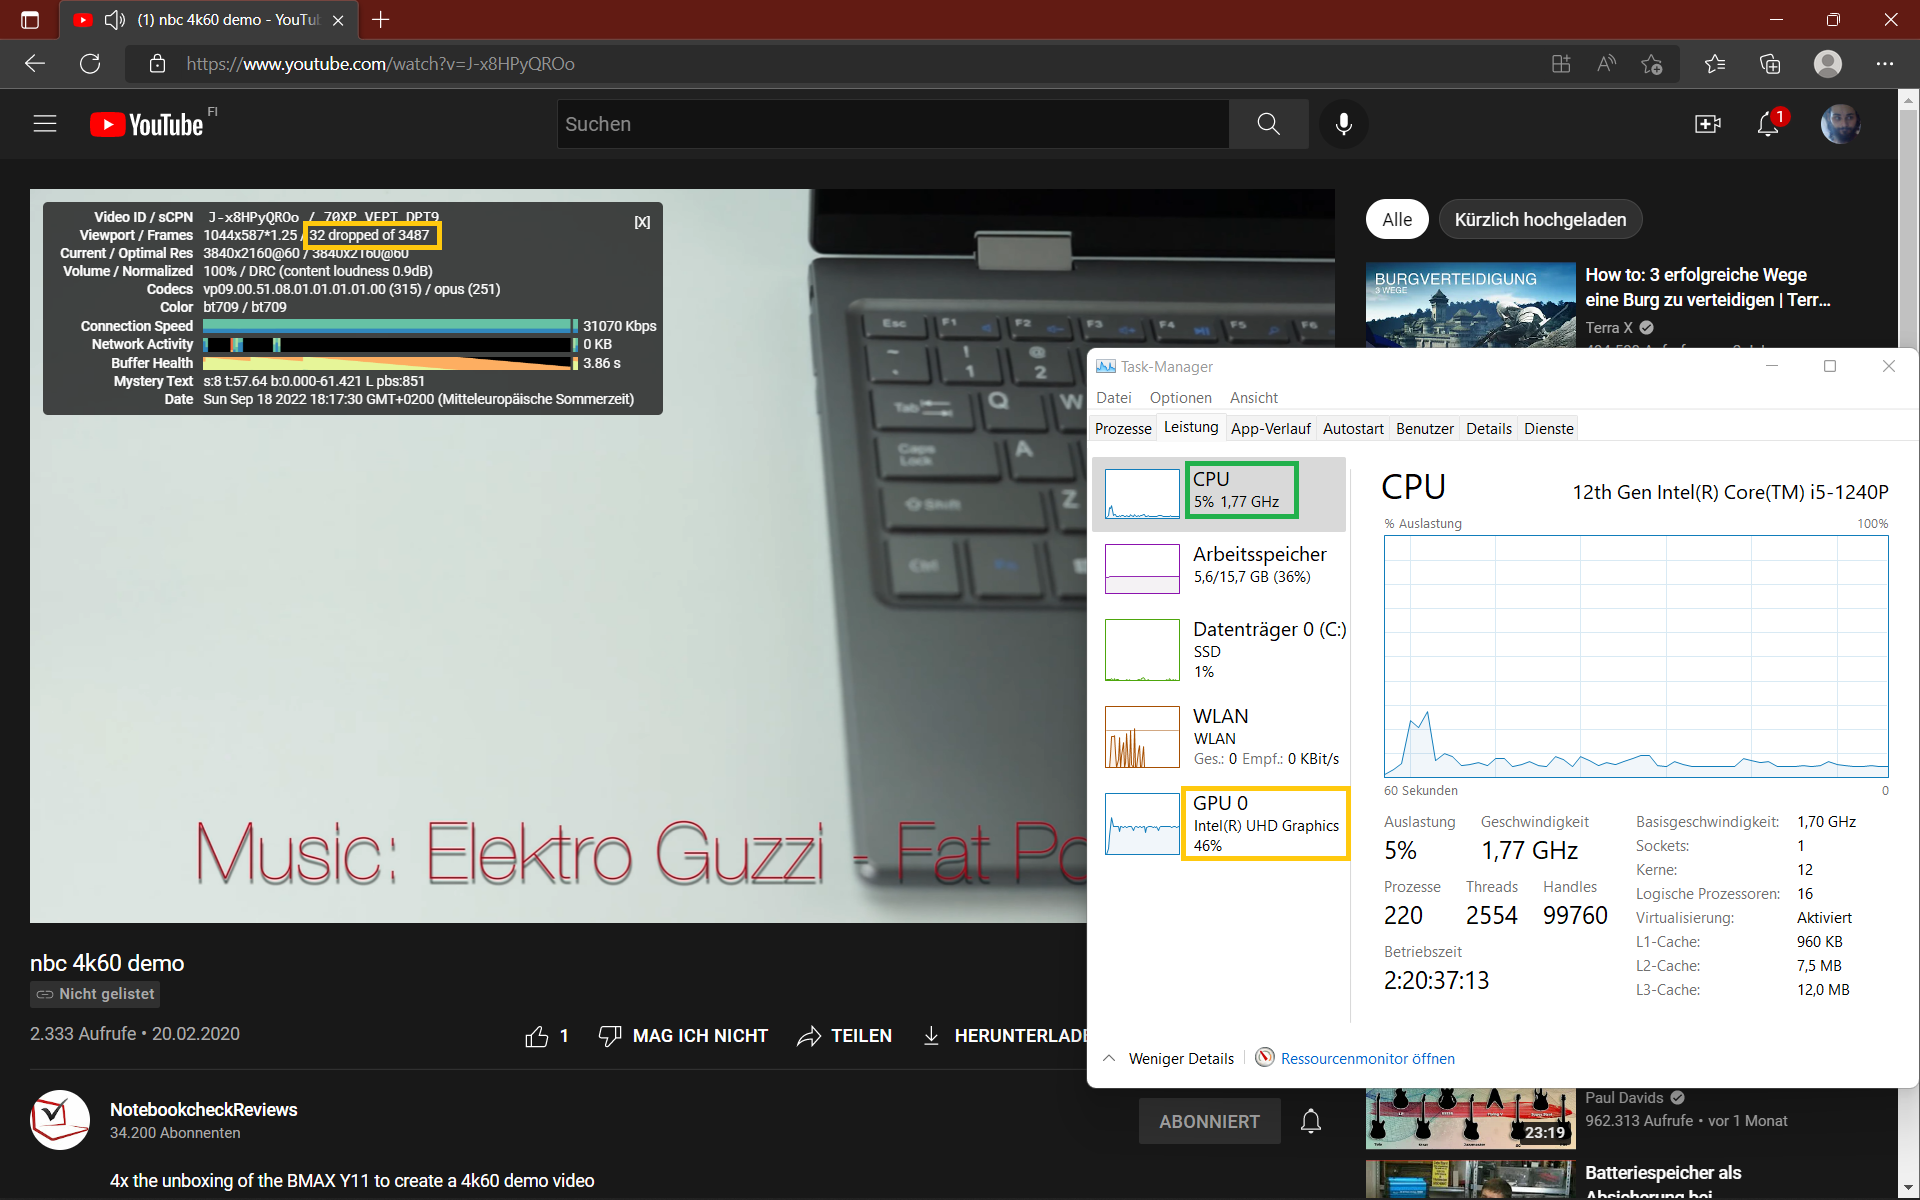
Gracias al fuerte turbo de corta duración, el sistema responde muy bien a pesar de la RAM monocanal. La navegación por la web durante la reproducción de YouTube 4K no es un problema, pero sí se dan caídas de frames.
Esto podría arreglarse ciertamente con la inserción de un segundo módulo de RAM, así como mejorando el rendimiento general del sistema. La CPU Alder Lake rinde muy bien en las pruebas de navegación web gracias al turbo, pero el rendimiento PCMark es mediocre.
CrossMark: Overall | Productivity | Creativity | Responsiveness
Sunspider: 1.0 Total Score
Mozilla Kraken 1.1: Total
Speedometer 2.0: Result 2.0
Octane V2: Total Score
Jetstream 2: 2.0 Total
WebXPRT 3: Overall
WebXPRT 4: Overall
| PCMark 10 / Score | |
| Dell Inspiron 16 Plus 7620 | |
| Media de la clase Office (2601 - 9298, n=67, últimos 2 años) | |
| Lenovo ThinkPad X1 Extreme G4-20Y5CTO1WW (3050 Ti) | |
| Huawei MateBook D 16 2022 | |
| Lenovo ThinkPad L15 G2 AMD | |
| Lenovo ThinkPad E15 G3-20YG003UGE | |
| Lenovo ThinkPad T15 Gen2-20W5S00100 | |
| Medio Intel Core i5-1240P, Intel Iris Xe Graphics G7 80EUs (4881 - 5345, n=11) | |
| Lenovo ThinkPad T16 G1 21BWS00200 | |
| HP ZBook Power 15 G8 313S5EA | |
| HP ProBook 450 G9 6A180EA | |
| PCMark 10 / Essentials | |
| Huawei MateBook D 16 2022 | |
| Lenovo ThinkPad X1 Extreme G4-20Y5CTO1WW (3050 Ti) | |
| Dell Inspiron 16 Plus 7620 | |
| Lenovo ThinkPad L15 G2 AMD | |
| Media de la clase Office (3245 - 11594, n=67, últimos 2 años) | |
| Medio Intel Core i5-1240P, Intel Iris Xe Graphics G7 80EUs (8890 - 10652, n=11) | |
| Lenovo ThinkPad T16 G1 21BWS00200 | |
| HP ProBook 450 G9 6A180EA | |
| Lenovo ThinkPad E15 G3-20YG003UGE | |
| Lenovo ThinkPad T15 Gen2-20W5S00100 | |
| HP ZBook Power 15 G8 313S5EA | |
| PCMark 10 / Productivity | |
| Media de la clase Office (5336 - 17243, n=67, últimos 2 años) | |
| Lenovo ThinkPad L15 G2 AMD | |
| Dell Inspiron 16 Plus 7620 | |
| Lenovo ThinkPad T15 Gen2-20W5S00100 | |
| Lenovo ThinkPad X1 Extreme G4-20Y5CTO1WW (3050 Ti) | |
| Lenovo ThinkPad E15 G3-20YG003UGE | |
| HP ZBook Power 15 G8 313S5EA | |
| Huawei MateBook D 16 2022 | |
| HP ProBook 450 G9 6A180EA | |
| Medio Intel Core i5-1240P, Intel Iris Xe Graphics G7 80EUs (6118 - 7058, n=11) | |
| Lenovo ThinkPad T16 G1 21BWS00200 | |
| PCMark 10 / Digital Content Creation | |
| Dell Inspiron 16 Plus 7620 | |
| Lenovo ThinkPad X1 Extreme G4-20Y5CTO1WW (3050 Ti) | |
| Media de la clase Office (2049 - 13541, n=67, últimos 2 años) | |
| Huawei MateBook D 16 2022 | |
| Medio Intel Core i5-1240P, Intel Iris Xe Graphics G7 80EUs (5169 - 6213, n=11) | |
| Lenovo ThinkPad E15 G3-20YG003UGE | |
| Lenovo ThinkPad T16 G1 21BWS00200 | |
| Lenovo ThinkPad T15 Gen2-20W5S00100 | |
| HP ZBook Power 15 G8 313S5EA | |
| Lenovo ThinkPad L15 G2 AMD | |
| HP ProBook 450 G9 6A180EA | |
| CrossMark / Overall | |
| Huawei MateBook D 16 2022 | |
| Dell Inspiron 16 Plus 7620 | |
| Media de la clase Office (381 - 2010, n=74, últimos 2 años) | |
| Medio Intel Core i5-1240P, Intel Iris Xe Graphics G7 80EUs (1392 - 1553, n=7) | |
| HP ZBook Power 15 G8 313S5EA | |
| Lenovo ThinkPad T16 G1 21BWS00200 | |
| HP ProBook 450 G9 6A180EA | |
| CrossMark / Productivity | |
| Huawei MateBook D 16 2022 | |
| Dell Inspiron 16 Plus 7620 | |
| HP ZBook Power 15 G8 313S5EA | |
| Media de la clase Office (464 - 1880, n=74, últimos 2 años) | |
| Medio Intel Core i5-1240P, Intel Iris Xe Graphics G7 80EUs (1393 - 1524, n=7) | |
| Lenovo ThinkPad T16 G1 21BWS00200 | |
| HP ProBook 450 G9 6A180EA | |
| CrossMark / Creativity | |
| Huawei MateBook D 16 2022 | |
| Dell Inspiron 16 Plus 7620 | |
| Media de la clase Office (319 - 2361, n=74, últimos 2 años) | |
| Medio Intel Core i5-1240P, Intel Iris Xe Graphics G7 80EUs (1426 - 1647, n=7) | |
| HP ZBook Power 15 G8 313S5EA | |
| Lenovo ThinkPad T16 G1 21BWS00200 | |
| HP ProBook 450 G9 6A180EA | |
| CrossMark / Responsiveness | |
| Huawei MateBook D 16 2022 | |
| Dell Inspiron 16 Plus 7620 | |
| Medio Intel Core i5-1240P, Intel Iris Xe Graphics G7 80EUs (1267 - 1545, n=7) | |
| Lenovo ThinkPad T16 G1 21BWS00200 | |
| Media de la clase Office (360 - 1820, n=74, últimos 2 años) | |
| HP ZBook Power 15 G8 313S5EA | |
| HP ProBook 450 G9 6A180EA | |
| Sunspider / 1.0 Total Score | |
| Lenovo ThinkPad T16 G1 21BWS00200 | |
| Medio Intel Core i5-1240P, Intel Iris Xe Graphics G7 80EUs (n=1) | |
| Media de la clase Office (87.2 - 111.8, n=2, últimos 2 años) | |
| HP ProBook 450 G9 6A180EA | |
| Mozilla Kraken 1.1 / Total | |
| Lenovo ThinkPad E15 G3-20YG003UGE | |
| HP ProBook 450 G9 6A180EA | |
| Medio Intel Core i5-1240P, Intel Iris Xe Graphics G7 80EUs (575 - 1422, n=12) | |
| HP ZBook Power 15 G8 313S5EA | |
| Lenovo ThinkPad L15 G2 AMD | |
| Lenovo ThinkPad T15 Gen2-20W5S00100 | |
| Lenovo ThinkPad X1 Extreme G4-20Y5CTO1WW (3050 Ti) | |
| Lenovo ThinkPad T16 G1 21BWS00200 | |
| Media de la clase Office (391 - 1297, n=77, últimos 2 años) | |
| Dell Inspiron 16 Plus 7620 | |
| Huawei MateBook D 16 2022 | |
| Speedometer 2.0 / Result 2.0 | |
| Media de la clase Office (173 - 640, n=17, últimos 2 años) | |
| Huawei MateBook D 16 2022 | |
| Medio Intel Core i5-1240P, Intel Iris Xe Graphics G7 80EUs (241 - 266, n=3) | |
| Lenovo ThinkPad T16 G1 21BWS00200 | |
| HP ProBook 450 G9 6A180EA | |
| Octane V2 / Total Score | |
| Media de la clase Office (49011 - 126830, n=19, últimos 2 años) | |
| Huawei MateBook D 16 2022 | |
| Lenovo ThinkPad T16 G1 21BWS00200 | |
| Medio Intel Core i5-1240P, Intel Iris Xe Graphics G7 80EUs (70915 - 80743, n=5) | |
| HP ProBook 450 G9 6A180EA | |
| HP ZBook Power 15 G8 313S5EA | |
| Jetstream 2 / 2.0 Total | |
| Media de la clase Office (126.6 - 483, n=20, últimos 2 años) | |
| Medio Intel Core i5-1240P, Intel Iris Xe Graphics G7 80EUs (203 - 418, n=4) | |
| Dell Inspiron 16 Plus 7620 | |
| Huawei MateBook D 16 2022 | |
| Lenovo ThinkPad T16 G1 21BWS00200 | |
| HP ProBook 450 G9 6A180EA | |
| HP ZBook Power 15 G8 313S5EA | |
| WebXPRT 3 / Overall | |
| Huawei MateBook D 16 2022 | |
| Dell Inspiron 16 Plus 7620 | |
| Media de la clase Office (129.9 - 444, n=76, últimos 2 años) | |
| Lenovo ThinkPad X1 Extreme G4-20Y5CTO1WW (3050 Ti) | |
| HP ZBook Power 15 G8 313S5EA | |
| Lenovo ThinkPad L15 G2 AMD | |
| Lenovo ThinkPad T16 G1 21BWS00200 | |
| Medio Intel Core i5-1240P, Intel Iris Xe Graphics G7 80EUs (119.2 - 268, n=11) | |
| Lenovo ThinkPad E15 G3-20YG003UGE | |
| HP ProBook 450 G9 6A180EA | |
| WebXPRT 4 / Overall | |
| Huawei MateBook D 16 2022 | |
| Dell Inspiron 16 Plus 7620 | |
| Media de la clase Office (104.2 - 313, n=76, últimos 2 años) | |
| Lenovo ThinkPad T16 G1 21BWS00200 | |
| Medio Intel Core i5-1240P, Intel Iris Xe Graphics G7 80EUs (217 - 231, n=6) | |
| HP ProBook 450 G9 6A180EA | |
* ... más pequeño es mejor
| PCMark 10 Score | 5007 puntos | |
ayuda | ||
| AIDA64 / Memory Copy | |
| Media de la clase Office (20075 - 110930, n=79, últimos 2 años) | |
| Huawei MateBook D 16 2022 | |
| Dell Inspiron 16 Plus 7620 | |
| Medio Intel Core i5-1240P (23312 - 70537, n=16) | |
| Lenovo ThinkPad X1 Extreme G4-20Y5CTO1WW (3050 Ti) | |
| Lenovo ThinkPad E15 G3-20YG003UGE | |
| HP ZBook Power 15 G8 313S5EA | |
| Lenovo ThinkPad T16 G1 21BWS00200 | |
| HP ProBook 450 G9 6A180EA | |
| Lenovo ThinkPad L15 G2 AMD | |
| AIDA64 / Memory Read | |
| Media de la clase Office (10084 - 128030, n=80, últimos 2 años) | |
| Dell Inspiron 16 Plus 7620 | |
| Huawei MateBook D 16 2022 | |
| Medio Intel Core i5-1240P (18989 - 70553, n=16) | |
| Lenovo ThinkPad E15 G3-20YG003UGE | |
| Lenovo ThinkPad X1 Extreme G4-20Y5CTO1WW (3050 Ti) | |
| HP ZBook Power 15 G8 313S5EA | |
| Lenovo ThinkPad T16 G1 21BWS00200 | |
| Lenovo ThinkPad L15 G2 AMD | |
| HP ProBook 450 G9 6A180EA | |
| AIDA64 / Memory Write | |
| Media de la clase Office (20073 - 119858, n=80, últimos 2 años) | |
| Huawei MateBook D 16 2022 | |
| Dell Inspiron 16 Plus 7620 | |
| Medio Intel Core i5-1240P (23454 - 62496, n=16) | |
| Lenovo ThinkPad X1 Extreme G4-20Y5CTO1WW (3050 Ti) | |
| Lenovo ThinkPad E15 G3-20YG003UGE | |
| Lenovo ThinkPad L15 G2 AMD | |
| Lenovo ThinkPad T16 G1 21BWS00200 | |
| HP ProBook 450 G9 6A180EA | |
| HP ZBook Power 15 G8 313S5EA | |
| AIDA64 / Memory Latency | |
| Medio Intel Core i5-1240P (85.1 - 188.3, n=11) | |
| Huawei MateBook D 16 2022 | |
| Media de la clase Office (7.6 - 162.9, n=75, últimos 2 años) | |
| Lenovo ThinkPad E15 G3-20YG003UGE | |
| Dell Inspiron 16 Plus 7620 | |
| Lenovo ThinkPad T16 G1 21BWS00200 | |
| Lenovo ThinkPad L15 G2 AMD | |
| Lenovo ThinkPad X1 Extreme G4-20Y5CTO1WW (3050 Ti) | |
| HP ProBook 450 G9 6A180EA | |
| HP ZBook Power 15 G8 313S5EA | |
* ... más pequeño es mejor
Latencia del CPD
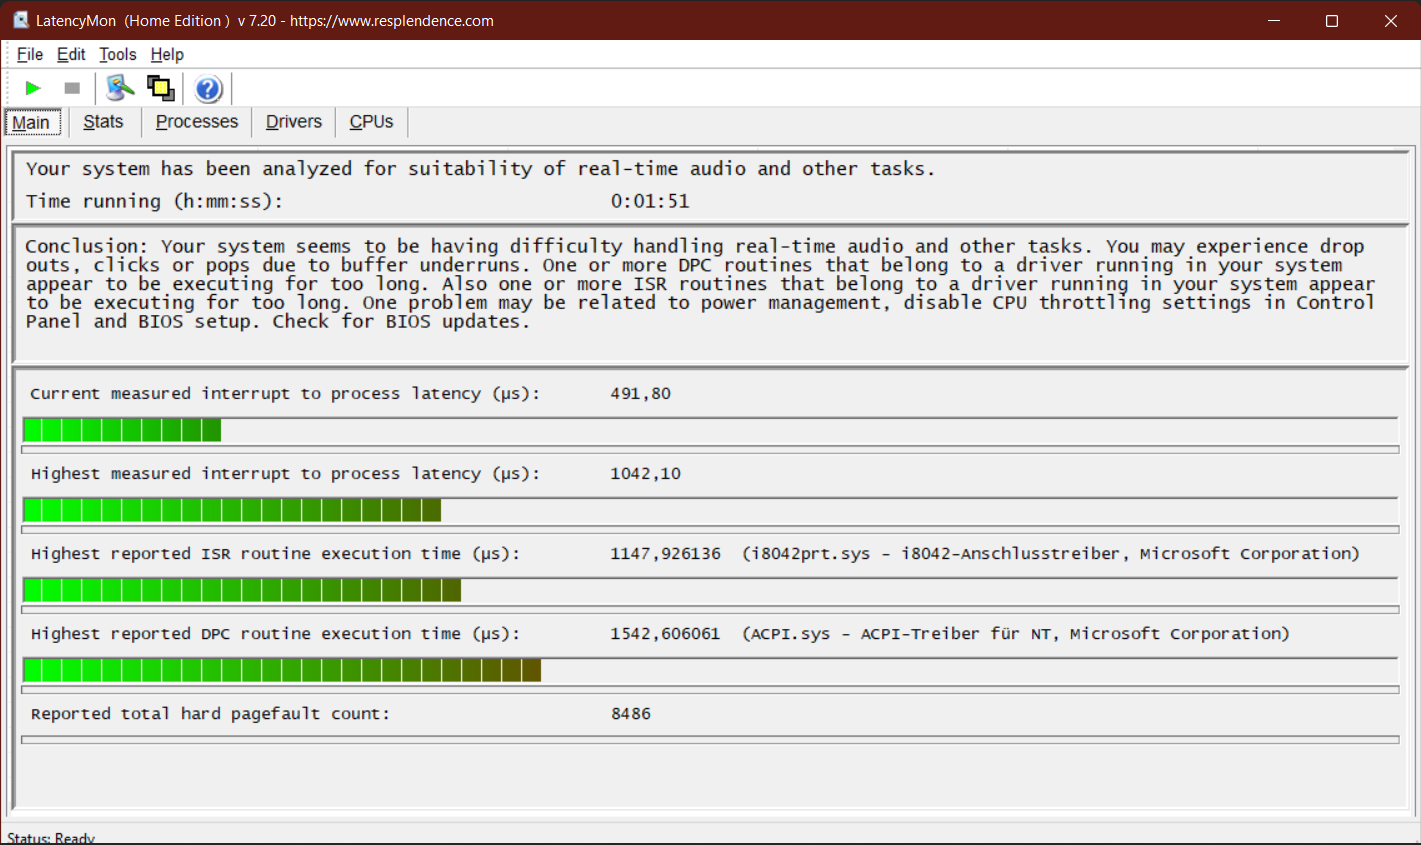
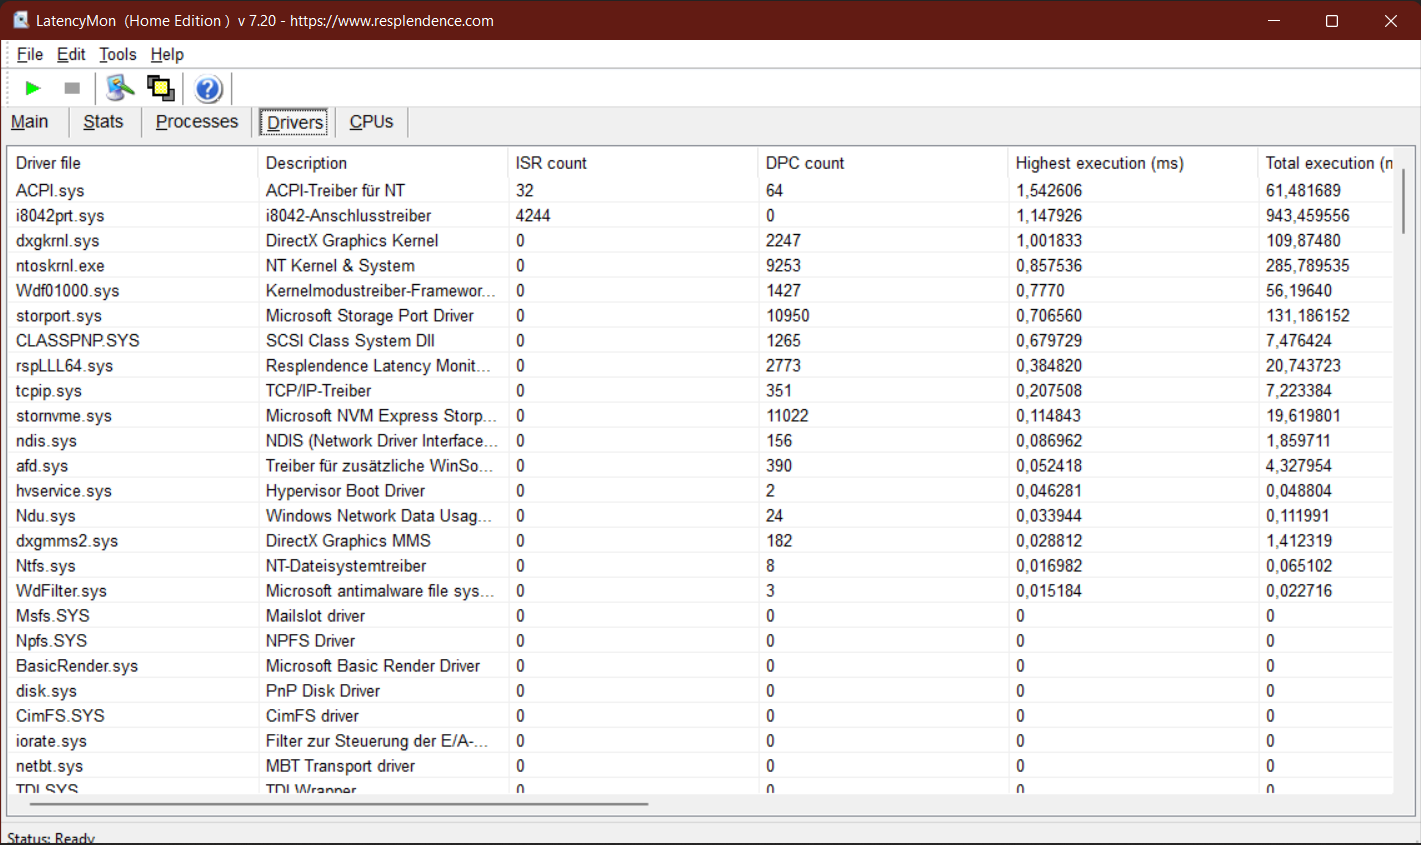
| DPC Latencies / LatencyMon - interrupt to process latency (max), Web, Youtube, Prime95 | |
| HP ProBook 450 G9 6A180EA | |
| Lenovo ThinkPad L15 G2 AMD | |
| Lenovo ThinkPad T16 G1 21BWS00200 | |
| Lenovo ThinkPad T15 Gen2-20W5S00100 | |
| Dell Inspiron 16 Plus 7620 | |
| Lenovo ThinkPad E15 G3-20YG003UGE | |
| Huawei MateBook D 16 2022 | |
| HP ZBook Power 15 G8 313S5EA | |
* ... más pequeño es mejor
Dispositivos de almacenamiento
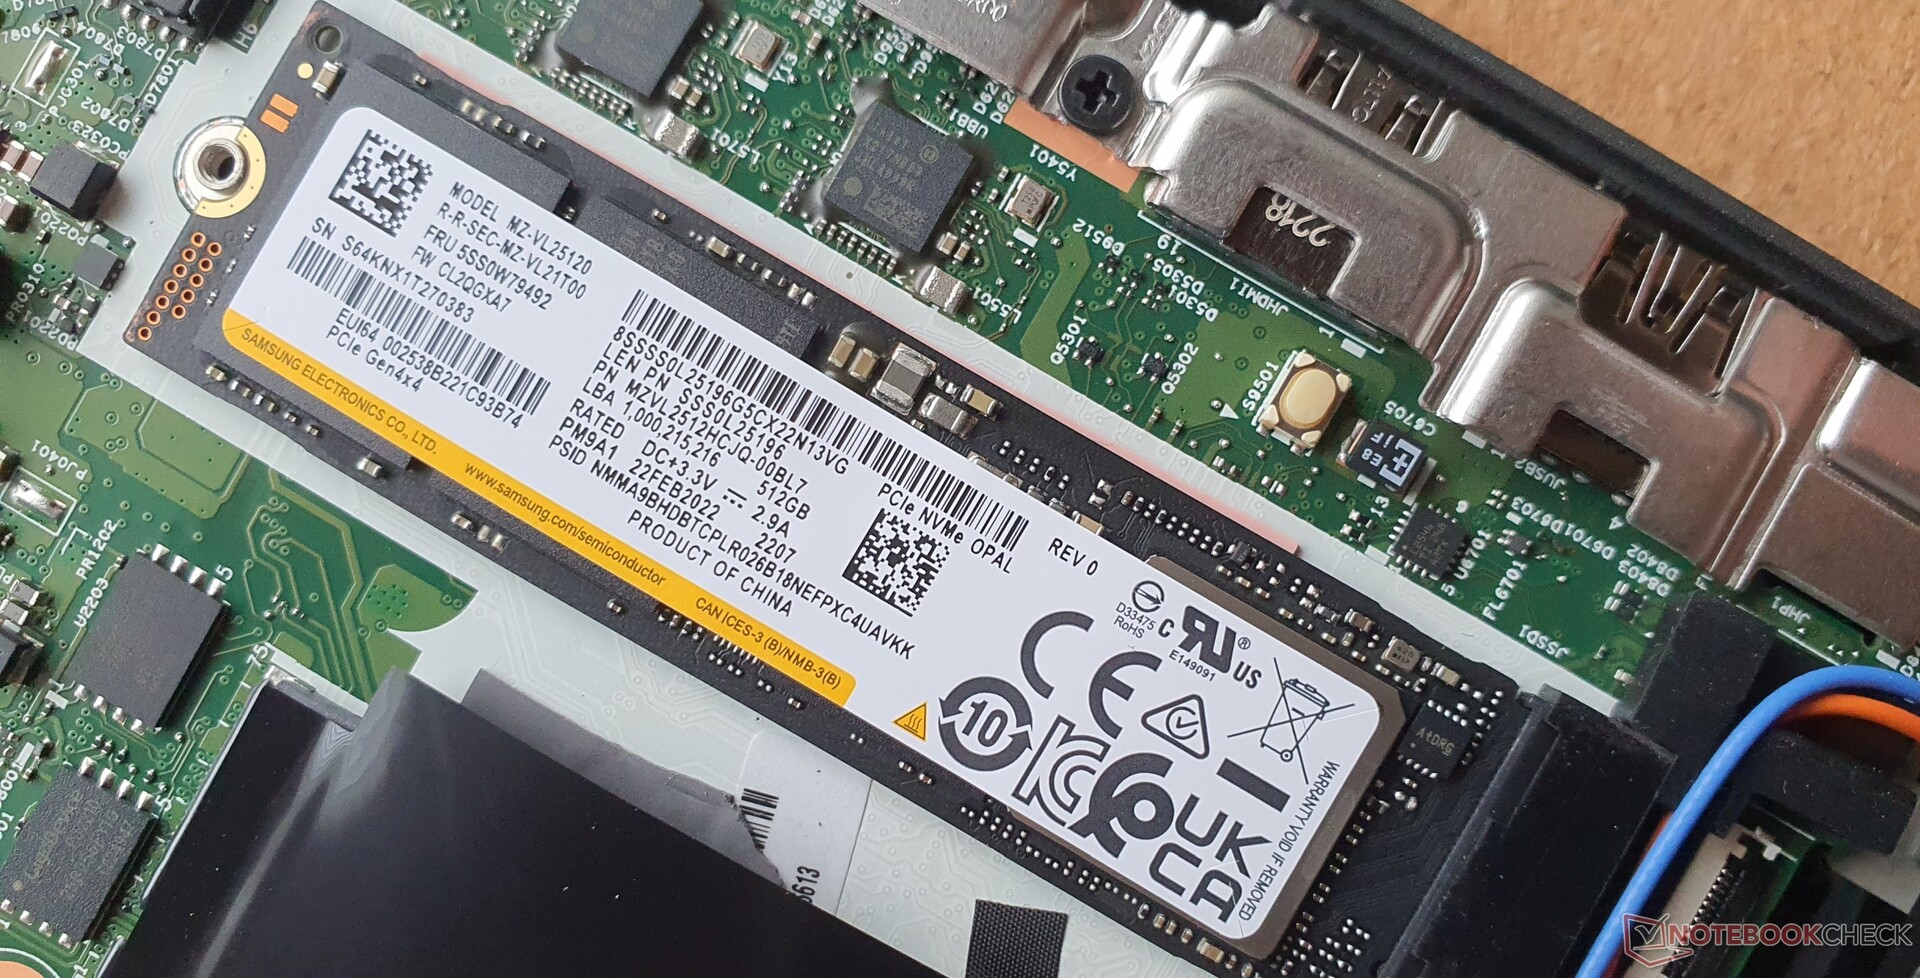
El PM9A1 de Samsunges un SSD PCIe 4.0 y tiene una capacidad de 512 GB. La velocidad es buena, pero las lecturas 4K 16/64 son bastante lentas, y caen rápidamente a la mitad en el test de lectura debido al sobrecalentamiento. El predecesor tenía un SSD más rápido, y el resto de nuestro campo de comparación tiene un rendimiento similar al de nuestra muestra de revisión.
| Lenovo ThinkPad T16 G1 21BWS00200 Samsung PM9A1 MZVL2512HCJQ | Lenovo ThinkPad T15 Gen2-20W5S00100 Samsung PM981a MZVLB1T0HBLR | Lenovo ThinkPad X1 Extreme G4-20Y5CTO1WW (3050 Ti) Samsung PM9A1 MZVL21T0HCLR | HP ZBook Power 15 G8 313S5EA Samsung PM9A1 MZVL2512HCJQ | HP ProBook 450 G9 6A180EA SK Hynix HFM512GD3JX013N | Huawei MateBook D 16 2022 Silicon Motion PCIe-8 SSD | Dell Inspiron 16 Plus 7620 Kioxia BG5 KBG50ZNS512G | Lenovo ThinkPad E15 G3-20YG003UGE SK Hynix PC711 1TB HFS001TDE9X084N | Lenovo ThinkPad L15 G2 AMD SK Hynix HFS512 GDE9X081N | |
|---|---|---|---|---|---|---|---|---|---|
| DiskSpd | 104% | 18% | 60% | -38% | 36% | -15% | 67% | -10% | |
| seq read (MB/s) | 3645 | 2090 -43% | 3285 -10% | 3354.8 -8% | 1914 -47% | 2012 -45% | 2355 -35% | 1624 -55% | 1688 -54% |
| seq write (MB/s) | 2809 | 2270 -19% | 2886 3% | 1353.3 -52% | 1762 -37% | 1438 -49% | 2020 -28% | 1901 -32% | 2072 -26% |
| seq q8 t1 read (MB/s) | 6524 | 3448 -47% | 6641 2% | 6230 -5% | 3463 -47% | 2883 -56% | 2569 -61% | 3269 -50% | 3582 -45% |
| seq q8 t1 write (MB/s) | 4812 | 2945 -39% | 4922 2% | 4757.9 -1% | 2600 -46% | 1911 -60% | 2752 -43% | 3250 -32% | 3072 -36% |
| 4k q1 t1 read (MB/s) | 68.2 | 74.4 9% | 78.4 15% | 51.8 -24% | 52.7 -23% | 43.1 -37% | 62.7 -8% | 57.4 -16% | 46.7 -32% |
| 4k q1 t1 write (MB/s) | 134.8 | 231 71% | 161 19% | 150.2 11% | 112.4 -17% | 273 103% | 162.6 21% | 128 -5% | 123 -9% |
| 4k q32 t16 read (MB/s) | 683 | 2506 267% | 1270 86% | 2187 220% | 328 -52% | 1391 104% | 652 -5% | 2037 198% | 983 44% |
| 4k q32 t16 write (MB/s) | 293 | 2137 629% | 373 27% | 1284.7 338% | 192.2 -34% | 1241 324% | 408 39% | 1833 526% | 521 78% |
| AS SSD | 11% | 28% | 22% | -21% | 11% | -23% | 12% | -8% | |
| Seq Read (MB/s) | 3225 | 2694 -16% | 4588 42% | 4951 54% | 2687 -17% | 2802 -13% | 2693.29 -16% | 2432 -25% | 2721 -16% |
| Seq Write (MB/s) | 1567 | 2370 51% | 1625 4% | 3725 138% | 1476.14 -6% | 1879 20% | 1683.46 7% | 1266 -19% | 1329 -15% |
| 4K Read (MB/s) | 69.7 | 68.4 -2% | 75.2 8% | 52.9 -24% | 60 -14% | 61.03 -12% | 65.01 -7% | 48.88 -30% | 51.5 -26% |
| 4K Write (MB/s) | 170.9 | 208.1 22% | 182.9 7% | 105.35 -38% | 176.81 3% | 248.56 45% | 197.81 16% | 128.4 -25% | 132.5 -22% |
| 4K-64 Read (MB/s) | 720 | 1961 172% | 1318 83% | 2200.26 206% | 696.46 -3% | 1135.53 58% | 855.48 19% | 1805 151% | 932 29% |
| 4K-64 Write (MB/s) | 2682 | 1935 -28% | 3056 14% | 2314.41 -14% | 1624.91 -39% | 1402.68 -48% | 395.8 -85% | 2470 -8% | 1856 -31% |
| Access Time Read * (ms) | 0.059 | 0.032 46% | 0.041 31% | 0.054 8% | 0.04 32% | 0.025 58% | 0.078 -32% | 0.044 25% | 0.038 36% |
| Access Time Write * (ms) | 0.024 | 0.081 -238% | 0.022 8% | 0.04 -67% | 0.028 -17% | 0.016 33% | 0.06 -150% | 0.038 -58% | 0.028 -17% |
| Score Read (Points) | 1112 | 2299 107% | 1852 67% | 2748 147% | 1025 -8% | 1477 33% | 1190 7% | 2097 89% | 1256 13% |
| Score Write (Points) | 3010 | 2380 -21% | 3402 13% | 2792 -7% | 1949 -35% | 1839 -39% | 762 -75% | 2725 -9% | 2122 -30% |
| Score Total (Points) | 4630 | 5846 26% | 6069 31% | 6880 49% | 3457 -25% | 4039 -13% | 2529 -45% | 5837 26% | 3961 -14% |
| Copy ISO MB/s (MB/s) | 1639 | 1287.6 -21% | 863.41 -47% | 1352.52 -17% | 1634.1 0% | 1301 -21% | |||
| Copy Program MB/s (MB/s) | 326.8 | 115.3 -65% | 127.34 -61% | 435.92 33% | 379.46 16% | 554 70% | |||
| Copy Game MB/s (MB/s) | 942.7 | 390.1 -59% | 384.67 -59% | 1058.52 12% | 1174.45 25% | 993 5% | |||
| Media total (Programa/Opciones) | 58% /
50% | 23% /
24% | 41% /
36% | -30% /
-27% | 24% /
20% | -19% /
-20% | 40% /
32% | -9% /
-9% |
* ... más pequeño es mejor
* ... más pequeño es mejor
Sustained Read Performance: DiskSpd Read Loop, Queue Depth 8
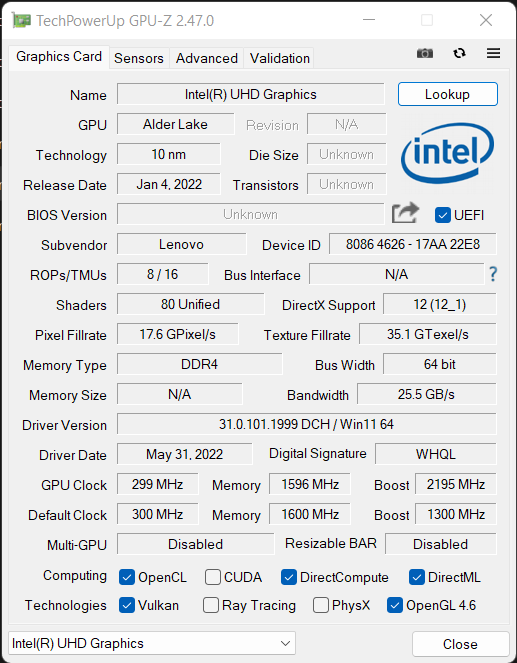
Tarjeta gráfica
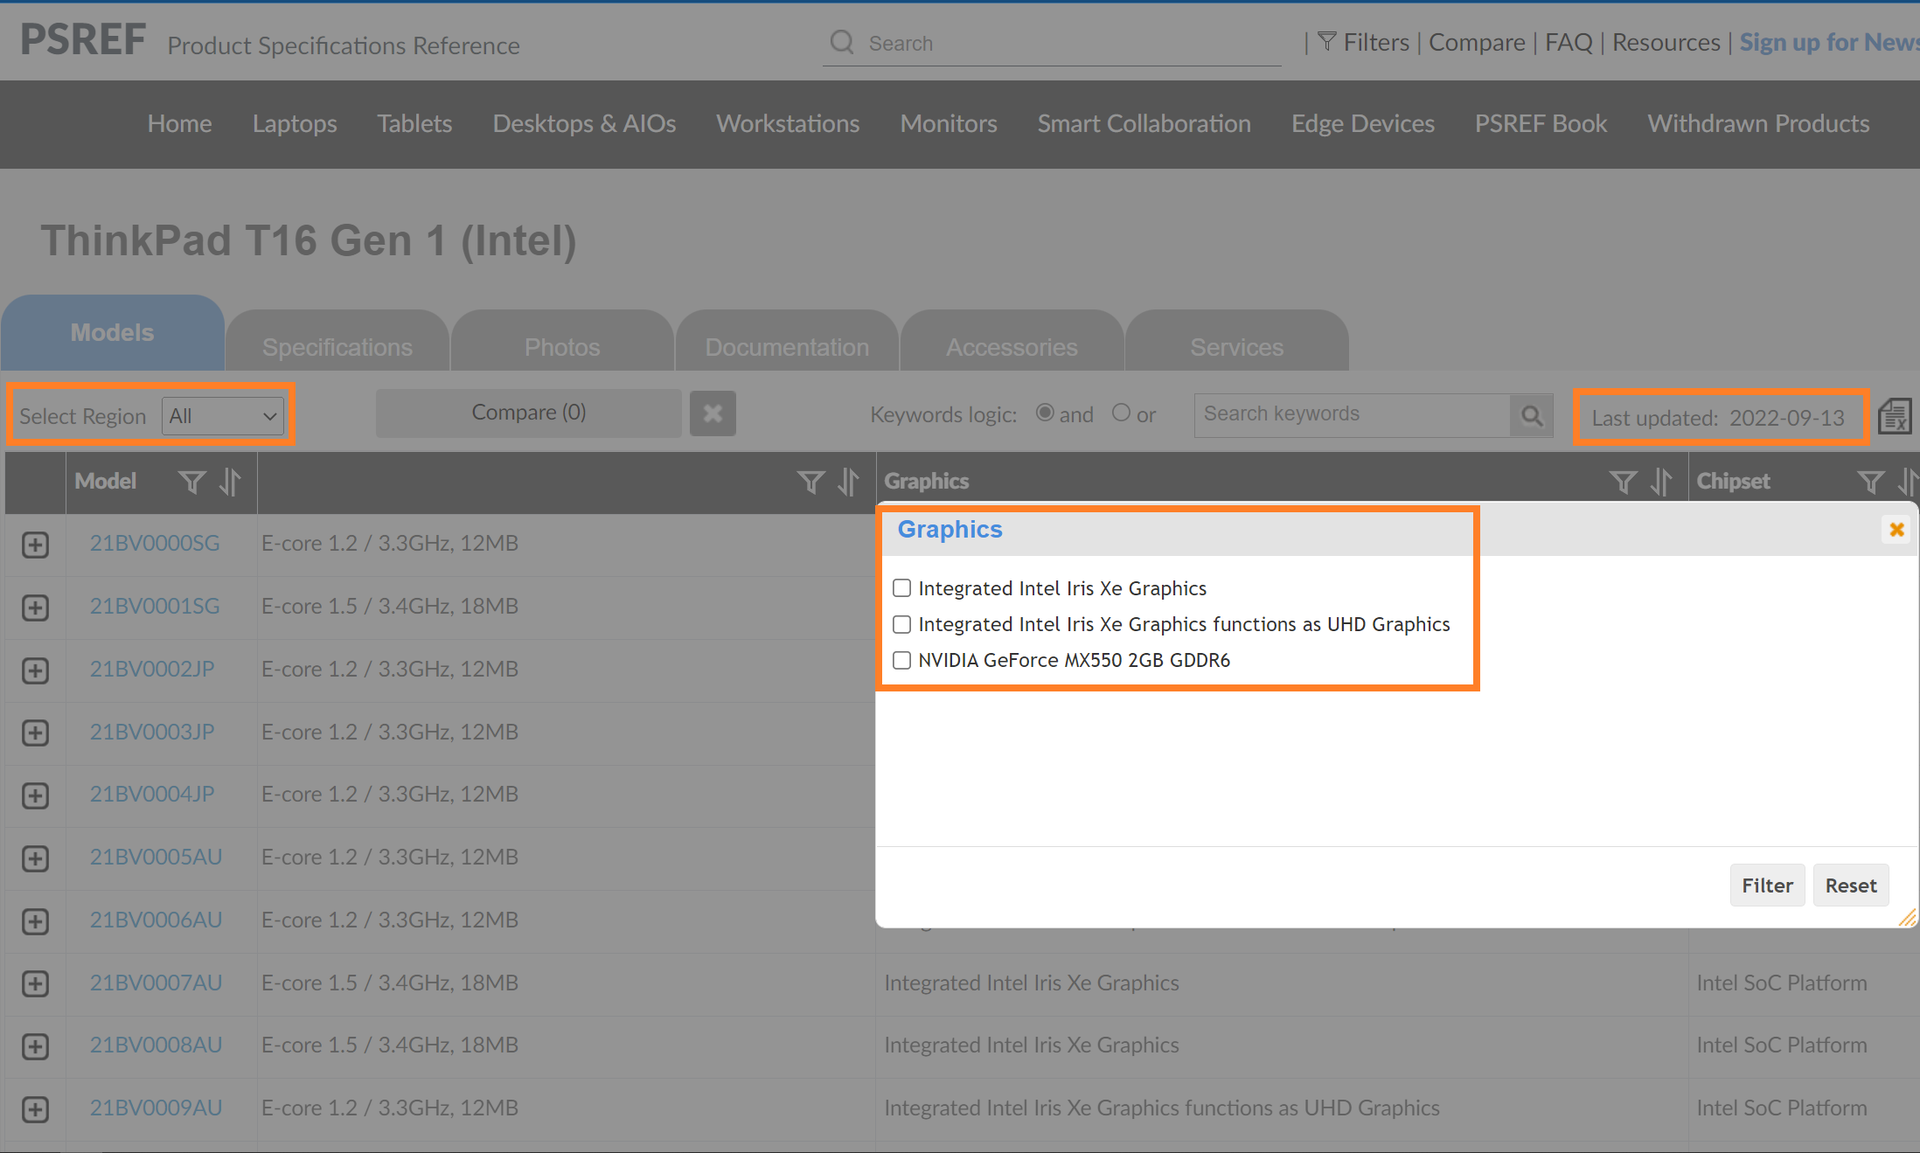
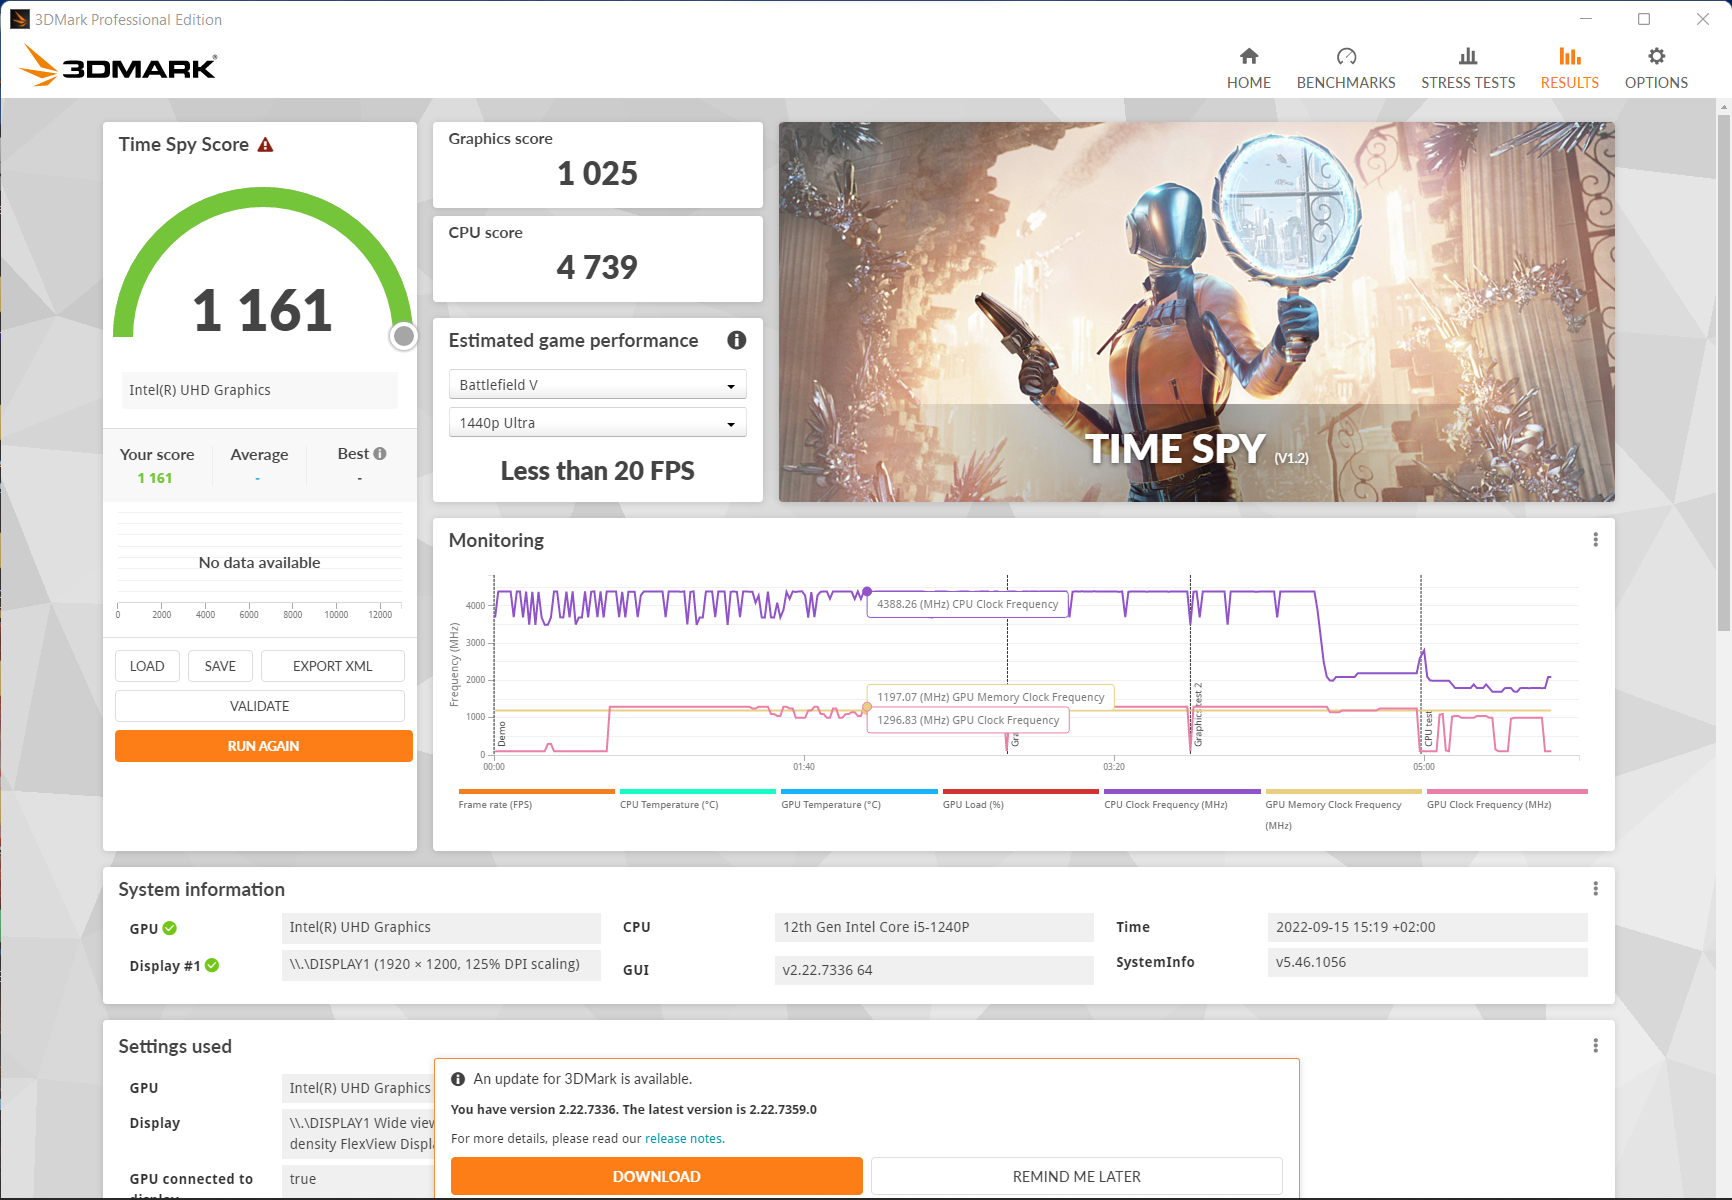
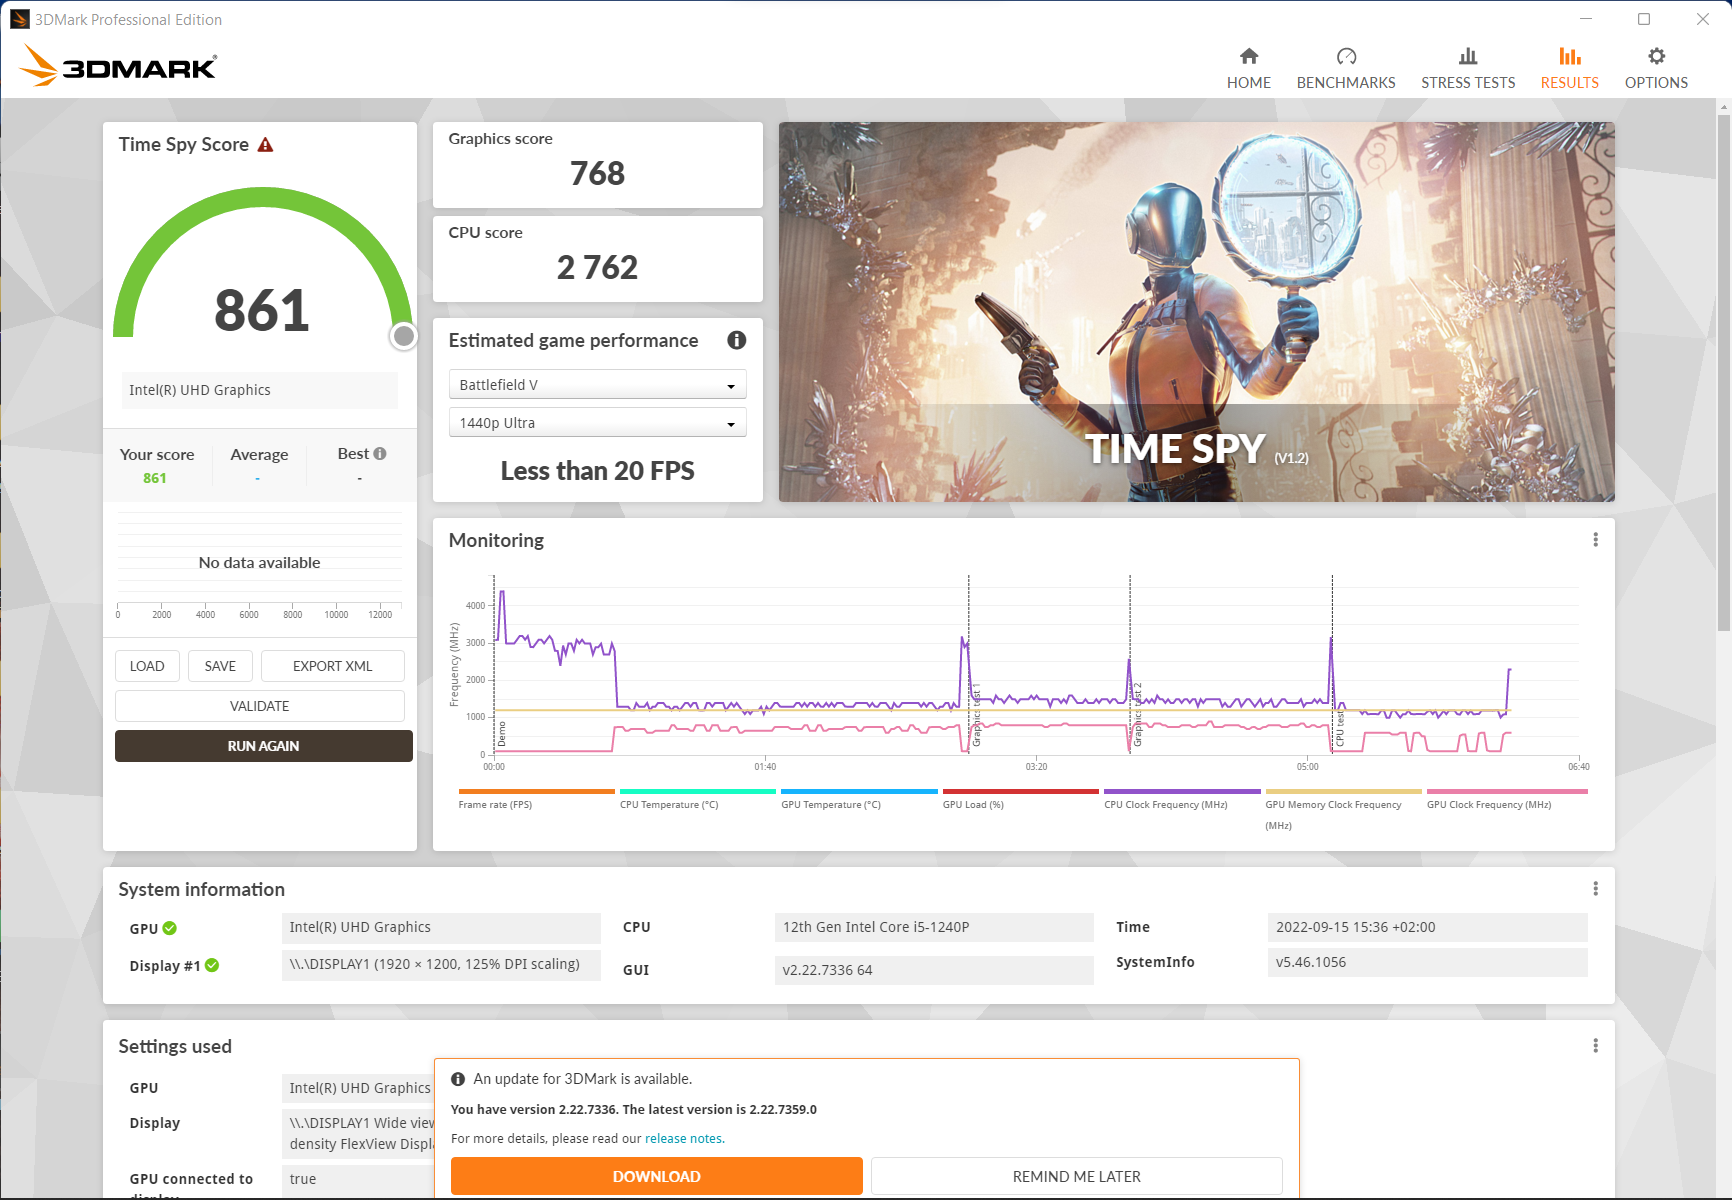
El integradoIntel UHD Graphics es técnicamente un Xe G7 (80 EUs)que está vinculado a una memoria RAM de un solo canal. En consecuencia, su rendimiento es limitado y los bajos niveles de detalle están a la orden del día. Como el portátil no está diseñado para jugar, esto es tolerable y puede mejorarse significativamente con un segundo módulo de RAM. El MX450del predecesor también sería una buena mejora de acompañamiento, mientras que el disponible opcionalmente GeForce MX550 es aún más rápido.
El ThinkPad T16 también se anunció con una NvidiaGeForce RTX 2050que ni siquiera aparece en las hojas de especificaciones, sino sólo como una nota de que no está disponible en la región EMEA. En el modo de batería, los fps en la configuración Witcher 3 @Medium caen de 32 a 24, lo que corresponde a una ralentización del 25%. Los 1.300 MHz completos caen a ~750 MHz.
| V-Ray 5 Benchmark - GPU CUDA | |
| HP ZBook Power 15 G8 313S5EA | |
| Lenovo ThinkPad T16 G1 21BWS00200 | |
| Medio Intel Iris Xe Graphics G7 80EUs (39 - 232, n=14) | |
| HP ProBook 450 G9 6A180EA | |
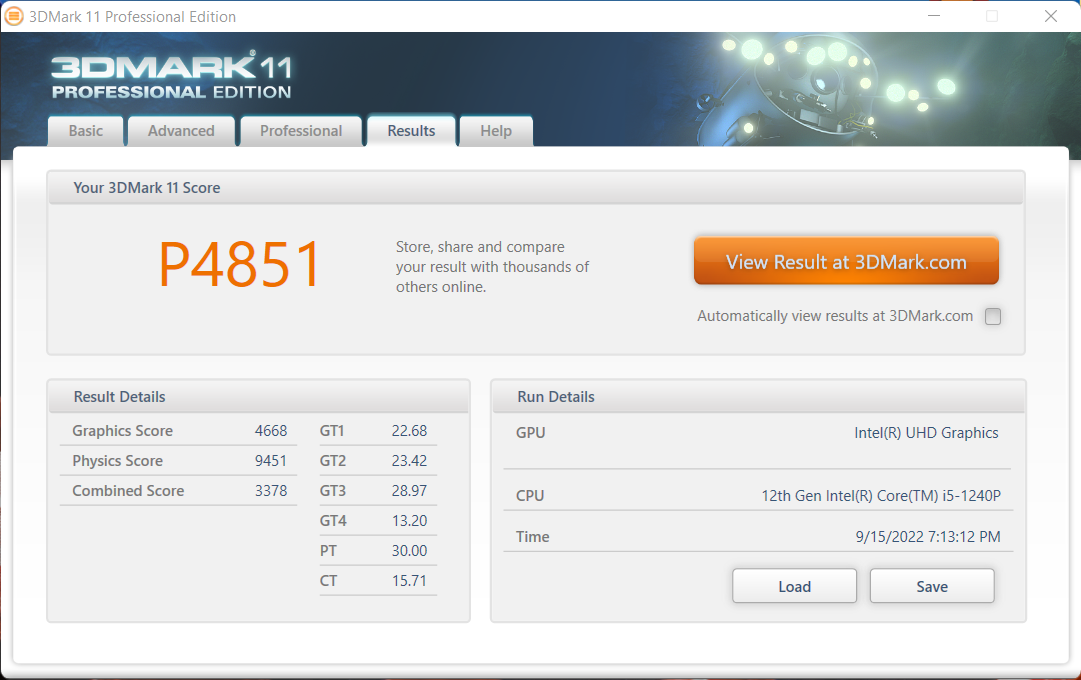
| 3DMark 11 Performance | 4851 puntos | |
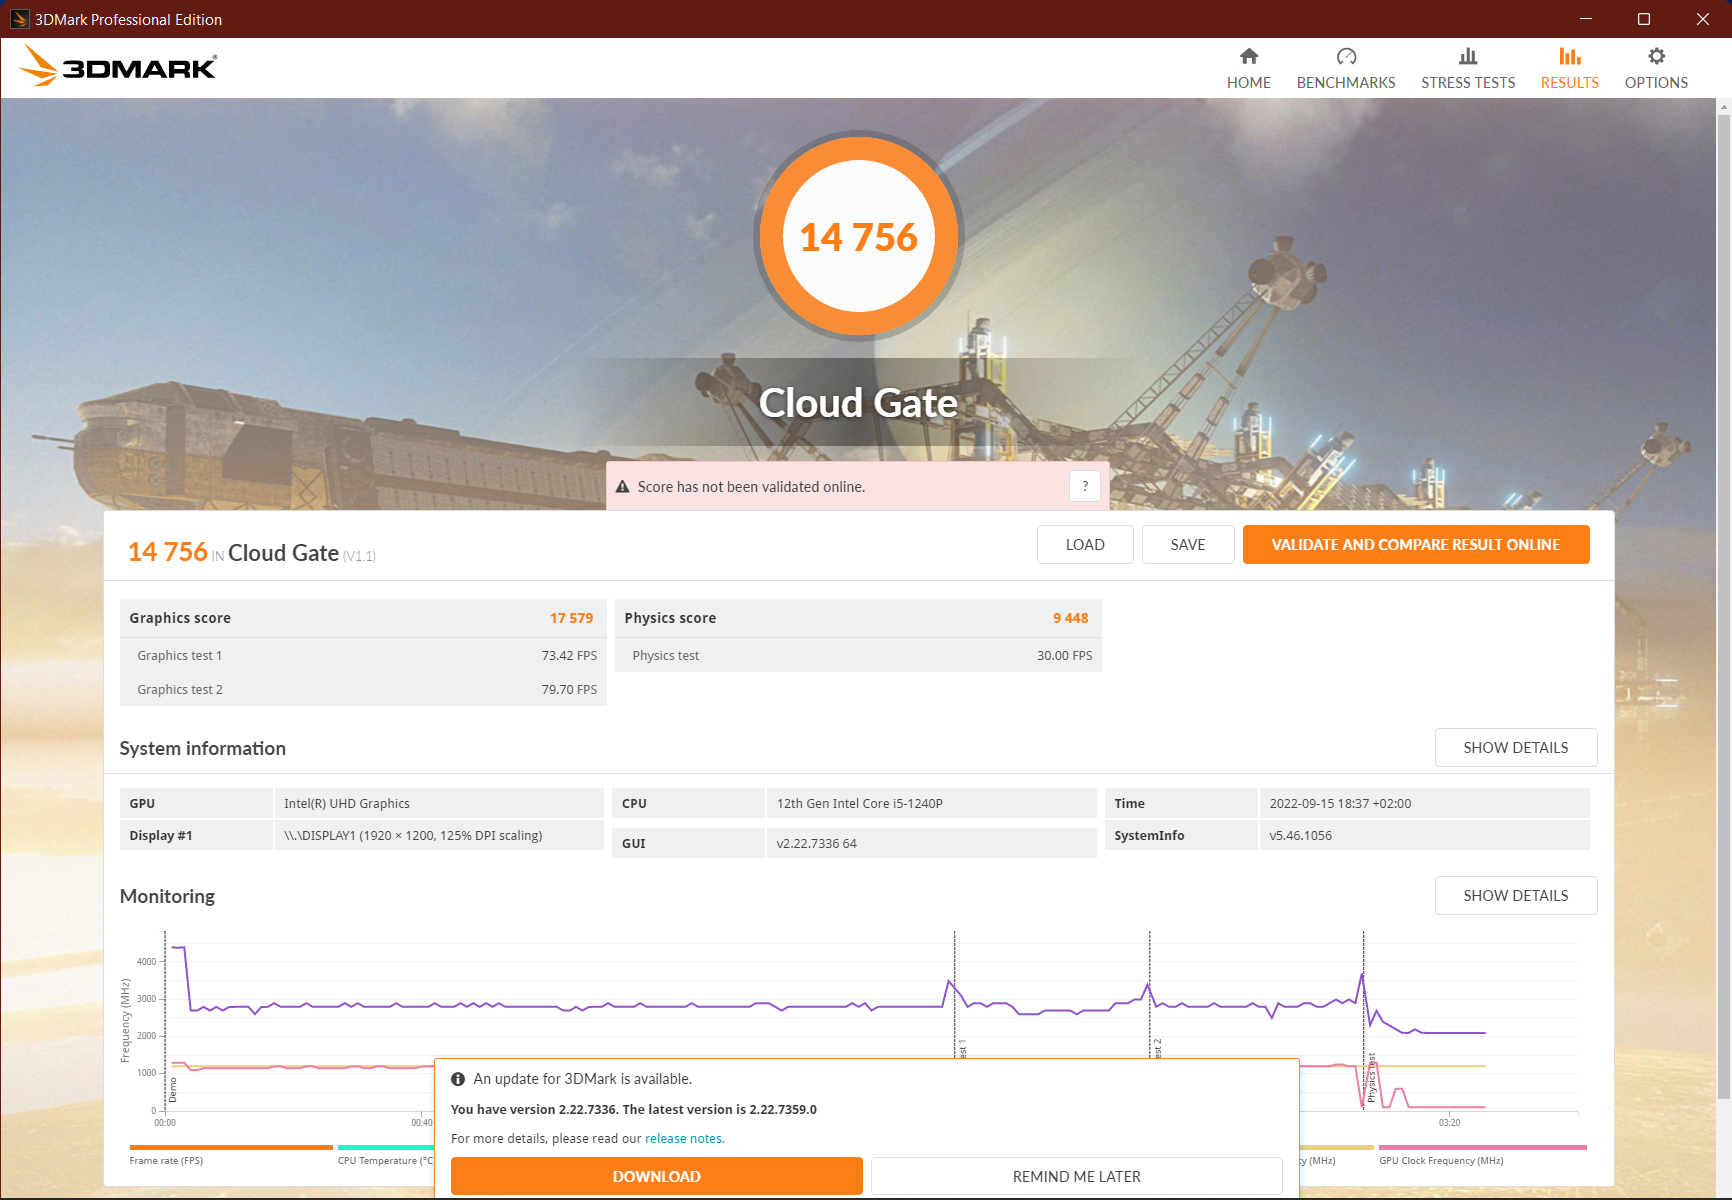
| 3DMark Cloud Gate Standard Score | 14756 puntos | |
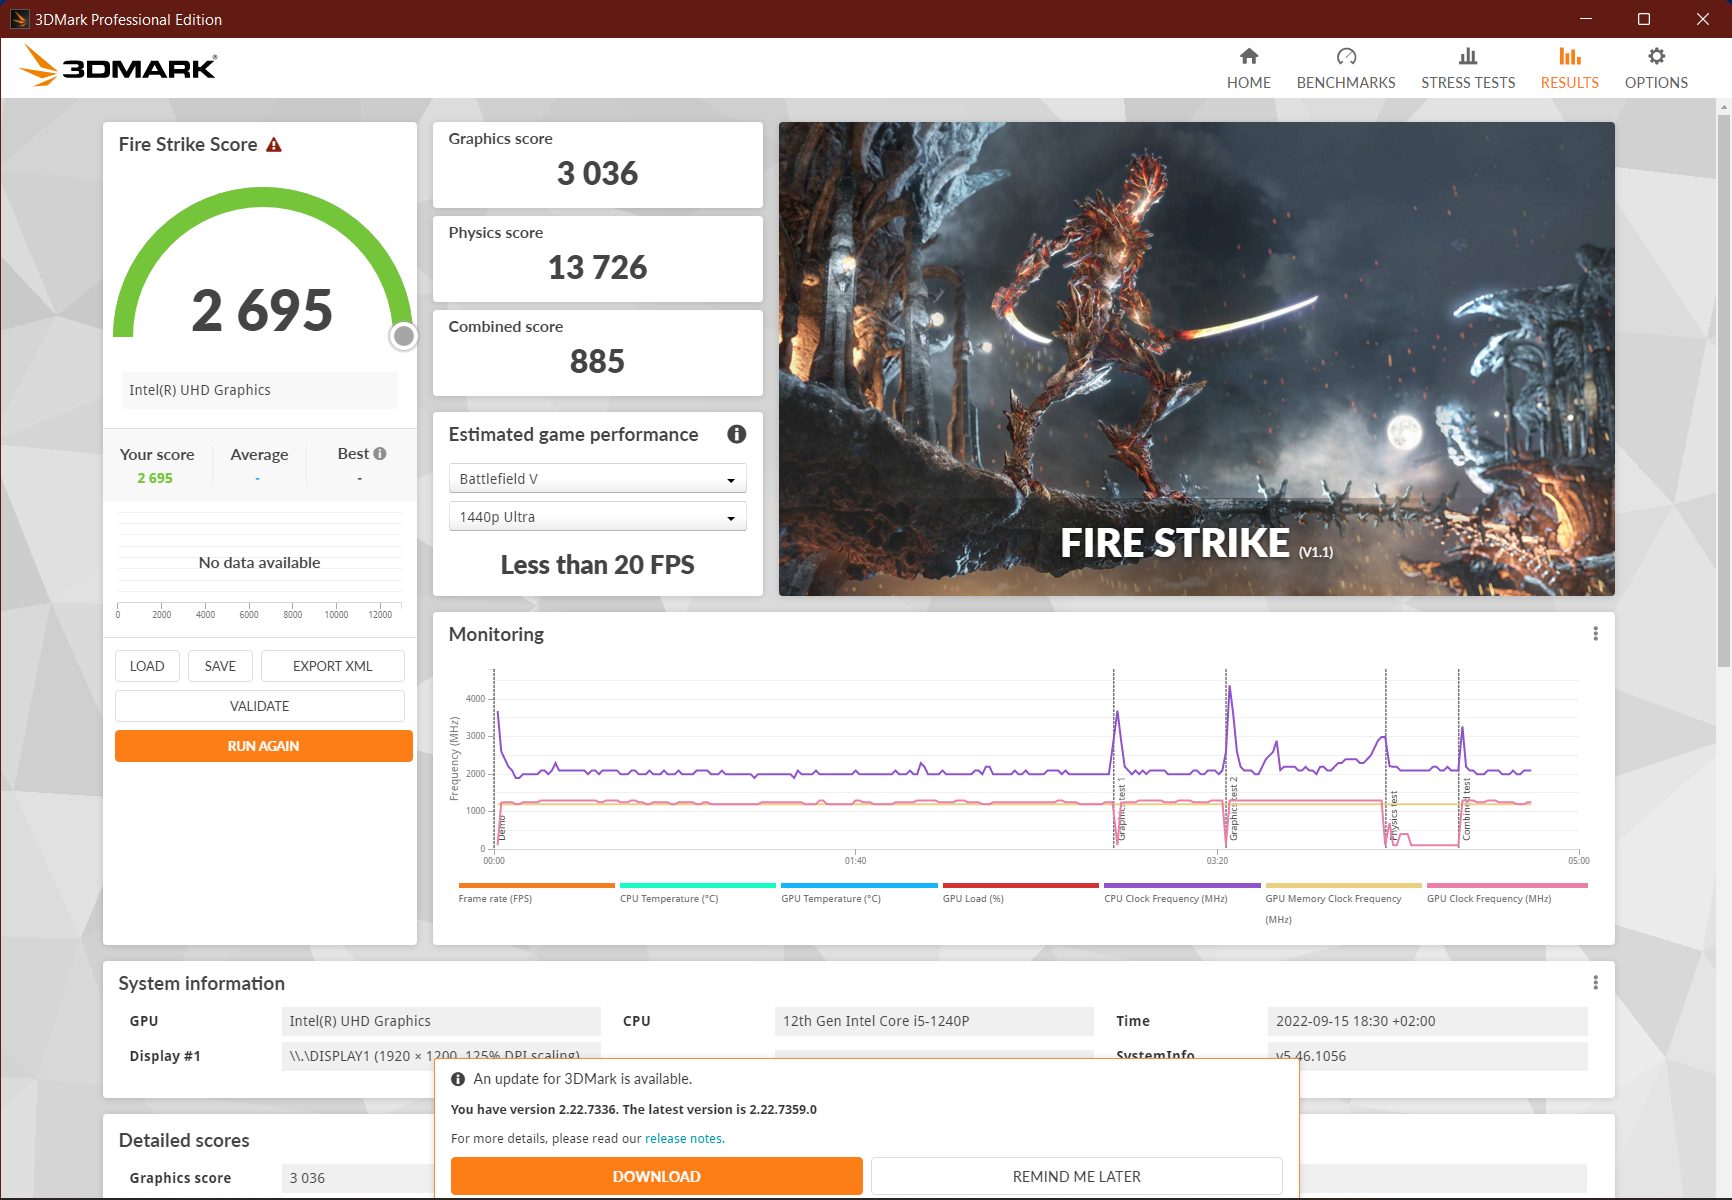
| 3DMark Fire Strike Score | 2695 puntos | |
| 3DMark Time Spy Score | 1161 puntos | |
ayuda | ||
| Shadow of the Tomb Raider - 1280x720 Lowest Preset | |
| HP ZBook Power 15 G8 313S5EA | |
| Media de la clase Office (16 - 105, n=2, últimos 2 años) | |
| Medio Intel Iris Xe Graphics G7 80EUs (31 - 62.8, n=6) | |
| HP ProBook 450 G9 6A180EA | |
| Lenovo ThinkPad T16 G1 21BWS00200 | |
| GRID Legends - 1920x1080 Medium Preset | |
| HP ZBook Power 15 G8 313S5EA | |
| Medio Intel Iris Xe Graphics G7 80EUs (25.7 - 39.7, n=4) | |
| HP ProBook 450 G9 6A180EA | |
| Lenovo ThinkPad T16 G1 21BWS00200 | |
Witcher 3 FPS Chart
| bajo | medio | alto | ultra | |
|---|---|---|---|---|
| GTA V (2015) | 61.9 | 50.1 | 9.54 | |
| The Witcher 3 (2015) | 50.7 | 32.1 | 15.7 | 8.36 |
| Dota 2 Reborn (2015) | 97.5 | 66.3 | 35.2 | 32.7 |
| Final Fantasy XV Benchmark (2018) | 24.9 | 13.5 | ||
| X-Plane 11.11 (2018) | 42.5 | 29.1 | 26.5 | |
| Far Cry 5 (2018) | 30 | 15 | 14 | 13 |
| Strange Brigade (2018) | 52.7 | 20.3 | 17 | 13.8 |
| Shadow of the Tomb Raider (2018) | 31 | 11 | ||
| GRID Legends (2022) | 36.2 | 25.7 | 21 |
Emisiones - Un portátil de 16 pulgadas de Lenovo prácticamente silencioso
Ruido
En reposo, el ThinkPad T16 permanece absolutamente silencioso. Incluso durante la navegación web intensiva y las tareas intensivas de la CPU, el ventilador permanece tan silencioso con una media de 25 dB(A) que apenas se puede distinguir del ruido ambiente.
Sólo bajo carga combinada, como cuando se juega, te das cuenta de que no es un dispositivo de refrigeración pasiva - aunque el portátil sigue manteniendo un perfil bajo con 32 dB(A). Sin embargo, el ventilador funciona entonces con tonos bastante altos. Al menos no hay ruidos electrónicos molestos.
Sólo el ThinkPad L15 G2 AMD y el ProBook 450 G9 de HP son igualmente silenciosos en comparación
Ruido
| Ocioso |
| 23.3 / 23.3 / 23.3 dB(A) |
| Carga |
| 25.1 / 34 dB(A) |
 | ||
30 dB silencioso 40 dB(A) audible 50 dB(A) ruidosamente alto |
||
min: | ||
| Lenovo ThinkPad T16 G1 21BWS00200 Iris Xe G7 80EUs, i5-1240P, Samsung PM9A1 MZVL2512HCJQ | Lenovo ThinkPad T15 Gen2-20W5S00100 GeForce MX450, i7-1165G7, Samsung PM981a MZVLB1T0HBLR | Lenovo ThinkPad E15 G3-20YG003UGE Vega 8, R7 5700U, SK Hynix PC711 1TB HFS001TDE9X084N | Lenovo ThinkPad L15 G2 AMD Vega 7, R5 5600U, SK Hynix HFS512 GDE9X081N | HP ProBook 450 G9 6A180EA Iris Xe G7 96EUs, i7-1255U, SK Hynix HFM512GD3JX013N | HP ZBook Power 15 G8 313S5EA T600 Laptop GPU, i7-11800H, Samsung PM9A1 MZVL2512HCJQ | Dell Inspiron 16 Plus 7620 GeForce RTX 3050 Ti Laptop GPU, i7-12700H, Kioxia BG5 KBG50ZNS512G | Huawei MateBook D 16 2022 Iris Xe G7 96EUs, i7-12700H, Silicon Motion PCIe-8 SSD | Asus Vivobook Pro 16X-M7600QE GeForce RTX 3050 Ti Laptop GPU, R9 5900HX, SK Hynix HFM001TD3JX013N | |
|---|---|---|---|---|---|---|---|---|---|
| Noise | -12% | -10% | -4% | -5% | -33% | -34% | -21% | -27% | |
| apagado / medio ambiente * (dB) | 23.3 | 24.2 -4% | 23.8 -2% | 24.22 -4% | 25.5 -9% | 25.54 -10% | 23.3 -0% | 24.2 -4% | 26 -12% |
| Idle Minimum * (dB) | 23.3 | 24.2 -4% | 23.8 -2% | 24.22 -4% | 25.5 -9% | 25.54 -10% | 25.7 -10% | 24.2 -4% | 27 -16% |
| Idle Average * (dB) | 23.3 | 24.2 -4% | 23.8 -2% | 24.22 -4% | 25.5 -9% | 25.54 -10% | 26.1 -12% | 25.8 -11% | 27 -16% |
| Idle Maximum * (dB) | 23.3 | 24.2 -4% | 28 -20% | 24.22 -4% | 25.5 -9% | 25.54 -10% | 30.6 -31% | 30.5 -31% | 27.5 -18% |
| Load Average * (dB) | 25.1 | 34.5 -37% | 32.9 -31% | 25.84 -3% | 28 -12% | 48.85 -95% | 46.2 -84% | 39.8 -59% | 41.7 -66% |
| Witcher 3 ultra * (dB) | 32.1 | 37.6 -17% | 46.58 -45% | 49.2 -53% | 39.8 -24% | ||||
| Load Maximum * (dB) | 34 | 37.6 -11% | 35 -3% | 36.02 -6% | 27.7 19% | 50.98 -50% | 49.4 -45% | 39.8 -17% | 45.3 -33% |
* ... más pequeño es mejor
Temperatura
El ThinkPad T16 se mantiene fresco en la mayoría de los escenarios, sólo se calienta hasta un grado normal bajo carga sostenida. No se nota mucho en la zona del teclado, sino sólo por encima de él, e incluso esto no se siente demasiado caliente durante mucho tiempo. La parte inferior generalmente se mantiene más fría, por lo que puedes usar el ThinkPad T16 en tu regazo.
El predecesor directo y también el ThinkPad E15se calientan considerablemente más con un máximo de 55 °C y 60 °C, respectivamente, en la parte inferior. El ZBook Power 15 y Vivobook Pro 16Xpor otro lado, se mantienen igual de fríos.
(±) La temperatura máxima en la parte superior es de 45 °C / 113 F, frente a la media de 34.3 °C / 94 F, que oscila entre 21.2 y 62.5 °C para la clase Office.
(±) El fondo se calienta hasta un máximo de 42.8 °C / 109 F, frente a la media de 36.8 °C / 98 F
(+) En reposo, la temperatura media de la parte superior es de 30.4 °C / 87# F, frente a la media del dispositivo de 29.5 °C / 85 F.
(±) Jugando a The Witcher 3, la temperatura media de la parte superior es de 35.9 °C / 97 F, frente a la media del dispositivo de 29.5 °C / 85 F.
(+) Los reposamanos y el panel táctil alcanzan como máximo la temperatura de la piel (33.4 °C / 92.1 F) y, por tanto, no están calientes.
(-) La temperatura media de la zona del reposamanos de dispositivos similares fue de 27.5 °C / 81.5 F (-5.9 °C / -10.6 F).
| Lenovo ThinkPad T16 G1 21BWS00200 Intel Core i5-1240P, Intel Iris Xe Graphics G7 80EUs | Lenovo ThinkPad T15 Gen2-20W5S00100 Intel Core i7-1165G7, NVIDIA GeForce MX450 | Lenovo ThinkPad E15 G3-20YG003UGE AMD Ryzen 7 5700U, AMD Radeon RX Vega 8 (Ryzen 4000/5000) | Lenovo ThinkPad L15 G2 AMD AMD Ryzen 5 5600U, AMD Radeon RX Vega 7 | HP ProBook 450 G9 6A180EA Intel Core i7-1255U, Intel Iris Xe Graphics G7 96EUs | HP ZBook Power 15 G8 313S5EA Intel Core i7-11800H, NVIDIA T600 Laptop GPU | Dell Inspiron 16 Plus 7620 Intel Core i7-12700H, NVIDIA GeForce RTX 3050 Ti Laptop GPU | Huawei MateBook D 16 2022 Intel Core i7-12700H, Intel Iris Xe Graphics G7 96EUs | Asus Vivobook Pro 16X-M7600QE AMD Ryzen 9 5900HX, NVIDIA GeForce RTX 3050 Ti Laptop GPU | |
|---|---|---|---|---|---|---|---|---|---|
| Heat | 8% | -2% | 6% | -1% | 16% | 3% | 5% | 11% | |
| Maximum Upper Side * (°C) | 45 | 42.2 6% | 46.4 -3% | 42.8 5% | 40.5 10% | 41.4 8% | 46 -2% | 41.8 7% | 39.4 12% |
| Maximum Bottom * (°C) | 42.8 | 55.1 -29% | 60.9 -42% | 46 -7% | 47.6 -11% | 41.5 3% | 45.8 -7% | 47.3 -11% | 43.6 -2% |
| Idle Upper Side * (°C) | 33 | 23.8 28% | 26.5 20% | 26.9 18% | 32.6 1% | 23.8 28% | 29.2 12% | 28.3 14% | 27.6 16% |
| Idle Bottom * (°C) | 33.6 | 25.1 25% | 27.5 18% | 31.1 7% | 34.2 -2% | 25 26% | 31 8% | 30.2 10% | 27.5 18% |
* ... más pequeño es mejor
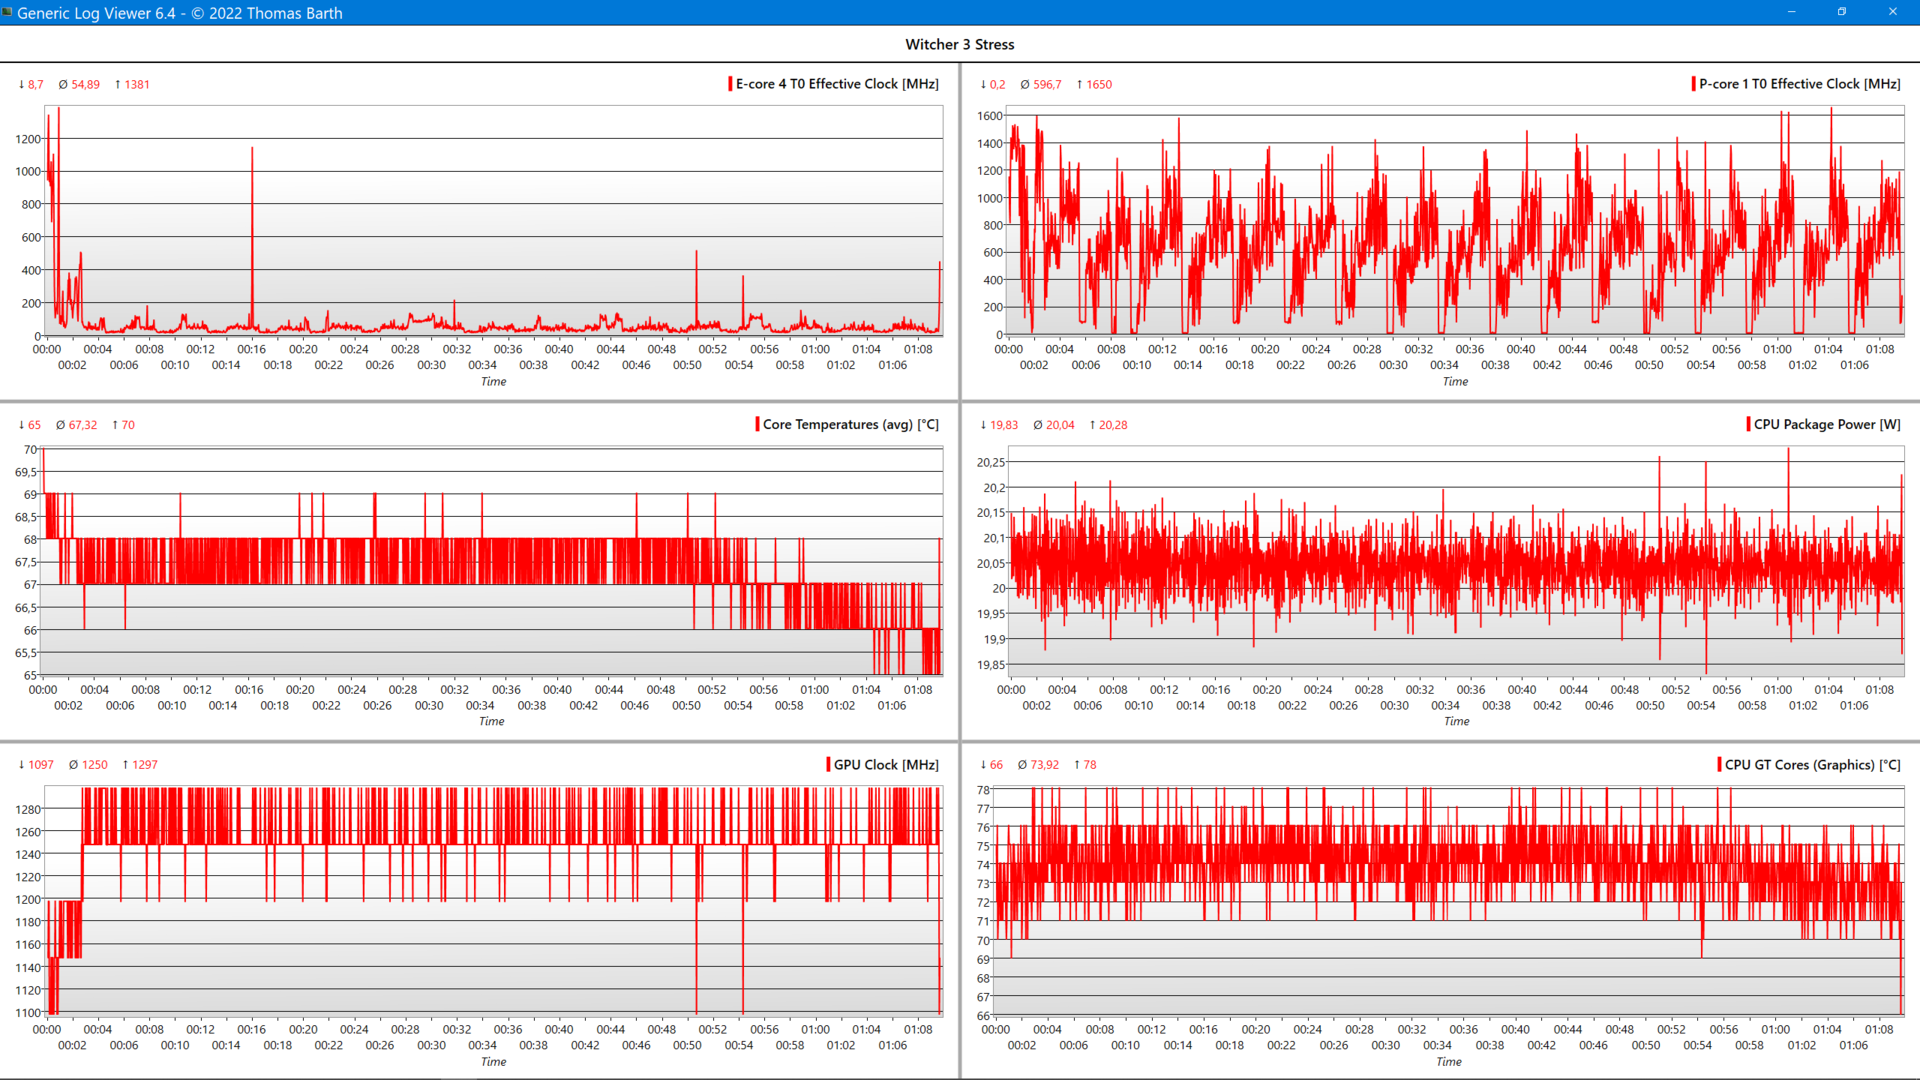
Pruebas de resistencia
Bajo carga combinada (Prime95+FurMark), los núcleos P cayeron de 2,2 a 1,4 GHz después de poco tiempo - ligeramente por debajo del reloj base de 1,7 GHz. Uno de los núcleos (P-Core 0) parece estar desactivado la mayor parte del tiempo (0 MHz). La temperatura cae de los 95 °C iniciales a unos estables 62 °C. La iGPU pasa de 1300 MHz a 480 MHz a 61 °C. Una vez más, el problema es el límite de potencia establecido de 20 vatios.
Bajo estrés puro de la CPU, los núcleos P tampoco alcanzan su reloj base, sino que lo hacen a 1,5 GHz (todos los núcleos activos). Sólo cuando la iGPU está estresada, consigue 1.118 MHz a 66 °C.
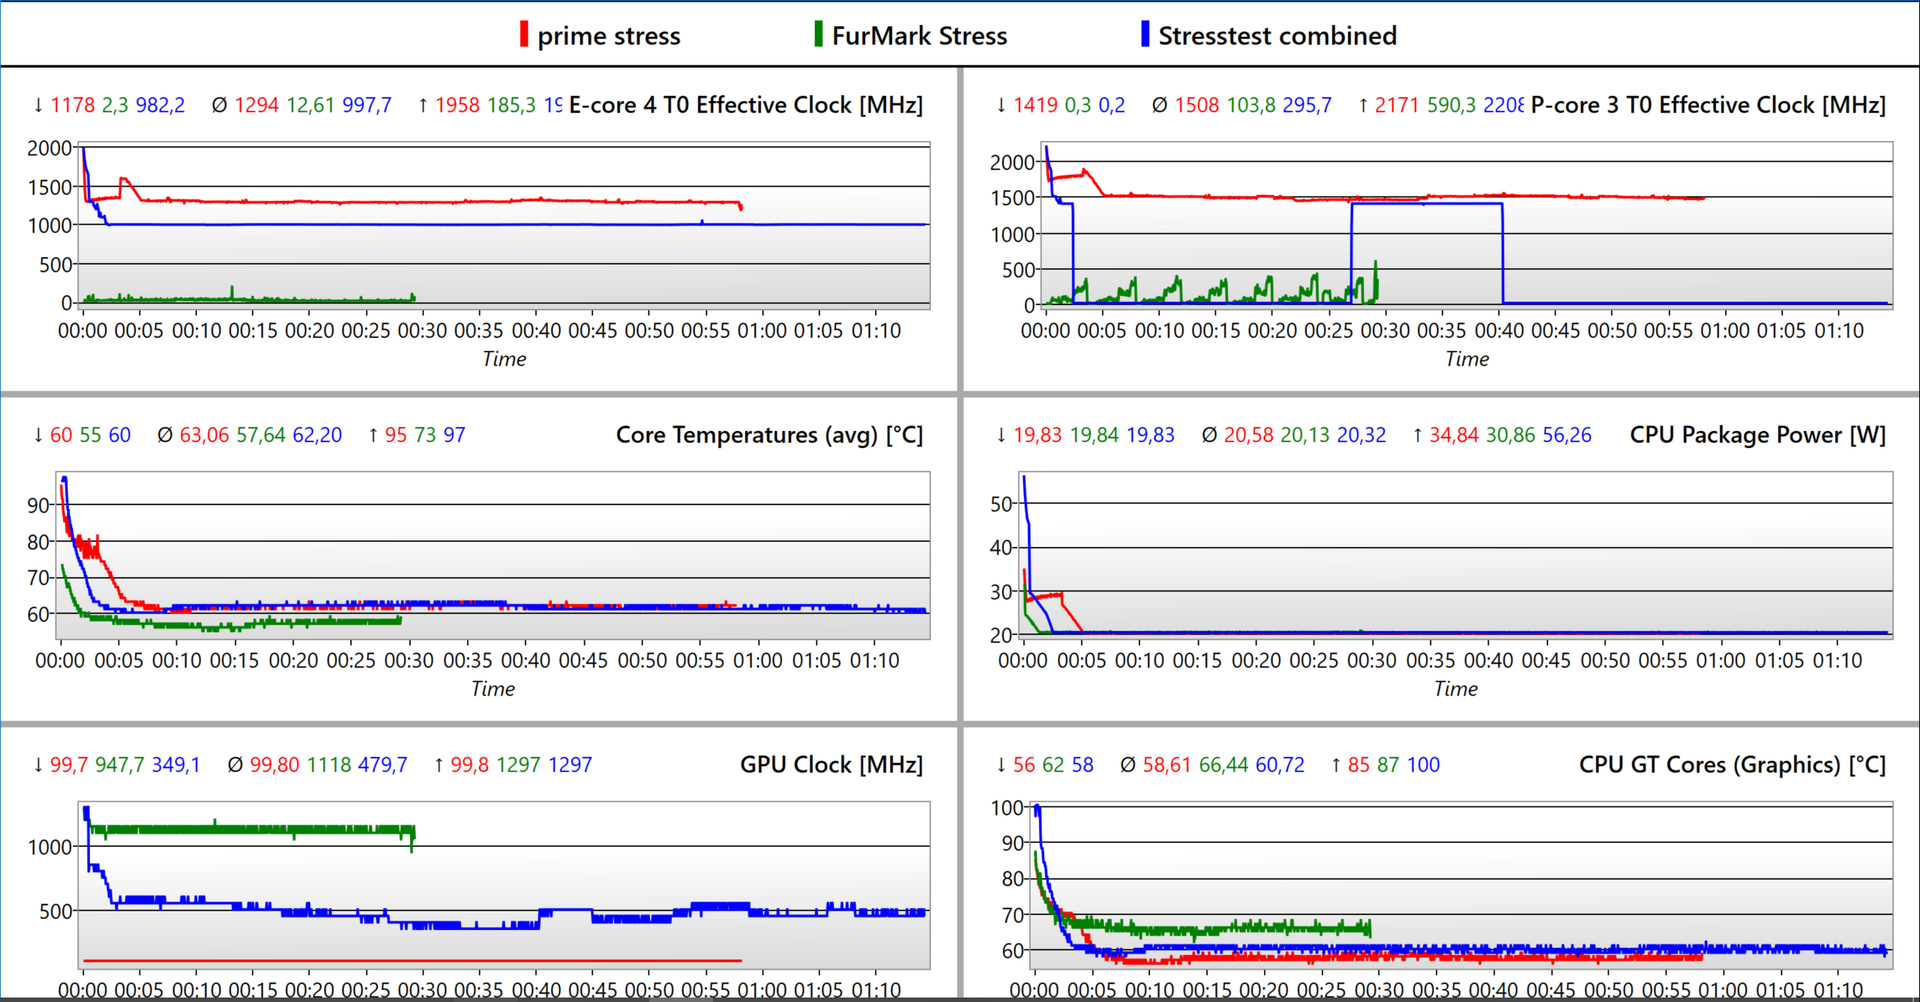
| Reloj de la CPU Núcleos P y E (GHz) | Reloj de la GPU (MHz) | Temperatura media dela CPU (°C) | Temperatura media de la GPU (°C) | |
| Sistema en reposo | - | 100 | 34 | 36 |
| Prime95+ FurMark Stress | 1,4 / 1 | 480 | 62 | 61 |
| Prime95 Stress | 1,5 / 1,3 | 100 | 63 | 58 |
| FurMark Stress | 0,1 / 0,01 | 1.120 | 58 | 66 |
| Witcher 3 Stress | 0,6 / 0,05 | 1.250 | 67 | 74 |
Altavoces
Afortunadamente, los altavoces de la serie T han mejorado. Siguen faltando graves, pero los medios y los agudos están equilibrados y se reproducen de forma lineal.
Esto es aceptable para las películas y los vídeos, pero el disfrute de la música sólo es posible con un sistema de sonido externo o con auriculares conectados mediante jack o Bluetooth. Con un máximo de 75 dB(A), puede llenar de sonido una habitación de tamaño medio.
Lenovo ThinkPad T16 G1 21BWS00200 análisis de audio
(±) | la sonoridad del altavoz es media pero buena (75.16 dB)
Graves 100 - 315 Hz
(-) | casi sin bajos - de media 20.5% inferior a la mediana
(-) | los graves no son lineales (15.5% delta a la frecuencia anterior)
Medios 400 - 2000 Hz
(+) | medios equilibrados - a sólo 2.3% de la mediana
(+) | los medios son lineales (4.1% delta a la frecuencia anterior)
Altos 2 - 16 kHz
(+) | máximos equilibrados - a sólo 3.2% de la mediana
(+) | los máximos son lineales (5.5% delta a la frecuencia anterior)
Total 100 - 16.000 Hz
(±) | la linealidad del sonido global es media (17% de diferencia con la mediana)
En comparación con la misma clase
» 24% de todos los dispositivos probados de esta clase eran mejores, 8% similares, 68% peores
» El mejor tuvo un delta de 7%, la media fue 21%, el peor fue ###max##%
En comparación con todos los dispositivos probados
» 31% de todos los dispositivos probados eran mejores, 8% similares, 61% peores
» El mejor tuvo un delta de 4%, la media fue 23%, el peor fue ###max##%
Huawei MateBook D 16 2022 análisis de audio
(±) | la sonoridad del altavoz es media pero buena (76 dB)
Graves 100 - 315 Hz
(-) | casi sin bajos - de media 17.7% inferior a la mediana
(±) | la linealidad de los graves es media (9.8% delta a frecuencia anterior)
Medios 400 - 2000 Hz
(+) | medios equilibrados - a sólo 1.9% de la mediana
(+) | los medios son lineales (5.6% delta a la frecuencia anterior)
Altos 2 - 16 kHz
(+) | máximos equilibrados - a sólo 4.4% de la mediana
(+) | los máximos son lineales (3.1% delta a la frecuencia anterior)
Total 100 - 16.000 Hz
(±) | la linealidad del sonido global es media (16.2% de diferencia con la mediana)
En comparación con la misma clase
» 41% de todos los dispositivos probados de esta clase eran mejores, 7% similares, 51% peores
» El mejor tuvo un delta de 5%, la media fue 17%, el peor fue ###max##%
En comparación con todos los dispositivos probados
» 26% de todos los dispositivos probados eran mejores, 6% similares, 68% peores
» El mejor tuvo un delta de 4%, la media fue 23%, el peor fue ###max##%
Gestión de la energía: batería de 14 horas en el ThinkPad de 16 pulgadas
Consumo de energía
Medimos un consumo de energía en reposo de ~6 vatios y un mínimo de 2,9 vatios. Nuestro campo de comparación, incluyendo los derivados de AMD, no es rival para esto. Bajo carga, medimos una media de 27.9 vatios - un valor que se debe a la CPU estrangulada. La carga combinada (CPU+iGPU) resulta en 42,6 vatios.
Los picos de potencia de hasta 90 vatios, causados por el turbo de corta duración, pueden ser absorbidos bien por el adaptador de corriente de 135 W. Además, el adaptador de corriente permite cargar rápidamente la gran batería de 86 Wh hasta el 80% en una hora. Queda la duda de si un adaptador de corriente de 100 vatios, que sería un poco más compacto y se ofrece con la versión de AMD, haría el trabajo igual de bien.
| Off / Standby | |
| Ocioso | |
| Carga |
|
Clave:
min: | |
| Lenovo ThinkPad T16 G1 21BWS00200 i5-1240P, Iris Xe G7 80EUs, Samsung PM9A1 MZVL2512HCJQ, IPS, 1920x1200, 16" | Lenovo ThinkPad T15 Gen2-20W5S00100 i7-1165G7, GeForce MX450, Samsung PM981a MZVLB1T0HBLR, IPS, 1920x1080, 15.6" | Lenovo ThinkPad X1 Extreme G4-20Y5CTO1WW (3050 Ti) i7-11800H, GeForce RTX 3050 Ti Laptop GPU, Samsung PM9A1 MZVL21T0HCLR, IPS LED, 3840x2400, 16" | HP ProBook 450 G9 6A180EA i7-1255U, Iris Xe G7 96EUs, SK Hynix HFM512GD3JX013N, , 1920x1080, 15.6" | HP ZBook Power 15 G8 313S5EA i7-11800H, T600 Laptop GPU, Samsung PM9A1 MZVL2512HCJQ, IPS LED, 1920x1080, 15.6" | Huawei MateBook D 16 2022 i7-12700H, Iris Xe G7 96EUs, Silicon Motion PCIe-8 SSD, IPS, 1920x1200, 16" | Dell Inspiron 16 Plus 7620 i7-12700H, GeForce RTX 3050 Ti Laptop GPU, Kioxia BG5 KBG50ZNS512G, IPS, 3072x1920, 16" | Lenovo ThinkPad L15 G2 AMD R5 5600U, Vega 7, SK Hynix HFS512 GDE9X081N, IPS LED, 1920x1080, 15.6" | Media de la clase Office | |
|---|---|---|---|---|---|---|---|---|---|
| Power Consumption | -44% | -210% | -8% | -55% | -70% | -151% | -14% | -27% | |
| Idle Minimum * (Watt) | 2.9 | 4.5 -55% | 10.3 -255% | 4.5 -55% | 4.17 -44% | 6.1 -110% | 6.8 -134% | 4.57 -58% | 4.3 ? -48% |
| Idle Average * (Watt) | 6 | 8.8 -47% | 22.06 -268% | 7.3 -22% | 6.32 -5% | 10.6 -77% | 9.6 -60% | 8.2 -37% | 7.35 ? -22% |
| Idle Maximum * (Watt) | 6.9 | 11.6 -68% | 23 -233% | 8.1 -17% | 7.1 -3% | 11.5 -67% | 17 -146% | 9.3 -35% | 8.6 ? -25% |
| Load Average * (Watt) | 27.3 | 60 -120% | 102.57 -276% | 32.8 -20% | 80.41 -195% | 65.5 -140% | 117.5 -330% | 31.9 -17% | 43.9 ? -61% |
| Witcher 3 ultra * (Watt) | 42.6 | 39.2 8% | 106 -149% | 32 25% | 62.3 -46% | 61.2 -44% | 113.1 -165% | 34.5 19% | |
| Load Maximum * (Watt) | 81.53 | 68.5 16% | 147.8 -81% | 47 42% | 110.18 -35% | 68.4 16% | 137.4 -69% | 47.4 42% | 64.5 ? 21% |
* ... más pequeño es mejor
Power consumption Witcher 3 / Stress test
Power consumption with an external monitor
Duración de la batería
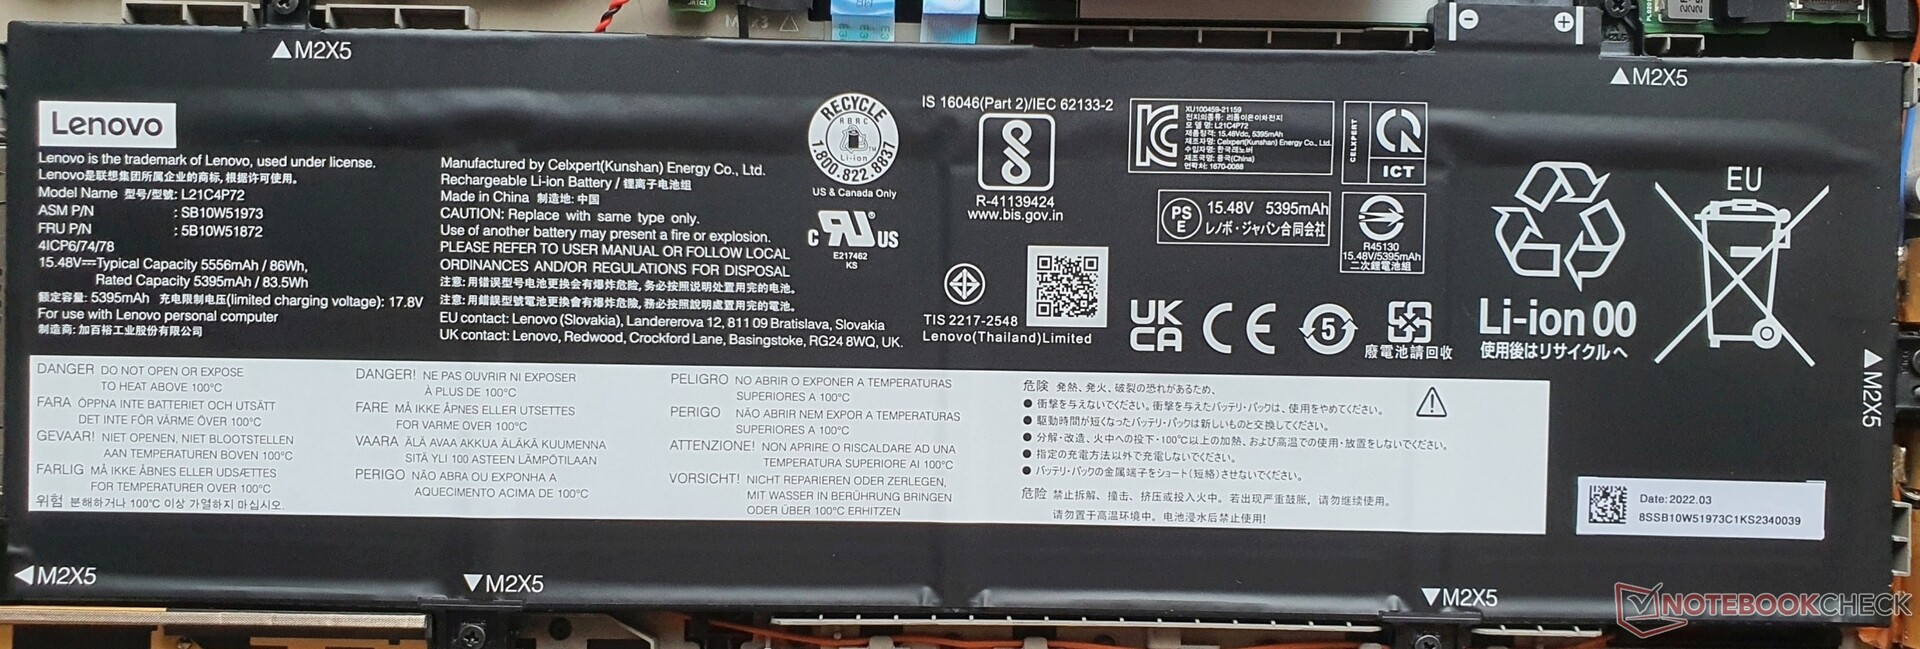
A pesar de la gran batería de 86 Wh de nuestro modelo, no esperábamos que la prueba WLAN durara más de 14 horas. Usamos un script que simula la navegación web a 150 nits fijos, usando el perfil de energía "equilibrado" en Windows. ElCore i5-1240P parece ser más económico que el Core i7-1280Pprobablemente porque este último tiene más núcleos P. La pantalla de bajo consumo con resolución FHD+ también tiene un efecto positivo, especialmente a pleno brillo de 390 nits, donde el ThinkPad logra casi 11 horas.
Una perspectiva emocionante es si una variante AMD del T16 podrá ofrecer aún más. La duración a plena carga de 3,5 horas es correspondientemente larga debido al bajo límite de potencia de 20 vatios.
| Lenovo ThinkPad T16 G1 21BWS00200 i5-1240P, Iris Xe G7 80EUs, 86 Wh | Lenovo ThinkPad T15 Gen2-20W5S00100 i7-1165G7, GeForce MX450, 57 Wh | Lenovo ThinkPad E15 G3-20YG003UGE R7 5700U, Vega 8, 57 Wh | Lenovo ThinkPad L15 G2 AMD R5 5600U, Vega 7, 45 Wh | HP ProBook 450 G9 6A180EA i7-1255U, Iris Xe G7 96EUs, 51 Wh | HP ZBook Power 15 G8 313S5EA i7-11800H, T600 Laptop GPU, 83 Wh | Dell Inspiron 16 Plus 7620 i7-12700H, GeForce RTX 3050 Ti Laptop GPU, 86 Wh | Huawei MateBook D 16 2022 i7-12700H, Iris Xe G7 96EUs, 60 Wh | Asus Vivobook Pro 16X-M7600QE R9 5900HX, GeForce RTX 3050 Ti Laptop GPU, 96 Wh | |
|---|---|---|---|---|---|---|---|---|---|
| Duración de Batería | -44% | -29% | -45% | -17% | -19% | -49% | -50% | -45% | |
| H.264 (h) | 10.4 | 10.1 -3% | |||||||
| WiFi v1.3 (h) | 14.1 | 7.9 -44% | 10 -29% | 7.8 -45% | 10.1 -28% | 12.3 -13% | 9.6 -32% | 7.1 -50% | 11.3 -20% |
| Load (h) | 3.5 | 3.3 -6% | 2.1 -40% | 1.2 -66% | 1.1 -69% | ||||
| Witcher 3 ultra (h) | 2.7 |
Pro
Contra
Veredicto - ThinkPad T16: pantalla potente, larga duración, rendimiento ralentizado

El ThinkPad T16 G1 Intel ofrece mucho: una pantalla brillante de 16 pulgadas y 16:10 de bajo consumo, una batería de muy larga duración, diversos equipos y un funcionamiento casi silencioso. Además, un diseño robusto de gama alta
Un rediseño acertado en general, a pesar del menor recorrido de las teclas y la ausencia de la opción 4K. La limitación del PL1 de 20 vatios es un poco molesta, lo que limita innecesariamente el por lo demás buen rendimiento
Lenovo ofrece un sólido portátil business con una duración de batería muy larga, una brillante pantalla 16:10 de bajo consumo y bajas emisiones en el ThinkPad T16 G1. Sin embargo, la ralentización de la CPU puede resultar problemática fuera de las tareas de oficina.
Para los usuarios de empresa que busquen un dispositivo compacto con mucho espacio en la pantalla y una larga duración de la batería, el T16 parece no tener rival por su buen teclado, sus características y su comportamiento silencioso. El análisis del EliteBook 865 G9 de HP, que se publicará próximamente, es por tanto una perspectiva emocionante. También será emocionante la comparación con la variante AMD del T16, que tiene el potencial de ofrecer más rendimiento con emisiones aún más bajas y tiempos de ejecución aún más altos, pero esto queda por ver en un futuro análisis
Los que también necesiten una GPU para estaciones de trabajo deberían mirar el ZBook Power 15. Los que no necesiten lo mejor de lo mejor encontrarán una mejor relación precio-rendimiento en el ThinkPad E15 AMDque es más del doble de barato
Precio y disponibilidad
El portátil Lenovo ThinkPad T16 G1 Intel parece estar ampliamente disponible como portátil de libre configuración a través de la web oficial de Lenovo. Por ejemplo, encontramos el portátil en los Estados Unidos (a partir de 1.099,50 dólares), el Reino Unido (1.169,99 libras), India (₹97.185), Francia (1.427,25€), Singapur (SG$1.494,58) y Australia (AU$2.229,00). Esta lista no es exhaustiva.
Los precios son a fecha de 23.09.22 y están sujetos a cambios
Lenovo ThinkPad T16 G1 21BWS00200
- 09/21/2022 v7 (old)
Marvin Gollor
Price comparison

