Breve análisis del portátil Samsung Notebook 9 NP900X3N (i5-7200U, FHD)

| SD Card Reader | |
| average JPG Copy Test (av. of 3 runs) | |
| Dell XPS 13 9360 FHD i5 | |
| Samsung Notebook 9 NP900X5N-X01US | |
| Samsung Notebook 9 NP900X3N-K01US | |
| maximum AS SSD Seq Read Test (1GB) | |
| Dell XPS 13 9360 FHD i5 | |
| Samsung Notebook 9 NP900X3N-K01US | |
| Samsung Notebook 9 NP900X5N-X01US | |
| Networking | |
| iperf3 transmit AX12 | |
| HP Spectre 13-v131ng | |
| Dell XPS 13 9360 FHD i5 | |
| Samsung Notebook 9 NP900X3N-K01US | |
| iperf3 receive AX12 | |
| Samsung Notebook 9 NP900X3N-K01US | |
| Dell XPS 13 9360 FHD i5 | |
| HP Spectre 13-v131ng | |
| |||||||||||||||||||||||||
iluminación: 90 %
Brillo con batería: 510.7 cd/m²
Contraste: 774:1 (Negro: 0.66 cd/m²)
ΔE ColorChecker Calman: 2.4 | ∀{0.5-29.43 Ø4.73}
ΔE Greyscale Calman: 2.4 | ∀{0.09-98 Ø4.97}
88.1% sRGB (Argyll 1.6.3 3D)
57% AdobeRGB 1998 (Argyll 1.6.3 3D)
64% AdobeRGB 1998 (Argyll 3D)
88.6% sRGB (Argyll 3D)
63.4% Display P3 (Argyll 3D)
Gamma: 2.23
CCT: 6747 K
| Samsung Notebook 9 NP900X3N-K01US ID: BOE06E1, Name: NV133FHB-N31, IPS, 13.3", 1920x1080 | HP Spectre 13-v131ng CMN1374, IPS UWVA, 13.3", 1920x1080 | Dell XPS 13 9360 FHD i5 Sharp SHP1449 LQ133M1, IPS, 13.3", 1920x1080 | Apple MacBook Pro 13 2017 APPA033, IPS, 13.3", 2560x1600 | Lenovo Yoga 910-13IKB-80VF004CGE AU Optronics AUO323D / B139HAN03.2, IPS, 13.9", 3840x2160 | |
|---|---|---|---|---|---|
| Display | 1% | -20% | 35% | -0% | |
| Display P3 Coverage (%) | 63.4 | 64.6 2% | 48.94 -23% | 99.2 56% | 62.2 -2% |
| sRGB Coverage (%) | 88.6 | 88.8 0% | 73.3 -17% | 99.9 13% | 90.1 2% |
| AdobeRGB 1998 Coverage (%) | 64 | 64.8 1% | 50.5 -21% | 87.1 36% | 63.5 -1% |
| Response Times | -4% | 12% | 6% | 9% | |
| Response Time Grey 50% / Grey 80% * (ms) | 41.6 ? | 46 ? -11% | 32.8 ? 21% | 42.8 ? -3% | 46 ? -11% |
| Response Time Black / White * (ms) | 34 ? | 33 ? 3% | 33.2 ? 2% | 28.8 ? 15% | 24 ? 29% |
| PWM Frequency (Hz) | 210.1 ? | ||||
| Screen | -26% | -30% | 29% | -49% | |
| Brightness middle (cd/m²) | 510.7 | 404 -21% | 351.2 -31% | 588 15% | 348 -32% |
| Brightness (cd/m²) | 481 | 382 -21% | 325 -32% | 561 17% | 310 -36% |
| Brightness Distribution (%) | 90 | 91 1% | 89 -1% | 92 2% | 80 -11% |
| Black Level * (cd/m²) | 0.66 | 0.35 47% | 0.195 70% | 0.45 32% | 0.25 62% |
| Contrast (:1) | 774 | 1154 49% | 1801 133% | 1307 69% | 1392 80% |
| Colorchecker dE 2000 * | 2.4 | 5.37 -124% | 7.4 -208% | 1.7 29% | 7.86 -228% |
| Colorchecker dE 2000 max. * | 7.3 | 9.46 -30% | 9.08 -24% | 3.5 52% | 13.43 -84% |
| Greyscale dE 2000 * | 2.4 | 6.44 -168% | 6.71 -180% | 1.9 21% | 8.25 -244% |
| Gamma | 2.23 99% | 2.52 87% | 2.74 80% | 2.33 94% | 2.05 107% |
| CCT | 6747 96% | 6738 96% | 7222 90% | 6738 96% | 6834 95% |
| Color Space (Percent of AdobeRGB 1998) (%) | 57 | 58 2% | 50.48 -11% | 77.92 37% | 58 2% |
| Color Space (Percent of sRGB) (%) | 88.1 | 89 1% | 73.31 -17% | 99.94 13% | 90 2% |
| Media total (Programa/Opciones) | -10% /
-18% | -13% /
-23% | 23% /
27% | -13% /
-31% |
* ... más pequeño es mejor
Tiempos de respuesta del display
| ↔ Tiempo de respuesta de Negro a Blanco | ||
|---|---|---|
| 34 ms ... subida ↗ y bajada ↘ combinada | ↗ 20 ms subida | 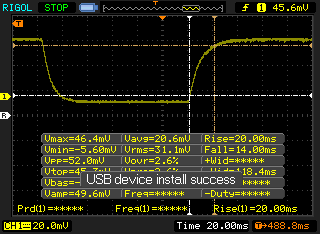 |
| ↘ 14 ms bajada | ||
| La pantalla mostró tiempos de respuesta lentos en nuestros tests y podría ser demasiado lenta para los jugones. En comparación, todos los dispositivos de prueba van de ##min### (mínimo) a 240 (máximo) ms. » 91 % de todos los dispositivos son mejores. Eso quiere decir que el tiempo de respuesta es peor que la media (19.9 ms) de todos los dispositivos testados. | ||
| ↔ Tiempo de respuesta 50% Gris a 80% Gris | ||
| 41.6 ms ... subida ↗ y bajada ↘ combinada | ↗ 22.8 ms subida | 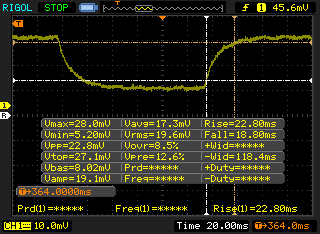 |
| ↘ 18.8 ms bajada | ||
| La pantalla mostró tiempos de respuesta lentos en nuestros tests y podría ser demasiado lenta para los jugones. En comparación, todos los dispositivos de prueba van de ##min### (mínimo) a 636 (máximo) ms. » 67 % de todos los dispositivos son mejores. Eso quiere decir que el tiempo de respuesta es peor que la media (31.1 ms) de todos los dispositivos testados. | ||
Parpadeo de Pantalla / PWM (Pulse-Width Modulation)
| Parpadeo de Pantalla / PWM detectado | 210.1 Hz | ≤ 99 % de brillo | 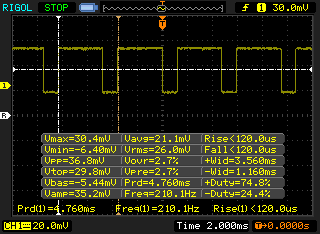 |
La retroiluminación del display parpadea a 210.1 Hz (seguramente usa PWM - Pulse-Width Modulation) a un brillo del 99 % e inferior. Sobre este nivel de brillo no debería darse parpadeo / PWM. La frecuencia de 210.1 Hz es relativamente baja, por lo que la gente sensible debería ver parpadeos y padecer fatiga visual por la pantalla (usado al brillo indicado a continuación). Comparación: 52 % de todos los dispositivos testados no usaron PWM para atenuar el display. Si se usó, medimos una media de 7801 (mínimo: 5 - máxmo: 343500) Hz. | |||
| wPrime 2.10 - 1024m | |
| Toshiba Tecra A50-C1510W10 | |
| Apple MacBook Pro 13 2017 Touchbar i5 | |
| Samsung Notebook 9 NP900X3N-K01US | |
| HP Envy 13-ad065nr | |
| Samsung Notebook 9 NP900X5N-X01US | |
* ... más pequeño es mejor
| PCMark 8 | |
| Home Score Accelerated v2 | |
| Samsung Notebook 9 NP900X5N-X01US | |
| HP Spectre 13-v131ng | |
| Samsung Notebook 9 NP900X3N-K01US | |
| Dell XPS 13 9360 FHD i5 | |
| Work Score Accelerated v2 | |
| HP Spectre 13-v131ng | |
| Samsung Notebook 9 NP900X5N-X01US | |
| Samsung Notebook 9 NP900X3N-K01US | |
| Dell XPS 13 9360 FHD i5 | |
| Creative Score Accelerated v2 | |
| Samsung Notebook 9 NP900X5N-X01US | |
| HP Spectre 13-v131ng | |
| Samsung Notebook 9 NP900X3N-K01US | |
| Dell XPS 13 9360 FHD i5 | |
| PCMark 8 Home Score Accelerated v2 | 3728 puntos | |
| PCMark 8 Creative Score Accelerated v2 | 4577 puntos | |
| PCMark 8 Work Score Accelerated v2 | 4786 puntos | |
| PCMark 10 Score | 3449 puntos | |
ayuda | ||
| Samsung Notebook 9 NP900X3N-K01US Samsung CM871a MZNTY256HDHP | HP Spectre 13-v131ng Samsung PM961 NVMe MZVLW512HMJP | Dell XPS 13 9360 FHD i5 Toshiba NVMe THNSN5256GPUK | Lenovo Yoga 910-13IKB-80VF004CGE Samsung PM951 NVMe MZVLV512 | Asus Zenbook 3 UX390UA-GS041T SK Hynix Canvas SC300 512GB M.2 (HFS512G39MND) | |
|---|---|---|---|---|---|
| AS SSD | 155% | 33% | 71% | -12% | |
| Copy Game MB/s (MB/s) | 186.8 | 397.9 113% | 390 109% | 189.4 1% | |
| Copy Program MB/s (MB/s) | 213 | 426 100% | 188 -12% | 204.3 -4% | |
| Copy ISO MB/s (MB/s) | 335.9 | 720 114% | 283.3 -16% | 293.5 -13% | |
| Score Total (Points) | 1057 | 3617 242% | 1607 52% | 1865 76% | 1056 0% |
| Score Write (Points) | 350 | 1115 219% | 327 -7% | 611 75% | 374 7% |
| Score Read (Points) | 463 | 1654 257% | 870 88% | 850 84% | 448 -3% |
| Access Time Write * (ms) | 0.053 | 0.026 51% | 0.035 34% | 0.028 47% | 0.11 -108% |
| Access Time Read * (ms) | 0.066 | 0.042 36% | 0.055 17% | 0.034 48% | 0.076 -15% |
| 4K-64 Write (MB/s) | 223.8 | 862 285% | 197.7 -12% | 422.2 89% | 271.4 21% |
| 4K-64 Read (MB/s) | 379.4 | 1465 286% | 723 91% | 671 77% | 370.3 -2% |
| 4K Write (MB/s) | 79.2 | 134.4 70% | 92 16% | 132.9 68% | 56.8 -28% |
| 4K Read (MB/s) | 31.24 | 56.4 81% | 29.52 -6% | 39.92 28% | 25.89 -17% |
| Seq Write (MB/s) | 466 | 1190 155% | 372.8 -20% | 560 20% | 463.4 -1% |
| Seq Read (MB/s) | 520 | 1325 155% | 1179 127% | 1389 167% | 514 -1% |
* ... más pequeño es mejor

| 3DMark 11 Performance | 1695 puntos | |
| 3DMark Ice Storm Standard Score | 64405 puntos | |
| 3DMark Cloud Gate Standard Score | 6418 puntos | |
| 3DMark Fire Strike Score | 892 puntos | |
| 3DMark Fire Strike Extreme Score | 411 puntos | |
ayuda | ||
| bajo | medio | alto | ultra | |
|---|---|---|---|---|
| BioShock Infinite (2013) | 42.6 | 26 | 24.7 | 7.6 |
| Rise of the Tomb Raider (2016) | 20 |
Ruido
| Ocioso |
| 28.4 / 28.4 / 28.4 dB(A) |
| Carga |
| 33.2 / 35.2 dB(A) |
 | ||
30 dB silencioso 40 dB(A) audible 50 dB(A) ruidosamente alto |
||
min: | ||
| Samsung Notebook 9 NP900X3N-K01US HD Graphics 620, i5-7200U, Samsung CM871a MZNTY256HDHP | HP Spectre 13-v131ng HD Graphics 620, i7-7500U, Samsung PM961 NVMe MZVLW512HMJP | Dell XPS 13 9360 FHD i5 HD Graphics 620, i5-7200U, Toshiba NVMe THNSN5256GPUK | Lenovo Yoga 910-13IKB-80VF004CGE HD Graphics 620, i7-7500U, Samsung PM951 NVMe MZVLV512 | Apple MacBook Pro 13 2017 Iris Plus Graphics 640, i5-7360U, Apple SSD AP0128 | Asus Zenbook 3 UX390UA-GS041T HD Graphics 620, i5-7200U, SK Hynix Canvas SC300 512GB M.2 (HFS512G39MND) | |
|---|---|---|---|---|---|---|
| Noise | -10% | 1% | -11% | -6% | -10% | |
| apagado / medio ambiente * (dB) | 28.4 | 30.4 -7% | 31.7 -12% | 30.2 -6% | 30.7 -8% | |
| Idle Minimum * (dB) | 28.4 | 30.4 -7% | 28.9 -2% | 31.7 -12% | 30.2 -6% | 30.7 -8% |
| Idle Average * (dB) | 28.4 | 30.4 -7% | 28.9 -2% | 31.7 -12% | 30.2 -6% | 30.7 -8% |
| Idle Maximum * (dB) | 28.4 | 30.4 -7% | 28.9 -2% | 31.7 -12% | 30.2 -6% | 30.9 -9% |
| Load Average * (dB) | 33.2 | 40 -20% | 30.9 7% | 38.4 -16% | 32.9 1% | 38.7 -17% |
| Load Maximum * (dB) | 35.2 | 40 -14% | 33.5 5% | 34.7 1% | 39.3 -12% | 38.9 -11% |
* ... más pequeño es mejor
(+) La temperatura máxima en la parte superior es de 39.8 °C / 104 F, frente a la media de 35.9 °C / 97 F, que oscila entre 21.4 y 59 °C para la clase Subnotebook.
(+) El fondo se calienta hasta un máximo de 38.8 °C / 102 F, frente a la media de 39.2 °C / 103 F
(+) En reposo, la temperatura media de la parte superior es de 24.2 °C / 76# F, frente a la media del dispositivo de 30.8 °C / 87 F.
(+) El reposamanos y el panel táctil están a una temperatura inferior a la de la piel, con un máximo de 25.2 °C / 77.4 F y, por tanto, son fríos al tacto.
(+) La temperatura media de la zona del reposamanos de dispositivos similares fue de 28.2 °C / 82.8 F (+3 °C / 5.4 F).
Samsung Notebook 9 NP900X3N-K01US análisis de audio
(-) | altavoces no muy altos (#61.9 dB)
Graves 100 - 315 Hz
(-) | casi sin bajos - de media 19.4% inferior a la mediana
(±) | la linealidad de los graves es media (12.6% delta a frecuencia anterior)
Medios 400 - 2000 Hz
(+) | medios equilibrados - a sólo 3.5% de la mediana
(±) | la linealidad de los medios es media (11.7% delta respecto a la frecuencia anterior)
Altos 2 - 16 kHz
(+) | máximos equilibrados - a sólo 2.7% de la mediana
(±) | la linealidad de los máximos es media (9% delta a frecuencia anterior)
Total 100 - 16.000 Hz
(±) | la linealidad del sonido global es media (27.4% de diferencia con la mediana)
En comparación con la misma clase
» 89% de todos los dispositivos probados de esta clase eran mejores, 3% similares, 8% peores
» El mejor tuvo un delta de 5%, la media fue 18%, el peor fue ###max##%
En comparación con todos los dispositivos probados
» 83% de todos los dispositivos probados eran mejores, 4% similares, 13% peores
» El mejor tuvo un delta de 4%, la media fue 24%, el peor fue ###max##%
Apple MacBook 12 (Early 2016) 1.1 GHz análisis de audio
(+) | los altavoces pueden reproducir a un volumen relativamente alto (#83.6 dB)
Graves 100 - 315 Hz
(±) | lubina reducida - en promedio 11.3% inferior a la mediana
(±) | la linealidad de los graves es media (14.2% delta a frecuencia anterior)
Medios 400 - 2000 Hz
(+) | medios equilibrados - a sólo 2.4% de la mediana
(+) | los medios son lineales (5.5% delta a la frecuencia anterior)
Altos 2 - 16 kHz
(+) | máximos equilibrados - a sólo 2% de la mediana
(+) | los máximos son lineales (4.5% delta a la frecuencia anterior)
Total 100 - 16.000 Hz
(+) | el sonido global es lineal (10.2% de diferencia con la mediana)
En comparación con la misma clase
» 7% de todos los dispositivos probados de esta clase eran mejores, 2% similares, 91% peores
» El mejor tuvo un delta de 5%, la media fue 18%, el peor fue ###max##%
En comparación con todos los dispositivos probados
» 5% de todos los dispositivos probados eran mejores, 1% similares, 94% peores
» El mejor tuvo un delta de 4%, la media fue 24%, el peor fue ###max##%
| Off / Standby | |
| Ocioso | |
| Carga |
|
Clave:
min: | |
| Samsung Notebook 9 NP900X3N-K01US i5-7200U, HD Graphics 620, Samsung CM871a MZNTY256HDHP, IPS, 1920x1080, 13.3" | HP Spectre 13-v131ng i7-7500U, HD Graphics 620, Samsung PM961 NVMe MZVLW512HMJP, IPS UWVA, 1920x1080, 13.3" | Dell XPS 13 9360 FHD i5 i5-7200U, HD Graphics 620, Toshiba NVMe THNSN5256GPUK, IPS, 1920x1080, 13.3" | Lenovo Yoga 910-13IKB-80VF004CGE i7-7500U, HD Graphics 620, Samsung PM951 NVMe MZVLV512, IPS, 3840x2160, 13.9" | Apple MacBook Pro 13 2017 i5-7360U, Iris Plus Graphics 640, Apple SSD AP0128, IPS, 2560x1600, 13.3" | Asus Zenbook 3 UX390UA-GS041T i5-7200U, HD Graphics 620, SK Hynix Canvas SC300 512GB M.2 (HFS512G39MND), IPS, 1920x1080, 12.5" | |
|---|---|---|---|---|---|---|
| Power Consumption | 16% | 34% | 16% | 7% | 23% | |
| Idle Minimum * (Watt) | 3.8 | 3.6 5% | 4.1 -8% | 4.3 -13% | 3.7 3% | 3.3 13% |
| Idle Average * (Watt) | 11 | 6.4 42% | 4.2 62% | 6.3 43% | 5.2 53% | 6.2 44% |
| Idle Maximum * (Watt) | 11.3 | 9.2 19% | 5.1 55% | 9 20% | 7.6 33% | 10.4 8% |
| Load Average * (Watt) | 35.6 | 34 4% | 22.1 38% | 32.7 8% | 41.6 -17% | 28 21% |
| Load Maximum * (Watt) | 37.2 | 34.4 8% | 29.4 21% | 28.8 23% | 50.5 -36% | 25.7 31% |
* ... más pequeño es mejor
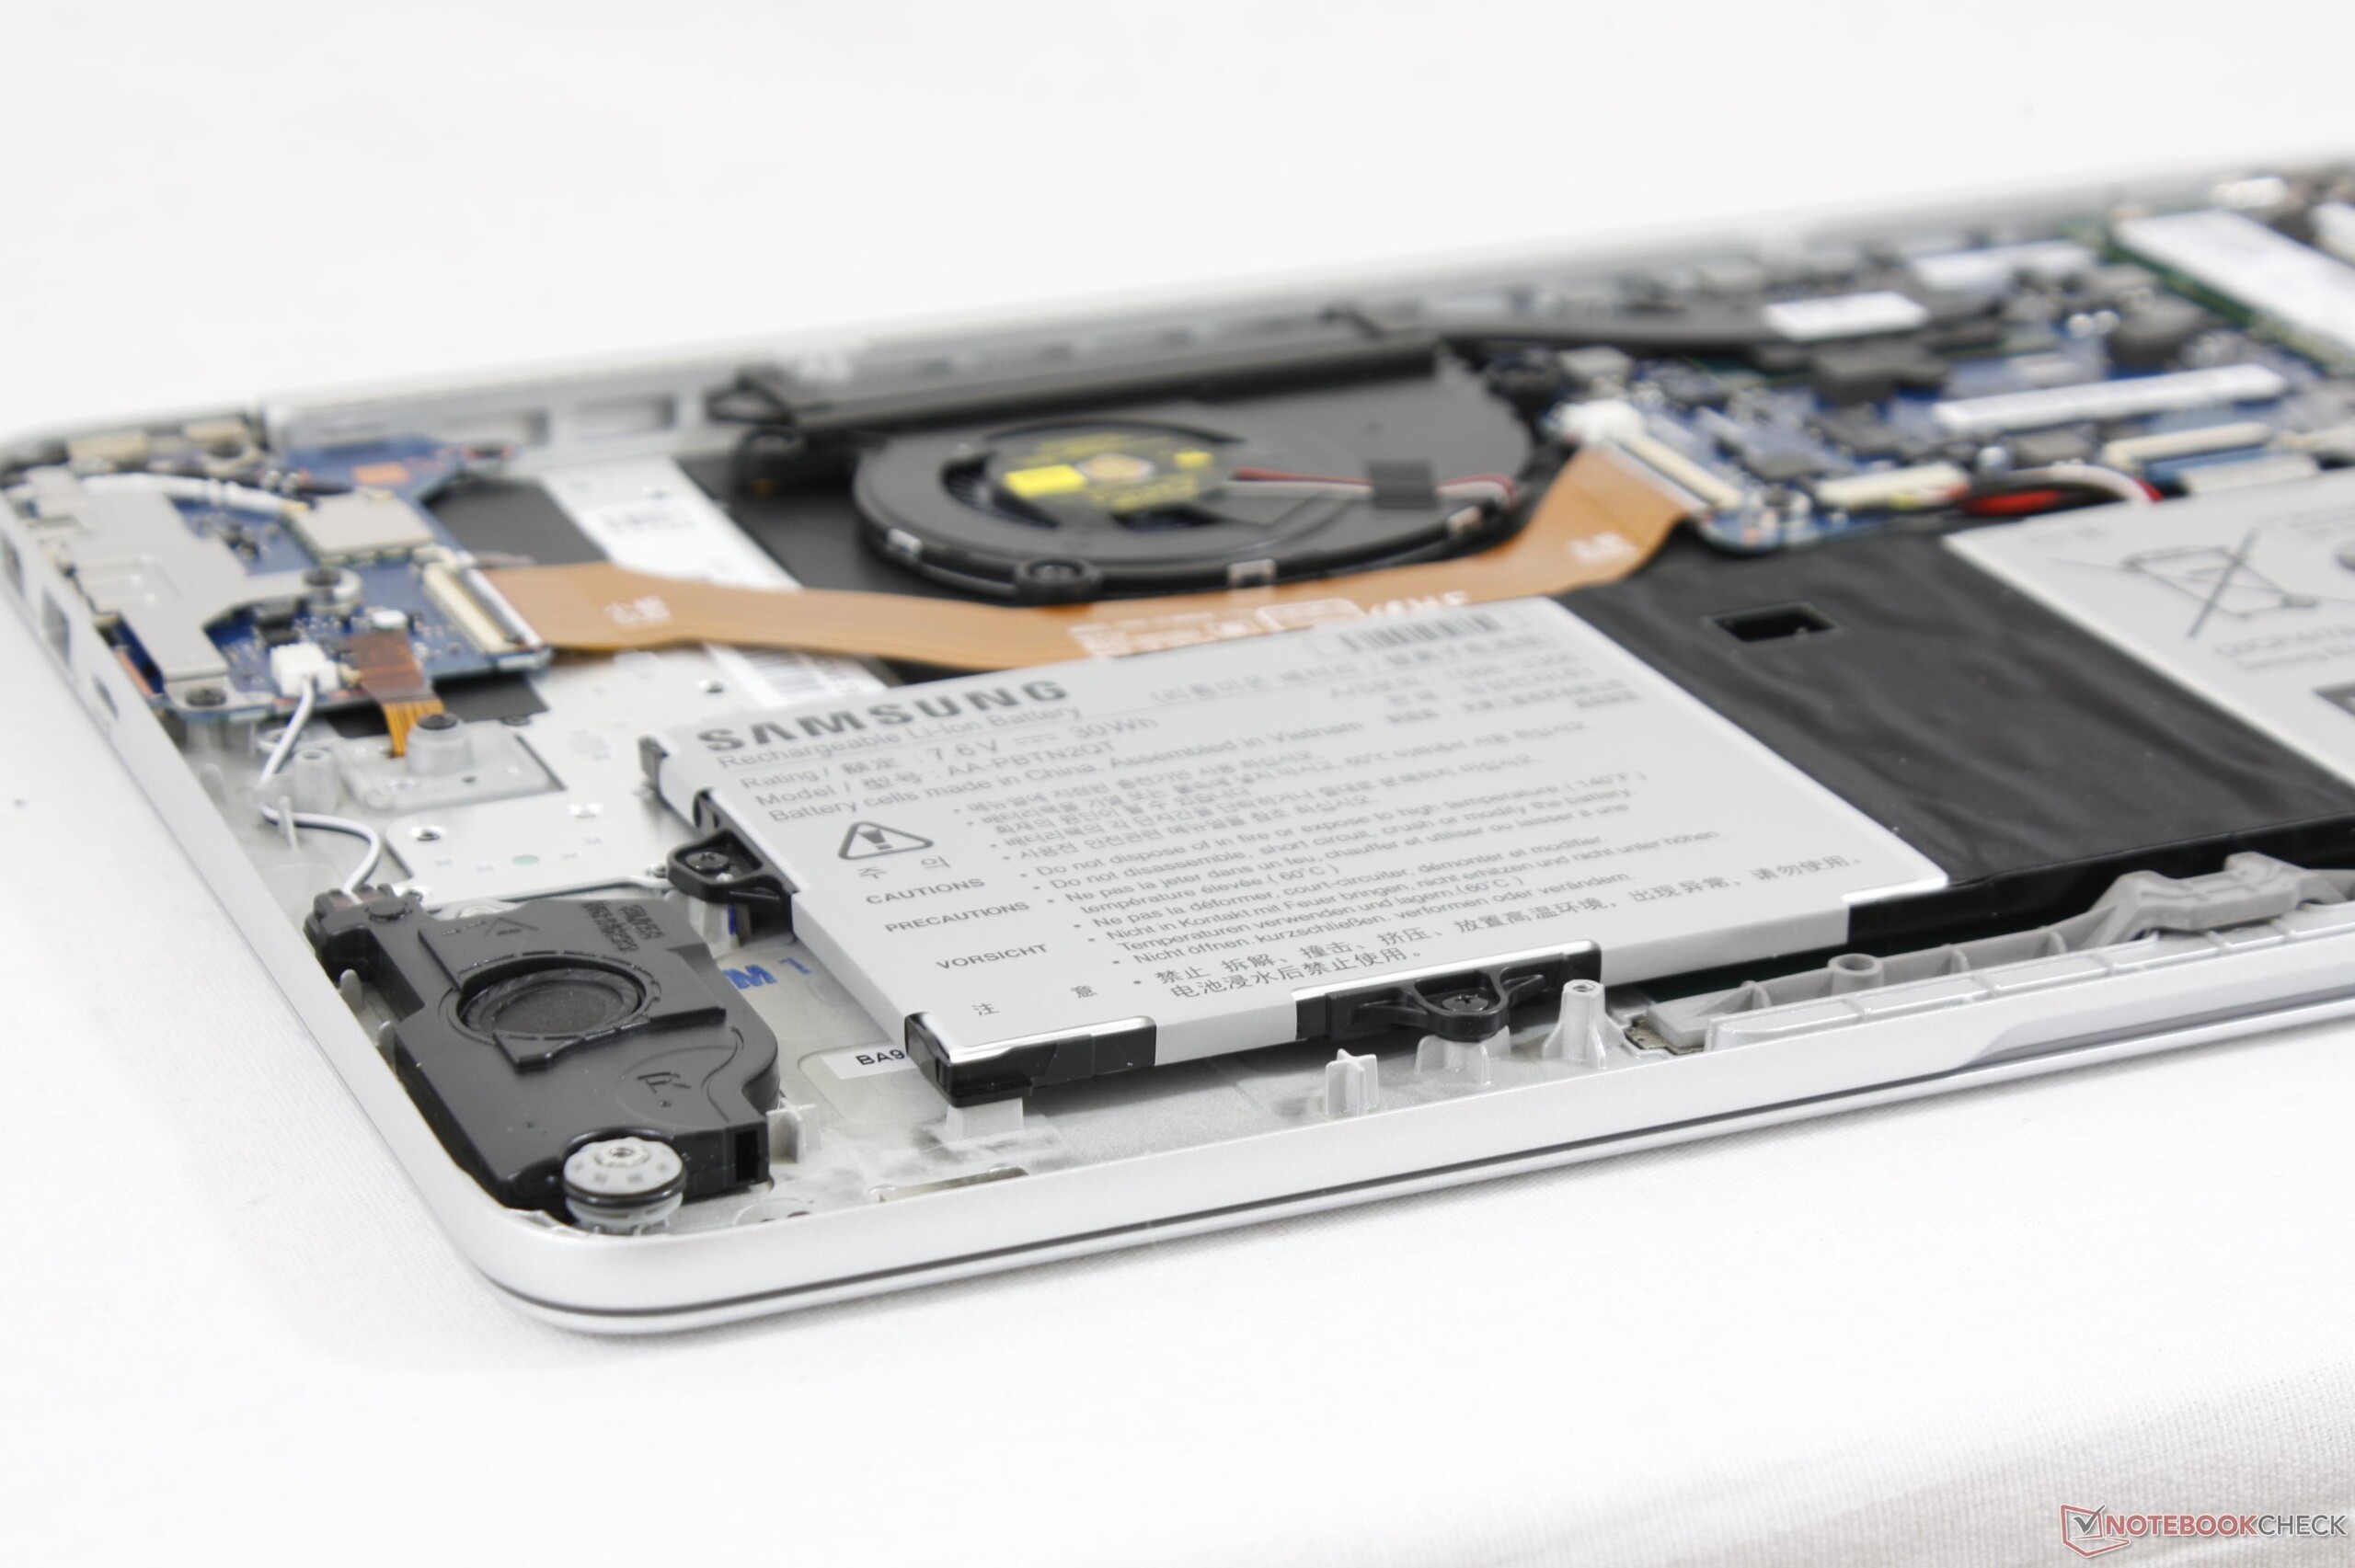
| Samsung Notebook 9 NP900X3N-K01US i5-7200U, HD Graphics 620, 30 Wh | HP Spectre 13-v131ng i7-7500U, HD Graphics 620, 38 Wh | Dell XPS 13 9360 FHD i5 i5-7200U, HD Graphics 620, 60 Wh | Lenovo Yoga 910-13IKB-80VF004CGE i7-7500U, HD Graphics 620, 78 Wh | Apple MacBook Pro 13 2017 i5-7360U, Iris Plus Graphics 640, 54.5 Wh | Asus Zenbook 3 UX390UA-GS041T i5-7200U, HD Graphics 620, 40 Wh | |
|---|---|---|---|---|---|---|
| Duración de Batería | 24% | 129% | 124% | 87% | 47% | |
| Reader / Idle (h) | 11.6 | 12 3% | 21.6 86% | 17.8 53% | 14.1 22% | |
| WiFi v1.3 (h) | 4.7 | 6.6 40% | 11.3 140% | 10.7 128% | 11.4 143% | 6.6 40% |
| Load (h) | 1 | 1.3 30% | 2.6 160% | 2.9 190% | 1.3 30% | 1.8 80% |
Pro
Contra
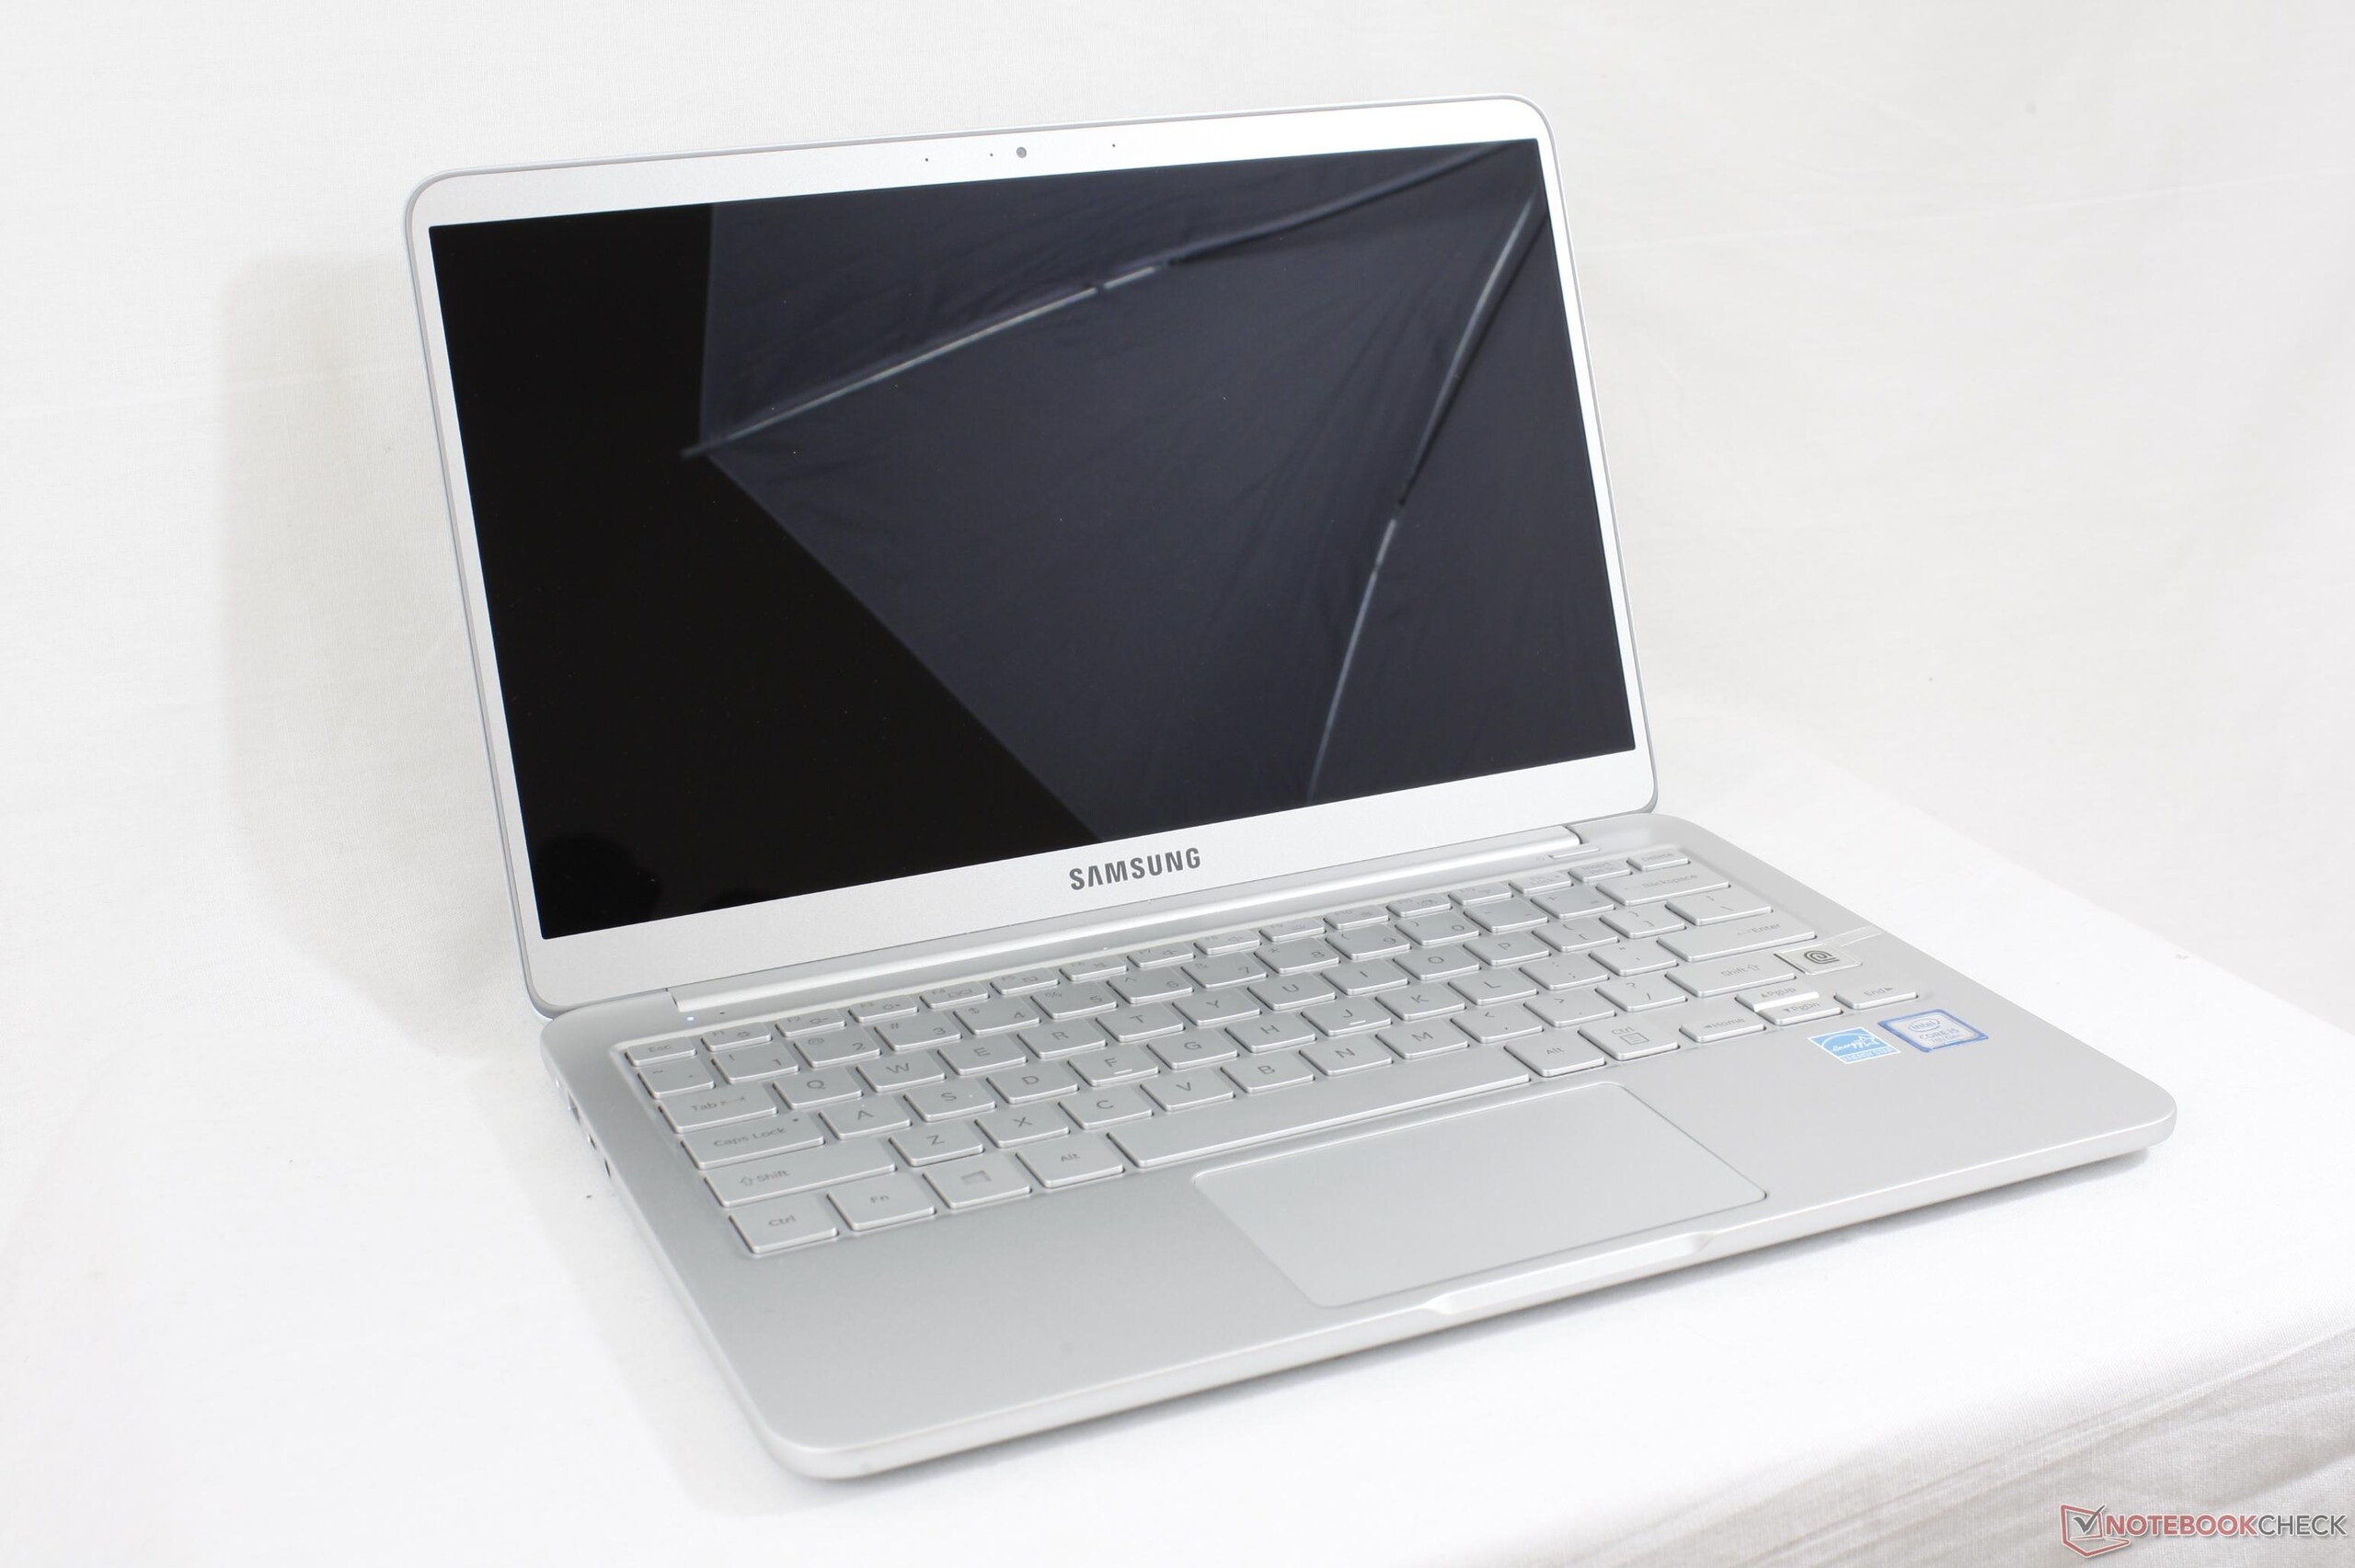
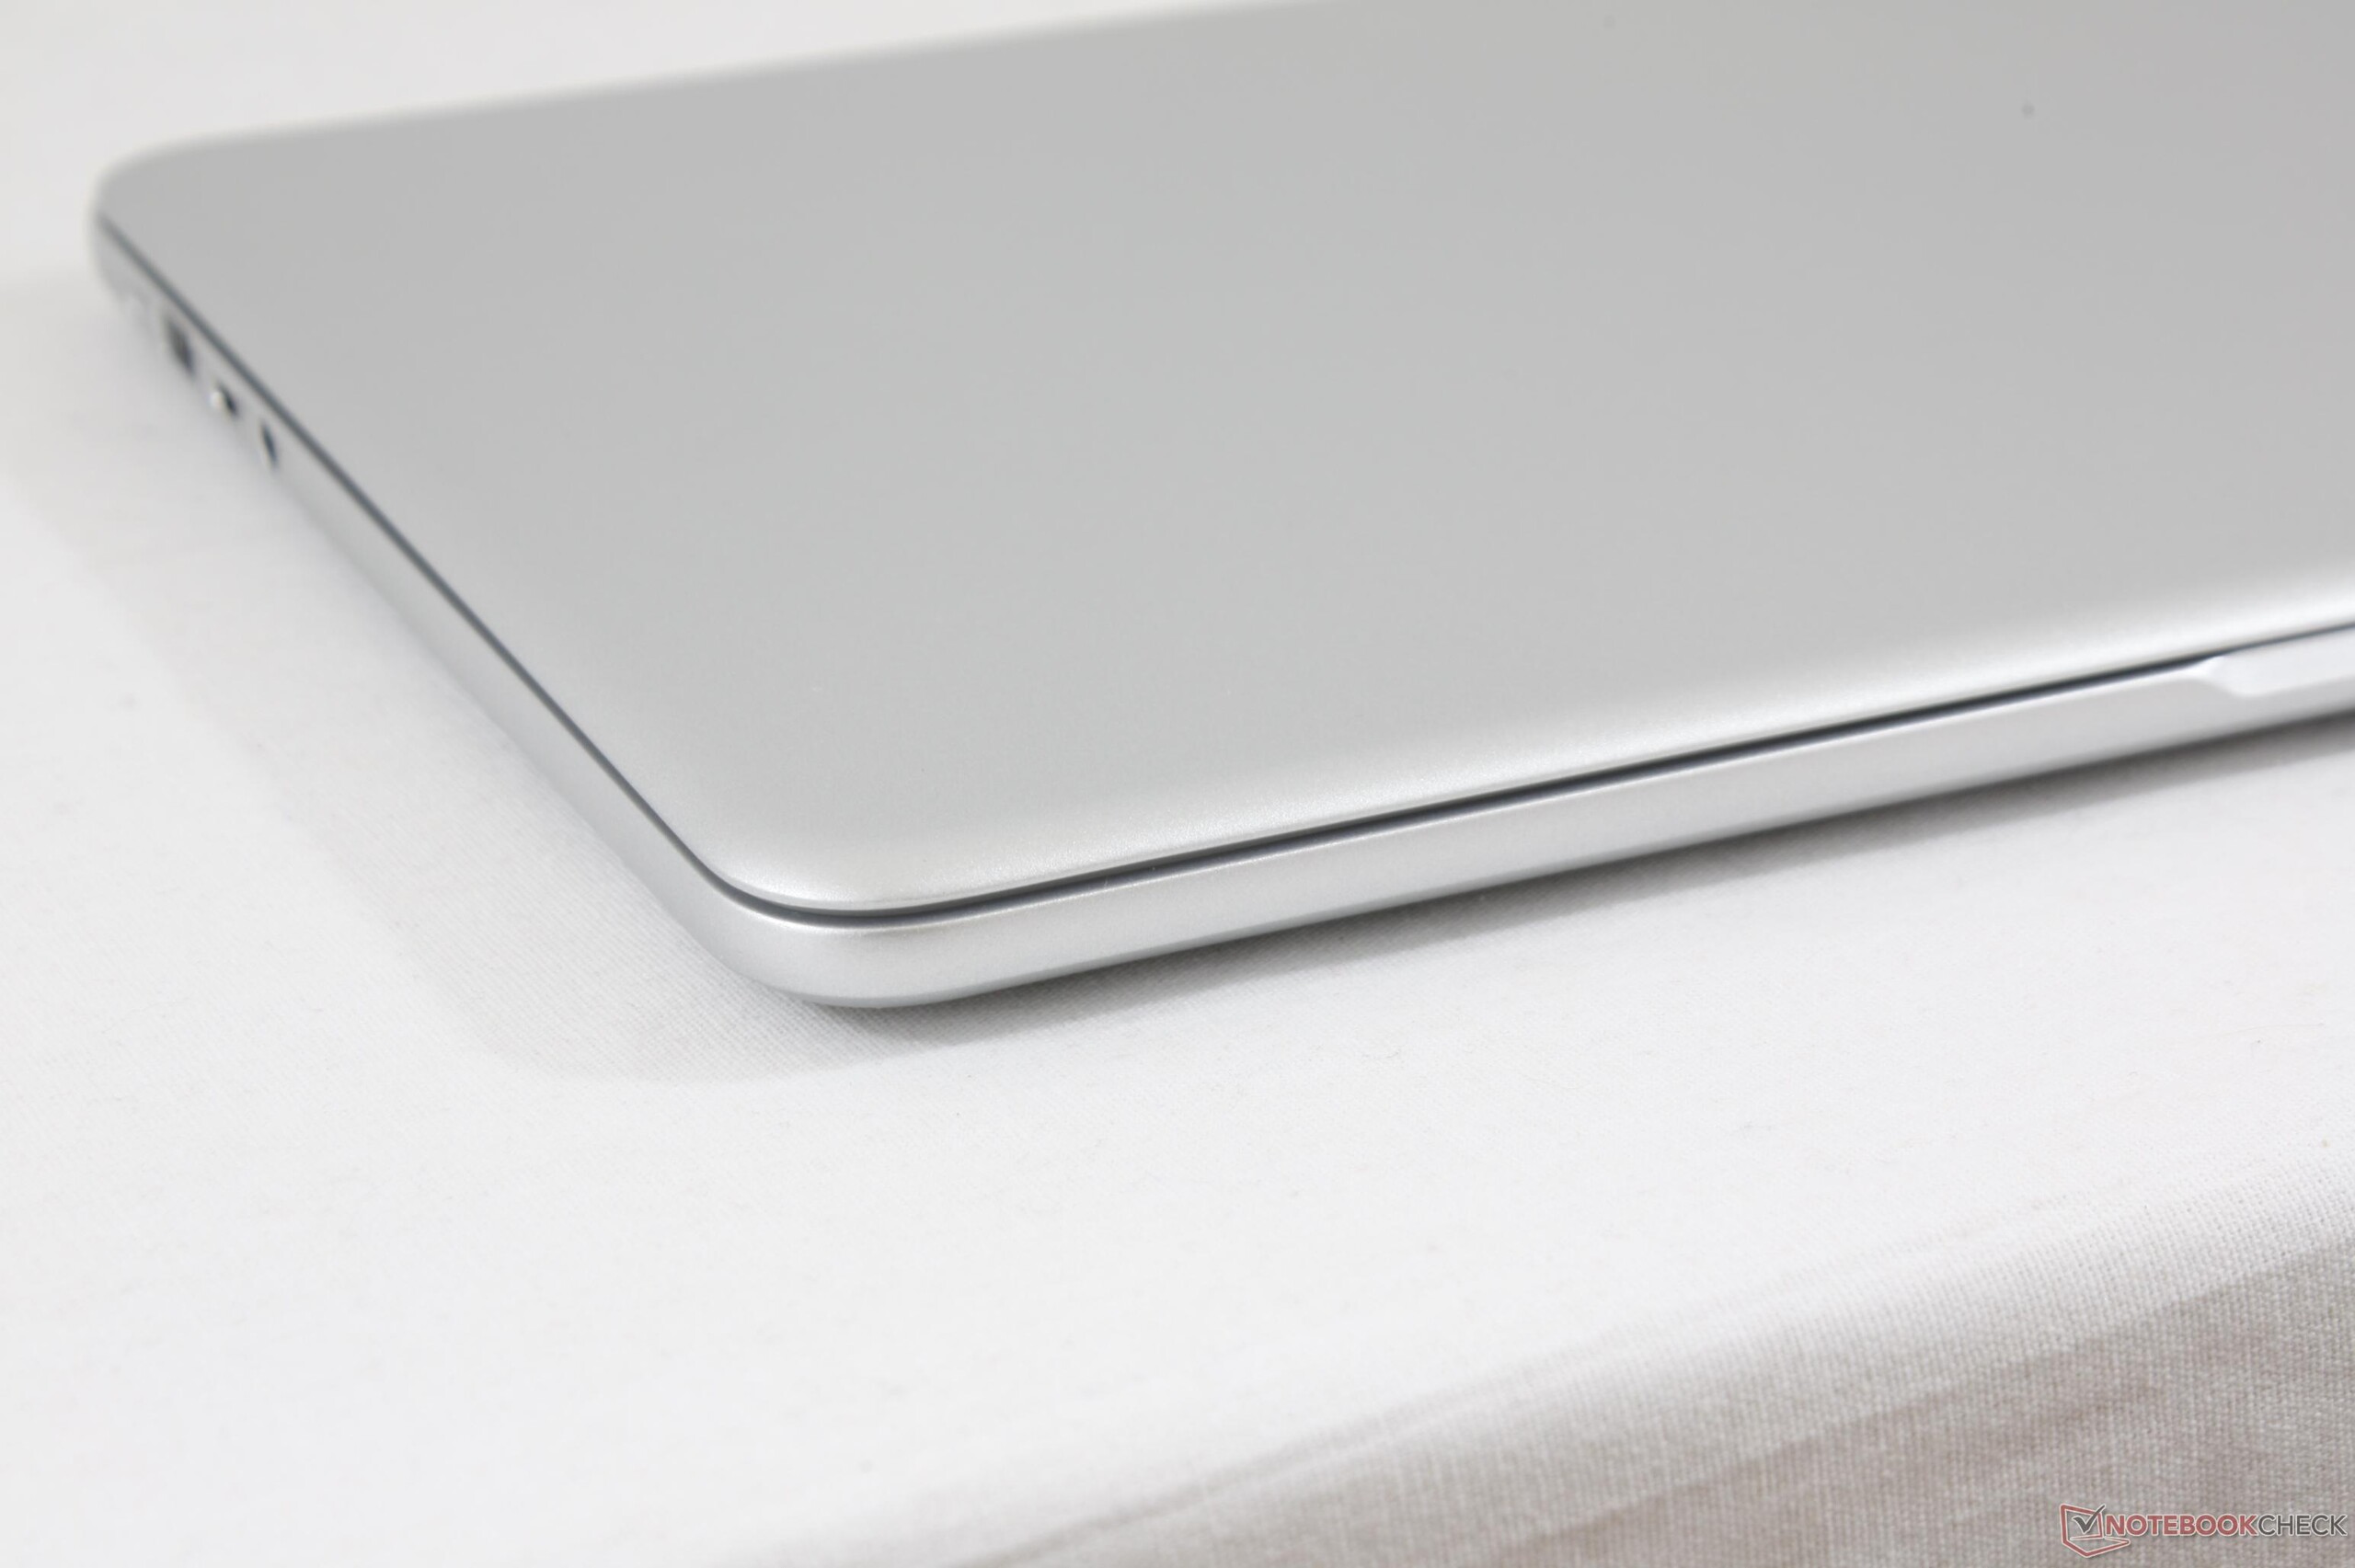
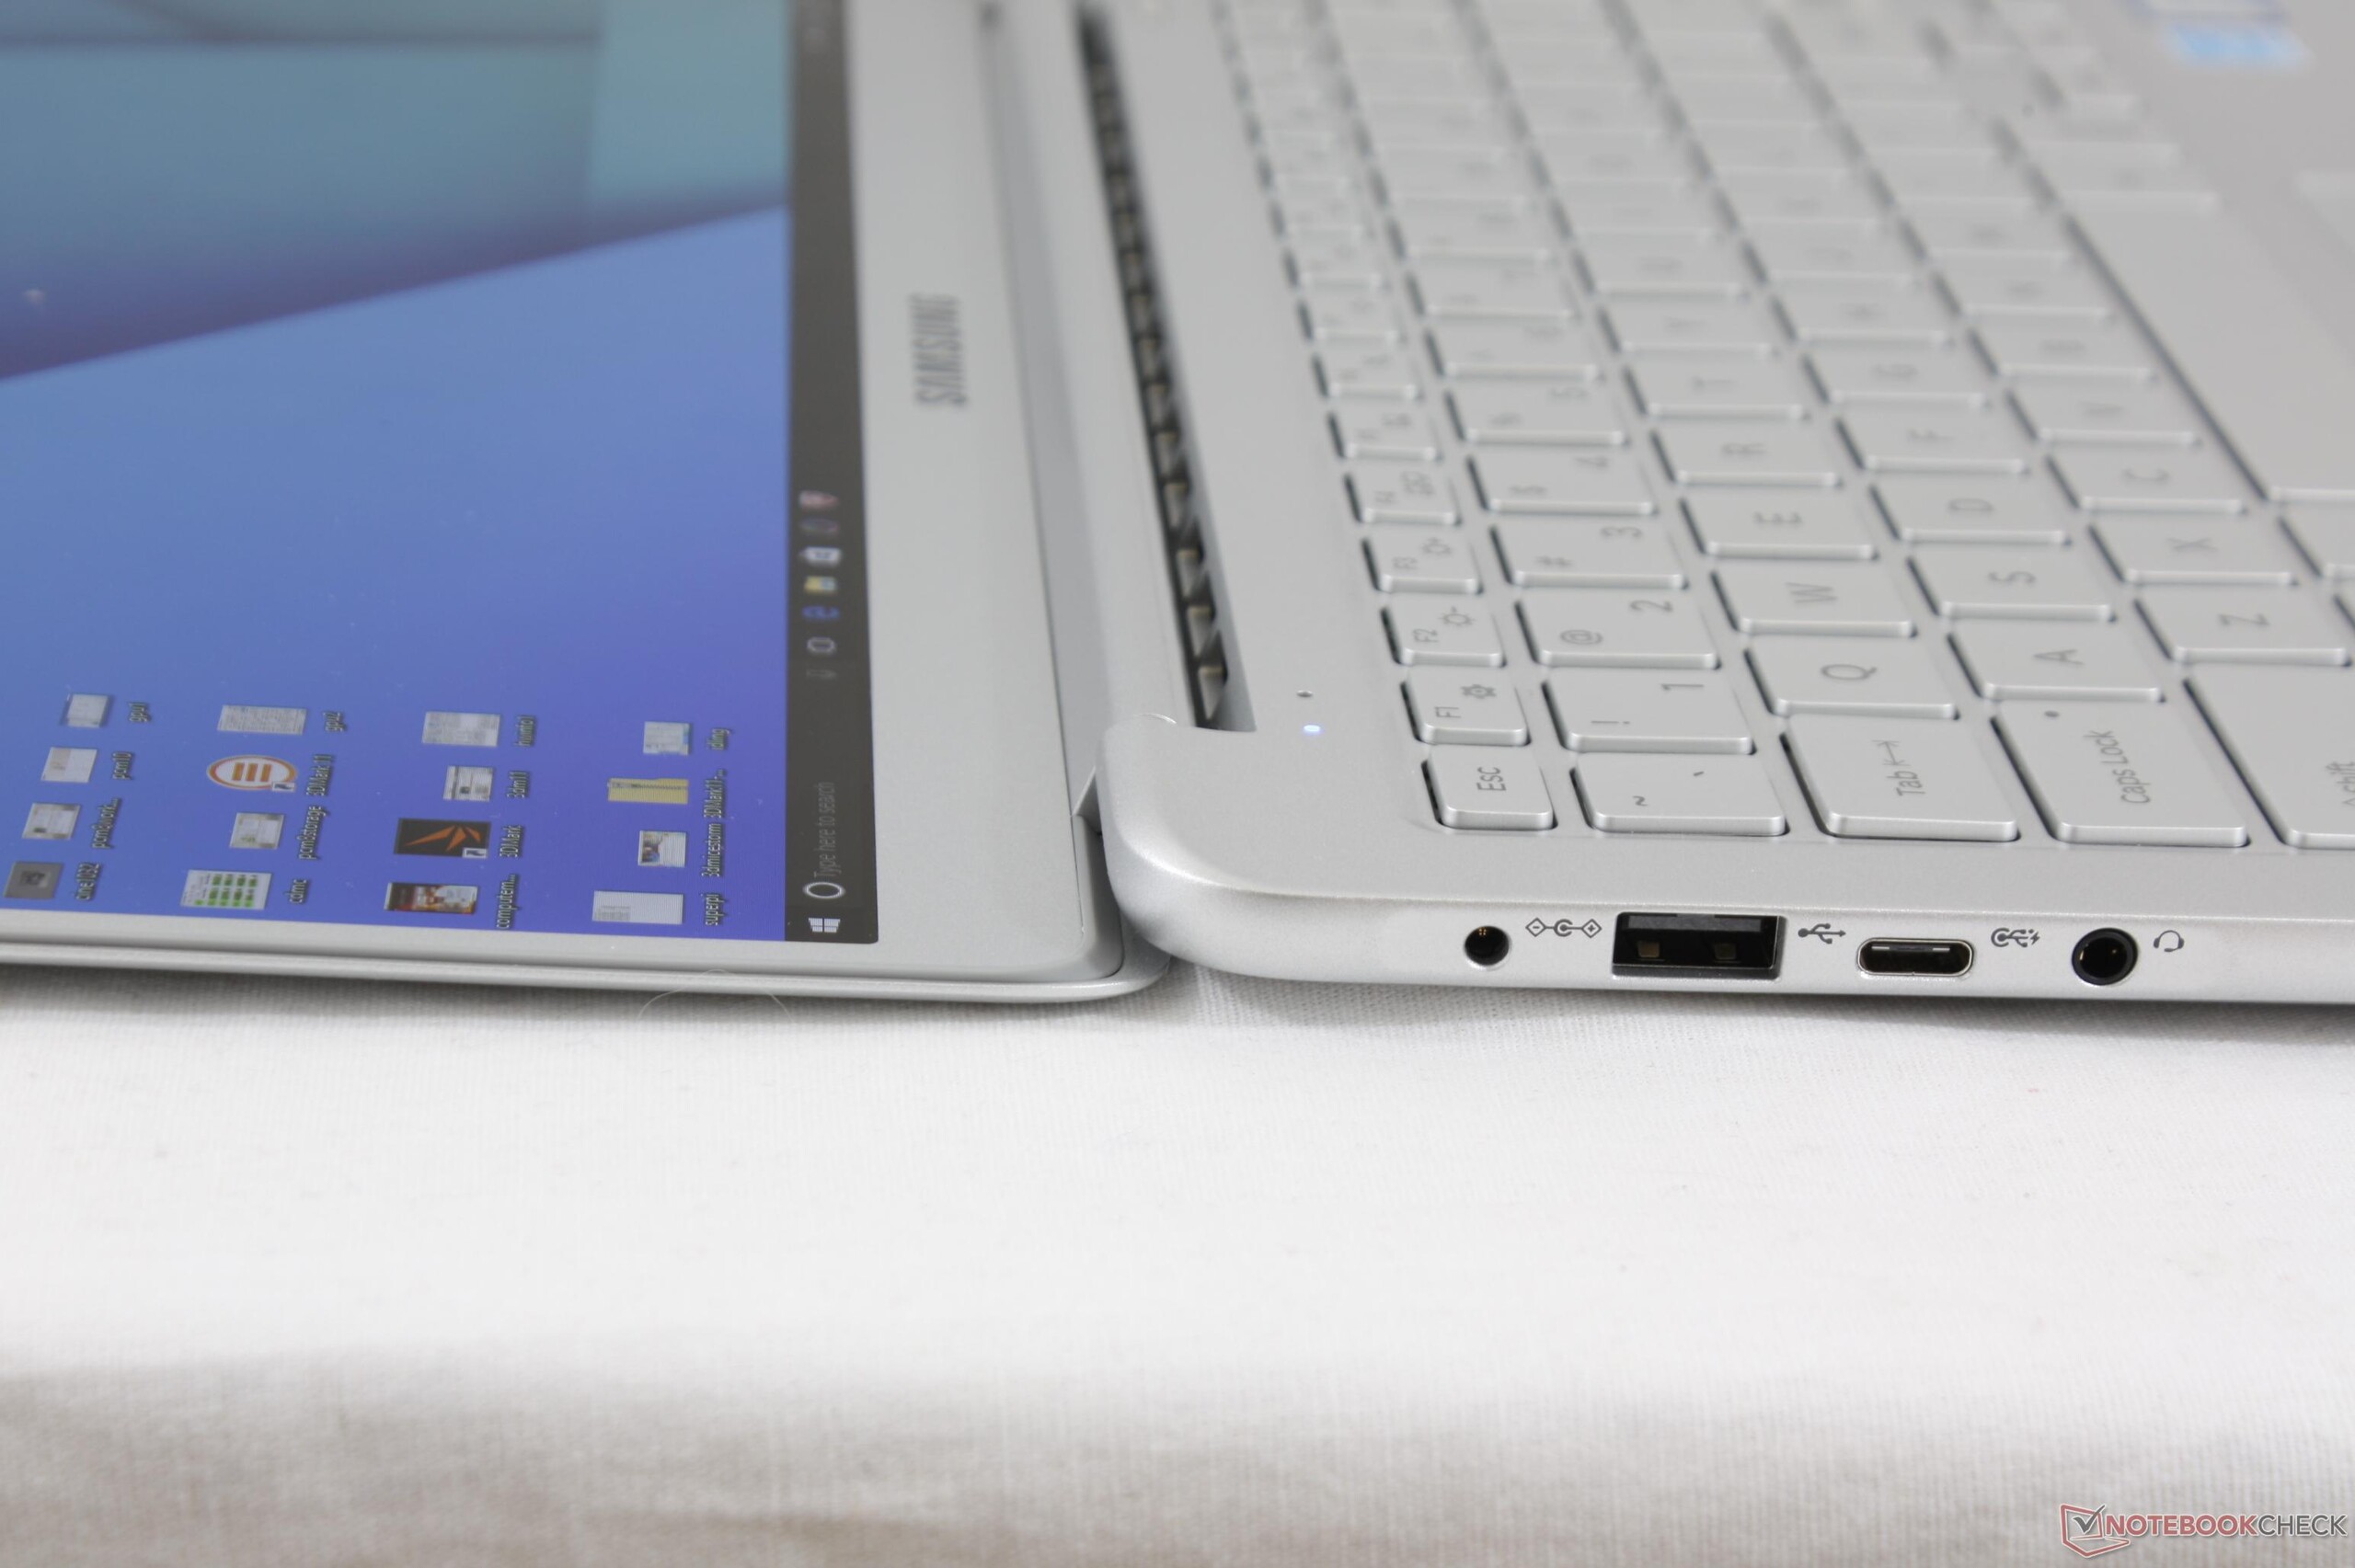
El Notebook 9 de 13" ha sido creado con un objetivo en mente - Para ser el Ultrabook más ligero y brillante en su rango de tamaño. Samsung se ha salido en este sentido como el NP900X3N no sólo es ligeramente más ligero y brillante que el siguiente mejor, pero es significativamente así. Combine esto con el ventilador silencioso, puertos USB de tamaño completo y teclado respetable y esto es fácilmente el mejor Ultrabook de 13" para viajes y uso al aire libre.
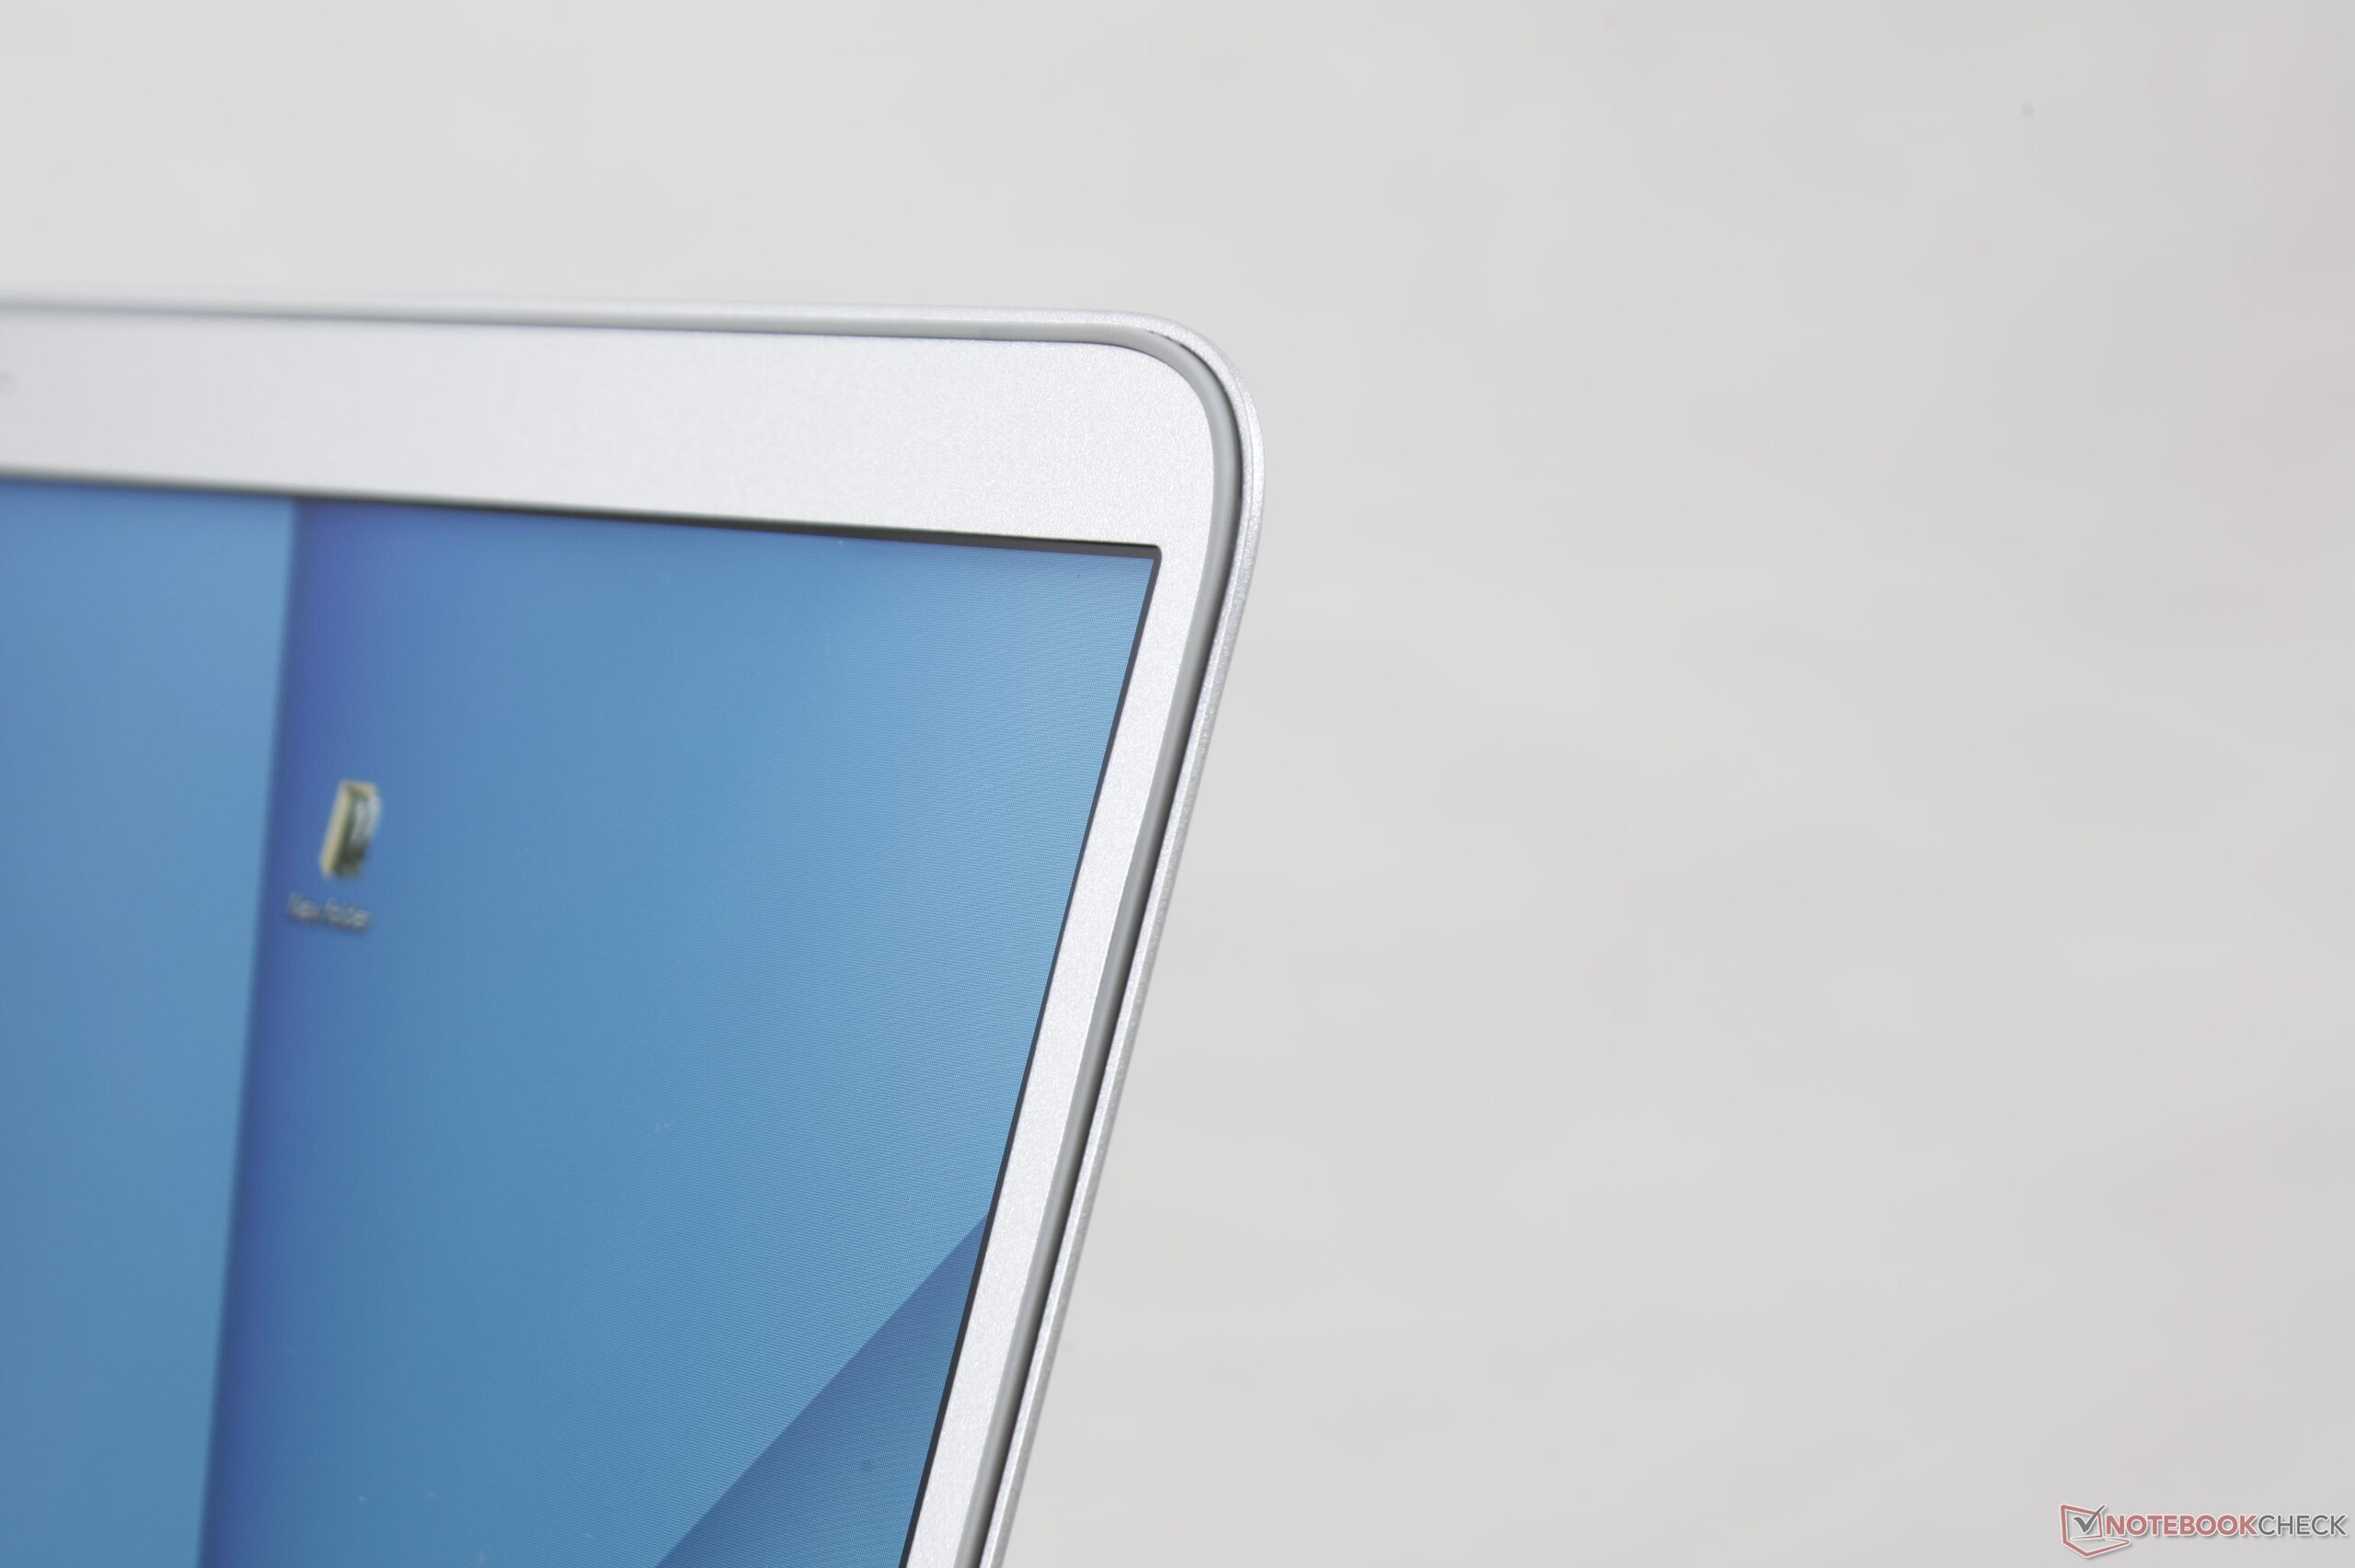
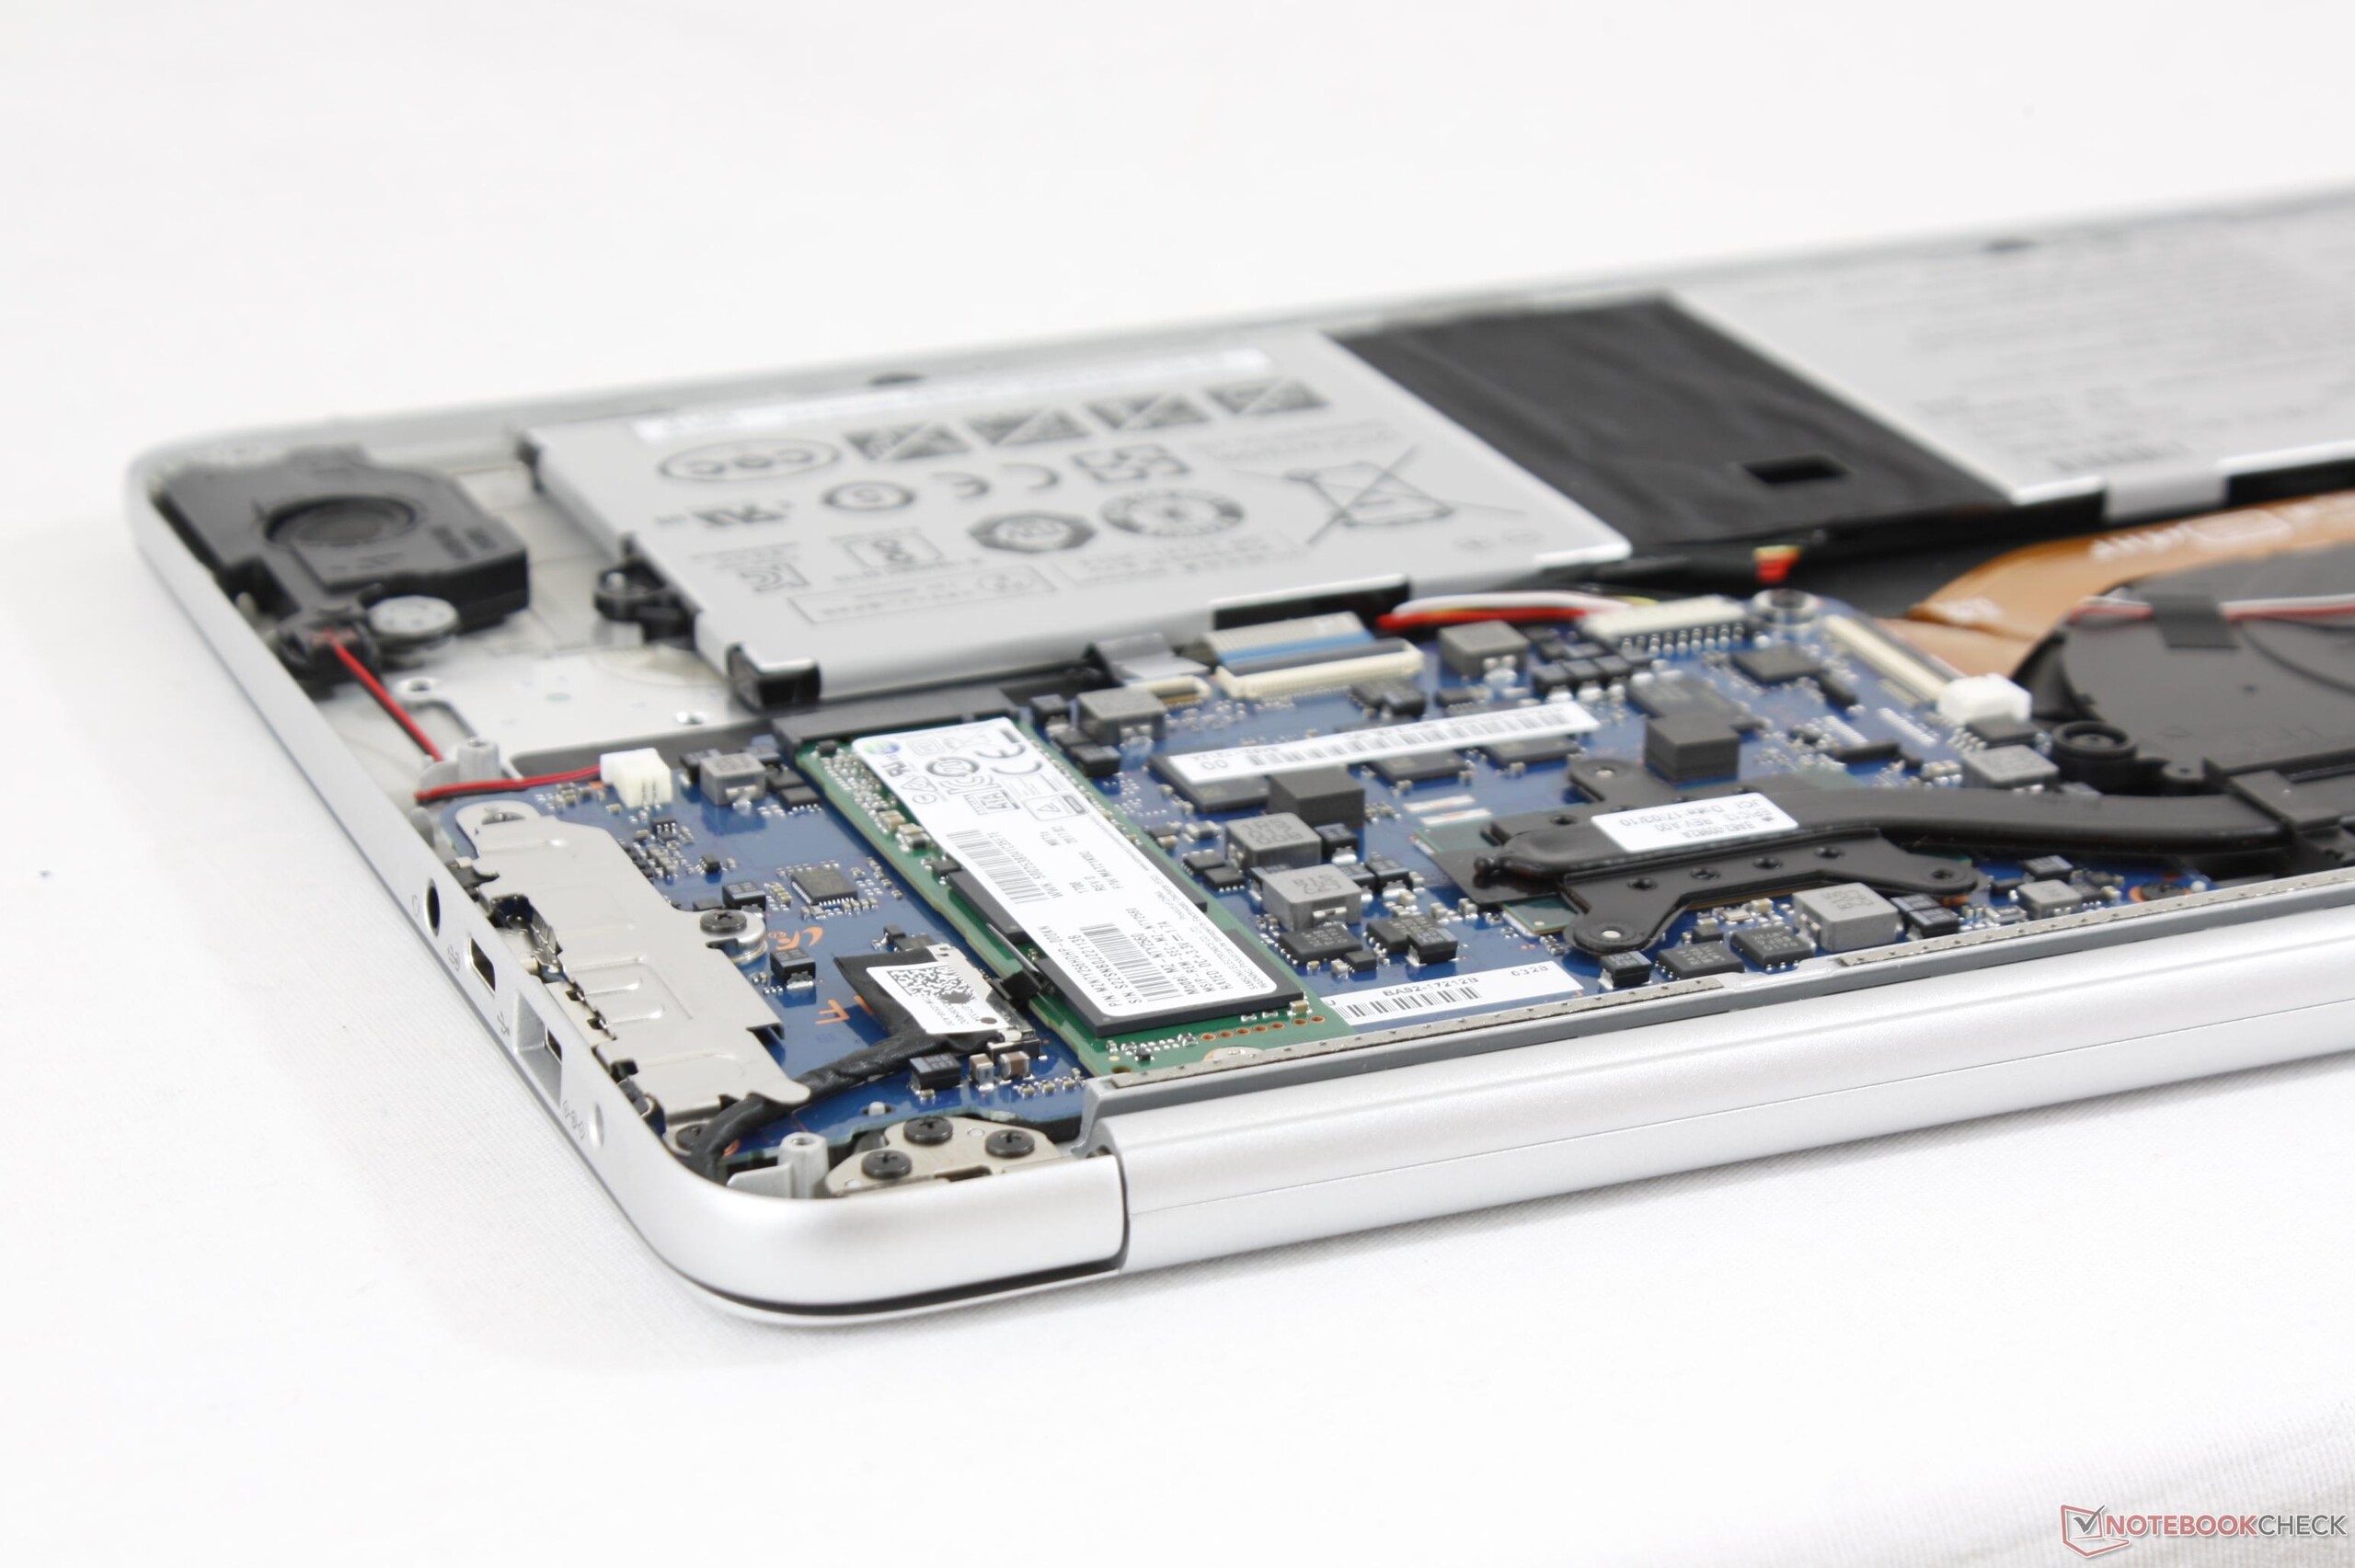
El enfoque feroz de Samsung para crear el Ultrabook más ligero disponible ha llevado a algunos sacrificios a lo largo del camino. Con el fin de mantener el peso lo más bajo posible, el sistema carece de pantalla táctil y las opciones Gorilla Glass y tanto su sistema de refrigeración como la capacidad de la batería son muy pequeños. Esta última revelación, en particular, ha dado como resultado una duración de la batería por debajo de la media para un portátil que es excelente para su uso fuera del hogar. La rigidez del chasis, aunque no es mala, no está exactamente al mismo nivel que el XPS 13 o el MacBook Pro 13.
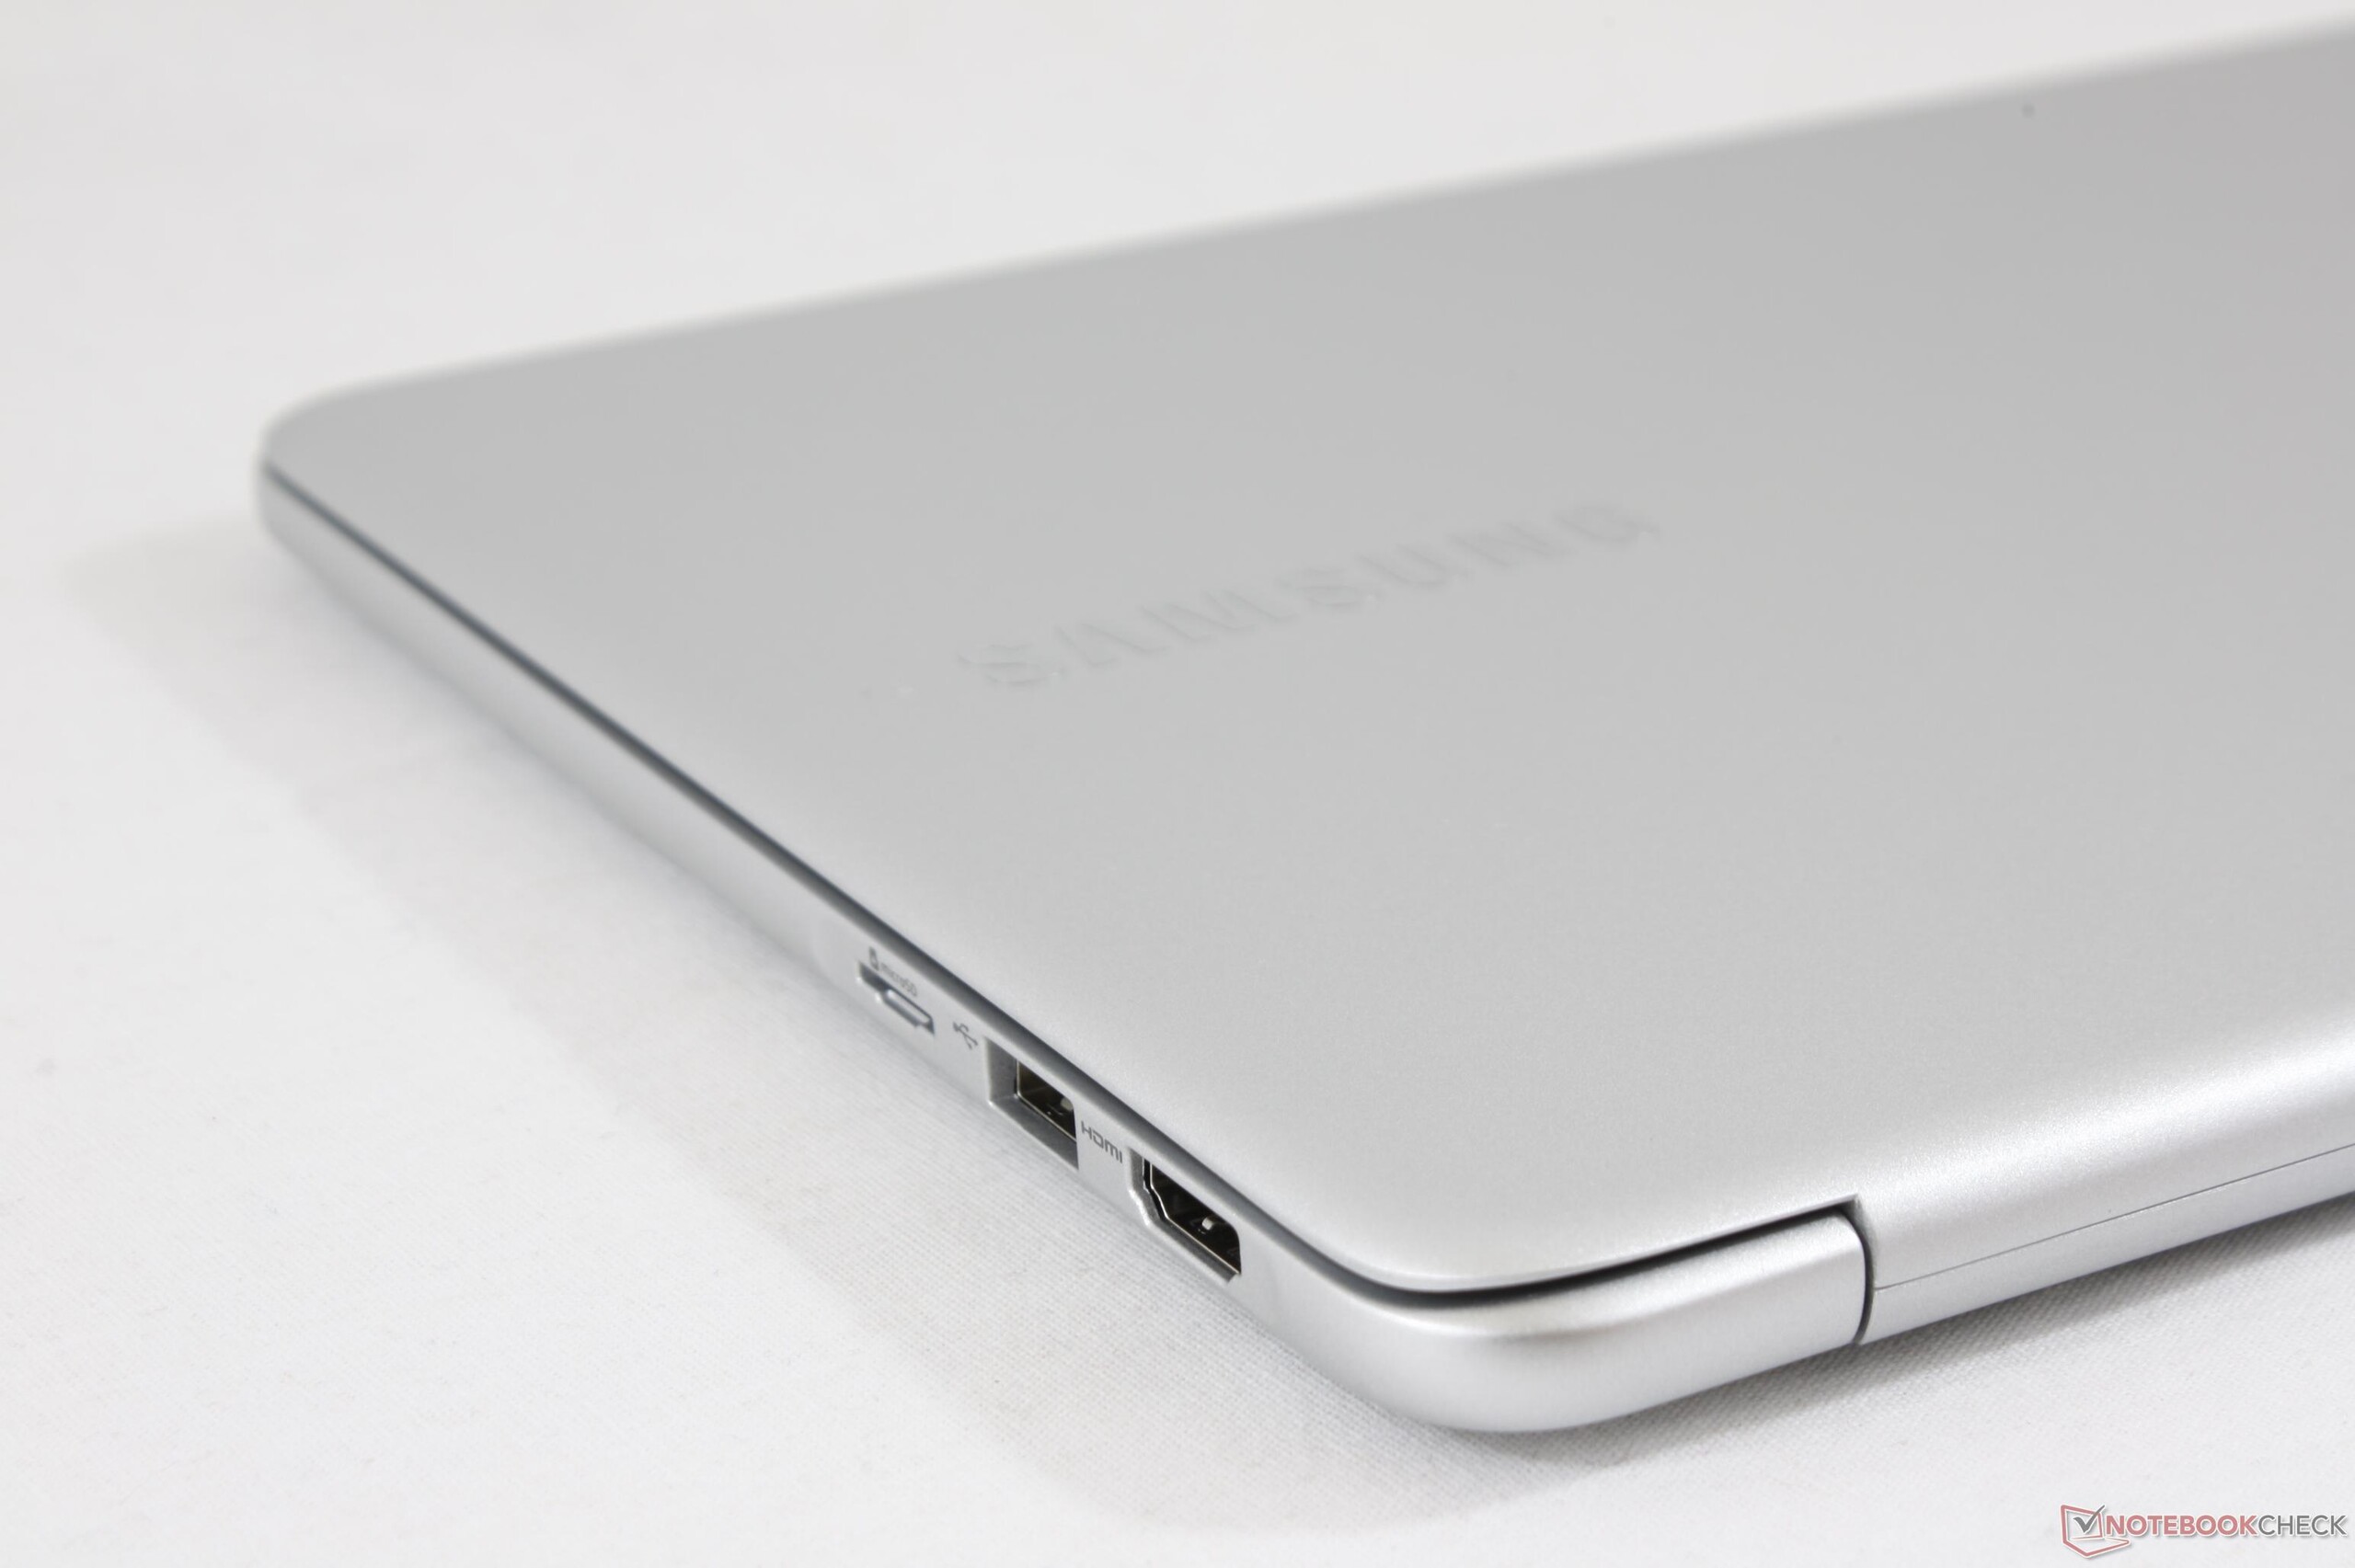
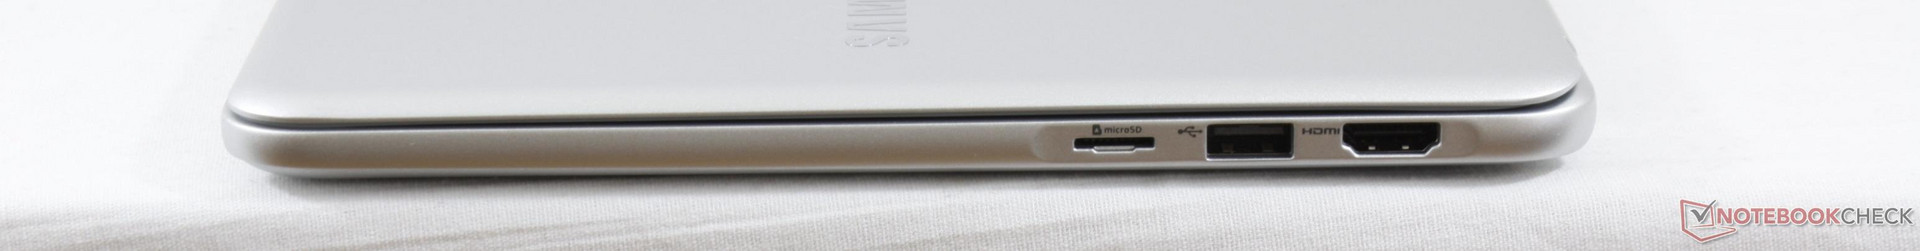
Esperamos que las futuras revisiones añadan Thunderbolt 3, compatibilidad SIM y una opción de panel mate para hacer que el portátil 9 sea un compañero de viaje aún mejor. Hasta entonces, los que quieren algo más ligero y más brillante que un XPS 13 sin sacrificar puertos USB o HDMI de tamaño completo como en el Zenbook 3, Matebook X, Yoga 910 o Specter 13 no quedarán decepcionados con el Samsung.
La pantalla extra luminosa y el peso superligero hacen de este portátil de 13" 9 una compra muy atractiva para cualquier usuario que esté constantemente en movimiento. Si la duración de la batería durante todo el día y las capacidades de acoplamiento Thunderbolt 3 son más importantes hay muchas opciones mejores.
Ésta es una versión acortada del análisis original. Puedes leer el análisis completo en inglés aquí.
Samsung Notebook 9 NP900X3N-K01US
- 08/29/2017 v6 (old)
Allen Ngo
Price comparison
