Prueba de rendimiento del Intel Celeron N5095 Jasper Lake: Análisis del mini PC Beelink U59

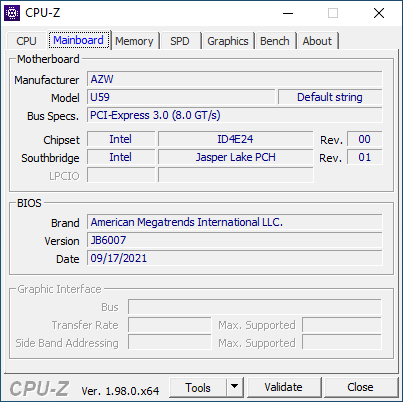
Beelink acaba de poner a la venta su mini PC U59 para suceder a su última generación U55. El sistema lleva el nuevo Celeron N5095 de cuatro núcleos de Intel para sustituir a los antiguos Celeron N4500, J4125 o N4120 que suelen encontrarse en otros mini PC de este mismo rango de precios de 300 dólares.
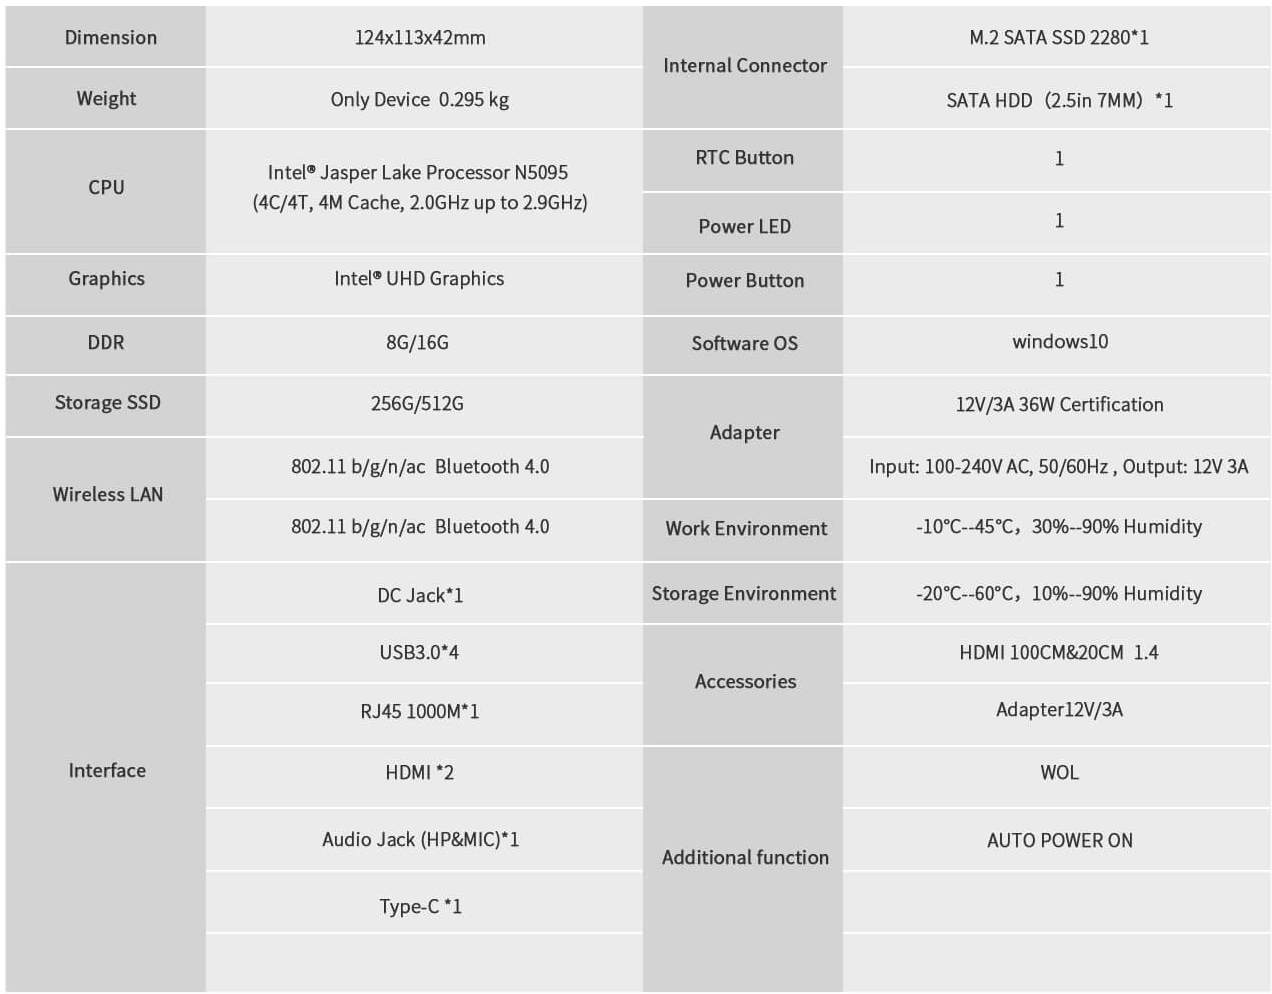
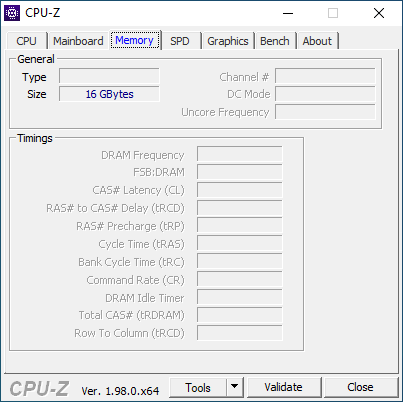
Nuestra configuración de prueba específica con 16 GB de RAM de doble canal y 512 GB de SSD M.2 se puede encontrar en línea por 349 dólares, mientras que una configuración menor con la mitad de RAM y almacenamiento se puede encontrar por sólo 279 dólares. Se pueden encontrar más especificaciones sobre el U59 en su página oficial de producto aquí.
Más reseñas de Beelink:
Potential Competitors in Comparison
Valoración | Fecha | Modelo | Peso | Altura | Tamaño | Resolución | Precio |
|---|---|---|---|---|---|---|---|
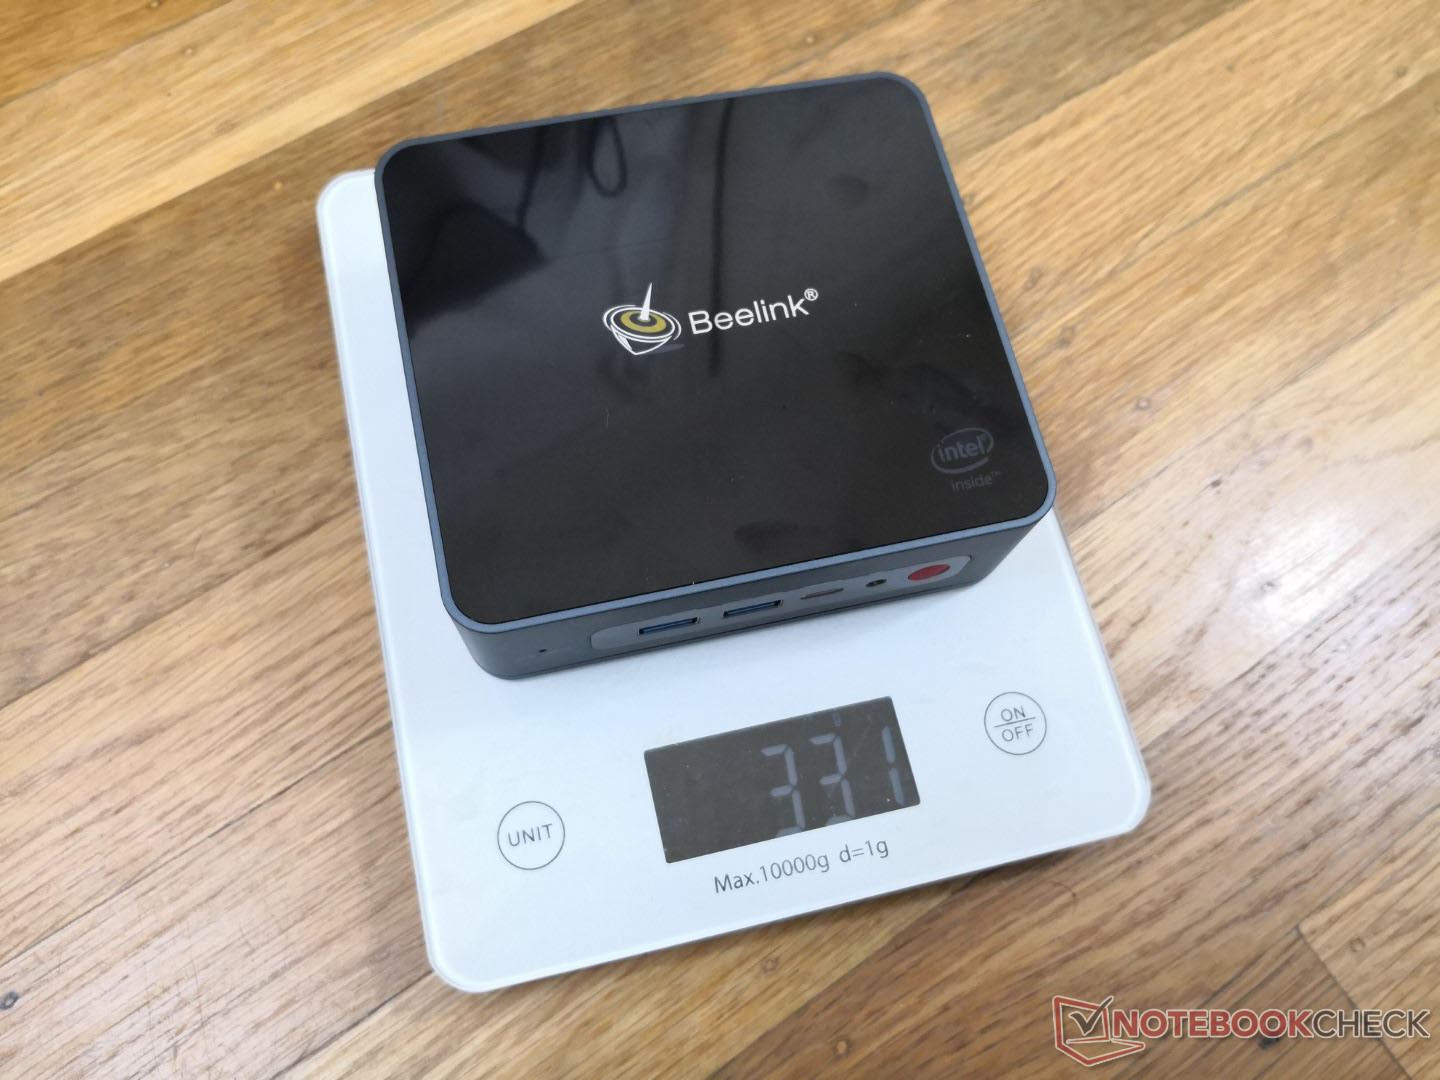
v (old) | 11/2021 | Beelink U59 Celeron N5095, UHD Graphics (Jasper Lake 16 EU) | 329 g | 42 mm | x | ||
v (old) | 04/2021 | Intel NUC11TNKi5 i5-1135G7, Iris Xe G7 80EUs | 504 g | 37 mm | x | ||
v (old) | 11/2018 | Intel NUC8i7BE i7-8559U, Iris Plus Graphics 655 | 683 g | 51 mm | x | ||
v (old) | Beelink SEi10 i3-1005G1, UHD Graphics G1 (Ice Lake 32 EU) | 350 g | 41 mm | x | |||
v (old) | 10/2020 | Zotac ZBOX MI642 Nano i5-10210U, UHD Graphics 620 | 472 g | 51 mm | x | ||
v (old) | 09/2020 | GMK NucBox K1 Celeron J4125, UHD Graphics 600 | 130 g | 42 mm | x |
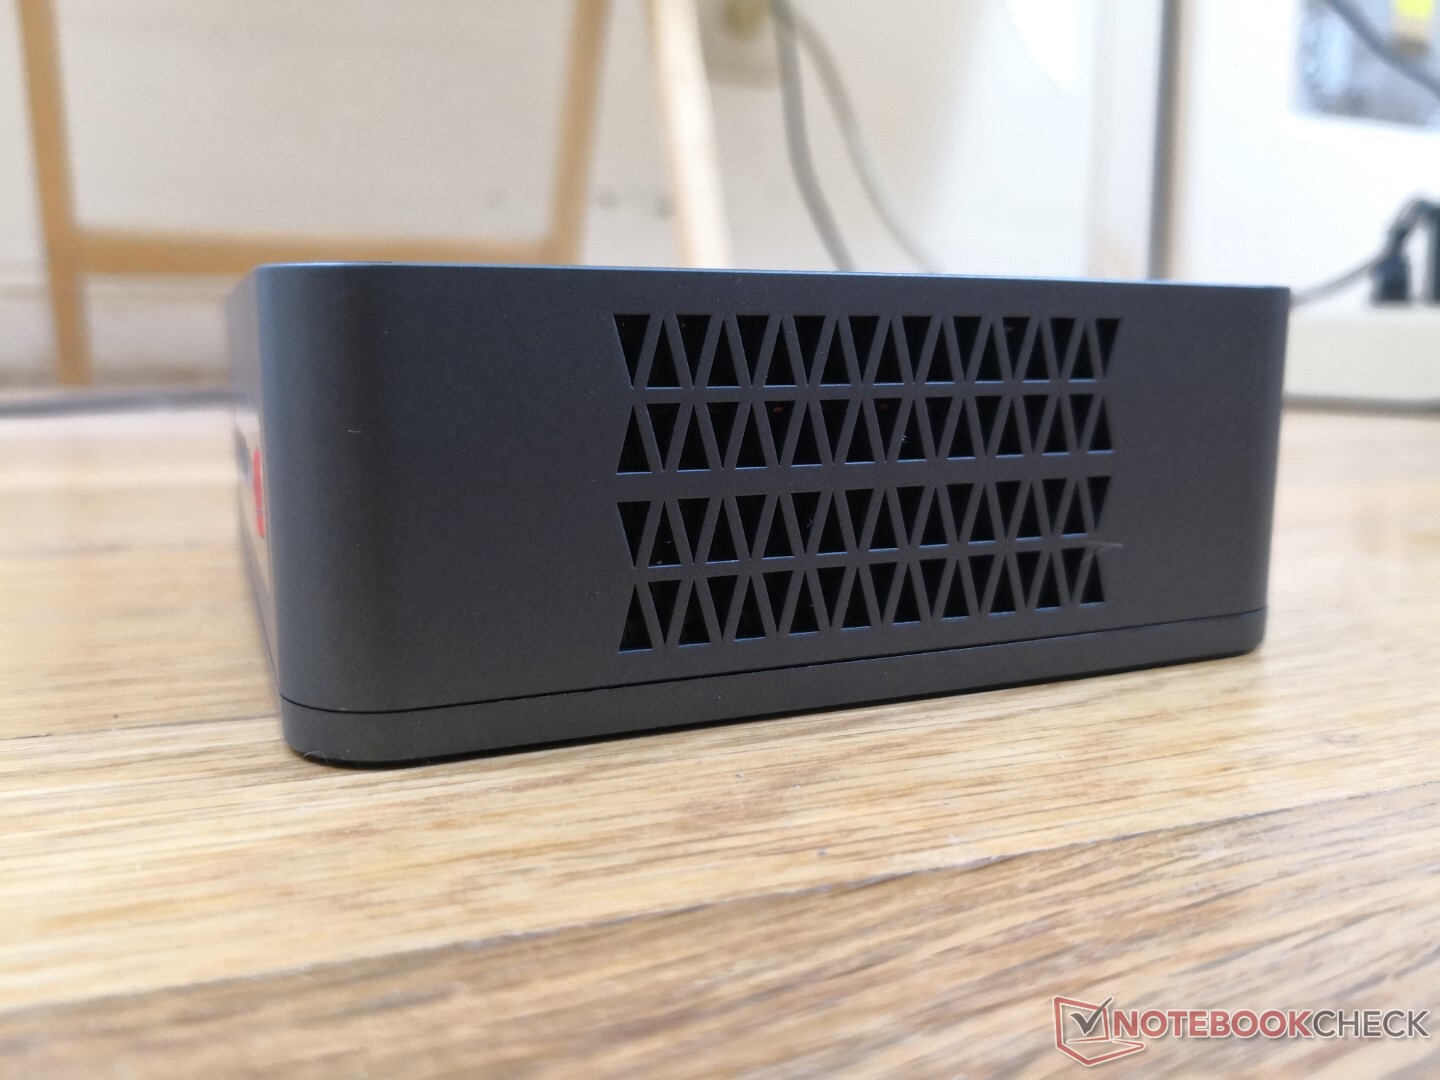
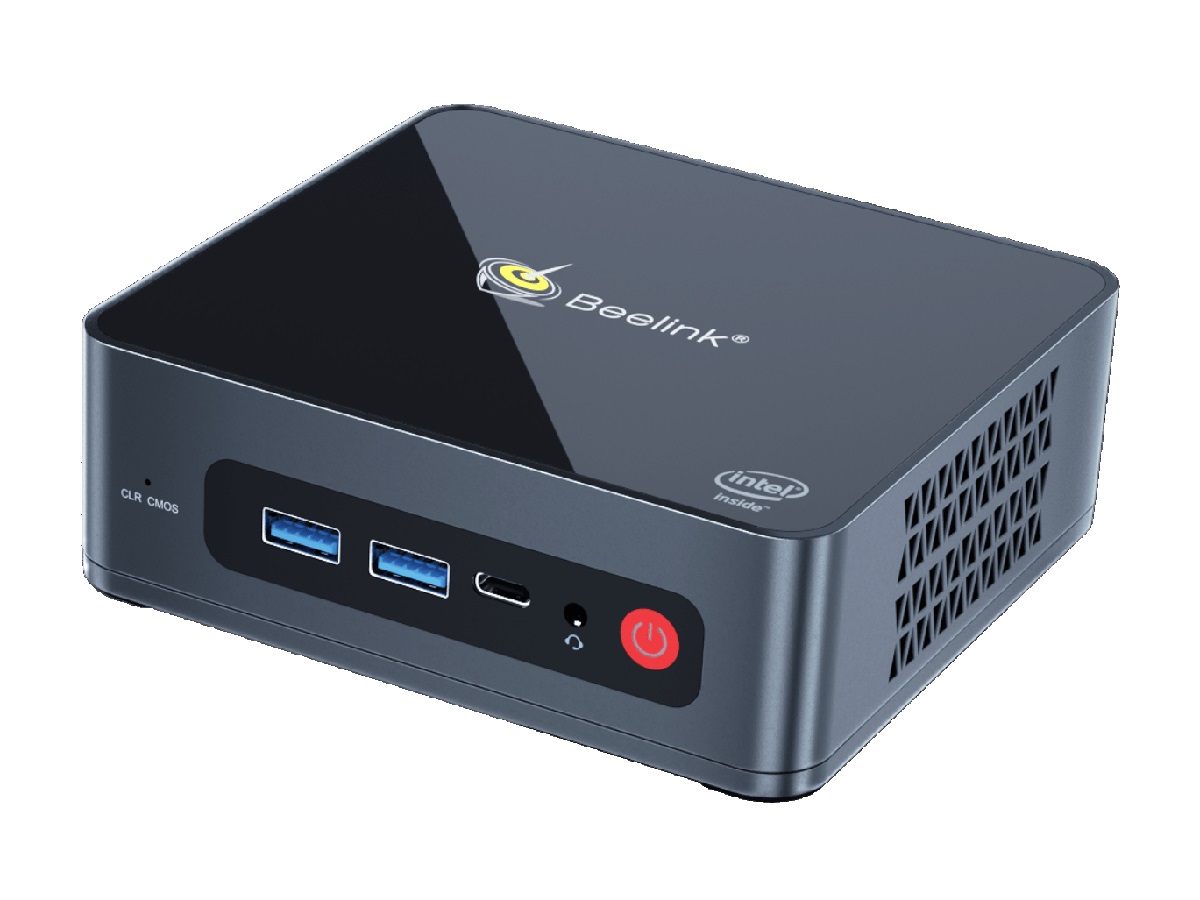
Caso
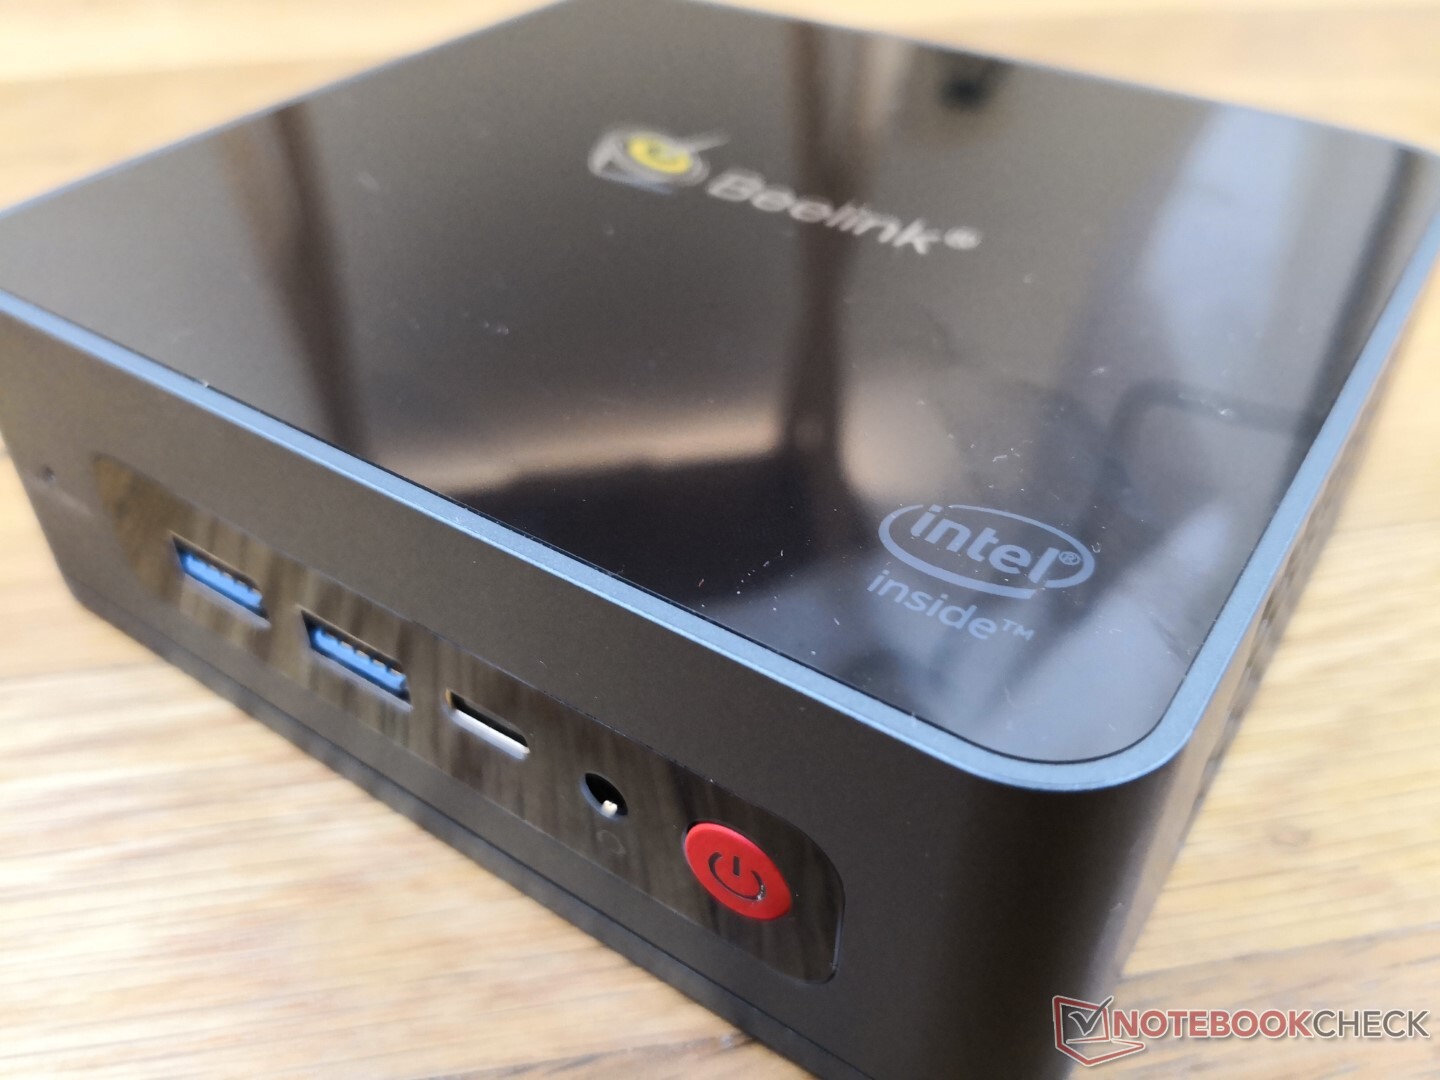
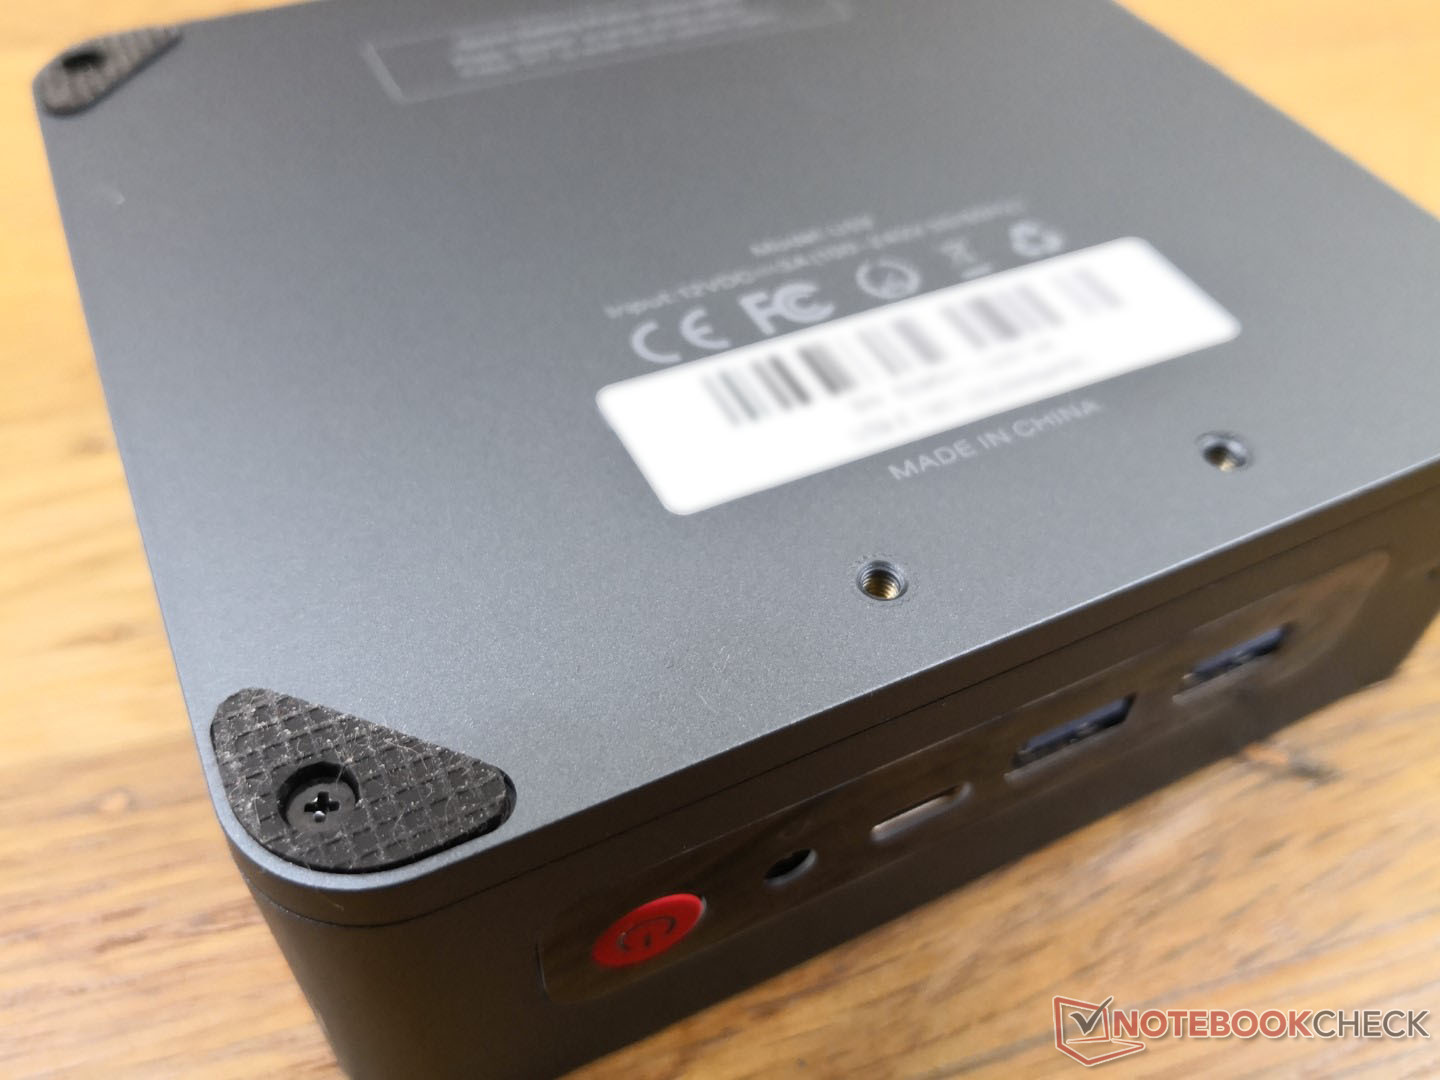
Beelink utiliza un diseño de chasis similar entre su serie U59 y la serie SER3 de mini PC basados en AMD. En el U59, sin embargo, la parte superior es simplemente de plástico brillante, sin las rejillas metálicas o el perímetro cromado que se encuentra en el SER3 para un aspecto más apagado. La parte superior de plástico tiene un aspecto agradable a primera vista, pero hasta el más mínimo arañazo o huella dactilar será difícil de ocultar. También se flexiona más fácilmente por su centro en comparación con otros mini PC más gruesos como el GMK NucBox 2 o Intel NUC de Intel.
Conectividad
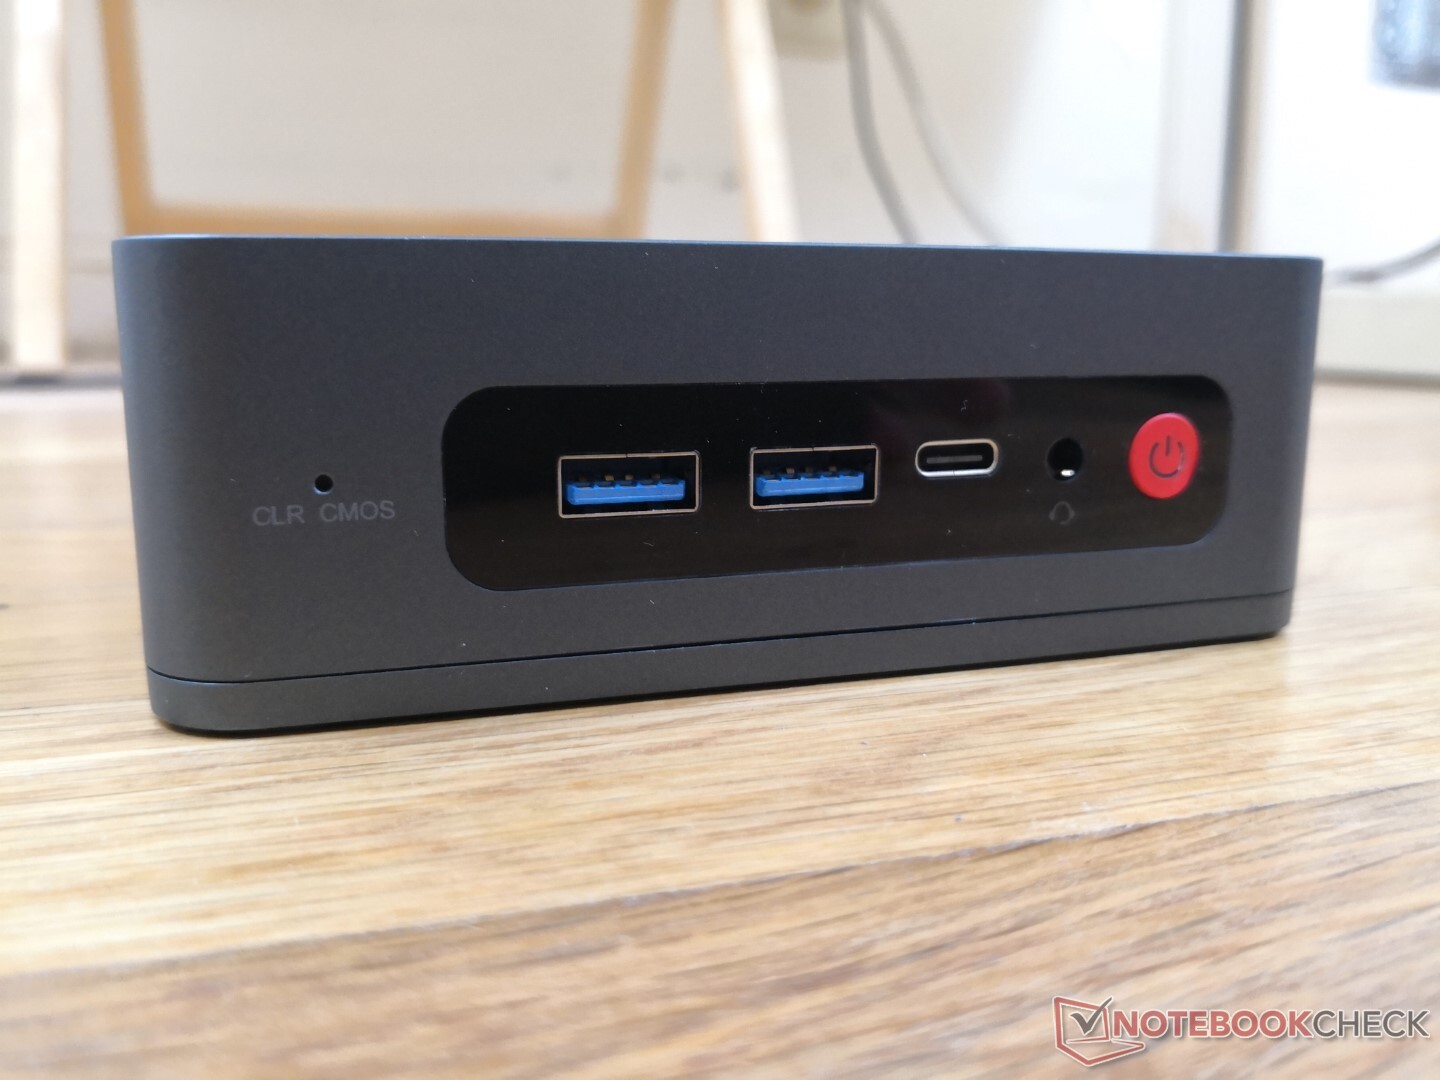
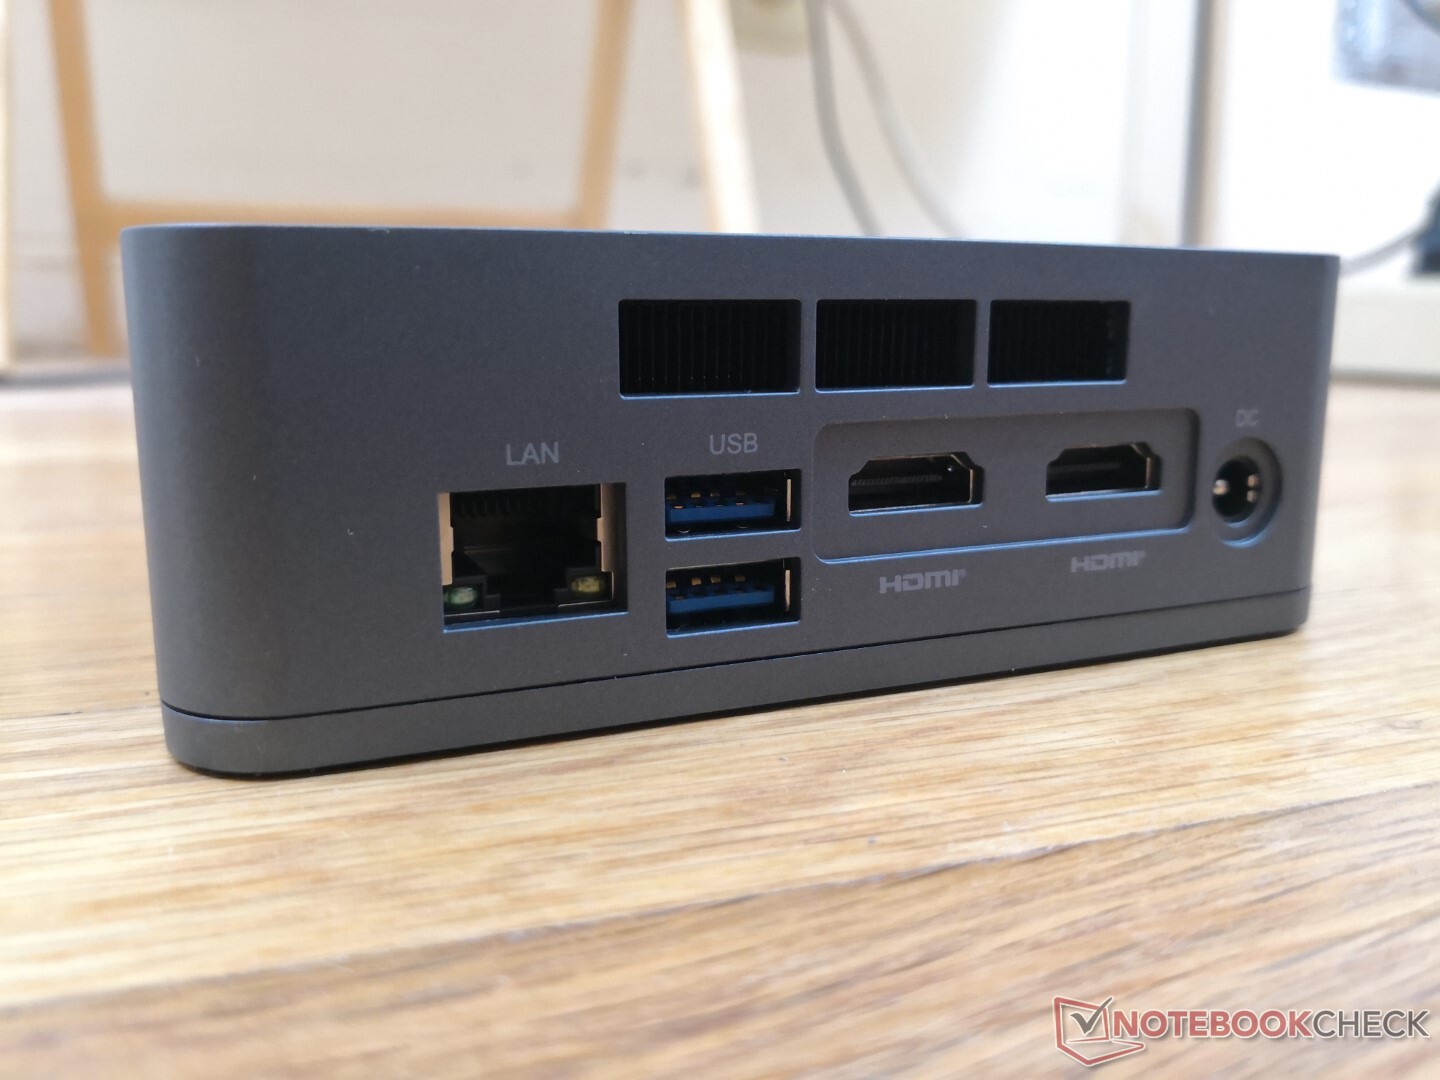
Las opciones de puerto físico son idénticas a las del Beelink SEi10 pero con la excepción del soporte de Thunderbolt. Se admiten tanto DisplayPort sobre USB-C como la salida 4K60.
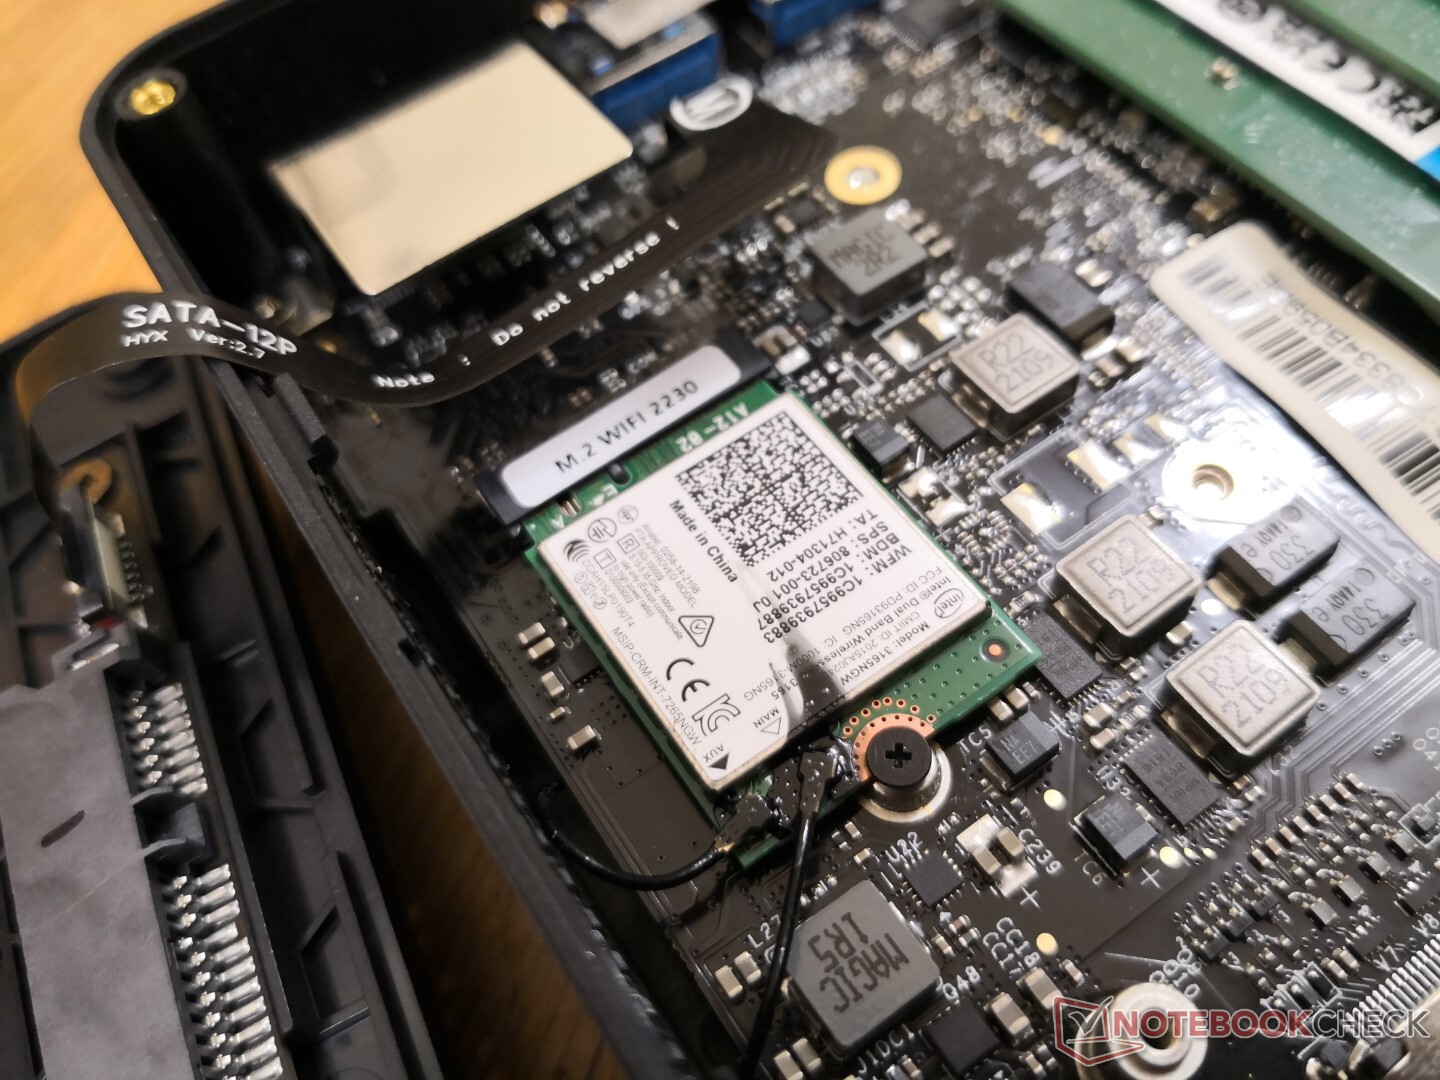
Comunicación
El Intel 3165, de 7 años de antigüedad, viene de serie para la conectividad Wi-Fi 5 hasta unos teóricos 433 Mbps. El rendimiento es estable aunque mucho más lento que los modernos módulos Wi-Fi 6 por más de un gigabit.
| Networking | |
| iperf3 transmit AX12 | |
| Intel NUC11TNKi5 | |
| Beelink SEi10 | |
| Intel NUC8i7BE | |
| Beelink U59 | |
| GMK NucBox K1 | |
| iperf3 receive AX12 | |
| Intel NUC11TNKi5 | |
| Beelink SEi10 | |
| Intel NUC8i7BE | |
| GMK NucBox K1 | |
| Beelink U59 | |
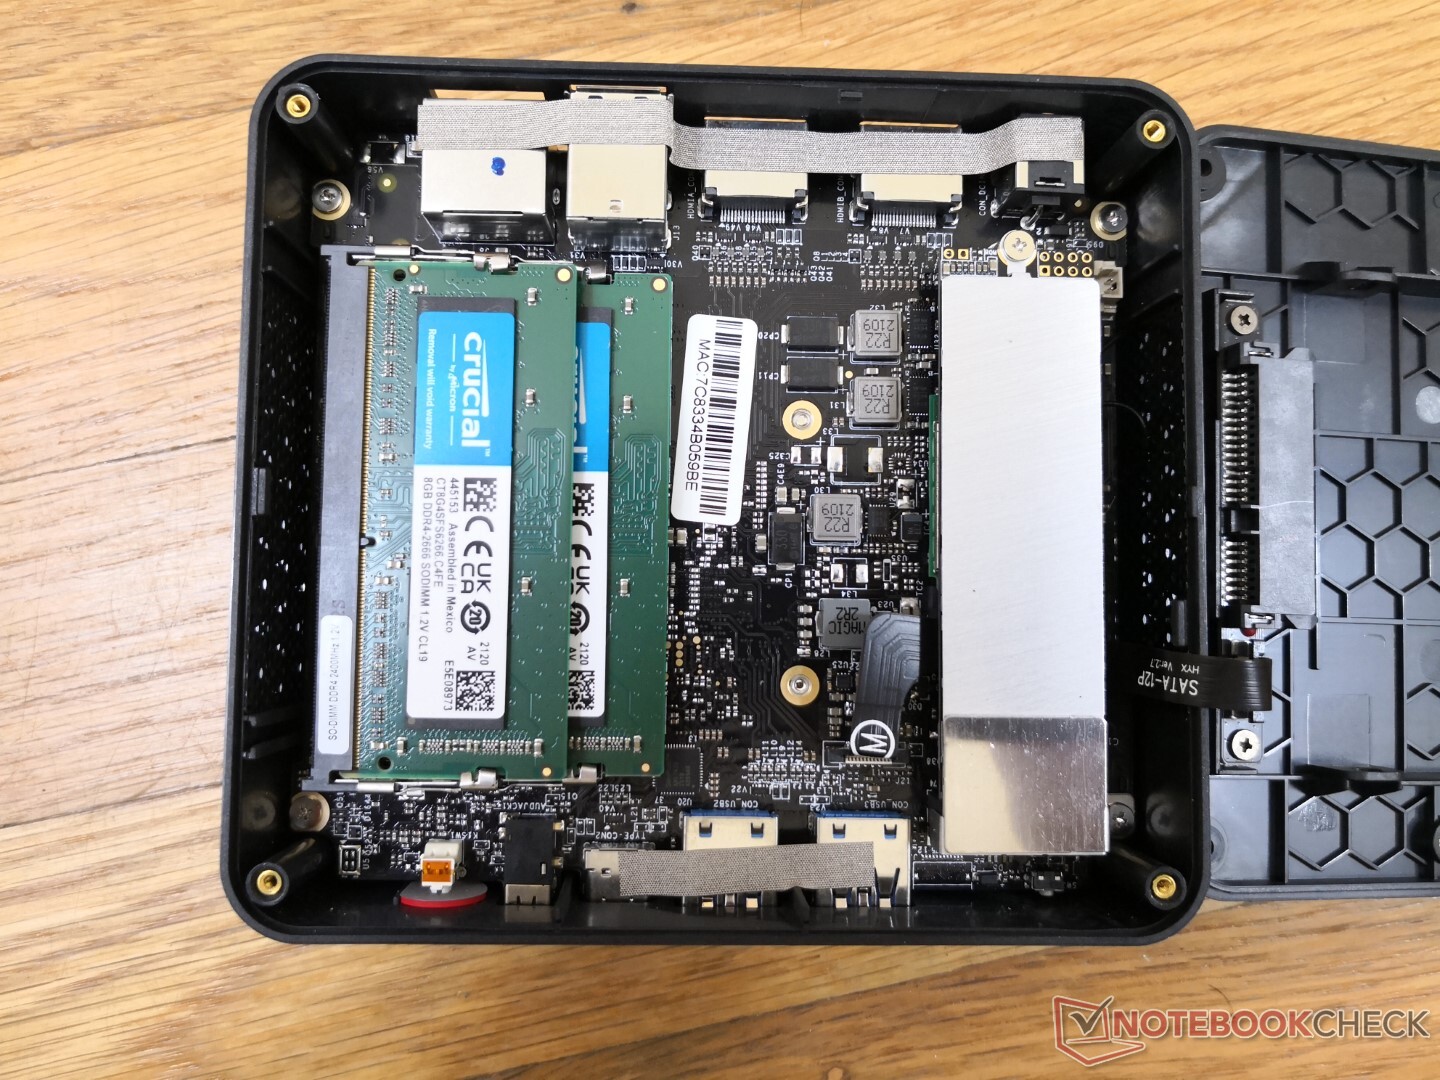
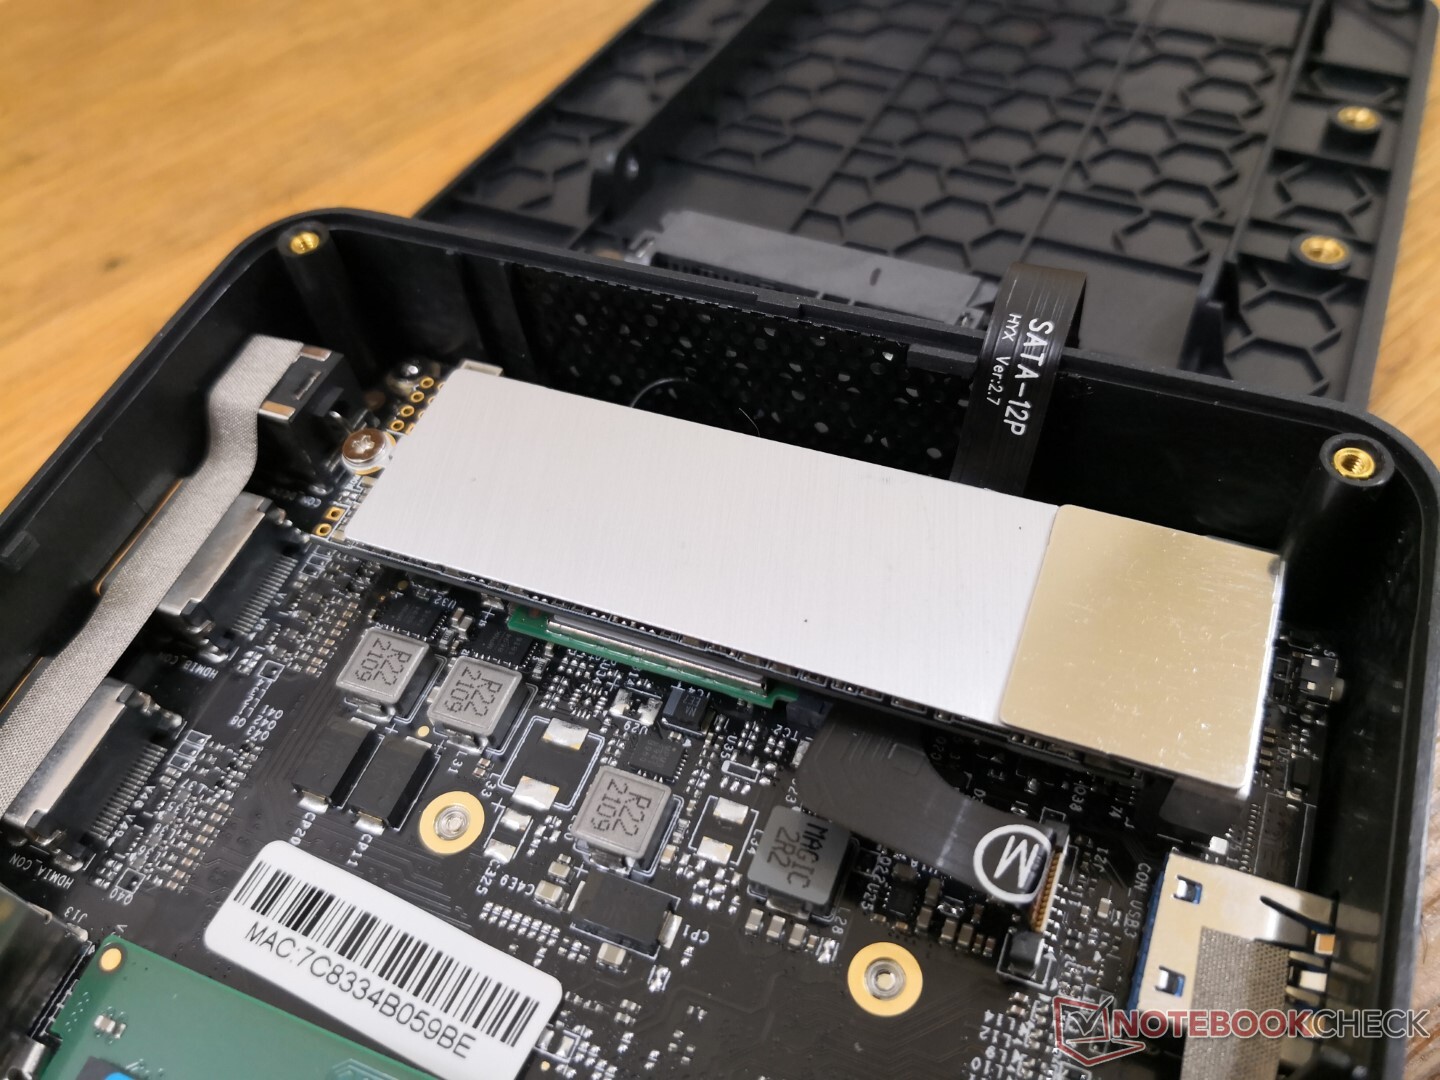
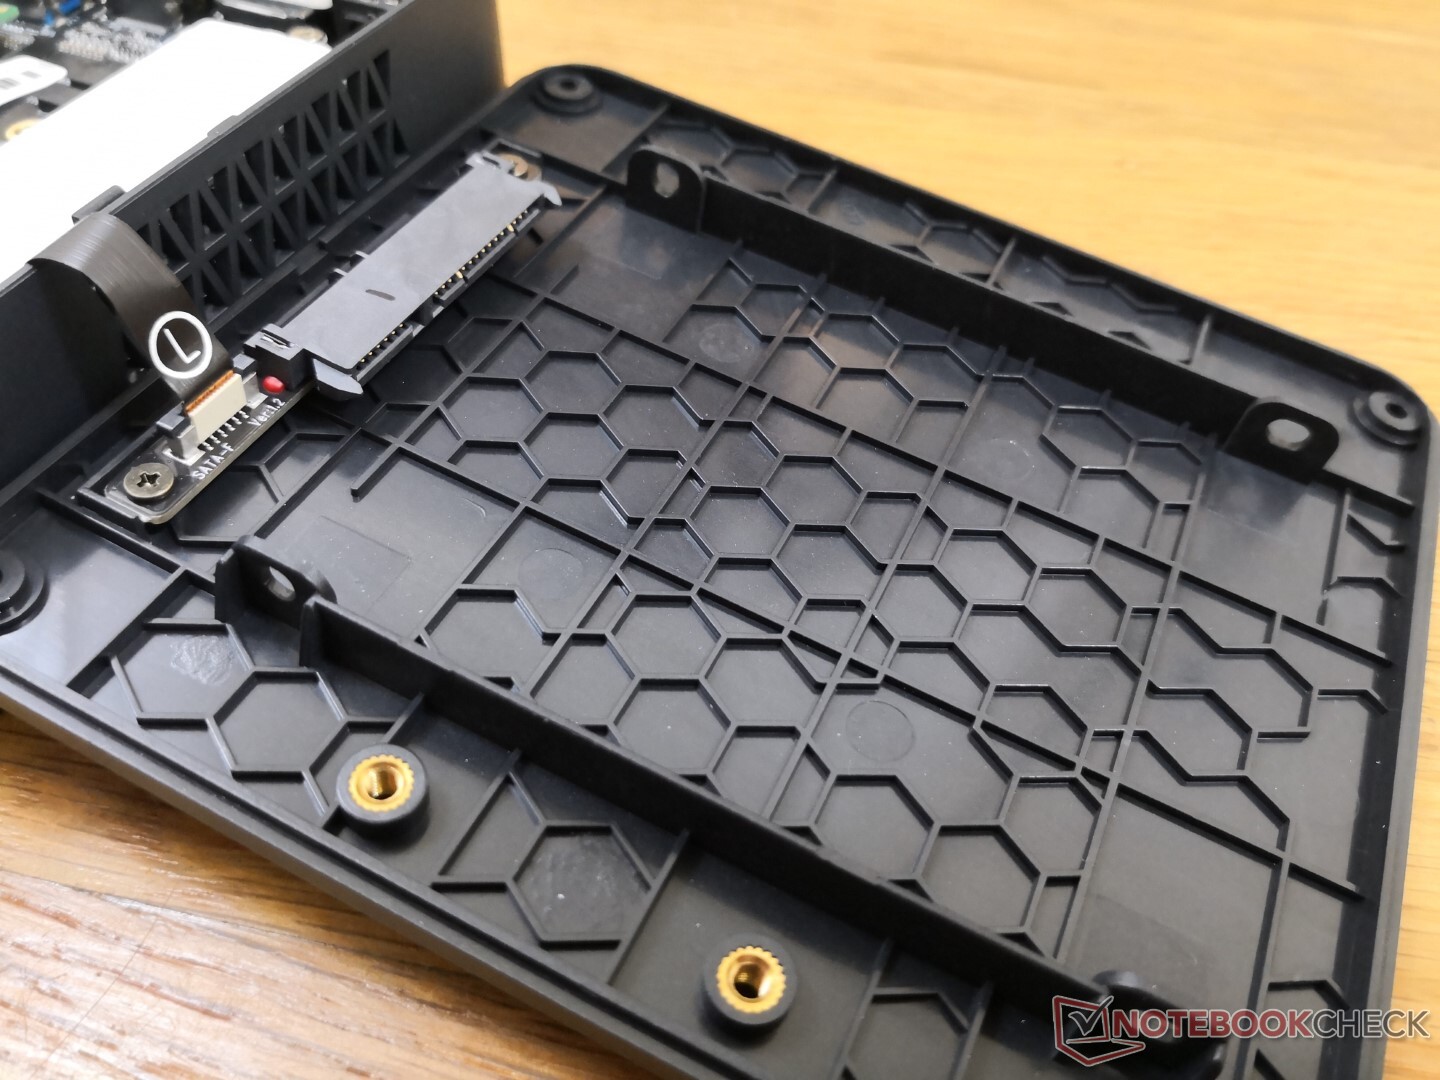
Mantenimiento
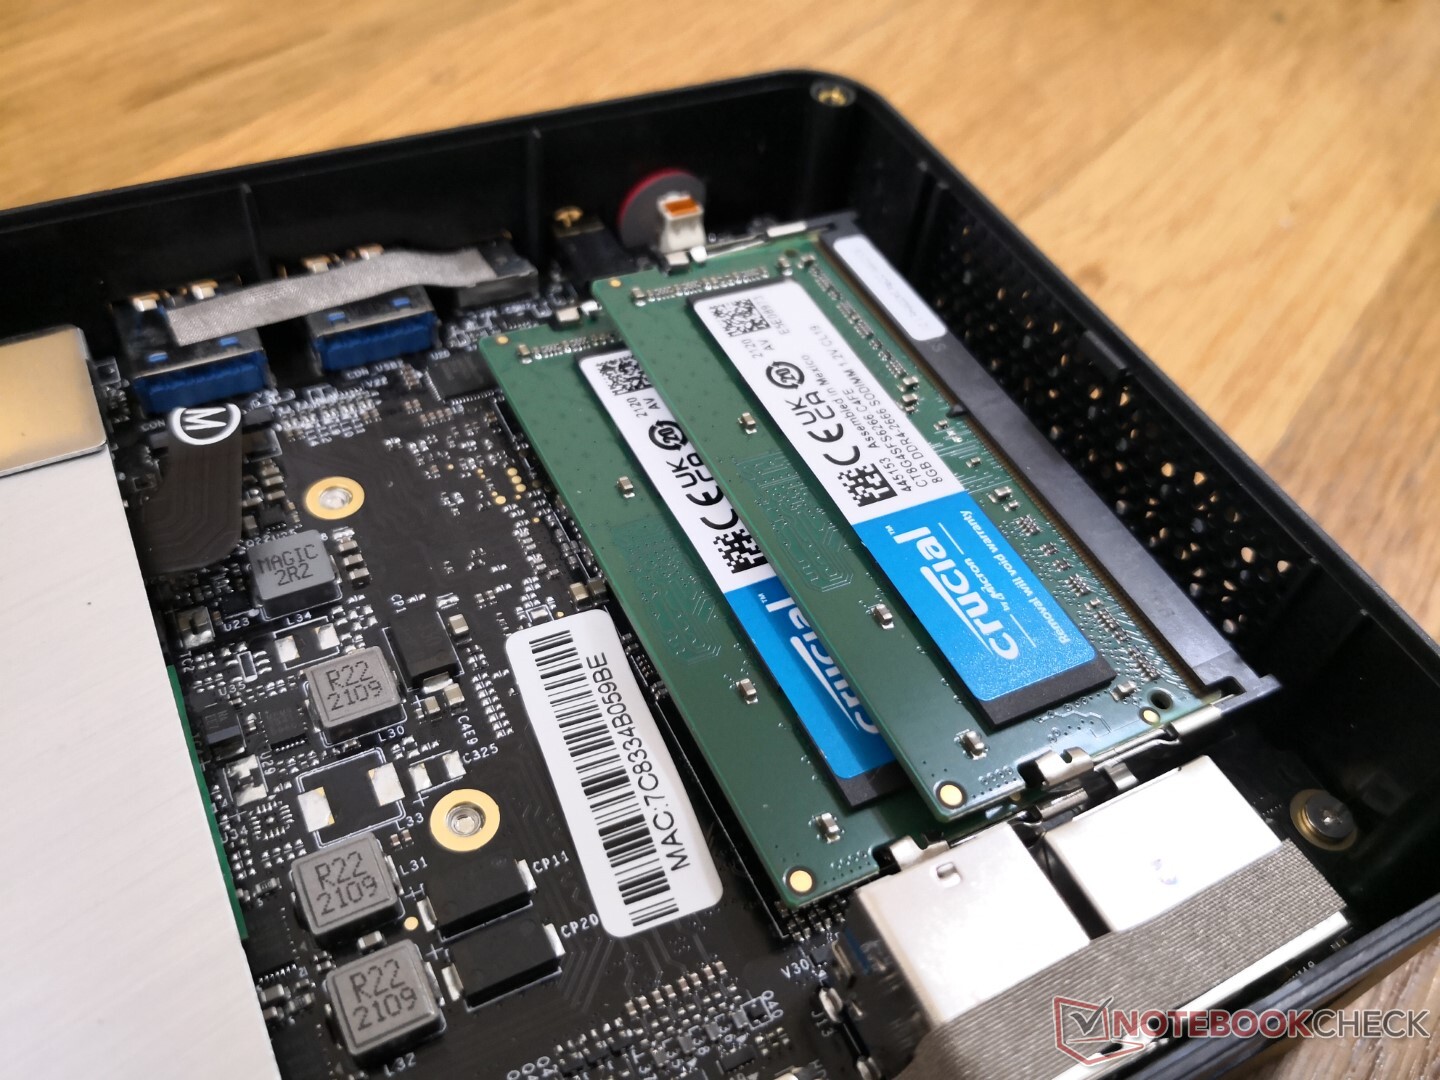
El panel inferior se fija con sólo cuatro tornillos Philips para facilitar su extracción. Los usuarios tienen acceso directo a 2 ranuras SODIMM, el módulo WLAN M.2 extraíble y dos bahías de almacenamiento (M.2 2280 SATA III + SATA III de 2,5 pulgadas). Por desgracia, el procesador y el ventilador requieren un desmontaje adicional, ya que ambos están en el otro lado de la placa base.
Accesorios y garantía
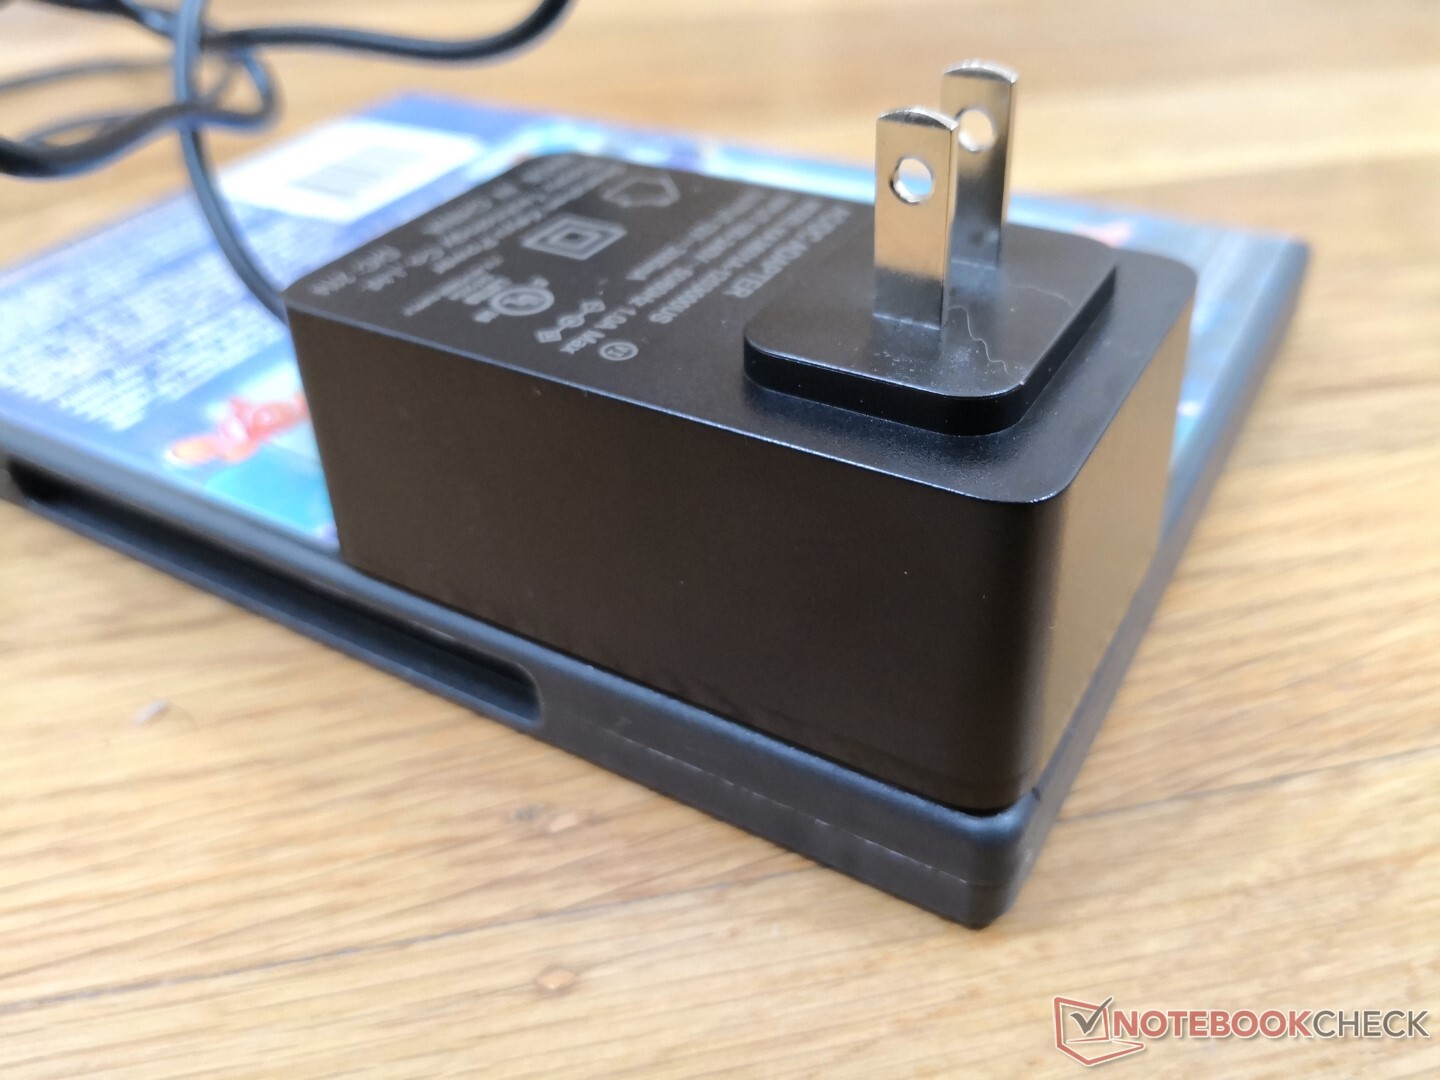
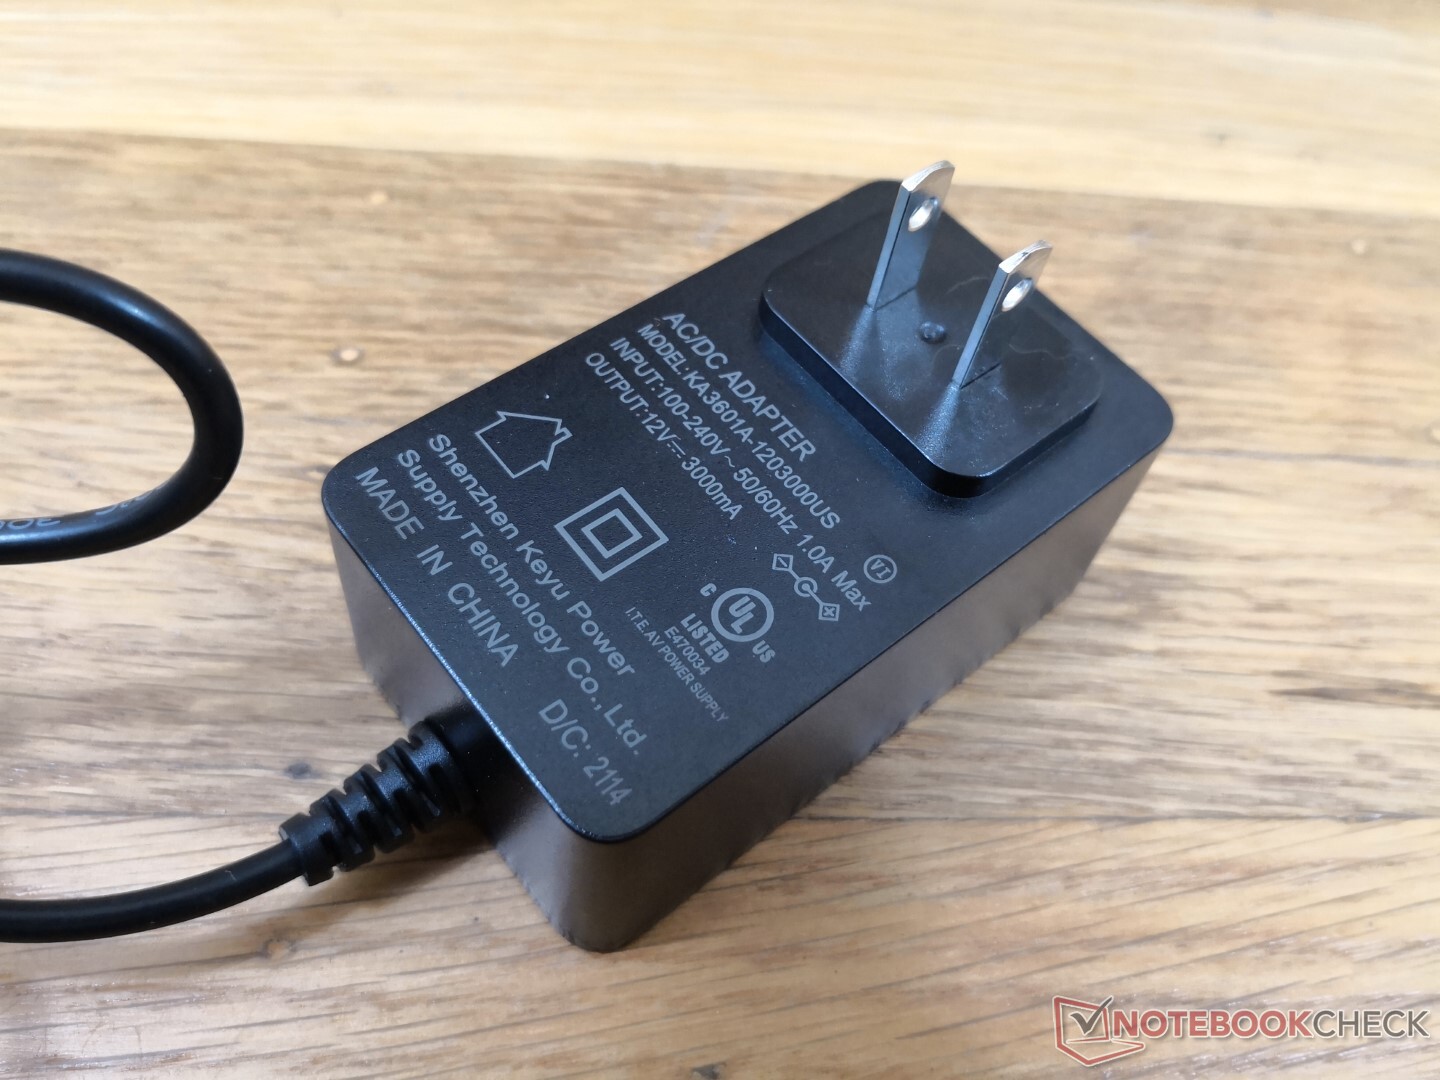
La caja incluye dos cables HDMI, un adaptador de CA, documentación y un soporte de montaje VESA extraíble. Se aplica la garantía limitada estándar de un año
Rendimiento
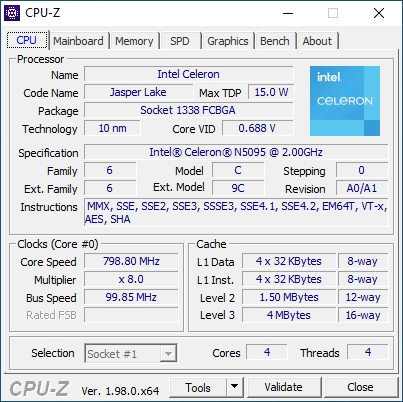
Procesador
El rendimiento de la CPU multihilo es sorprendentemente bastante parecido al de Ice LakeCore i3-1005G1. Por el contrario, el rendimiento de un solo hilo es mucho más lento, entre un 30 y un 40 por ciento. El Celeron N5095 tiene cuatro núcleos físicos sin Hyper-Threading, mientras que el i3-1005G1 tiene dos núcleos físicos con Hyper-Threading, por lo que no es de extrañar que el rendimiento de un solo hilo sea más rápido en el procesador con menos núcleos. Por lo demás, la sostenibilidad del rendimiento en el tiempo es excelente cuando se ejecuta CineBench R15 xT en bucle.
Cinebench R15 Multi Loop
Cinebench R23: Multi Core | Single Core
Cinebench R20: CPU (Multi Core) | CPU (Single Core)
Cinebench R15: CPU Multi 64Bit | CPU Single 64Bit
Blender: v2.79 BMW27 CPU
7-Zip 18.03: 7z b 4 | 7z b 4 -mmt1
Geekbench 5.5: Multi-Core | Single-Core
HWBOT x265 Benchmark v2.2: 4k Preset
LibreOffice : 20 Documents To PDF
R Benchmark 2.5: Overall mean
| CPU Performance rating | |
| Intel NUC11TNKi5 | |
| Intel NUC8i7BE -3! | |
| Zotac ZBOX MI642 Nano -2! | |
| Beelink SEi10 -2! | |
| Beelink U59 -2! | |
| Medio Intel Celeron N5095 | |
| GMK NucBox K1 -2! | |
| Blackview AceBook 1 -2! | |
| Jumper Tech Ez Book X3 Air -2! | |
| Asus BR1100FKA-BP0109RA | |
| Chuwi LapBook Plus -6! | |
| Cinebench R23 / Multi Core | |
| Intel NUC11TNKi5 | |
| Beelink U59 | |
| Medio Intel Celeron N5095 (2150 - 2219, n=5) | |
| Blackview AceBook 1 | |
| Asus BR1100FKA-BP0109RA | |
| Cinebench R23 / Single Core | |
| Intel NUC11TNKi5 | |
| Beelink U59 | |
| Medio Intel Celeron N5095 (587 - 621, n=5) | |
| Asus BR1100FKA-BP0109RA | |
| Blackview AceBook 1 | |
| Cinebench R20 / CPU (Multi Core) | |
| Intel NUC11TNKi5 | |
| Intel NUC8i7BE | |
| Zotac ZBOX MI642 Nano | |
| Beelink SEi10 | |
| Beelink U59 | |
| Medio Intel Celeron N5095 (804 - 844, n=5) | |
| Jumper Tech Ez Book X3 Air | |
| Blackview AceBook 1 | |
| Asus BR1100FKA-BP0109RA | |
| GMK NucBox K1 | |
| Chuwi LapBook Plus | |
| Cinebench R20 / CPU (Single Core) | |
| Intel NUC11TNKi5 | |
| Intel NUC8i7BE | |
| Zotac ZBOX MI642 Nano | |
| Beelink SEi10 | |
| Beelink U59 | |
| Medio Intel Celeron N5095 (228 - 239, n=5) | |
| Asus BR1100FKA-BP0109RA | |
| GMK NucBox K1 | |
| Blackview AceBook 1 | |
| Jumper Tech Ez Book X3 Air | |
| Chuwi LapBook Plus | |
| Cinebench R15 / CPU Multi 64Bit | |
| Intel NUC8i7BE | |
| Intel NUC11TNKi5 | |
| Zotac ZBOX MI642 Nano | |
| Beelink SEi10 | |
| Beelink U59 | |
| Medio Intel Celeron N5095 (221 - 379, n=6) | |
| GMK NucBox K1 | |
| Blackview AceBook 1 | |
| Jumper Tech Ez Book X3 Air | |
| Asus BR1100FKA-BP0109RA | |
| Chuwi LapBook Plus | |
| Cinebench R15 / CPU Single 64Bit | |
| Intel NUC11TNKi5 | |
| Intel NUC8i7BE | |
| Zotac ZBOX MI642 Nano | |
| Beelink SEi10 | |
| Beelink U59 | |
| Medio Intel Celeron N5095 (95.4 - 109, n=5) | |
| Asus BR1100FKA-BP0109RA | |
| GMK NucBox K1 | |
| Blackview AceBook 1 | |
| Jumper Tech Ez Book X3 Air | |
| Chuwi LapBook Plus | |
| Blender / v2.79 BMW27 CPU | |
| Chuwi LapBook Plus | |
| Asus BR1100FKA-BP0109RA | |
| Jumper Tech Ez Book X3 Air | |
| Blackview AceBook 1 | |
| GMK NucBox K1 | |
| Medio Intel Celeron N5095 (1502 - 1624, n=5) | |
| Beelink U59 | |
| Beelink SEi10 | |
| Zotac ZBOX MI642 Nano | |
| Intel NUC8i7BE | |
| Intel NUC8i7BE | |
| Intel NUC11TNKi5 | |
| 7-Zip 18.03 / 7z b 4 | |
| Intel NUC8i7BE | |
| Intel NUC8i7BE | |
| Intel NUC11TNKi5 | |
| Zotac ZBOX MI642 Nano | |
| Beelink U59 | |
| Medio Intel Celeron N5095 (10924 - 11168, n=5) | |
| Beelink SEi10 | |
| GMK NucBox K1 | |
| Blackview AceBook 1 | |
| Jumper Tech Ez Book X3 Air | |
| Asus BR1100FKA-BP0109RA | |
| Chuwi LapBook Plus | |
| 7-Zip 18.03 / 7z b 4 -mmt1 | |
| Intel NUC8i7BE | |
| Intel NUC8i7BE | |
| Intel NUC11TNKi5 | |
| Zotac ZBOX MI642 Nano | |
| Beelink SEi10 | |
| Beelink U59 | |
| Medio Intel Celeron N5095 (2935 - 3124, n=5) | |
| Asus BR1100FKA-BP0109RA | |
| Blackview AceBook 1 | |
| GMK NucBox K1 | |
| Jumper Tech Ez Book X3 Air | |
| Chuwi LapBook Plus | |
| Geekbench 5.5 / Multi-Core | |
| Intel NUC11TNKi5 | |
| Zotac ZBOX MI642 Nano | |
| Intel NUC8i7BE | |
| Beelink SEi10 | |
| Medio Intel Celeron N5095 (1933 - 2052, n=4) | |
| Jumper Tech Ez Book X3 Air | |
| GMK NucBox K1 | |
| Asus BR1100FKA-BP0109RA | |
| Geekbench 5.5 / Single-Core | |
| Intel NUC11TNKi5 | |
| Beelink SEi10 | |
| Zotac ZBOX MI642 Nano | |
| Intel NUC8i7BE | |
| Medio Intel Celeron N5095 (637 - 659, n=4) | |
| GMK NucBox K1 | |
| Jumper Tech Ez Book X3 Air | |
| Asus BR1100FKA-BP0109RA | |
| HWBOT x265 Benchmark v2.2 / 4k Preset | |
| Intel NUC11TNKi5 | |
| Intel NUC8i7BE | |
| Intel NUC8i7BE | |
| Zotac ZBOX MI642 Nano | |
| Beelink SEi10 | |
| Beelink U59 | |
| Medio Intel Celeron N5095 (1.9 - 2.05, n=5) | |
| GMK NucBox K1 | |
| Jumper Tech Ez Book X3 Air | |
| Blackview AceBook 1 | |
| Chuwi LapBook Plus | |
| Asus BR1100FKA-BP0109RA | |
| LibreOffice / 20 Documents To PDF | |
| Asus BR1100FKA-BP0109RA | |
| Blackview AceBook 1 | |
| Jumper Tech Ez Book X3 Air | |
| GMK NucBox K1 | |
| Medio Intel Celeron N5095 (97 - 107.9, n=5) | |
| Beelink U59 | |
| Zotac ZBOX MI642 Nano | |
| Beelink SEi10 | |
| Intel NUC11TNKi5 | |
| R Benchmark 2.5 / Overall mean | |
| Asus BR1100FKA-BP0109RA | |
| Jumper Tech Ez Book X3 Air | |
| Blackview AceBook 1 | |
| GMK NucBox K1 | |
| Medio Intel Celeron N5095 (1.16 - 1.2, n=5) | |
| Beelink U59 | |
| Beelink SEi10 | |
| Zotac ZBOX MI642 Nano | |
| Intel NUC8i7BE | |
| Intel NUC11TNKi5 | |
* ... más pequeño es mejor
AIDA64: FP32 Ray-Trace | FPU Julia | CPU SHA3 | CPU Queen | FPU SinJulia | FPU Mandel | CPU AES | CPU ZLib | FP64 Ray-Trace | CPU PhotoWorxx
| Performance rating | |
| Intel NUC11TNKi5 | |
| Intel NUC8i7BE -1! | |
| Zotac ZBOX MI642 Nano | |
| Beelink U59 | |
| AIDA64 / FP32 Ray-Trace | |
| Intel NUC11TNKi5 | |
| Intel NUC8i7BE | |
| Zotac ZBOX MI642 Nano | |
| Beelink U59 | |
| AIDA64 / FPU Julia | |
| Intel NUC11TNKi5 | |
| Intel NUC8i7BE | |
| Zotac ZBOX MI642 Nano | |
| Beelink U59 | |
| AIDA64 / CPU SHA3 | |
| Intel NUC11TNKi5 | |
| Zotac ZBOX MI642 Nano | |
| Beelink U59 | |
| AIDA64 / CPU Queen | |
| Intel NUC8i7BE | |
| Zotac ZBOX MI642 Nano | |
| Intel NUC11TNKi5 | |
| Beelink U59 | |
| AIDA64 / FPU SinJulia | |
| Intel NUC8i7BE | |
| Intel NUC11TNKi5 | |
| Zotac ZBOX MI642 Nano | |
| Beelink U59 | |
| AIDA64 / FPU Mandel | |
| Intel NUC11TNKi5 | |
| Intel NUC8i7BE | |
| Zotac ZBOX MI642 Nano | |
| Beelink U59 | |
| AIDA64 / CPU AES | |
| Intel NUC11TNKi5 | |
| Beelink U59 | |
| Intel NUC8i7BE | |
| Zotac ZBOX MI642 Nano | |
| AIDA64 / CPU ZLib | |
| Intel NUC11TNKi5 | |
| Intel NUC8i7BE | |
| Zotac ZBOX MI642 Nano | |
| Beelink U59 | |
| AIDA64 / FP64 Ray-Trace | |
| Intel NUC11TNKi5 | |
| Intel NUC8i7BE | |
| Zotac ZBOX MI642 Nano | |
| Beelink U59 | |
| AIDA64 / CPU PhotoWorxx | |
| Intel NUC8i7BE | |
| Intel NUC11TNKi5 | |
| Zotac ZBOX MI642 Nano | |
| Beelink U59 | |
Rendimiento del sistema
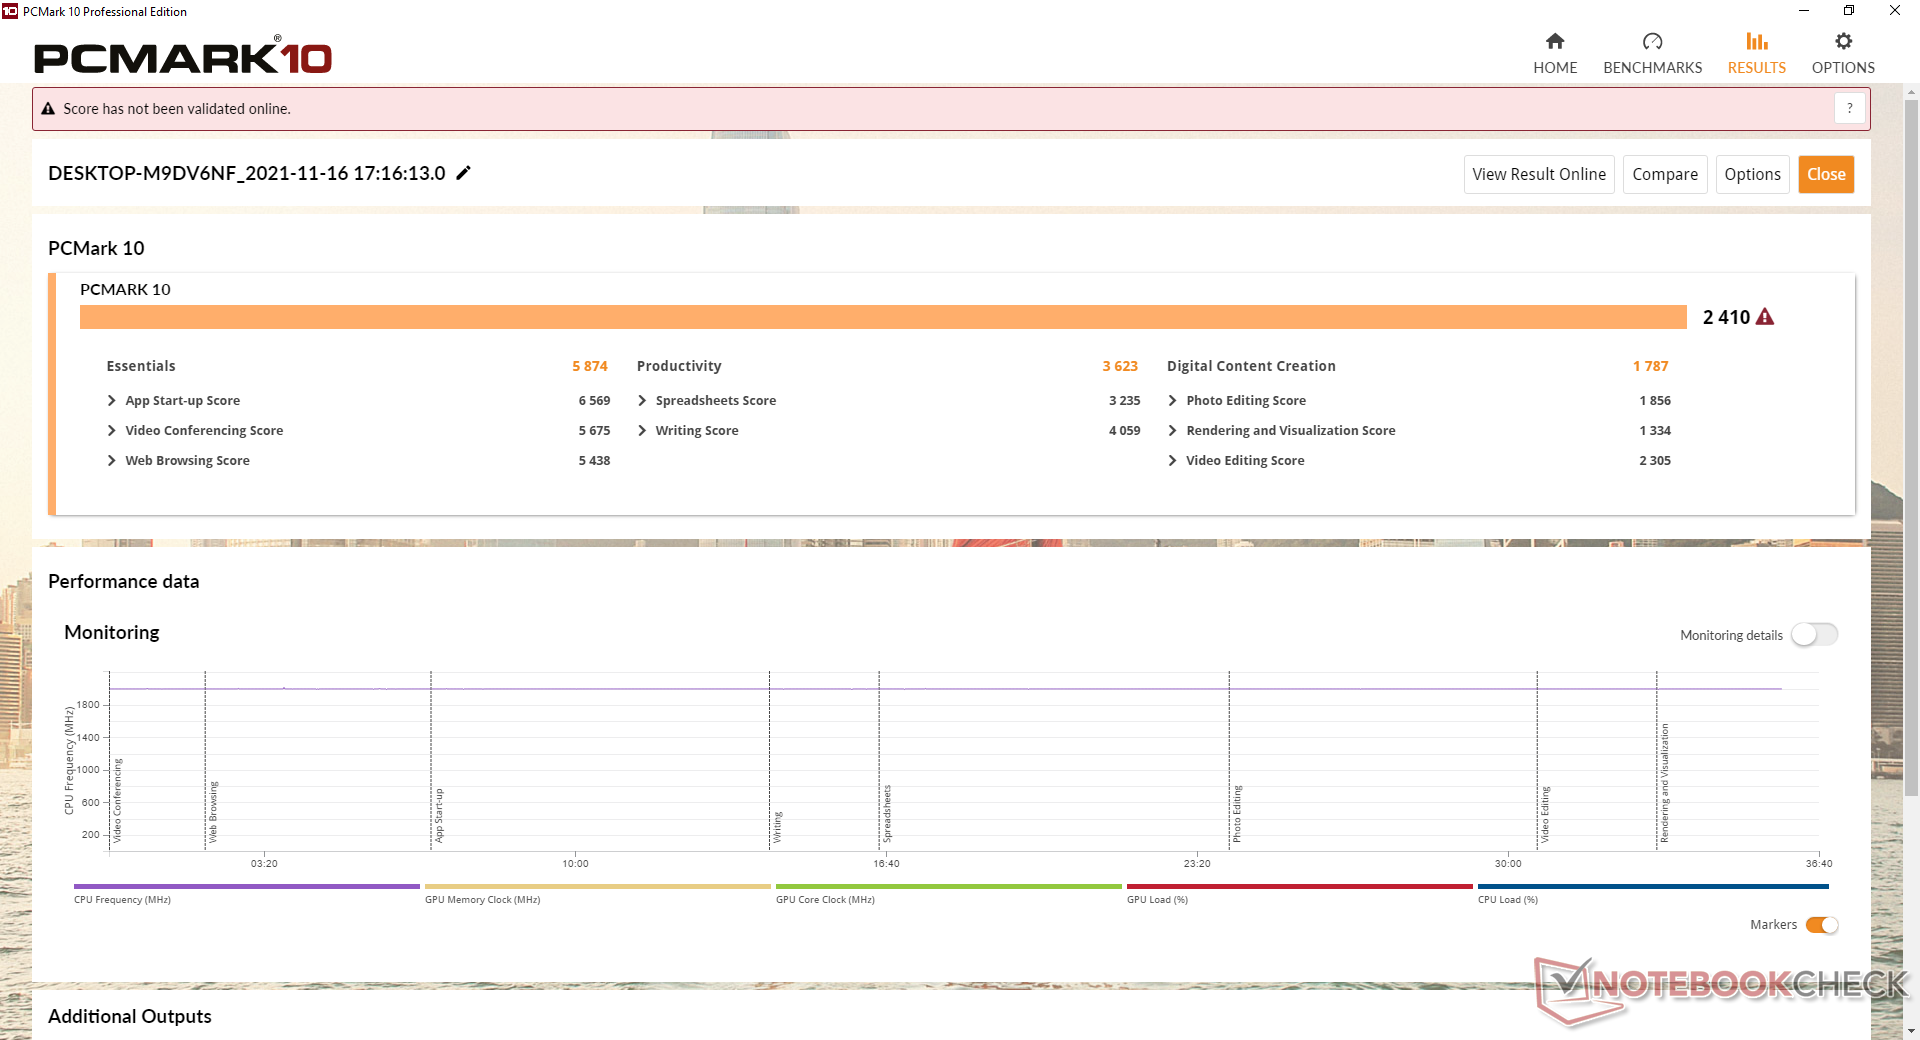
Las puntuaciones de PCMark 10 son sistemáticamente superiores a las delGMK NucBox K1 mientras que son más lentos que el Core i3 de Beelink SEi10.
| PCMark 10 / Score | |
| Intel NUC8i7BE | |
| Intel NUC11TNKi5 | |
| Zotac ZBOX MI642 Nano | |
| Beelink SEi10 | |
| Beelink U59 | |
| Medio Intel Celeron N5095, Intel UHD Graphics (Jasper Lake 16 EU) (2317 - 2417, n=5) | |
| GMK NucBox K1 | |
| PCMark 10 / Essentials | |
| Intel NUC11TNKi5 | |
| Intel NUC8i7BE | |
| Zotac ZBOX MI642 Nano | |
| Beelink SEi10 | |
| Beelink U59 | |
| Medio Intel Celeron N5095, Intel UHD Graphics (Jasper Lake 16 EU) (5516 - 5874, n=5) | |
| GMK NucBox K1 | |
| PCMark 10 / Productivity | |
| Intel NUC8i7BE | |
| Zotac ZBOX MI642 Nano | |
| Intel NUC11TNKi5 | |
| Beelink SEi10 | |
| Beelink U59 | |
| Medio Intel Celeron N5095, Intel UHD Graphics (Jasper Lake 16 EU) (3454 - 3666, n=5) | |
| GMK NucBox K1 | |
| PCMark 10 / Digital Content Creation | |
| Intel NUC11TNKi5 | |
| Intel NUC8i7BE | |
| Zotac ZBOX MI642 Nano | |
| Beelink SEi10 | |
| Beelink U59 | |
| Medio Intel Celeron N5095, Intel UHD Graphics (Jasper Lake 16 EU) (1752 - 1787, n=5) | |
| GMK NucBox K1 | |
| PCMark 10 Score | 2410 puntos | |
ayuda | ||
| AIDA64 / Memory Copy | |
| Intel NUC8i7BE | |
| Zotac ZBOX MI642 Nano | |
| Beelink U59 | |
| Intel NUC11TNKi5 | |
| AIDA64 / Memory Read | |
| Intel NUC8i7BE | |
| Zotac ZBOX MI642 Nano | |
| Intel NUC11TNKi5 | |
| Beelink U59 | |
| AIDA64 / Memory Write | |
| Intel NUC8i7BE | |
| Zotac ZBOX MI642 Nano | |
| Beelink U59 | |
| Intel NUC11TNKi5 | |
| AIDA64 / Memory Latency | |
| Zotac ZBOX MI642 Nano | |
| Intel NUC11TNKi5 | |
| Beelink U59 | |
| Intel NUC8i7BE | |
* ... más pequeño es mejor
Latencia del CPD
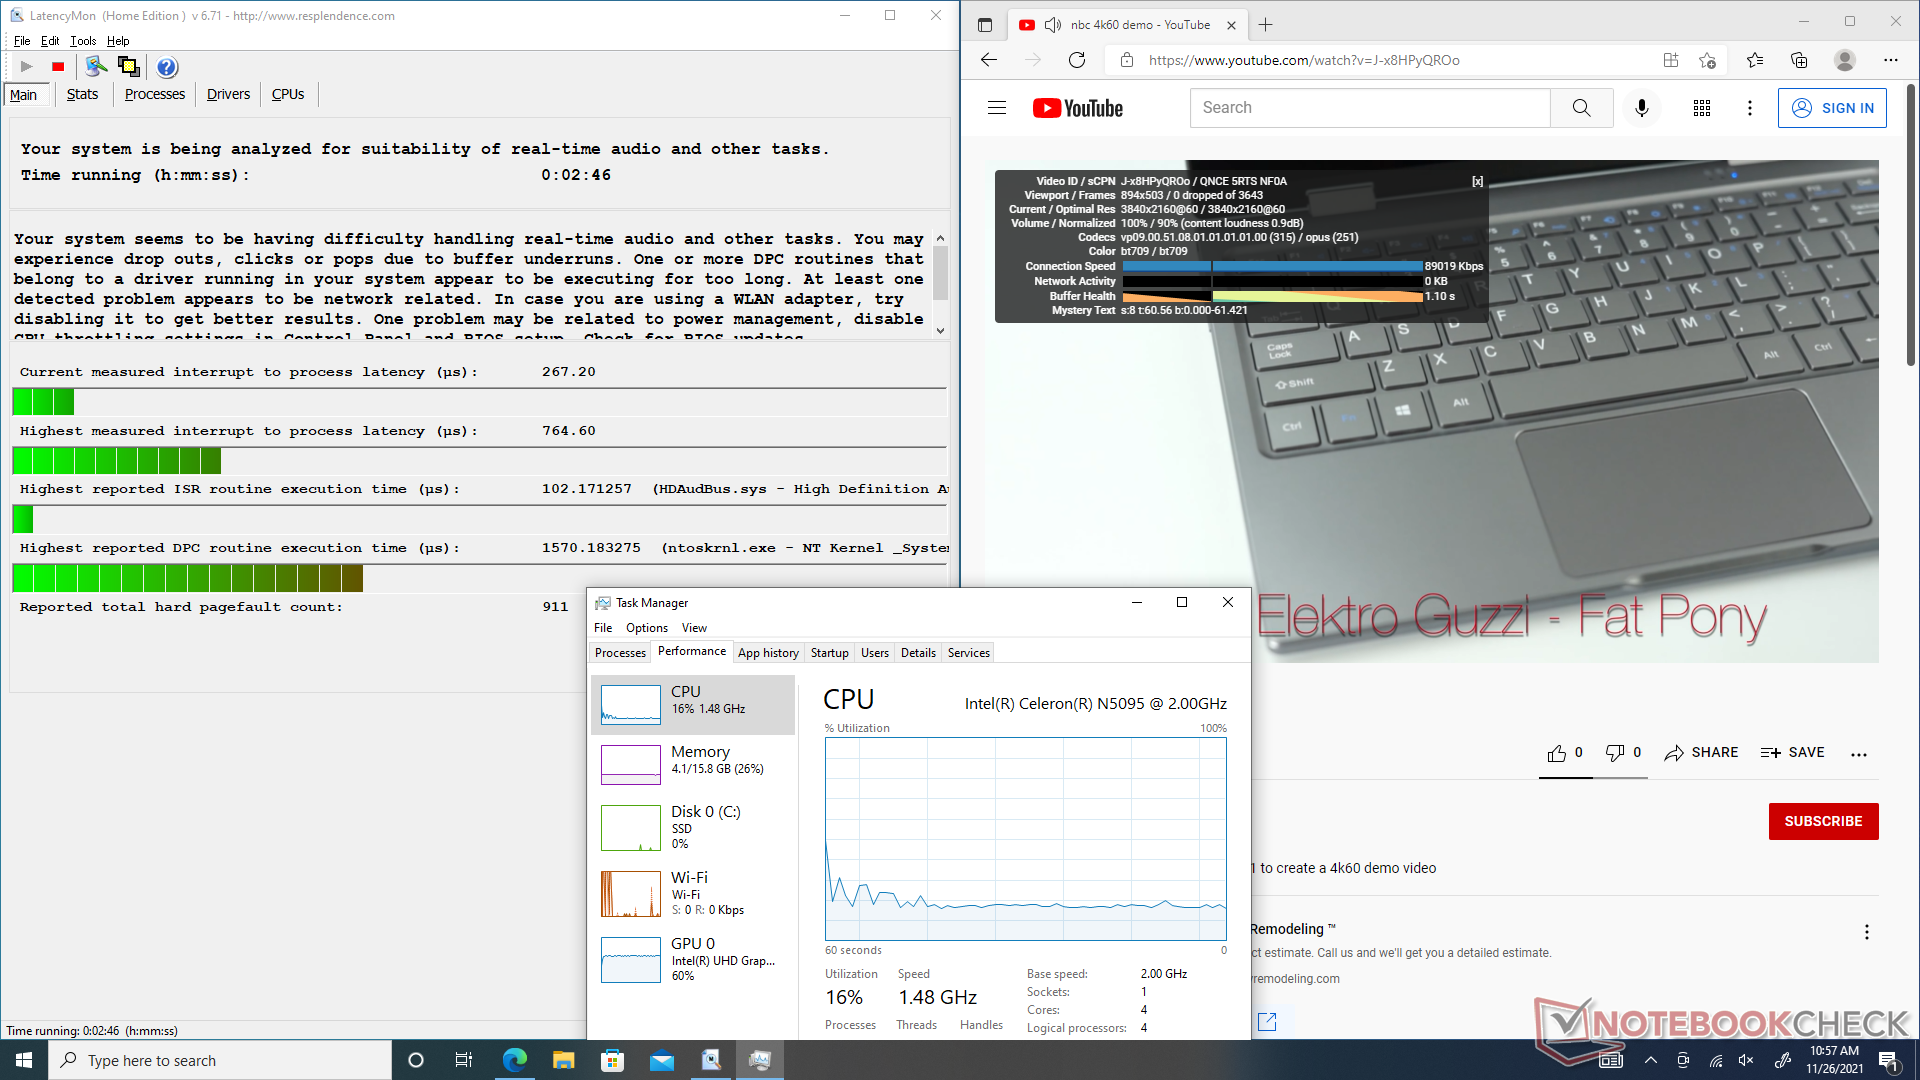
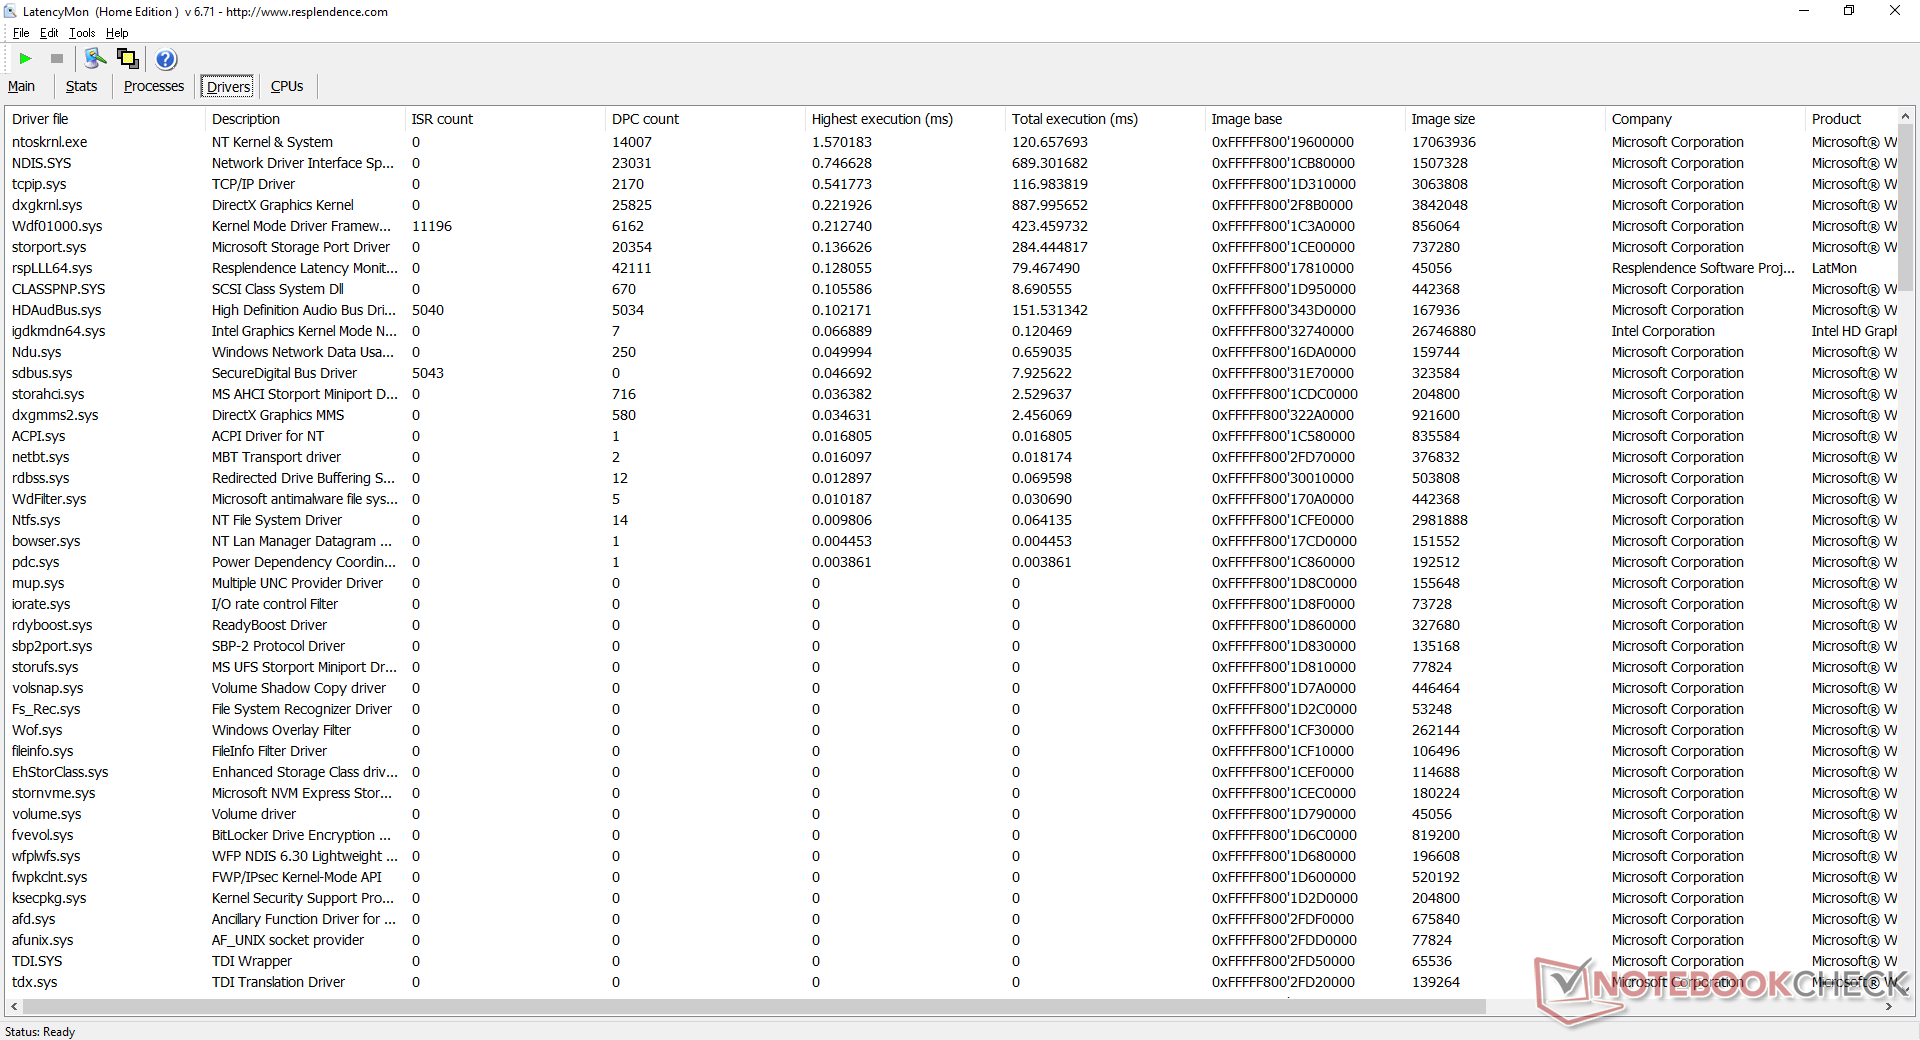
LatencyMon revela problemas menores de latencia del CPD al abrir varias pestañas del navegador en nuestra página de inicio. La reproducción de vídeo 4K es, por lo demás, excelente, sin caídas de frames durante nuestra prueba de un minuto. La utilización de la GPU es relativamente alta, un 60%.
| DPC Latencies / LatencyMon - interrupt to process latency (max), Web, Youtube, Prime95 | |
| GMK NucBox K1 | |
| Beelink SEi10 | |
| Beelink U59 | |
| Intel NUC11TNKi5 | |
* ... más pequeño es mejor
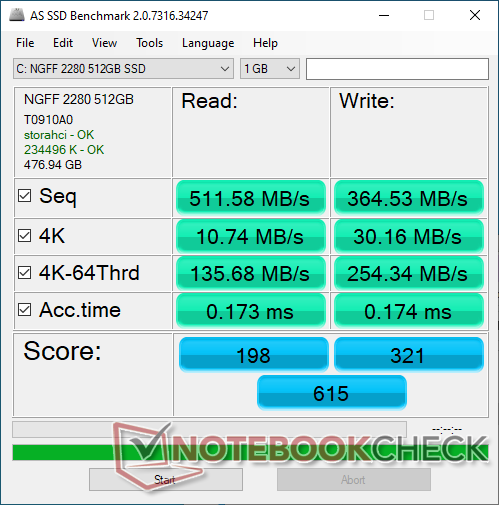
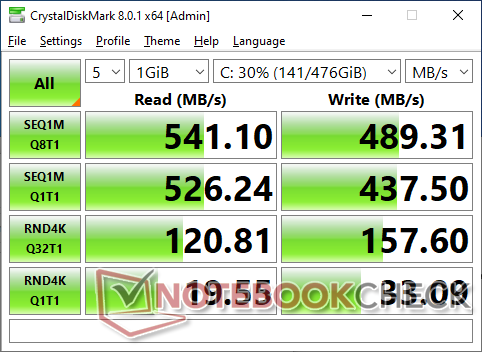
Dispositivos de almacenamiento
Nuestra unidad de prueba viene con un 512 GB AZW M.2 2280 SATA III SSD que es una marca relativamente desconocida para ahorrar costes. La mayoría de los otros PCs utilizan marcas de SSD más conocidas como Samsung, Intel, Kingston u otras. Sin embargo, las tasas de transferencia son excelentes para una unidad SATA III, con tasas de lectura y escritura secuenciales de unos 500 MB/s cada una.

| Drive Performance rating - Percent | |
| Beelink SEi10 | |
| Zotac ZBOX MI642 Nano | |
| Intel NUC11TNKi5 | |
| Beelink U59 | |
| GMK NucBox K1 | |
| DiskSpd | |
| seq read | |
| Beelink SEi10 | |
| Intel NUC11TNKi5 | |
| Zotac ZBOX MI642 Nano | |
| Beelink U59 | |
| GMK NucBox K1 | |
| seq write | |
| Beelink SEi10 | |
| Zotac ZBOX MI642 Nano | |
| Intel NUC11TNKi5 | |
| Beelink U59 | |
| GMK NucBox K1 | |
| seq q8 t1 read | |
| Beelink SEi10 | |
| Intel NUC11TNKi5 | |
| Zotac ZBOX MI642 Nano | |
| Beelink U59 | |
| GMK NucBox K1 | |
| seq q8 t1 write | |
| Beelink SEi10 | |
| Zotac ZBOX MI642 Nano | |
| Intel NUC11TNKi5 | |
| GMK NucBox K1 | |
| Beelink U59 | |
| 4k q1 t1 read | |
| Beelink SEi10 | |
| Zotac ZBOX MI642 Nano | |
| Intel NUC11TNKi5 | |
| Beelink U59 | |
| GMK NucBox K1 | |
| 4k q1 t1 write | |
| Beelink SEi10 | |
| Zotac ZBOX MI642 Nano | |
| GMK NucBox K1 | |
| Intel NUC11TNKi5 | |
| Beelink U59 | |
| 4k q32 t16 read | |
| Beelink SEi10 | |
| Zotac ZBOX MI642 Nano | |
| Intel NUC11TNKi5 | |
| Beelink U59 | |
| GMK NucBox K1 | |
| 4k q32 t16 write | |
| Beelink SEi10 | |
| Intel NUC11TNKi5 | |
| Zotac ZBOX MI642 Nano | |
| GMK NucBox K1 | |
| Beelink U59 | |
| AS SSD | |
| Score Total | |
| Zotac ZBOX MI642 Nano | |
| Beelink SEi10 | |
| Intel NUC11TNKi5 | |
| Beelink U59 | |
| GMK NucBox K1 | |
| Score Read | |
| Beelink SEi10 | |
| Zotac ZBOX MI642 Nano | |
| Intel NUC11TNKi5 | |
| Beelink U59 | |
| GMK NucBox K1 | |
| Score Write | |
| Intel NUC11TNKi5 | |
| Zotac ZBOX MI642 Nano | |
| Beelink U59 | |
| Beelink SEi10 | |
| GMK NucBox K1 | |
| Seq Read | |
| Beelink SEi10 | |
| Intel NUC11TNKi5 | |
| Beelink U59 | |
| Zotac ZBOX MI642 Nano | |
| GMK NucBox K1 | |
| Seq Write | |
| Intel NUC11TNKi5 | |
| Zotac ZBOX MI642 Nano | |
| GMK NucBox K1 | |
| Beelink U59 | |
| Beelink SEi10 | |
| 4K Read | |
| Zotac ZBOX MI642 Nano | |
| Beelink SEi10 | |
| Intel NUC11TNKi5 | |
| Beelink U59 | |
| GMK NucBox K1 | |
| 4K Write | |
| Zotac ZBOX MI642 Nano | |
| Beelink SEi10 | |
| GMK NucBox K1 | |
| Intel NUC11TNKi5 | |
| Beelink U59 | |
| 4K-64 Read | |
| Zotac ZBOX MI642 Nano | |
| Beelink SEi10 | |
| Intel NUC11TNKi5 | |
| Beelink U59 | |
| GMK NucBox K1 | |
| 4K-64 Write | |
| Intel NUC11TNKi5 | |
| Beelink U59 | |
| Zotac ZBOX MI642 Nano | |
| Beelink SEi10 | |
| GMK NucBox K1 | |
| Access Time Read | |
| GMK NucBox K1 | |
| Beelink U59 | |
| Intel NUC11TNKi5 | |
| Zotac ZBOX MI642 Nano | |
| Beelink SEi10 | |
| Access Time Write | |
| Beelink SEi10 | |
| GMK NucBox K1 | |
| Intel NUC11TNKi5 | |
| Beelink U59 | |
| Zotac ZBOX MI642 Nano | |
* ... más pequeño es mejor
Disk Throttling: DiskSpd Read Loop, Queue Depth 8
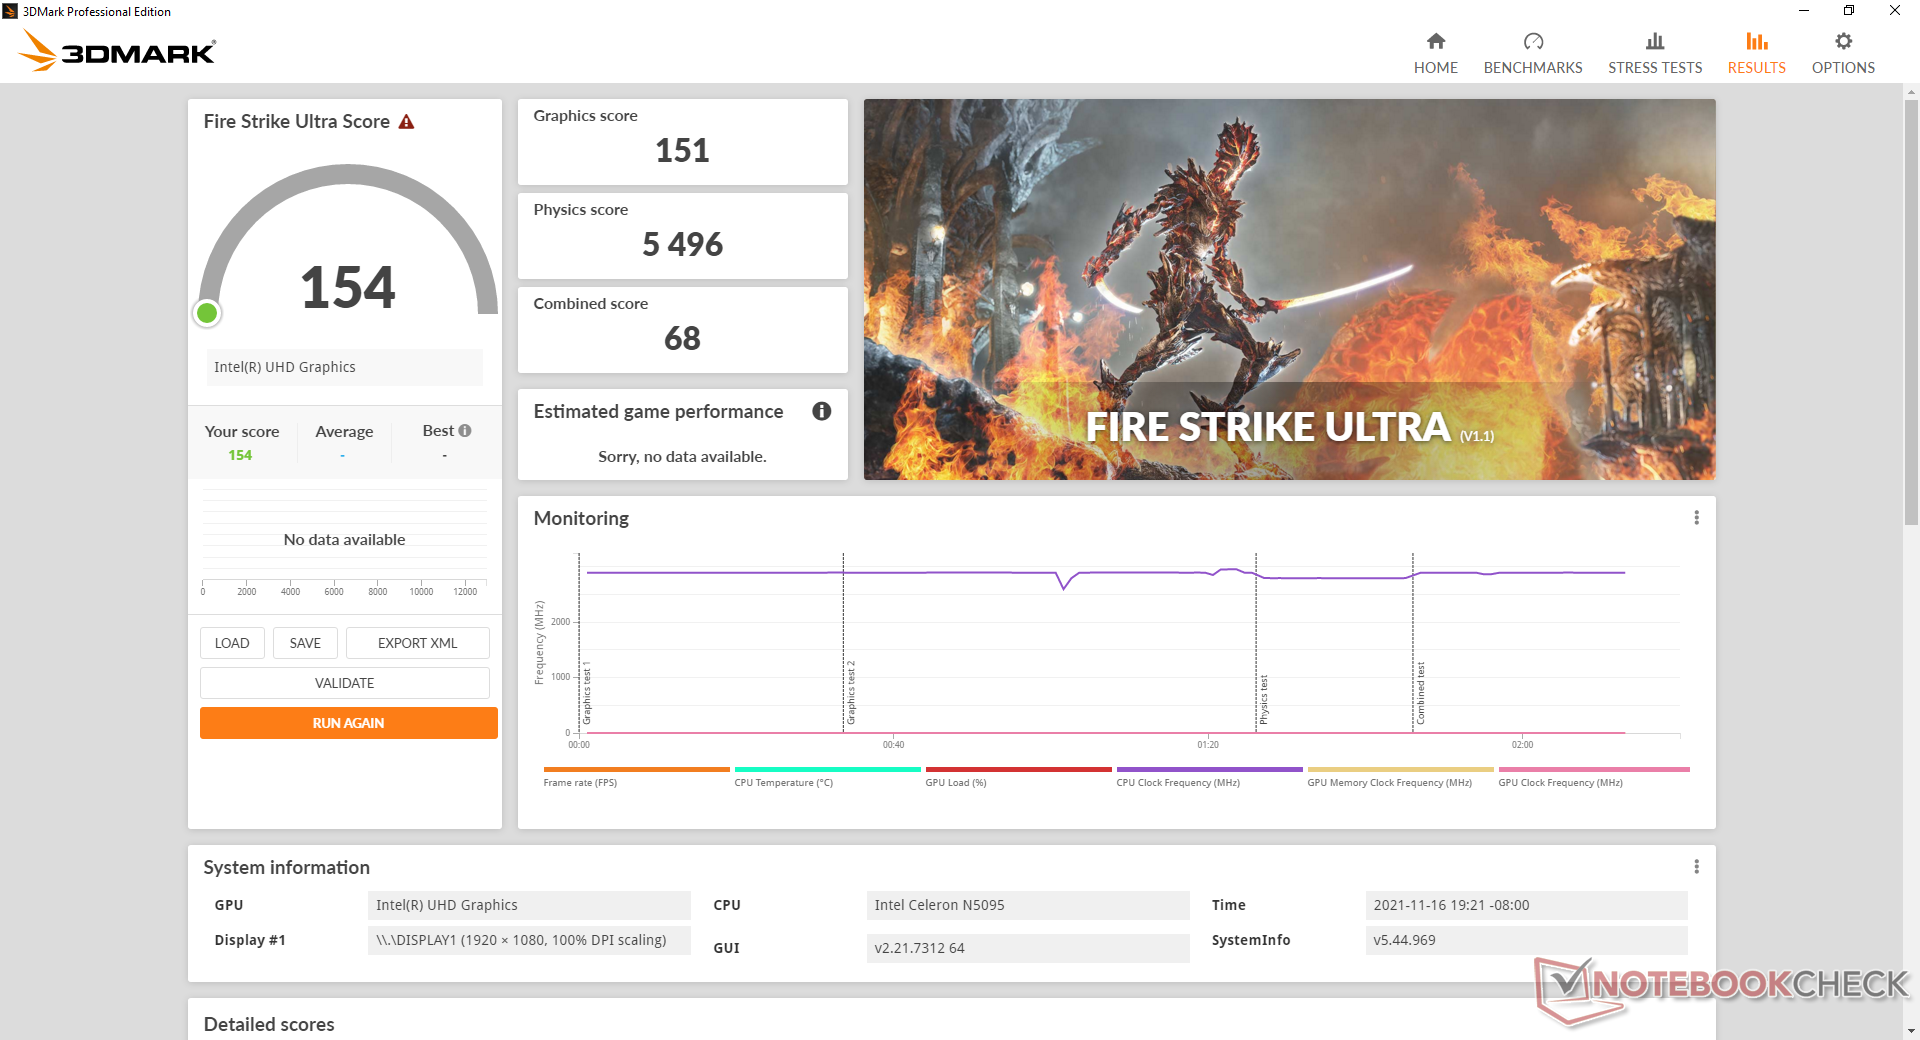
Rendimiento de la GPU
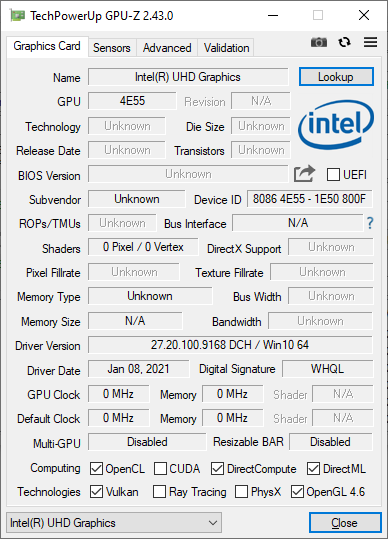
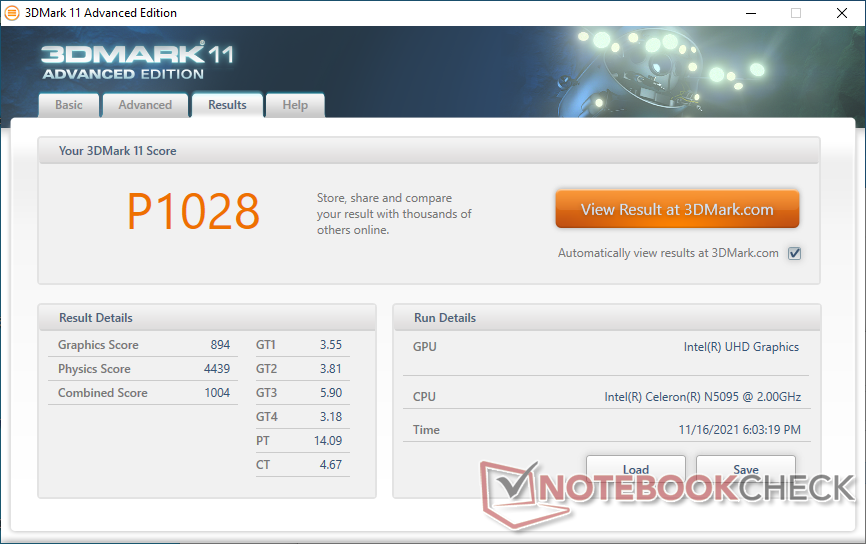
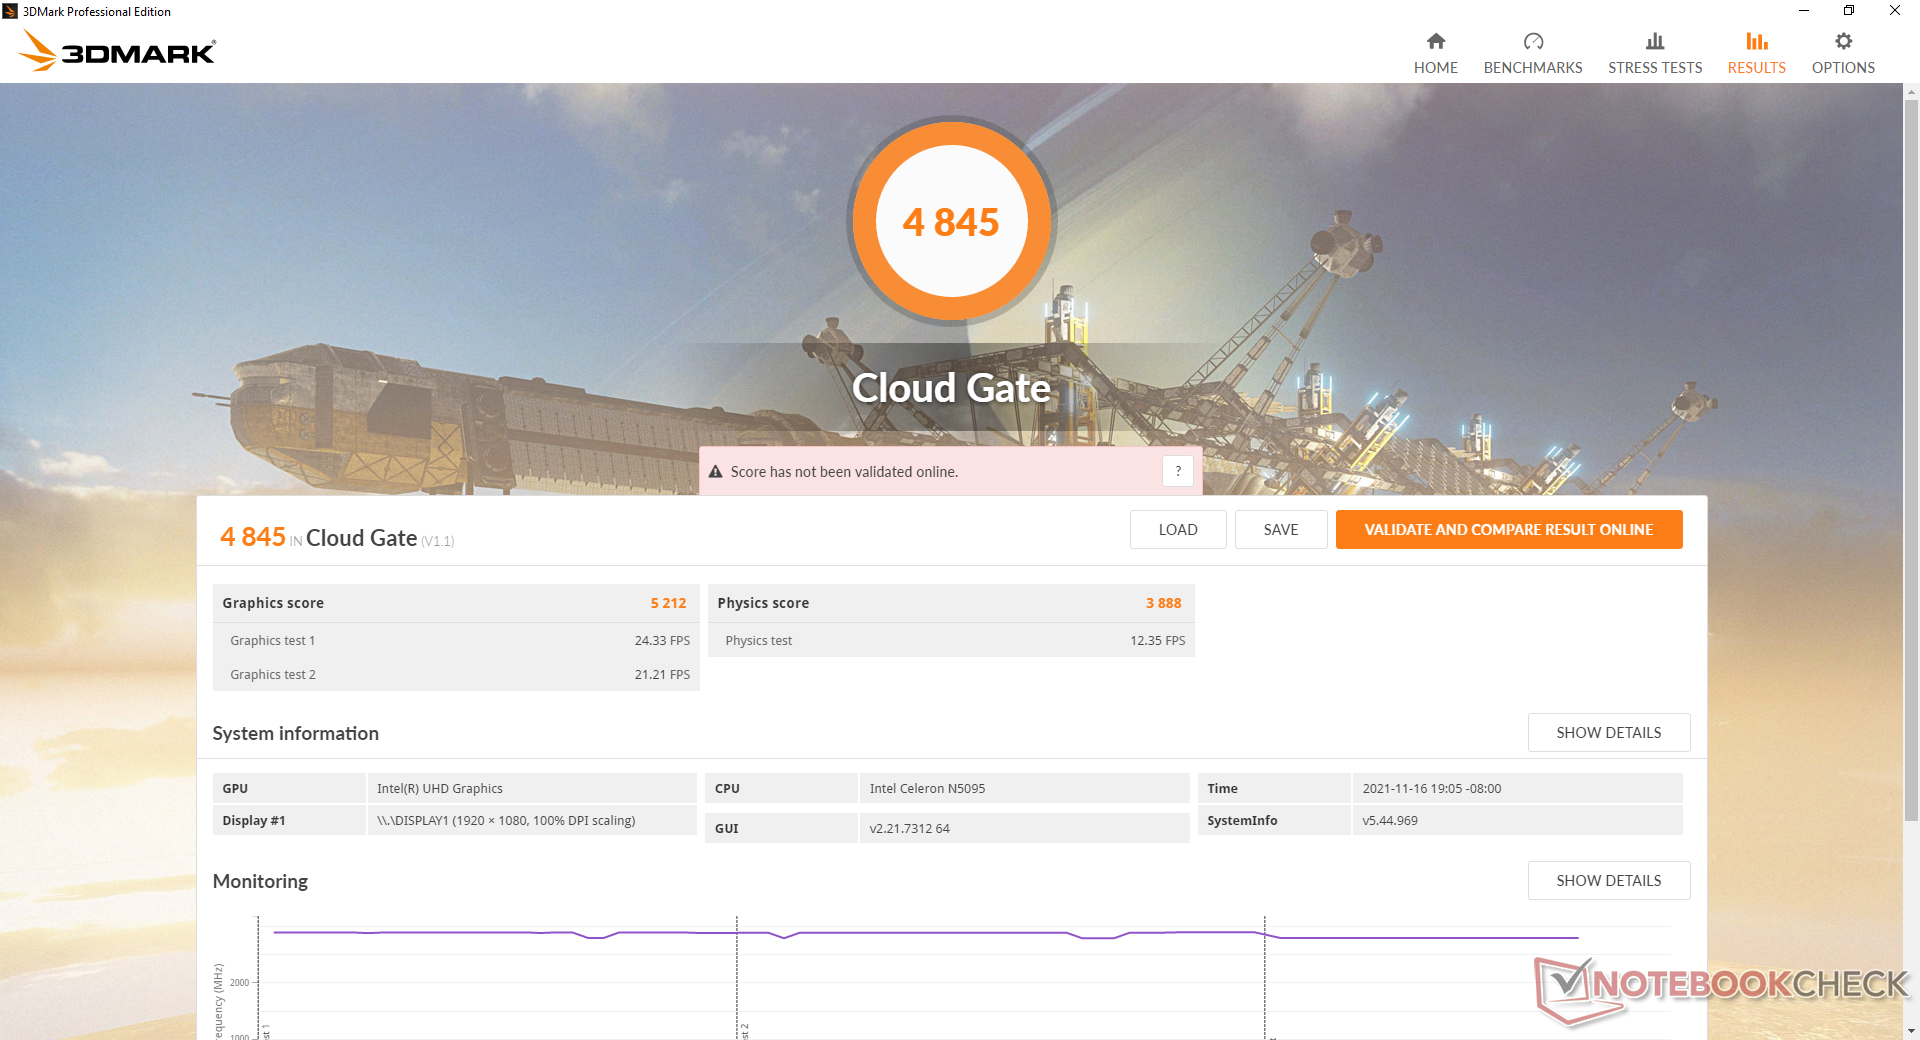
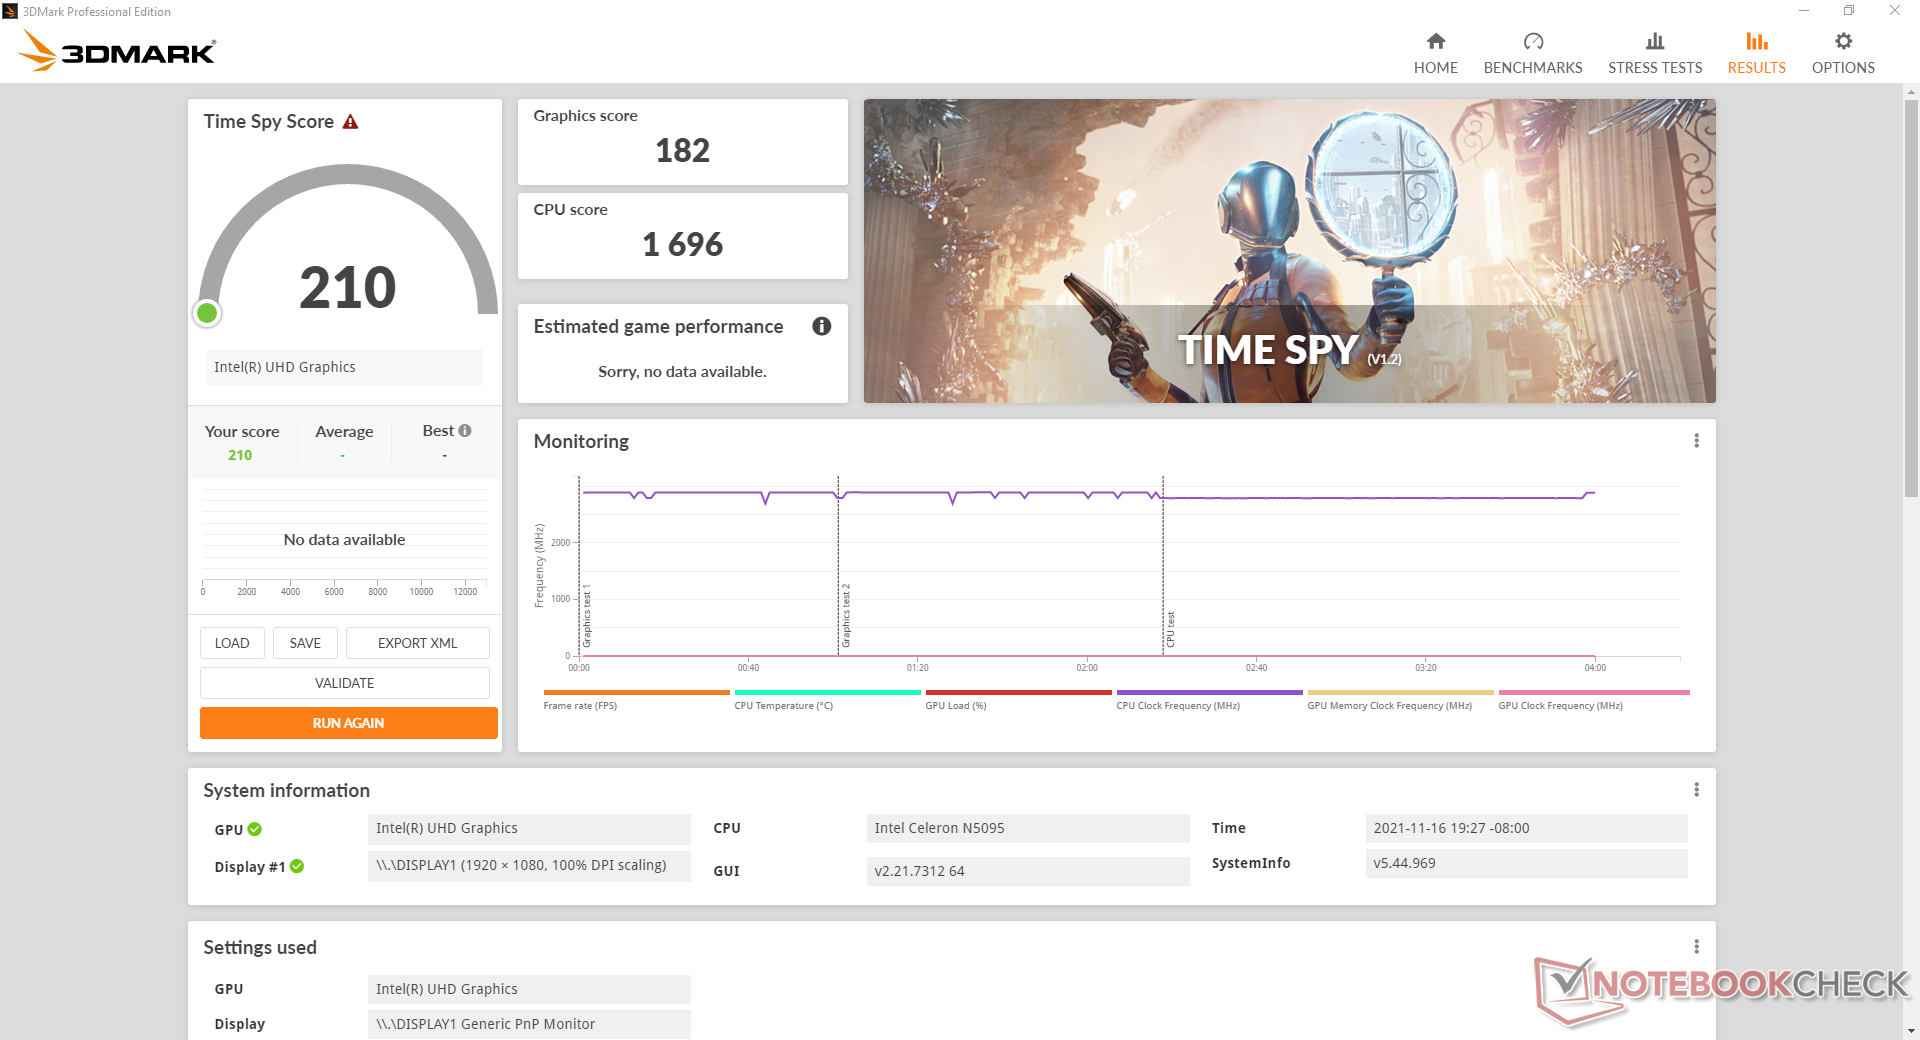
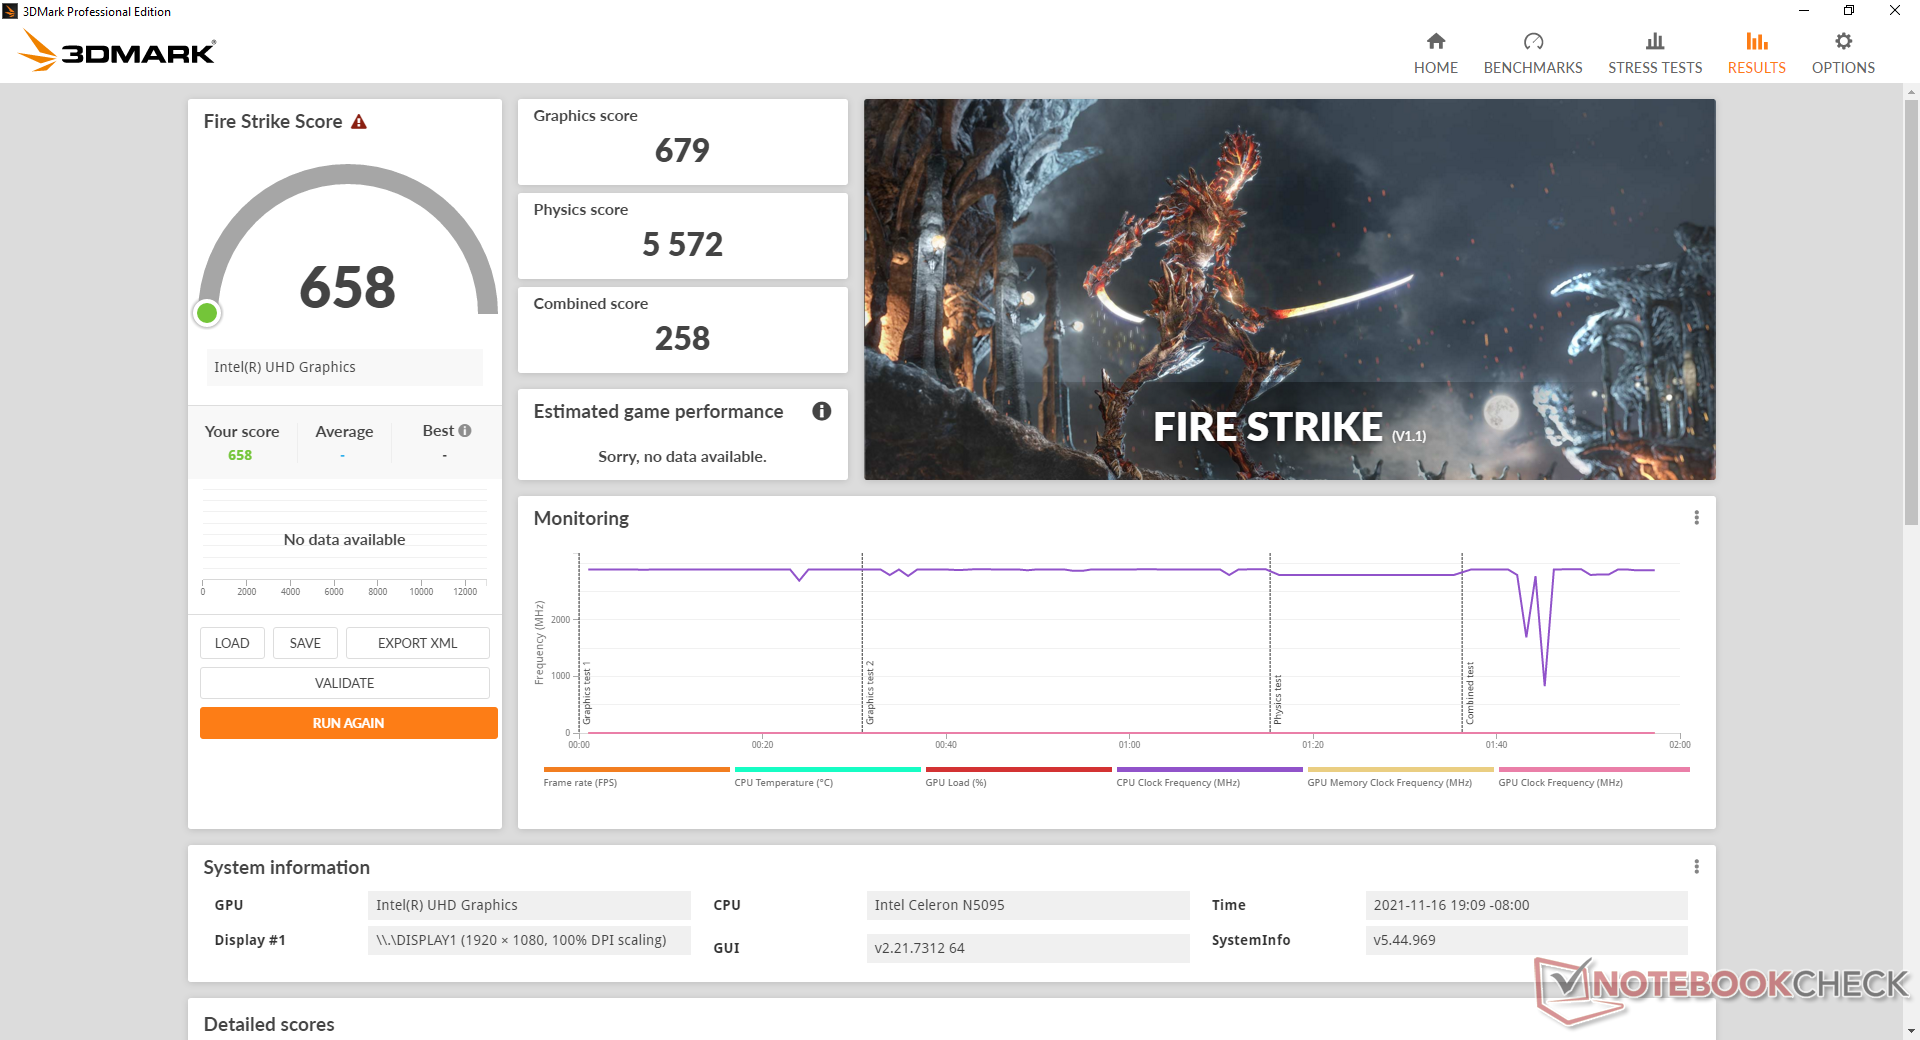
El rendimiento de los gráficos es entre un 40 y un 50 por ciento más lento que el común UHD Graphics 620 que se encontraba en los portátiles y mini PC más antiguos antes de la llegada de Iris Xe. Aunque es capaz de transmitir, no esperes que la mayoría de los juegos nativos se ejecuten bien.
| 3DMark Performance rating - Percent | |
| Intel NUC11TNKi5 | |
| Intel NUC8i7BE | |
| Zotac ZBOX MI642 Nano -3! | |
| Prime Computer PrimeMini 5 i7 NUC8v7PNB | |
| Beelink SEi10 | |
| Beelink U59 | |
| Medio Intel UHD Graphics (Jasper Lake 16 EU) | |
| Chuwi LapBook Plus -1! | |
| Blackview AceBook 1 -2! | |
| Asus BR1100FKA-BP0109RA | |
| GMK NucBox K1 | |
| Jumper Tech Ez Book X3 Air -1! | |
| 3DMark 11 Performance | 1028 puntos | |
| 3DMark Cloud Gate Standard Score | 4845 puntos | |
| 3DMark Fire Strike Score | 658 puntos | |
| 3DMark Time Spy Score | 210 puntos | |
ayuda | ||
Witcher 3 FPS Chart
| bajo | medio | alto | ultra | |
|---|---|---|---|---|
| The Witcher 3 (2015) | 14 | |||
| Dota 2 Reborn (2015) | 57.3 | 26.6 | 12 | 11.2 |
| Final Fantasy XV Benchmark (2018) | 7.17 | |||
| X-Plane 11.11 (2018) | 10.8 | 9.18 | 8.62 |
Emisiones
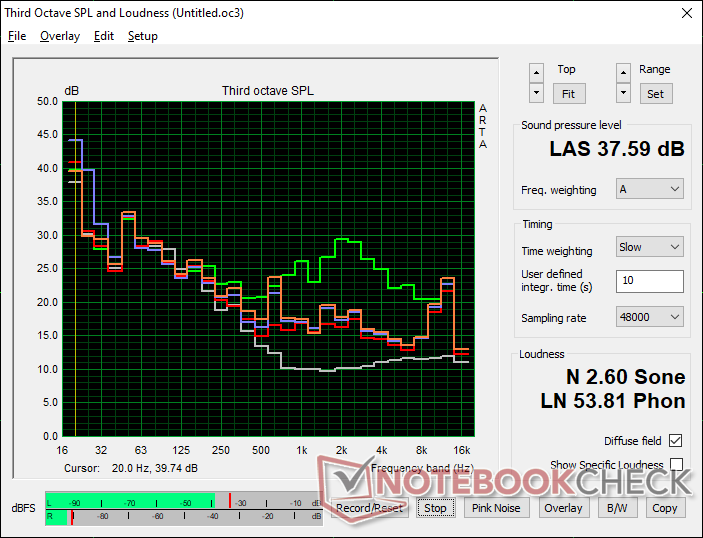
Ruido del sistema
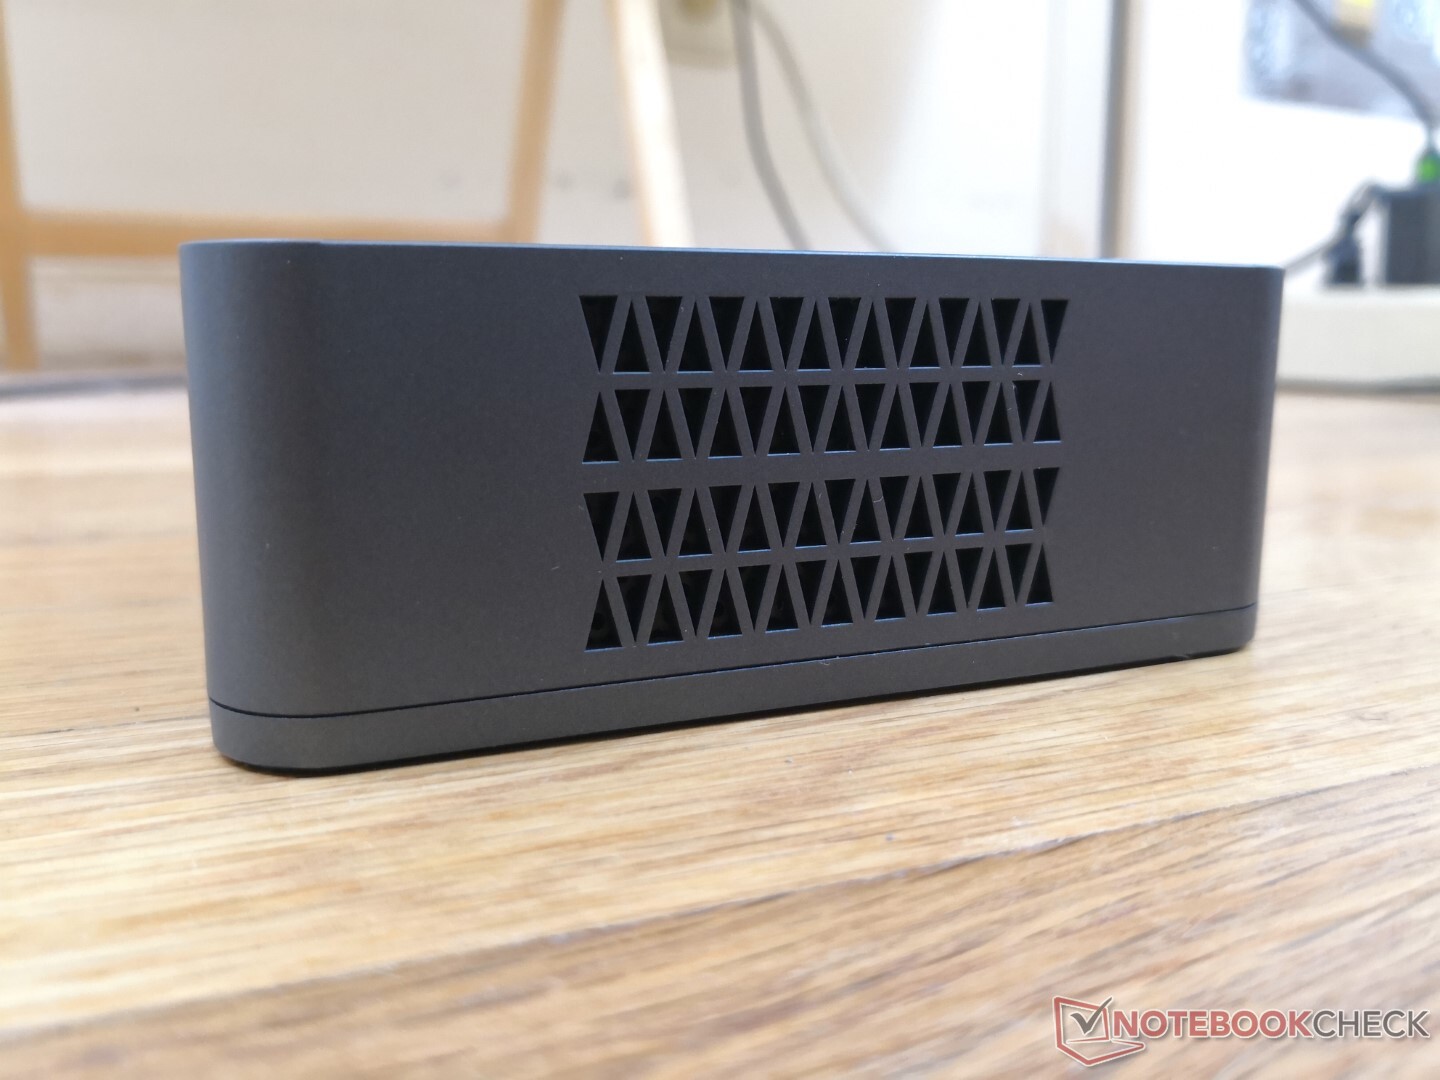
El ventilador interno es silencioso con 24,5 dB(A) cuando el sistema no está ejecutando ninguna aplicación. Sin embargo, la mayoría de las veces, los usuarios estarán haciendo streaming de vídeo o navegando por la web, por lo que el ventilador saltará ocasionalmente a 28,6 dB(A) o 30,4 dB(A). Otros mini PCs son mucho más ruidosos, incluyendo el propio SEi10 de Beelink.
Ejecutar Prime95 induce un ruido máximo del ventilador de 37,6 dB(A) que es perceptible pero no distrae en un entorno HTPC.
Ruido
| Ocioso |
| 24.5 / 24.5 / 28.6 dB(A) |
| Carga |
| 29.7 / 37.6 dB(A) |
 | ||
30 dB silencioso 40 dB(A) audible 50 dB(A) ruidosamente alto |
||
min: | ||
| Beelink U59 UHD Graphics (Jasper Lake 16 EU), Celeron N5095, Silicon Motion AZW 512G NV428 | Intel NUC11TNKi5 Iris Xe G7 80EUs, i5-1135G7, Transcend M.2 SSD 430S TS512GMTS430S | Intel NUC8i7BE Iris Plus Graphics 655, i7-8559U | Beelink SEi10 UHD Graphics G1 (Ice Lake 32 EU), i3-1005G1, Silicon Motion AZW 256G M.2280 NVMe 4X 200725 D | Zotac ZBOX MI642 Nano UHD Graphics 620, i5-10210U, Western Digital WD Blue 3D WDBNCE5000PNC | GMK NucBox K1 UHD Graphics 600, Celeron J4125, HIKVision C100 NGFF SSD 128GB | |
|---|---|---|---|---|---|---|
| Noise | -27% | -19% | -27% | -24% | -20% | |
| apagado / medio ambiente * (dB) | 24.5 | 24.8 -1% | 28.7 -17% | 27.5 -12% | 27.8 -13% | 27.8 -13% |
| Idle Minimum * (dB) | 24.5 | 35.6 -45% | 28.7 -17% | 30.9 -26% | 27.8 -13% | 27.8 -13% |
| Idle Average * (dB) | 24.5 | 35.6 -45% | 29.3 -20% | 33.5 -37% | 33.9 -38% | 27.8 -13% |
| Idle Maximum * (dB) | 28.6 | 35.6 -24% | 31.8 -11% | 33.5 -17% | 33.9 -19% | 27.8 3% |
| Load Average * (dB) | 29.7 | 36.2 -22% | 39 -31% | 38.5 -30% | 43.7 -47% | 46.8 -58% |
| Witcher 3 ultra * (dB) | 30.4 | 38 -25% | 39 -28% | |||
| Load Maximum * (dB) | 37.6 | 47.6 -27% | 41.4 -10% | 51.6 -37% | 43.7 -16% | 46.8 -24% |
* ... más pequeño es mejor
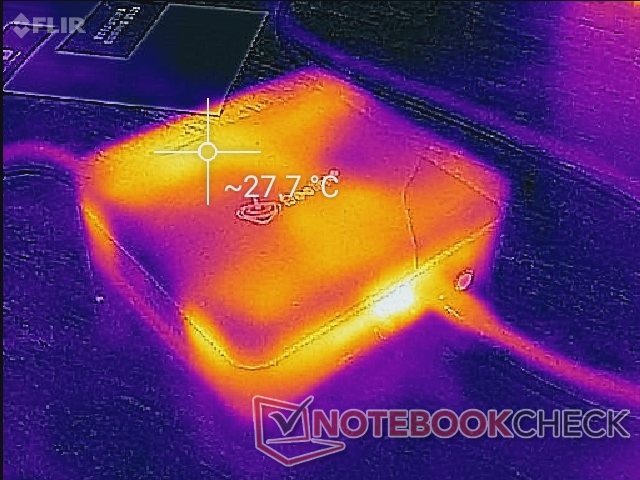
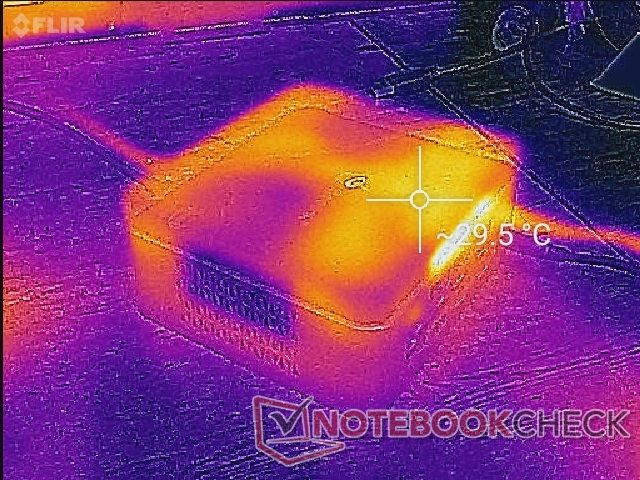
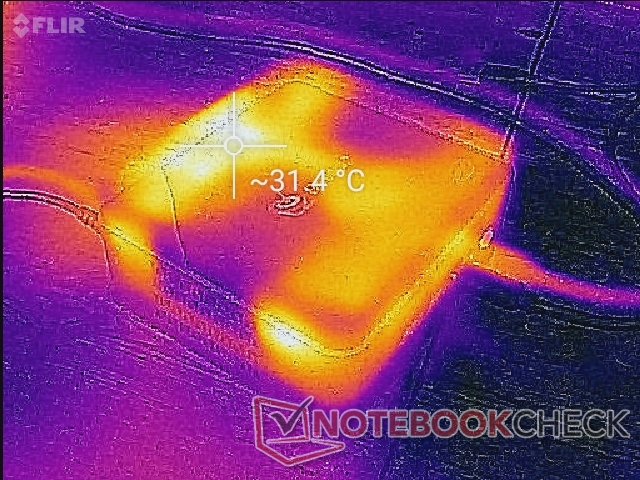
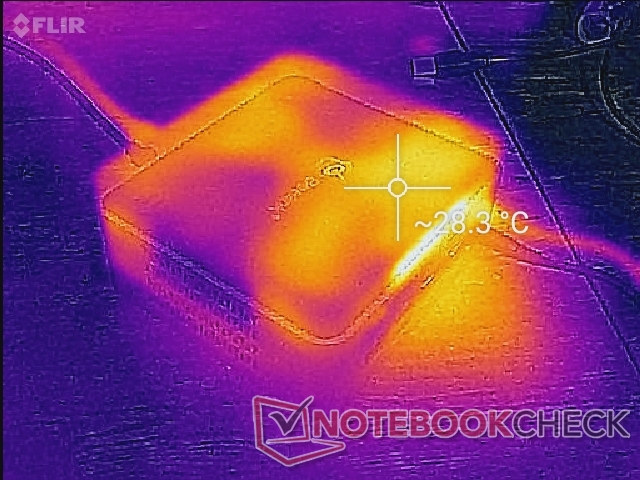
Temperatura
Las temperaturas no son un problema en el U59. Los puntos calientes apenas se calientan, incluso cuando el sistema está totalmente estresado.
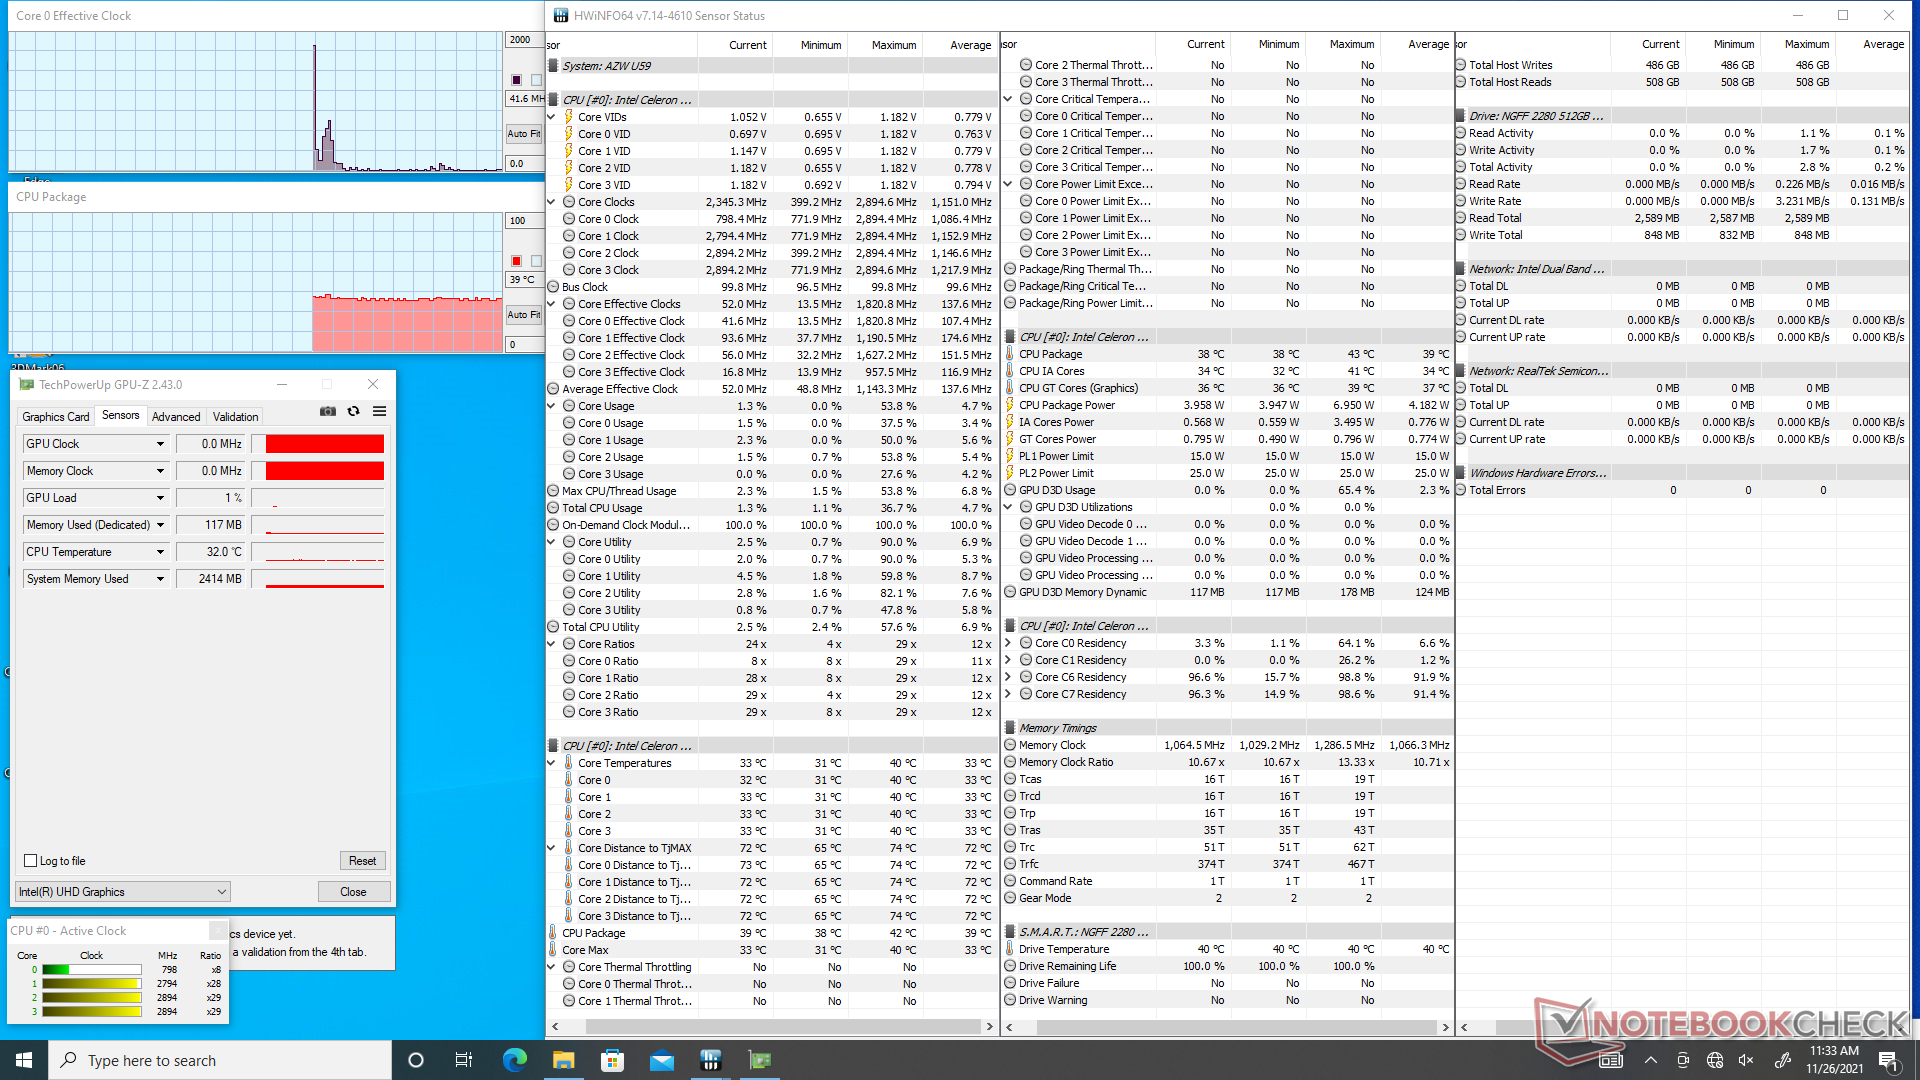
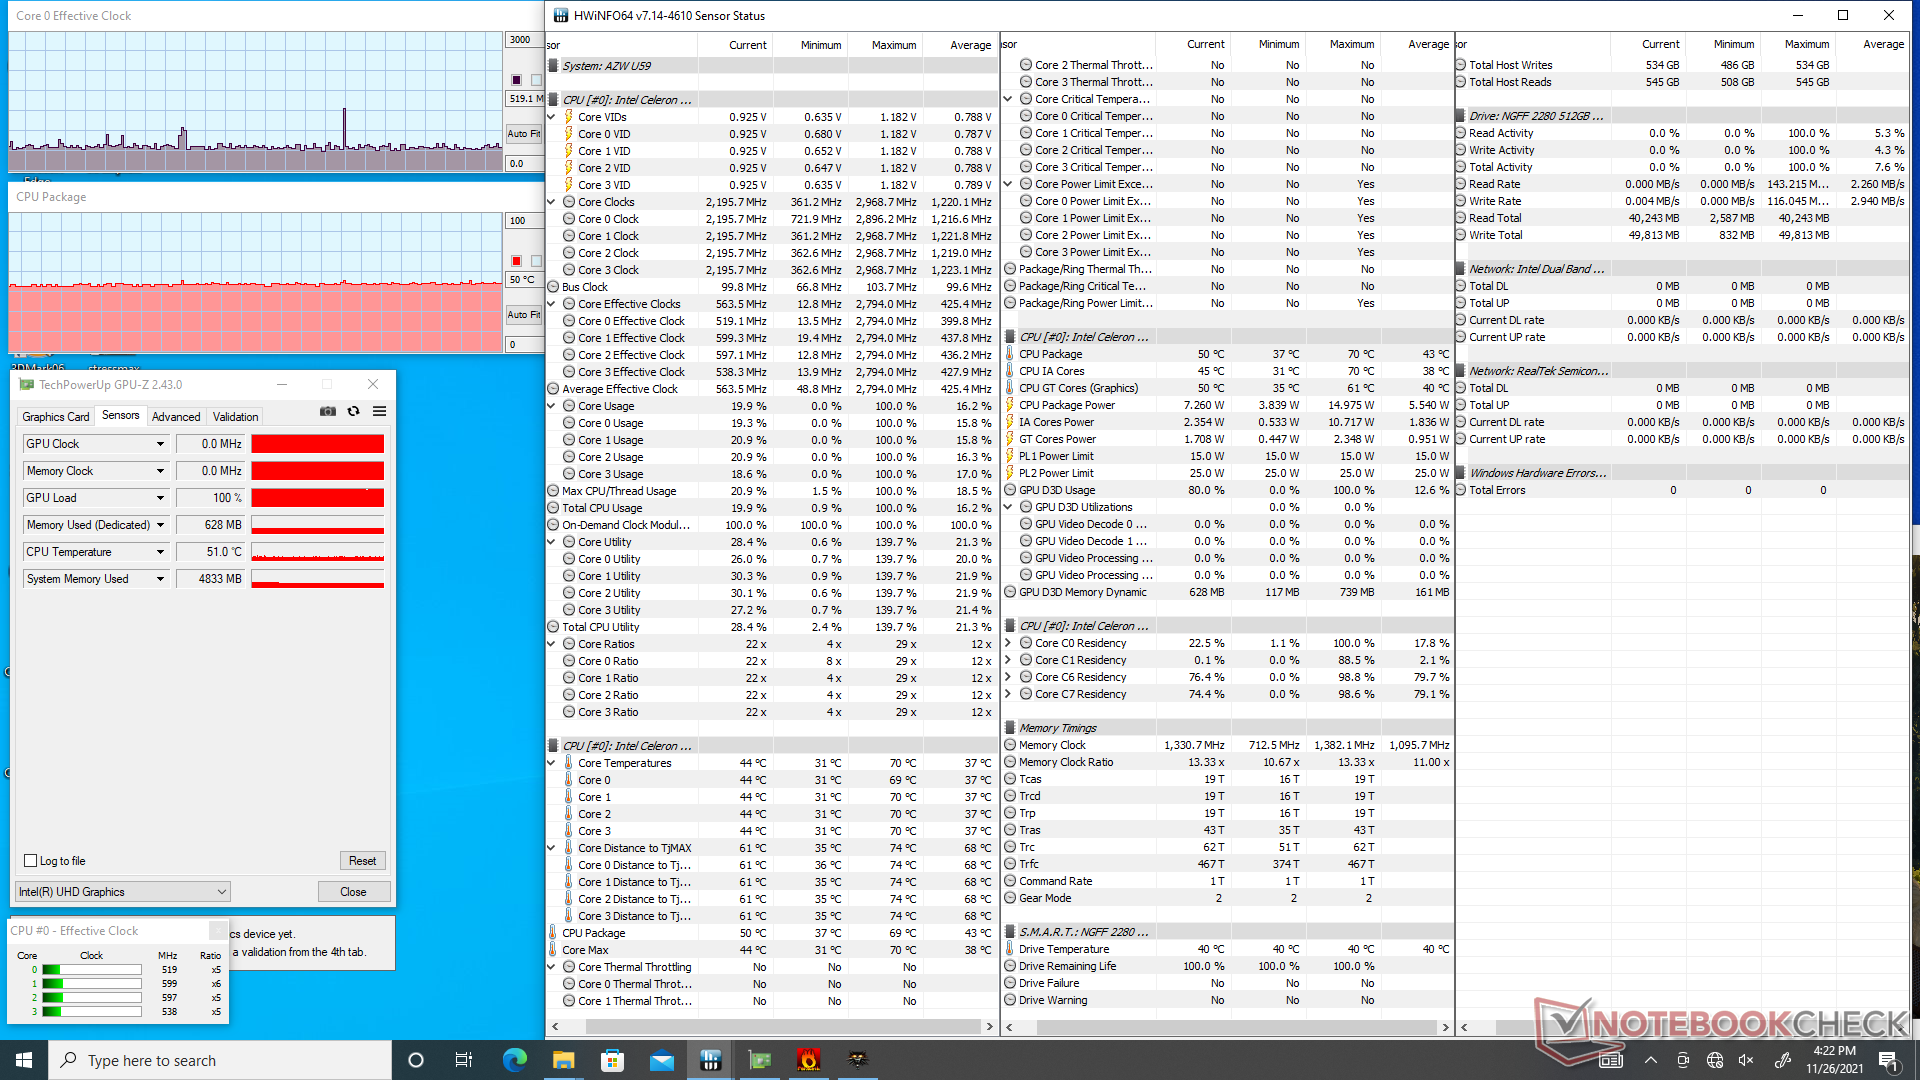
Prueba de esfuerzo
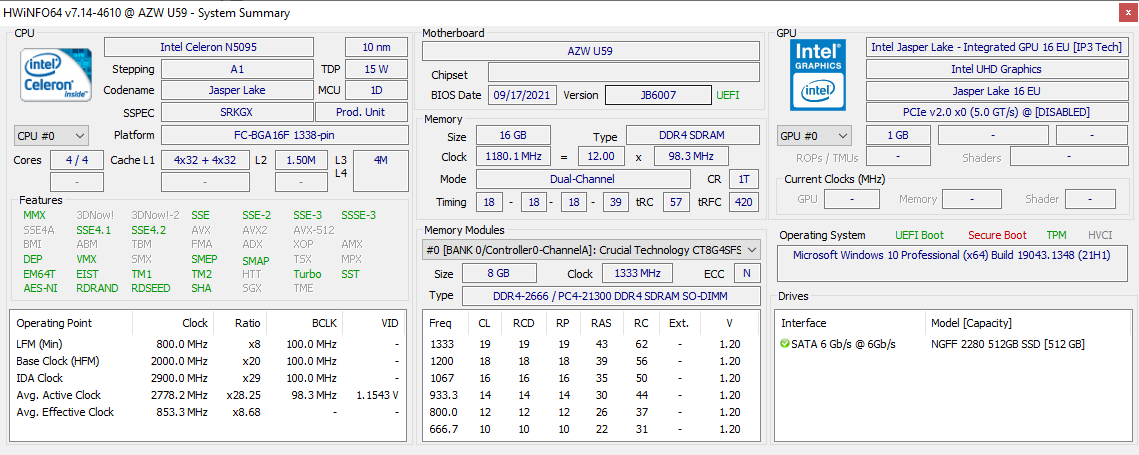
La CPU se estabilizó a 2,8 GHz y 69 C cuando se sometió a la tensión de Prime95. El hecho de que el sistema utilice un ventilador activo para la refrigeración es probablemente el responsable de las temperaturas más bajas de lo esperado y del rendimiento estable a lo largo del tiempo. HWiNFO informa de niveles de PL1 y PL2 de 15 W y 25 W, respectivamente, pero sólo somos capaces de alcanzar 15 W estables cuando se ejecutan cargas tan extremas. Al ejecutar esta misma prueba en el Core i3 de Beelink SEi10 resultaría en una temperatura del núcleo significativamente mayor, de 90 C
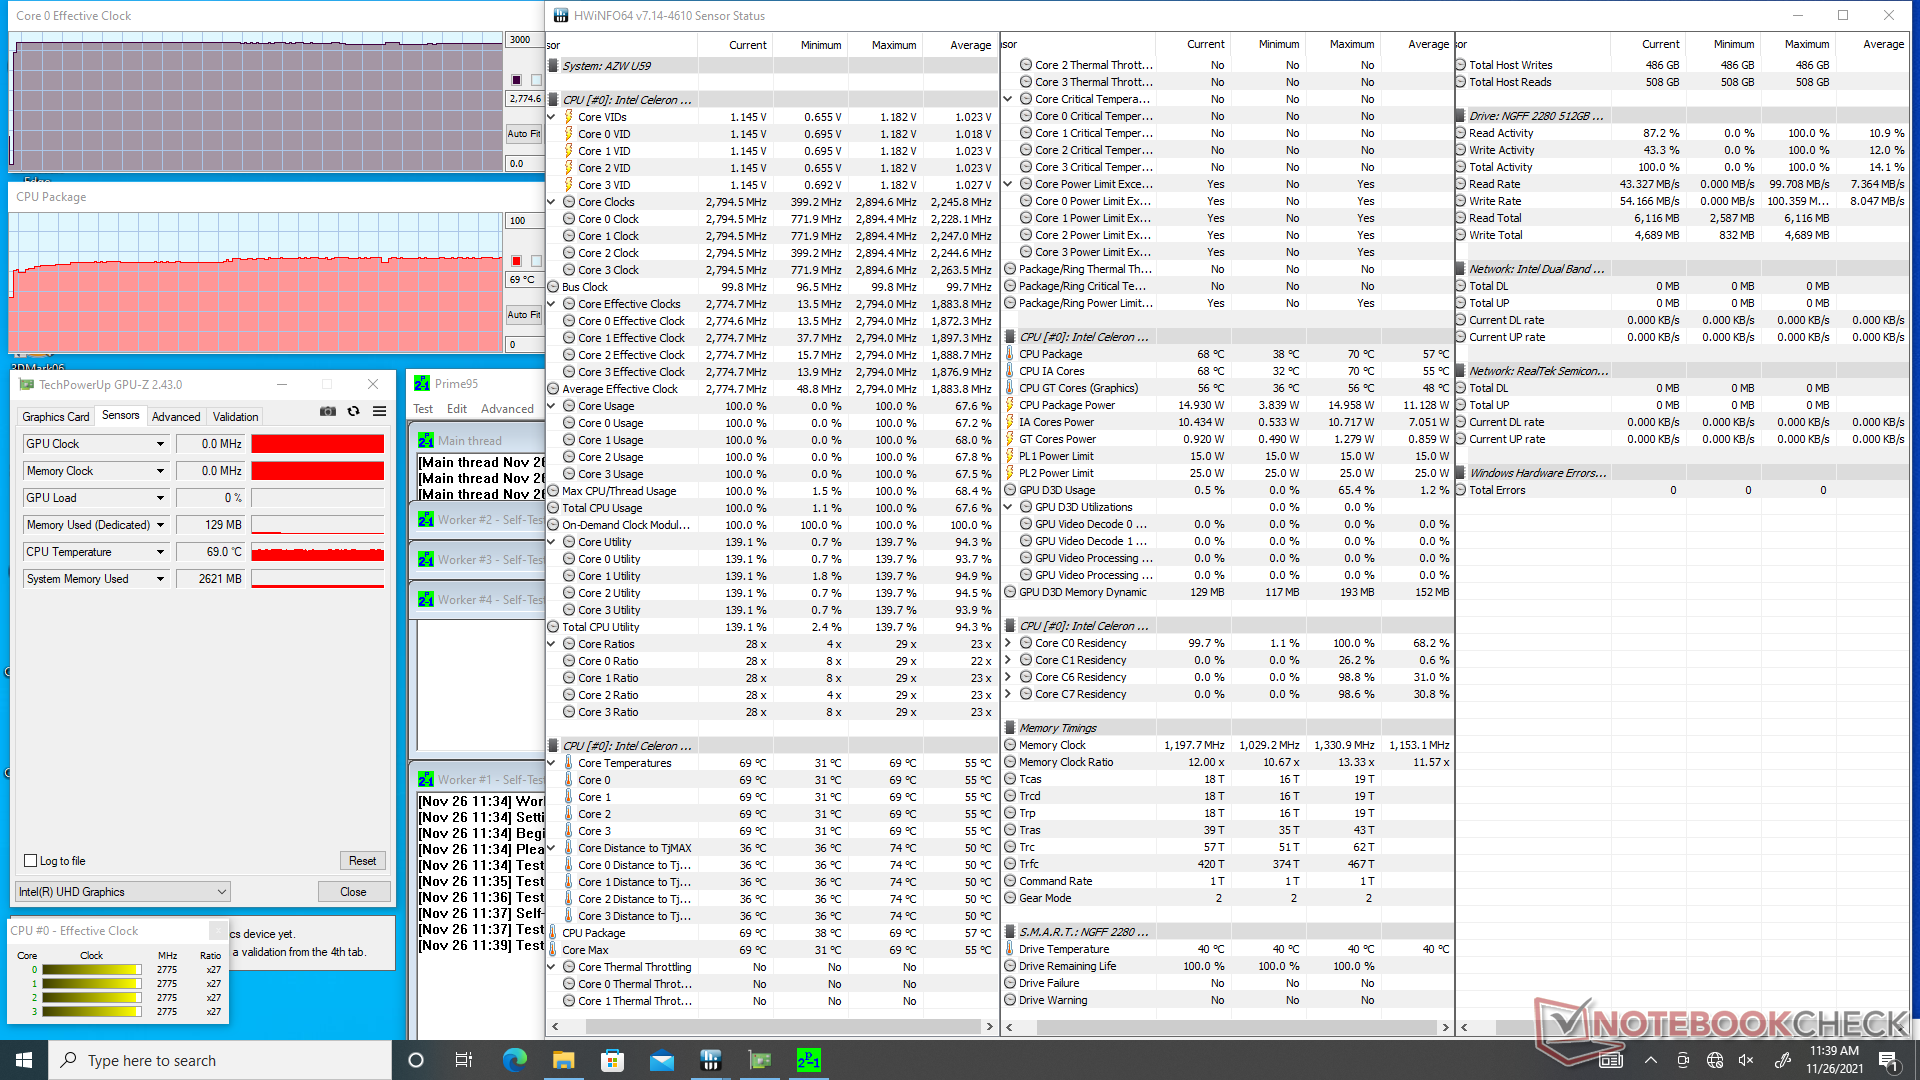
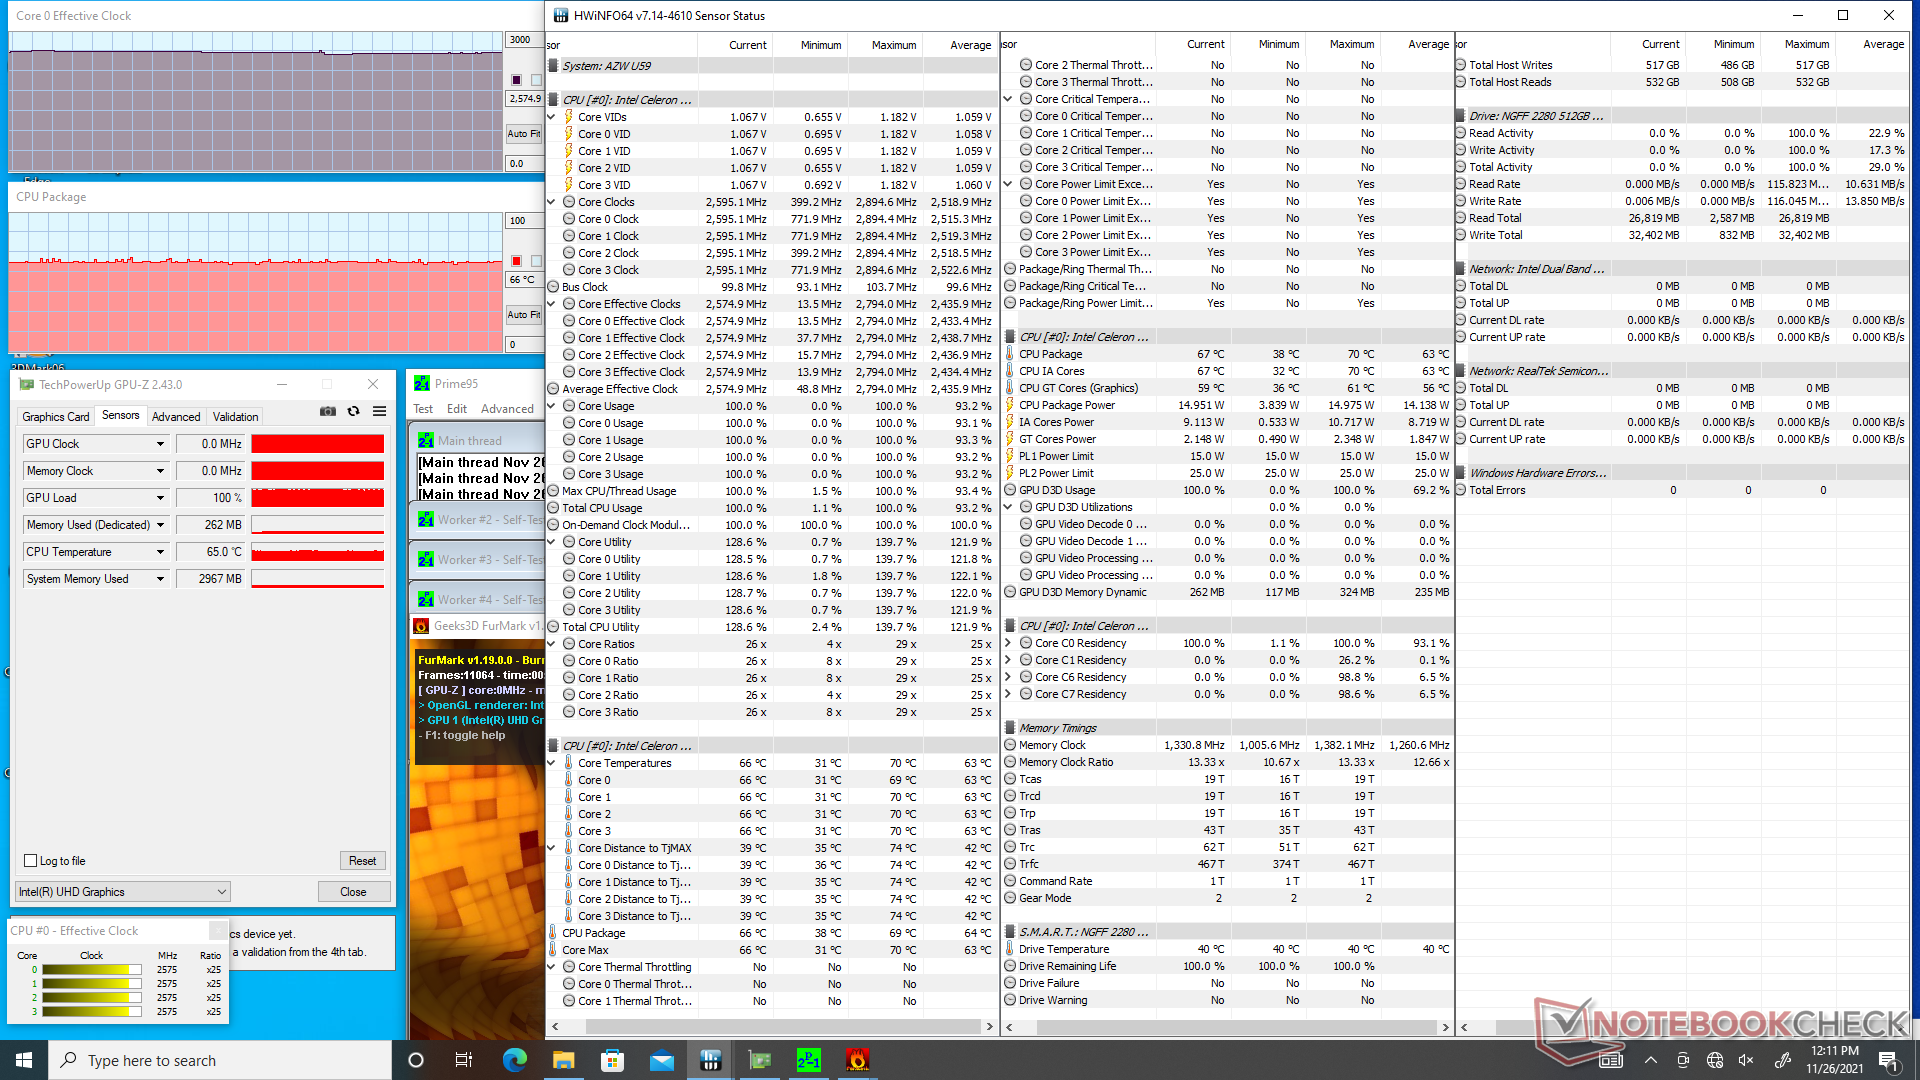
| Relojde la CPU(GHz) | Reloj dela GPU(MHz) | Temperaturamediade la CPU (°C) | |
| Sistema en reposo | |||
| EstrésPrime95 | 2.8 | -- | 69 |
| Estrés de Prime95+ FurMark | 2,6 | -- | 66 |
| Witcher 3 Estrés | 0.5 | -- | 50 |
Gestión de la energía
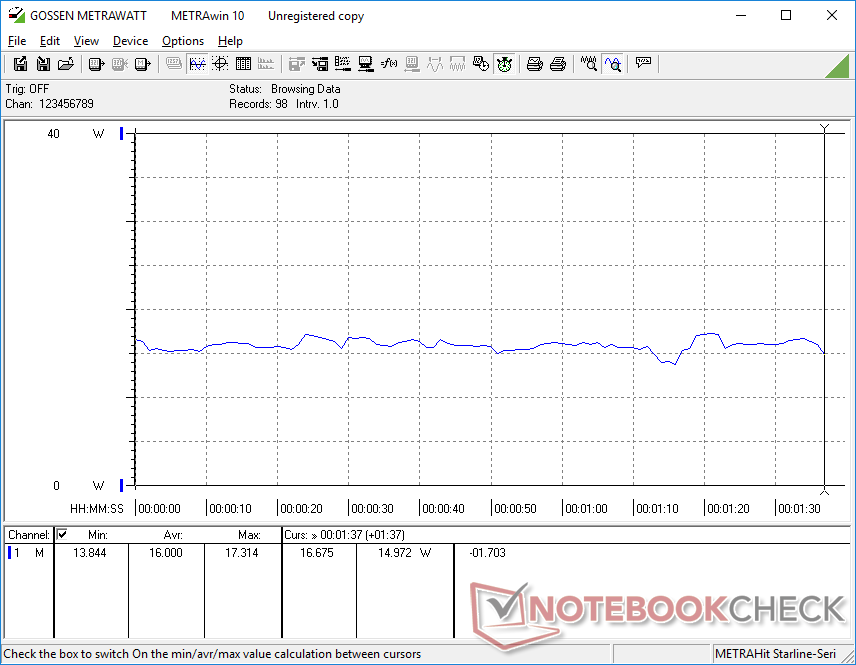
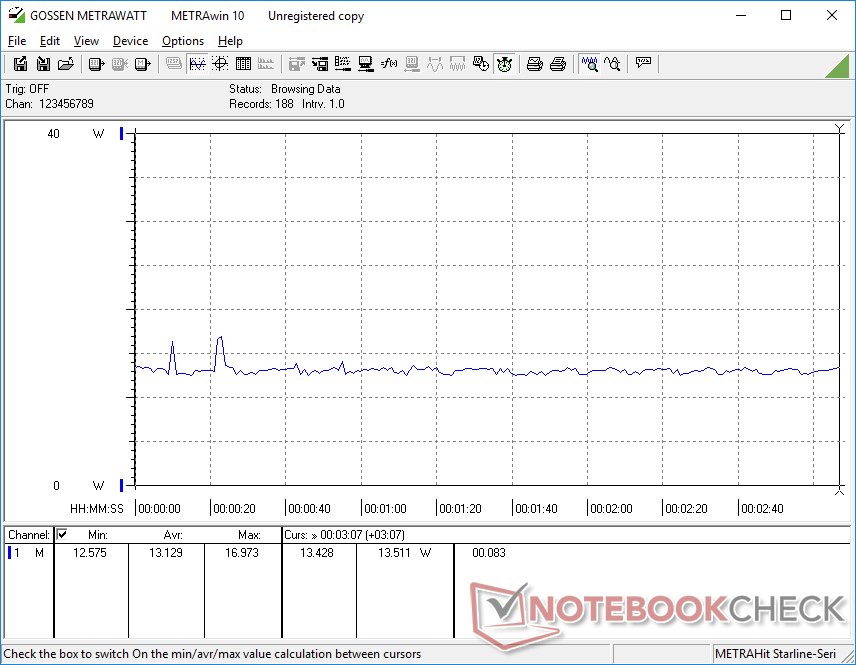
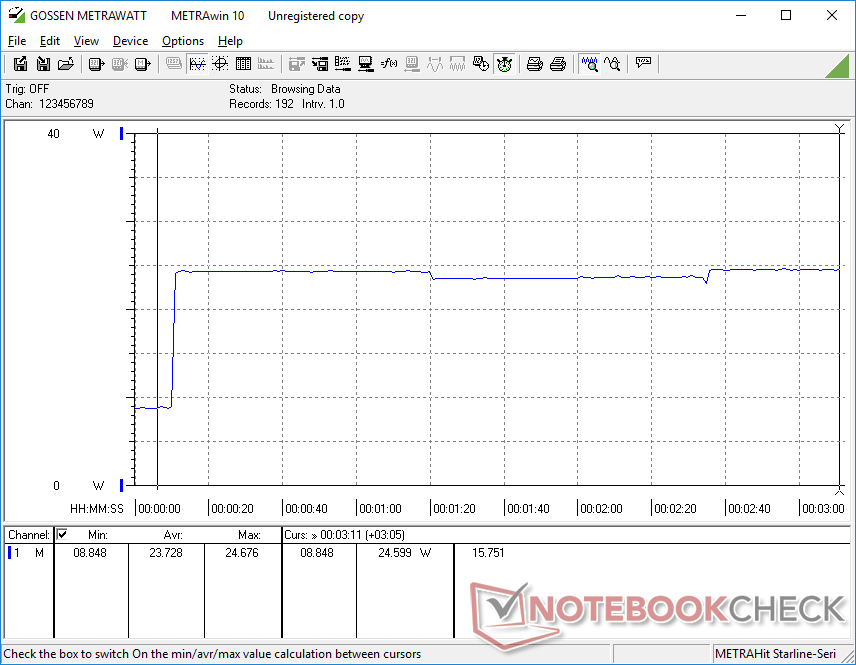
Consumo de energía
El funcionamiento en reposo en el escritorio sin aplicaciones en ejecución consumiría más de lo esperado, alrededor de 7 W, mientras que el Intel NUC8 o el GMK NucBox K1 podrían consumir tan solo 3 W cada uno. Las cargas más altas, como los juegos, consumirían mucho menos en nuestro U59, entre 13 y 16 W de media, en comparación con el doble o más en los mini PC con GPUs UHD Graphics 620 o Iris Xe más rápidas.

| Off / Standby | |
| Ocioso | |
| Carga |
|
Clave:
min: | |
| Beelink U59 Celeron N5095, UHD Graphics (Jasper Lake 16 EU), Silicon Motion AZW 512G NV428, , x, | Intel NUC11TNKi5 i5-1135G7, Iris Xe G7 80EUs, Transcend M.2 SSD 430S TS512GMTS430S, , x, | Intel NUC8i7BE i7-8559U, Iris Plus Graphics 655, , , x, | Beelink SEi10 i3-1005G1, UHD Graphics G1 (Ice Lake 32 EU), Silicon Motion AZW 256G M.2280 NVMe 4X 200725 D, , x, | Zotac ZBOX MI642 Nano i5-10210U, UHD Graphics 620, Western Digital WD Blue 3D WDBNCE5000PNC, , x, | GMK NucBox K1 Celeron J4125, UHD Graphics 600, HIKVision C100 NGFF SSD 128GB, , x, | |
|---|---|---|---|---|---|---|
| Power Consumption | -135% | -102% | -26% | -67% | 34% | |
| Idle Minimum * (Watt) | 6.7 | 11.5 -72% | 2.7 60% | 6.3 6% | 8.9 -33% | 3.4 49% |
| Idle Average * (Watt) | 6.7 | 12.4 -85% | 3.1 54% | 6.6 1% | 9 -34% | 3.8 43% |
| Idle Maximum * (Watt) | 7.4 | 12.9 -74% | 6.3 15% | 6.7 9% | 9.9 -34% | 3.9 47% |
| Load Average * (Watt) | 16 | 40.7 -154% | 59.7 -273% | 25.9 -62% | 33 -106% | 12.5 22% |
| Witcher 3 ultra * (Watt) | 13.1 | 43.9 -235% | 47.2 -260% | |||
| Load Maximum * (Watt) | 25.6 | 73.5 -187% | 78 -205% | 46.7 -82% | 58 -127% | 22.7 11% |
* ... más pequeño es mejor
Power Consumption Witcher 3 / Stresstest
Power Consumption external Monitor
Pro
Contra
Veredicto
El bajo precio de entre 279 y 349 dólares, con RAM, almacenamiento y Windows 11 Pro, es el punto de venta más convincente del Beelink U59. El rendimiento por dólar es notablemente superior al de la generación anterior de mini PCs Celeron, ya que es entre 2 y 2,5 veces mayor en términos de rendimiento multihilo o un 50% en términos de rendimiento de un solo hilo y gráficos. Apreciamos que las dos bahías de almacenamiento, las dos ranuras de RAM y el módulo WLAN son fácilmente accesibles y actualizables, lo que significa que los compradores interesados no necesitan desembolsar la configuración de gama alta si no les importa actualizar dichos componentes ellos mismos.
No es un Core i3, pero el Jasper Lake Celeron N5095 está mucho más cerca de serlo que cualquier otra CPU Celeron móvil anterior. El Beelink U59 ofrece un rendimiento notablemente superior al de la mayoría de los mini PC de entre 200 y 350 dólares.
Los inconvenientes son menores, pero se suman. El hecho de que el sistema requiera un adaptador de barril de CA propietario es una molestia cuando podría haber sido alimentado por el USB-C más universal en su lugar. El ventilador, aunque en general es silencioso, tiende a pulsar con frecuencia en respuesta a las cargas de trabajo. La falta de un lector de tarjetas SD puede irritar a los usuarios que dependen de él, mientras que la placa de plástico superior parece barata y propensa a los arañazos. Sin embargo, si tiene que adquirir algún mini PC Celeron, el Beelink U59, alimentado por Jasper Lake, puede ser una buena opción simplemente por las notables ventajas de rendimiento respecto a los chips Celeron más antiguos, como los delGMK NucBox K1 o Chuwi GBox.
Precio y disponibilidad
Amazon está enviando actualmente el Beelink U59 a partir de $279 USD hasta $349 USD dependiendo de la opción de RAM y almacenamiento.
Price comparison

