Reseña del mini PC GMK NucBox 2: Precio razonable con buena capacidad de actualización
 frente a NucBox K1 (derecha)")
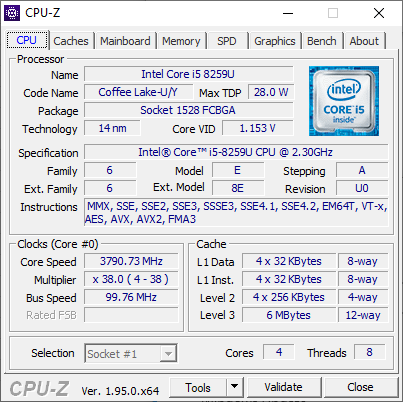
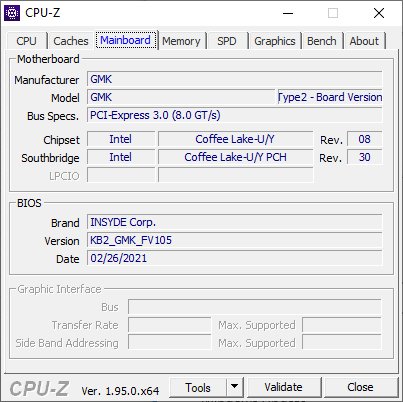
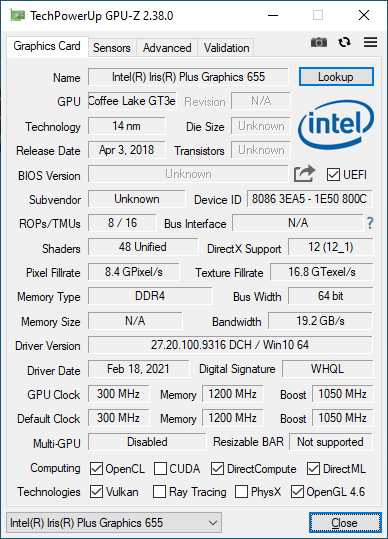
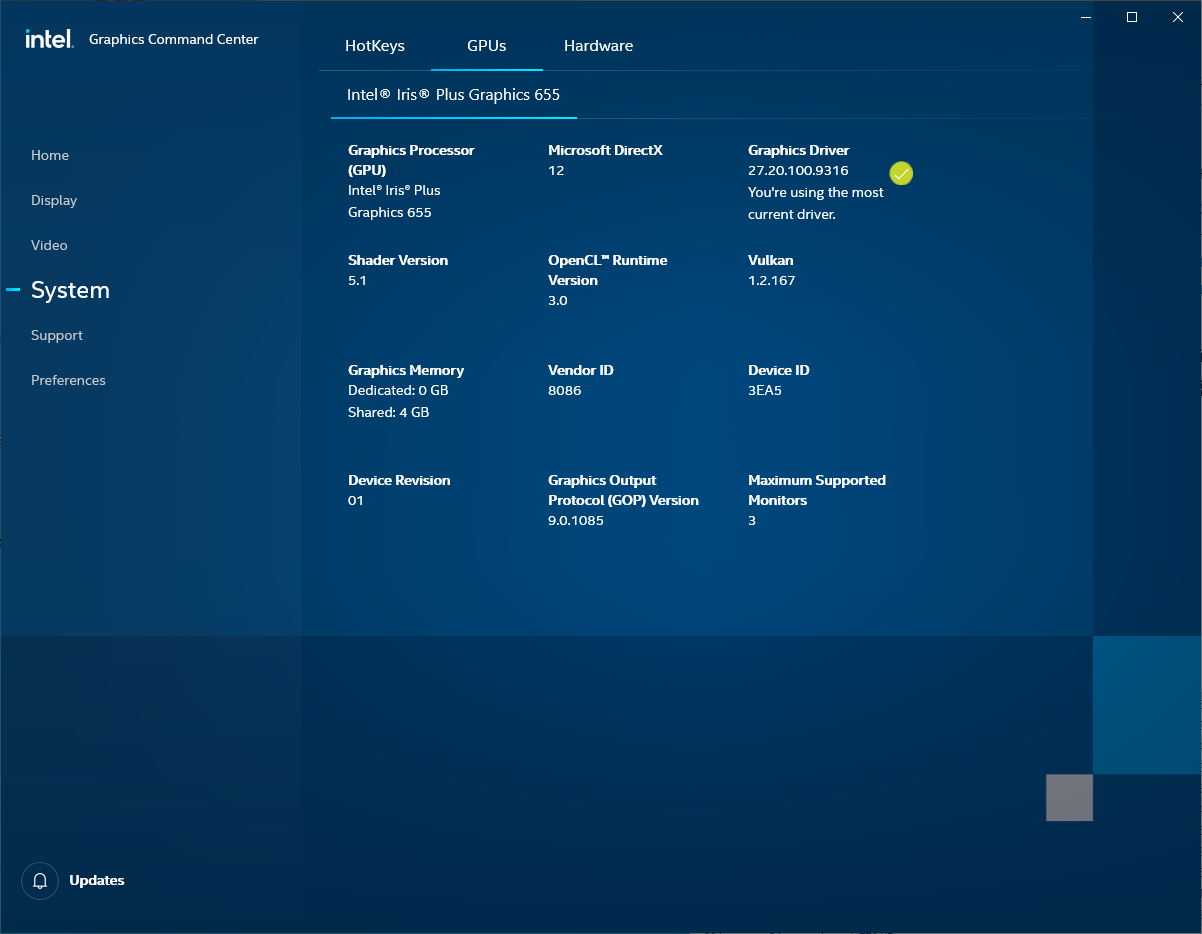
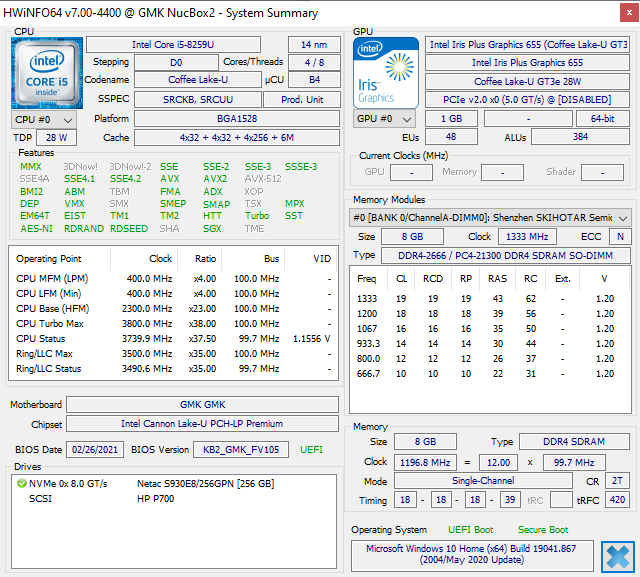
A diferencia del súper pequeño GMK NucBox K1 del año pasado, el NucBox 2 es un mini PC más tradicional en la misma línea que el Intel NUC. La configuración actual viene con una CPU Intel Coffee Lake-U Core i5, GPU Iris Plus Graphics 655, 8 GB de RAM de un solo canal y 256 GB de SSD NVMe por unos 500 dólares (o 440 dólares cuando está en oferta).
Los competidores en este espacio son cada vez más comunes con alternativas como la expansiva serie Zotac ZBox, Beelink SEi10, Chuwi GBox, Lenovo ThinkCentre o la popular serie Intel NUC.
Los usuarios pueden obtener más información sobre el NucBox 2 a través de su página oficial de producto aquí.
potential competitors in comparison
Valoración | Fecha | Modelo | Peso | Altura | Tamaño | Resolución | Precio |
|---|---|---|---|---|---|---|---|
v (old) | 03/2021 | GMK NucBox 2 i5-8259U, Iris Plus Graphics 655 | 430 g | 50 mm | x | ||
v (old) | 02/2021 | Intel NUC11PAQi7 i7-1165G7, Iris Xe G7 96EUs | 647 g | 56 mm | x | ||
v (old) | 11/2018 | Intel NUC8i7BE i7-8559U, Iris Plus Graphics 655 | 683 g | 51 mm | x | ||
v (old) | 09/2020 | GMK NucBox K1 Celeron J4125, UHD Graphics 600 | 130 g | 42 mm | x | ||
v (old) | Beelink SEi10 i3-1005G1, UHD Graphics G1 (Ice Lake 32 EU) | 350 g | 41 mm | x | |||
v (old) | 07/2020 | Zotac ZBox MI643 i5-10210U, UHD Graphics 620 | 550 g | 28.5 mm | x |
Caso
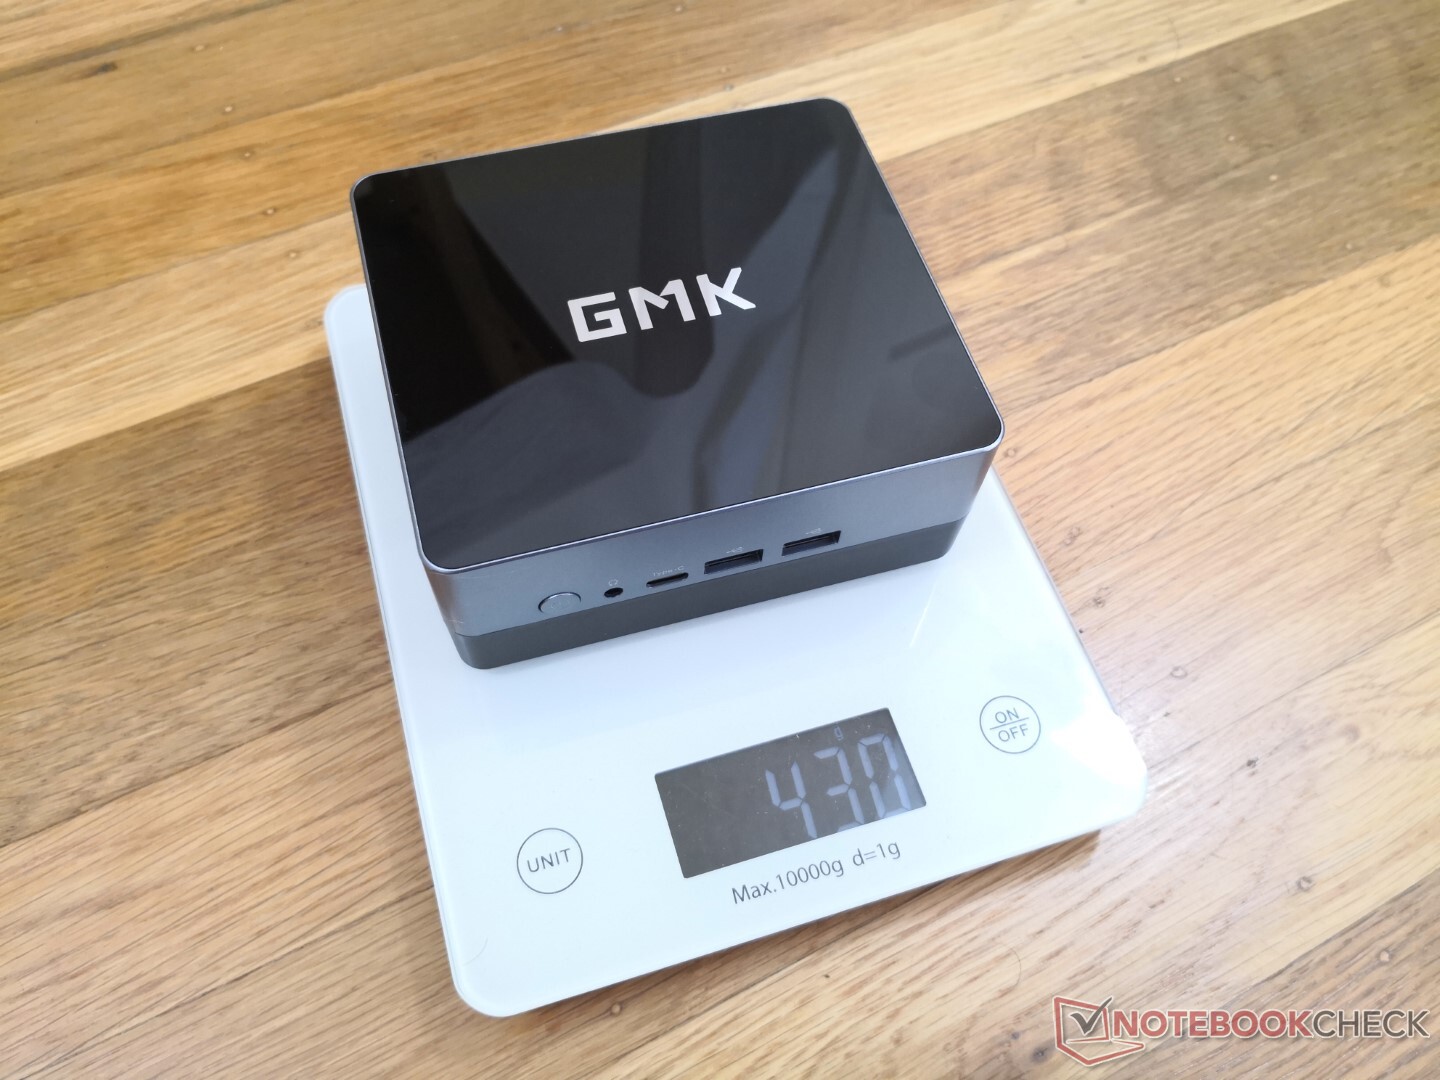
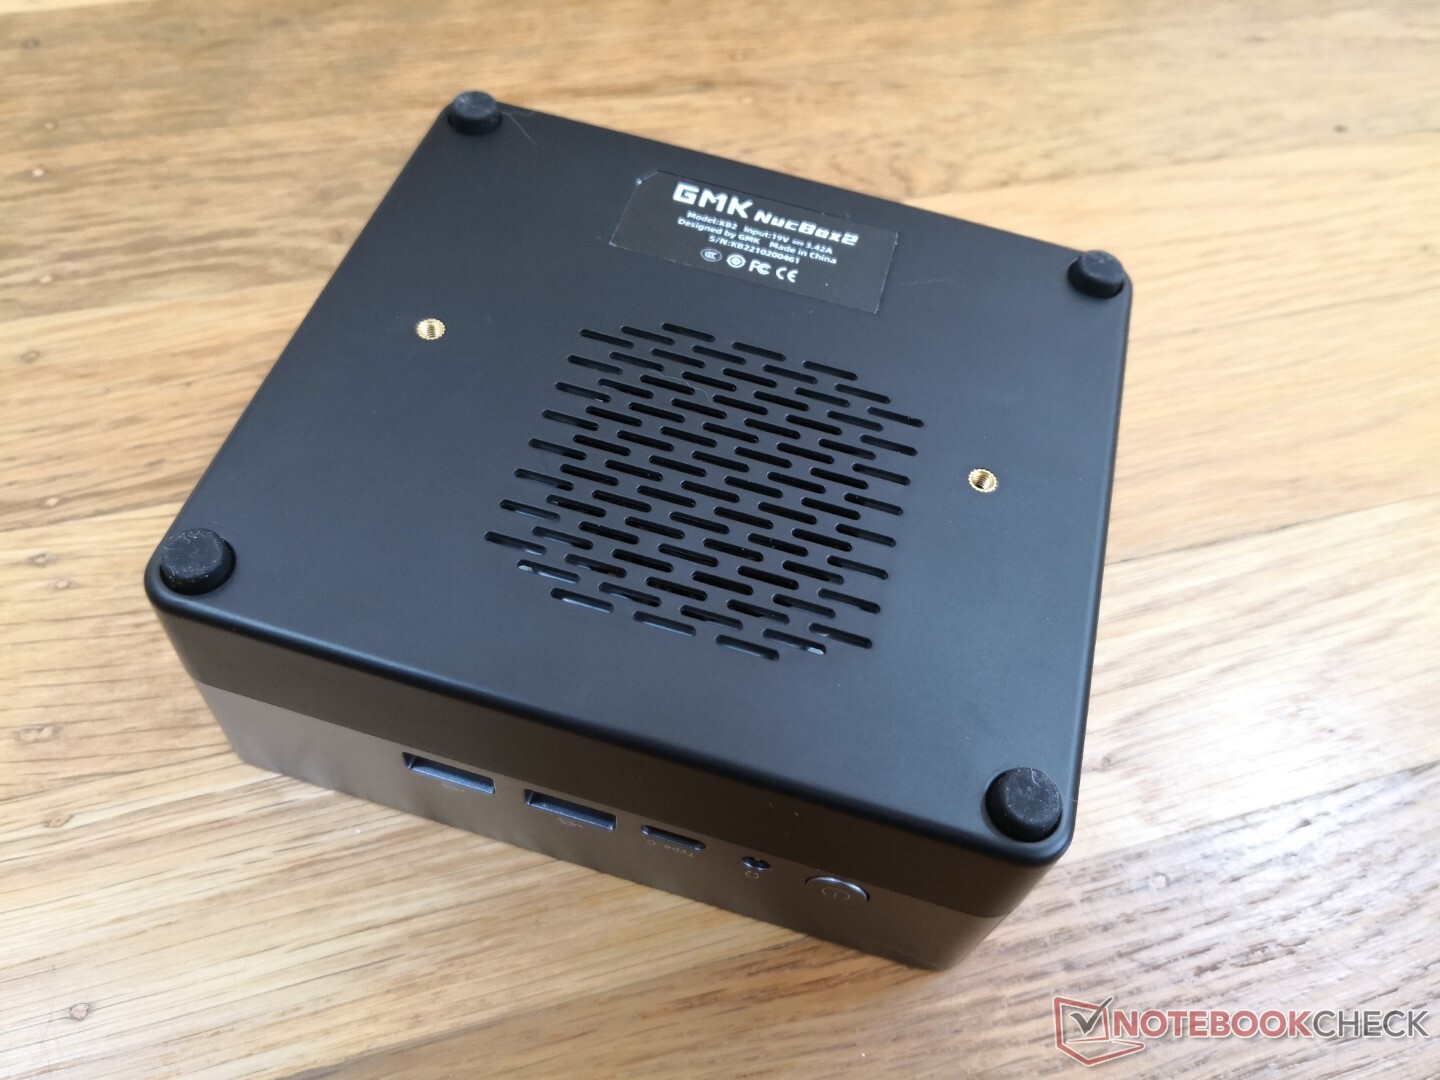
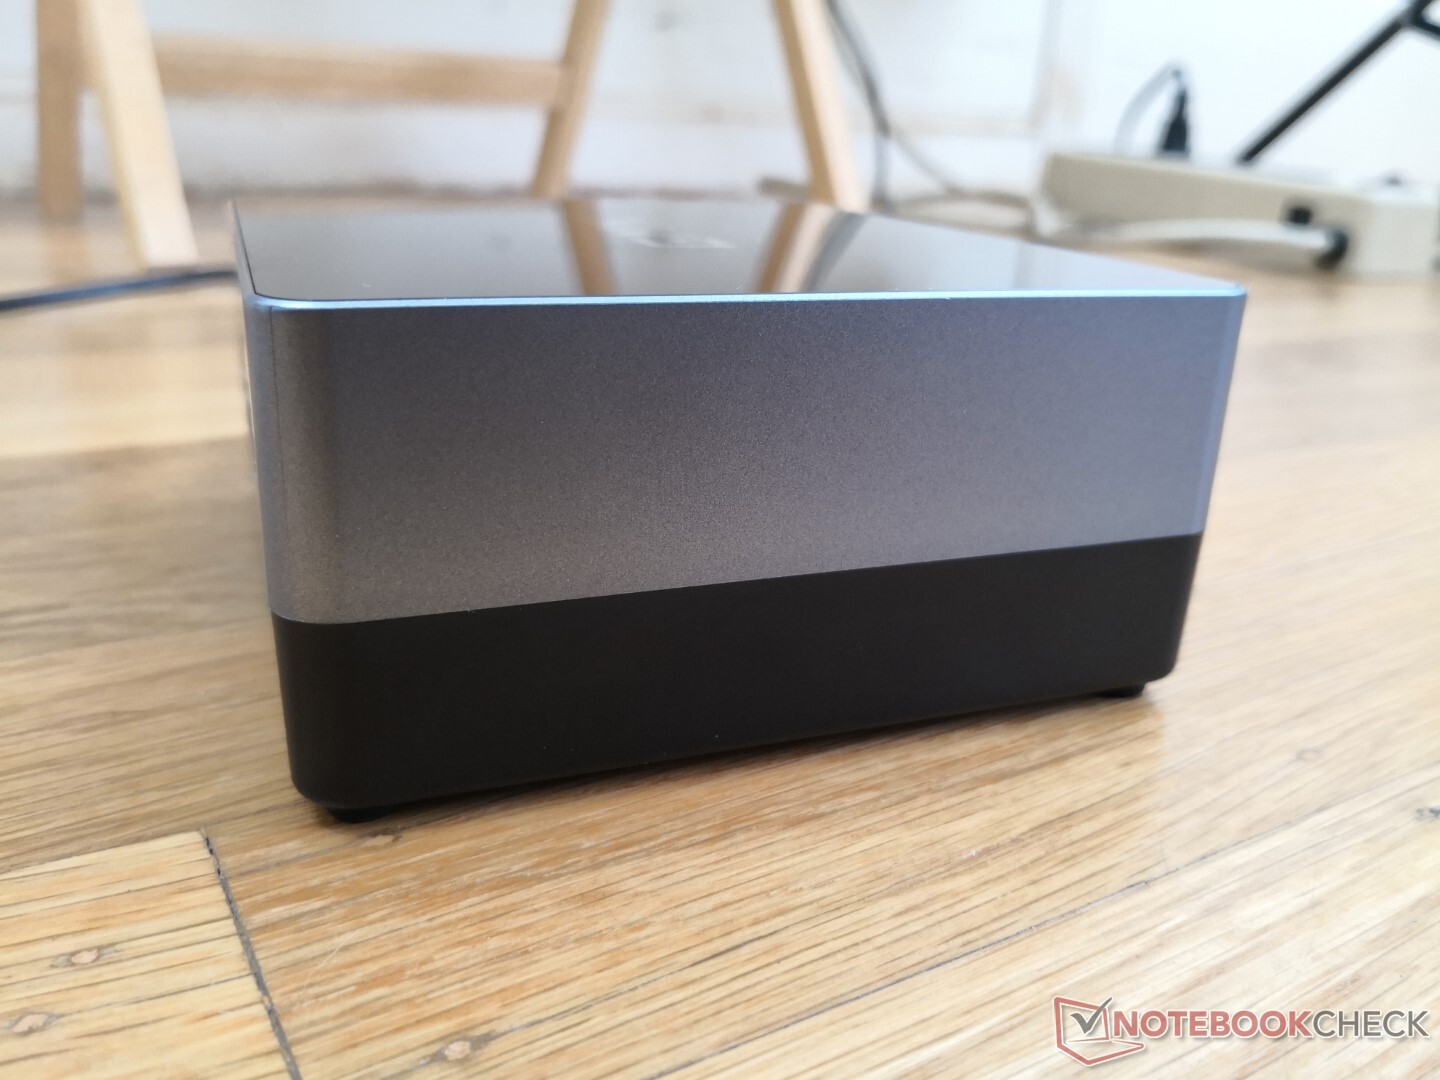
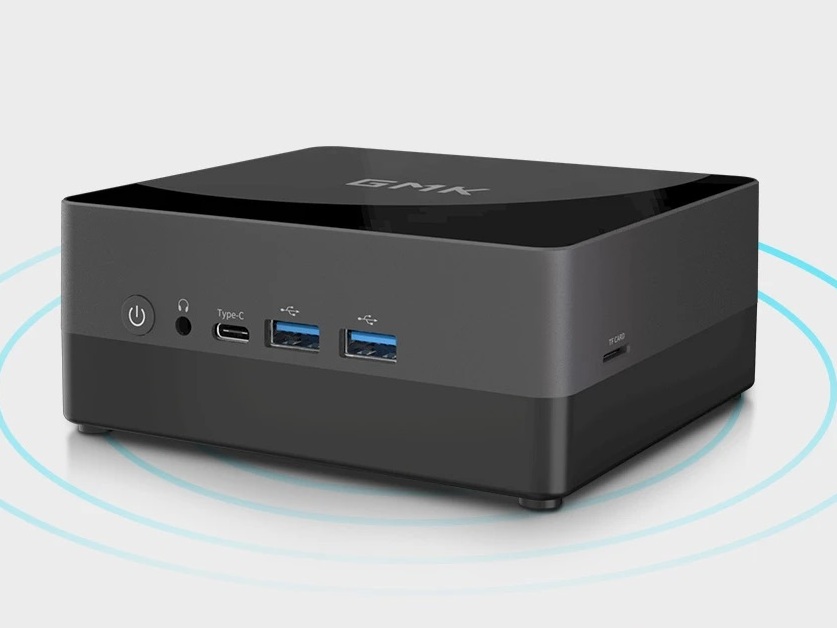
Las dimensiones generales son muy similares a las del antiguo Intel NUC 8, pero casi un 40% más ligero. La calidad de construcción es excelente en todos los aspectos, sin deformaciones en ninguna de sus seis caras. Es de esperar que la superficie de plástico brillante de la parte superior se ensucie más rápidamente que el resto del chasis de metal mate.
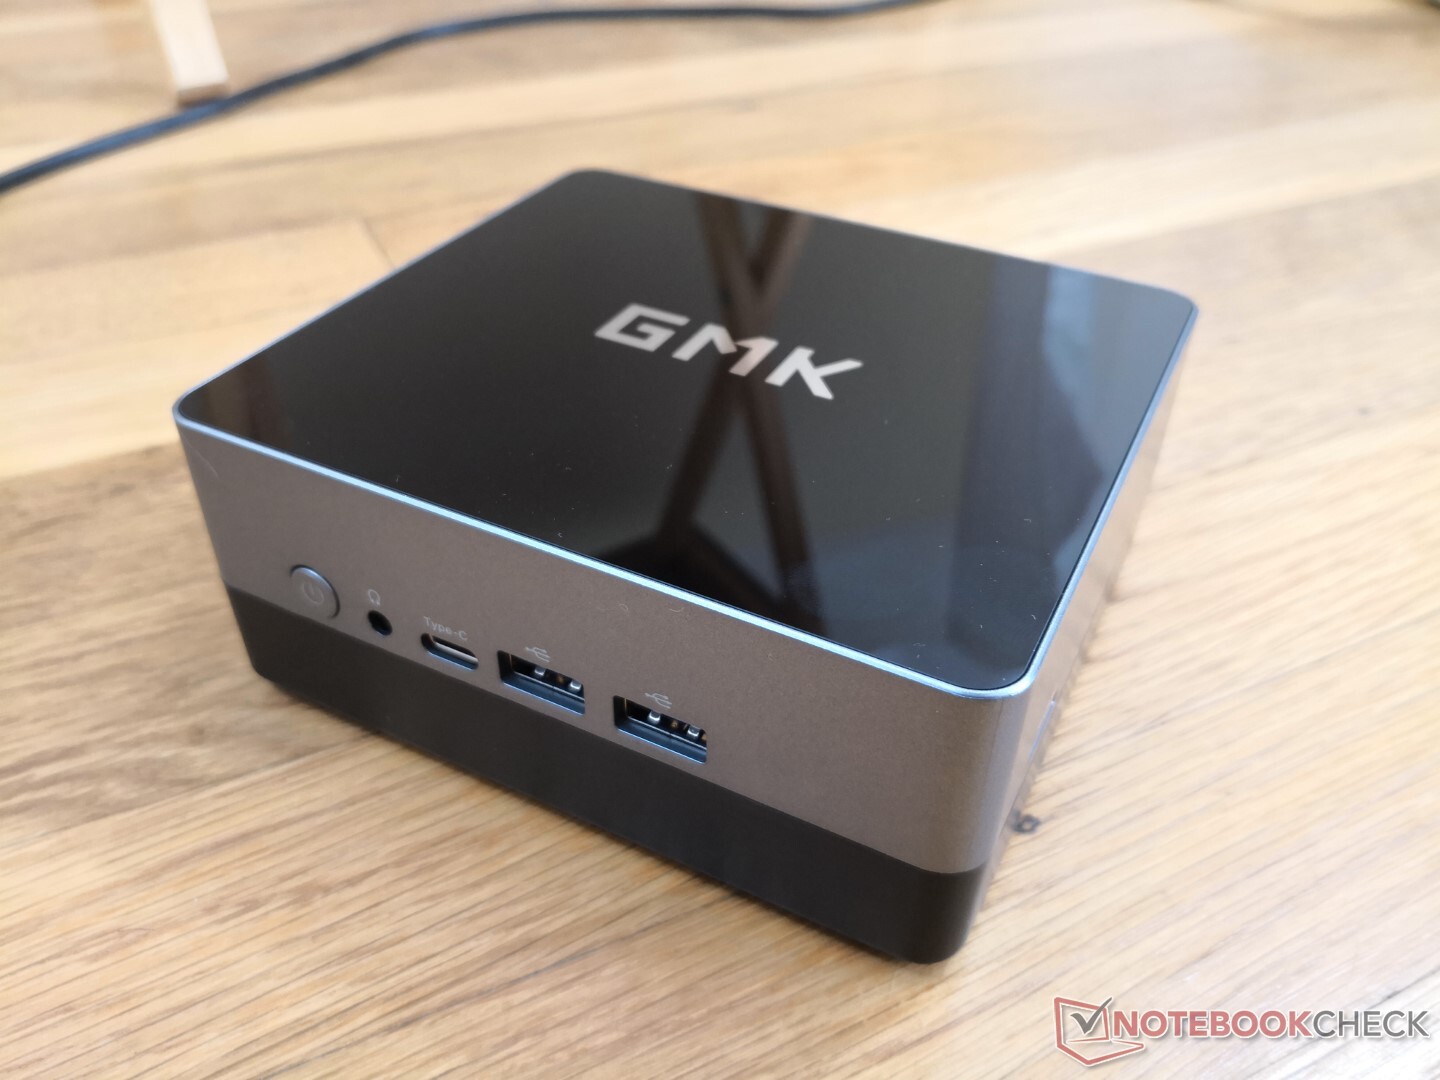
Conectividad
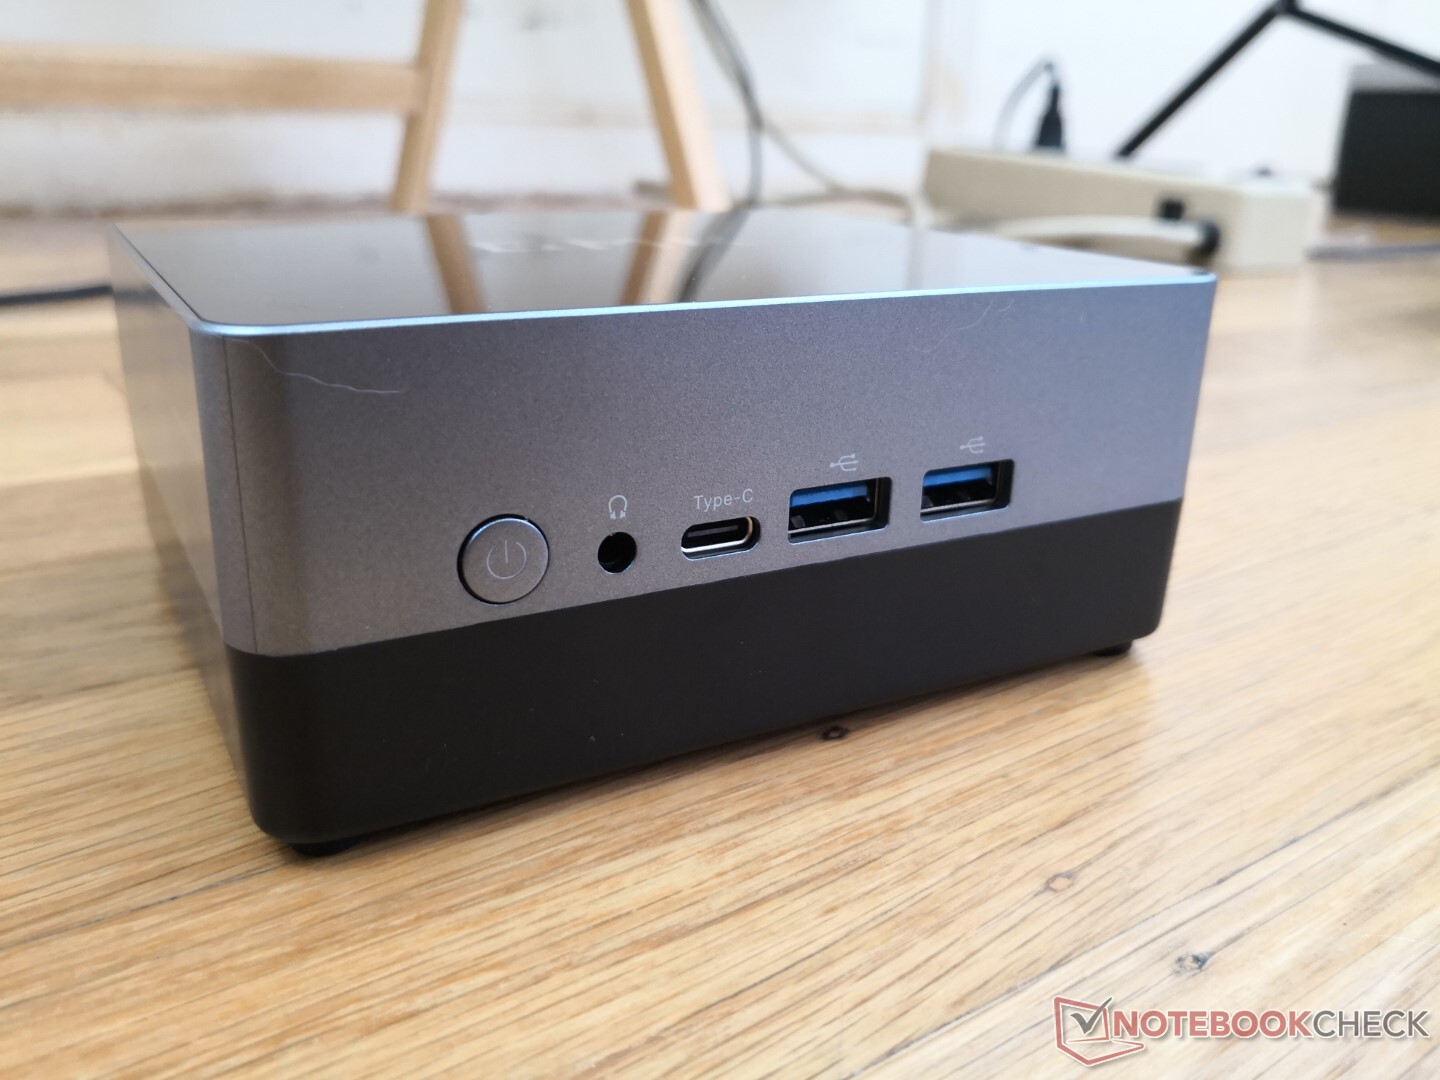
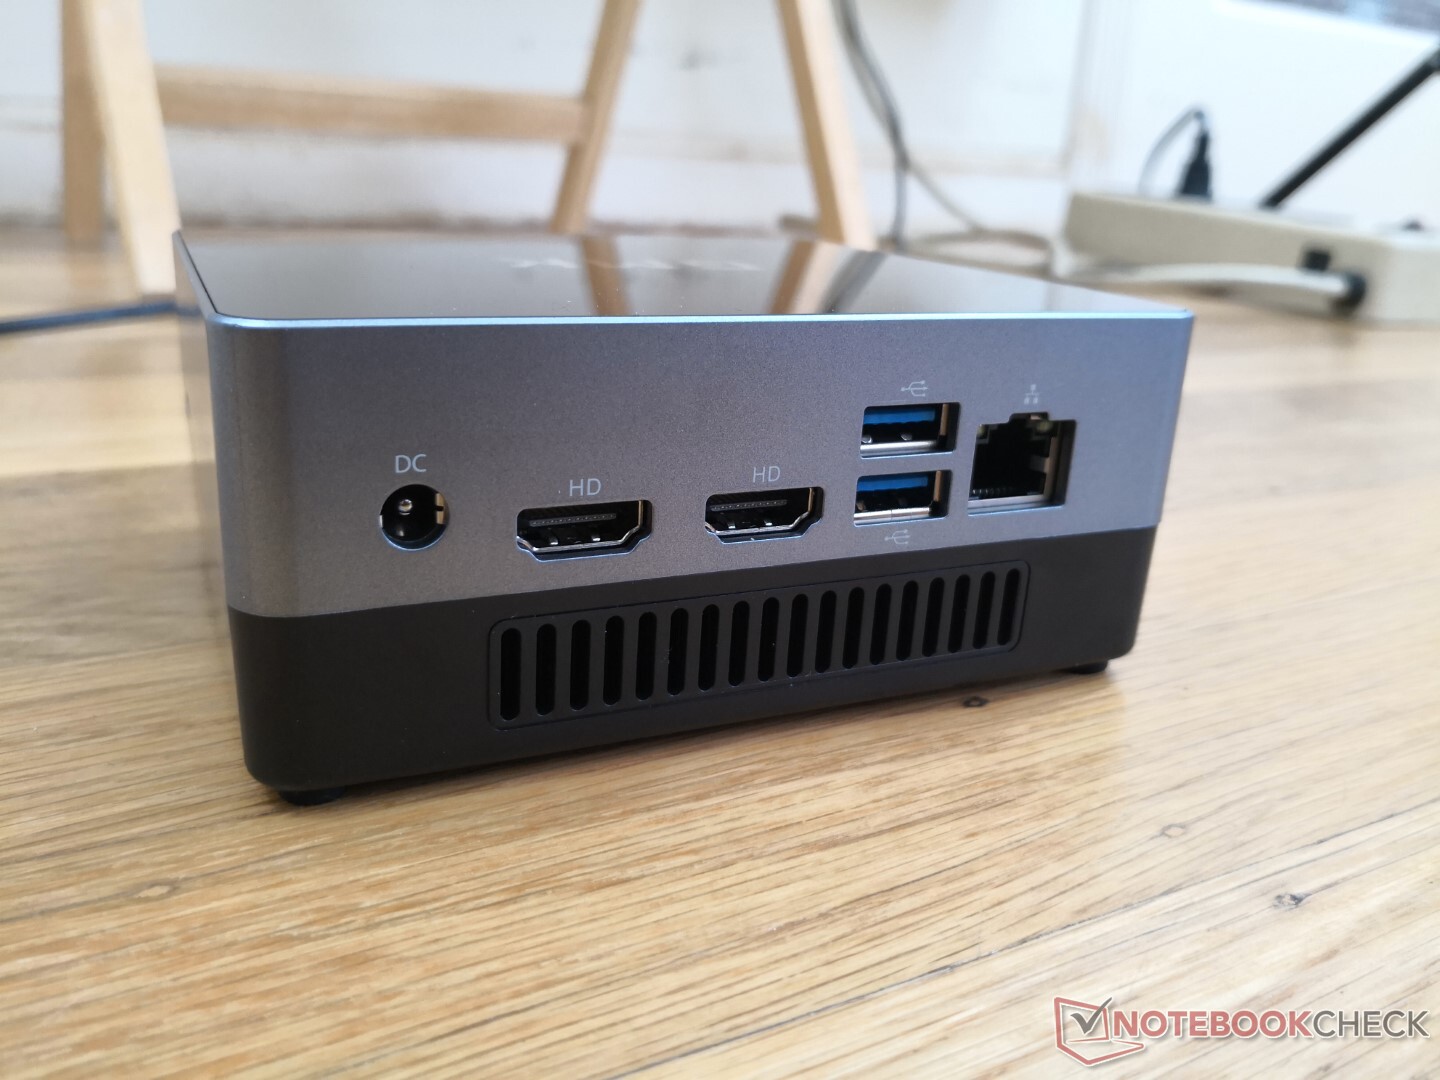
Las opciones de puerto son buenas, pero podrían haber sido mejores. En particular, sólo hay un puerto USB-C y no admite DisplayPort, Thunderbolt o Power Delivery en contraste con el puerto USB-C del Beelink SEi10 de la competencia. Tampoco hay receptor de infrarrojos.
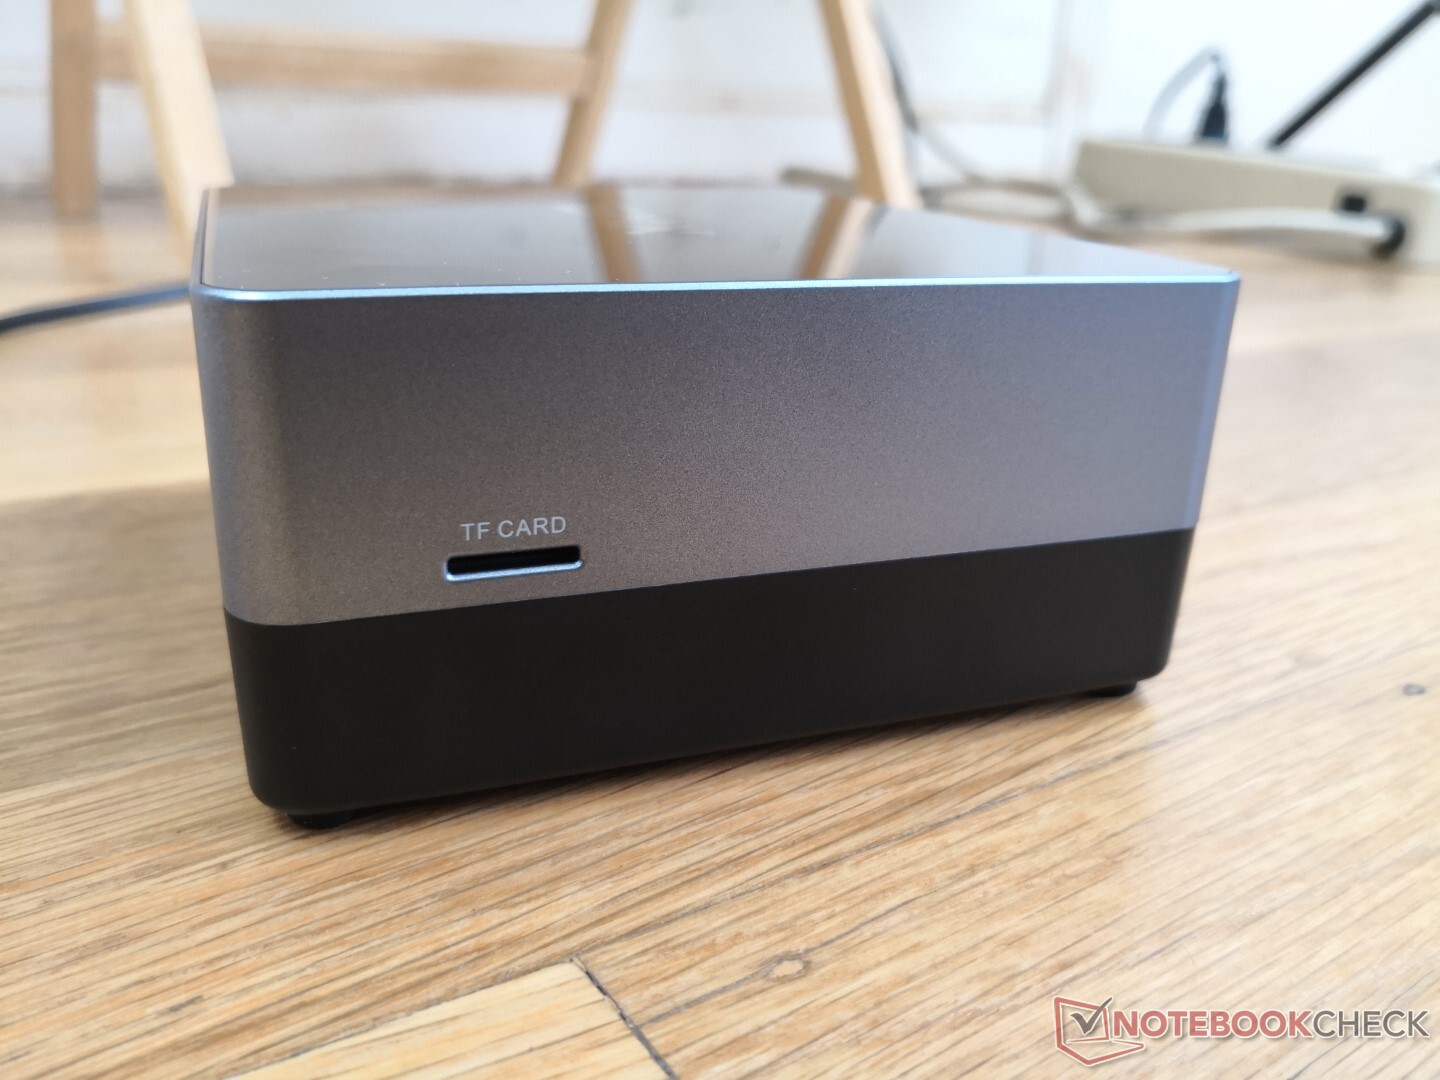
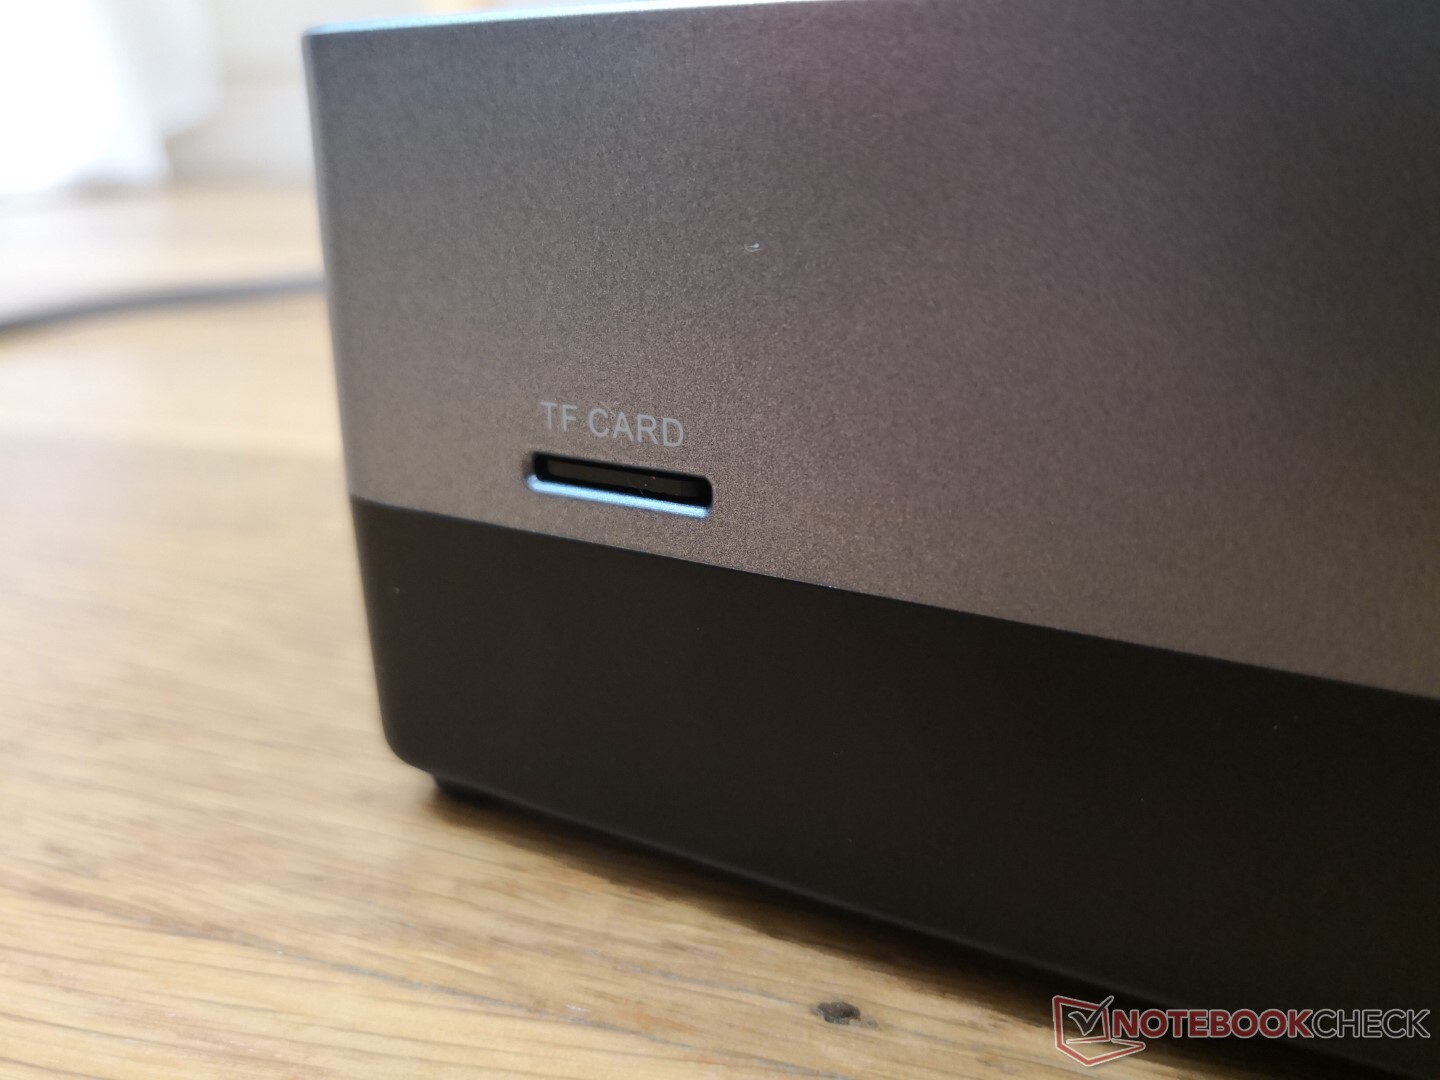
Lector de tarjetas SD
| SD Card Reader | |
| average JPG Copy Test (av. of 3 runs) | |
| Intel NUC11PAQi7 (Toshiba Exceria Pro SDXC 64 GB UHS-II) | |
| Intel NUC8i7BE (Toshiba Exceria Pro M501 UHS-II) | |
| GMK NucBox K1 (Toshiba Exceria Pro M501 UHS-) | |
| Zotac ZBox MI643 (Toshiba Exceria Pro M501 UHS-II) | |
| GMK NucBox 2 (Toshiba Exceria Pro M501 UHS-II) | |
| Beelink SEi10 (Toshiba Exceria Pro M501 UHS-II) | |
| maximum AS SSD Seq Read Test (1GB) | |
| Intel NUC11PAQi7 (Toshiba Exceria Pro SDXC 64 GB UHS-II) | |
| Intel NUC8i7BE (Toshiba Exceria Pro M501 UHS-II) | |
| GMK NucBox K1 (Toshiba Exceria Pro M501 UHS-) | |
| Zotac ZBox MI643 (Toshiba Exceria Pro M501 UHS-II) | |
| Beelink SEi10 (Toshiba Exceria Pro M501 UHS-II) | |
| GMK NucBox 2 (Toshiba Exceria Pro M501 UHS-II) | |
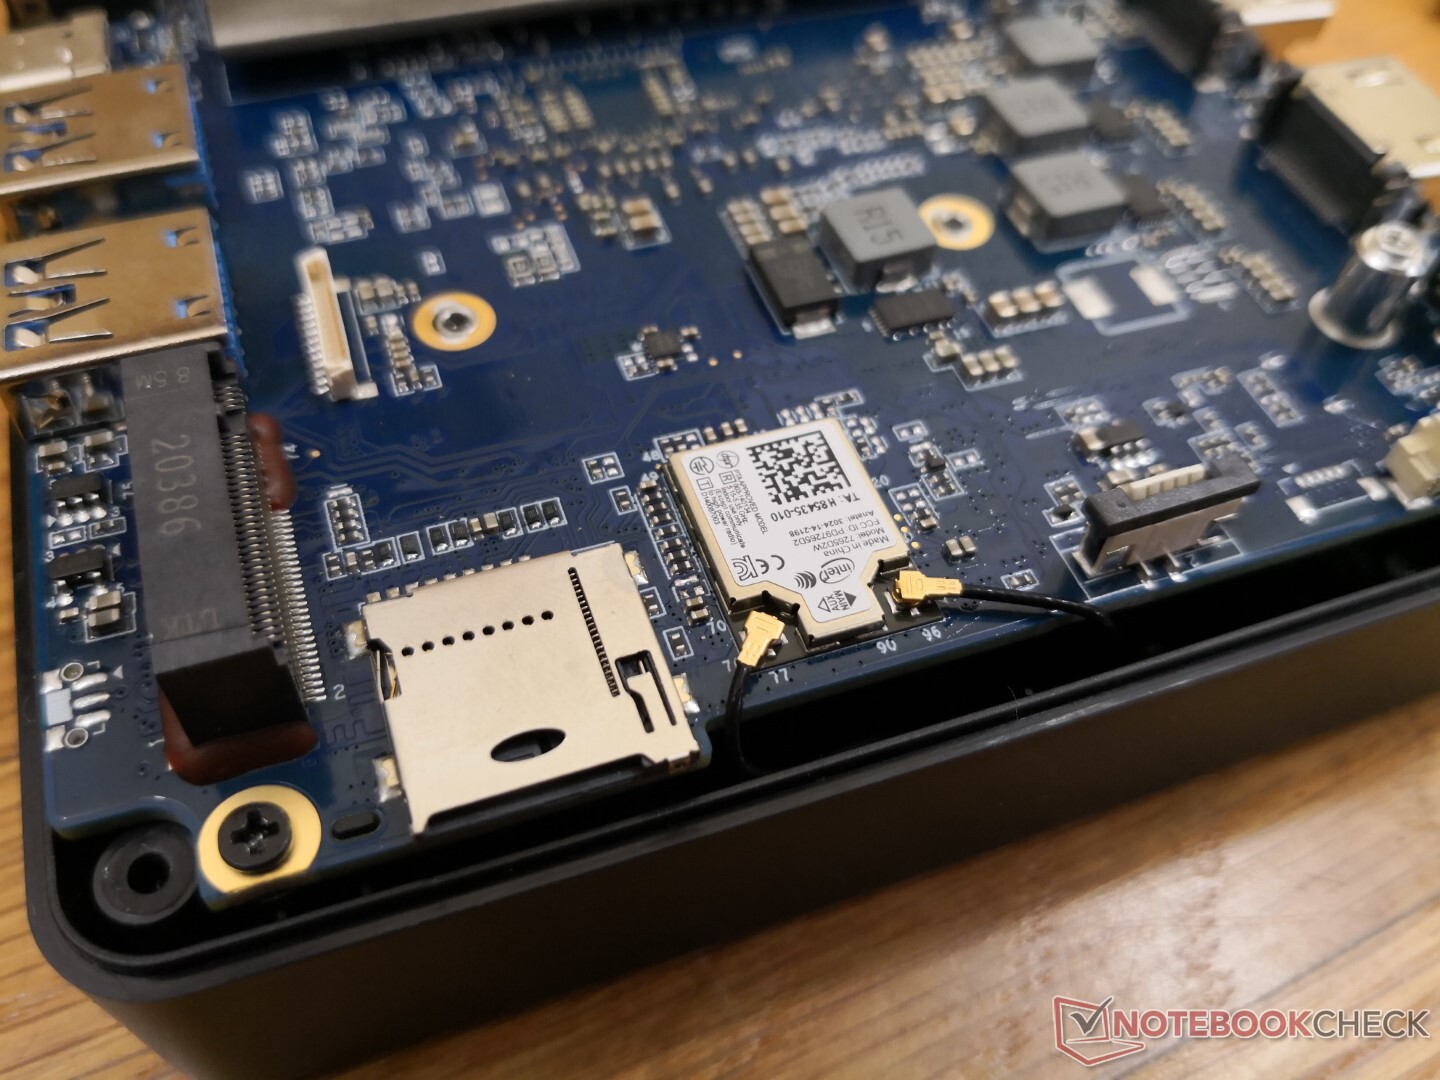
Comunicación
Una Intel 7265 viene soldada para la conectividad Wi-Fi 5. El Wi-Fi 6 no está disponible, probablemente para ahorrar costes. Aunque las tasas de recepción son excelentes, las tasas de transmisión en el mundo real son más lentas de lo esperado, casi la mitad, cuando se conecta a nuestro router de prueba Netgear RAX200.
| Networking | |
| iperf3 transmit AX12 | |
| Beelink SEi10 | |
| Intel NUC8i7BE | |
| Intel NUC11PAQi7 | |
| GMK NucBox 2 | |
| Zotac ZBox MI643 | |
| GMK NucBox K1 | |
| iperf3 receive AX12 | |
| Beelink SEi10 | |
| Intel NUC11PAQi7 | |
| GMK NucBox 2 | |
| Intel NUC8i7BE | |
| GMK NucBox K1 | |
| Zotac ZBox MI643 | |
Mantenimiento
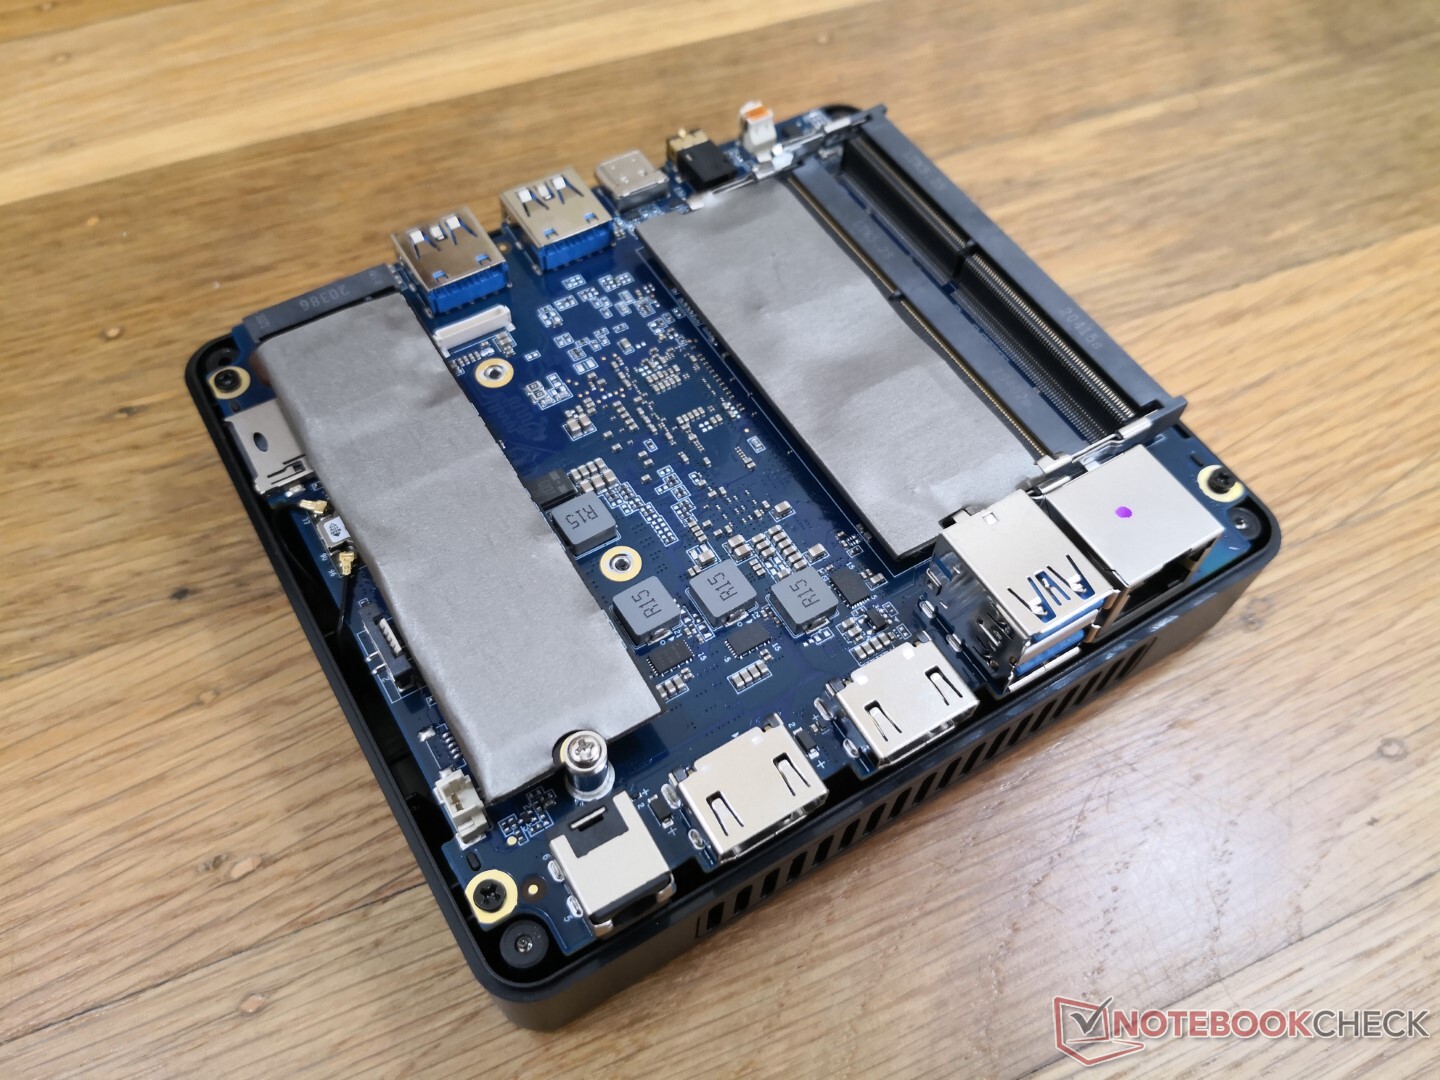
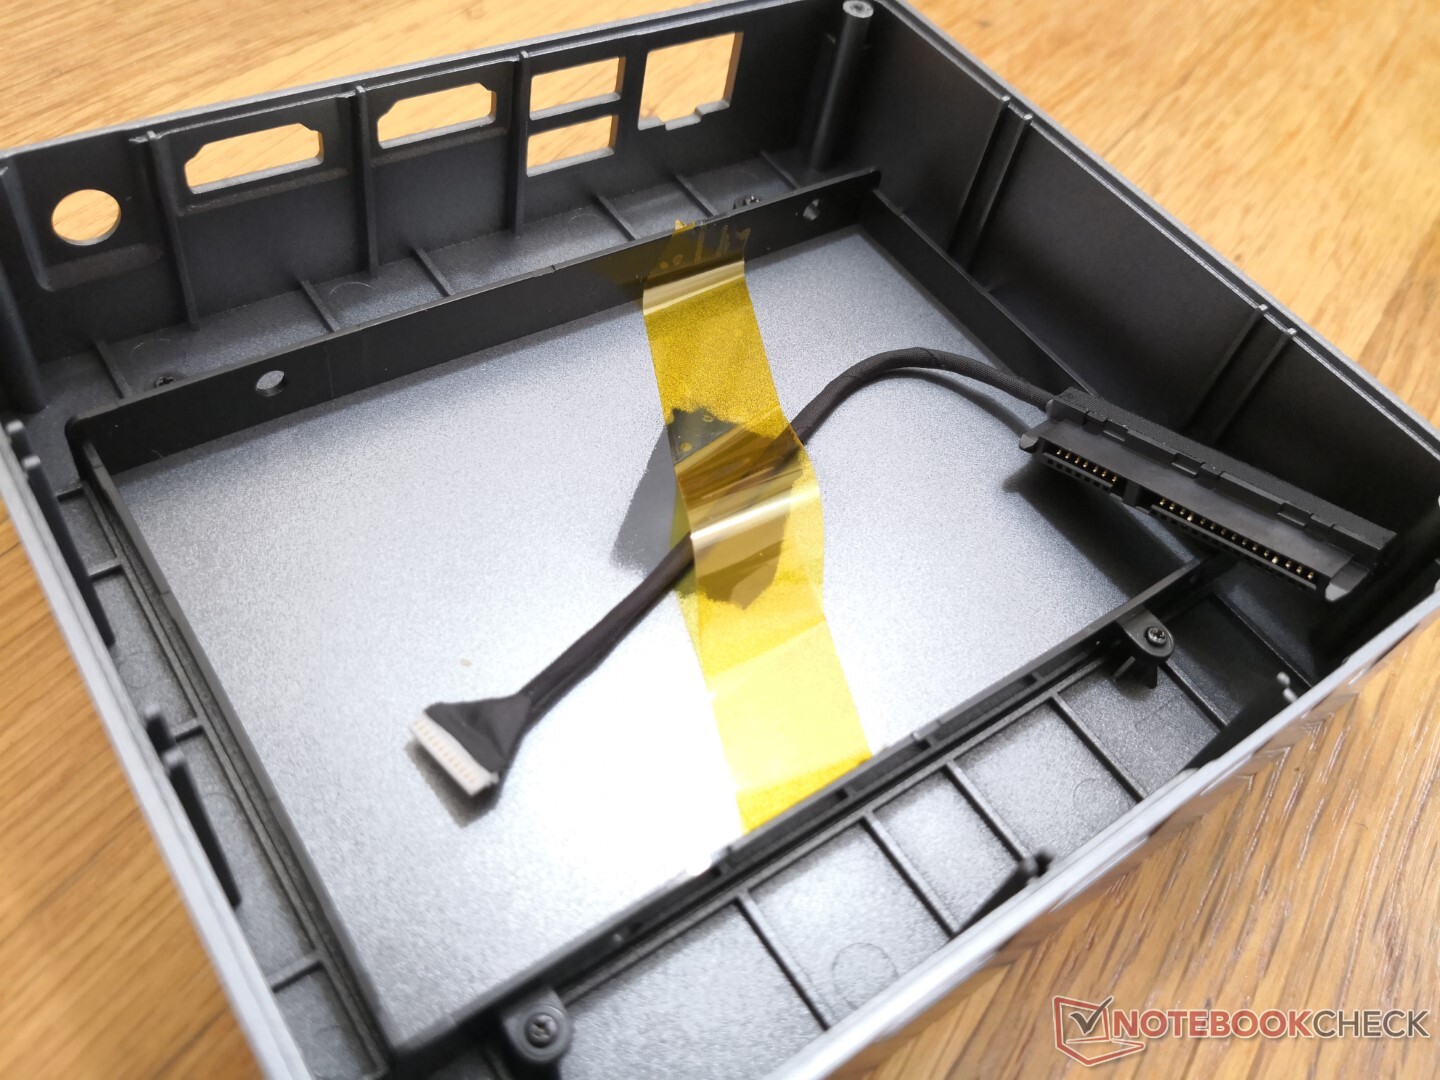
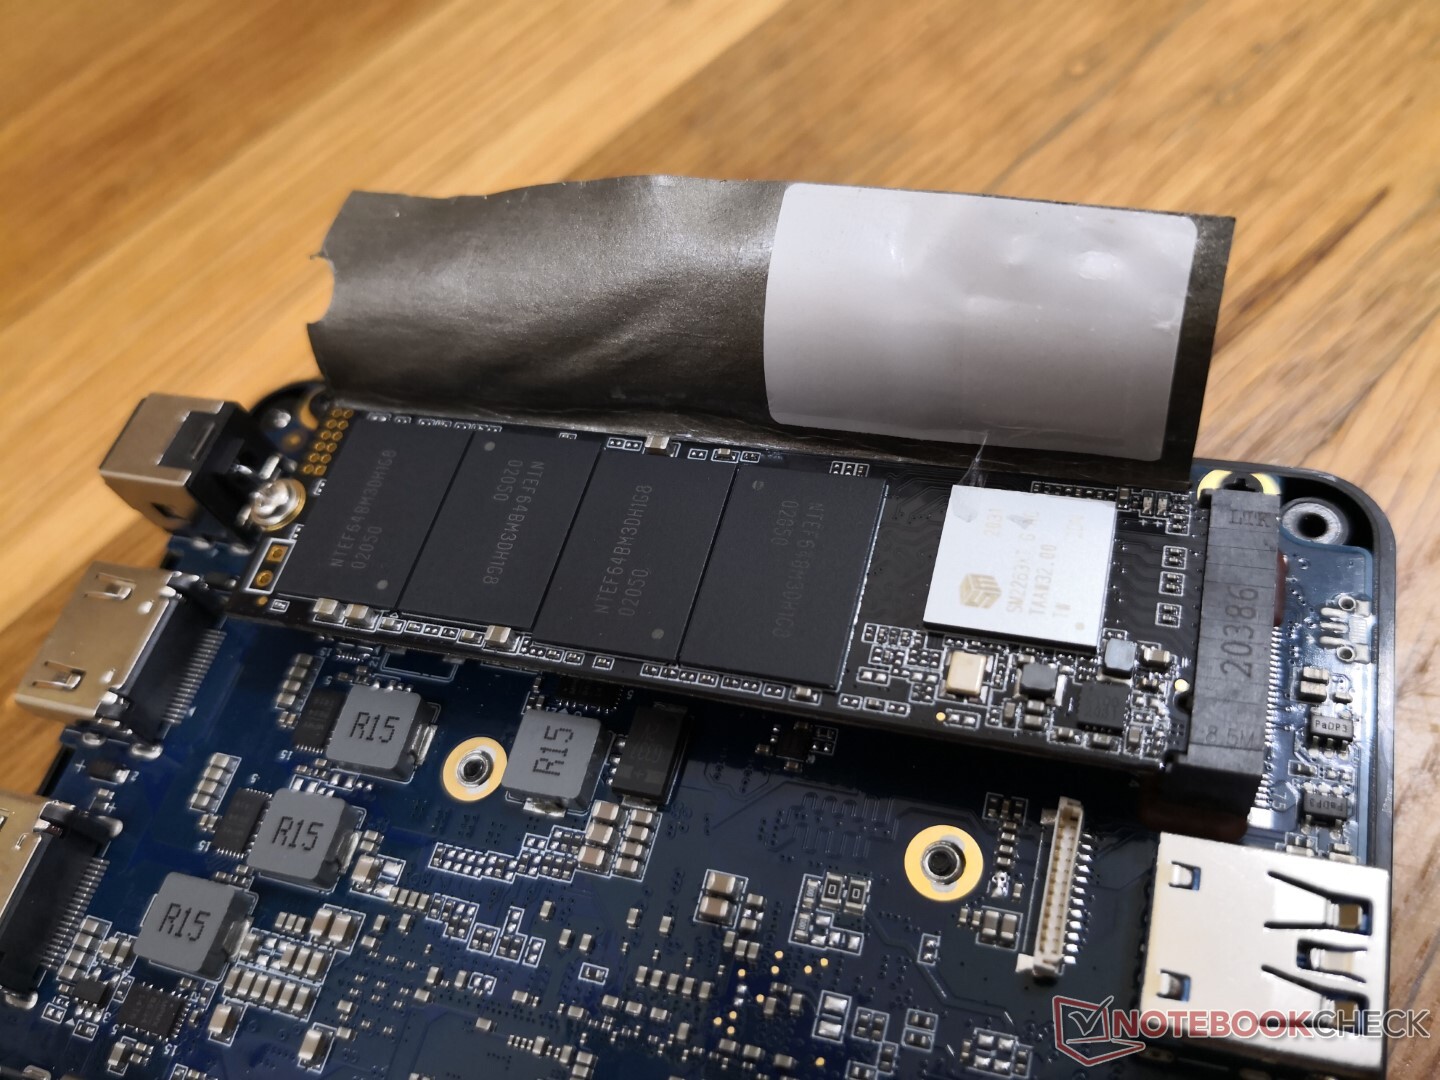
Cuatro tornillos Philips están ocultos debajo de las patas de goma para un mantenimiento relativamente fácil. Una vez dentro, los usuarios verán 1 M.2 2280, 1 bahía SATA III de 2,5 pulgadas y 2 ranuras SODIMM DDR4. El cable de la unidad SATA III de 2,5 pulgadas viene desconectado por defecto.
Accesorios y garantía
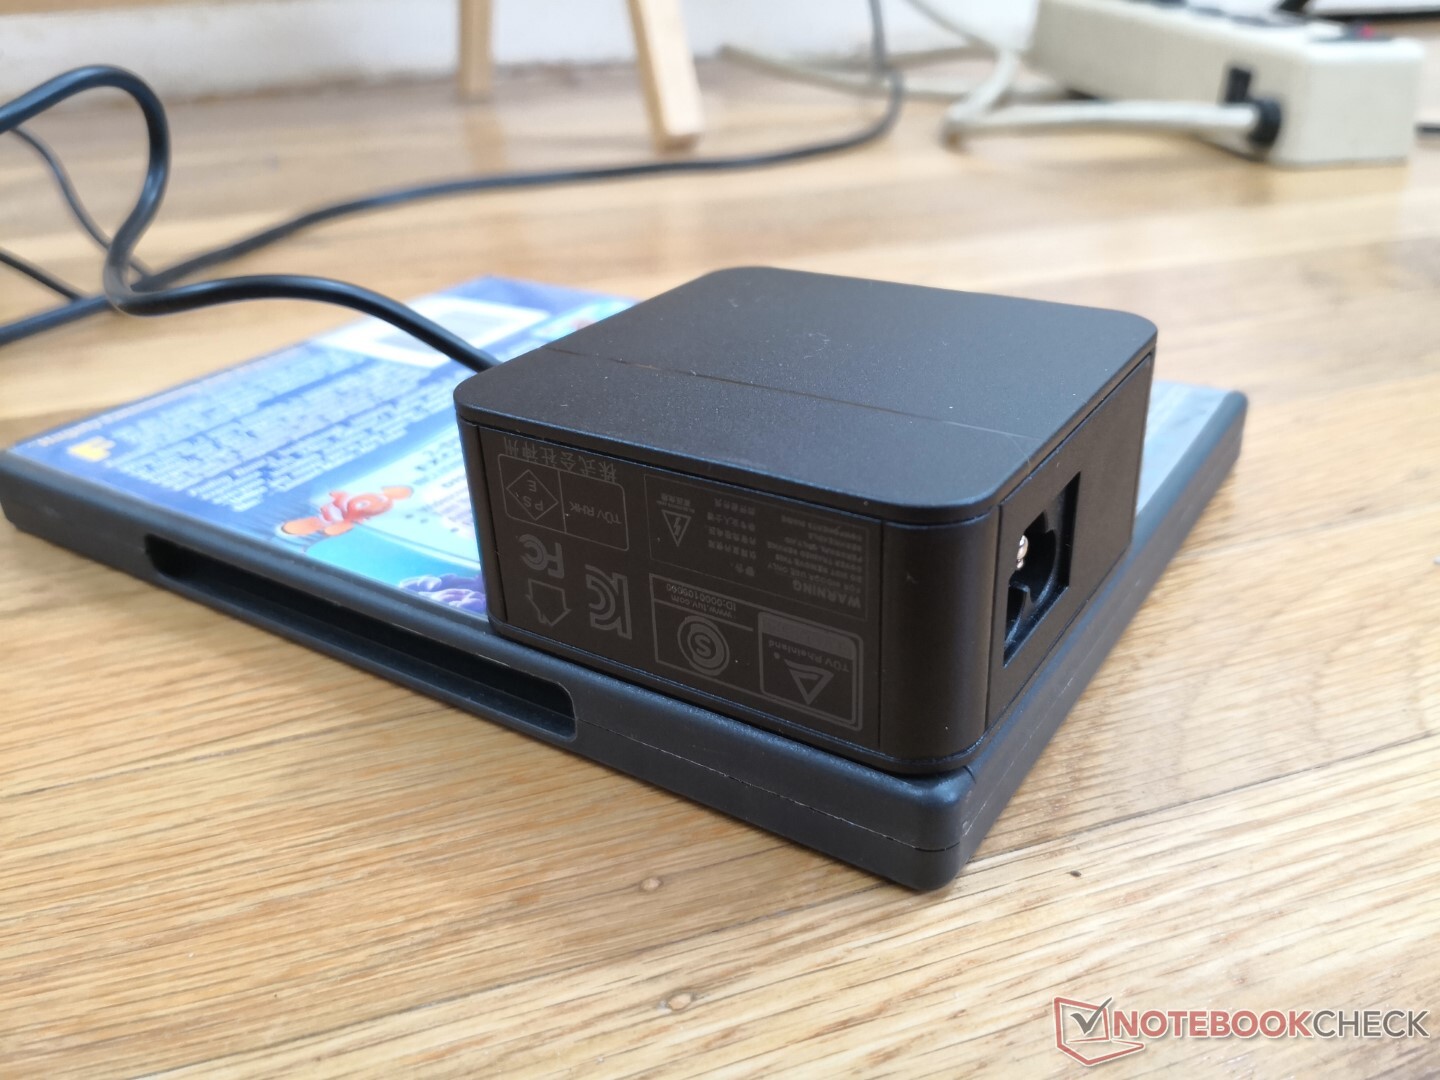
No hay extras en la caja, aparte del adaptador de CA y la documentación, lo que significa que los usuarios tendrán que suministrar sus propios tornillos VESA si desean montar el PC. Es posible que los usuarios tengan que pagar los gastos de envío al extranjero si reclaman la garantía.
Rendimiento
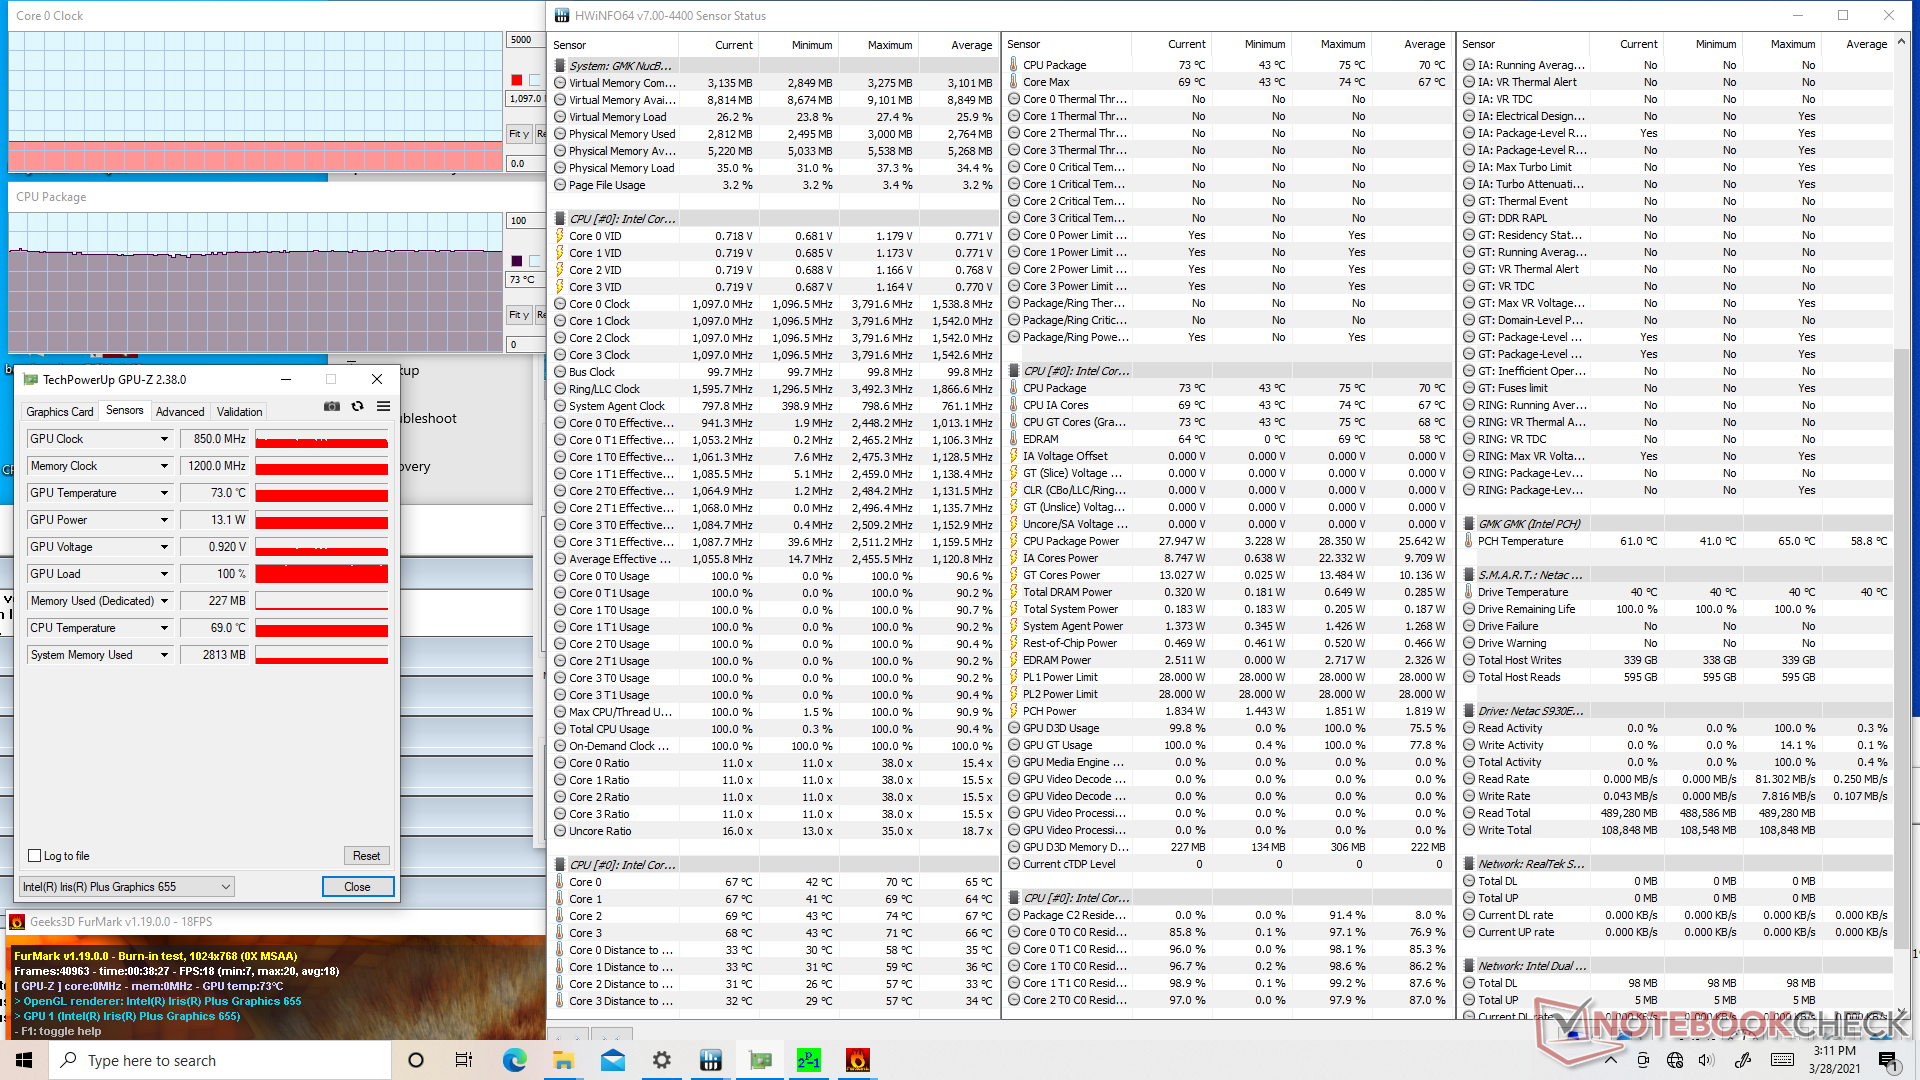
Los mini PC baratos como el Chuwi GBox suelen venir con CPUs Celeron que son mucho más lentas que la mayoría de las opciones de la serie Core. Mientras tanto, los mini PC más caros, como el Intel NUC, vienen con las últimas CPU Core i5/i7 de gama alta. El NucBox 2 adopta un enfoque intermedio al utilizar las antiguas CPU Coffee Lake-U de 8ª generación en lugar de los nuevos procesadores Tiger Lake-U de 11ª generación.
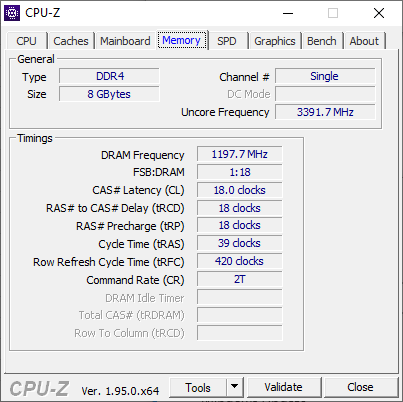
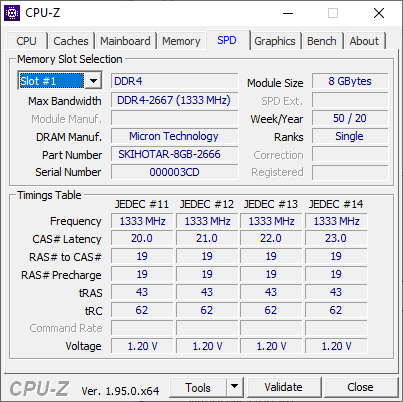
Nuestra unidad se entrega con un módulo de memoria RAM extraíble de 8 GB DDR4 a 2666 MHz. Los usuarios pueden ampliar hasta 32 GB en ambas ranuras SODIMM.
Procesador
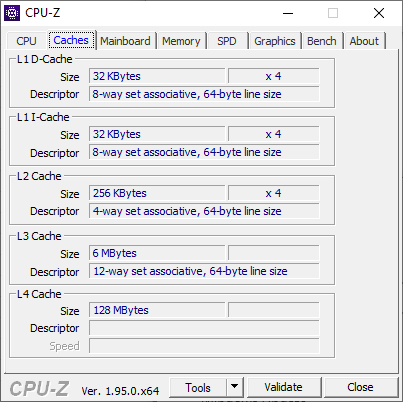
El rendimiento bruto de la CPU es muy similar al del Core i5-8250U, aunque está muy por encima del Celeron J4125 y el Core i3-1005G1 que se encuentran en el NucBox K1 y el Beelink SEi10, respectivamente. Nuestro Core i5-8259U es un procesador de gama media que es entre un 15 y un 25 por ciento más lento que el Core i7-8559U que está justo encima. La estabilidad del rendimiento también es buena, sin caídas bruscas de la velocidad de reloj tras varios bucles de CineBench R15 xT.
Cinebench R20: CPU (Multi Core) | CPU (Single Core)
Blender: v2.79 BMW27 CPU
7-Zip 18.03: 7z b 4 -mmt1 | 7z b 4
Geekbench 5.5: Single-Core | Multi-Core
HWBOT x265 Benchmark v2.2: 4k Preset
LibreOffice : 20 Documents To PDF
R Benchmark 2.5: Overall mean
| Cinebench R15 / CPU Multi 64Bit | |
| Lenovo Yoga Slim 7 14ARE05 82A20008GE | |
| Intel NUC11PAQi7 | |
| HP Envy x360 15-ee0257ng | |
| Intel NUC8i7BE | |
| GPD Win 3 | |
| Medio Intel Core i5-8259U (575 - 687, n=7) | |
| GMK NucBox 2 | |
| Lenovo Yoga C930-13IKB | |
| Zotac ZBox MI643 | |
| Beelink SEi10 | |
| GMK NucBox K1 | |
| Chuwi LarkBook CWI509 | |
| Apple MacBook 12 (Early 2016) 1.1 GHz | |
| Cinebench R15 / CPU Single 64Bit | |
| Intel NUC11PAQi7 | |
| GPD Win 3 | |
| Intel NUC8i7BE | |
| Lenovo Yoga Slim 7 14ARE05 82A20008GE | |
| Zotac ZBox MI643 | |
| HP Envy x360 15-ee0257ng | |
| Beelink SEi10 | |
| GMK NucBox 2 | |
| Medio Intel Core i5-8259U (132 - 154, n=6) | |
| Lenovo Yoga C930-13IKB | |
| Apple MacBook 12 (Early 2016) 1.1 GHz | |
| Apple MacBook 12 (Early 2016) 1.1 GHz | |
| GMK NucBox K1 | |
| Chuwi LarkBook CWI509 | |
| Cinebench R20 / CPU (Multi Core) | |
| Lenovo Yoga Slim 7 14ARE05 82A20008GE | |
| Intel NUC11PAQi7 | |
| HP Envy x360 15-ee0257ng | |
| GPD Win 3 | |
| Intel NUC8i7BE | |
| Medio Intel Core i5-8259U (1385 - 1567, n=5) | |
| GMK NucBox 2 | |
| Zotac ZBox MI643 | |
| Beelink SEi10 | |
| Chuwi LarkBook CWI509 | |
| GMK NucBox K1 | |
| Cinebench R20 / CPU (Single Core) | |
| Intel NUC11PAQi7 | |
| GPD Win 3 | |
| Lenovo Yoga Slim 7 14ARE05 82A20008GE | |
| Intel NUC8i7BE | |
| HP Envy x360 15-ee0257ng | |
| Zotac ZBox MI643 | |
| Beelink SEi10 | |
| GMK NucBox 2 | |
| Medio Intel Core i5-8259U (369 - 386, n=5) | |
| Chuwi LarkBook CWI509 | |
| GMK NucBox K1 | |
| Blender / v2.79 BMW27 CPU | |
| GMK NucBox K1 | |
| Beelink SEi10 | |
| Zotac ZBox MI643 | |
| GMK NucBox 2 | |
| HP Envy x360 15-ee0257ng | |
| Medio Intel Core i5-8259U (688 - 769, n=6) | |
| Intel NUC8i7BE | |
| Intel NUC8i7BE | |
| GPD Win 3 | |
| Lenovo Yoga Slim 7 14ARE05 82A20008GE | |
| Intel NUC11PAQi7 | |
| 7-Zip 18.03 / 7z b 4 -mmt1 | |
| Intel NUC8i7BE | |
| Intel NUC8i7BE | |
| Intel NUC11PAQi7 | |
| GPD Win 3 | |
| Zotac ZBox MI643 | |
| Lenovo Yoga Slim 7 14ARE05 82A20008GE | |
| HP Envy x360 15-ee0257ng | |
| Beelink SEi10 | |
| GMK NucBox 2 | |
| Medio Intel Core i5-8259U (3753 - 4022, n=6) | |
| GMK NucBox K1 | |
| Chuwi LarkBook CWI509 | |
| 7-Zip 18.03 / 7z b 4 | |
| Lenovo Yoga Slim 7 14ARE05 82A20008GE | |
| Intel NUC8i7BE | |
| Intel NUC8i7BE | |
| Intel NUC11PAQi7 | |
| HP Envy x360 15-ee0257ng | |
| GPD Win 3 | |
| Medio Intel Core i5-8259U (17799 - 28824, n=6) | |
| GMK NucBox 2 | |
| Zotac ZBox MI643 | |
| Beelink SEi10 | |
| GMK NucBox K1 | |
| Chuwi LarkBook CWI509 | |
| Geekbench 5.5 / Single-Core | |
| Intel NUC11PAQi7 | |
| GPD Win 3 | |
| Zotac ZBox MI643 | |
| Lenovo Yoga Slim 7 14ARE05 82A20008GE | |
| Beelink SEi10 | |
| HP Envy x360 15-ee0257ng | |
| GMK NucBox 2 | |
| Medio Intel Core i5-8259U (948 - 984, n=3) | |
| Intel NUC8i7BE | |
| Chuwi LarkBook CWI509 | |
| GMK NucBox K1 | |
| Geekbench 5.5 / Multi-Core | |
| Lenovo Yoga Slim 7 14ARE05 82A20008GE | |
| HP Envy x360 15-ee0257ng | |
| Intel NUC11PAQi7 | |
| GPD Win 3 | |
| Zotac ZBox MI643 | |
| Intel NUC8i7BE | |
| Medio Intel Core i5-8259U (3359 - 3839, n=3) | |
| GMK NucBox 2 | |
| Beelink SEi10 | |
| Chuwi LarkBook CWI509 | |
| GMK NucBox K1 | |
| HWBOT x265 Benchmark v2.2 / 4k Preset | |
| Lenovo Yoga Slim 7 14ARE05 82A20008GE | |
| Intel NUC11PAQi7 | |
| GPD Win 3 | |
| Intel NUC8i7BE | |
| Intel NUC8i7BE | |
| HP Envy x360 15-ee0257ng | |
| GMK NucBox 2 | |
| Medio Intel Core i5-8259U (4.72 - 5.49, n=6) | |
| Zotac ZBox MI643 | |
| Beelink SEi10 | |
| GMK NucBox K1 | |
| Chuwi LarkBook CWI509 | |
| LibreOffice / 20 Documents To PDF | |
| Chuwi LarkBook CWI509 | |
| GMK NucBox K1 | |
| HP Envy x360 15-ee0257ng | |
| Medio Intel Core i5-8259U (62.7 - 76, n=5) | |
| Lenovo Yoga Slim 7 14ARE05 82A20008GE | |
| GMK NucBox 2 | |
| Zotac ZBox MI643 | |
| Beelink SEi10 | |
| GPD Win 3 | |
| Intel NUC11PAQi7 | |
| R Benchmark 2.5 / Overall mean | |
| Chuwi LarkBook CWI509 | |
| GMK NucBox K1 | |
| GMK NucBox 2 | |
| Medio Intel Core i5-8259U (0.738 - 0.818, n=5) | |
| Beelink SEi10 | |
| Zotac ZBox MI643 | |
| GPD Win 3 | |
| Intel NUC8i7BE | |
| Lenovo Yoga Slim 7 14ARE05 82A20008GE | |
| HP Envy x360 15-ee0257ng | |
| Intel NUC11PAQi7 | |
Cinebench R20: CPU (Multi Core) | CPU (Single Core)
Blender: v2.79 BMW27 CPU
7-Zip 18.03: 7z b 4 -mmt1 | 7z b 4
Geekbench 5.5: Single-Core | Multi-Core
HWBOT x265 Benchmark v2.2: 4k Preset
LibreOffice : 20 Documents To PDF
R Benchmark 2.5: Overall mean
* ... más pequeño es mejor
Rendimiento del sistema
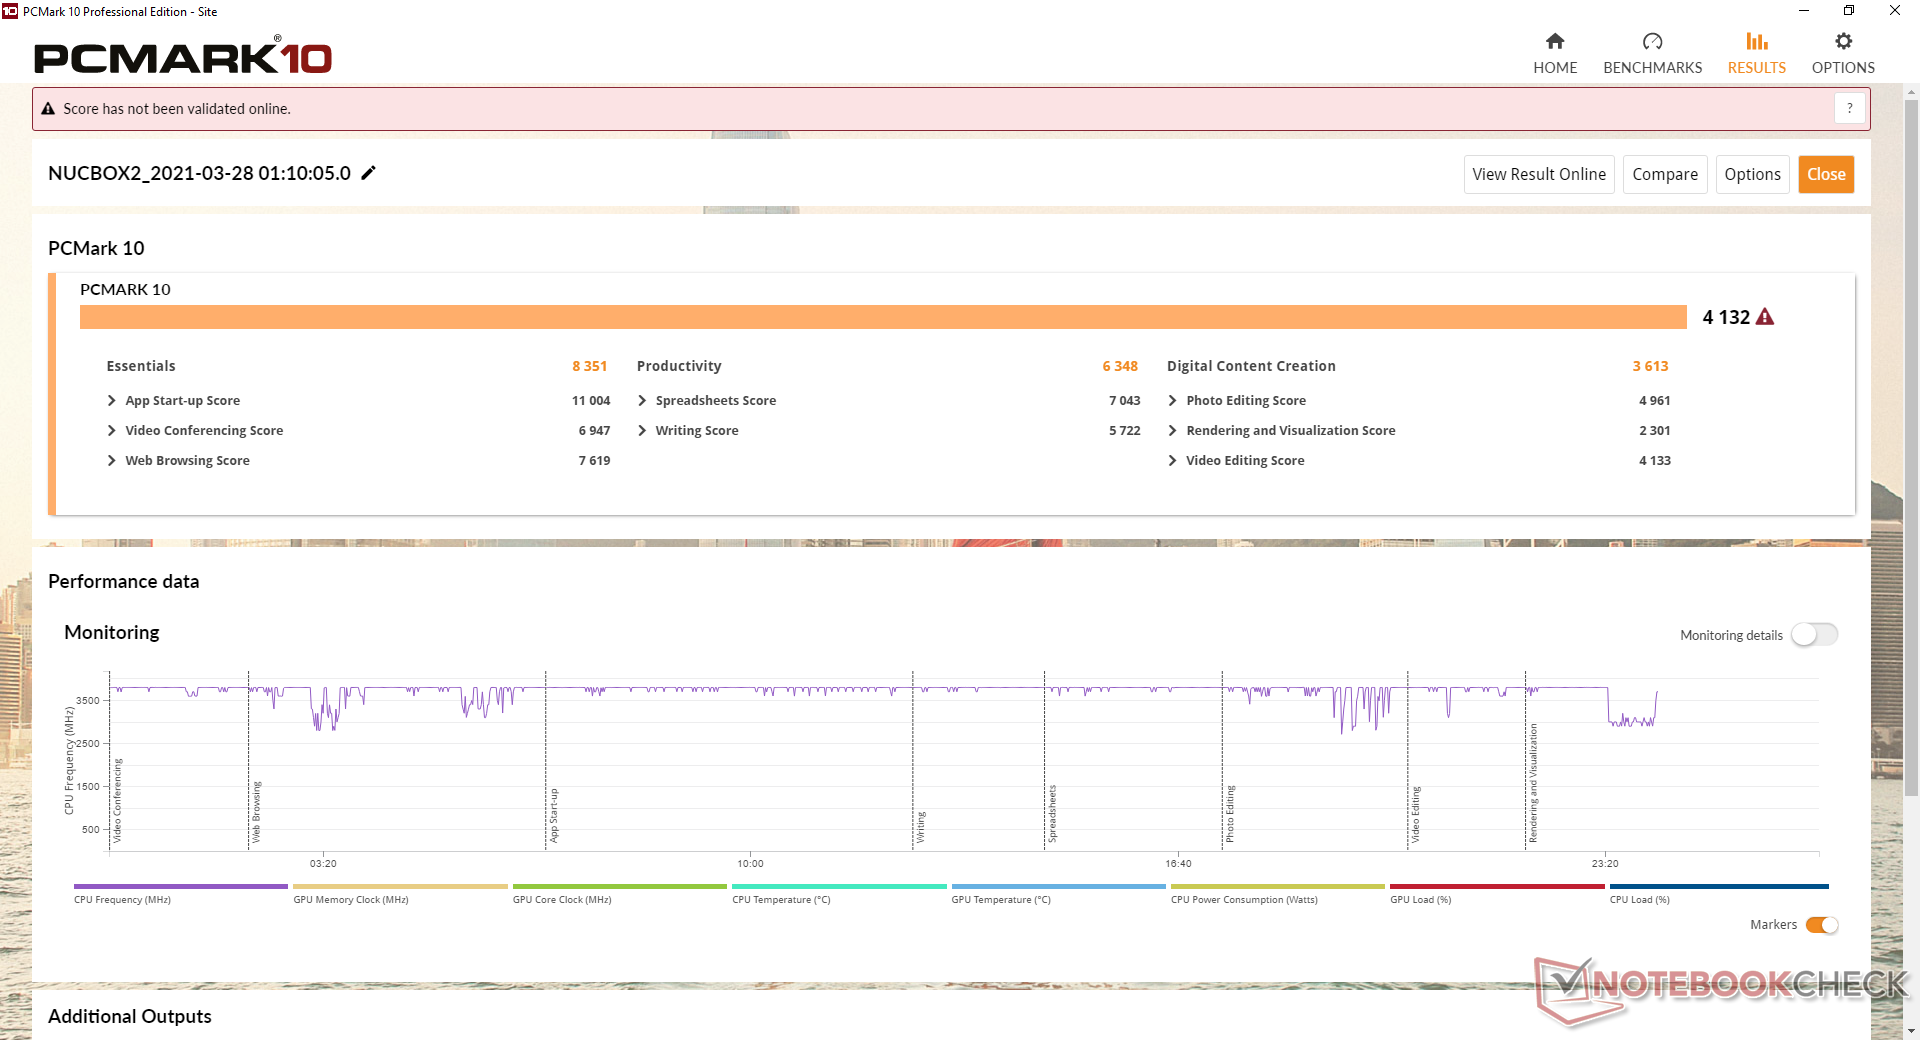
| PCMark 10 Score | 4132 puntos | |
ayuda | ||
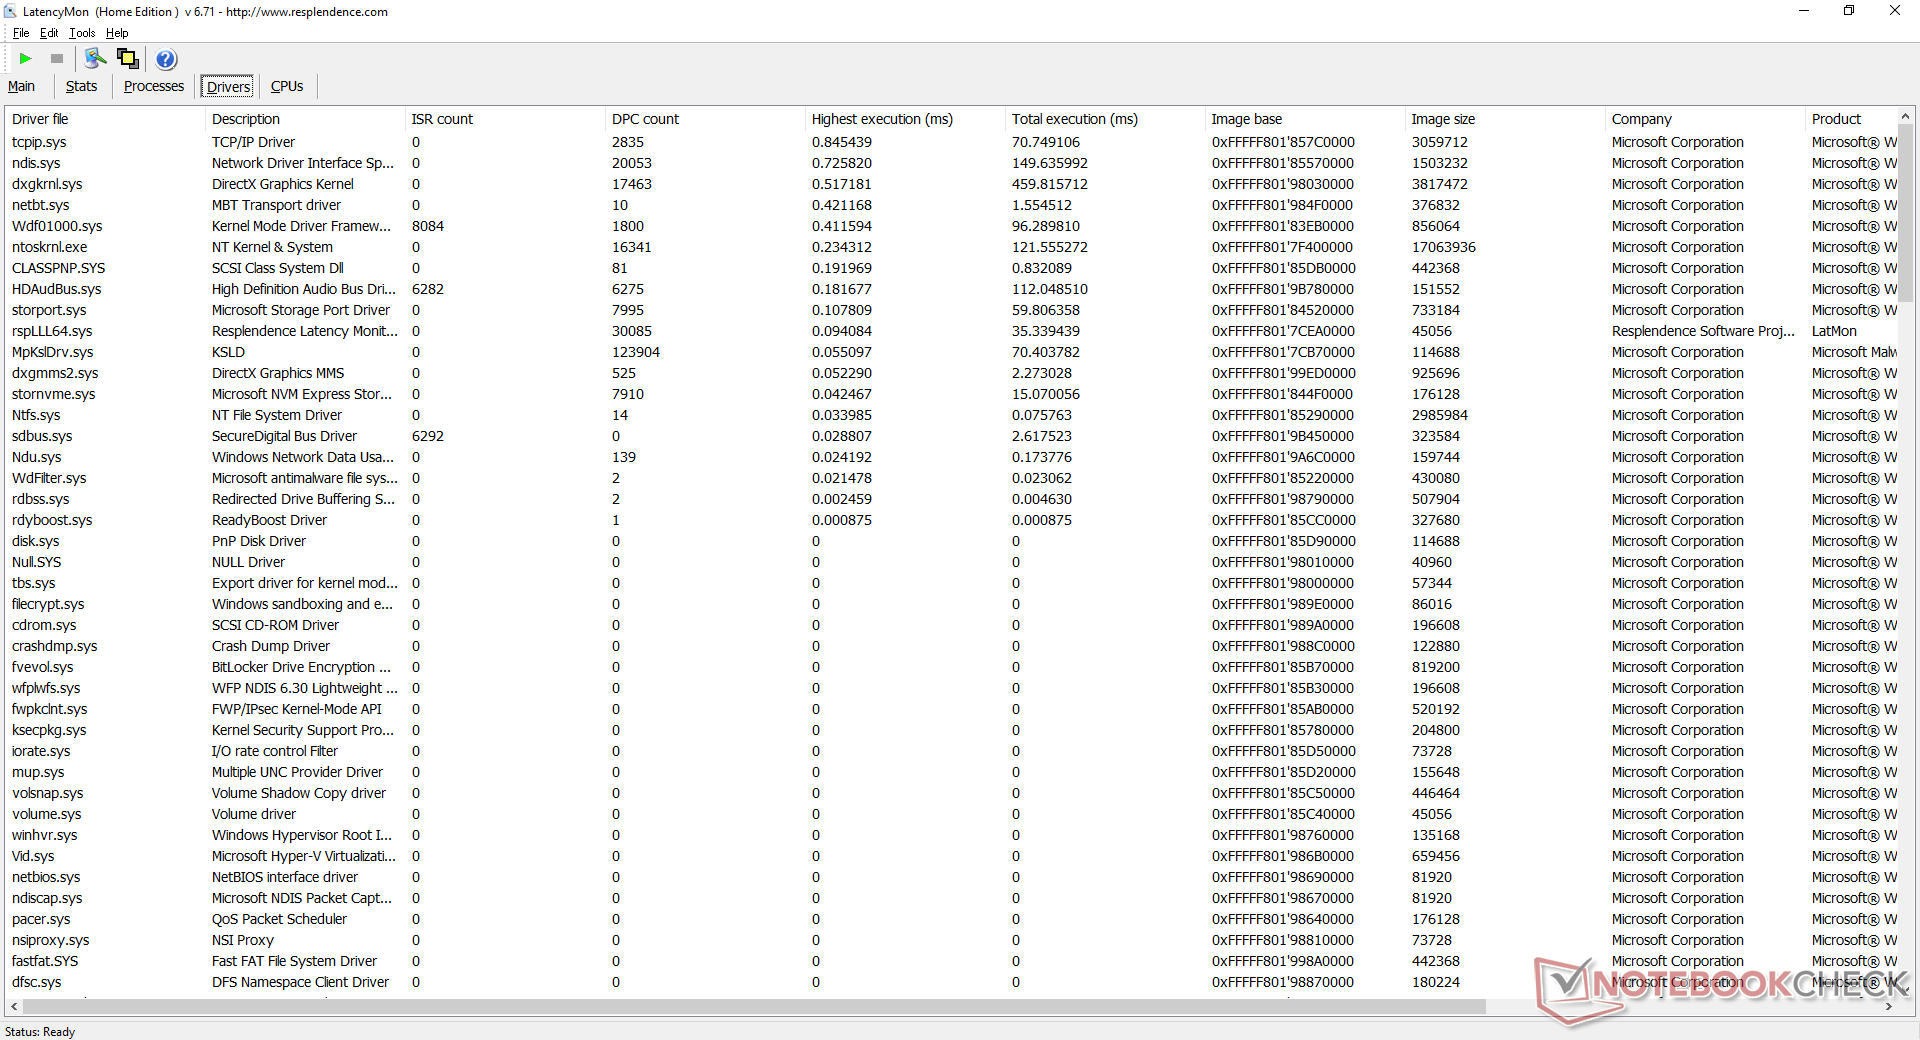
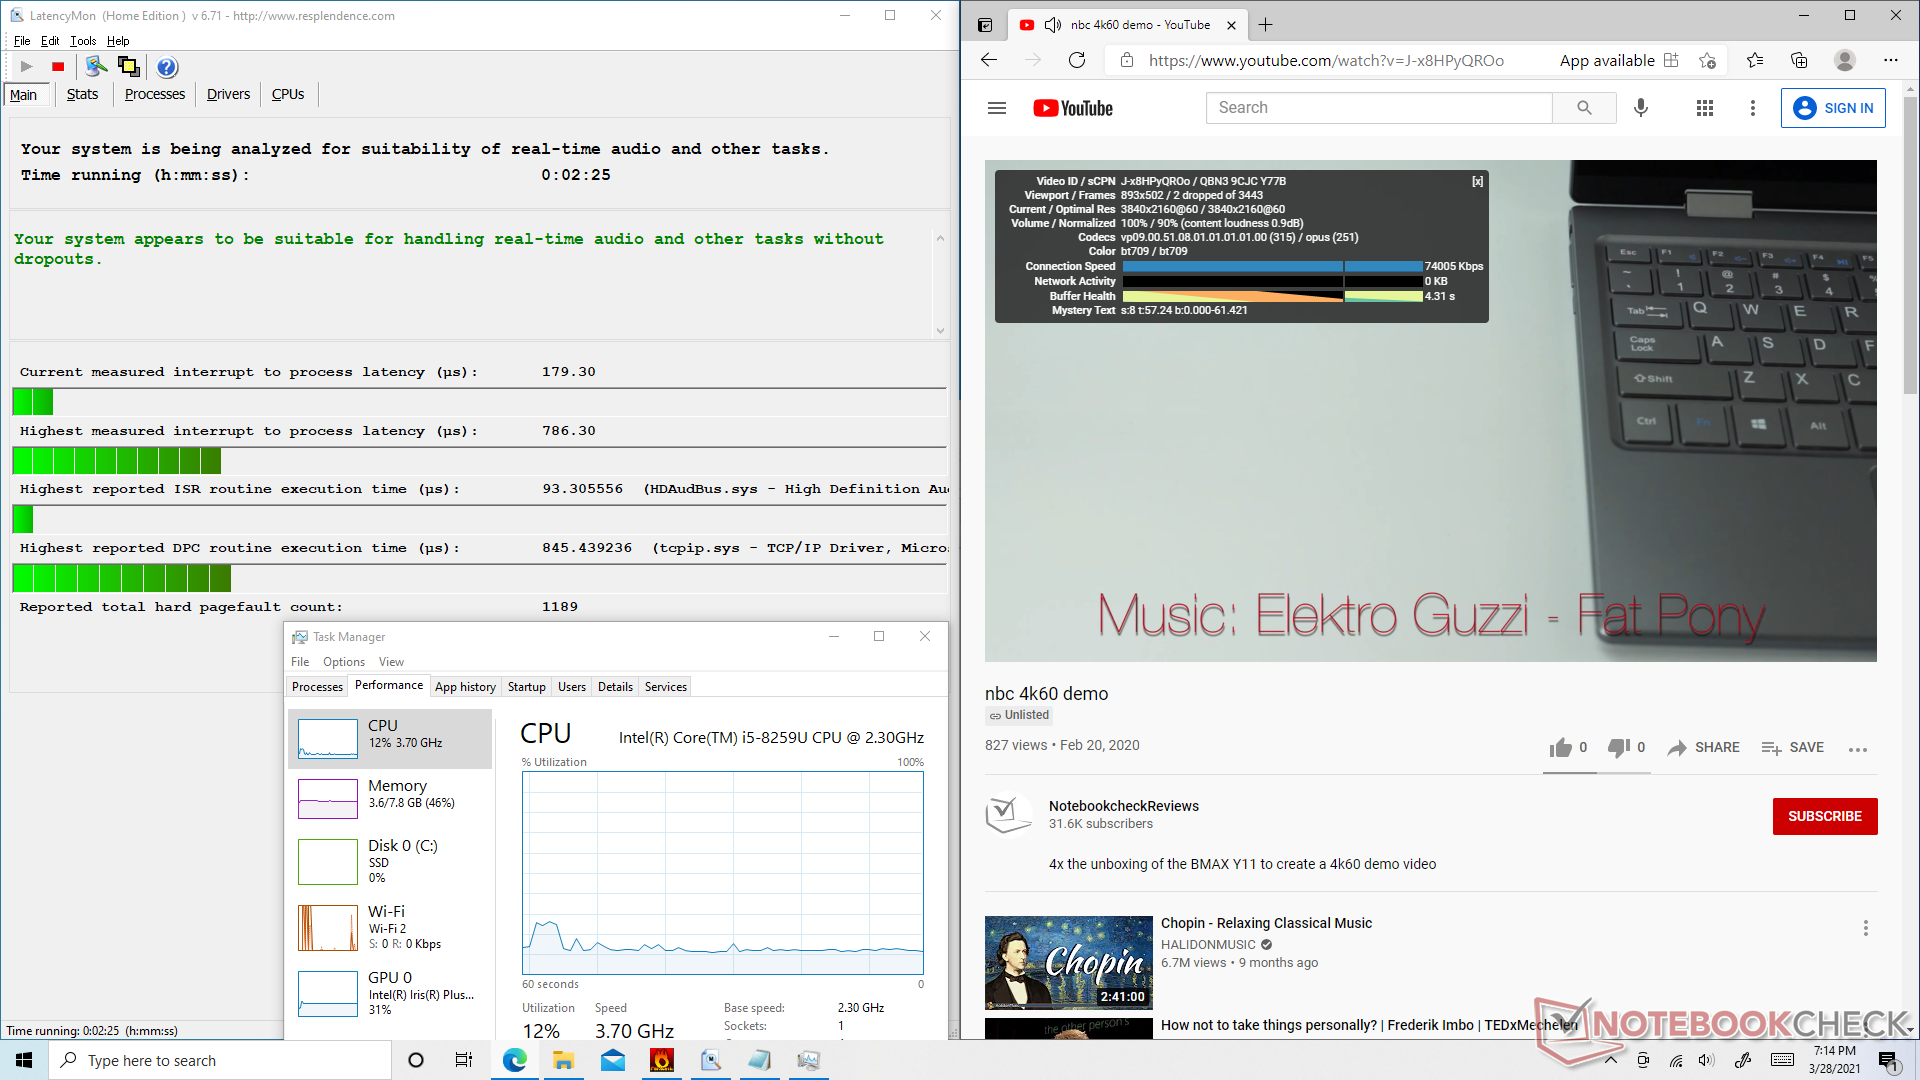
Latencia del CPD
LatencyMon no muestra problemas importantes de latencia del CPD al abrir varias pestañas del navegador en nuestra página web. La reproducción 4K UHD a 60 FPS también es fluida, con solo dos caídas de fotogramas durante nuestra prueba de YouTube de un minuto de duración.
| DPC Latencies / LatencyMon - interrupt to process latency (max), Web, Youtube, Prime95 | |
| GMK NucBox K1 | |
| Beelink SEi10 | |
| GMK NucBox 2 | |
| Zotac ZBox MI643 | |
| Intel NUC11PAQi7 | |
* ... más pequeño es mejor
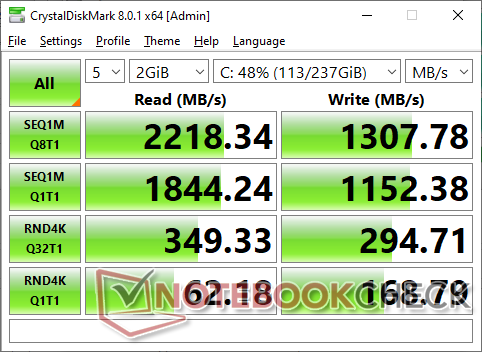
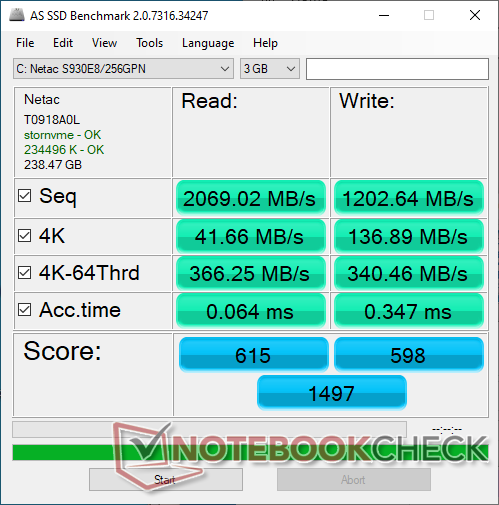
Dispositivos de almacenamiento
Se incluye un SSD NVMe Netac S930E8 de 256 GB con la opción de añadir una unidad SATA III de 2,5 pulgadas para almacenamiento adicional. Las tasas de transferencia son bastante buenas para un SSD NVMe de 256 GB especialmente de este fabricante menos conocido, pero nuestra prueba de bucle DiskSpd muestra que puede tener problemas para mantener los niveles máximos de rendimiento durante periodos prolongados.
| GMK NucBox 2 Netac S930E8/256GPN | Intel NUC11PAQi7 Samsung SSD 980 Pro 500GB MZ-V8P500BW | Zotac ZBox MI643 Lexar NM610 1TB | GPD Win 3 BIWIN NS200 1TB CNF82GS1G02-1TB | |
|---|---|---|---|---|
| AS SSD | 209% | 45% | 99% | |
| Seq Read (MB/s) | 2069 | 3257 57% | 1511 -27% | 1585 -23% |
| Seq Write (MB/s) | 1203 | 3937 227% | 1558 30% | 1776 48% |
| 4K Read (MB/s) | 41.66 | 51.3 23% | 43.77 5% | 61.6 48% |
| 4K Write (MB/s) | 136.9 | 75.7 -45% | 119.5 -13% | 208.9 53% |
| 4K-64 Read (MB/s) | 366.3 | 2283 523% | 839 129% | 1142 212% |
| 4K-64 Write (MB/s) | 340.5 | 2206 548% | 909 167% | 1103 224% |
| Access Time Read * (ms) | 0.064 | 0.056 12% | 0.032 50% | 0.03 53% |
| Access Time Write * (ms) | 0.347 | 0.154 56% | 0.242 30% | 0.074 79% |
| Score Read (Points) | 615 | 2660 333% | 1034 68% | 1362 121% |
| Score Write (Points) | 598 | 2676 347% | 1185 98% | 1489 149% |
| Score Total (Points) | 1497 | 6725 349% | 2760 84% | 3573 139% |
| Copy ISO MB/s (MB/s) | 1186 | 2030 71% | 1373 16% | 1741 47% |
| Copy Program MB/s (MB/s) | 428.6 | 883 106% | 280.4 -35% | 543 27% |
| Copy Game MB/s (MB/s) | 435.7 | 1817 317% | 531 22% | 1318 203% |
| CrystalDiskMark 5.2 / 6 | 153% | 9% | 39% | |
| Write 4K (MB/s) | 178.4 | 244.6 37% | 214.1 20% | 223 25% |
| Read 4K (MB/s) | 61 | 80.4 32% | 62.1 2% | 66.5 9% |
| Write Seq (MB/s) | 1040 | 4094 294% | 1664 60% | 1857 79% |
| Read Seq (MB/s) | 1919 | 4099 114% | 1797 -6% | 1737 -9% |
| Write 4K Q32T1 (MB/s) | 417.7 | 715 71% | 421.8 1% | 611 46% |
| Read 4K Q32T1 (MB/s) | 325.6 | 783 140% | 512 57% | 688 111% |
| Write Seq Q32T1 (MB/s) | 1144 | 5065 343% | 564 -51% | 1948 70% |
| Read Seq Q32T1 (MB/s) | 2379 | 6884 189% | 2073 -13% | 1995 -16% |
| Media total (Programa/Opciones) | 181% /
188% | 27% /
32% | 69% /
77% |
* ... más pequeño es mejor

Disk Throttling: DiskSpd Read Loop, Queue Depth 8
Rendimiento de la GPU
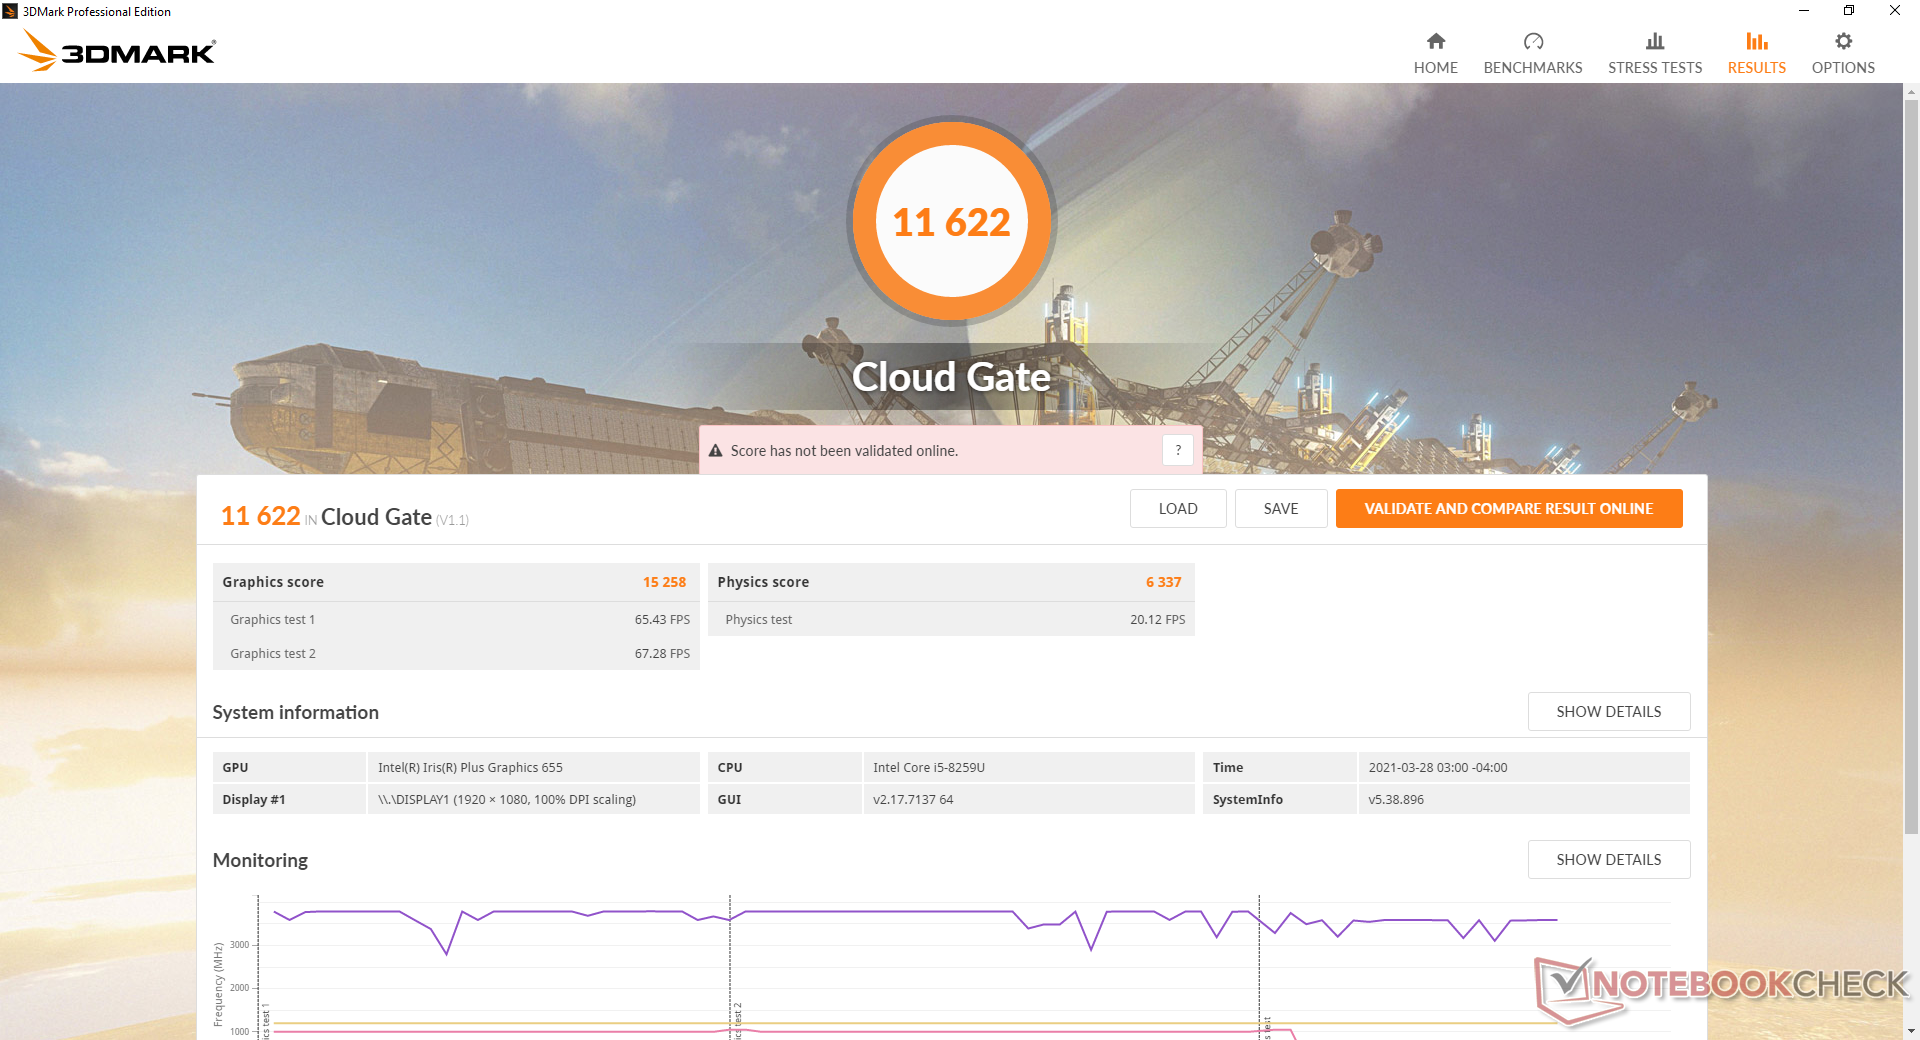
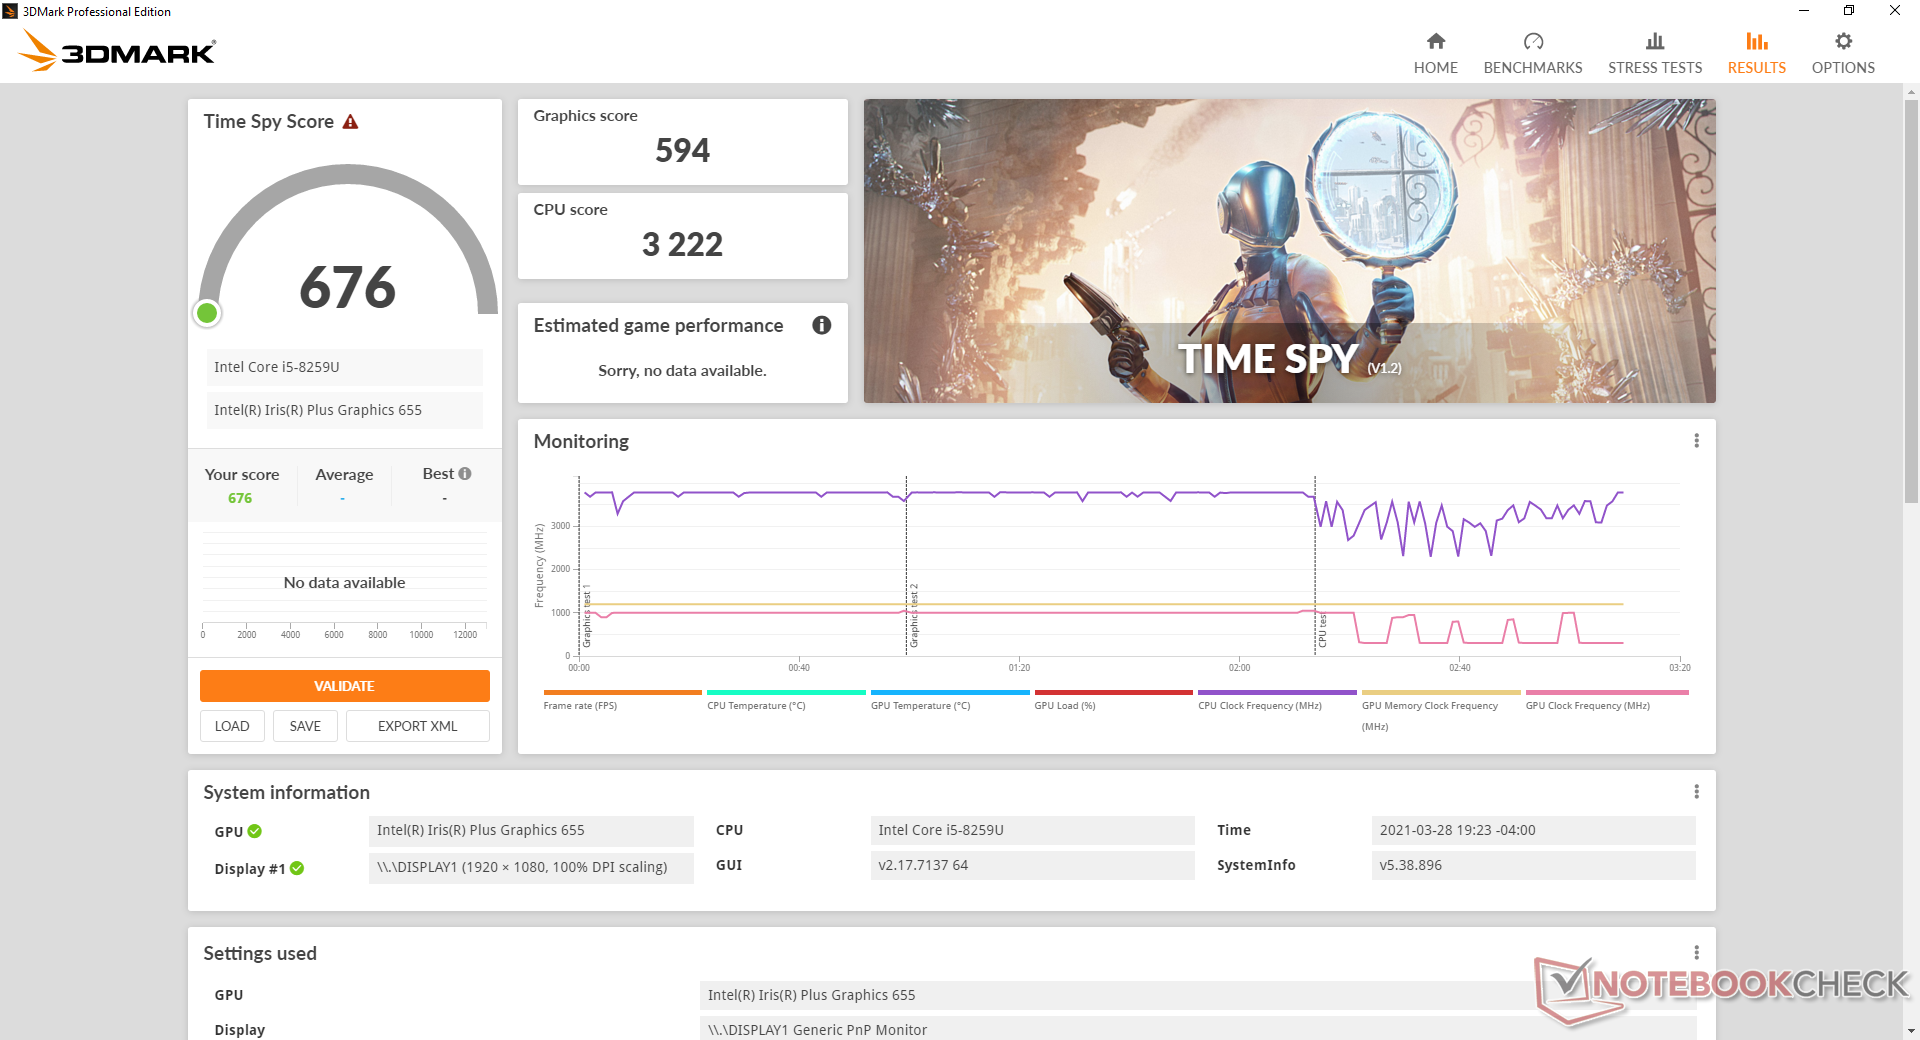
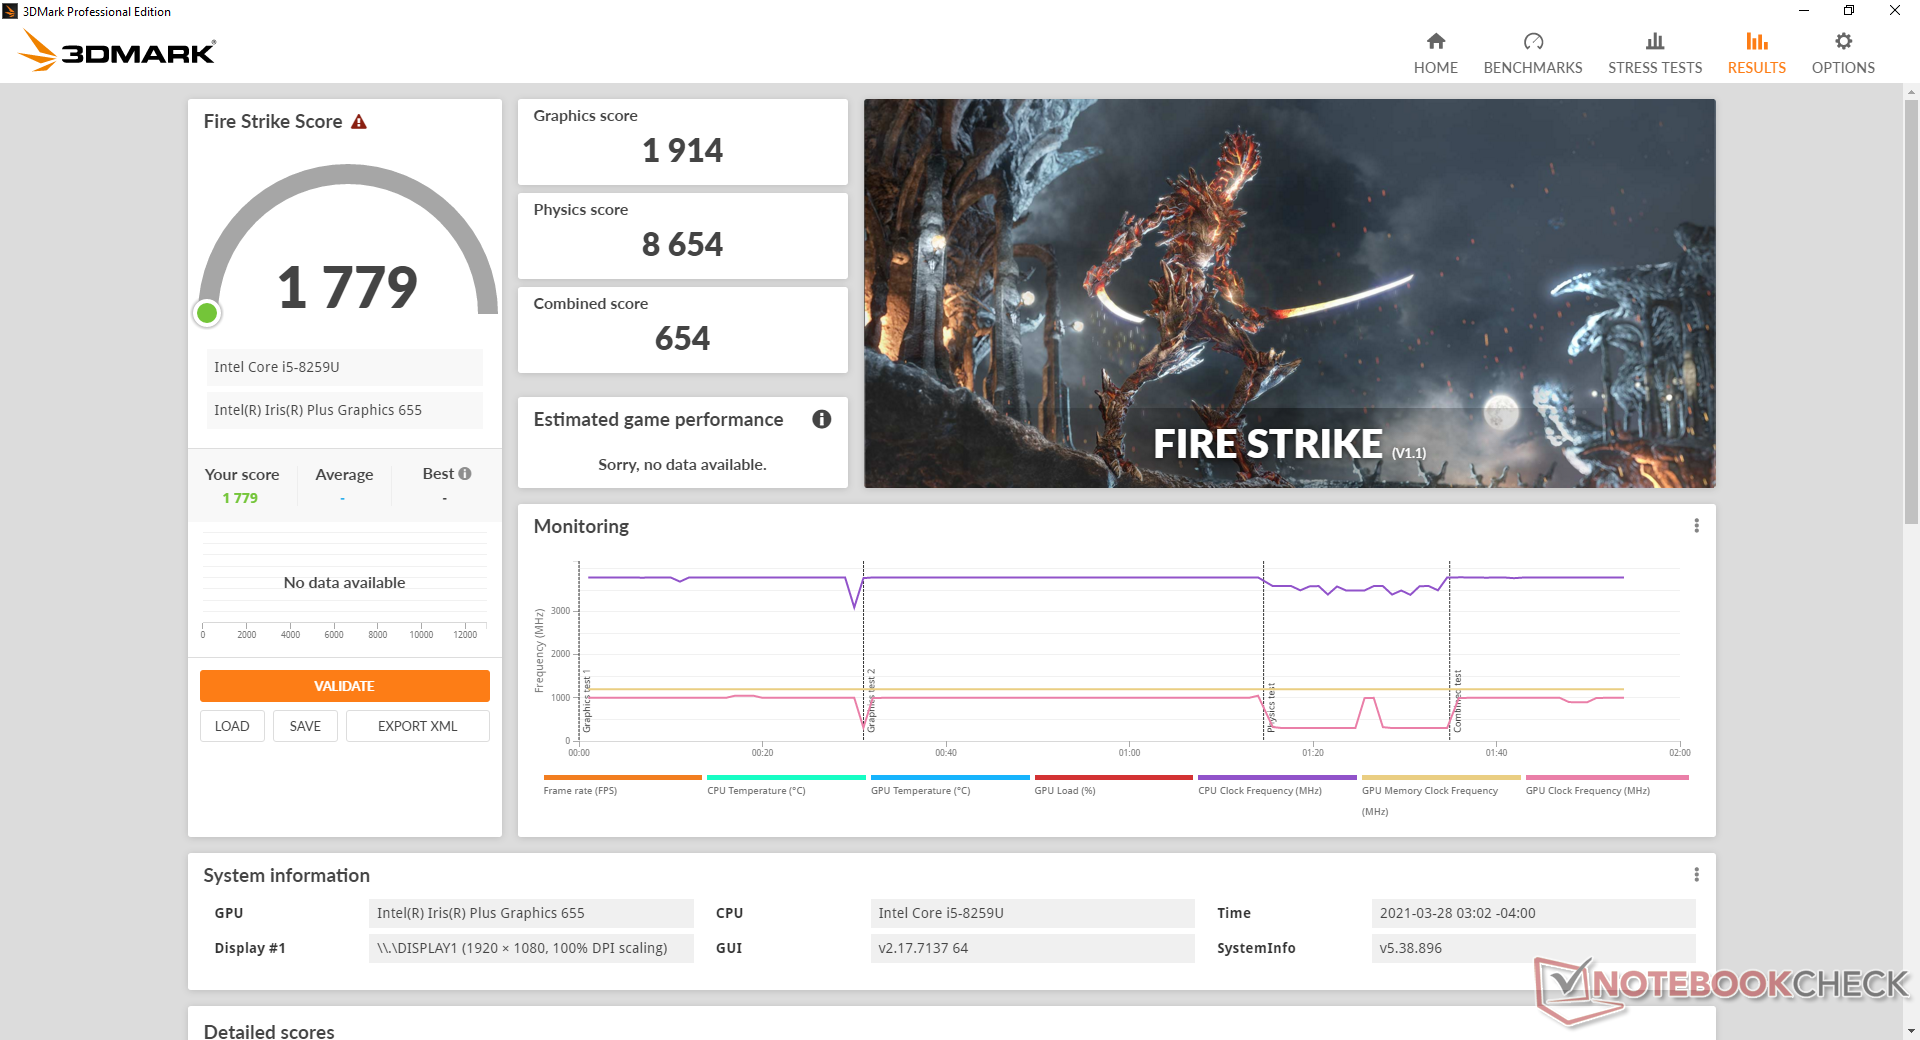
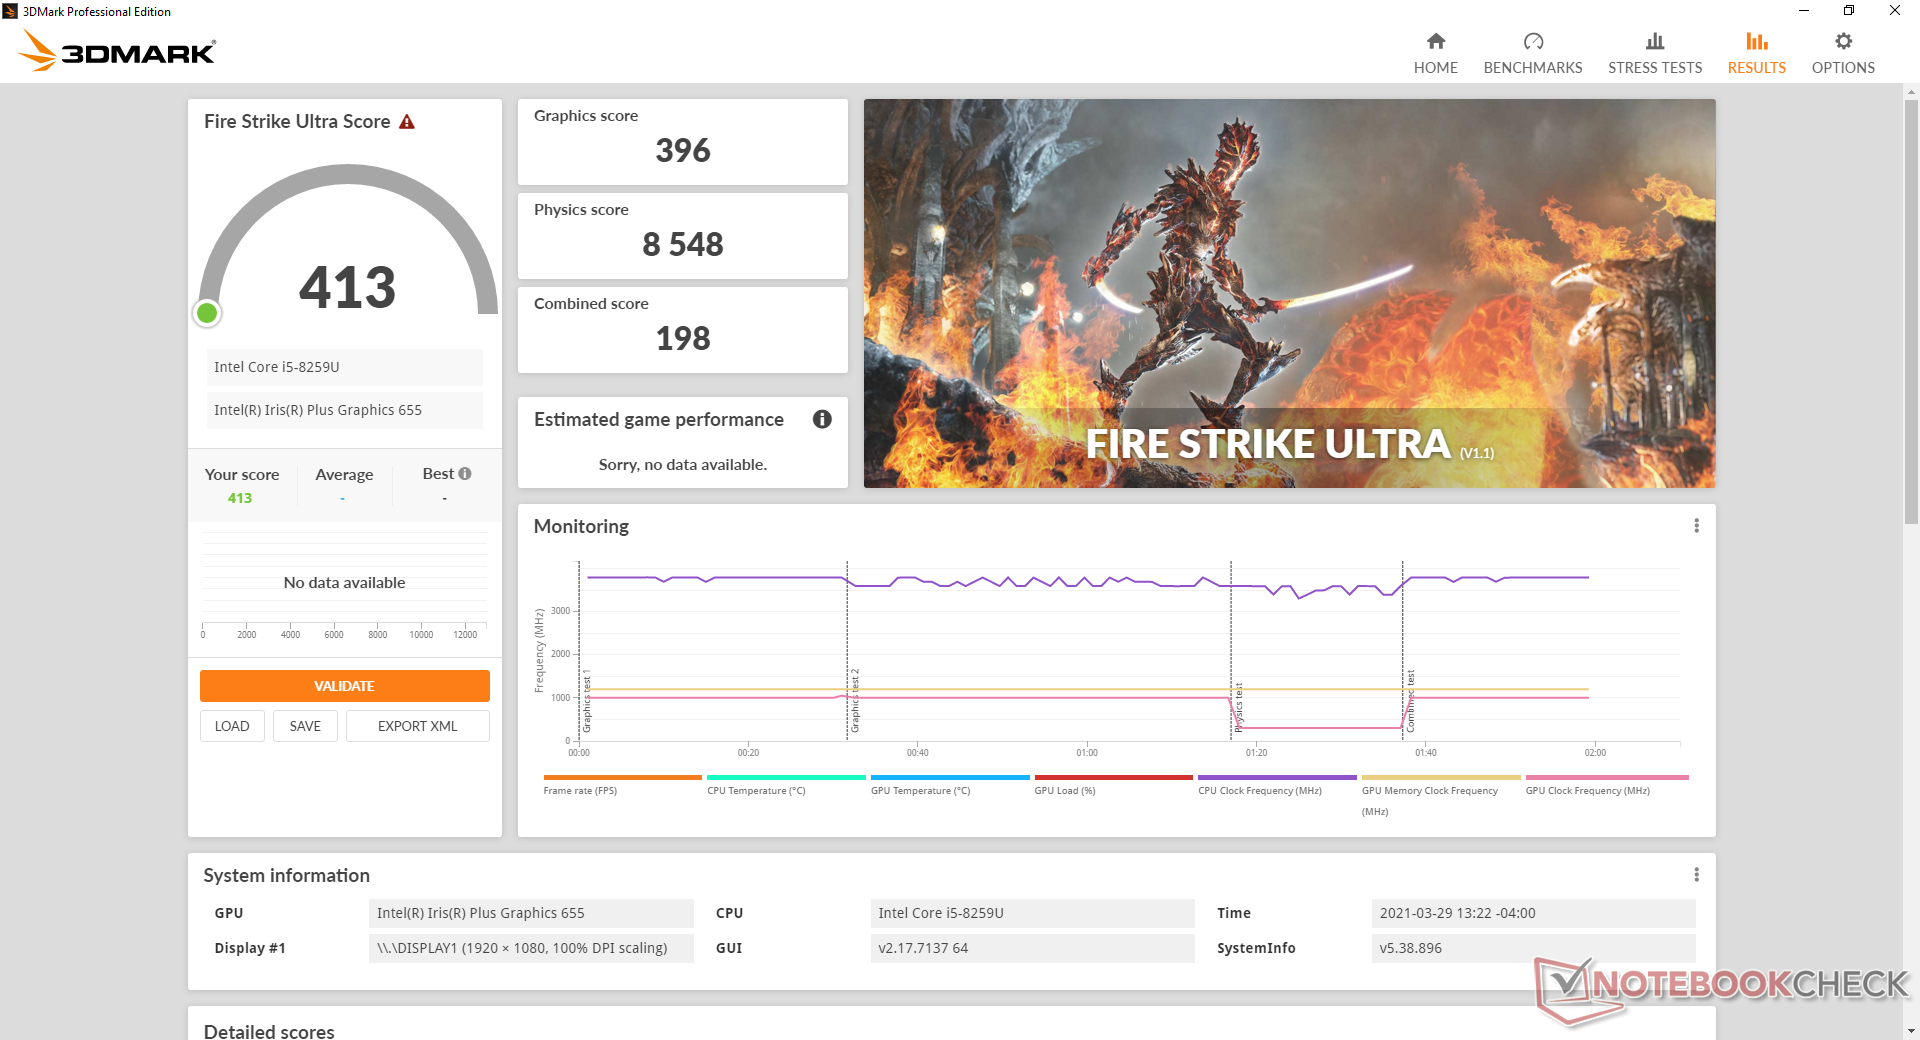
El rendimiento gráfico se sitúa entre la antigua UHD Graphics 620 y la nueva 10ª generación de gráficos Ice Lake Iris Plus G7. La última solución Tiger Lake Iris Xe de 11ª generación es aún más rápida, pero también mucho más cara. La potencia adicional sobre la UHD Graphics 620 es útil para la edición ligera y la salida 4K, como en el MacBook Pro 13 de 2018. Hay que tener en cuenta que la gráfica Iris Plus 655 no ha envejecido muy bien en comparación incluso con la serie Radeon RX Vega
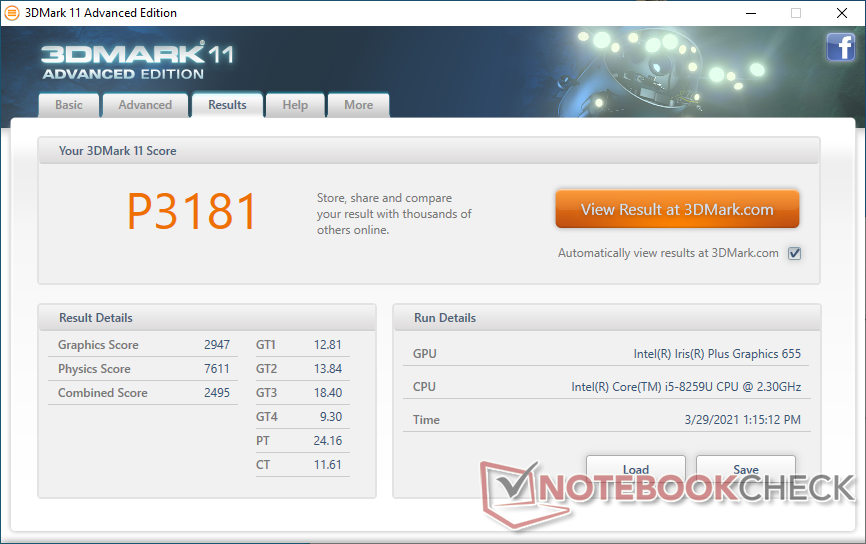
| 3DMark 11 Performance | 3181 puntos | |
| 3DMark Cloud Gate Standard Score | 11622 puntos | |
| 3DMark Fire Strike Score | 1779 puntos | |
| 3DMark Time Spy Score | 676 puntos | |
ayuda | ||
| Final Fantasy XV Benchmark | |
| 1280x720 Lite Quality | |
| GPD Win 3 | |
| Intel NUC11PAQi7 | |
| GMK NucBox 2 | |
| Intel NUC8i7BE | |
| Medio Intel Iris Plus Graphics 655 (9.11 - 18.1, n=8) | |
| Apple MacBook Pro 13 2018 Touchbar i5 | |
| 1920x1080 Standard Quality | |
| GPD Win 3 | |
| Intel NUC11PAQi7 | |
| GMK NucBox 2 | |
| Medio Intel Iris Plus Graphics 655 (7.88 - 9.73, n=4) | |
| 1920x1080 High Quality | |
| GPD Win 3 | |
| Intel NUC11PAQi7 | |
| GMK NucBox 2 | |
| Medio Intel Iris Plus Graphics 655 (5.25 - 6.55, n=4) | |
| bajo | medio | alto | ultra | |
|---|---|---|---|---|
| Dota 2 Reborn (2015) | 98 | 66 | 31.9 | 27.7 |
| Final Fantasy XV Benchmark (2018) | 17.3 | 9.07 | 6.04 | |
| X-Plane 11.11 (2018) | 25.3 | 18 | 15.9 |
Emissions
Ruido del sistema
Un único ventilador de ~45 mm aspira el aire frío por la parte inferior y expulsa el aire caliente por la trasera. Casi siempre es silencioso cuando está en reposo en el escritorio, pero las cargas bajas como la navegación o el streaming de vídeo inducirán rápidamente un ruido de ventilador constante de 29,1 dB(A) contra un fondo silencioso de 25,6 dB(A). Cargas más altas como 3DMark 06 o juegos inducirán un ruido de ventilador constante de 35 dB(A) que sigue siendo más silencioso que la mayoría de otros mini PC bajo cargas y condiciones similares.
Podemos notar un ligero zumbido de la bobina de nuestra unidad de prueba sólo cuando está apagada o en modo de espera.
| GMK NucBox 2 Iris Plus Graphics 655, i5-8259U, Netac S930E8/256GPN | Intel NUC8i7BE Iris Plus Graphics 655, i7-8559U | Zotac ZBox MI643 UHD Graphics 620, i5-10210U, Lexar NM610 1TB | GMK NucBox K1 UHD Graphics 600, Celeron J4125, HIKVision C100 NGFF SSD 128GB | |
|---|---|---|---|---|
| Noise | -15% | -4% | -17% | |
| apagado / medio ambiente * (dB) | 25.6 | 28.7 -12% | 26.1 -2% | 27.8 -9% |
| Idle Minimum * (dB) | 25.7 | 28.7 -12% | 27.5 -7% | 27.8 -8% |
| Idle Average * (dB) | 25.7 | 29.3 -14% | 27.5 -7% | 27.8 -8% |
| Idle Maximum * (dB) | 25.7 | 31.8 -24% | 27.5 -7% | 27.8 -8% |
| Load Average * (dB) | 35.3 | 39 -10% | 28.9 18% | 46.8 -33% |
| Load Maximum * (dB) | 35.1 | 41.4 -18% | 42 -20% | 46.8 -33% |
| Witcher 3 ultra * (dB) | 39 |
* ... más pequeño es mejor
Ruido
| Ocioso |
| 25.7 / 25.7 / 25.7 dB(A) |
| Carga |
| 35.3 / 35.1 dB(A) |
 | ||
30 dB silencioso 40 dB(A) audible 50 dB(A) ruidosamente alto |
||
min: | ||
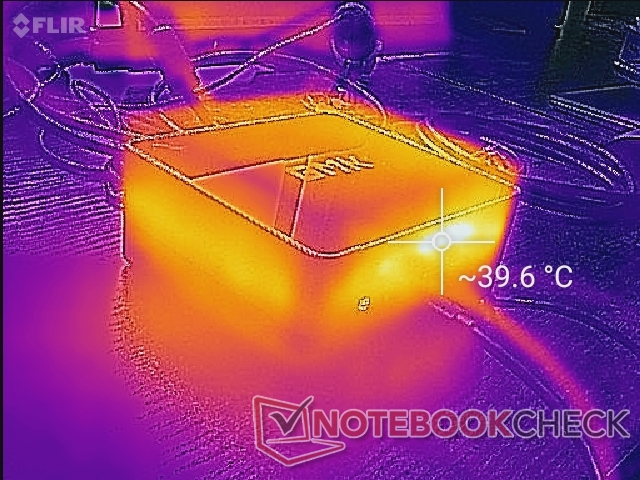
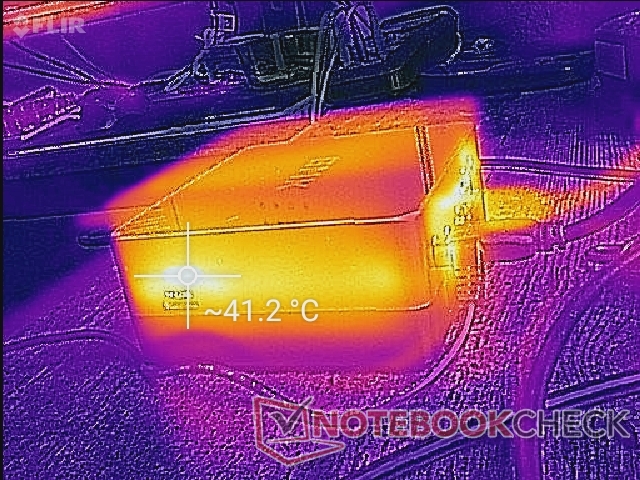
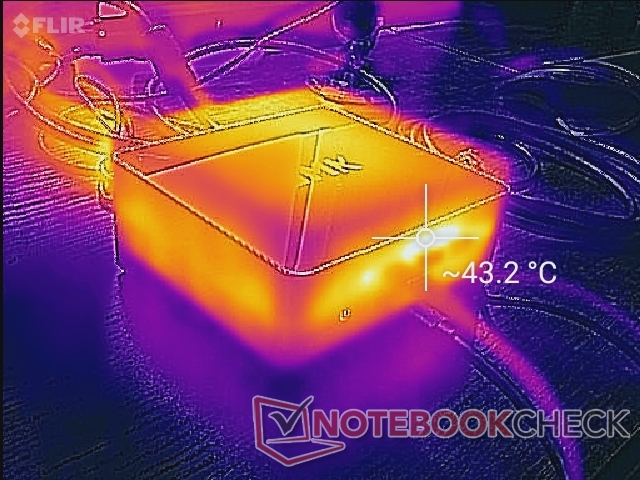
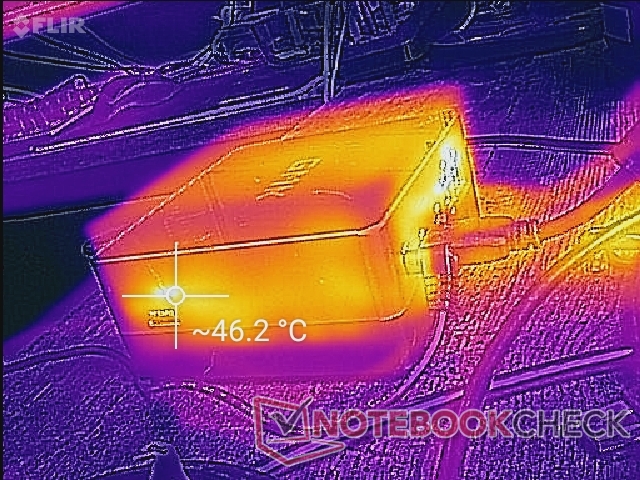
Temperatura
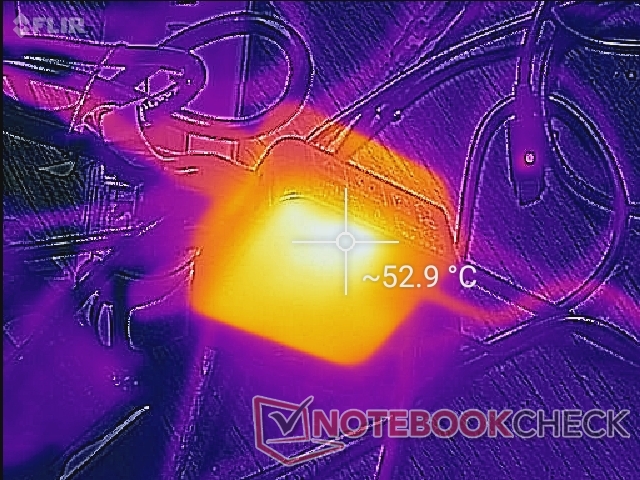
Las rejillas de ventilación sólo se extienden a lo largo del borde trasero del mini PC, lo que significa que puedes colocar la unidad en vertical o de lado sin impedir la solución de refrigeración. Las superficies se calientan a unos 27 C en lasuperficiesuperiordel sistema incluso cuando está en reposoen el escritorio.
Prueba de esfuerzo
Cuando se estresa con Prime95, la CPU simplemente se estabiliza en el rango de 2,3 a 2,5 GHz sin mayor potencial de Turbo Boost. La CPU es capaz de alcanzar hasta 3,8 GHz pero sólo en cargas de trabajo de un solo hilo. La temperatura del núcleo se estabiliza en unos respetables 73 C cuando se somete a cargas multihilo muy altas. El procesador no se ralentiza a menos que tanto la CPU como la GPU integrada estén completamente estresadas.
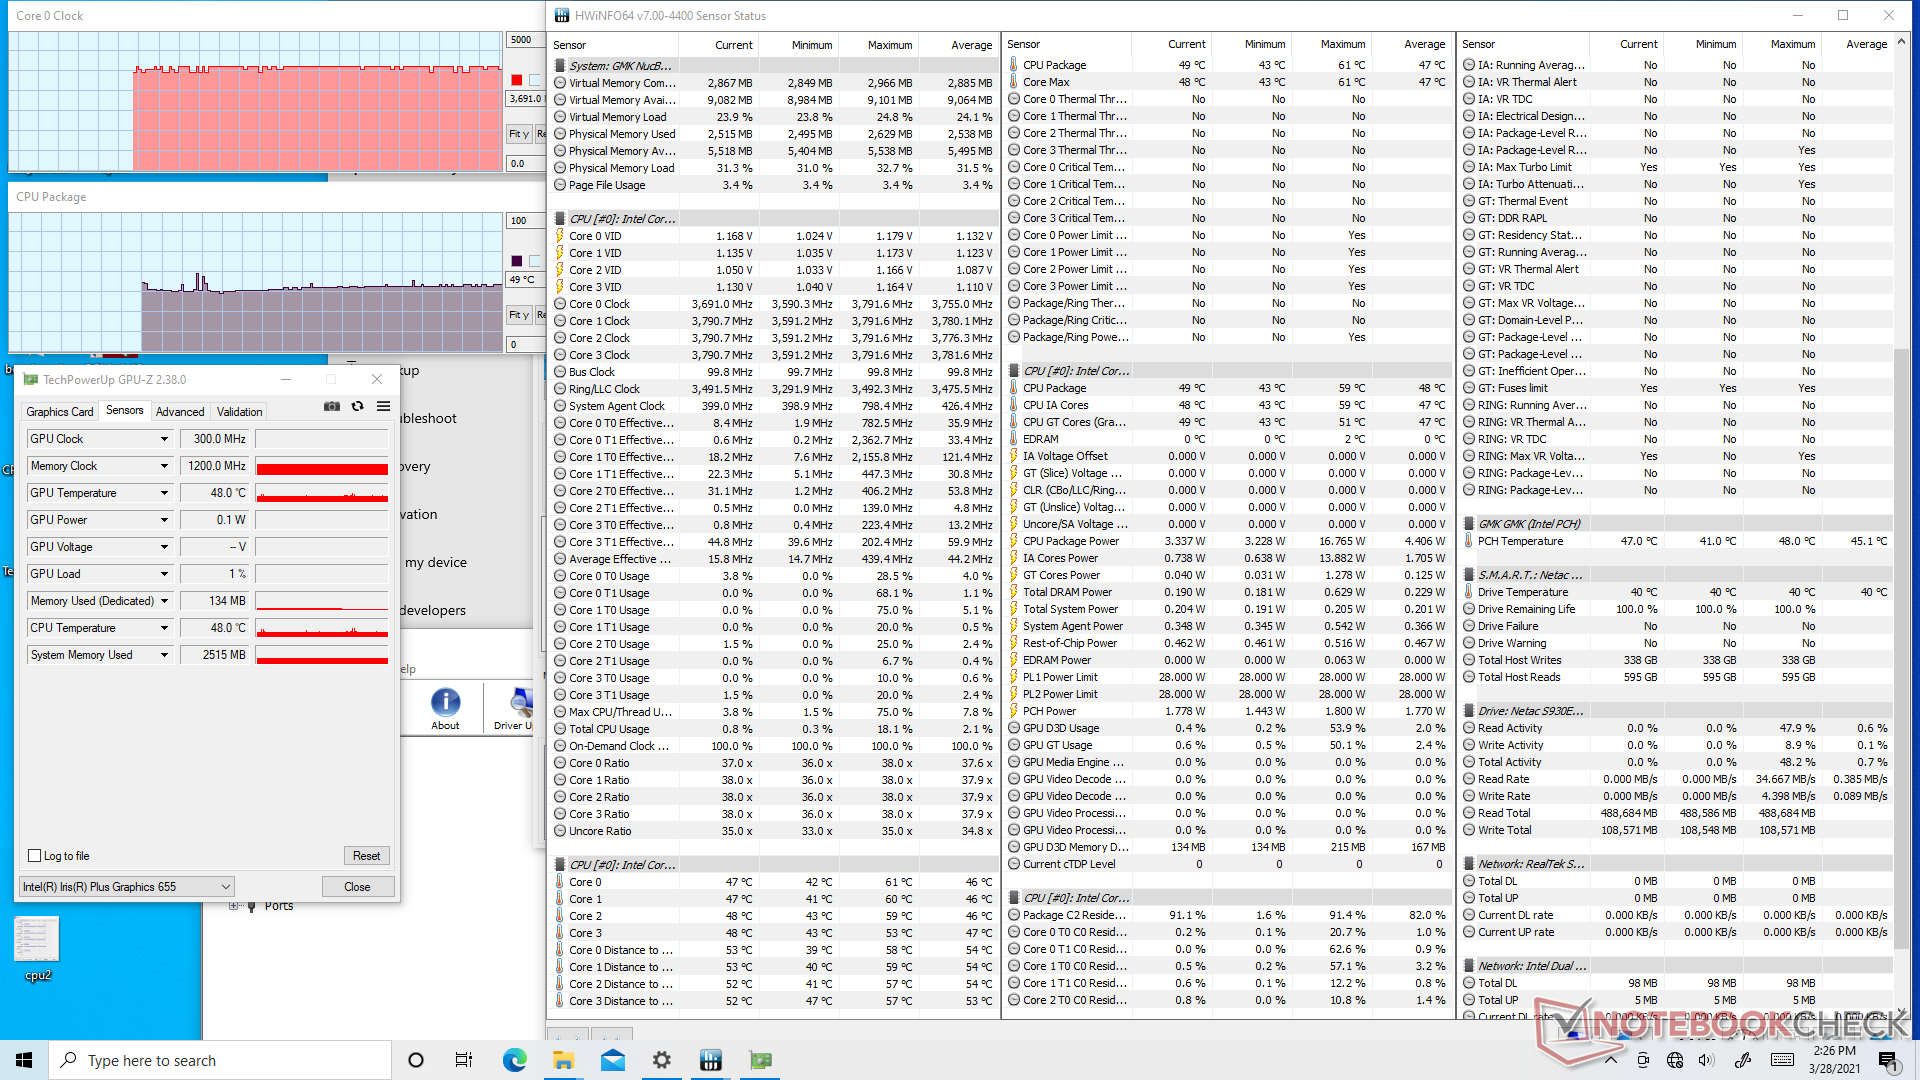
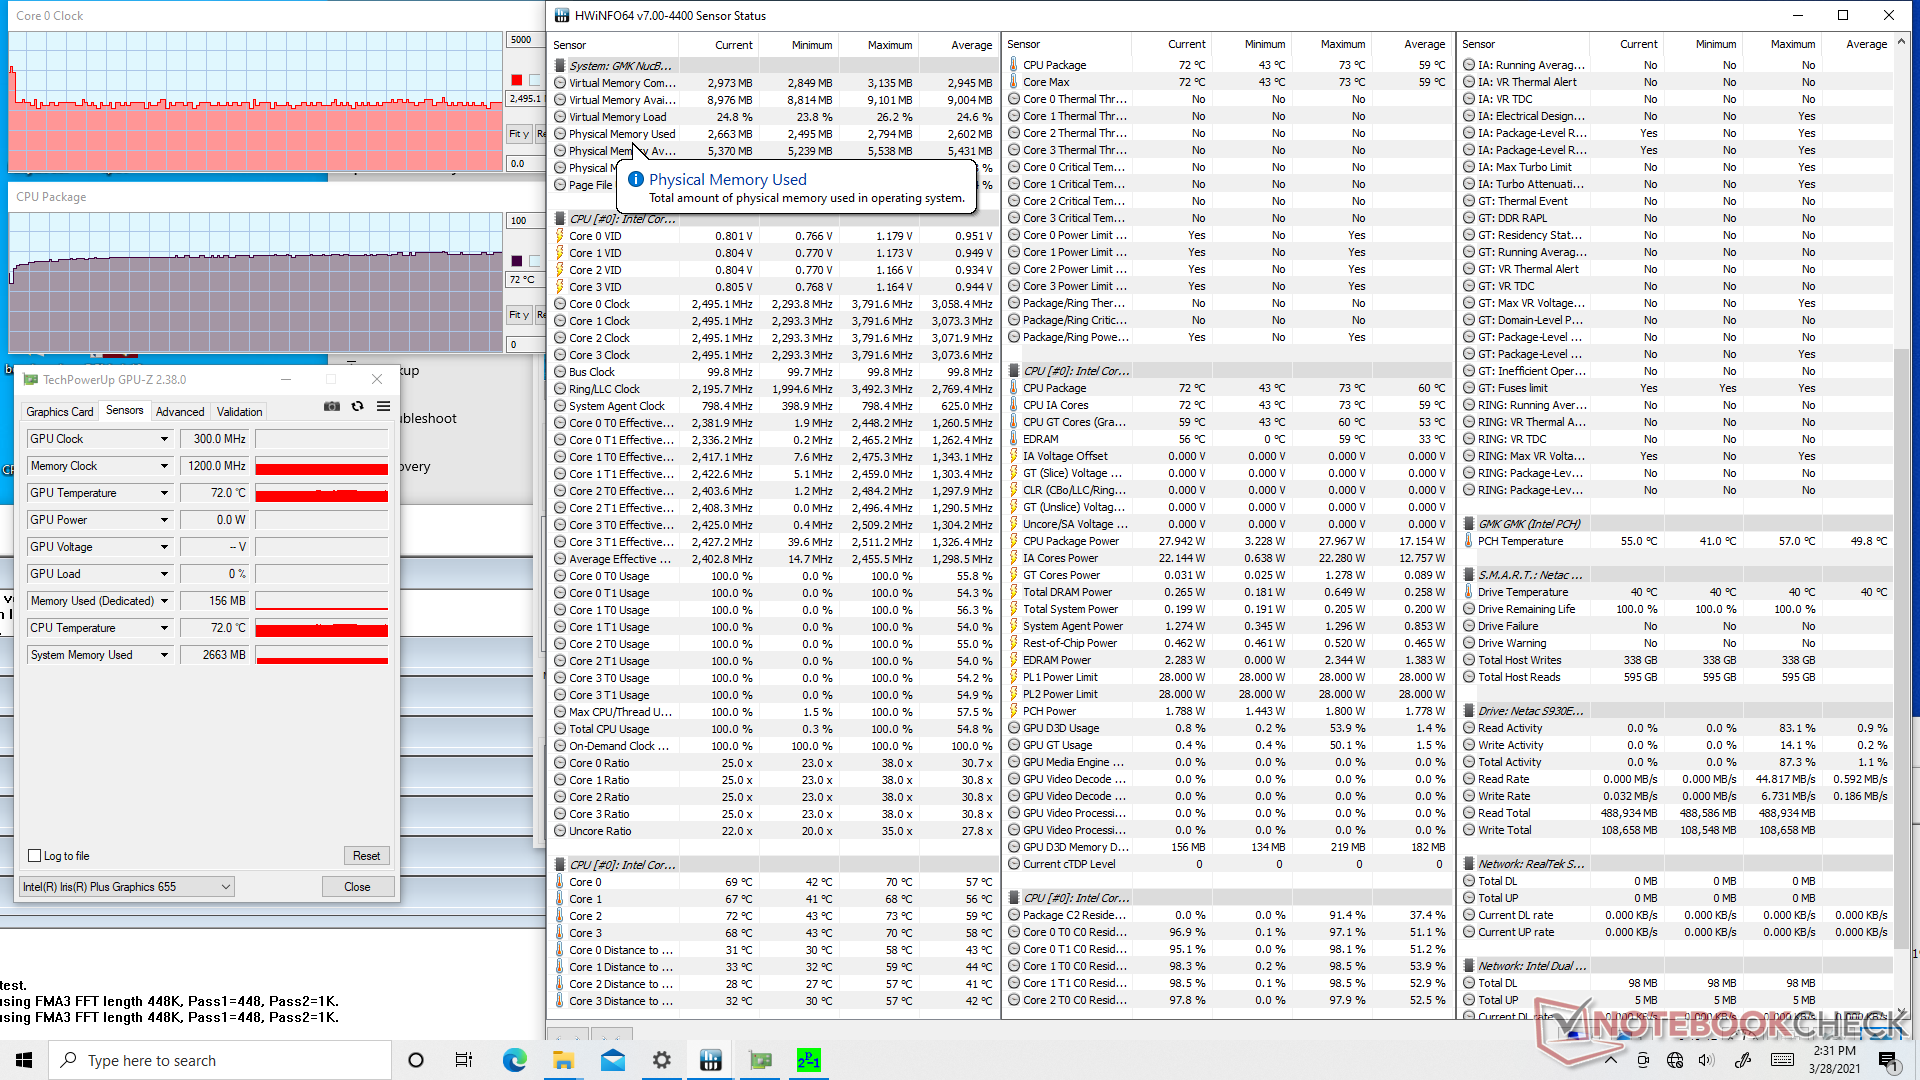
| Relojde la CPU(GHz) | Reloj dela GPU(MHz) | Temperaturamediade la CPU (°C) |
| Sistema en reposo | 49 | |
| EstrésPrime95 | 2,3 - 2,5 | -- |
| Prime95+ FurMark Stress | 1.1 | 850 - 1000 |
Energy Management
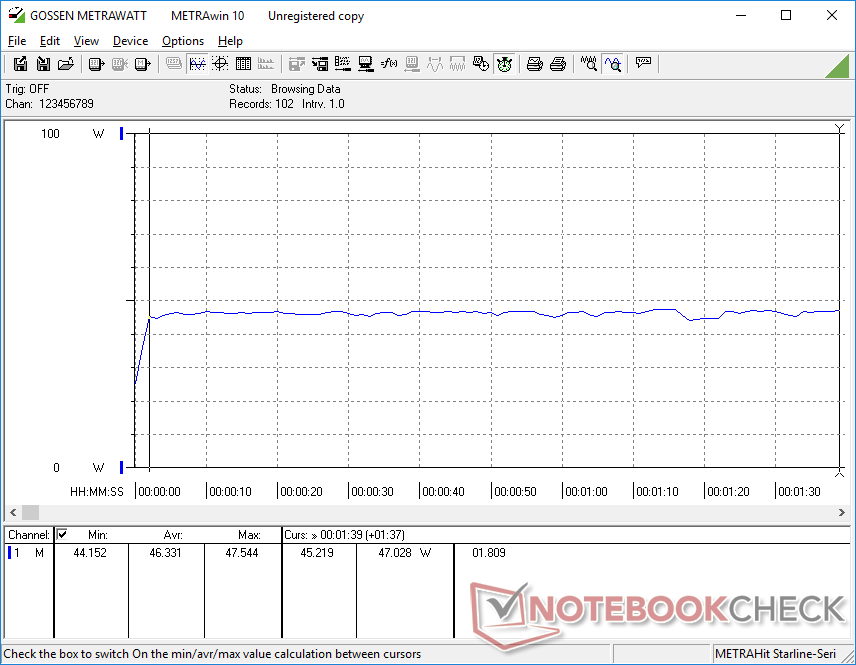
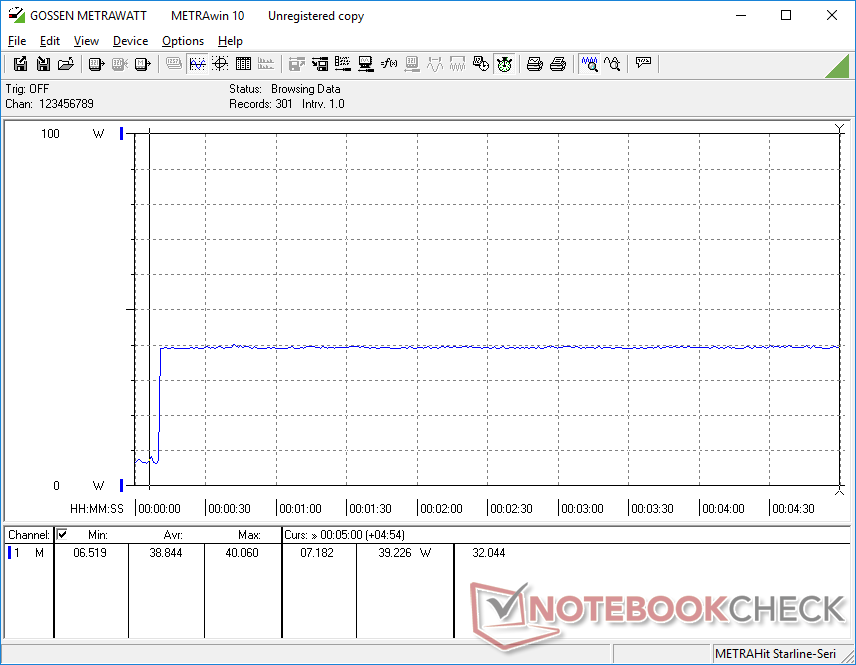
Consumo de energía
El funcionamiento en vacío del ordenador de sobremesa consume entre 6 y 8 W, mientras que las cargas más altas, como los juegos, pueden consumir unos 46 W. Ten en cuenta que el Intel NUC 11, con su nueva generación de gráficos Iris Xe, sólo consume entre 31 y 39 W al ejecutar juegos, a pesar de que ofrece casi el doble de rendimiento gráfico que nuestro Iris Plus 655.

| Off / Standby | |
| Ocioso | |
| Carga |
|
Clave:
min: | |
| GMK NucBox 2 i5-8259U, Iris Plus Graphics 655, Netac S930E8/256GPN, , x, | Intel NUC11PAQi7 i7-1165G7, Iris Xe G7 96EUs, Samsung SSD 980 Pro 500GB MZ-V8P500BW, , x, | Intel NUC8i7BE i7-8559U, Iris Plus Graphics 655, , , x, | GMK NucBox K1 Celeron J4125, UHD Graphics 600, HIKVision C100 NGFF SSD 128GB, , x, | Beelink SEi10 i3-1005G1, UHD Graphics G1 (Ice Lake 32 EU), Silicon Motion AZW 256G M.2280 NVMe 4X 200725 D, , x, | Zotac ZBox MI643 i5-10210U, UHD Graphics 620, Lexar NM610 1TB, , x, | |
|---|---|---|---|---|---|---|
| Power Consumption | 3% | 8% | 53% | 12% | -17% | |
| Idle Minimum * (Watt) | 6.1 | 5.6 8% | 2.7 56% | 3.4 44% | 6.3 -3% | 7.5 -23% |
| Idle Average * (Watt) | 6.8 | 5.6 18% | 3.1 54% | 3.8 44% | 6.6 3% | 9.2 -35% |
| Idle Maximum * (Watt) | 7.3 | 6 18% | 6.3 14% | 3.9 47% | 6.7 8% | 9.6 -32% |
| Load Average * (Watt) | 46.3 | 31.4 32% | 59.7 -29% | 12.5 73% | 25.9 44% | 34.4 26% |
| Load Maximum * (Watt) | 50.7 | 80.5 -59% | 78 -54% | 22.7 55% | 46.7 8% | 60.6 -20% |
| Witcher 3 ultra * (Watt) | 39 | 47.2 |
* ... más pequeño es mejor
Pro
Contra
Veredicto
El NucBox 2 no pretende ser el mini PC más pequeño ni el más rápido. En su lugar, es una oferta de gama media sin lujos con una CPU Core i5 decente, una GPU Iris Plus para soporte dual 4K60, y la memoria RAM y el almacenamiento suficientes para cumplir con los propósitos del HTPC. El ruido del ventilador es más silencioso que el del NUC de Intel, especialmente cuando se ejecutan cargas más altas.
A diferencia de los kits barebone que cuestan más o menos lo mismo, el NucBox 2 viene con todo lo que necesitas para empezar y con espacio para una fácil expansión si surge la necesidad.
La dependencia de un enchufe de adaptador de CA propietario en lugar de una solución USB-C más estándar hace que la NucBox 2 sea menos universal. Nos encantaría ver más puertos USB-C en futuros modelos o incluso una fuente de alimentación integrada para evitar por completo un adaptador de CA externo. Esta medida superaría a la competencia, donde los adaptadores externos pueden ser a veces tan grandes como los propios mini PC.
Precio y disponibilidad
La GMK NucBox 2 está disponible en Amazon por 499 dólares. Una oferta actual reduce 60 dólares para un precio final de 439 dólares. También se puede comprar directamente en GMK por el mismo precio de venta si se aplica el código de cupón "Easter60OFF" en el momento de escribir este artículo
Price comparison

