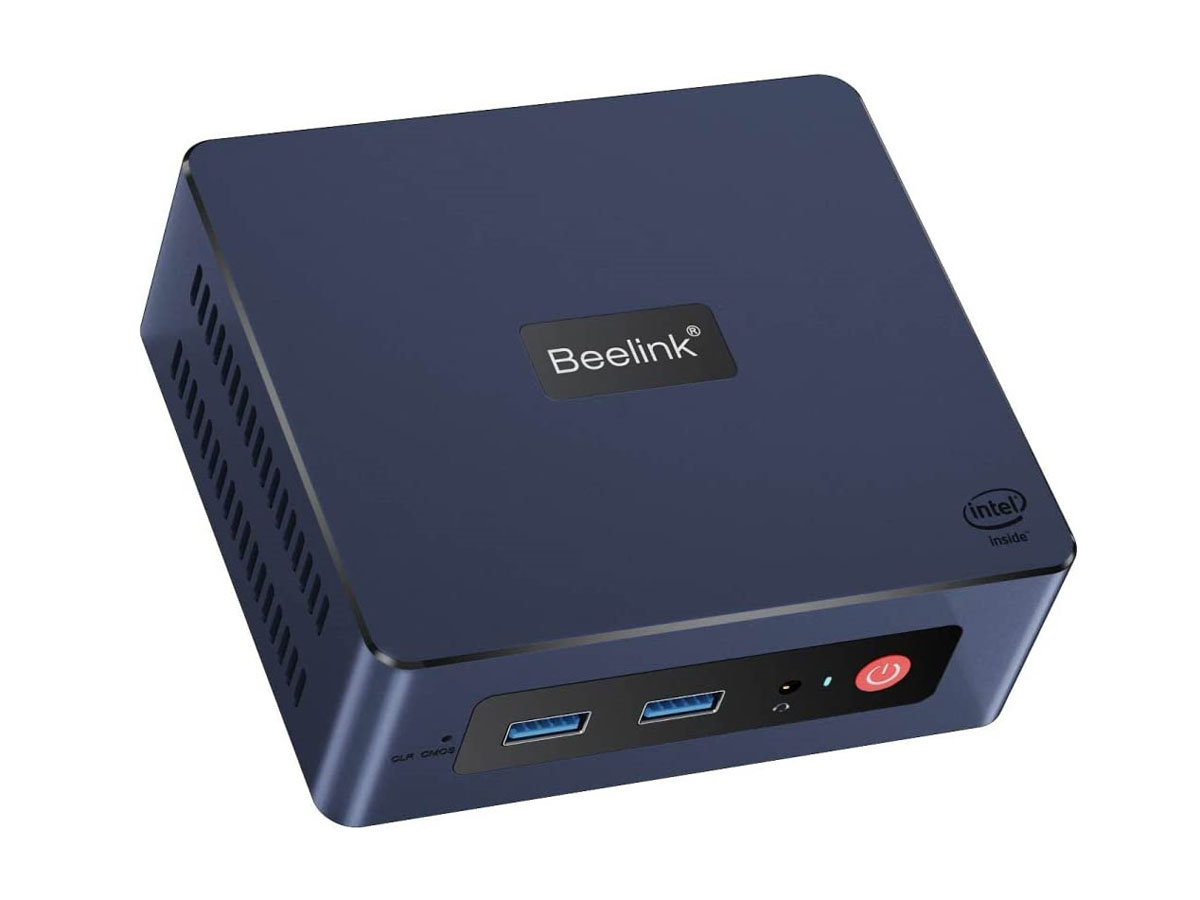
Análisis del mini PC Beelink U59 Mini-S: La alternativa al HTPC NUC de Intel más económico
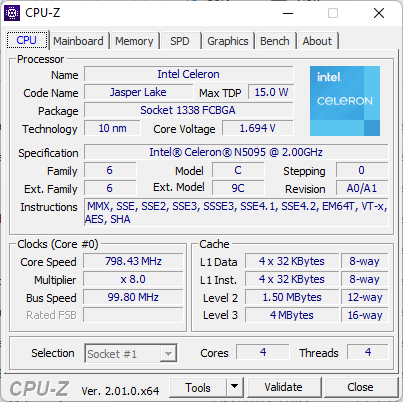
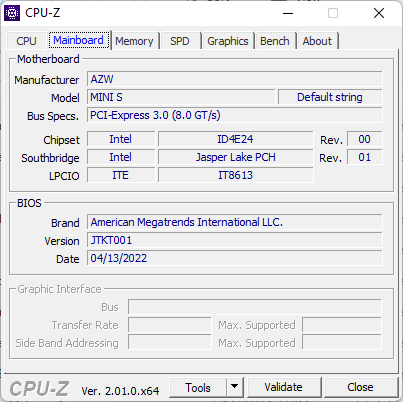
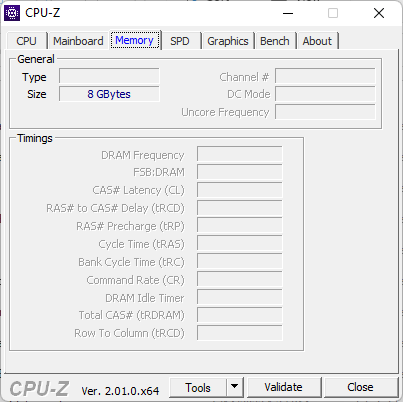
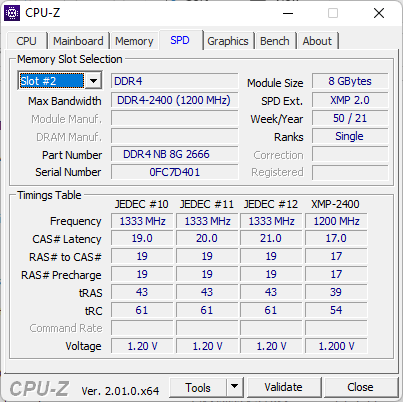
Beelink ofrece una amplia familia de mini PCs que van desde el económico U59 con CPU Celeron hasta el rapidísimo GTR5 con Ryzen 9 5900HX. Nuestro modelo de análisis U59 Mini-S de hoy se sitúa en el extremo inferior del espectro, con la CPU Celeron N5095, sólo 8 GB de memoria de un solo canal y una unidad SSD de 256 GB por unos 220 dólares al por menor.
Entre las alternativas al U59 Mini-S se encuentran los mini PC con Atom o Celeron, como el Chuwi HeroBox, GMK NucBox K1, NucBox 3o el Intel NUC 11 Essential. El U59 Mini-S en revisión no debe confundirse con el ligeramente más caro original U59.
Más reseñas de Beelink:
Posibles contendientes en la comparación
Valoración | Fecha | Modelo | Peso | Altura | Tamaño | Resolución | Precio |
|---|---|---|---|---|---|---|---|
v (old) | 06/2022 | Beelink U59 Mini-S Celeron N5095, UHD Graphics (Jasper Lake 16 EU) | 279 g | 41 mm | x | ||
v (old) | 04/2022 | Beelink SEi8 i3-8109U, Iris Plus Graphics 655 | 346 g | 41 mm | x | ||
v (old) | 04/2021 | Intel NUC11TNKi5 i5-1135G7, Iris Xe G7 80EUs | 504 g | 37 mm | x | ||
v (old) | 11/2021 | Beelink U59 Celeron N5095, UHD Graphics (Jasper Lake 16 EU) | 329 g | 42 mm | x | ||
v (old) | 02/2022 | GMK NucBox 3 Celeron J4125, UHD Graphics 600 | 410 g | 32.5 mm | x | ||
v (old) | 10/2020 | Zotac ZBOX MI642 Nano i5-10210U, UHD Graphics 620 | 472 g | 51 mm | x |
Maletín - Más ligero de lo que parece
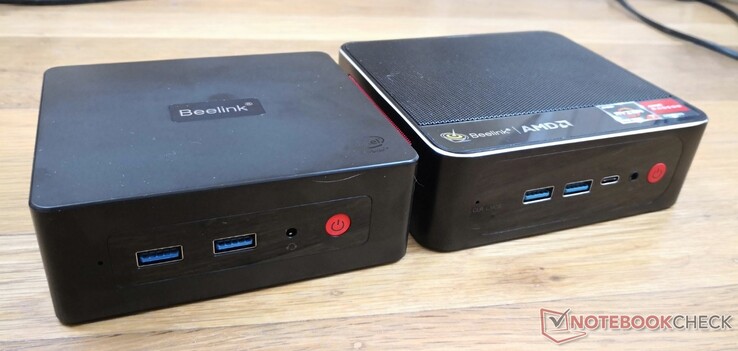
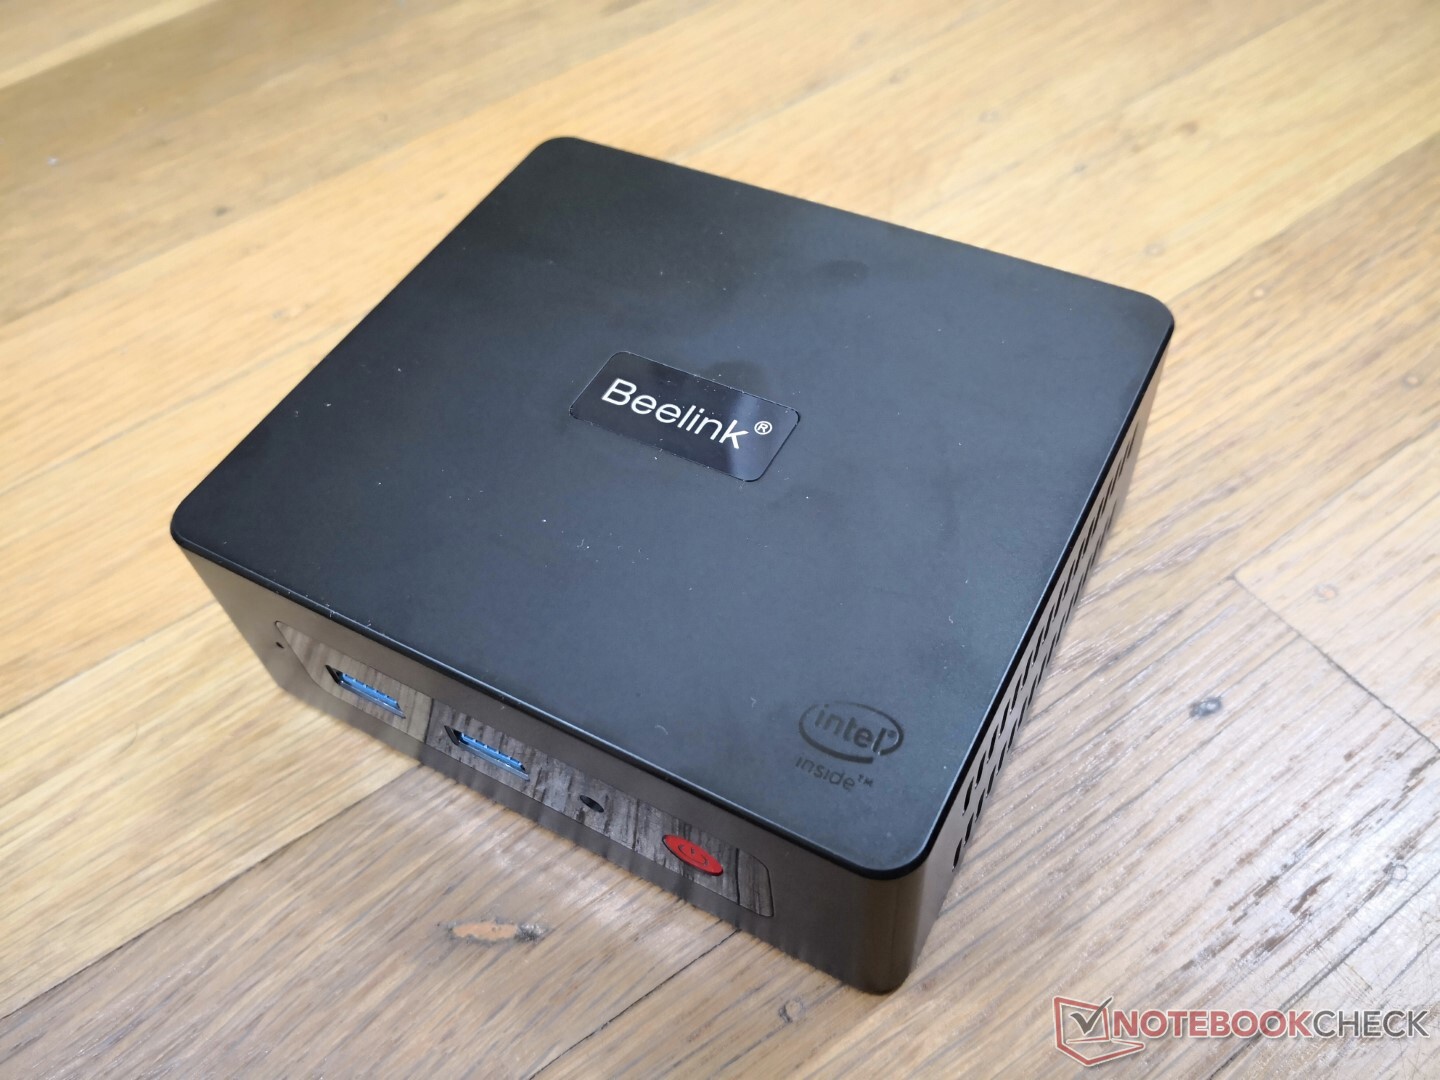
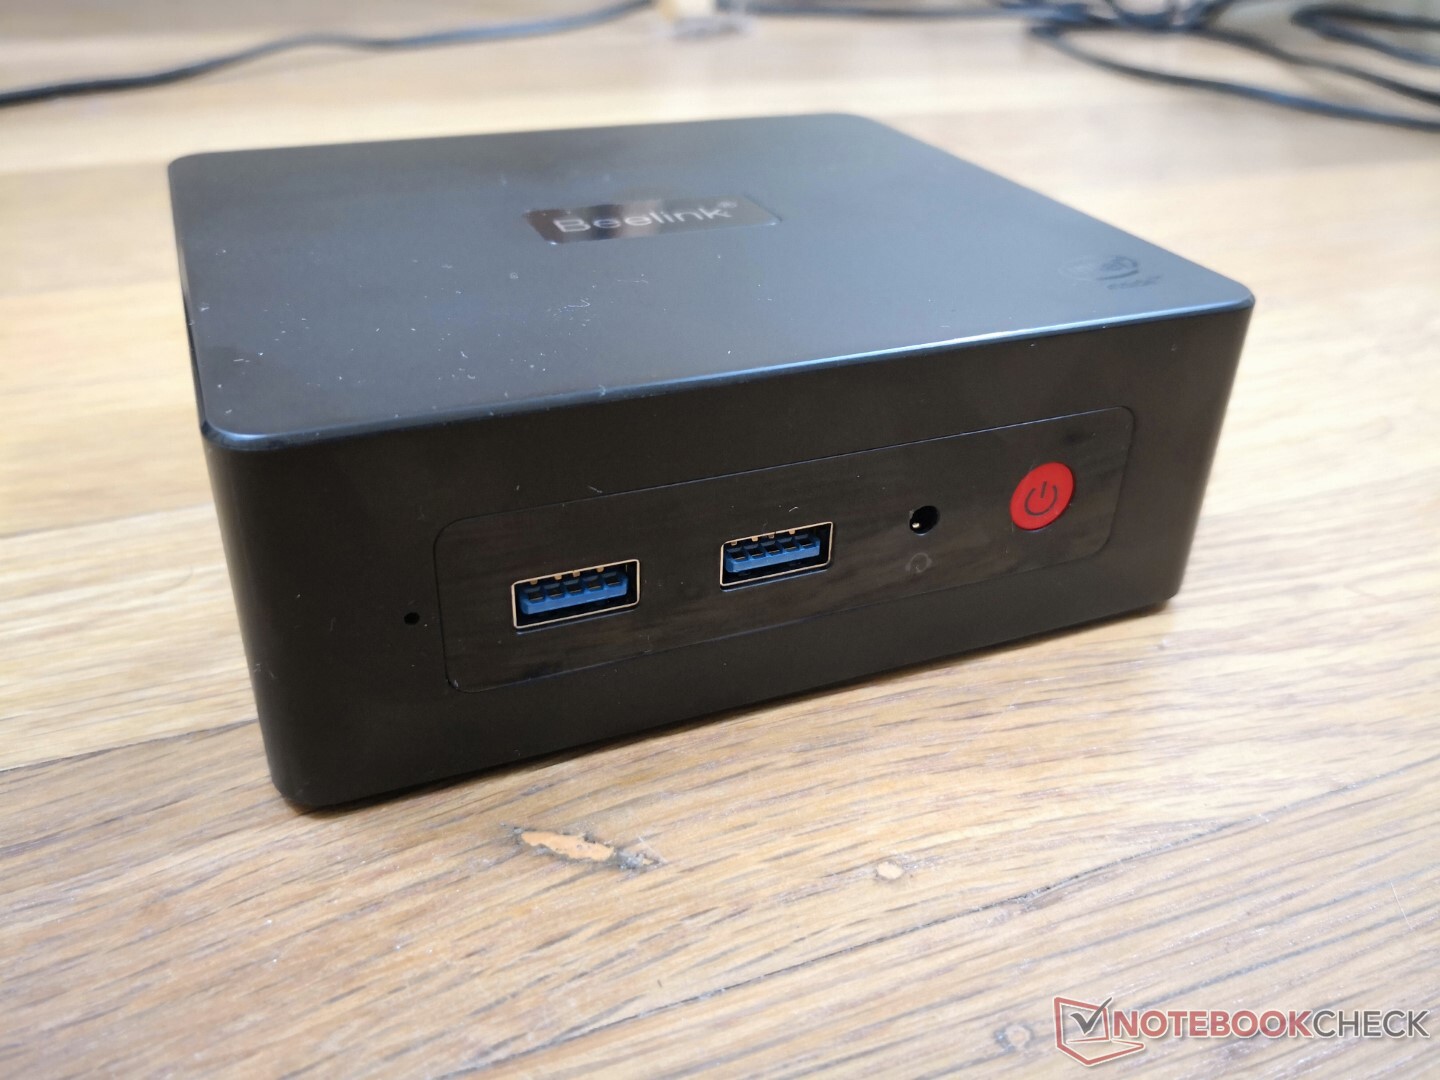
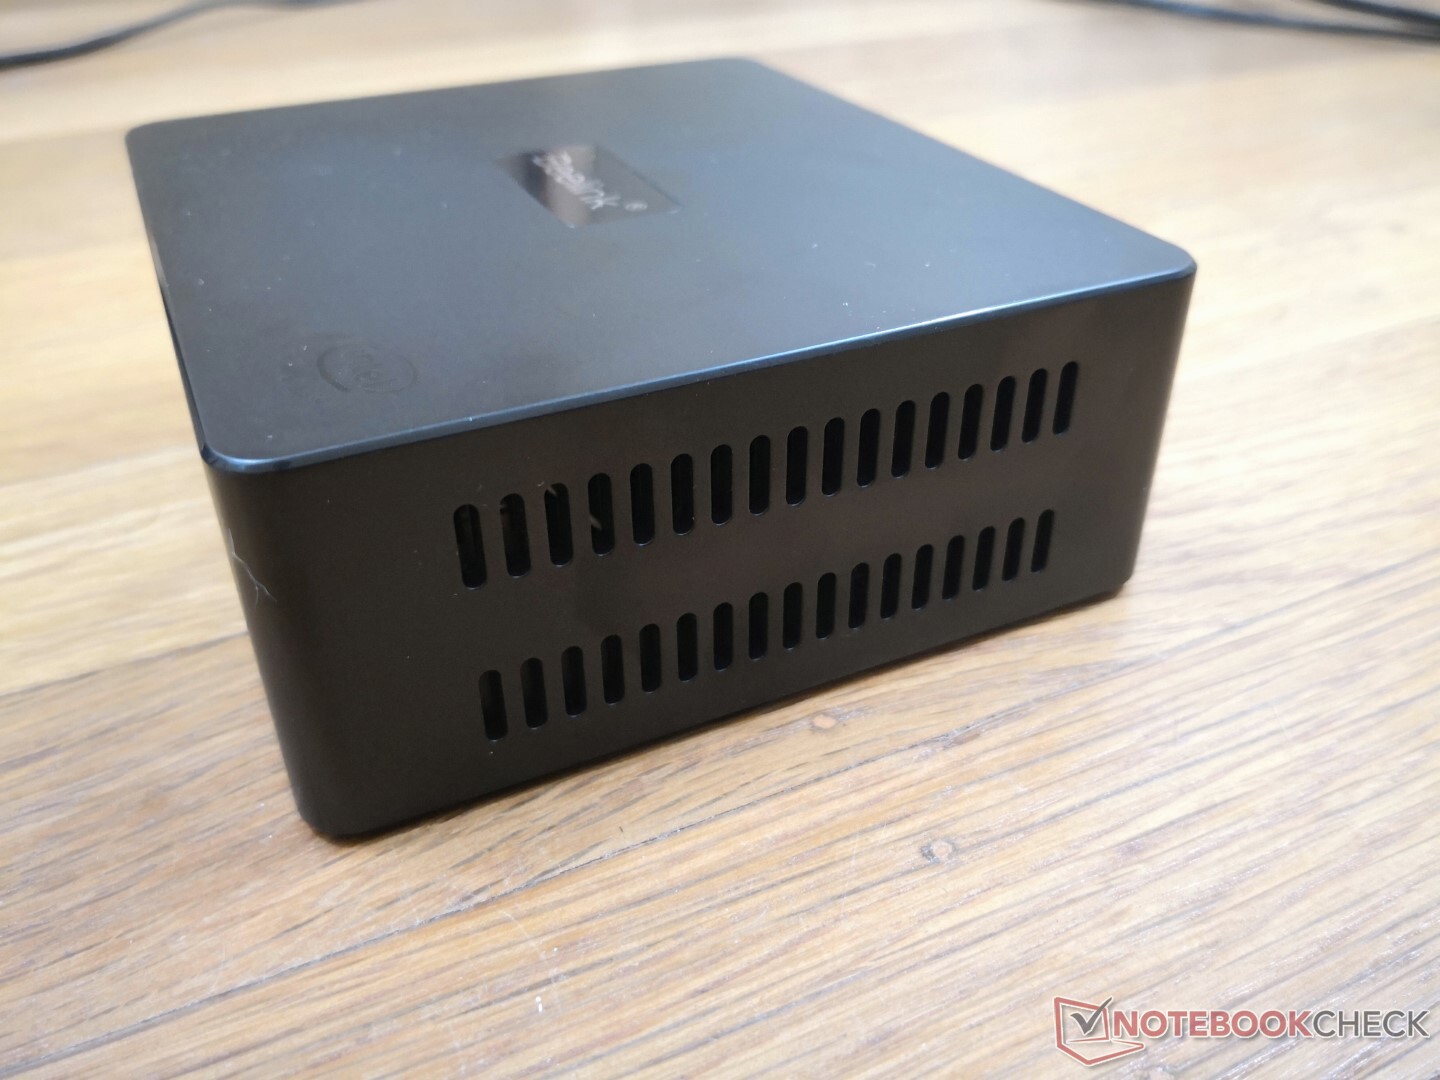
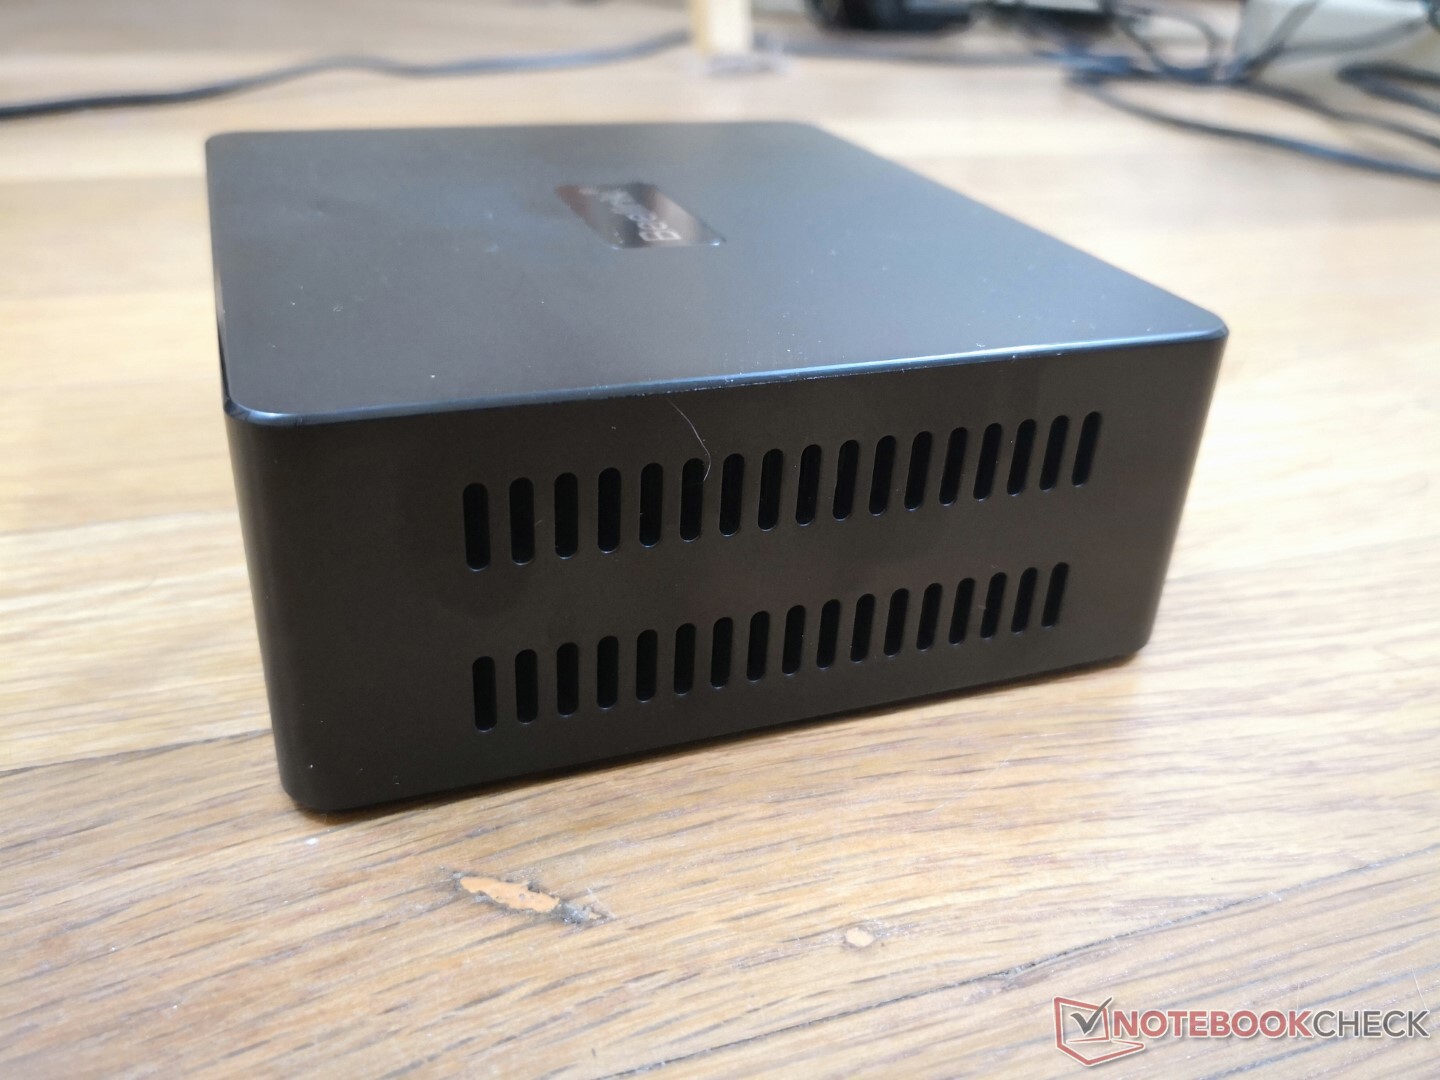
El chasis es casi idéntico al del U59 original, aunque con algunas diferencias superficiales. El panel superior, por ejemplo, es ahora mate liso en lugar de brillante, lo que creemos que es un cambio inteligente ya que la superficie mate es más resistente a las huellas dactilares y a los arañazos. Los laterales y la parte inferior del chasis son metálicos para dar una primera impresión fuerte.
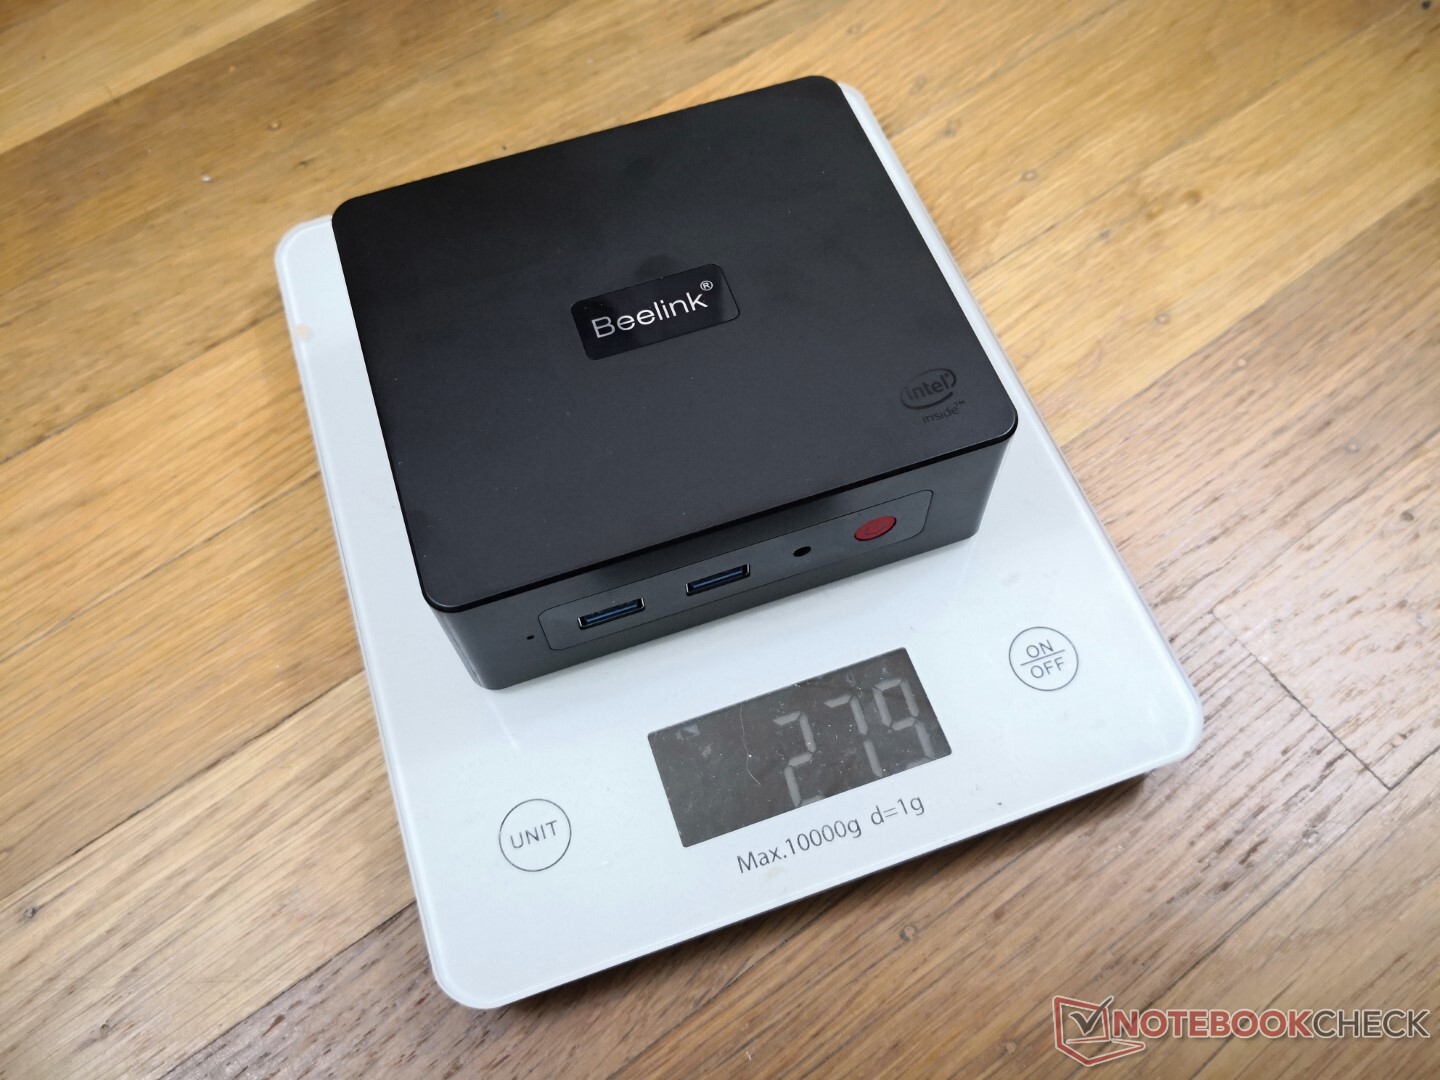
Un aspecto notable del Beelink es su peso muy ligero de sólo 279 g en comparación con los más de 500 g del Intel NUC 11. Los materiales más finos del chasis del Beelink y la ausencia de una jaula metálica interna para reforzarlo contribuyen a las importantes diferencias de peso entre los dos modelos.
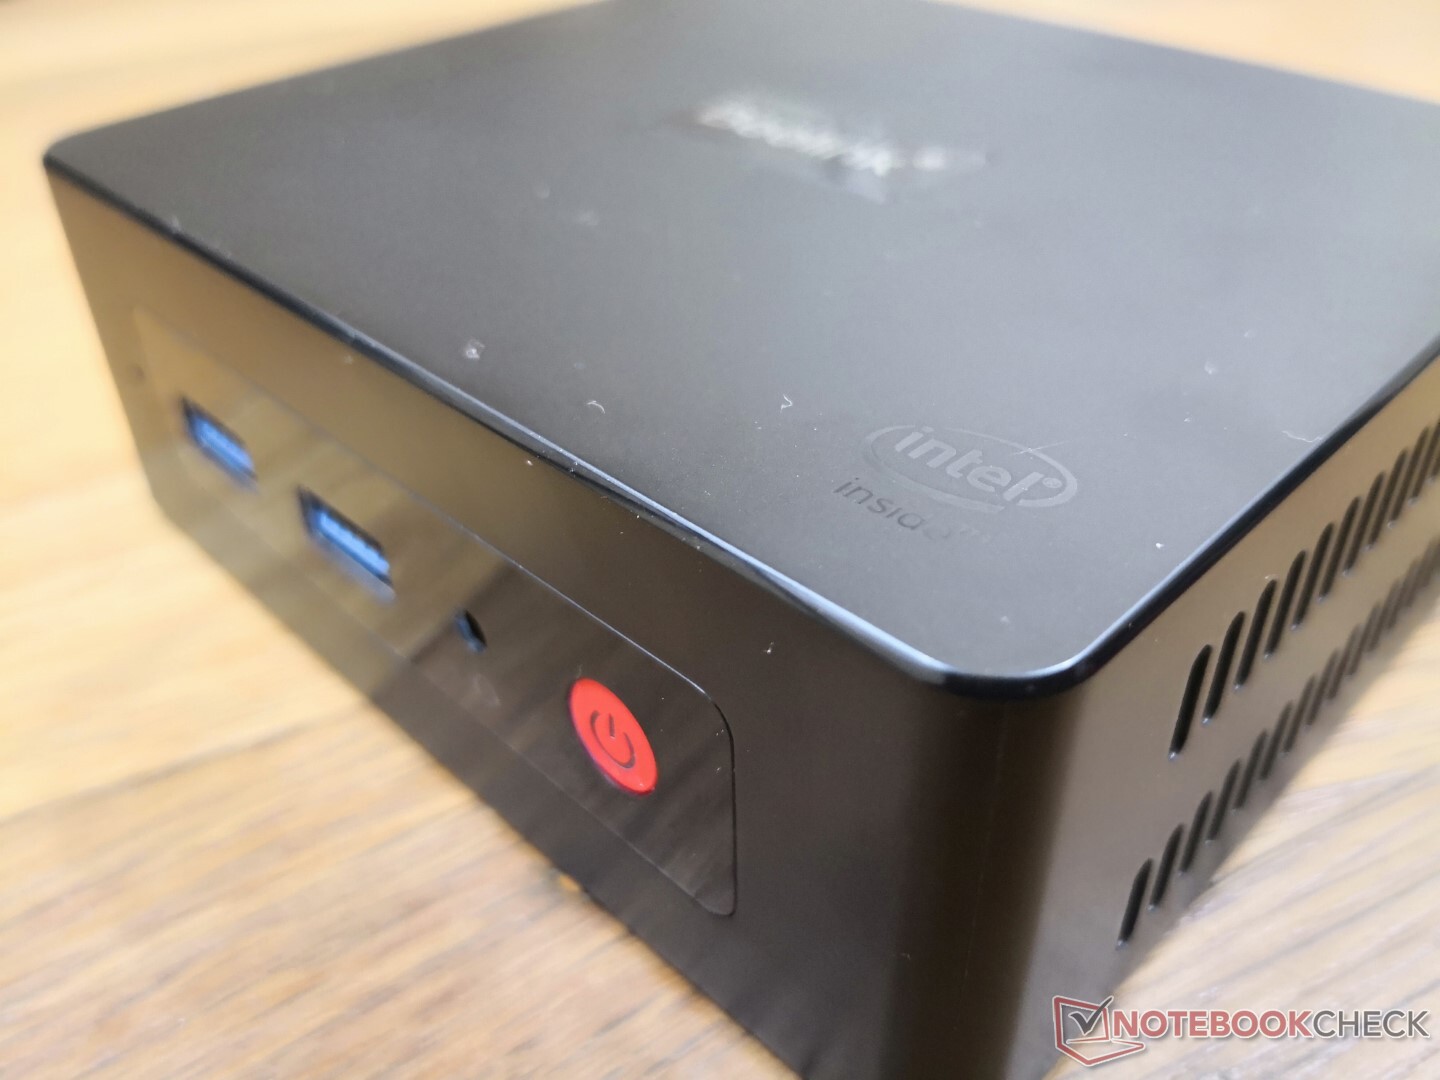
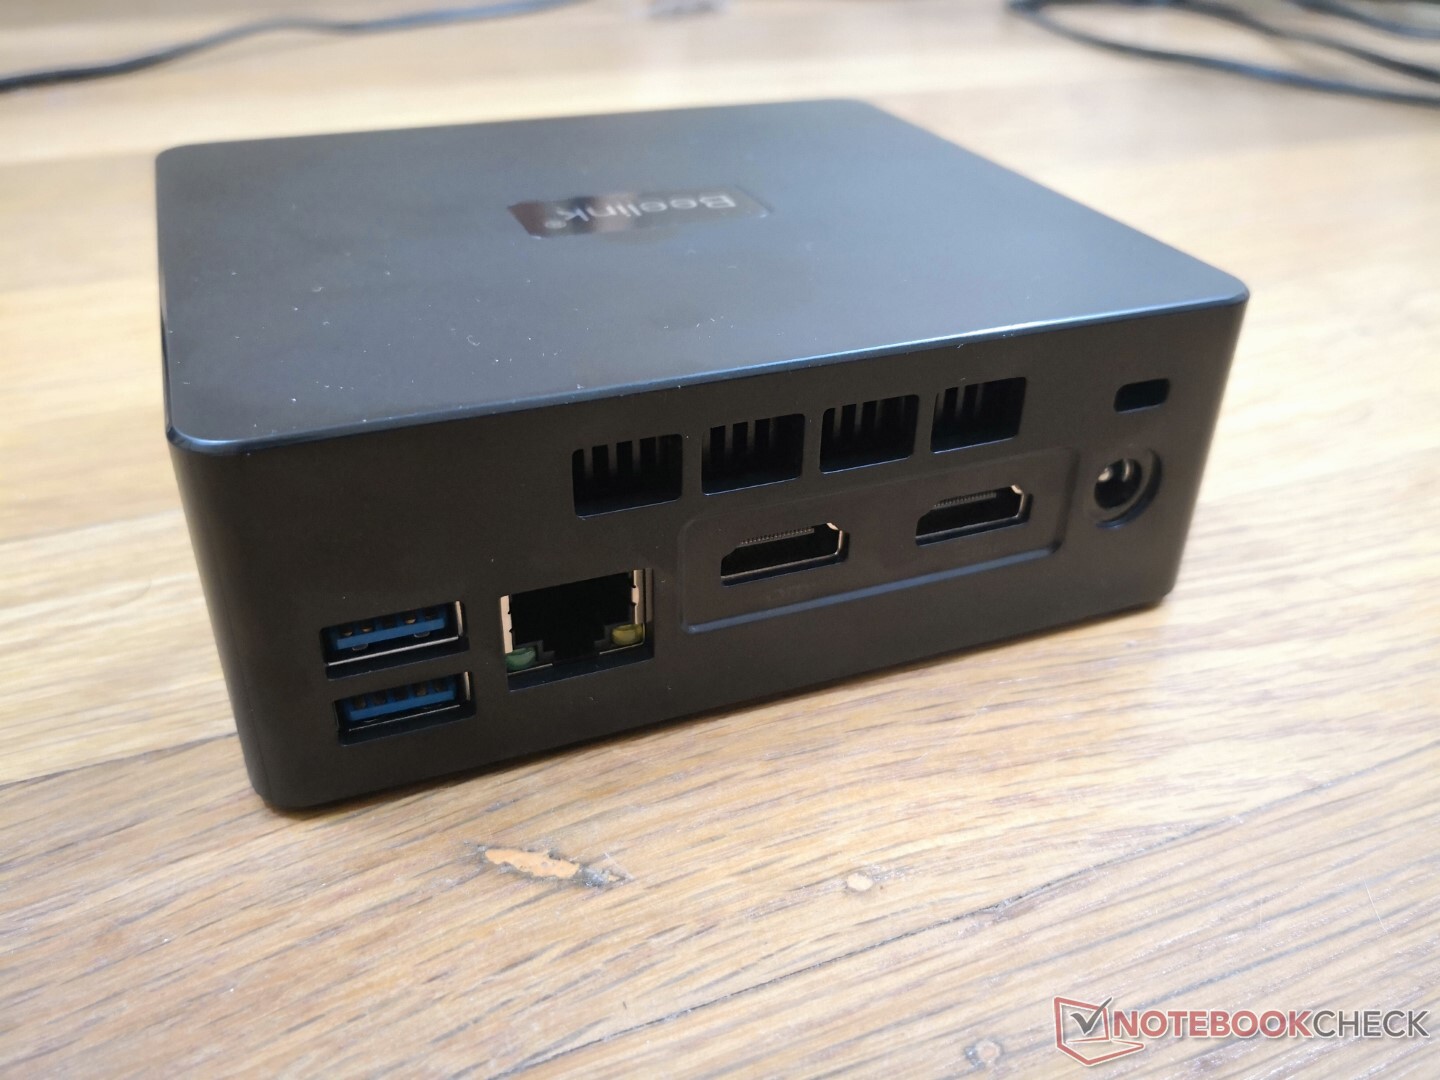
Conectividad - Sin USB-C
Las opciones de puerto son idénticas a las del U59, pero con una excepción importante: se ha eliminado el puerto USB-C. Sospechamos que se trata de una medida de ahorro.
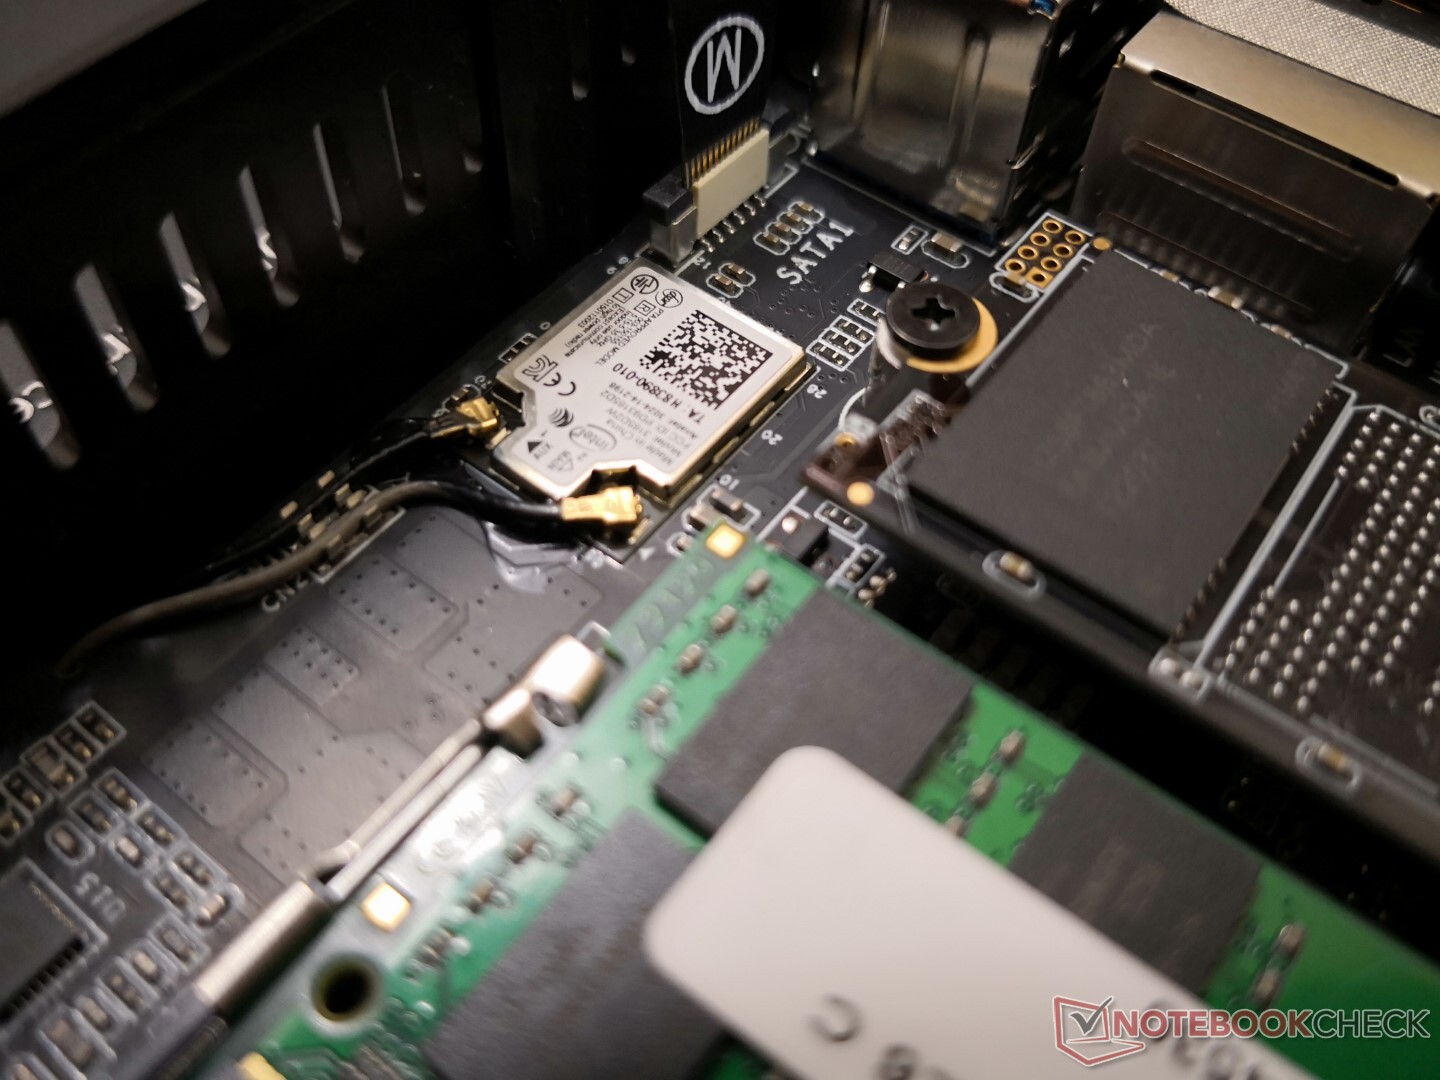
Comunicación
Un Intel 3165 viene de serie una vez más para la conectividad 1x1 Wi-Fi 5 y Bluetooth 4.2. Aunque es lento para los estándares actuales, sigue siendo lo suficientemente rápido para el streaming de vídeo 4K.
| Networking | |
| iperf3 transmit AX12 | |
| Intel NUC11TNKi5 | |
| Beelink SEi8 | |
| Beelink U59 | |
| GMK NucBox 3 | |
| iperf3 receive AX12 | |
| Intel NUC11TNKi5 | |
| GMK NucBox 3 | |
| Beelink U59 | |
| Beelink SEi8 | |
| iperf3 transmit AXE11000 | |
| Beelink U59 Mini-S | |
| iperf3 receive AXE11000 | |
| Beelink U59 Mini-S | |
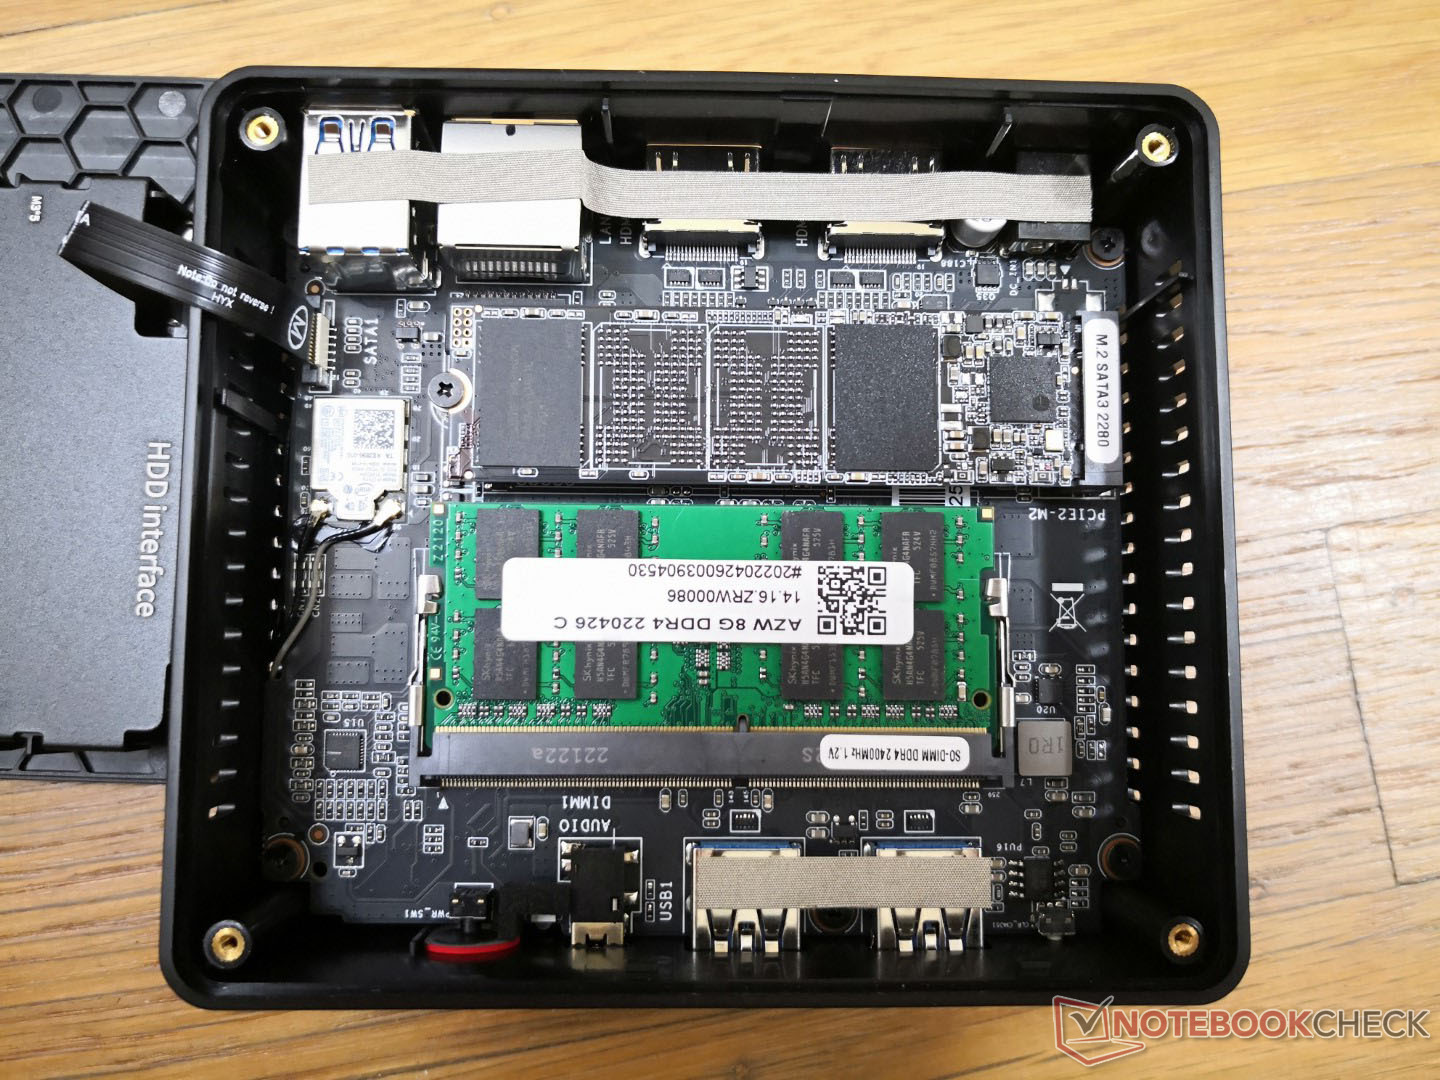
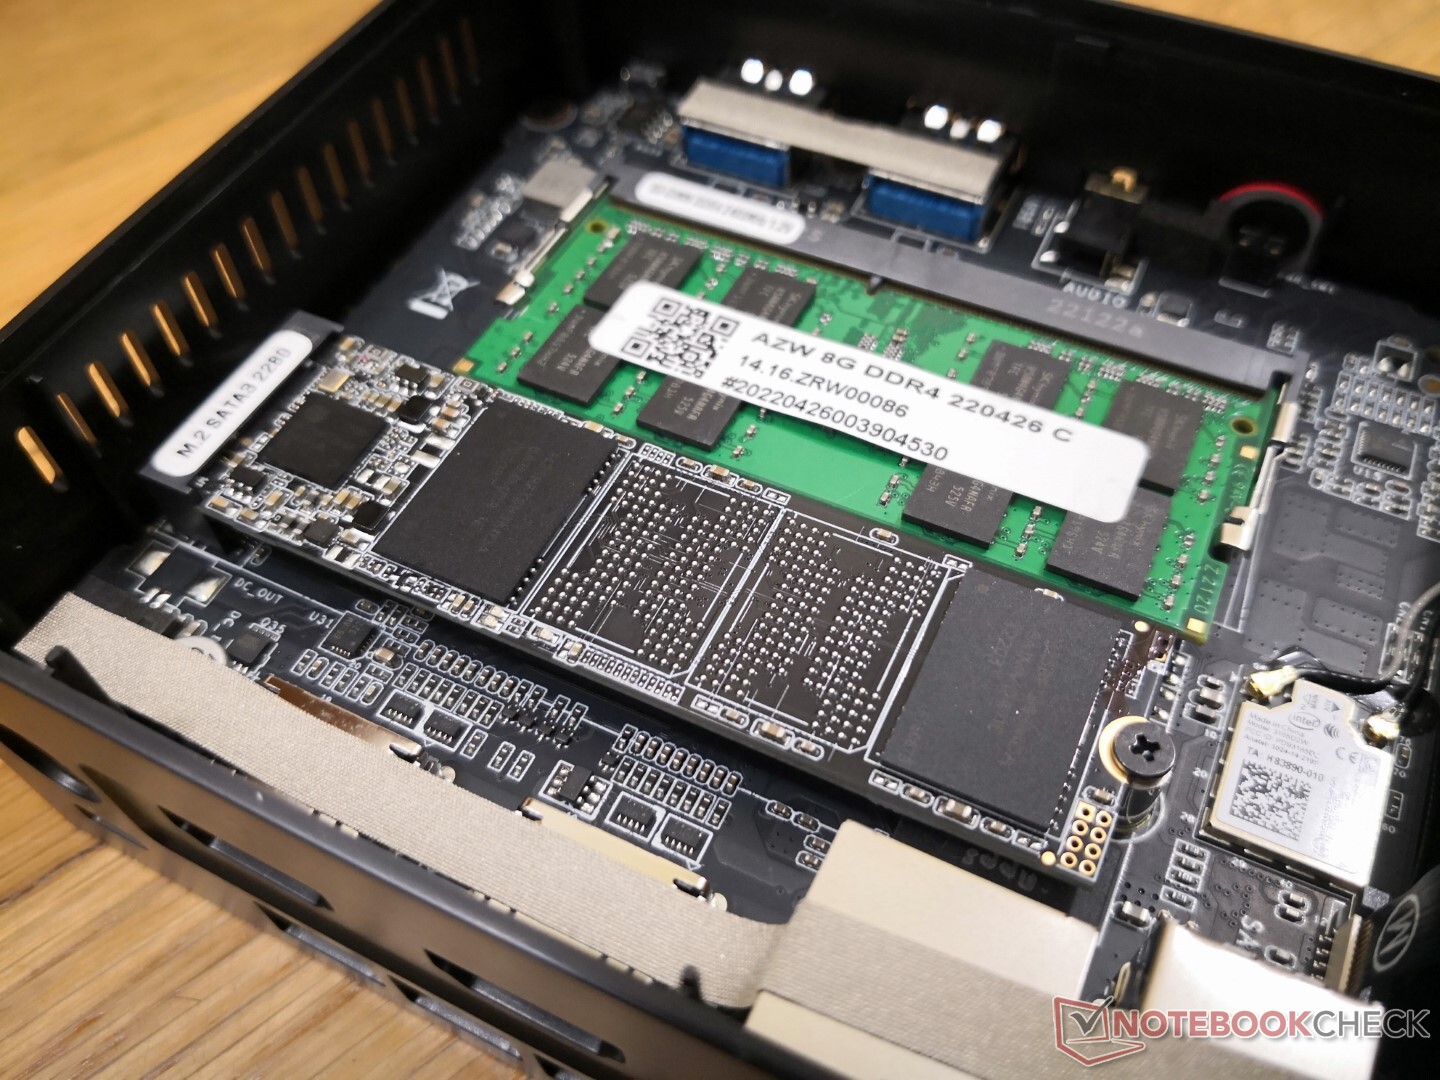
Mantenimiento
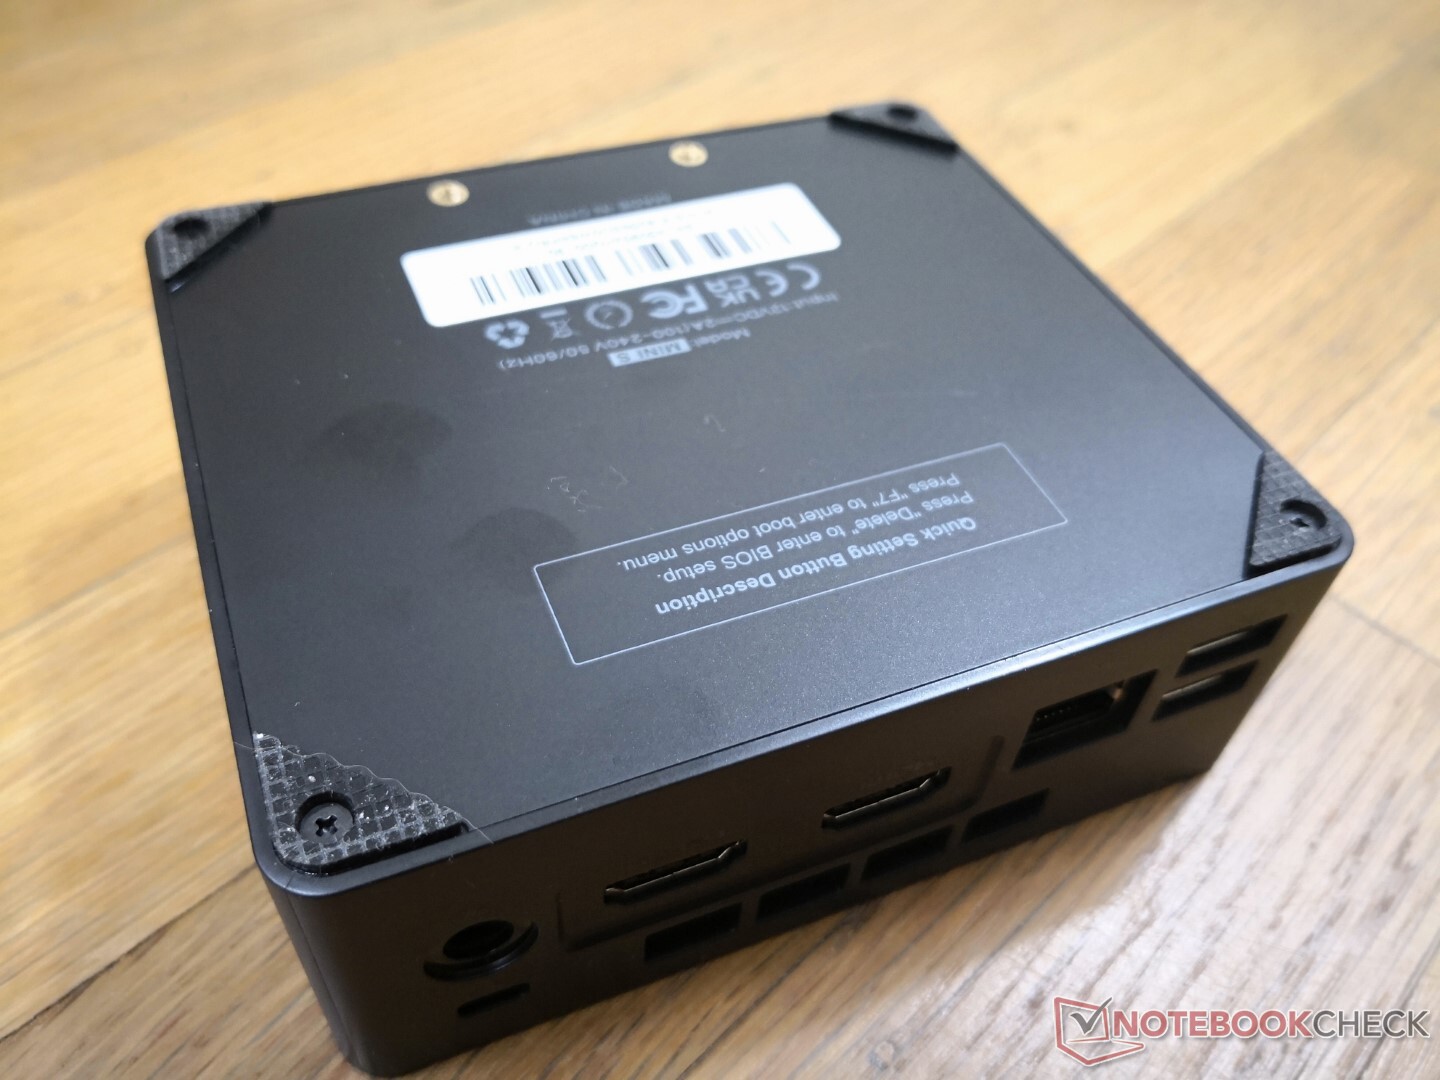
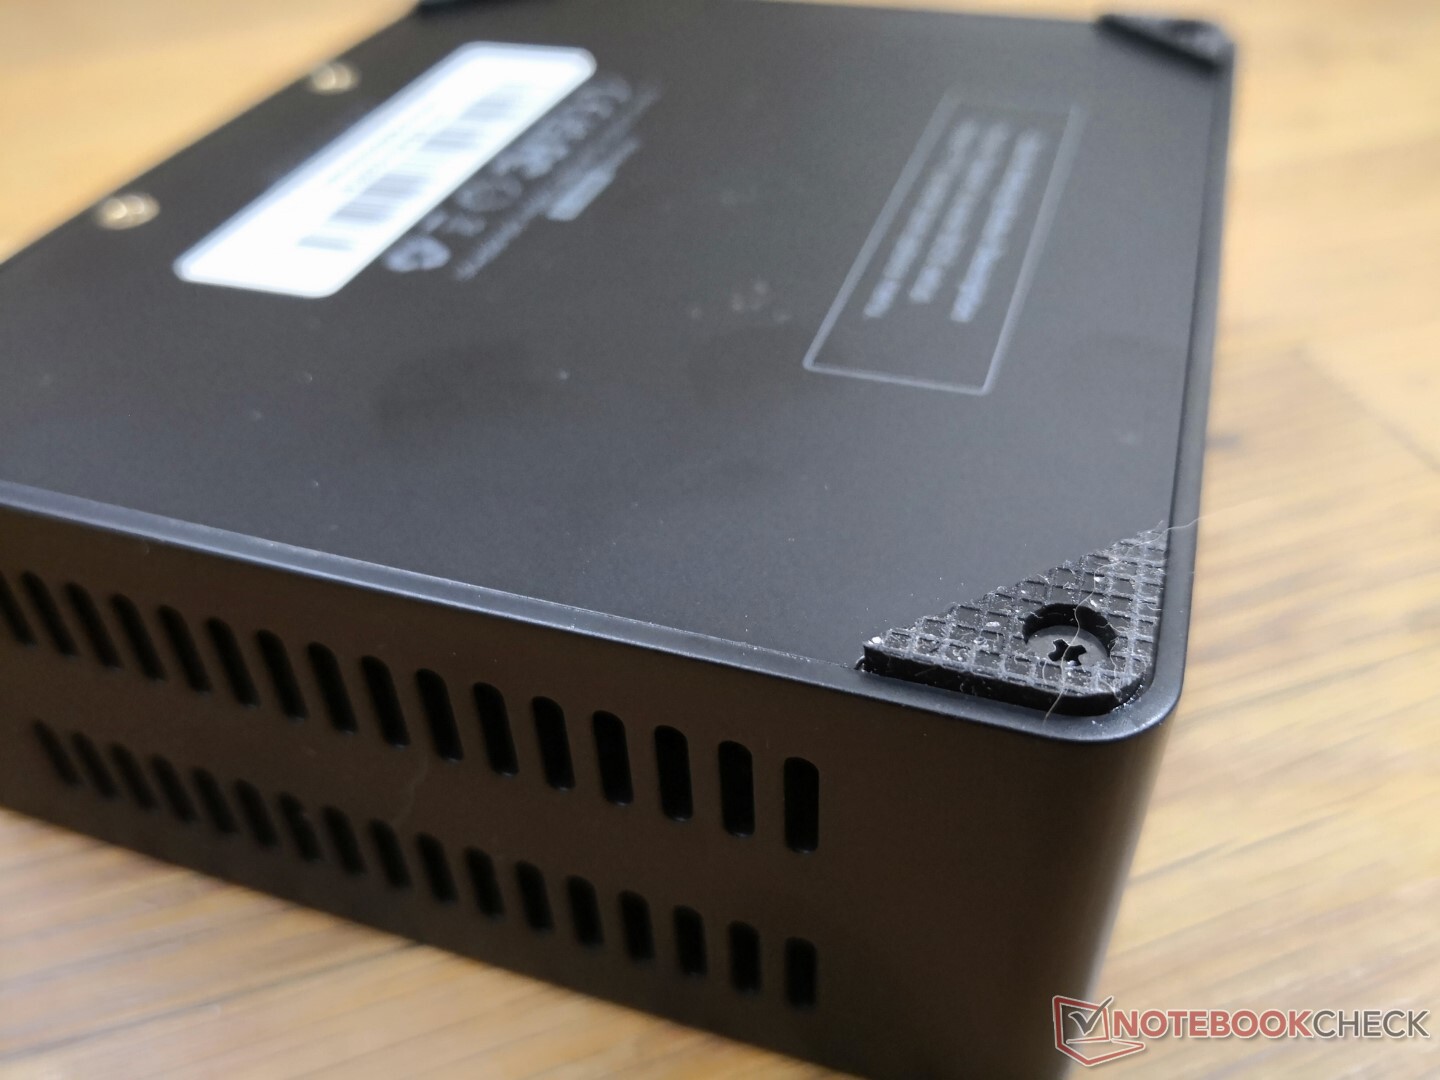
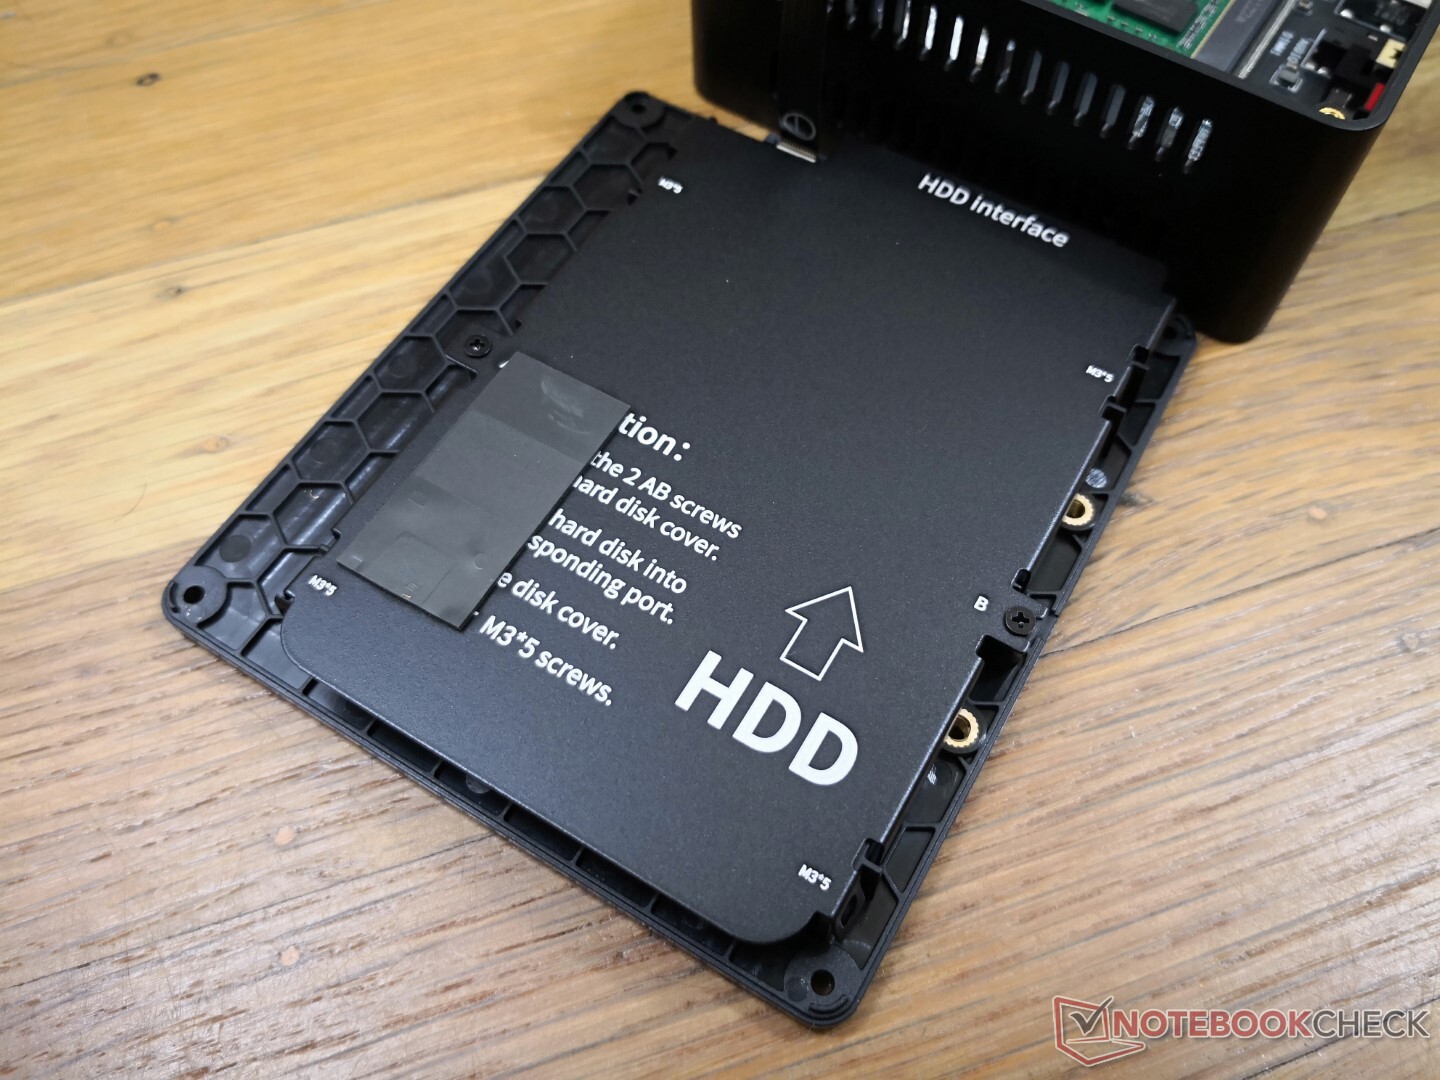
El panel inferior se desprende fácilmente tras retirar los 4 tornillos Philips de las esquinas. Los usuarios tienen acceso directo a dos bahías de almacenamiento (1x M.2 2280 SATA III + 1x SATA III de 2,5 pulgadas) y una única ranura SODIMM DDR4 que admite hasta 16 GB de memoria de un solo canal.
Accesorios y garantía
La caja de venta incluye un soporte de montaje VESA extraíble con tornillos que se fijan a la placa inferior de la unidad. También se incluyen dos cables HDMI.
Se aplica la garantía limitada estándar de un año si se adquiere en Estados Unidos.
Rendimiento
Condiciones de la prueba
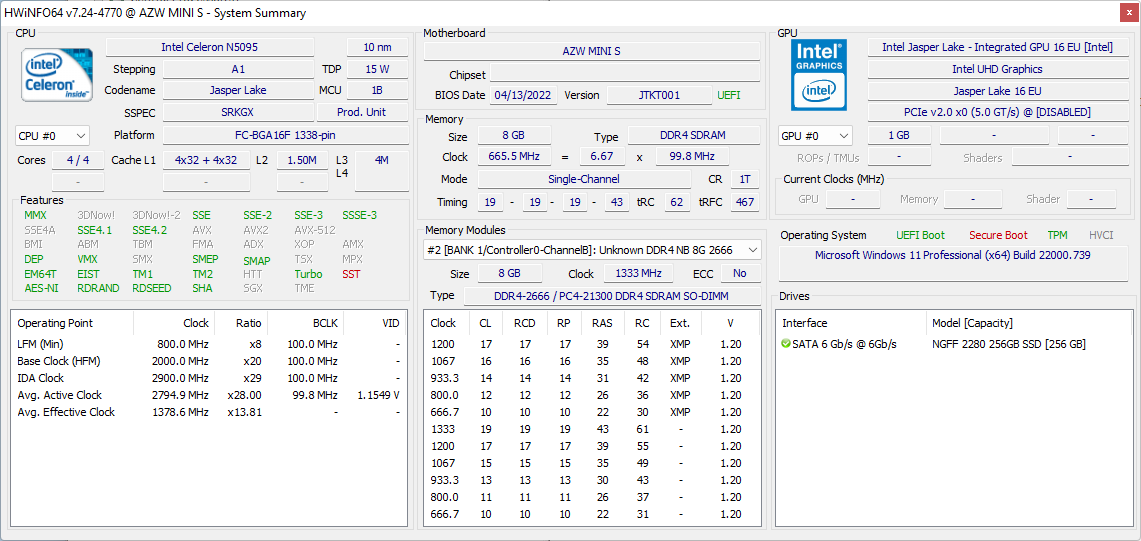
Nuestra unidad de pruebas se configuró en el modo de rendimiento de Windows antes de ejecutar cualquier prueba de referencia para obtener las puntuaciones más altas posibles. Aparte de los ajustes habituales de la BIOS, no hay aplicaciones especiales para controlar características o comportamientos específicos del U59 Mini-S.
Procesador - Más rápido que el Atom, más lento que el Core i3
El rendimiento multihilo es comparable al del doble núcleo de cuatro hilos Core i3-8109U mientras que es entre un 20 y un 45 por ciento más lento en el rendimiento de un solo hilo. No obstante, el Celeron N5095 es más rápido que las soluciones Celeron de la generación anterior, incluido elJ4125 oN4100 hasta el doble en aplicaciones multihilo.
La sostenibilidad del rendimiento es buena, sin grandes caídas al ejecutar CineBench R15 xT en bucle.
Cinebench R15 Multi Loop
Cinebench R23: Multi Core | Single Core
Cinebench R15: CPU Multi 64Bit | CPU Single 64Bit
Blender: v2.79 BMW27 CPU
7-Zip 18.03: 7z b 4 | 7z b 4 -mmt1
Geekbench 5.5: Multi-Core | Single-Core
HWBOT x265 Benchmark v2.2: 4k Preset
LibreOffice : 20 Documents To PDF
R Benchmark 2.5: Overall mean
| Cinebench R20 / CPU (Multi Core) | |
| Lenovo Yoga Slim 7 14ARE05 82A20008GE | |
| Intel NUC11TNKi5 | |
| Acer Swift 3 SF314-42-R27B | |
| Zotac ZBOX MI642 Nano | |
| Medio Intel Celeron N5095 (804 - 844, n=5) | |
| Beelink U59 Mini-S | |
| Beelink SEi8 | |
| GMK NucBox 3 | |
| Chuwi UBook CWI509 | |
| Blackview AceBook 1 | |
| Chuwi LapBook Plus | |
| Cinebench R20 / CPU (Single Core) | |
| Intel NUC11TNKi5 | |
| Lenovo Yoga Slim 7 14ARE05 82A20008GE | |
| Acer Swift 3 SF314-42-R27B | |
| Zotac ZBOX MI642 Nano | |
| Beelink SEi8 | |
| Medio Intel Celeron N5095 (228 - 239, n=5) | |
| Beelink U59 Mini-S | |
| GMK NucBox 3 | |
| Blackview AceBook 1 | |
| Chuwi UBook CWI509 | |
| Chuwi LapBook Plus | |
| Cinebench R23 / Multi Core | |
| Lenovo Yoga Slim 7 14ARE05 82A20008GE | |
| Intel NUC11TNKi5 | |
| Medio Intel Celeron N5095 (2150 - 2219, n=5) | |
| Beelink U59 Mini-S | |
| Beelink SEi8 | |
| GMK NucBox 3 | |
| Blackview AceBook 1 | |
| Cinebench R23 / Single Core | |
| Intel NUC11TNKi5 | |
| Lenovo Yoga Slim 7 14ARE05 82A20008GE | |
| Beelink SEi8 | |
| Beelink U59 Mini-S | |
| Medio Intel Celeron N5095 (587 - 621, n=5) | |
| GMK NucBox 3 | |
| Blackview AceBook 1 | |
| Cinebench R15 / CPU Multi 64Bit | |
| Lenovo Yoga Slim 7 14ARE05 82A20008GE | |
| Intel NUC11TNKi5 | |
| Acer Swift 3 SF314-42-R27B | |
| Zotac ZBOX MI642 Nano | |
| Beelink U59 Mini-S | |
| Medio Intel Celeron N5095 (221 - 379, n=6) | |
| Beelink SEi8 | |
| Blackview AceBook 1 | |
| GMK NucBox 3 | |
| Chuwi UBook CWI509 | |
| Chuwi LapBook Plus | |
| Cinebench R15 / CPU Single 64Bit | |
| Intel NUC11TNKi5 | |
| Lenovo Yoga Slim 7 14ARE05 82A20008GE | |
| Zotac ZBOX MI642 Nano | |
| Acer Swift 3 SF314-42-R27B | |
| Beelink SEi8 | |
| Medio Intel Celeron N5095 (95.4 - 109, n=5) | |
| Beelink U59 Mini-S | |
| Blackview AceBook 1 | |
| Chuwi UBook CWI509 | |
| GMK NucBox 3 | |
| Chuwi LapBook Plus | |
| Blender / v2.79 BMW27 CPU | |
| Chuwi LapBook Plus | |
| GMK NucBox 3 | |
| Blackview AceBook 1 | |
| Beelink U59 Mini-S | |
| Medio Intel Celeron N5095 (1502 - 1624, n=5) | |
| Beelink SEi8 | |
| Acer Swift 3 SF314-42-R27B | |
| Zotac ZBOX MI642 Nano | |
| Intel NUC11TNKi5 | |
| Lenovo Yoga Slim 7 14ARE05 82A20008GE | |
| 7-Zip 18.03 / 7z b 4 -mmt1 | |
| Intel NUC11TNKi5 | |
| Lenovo Yoga Slim 7 14ARE05 82A20008GE | |
| Zotac ZBOX MI642 Nano | |
| Acer Swift 3 SF314-42-R27B | |
| Beelink SEi8 | |
| Beelink U59 Mini-S | |
| Medio Intel Celeron N5095 (2935 - 3124, n=5) | |
| Blackview AceBook 1 | |
| GMK NucBox 3 | |
| Chuwi LapBook Plus | |
| Geekbench 5.5 / Multi-Core | |
| Lenovo Yoga Slim 7 14ARE05 82A20008GE | |
| Intel NUC11TNKi5 | |
| Zotac ZBOX MI642 Nano | |
| Acer Swift 3 SF314-42-R27B | |
| Medio Intel Celeron N5095 (1933 - 2052, n=4) | |
| Beelink U59 Mini-S | |
| Beelink SEi8 | |
| GMK NucBox 3 | |
| Geekbench 5.5 / Single-Core | |
| Intel NUC11TNKi5 | |
| Lenovo Yoga Slim 7 14ARE05 82A20008GE | |
| Zotac ZBOX MI642 Nano | |
| Acer Swift 3 SF314-42-R27B | |
| Beelink SEi8 | |
| Medio Intel Celeron N5095 (637 - 659, n=4) | |
| Beelink U59 Mini-S | |
| GMK NucBox 3 | |
| HWBOT x265 Benchmark v2.2 / 4k Preset | |
| Lenovo Yoga Slim 7 14ARE05 82A20008GE | |
| Intel NUC11TNKi5 | |
| Acer Swift 3 SF314-42-R27B | |
| Zotac ZBOX MI642 Nano | |
| Beelink SEi8 | |
| Beelink U59 Mini-S | |
| Medio Intel Celeron N5095 (1.9 - 2.05, n=5) | |
| GMK NucBox 3 | |
| Blackview AceBook 1 | |
| Chuwi LapBook Plus | |
| LibreOffice / 20 Documents To PDF | |
| GMK NucBox 3 | |
| Blackview AceBook 1 | |
| Beelink U59 Mini-S | |
| Medio Intel Celeron N5095 (97 - 107.9, n=5) | |
| Beelink SEi8 | |
| Zotac ZBOX MI642 Nano | |
| Lenovo Yoga Slim 7 14ARE05 82A20008GE | |
| Acer Swift 3 SF314-42-R27B | |
| Intel NUC11TNKi5 | |
| R Benchmark 2.5 / Overall mean | |
| Blackview AceBook 1 | |
| GMK NucBox 3 | |
| Beelink U59 Mini-S | |
| Medio Intel Celeron N5095 (1.16 - 1.2, n=5) | |
| Beelink SEi8 | |
| Zotac ZBOX MI642 Nano | |
| Acer Swift 3 SF314-42-R27B | |
| Intel NUC11TNKi5 | |
| Lenovo Yoga Slim 7 14ARE05 82A20008GE | |
* ... más pequeño es mejor
AIDA64: FP32 Ray-Trace | FPU Julia | CPU SHA3 | CPU Queen | FPU SinJulia | FPU Mandel | CPU AES | CPU ZLib | FP64 Ray-Trace | CPU PhotoWorxx
| Performance rating | |
| Intel NUC11TNKi5 | |
| Zotac ZBOX MI642 Nano | |
| Beelink SEi8 | |
| Beelink U59 | |
| Medio Intel Celeron N5095 | |
| Beelink U59 Mini-S | |
| GMK NucBox 3 | |
| AIDA64 / FP32 Ray-Trace | |
| Intel NUC11TNKi5 | |
| Zotac ZBOX MI642 Nano | |
| Beelink SEi8 | |
| Beelink U59 | |
| Beelink U59 Mini-S | |
| Medio Intel Celeron N5095 (1241 - 1245, n=5) | |
| GMK NucBox 3 | |
| AIDA64 / FPU Julia | |
| Intel NUC11TNKi5 | |
| Zotac ZBOX MI642 Nano | |
| Beelink SEi8 | |
| Beelink U59 | |
| Medio Intel Celeron N5095 (7264 - 7466, n=5) | |
| Beelink U59 Mini-S | |
| GMK NucBox 3 | |
| AIDA64 / CPU SHA3 | |
| Intel NUC11TNKi5 | |
| Zotac ZBOX MI642 Nano | |
| Beelink SEi8 | |
| Beelink U59 | |
| Medio Intel Celeron N5095 (508 - 515, n=5) | |
| Beelink U59 Mini-S | |
| GMK NucBox 3 | |
| AIDA64 / CPU Queen | |
| Zotac ZBOX MI642 Nano | |
| Intel NUC11TNKi5 | |
| Beelink SEi8 | |
| Beelink U59 | |
| Medio Intel Celeron N5095 (21458 - 22326, n=5) | |
| Beelink U59 Mini-S | |
| GMK NucBox 3 | |
| AIDA64 / FPU SinJulia | |
| Intel NUC11TNKi5 | |
| Zotac ZBOX MI642 Nano | |
| Beelink SEi8 | |
| GMK NucBox 3 | |
| Beelink U59 | |
| Beelink U59 Mini-S | |
| Medio Intel Celeron N5095 (1000 - 1003, n=5) | |
| AIDA64 / FPU Mandel | |
| Intel NUC11TNKi5 | |
| Zotac ZBOX MI642 Nano | |
| Beelink SEi8 | |
| Beelink U59 | |
| Medio Intel Celeron N5095 (3802 - 3967, n=5) | |
| Beelink U59 Mini-S | |
| GMK NucBox 3 | |
| AIDA64 / CPU AES | |
| Intel NUC11TNKi5 | |
| Medio Intel Celeron N5095 (19076 - 19354, n=5) | |
| Beelink U59 | |
| Beelink U59 Mini-S | |
| Zotac ZBOX MI642 Nano | |
| GMK NucBox 3 | |
| Beelink SEi8 | |
| AIDA64 / CPU ZLib | |
| Intel NUC11TNKi5 | |
| Zotac ZBOX MI642 Nano | |
| Beelink U59 | |
| Medio Intel Celeron N5095 (187.7 - 190, n=5) | |
| Beelink U59 Mini-S | |
| Beelink SEi8 | |
| GMK NucBox 3 | |
| AIDA64 / FP64 Ray-Trace | |
| Intel NUC11TNKi5 | |
| Zotac ZBOX MI642 Nano | |
| Beelink SEi8 | |
| Beelink U59 | |
| Medio Intel Celeron N5095 (673 - 676, n=5) | |
| Beelink U59 Mini-S | |
| GMK NucBox 3 | |
| AIDA64 / CPU PhotoWorxx | |
| Intel NUC11TNKi5 | |
| Zotac ZBOX MI642 Nano | |
| Beelink SEi8 | |
| Beelink U59 | |
| Medio Intel Celeron N5095 (7386 - 9899, n=5) | |
| Beelink U59 Mini-S | |
| GMK NucBox 3 | |
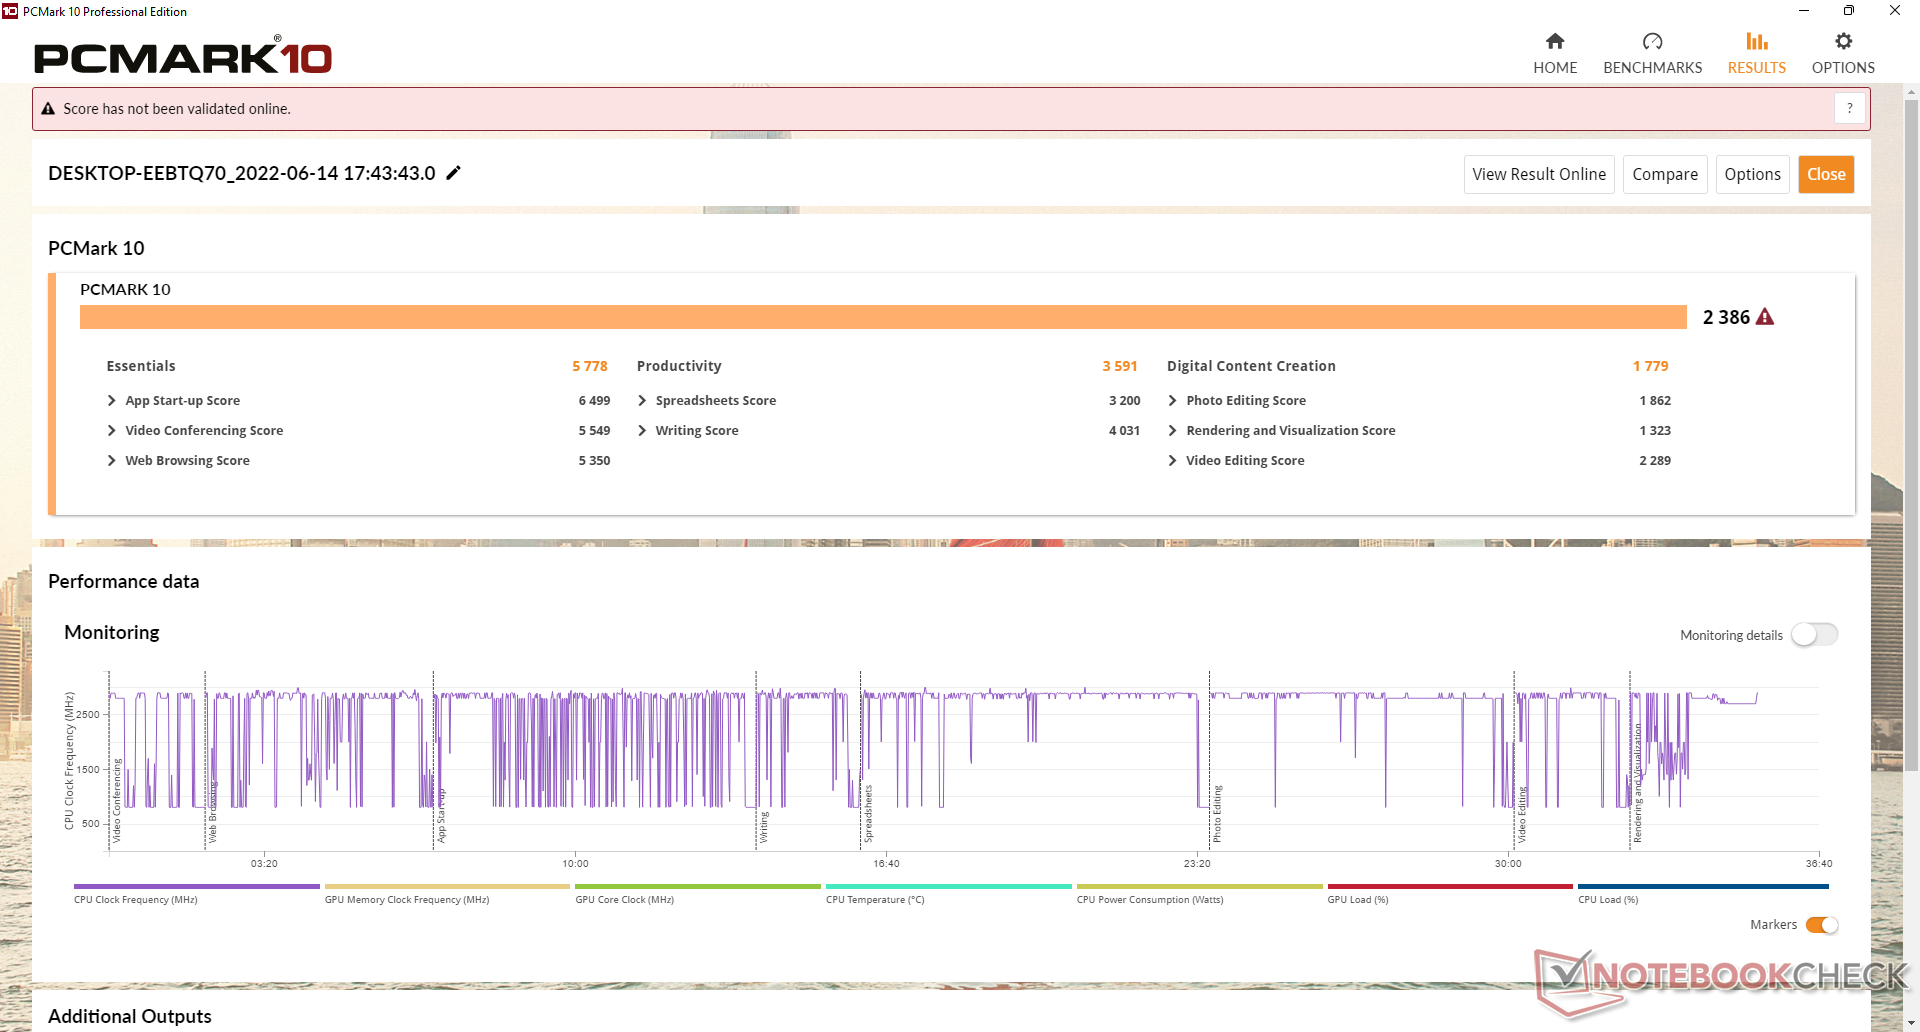
Rendimiento del sistema
Las puntuaciones de PCMark se sitúan cómodamente entre los mini PC con el antiguo Celeron J4125 como el GMK NucBox 3 y los mini PC con CPU Core i3 como el Beelink SEi8.
CrossMark: Overall | Productivity | Creativity | Responsiveness
| PCMark 10 / Score | |
| Intel NUC11TNKi5 | |
| Zotac ZBOX MI642 Nano | |
| Beelink SEi8 | |
| Beelink U59 | |
| Beelink U59 Mini-S | |
| Medio Intel Celeron N5095, Intel UHD Graphics (Jasper Lake 16 EU) (2317 - 2417, n=5) | |
| GMK NucBox 3 | |
| PCMark 10 / Essentials | |
| Intel NUC11TNKi5 | |
| Beelink SEi8 | |
| Zotac ZBOX MI642 Nano | |
| Beelink U59 | |
| Beelink U59 Mini-S | |
| Medio Intel Celeron N5095, Intel UHD Graphics (Jasper Lake 16 EU) (5516 - 5874, n=5) | |
| GMK NucBox 3 | |
| PCMark 10 / Productivity | |
| Zotac ZBOX MI642 Nano | |
| Intel NUC11TNKi5 | |
| Beelink SEi8 | |
| Beelink U59 | |
| Beelink U59 Mini-S | |
| Medio Intel Celeron N5095, Intel UHD Graphics (Jasper Lake 16 EU) (3454 - 3666, n=5) | |
| GMK NucBox 3 | |
| PCMark 10 / Digital Content Creation | |
| Intel NUC11TNKi5 | |
| Zotac ZBOX MI642 Nano | |
| Beelink SEi8 | |
| Beelink U59 | |
| Beelink U59 Mini-S | |
| Medio Intel Celeron N5095, Intel UHD Graphics (Jasper Lake 16 EU) (1752 - 1787, n=5) | |
| GMK NucBox 3 | |
| CrossMark / Overall | |
| Beelink U59 Mini-S | |
| Medio Intel Celeron N5095, Intel UHD Graphics (Jasper Lake 16 EU) (473 - 495, n=3) | |
| CrossMark / Productivity | |
| Beelink U59 Mini-S | |
| Medio Intel Celeron N5095, Intel UHD Graphics (Jasper Lake 16 EU) (535 - 561, n=3) | |
| CrossMark / Creativity | |
| Medio Intel Celeron N5095, Intel UHD Graphics (Jasper Lake 16 EU) (434 - 440, n=3) | |
| Beelink U59 Mini-S | |
| CrossMark / Responsiveness | |
| Beelink U59 Mini-S | |
| Medio Intel Celeron N5095, Intel UHD Graphics (Jasper Lake 16 EU) (403 - 497, n=3) | |
| PCMark 10 Score | 2386 puntos | |
ayuda | ||
| AIDA64 / Memory Copy | |
| Beelink SEi8 | |
| Zotac ZBOX MI642 Nano | |
| Beelink U59 | |
| Intel NUC11TNKi5 | |
| Medio Intel Celeron N5095 (16422 - 23009, n=5) | |
| Beelink U59 Mini-S | |
| GMK NucBox 3 | |
| AIDA64 / Memory Read | |
| Zotac ZBOX MI642 Nano | |
| Beelink SEi8 | |
| Intel NUC11TNKi5 | |
| Beelink U59 Mini-S | |
| Medio Intel Celeron N5095 (15464 - 16959, n=5) | |
| Beelink U59 | |
| GMK NucBox 3 | |
| AIDA64 / Memory Write | |
| Zotac ZBOX MI642 Nano | |
| Beelink U59 | |
| Medio Intel Celeron N5095 (18612 - 30843, n=5) | |
| Intel NUC11TNKi5 | |
| Beelink U59 Mini-S | |
| Beelink SEi8 | |
| GMK NucBox 3 | |
| AIDA64 / Memory Latency | |
| Zotac ZBOX MI642 Nano | |
| Intel NUC11TNKi5 | |
| GMK NucBox 3 | |
| Medio Intel Celeron N5095 (58 - 74.1, n=5) | |
| Beelink U59 | |
| Beelink U59 Mini-S | |
| Beelink SEi8 | |
* ... más pequeño es mejor
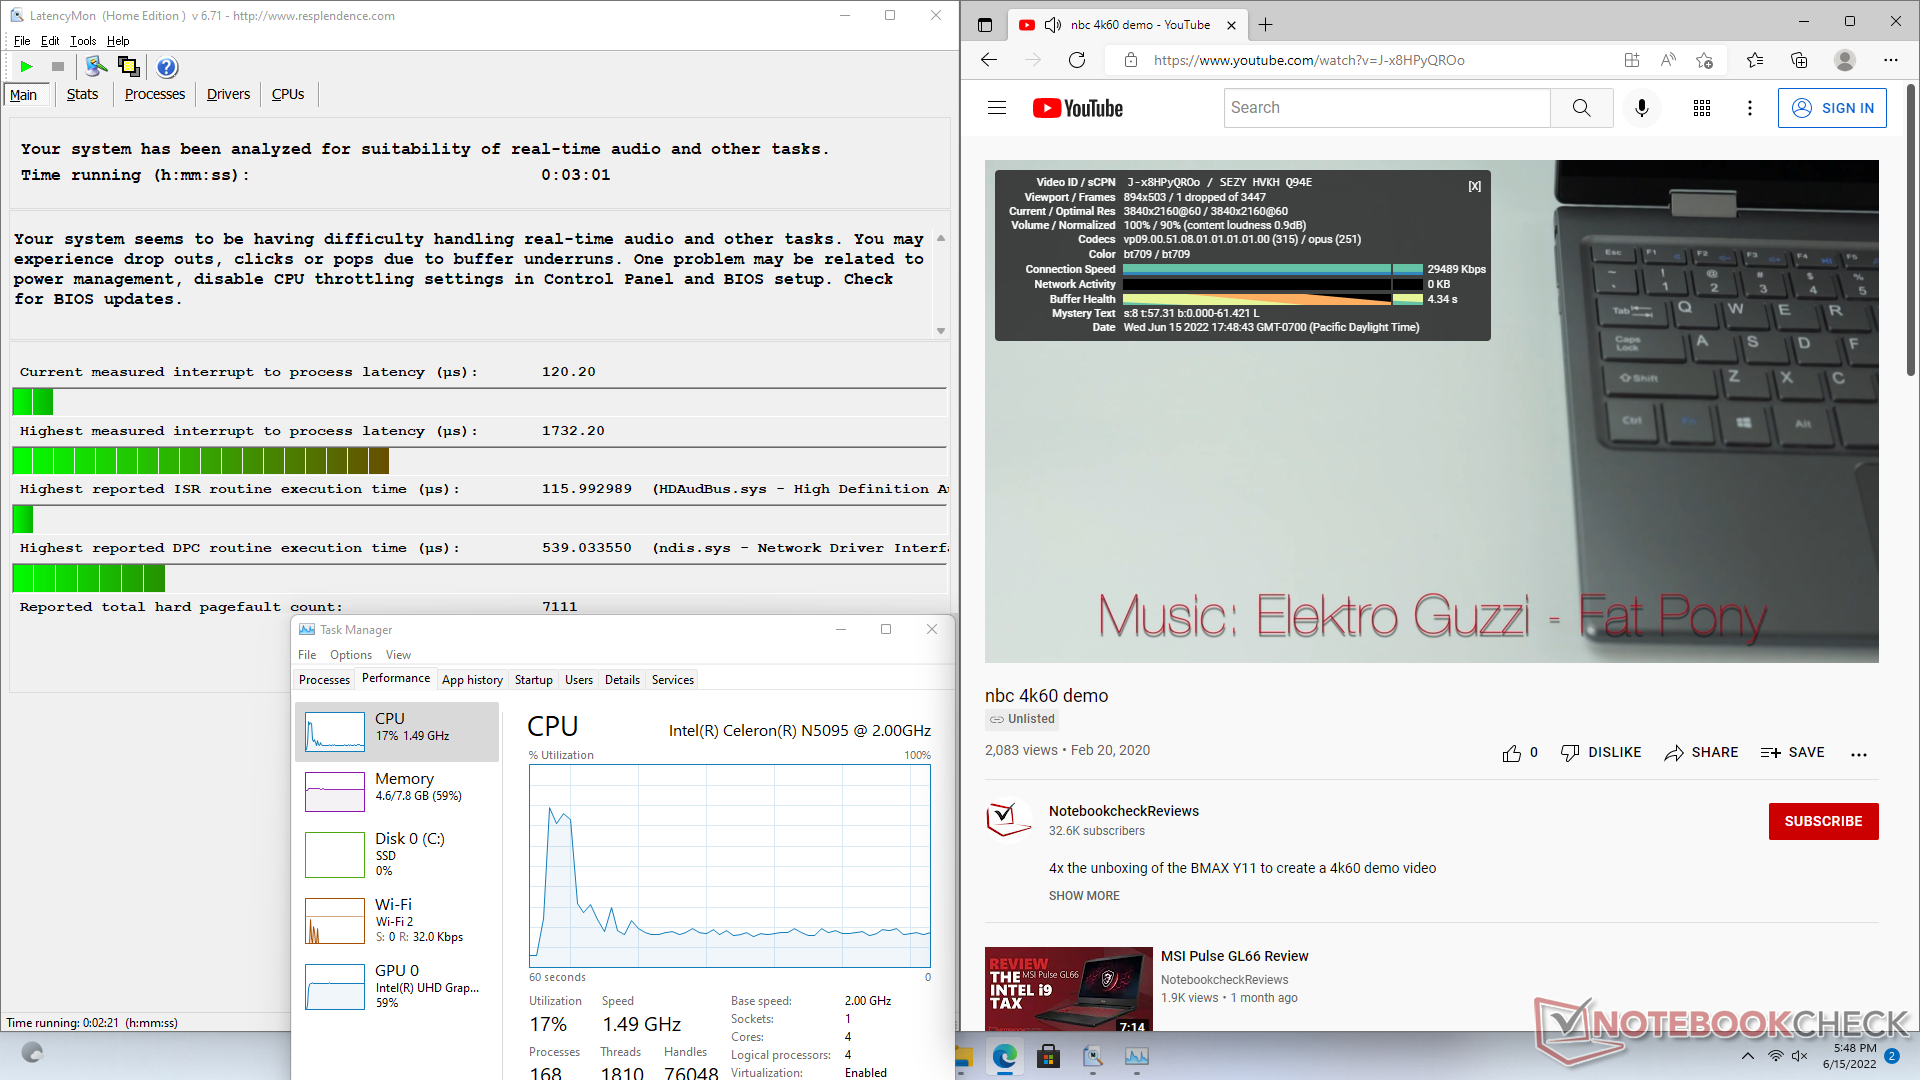
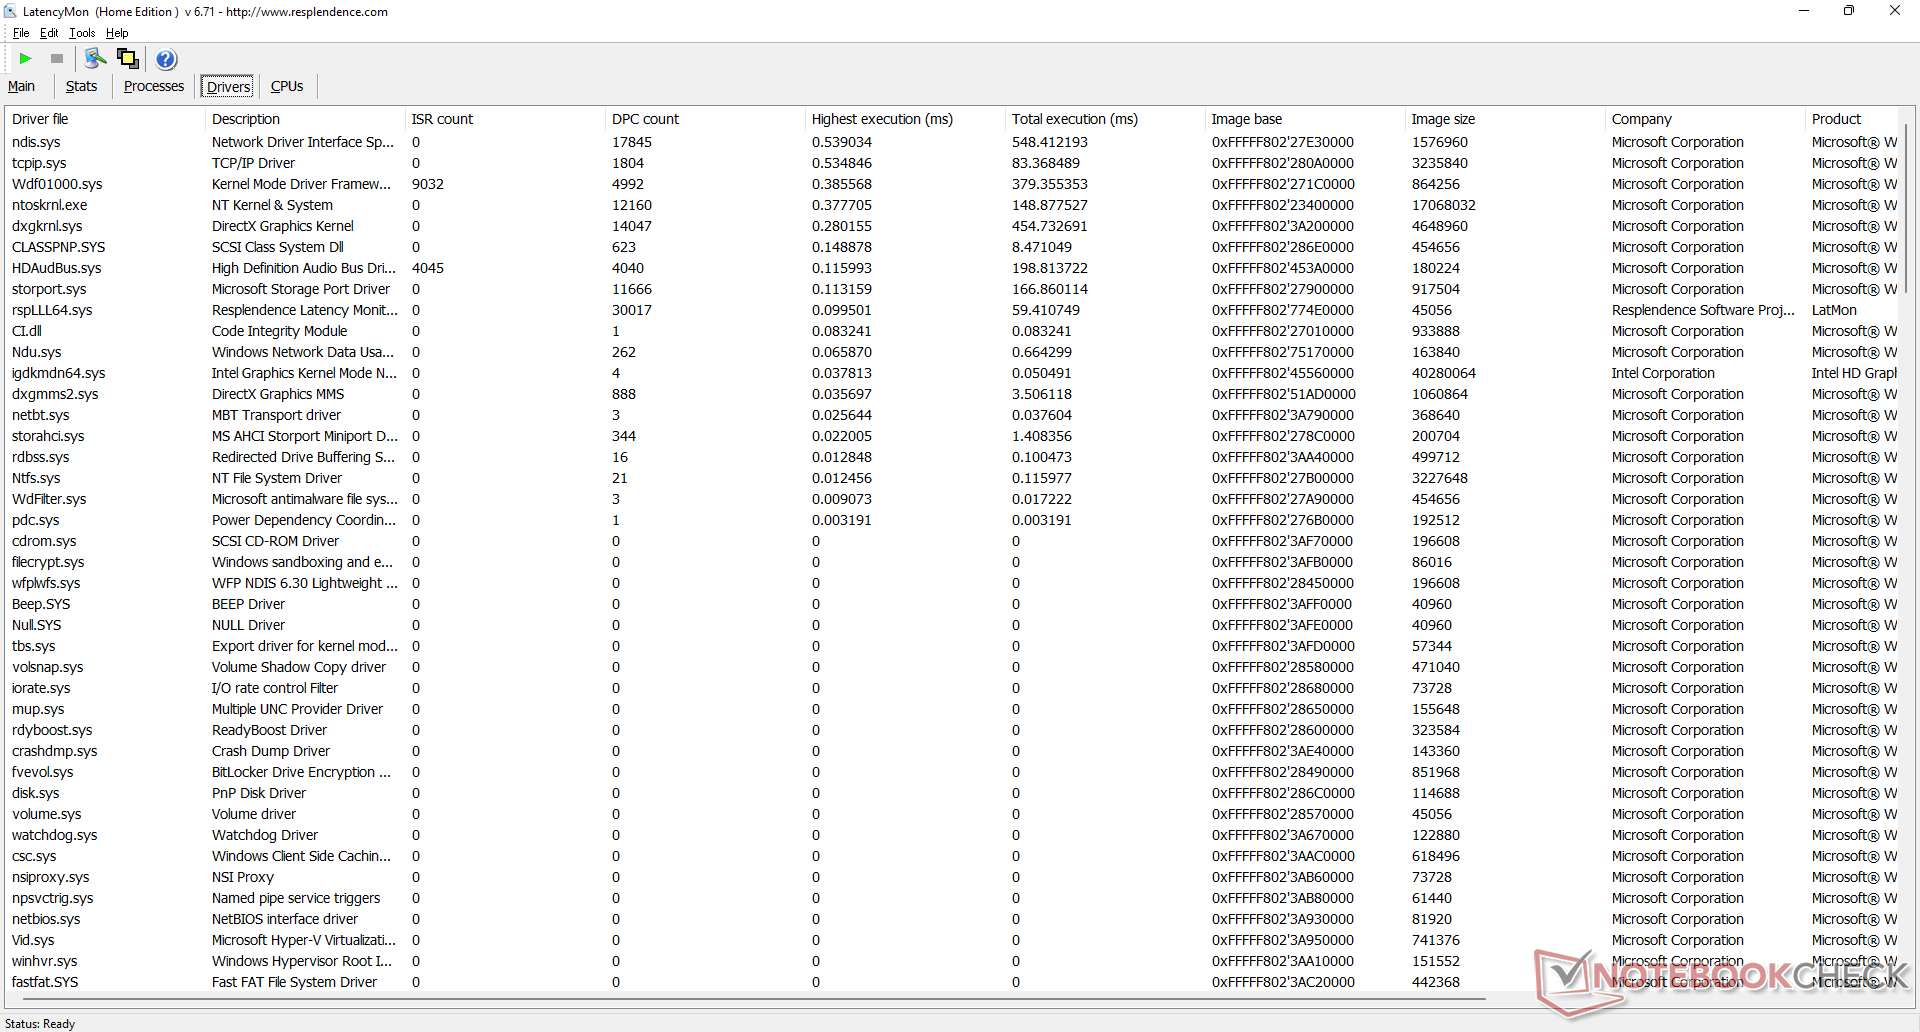
Latencia del CPD
LatencyMon revela problemas de CPD al abrir varias pestañas del navegador de nuestra página web. la reproducción de vídeo 4K a 60 FPS es, por lo demás, fluida y con un uso de la CPU razonablemente bajo del 17%, con una sola caída de fotogramas durante nuestras pruebas.
| DPC Latencies / LatencyMon - interrupt to process latency (max), Web, Youtube, Prime95 | |
| Beelink SEi8 | |
| GMK NucBox 3 | |
| Beelink U59 Mini-S | |
| Beelink U59 | |
| Intel NUC11TNKi5 | |
* ... más pequeño es mejor
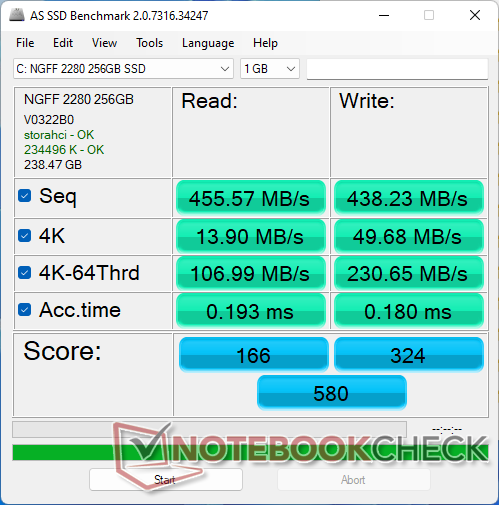
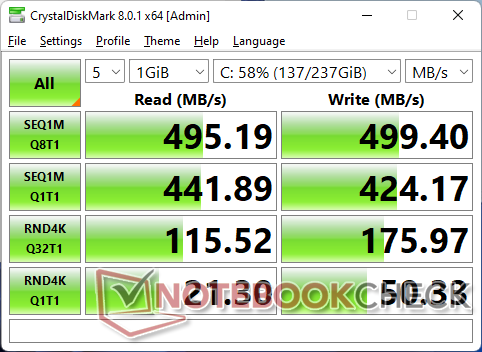
Dispositivos de almacenamiento: hasta dos unidades internas
Nuestra unidad se envía con unSilicon Motion AZW 256G M.228 220426 SATA III M.2 para tasas de transferencia secuencial que alcanzan un máximo de 500 MB/s. Aunque no es tan rápido como una solución NVMe, es suficiente teniendo en cuenta el público al que va dirigido y la CPU Celeron.

| Drive Performance rating - Percent | |
| Beelink SEi8 | |
| Zotac ZBOX MI642 Nano | |
| Intel NUC11TNKi5 | |
| Beelink U59 Mini-S | |
| Beelink U59 | |
| GMK NucBox 3 | |
* ... más pequeño es mejor
Disk Throttling: DiskSpd Read Loop, Queue Depth 8
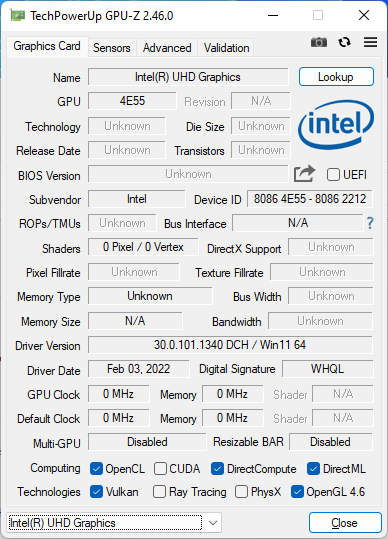
Rendimiento de la GPU: demasiado lento para los juegos
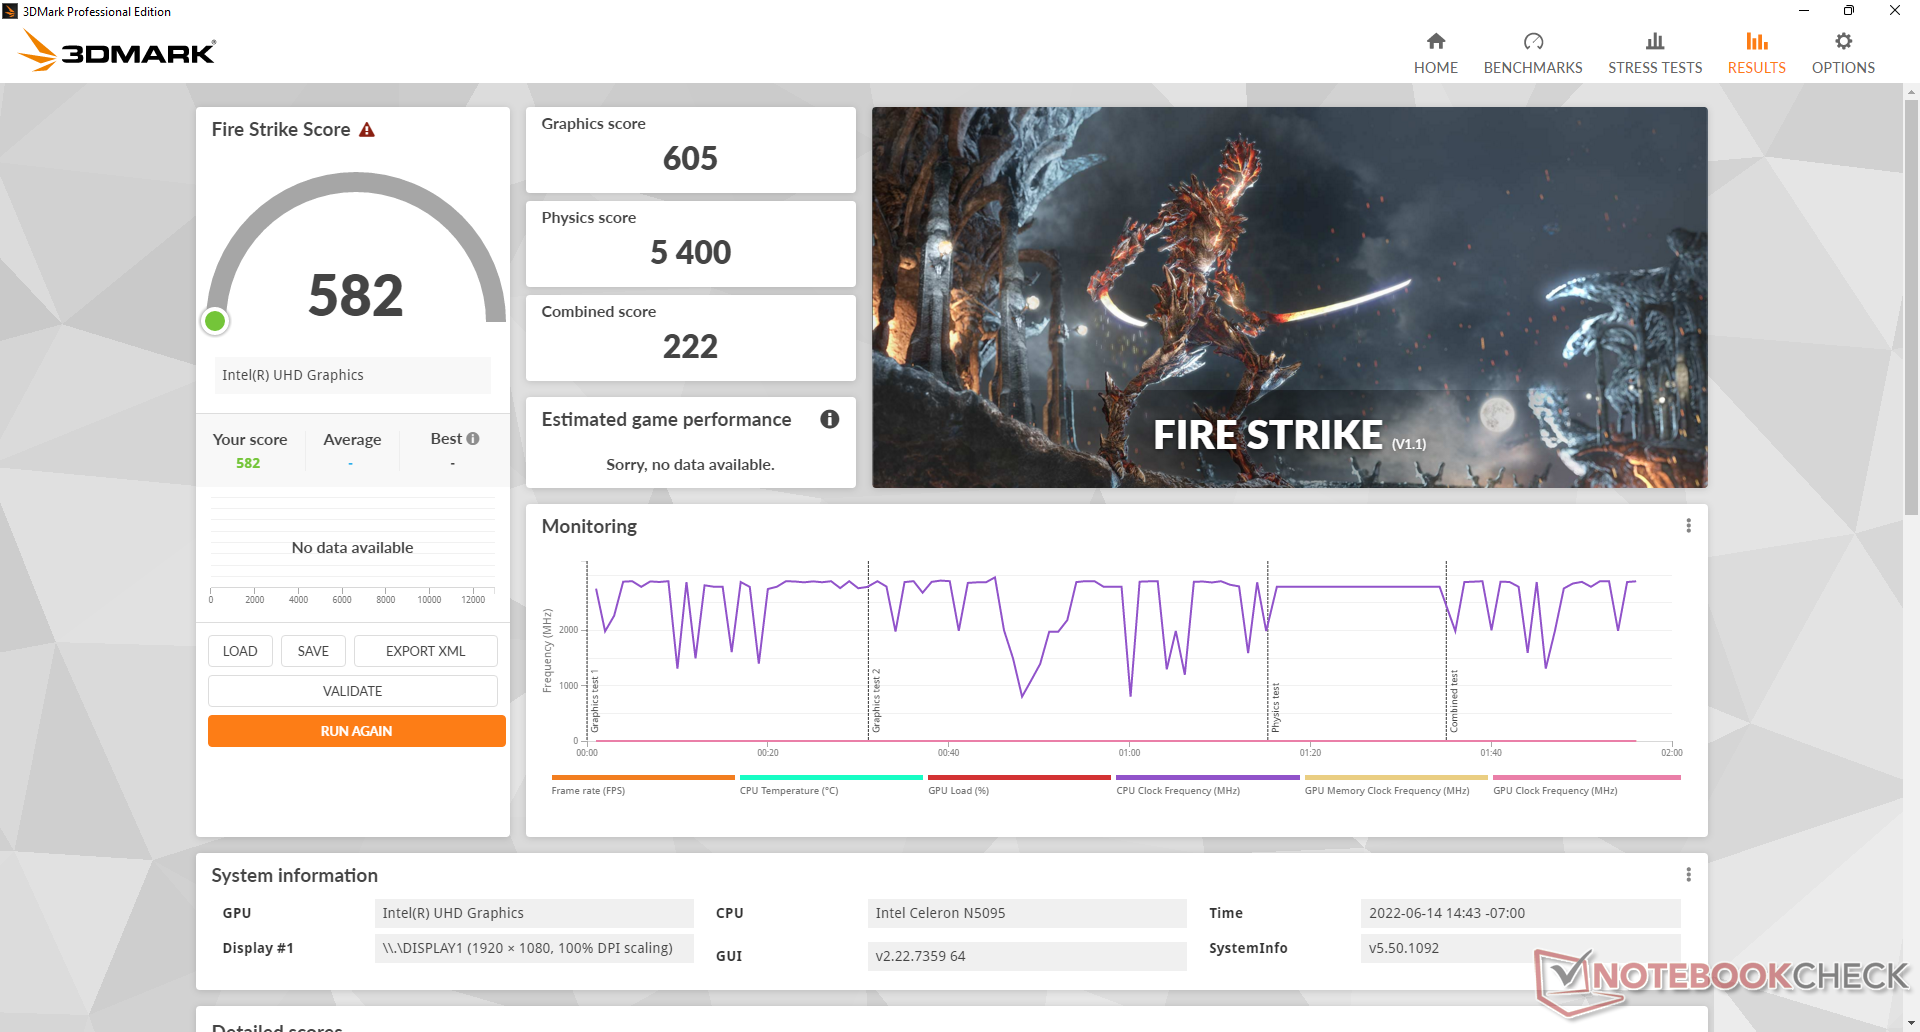
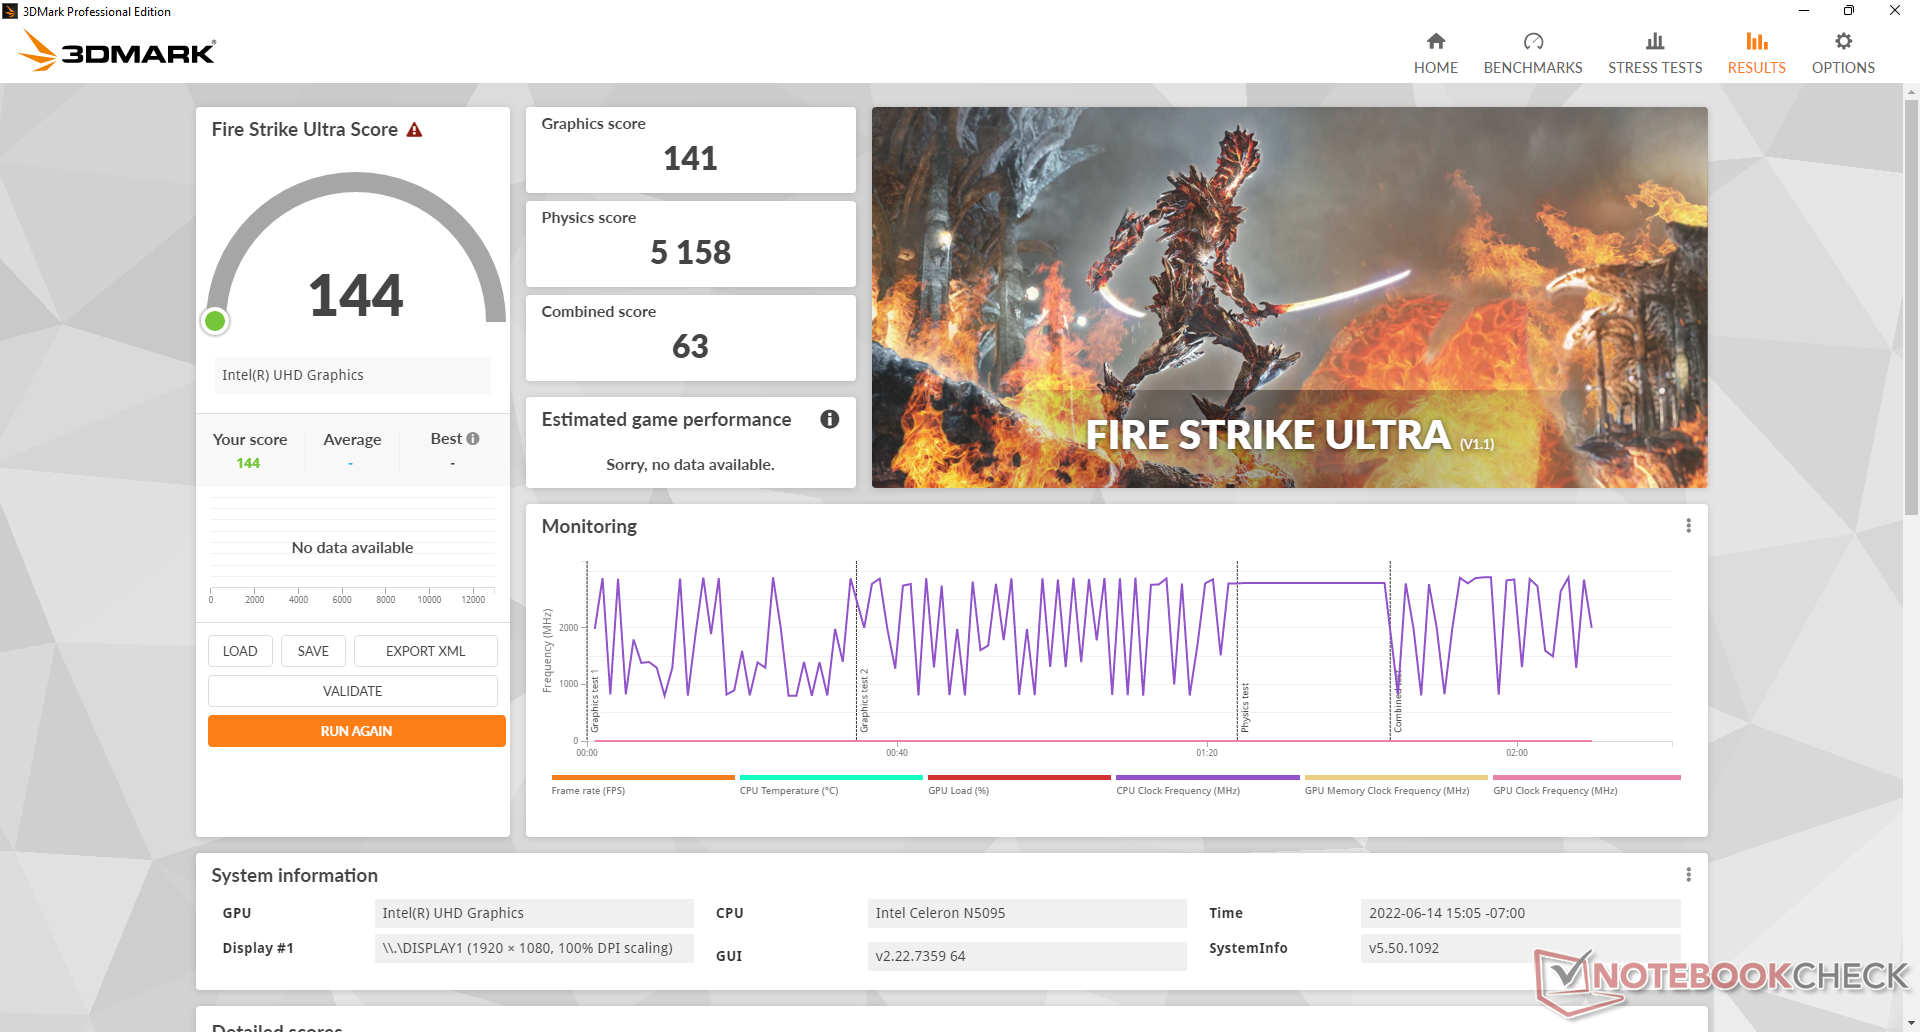
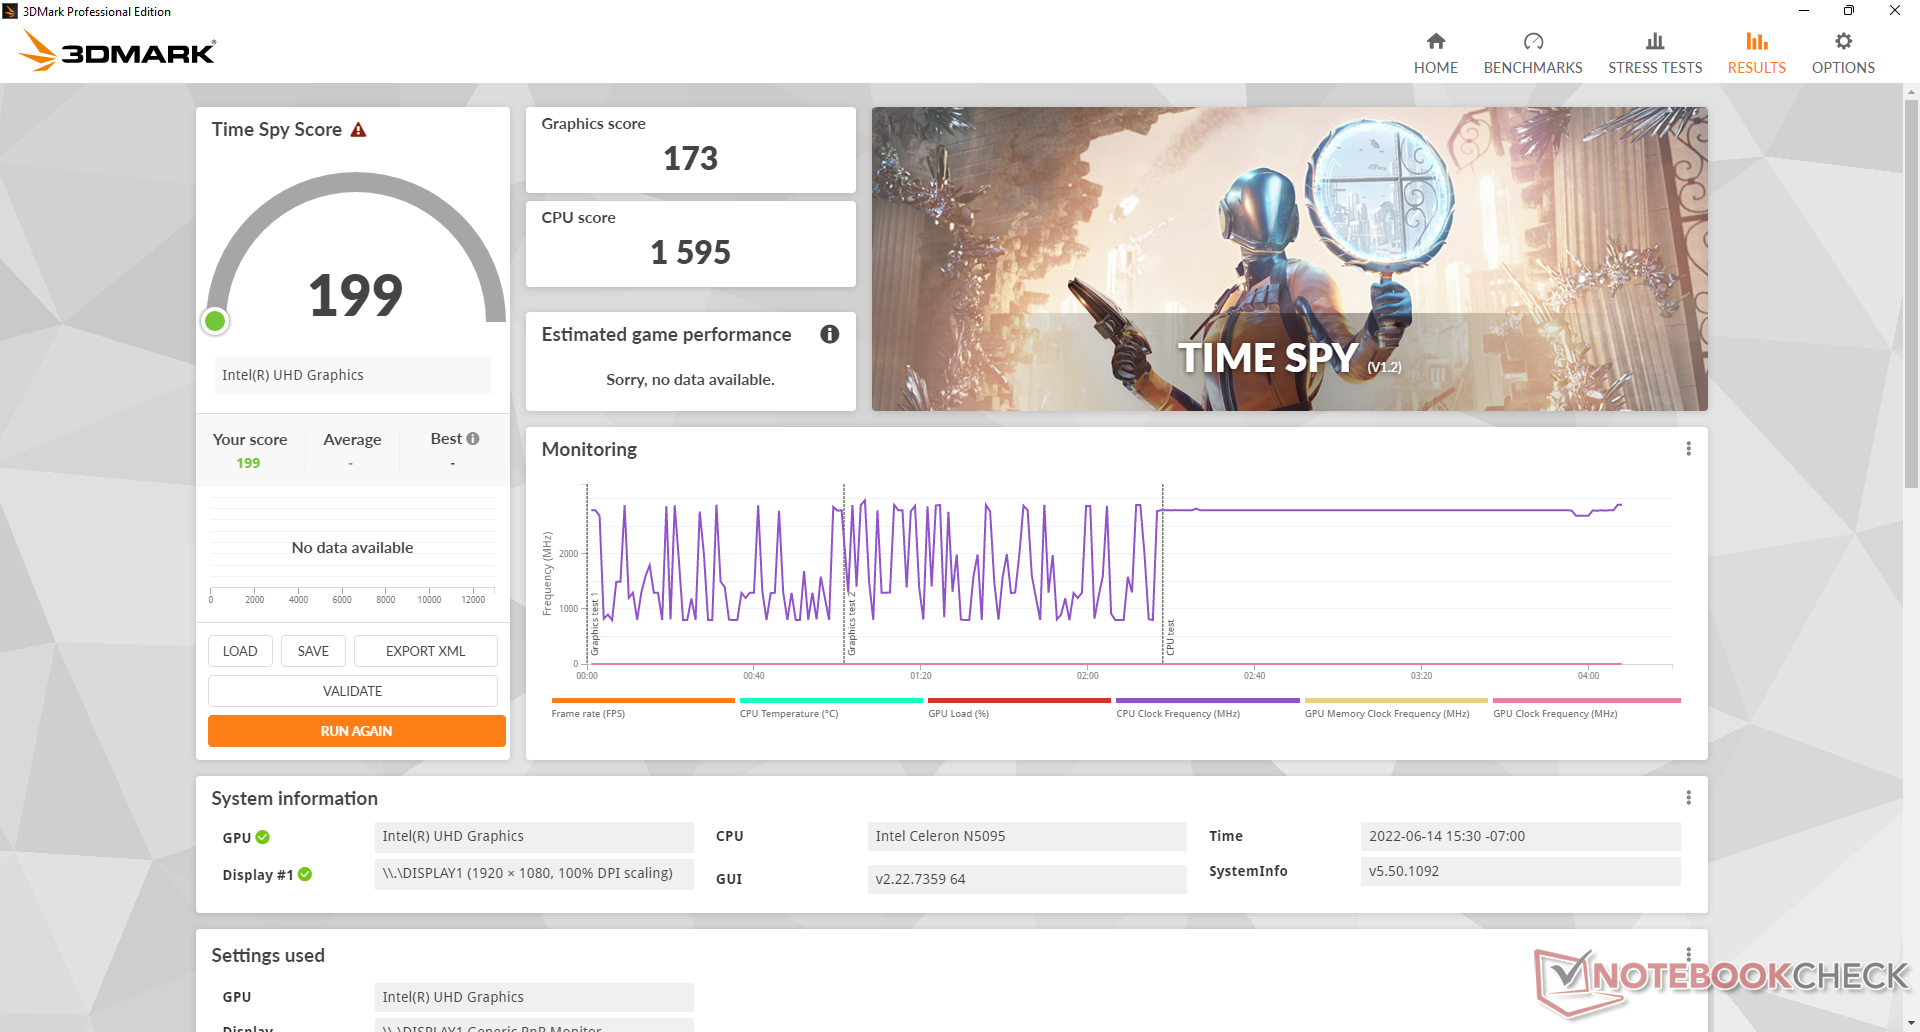
El rendimiento gráfico es pobre con resultados que están por debajo incluso de los antiguosUHD Graphics 620 en más de un 50%. No esperes poder ejecutar ni siquiera los juegos 3D menos exigentes, ya que este mini PC en particular fue diseñado más bien para el streaming de vídeo FHD o 4K.
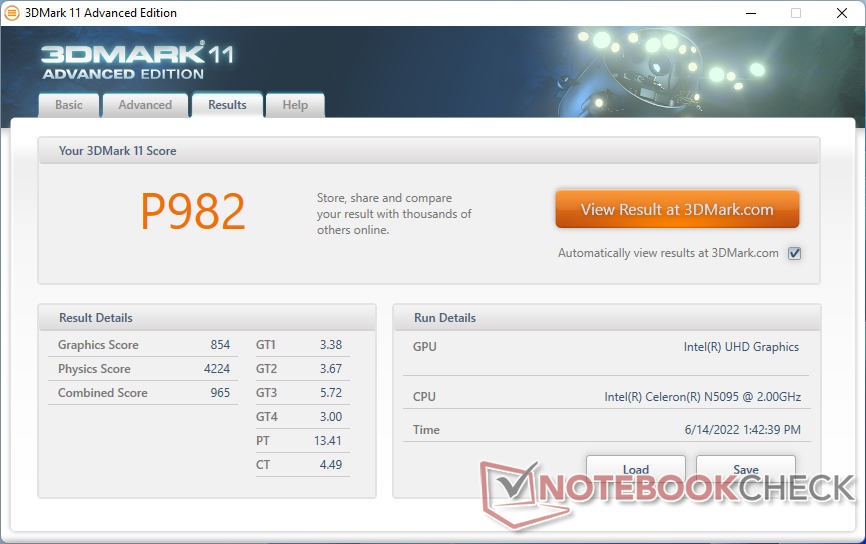
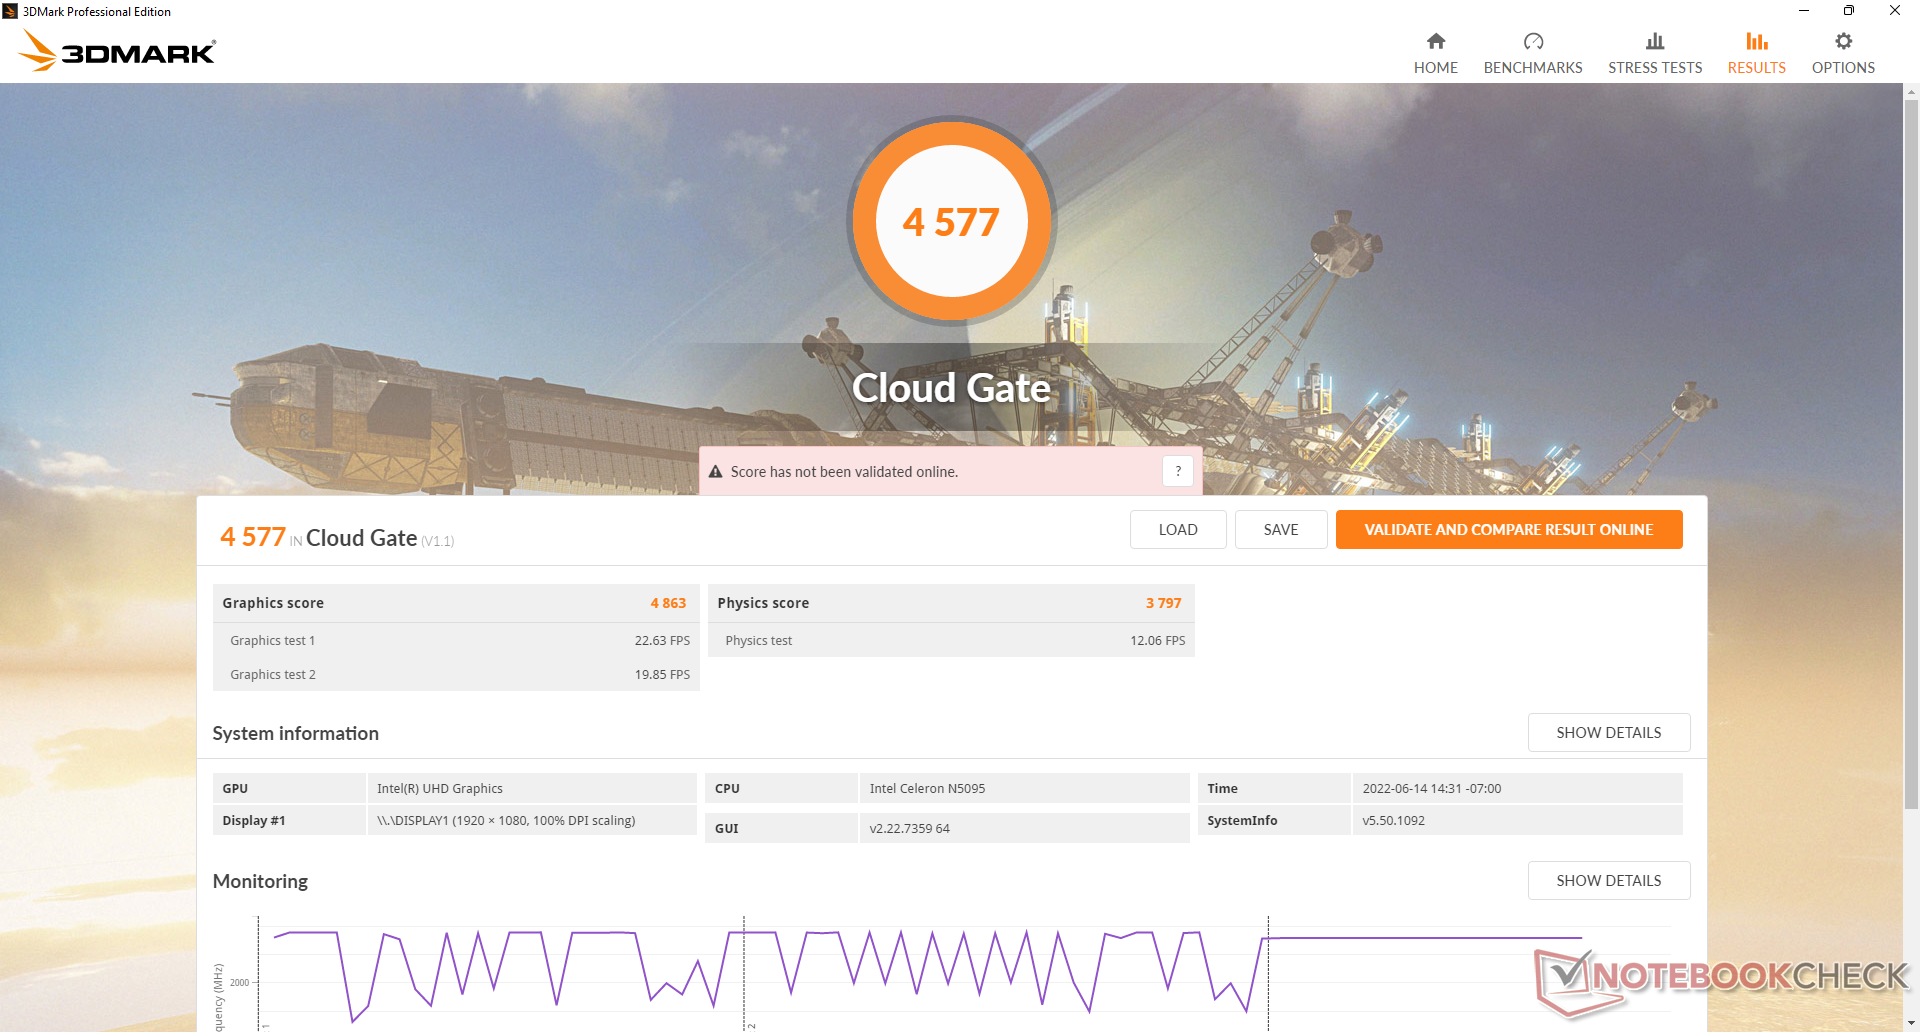
| 3DMark 11 Performance | 982 puntos | |
| 3DMark Cloud Gate Standard Score | 4577 puntos | |
| 3DMark Fire Strike Score | 582 puntos | |
| 3DMark Time Spy Score | 199 puntos | |
ayuda | ||
| bajo | medio | alto | ultra | |
|---|---|---|---|---|
| Dota 2 Reborn (2015) | 58.3 | 20.7 | 11.6 | 10.8 |
| Final Fantasy XV Benchmark (2018) | 6.86 | |||
| X-Plane 11.11 (2018) | 13.3 | 7.54 | 7.07 |
Emisiones
Ruido del sistema: silencioso en la mayoría de las condiciones
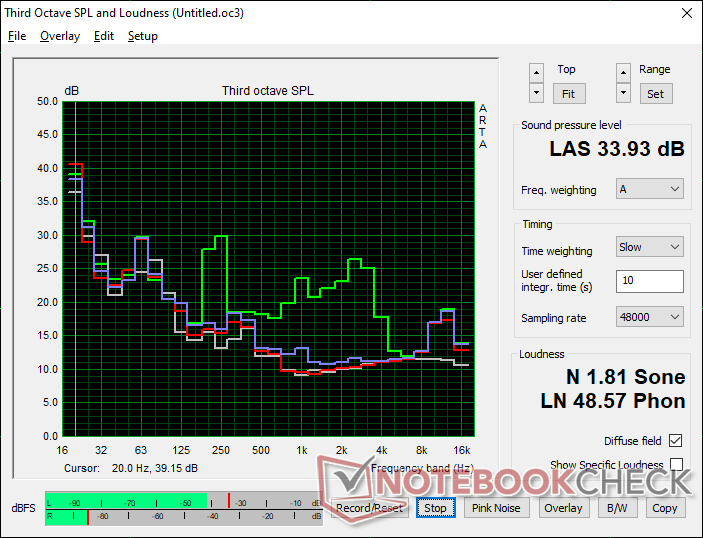
Aunque el modelo no está refrigerado de forma pasiva, en la práctica podría serlo, ya que el ventilador está en reposo o es apenas audible durante la mayoría de las cargas. Cuando se ejecuta la primera escena de pruebas de 3DMark 06, por ejemplo, el ruido del ventilador sólo es de unos 25 dB(A) contra un fondo silencioso de 23 dB(A). Los resultados son mucho más silenciosos que lo que observamos en el Beelink SEi8 o el Intel NUC11, cada uno con un hardware más potente.
Somos capaces de registrar hasta 34 dB(A) cuando la CPU está estresada bajo Prime95. Cuando se navega o se hace streaming de vídeo durante periodos más largos, el ruido del ventilador rondará los 31 dB(A).
Ruido
| Ocioso |
| 24.2 / 24.2 / 24.2 dB(A) |
| Carga |
| 25.1 / 33.9 dB(A) |
 | ||
30 dB silencioso 40 dB(A) audible 50 dB(A) ruidosamente alto |
||
min: | ||
| Beelink U59 Mini-S UHD Graphics (Jasper Lake 16 EU), Celeron N5095, Silicon Motion AZW 256G M.228 220426 C SATA 3 | Beelink SEi8 Iris Plus Graphics 655, i3-8109U, Intel SSD 660p SSDPEKNW512G8 | Intel NUC11TNKi5 Iris Xe G7 80EUs, i5-1135G7, Transcend M.2 SSD 430S TS512GMTS430S | Beelink U59 UHD Graphics (Jasper Lake 16 EU), Celeron N5095, Silicon Motion AZW 512G NV428 | Zotac ZBOX MI642 Nano UHD Graphics 620, i5-10210U, Western Digital WD Blue 3D WDBNCE5000PNC | |
|---|---|---|---|---|---|
| Noise | -19% | -39% | -9% | -36% | |
| apagado / medio ambiente * (dB) | 23.3 | 24.5 -5% | 24.8 -6% | 24.5 -5% | 27.8 -19% |
| Idle Minimum * (dB) | 24.2 | 26.5 -10% | 35.6 -47% | 24.5 -1% | 27.8 -15% |
| Idle Average * (dB) | 24.2 | 26.5 -10% | 35.6 -47% | 24.5 -1% | 33.9 -40% |
| Idle Maximum * (dB) | 24.2 | 31.1 -29% | 35.6 -47% | 28.6 -18% | 33.9 -40% |
| Load Average * (dB) | 25.1 | 37.7 -50% | 36.2 -44% | 29.7 -18% | 43.7 -74% |
| Load Maximum * (dB) | 33.9 | 37.5 -11% | 47.6 -40% | 37.6 -11% | 43.7 -29% |
| Witcher 3 ultra * (dB) | 38 | 30.4 |
* ... más pequeño es mejor
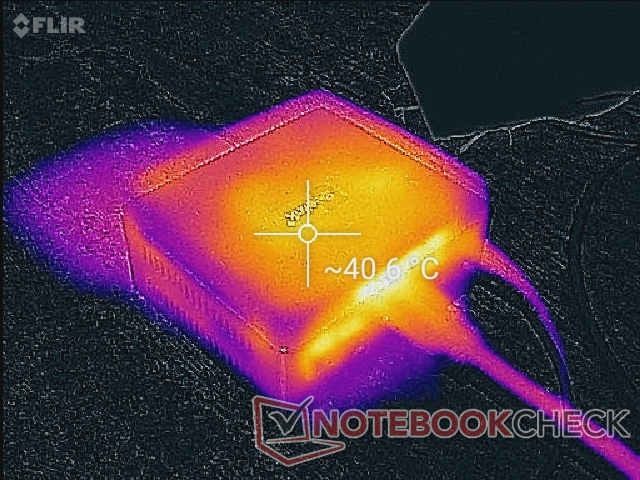
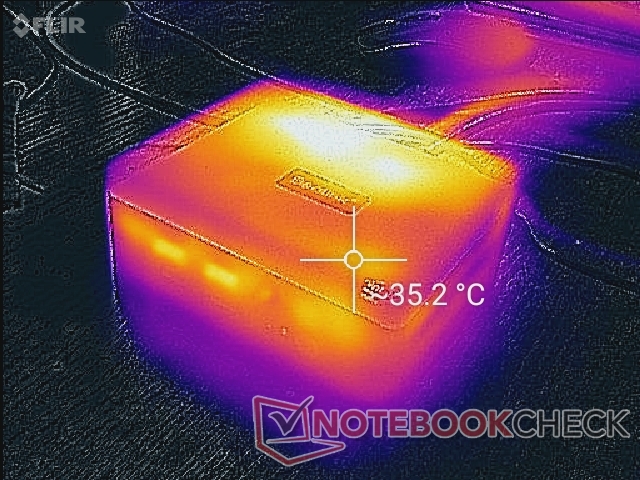
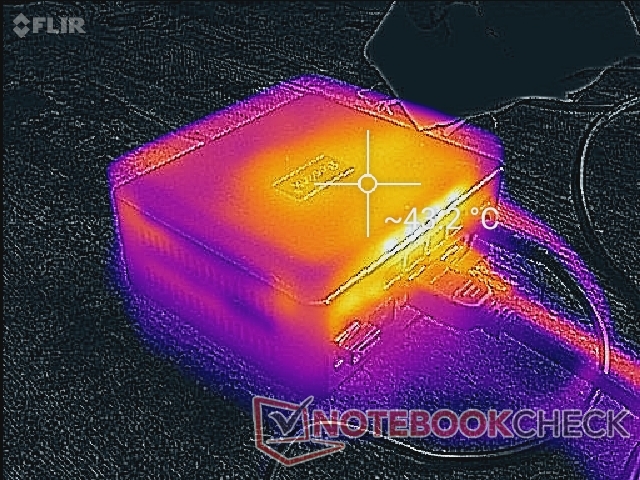
Temperatura
Las temperaturas de la superficie son más cálidas de lo esperado, hasta 40 C en la parte superior, incluso cuando está en ralentí en el escritorio. Cuando se ejecutan cargas exigentes, el punto caliente superior aumenta ligeramente hasta los 43 C. La elevada temperatura de la superficie en ralentí puede atribuirse al ventilador en ralentí durante cargas de procesamiento bajas para mantener el sistema lo más silencioso posible hasta que se necesite el ventilador.
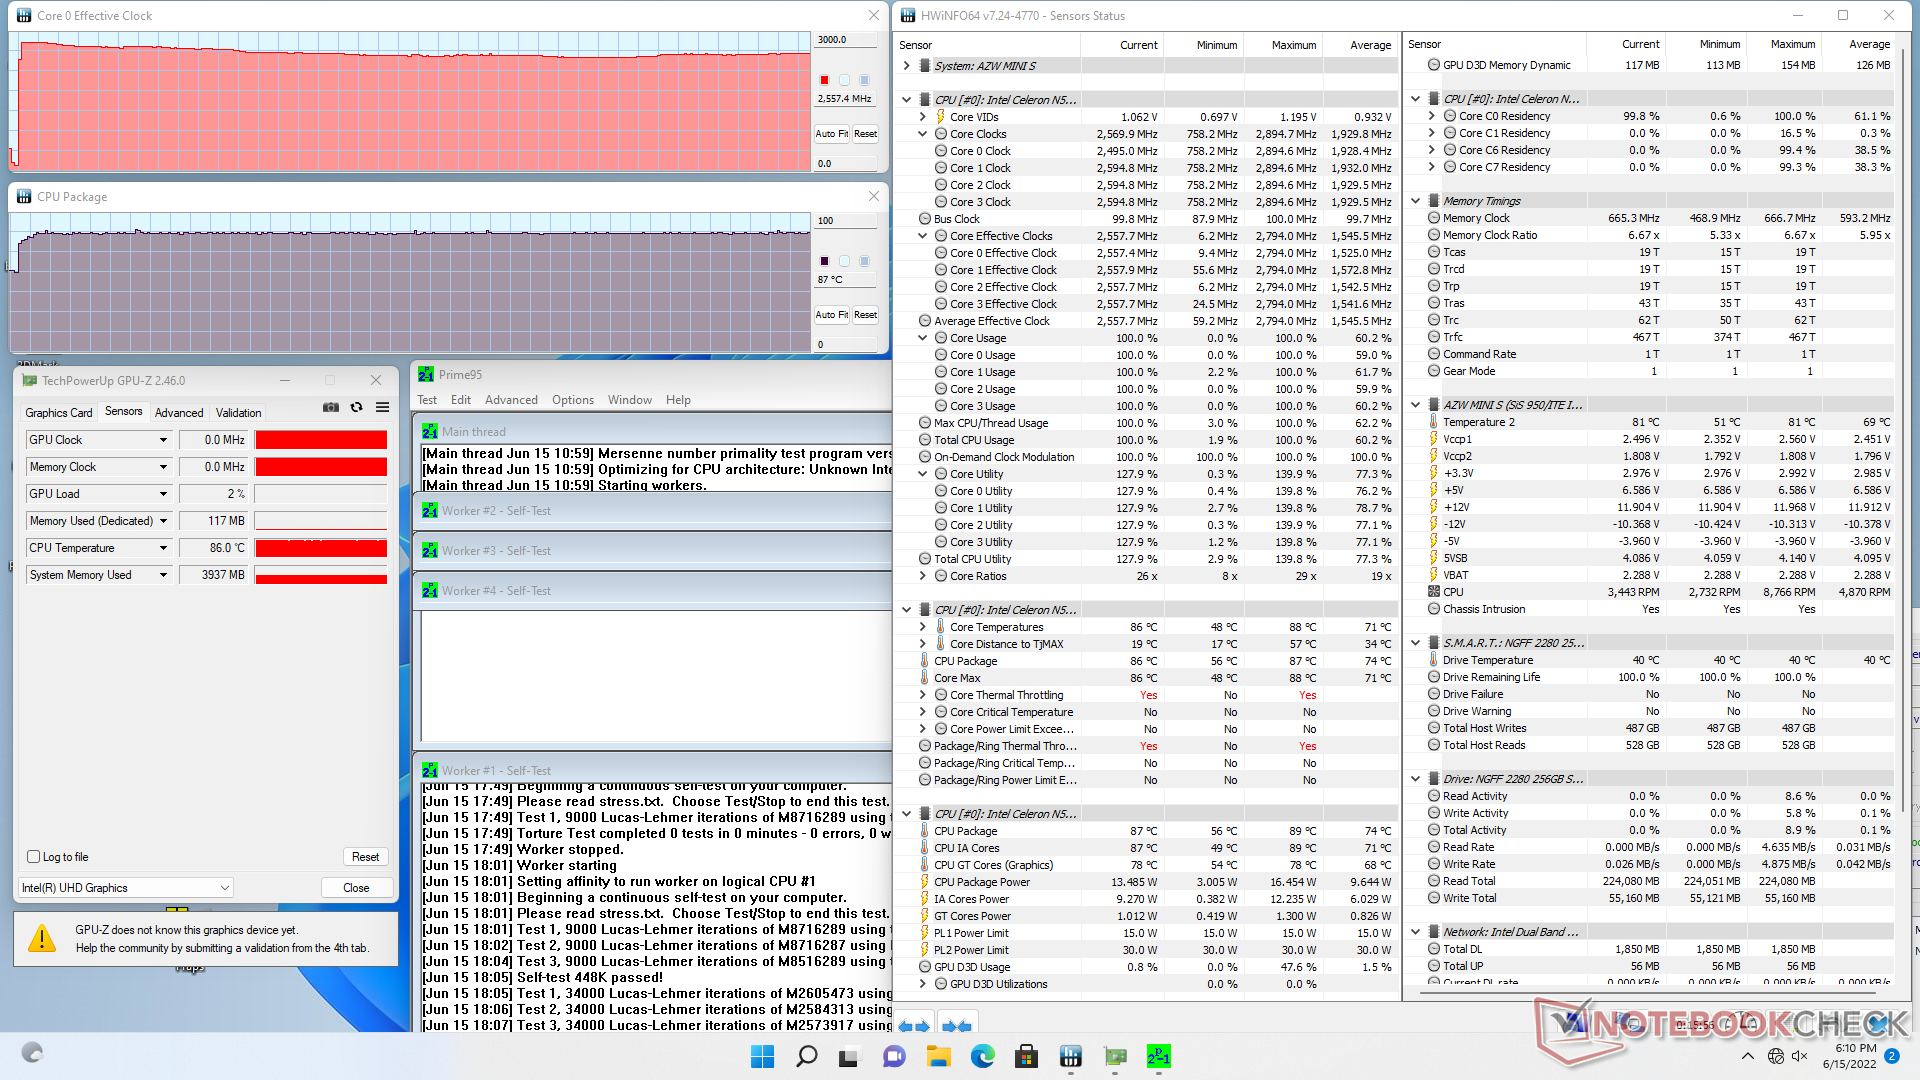
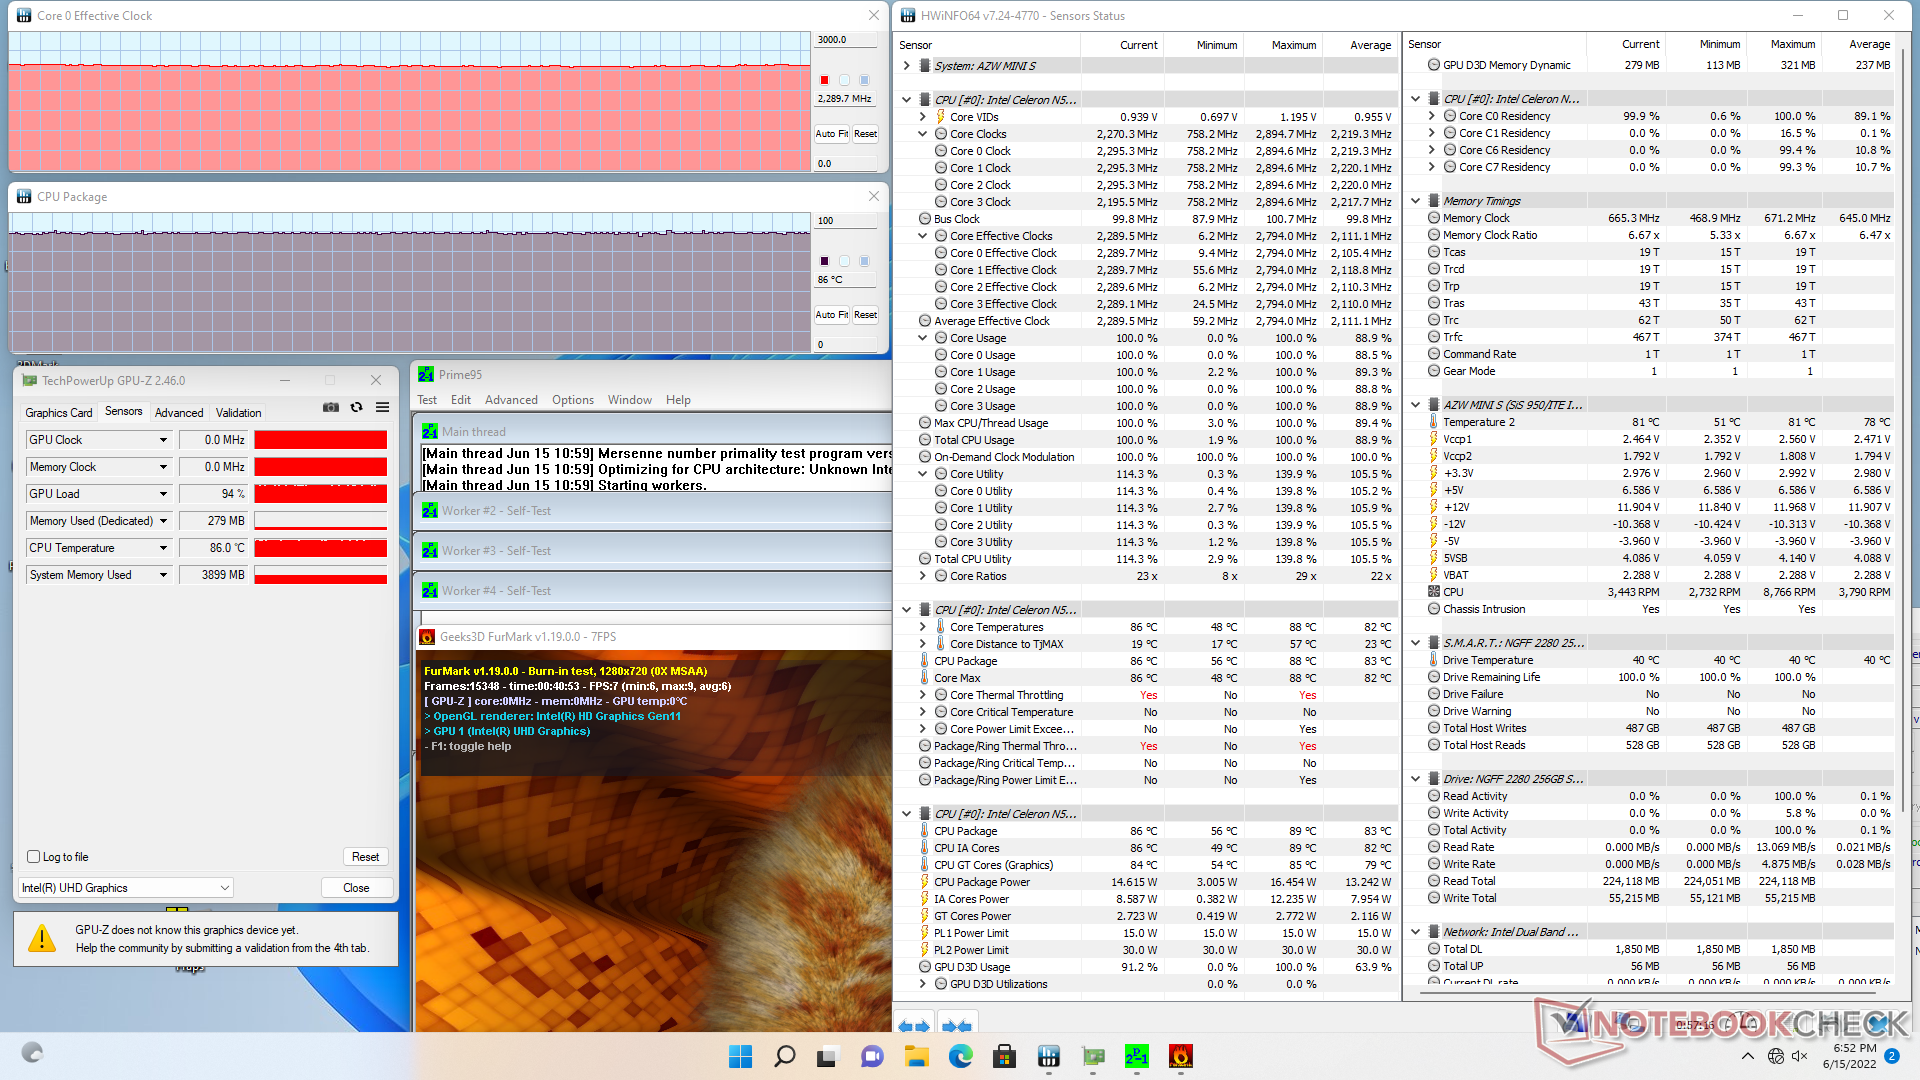
Prueba de esfuerzo
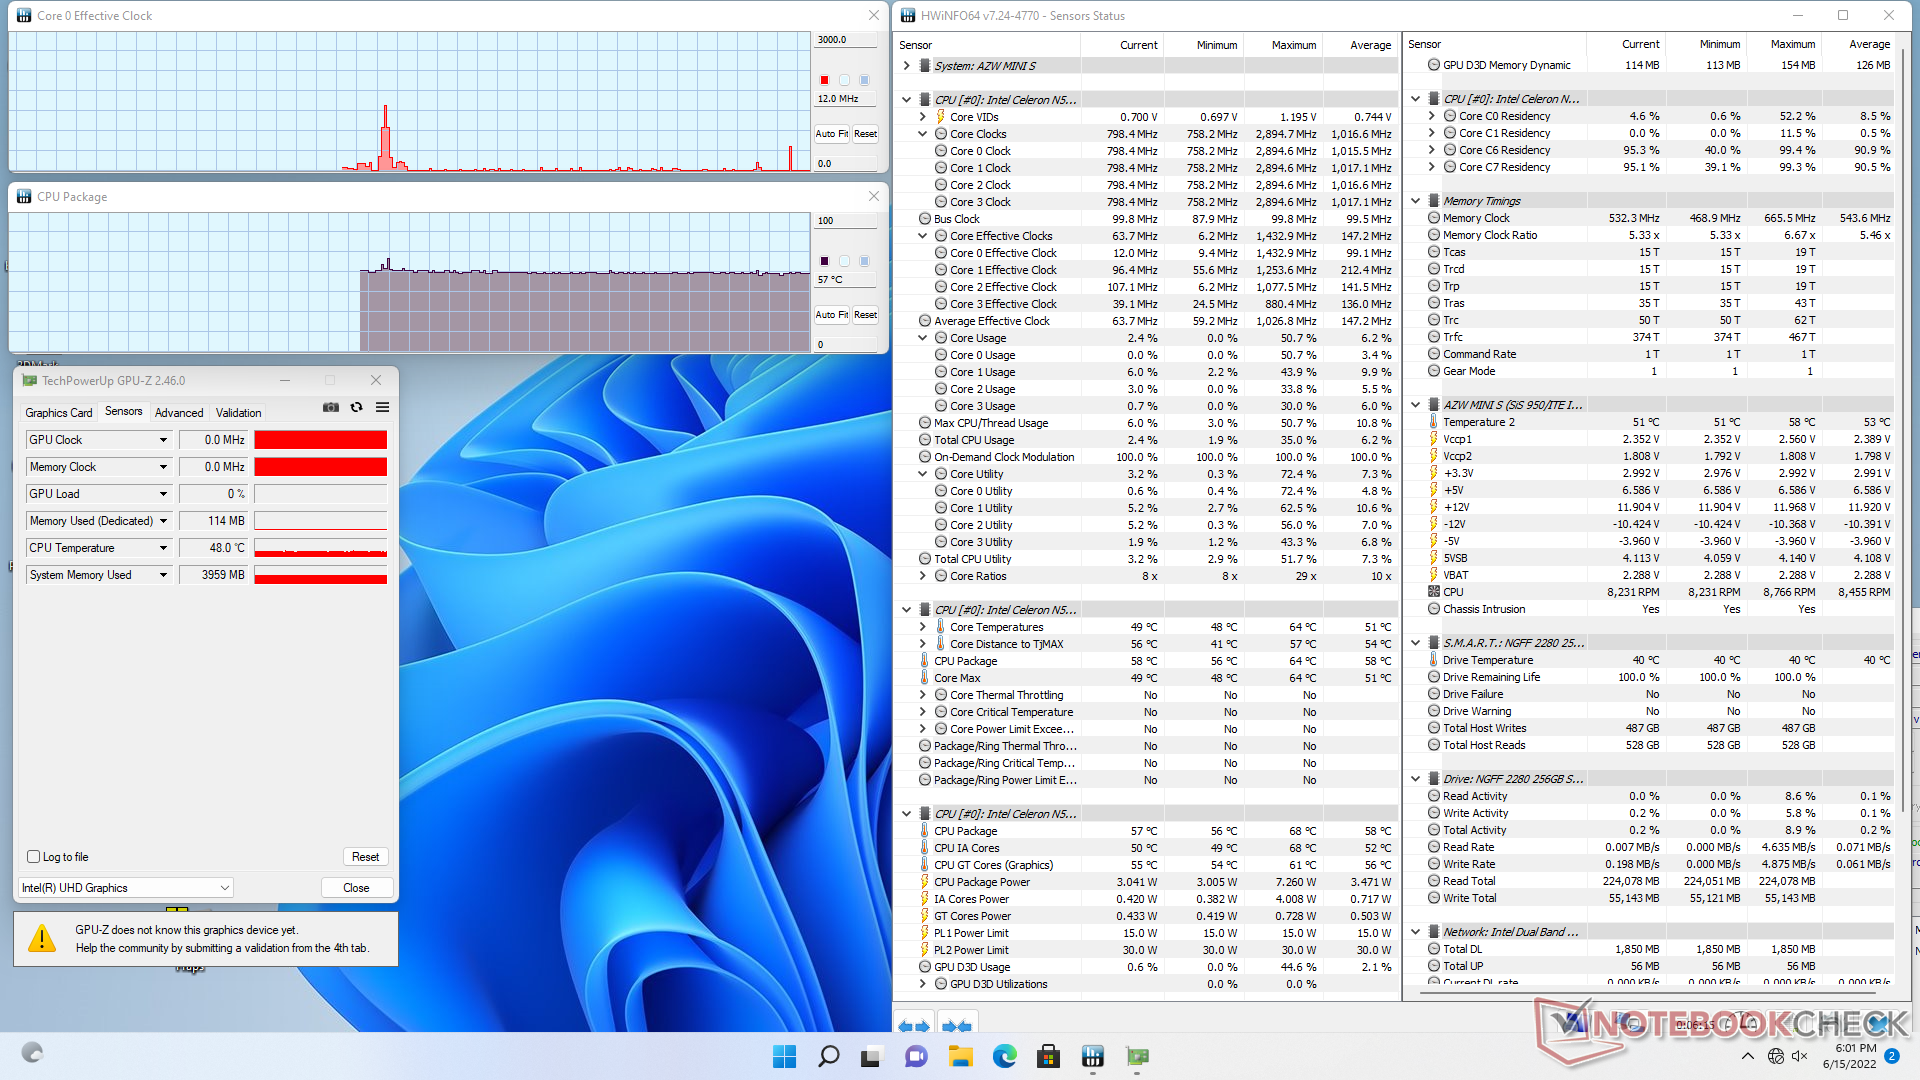
La ejecución de Prime95 hace que la velocidad de reloj de la CPU y la temperatura se disparen hasta los 2,8 GHz y los 87 C, respectivamente. La velocidad de reloj acaba bajando a 2,5 o 2,6 GHz al poco tiempo para mantener la temperatura de 87 C del núcleo. El consumo de energía de la CPU llegó a ser de 16 W durante el inicio de la prueba antes de estabilizarse en 13 W debido a las limitaciones térmicas.
| Reloj dela CPU (GHz) | Reloj de la GPU (MHz) | Temperatura media de la CPU (°C) | |
| Sistema en reposo | -- | -- | 57 |
| Prime95Stress | 2.6 | -- | 87 |
| Prime95+ FurMarkStress | 2.3 | -- | 86 |
Gestión de la energía - Muy eficiente
Consumo de energía
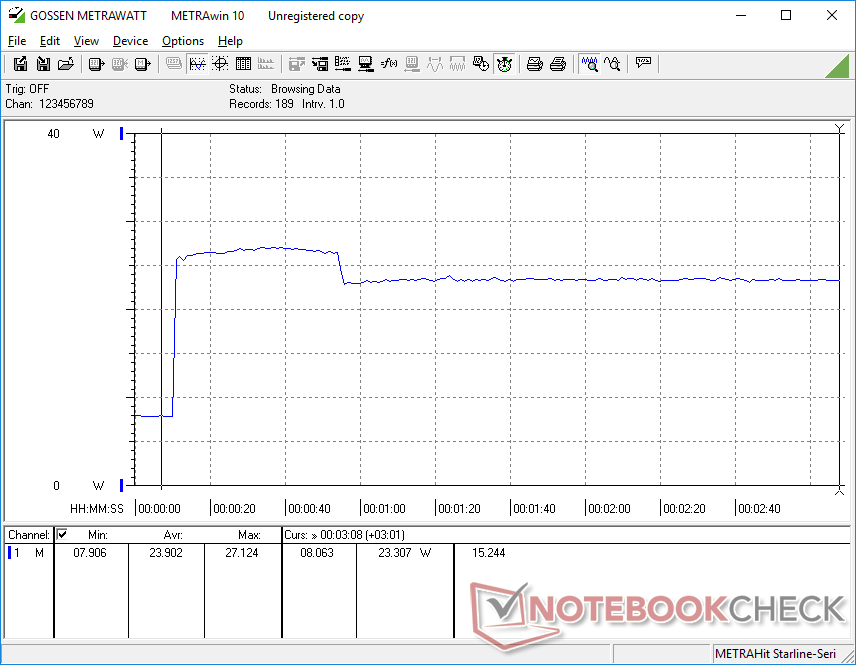
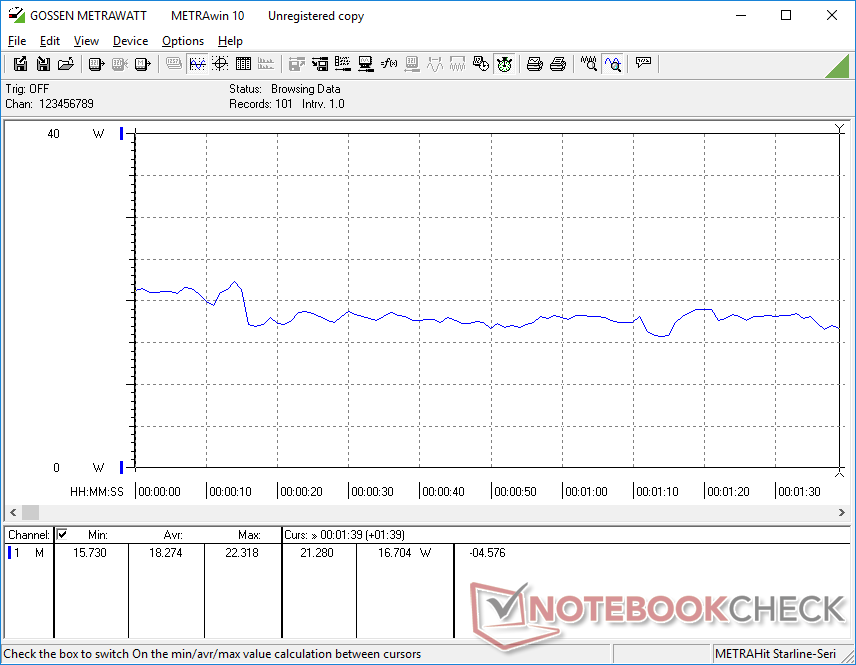
La unidad consume entre 7 y 8 W cuando está en reposo en el escritorio sin ejecutar aplicaciones, lo que es más eficiente que el Intel NUC11 con Core i5 de 11ª generación o el Core i5 de 10ª generación Zotac ZBox Nano. Cuando se ejecutan cargas más exigentes, como los juegos, el sistema sólo consume 18 W de media, en comparación con los 41 W o 33 W de los modelos de Intel y Zotac antes mencionados, respectivamente. Por supuesto, el rendimiento de la GPU es significativamente más lento en el Beelink Mini-S, por lo que se espera una menor demanda de energía.
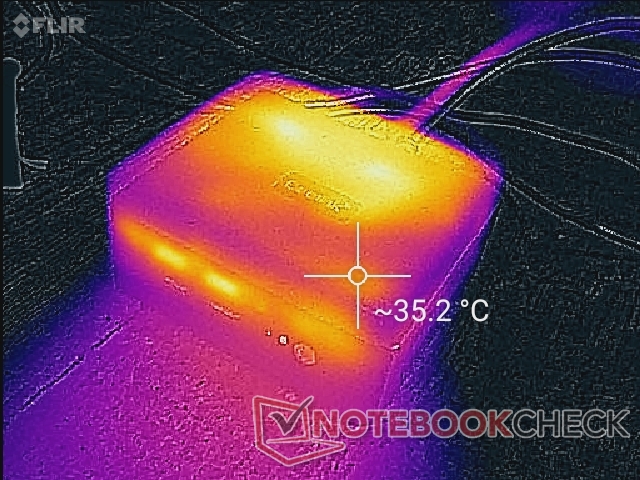
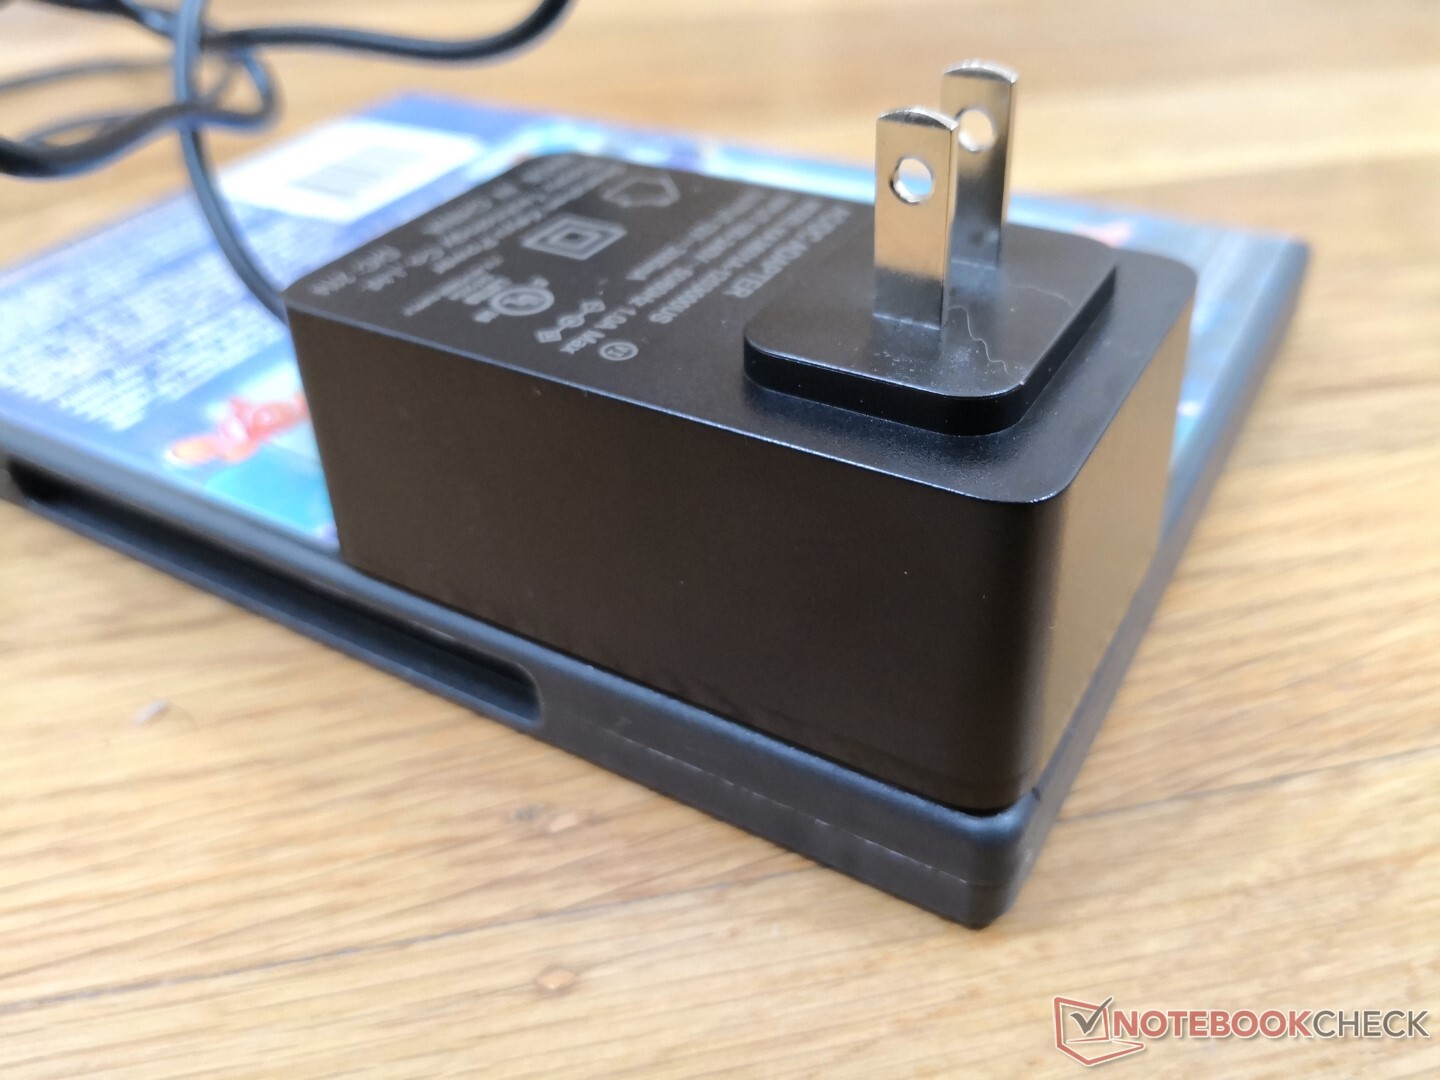
Hemos podido medir un consumo máximo de 27 W con el pequeño adaptador de CA de 36 W (~7,9 x 4,8 x 3,4 cm). Se trata del mismo adaptador que se suministra con el U59 original.
| Off / Standby | |
| Ocioso | |
| Carga |
|
Clave:
min: | |
| Beelink U59 Mini-S Celeron N5095, UHD Graphics (Jasper Lake 16 EU), Silicon Motion AZW 256G M.228 220426 C SATA 3, , x, | Beelink SEi8 i3-8109U, Iris Plus Graphics 655, Intel SSD 660p SSDPEKNW512G8, , x, | Intel NUC11TNKi5 i5-1135G7, Iris Xe G7 80EUs, Transcend M.2 SSD 430S TS512GMTS430S, , x, | Beelink U59 Celeron N5095, UHD Graphics (Jasper Lake 16 EU), Silicon Motion AZW 512G NV428, , x, | GMK NucBox 3 Celeron J4125, UHD Graphics 600, Netac S535N8/256GYN, , x, | Zotac ZBOX MI642 Nano i5-10210U, UHD Graphics 620, Western Digital WD Blue 3D WDBNCE5000PNC, , x, | |
|---|---|---|---|---|---|---|
| Power Consumption | -43% | -101% | 6% | 42% | -56% | |
| Idle Minimum * (Watt) | 7 | 7.5 -7% | 11.5 -64% | 6.7 4% | 3 57% | 8.9 -27% |
| Idle Average * (Watt) | 7 | 7.6 -9% | 12.4 -77% | 6.7 4% | 3.1 56% | 9 -29% |
| Idle Maximum * (Watt) | 7.6 | 9.2 -21% | 12.9 -70% | 7.4 3% | 3.6 53% | 9.9 -30% |
| Load Average * (Watt) | 18.3 | 41.1 -125% | 40.7 -122% | 16 13% | 11.1 39% | 33 -80% |
| Load Maximum * (Watt) | 27.1 | 41.4 -53% | 73.5 -171% | 25.6 6% | 25.4 6% | 58 -114% |
| Witcher 3 ultra * (Watt) | 43.9 | 13.1 |
* ... más pequeño es mejor
Power Consumption Witcher 3 / Stresstest
Power Consumption external Monitor
Pro
Contra
Veredicto - Para configuraciones HTPC económicas
Por poco más de 200 dólares, el Beelink U59 Mini-S es uno de los mini PC más baratos que se pueden encontrar y que viene completamente cargado con RAM, almacenamiento y Windows 11. A este bajo precio, el Mini-S puede ser una opción decente para los usuarios que no estén dispuestos a gastar cientos más en un mini PC con un Core ix más rápido y que no estén dispuestos a conformarse con dongles de medios digitales como el Chromecast, Roku o Amazon Fire TV. El Celeron N5905 no es especialmente rápido, pero sigue siendo más veloz que cualquier opción Atom del mercado para un funcionamiento relativamente más fluido y una excelente transmisión de vídeo 4K a 60 FPS.
Lo más destacado del Mini-S, además de su asequibilidad, es la opción de almacenamiento dual interno y el ruido de los ventiladores, muy silencioso.
Hay que tener en cuenta muchos recortes, sobre todo relacionados con la falta de funciones del modelo. No hay lector de tarjetas SD, USB-C, Wi-Fi 6 ni RAM de doble canal. El cable del adaptador de CA también es algo corto, de apenas un metro. Por suerte, estos contratiempos no restan demasiada importancia a la experiencia central del HTPC.
Precio y disponibilidad
El Beelink U59 Mini-S está ahora disponible en Amazon por 209 dólares tras aplicar el cupón actual o por 229 dólares a través de la web oficial de Beelink https://www.bee-link.com/catalog/product/buy?id=298.
Price comparison

