Análisis del portátil para juegos Schenker XMG Neo 15: Ryzen 6000 con puertos de refrigeración líquida
El Neo 15 basado en Intel que analizamos en julioera un portátil inusual que cuenta con una conexión para el sistema de refrigeración opcional OASIS (que se vende por separado por unos 199 euros, o US$198), que también probamos al mismo tiempo.
XMG ha lanzado un nuevo modelo Neo 15 equipado con el último procesador AMD Ryzen. El cambio a una CPU AMD también ha traído consigo algunos otros cambios en la selección de puertos y demás.
¿Qué tal funciona el Neo basado en AMD en comparación con el modelo basado en Intel? En este análisis, vamos a probar una variante con la RTX 3070 Ti ligeramente más asequible (que sigue costando 2.850 euros, o 2.826 dólares) y echaremos un vistazo a lo que los cambios de hardware significan para el rendimiento y las emisiones del portátil.
Además de comparar los Neo 15 basados en AMD e Intel, compararemos el modelo de análisis con otros portátiles para juegos con una RTX 3070 Ti, como el MSI Raider GE67, Asus ROG Strix Scar 15, Acer Nitro 5 y MSI Stealth GS66.
Posibles contendientes en la comparación
Valoración | Fecha | Modelo | Peso | Altura | Tamaño | Resolución | Precio |
|---|---|---|---|---|---|---|---|
| 88 % v7 (old) | 11/2022 | Schenker XMG Neo 15 (Ryzen 9 6900HX, RTX 3070 Ti) R9 6900HX, GeForce RTX 3070 Ti Laptop GPU | 2.3 kg | 26.6 mm | 15.60" | 2560x1440 | |
| 88.4 % v7 (old) | 07/2022 | Schenker XMG Neo 15 (i7-12700H, RTX 3080 Ti) i7-12700H, GeForce RTX 3080 Ti Laptop GPU | 2.3 kg | 26.6 mm | 15.60" | 2560x1440 | |
| 87.7 % v7 (old) | 07/2022 | MSI GE67 HX 12UGS i7-12800HX, GeForce RTX 3070 Ti Laptop GPU | 2.5 kg | 23.4 mm | 15.60" | 1920x1080 | |
| 86.3 % v7 (old) | 06/2022 | Asus ROG Strix Scar 15 G533ZW-LN106WS i9-12900H, GeForce RTX 3070 Ti Laptop GPU | 2.3 kg | 27.2 mm | 15.60" | 2560x1440 | |
| 84 % v7 (old) | 06/2022 | Acer Nitro 5 AN515-58-72QR i7-12700H, GeForce RTX 3070 Ti Laptop GPU | 2.5 kg | 26.8 mm | 15.60" | 2560x1440 | |
| 84.5 % v7 (old) | 02/2022 | MSI Stealth GS66 12UGS i7-12700H, GeForce RTX 3070 Ti Laptop GPU | 2.2 kg | 19.8 mm | 15.60" | 2560x1440 |
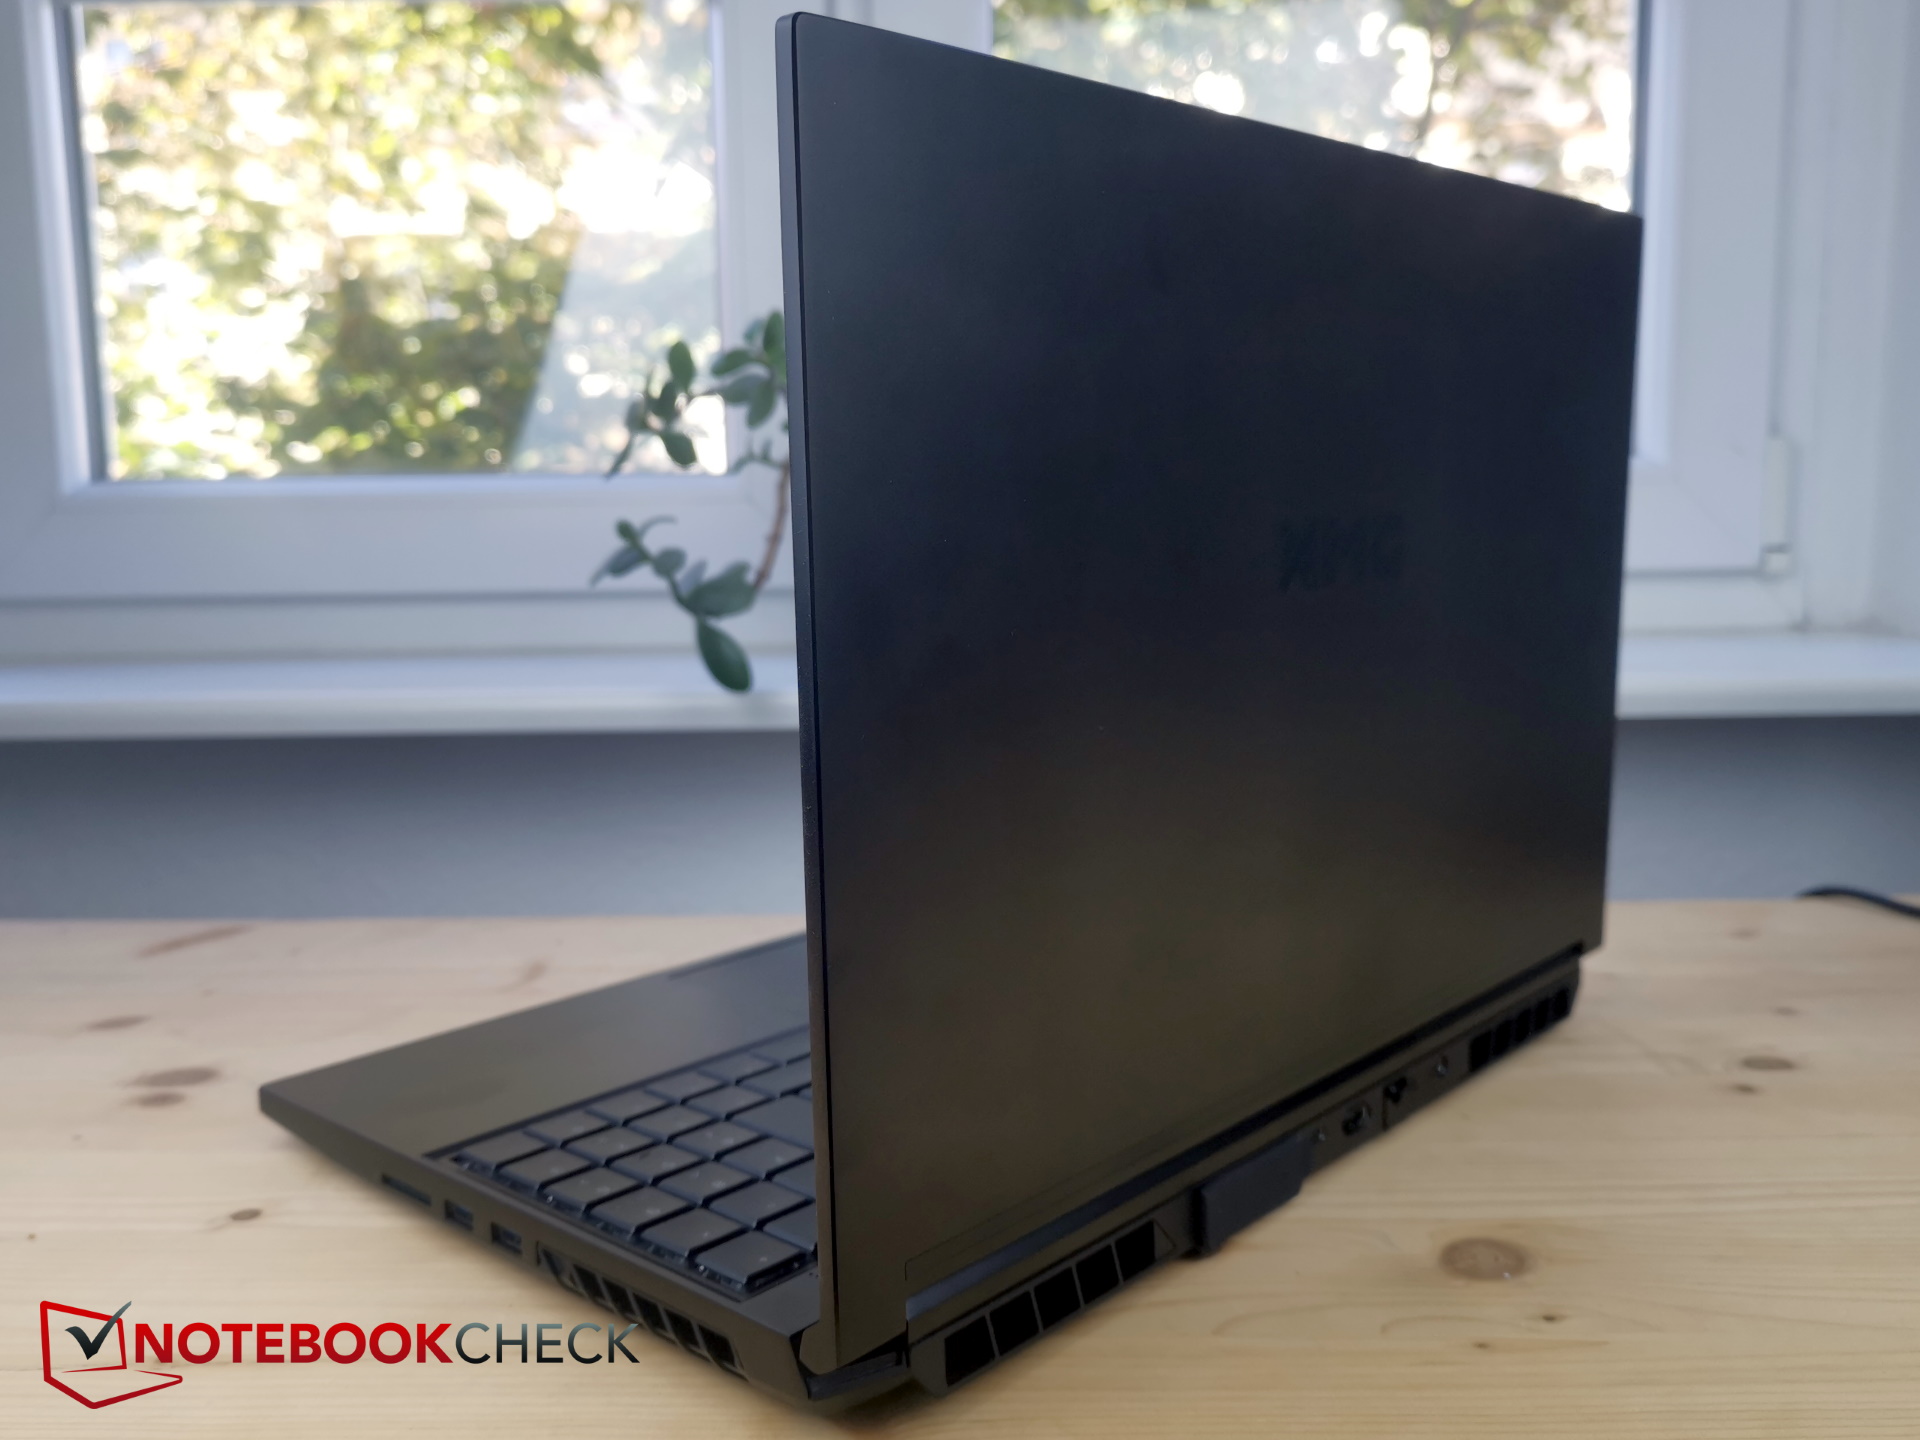
Estuche - cubierta de teclado robusta, caja inferior (excesivamente) blanda
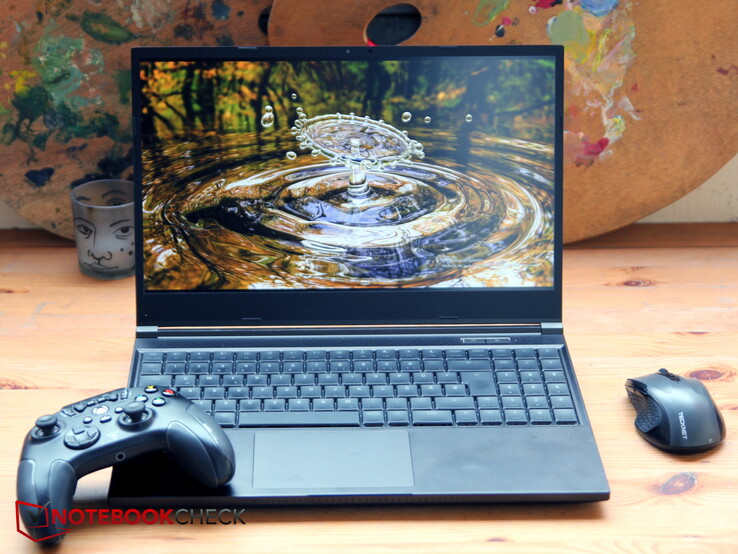
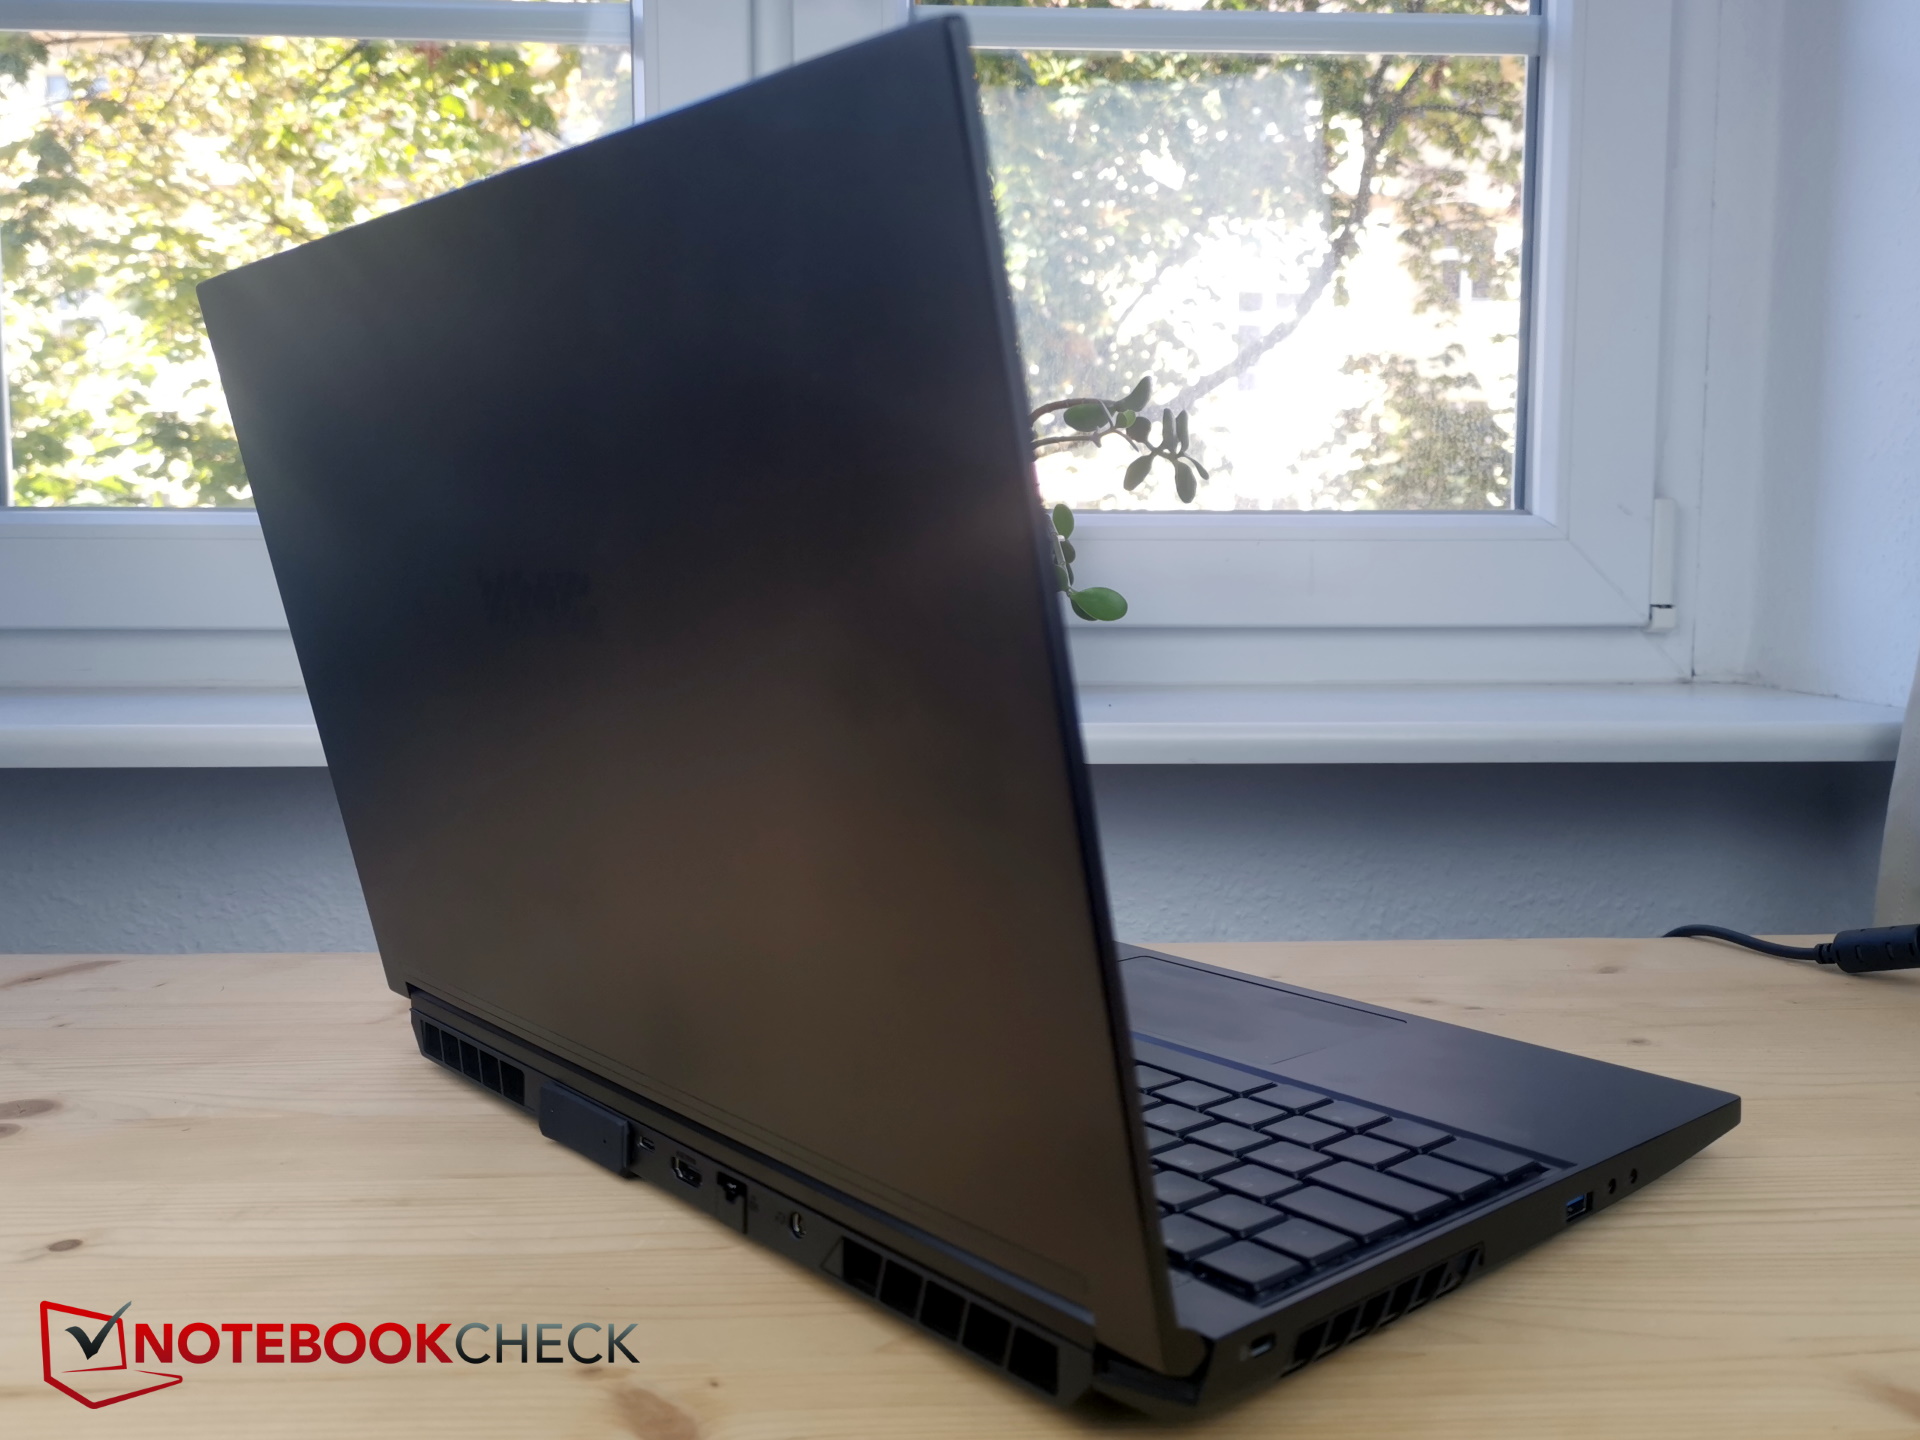
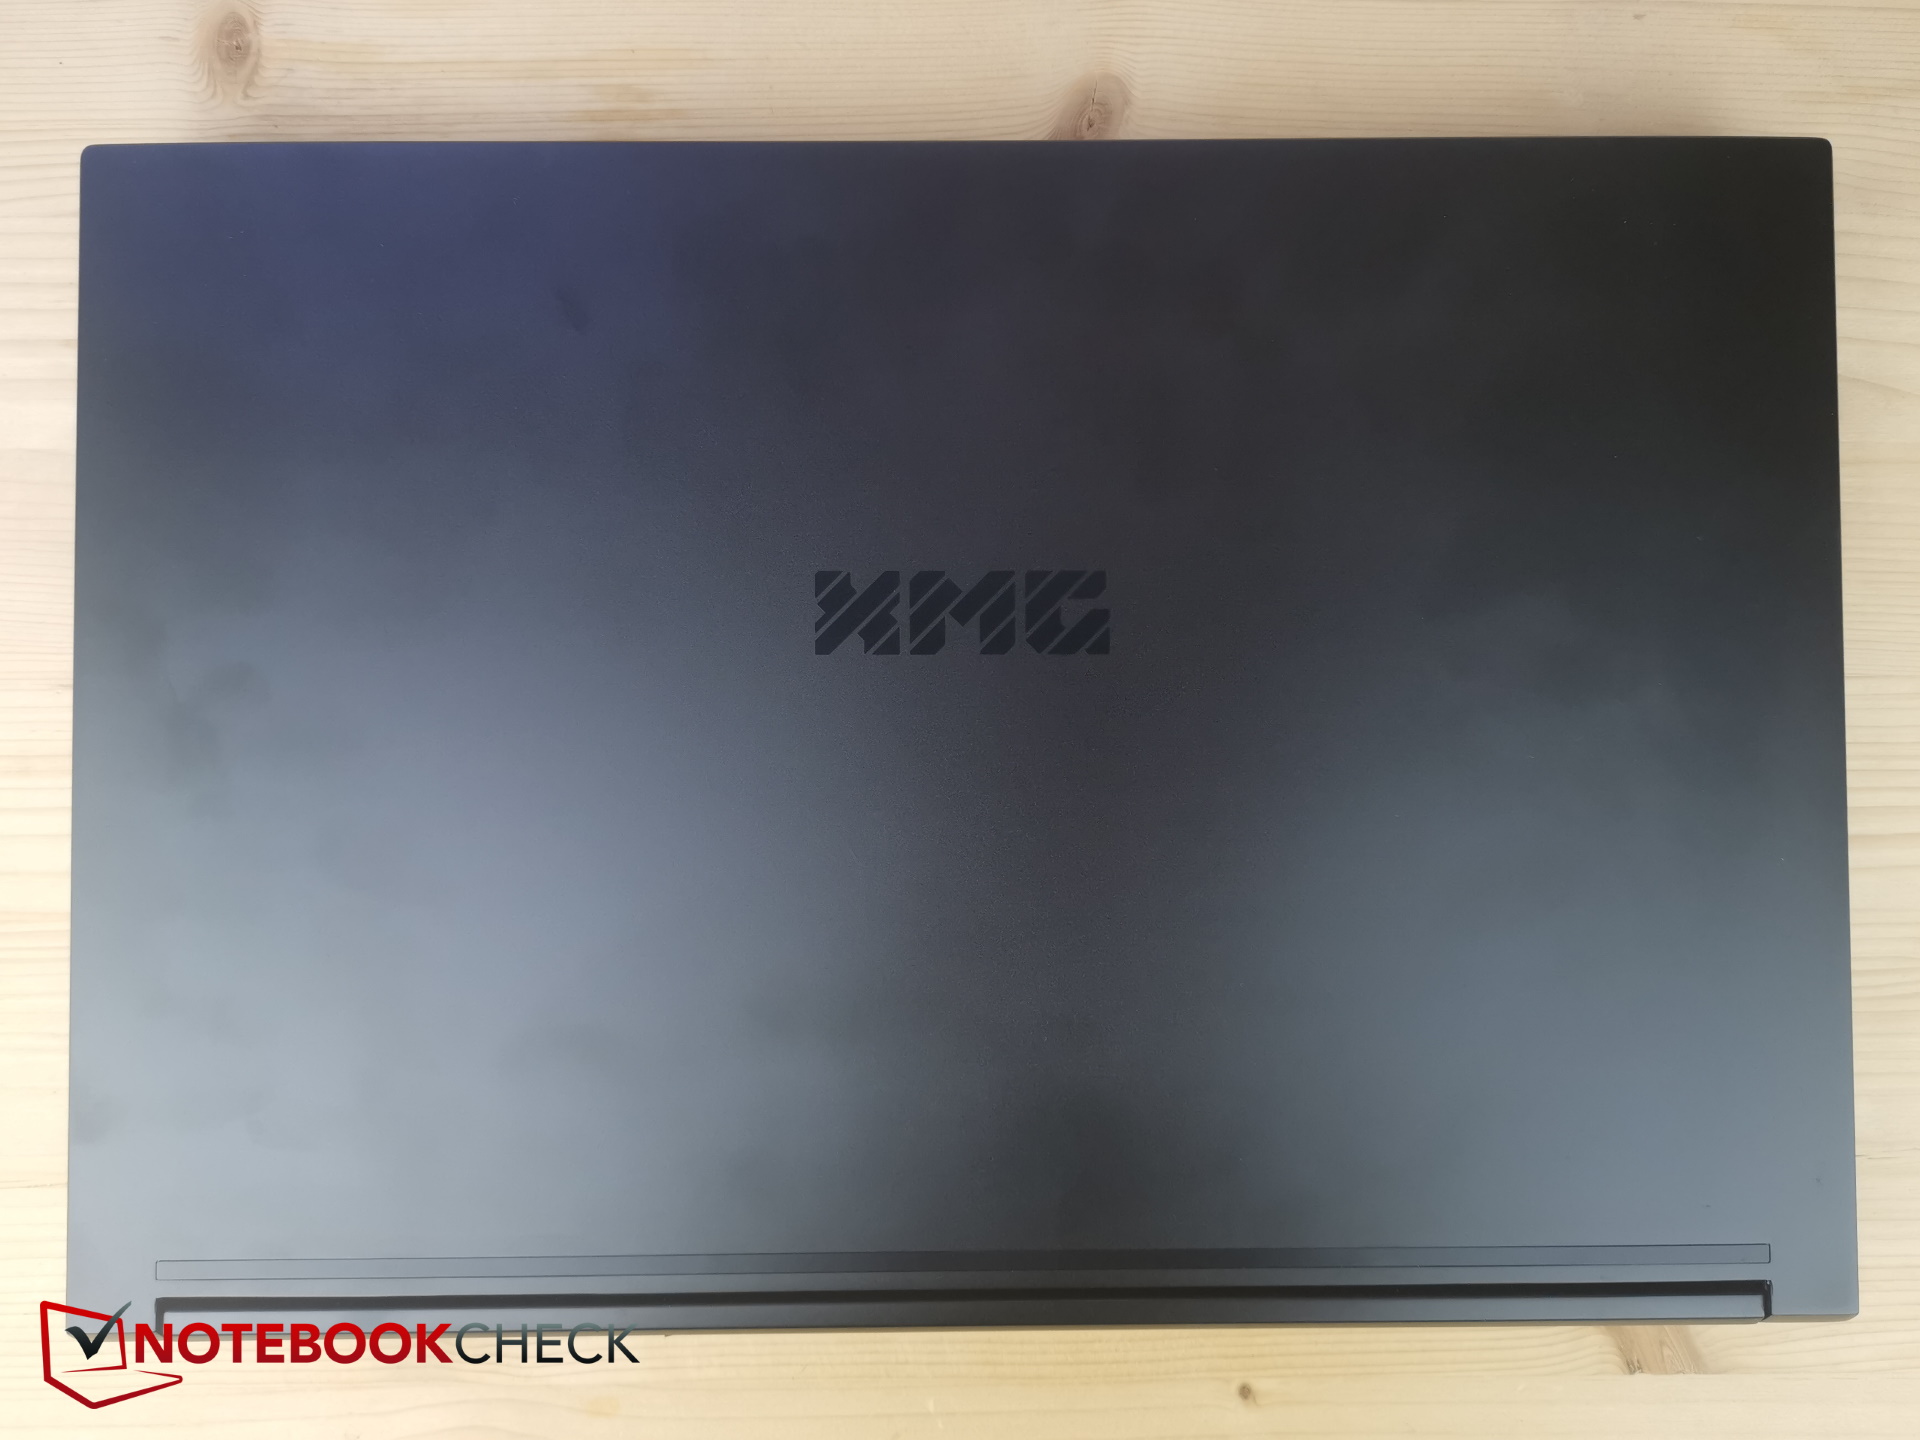
Para ser un portátil de juegos, el Neo 15 no tiene un diseño demasiado llamativo. En su mayor parte, su esquema de colores va desde un gris oscuro liso hasta el negro. La tapa de la pantalla y la sección de la base son de metal, mientras que la parte inferior y el bisel son de plástico blando. En el centro de la tapa hay un logotipo de XMG. La barra de LEDs punteada en la parte delantera confiere al dispositivo una cierta estética de juego.
Gracias al uso del metal, el Neo 15 se siente muy sólido, especialmente en la sección de la base. El portátil apenas muestra flexión y no hace ningún ruido de crujido cuando se gira o se dobla. Naturalmente, la tapa será algo menos rígida. Dicho esto, la pantalla puede soportar algunas torsiones sin verse afectada. Un inconveniente, sin embargo, es que las huellas dactilares pueden acumularse en la superficie mate.
Desgraciadamente, la carcasa inferior de plástico es tan blanda que esto puede ocurrir: si se sujeta el dispositivo en el lugar "equivocado" (es decir, la zona que rodea la rejilla de ventilación en la parte inferior derecha) utilizando sólo una mano, este punto puede ser empujado tan lejos que toque los ventiladores que giran.
Aparte de eso, el Neo 15 tiene un excelente ajuste y acabado, se siente muy compacto y robusto, y está equipado con bisagras que son lo suficientemente firmes pero no demasiado rígidas.
Con 26,6 mm de grosor, el Neo no intenta competir con el delgado Razer Blade 15. Pero parece más delgado de lo que realmente es gracias a su diseño compacto. La mayoría de los competidores tienen más o menos el mismo grosor; sólo el MSI Stealth es considerablemente más delgado.
La compacidad del portátil también se refleja en sus dimensiones: ninguno de los otros portátiles ocupa tan poco espacio como el Neo 15. En términos de peso, el Neo se encuentra en el centro del grupo de comparación. Sólo el Stealth es unos 100 g (0,22 lb) más ligero, mientras que tanto el Nitro como el MSI GE67 pesan unos 200 g (0,44 lb) más.
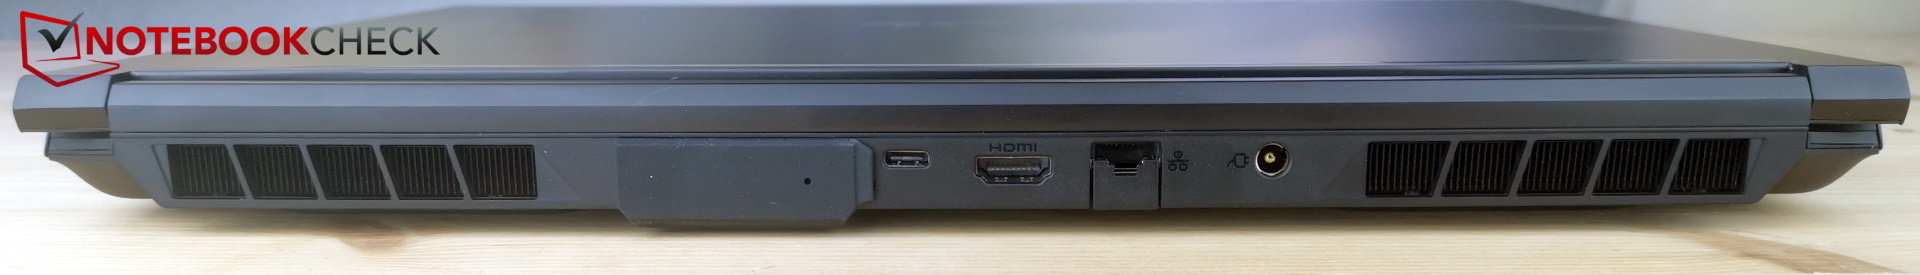
Especificaciones - Sin Thunderbolt, puerto USB-C lento
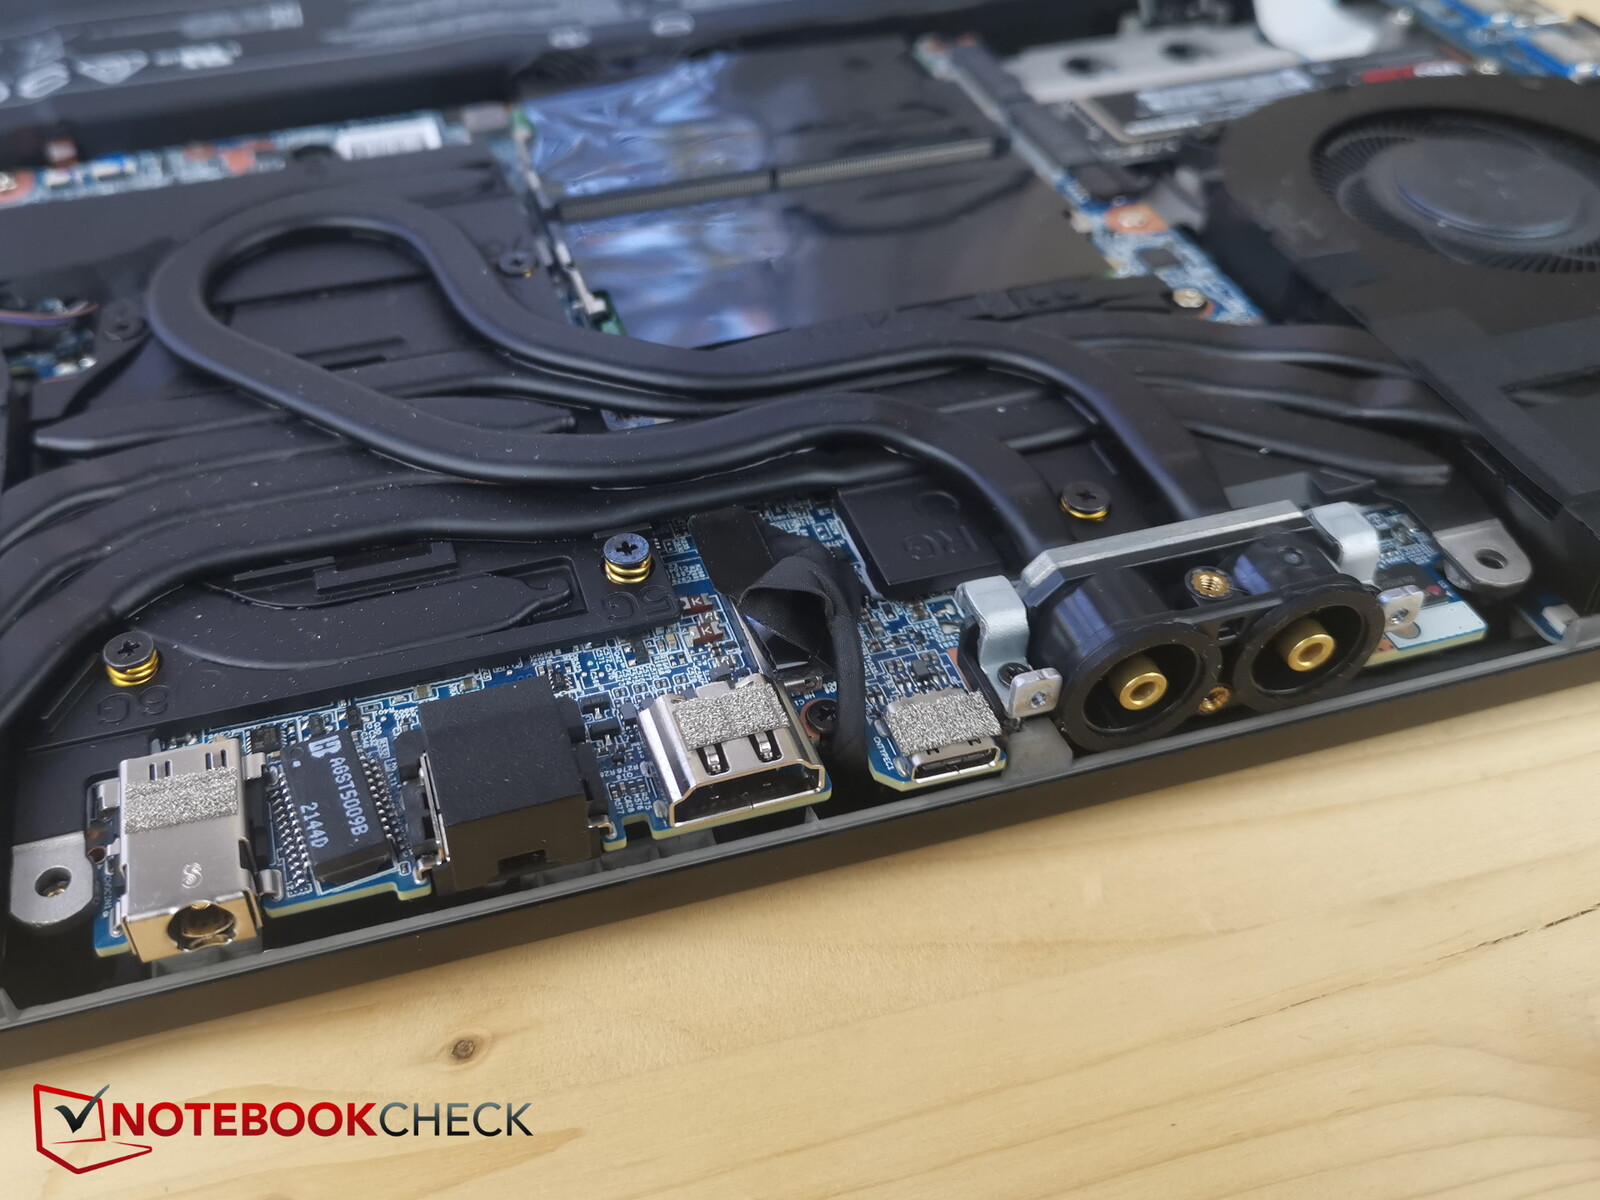
Por desgracia, el puerto USB-C del Neo 15 basado en AMD es diferente al del modelo Intel. En la versión AMD, no sólo no tienes Thunderbolt, sino que el puerto USB-C es sólo de tipo 3.2 Gen2x1 en vez de Gen2x2. Tampoco es compatible con Power Delivery.
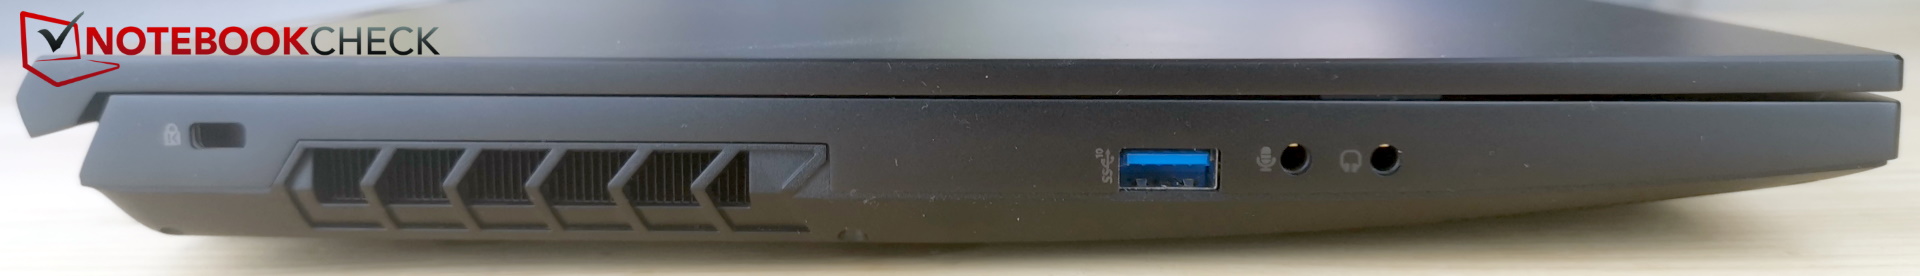
Como nota positiva, el portátil cuenta con dos tomas de audio separadas (micrófono + auriculares), y los puertos están bien dispuestos a la izquierda, la derecha y la parte trasera. La conexión de agua para XMG OASIS también se encuentra en la parte trasera.
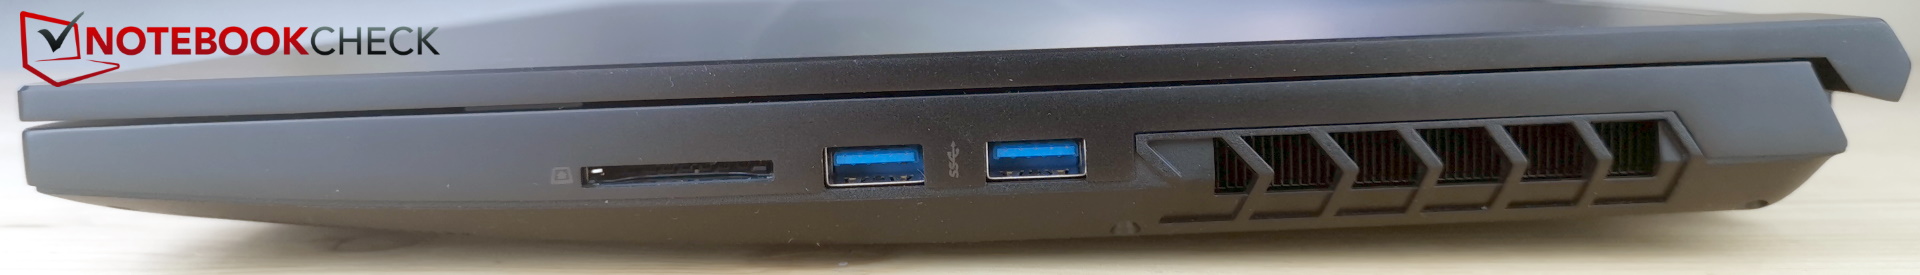
Lector de tarjetas SD
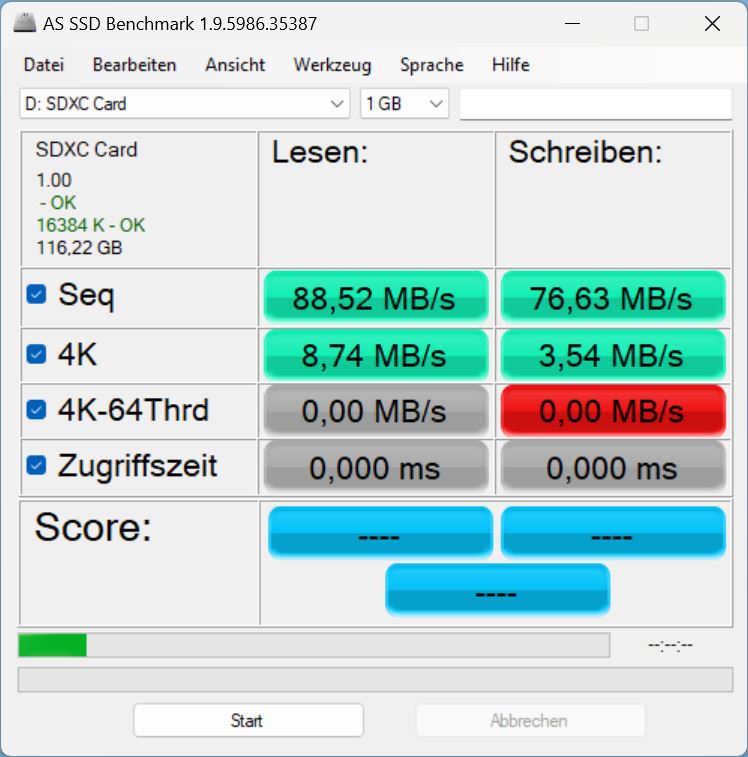
El lector de tarjetas acepta tarjetas SD normales. Cuando se inserta una tarjeta SD, alrededor de la mitad de la tarjeta sobresale de la ranura porque no tiene un mecanismo de bloqueo.
Las velocidades de transferencia del lector de tarjetas están más o menos en el extremo inferior del espectro.
| SD Card Reader | |
| average JPG Copy Test (av. of 3 runs) | |
| Media de la clase Gaming (20.9 - 210, n=54, últimos 2 años) | |
| Schenker XMG Neo 15 (i7-12700H, RTX 3080 Ti) | |
| MSI GE67 HX 12UGS (Toshiba Exceria Pro SDXC 64 GB UHS-II) | |
| Schenker XMG Neo 15 (Ryzen 9 6900HX, RTX 3070 Ti) | |
| maximum AS SSD Seq Read Test (1GB) | |
| Media de la clase Gaming (25.5 - 261, n=51, últimos 2 años) | |
| Schenker XMG Neo 15 (Ryzen 9 6900HX, RTX 3070 Ti) | |
| Schenker XMG Neo 15 (i7-12700H, RTX 3080 Ti) | |
| MSI GE67 HX 12UGS (Toshiba Exceria Pro SDXC 64 GB UHS-II) | |
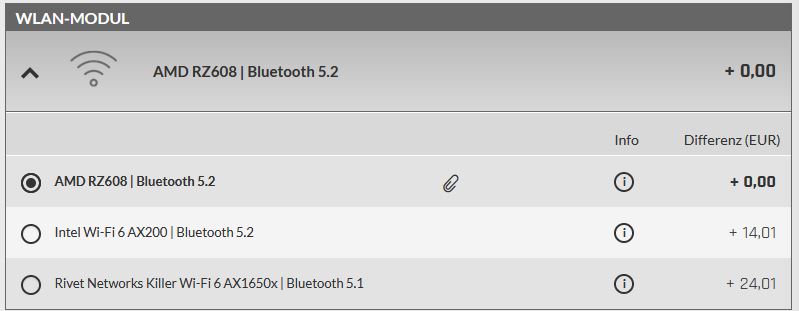
Conectividad
El Neo viene con un módulo inalámbrico Intel AX200. Aunque esta tarjeta inalámbrica es compatible con Wi-Fi 6, todavía no funciona con la banda de frecuencia de 6 GHz. Ofrece tasas de transferencia buenas y estables, pero los otros módulos Wi-Fi de la comparación son marginalmente más rápidos.
Cámara web
Lo bueno: el Neo 15 está equipado con una cámara web Full HD. Lo no tan bueno: la calidad de imagen es peor que la de algunos modelos de 720p (véase la foto de abajo).


 GeForce RTX 3070 Ti Laptop GPU, R9 6900HX, Samsung SSD 980 Pro 1TB MZ-V8P1T0BW")
 GeForce RTX 3070 Ti Laptop GPU, R9 6900HX, Samsung SSD 980 Pro 1TB MZ-V8P1T0BW")
Seguridad
No hay sensor de huellas dactilares en el Neo 15, pero sí hay TPM 2.0 y una ranura Kensington.
Accesorios y garantía
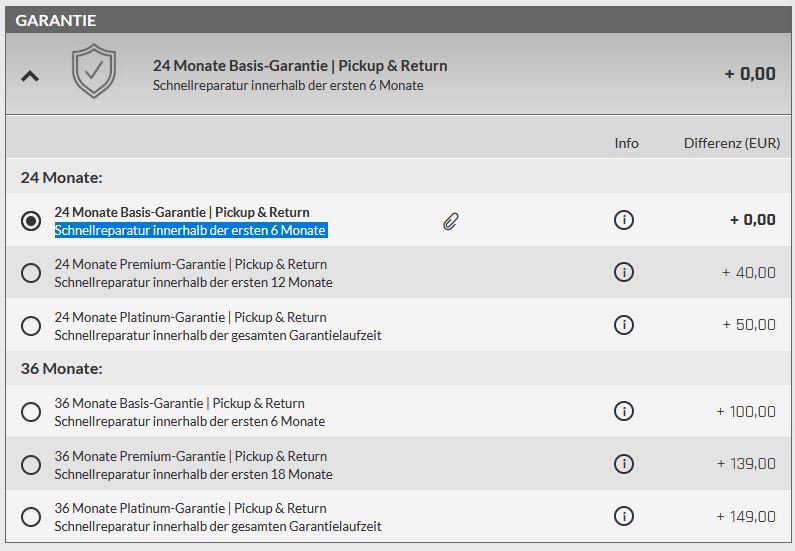
A diferencia de muchos otros fabricantes, Schenker es conocido por no escatimar en accesorios. Por ejemplo, en la caja se incluye una gran alfombrilla de ratón y una unidad flash USB con los controladores.
La empresa ofrece una garantía de 24 meses que incluye servicio de recogida y devolución, así como una rápida reparación durante los seis primeros meses de la compra.
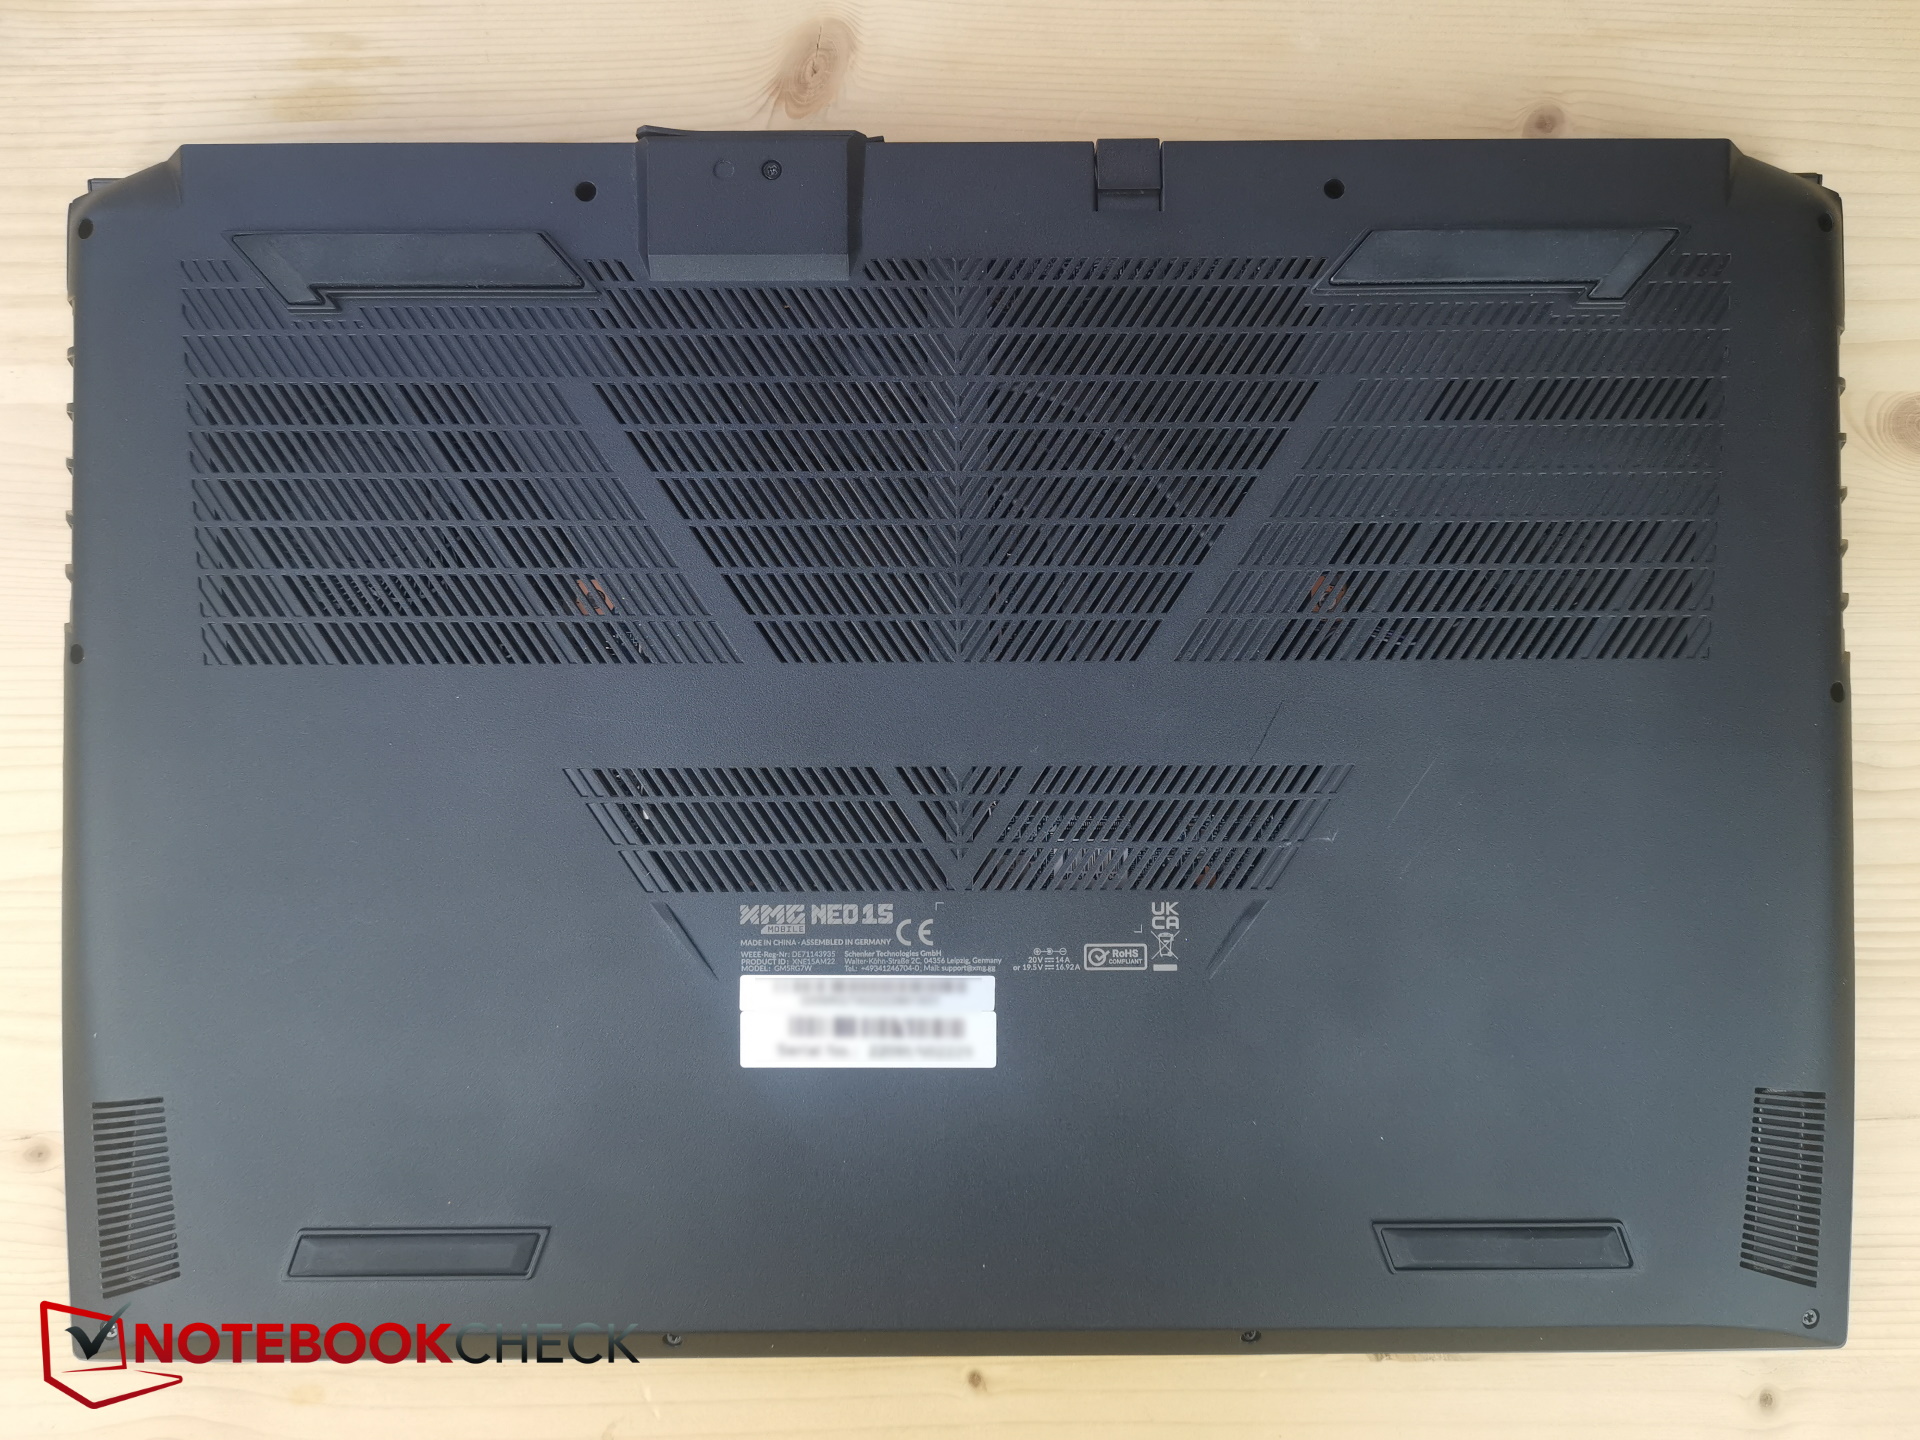
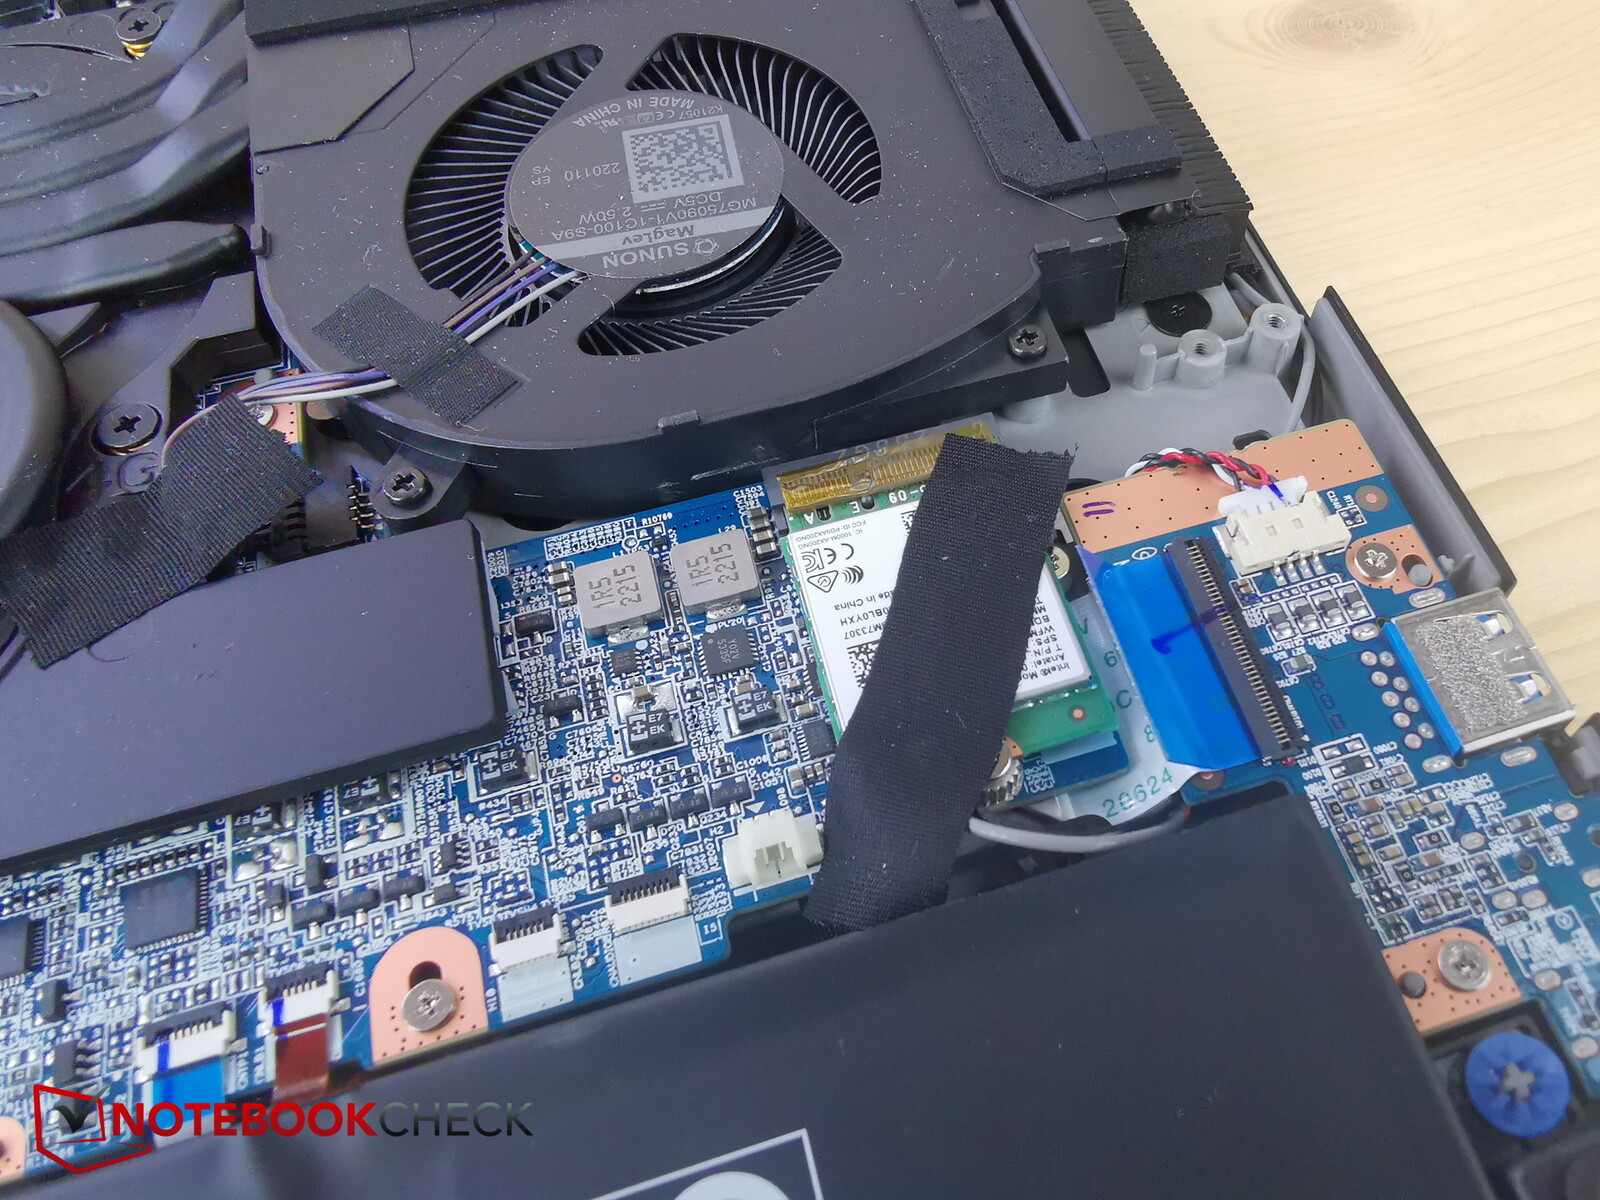
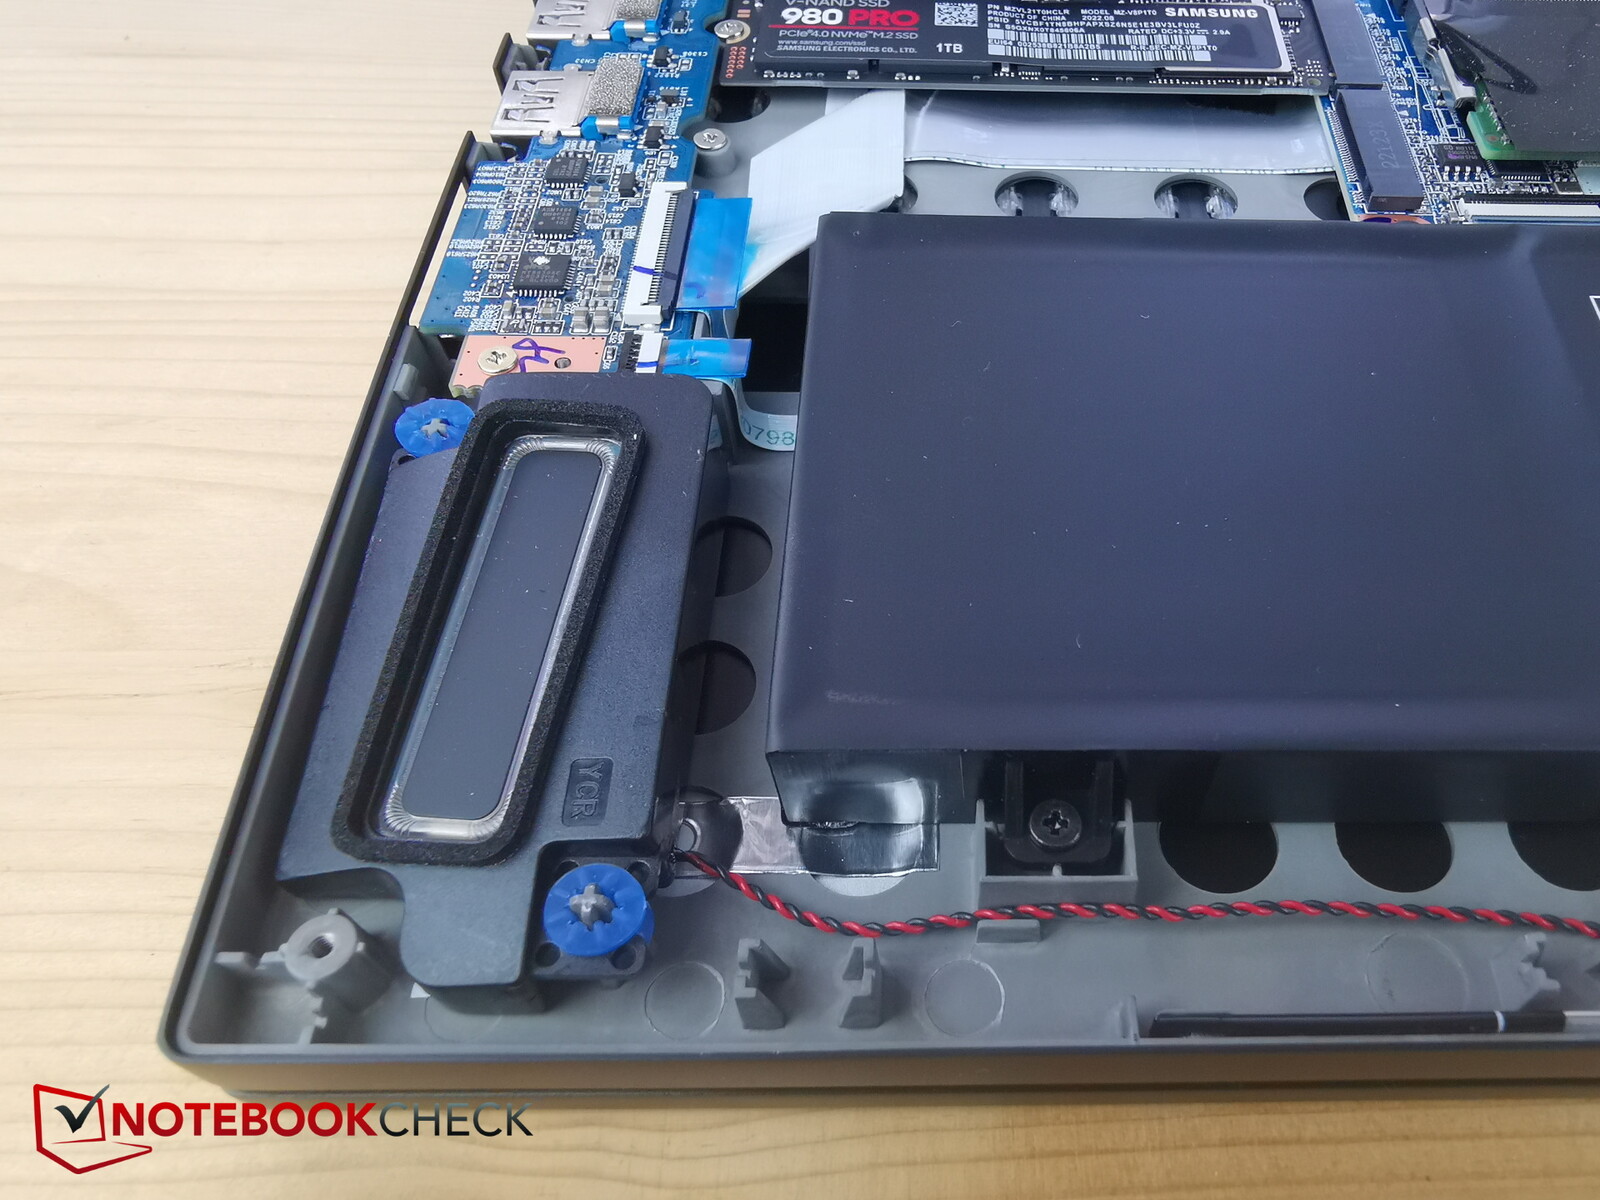
Mantenimiento
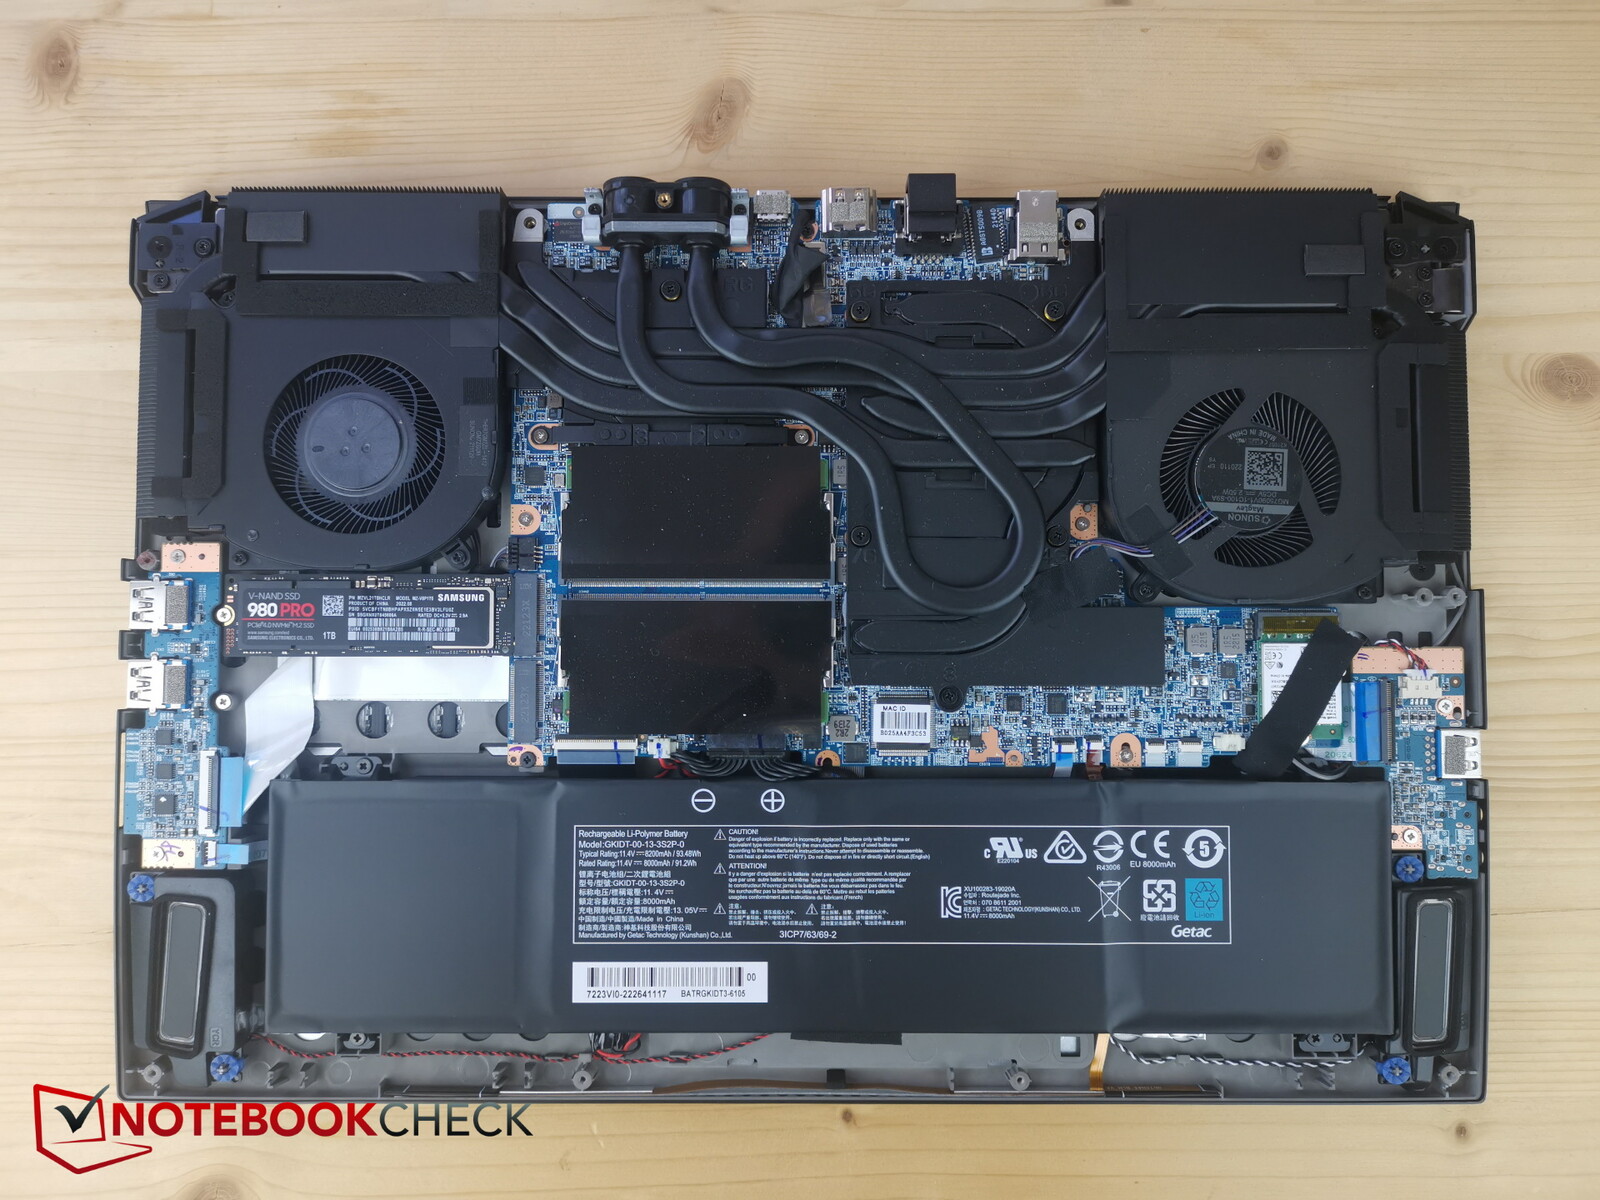
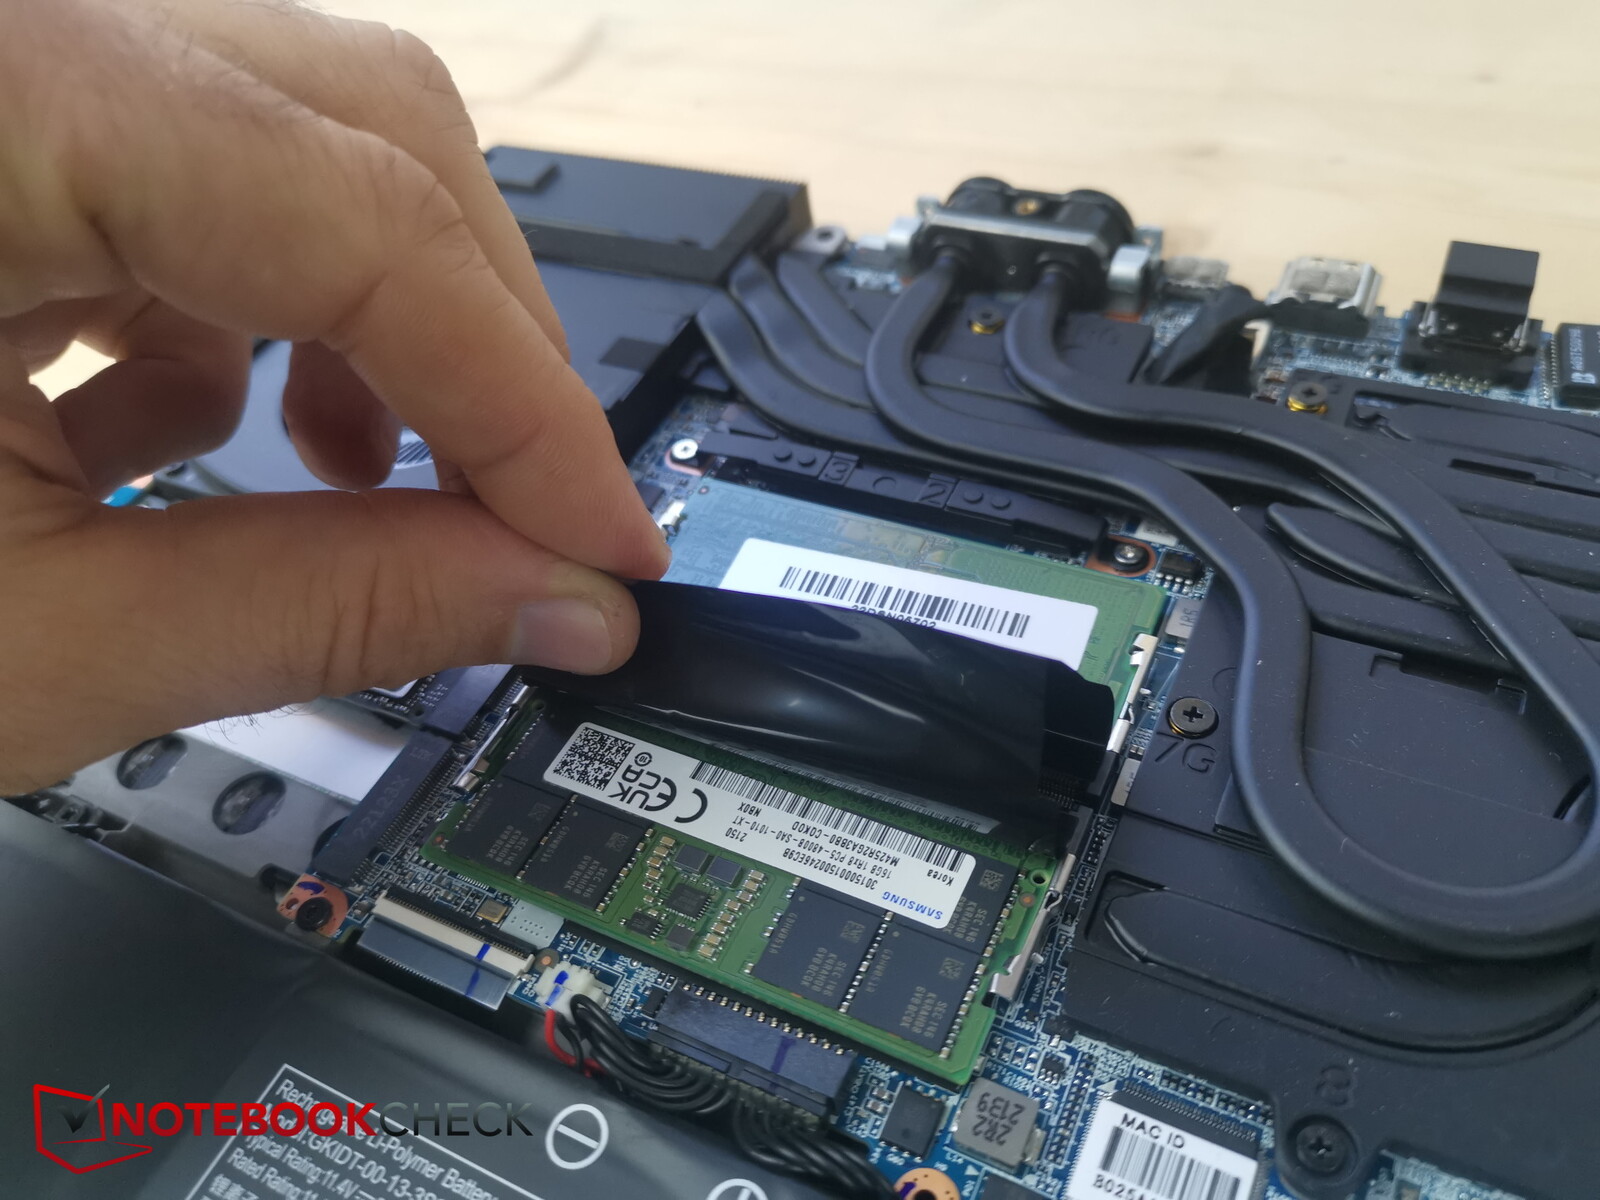
El fondo de plástico está asegurado en su lugar por un total de 14 tornillos de cabeza Phillips, cuatro de los cuales están en los puertos de refrigeración líquida. Es muy fácil levantar el panel inferior cuando se empieza por la parte trasera. Una vez abierto el chasis del portátil, tendrás acceso a las dos ranuras M.2 SSD, los ventiladores, la batería, el módulo Wi-Fi y las dos ranuras RAM.
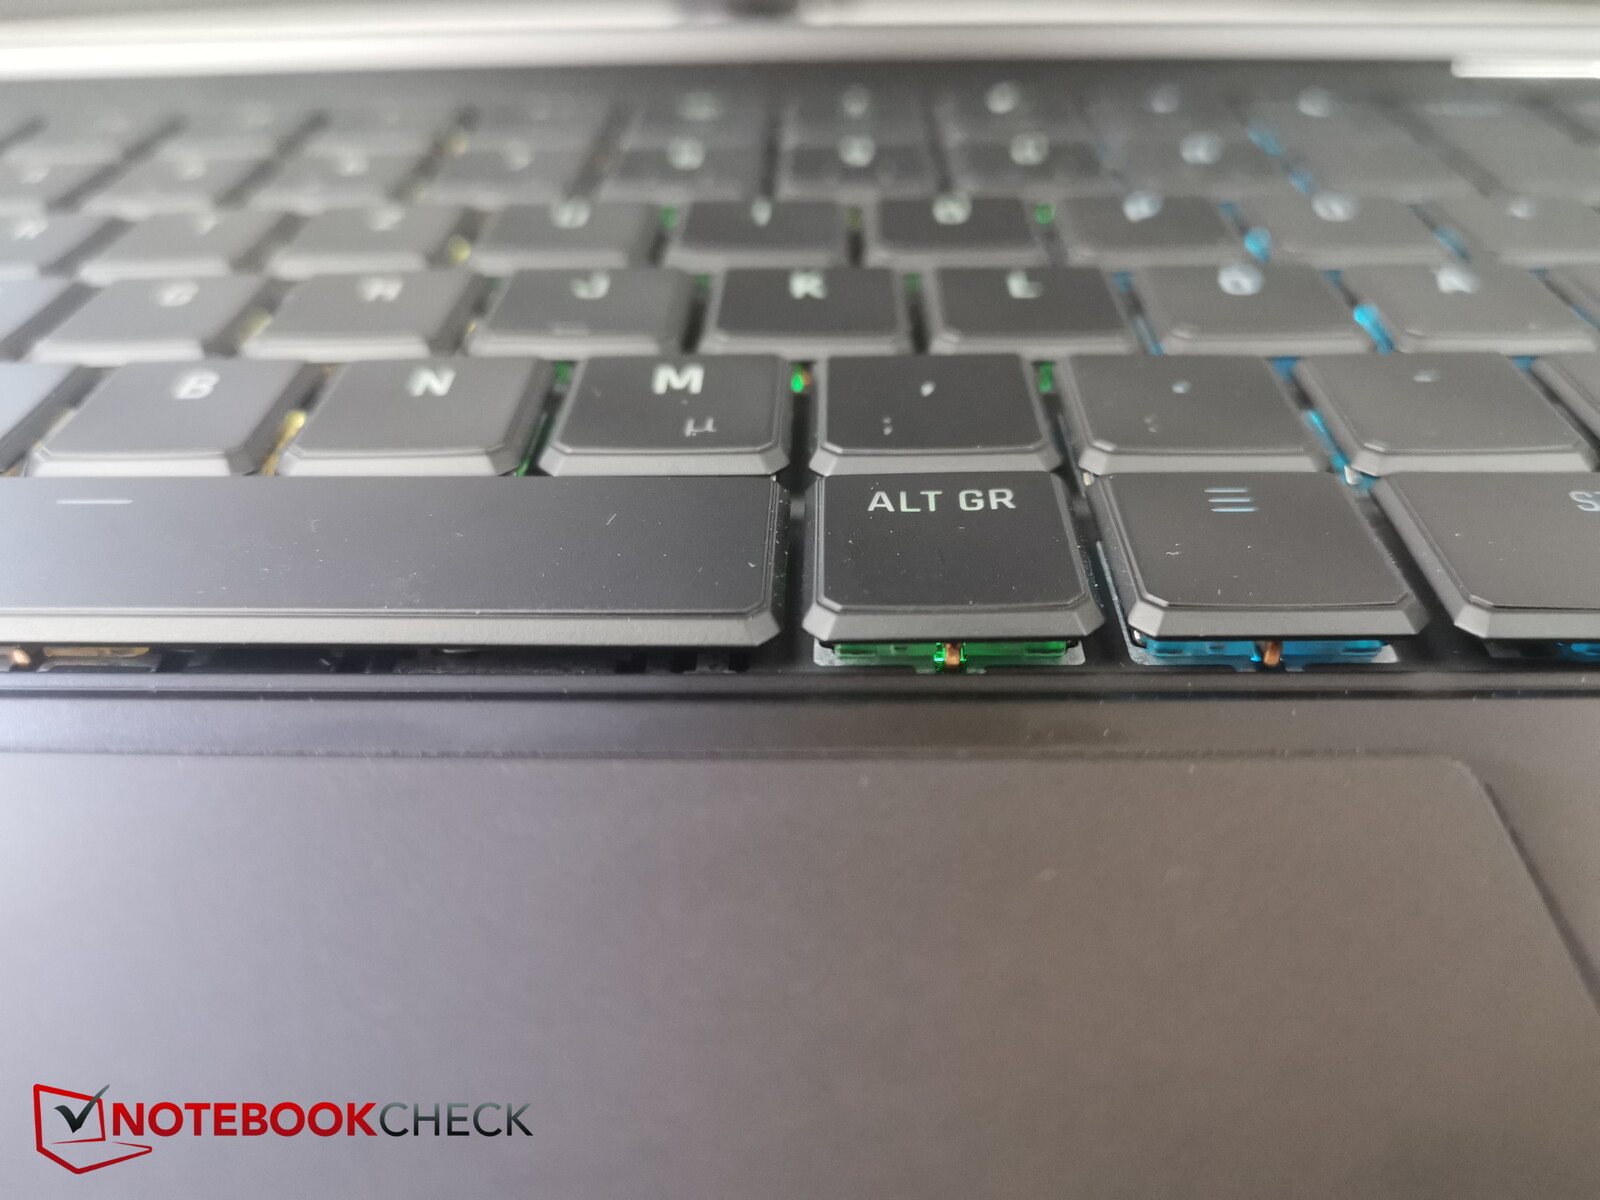
Dispositivos de entrada - Interruptores opto-mecánicos
Teclado
El teclado opto-mecánico ocupa casi todo el ancho del portátil de 15 pulgadas. Es lo suficientemente grande como para albergar teclas de tamaño completo e incluso un teclado numérico del mismo tamaño junto a ellas. No hay mucho espacio entre las teclas, pero esto no es un problema teniendo en cuenta lo grandes que son.
El teclado tiene una disposición muy ordenada: todo cabe dentro de un rectángulo sin muescas ni nada parecido. Por un lado, esto significa que ninguna de las teclas sobresale o está aislada de otras, y el usuario sólo tiene que confiar en las leyendas y en su propia experiencia para navegar por el teclado. Por otro lado, todo está en su sitio.
El teclado del Neo también es bastante cómodo para escribir gracias a su moderado recorrido de las teclas y a su clara respuesta, lo que permite escribir rápidamente. El sonido de la escritura es un poco "ruidoso", pero no es demasiado malo. El portátil también cuenta con iluminación RGB por tecla para su uso en entornos oscuros.

Teclado táctil
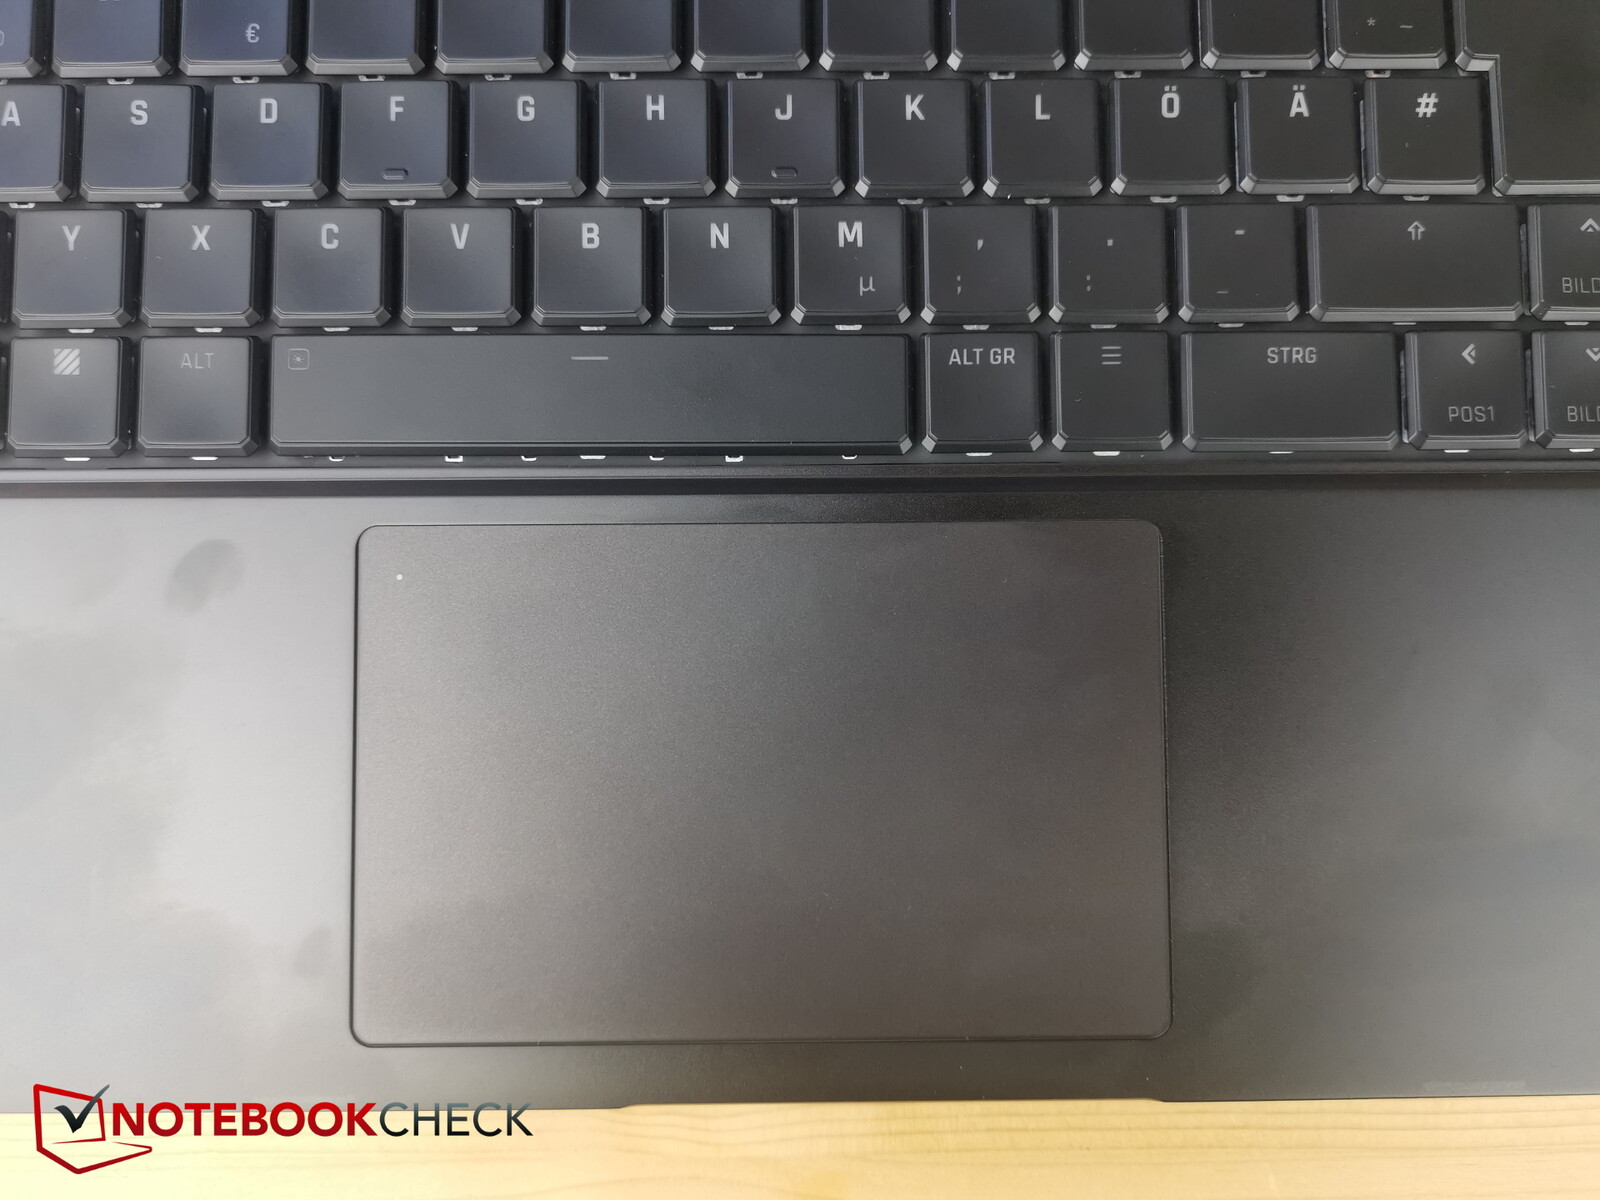
El panel táctil tiene un buen tamaño (aprox. 11,6 x 7,4 cm, o 4,6 x 2,9") y tiene una superficie lisa, lo que significa que no experimentarás tartamudeo incluso al deslizar el dedo lentamente por el panel táctil. Hay un pequeño LED en la esquina superior izquierda que indica si el touchpad está activado o no.
Los botones de clic integrados son ligeramente más rígidos de lo que nos parecería cómodo, pero proporcionan una respuesta distintiva y un claro sonido de clic.
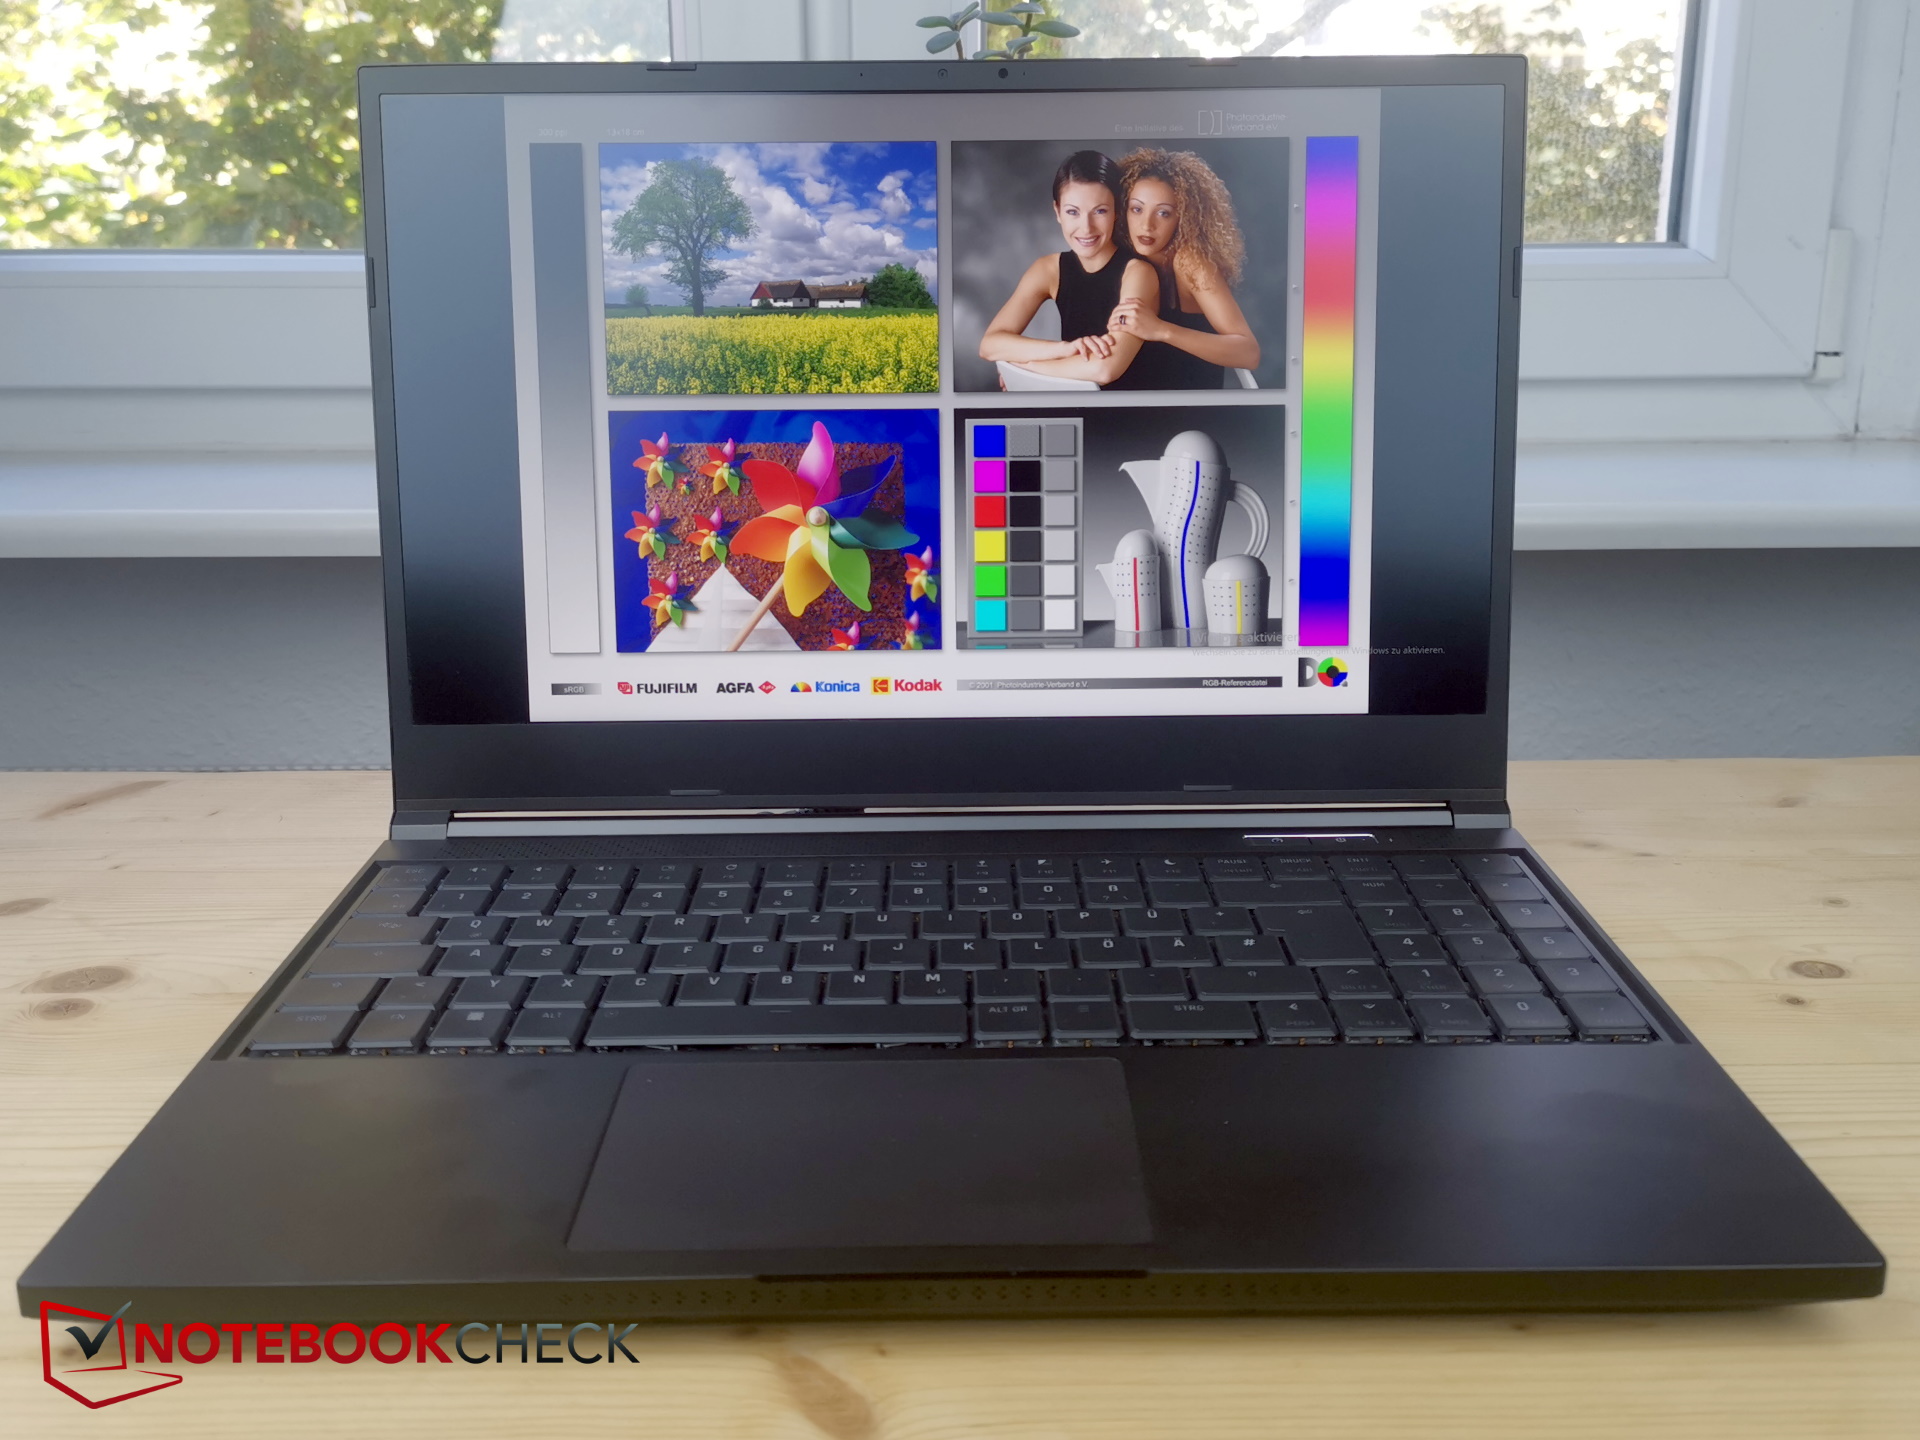
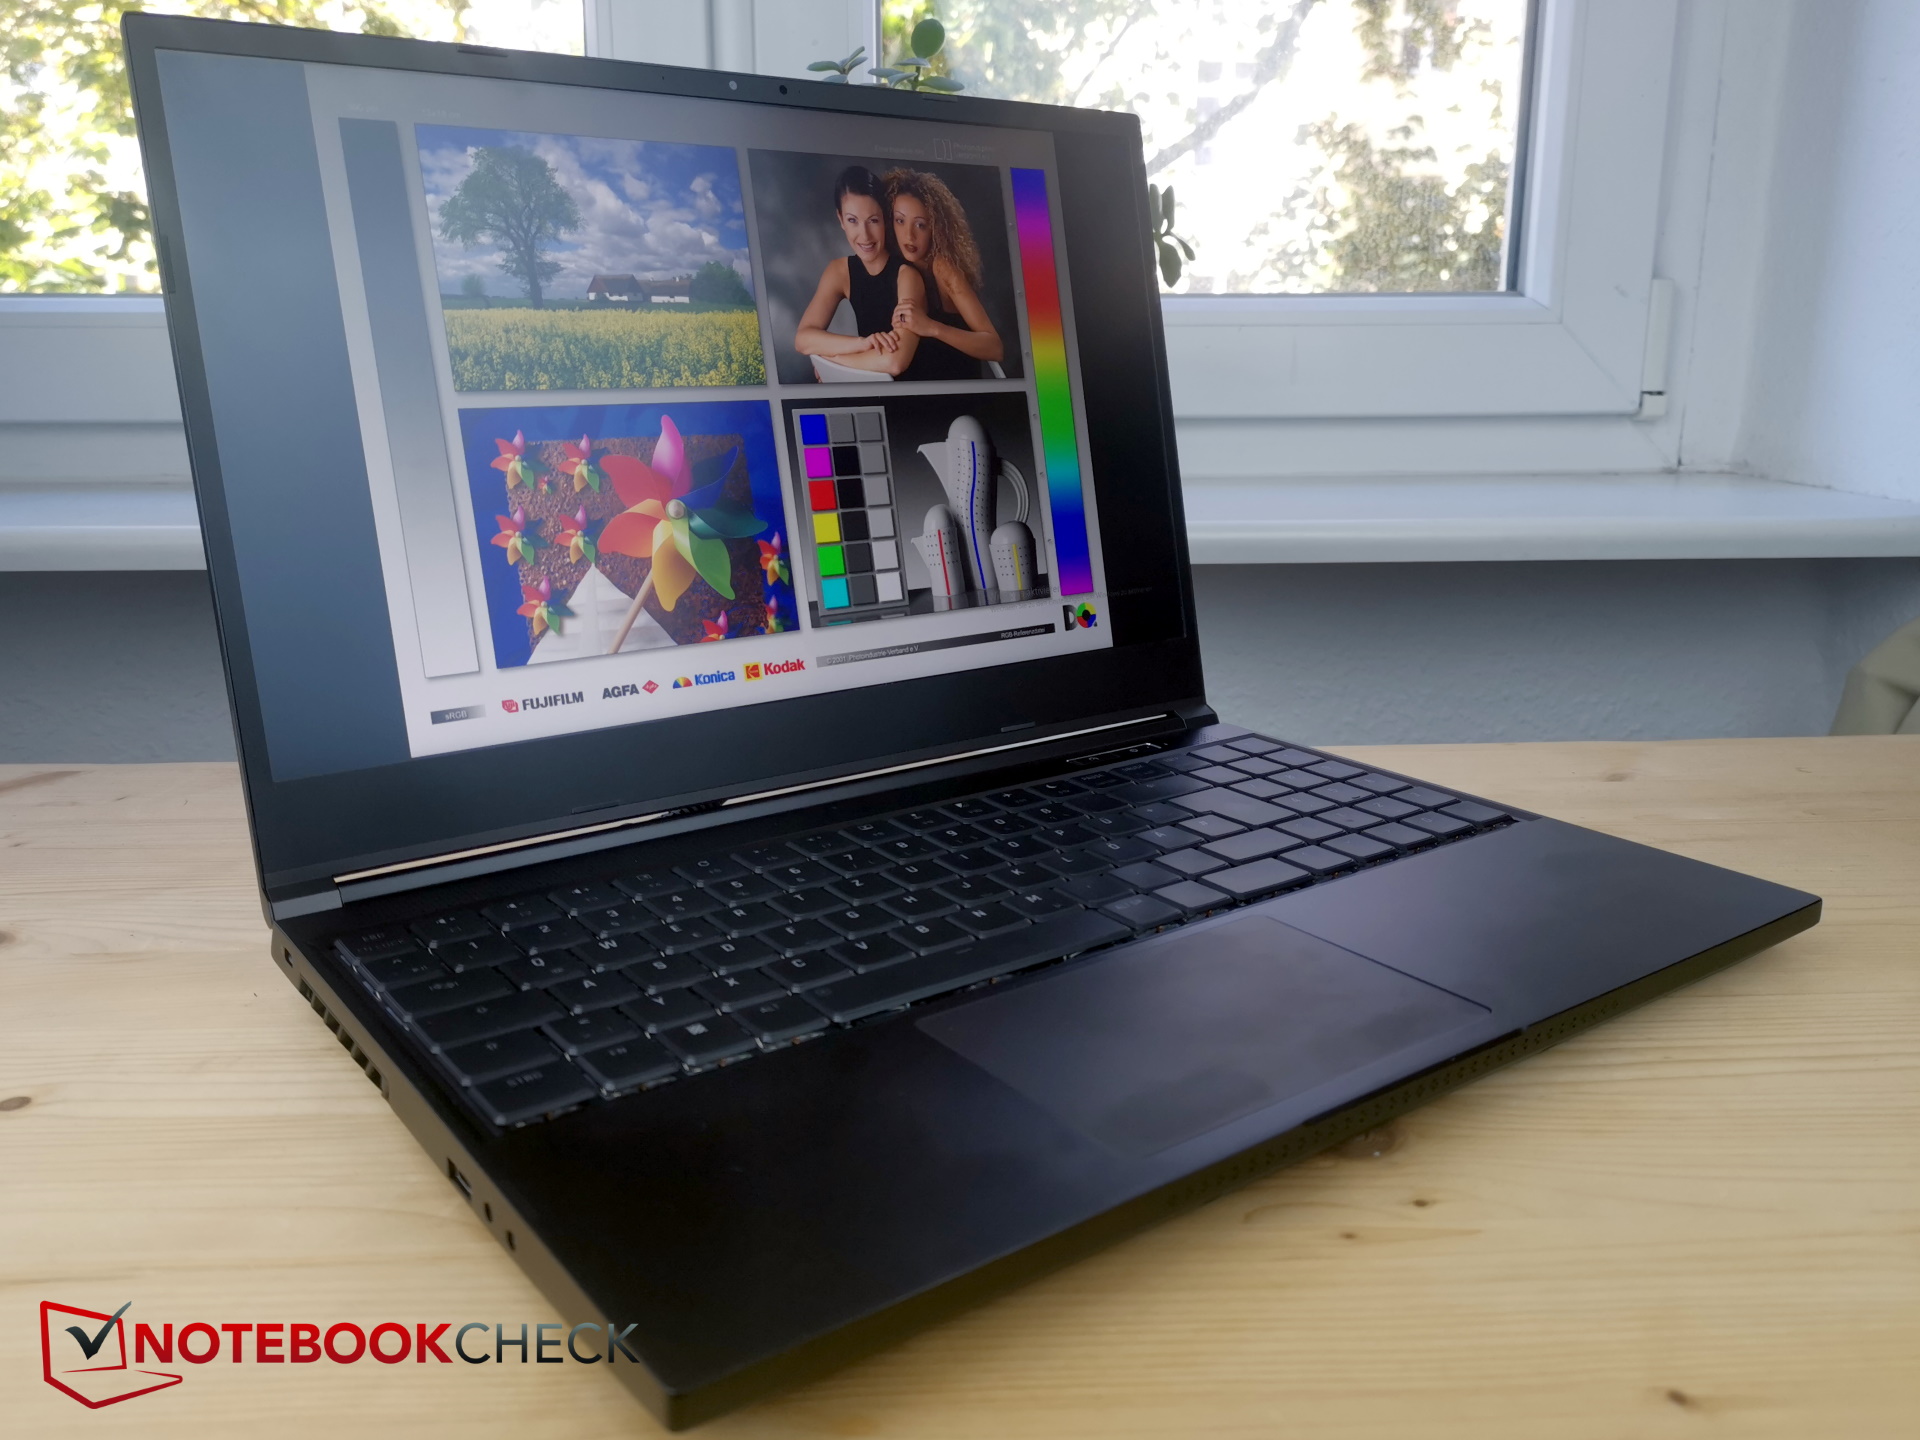
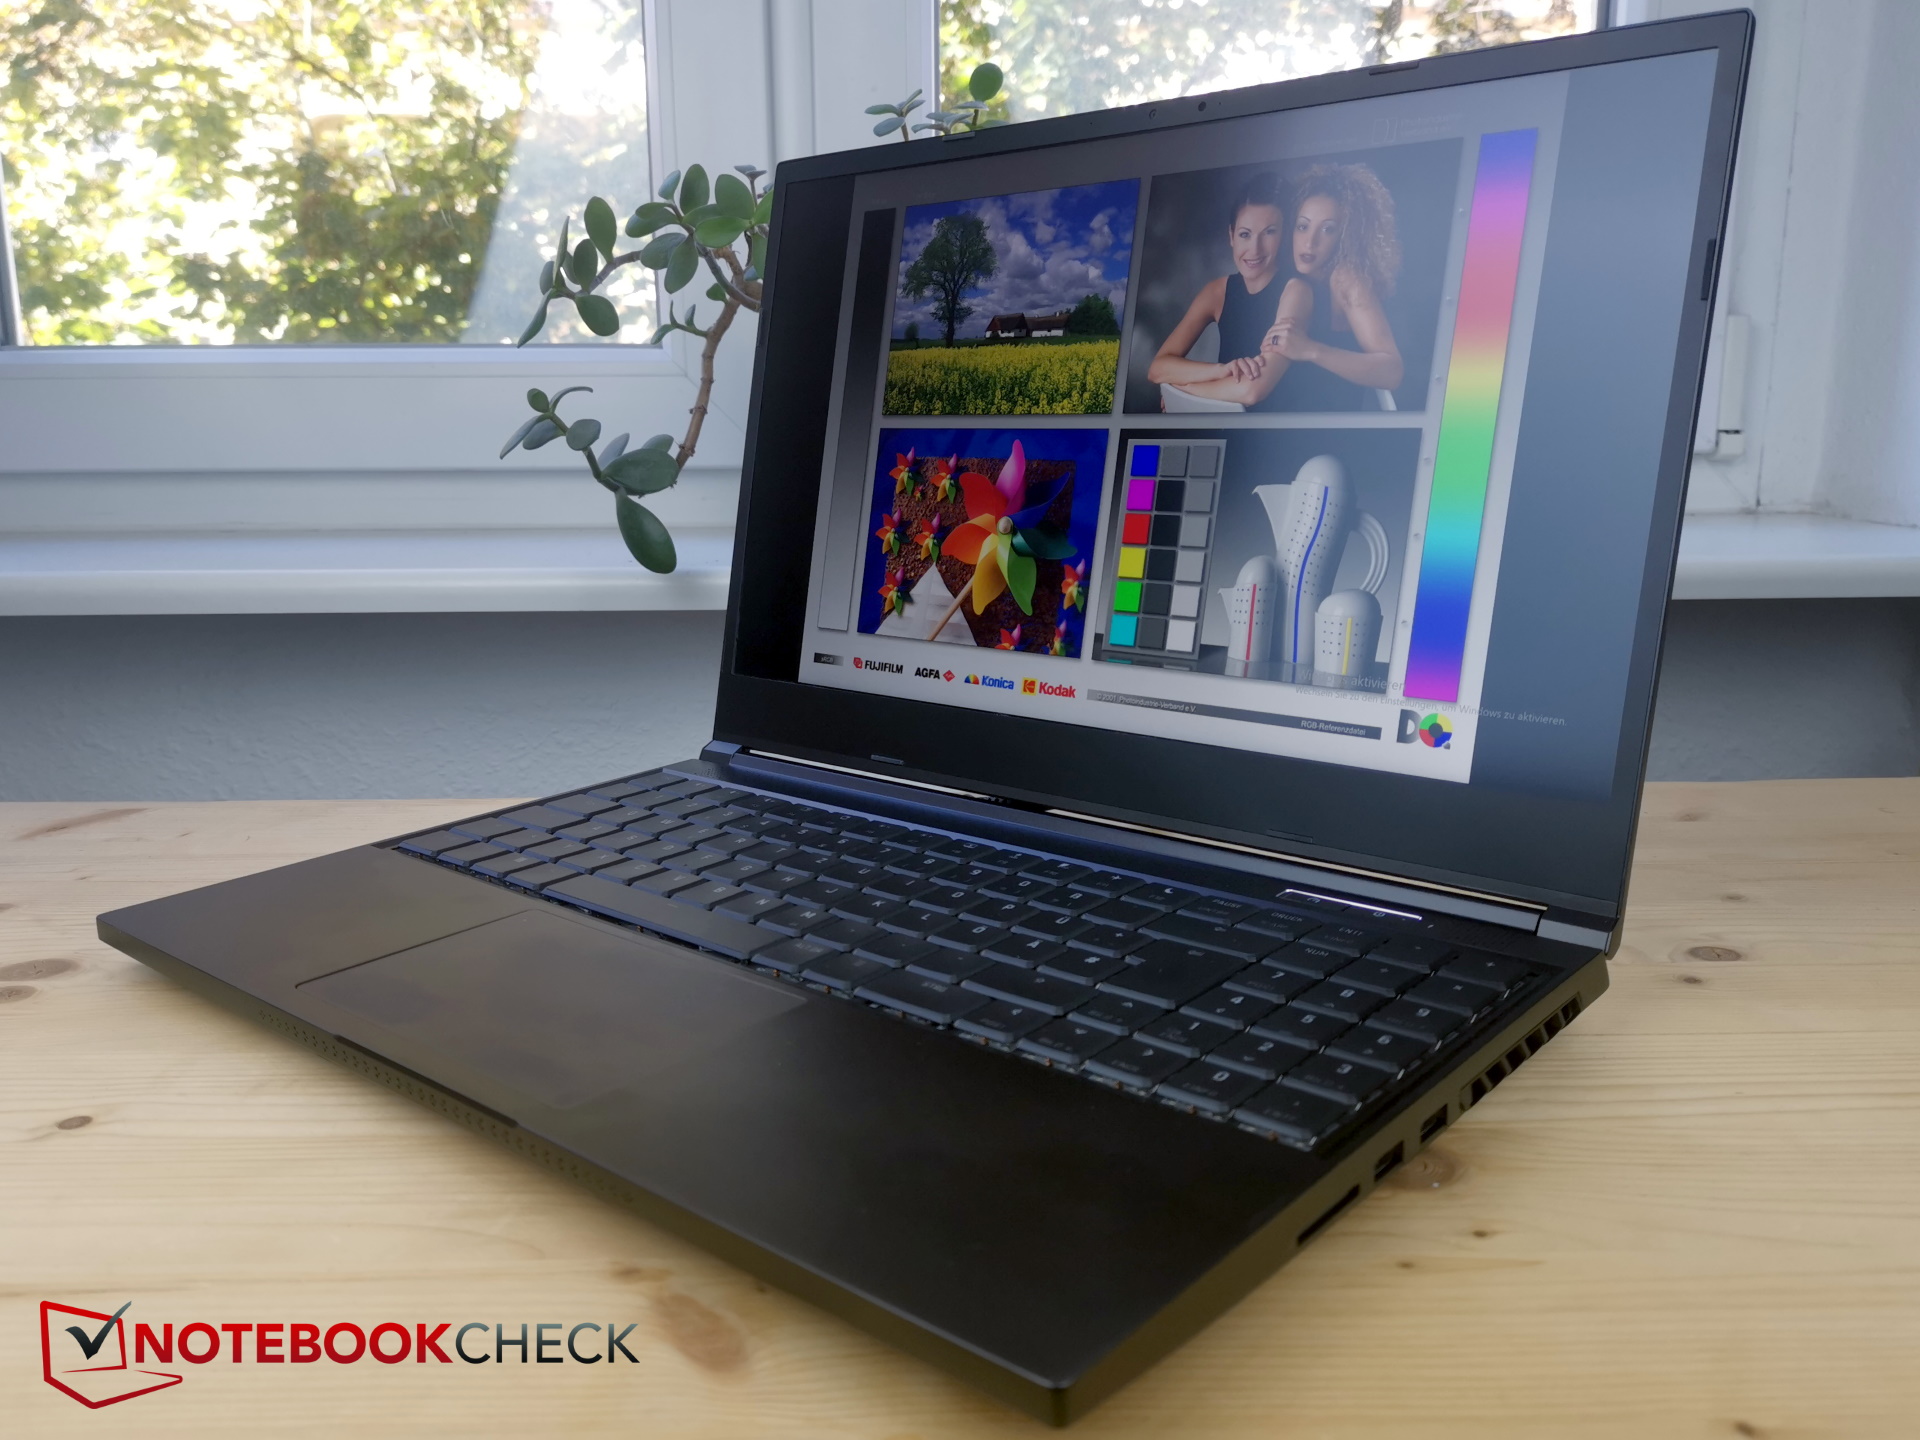
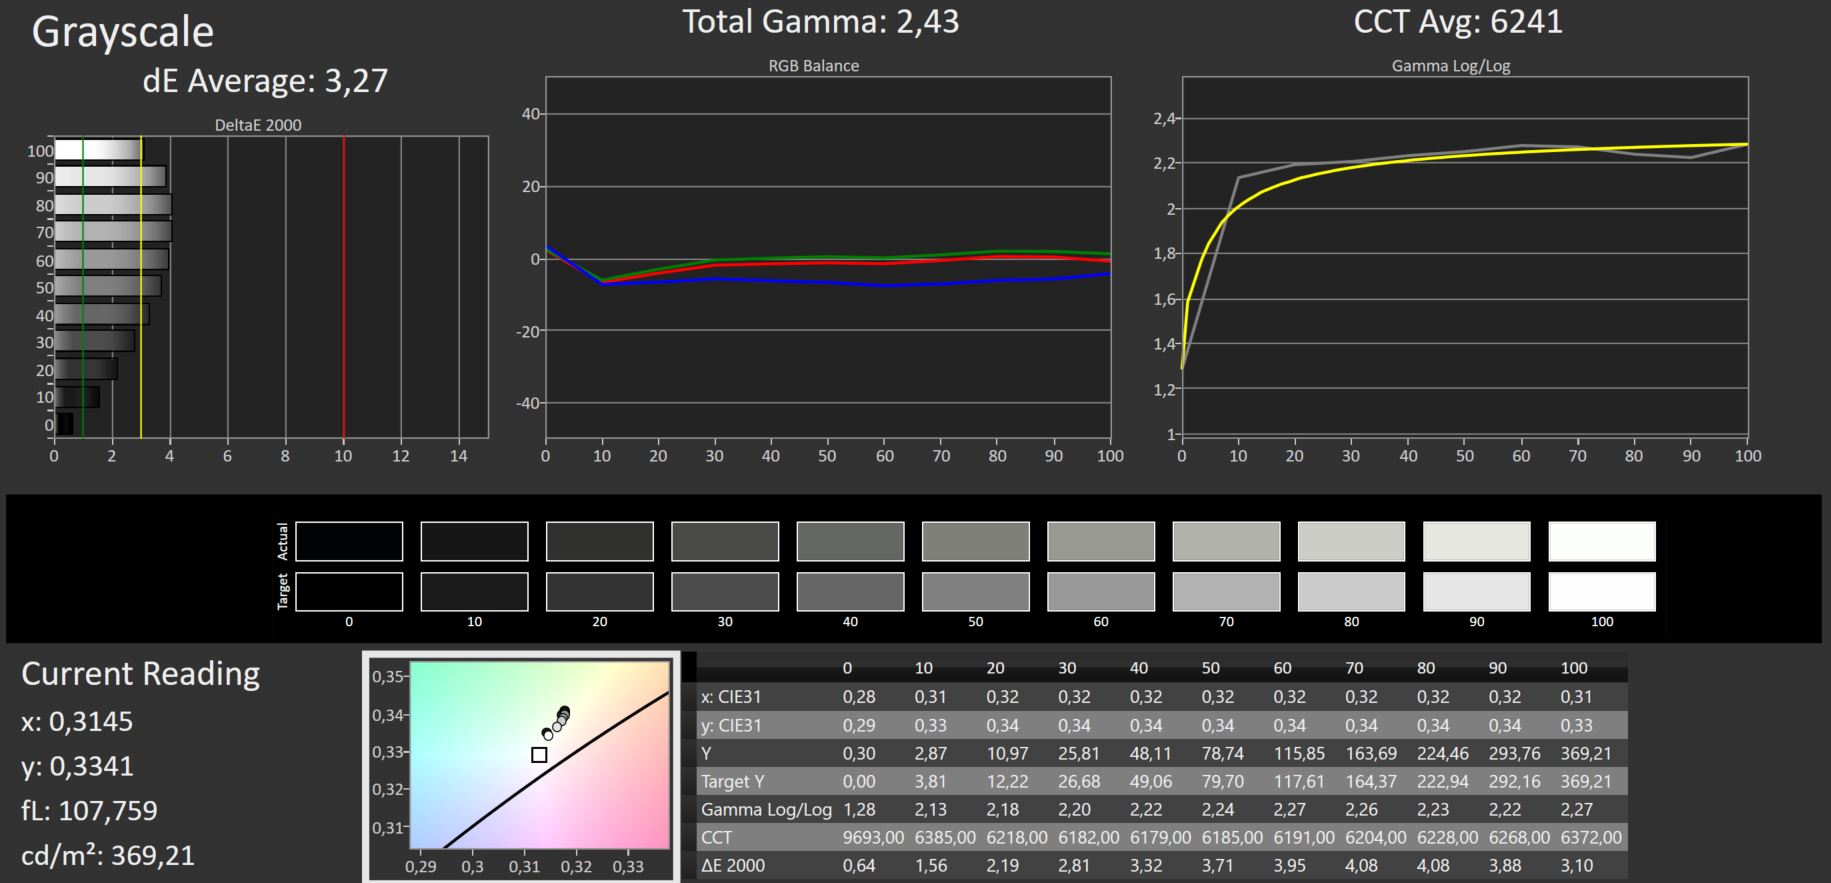
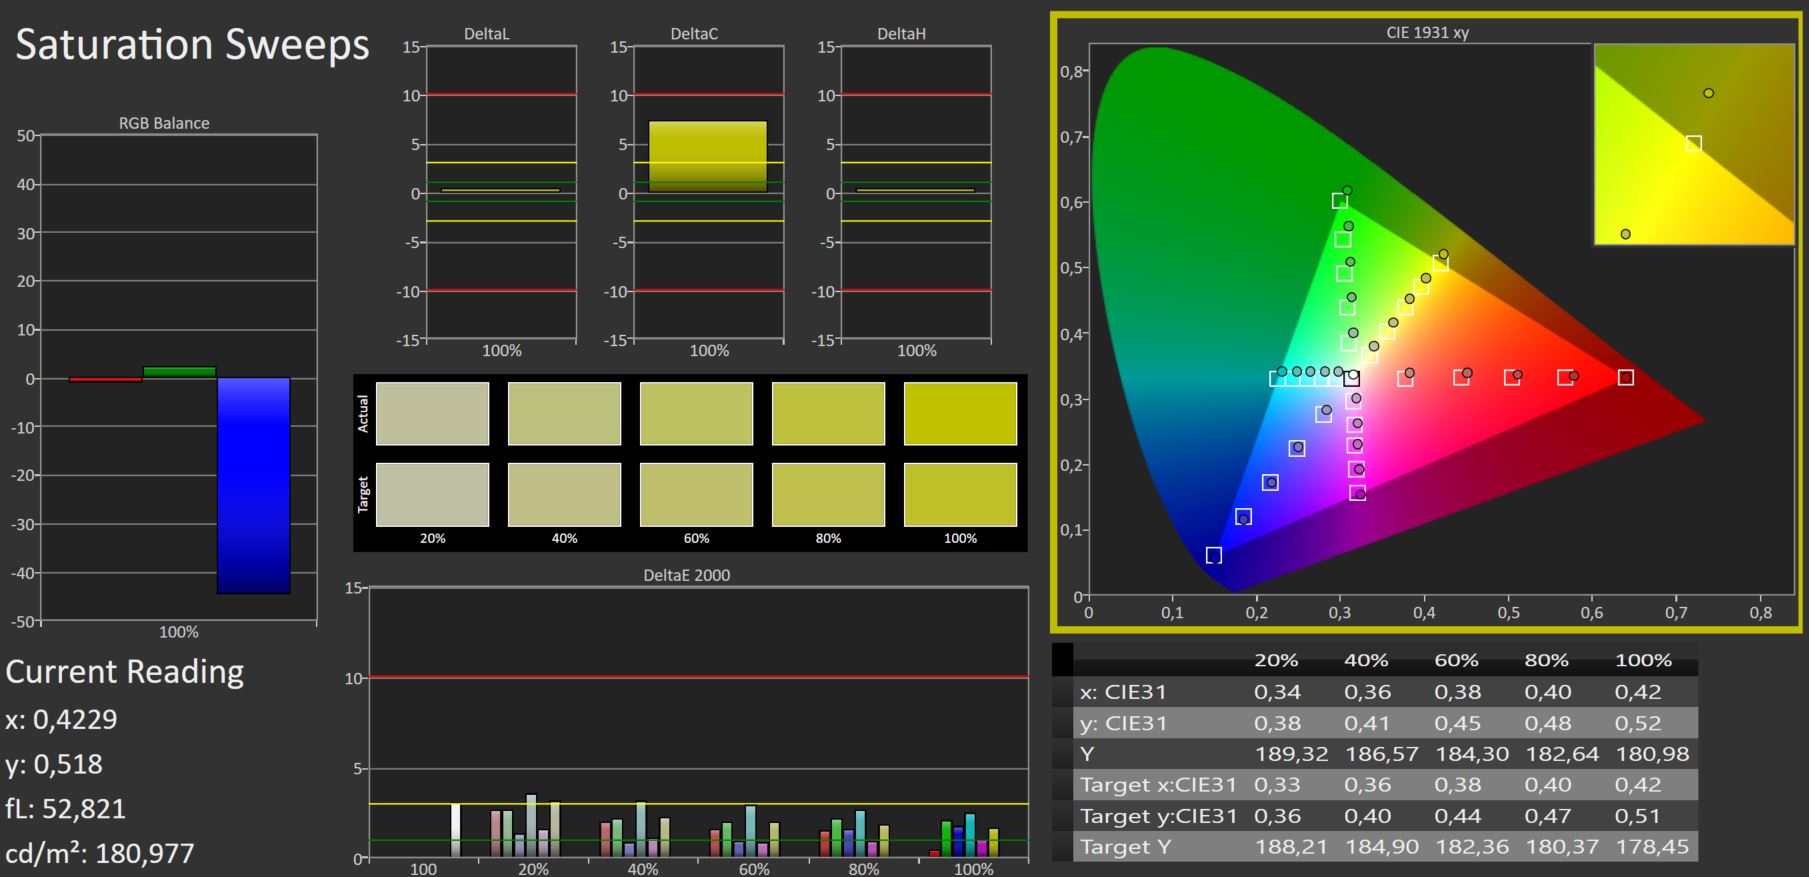
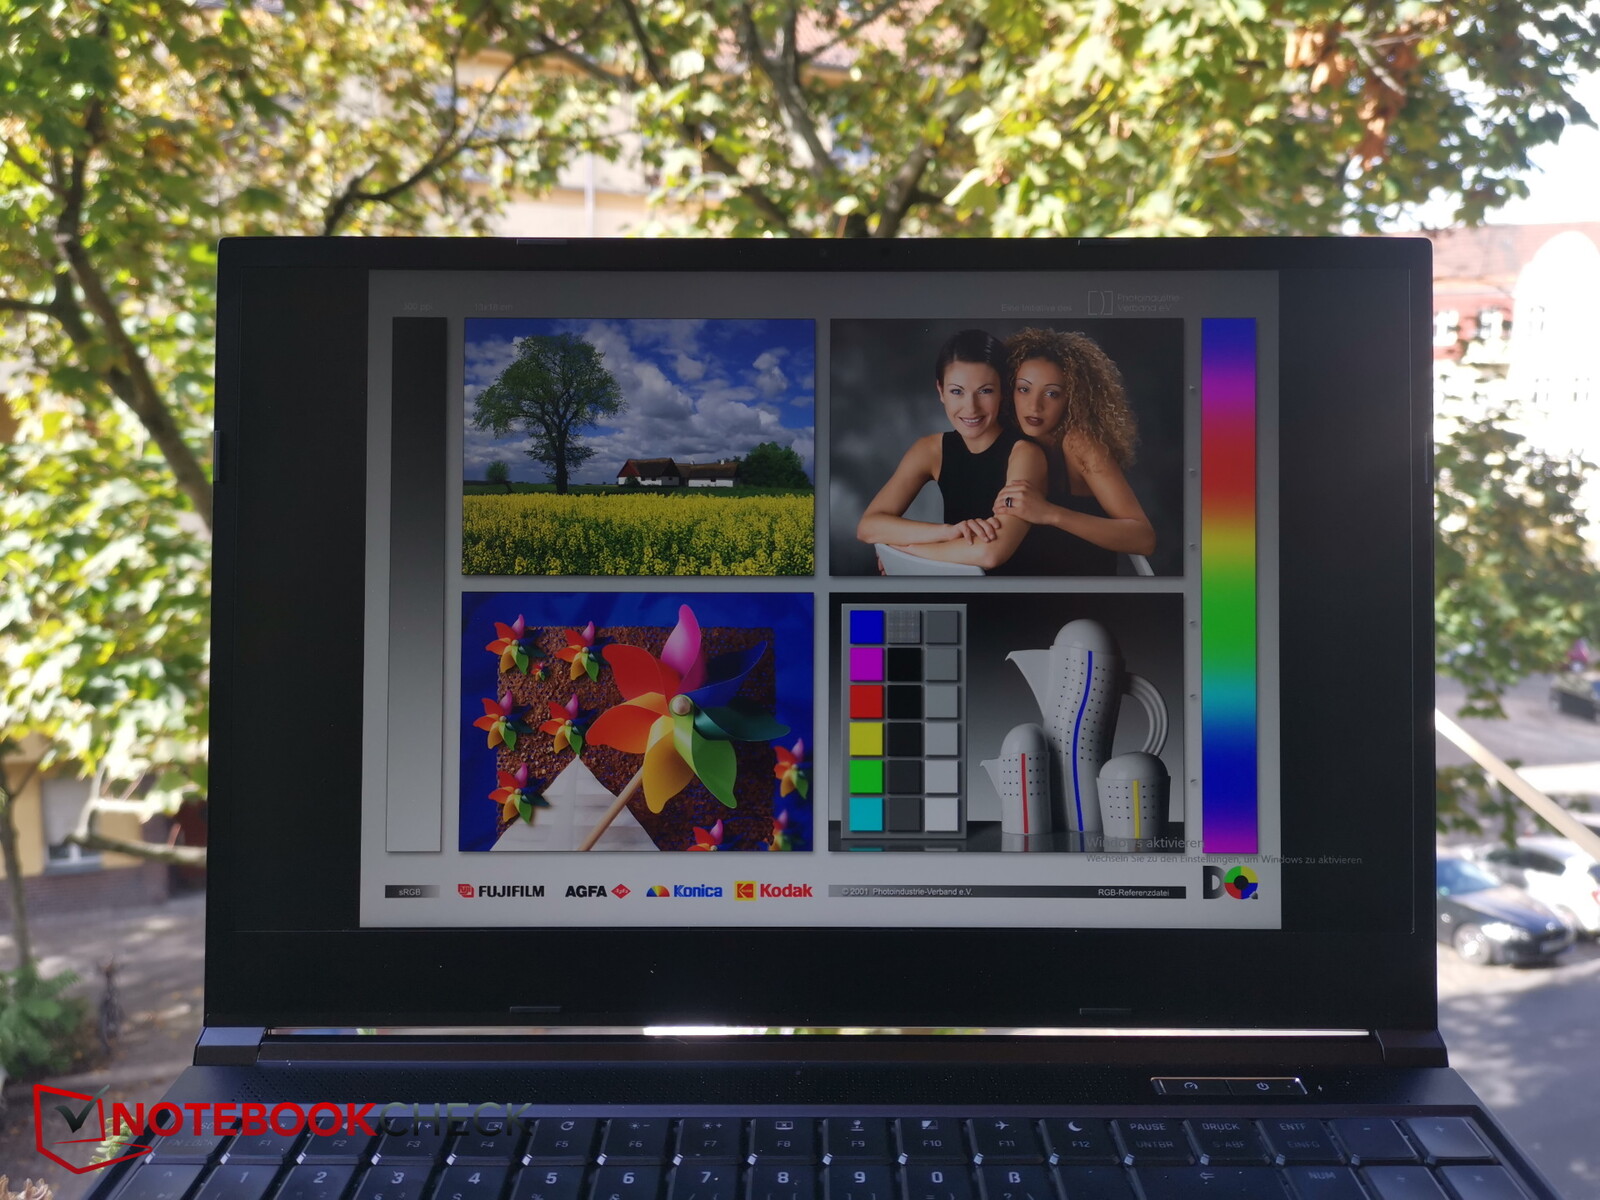
Pantalla: pantalla QHD de 240 Hz con cobertura sRGB completa
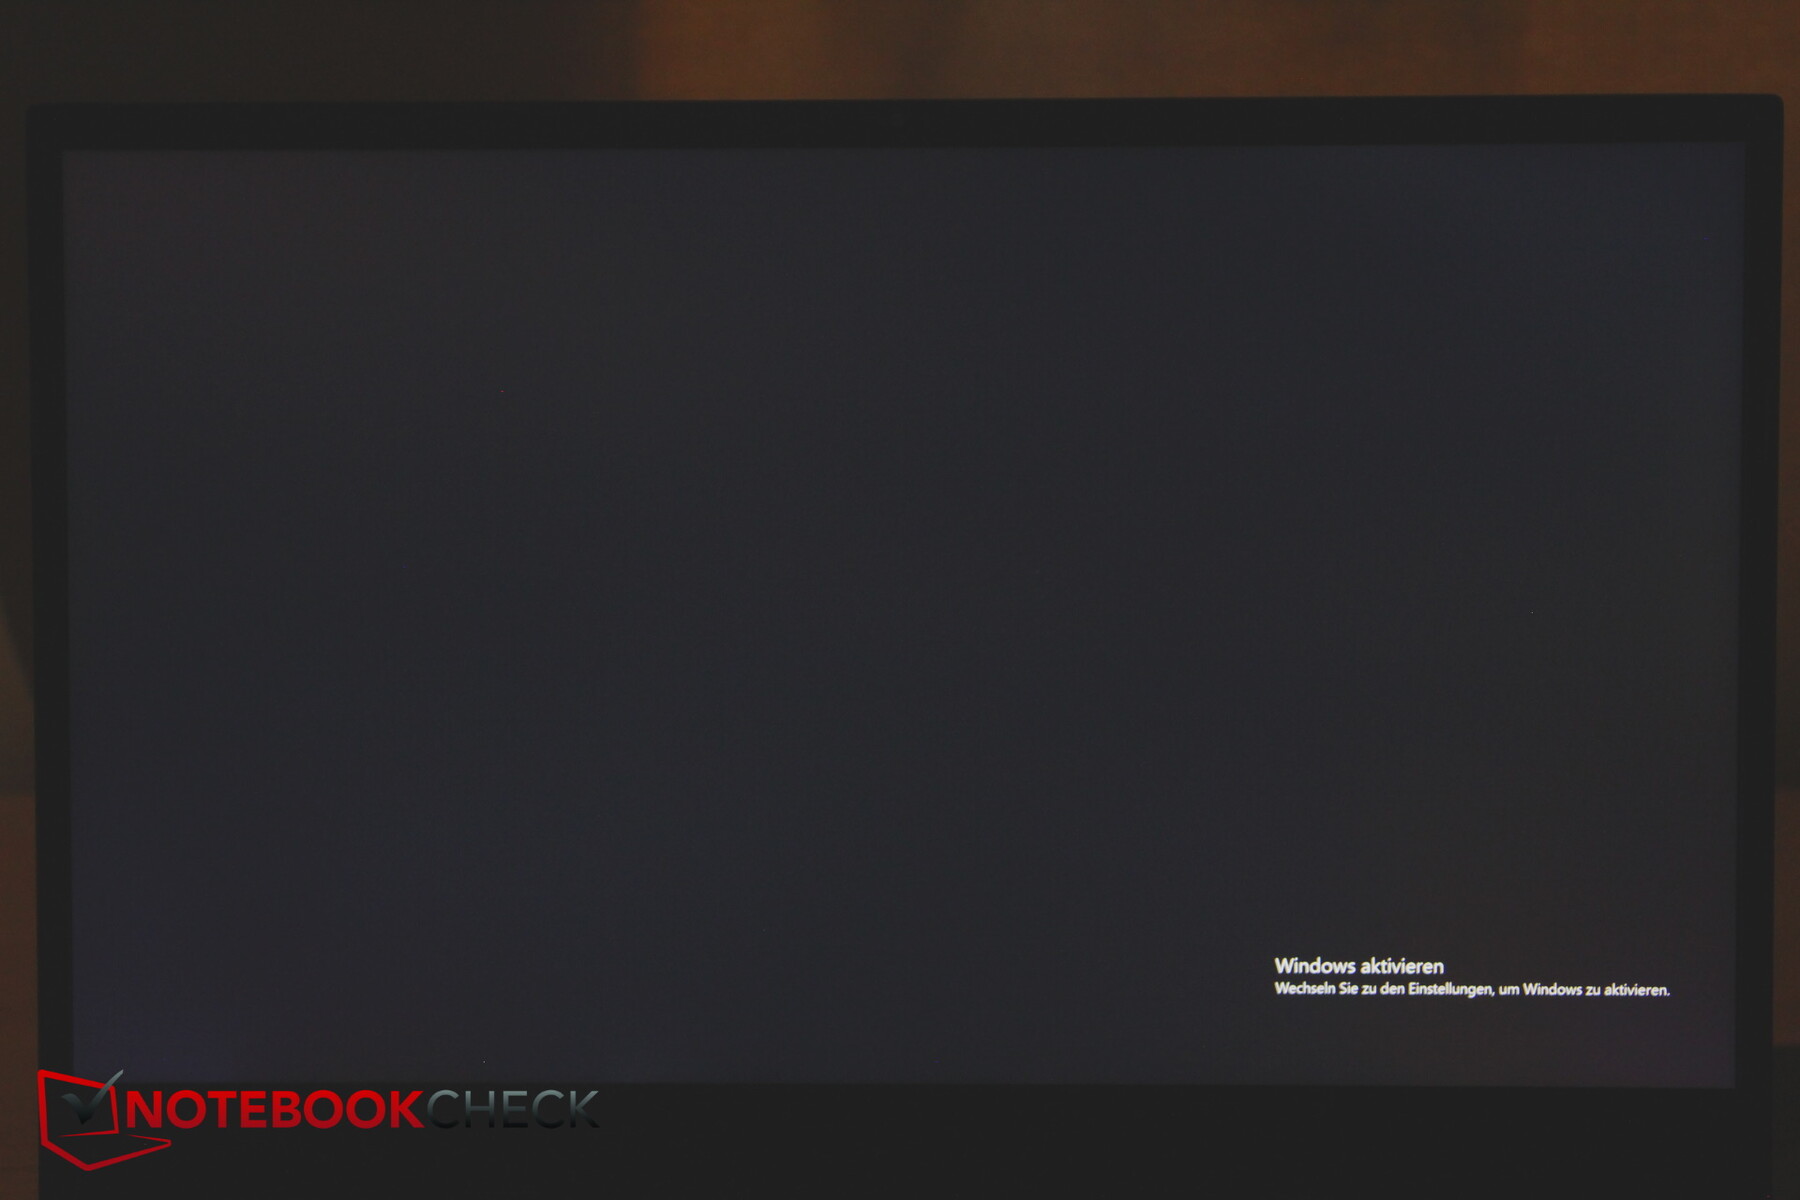
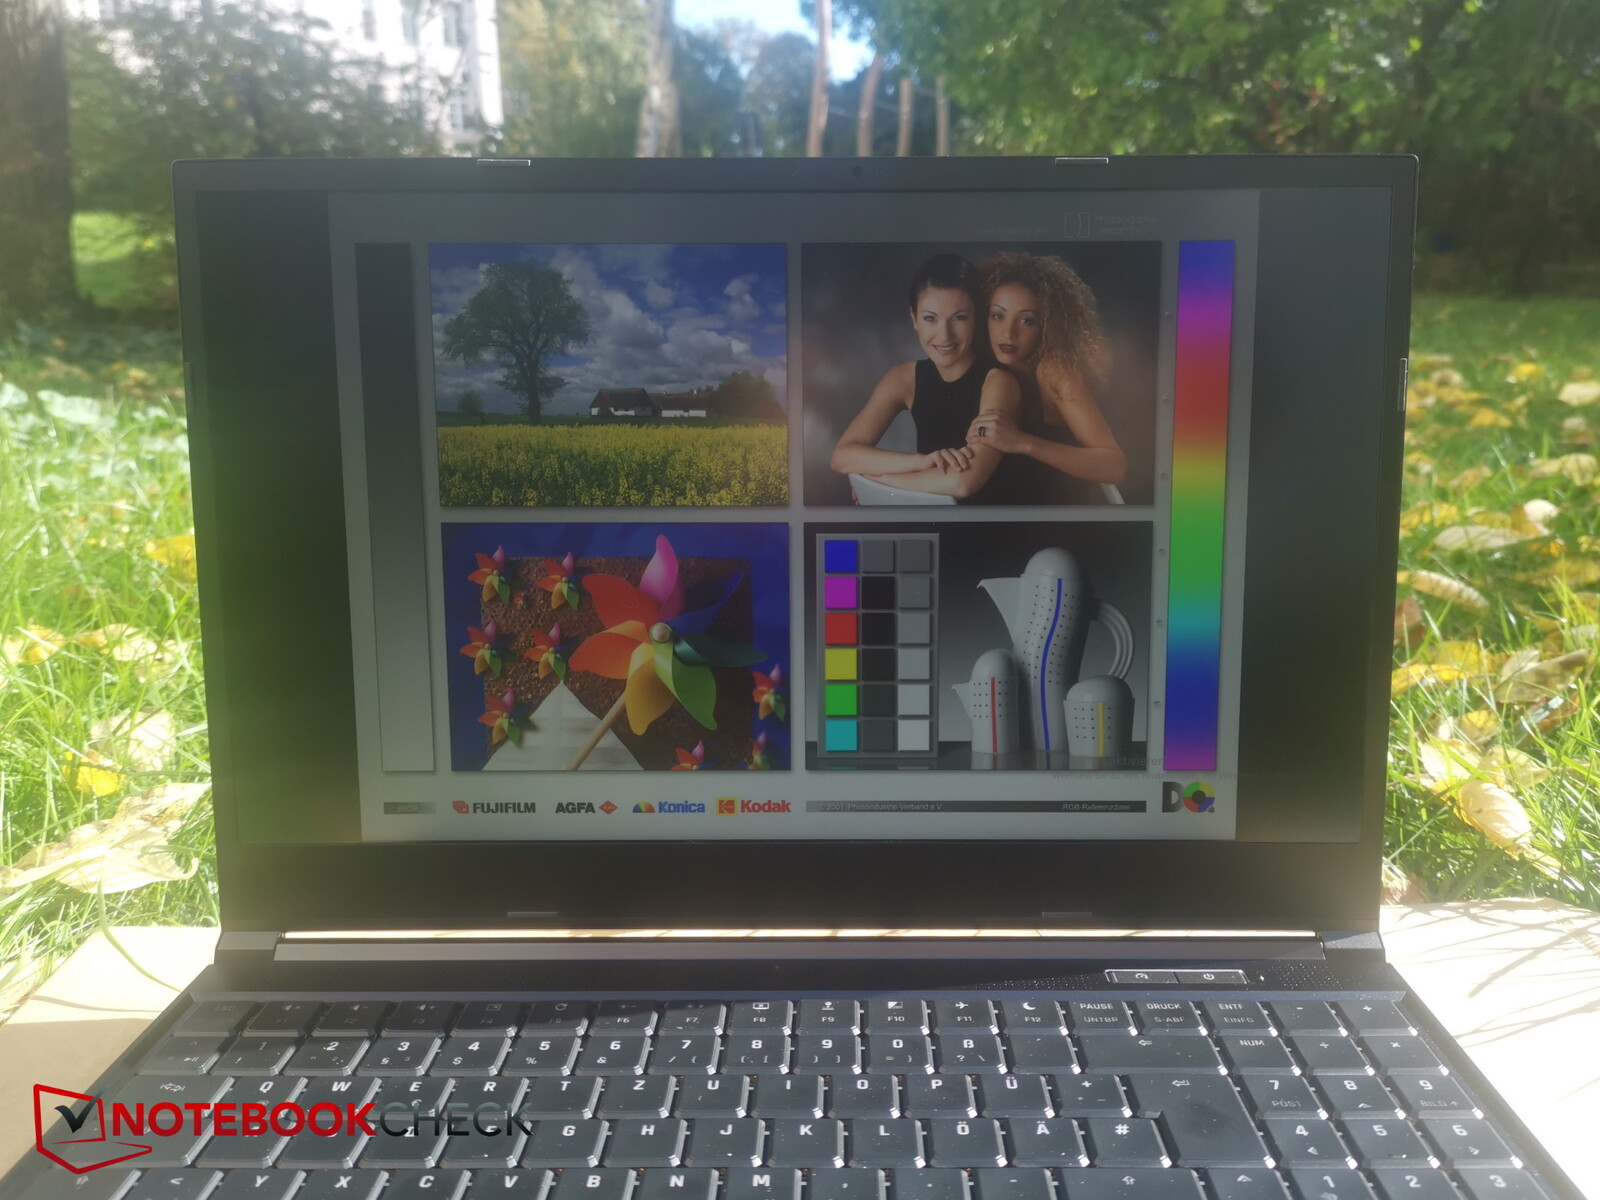
Schenker utiliza el mismo panel IPS 16:9 QHD con una resolución de 2.560 x 1.440 en todos los modelos. La pantalla tiene un brillo máximo de 350 nits, que es un nivel relativamente bueno que sitúa al Neo 15 por delante del MSI Stealth y el Acer Nitro.
Sin embargo, su distribución de brillo de sólo el 82% está algo por debajo de la media. En particular, el brillo de la pantalla es significativamente menor en la parte inferior de la pantalla.
El nivel de negro y el contraste son excelentes para un portátil de esta clase. La pantalla también tiene un buen tiempo de respuesta y no utiliza PWM.
| |||||||||||||||||||||||||
iluminación: 82 %
Brillo con batería: 367 cd/m²
Contraste: 1321:1 (Negro: 0.28 cd/m²)
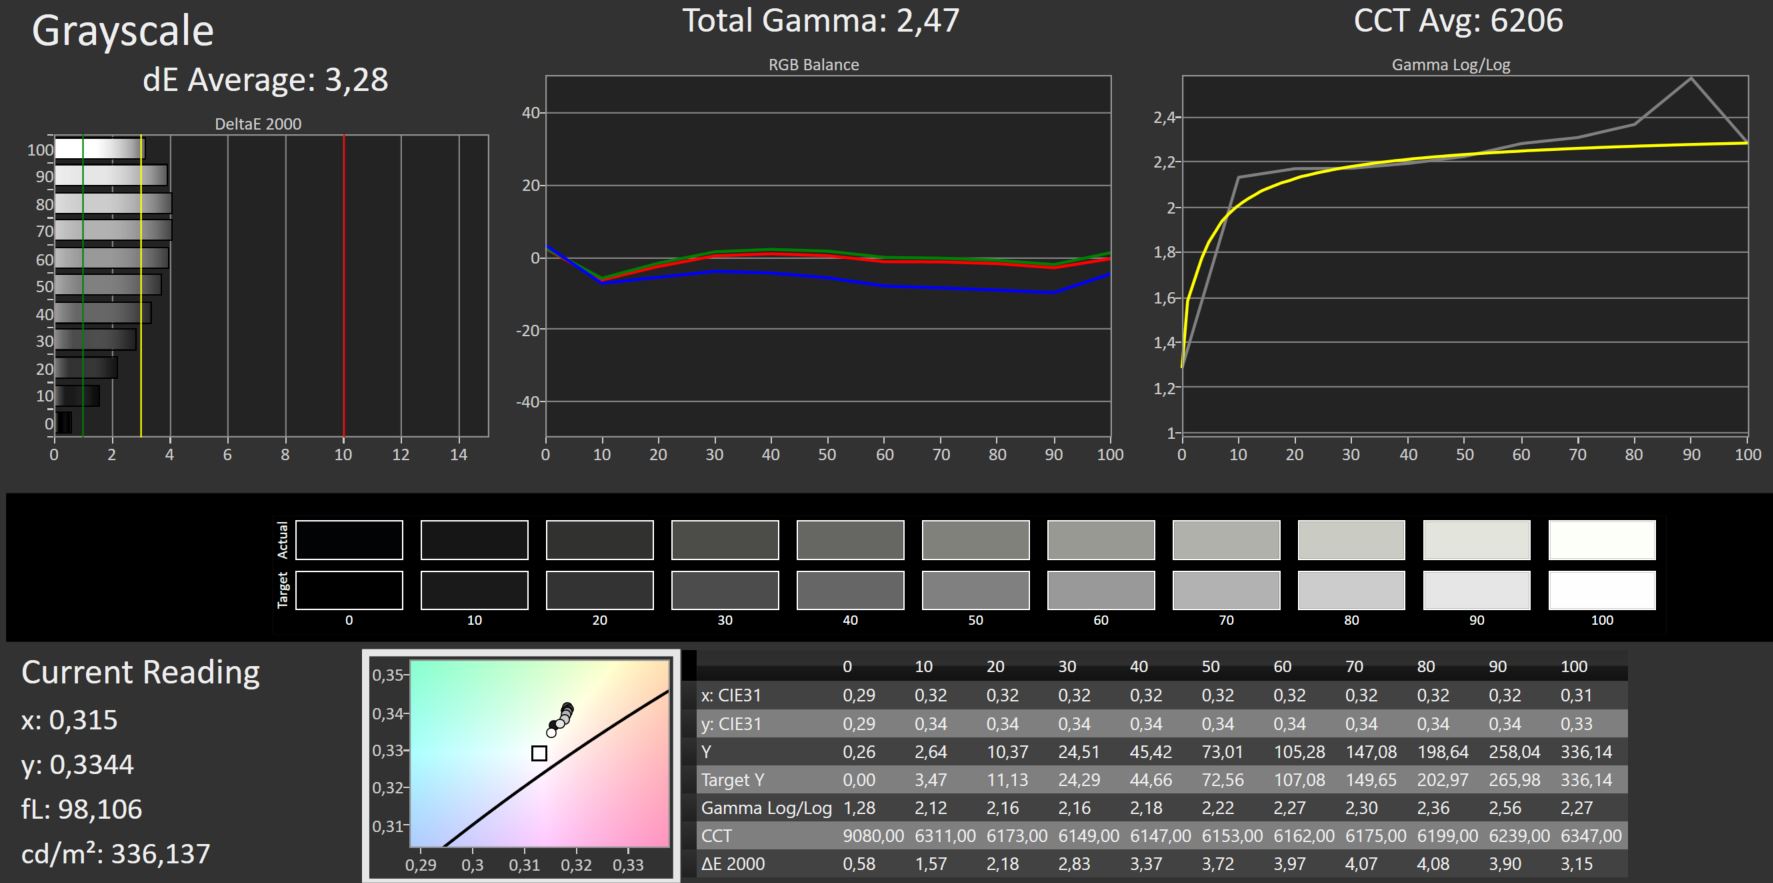
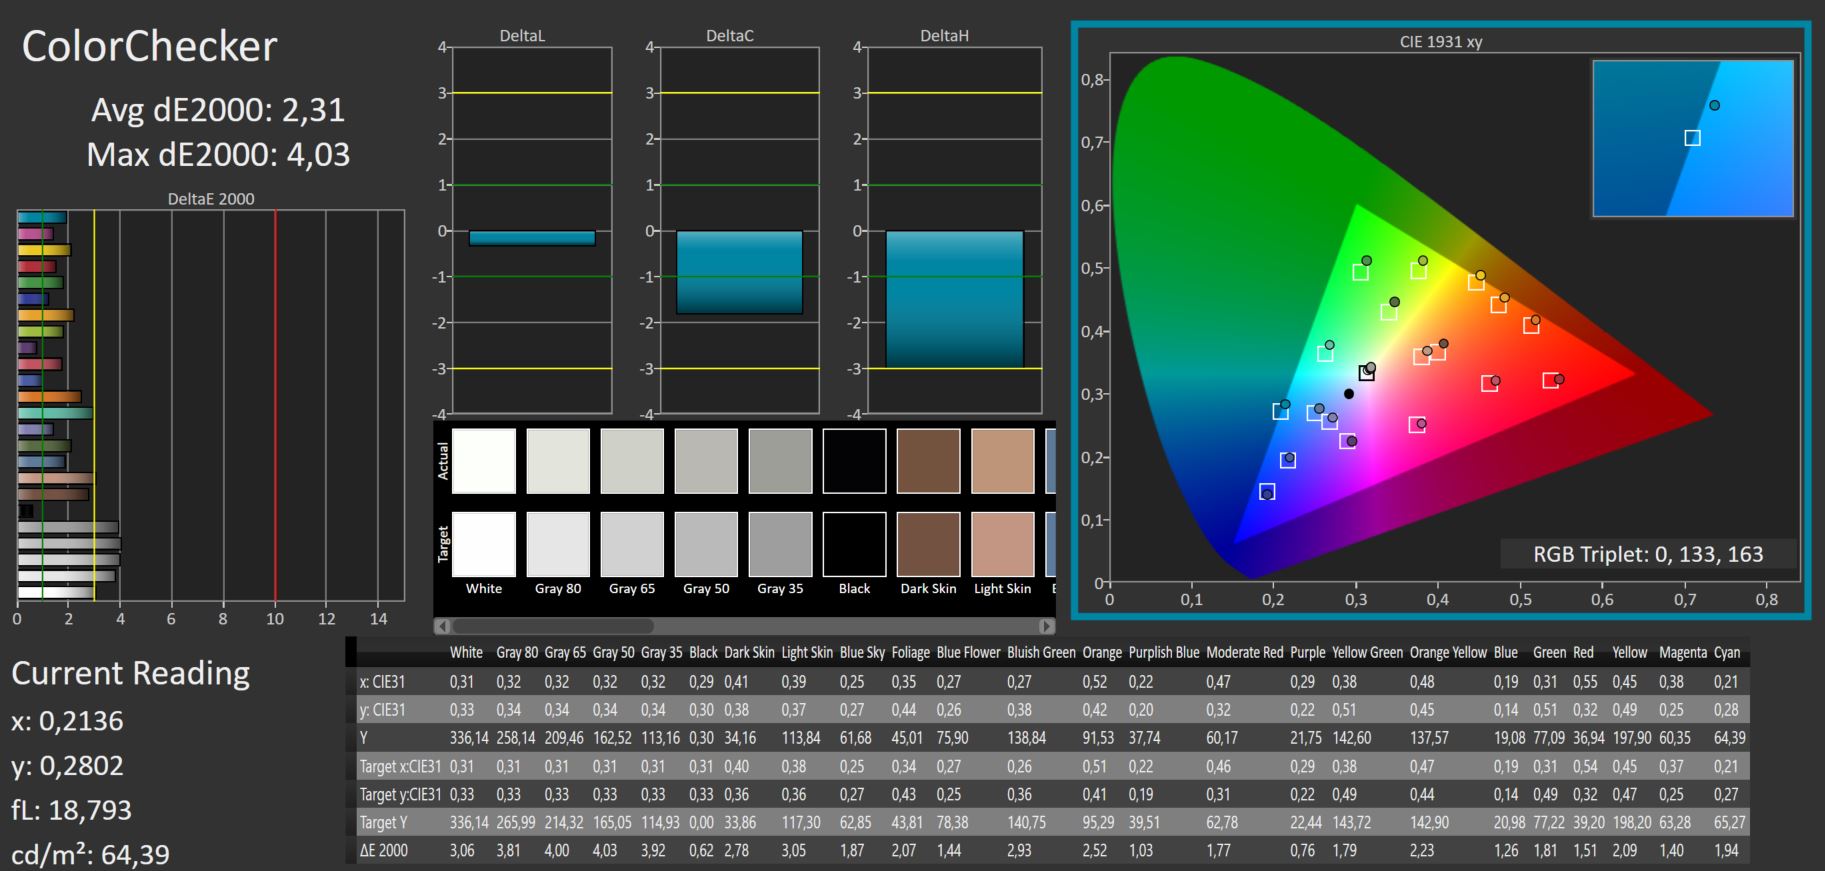
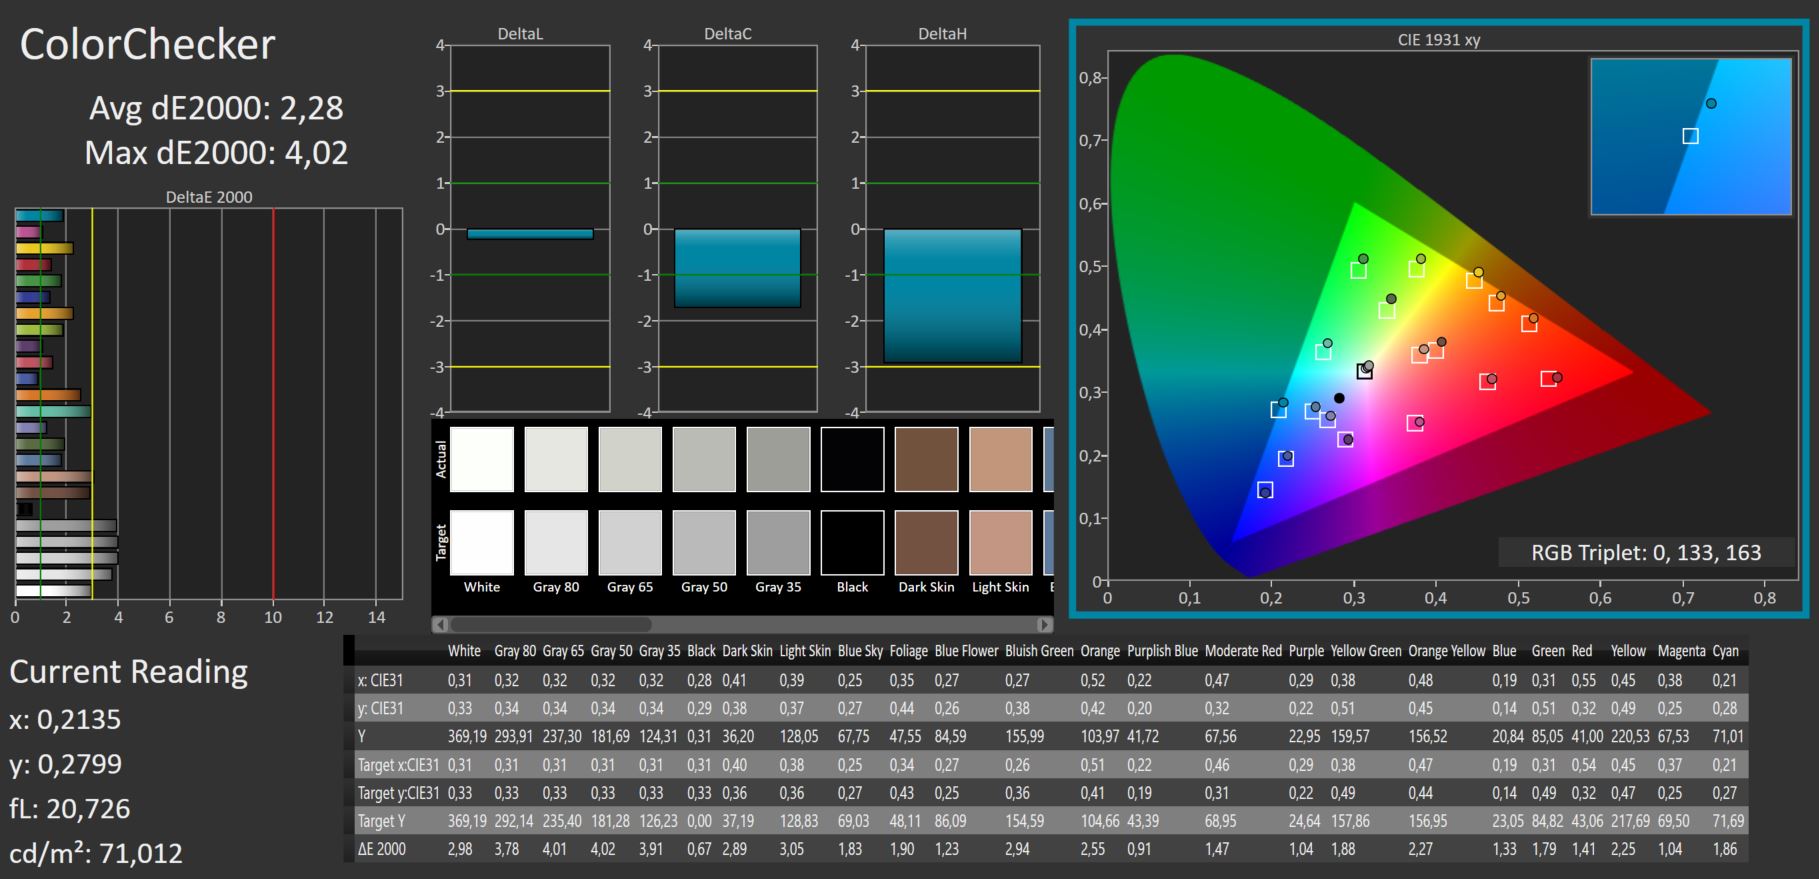
ΔE ColorChecker Calman: 2.31 | ∀{0.5-29.43 Ø4.71}
ΔE Greyscale Calman: 3.28 | ∀{0.09-98 Ø4.96}
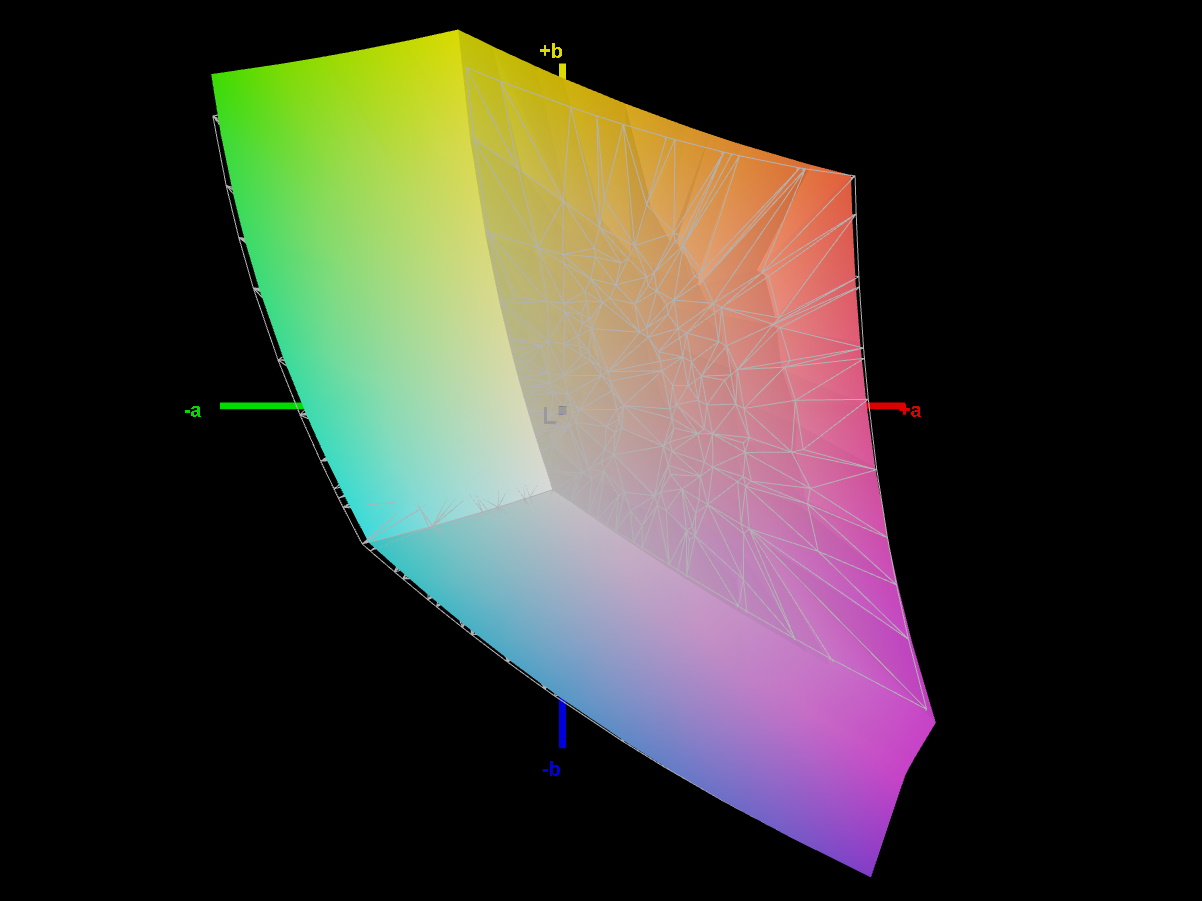
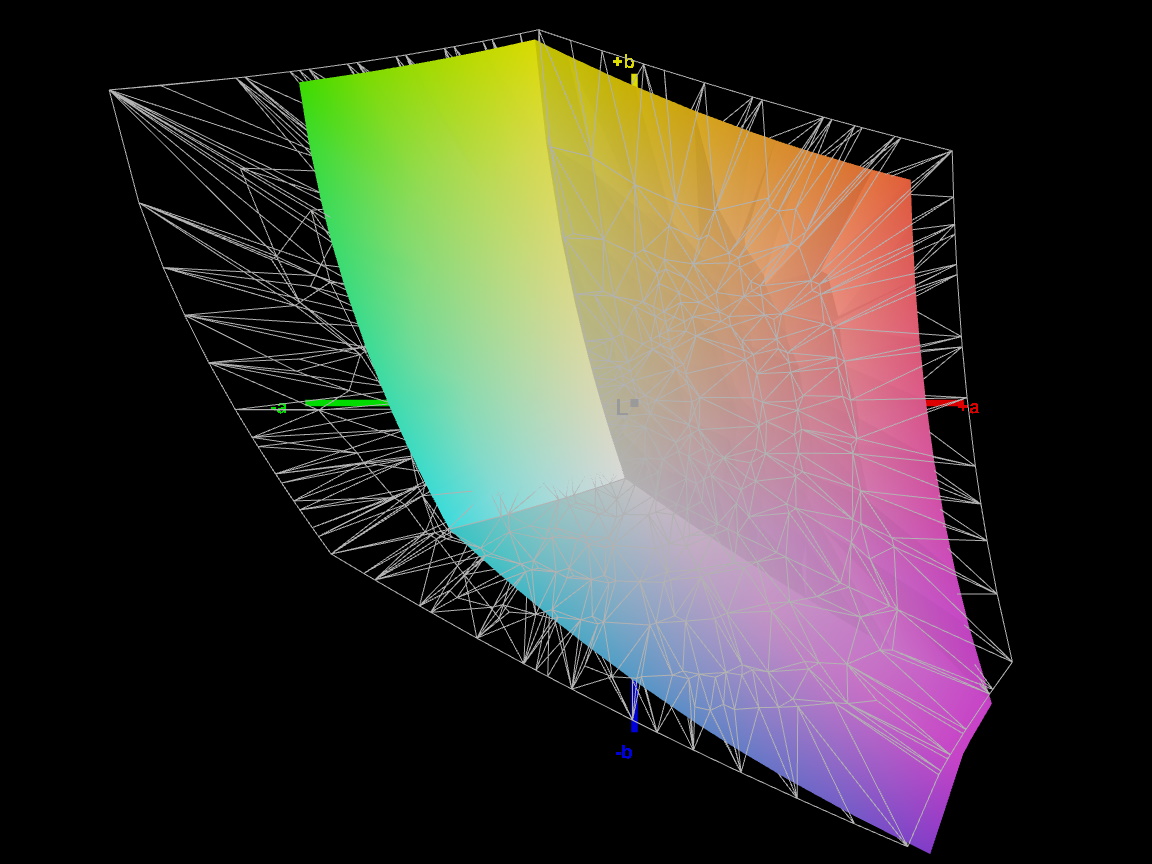
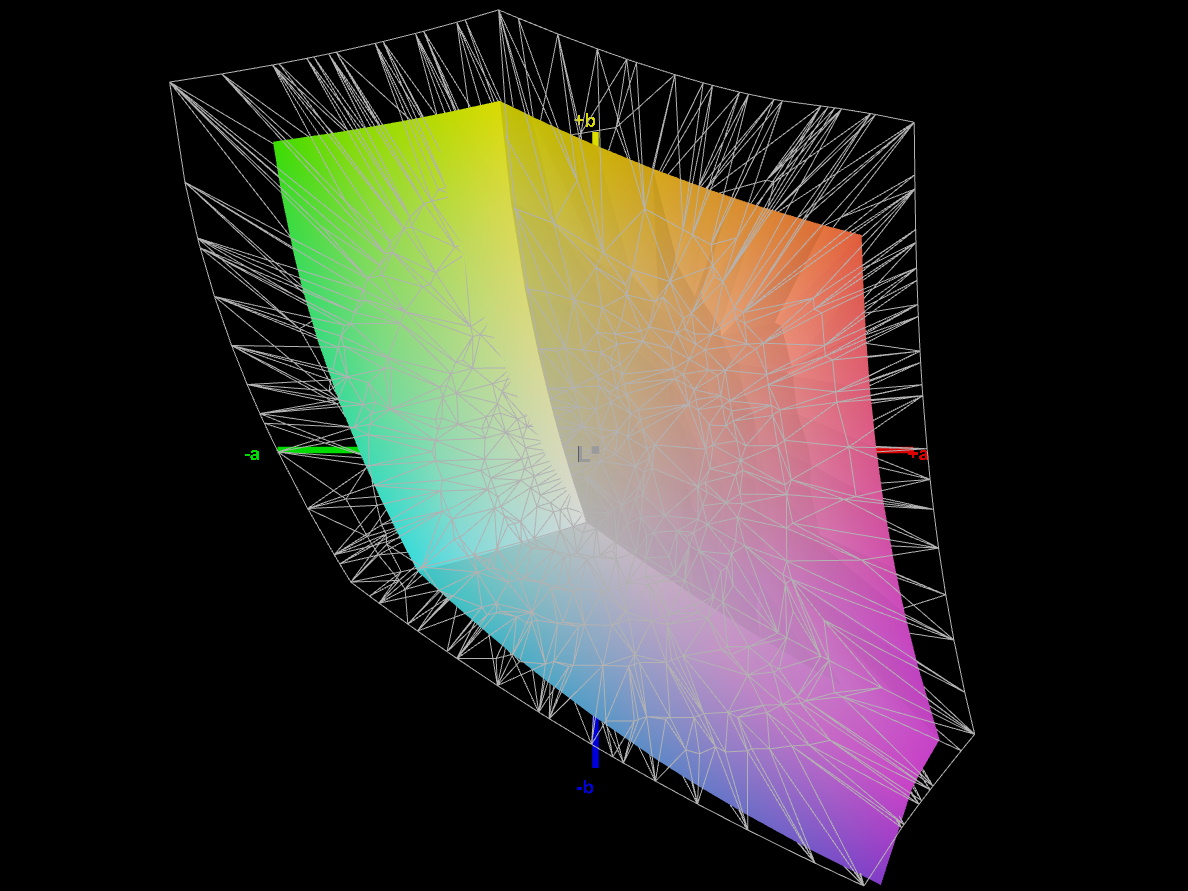
70.4% AdobeRGB 1998 (Argyll 3D)
97.7% sRGB (Argyll 3D)
68.9% Display P3 (Argyll 3D)
Gamma: 2.47
CCT: 6206 K
| Schenker XMG Neo 15 (Ryzen 9 6900HX, RTX 3070 Ti) BOE0A67, IPS, 2560x1440, 15.6" | Schenker XMG Neo 15 (i7-12700H, RTX 3080 Ti) BOE0A67, IPS, 2560x1440, 15.6" | MSI GE67 HX 12UGS Samsung ATNA562P02-0, OLED, 1920x1080, 15.6" | Asus ROG Strix Scar 15 G533ZW-LN106WS BOE CQ NE156QHM-NZ2, IPS-level, 2560x1440, 15.6" | Acer Nitro 5 AN515-58-72QR Chi Mei N156KME-GNA, IPS, 2560x1440, 15.6" | MSI Stealth GS66 12UGS Sharp LQ156T1JW04 (SHP153C), IPS-Level, 2560x1440, 15.6" | |
|---|---|---|---|---|---|---|
| Display | -1% | 1% | 21% | 21% | 21% | |
| Display P3 Coverage (%) | 68.9 | 68.2 -1% | 71.7 4% | 96.2 40% | 95.6 39% | 96.4 40% |
| sRGB Coverage (%) | 97.7 | 97.2 -1% | 89.7 -8% | 99.9 2% | 99.8 2% | 99.7 2% |
| AdobeRGB 1998 Coverage (%) | 70.4 | 69.4 -1% | 75.2 7% | 84.5 20% | 85.2 21% | 85.6 22% |
| Response Times | 0% | 97% | 39% | -22% | 29% | |
| Response Time Grey 50% / Grey 80% * (ms) | 12.4 ? | 12.4 ? -0% | 0.25 ? 98% | 7.86 ? 37% 4.21 ? 66% | 15.7 ? -27% | 6 ? 52% |
| Response Time Black / White * (ms) | 8.8 ? | 8.8 ? -0% | 0.4 ? 95% | 7.5 ? 15% | 10.2 ? -16% | 8.4 ? 5% |
| PWM Frequency (Hz) | 480.4 ? | |||||
| Screen | 15% | -30% | -35% | -30% | -43% | |
| Brightness middle (cd/m²) | 370 | 365 -1% | 356.1 -4% | 346 -6% | 332 -10% | 272 -26% |
| Brightness (cd/m²) | 343 | 335 -2% | 358 4% | 329 -4% | 303 -12% | 253 -26% |
| Brightness Distribution (%) | 82 | 81 -1% | 99 21% | 91 11% | 86 5% | 87 6% |
| Black Level * (cd/m²) | 0.28 | 0.32 -14% | 0.59 -111% | 0.29 -4% | 0.25 11% | |
| Contrast (:1) | 1321 | 1141 -14% | 586 -56% | 1145 -13% | 1088 -18% | |
| Colorchecker dE 2000 * | 2.31 | 1.38 40% | 4.83 -109% | 3.06 -32% | 3.61 -56% | 3.73 -61% |
| Colorchecker dE 2000 max. * | 4.03 | 2.01 50% | 7.94 -97% | 5.81 -44% | 7.71 -91% | 9.43 -134% |
| Greyscale dE 2000 * | 3.28 | 1.36 59% | 3.1 5% | 5.2 -59% | 6.5 -98% | |
| Gamma | 2.47 89% | 2.48 89% | 2.2 100% | 2.12 104% | 2.155 102% | 2.172 101% |
| CCT | 6206 105% | 6412 101% | 5938 109% | 7021 93% | 6724 97% | 6485 100% |
| Colorchecker dE 2000 calibrated * | 1.22 | 2.57 | 0.59 | 0.98 | ||
| Media total (Programa/Opciones) | 5% /
9% | 23% /
1% | 8% /
-5% | -10% /
-17% | 2% /
-17% |
* ... más pequeño es mejor
La pantalla no es realmente adecuada para la edición profesional de fotos y vídeos. Aunque la pantalla tiene una cobertura completa de sRGB, sólo consigue cubrir aproximadamente el 70% del espacio de color AdobeRGB y DisplayP3.
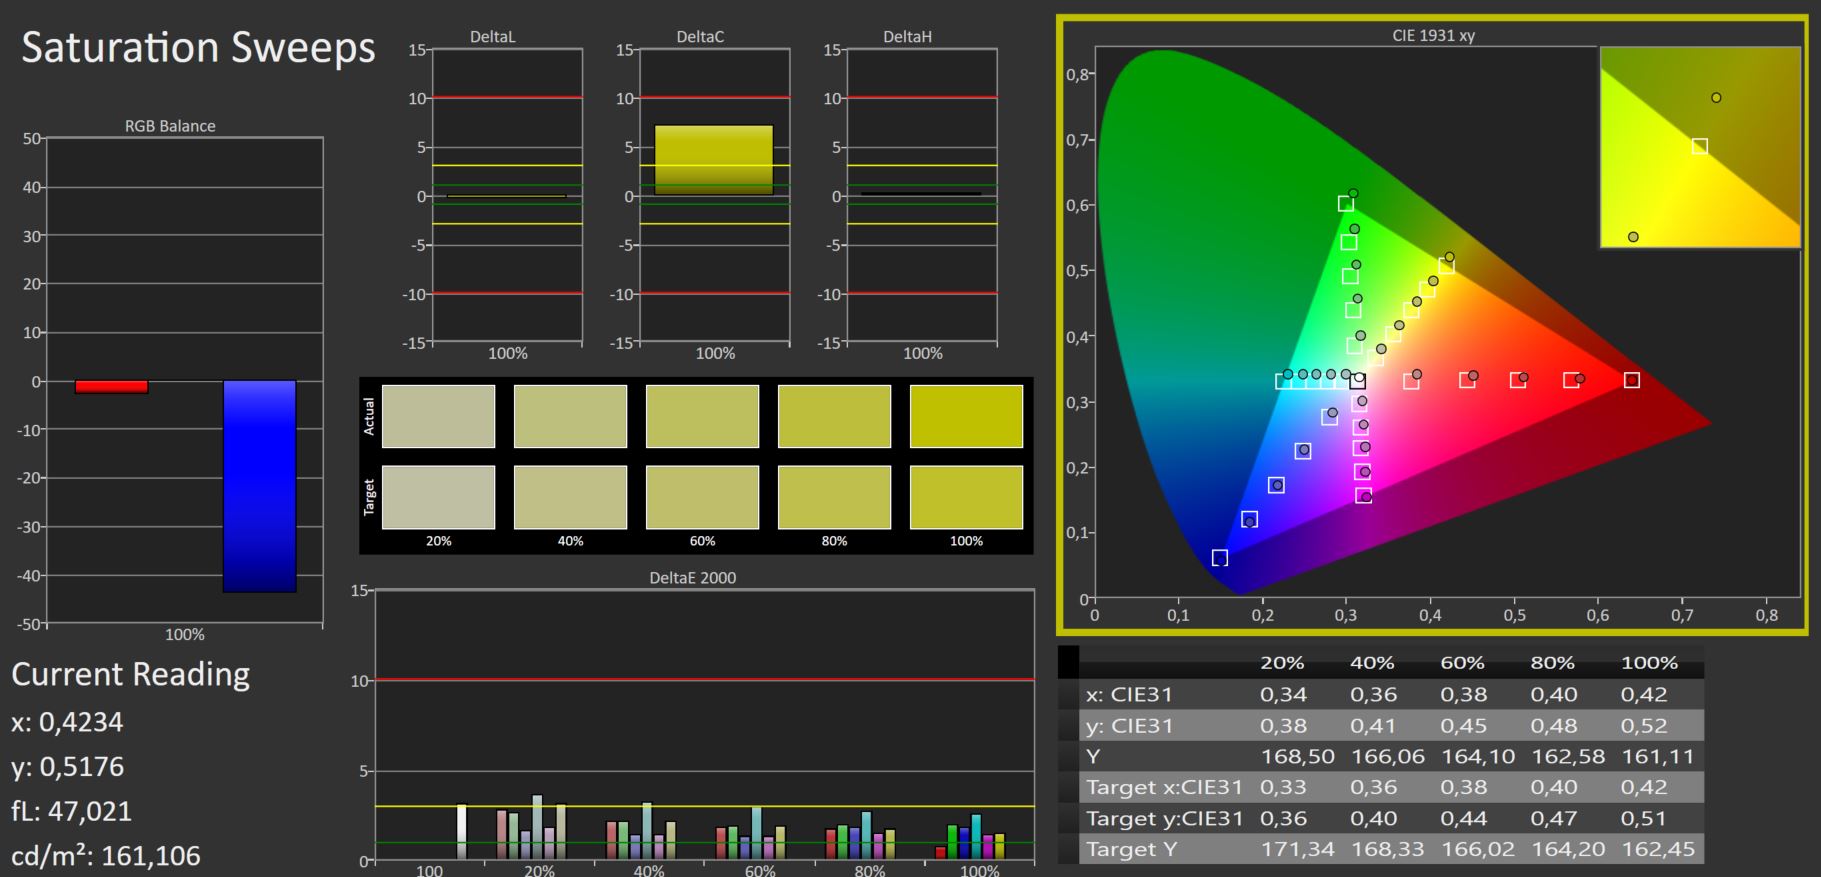
La pantalla ya está bastante bien calibrada nada más sacarla de la caja. A pesar de que los valores Delta E no son especialmente bajos, no hubo ninguna mejora incluso después de calibrar la pantalla manualmente nosotros mismos.
Tiempos de respuesta del display
| ↔ Tiempo de respuesta de Negro a Blanco | ||
|---|---|---|
| 8.8 ms ... subida ↗ y bajada ↘ combinada | ↗ 4.6 ms subida | 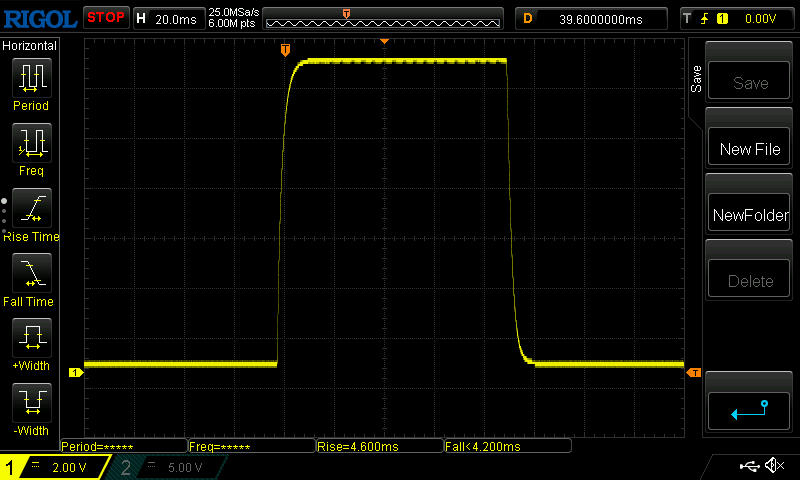 |
| ↘ 4.2 ms bajada | ||
| La pantalla mostró tiempos de respuesta rápidos en nuestros tests y debería ser adecuada para juegos. En comparación, todos los dispositivos de prueba van de ##min### (mínimo) a 240 (máximo) ms. » 25 % de todos los dispositivos son mejores. Esto quiere decir que el tiempo de respuesta medido es mejor que la media (19.8 ms) de todos los dispositivos testados. | ||
| ↔ Tiempo de respuesta 50% Gris a 80% Gris | ||
| 12.4 ms ... subida ↗ y bajada ↘ combinada | ↗ 5.8 ms subida | 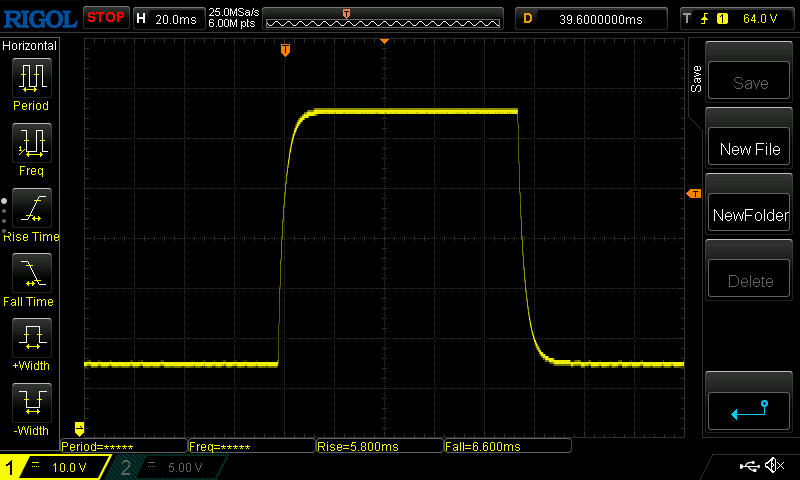 |
| ↘ 6.6 ms bajada | ||
| La pantalla mostró buenos tiempos de respuesta en nuestros tests pero podría ser demasiado lenta para los jugones competitivos. En comparación, todos los dispositivos de prueba van de ##min### (mínimo) a 636 (máximo) ms. » 26 % de todos los dispositivos son mejores. Esto quiere decir que el tiempo de respuesta medido es mejor que la media (30.9 ms) de todos los dispositivos testados. | ||
Parpadeo de Pantalla / PWM (Pulse-Width Modulation)
| Parpadeo de Pantalla / PWM no detectado | 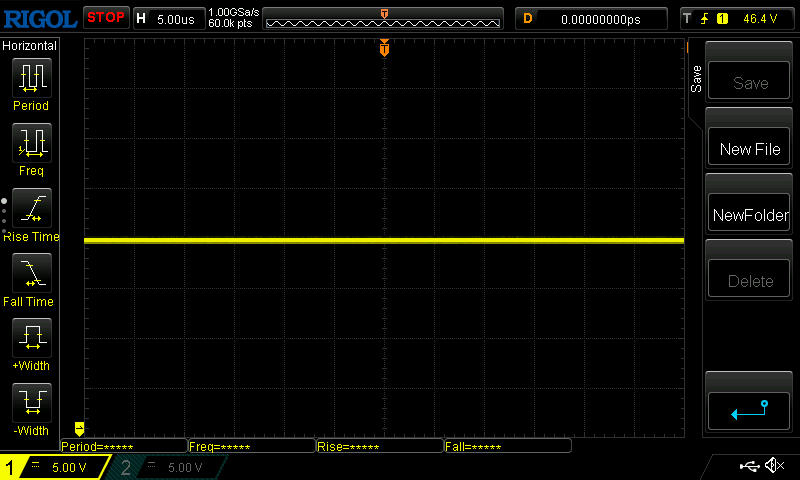 | ||
Comparación: 52 % de todos los dispositivos testados no usaron PWM para atenuar el display. Si se usó, medimos una media de 7744 (mínimo: 5 - máxmo: 343500) Hz. | |||
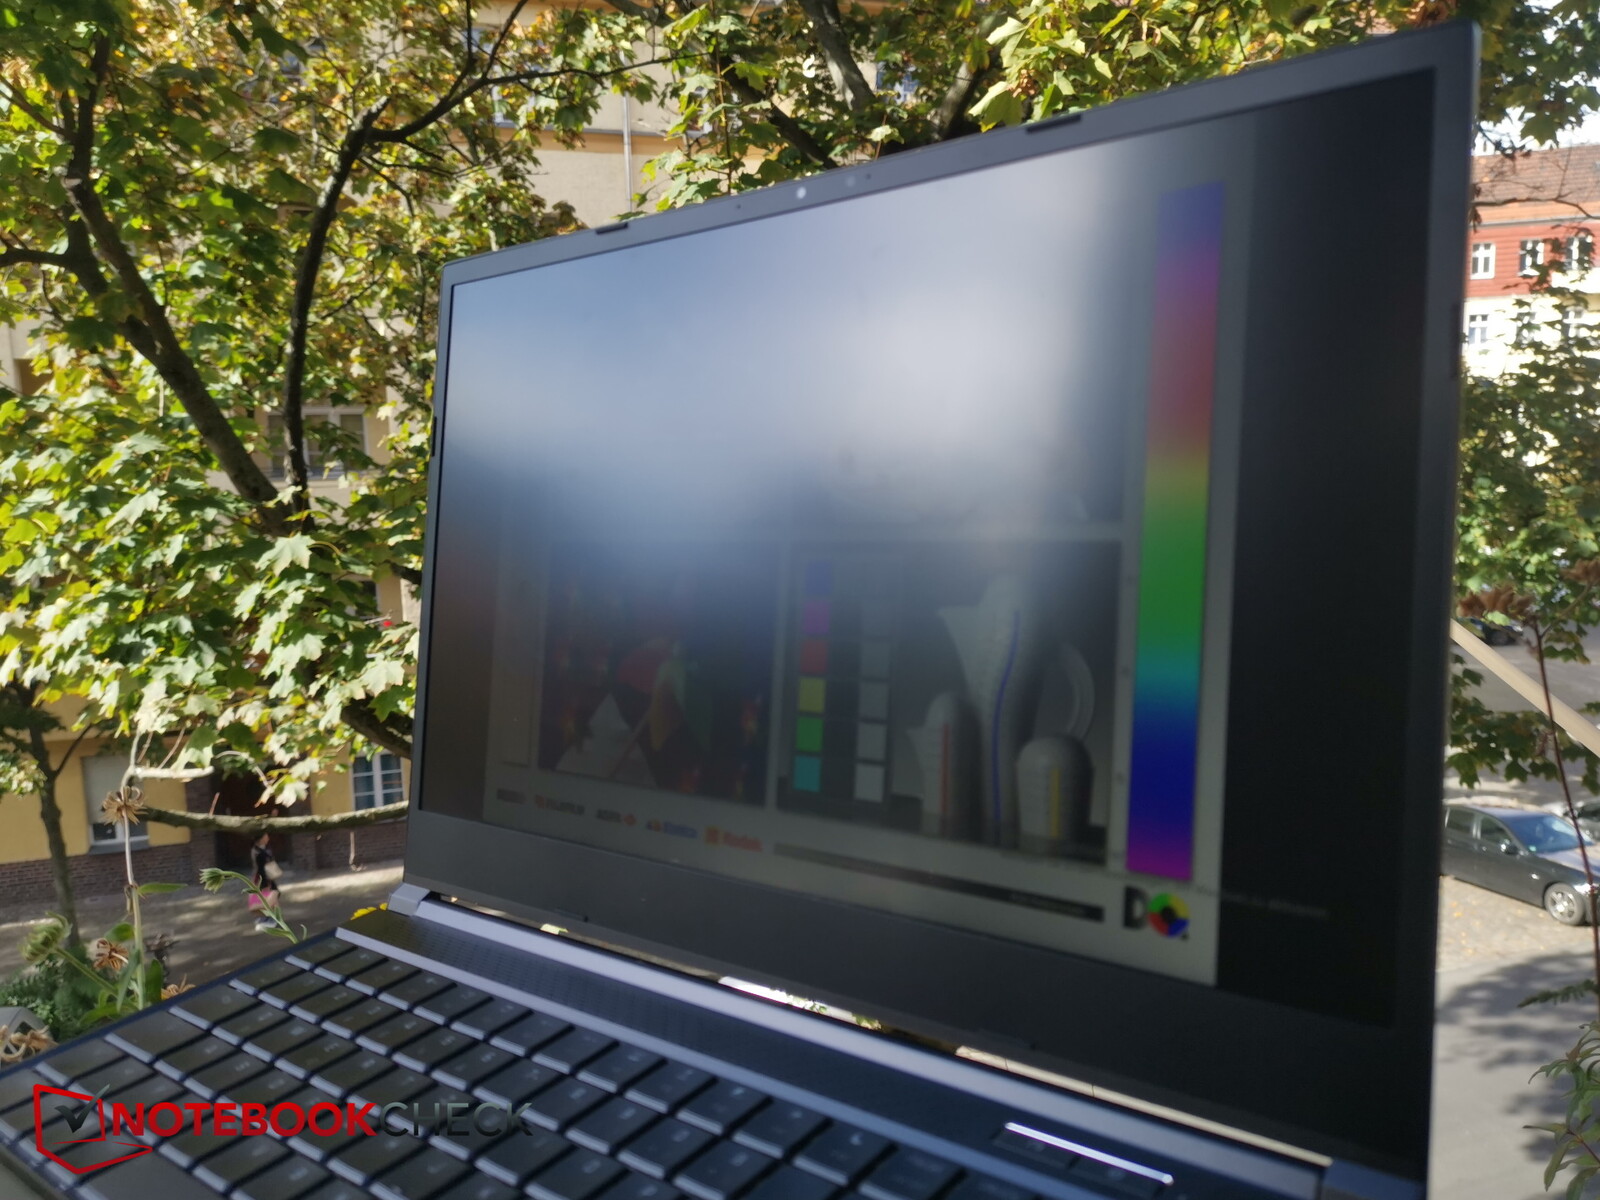
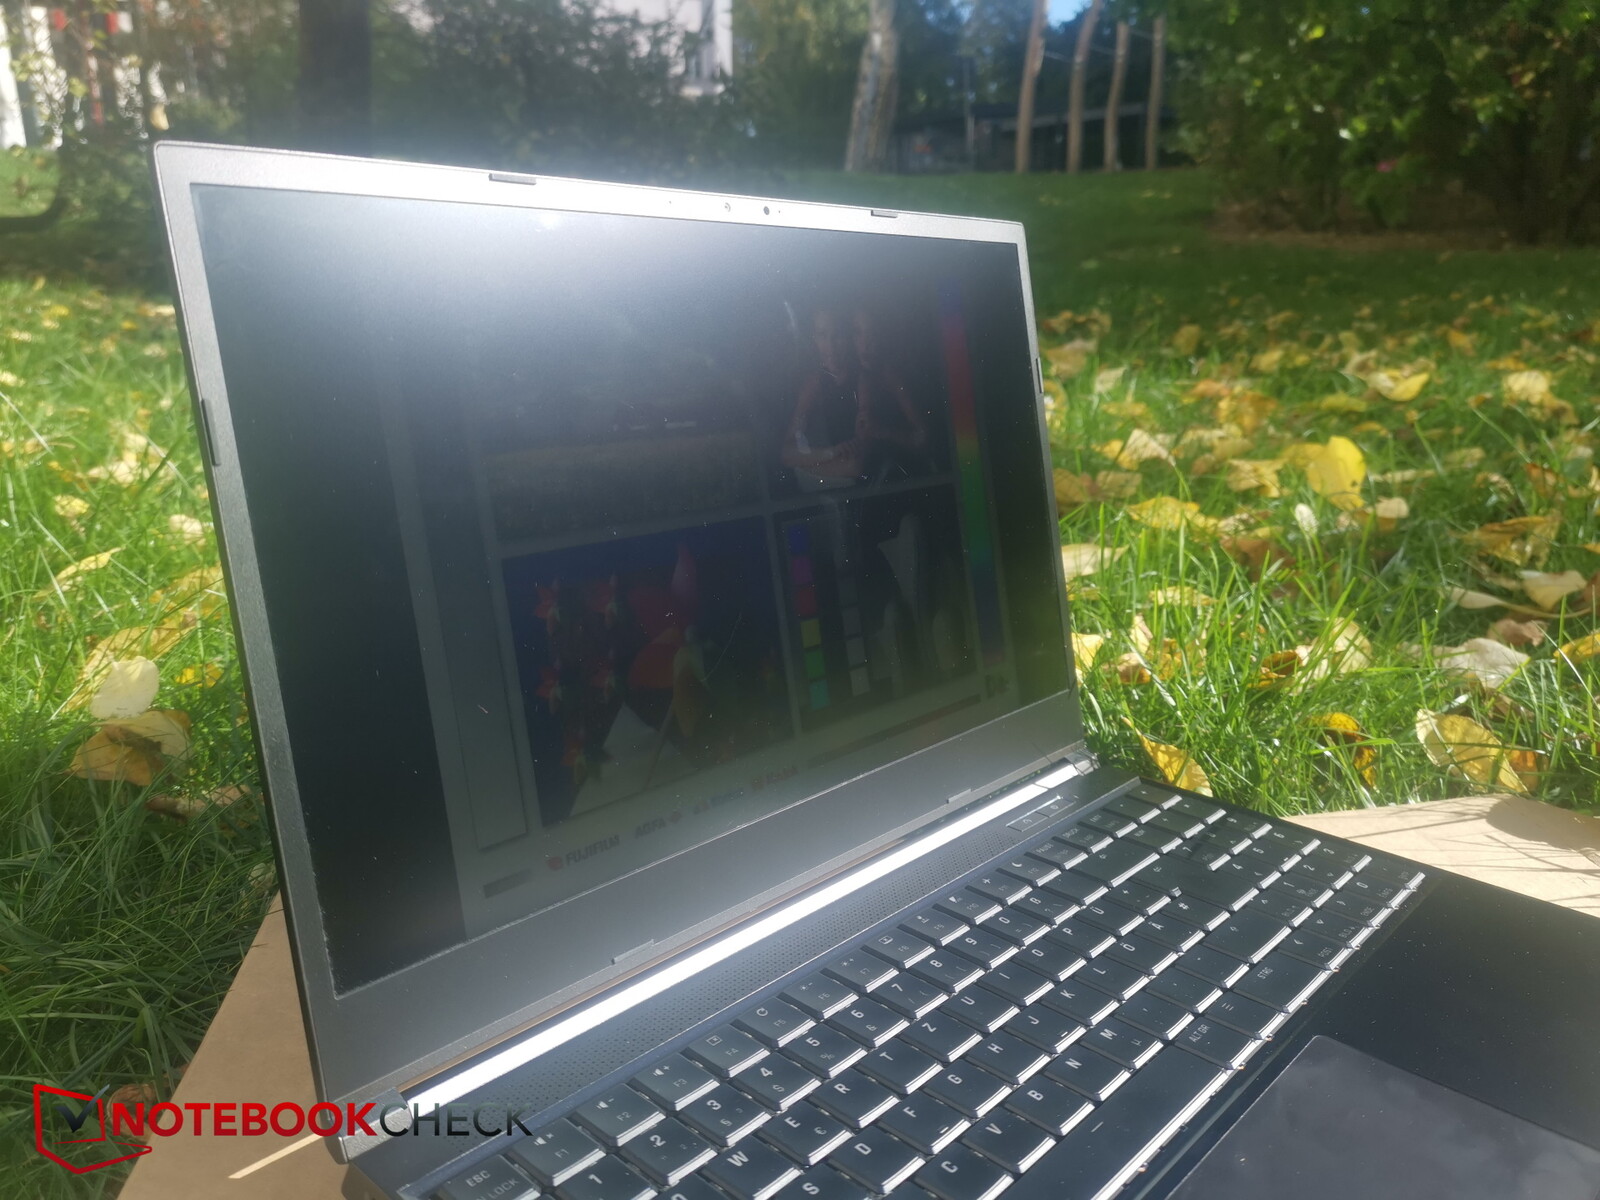
Cuando utilices el dispositivo en exteriores, debes buscar un lugar con sombra y asegurarte de que estás viendo la pantalla de frente. Esto se debe a que el contenido de la pantalla es muy difícil de leer cuando se ve en ángulo o bajo la luz directa del sol.

Rendimiento - AMD e Intel casi a la par
Encontrarás muchas formas diferentes de configurar el Neo 15 M22 en la página web de bestware. Pero siempre viene con el mismo panel y procesador AMD. Los que quieran una CPU Intel en su lugar pueden mirar el Neo 15 E22.
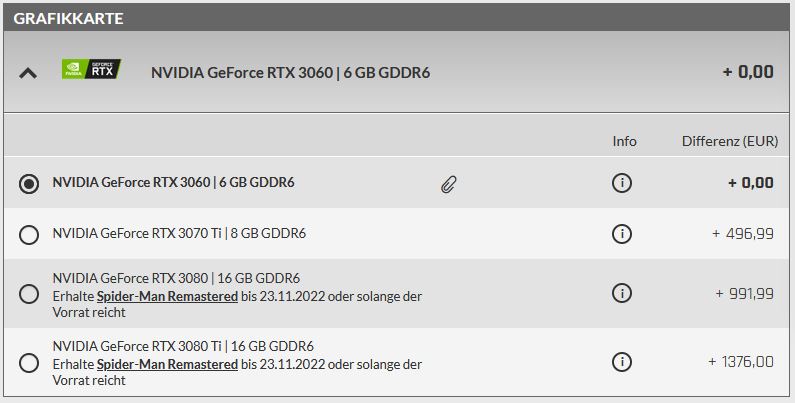
El RTX 3070 Ti de nuestra unidad de análisis añade unos 497 euros (494 dólares) al precio de compra en comparación con la opción de GPU de gama más baja (RTX 3060). La actualización de una RTX 3060 a una RTX 3080 Ti.
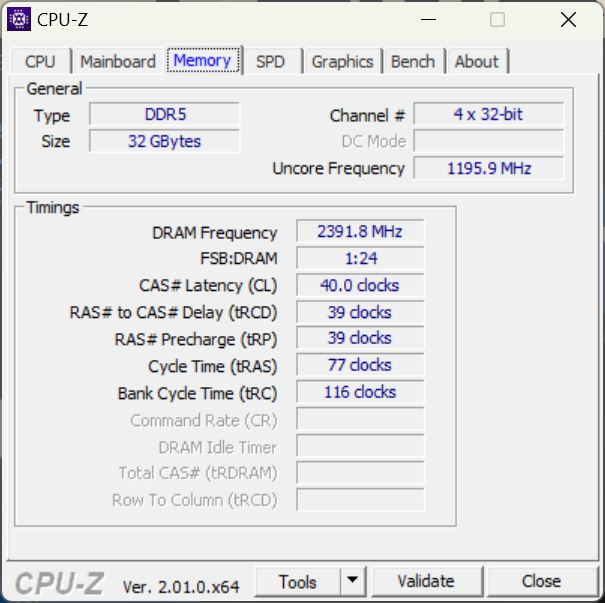
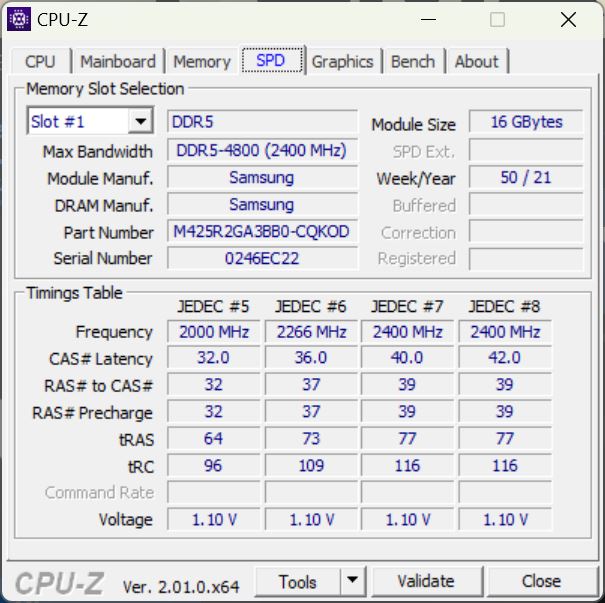
Muchos otros componentes, como el SSD, la RAM DDR5 y el módulo Wi-Fi, son igualmente actualizables.
Condiciones de la prueba
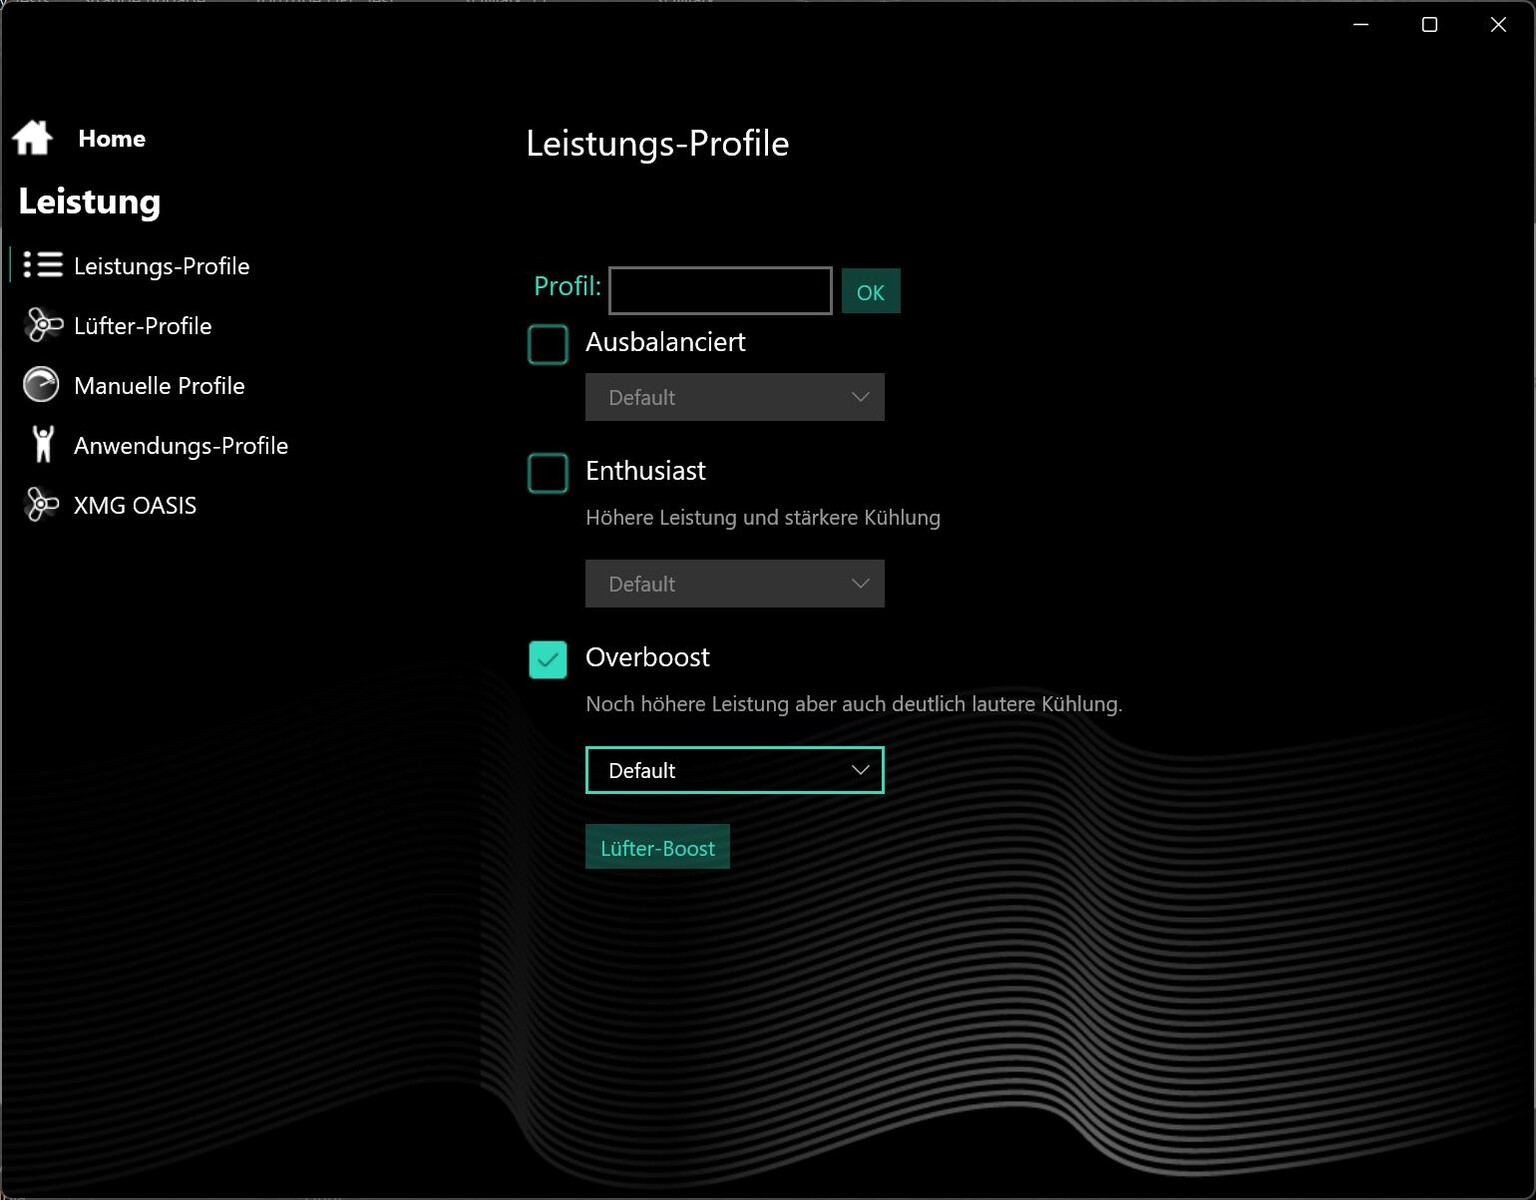
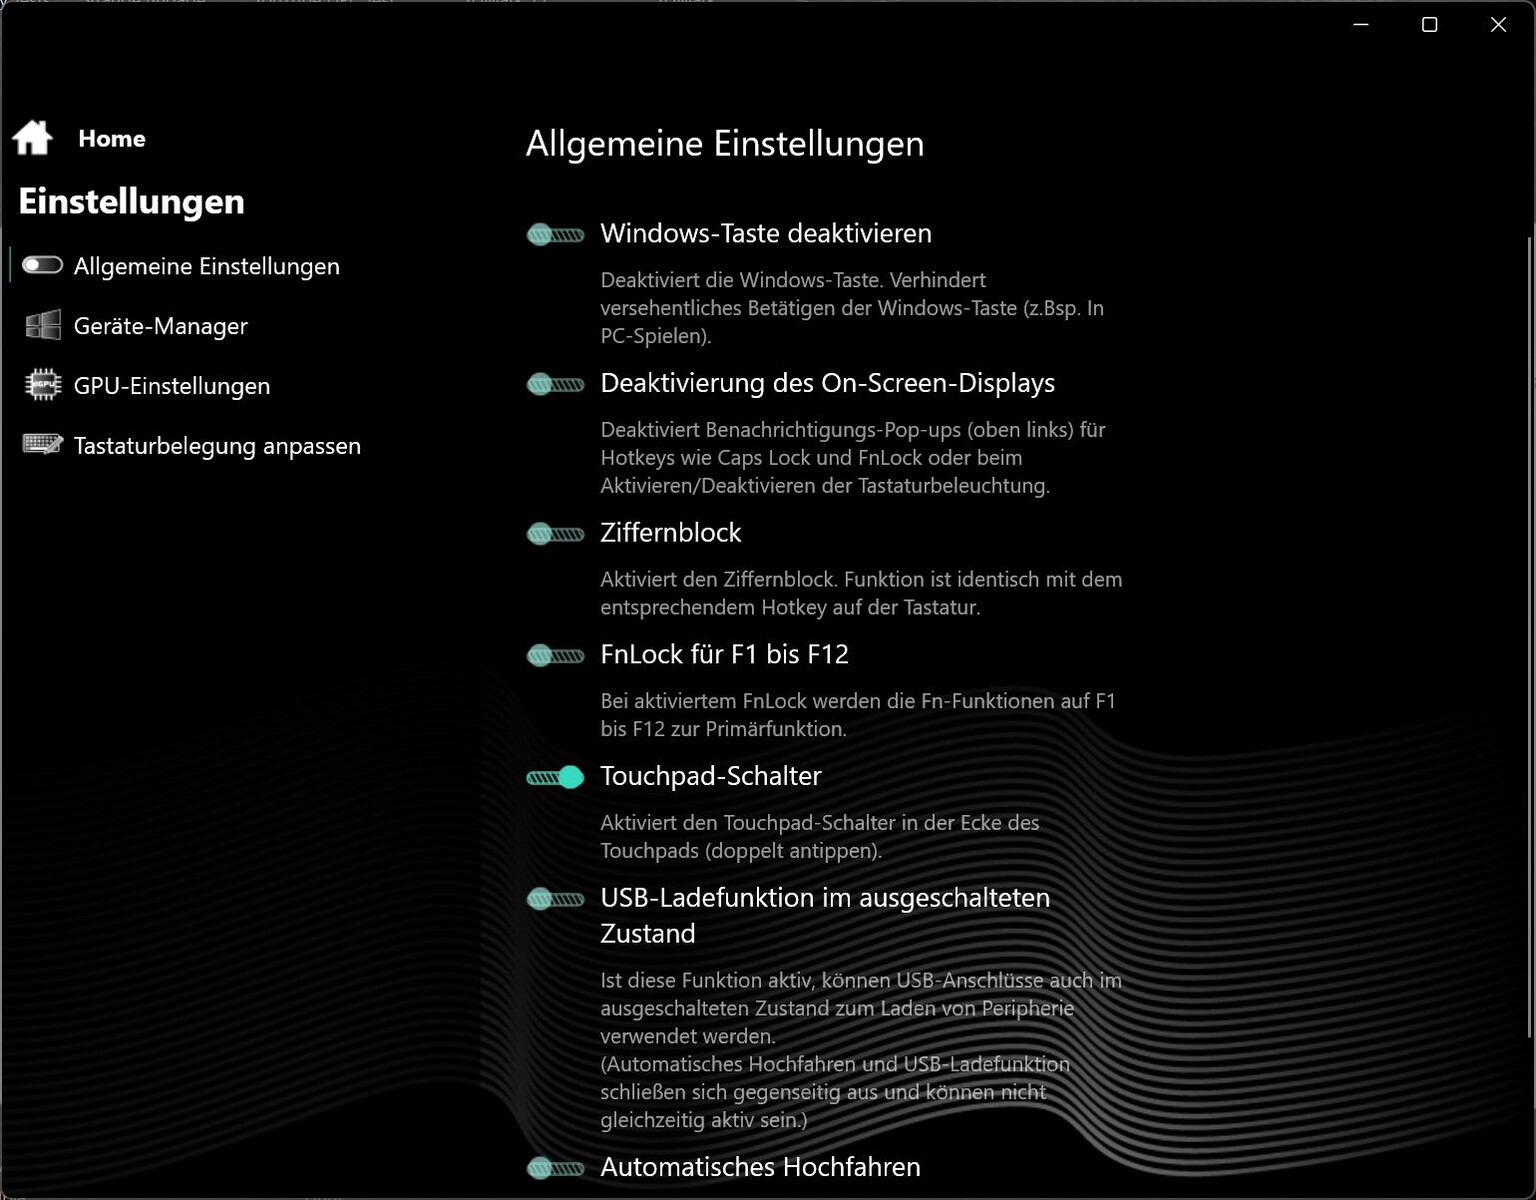
El software del Centro de Control ofrece unos cuantos perfiles de rendimiento (Equilibrado, Enthusiast y Overboost). Seleccionamos el modo más potente (Overboost) para obtener los mejores resultados del benchmark, a pesar de que Schenker recomienda la opción intermedia, que está diseñada para ser el mejor compromiso entre rendimiento y niveles de ruido.
Además, el software permite a los usuarios ajustar manualmente varios parámetros (por ejemplo, Dynamic Boost), así como los valores de compensación. No obstante, nos gustaría que se añadiera a las opciones un modo silencioso.
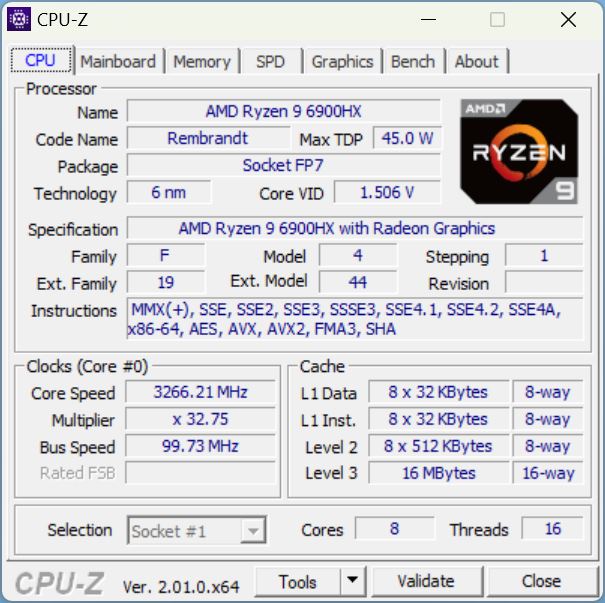
Procesador

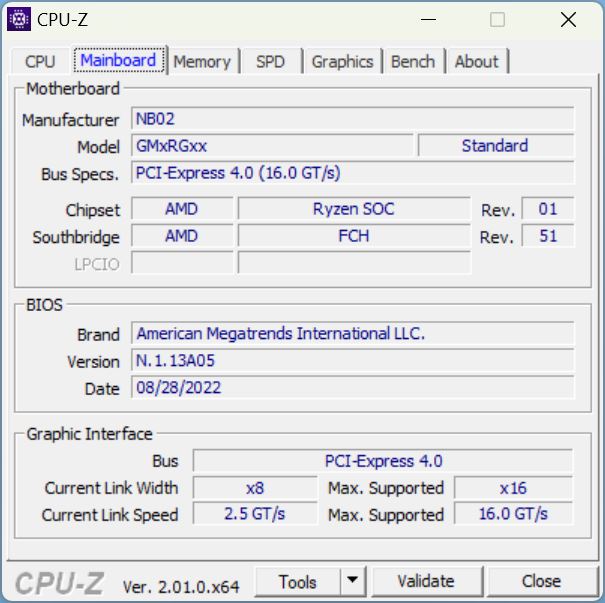
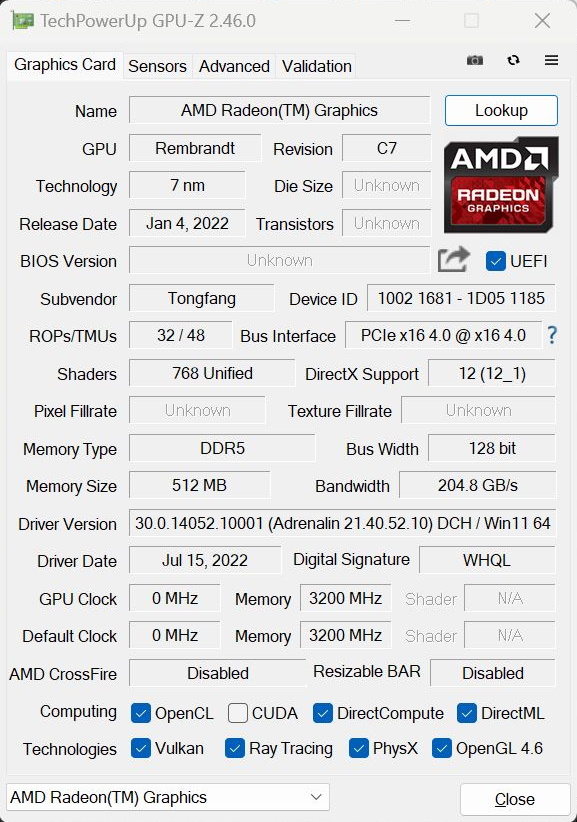
A diferencia del Neo 15 E22, que cuenta con un Core i7-12700Hel Neo M22 está alimentado por un AMD Ryzen 9 6900HX. La CPU Zen 3+ tiene ocho núcleos que pueden funcionar hasta a 4,9 GHz y ejecutar 16 hilos simultáneamente. El procesador también alberga una Radeon 680M integrada.
Al ejecutar Cinebench de forma continuada en un bucle, la CPU Ryzen ofreció su habitual rendimiento consistente sin ninguna caída después de las primeras ejecuciones. Sin embargo, el Core i7-12700H del Neo 15 basado en Intel es ligeramente más rápido. Y esto es naturalmente también cierto para el Core i9-12900H del ROG Strix o incluso el Core i7-12800HX del MSI GE67.
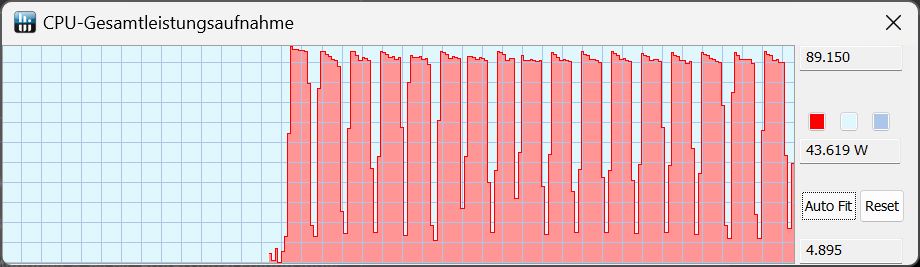
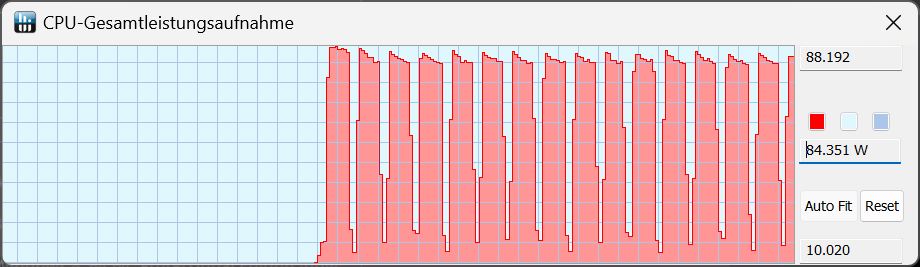
El TDP se mantuvo siempre por debajo de los 90 vatios. En el modo Enthusiast, el uso de energía se redujo ligeramente a unos 85 vatios.
Por el contrario, hubo una caída en el rendimiento cuando el portátil estaba en batería, con el TDP reduciéndose a "sólo" 50 vatios.
Cinebench R15 Multi Sustained Load
Cinebench R23: Multi Core | Single Core
Cinebench R20: CPU (Multi Core) | CPU (Single Core)
Cinebench R15: CPU Multi 64Bit | CPU Single 64Bit
Blender: v2.79 BMW27 CPU
7-Zip 18.03: 7z b 4 | 7z b 4 -mmt1
Geekbench 5.5: Multi-Core | Single-Core
HWBOT x265 Benchmark v2.2: 4k Preset
LibreOffice : 20 Documents To PDF
R Benchmark 2.5: Overall mean
| CPU Performance rating | |
| Media de la clase Gaming | |
| MSI GE67 HX 12UGS | |
| Asus ROG Strix Scar 15 G533ZW-LN106WS | |
| Schenker XMG Neo 15 (i7-12700H, RTX 3080 Ti) | |
| MSI Stealth GS66 12UGS | |
| Acer Nitro 5 AN515-58-72QR | |
| Schenker XMG Neo 15 (Ryzen 9 6900HX, RTX 3070 Ti) | |
| Medio AMD Ryzen 9 6900HX | |
| Cinebench R23 / Multi Core | |
| Media de la clase Gaming (10488 - 42661, n=104, últimos 2 años) | |
| MSI GE67 HX 12UGS | |
| Asus ROG Strix Scar 15 G533ZW-LN106WS | |
| MSI Stealth GS66 12UGS | |
| Schenker XMG Neo 15 (i7-12700H, RTX 3080 Ti) | |
| Acer Nitro 5 AN515-58-72QR | |
| Schenker XMG Neo 15 (Ryzen 9 6900HX, RTX 3070 Ti) | |
| Medio AMD Ryzen 9 6900HX (9709 - 15100, n=19) | |
| Cinebench R23 / Single Core | |
| Media de la clase Gaming (1601 - 2415, n=104, últimos 2 años) | |
| Asus ROG Strix Scar 15 G533ZW-LN106WS | |
| Acer Nitro 5 AN515-58-72QR | |
| MSI GE67 HX 12UGS | |
| Schenker XMG Neo 15 (i7-12700H, RTX 3080 Ti) | |
| MSI Stealth GS66 12UGS | |
| Schenker XMG Neo 15 (Ryzen 9 6900HX, RTX 3070 Ti) | |
| Medio AMD Ryzen 9 6900HX (1516 - 1616, n=19) | |
| Cinebench R20 / CPU (Multi Core) | |
| Media de la clase Gaming (4029 - 16433, n=103, últimos 2 años) | |
| MSI GE67 HX 12UGS | |
| Asus ROG Strix Scar 15 G533ZW-LN106WS | |
| Schenker XMG Neo 15 (i7-12700H, RTX 3080 Ti) | |
| MSI Stealth GS66 12UGS | |
| Acer Nitro 5 AN515-58-72QR | |
| Schenker XMG Neo 15 (Ryzen 9 6900HX, RTX 3070 Ti) | |
| Medio AMD Ryzen 9 6900HX (3742 - 5813, n=19) | |
| Cinebench R20 / CPU (Single Core) | |
| Media de la clase Gaming (622 - 913, n=103, últimos 2 años) | |
| Asus ROG Strix Scar 15 G533ZW-LN106WS | |
| Acer Nitro 5 AN515-58-72QR | |
| MSI Stealth GS66 12UGS | |
| Schenker XMG Neo 15 (i7-12700H, RTX 3080 Ti) | |
| MSI GE67 HX 12UGS | |
| Schenker XMG Neo 15 (Ryzen 9 6900HX, RTX 3070 Ti) | |
| Medio AMD Ryzen 9 6900HX (595 - 631, n=19) | |
| Cinebench R15 / CPU Multi 64Bit | |
| Media de la clase Gaming (1578 - 6330, n=102, últimos 2 años) | |
| MSI GE67 HX 12UGS | |
| Asus ROG Strix Scar 15 G533ZW-LN106WS | |
| MSI Stealth GS66 12UGS | |
| Acer Nitro 5 AN515-58-72QR | |
| Schenker XMG Neo 15 (i7-12700H, RTX 3080 Ti) | |
| Schenker XMG Neo 15 (Ryzen 9 6900HX, RTX 3070 Ti) | |
| Medio AMD Ryzen 9 6900HX (1588 - 2411, n=19) | |
| Cinebench R15 / CPU Single 64Bit | |
| Media de la clase Gaming (188.8 - 350, n=103, últimos 2 años) | |
| Asus ROG Strix Scar 15 G533ZW-LN106WS | |
| Acer Nitro 5 AN515-58-72QR | |
| Schenker XMG Neo 15 (i7-12700H, RTX 3080 Ti) | |
| MSI Stealth GS66 12UGS | |
| MSI GE67 HX 12UGS | |
| Schenker XMG Neo 15 (Ryzen 9 6900HX, RTX 3070 Ti) | |
| Medio AMD Ryzen 9 6900HX (241 - 261, n=19) | |
| Blender / v2.79 BMW27 CPU | |
| Medio AMD Ryzen 9 6900HX (212 - 357, n=21) | |
| Schenker XMG Neo 15 (Ryzen 9 6900HX, RTX 3070 Ti) | |
| Acer Nitro 5 AN515-58-72QR | |
| MSI Stealth GS66 12UGS | |
| Schenker XMG Neo 15 (i7-12700H, RTX 3080 Ti) | |
| Asus ROG Strix Scar 15 G533ZW-LN106WS | |
| MSI GE67 HX 12UGS | |
| Media de la clase Gaming (79 - 330, n=101, últimos 2 años) | |
| 7-Zip 18.03 / 7z b 4 | |
| Media de la clase Gaming (33491 - 148086, n=102, últimos 2 años) | |
| MSI GE67 HX 12UGS | |
| Schenker XMG Neo 15 (i7-12700H, RTX 3080 Ti) | |
| MSI Stealth GS66 12UGS | |
| Asus ROG Strix Scar 15 G533ZW-LN106WS | |
| Schenker XMG Neo 15 (Ryzen 9 6900HX, RTX 3070 Ti) | |
| Medio AMD Ryzen 9 6900HX (49526 - 65336, n=20) | |
| Acer Nitro 5 AN515-58-72QR | |
| 7-Zip 18.03 / 7z b 4 -mmt1 | |
| Media de la clase Gaming (4824 - 7436, n=102, últimos 2 años) | |
| Asus ROG Strix Scar 15 G533ZW-LN106WS | |
| Schenker XMG Neo 15 (i7-12700H, RTX 3080 Ti) | |
| Schenker XMG Neo 15 (Ryzen 9 6900HX, RTX 3070 Ti) | |
| Acer Nitro 5 AN515-58-72QR | |
| MSI Stealth GS66 12UGS | |
| Medio AMD Ryzen 9 6900HX (5090 - 6070, n=20) | |
| MSI GE67 HX 12UGS | |
| Geekbench 5.5 / Multi-Core | |
| Media de la clase Gaming (6460 - 28263, n=102, últimos 2 años) | |
| MSI GE67 HX 12UGS | |
| Asus ROG Strix Scar 15 G533ZW-LN106WS | |
| Schenker XMG Neo 15 (i7-12700H, RTX 3080 Ti) | |
| MSI Stealth GS66 12UGS | |
| Schenker XMG Neo 15 (Ryzen 9 6900HX, RTX 3070 Ti) | |
| Acer Nitro 5 AN515-58-72QR | |
| Medio AMD Ryzen 9 6900HX (8313 - 10490, n=21) | |
| Geekbench 5.5 / Single-Core | |
| Media de la clase Gaming (1403 - 2474, n=102, últimos 2 años) | |
| Asus ROG Strix Scar 15 G533ZW-LN106WS | |
| Acer Nitro 5 AN515-58-72QR | |
| MSI GE67 HX 12UGS | |
| Schenker XMG Neo 15 (i7-12700H, RTX 3080 Ti) | |
| MSI Stealth GS66 12UGS | |
| Schenker XMG Neo 15 (Ryzen 9 6900HX, RTX 3070 Ti) | |
| Medio AMD Ryzen 9 6900HX (1523 - 1652, n=21) | |
| HWBOT x265 Benchmark v2.2 / 4k Preset | |
| Media de la clase Gaming (11.5 - 44.4, n=102, últimos 2 años) | |
| MSI GE67 HX 12UGS | |
| Asus ROG Strix Scar 15 G533ZW-LN106WS | |
| Schenker XMG Neo 15 (i7-12700H, RTX 3080 Ti) | |
| MSI Stealth GS66 12UGS | |
| Acer Nitro 5 AN515-58-72QR | |
| Schenker XMG Neo 15 (Ryzen 9 6900HX, RTX 3070 Ti) | |
| Medio AMD Ryzen 9 6900HX (12.6 - 18.7, n=20) | |
| LibreOffice / 20 Documents To PDF | |
| Schenker XMG Neo 15 (Ryzen 9 6900HX, RTX 3070 Ti) | |
| Medio AMD Ryzen 9 6900HX (44.8 - 81.7, n=20) | |
| Media de la clase Gaming (33.2 - 88.8, n=102, últimos 2 años) | |
| Schenker XMG Neo 15 (i7-12700H, RTX 3080 Ti) | |
| MSI GE67 HX 12UGS | |
| Acer Nitro 5 AN515-58-72QR | |
| MSI Stealth GS66 12UGS | |
| Asus ROG Strix Scar 15 G533ZW-LN106WS | |
| R Benchmark 2.5 / Overall mean | |
| Schenker XMG Neo 15 (Ryzen 9 6900HX, RTX 3070 Ti) | |
| Medio AMD Ryzen 9 6900HX (0.4627 - 0.4974, n=20) | |
| MSI GE67 HX 12UGS | |
| Schenker XMG Neo 15 (i7-12700H, RTX 3080 Ti) | |
| Acer Nitro 5 AN515-58-72QR | |
| MSI Stealth GS66 12UGS | |
| Asus ROG Strix Scar 15 G533ZW-LN106WS | |
| Media de la clase Gaming (0.3439 - 0.59, n=102, últimos 2 años) | |
* ... más pequeño es mejor
AIDA64: FP32 Ray-Trace | FPU Julia | CPU SHA3 | CPU Queen | FPU SinJulia | FPU Mandel | CPU AES | CPU ZLib | FP64 Ray-Trace | CPU PhotoWorxx
| Performance rating | |
| Media de la clase Gaming | |
| Medio AMD Ryzen 9 6900HX | |
| Schenker XMG Neo 15 (Ryzen 9 6900HX, RTX 3070 Ti) | |
| MSI GE67 HX 12UGS | |
| Asus ROG Strix Scar 15 G533ZW-LN106WS | |
| MSI Stealth GS66 12UGS | |
| Schenker XMG Neo 15 (i7-12700H, RTX 3080 Ti) | |
| Acer Nitro 5 AN515-58-72QR | |
| AIDA64 / FP32 Ray-Trace | |
| Media de la clase Gaming (10227 - 85542, n=102, últimos 2 años) | |
| Schenker XMG Neo 15 (Ryzen 9 6900HX, RTX 3070 Ti) | |
| Medio AMD Ryzen 9 6900HX (10950 - 17963, n=20) | |
| MSI GE67 HX 12UGS | |
| Asus ROG Strix Scar 15 G533ZW-LN106WS | |
| Schenker XMG Neo 15 (i7-12700H, RTX 3080 Ti) | |
| MSI Stealth GS66 12UGS | |
| Acer Nitro 5 AN515-58-72QR | |
| AIDA64 / FPU Julia | |
| Media de la clase Gaming (51376 - 372155, n=102, últimos 2 años) | |
| Schenker XMG Neo 15 (Ryzen 9 6900HX, RTX 3070 Ti) | |
| Medio AMD Ryzen 9 6900HX (71414 - 110797, n=20) | |
| MSI GE67 HX 12UGS | |
| Asus ROG Strix Scar 15 G533ZW-LN106WS | |
| Schenker XMG Neo 15 (i7-12700H, RTX 3080 Ti) | |
| MSI Stealth GS66 12UGS | |
| Acer Nitro 5 AN515-58-72QR | |
| AIDA64 / CPU SHA3 | |
| Media de la clase Gaming (2180 - 10115, n=102, últimos 2 años) | |
| MSI GE67 HX 12UGS | |
| Schenker XMG Neo 15 (Ryzen 9 6900HX, RTX 3070 Ti) | |
| Asus ROG Strix Scar 15 G533ZW-LN106WS | |
| Medio AMD Ryzen 9 6900HX (2471 - 3804, n=20) | |
| Schenker XMG Neo 15 (i7-12700H, RTX 3080 Ti) | |
| MSI Stealth GS66 12UGS | |
| Acer Nitro 5 AN515-58-72QR | |
| AIDA64 / CPU Queen | |
| Media de la clase Gaming (49785 - 173351, n=86, últimos 2 años) | |
| Schenker XMG Neo 15 (Ryzen 9 6900HX, RTX 3070 Ti) | |
| Asus ROG Strix Scar 15 G533ZW-LN106WS | |
| Medio AMD Ryzen 9 6900HX (84185 - 107544, n=20) | |
| Acer Nitro 5 AN515-58-72QR | |
| Schenker XMG Neo 15 (i7-12700H, RTX 3080 Ti) | |
| MSI Stealth GS66 12UGS | |
| MSI GE67 HX 12UGS | |
| AIDA64 / FPU SinJulia | |
| Media de la clase Gaming (4424 - 33636, n=102, últimos 2 años) | |
| Schenker XMG Neo 15 (Ryzen 9 6900HX, RTX 3070 Ti) | |
| Medio AMD Ryzen 9 6900HX (10970 - 13205, n=20) | |
| MSI GE67 HX 12UGS | |
| Asus ROG Strix Scar 15 G533ZW-LN106WS | |
| Schenker XMG Neo 15 (i7-12700H, RTX 3080 Ti) | |
| Acer Nitro 5 AN515-58-72QR | |
| MSI Stealth GS66 12UGS | |
| AIDA64 / FPU Mandel | |
| Media de la clase Gaming (25115 - 196829, n=102, últimos 2 años) | |
| Schenker XMG Neo 15 (Ryzen 9 6900HX, RTX 3070 Ti) | |
| Medio AMD Ryzen 9 6900HX (39164 - 61370, n=20) | |
| MSI GE67 HX 12UGS | |
| Asus ROG Strix Scar 15 G533ZW-LN106WS | |
| Schenker XMG Neo 15 (i7-12700H, RTX 3080 Ti) | |
| MSI Stealth GS66 12UGS | |
| Acer Nitro 5 AN515-58-72QR | |
| AIDA64 / CPU AES | |
| MSI GE67 HX 12UGS | |
| Medio AMD Ryzen 9 6900HX (54613 - 142360, n=20) | |
| Media de la clase Gaming (39258 - 247074, n=102, últimos 2 años) | |
| Asus ROG Strix Scar 15 G533ZW-LN106WS | |
| MSI Stealth GS66 12UGS | |
| Schenker XMG Neo 15 (Ryzen 9 6900HX, RTX 3070 Ti) | |
| Schenker XMG Neo 15 (i7-12700H, RTX 3080 Ti) | |
| Acer Nitro 5 AN515-58-72QR | |
| AIDA64 / CPU ZLib | |
| Media de la clase Gaming (574 - 2531, n=102, últimos 2 años) | |
| MSI GE67 HX 12UGS | |
| Asus ROG Strix Scar 15 G533ZW-LN106WS | |
| Schenker XMG Neo 15 (i7-12700H, RTX 3080 Ti) | |
| Acer Nitro 5 AN515-58-72QR | |
| MSI Stealth GS66 12UGS | |
| Medio AMD Ryzen 9 6900HX (578 - 911, n=20) | |
| Schenker XMG Neo 15 (Ryzen 9 6900HX, RTX 3070 Ti) | |
| AIDA64 / FP64 Ray-Trace | |
| Media de la clase Gaming (5509 - 45446, n=102, últimos 2 años) | |
| Schenker XMG Neo 15 (Ryzen 9 6900HX, RTX 3070 Ti) | |
| Medio AMD Ryzen 9 6900HX (5798 - 9540, n=20) | |
| MSI GE67 HX 12UGS | |
| Asus ROG Strix Scar 15 G533ZW-LN106WS | |
| Schenker XMG Neo 15 (i7-12700H, RTX 3080 Ti) | |
| MSI Stealth GS66 12UGS | |
| Acer Nitro 5 AN515-58-72QR | |
| AIDA64 / CPU PhotoWorxx | |
| Media de la clase Gaming (12271 - 89891, n=102, últimos 2 años) | |
| Schenker XMG Neo 15 (i7-12700H, RTX 3080 Ti) | |
| MSI Stealth GS66 12UGS | |
| Asus ROG Strix Scar 15 G533ZW-LN106WS | |
| MSI GE67 HX 12UGS | |
| Schenker XMG Neo 15 (Ryzen 9 6900HX, RTX 3070 Ti) | |
| Medio AMD Ryzen 9 6900HX (26873 - 30604, n=20) | |
| Acer Nitro 5 AN515-58-72QR | |
Rendimiento del sistema
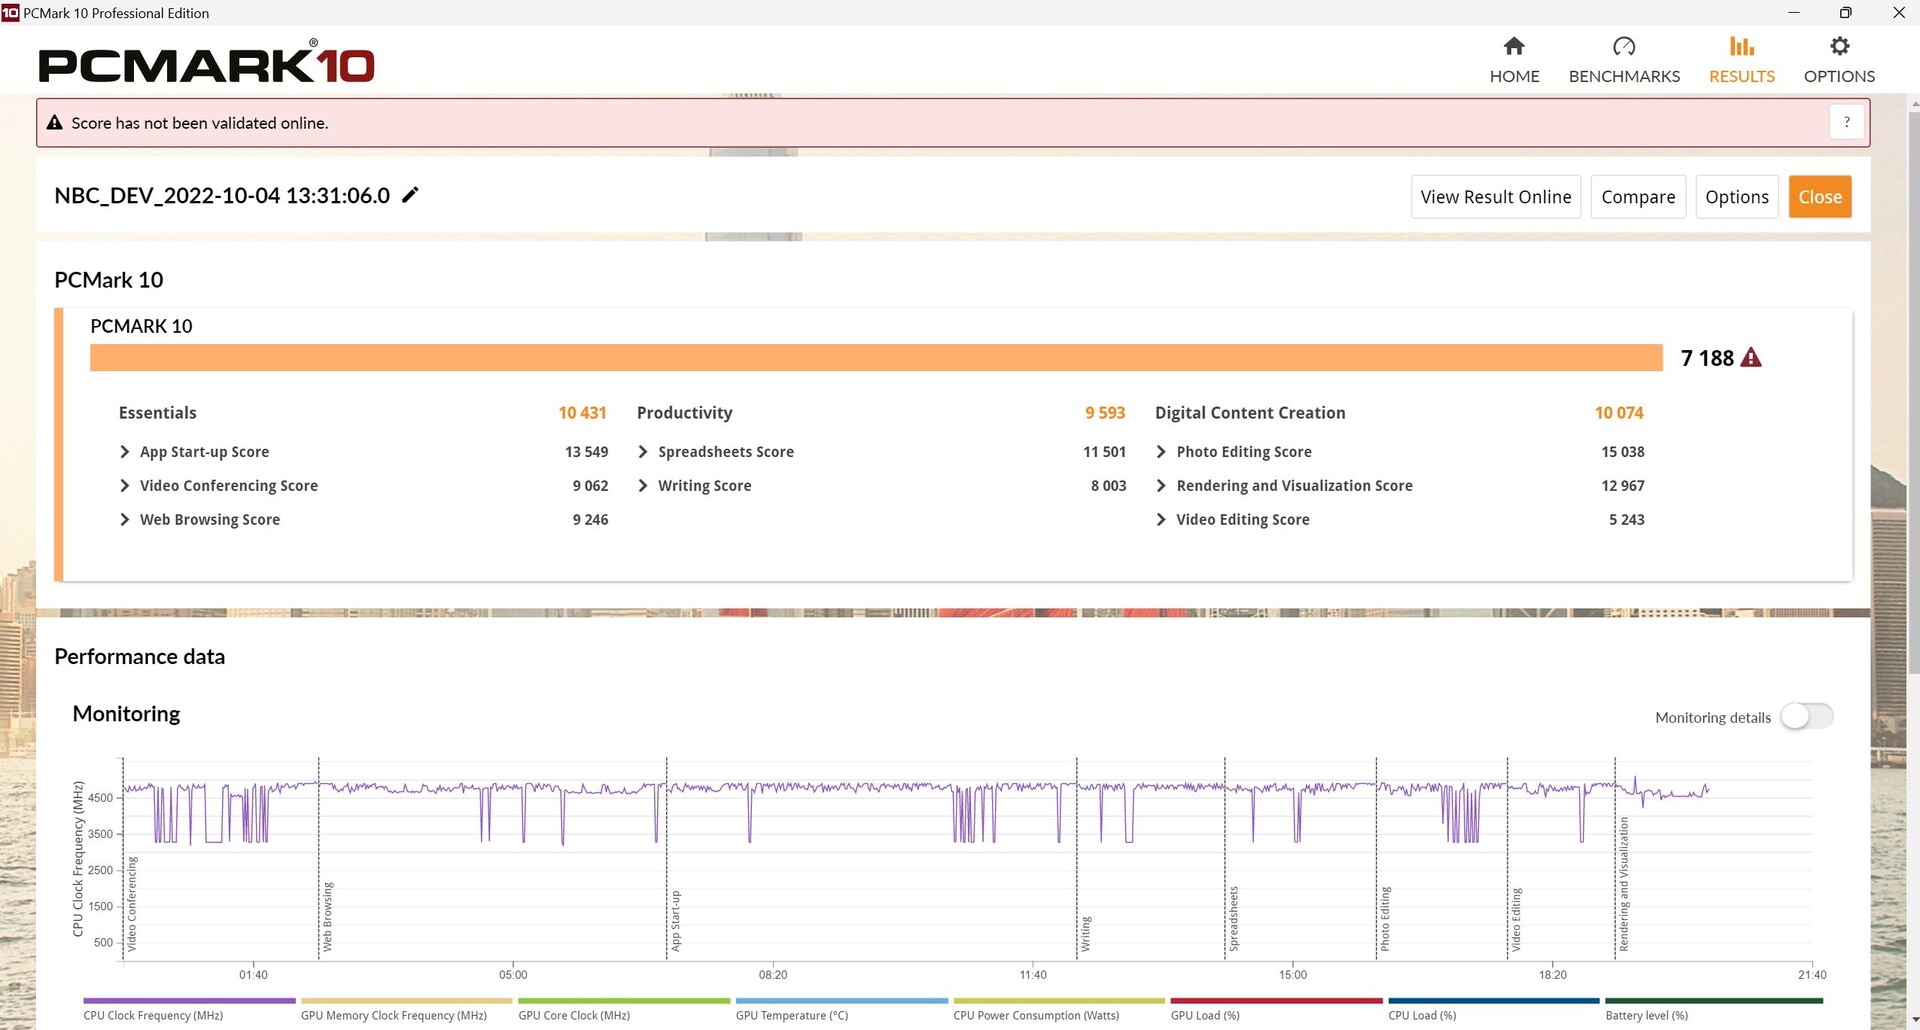
En PCMark 10, el Neo 15 obtuvo resultados que están más o menos en línea con nuestras expectativas. Sin embargo, aparte del titubeante Acer Nitro 5, todos los demás competidores fueron más rápidos, especialmente el MSI Raider GE67 y el Asus ROG Strix.
CrossMark: Overall | Productivity | Creativity | Responsiveness
| PCMark 10 / Score | |
| Media de la clase Gaming (5828 - 12414, n=93, últimos 2 años) | |
| MSI GE67 HX 12UGS | |
| Asus ROG Strix Scar 15 G533ZW-LN106WS | |
| MSI Stealth GS66 12UGS | |
| Schenker XMG Neo 15 (i7-12700H, RTX 3080 Ti) | |
| Medio AMD Ryzen 9 6900HX, NVIDIA GeForce RTX 3070 Ti Laptop GPU (7161 - 7332, n=3) | |
| Schenker XMG Neo 15 (Ryzen 9 6900HX, RTX 3070 Ti) | |
| Acer Nitro 5 AN515-58-72QR | |
| PCMark 10 / Essentials | |
| MSI GE67 HX 12UGS | |
| MSI Stealth GS66 12UGS | |
| Asus ROG Strix Scar 15 G533ZW-LN106WS | |
| Medio AMD Ryzen 9 6900HX, NVIDIA GeForce RTX 3070 Ti Laptop GPU (10431 - 10934, n=3) | |
| Media de la clase Gaming (8810 - 11935, n=97, últimos 2 años) | |
| Schenker XMG Neo 15 (i7-12700H, RTX 3080 Ti) | |
| Schenker XMG Neo 15 (Ryzen 9 6900HX, RTX 3070 Ti) | |
| Acer Nitro 5 AN515-58-72QR | |
| PCMark 10 / Productivity | |
| Media de la clase Gaming (6845 - 25323, n=95, últimos 2 años) | |
| Asus ROG Strix Scar 15 G533ZW-LN106WS | |
| MSI GE67 HX 12UGS | |
| Schenker XMG Neo 15 (Ryzen 9 6900HX, RTX 3070 Ti) | |
| Medio AMD Ryzen 9 6900HX, NVIDIA GeForce RTX 3070 Ti Laptop GPU (9043 - 9960, n=3) | |
| MSI Stealth GS66 12UGS | |
| Schenker XMG Neo 15 (i7-12700H, RTX 3080 Ti) | |
| Acer Nitro 5 AN515-58-72QR | |
| PCMark 10 / Digital Content Creation | |
| Media de la clase Gaming (7602 - 19954, n=95, últimos 2 años) | |
| MSI GE67 HX 12UGS | |
| Schenker XMG Neo 15 (i7-12700H, RTX 3080 Ti) | |
| Asus ROG Strix Scar 15 G533ZW-LN106WS | |
| MSI Stealth GS66 12UGS | |
| Acer Nitro 5 AN515-58-72QR | |
| Medio AMD Ryzen 9 6900HX, NVIDIA GeForce RTX 3070 Ti Laptop GPU (9351 - 10817, n=3) | |
| Schenker XMG Neo 15 (Ryzen 9 6900HX, RTX 3070 Ti) | |
| CrossMark / Overall | |
| Asus ROG Strix Scar 15 G533ZW-LN106WS | |
| Media de la clase Gaming (1366 - 2409, n=94, últimos 2 años) | |
| MSI GE67 HX 12UGS | |
| Schenker XMG Neo 15 (i7-12700H, RTX 3080 Ti) | |
| Acer Nitro 5 AN515-58-72QR | |
| Medio AMD Ryzen 9 6900HX, NVIDIA GeForce RTX 3070 Ti Laptop GPU (1624 - 1743, n=2) | |
| Schenker XMG Neo 15 (Ryzen 9 6900HX, RTX 3070 Ti) | |
| CrossMark / Productivity | |
| Asus ROG Strix Scar 15 G533ZW-LN106WS | |
| MSI GE67 HX 12UGS | |
| Media de la clase Gaming (1386 - 2254, n=94, últimos 2 años) | |
| Acer Nitro 5 AN515-58-72QR | |
| Schenker XMG Neo 15 (i7-12700H, RTX 3080 Ti) | |
| Medio AMD Ryzen 9 6900HX, NVIDIA GeForce RTX 3070 Ti Laptop GPU (1591 - 1722, n=2) | |
| Schenker XMG Neo 15 (Ryzen 9 6900HX, RTX 3070 Ti) | |
| CrossMark / Creativity | |
| Media de la clase Gaming (1343 - 2786, n=94, últimos 2 años) | |
| Asus ROG Strix Scar 15 G533ZW-LN106WS | |
| MSI GE67 HX 12UGS | |
| Schenker XMG Neo 15 (i7-12700H, RTX 3080 Ti) | |
| Acer Nitro 5 AN515-58-72QR | |
| Medio AMD Ryzen 9 6900HX, NVIDIA GeForce RTX 3070 Ti Laptop GPU (1749 - 1809, n=2) | |
| Schenker XMG Neo 15 (Ryzen 9 6900HX, RTX 3070 Ti) | |
| CrossMark / Responsiveness | |
| Asus ROG Strix Scar 15 G533ZW-LN106WS | |
| MSI GE67 HX 12UGS | |
| Media de la clase Gaming (1226 - 2334, n=94, últimos 2 años) | |
| Acer Nitro 5 AN515-58-72QR | |
| Schenker XMG Neo 15 (i7-12700H, RTX 3080 Ti) | |
| Medio AMD Ryzen 9 6900HX, NVIDIA GeForce RTX 3070 Ti Laptop GPU (1382 - 1615, n=2) | |
| Schenker XMG Neo 15 (Ryzen 9 6900HX, RTX 3070 Ti) | |
| PCMark 10 Score | 7188 puntos | |
ayuda | ||
| AIDA64 / Memory Copy | |
| Media de la clase Gaming (21750 - 129946, n=102, últimos 2 años) | |
| Schenker XMG Neo 15 (i7-12700H, RTX 3080 Ti) | |
| MSI Stealth GS66 12UGS | |
| Asus ROG Strix Scar 15 G533ZW-LN106WS | |
| Medio AMD Ryzen 9 6900HX (47938 - 53345, n=20) | |
| Schenker XMG Neo 15 (Ryzen 9 6900HX, RTX 3070 Ti) | |
| MSI GE67 HX 12UGS | |
| Acer Nitro 5 AN515-58-72QR | |
| AIDA64 / Memory Read | |
| Media de la clase Gaming (22956 - 118858, n=102, últimos 2 años) | |
| Schenker XMG Neo 15 (i7-12700H, RTX 3080 Ti) | |
| MSI Stealth GS66 12UGS | |
| Asus ROG Strix Scar 15 G533ZW-LN106WS | |
| MSI GE67 HX 12UGS | |
| Schenker XMG Neo 15 (Ryzen 9 6900HX, RTX 3070 Ti) | |
| Medio AMD Ryzen 9 6900HX (43892 - 53321, n=20) | |
| Acer Nitro 5 AN515-58-72QR | |
| AIDA64 / Memory Write | |
| Media de la clase Gaming (22297 - 135096, n=102, últimos 2 años) | |
| MSI Stealth GS66 12UGS | |
| Schenker XMG Neo 15 (i7-12700H, RTX 3080 Ti) | |
| Asus ROG Strix Scar 15 G533ZW-LN106WS | |
| MSI GE67 HX 12UGS | |
| Schenker XMG Neo 15 (Ryzen 9 6900HX, RTX 3070 Ti) | |
| Medio AMD Ryzen 9 6900HX (51085 - 57202, n=20) | |
| Acer Nitro 5 AN515-58-72QR | |
| AIDA64 / Memory Latency | |
| Media de la clase Gaming (75.3 - 165.4, n=102, últimos 2 años) | |
| Asus ROG Strix Scar 15 G533ZW-LN106WS | |
| MSI GE67 HX 12UGS | |
| MSI Stealth GS66 12UGS | |
| Schenker XMG Neo 15 (Ryzen 9 6900HX, RTX 3070 Ti) | |
| Medio AMD Ryzen 9 6900HX (80.7 - 120.6, n=20) | |
| Acer Nitro 5 AN515-58-72QR | |
| Acer Nitro 5 AN515-58-72QR | |
* ... más pequeño es mejor
Latencia del CPD
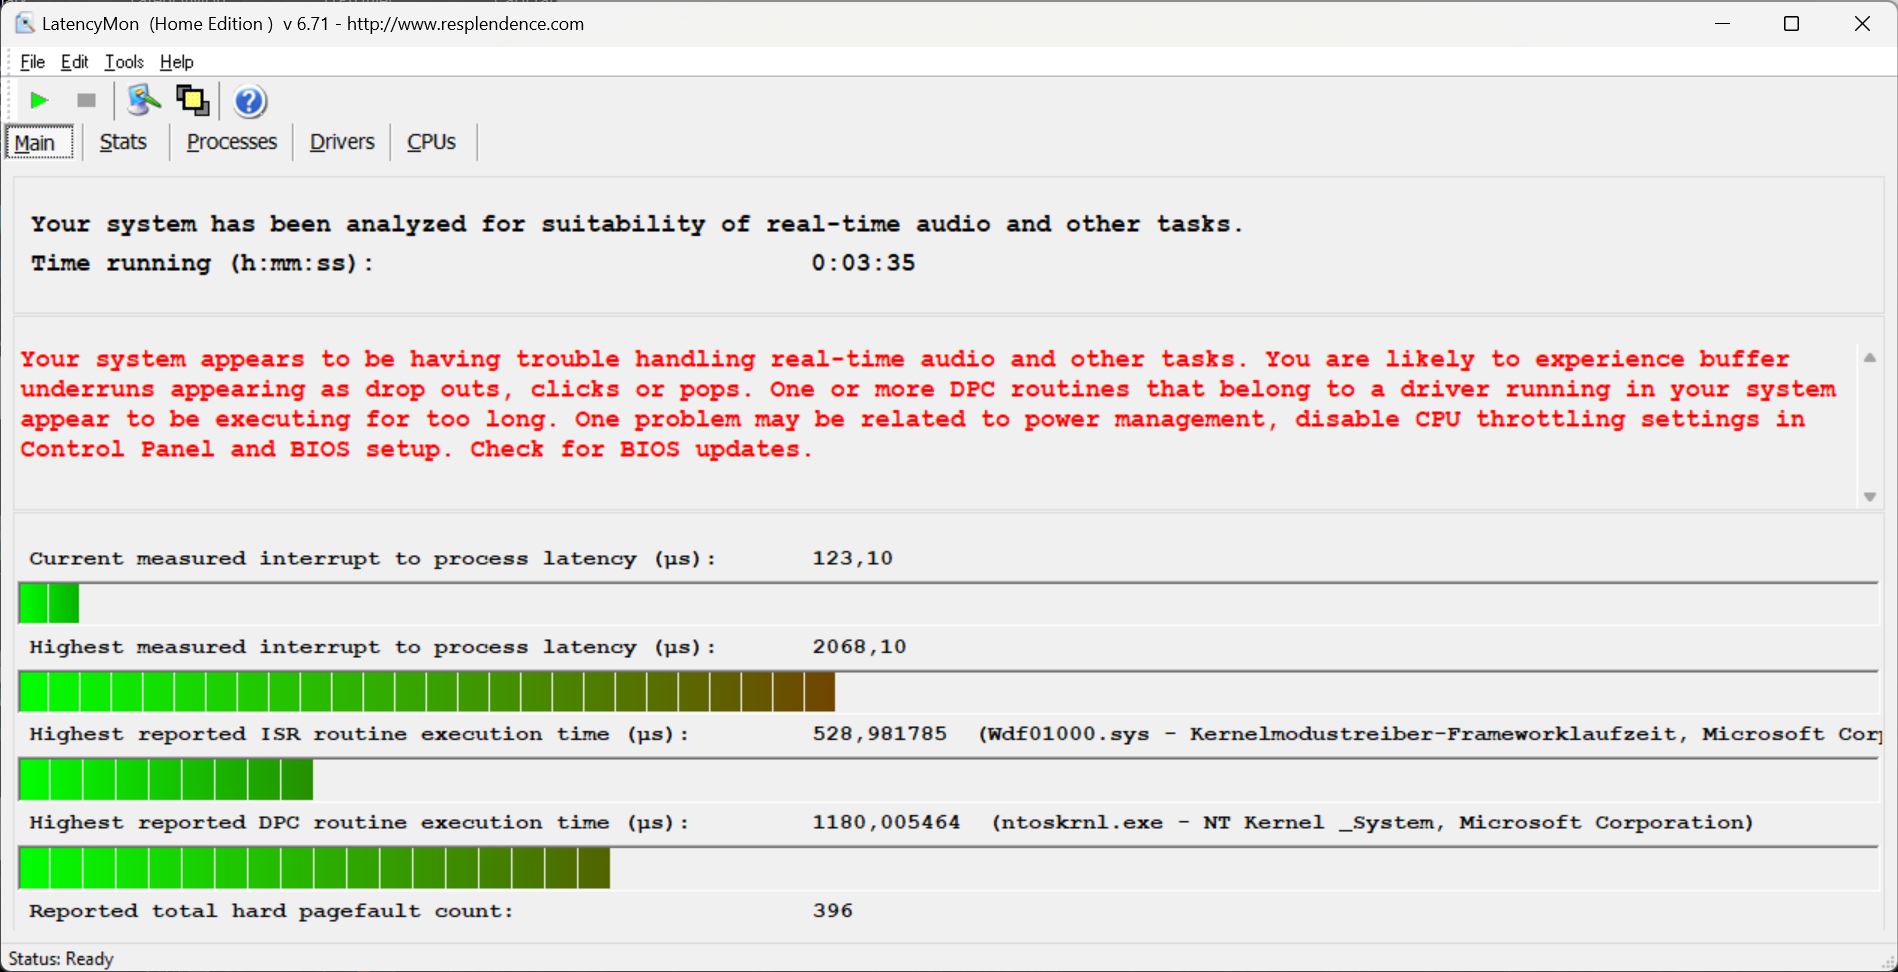
Encontramos los primeros problemas de CPD tras abrir varias pestañas del navegador en nuestra página de inicio. La latencia aumentó durante la reproducción de nuestros vídeos 4K de YouTube a 60 FPS. Se sospecha que los drivers del kernel son la principal causa de este problema.
Pero al menos no hubo caídas de frames y el uso de la CPU/GPU es muy bajo durante la reproducción del vídeo de prueba.


| DPC Latencies / LatencyMon - interrupt to process latency (max), Web, Youtube, Prime95 | |
| Schenker XMG Neo 15 (i7-12700H, RTX 3080 Ti) | |
| MSI Stealth GS66 12UGS | |
| Schenker XMG Neo 15 (Ryzen 9 6900HX, RTX 3070 Ti) | |
| MSI GE67 HX 12UGS | |
| Asus ROG Strix Scar 15 G533ZW-LN106WS | |
| Acer Nitro 5 AN515-58-72QR | |
* ... más pequeño es mejor
Almacenamiento masivo
El Neo 15 puede configurarse con innumerables opciones de SSD. Nuestra unidad de análisis cuenta con un SSD Samsung 980 Pro de 1 TB, que actualmente ocupa el puesto 12 en nuestra lista de referencia de SSD/HDD de https://www.notebookcheck.net/Laptop-harddisks-HDD-SSD-benchmarks.22089.0.html. La unidad es capaz de mantener su gran rendimiento incluso durante un periodo prolongado.

* ... más pequeño es mejor
Sustained Load Read: DiskSpd Read Loop, Queue Depth 8
Tarjeta gráfica

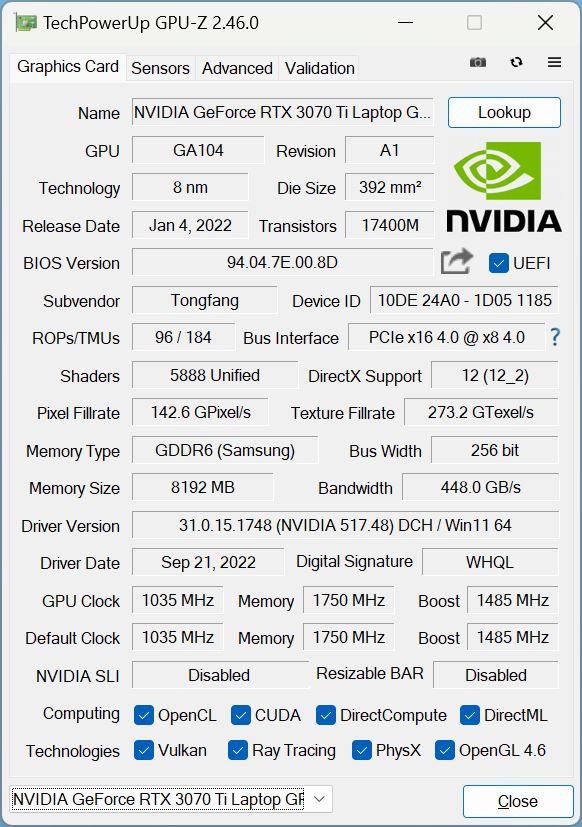
Nuestra unidad de análisis tiene una GeForce RTX 3070 Ti con un objetivo de TGP de 150 vatios incluyendo Dynamic Boost. Estos valores pueden ajustarse manualmente en el Centro de Control. Como alternativa, se puede obtener el Neo 15 con varias GPU que van desde una RTX 3060 hasta RTX 3080 Ti.
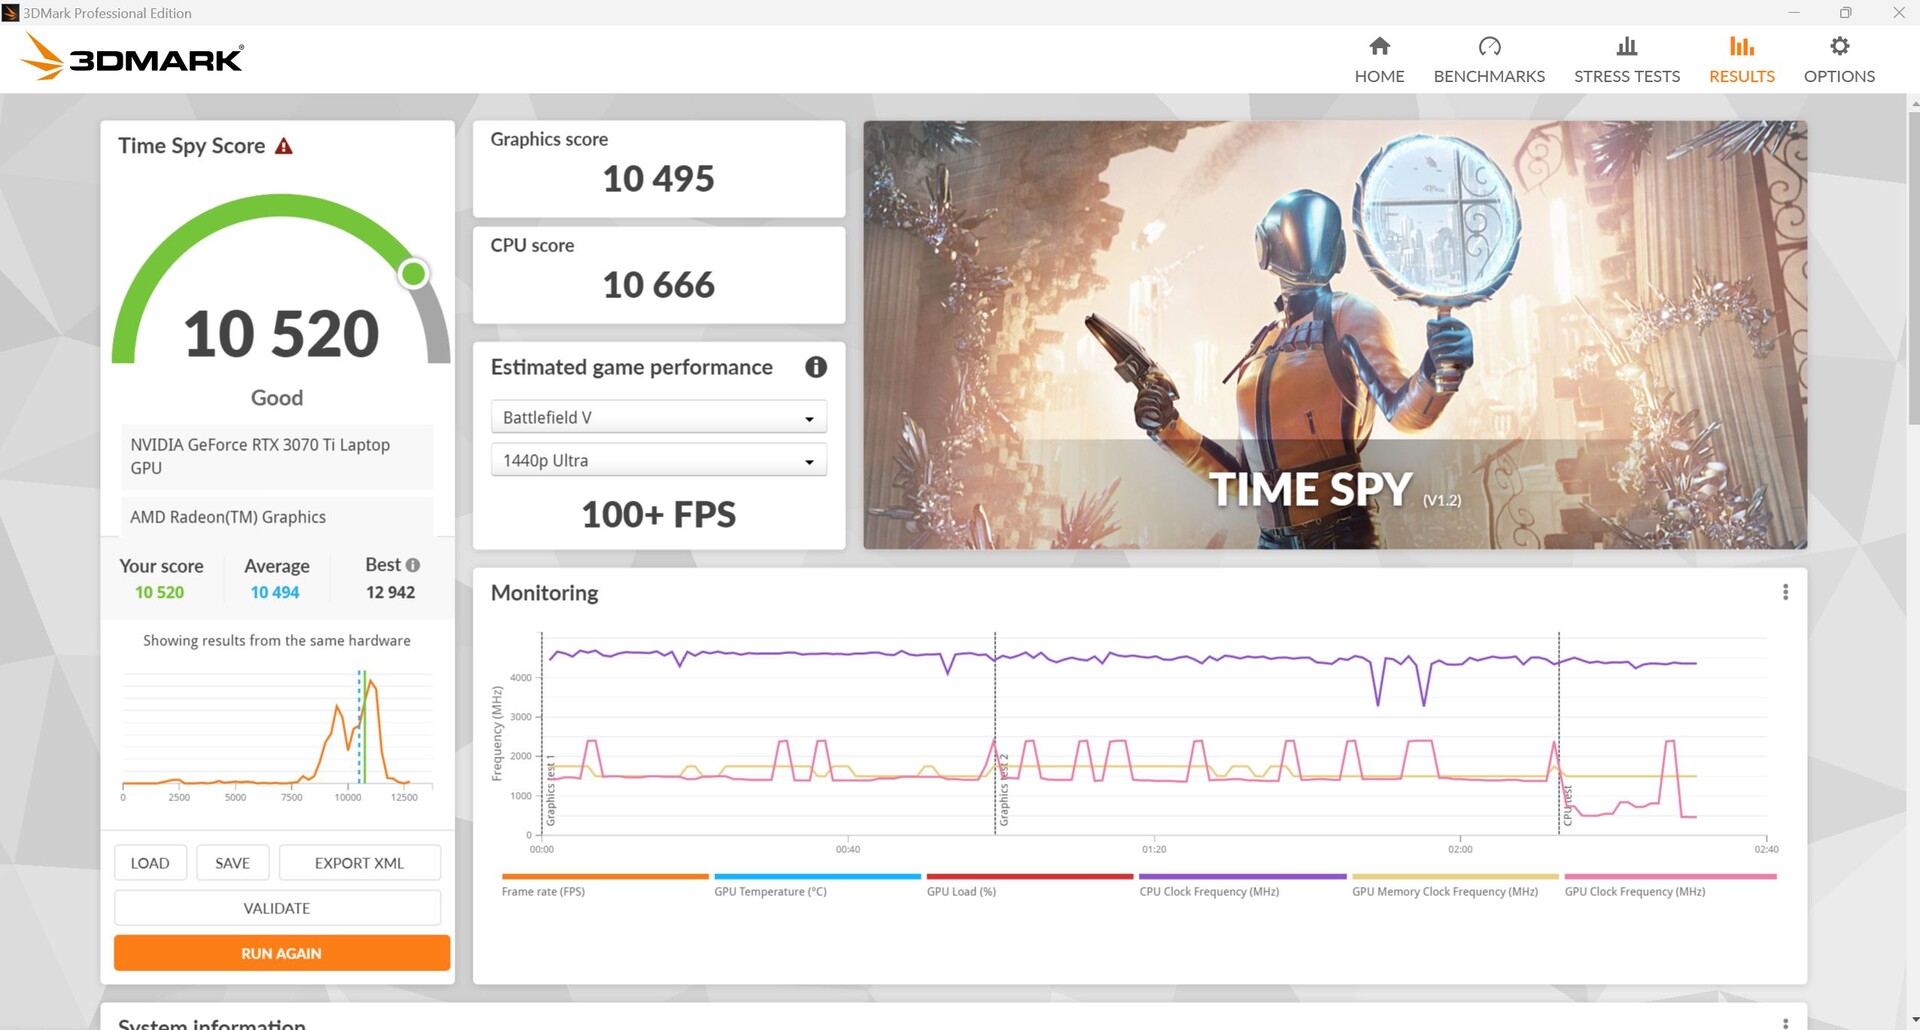
Tal y como esperábamos, la GPU de la unidad de análisis obtuvo una puntuación entre un 5 y un 10 por ciento mejor que una RTX 3070 Ti media. El MSI GE67 es el único dispositivo de la comparación que es significativamente más rápido. Aunque el Strix Scar a menudo obtuvo una mejor puntuación que el Neo, las diferencias de rendimiento son en su mayoría insignificantes, con apenas un 2 por ciento.
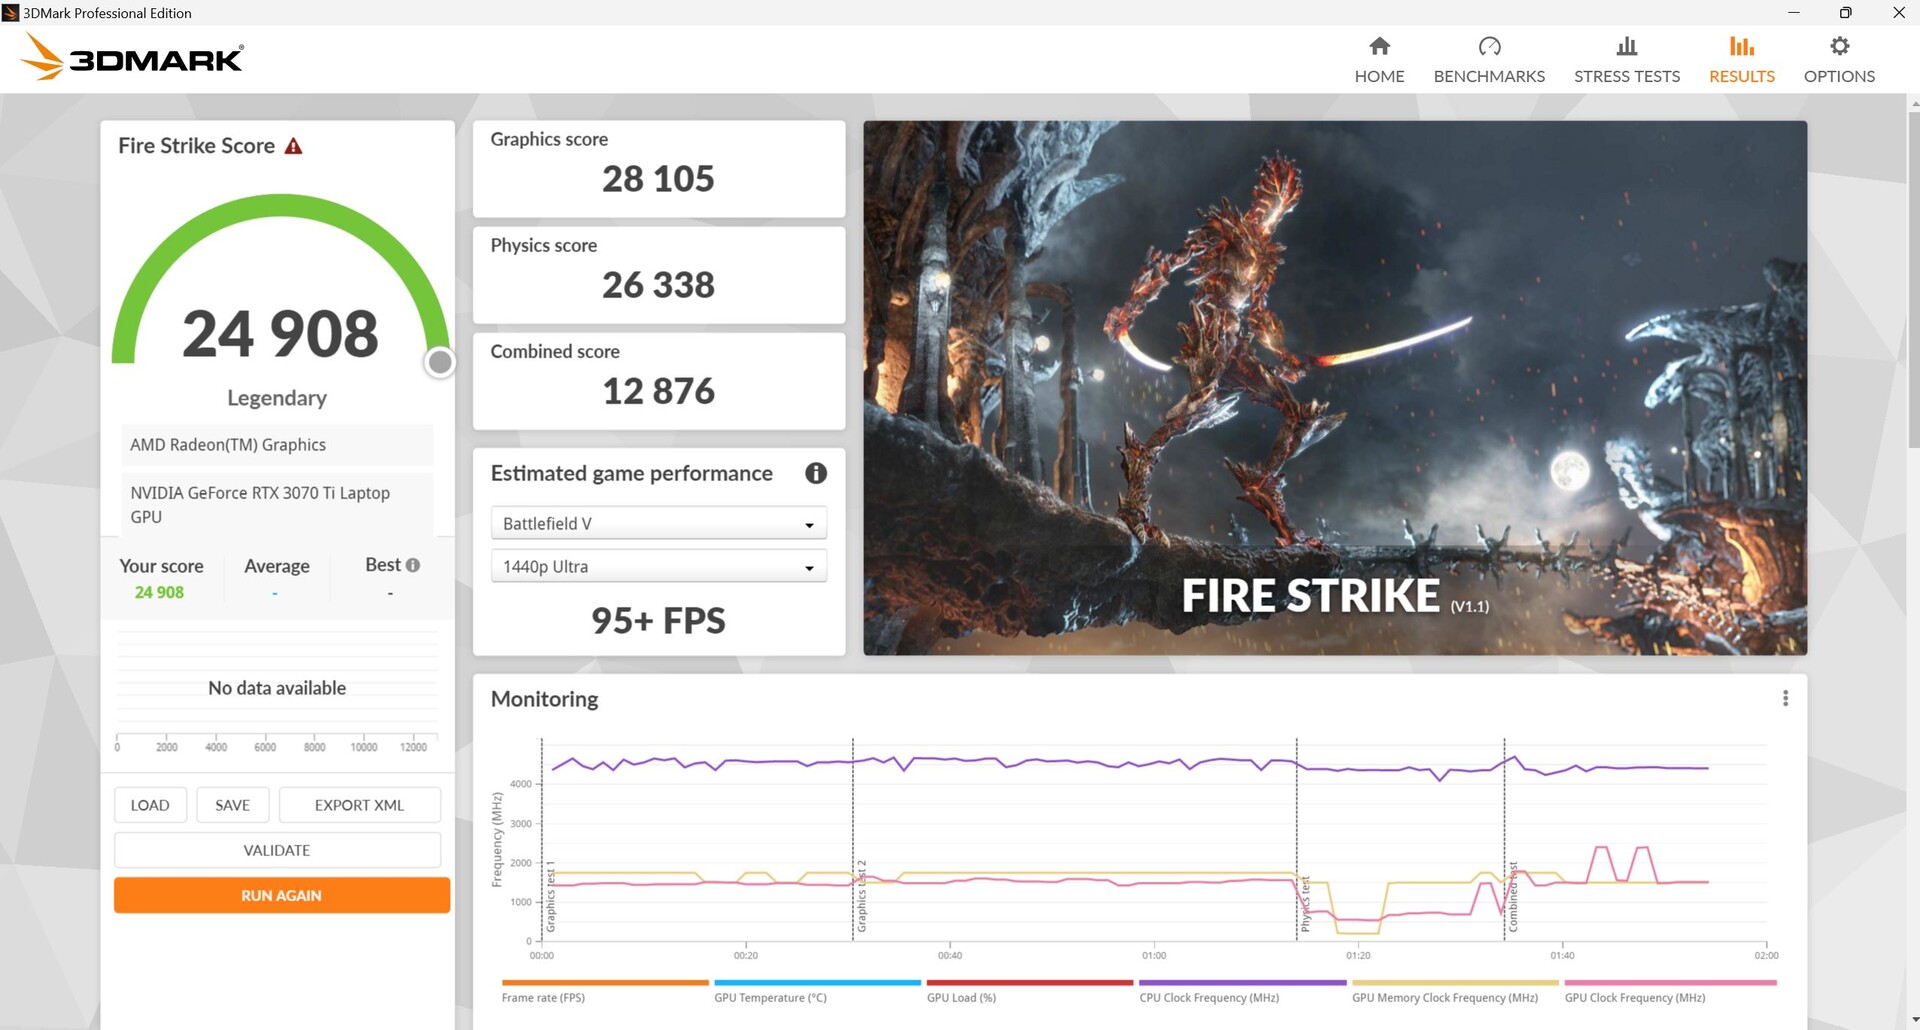
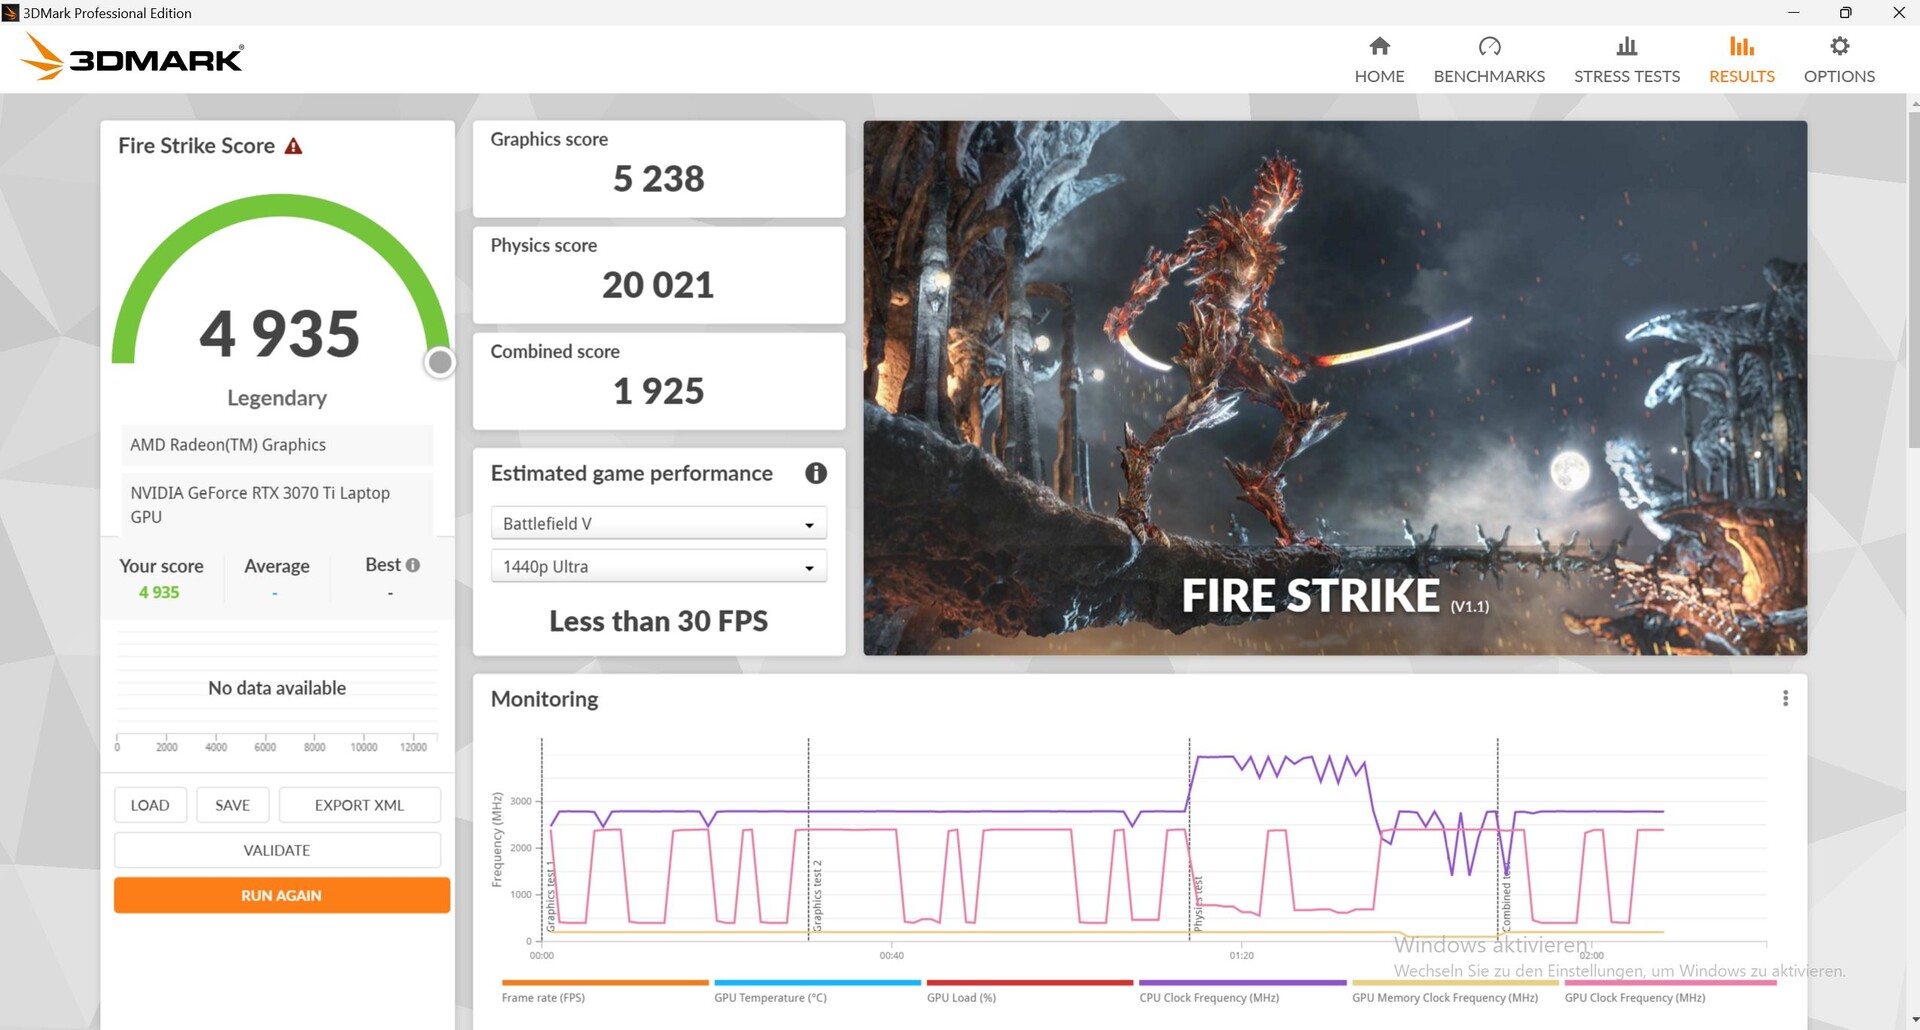
El Neo 15 pierde una gran cantidad de rendimiento 3D cuando funciona con batería. Por ejemplo, cuando desenchufamos el portátil y volvimos a ejecutar Fire Strike, la puntuación de física y gráficos fue de sólo 20.021 y 5.238 respectivamente, en lugar de los 26.338 y 28.105 obtenidos cuando el Neo estaba conectado a la red eléctrica.
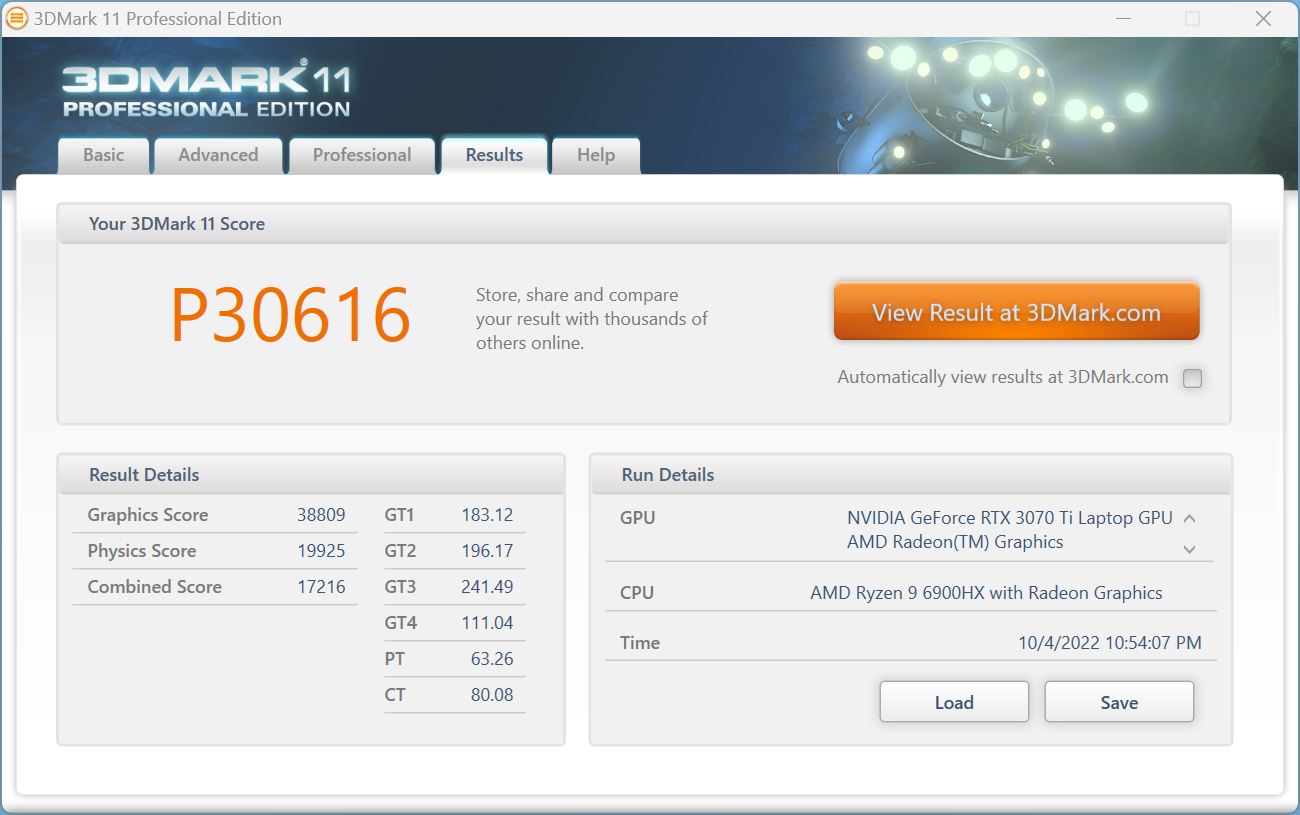

| 3DMark 11 Performance | 30616 puntos | |
| 3DMark Cloud Gate Standard Score | 57616 puntos | |
| 3DMark Fire Strike Score | 24908 puntos | |
| 3DMark Time Spy Score | 10520 puntos | |
ayuda | ||
* ... más pequeño es mejor
Rendimiento de los juegos
El Neo 15 es capaz de ejecutar todos los juegos probados sin problemas, incluso con resolución QHD y ajustes máximos. El portátil sólo empieza a tener problemas cuando los ajustes de ray-tracing se ponen al máximo en juegos como Dying Light 2 (35 FPS).
En la comparación, los resultados de las pruebas de juego pintan una imagen similar a los de 3DMark: La GPU del Neo rindió en gran medida (pero no siempre) mejor que una RTX 3070 Ti media. Eso sí, la Asus ROG Strix Scar y, sobre todo, la MSI GE67 fueron más rápidas que la Neo.
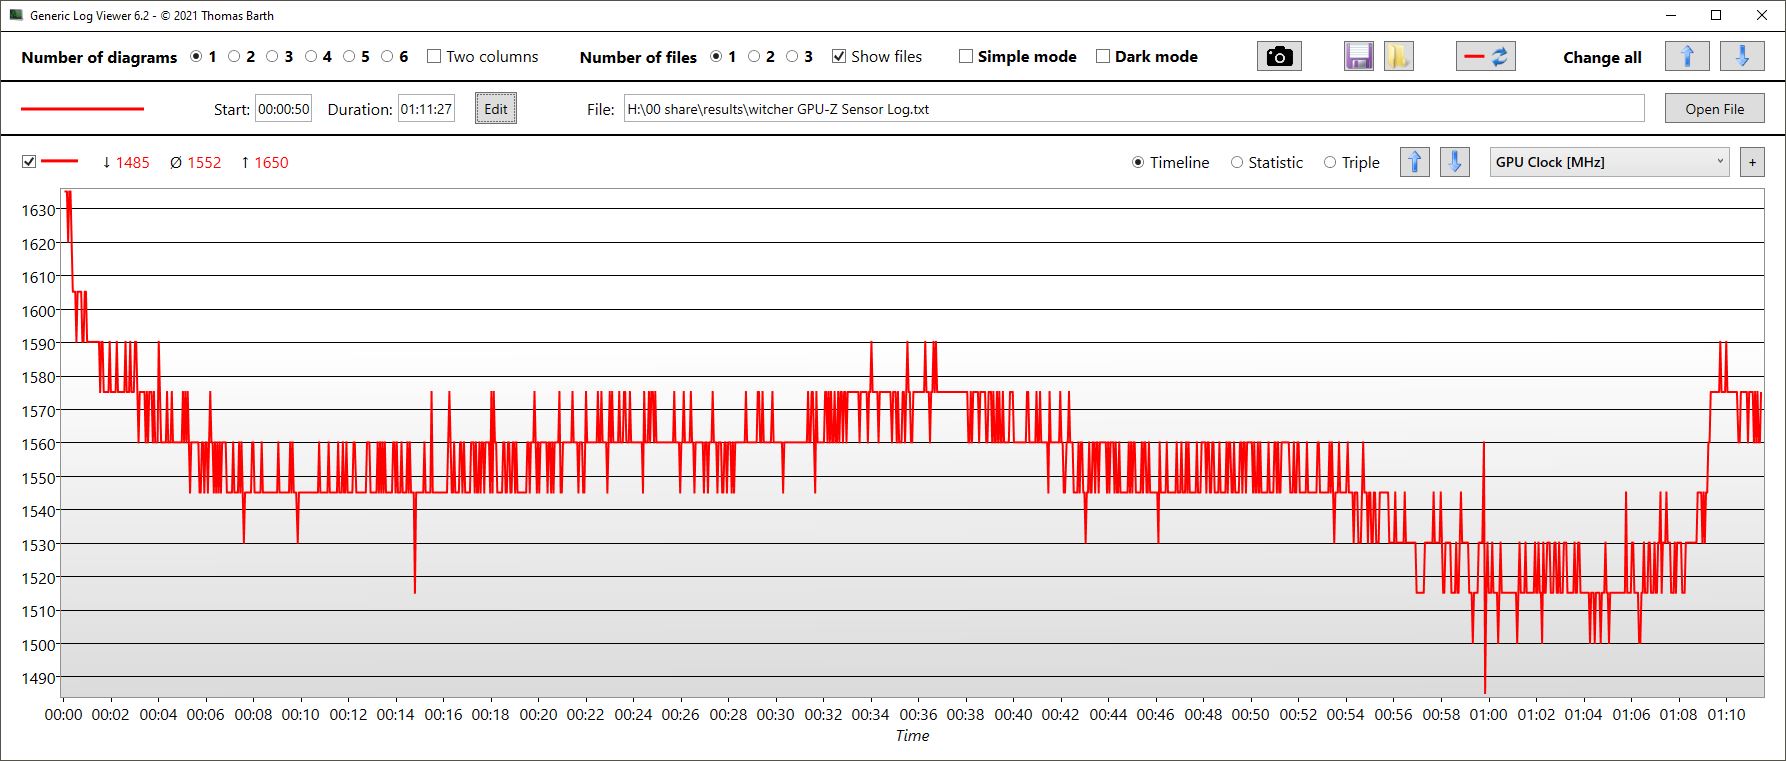
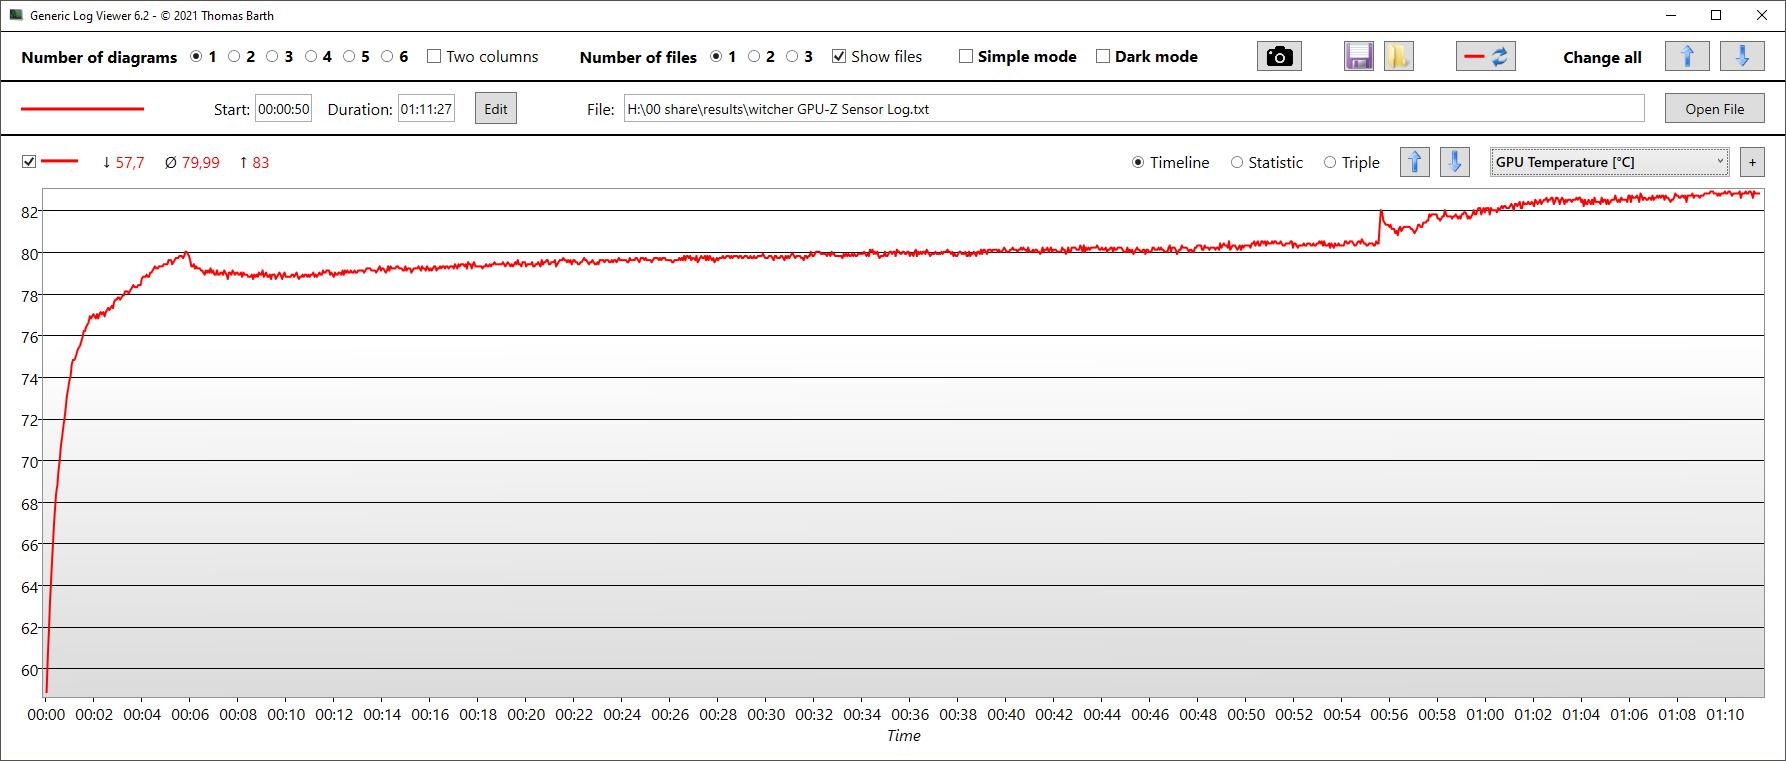
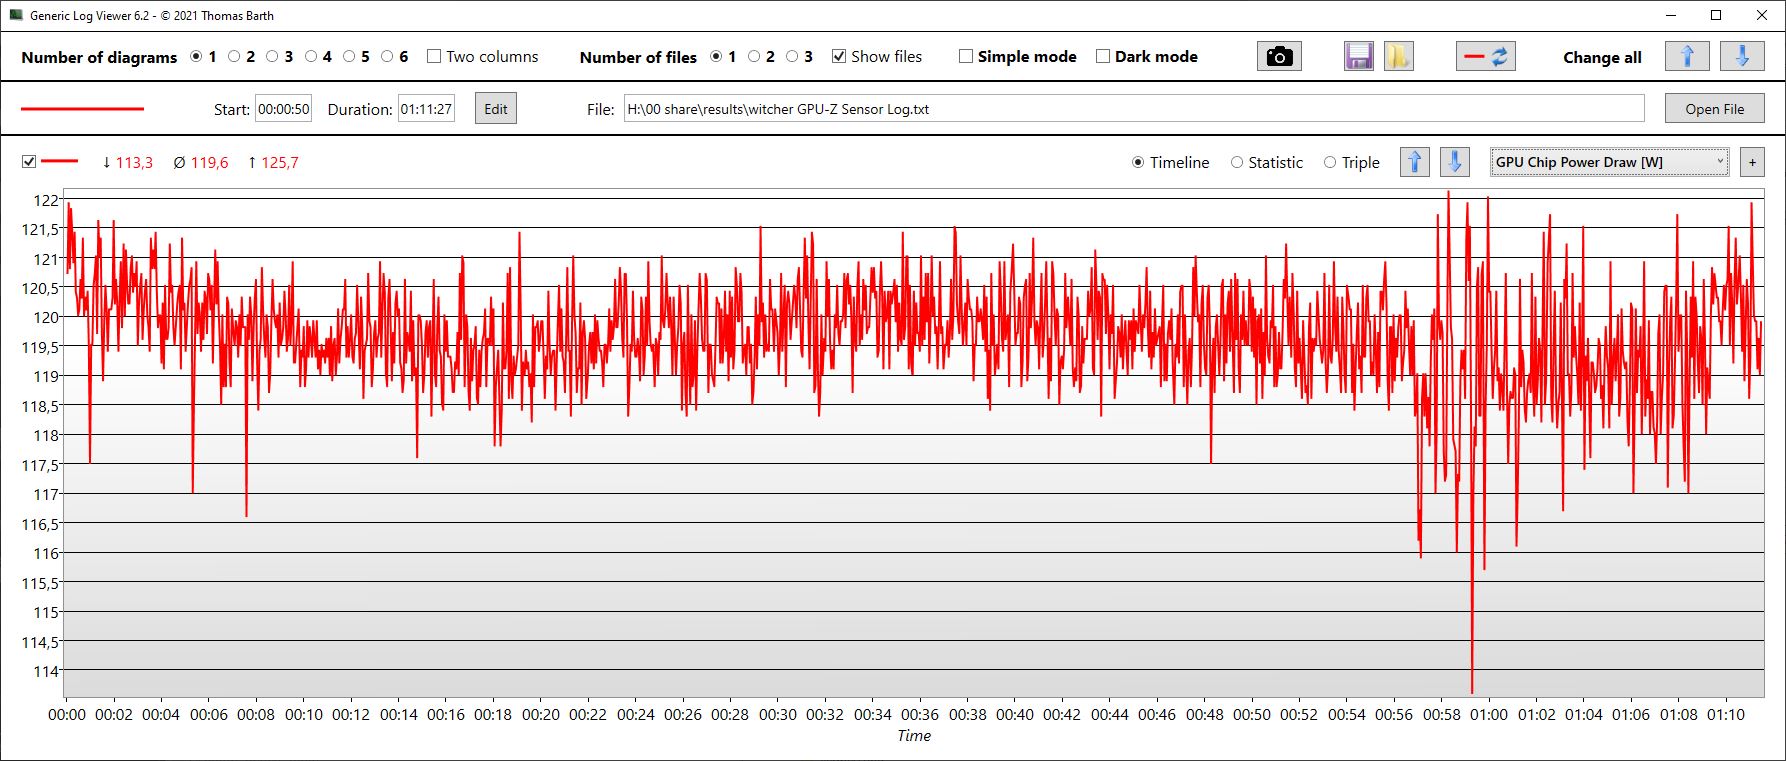
En la página Witcher 3, las velocidades de fotogramas se mantuvieron estables en su mayor parte. Pero observamos que la temperatura de la GPU (registrada en paralelo) siguió aumentando durante la prueba y no se estabilizó. Esto indica que la GPU puede empezar a experimentar un estrangulamiento térmico después de ejecutar juegos exigentes durante mucho tiempo, aunque esto no ocurrió durante la prueba de una hora. El consumo de energía de la GPU fue de 120 vatios de media.
En la comparación, incluso el Neo basado en Intel con una RTX 3080 Ti no fue sustancialmente más rápido con los mismos ajustes. En general, la carísima GPU del Neo basado en Intel apenas justifica su elevado precio con las ganancias de rendimiento que proporciona. Dependiendo del juego y de los ajustes, solo tenía una ventaja de entre el 1 y el 25 por ciento.
Witcher 3 FPS chart
| bajo | medio | alto | ultra | QHD | |
|---|---|---|---|---|---|
| GTA V (2015) | 176.6 | 170.3 | 156.2 | 97.6 | 93 |
| The Witcher 3 (2015) | 195 | 110 | |||
| Dota 2 Reborn (2015) | 135.9 | 123.1 | 116.3 | 114.1 | |
| X-Plane 11.11 (2018) | 109.5 | 94.9 | 77.6 | ||
| Far Cry 5 (2018) | 119 | 110 | 102 | ||
| Strange Brigade (2018) | 305 | 224 | 206 | 189 | 143 |
| Dying Light 2 (2022) | 82.5 | 59 |
Emisiones - Más frío que el Intel Neo en reposo
Emisiones acústicas
Aunque el portátil no tiene un modo silencioso, los ventiladores del interior no suelen girar en reposo. Es interesante que, a pesar de tener una GPU más débil, el Neo basado en AMD no es tan silencioso bajo carga como su homólogo basado en Intel. Entre los competidores, sólo el Acer Nitro 5 es ligeramente más silencioso. Pero también es menos potente que el Neo.
Cuando los ventiladores están inactivos, hay un suave pero agudo pitido procedente del chasis. Aunque este ruido no es audible cuando los ventiladores están en funcionamiento, sigue siendo molesto en un entorno silencioso.
Ruido
| Ocioso |
| 23 / 25.82 / 27.3 dB(A) |
| Carga |
| 42.7 / 56 dB(A) |
 | ||
30 dB silencioso 40 dB(A) audible 50 dB(A) ruidosamente alto |
||
min: | ||
| Schenker XMG Neo 15 (Ryzen 9 6900HX, RTX 3070 Ti) GeForce RTX 3070 Ti Laptop GPU, R9 6900HX, Samsung SSD 980 Pro 1TB MZ-V8P1T0BW | Schenker XMG Neo 15 (i7-12700H, RTX 3080 Ti) GeForce RTX 3080 Ti Laptop GPU, i7-12700H, Samsung SSD 980 Pro 1TB MZ-V8P1T0BW | MSI GE67 HX 12UGS GeForce RTX 3070 Ti Laptop GPU, i7-12800HX, Samsung PM9A1 MZVL21T0HCLR | Asus ROG Strix Scar 15 G533ZW-LN106WS GeForce RTX 3070 Ti Laptop GPU, i9-12900H, Samsung PM9A1 MZVL22T0HBLB | Acer Nitro 5 AN515-58-72QR GeForce RTX 3070 Ti Laptop GPU, i7-12700H, Samsung PM9A1 MZVL21T0HCLR | MSI Stealth GS66 12UGS GeForce RTX 3070 Ti Laptop GPU, i7-12700H, WDC PC SN810 1TB | |
|---|---|---|---|---|---|---|
| Noise | -1% | 3% | -30% | -8% | -9% | |
| apagado / medio ambiente * (dB) | 23 | 23 -0% | 22.7 1% | 26.86 -17% | 26 -13% | 24 -4% |
| Idle Minimum * (dB) | 23 | 23 -0% | 22.9 -0% | 39.07 -70% | 26 -13% | 31 -35% |
| Idle Average * (dB) | 25.82 | 26.39 -2% | 22.9 11% | 39.07 -51% | 29 -12% | 32 -24% |
| Idle Maximum * (dB) | 27.3 | 26.39 3% | 22.9 16% | 39.07 -43% | 33 -21% | 35 -28% |
| Load Average * (dB) | 42.7 | 45.52 -7% | 44.4 -4% | 53.34 -25% | 47 -10% | 48 -12% |
| Witcher 3 ultra * (dB) | 56 | 55.89 -0% | 55.7 1% | 56.6 -1% | 53 5% | 43 23% |
| Load Maximum * (dB) | 56 | 55.89 -0% | 57.4 -2% | 56.6 -1% | 53 5% | 48 14% |
* ... más pequeño es mejor
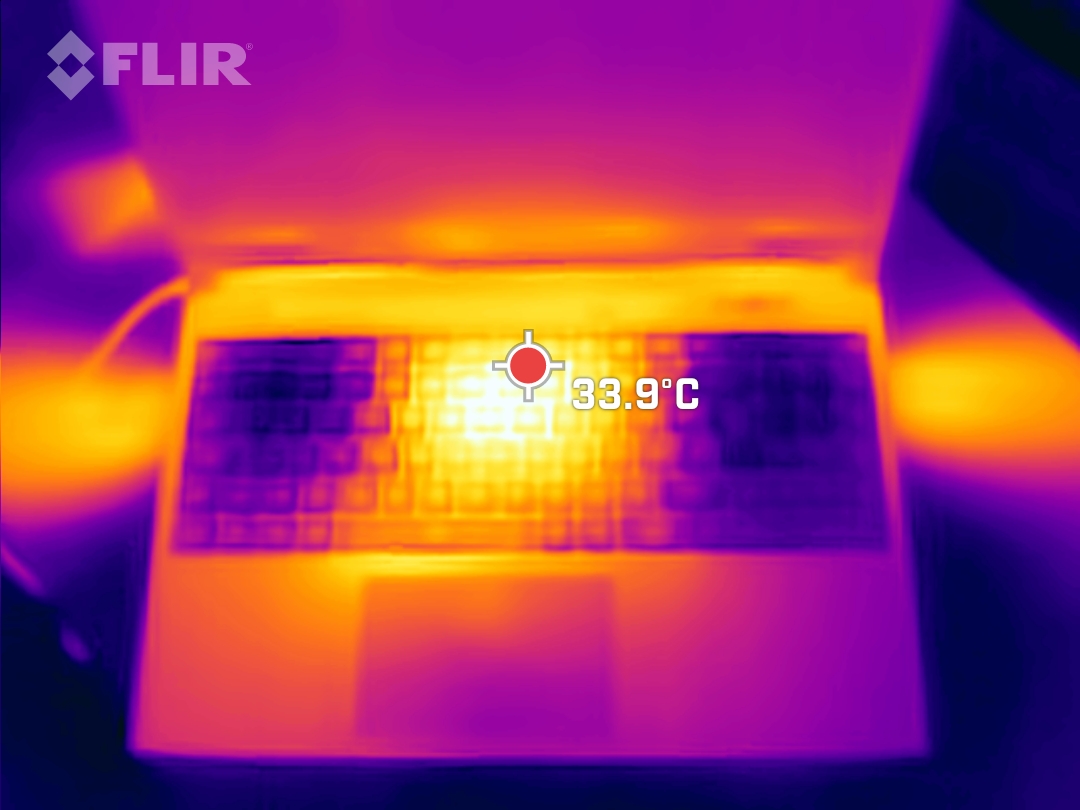
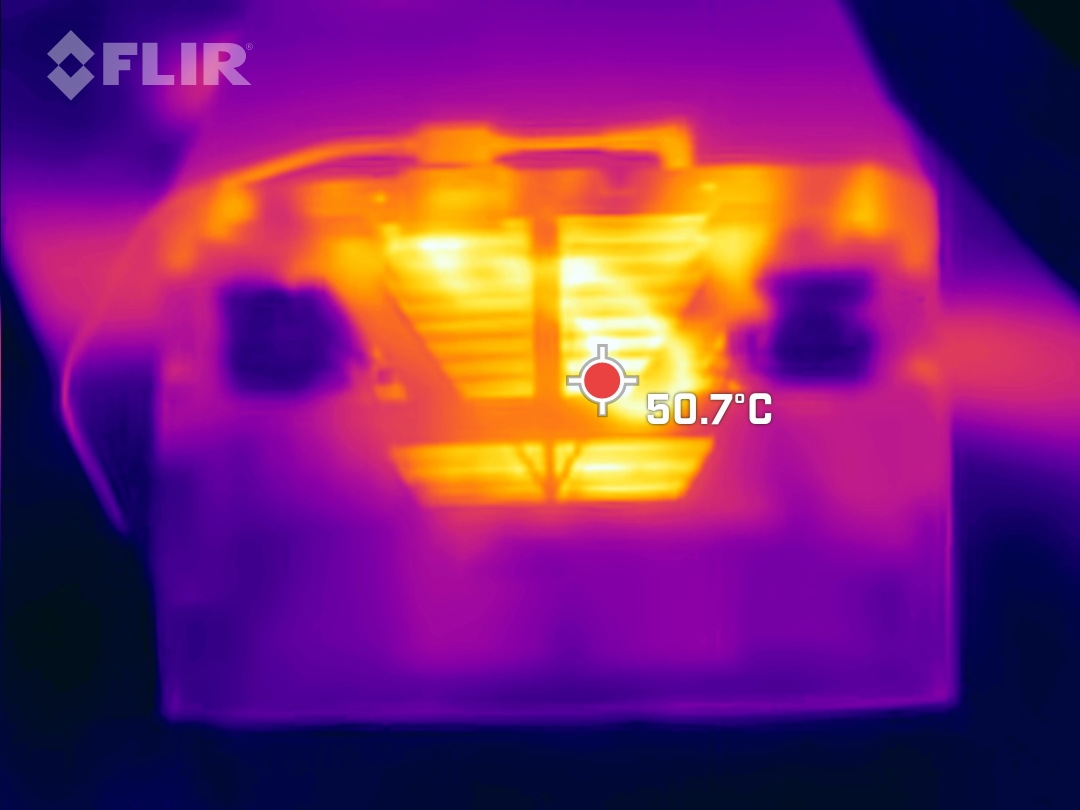
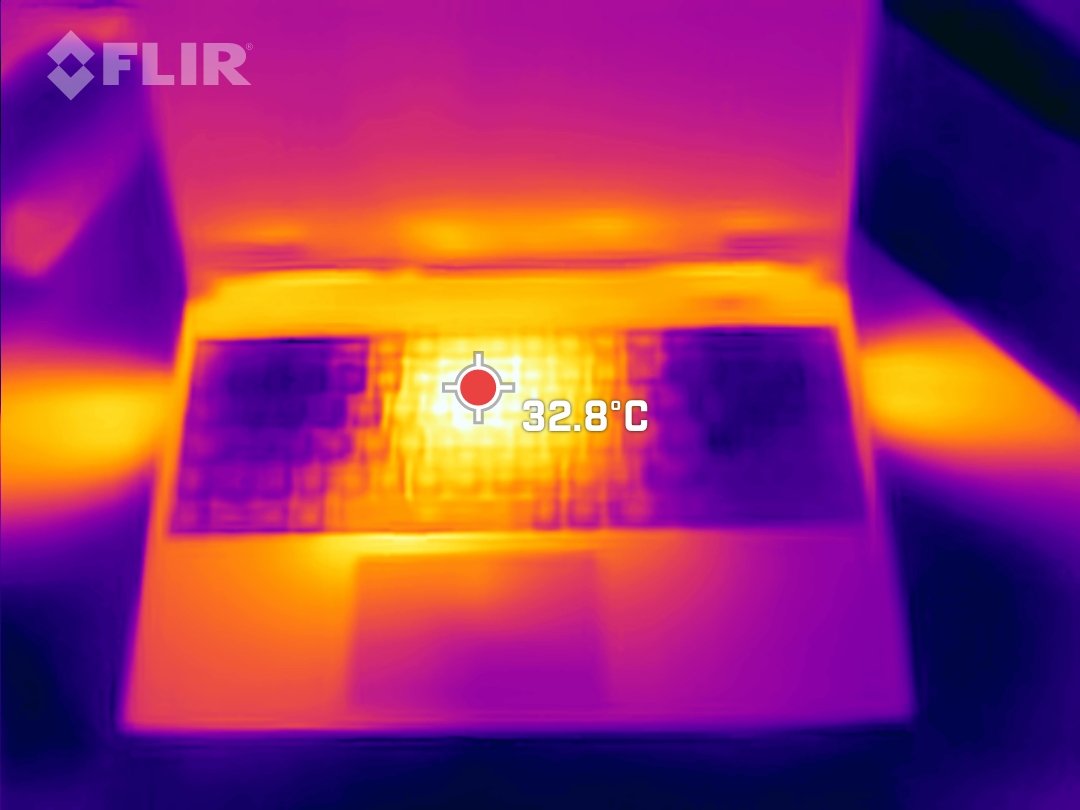
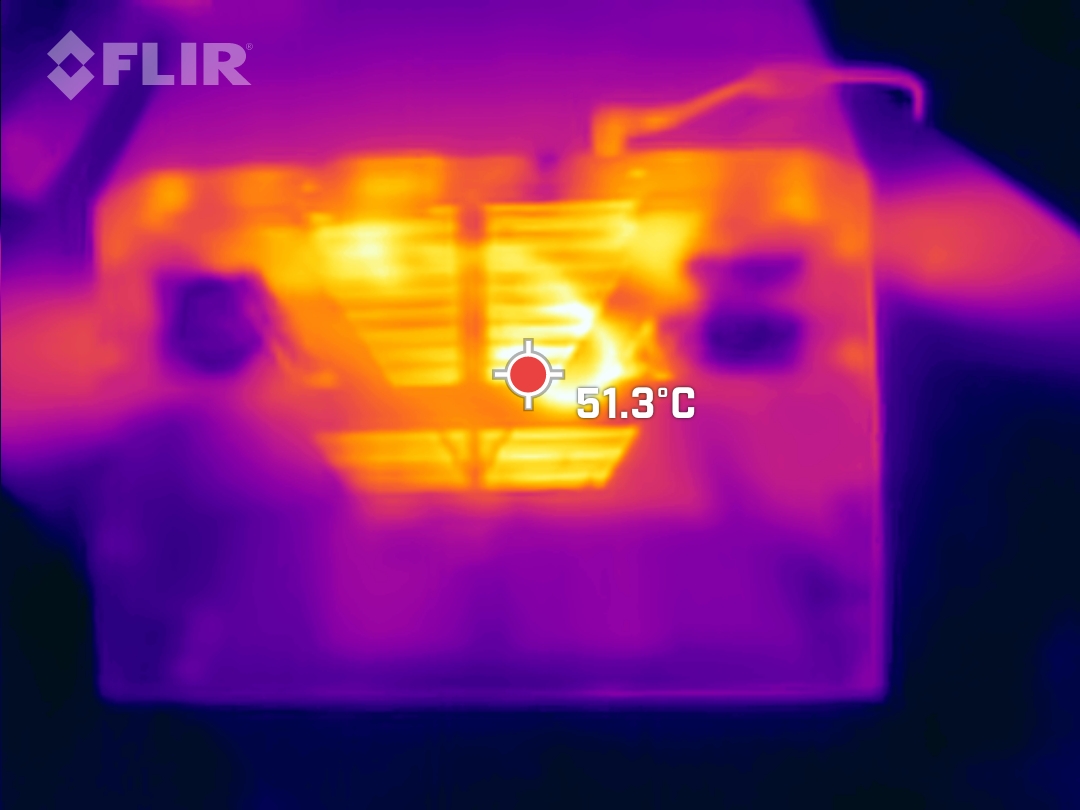
Temperatura
En reposo, las temperaturas de la carcasa siguen siendo más cómodas que en el Neo basado en Intel con RTX 3080 Ti. Sin embargo, esta ventaja desaparece prácticamente bajo carga. Los otros dispositivos del grupo de comparación pueden calentarse tanto como el Neo. Pero de todo, es el MSI GE67, de gran rendimiento pero ligeramente más voluminoso, el que va más fresco que los otros portátiles de juego.
Los reposamanos nunca se calientan de forma desagradable, y lo mismo ocurre con las teclas WASD. El calor se concentra principalmente en el centro y en la zona cercana a la pantalla. El delgado panel inferior de plástico tiene muchas rejillas de ventilación, lo que hace que esté considerablemente más caliente que la cubierta del teclado.
(±) La temperatura máxima en la parte superior es de 41 °C / 106 F, frente a la media de 40.4 °C / 105 F, que oscila entre 21.2 y 68.8 °C para la clase Gaming.
(-) El fondo se calienta hasta un máximo de 57 °C / 135 F, frente a la media de 43.2 °C / 110 F
(+) En reposo, la temperatura media de la parte superior es de 27.1 °C / 81# F, frente a la media del dispositivo de 33.9 °C / 93 F.
(±) Jugando a The Witcher 3, la temperatura media de la parte superior es de 33.3 °C / 92 F, frente a la media del dispositivo de 33.9 °C / 93 F.
(+) El reposamanos y el panel táctil están a una temperatura inferior a la de la piel, con un máximo de 31 °C / 87.8 F y, por tanto, son fríos al tacto.
(-) La temperatura media de la zona del reposamanos de dispositivos similares fue de 28.8 °C / 83.8 F (-2.2 °C / -4 F).
| Schenker XMG Neo 15 (Ryzen 9 6900HX, RTX 3070 Ti) AMD Ryzen 9 6900HX, NVIDIA GeForce RTX 3070 Ti Laptop GPU | Schenker XMG Neo 15 (i7-12700H, RTX 3080 Ti) Intel Core i7-12700H, NVIDIA GeForce RTX 3080 Ti Laptop GPU | MSI GE67 HX 12UGS Intel Core i7-12800HX, NVIDIA GeForce RTX 3070 Ti Laptop GPU | Asus ROG Strix Scar 15 G533ZW-LN106WS Intel Core i9-12900H, NVIDIA GeForce RTX 3070 Ti Laptop GPU | Acer Nitro 5 AN515-58-72QR Intel Core i7-12700H, NVIDIA GeForce RTX 3070 Ti Laptop GPU | MSI Stealth GS66 12UGS Intel Core i7-12700H, NVIDIA GeForce RTX 3070 Ti Laptop GPU | |
|---|---|---|---|---|---|---|
| Heat | -20% | 11% | -14% | -9% | -5% | |
| Maximum Upper Side * (°C) | 41 | 44 -7% | 34.4 16% | 42.6 -4% | 48 -17% | 54 -32% |
| Maximum Bottom * (°C) | 57 | 56 2% | 42 26% | 50.2 12% | 51 11% | 59 -4% |
| Idle Upper Side * (°C) | 28 | 38 -36% | 24 14% | 36.2 -29% | 34 -21% | 26 7% |
| Idle Bottom * (°C) | 30 | 41 -37% | 33.2 -11% | 40.2 -34% | 33 -10% | 27 10% |
* ... más pequeño es mejor
Prueba de esfuerzo
A diferencia de muchos sistemas basados en Intel, la velocidad de reloj de la CPU del Neo consiguió mantenerse bastante estable durante nuestra prueba de estrés de una hora. Los núcleos comenzaron la prueba a 4,1 GHz y no bajaron de 3,9 GHz. También consiguieron acercarse ocasionalmente al valor inicial. Las temperaturas de los núcleos se mantuvieron constantes en 95°C, y el consumo de energía fue de 64 vatios de media.
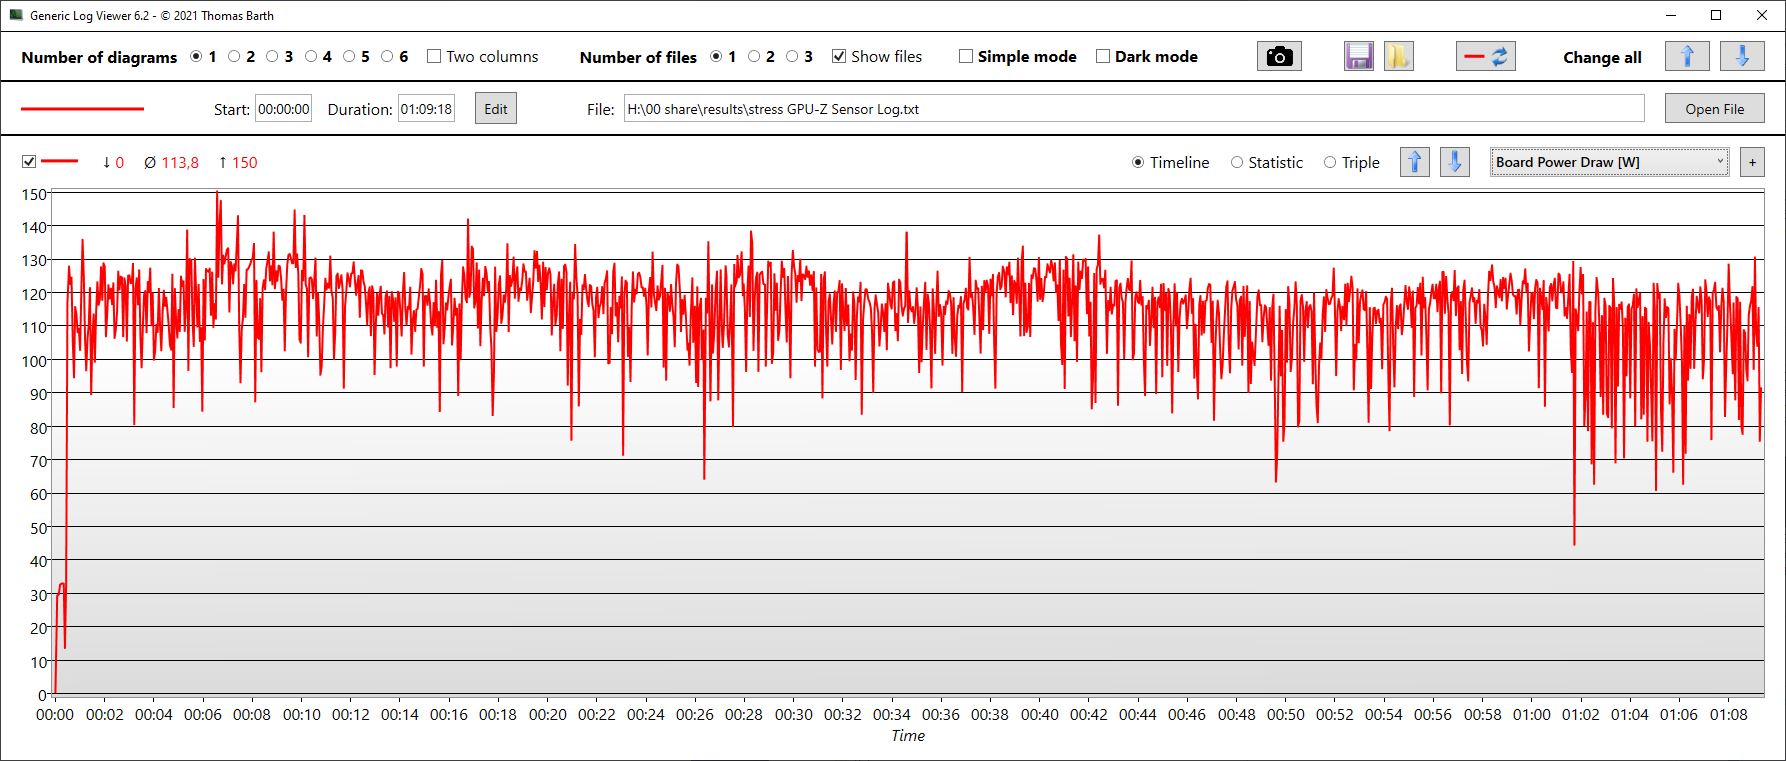
Los valores de la GPU fluctuaron más en comparación. Tras funcionar inicialmente a 1,7 GHz, la GPU bajó a veces a 1 GHz antes de volver a la velocidad de reloj inicial. La velocidad de la VRAM fue constante durante la prueba. La temperatura de la GPU se estabilizó en torno a los 78 °C, mientras que el consumo de energía rara vez alcanzó el objetivo de 150 vatios, con una media de aproximadamente 114 vatios.
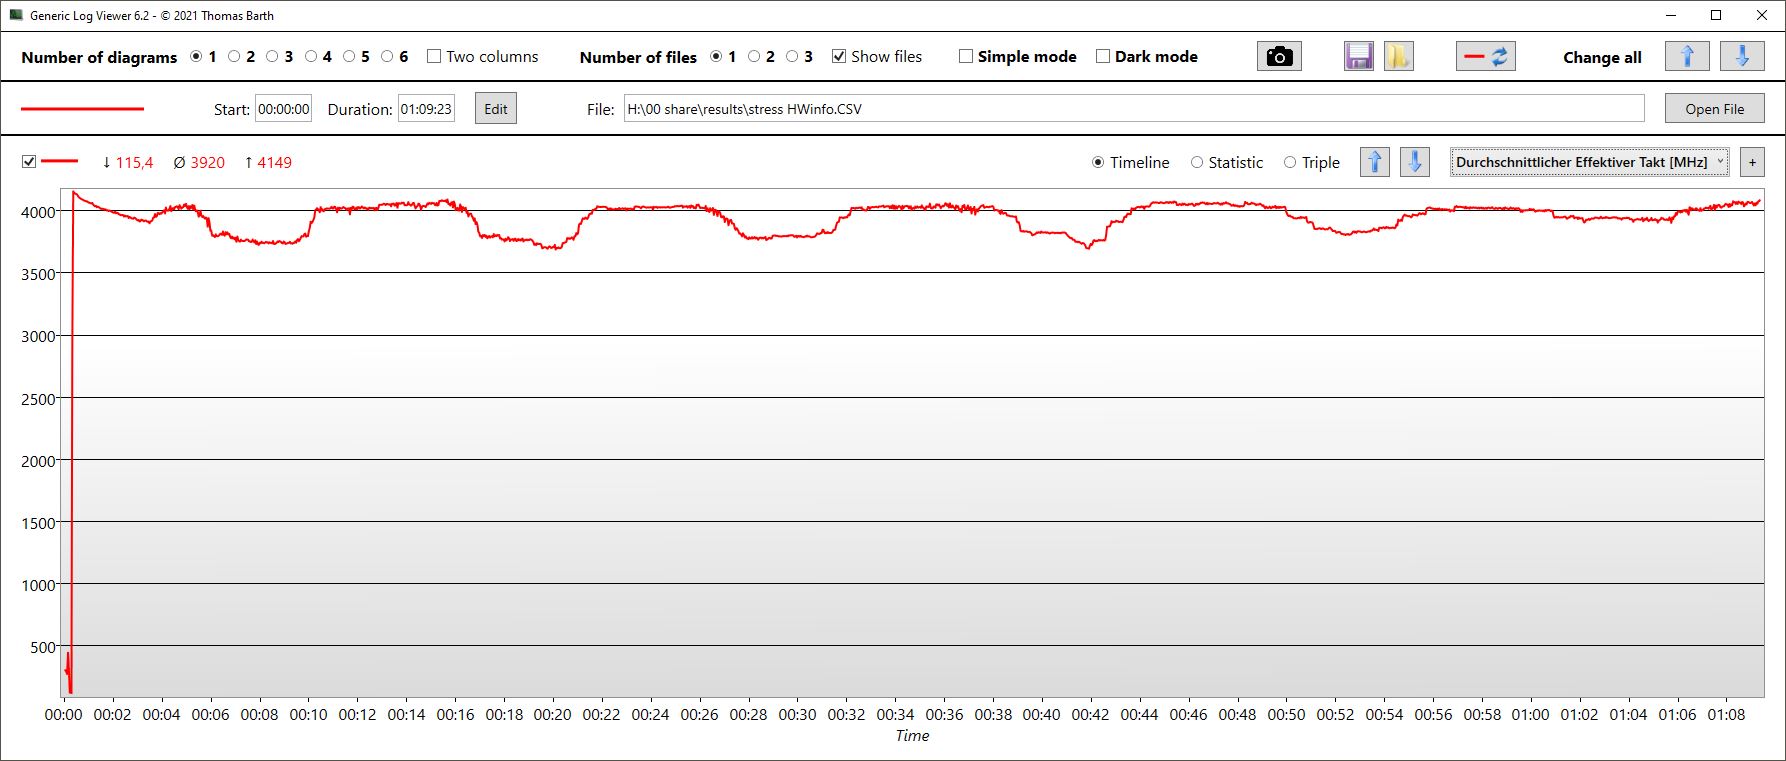

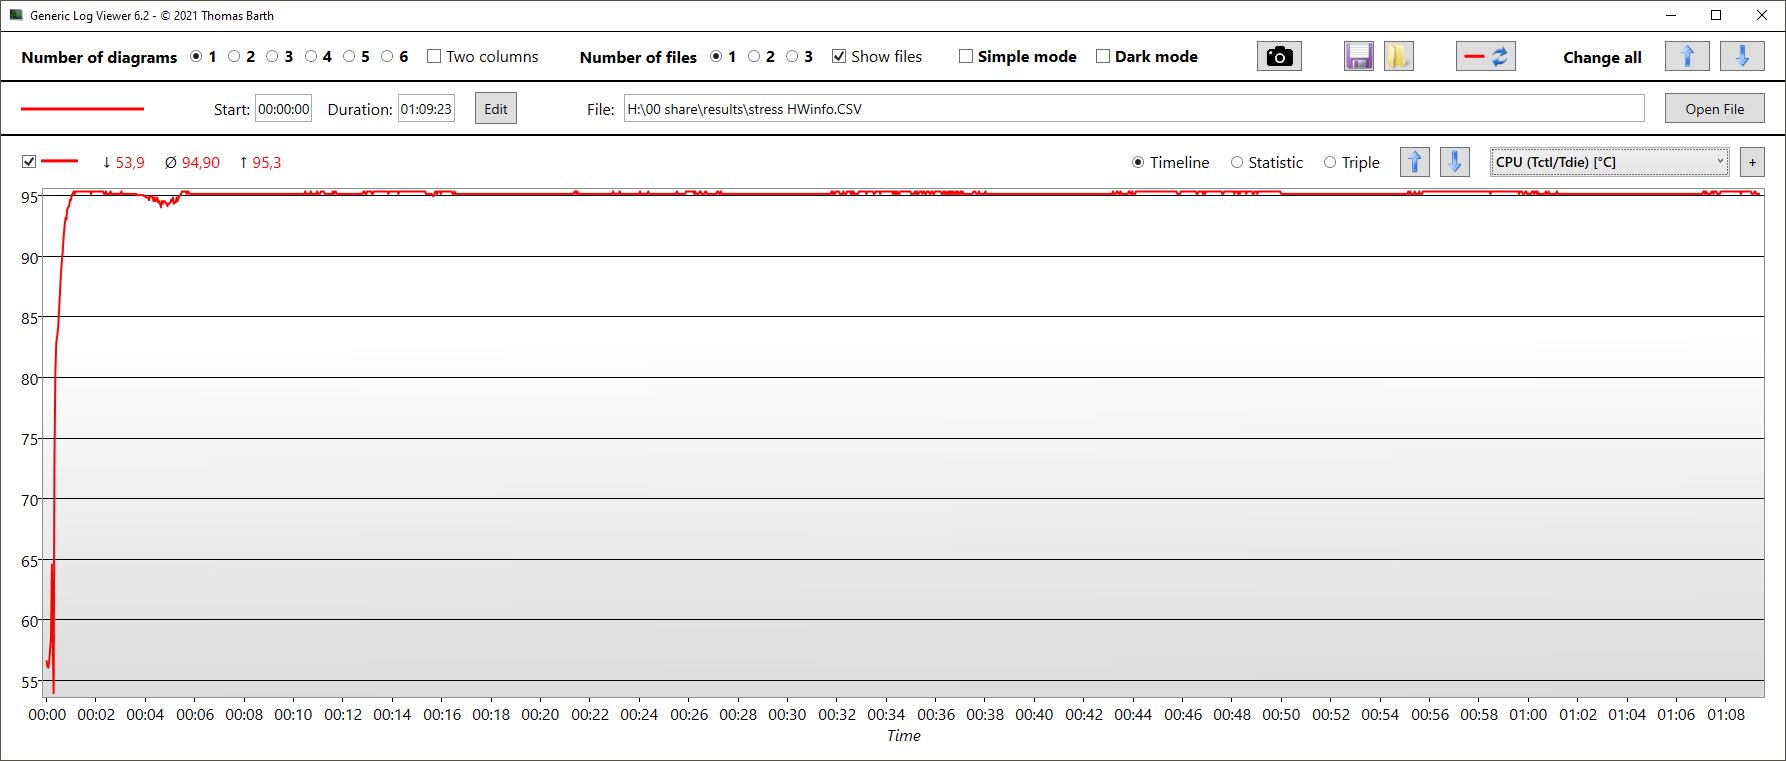
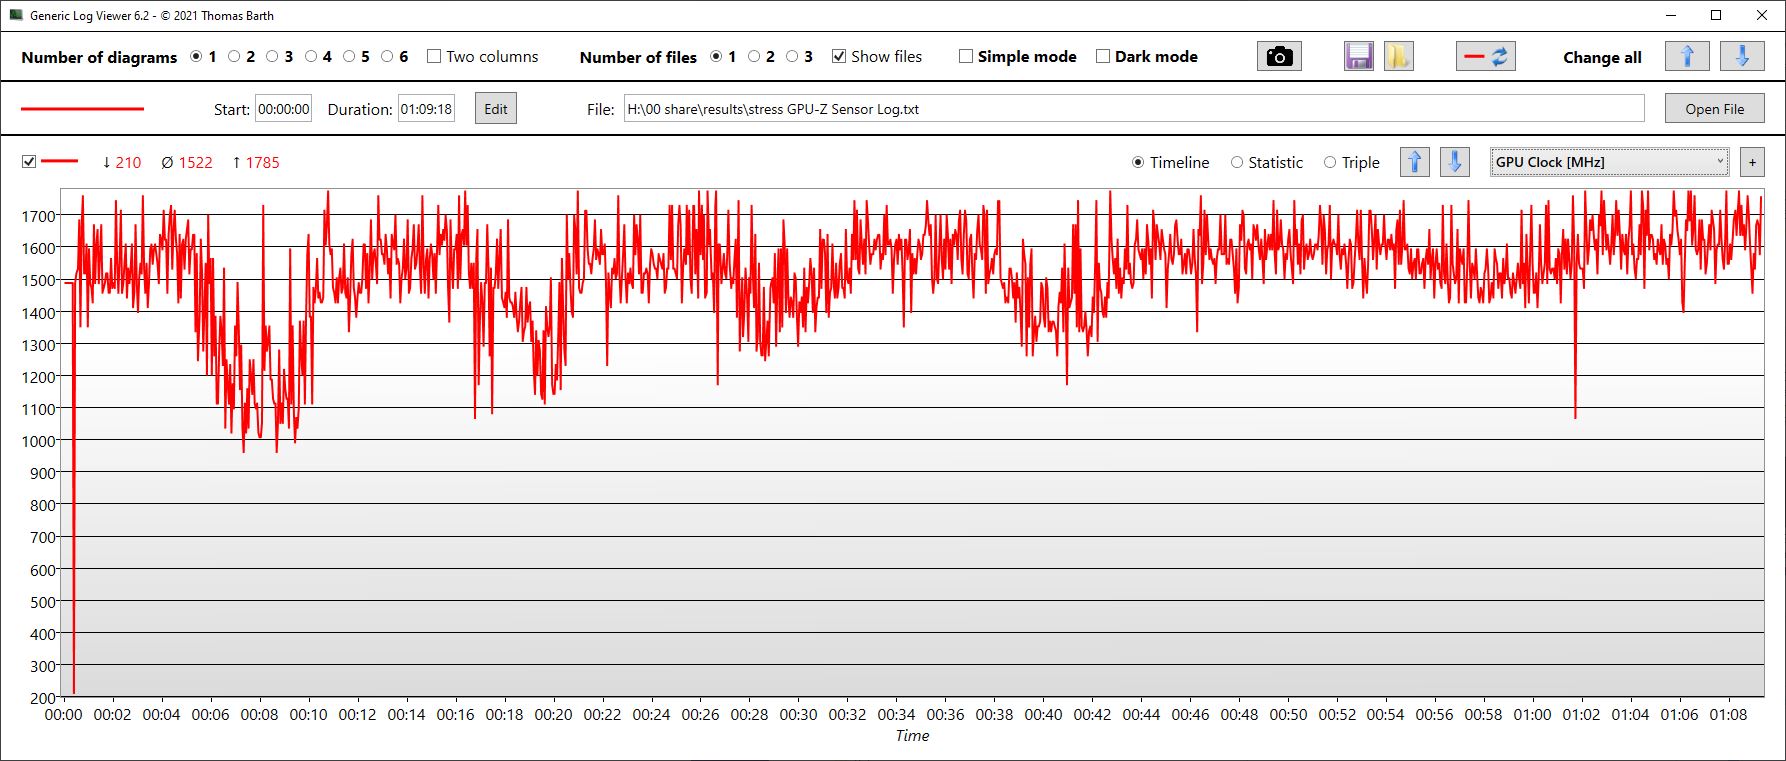
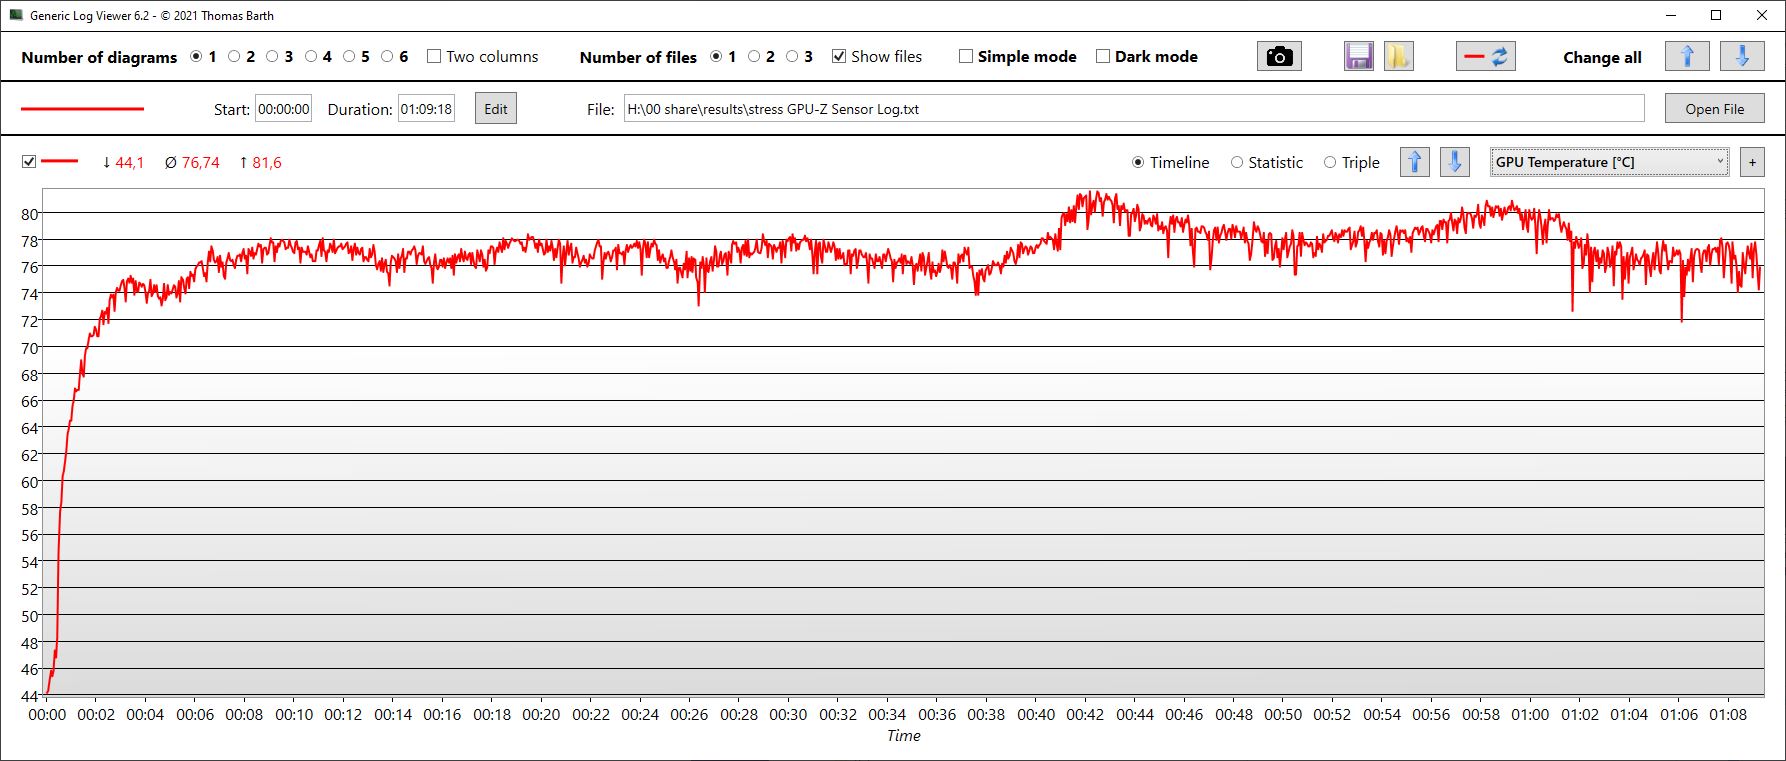
| Reloj dela CPU (GHz) | Reloj de la GPU (MHz) | Temperatura media dela CPU (°C) | Temperatura media de la GPU (°C) | |
| Sistema en reposo | -- | -- | 55 | 44 |
| Prime95 + FurMark Stress | 3,9 | 1.522 | 95 | 77 |
| Witcher 3 Estrés | 3,1 | 1.550 | 67 | 83 |
Altavoces
Schenker XMG Neo 15 (Ryzen 9 6900HX, RTX 3070 Ti) análisis de audio
(±) | la sonoridad del altavoz es media pero buena (78.26 dB)
Graves 100 - 315 Hz
(-) | casi sin bajos - de media 19.2% inferior a la mediana
(±) | la linealidad de los graves es media (8.2% delta a frecuencia anterior)
Medios 400 - 2000 Hz
(±) | medias más altas - de media 6.6% más altas que la mediana
(±) | la linealidad de los medios es media (9.9% delta respecto a la frecuencia anterior)
Altos 2 - 16 kHz
(+) | máximos equilibrados - a sólo 2.8% de la mediana
(+) | los máximos son lineales (6% delta a la frecuencia anterior)
Total 100 - 16.000 Hz
(±) | la linealidad del sonido global es media (19.1% de diferencia con la mediana)
En comparación con la misma clase
» 64% de todos los dispositivos probados de esta clase eran mejores, 7% similares, 28% peores
» El mejor tuvo un delta de 6%, la media fue 18%, el peor fue ###max##%
En comparación con todos los dispositivos probados
» 46% de todos los dispositivos probados eran mejores, 7% similares, 47% peores
» El mejor tuvo un delta de 4%, la media fue 23%, el peor fue ###max##%
Asus ROG Strix Scar 15 G533ZW-LN106WS análisis de audio
(±) | la sonoridad del altavoz es media pero buena (80.5 dB)
Graves 100 - 315 Hz
(+) | buen bajo - sólo 3.7% lejos de la mediana
(+) | el bajo es lineal (5.5% delta a la frecuencia anterior)
Medios 400 - 2000 Hz
(±) | medias más altas - de media 7.1% más altas que la mediana
(+) | los medios son lineales (3.1% delta a la frecuencia anterior)
Altos 2 - 16 kHz
(+) | máximos equilibrados - a sólo 3.3% de la mediana
(+) | los máximos son lineales (5.9% delta a la frecuencia anterior)
Total 100 - 16.000 Hz
(+) | el sonido global es lineal (12.2% de diferencia con la mediana)
En comparación con la misma clase
» 13% de todos los dispositivos probados de esta clase eran mejores, 4% similares, 83% peores
» El mejor tuvo un delta de 6%, la media fue 18%, el peor fue ###max##%
En comparación con todos los dispositivos probados
» 10% de todos los dispositivos probados eran mejores, 2% similares, 88% peores
» El mejor tuvo un delta de 4%, la media fue 23%, el peor fue ###max##%
Gestión de la energía - XMG Neo 15 tiene una gran duración de la batería
Consumo de energía
El portátil utiliza entre 13 y 20 vatios de energía en reposo, dependiendo del perfil de rendimiento seleccionado y del brillo de la pantalla. En el mejor de los casos se trata de un resultado medio en nuestra comparación.
Cuando se ejecuta el Witcher 3, el sistema consumió unos 200 vatios de energía - una fracción más que el Asus ROG Strix, ligeramente más rápido.
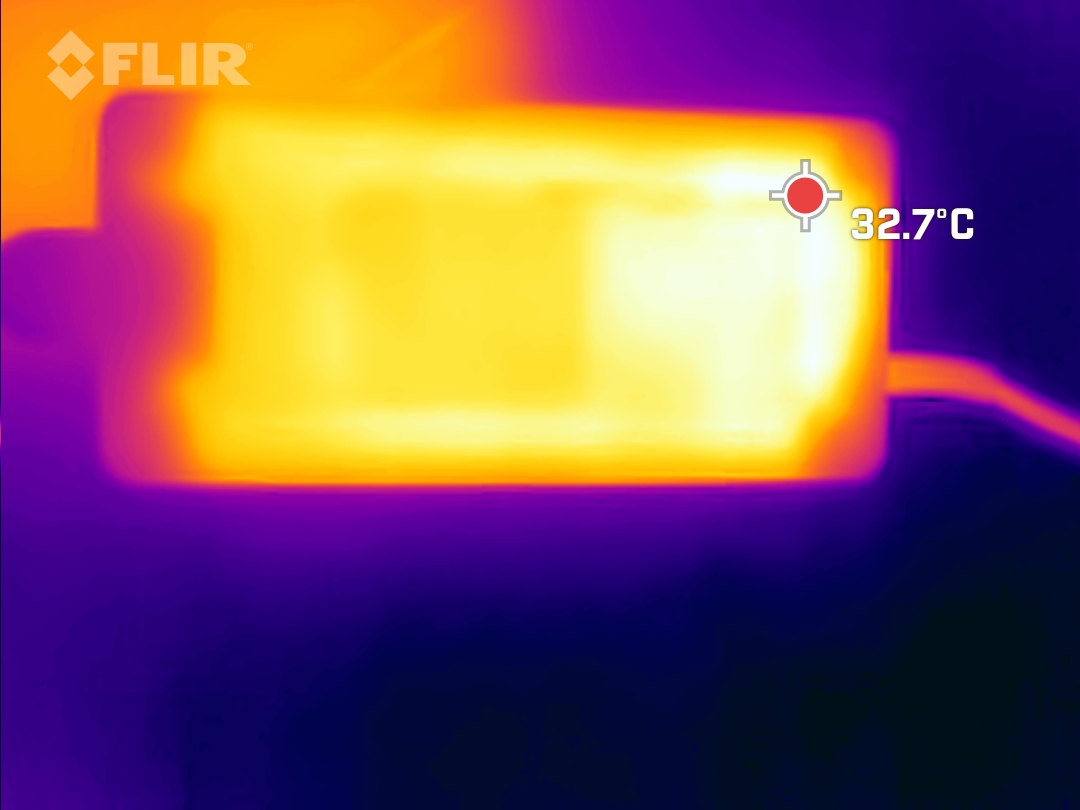
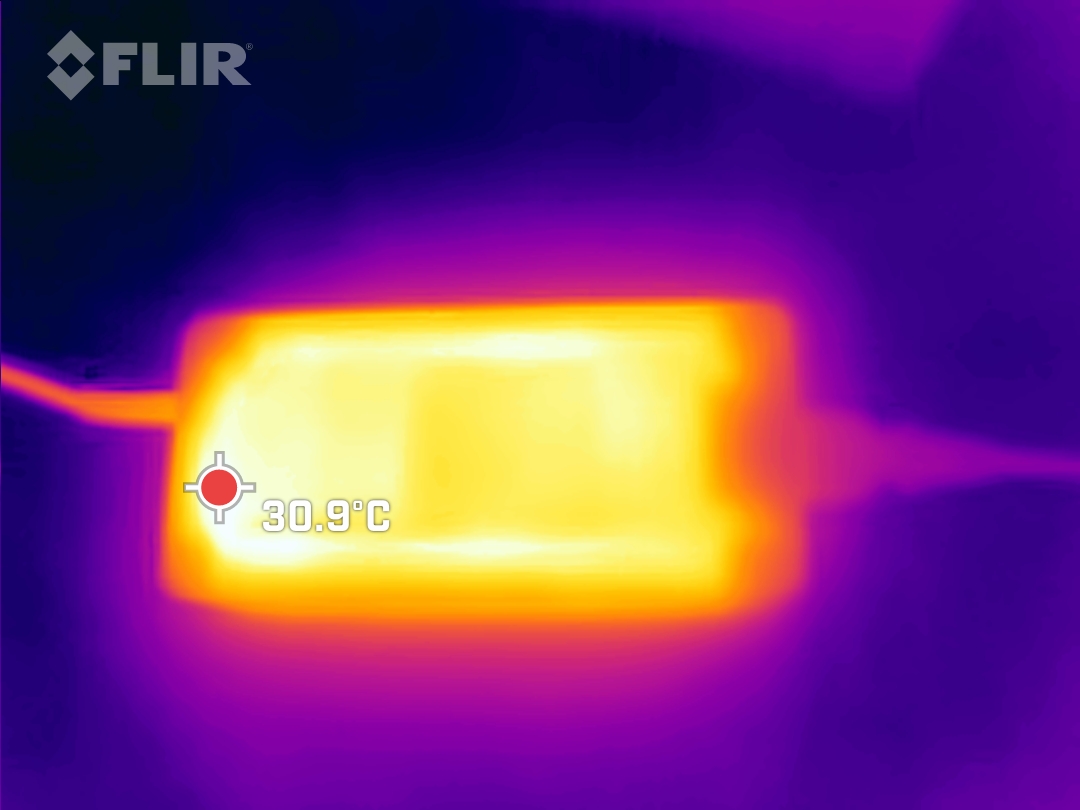
Durante la prueba de estrés, medimos un pico temporal de uso de energía de 260 vatios. El robusto cargador de 280 vatios puede manejar fácilmente los requisitos de energía del portátil, especialmente teniendo en cuenta que el consumo de energía se estabilizó en 210 vatios en el transcurso de la prueba de estrés.
| Off / Standby | |
| Ocioso | |
| Carga |
|
Clave:
min: | |
| Schenker XMG Neo 15 (Ryzen 9 6900HX, RTX 3070 Ti) R9 6900HX, GeForce RTX 3070 Ti Laptop GPU, Samsung SSD 980 Pro 1TB MZ-V8P1T0BW, IPS, 2560x1440, 15.6" | Schenker XMG Neo 15 (i7-12700H, RTX 3080 Ti) i7-12700H, GeForce RTX 3080 Ti Laptop GPU, Samsung SSD 980 Pro 1TB MZ-V8P1T0BW, IPS, 2560x1440, 15.6" | MSI GE67 HX 12UGS i7-12800HX, GeForce RTX 3070 Ti Laptop GPU, Samsung PM9A1 MZVL21T0HCLR, OLED, 1920x1080, 15.6" | Asus ROG Strix Scar 15 G533ZW-LN106WS i9-12900H, GeForce RTX 3070 Ti Laptop GPU, Samsung PM9A1 MZVL22T0HBLB, IPS-level, 2560x1440, 15.6" | Acer Nitro 5 AN515-58-72QR i7-12700H, GeForce RTX 3070 Ti Laptop GPU, Samsung PM9A1 MZVL21T0HCLR, IPS, 2560x1440, 15.6" | MSI Stealth GS66 12UGS i7-12700H, GeForce RTX 3070 Ti Laptop GPU, WDC PC SN810 1TB, IPS-Level, 2560x1440, 15.6" | Medio NVIDIA GeForce RTX 3070 Ti Laptop GPU | Media de la clase Gaming | |
|---|---|---|---|---|---|---|---|---|
| Power Consumption | -14% | -20% | 5% | 3% | 3% | -19% | -12% | |
| Idle Minimum * (Watt) | 13 | 15 -15% | 16.1 -24% | 7.56 42% | 7 46% | 11 15% | 14.2 ? -9% | 13.1 ? -1% |
| Idle Average * (Watt) | 17 | 18 -6% | 17.1 -1% | 13.5 21% | 15 12% | 16 6% | 19.9 ? -17% | 19 ? -12% |
| Idle Maximum * (Watt) | 20 | 18 10% | 26.6 -33% | 16.87 16% | 24 -20% | 23 -15% | 26.2 ? -31% | 24.6 ? -23% |
| Load Average * (Watt) | 89 | 123 -38% | 116.3 -31% | 128.9 -45% | 124 -39% | 110 -24% | 125.8 ? -41% | 111.3 ? -25% |
| Witcher 3 ultra * (Watt) | 200 | 234 -17% | 237 -19% | 196.2 2% | 195.1 2% | 151 24% | ||
| Load Maximum * (Watt) | 260 | 301 -16% | 291.1 -12% | 274.86 -6% | 220 15% | 230 12% | 248 ? 5% | 260 ? -0% |
* ... más pequeño es mejor
Power Consumption Witcher 3 / Stress test
Power Consumption with External Monitor
Duración de la batería
Schenker ha dotado al portátil de una batería de 96Wh. Aparte del Acer Nitro, todos los dispositivos de la comparación tienen baterías de tamaño similar.
El XMG Neo 15 ofrece una excelente duración de la batería en relación con la competencia. Parece que Schenker ha hecho un buen trabajo ajustando los modos de energía.
En cualquier caso, con el brillo de la pantalla bajado, el portátil nos proporcionó casi 11 horas de navegación web y reproducción de vídeo. Incluso con el brillo de la pantalla al máximo, pudimos navegar por Internet durante 8,5 horas a través de Wi-Fi.
| Schenker XMG Neo 15 (Ryzen 9 6900HX, RTX 3070 Ti) R9 6900HX, GeForce RTX 3070 Ti Laptop GPU, 93 Wh | Schenker XMG Neo 15 (i7-12700H, RTX 3080 Ti) i7-12700H, GeForce RTX 3080 Ti Laptop GPU, 93 Wh | MSI GE67 HX 12UGS i7-12800HX, GeForce RTX 3070 Ti Laptop GPU, 99.9 Wh | Asus ROG Strix Scar 15 G533ZW-LN106WS i9-12900H, GeForce RTX 3070 Ti Laptop GPU, 90 Wh | Acer Nitro 5 AN515-58-72QR i7-12700H, GeForce RTX 3070 Ti Laptop GPU, 57.5 Wh | MSI Stealth GS66 12UGS i7-12700H, GeForce RTX 3070 Ti Laptop GPU, 99.9 Wh | Media de la clase Gaming | |
|---|---|---|---|---|---|---|---|
| Duración de Batería | -23% | -9% | -29% | -48% | -25% | -21% | |
| H.264 (h) | 10.7 | 7.1 -34% | 8.5 -21% | 4.7 -56% | 8.27 ? -23% | ||
| WiFi v1.3 (h) | 10.9 | 7.7 -29% | 5.6 -49% | 8.4 -23% | 3.9 -64% | 5.4 -50% | 7.08 ? -35% |
| Load (h) | 1.6 | 1.5 -6% | 2.1 31% | 0.9 -44% | 1.2 -25% | 1.6 0% | 1.496 ? -6% |
| Reader / Idle (h) | 8.4 | 5.7 | 7.8 | 7.84 ? | |||
| Witcher 3 ultra (h) | 1.2 |
Pro
Contra
Veredicto: ¿Intel o AMD? Es una cuestión de preferencia.
El Neo 15 es un gran portátil para juegos incluso con un procesador AMD. En reposo, el Neo basado en AMD funciona mucho más fresco y tiene una mayor duración de la batería que su homólogo basado en Intel. Por otro lado, tiene un rendimiento de la CPU ligeramente inferior y carece de soporte para Thunderbolt. Los consumidores deben decidir qué es más importante para ellos
El rendimiento de juego del portátil está en el nivel medio superior, pero puede mejorarse aún más usando la amplia gama de ajustes manuales disponibles.
Nos impresiona la magnífica duración de la batería, pero estamos ligeramente divididos en algunos aspectos. Nos gustan los robustos materiales metálicos utilizados en la pantalla y en la cubierta del teclado, pero la carcasa inferior es demasiado blanda para nuestro gusto. El dispositivo tiene una webcam Full HD, pero ofrece una calidad de imagen tan pobre que muchos modelos 720p son capaces de hacerlo mejor. Aquí todavía hay un poco de margen de mejora. Dicho esto, se trata de una crítica relativamente menor.
El XMG Neo 15 con AMD Ryzen es un portátil para juegos de alto rendimiento sin ningún inconveniente importante que tiene una conexión para la refrigeración externa por agua opcional. No obstante, algunas de las muchas ideas geniales del portátil aún pueden necesitar algo de refinamiento.
Si buscas alternativas, te recomendamos especialmente el MSI GE6 HX 12UGSque está por delante en casi todas las pruebas de rendimiento y, sin embargo, no es mucho peor en términos de emisiones. También puedes echar un vistazo al Asus ROG Strix Scarun portátil que está a la altura del Neo 15.
Precio y disponibilidad
El Neo 15 se puede configurar de muchas maneras en la propia tienda online de XMG (bestware.com). Nuestro modelo de revisión cuesta 2.877 euros (2.850 dólares) en el sitio web. Puedes ahorrar casi 500 euros (495 dólares) si optas por una RTX 3060 en lugar de una RTX 3070 Ti Si buscas en sitios web de comparación, puede que a veces encuentres el portátil por un precio ligeramente inferior.
Schenker XMG Neo 15 (Ryzen 9 6900HX, RTX 3070 Ti)
- 10/26/2022 v7 (old)
Christian Hintze
Price comparison

