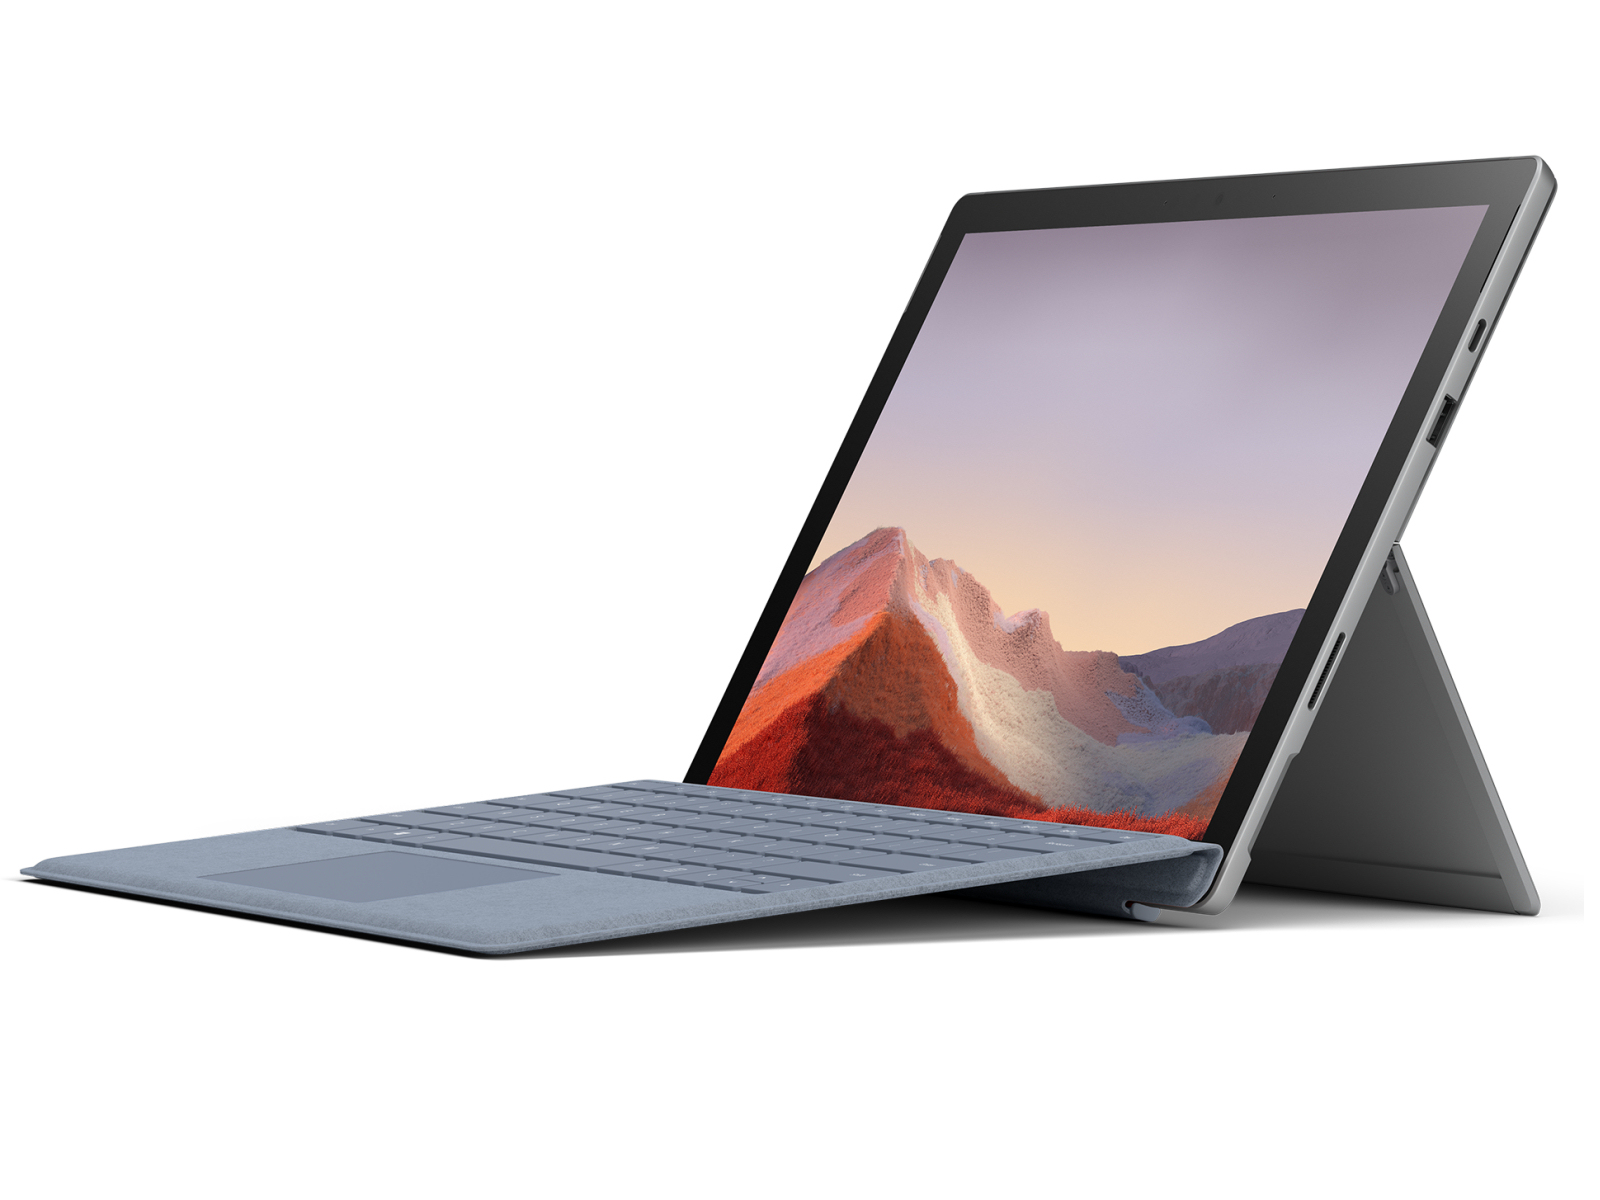
Análisis de la Microsoft Surface Pro 7 Plus: Tiger Lake proporciona un aumento de rendimiento

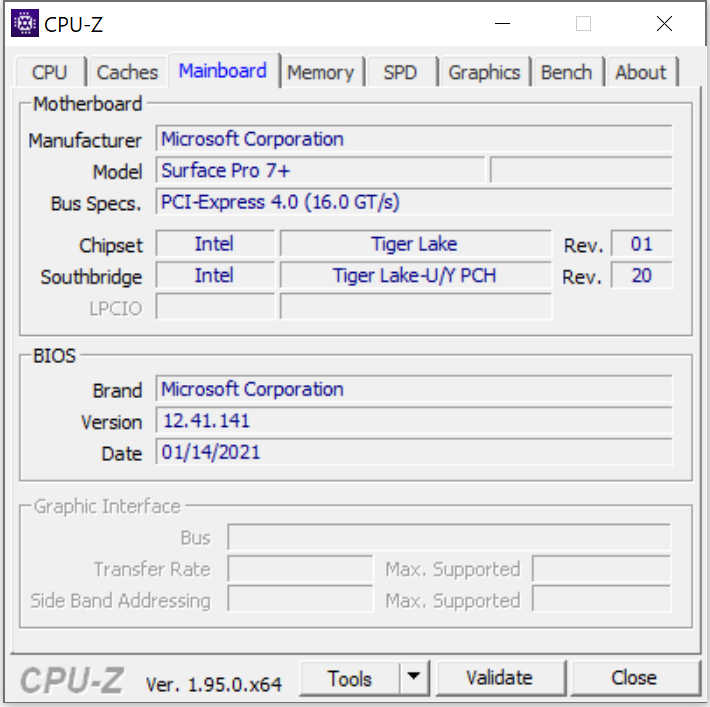
La Surface Pro 7 está disponible desde 2019. Por tanto, Microsoft considera que ha llegado el momento de introducir algunas actualizaciones. En el interior, ahora hay procesadores Tiger Lake en lugar de Ice Lake, el SSD se puede reemplazar, la capacidad de la batería ha aumentado un poco, y un módem LTE está disponible opcionalmente - este último sólo en combinación con un procesador Core i5. Externamente, no ha cambiado prácticamente nada en comparación con los modelos regulares de Surface Pro 7. El Surface Pro 7 Plus compite con el Dell Latitude 12 7210y elLenovo Yoga Duet 7.
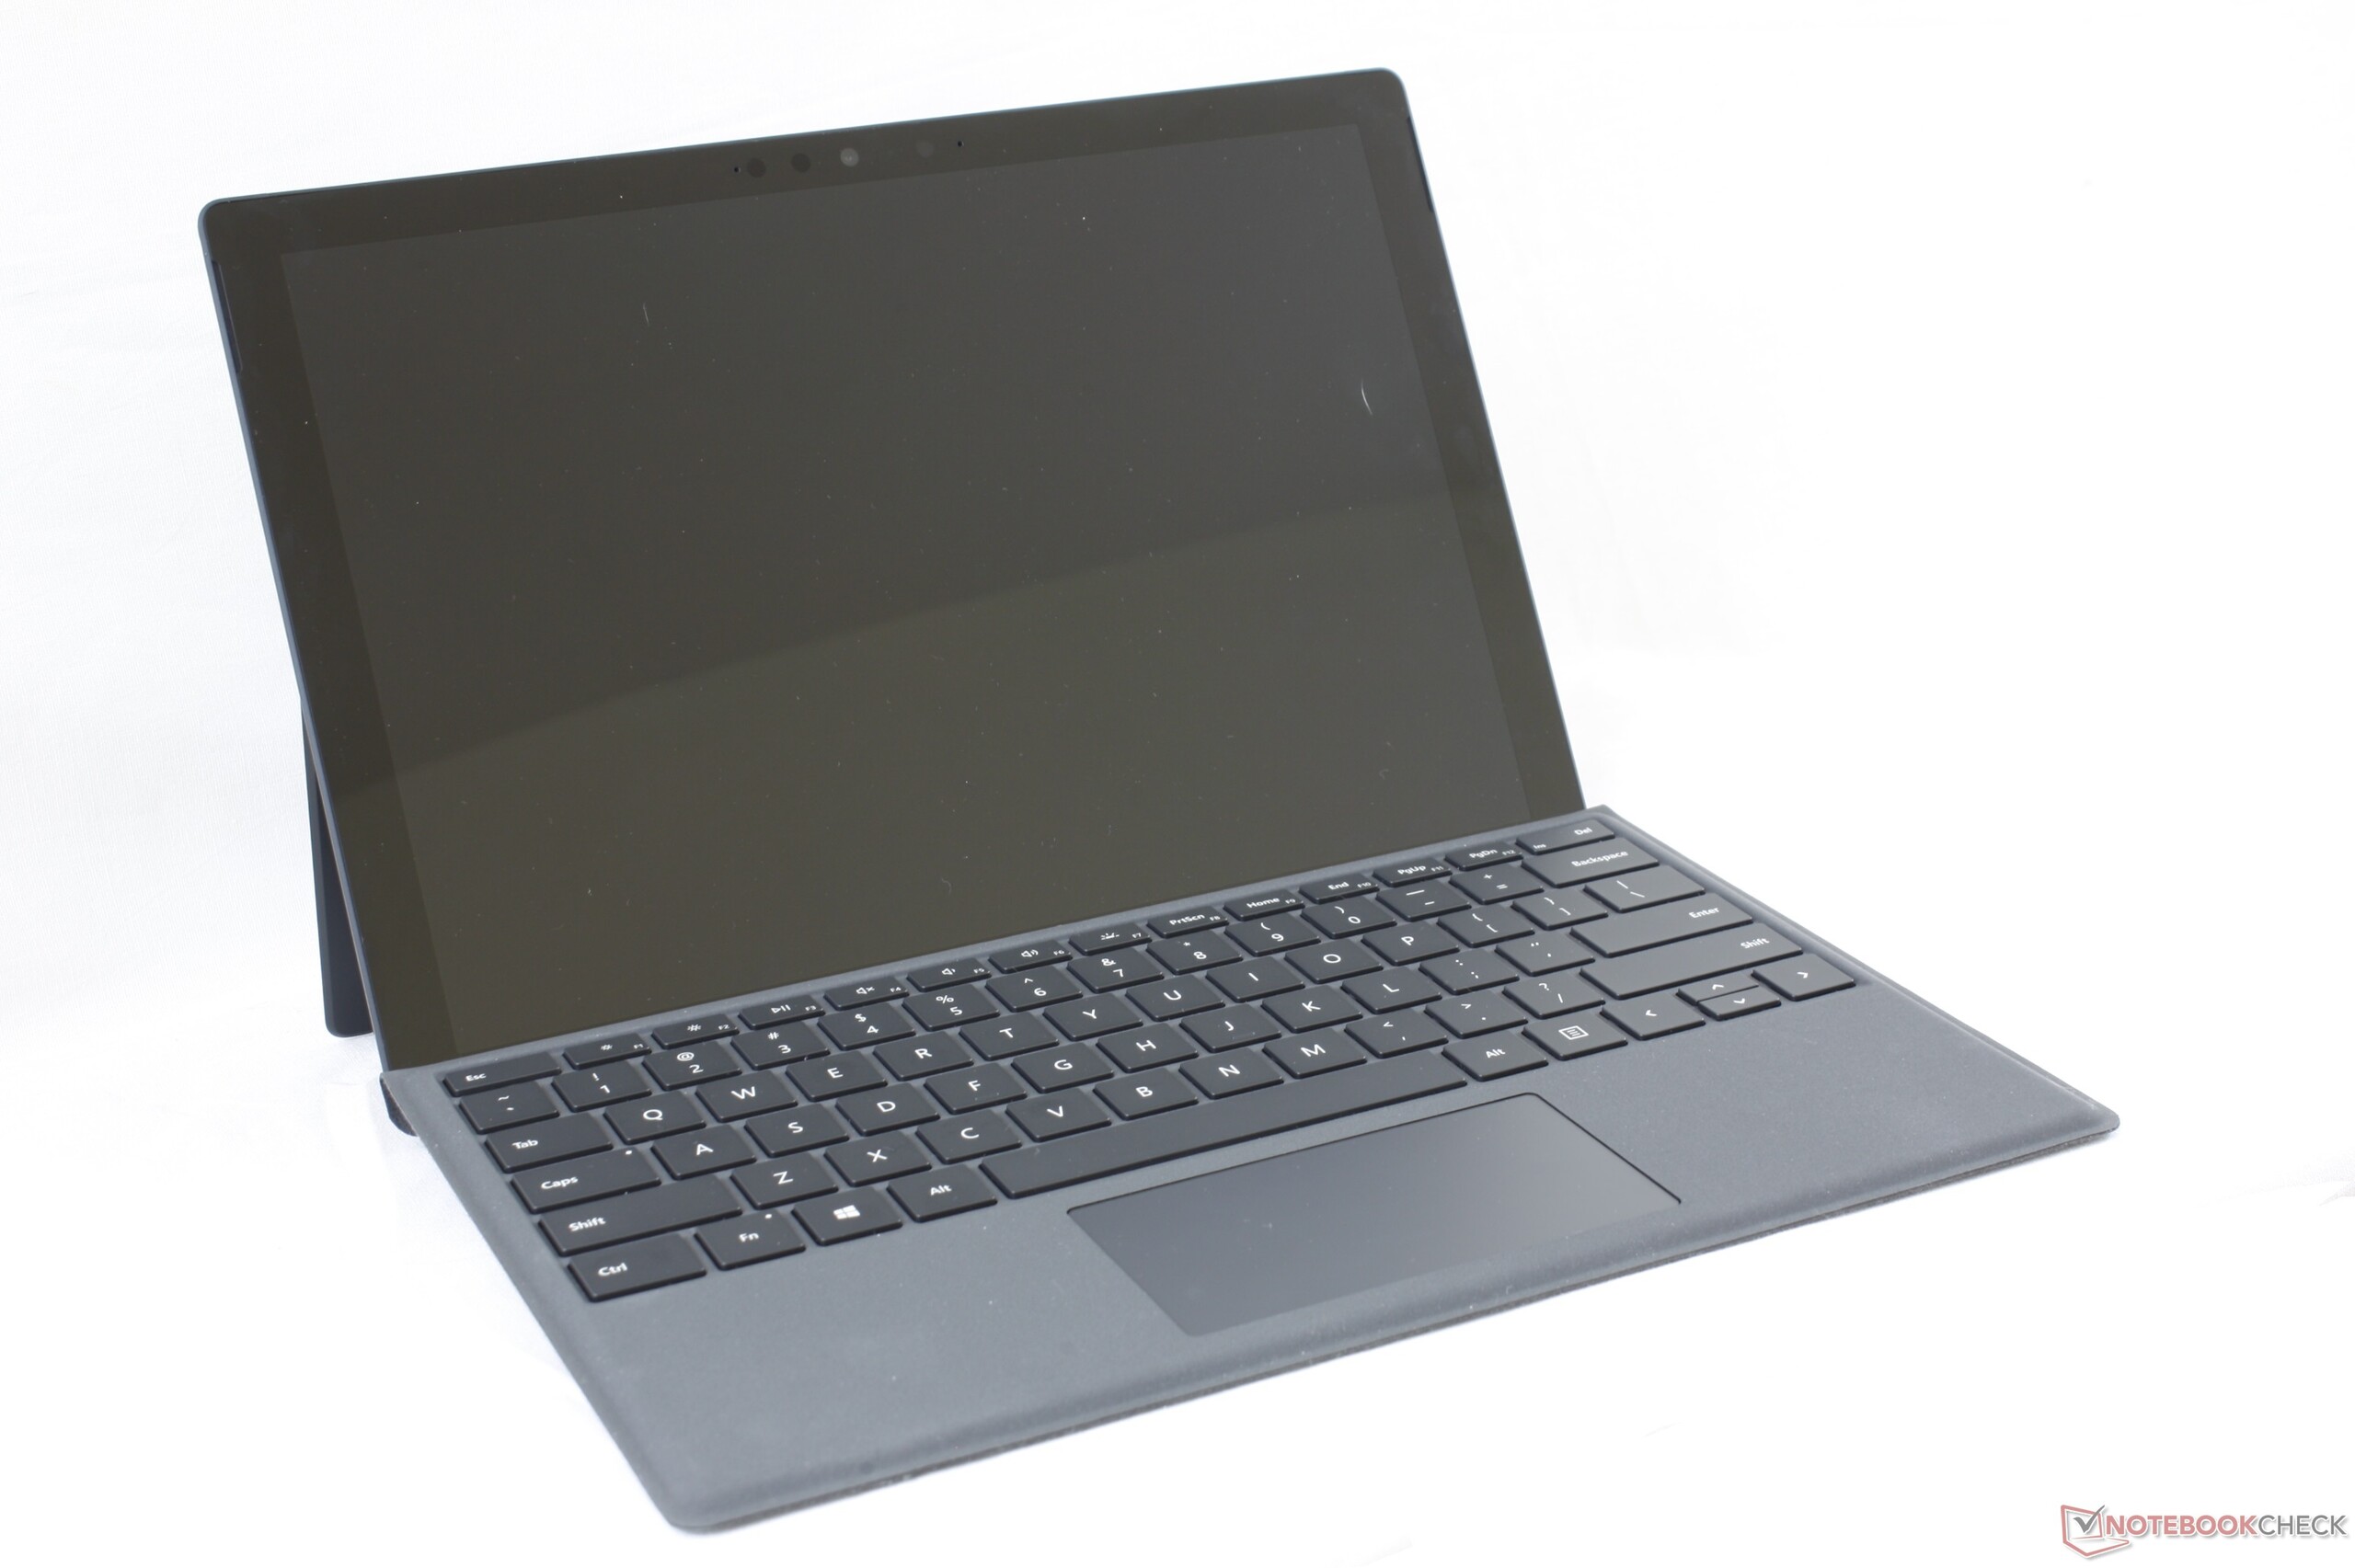
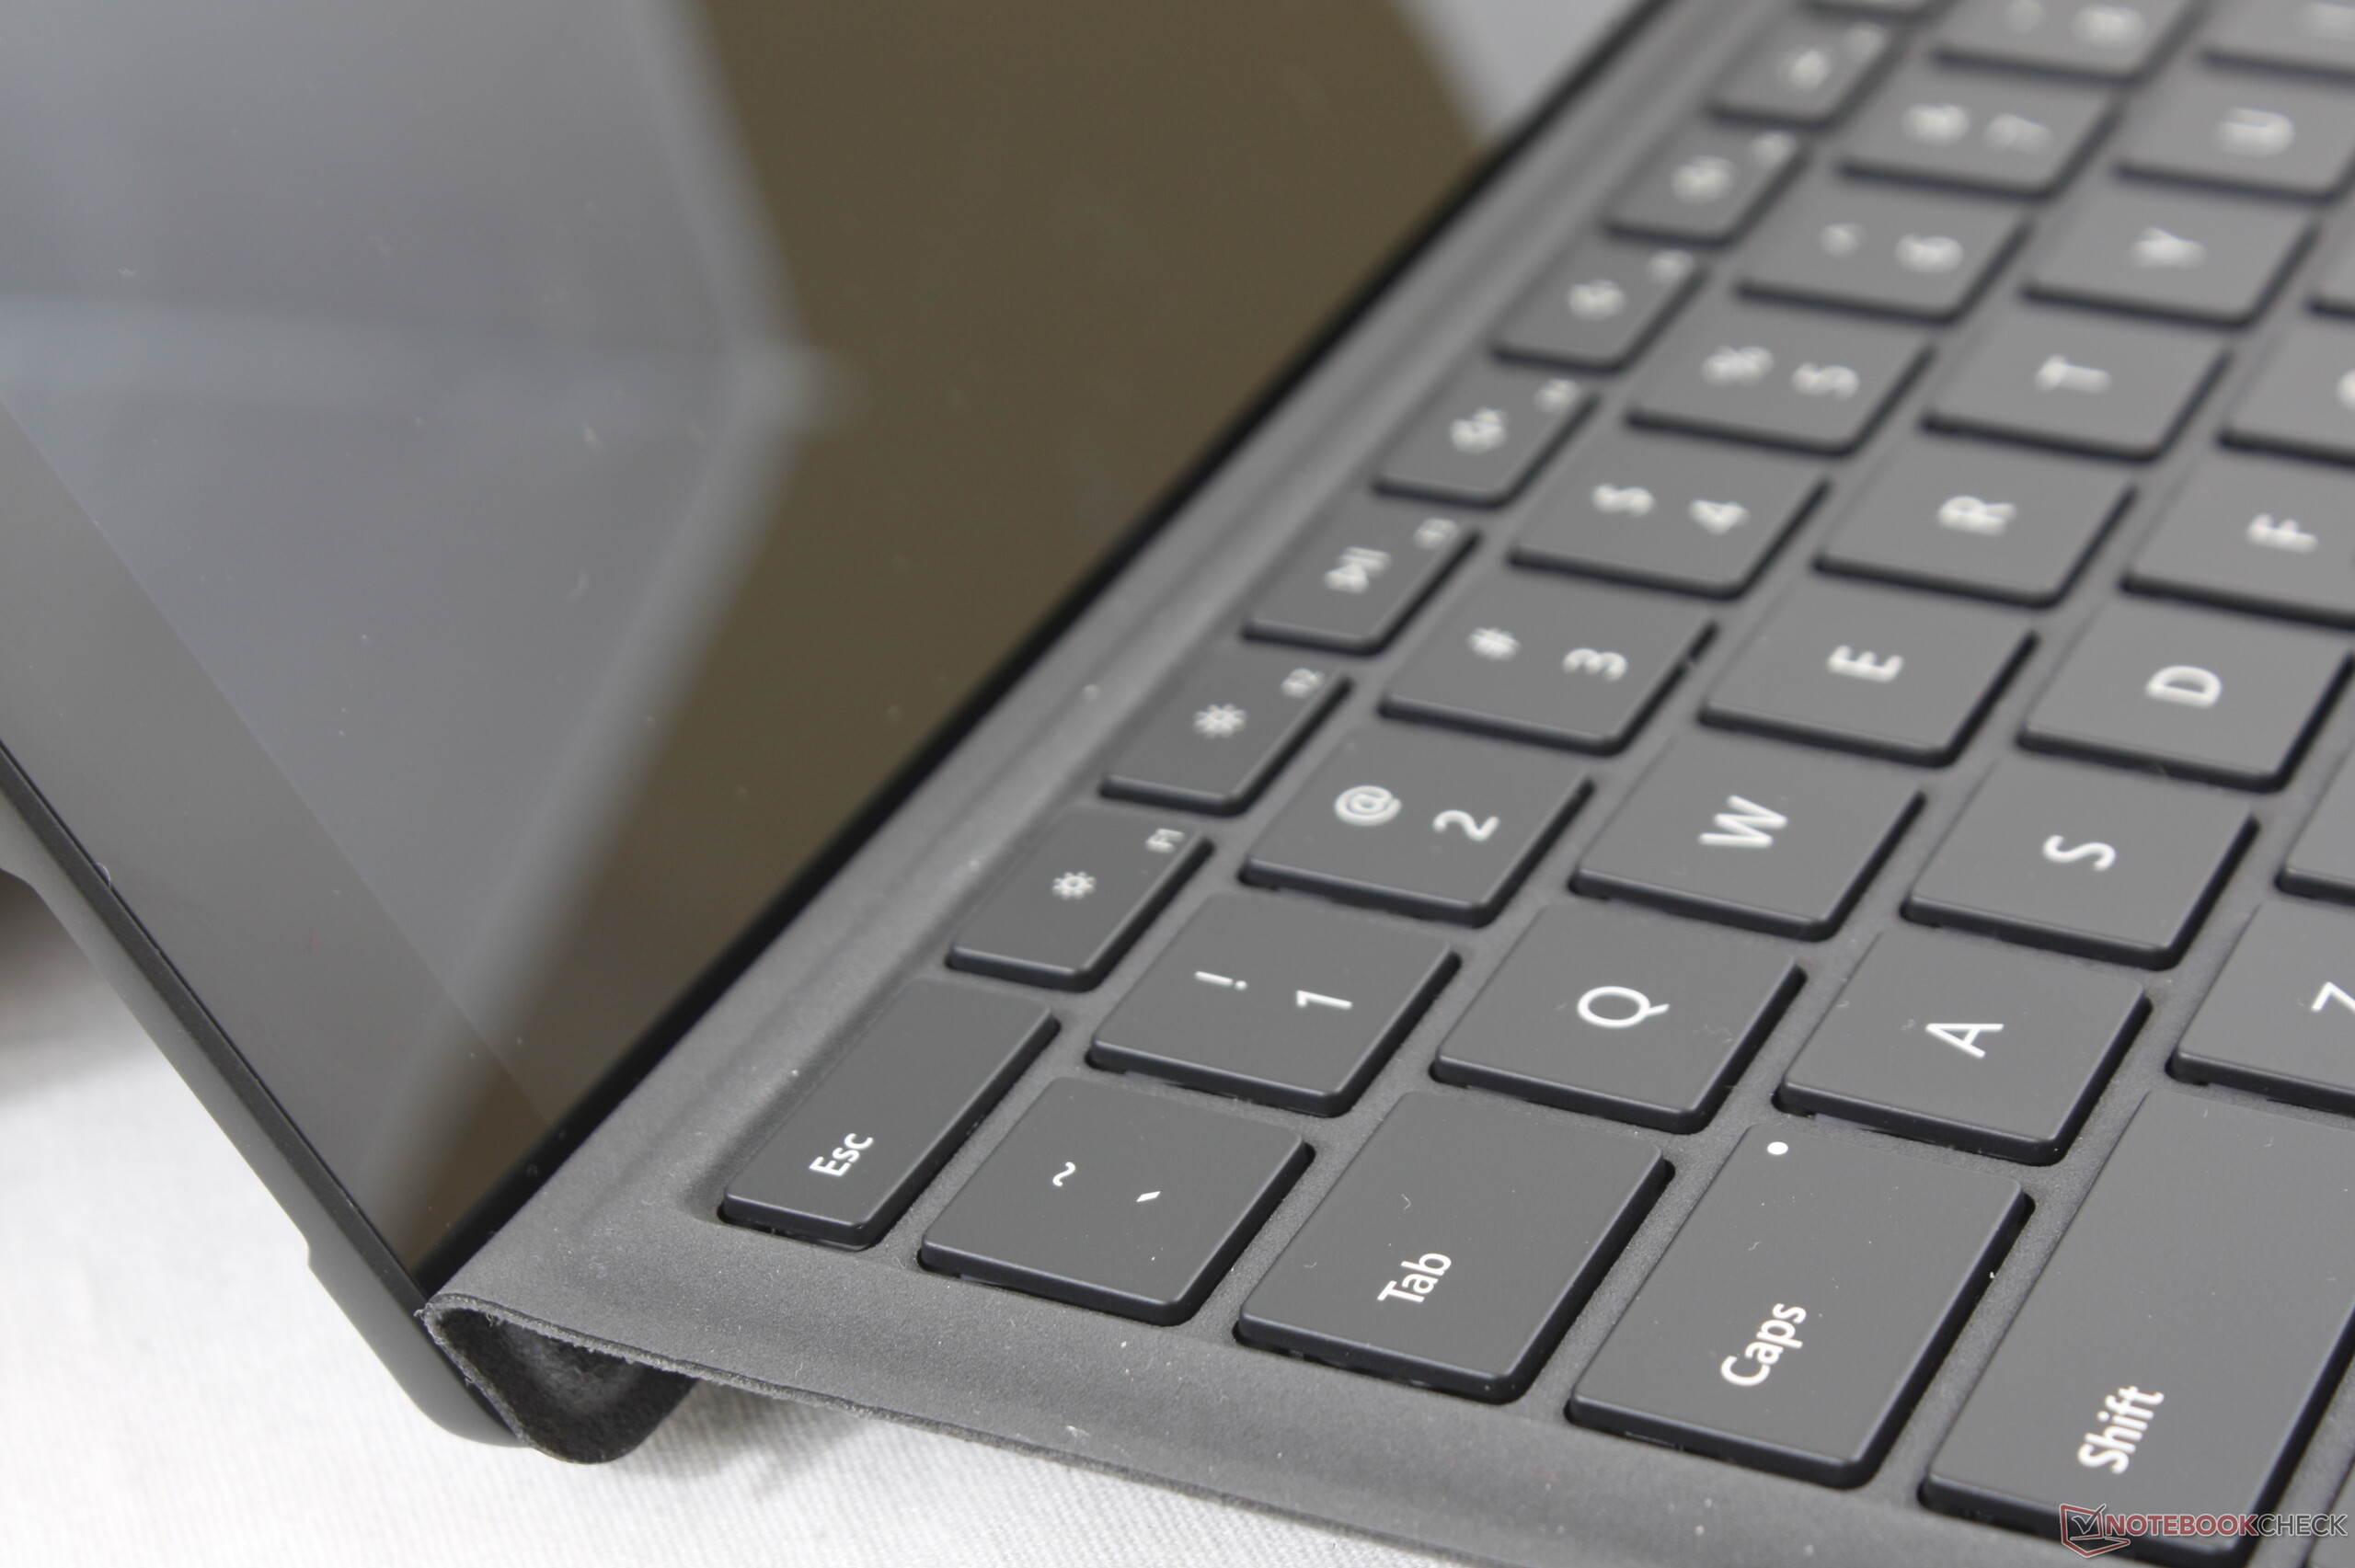
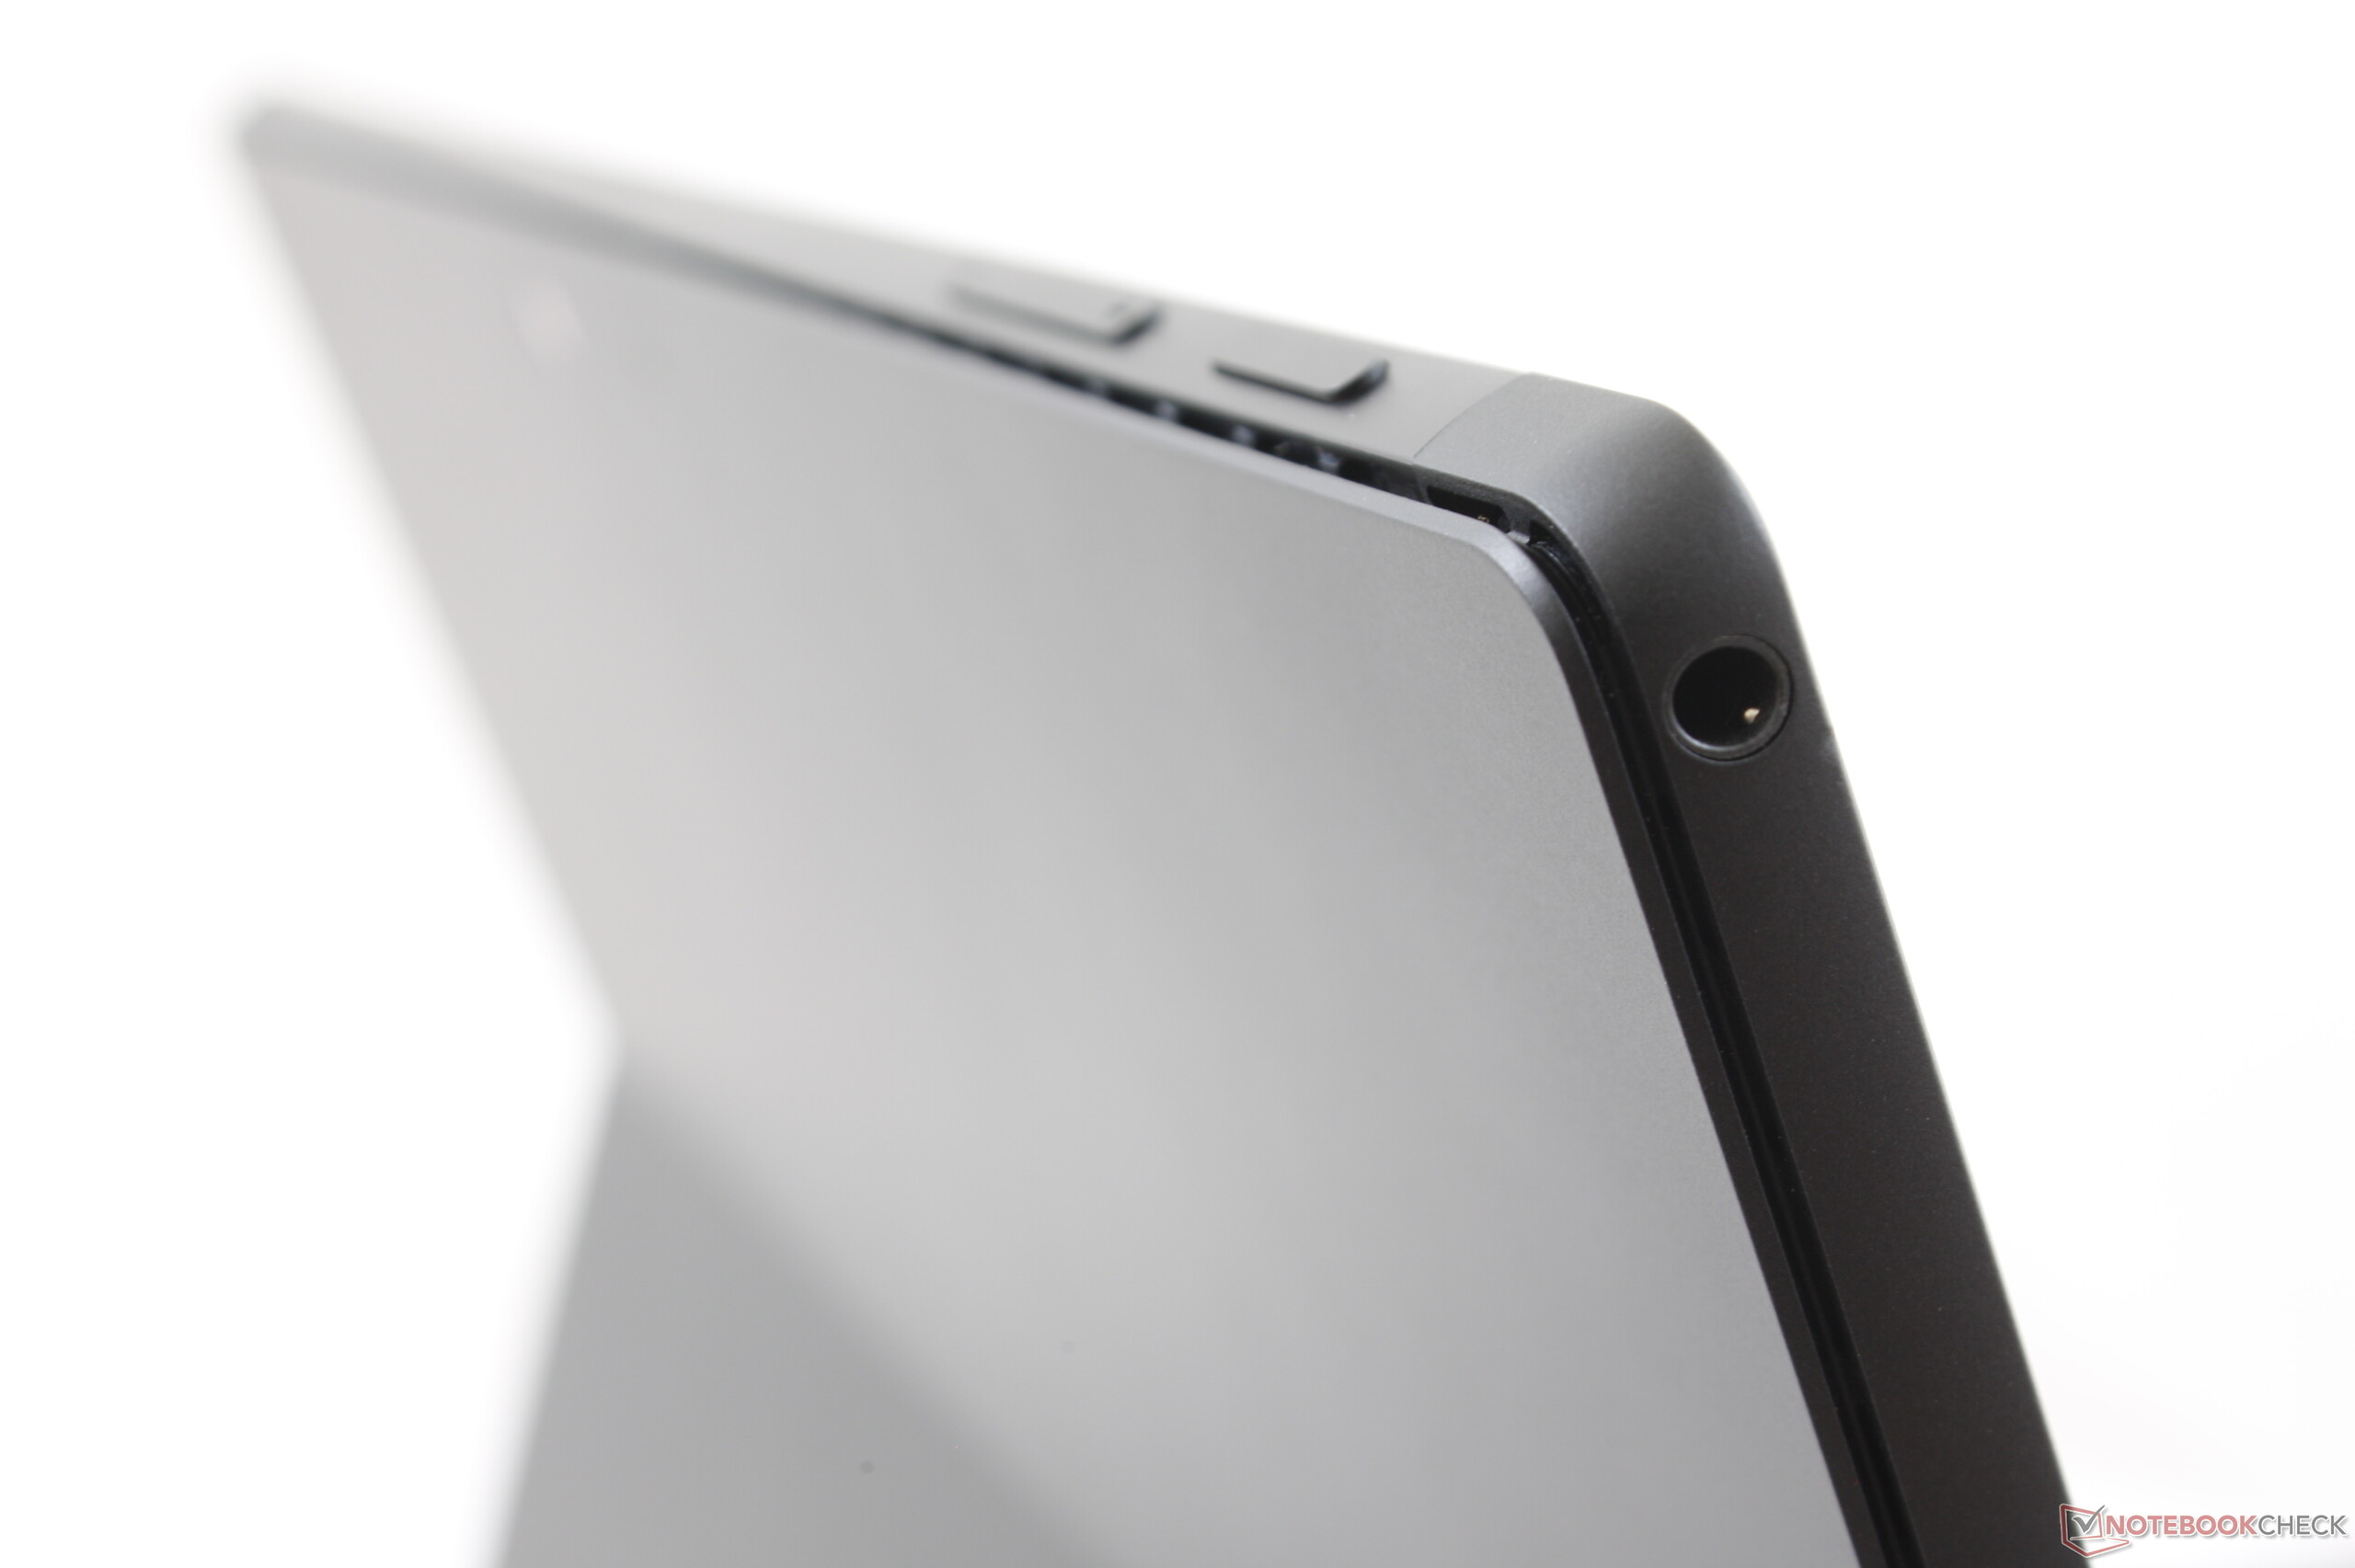
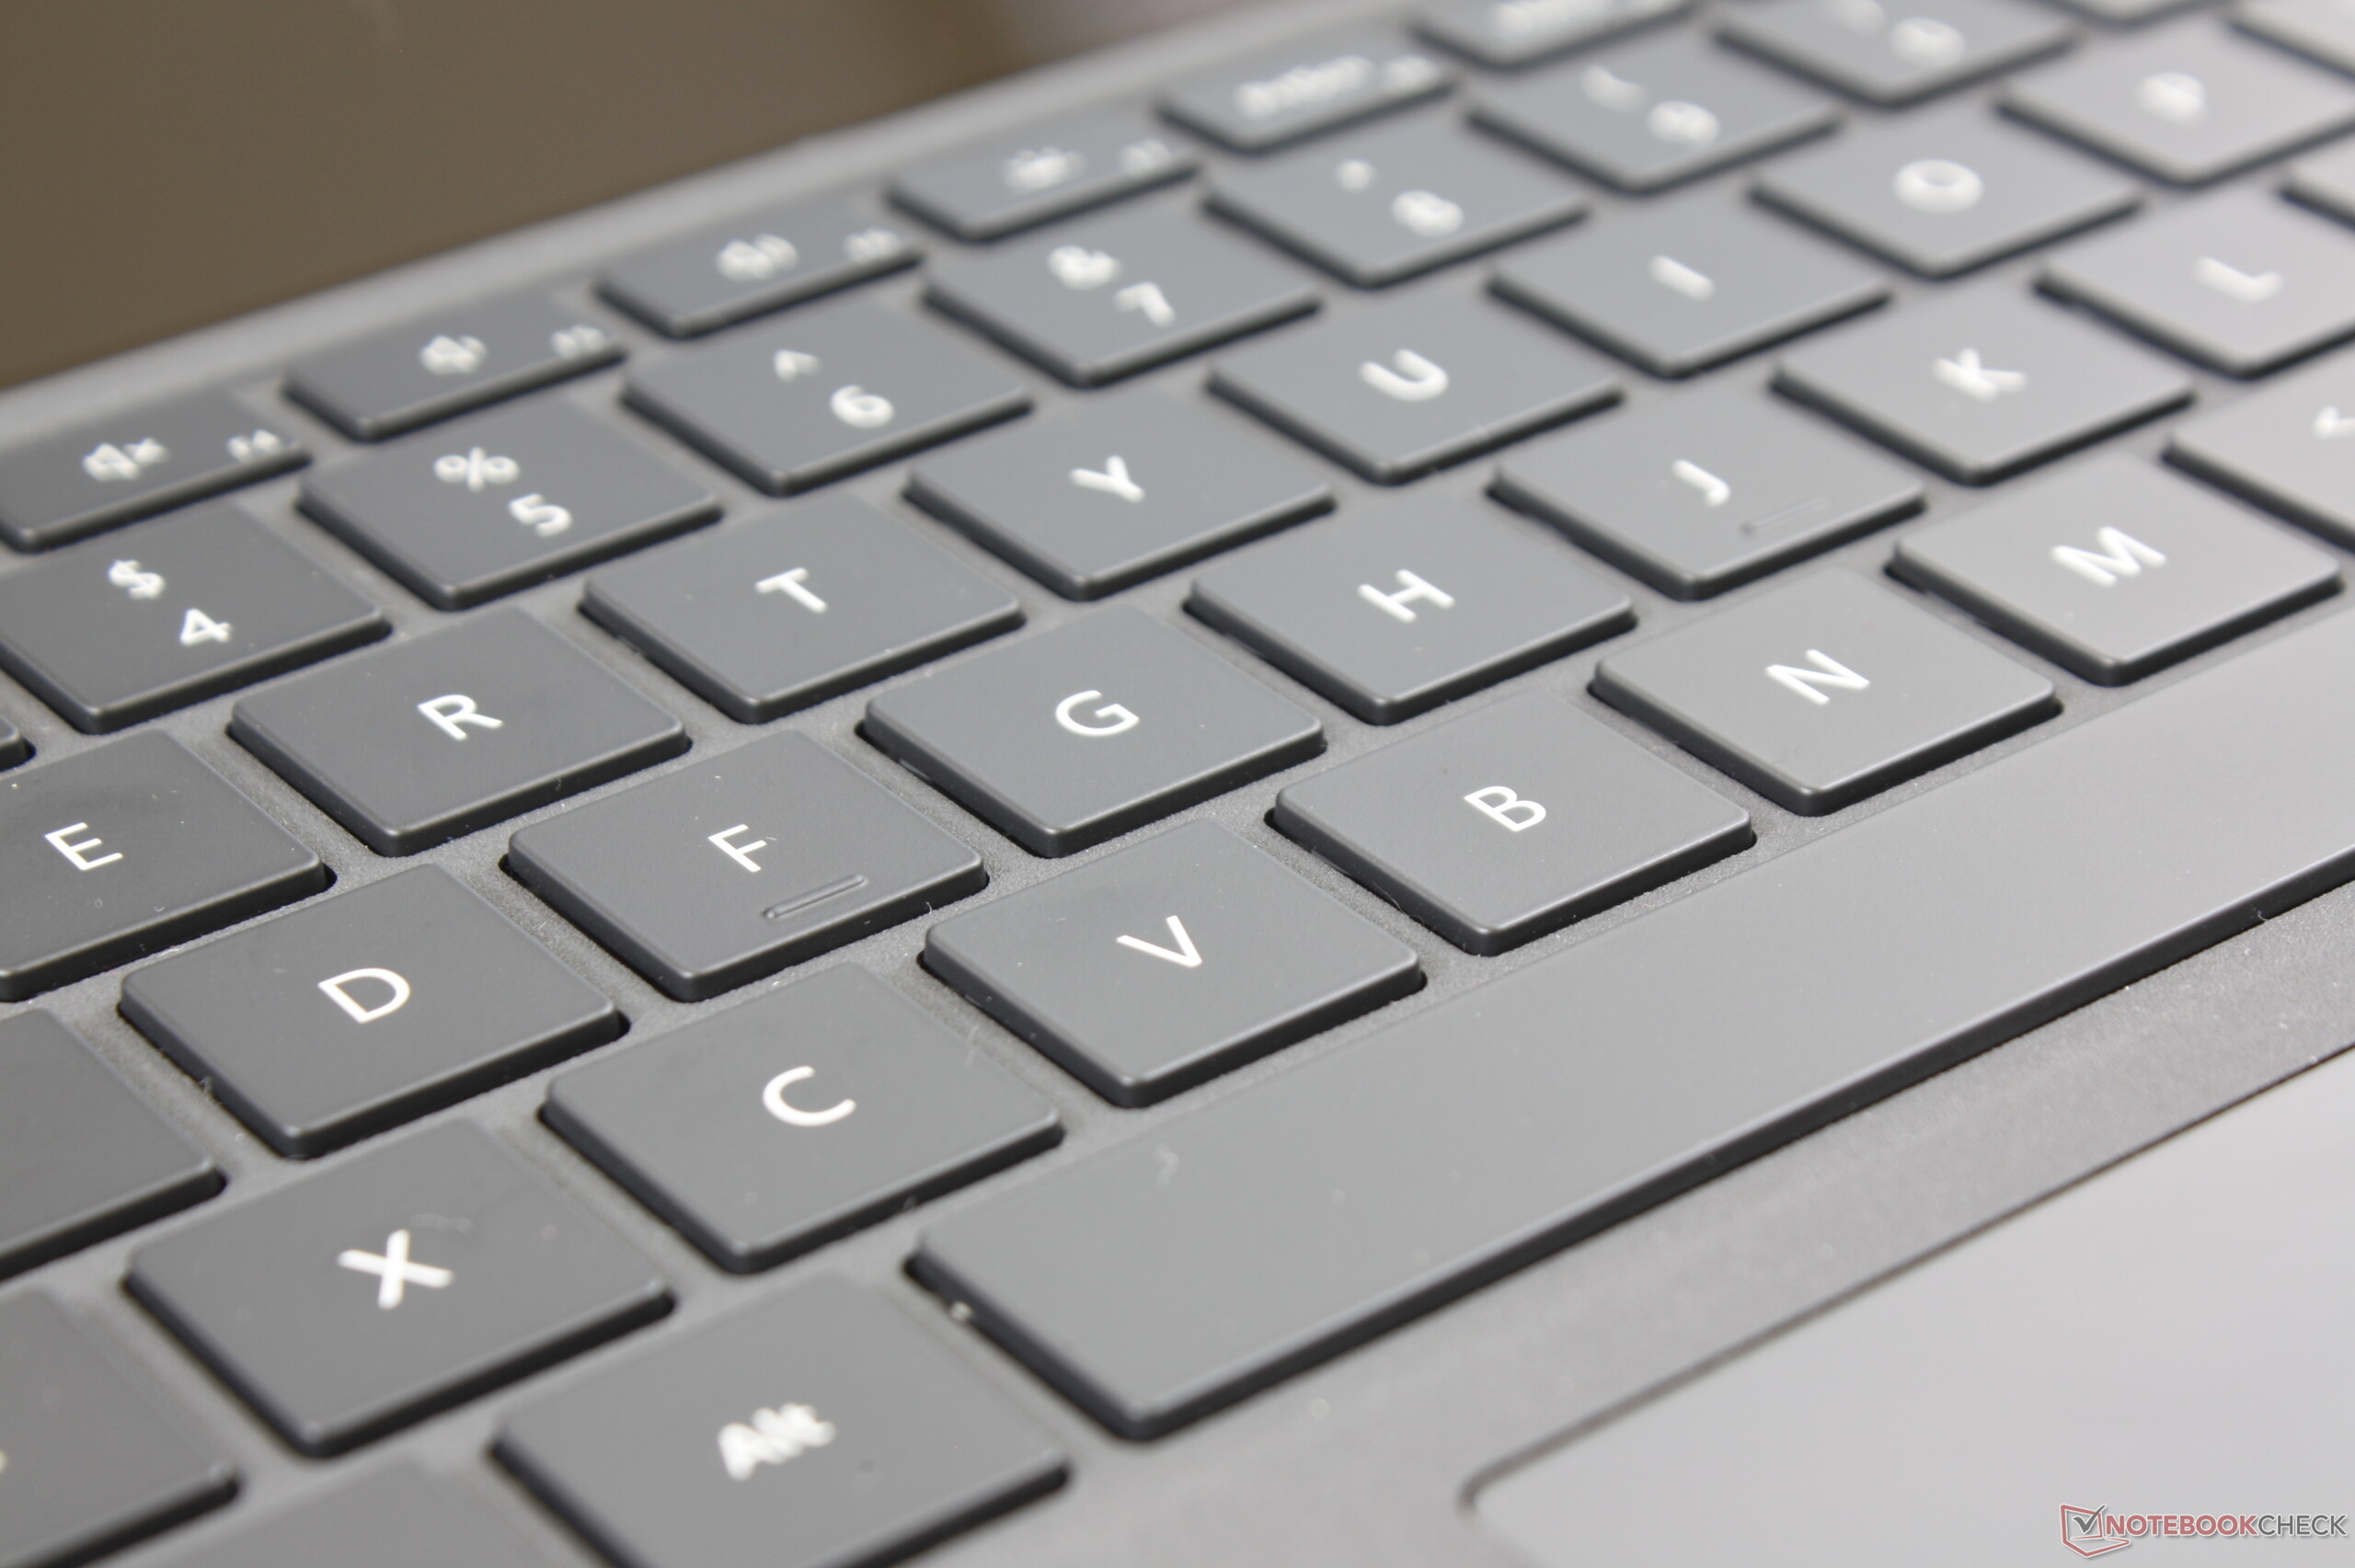
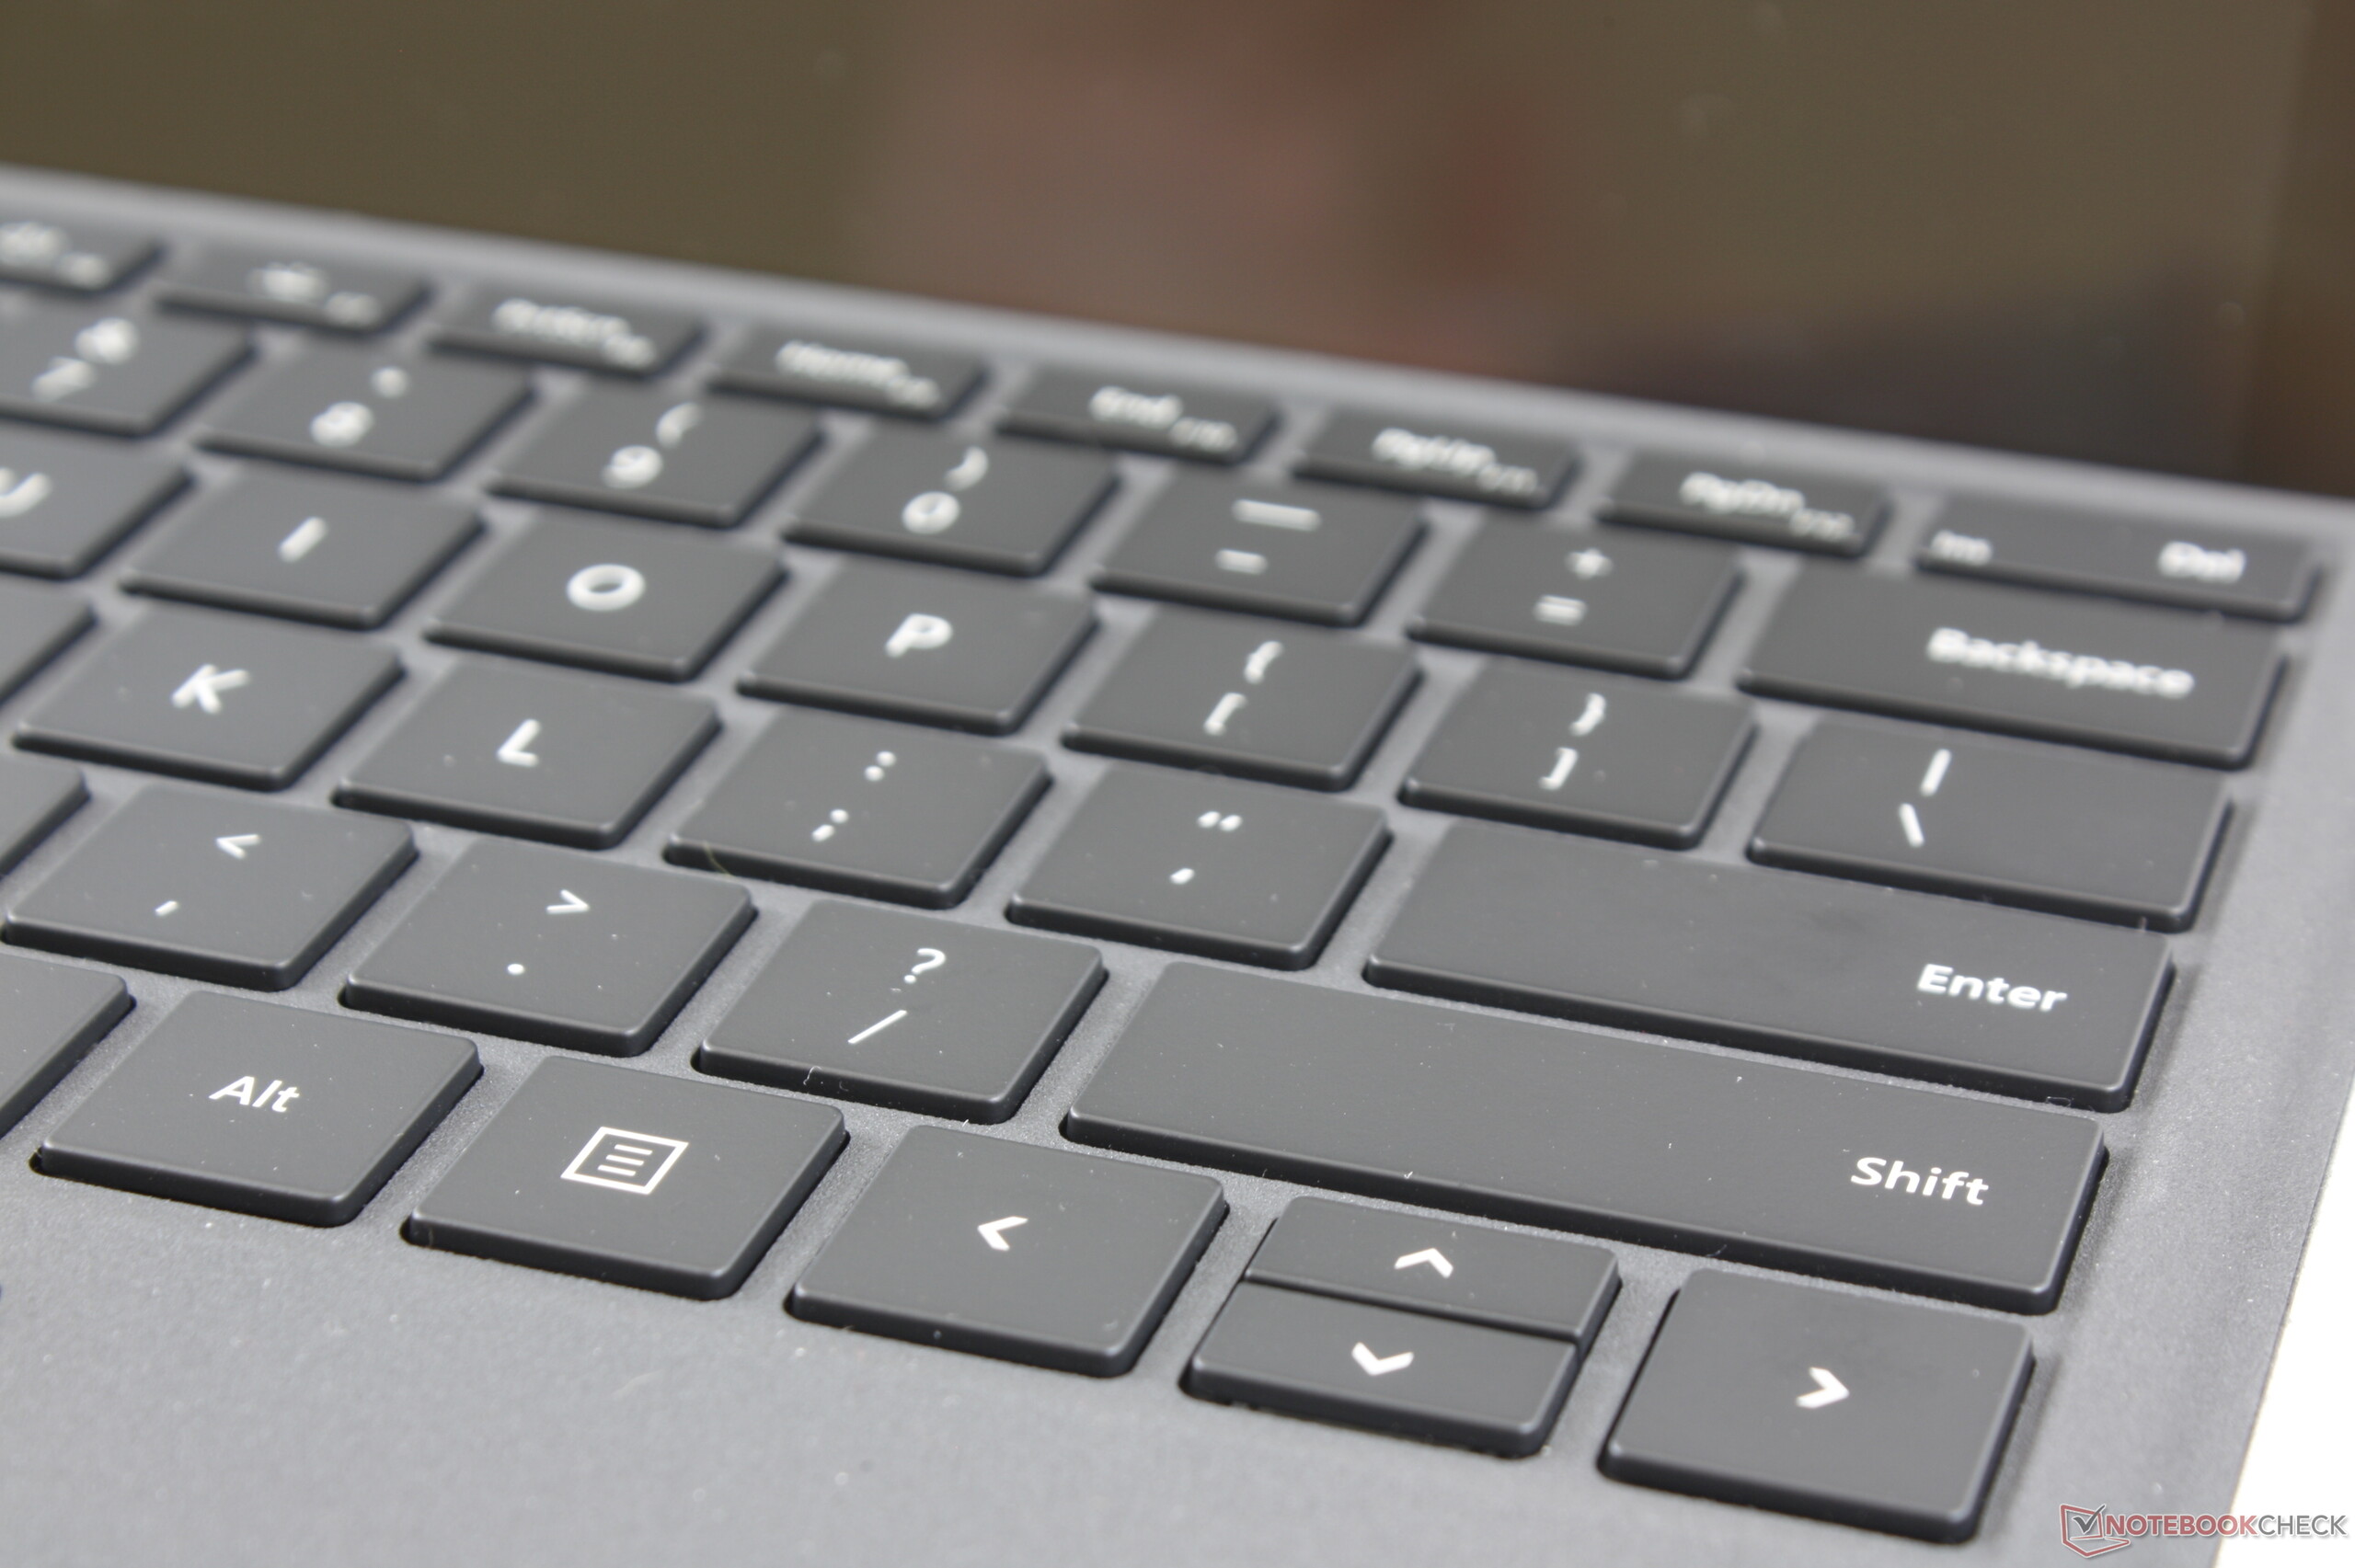
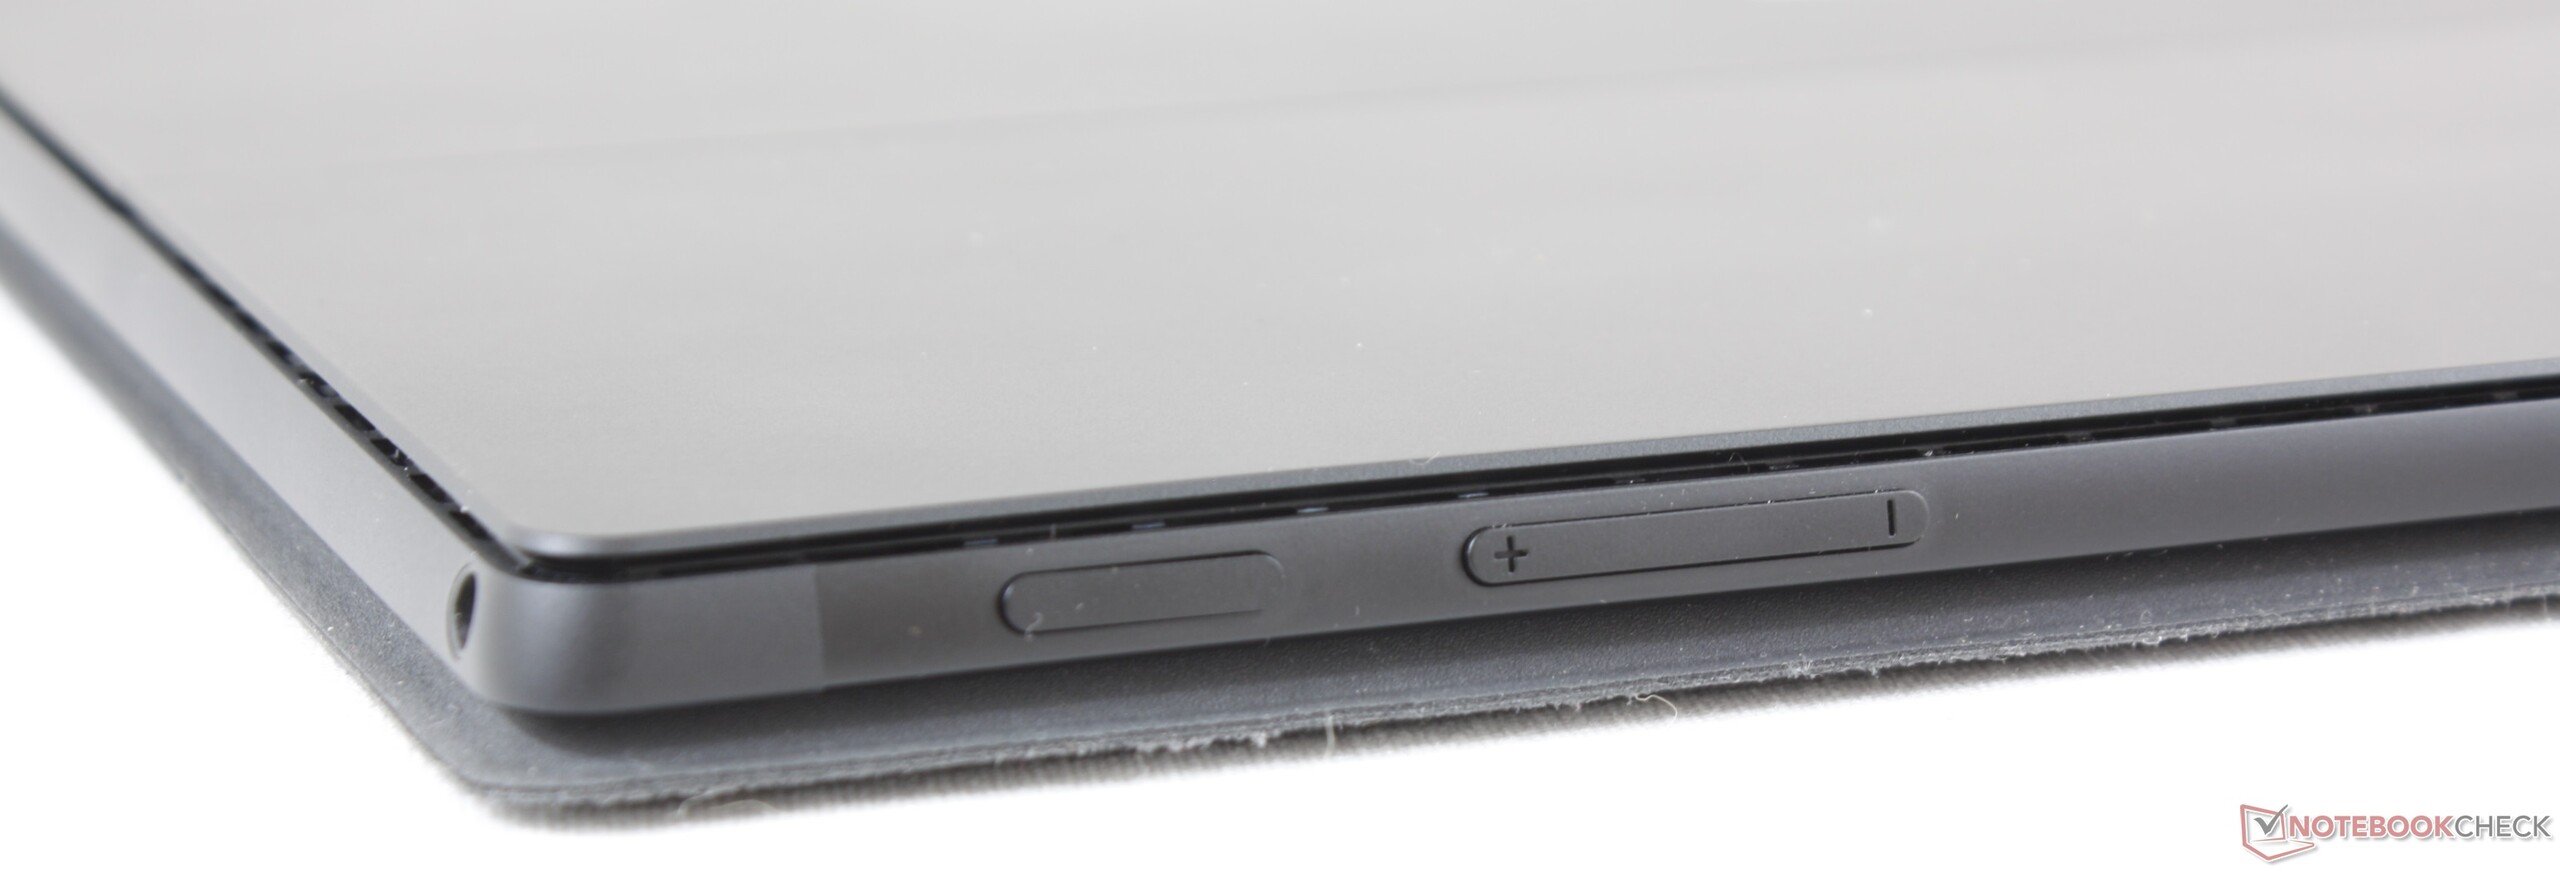
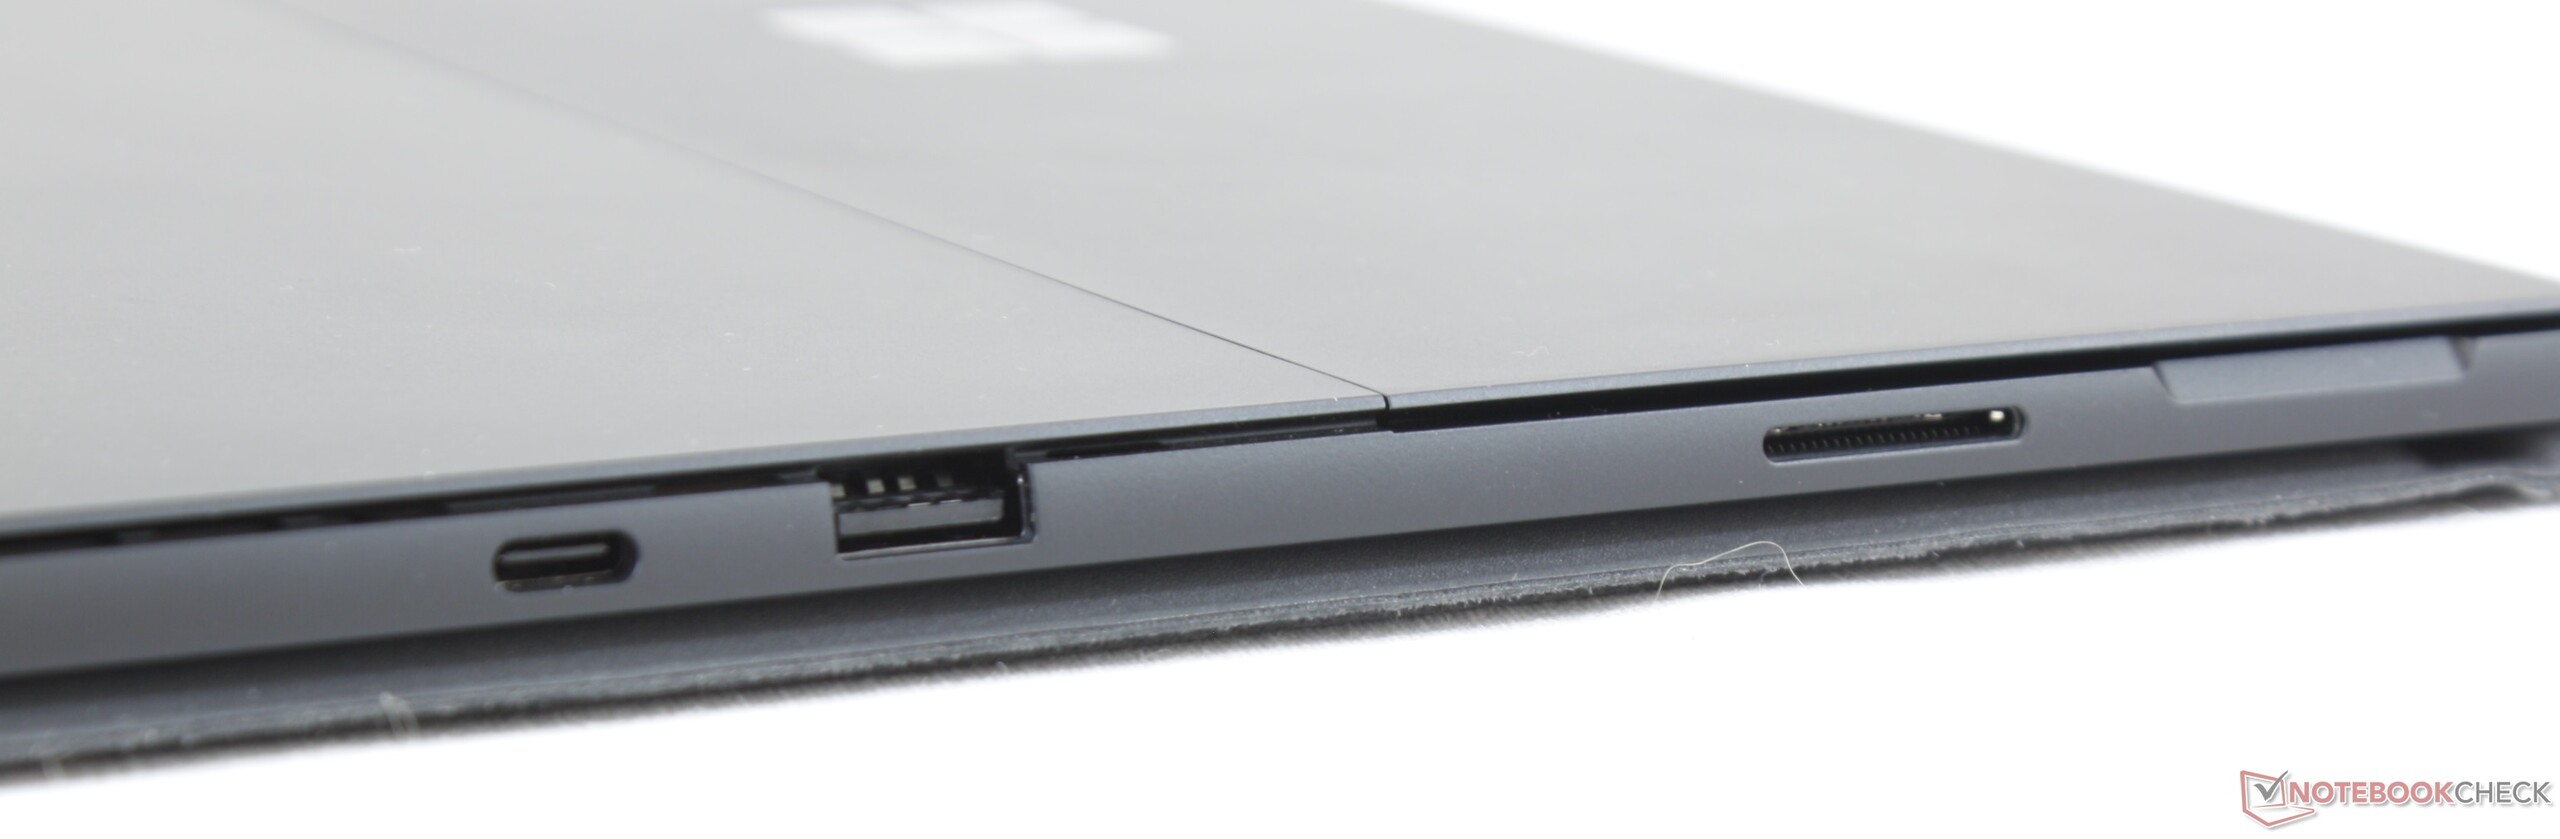
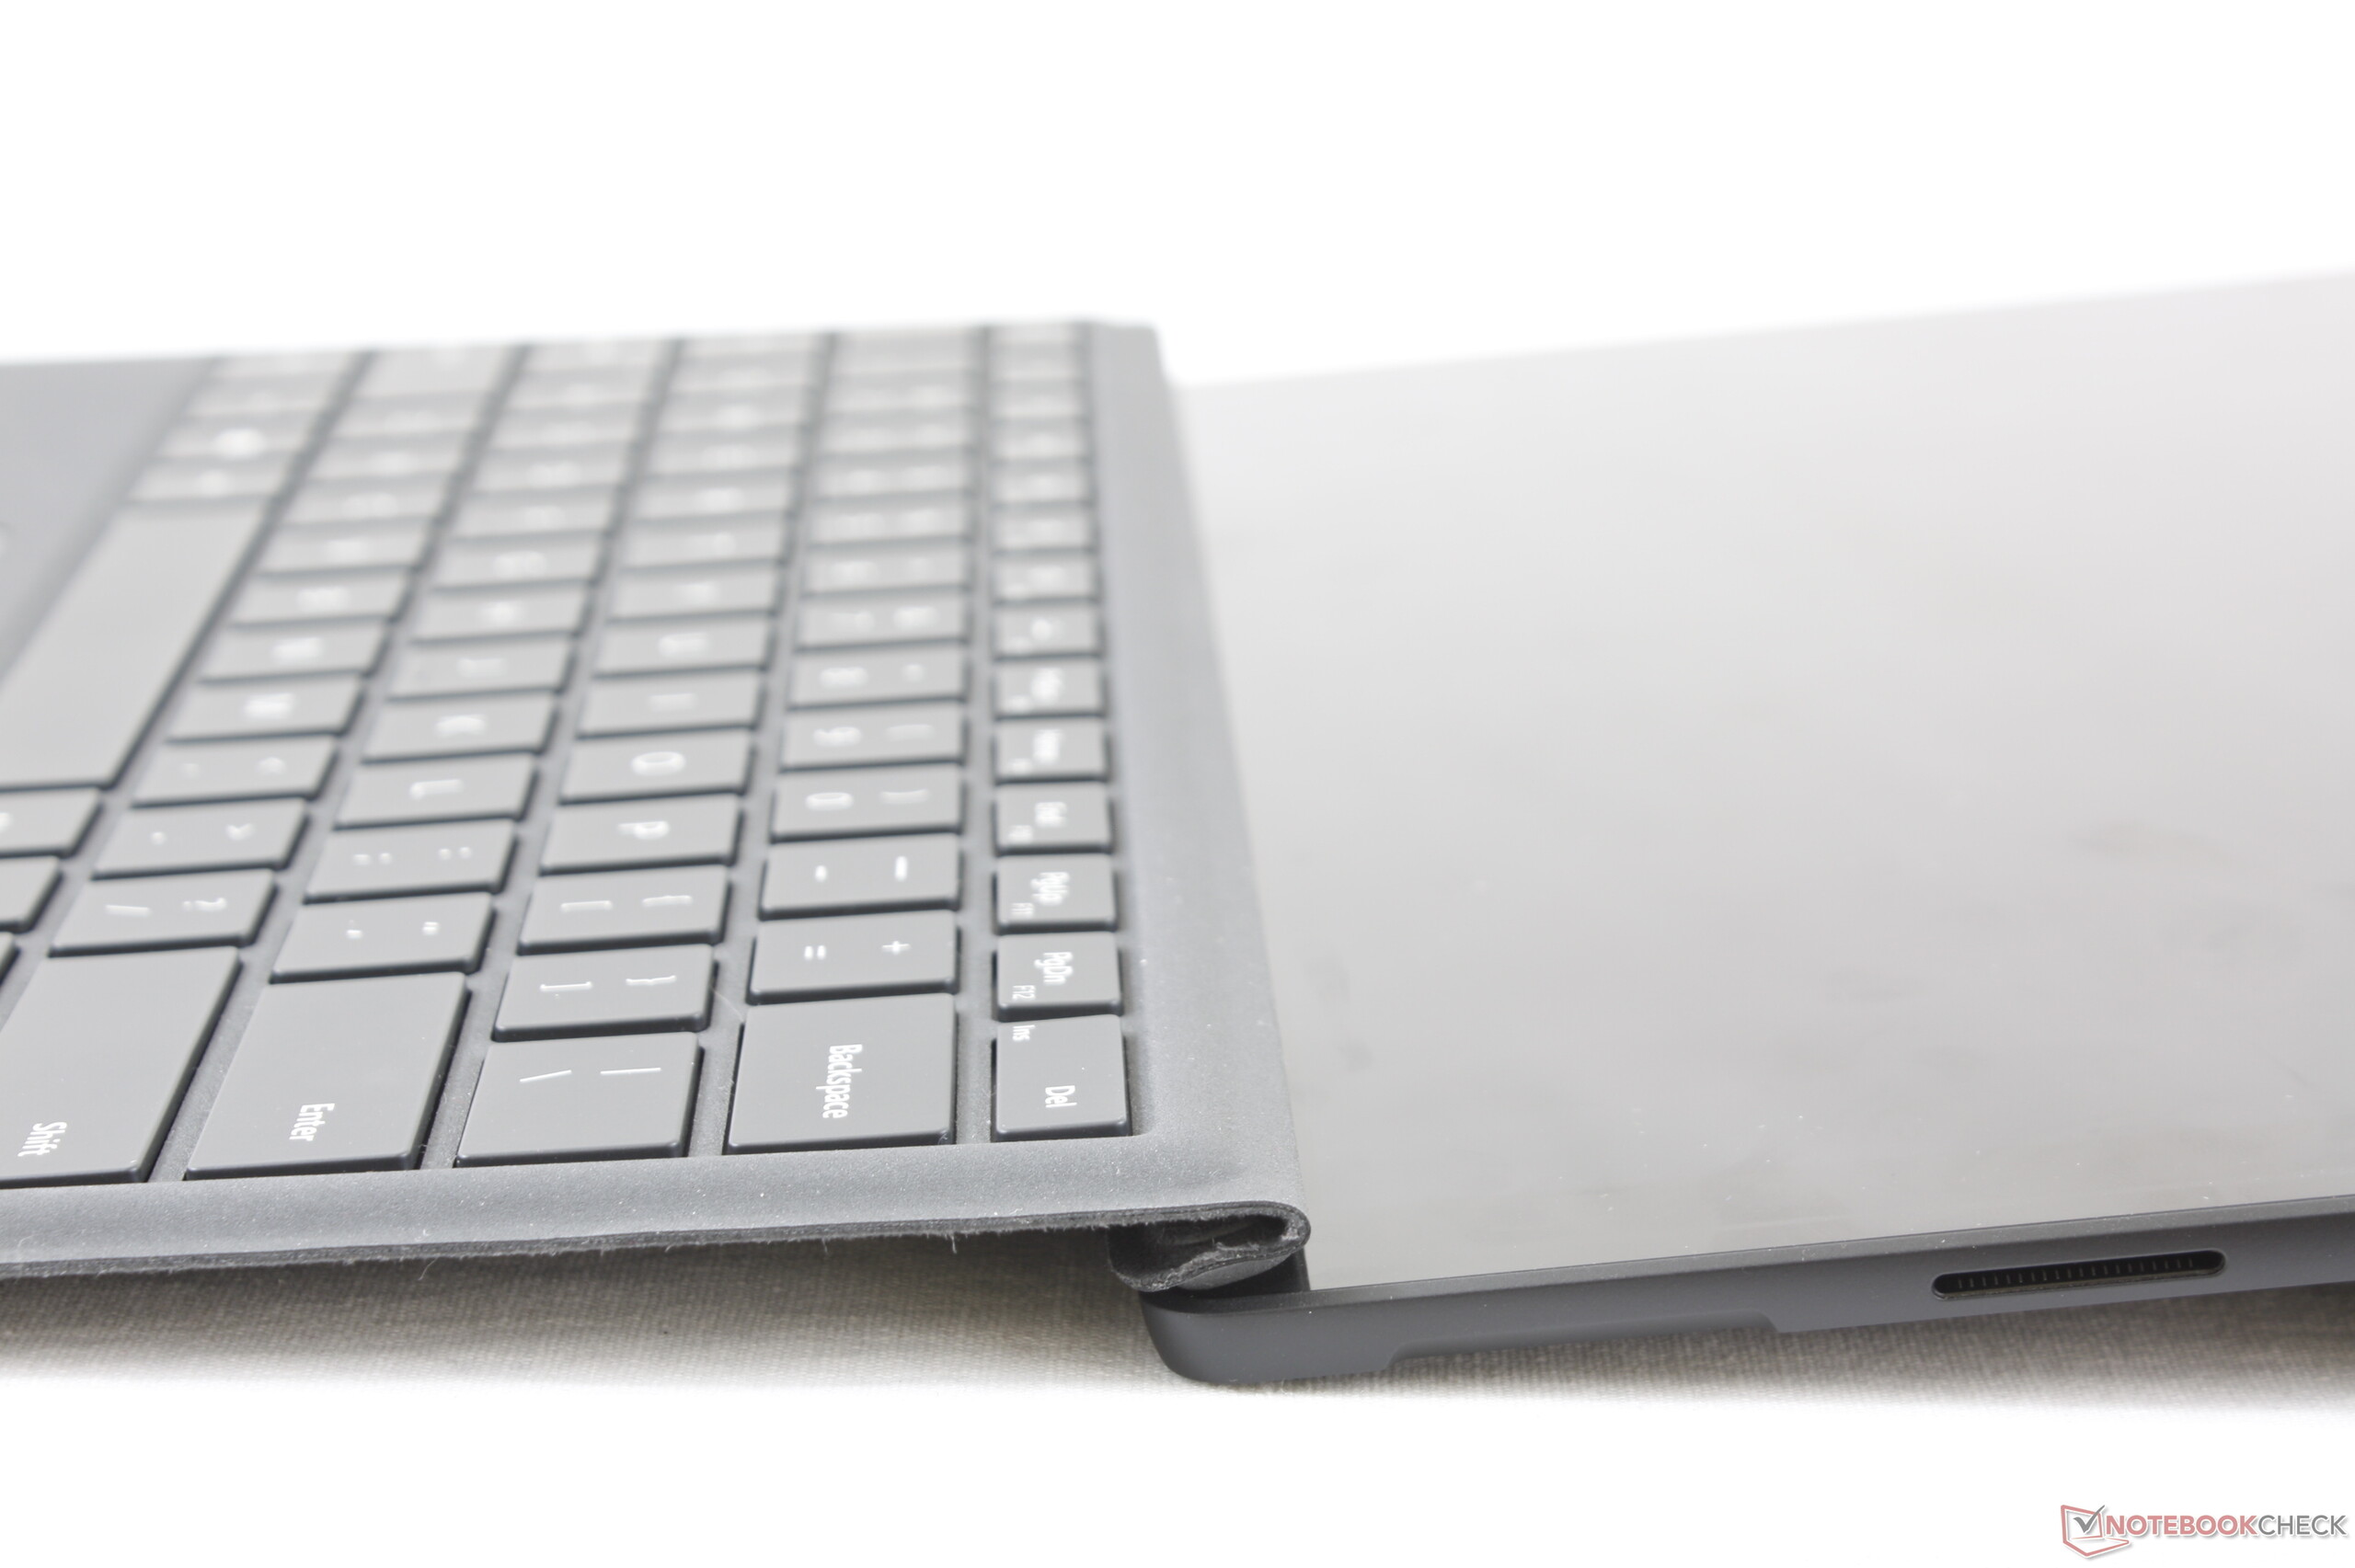
Como ya hemos analizado dos modelos de Surface Pro 7, no vamos a profundizar en la carcasa, la conectividad, los dispositivos de entrada y los altavoces en este análisis. La información correspondiente se puede encontrar en el análisis del Core i5 Surface Pro 7
Possible contenders in comparison
Valoración | Fecha | Modelo | Peso | Altura | Tamaño | Resolución | Precio |
|---|---|---|---|---|---|---|---|
| 88.5 % v7 (old) | 03/2021 | Microsoft Surface Pro 7 Plus i5-1135G7, Iris Xe G7 80EUs | 796 g | 8.5 mm | 12.30" | 2736x1824 | |
| 87.1 % v7 (old) | 11/2020 | Lenovo Yoga Duet 7 13IML05-82AS000WGE i5-10210U, UHD Graphics 620 | 1.2 kg | 9.2 mm | 13.00" | 2160x1350 | |
| 89.5 % v7 (old) | 03/2021 | Dell Latitude 12 7210 2-in-1 i7-10610U, UHD Graphics 620 | 850 g | 9.35 mm | 12.30" | 1920x1280 |
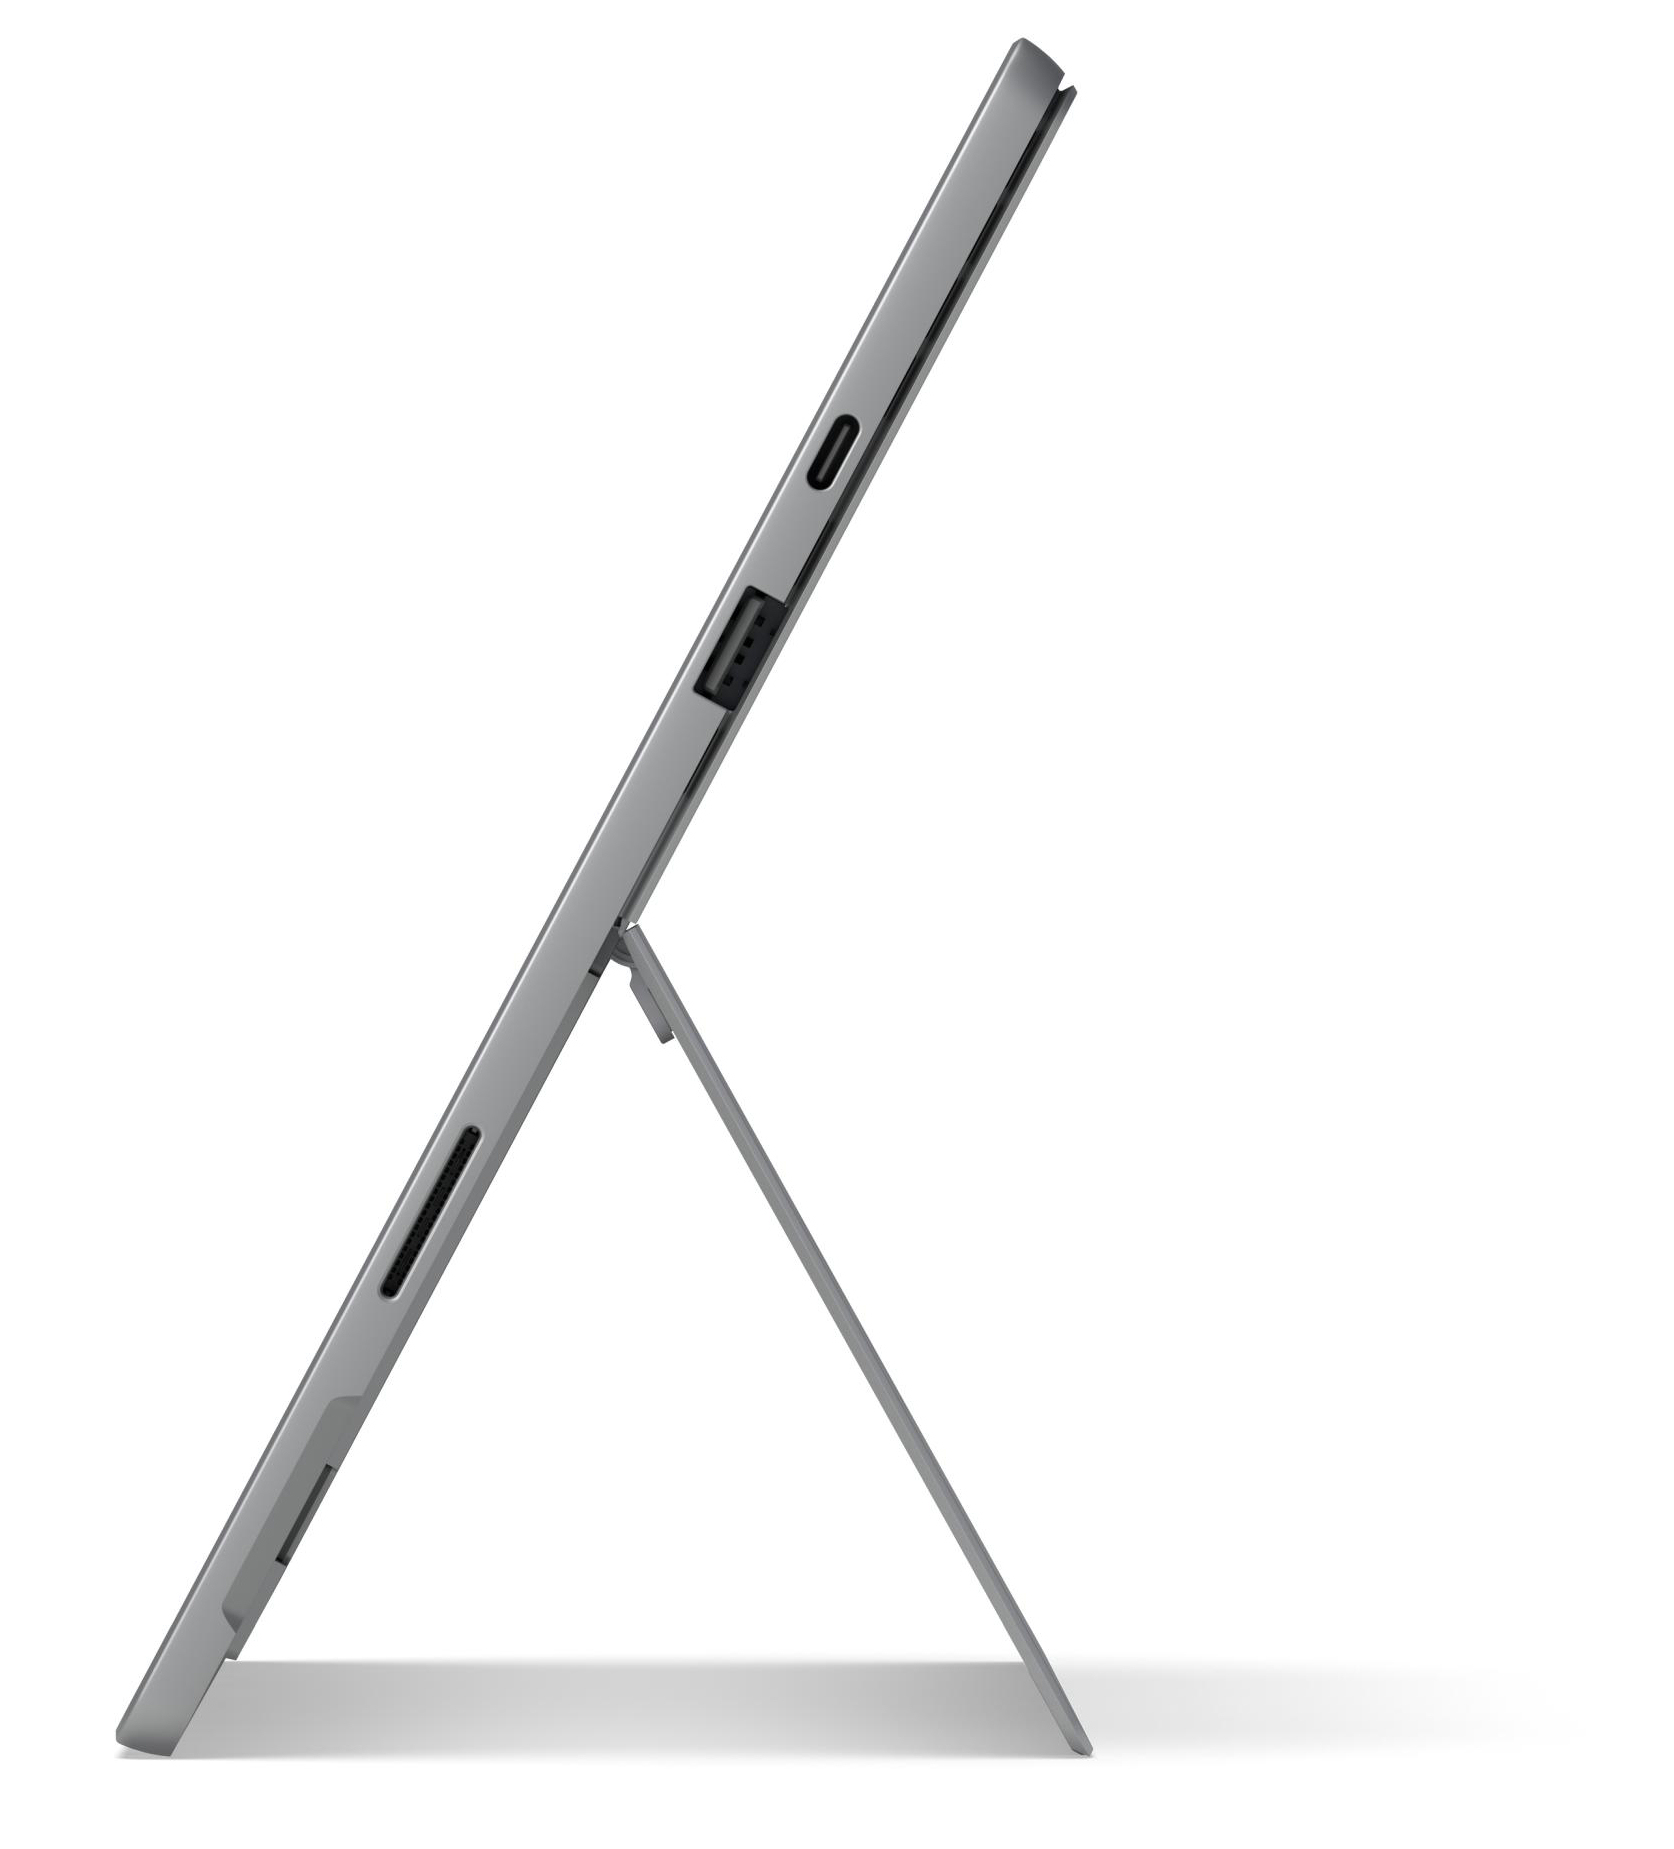
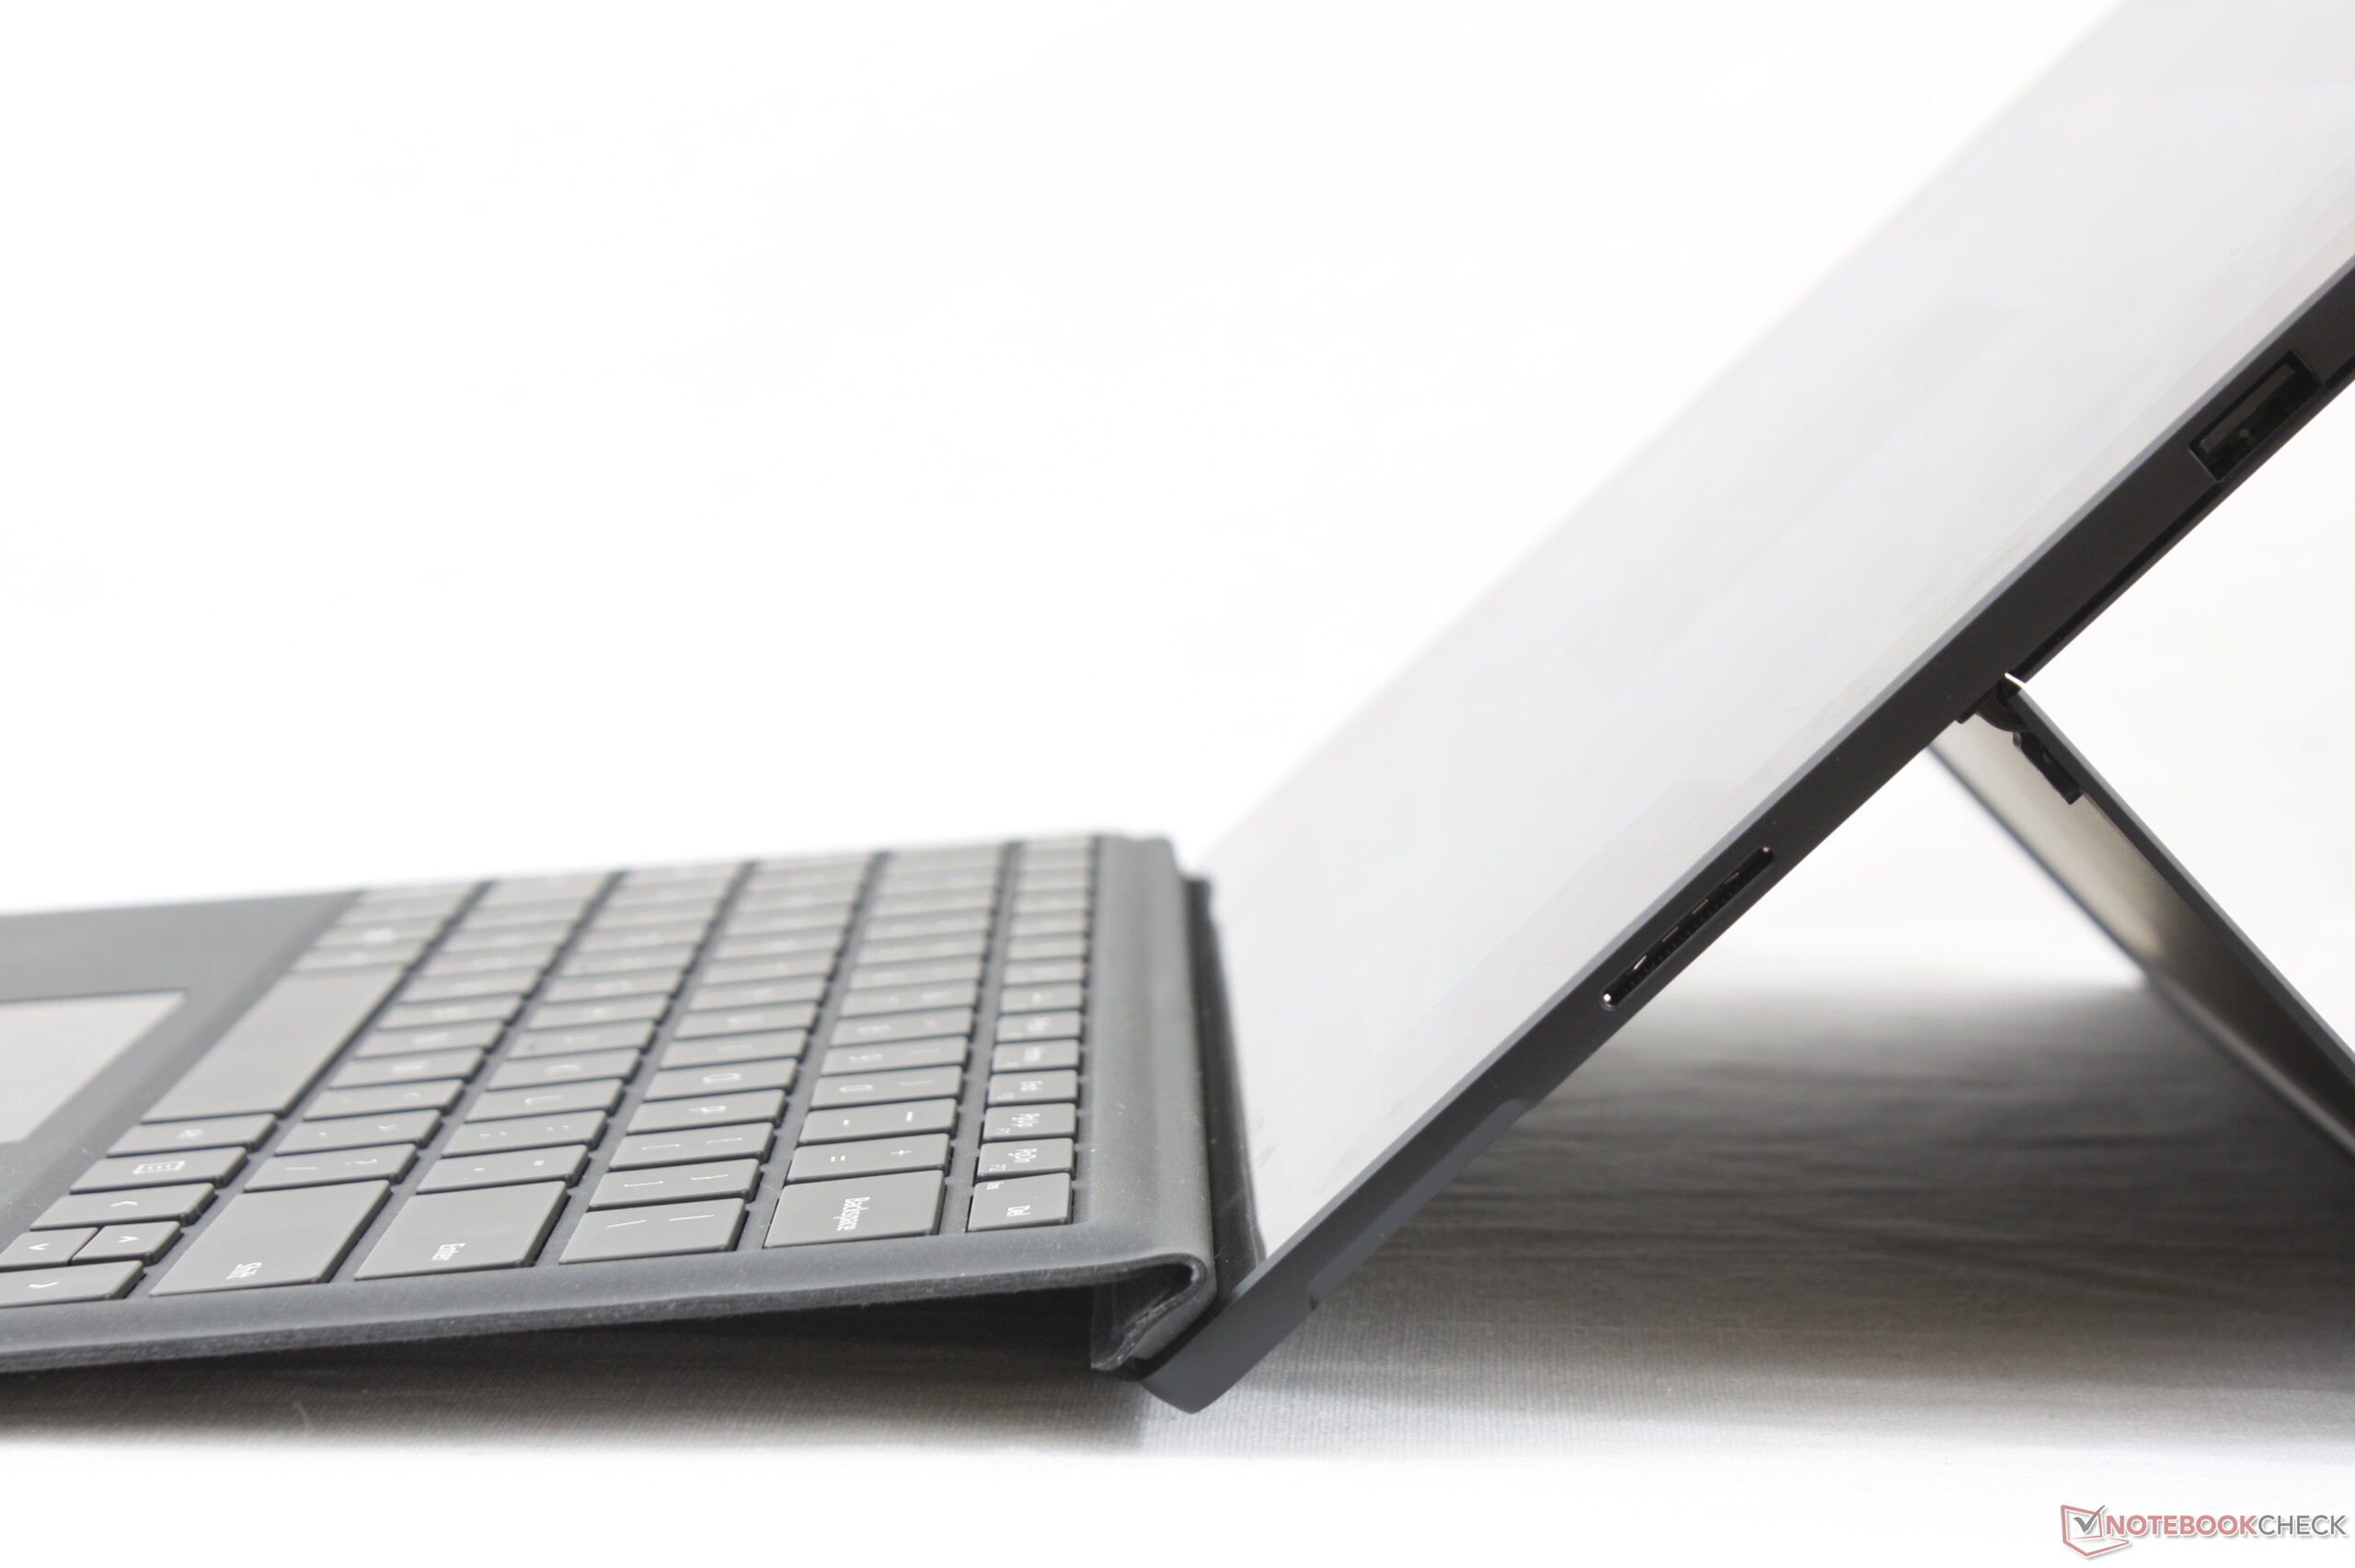
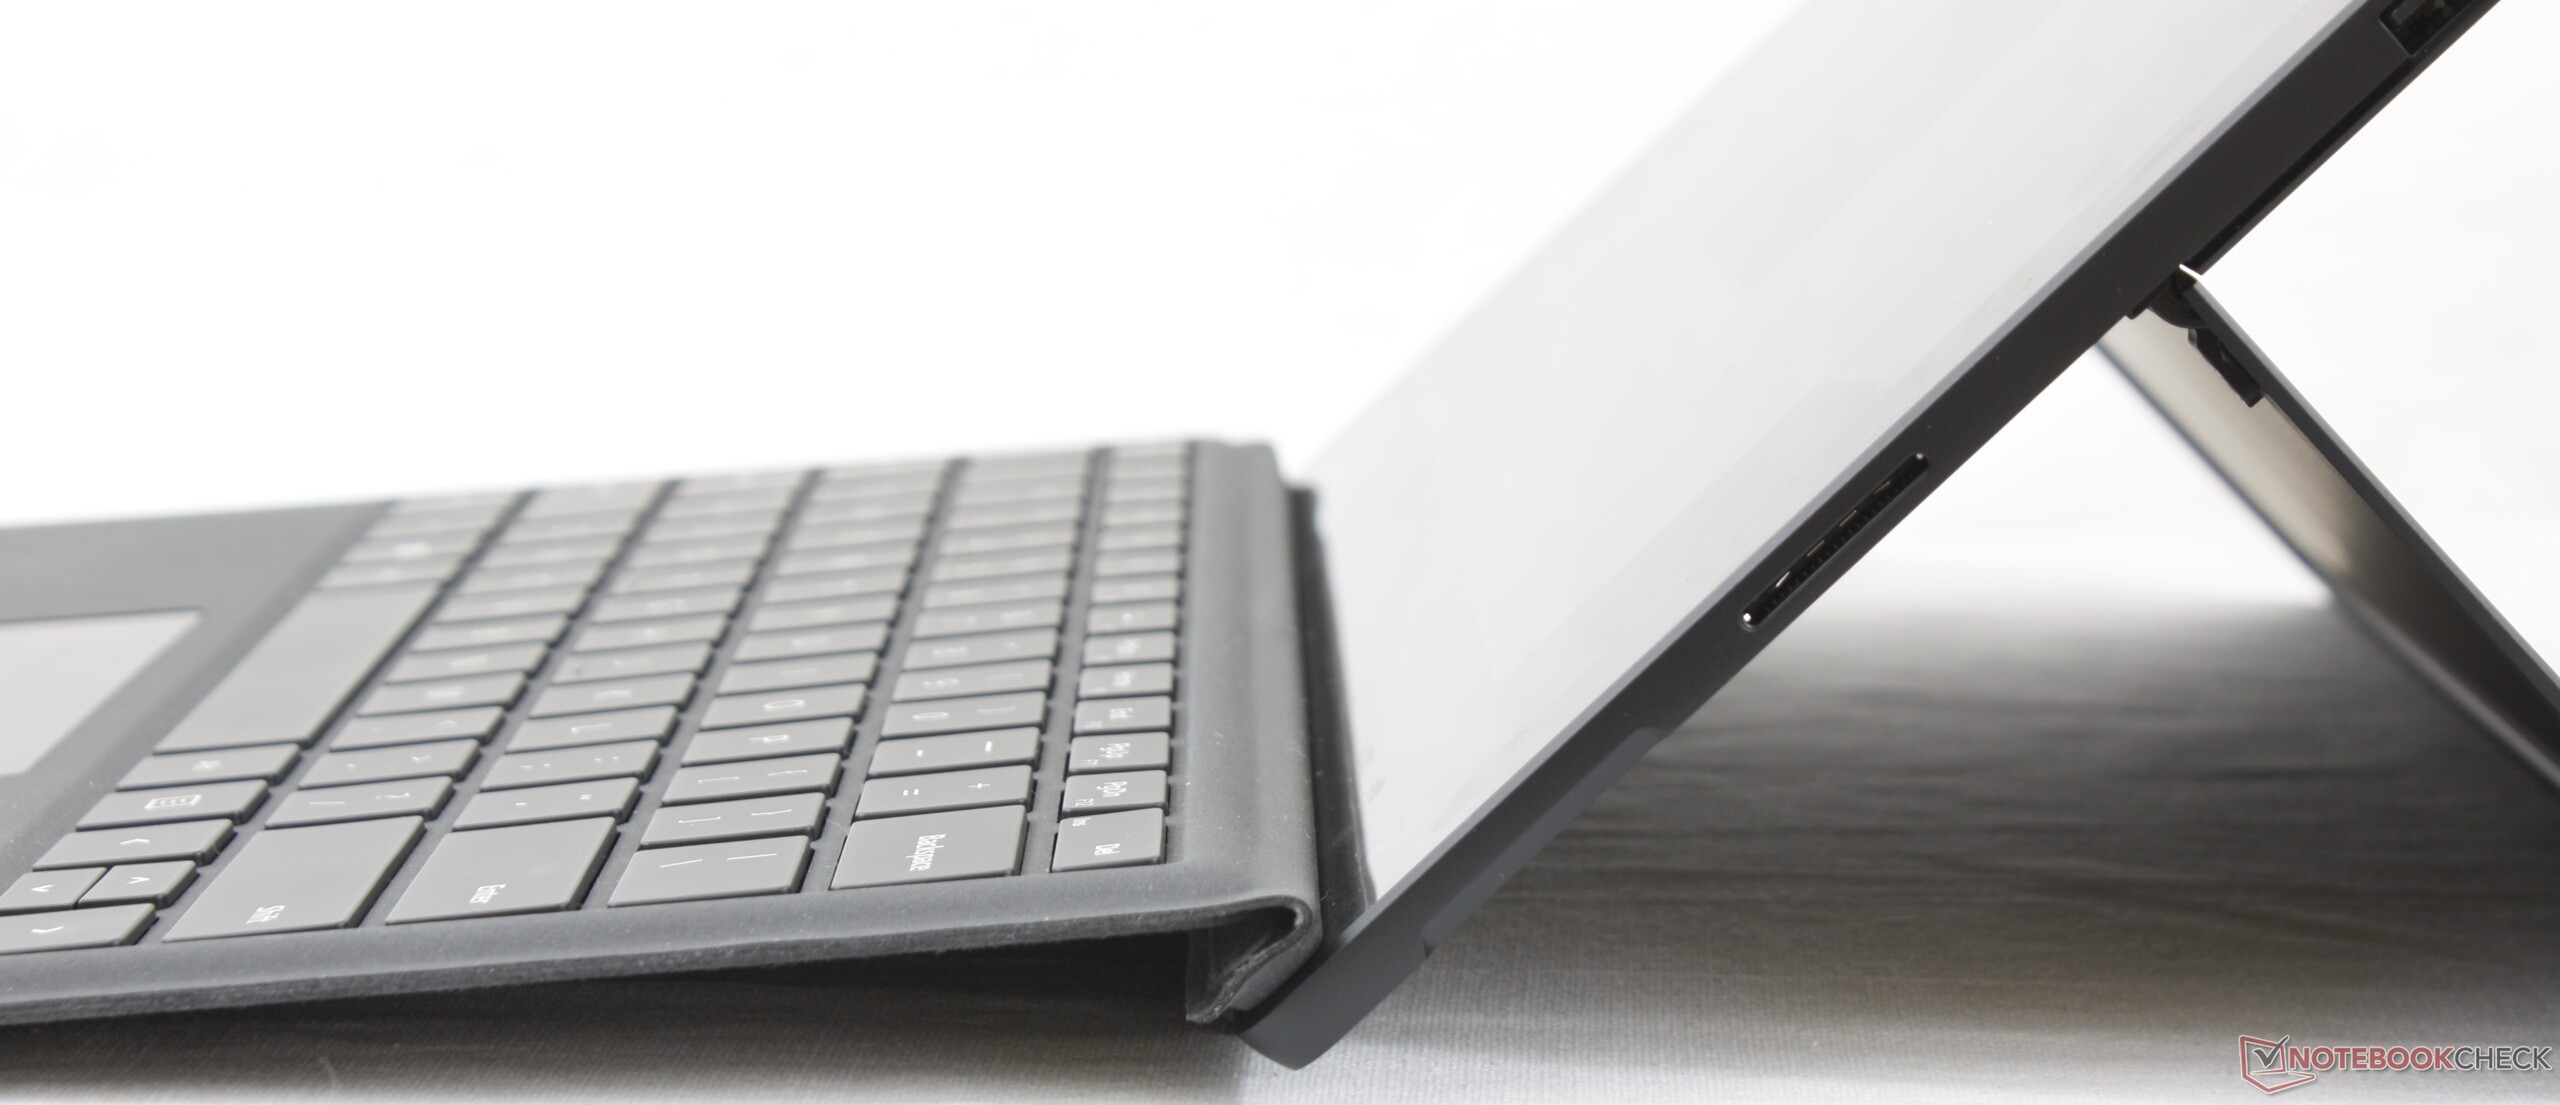
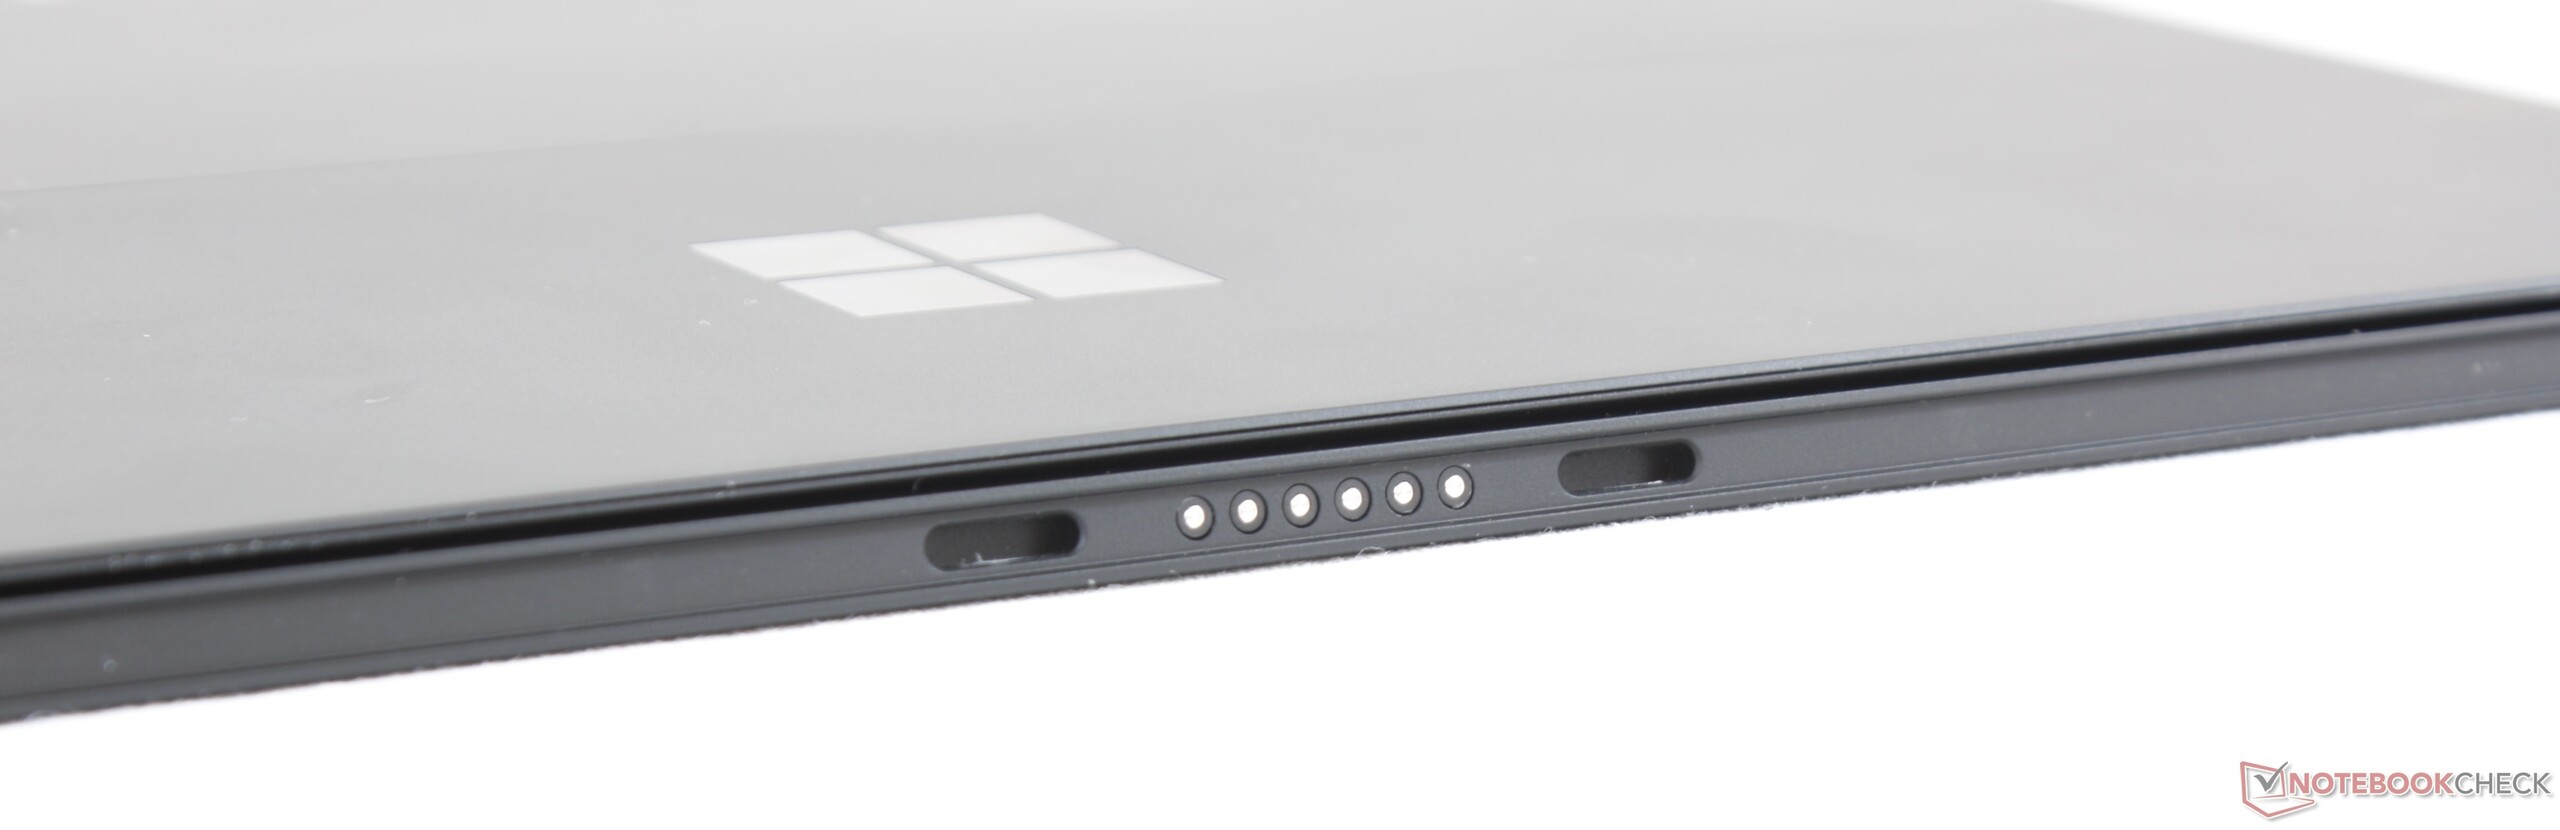

Conectividad - Un módem LTE es ahora opcional
Snapdragon X20
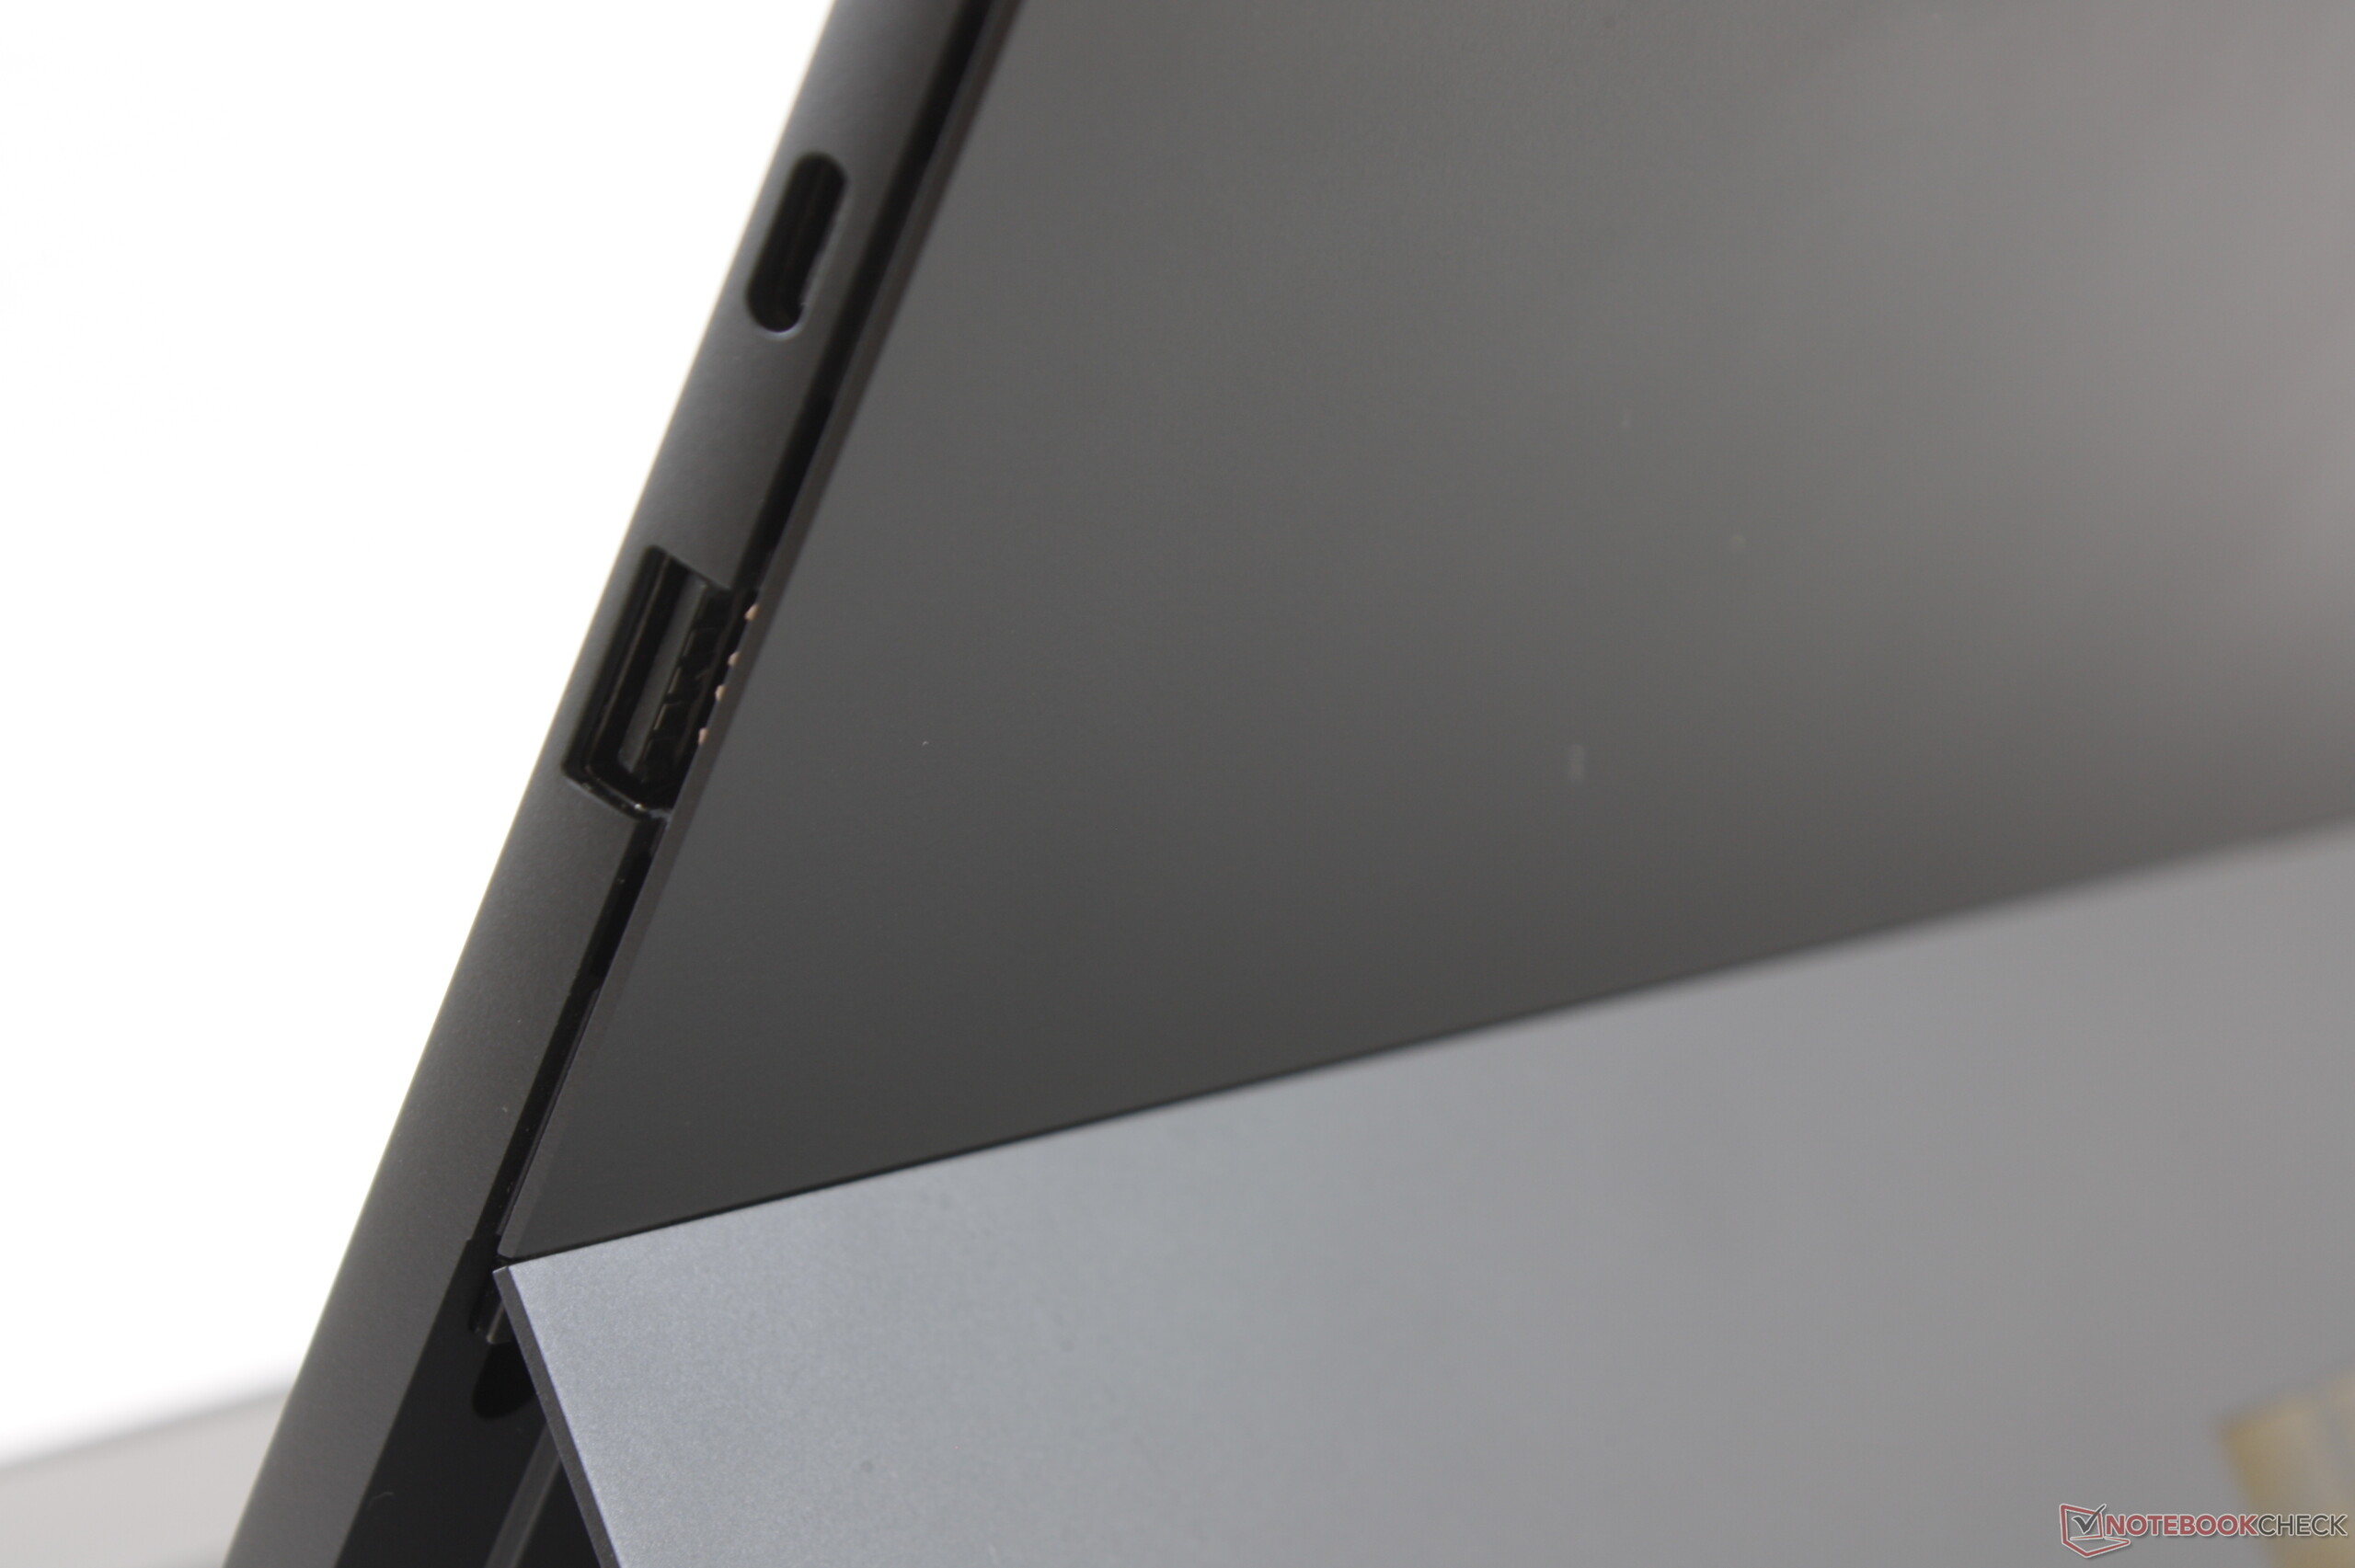
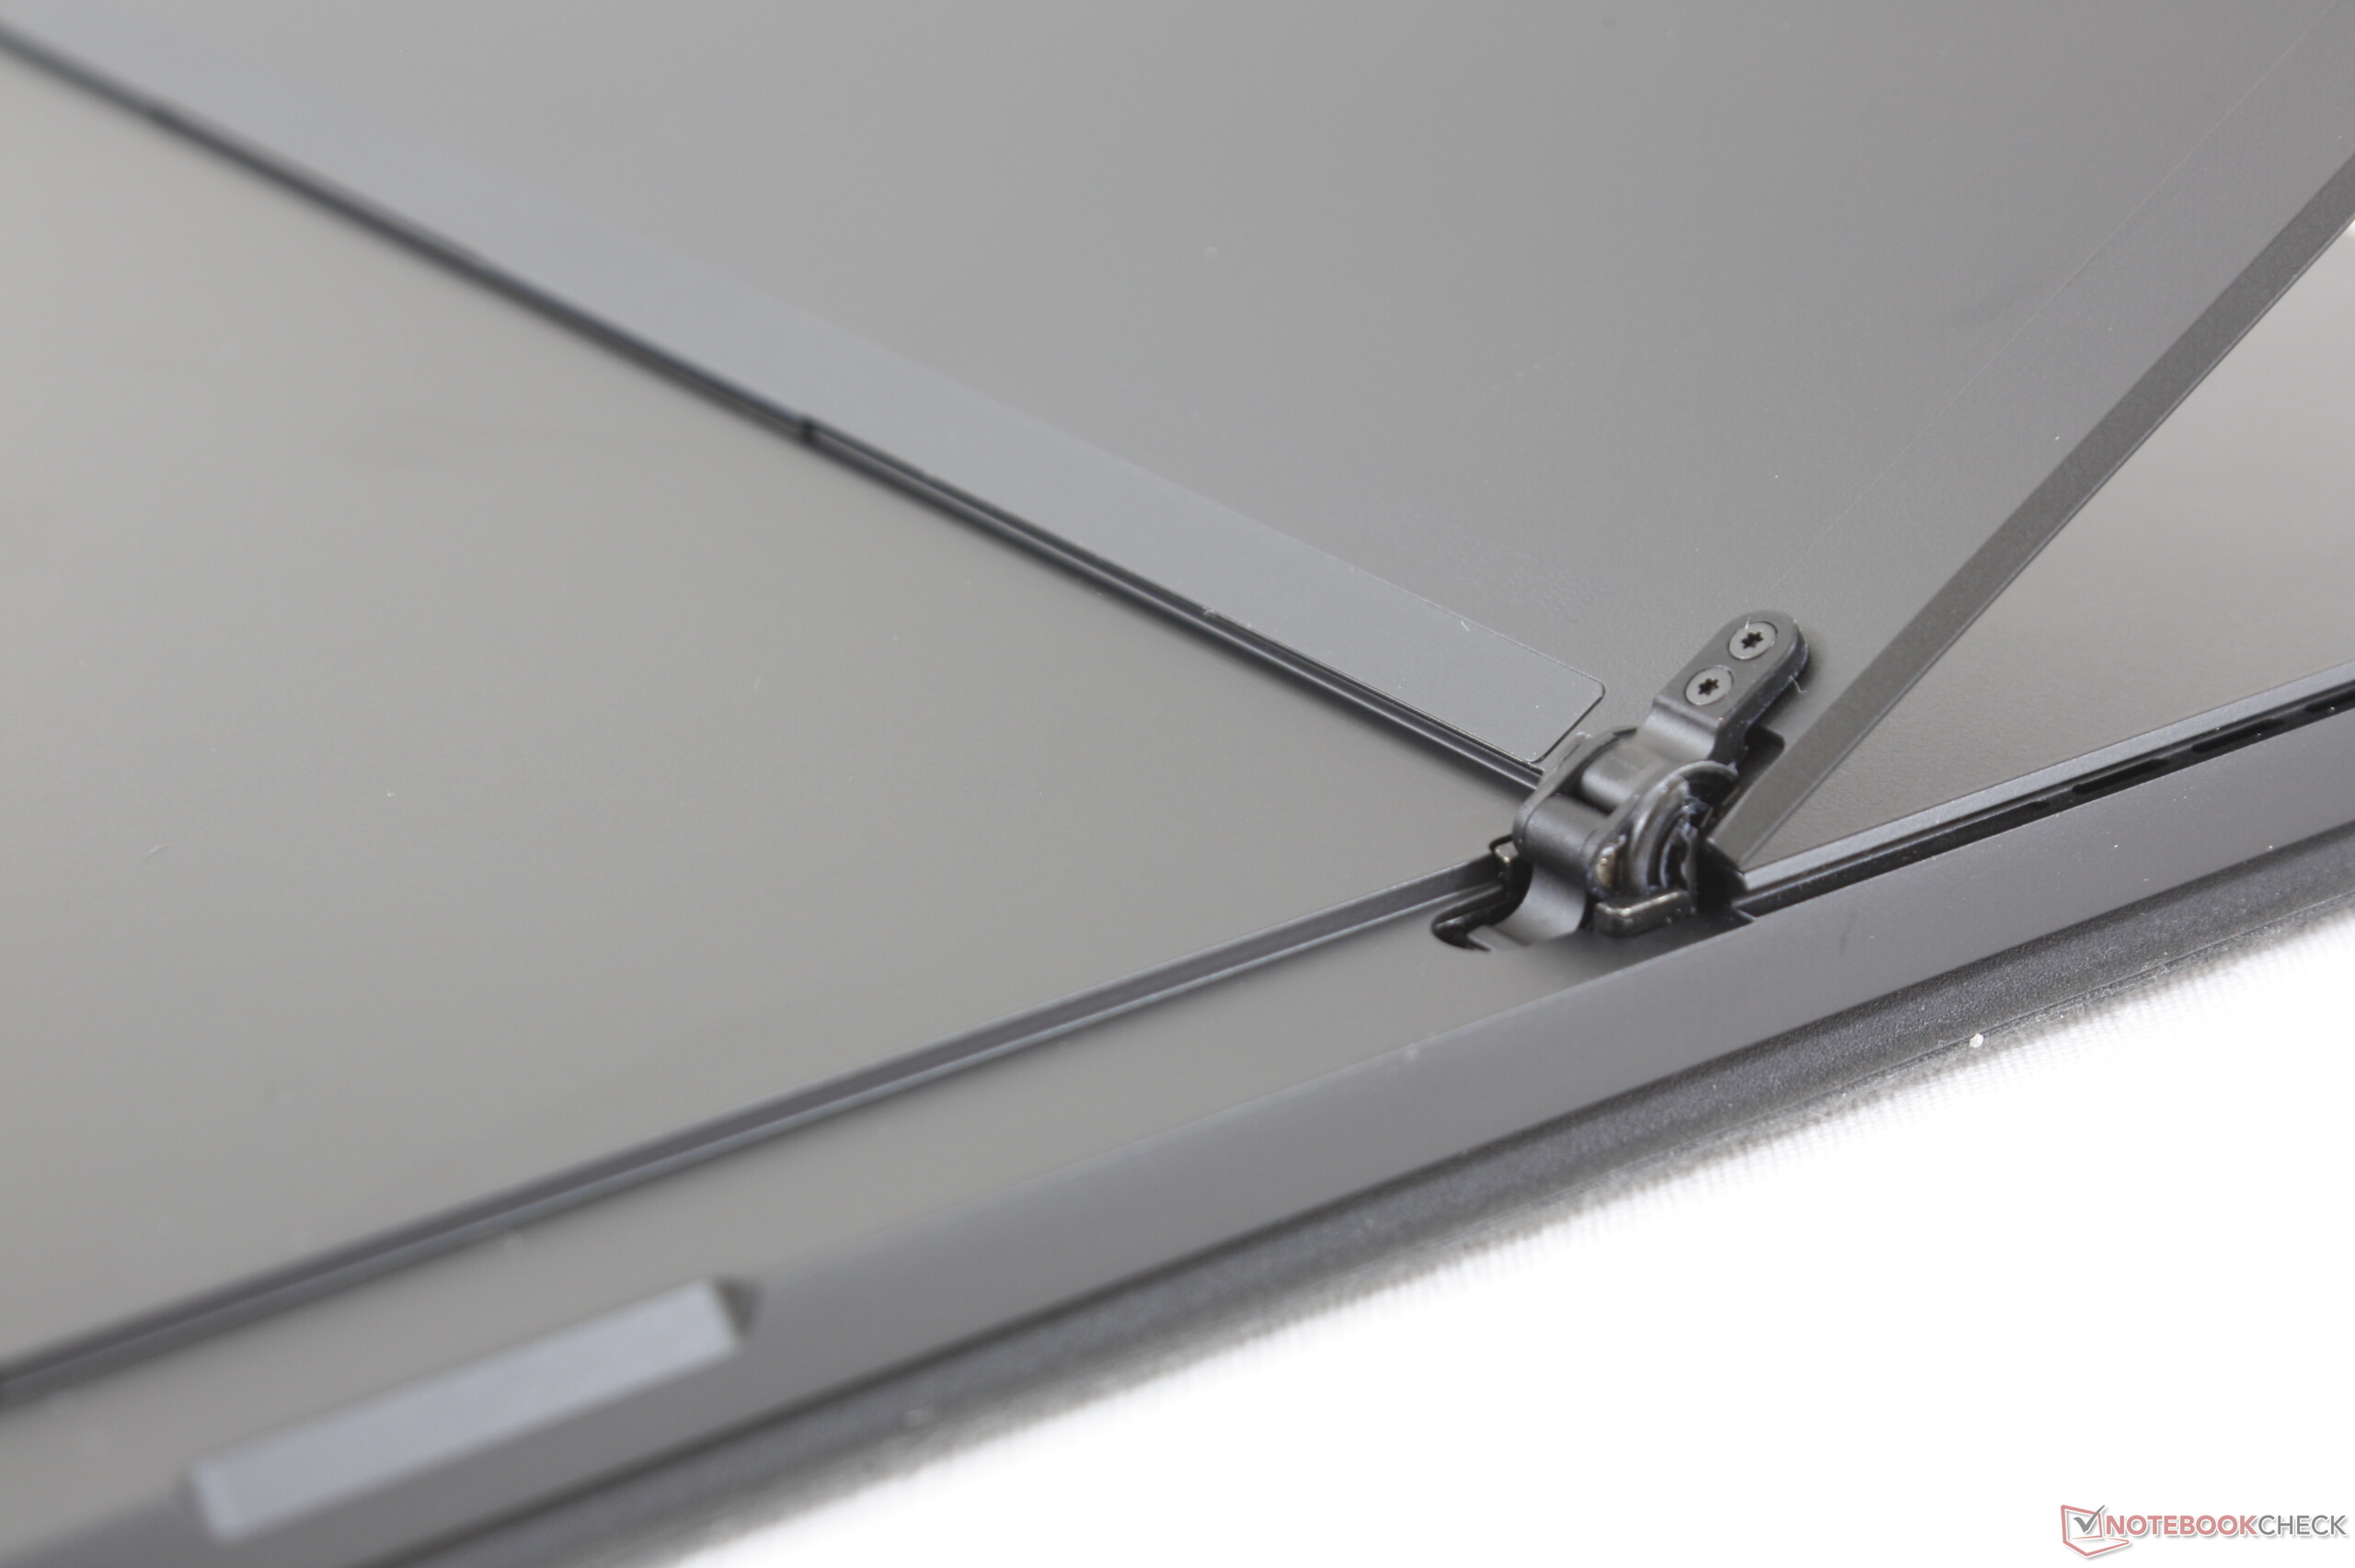
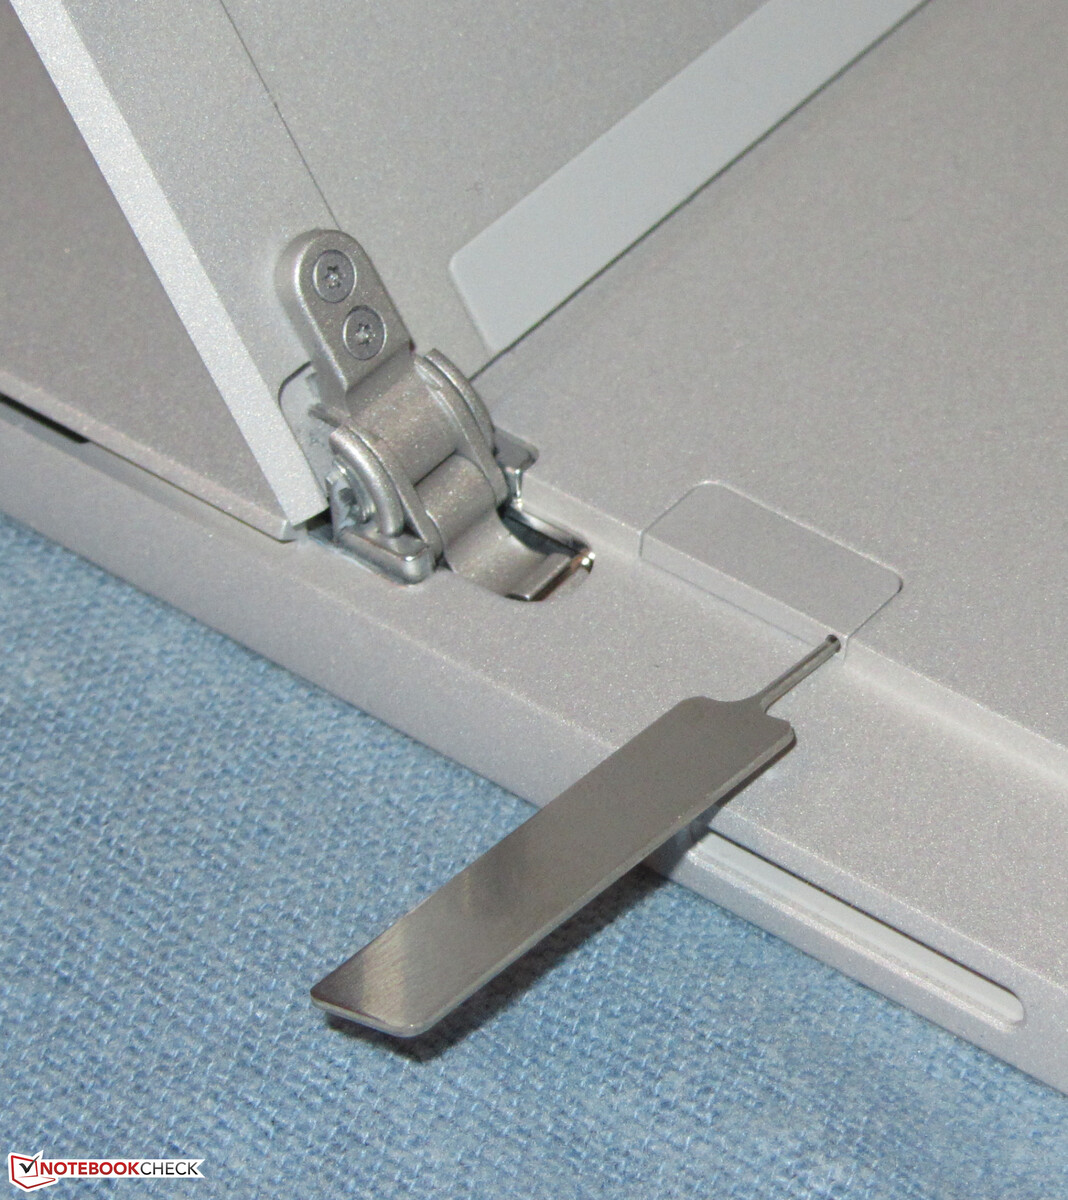
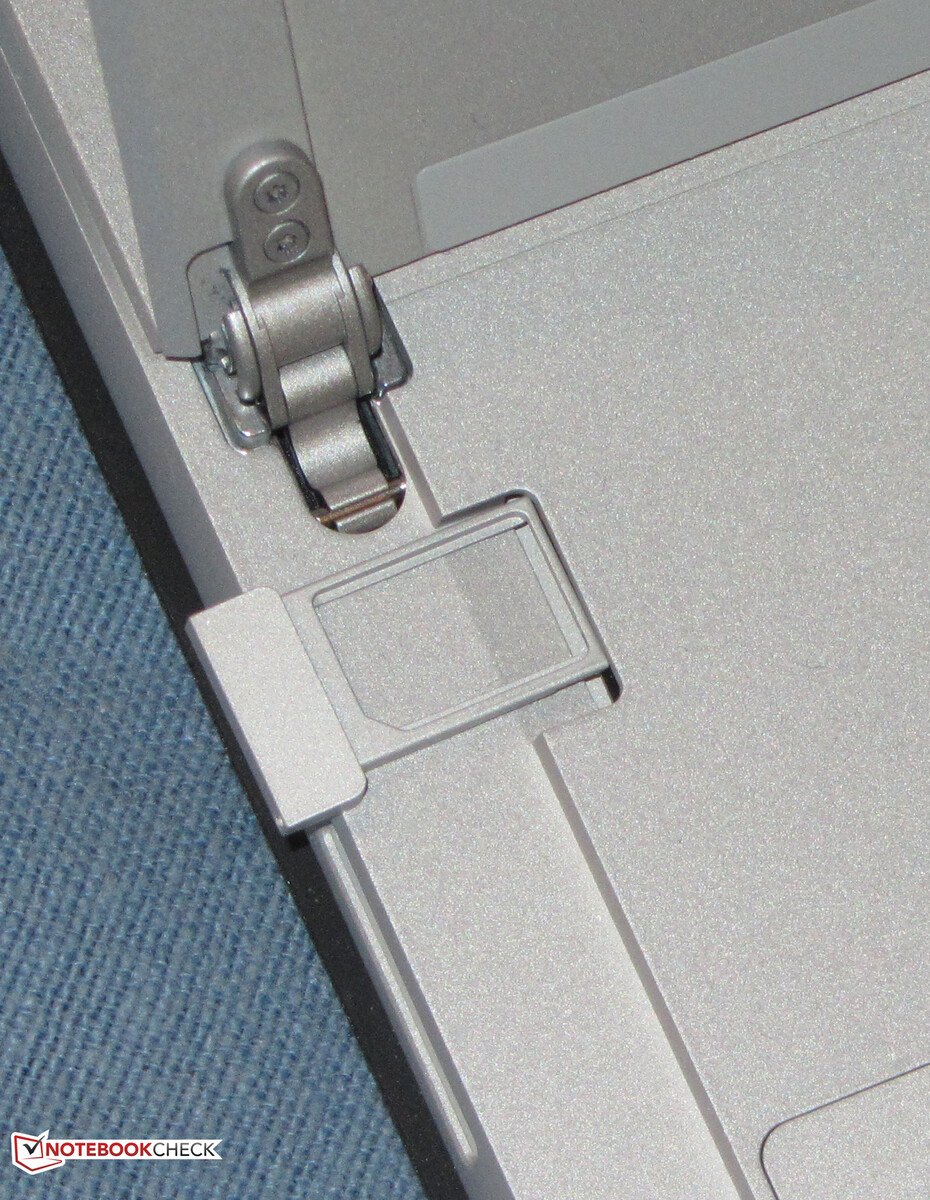
Microsoft instala el módem Qualcomm Snapdragon X20 en el Surface. La ranura para la tarjeta SIM está detrás del soporte. El lector de tarjetas de memoria tuvo que ser retirado. Además, el módem LTE sólo está disponible en combinación con un procesador Core i5


Pantalla - IPS en formato 3:2
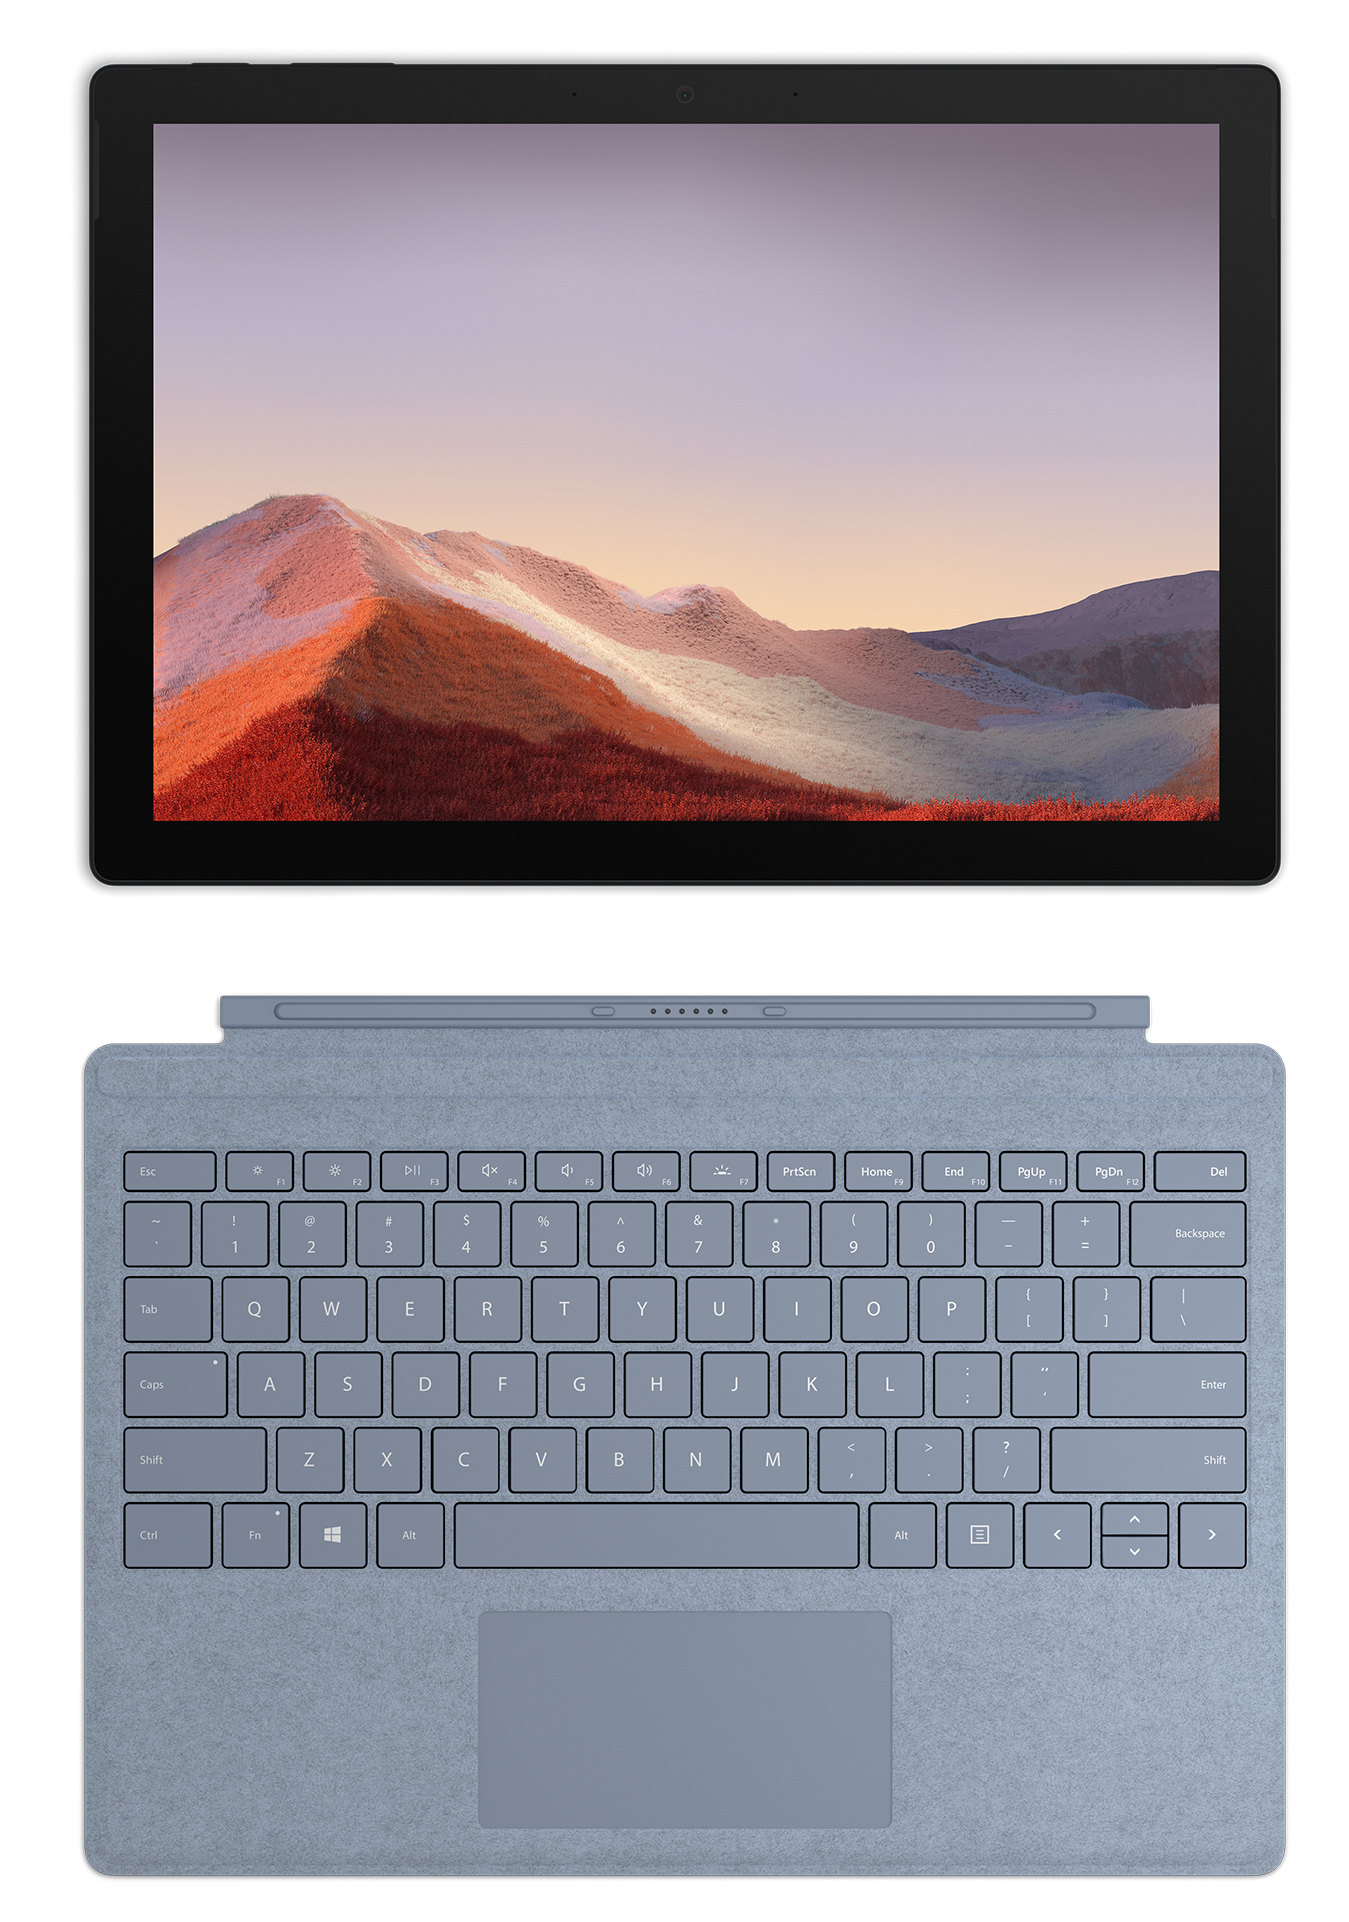
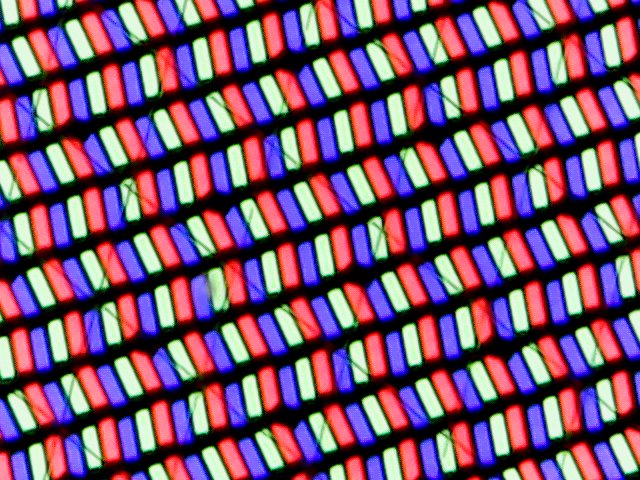
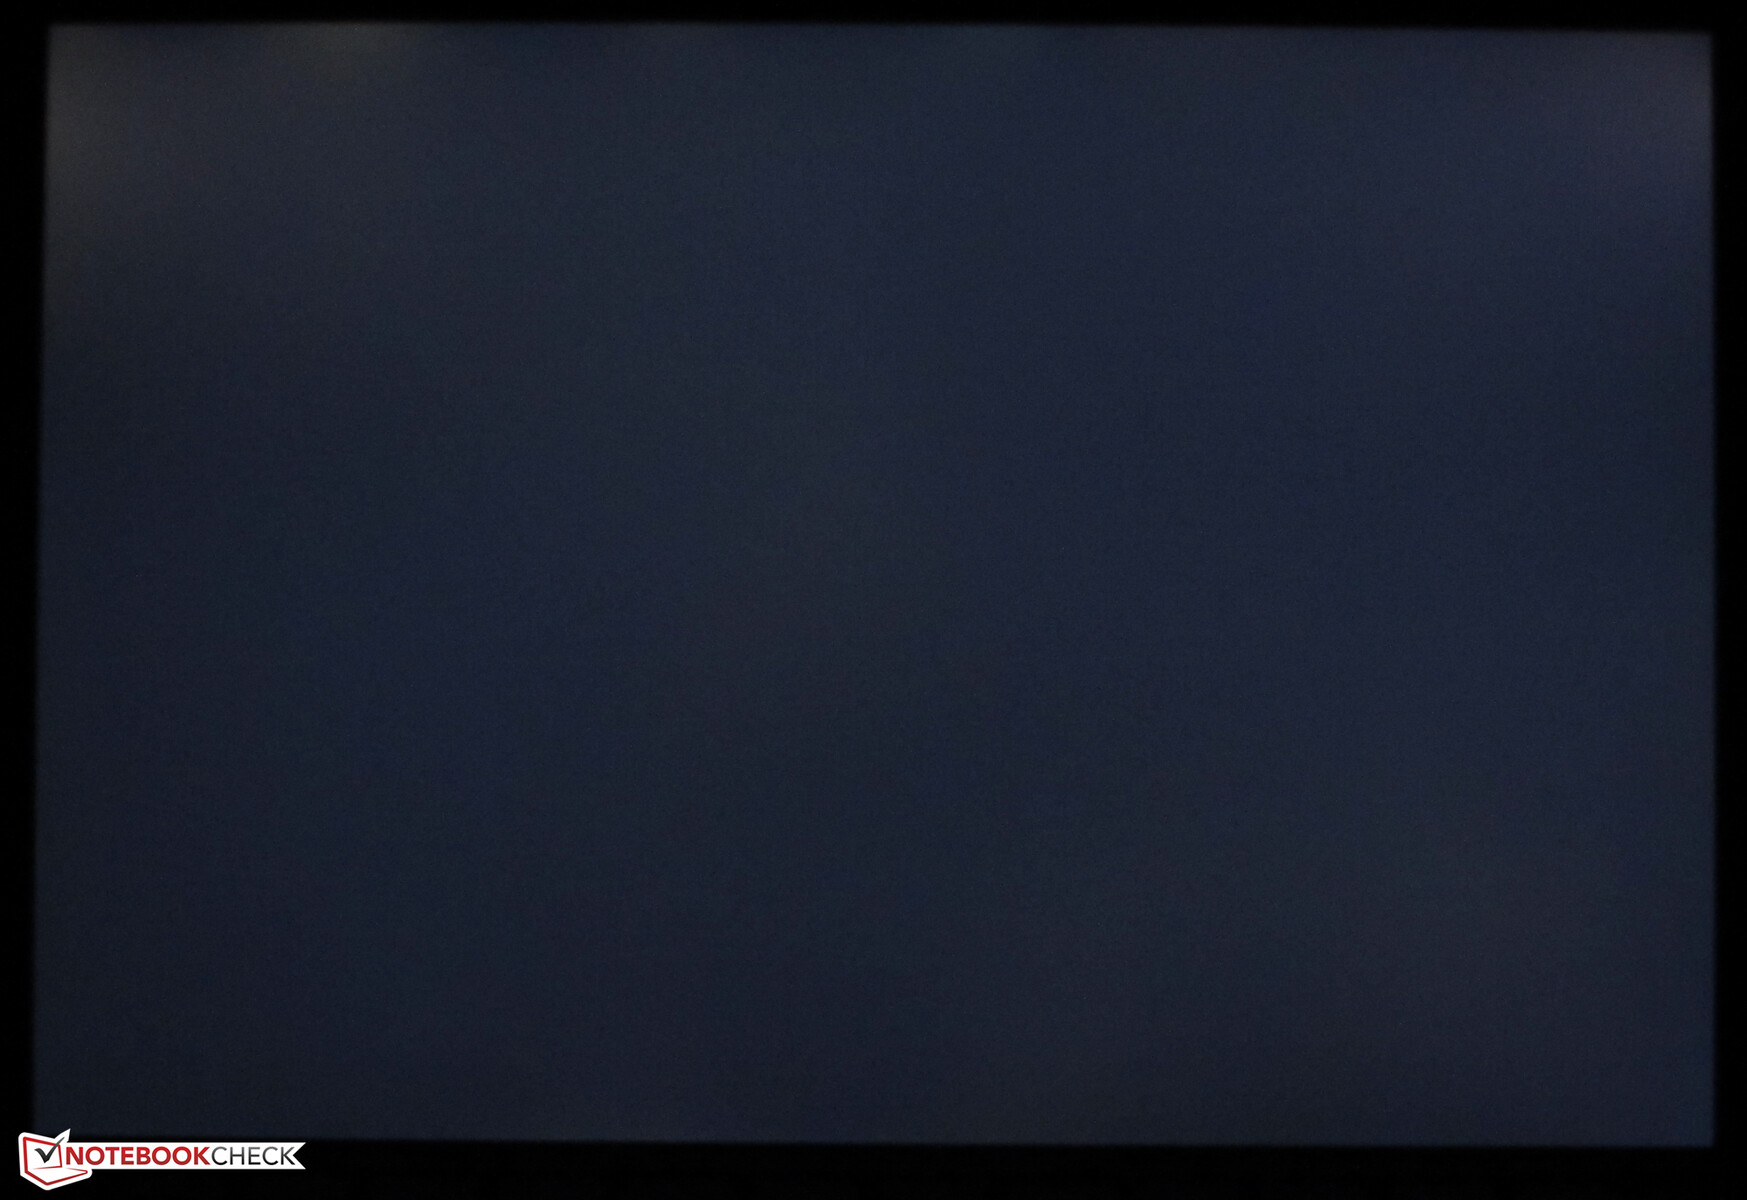
La pantalla táctil de 12,3 pulgadas tiene una resolución nativa de 2736x1824 píxeles. El brillo (425,4 cd/m²) y el contraste (1.200:1) son buenos. Además, la pantalla parpadea a una frecuencia de 199,2 Hz a niveles de brillo del 57% (equivalente a unos 119 cd/m²) y menos. Debido a la baja frecuencia, los usuarios sensibles podrían experimentar dolores de cabeza y/o problemas oculares
| |||||||||||||||||||||||||
iluminación: 85 %
Brillo con batería: 407 cd/m²
Contraste: 1200:1 (Negro: 0.34 cd/m²)
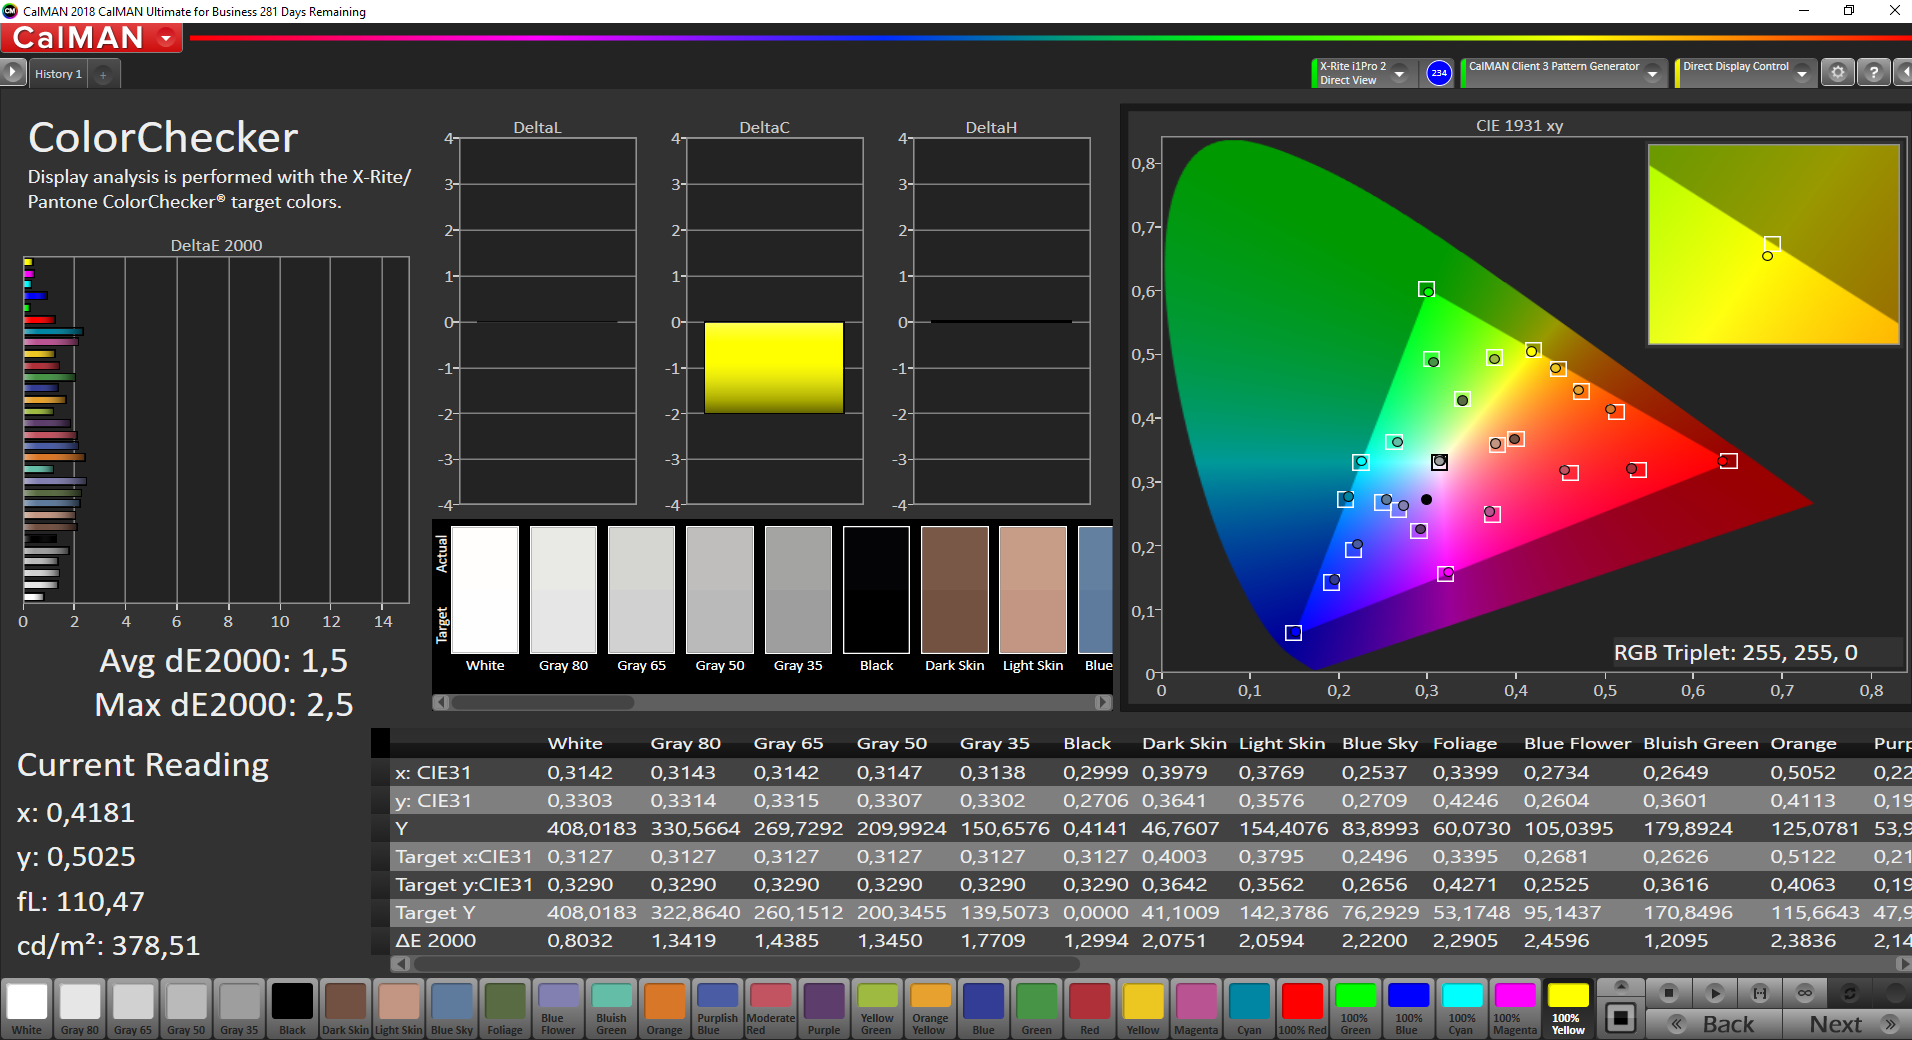
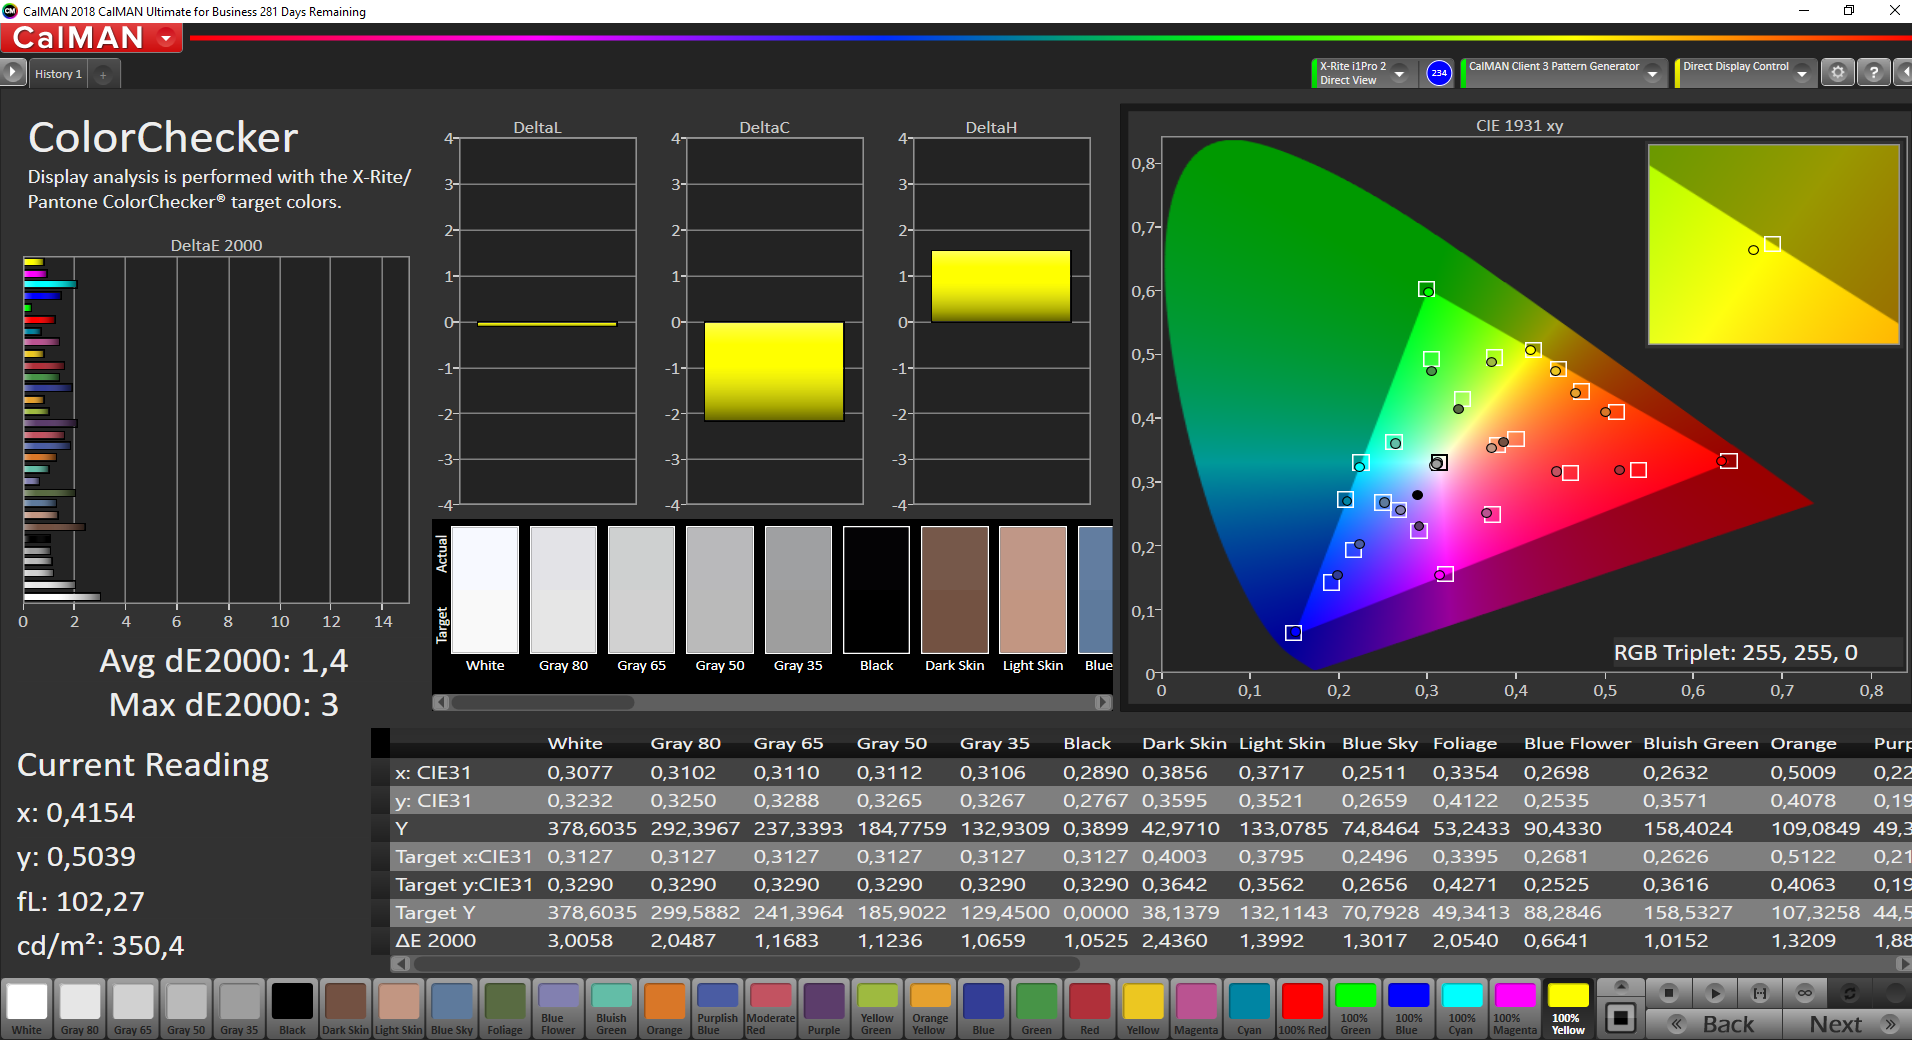
ΔE ColorChecker Calman: 1.5 | ∀{0.5-29.43 Ø4.73}
calibrated: 1.4
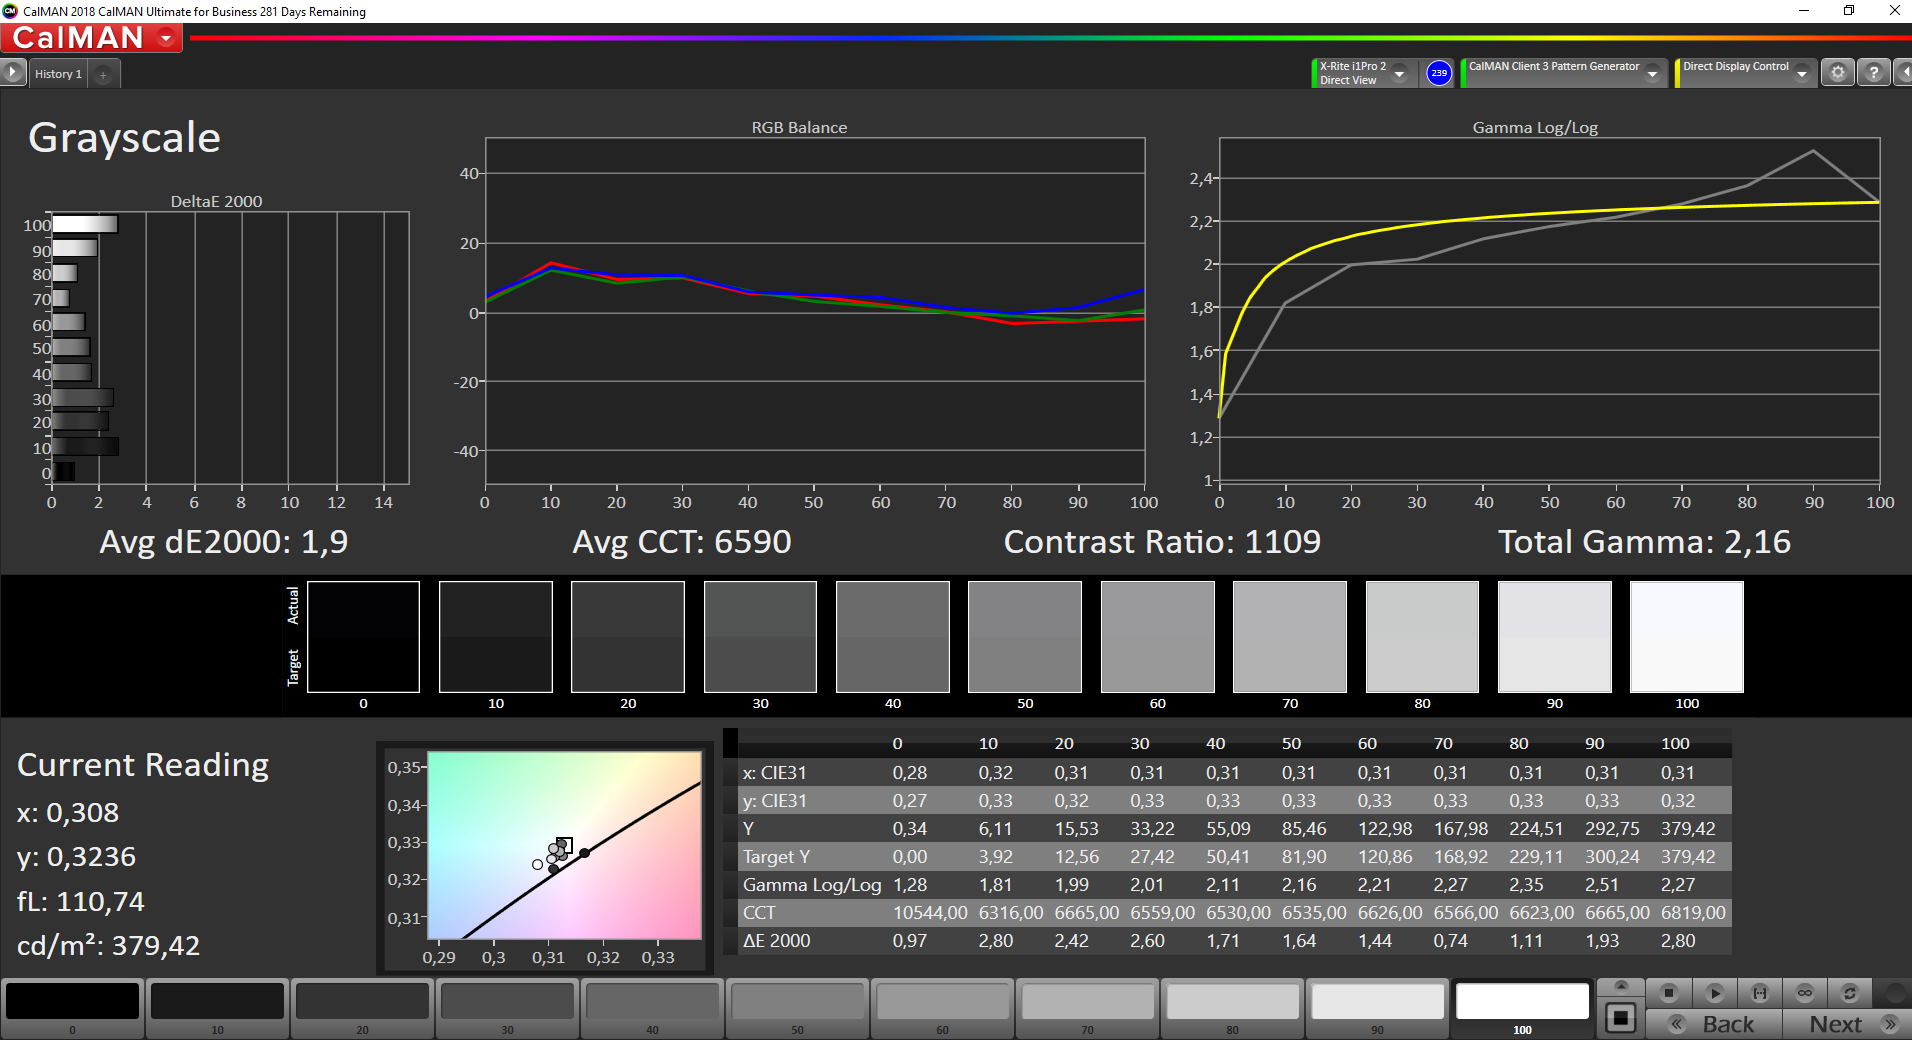
ΔE Greyscale Calman: 1.6 | ∀{0.09-98 Ø4.97}
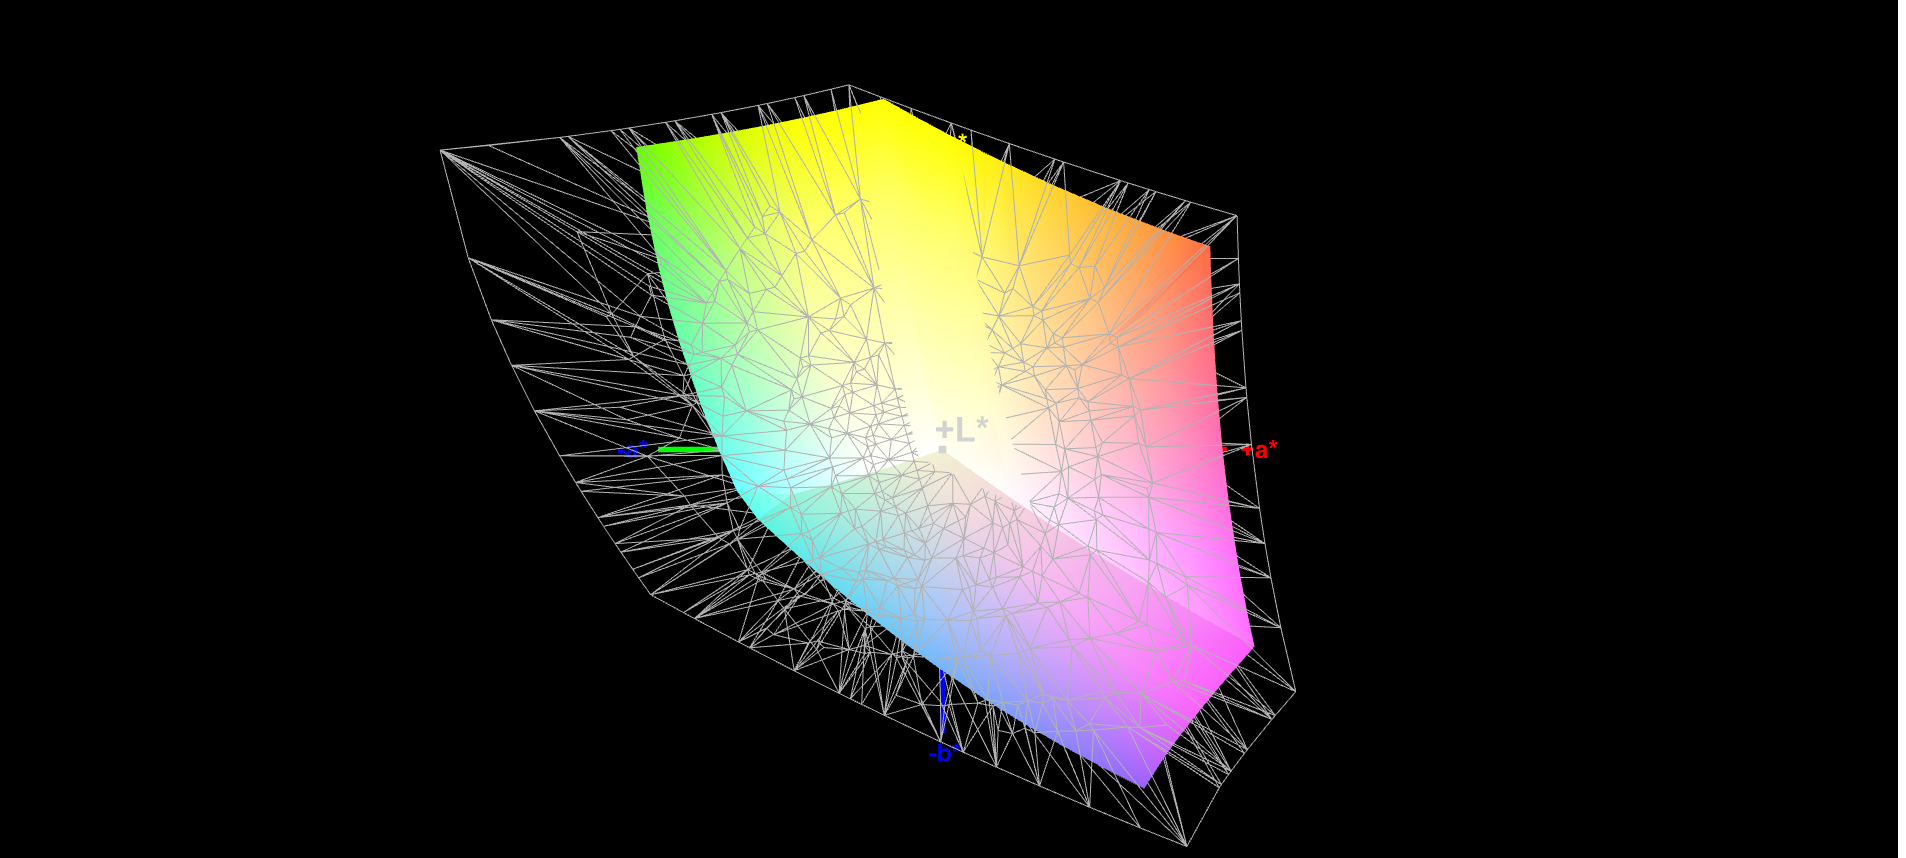
96.8% sRGB (Argyll 1.6.3 3D)
63.7% AdobeRGB 1998 (Argyll 1.6.3 3D)
69.1% AdobeRGB 1998 (Argyll 3D)
96.7% sRGB (Argyll 3D)
66.9% Display P3 (Argyll 3D)
Gamma: 2.05
CCT: 6432 K
| Microsoft Surface Pro 7 Plus LG Philips LP123WQ332684, IPS, 2736x1824, 12.3" | Lenovo Yoga Duet 7 13IML05-82AS000WGE CSOT T3 LEN8290, IPS, 2160x1350, 13" | Dell Latitude 12 7210 2-in-1 Sharp LQ123N1, IPS, 1920x1280, 12.3" | Microsoft Surface Pro 7 LG Philips LP123WQ112604, IPS, 2736x1824, 12.3" | Microsoft Surface Pro 7 Core i5-1035G4 LG Philips LP123WQ112604, IPS, 2736x1824, 12.3" | |
|---|---|---|---|---|---|
| Display | 3% | 0% | -4% | -2% | |
| Display P3 Coverage (%) | 66.9 | 68.9 3% | 67.9 1% | 63.7 -5% | 66 -1% |
| sRGB Coverage (%) | 96.7 | 98.2 2% | 96.8 0% | 95.8 -1% | 93.8 -3% |
| AdobeRGB 1998 Coverage (%) | 69.1 | 71.1 3% | 68.8 0% | 65.7 -5% | 66.9 -3% |
| Response Times | 5% | 48% | 19% | 26% | |
| Response Time Grey 50% / Grey 80% * (ms) | 50.8 ? | 58 ? -14% | 29 ? 43% | 40 ? 21% | 34.8 ? 31% |
| Response Time Black / White * (ms) | 33.6 ? | 26 ? 23% | 16 ? 52% | 28 ? 17% | 26.4 ? 21% |
| PWM Frequency (Hz) | 199.2 ? | 1250 ? | 250 ? | 21550 ? | |
| Screen | -65% | -13% | -6% | -74% | |
| Brightness middle (cd/m²) | 408 | 450 10% | 380 -7% | 435 7% | 480.4 18% |
| Brightness (cd/m²) | 425 | 411 -3% | 378 -11% | 422 -1% | 485 14% |
| Brightness Distribution (%) | 85 | 83 -2% | 86 1% | 90 6% | 91 7% |
| Black Level * (cd/m²) | 0.34 | 0.22 35% | 0.31 9% | 0.32 6% | 0.48 -41% |
| Contrast (:1) | 1200 | 2045 70% | 1226 2% | 1359 13% | 1001 -17% |
| Colorchecker dE 2000 * | 1.5 | 4.15 -177% | 2.28 -52% | 1.18 21% | 5 -233% |
| Colorchecker dE 2000 max. * | 2.5 | 11.49 -360% | 3.93 -57% | 2.27 9% | 7.72 -209% |
| Colorchecker dE 2000 calibrated * | 1.4 | 1.09 22% | 0.97 31% | 3.49 -149% | 2.44 -74% |
| Greyscale dE 2000 * | 1.6 | 6.66 -316% | 2.56 -60% | 1.12 30% | 5.9 -269% |
| Gamma | 2.05 107% | 2.42 91% | 2.32 95% | 2.3 96% | 2.38 92% |
| CCT | 6432 101% | 6043 108% | 6130 106% | 6502 100% | 7805 83% |
| Color Space (Percent of AdobeRGB 1998) (%) | 63.7 | 65 2% | 63 -1% | 60 -6% | 60.3 -5% |
| Color Space (Percent of sRGB) (%) | 96.8 | 98 1% | 97 0% | 96 -1% | 93.2 -4% |
| Media total (Programa/Opciones) | -19% /
-44% | 12% /
-3% | 3% /
-2% | -17% /
-48% |
* ... más pequeño es mejor
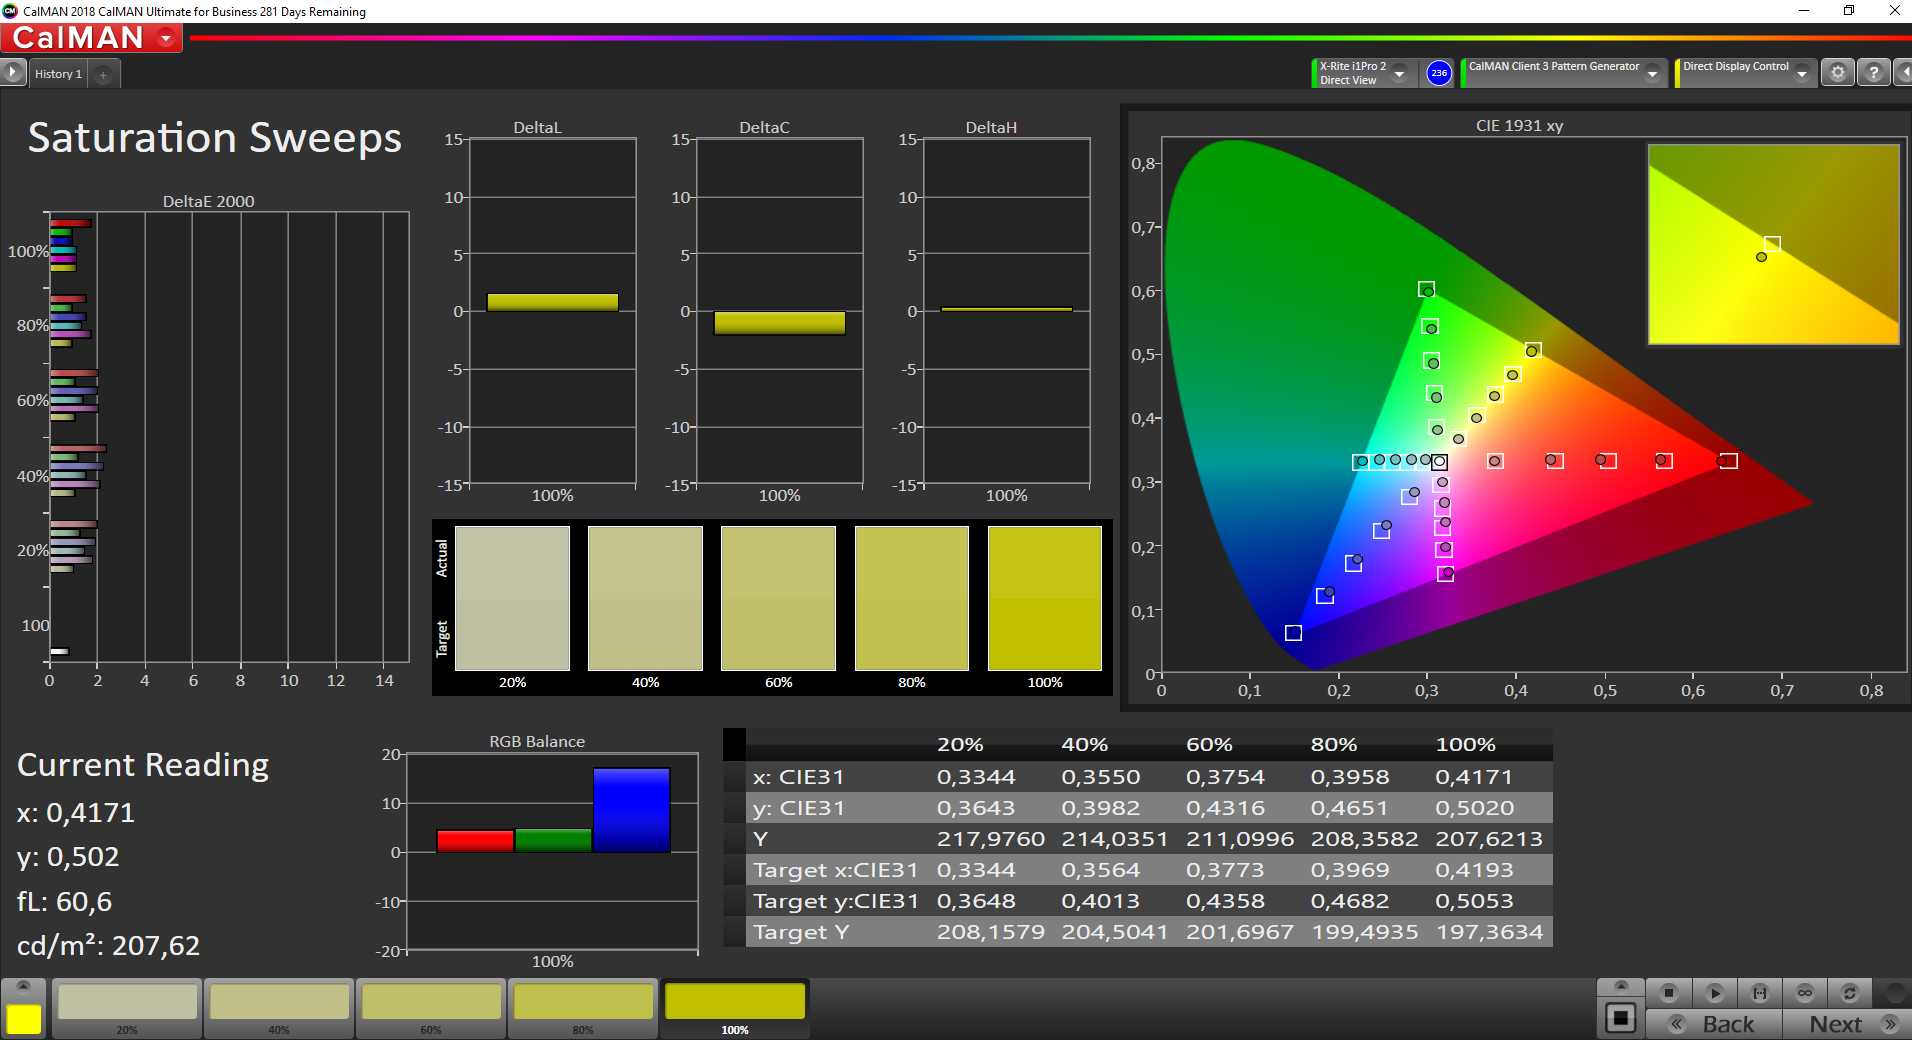
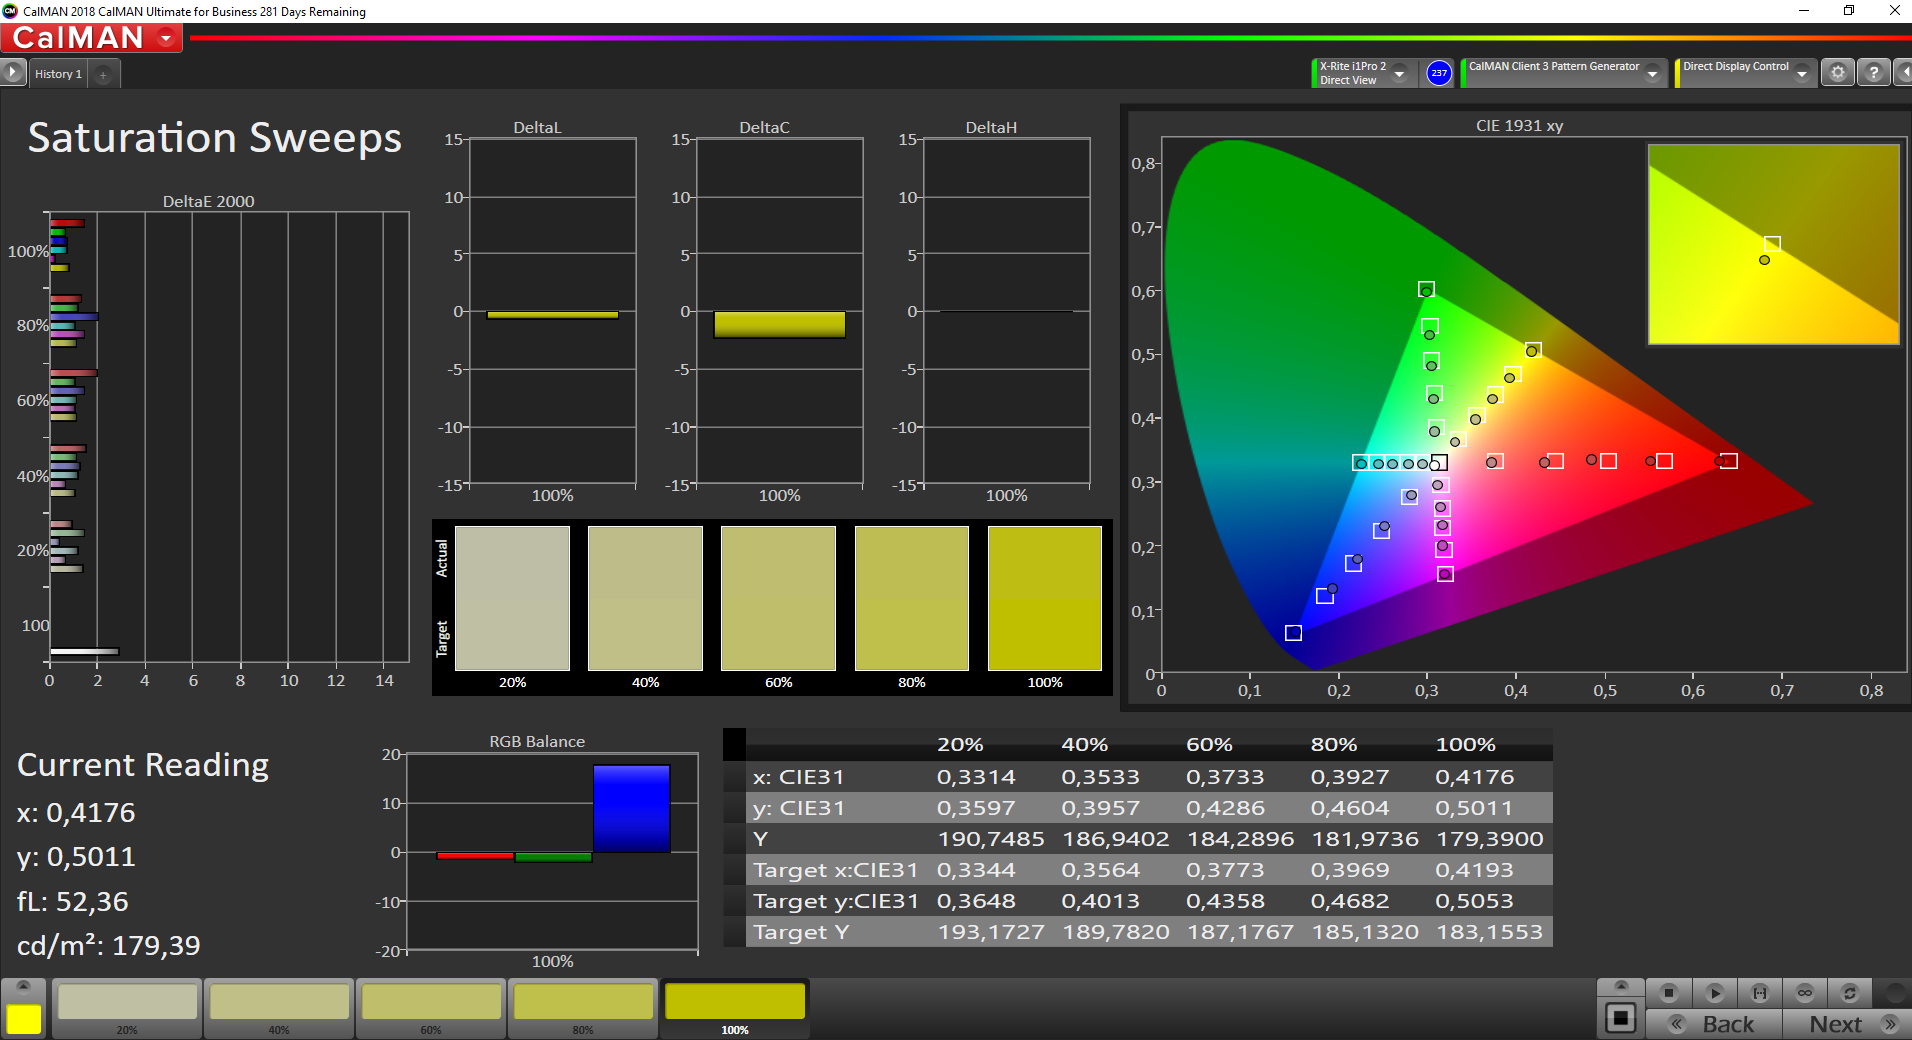
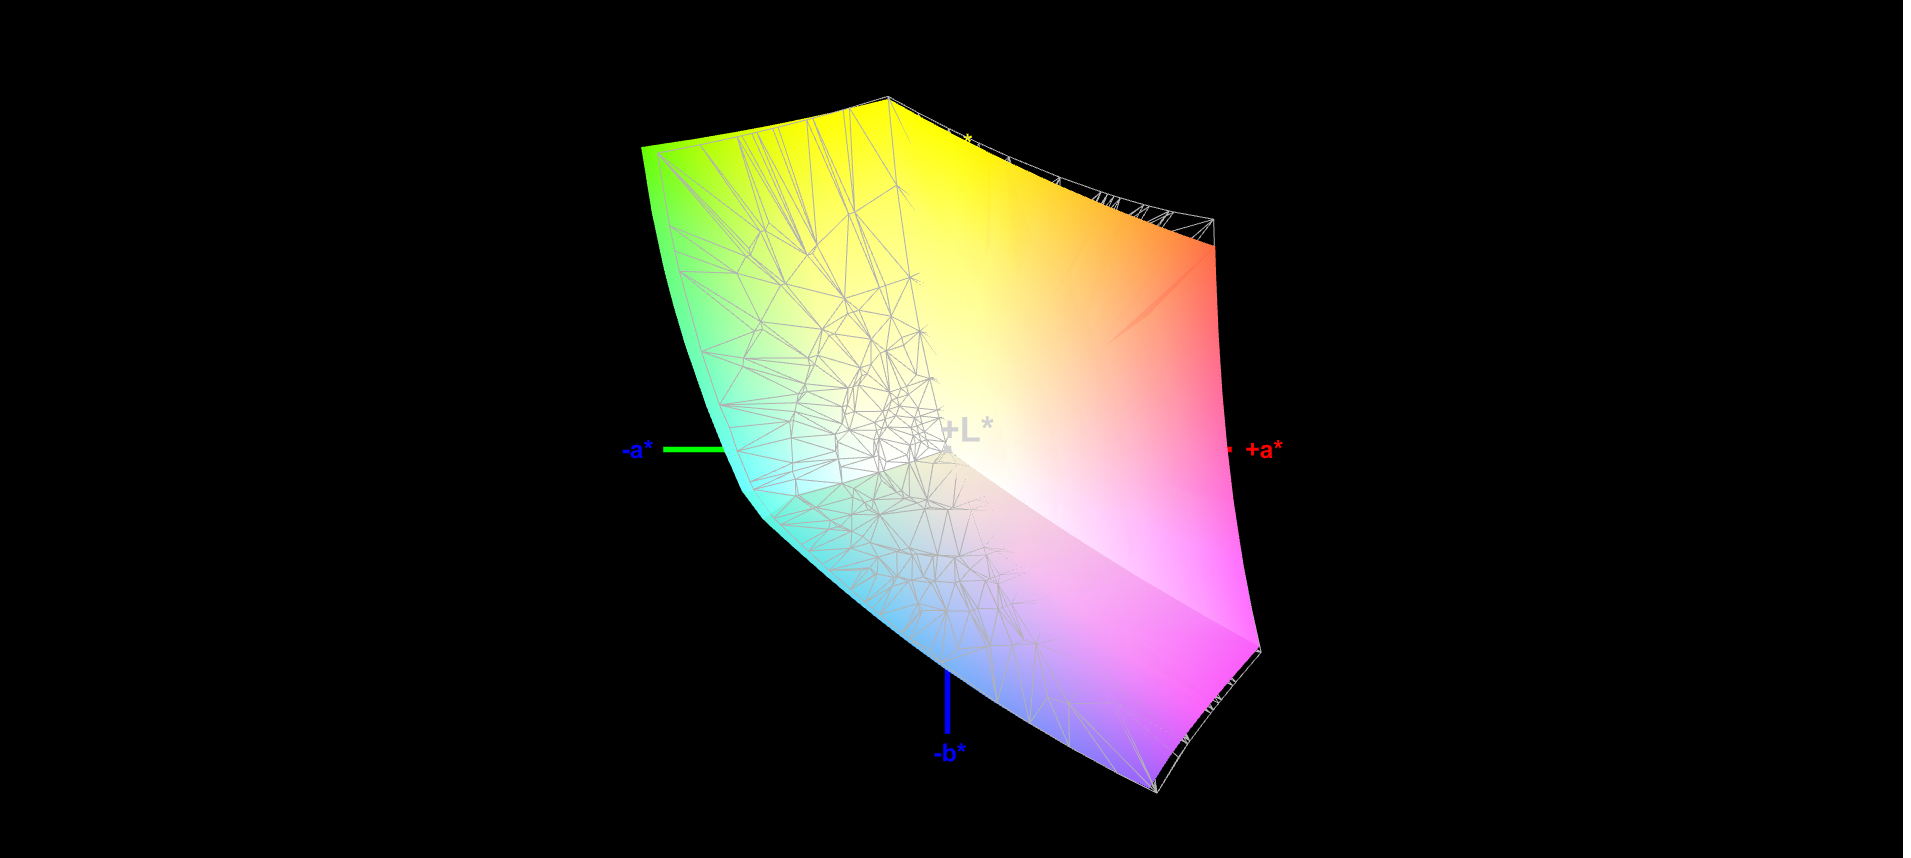
La pantalla muestra una buena reproducción del color desde el primer momento y cumple el objetivo (Delta E inferior a 3) con una desviación del color de 1,5. La pantalla tampoco sufre de un tinte azul. Además, la calibración proporciona ligeras mejoras: La desviación de color baja a 1,4 y las escalas de grises se muestran de forma más equilibrada. La pantalla no puede reproducir completamente los espacios de color AdobeRGB (63,7%) y sRGB (96,8%)

Tiempos de respuesta del display
| ↔ Tiempo de respuesta de Negro a Blanco | ||
|---|---|---|
| 33.6 ms ... subida ↗ y bajada ↘ combinada | ↗ 18.8 ms subida | 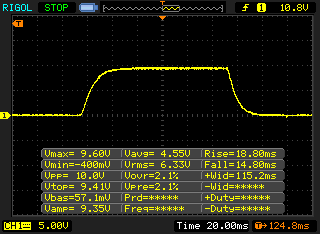 |
| ↘ 14.8 ms bajada | ||
| La pantalla mostró tiempos de respuesta lentos en nuestros tests y podría ser demasiado lenta para los jugones. En comparación, todos los dispositivos de prueba van de ##min### (mínimo) a 240 (máximo) ms. » 90 % de todos los dispositivos son mejores. Eso quiere decir que el tiempo de respuesta es peor que la media (19.9 ms) de todos los dispositivos testados. | ||
| ↔ Tiempo de respuesta 50% Gris a 80% Gris | ||
| 50.8 ms ... subida ↗ y bajada ↘ combinada | ↗ 25.2 ms subida | 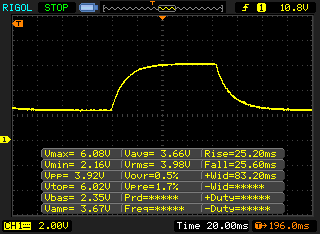 |
| ↘ 25.6 ms bajada | ||
| La pantalla mostró tiempos de respuesta lentos en nuestros tests y podría ser demasiado lenta para los jugones. En comparación, todos los dispositivos de prueba van de ##min### (mínimo) a 636 (máximo) ms. » 87 % de todos los dispositivos son mejores. Eso quiere decir que el tiempo de respuesta es peor que la media (31.1 ms) de todos los dispositivos testados. | ||
Parpadeo de Pantalla / PWM (Pulse-Width Modulation)
| Parpadeo de Pantalla / PWM detectado | 199.2 Hz | ≤ 57 % de brillo | 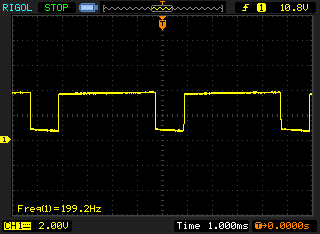 |
| ≤ 119 cd/m² brillo | |||
La retroiluminación del display parpadea a 199.2 Hz (seguramente usa PWM - Pulse-Width Modulation) a un brillo del 57 % (119 cd/m²) e inferior. Sobre este nivel de brillo no debería darse parpadeo / PWM. La frecuencia de 199.2 Hz es relativamente baja, por lo que la gente sensible debería ver parpadeos y padecer fatiga visual por la pantalla (usado al brillo indicado a continuación). El parpadeo se da a un brillo relativamente bajo, por lo que el uso prolongado en interiores con este nivel de brillo puede ser fatigoso. Comparación: 52 % de todos los dispositivos testados no usaron PWM para atenuar el display. Si se usó, medimos una media de 7798 (mínimo: 5 - máxmo: 343500) Hz. | |||
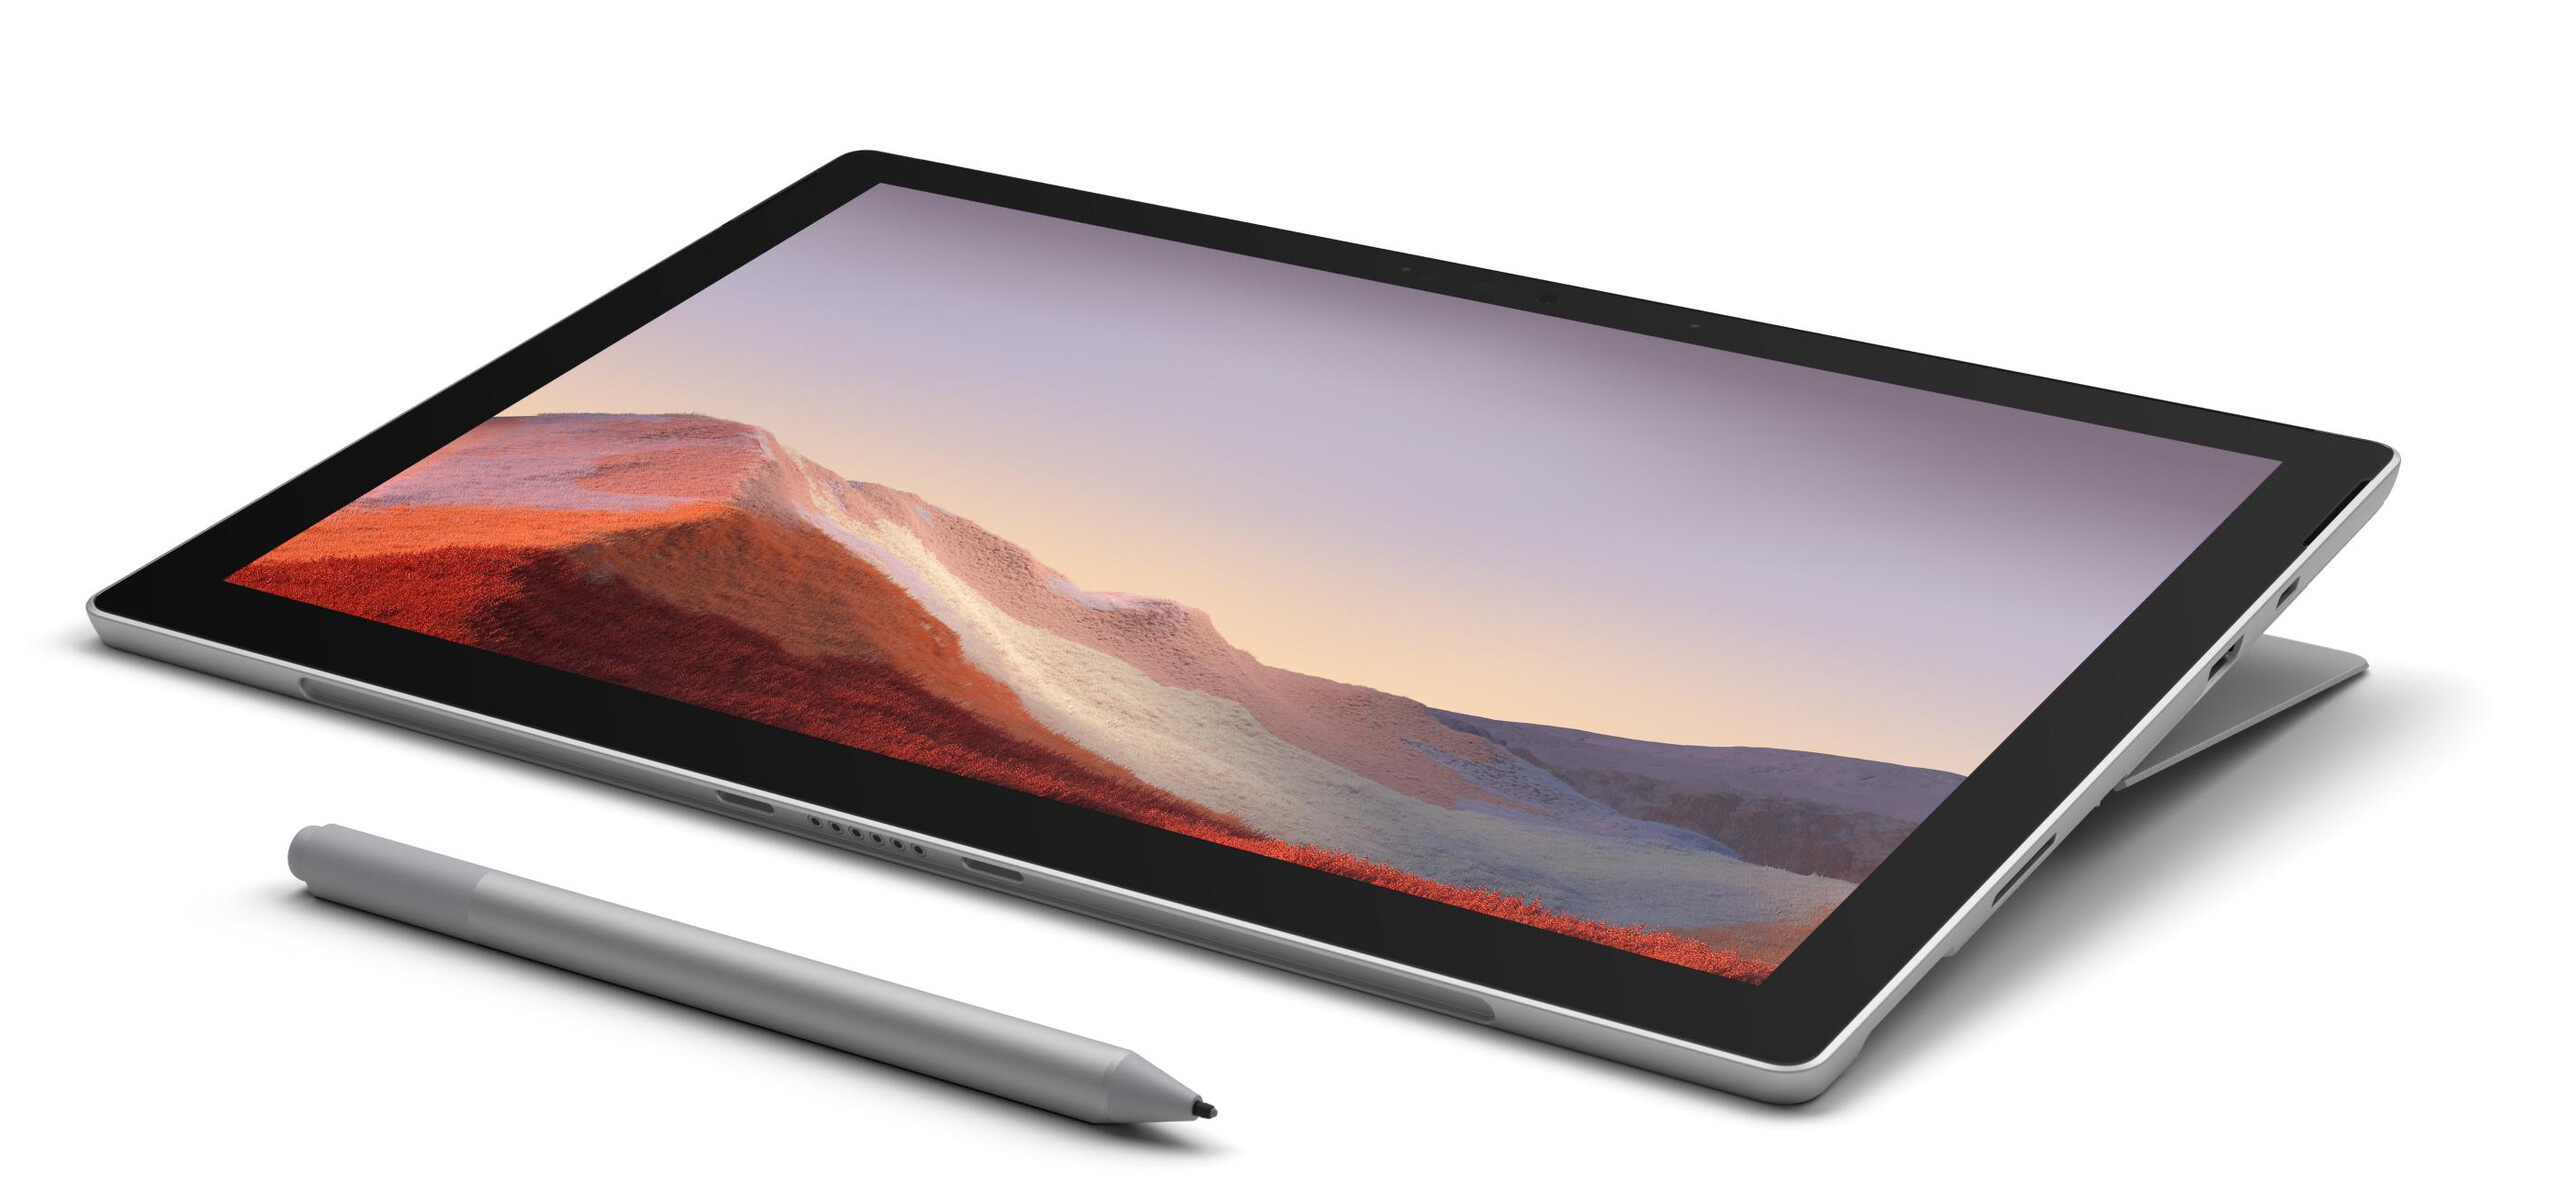
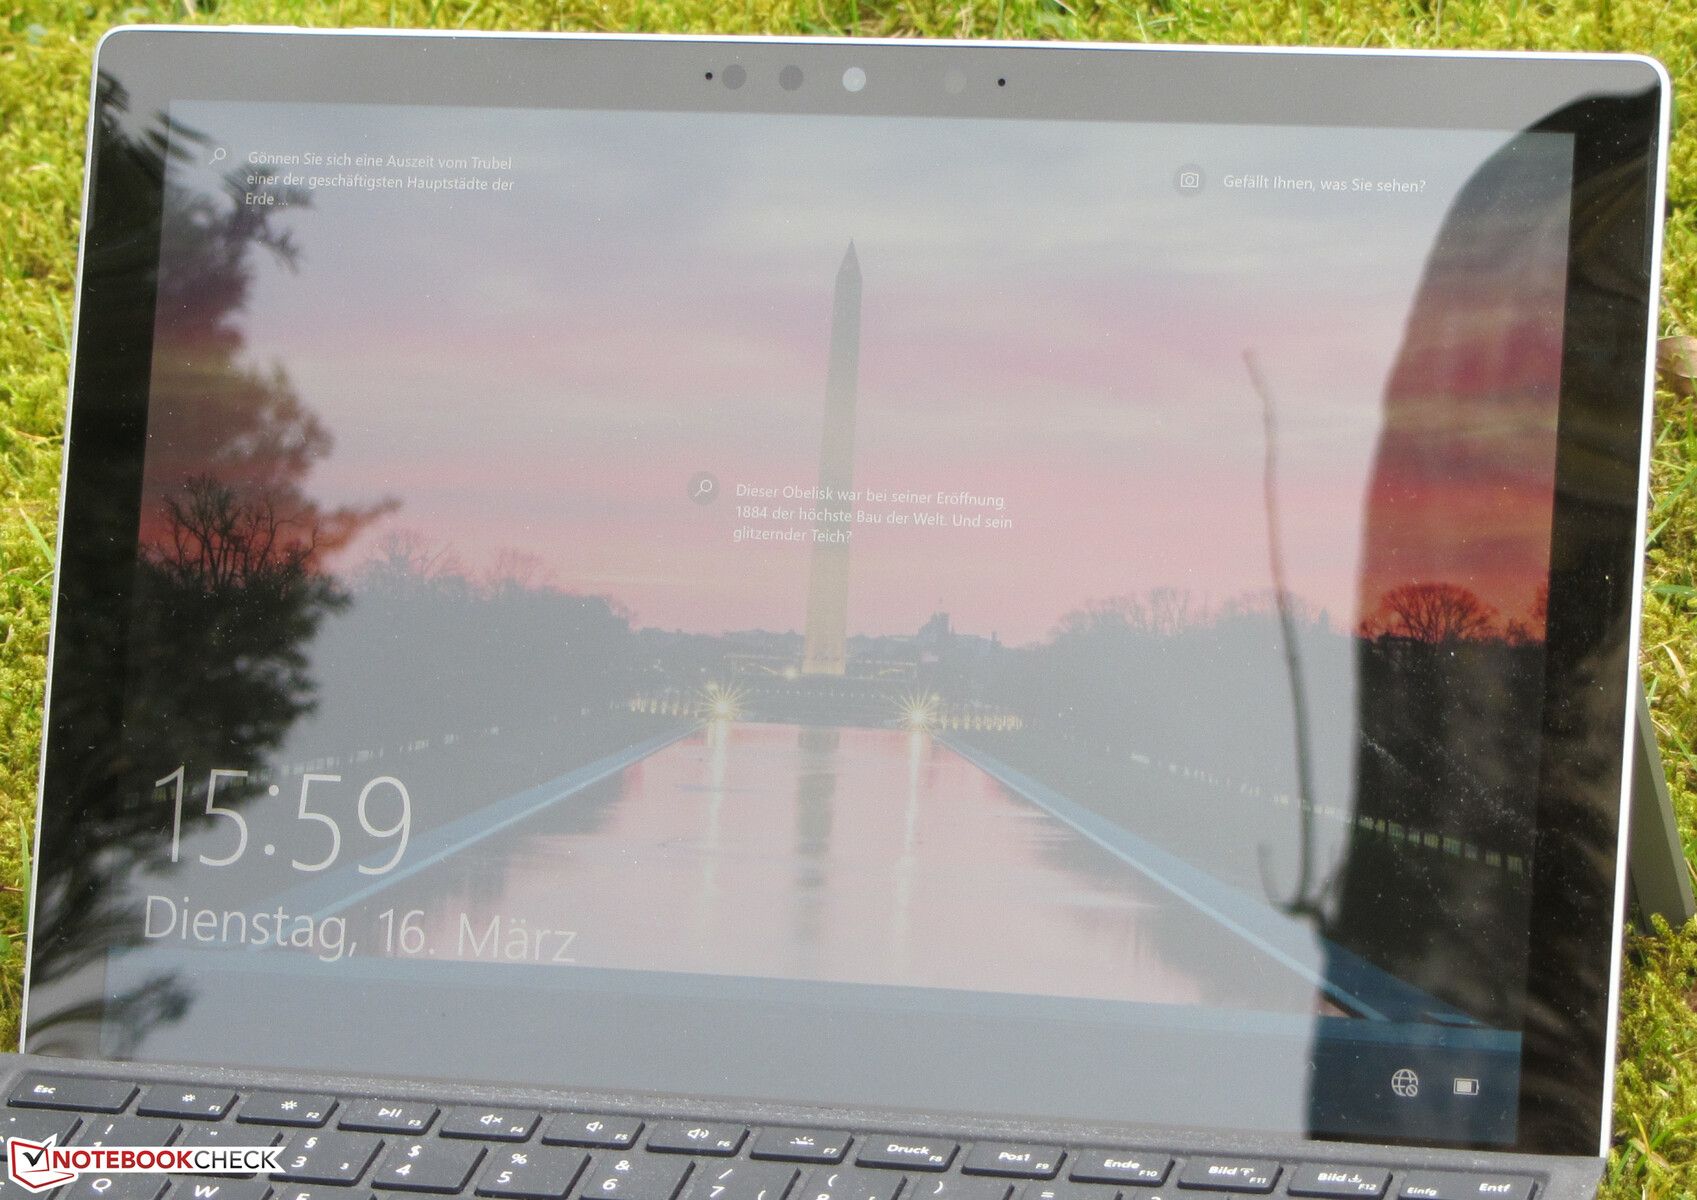
El panel IPS de ángulo de visión estable puede leerse desde cualquier posición. Ofrece suficiente brillo para ser visto en exteriores también. Sin embargo, la superficie brillante de la pantalla a menudo obstruye la legibilidad

Rendimiento - Más rendimiento gracias a Tiger Lake
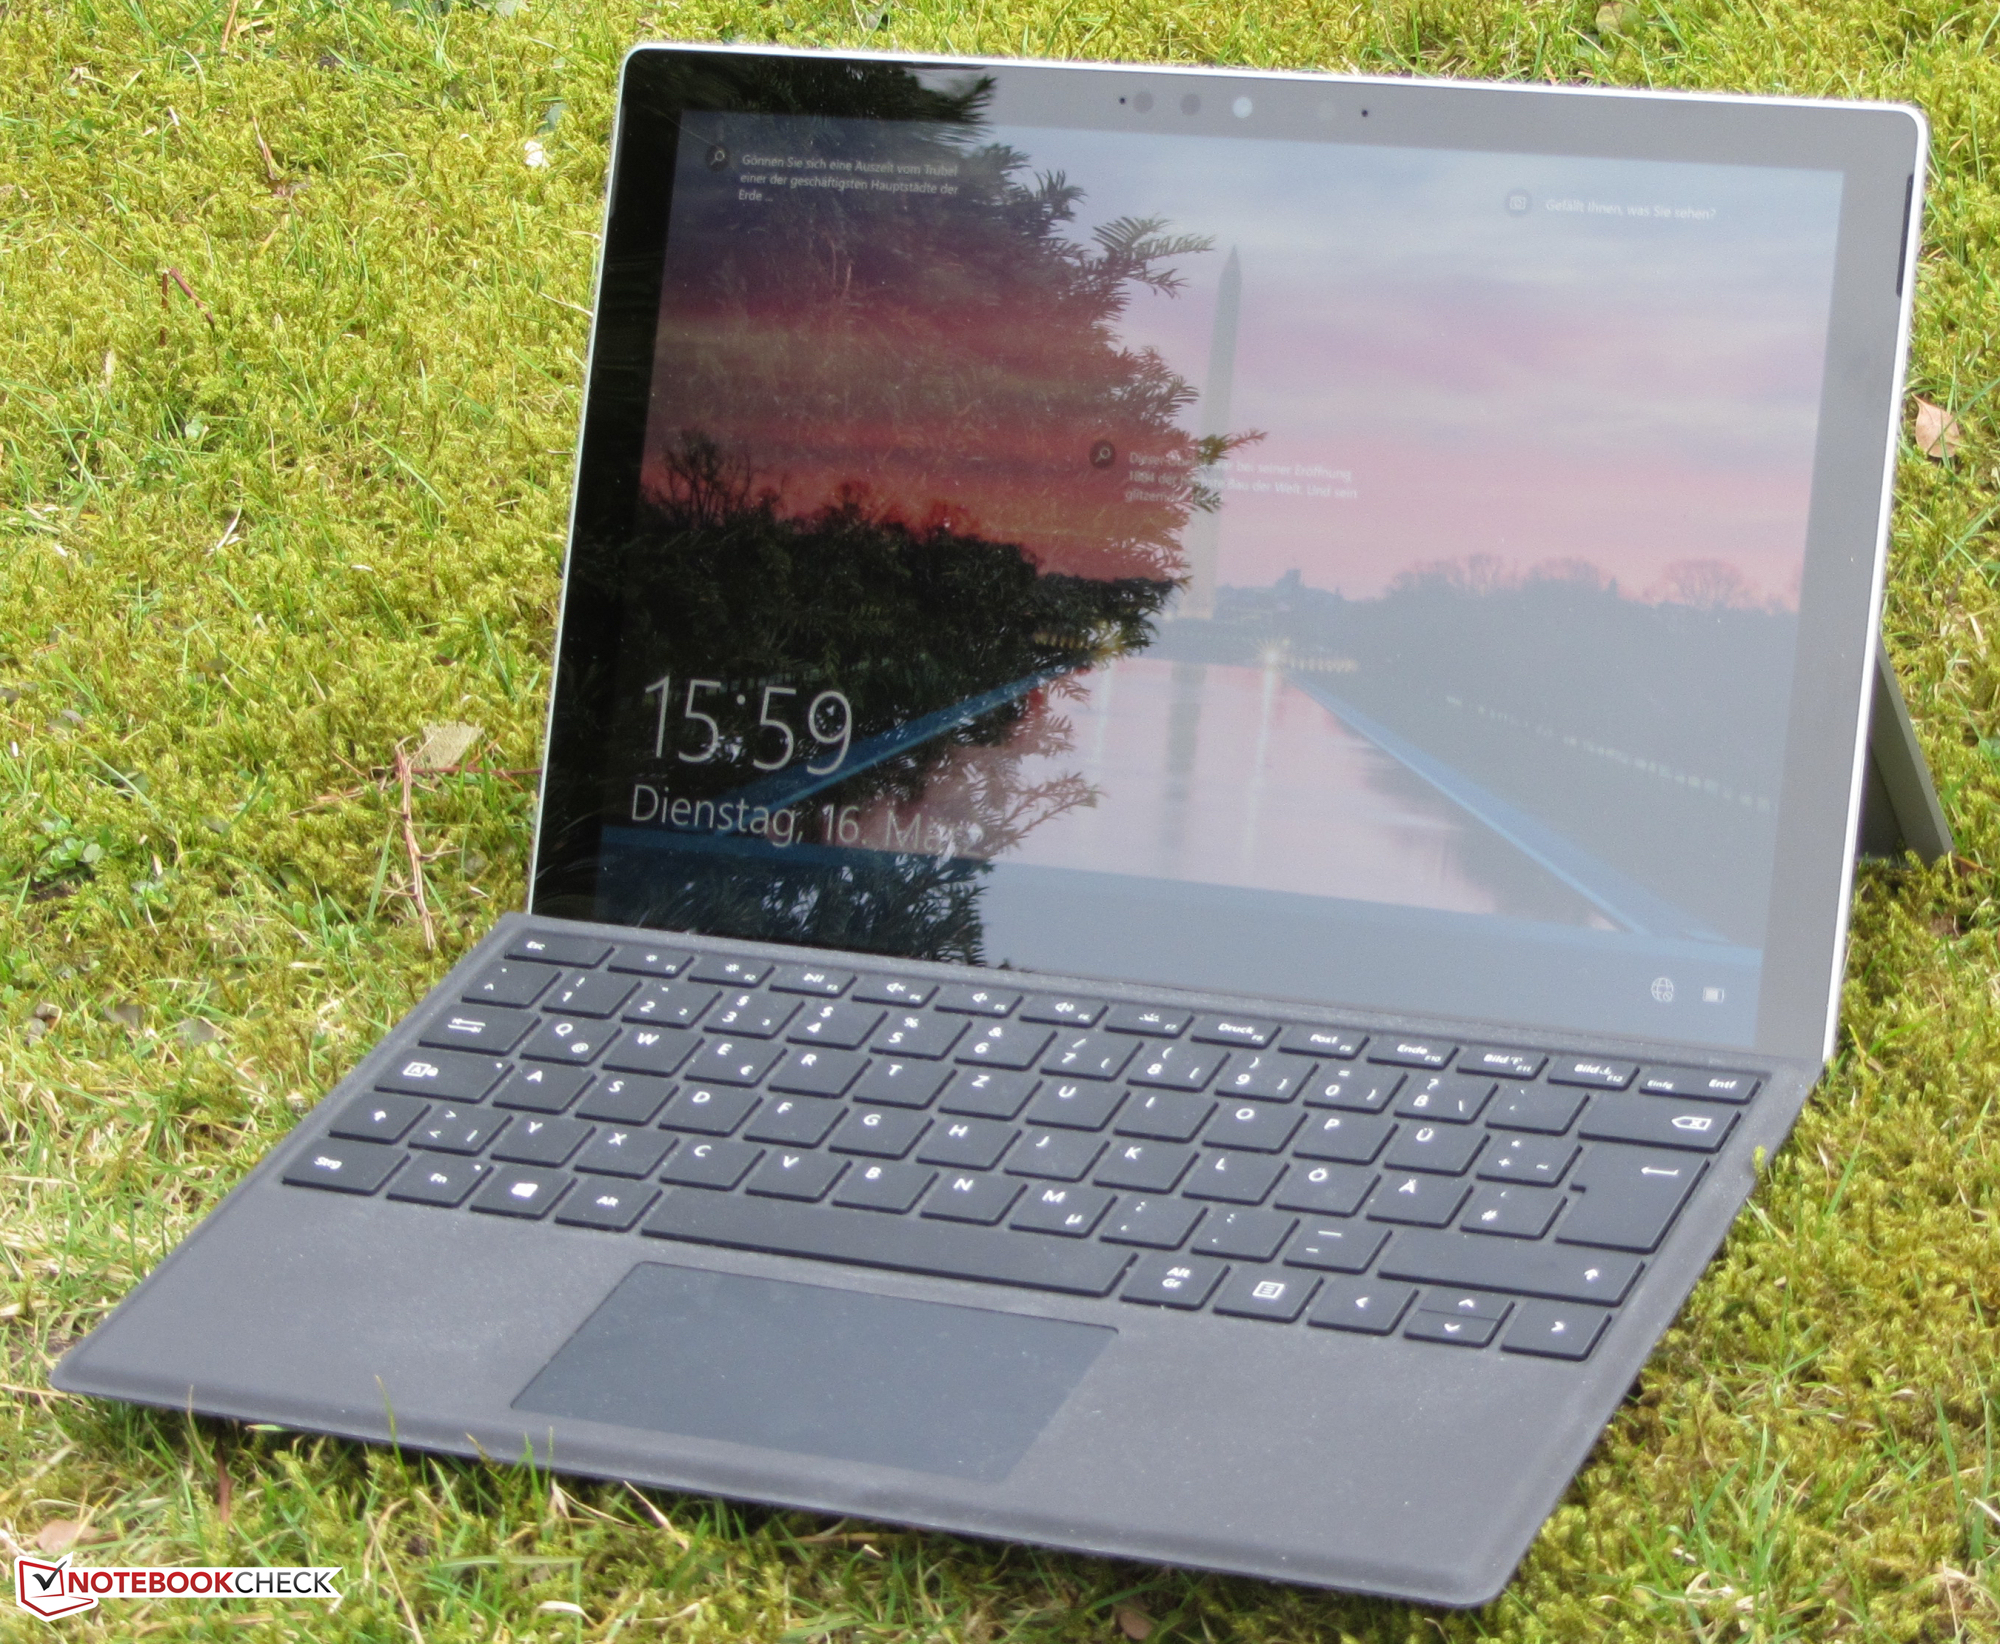
La Surface Pro 7 Plus de Microsoft es un dispositivo 2 en 1 de 12,3 pulgadas para empresas y colegios que ofrece suficiente potencia de cálculo para aplicaciones de oficina e Internet. Hay una gran variedad de configuraciones disponibles
Procesador
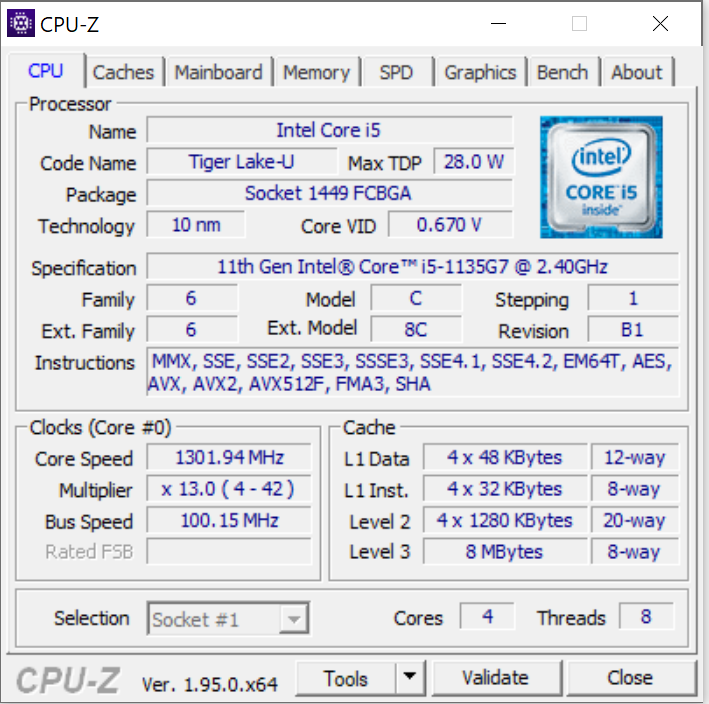
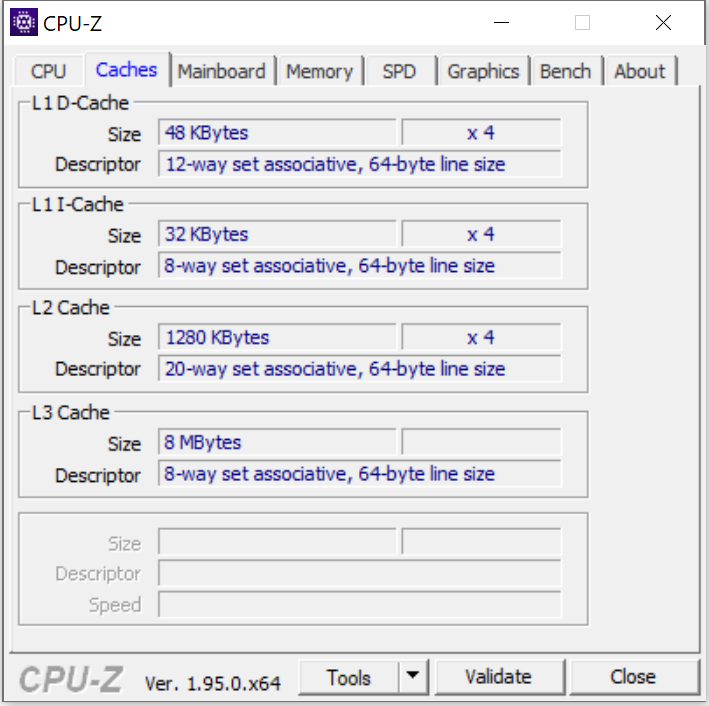
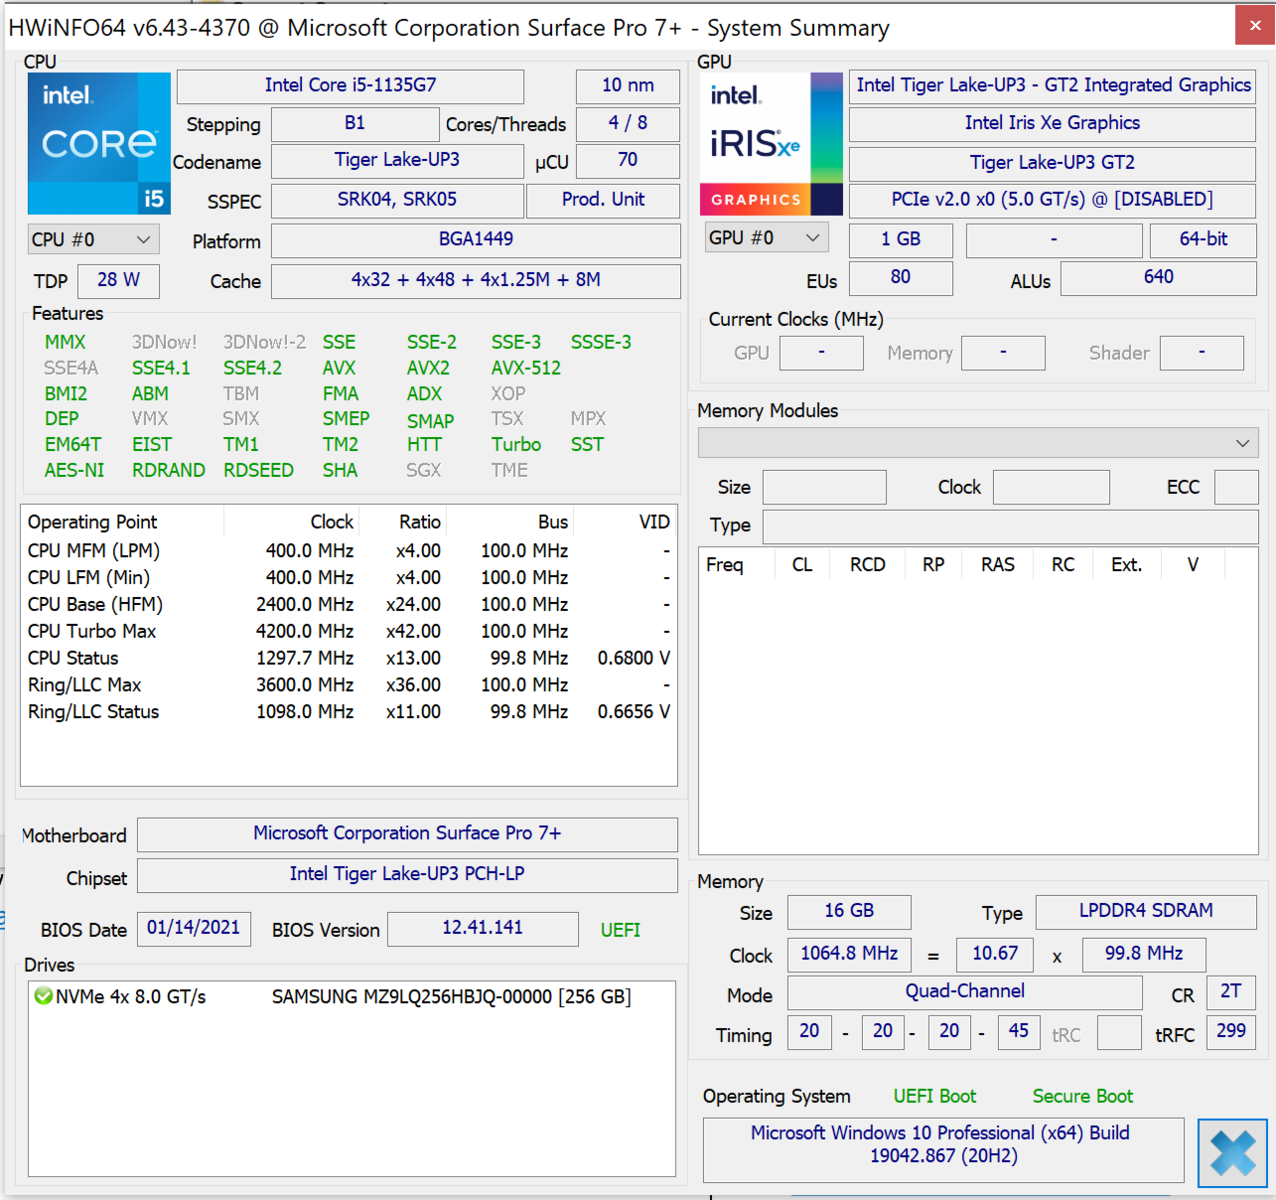
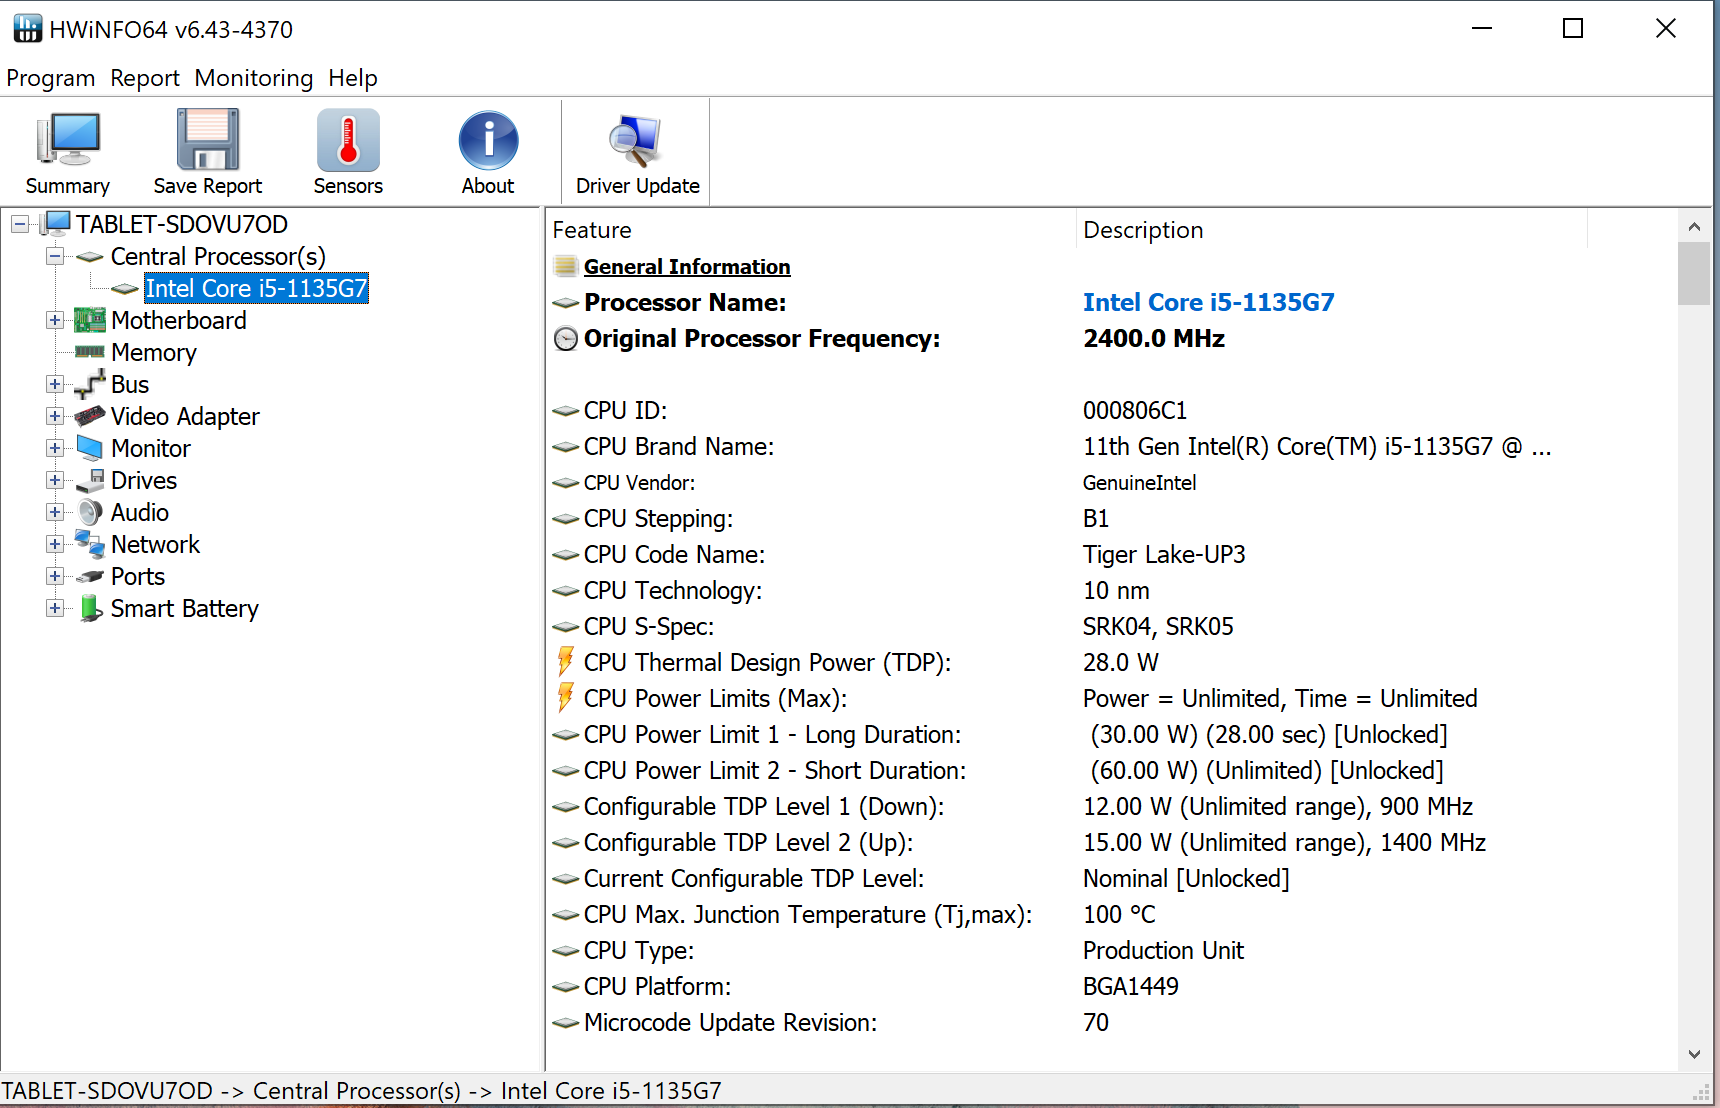
Microsoft ha optado por las CPUs Tiger Lake para el modelo Plus del Surface Pro 7. Nuestro modelo de pruebas está equipado con un procesador Corei5-1135G7 de cuatro núcleos
que funciona a una velocidad base de 2.4 GHz. Se puede aumentar a 3.8 GHz (todos los núcleos) o a 4.2 GHz (un núcleo) mediante Turbo. Soporta Hyper-Threading (dos hilos por núcleo).Las pruebas multihilo de los benchmarks Cinebench se ejecutan entre 3 y 3,5 GHz, mientras que las pruebas monohilo se ejecutan entre 3,1 y 4,1 GHz. En batería, las velocidades de reloj son de 2,4 a 2,8 GHz (multihilo) y de 1,5 a 2,5 GHz (monohilo), respectivamente.
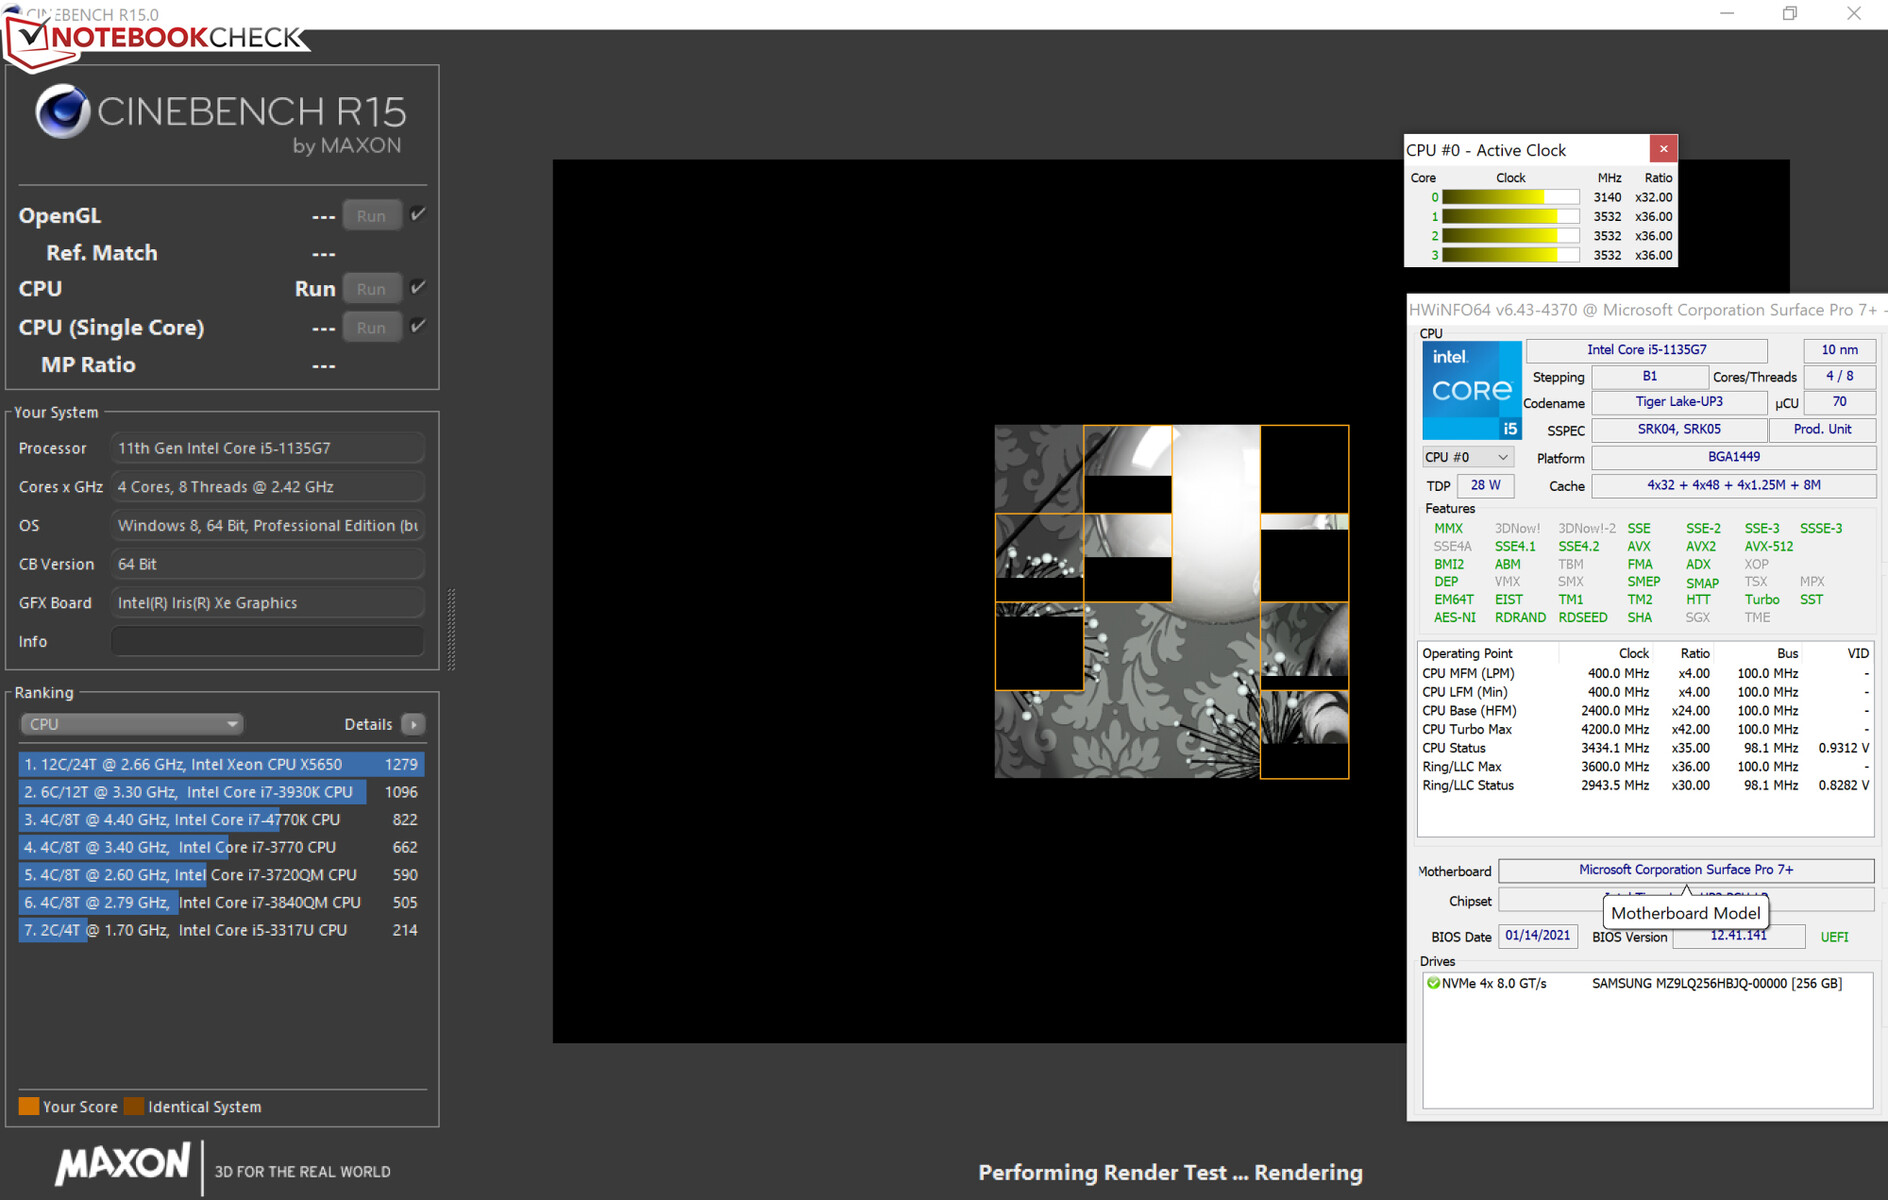
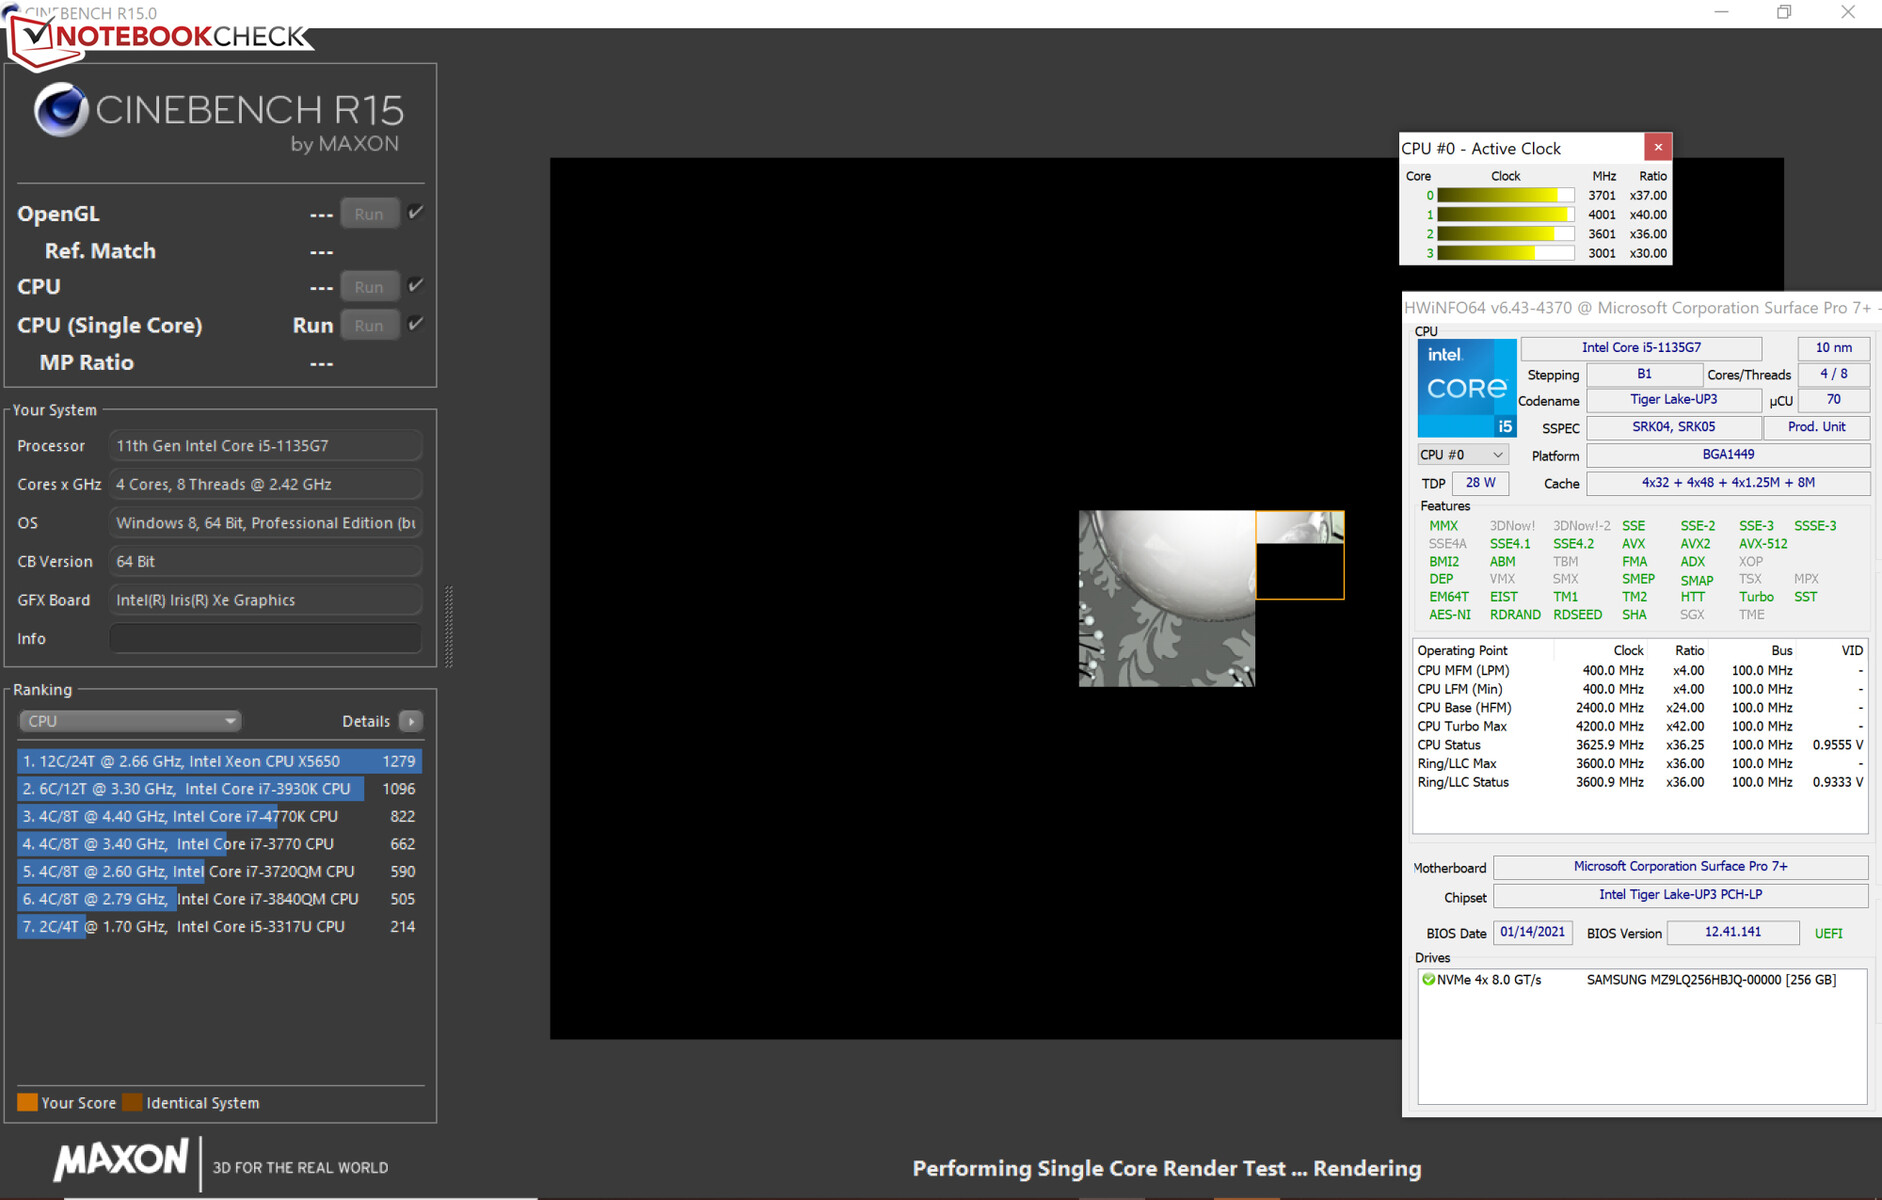
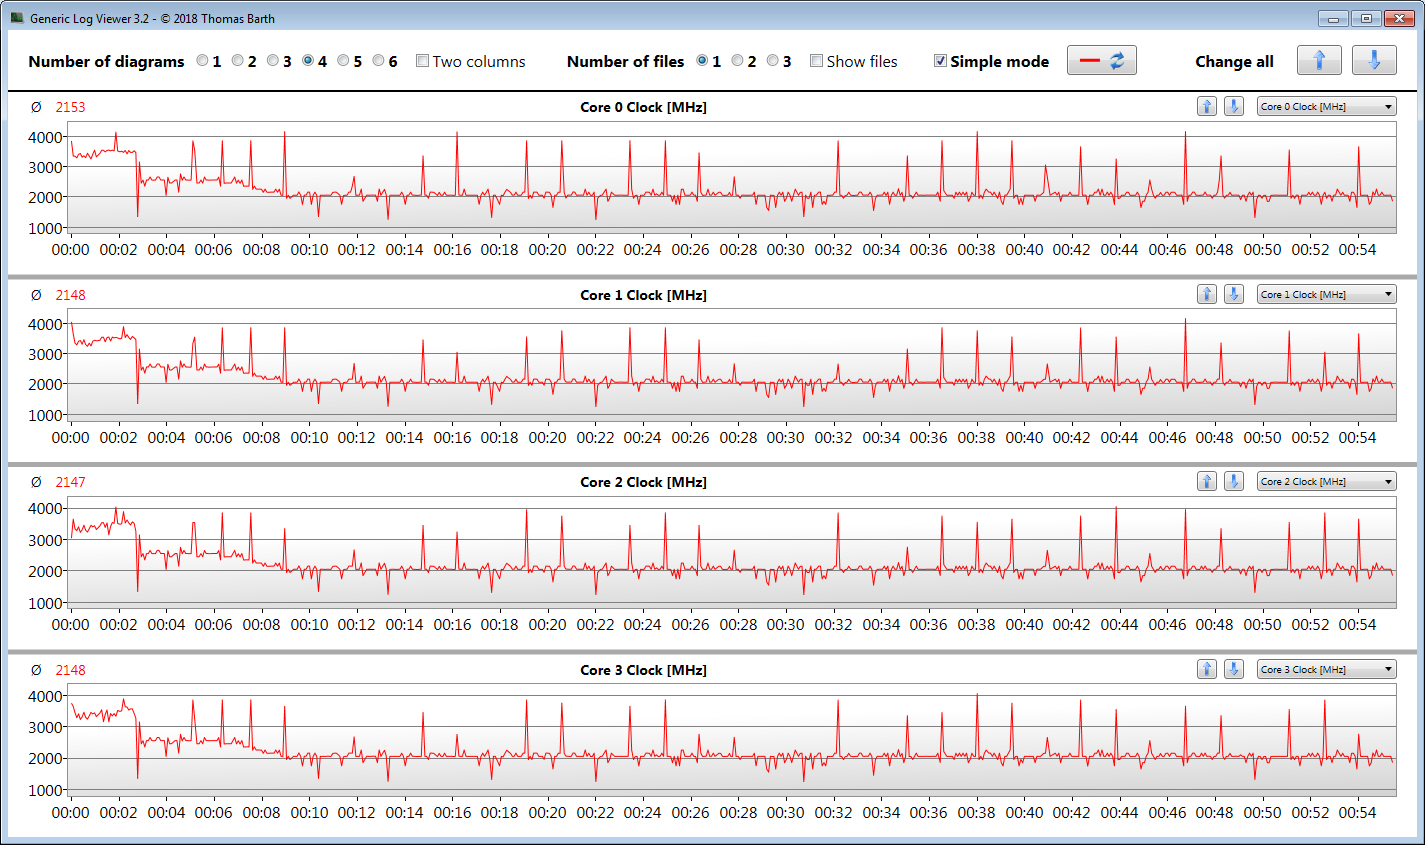
Verificamos si el Turbo de la CPU se usa de forma consistente cuando está conectado ejecutando el test multihilo del benchmark Cinebench R15 en un bucle continuo durante al menos 30 minutos. Las velocidades de reloj más allá de los 3 GHz sólo se alcanzan en los primeros tres minutos del test. En el curso posterior, la CPU tiene que ser estrangulada y cae por debajo de su velocidad de reloj base - la refrigeración pasiva se hace notar aquí.
Con todo, los resultados del benchmark son buenos. El procesador Tiger Lake responde a los picos de carga cortos con mucha potencia de cálculo y supera al procesador Ice Lake Core i5 del Surface Pro 7. Sin embargo, el rendimiento se pone de rodillas bajo carga prolongada
* ... más pequeño es mejor
Rendimiento del sistema
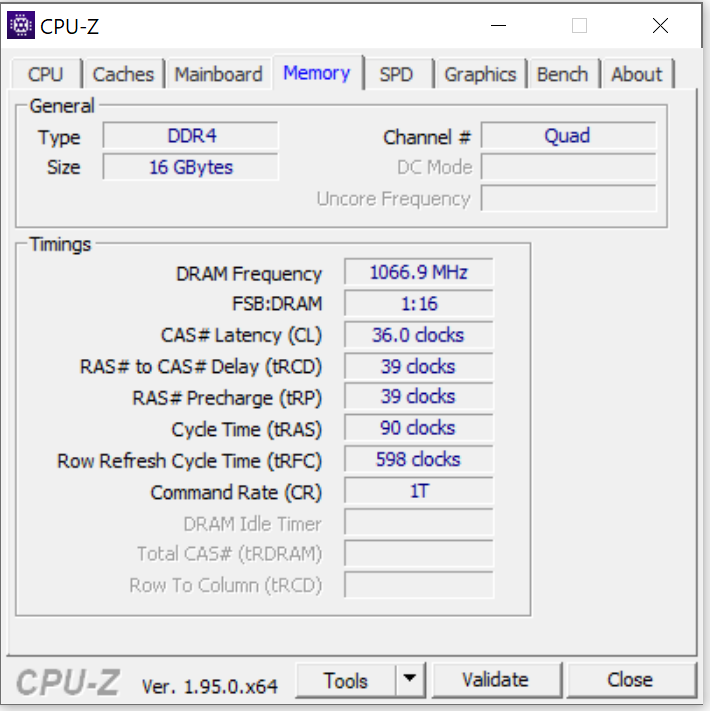
El sistema, fluido y rápido, no ha causado ningún problema. Ofrece una potencia de cálculo más que suficiente para las aplicaciones de oficina e Internet. Esto se complementa con los buenos resultados de PCMark. La memoria RAM del 12,3 pulgadas (16 GB, LPDDR4X, integrada) funciona en modo de doble canal. No es posible ampliar la memoria.
| PCMark 8 Home Score Accelerated v2 | 3472 puntos | |
| PCMark 8 Creative Score Accelerated v2 | 4157 puntos | |
| PCMark 8 Work Score Accelerated v2 | 2473 puntos | |
| PCMark 10 Score | 4026 puntos | |
ayuda | ||
Latencias del CPD
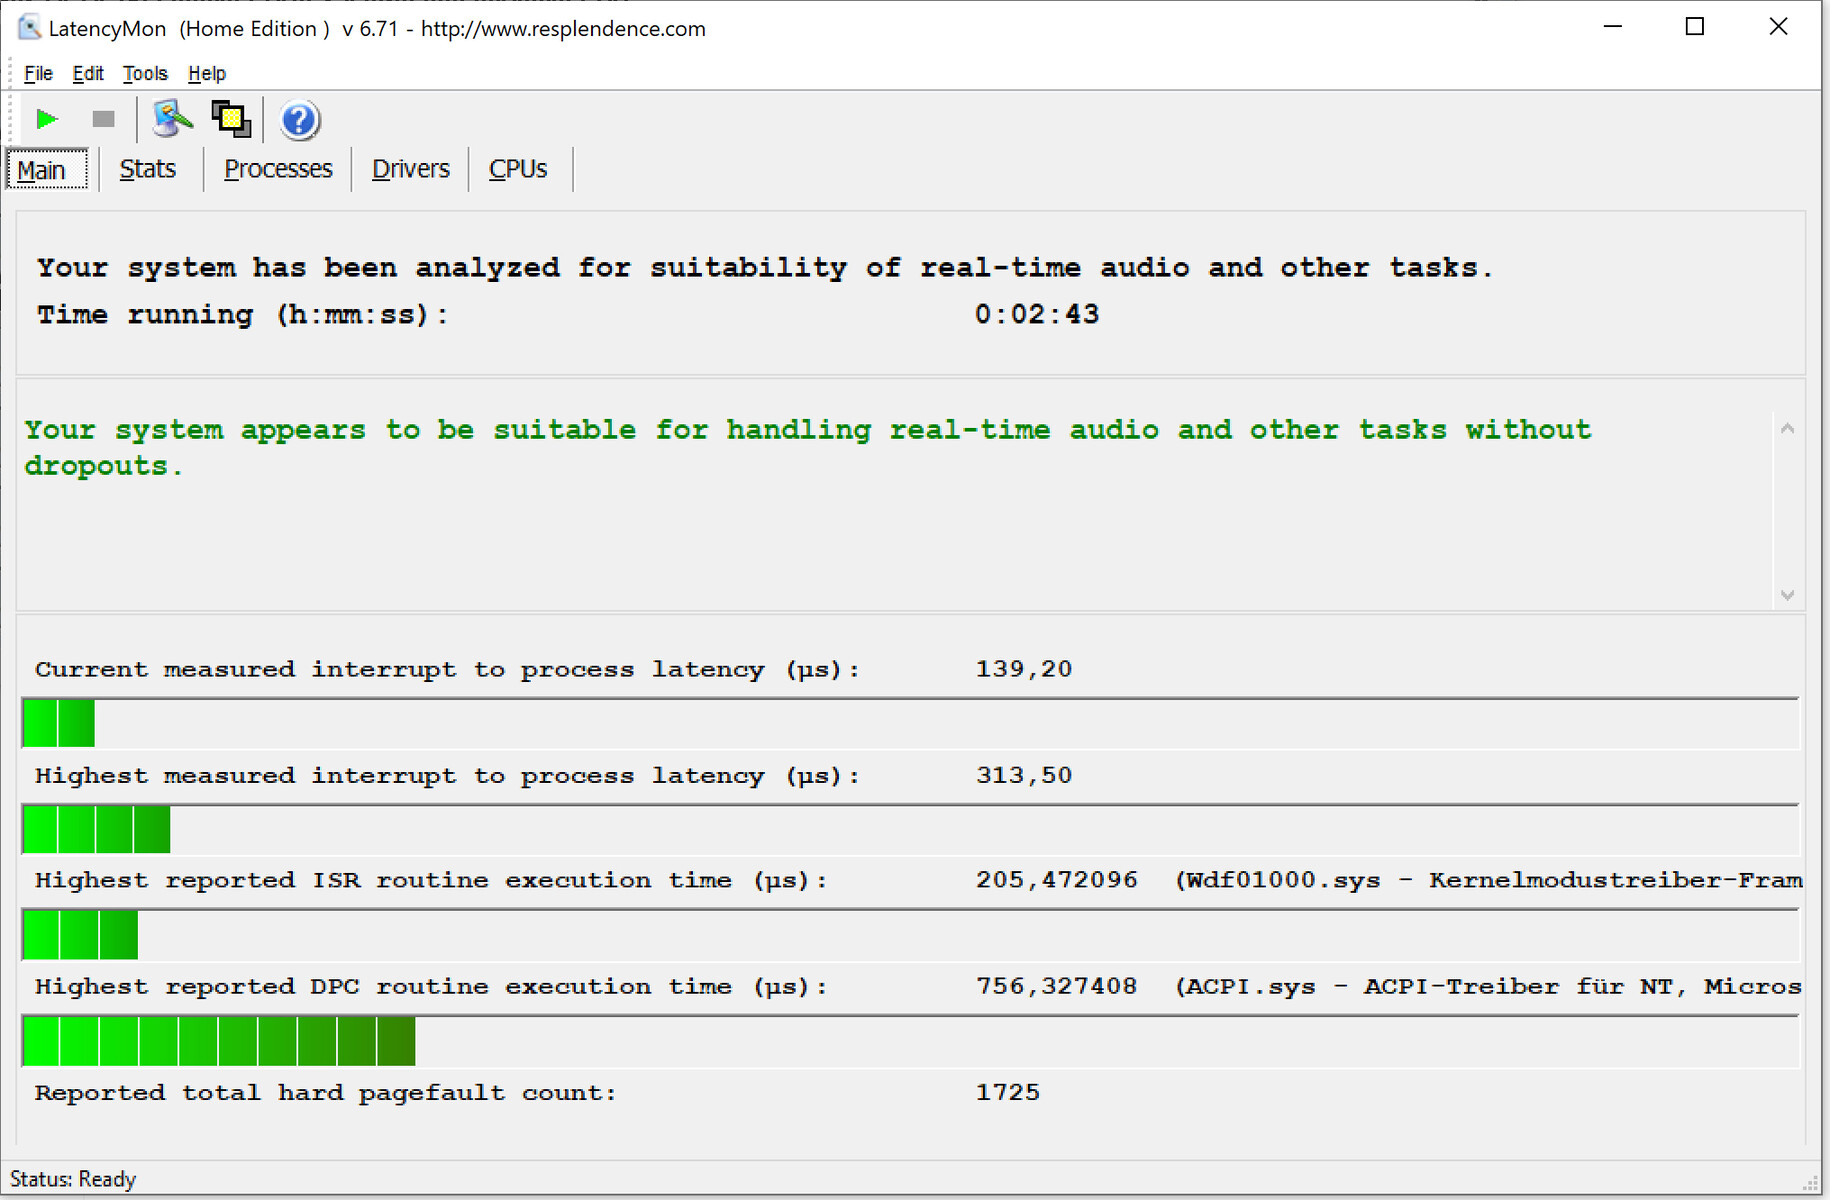
En nuestra prueba de monitorización de latencia estandarizada (navegación web, reproducción de vídeo 4K, Prime95 de alta carga), no observamos ningún problema con las latencias del CPD. El sistema parece adecuado para la edición de vídeo y audio en tiempo real
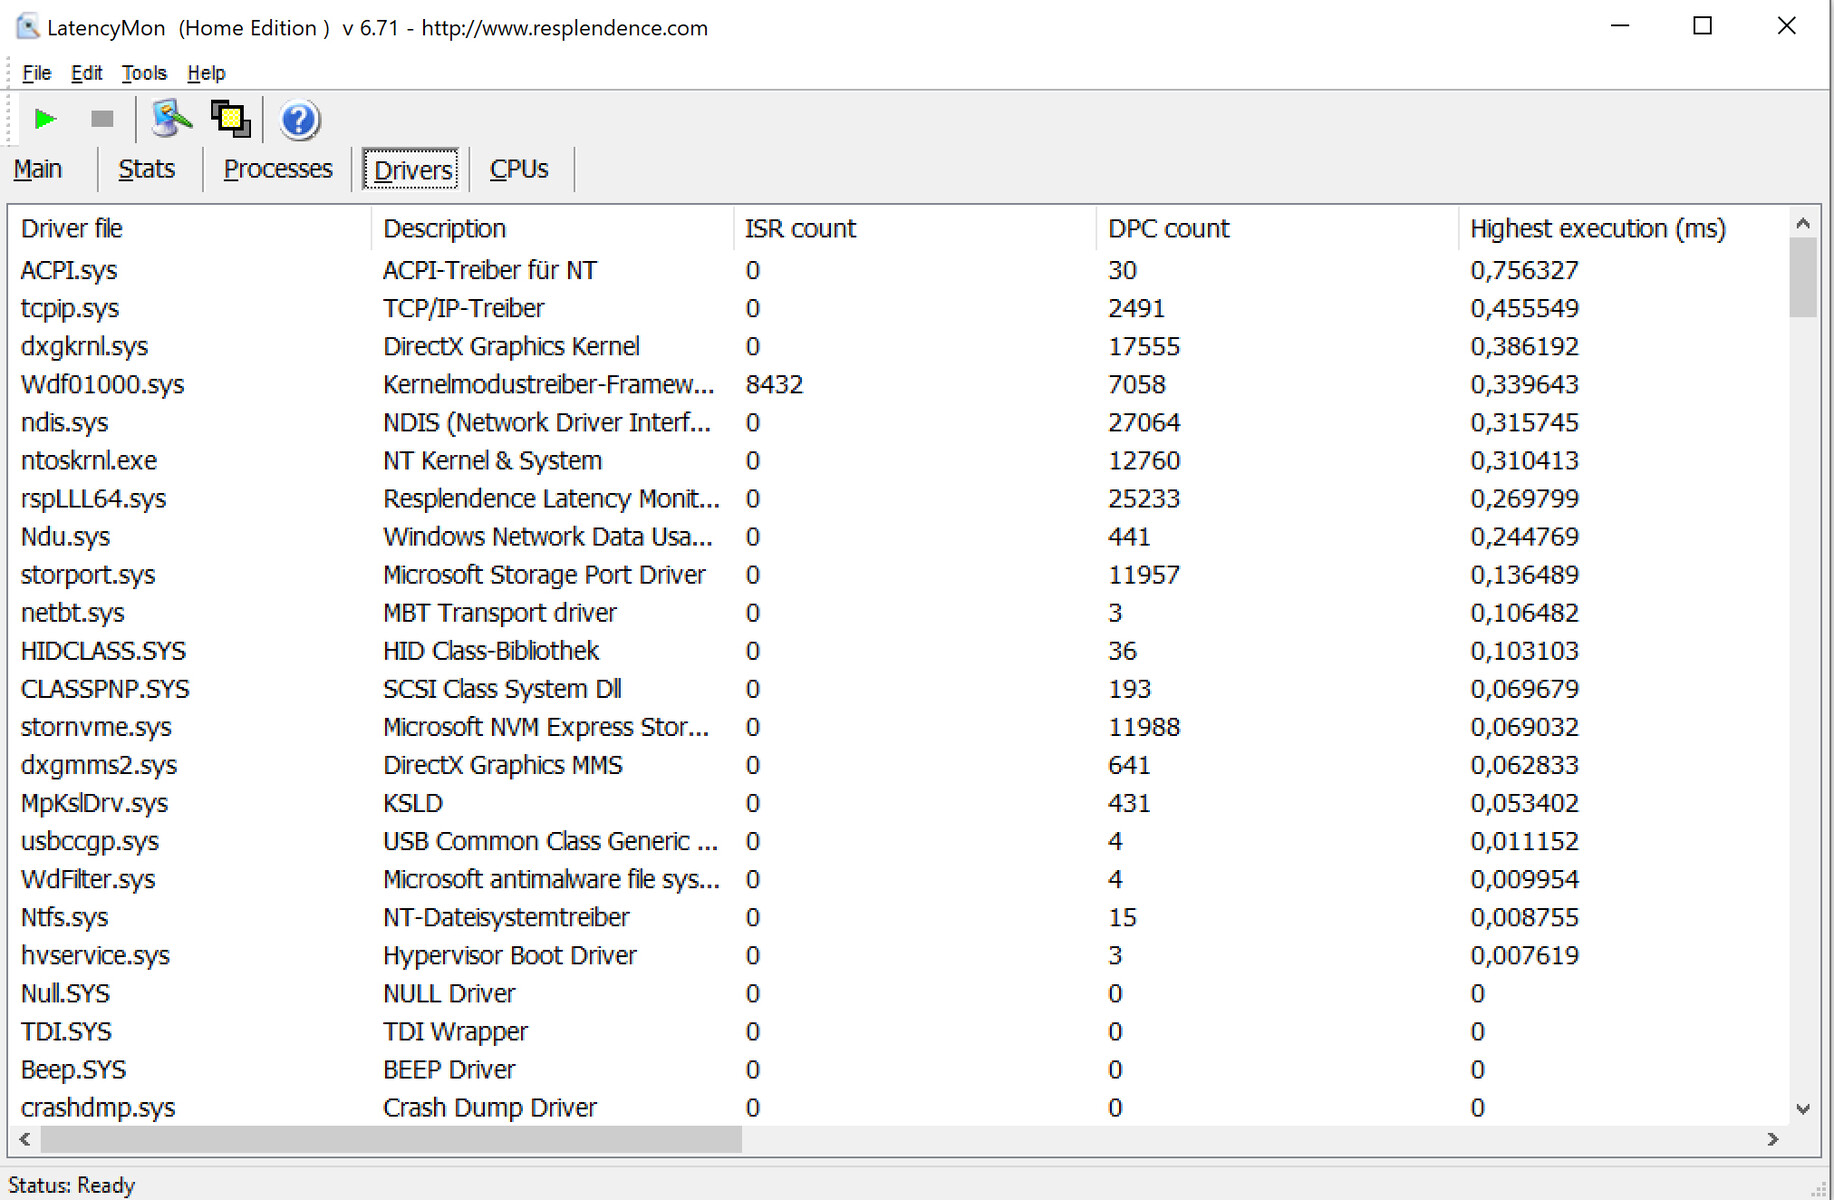
| DPC Latencies / LatencyMon - interrupt to process latency (max), Web, Youtube, Prime95 | |
| Lenovo Yoga Duet 7 13IML05-82AS000WGE | |
| Dell Latitude 12 7210 2-in-1 | |
| Microsoft Surface Pro 7 Plus | |
* ... más pequeño es mejor
Almacenamiento
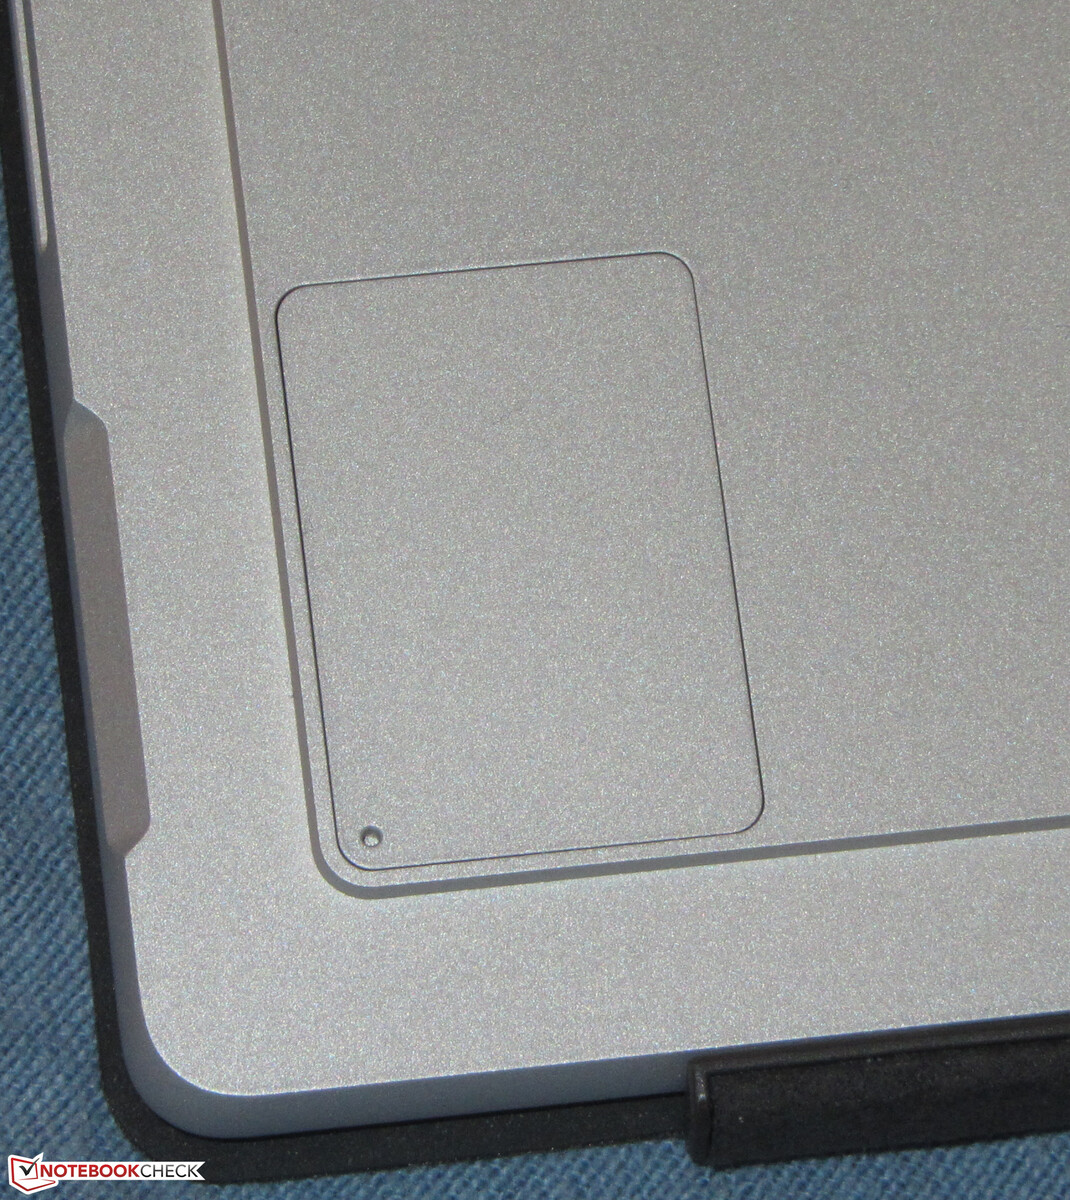
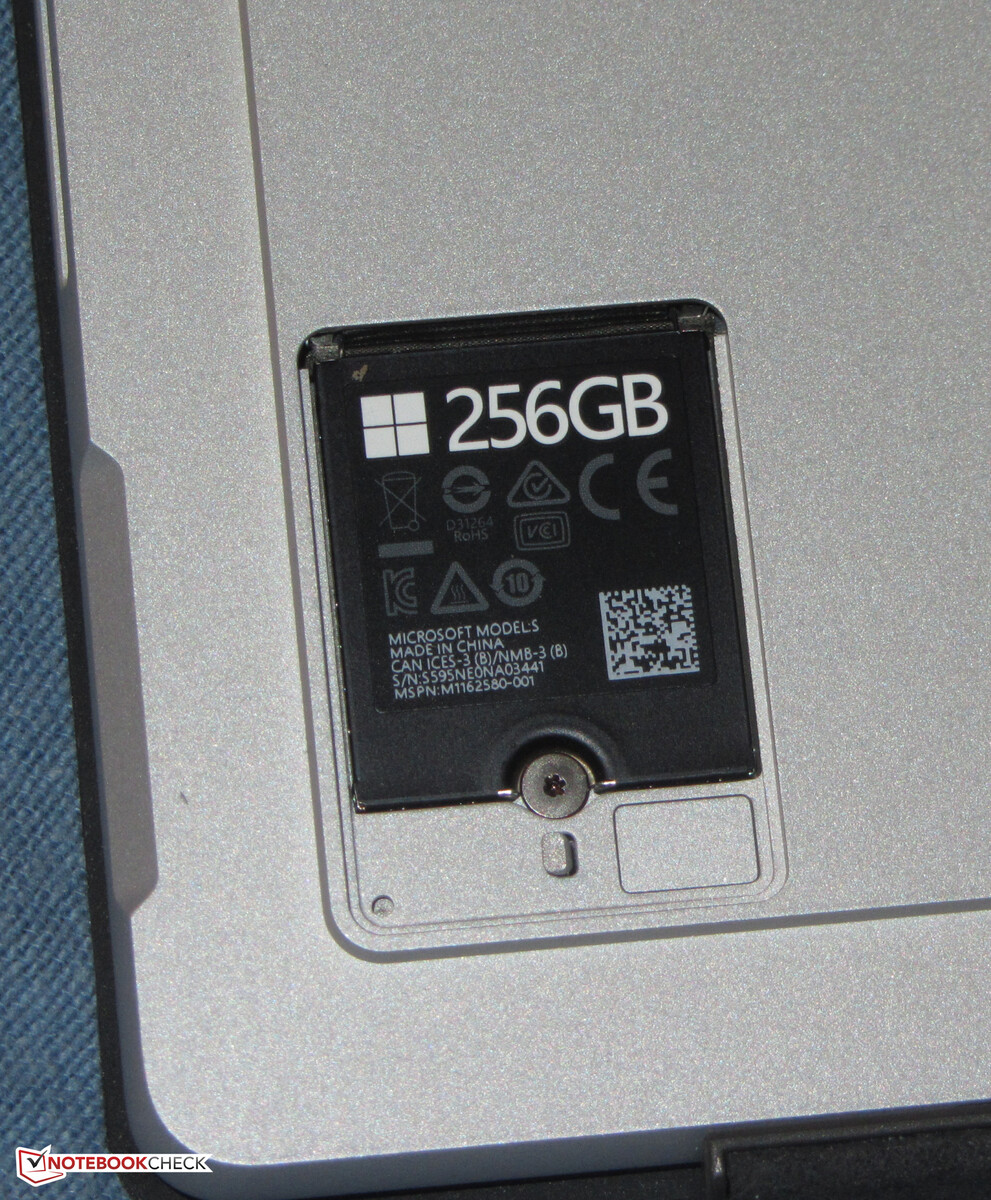
Un SSD NVMe de 256 GB (M.2-2230) de Samsung sirve como unidad de sistema, y ofrece buenas tasas de transferencia. No es uno de los mejores modelos de SSD, empero. El reemplazo del SSD puede hacerse fácilmente gracias a una pequeña escotilla de mantenimiento, pero la gama de SSDs en el formato M.2-2230 es (aún) limitada. La escotilla se sujeta magnéticamente y puede abrirse con la herramienta SIM incluida o un equipo similar

| Microsoft Surface Pro 7 Plus Samsung PM991 MZ9LQ256HBJQ | Lenovo Yoga Duet 7 13IML05-82AS000WGE Lenovo UMIS RPJTJ256MEE1OWX | Dell Latitude 12 7210 2-in-1 WDC PC SN530 SDBPTPZ-512G | Microsoft Surface Pro 7 Toshiba KBG40ZNS256G NVMe | Microsoft Surface Pro 7 Core i5-1035G4 Toshiba BG4 KBG40ZPZ256G | Medio Samsung PM991 MZ9LQ256HBJQ | |
|---|---|---|---|---|---|---|
| CrystalDiskMark 5.2 / 6 | 11% | 25% | 29% | 16% | -10% | |
| Write 4K (MB/s) | 165.3 | 118 -29% | 182.7 11% | 131.3 -21% | 118.5 -28% | 122.1 ? -26% |
| Read 4K (MB/s) | 42.95 | 53 23% | 51.4 20% | 52.4 22% | 54.1 26% | 35.4 ? -18% |
| Write Seq (MB/s) | 955 | 1208 26% | 1303 36% | 1613 69% | 1166 22% | 849 ? -11% |
| Read Seq (MB/s) | 867 | 1625 87% | 1450 67% | 1613 86% | 1676 93% | 854 ? -1% |
| Write 4K Q32T1 (MB/s) | 423.5 | 431 2% | 342.9 -19% | 411.6 -3% | 330.5 -22% | 394 ? -7% |
| Read 4K Q32T1 (MB/s) | 479.2 | 356 -26% | 523 9% | 415.6 -13% | 393.1 -18% | 398 ? -17% |
| Write Seq Q32T1 (MB/s) | 1060 | 1278 21% | 1776 68% | 2340 121% | 1569 48% | 1059 ? 0% |
| Read Seq Q32T1 (MB/s) | 2251 | 1949 -13% | 2378 6% | 1568 -30% | 2390 6% | 2254 ? 0% |
| Write 4K Q8T8 (MB/s) | 410.9 | |||||
| Read 4K Q8T8 (MB/s) | 1033 | |||||
| AS SSD | -9% | 32% | -31% | -169% | -1% | |
| Seq Read (MB/s) | 1725 | 1629 -6% | 2185 27% | 1881 9% | 1590 -8% | 1706 ? -1% |
| Seq Write (MB/s) | 931 | 694 -25% | 1731 86% | 703 -24% | 714 -23% | 803 ? -14% |
| 4K Read (MB/s) | 50.1 | 47.87 -4% | 46.28 -8% | 52.3 4% | 50.7 1% | 45.1 ? -10% |
| 4K Write (MB/s) | 136.9 | 107 -22% | 161.6 18% | 154.1 13% | 109.4 -20% | 123.6 ? -10% |
| 4K-64 Read (MB/s) | 870 | 411 -53% | 1021 17% | 1048 20% | 924 6% | 773 ? -11% |
| 4K-64 Write (MB/s) | 762 | 377 -51% | 1125 48% | 703 -8% | 294.6 -61% | 721 ? -5% |
| Access Time Read * (ms) | 0.279 | 0.068 76% | 0.069 75% | 0.069 75% | 0.066 76% | 0.229 ? 18% |
| Access Time Write * (ms) | 0.028 | 0.035 -25% | 0.046 -64% | 0.221 -689% | 0.697 -2389% | 0.0315 ? -13% |
| Score Read (Points) | 1093 | 614 -44% | 1286 18% | 1288 18% | 1133 4% | 989 ? -10% |
| Score Write (Points) | 992 | 550 -45% | 1460 47% | 927 -7% | 475 -52% | 925 ? -7% |
| Score Total (Points) | 2616 | 1441 -45% | 3389 30% | 2826 8% | 2157 -18% | 2386 ? -9% |
| Copy ISO MB/s (MB/s) | 1174 | 1074 -9% | 1555 32% | 1160 -1% | 1177 0% | 1085 ? -8% |
| Copy Program MB/s (MB/s) | 262.8 | 532 102% | 468.5 78% | 454.7 73% | 406 54% | 389 ? 48% |
| Copy Game MB/s (MB/s) | 562 | 730 30% | 841 50% | 991 76% | 923 64% | 687 ? 22% |
| Media total (Programa/Opciones) | 1% /
-1% | 29% /
30% | -1% /
-9% | -77% /
-102% | -6% /
-4% |
* ... más pequeño es mejor
Continuous load read: DiskSpd Read Loop, Queue Depth 8
Tarjeta gráfica
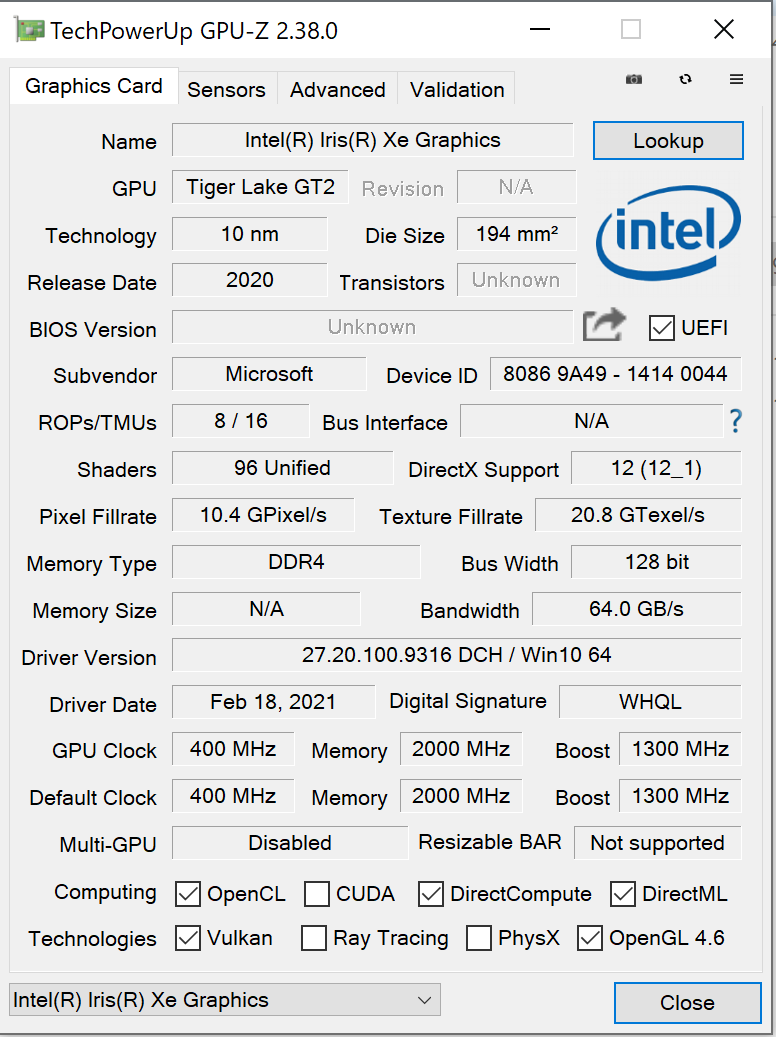
LaGPU Intel IrisXe Graphics G7 80EUs
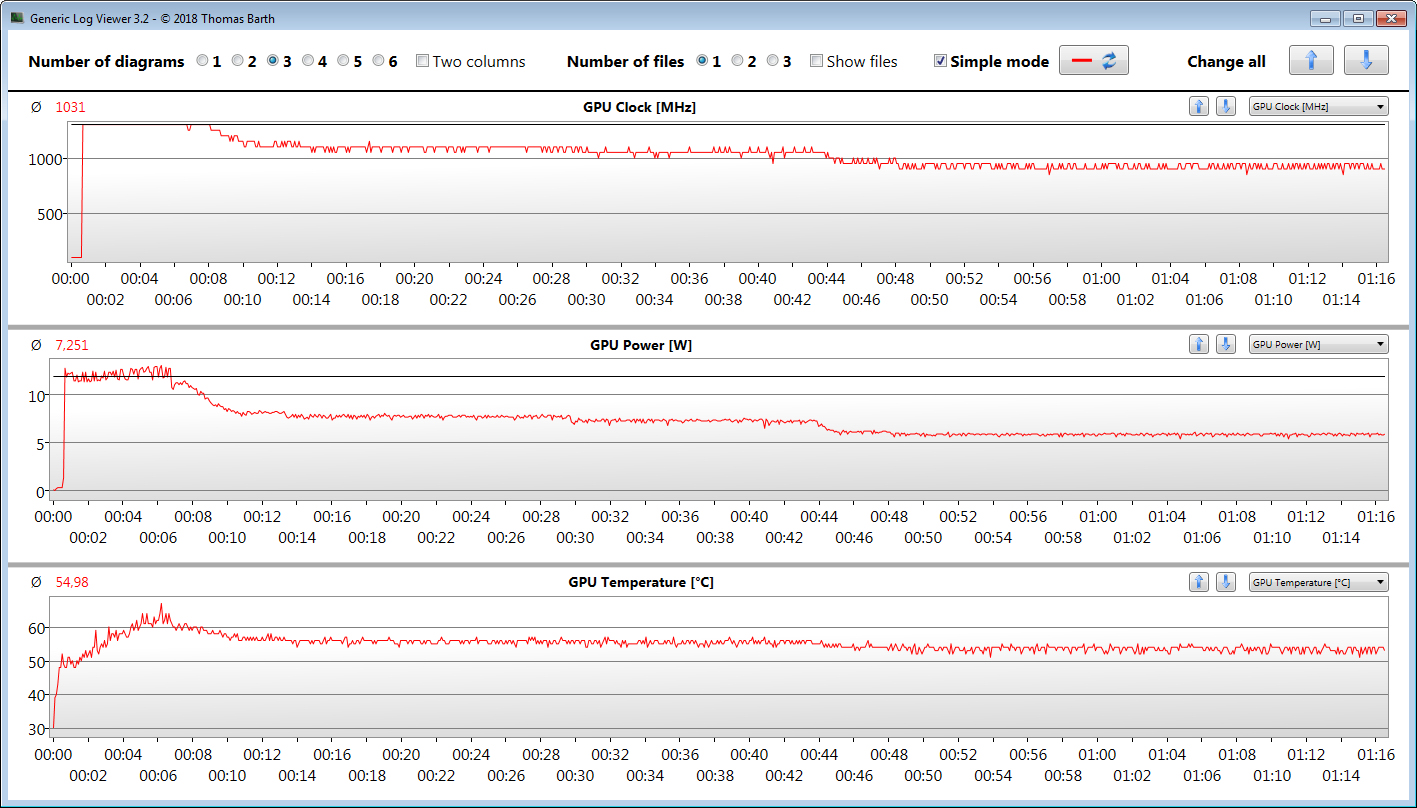
integrada es la responsable de la salida de gráficos. Soporta DirectX 12 y alcanza una velocidad de reloj operativa de hasta 1.300 MHz. La prueba Witcher 3muestra que la GPUTiger Lake puede trabajar a toda velocidad durante unos siete minutos. Después, la refrigeración pasiva pasa factura.
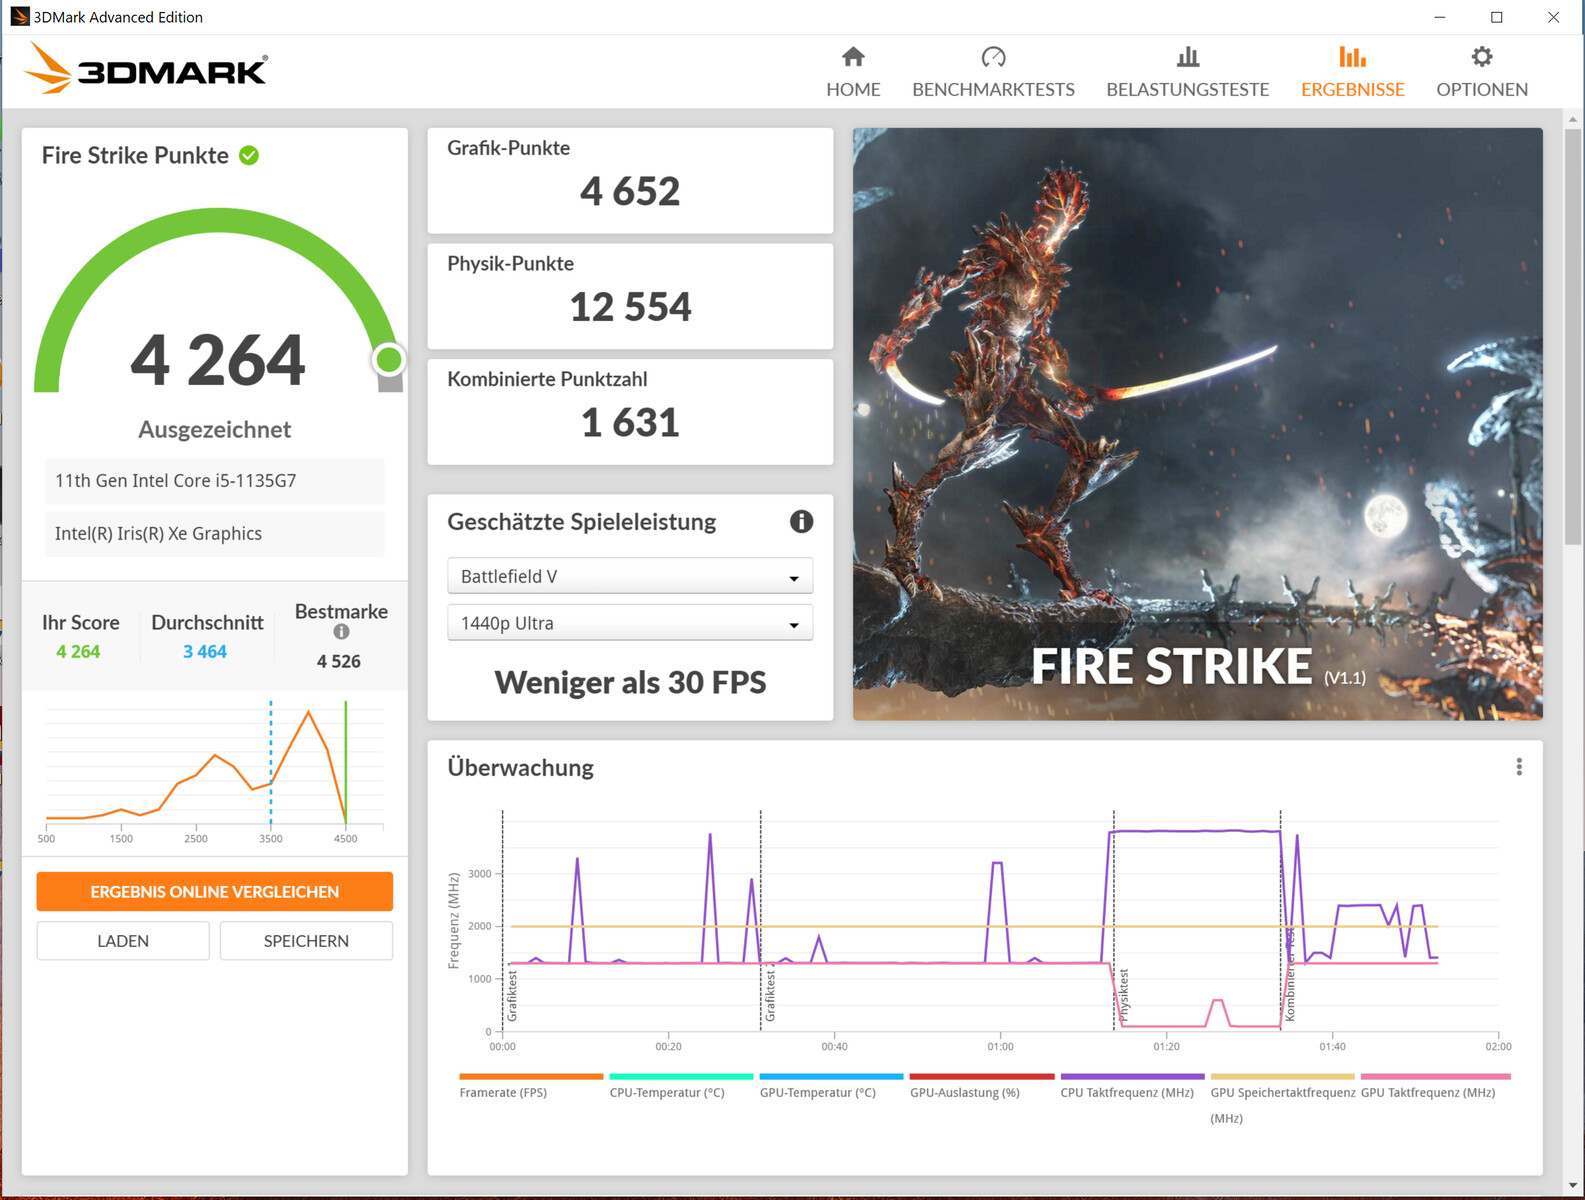
Los resultados de 3DMark están entre los mejores valores que hemos determinado para la GPU instalada aquí hasta ahora. Comparado con los modelos Ice Lake Surface Pro 7, hay un aumento significativo del rendimiento gráfico

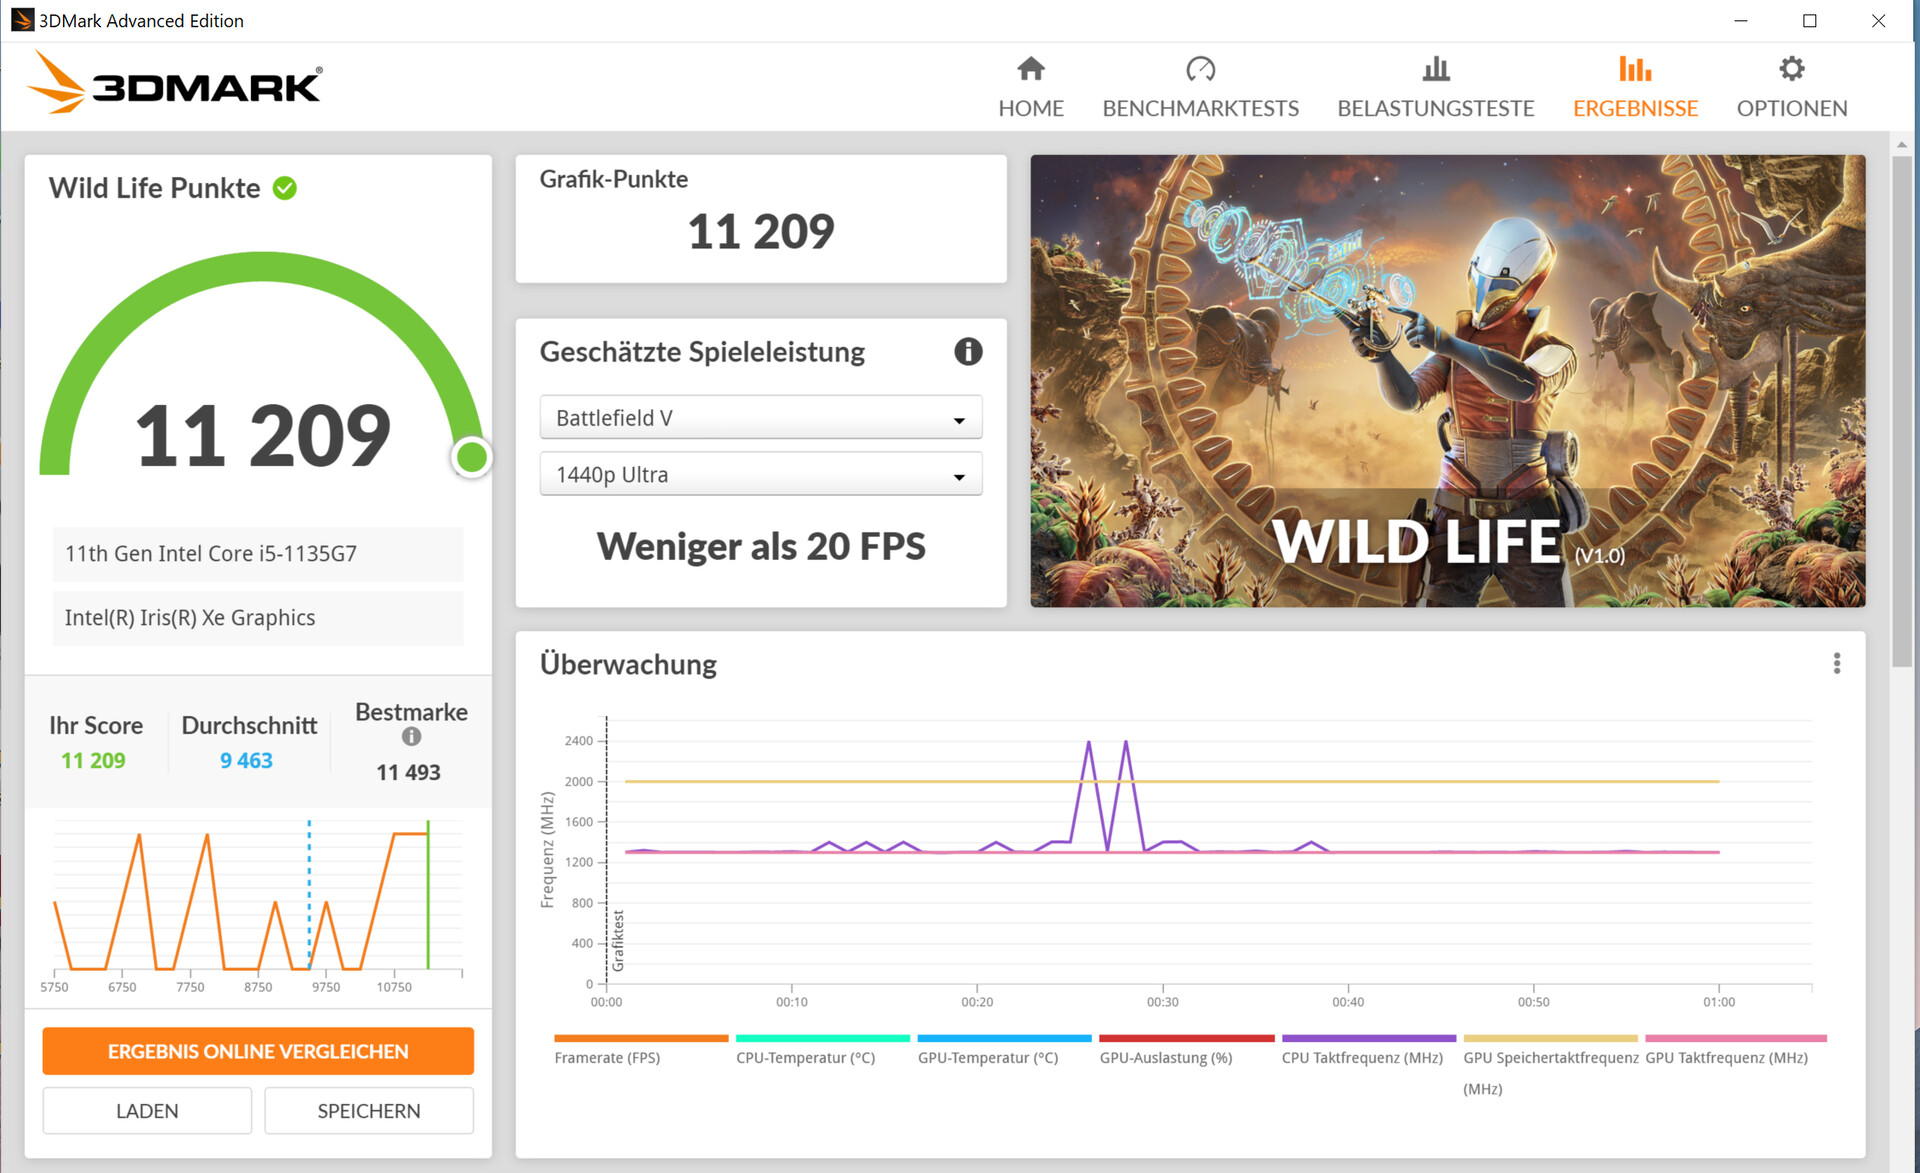
| 3DMark 11 Performance | 6343 puntos | |
| 3DMark Ice Storm Standard Score | 81444 puntos | |
| 3DMark Cloud Gate Standard Score | 17777 puntos | |
| 3DMark Fire Strike Score | 4264 puntos | |
| 3DMark Time Spy Score | 1537 puntos | |
ayuda | ||
| GFXBench (DX / GLBenchmark) 2.7 | |
| 1920x1080 T-Rex Offscreen | |
| Media de la clase Convertible (83 - 495, n=3, últimos 2 años) | |
| Microsoft Surface Pro 7 Plus | |
| Medio Intel Iris Xe Graphics G7 80EUs (220 - 257, n=3) | |
| T-Rex Onscreen | |
| Media de la clase Convertible (n=1últimos 2 años) | |
| Microsoft Surface Pro 7 Plus | |
| Medio Intel Iris Xe Graphics G7 80EUs (55 - 236, n=3) | |
| GFXBench 3.0 | |
| 1920x1080 1080p Manhattan Offscreen | |
| Microsoft Surface Pro 7 Plus | |
| Media de la clase Convertible (48 - 290, n=3, últimos 2 años) | |
| Medio Intel Iris Xe Graphics G7 80EUs (101.5 - 170.4, n=3) | |
| on screen Manhattan Onscreen OGL | |
| Media de la clase Convertible (n=1últimos 2 años) | |
| Microsoft Surface Pro 7 Plus | |
| Medio Intel Iris Xe Graphics G7 80EUs (44 - 100.4, n=3) | |
| GFXBench 3.1 | |
| 1920x1080 Manhattan ES 3.1 Offscreen | |
| Media de la clase Convertible (34 - 229, n=3, últimos 2 años) | |
| Microsoft Surface Pro 7 Plus | |
| Medio Intel Iris Xe Graphics G7 80EUs (69 - 108.6, n=3) | |
| on screen Manhattan ES 3.1 Onscreen | |
| Media de la clase Convertible (n=1últimos 2 años) | |
| Medio Intel Iris Xe Graphics G7 80EUs (46.5 - 69.4, n=3) | |
| Microsoft Surface Pro 7 Plus | |
| Unigine Heaven 2.1 - 1280x1024 high, Tesselation (normal), DirectX11 AA:off AF:1x | |
| Microsoft Surface Pro 7 Plus | |
| Medio Intel Iris Xe Graphics G7 80EUs (n=1) | |
| Unigine Heaven 3.0 | |
| 1920x1080 OpenGL, Normal Tessellation, High Shaders AA:Off AF:Off | |
| Microsoft Surface Pro 7 Plus | |
| Medio Intel Iris Xe Graphics G7 80EUs (n=1) | |
| 1920x1080 DX 11, Normal Tessellation, High Shaders AA:Off AF:Off | |
| Microsoft Surface Pro 7 Plus | |
| Medio Intel Iris Xe Graphics G7 80EUs (n=1) | |
| Unigine Superposition | |
| 1920x1080 1080p High | |
| Media de la clase Convertible (1450 - 2770, n=2, últimos 2 años) | |
| Medio Intel Iris Xe Graphics G7 80EUs (1907 - 2216, n=2) | |
| Microsoft Surface Pro 7 Plus | |
| 1280x720 720p Low | |
| Media de la clase Convertible (4558 - 9507, n=2, últimos 2 años) | |
| Medio Intel Iris Xe Graphics G7 80EUs (6057 - 6928, n=2) | |
| Microsoft Surface Pro 7 Plus | |
| Unigine Valley 1.0 | |
| 1920x1080 Extreme HD DirectX AA:x8 | |
| Media de la clase Convertible (21.5 - 53.5, n=2, últimos 2 años) | |
| Microsoft Surface Pro 7 Plus | |
| Medio Intel Iris Xe Graphics G7 80EUs (14.6 - 17.4, n=4) | |
| 1920x1080 Extreme HD Preset OpenGL AA:x8 | |
| Media de la clase Convertible (19.3 - 51.7, n=2, últimos 2 años) | |
| Microsoft Surface Pro 7 Plus | |
| Medio Intel Iris Xe Graphics G7 80EUs (14.1 - 18.8, n=4) | |
Rendimiento de los juegos
La Surface Pro 7 Plus no es un dispositivo para juegos. Sin embargo: La combinación CPU-GPU instalada es capaz, en general, de llevar a la pantalla muchos de los juegos de nuestra base de datos sin problemas - con resoluciones bajas y ajustes de baja calidad.
Dado que la CPU y la GPU se ralentizan tras unos minutos, las tasas de frames caen como resultado. Por lo tanto, recomendamos títulos que no tengan requisitos de hardware excesivamente altos y que sigan funcionando sin problemas incluso a velocidades de reloj más bajas.
| The Witcher 3 - 1024x768 Low Graphics & Postprocessing | |
| Media de la clase Convertible (22 - 141.5, n=6, últimos 2 años) | |
| Microsoft Surface Pro 7 Plus | |
| Medio Intel Iris Xe Graphics G7 80EUs (30.2 - 97.4, n=101) | |
| Microsoft Surface Pro 7 Core i5-1035G4 | |
| Lenovo Yoga Duet 7 13IML05-82AS000WGE | |
| Shadow of the Tomb Raider - 1280x720 Lowest Preset | |
| Media de la clase Convertible (24 - 180, n=2, últimos 2 años) | |
| Medio Intel Iris Xe Graphics G7 80EUs (31 - 62.8, n=6) | |
| Microsoft Surface Pro 7 Plus | |
| Microsoft Surface Pro 7 | |
| Microsoft Surface Pro 7 Core i5-1035G4 | |
| F1 2020 - 1280x720 Ultra Low Preset | |
| Microsoft Surface Pro 7 Plus | |
| Medio Intel Iris Xe Graphics G7 80EUs (45 - 76.6, n=10) | |
| Serious Sam 4 - 1280x720 Lowest (DX12) | |
| Microsoft Surface Pro 7 Plus | |
| Medio Intel Iris Xe Graphics G7 80EUs (n=1) | |
| Hitman 3 - 1280x720 Minimum Settings | |
| Microsoft Surface Pro 7 Plus | |
| Medio Intel Iris Xe Graphics G7 80EUs (56.3 - 82.3, n=2) | |
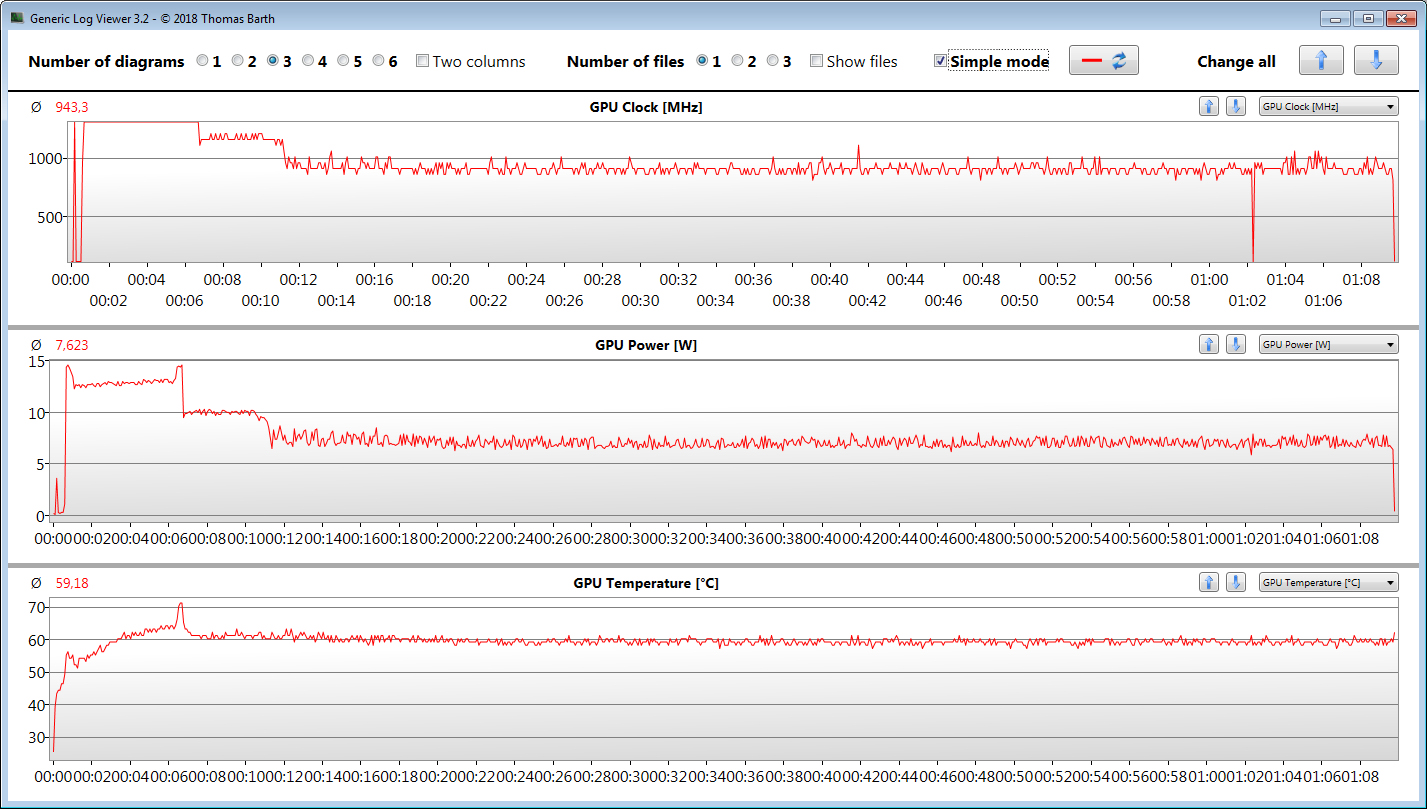
Para comprobar si la velocidad de fotogramas se mantiene prácticamente constante durante un periodo de tiempo prolongado, dejamos que el juego The Witcher 3 funcionara durante unos 60 minutos a resolución Full HD y con los ajustes de máxima calidad. El personaje no se mueve. La velocidad de reloj de la GPU se reduce de 1.300 MHz a unos 1.000 MHz después de unos siete minutos. En consecuencia, se produce una caída de la velocidad de fotogramas.
Como no se consiguen velocidades de fotogramas jugables, repetimos nuestra prueba de The Witcher 3 con la configuración mínima. Se observa el mismo comportamiento, pero las frecuencias de cuadro siguen estando dentro de un rango jugable incluso después de que se produzca la ralentización
| bajo | medio | alto | ultra | |
|---|---|---|---|---|
| The Witcher 3 (2015) | 81.9 | 55.8 | 29 | 13.5 |
| Dota 2 Reborn (2015) | 80.4 | 60.5 | 38.7 | 36.8 |
| X-Plane 11.11 (2018) | 37.4 | 29.9 | 27.7 | |
| Far Cry 5 (2018) | 54 | 23 | 21 | 19 |
| Shadow of the Tomb Raider (2018) | 37 | 17 | 14 | 9 |
| Battlefield V (2018) | 51.7 | 25.8 | 23.3 | 22.6 |
| Apex Legends (2019) | 82 | 37.7 | 28.2 | 25.3 |
| Metro Exodus (2019) | 28 | 13.7 | 10.5 | 8.7 |
| Control (2019) | 57.9 | 17.3 | 11.6 | |
| Borderlands 3 (2019) | 46.6 | 20.6 | 12.6 | 9.34 |
| Red Dead Redemption 2 (2019) | 49.2 | 22.7 | 12.9 | |
| F1 2020 (2020) | 76.6 | 38.7 | 26.8 | 17.5 |
| Death Stranding (2020) | 42.2 | 23.4 | 20.7 | 19.8 |
| Crysis Remastered (2020) | 54.9 | 24.9 | 8.49 | |
| Serious Sam 4 (2020) | 99.4 | 14.6 | 10.1 | 6.67 |
| Assassin´s Creed Valhalla (2020) | 31 | 19 | 16 | |
| Yakuza Like a Dragon (2020) | 32.5 | 16.3 | 14.6 | 12.4 |
| Immortals Fenyx Rising (2020) | 36 | 22 | 19 | 17 |
| Cyberpunk 2077 1.0 (2020) | 23.8 | 10.5 | ||
| Hitman 3 (2021) | 82.3 | 35.2 | 28.5 | 23.9 |
Emisiones: el dispositivo 2 en 1 de Microsoft se refrigera de forma pasiva
Emisiones acústicas
El aparato no tiene ventilador ni accionamiento mecánico. Sin embargo, no es completamente silencioso. De vez en cuando, se puede escuchar un sonido de traqueteo electrónico procedente del interior
Temperatura
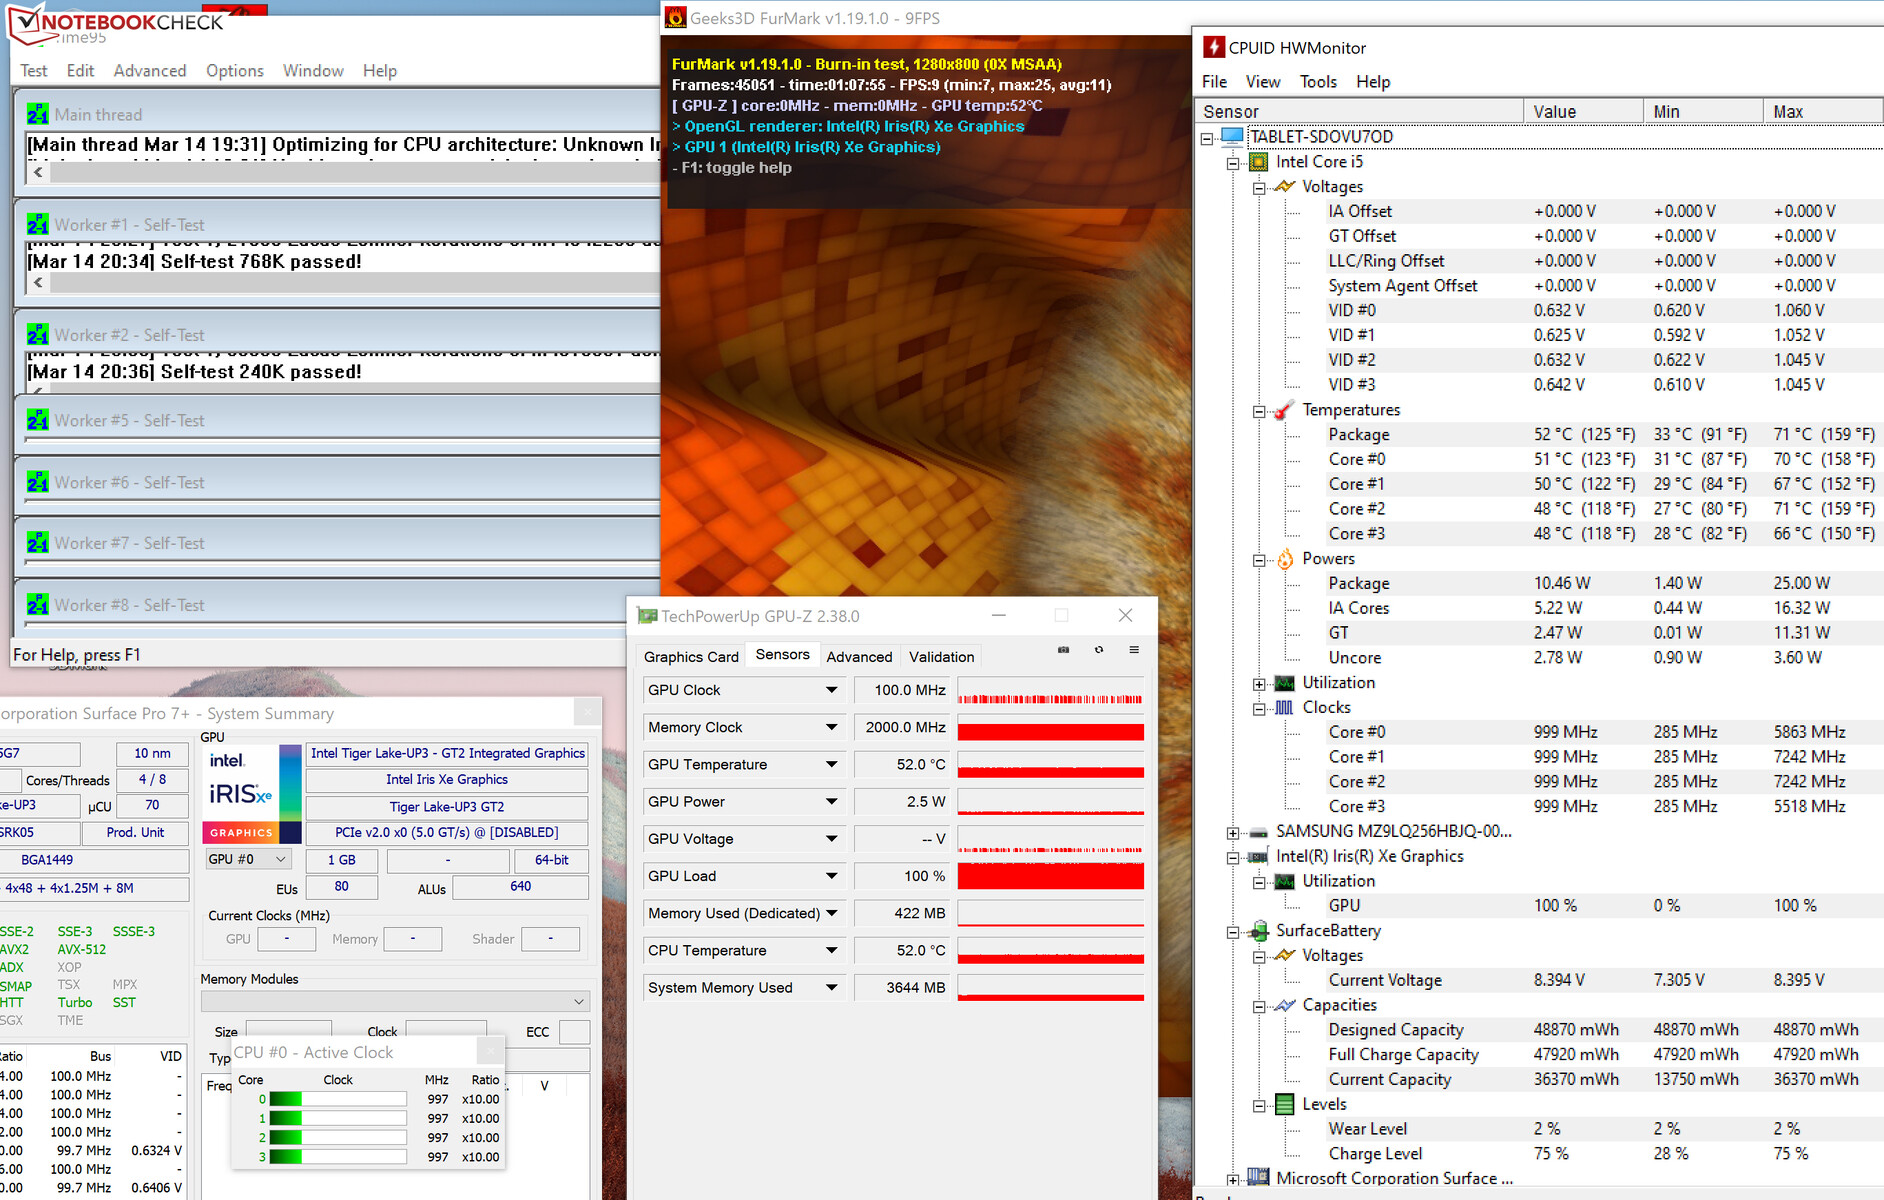
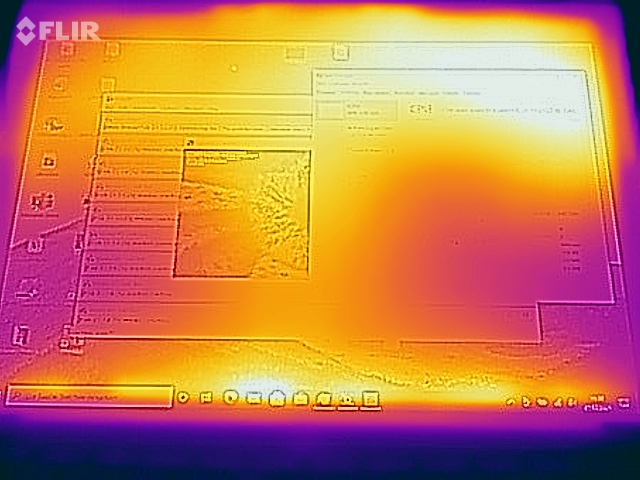
En los primeros minutos de nuestra prueba de estrés (Prime95 y FurMark se ejecutan durante al menos una hora), la CPU y la GPU funcionan a entre 900 y 2.000 MHz y entre 700 y 750 MHz, respectivamente. En el transcurso posterior de la prueba, las velocidades caen a entre 900 y 1.000 MHz (CPU) y 100 MHz (GPU). Sin embargo, la prueba de estrés representa un escenario extremo. Utilizamos esta prueba para comprobar que el sistema se mantiene estable incluso a plena carga.
No es de extrañar que la Surface se caliente notablemente bajo carga. Al fin y al cabo, el dispositivo se refrigera de forma pasiva. Durante la prueba de estrés, registramos temperaturas en el rango inferior o medio de 40 °C en varios puntos de medición. Además, los índices están dentro del rango verde en el uso diario
(±) La temperatura máxima en la parte superior es de 42.9 °C / 109 F, frente a la media de 35.4 °C / 96 F, que oscila entre 19.6 y 60 °C para la clase Convertible.
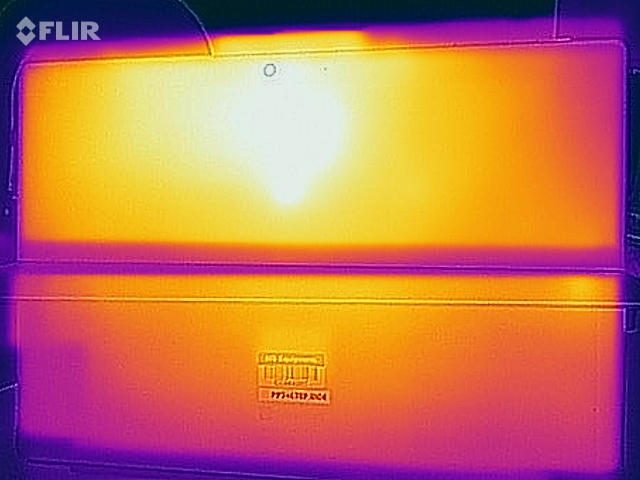
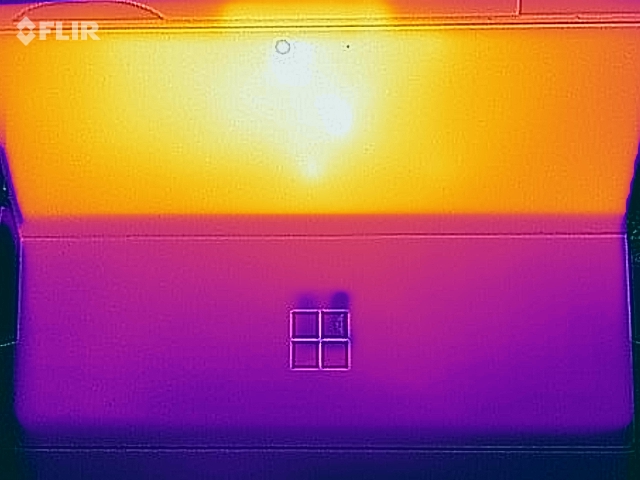
(±) El fondo se calienta hasta un máximo de 44.8 °C / 113 F, frente a la media de 36.9 °C / 98 F
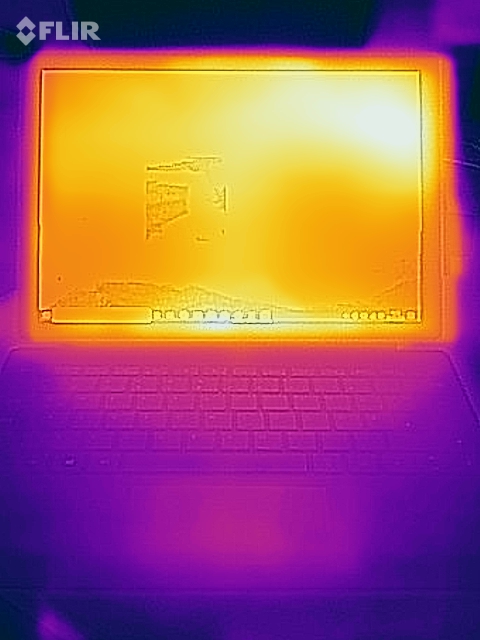
(+) En reposo, la temperatura media de la parte superior es de 25.3 °C / 78# F, frente a la media del dispositivo de 30.3 °C / 87 F.
(-) El reposamanos y el touchpad pueden calentarse mucho al tacto con un máximo de 41.1 °C / 106 F.
(-) La temperatura media de la zona del reposamanos de dispositivos similares fue de 28 °C / 82.4 F (-13.1 °C / -23.6 F).
| Microsoft Surface Pro 7 Plus i5-1135G7, Iris Xe G7 80EUs | Lenovo Yoga Duet 7 13IML05-82AS000WGE i5-10210U, UHD Graphics 620 | Dell Latitude 12 7210 2-in-1 i7-10610U, UHD Graphics 620 | Microsoft Surface Pro 7 i7-1065G7, Iris Plus Graphics G7 (Ice Lake 64 EU) | Microsoft Surface Pro 7 Core i5-1035G4 i5-1035G4, Iris Plus Graphics G4 (Ice Lake 48 EU) | Medio Intel Iris Xe Graphics G7 80EUs | Media de la clase Convertible | |
|---|---|---|---|---|---|---|---|
| Heat | 16% | 12% | -2% | -12% | -1% | -1% | |
| Maximum Upper Side * (°C) | 42.9 | 33.6 22% | 37.5 13% | 40.1 7% | 43.6 -2% | 40.5 ? 6% | 42 ? 2% |
| Maximum Bottom * (°C) | 44.8 | 33.9 24% | 36.2 19% | 41 8% | 47.8 -7% | 43.7 ? 2% | 43.7 ? 2% |
| Idle Upper Side * (°C) | 28.8 | 24.8 14% | 25.7 11% | 31.7 -10% | 32 -11% | 27.9 ? 3% | 27.7 ? 4% |
| Idle Bottom * (°C) | 25.8 | 25.4 2% | 24.3 6% | 28.8 -12% | 32.4 -26% | 29.2 ? -13% | 28.5 ? -10% |
* ... más pequeño es mejor
Altavoces
Microsoft Surface Pro 7 Plus análisis de audio
(±) | la sonoridad del altavoz es media pero buena (75.2 dB)
Graves 100 - 315 Hz
(±) | lubina reducida - en promedio 14.7% inferior a la mediana
(±) | la linealidad de los graves es media (10.2% delta a frecuencia anterior)
Medios 400 - 2000 Hz
(+) | medios equilibrados - a sólo 4.9% de la mediana
(+) | los medios son lineales (6.1% delta a la frecuencia anterior)
Altos 2 - 16 kHz
(+) | máximos equilibrados - a sólo 4.1% de la mediana
(±) | la linealidad de los máximos es media (9% delta a frecuencia anterior)
Total 100 - 16.000 Hz
(±) | la linealidad del sonido global es media (17.4% de diferencia con la mediana)
En comparación con la misma clase
» 33% de todos los dispositivos probados de esta clase eran mejores, 8% similares, 59% peores
» El mejor tuvo un delta de 6%, la media fue 20%, el peor fue ###max##%
En comparación con todos los dispositivos probados
» 33% de todos los dispositivos probados eran mejores, 8% similares, 59% peores
» El mejor tuvo un delta de 4%, la media fue 24%, el peor fue ###max##%
Consumo de energía: el Surface Pro Plus ofrece una buena duración de la batería
Consumo de energía
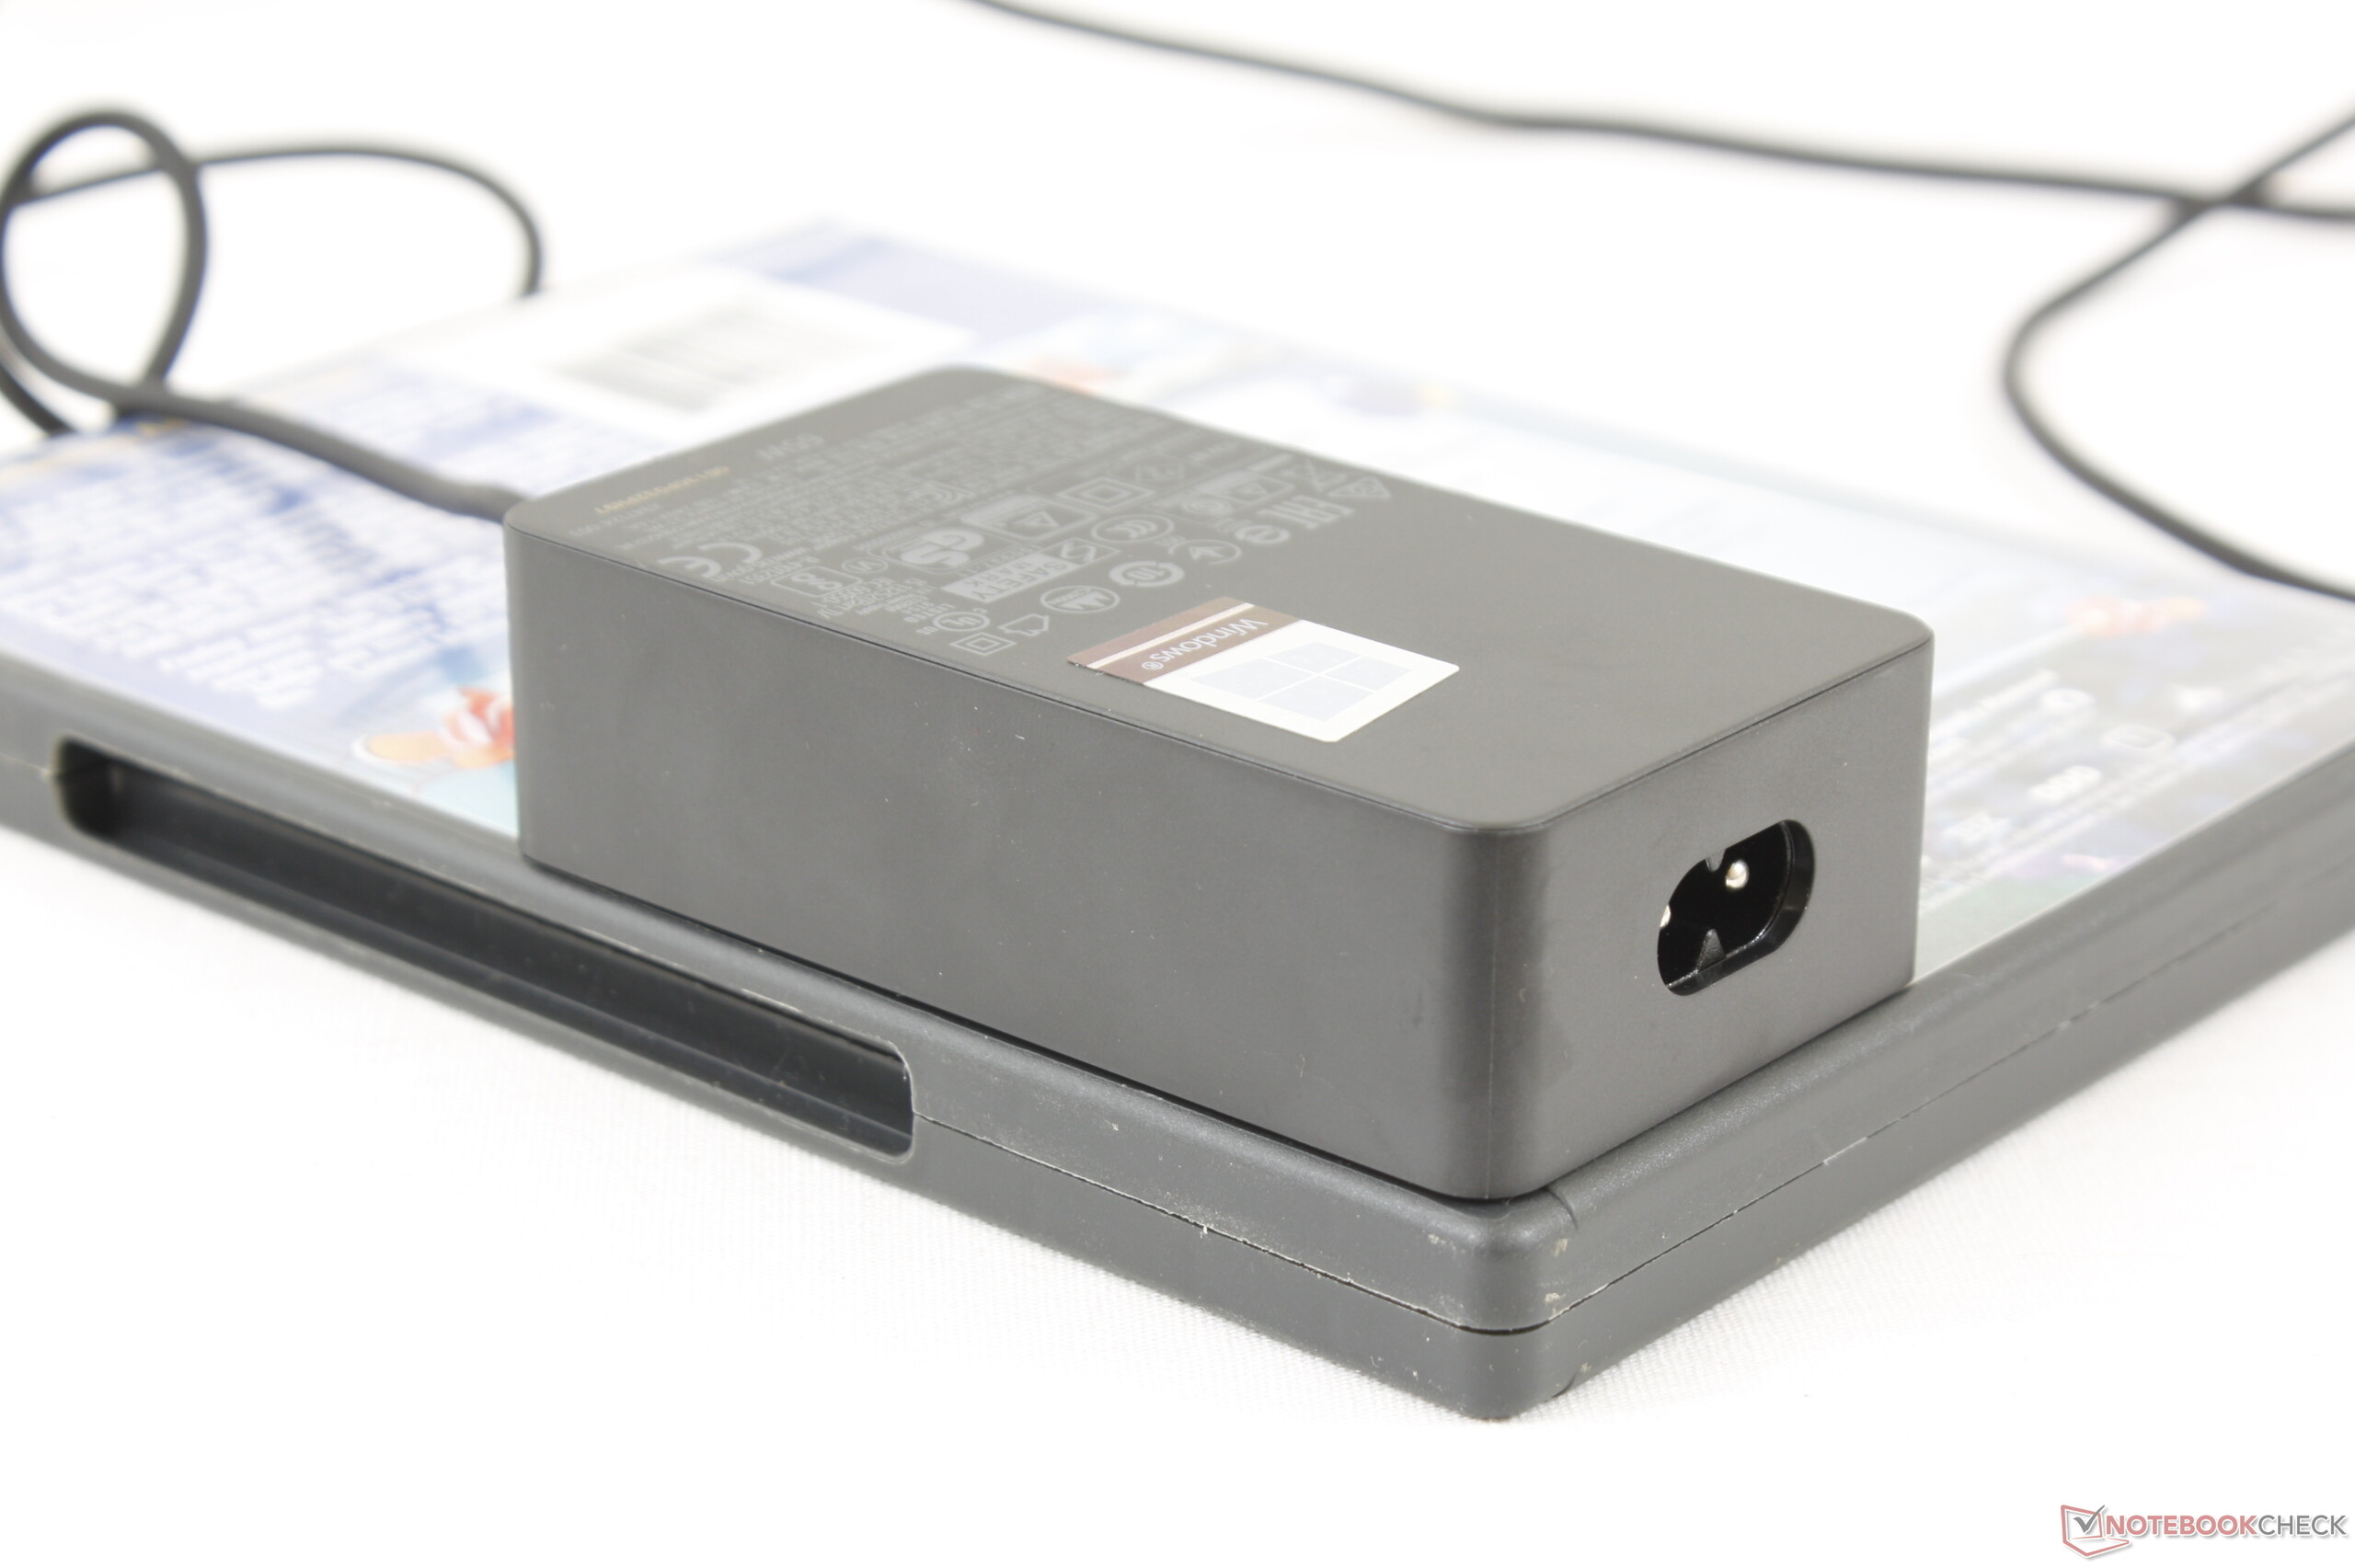
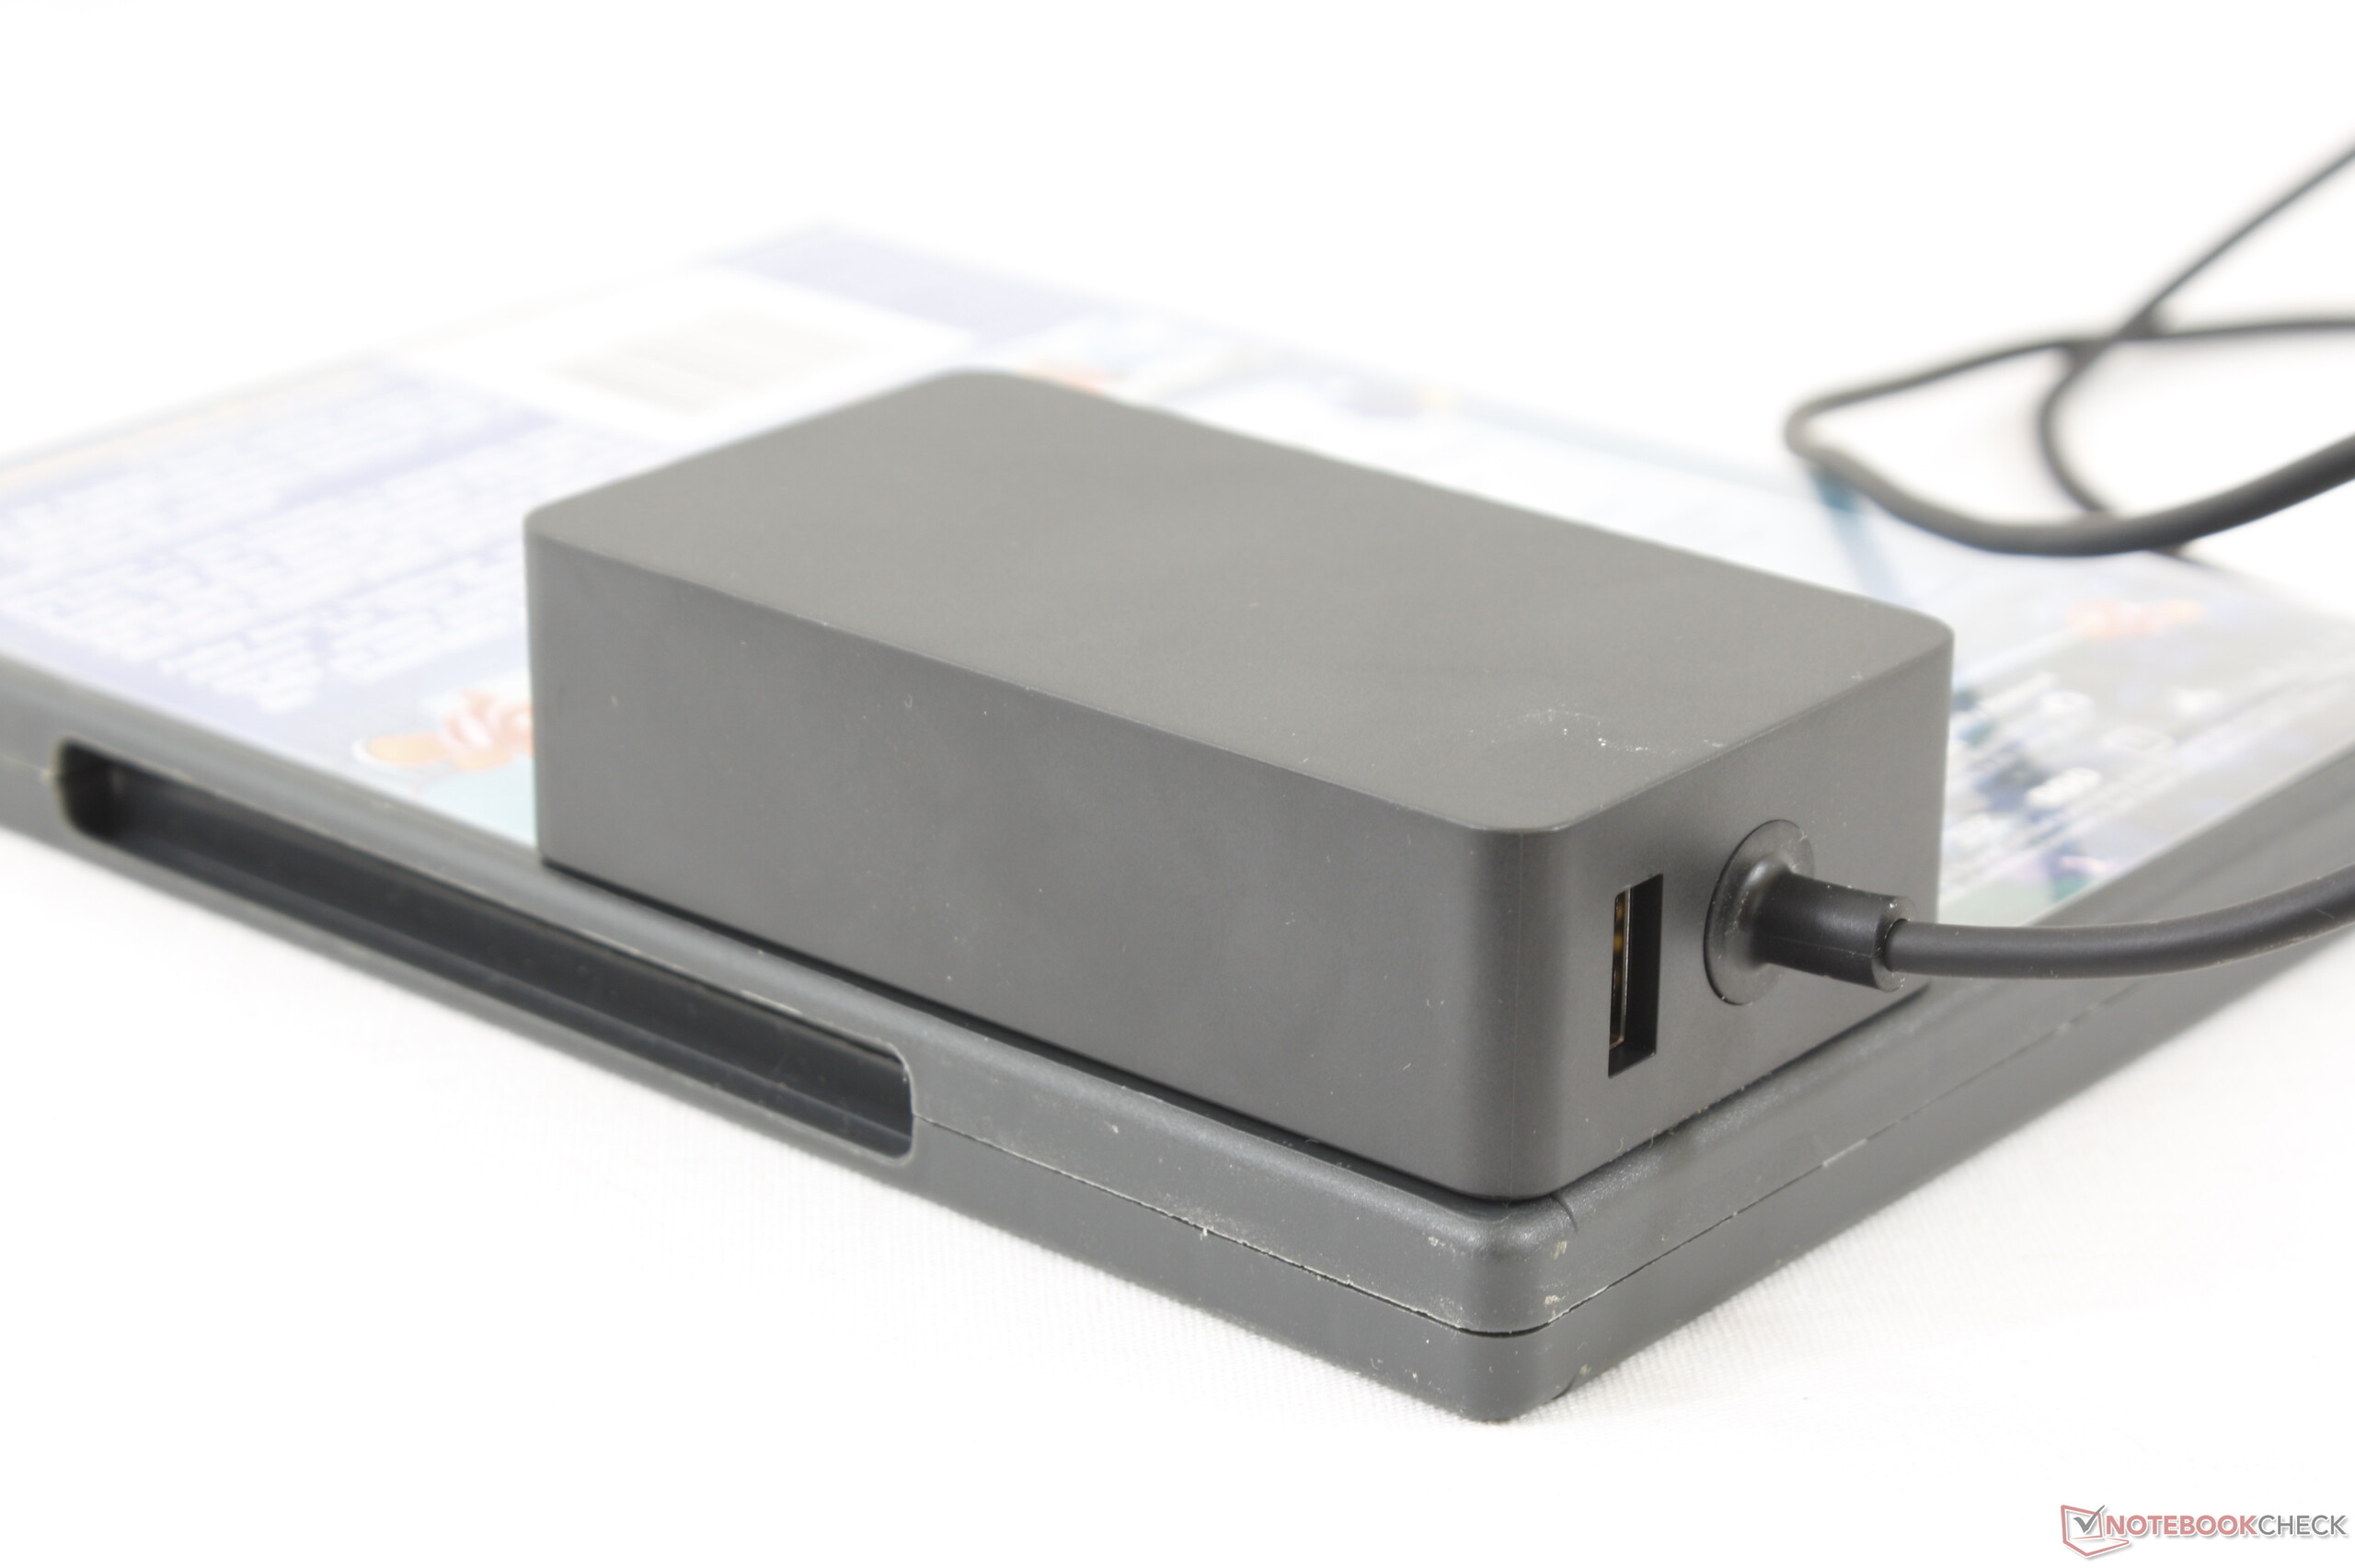
El dispositivo no revela ningún problema en términos de consumo de energía. El consumo de energía está a la par con los modelos Ice Lake Surface Pro 7. Además, la salida del adaptador de corriente USB Type-C incluido es de 65 vatios
| Off / Standby | |
| Ocioso | |
| Carga |
|
Clave:
min: | |
| Microsoft Surface Pro 7 Plus i5-1135G7, Iris Xe G7 80EUs | Lenovo Yoga Duet 7 13IML05-82AS000WGE i5-10210U, UHD Graphics 620 | Dell Latitude 12 7210 2-in-1 i7-10610U, UHD Graphics 620 | Microsoft Surface Pro 7 i7-1065G7, Iris Plus Graphics G7 (Ice Lake 64 EU) | Microsoft Surface Pro 7 Core i5-1035G4 i5-1035G4, Iris Plus Graphics G4 (Ice Lake 48 EU) | Medio Intel Iris Xe Graphics G7 80EUs | Media de la clase Convertible | |
|---|---|---|---|---|---|---|---|
| Power Consumption | 42% | 32% | 5% | 4% | 12% | 9% | |
| Idle Minimum * (Watt) | 5.5 | 3.1 44% | 3.2 42% | 4.4 20% | 4.5 18% | 4.49 ? 18% | 4.29 ? 22% |
| Idle Average * (Watt) | 9.1 | 5.7 37% | 5.3 42% | 8.7 4% | 9.2 -1% | 7.4 ? 19% | 7.08 ? 22% |
| Idle Maximum * (Watt) | 10.8 | 8.7 19% | 8.4 22% | 9.6 11% | 9.6 11% | 9.26 ? 14% | 8.68 ? 20% |
| Load Average * (Watt) | 39.2 | 20.5 48% | 27 31% | 44 -12% | 42 -7% | 36.6 ? 7% | 44 ? -12% |
| Load Maximum * (Watt) | 62.5 | 22.6 64% | 46.9 25% | 61 2% | 63.5 -2% | 61.7 ? 1% | 67.3 ? -8% |
* ... más pequeño es mejor
Duración de la batería
Microsoft promete una duración máxima de la batería de 15 horas - pudimos determinar una duración máxima en reposo de 13:36 horas. La prueba de Wi-Fi (acceso a sitios web a través de un script) y la prueba de vídeo (el cortometraje Big Buck Bunny (H.264, Full HD) ejecutado en bucle) son completadas por el dispositivo tras 8:03 horas y 10:50 horas, respectivamente. Durante las pruebas, las funciones de ahorro de energía del 2-en-1 están desactivadas, y el brillo de la pantalla se ajusta a unos 150 cd/m². Los módulos inalámbricos también se desactivan durante la prueba de vídeo
| Microsoft Surface Pro 7 Plus i5-1135G7, Iris Xe G7 80EUs, 48.9 Wh | Lenovo Yoga Duet 7 13IML05-82AS000WGE i5-10210U, UHD Graphics 620, 39 Wh | Dell Latitude 12 7210 2-in-1 i7-10610U, UHD Graphics 620, 38 Wh | Microsoft Surface Pro 7 i7-1065G7, Iris Plus Graphics G7 (Ice Lake 64 EU), 45 Wh | Microsoft Surface Pro 7 Core i5-1035G4 i5-1035G4, Iris Plus Graphics G4 (Ice Lake 48 EU), 45 Wh | Media de la clase Convertible | |
|---|---|---|---|---|---|---|
| Duración de Batería | -21% | 6% | -21% | 12% | 35% | |
| Reader / Idle (h) | 13.6 | 12.8 -6% | 22.8 68% | 11.5 -15% | 22.3 64% | 27.7 ? 104% |
| H.264 (h) | 10.8 | 8.2 -24% | 11.3 5% | 6.7 -38% | 15.3 ? 42% | |
| WiFi v1.3 (h) | 8.1 | 8.7 7% | 8.2 1% | 9.8 21% | 10 23% | 11.9 ? 47% |
| Load (h) | 3.9 | 1.6 -59% | 1.9 -51% | 1.9 -51% | 1.9 -51% | 1.779 ? -54% |
Pro
Contra
Veredicto
El Surface Pro 7 Plus es la variante 2 en 1 más completa en comparación con el Surface Pro 7. La plataforma Tiger Lake utilizada ofrece más rendimiento en general en comparación con Ice Lake - el rendimiento de la GPU aumenta significativamente más que el de la CPU. Una pequeña escotilla de mantenimiento permite sustituir fácilmente el SSD. El dispositivo también puede conectarse al mundo exterior a través de LTE.
Todavía no está claro si muchos usuarios podrán adquirir la Surface Pro 7 Plus. Por ahora, solo se venderá a empresas y colegios.
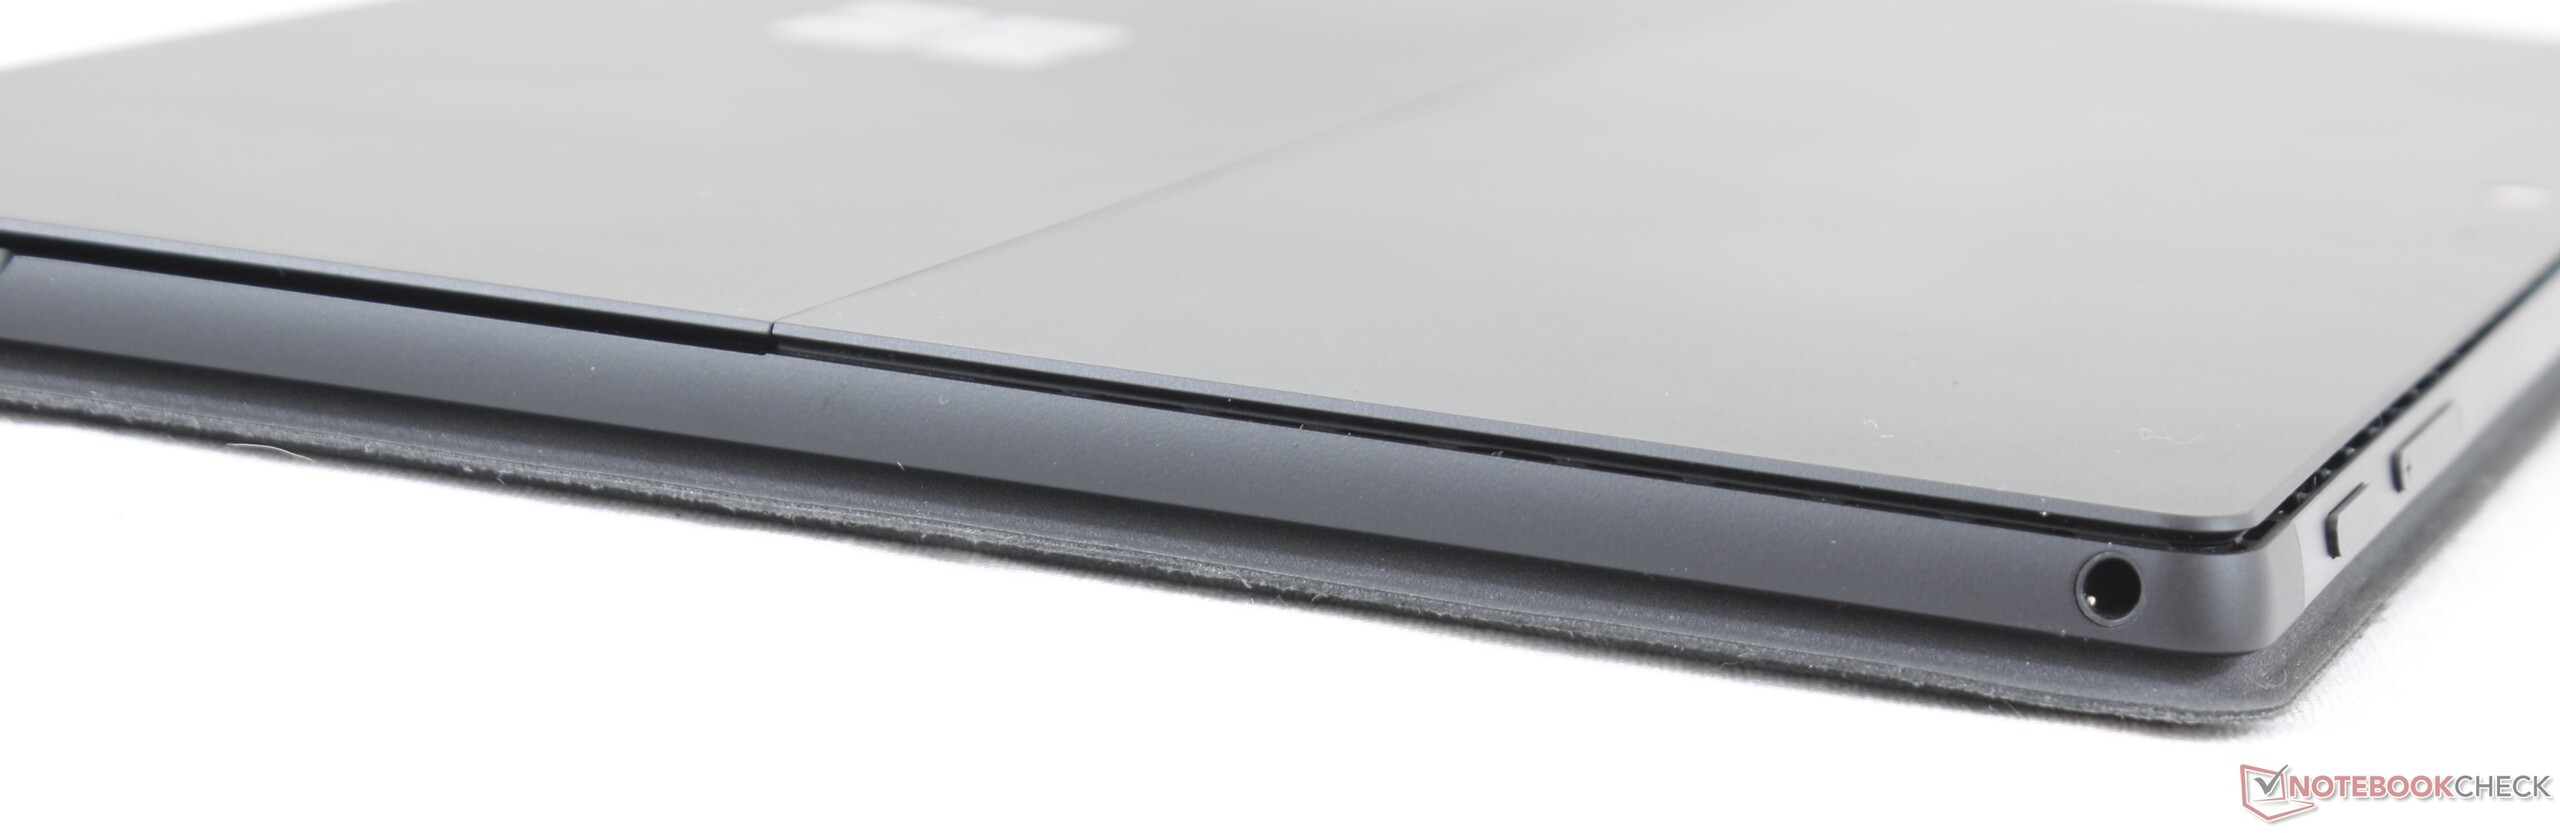
El ligero aumento de la capacidad de la batería (48,9 Wh frente a 45 Wh) no tiene realmente ningún impacto. La Surface Pro 7 Plus logra tiempos de ejecución en el mundo real de 8 a 11 horas y está más o menos a la par con las tasas de la Surface Pro 7 como resultado. El puerto USB-C integrado (DisplayPort, Power Delivery) sigue funcionando según el estándar USB 3.2 Gen. 1. Aquí se ha perdido la oportunidad de actualizar a Thunderbolt 4/USB 4.
Algunos puntos débiles del Surface normal se han mantenido: A pesar de estar refrigerado pasivamente, el dispositivo 2-en-1 de Microsoft no es completamente silencioso. De vez en cuando se oye un traqueteo electrónico desde el interior. La pantalla táctil parpadea con una frecuencia de 199,2 Hz a niveles de brillo del 57% (que corresponde a unos 119 cd/m²) y menos.
Aunque el Surface está dirigido a empresas y escuelas, carece de un lector de huellas dactilares. Si es necesario, hay que usar un teclado equipado como tal (Microsoft Surface Pro Type Cover con Fingerprint ID). Por último, el periodo de garantía de un año no es apropiado para un dispositivo de este rango de precios.
Precio y disponibilidad
La Microsoft Store tiene la Surface Pro 7 Plus a precios a partir de 899,99 dólares. Hay varias configuraciones disponibles, así como un "Business Essentials Bundle" que incluye la Type Cover y el Plan de Protección que elijas. El paquete empieza a costar unos 1.100 dólares.
Microsoft Surface Pro 7 Plus
- 03/19/2021 v7 (old)
Sascha Mölck
Price comparison

