Notebookcheck Logo

Análisis del AMD Ryzen 5 7600 65 W: El punto dulce para juegos de gama media de 220 dólares que supera al Core i9-12900K y a todas las CPU Zen 3 en un solo núcleo

Zen para el resto de nosotros. El AMD Ryzen 5 7600 es una CPU Raphael de 65 W que pretende bajar la barrera de los juegos AAA y las tareas de creación de contenidos. En este análisis, probamos la CPU Zen 4 básica de AMD, vemos cómo se compara con la competencia, incluyendo Intel Raptor Lake y Alder Lake junto con otras ofertas Zen 3 y Zen 4, y evaluamos si puede ser una CPU viable para tu próxima construcción convencional.
Análisis del AMD Ryzen 5 7600

AMD presentó la familia Ryzen 7000 de 65 W en el CES 2023, dirigida a precios asequibles. Estas CPU son prácticamente idénticas a las Ryzen 7000X, salvo por unos frecuencias de reloj ligeramente inferiores, y admiten overclocking.

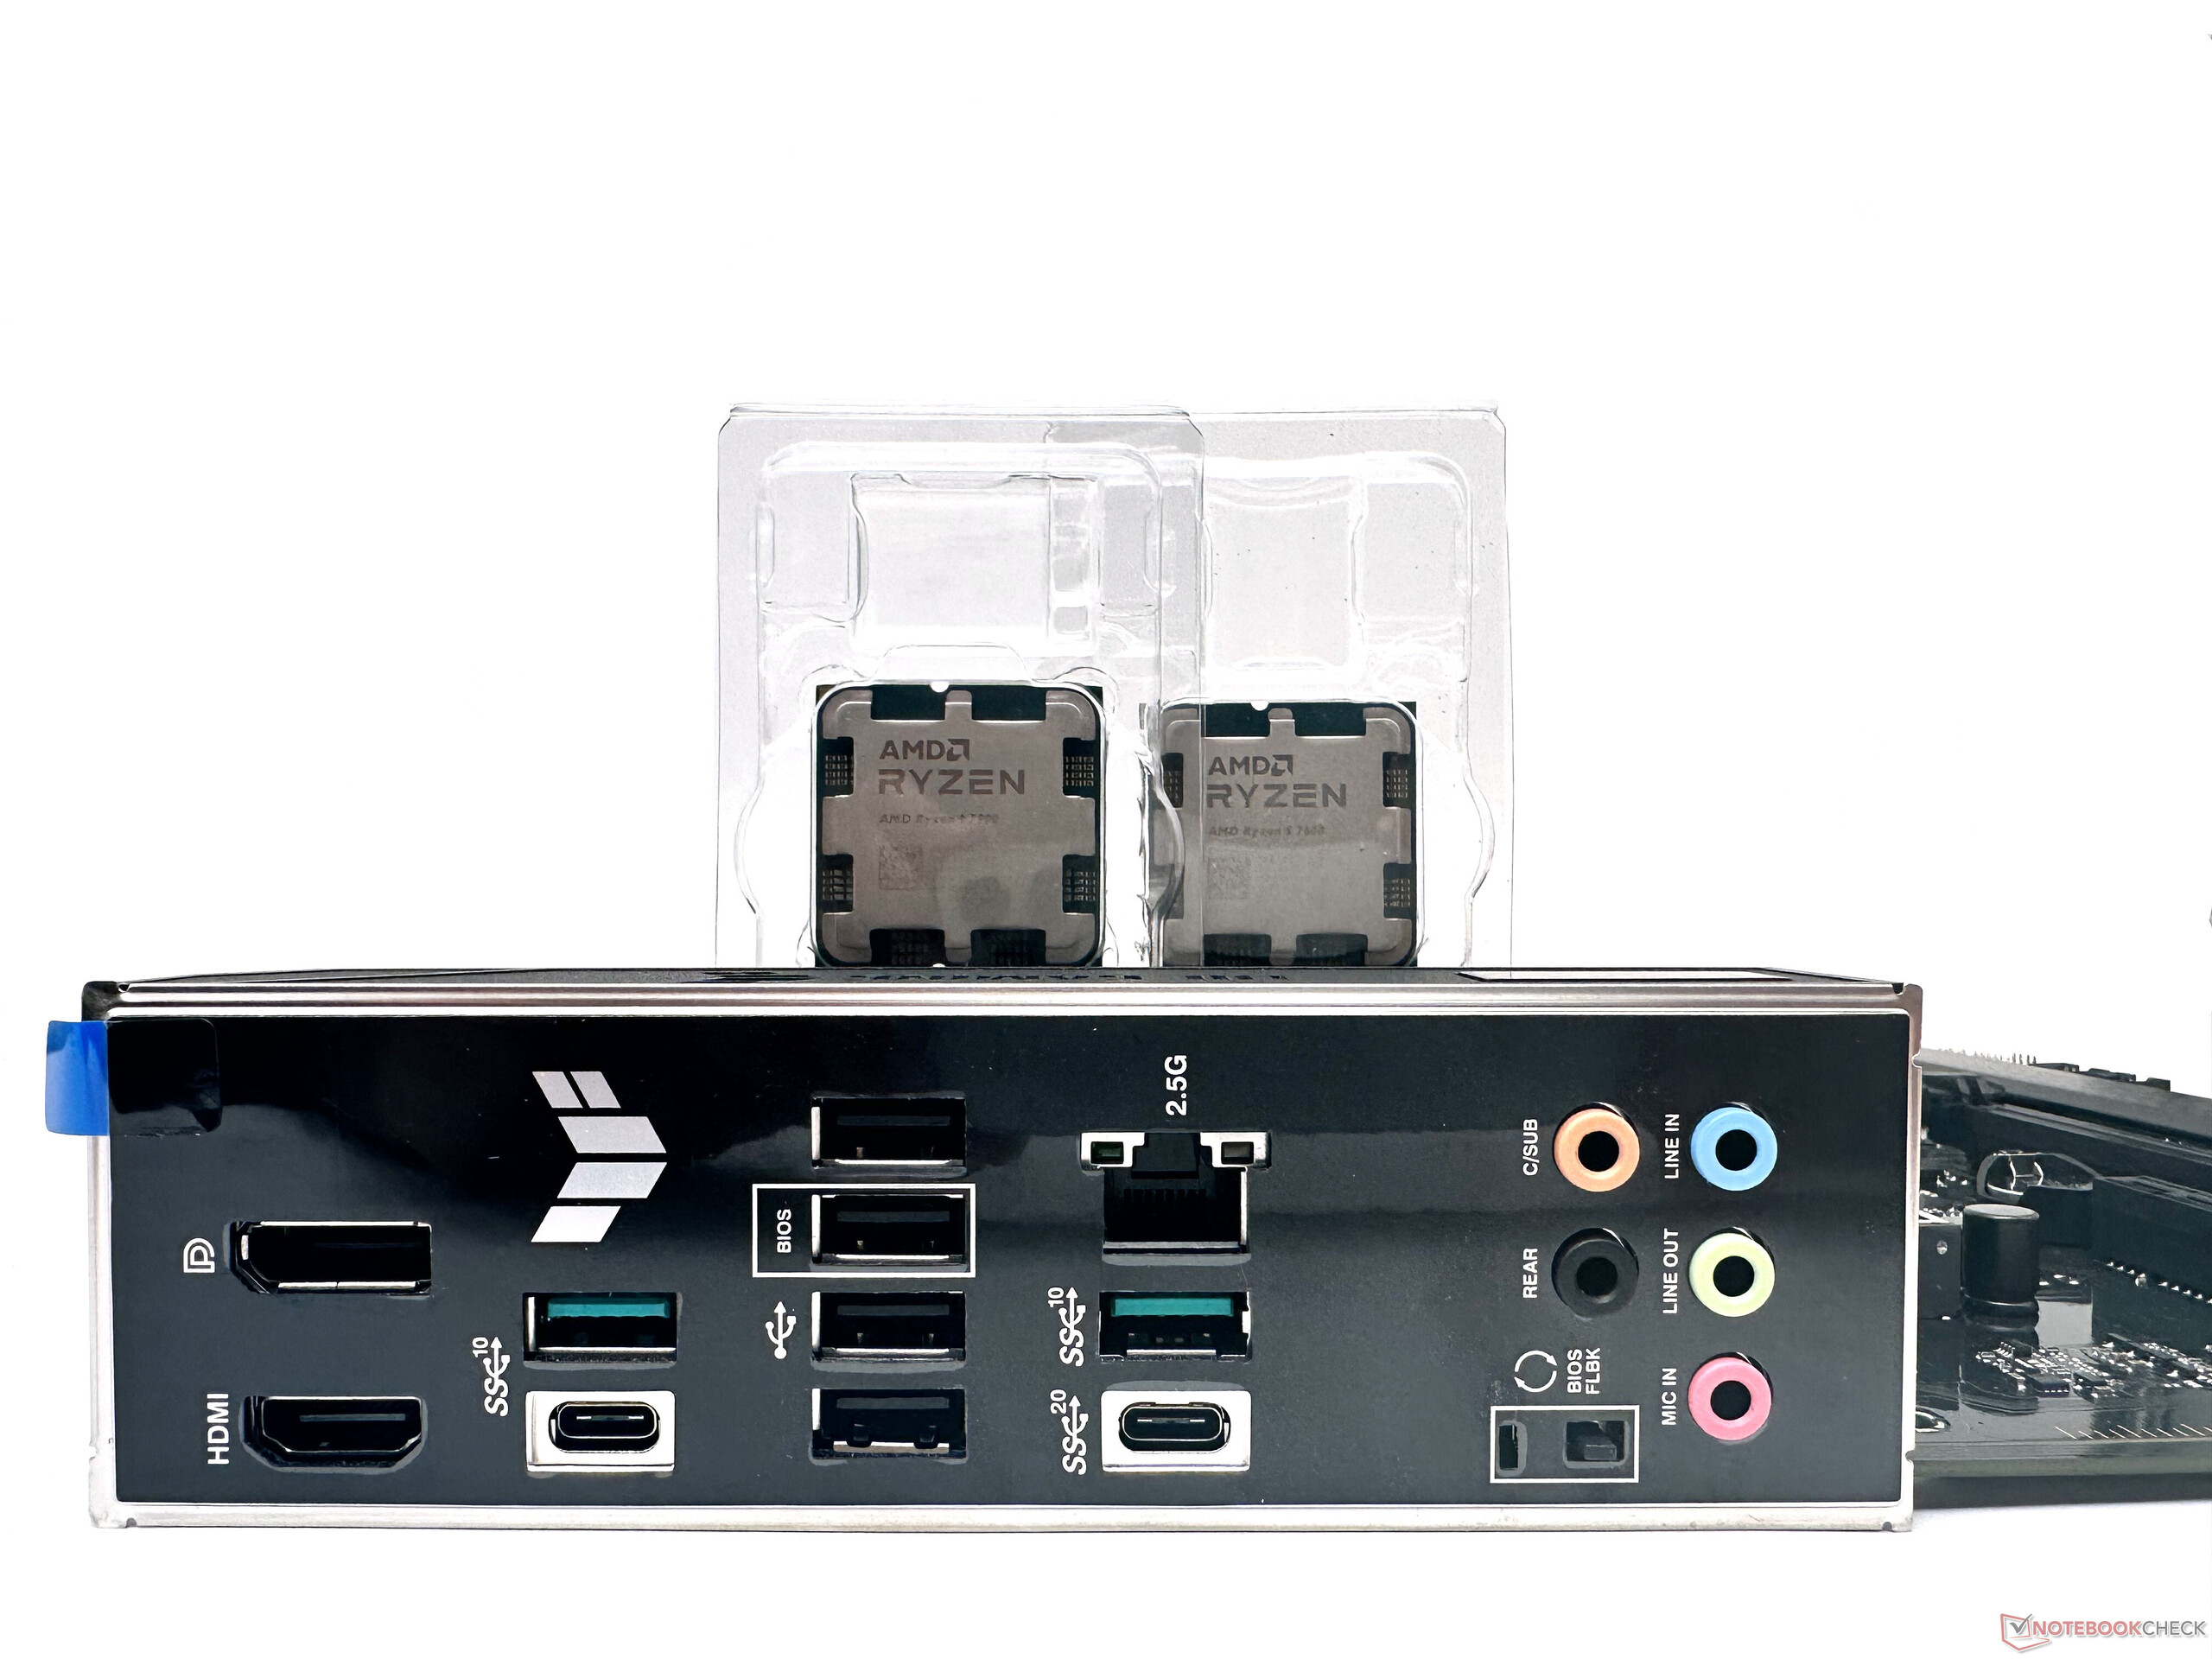
Anteriormente, hemos revisado el AMD Ryzen 7 7700 como una de las primeras partes de 65 W no-X. Ahora analizamos el Ryzen 5 7600 básico. En breve analizaremos el Ryzen 9 7900 de gama alta.


Visión general de los procesadores de sobremesa AMD 'Raphael' Zen 4 Ryzen 7000

AMD Ryzen 7000 SKU Núcleos / Hilos Reloj Base Turbo Clock Caché L2 Caché L3 TDP PPT Precio de Lanzamiento
AMD Ryzen 9 7950X3D 16 / 32 4,2 GHz 5,7 GHz 16x 1 MB 128 MB 120 W 162 W US$699
AMD Ryzen 9 7950X 16 / 32 4,5 GHz 5,7 GHz 16x 1 MB 64 MB 170 W 230 W US$699
AMD Ryzen 9 7900X 12 / 24 4,7 GHz 5,6 GHz 12x 1 MB 64 MB 170 W 230 W 549 US$
AMD Ryzen 9 7900 12 / 24 3,7 GHz 5,4 GHz 12x 1 MB 64 MB 65 W 88 W 429 US$
AMD Ryzen 7 7700X 8 / 16 4,5 GHz 5,4 GHz 8x 1 MB 32 MB 105 W 142 W US$399
AMD Ryzen 7 7700 8 / 16 3,8 GHz 5,3 GHz 8x 1 MB 32 MB 65 W 88 W 329 US$
AMD Ryzen 5 7600X 6 / 12 4,7 GHz 5,3 GHz 6x 1 MB 32 MB 105 W 142 W US$299
AMDRyzen 5 7600 6 / 12 3,8 GHz 5,1 GHz 6x 1 MB 32 MB 65 W 88 W US$229

El Ryzen 5 7600 ofrece seis núcleos y 12 subprocesos con un boost clock de 5,1 GHz (frente al boost de 5,3 GHz delRyzen 5 7600X). La CPU tiene un TDP de 65 W y actualmente se vende por 22.997 yenes (281,5 dólares) en el mercado indio.

AMD incluye en la caja un refrigerador Wraith Stealth y tres años de garantía.

Asus TUF Gaming B650-Plus
AMD Ryzen 5 7600 y Ryzen 9 7900
Asus TUF Gaming B650-Plus

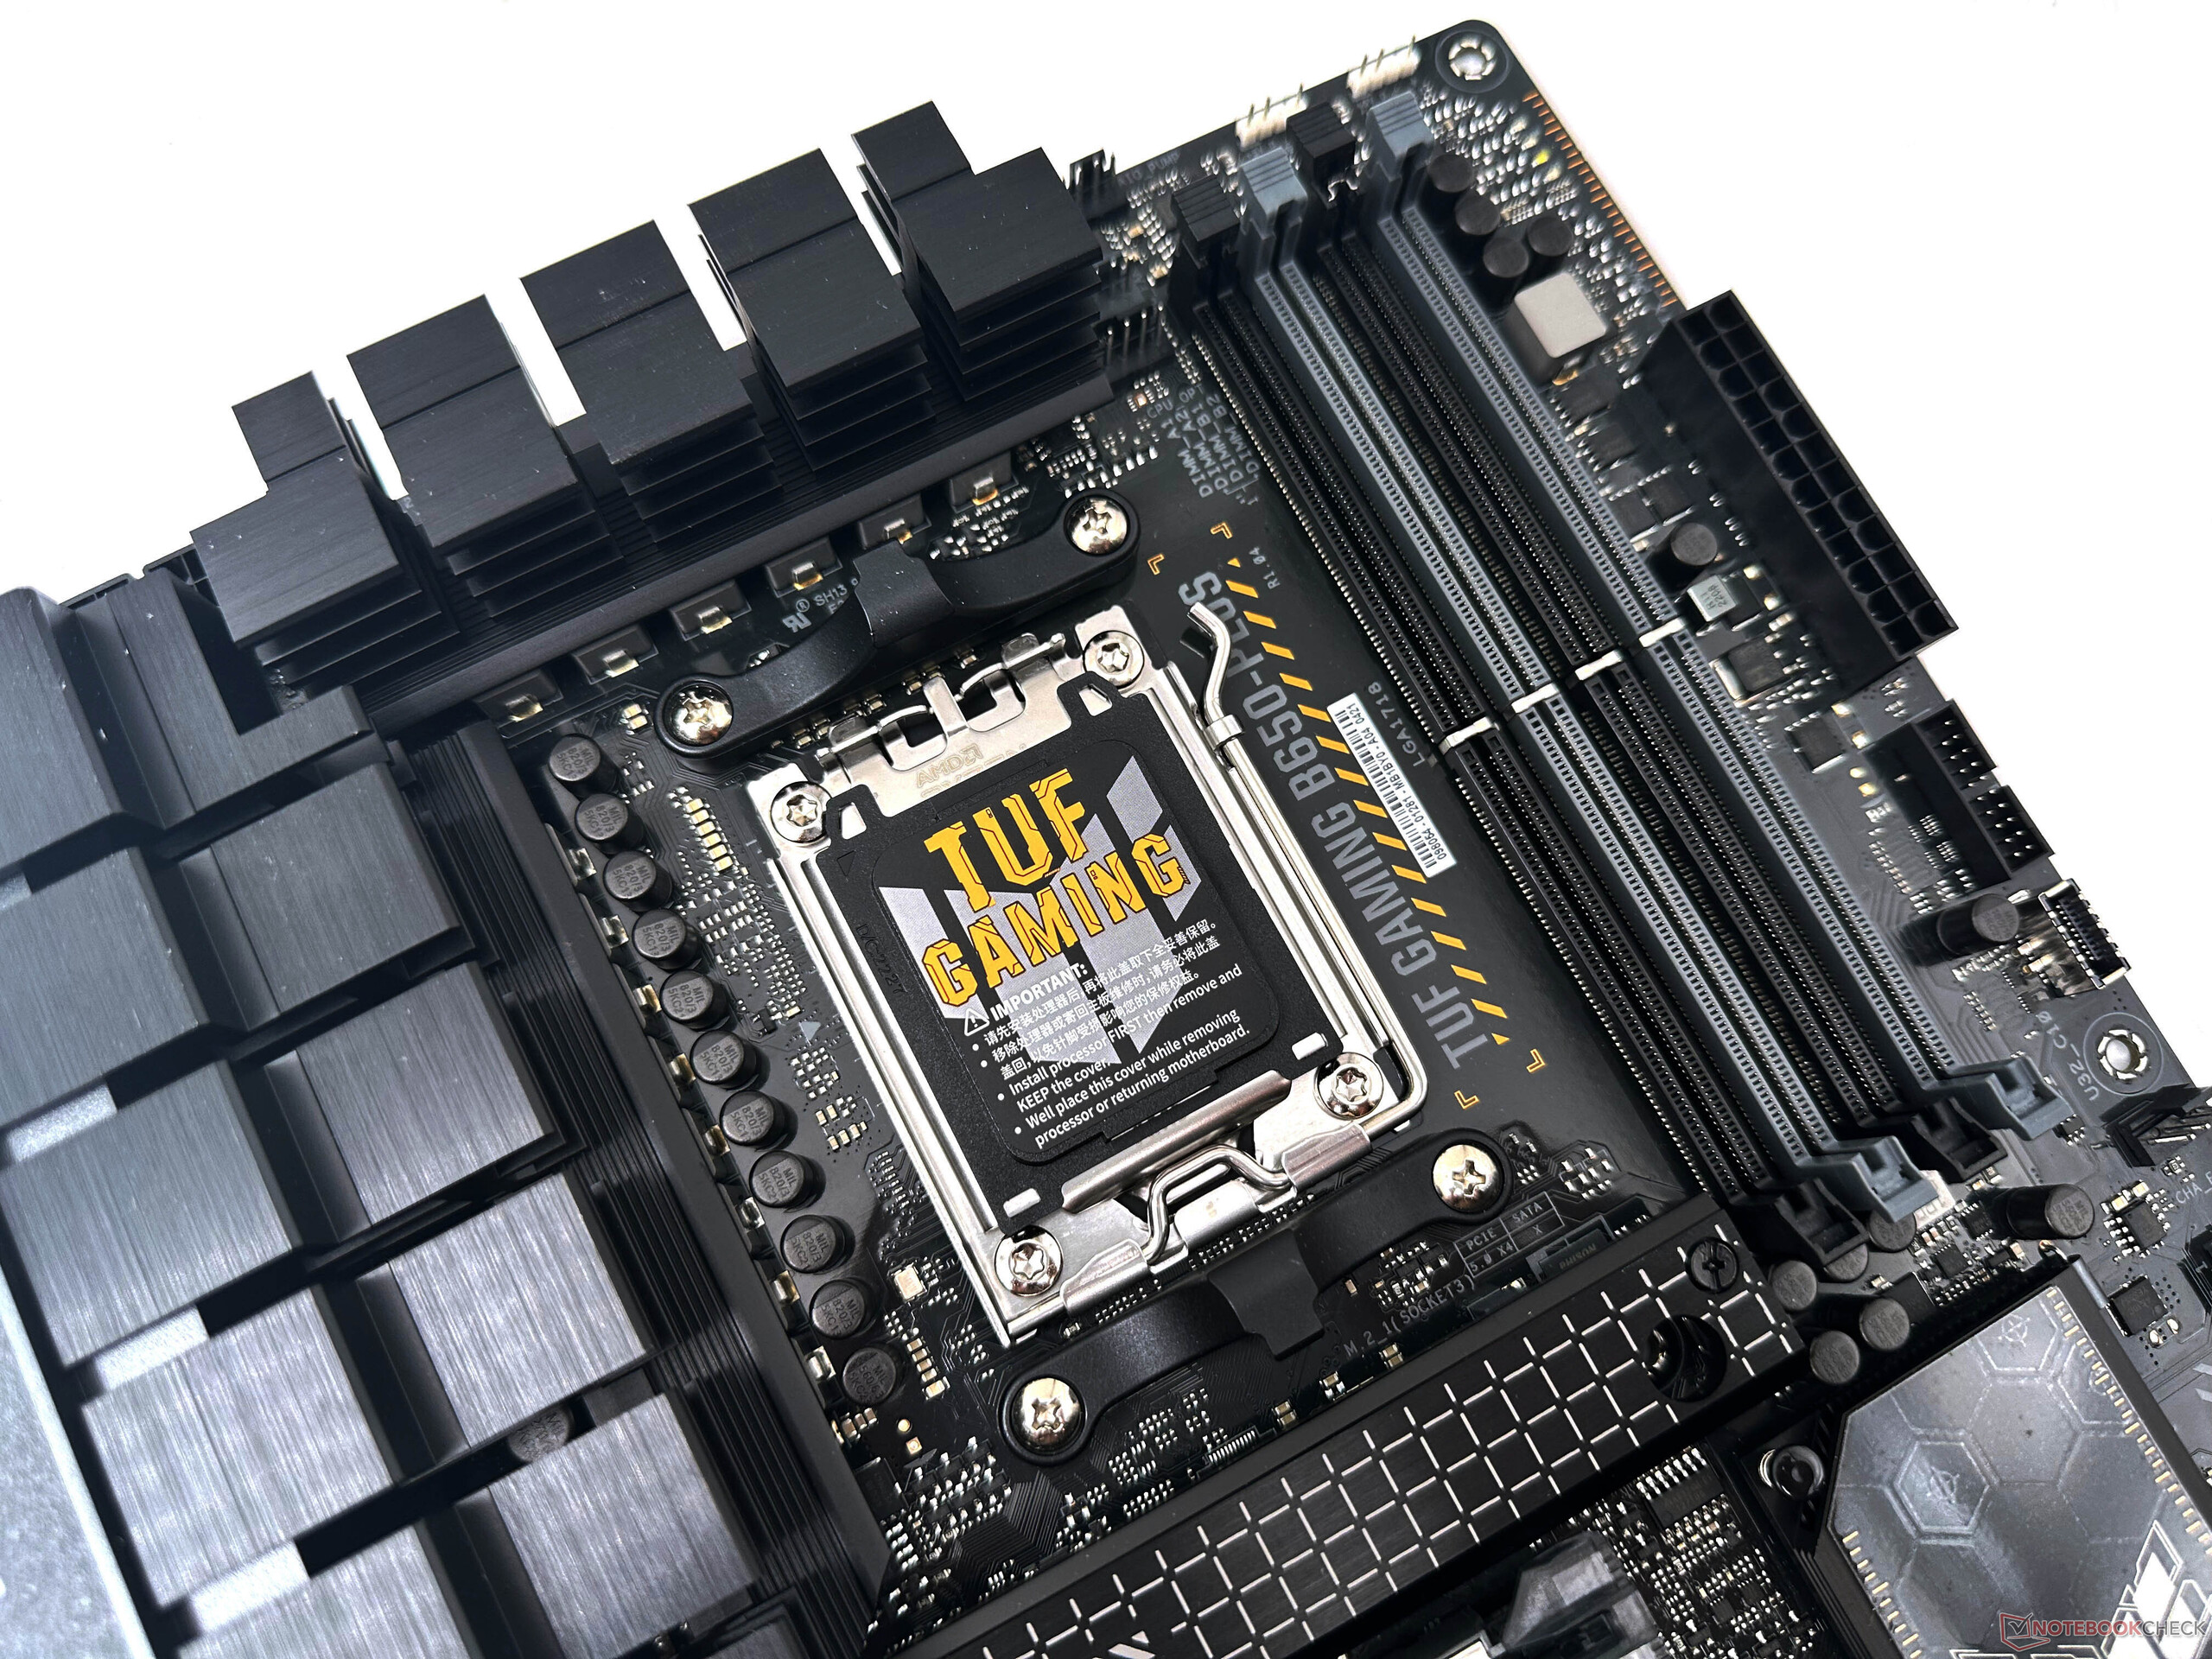
El banco de pruebas: Una combinación de Ryzen 5 7600 y RTX 4090

Nuestro banco de pruebas para el AMD Ryzen 5 7600 se basa en el nuevo chipset B650. Incluye los siguientes componentes:

  • Banco de pruebas Cooler Master MasterFrame 700
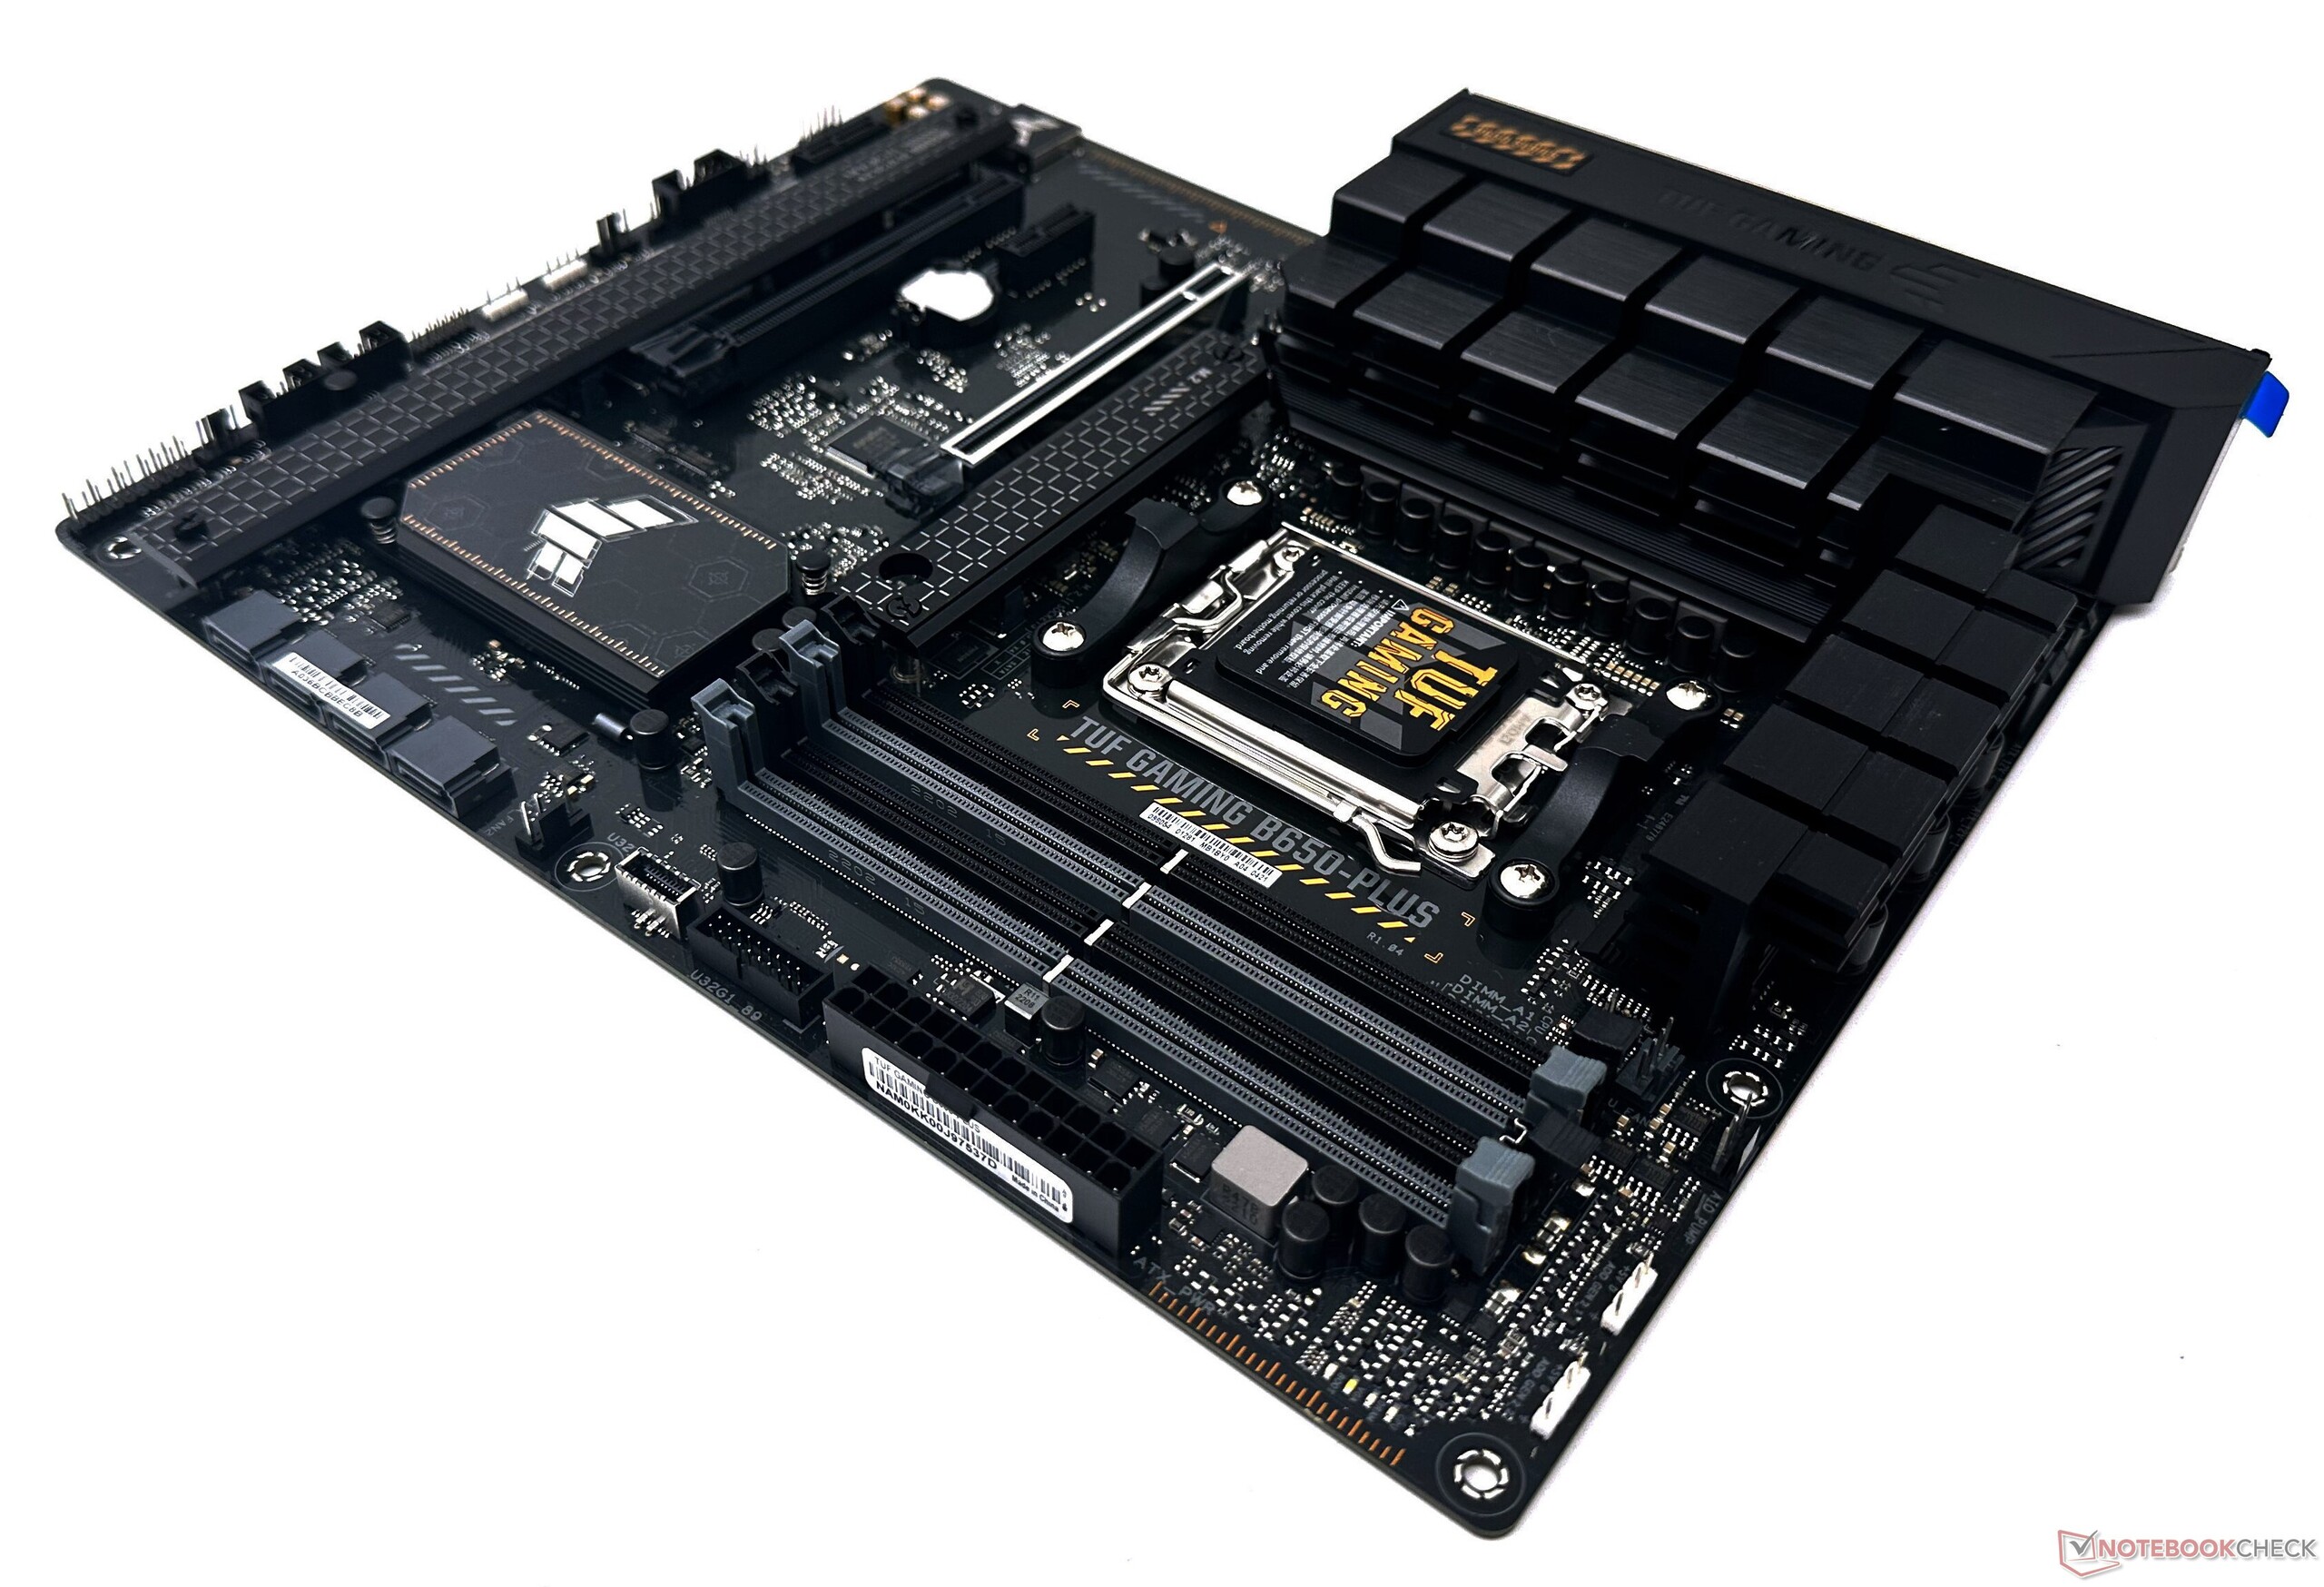
  • Asus TUF Gaming B650-Plus con BIOS versión 1222
  • Nvidia GeForce RTX 4090 Founders Edition
  • SSD NVMe Kingston Fury Renegade de 1 TB para pruebas y juegos
  • 2 memorias RAM Kingston Fury Beast RGB DDR5-6000 de 16 GB con tiempos de 36-38-38-80 a 1,35 V
  • Monitor Gigabyte M28U 4K 144 Hz
  • Refrigerador Cooler Master MasterLiquid ML360L V2 ARGB AIO
  • Fuente de alimentación Thermaltake ToughPower Grand RGB de 850 W
  • Una nueva instalación de Windows 11 22H2 con los últimos parches y controladores

Nos gustaría dar las gracias a AMD por suministrar la CPU Ryzen 5 7600 y el kit de memoria DDR5 de Kingston, y a Asus por la placa base TUF Gaming B650-Plus y la SSD de Kingston. También nos gustaría dar las gracias a Nvidia por la GPU RTX 4090, a Gigabyte por el monitor M28U y, por último, a Cooler Master por el banco de pruebas y el disipador AIO.

Nota: Estamos en el proceso de transición de nuestra GPU de elección de la RTX 3090 a la RTX 4090 para las pruebas de CPU de escritorio. Por tanto, las comparaciones sintéticas de juegos y 3D con la RTX 4090 sólo están disponibles para un número limitado de CPUs por el momento. Esperamos poder probar más CPU con la RTX 4090 en los próximos días.

Las pruebas de CPU no deberían verse afectadas por este cambio.

Pruebas de CPU: supera a todas las CPU Zen 3 y al Core i9-12900K en un solo núcleo

El AMD Ryzen 5 7600 de 6C/12T a 65 W se las arregla para ser un pelo más rápido que el 8C/16T Ryzen 7 5800X de 105 W en rendimiento acumulado de la CPU, pero queda por detrás del Ryzen 5 7600X en torno a un 7% debido a la reducción de los boost clocks.

Mientras que vemos ventajas del 11% en comparación con el Intel Core i5-12600Kla CPU también va a la zaga del Core i5-13600K en un 15%.

Cinebench R20 y Cinebench R23 ven al Ryzen 5 7600 superar fácilmente a todas las CPUs Zen 3, incluyendo el Ryzen 9 5950X, en single core. AMD ha demostrado constantemente un excelente rendimiento de un solo núcleo con Zen 4, y vemos que el Ryzen 5 7600 está sólo un 8% y un 10% por detrás del buque insignia Ryzen 9 7950X y Ryzen 9 7950X3D partes, respectivamente, en las pruebas antes mencionadas.

Aunque las pruebas Cinebench muestran una diferencia considerable entre el Ryzen 5 7600 y el Core i9-13900K en el rendimiento de un solo núcleo, vemos que esta diferencia se reduce significativamente en Geekbench. Aquí, el Ryzen 5 7600 se las arregla para superar al Core i9-12900K, que opera con una potencia base del procesador (PBP) mucho más alta de 125 W.

Las puntuaciones multinúcleo y la CPU Blender sufren una paliza debido al menor número de núcleos e hilos. No obstante, vemos muy buenas ganancias sobre el Ryzen 5 5600X y solo una deficiencia marginal comparado con el Ryzen 5 7600X dependiendo del benchmark.

Performance Rating - Percent
AMD Ryzen 9 7950X
88.8 pt
Intel Core i9-13900K
88.7 pt
AMD Ryzen 9 7950X3D
87.4 pt
AMD Ryzen 9 7950X ECO 105 W -12!
83.9 pt
AMD Ryzen 9 7900X
77.6 pt
AMD Ryzen 9 7950X ECO 65 W -14!
75.6 pt
AMD Ryzen 9 5950X
69 pt
AMD Ryzen 7 7700X
66.6 pt
Intel Core i5-13600K
65.2 pt
Intel Core i9-12900K
65.2 pt
AMD Ryzen 7 7700
64.1 pt
AMD Ryzen 7 7700X ECO 65 W -12!
63.5 pt
AMD Ryzen 9 5900X -2!
61.6 pt
AMD Ryzen 5 7600X
60.2 pt
AMD Ryzen 5 7600
55.7 pt
AMD Ryzen 7 5800X
54.3 pt
Intel Core i5-12600K
50.3 pt
AMD Ryzen 7 5800X3D
49.4 pt
AMD Ryzen 5 5600X
45.5 pt
Cinebench R23
Single Core
Intel Core i9-13900K
2267 Points +22%
AMD Ryzen 9 7950X3D
2053 Points +11%
AMD Ryzen 9 7900X
2039 Points +10%
AMD Ryzen 9 7950X
2017 Points +9%
Intel Core i5-13600K
2010 Points +9%
AMD Ryzen 9 7950X ECO 65 W
2001 Points +8%
AMD Ryzen 9 7950X ECO 105 W
1999 Points +8%
Intel Core i9-12900K
1998 Points +8%
AMD Ryzen 7 7700X ECO 65 W
1988 Points +7%
AMD Ryzen 7 7700X
1986 Points +7%
AMD Ryzen 5 7600X
1967 Points +6%
AMD Ryzen 7 7700
1930 Points +4%
Intel Core i5-12600K
1907 Points +3%
AMD Ryzen 5 7600
1852 Points
AMD Ryzen 9 5950X
1649 Points -11%
AMD Ryzen 9 5900X
1568 Points -15%
AMD Ryzen 7 5800X
1554 Points -16%
AMD Ryzen 5 5600X
1541 Points -17%
AMD Ryzen 7 5800X3D
1452 Points -22%
Multi Core
Intel Core i9-13900K
40103 Points +215%
AMD Ryzen 9 7950X
38248 Points +200%
AMD Ryzen 9 7950X3D
36291 Points +185%
AMD Ryzen 9 7950X ECO 105 W
35693 Points +180%
AMD Ryzen 9 7950X ECO 65 W
29882 Points +135%
AMD Ryzen 9 7900X
29480 Points +131%
AMD Ryzen 9 5950X
27062 Points +113%
Intel Core i9-12900K
27005 Points +112%
Intel Core i5-13600K
24268 Points +91%
AMD Ryzen 9 5900X
20634 Points +62%
AMD Ryzen 7 7700X
19509 Points +53%
AMD Ryzen 7 7700
18760 Points +47%
AMD Ryzen 7 7700X ECO 65 W
18667 Points +47%
Intel Core i5-12600K
17491 Points +37%
AMD Ryzen 5 7600X
15322 Points +20%
AMD Ryzen 7 5800X
15241 Points +20%
AMD Ryzen 7 5800X3D
14317 Points +12%
AMD Ryzen 5 7600
12735 Points
AMD Ryzen 5 5600X
11838 Points -7%
Cinebench R20
CPU (Single Core)
Intel Core i9-13900K
828 Points +14%
AMD Ryzen 9 7950X3D
795 Points +10%
AMD Ryzen 9 7900X
786 Points +9%
AMD Ryzen 9 7950X
783 Points +8%
AMD Ryzen 9 7950X ECO 65 W
778 Points +7%
AMD Ryzen 9 7950X ECO 105 W
776 Points +7%
Intel Core i5-13600K
775 Points +7%
AMD Ryzen 7 7700X ECO 65 W
773 Points +7%
AMD Ryzen 7 7700X
772 Points +7%
Intel Core i9-12900K
766 Points +6%
AMD Ryzen 5 7600X
761 Points +5%
AMD Ryzen 7 7700
750 Points +4%
Intel Core i5-12600K
734 Points +1%
AMD Ryzen 5 7600
724 Points
AMD Ryzen 9 5950X
641 Points -11%
AMD Ryzen 9 5900X
639 Points -12%
AMD Ryzen 7 5800X
625 Points -14%
AMD Ryzen 5 5600X
601 Points -17%
AMD Ryzen 7 5800X3D
566 Points -22%
CPU (Multi Core)
Intel Core i9-13900K
15181 Points +177%
AMD Ryzen 9 7950X
14891 Points +171%
AMD Ryzen 9 7950X3D
14188 Points +159%
AMD Ryzen 9 7950X ECO 105 W
13945 Points +154%
AMD Ryzen 9 7950X ECO 65 W
11727 Points +114%
AMD Ryzen 9 7900X
11563 Points +111%
AMD Ryzen 9 5950X
10482 Points +91%
Intel Core i9-12900K
10240 Points +87%
Intel Core i5-13600K
9265 Points +69%
AMD Ryzen 9 5900X
8629 Points +57%
AMD Ryzen 7 7700X
7617 Points +39%
AMD Ryzen 7 7700X ECO 65 W
7308 Points +33%
AMD Ryzen 7 7700
7259 Points +32%
Intel Core i5-12600K
6692 Points +22%
AMD Ryzen 7 5800X
6068 Points +11%
AMD Ryzen 5 7600X
5985 Points +9%
AMD Ryzen 5 7600
5487 Points
AMD Ryzen 7 5800X3D
5479 Points 0%
AMD Ryzen 5 5600X
4567 Points -17%
Cinebench R15
CPU Single 64Bit
Intel Core i9-13900K
327 Points +10%
AMD Ryzen 9 7950X3D
326 Points +9%
AMD Ryzen 9 7900X
324 Points +9%
AMD Ryzen 9 7950X
317 Points +6%
AMD Ryzen 9 7950X ECO 105 W
316 Points +6%
AMD Ryzen 7 7700X ECO 65 W
316 Points +6%
AMD Ryzen 5 7600X
315 Points +6%
AMD Ryzen 9 7950X ECO 65 W
315 Points +6%
AMD Ryzen 7 7700X
314 Points +5%
AMD Ryzen 7 7700
308 Points +3%
AMD Ryzen 5 7600
298 Points
Intel Core i5-13600K
289 Points -3%
Intel Core i9-12900K
286 Points -4%
Intel Core i5-12600K
275 Points -8%
AMD Ryzen 9 5950X
272 Points -9%
AMD Ryzen 9 5900X
271 Points -9%
AMD Ryzen 7 5800X
266 Points -11%
AMD Ryzen 5 5600X
254 Points -15%
AMD Ryzen 7 5800X3D
241 Points -19%
CPU Multi 64Bit
AMD Ryzen 9 7950X
6236 (6091.06min - 6236.36max) Points +167%
Intel Core i9-13900K
6191 Points +165%
AMD Ryzen 9 7950X3D
5974 Points +155%
AMD Ryzen 9 7950X ECO 105 W
5800 (5721.64min - 5799.62max) Points +148%
AMD Ryzen 9 7900X
4856 Points +108%
AMD Ryzen 9 7950X ECO 65 W
4836 (4772.13min - 4835.59max) Points +107%
AMD Ryzen 9 5950X
4492 Points +92%
Intel Core i9-12900K
4057 Points +73%
AMD Ryzen 9 5900X
3717 Points +59%
Intel Core i5-13600K
3643 Points +56%
AMD Ryzen 7 7700X
3191 (3116.72min - 3191.32max) Points +36%
AMD Ryzen 7 7700
3047 (2985.74min - 3046.92max) Points +30%
AMD Ryzen 7 7700X ECO 65 W
3036 (2977.74min - 3035.82max) Points +30%
AMD Ryzen 7 5800X
2616 Points +12%
Intel Core i5-12600K
2555 Points +9%
AMD Ryzen 5 7600X
2507 Points +7%
AMD Ryzen 7 5800X3D
2413 (2388.2min - 2413.42max) Points +3%
AMD Ryzen 5 7600
2339 (2319.92min - 2338.77max) Points
AMD Ryzen 5 5600X
1968 Points -16%
Blender - v2.79 BMW27 CPU
AMD Ryzen 5 5600X
260.2 Seconds * -19%
AMD Ryzen 5 7600
219 Seconds *
AMD Ryzen 7 5800X3D
212.6 Seconds * +3%
AMD Ryzen 5 7600X
203 Seconds * +7%
AMD Ryzen 7 5800X
196.8 Seconds * +10%
Intel Core i5-12600K
189.5 Seconds * +13%
AMD Ryzen 7 7700X ECO 65 W
166 Seconds * +24%
AMD Ryzen 7 7700
166 Seconds * +24%
AMD Ryzen 7 7700X
160 Seconds * +27%
AMD Ryzen 9 5900X
141 Seconds * +36%
Intel Core i5-13600K
135 Seconds * +38%
Intel Core i9-12900K
121.1 Seconds * +45%
AMD Ryzen 9 5950X
112.8 Seconds * +48%
AMD Ryzen 9 7900X
106 Seconds * +52%
AMD Ryzen 9 7950X ECO 65 W
103 Seconds * +53%
AMD Ryzen 9 7950X ECO 105 W
87 Seconds * +60%
AMD Ryzen 9 7950X3D
86 Seconds * +61%
AMD Ryzen 9 7950X
82 Seconds * +63%
Intel Core i9-13900K
80 Seconds * +63%
wPrime 2.10
32m
Intel Core i9-12900K
4.924 s * -61%
Intel Core i5-12600K
4.725 s * -54%
AMD Ryzen 5 5600X
3.891 s * -27%
AMD Ryzen 7 5800X3D
3.648 s * -19%
AMD Ryzen 5 7600
3.059 s *
AMD Ryzen 7 5800X
3.037 s * +1%
AMD Ryzen 5 7600X
2.78 s * +9%
AMD Ryzen 7 7700
2.72 s * +11%
AMD Ryzen 9 5950X
2.538 s * +17%
Intel Core i5-13600K
2.527 s * +17%
AMD Ryzen 7 7700X
2.154 s * +30%
AMD Ryzen 9 7950X3D
2.007 s * +34%
Intel Core i9-13900K
1.818 s * +41%
AMD Ryzen 9 7900X
1.781 s * +42%
AMD Ryzen 9 7950X
1.557 s * +49%
1024m
Intel Core i5-12600K
202.7 s * -142%
Intel Core i9-12900K
190.6 s * -127%
Intel Core i5-13600K
177.592 s * -112%
AMD Ryzen 5 5600X
113.9 s * -36%
AMD Ryzen 7 5800X3D
92.572 s * -10%
AMD Ryzen 7 5800X
86.1 s * -3%
AMD Ryzen 5 7600
83.811 s *
Intel Core i9-13900K
79.738 s * +5%
AMD Ryzen 5 7600X
74.491 s * +11%
AMD Ryzen 9 5950X
64.9 s * +23%
AMD Ryzen 7 7700
62.625 s * +25%
AMD Ryzen 7 7700X
61.148 s * +27%
AMD Ryzen 9 7900X
39.954 s * +52%
AMD Ryzen 9 7950X3D
33.879 s * +60%
AMD Ryzen 9 7950X
30.427 s * +64%
X264 HD Benchmark 4.0
Pass 1
Intel Core i9-13900K
412 (410min - 417max) fps +19%
AMD Ryzen 9 7950X3D
392.5 (391min - 397max) fps +13%
Intel Core i5-13600K
388 (386min - 388max) fps +12%
AMD Ryzen 9 7950X
383 (381min - 386max) fps +10%
AMD Ryzen 9 7900X
376 (369min - 378max) fps +8%
AMD Ryzen 7 7700X
373.5 (363min - 381max) fps +8%
Intel Core i9-12900K
368.5 (366min - 369max) fps +6%
AMD Ryzen 7 7700
368 (359min - 370max) fps +6%
AMD Ryzen 5 7600X
367 (363min - 371max) fps +6%
AMD Ryzen 5 7600
347 (345min - 352max) fps
AMD Ryzen 7 5800X
339 (338min - 341max) fps -2%
AMD Ryzen 9 5950X
338.5 (337min - 340max) fps -2%
AMD Ryzen 9 5900X
335 (325min - 337max) fps -3%
Intel Core i5-12600K
333.5 (332min - 336max) fps -4%
AMD Ryzen 5 5600X
320 (319min - 321max) fps -8%
AMD Ryzen 7 5800X3D
292 (290min - 295max) fps -16%
Pass 2
AMD Ryzen 9 7950X
274 (272min - 274max) fps +99%
Intel Core i9-13900K
267 (266min - 271max) fps +94%
AMD Ryzen 9 7950X3D
265.5 (263min - 266max) fps +93%
AMD Ryzen 9 7900X
241 (240min - 242max) fps +75%
AMD Ryzen 9 5950X
221 (220min - 221max) fps +60%
Intel Core i9-12900K
206 (206min - 206max) fps +49%
Intel Core i5-13600K
199 (198.5min - 199.4max) fps +44%
AMD Ryzen 9 5900X
191 (190min - 192max) fps +39%
AMD Ryzen 7 7700X
181.2 (181min - 181.4max) fps +31%
AMD Ryzen 7 7700
174.95 (174.4min - 175.5max) fps +27%
AMD Ryzen 7 5800X
152 (151min - 152max) fps +10%
Intel Core i5-12600K
148 (147min - 148max) fps +7%
AMD Ryzen 5 7600X
147.8 (147.7min - 147.9max) fps +7%
AMD Ryzen 7 5800X3D
138.25 (137.7min - 138.6max) fps 0%
AMD Ryzen 5 7600
137.8 (136.9min - 137.9max) fps
AMD Ryzen 5 5600X
117 (117min - 117max) fps -15%
WinRAR - Result
AMD Ryzen 9 7900X
17225 KB/s +23%
AMD Ryzen 5 7600X
16178 KB/s +15%
AMD Ryzen 9 7950X3D
15779 KB/s +12%
AMD Ryzen 7 5800X
15604 KB/s +11%
AMD Ryzen 9 7950X
15449 KB/s +10%
AMD Ryzen 7 7700X
14879 KB/s +6%
AMD Ryzen 7 7700
14860 KB/s +6%
Intel Core i9-13900K
14836 KB/s +6%
AMD Ryzen 7 5800X3D
14431 KB/s +3%
AMD Ryzen 5 7600
14038 KB/s
AMD Ryzen 9 5900X
13361 KB/s -5%
AMD Ryzen 5 5600X
13282 KB/s -5%
AMD Ryzen 9 5950X
12503 KB/s -11%
Intel Core i5-13600K
10937 KB/s -22%
Intel Core i9-12900K
10792 KB/s -23%
Intel Core i5-12600K
6239 KB/s -56%
TrueCrypt
AES Mean 100MB
AMD Ryzen 9 7950X
32.5 GB/s +160%
Intel Core i9-13900K
27 GB/s +116%
AMD Ryzen 9 5950X
26.9 GB/s +115%
AMD Ryzen 9 7950X3D
26.9 GB/s +115%
AMD Ryzen 9 5900X
21.2 GB/s +70%
Intel Core i5-13600K
18.8 GB/s +50%
Intel Core i9-12900K
18.5 GB/s +48%
AMD Ryzen 7 7700X
17.5 GB/s +40%
AMD Ryzen 7 7700
15.9 GB/s +27%
AMD Ryzen 7 5800X
15 GB/s +20%
AMD Ryzen 9 7900X
14.8 GB/s +18%
AMD Ryzen 7 5800X3D
13.8 GB/s +10%
AMD Ryzen 5 7600X
13.2 GB/s +6%
Intel Core i5-12600K
12.8 GB/s +2%
AMD Ryzen 5 7600
12.5 GB/s
AMD Ryzen 5 5600X
10.7 GB/s -14%
Twofish Mean 100MB
Intel Core i9-13900K
5.4 GB/s +238%
AMD Ryzen 9 7950X
4.6 GB/s +188%
AMD Ryzen 9 7950X3D
4.2 GB/s +163%
AMD Ryzen 9 5950X
3.7 GB/s +131%
Intel Core i9-12900K
3.7 GB/s +131%
Intel Core i5-13600K
3.1 GB/s +94%
AMD Ryzen 9 5900X
2.9 GB/s +81%
AMD Ryzen 9 7900X
2.8 GB/s +75%
AMD Ryzen 7 7700X
2.3 GB/s +44%
AMD Ryzen 7 7700
2.3 GB/s +44%
Intel Core i5-12600K
2.2 GB/s +38%
AMD Ryzen 7 5800X
2 GB/s +25%
AMD Ryzen 7 5800X3D
1.9 GB/s +19%
AMD Ryzen 5 7600X
1.8 GB/s +13%
AMD Ryzen 5 7600
1.6 GB/s
AMD Ryzen 5 5600X
1.5 GB/s -6%
Serpent Mean 100MB
Intel Core i9-13900K
3 GB/s +173%
AMD Ryzen 9 7950X
2.9 GB/s +164%
AMD Ryzen 9 7950X3D
2.8 GB/s +155%
AMD Ryzen 9 5950X
2.4 GB/s +118%
Intel Core i9-12900K
1.9 GB/s +73%
AMD Ryzen 9 5900X
1.8 GB/s +64%
Intel Core i5-13600K
1.7 GB/s +55%
AMD Ryzen 9 7900X
1.5 GB/s +36%
AMD Ryzen 7 7700
1.5 GB/s +36%
AMD Ryzen 7 7700X
1.4 GB/s +27%
AMD Ryzen 7 5800X
1.3 GB/s +18%
Intel Core i5-12600K
1.3 GB/s +18%
AMD Ryzen 7 5800X3D
1.2 GB/s +9%
AMD Ryzen 5 7600X
1.1 GB/s 0%
AMD Ryzen 5 7600
1.1 GB/s
AMD Ryzen 5 5600X
0.938 GB/s -15%
Geekbench 5.5
Single-Core
AMD Ryzen 9 7950X3D
2311 Points +11%
Intel Core i9-13900K
2290 Points +10%
AMD Ryzen 9 7900X
2274 Points +9%
AMD Ryzen 9 7950X ECO 65 W
2252 Points +8%
AMD Ryzen 9 7950X ECO 105 W
2250 Points +8%
AMD Ryzen 9 7950X
2241 Points +7%
AMD Ryzen 7 7700X
2218 Points +6%
AMD Ryzen 7 7700X ECO 65 W
2218 Points +6%
AMD Ryzen 5 7600X
2205 Points +6%
AMD Ryzen 7 7700
2161 Points +3%
AMD Ryzen 5 7600
2088 Points
Intel Core i9-12900K
2042 Points -2%
Intel Core i5-13600K
1967 Points -6%
Intel Core i5-12600K
1904 Points -9%
AMD Ryzen 9 5950X
1682 Points -19%
AMD Ryzen 9 5900X
1669 Points -20%
AMD Ryzen 7 5800X
1665 Points -20%
AMD Ryzen 5 5600X
1657 Points -21%
AMD Ryzen 7 5800X3D
1622 Points -22%
Multi-Core
AMD Ryzen 9 7950X3D
24343 Points +119%
Intel Core i9-13900K
24157 Points +118%
AMD Ryzen 9 7950X
23948 Points +116%
AMD Ryzen 9 7950X ECO 105 W
22921 Points +107%
AMD Ryzen 9 7950X ECO 65 W
20496 Points +85%
AMD Ryzen 9 7900X
19987 Points +80%
Intel Core i9-12900K
17854 Points +61%
AMD Ryzen 9 5950X
16891 Points +52%
Intel Core i5-13600K
16651 Points +50%
AMD Ryzen 7 7700X
14373 Points +30%
AMD Ryzen 7 7700
13929 Points +26%
AMD Ryzen 7 7700X ECO 65 W
13889 Points +25%
AMD Ryzen 9 5900X
12990 Points +17%
Intel Core i5-12600K
12797 Points +15%
AMD Ryzen 5 7600X
11917 Points +7%
AMD Ryzen 7 5800X
11354 Points +2%
AMD Ryzen 5 7600
11095 Points
AMD Ryzen 7 5800X3D
10856 Points -2%
AMD Ryzen 5 5600X
8980 Points -19%
Geekbench 5.0
5.0 Single-Core
Intel Core i9-13900K
2214 Points +10%
AMD Ryzen 9 7900X
2194 Points +9%
AMD Ryzen 9 7950X3D
2183 Points +9%
AMD Ryzen 9 7950X
2156 Points +8%
AMD Ryzen 5 7600X
2126 Points +6%
AMD Ryzen 7 7700X
2123 Points +6%
AMD Ryzen 7 7700
2078 Points +4%
AMD Ryzen 5 7600
2005 Points
Intel Core i9-12900K
1968 Points -2%
Intel Core i5-13600K
1931 Points -4%
Intel Core i5-12600K
1821 Points -9%
AMD Ryzen 9 5950X
1683 Points -16%
AMD Ryzen 7 5800X
1673 Points -17%
AMD Ryzen 9 5900X
1667 Points -17%
AMD Ryzen 5 5600X
1587 Points -21%
AMD Ryzen 7 5800X3D
1526 Points -24%
5.0 Multi-Core
Intel Core i9-13900K
24021 Points +124%
AMD Ryzen 9 7950X3D
23720 Points +121%
AMD Ryzen 9 7950X
22891 Points +113%
AMD Ryzen 9 7900X
19975 Points +86%
Intel Core i9-12900K
17959 Points +67%
Intel Core i5-13600K
16635 Points +55%
AMD Ryzen 9 5950X
16570 Points +54%
AMD Ryzen 7 7700X
14215 Points +32%
AMD Ryzen 7 7700
13869 Points +29%
AMD Ryzen 9 5900X
12974 Points +21%
Intel Core i5-12600K
12746 Points +19%
AMD Ryzen 5 7600X
11880 Points +11%
AMD Ryzen 7 5800X
11246 Points +5%
AMD Ryzen 7 5800X3D
10836 Points +1%
AMD Ryzen 5 7600
10745 Points
AMD Ryzen 5 5600X
8926 Points -17%
Geekbench 4.4
64 Bit Single-Core Score
Intel Core i9-13900K
9598 Points +14%
AMD Ryzen 9 7950X3D
9240 Points +9%
AMD Ryzen 9 7900X
9193 Points +9%
AMD Ryzen 9 7950X
9023 Points +7%
AMD Ryzen 7 7700X
8991 Points +6%
AMD Ryzen 5 7600X
8926 Points +6%
AMD Ryzen 7 7700
8753 Points +4%
Intel Core i9-12900K
8665 Points +3%
Intel Core i5-13600K
8618 Points +2%
AMD Ryzen 5 7600
8453 Points
Intel Core i5-12600K
8223 Points -3%
AMD Ryzen 7 5800X
7333 Points -13%
AMD Ryzen 9 5900X
7297 Points -14%
AMD Ryzen 9 5950X
7216 Points -15%
AMD Ryzen 7 5800X3D
7187 Points -15%
AMD Ryzen 5 5600X
6953 Points -18%
64 Bit Multi-Core Score
AMD Ryzen 9 7950X3D
87922 Points +99%
Intel Core i9-13900K
86695 Points +96%
AMD Ryzen 9 7950X
85554 Points +93%
AMD Ryzen 9 7900X
74731 Points +69%
Intel Core i9-12900K
63583 Points +44%
AMD Ryzen 9 5950X
63233 Points +43%
Intel Core i5-13600K
60407 Points +37%
AMD Ryzen 7 7700X
56909 Points +29%
AMD Ryzen 7 7700
55542 Points +26%
AMD Ryzen 9 5900X
51794 Points +17%
AMD Ryzen 5 7600X
47407 Points +7%
Intel Core i5-12600K
46557 Points +5%
AMD Ryzen 5 7600
44221 Points
AMD Ryzen 7 5800X
44131 Points 0%
AMD Ryzen 7 5800X3D
43687 Points -1%
AMD Ryzen 5 5600X
35617 Points -19%
7-Zip 18.03
7z b 4
AMD Ryzen 9 7950X3D
159341 MIPS +147%
AMD Ryzen 9 7950X
158242 MIPS +145%
AMD Ryzen 9 7950X ECO 105 W
151967 MIPS +135%
Intel Core i9-13900K
147068 MIPS +128%
AMD Ryzen 9 5950X
127792 MIPS +98%
AMD Ryzen 9 7900X
124975 MIPS +93%
Intel Core i9-12900K
97671 MIPS +51%
AMD Ryzen 9 5900X
95123 MIPS +47%
Intel Core i5-13600K
89647 MIPS +39%
AMD Ryzen 7 7700X
85789 MIPS +33%
AMD Ryzen 7 7700X ECO 65 W
85624 MIPS +33%
AMD Ryzen 7 7700
85260 MIPS +32%
AMD Ryzen 7 5800X
74306 MIPS +15%
AMD Ryzen 7 5800X3D
69518 MIPS +8%
AMD Ryzen 5 7600X
69291 MIPS +7%
AMD Ryzen 5 7600
64613 MIPS
Intel Core i5-12600K
64260 MIPS -1%
AMD Ryzen 5 5600X
56607 MIPS -12%
7z b 4 -mmt1
AMD Ryzen 9 7950X3D
8321 MIPS +10%
AMD Ryzen 9 7900X
8282 MIPS +9%
AMD Ryzen 9 7950X
8211 MIPS +9%
AMD Ryzen 9 7950X ECO 105 W
8176 MIPS +8%
AMD Ryzen 7 7700X
8096 MIPS +7%
AMD Ryzen 5 7600X
8063 MIPS +7%
AMD Ryzen 7 7700X ECO 65 W
8052 MIPS +6%
AMD Ryzen 7 7700
7880 MIPS +4%
AMD Ryzen 5 7600
7566 MIPS
Intel Core i9-13900K
7272 MIPS -4%
AMD Ryzen 9 5950X
6974 MIPS -8%
AMD Ryzen 7 5800X
6970 MIPS -8%
AMD Ryzen 7 5800X3D
6799 MIPS -10%
AMD Ryzen 9 5900X
6785 MIPS -10%
AMD Ryzen 5 5600X
6594 MIPS -13%
Intel Core i9-12900K
6571 MIPS -13%
Intel Core i5-13600K
6502 MIPS -14%
Intel Core i5-12600K
5944 MIPS -21%
HWBOT x265 Benchmark v2.2 - 4k Preset
AMD Ryzen 9 7950X
44 fps +126%
Intel Core i9-13900K
42.6 fps +118%
AMD Ryzen 9 7950X3D
42.4 fps +117%
AMD Ryzen 9 7950X ECO 105 W
41.7 fps +114%
AMD Ryzen 9 7900X
36.2 fps +86%
AMD Ryzen 9 7950X ECO 65 W
36.2 fps +86%
AMD Ryzen 9 5950X
31.8 fps +63%
Intel Core i5-12600K
30.1 fps +54%
Intel Core i9-12900K
30 fps +54%
Intel Core i5-13600K
27.6 fps +42%
AMD Ryzen 7 7700X
26.1 fps +34%
AMD Ryzen 9 5900X
25.5 fps +31%
AMD Ryzen 7 7700
25 fps +28%
AMD Ryzen 7 7700X ECO 65 W
24.8 fps +27%
AMD Ryzen 5 7600X
21.1 fps +8%
AMD Ryzen 7 5800X
20.8 fps +7%
AMD Ryzen 5 7600
19.5 fps
AMD Ryzen 7 5800X3D
19.1 fps -2%
AMD Ryzen 5 5600X
15.7 fps -19%
R Benchmark 2.5 - Overall mean
AMD Ryzen 7 5800X3D
0.4784 sec * -18%
AMD Ryzen 5 5600X
0.4778 sec * -18%
AMD Ryzen 9 5950X
0.4556 sec * -13%
AMD Ryzen 9 5900X
0.4513 sec * -12%
AMD Ryzen 7 5800X
0.4509 sec * -11%
Intel Core i5-12600K
0.4456 sec * -10%
Intel Core i9-12900K
0.4216 sec * -4%
Intel Core i5-13600K
0.405 sec * -0%
AMD Ryzen 5 7600
0.4047 sec *
AMD Ryzen 7 7700
0.4022 sec * +1%
AMD Ryzen 7 7700X ECO 65 W
0.383 sec * +5%
AMD Ryzen 9 7950X
0.3776 sec * +7%
AMD Ryzen 9 7950X ECO 65 W
0.3773 sec * +7%
AMD Ryzen 9 7950X ECO 105 W
0.3769 sec * +7%
AMD Ryzen 7 7700X
0.3758 sec * +7%
AMD Ryzen 5 7600X
0.3749 sec * +7%
AMD Ryzen 9 7900X
0.3736 sec * +8%
AMD Ryzen 9 7950X3D
0.372 sec * +8%
Intel Core i9-13900K
0.3539 sec * +13%
LibreOffice - 20 Documents To PDF
Intel Core i5-12600K
71.8 s * -91%
AMD Ryzen 7 5800X3D
55 s * -47%
AMD Ryzen 9 5900X
47.65 s * -27%
AMD Ryzen 9 5950X
45.97 s * -23%
AMD Ryzen 5 5600X
45.14 s * -20%
AMD Ryzen 7 5800X
43.31 s * -15%
Intel Core i9-12900K
40.6 s * -8%
AMD Ryzen 7 7700
39.5 s * -5%
AMD Ryzen 9 7950X3D
38.6 s * -3%
AMD Ryzen 5 7600
37.5 s *
AMD Ryzen 5 7600X
36.8 s * +2%
Intel Core i9-13900K
36.6 s * +2%
AMD Ryzen 9 7950X
36.6 s * +2%
Intel Core i5-13600K
35 s * +7%
AMD Ryzen 9 7900X
34.9 s * +7%
AMD Ryzen 7 7700X ECO 65 W
34.1 s * +9%
AMD Ryzen 7 7700X
33.6 s * +10%
AMD Ryzen 9 7950X ECO 65 W
33.1 s * +12%
AMD Ryzen 9 7950X ECO 105 W
33 s * +12%

* ... más pequeño es mejor

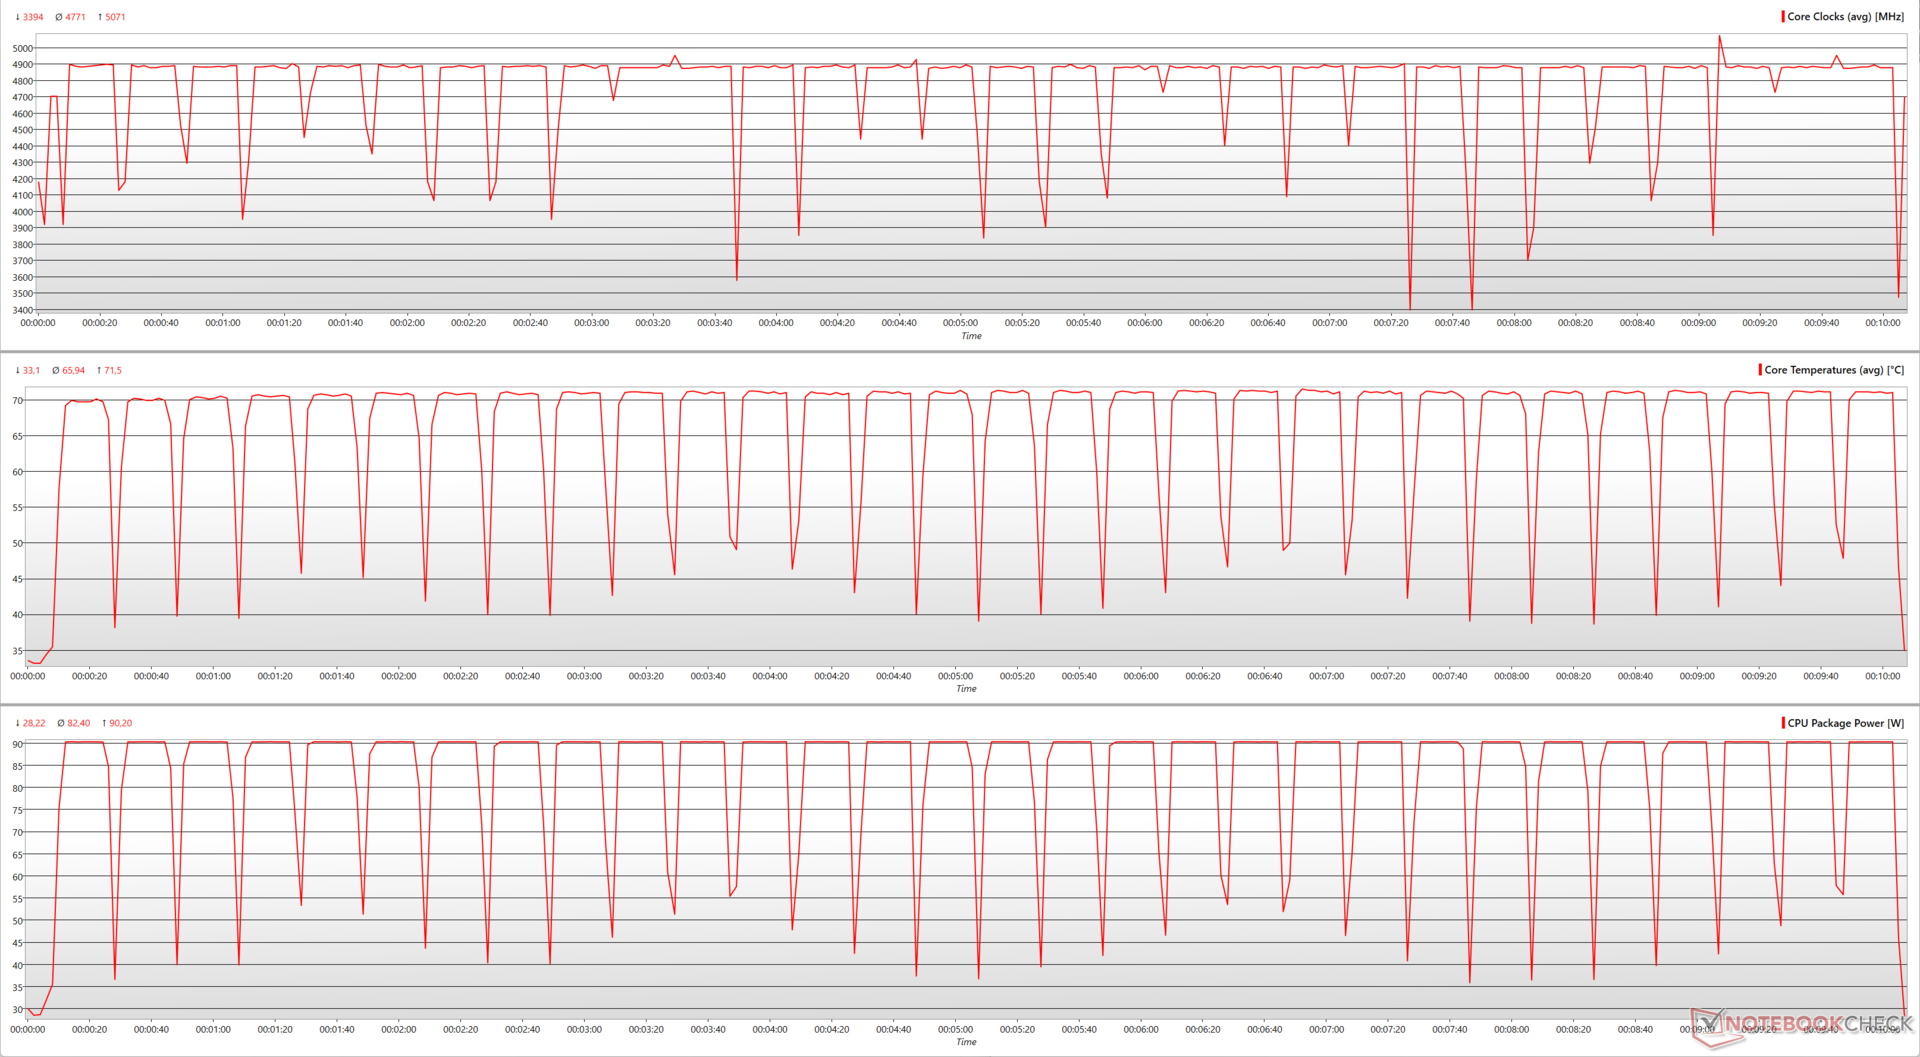
Bucle múltiple Cinebench R15

AMD suministra refrigeradores Wraith en la caja para los procesadores Ryzen 7000 de 65 W. Nuestra unidad Ryzen 5 7600 venía con un refrigerador de bajo perfil Wraith Stealth. El Wraith Stealth puede hacer el trabajo si sólo utilizas la CPU para tareas básicas y multimedia.

Recomendamos usar un disipador AIO si quieres usar la CPU para flujos de trabajo exigentes.

El Ryzen 5 7600 mostró un excelente rendimiento sostenido sin ninguna ralentización en nuestra prueba Cinebench R15 multi-core loop cuando se utiliza junto con el Cooler MasterLiquid ML360L V2 ARGB AIO cooler.

03156309451260157518902205252028353150346537804095441047255040535556705985Tooltip
AMD Ryzen 5 7600 AMD Ryzen 5 7600: Ø2330 (2319.92-2338.77)
AMD Ryzen 9 7950X AMD Ryzen 9 7950X: Ø6157 (6091.06-6236.36)
Intel Core i9-13900K Intel Core i9-13900K: Ø6182 (6045.95-6213.11)
AMD Ryzen 9 7950X3D AMD Ryzen 9 7950X3D: Ø5942 (5923.29-5966.59)
Intel Core i5-12600K Intel Core i5-12600K: Ø2545 (2497.35-2570.36)
Intel Core i5-13600K Intel Core i5-13600K: Ø3620 (3607.83-3632.07)

El Ryzen 5 7600 puede alcanzar momentáneamente un pico de 5,07 GHz durante esta prueba, que está cerca de su velocidad nominal de 5,1 GHz. Sin embargo, la velocidad media del núcleo durante la prueba ronda los 4,8 GHz.

La potencia del encapsulado alcanza constantemente los 90,2 W durante cada bucle, con temperaturas del núcleo que rozan los 71,5 °C. La TjMax de 95 °C es la más alta. La TjMax de 95 °C no se alcanza durante la ejecución, pero hay suficiente margen térmico para que Precision Boost 2 haga su magia.

AMD Ryzen 5 7600: Parámetros de la CPU durante el bucle multinúcleo de Cinebench R15
Cinebench R10 Rendering Multiple CPUs 32Bit
46166
Cinebench R10 Shading 32Bit
15780
Cinebench R10 Rendering Single 32Bit
8122
Cinebench R11.5 CPU Multi 64Bit
26.4 Points
Cinebench R11.5 OpenGL 64Bit
190.02 fps
Cinebench R11.5 CPU Single 64Bit
3.51 Points
Cinebench R15 CPU Single 64Bit
298 Points
Cinebench R15 Ref. Match 64Bit
99.6 %
Cinebench R15 OpenGL 64Bit
344 fps
Cinebench R15 CPU Multi 64Bit
2339 Points
ayuda

Rendimiento del sistema: Sin mayores reparos con el Ryzen 5 7600

El Ryzen 5 7600 es capaz de superar al Ryzen 9 5900X en 3DMark 11 Physics aunque 3DMark Time Spy Physics resulta ser una tarea un poco cuesta arriba para este chip.

En AIDA64, el Ryzen 5 7600 es capaz de vencer a su primo de la serie X y a otros chips Zen 3 y Alder Lake en varios benchmarks de CPU.

Por alguna razón, CrossMark no funcionó bien en nuestro sistema de pruebas. Sin embargo, el rendimiento general del sistema y la capacidad de respuesta no es un problema con el Ryzen 5 7600.

3DMark 11 - 1280x720 Performance Physics
AMD Ryzen 9 7950X3D
36991 Points +55%
AMD Ryzen 9 7950X
34239 Points +44%
Intel Core i9-13900K
32273 Points +35%
AMD Ryzen 7 7700X
31467 Points +32%
AMD Ryzen 7 7700
30945 Points +30%
Intel Core i5-13600K
30480 Points +28%
AMD Ryzen 9 7900X
28618 Points +20%
Intel Core i9-12900K
28211 Points +18%
AMD Ryzen 7 5800X3D
27236 Points +14%
AMD Ryzen 5 7600X
25396 Points +6%
AMD Ryzen 9 5950X
25367 Points +6%
Intel Core i5-12600K
25017 Points +5%
AMD Ryzen 5 7600
23854 Points
AMD Ryzen 9 5900X
23423 Points -2%
AMD Ryzen 7 5800X
23381 Points -2%
AMD Ryzen 5 5600X
19649 Points -18%
3DMark - 2560x1440 Time Spy CPU
Intel Core i9-13900K
19392 Points +97%
Intel Core i9-12900K
18431 Points +88%
AMD Ryzen 9 7950X3D
17206 Points +75%
Intel Core i5-13600K
17124 Points +74%
AMD Ryzen 9 7900X
16616 Points +69%
AMD Ryzen 9 7950X
15856 Points +61%
AMD Ryzen 7 7700X
14182 Points +44%
AMD Ryzen 7 7700
13918 Points +42%
Intel Core i5-12600K
13869 Points +41%
AMD Ryzen 9 5950X
13650 Points +39%
AMD Ryzen 9 5900X
12633 Points +29%
AMD Ryzen 7 5800X3D
11809 Points +20%
AMD Ryzen 7 5800X
11599 Points +18%
AMD Ryzen 5 7600X
10458 Points +7%
AMD Ryzen 5 7600
9819 Points
AMD Ryzen 5 5600X
8911 Points -9%
AIDA64
FP32 Ray-Trace
AMD Ryzen 9 7950X
62786 KRay/s +171%
AMD Ryzen 9 7950X3D
58359 KRay/s +152%
AMD Ryzen 9 7950X
57844 KRay/s +150%
AMD Ryzen 9 7950X
47514 KRay/s +105%
Intel Core i9-13900K
36939 KRay/s +60%
AMD Ryzen 9 7900X
33676 KRay/s +45%
AMD Ryzen 7 7700X
32035 KRay/s +38%
AMD Ryzen 7 7700
29867 KRay/s +29%
AMD Ryzen 7 7700X
29659 KRay/s +28%
AMD Ryzen 9 5950X
28150 KRay/s +22%
Intel Core i5-13600K
23446 KRay/s +1%
AMD Ryzen 9 5900X
23391 KRay/s +1%
AMD Ryzen 5 7600
23151 KRay/s
AMD Ryzen 5 7600X
17633 KRay/s -24%
AMD Ryzen 7 5800X
17545 KRay/s -24%
AMD Ryzen 7 5800X3D
17125 KRay/s -26%
Intel Core i9-12900K
13266 KRay/s -43%
AMD Ryzen 5 5600X
12482 KRay/s -46%
Intel Core i5-12600K
8243 KRay/s -64%
FPU Julia
AMD Ryzen 9 7950X
264044 Points +171%
AMD Ryzen 9 7950X
251718 Points +159%
AMD Ryzen 9 7950X3D
245308 Points +152%
AMD Ryzen 9 7950X
212888 Points +119%
AMD Ryzen 9 7900X
201995 Points +108%
Intel Core i9-13900K
183390 Points +88%
AMD Ryzen 9 5950X
144072 Points +48%
AMD Ryzen 7 7700X
133006 Points +37%
AMD Ryzen 7 7700X
128425 Points +32%
AMD Ryzen 7 7700
128212 Points +32%
AMD Ryzen 9 5900X
114330 Points +17%
Intel Core i5-13600K
111374 Points +14%
AMD Ryzen 5 7600X
103526 Points +6%
AMD Ryzen 7 5800X3D
103015 Points +6%
AMD Ryzen 5 7600
97332 Points
AMD Ryzen 7 5800X
82429 Points -15%
AMD Ryzen 5 5600X
61688 Points -37%
Intel Core i9-12900K
59419 Points -39%
Intel Core i5-12600K
37321 Points -62%
CPU SHA3
AMD Ryzen 9 7950X3D
11001 MB/s +172%
AMD Ryzen 9 7950X
10362 MB/s +156%
AMD Ryzen 9 7950X
9704 MB/s +140%
Intel Core i9-13900K
9180 MB/s +127%
AMD Ryzen 9 7950X
8120 MB/s +101%
AMD Ryzen 9 7900X
7018 MB/s +74%
Intel Core i5-13600K
5253 MB/s +30%
AMD Ryzen 7 7700X
5214 MB/s +29%
AMD Ryzen 7 7700X
4961 MB/s +23%
AMD Ryzen 7 7700
4956 MB/s +23%
Intel Core i9-12900K
4952 MB/s +22%
AMD Ryzen 9 5950X
4569 MB/s +13%
AMD Ryzen 5 7600
4044 MB/s
AMD Ryzen 5 7600X
3601 MB/s -11%
AMD Ryzen 9 5900X
3591 MB/s -11%
AMD Ryzen 7 5800X3D
3587 MB/s -11%
Intel Core i5-12600K
3250 MB/s -20%
AMD Ryzen 7 5800X
2542 MB/s -37%
AMD Ryzen 5 5600X
1920 MB/s -53%
CPU Queen
AMD Ryzen 9 7950X
205588 Points +104%
AMD Ryzen 9 7950X3D
199943 Points +98%
AMD Ryzen 9 7950X
196106 Points +94%
AMD Ryzen 9 7950X
173696 Points +72%
AMD Ryzen 9 7900X
172637 Points +71%
AMD Ryzen 9 5950X
164437 Points +63%
Intel Core i9-13900K
159676 Points +58%
AMD Ryzen 9 5900X
138724 Points +38%
AMD Ryzen 7 7700X
137151 Points +36%
AMD Ryzen 7 7700X
129890 Points +29%
AMD Ryzen 7 7700
129569 Points +29%
Intel Core i5-13600K
120485 Points +19%
AMD Ryzen 7 5800X
113297 Points +12%
Intel Core i9-12900K
112694 Points +12%
AMD Ryzen 5 7600X
107954 Points +7%
AMD Ryzen 7 5800X3D
104367 Points +4%
AMD Ryzen 5 7600
100827 Points
Intel Core i5-12600K
88337 Points -12%
AMD Ryzen 5 5600X
85863 Points -15%
FPU SinJulia
AMD Ryzen 9 7950X
32855 Points +181%
AMD Ryzen 9 7950X
32428 Points +177%
AMD Ryzen 9 7950X3D
32423 Points +177%
AMD Ryzen 9 7950X
29104 Points +149%
AMD Ryzen 9 5950X
26364 Points +125%
AMD Ryzen 9 7900X
24881 Points +112%
Intel Core i9-13900K
19920 Points +70%
AMD Ryzen 9 5900X
19353 Points +65%
AMD Ryzen 7 7700X
16496 Points +41%
AMD Ryzen 7 7700X
16425 Points +40%
AMD Ryzen 7 7700
16050 Points +37%
Intel Core i9-12900K
14664 Points +25%
AMD Ryzen 7 5800X
13527 Points +16%
AMD Ryzen 7 5800X3D
12794 Points +9%
AMD Ryzen 5 7600X
12774 Points +9%
Intel Core i5-13600K
12201 Points +4%
AMD Ryzen 5 7600
11709 Points
AMD Ryzen 5 5600X
10088 Points -14%
Intel Core i5-12600K
9510 Points -19%
FPU Mandel
AMD Ryzen 9 7950X
138291 Points +165%
AMD Ryzen 9 7950X
131879 Points +153%
AMD Ryzen 9 7950X3D
131740 Points +152%
AMD Ryzen 9 7950X
110698 Points +112%
AMD Ryzen 9 7900X
106620 Points +104%
Intel Core i9-13900K
91721 Points +76%
AMD Ryzen 9 5950X
78269 Points +50%
AMD Ryzen 7 7700X
69986 Points +34%
AMD Ryzen 7 7700X
67376 Points +29%
AMD Ryzen 7 7700
66267 Points +27%
AMD Ryzen 9 5900X
62547 Points +20%
Intel Core i5-13600K
57797 Points +11%
AMD Ryzen 7 5800X3D
56568 Points +8%
AMD Ryzen 5 7600X
54555 Points +5%
AMD Ryzen 5 7600
52184 Points
AMD Ryzen 7 5800X
45369 Points -13%
Intel Core i9-12900K
38042 Points -27%
AMD Ryzen 5 5600X
33927 Points -35%
Intel Core i5-12600K
24230 Points -54%
CPU AES
AMD Ryzen 9 7950X
379659 MB/s +181%
AMD Ryzen 9 7950X
370183 MB/s +174%
AMD Ryzen 9 7950X3D
364030 MB/s +170%
AMD Ryzen 9 7950X
324249 MB/s +140%
Intel Core i9-13900K
297727 MB/s +121%
AMD Ryzen 9 7900X
279956 MB/s +107%
AMD Ryzen 7 7700X
189933 MB/s +41%
AMD Ryzen 7 7700X
187326 MB/s +39%
AMD Ryzen 7 7700
185246 MB/s +37%
Intel Core i5-13600K
175556 MB/s +30%
AMD Ryzen 9 5950X
153484 MB/s +14%
AMD Ryzen 5 7600X
144365 MB/s +7%
AMD Ryzen 5 7600
134999 MB/s
AMD Ryzen 9 5900X
118228 MB/s -12%
Intel Core i9-12900K
94062 MB/s -30%
AMD Ryzen 7 5800X
82897 MB/s -39%
AMD Ryzen 7 5800X3D
66065 MB/s -51%
AMD Ryzen 5 5600X
62563 MB/s -54%
Intel Core i5-12600K
58635 MB/s -57%
CPU ZLib
Intel Core i9-13900K
2490 MB/s +179%
AMD Ryzen 9 7950X
2441 MB/s +173%
AMD Ryzen 9 7950X
2325 MB/s +160%
AMD Ryzen 9 7950X3D
2315 MB/s +159%
AMD Ryzen 9 7950X
1965 MB/s +120%
AMD Ryzen 9 7900X
1848 MB/s +107%
AMD Ryzen 9 5950X
1727 MB/s +93%
Intel Core i9-12900K
1560 MB/s +74%
Intel Core i5-13600K
1426 MB/s +60%
AMD Ryzen 9 5900X
1345 MB/s +50%
AMD Ryzen 7 7700X
1224 MB/s +37%
AMD Ryzen 7 7700X
1181 MB/s +32%
AMD Ryzen 7 7700
1181 MB/s +32%
Intel Core i5-12600K
988 MB/s +11%
AMD Ryzen 5 7600X
945 MB/s +6%
AMD Ryzen 7 5800X
942 MB/s +5%
AMD Ryzen 5 7600
894 MB/s
AMD Ryzen 7 5800X3D
890 MB/s 0%
AMD Ryzen 5 5600X
719 MB/s -20%
FP64 Ray-Trace
AMD Ryzen 9 7950X
33821 KRay/s +171%
AMD Ryzen 9 7950X3D
31732 KRay/s +154%
AMD Ryzen 9 7950X
30838 KRay/s +147%
AMD Ryzen 9 7950X
25132 KRay/s +101%
Intel Core i9-13900K
20298 KRay/s +62%
AMD Ryzen 9 7900X
18490 KRay/s +48%
AMD Ryzen 7 7700X
17051 KRay/s +36%
AMD Ryzen 7 7700
16020 KRay/s +28%
AMD Ryzen 7 7700X
15819 KRay/s +27%
AMD Ryzen 9 5950X
15213 KRay/s +22%
Intel Core i5-13600K
12806 KRay/s +2%
AMD Ryzen 9 5900X
12613 KRay/s +1%
AMD Ryzen 5 7600
12501 KRay/s
AMD Ryzen 5 7600X
9488 KRay/s -24%
AMD Ryzen 7 5800X
9469 KRay/s -24%
AMD Ryzen 7 5800X3D
9090 KRay/s -27%
Intel Core i9-12900K
8078 KRay/s -35%
AMD Ryzen 5 5600X
6894 KRay/s -45%
Intel Core i5-12600K
5149 KRay/s -59%
CPU PhotoWorxx
AMD Ryzen 9 7950X3D
53949 MPixel/s +39%
Intel Core i9-13900K
48674 MPixel/s +26%
Intel Core i5-12600K
48577 MPixel/s +26%
Intel Core i5-13600K
48434 MPixel/s +25%
Intel Core i9-12900K
48307 MPixel/s +25%
AMD Ryzen 9 7900X
40893 MPixel/s +6%
AMD Ryzen 9 7950X
40443 MPixel/s +5%
AMD Ryzen 9 7950X
40323 MPixel/s +4%
AMD Ryzen 9 7950X
40261 MPixel/s +4%
AMD Ryzen 5 7600
38698 MPixel/s
AMD Ryzen 5 7600X
32202 MPixel/s -17%
AMD Ryzen 7 7700
32185 MPixel/s -17%
AMD Ryzen 7 7700X
31910 MPixel/s -18%
AMD Ryzen 7 7700X
31859 MPixel/s -18%
AMD Ryzen 9 5950X
27530 MPixel/s -29%
AMD Ryzen 7 5800X
25309 MPixel/s -35%
AMD Ryzen 7 5800X3D
25224 MPixel/s -35%
AMD Ryzen 5 5600X
24352 MPixel/s -37%
AMD Ryzen 9 5900X
21433 MPixel/s -45%
Performance Rating - Percent
Intel Core i9-12900K -1!
93.3 pt
Intel Core i5-12600K -1!
90.6 pt
AMD Ryzen 9 7950X3D
78.5 pt
AMD Ryzen 9 7900X
73.4 pt
Intel Core i9-13900K
73 pt
AMD Ryzen 9 7950X
72.8 pt
AMD Ryzen 9 7950X
72.8 pt
AMD Ryzen 9 7950X
72.5 pt
Intel Core i5-13600K
67.9 pt
AMD Ryzen 5 7600X
66.6 pt
AMD Ryzen 9 5900X
66.3 pt
AMD Ryzen 7 7700
66.3 pt
AMD Ryzen 7 7700X
65.7 pt
AMD Ryzen 7 7700X
65.1 pt
AMD Ryzen 5 7600
64.9 pt
AMD Ryzen 9 5950X
56.8 pt
AMD Ryzen 7 5800X
53.1 pt
AMD Ryzen 5 5600X
49.3 pt
AMD Ryzen 7 5800X3D
43.7 pt
AIDA64
Memory Copy
Intel Core i9-13900K
74937 MB/s +25%
AMD Ryzen 9 7950X3D
73868 MB/s +24%
Intel Core i9-12900K
73146 MB/s +22%
Intel Core i5-13600K
71725 MB/s +20%
Intel Core i5-12600K
70749 MB/s +18%
AMD Ryzen 9 7900X
69140 MB/s +16%
AMD Ryzen 9 7950X
68962 MB/s +15%
AMD Ryzen 9 7950X
68843 MB/s +15%
AMD Ryzen 9 7950X
68526 MB/s +15%
AMD Ryzen 9 5900X
66130 MB/s +11%
AMD Ryzen 7 7700X
59963 MB/s 0%
AMD Ryzen 5 7600X
59949 MB/s 0%
AMD Ryzen 7 7700
59838 MB/s 0%
AMD Ryzen 7 7700X
59803 MB/s 0%
AMD Ryzen 5 7600
59783 MB/s
AMD Ryzen 9 5950X
59171 MB/s -1%
AMD Ryzen 7 5800X
57120 MB/s -4%
AMD Ryzen 5 5600X
53947 MB/s -10%
AMD Ryzen 7 5800X3D
49404 MB/s -17%
Memory Latency
Intel Core i5-13600K
81.1 ns * -17%
Intel Core i9-13900K
76.5 ns * -11%
AMD Ryzen 7 5800X3D
69.3 ns * -0%
AMD Ryzen 5 7600
69.2 ns *
AMD Ryzen 7 7700X
68.7 ns * +1%
AMD Ryzen 9 5950X
67.7 ns * +2%
AMD Ryzen 7 7700X
65.7 ns * +5%
AMD Ryzen 9 7950X3D
65.6 ns * +5%
AMD Ryzen 9 7950X
65.3 ns * +6%
AMD Ryzen 9 7950X
65.1 ns * +6%
AMD Ryzen 9 7950X
65.1 ns * +6%
AMD Ryzen 7 7700
64.3 ns * +7%
AMD Ryzen 5 5600X
63.9 ns * +8%
AMD Ryzen 5 7600X
63.8 ns * +8%
AMD Ryzen 9 7900X
63.3 ns * +9%
AMD Ryzen 7 5800X
60.9 ns * +12%
AMD Ryzen 9 5900X
58.4 ns * +16%
Memory Read
Intel Core i9-13900K
83883 MB/s +41%
Intel Core i9-12900K
81059 MB/s +36%
AMD Ryzen 9 7950X3D
80946 MB/s +36%
Intel Core i5-12600K
76864 MB/s +29%
AMD Ryzen 9 7950X
75798 MB/s +28%
Intel Core i5-13600K
75757 MB/s +28%
AMD Ryzen 9 7950X
75664 MB/s +27%
AMD Ryzen 9 7950X
75590 MB/s +27%
AMD Ryzen 9 7900X
75338 MB/s +27%
AMD Ryzen 9 5900X
70692 MB/s +19%
AMD Ryzen 7 5800X
63645 MB/s +7%
AMD Ryzen 9 5950X
62991 MB/s +6%
AMD Ryzen 5 7600
59405 MB/s
AMD Ryzen 7 7700X
59292 MB/s 0%
AMD Ryzen 5 5600X
59238 MB/s 0%
AMD Ryzen 7 7700X
59238 MB/s 0%
AMD Ryzen 5 7600X
59007 MB/s -1%
AMD Ryzen 7 7700
58988 MB/s -1%
AMD Ryzen 7 5800X3D
50995 MB/s -14%
Memory Write
AMD Ryzen 9 7950X3D
85951 MB/s +6%
AMD Ryzen 5 7600X
81320 MB/s 0%
AMD Ryzen 5 7600
81193 MB/s
AMD Ryzen 7 7700X
81041 MB/s 0%
AMD Ryzen 7 7700
80948 MB/s 0%
AMD Ryzen 7 7700X
80230 MB/s -1%
AMD Ryzen 9 7900X
76967 MB/s -5%
AMD Ryzen 9 7950X
76732 MB/s -5%
AMD Ryzen 9 7950X
76721 MB/s -6%
AMD Ryzen 9 7950X
76515 MB/s -6%
Intel Core i9-13900K
74140 MB/s -9%
Intel Core i5-12600K
73824 MB/s -9%
Intel Core i9-12900K
73707 MB/s -9%
Intel Core i5-13600K
73484 MB/s -9%
AMD Ryzen 9 5900X
55525 MB/s -32%
AMD Ryzen 9 5950X
48748 MB/s -40%
AMD Ryzen 7 5800X
30399 MB/s -63%
AMD Ryzen 5 5600X
28798 MB/s -65%
AMD Ryzen 7 5800X3D
28787 MB/s -65%

* ... más pequeño es mejor

3D y rendimiento en juegos: CPU de alta capacidad para juegos

Todos los procesadores Zen 4 han resultado ser excelentes opciones para juegos hasta ahora, y el Ryzen 5 7600 no es diferente.

Teniendo en cuenta 3DMark 11 y 3DMark Time Spy de forma acumulativa, vemos que el Ryzen 5 7600 está a la par con el Core i9-13900K, más potente y caro, mientras que le pisa los talones al Ryzen 9 7950X3D. En esta comparación, el Ryzen 5 7600X parece ofrecer el mayor rendimiento.

En juegos, sin embargo, el Core i9-13900K obtiene una ventaja perceptible sobre el Ryzen 5 de 65 W. El Ryzen 9 7950X3D se beneficia de la caché 3D V, que le ayuda a conseguir muchos más fotogramas con ajustes de resolución y calidad muy bajos.

No obstante, si buscas principalmente una CPU de juego para un modelo de gama media, no puedes equivocarte con el Ryzen 5 7600.

3DMark Performance Rating - Percent
AMD Ryzen 5 7600X
100 pt
AMD Ryzen 9 7950X
95.7 pt
AMD Ryzen 9 7950X3D
94.7 pt
AMD Ryzen 5 7600
91.6 pt
Intel Core i9-13900K
91.4 pt
3DMark - 2560x1440 Time Spy Graphics
AMD Ryzen 5 7600X
37251 Points +3%
AMD Ryzen 9 7950X
36836 Points +2%
AMD Ryzen 9 7950X3D
36665 Points +1%
AMD Ryzen 5 7600
36138 Points
Intel Core i9-13900K
36101 Points 0%
3DMark 11 - 1280x720 Performance GPU
AMD Ryzen 5 7600X
116361 Points +16%
AMD Ryzen 9 7950X
107723 Points +7%
AMD Ryzen 9 7950X3D
105886 Points +6%
AMD Ryzen 5 7600
100349 Points
Intel Core i9-13900K
99834 Points -1%
Gaming Performance Rating - Percent
AMD Ryzen 9 7950X3D
NVIDIA GeForce RTX 4090
96.8 pt
AMD Ryzen 9 7950X
NVIDIA GeForce RTX 4090
92.2 pt
Intel Core i9-13900K -2!
NVIDIA GeForce RTX 4090
91.9 pt
AMD Ryzen 5 7600X -2!
NVIDIA GeForce RTX 4090
91.5 pt
AMD Ryzen 5 7600
NVIDIA GeForce RTX 4090
83.7 pt
Average of class Desktop
 
61.9 pt
Cyberpunk 2077 1.6
1920x1080 Ultra Preset
AMD Ryzen 9 7950X3D
NVIDIA GeForce RTX 4090
238.2 fps +25%
Intel Core i9-13900K
NVIDIA GeForce RTX 4090
210 (121.7min) fps +10%
AMD Ryzen 9 7950X
NVIDIA GeForce RTX 4090
207 (96.4min) fps +9%
AMD Ryzen 5 7600
NVIDIA GeForce RTX 4090
190.3 (93.2min) fps
Average of class Desktop
  (72.3 - 210, n=18, last 2 years)
145.3 fps -24%
1920x1080 Low Preset
AMD Ryzen 9 7950X3D
NVIDIA GeForce RTX 4090
252 fps +24%
Intel Core i9-13900K
NVIDIA GeForce RTX 4090
241 (97.9min) fps +18%
AMD Ryzen 9 7950X
NVIDIA GeForce RTX 4090
229 (93min) fps +12%
AMD Ryzen 5 7600
NVIDIA GeForce RTX 4090
204 (73.5min) fps
Average of class Desktop
  (139 - 246, n=15, last 2 years)
195.4 fps -4%
F1 22
1920x1080 Ultra High Preset AA:T AF:16x
AMD Ryzen 5 7600X
NVIDIA GeForce RTX 4090
205 (168min, 137P1) fps +17%
AMD Ryzen 9 7950X3D
NVIDIA GeForce RTX 4090
204 (138min, 120P1) fps +16%
Intel Core i9-13900K
NVIDIA GeForce RTX 4090
199.2 (162min, 134P1) fps +13%
AMD Ryzen 9 7950X
NVIDIA GeForce RTX 4090
194.5 fps +11%
AMD Ryzen 5 7600
NVIDIA GeForce RTX 4090
175.9 (125min, 112P1) fps
Average of class Desktop
  (61.9 - 199.2, n=17, last 2 years)
143.9 fps -18%
1920x1080 Low Preset AA:T AF:16x
AMD Ryzen 9 7950X3D
NVIDIA GeForce RTX 4090
475 (338min, 264P1) fps +35%
AMD Ryzen 9 7950X
NVIDIA GeForce RTX 4090
443 (278min, 245P1) fps +25%
AMD Ryzen 5 7600X
NVIDIA GeForce RTX 4090
417 (281min, 236P1) fps +18%
Intel Core i9-13900K
NVIDIA GeForce RTX 4090
387 (269min, 215P1) fps +10%
Average of class Desktop
  (239 - 427, n=17, last 2 years)
371 fps +5%
AMD Ryzen 5 7600
NVIDIA GeForce RTX 4090
353 (238min, 207P1) fps
F1 2021 - 1920x1080 Ultra High Preset + Raytracing AA:T AF:16x
Intel Core i9-13900K
NVIDIA GeForce RTX 4090
289 (248min, 217P1) fps +14%
AMD Ryzen 5 7600X
NVIDIA GeForce RTX 4090
277 (233min, 216P1) fps +9%
AMD Ryzen 9 7950X
NVIDIA GeForce RTX 4090
271 (224min, 205P1) fps +7%
AMD Ryzen 9 7950X3D
NVIDIA GeForce RTX 4090
271 (216min, 208P1) fps +7%
AMD Ryzen 5 7600
NVIDIA GeForce RTX 4090
254 (209min, 187P1) fps
Average of class Desktop
  (21.4 - 289, n=22, last 2 years)
188.9 fps -26%
Metro Exodus
1920x1080 Ultra Quality AF:16x
AMD Ryzen 9 7950X
NVIDIA GeForce RTX 4090
201 (109.06min) fps +9%
AMD Ryzen 5 7600X
NVIDIA GeForce RTX 4090
197.7 (103.17min) fps +7%
AMD Ryzen 9 7950X3D
NVIDIA GeForce RTX 4090
193.5 (110.2min) fps +5%
Intel Core i9-13900K
NVIDIA GeForce RTX 4090
191.2 (84.99min) fps +4%
AMD Ryzen 5 7600
NVIDIA GeForce RTX 4090
184.3 (97.77min) fps
Average of class Desktop
  (5.22 - 194.7, n=25, last 2 years)
118.2 fps -36%
1280x720 Low Quality AF:4x
AMD Ryzen 5 7600X
NVIDIA GeForce RTX 4090
309 (157.23min) fps +9%
AMD Ryzen 9 7950X
NVIDIA GeForce RTX 4090
300 (162.95min) fps +6%
AMD Ryzen 9 7950X3D
NVIDIA GeForce RTX 4090
293 (157.18min) fps +3%
AMD Ryzen 5 7600
NVIDIA GeForce RTX 4090
284 (142.17min) fps
Intel Core i9-13900K
NVIDIA GeForce RTX 4090
273 (121.97min) fps -4%
Average of class Desktop
  (17.7 - 317, n=18, last 2 years)
197.7 fps -30%
The Witcher 3
1920x1080 Ultra Graphics & Postprocessing (HBAO+)
AMD Ryzen 9 7950X
NVIDIA GeForce RTX 4090
320 (30min, 161.1P0.1, 244P1) fps +16%
AMD Ryzen 5 7600X
NVIDIA GeForce RTX 4090
313 fps +13%
AMD Ryzen 9 7950X3D
NVIDIA GeForce RTX 4090
305 fps +11%
Intel Core i9-13900K
NVIDIA GeForce RTX 4090
297 (271min, 271P1) fps +8%
AMD Ryzen 5 7600
NVIDIA GeForce RTX 4090
276 (241min, 245.13P1) fps
Average of class Desktop
  (3.9 - 314, n=29, last 2 years)
162.9 fps -41%
1024x768 Low Graphics & Postprocessing
AMD Ryzen 9 7950X3D
NVIDIA GeForce RTX 4090
864.7 fps +34%
AMD Ryzen 9 7950X
NVIDIA GeForce RTX 4090
826 (23.6min, 360P0.1, 574P1) fps +28%
Intel Core i9-13900K
NVIDIA GeForce RTX 4090
747 (631min, 633.24P1) fps +16%
AMD Ryzen 5 7600X
NVIDIA GeForce RTX 4090
738 fps +14%
AMD Ryzen 5 7600
NVIDIA GeForce RTX 4090
645 (562min, 563.71P1) fps
Average of class Desktop
  (11.3 - 790, n=21, last 2 years)
430 fps -33%
Far Cry 5
1920x1080 Ultra Preset AA:T
AMD Ryzen 9 7950X3D
NVIDIA GeForce RTX 4090
248 (186min) fps +42%
Intel Core i9-13900K
NVIDIA GeForce RTX 4090
203 (153min) fps +16%
AMD Ryzen 9 7950X
NVIDIA GeForce RTX 4090
188 (136min) fps +7%
AMD Ryzen 5 7600X
NVIDIA GeForce RTX 4090
187 (141min) fps +7%
AMD Ryzen 5 7600
NVIDIA GeForce RTX 4090
175 (124min) fps
Average of class Desktop
  (8 - 219, n=22, last 2 years)
132.5 fps -24%
1280x720 Low Preset AA:T
AMD Ryzen 9 7950X3D
NVIDIA GeForce RTX 4090
299 (201min) fps +44%
AMD Ryzen 5 7600X
NVIDIA GeForce RTX 4090
241 (180min) fps +16%
Intel Core i9-13900K
NVIDIA GeForce RTX 4090
239 (191min) fps +15%
AMD Ryzen 9 7950X
NVIDIA GeForce RTX 4090
238 (182min) fps +15%
AMD Ryzen 5 7600
NVIDIA GeForce RTX 4090
207 (162min) fps
Average of class Desktop
  (8 - 259, n=20, last 2 years)
155.3 fps -25%
GTA V
1920x1080 Highest Settings possible AA:4xMSAA + FX AF:16x
Intel Core i9-13900K
NVIDIA GeForce RTX 4090
168.6 (3.72min, 142.9P1) fps +16%
AMD Ryzen 9 7950X
NVIDIA GeForce RTX 4090
162 (3.52min, 111.1P1) fps +12%
AMD Ryzen 9 7950X3D
NVIDIA GeForce RTX 4090
160.2 (11.4min, 111.1P1) fps +10%
AMD Ryzen 5 7600X
NVIDIA GeForce RTX 4090
155.6 (8.2min, 111.1P1) fps +7%
AMD Ryzen 5 7600
NVIDIA GeForce RTX 4090
145 (4.43min, 100P1) fps
Average of class Desktop
  (3.38 - 172.4, n=26, last 2 years)
121.4 fps -16%
1920x1080 Lowest Settings possible
AMD Ryzen 9 7950X3D
NVIDIA GeForce RTX 4090
188.3 (3.21min, 200P1) fps 0%
Intel Core i9-13900K
NVIDIA GeForce RTX 4090
188.1 (3.25min, 200P1) fps 0%
AMD Ryzen 9 7950X
NVIDIA GeForce RTX 4090
187.7 (2.38min, 200P1) fps 0%
AMD Ryzen 5 7600X
NVIDIA GeForce RTX 4090
187.7 (2.67min, 200P1) fps 0%
AMD Ryzen 5 7600
NVIDIA GeForce RTX 4090
187.6 (56.3min, 200P1) fps
Average of class Desktop
  (19 - 188.1, n=25, last 2 years)
159.7 fps -15%
X-Plane 11.11
1920x1080 high (fps_test=3)
AMD Ryzen 9 7950X3D
NVIDIA GeForce RTX 4090
187.1 fps +34%
Intel Core i9-13900K
NVIDIA GeForce RTX 4090
164.8 fps +18%
AMD Ryzen 9 7950X
NVIDIA GeForce RTX 4090
151.6 fps +9%
AMD Ryzen 5 7600X
NVIDIA GeForce RTX 4090
148.5 fps +7%
AMD Ryzen 5 7600
NVIDIA GeForce RTX 4090
139.4 fps
Average of class Desktop
  (4.64 - 166.3, n=30, last 2 years)
102.1 fps -27%
1280x720 low (fps_test=1)
Intel Core i9-13900K
NVIDIA GeForce RTX 4090
251 fps +18%
AMD Ryzen 9 7950X3D
NVIDIA GeForce RTX 4090
225 fps +6%
AMD Ryzen 9 7950X
NVIDIA GeForce RTX 4090
223 fps +5%
AMD Ryzen 5 7600X
NVIDIA GeForce RTX 4090
217 fps +2%
AMD Ryzen 5 7600
NVIDIA GeForce RTX 4090
212 fps
Average of class Desktop
  (7.76 - 251, n=30, last 2 years)
150.9 fps -29%
Dota 2 Reborn
1920x1080 ultra (3/3) best looking
AMD Ryzen 9 7950X3D
NVIDIA GeForce RTX 4090
252.7 (208.9min) fps +24%
Intel Core i9-13900K
NVIDIA GeForce RTX 4090
239.8 (204min) fps +18%
AMD Ryzen 9 7950X
NVIDIA GeForce RTX 4090
239.2 (203.6min) fps +18%
AMD Ryzen 5 7600X
NVIDIA GeForce RTX 4090
224.3 (189min) fps +10%
AMD Ryzen 5 7600
NVIDIA GeForce RTX 4090
203 (173.4min) fps
Average of class Desktop
  (5.2 - 246, n=32, last 2 years)
146.3 fps -28%
1280x720 min (0/3) fastest
AMD Ryzen 9 7950X3D
NVIDIA GeForce RTX 4090
314.1 (261.7min) fps +22%
AMD Ryzen 9 7950X
NVIDIA GeForce RTX 4090
310.6 (261.3min) fps +21%
Intel Core i9-13900K
NVIDIA GeForce RTX 4090
292.4 (248.2min) fps +14%
AMD Ryzen 5 7600X
NVIDIA GeForce RTX 4090
278.1 (211.4min) fps +8%
AMD Ryzen 5 7600
NVIDIA GeForce RTX 4090
257 (218.5min) fps
Average of class Desktop
  (24.3 - 303, n=32, last 2 years)
197 fps -23%
Strange Brigade
1920x1080 ultra AA:ultra AF:16
AMD Ryzen 5 7600X
NVIDIA GeForce RTX 4090
595 (60.2min, 433P1) fps +5%
AMD Ryzen 5 7600
NVIDIA GeForce RTX 4090
569 (124.7min, 414P1) fps
AMD Ryzen 9 7950X
NVIDIA GeForce RTX 4090
565 (104.9min, 433P1) fps -1%
AMD Ryzen 9 7950X3D
NVIDIA GeForce RTX 4090
524 (115.8min, 393P1) fps -8%
Average of class Desktop
  (13.6 - 569, n=20, last 2 years)
286 fps -50%
1280x720 lowest AF:1
AMD Ryzen 5 7600X
NVIDIA GeForce RTX 4090
780 (275min, 597P1) fps +6%
AMD Ryzen 5 7600
NVIDIA GeForce RTX 4090
736 (61.8min, 561P1) fps
AMD Ryzen 9 7950X
NVIDIA GeForce RTX 4090
698 (182.7min, 569P1) fps -5%
AMD Ryzen 9 7950X3D
NVIDIA GeForce RTX 4090
672 (259min, 529P1) fps -9%
Average of class Desktop
  (9.2 - 797, n=23, last 2 years)
428 fps -42%

AMD Ryzen 5 7600 with Nvidia GeForce RTX 4090

bajo medio alto ultraQHD4K
GTA V (2015) 187.6 187.5 185 145 147.7
The Witcher 3 (2015) 645 574 547 276 275
Dota 2 Reborn (2015) 257 228 218 203 202
Final Fantasy XV Benchmark (2018) 237 237 237 237 145.9
X-Plane 11.11 (2018) 212 182.4 139.4 117.3
Far Cry 5 (2018) 207 187 182 175 170 158
Strange Brigade (2018) 736 600 580 569 509 279
Metro Exodus (2019) 284 243 221 184.3 173.6 133.6
F1 2021 (2021) 640 603 502 254 249 199.1
Cyberpunk 2077 1.6 (2022) 204 203 192.2 190.3 147.4 78.9
F1 22 (2022) 353 374 342 175.9 150 80.9

Gestión de la energía: Mayor eficiencia energética que Ryzen 7000 serie X

Similar a lo que hemos visto antes con el Ryzen 7 7700, el Ryzen 5 7600 sigue ofreciendo un mayor rendimiento por vatio en Cinebench R15 multi-core en comparación con la serie Ryzen 7000 X - 49% más eficiente que el Ryzen 5 7600X. Dicho esto, un Ryzen 9 7950X con un consumo máximo de 65 W ofrece la mayor eficiencia energética en relación con la competencia.

En comparación, el Ryzen 5 7600 consume la menor cantidad de energía de la pared cuando ejecuta grandes FFT en Prime95, utilizando solo 134,5 W.

El Ryzen 5 7600 es un 11% más eficiente que el Ryzen 9 7950X3D en

Witcher 3 cuando se utiliza en combinación con una RTX 4090, pero se queda atrás en un 21% en la eficiencia energética multinúcleo de Cinebench R15.


Como ya hemos indicado, estamos en proceso de transición a la RTX 4090 como GPU de elección. Las pruebas anteriores se realizaron principalmente con una RTX 3090 o una Titan RTX, pero seguimos viendo que la combinación de Ryzen 5 7600 con RTX 4090 lidera las tablas de eficiencia en

y Witcher 3

a 1080p Ultra.


Power Consumption: External monitor

0255075100125150175200225250275300325350375400425Tooltip
AMD Ryzen 5 7600; Prime95 V2810 Stress (external Monitor): Ø134.5 (132.3-137.8)
AMD Ryzen 5 7600; Cinebench R15 Multi (external Monitor): Ø134.2 (132.2-134.8)
AMD Ryzen 5 7600; Cinebench R20 Single (external Monitor): Ø97.8 (96-131.3)
AMD Ryzen 5 7600; Cinebench R20 Multi (external Monitor): Ø134 (133-135.6)
AMD Ryzen 5 7600; Cinebench R23 Single (external Monitor): Ø97.4 (96-129.5)
AMD Ryzen 5 7600; Cinebench R23 Multi (external Monitor): Ø133 (132.1-134.1)
AMD Ryzen 5 7600; 1920x1080 The Witcher 3 ultra (external Monitor): Ø423 (414-442)
AMD Ryzen 5 7600; Idle 1min (external Monitor): Ø81.5 (80.5-88.6)
Power Consumption / Cinebench R15 Multi Efficiency (external Monitor)
AMD Ryzen 9 7950X ECO 65 W, NVIDIA GeForce RTX 3090
25.2 Points per Watt +45%
AMD Ryzen 9 7950X ECO 105 W, NVIDIA GeForce RTX 3090
22.1 Points per Watt +27%
AMD Ryzen 9 7950X3D, NVIDIA GeForce RTX 4090
21.9 Points per Watt +26%
AMD Ryzen 7 7700, NVIDIA GeForce RTX 3090
20.4 Points per Watt +17%
AMD Ryzen 9 5950X, NVIDIA Titan RTX
19.9 Points per Watt +14%
AMD Ryzen 5 7600, NVIDIA GeForce RTX 4090
17.4 Points per Watt
AMD Ryzen 9 7950X, NVIDIA GeForce RTX 3090
17.1 Points per Watt -2%
Average of class Desktop (10.1 - 26.5, n=20, last 2 years)
16.7 Points per Watt -4%
Average NVIDIA GeForce RTX 4090 (11.1 - 21.9, n=6)
16.3 Points per Watt -6%
AMD Ryzen 9 5900X, NVIDIA Titan RTX
15.8 Points per Watt -9%
AMD Ryzen 9 7900X, NVIDIA GeForce RTX 3090
15.5 Points per Watt -11%
AMD Ryzen 7 7700X ECO 65 W, NVIDIA GeForce RTX 3090
15.5 Points per Watt -11%
AMD Ryzen 7 7700X, NVIDIA GeForce RTX 3090
13.3 Points per Watt -24%
Intel Core i9-13900K, NVIDIA GeForce RTX 3090
12.9 Points per Watt -26%
Intel Core i5-13600K, NVIDIA GeForce RTX 3090
12.7 Points per Watt -27%
Intel Core i9-12900K, NVIDIA Titan RTX
12.5 Points per Watt -28%
Intel Core i5-12600K, NVIDIA Titan RTX
12.4 Points per Watt -29%
AMD Ryzen 7 5800X, NVIDIA Titan RTX
11.9 Points per Watt -32%
AMD Ryzen 5 7600X, NVIDIA GeForce RTX 3090
11.7 Points per Watt -33%
AMD Ryzen 5 5600X, NVIDIA Titan RTX
11.6 Points per Watt -33%
AMD Ryzen 7 5800X3D, NVIDIA GeForce RTX 3090 Ti
11.5 Points per Watt -34%
Power Consumption / Witcher 3 ultra Efficiency (external Monitor)
AMD Ryzen 5 7600, NVIDIA GeForce RTX 4090
0.652 fps per Watt
AMD Ryzen 9 7950X3D, NVIDIA GeForce RTX 4090
0.59 fps per Watt -10%
Average NVIDIA GeForce RTX 4090 (0.518 - 0.712, n=19)
0.587 fps per Watt -10%
Average of class Desktop (0.1429 - 0.652, n=26, last 2 years)
0.437 fps per Watt -33%
AMD Ryzen 7 7700, NVIDIA GeForce RTX 3090
0.3699 fps per Watt -43%
Intel Core i5-13600K, NVIDIA GeForce RTX 3090
0.3664 fps per Watt -44%
AMD Ryzen 5 7600X, NVIDIA GeForce RTX 3090
0.3592 fps per Watt -45%
Intel Core i5-12600K, NVIDIA Titan RTX
0.3522 fps per Watt -46%
AMD Ryzen 7 5800X3D, NVIDIA GeForce RTX 3090 Ti
0.3447 fps per Watt -47%
AMD Ryzen 5 5600X, NVIDIA Titan RTX
0.3397 fps per Watt -48%
AMD Ryzen 9 7900X, NVIDIA GeForce RTX 3090
0.3389 fps per Watt -48%
Intel Core i9-13900K, NVIDIA GeForce RTX 3090
0.3373 fps per Watt -48%
AMD Ryzen 7 7700X, NVIDIA GeForce RTX 3090
0.3341 fps per Watt -49%
AMD Ryzen 7 5800X, NVIDIA Titan RTX
0.332 fps per Watt -49%
AMD Ryzen 9 7950X ECO 105 W, NVIDIA GeForce RTX 3090
0.3286 fps per Watt -50%
AMD Ryzen 9 7950X ECO 65 W, NVIDIA GeForce RTX 3090
0.3284 fps per Watt -50%
AMD Ryzen 9 7950X, NVIDIA GeForce RTX 3090
0.325 fps per Watt -50%
AMD Ryzen 7 7700X ECO 65 W, NVIDIA GeForce RTX 3090
0.3218 fps per Watt -51%
AMD Ryzen 9 5900X, NVIDIA Titan RTX
0.3207 fps per Watt -51%
AMD Ryzen 9 5950X, NVIDIA Titan RTX
0.3201 fps per Watt -51%
Intel Core i9-12900K, NVIDIA Titan RTX
0.3002 fps per Watt -54%
Power Consumption / Cinebench R15 Multi (external Monitor)
Intel Core i9-13900K, NVIDIA GeForce RTX 3090
480 (263min, 277P1 - 553max) Watt * -258%
AMD Ryzen 9 7950X, NVIDIA GeForce RTX 3090 (Idle: 95.2 W)
364 (357min, 357P1 - 373max) Watt * -171%
Intel Core i9-12900K, NVIDIA Titan RTX (Idle: 70.5 W)
324.4 Watt * -142%
AMD Ryzen 9 7900X, NVIDIA GeForce RTX 3090
313 (214min, 221P1 - 406max) Watt * -133%
Average NVIDIA GeForce RTX 4090 (Idle: 134.2 - 548, n=13 W)
300 Watt * -124%
Intel Core i5-13600K, NVIDIA GeForce RTX 3090
286 (232min, 235P1 - 343max) Watt * -113%
AMD Ryzen 9 7950X3D, NVIDIA GeForce RTX 4090
273 (264min, 264P1 - 304max) Watt * -103%
AMD Ryzen 9 7950X ECO 105 W, NVIDIA GeForce RTX 3090 (Idle: 93.4 W)
263 (262min, 262P1 - 265max) Watt * -96%
AMD Ryzen 7 7700X, NVIDIA GeForce RTX 3090 (Idle: 89.8 W)
240 (236min, 236P1 - 252max) Watt * -79%
AMD Ryzen 9 5900X, NVIDIA Titan RTX (Idle: 78.1 W)
235.8 (204min - 238max) Watt * -76%
AMD Ryzen 9 5950X, NVIDIA Titan RTX (Idle: 78 W)
226.1 (160min - 249max) Watt * -68%
AMD Ryzen 7 5800X, NVIDIA Titan RTX (Idle: 77.5 W)
220.7 (219min - 222max) Watt * -64%
AMD Ryzen 5 7600X, NVIDIA GeForce RTX 3090
215 (134.8min, 135.6P1 - 259max) Watt * -60%
AMD Ryzen 7 5800X3D, NVIDIA GeForce RTX 3090 Ti (Idle: 102 W)
209 (208min, 208P1 - 212max) Watt * -56%
Intel Core i5-12600K, NVIDIA Titan RTX (Idle: 70.45 W)
205.9 (145min - 213max) Watt * -53%
AMD Ryzen 7 7700X ECO 65 W, NVIDIA GeForce RTX 3090
196.1 (195.3min, 195.3P1 - 196.7max) Watt * -46%
AMD Ryzen 9 7950X ECO 65 W, NVIDIA GeForce RTX 3090 (Idle: 93.1 W)
191.9 (191.1min, 191.1P1 - 192.5max) Watt * -43%
AMD Ryzen 5 5600X, NVIDIA Titan RTX (Idle: 79.23 W)
170.1 (165min - 210max) Watt * -27%
Average of class Desktop (Idle: 10.4 - 428, n=21, last 2 years W)
161.9 Watt * -21%
AMD Ryzen 7 7700, NVIDIA GeForce RTX 3090 (Idle: 73.4 W)
149.4 (148.6min, 148.6P1 - 150.3max) Watt * -11%
AMD Ryzen 5 7600, NVIDIA GeForce RTX 4090 (Idle: 81.5 W)
134.2 (132.2min, 132.4P1 - 134.8max) Watt *
Power Consumption / Prime95 V2810 Stress (external Monitor)
Intel Core i9-13900K, NVIDIA GeForce RTX 3090
471 (414min, 427P1 - 561max) Watt * -250%
Intel Core i5-13600K, NVIDIA GeForce RTX 3090
348 (283min, 288P1 - 496max) Watt * -159%
AMD Ryzen 9 7950X, NVIDIA GeForce RTX 3090 (Idle: 95.2 W)
335 (311min, 312P1 - 364max) Watt * -149%
AMD Ryzen 9 7900X, NVIDIA GeForce RTX 3090
319 (310min, 311P1 - 357max) Watt * -137%
Average NVIDIA GeForce RTX 4090 (Idle: 134.5 - 537, n=13 W)
311 Watt * -131%
Intel Core i9-12900K, NVIDIA Titan RTX (Idle: 70.5 W)
279.6 (261min - 357max) Watt * -108%
AMD Ryzen 9 7950X3D, NVIDIA GeForce RTX 4090
276 (267min, 267P1 - 329max) Watt * -105%
Intel Core i5-12600K, NVIDIA Titan RTX (Idle: 70.45 W)
256.5 (238min - 275max) Watt * -91%
AMD Ryzen 9 7950X ECO 105 W, NVIDIA GeForce RTX 3090 (Idle: 93.4 W)
254 (247min, 247P1 - 268max) Watt * -89%
AMD Ryzen 9 5950X, NVIDIA Titan RTX (Idle: 78 W)
252.3 (227min - 259max) Watt * -88%
AMD Ryzen 7 5800X, NVIDIA Titan RTX (Idle: 77.5 W)
242.3 (222min - 254max) Watt * -80%
AMD Ryzen 9 5900X, NVIDIA Titan RTX (Idle: 78.1 W)
235.6 (211min - 284max) Watt * -75%
AMD Ryzen 7 7700X, NVIDIA GeForce RTX 3090 (Idle: 89.8 W)
230 (216min, 217P1 - 265max) Watt * -71%
AMD Ryzen 5 7600X, NVIDIA GeForce RTX 3090
227 (218min, 219P1 - 245max) Watt * -69%
AMD Ryzen 7 5800X3D, NVIDIA GeForce RTX 3090 Ti (Idle: 102 W)
226 (221min, 222P1 - 234max) Watt * -68%
AMD Ryzen 7 7700X ECO 65 W, NVIDIA GeForce RTX 3090
189.8 (184.1min, 184.2P1 - 204max) Watt * -41%
AMD Ryzen 9 7950X ECO 65 W, NVIDIA GeForce RTX 3090 (Idle: 93.1 W)
186.8 (180.7min, 180.9P1 - 201max) Watt * -39%
AMD Ryzen 5 5600X, NVIDIA Titan RTX (Idle: 79.23 W)
175.8 (170min - 179max) Watt * -31%
AMD Ryzen 7 7700, NVIDIA GeForce RTX 3090 (Idle: 73.4 W)
163.2 (156.6min, 156.8P1 - 174.5max) Watt * -21%
Average of class Desktop (Idle: 11.1 - 400, n=21, last 2 years W)
150.8 Watt * -12%
AMD Ryzen 5 7600, NVIDIA GeForce RTX 4090 (Idle: 81.5 W)
134.5 (132.3min, 132.5P1 - 137.8max) Watt *
Power Consumption / The Witcher 3 ultra (external Monitor)
AMD Ryzen 7 5800X3D, NVIDIA GeForce RTX 3090 Ti (Idle: 102 W)
561 (533min, 542P1 - 582max) Watt * -33%
AMD Ryzen 9 7900X, NVIDIA GeForce RTX 3090
555 (547min, 549P1 - 607max) Watt * -31%
AMD Ryzen 9 7950X, NVIDIA GeForce RTX 3090 (Idle: 95.2 W)
539 (534min, 535P1 - 547max) Watt * -27%
AMD Ryzen 9 7950X ECO 105 W, NVIDIA GeForce RTX 3090 (Idle: 93.4 W)
539 (252min, 535P1 - 573max) Watt * -27%
AMD Ryzen 9 7950X ECO 65 W, NVIDIA GeForce RTX 3090 (Idle: 93.1 W)
539 (534min, 534P1 - 547max) Watt * -27%
Intel Core i9-13900K, NVIDIA GeForce RTX 3090
533 (520min, 525P1 - 568max) Watt * -26%
AMD Ryzen 7 7700X ECO 65 W, NVIDIA GeForce RTX 3090
524 (515min, 517P1 - 533max) Watt * -24%
AMD Ryzen 5 7600X, NVIDIA GeForce RTX 3090
519 (510min, 513P1 - 564max) Watt * -23%
AMD Ryzen 7 7700, NVIDIA GeForce RTX 3090 (Idle: 73.4 W)
519 (511min, 512P1 - 532max) Watt * -23%
Average NVIDIA GeForce RTX 4090 (Idle: 423 - 600, n=19 W)
518 Watt * -22%
AMD Ryzen 9 7950X3D, NVIDIA GeForce RTX 4090
517 (508min, 510P1 - 539max) Watt * -22%
AMD Ryzen 7 7700X, NVIDIA GeForce RTX 3090 (Idle: 89.8 W)
516 (512min, 512P1 - 529max) Watt * -22%
Intel Core i5-13600K, NVIDIA GeForce RTX 3090
500 (491min, 493P1 - 528max) Watt * -18%
Intel Core i9-12900K, NVIDIA Titan RTX (Idle: 70.5 W)
463 (439min - 490max) Watt * -9%
AMD Ryzen 9 5950X, NVIDIA Titan RTX (Idle: 78 W)
440.5 (420min - 466max) Watt * -4%
AMD Ryzen 9 5900X, NVIDIA Titan RTX (Idle: 78.1 W)
439.6 (419min - 497max) Watt * -4%
AMD Ryzen 5 7600, NVIDIA GeForce RTX 4090 (Idle: 81.5 W)
423 (414min, 415P1 - 442max) Watt *
AMD Ryzen 7 5800X, NVIDIA Titan RTX (Idle: 77.5 W)
418.7 (403min - 452max) Watt * +1%
AMD Ryzen 5 5600X, NVIDIA Titan RTX (Idle: 79.23 W)
409.2 (381min - 434max) Watt * +3%
Intel Core i5-12600K, NVIDIA Titan RTX (Idle: 70.45 W)
408.9 (401min - 460max) Watt * +3%
Average of class Desktop (Idle: 19.1 - 569, n=37, last 2 years W)
354 Watt * +16%

* ... más pequeño es mejor

Pro

+ Supera a las CPU Zen 3 y al Core i9-12900K en núcleo único
+ Soporte de overclocking manual y PBO
+ Alta eficiencia energética
+ IGPU RDNA 2 integrada en la matriz de E/S
+ Refrigerador Wraith Stealth incluido

Contra

- No puede compararse con el Core i5-13600K en las pruebas de CPU
- No hay retrocompatibilidad con DDR4; los precios de DDR5 siguen siendo altos
- El coste inicial de actualización de la plataforma puede ser elevado

Veredicto: Una elección inteligente para juegos de gama media

AMD Ryzen 5 7600. Unidad de prueba cortesía de AMD India.

Aunque los procesadores Ryzen 7000 no X de 65 W pueden parecer superfluos a primera vista, estas CPU ofrecen una opción viable para aquellos que buscan construcciones económicas sin penalizaciones de rendimiento perceptibles en comparación con la serie Ryzen 7000X.

AMD ha logrado ofrecer aumentos significativos de rendimiento con el Ryzen 5 7600, superando a la mayoría de las CPU Zen 3 e incluso a un behemoth de la talla de un Intel Core i9-12900K con un TDP muy económico de 65 W que puede llegar hasta los 90 W bajo carga. Esto también se refleja en las excelentes cifras de eficiencia energética del procesador.

El Intel Raptor Lake Core i5-13600K sigue llevando la delantera en rendimiento general de CPU, pero el Ryzen 5 cuesta 100 $ menos según los precios actuales y le pisa los talones al Core i5-13600K en las pruebas mononúcleo. El chip Intel tiene la ventaja en número de núcleos/hilos en multi-core, pero el impacto real de esto dependerá de tu flujo de trabajo específico.

El AMD Ryzen 5 7600 cumple todos los requisitos de una CPU viable para juegos y creación de contenidos a un precio que no hace saltar la banca, a pesar del gasto inicial en la plataforma Socket AM5"

Los juegos, en general, han sido el fuerte de Zen 4 desde el principio. El Ryzen 5 7600 puede ser un 9% más lento que un Ryzen 9 7950X o un Core i9-13900K con ajustes bajos, y esta diferencia puede reducirse aún más con ajustes y resoluciones de mayor calidad.

El procesador también viene con una iGPU RDNA 2 en la matriz de E/S. Aunque en realidad no puede proporcionar ningún impulso a nada más que el juego básico, casual 720p, funciona muy bien como un acelerador de hardware para la codificación y decodificación de medios de comunicación. También resulta útil cuando las estrellas no se alinean y la GPU discreta se rinde.

Lo único que puede frenar su compra es el coste inicial de adoptar la plataforma AM5 y la memoria DDR5. Si no te importa tragarte esta píldora y tu caso de uso principal son los juegos, el Ryzen 5 7600 ofrece una gran relación calidad-precio y puede mantener tu tarjeta gráfica moderna felizmente alimentada sin cuellos de botella perceptibles.

Precio y disponibilidad

El AMD Ryzen 5 7600 está disponible actualmente a un precio rebajado de ₹22.997 en Amazon India.

En EE. UU., este procesador de 65 W puede adquirirse por 220 dólares en Amazon US junto con un paquete de juegos Star Wars: Jedi Survivor. El Ryzen 5 7600 también se vende al precio de 229 dólares en Best Buy.

Transparency

The present review sample was made available to the author as a loan by the manufacturer or a shop for the purposes of review. The lender had no influence on this review, nor did the manufacturer receive a copy of this review before publication. There was no obligation to publish this review.

Pricecompare

Please share our article, every link counts!
> Análisis y pruebas de ordenadores portátiles y móviles teléfonos > Análisis > Análisis del AMD Ryzen 5 7600 65 W: El punto dulce para juegos de gama media de 220 dólares que supera al Core i9-12900K y a todas las CPU Zen 3 en un solo núcleo
Vaidyanathan Subramaniam, 2023-04-27 (Update: 2023-04-27)