Análisis para el Intel Core i3-1005G1 procesador
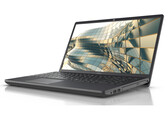
Análisis del Fujitsu Lifebook A3510: Un portátil de oficina asequible con solapa de mantenimiento
El Lifebook A3510 produce unas emisiones relativamente bajas, no tiene mucho peso (1,8 kg, ~4 lb) y también incluye una unidad de DVD a bordo. El sistema operativo es Windows 10 Pro con la posibilidad de actualizarlo a Windows 11. Una característica positiva es una solapa de mantenimiento que da acceso al SSD, la RAM y la batería.
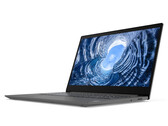
Intel Core i3-1005G1, UHD Graphics G1 (Ice Lake 32 EU), 15.6", 1.8 kgAnálisis del Lenovo V17-IIL: Un silencioso portátil para la oficina en casa con una buena pantalla
Con el V17-IIL, Lenovo ofrece un dispositivo de trabajo para uso de escritorio. El portátil de 17,3 pulgadas puntúa con un bajo ruido de funcionamiento, un bajo desarrollo de calor, y una pantalla IPS muy completa. La carcasa inestable prohíbe el uso móvil.
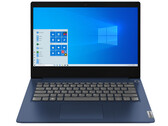
Intel Core i3-1005G1, UHD Graphics G1 (Ice Lake 32 EU), 17.3", 2.2 kgReview del Lenovo IdeaPad 3 14IIL05: Un portátil de oficina silencioso con una batería de duración mediocre
El 14 pulgadas de Lenovo puntúa con un bajo ruido de funcionamiento y bajas temperaturas. Un procesador Ice Lake Core i3, un SSD NVMe y una pantalla IPS mate se encuentran a bordo. El sistema operativo es Windows 10 Home en modo S.
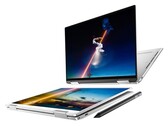
Intel Core i3-1005G1, UHD Graphics G1 (Ice Lake 32 EU), 14", 1.6 kgHielo caliente: Review de la computadora portátil Dell XPS 13 7390 2 en 1 Core i3
El último convertible XPS de Dell no se parece a la mayoría de los Ultrabooks o convertibles que hemos probado este año simplemente porque cuenta con una larga lista de características poco comunes: Ice Lake-U, teclado MagLev, cámara de vapor, refrigeración GORE, pantalla táctil de 13,4 pulgadas y una relación de aspecto 16:10. El resultado es un descapotable apto para viajar con una de las pantallas más brillantes y bien calibradas que hemos visto en su categoría. Desafortunadamente, tendrá que renunciar a algunas actualizaciones a lo largo del camino que pueden afectar la longevidad.
Intel Core i3-1005G1, UHD Graphics G1 (Ice Lake 32 EU), 13.4", 1.3 kgAcer Aspire 5 A514-53-3970: Intel UHD Graphics G1 (Ice Lake 32 EU), 14.00", 1.7 kg
análise externo » Acer Aspire 5 A514-53-3970
Medion Akoya E14409, i3-1005G1: Intel UHD Graphics G1 (Ice Lake 32 EU), 14.00", 1.6 kg
análise externo » Medion Akoya E14409, i3-1005G1
Asus VivoBook 15 F515JA-BR1840: Intel UHD Graphics G1 (Ice Lake 32 EU), 15.60", 1.8 kg
análise externo » Asus VivoBook 15 F515JA-BR1840
Allview Allbook i: Intel UHD Graphics G1 (Ice Lake 32 EU), 15.60", 2 kg
análise externo » Allview Allbook i
Fujitsu LifeBook A3510-FPC04905BP: Intel UHD Graphics G1 (Ice Lake 32 EU), 15.60", 2 kg
análise externo » Fujitsu LifeBook A3510-FPC04905BP
Asus VivoBook 15 F512JA-AS34: Intel UHD Graphics G1 (Ice Lake 32 EU), 15.60", 1.8 kg
análise externo » Asus VivoBook 15 F512JA-AS34
Asus F415JA-BV393T: Intel UHD Graphics G1 (Ice Lake 32 EU), 14.00", 1.6 kg
análise externo » Asus F415JA-BV393T
Acer Aspire 3 A317-52-36L5: Intel UHD Graphics G1 (Ice Lake 32 EU), 17.30", 2.7 kg
análise externo » Acer Aspire 3 A317-52-36L5
Acer Aspire 5 A515-55-35SE: Intel UHD Graphics G1 (Ice Lake 32 EU), 15.60", 1.8 kg
análise externo » Acer Aspire 5 A515-55-35SE
Asus VivoBook 15 F515JA-AH31: Intel UHD Graphics G1 (Ice Lake 32 EU), 15.60", 1.8 kg
análise externo » Asus VivoBook 15 F515JA-AH31
HP 240 G8, i3-1005G1: Intel UHD Graphics G1 (Ice Lake 32 EU), 14.00", 1.5 kg
análise externo » HP 240 G8, i3-1005G1
Asus VivoBook 15 R565J: Intel UHD Graphics G1 (Ice Lake 32 EU), 15.60", 1.8 kg
análise externo » Asus VivoBook 15 R565J
Asus VivoBook 15 F515JA-BR097T: Intel UHD Graphics G1 (Ice Lake 32 EU), 15.60", 1.8 kg
análise externo » Asus VivoBook 15 F515JA-BR097T
Asus VivoBook 15 R543MA-GQ1264: Intel UHD Graphics G1 (Ice Lake 32 EU), 15.60"
análise externo » Asus VivoBook 15 R543MA-GQ1264
Lenovo IdeaPad 3 15IIL05-4GSP: Intel UHD Graphics G1 (Ice Lake 32 EU), 15.60", 1.9 kg
análise externo » Lenovo IdeaPad 3i 15IIL05-4GSP
Lenovo IdeaPad Flex 5 15IIL05-81X3002BMH: Intel UHD Graphics G1 (Ice Lake 32 EU), 15.60", 1.8 kg
análise externo » Lenovo IdeaPad Flex 5 15IIL05-81X3002BMH
Dell Vostro 15 3501: Intel UHD Graphics G1 (Ice Lake 32 EU), 15.60", 1.9 kg
análise externo » Dell Vostro 15 3501
HP 340S G7, i3-1005G1: Intel UHD Graphics G1 (Ice Lake 32 EU), 14.00", 1.4 kg
análise externo » HP 340S G7, i3-1005G1
Lenovo IdeaPad Flex 5 15IIL05-81X3007XGE: Intel UHD Graphics G1 (Ice Lake 32 EU), 15.60", 1.8 kg
análise externo » Lenovo IdeaPad Flex 5 15IIL05-81X3007XGE
HP 14s-dq1931nd: Intel UHD Graphics G1 (Ice Lake 32 EU), 14.00", 1.5 kg
análise externo » HP 14s-dq1931nd
Asus Vivobook X509JA-EJ371T: Intel UHD Graphics G1 (Ice Lake 32 EU), 15.60", 1.9 kg
análise externo » Asus Vivobook X509JA-EJ371T
Asus ZenBook 14 UX425JA, i3-1005G1: Intel UHD Graphics G1 (Ice Lake 32 EU), 14.00", 1.1 kg
análise externo » Asus ZenBook 14 UX425JA, i3-1005G1
HP 14s-dq1040ns: Intel UHD Graphics G1 (Ice Lake 32 EU), 14.00", 1.5 kg
análise externo » HP 14s-dq1040ns
HP 17-by3099ng: Intel UHD Graphics G1 (Ice Lake 32 EU), 17.30", 2.4 kg
análise externo » HP 17-by3099ng
Lenovo IdeaPad 3 15IIL05-81WE00KYGE: Intel UHD Graphics G1 (Ice Lake 32 EU), 15.60", 1.9 kg
análise externo » Lenovo IdeaPad 3 15IIL05-81WE00KYGE
HP 15s-fq1111tu: Intel UHD Graphics G1 (Ice Lake 32 EU), 15.60", 1.7 kg
análise externo » HP 15s-fq1111tu
HP 15s-fq1075ns: Intel UHD Graphics G1 (Ice Lake 32 EU), 15.60", 1.7 kg
análise externo » HP 15s-fq1075ns
Asus VivoBook 15 S512JA-BR192T: Intel UHD Graphics G1 (Ice Lake 32 EU), 15.60", 1.6 kg
análise externo » Asus VivoBook 15 S512JA-BR192T
Lenovo Ideapad S145-15IIL-81W800BMGE: Intel UHD Graphics G1 (Ice Lake 32 EU), 15.60", 1.9 kg
análise externo » Lenovo Ideapad S145-15IIL-81W800BMGE
Lenovo IdeaPad 3 14IIL05: Intel UHD Graphics G1 (Ice Lake 32 EU), 14.00", 1.6 kg
análise externo » Lenovo IdeaPad 3 14IIL05
Acer Aspire 5 A514-53-30VS: Intel UHD Graphics G1 (Ice Lake 32 EU), 14.00", 1.6 kg
análise externo » Acer Aspire 5 A514-53-30VS
Asus VivoBook X409JA i3-1005G1: Intel UHD Graphics G1 (Ice Lake 32 EU), 14.00", 1.5 kg
análise externo » Asus VivoBook X409JA i3-1005G1
Asus VivoBook 15 R521JA-EJ113T: Intel UHD Graphics G1 (Ice Lake 32 EU), 15.60", 1.9 kg
análise externo » Asus VivoBook 15 R521JA-EJ113T
HP 14s-dq1001ns: Intel UHD Graphics G1 (Ice Lake 32 EU), 14.00", 1.5 kg
análise externo » HP 14s-dq1001ns
HP Pavilion 13-an1033tu: Intel UHD Graphics G1 (Ice Lake 32 EU), 13.30", 1.3 kg
análise externo » HP Pavilion 13-an1033tu
HP 14s-dq1002ns: Intel UHD Graphics G1 (Ice Lake 32 EU), 14.00", 1.5 kg
análise externo » HP 14s-dq1002ns
HP 14s-DQ1013TU: Intel UHD Graphics G1 (Ice Lake 32 EU), 14.00", 1.5 kg
análise externo » HP 14s-DQ1013TU
HP 15s-fq1013ns: Intel UHD Graphics G1 (Ice Lake 32 EU), 15.60", 1.7 kg
análise externo » HP 15s-fq1013ns
Lenovo Ideapad S340-14IIL-81VV0032GE: Intel UHD Graphics G1 (Ice Lake 32 EU), 14.00", 1.6 kg
análise externo » Lenovo Ideapad S340-14IIL-81VV0032GE
Acer Swift 3 SF314-57, i3-1005G1: Intel UHD Graphics G1 (Ice Lake 32 EU), 14.00", 1.2 kg
análise externo » Acer Swift 3 SF314-57, i3-1005G1