Veredicto - Rendimiento equilibrado y portabilidad
El ZBook X G1i 16 se sitúa cómodamente en el medio entre la serie ZBook 8, más lenta, y la serie ZBook Fury, más rápida pero más pesada. Externamente, casi nada ha cambiado con respecto al ZBook Power 16 G11 por lo que la experiencia de usuario sigue siendo idéntica, incluidos los puertos con multitud de funciones y las cómodas teclas. Tanto la duración de la batería como el rendimiento han mejorado, pero el consumo de energía también es ligeramente superior cuando se ejecutan cargas exigentes.
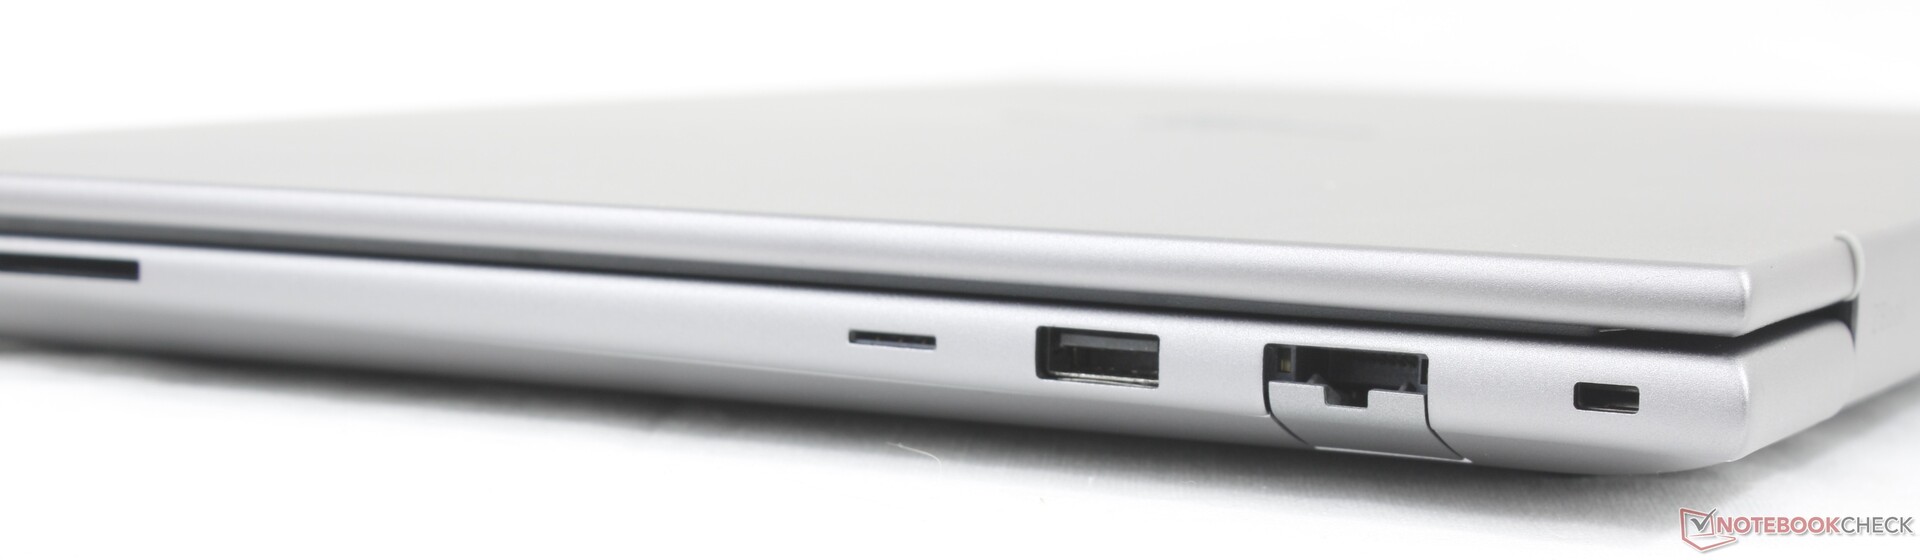
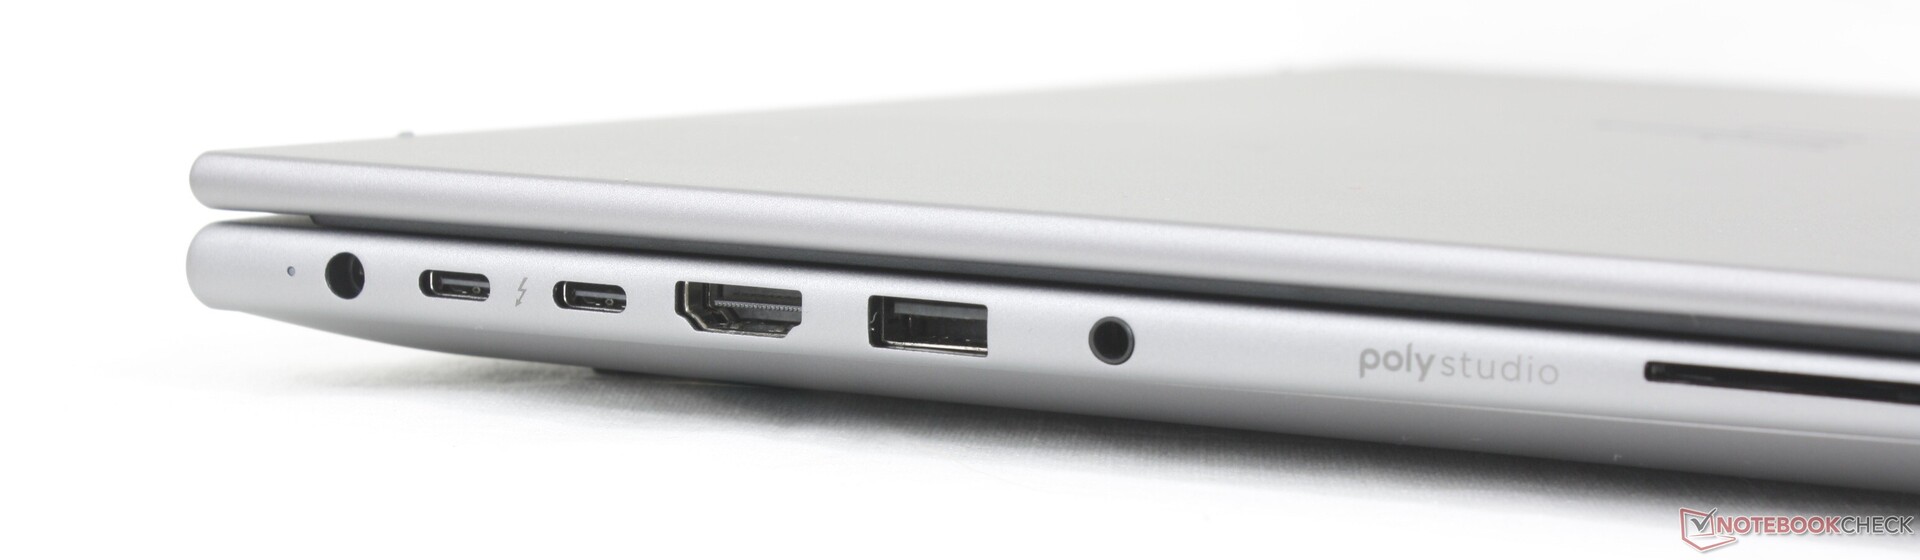
Siguen faltando algunas características en la máquina. Mientras que las opciones de CPU y GPU de gama alta están fuera de alcance, como era de esperar, el modelo carece de OLED, HDR y soporte de RAM ECC, lo que puede irritar a un pequeño subconjunto de usuarios. Los puertos se sienten abarrotados a lo largo del borde izquierdo, especialmente porque no hay puertos USB-C a lo largo del borde derecho. Los usuarios a los que les gusta estresar la CPU y la GPU también encontrarán que el sistema no funcionará más silencioso que su homólogo de última generación.
Para futuros modelos, nos gustaría ver que la serie ZBook X se aleja de la carga de barril de CA propietaria al tiempo que ofrece un mejor rendimiento Turbo Boost de la CPU. El procesador alcanzaría más de 100 C con bastante rapidez cuando se estresa, lo que sugiere que una solución de refrigeración más potente podría ser beneficiosa.
Pro
Contra
Precio y disponibilidad
La configuración reseñada ya está a la venta en HP.com por 2900 dólares junto con muchas otras opciones. La configuración Core Ultra 9 y 2400p está disponible en Amazon por 3500$.
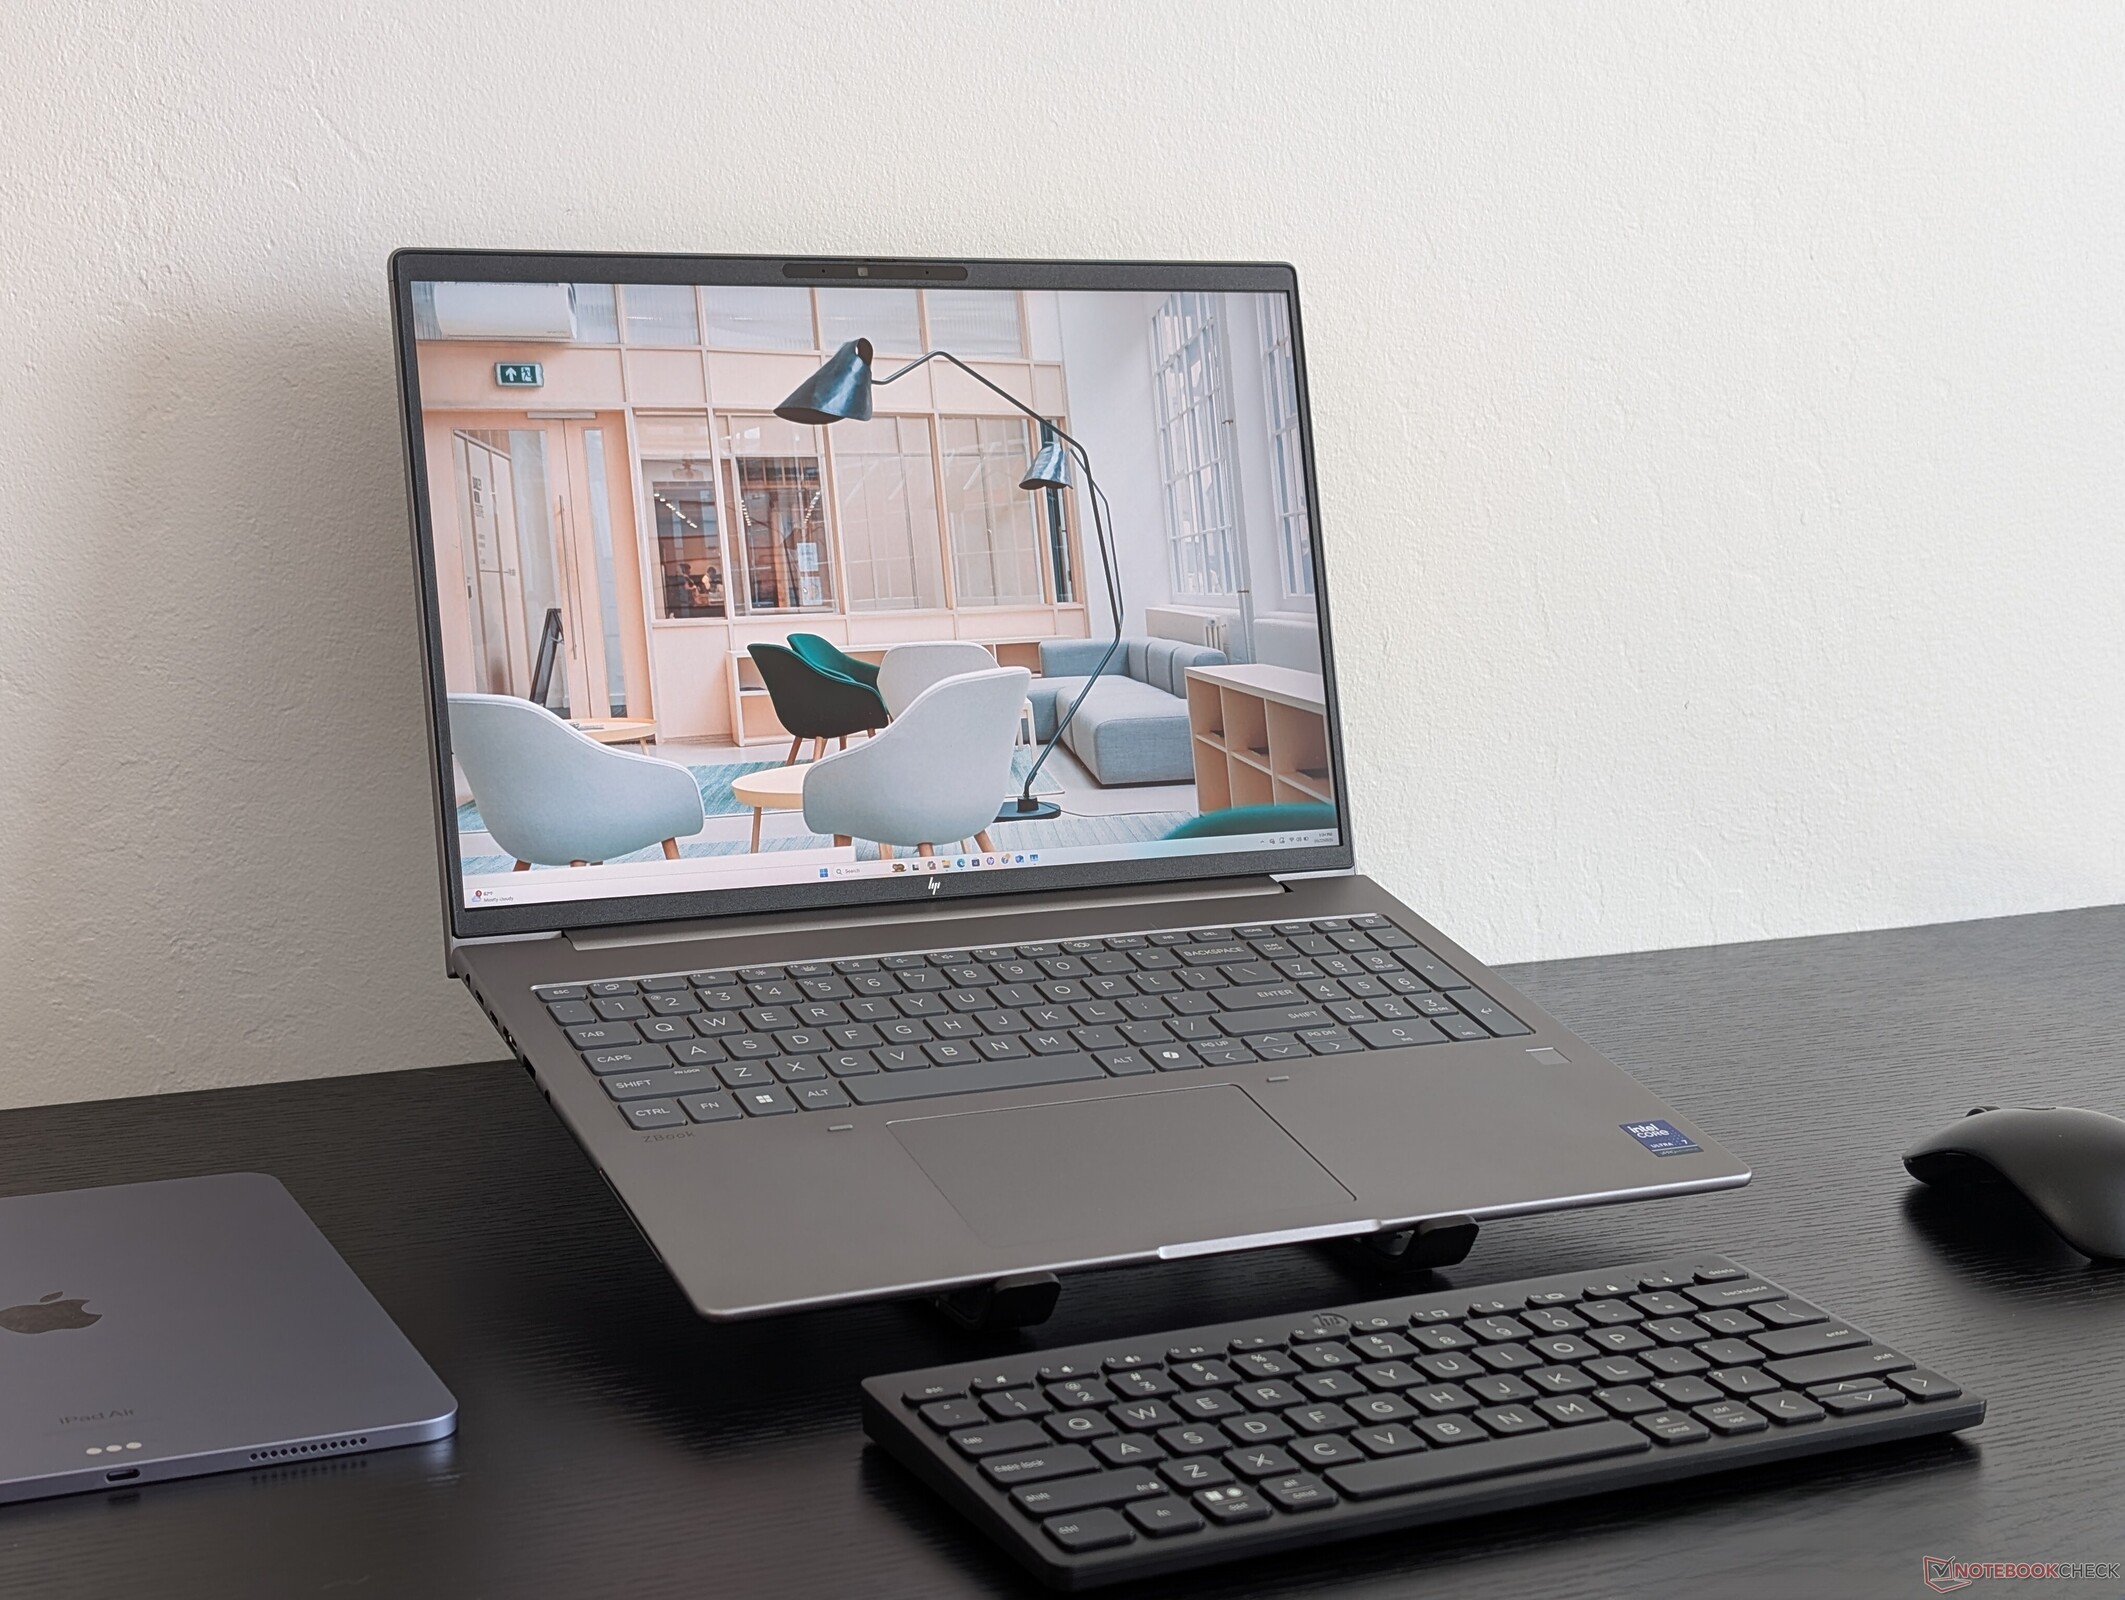
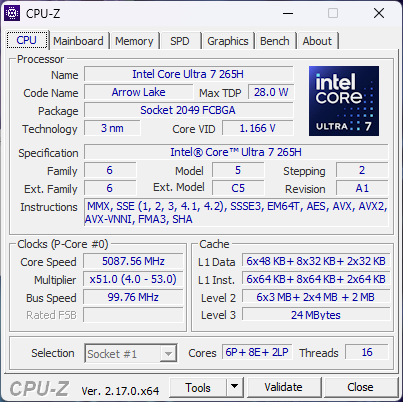
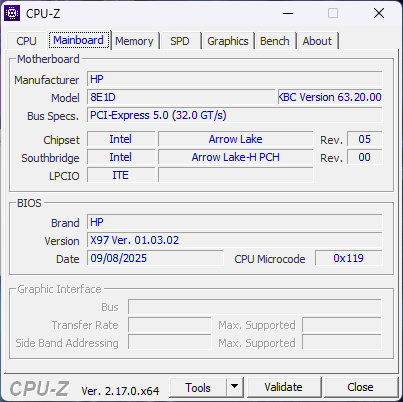
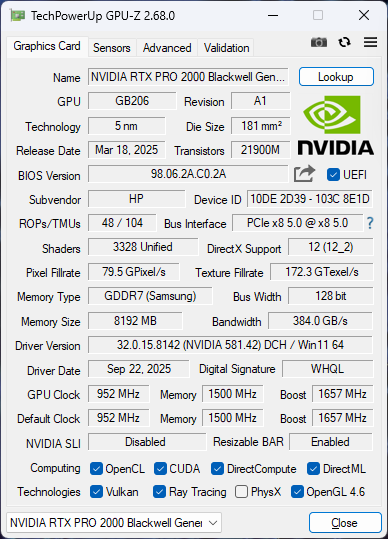
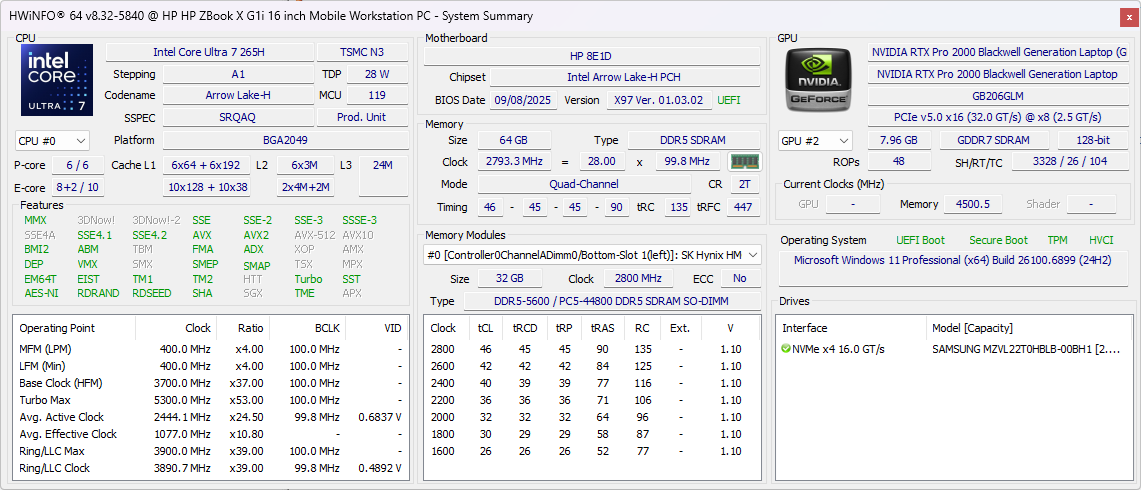
La HP ZBook X G1i 16 es una estación de trabajo móvil ultradelgada con procesadores Arrow Lake-H de gama media y gráficos GPU Nvidia RTX Pro Blackwell. Su máximo es la CPU Core Ultra 9 285H y la GPU RTX Pro 2000, mientras que la ZBook Fury G1i 16, más gruesa, puede equiparse con gráficos Arrow Lake-HX y RTX Pro 5000 más rápidos.
Nuestra unidad de prueba es la configuración intermedia con el Core Ultra 7 265H, pantalla 2K 1600p120 y GPU RTX Pro 2000 por aproximadamente 2700 USD. La lista completa de configuraciones disponibles puede consultarse en https://www.hp.com/us-en/workstations/zbook-x-configure.html.
Las alternativas al ZBook X G1i 16 incluyen otras estaciones de trabajo ultradelgadas de 16 pulgadas como el Dell Precision 5690, Lenovo ThinkPad P16s G2o la Serie MSI CreatorPro. El ZBook X G1i 16 no debe confundirse con el ZBook 8 G1i 16 que es una versión de gama más baja que alcanza la GPU RTX Pro 500 más lenta.
Más análisis de HP:
Especificaciones
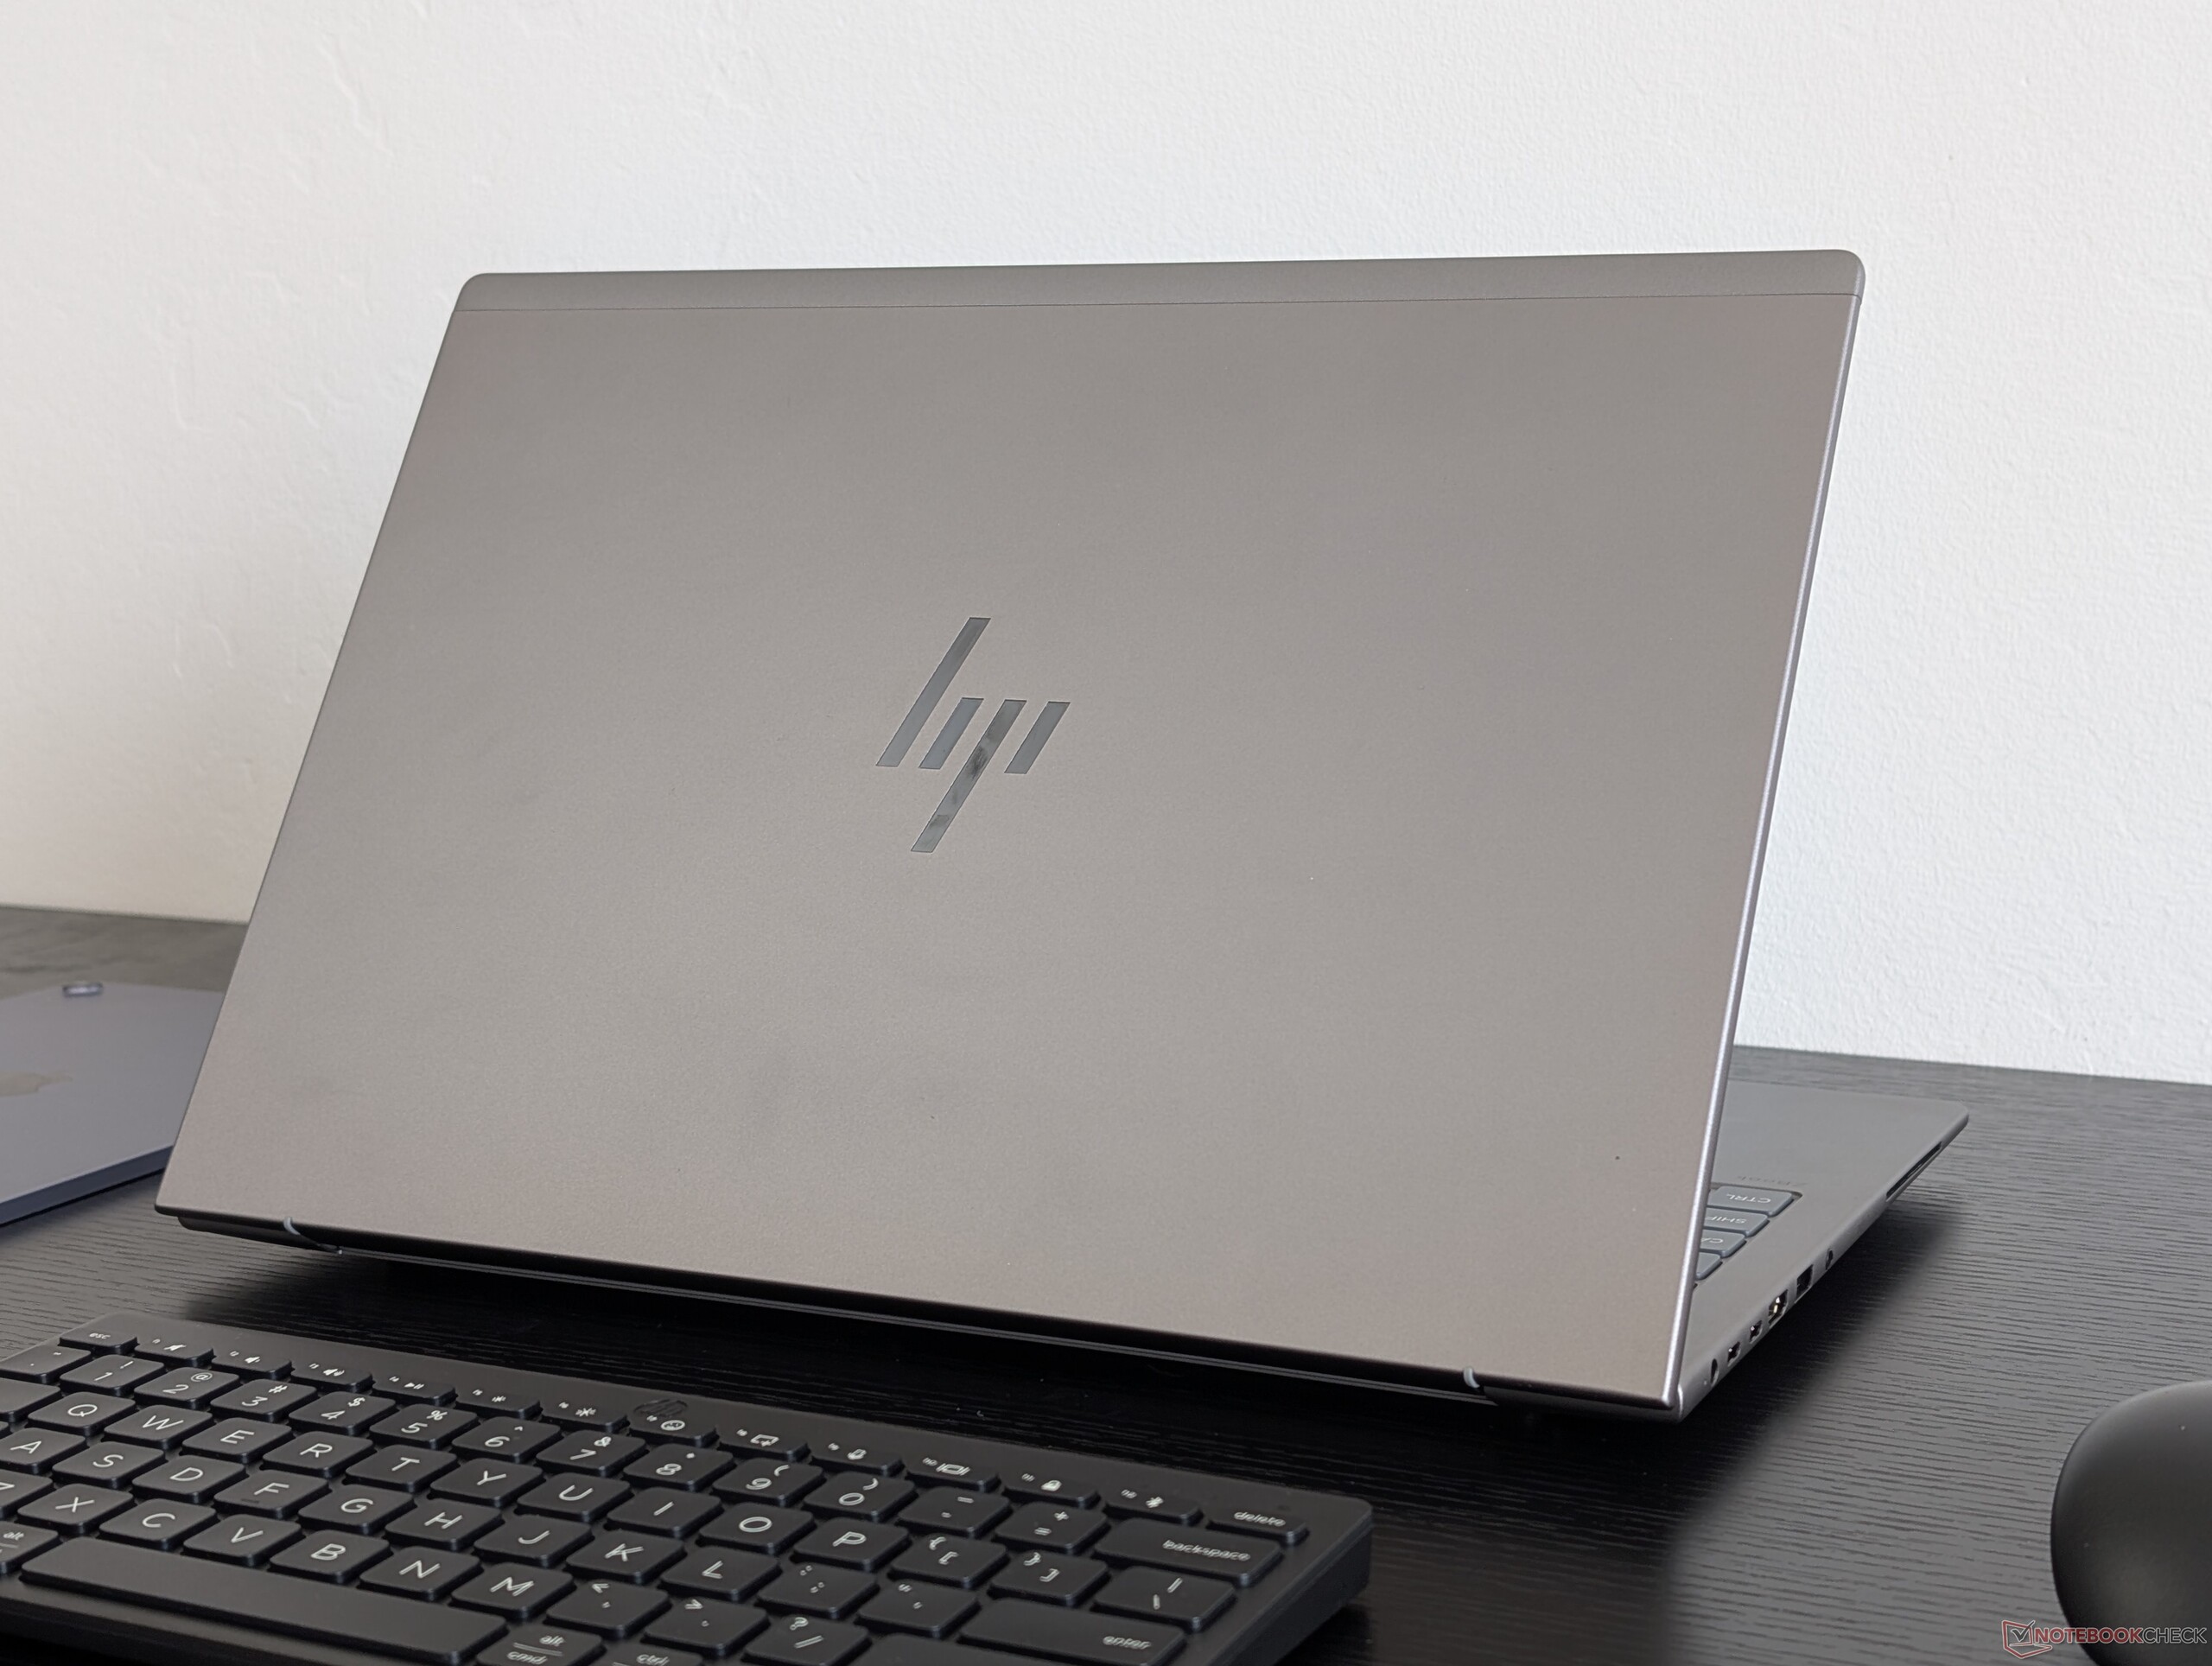
Caso
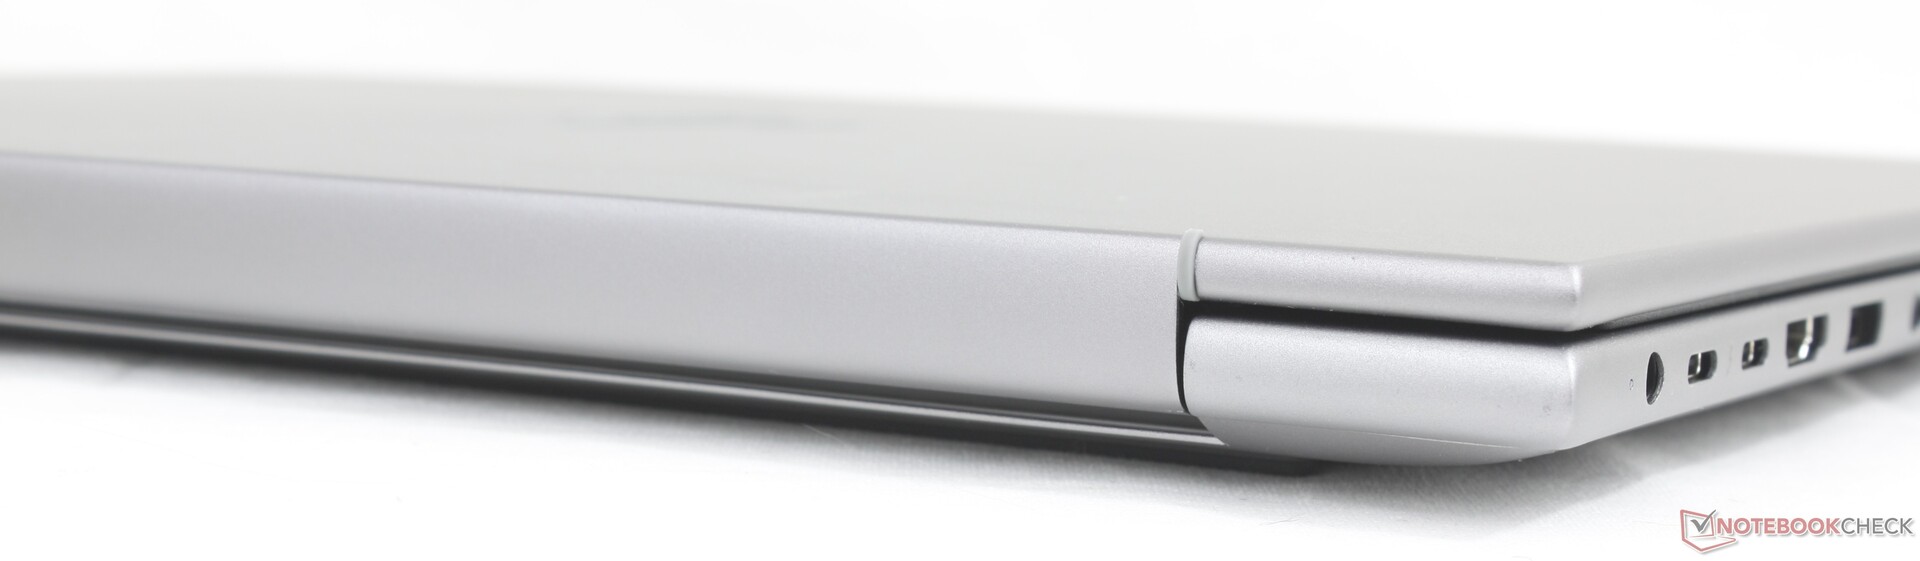
El ZBook X G1i 16 sustituye directamente al del año pasado ZBook Power 16 G11 y, a pesar del cambio de nombre, los dos modelos son por lo demás casi idénticos visualmente. Las características físicas siguen siendo casi las mismas, incluyendo el peso, las dimensiones y los puertos, por lo que nuestros comentarios sobre el ZBook Power 16 G11 siguen siendo aplicables aquí para el ZBook X G1i 16.
Conectividad
Las opciones de puerto han mejorado respecto al año pasado ZBook Studio 16 G11 con una excepción. Mientras que el ZBook X G1i 16 incluye puertos adicionales como RJ-45, HDMI y más puertos USB-A, ha eliminado uno de los puertos USB-C. Además, nos gustaría ver una transición completa a la carga USB-C similar a la reciente Dell Pro Max 16 Plus.
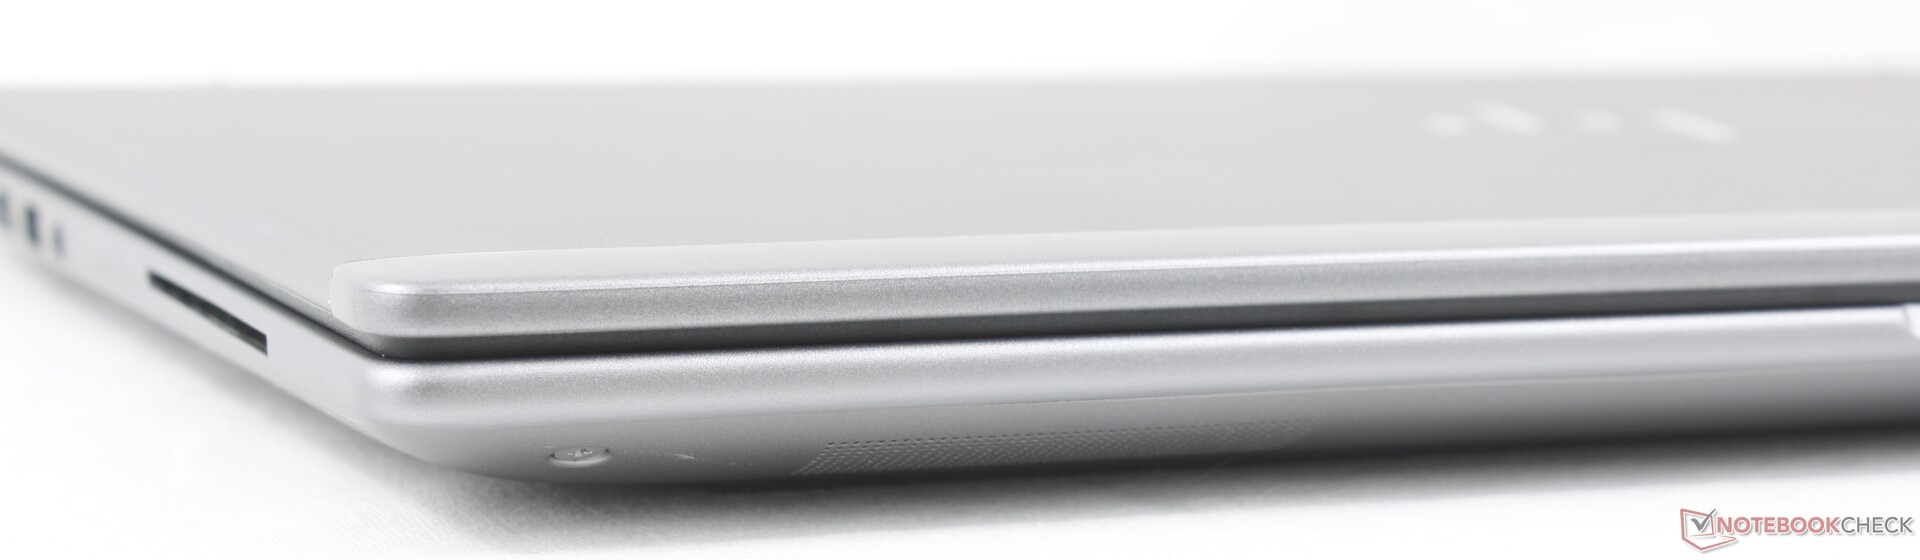
Lector de tarjetas SD
| SD Card Reader | |
| average JPG Copy Test (av. of 3 runs) | |
| HP ZBook X G1i 16 (Toshiba Exceria Pro SDXC 64 GB UHS-II) | |
| HP ZBook Power 16 G11 A (Toshiba Exceria Pro SDXC 64 GB UHS-II) | |
| Lenovo ThinkPad P16 Gen 2 (Toshiba Exceria Pro SDXC 64 GB UHS-II) | |
| Dell Pro Max 16 Plus (Toshiba Exceria Pro SDXC 64 GB UHS-II) | |
| maximum AS SSD Seq Read Test (1GB) | |
| HP ZBook Power 16 G11 A (Toshiba Exceria Pro SDXC 64 GB UHS-II) | |
| HP ZBook X G1i 16 (Toshiba Exceria Pro SDXC 64 GB UHS-II) | |
| Dell Pro Max 16 Plus (Toshiba Exceria Pro SDXC 64 GB UHS-II) | |
| Lenovo ThinkPad P16 Gen 2 (Toshiba Exceria Pro SDXC 64 GB UHS-II) | |
Comunicación
Cámara web
Las opciones de cámara web incluyen 2 MP o 5 MP con IR y un obturador físico.


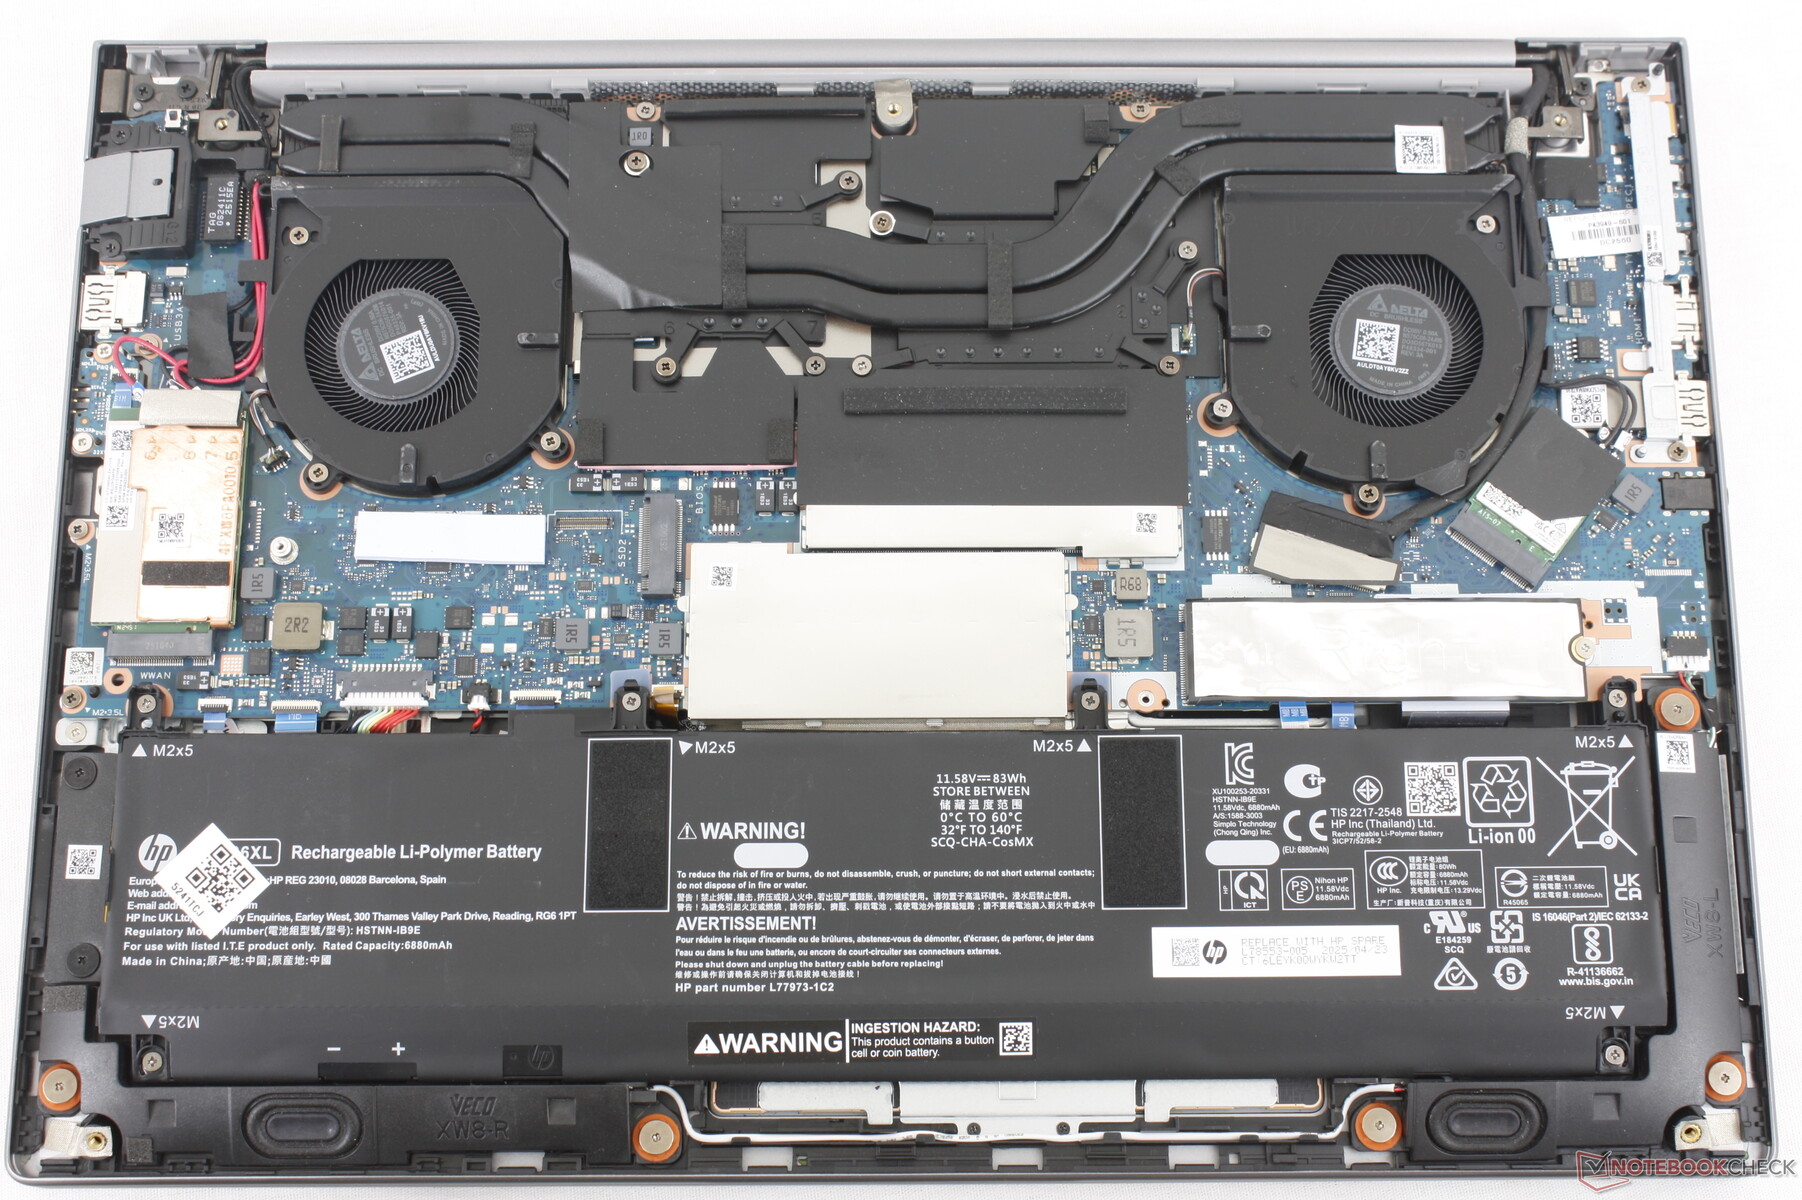
Mantenimiento
HP proporciona vídeos de desmontaje y guías escritas para el mantenimiento del ZBook X G1i 16.
Sostenibilidad
Todas las estaciones de trabajo HP Z cuentan con la certificación EPEAT Oro o Plata e incorporan plásticos o metales reciclados y procedentes del océano durante el proceso de fabricación.
Accesorios y garantía
No hay más extras en la caja que el adaptador de CA y la documentación. Una garantía limitada de tres años viene de serie si se adquiere a través de la página web del fabricante.
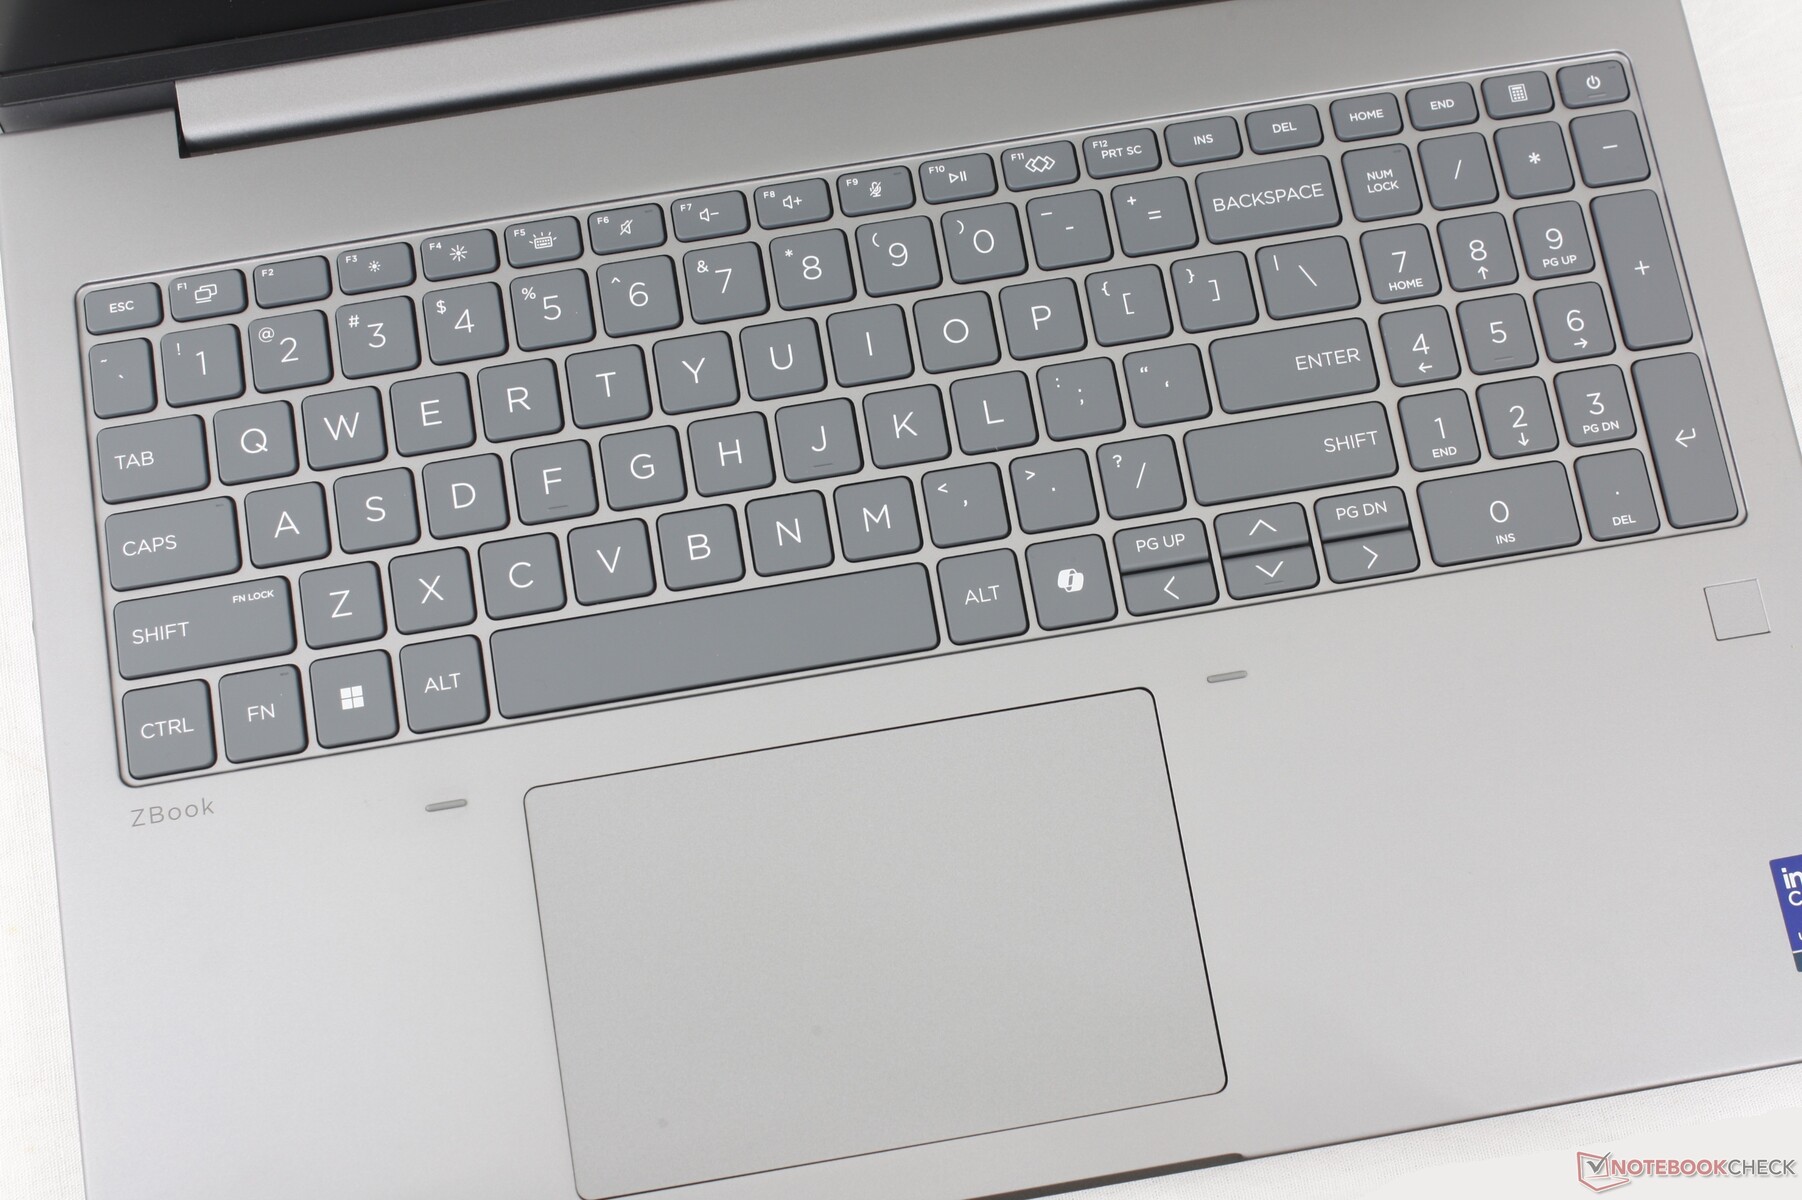
Dispositivos de entrada
La experiencia de tecleo es similar a la del antiguo ZBook Fury 16 G9 ya que la distribución del teclado ha cambiado poco a lo largo de las generaciones ZBook. En el ZBook X G1i 16, sin embargo, HP ha eliminado los botones dedicados al ratón sin aumentar la superficie (12 x 8 cm frente a 12,4 x 8,3 cm en el ZBook Fury 16 G9).
Mostrar
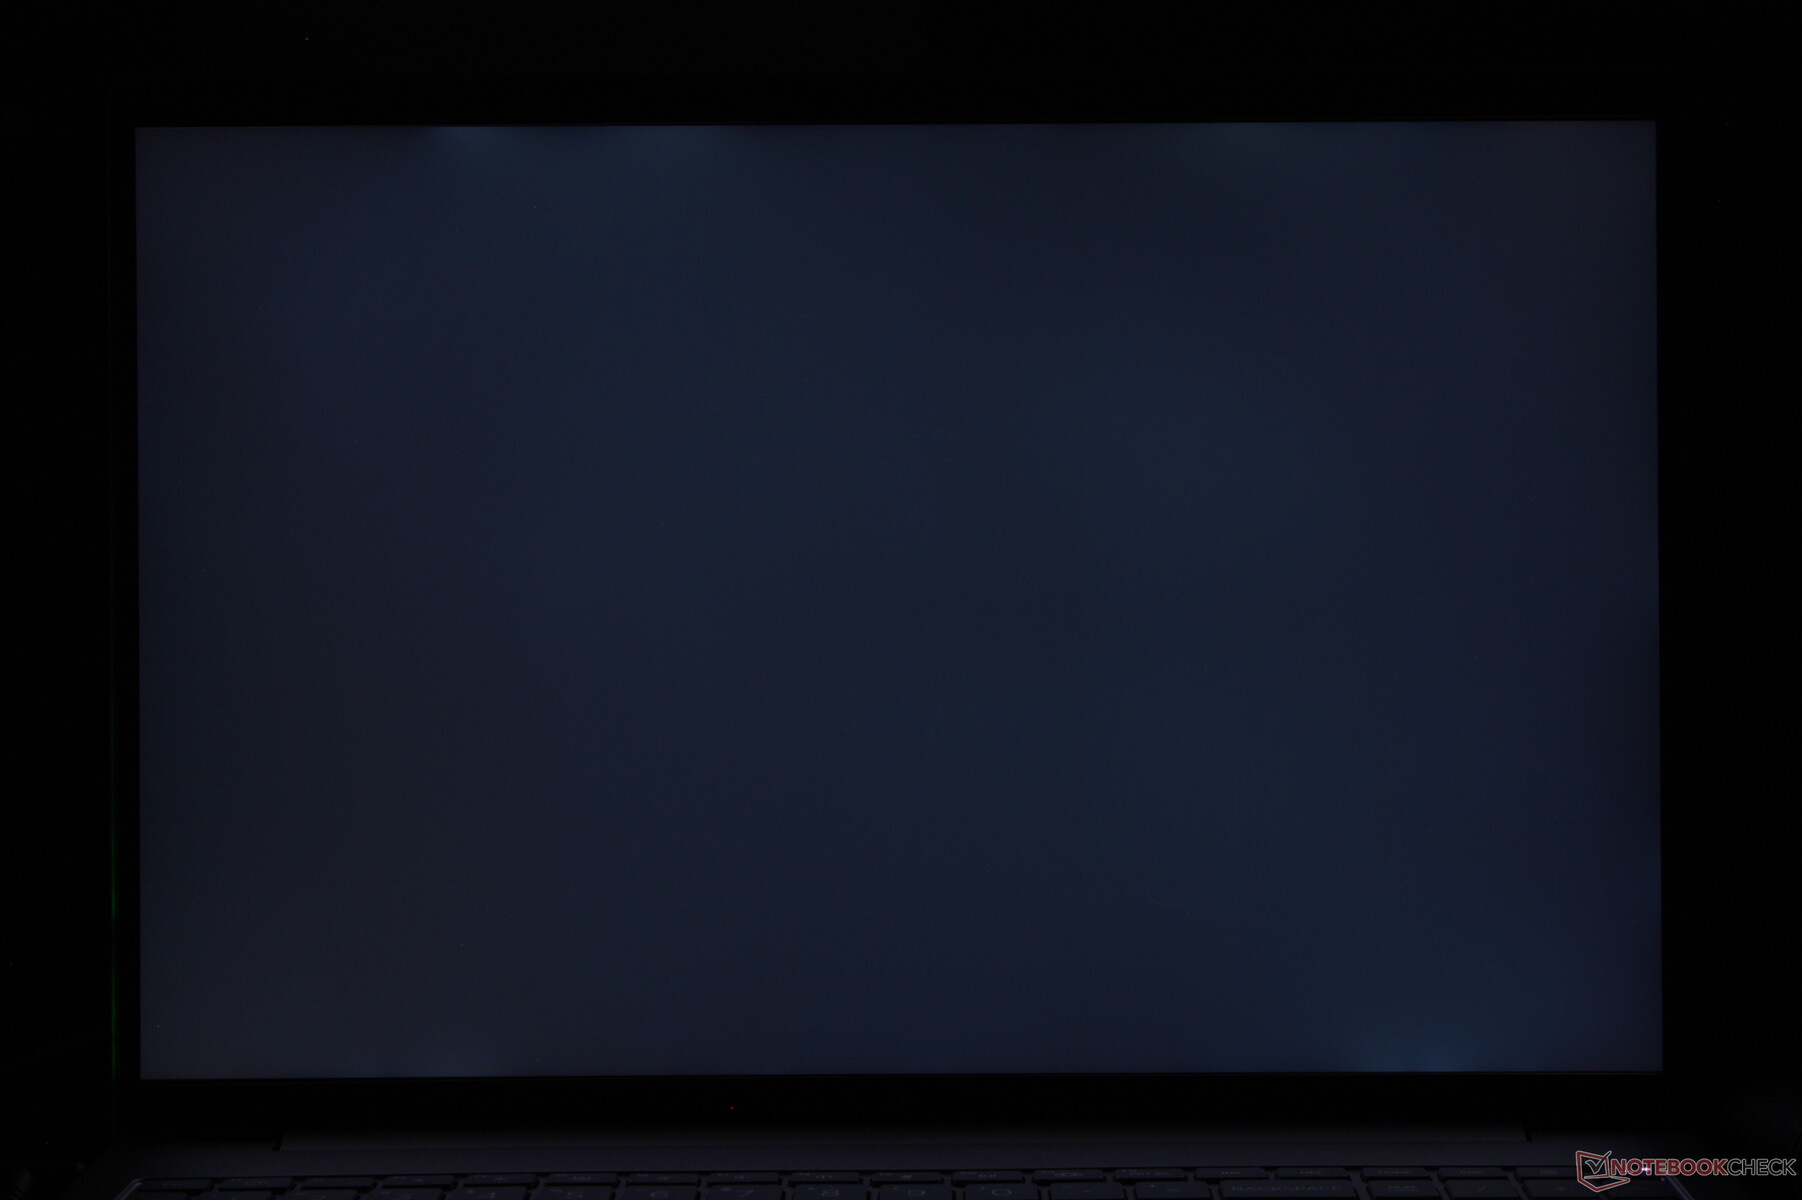
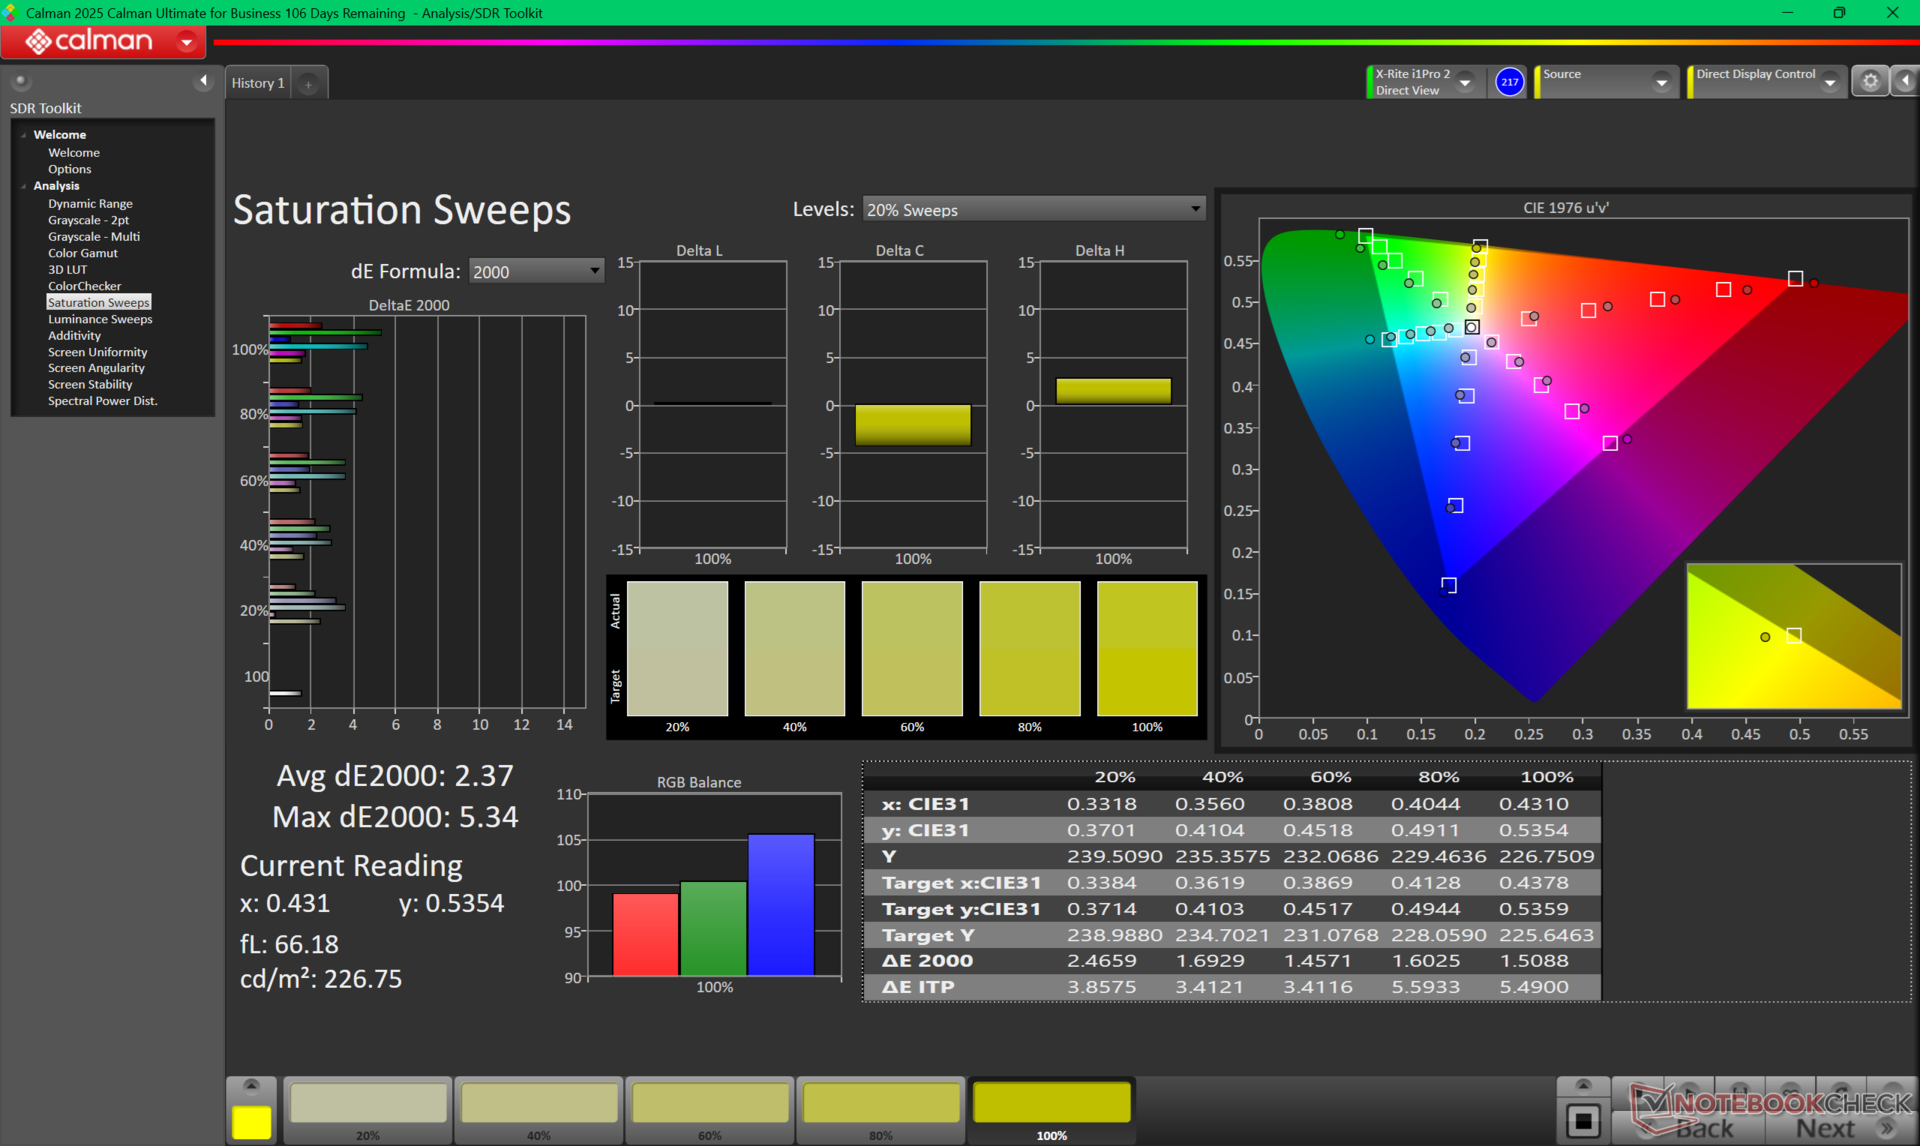
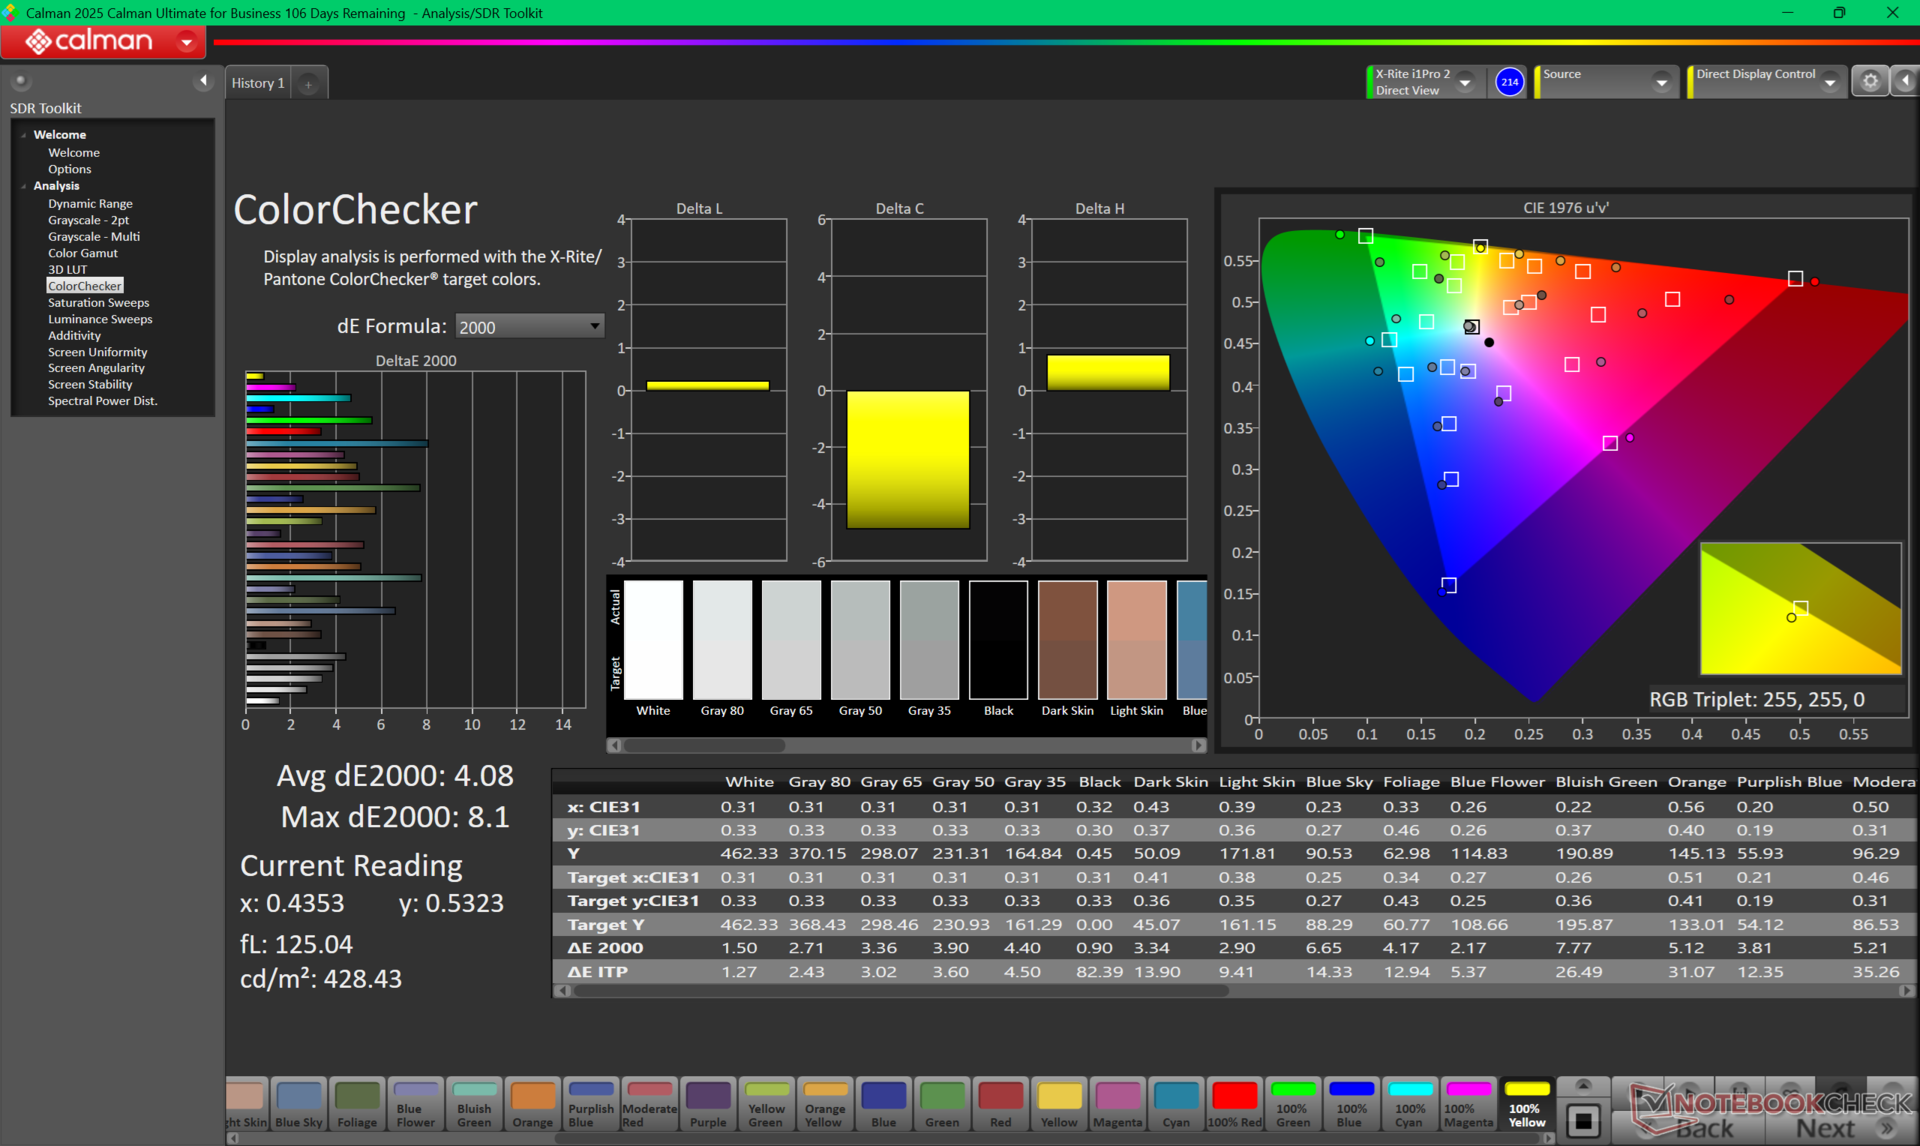
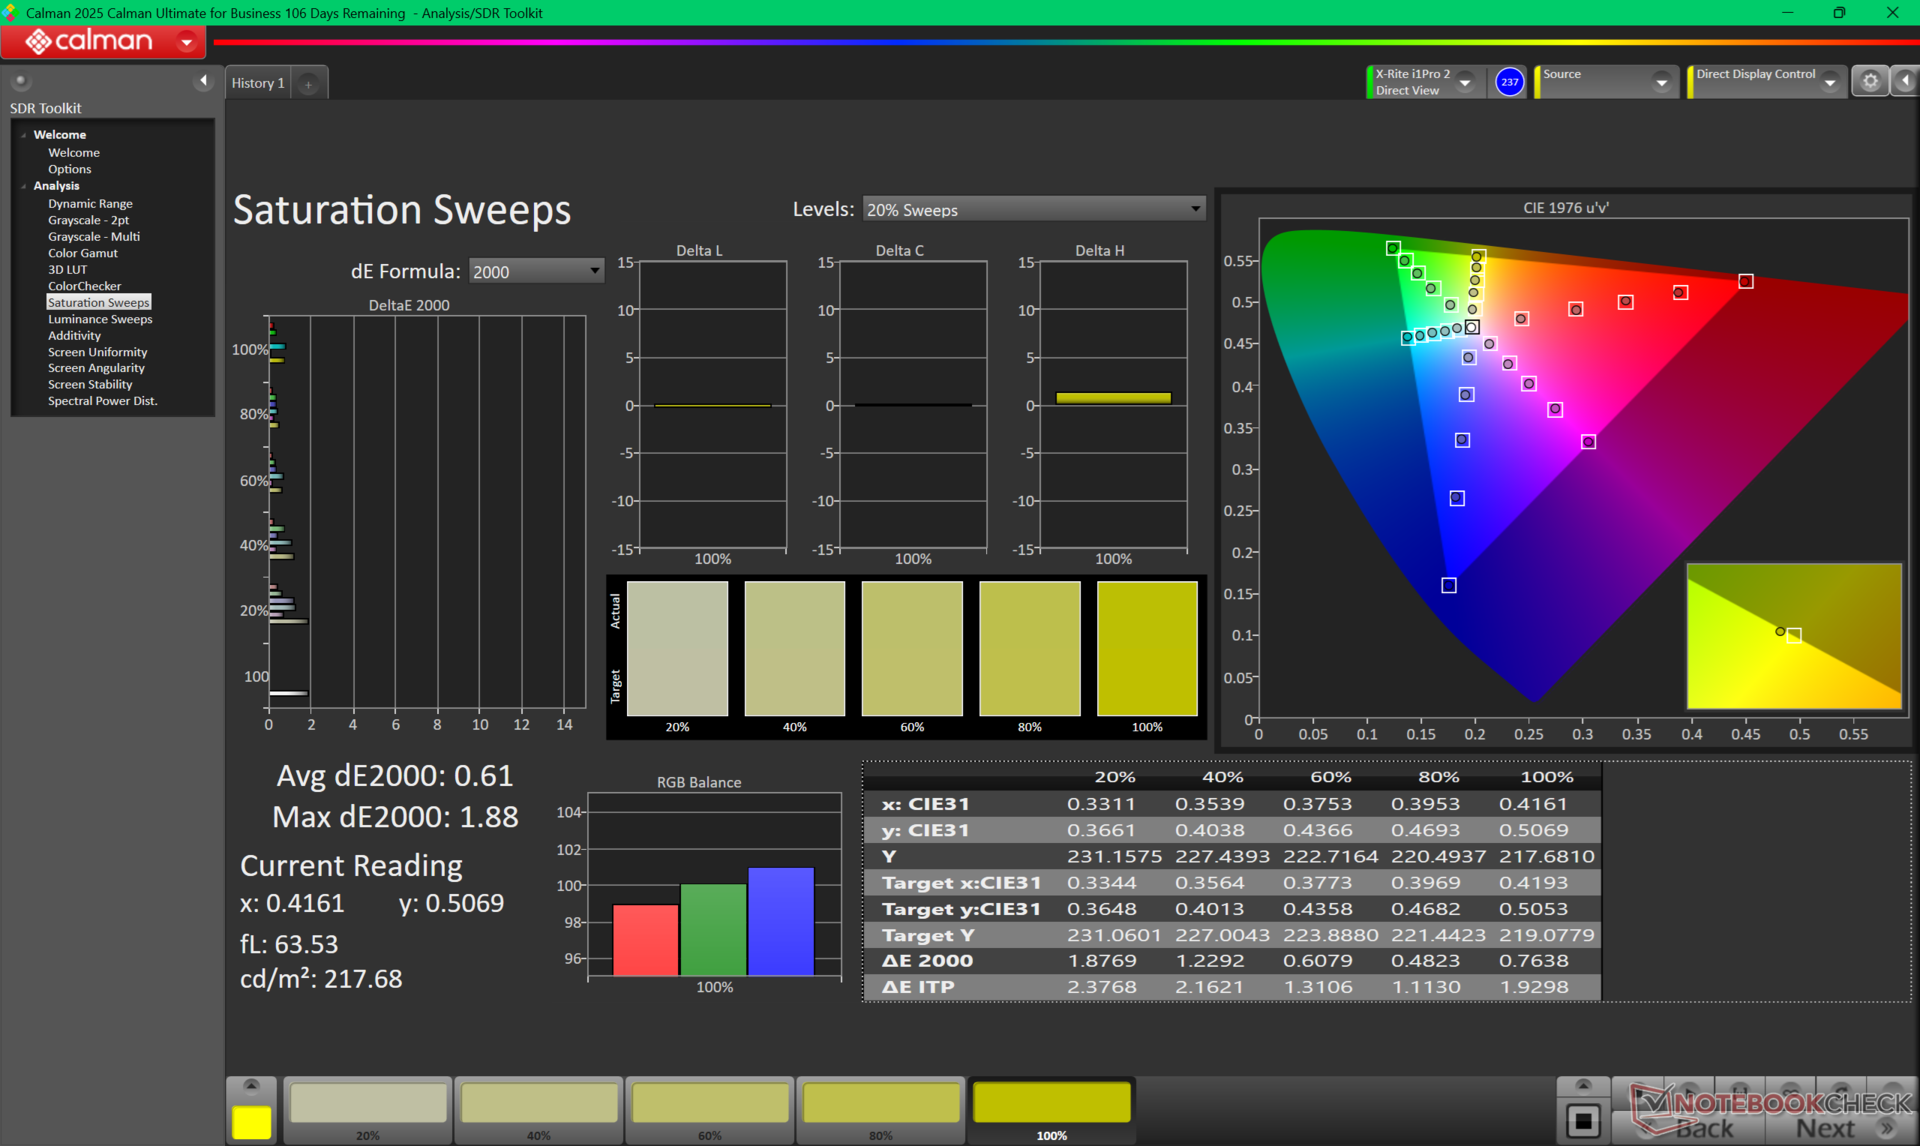
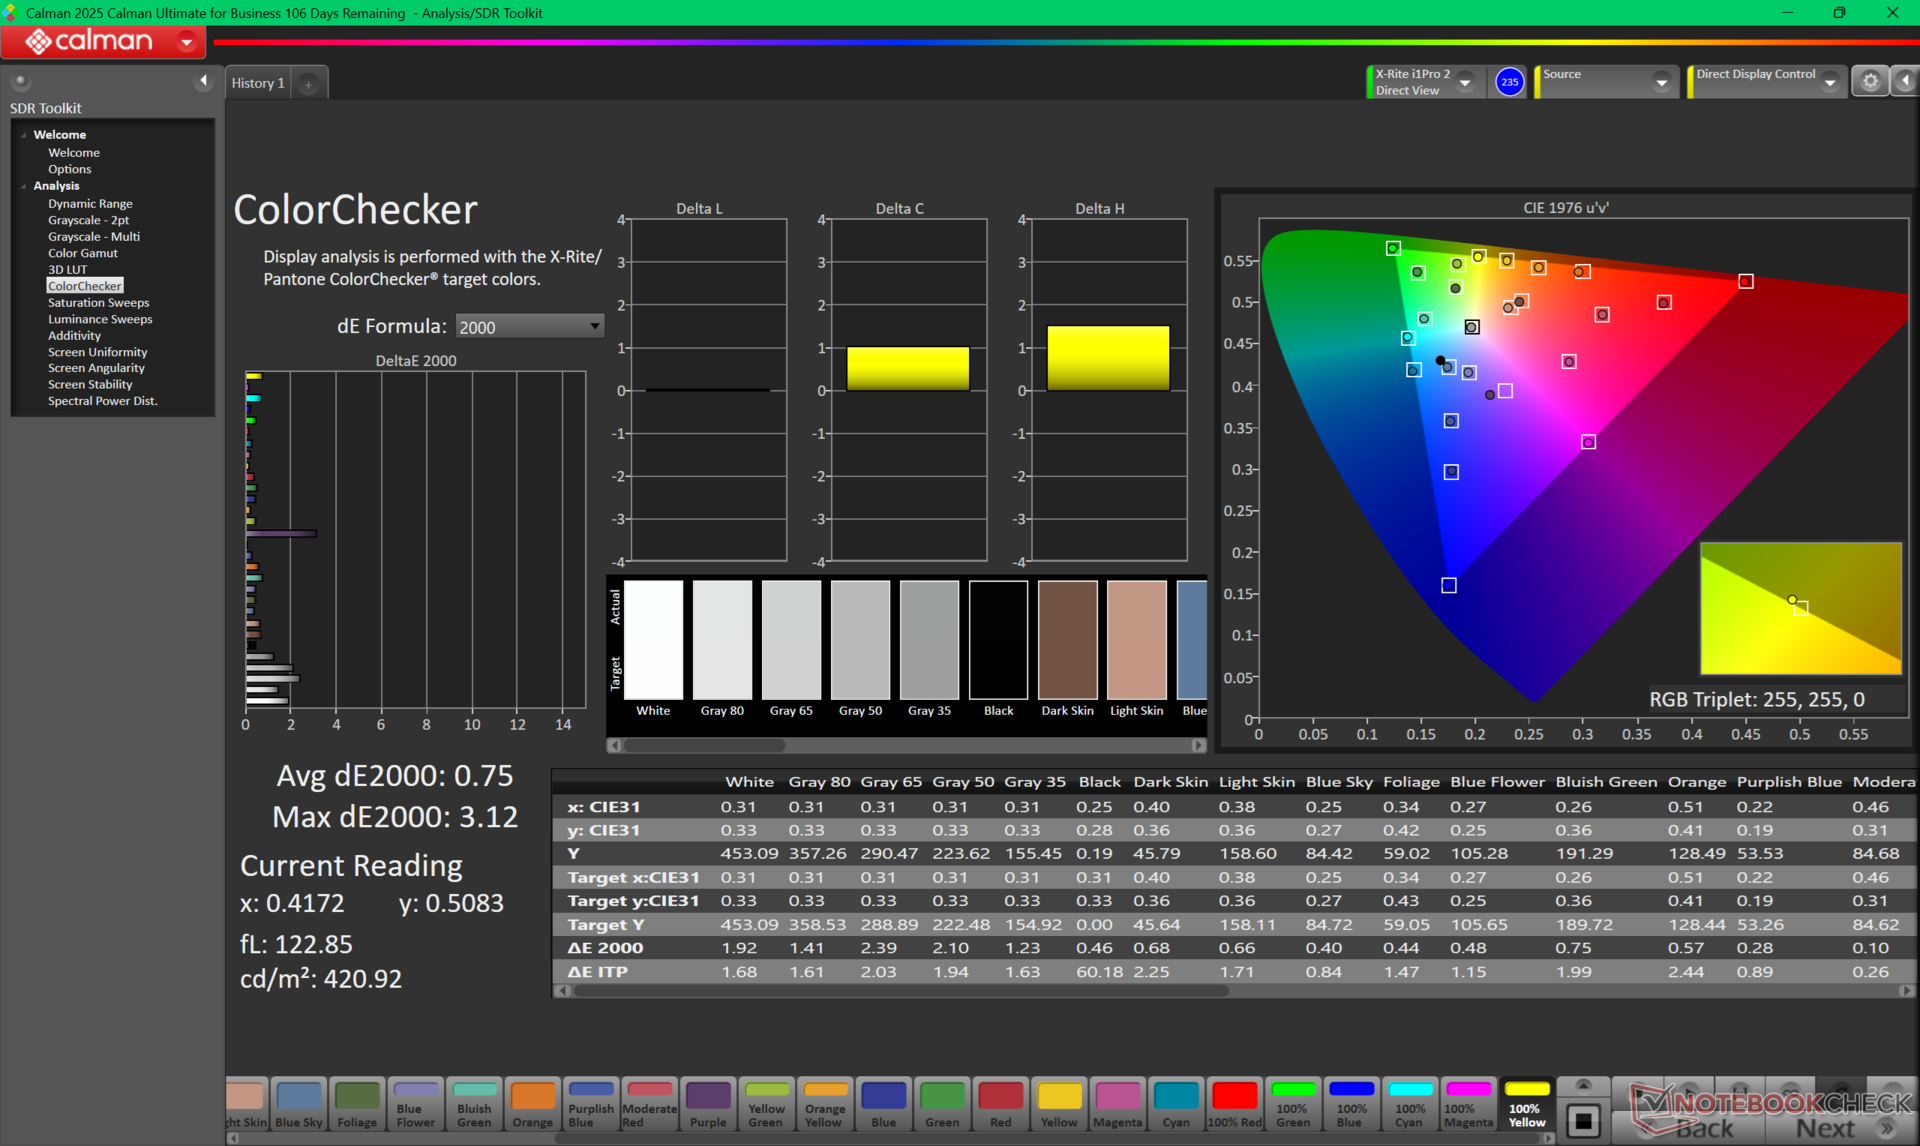
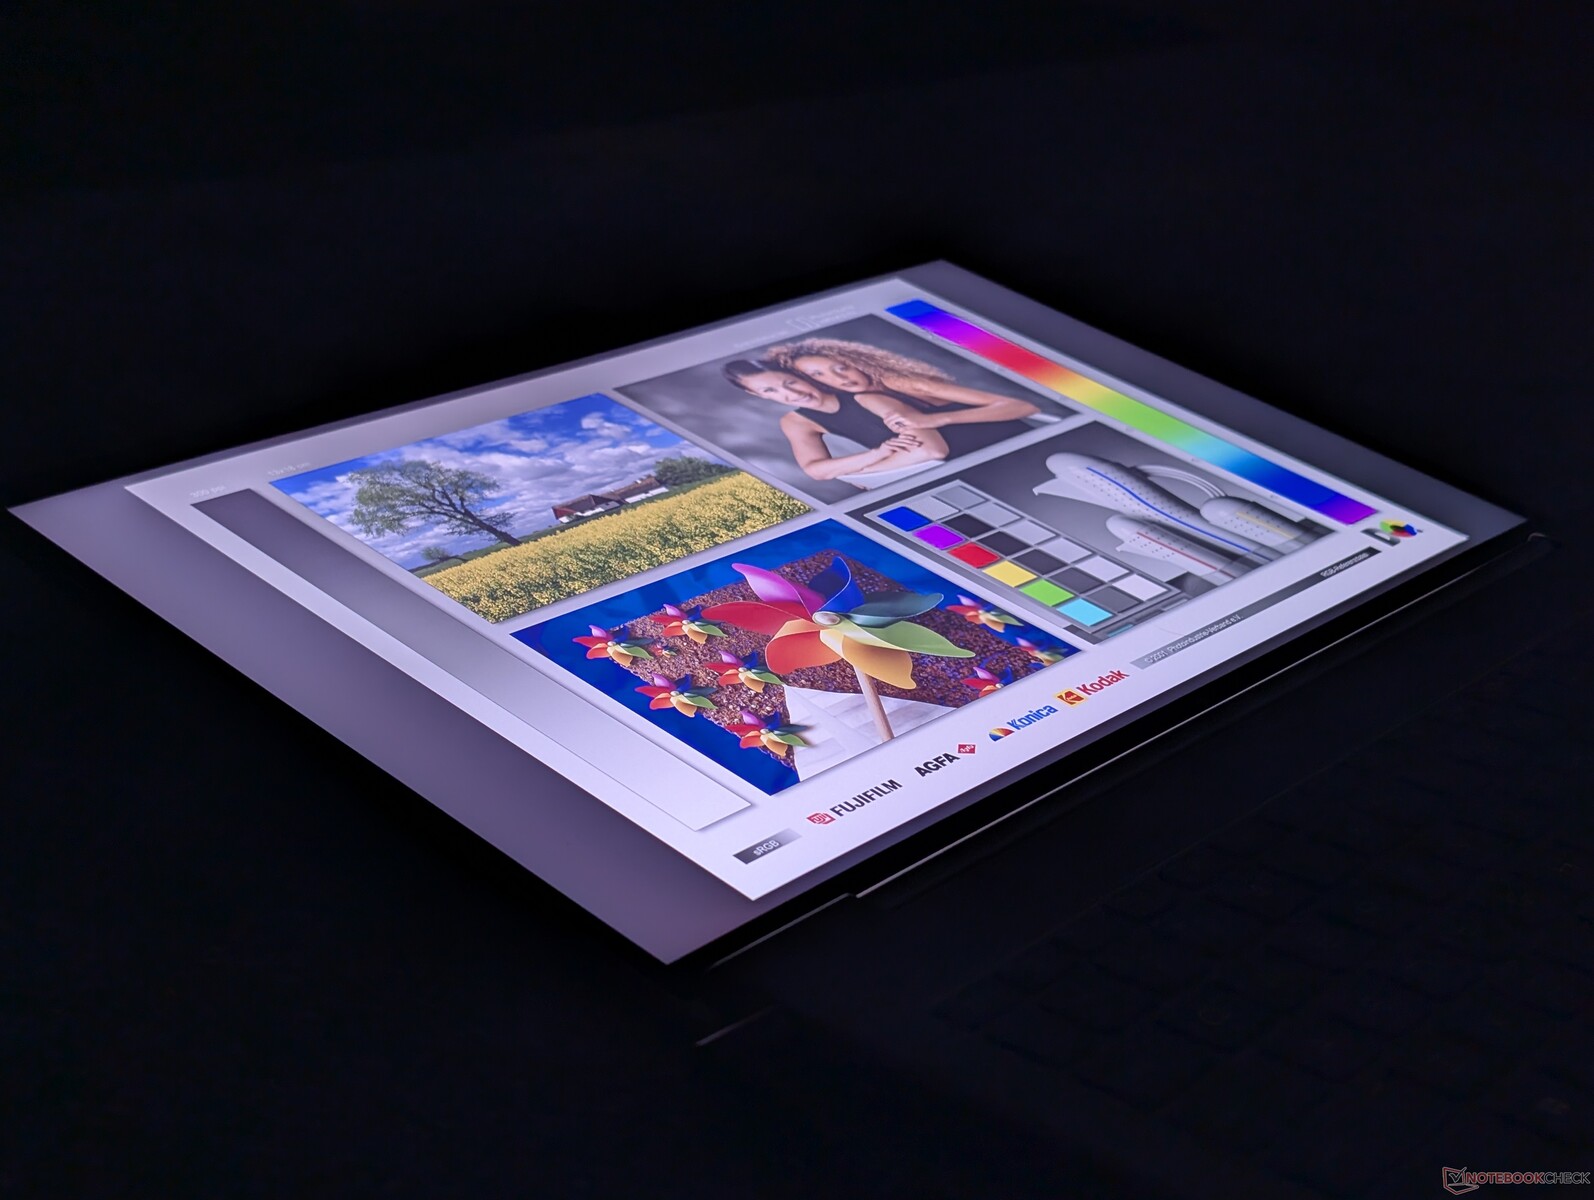
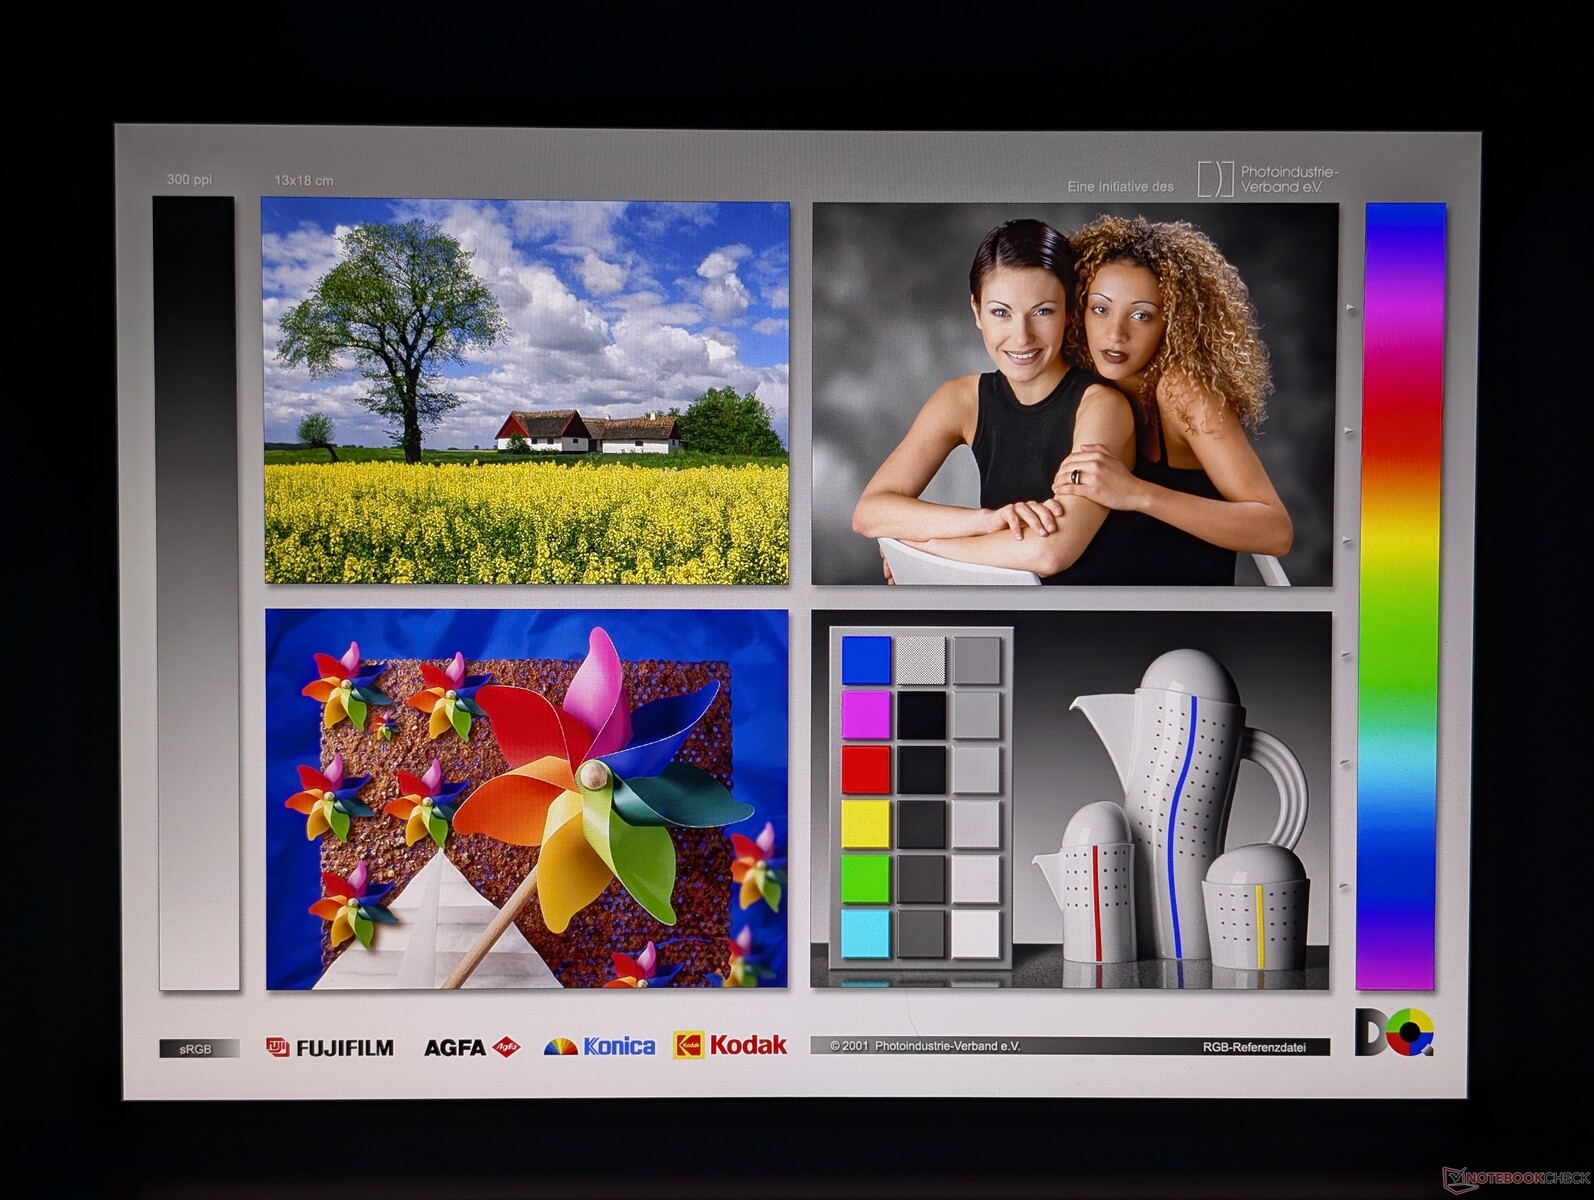
Hay seis opciones de pantalla IPS disponibles que van desde 1200p60 y 300 nits hasta 2400p120 y 500 nits con colores DCI-P3 completos. Nuestra unidad de prueba se entrega con la opción mate intermedia de 1600p y 120 Hz, que sigue ofreciendo colores P3 pero sin pantalla táctil ni funciones Sure View. De hecho, esta última sólo está disponible en el panel no táctil de 1200p.
Tenga en cuenta que no hay opciones OLED ni soporte HDR para este modelo. Si la precisión del color es importante, le recomendamos que evite algunas opciones 1200p de gama baja, ya que sólo ofrecen ~60% de los colores sRGB.

| |||||||||||||||||||||||||
iluminación: 88 %
Brillo con batería: 461.8 cd/m²
Contraste: 1004:1 (Negro: 0.46 cd/m²)
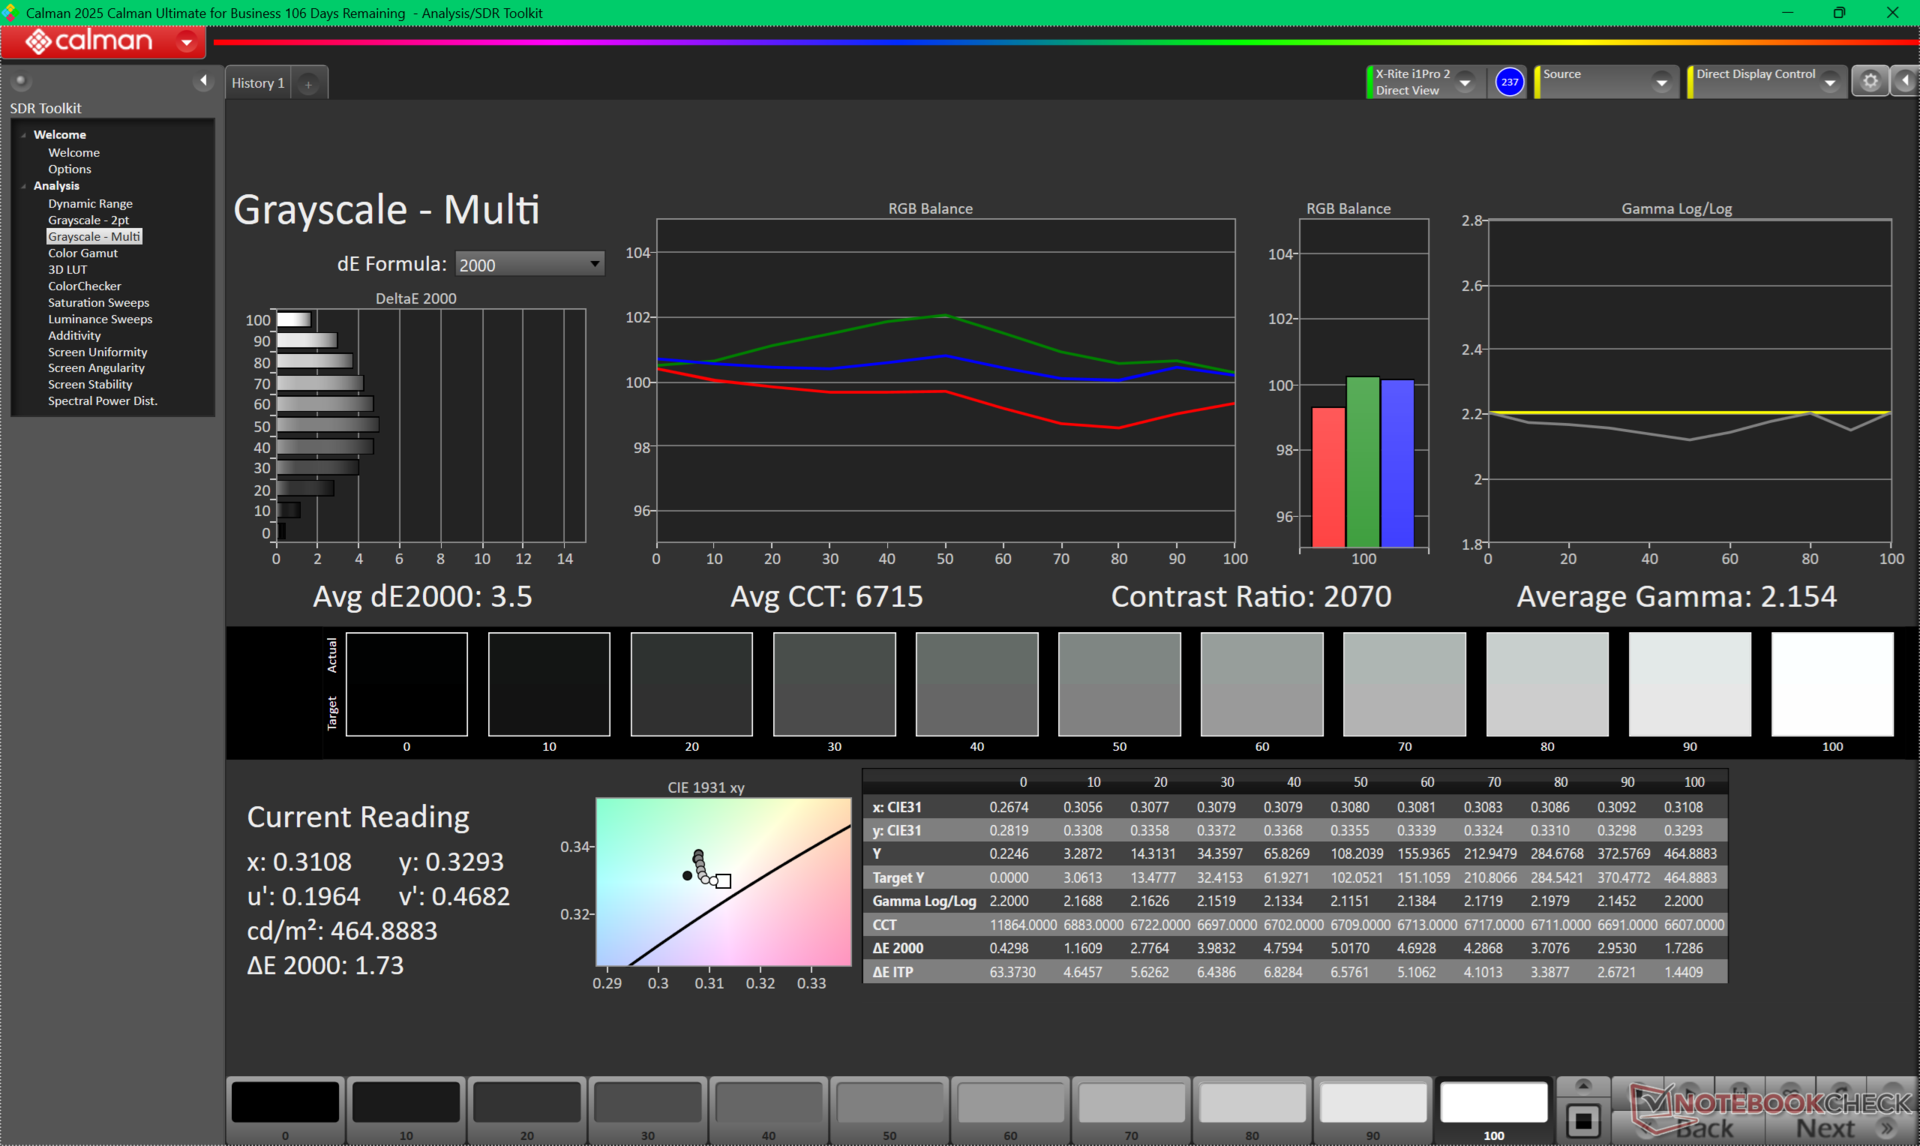
ΔE ColorChecker Calman: 4.08 | ∀{0.5-29.43 Ø4.71}
calibrated: 0.75
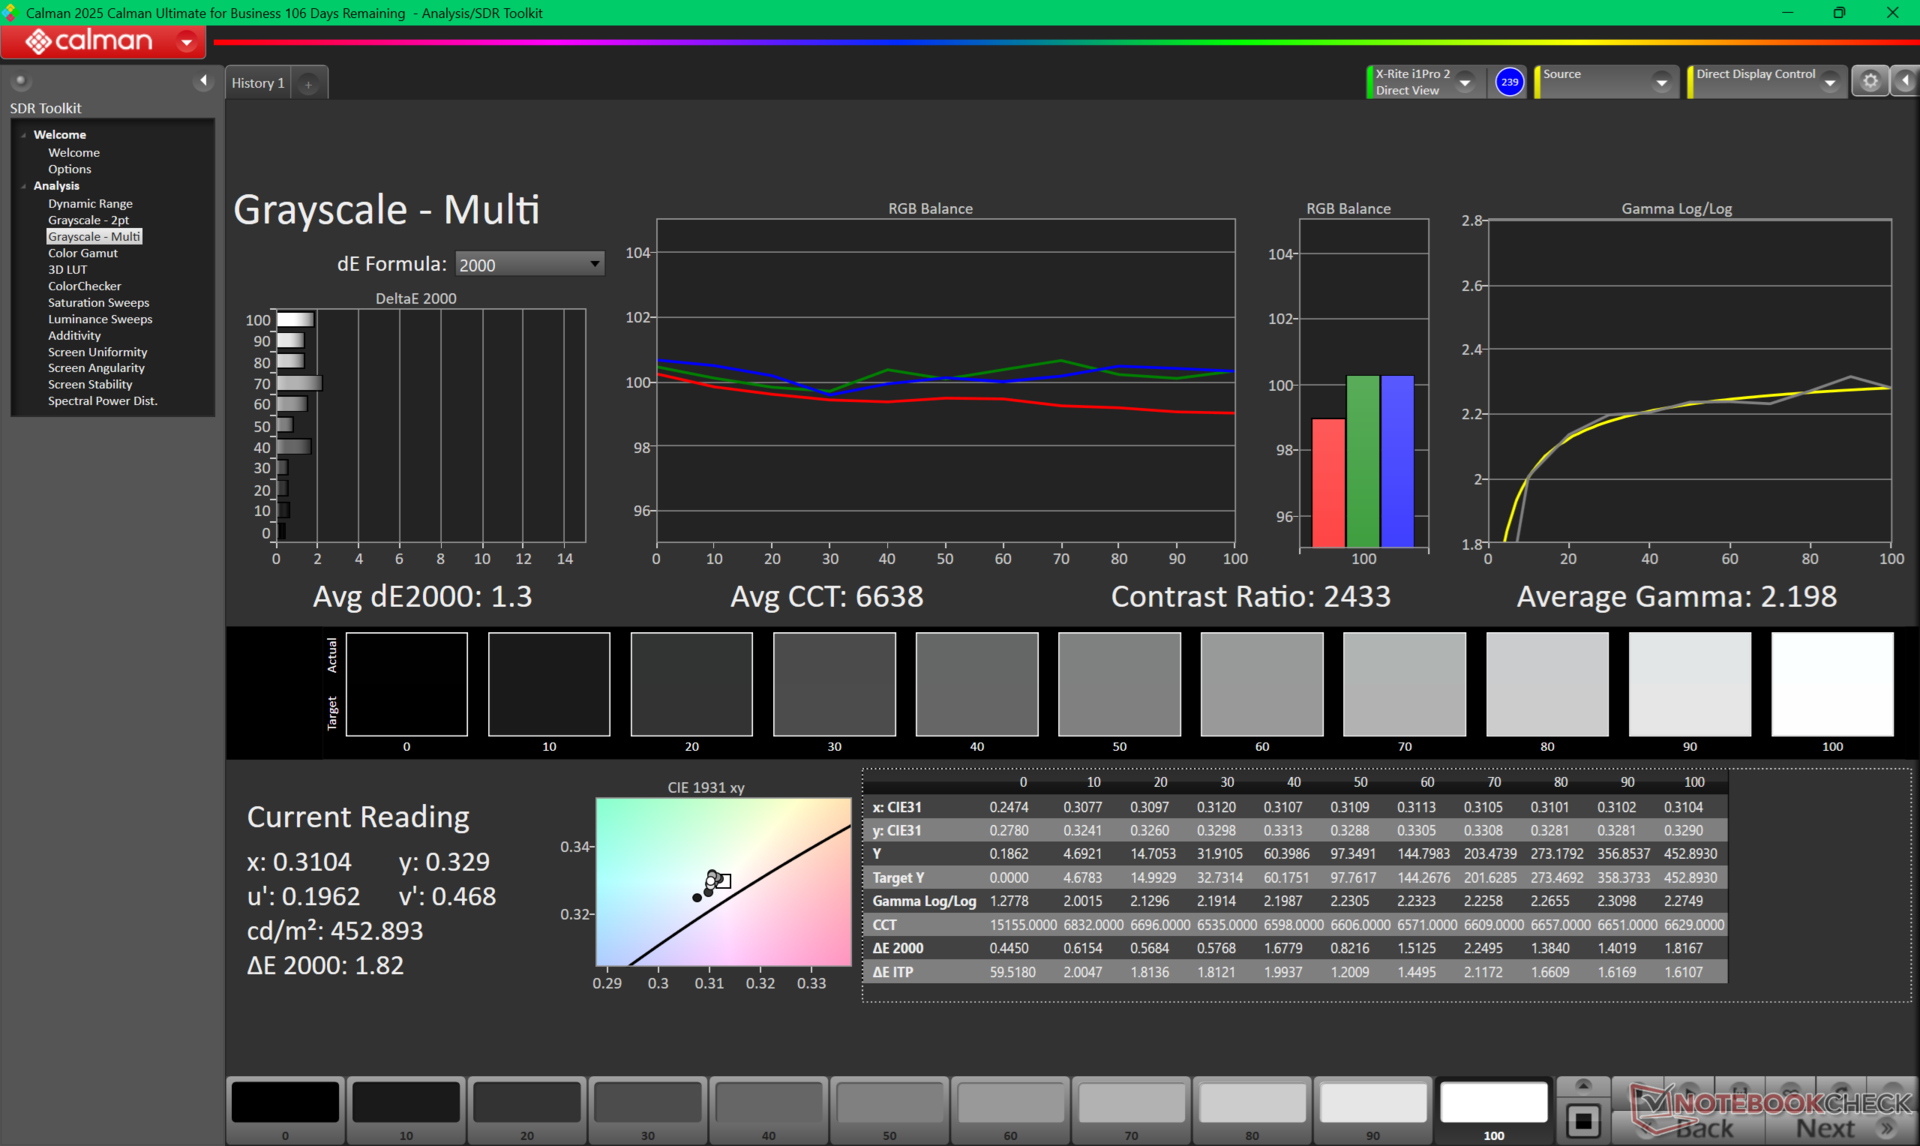
ΔE Greyscale Calman: 3.5 | ∀{0.09-98 Ø4.96}
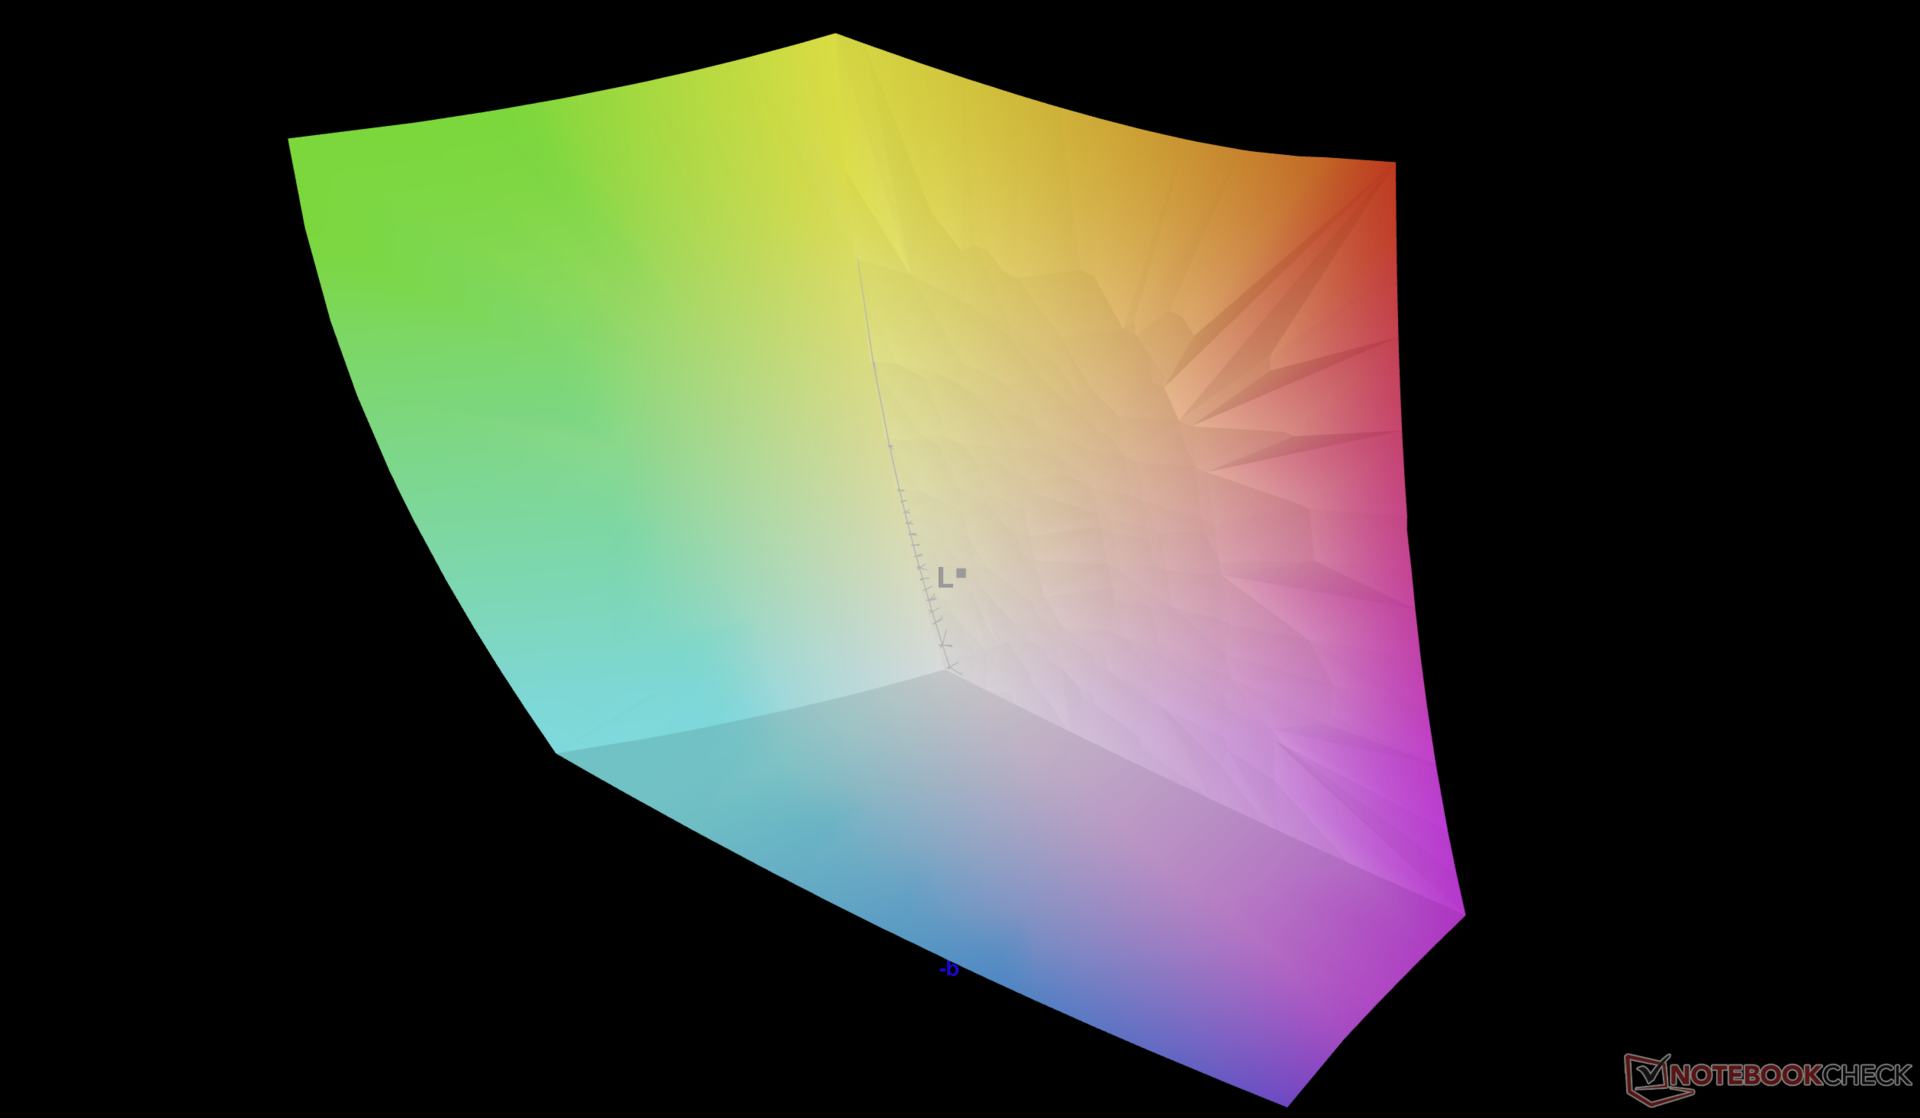
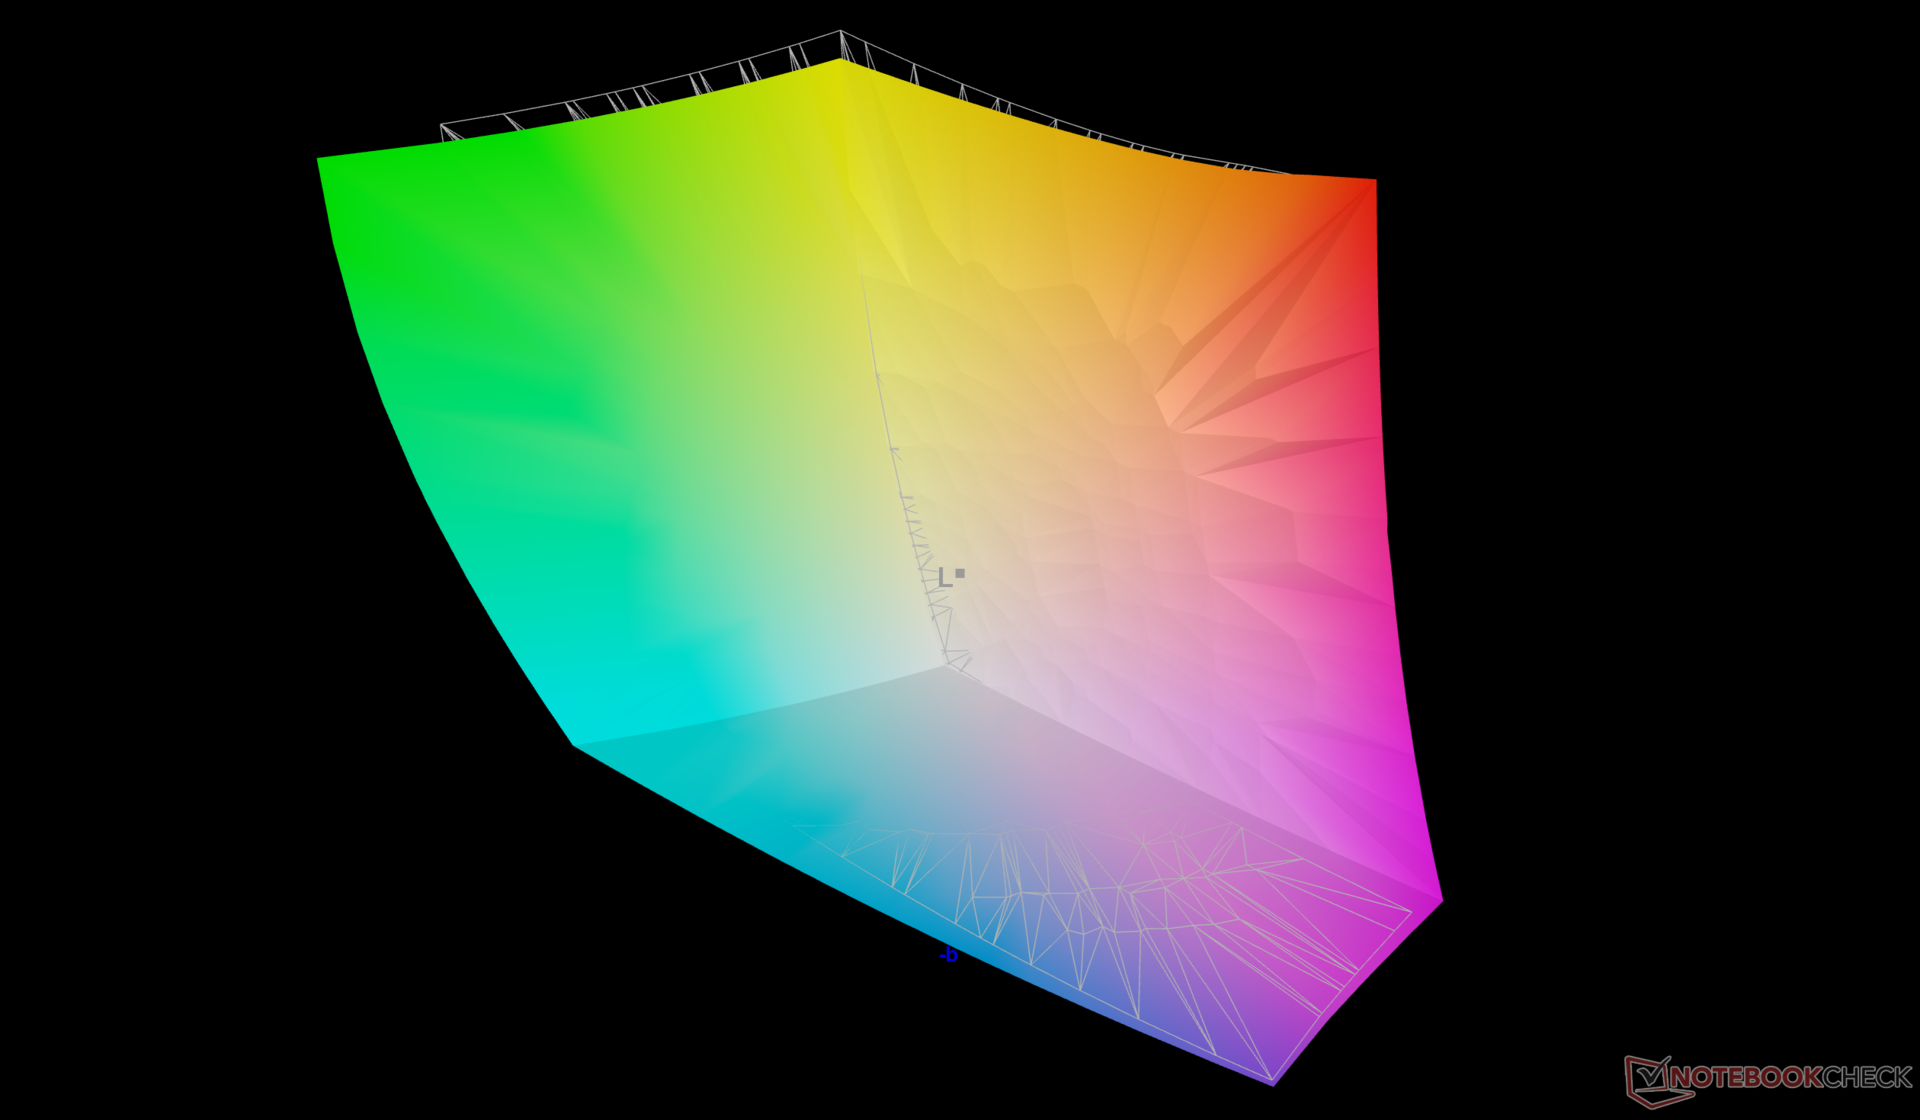
99.9% AdobeRGB 1998 (Argyll 3D)
100% sRGB (Argyll 3D)
97.2% Display P3 (Argyll 3D)
Gamma: 2.15
CCT: 6715 K
| HP ZBook X G1i 16 LG Philips LGD07B3, IPS, 2560x1600, 16", 120 Hz | HP ZBook Power 16 G11 A AUOA0A9, IPS, 2560x1600, 16", 120 Hz | HP ZBook Studio 16 G11 AUO87A8, IPS, 3840x2400, 16", 120 Hz | Lenovo ThinkPad P16 Gen 2 NE160QDM-NY1, IPS, 2560x1600, 16", 165 Hz | Dell Pro Max 16 Plus Samsung 160HC01, OLED, 3840x2400, 16", 120 Hz | Dell Precision 5690 Samsung 160YV03, OLED, 3840x2400, 16", 60 Hz | |
|---|---|---|---|---|---|---|
| Display | -20% | -4% | -21% | -4% | 0% | |
| Display P3 Coverage (%) | 97.2 | 69.1 -29% | 97.7 1% | 68.4 -30% | 97.3 0% | 99.8 3% |
| sRGB Coverage (%) | 100 | 97.7 -2% | 99.9 0% | 96.9 -3% | 100 0% | 100 0% |
| AdobeRGB 1998 Coverage (%) | 99.9 | 71 -29% | 85.7 -14% | 70.6 -29% | 88.8 -11% | 96.6 -3% |
| Response Times | 69% | 64% | 66% | 79% | 95% | |
| Response Time Grey 50% / Grey 80% * (ms) | 45.5 ? | 13.6 ? 70% | 14.2 ? 69% | 14.1 ? 69% | 0.63 ? 99% | 1.7 ? 96% |
| Response Time Black / White * (ms) | 26.1 ? | 8.4 ? 68% | 10.6 ? 59% | 9.9 ? 62% | 0.89 ? 97% | 1.7 ? 93% |
| PWM Frequency (Hz) | 26536 ? | 479.9 ? | 60 ? | |||
| PWM Amplitude * (%) | 47 | 28 40% | ||||
| Screen | -4% | 11% | 31% | 29% | 1% | |
| Brightness middle (cd/m²) | 461.8 | 470.7 2% | 404.3 -12% | 531.5 15% | 530.9 15% | 348.1 -25% |
| Brightness (cd/m²) | 427 | 431 1% | 405 -5% | 499 17% | 540 26% | 351 -18% |
| Brightness Distribution (%) | 88 | 88 0% | 92 5% | 89 1% | 95 8% | 97 10% |
| Black Level * (cd/m²) | 0.46 | 0.57 -24% | 0.28 39% | 0.38 17% | ||
| Contrast (:1) | 1004 | 826 -18% | 1444 44% | 1399 39% | ||
| Colorchecker dE 2000 * | 4.08 | 2.16 47% | 2.63 36% | 1.82 55% | 2.42 41% | 4.18 -2% |
| Colorchecker dE 2000 max. * | 8.1 | 4.39 46% | 4.48 45% | 4.1 49% | 5.76 29% | 6.68 18% |
| Colorchecker dE 2000 calibrated * | 0.75 | 1.37 -83% | 1.46 -95% | 0.63 16% | 0.7 7% | 0.97 -29% |
| Greyscale dE 2000 * | 3.5 | 3.7 -6% | 2.1 40% | 1.2 66% | 0.8 77% | 1.7 51% |
| Gamma | 2.15 102% | 2.38 92% | 2.3 96% | 2.15 102% | 2.23 99% | 2.2 100% |
| CCT | 6715 97% | 6765 96% | 6810 95% | 6484 100% | 6488 100% | 6198 105% |
| Media total (Programa/Opciones) | 15% /
3% | 24% /
15% | 25% /
25% | 35% /
33% | 32% /
16% |
* ... más pequeño es mejor
Tiempos de respuesta del display
| ↔ Tiempo de respuesta de Negro a Blanco | ||
|---|---|---|
| 26.1 ms ... subida ↗ y bajada ↘ combinada | ↗ 11.8 ms subida | 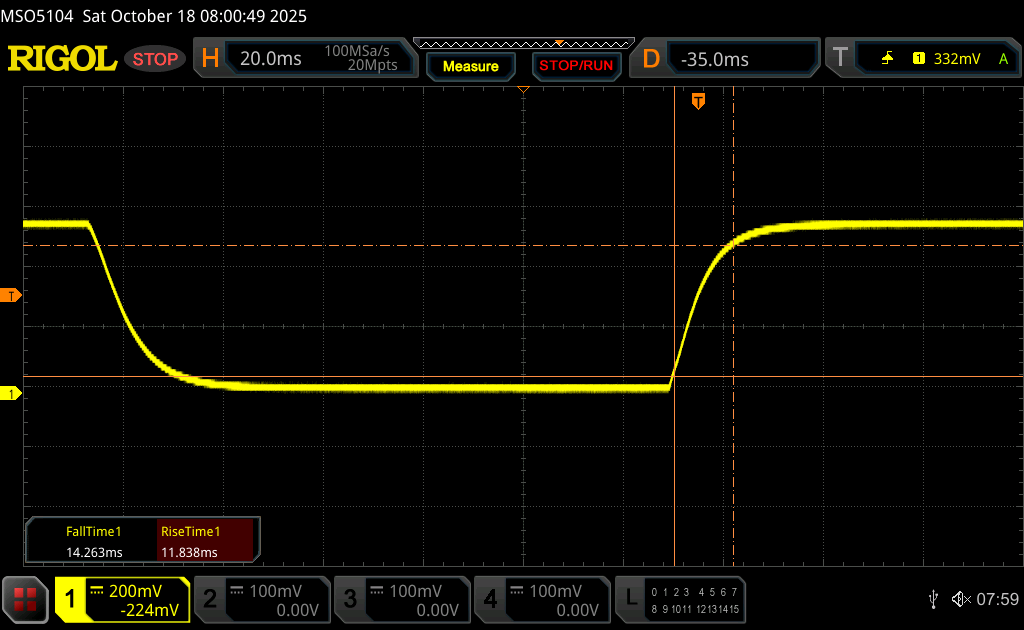 |
| ↘ 14.3 ms bajada | ||
| La pantalla mostró tiempos de respuesta relativamente lentos en nuestros tests pero podría ser demasiado lenta para los jugones. En comparación, todos los dispositivos de prueba van de ##min### (mínimo) a 240 (máximo) ms. » 65 % de todos los dispositivos son mejores. Eso quiere decir que el tiempo de respuesta es peor que la media (19.8 ms) de todos los dispositivos testados. | ||
| ↔ Tiempo de respuesta 50% Gris a 80% Gris | ||
| 45.5 ms ... subida ↗ y bajada ↘ combinada | ↗ 21.1 ms subida | 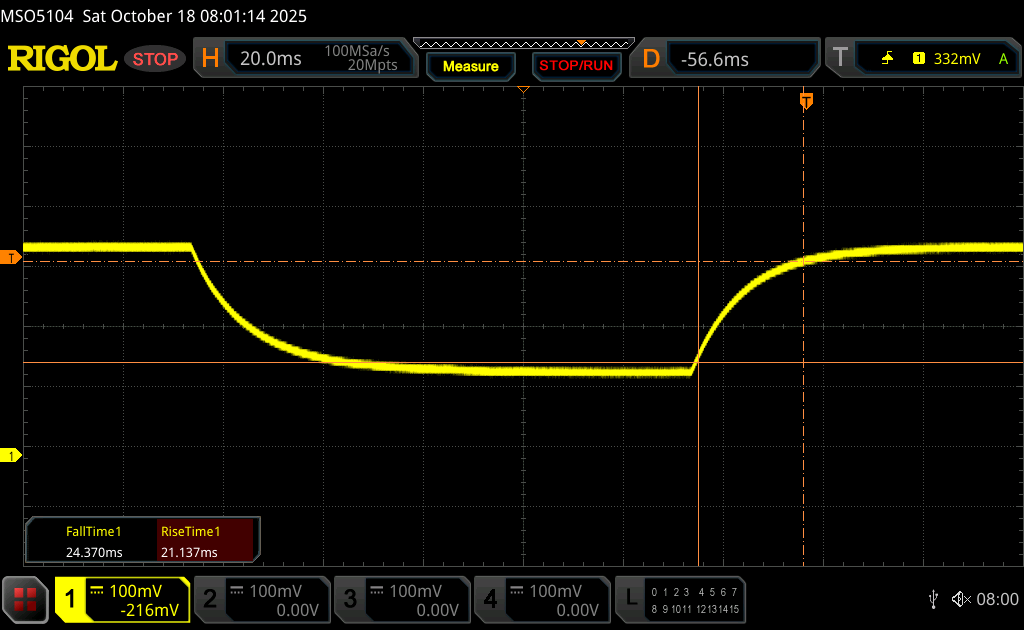 |
| ↘ 24.4 ms bajada | ||
| La pantalla mostró tiempos de respuesta lentos en nuestros tests y podría ser demasiado lenta para los jugones. En comparación, todos los dispositivos de prueba van de ##min### (mínimo) a 636 (máximo) ms. » 78 % de todos los dispositivos son mejores. Eso quiere decir que el tiempo de respuesta es peor que la media (31 ms) de todos los dispositivos testados. | ||
Parpadeo de Pantalla / PWM (Pulse-Width Modulation)
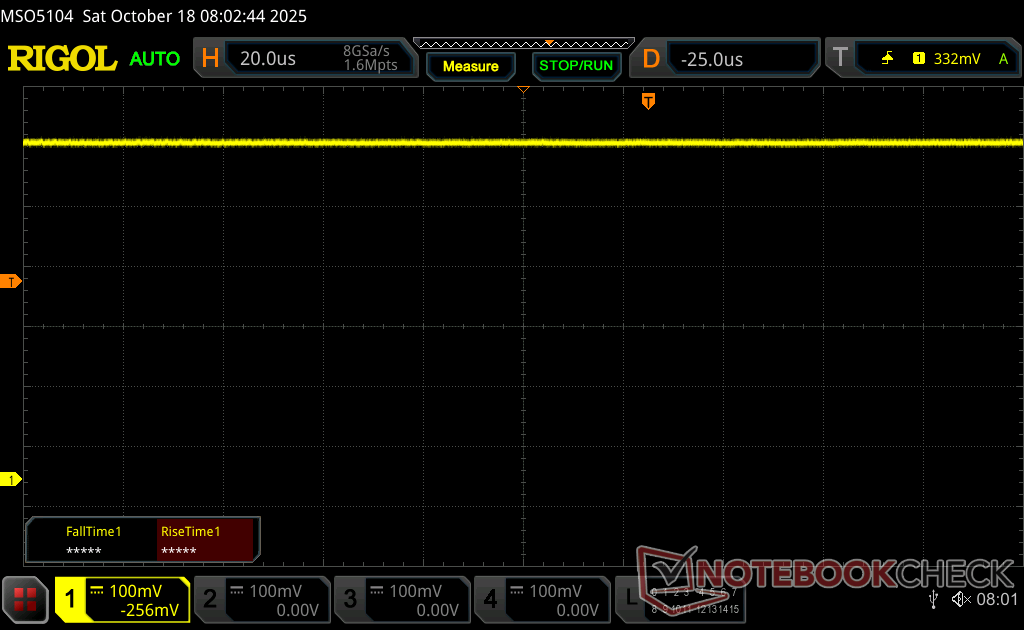
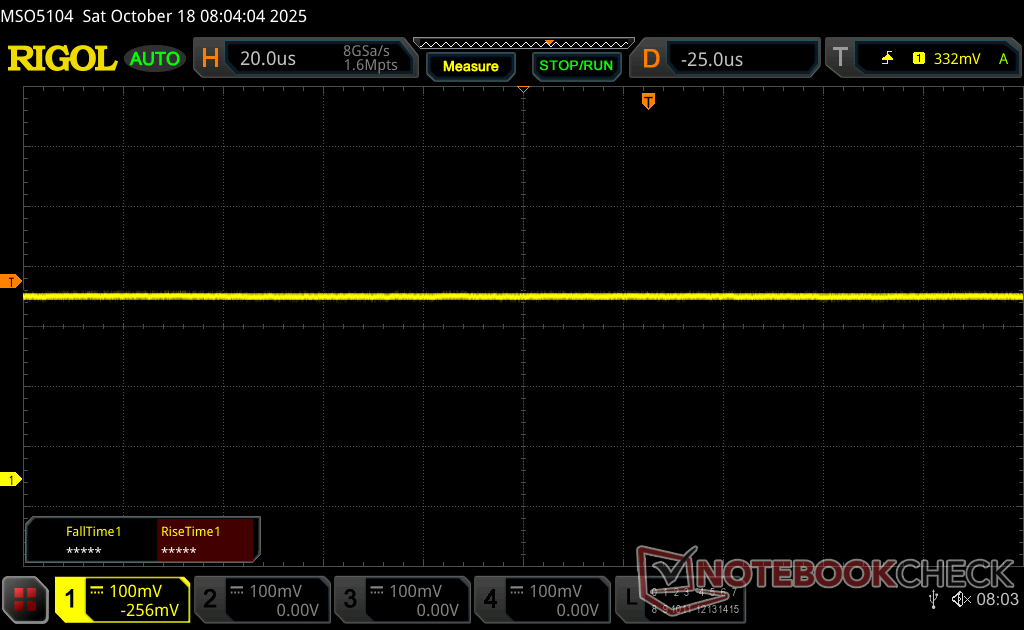
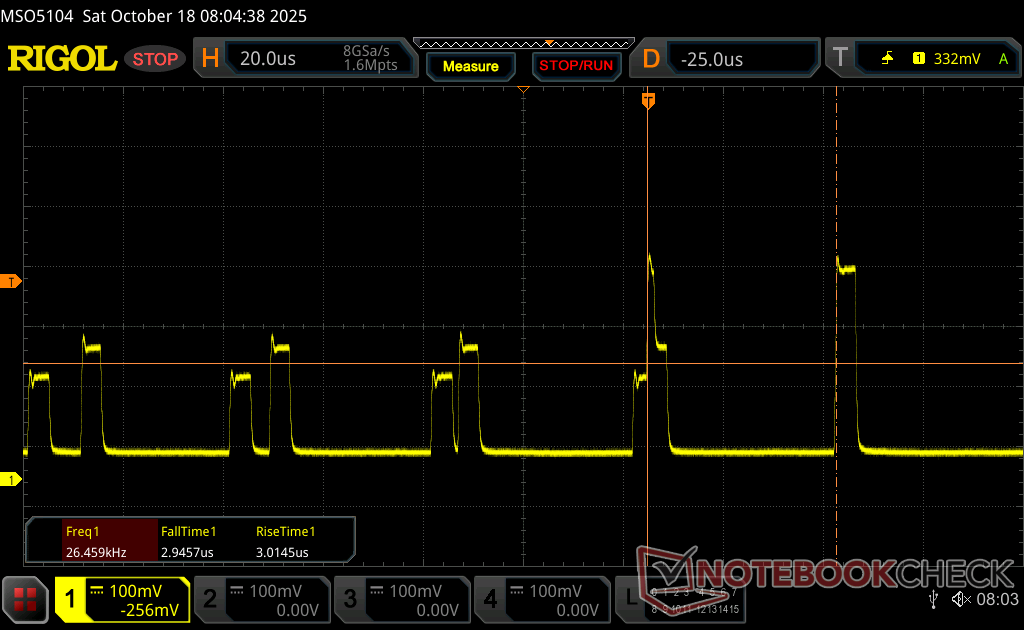
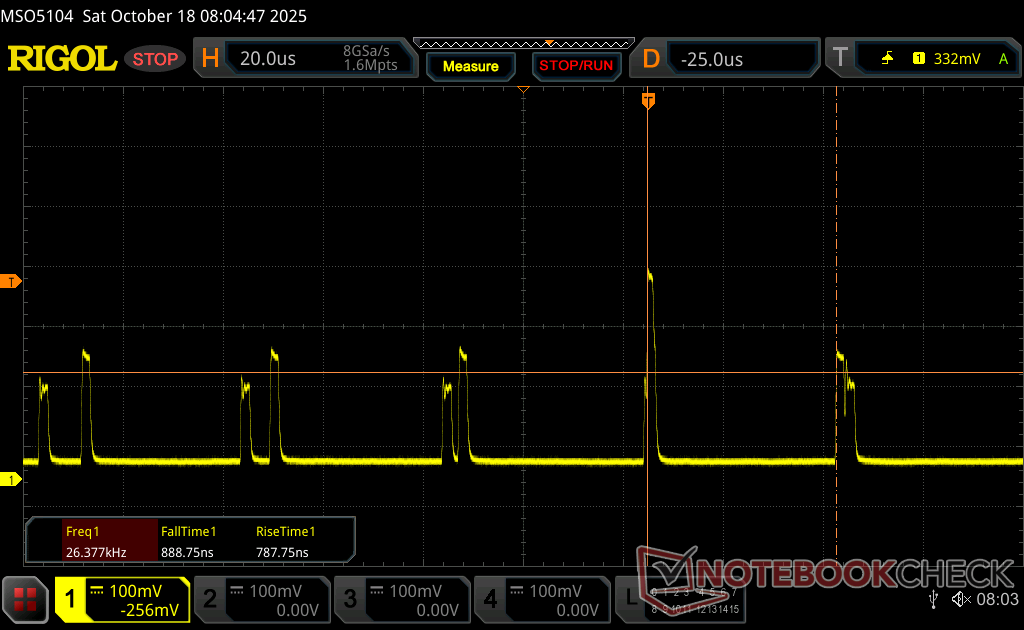
| Parpadeo de Pantalla / PWM detectado | 26536 Hz Amplitude: 47 % | ≤ 74 % de brillo | 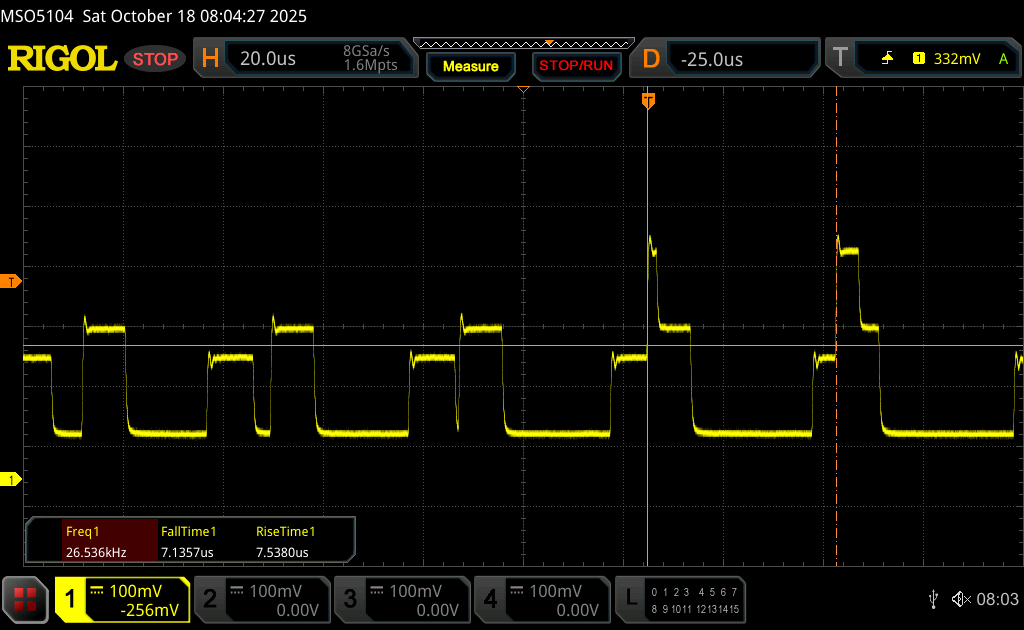 |
La retroiluminación del display parpadea a 26536 Hz (seguramente usa PWM - Pulse-Width Modulation) a un brillo del 74 % e inferior. Sobre este nivel de brillo no debería darse parpadeo / PWM. La frecuencia de 26536 Hz es bastante alta, por lo que la mayoría de gente sensible al parpadeo no debería ver parpadeo o tener fatiga visual. Comparación: 52 % de todos los dispositivos testados no usaron PWM para atenuar el display. Si se usó, medimos una media de 7757 (mínimo: 5 - máxmo: 343500) Hz. | |||


Rendimiento
Condiciones de prueba
Pusimos Windows en modo Rendimiento antes de ejecutar las pruebas comparativas que se indican a continuación.
Procesador
El Core Ultra 7 265H ofrece sólo un aumento relativamente menor del rendimiento con respecto al Core Ultra 7 155H en aproximadamente un 15 por ciento. Los usuarios que actualicen desde un modelo mucho más antiguo como el HP ZBook Studio 16 G9 verán un aumento más significativo de alrededor del 30 por ciento.
El rendimiento cae en torno a un 10 por ciento al ejecutar nuestra prueba de estrés CineBench R15 xT en bucle debido a las limitaciones de Turbo Boost, como se detalla en nuestra sección de pruebas de estrés más adelante.
Bucle múltiple Cinebench R15
Cinebench R23: Multi Core | Single Core
Cinebench R20: CPU (Multi Core) | CPU (Single Core)
Cinebench R15: CPU Multi 64Bit | CPU Single 64Bit
Blender: v2.79 BMW27 CPU
7-Zip 18.03: 7z b 4 | 7z b 4 -mmt1
Geekbench 6.7: Multi-Core | Single-Core
Geekbench 5.5: Multi-Core | Single-Core
HWBOT x265 Benchmark v2.2: 4k Preset
LibreOffice : 20 Documents To PDF
R Benchmark 2.5: Overall mean
* ... más pequeño es mejor
Rendimiento del sistema
Un pequeño puñado de pruebas de rendimiento se bloqueaban o no se completaban en nuestra unidad de pruebas, incluyendo PCMark 10, SpecViewPerf 13 Maya y AIDA64 Engineer.
CrossMark: Overall | Productivity | Creativity | Responsiveness
WebXPRT 3: Overall
WebXPRT 4: Overall
Mozilla Kraken 1.1: Total
| Performance rating | |
| Dell Pro Max 16 Plus | |
| Lenovo ThinkPad P16 Gen 2 | |
| HP ZBook X G1i 16 | |
| Medio Intel Core Ultra 7 265H, NVIDIA RTX PRO 2000 Blackwell Generation Laptop | |
| Dell Precision 5690 | |
| HP ZBook Studio 16 G11 | |
| HP ZBook Power 16 G11 A | |
| CrossMark / Overall | |
| Dell Pro Max 16 Plus | |
| Lenovo ThinkPad P16 Gen 2 | |
| HP ZBook X G1i 16 | |
| Medio Intel Core Ultra 7 265H, NVIDIA RTX PRO 2000 Blackwell Generation Laptop (n=1) | |
| Dell Precision 5690 | |
| HP ZBook Power 16 G11 A | |
| HP ZBook Studio 16 G11 | |
| CrossMark / Productivity | |
| Dell Pro Max 16 Plus | |
| HP ZBook X G1i 16 | |
| Medio Intel Core Ultra 7 265H, NVIDIA RTX PRO 2000 Blackwell Generation Laptop (n=1) | |
| Lenovo ThinkPad P16 Gen 2 | |
| Dell Precision 5690 | |
| HP ZBook Power 16 G11 A | |
| HP ZBook Studio 16 G11 | |
| CrossMark / Creativity | |
| Dell Pro Max 16 Plus | |
| Lenovo ThinkPad P16 Gen 2 | |
| HP ZBook X G1i 16 | |
| Medio Intel Core Ultra 7 265H, NVIDIA RTX PRO 2000 Blackwell Generation Laptop (n=1) | |
| HP ZBook Power 16 G11 A | |
| Dell Precision 5690 | |
| HP ZBook Studio 16 G11 | |
| CrossMark / Responsiveness | |
| Dell Pro Max 16 Plus | |
| Lenovo ThinkPad P16 Gen 2 | |
| Dell Precision 5690 | |
| HP ZBook X G1i 16 | |
| Medio Intel Core Ultra 7 265H, NVIDIA RTX PRO 2000 Blackwell Generation Laptop (n=1) | |
| HP ZBook Studio 16 G11 | |
| HP ZBook Power 16 G11 A | |
| WebXPRT 3 / Overall | |
| Lenovo ThinkPad P16 Gen 2 | |
| Dell Pro Max 16 Plus | |
| HP ZBook X G1i 16 | |
| Medio Intel Core Ultra 7 265H, NVIDIA RTX PRO 2000 Blackwell Generation Laptop (n=1) | |
| HP ZBook Power 16 G11 A | |
| HP ZBook Studio 16 G11 | |
| Dell Precision 5690 | |
| WebXPRT 4 / Overall | |
| Dell Pro Max 16 Plus | |
| Lenovo ThinkPad P16 Gen 2 | |
| HP ZBook X G1i 16 | |
| Medio Intel Core Ultra 7 265H, NVIDIA RTX PRO 2000 Blackwell Generation Laptop (n=1) | |
| Dell Precision 5690 | |
| HP ZBook Studio 16 G11 | |
| HP ZBook Power 16 G11 A | |
| Mozilla Kraken 1.1 / Total | |
| HP ZBook Power 16 G11 A | |
| HP ZBook Studio 16 G11 | |
| Dell Precision 5690 | |
| HP ZBook X G1i 16 | |
| Medio Intel Core Ultra 7 265H, NVIDIA RTX PRO 2000 Blackwell Generation Laptop (n=1) | |
| Lenovo ThinkPad P16 Gen 2 | |
| Dell Pro Max 16 Plus | |
* ... más pequeño es mejor
» No benchmarks for this notebook found!
Latencia del CPD
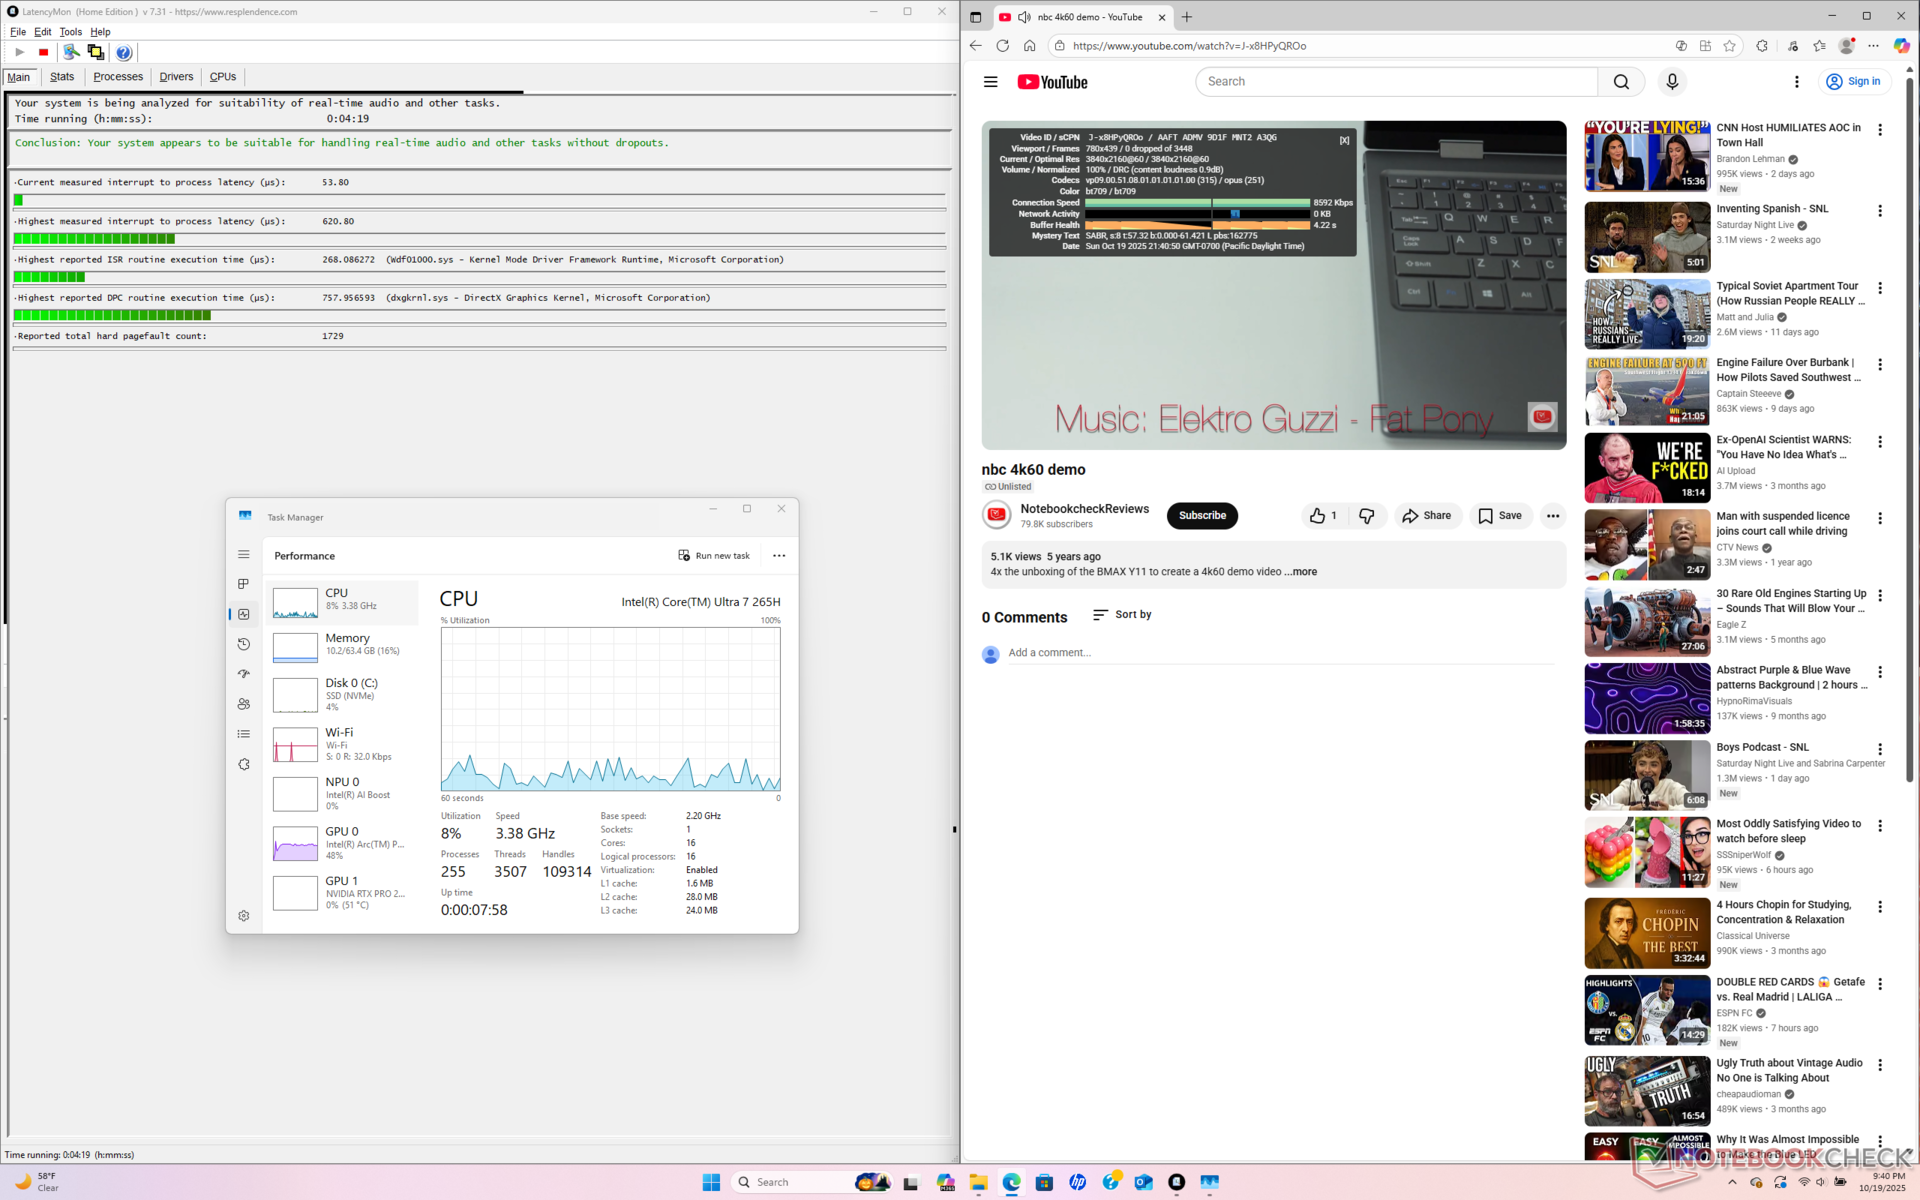
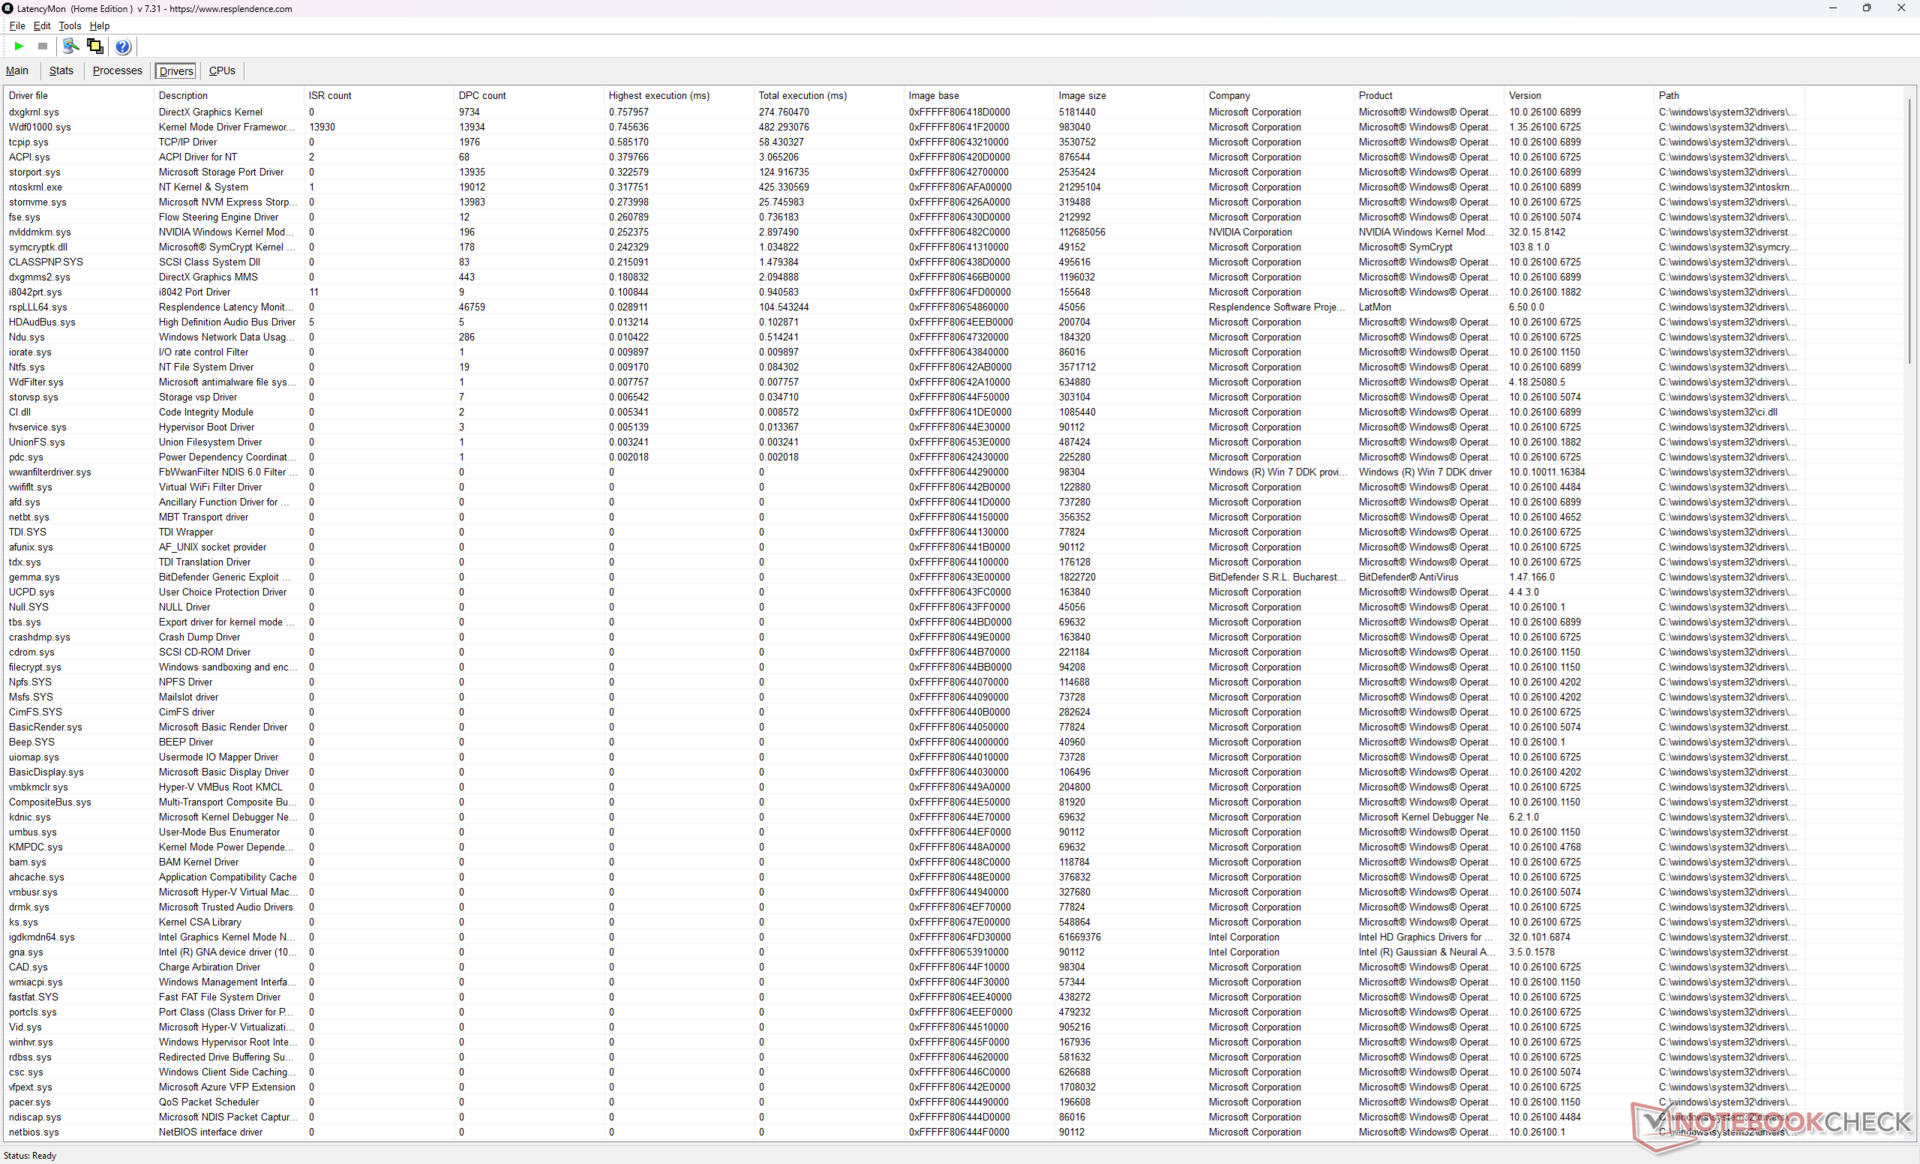
| DPC Latencies / LatencyMon - interrupt to process latency (max), Web, Youtube, Prime95 | |
| HP ZBook Power 16 G11 A | |
| Dell Pro Max 16 Plus | |
| HP ZBook Studio 16 G11 | |
| Lenovo ThinkPad P16 Gen 2 | |
| HP ZBook X G1i 16 | |
| Dell Precision 5690 | |
* ... más pequeño es mejor
Dispositivos de almacenamiento
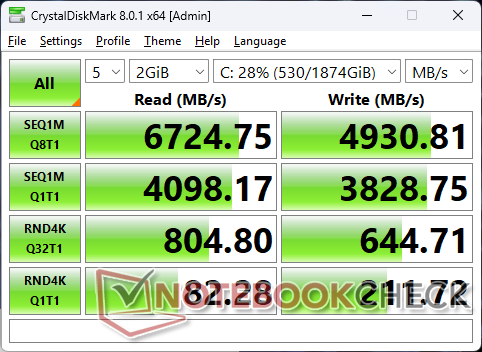
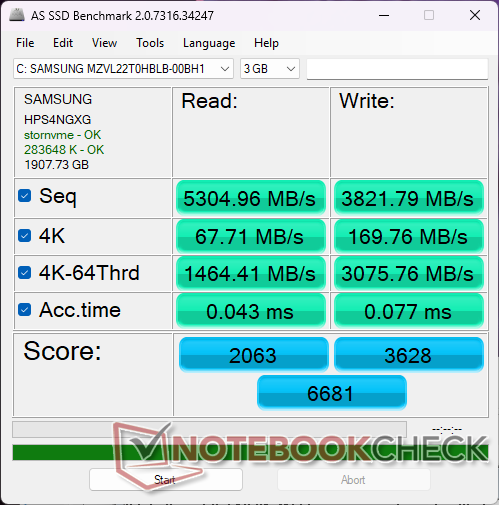

| Drive Performance rating - Percent | |
| HP ZBook X G1i 16 | |
| Dell Pro Max 16 Plus | |
| Dell Precision 5690 | |
| Lenovo ThinkPad P16 Gen 2 | |
| HP ZBook Power 16 G11 A | |
| HP ZBook Studio 16 G11 | |
* ... más pequeño es mejor
Estrangulamiento de disco: Bucle de lectura DiskSpd, profundidad de cola 8
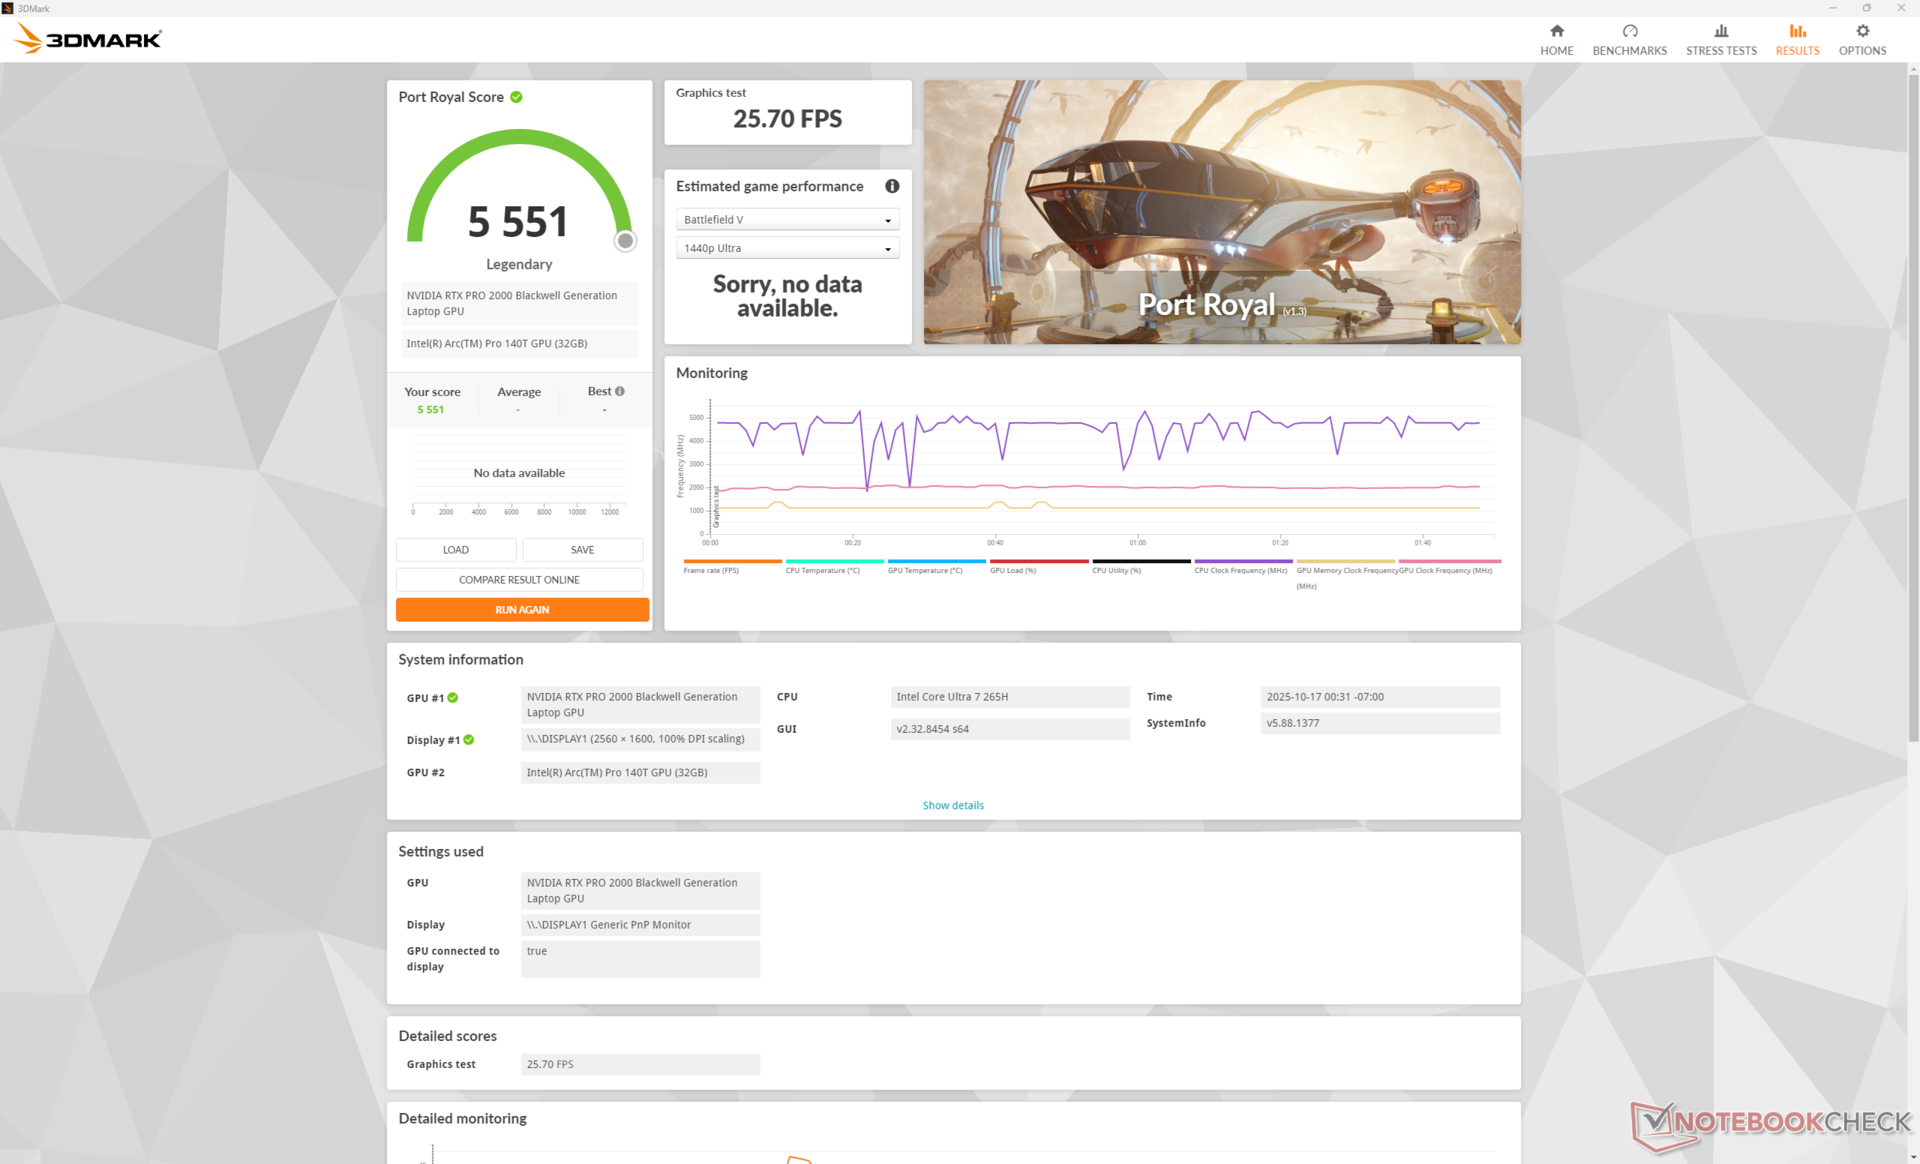
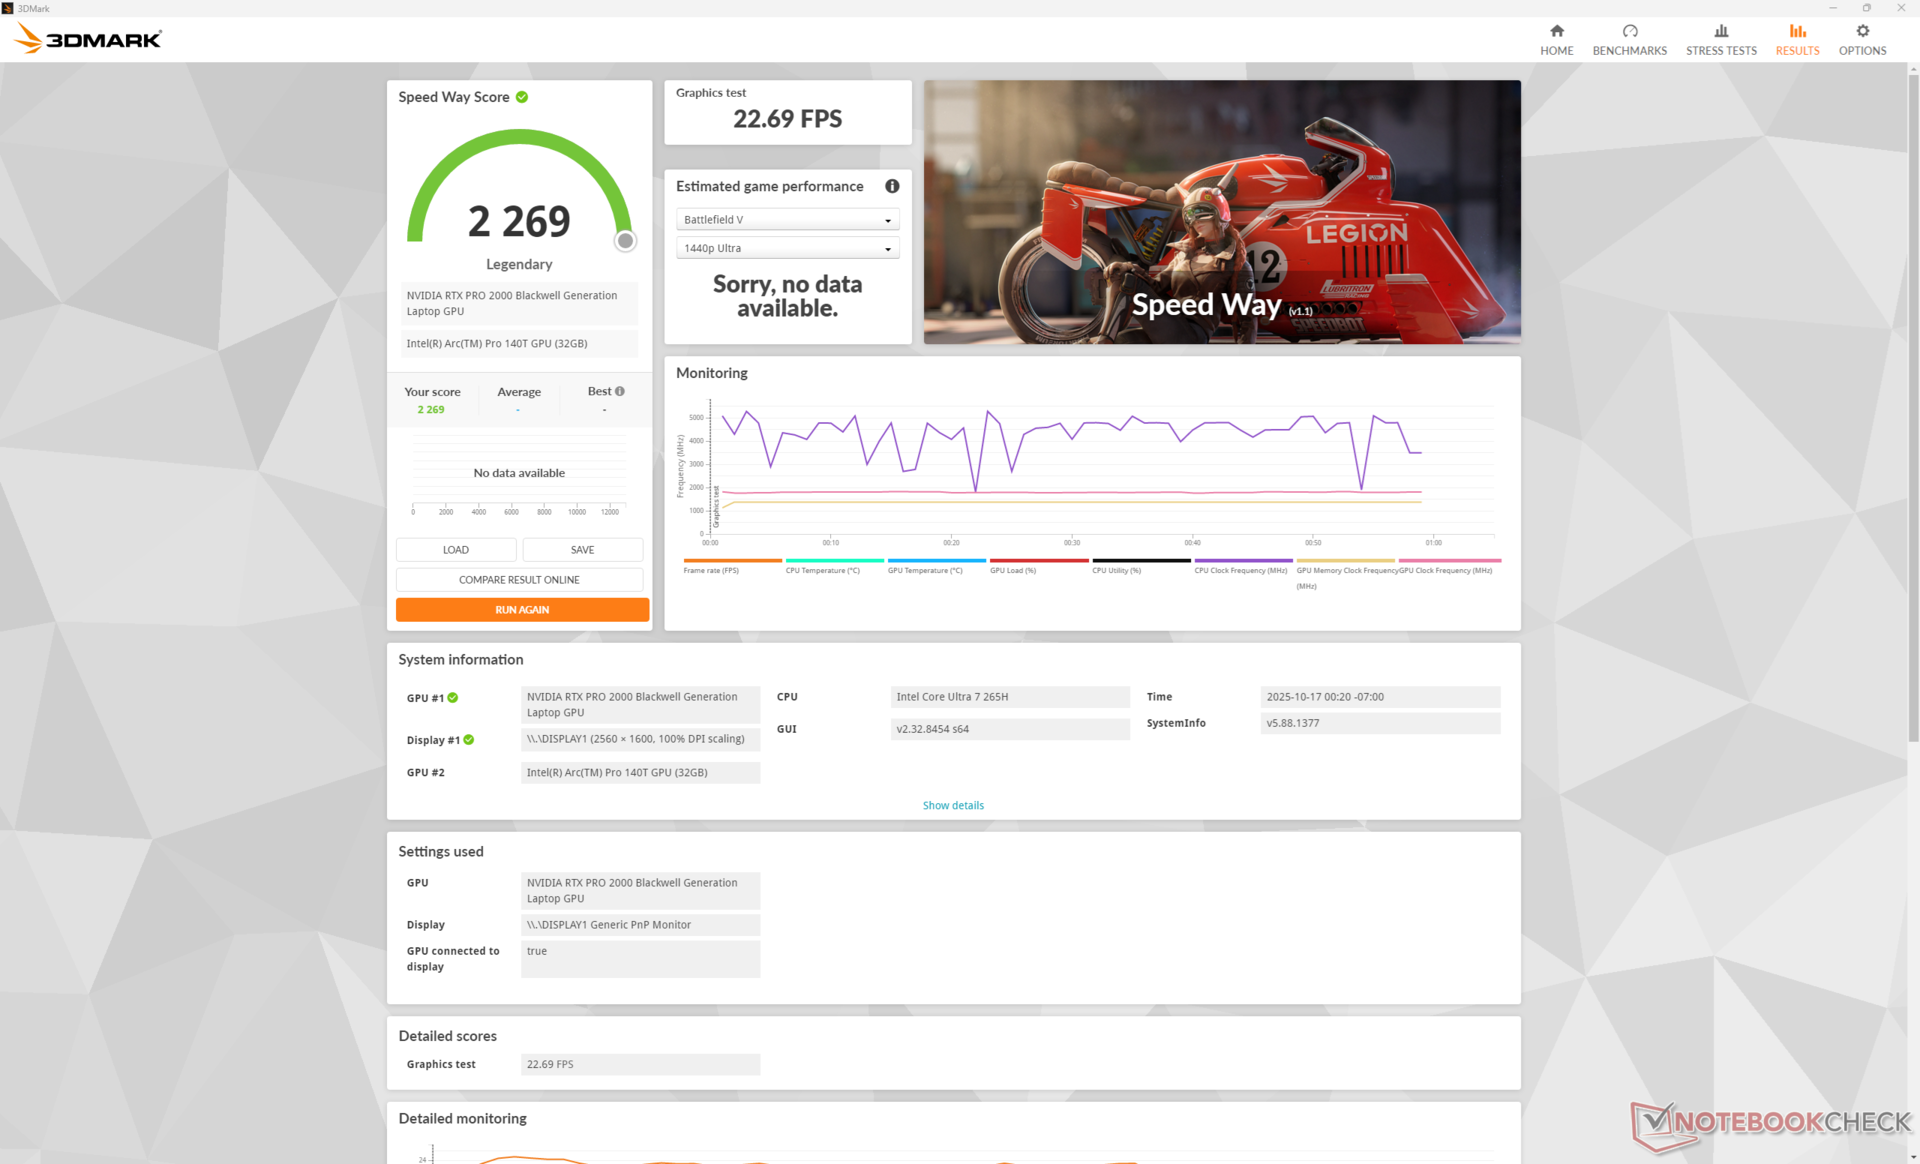
Rendimiento de la GPU
El RTX Pro 2000 Blackwell de HP alcanza los 60 W para un nivel de rendimiento bruto sólo ligeramente superior al de la última generación RTX 2000 Ada Lovelace. Mientras tanto, los usuarios que se actualicen desde la mucho más antigua RTX A2000 en modelos como el 2022 ZBook Studio 16 G9 verán aumentos más significativos de 1,5x a 1,9x.
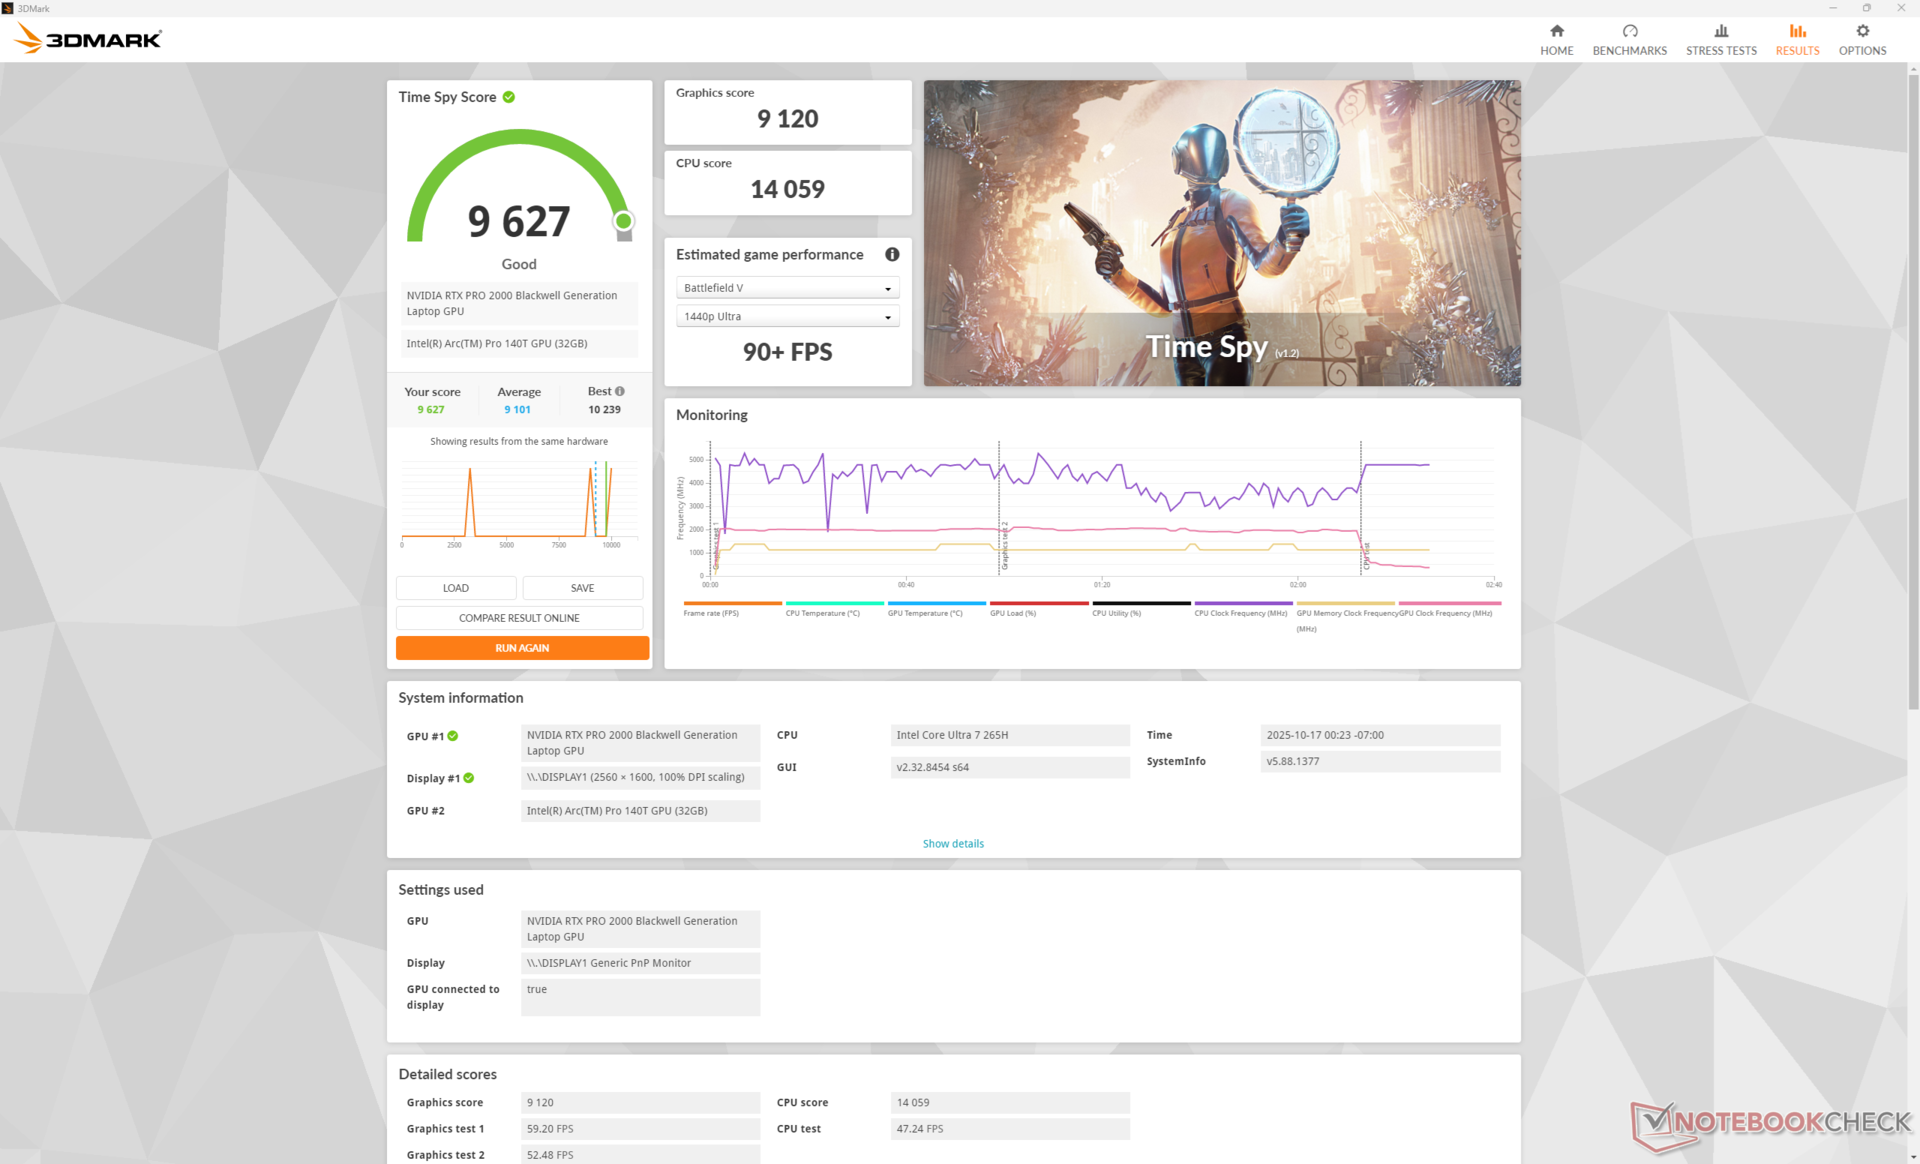
Ejecutar en modo Equilibrado en lugar de en modo Rendimiento tendría un impacto en el rendimiento gráfico de alrededor del 5 por ciento, como se muestra en nuestra tabla de resultados Fire Strike a continuación. Si se trata de juegos, la RTX Pro 2000 tiene un rendimiento muy similar a la GeForce RTX 4060 móvil o 5060.
| Perfil de potencia | Puntuación de gráficos | Puntuación física | Puntuación combinada |
| Modo Rendimiento | 25085 | 33858 | 11010 |
| Modo equilibrado | 23771 (-5%) | 35309 (+4%) | 9366 (-15%) |
| Batería | 18195 (-27%) | 25739 (-24%) | 5646 (-49%) |
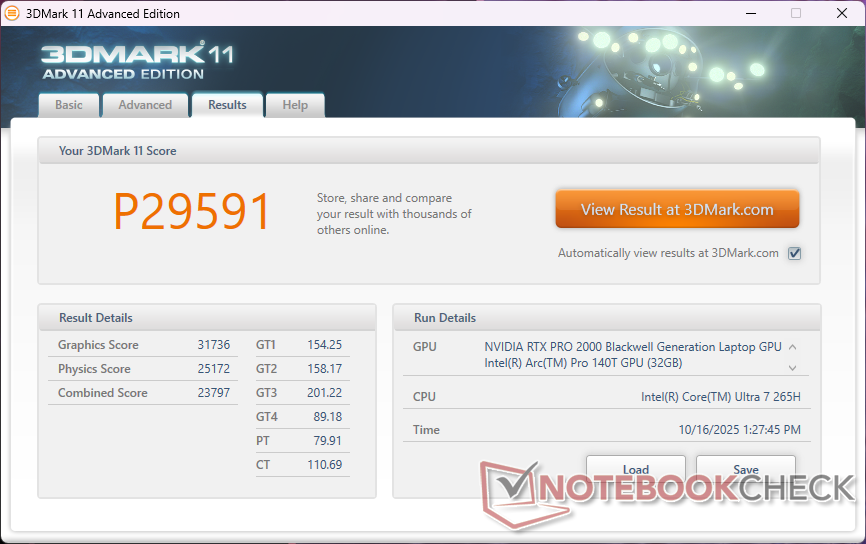

| 3DMark 11 Performance | 29591 puntos | |
| 3DMark Cloud Gate Standard Score | 60675 puntos | |
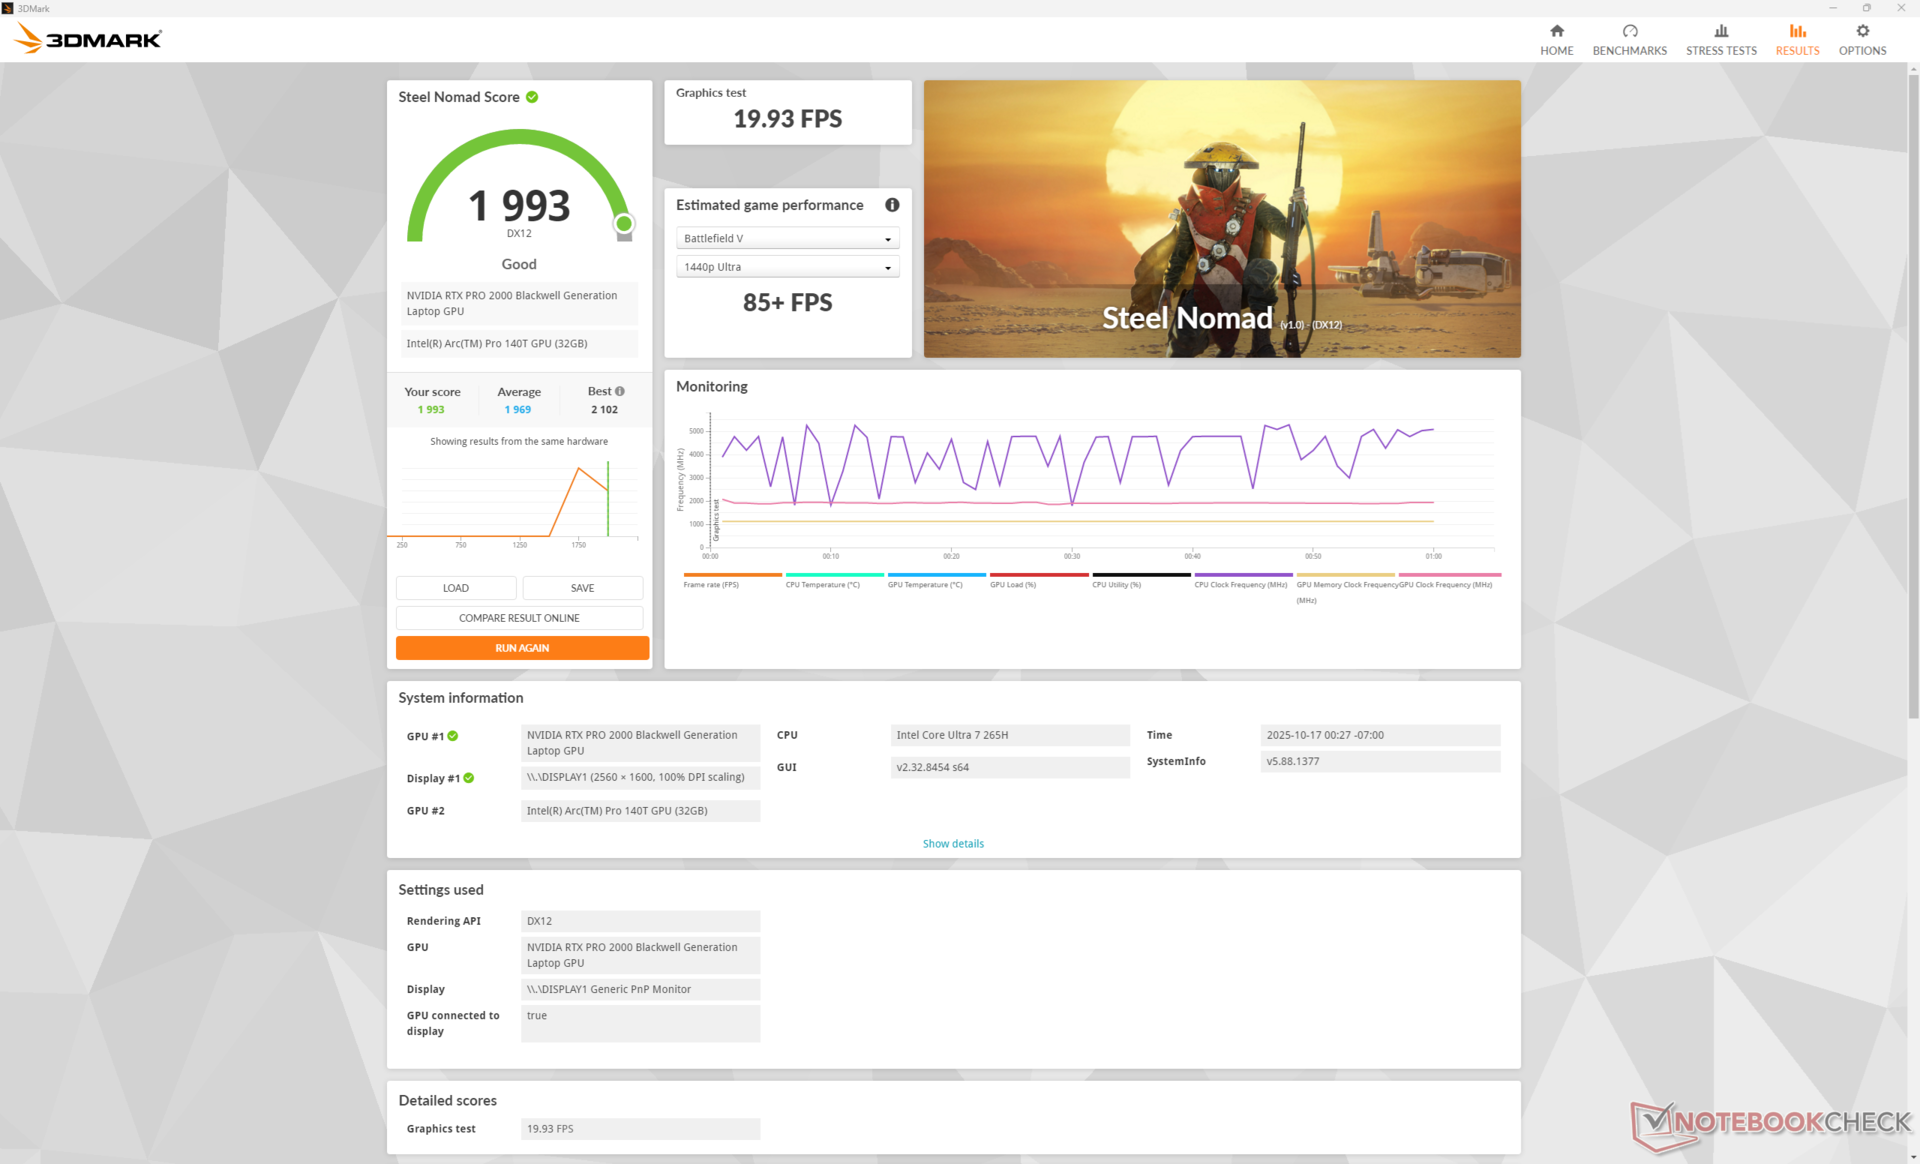
| 3DMark Fire Strike Score | 23035 puntos | |
| 3DMark Time Spy Score | 9627 puntos | |
| 3DMark Steel Nomad Score | 1993 puntos | |
ayuda | ||
* ... más pequeño es mejor
| Performance rating - Percent | |
| Dell Pro Max 16 Plus | |
| Lenovo ThinkPad P16 Gen 2 | |
| Dell Precision 5690 -1! | |
| HP ZBook X G1i 16 | |
| HP ZBook Studio 16 G11 | |
| HP ZBook Power 16 G11 A | |
| Cyberpunk 2077 - 1920x1080 Ultra Preset (FSR off) | |
| Dell Pro Max 16 Plus | |
| Dell Precision 5690 | |
| Lenovo ThinkPad P16 Gen 2 | |
| HP ZBook X G1i 16 | |
| HP ZBook Studio 16 G11 | |
| HP ZBook Power 16 G11 A | |
| Baldur's Gate 3 - 1920x1080 Ultra Preset AA:T | |
| Dell Pro Max 16 Plus | |
| Lenovo ThinkPad P16 Gen 2 | |
| Dell Precision 5690 | |
| HP ZBook Studio 16 G11 | |
| HP ZBook X G1i 16 | |
| HP ZBook Power 16 G11 A | |
| GTA V - 1920x1080 Highest AA:4xMSAA + FX AF:16x | |
| Dell Pro Max 16 Plus | |
| Lenovo ThinkPad P16 Gen 2 | |
| HP ZBook X G1i 16 | |
| HP ZBook Studio 16 G11 | |
| HP ZBook Power 16 G11 A | |
| Final Fantasy XV Benchmark - 1920x1080 High Quality | |
| Dell Pro Max 16 Plus | |
| Lenovo ThinkPad P16 Gen 2 | |
| Dell Precision 5690 | |
| HP ZBook X G1i 16 | |
| HP ZBook Studio 16 G11 | |
| HP ZBook Power 16 G11 A | |
| Strange Brigade - 1920x1080 ultra AA:ultra AF:16 | |
| Lenovo ThinkPad P16 Gen 2 | |
| Dell Pro Max 16 Plus | |
| Dell Precision 5690 | |
| HP ZBook Studio 16 G11 | |
| HP ZBook X G1i 16 | |
| HP ZBook Power 16 G11 A | |
| Dota 2 Reborn - 1920x1080 ultra (3/3) best looking | |
| Dell Pro Max 16 Plus | |
| Lenovo ThinkPad P16 Gen 2 | |
| HP ZBook Studio 16 G11 | |
| HP ZBook X G1i 16 | |
| Dell Precision 5690 | |
| HP ZBook Power 16 G11 A | |
| X-Plane 11.11 - 1920x1080 high (fps_test=3) | |
| Lenovo ThinkPad P16 Gen 2 | |
| Dell Pro Max 16 Plus | |
| Dell Precision 5690 | |
| HP ZBook Studio 16 G11 | |
| HP ZBook X G1i 16 | |
| HP ZBook Power 16 G11 A | |
Cyberpunk 2077 ultra FPS Gráfico
| bajo | medio | alto | ultra | QHD DLSS | QHD | |
|---|---|---|---|---|---|---|
| GTA V (2015) | 186.2 | 183.1 | 177.8 | 112.7 | 88.4 | |
| Dota 2 Reborn (2015) | 170.1 | 158.1 | 151.1 | 141.8 | ||
| Final Fantasy XV Benchmark (2018) | 206 | 129.5 | 100.2 | 71 | ||
| X-Plane 11.11 (2018) | 102 | 92.2 | 80.6 | |||
| Strange Brigade (2018) | 480 | 252 | 198.7 | 171.3 | 119.2 | |
| Baldur's Gate 3 (2023) | 116.1 | 99.7 | 89.6 | 89.5 | 90 | 60.4 |
| Cyberpunk 2077 (2023) | 112.5 | 93.5 | 80 | 72.1 | 52.4 | 43.6 |
| F1 24 (2024) | 214 | 205 | 161.4 | 48.2 | 48.8 | 32.2 |
Emisiones
Ruido del sistema
Los ventiladores son letárgicos cuando se ejecutan cargas poco exigentes, pero pueden llegar a ser bastante ruidosos, con algo más de 50 dB(A), cuando se ejecutan cargas más exigentes durante periodos prolongados, como Cyberpunk 2077.
Ruido
| Ocioso |
| 23.7 / 23.7 / 23.7 dB(A) |
| Carga |
| 32.7 / 48 dB(A) |
 | ||
30 dB silencioso 40 dB(A) audible 50 dB(A) ruidosamente alto |
||
min: | ||
| HP ZBook X G1i 16 RTX PRO 2000 Blackwell Generation Laptop, Ultra 7 265H, Samsung PM9A1 MZVL22T0HBLB | HP ZBook Power 16 G11 A RTX 2000 Ada Generation Laptop, R7 8845HS, Samsung PM9A1 MZVL22T0HBLB | HP ZBook Studio 16 G11 RTX 3000 Ada Generation Laptop, Ultra 9 185H, Kioxia XG8 KXG80ZNV1T02 | Lenovo ThinkPad P16 Gen 2 RTX 4000 Ada Generation Laptop, i7-14700HX, SK hynix PC801 HFS001TEJ9X162N | Dell Pro Max 16 Plus RTX PRO 5000 Blackwell Generation Laptop, Ultra 9 285HX, SK hynix PCB01 HFS001TFM9X186N | Dell Precision 5690 RTX 5000 Ada Generation Laptop, Ultra 9 185H, 2x Samsung PM9A1 1TB (RAID 0) | |
|---|---|---|---|---|---|---|
| Noise | 6% | -4% | -16% | -18% | -11% | |
| apagado / medio ambiente * (dB) | 23.7 | 23.5 1% | 23.8 -0% | 23.9 -1% | 23.2 2% | 23.4 1% |
| Idle Minimum * (dB) | 23.7 | 23.8 -0% | 23.8 -0% | 29.1 -23% | 26.7 -13% | 23.6 -0% |
| Idle Average * (dB) | 23.7 | 24.2 -2% | 26.4 -11% | 29.1 -23% | 30.5 -29% | 24.9 -5% |
| Idle Maximum * (dB) | 23.7 | 24.2 -2% | 26.4 -11% | 29.1 -23% | 34 -43% | 30.9 -30% |
| Load Average * (dB) | 32.7 | 25.4 22% | 33.7 -3% | 41 -25% | 39.8 -22% | 40.4 -24% |
| Cyberpunk 2077 ultra * (dB) | 50.9 | 43 16% | 46.1 9% | 52.8 -4% | 54.3 -7% | |
| Load Maximum * (dB) | 48 | 45 6% | 53.2 -11% | 52.9 -10% | 54.3 -13% | 51.9 -8% |
| Witcher 3 ultra * (dB) | 48.3 |
* ... más pequeño es mejor
Temperatura
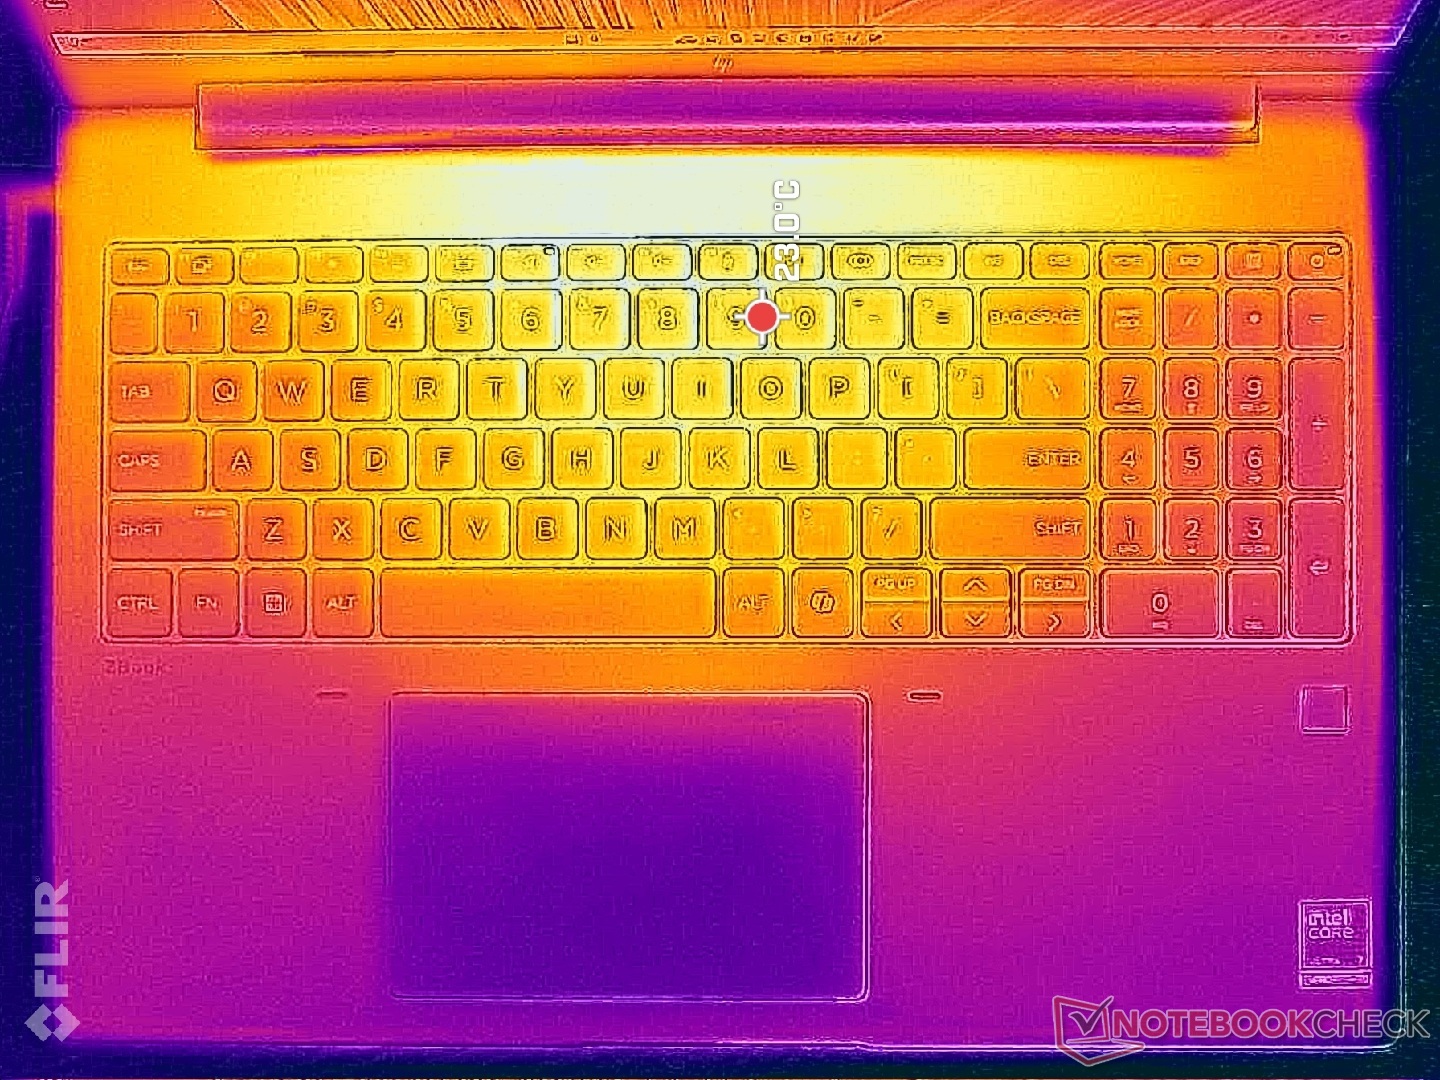
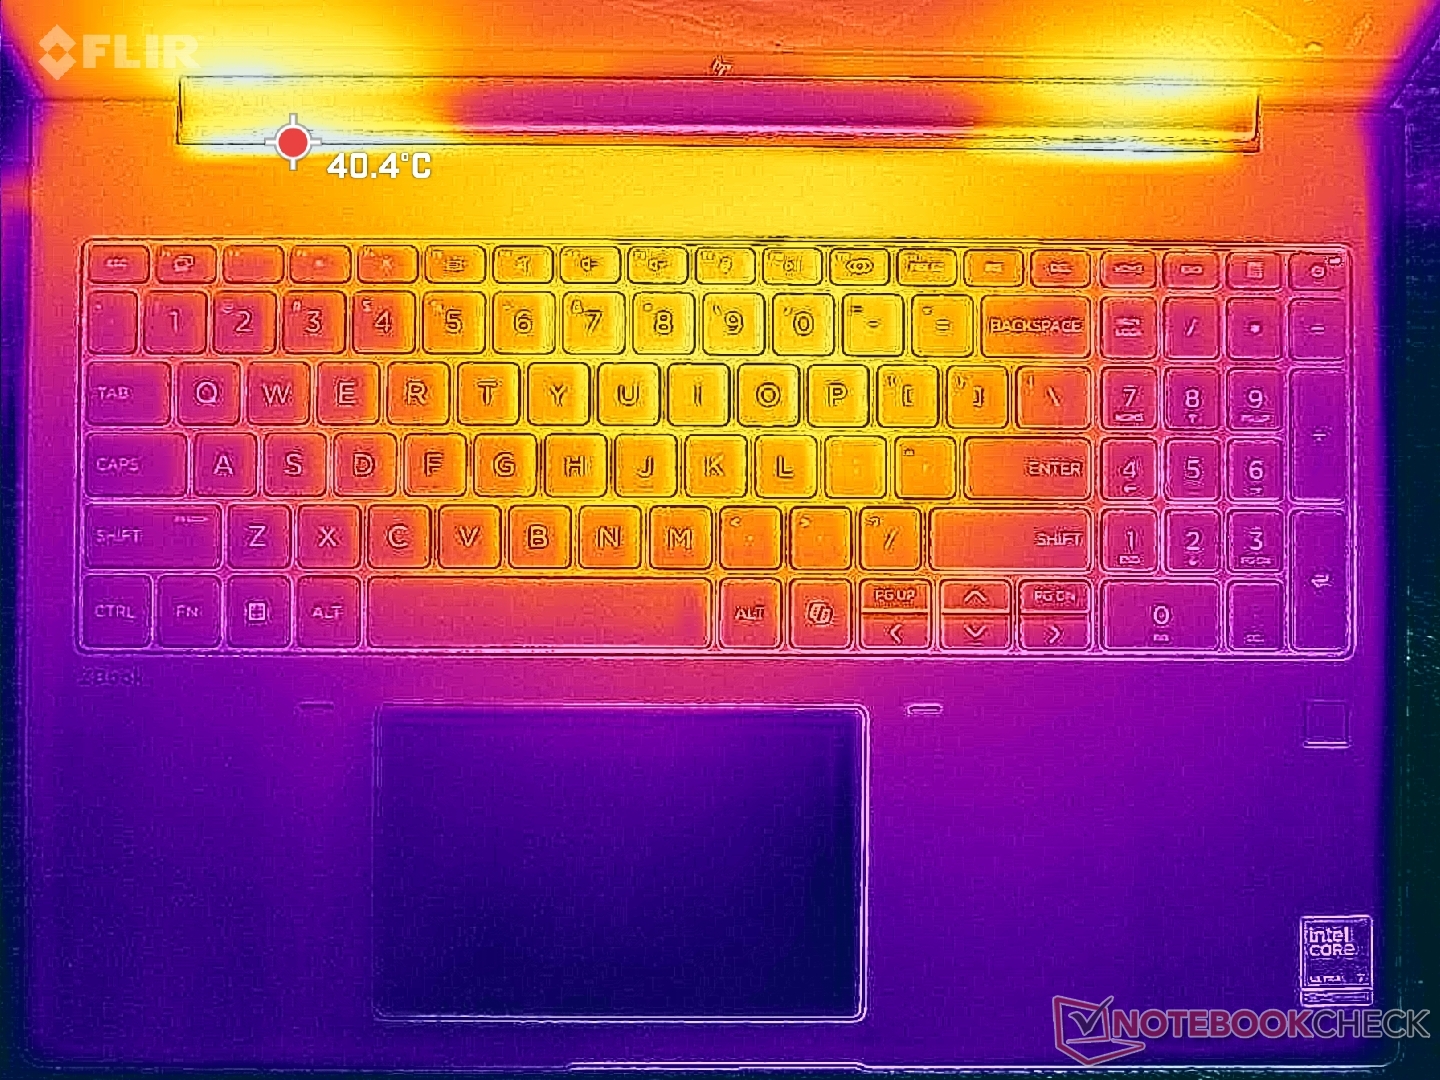
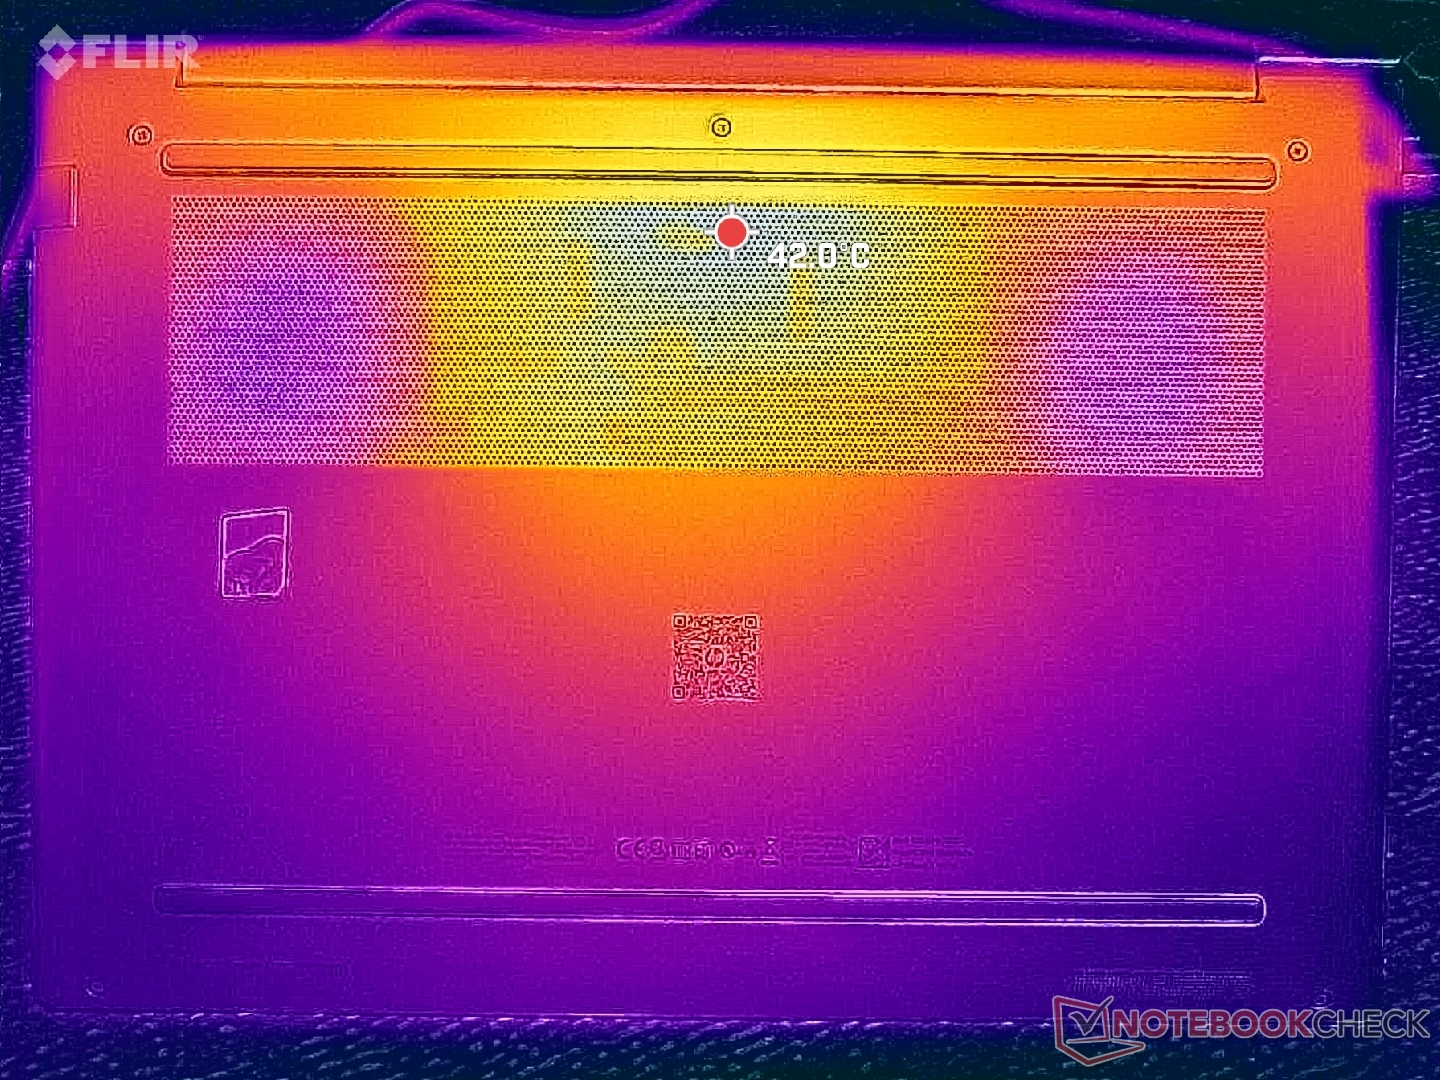
El desarrollo de la temperatura de la superficie es más cálido hacia el centro, donde puede alcanzar más de 36 C cuando se ejecutan cargas exigentes, lo que es significativamente más frío que lo que registramos en el ThinkPad P16 Gen 2 o Dell Precision 5690.
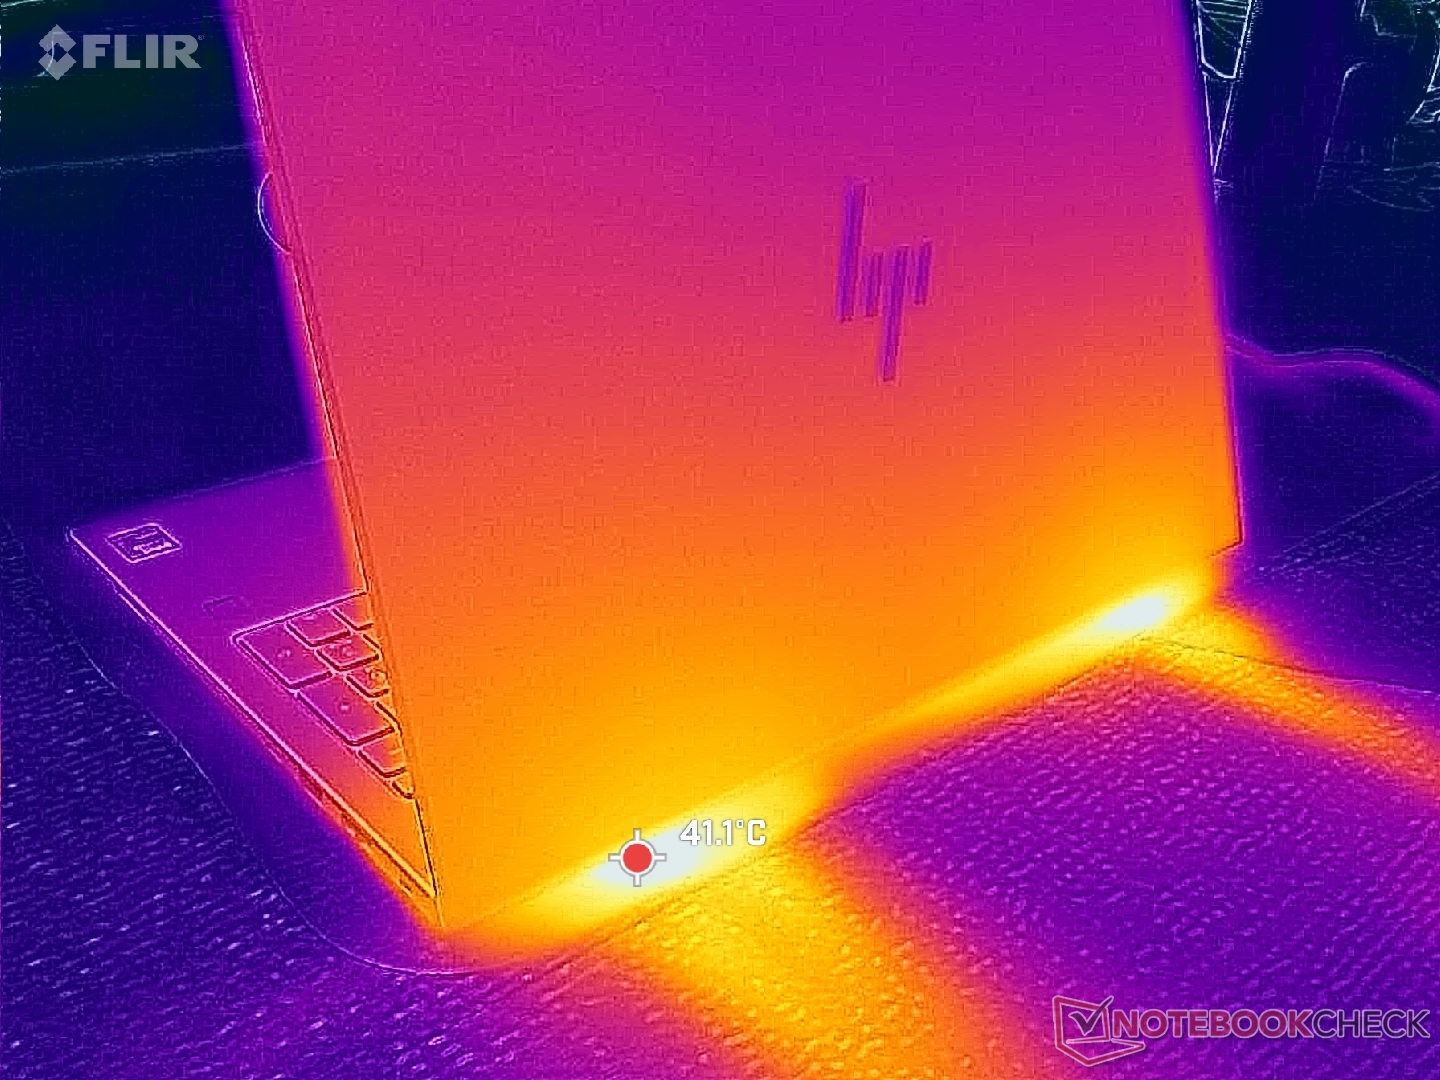
(+) La temperatura máxima en la parte superior es de 36 °C / 97 F, frente a la media de 38.2 °C / 101 F, que oscila entre 22.2 y 69.8 °C para la clase Workstation.
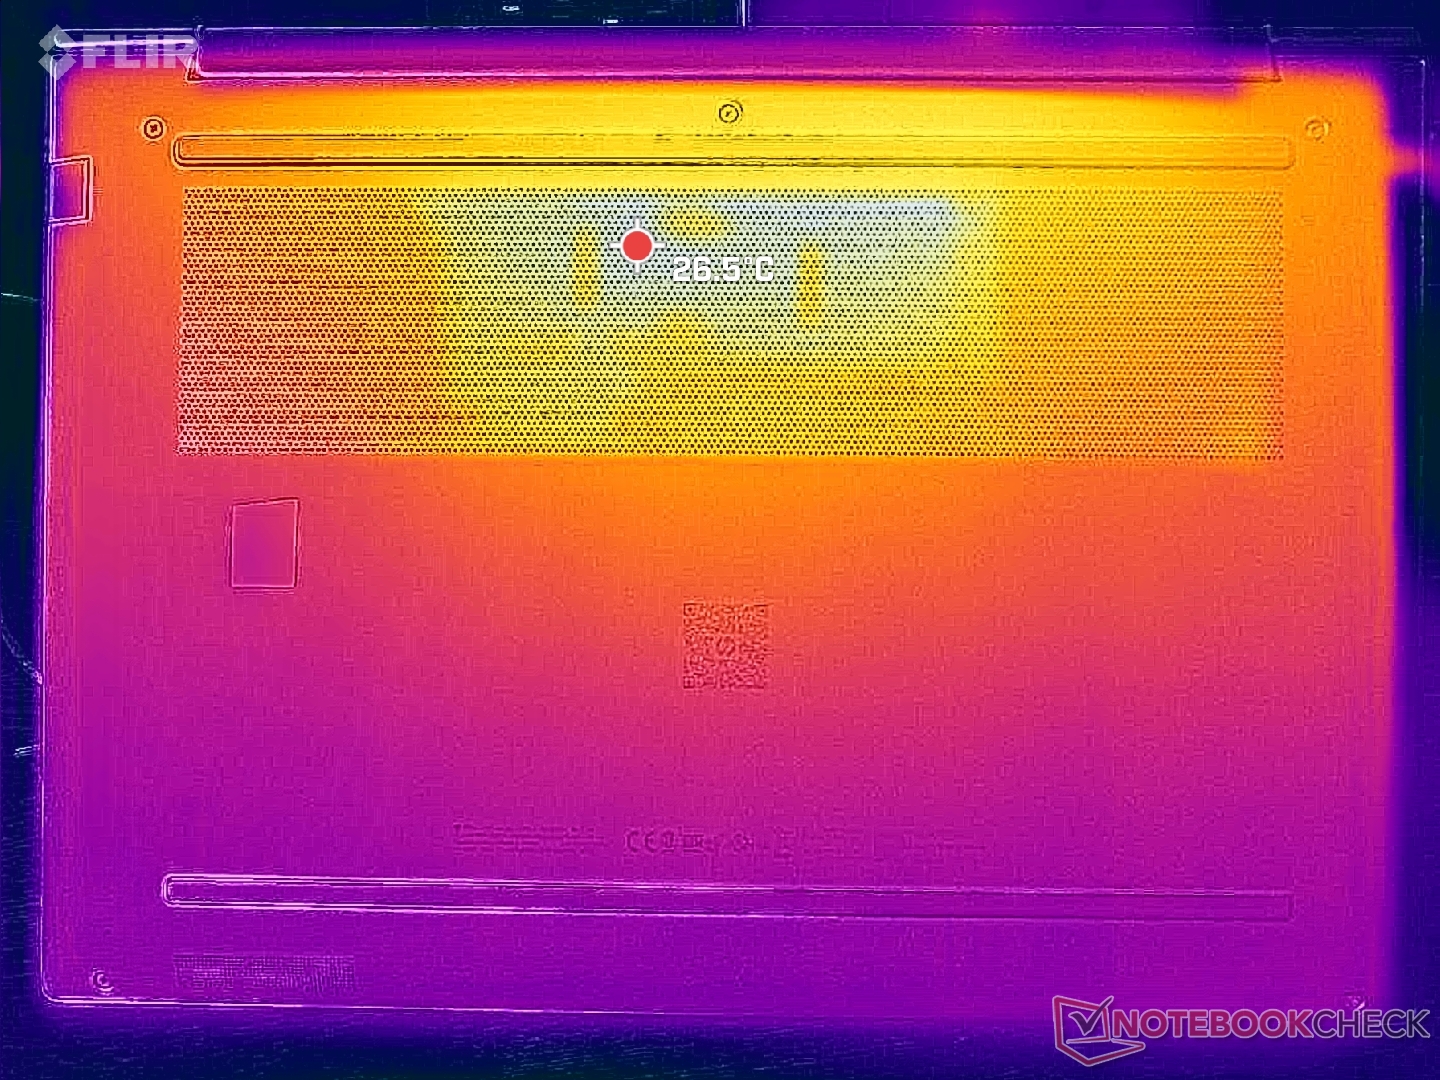
(+) El fondo se calienta hasta un máximo de 39.4 °C / 103 F, frente a la media de 41.1 °C / 106 F
(+) En reposo, la temperatura media de la parte superior es de 26.9 °C / 80# F, frente a la media del dispositivo de 32 °C / 90 F.
(+) El reposamanos y el panel táctil están a una temperatura inferior a la de la piel, con un máximo de 24.2 °C / 75.6 F y, por tanto, son fríos al tacto.
(+) La temperatura media de la zona del reposamanos de dispositivos similares fue de 27.8 °C / 82 F (+3.6 °C / 6.4 F).
| HP ZBook X G1i 16 Intel Core Ultra 7 265H, NVIDIA RTX PRO 2000 Blackwell Generation Laptop | HP ZBook Power 16 G11 A AMD Ryzen 7 8845HS, NVIDIA RTX 2000 Ada Generation Laptop | HP ZBook Studio 16 G11 Intel Core Ultra 9 185H, NVIDIA RTX 3000 Ada Generation Laptop | Lenovo ThinkPad P16 Gen 2 Intel Core i7-14700HX, NVIDIA RTX 4000 Ada Generation Laptop | Dell Pro Max 16 Plus Intel Core Ultra 9 285HX, NVIDIA RTX PRO 5000 Blackwell Generation Laptop | Dell Precision 5690 Intel Core Ultra 9 185H, NVIDIA RTX 5000 Ada Generation Laptop | |
|---|---|---|---|---|---|---|
| Heat | 4% | -10% | -5% | -10% | -3% | |
| Maximum Upper Side * (°C) | 36 | 40.6 -13% | 36.6 -2% | 46.6 -29% | 40.4 -12% | 46.6 -29% |
| Maximum Bottom * (°C) | 39.4 | 40.6 -3% | 47.8 -21% | 51 -29% | 45.6 -16% | 33 16% |
| Idle Upper Side * (°C) | 30.4 | 26 14% | 31.4 -3% | 24.8 18% | 32.8 -8% | 32.4 -7% |
| Idle Bottom * (°C) | 31.8 | 26.6 16% | 35.6 -12% | 25.6 19% | 33 -4% | 29.4 8% |
* ... más pequeño es mejor
Prueba de estrés
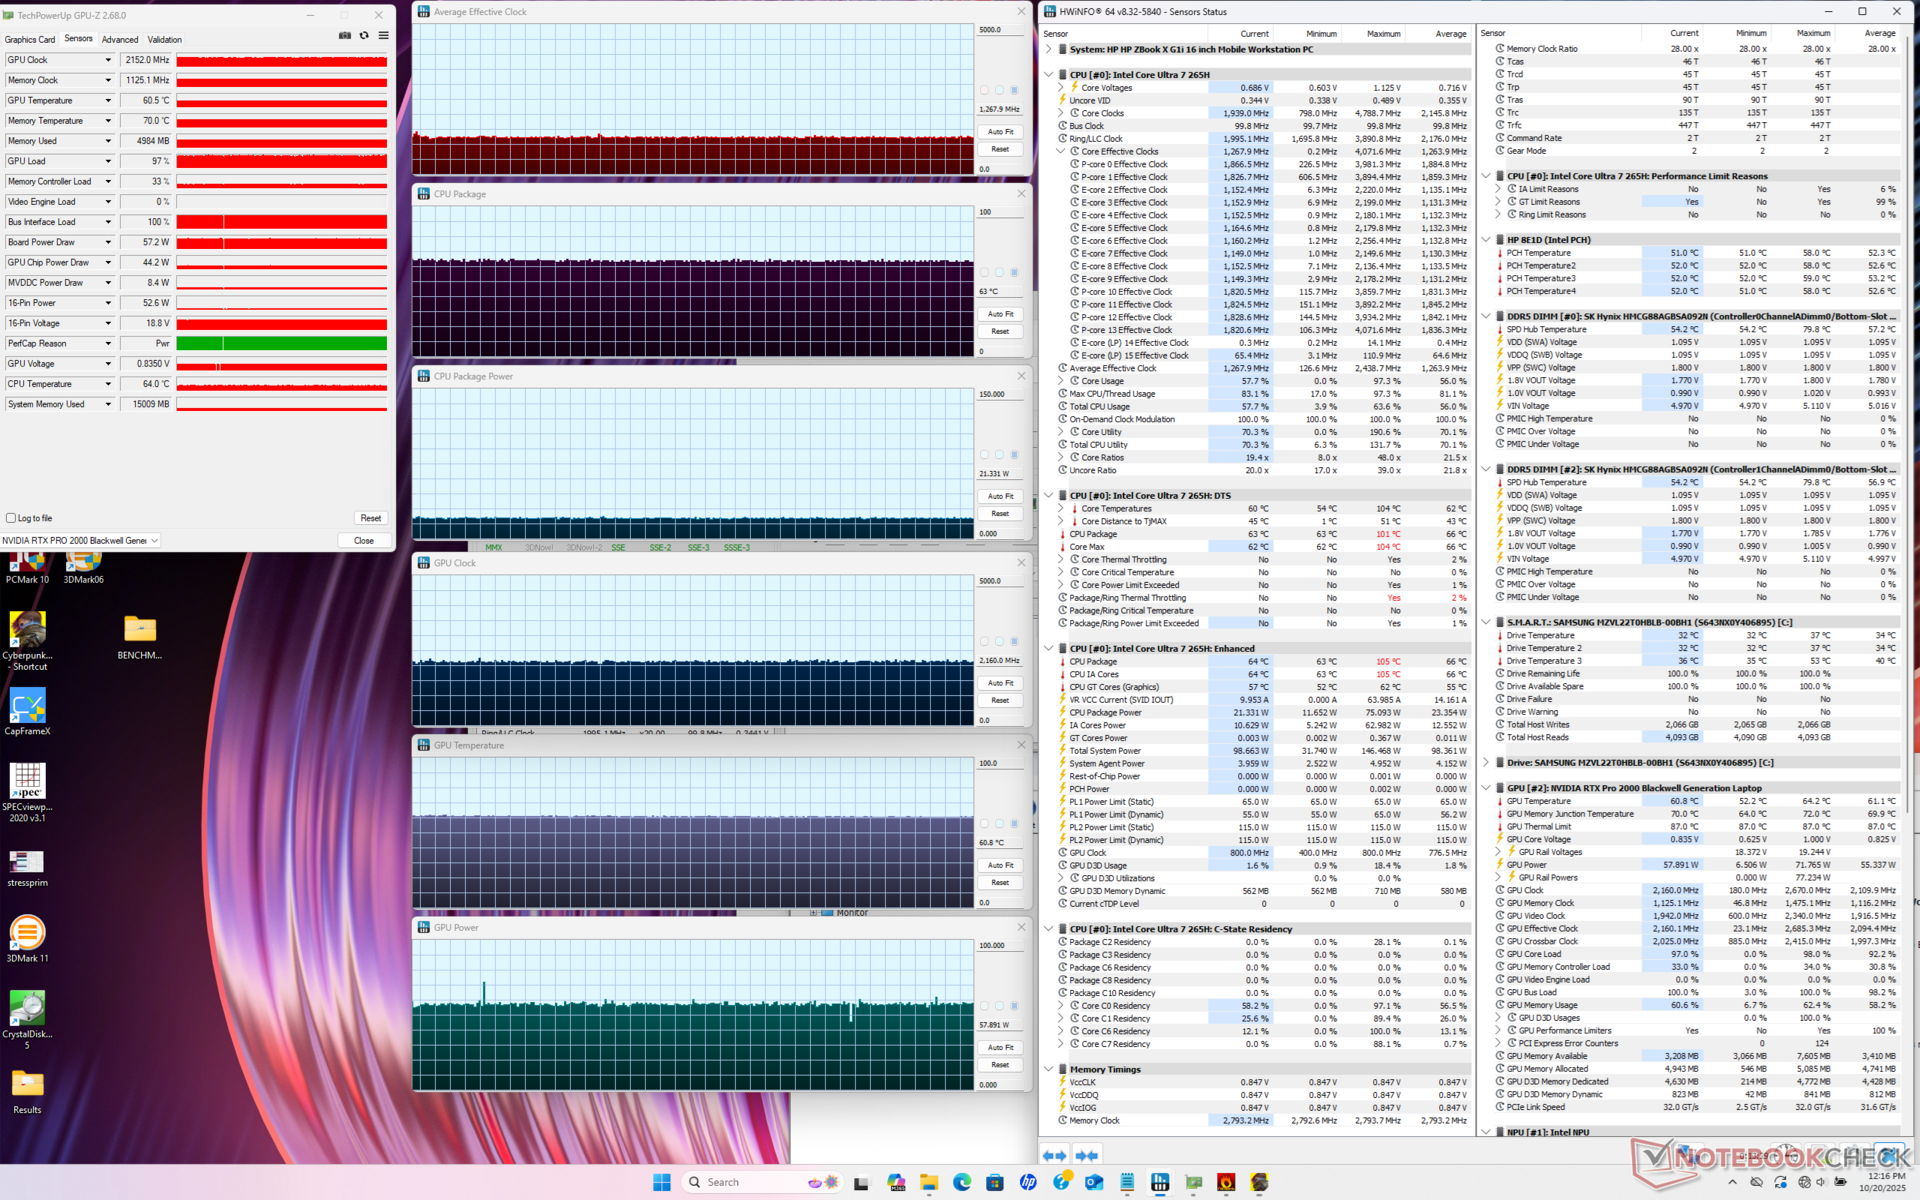
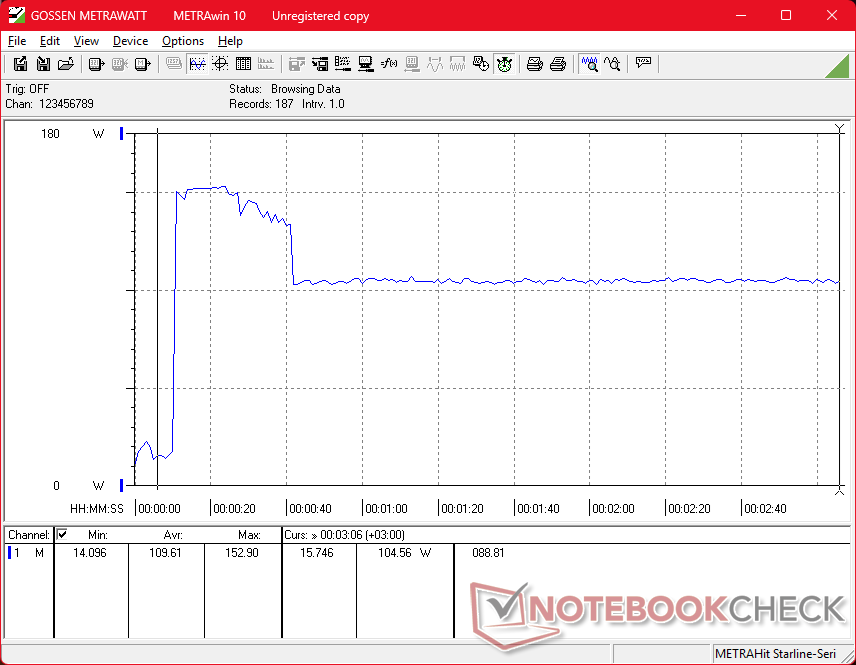
La CPU aumentaría a 3,6 GHz, 108 W, y un tostado 104 C al iniciar el estrés Prime95 antes de caer y estabilizarse en 3,0 GHz, 62 W, y 88 C sólo unos momentos más tarde para representar la sostenibilidad máxima limitada Turbo Boost. Curiosamente, las frecuencias de reloj de la CPU realizaban ciclos mientras que las frecuencias de reloj de la GPU permanecían constantes al ejecutar Prime95 y FurMark simultáneamente.
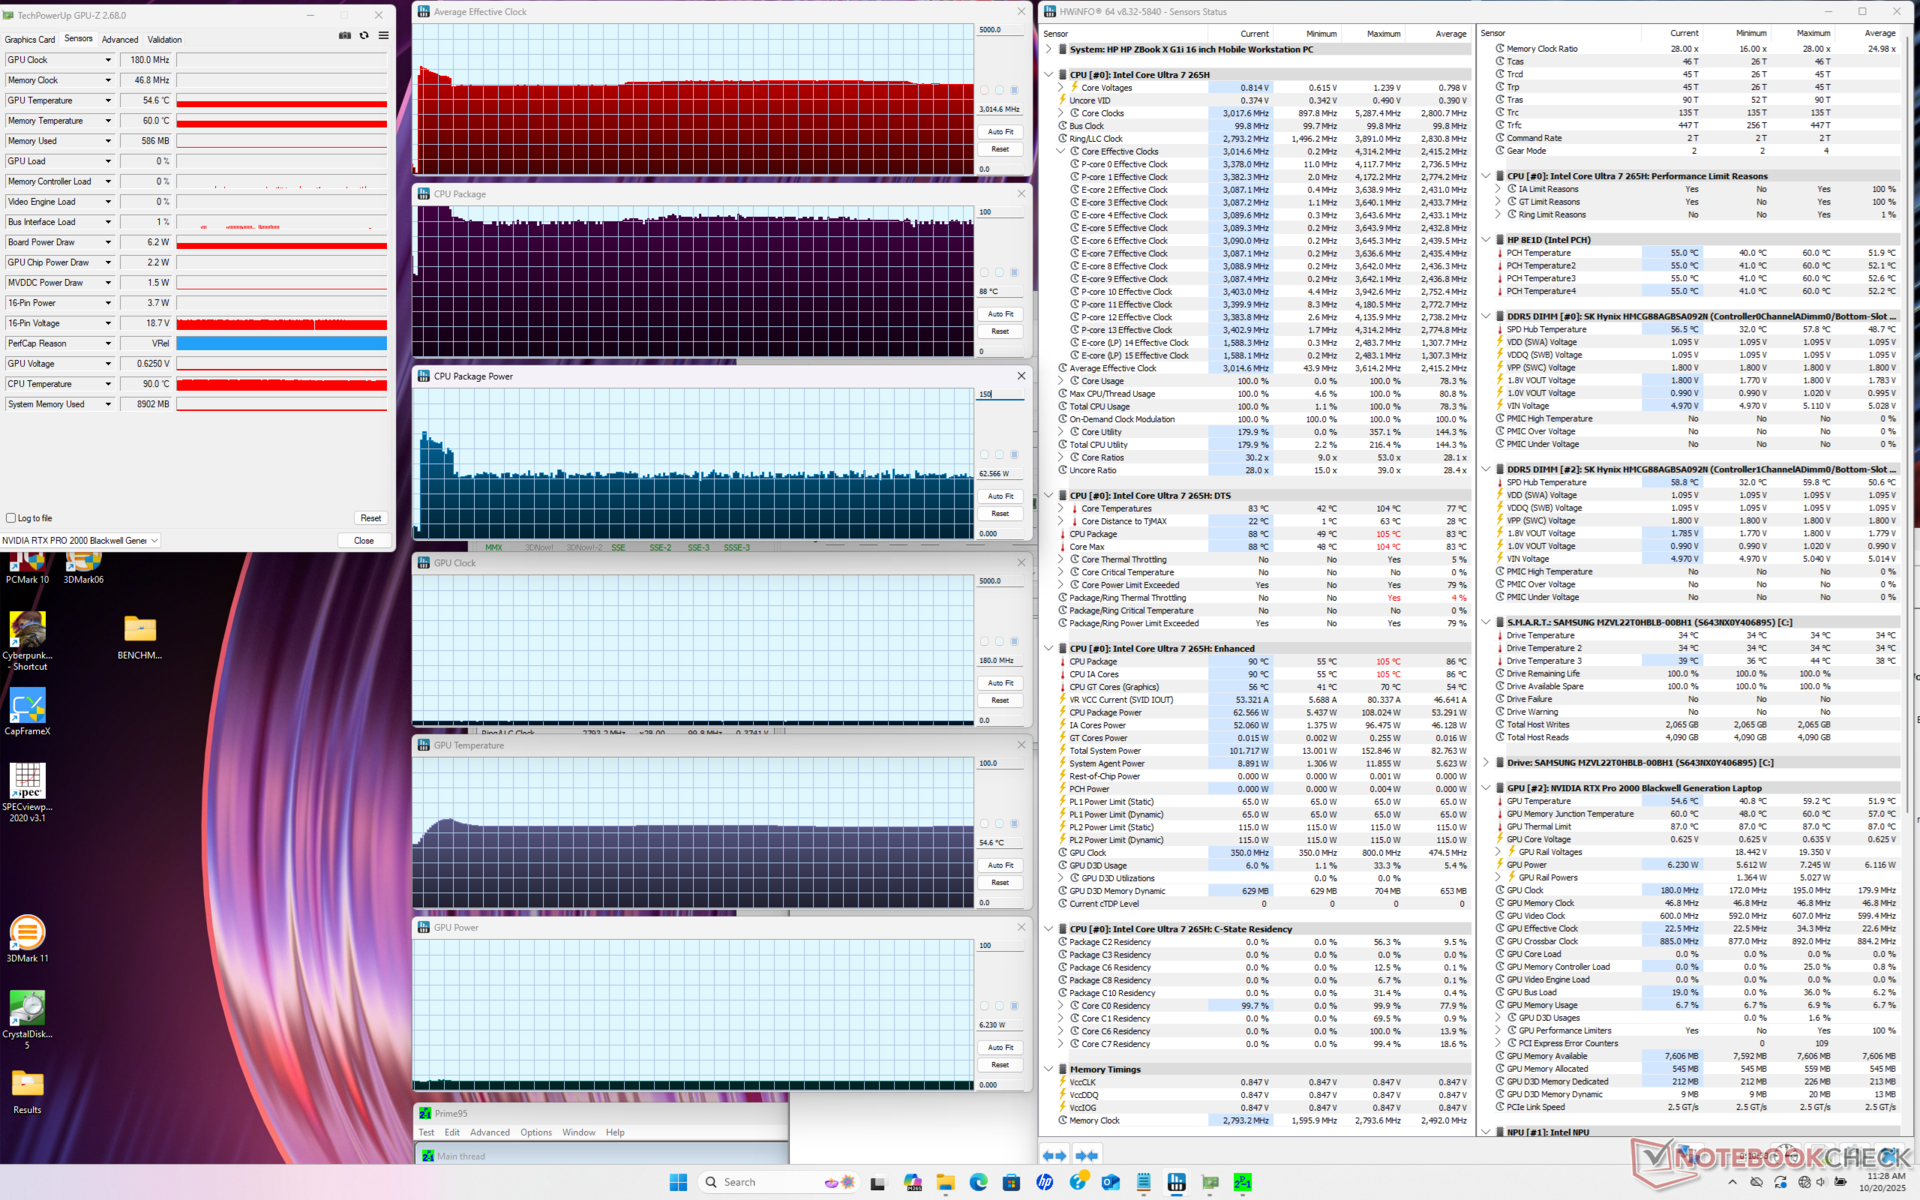

| Reloj medio de la CPU (GHz) | Reloj medio de la GPU (MHz) | Temperatura media dela CPU (°C) | Temperatura media de la GPU (°C) | |
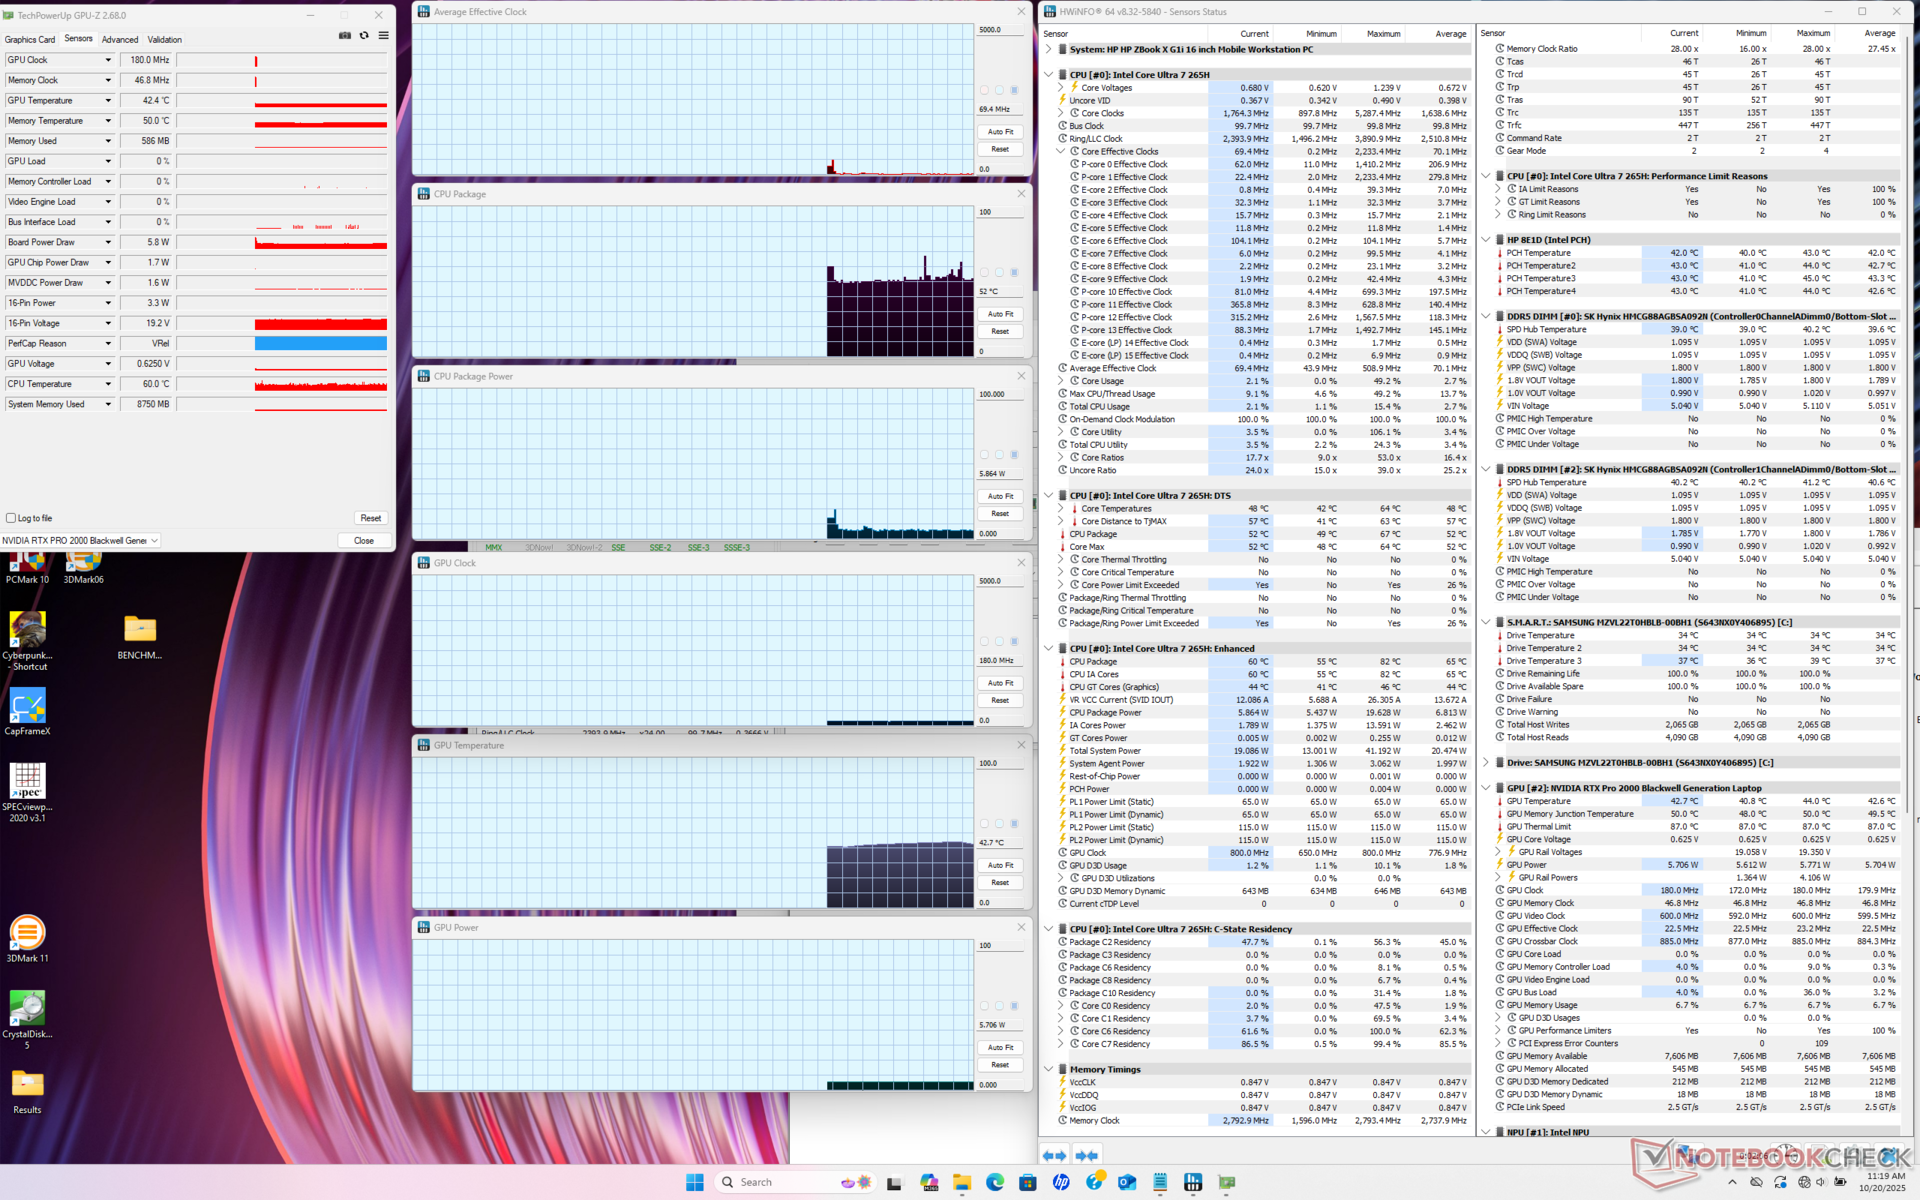
| Sistema en reposo | -- | -- | 52 | 43 |
| Prime95 Stress | 3.0 | -- | 88 | 55 |
| Prime95 + FurMark Estrés | 2,5 - 2,9 | 1215 | 83 - 91 | 65 |
| Cyberpunk 2077 Estrés | 1,3 | 2160 | 63 | 61 |
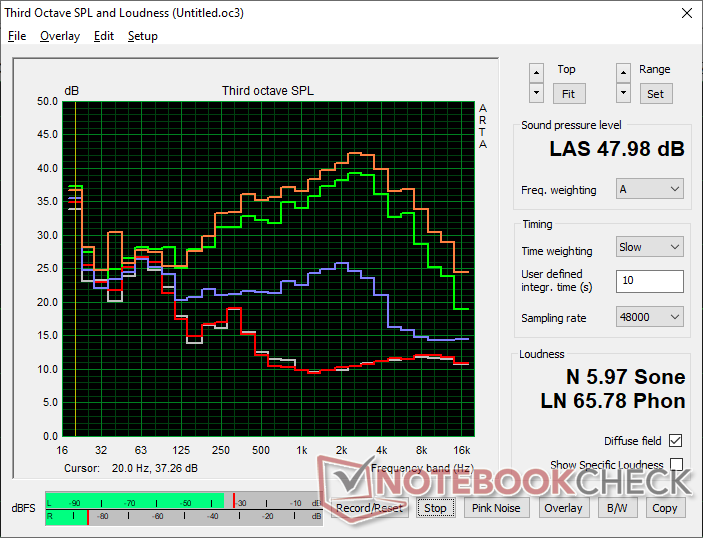
Altavoces
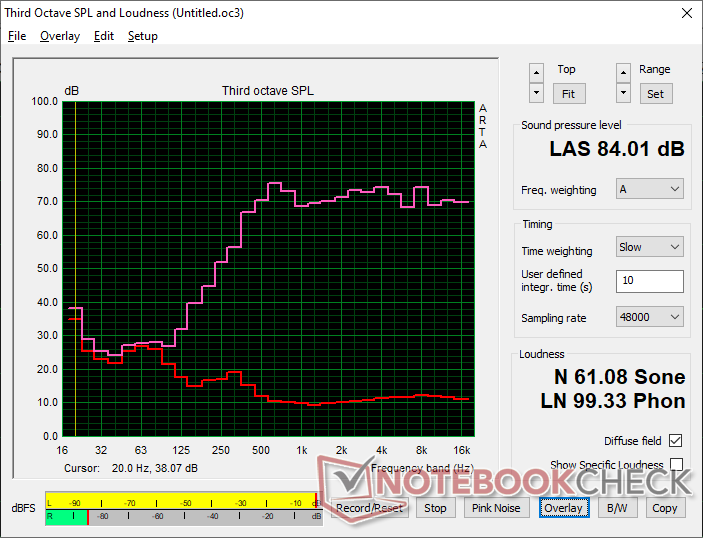
HP ZBook X G1i 16 análisis de audio
(+) | los altavoces pueden reproducir a un volumen relativamente alto (#84 dB)
Graves 100 - 315 Hz
(-) | casi sin bajos - de media 28% inferior a la mediana
(±) | la linealidad de los graves es media (8.8% delta a frecuencia anterior)
Medios 400 - 2000 Hz
(+) | medios equilibrados - a sólo 1.9% de la mediana
(+) | los medios son lineales (6.1% delta a la frecuencia anterior)
Altos 2 - 16 kHz
(+) | máximos equilibrados - a sólo 2.9% de la mediana
(+) | los máximos son lineales (5.1% delta a la frecuencia anterior)
Total 100 - 16.000 Hz
(±) | la linealidad del sonido global es media (15.6% de diferencia con la mediana)
En comparación con la misma clase
» 35% de todos los dispositivos probados de esta clase eran mejores, 11% similares, 54% peores
» El mejor tuvo un delta de 7%, la media fue 17%, el peor fue ###max##%
En comparación con todos los dispositivos probados
» 23% de todos los dispositivos probados eran mejores, 5% similares, 72% peores
» El mejor tuvo un delta de 4%, la media fue 23%, el peor fue ###max##%
Apple MacBook Pro 16 2021 M1 Pro análisis de audio
(+) | los altavoces pueden reproducir a un volumen relativamente alto (#84.7 dB)
Graves 100 - 315 Hz
(+) | buen bajo - sólo 3.8% lejos de la mediana
(+) | el bajo es lineal (5.2% delta a la frecuencia anterior)
Medios 400 - 2000 Hz
(+) | medios equilibrados - a sólo 1.3% de la mediana
(+) | los medios son lineales (2.1% delta a la frecuencia anterior)
Altos 2 - 16 kHz
(+) | máximos equilibrados - a sólo 1.9% de la mediana
(+) | los máximos son lineales (2.7% delta a la frecuencia anterior)
Total 100 - 16.000 Hz
(+) | el sonido global es lineal (4.6% de diferencia con la mediana)
En comparación con la misma clase
» 0% de todos los dispositivos probados de esta clase eran mejores, 0% similares, 100% peores
» El mejor tuvo un delta de 5%, la media fue 17%, el peor fue ###max##%
En comparación con todos los dispositivos probados
» 0% de todos los dispositivos probados eran mejores, 0% similares, 100% peores
» El mejor tuvo un delta de 4%, la media fue 23%, el peor fue ###max##%
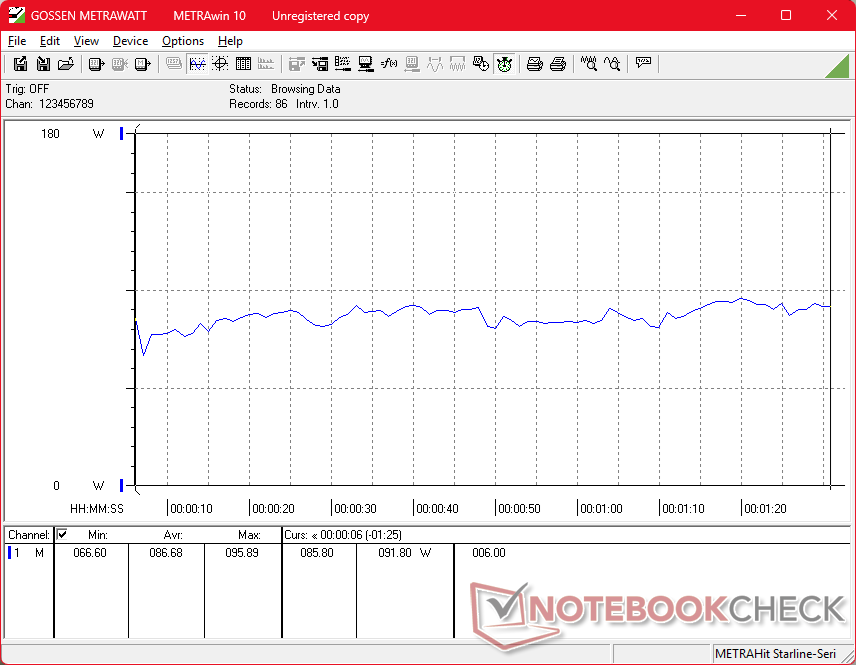
Gestión de la energía
Consumo de energía
El consumo bajo carga es ligeramente superior en promedio al que registramos en el antiguo AMD-powered ZBook Power 16 G11 A. Sin embargo, nuestro ZBook X G1i 16 es también la máquina más rápida y más delgada, por lo que se mantiene el alto rendimiento por vatio.
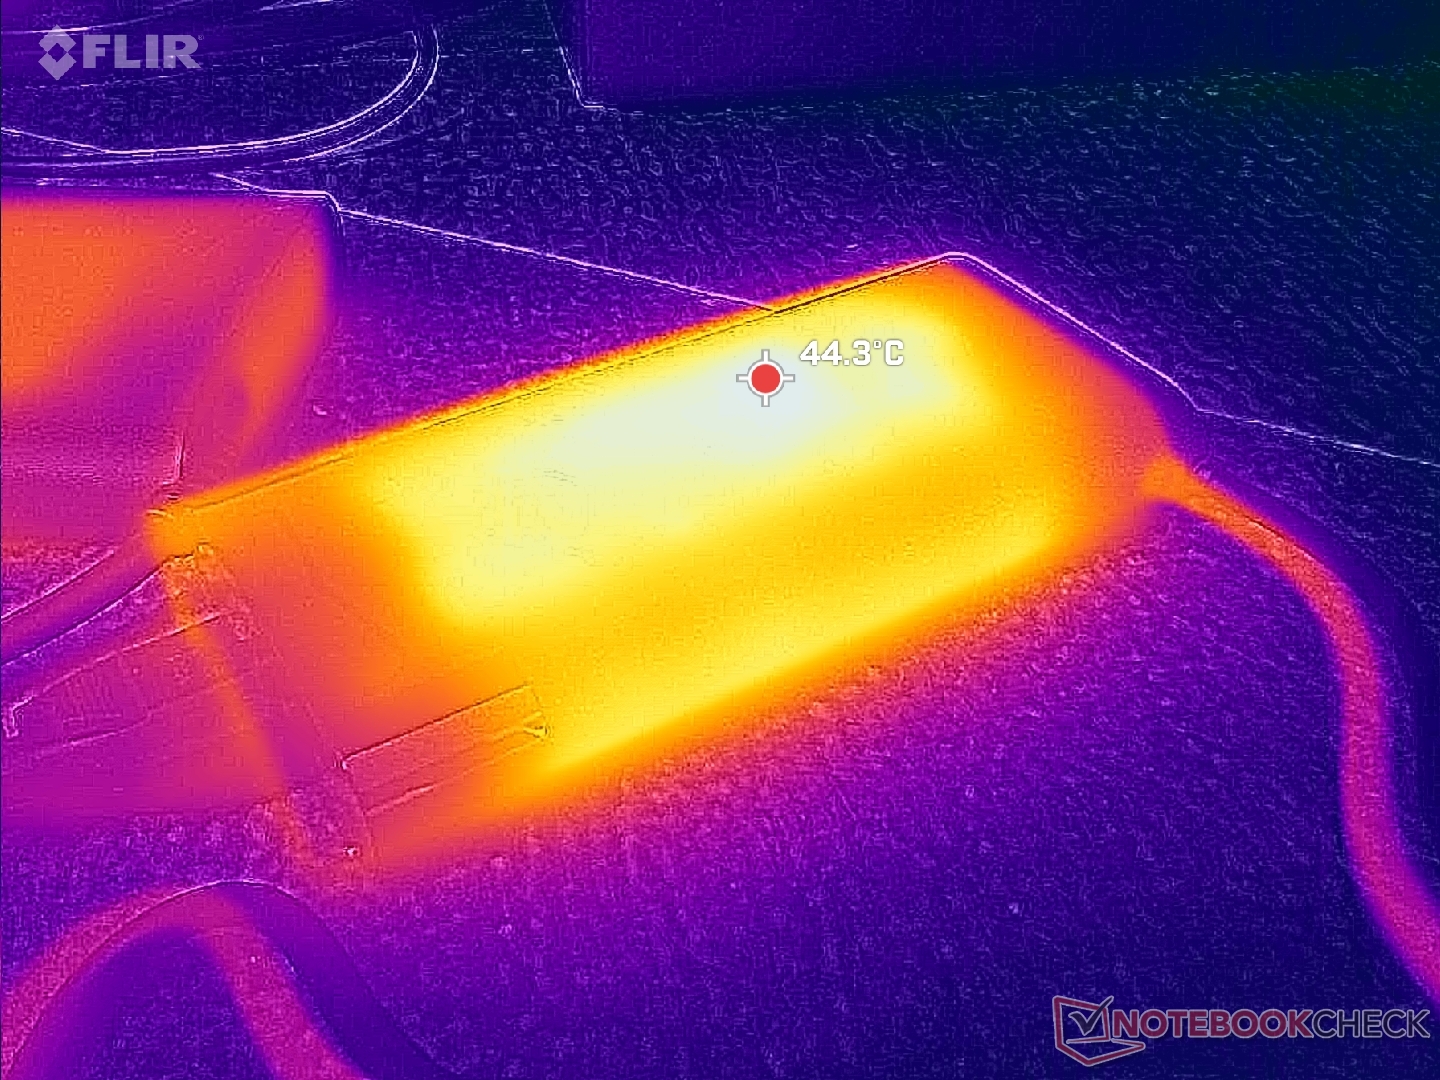
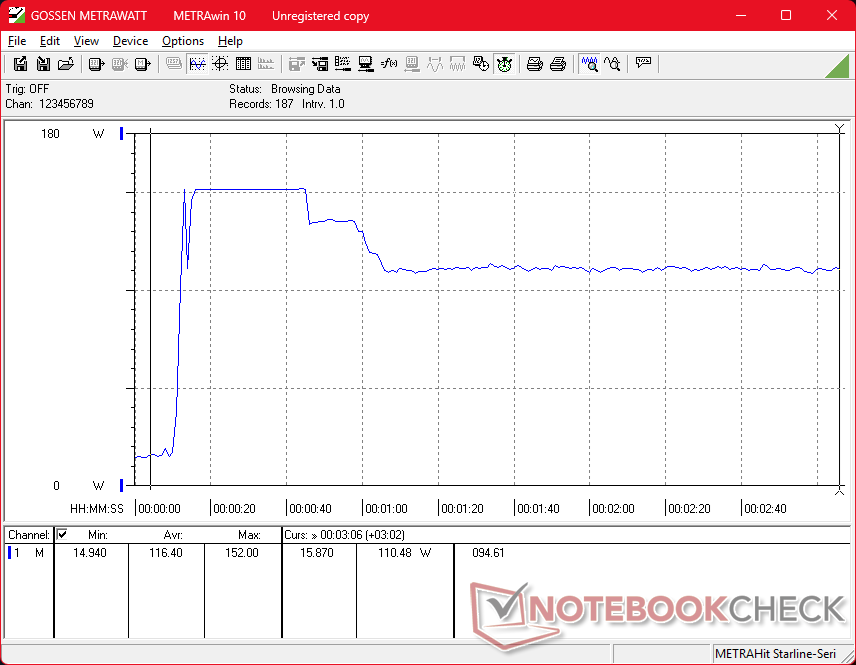
Somos capaces de medir un consumo máximo temporal de 153 W desde el pequeño (~13,8 x 6,5 x 2,2 cm) adaptador de CA de 150 W cuando la CPU y la GPU están totalmente estresadas.
| Off / Standby | |
| Ocioso | |
| Carga |
|
Clave:
min: | |
| HP ZBook X G1i 16 Ultra 7 265H, RTX PRO 2000 Blackwell Generation Laptop, Samsung PM9A1 MZVL22T0HBLB, IPS, 2560x1600, 16" | HP ZBook Power 16 G11 A R7 8845HS, RTX 2000 Ada Generation Laptop, Samsung PM9A1 MZVL22T0HBLB, IPS, 2560x1600, 16" | HP ZBook Studio 16 G11 Ultra 9 185H, RTX 3000 Ada Generation Laptop, Kioxia XG8 KXG80ZNV1T02, IPS, 3840x2400, 16" | Lenovo ThinkPad P16 Gen 2 i7-14700HX, RTX 4000 Ada Generation Laptop, SK hynix PC801 HFS001TEJ9X162N, IPS, 2560x1600, 16" | Dell Pro Max 16 Plus Ultra 9 285HX, RTX PRO 5000 Blackwell Generation Laptop, SK hynix PCB01 HFS001TFM9X186N, OLED, 3840x2400, 16" | Dell Precision 5690 Ultra 9 185H, RTX 5000 Ada Generation Laptop, 2x Samsung PM9A1 1TB (RAID 0), OLED, 3840x2400, 16" | |
|---|---|---|---|---|---|---|
| Power Consumption | 2% | -85% | -90% | -279% | -72% | |
| Idle Minimum * (Watt) | 4.1 | 4.6 -12% | 14 -241% | 7.9 -93% | 35.1 -756% | 7.9 -93% |
| Idle Average * (Watt) | 9 | 10 -11% | 22.4 -149% | 13.1 -46% | 39.2 -336% | 12 -33% |
| Idle Maximum * (Watt) | 9.4 | 10.6 -13% | 25.7 -173% | 24.2 -157% | 56 -496% | 28.6 -204% |
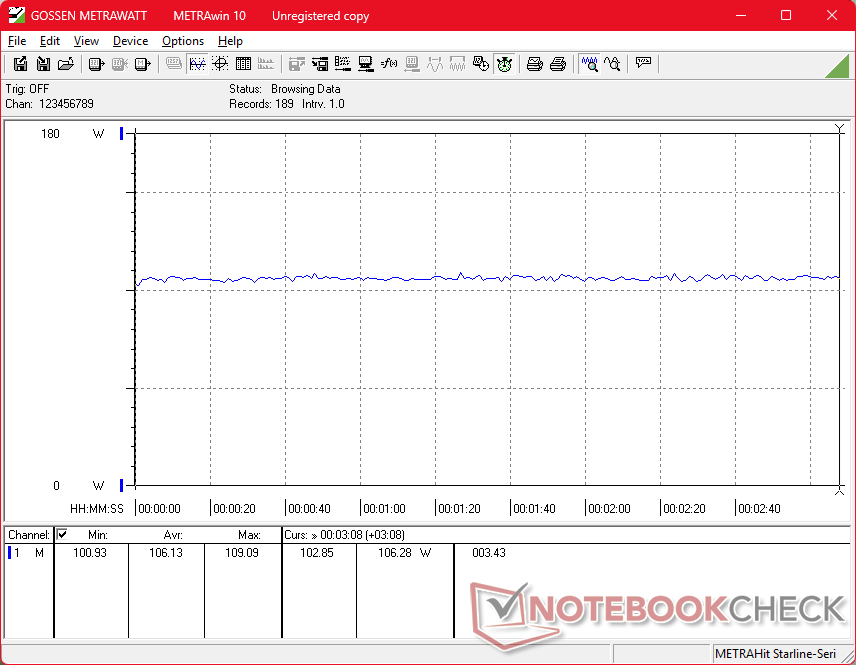
| Load Average * (Watt) | 86.7 | 60.9 30% | 90.2 -4% | 127.4 -47% | 130.2 -50% | 98.8 -14% |
| Cyberpunk 2077 ultra external monitor * (Watt) | 102 | 92.8 9% | 120.3 -18% | 219 -115% | 213 -109% | |
| Cyberpunk 2077 ultra * (Watt) | 106.1 | 96.8 9% | 125.4 -18% | 225 -112% | 229 -116% | |
| Load Maximum * (Watt) | 152.9 | 154.8 -1% | 142 7% | 248.5 -63% | 285.2 -87% | 174.8 -14% |
| Witcher 3 ultra * (Watt) | 144.5 |
* ... más pequeño es mejor
Consumo de energía Cyberpunk / Prueba de estrés
Consumo de energía Monitor externo
Duración de las pilas
La autonomía WLAN es excelente con 12,5 horas, superando a la última generación Precision 5690 o al ZBook Power 16 G11 A en unas pocas horas cada uno.
| HP ZBook X G1i 16 Ultra 7 265H, RTX PRO 2000 Blackwell Generation Laptop, 83 Wh | HP ZBook Power 16 G11 A R7 8845HS, RTX 2000 Ada Generation Laptop, 83 Wh | HP ZBook Studio 16 G11 Ultra 9 185H, RTX 3000 Ada Generation Laptop, 86 Wh | Lenovo ThinkPad P16 Gen 2 i7-14700HX, RTX 4000 Ada Generation Laptop, 94 Wh | Dell Pro Max 16 Plus Ultra 9 285HX, RTX PRO 5000 Blackwell Generation Laptop, 96 Wh | Dell Precision 5690 Ultra 9 185H, RTX 5000 Ada Generation Laptop, 98 Wh | |
|---|---|---|---|---|---|---|
| Duración de Batería | -22% | -62% | -80% | -71% | -26% | |
| WiFi v1.3 (h) | 12.5 | 9.7 -22% | 4.8 -62% | 2.5 -80% | 3.6 -71% | 9.2 -26% |
| Reader / Idle (h) | 26.1 | |||||
| Load (h) | 1.7 |
Valoración de Notebookcheck
Estación de trabajo móvil esbelta y de alta calidad con un rendimiento de gama media.
HP ZBook X G1i 16
- 10/22/2025 v8
Allen Ngo
 Total Sustainability Score:
 Competidores potenciales en comparación
Imagen | Modelo | Precio | Peso | Altura | Pantalla |
|---|---|---|---|---|---|
1. 87.4%  | HP ZBook X G1i 16 Intel Core Ultra 7 265H ⎘ NVIDIA RTX PRO 2000 Blackwell Generation Laptop ⎘ 64 GB Memoría, 2048 GB SSD | Amazon: Precio de catálogo: 2700 USD | 2.2 kg | 23 mm | 16.00" 2560x1600 189 PPI IPS |
2. 85.4%  | HP ZBook Power 16 G11 A AMD Ryzen 7 8845HS ⎘ NVIDIA RTX 2000 Ada Generation Laptop ⎘ 64 GB Memoría, 2048 GB SSD | Amazon: Precio de catálogo: 2100 USD | 2.2 kg | 22.9 mm | 16.00" 2560x1600 189 PPI IPS |
3. 84.2%  | HP ZBook Studio 16 G11 Intel Core Ultra 9 185H ⎘ NVIDIA RTX 3000 Ada Generation Laptop ⎘ 64 GB Memoría, 1024 GB SSD | Amazon: Precio de catálogo: 4300 USD | 1.8 kg | 19 mm | 16.00" 3840x2400 283 PPI IPS |
4. 85.9%  | Lenovo ThinkPad P16 Gen 2 Intel Core i7-14700HX ⎘ NVIDIA RTX 4000 Ada Generation Laptop ⎘ 32 GB Memoría, 1024 GB SSD | Amazon: Precio de catálogo: 3500 USD | 3.1 kg | 30.23 mm | 16.00" 2560x1600 189 PPI IPS |
5. 88.4%  | Dell Pro Max 16 Plus Intel Core Ultra 9 285HX ⎘ NVIDIA RTX PRO 5000 Blackwell Generation Laptop ⎘ 128 GB Memoría, SSD | Amazon: Precio de catálogo: 5000 USD | 2.8 kg | 30.9 mm | 16.00" 3840x2400 283 PPI OLED |
6. 88.3% v7 (old)  | Dell Precision 5690 Intel Core Ultra 9 185H ⎘ NVIDIA RTX 5000 Ada Generation Laptop ⎘ 32 GB Memoría, 2048 GB SSD | Amazon: Precio de catálogo: 5900 USD | 2.3 kg | 22.17 mm | 16.00" 3840x2400 283 PPI OLED |
Transparencia
La selección de los dispositivos que se van a reseñar corre a cargo de nuestro equipo editorial. La muestra de prueba fue proporcionada al autor en calidad de préstamo por el fabricante o el minorista a los efectos de esta reseña. El prestamista no tuvo ninguna influencia en esta reseña, ni el fabricante recibió una copia de la misma antes de su publicación. No había ninguna obligación de publicar esta reseña. Como empresa de medios independiente, Notebookcheck no está sujeta a la autoridad de fabricantes, minoristas o editores.
Así es como prueba Notebookcheck
Cada año, Notebookcheck revisa de forma independiente cientos de portátiles y smartphones utilizando procedimientos estandarizados para asegurar que todos los resultados son comparables. Hemos desarrollado continuamente nuestros métodos de prueba durante unos 20 años y hemos establecido los estándares de la industria en el proceso. En nuestros laboratorios de pruebas, técnicos y editores experimentados utilizan equipos de medición de alta calidad. Estas pruebas implican un proceso de validación en varias fases. Nuestro complejo sistema de clasificación se basa en cientos de mediciones y puntos de referencia bien fundamentados, lo que mantiene la objetividad.
