Análisis de la estación de trabajo HP ZBook Fury 16 G9: Dell Precision 7670 y ThinkPad P16 G1 alternativa

La serie ZBook Fury alberga las estaciones de trabajo móviles de mayor rendimiento de HP, en contraste con la gama media Serie ZBook Studio y la serie ultradelgada Serie ZBook Firefly.
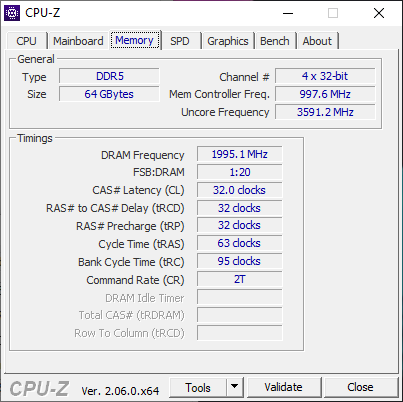
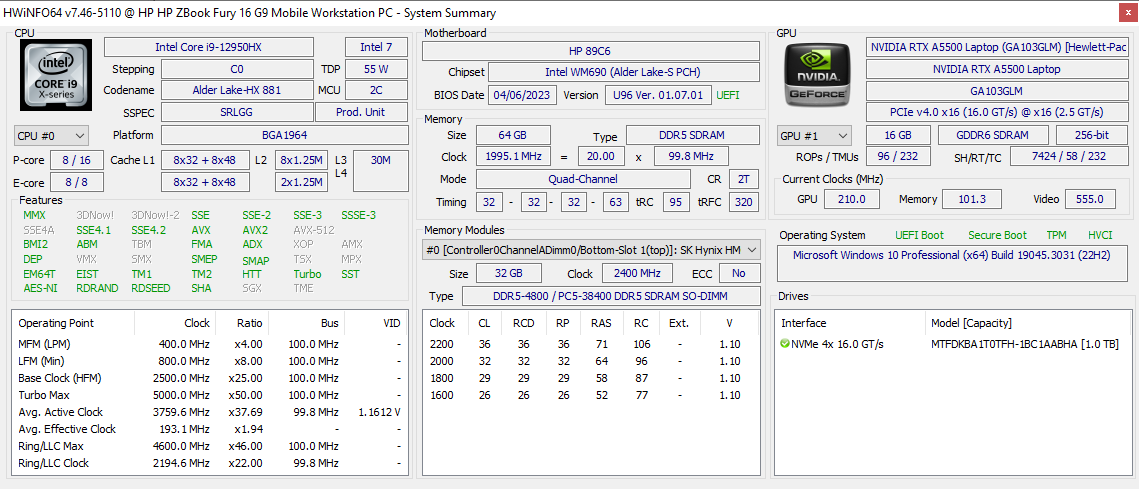
Nuestra unidad de análisis es una configuración de gama alta del Fury 16 G9 con la CPU Core i9-12950HX Alder Lake-H de 12ª generación, GPU RTX A5500 Ampere, 64 GB de RAM y pantalla IPS de 3840 x 2400 que se vende al por menor por poco más de 4000 USD. Las opciones de configuración son enormes, con paneles LTE, 5G e incluso OLED, como se indica en https://www.hp.com/us-en/shop/pdp/hp-zbook-fury-16-g9-customizable-609l4av-mb#techSpecs. Ten en cuenta que también está disponible el ZBook Fury G10 con opciones Intel de 13ª generación más recientes, pero el chasis sigue siendo idéntico al de nuestro Fury G9.
Las alternativas a la ZBook Fury 16 G9 incluyen otras estaciones de trabajo móviles de 16 pulgadas insignia como la Dell Precision 7670, MSI CreatorPro Z16P, Asus ProArt StudioBook 16o Lenovo ThinkPad P16 G1.
Más opiniones sobre HP:
Posibles contendientes en la comparación
Valoración | Fecha | Modelo | Peso | Altura | Tamaño | Resolución | Precio |
|---|---|---|---|---|---|---|---|
| 91 % v7 (old) | 06/2023 | HP ZBook Fury 16 G9 i9-12950HX, RTX A5500 Laptop GPU | 2.6 kg | 28.5 mm | 16.00" | 3840x2400 | |
| 90.1 % v7 (old) | 11/2022 | HP ZBook Studio 16 G9 62U04EA i7-12800H, RTX A2000 Laptop GPU | 1.8 kg | 19 mm | 16.00" | 3840x2400 | |
| 82.9 % v7 (old) | 10/2022 | HP ZBook Firefly 16 G9-6B897EA i7-1265U, T550 Laptop GPU | 2 kg | 19.2 mm | 16.00" | 1920x1200 | |
| 91 % v7 (old) | 02/2023 | Lenovo ThinkPad P16 G1 RTX A5500 i9-12950HX, RTX A5500 Laptop GPU | 3 kg | 30.23 mm | 16.00" | 3840x2400 | |
| 89.1 % v7 (old) | 12/2022 | Dell Precision 7000 7670 Performance i9-12950HX, RTX A5500 Laptop GPU | 2.8 kg | 25.95 mm | 16.00" | 3840x2400 | |
| 84.3 % v7 (old) | 11/2022 | MSI CreatorPro Z16P B12UKST i7-12700H, RTX A3000 Laptop GPU | 2.4 kg | 19 mm | 16.00" | 2560x1600 |
Maletín - Classic ZBook
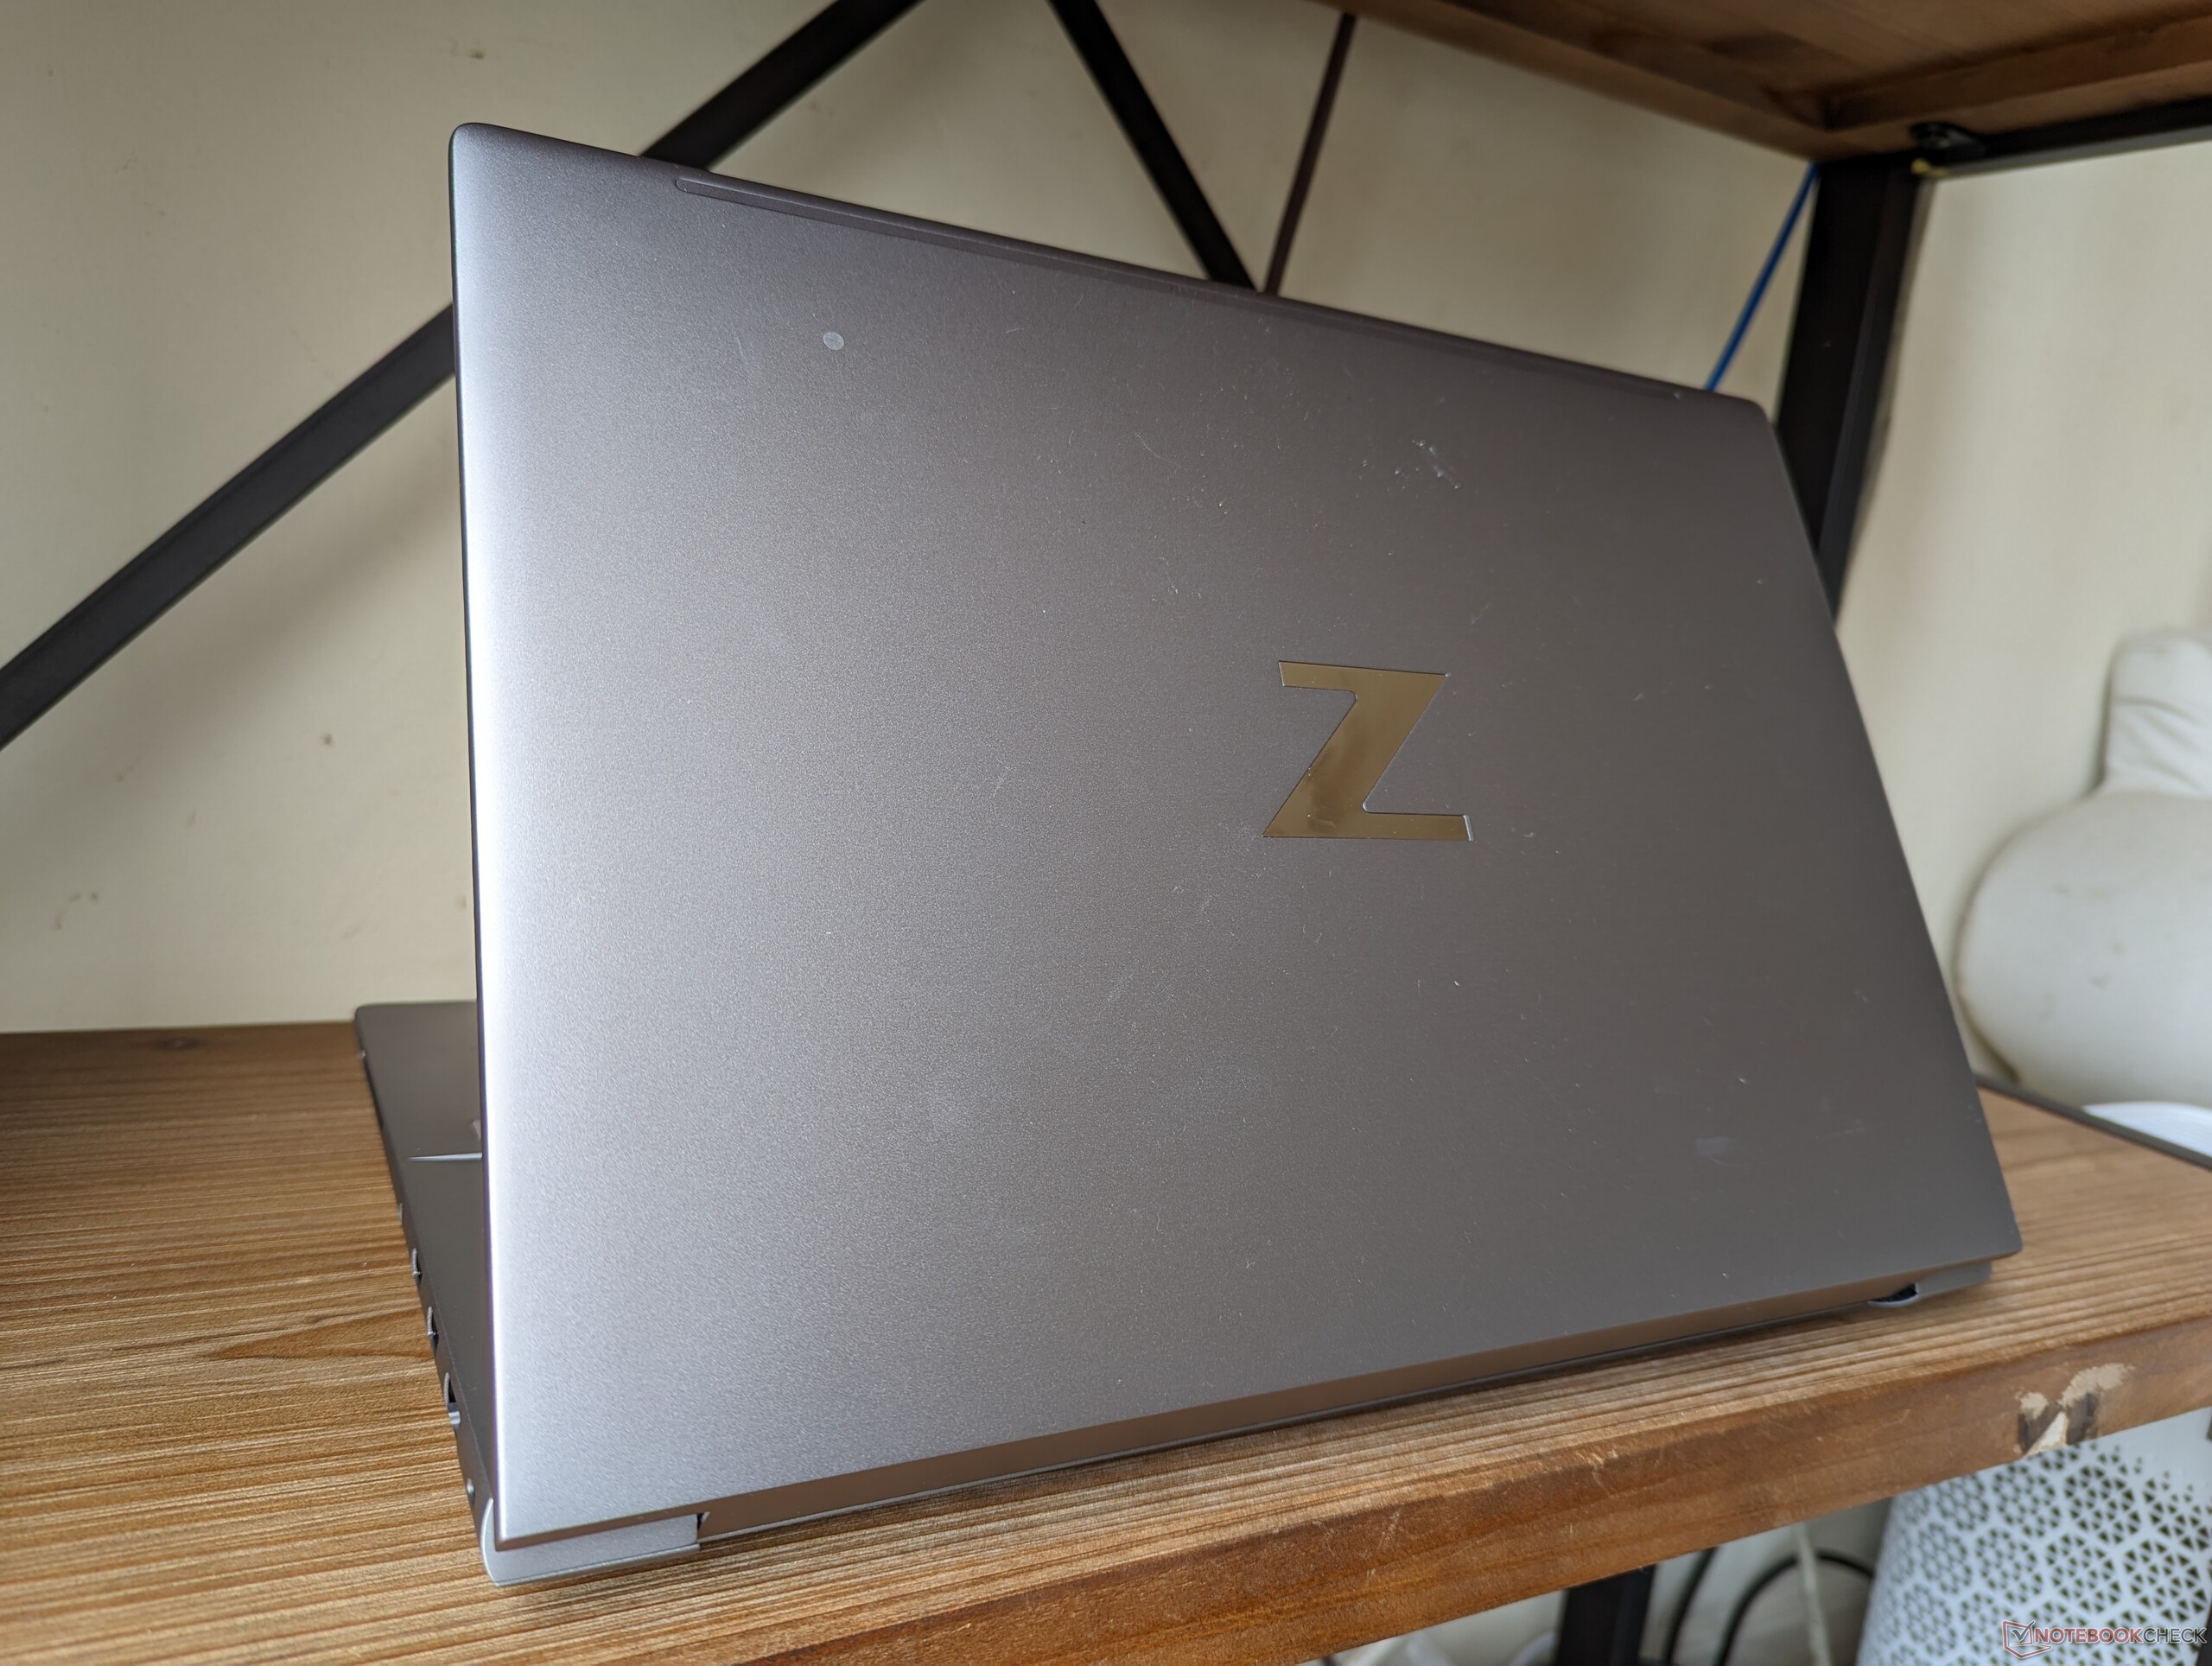
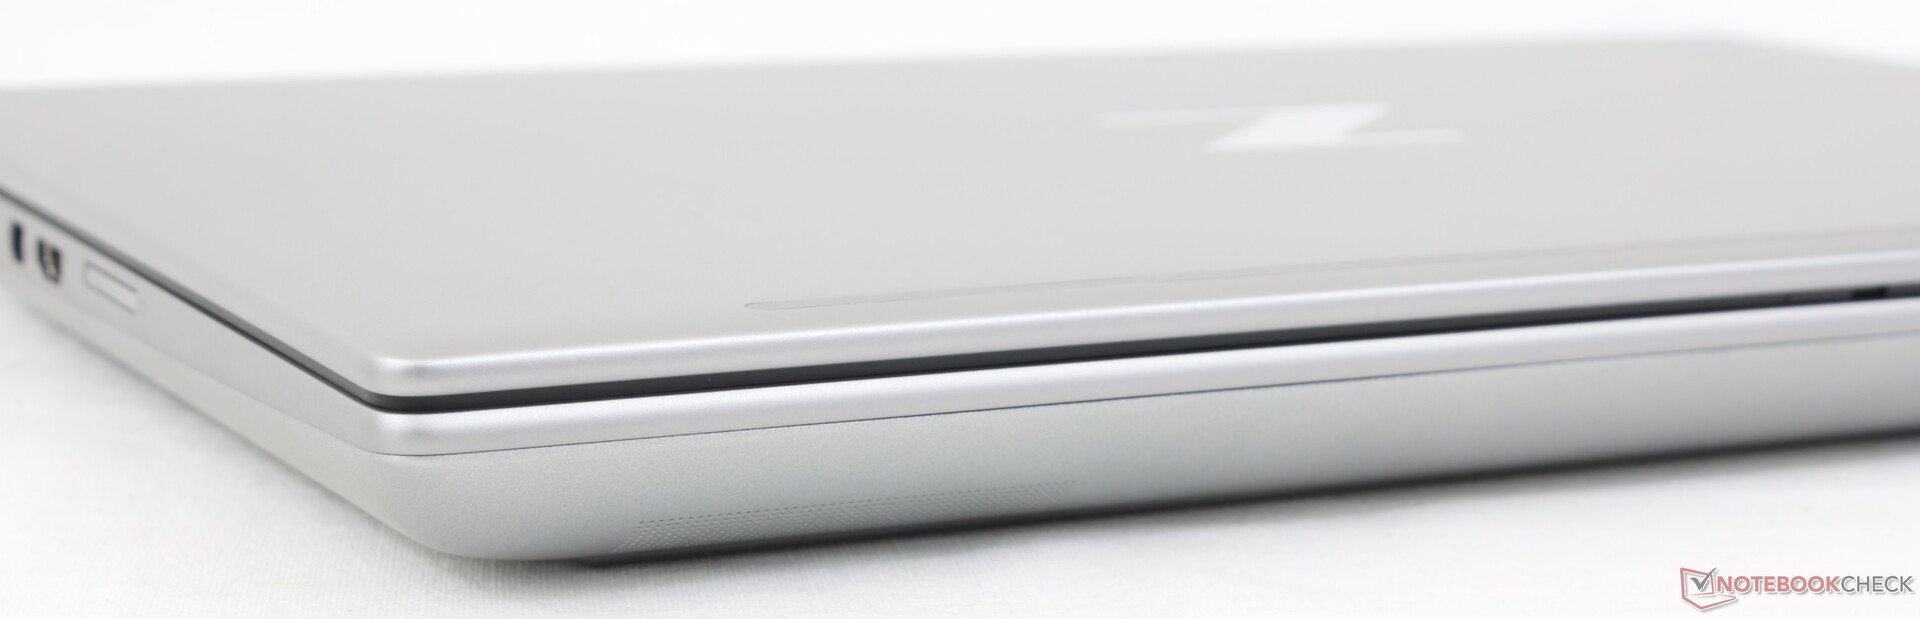
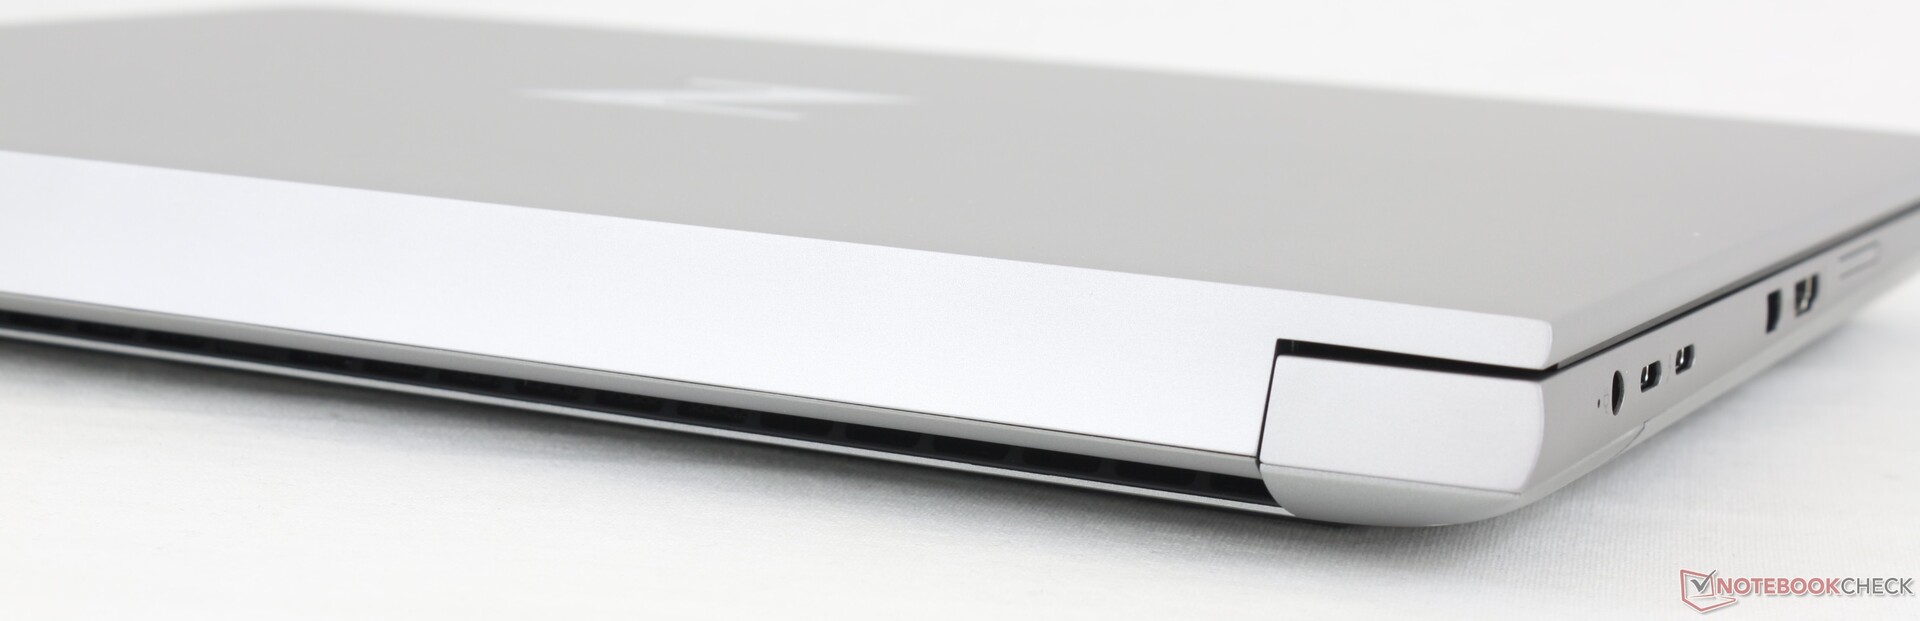
El chasis está formado por los mismos materiales de aleación de aluminio con los que ya están familiarizados los propietarios del ZBook. Las torsiones, deformaciones y crujidos son mínimos y comparables a los del Precision 7670 para una primera impresión fuerte y sin áreas problemáticas. La flexión se nota más al aplicar presión en el centro de la tapa exterior donde está el logo "Z", pero no es motivo de preocupación a largo plazo.
El HP es notablemente más ligero que elThinkPad P16 G1 y Precision 7670 a pesar de que todos vienen con opciones similares de CPU y GPU. Sin embargo, esto se produce a costa del rendimiento, como mostrarán nuestras comparaciones más adelante. Para algo más portátil, los usuarios pueden considerar el mucho más delgado ZBook Firefly 16 G9 o ZBook Studio 16 G9 en su lugar.
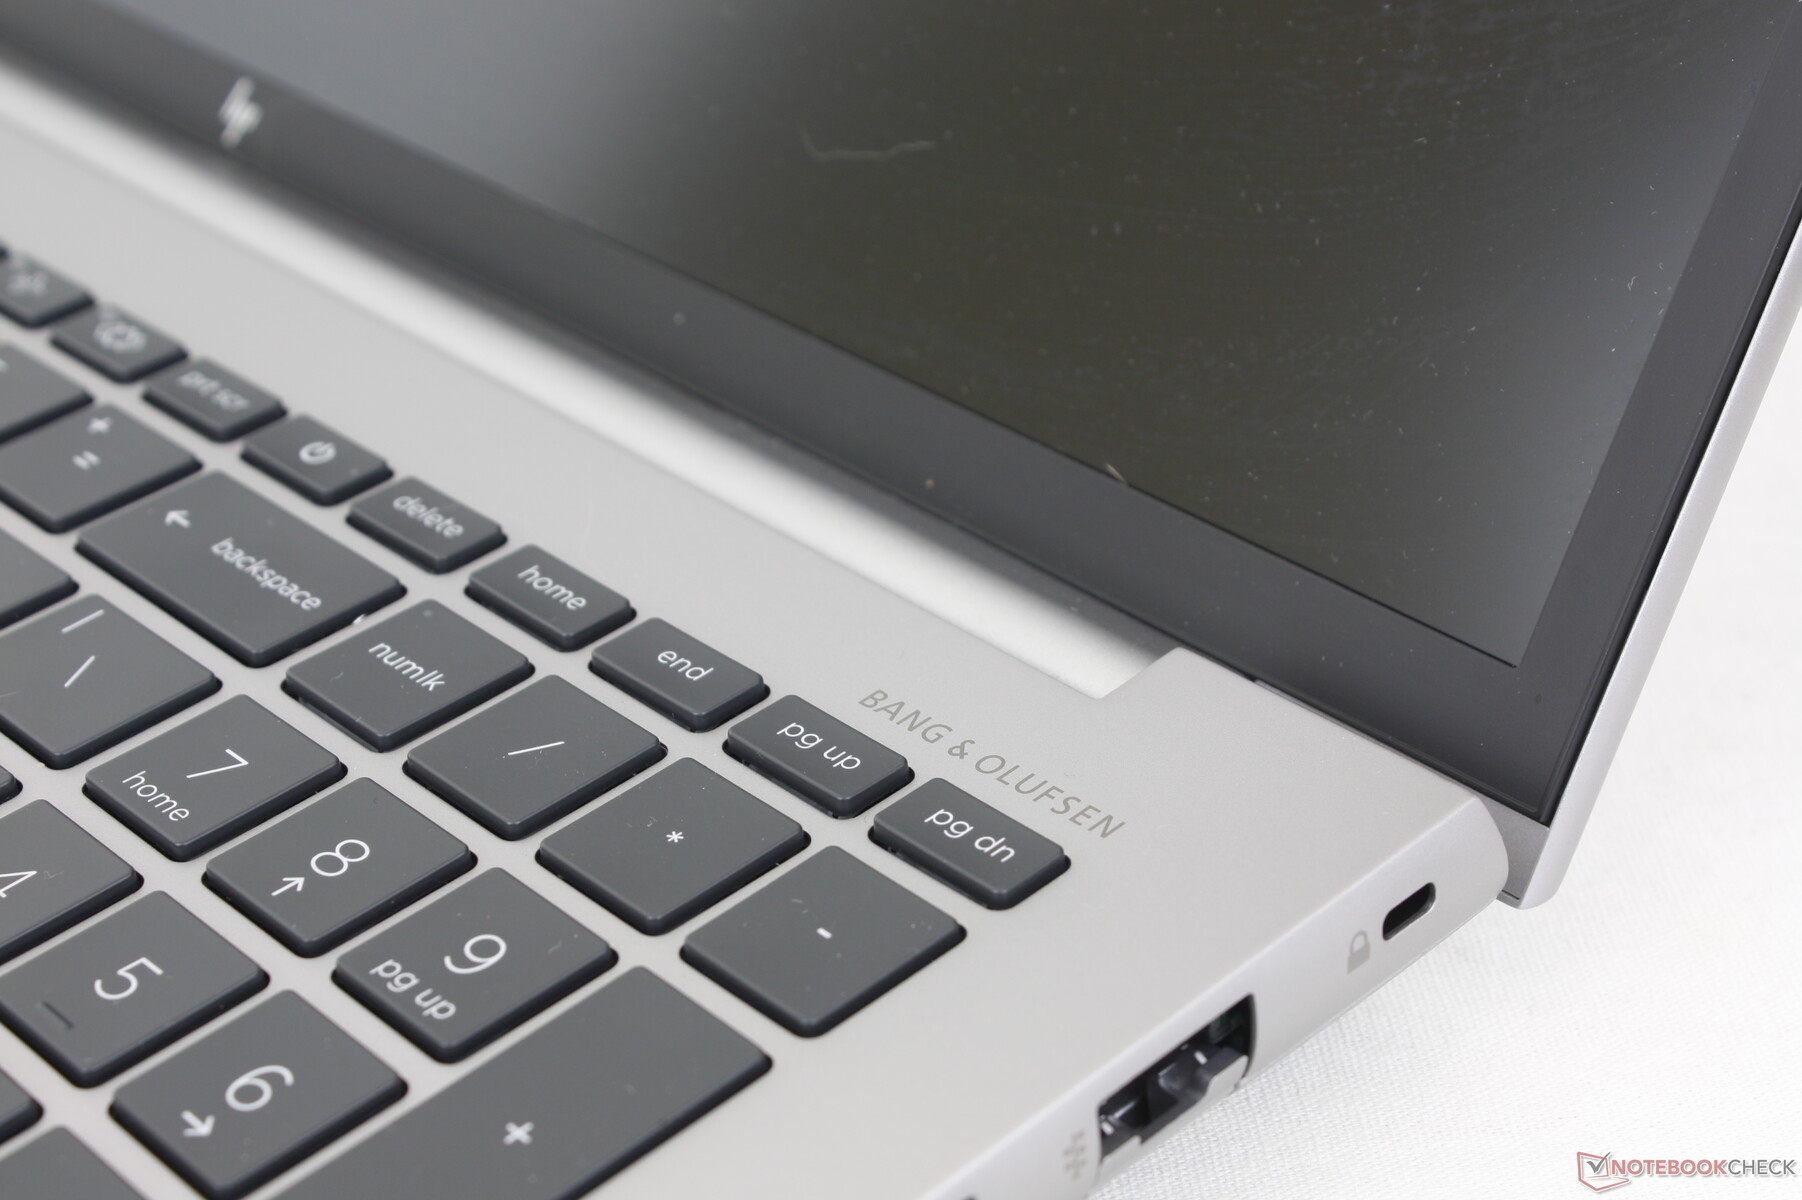
El bisel inferior del Fury G9 es sorprendentemente estrecho para una estación de trabajo, lo que contribuye a que el modelo sea más corto que la mayoría de las alternativas de 16 pulgadas.
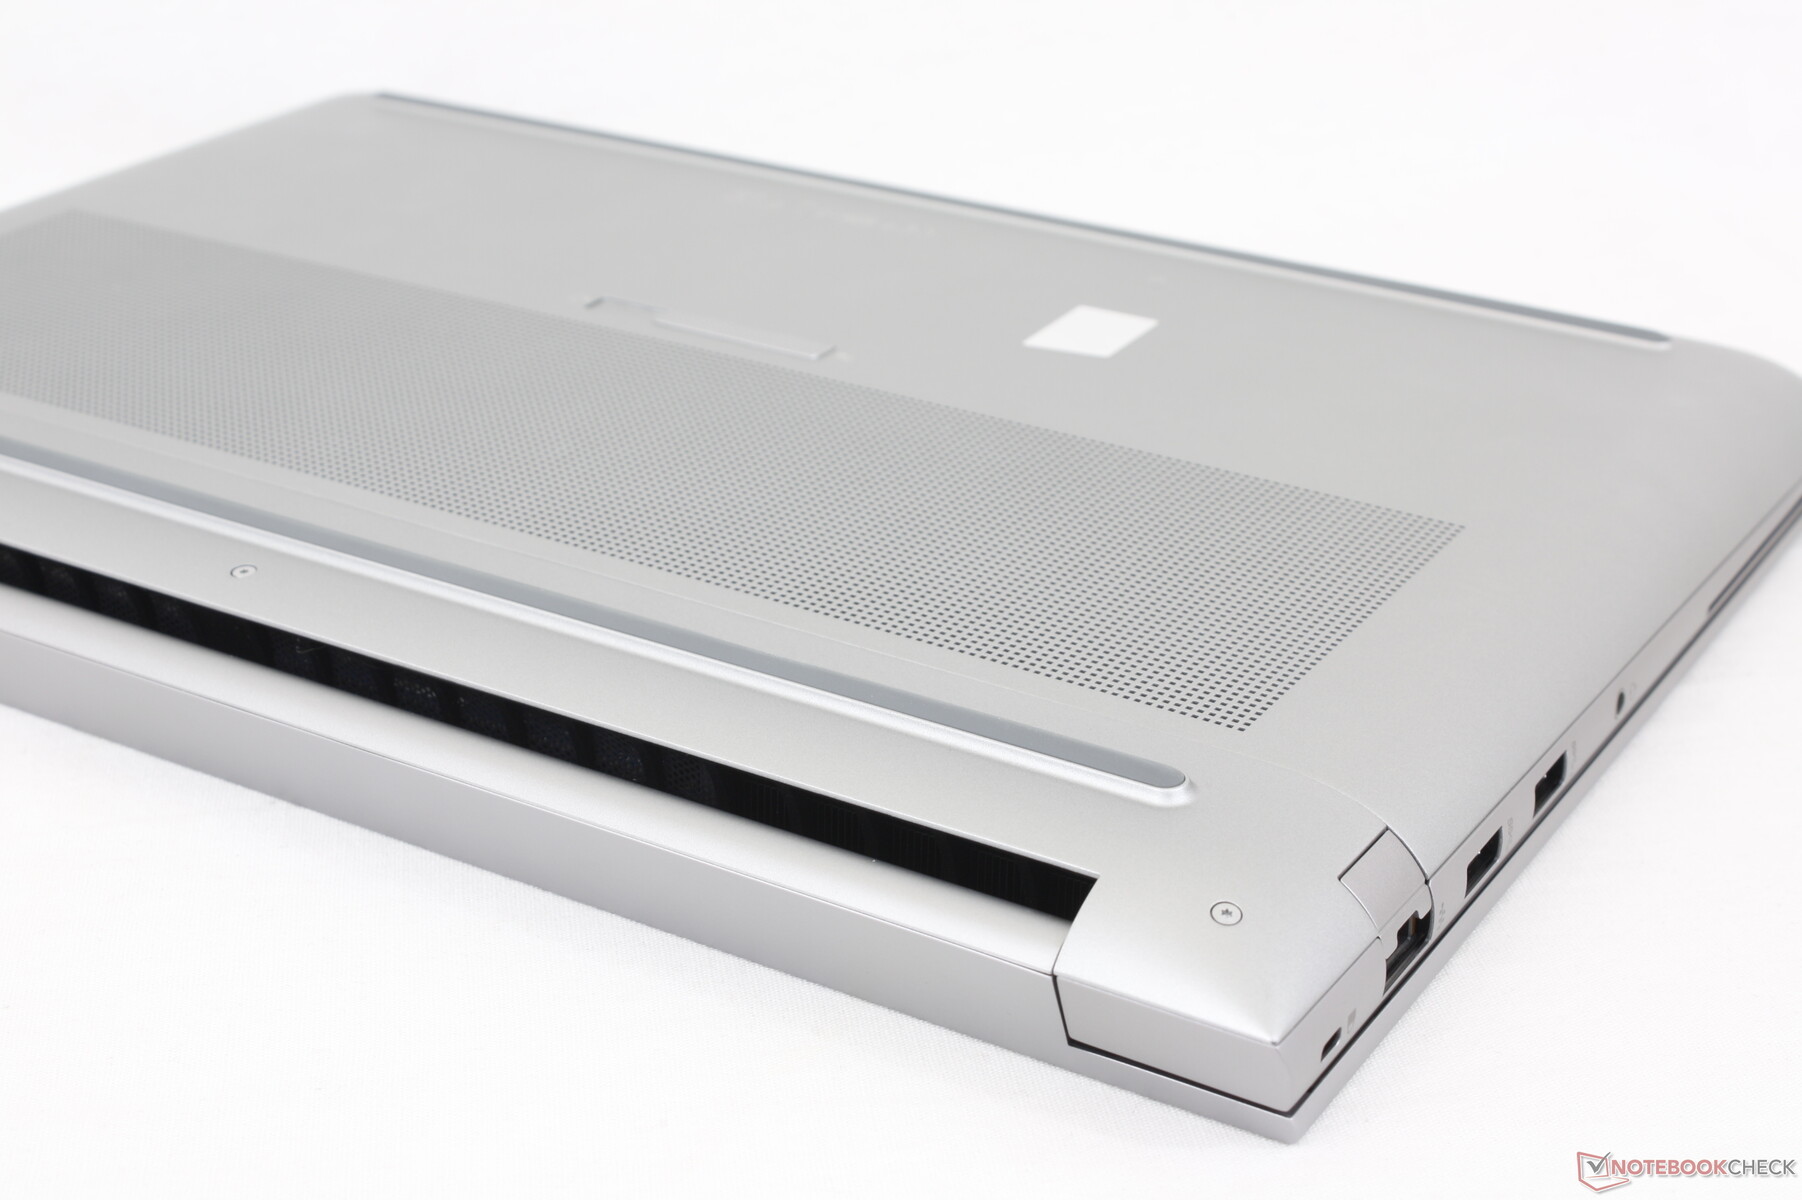
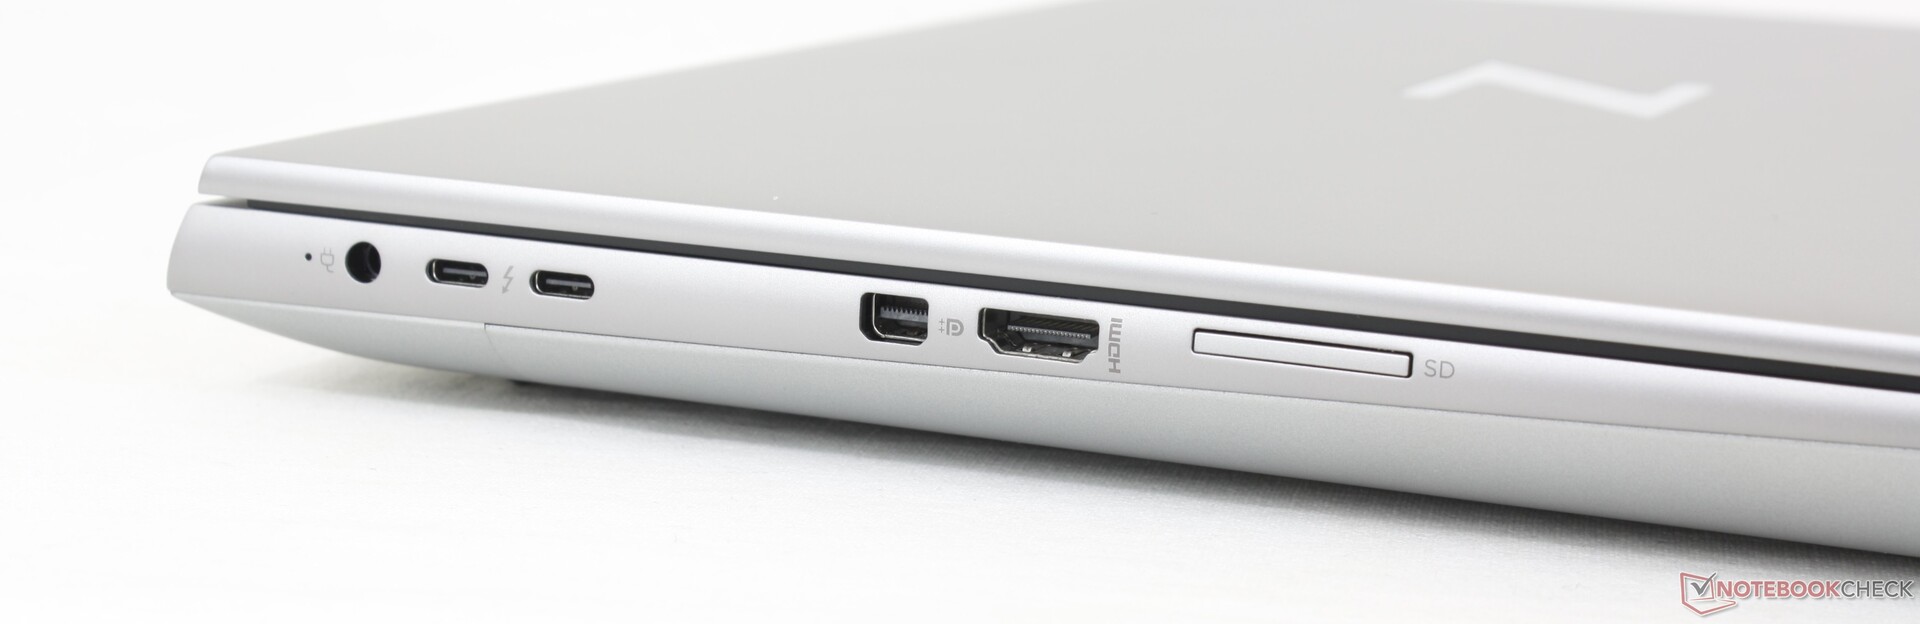
Conectividad
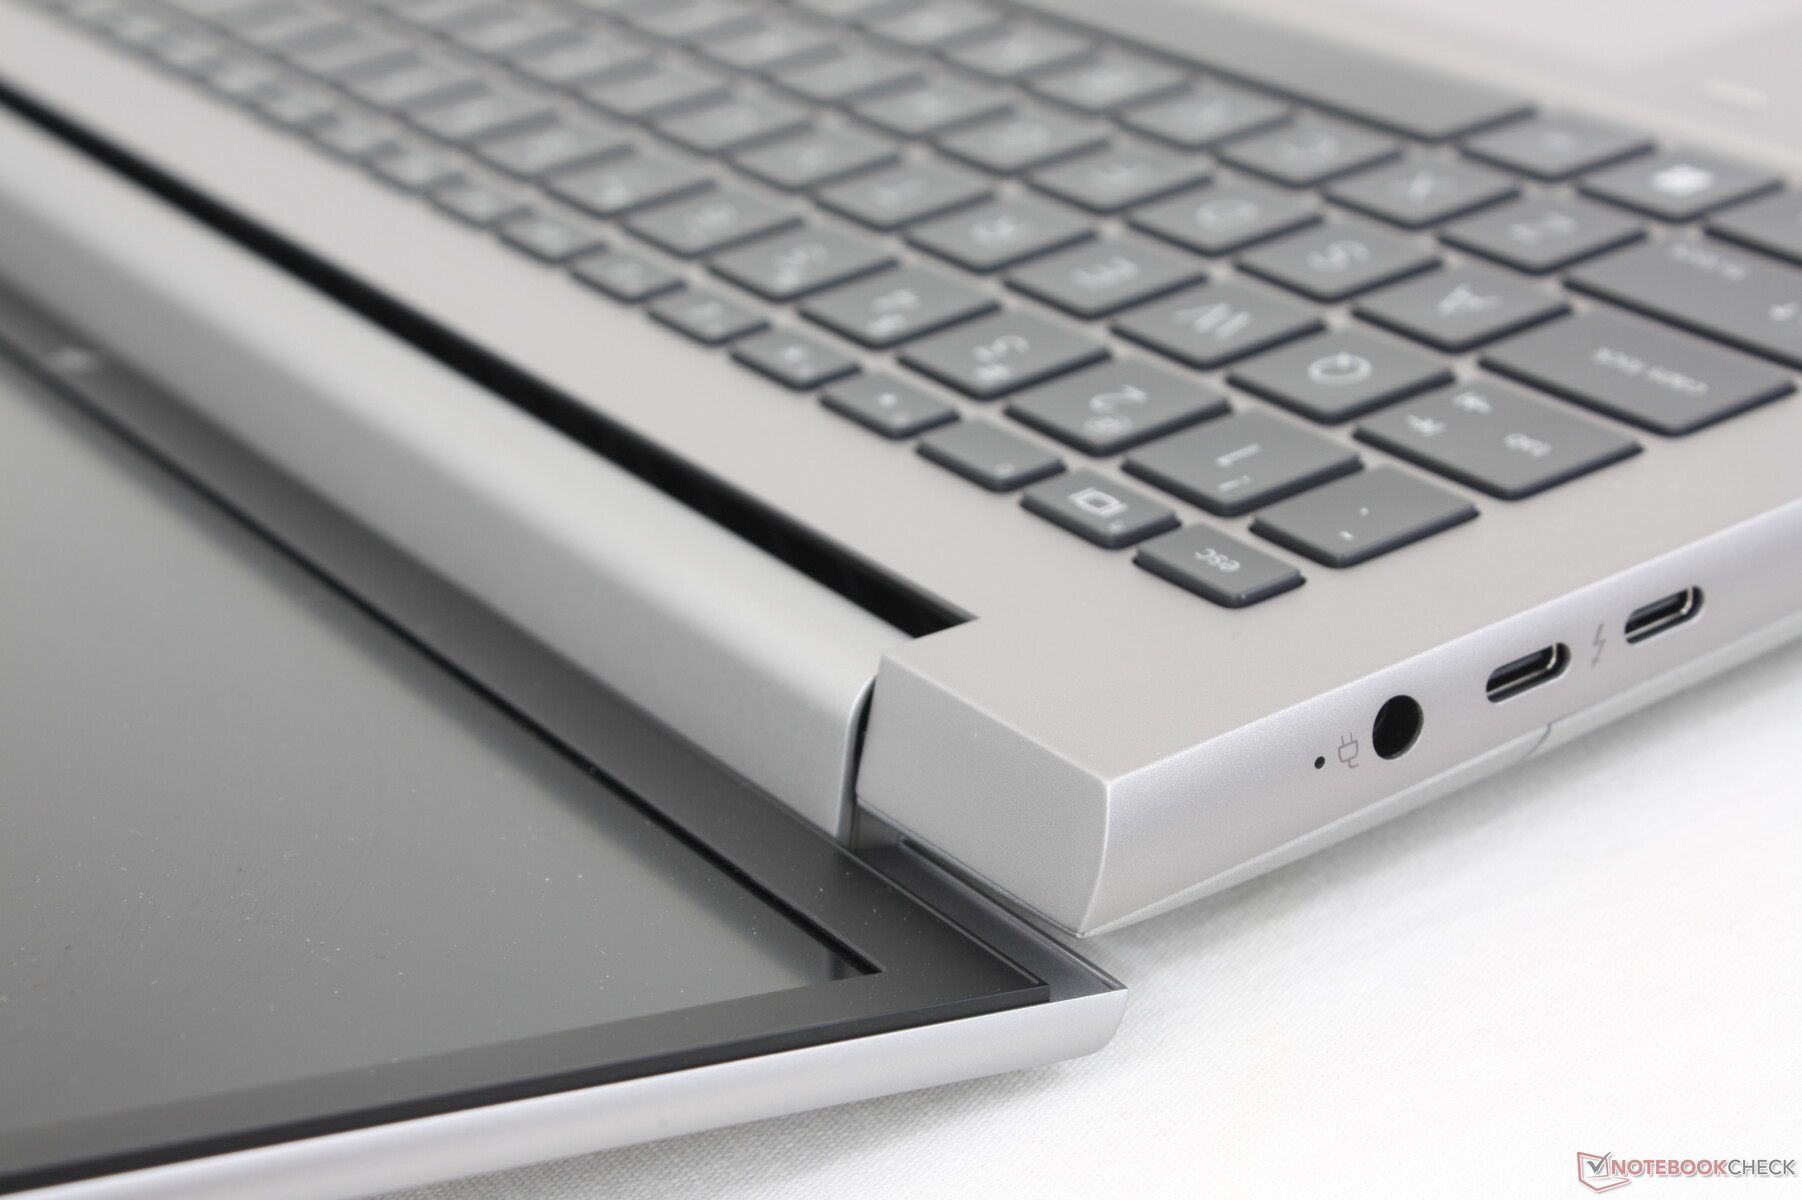
Nuestro HP incluye todos los puertos del Precision 7670 pero con un mini-DisplayPort integrado en vez de un tercer puerto USB-C. De hecho, es una de las pocas estaciones de trabajo móviles con una opción de mini-DisplayPort.
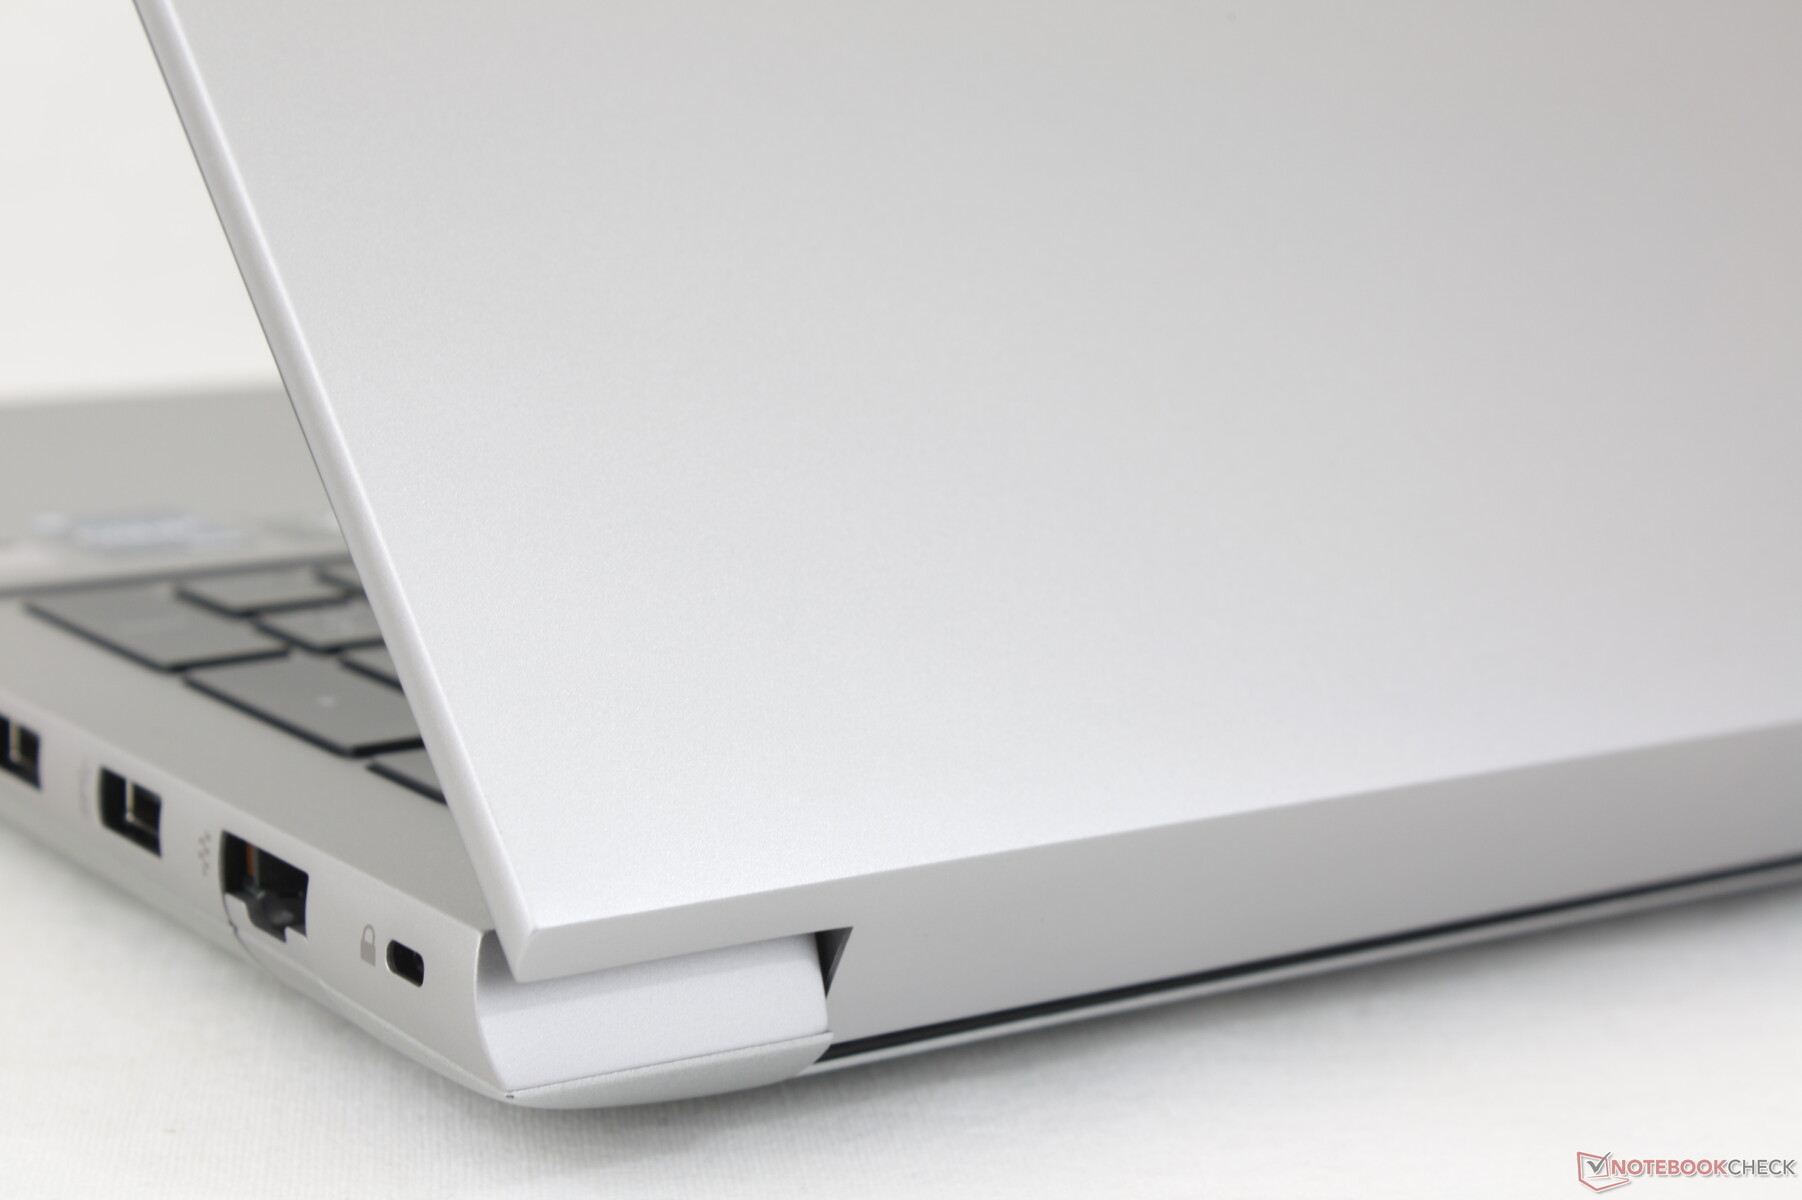
La posición de los puertos podría haber sido mejor en lo tocante a los dos puertos USB-C, ya que están muy apretados junto al puerto del adaptador de corriente. Conectar ciertos adaptadores o cables en un puerto, por ejemplo, podría bloquear el acceso a los otros dos puertos.
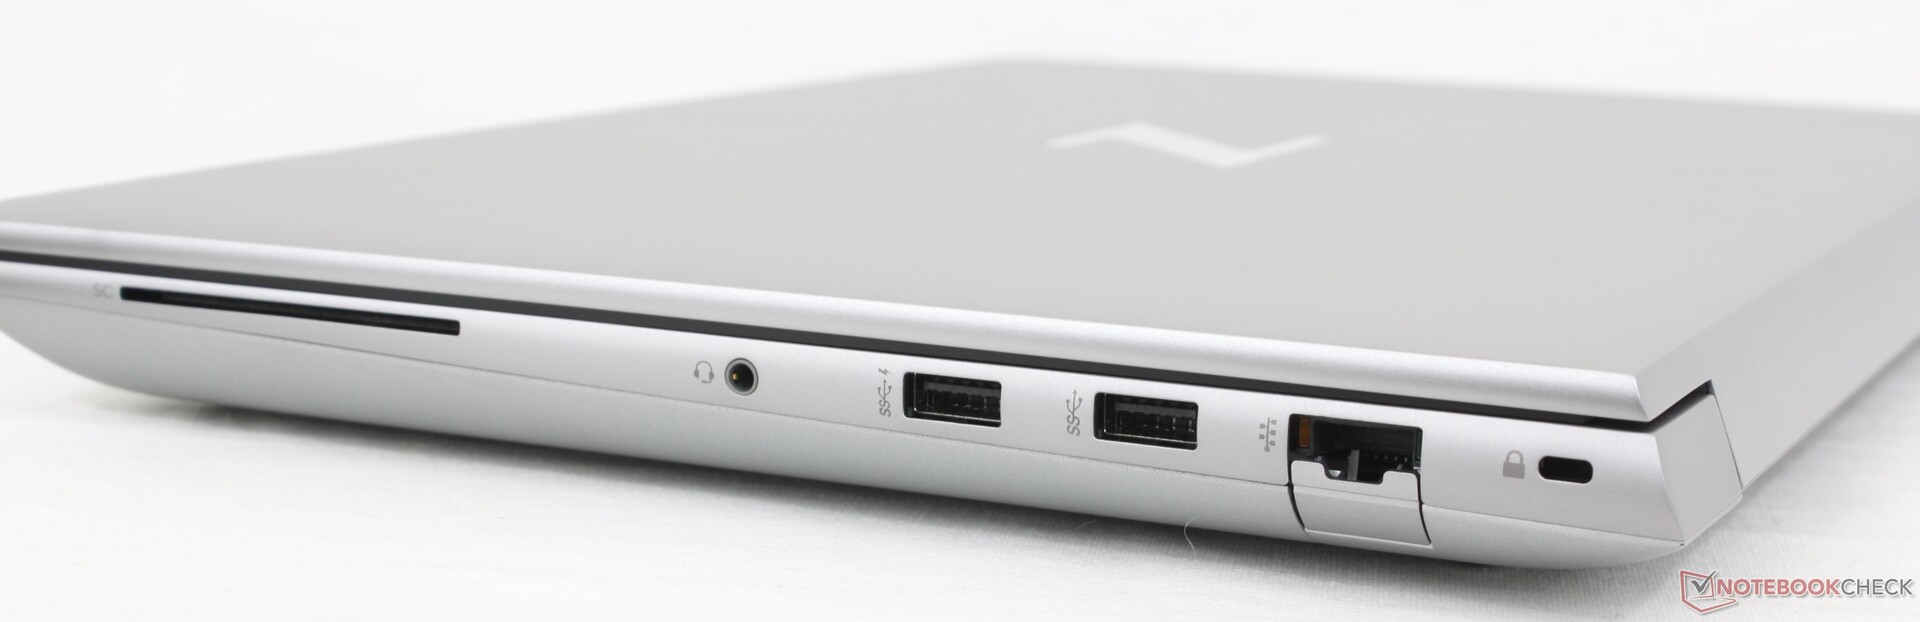
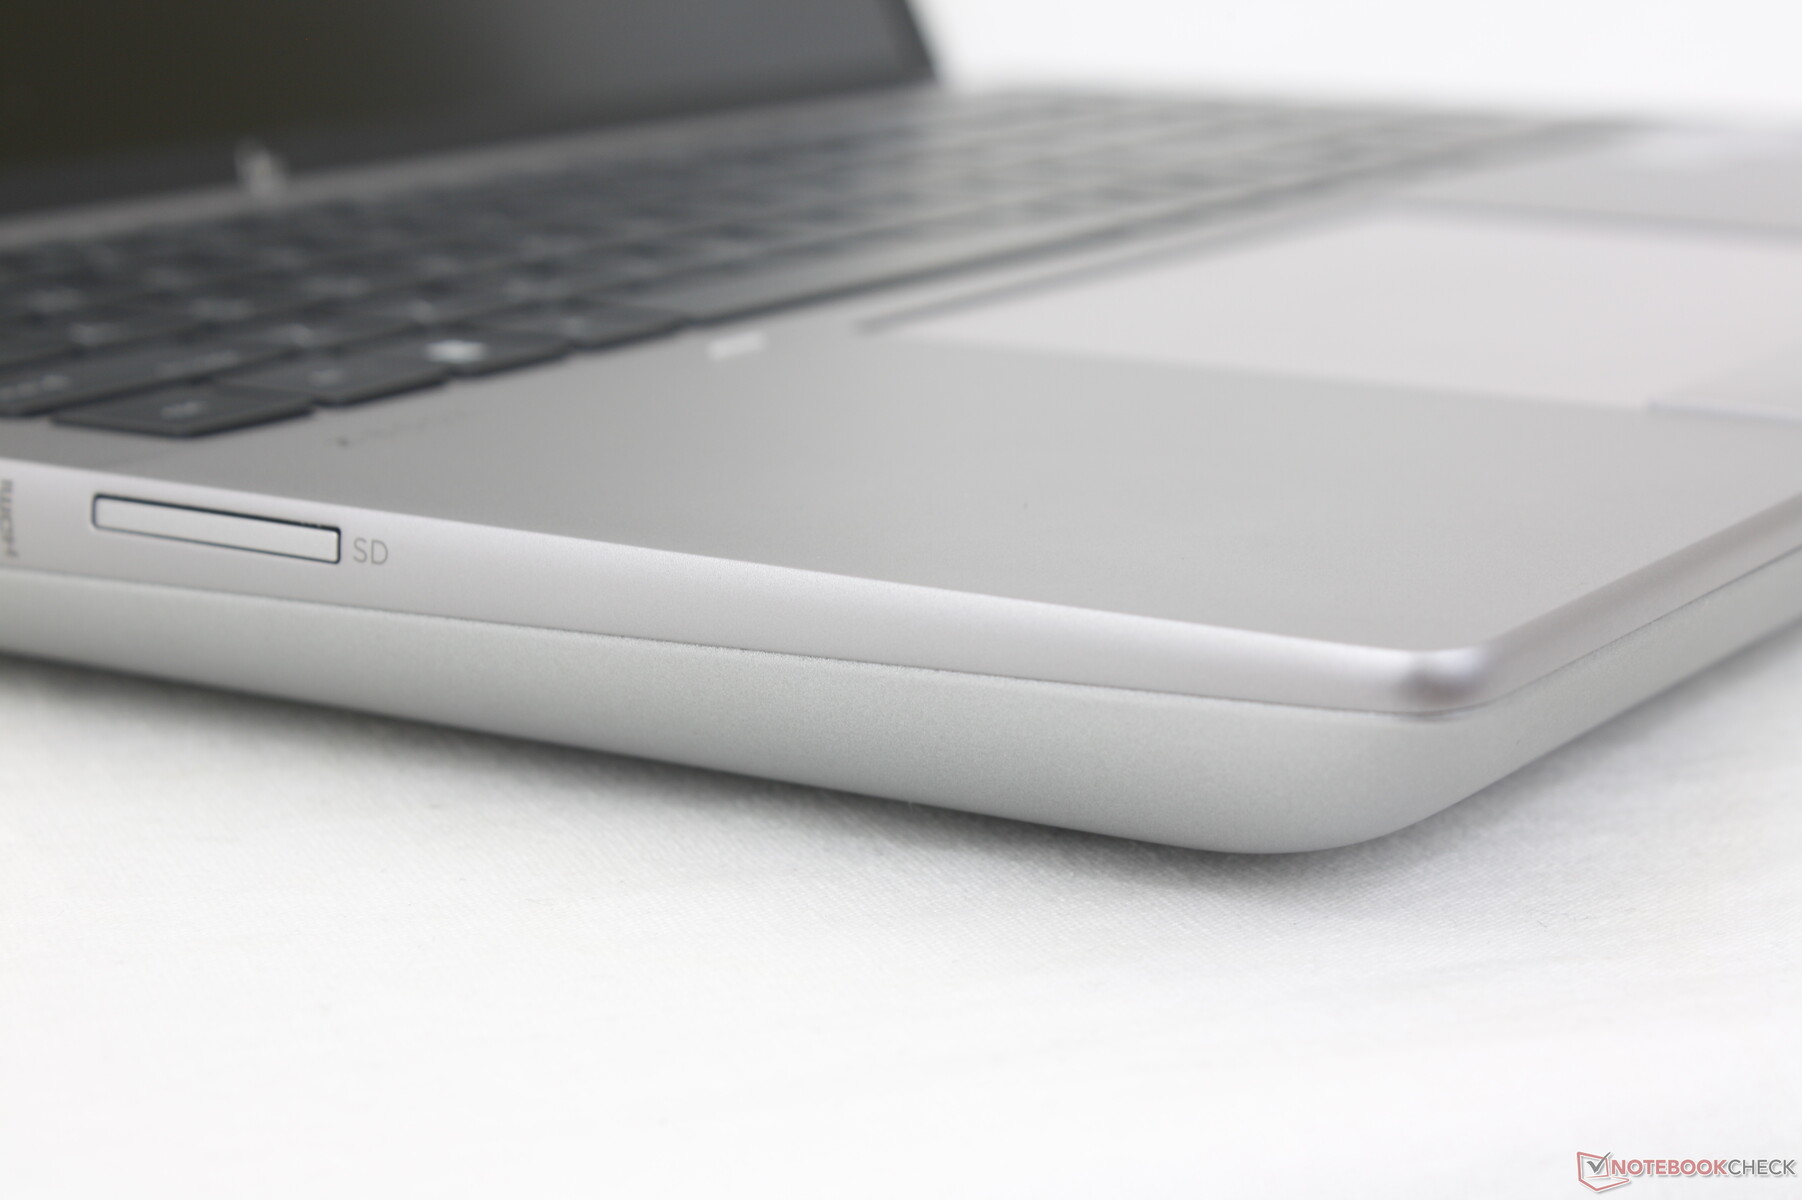
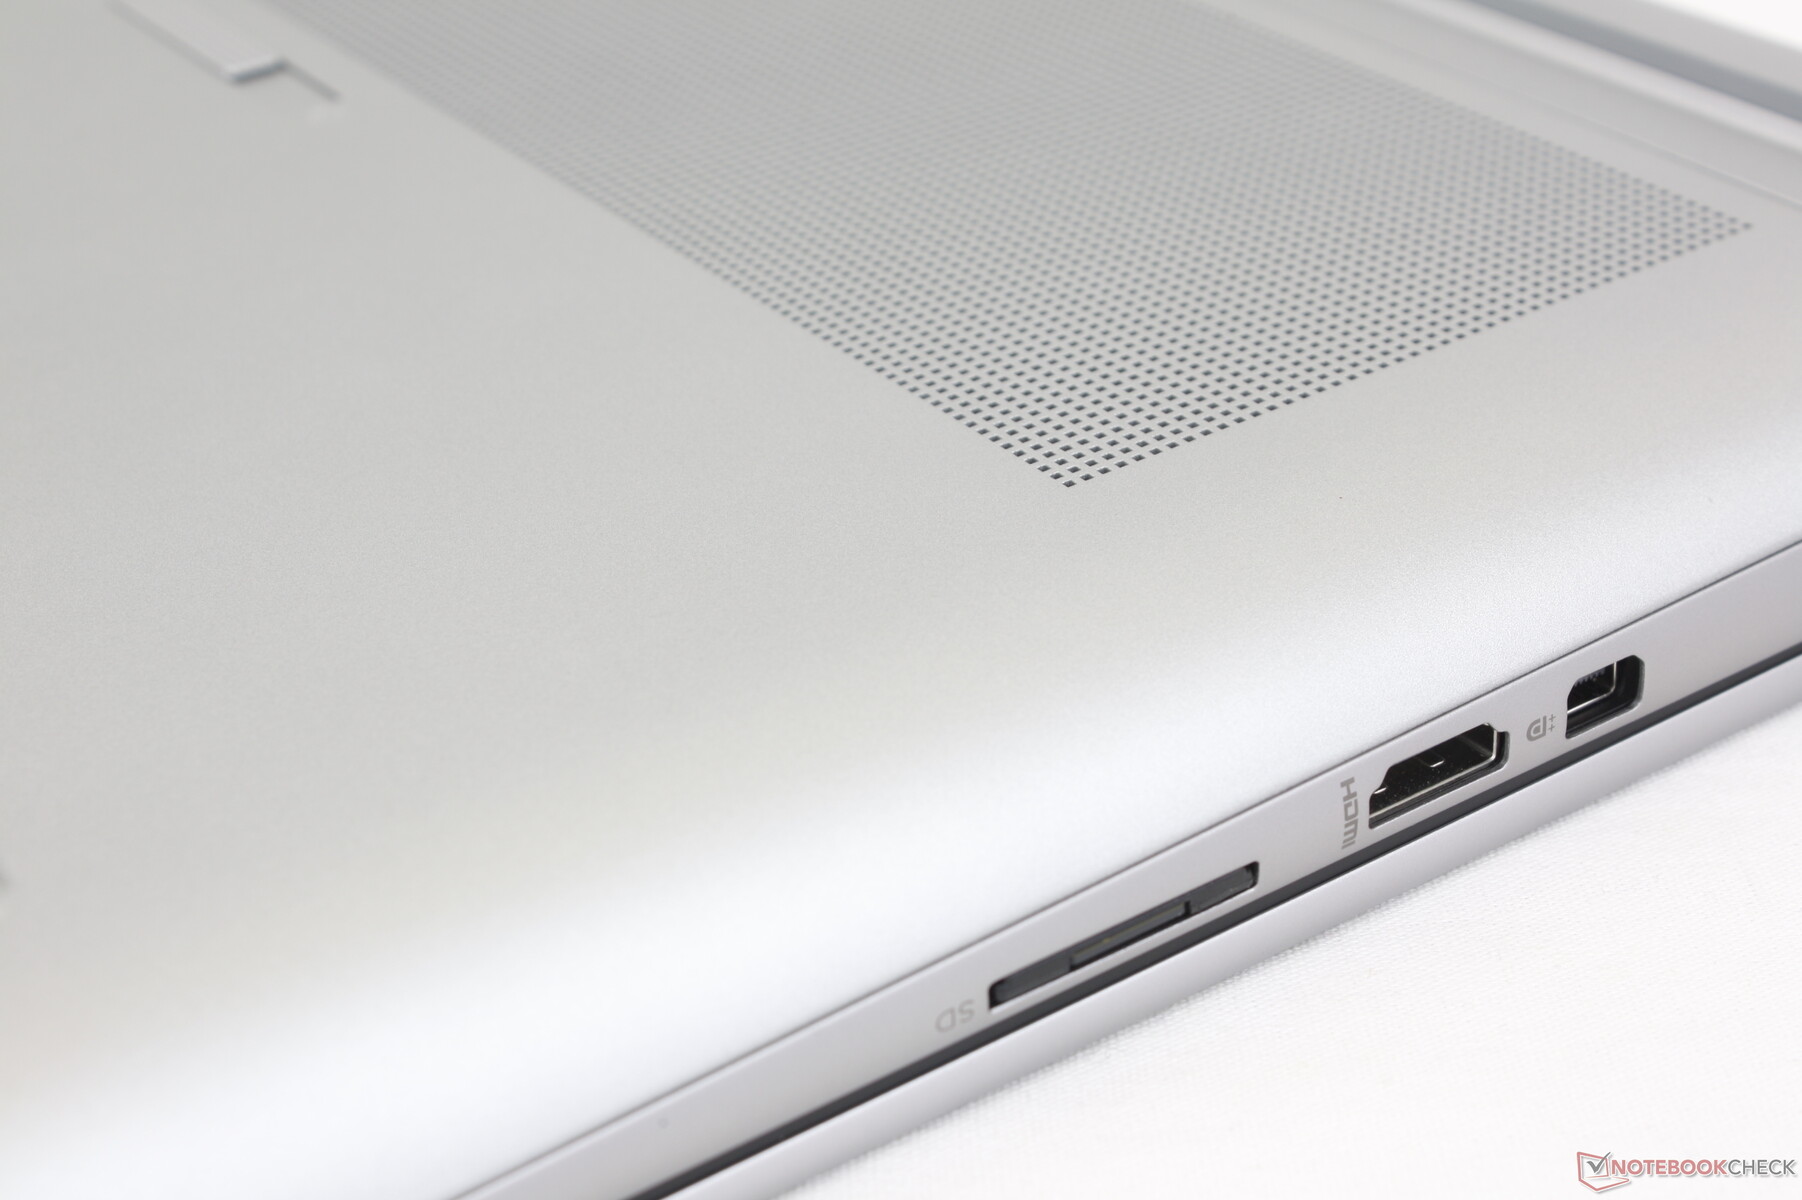
Lector de tarjetas SD
Las velocidades de transferencia alcanzan un máximo de unos 80 MB/s con nuestra tarjeta de prueba PNY EliteX-PRO60, a pesar de que la tarjeta es capaz de alcanzar velocidades de transferencia de hasta 280 MB/s. En comparación, el lector SD integrado de la Precision 7670 es dos veces más rápido. Los usuarios que confían en las tarjetas SD para transferir vídeo y archivos pueden sentirse decepcionados por la Fury 16 G9 en este aspecto.
| SD Card Reader | |
| average JPG Copy Test (av. of 3 runs) | |
| Dell Precision 7000 7670 Performance (Toshiba Exceria Pro SDXC 64 GB UHS-II) | |
| MSI CreatorPro Z16P B12UKST (AV Pro V60) | |
| HP ZBook Fury 16 G9 (PNY EliteX-PRO60) | |
| Lenovo ThinkPad P16 G1 RTX A5500 (Toshiba Exceria Pro SDXC 64 GB UHS-II) | |
| HP ZBook Studio 16 G9 62U04EA (Angelbird AV PRO V60) | |
| maximum AS SSD Seq Read Test (1GB) | |
| Dell Precision 7000 7670 Performance (Toshiba Exceria Pro SDXC 64 GB UHS-II) | |
| HP ZBook Fury 16 G9 (PNY EliteX-PRO60) | |
| MSI CreatorPro Z16P B12UKST (AV Pro V60) | |
| Lenovo ThinkPad P16 G1 RTX A5500 (Toshiba Exceria Pro SDXC 64 GB UHS-II) | |
| HP ZBook Studio 16 G9 62U04EA (Angelbird AV PRO V60) | |
Comunicación
Nuestra unidad Windows 10 viene con Intel AX211 para conectividad Wi-Fi 6E y Bluetooth 5.2. Por desgracia, Wi-Fi 6E está desactivado en Windows 10, ya que Microsoft lo ha hecho exclusivo de Windows 11 (por una idiotez). Por tanto, tendrás que configurarlo con Windows 11 si quieres aprovechar las ventajas de la Wi-Fi de 6 GHz. Por lo demás, no tuvimos problemas de rendimiento cuando lo conectamos a nuestra red Wi-Fi 6 normal.
Cámara web
El ZBook Fury 16 G9 ha heredado la webcam de 5 MP del último Spectre y EliteBook. La calidad de imagen es más nítida que en la mayoría de portátiles en los que los sensores de 1 MP y 2 MP siguen siendo habituales, incluidos los ThinkPad P16 y Precision 7670 de la competencia.
Se incluye un obturador deslizante y un sensor IR para privacidad y soporte Hello, respectivamente.


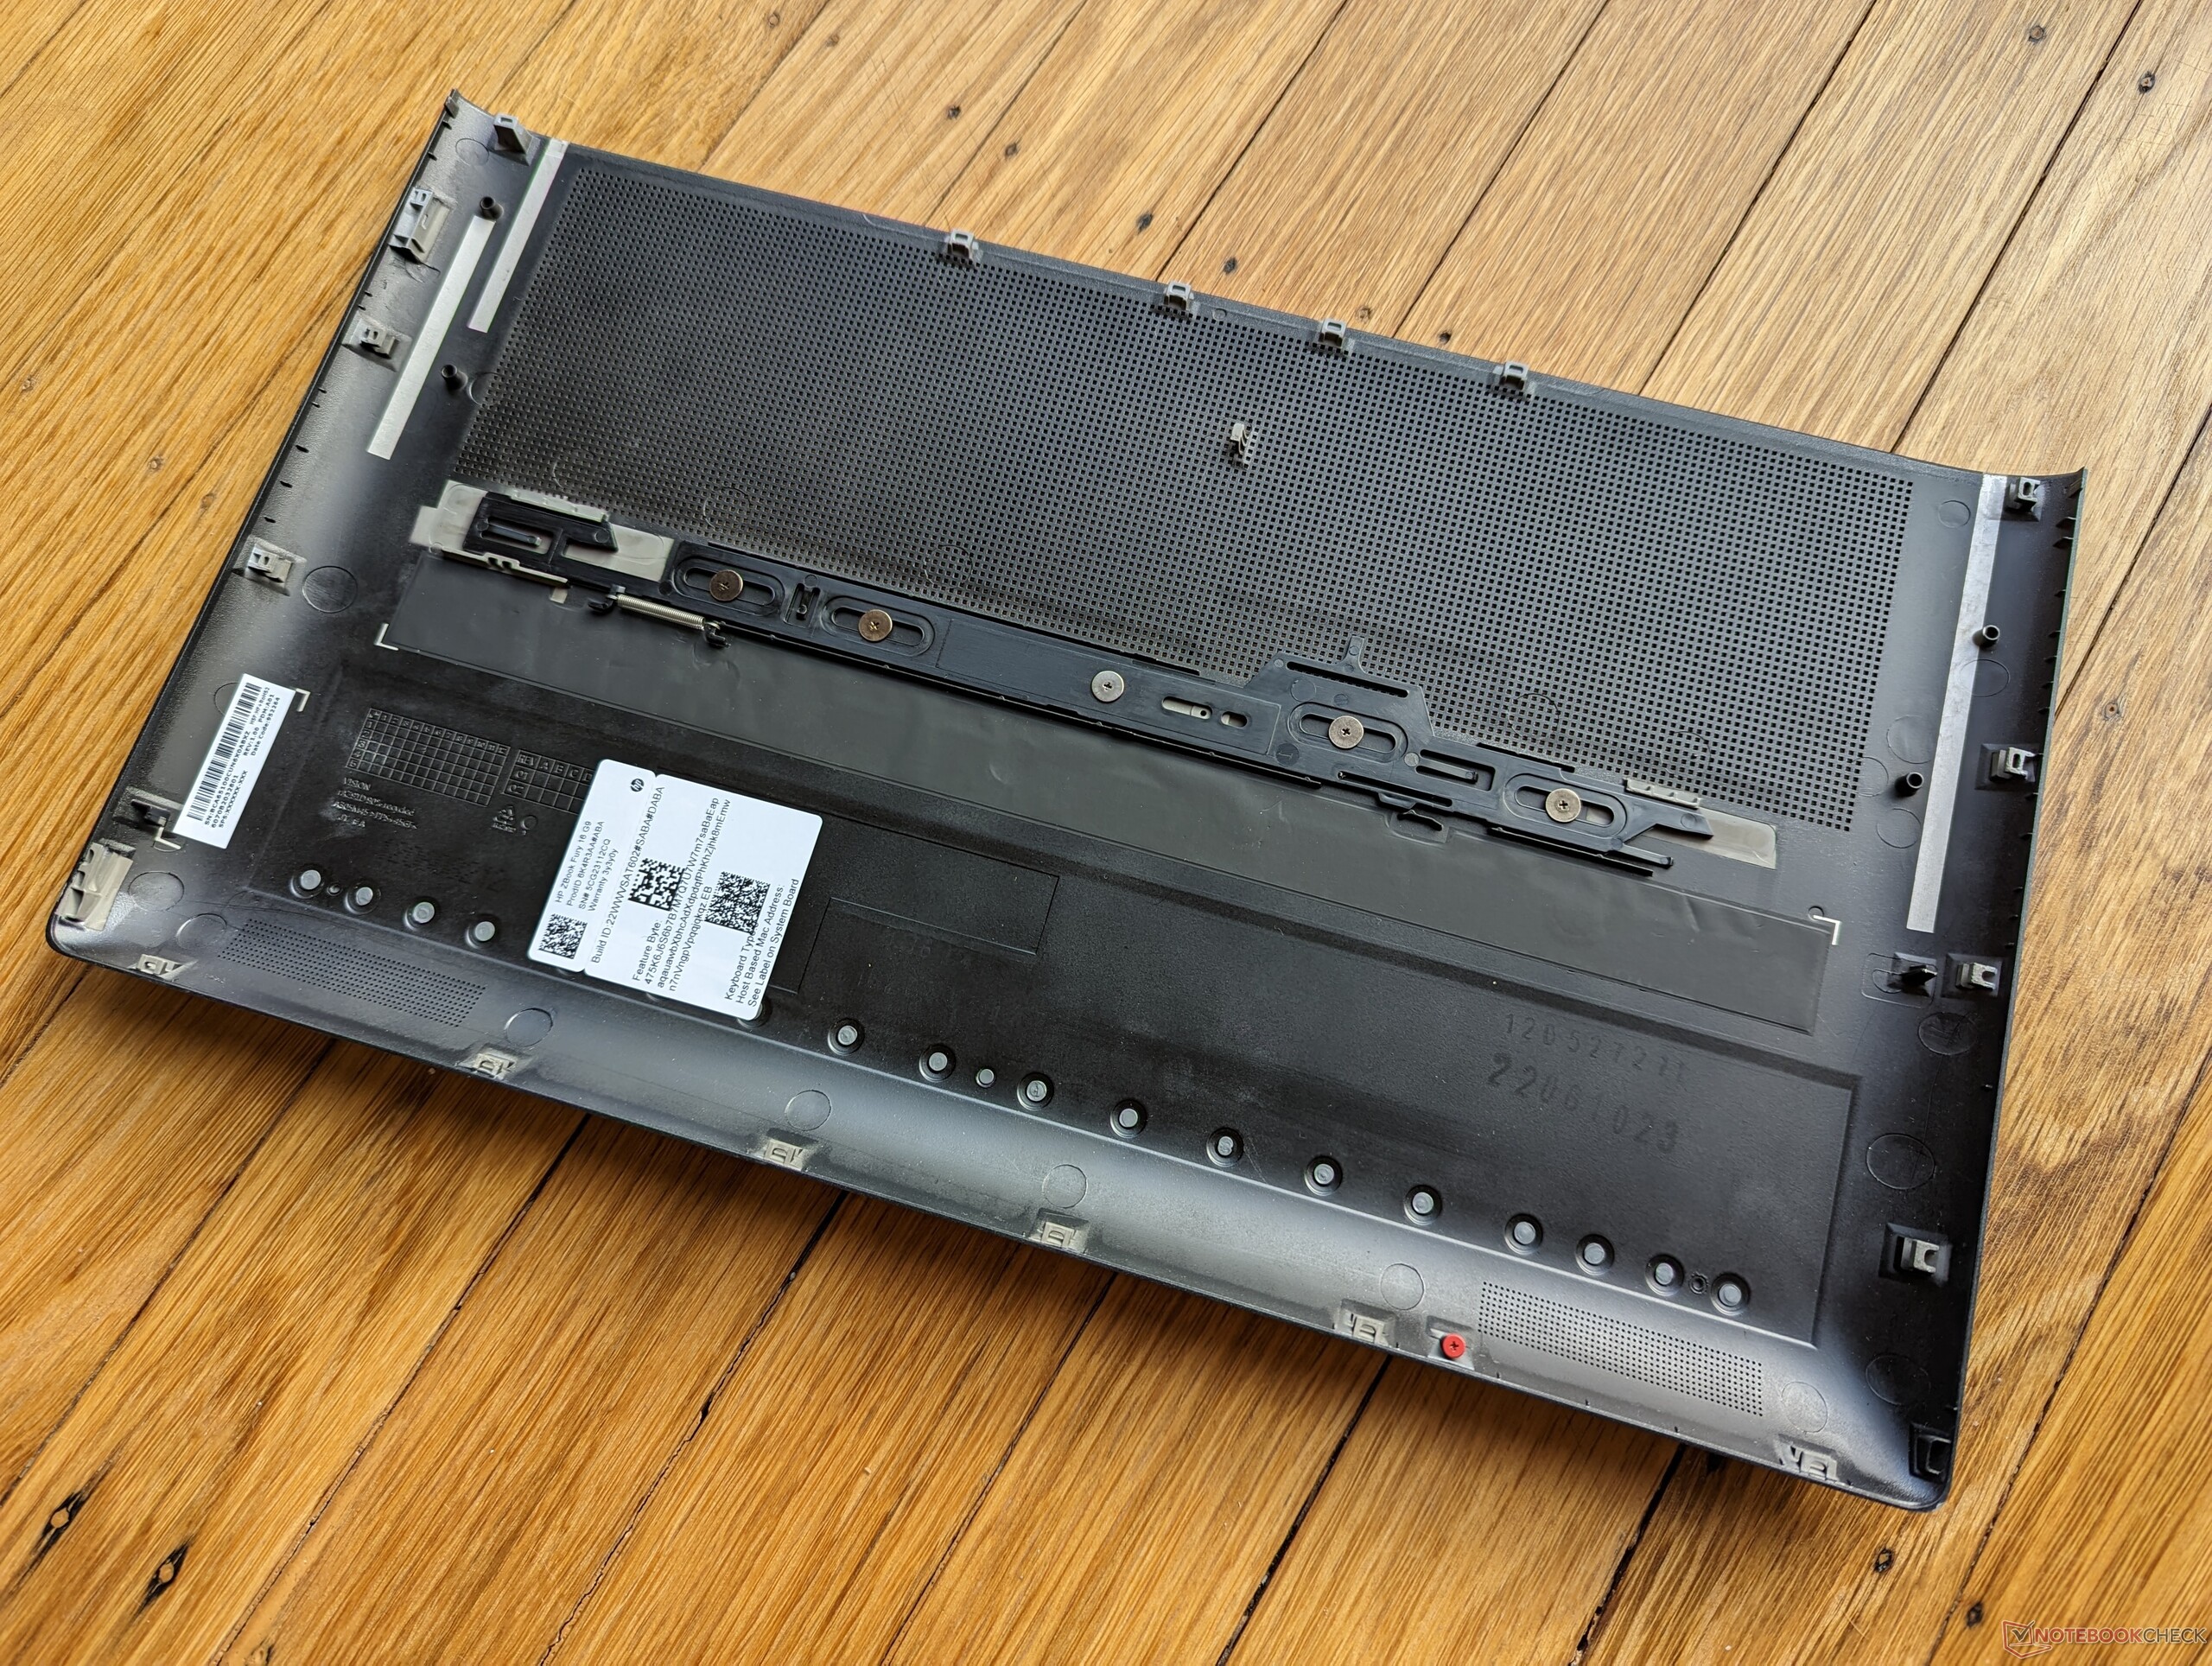
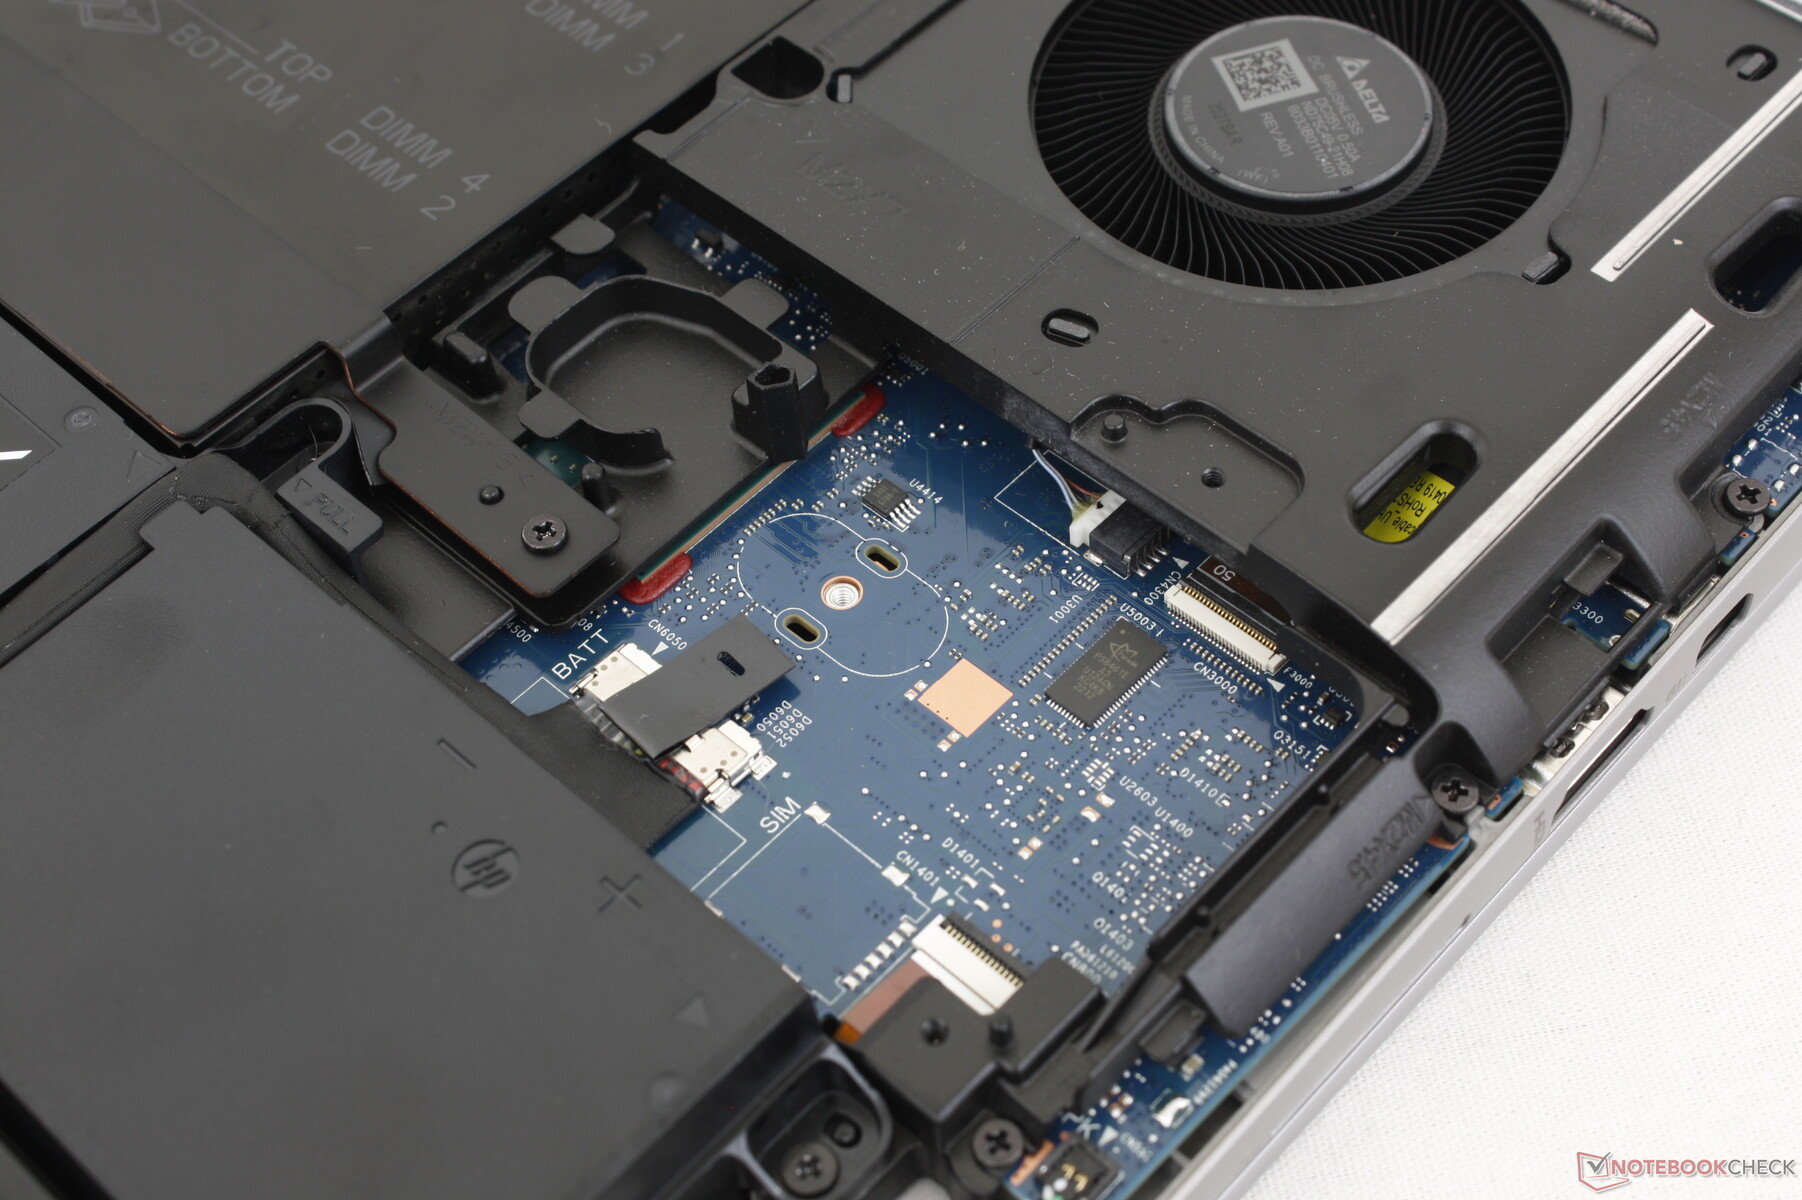
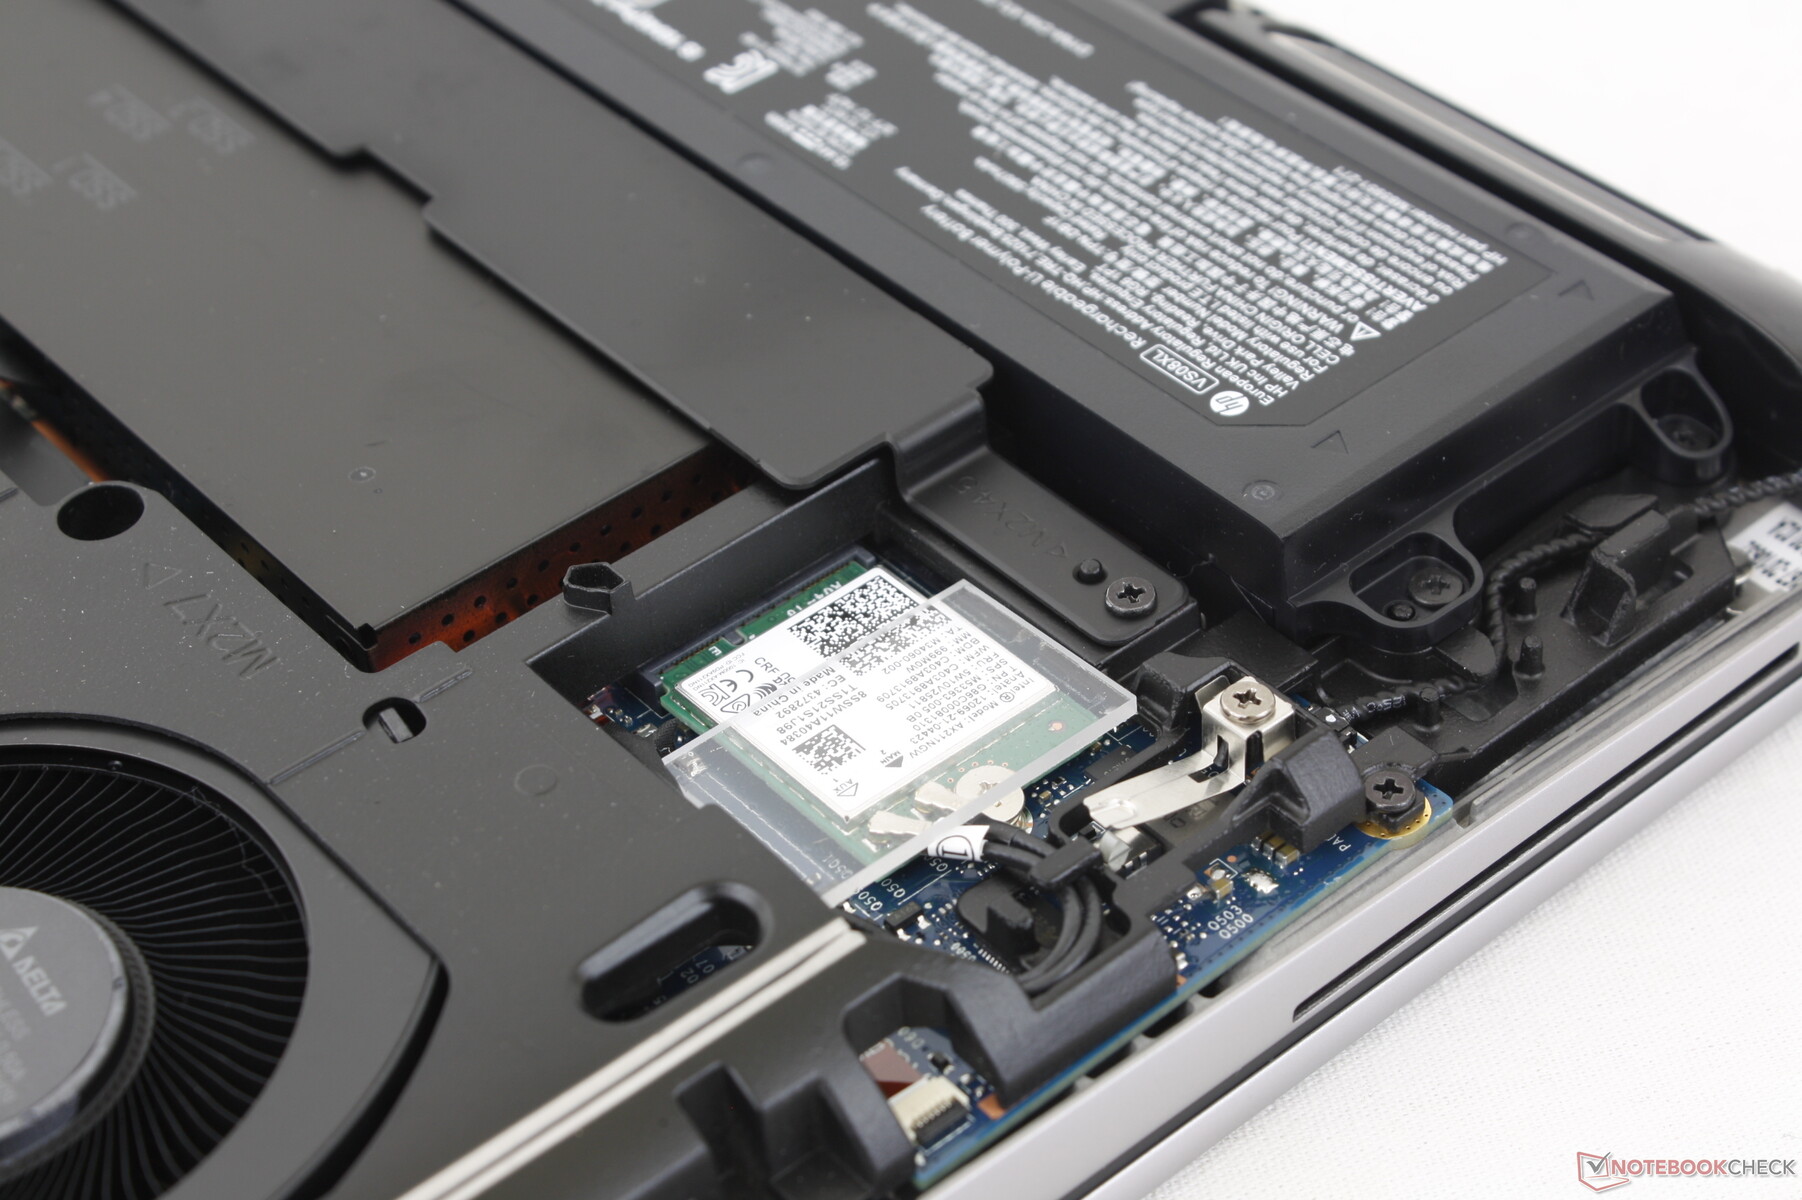
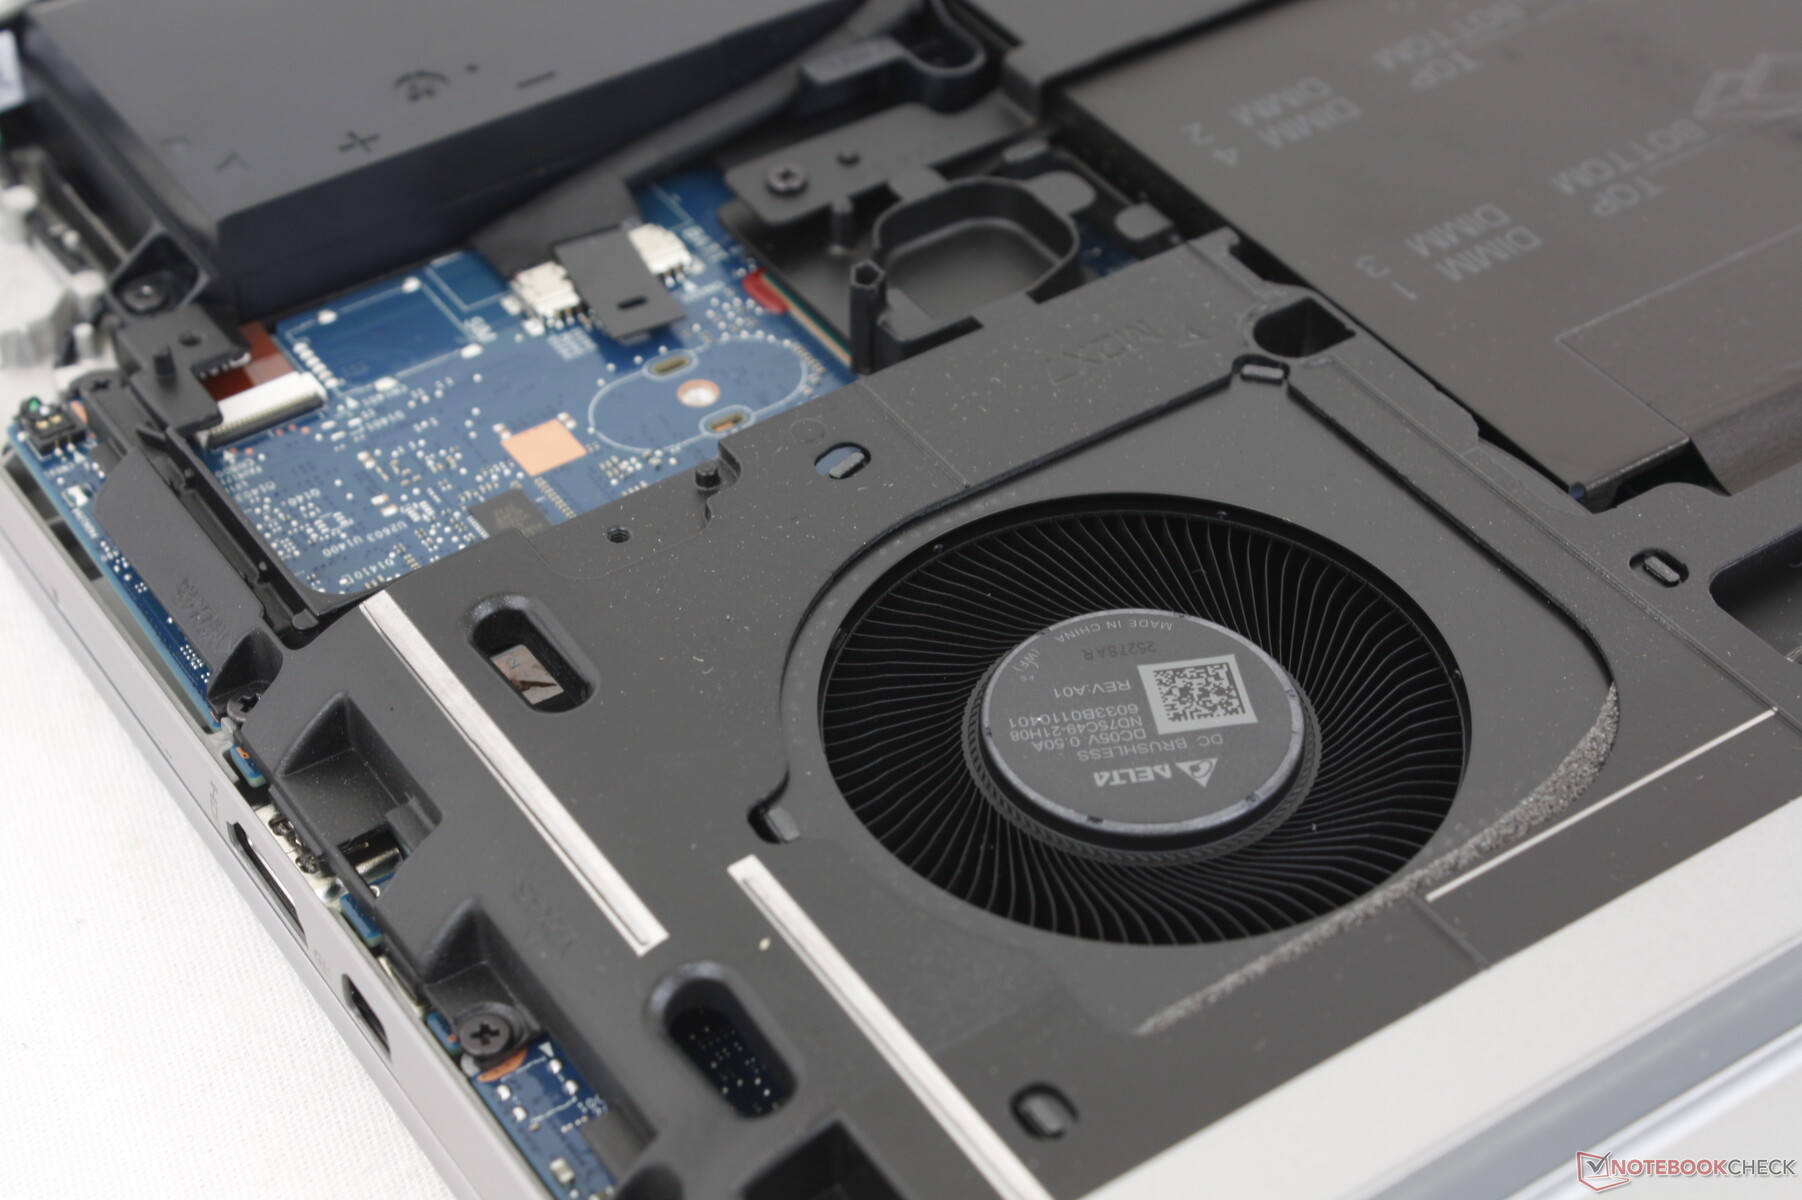
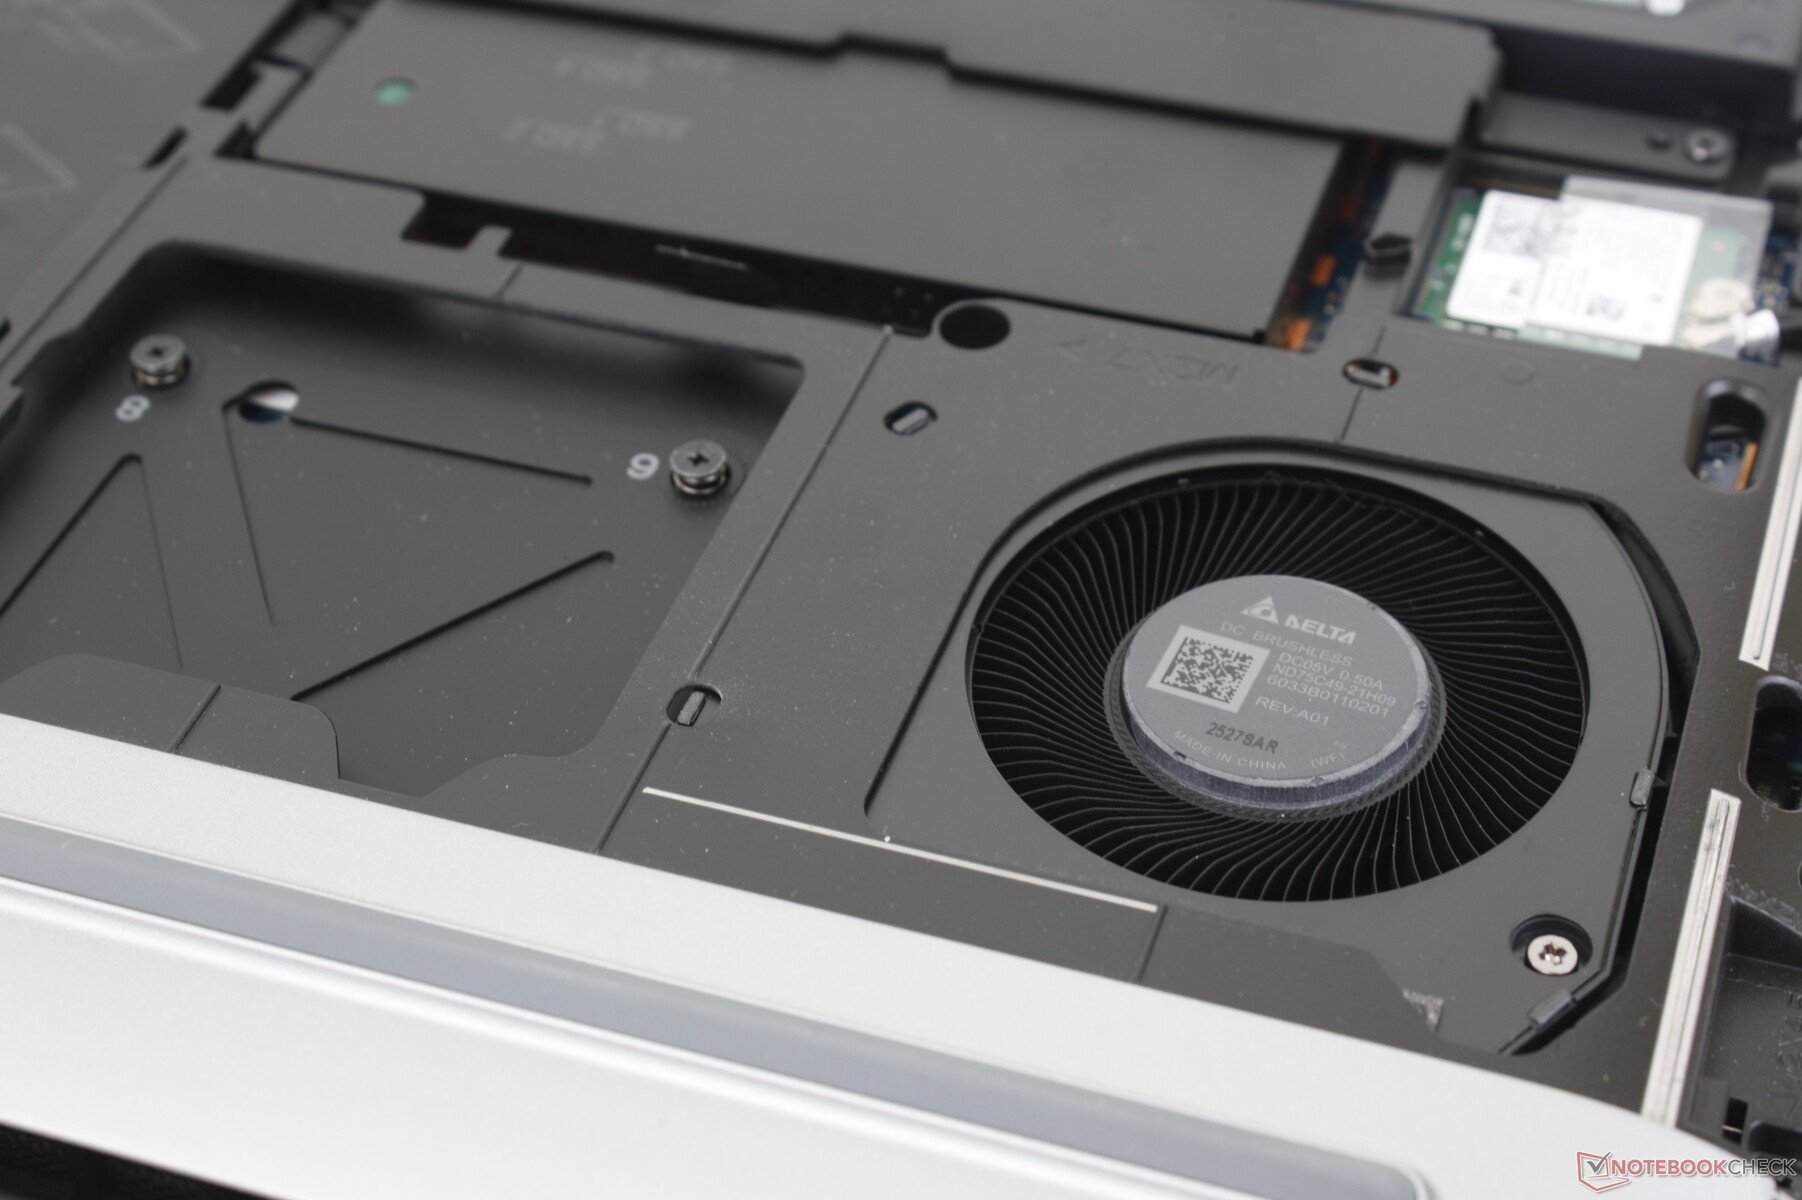
Mantenimiento
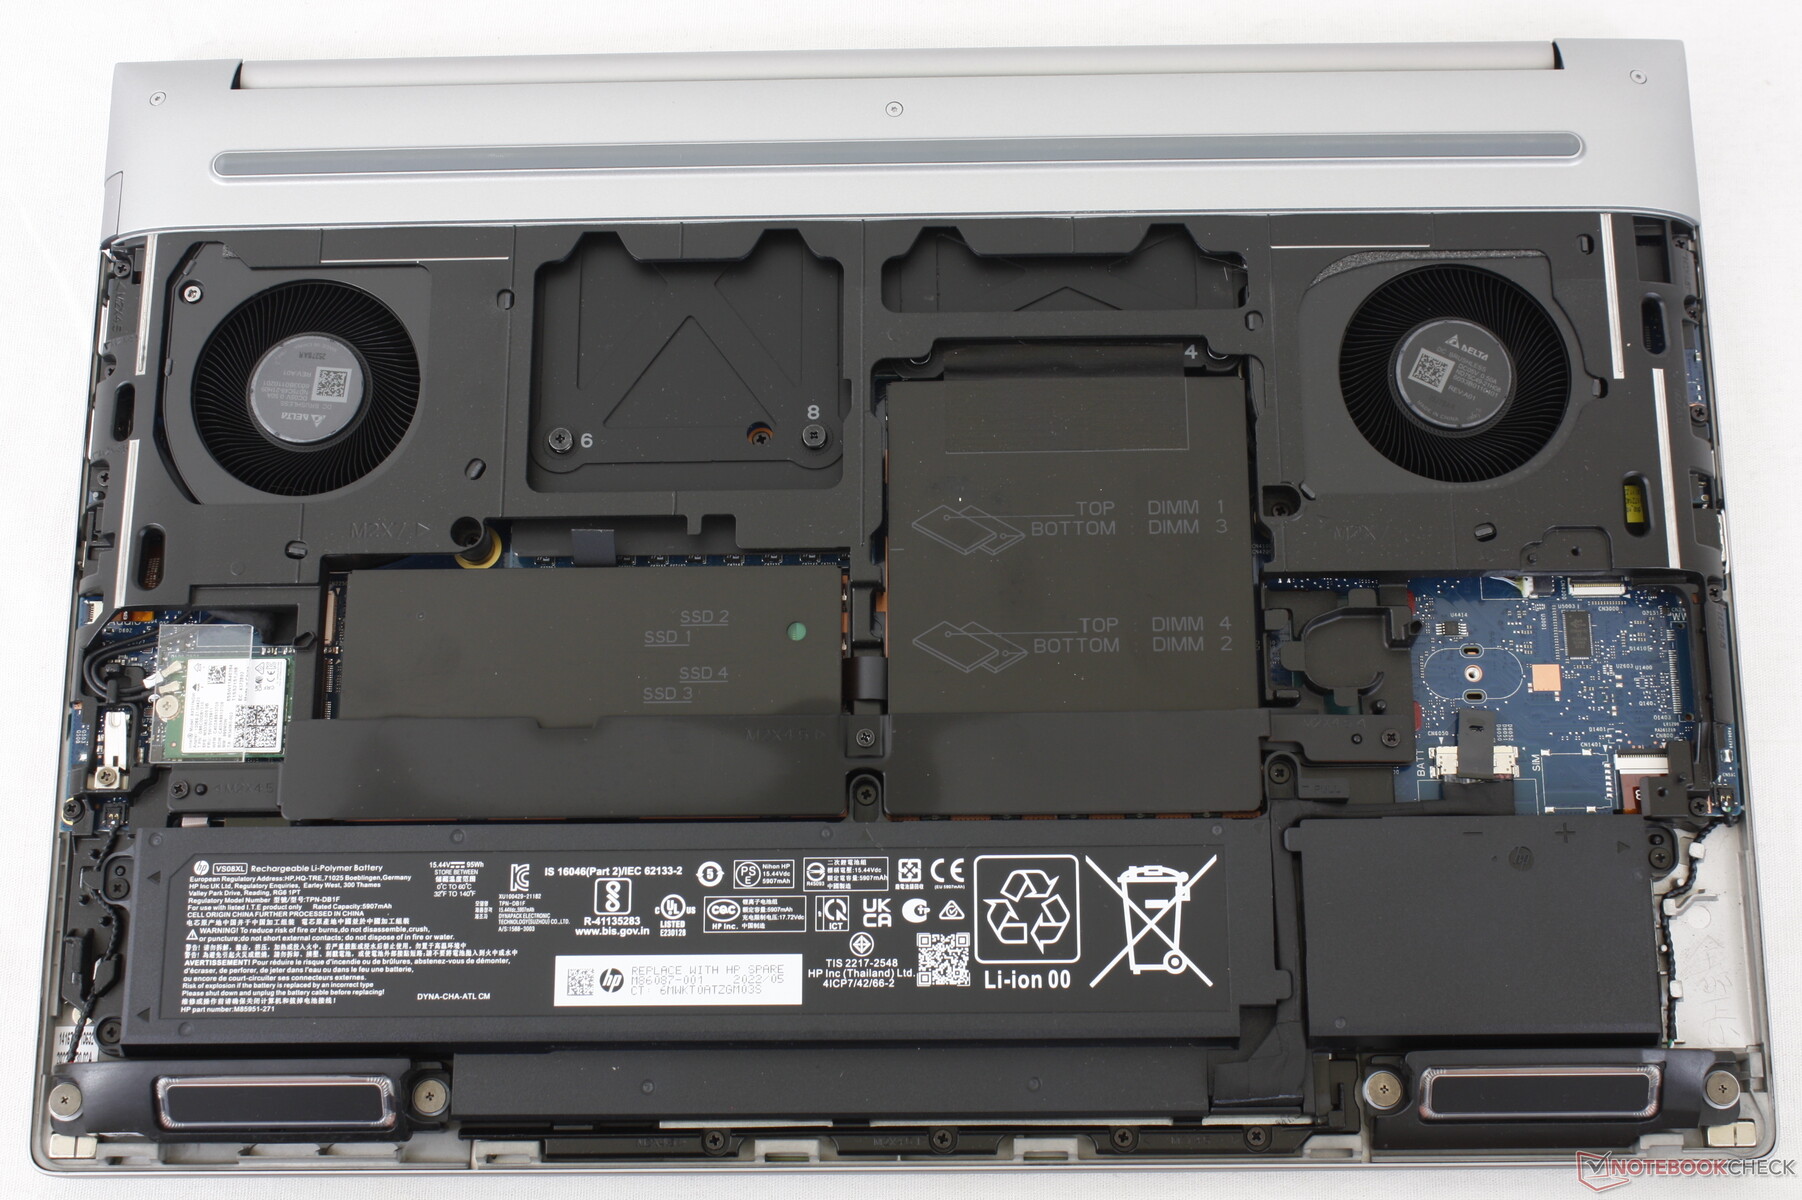
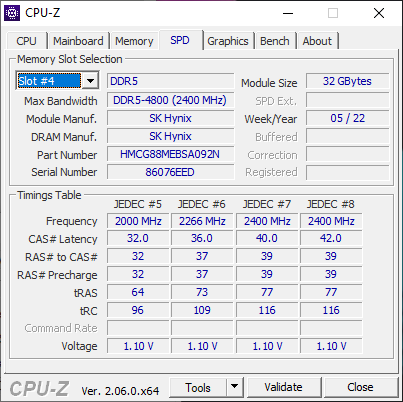
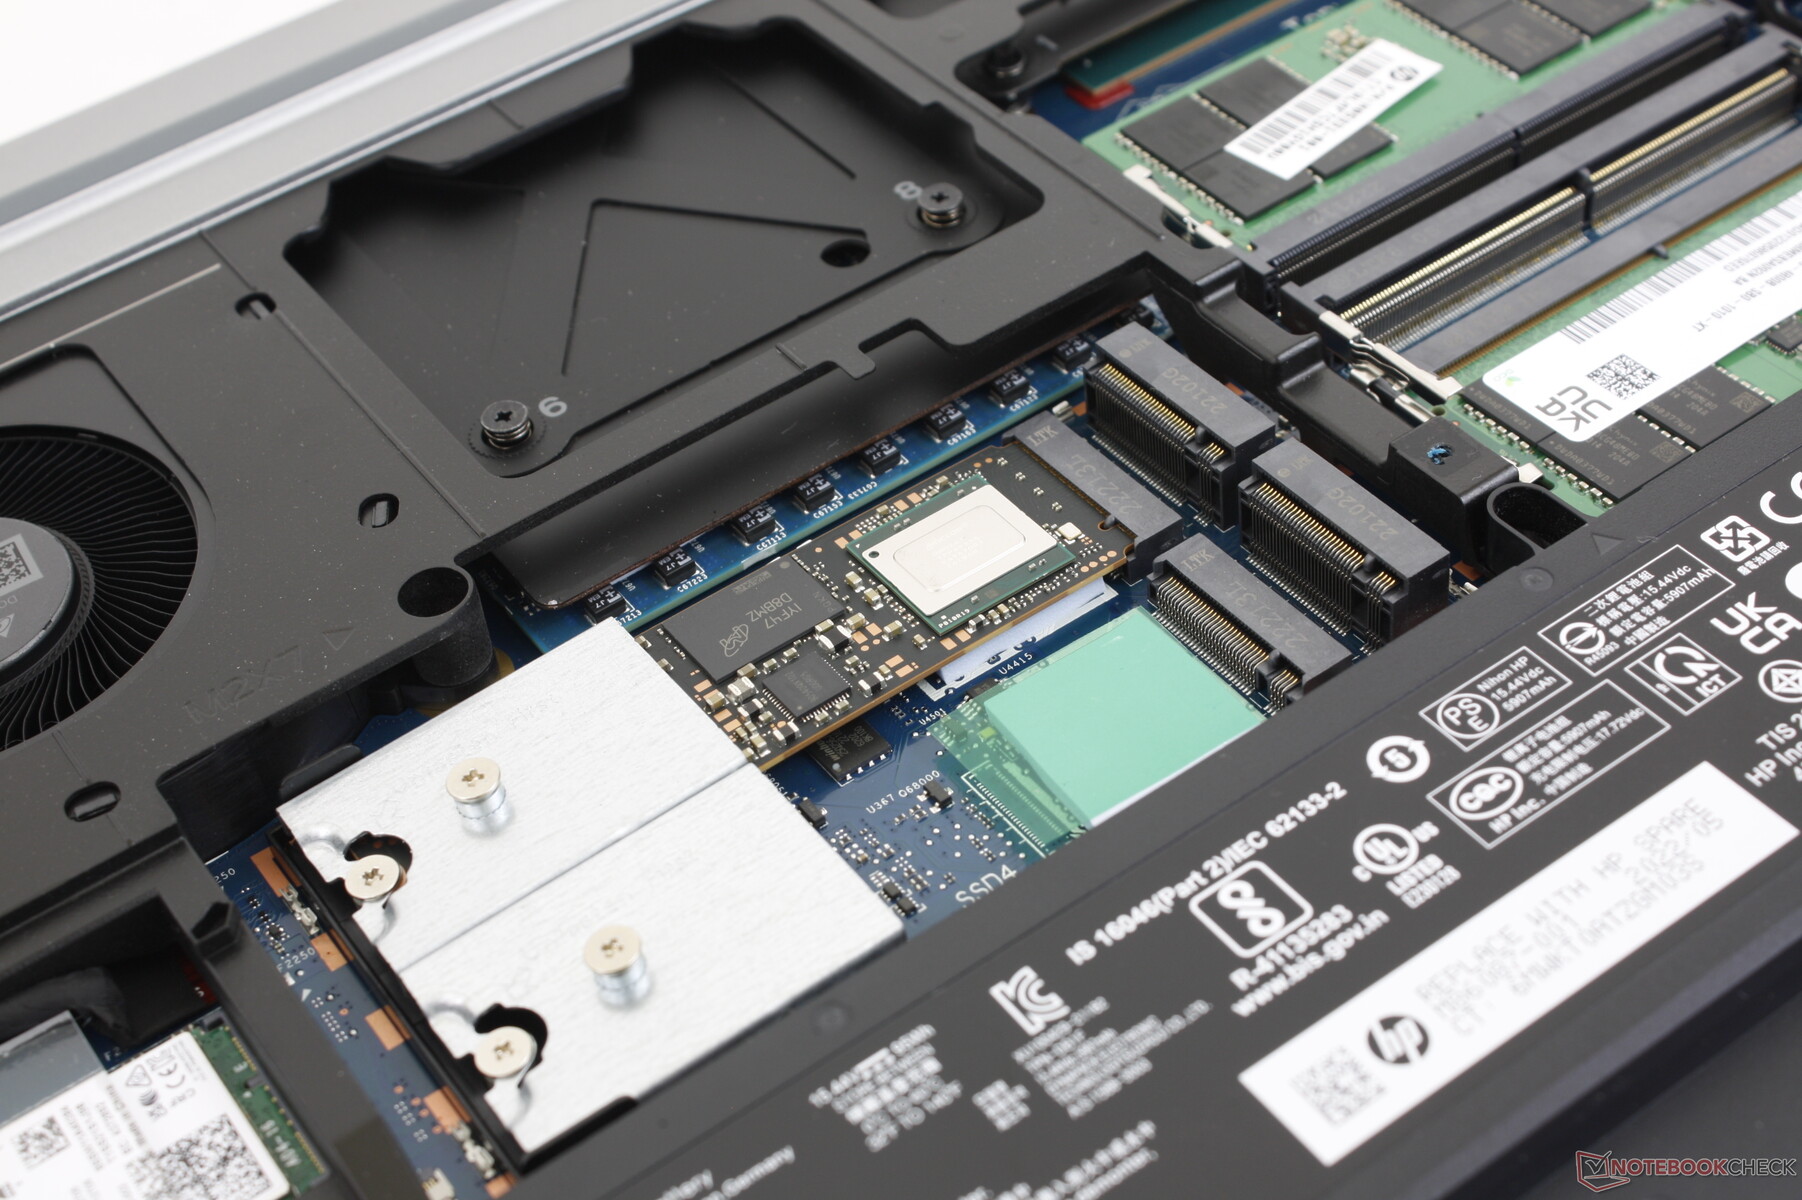
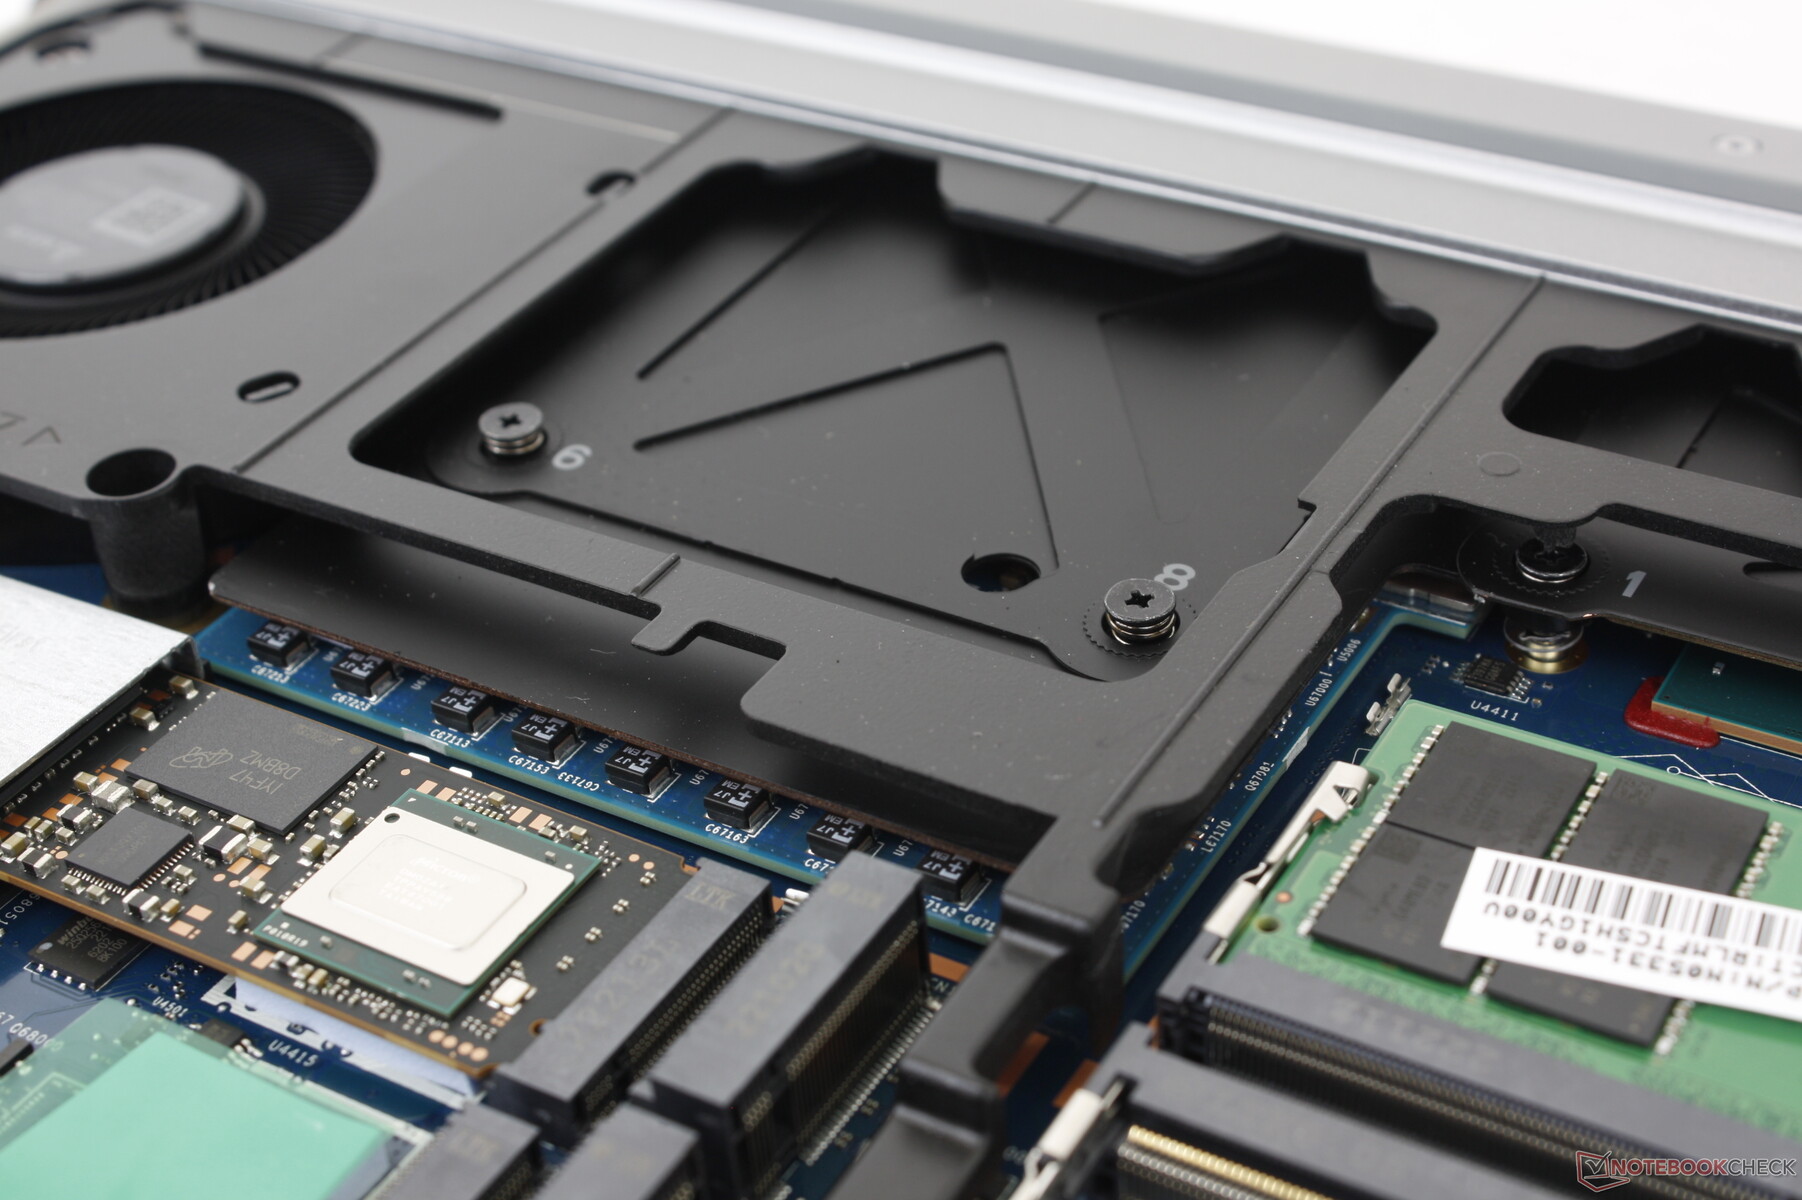
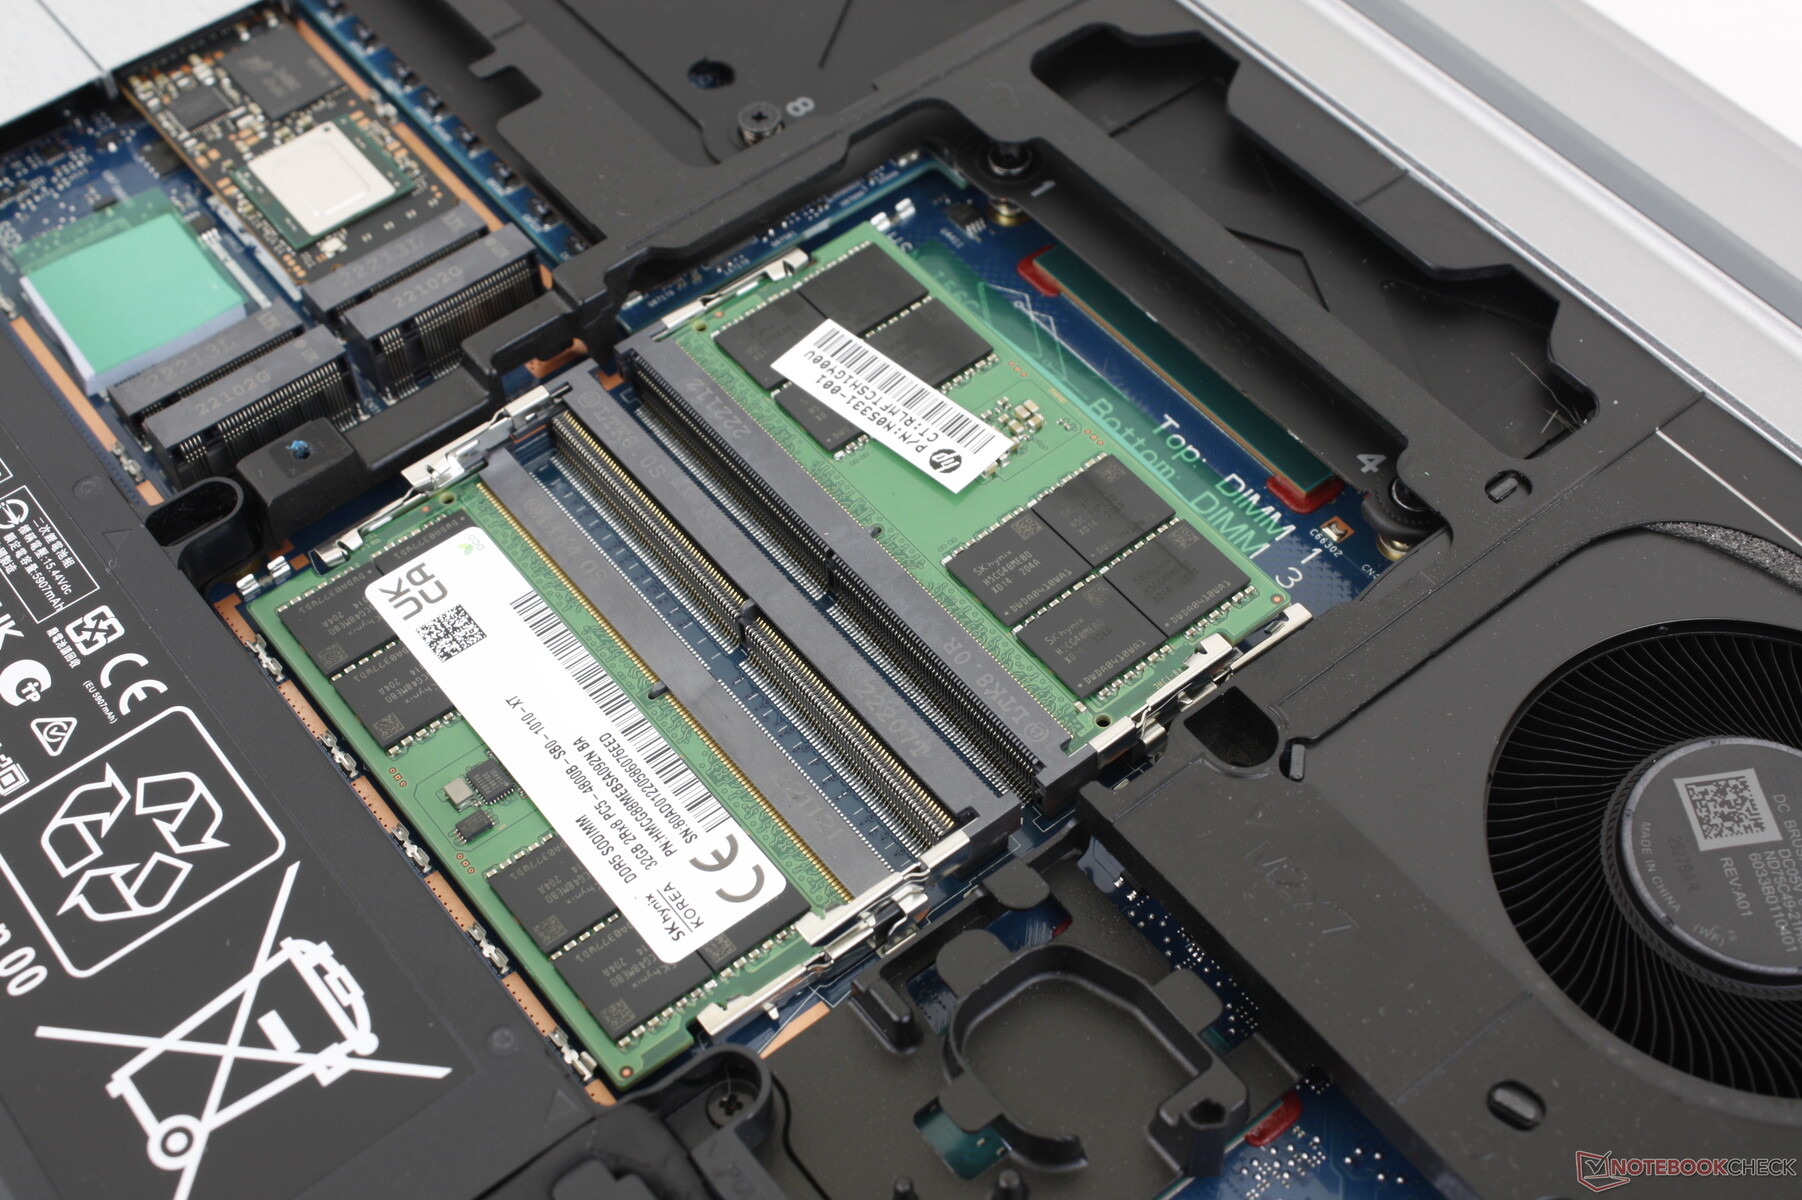
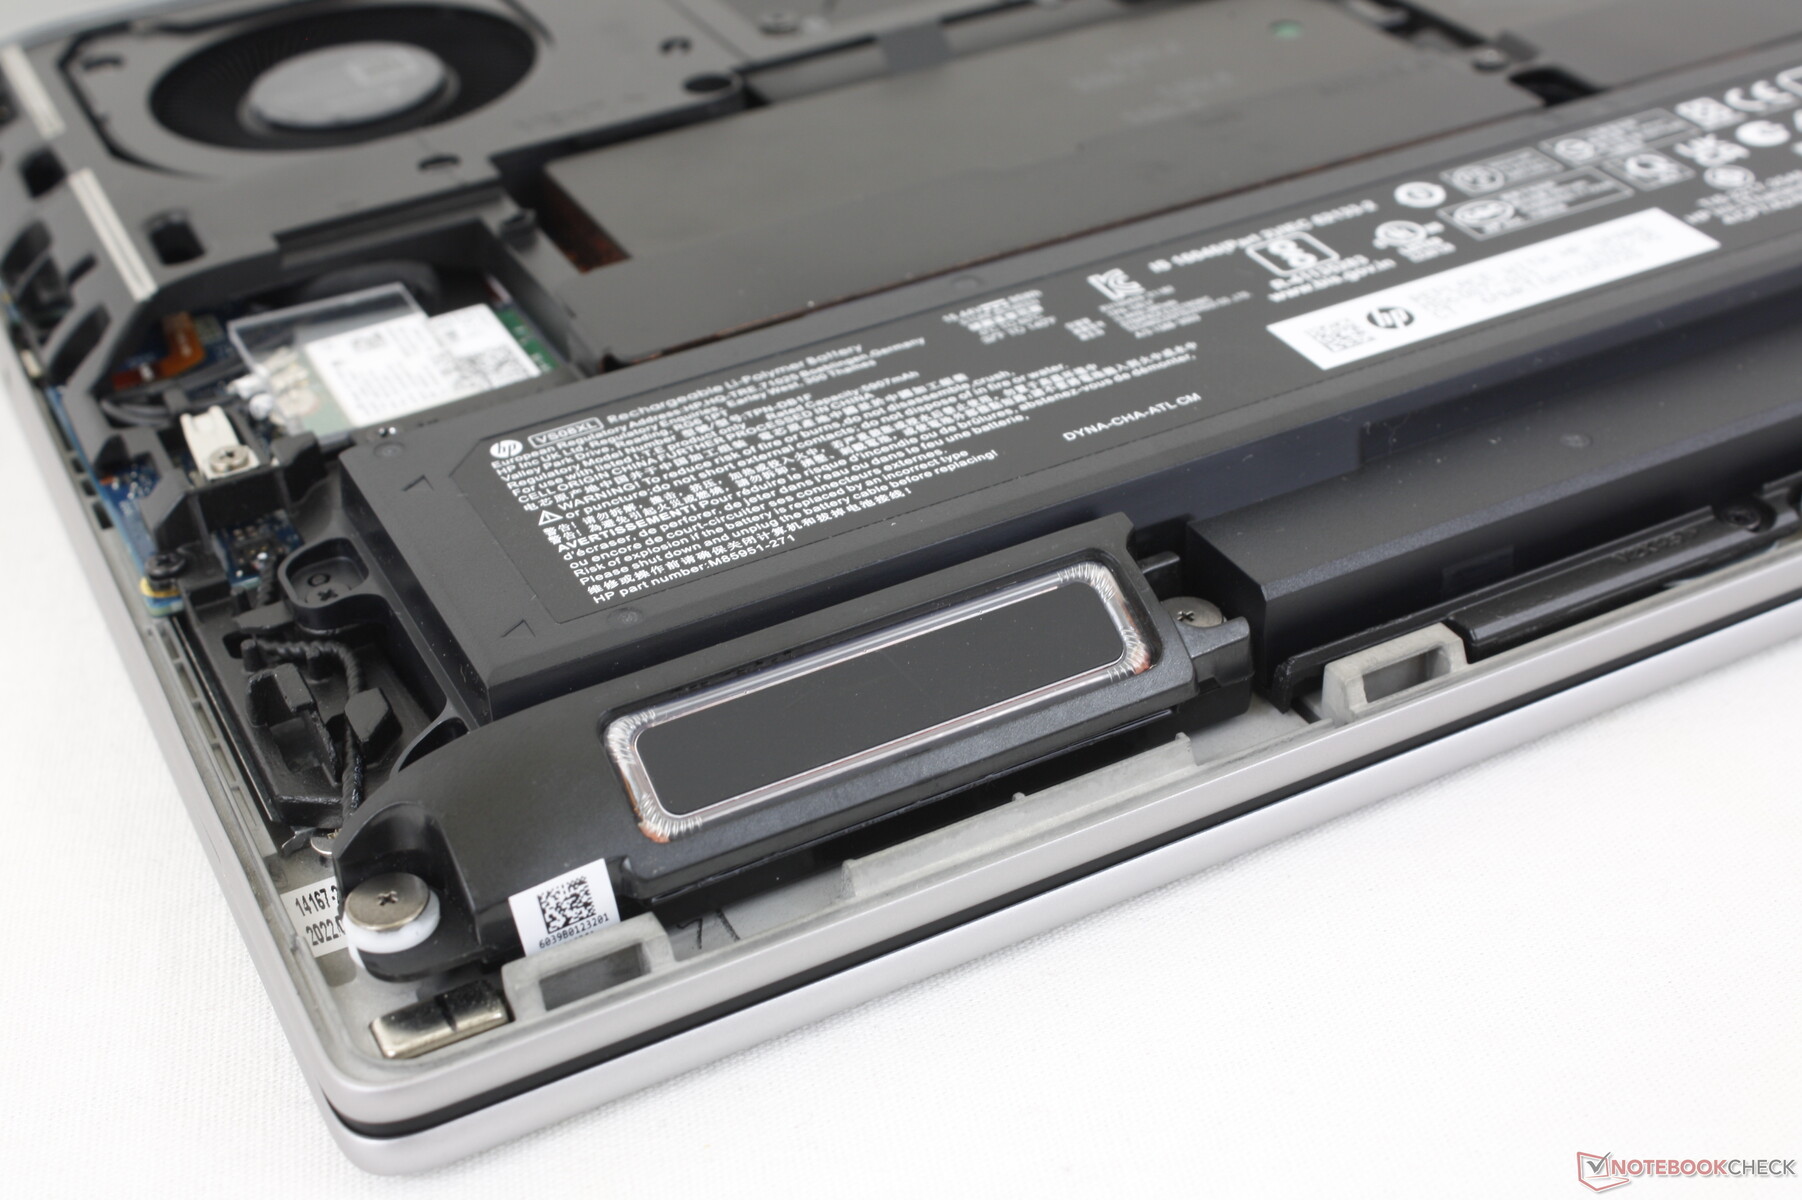
El panel inferior es "toolless" en el sentido de que se desliza fácilmente sin necesidad de herramientas. Por desgracia, sigue haciendo falta un destornillador, ya que las bahías de almacenamiento y las ranuras SODIMM están protegidas por placas de aluminio. El modelo admite hasta 4 SSD M.2 2280 y 4 módulos RAM DDR5, que es más de lo que pueden ofrecer el Precision 7670 y el ThinkPad P16.
Accesorios y garantía
No se incluyen extras en la caja, aparte del habitual adaptador de CA y la documentación. Si se adquiere en EE.UU., incluye una garantía limitada de tres años.
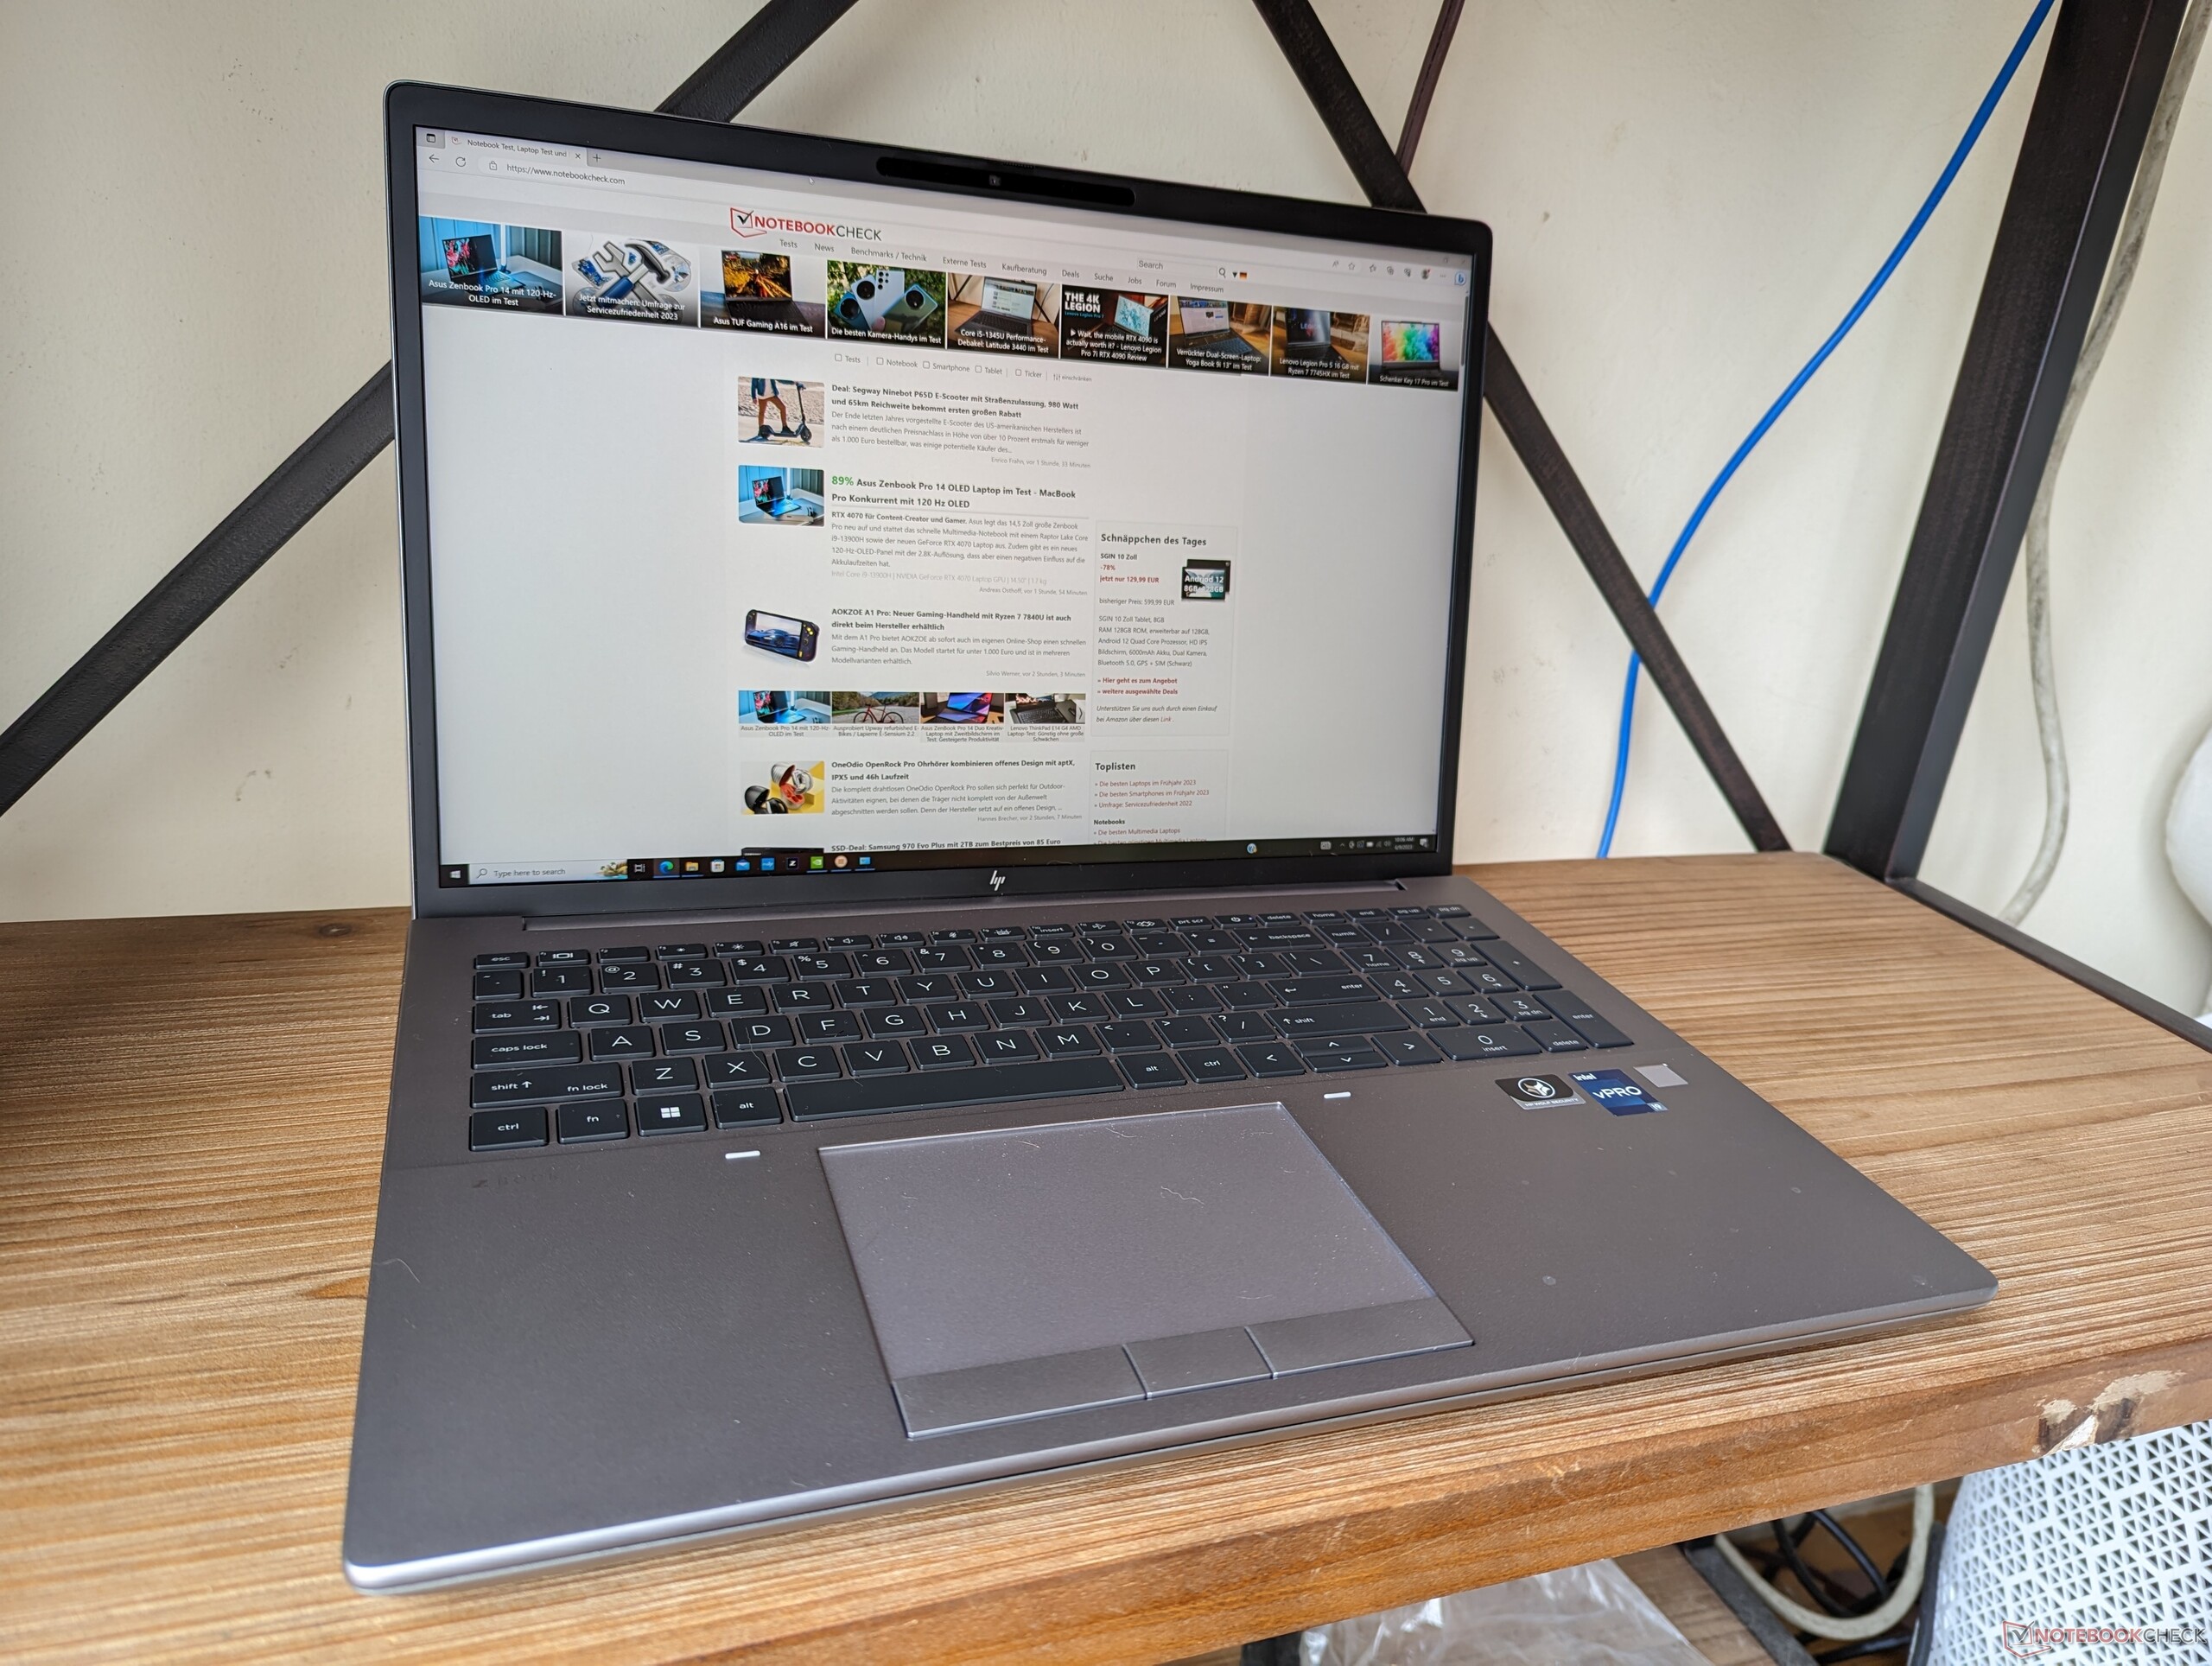
Dispositivos de entrada: espaciosos y cómodos
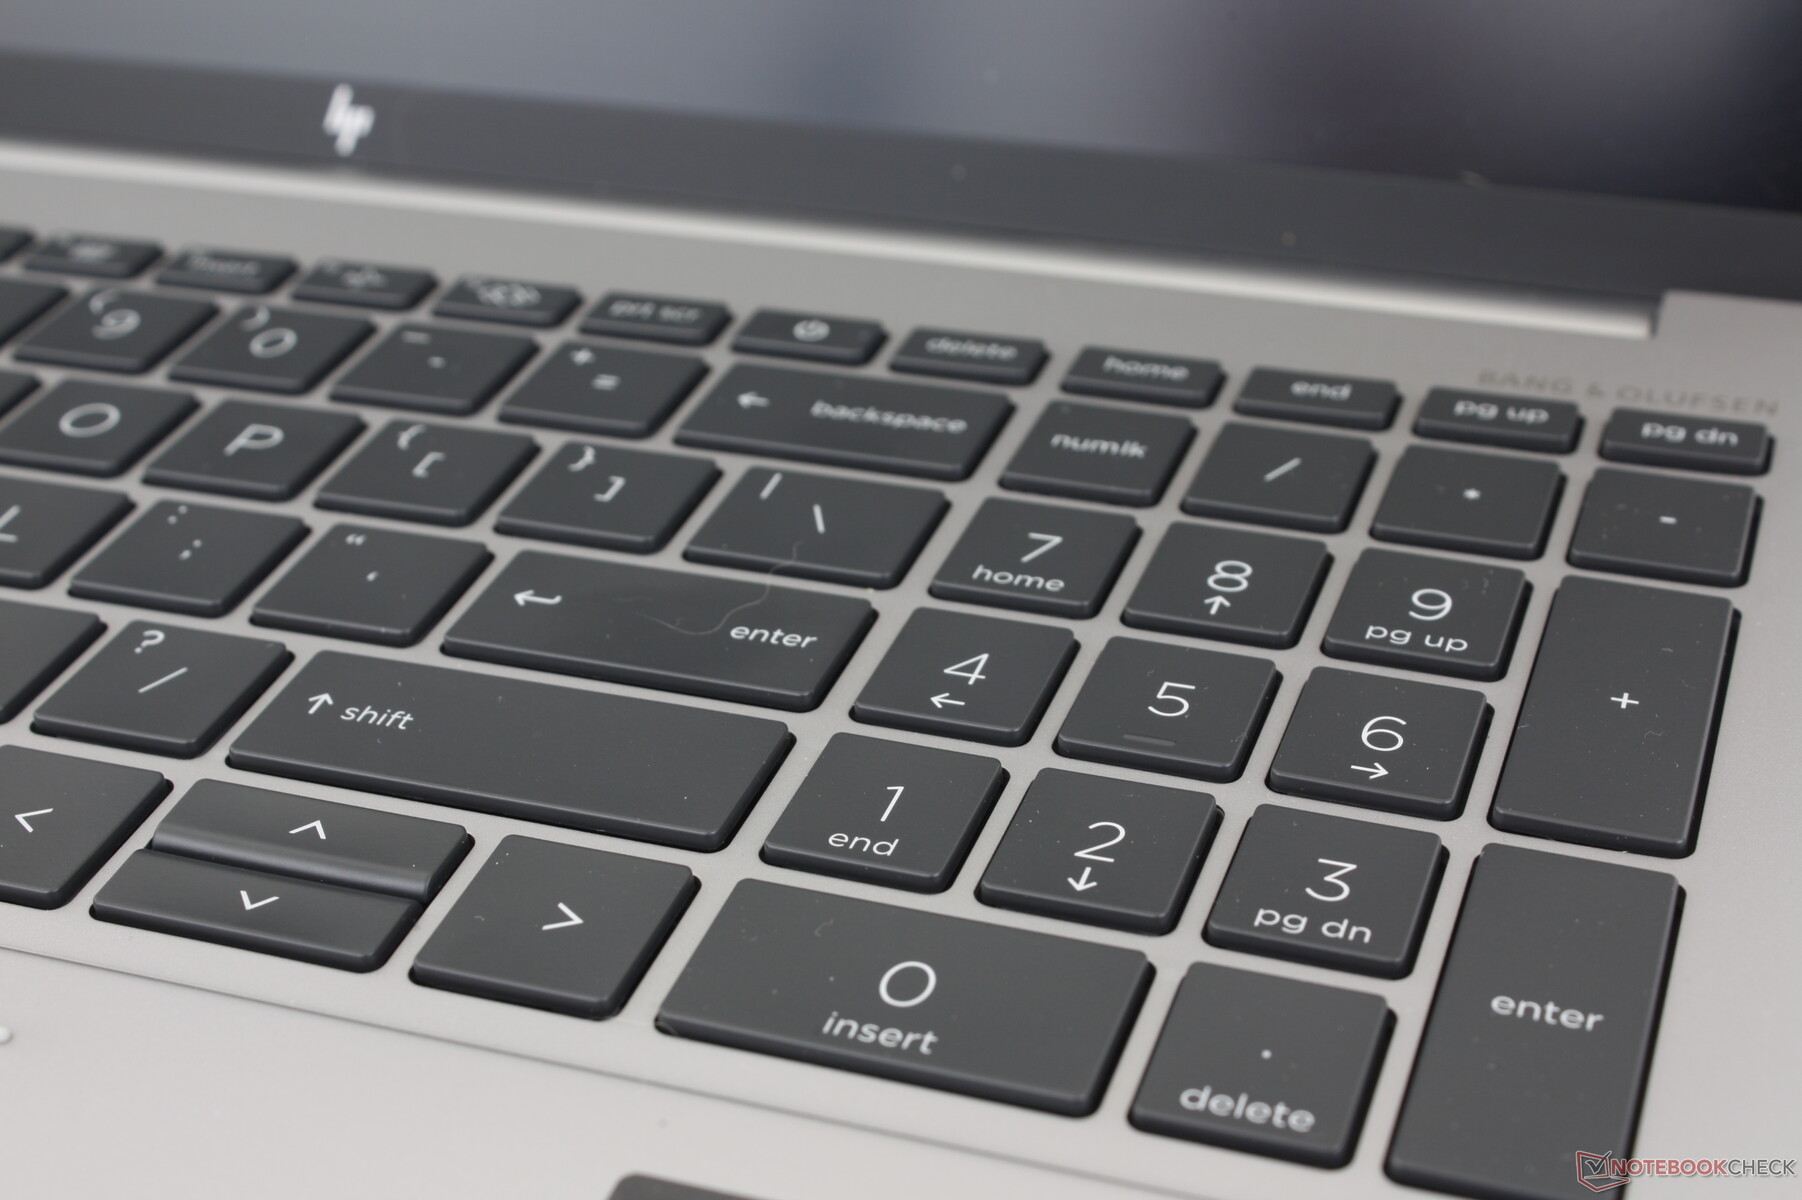
Teclado
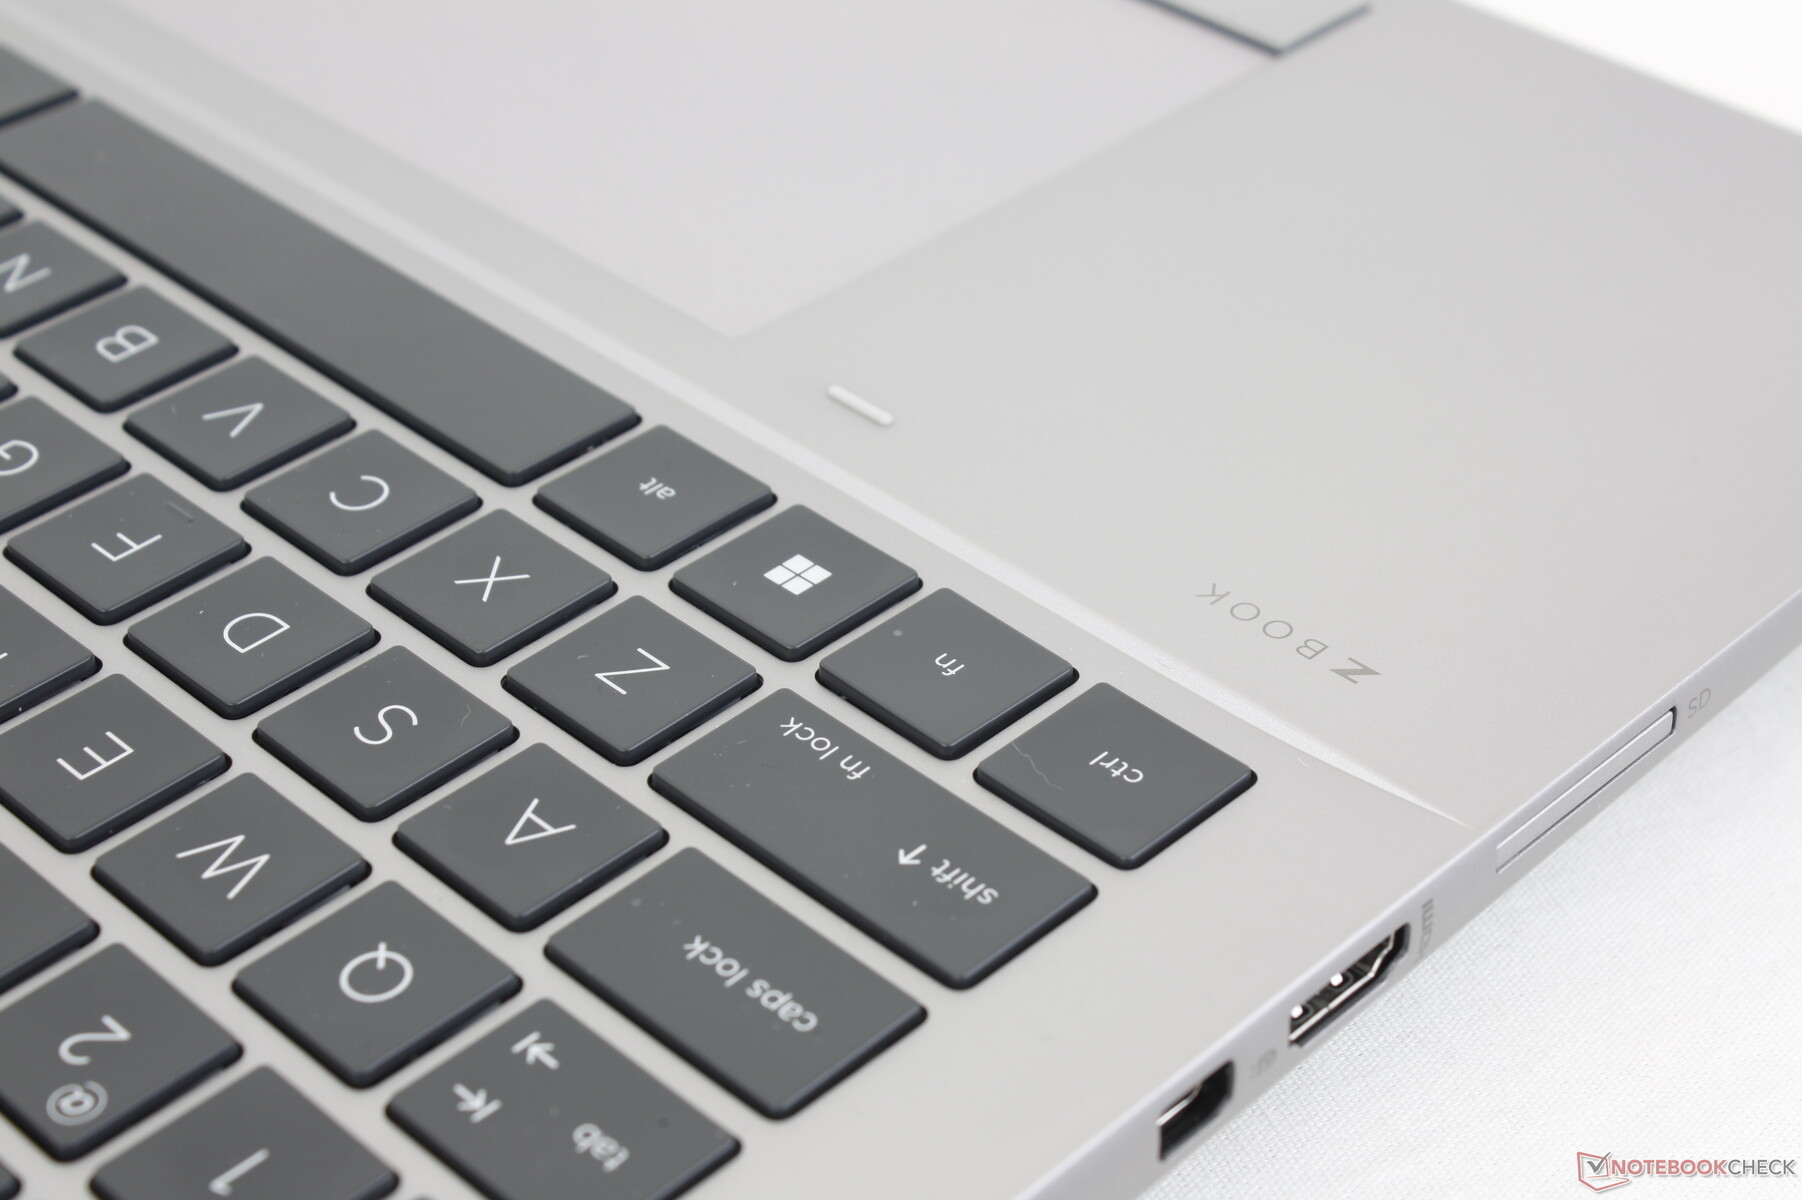
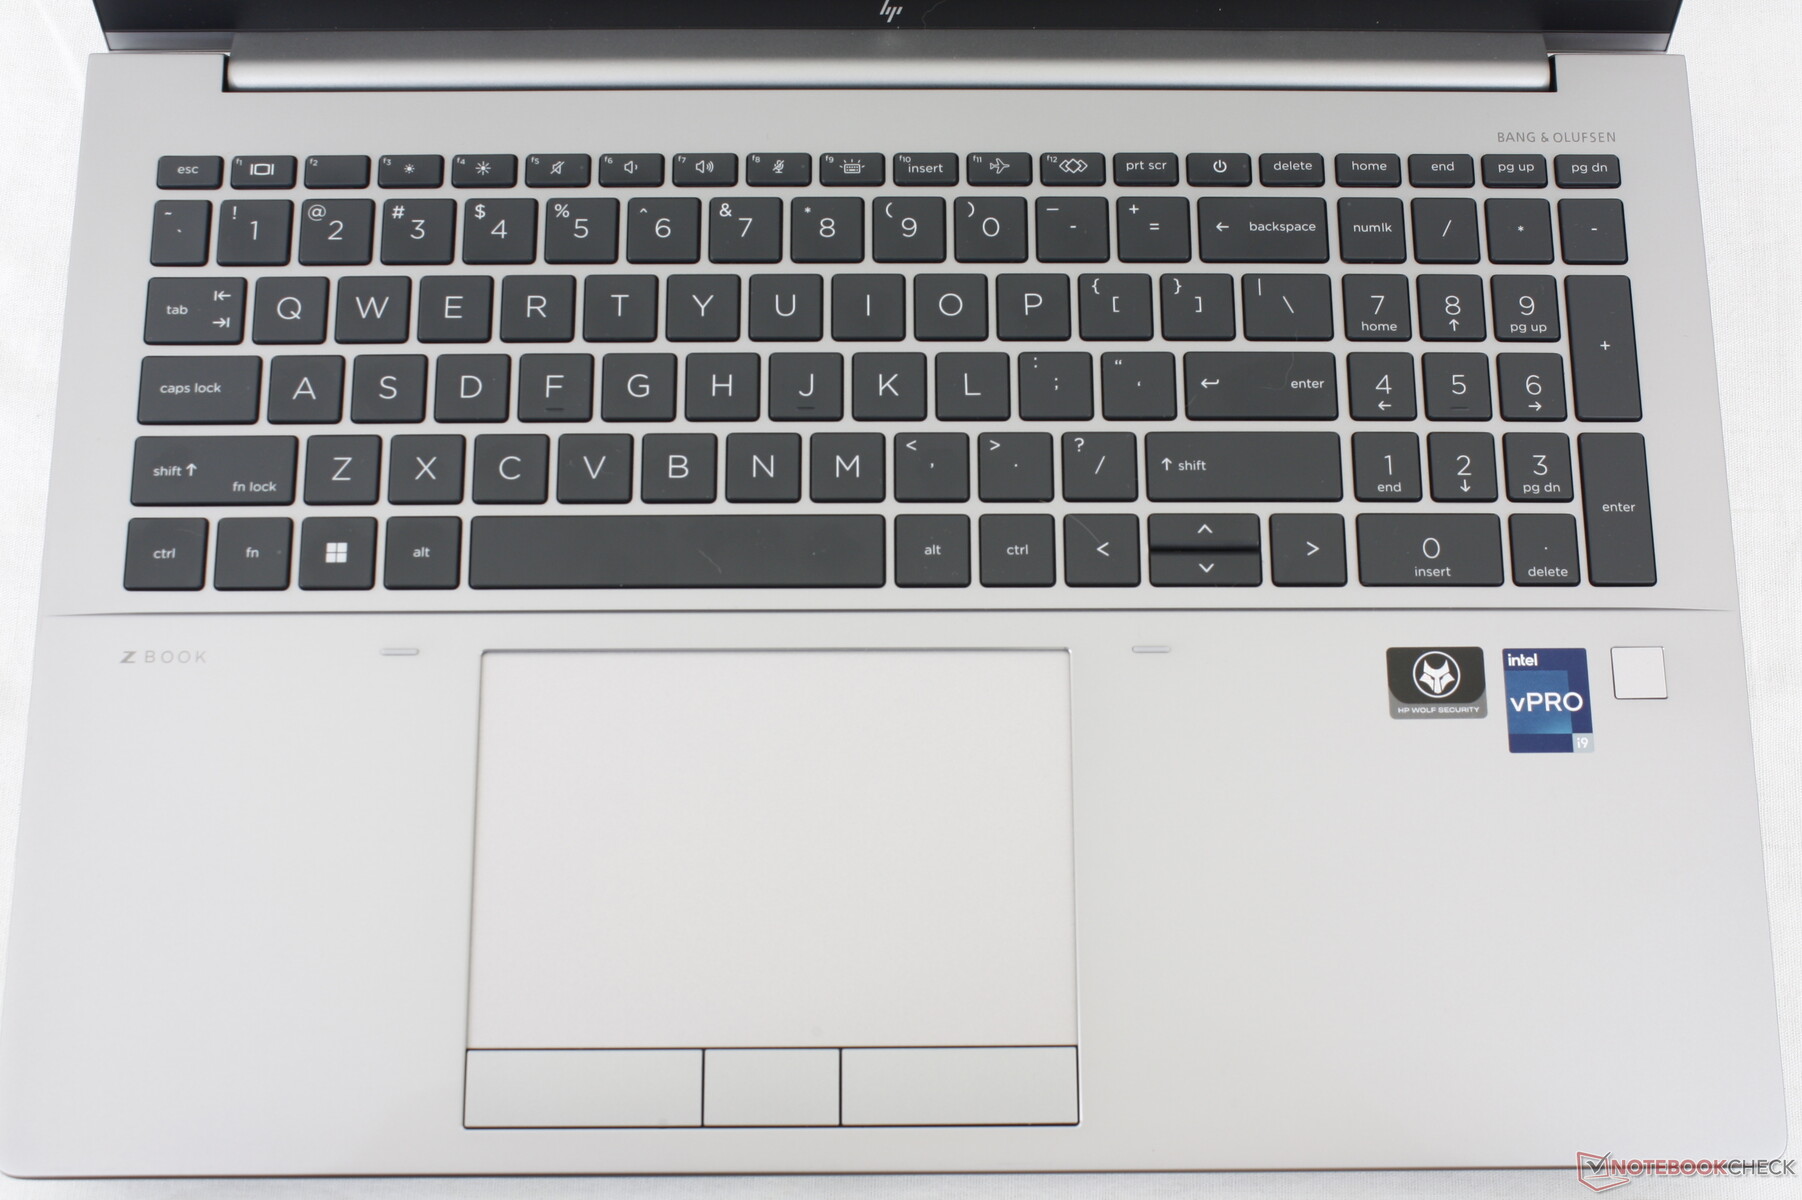
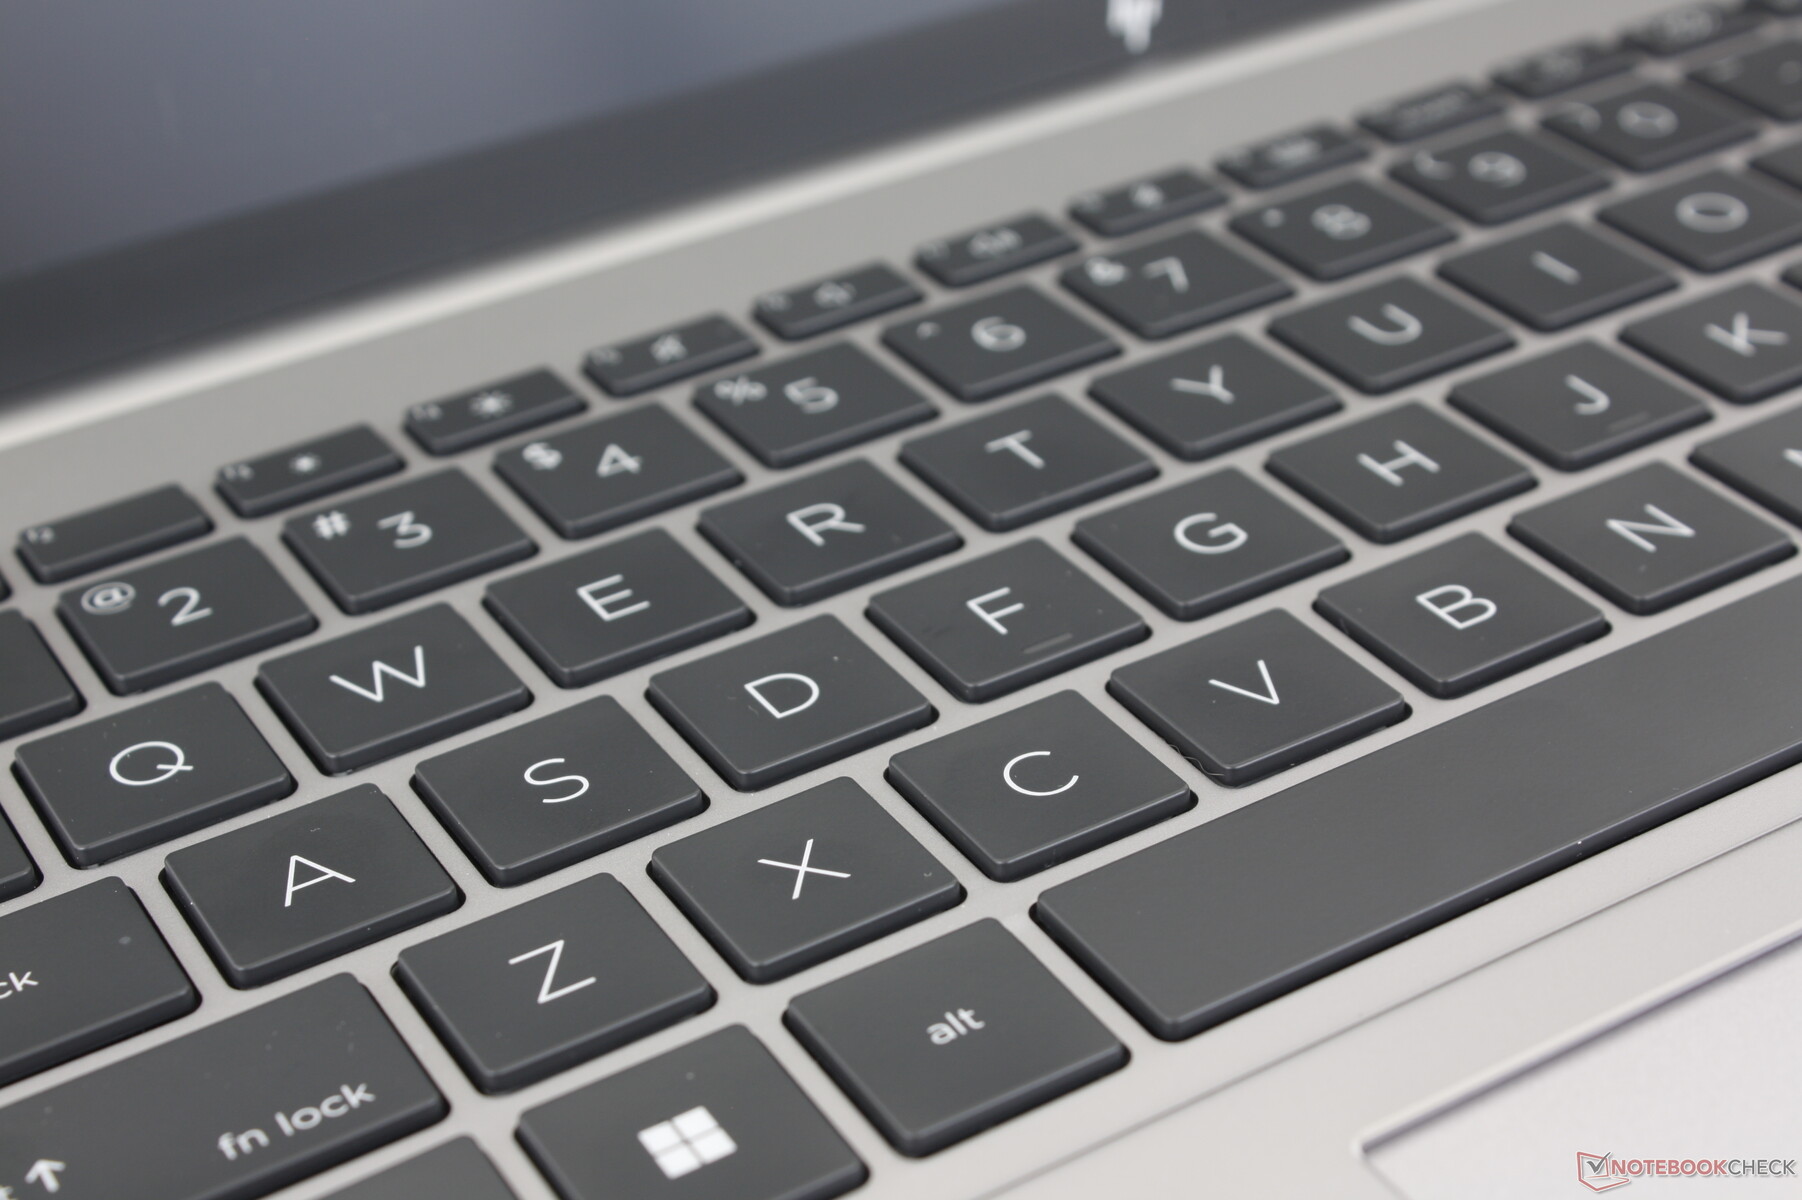
Las familias HP Spectre, EliteBook y ZBook tienen algunos de los mejores teclados de sus respectivas categorías en lo que respecta a respuesta y desplazamiento. Las teclas del Fury 16 G9 son firmes para una experiencia de mecanografiado satisfactoria. Sin embargo, el ruido es más fuerte que en el ThinkPad P16 G1 o Precision 7670, especialmente al pulsar las teclas Espacio o Intro. Los mecanógrafos que prefieren teclas más silenciosas pueden probar el teclado ZBook antes de comprometerse.
Entre las características notables del teclado ZBook se incluyen la retroiluminación RGB por tecla y la única tecla programable/personalizable. La mayoría de las demás estaciones de trabajo aún no incorporan funciones auxiliares similares.
Panel táctil
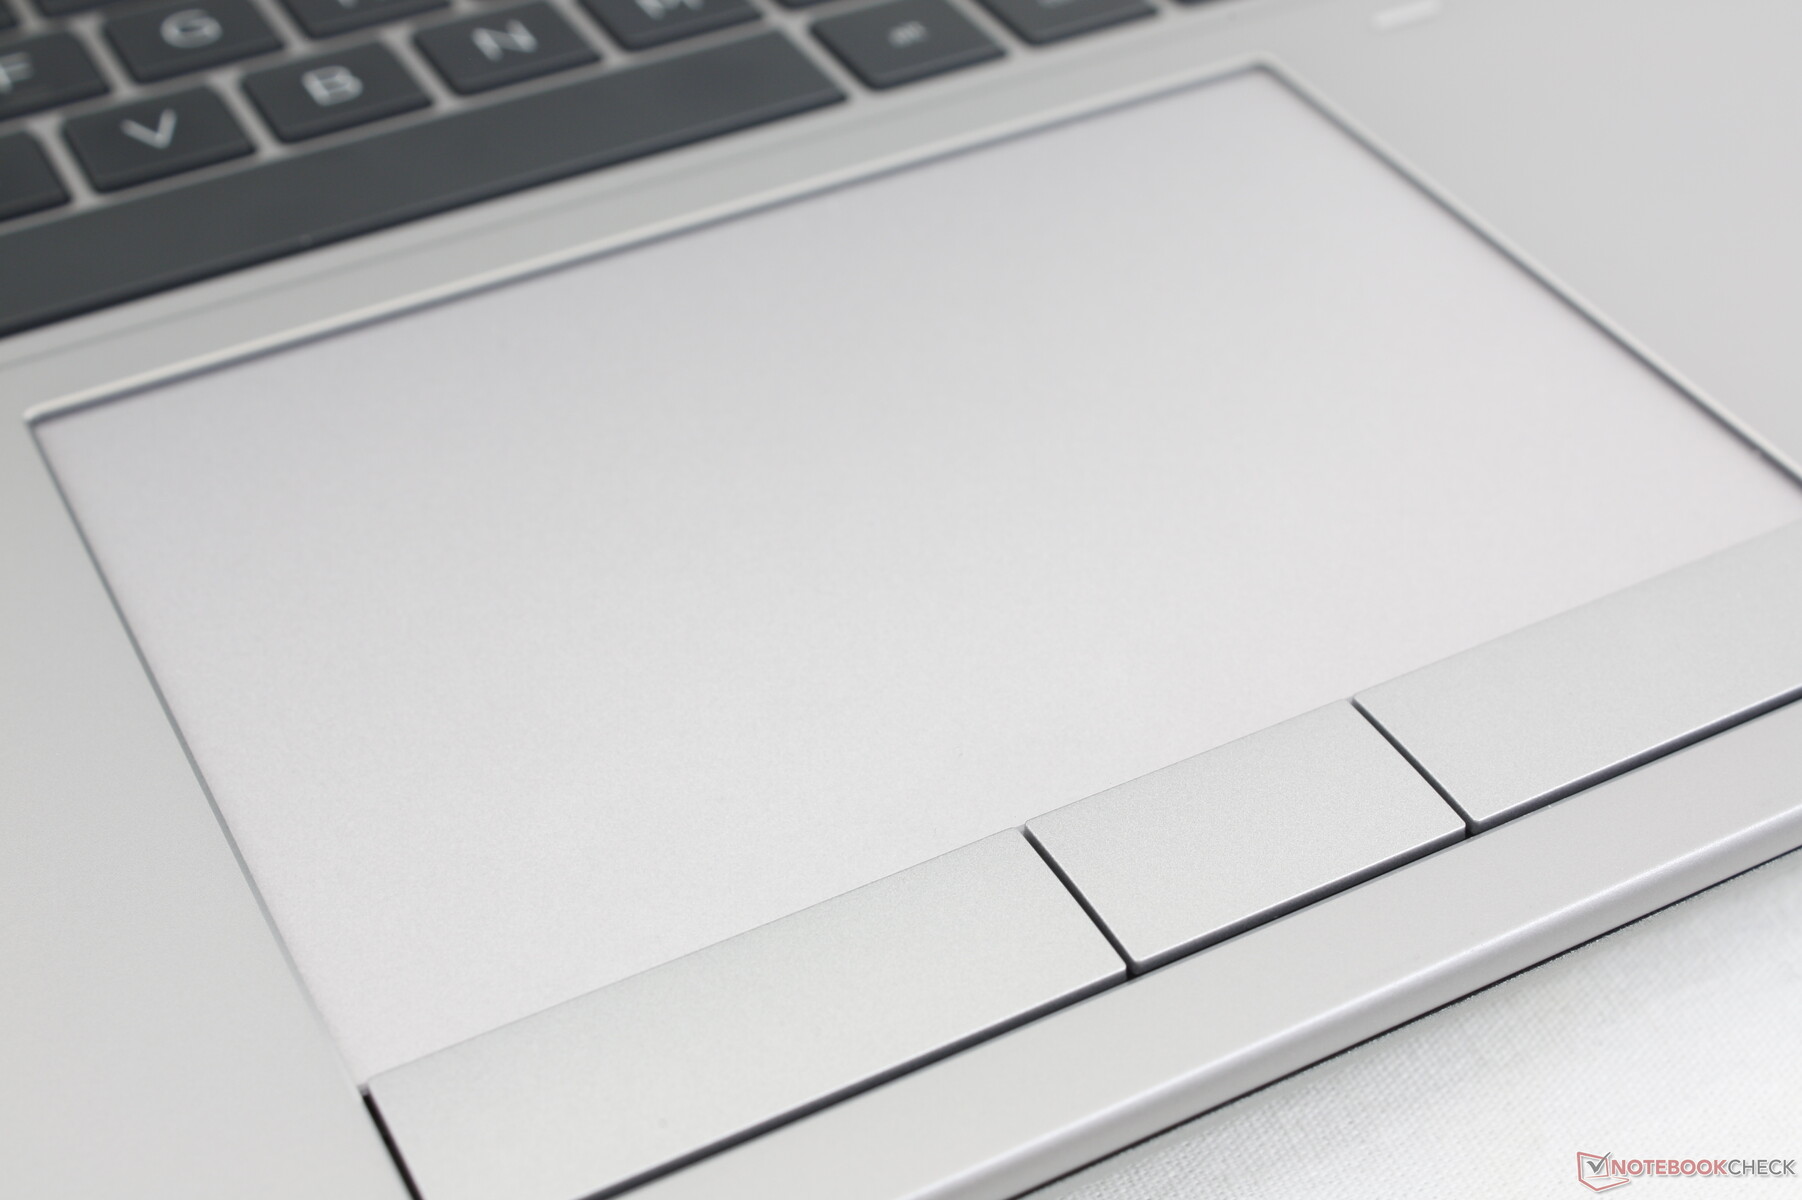
El touchpad es uno de los mejores que hemos utilizado en cualquier portátil, ya sea una estación de trabajo o de otro tipo. No sólo es más grande (12,4 x 8,3 cm) que los touchpads del ThinkPad P16 G1 (11,5 x 6,9 cm) o Precision 7670 (11,5 x 8 cm), sino que sus propiedades de deslizamiento son suaves para un control fiable del cursor a cualquier velocidad. Mientras tanto, los botones dedicados del ratón tienen un recorrido más profundo que en la mayoría de los portátiles, al tiempo que mantienen un clic satisfactorio cuando se pulsan. En comparación, el Precision 7670 carece de botones de ratón dedicados en favor de una solución de clickpad.
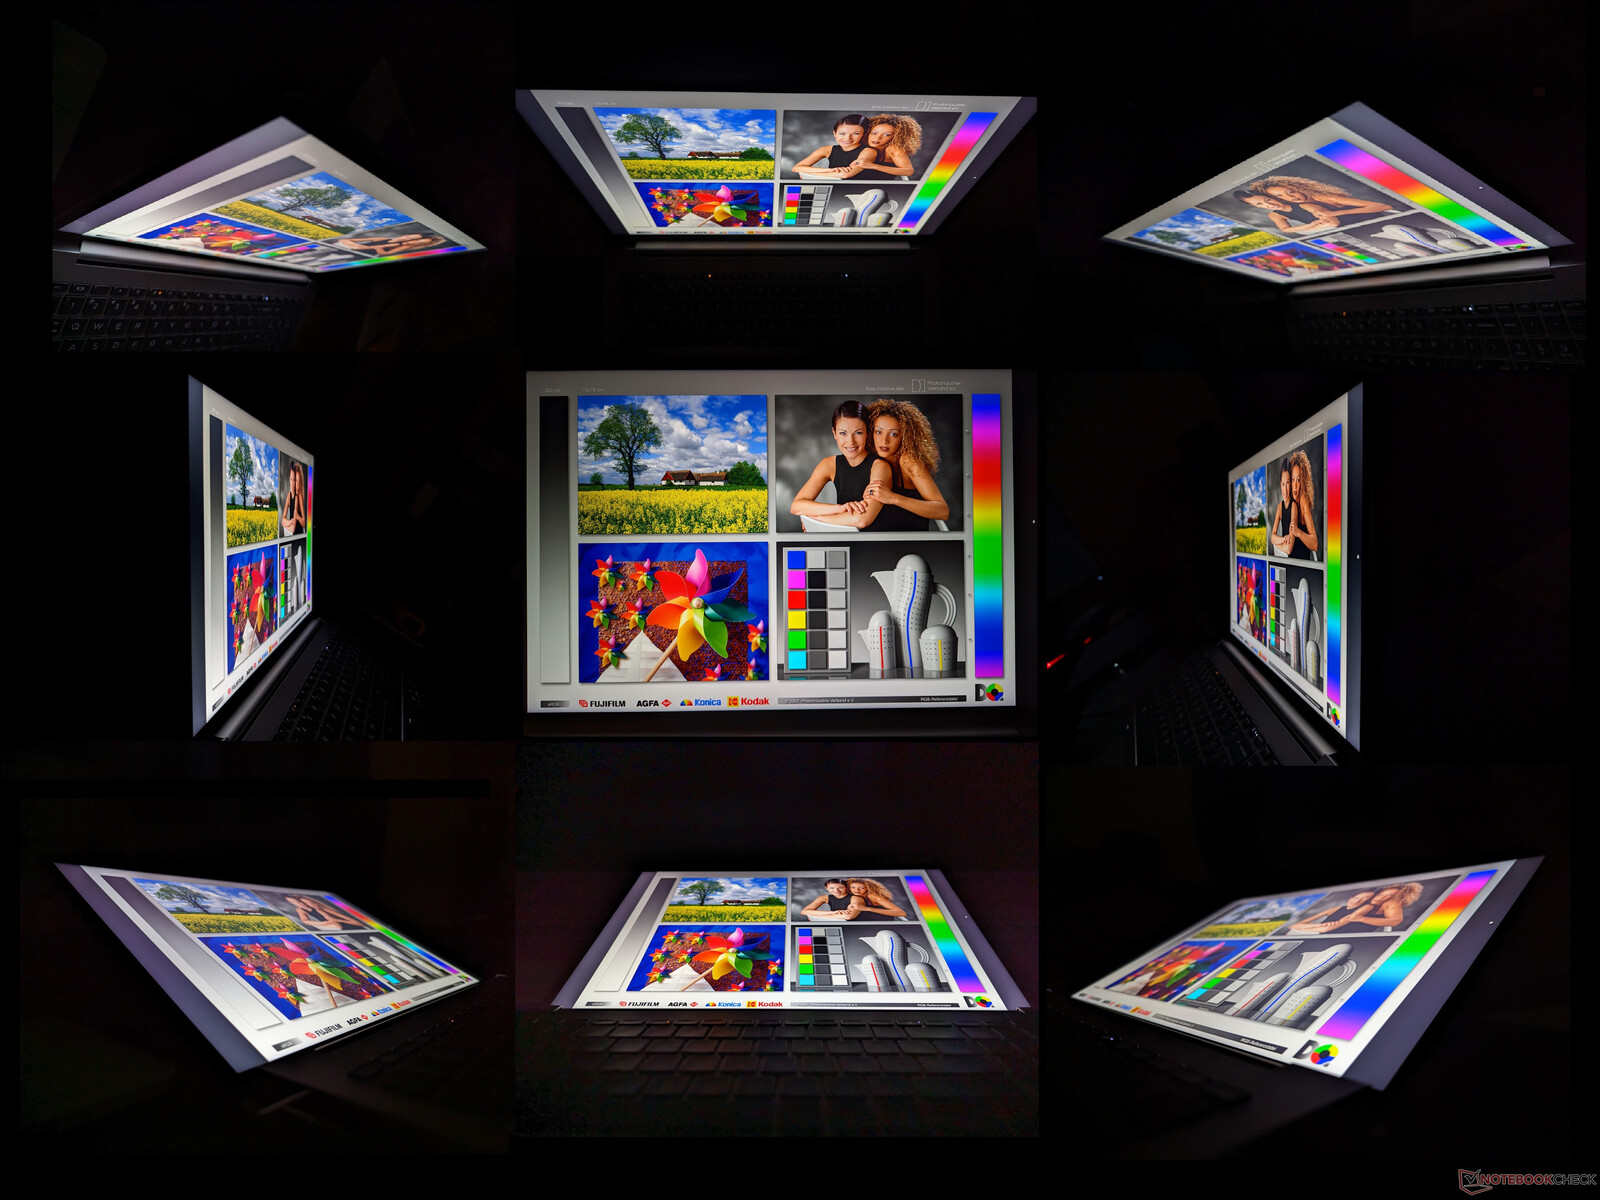
Pantalla - Excelentes colores con buenos tiempos de respuesta
HP emplea las mismas opciones de panel BOE en muchos de sus portátiles de 16 pulgadas. El ZBook Studio 16 G9por ejemplo, utiliza el mismo panel 4K 16:10 que nuestro ZBook Fury 16 G9, como demuestran sus atributos similares en la siguiente tabla.
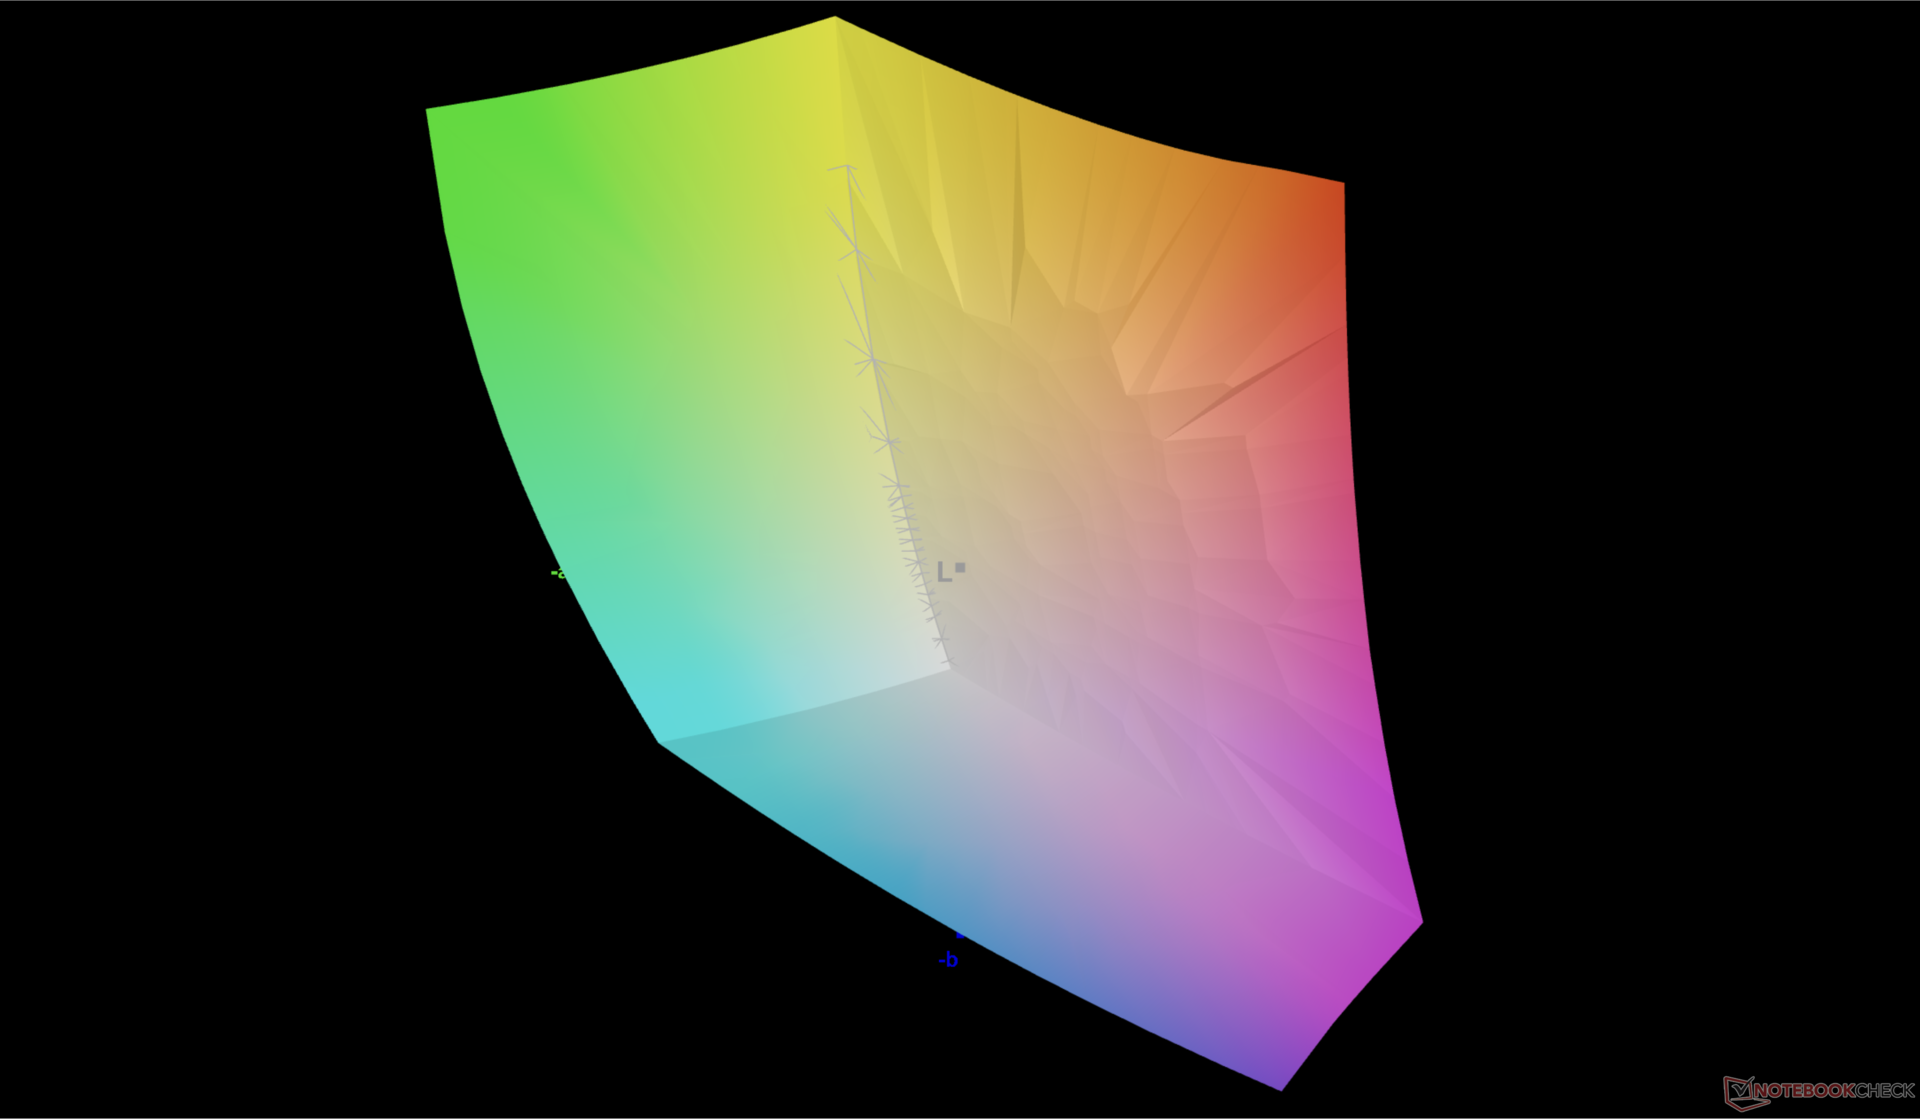
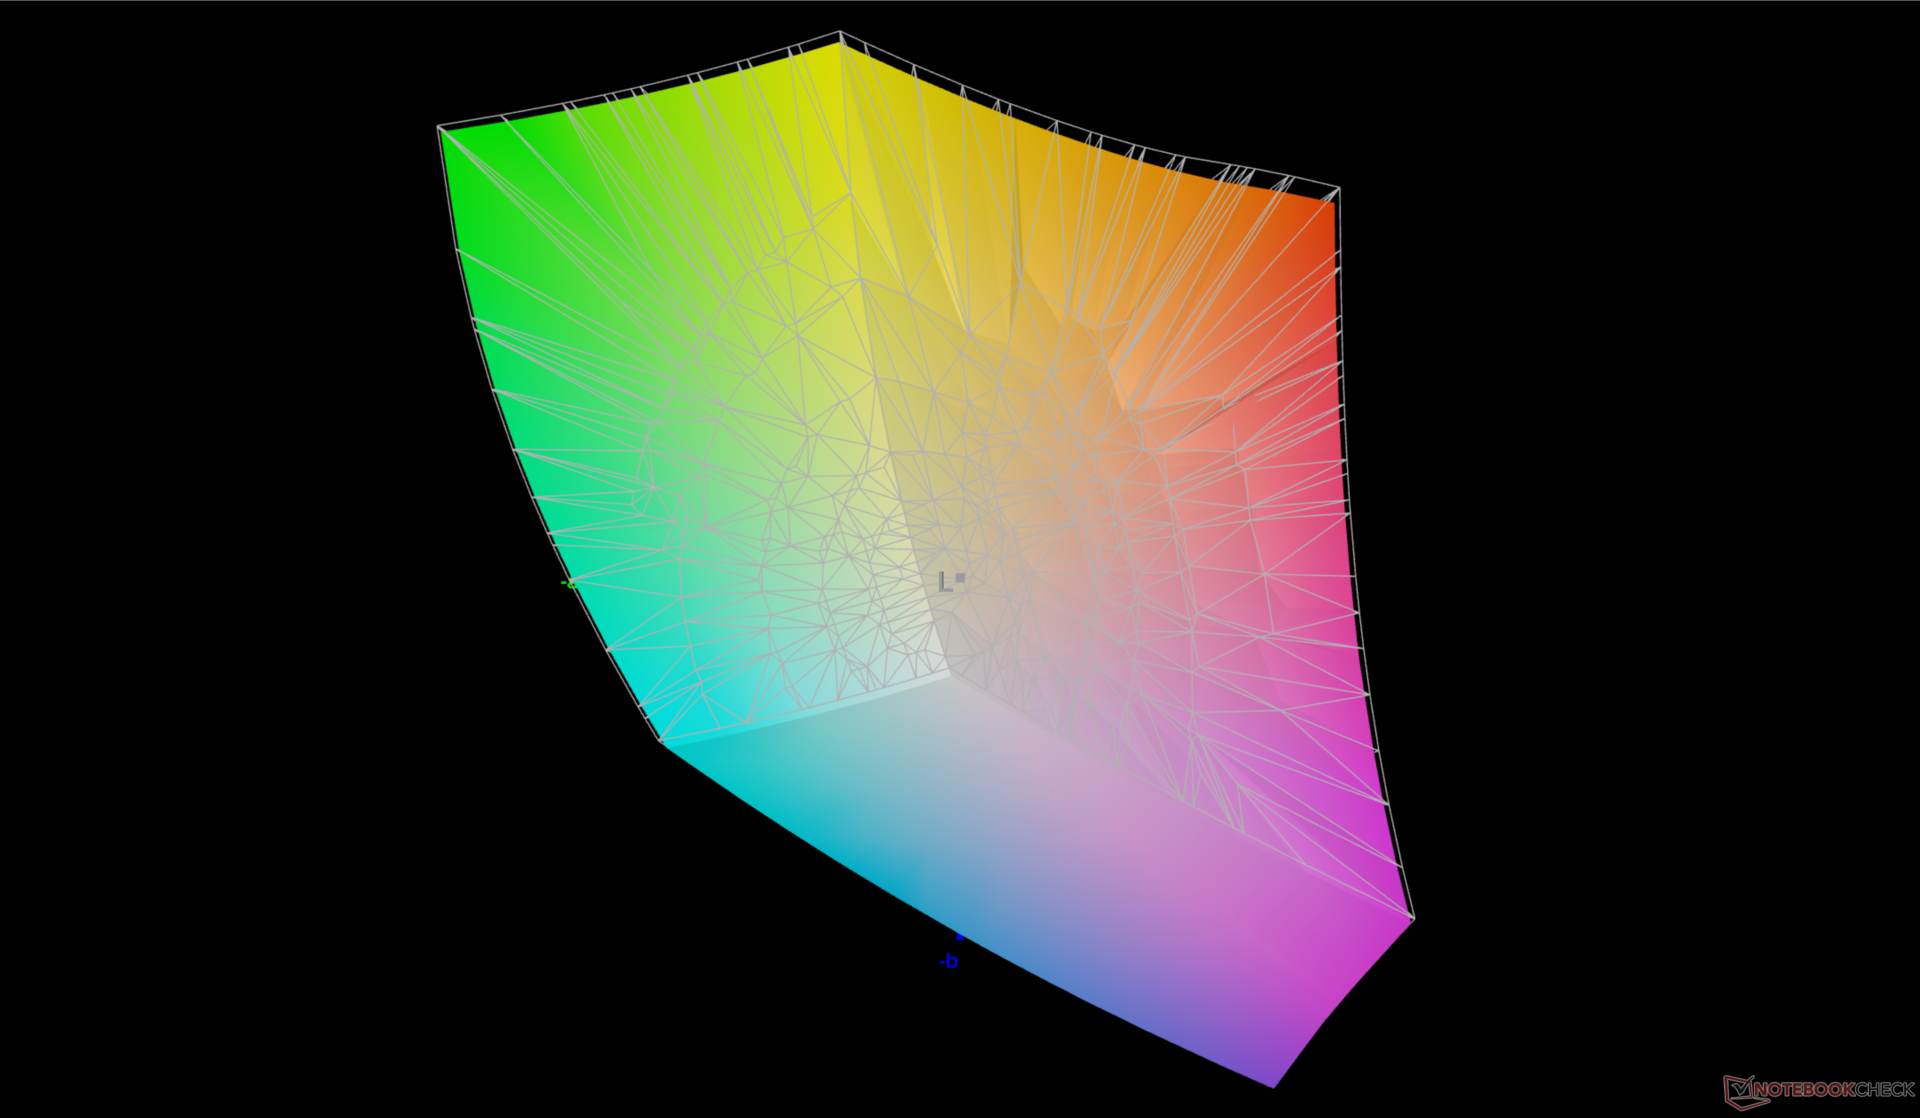
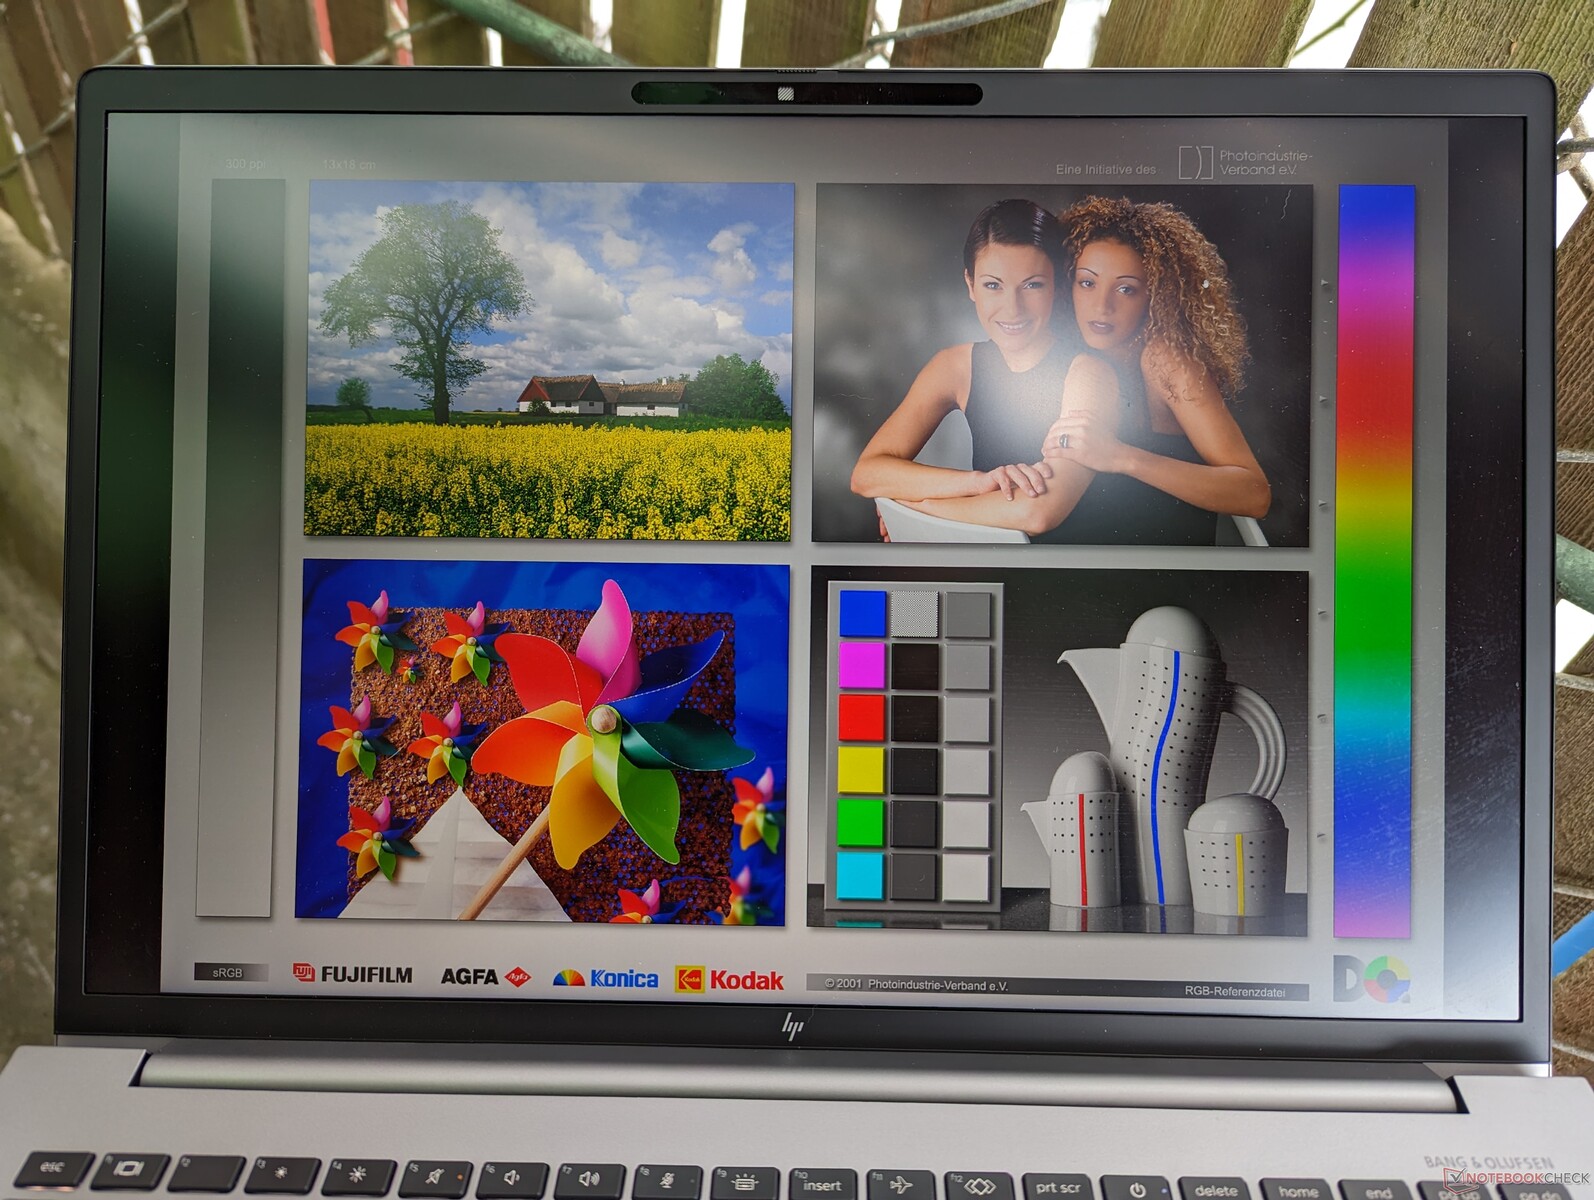
Nuestro panel IPS 4K en particular es una oferta de gama alta con sus amplios colores P3 y buenos tiempos de respuesta blanco-negro y gris-gris para ser adecuado tanto para la creación de contenidos como para aplicaciones de juegos. Sin embargo, la superposición mate no es tan nítida como una alternativa brillante y la relación de contraste está limitada a sólo ~1000:1. Afortunadamente, HP ofrece una opción OLED para solucionar directamente estas dos deficiencias.
| |||||||||||||||||||||||||
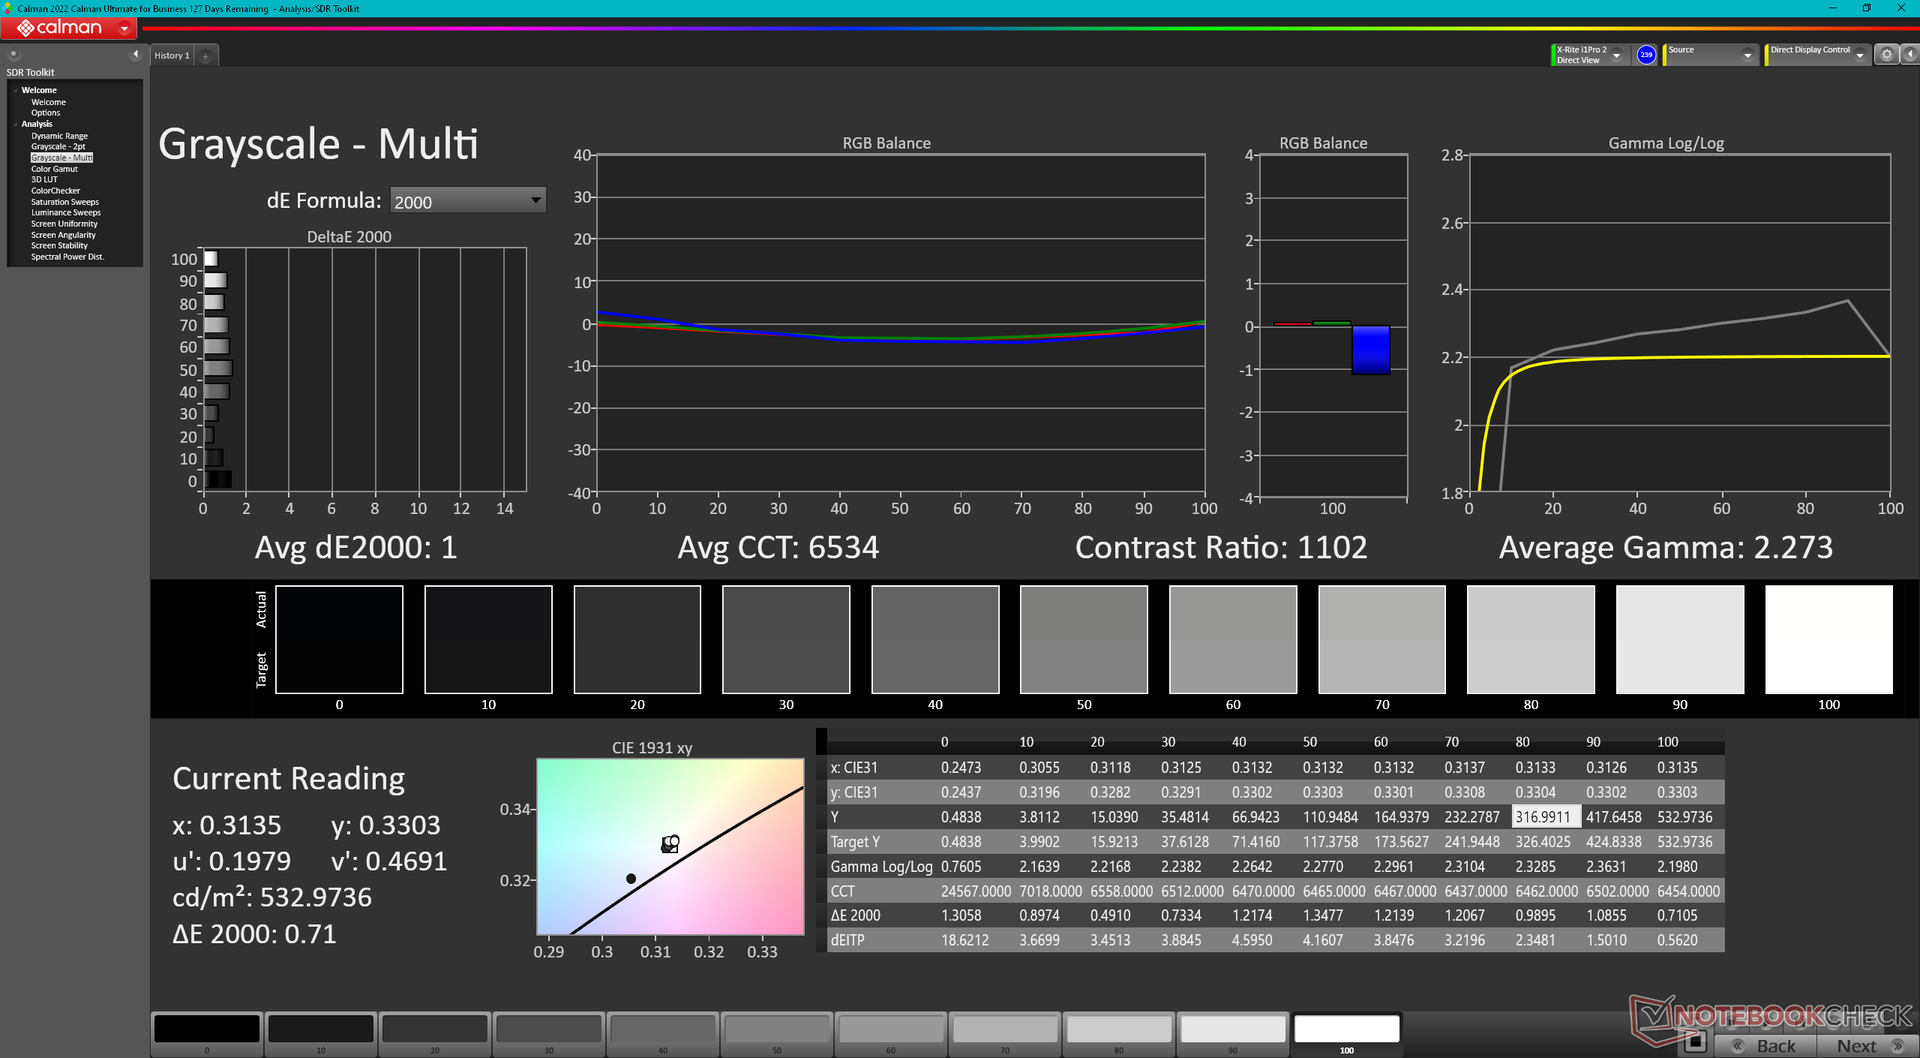
iluminación: 83 %
Brillo con batería: 451.7 cd/m²
Contraste: 931:1 (Negro: 0.57 cd/m²)
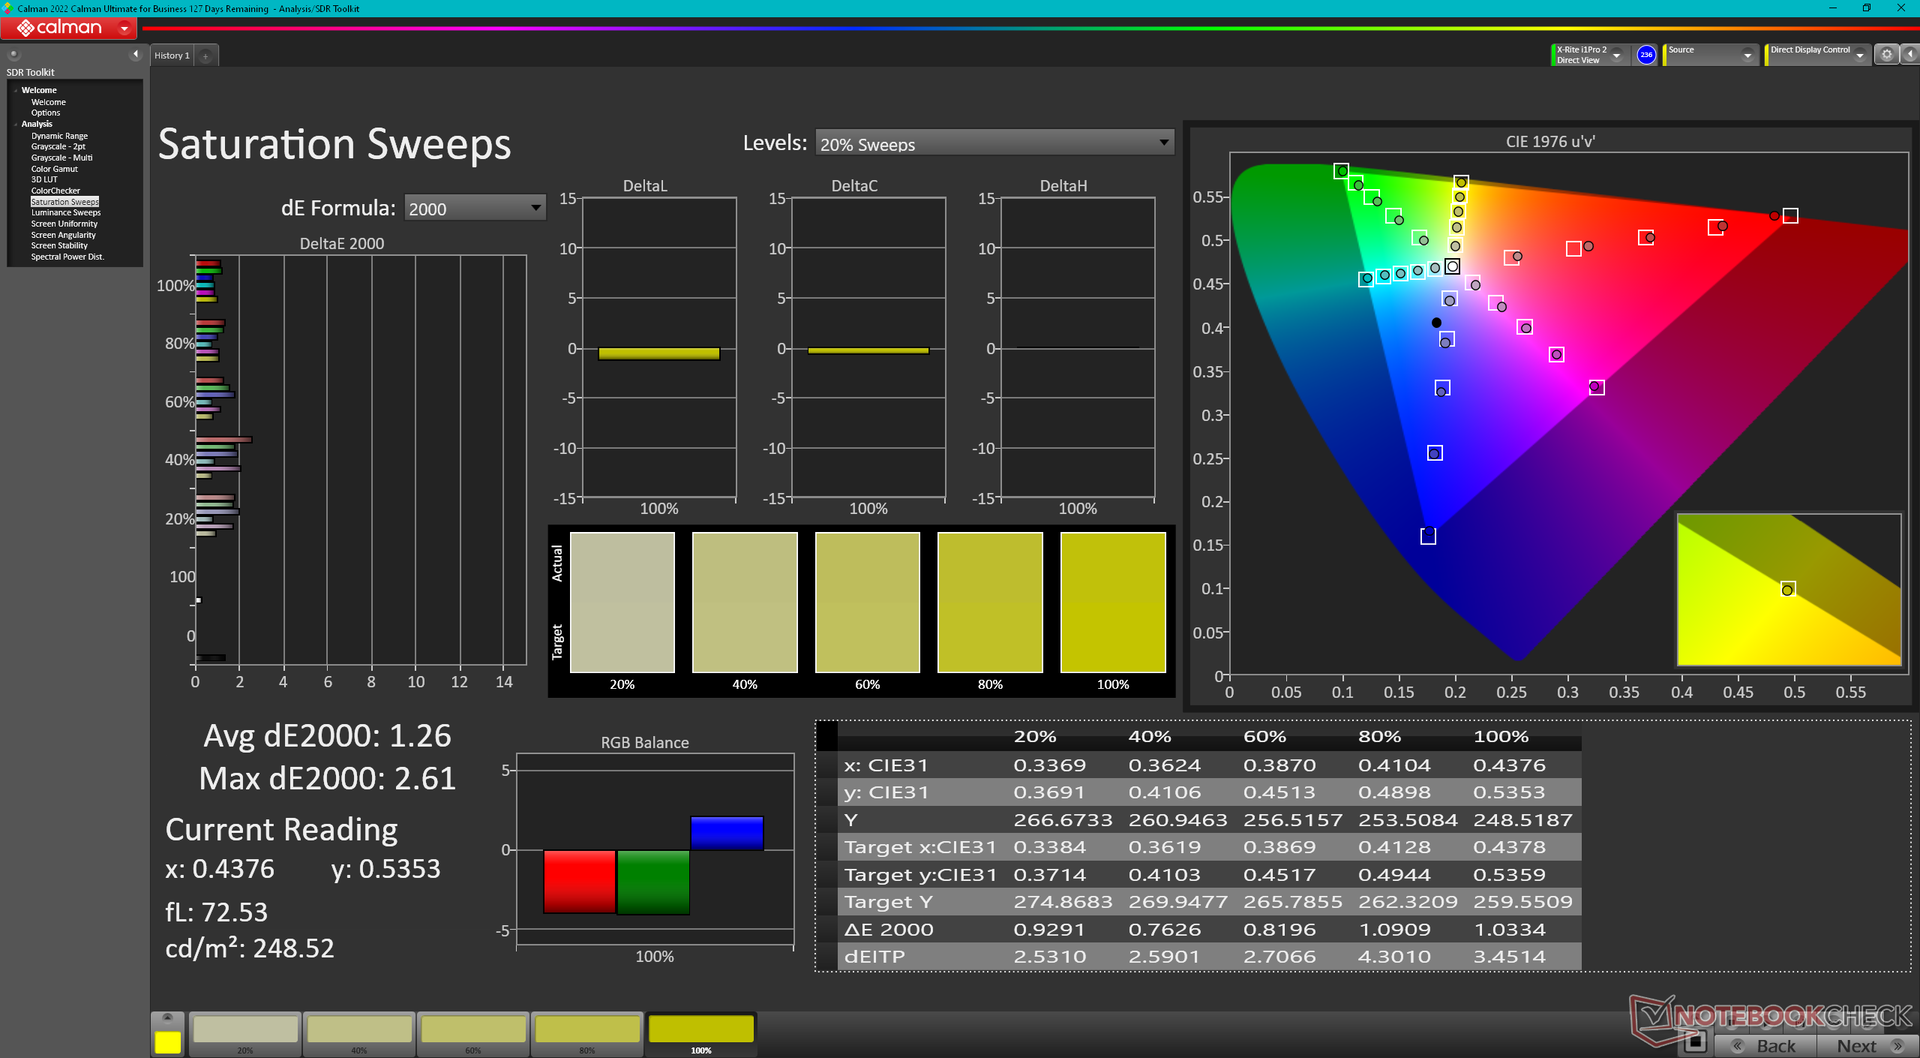
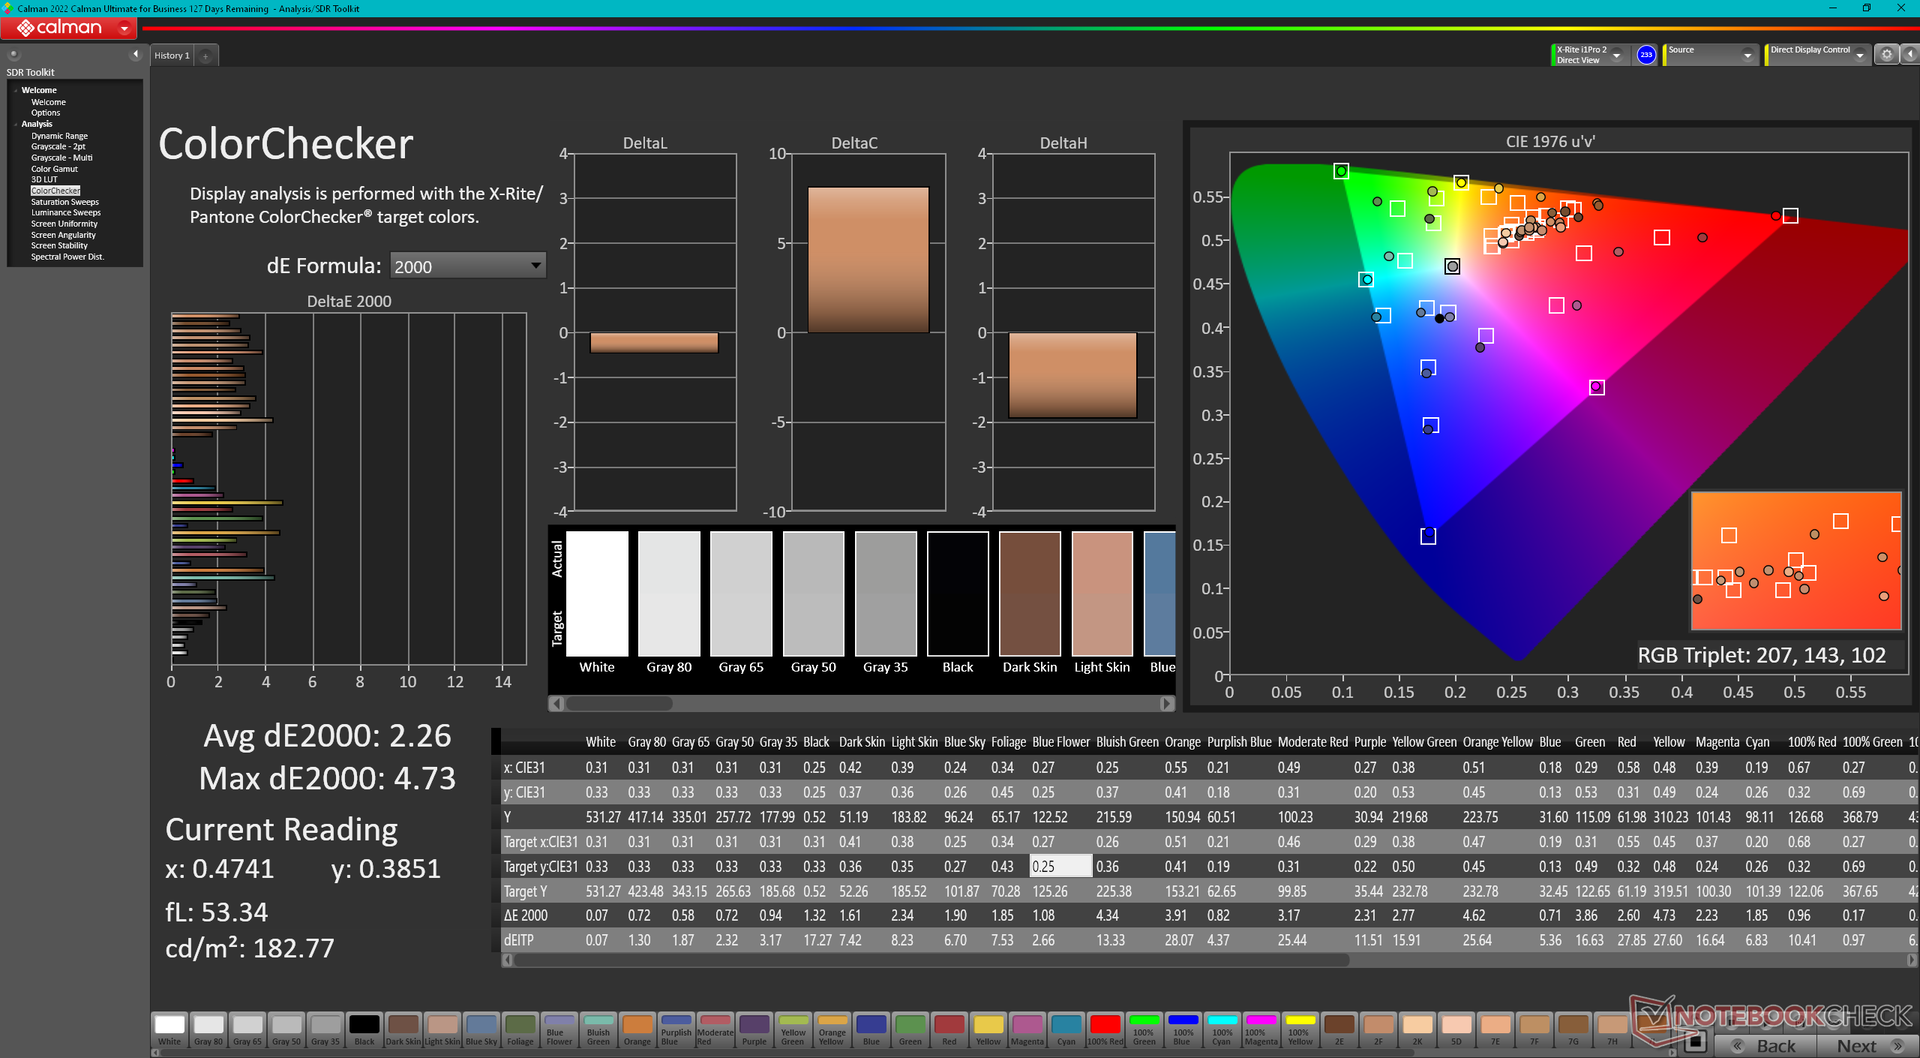
ΔE ColorChecker Calman: 2.26 | ∀{0.5-29.43 Ø4.71}
calibrated: 4.73
ΔE Greyscale Calman: 1 | ∀{0.09-98 Ø4.96}
86.3% AdobeRGB 1998 (Argyll 3D)
99.9% sRGB (Argyll 3D)
97.4% Display P3 (Argyll 3D)
Gamma: 2.28
CCT: 6543 K
| HP ZBook Fury 16 G9 BOE0A52, IPS, 3840x2400, 16" | HP ZBook Studio 16 G9 62U04EA BOE0A52, IPS, 3840x2400, 16" | HP ZBook Firefly 16 G9-6B897EA BOE0A02, IPS, 1920x1200, 16" | Lenovo ThinkPad P16 G1 RTX A5500 LP160UQ1-SPB1, IPS, 3840x2400, 16" | Dell Precision 7000 7670 Performance Samsung 160YV03, OLED, 3840x2400, 16" | MSI CreatorPro Z16P B12UKST B160QAN02.N, IPS, 2560x1600, 16" | |
|---|---|---|---|---|---|---|
| Display | 0% | -18% | -2% | 6% | 0% | |
| Display P3 Coverage (%) | 97.4 | 97.5 0% | 68.1 -30% | 82.9 -15% | 99.9 3% | 97.6 0% |
| sRGB Coverage (%) | 99.9 | 99.9 0% | 96.1 -4% | 98.9 -1% | 100 0% | 99.9 0% |
| AdobeRGB 1998 Coverage (%) | 86.3 | 86.3 0% | 70 -19% | 95.9 11% | 98.1 14% | 87.4 1% |
| Response Times | 9% | -206% | -281% | 83% | 11% | |
| Response Time Grey 50% / Grey 80% * (ms) | 13.7 ? | 15.3 ? -12% | 52.8 ? -285% | 45.6 ? -233% | 1.84 ? 87% | 12.8 ? 7% |
| Response Time Black / White * (ms) | 8.6 ? | 6.1 ? 29% | 19.5 ? -127% | 36.8 ? -328% | 1.92 ? 78% | 7.4 ? 14% |
| PWM Frequency (Hz) | 59.52 ? | |||||
| Screen | 18% | -40% | -12% | -61% | 5% | |
| Brightness middle (cd/m²) | 530.5 | 554 4% | 526 -1% | 601.9 13% | 325.2 -39% | 407 -23% |
| Brightness (cd/m²) | 476 | 516 8% | 499 5% | 569 20% | 328 -31% | 388 -18% |
| Brightness Distribution (%) | 83 | 84 1% | 93 12% | 77 -7% | 97 17% | 88 6% |
| Black Level * (cd/m²) | 0.57 | 0.47 18% | 0.31 46% | 0.47 18% | 0.36 37% | |
| Contrast (:1) | 931 | 1179 27% | 1697 82% | 1281 38% | 1131 21% | |
| Colorchecker dE 2000 * | 2.26 | 1 56% | 3.6 -59% | 2.45 -8% | 4.59 -103% | 1.3 42% |
| Colorchecker dE 2000 calibrated * | 4.73 | 0.6 87% | 2.6 45% | 0.7 85% | ||
| Greyscale dE 2000 * | 1 | 1.6 -60% | 5.5 -450% | 2.6 -160% | 2.5 -150% | 2.1 -110% |
| Gamma | 2.28 96% | 2.29 96% | 2.02 109% | 2.3 96% | 2.1 105% | 2.26 97% |
| CCT | 6543 99% | 6458 101% | 6527 100% | 6805 96% | 6541 99% | 6437 101% |
| Colorchecker dE 2000 max. * | 2.4 | 6.6 | 4.46 | 7.65 | 2.5 | |
| Media total (Programa/Opciones) | 9% /
12% | -88% /
-60% | -98% /
-54% | 9% /
-12% | 5% /
5% |
* ... más pequeño es mejor
La pantalla está calibrada de fábrica según el estándar P3 con valores DeltaE medios de escala de grises y color de sólo 1,0 y 2,26, respectivamente.
Tiempos de respuesta del display
| ↔ Tiempo de respuesta de Negro a Blanco | ||
|---|---|---|
| 8.6 ms ... subida ↗ y bajada ↘ combinada | ↗ 4.7 ms subida | 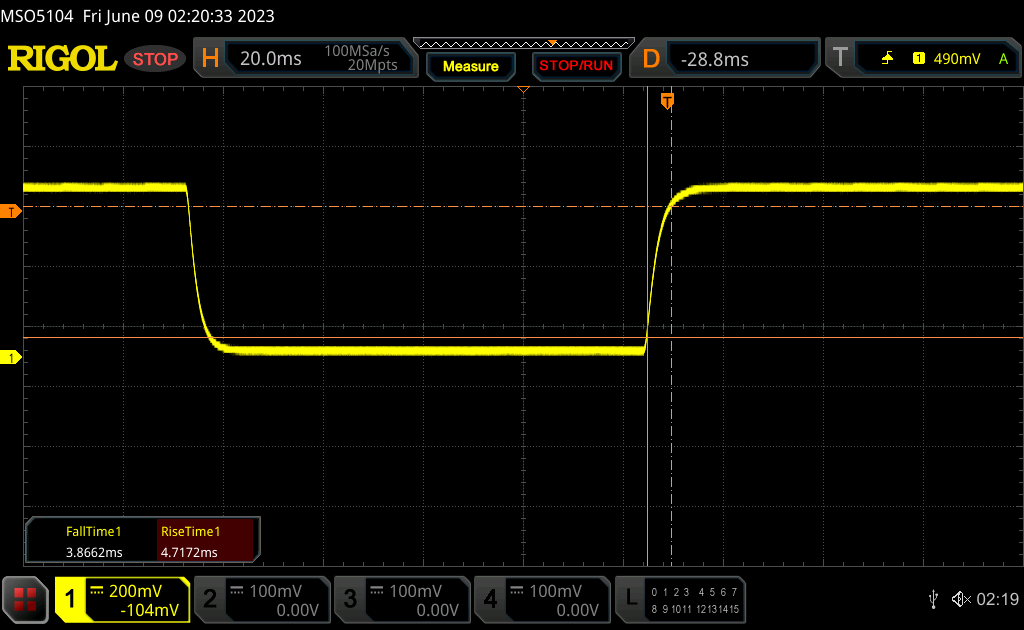 |
| ↘ 3.9 ms bajada | ||
| La pantalla mostró tiempos de respuesta rápidos en nuestros tests y debería ser adecuada para juegos. En comparación, todos los dispositivos de prueba van de ##min### (mínimo) a 240 (máximo) ms. » 24 % de todos los dispositivos son mejores. Esto quiere decir que el tiempo de respuesta medido es mejor que la media (19.8 ms) de todos los dispositivos testados. | ||
| ↔ Tiempo de respuesta 50% Gris a 80% Gris | ||
| 13.7 ms ... subida ↗ y bajada ↘ combinada | ↗ 6.6 ms subida | 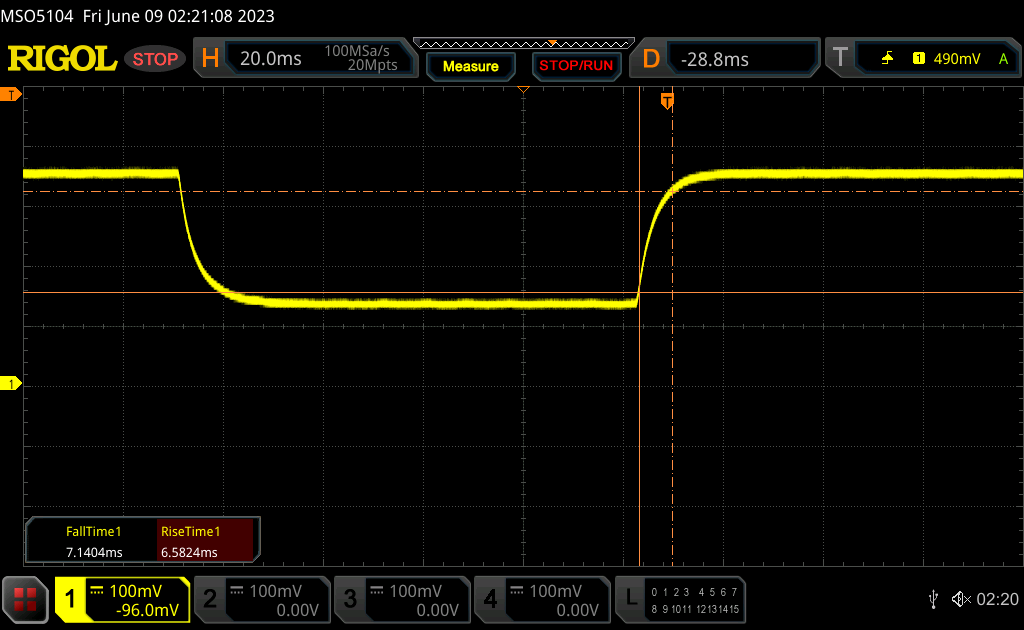 |
| ↘ 7.1 ms bajada | ||
| La pantalla mostró buenos tiempos de respuesta en nuestros tests pero podría ser demasiado lenta para los jugones competitivos. En comparación, todos los dispositivos de prueba van de ##min### (mínimo) a 636 (máximo) ms. » 28 % de todos los dispositivos son mejores. Esto quiere decir que el tiempo de respuesta medido es mejor que la media (31 ms) de todos los dispositivos testados. | ||
Parpadeo de Pantalla / PWM (Pulse-Width Modulation)
| Parpadeo de Pantalla / PWM no detectado | 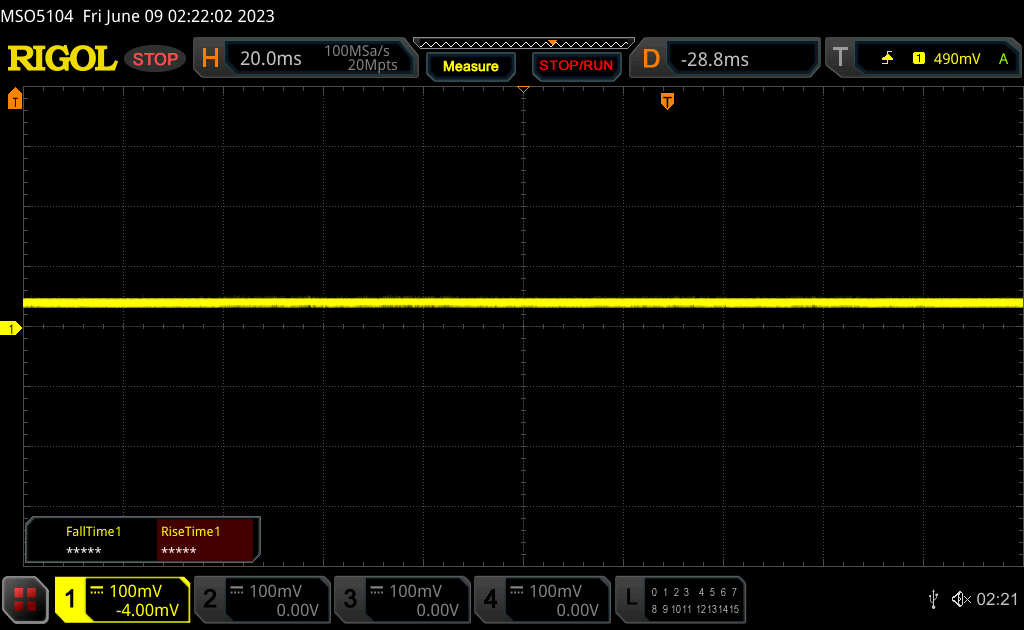 | ||
Comparación: 52 % de todos los dispositivos testados no usaron PWM para atenuar el display. Si se usó, medimos una media de 7754 (mínimo: 5 - máxmo: 343500) Hz. | |||
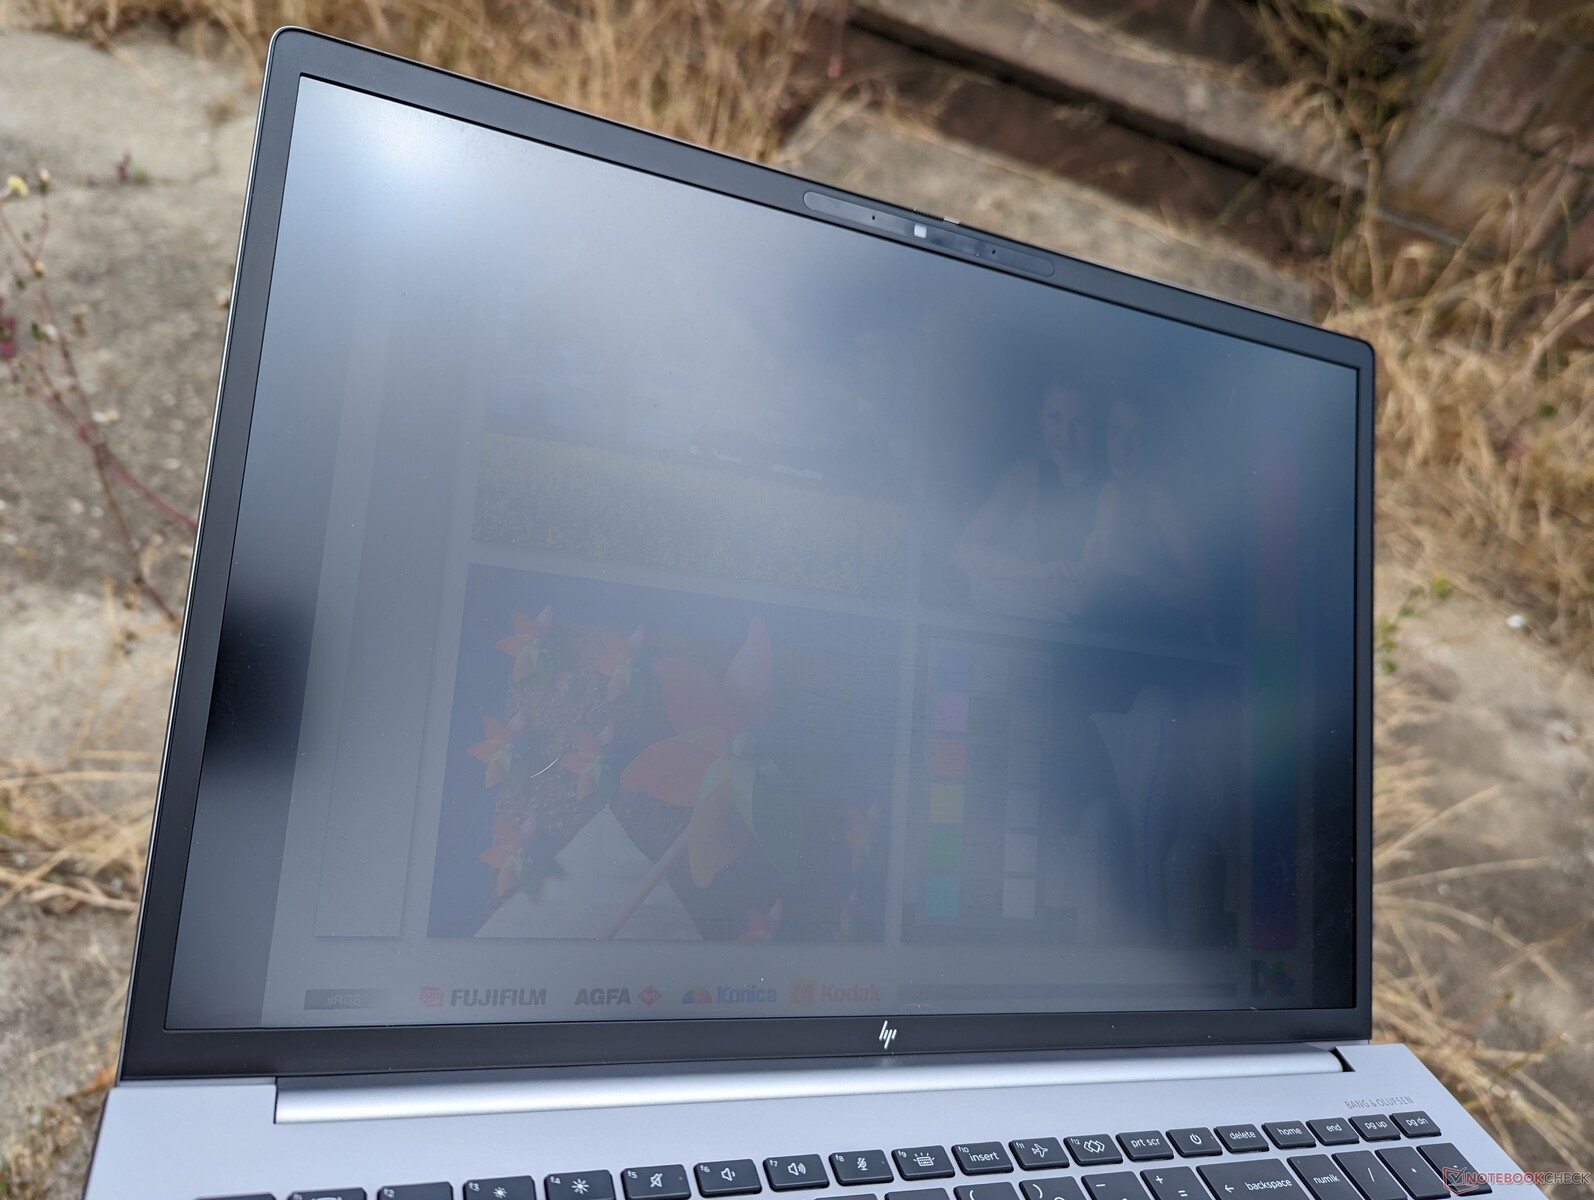
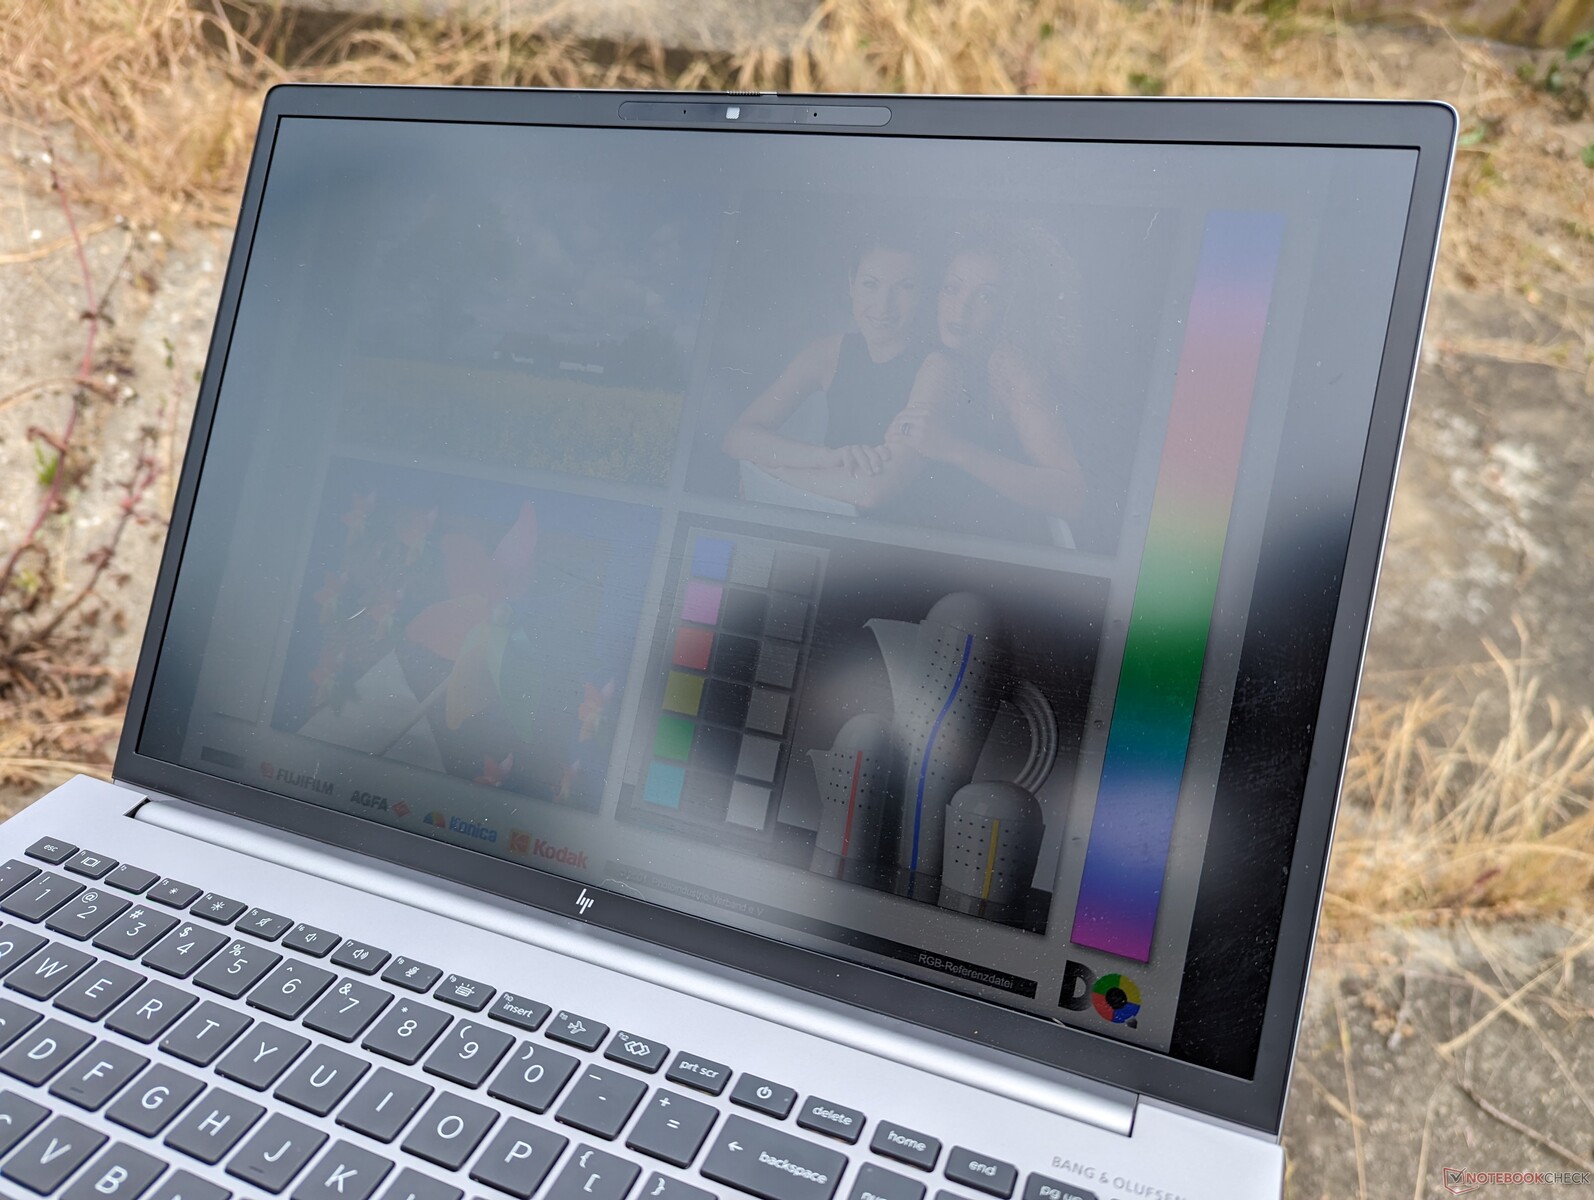
La visibilidad en exteriores es decente a la sombra y comparable a la de muchos Ultrabooks de consumo ya que 400 nits es un objetivo común. HP ofrece una opción mucho más brillante de 1000 nits si la visibilidad en exteriores es una prioridad, pero los paneles están limitados a IPS y una resolución de sólo 1920 x 1200 por ahora.
Vale la pena señalar que Display Power Savings está activado por defecto, lo que significa que el brillo máximo de la pantalla caerá hasta 80 nits si funciona con batería. Para evitarlo, inicia el Centro de comandos de gráficos Intel y ve a los submenús Sistema y Energía para desactivar el Ahorro de energía de pantalla.
Rendimiento - Intel Alder Lake-H de 12ª generación con Nvidia RTX Ampere
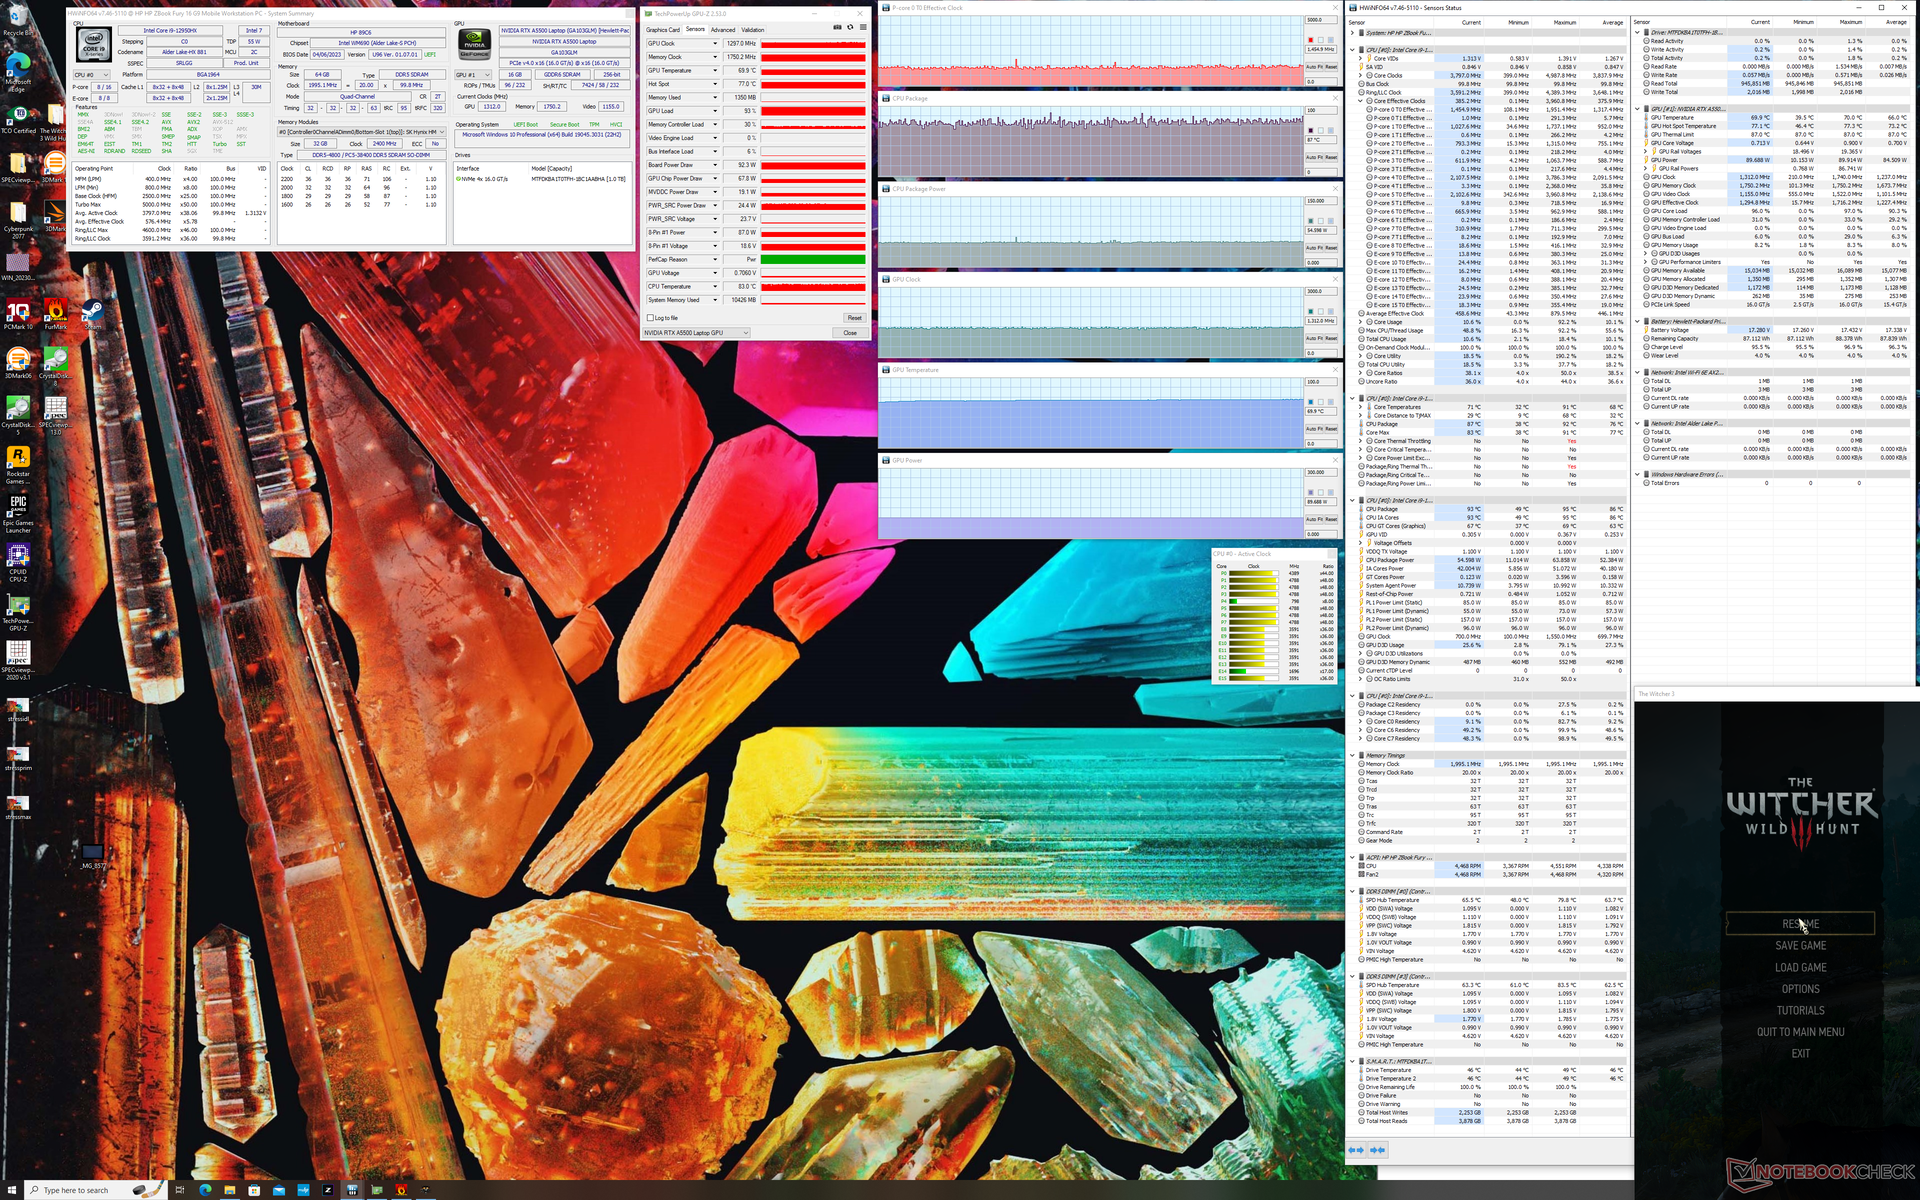
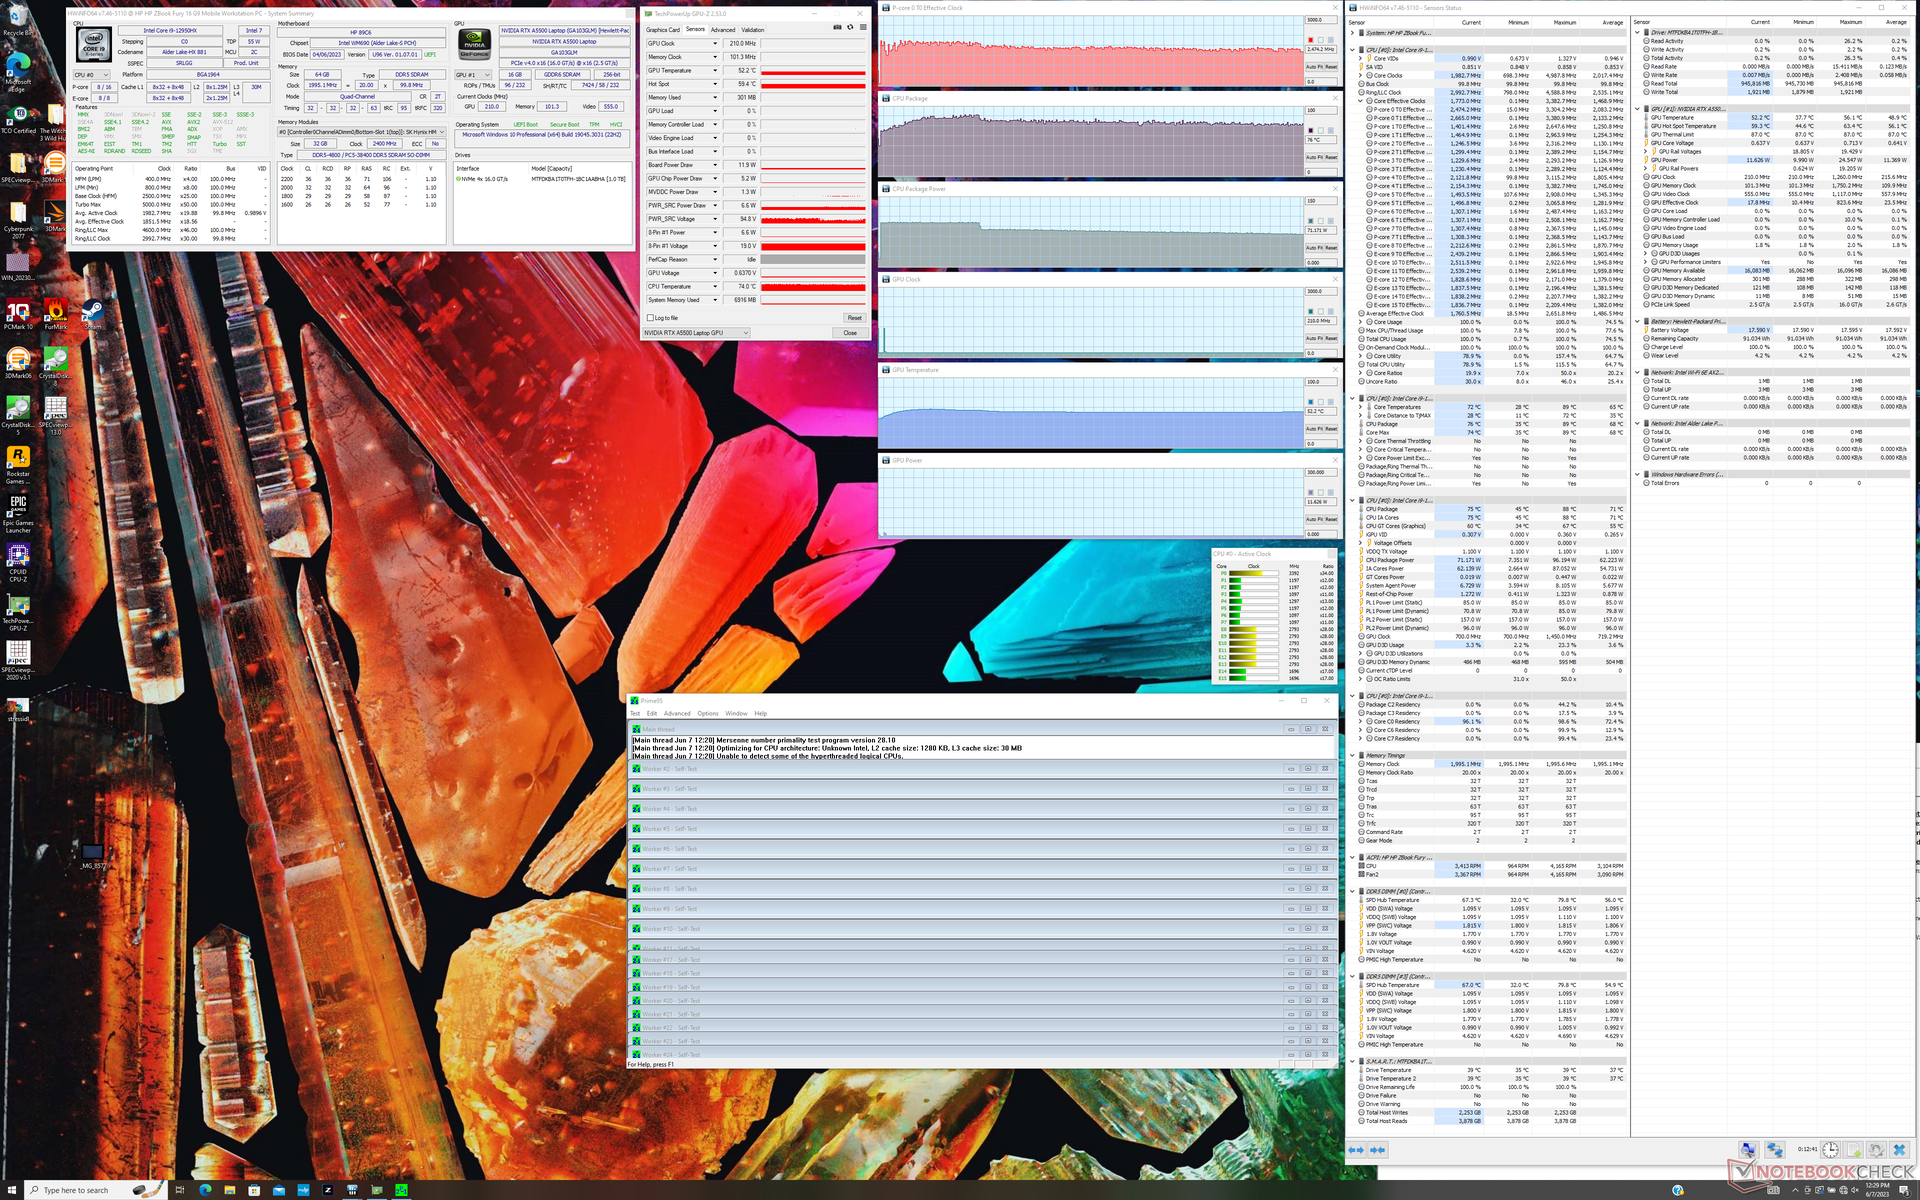
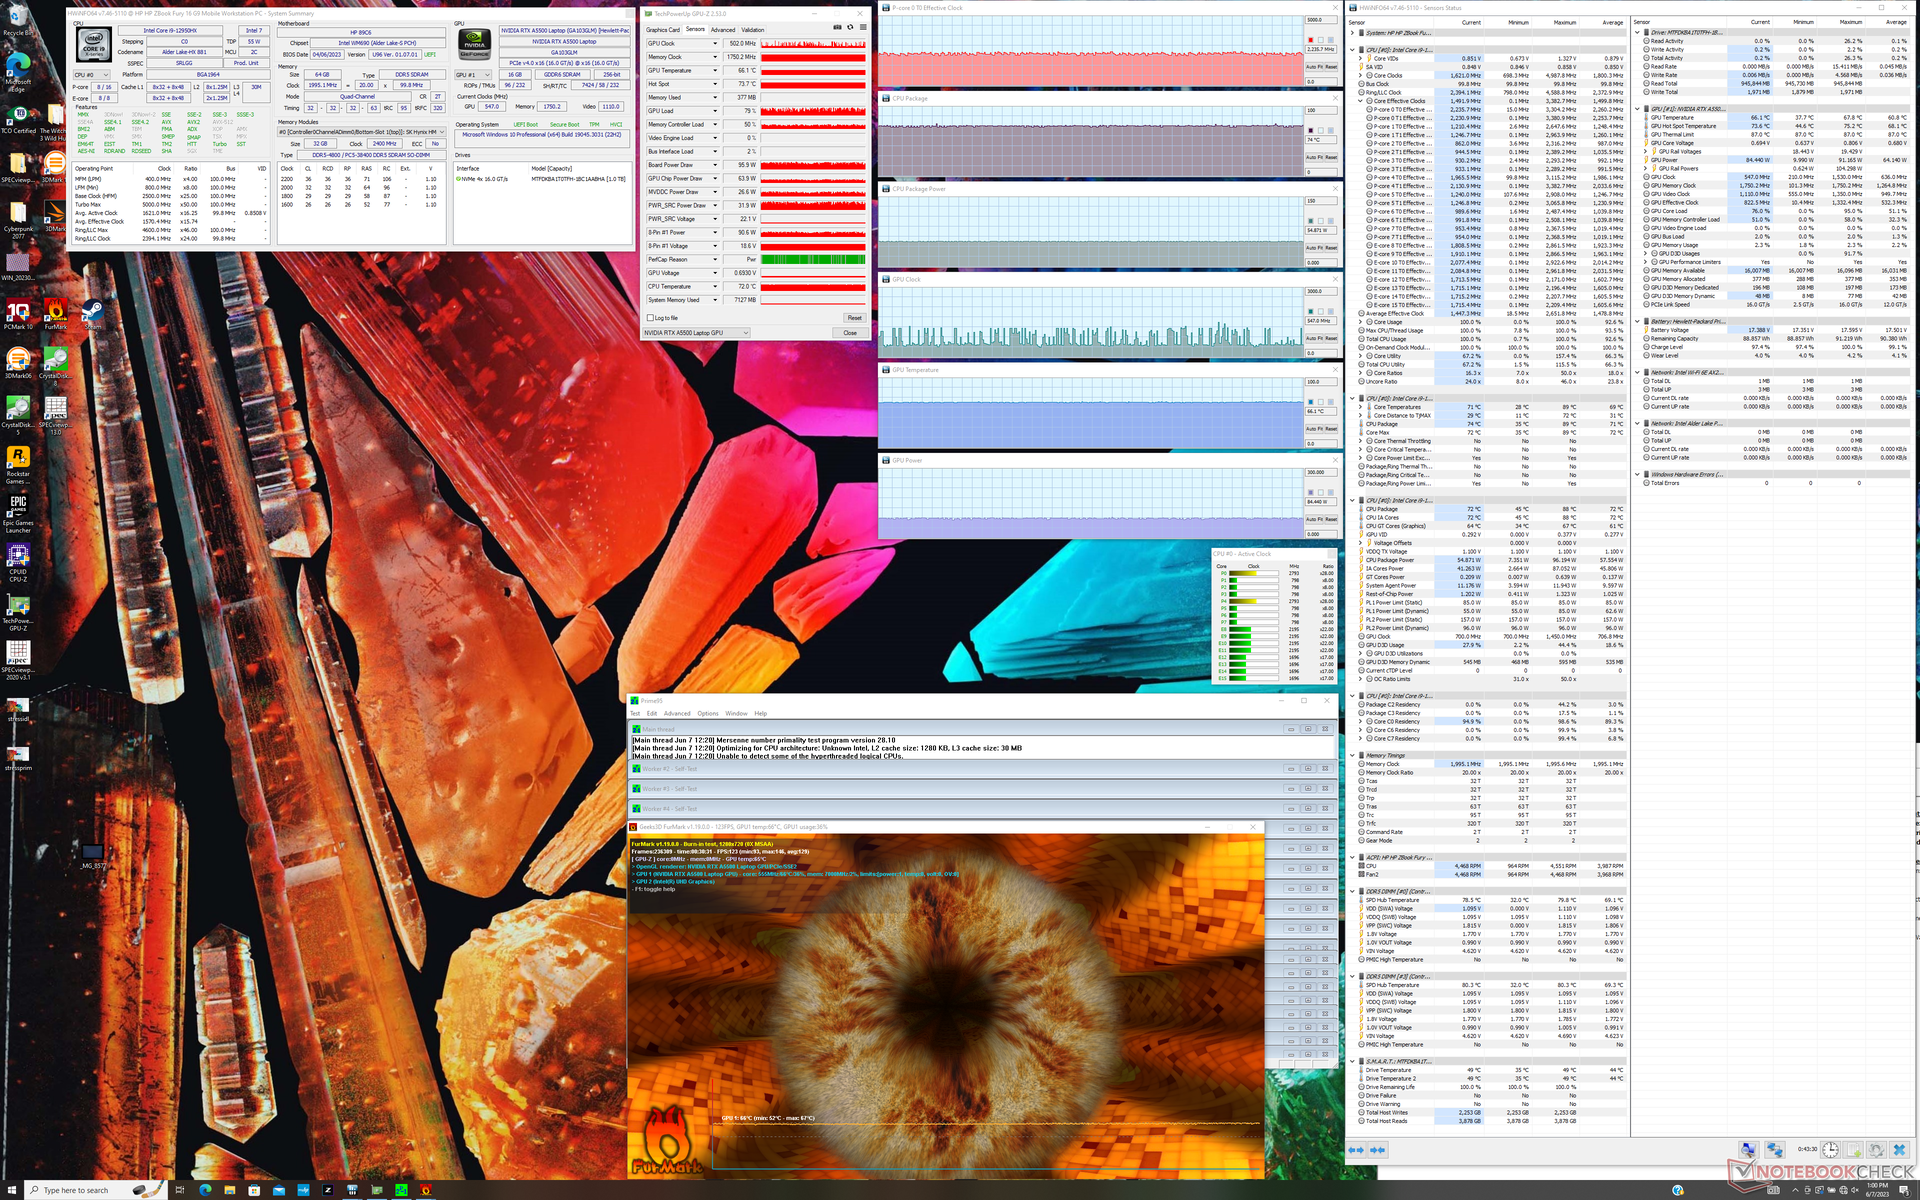
Condiciones de ensayo
Configuramos nuestra unidad en modo Rendimiento antes de ejecutar las pruebas que se muestran a continuación. HP no tiene perfiles de energía adicionales aparte de los estándar de Windows y no soporta características avanzadas como Optimus 2.0 o MUX.
Se recomienda que los usuarios se familiaricen con MyHP y Z Light Space para las actualizaciones de software específicas de HP y la configuración del teclado RGB, respectivamente.
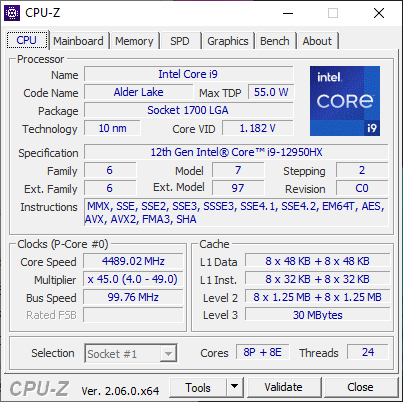
Procesador
La 12ª generación Core i9-12950HX era una de las CPU móviles más rápidas disponibles con soporte vPro y ECC hasta el lanzamiento de la 13ª generación de Core i9-13950HX. En cuanto a las opciones de la 13ª generación, la Fury 16 G10 ha empezado a comercializarse recientemente.
El procesador de nuestro HP rinde ligeramente por debajo del 5% en comparación con la media de portátiles de nuestra base de datos equipados con la misma CPU Core i9-12950HX. Peor aún, la CPU parece acelerarse más bruscamente cuando se somete a largos periodos de estrés. Cuando se ejecuta CineBench R15 xT en bucle, por ejemplo, el rendimiento cae un 20% después del séptimo u octavo bucle. El ThinkPad P16 G1 experimenta un menor grado de ralentización de la CPU, como muestra nuestro gráfico comparativo de abajo.
Se espera que el cambio a la configuración Core i7-12850HX desde nuestro Core i9-12950HX afecte a los rendimientos monohilo y multihilo entre un 15 y un 20 por ciento.
Cinebench R15 Multi Loop
Cinebench R23: Multi Core | Single Core
Cinebench R20: CPU (Multi Core) | CPU (Single Core)
Cinebench R15: CPU Multi 64Bit | CPU Single 64Bit
Blender: v2.79 BMW27 CPU
7-Zip 18.03: 7z b 4 | 7z b 4 -mmt1
Geekbench 5.5: Multi-Core | Single-Core
HWBOT x265 Benchmark v2.2: 4k Preset
LibreOffice : 20 Documents To PDF
R Benchmark 2.5: Overall mean
* ... más pequeño es mejor
AIDA64: FP32 Ray-Trace | FPU Julia | CPU SHA3 | CPU Queen | FPU SinJulia | FPU Mandel | CPU AES | CPU ZLib | FP64 Ray-Trace | CPU PhotoWorxx
| Performance rating | |
| Medio Intel Core i9-12950HX | |
| Lenovo ThinkPad P16 G1 RTX A5500 | |
| HP ZBook Fury 16 G9 | |
| MSI CreatorPro Z16P B12UKST | |
| HP ZBook Studio 16 G9 62U04EA | |
| Dell Precision 7000 7670 Performance | |
| HP ZBook Firefly 16 G9-6B897EA | |
| AIDA64 / FP32 Ray-Trace | |
| Lenovo ThinkPad P16 G1 RTX A5500 | |
| Medio Intel Core i9-12950HX (15499 - 22868, n=7) | |
| HP ZBook Fury 16 G9 | |
| Dell Precision 7000 7670 Performance | |
| HP ZBook Studio 16 G9 62U04EA | |
| MSI CreatorPro Z16P B12UKST | |
| HP ZBook Firefly 16 G9-6B897EA | |
| AIDA64 / FPU Julia | |
| HP ZBook Fury 16 G9 | |
| Lenovo ThinkPad P16 G1 RTX A5500 | |
| Medio Intel Core i9-12950HX (77846 - 115907, n=7) | |
| HP ZBook Studio 16 G9 62U04EA | |
| Dell Precision 7000 7670 Performance | |
| MSI CreatorPro Z16P B12UKST | |
| HP ZBook Firefly 16 G9-6B897EA | |
| AIDA64 / CPU SHA3 | |
| Lenovo ThinkPad P16 G1 RTX A5500 | |
| Medio Intel Core i9-12950HX (3426 - 5069, n=7) | |
| HP ZBook Fury 16 G9 | |
| HP ZBook Studio 16 G9 62U04EA | |
| MSI CreatorPro Z16P B12UKST | |
| Dell Precision 7000 7670 Performance | |
| HP ZBook Firefly 16 G9-6B897EA | |
| AIDA64 / CPU Queen | |
| HP ZBook Studio 16 G9 62U04EA | |
| Medio Intel Core i9-12950HX (102752 - 104726, n=7) | |
| Lenovo ThinkPad P16 G1 RTX A5500 | |
| Dell Precision 7000 7670 Performance | |
| HP ZBook Fury 16 G9 | |
| MSI CreatorPro Z16P B12UKST | |
| HP ZBook Firefly 16 G9-6B897EA | |
| AIDA64 / FPU SinJulia | |
| Lenovo ThinkPad P16 G1 RTX A5500 | |
| HP ZBook Fury 16 G9 | |
| Medio Intel Core i9-12950HX (10134 - 12823, n=7) | |
| Dell Precision 7000 7670 Performance | |
| HP ZBook Studio 16 G9 62U04EA | |
| MSI CreatorPro Z16P B12UKST | |
| HP ZBook Firefly 16 G9-6B897EA | |
| AIDA64 / FPU Mandel | |
| HP ZBook Fury 16 G9 | |
| Lenovo ThinkPad P16 G1 RTX A5500 | |
| Medio Intel Core i9-12950HX (37146 - 57340, n=7) | |
| HP ZBook Studio 16 G9 62U04EA | |
| Dell Precision 7000 7670 Performance | |
| MSI CreatorPro Z16P B12UKST | |
| HP ZBook Firefly 16 G9-6B897EA | |
| AIDA64 / CPU ZLib | |
| Lenovo ThinkPad P16 G1 RTX A5500 | |
| HP ZBook Fury 16 G9 | |
| Medio Intel Core i9-12950HX (996 - 1417, n=7) | |
| HP ZBook Studio 16 G9 62U04EA | |
| MSI CreatorPro Z16P B12UKST | |
| Dell Precision 7000 7670 Performance | |
| HP ZBook Firefly 16 G9-6B897EA | |
| AIDA64 / FP64 Ray-Trace | |
| Lenovo ThinkPad P16 G1 RTX A5500 | |
| Medio Intel Core i9-12950HX (8455 - 12432, n=7) | |
| HP ZBook Fury 16 G9 | |
| HP ZBook Studio 16 G9 62U04EA | |
| Dell Precision 7000 7670 Performance | |
| MSI CreatorPro Z16P B12UKST | |
| HP ZBook Firefly 16 G9-6B897EA | |
| AIDA64 / CPU PhotoWorxx | |
| MSI CreatorPro Z16P B12UKST | |
| Dell Precision 7000 7670 Performance | |
| Medio Intel Core i9-12950HX (35479 - 42655, n=7) | |
| Lenovo ThinkPad P16 G1 RTX A5500 | |
| HP ZBook Fury 16 G9 | |
| HP ZBook Studio 16 G9 62U04EA | |
| HP ZBook Firefly 16 G9-6B897EA | |
Rendimiento del sistema
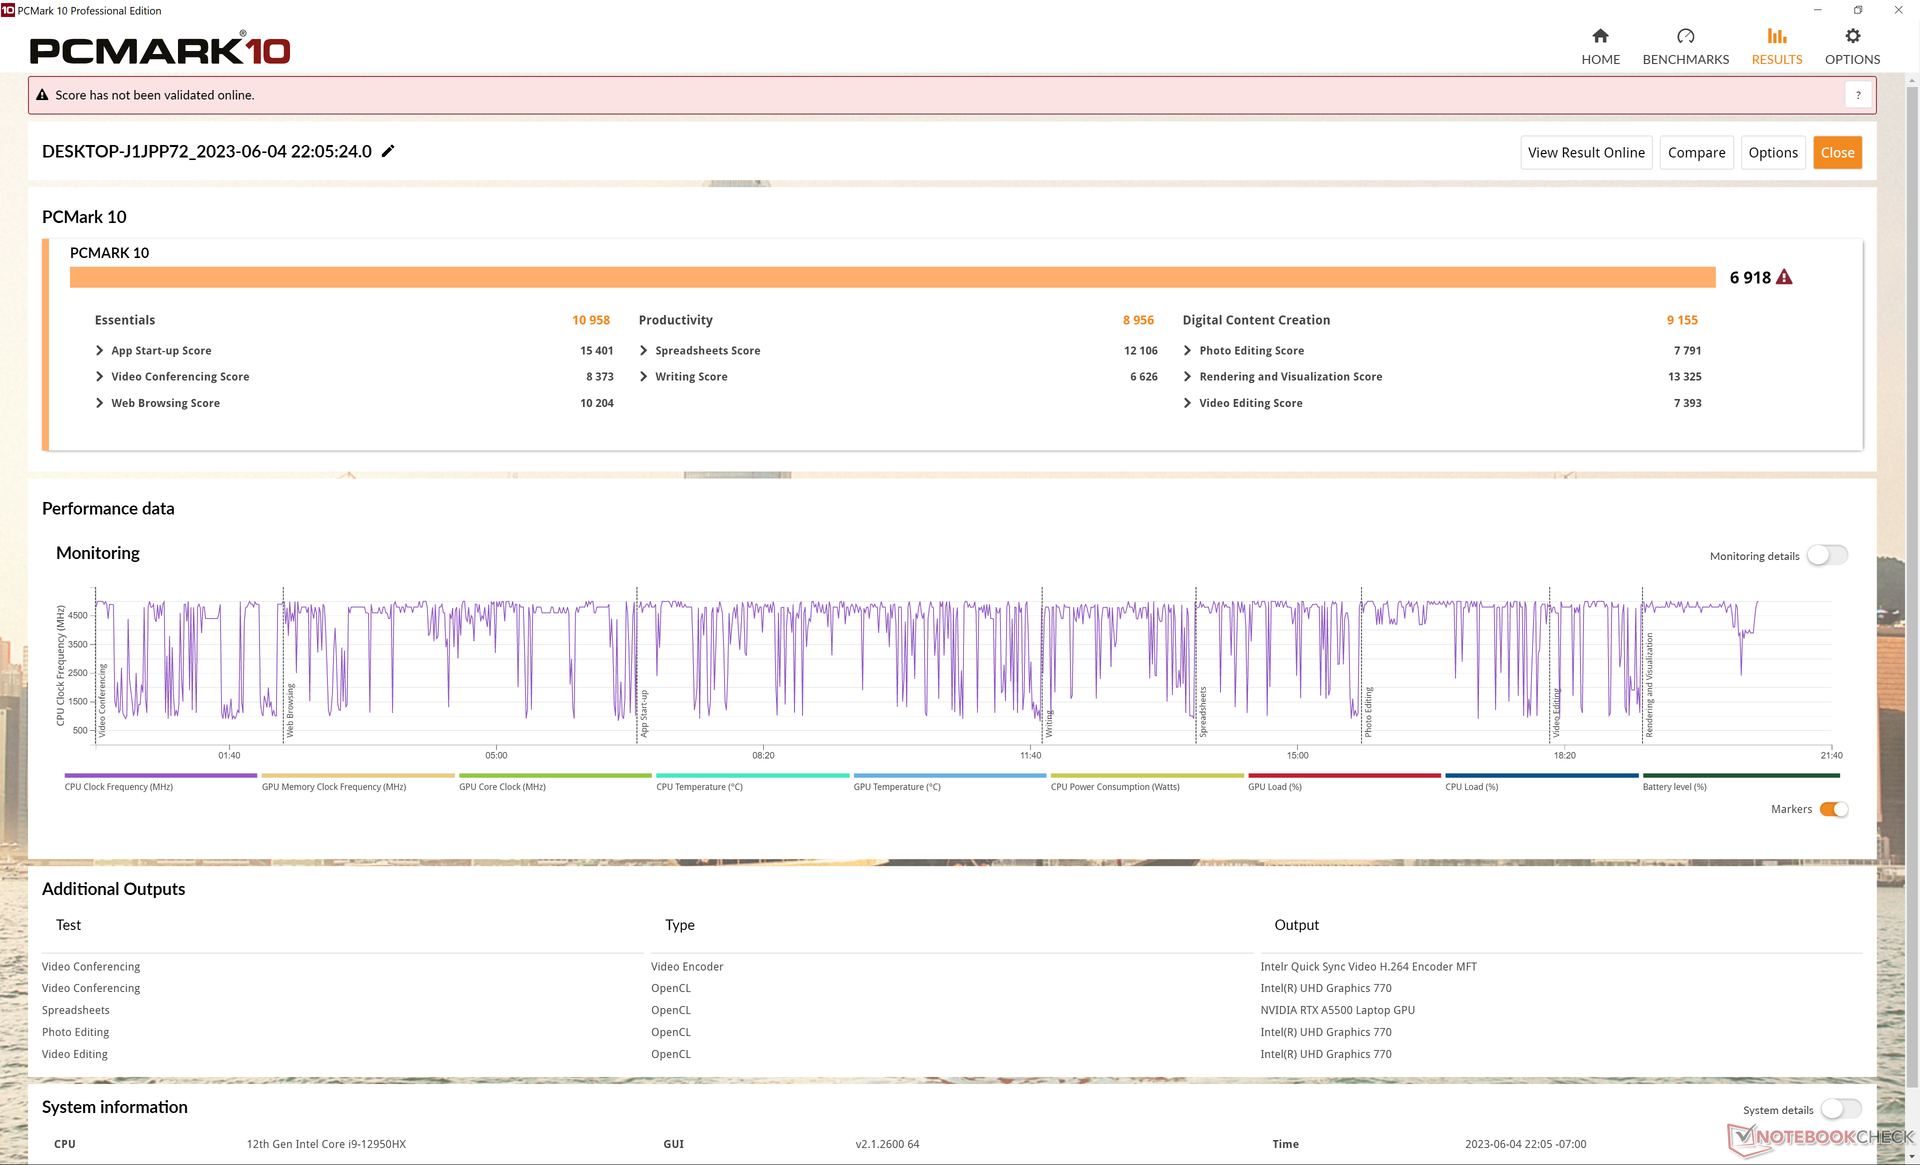
Los resultados de PCMark son comparables a los del Dell Precision 7670 y el Lenovo ThinkPad P16 G1. Nótese la significativa ventaja sobre el más pequeño ZBook Firefly 16 G9 en la subprueba de Creación de Contenido Digital debido a la GPU RTX A5500 más rápida de nuestro Fury 16 G9.
CrossMark: Overall | Productivity | Creativity | Responsiveness
| PCMark 10 / Score | |
| Lenovo ThinkPad P16 G1 RTX A5500 | |
| MSI CreatorPro Z16P B12UKST | |
| Medio Intel Core i9-12950HX, NVIDIA RTX A5500 Laptop GPU (6883 - 7236, n=3) | |
| HP ZBook Fury 16 G9 | |
| Dell Precision 7000 7670 Performance | |
| HP ZBook Studio 16 G9 62U04EA | |
| HP ZBook Firefly 16 G9-6B897EA | |
| PCMark 10 / Essentials | |
| Dell Precision 7000 7670 Performance | |
| Medio Intel Core i9-12950HX, NVIDIA RTX A5500 Laptop GPU (10898 - 11465, n=3) | |
| HP ZBook Fury 16 G9 | |
| Lenovo ThinkPad P16 G1 RTX A5500 | |
| MSI CreatorPro Z16P B12UKST | |
| HP ZBook Firefly 16 G9-6B897EA | |
| HP ZBook Studio 16 G9 62U04EA | |
| PCMark 10 / Productivity | |
| Lenovo ThinkPad P16 G1 RTX A5500 | |
| MSI CreatorPro Z16P B12UKST | |
| HP ZBook Fury 16 G9 | |
| Medio Intel Core i9-12950HX, NVIDIA RTX A5500 Laptop GPU (8054 - 9489, n=3) | |
| HP ZBook Firefly 16 G9-6B897EA | |
| Dell Precision 7000 7670 Performance | |
| HP ZBook Studio 16 G9 62U04EA | |
| PCMark 10 / Digital Content Creation | |
| Lenovo ThinkPad P16 G1 RTX A5500 | |
| MSI CreatorPro Z16P B12UKST | |
| Dell Precision 7000 7670 Performance | |
| Medio Intel Core i9-12950HX, NVIDIA RTX A5500 Laptop GPU (9155 - 9944, n=3) | |
| HP ZBook Studio 16 G9 62U04EA | |
| HP ZBook Fury 16 G9 | |
| HP ZBook Firefly 16 G9-6B897EA | |
| CrossMark / Overall | |
| MSI CreatorPro Z16P B12UKST | |
| HP ZBook Fury 16 G9 | |
| Lenovo ThinkPad P16 G1 RTX A5500 | |
| Medio Intel Core i9-12950HX, NVIDIA RTX A5500 Laptop GPU (1801 - 1889, n=3) | |
| HP ZBook Studio 16 G9 62U04EA | |
| Dell Precision 7000 7670 Performance | |
| HP ZBook Firefly 16 G9-6B897EA | |
| CrossMark / Productivity | |
| MSI CreatorPro Z16P B12UKST | |
| HP ZBook Fury 16 G9 | |
| Lenovo ThinkPad P16 G1 RTX A5500 | |
| Medio Intel Core i9-12950HX, NVIDIA RTX A5500 Laptop GPU (1684 - 1785, n=3) | |
| HP ZBook Studio 16 G9 62U04EA | |
| Dell Precision 7000 7670 Performance | |
| HP ZBook Firefly 16 G9-6B897EA | |
| CrossMark / Creativity | |
| Lenovo ThinkPad P16 G1 RTX A5500 | |
| HP ZBook Fury 16 G9 | |
| Medio Intel Core i9-12950HX, NVIDIA RTX A5500 Laptop GPU (2042 - 2192, n=3) | |
| HP ZBook Studio 16 G9 62U04EA | |
| MSI CreatorPro Z16P B12UKST | |
| Dell Precision 7000 7670 Performance | |
| HP ZBook Firefly 16 G9-6B897EA | |
| CrossMark / Responsiveness | |
| MSI CreatorPro Z16P B12UKST | |
| HP ZBook Fury 16 G9 | |
| HP ZBook Studio 16 G9 62U04EA | |
| Medio Intel Core i9-12950HX, NVIDIA RTX A5500 Laptop GPU (1501 - 1585, n=3) | |
| Dell Precision 7000 7670 Performance | |
| Lenovo ThinkPad P16 G1 RTX A5500 | |
| HP ZBook Firefly 16 G9-6B897EA | |
| PCMark 10 Score | 6918 puntos | |
ayuda | ||
| AIDA64 / Memory Copy | |
| Dell Precision 7000 7670 Performance | |
| Medio Intel Core i9-12950HX (59731 - 64732, n=7) | |
| Lenovo ThinkPad P16 G1 RTX A5500 | |
| MSI CreatorPro Z16P B12UKST | |
| HP ZBook Studio 16 G9 62U04EA | |
| HP ZBook Fury 16 G9 | |
| HP ZBook Firefly 16 G9-6B897EA | |
| AIDA64 / Memory Read | |
| Dell Precision 7000 7670 Performance | |
| Medio Intel Core i9-12950HX (59744 - 70359, n=7) | |
| MSI CreatorPro Z16P B12UKST | |
| HP ZBook Studio 16 G9 62U04EA | |
| Lenovo ThinkPad P16 G1 RTX A5500 | |
| HP ZBook Fury 16 G9 | |
| HP ZBook Firefly 16 G9-6B897EA | |
| AIDA64 / Memory Write | |
| MSI CreatorPro Z16P B12UKST | |
| Dell Precision 7000 7670 Performance | |
| HP ZBook Studio 16 G9 62U04EA | |
| Medio Intel Core i9-12950HX (57750 - 67899, n=7) | |
| HP ZBook Firefly 16 G9-6B897EA | |
| Lenovo ThinkPad P16 G1 RTX A5500 | |
| HP ZBook Fury 16 G9 | |
| AIDA64 / Memory Latency | |
| MSI CreatorPro Z16P B12UKST | |
| HP ZBook Fury 16 G9 | |
| Lenovo ThinkPad P16 G1 RTX A5500 | |
| HP ZBook Firefly 16 G9-6B897EA | |
| HP ZBook Studio 16 G9 62U04EA | |
| Medio Intel Core i9-12950HX (84.5 - 92.2, n=7) | |
| Dell Precision 7000 7670 Performance | |
* ... más pequeño es mejor
Latencia del CPD
LatencyMon revela problemas de CPD al abrir varias pestañas de nuestra página de inicio. por lo demás, la reproducción de vídeo 4K a 60 FPS es perfecta, sin caídas de frames durante las pruebas.
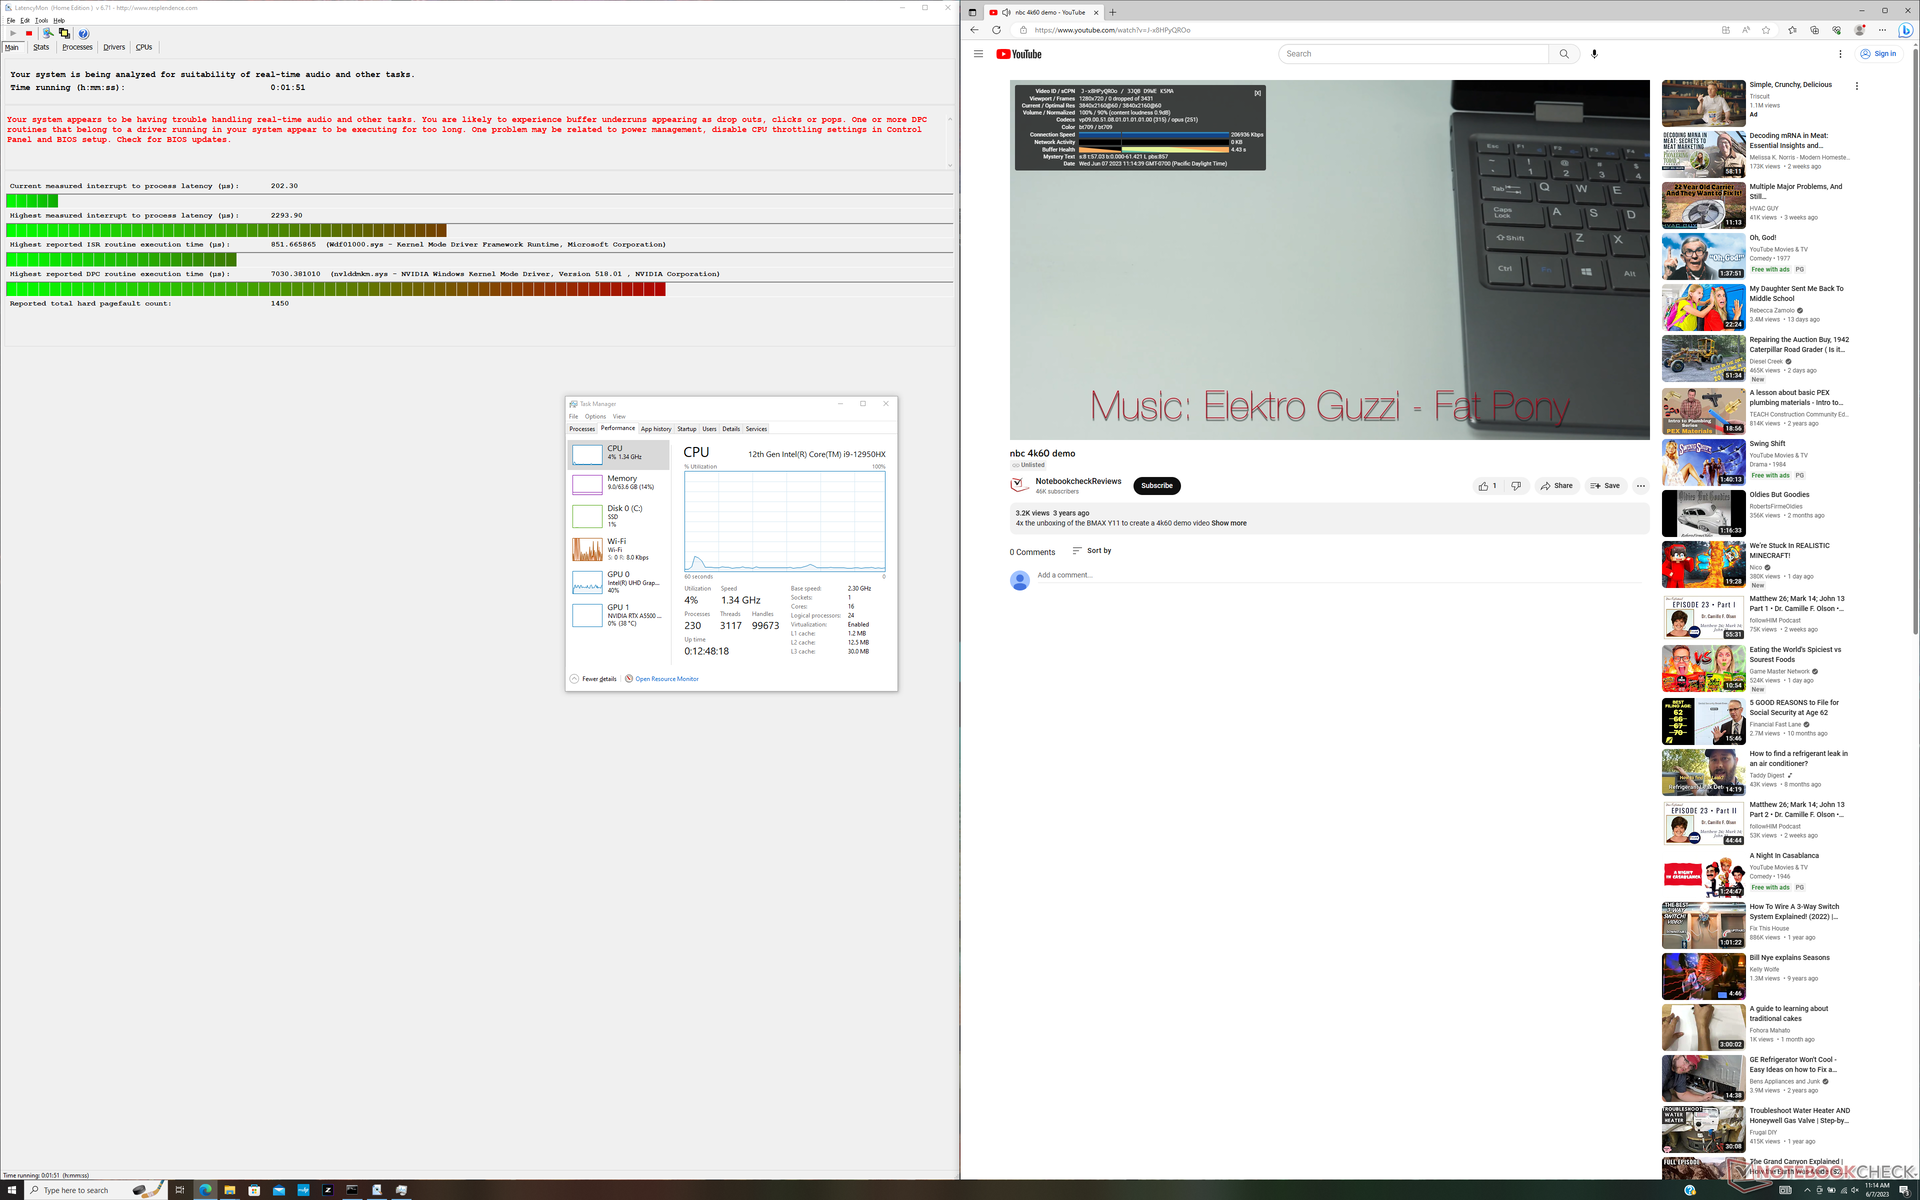

| DPC Latencies / LatencyMon - interrupt to process latency (max), Web, Youtube, Prime95 | |
| HP ZBook Fury 16 G9 | |
| Dell Precision 7000 7670 Performance | |
| Lenovo ThinkPad P16 G1 RTX A5500 | |
| HP ZBook Studio 16 G9 62U04EA | |
| HP ZBook Firefly 16 G9-6B897EA | |
| MSI CreatorPro Z16P B12UKST | |
* ... más pequeño es mejor
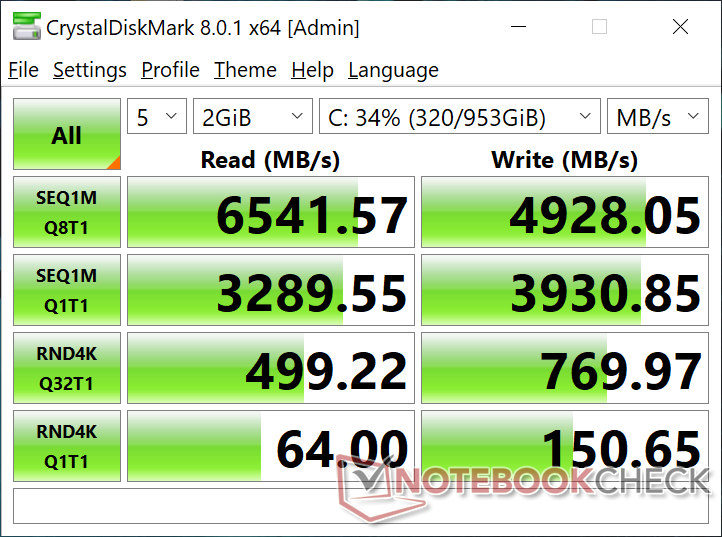
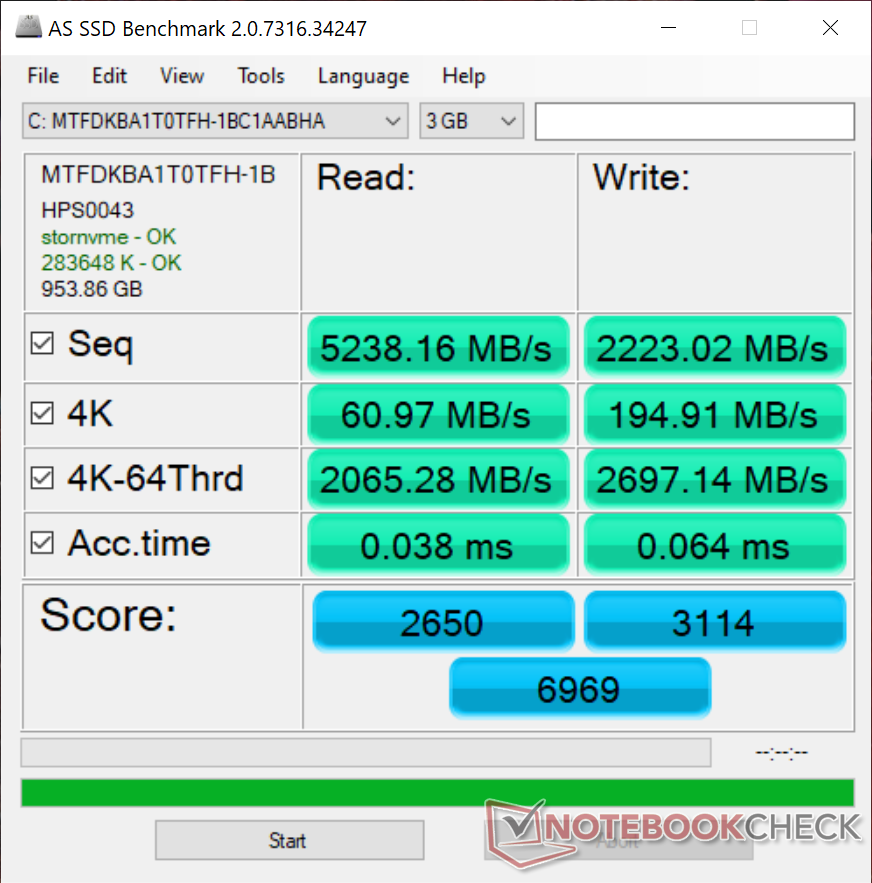
Dispositivos de almacenamiento: posible estrangulamiento del rendimiento
Nuestra unidad de prueba se entrega con el mismoMicron 3400 MTFDKBA1T0TFH De 1 TB que se encuentra en elLenovo ThinkPad X1 Extreme G5. Desafortunadamente, el SSD en nuestro HP parece sufrir de importantes problemas de estrangulamiento de rendimiento como se muestra en el gráfico de comparación a continuación. Al ejecutar DiskSpd en bucle, las tasas de transferencia caían ocasionalmente de 6500 MB/s a tan sólo 1700 MB/s, mientras que la misma unidad en el Lenovo funcionaba a 6500 MB/s indefinidamente. Esto sugiere que el Fury 16 puede tener problemas para refrigerar los SSD. Los resultados no mejoraron ni siquiera después de repetir varias pruebas.

* ... más pequeño es mejor
Disk Throttling: DiskSpd Read Loop, Queue Depth 8
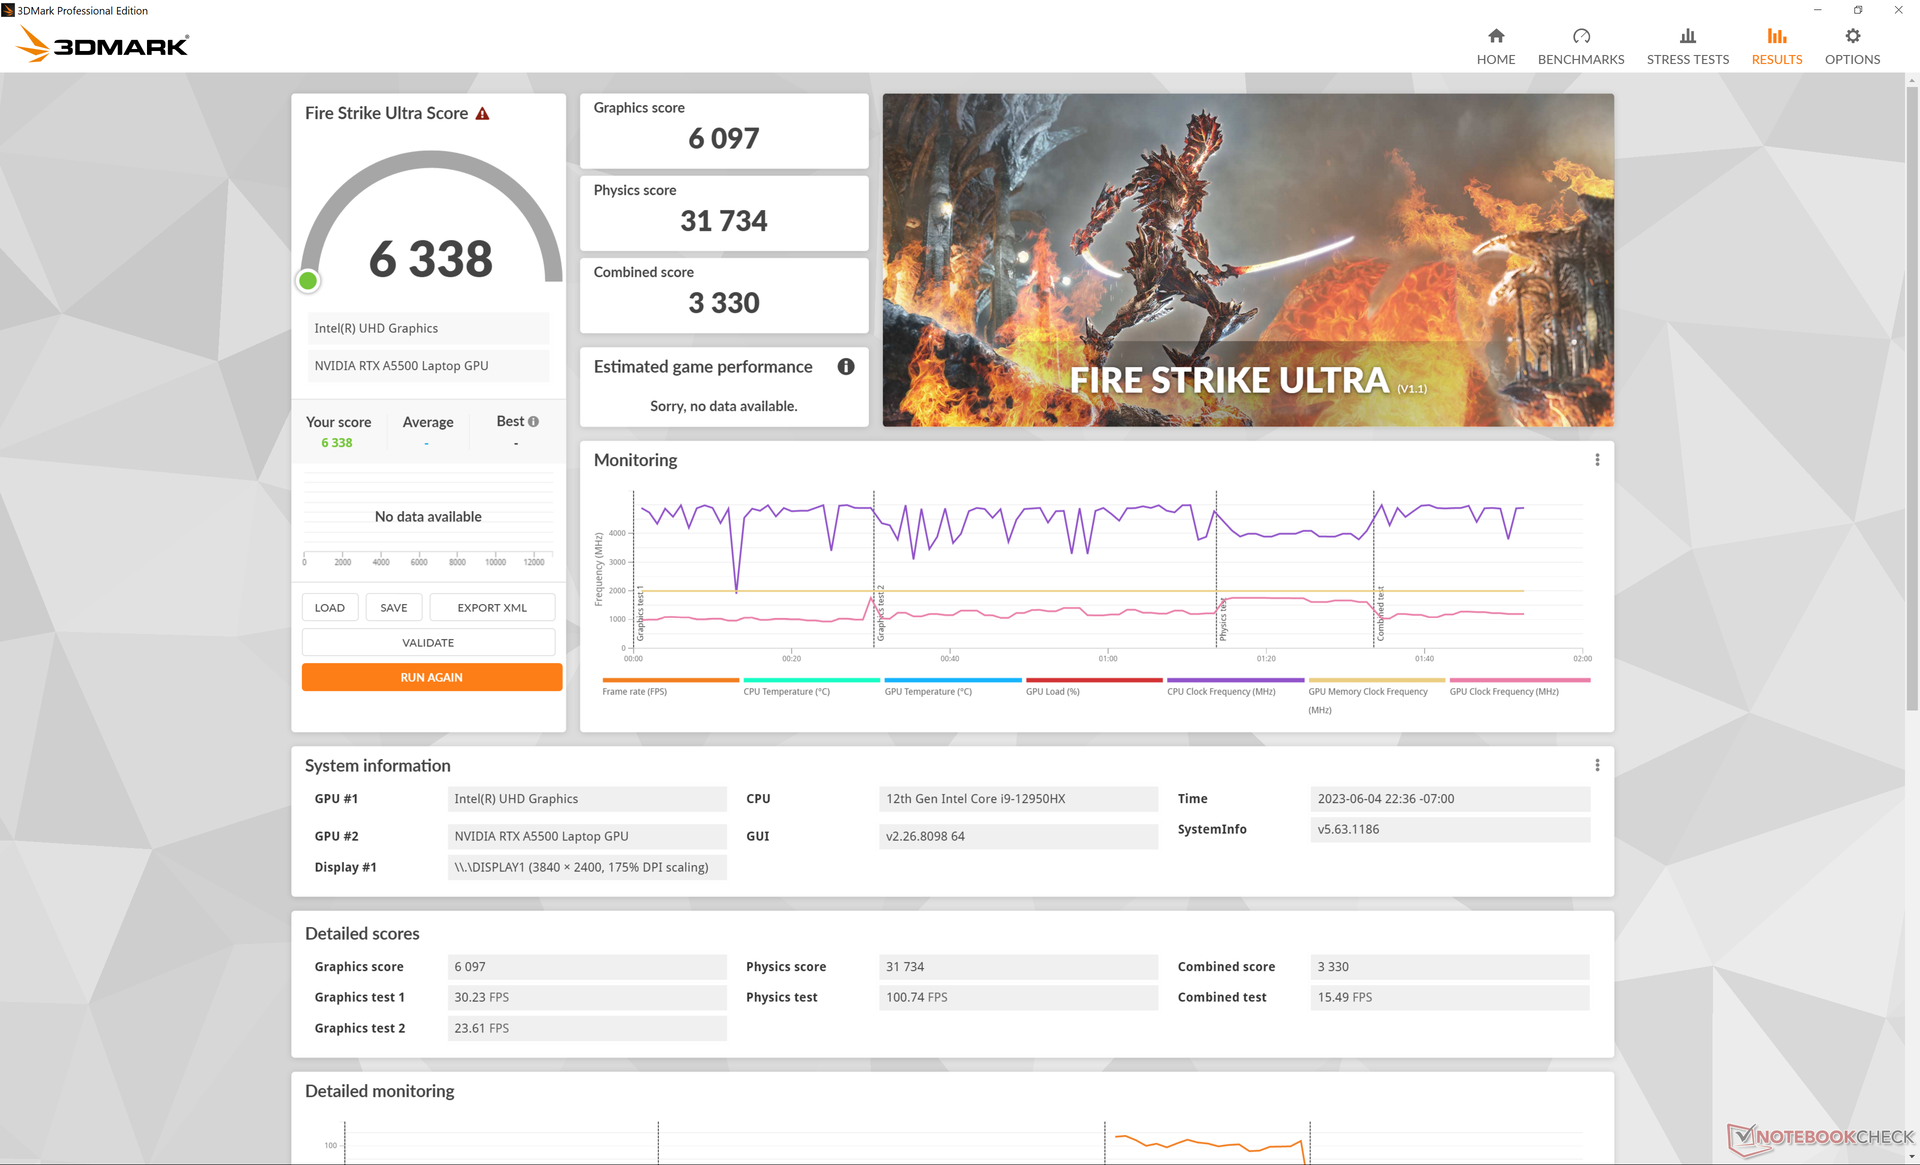
Rendimiento de la GPU - 100 W TGP
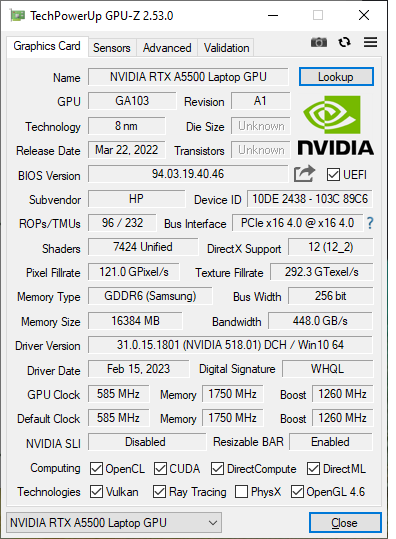
La RTX A5500 de nuestro HP alcanza un TGP de 100 W, frente a los 130 W y 135 W de los ThinkPad P16 G1 y Precision 7670respectivamente. Por tanto, el rendimiento gráfico debería ser ligeramente inferior en el HP aunque los tres sistemas usen la misma GPU RTX A5500. los resultados 3DMark y SpecViewPerf lo confirman, ya que nuestro HP quedaría consistentemente por detrás de los modelos Dell y Lenovo hasta un 15% en algunos casos. Sigue siendo una estación de trabajo muy rápida, por supuesto, pero no es la opción más rápida del mercado.
Si cambiamos a la RTX A3000 desde nuestra configuración RTX A5500 de gama alta se espera que reduzca el rendimiento gráfico entre un 20 y un 30 por ciento.
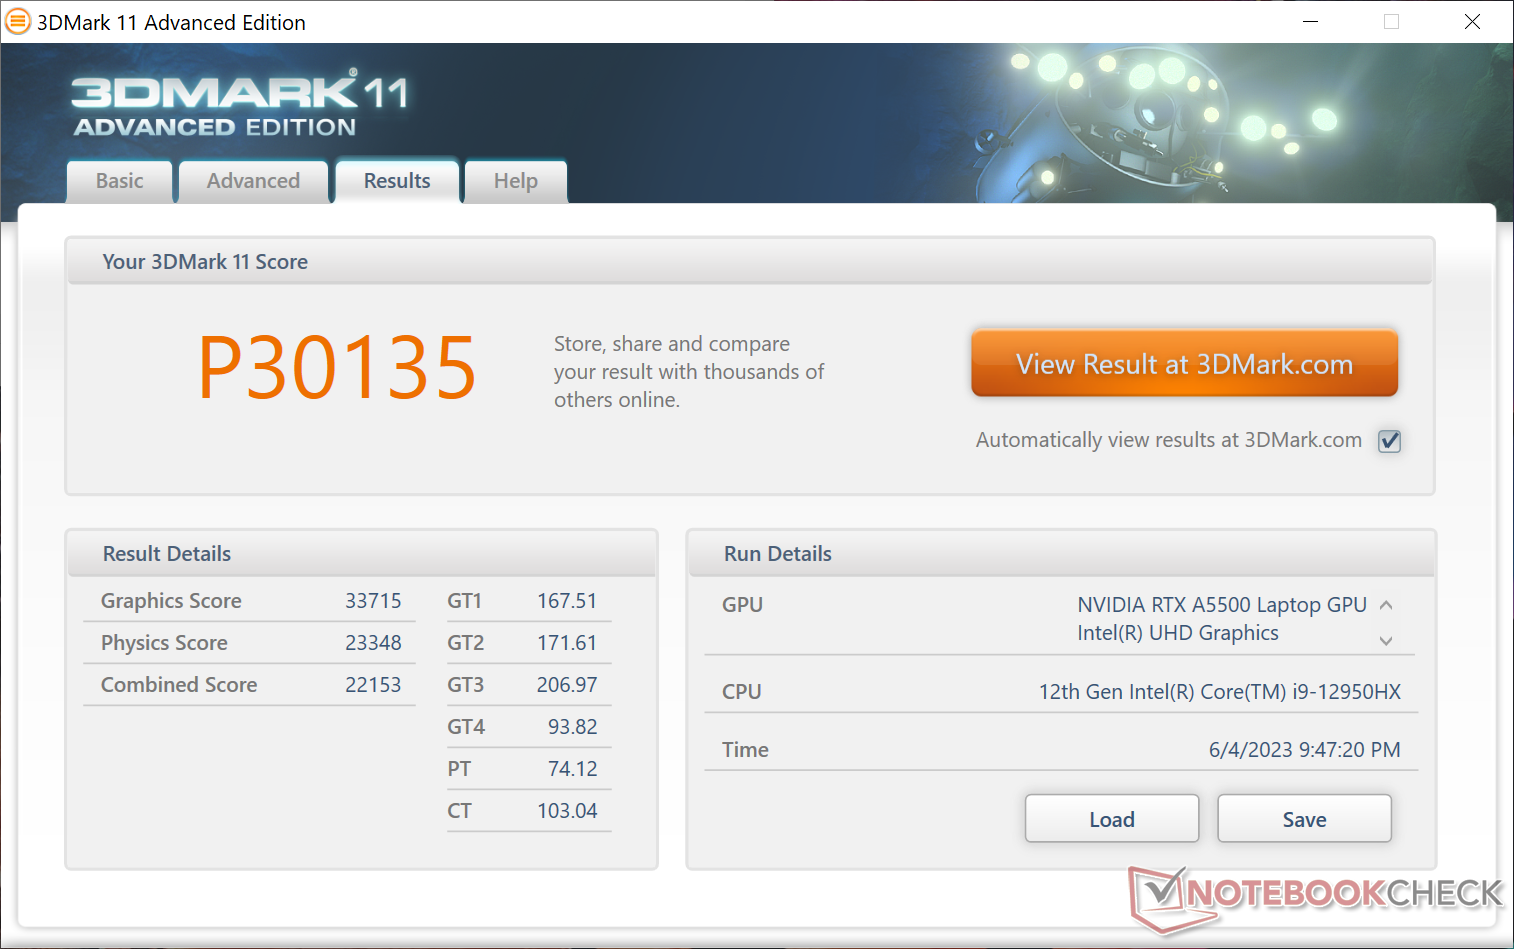
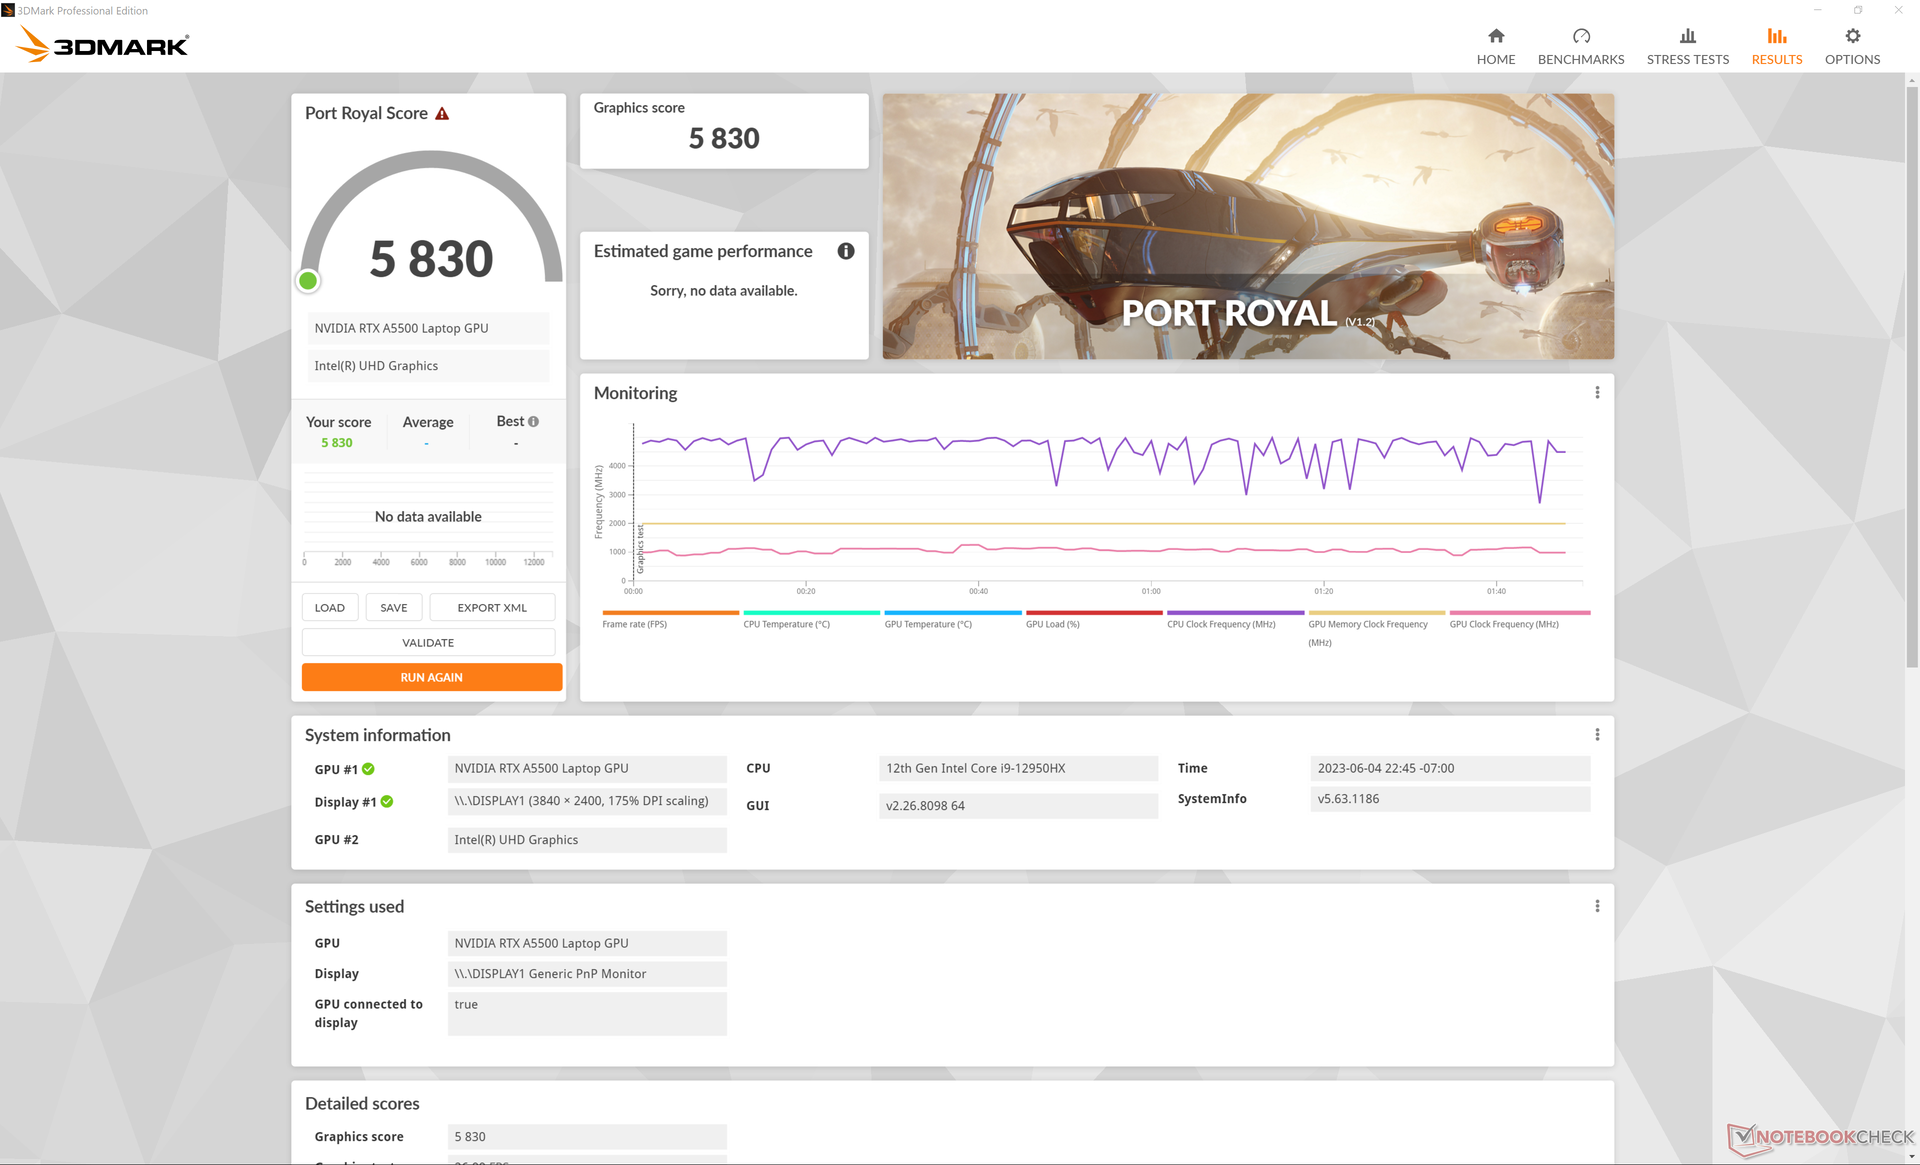
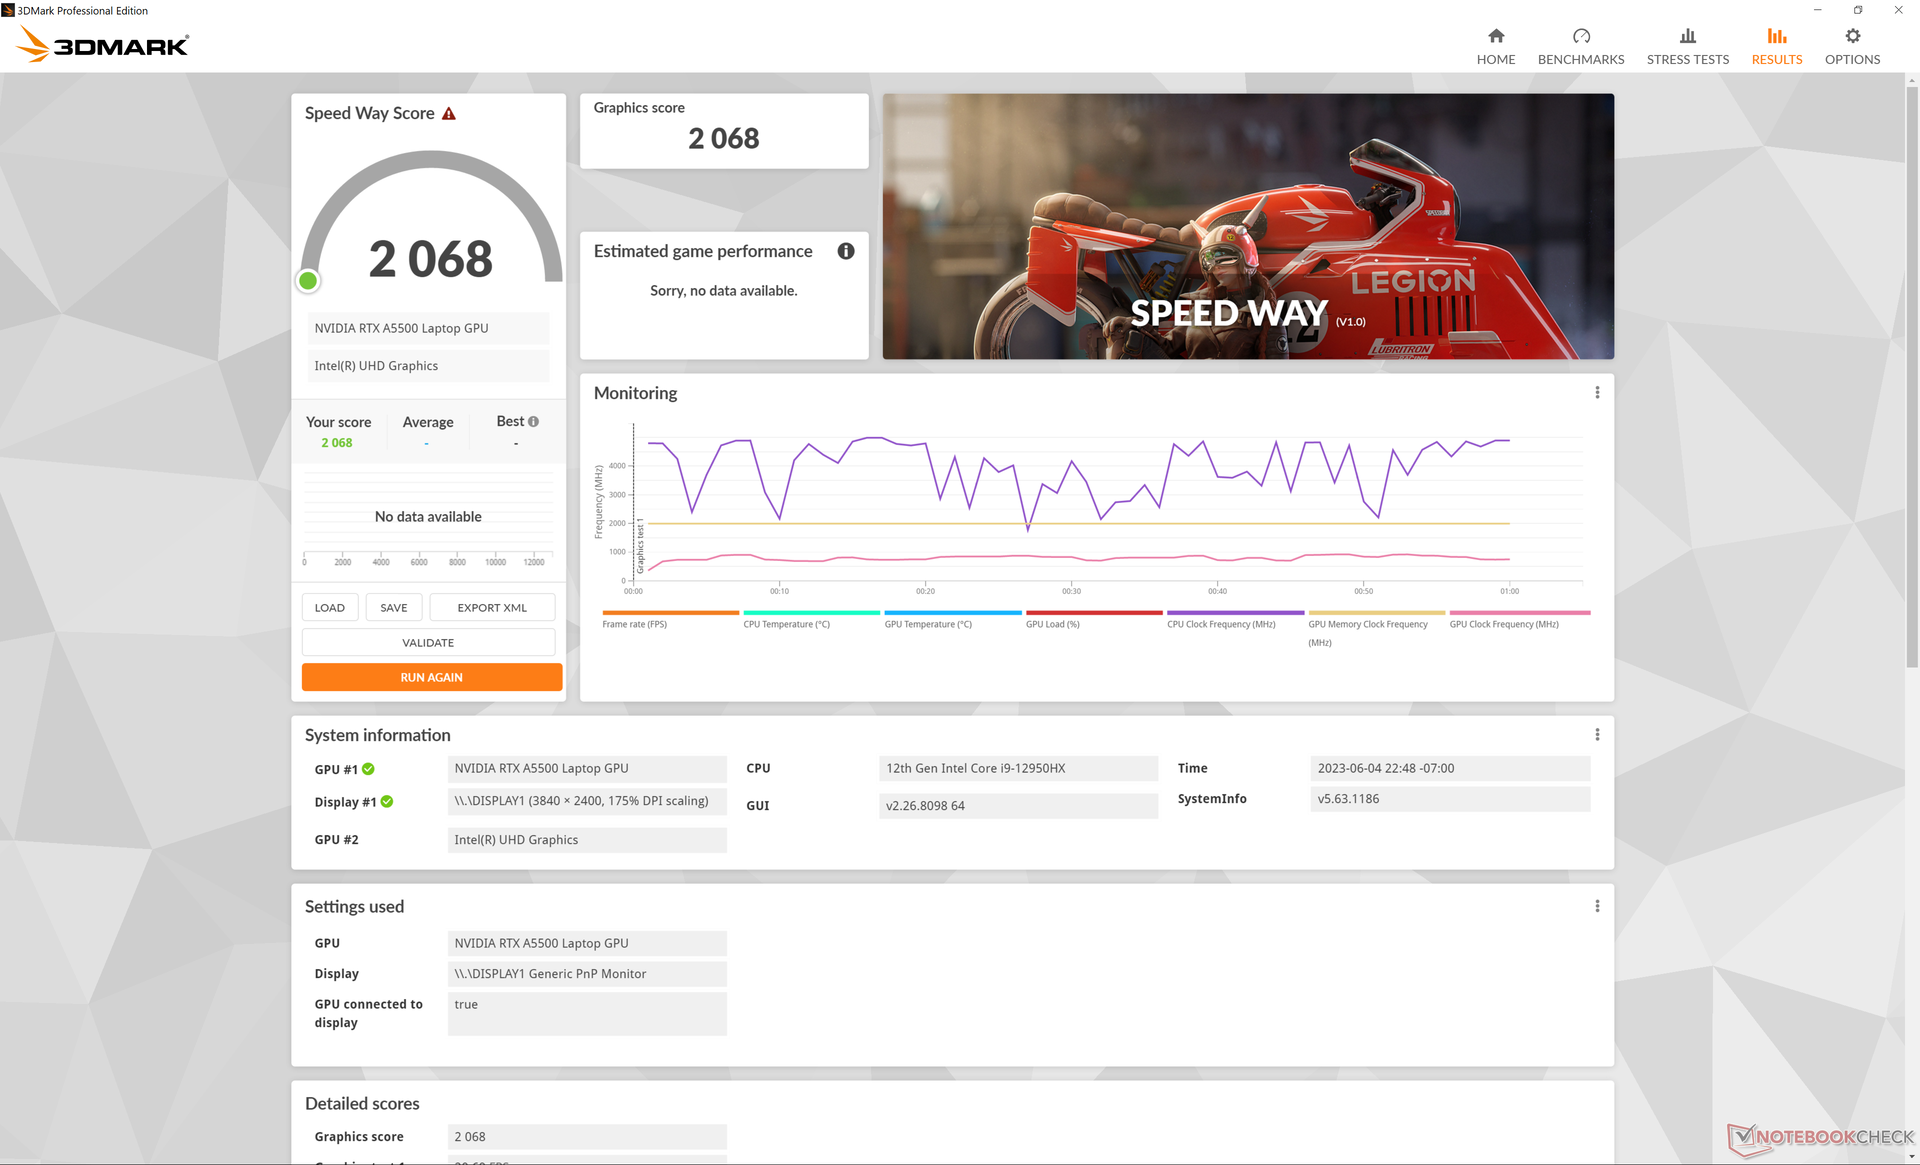
| 3DMark 11 Performance | 30135 puntos | |
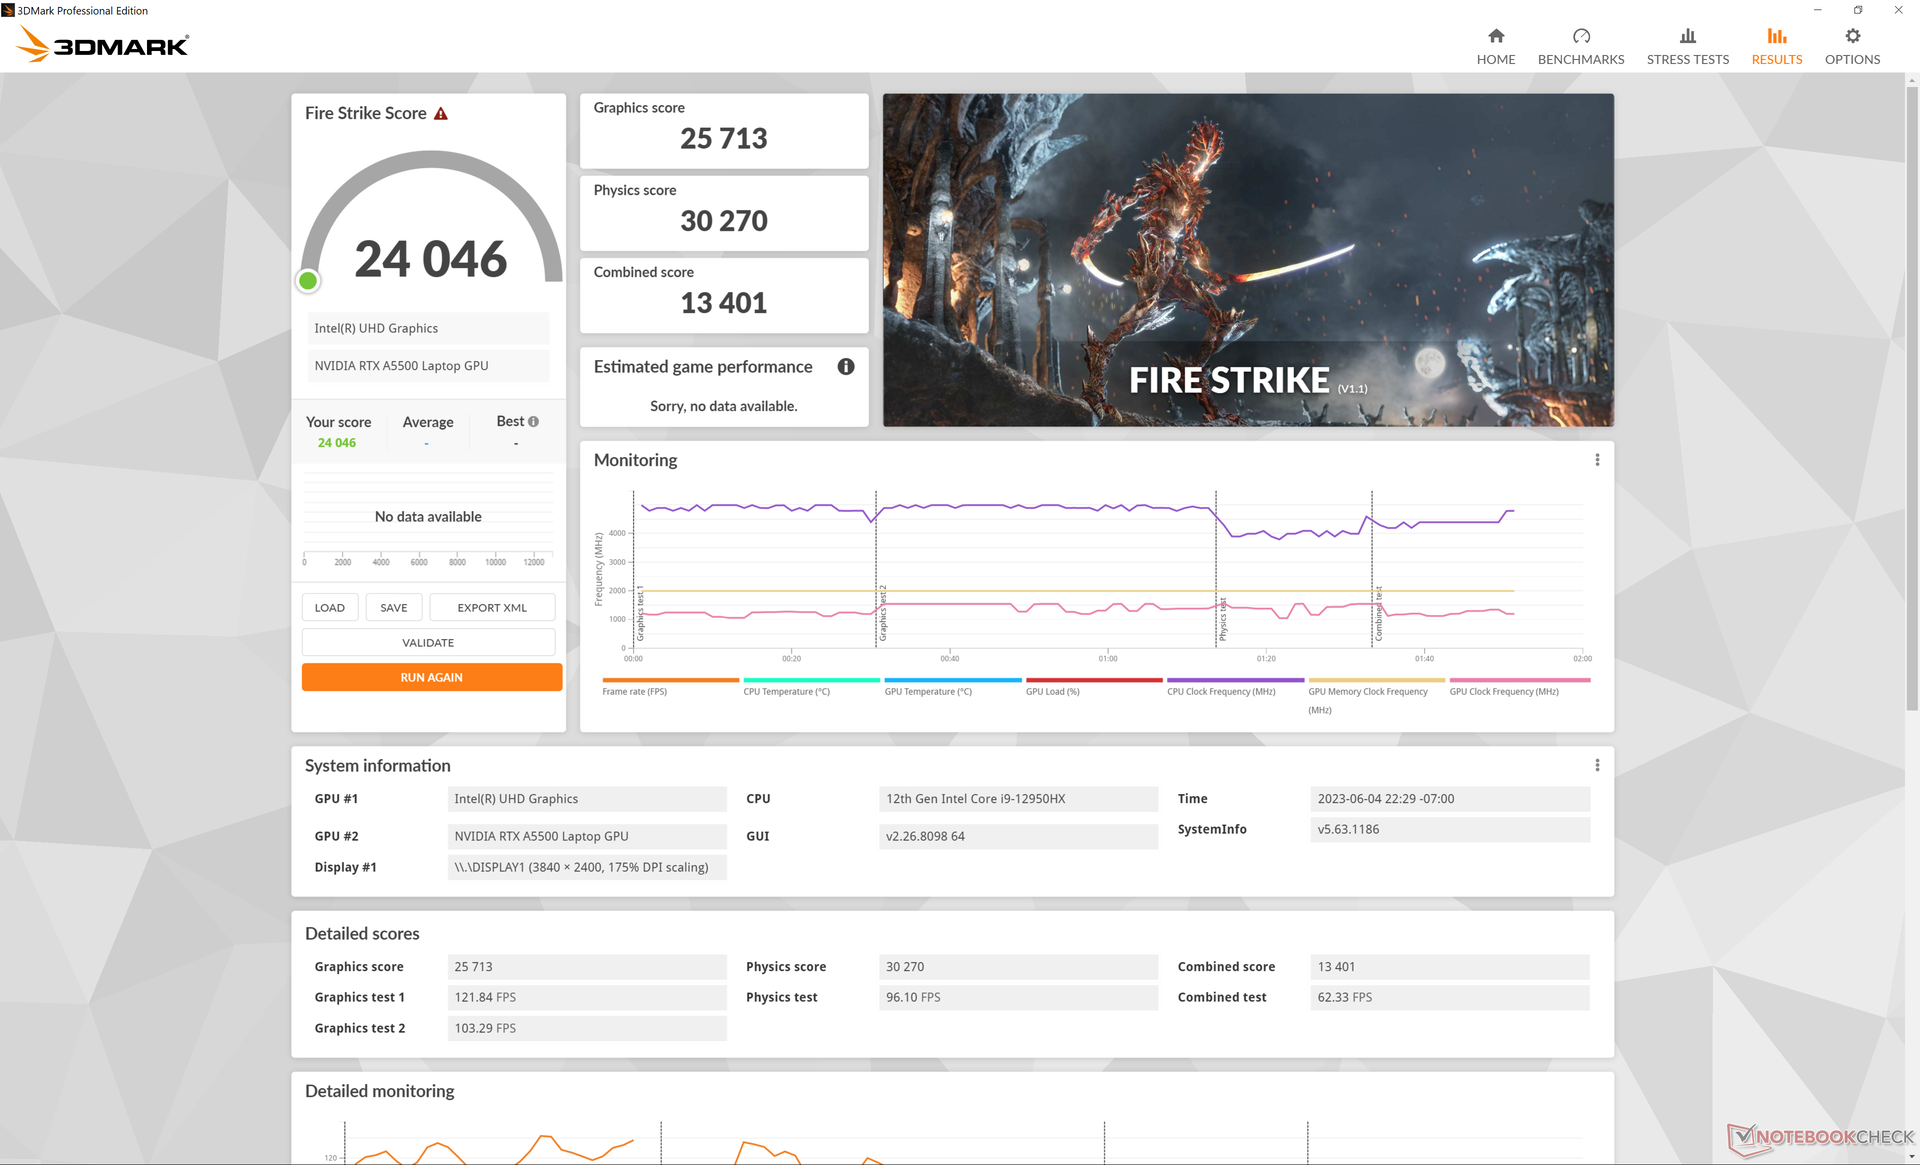
| 3DMark Fire Strike Score | 24046 puntos | |
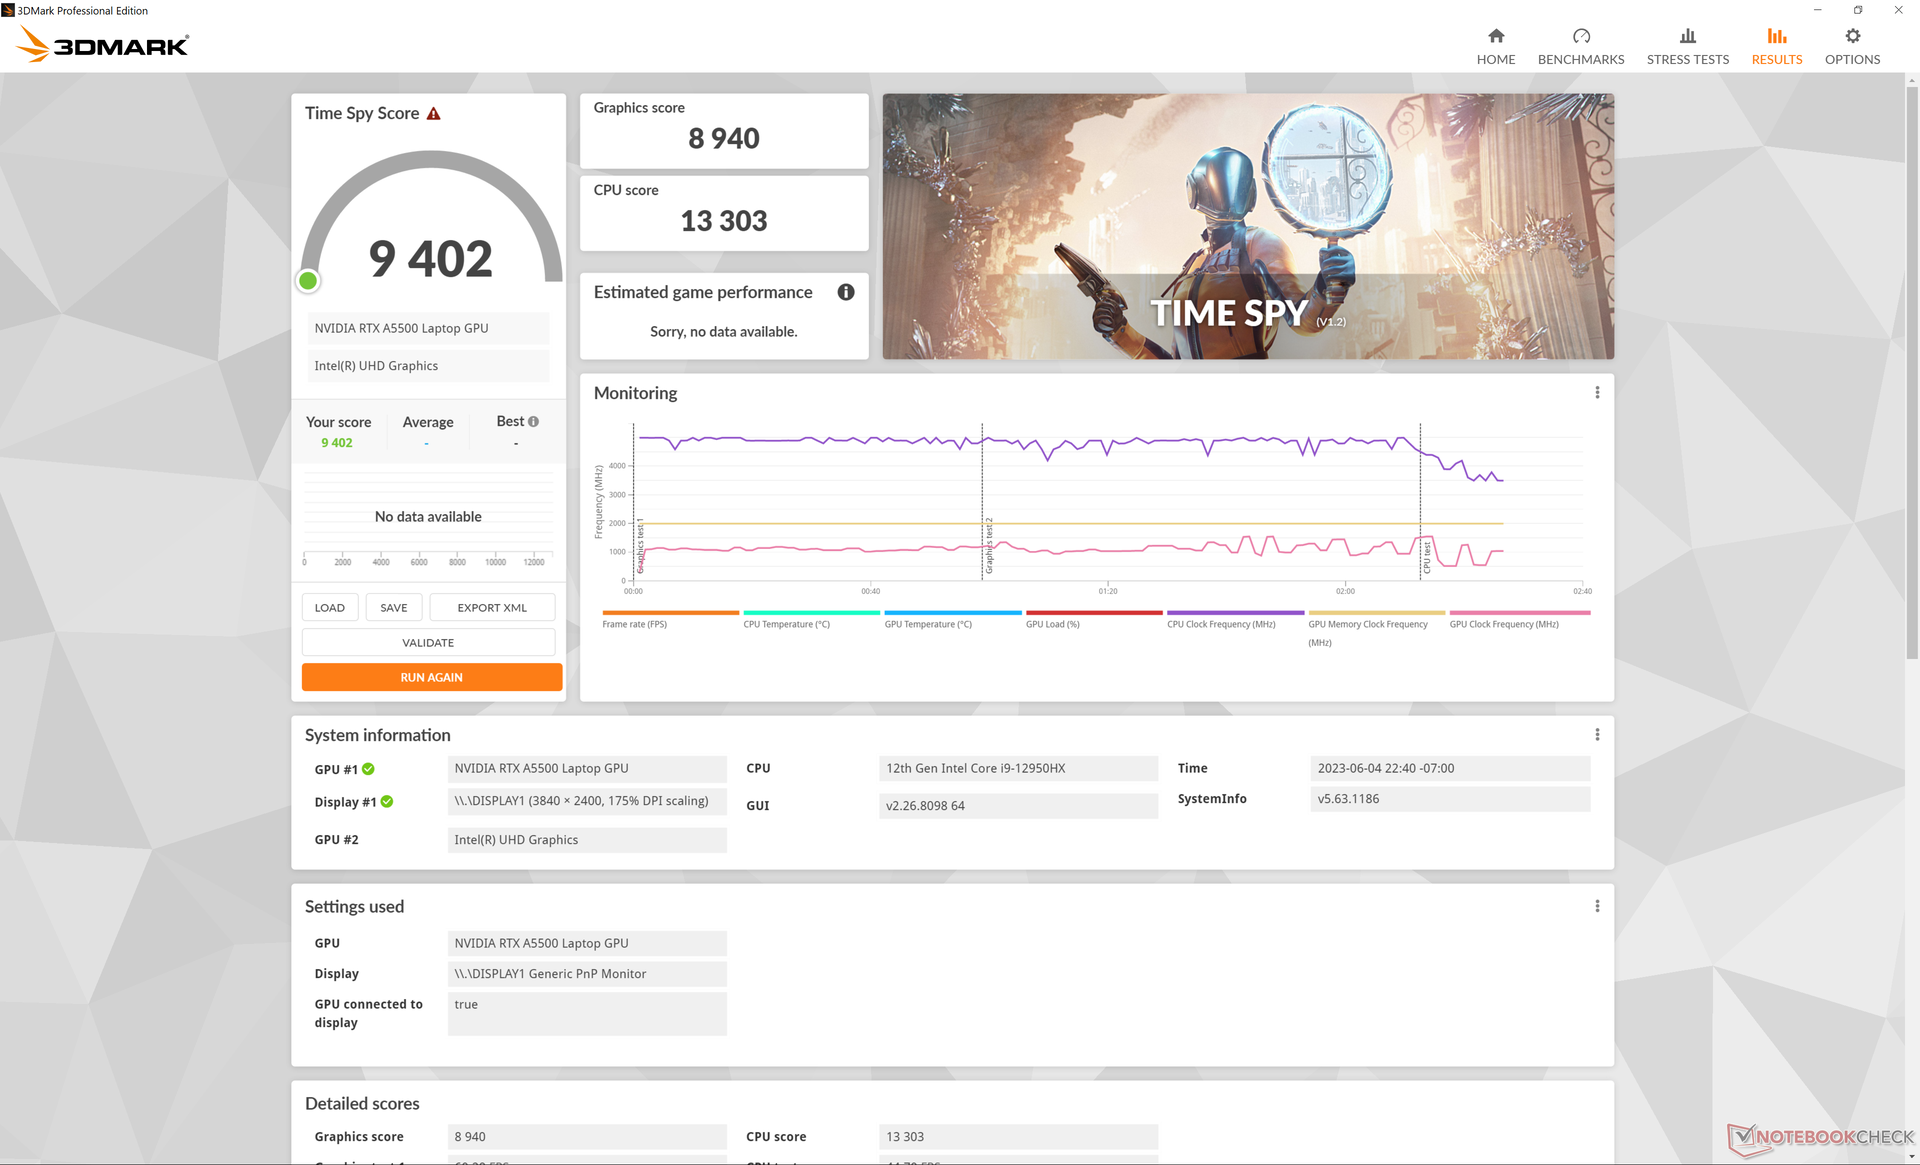
| 3DMark Time Spy Score | 9402 puntos | |
ayuda | ||
* ... más pequeño es mejor
Rendimiento en juegos
Aunque no es una GPU para juegos, la RTX A5500 es más que capaz de jugar a los últimos títulos a altas resoluciones y ajustes. Los usuarios pueden esperar un rendimiento de juego a la par con la móvil GeForce RTX 4070.
| Tiny Tina's Wonderlands | |
| 1920x1080 Low Preset (DX12) | |
| Lenovo Legion Pro 5 16IRX8 | |
| HP ZBook Fury 16 G9 | |
| Medio NVIDIA RTX A5500 Laptop GPU (n=1) | |
| Dell XPS 17 9730 RTX 4070 | |
| 1920x1080 Medium Preset (DX12) | |
| Lenovo Legion Pro 5 16IRX8 | |
| HP ZBook Fury 16 G9 | |
| Medio NVIDIA RTX A5500 Laptop GPU (n=1) | |
| Dell XPS 17 9730 RTX 4070 | |
| 1920x1080 High Preset (DX12) | |
| Lenovo Legion Pro 5 16IRX8 | |
| HP ZBook Fury 16 G9 | |
| Medio NVIDIA RTX A5500 Laptop GPU (n=1) | |
| Dell XPS 17 9730 RTX 4070 | |
| 1920x1080 Badass Preset (DX12) | |
| Asus Zephyrus Duo 16 GX650PY-NM006W | |
| Lenovo Legion Pro 5 16IRX8 | |
| HP ZBook Fury 16 G9 | |
| Medio NVIDIA RTX A5500 Laptop GPU (n=1) | |
| Dell XPS 17 9730 RTX 4070 | |
| 2560x1440 Badass Preset (DX12) | |
| Asus Zephyrus Duo 16 GX650PY-NM006W | |
| Lenovo Legion Pro 5 16IRX8 | |
| HP ZBook Fury 16 G9 | |
| Medio NVIDIA RTX A5500 Laptop GPU (n=1) | |
| Dell XPS 17 9730 RTX 4070 | |
| 3840x2160 Badass Preset (DX12) | |
| Lenovo Legion Pro 5 16IRX8 | |
| HP ZBook Fury 16 G9 | |
| Medio NVIDIA RTX A5500 Laptop GPU (n=1) | |
| Dell XPS 17 9730 RTX 4070 | |
Witcher 3 FPS Chart
| bajo | medio | alto | ultra | QHD | 4K | |
|---|---|---|---|---|---|---|
| GTA V (2015) | 185.4 | 182.7 | 170.7 | 118.5 | 97.5 | 97.1 |
| The Witcher 3 (2015) | 447 | 308.5 | 169.3 | 92.8 | 62.2 | |
| Dota 2 Reborn (2015) | 191.3 | 173.1 | 162.4 | 150.7 | 116.1 | |
| Final Fantasy XV Benchmark (2018) | 180.1 | 131.6 | 103.5 | 75.1 | 39.4 | |
| X-Plane 11.11 (2018) | 151.3 | 130.9 | 103.6 | 81.9 | ||
| Strange Brigade (2018) | 447 | 235 | 190.2 | 168.6 | 122 | 67.6 |
| Cyberpunk 2077 1.6 (2022) | 128.7 | 114.4 | 87.6 | 69.8 | 41.4 | 18.1 |
| Tiny Tina's Wonderlands (2022) | 193.7 | 158.6 | 109.5 | 87.5 | 57.9 | 29.6 |
| F1 22 (2022) | 224 | 209 | 170.2 | 60.9 | 37.2 | 17.6 |
| Returnal (2023) | 70 | 68 | 64 | 59 | 42 | 20 |
Emisiones - Silencio a baja carga
Ruido del sistema
El ruido del ventilador es silencioso cuando funciona con cargas poco exigentes. Tiende a rondar entre los 29 dB(A) y los 35 dB(A) durante cargas bajas o medias-bajas, lo que es apenas audible en la mayoría de entornos de oficina.
Si se ejecutan cargas más exigentes, como juegos, el ruido máximo del ventilador puede situarse justo por debajo de los 50 dB(A), lo que se acerca a lo que registramos en el ThinkPad P16 G1 o en Precision 7670. No obstante, elThinkPad P16 G1 es capaz de permanecer más silencioso durante periodos más largos. Cuando ejecutamos 3DMark 06, por ejemplo, el ruido del ventilador de nuestro HP alcanzó los 36 dB(A) hacia el final de la primera escena del benchmark comparado con los 29 dB(A) del Lenovo.
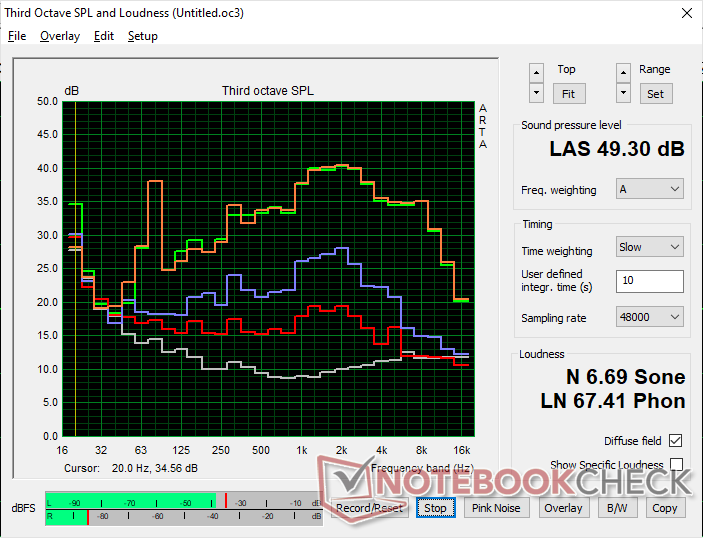
Ruido
| Ocioso |
| 22.7 / 22.7 / 28.8 dB(A) |
| Carga |
| 36.2 / 49.3 dB(A) |
 | ||
30 dB silencioso 40 dB(A) audible 50 dB(A) ruidosamente alto |
||
min: | ||
| HP ZBook Fury 16 G9 RTX A5500 Laptop GPU, i9-12950HX, Micron 3400 1TB MTFDKBA1T0TFH | HP ZBook Studio 16 G9 62U04EA RTX A2000 Laptop GPU, i7-12800H, Micron 3400 1TB MTFDKBA1T0TFH | HP ZBook Firefly 16 G9-6B897EA T550 Laptop GPU, i7-1265U, Samsung PM9A1 MZVL21T0HCLR | Lenovo ThinkPad P16 G1 RTX A5500 RTX A5500 Laptop GPU, i9-12950HX, WDC PC SN810 2TB | Dell Precision 7000 7670 Performance RTX A5500 Laptop GPU, i9-12950HX | MSI CreatorPro Z16P B12UKST RTX A3000 Laptop GPU, i7-12700H, Samsung PM9A1 MZVL21T0HCLR | |
|---|---|---|---|---|---|---|
| Noise | -4% | 4% | 4% | -9% | -6% | |
| apagado / medio ambiente * (dB) | 22.6 | 24 -6% | 23.8 -5% | 23.1 -2% | 23.9 -6% | 24.1 -7% |
| Idle Minimum * (dB) | 22.7 | 24 -6% | 23.8 -5% | 23.1 -2% | 24 -6% | 27.1 -19% |
| Idle Average * (dB) | 22.7 | 27.7 -22% | 23.8 -5% | 23.1 -2% | 24 -6% | 27.1 -19% |
| Idle Maximum * (dB) | 28.8 | 27.7 4% | 23.8 17% | 23.1 20% | 38 -32% | 27.1 6% |
| Load Average * (dB) | 36.2 | 39.8 -10% | 39.4 -9% | 28.9 20% | 46.3 -28% | 42.9 -19% |
| Witcher 3 ultra * (dB) | 49.5 | 44.3 11% | 40.5 18% | 51.6 -4% | 41.9 15% | 44 11% |
| Load Maximum * (dB) | 49.3 | 47.7 3% | 41.4 16% | 51.4 -4% | 47.9 3% | 47 5% |
* ... más pequeño es mejor
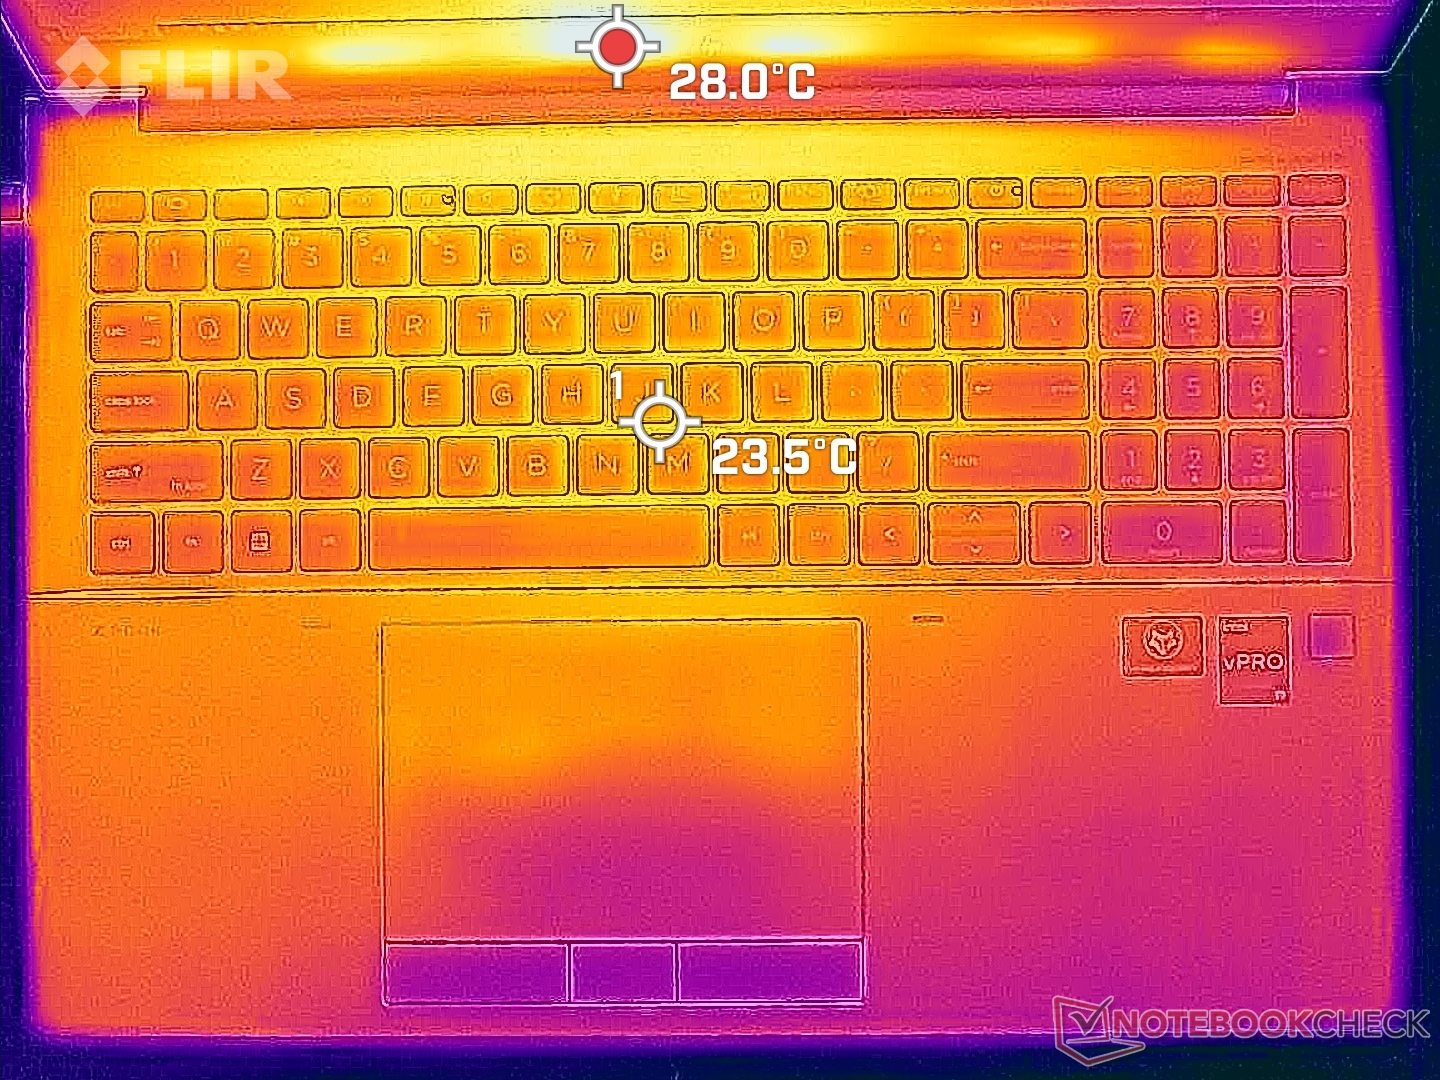
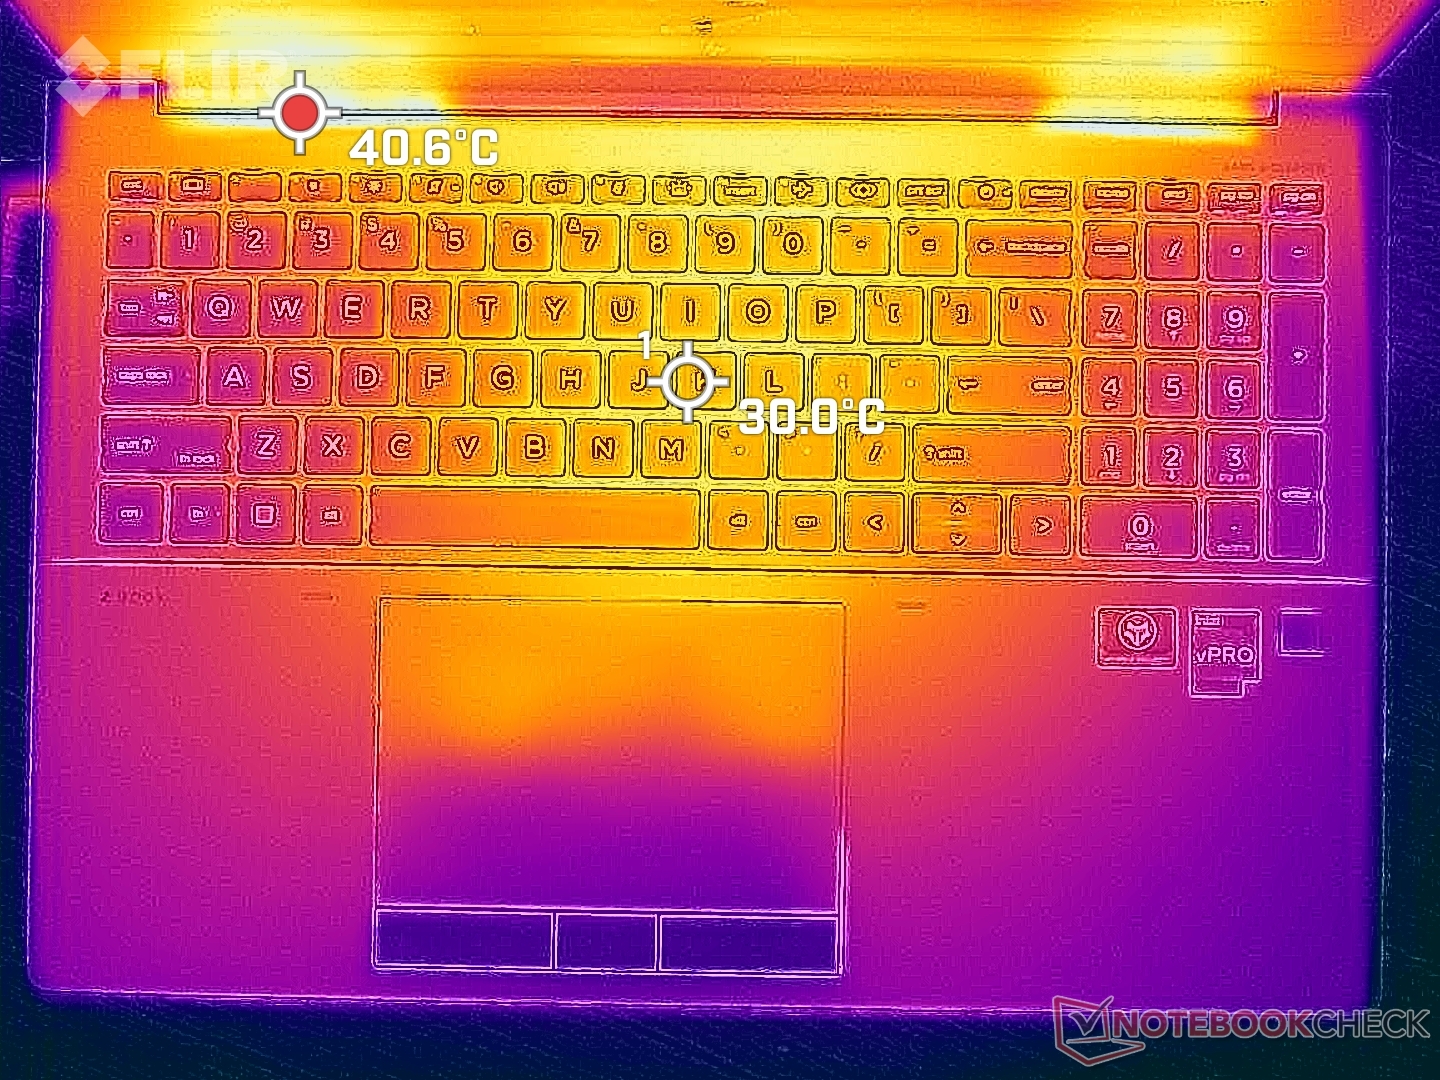
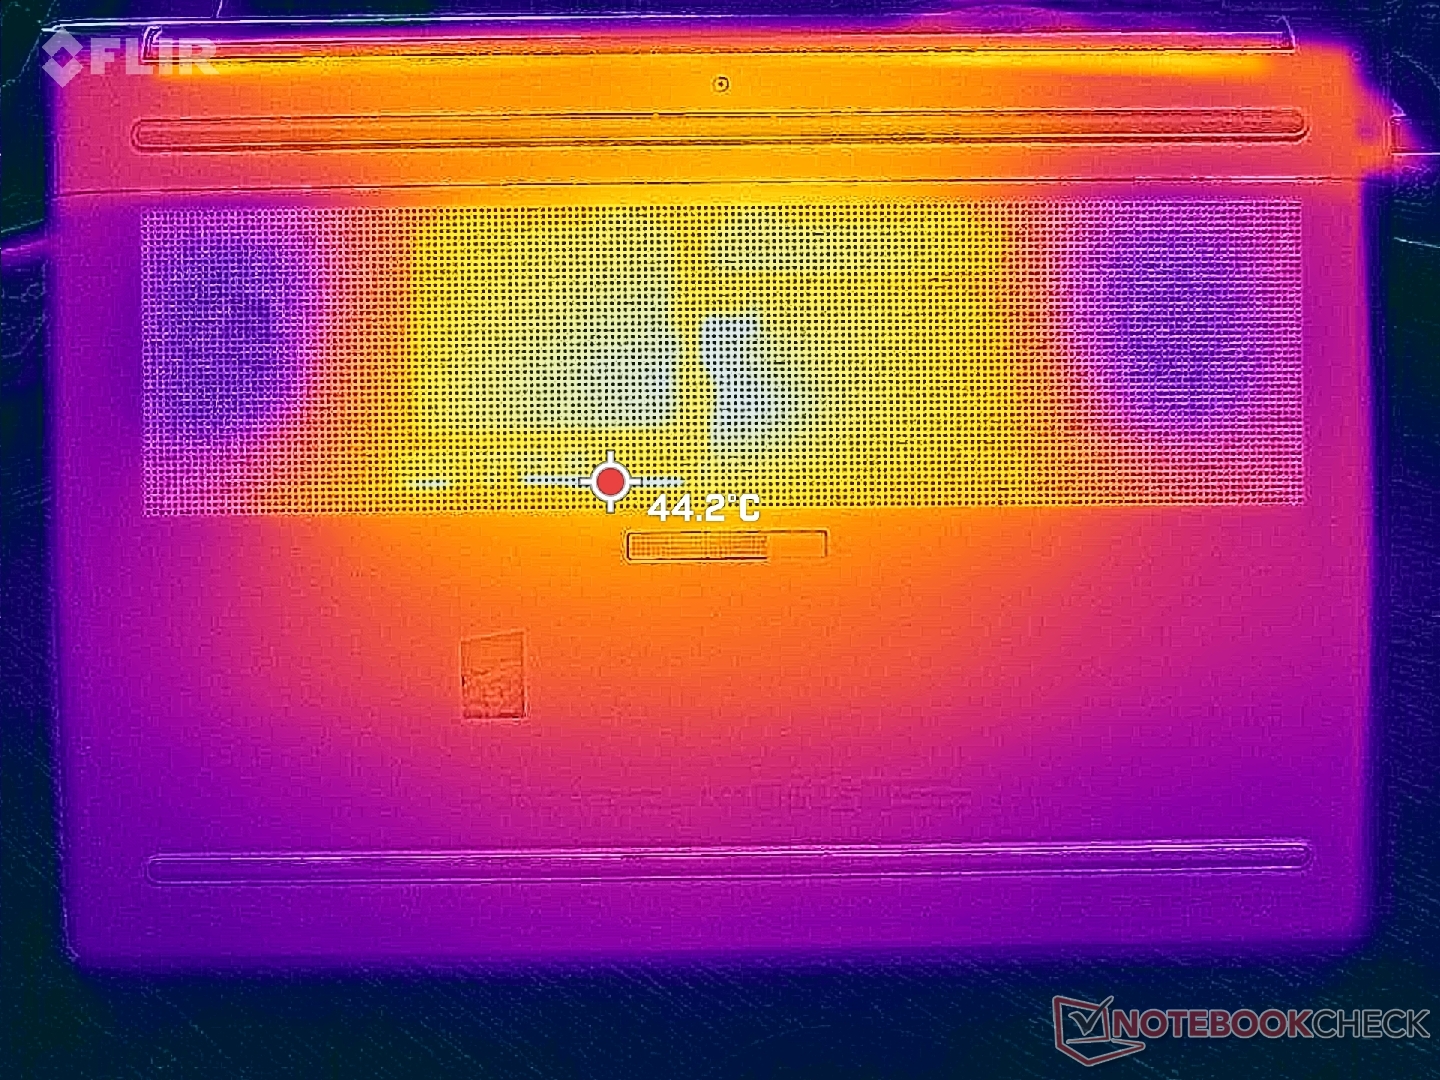
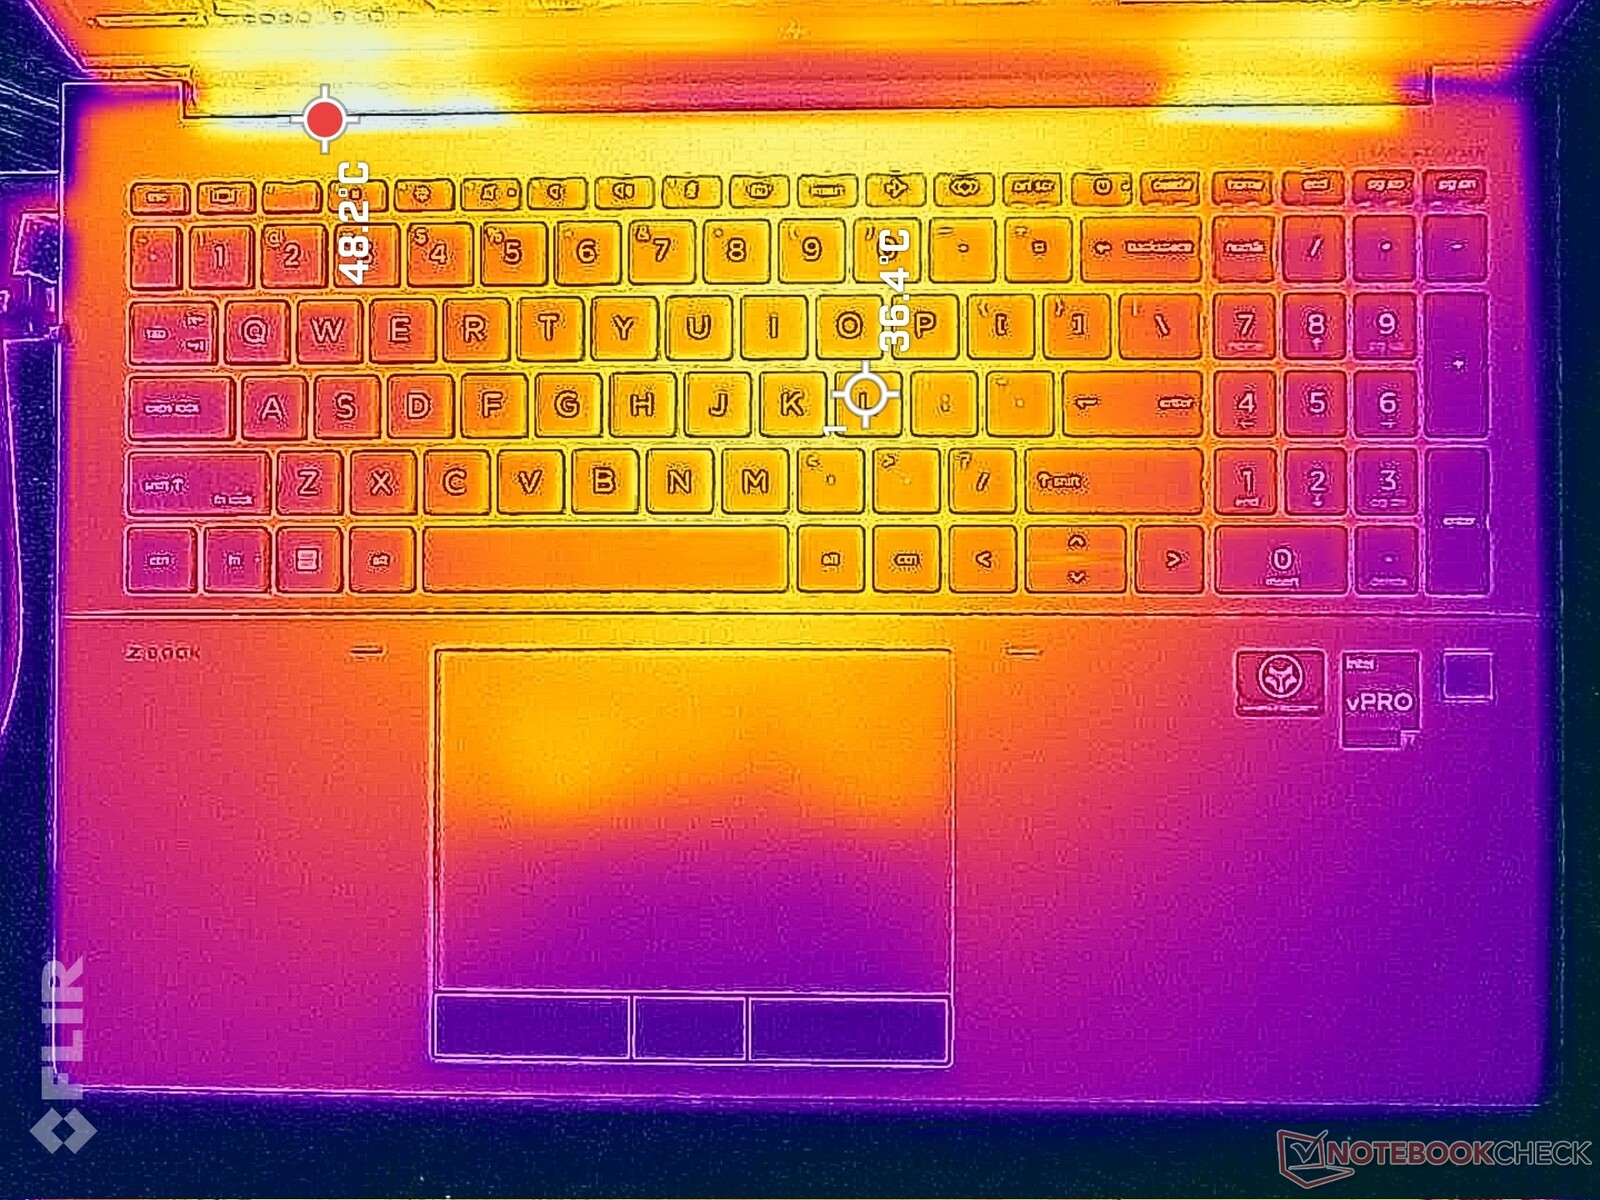
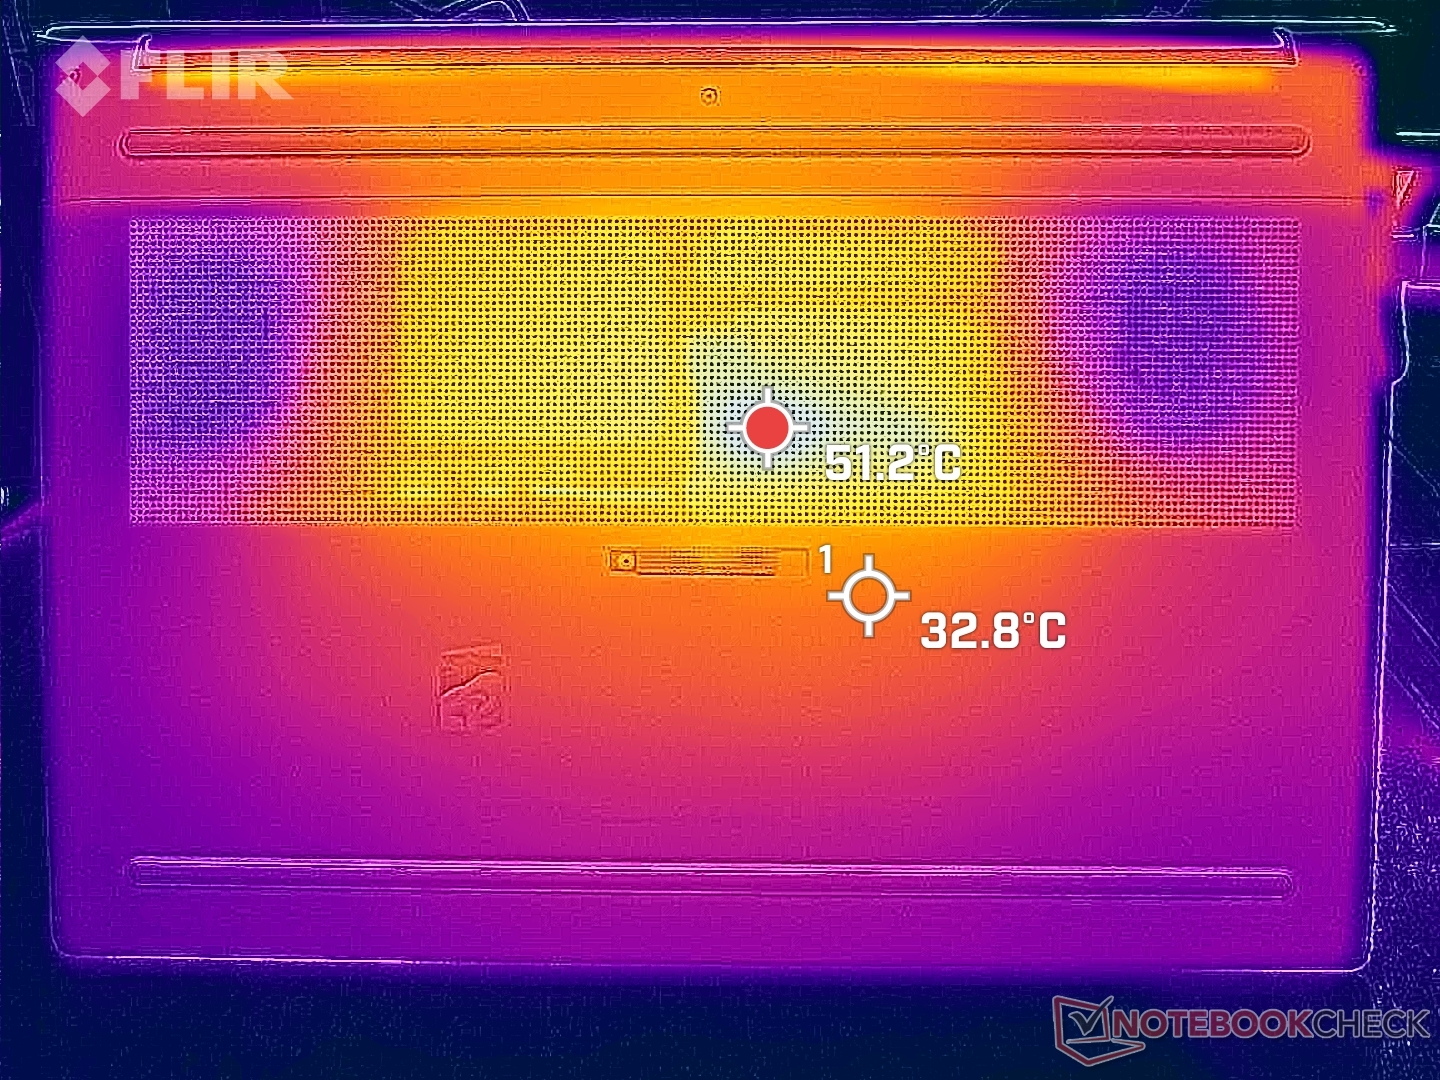
Temperatura - Reposamanos caliente bajo carga
La temperatura de la superficie tiende a ser más cálida hacia el centro del teclado, donde puede alcanzar más de 36 C cuando se somete a cargas de procesado extremas. El desarrollo de temperatura es más simétrico que en el Precision 7670 o el ThinkPad P16, pero el touchpad y los reposamanos pueden calentarse más de lo que nos gustaría. Al ejecutar cargas exigentes, por ejemplo, el touchpad del HP puede alcanzar más de 35 C comparado con los 30 C o menos de las alternativas Lenovo y Dell antes mencionadas.
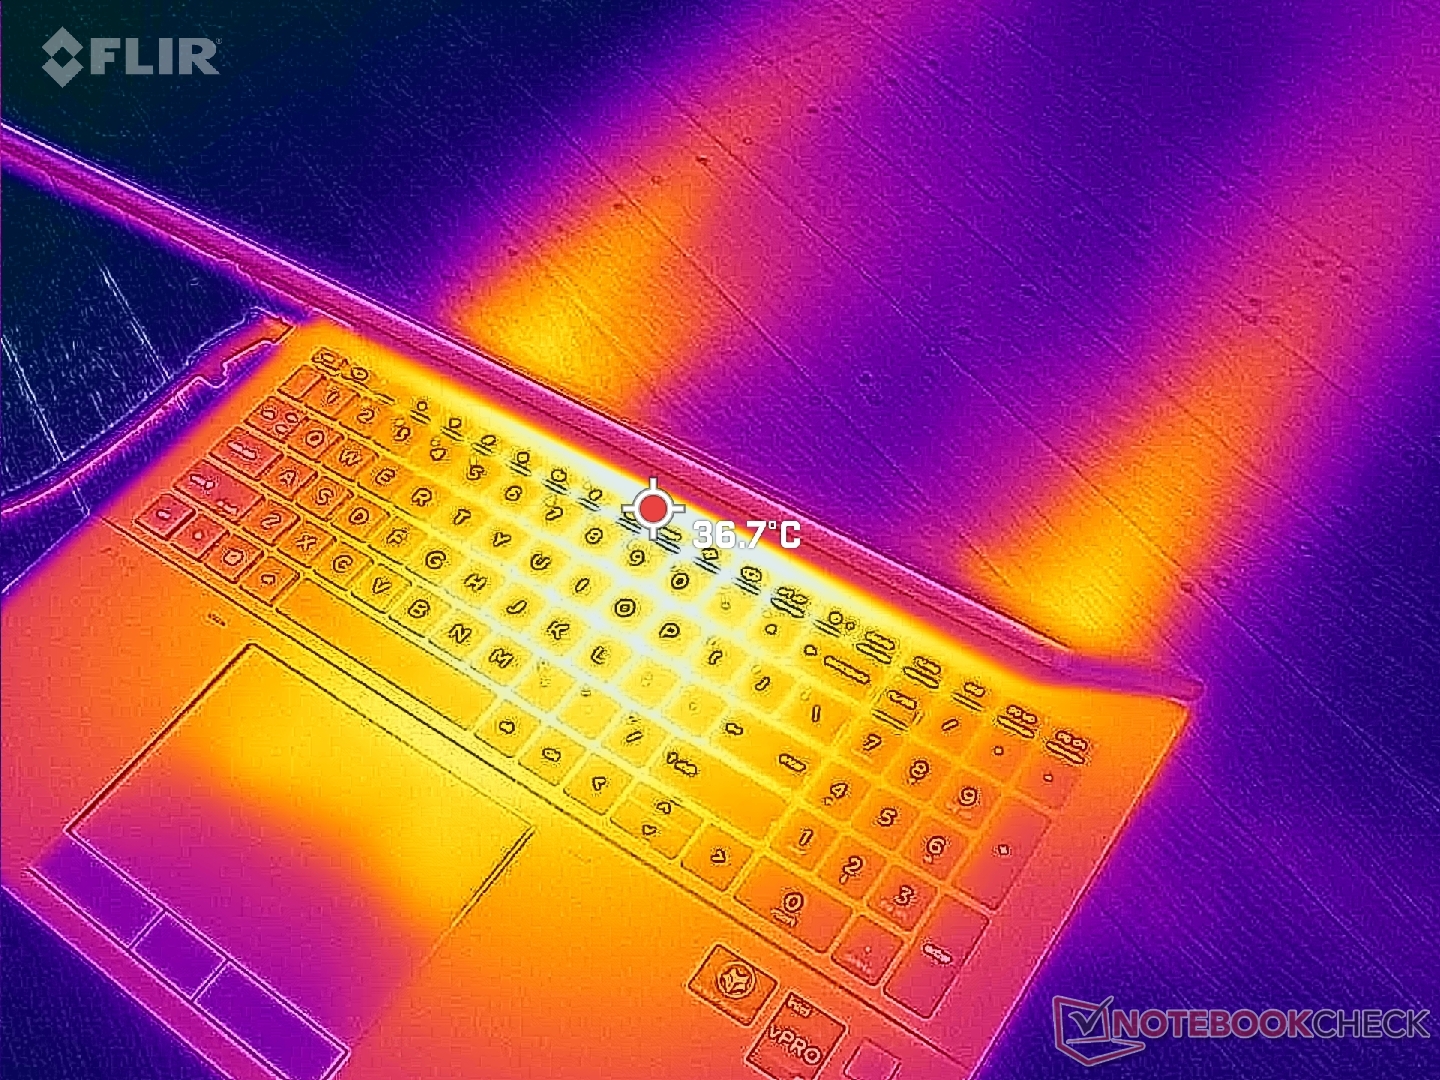
(±) La temperatura máxima en la parte superior es de 43.2 °C / 110 F, frente a la media de 38.2 °C / 101 F, que oscila entre 22.2 y 69.8 °C para la clase Workstation.
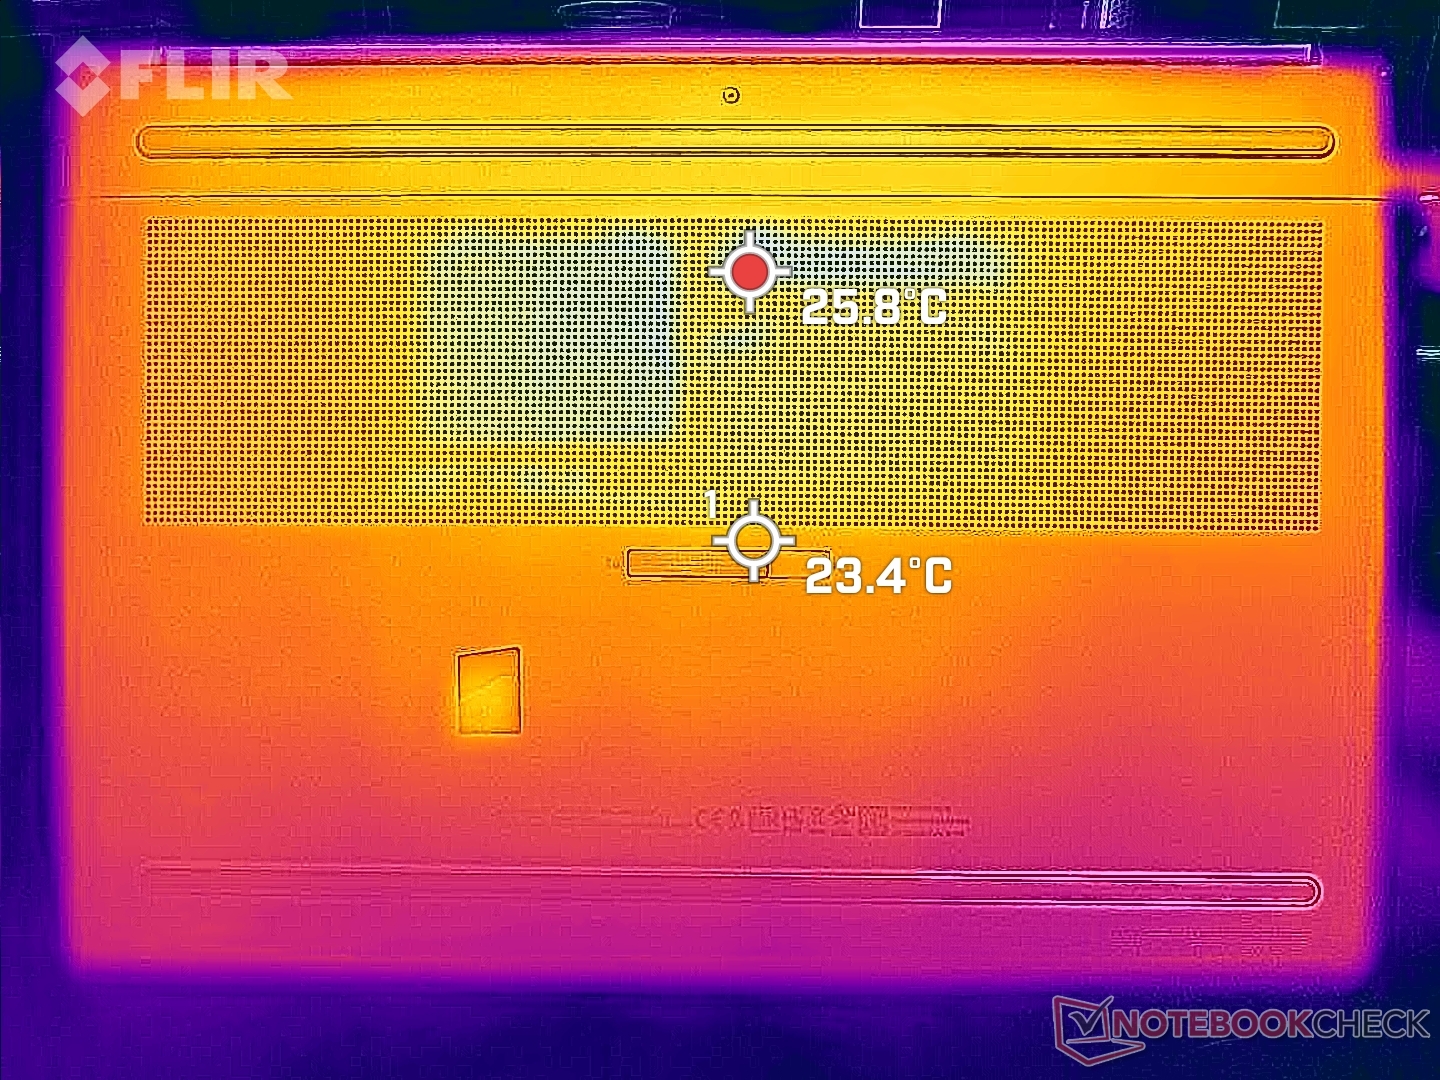
(-) El fondo se calienta hasta un máximo de 50.4 °C / 123 F, frente a la media de 41.1 °C / 106 F
(+) En reposo, la temperatura media de la parte superior es de 27.1 °C / 81# F, frente a la media del dispositivo de 32 °C / 90 F.
(±) Jugando a The Witcher 3, la temperatura media de la parte superior es de 34 °C / 93 F, frente a la media del dispositivo de 32 °C / 90 F.
(+) Los reposamanos y el panel táctil alcanzan como máximo la temperatura de la piel (35.6 °C / 96.1 F) y, por tanto, no están calientes.
(-) La temperatura media de la zona del reposamanos de dispositivos similares fue de 27.8 °C / 82 F (-7.8 °C / -14.1 F).
| HP ZBook Fury 16 G9 Intel Core i9-12950HX, NVIDIA RTX A5500 Laptop GPU | HP ZBook Studio 16 G9 62U04EA Intel Core i7-12800H, NVIDIA RTX A2000 Laptop GPU | HP ZBook Firefly 16 G9-6B897EA Intel Core i7-1265U, NVIDIA T550 Laptop GPU | Lenovo ThinkPad P16 G1 RTX A5500 Intel Core i9-12950HX, NVIDIA RTX A5500 Laptop GPU | Dell Precision 7000 7670 Performance Intel Core i9-12950HX, NVIDIA RTX A5500 Laptop GPU | MSI CreatorPro Z16P B12UKST Intel Core i7-12700H, NVIDIA RTX A3000 Laptop GPU | |
|---|---|---|---|---|---|---|
| Heat | -1% | -4% | -12% | -15% | -12% | |
| Maximum Upper Side * (°C) | 43.2 | 38.7 10% | 42.1 3% | 44.8 -4% | 53 -23% | 56.3 -30% |
| Maximum Bottom * (°C) | 50.4 | 53.4 -6% | 48 5% | 49.8 1% | 43.2 14% | 68.3 -36% |
| Idle Upper Side * (°C) | 28.6 | 27.3 5% | 29.9 -5% | 30.6 -7% | 36.8 -29% | 25.2 12% |
| Idle Bottom * (°C) | 28.2 | 31.6 -12% | 32.9 -17% | 38.6 -37% | 33.8 -20% | 25.9 8% |
* ... más pequeño es mejor
Prueba de resistencia
Cuando se ejecuta Prime95 para estresar la CPU, las velocidades de reloj y el consumo de energía de la placa se disparan a 3,1 GHz y 96 W, respectivamente, durante sólo un par de minutos o hasta que la temperatura del núcleo alcanza los 89 C. A partir de entonces, la CPU cae aún más antes de estabilizarse en 2,4 GHz, 76 C y 71 W. Repitiendo esta prueba en el ThinkPad P16 G1 con exactamente el mismo Core i9-12950HX Resultaría en una frecuencia estable superior (3.0 GHz) y un consumo de energía (81 W) a costa de una temperatura del núcleo mucho mayor (100 C). HP está adoptando un enfoque más reservado a este respecto, lo que concuerda con nuestros resultados CineBench anteriores.
Si se ejecuta Witcher 3 para representar una carga gráfica alta resultaría en una velocidad de reloj de GPU estable, temperatura, y consumo de energía de la placa de 1297 MHz, 70 C, y 92 W, respectivamente. La repetición de esta prueba en el ThinkPad P16 G1 daría como resultado valores estables más altos en toda la placa: 1477 MHz, 78 C y 129 W. El reloj de memoria de la GPU también sería más alto en el ThinkPad.
Funcionar con batería limita el rendimiento incluso en el perfil Rendimiento. Un test Fire Strike a pilas devolvería puntuaciones de Física y Gráficos de 22837 y 5625 puntos, respectivamente, comparados con 30270 y 25713 puntos cuando está enchufado.
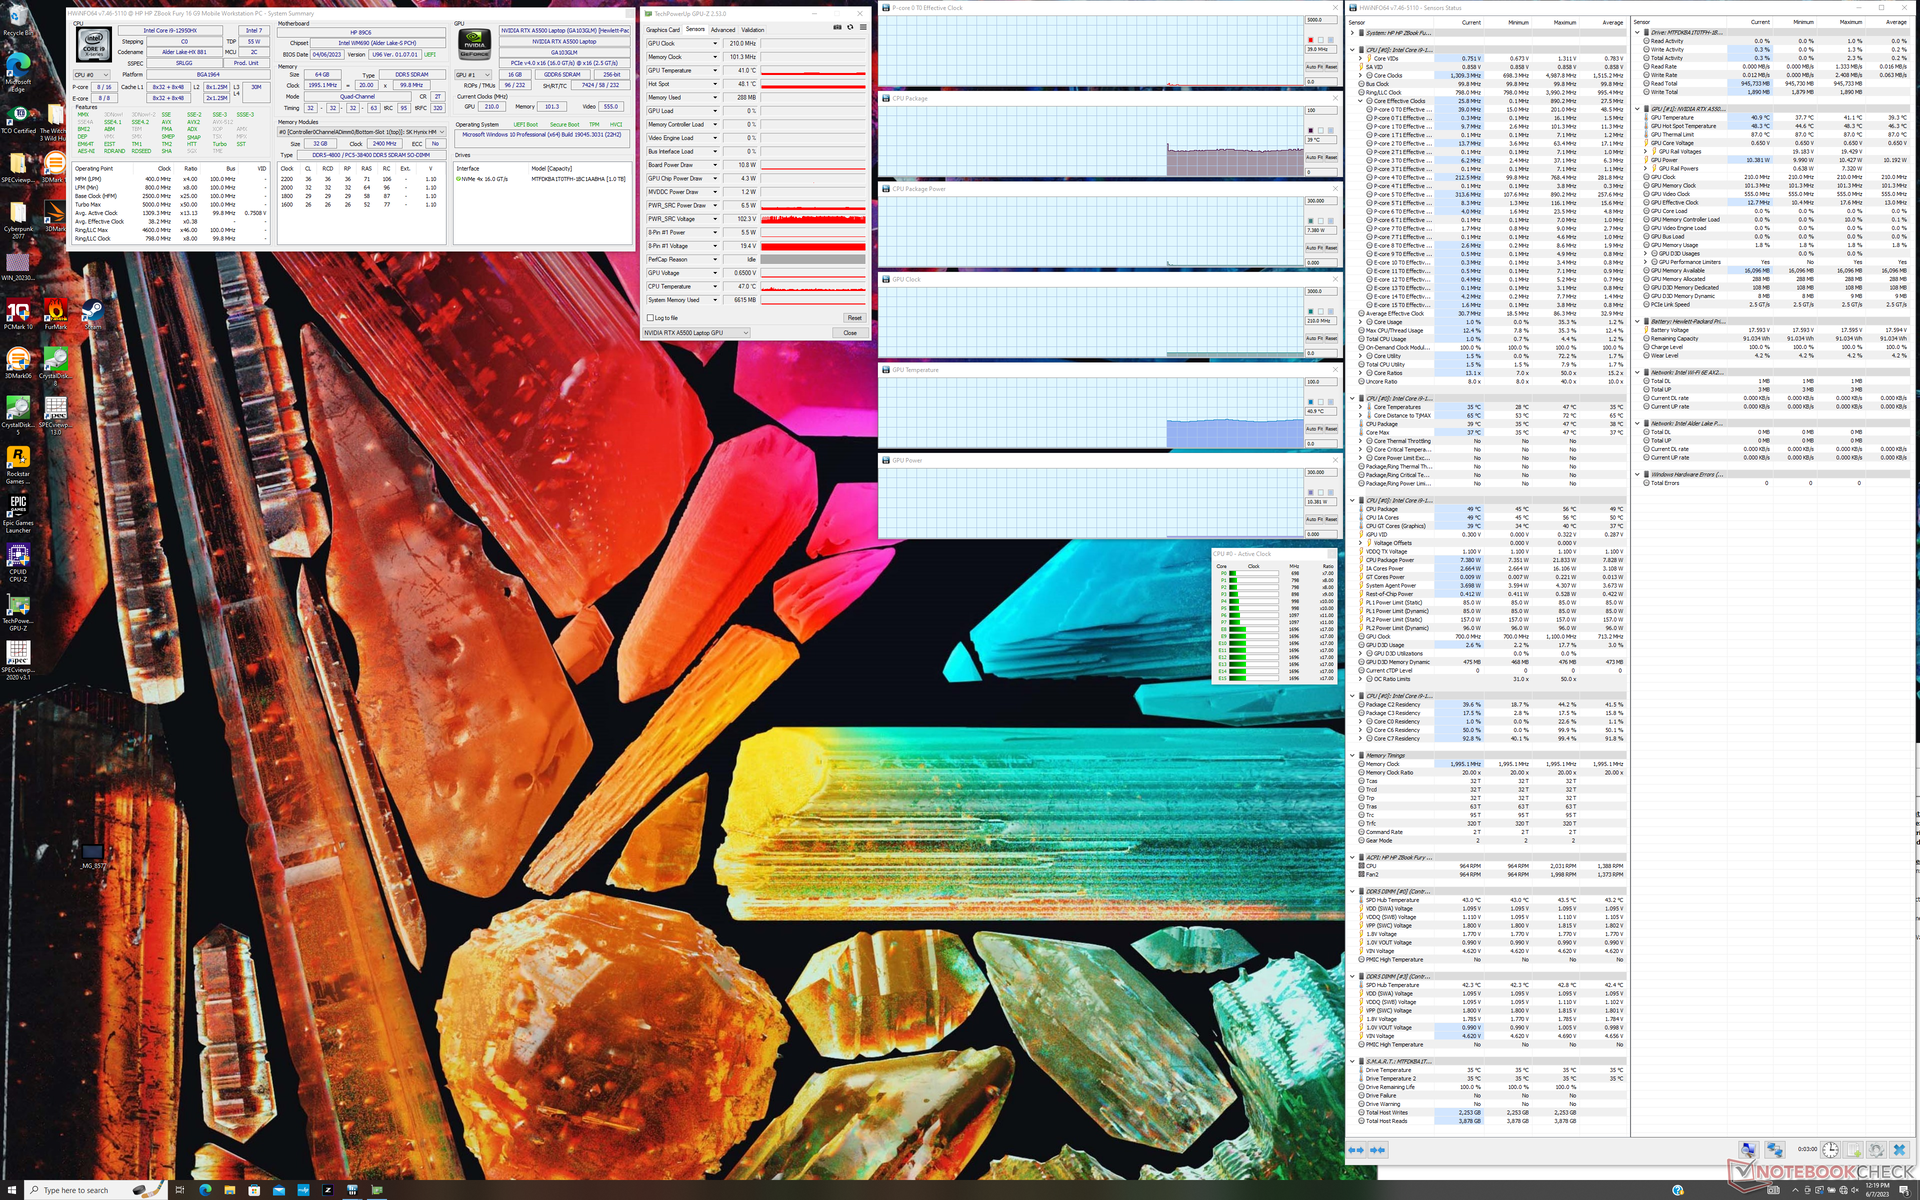
| RelojCPU (GHz) | Reloj GPU (MHz) | Temperatura mediaCPU (°C) | Temperatura media GPU (°C) | |
| Sistema en reposo | -- | -- | 39 | 41 |
| Prime95 Stress | 2,5 - 2,7 | -- | 76 | 52 |
| Prime95+ FurMark Estrés | 2,2 - 2,3 | 547 - 1200 | 74 | 66 |
| Witcher 3 Tensión | ~1,4 | 1297 | 87 | 70 |
Altavoces
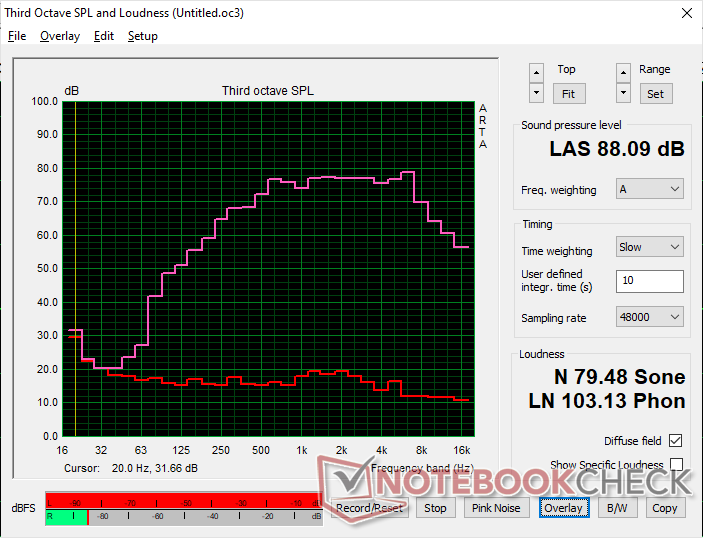
HP ZBook Fury 16 G9 análisis de audio
(+) | los altavoces pueden reproducir a un volumen relativamente alto (#88.1 dB)
Graves 100 - 315 Hz
(-) | casi sin bajos - de media 16.1% inferior a la mediana
(±) | la linealidad de los graves es media (7.5% delta a frecuencia anterior)
Medios 400 - 2000 Hz
(+) | medios equilibrados - a sólo 2.7% de la mediana
(+) | los medios son lineales (3.2% delta a la frecuencia anterior)
Altos 2 - 16 kHz
(+) | máximos equilibrados - a sólo 4.2% de la mediana
(+) | los máximos son lineales (4.9% delta a la frecuencia anterior)
Total 100 - 16.000 Hz
(+) | el sonido global es lineal (13.5% de diferencia con la mediana)
En comparación con la misma clase
» 26% de todos los dispositivos probados de esta clase eran mejores, 5% similares, 70% peores
» El mejor tuvo un delta de 7%, la media fue 17%, el peor fue ###max##%
En comparación con todos los dispositivos probados
» 14% de todos los dispositivos probados eran mejores, 4% similares, 82% peores
» El mejor tuvo un delta de 4%, la media fue 23%, el peor fue ###max##%
Apple MacBook Pro 16 2021 M1 Pro análisis de audio
(+) | los altavoces pueden reproducir a un volumen relativamente alto (#84.7 dB)
Graves 100 - 315 Hz
(+) | buen bajo - sólo 3.8% lejos de la mediana
(+) | el bajo es lineal (5.2% delta a la frecuencia anterior)
Medios 400 - 2000 Hz
(+) | medios equilibrados - a sólo 1.3% de la mediana
(+) | los medios son lineales (2.1% delta a la frecuencia anterior)
Altos 2 - 16 kHz
(+) | máximos equilibrados - a sólo 1.9% de la mediana
(+) | los máximos son lineales (2.7% delta a la frecuencia anterior)
Total 100 - 16.000 Hz
(+) | el sonido global es lineal (4.6% de diferencia con la mediana)
En comparación con la misma clase
» 0% de todos los dispositivos probados de esta clase eran mejores, 0% similares, 100% peores
» El mejor tuvo un delta de 5%, la media fue 17%, el peor fue ###max##%
En comparación con todos los dispositivos probados
» 0% de todos los dispositivos probados eran mejores, 0% similares, 100% peores
» El mejor tuvo un delta de 4%, la media fue 23%, el peor fue ###max##%
Gestión de la energía
Consumo de energía
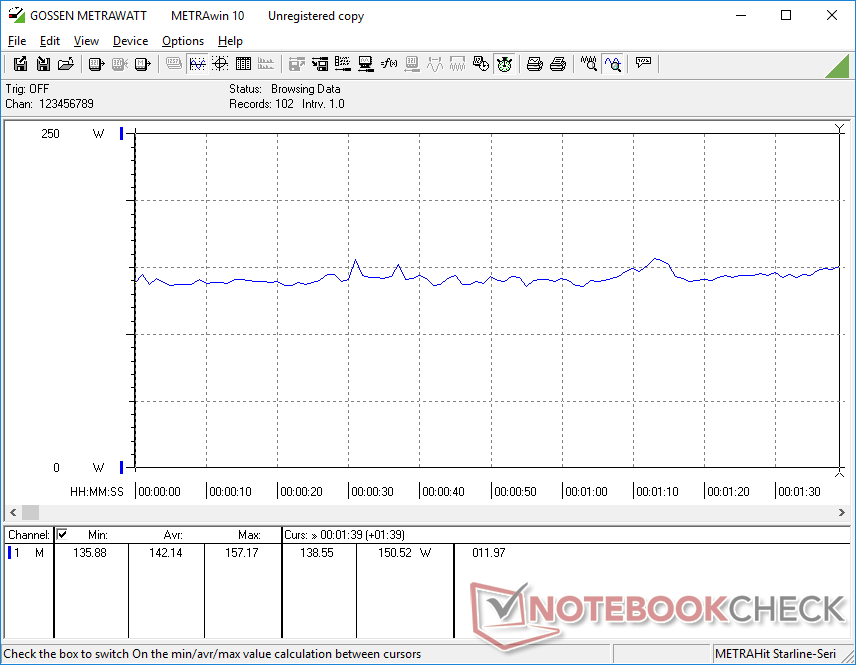
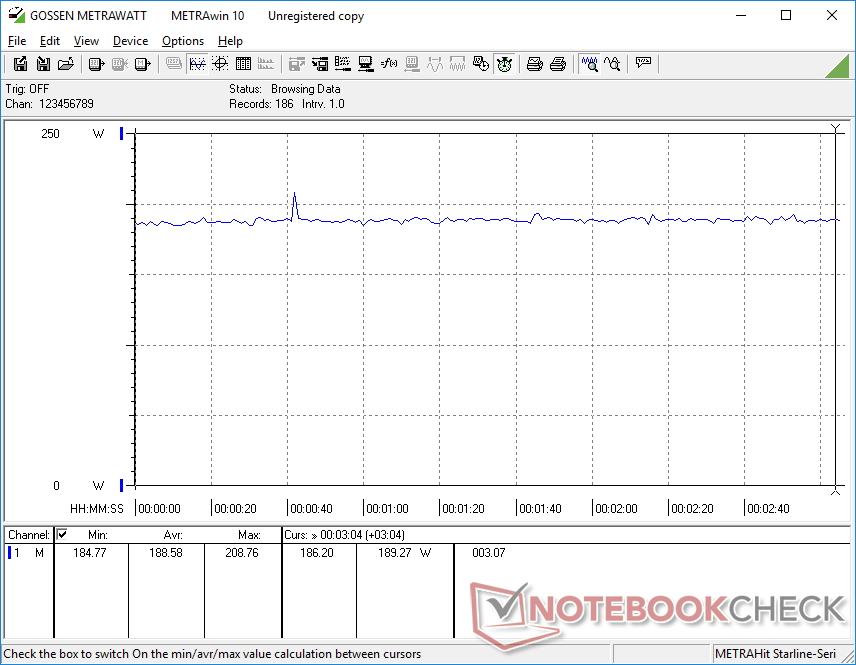
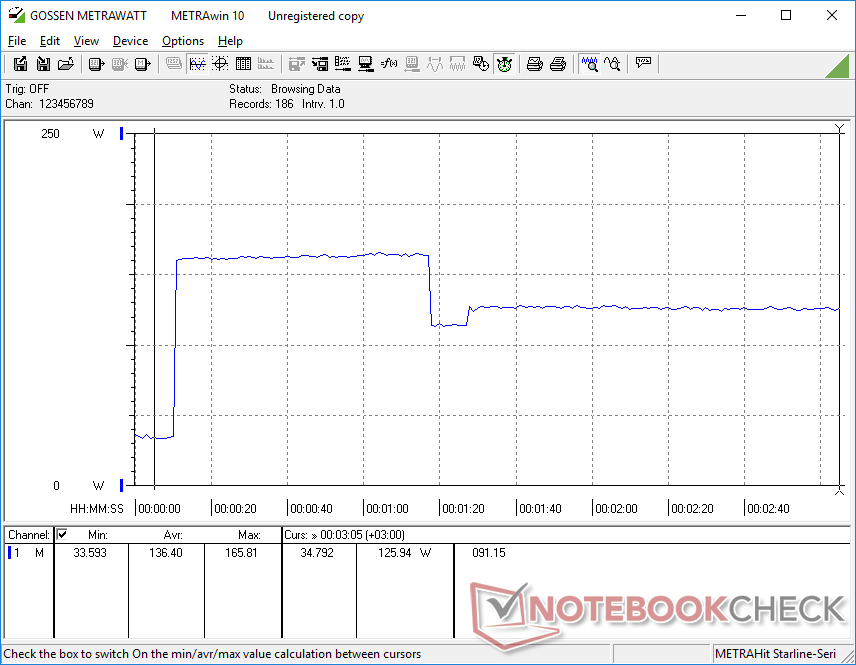
El consumo de energía es relativamente alto en todos los casos. Por ejemplo, con el escritorio en ralentí consume algo más de 19 W, incluso con el perfil de ahorro de energía y el brillo al mínimo, frente a los 7 W o 16 W del ThinkPad P16 G1 o Precision 7670, respectivamente. Con cargas más exigentes como Witcher 3 consumiría 189 W o casi 30 W más que en el Precision 7670 a pesar de que el Dell ofrece un rendimiento gráfico ligeramente superior.
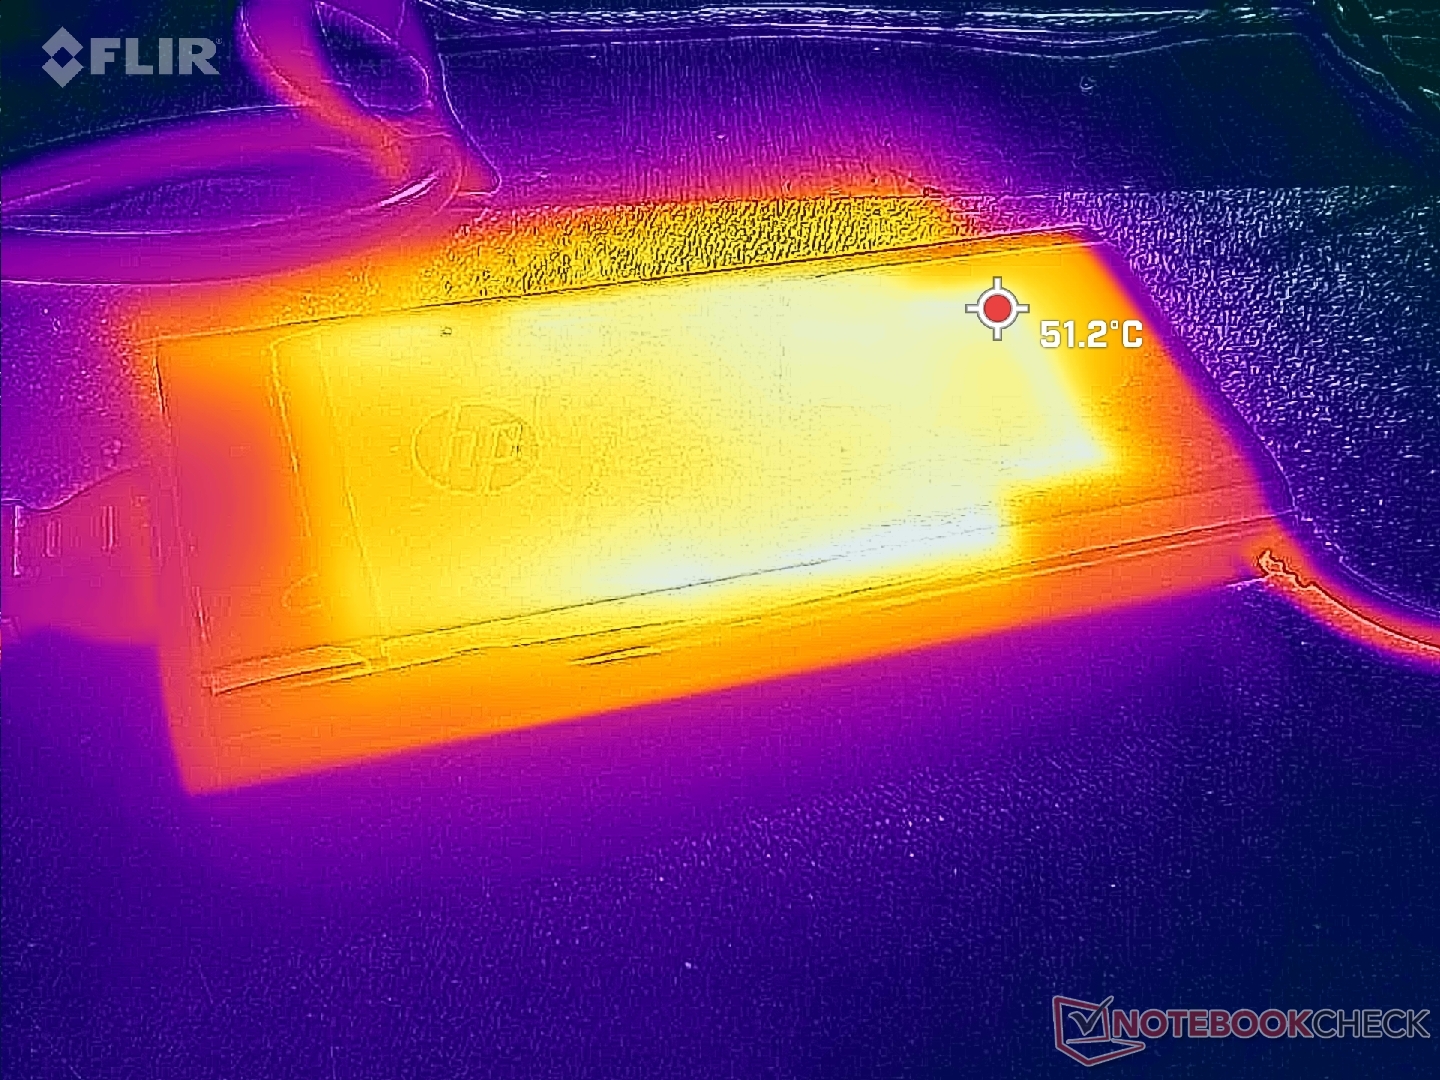
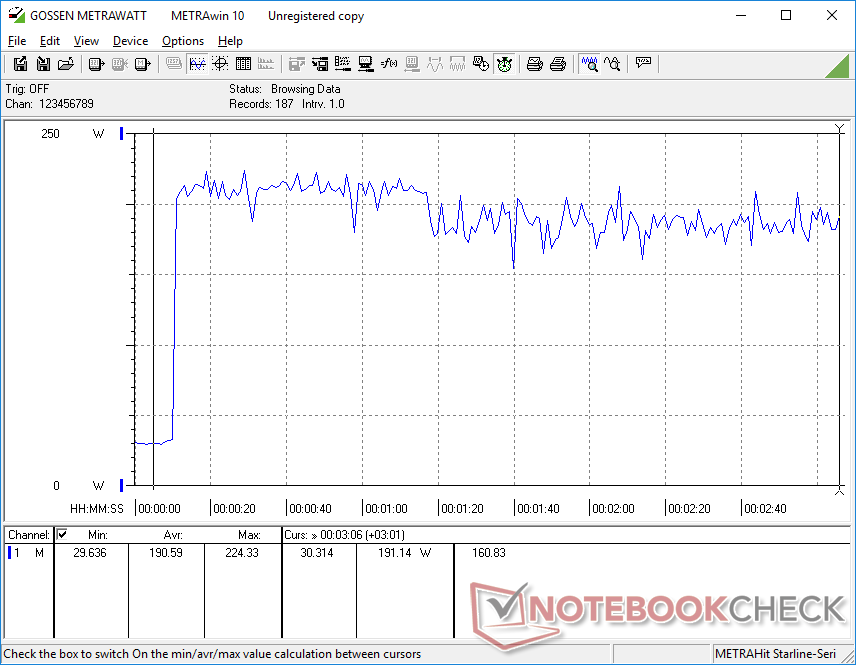
Podemos registrar un consumo máximo temporal de 224 W del adaptador de CA de 230 W de tamaño medio (~18 x 8.9 x 2.7 cm) cuando CPU y GPU están al 100% de uso. Por tanto, la carga se ralentizaría mucho si se ejecutaran cargas tan altas simultáneamente. Repitiendo esta prueba en el Precision 7670 o el ThinkPad P16 G1 se obtendrían niveles de consumo temporal mucho más altos, de unos 300 W cada uno, ya que tienen objetivos TGP/TDP más altos y, por tanto, techos Turbo Boost más altos.
| Off / Standby | |
| Ocioso | |
| Carga |
|
Clave:
min: | |
| HP ZBook Fury 16 G9 i9-12950HX, RTX A5500 Laptop GPU, Micron 3400 1TB MTFDKBA1T0TFH, IPS, 3840x2400, 16" | HP ZBook Studio 16 G9 62U04EA i7-12800H, RTX A2000 Laptop GPU, Micron 3400 1TB MTFDKBA1T0TFH, IPS, 3840x2400, 16" | HP ZBook Firefly 16 G9-6B897EA i7-1265U, T550 Laptop GPU, Samsung PM9A1 MZVL21T0HCLR, IPS, 1920x1200, 16" | Lenovo ThinkPad P16 G1 RTX A5500 i9-12950HX, RTX A5500 Laptop GPU, WDC PC SN810 2TB, IPS, 3840x2400, 16" | Dell Precision 7000 7670 Performance i9-12950HX, RTX A5500 Laptop GPU, , OLED, 3840x2400, 16" | MSI CreatorPro Z16P B12UKST i7-12700H, RTX A3000 Laptop GPU, Samsung PM9A1 MZVL21T0HCLR, IPS, 2560x1600, 16" | |
|---|---|---|---|---|---|---|
| Power Consumption | 40% | 71% | 10% | -8% | 35% | |
| Idle Minimum * (Watt) | 19.5 | 7.2 63% | 4.5 77% | 7.5 62% | 16.4 16% | 10.8 45% |
| Idle Average * (Watt) | 29 | 18.1 38% | 8 72% | 20.1 31% | 35.9 -24% | 16.3 44% |
| Idle Maximum * (Watt) | 40.7 | 18.5 55% | 8.7 79% | 40 2% | 47 -15% | 16.9 58% |
| Load Average * (Watt) | 142.1 | 112.8 21% | 48.3 66% | 137 4% | 147.1 -4% | 111.7 21% |
| Witcher 3 ultra * (Watt) | 188.6 | 106.7 43% | 45.3 76% | 208 -10% | 158.8 16% | 152.1 19% |
| Load Maximum * (Watt) | 224.4 | 186 17% | 94.7 58% | 285.9 -27% | 311 -39% | 177.4 21% |
* ... más pequeño es mejor
Power Consumption Witcher 3 / Stresstest
Power Consumption external Monitor
Duración de la batería - Ejecuciones con errores
La autonomía WLAN de 6 horas es comparable a la delZBook Studio 16 G9 y ThinkPad P16 G1 mientras que es más de una hora más que el Precision 7670. El más delgado ZBook Firefly 16 G9 puede durar casi dos veces más ya que utiliza una CPU Core serie U más lenta.
La carga de la batería de 95 Wh de vacío a plena capacidad es rápida, poco más de una hora con el adaptador de CA incluido. El sistema también se puede recargar con adaptadores USB-C de terceros, pero la compatibilidad no está garantizada para capacidades menores. Por ejemplo, al conectar nuestro adaptador USB-C de 65 W a la Fury 16 G9 aparecía una ventana emergente de Windows diciendo que no había suficiente energía para cargar. Por otro lado, nuestro adaptador de CA USB-C de 130 W cargaría el sistema sin problemas. El rendimiento se reduce si se carga por USB-C, como era de esperar.
Extrañamente, la duración de la batería en inactivo en Ahorro de Energía y con el brillo al mínimo es inferior a la de nuestra configuración WLAN Equilibrada incluso tras múltiples pruebas. Probablemente sea un bug del modelo que apunta a una mala gestión de recursos en segundo plano o estados de CPU defectuosos relacionados con los ajustes de perfil de energía de Windows.
| HP ZBook Fury 16 G9 i9-12950HX, RTX A5500 Laptop GPU, 95 Wh | HP ZBook Studio 16 G9 62U04EA i7-12800H, RTX A2000 Laptop GPU, 86 Wh | HP ZBook Firefly 16 G9-6B897EA i7-1265U, T550 Laptop GPU, 76 Wh | Lenovo ThinkPad P16 G1 RTX A5500 i9-12950HX, RTX A5500 Laptop GPU, 94 Wh | Dell Precision 7000 7670 Performance i9-12950HX, RTX A5500 Laptop GPU, 93 Wh | MSI CreatorPro Z16P B12UKST i7-12700H, RTX A3000 Laptop GPU, 90 Wh | |
|---|---|---|---|---|---|---|
| Duración de Batería | -2% | 92% | -3% | -22% | -3% | |
| Reader / Idle (h) | 5.3 | |||||
| WiFi v1.3 (h) | 6 | 6.3 5% | 13 117% | 5.8 -3% | 4.7 -22% | 5.8 -3% |
| Load (h) | 1.2 | 1.1 -8% | 2 67% | |||
| H.264 (h) | 8.5 | 18.4 |
Pro
Contra
Veredicto - Buen rendimiento, pero Lenovo y Dell lo hacen más rápido
La ZBook Fury 16 G9 ofrece características que no están disponibles en la mayoría de las estaciones de trabajo portátiles. El panel superbrillante de 1000 nits, OLED opcional, iluminación RGB por tecla, tecla programable dedicada y compatibilidad con hasta 4 SSD y 4 módulos SODIMM son características que los entusiastas pueden apreciar. Mientras tanto, el cómodo teclado y el touchpad son algo que desearíamos que otros fabricantes pudieran emular.
El principal inconveniente que impide que el ZBook Fury 16 G9 sea una recomendación inmediata es su mayor ralentización del rendimiento en comparación con el Lenovo ThinkPad P16 G1 o Dell Precision 7670. Si bien es cierto que el HP puede soportar 4x unidades internas, el rendimiento de esas unidades tiende a ralentizarse cuando se estresan. También es decepcionante que el RTX A5500 apunte a un TGP de sólo 100 W cuando los modelos Lenovo y Dell antes mencionados apuntan cada uno a ~130 W para un rendimiento más rápido. Incluso la CPU rinde ligeramente por debajo de otros modelos con la misma opción de procesador.
El HP ZBook Fury 16 G9 es más ligero y tiene más características que muchas otras estaciones de trabajo de 16". El rendimiento sufre ligeramente, sin embargo, debido a unos objetivos TGP y TDP inferiores y a una refrigeración SSD insuficiente.
Si las características auxiliares anteriores no te interesan, es mejor que maximices el rendimiento con el ThinkPad P16 G1 o el Precision 7670. Sin embargo, si no te importa recortar algo de rendimiento a cambio de esas características, puede que merezca la pena considerar el HP Fury, más ligero.
Precio y disponibilidad
HP ya está distribuyendo su ZBook Fury 16 G 9 desde $1490 USD para la configuración base hasta más de $4000 USD para nuestra configuración de prueba. También está disponible el Fury 16 G10.
HP ZBook Fury 16 G9
- 06/09/2023 v7 (old)
Allen Ngo
Transparencia
La selección de los dispositivos que se van a reseñar corre a cargo de nuestro equipo editorial. La muestra de prueba fue proporcionada al autor en calidad de préstamo por el fabricante o el minorista a los efectos de esta reseña. El prestamista no tuvo ninguna influencia en esta reseña, ni el fabricante recibió una copia de la misma antes de su publicación. No había ninguna obligación de publicar esta reseña. Como empresa de medios independiente, Notebookcheck no está sujeta a la autoridad de fabricantes, minoristas o editores.
Así es como prueba Notebookcheck
Cada año, Notebookcheck revisa de forma independiente cientos de portátiles y smartphones utilizando procedimientos estandarizados para asegurar que todos los resultados son comparables. Hemos desarrollado continuamente nuestros métodos de prueba durante unos 20 años y hemos establecido los estándares de la industria en el proceso. En nuestros laboratorios de pruebas, técnicos y editores experimentados utilizan equipos de medición de alta calidad. Estas pruebas implican un proceso de validación en varias fases. Nuestro complejo sistema de clasificación se basa en cientos de mediciones y puntos de referencia bien fundamentados, lo que mantiene la objetividad.Price comparison

