Análisis del Lenovo ThinkPad P16s G2 AMD: Potencia y OLED en el interior de este portátil para estaciones de trabajo

Aunque un chip de seguridad adicional, la opción de realizar el mantenimiento a distancia y un lector de SmartCard sólo pueden interesar a los clientes corporativos, la potencia del portátil, su rendimiento gráfico, su larga autonomía y su bonita pantalla deberían despertar el interés del público en general. Su potente procesador AMD Ryzen 7 Pro 7840U llama especialmente la atención.
Esto hace que el ThinkPad P16s G2 sea adecuado para trabajar en casa, de viaje, en la universidad o incluso para creativos. Además, no fue necesario instalar una pantalla OLED y su RAM y SSD ofrecen una buena gama de opciones de configuración para casi todos los ámbitos de uso. A cambio, su aspecto visual podría describirse como más bien conservador, pero esto no tiene por qué ser un punto negativo.
Al mismo tiempo, competidores comparables como el Microsoft Surface Laptop Studio 2 o el HP EliteBook 845 G10 tienen diseños ligeramente más valientes. Nuestro análisis mostrará si estos son mejores o peores o simplemente diferentes, y si el ThinkPad P16s G2 aún tiene espacio para crecer.
Posibles contendientes en la comparación
Valoración | Fecha | Modelo | Peso | Altura | Tamaño | Resolución | Precio |
|---|---|---|---|---|---|---|---|
| 88.6 % v7 (old) | 01/2024 | Lenovo ThinkPad P16s G2 21K9000CGE R7 PRO 7840U, Radeon 780M | 1.8 kg | 24.4 mm | 16.00" | 3840x2400 | |
| 90.1 % v7 (old) | 08/2023 | HP EliteBook 845 G10 818N0EA R9 PRO 7940HS, Radeon 780M | 1.5 kg | 17.9 mm | 14.00" | 2560x1600 | |
| 87.8 % v7 (old) | 01/2024 | Lenovo ThinkPad P14s G4 21K5000LGE R7 PRO 7840U, Radeon 780M | 1.3 kg | 21.8 mm | 14.00" | 1920x1200 | |
| 88.6 % v7 (old) | 08/2023 | Schenker Vision 16 PH6PRX1 i7-13700H, Iris Xe G7 96EUs | 1.5 kg | 17.1 mm | 16.00" | 2560x1600 | |
| 88.6 % v7 (old) | 10/2023 | Acer Swift Edge SFE16 Ryzen 7 7840U R7 7840U, Radeon 780M | 1.2 kg | 13 mm | 16.00" | 3200x2000 | |
| 86.2 % v7 (old) | 01/2024 | Lenovo ThinkPad P16v G1 AMD R7 PRO 7840HS, RTX A1000 Laptop GPU | 2.3 kg | 24.7 mm | 16.00" | 1920x1200 | |
| 85.5 % v7 (old) | 10/2023 | Microsoft Surface Laptop Studio 2 RTX 4060 i7-13700H, GeForce RTX 4060 Laptop GPU | 2 kg | 22 mm | 14.40" | 2400x1600 |
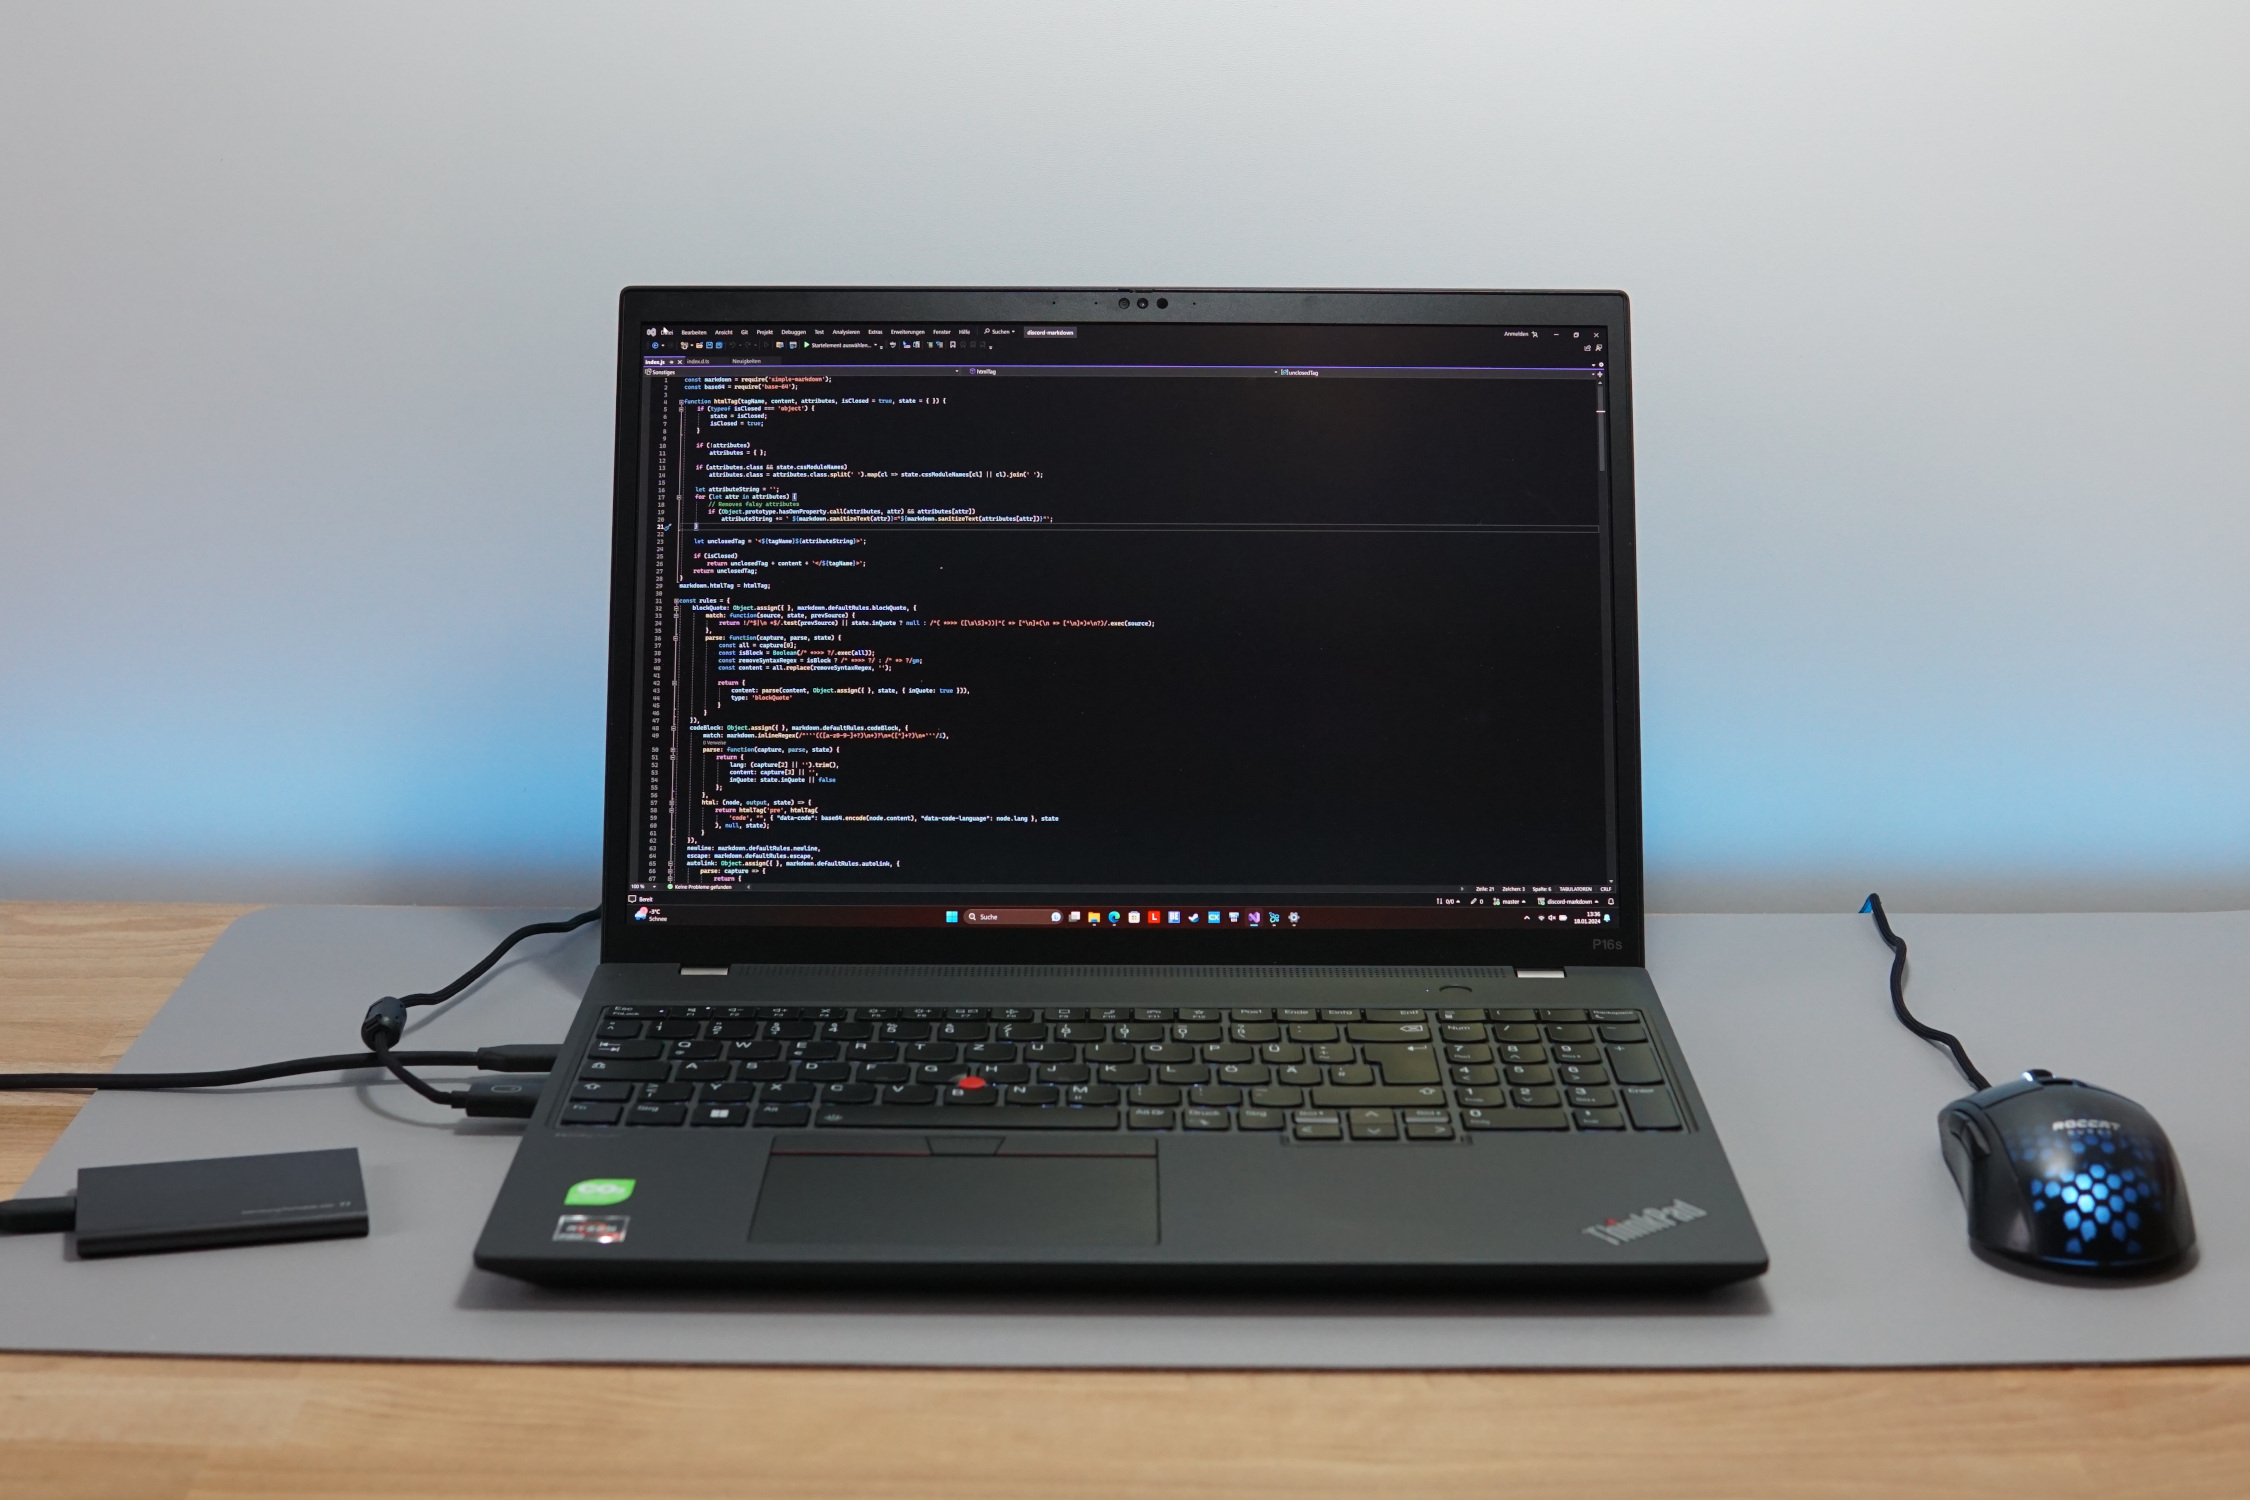
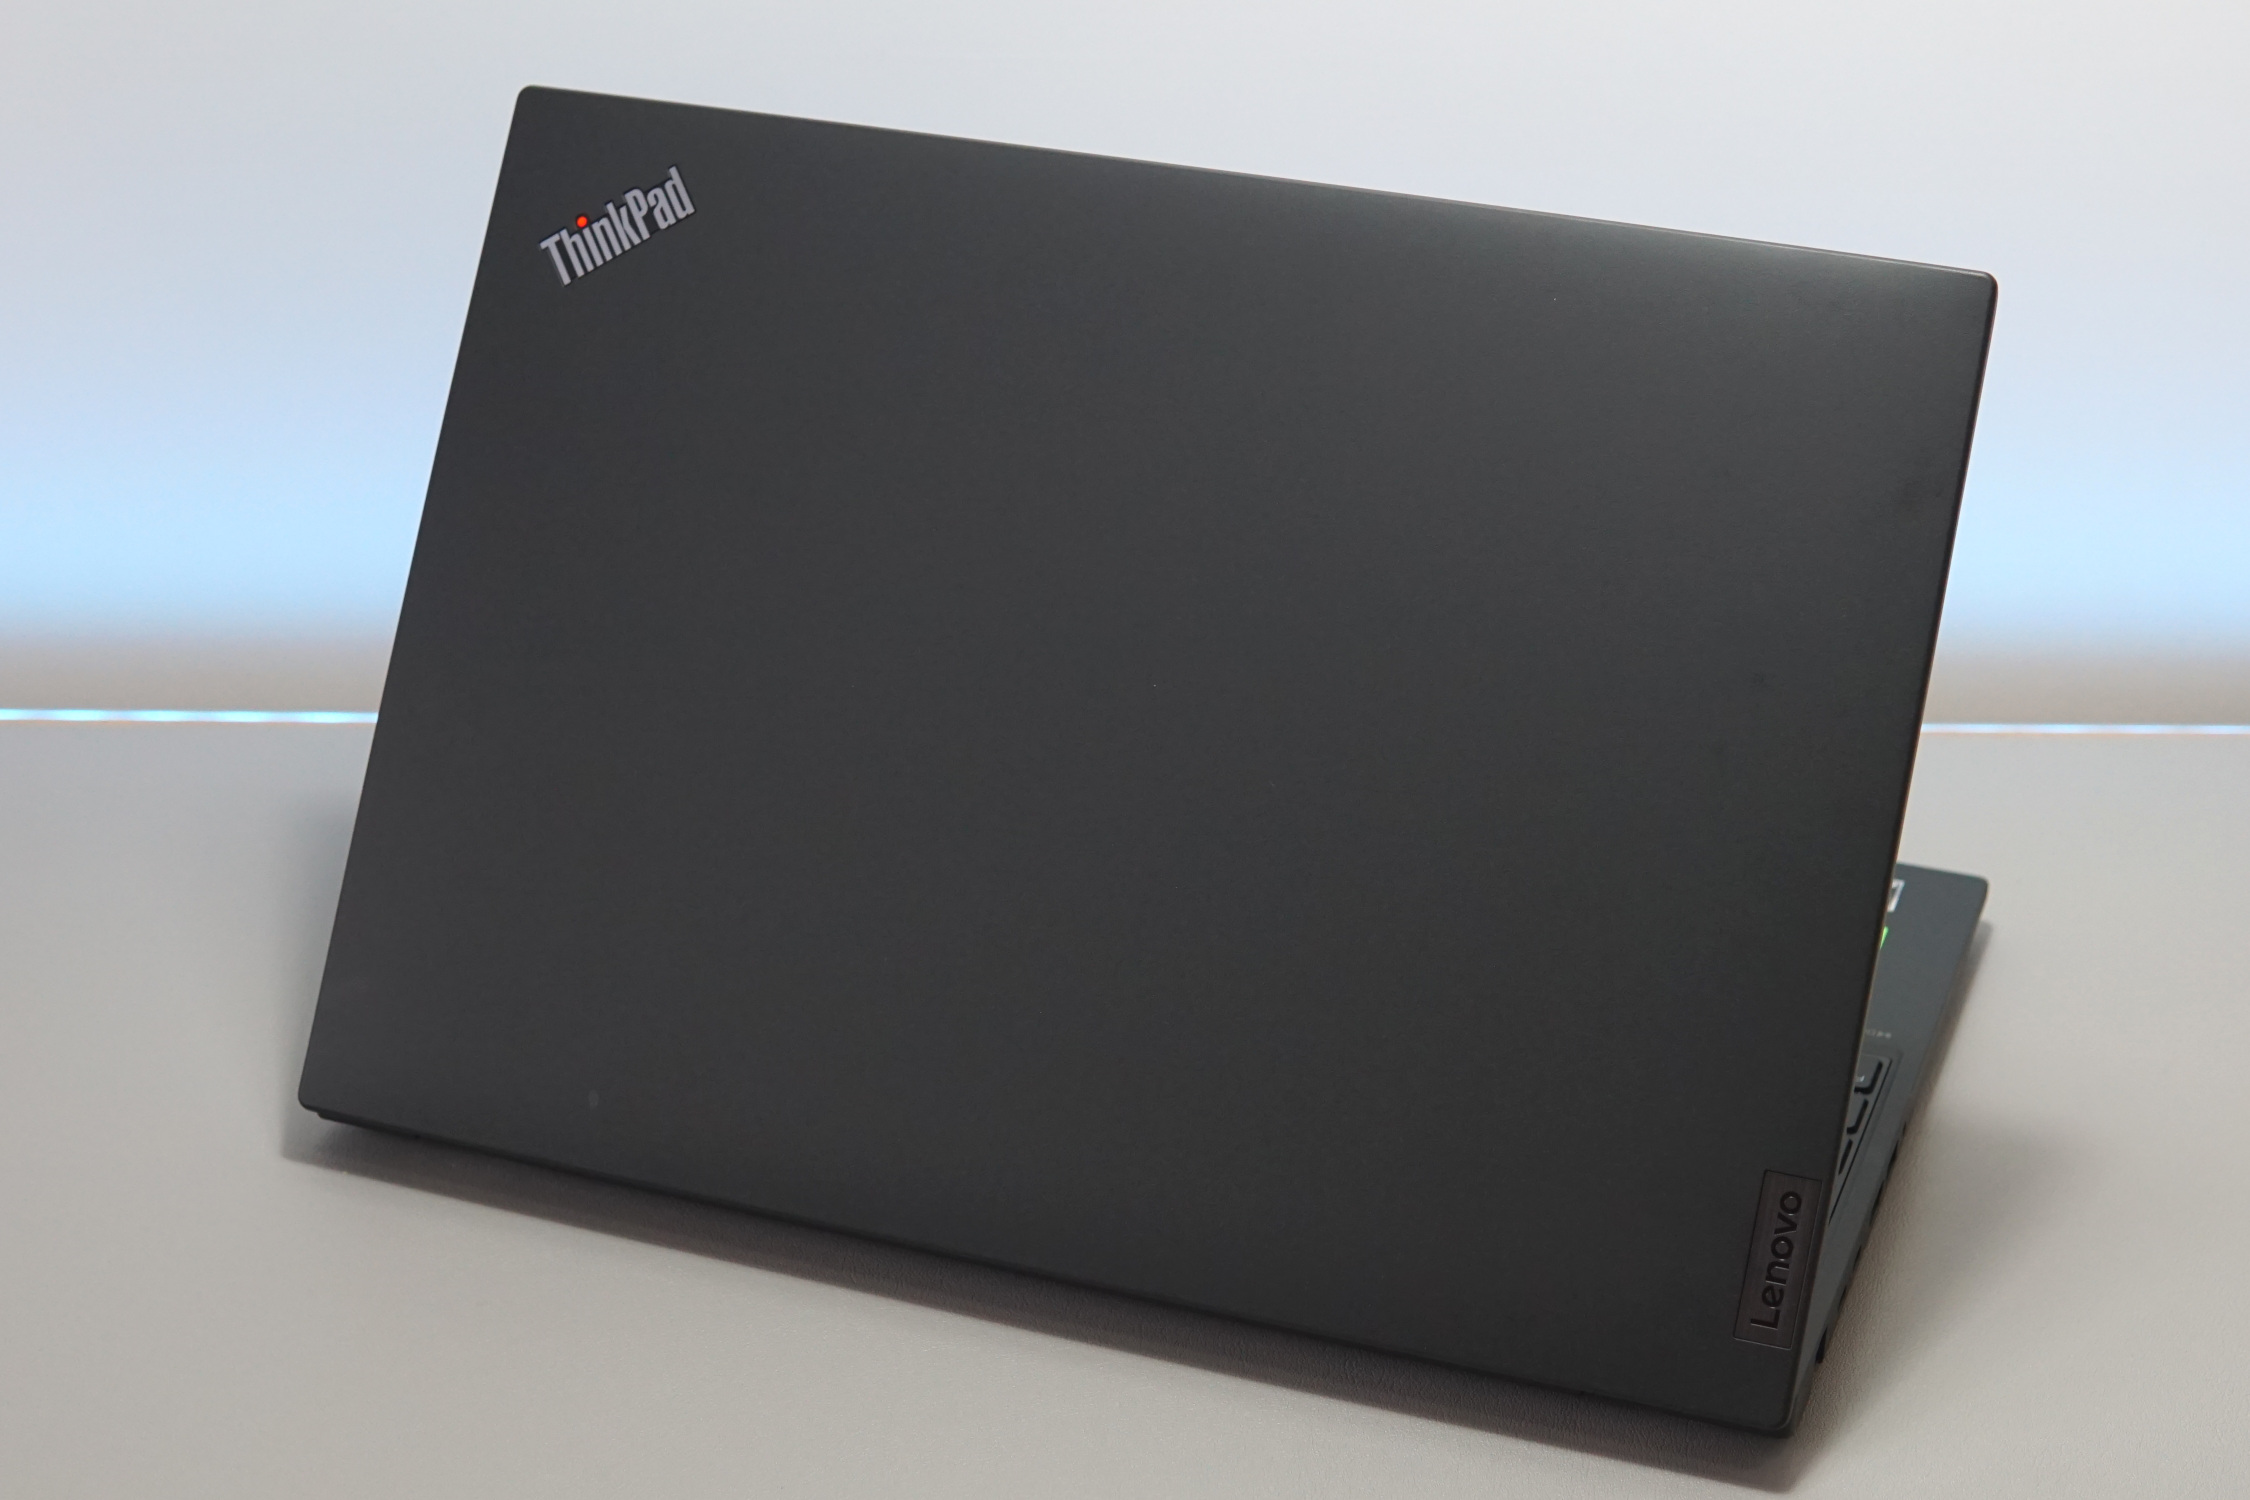
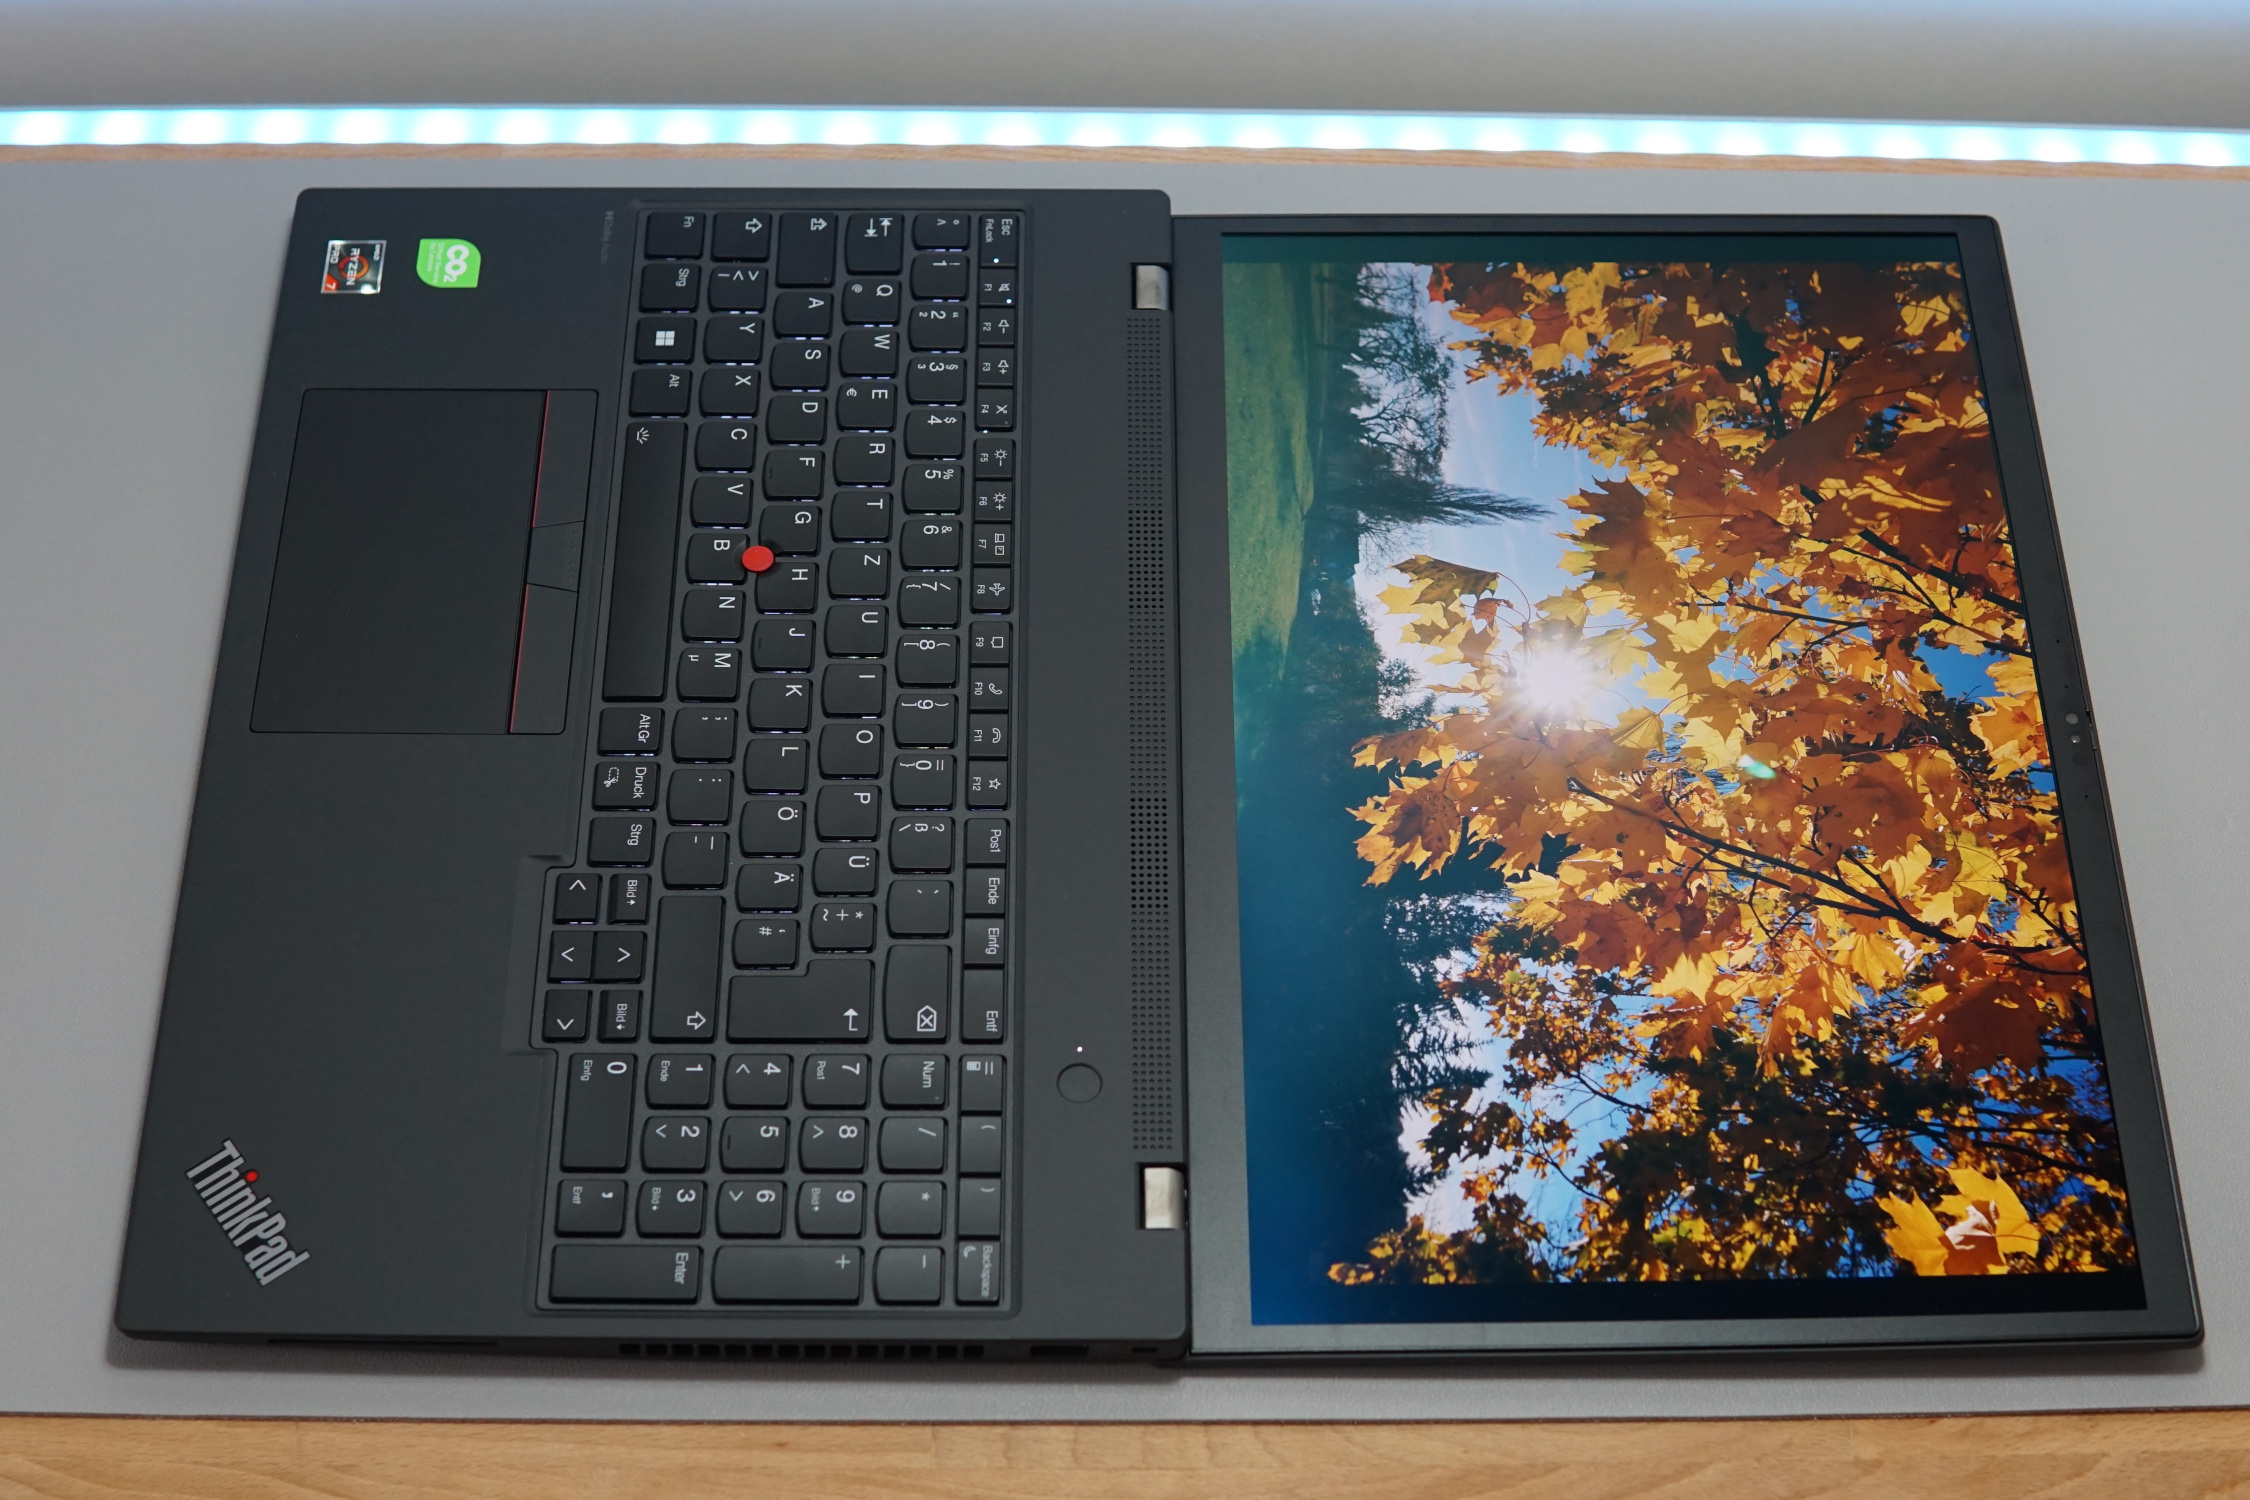
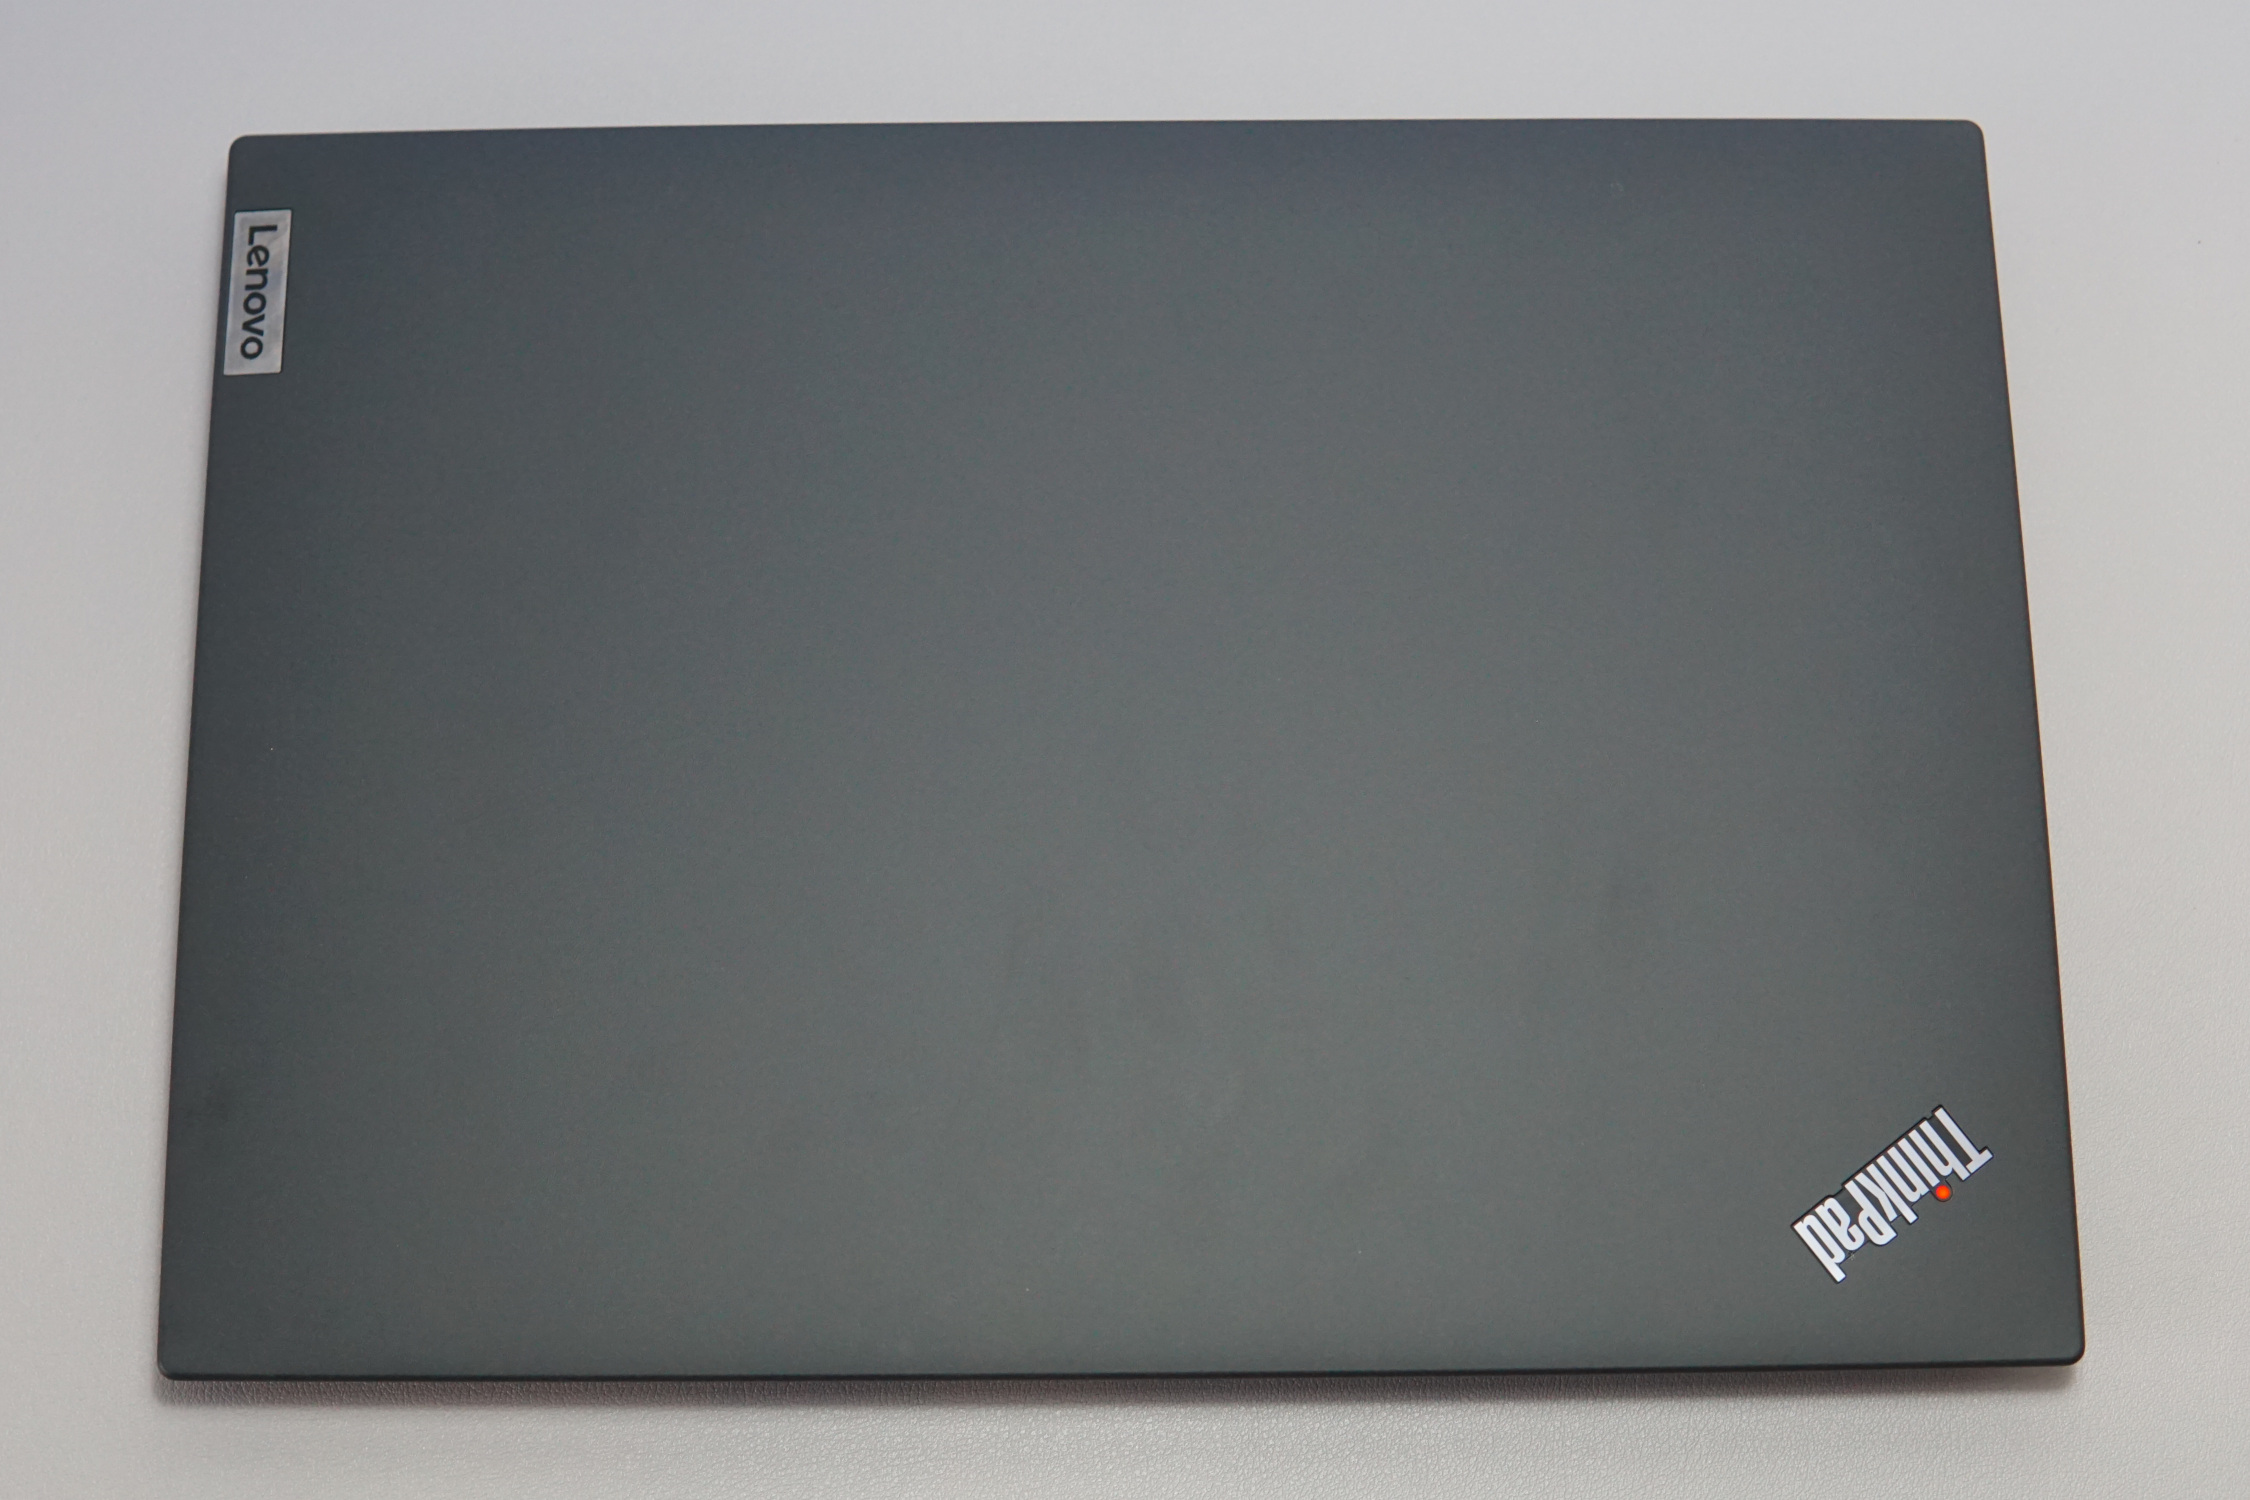
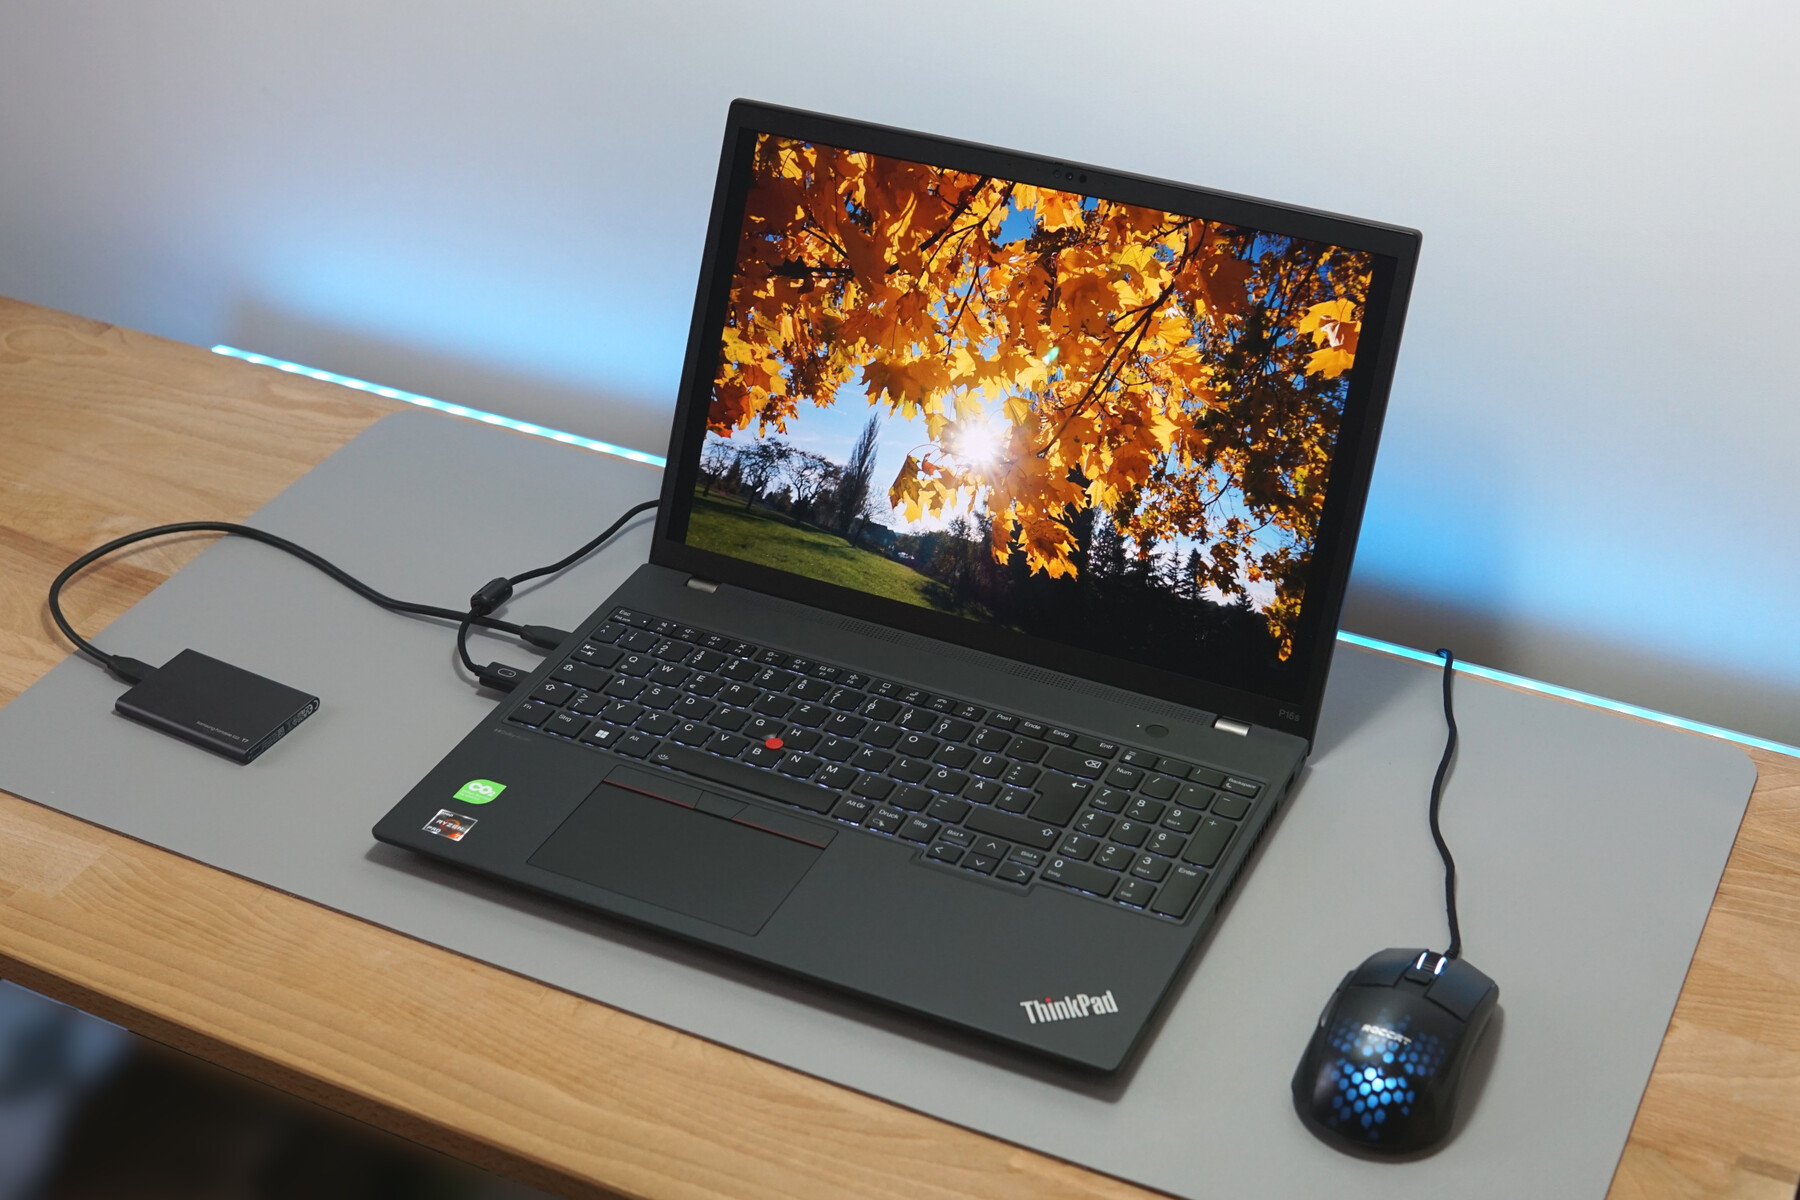
Carcasa - La ThinkPad gris y robusta
Superficie texturizada, carcasa gris oscuro: El aspecto visual del ThinkPad se puede identificar a la legua. Y como siempre, el punto sobre la "I" está iluminado. No parece elegante y de ninguna manera es moderno. En cambio, se siente robusto y duradero. Unas bisagras ajustadas que sujetan la pantalla de 16 pulgadas en cualquier ángulo y una tapa que se cierra casi a la perfección cimentan aún más esta impresión de alta calidad y estabilidad, incluso sin que haya ningún componente metálico en la carcasa exterior.
Naturalmente, la pantalla relativamente grande se puede girar muy ligeramente. La base, en cambio, permanece totalmente estable en cualquier situación. Tampoco pudimos sacar ningún ruido de la carcasa. Después de todo, se trata de un portátil de trabajo que no siempre se manejará con cuidado.

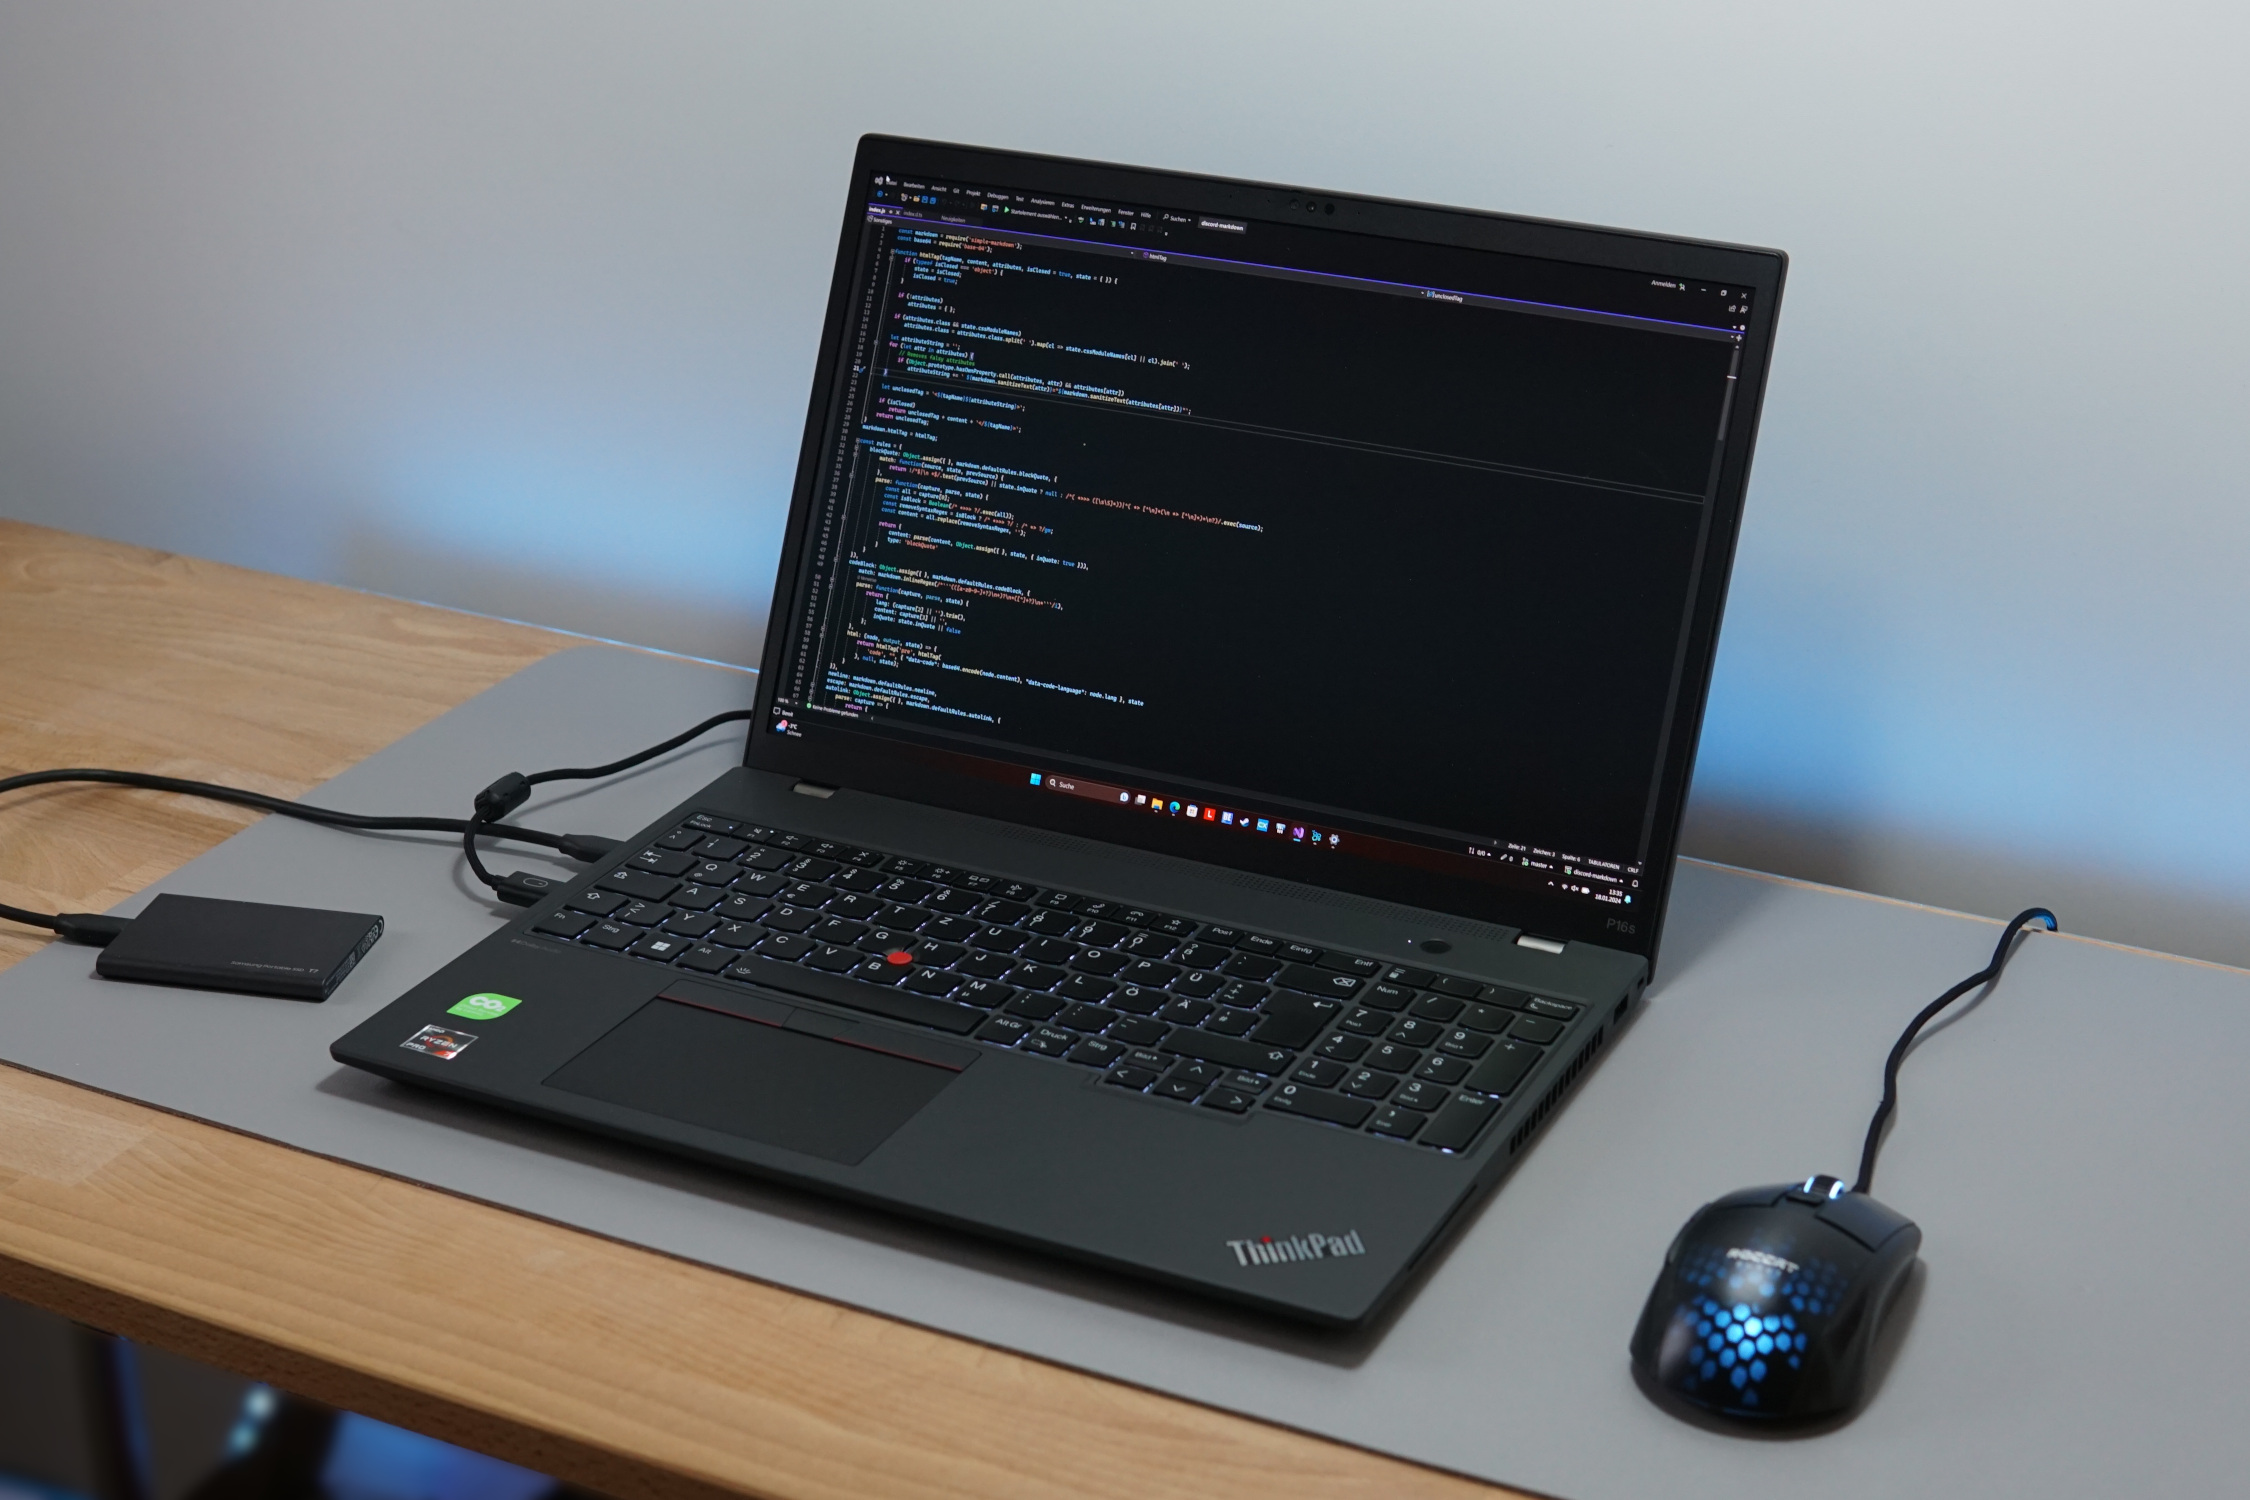
El tamaño y el peso del dispositivo demuestran de dónde procede su estabilidad. Para un portátil sin tarjeta gráfica dedicada y fabricado completamente en plástico, 1,8 kg es ciertamente digno de mención. Más aún lo es el grosor de su carcasa, que mide casi 24 milímetros. El casi idéntico Acer Swift Edge SFE16 es aproximadamente la mitad de grueso y pesa 500 gramos menos. A su vez, da la sensación de ser un poco más frágil que el ThinkPad P16.
Además, una carcasa gruesa tiene algunas ventajas más, de las que hablaremos en la sección "rendimiento".
Conectividad - Luz y un poco de sombra en el P16s
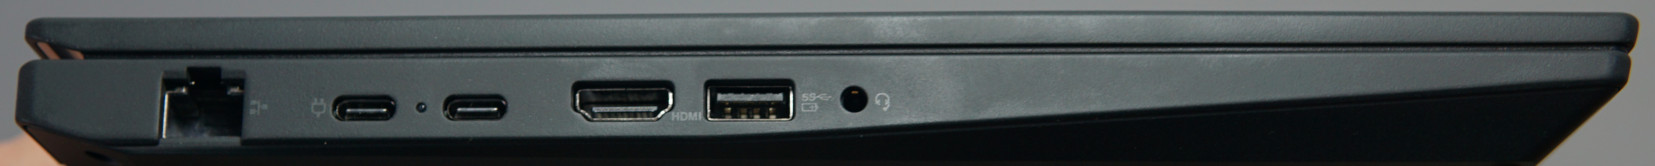
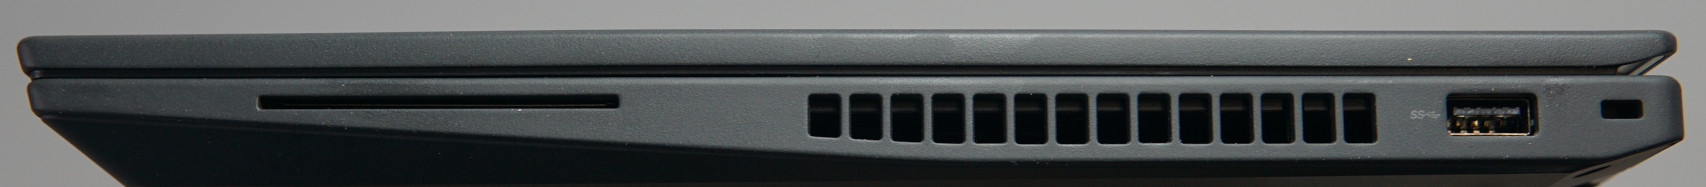
La selección de opciones de conectividad del portátil parece buena en general. Cuenta con un puerto LAN de tamaño completo sin solapa ni adaptador. Hay un puerto USB-4 rápido y un total de cuatro puertos USB flexibles, lo que le permite muchas opciones para periféricos. También dispone de un puerto HMDI.
Por otro lado, un solo puerto USB-4 no es óptimo. Lo normal sería tener la estación de acoplamiento conectada a éste para acceder a todo el rendimiento del portátil. El segundo puerto USB-C al menos admite la carga, así como DisplayPort, pero sólo a una cuarta parte de las velocidades de transferencia que puede alcanzar el USB 4. Además, a los otros dos puertos USB también les vendría bien ser un poco más rápidos. Ambos se conectan mediante USB 3.0, que muchas unidades SSD superan ahora con facilidad.
Conectado a la estación de acoplamiento mientras está sentado en su escritorio, estos pequeños defectos no deberían ser demasiado perceptibles. Pero muchos de los portátiles de gama alta de Intel ofrecen mejores opciones de conectividad. Esto incluye normalmente dos puertos TB4. Sin embargo, los puertos USB-A rápidos tampoco son habituales aquí.
Comunicación
Las tasas de transferencia del dispositivo son un poco débiles cuando se trata de enviar, tanto a 5 GHz como a 6 GHz. Sin embargo, sus tasas de recepción son las esperadas para Wi-Fi 6E. Esto es mucho mejor de lo que puede ofrecer un simple cable LAN. Además, gracias a la ampliación de su rango de frecuencias, debería seguir siendo capaz de alcanzar una alta tasa de transferencia con redes inalámbricas superpuestas.
Cámara web
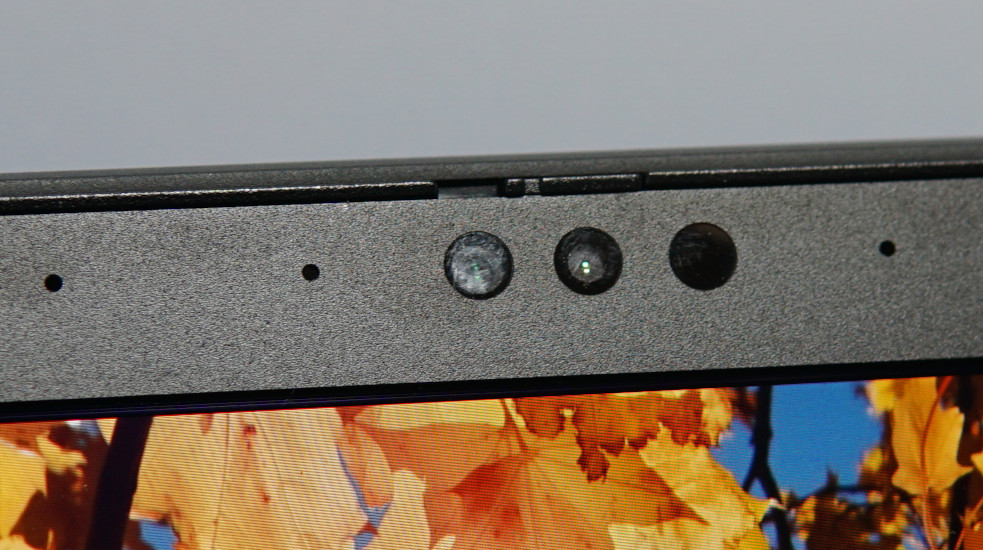
Sólo sus 5 MP garantizan una buena calidad de imagen, lo que significa que las personas al otro lado de su videollamada en un smartphone probablemente no podrán decir que está utilizando la webcam de un portátil, muy al contrario que las webcams HD que se instalan tan a menudo y que ofrecen una fracción de la resolución.
Las altísimas desviaciones de color que hemos medido se deben a que las imágenes se aclaran automáticamente. Y esto funciona realmente bien. Incluso en condiciones de poca luz, los rostros siguen siendo reconocibles. Al mismo tiempo, la imagen se vuelve rápidamente bastante granulada. Aun así, la cámara en su forma actual es perfectamente adecuada para las llamadas de videoconferencia.
Esto se debe, entre otras cosas, a su estupendo micrófono de doble array, que graba las voces con gran precisión y a un volumen constante, incluso cuando la distancia y la dirección del habla varían durante la conversación.
Un sensor de infrarrojos hace posible el reconocimiento facial a través de Windows Hello y una tapa mecánica para bloquear el objetivo redondea las características de la webcam.


Seguridad
No le faltará ninguna función de seguridad. Todo está incluido, desde una tarjeta SmartCard hasta un bloqueo Kensington y funciones de inicio de sesión biométrico. Para ello puede utilizar el sensor de huellas dactilares o el reconocimiento facial. A esto se añaden extras como una BIOS autorrecuperable. Lenovo ha resumido todas estas funciones bajo el término "ThinkShield". Encontrará más información en .
Accesorios
El portátil no viene con ningún adaptador adicional, funda ni nada por el estilo. En su lugar, sólo se incluye una simple fuente de alimentación USB-C. Como nota positiva, el embalaje del ThinkPad está fabricado íntegramente con cartón reciclado.
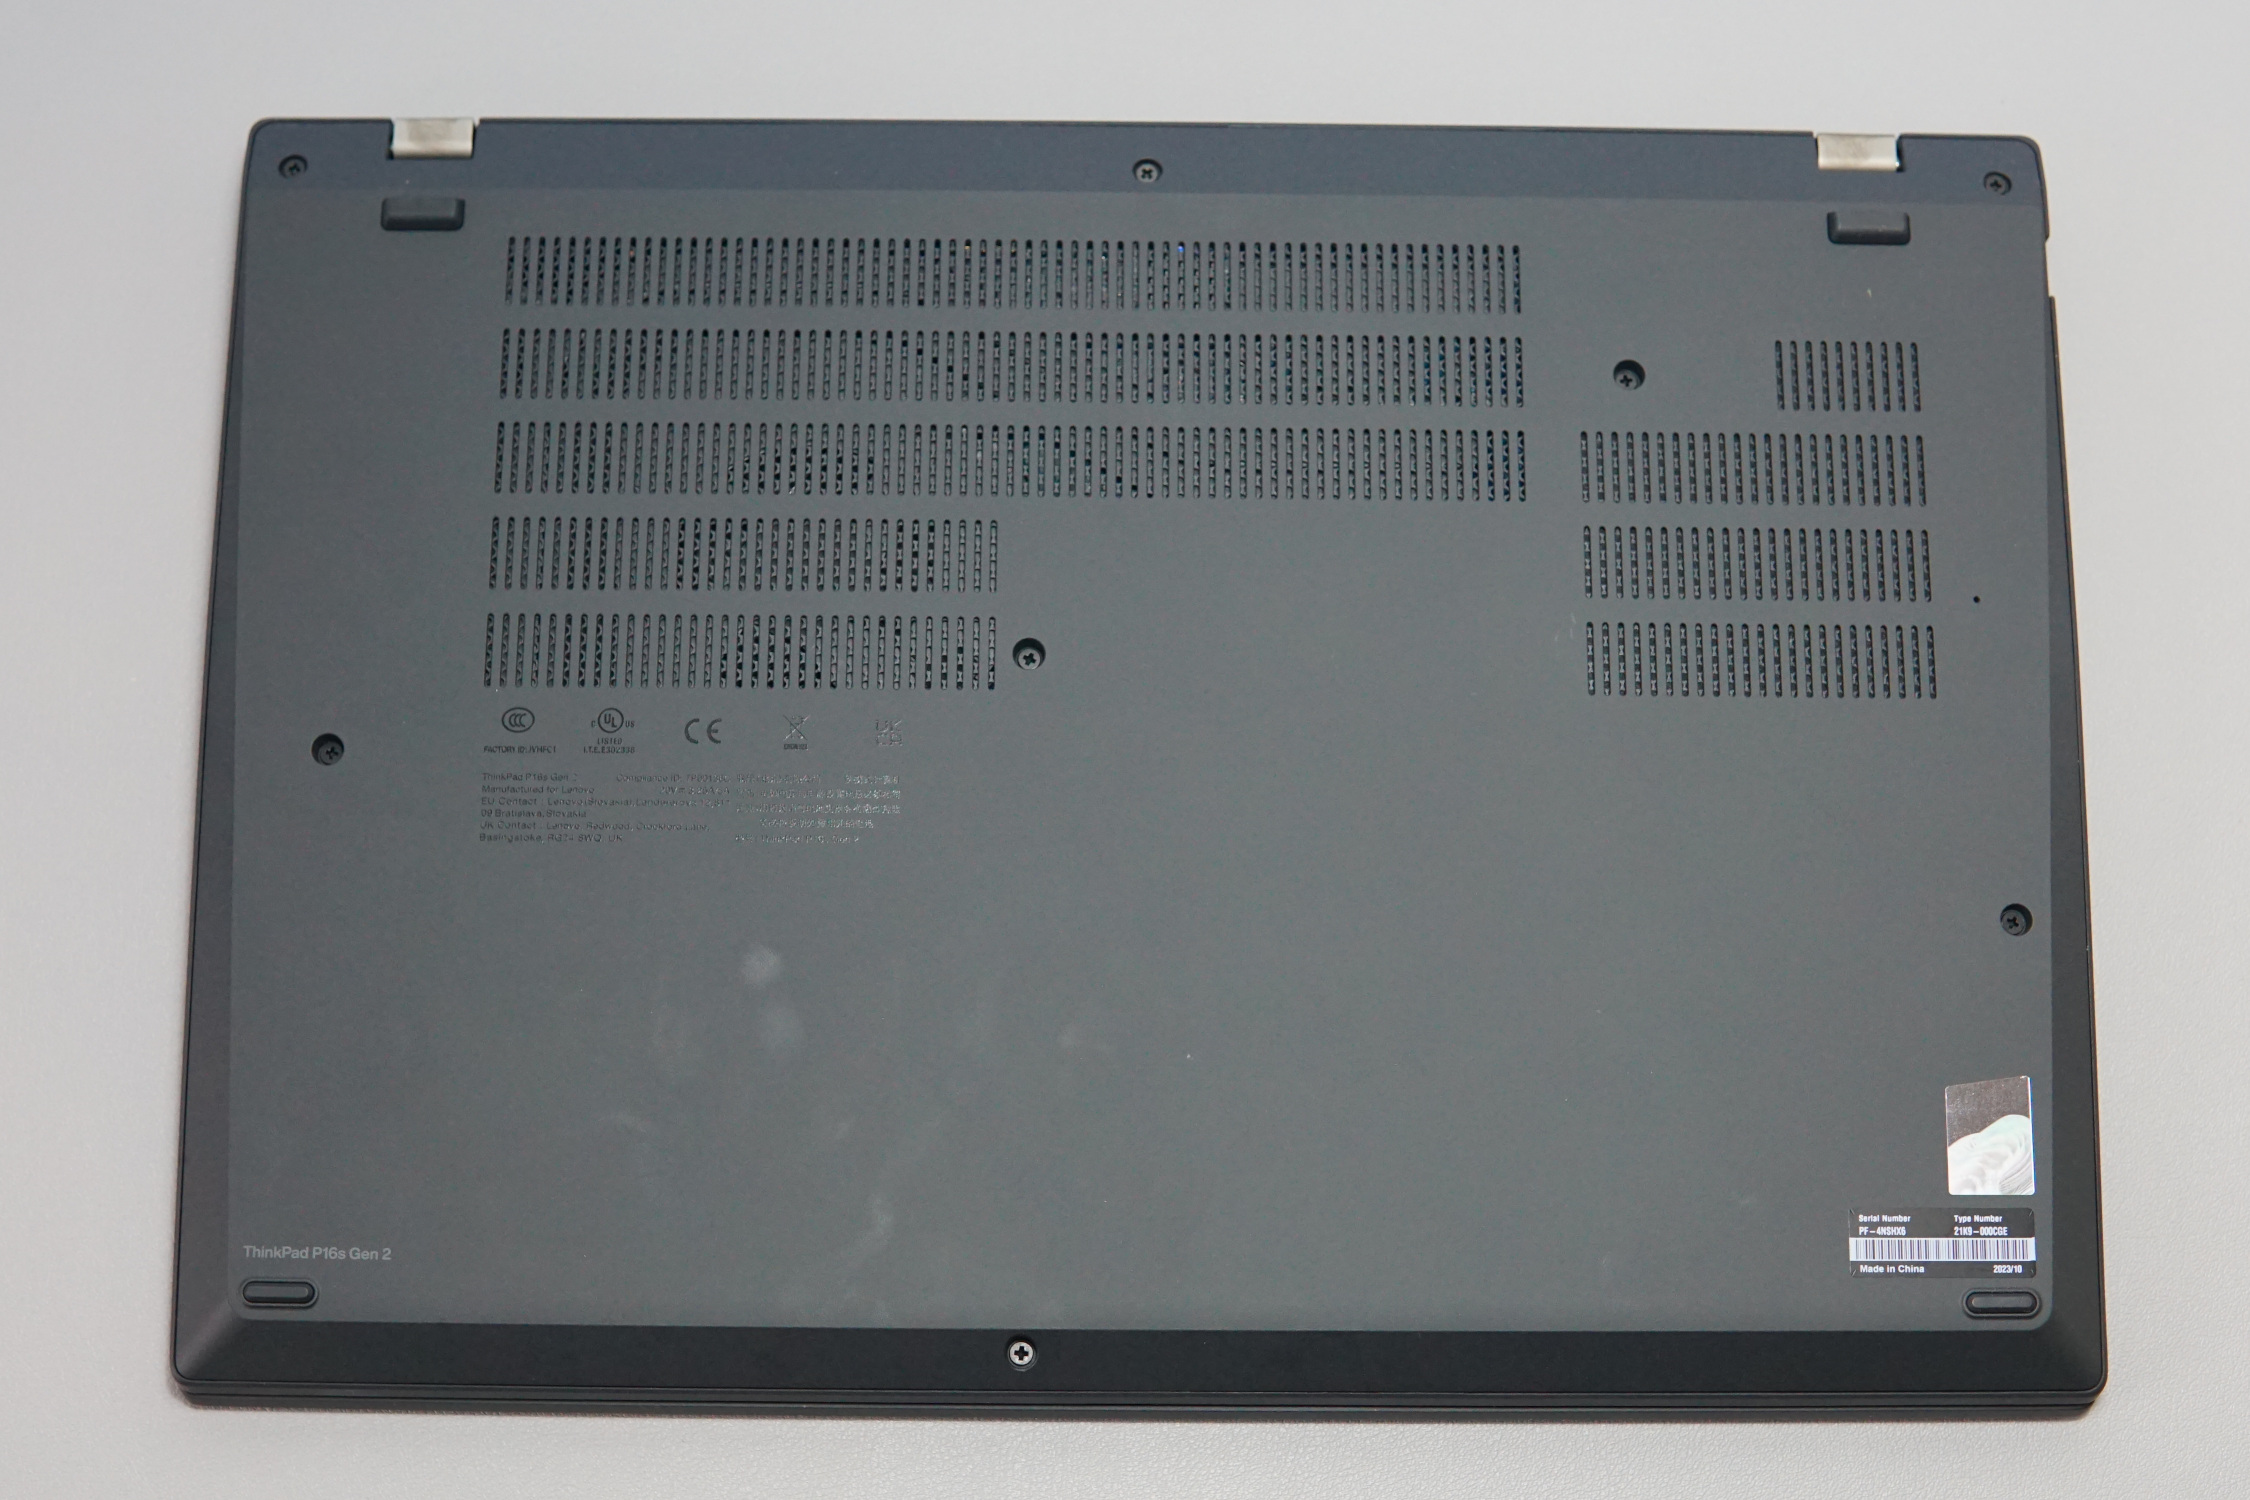
Mantenimiento
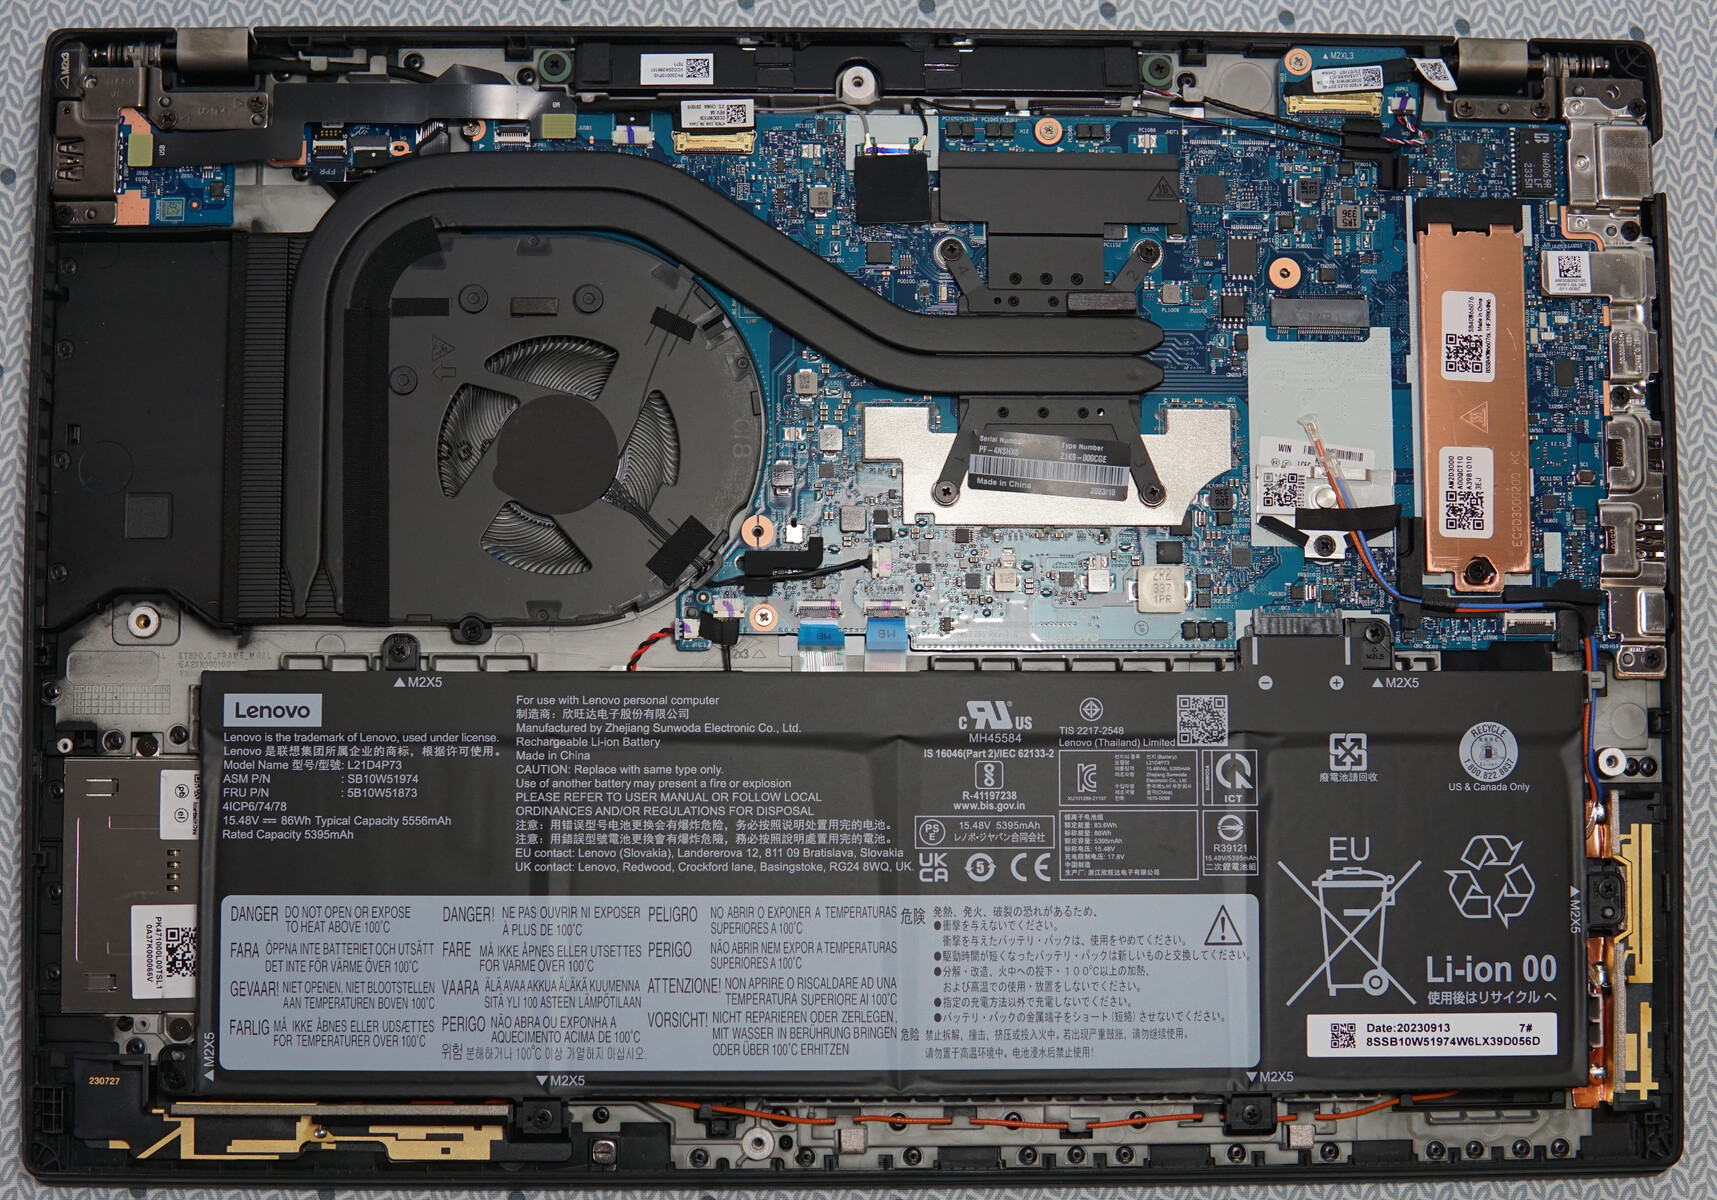
Como era de esperar, el ThinkPad P16s G2 AMD se puede abrir fácilmente y sin problemas. Todos los tornillos Phillips son fácilmente accesibles. A continuación, puede retirar la parte inferior de la carcasa con suficiente paciencia y fuerza (pero sin necesidad de tirar violentamente de ella) e, idealmente, con la ayuda de una pequeña herramienta de elevación.
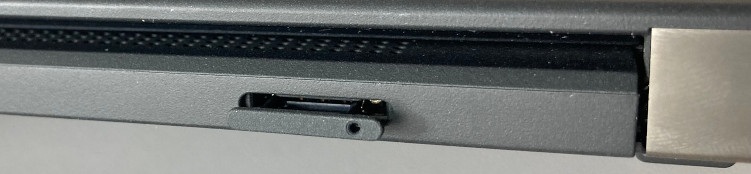
Su SSD NVMe-M.2 puede intercambiarse. Se puede acceder a la batería y a los ventiladores sin problemas. Además, puede instalar un módulo 5G/LTE en la carcasa. Hay espacio para ello, los cables de la antena están listos para ser utilizados y en la parte trasera hay una ranura para la tarjeta SIM.
Por desgracia, los módulos WLAN y RAM han sido soldados. Especialmente en un portátil para estaciones de trabajo, desearía que la RAM fuera un poco más flexible. Esto significa que, a la hora de comprarlo, debería tener muy claro si le conviene seleccionar demasiada RAM en lugar de muy poca.
Garantía
Lenovo ofrece un año de asistencia Premium que también cubre las reparaciones in situ al siguiente día laborable. Por un recargo, existen opciones para ampliar esta garantía.
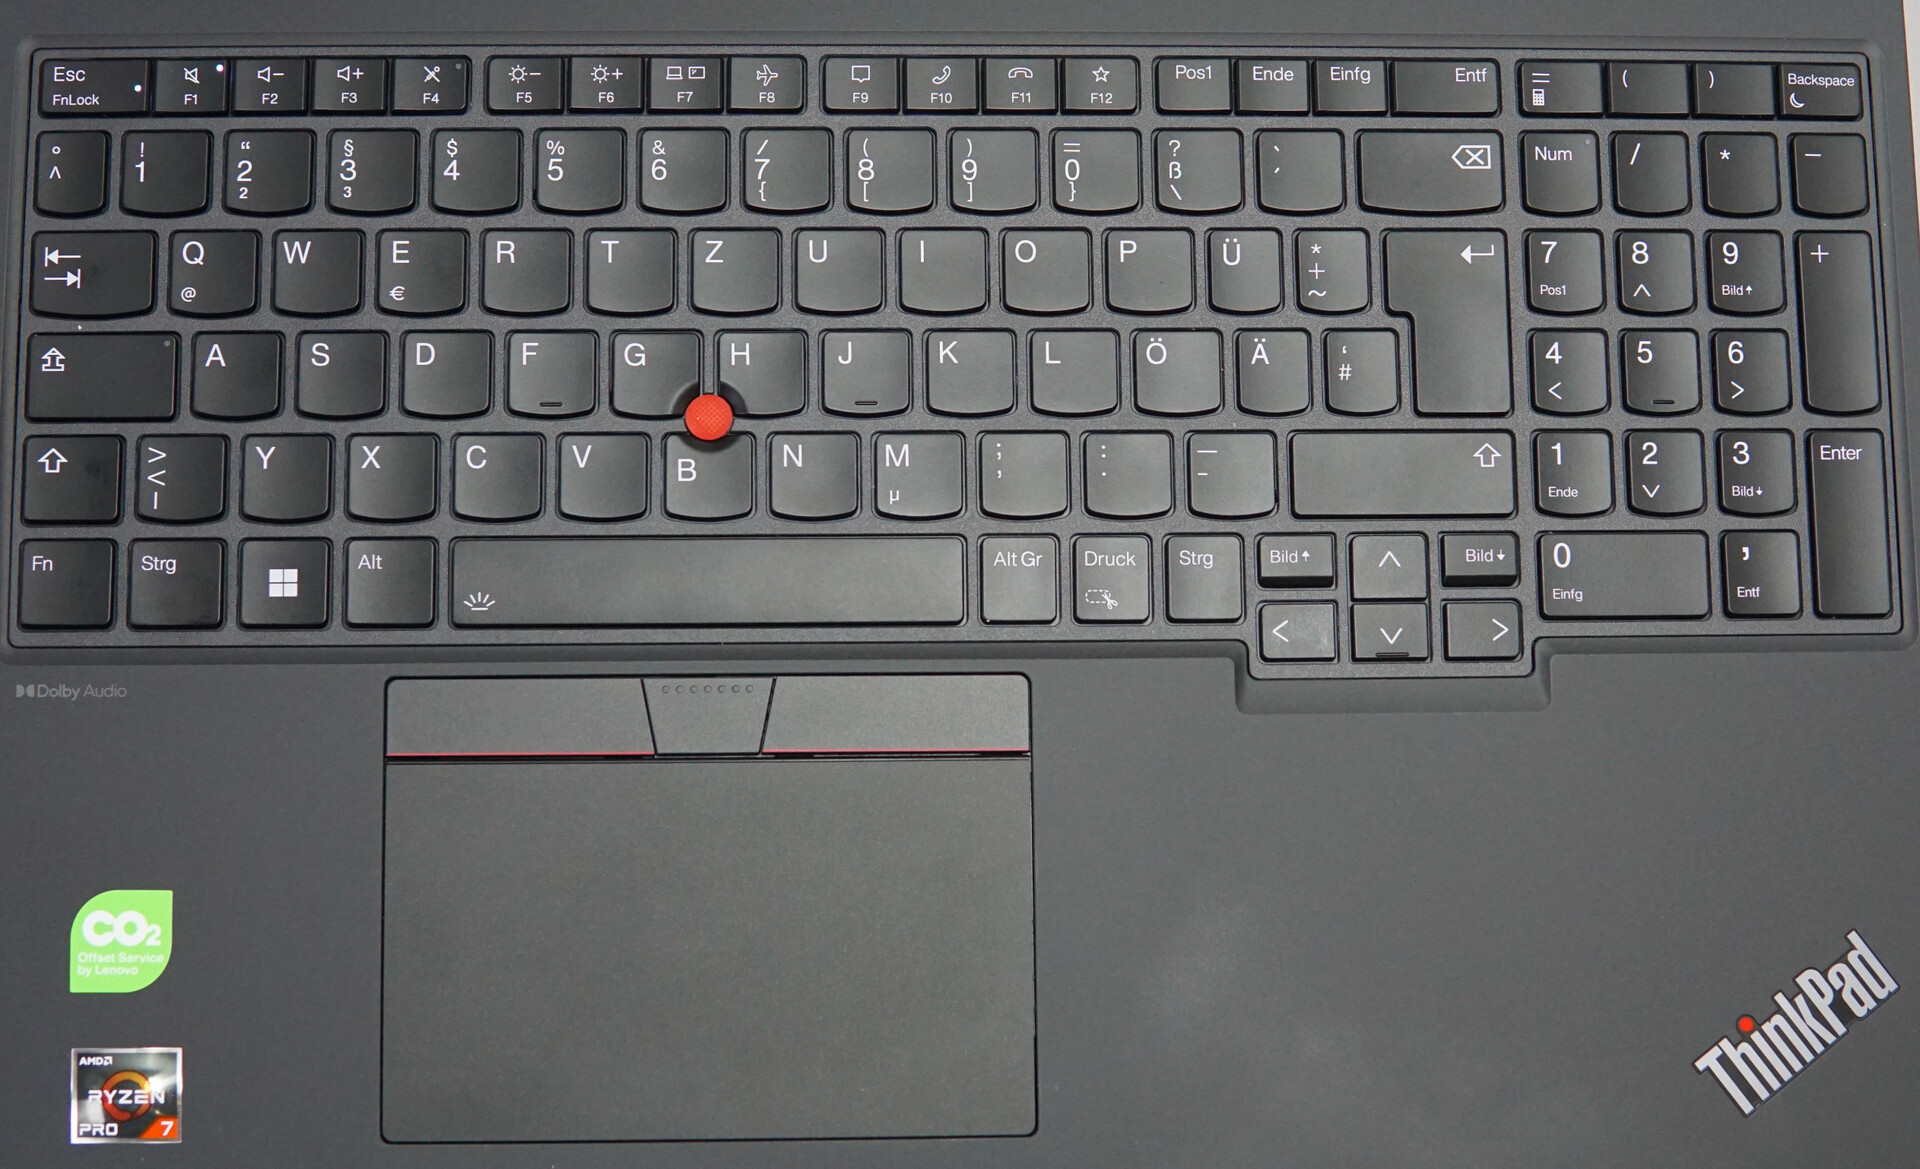
Dispositivos de entrada - No es perfecto, pero es un teclado sólido para una estación de trabajo
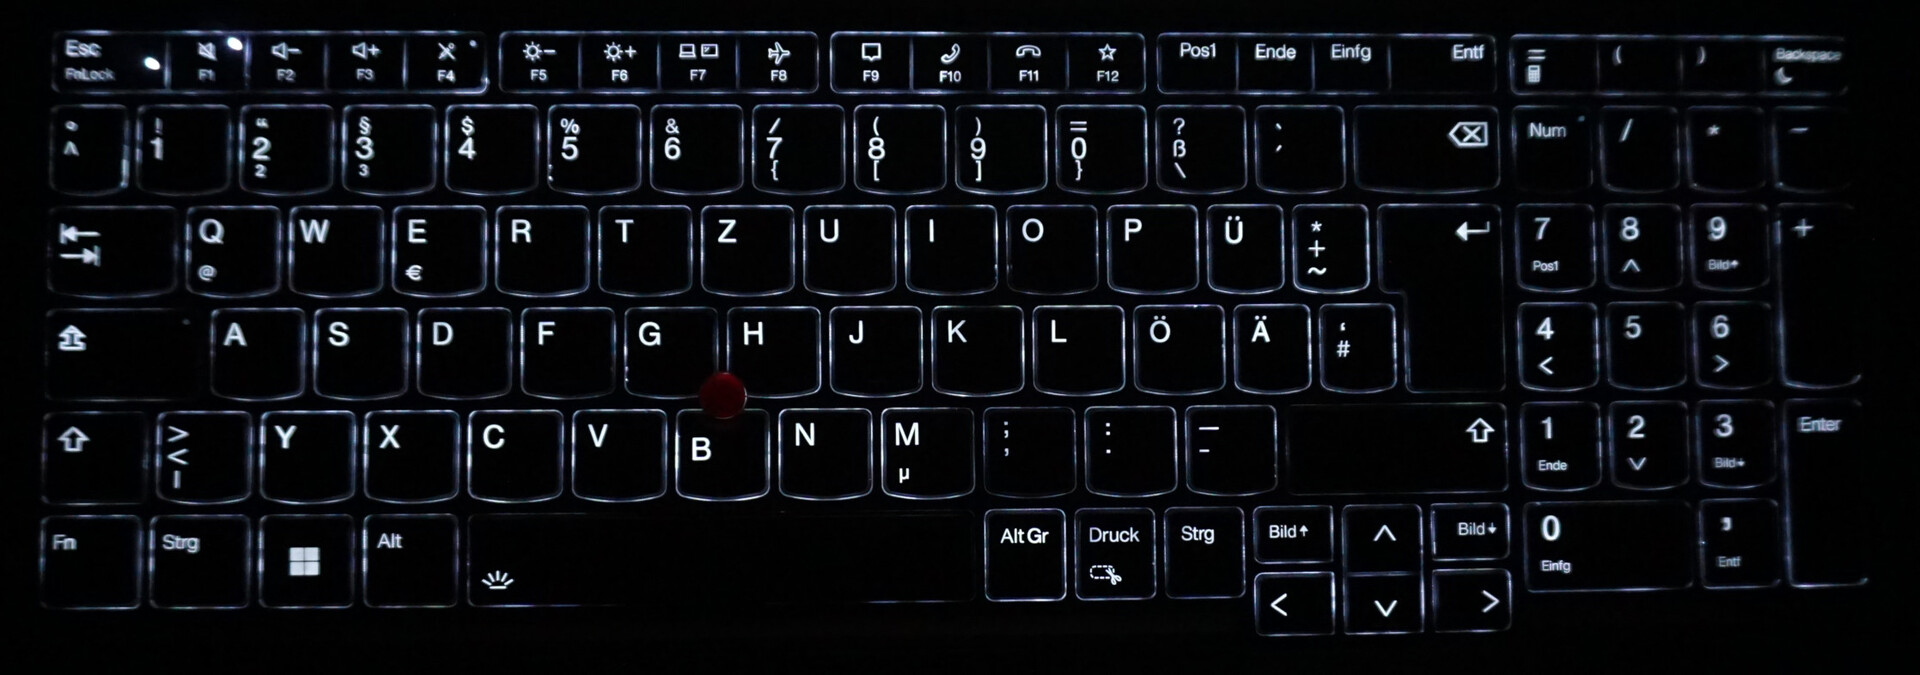
El teclado, el touchpad y el trackpoint merecen elogios. Los puntos de presión satisfactorios, la cómoda resistencia de las teclas y la precisión de las entradas permiten un funcionamiento fluido y rápido. No es probable que tenga que lidiar con la fatiga al teclear o tener que hacer triple clic al controlar el puntero. Además, la retroiluminación del teclado, que tiene dos niveles de brillo, mantiene las teclas legibles en todo momento.
Aunque no puede escapar a todas las críticas. Su elevación de 1,5 mm (nuestra medición) no es terriblemente grande y definitivamente lo notará al teclear si está acostumbrado a una elevación mucho mayor. Además, el marco del teclado que, como todos los demás componentes de la carcasa, está hecho de plástico, cede un poco. Esto se nota más en el lado derecho que en el izquierdo. Sin embargo, uno se acostumbra a ello y estos problemas no deberían ser realmente un obstáculo. Sin embargo, no podemos darle la máxima puntuación.
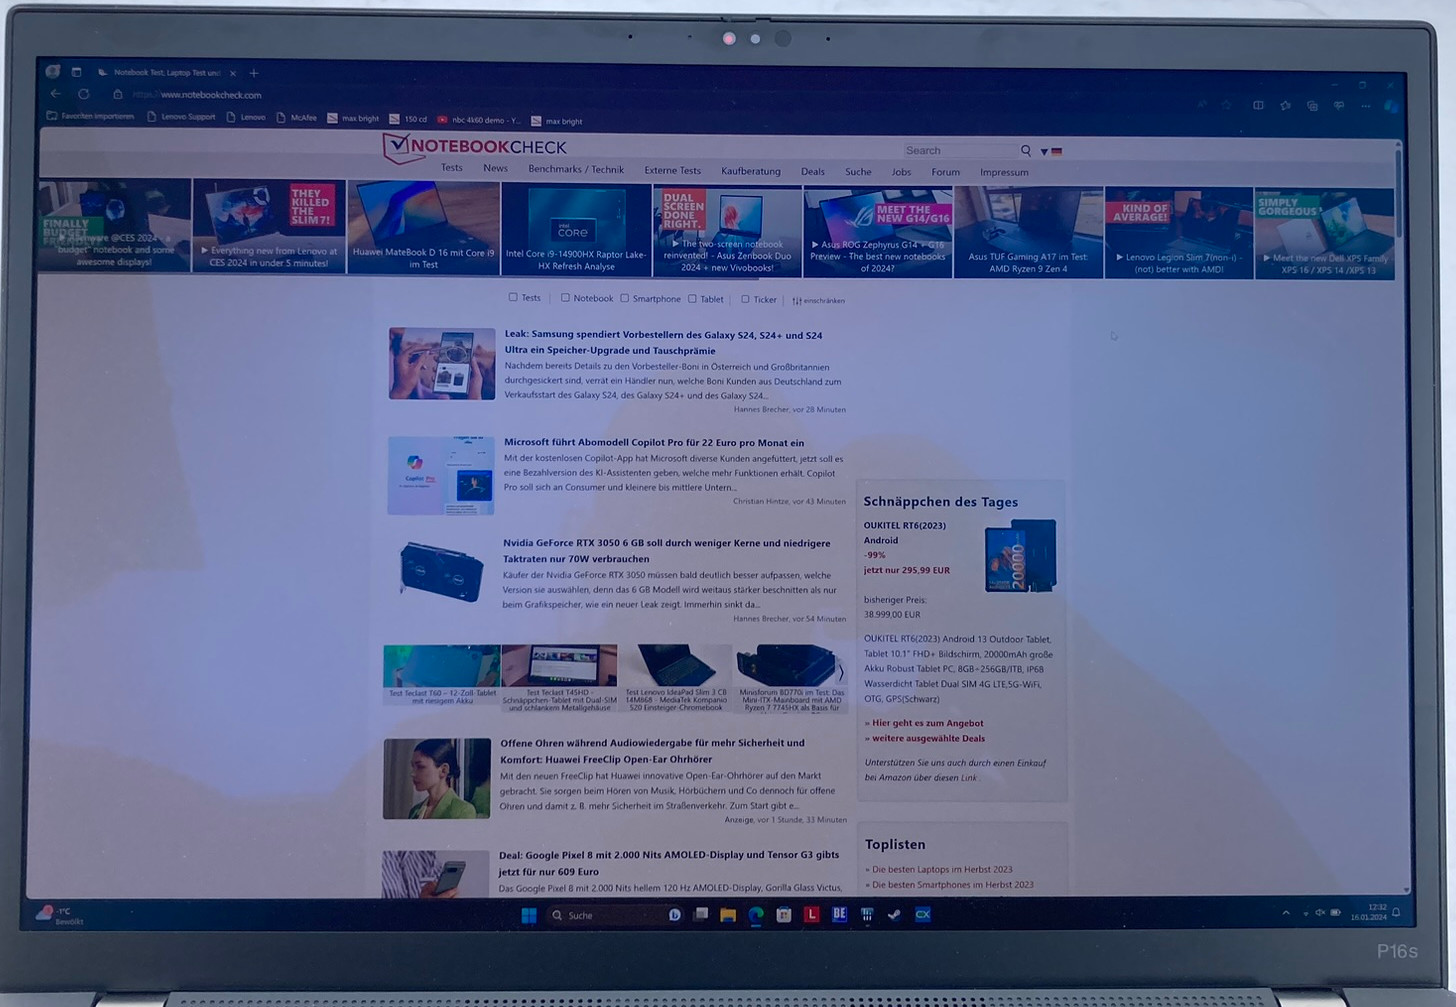
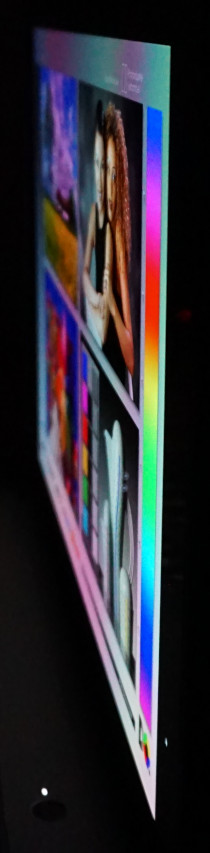
Pantalla - El P16s tiene una pantalla OLED viva y brillante
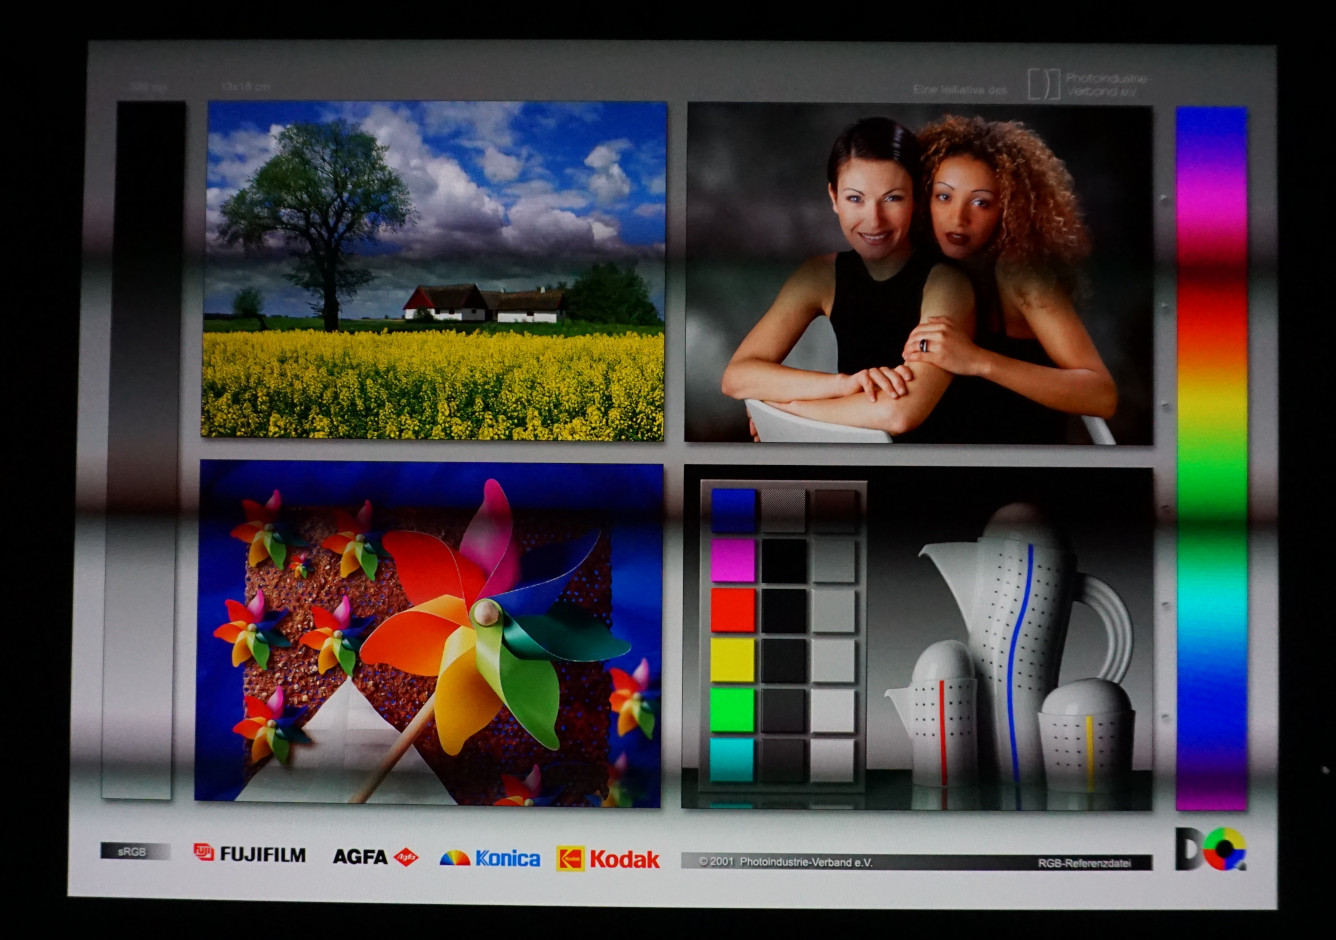
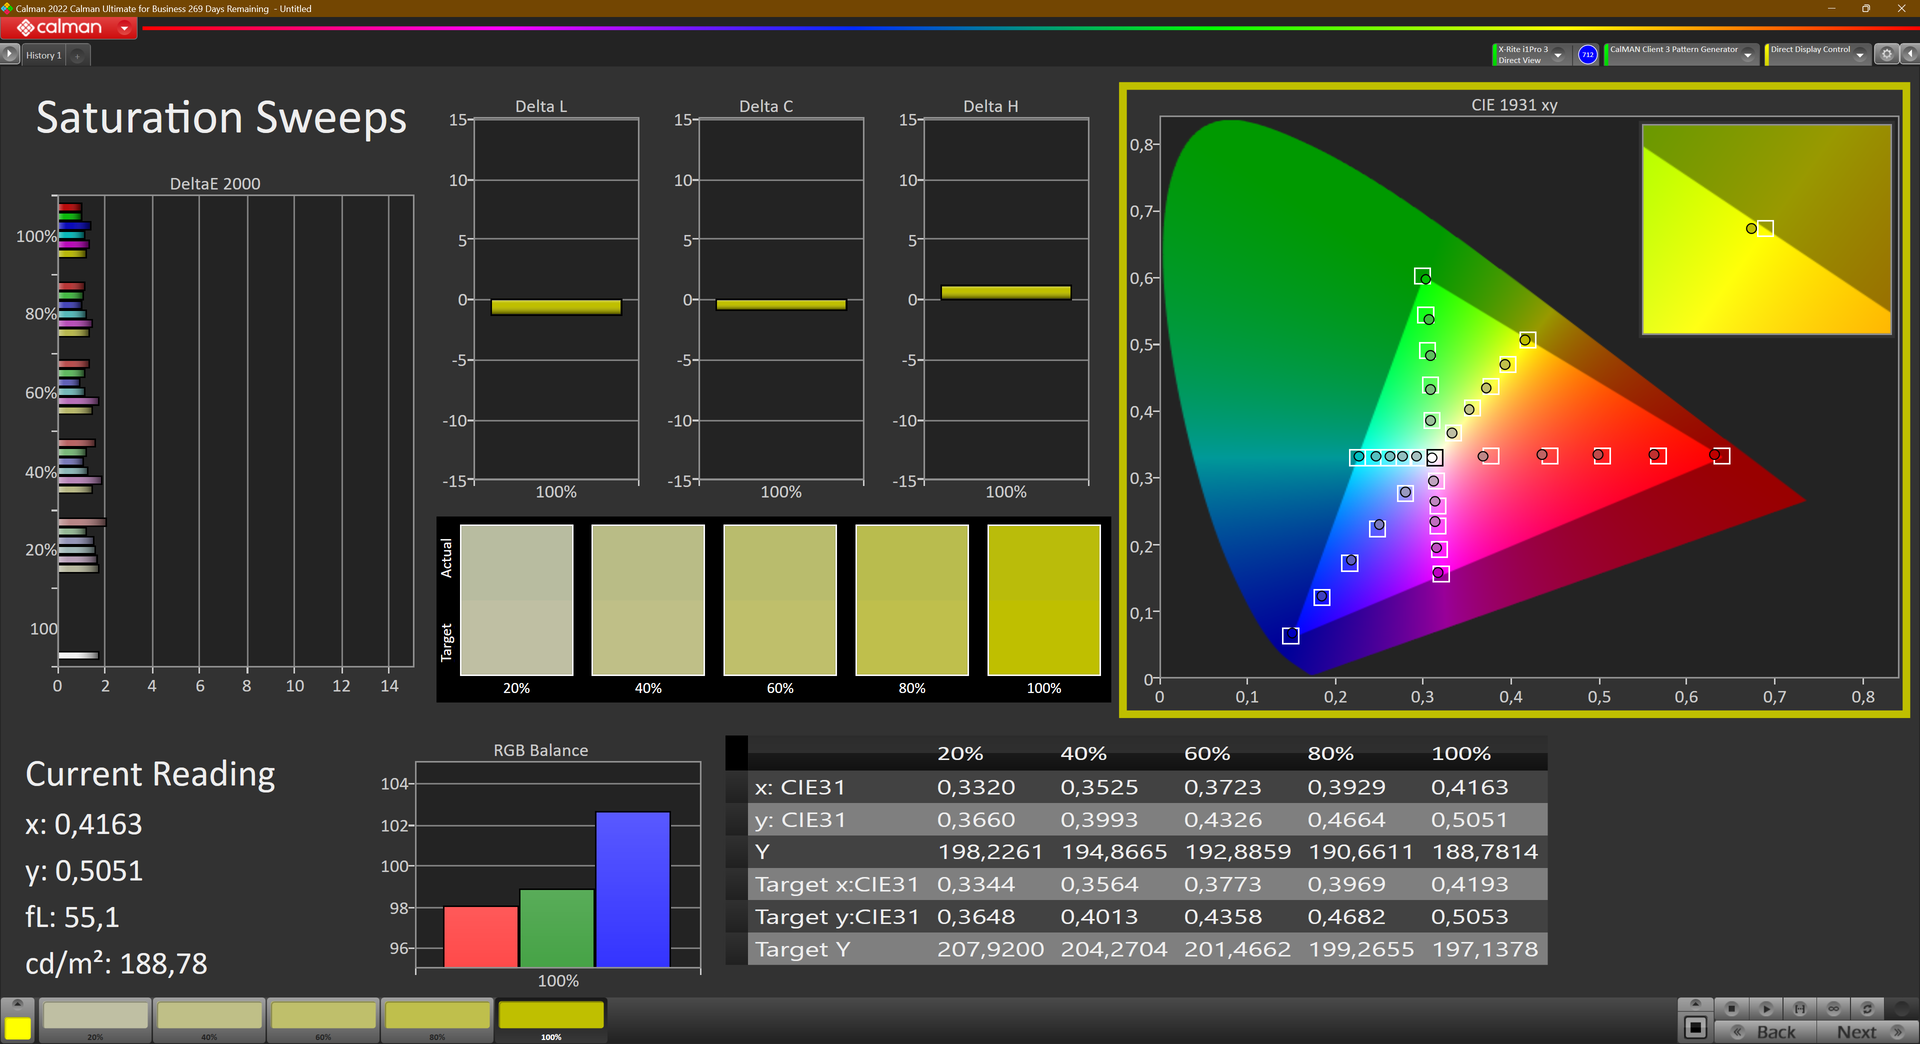
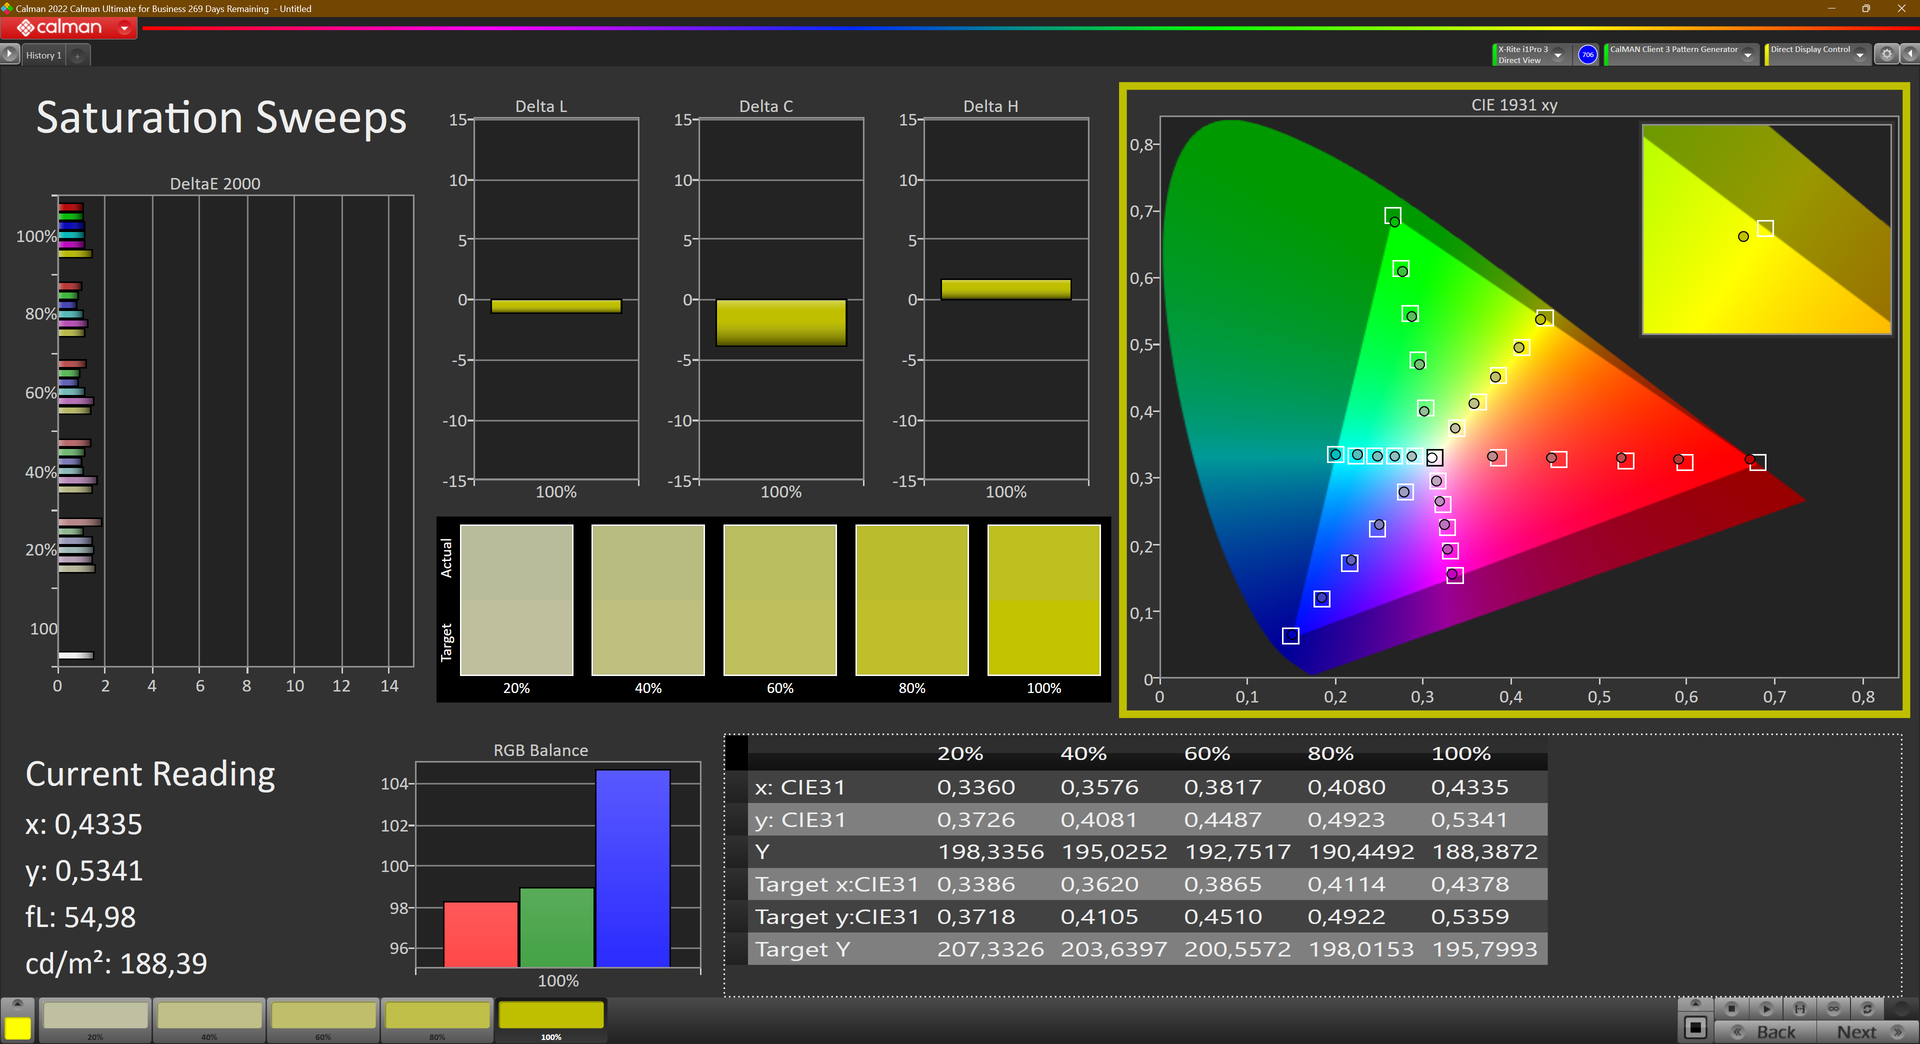
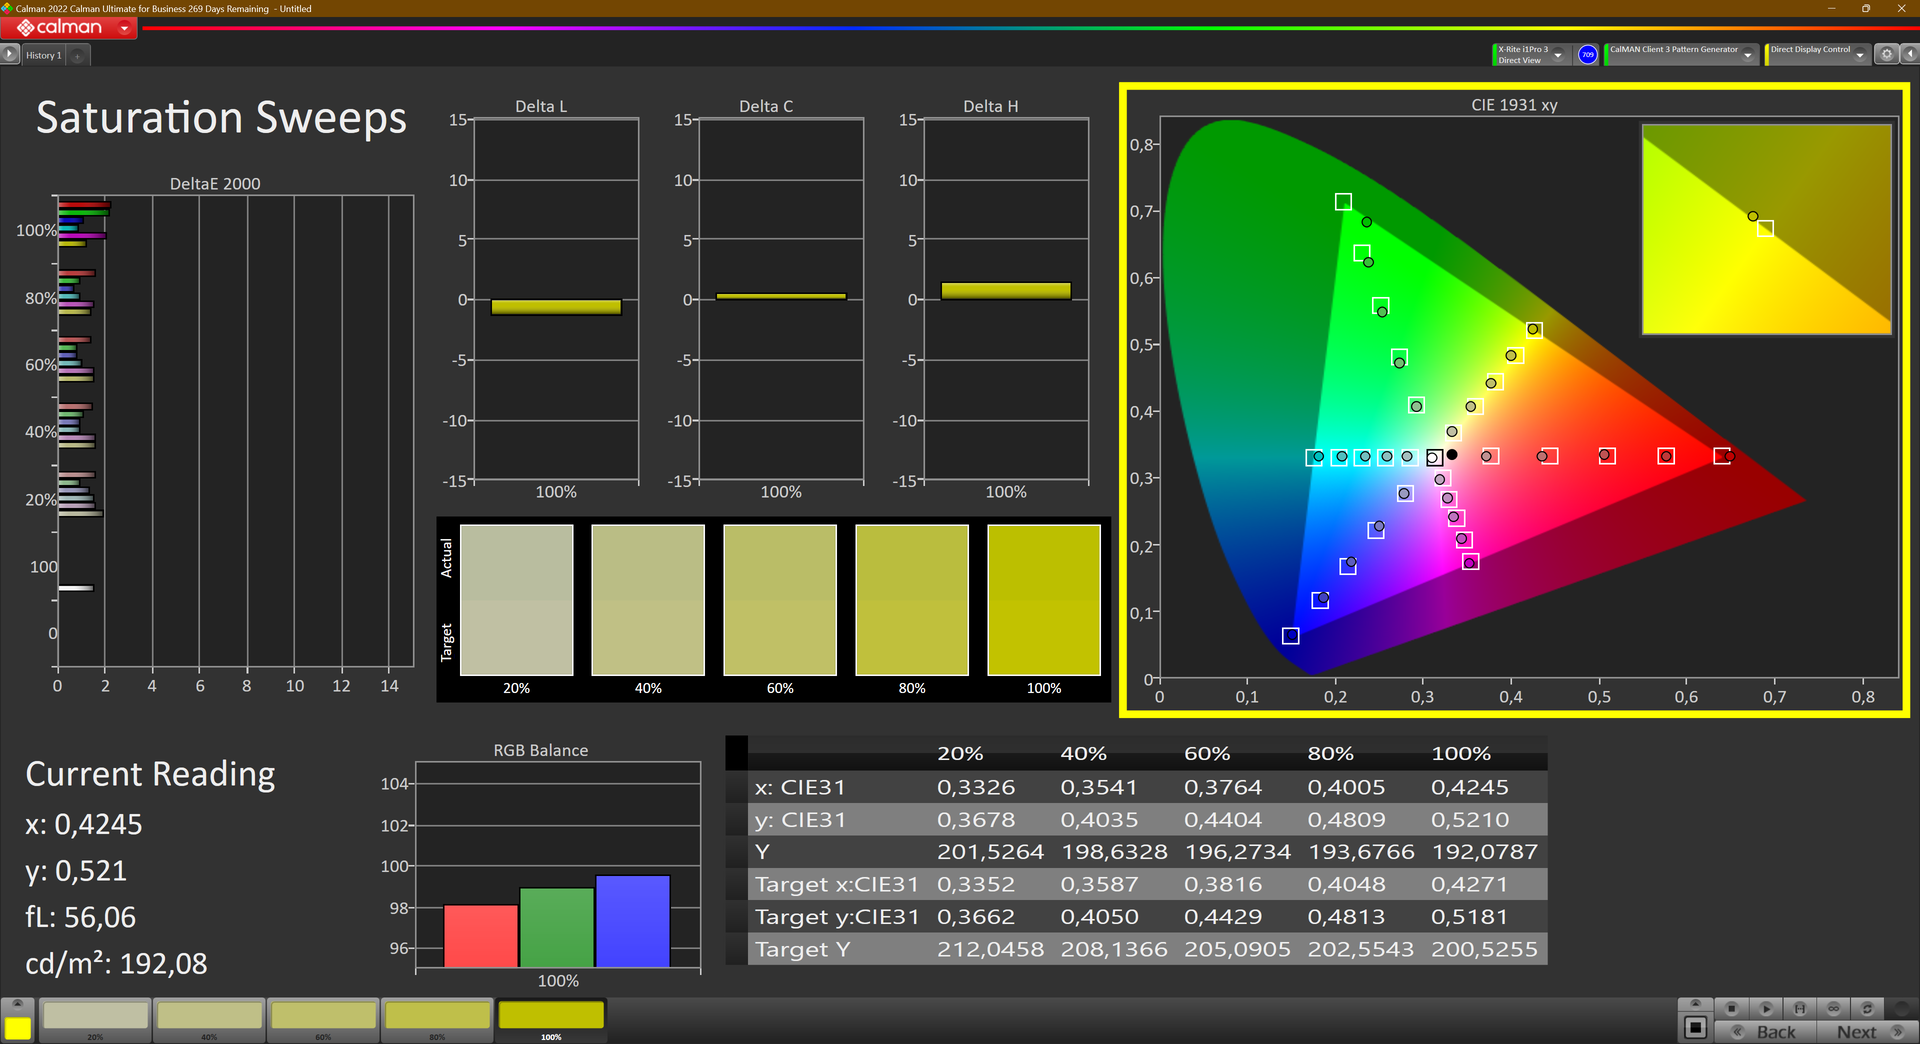
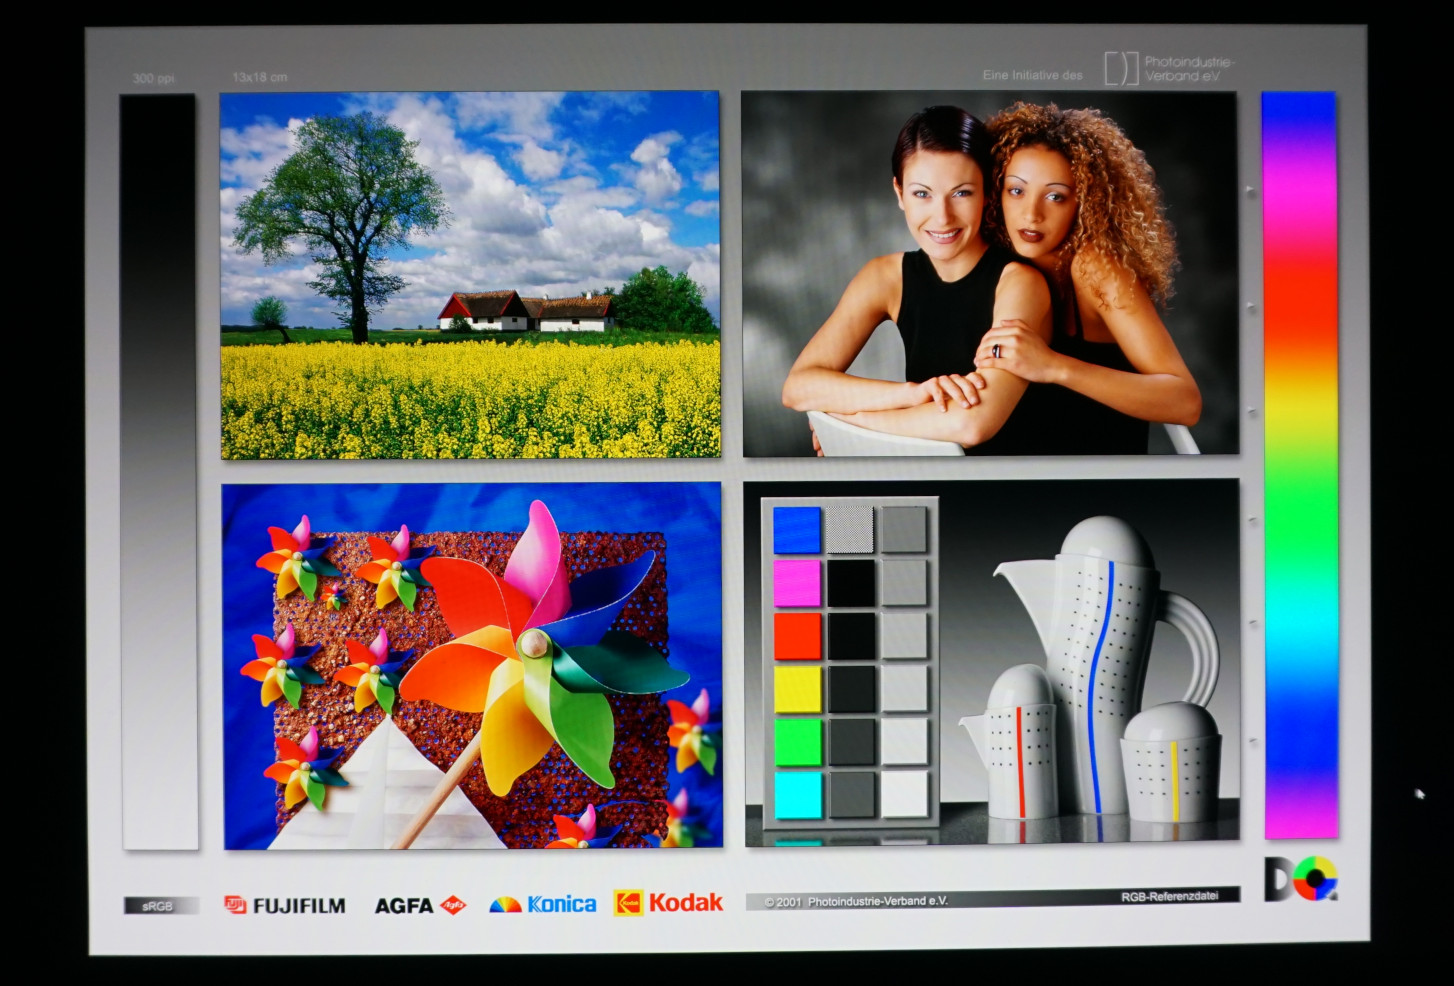
La pantalla OLED instalada no sólo debería ser interesante para el trabajo creativo. Aunque su resolución 4K que, en teoría, cubre el espacio de color Display P3 en su totalidad y asegura un fuerte contraste y precisión de color, es claramente un buen comienzo para aplicaciones gráficas exigentes.
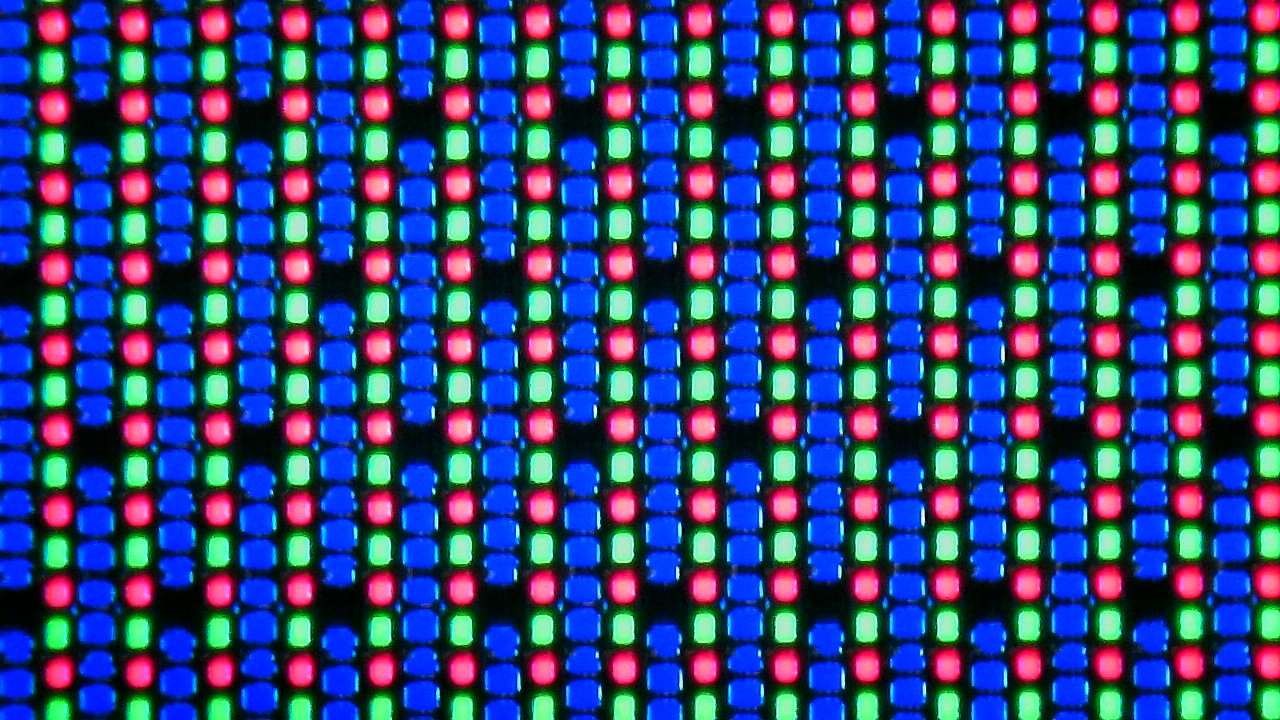
Incluso en general, el contenido se ve intenso y radiante en la pantalla del portátil. El hecho de que el texto se muestre ligeramente sucio en ocasiones se compensa con su altísima resolución. El hecho de que los subpíxeles no estén estructurados uniformemente da lugar a veces a bordes borrosos. Ampliar el texto en el valor recomendado del 175 % hace que esto no se note.
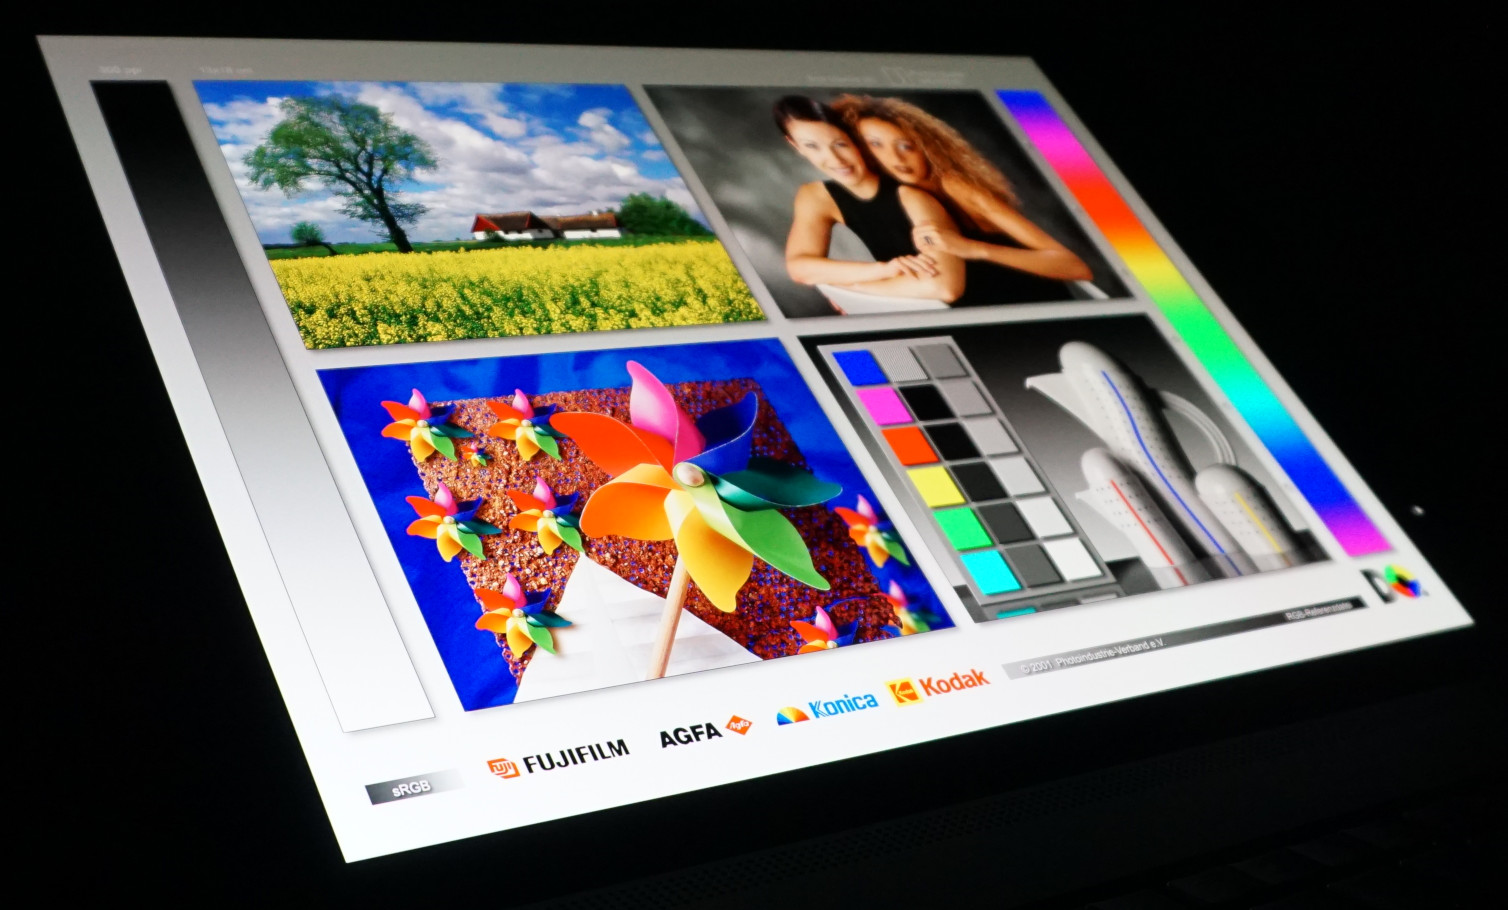
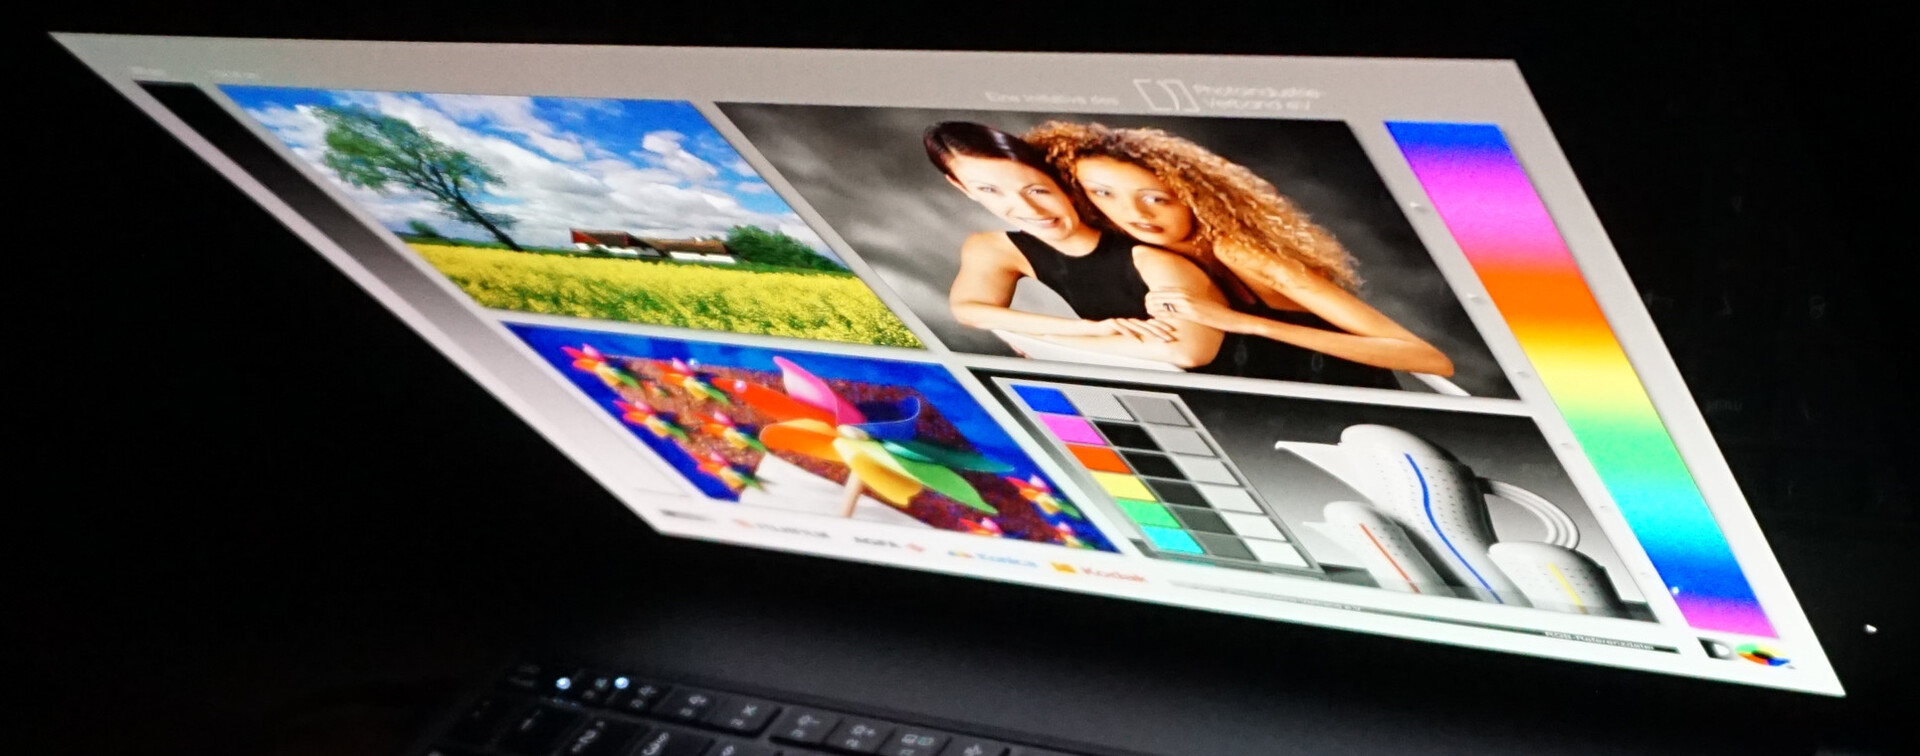
Hay que tener en cuenta su superficie reflectante cuando se trata de la representación precisa del color de la pantalla, lo que no es ideal cuando se utiliza el dispositivo en exteriores. En el interior, los altos niveles de contraste de la pantalla lo compensan.
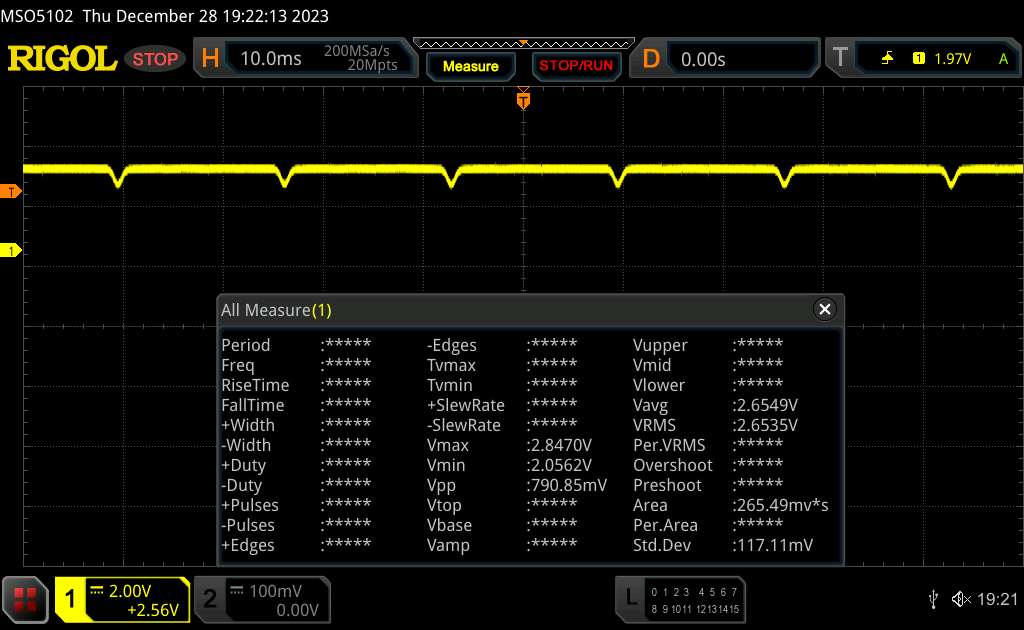
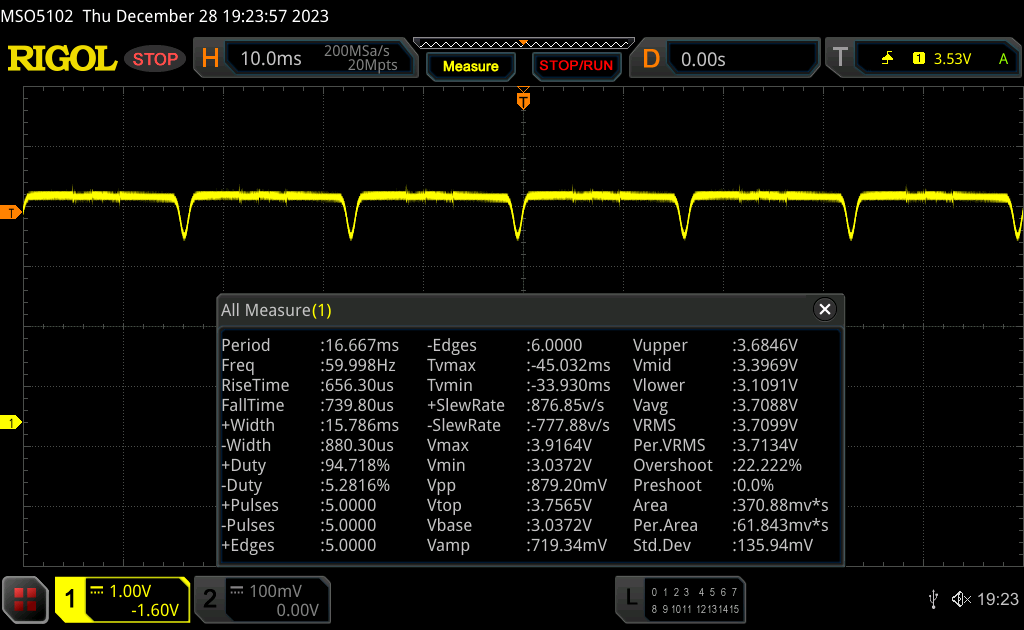
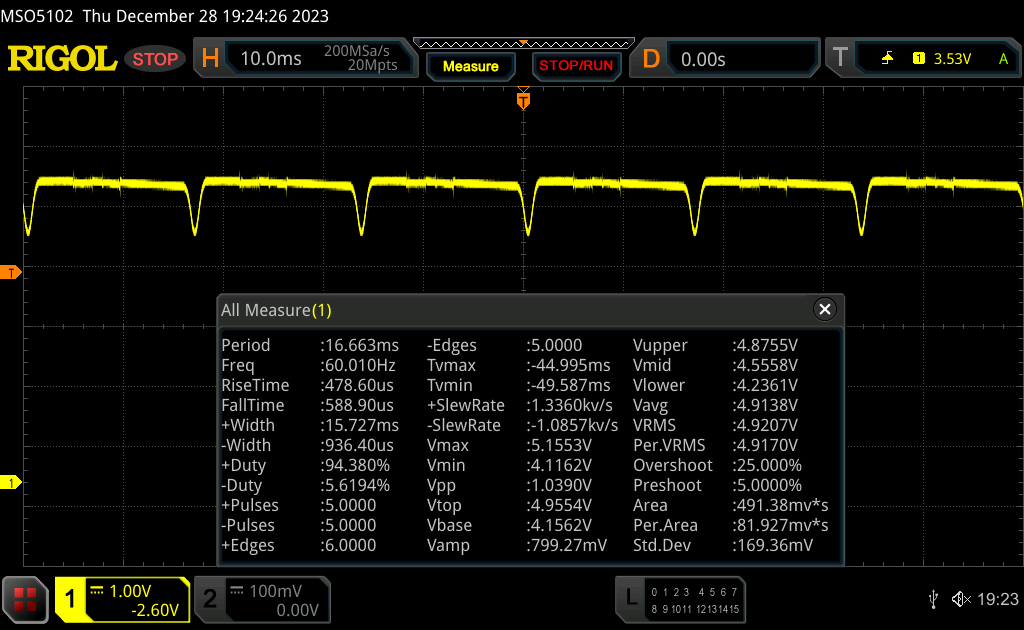
Además, la pantalla OLED utiliza un tipo de modulación por ancho de pulso. No es ni mucho menos tan agresiva como en bastantes monitores LCD antiguos. Sin embargo, es posible que se note ligeramente, ya que la frecuencia que medimos a alto brillo mostró sólo 60 Hz.
Para los usuarios sensibles, recomendaríamos una de las muchas otras opciones de pantalla que utilizan paneles IPS y, a su vez, no utilizan PWM:
- WUXGA (1920x1200), IPS, 300nits, antirreflejos, 16:10, 800:1, 45% NTSC
- WUXGA (1920x1200), Multitáctil, IPS, 300 nits, Antirreflejos, 16:10, 800:1, 45% NTSC
- WUXGA (1920x1200), IPS, 400 nits, Antirreflejos, 16:10, 1000:1, 100% sRGB
- WUXGA (1920x1200), Multitáctil, IPS, 500 nits, Antirreflejos, 16:10, 1000:1, 100% sRGB
| |||||||||||||||||||||||||
iluminación: 98 %
Brillo con batería: 417 cd/m²
Contraste: ∞:1 (Negro: 0 cd/m²)
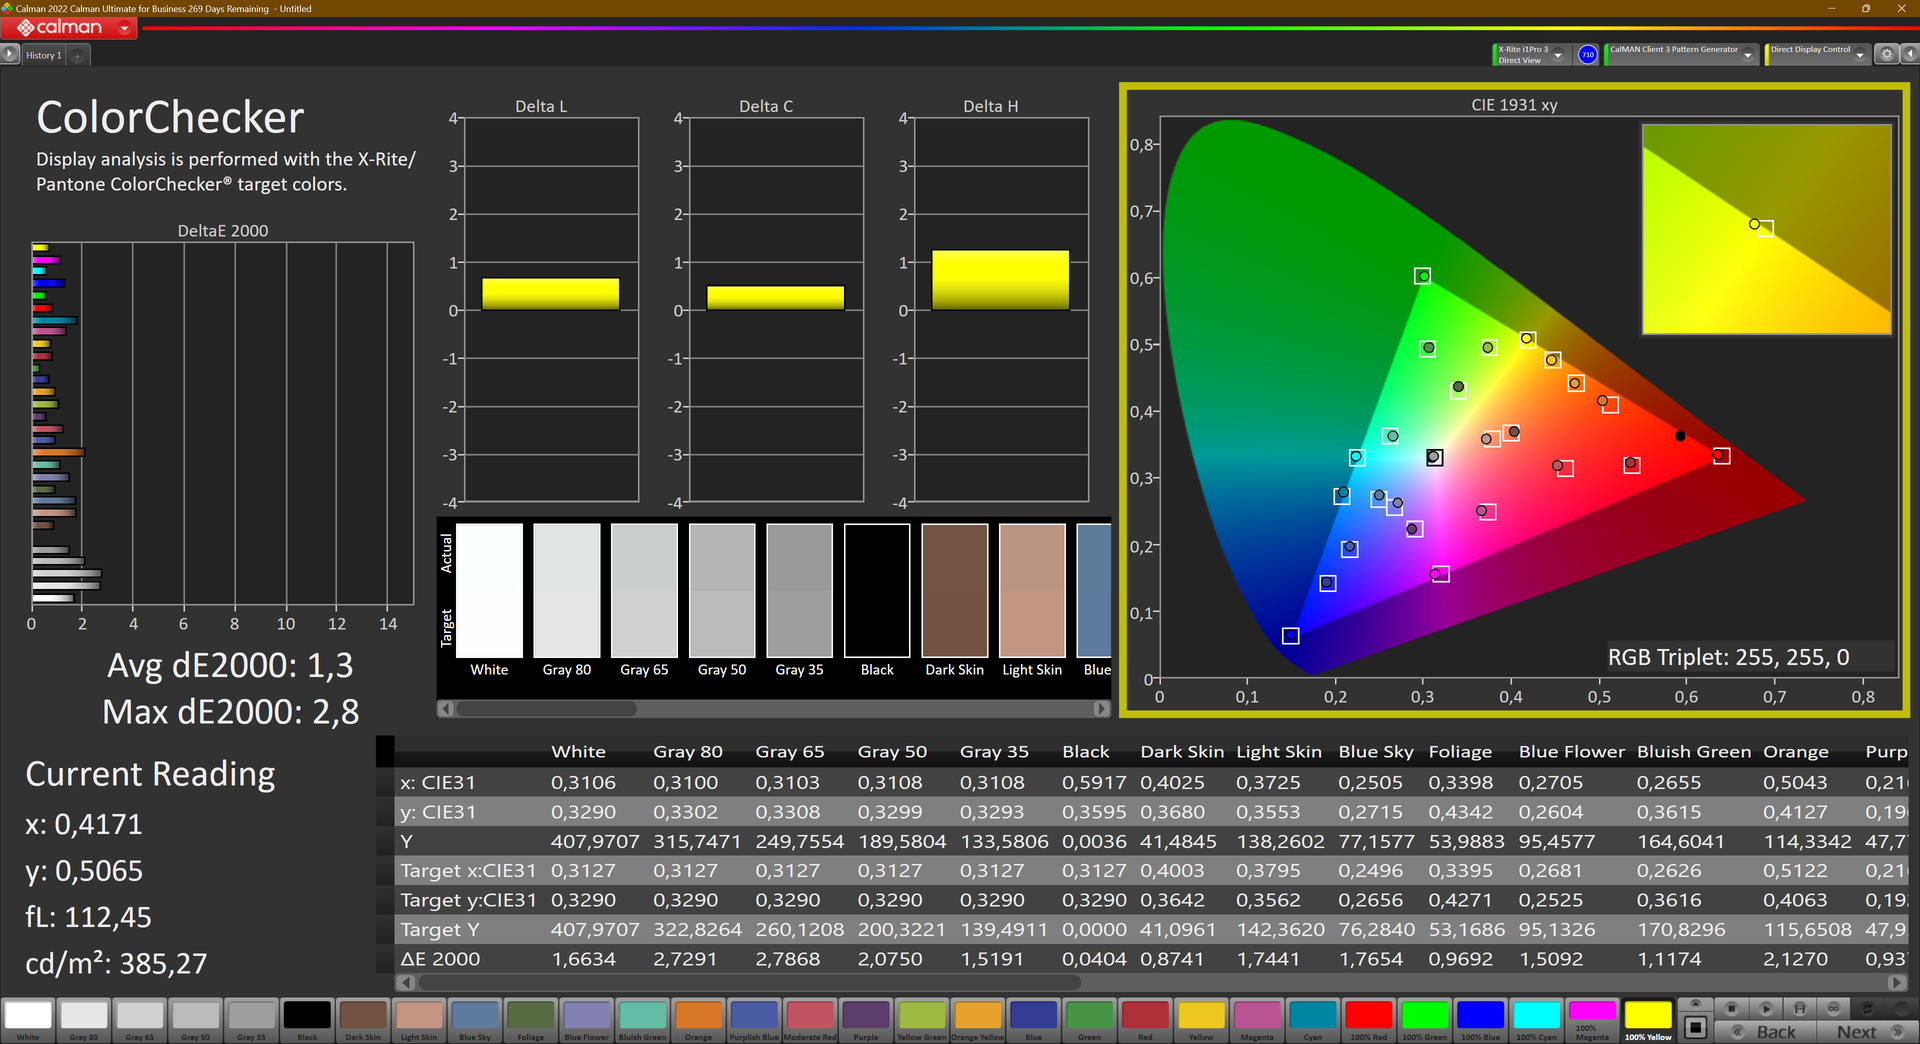
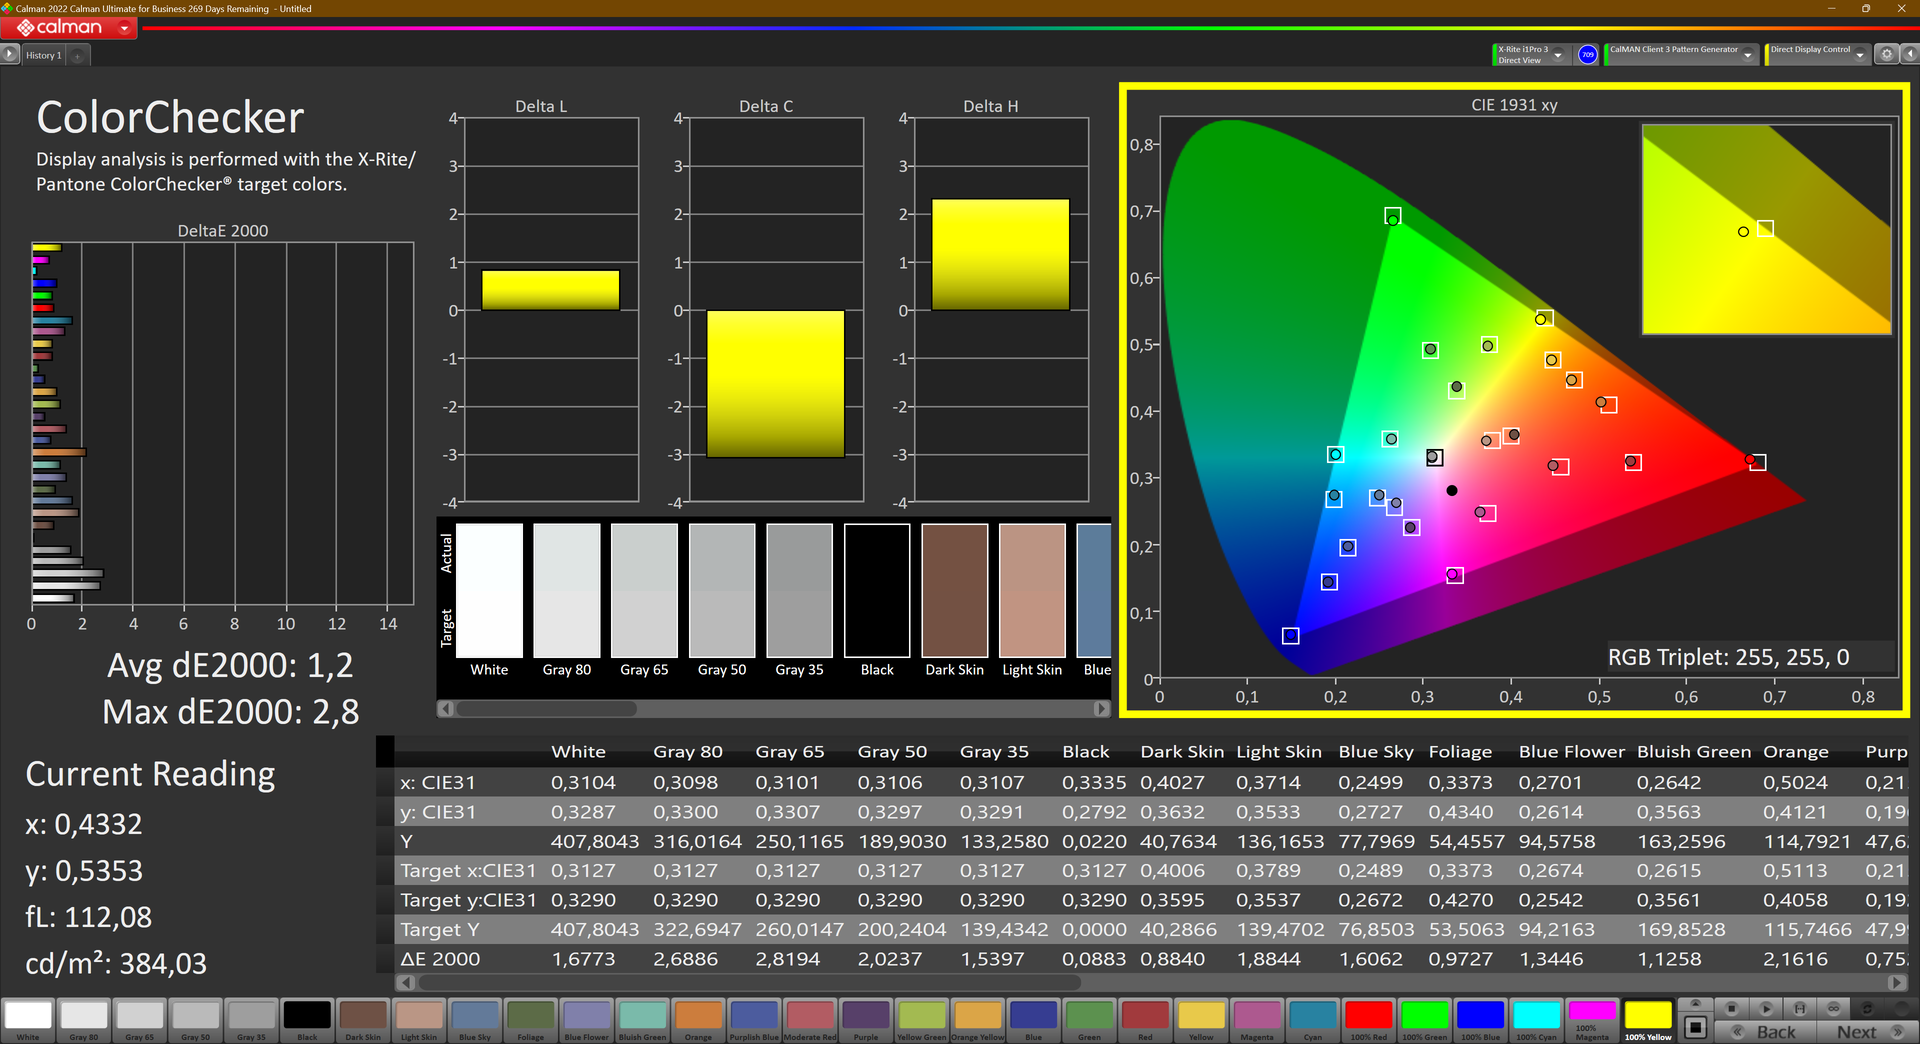
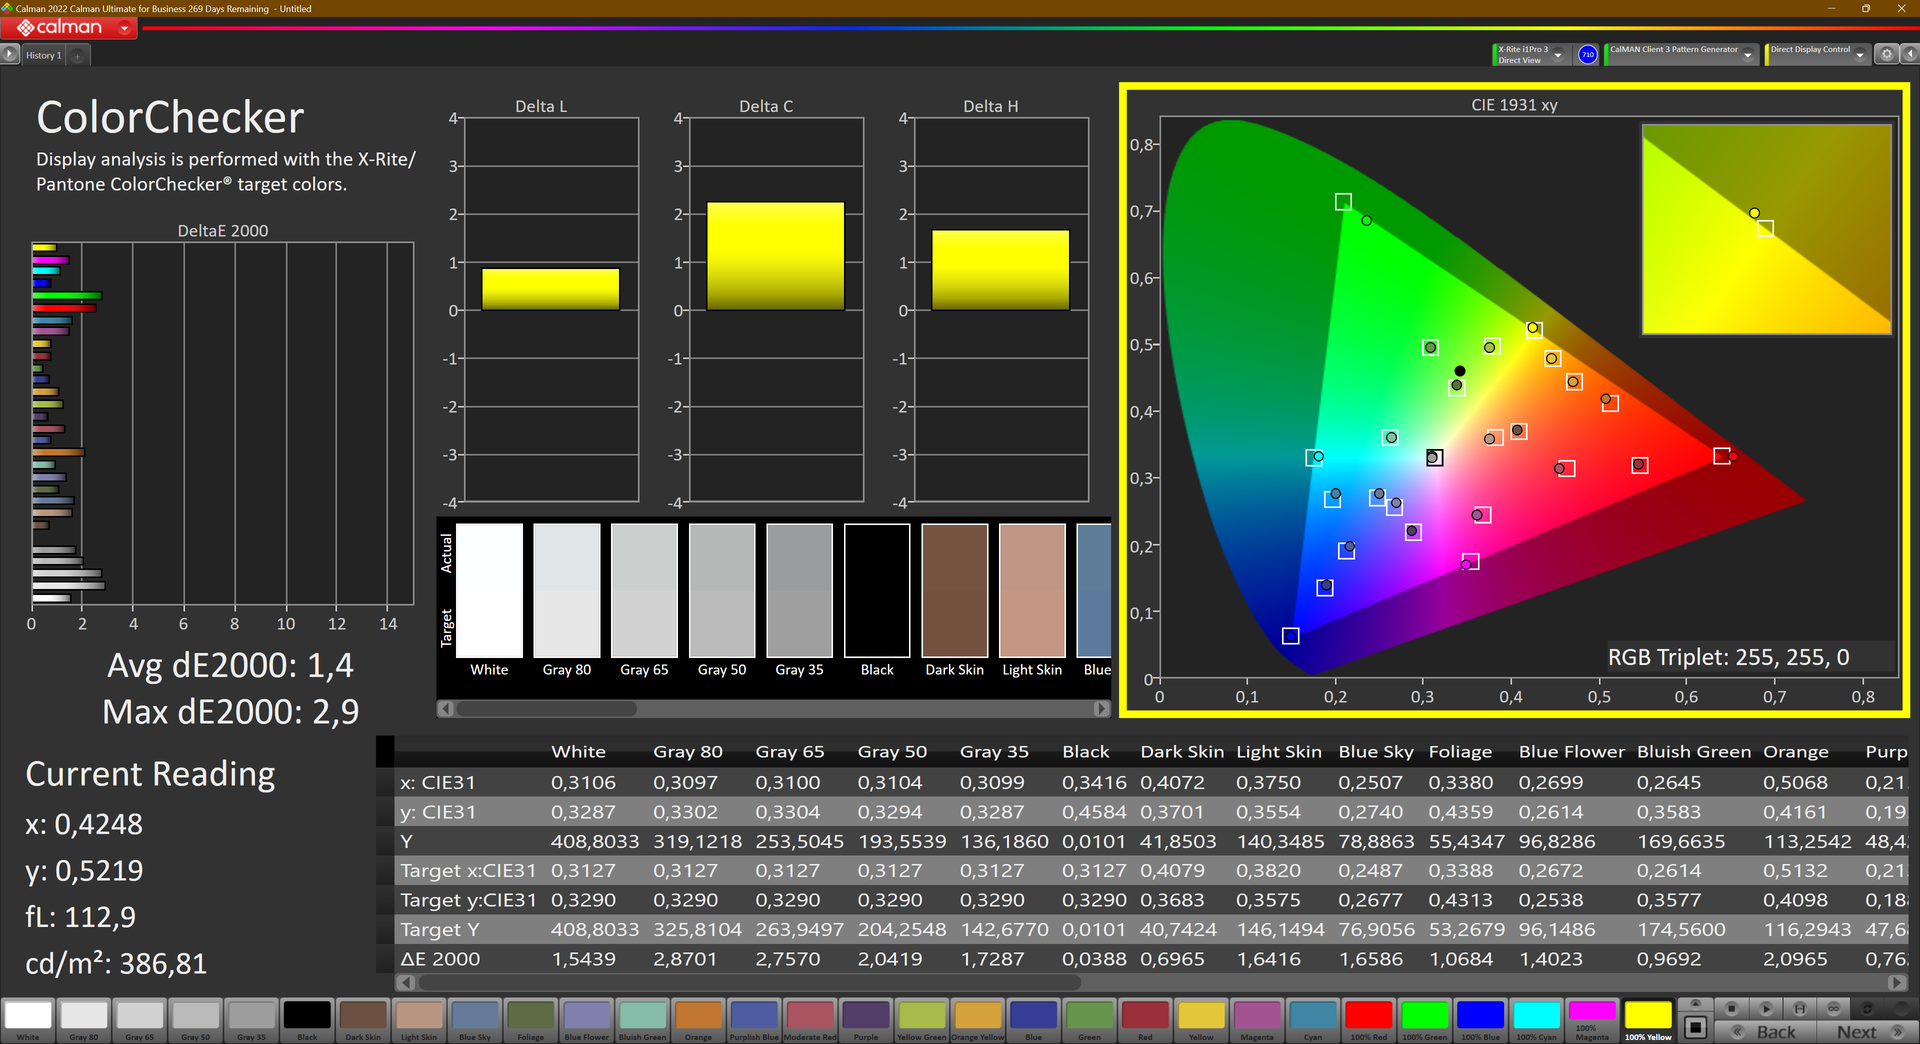
ΔE ColorChecker Calman: 1.3 | ∀{0.5-29.43 Ø4.73}
calibrated: 2.9
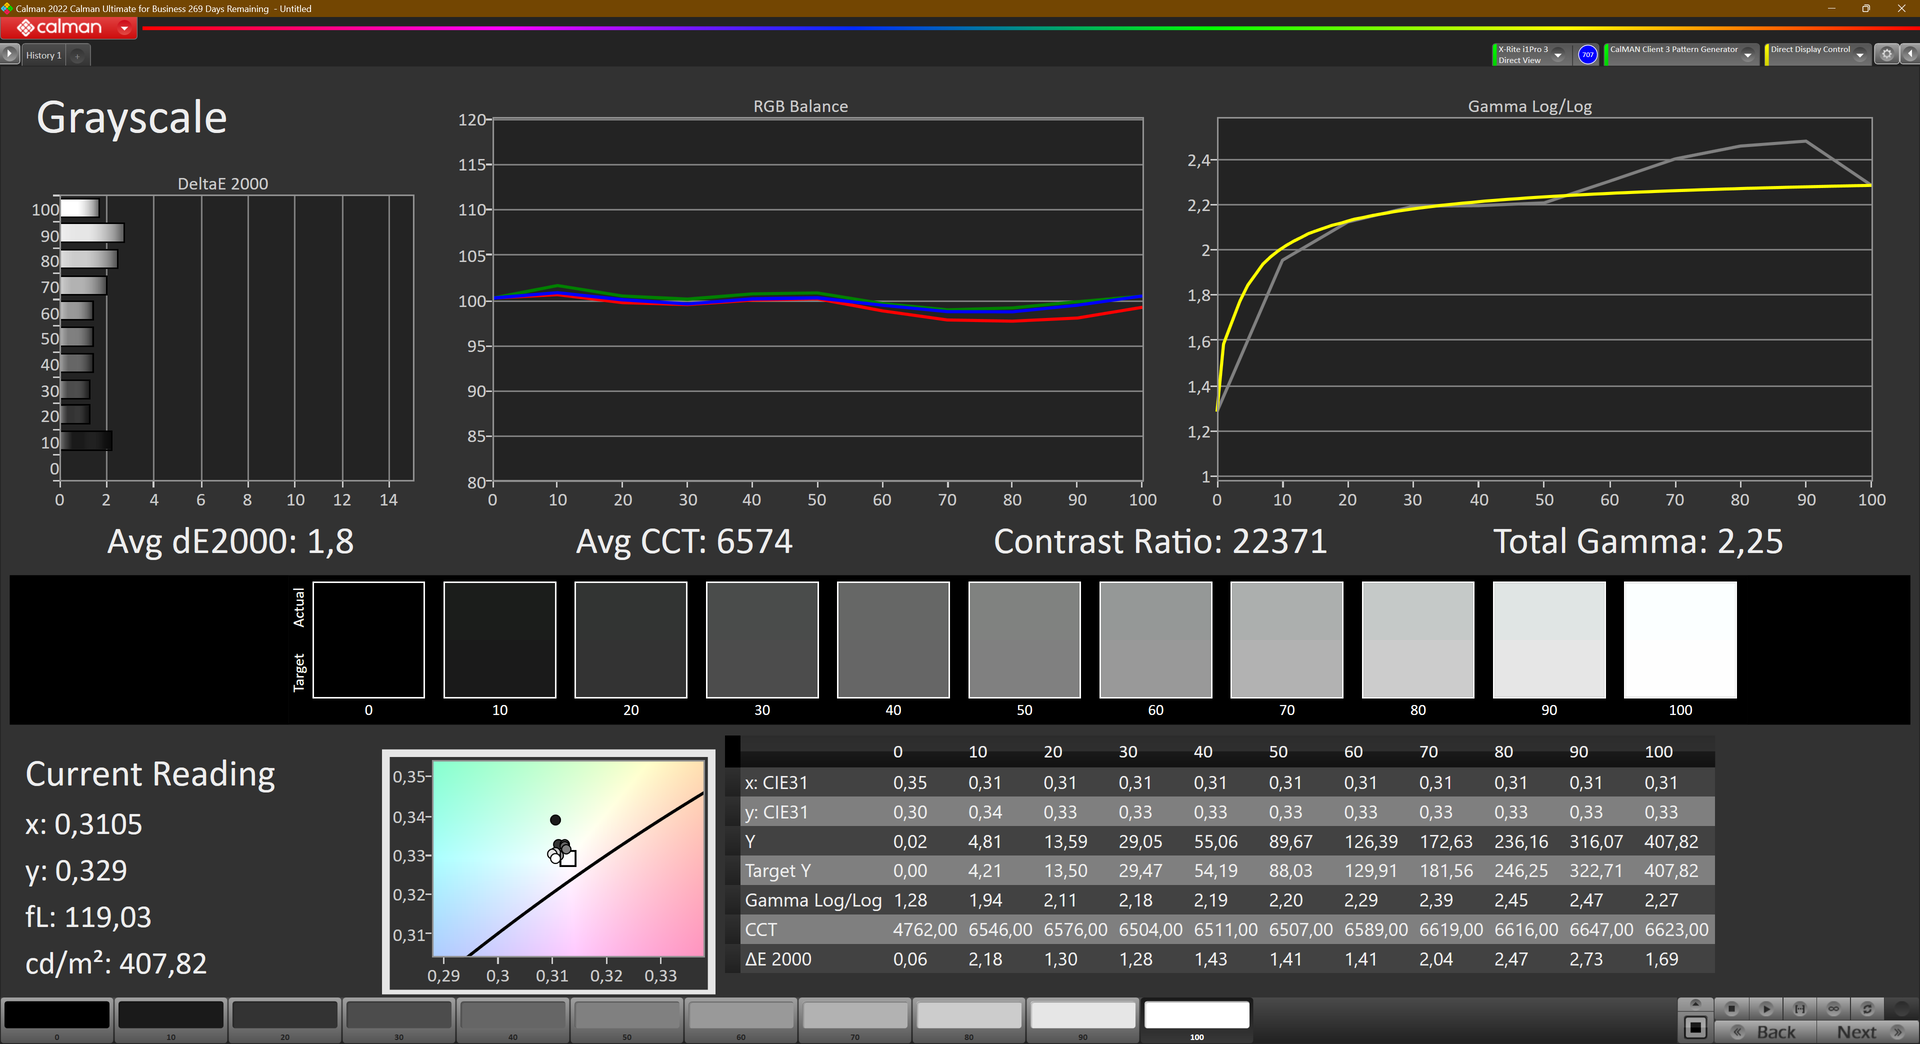
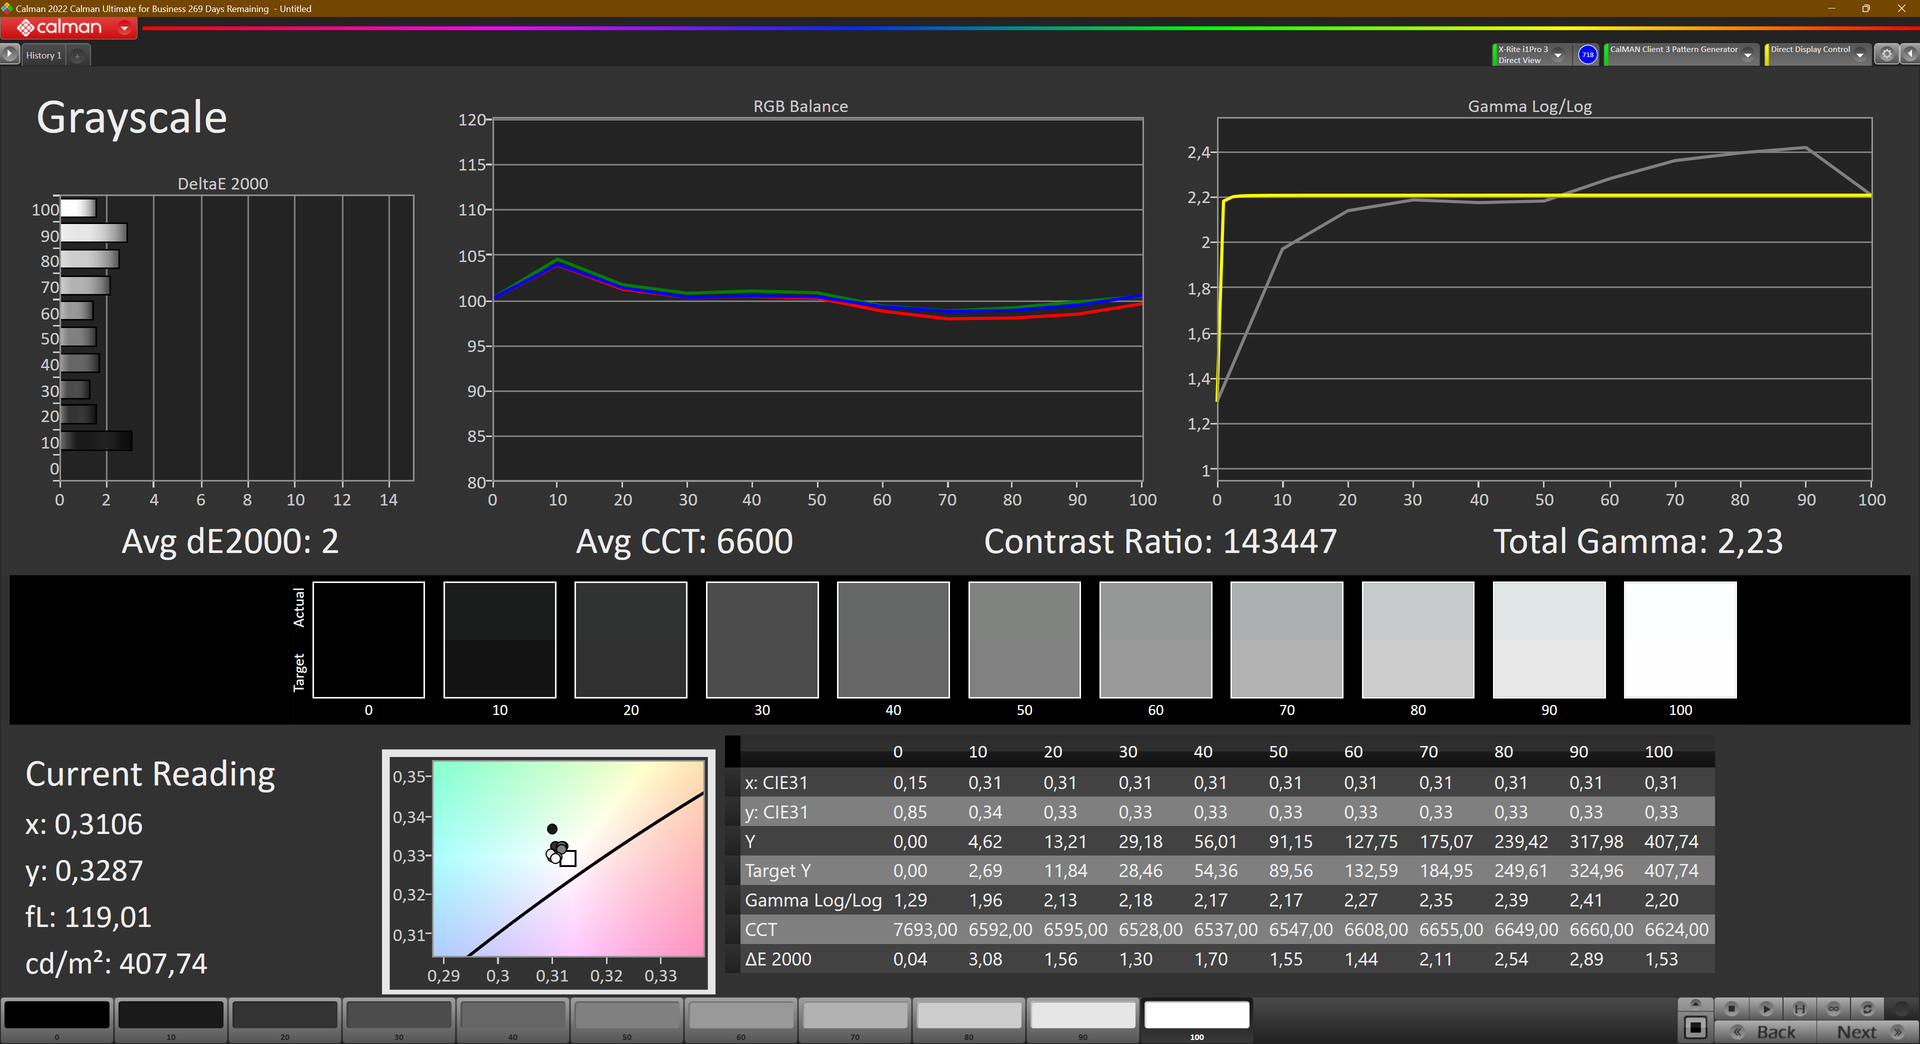
ΔE Greyscale Calman: 1.8 | ∀{0.09-98 Ø4.97}
96.9% AdobeRGB 1998 (Argyll 3D)
100% sRGB (Argyll 3D)
99.9% Display P3 (Argyll 3D)
Gamma: 2.25
CCT: 6574 K
| Lenovo ThinkPad P16s G2 21K9000CGE ATNA60YV04-0, OLED, 3840x2400, 16" | HP EliteBook 845 G10 818N0EA AUO6DA8, IPS, 2560x1600, 14" | Lenovo ThinkPad P14s G4 21K5000LGE Lenovo MNE007JA1-1, IPS, 1920x1200, 14" | Schenker Vision 16 PH6PRX1 BOE CQ NE160QDM-NZ1 , IPS, 2560x1600, 16" | Acer Swift Edge SFE16 Ryzen 7 7840U Samsung ATNA60BX03-0, OLED, 3200x2000, 16" | Lenovo ThinkPad P16v G1 AMD NE160WUM-N64, IPS, 1920x1200, 16" | Microsoft Surface Laptop Studio 2 RTX 4060 LQ144P1JX01, IPS, 2400x1600, 14.4" | |
|---|---|---|---|---|---|---|---|
| Display | -4% | -19% | -19% | 1% | -21% | -21% | |
| Display P3 Coverage (%) | 99.9 | 98.3 -2% | 69.4 -31% | 70 -30% | 99.9 0% | 67.8 -32% | 66.7 -33% |
| sRGB Coverage (%) | 100 | 99.8 0% | 99.9 0% | 99.3 -1% | 100 0% | 97.7 -2% | 99 -1% |
| AdobeRGB 1998 Coverage (%) | 96.9 | 86.2 -11% | 71.4 -26% | 71.2 -27% | 100 3% | 69.8 -28% | 68.9 -29% |
| Response Times | -628% | -2611% | -574% | 43% | -2587% | -3806% | |
| Response Time Grey 50% / Grey 80% * (ms) | 1.5 ? | 12.7 ? -747% | 45.9 ? -2960% | 11 ? -633% | 0.57 ? 62% | 50.6 ? -3273% | 77.6 ? -5073% |
| Response Time Black / White * (ms) | 1.3 ? | 7.9 ? -508% | 30.7 ? -2262% | 8 ? -515% | 1 ? 23% | 26 ? -1900% | 34.3 ? -2538% |
| PWM Frequency (Hz) | 60 | 238.8 | 17600 ? | ||||
| Screen | 9% | -11% | 3% | -44% | -51% | 35% | |
| Brightness middle (cd/m²) | 416 | 546 31% | 414 0% | 356 -14% | 379.8 -9% | 355 -15% | 511 23% |
| Brightness (cd/m²) | 421 | 564 34% | 392 -7% | 349 -17% | 383 -9% | 344 -18% | 503 19% |
| Brightness Distribution (%) | 98 | 86 -12% | 89 -9% | 93 -5% | 98 0% | 92 -6% | 89 -9% |
| Black Level * (cd/m²) | 0.38 | 0.26 | 0.28 | 0.17 | 0.26 | ||
| Colorchecker dE 2000 * | 1.3 | 1.3 -0% | 1.9 -46% | 1.7 -31% | 4.7 -262% | 2.9 -123% | 0.5 62% |
| Colorchecker dE 2000 max. * | 2.8 | 5.3 -89% | 3.6 -29% | 3 -7% | 7.51 -168% | 5.6 -100% | 1.1 61% |
| Colorchecker dE 2000 calibrated * | 2.9 | 1.2 59% | 0.8 72% | 1 66% | 0.55 81% | 1 66% | |
| Greyscale dE 2000 * | 1.8 | 1.1 39% | 2.9 -61% | 1.3 28% | 0.8 56% | 4.7 -161% | 0.8 56% |
| Gamma | 2.25 98% | 2.27 97% | 2.26 97% | 2.1 105% | 2.22 99% | 2.12 104% | 2.19 100% |
| CCT | 6574 99% | 6463 101% | 6227 104% | 6625 98% | 6381 102% | 6356 102% | 6650 98% |
| Contrast (:1) | 1437 | 1592 | 1271 | 2088 | 1965 | ||
| Media total (Programa/Opciones) | -208% /
-101% | -880% /
-447% | -197% /
-99% | 0% /
-19% | -886% /
-466% | -1264% /
-678% |
* ... más pequeño es mejor
La pantalla OLED es tan generosa como cabía esperar en lo que se refiere a la representación del color. Cubre por completo Display-P3, un espacio de color que se utiliza para producciones de vídeo profesionales. Sólo no cubre AdobeRGB en su totalidad.
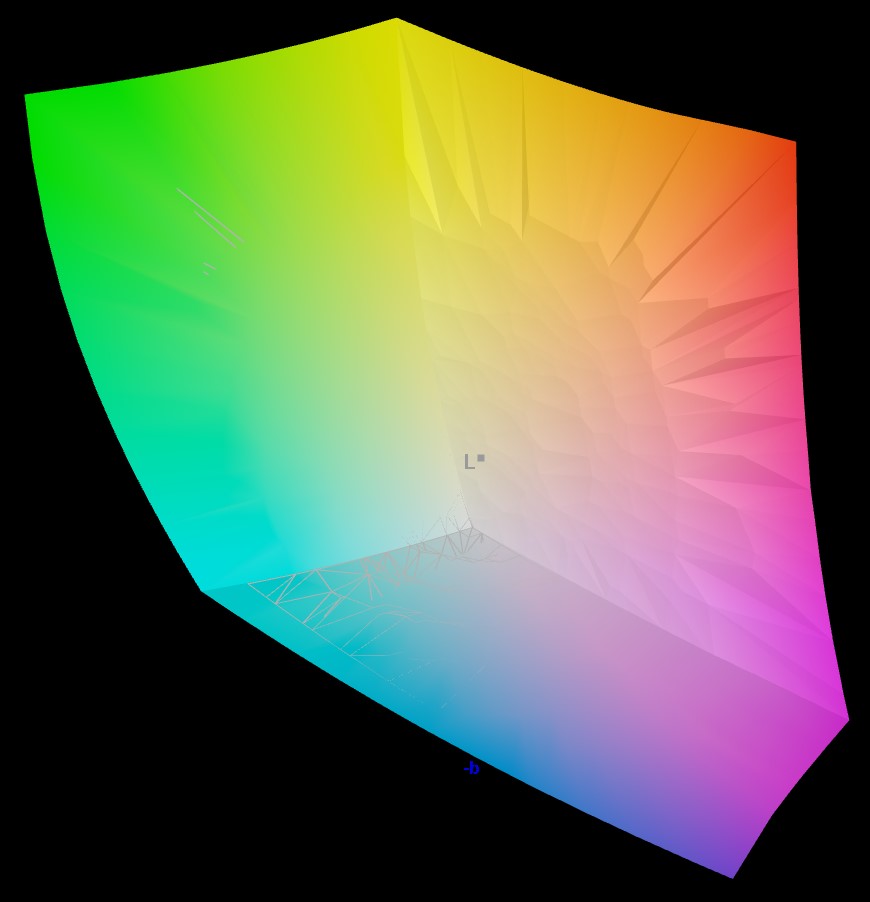
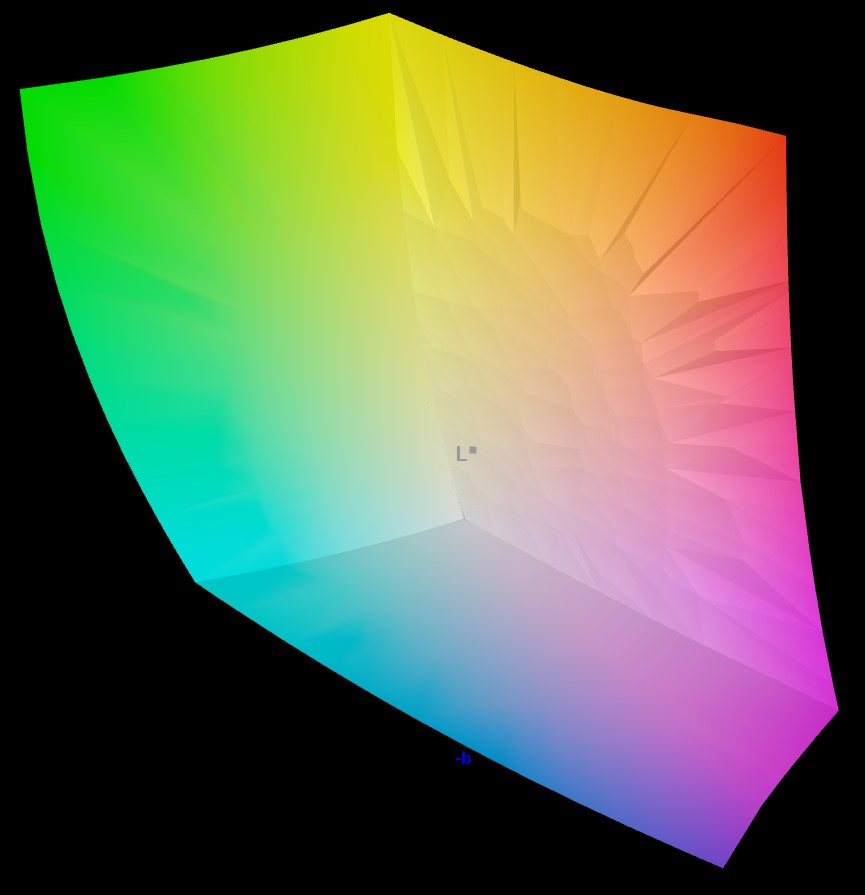
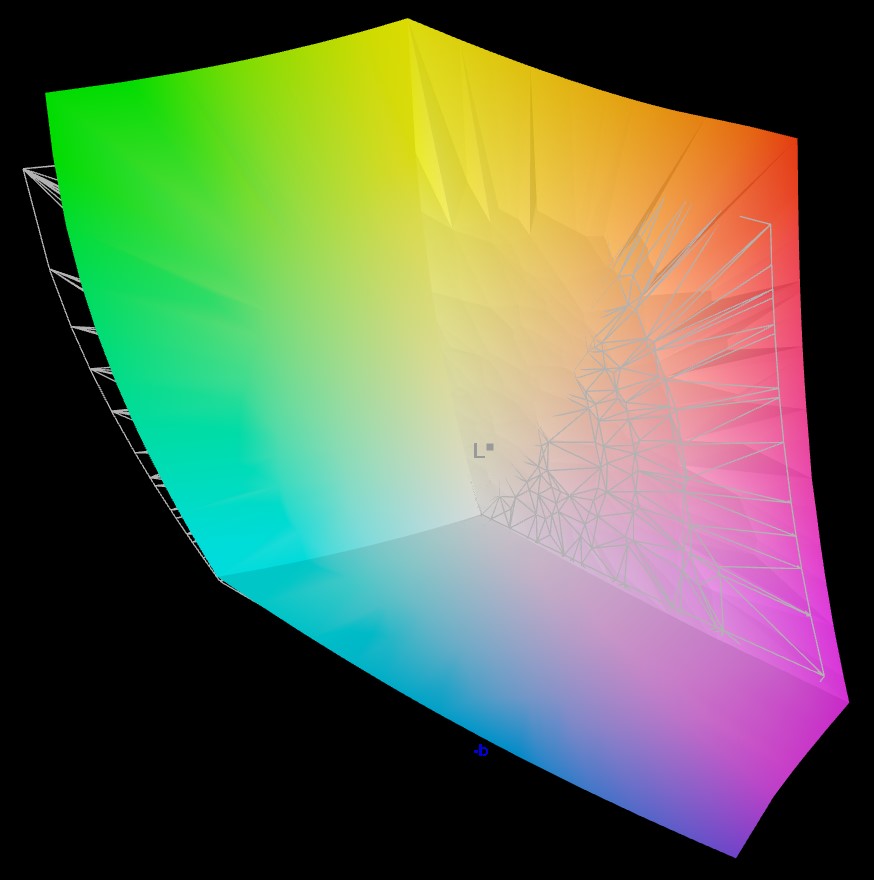
Al medir la precisión del color de la pantalla, observamos valores por debajo de lo perceptible a simple vista, incluso en las desviaciones más altas. Por término medio, las desviaciones fueron incluso menores. Esto significa que los colores se representan con una precisión casi perfecta.

Tiempos de respuesta del display
| ↔ Tiempo de respuesta de Negro a Blanco | ||
|---|---|---|
| 1.3 ms ... subida ↗ y bajada ↘ combinada | ↗ 0.7 ms subida | 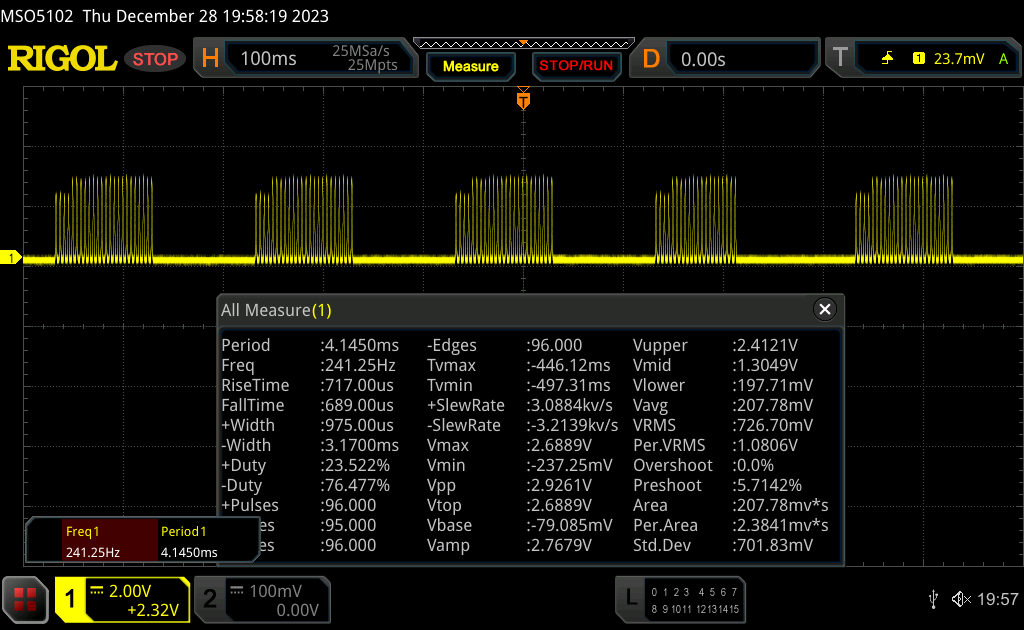 |
| ↘ 0.6 ms bajada | ||
| La pantalla mostró tiempos de respuesta muy rápidos en nuestros tests y debería ser adecuada para juegos frenéticos. En comparación, todos los dispositivos de prueba van de ##min### (mínimo) a 240 (máximo) ms. » 7 % de todos los dispositivos son mejores. Esto quiere decir que el tiempo de respuesta medido es mejor que la media (19.9 ms) de todos los dispositivos testados. | ||
| ↔ Tiempo de respuesta 50% Gris a 80% Gris | ||
| 1.5 ms ... subida ↗ y bajada ↘ combinada | ↗ 0.8 ms subida | 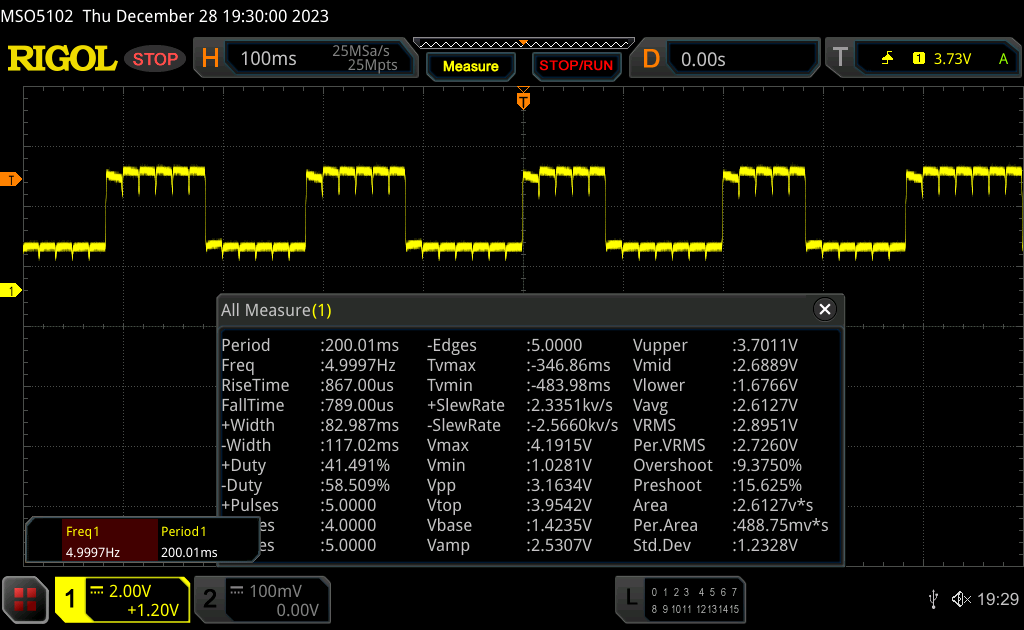 |
| ↘ 0.7 ms bajada | ||
| La pantalla mostró tiempos de respuesta muy rápidos en nuestros tests y debería ser adecuada para juegos frenéticos. En comparación, todos los dispositivos de prueba van de ##min### (mínimo) a 636 (máximo) ms. » 7 % de todos los dispositivos son mejores. Esto quiere decir que el tiempo de respuesta medido es mejor que la media (31.1 ms) de todos los dispositivos testados. | ||
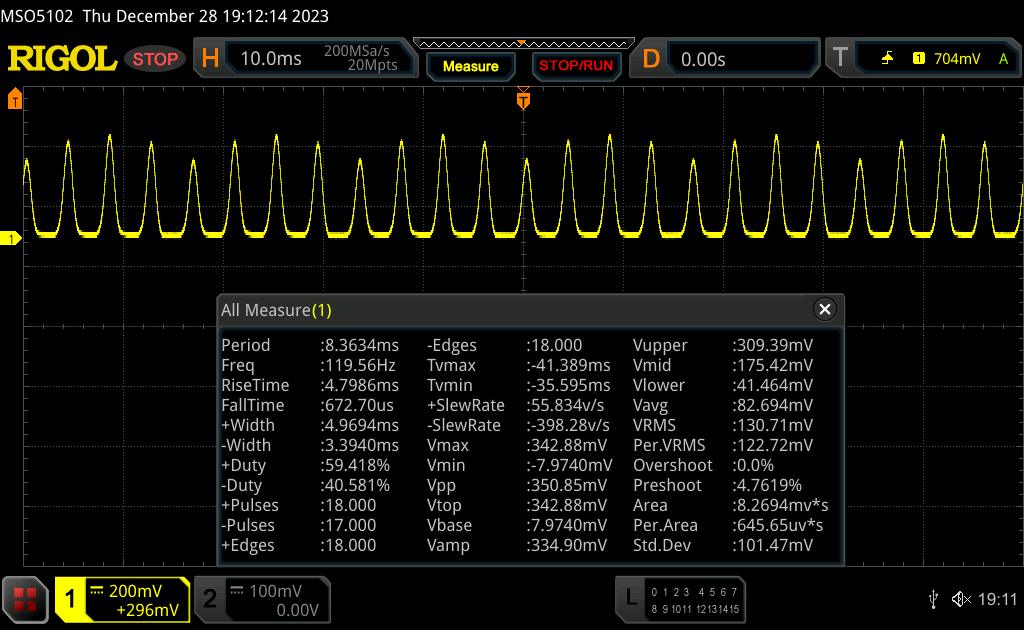
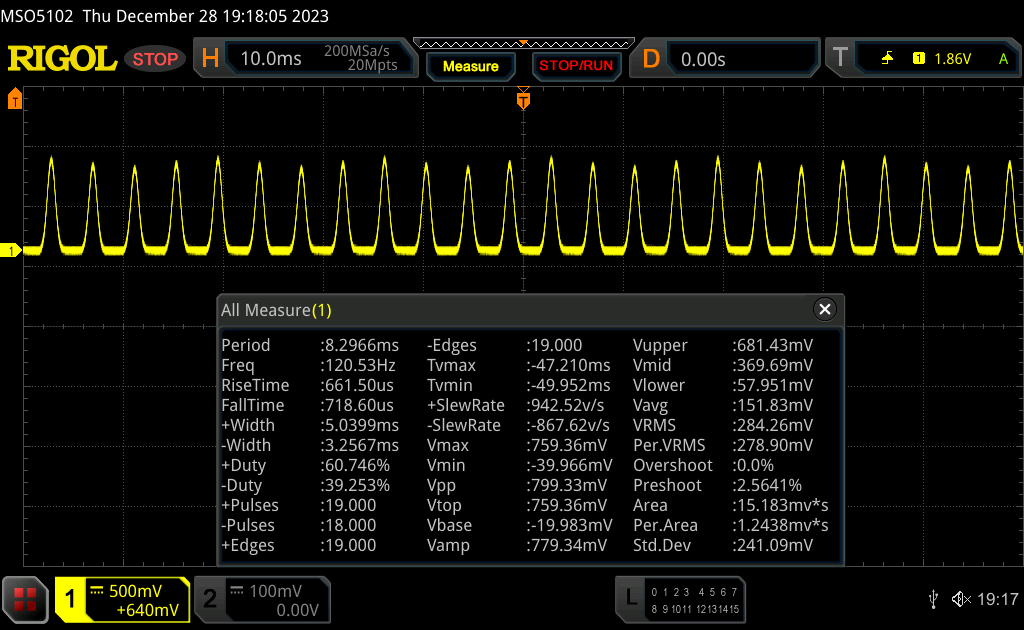
Parpadeo de Pantalla / PWM (Pulse-Width Modulation)
| Parpadeo de Pantalla / PWM detectado | 60 Hz | 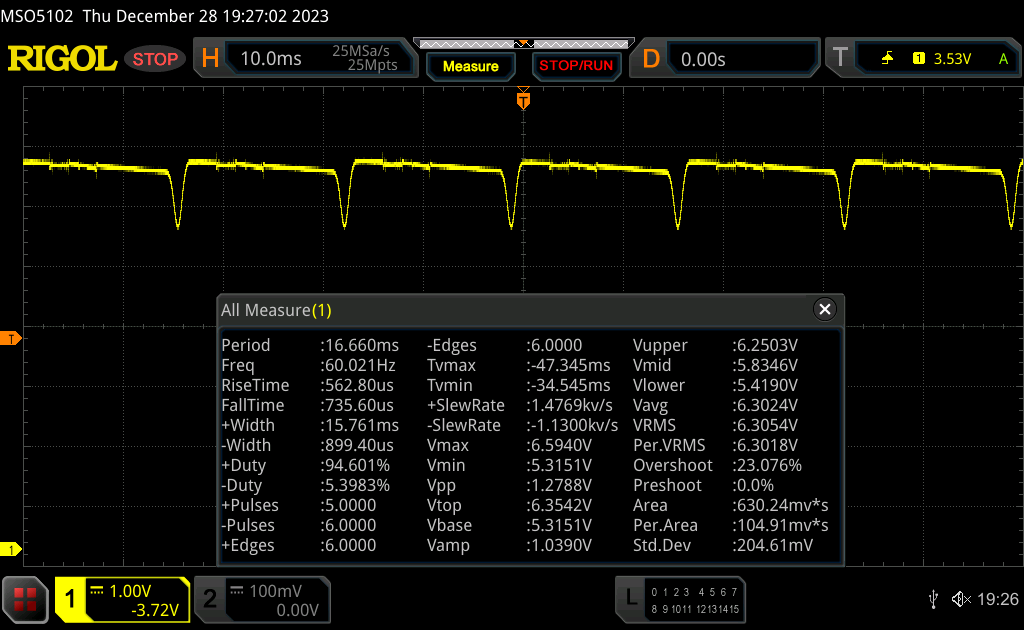 | |
La retroiluminación del display parpadea a 60 Hz (seguramente usa PWM - Pulse-Width Modulation) . La frecuencia de 60 Hz es bajísima, por lo que el parpadeo puede causar fatiga visual y cefaleas cuando se usa mucho tiempo. Comparación: 52 % de todos los dispositivos testados no usaron PWM para atenuar el display. Si se usó, medimos una media de 7798 (mínimo: 5 - máxmo: 343500) Hz. | |||

Los altos niveles de contraste y el brillo de más de 400 cd/m² garantizan que los contenidos sigan siendo legibles incluso en exteriores. No obstante, debe buscar un lugar a la sombra, ya que de lo contrario los reflejos podrían estorbar.
Los colores y el brillo permanecen siempre iguales, casi independientemente del ángulo de visión. Las distorsiones de color típicas de las pantallas OLED sólo se producen a más de 80 grados.
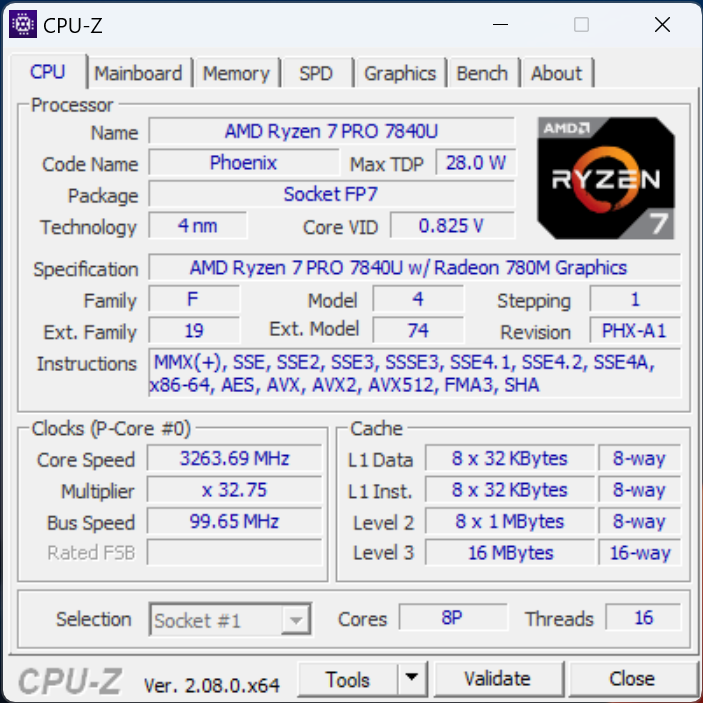
Rendimiento - Ryzen 7 bajo potencia
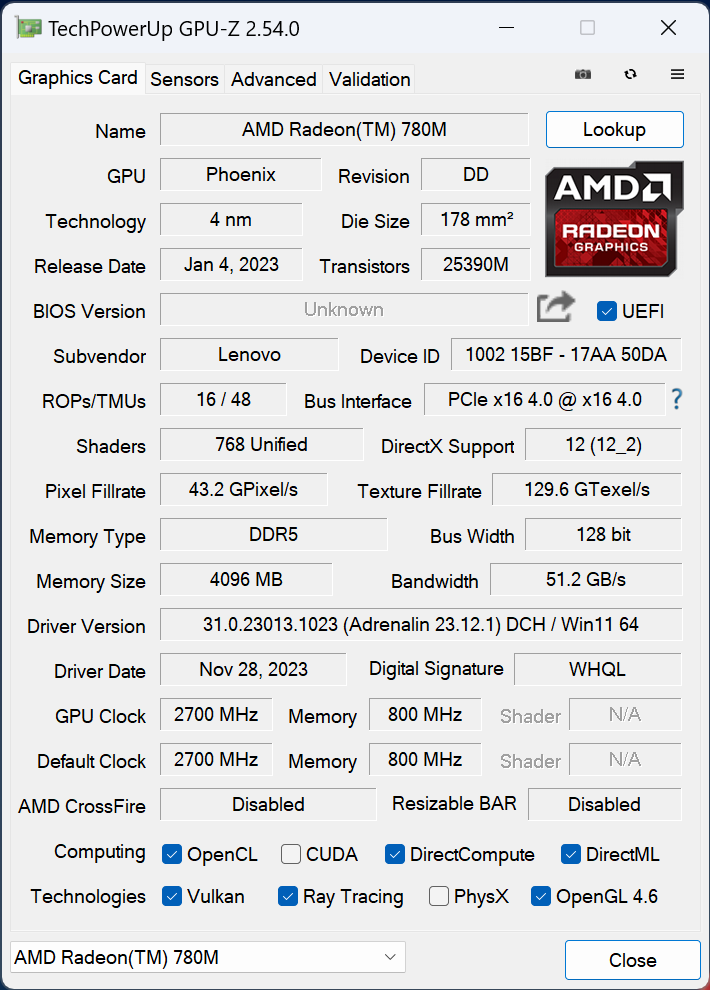
El AMD Ryzen 7 Pro 7840U es la potencia de los ThinkPads P16s G2, junto con su Radeon 780M iGPU. Esta combinación no sólo da como resultado una potencia de cálculo asombrosa, sino que también genera un gran rendimiento gráfico, al menos para una GPU integrada. La eficiencia del sistema tampoco se queda atrás. Además, también tiene la opción de seleccionar el menor AMD Ryzen 5 Pro 7540U con la GPU Radeon 740M.
Además de su alto rendimiento para un sistema móvil, la serie Pro también cuenta con un chip de seguridad y muchas opciones de mantenimiento remoto, que son particularmente útiles para el uso en flotas.
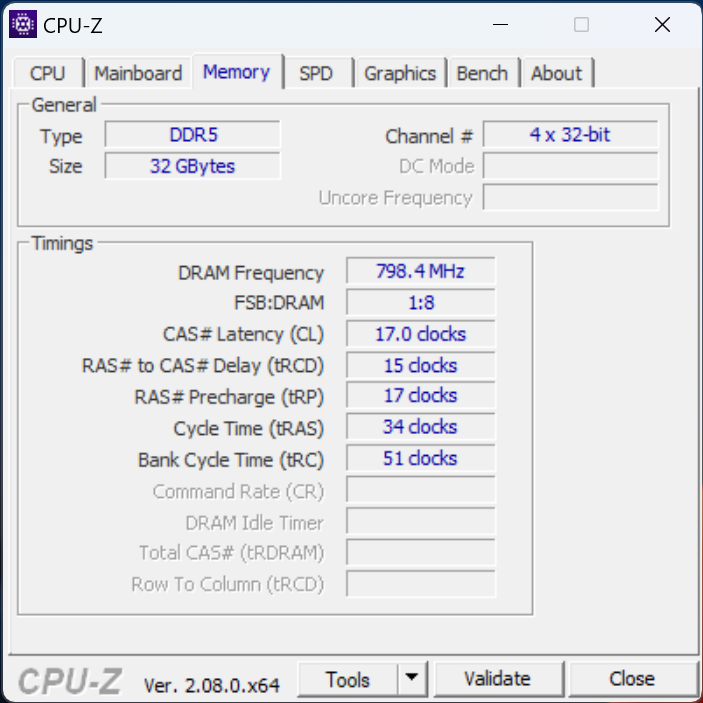
Además, puede elegir entre tres tamaños de RAM: 16, 32 o 64 GB a 6.400 MHz. Están soldadas, lo que significa que no se pueden intercambiar ni ampliar.

Condiciones de prueba
Dispone de los tres modos de rendimiento conocidos de Windows: máximo rendimiento, equilibrado y máximo ahorro de energía. Utilizando el software suministrado "Lenovo Commercial Vantage", el rendimiento se establece siempre en el ajuste más alto. Incluso utilizando el ajuste más bajo, el consumo de energía de la CPU sigue siendo bastante elevado. Realizamos todas nuestras pruebas utilizando el modo de rendimiento más alto .
Por otro lado, si selecciona el modo equilibrado, la potencia de cálculo del portátil se reduce ligeramente. Sin embargo, no debería notarlo al arrancar aplicaciones, navegar por Internet o durante la mayoría de las tareas cotidianas. A su vez, el ruido del ventilador sólo se reduce en una pequeña cantidad, pero incluso utilizando el modo de mayor rendimiento, nunca llega a molestar. Como era de esperar, su rendimiento se hunde aún más utilizando el modo de ahorro de energía . Al mismo tiempo, sus velocidades de cálculo siguen siendo bastante elevadas, mientras que el arranque de programas conlleva un ligero retardo. Además, los ventiladores permanecen considerablemente más silenciosos con este modo seleccionado.
Si desconecta el aparato de la red eléctrica, los ajustes pasan a equilibrados. Sin embargo, se pueden volver a cambiar al máximo de inmediato. Como resultado, tiene acceso al máximo rendimiento del portátil incluso en modo batería. La siguiente tabla muestra cómo cambian exactamente los límites de potencia:
| PL2 | PL1 | |
|---|---|---|
| Máximo rendimiento | 51 vatios | 41 vatios |
| Equilibrado | 40 vatios | 36 vatios |
| Ahorro de energía | 32 vatios | 30 vatios |
Procesador
Como era de esperar, el AMD Ryzen 7 Pro 7840U que, además, está ajustado para ofrecer una mayor eficiencia, ofrece unos índices de rendimiento muy elevados. Es una de las CPU móviles más potentes. Con un total de 16 hilos y una velocidad de reloj máxima superior a 5 GHz, siempre tiene reservas de sobra para la multitarea y los usos complejos, como cabría esperar de un portátil de estación de trabajo.
Su alimentación máxima de 51 vatios es adecuada para un modelo de 16 pulgadas y se estabiliza en 41 vatios durante un periodo de tiempo más largo. El modelo de 14 pulgadas ThinkPad P14s G4 con una CPU idéntica tiene acceso a un 20% menos de energía, por ejemplo, y lo hizo correspondientemente peor en los benchmarks de CPU.
Pero incluso el AMD Ryzen 9 Pro 7940HS en el HP EliteBook 845 G10que es mejor sobre el papel, sólo pudo mantener el ritmo. El Intel Core i7-13700H también está a un nivel similar pero dentro del Microsoft Surface Laptop Studio 2por ejemplo, lo hizo peor bajo carga permanente. Además, el consumo de energía del i7-13700H es mucho mayor.
Como resultado, nuestro dispositivo de prueba causó una muy buena impresión total a lo largo de todas las pruebas, ofreciendo resultados por encima de la media con valores de consumo de energía moderados. La CPU de AMD rinde extremadamente bien en el interior del ThinkPad P16s G2.
Puede encontrar más pruebas comparativas en nuestra lista de pruebas comparativas de CPU de http://www.notebookcheck.com/Mobile-Prozessoren-Benchmarkliste.1809.0.html.
Cinebench R15 Multi continuous test
Cinebench R23: Multi Core | Single Core
Cinebench R20: CPU (Multi Core) | CPU (Single Core)
Cinebench R15: CPU Multi 64Bit | CPU Single 64Bit
Blender: v2.79 BMW27 CPU
7-Zip 18.03: 7z b 4 | 7z b 4 -mmt1
Geekbench 5.5: Multi-Core | Single-Core
HWBOT x265 Benchmark v2.2: 4k Preset
LibreOffice : 20 Documents To PDF
R Benchmark 2.5: Overall mean
| Cinebench R15 / CPU Multi 64Bit | |
| Media de la clase Workstation (2489 - 5810, n=25, últimos 2 años) | |
| Microsoft Surface Laptop Studio 2 RTX 4060 | |
| Lenovo ThinkPad P16s G2 21K9000CGE | |
| MSI Prestige 16 B1MG-001US | |
| Lenovo ThinkPad P16v G1 AMD | |
| HP EliteBook 845 G10 818N0EA | |
| Lenovo ThinkPad P14s G4 21K5000LGE | |
| Medio AMD Ryzen 7 PRO 7840U (1590 - 2418, n=5) | |
| Lenovo ThinkPad P15v G3 21EM001AGE | |
| Lenovo ThinkPad X1 Carbon G11 21HNS54T00 | |
| Acer Swift Edge SFE16 Ryzen 7 7840U | |
| Schenker Vision 16 PH6PRX1 | |
| Cinebench R15 / CPU Single 64Bit | |
| Media de la clase Workstation (191.4 - 328, n=25, últimos 2 años) | |
| Microsoft Surface Laptop Studio 2 RTX 4060 | |
| Acer Swift Edge SFE16 Ryzen 7 7840U | |
| Schenker Vision 16 PH6PRX1 | |
| Lenovo ThinkPad P14s G4 21K5000LGE | |
| Lenovo ThinkPad P16s G2 21K9000CGE | |
| Medio AMD Ryzen 7 PRO 7840U (247 - 273, n=5) | |
| Lenovo ThinkPad P16v G1 AMD | |
| Lenovo ThinkPad X1 Carbon G11 21HNS54T00 | |
| MSI Prestige 16 B1MG-001US | |
| HP EliteBook 845 G10 818N0EA | |
| Lenovo ThinkPad P15v G3 21EM001AGE | |
| HWBOT x265 Benchmark v2.2 / 4k Preset | |
| Media de la clase Workstation (14.4 - 40.5, n=25, últimos 2 años) | |
| Lenovo ThinkPad P16v G1 AMD | |
| Lenovo ThinkPad P16s G2 21K9000CGE | |
| Microsoft Surface Laptop Studio 2 RTX 4060 | |
| HP EliteBook 845 G10 818N0EA | |
| MSI Prestige 16 B1MG-001US | |
| Lenovo ThinkPad P14s G4 21K5000LGE | |
| Medio AMD Ryzen 7 PRO 7840U (13.6 - 17.8, n=5) | |
| Acer Swift Edge SFE16 Ryzen 7 7840U | |
| Schenker Vision 16 PH6PRX1 | |
| Lenovo ThinkPad P15v G3 21EM001AGE | |
| Lenovo ThinkPad X1 Carbon G11 21HNS54T00 | |
| LibreOffice / 20 Documents To PDF | |
| Lenovo ThinkPad P15v G3 21EM001AGE | |
| Lenovo ThinkPad P16s G2 21K9000CGE | |
| Lenovo ThinkPad P14s G4 21K5000LGE | |
| HP EliteBook 845 G10 818N0EA | |
| Medio AMD Ryzen 7 PRO 7840U (45.8 - 52, n=5) | |
| Media de la clase Workstation (37.1 - 74.7, n=25, últimos 2 años) | |
| MSI Prestige 16 B1MG-001US | |
| Lenovo ThinkPad P16v G1 AMD | |
| Lenovo ThinkPad X1 Carbon G11 21HNS54T00 | |
| Microsoft Surface Laptop Studio 2 RTX 4060 | |
| Acer Swift Edge SFE16 Ryzen 7 7840U | |
| Schenker Vision 16 PH6PRX1 | |
* ... más pequeño es mejor
AIDA64: FP32 Ray-Trace | FPU Julia | CPU SHA3 | CPU Queen | FPU SinJulia | FPU Mandel | CPU AES | CPU ZLib | FP64 Ray-Trace | CPU PhotoWorxx
* ... más pequeño es mejor
Rendimiento del sistema
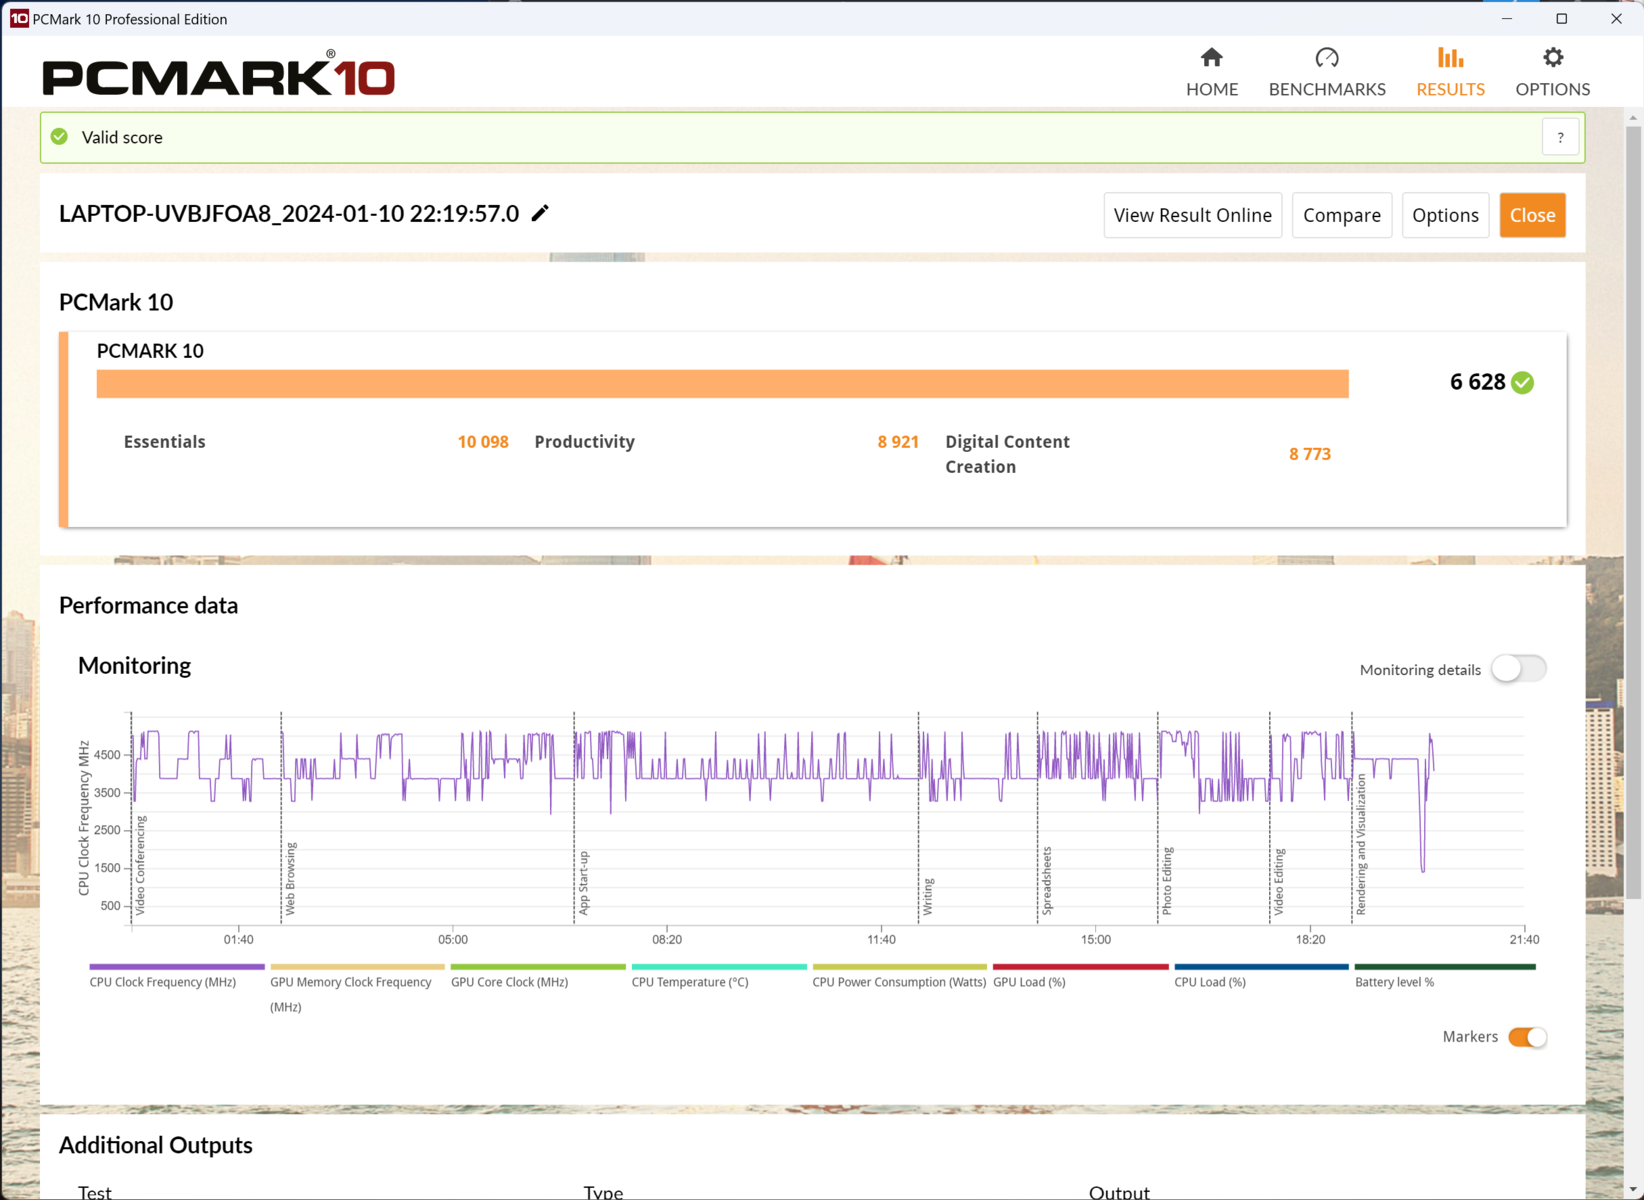
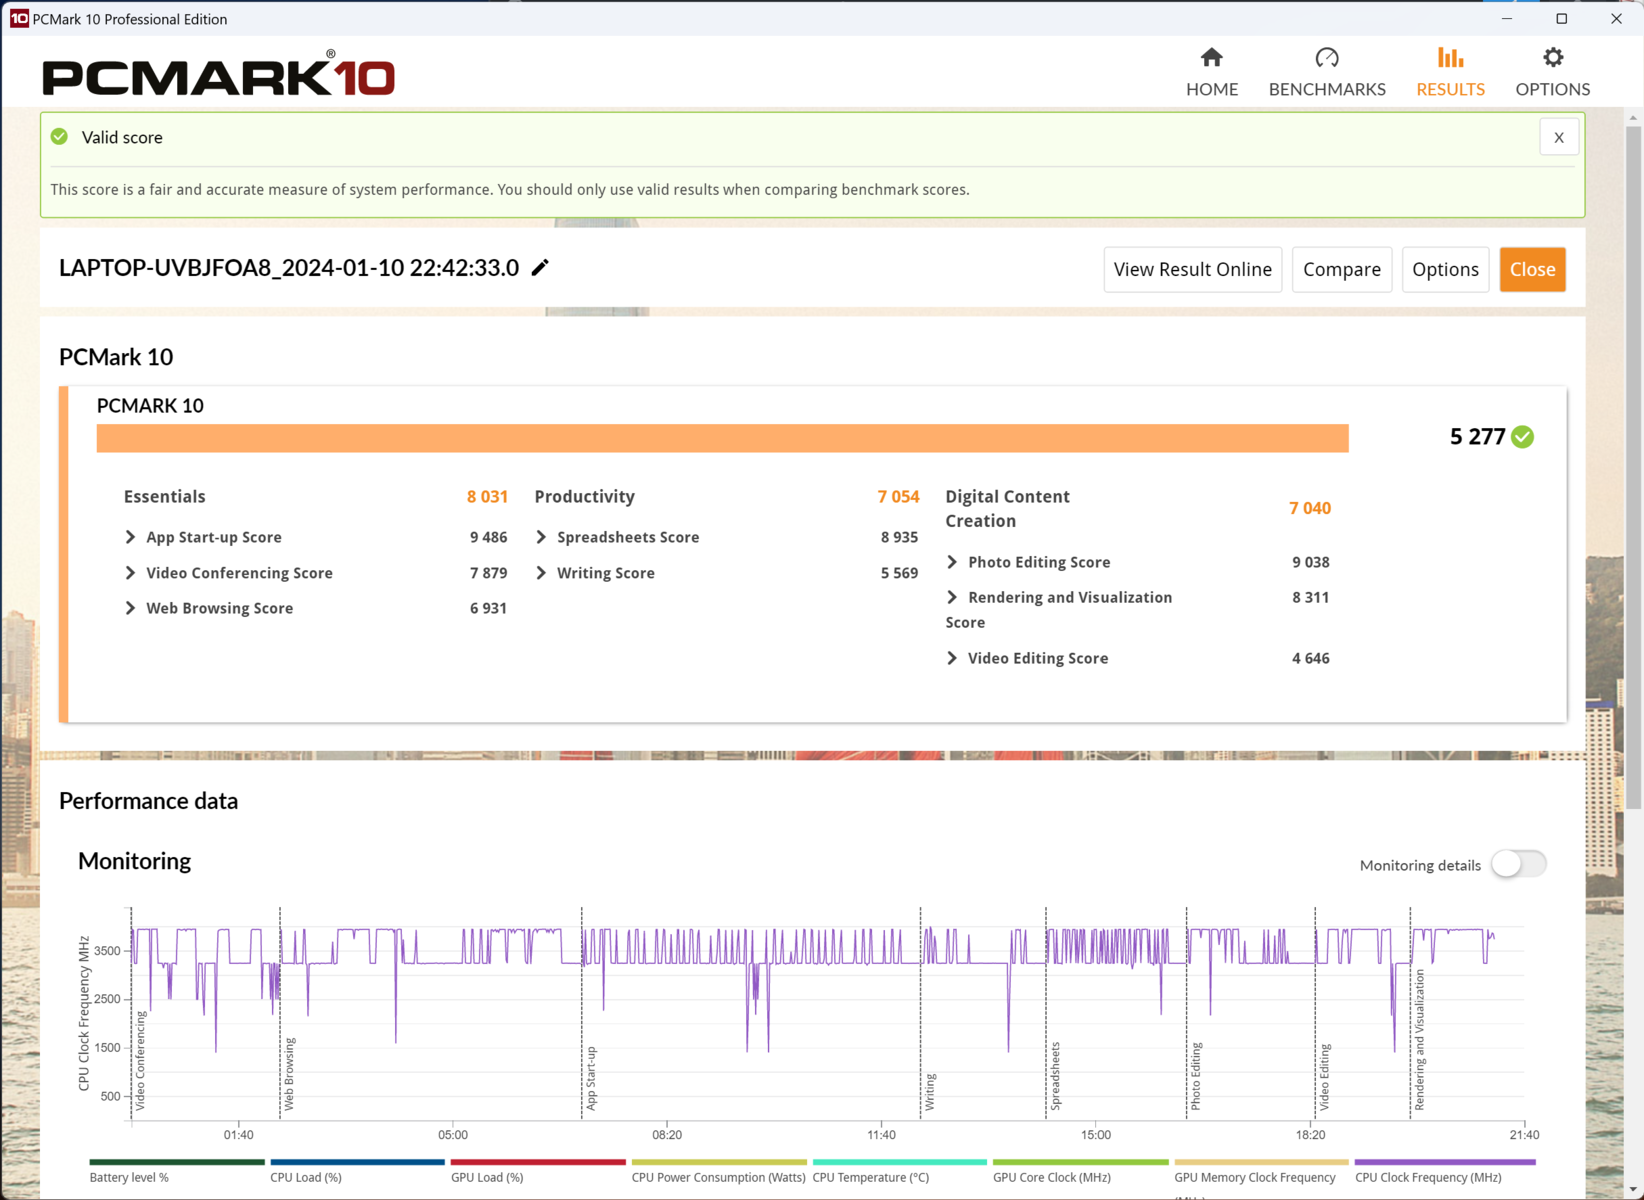
El rendimiento general del sistema del ThinkPad P16s G2 está a un nivel muy alto. Superó claramente al Schenker Vision 16 con un i7-13700Hpor ejemplo. E incluso un Lenovo ThinkPad P16v con una tarjeta gráfica dedicada estaba sólo unos pocos puntos porcentuales por delante.
Esto significa que el manejo del AMD P16s G2 es en consecuencia suave, casi independiente de la carga actual. Incluso con los benchmarks ejecutándose en segundo plano, el portátil se maneja bien y reacciona con rapidez. Puede utilizar varios programas al mismo tiempo y los procesos de instalación o las tareas complejas se completan en un abrir y cerrar de ojos.
CrossMark: Overall | Productivity | Creativity | Responsiveness
WebXPRT 3: Overall
WebXPRT 4: Overall
Mozilla Kraken 1.1: Total
| PCMark 10 / Score | |
| Media de la clase Workstation (6436 - 10409, n=21, últimos 2 años) | |
| Microsoft Surface Laptop Studio 2 RTX 4060 | |
| MSI Prestige 16 B1MG-001US | |
| Lenovo ThinkPad P16v G1 AMD | |
| Acer Swift Edge SFE16 Ryzen 7 7840U | |
| Medio AMD Ryzen 7 PRO 7840U, AMD Radeon 780M (6541 - 7012, n=5) | |
| Lenovo ThinkPad P14s G4 21K5000LGE | |
| Lenovo ThinkPad P16s G2 21K9000CGE | |
| HP EliteBook 845 G10 818N0EA | |
| Lenovo ThinkPad P15v G3 21EM001AGE | |
| Schenker Vision 16 PH6PRX1 | |
| Lenovo ThinkPad X1 Carbon G11 21HNS54T00 | |
| PCMark 10 / Essentials | |
| MSI Prestige 16 B1MG-001US | |
| Acer Swift Edge SFE16 Ryzen 7 7840U | |
| Microsoft Surface Laptop Studio 2 RTX 4060 | |
| Lenovo ThinkPad X1 Carbon G11 21HNS54T00 | |
| Media de la clase Workstation (9622 - 11157, n=21, últimos 2 años) | |
| Medio AMD Ryzen 7 PRO 7840U, AMD Radeon 780M (10055 - 10934, n=5) | |
| Lenovo ThinkPad P16v G1 AMD | |
| Lenovo ThinkPad P16s G2 21K9000CGE | |
| Lenovo ThinkPad P14s G4 21K5000LGE | |
| Schenker Vision 16 PH6PRX1 | |
| Lenovo ThinkPad P15v G3 21EM001AGE | |
| HP EliteBook 845 G10 818N0EA | |
| PCMark 10 / Productivity | |
| Media de la clase Workstation (8789 - 20616, n=21, últimos 2 años) | |
| Acer Swift Edge SFE16 Ryzen 7 7840U | |
| Lenovo ThinkPad P16v G1 AMD | |
| Medio AMD Ryzen 7 PRO 7840U, AMD Radeon 780M (8921 - 9933, n=5) | |
| Microsoft Surface Laptop Studio 2 RTX 4060 | |
| Lenovo ThinkPad P14s G4 21K5000LGE | |
| HP EliteBook 845 G10 818N0EA | |
| Lenovo ThinkPad P16s G2 21K9000CGE | |
| MSI Prestige 16 B1MG-001US | |
| Lenovo ThinkPad P15v G3 21EM001AGE | |
| Lenovo ThinkPad X1 Carbon G11 21HNS54T00 | |
| Schenker Vision 16 PH6PRX1 | |
| PCMark 10 / Digital Content Creation | |
| Media de la clase Workstation (7744 - 15631, n=21, últimos 2 años) | |
| Microsoft Surface Laptop Studio 2 RTX 4060 | |
| MSI Prestige 16 B1MG-001US | |
| Lenovo ThinkPad P16v G1 AMD | |
| Lenovo ThinkPad P16s G2 21K9000CGE | |
| Lenovo ThinkPad P14s G4 21K5000LGE | |
| Lenovo ThinkPad P15v G3 21EM001AGE | |
| Medio AMD Ryzen 7 PRO 7840U, AMD Radeon 780M (7806 - 8874, n=5) | |
| Acer Swift Edge SFE16 Ryzen 7 7840U | |
| HP EliteBook 845 G10 818N0EA | |
| Schenker Vision 16 PH6PRX1 | |
| Lenovo ThinkPad X1 Carbon G11 21HNS54T00 | |
| CrossMark / Overall | |
| Media de la clase Workstation (1307 - 2267, n=24, últimos 2 años) | |
| Lenovo ThinkPad X1 Carbon G11 21HNS54T00 | |
| Acer Swift Edge SFE16 Ryzen 7 7840U | |
| MSI Prestige 16 B1MG-001US | |
| Microsoft Surface Laptop Studio 2 RTX 4060 | |
| Schenker Vision 16 PH6PRX1 | |
| Medio AMD Ryzen 7 PRO 7840U, AMD Radeon 780M (1533 - 1669, n=5) | |
| Lenovo ThinkPad P16s G2 21K9000CGE | |
| Lenovo ThinkPad P14s G4 21K5000LGE | |
| Lenovo ThinkPad P16v G1 AMD | |
| HP EliteBook 845 G10 818N0EA | |
| Lenovo ThinkPad P15v G3 21EM001AGE | |
| CrossMark / Productivity | |
| Acer Swift Edge SFE16 Ryzen 7 7840U | |
| Media de la clase Workstation (1130 - 2122, n=24, últimos 2 años) | |
| Lenovo ThinkPad X1 Carbon G11 21HNS54T00 | |
| MSI Prestige 16 B1MG-001US | |
| Schenker Vision 16 PH6PRX1 | |
| Microsoft Surface Laptop Studio 2 RTX 4060 | |
| Lenovo ThinkPad P16v G1 AMD | |
| Medio AMD Ryzen 7 PRO 7840U, AMD Radeon 780M (1461 - 1624, n=5) | |
| Lenovo ThinkPad P16s G2 21K9000CGE | |
| Lenovo ThinkPad P14s G4 21K5000LGE | |
| Lenovo ThinkPad P15v G3 21EM001AGE | |
| HP EliteBook 845 G10 818N0EA | |
| CrossMark / Creativity | |
| Media de la clase Workstation (1657 - 2725, n=24, últimos 2 años) | |
| Lenovo ThinkPad X1 Carbon G11 21HNS54T00 | |
| Microsoft Surface Laptop Studio 2 RTX 4060 | |
| MSI Prestige 16 B1MG-001US | |
| Acer Swift Edge SFE16 Ryzen 7 7840U | |
| Medio AMD Ryzen 7 PRO 7840U, AMD Radeon 780M (1697 - 1824, n=5) | |
| Lenovo ThinkPad P16s G2 21K9000CGE | |
| Schenker Vision 16 PH6PRX1 | |
| Lenovo ThinkPad P14s G4 21K5000LGE | |
| Lenovo ThinkPad P16v G1 AMD | |
| HP EliteBook 845 G10 818N0EA | |
| Lenovo ThinkPad P15v G3 21EM001AGE | |
| CrossMark / Responsiveness | |
| Acer Swift Edge SFE16 Ryzen 7 7840U | |
| Schenker Vision 16 PH6PRX1 | |
| Media de la clase Workstation (993 - 2096, n=24, últimos 2 años) | |
| MSI Prestige 16 B1MG-001US | |
| Lenovo ThinkPad X1 Carbon G11 21HNS54T00 | |
| Microsoft Surface Laptop Studio 2 RTX 4060 | |
| Lenovo ThinkPad P14s G4 21K5000LGE | |
| Lenovo ThinkPad P16v G1 AMD | |
| Lenovo ThinkPad P16s G2 21K9000CGE | |
| Medio AMD Ryzen 7 PRO 7840U, AMD Radeon 780M (1049 - 1499, n=5) | |
| Lenovo ThinkPad P15v G3 21EM001AGE | |
| HP EliteBook 845 G10 818N0EA | |
| WebXPRT 3 / Overall | |
| Lenovo ThinkPad P16v G1 AMD | |
| Media de la clase Workstation (260 - 360, n=25, últimos 2 años) | |
| Acer Swift Edge SFE16 Ryzen 7 7840U | |
| Microsoft Surface Laptop Studio 2 RTX 4060 | |
| MSI Prestige 16 B1MG-001US | |
| Lenovo ThinkPad X1 Carbon G11 21HNS54T00 | |
| Lenovo ThinkPad X1 Carbon G11 21HNS54T00 | |
| Medio AMD Ryzen 7 PRO 7840U, AMD Radeon 780M (259 - 317, n=5) | |
| HP EliteBook 845 G10 818N0EA | |
| Lenovo ThinkPad P14s G4 21K5000LGE | |
| Lenovo ThinkPad P16s G2 21K9000CGE | |
| Lenovo ThinkPad P15v G3 21EM001AGE | |
| WebXPRT 4 / Overall | |
| Media de la clase Workstation (189.2 - 326, n=25, últimos 2 años) | |
| Microsoft Surface Laptop Studio 2 RTX 4060 | |
| MSI Prestige 16 B1MG-001US | |
| Lenovo ThinkPad P16v G1 AMD | |
| Acer Swift Edge SFE16 Ryzen 7 7840U | |
| Medio AMD Ryzen 7 PRO 7840U, AMD Radeon 780M (234 - 245, n=2) | |
| HP EliteBook 845 G10 818N0EA | |
| Lenovo ThinkPad P15v G3 21EM001AGE | |
| Mozilla Kraken 1.1 / Total | |
| Lenovo ThinkPad P15v G3 21EM001AGE | |
| Lenovo ThinkPad P14s G4 21K5000LGE | |
| HP EliteBook 845 G10 818N0EA | |
| Lenovo ThinkPad P16s G2 21K9000CGE | |
| Medio AMD Ryzen 7 PRO 7840U, AMD Radeon 780M (523 - 571, n=5) | |
| Lenovo ThinkPad P16v G1 AMD | |
| MSI Prestige 16 B1MG-001US | |
| Acer Swift Edge SFE16 Ryzen 7 7840U | |
| Microsoft Surface Laptop Studio 2 RTX 4060 | |
| Lenovo ThinkPad X1 Carbon G11 21HNS54T00 | |
| Lenovo ThinkPad X1 Carbon G11 21HNS54T00 | |
| Media de la clase Workstation (411 - 538, n=25, últimos 2 años) | |
* ... más pequeño es mejor
| PCMark 10 Score | 6628 puntos | |
ayuda | ||
| AIDA64 / Memory Copy | |
| Media de la clase Workstation (56003 - 164795, n=25, últimos 2 años) | |
| Acer Swift Edge SFE16 Ryzen 7 7840U | |
| Lenovo ThinkPad P14s G4 21K5000LGE | |
| Medio AMD Ryzen 7 PRO 7840U (66487 - 67856, n=5) | |
| Lenovo ThinkPad P16s G2 21K9000CGE | |
| Microsoft Surface Laptop Studio 2 RTX 4060 | |
| Schenker Vision 16 PH6PRX1 | |
| HP EliteBook 845 G10 818N0EA | |
| Lenovo ThinkPad P16v G1 AMD | |
| AIDA64 / Memory Read | |
| Media de la clase Workstation (55795 - 121563, n=25, últimos 2 años) | |
| Schenker Vision 16 PH6PRX1 | |
| Microsoft Surface Laptop Studio 2 RTX 4060 | |
| Lenovo ThinkPad P16s G2 21K9000CGE | |
| Acer Swift Edge SFE16 Ryzen 7 7840U | |
| Medio AMD Ryzen 7 PRO 7840U (47725 - 50543, n=5) | |
| Lenovo ThinkPad P14s G4 21K5000LGE | |
| Lenovo ThinkPad P16v G1 AMD | |
| HP EliteBook 845 G10 818N0EA | |
| AIDA64 / Memory Write | |
| Lenovo ThinkPad P14s G4 21K5000LGE | |
| Medio AMD Ryzen 7 PRO 7840U (89477 - 94965, n=5) | |
| Acer Swift Edge SFE16 Ryzen 7 7840U | |
| Lenovo ThinkPad P16s G2 21K9000CGE | |
| Media de la clase Workstation (55663 - 214520, n=25, últimos 2 años) | |
| Microsoft Surface Laptop Studio 2 RTX 4060 | |
| Schenker Vision 16 PH6PRX1 | |
| HP EliteBook 845 G10 818N0EA | |
| Lenovo ThinkPad P16v G1 AMD | |
| AIDA64 / Memory Latency | |
| Lenovo ThinkPad P14s G4 21K5000LGE | |
| Medio AMD Ryzen 7 PRO 7840U (128.6 - 138.9, n=5) | |
| Lenovo ThinkPad P16s G2 21K9000CGE | |
| Media de la clase Workstation (84.5 - 165.2, n=25, últimos 2 años) | |
| Acer Swift Edge SFE16 Ryzen 7 7840U | |
| HP EliteBook 845 G10 818N0EA | |
| Lenovo ThinkPad P16v G1 AMD | |
| Microsoft Surface Laptop Studio 2 RTX 4060 | |
| Schenker Vision 16 PH6PRX1 | |
* ... más pequeño es mejor
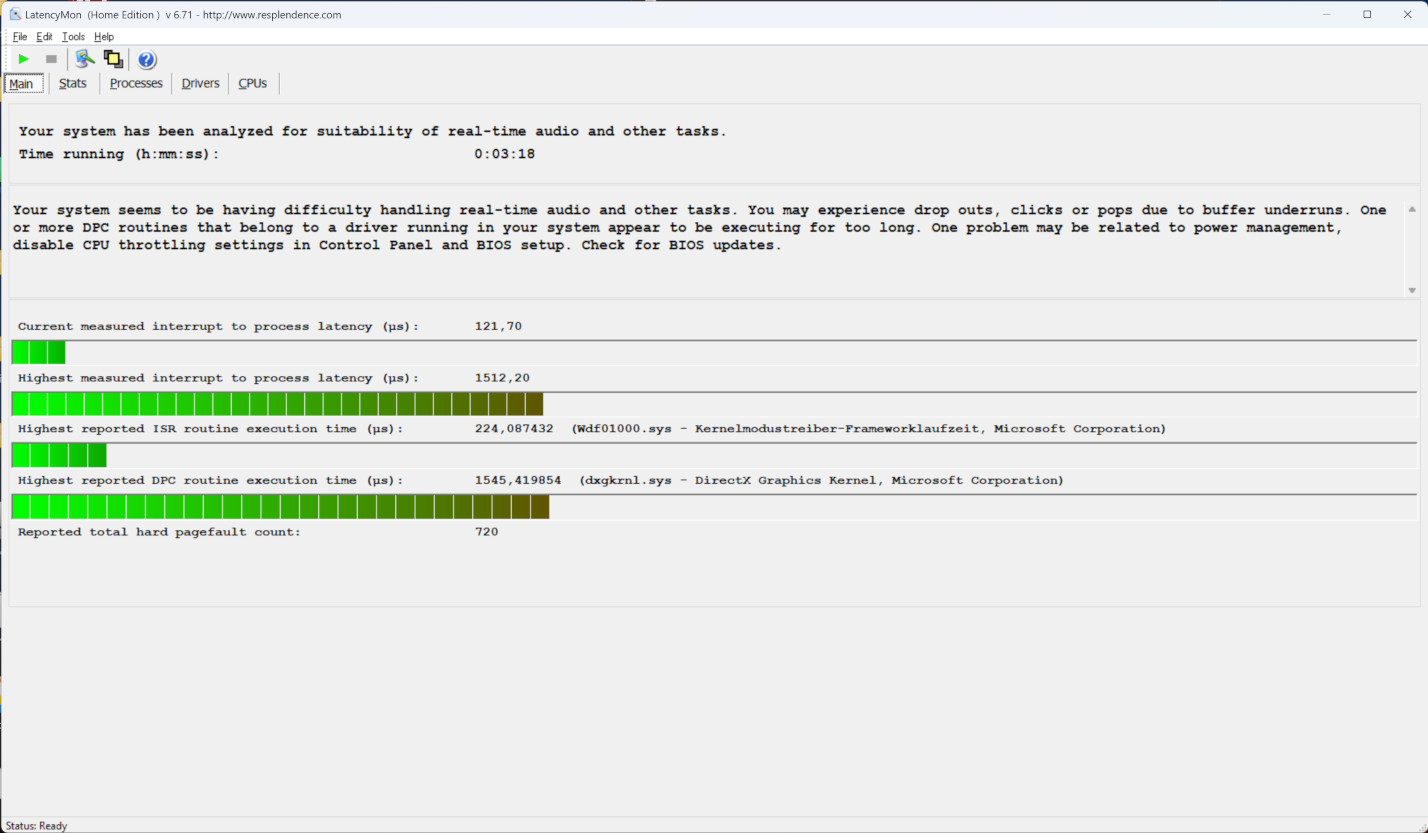
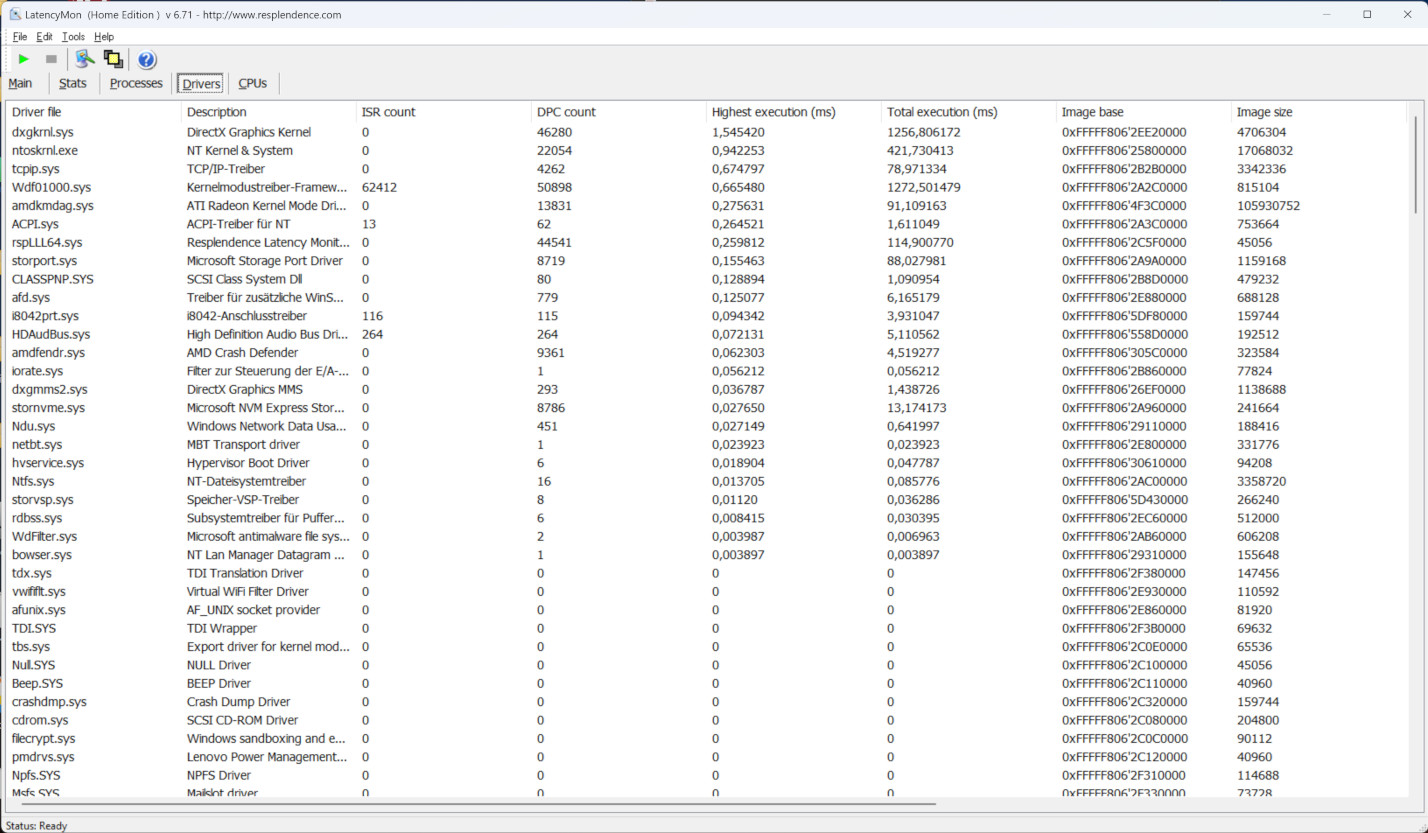
Latencia del CPD
Sus resultados de LatencyMon no estaban del todo a la altura. Al menos la edición de audio en tiempo real podría plantear algunos problemas al dispositivo. Es interesante señalar que los programas de controladores DirectX en particular provocaron algunos problemas. Una actualización resolvería muy probablemente algunos de ellos. En general, los resultados podrían cambiarse fácilmente en ambos sentidos mediante controladores actualizados o nuevo software.
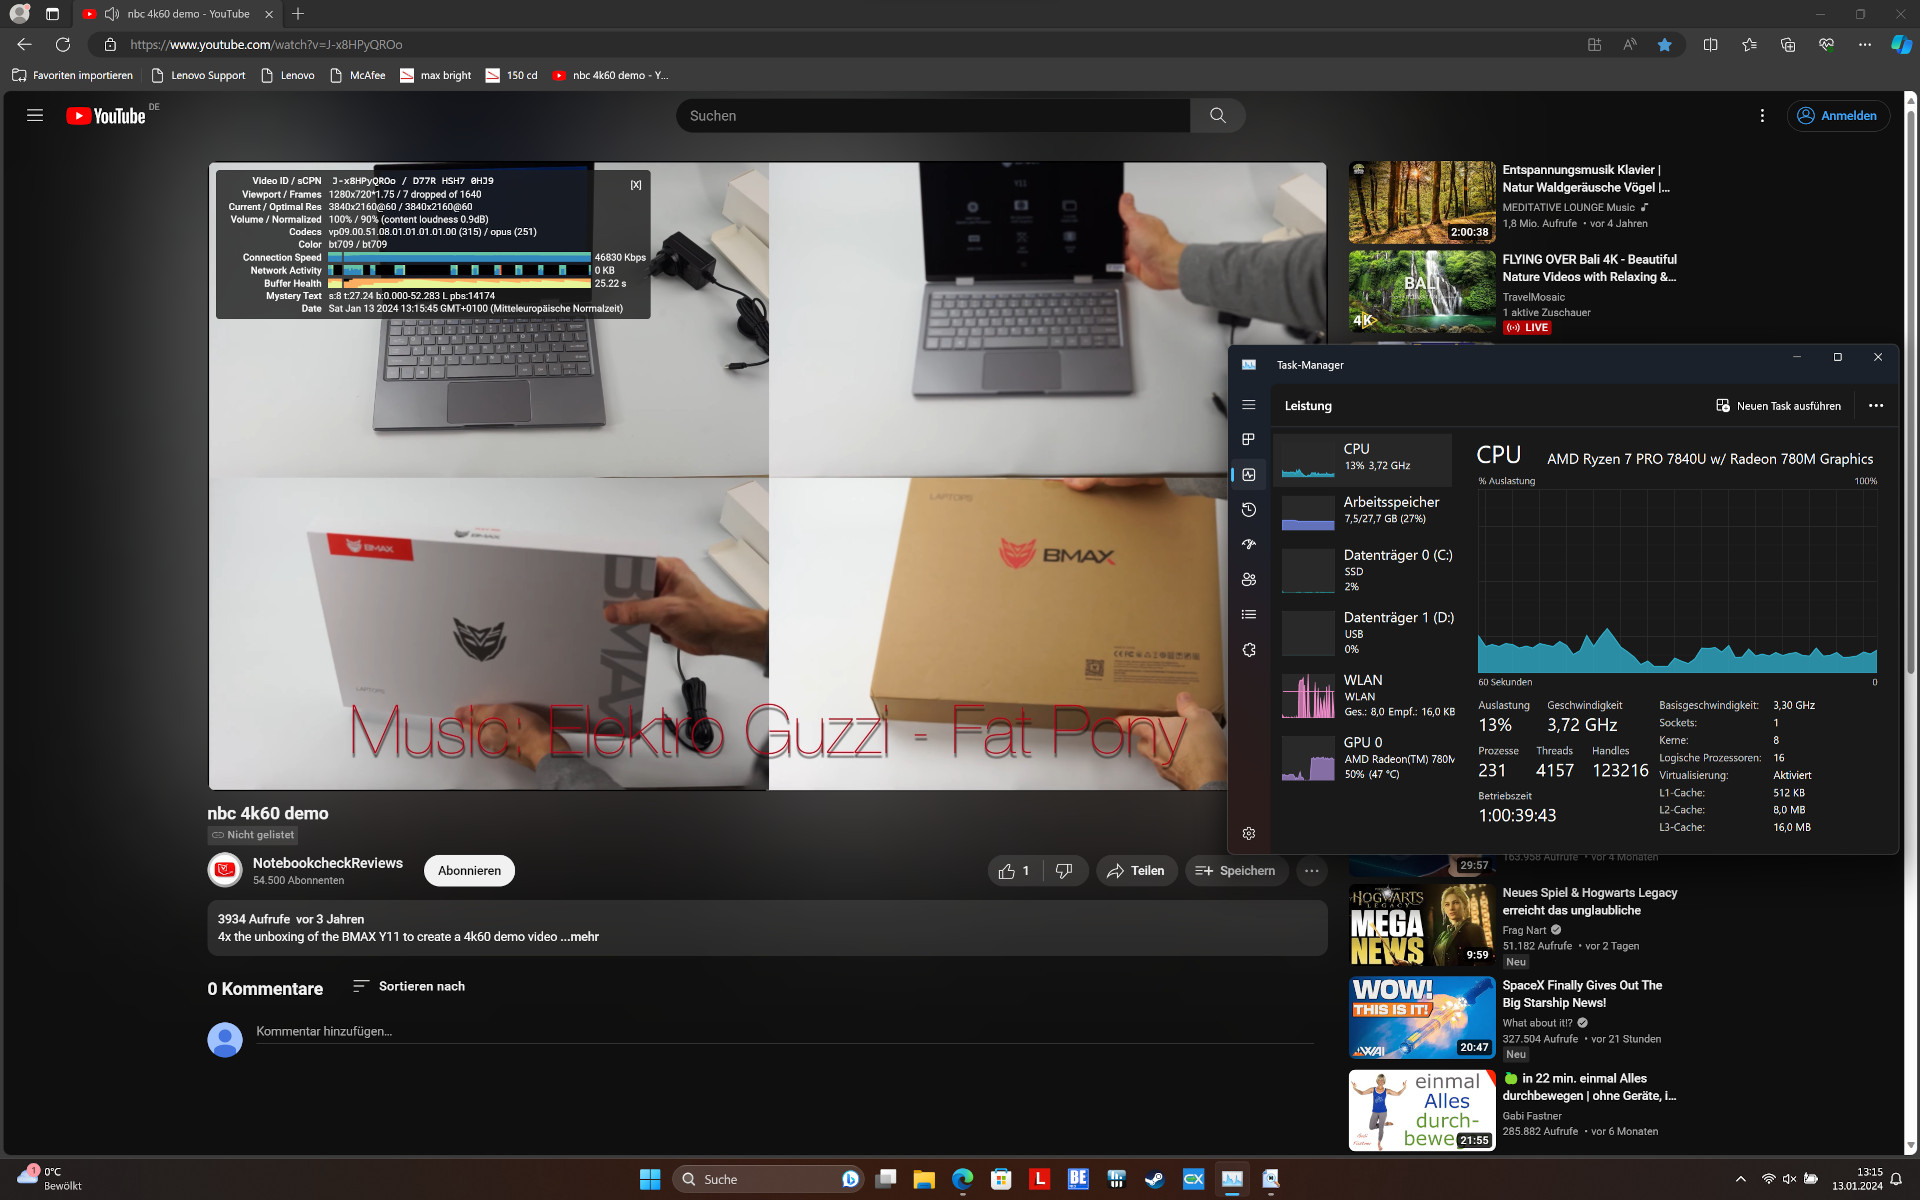
Sus resultados de transmisión de vídeo dejan un margen de mejora similar. Los 15 fotogramas caídos son simplemente demasiados y una carga de la GPU del 50 % muestra que el controlador de gráficos aún no se ha ajustado de forma ideal (durante nuestra prueba, el estado actual del controlador era de 01/2024).
| DPC Latencies / LatencyMon - interrupt to process latency (max), Web, Youtube, Prime95 | |
| Microsoft Surface Laptop Studio 2 RTX 4060 | |
| Schenker Vision 16 PH6PRX1 | |
| Lenovo ThinkPad P16s G2 21K9000CGE | |
| Lenovo ThinkPad P14s G4 21K5000LGE | |
| HP EliteBook 845 G10 818N0EA | |
| Lenovo ThinkPad P16v G1 AMD | |
| Acer Swift Edge SFE16 Ryzen 7 7840U | |
* ... más pequeño es mejor
Dispositivos de almacenamiento
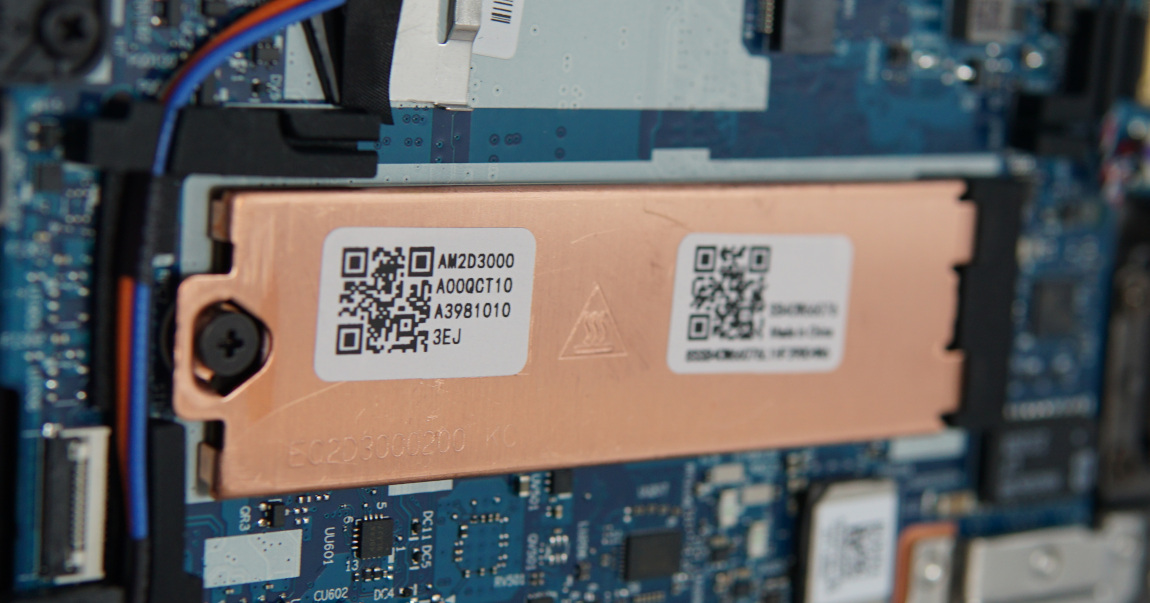
La elaborada refrigeración del portátil con una gran placa de cobre realmente mereció la pena durante nuestra prueba continua. Su rendimiento de escritura secuencial se mantuvo completamente estable y alto durante un largo periodo de tiempo.
La M.2-SSD de SK Hynix no puede manejar bien grandes cantidades de archivos pequeños con muchos accesos paralelos. Sin embargo, esto sólo debería tener un pequeño efecto negativo al arrancar. En el uso normal, esto no debería tener un impacto notable.

* ... más pequeño es mejor
Reading continuous performance: DiskSpd Read Loop, Queue Depth 8
Tarjeta gráfica
Por supuesto, no debe esperar demasiado de una iGPU, aunque la AMD Radeon 780M lo hizo generalmente bien. Incluso sin su propia RAM y con un hardware y una fuente de alimentación limitados, estuvo más o menos al mismo nivel que una RTX 2050 Mobile. Su distancia con la Nvidia RTX A1000 o la RTX 3050 tampoco fue demasiado grande.
En consecuencia, el ThinkPad P16s G2 AMD obtuvo buenos resultados en la prueba comparativa SPECviewperf, que nos da una idea de su rendimiento con software gráfico profesional. Aquí, el Nvidia T550 se mantuvo claramente a distancia. Y aunque la RTX A1000 quedó un 50 % por delante, requiere mucha más potencia, más espacio y portátiles para estaciones de trabajo como un Dell Precision 5470 también son mucho más caros.
Otras iGPU como la Intel Iris Xe Graphics G7 96EUs son mucho más débiles y su predecesora, la Radeon 680Mtambién se queda muy atrás en lo que a rendimiento gráfico se refiere.
Encontrará más mediciones, pruebas y puntuaciones en nuestra lista de pruebas comparativas de GPU en http://www.notebookcheck.com/Mobile-Grafikkarten-Benchmarkliste.735.0.html.
| 3DMark 11 Performance | 12655 puntos | |
| 3DMark Cloud Gate Standard Score | 35205 puntos | |
| 3DMark Fire Strike Score | 7524 puntos | |
| 3DMark Time Spy Score | 3126 puntos | |
ayuda | ||
| SPECviewperf Performance rating - Percent | |
| Media de la clase Workstation | |
| HP ZBook Power 15 G10 | |
| Lenovo ThinkPad P16v G1 AMD | |
| Dell Precision 5000 5470 | |
| Lenovo ThinkPad P16s G2 21K9000CGE | |
| Medio AMD Radeon 780M | |
| HP ZBook Firefly 14 G9-6B8A2EA | |
| Lenovo ThinkPad T14 G3-21CF004NGE | |
Rendimiento en juegos
Los juegos no son en absoluto uno de los puntos fuertes del P16. Aun así, el ThinkPad demostró ser capaz de jugar bien a la mayoría de los juegos con su unidad gráfica integrada. Incluso el relativamente actual F1 23 puede ejecutarse en Full HD y con detalles elevados.
Los juegos complejos como Starfield y, en general, las resoluciones altas y los detalles máximos muestran rápidamente dónde están los límites de la iGPU. En particular, su memoria de vídeo externa ya no es entonces suficiente.
| Starfield | |
| 1920x1080 High Preset | |
| Medio AMD Radeon 780M (19 - 21.3, n=3) | |
| Lenovo ThinkPad P16s G2 21K9000CGE | |
| Lenovo ThinkPad P14s G4 21K5000LGE | |
| 1920x1080 Ultra Preset | |
| Medio AMD Radeon 780M (15 - 19.1, n=3) | |
| Lenovo ThinkPad P14s G4 21K5000LGE | |
| Lenovo ThinkPad P16s G2 21K9000CGE | |
Utilizando el ajuste de detalle más alto, la prueba continua con The Witcher 3 se desarrolló con total fluidez y sin sorpresas desagradables. Esto significa que su buen rendimiento gráfico sigue estando disponible también durante periodos de tiempo más largos.
Witcher 3 FPS diagram
| bajo | medio | alto | ultra | QHD | 4K | |
|---|---|---|---|---|---|---|
| GTA V (2015) | 140 | 128.7 | 64.5 | 27.3 | 19.1 | 20.7 |
| The Witcher 3 (2015) | 138 | 94 | 47 | 30 | 20 | 15 |
| Dota 2 Reborn (2015) | 117.5 | 89.9 | 82.1 | 69.5 | 31.2 | |
| Final Fantasy XV Benchmark (2018) | 74.9 | 34.3 | 25.2 | 17.7 | 11.2 | |
| X-Plane 11.11 (2018) | 47.1 | 33.2 | 28.1 | 19.2 | ||
| Far Cry 5 (2018) | 69 | 46 | 42 | 40 | 27 | 12 |
| Strange Brigade (2018) | 157.4 | 65.5 | 56.1 | 46.9 | 31.7 | 16.3 |
| F1 23 (2023) | 81.6 | 72.3 | 51.3 | 11.9 | 7.36 | 3.24 |
| Starfield (2023) | 27 | 23 | 19 | 15 | 12 | 7 |
Emisiones - El ThinkPad P16s siempre está reservado
Emisiones sonoras
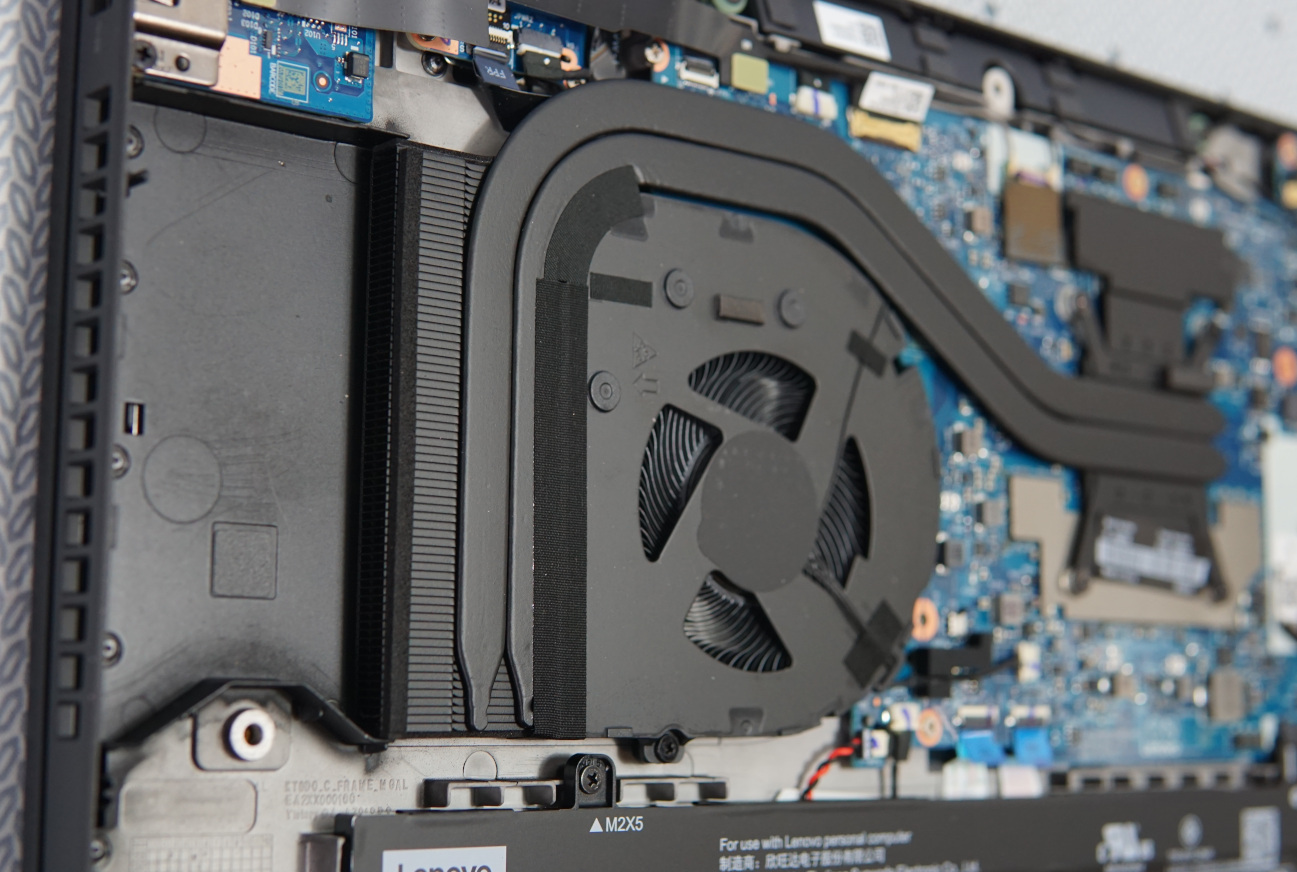
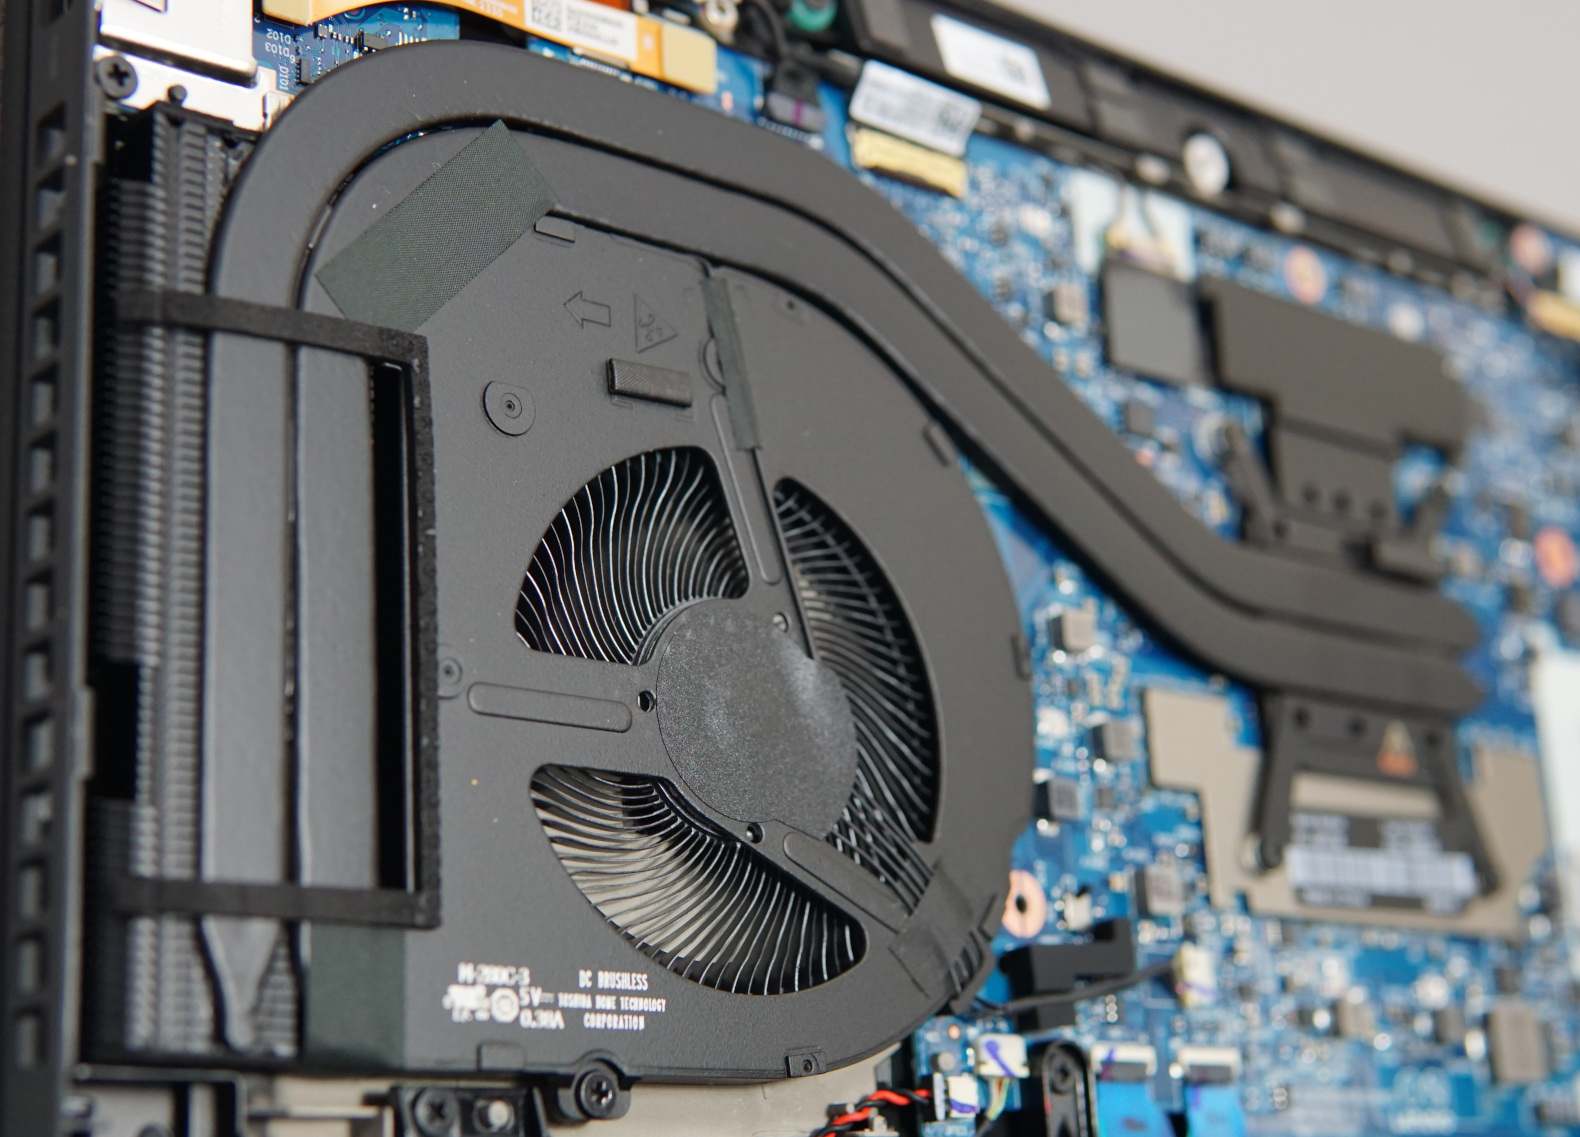
Comparado con el más pequeño ThinkPad P14s G4el ventilador del mismo tamaño del actual ThinkPad P16s G2 tiene que hacer frente a mucho más calor. Al mismo tiempo, incluso tiene que superar una pequeña distancia hacia el exterior. Esto no es lo ideal, pero lo más probable es que se hiciera para ahorrar algo de dinero.
Esto significa que las emisiones de ruido del dispositivo son bastante más intensas durante la carga alta, estimaríamos que son aproximadamente el doble de fuertes que las del P14s G4. Medimos unas emisiones de ruido máximas de 40 dB, lo que no es nada preocupante. Además, el P16s ofrece un poco más de rendimiento en comparación con el P14s G4 con la misma CPU. Un ventilador más grande o mejor situado podría haber dado unos resultados considerablemente mejores.
Un aspecto positivo, por otro lado, es cómo se comporta durante tareas muy sencillas. Entonces el ventilador permanece completamente silencioso.
Ruido
| Ocioso |
| 22.6 / 22.6 / 22.6 dB(A) |
| Carga |
| 37.8 / 40.5 dB(A) |
 | ||
30 dB silencioso 40 dB(A) audible 50 dB(A) ruidosamente alto |
||
min: | ||
| Lenovo ThinkPad P16s G2 21K9000CGE Radeon 780M, R7 PRO 7840U, SK hynix PC801 HFS001TEJ9X162N | HP EliteBook 845 G10 818N0EA Radeon 780M, R9 PRO 7940HS, SK hynix PC801 HFS001TEJ9X101N | Lenovo ThinkPad P14s G4 21K5000LGE Radeon 780M, R7 PRO 7840U, SK hynix PC801 HFS512GEJ9X162N | Schenker Vision 16 PH6PRX1 Iris Xe G7 96EUs, i7-13700H, Samsung 990 Pro 1 TB | Acer Swift Edge SFE16 Ryzen 7 7840U Radeon 780M, R7 7840U, SK hynix HFS512GEJ9X125N | Lenovo ThinkPad P16v G1 AMD RTX A1000 Laptop GPU, R7 PRO 7840HS, SK hynix PC801 HFS001TEJ9X101N | Microsoft Surface Laptop Studio 2 RTX 4060 GeForce RTX 4060 Laptop GPU, i7-13700H, Kioxia XG8 KXG80ZNV1T02 | |
|---|---|---|---|---|---|---|---|
| Noise | -8% | 4% | -11% | -8% | -8% | -18% | |
| apagado / medio ambiente * (dB) | 22.6 | 25.3 -12% | 22.4 1% | 25.5 -13% | 23.4 -4% | 24.3 -8% | 23.9 -6% |
| Idle Minimum * (dB) | 22.6 | 25.3 -12% | 22.4 1% | 25.5 -13% | 24.1 -7% | 24.3 -8% | 23.9 -6% |
| Idle Average * (dB) | 22.6 | 25.3 -12% | 22.4 1% | 28.7 -27% | 24.3 -8% | 24.3 -8% | 24.4 -8% |
| Idle Maximum * (dB) | 22.6 | 25.3 -12% | 22.4 1% | 29.1 -29% | 28 -24% | 24.3 -8% | 26.9 -19% |
| Load Average * (dB) | 37.8 | 34.4 9% | 31.3 17% | 33.8 11% | 41 -8% | 35.7 6% | 48.5 -28% |
| Witcher 3 ultra * (dB) | 40.3 | 43.4 -8% | 39.5 2% | 37.6 7% | 40.9 -1% | 43.7 -8% | 51.8 -29% |
| Load Maximum * (dB) | 40.5 | 43.4 -7% | 39.2 3% | 44.9 -11% | 40.9 -1% | 50.2 -24% | 51.8 -28% |
* ... más pequeño es mejor
Temperatura
Incluso sin que los ventiladores estén activos, el portátil sólo se calienta mínimamente. Esto es así mientras se navega por Internet, se hace streaming, se realizan trabajos de oficina o algo similar. En ningún momento la carcasa alcanza los 30 °C en estos escenarios.
En el lado opuesto, la carcasa se calienta bastante más en cuanto hay que disipar el calor del procesador. Medimos más de 40 °C en el teclado e incluso más de 47 °C en la parte inferior. Esto significa que puede resultar un poco incómodo de usar a plena carga.
(±) La temperatura máxima en la parte superior es de 42.7 °C / 109 F, frente a la media de 38.2 °C / 101 F, que oscila entre 22.2 y 69.8 °C para la clase Workstation.
(-) El fondo se calienta hasta un máximo de 47.2 °C / 117 F, frente a la media de 41.1 °C / 106 F
(+) En reposo, la temperatura media de la parte superior es de 25.7 °C / 78# F, frente a la media del dispositivo de 32 °C / 90 F.
(±) Jugando a The Witcher 3, la temperatura media de la parte superior es de 34.5 °C / 94 F, frente a la media del dispositivo de 32 °C / 90 F.
(+) Los reposamanos y el panel táctil alcanzan como máximo la temperatura de la piel (32.9 °C / 91.2 F) y, por tanto, no están calientes.
(-) La temperatura media de la zona del reposamanos de dispositivos similares fue de 27.8 °C / 82 F (-5.1 °C / -9.2 F).
| Lenovo ThinkPad P16s G2 21K9000CGE AMD Ryzen 7 PRO 7840U, AMD Radeon 780M | HP EliteBook 845 G10 818N0EA AMD Ryzen 9 PRO 7940HS, AMD Radeon 780M | Lenovo ThinkPad P14s G4 21K5000LGE AMD Ryzen 7 PRO 7840U, AMD Radeon 780M | Schenker Vision 16 PH6PRX1 Intel Core i7-13700H, Intel Iris Xe Graphics G7 96EUs | Acer Swift Edge SFE16 Ryzen 7 7840U AMD Ryzen 7 7840U, AMD Radeon 780M | Lenovo ThinkPad P16v G1 AMD AMD Ryzen 7 PRO 7840HS, NVIDIA RTX A1000 Laptop GPU | Microsoft Surface Laptop Studio 2 RTX 4060 Intel Core i7-13700H, NVIDIA GeForce RTX 4060 Laptop GPU | |
|---|---|---|---|---|---|---|---|
| Heat | -2% | 3% | 5% | -4% | 1% | 6% | |
| Maximum Upper Side * (°C) | 42.7 | 45.6 -7% | 41.1 4% | 41.1 4% | 41.6 3% | 40.9 4% | 40.4 5% |
| Maximum Bottom * (°C) | 47.2 | 51.9 -10% | 48.2 -2% | 42 11% | 46.6 1% | 57.9 -23% | 42.2 11% |
| Idle Upper Side * (°C) | 27.8 | 26.5 5% | 26.5 5% | 28.5 -3% | 30.4 -9% | 24.5 12% | 26.6 4% |
| Idle Bottom * (°C) | 28.4 | 27 5% | 26.9 5% | 26.8 6% | 31 -9% | 25.5 10% | 27 5% |
* ... más pequeño es mejor
Prueba de esfuerzo
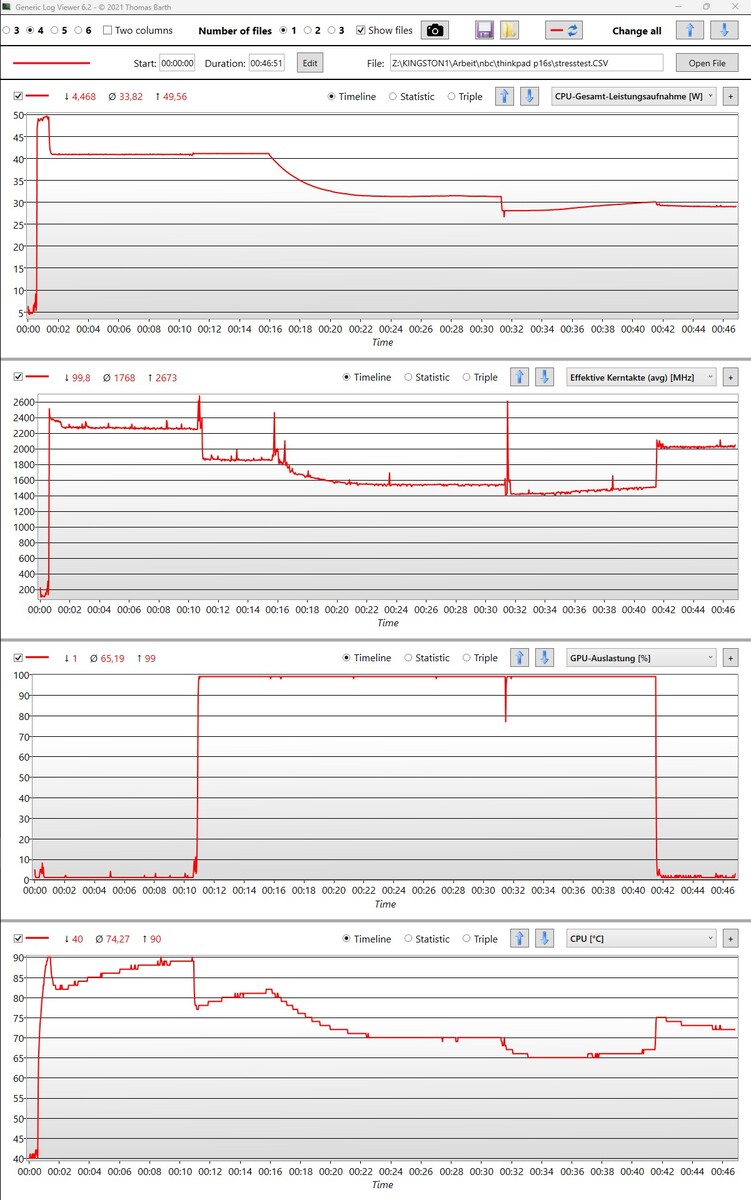
Si la CPU y la iGPU se cargan por completo utilizando Prime95 y FurMark, su suministro de energía se mantiene estable, con 41 vatios suministrados al procesador. Al cambiar el modo de rendimiento, los parámetros se ajustan suavemente.
La unidad gráfica puede utilizarse plenamente al mismo tiempo, a través de los diferentes ajustes de potencia. El ventilador se vuelve un poco más silencioso cuanto más se estrangula la fuente de alimentación máxima.
La temperatura del procesador que medimos sólo alcanzó los 90 °C durante unos instantes a plena carga. Con la mayor potencia ahorrada, las temperaturas se mantuvieron en 65 °C a pesar del menor volumen del ventilador. Nada se interpone en el camino para poder utilizar el sistema en todo momento.
Altavoces
Los altavoces son débiles: les faltan graves. Incluso los medios graves apenas destacan y a su volumen máximo le vendría bien ser más alto. Además, les falta algo de detalle, aunque las voces suenan bien en general, incluso durante canciones complejas.
Son lo suficientemente buenos para videollamadas, música de fondo o el streaming ocasional. No esperaríamos nada mejor de unos sencillos altavoces de portátil, especialmente en una estación de trabajo.
Lenovo ThinkPad P16s G2 21K9000CGE análisis de audio
(±) | la sonoridad del altavoz es media pero buena (76.2 dB)
Graves 100 - 315 Hz
(-) | casi sin bajos - de media 26.5% inferior a la mediana
(±) | la linealidad de los graves es media (12.3% delta a frecuencia anterior)
Medios 400 - 2000 Hz
(+) | medios equilibrados - a sólo 3.9% de la mediana
(+) | los medios son lineales (6.9% delta a la frecuencia anterior)
Altos 2 - 16 kHz
(+) | máximos equilibrados - a sólo 3.5% de la mediana
(+) | los máximos son lineales (4.8% delta a la frecuencia anterior)
Total 100 - 16.000 Hz
(±) | la linealidad del sonido global es media (21.3% de diferencia con la mediana)
En comparación con la misma clase
» 77% de todos los dispositivos probados de esta clase eran mejores, 6% similares, 18% peores
» El mejor tuvo un delta de 7%, la media fue 17%, el peor fue ###max##%
En comparación con todos los dispositivos probados
» 59% de todos los dispositivos probados eran mejores, 7% similares, 33% peores
» El mejor tuvo un delta de 4%, la media fue 24%, el peor fue ###max##%
Apple MacBook Pro 16 2021 M1 Pro análisis de audio
(+) | los altavoces pueden reproducir a un volumen relativamente alto (#84.7 dB)
Graves 100 - 315 Hz
(+) | buen bajo - sólo 3.8% lejos de la mediana
(+) | el bajo es lineal (5.2% delta a la frecuencia anterior)
Medios 400 - 2000 Hz
(+) | medios equilibrados - a sólo 1.3% de la mediana
(+) | los medios son lineales (2.1% delta a la frecuencia anterior)
Altos 2 - 16 kHz
(+) | máximos equilibrados - a sólo 1.9% de la mediana
(+) | los máximos son lineales (2.7% delta a la frecuencia anterior)
Total 100 - 16.000 Hz
(+) | el sonido global es lineal (4.6% de diferencia con la mediana)
En comparación con la misma clase
» 0% de todos los dispositivos probados de esta clase eran mejores, 0% similares, 100% peores
» El mejor tuvo un delta de 5%, la media fue 17%, el peor fue ###max##%
En comparación con todos los dispositivos probados
» 0% de todos los dispositivos probados eran mejores, 0% similares, 100% peores
» El mejor tuvo un delta de 4%, la media fue 24%, el peor fue ###max##%
Gestión de la energía - La estación de trabajo llega a sus límites
Consumo de energía
Debido al elevado consumo de energía permanente del sistema, la mísera fuente de alimentación de 65 vatios podría llegar a su límite cuando más se exige al hardware. Sin embargo, los 68 vatios que medimos deberían estar disponibles sin grandes problemas. Aún así, no dispone de un búfer para cargar el portátil. Si sólo tiene media carga, así seguirá siendo hasta que la CPU y la GPU requieran menos potencia. Al mismo tiempo, no registramos ninguna descarga no deseada durante la prueba de estrés.
Una mayor potencia de 90 vatios seguramente habría sido la mejor opción para el ThinkPad P16s G2 AMD.
| Off / Standby | |
| Ocioso | |
| Carga |
|
Clave:
min: | |
| Lenovo ThinkPad P16s G2 21K9000CGE R7 PRO 7840U, Radeon 780M, SK hynix PC801 HFS001TEJ9X162N, OLED, 3840x2400, 16" | HP EliteBook 845 G10 818N0EA R9 PRO 7940HS, Radeon 780M, SK hynix PC801 HFS001TEJ9X101N, IPS, 2560x1600, 14" | Lenovo ThinkPad P14s G4 21K5000LGE R7 PRO 7840U, Radeon 780M, SK hynix PC801 HFS512GEJ9X162N, IPS, 1920x1200, 14" | Schenker Vision 16 PH6PRX1 i7-13700H, Iris Xe G7 96EUs, Samsung 990 Pro 1 TB, IPS, 2560x1600, 16" | Acer Swift Edge SFE16 Ryzen 7 7840U R7 7840U, Radeon 780M, SK hynix HFS512GEJ9X125N, OLED, 3200x2000, 16" | Lenovo ThinkPad P16v G1 AMD R7 PRO 7840HS, RTX A1000 Laptop GPU, SK hynix PC801 HFS001TEJ9X101N, IPS, 1920x1200, 16" | Medio AMD Radeon 780M | Media de la clase Workstation | |
|---|---|---|---|---|---|---|---|---|
| Power Consumption | -16% | 22% | -41% | -27% | -20% | -17% | -107% | |
| Idle Minimum * (Watt) | 6.1 | 4.3 30% | 2.9 52% | 6.3 -3% | 7.1 -16% | 4.1 33% | 6.01 ? 1% | 8.94 ? -47% |
| Idle Average * (Watt) | 6.5 | 10.1 -55% | 5.1 22% | 14.4 -122% | 10.1 -55% | 6.5 -0% | 8.15 ? -25% | 13.8 ? -112% |
| Idle Maximum * (Watt) | 7 | 11.2 -60% | 5.6 20% | 16.2 -131% | 18.6 -166% | 6.7 4% | 10.3 ? -47% | 17.5 ? -150% |
| Load Average * (Watt) | 56.6 | 64.4 -14% | 51.2 10% | 46.2 18% | 45.3 20% | 65.2 -15% | 57.6 ? -2% | 95 ? -68% |
| Witcher 3 ultra * (Watt) | 61.2 | 59.4 3% | 49.9 18% | 49.4 19% | 39.5 35% | 77.2 -26% | ||
| Load Maximum * (Watt) | 68.3 | 66.7 2% | 60.2 12% | 85.2 -25% | 52.9 23% | 147 -115% | 77 ? -13% | 175.2 ? -157% |
* ... más pequeño es mejor
Power consumption Witcher 3 / stress test
Power consumption with external monitor
Tiempos de ejecución
La alta eficiencia del AMD Ryzen 7 Pro 7840U se ve algo amortiguada por la pantalla OLED del portátil. Sus buenos tiempos de ejecución se deben en gran medida a la gran capacidad de 84 Wh de la batería y no a que sea frugal con poca carga.
Sus tiempos de ejecución de más de 13 horas y 10 horas (prueba de navegación web) significan que puede utilizar el portátil sobre la marcha sin ningún problema. Sin embargo, esto sólo es así cuando se reduce el brillo. En nuestra prueba, éste se fijó en torno al 60 %. En cambio, con el brillo al máximo, la pantalla OLED requiere mucha más energía, lo que hace que la navegación web agote la batería en menos de 7 horas.
Con una pantalla diferente, por ejemplo la del muy similar ThinkPad P14s G4es posible abrir páginas web de forma continuada durante más de 11 horas, con una batería significativamente más pequeña de 52 Wh. Extrapolando con cuidado, el P16s G2 con el panel IPS y la representación media del color debería poder utilizarse entonces durante 16 horas de navegación.
| Lenovo ThinkPad P16s G2 21K9000CGE R7 PRO 7840U, Radeon 780M, 84 Wh | HP EliteBook 845 G10 818N0EA R9 PRO 7940HS, Radeon 780M, 51 Wh | Schenker Vision 16 PH6PRX1 i7-13700H, Iris Xe G7 96EUs, 80 Wh | Acer Swift Edge SFE16 Ryzen 7 7840U R7 7840U, Radeon 780M, 54 Wh | Lenovo ThinkPad P16v G1 AMD R7 PRO 7840HS, RTX A1000 Laptop GPU, 90 Wh | Microsoft Surface Laptop Studio 2 RTX 4060 i7-13700H, GeForce RTX 4060 Laptop GPU, 58 Wh | Media de la clase Workstation | |
|---|---|---|---|---|---|---|---|
| Duración de Batería | -32% | 24% | -47% | 16% | 3% | -18% | |
| H.264 (h) | 13.3 | 9.3 -30% | 17.8 34% | 11.3 -15% | 9.51 ? -28% | ||
| WiFi v1.3 (h) | 10.6 | 7.9 -25% | 8 -25% | 5.6 -47% | 15 42% | 8.3 -22% | 8.53 ? -20% |
| Load (h) | 1.5 | 0.9 -40% | 2.6 73% | 1.1 -27% | 2.2 47% | 1.429 ? -5% |
Pro
Contra
Veredicto - El rendimiento y la imagen son estupendos, todo lo demás está bien

El ThinkPad P16s G2 AMD presenta una variedad inusualmente grande de usos potenciales. El alto rendimiento de la CPU emparejado con su buena Radeon 780M iGPU permite un uso profesional, incluso para las tareas más exigentes desde el punto de vista gráfico. Puede que no sea tan rápido como en un dispositivo con una tarjeta gráfica dedicada, sin embargo, el portátil para estaciones de trabajo tiene otras cosas que ofrecer.
Los ventiladores suelen ser silenciosos o permanecer completamente desactivados y, a pesar de que la pantalla OLED consume mucha energía, ofrece tiempos de ejecución decentes. Además, su precio está bien si se tienen en cuenta sus capacidades de rendimiento. Todo esto se traduce en imágenes brillantes y ricas en contraste, lo que le permite utilizar el portátil para tareas creativas. Por otro lado, su portabilidad seguro que podría beneficiarse de una pantalla algo menos elaborada.
Mucha potencia, un rendimiento gráfico generalmente suficiente y una conectividad decente hacen del AMD P16s G2 un portátil excelente para el trabajo, la universidad o las tareas creativas.
Además, el dispositivo cuenta con una gran cantidad de funciones de seguridad y su función de mantenimiento remoto podría resultar realmente útil para los dispositivos de la empresa. Su robusta carcasa y su buen teclado también lo convierten en un gran portátil de trabajo.
A su vez, sus críticas no son las más duras. Por supuesto, un segundo puerto USB4 sería práctico. Los ventiladores podrían ser un poco más eficientes, sobre todo si se tiene en cuenta el espacio que no se utiliza en el interior. Además, la potencia suministrada a través de su fuente de alimentación puede ser un poco ajustada, pero no debería causar ninguna limitación grave.
Una alternativa que ofrece un rendimiento gráfico adicional podría ser el Lenovo ThinkPad P16v G1por ejemplo. Mejor portabilidad y algo menos de rendimiento ofrece el muy similar Lenovo ThinkPad P14s G4 AMD-su pantalla de 14 pulgadas puede hacerlo más adecuado para ser utilizado sobre la marcha.
Precio y disponibilidad
La versión del ThinkPad P16s G2 con 64 GB de RAM y pantalla OLED se puede encontrar por 1.599 dólares en Amazon.
Lenovo ThinkPad P16s G2 21K9000CGE
- 01/23/2024 v7 (old)
Mario Petzold
Transparencia
La selección de los dispositivos que se van a reseñar corre a cargo de nuestro equipo editorial. La muestra de prueba fue proporcionada al autor en calidad de préstamo por el fabricante o el minorista a los efectos de esta reseña. El prestamista no tuvo ninguna influencia en esta reseña, ni el fabricante recibió una copia de la misma antes de su publicación. No había ninguna obligación de publicar esta reseña. Como empresa de medios independiente, Notebookcheck no está sujeta a la autoridad de fabricantes, minoristas o editores.
Así es como prueba Notebookcheck
Cada año, Notebookcheck revisa de forma independiente cientos de portátiles y smartphones utilizando procedimientos estandarizados para asegurar que todos los resultados son comparables. Hemos desarrollado continuamente nuestros métodos de prueba durante unos 20 años y hemos establecido los estándares de la industria en el proceso. En nuestros laboratorios de pruebas, técnicos y editores experimentados utilizan equipos de medición de alta calidad. Estas pruebas implican un proceso de validación en varias fases. Nuestro complejo sistema de clasificación se basa en cientos de mediciones y puntos de referencia bien fundamentados, lo que mantiene la objetividad.Price comparison

