El PC de sobremesa Corsair One i300 domina el Core i9-12900K y la RTX 3080 Ti en una caja de 12 litros

Corsair lleva vendiendo la serie One desde 2018, empaquetando hardware gaming actual en una caja compacta que incluye refrigeración por agua. Ya hemos visto en laCorsair One i160que este sistema funciona.
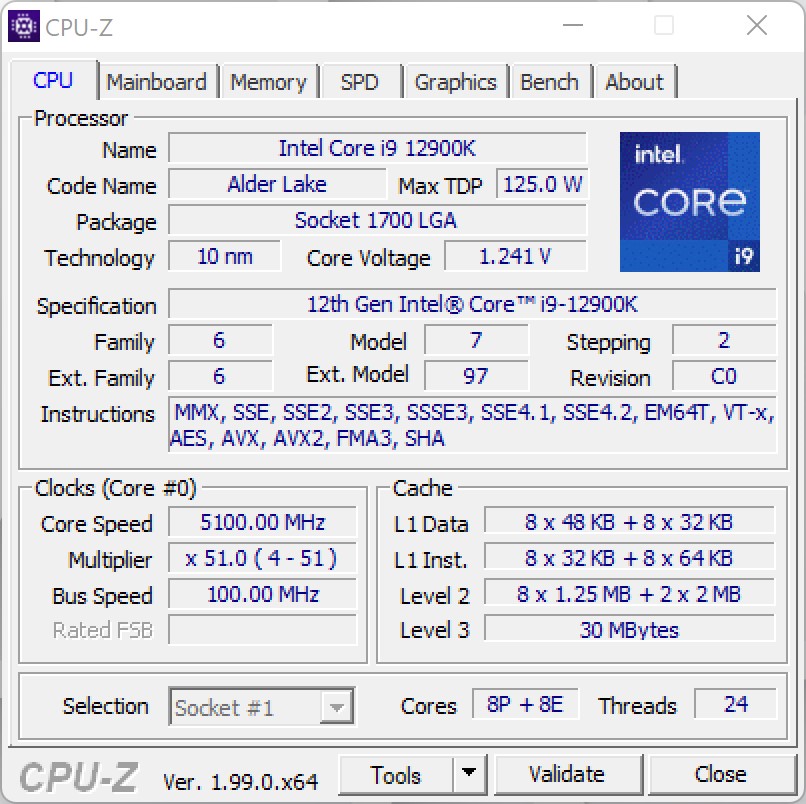
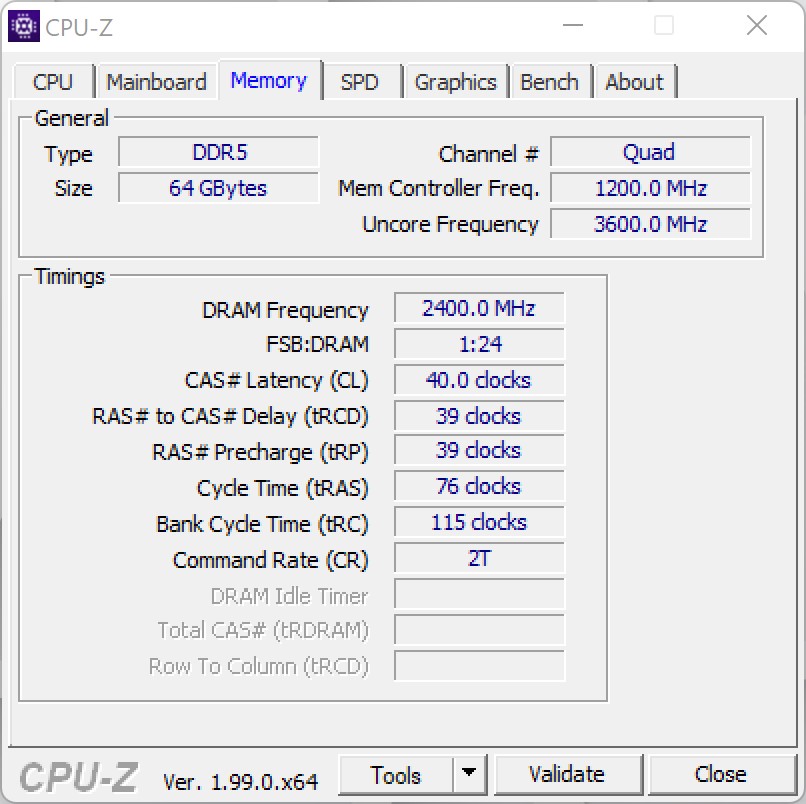
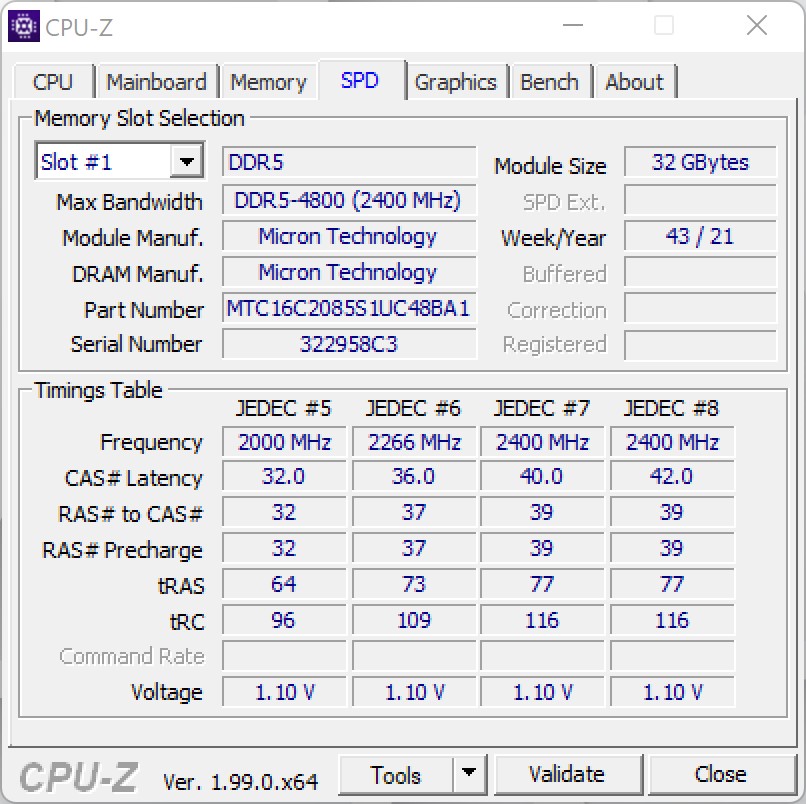
En el CES de este año, Corsair anunció una actualización para el Corsair One que está equipado con la actual serie Alder Lake, que ahora ha recuperado la corona de rendimiento como la CPU de juegos más rápida. Además del Intel Core i9-12900Kcorsair también incluye unaNvidia GeForce RTX 3080 Ti. Ambos componentes ofrecen una base excelente para el juego 4K sin compromisos. Tras nuestras pruebas iniciales, también pudimos confirmarlo, aunque el fabricante sigue manteniendo el Intel Core i9-12900K algo atado. Más sobre esto más adelante en la prueba. En cuanto a los potentes componentes, también hay amplios 64 GB de memoria de trabajo y un veloz SSD de 2 TB que incluye la versión profesional de Windows 11.
Corsair pide 5100 Euros por el sistema equipado en nuestro test. Si te conformas con 32 GB de memoria de trabajo y unaNvidia GeForce RTX 3080tienes que pagar exactamente 1000 Euros menos.
Caso
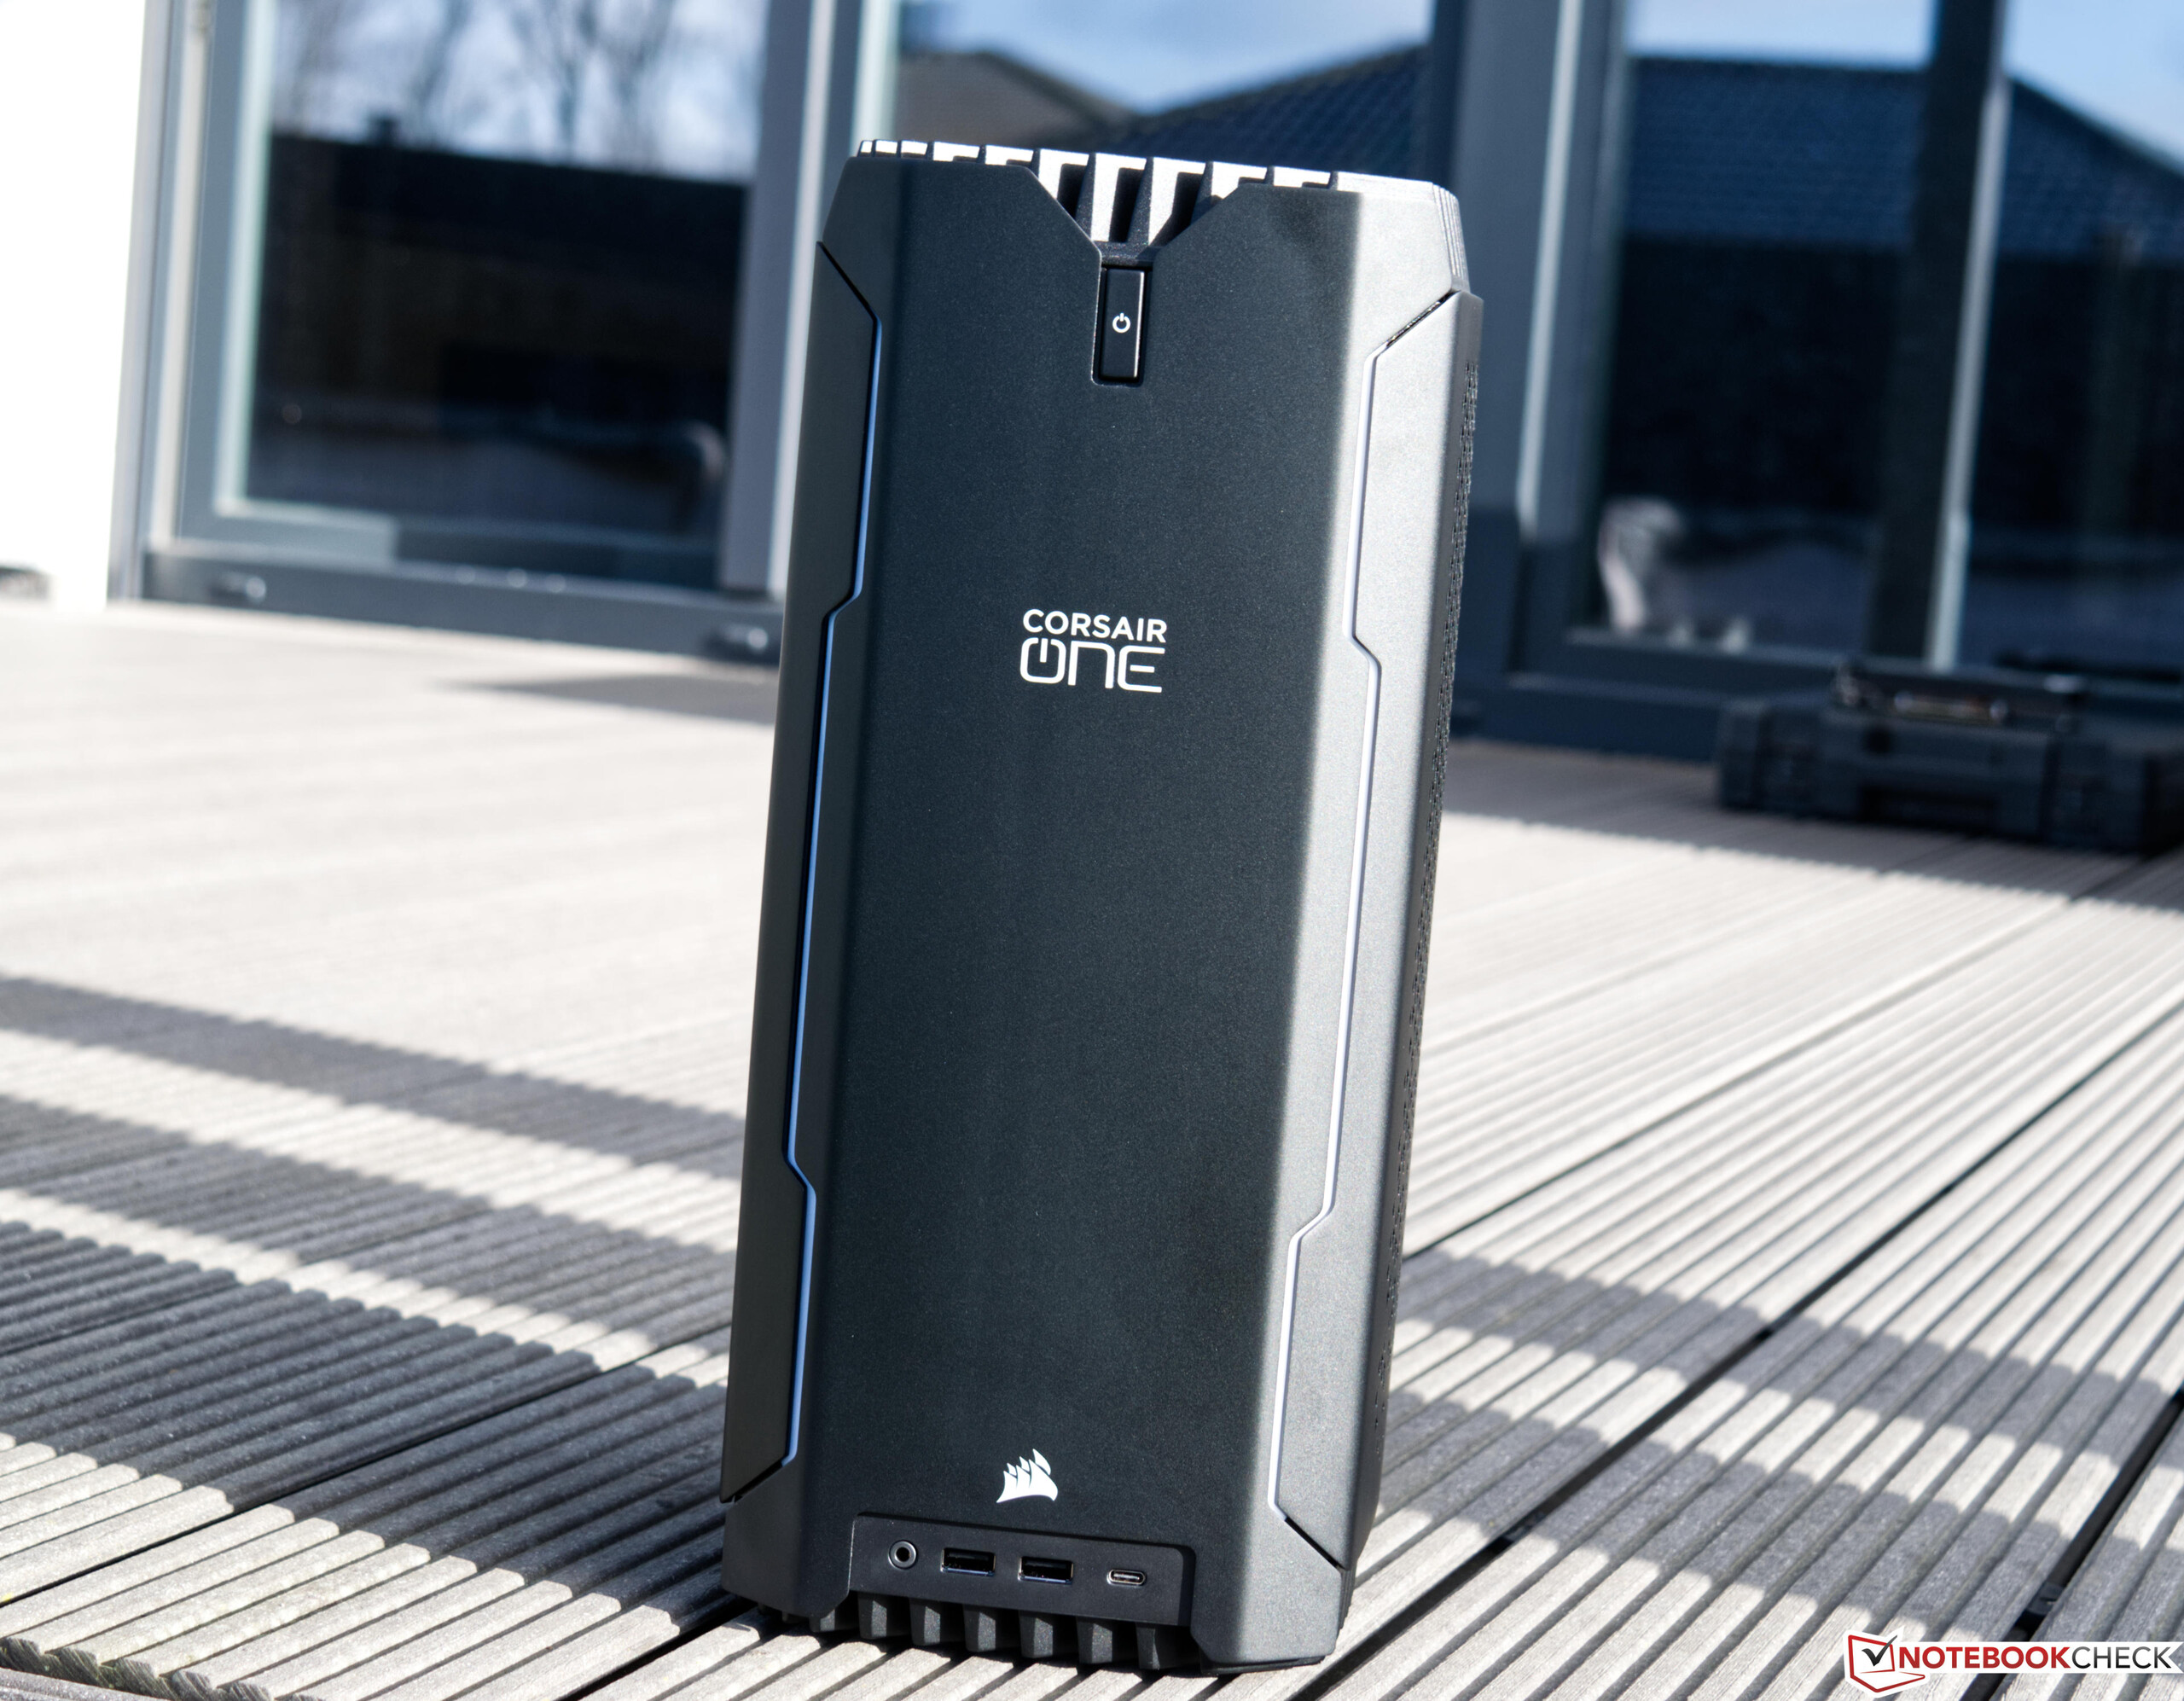
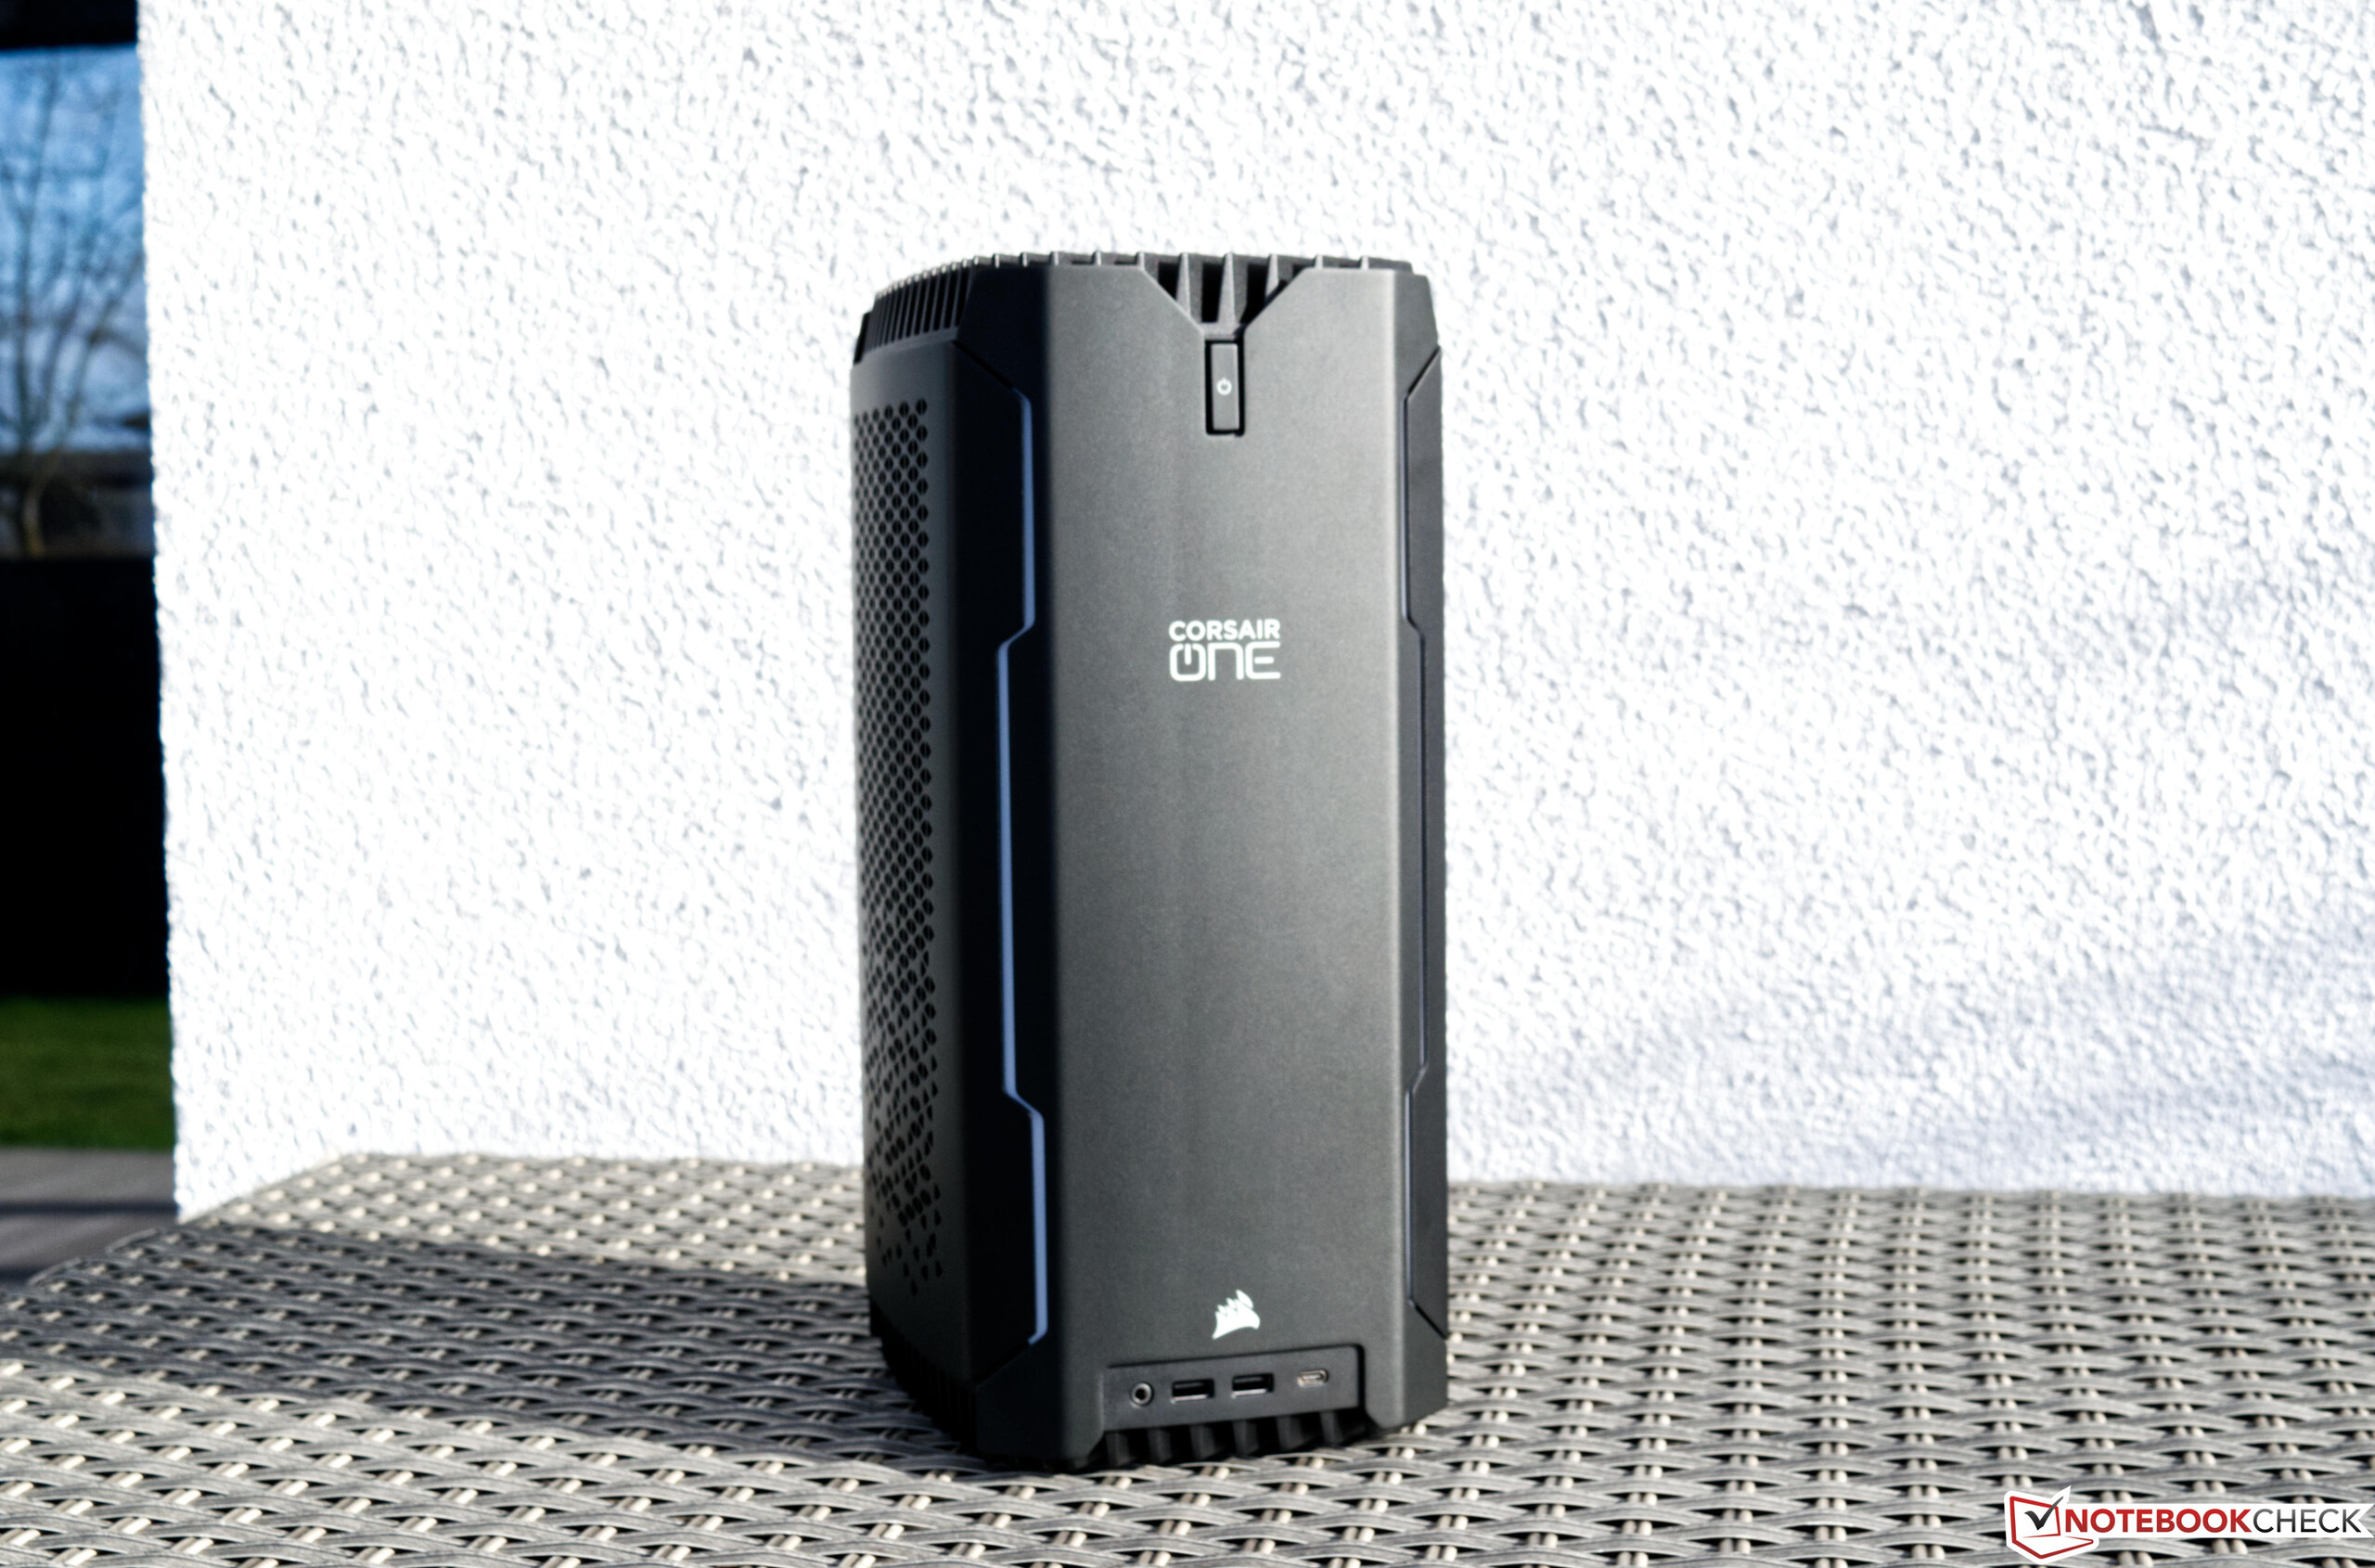
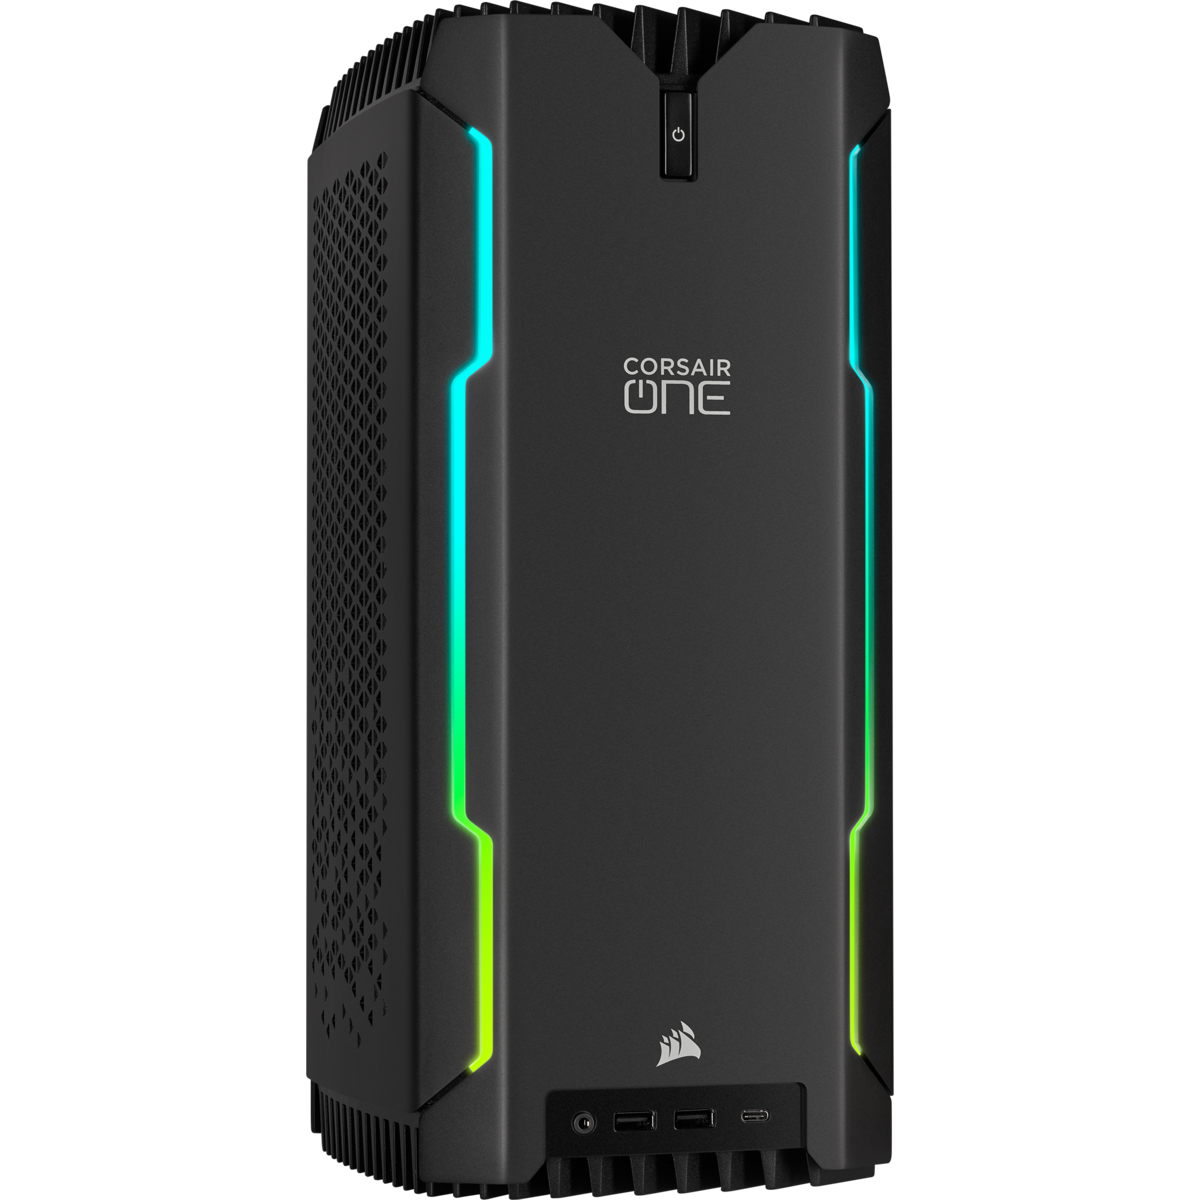
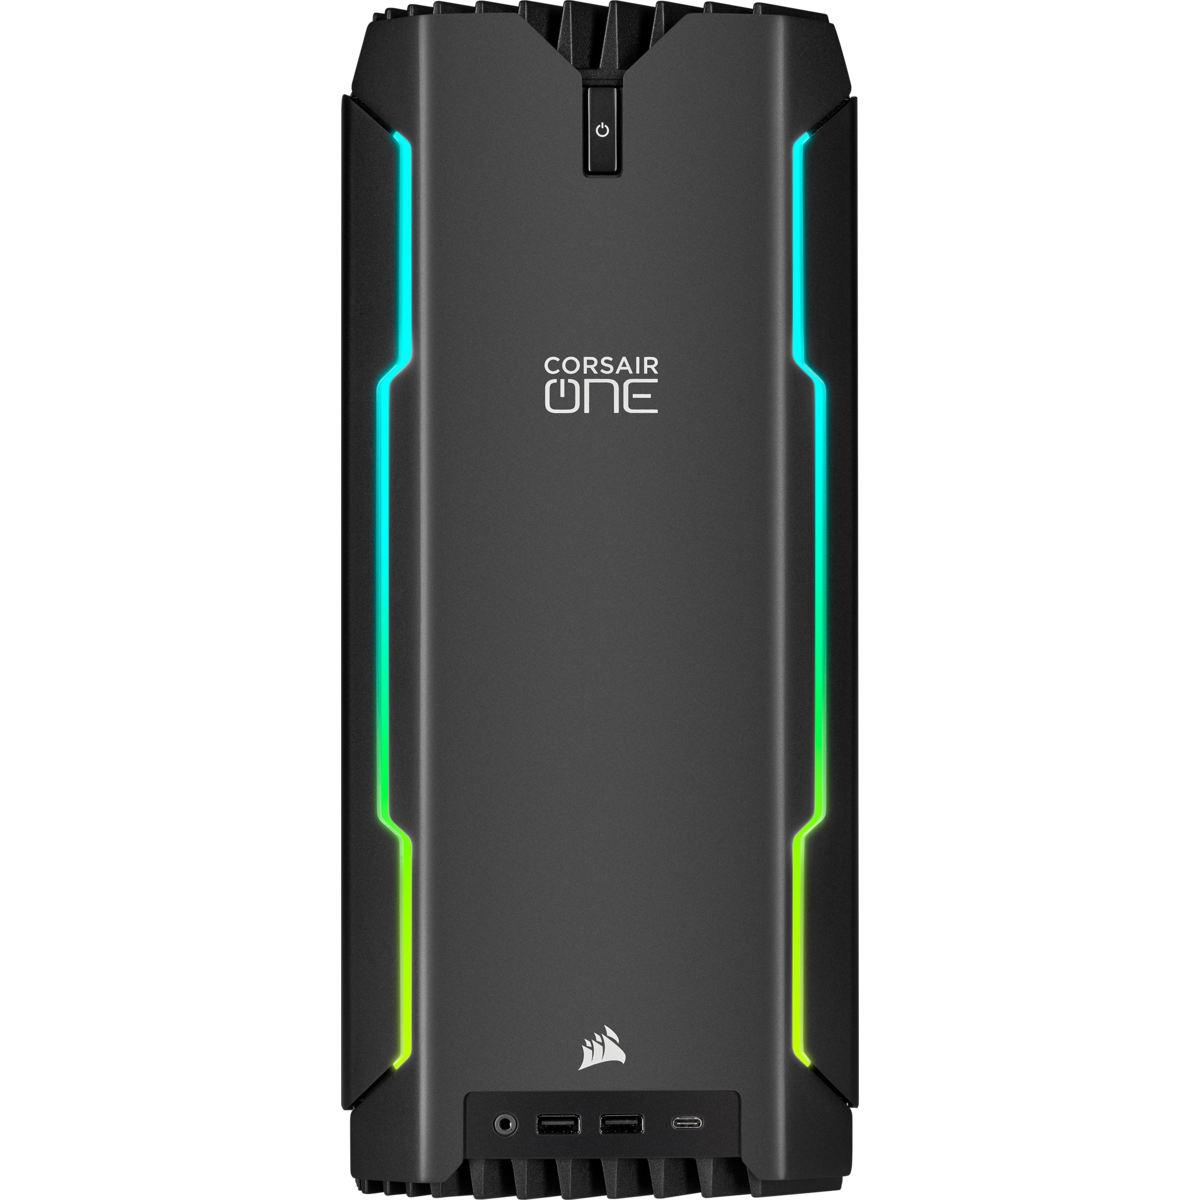
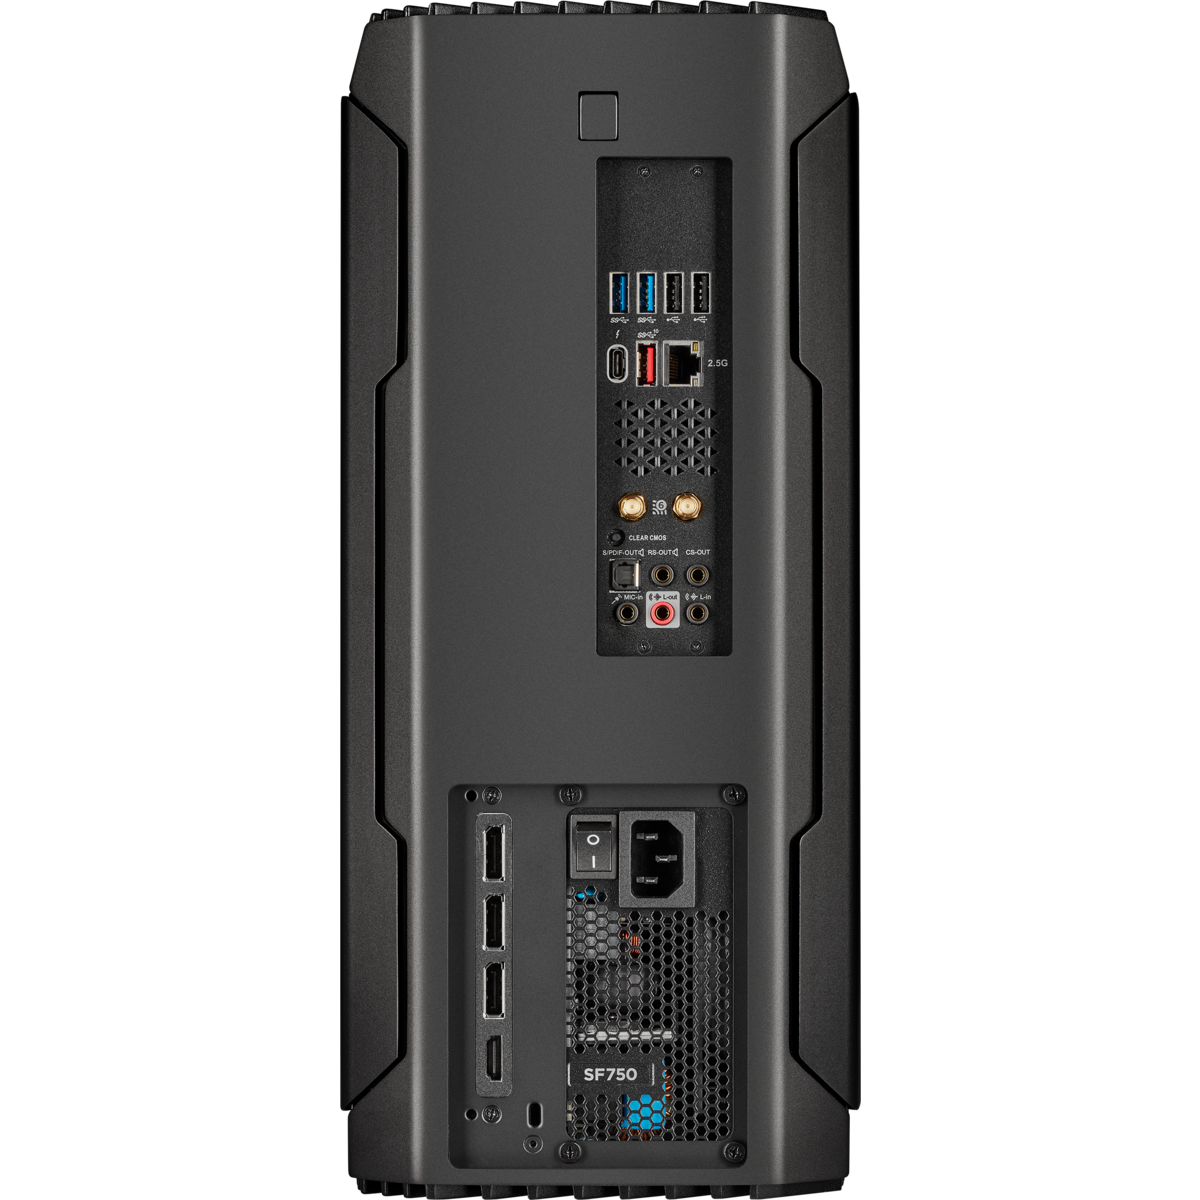
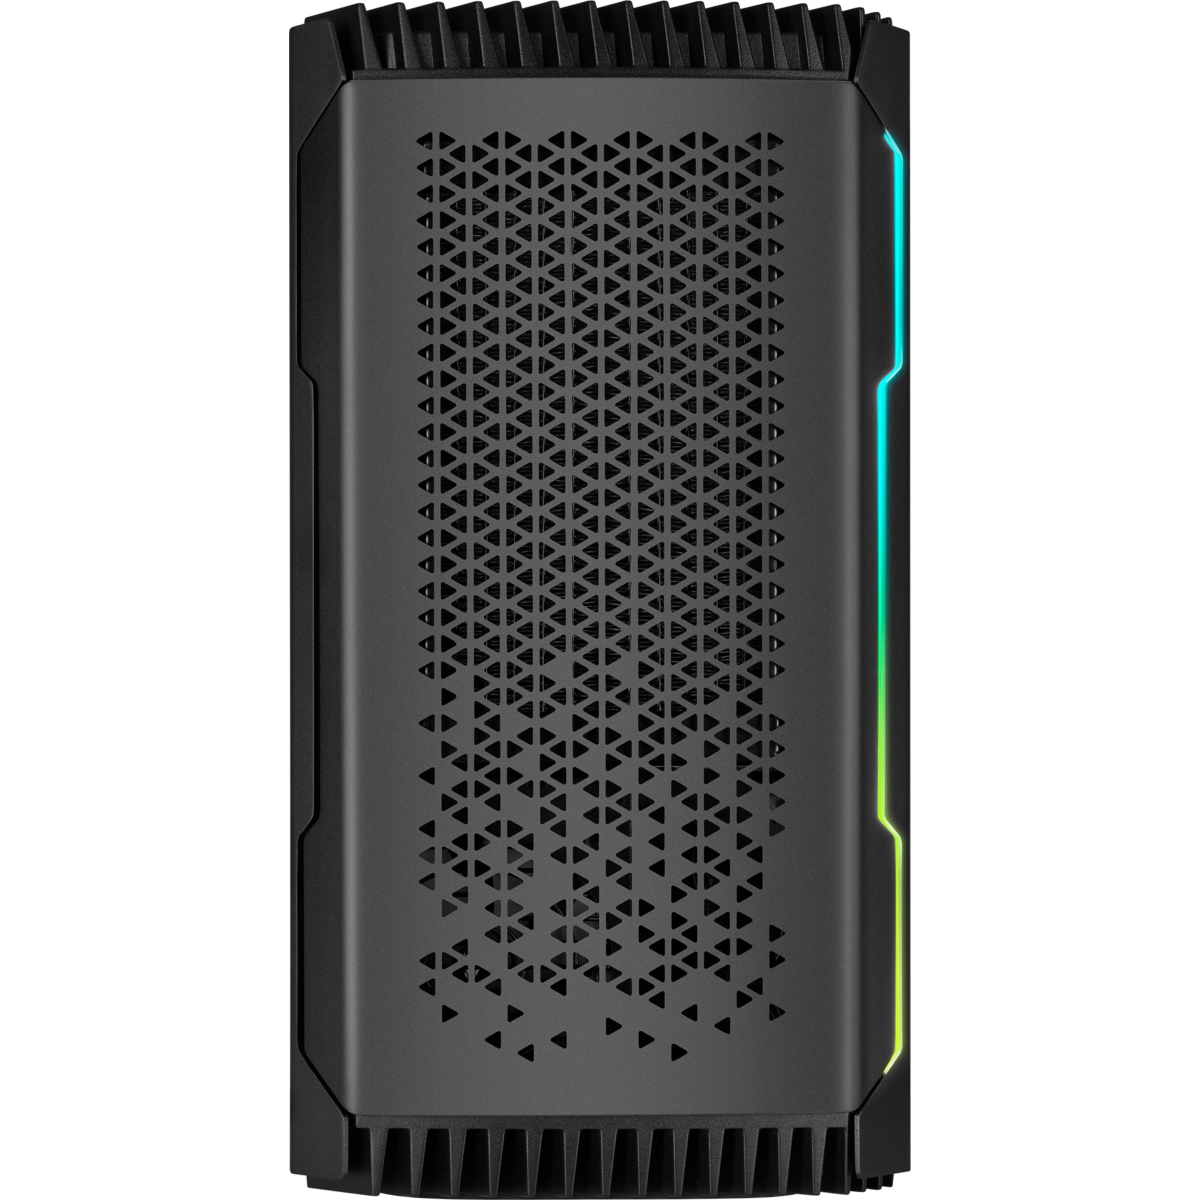
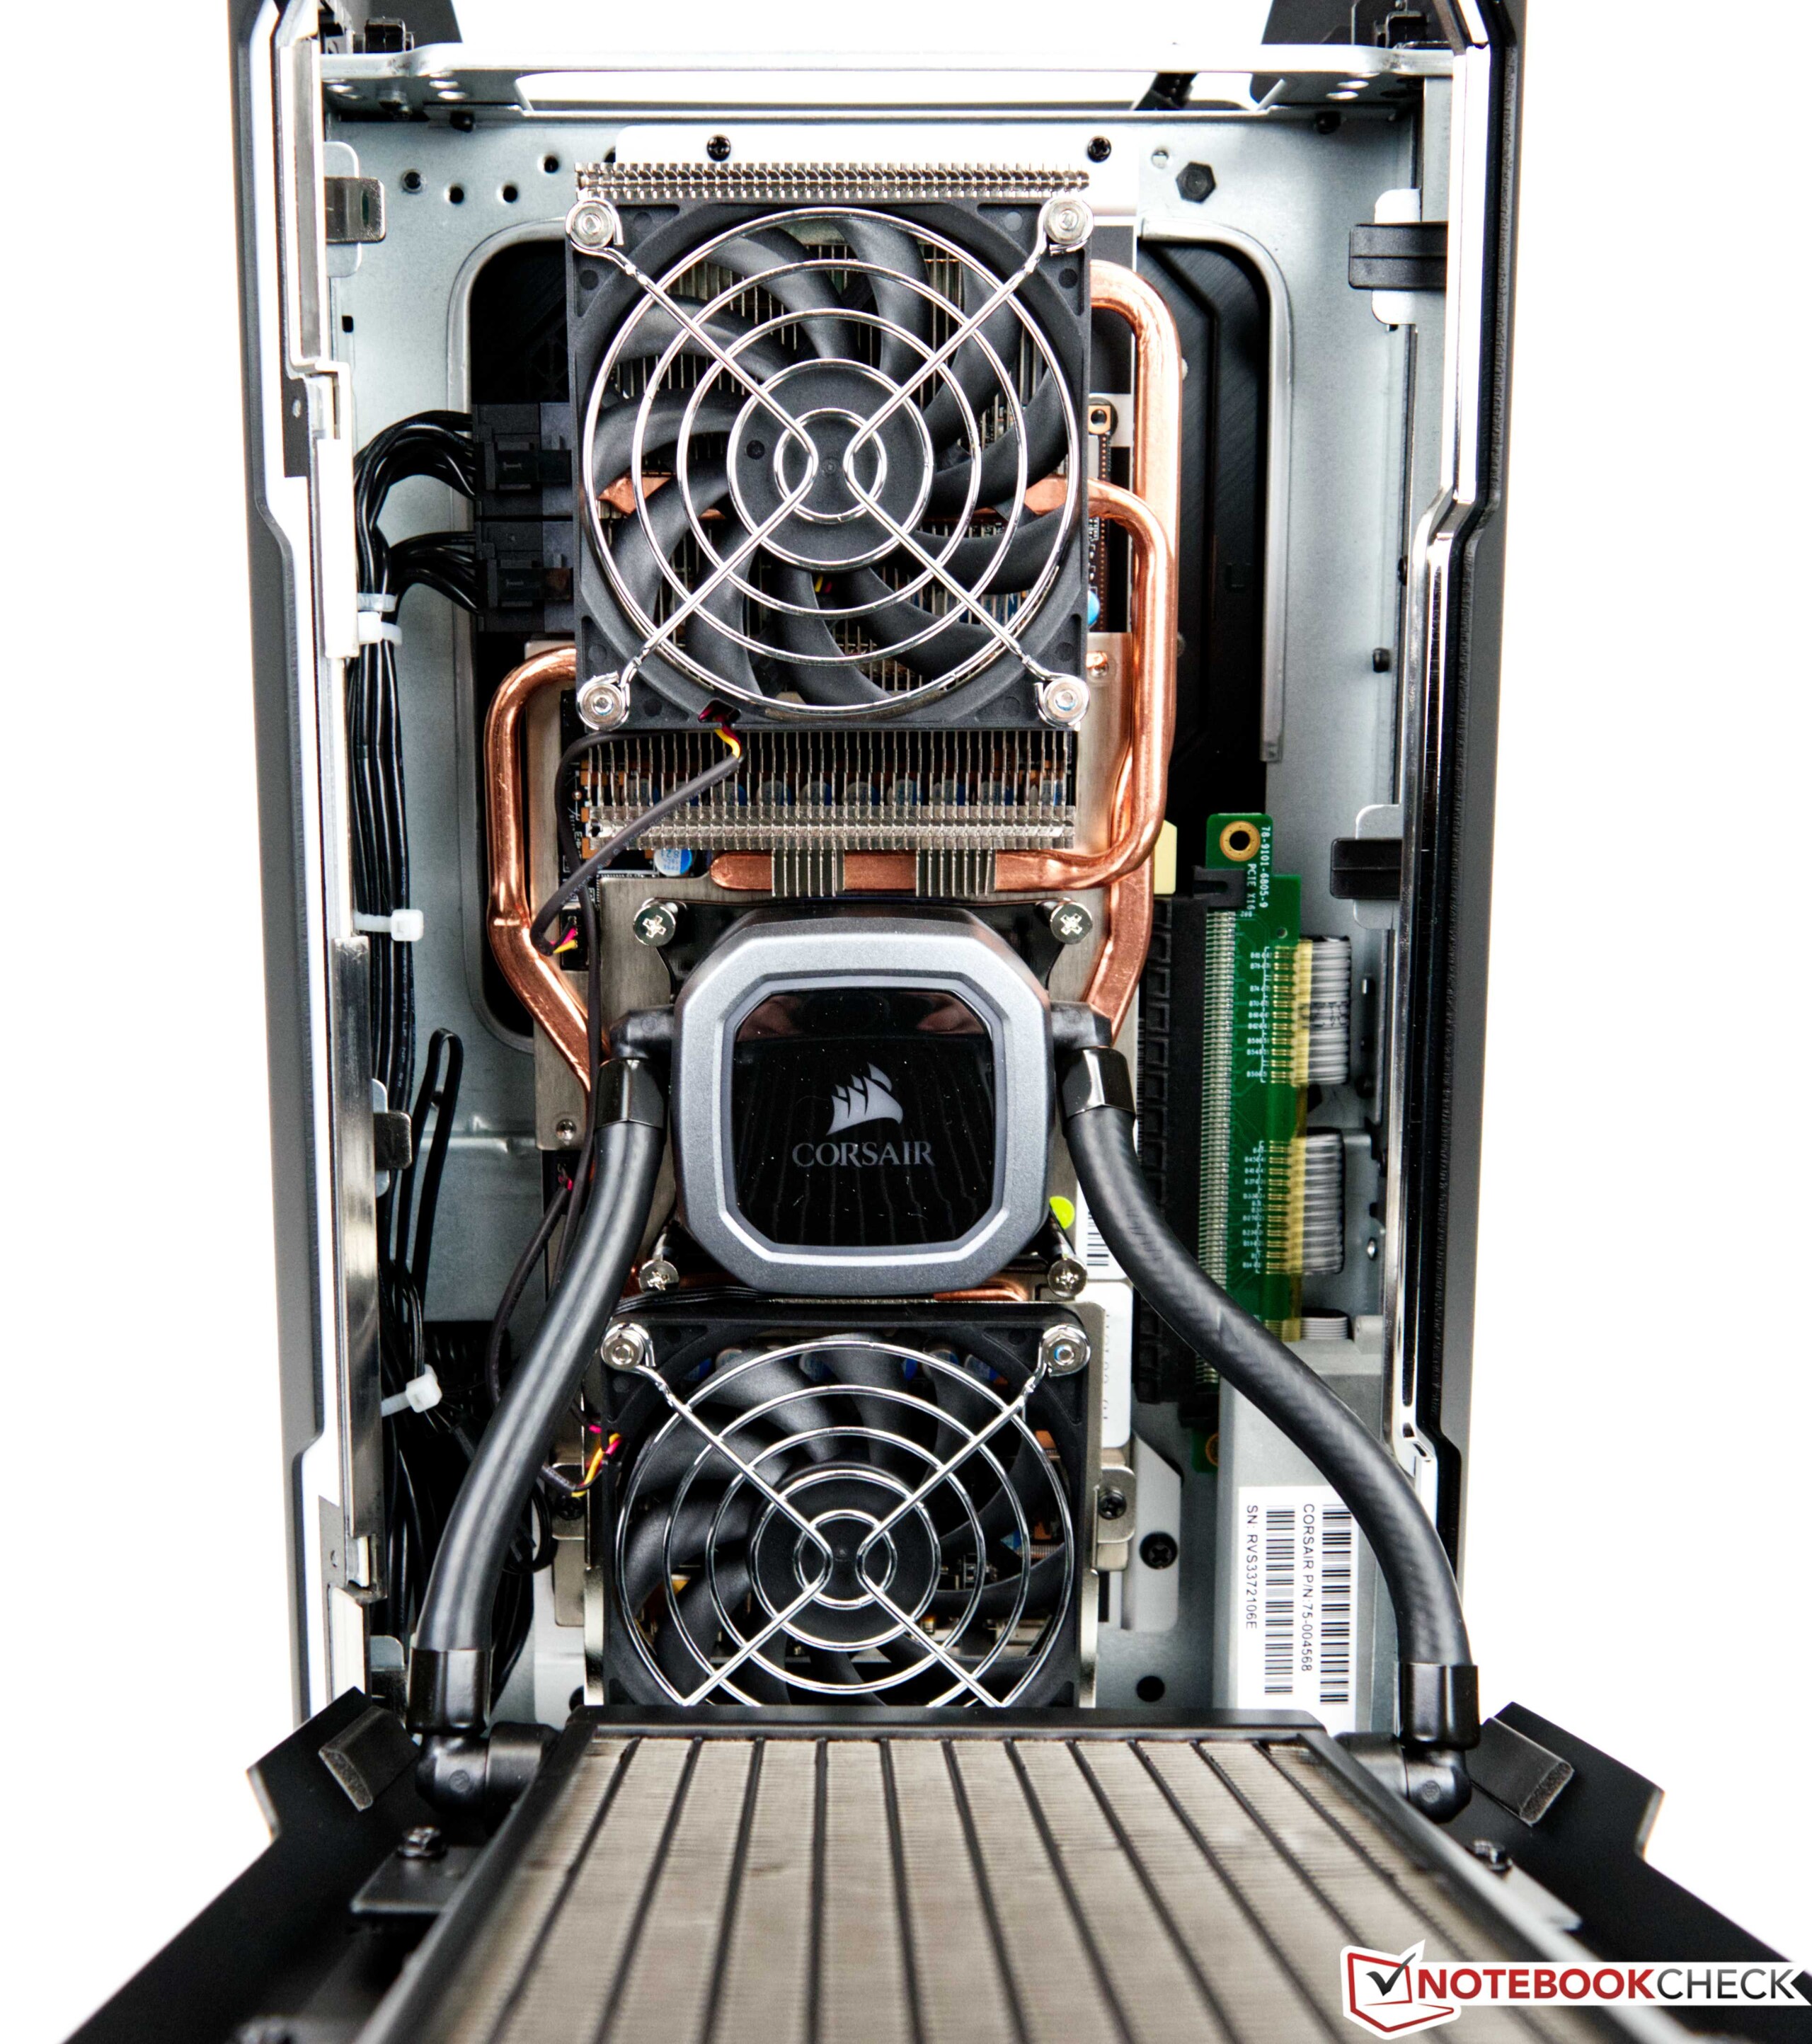
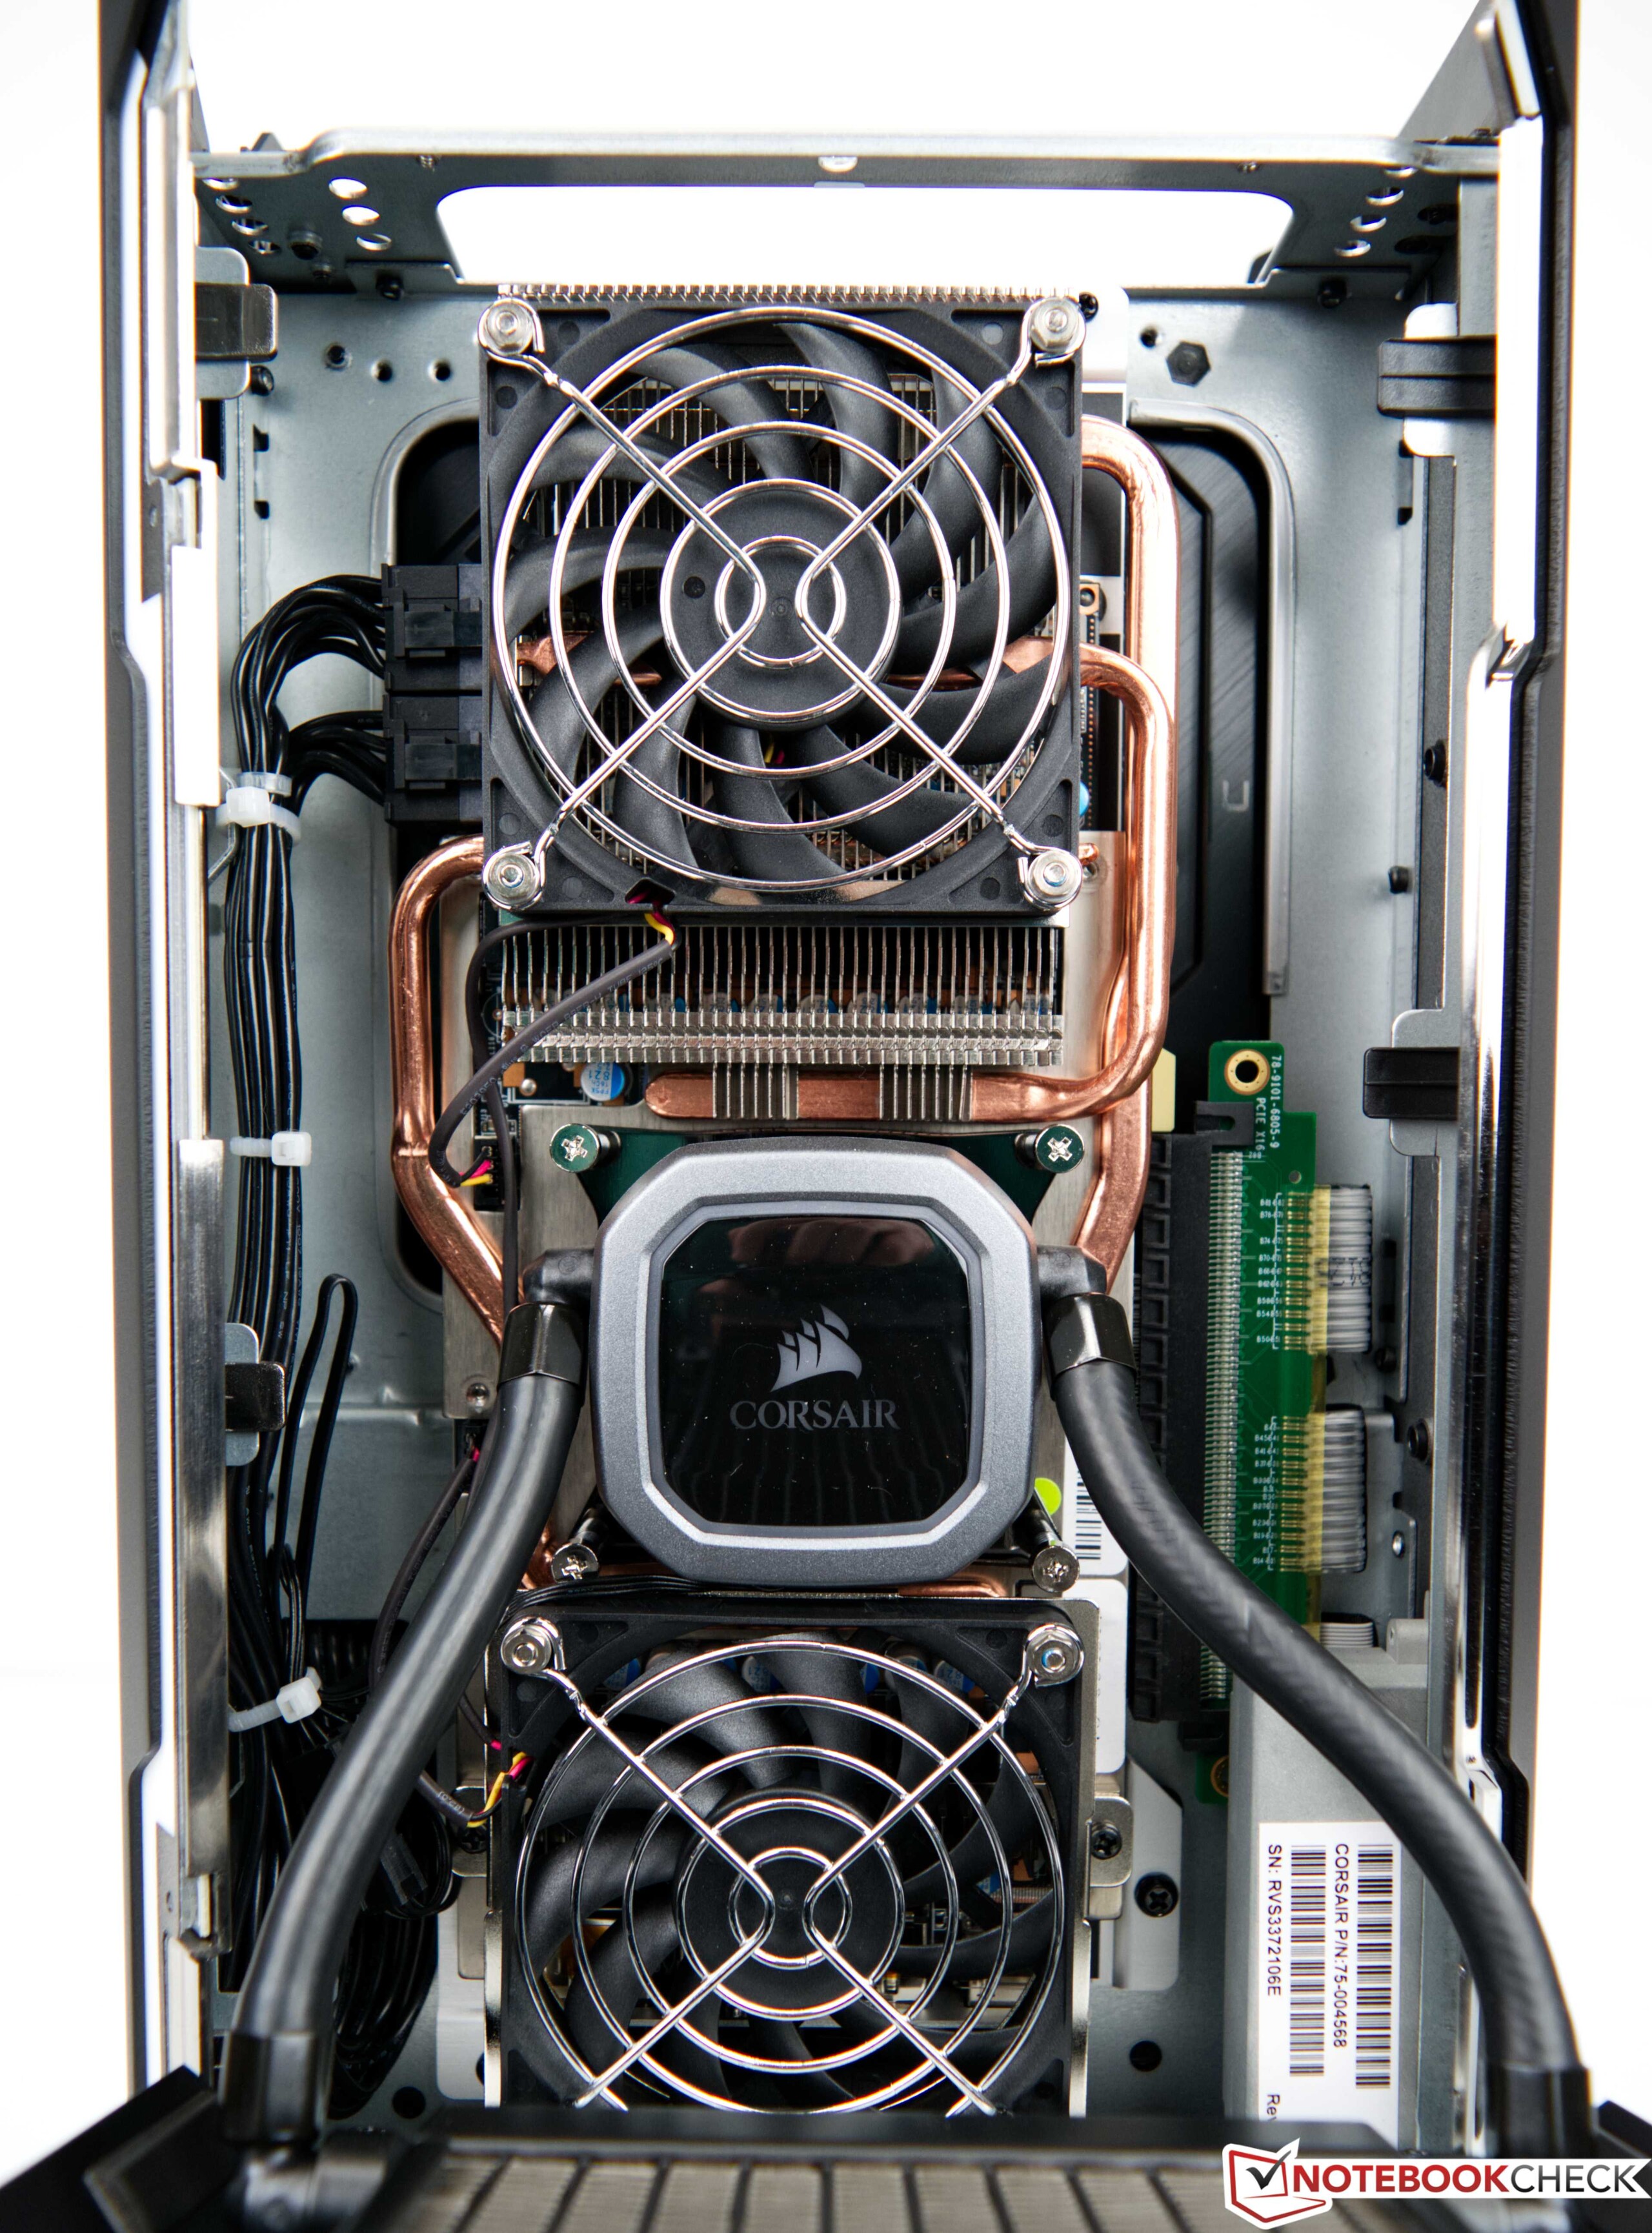
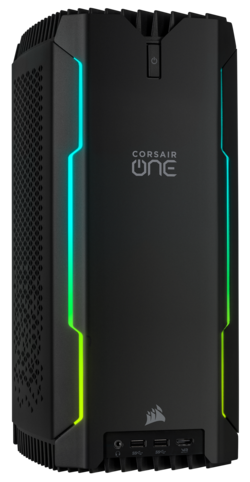
Visualmente, la carcasa del Corsair One i300 apenas se distingue delCorsair One i160y en cuanto a la elección de los materiales, el fabricante también ha mantenido el mismo concepto con todas las superficies de metal que ofrecen una impresión de alta calidad no sólo en términos de apariencia. La háptica también da la impresión de tener siempre un producto de muy alta calidad en las manos. El diseño negro y modesto está marcado por dos barras de luz RGB en la parte delantera, que pueden ajustarse según sus preferencias mediante el software iCUE. La fabricación es de primera categoría, y no vimos ningún fallo. El diseño del interior ofrece espacio para dos sistemas de refrigeración por agua independientes para la CPU y la GPU.
A pesar de su compacidad, el pequeño PC aporta 7,5 kg a la balanza. Esto no se espera a primera vista, pero también confirma los materiales utilizados, ya que en una carcasa tan pequeña hay que utilizar todo lo posible para transferir el calor creado

Equipos - Los más actuales
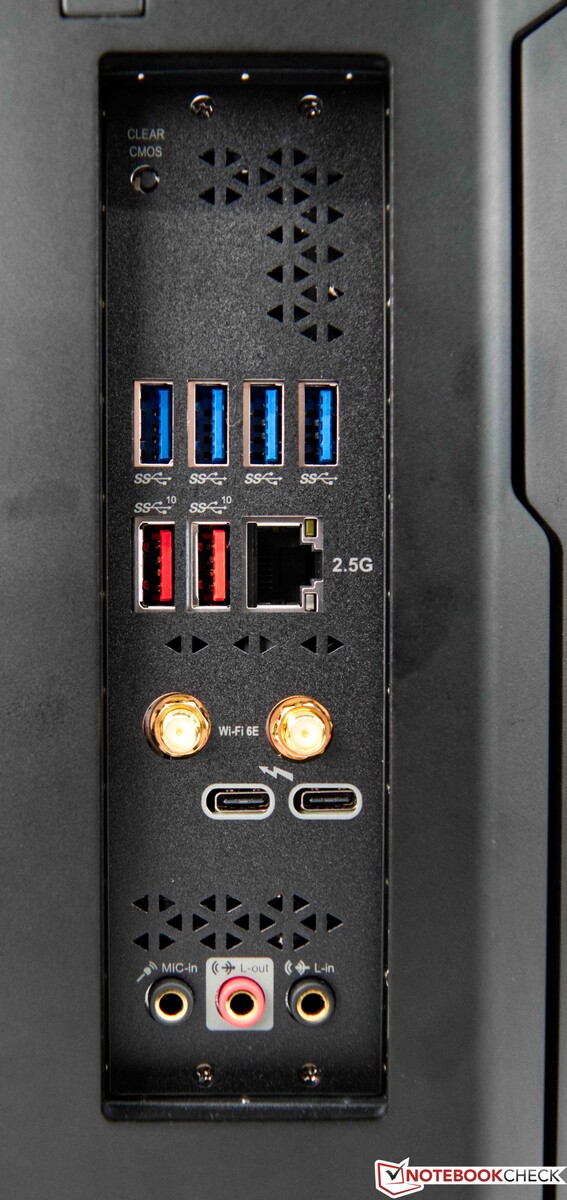
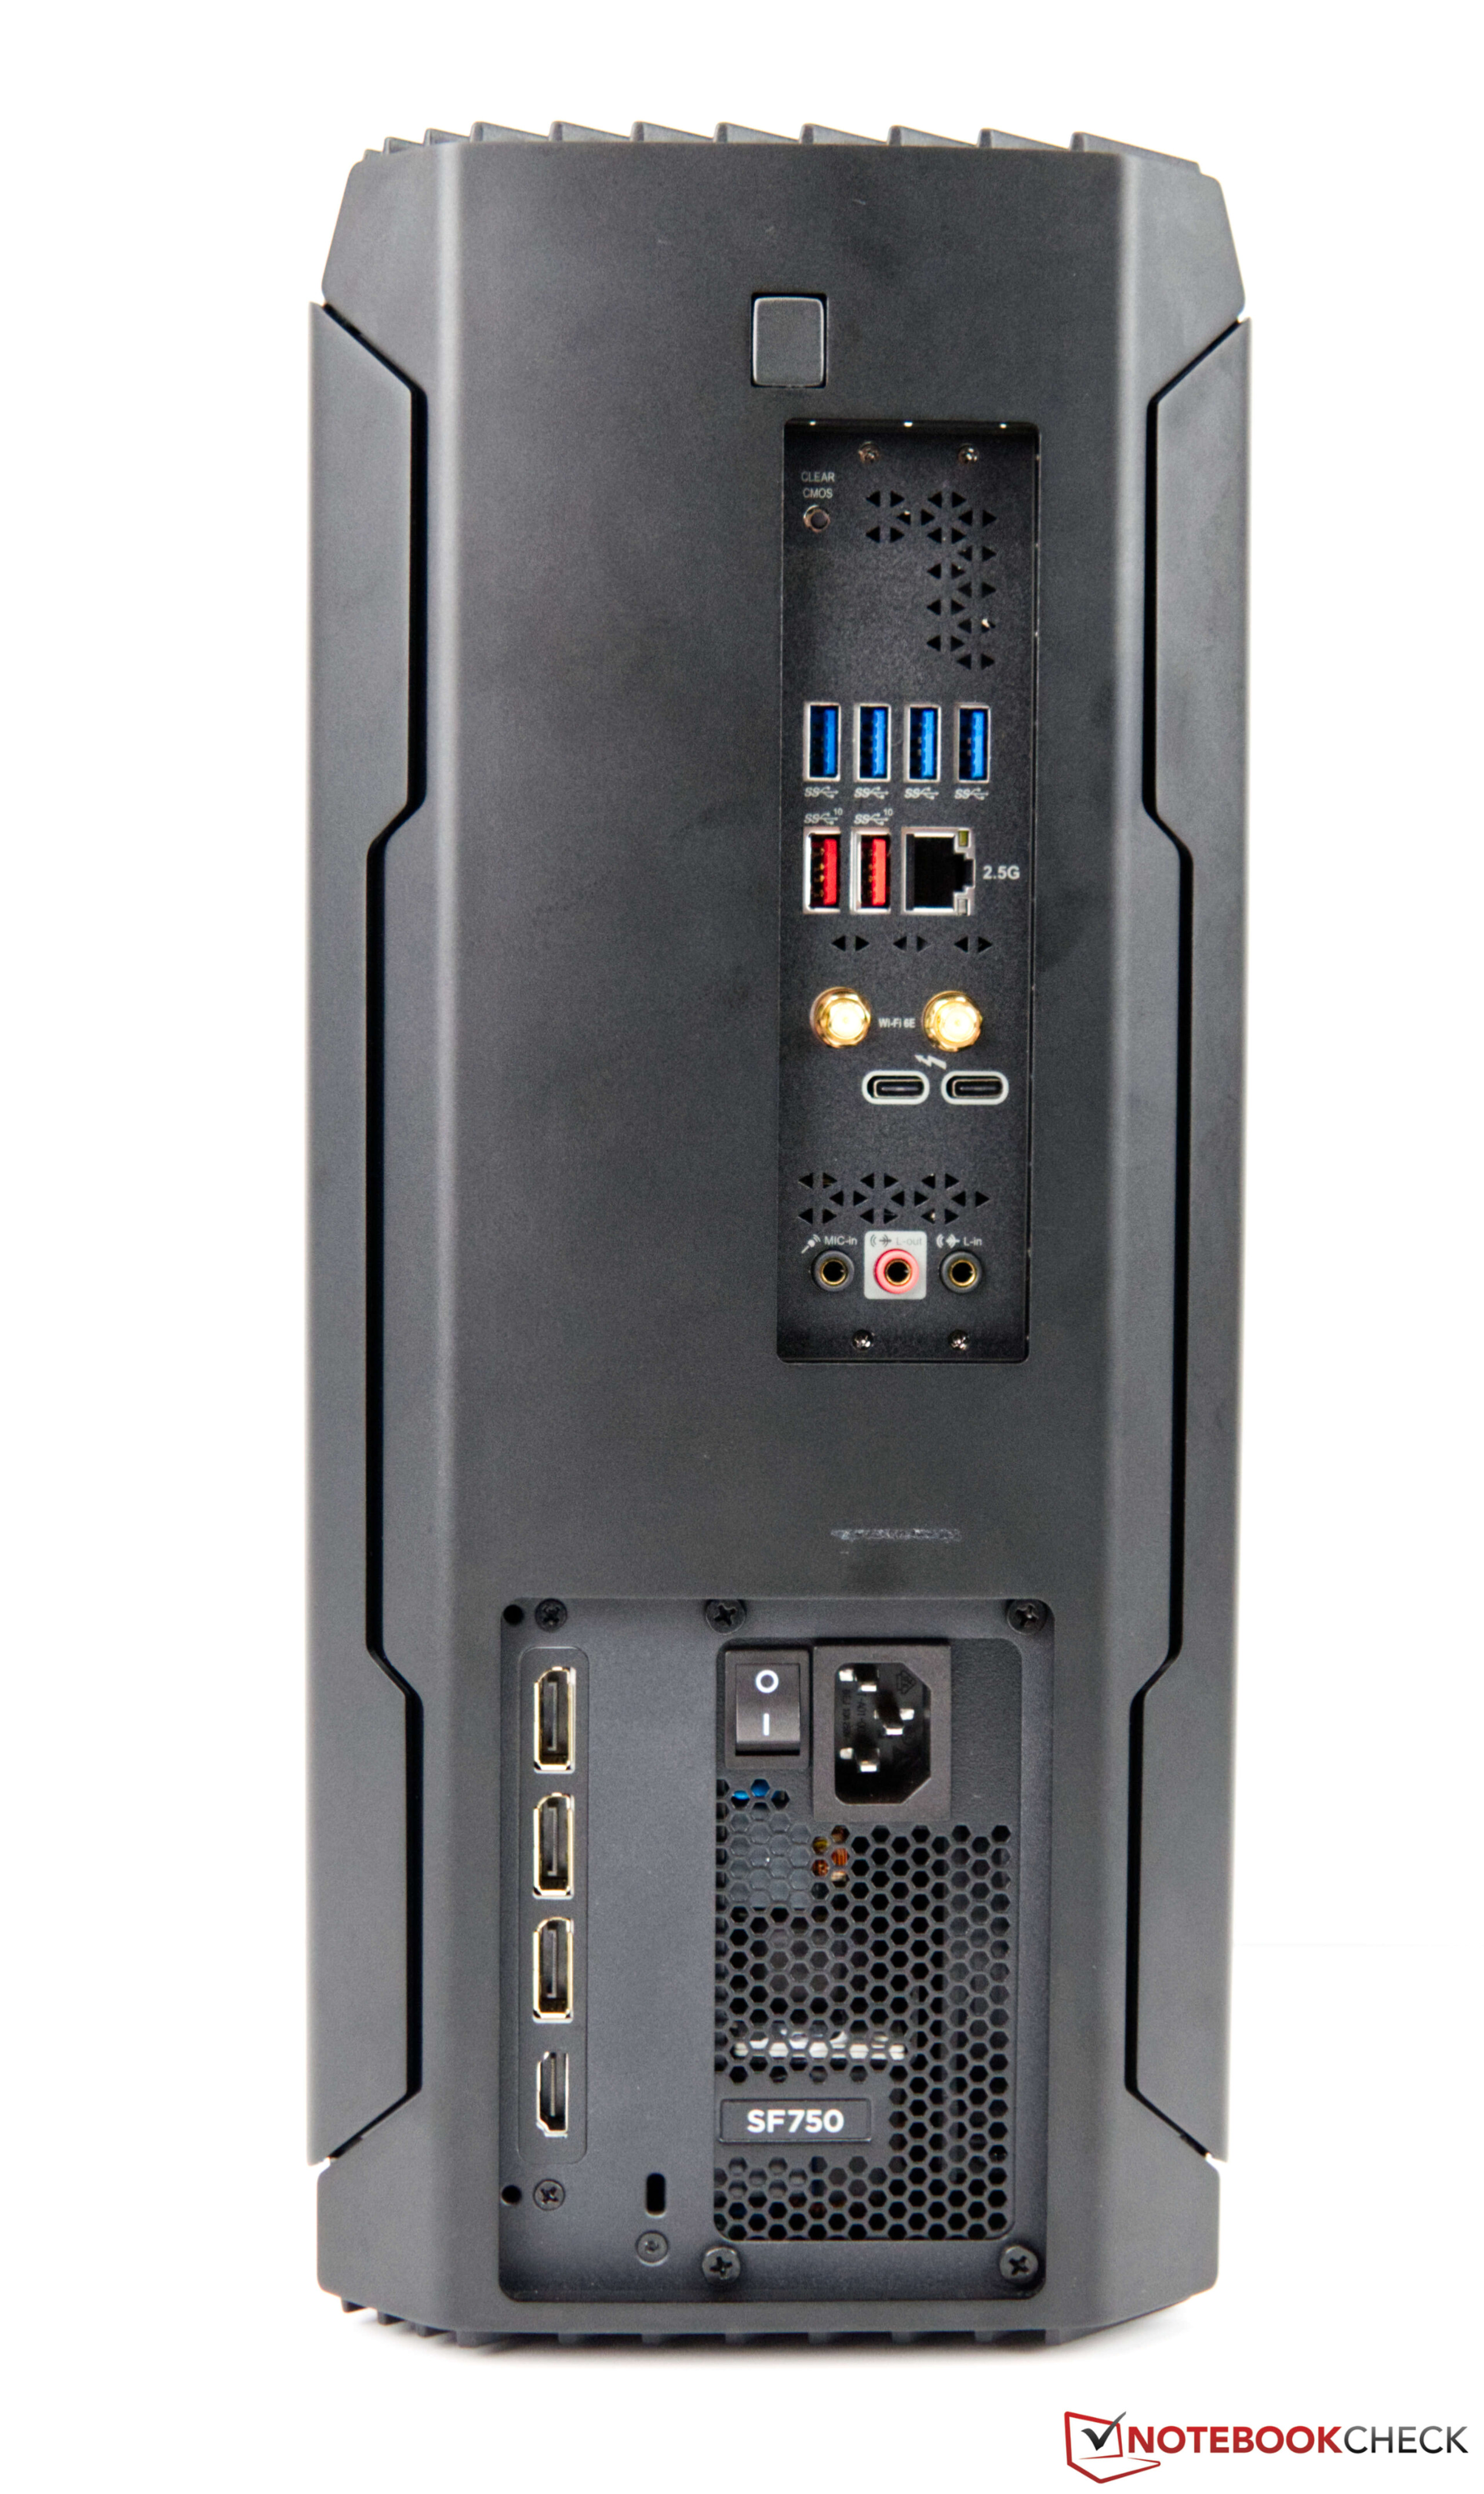
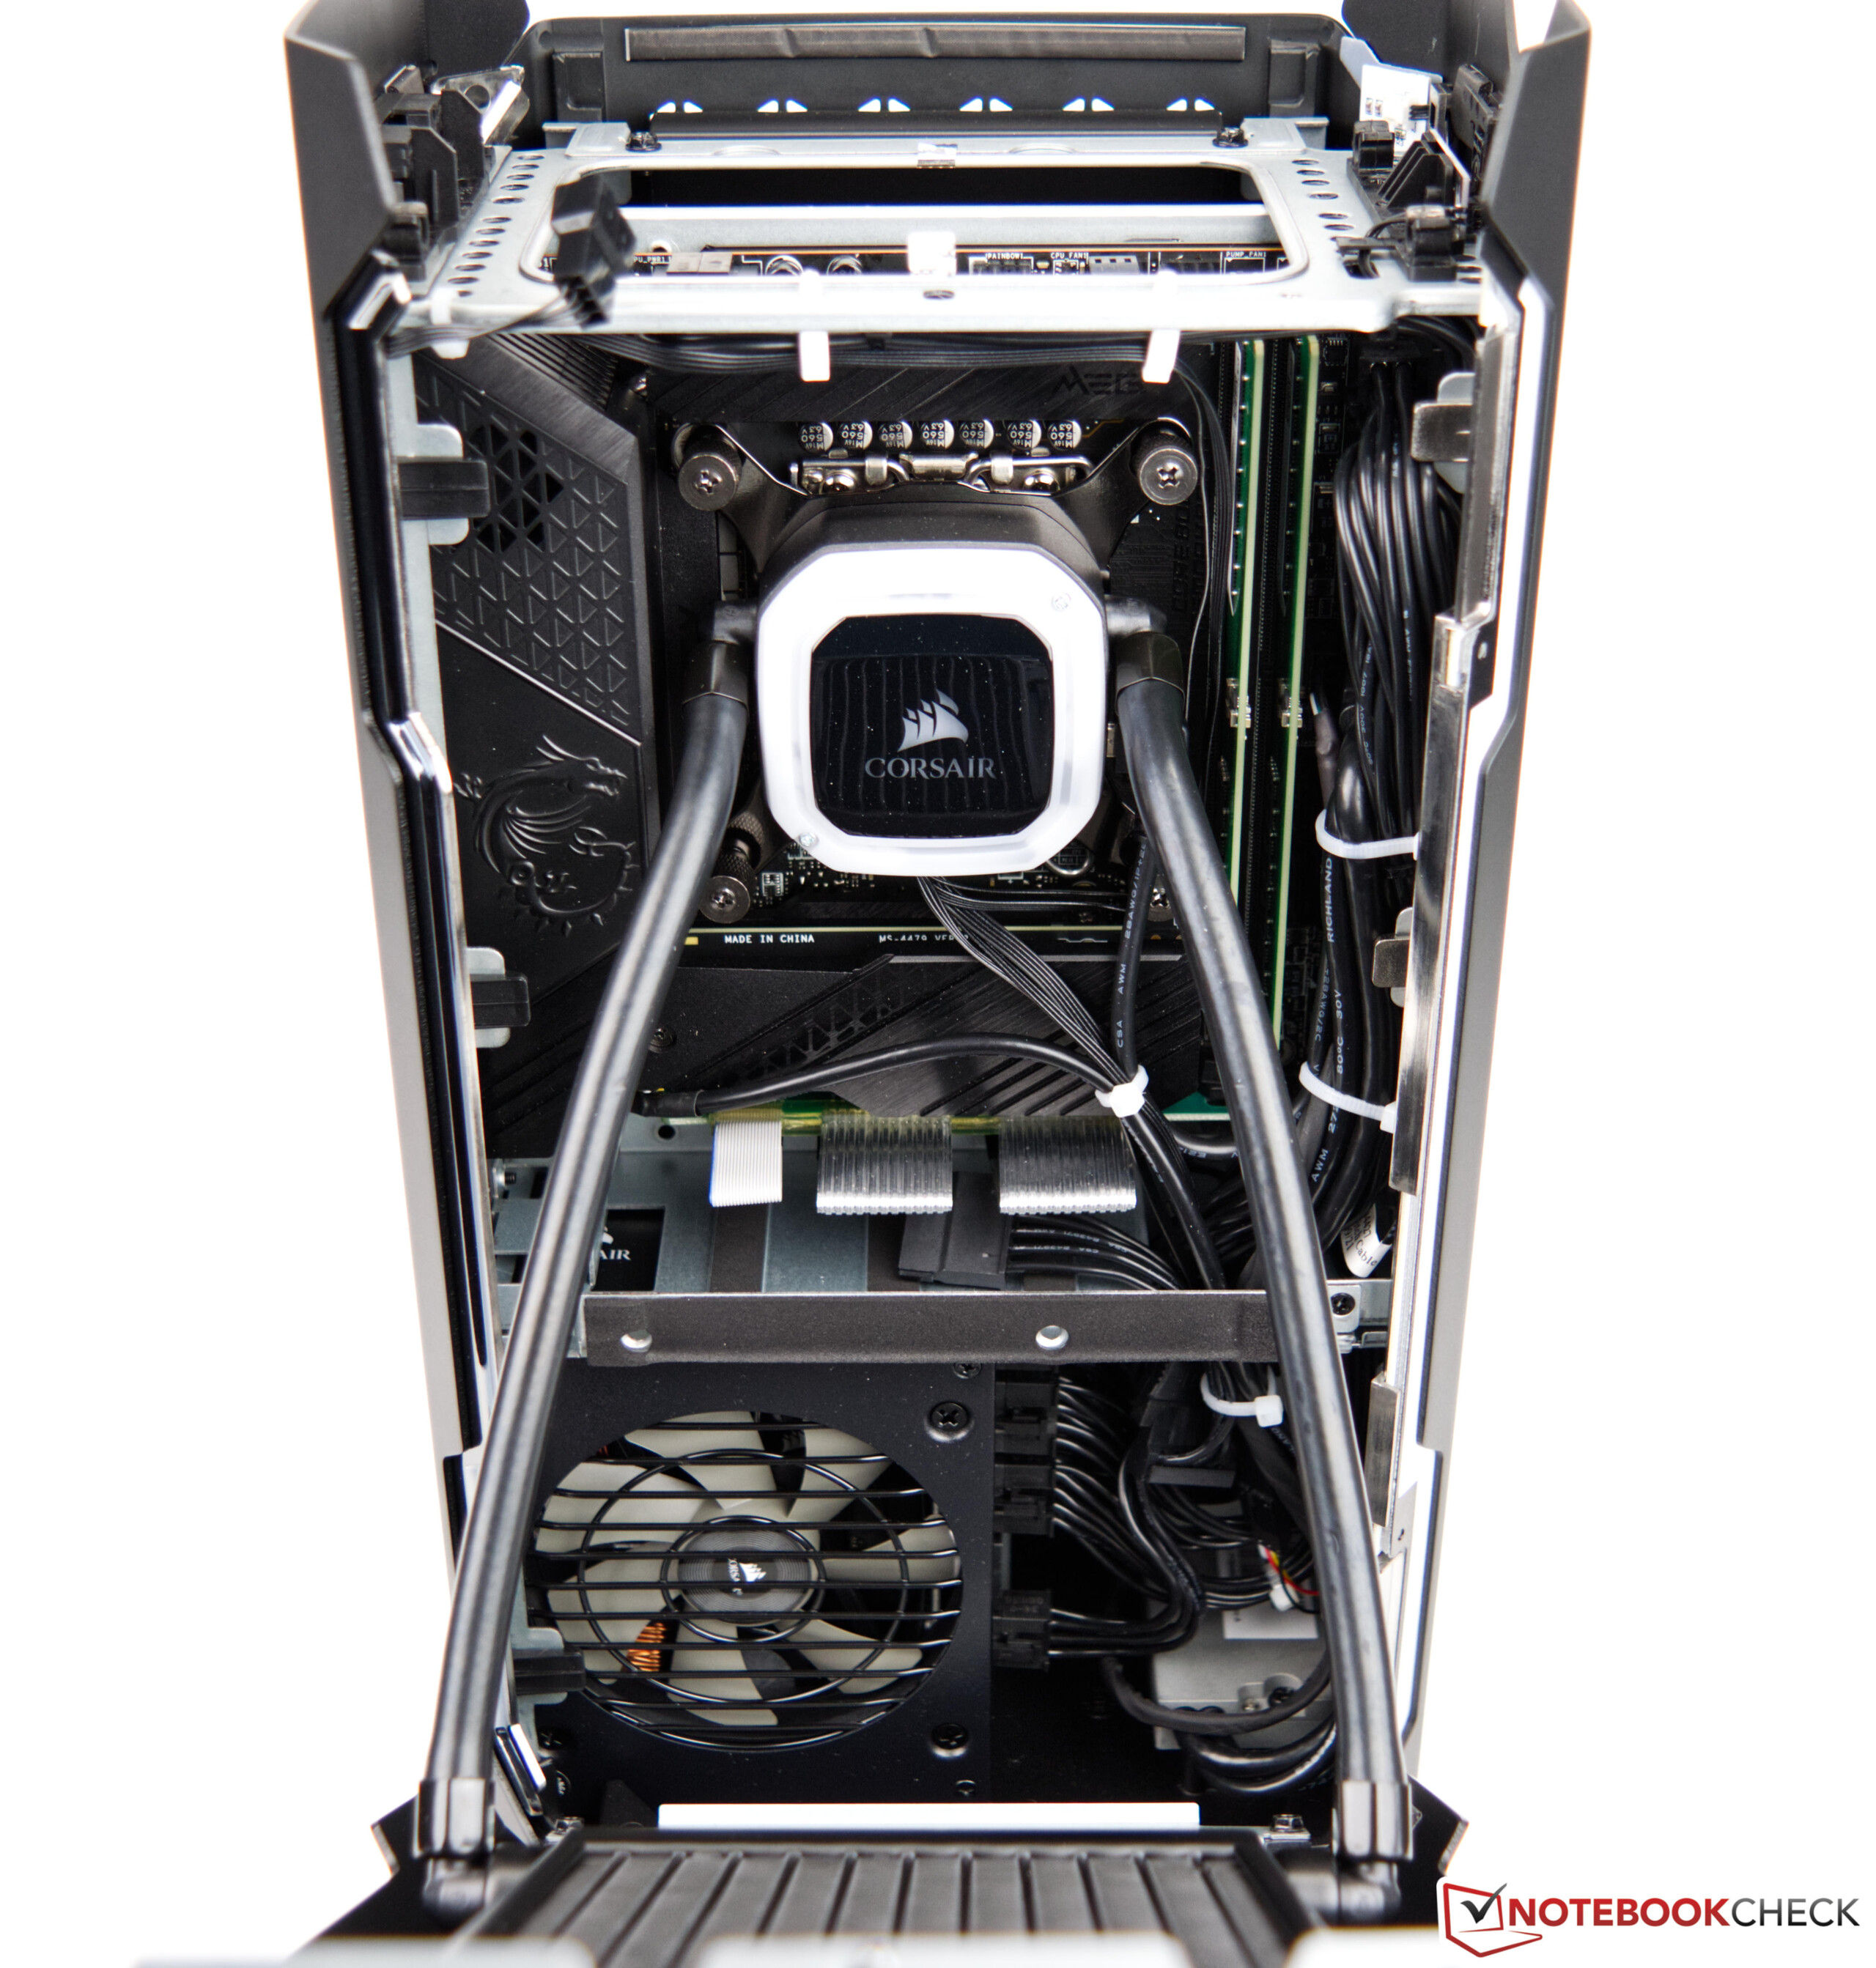
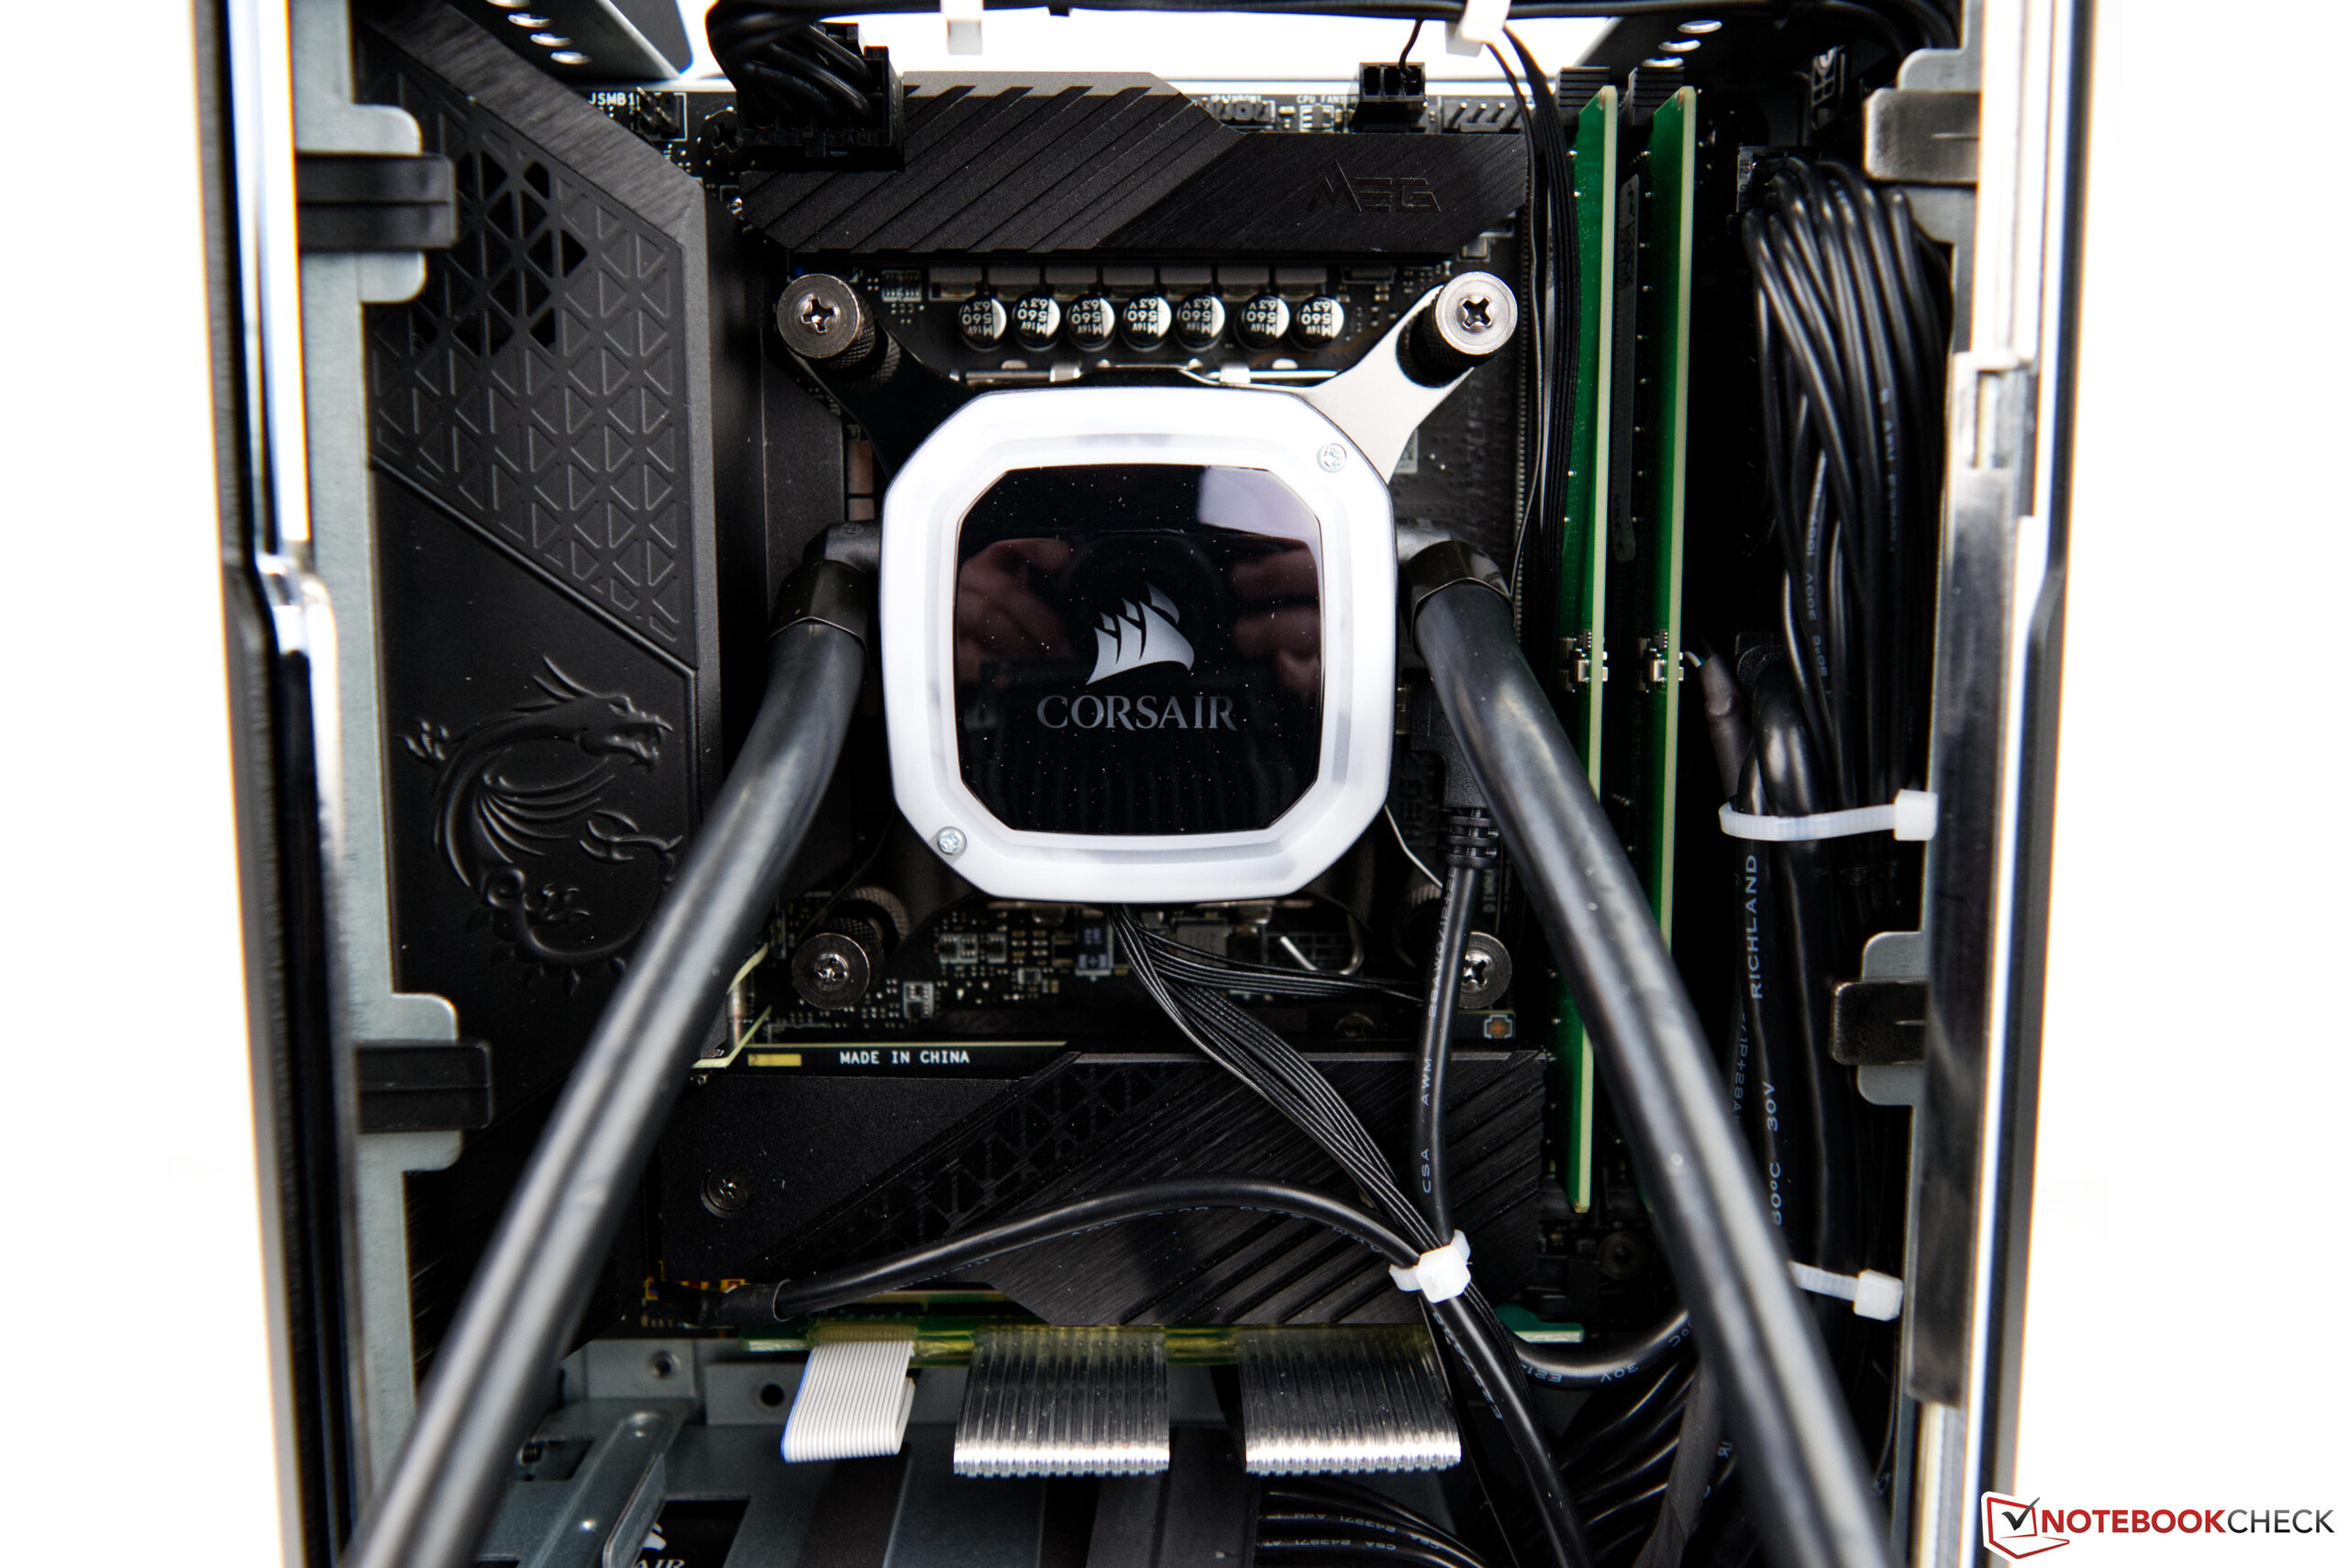
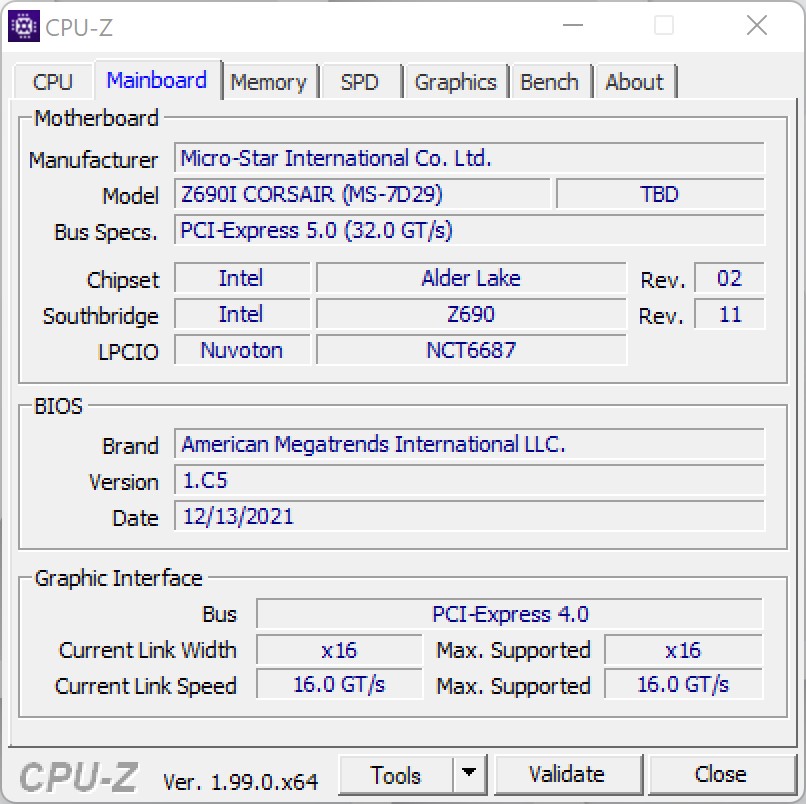
En el One i300, Corsair utiliza una placa base Mini-ITX convencional de MSI. Para ser exactos, Corsair utiliza la MSI MEG Z690I Unify en nuestra unidad de prueba. Con esto, el PC de sobremesa también está bien equipado con conexiones externas. Hay un total de 8 puertos USB en la parte trasera, dos de los cuales también soportan Thunderbolt 4. La parte delantera alberga otros 3 puertos USB. La propia Nvidia GeForce RTX 3080 Ti también añade 3x DisplayPort y una conexión HDMI.
En cuanto a las conexiones de red, el usuario puede elegir entre WLAN en el estándar más actual o Ethernet (2,5G).
Comunicación
El módulo Intel Wi-Fi 6E AX211 integrado en la placa base es el más actual disponible, por lo que también puede utilizar redes Wi-Fi 6G. Utilizando nuestro router de prueba actual, que también soporta el estándar más reciente, el Corsair One i300 ofrece tasas de transferencia rápidas y estables en nuestra prueba WLAN.
Nota: Dado que nuestra unidad de prueba nos fue enviada lamentablemente sin las antenas WLAN originales, realizamos esta prueba utilizando antenas alternativas. Actualmente no podemos decir si las tasas de transferencia son incluso ligeramente mejores cuando se utilizan las antenas originales.
| Networking | |
| iperf3 transmit AX12 | |
| Asus ROG Flow Z13 GZ301ZE | |
| Medio Intel Wi-Fi 6E AX211 (1003 - 1501, n=4) | |
| Huawei MateBook 13s i5 11300H | |
| iperf3 receive AX12 | |
| Medio Intel Wi-Fi 6E AX211 (1178 - 1623, n=4) | |
| Asus ROG Flow Z13 GZ301ZE | |
| Huawei MateBook 13s i5 11300H | |
| iperf3 receive AXE11000 | |
| MSI Stealth GS66 12UGS | |
| Medio Intel Wi-Fi 6E AX211 (582 - 1890, n=276) | |
| Corsair One i300 | |
| Media de la clase Desktop (n=1últimos 2 años) | |
| iperf3 transmit AXE11000 | |
| Corsair One i300 | |
| Medio Intel Wi-Fi 6E AX211 (64 - 1921, n=276) | |
| Media de la clase Desktop (n=1últimos 2 años) | |
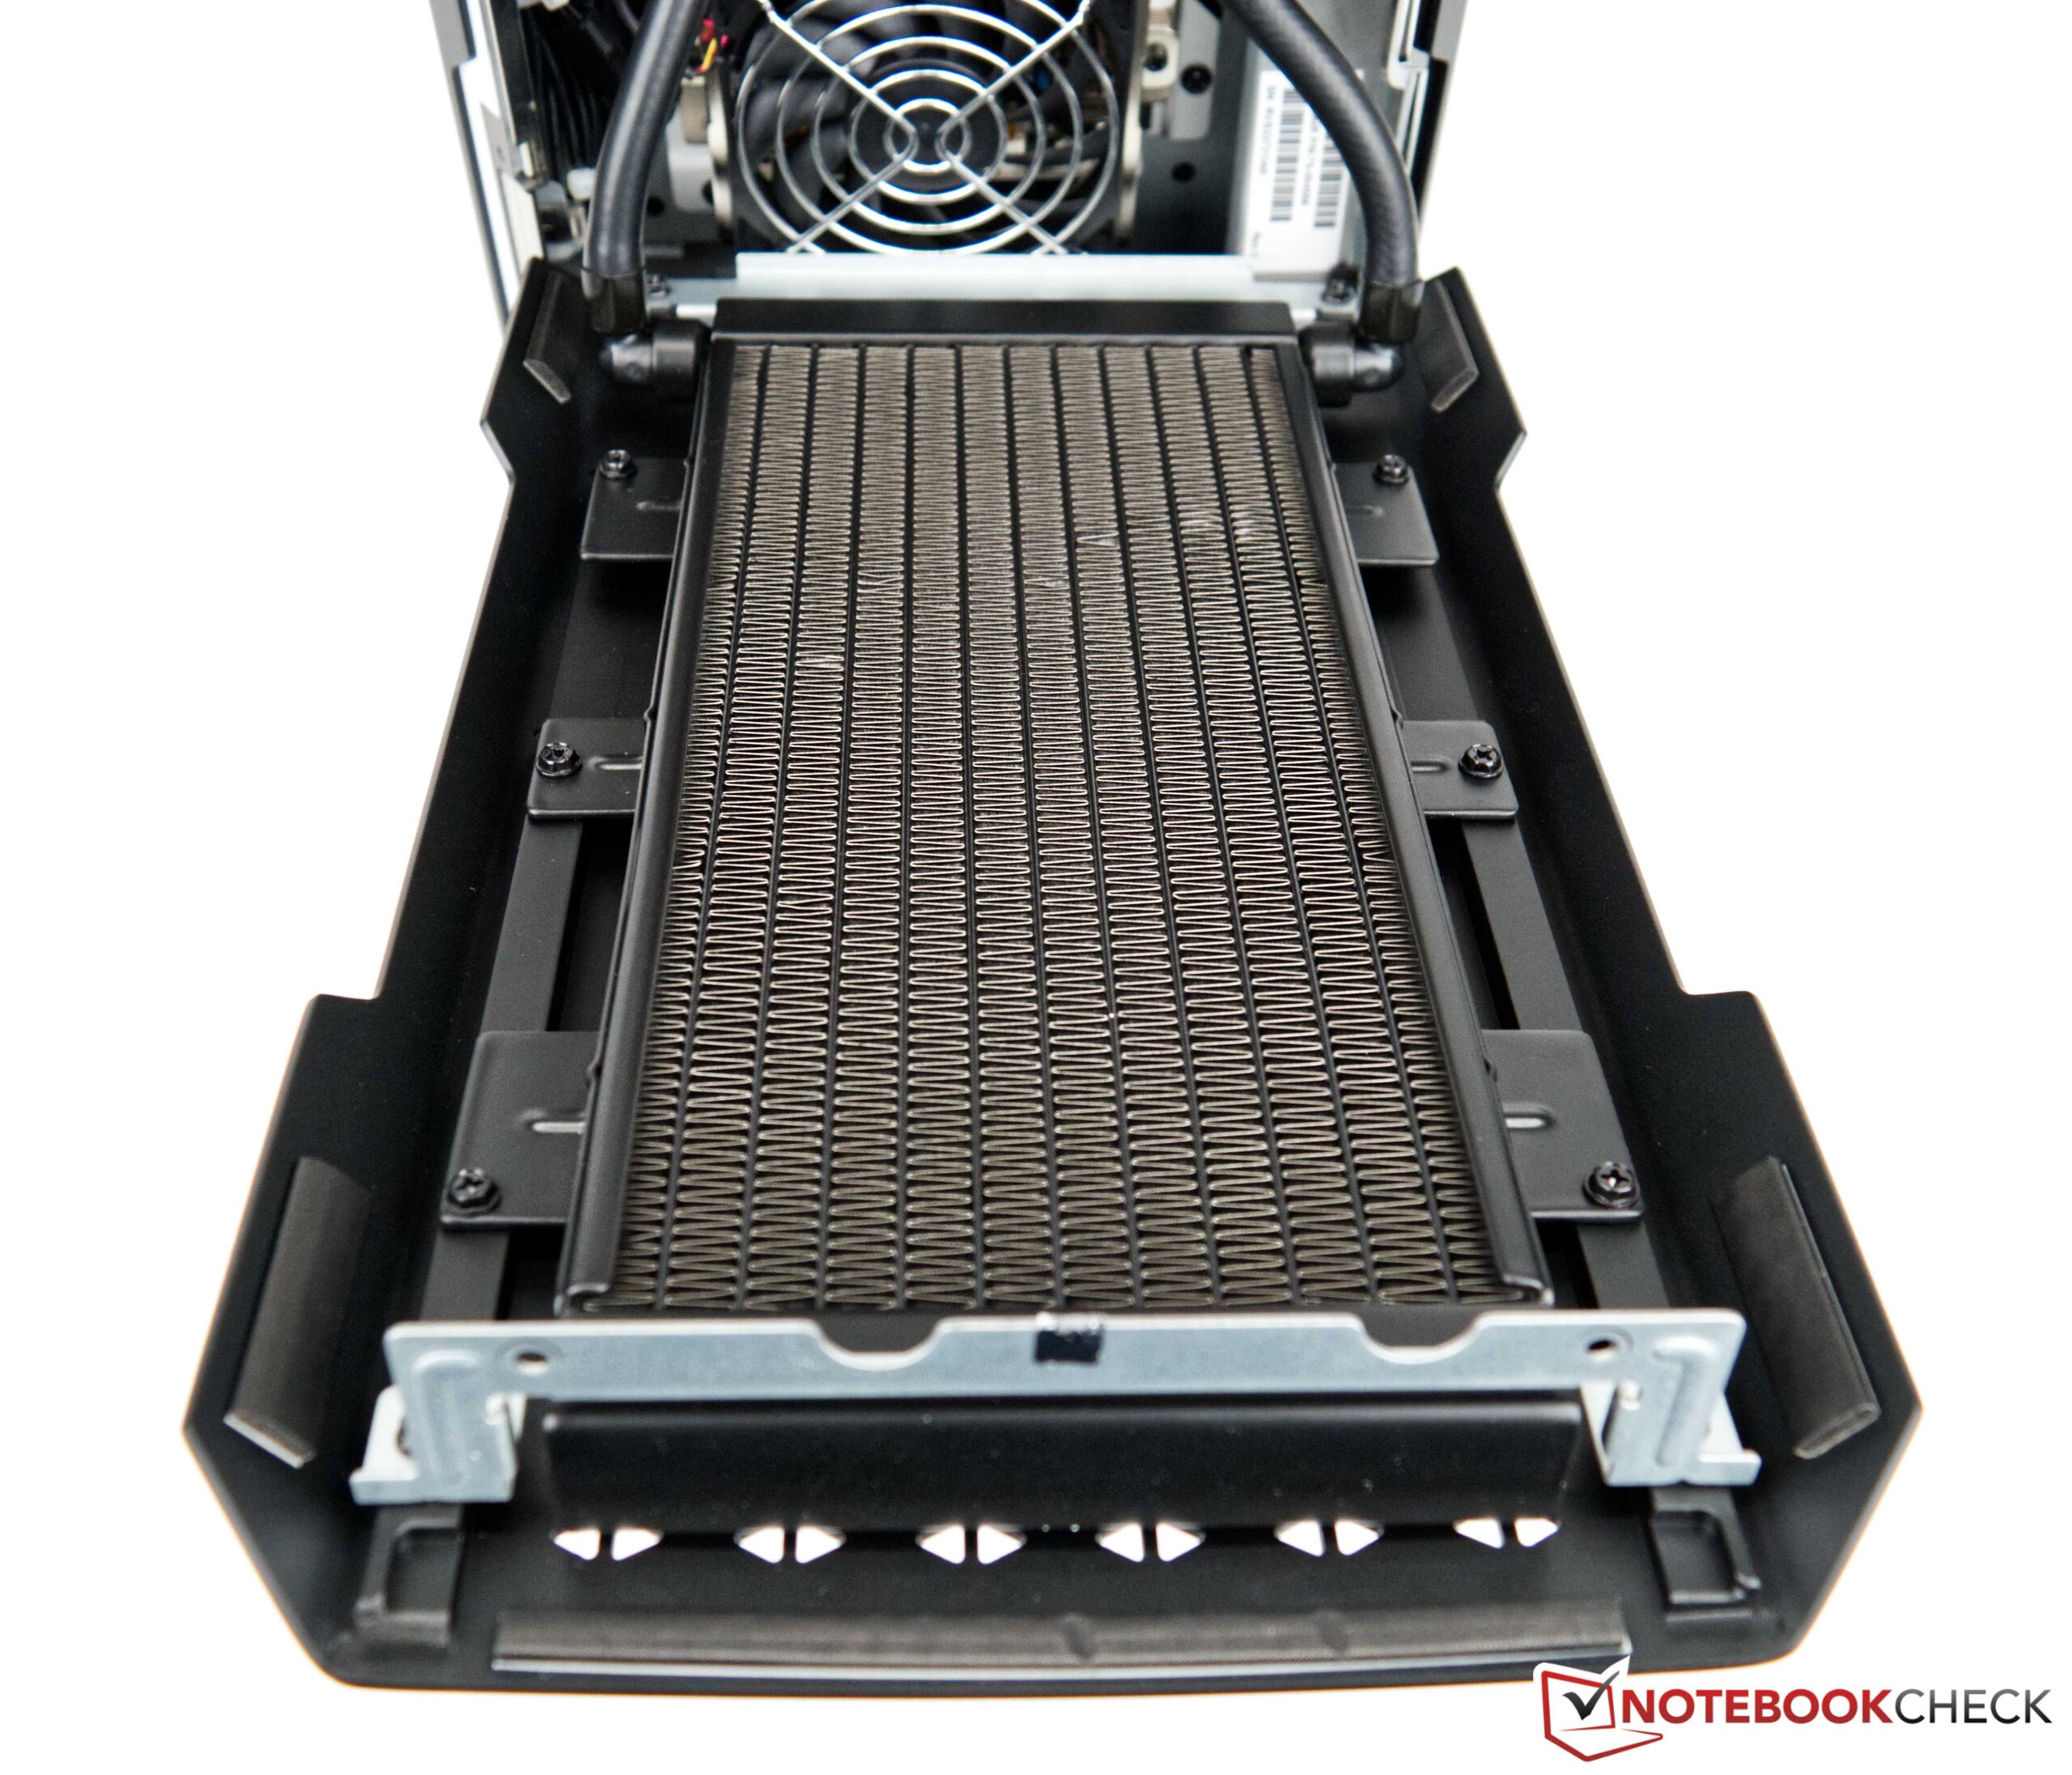
Mantenimiento
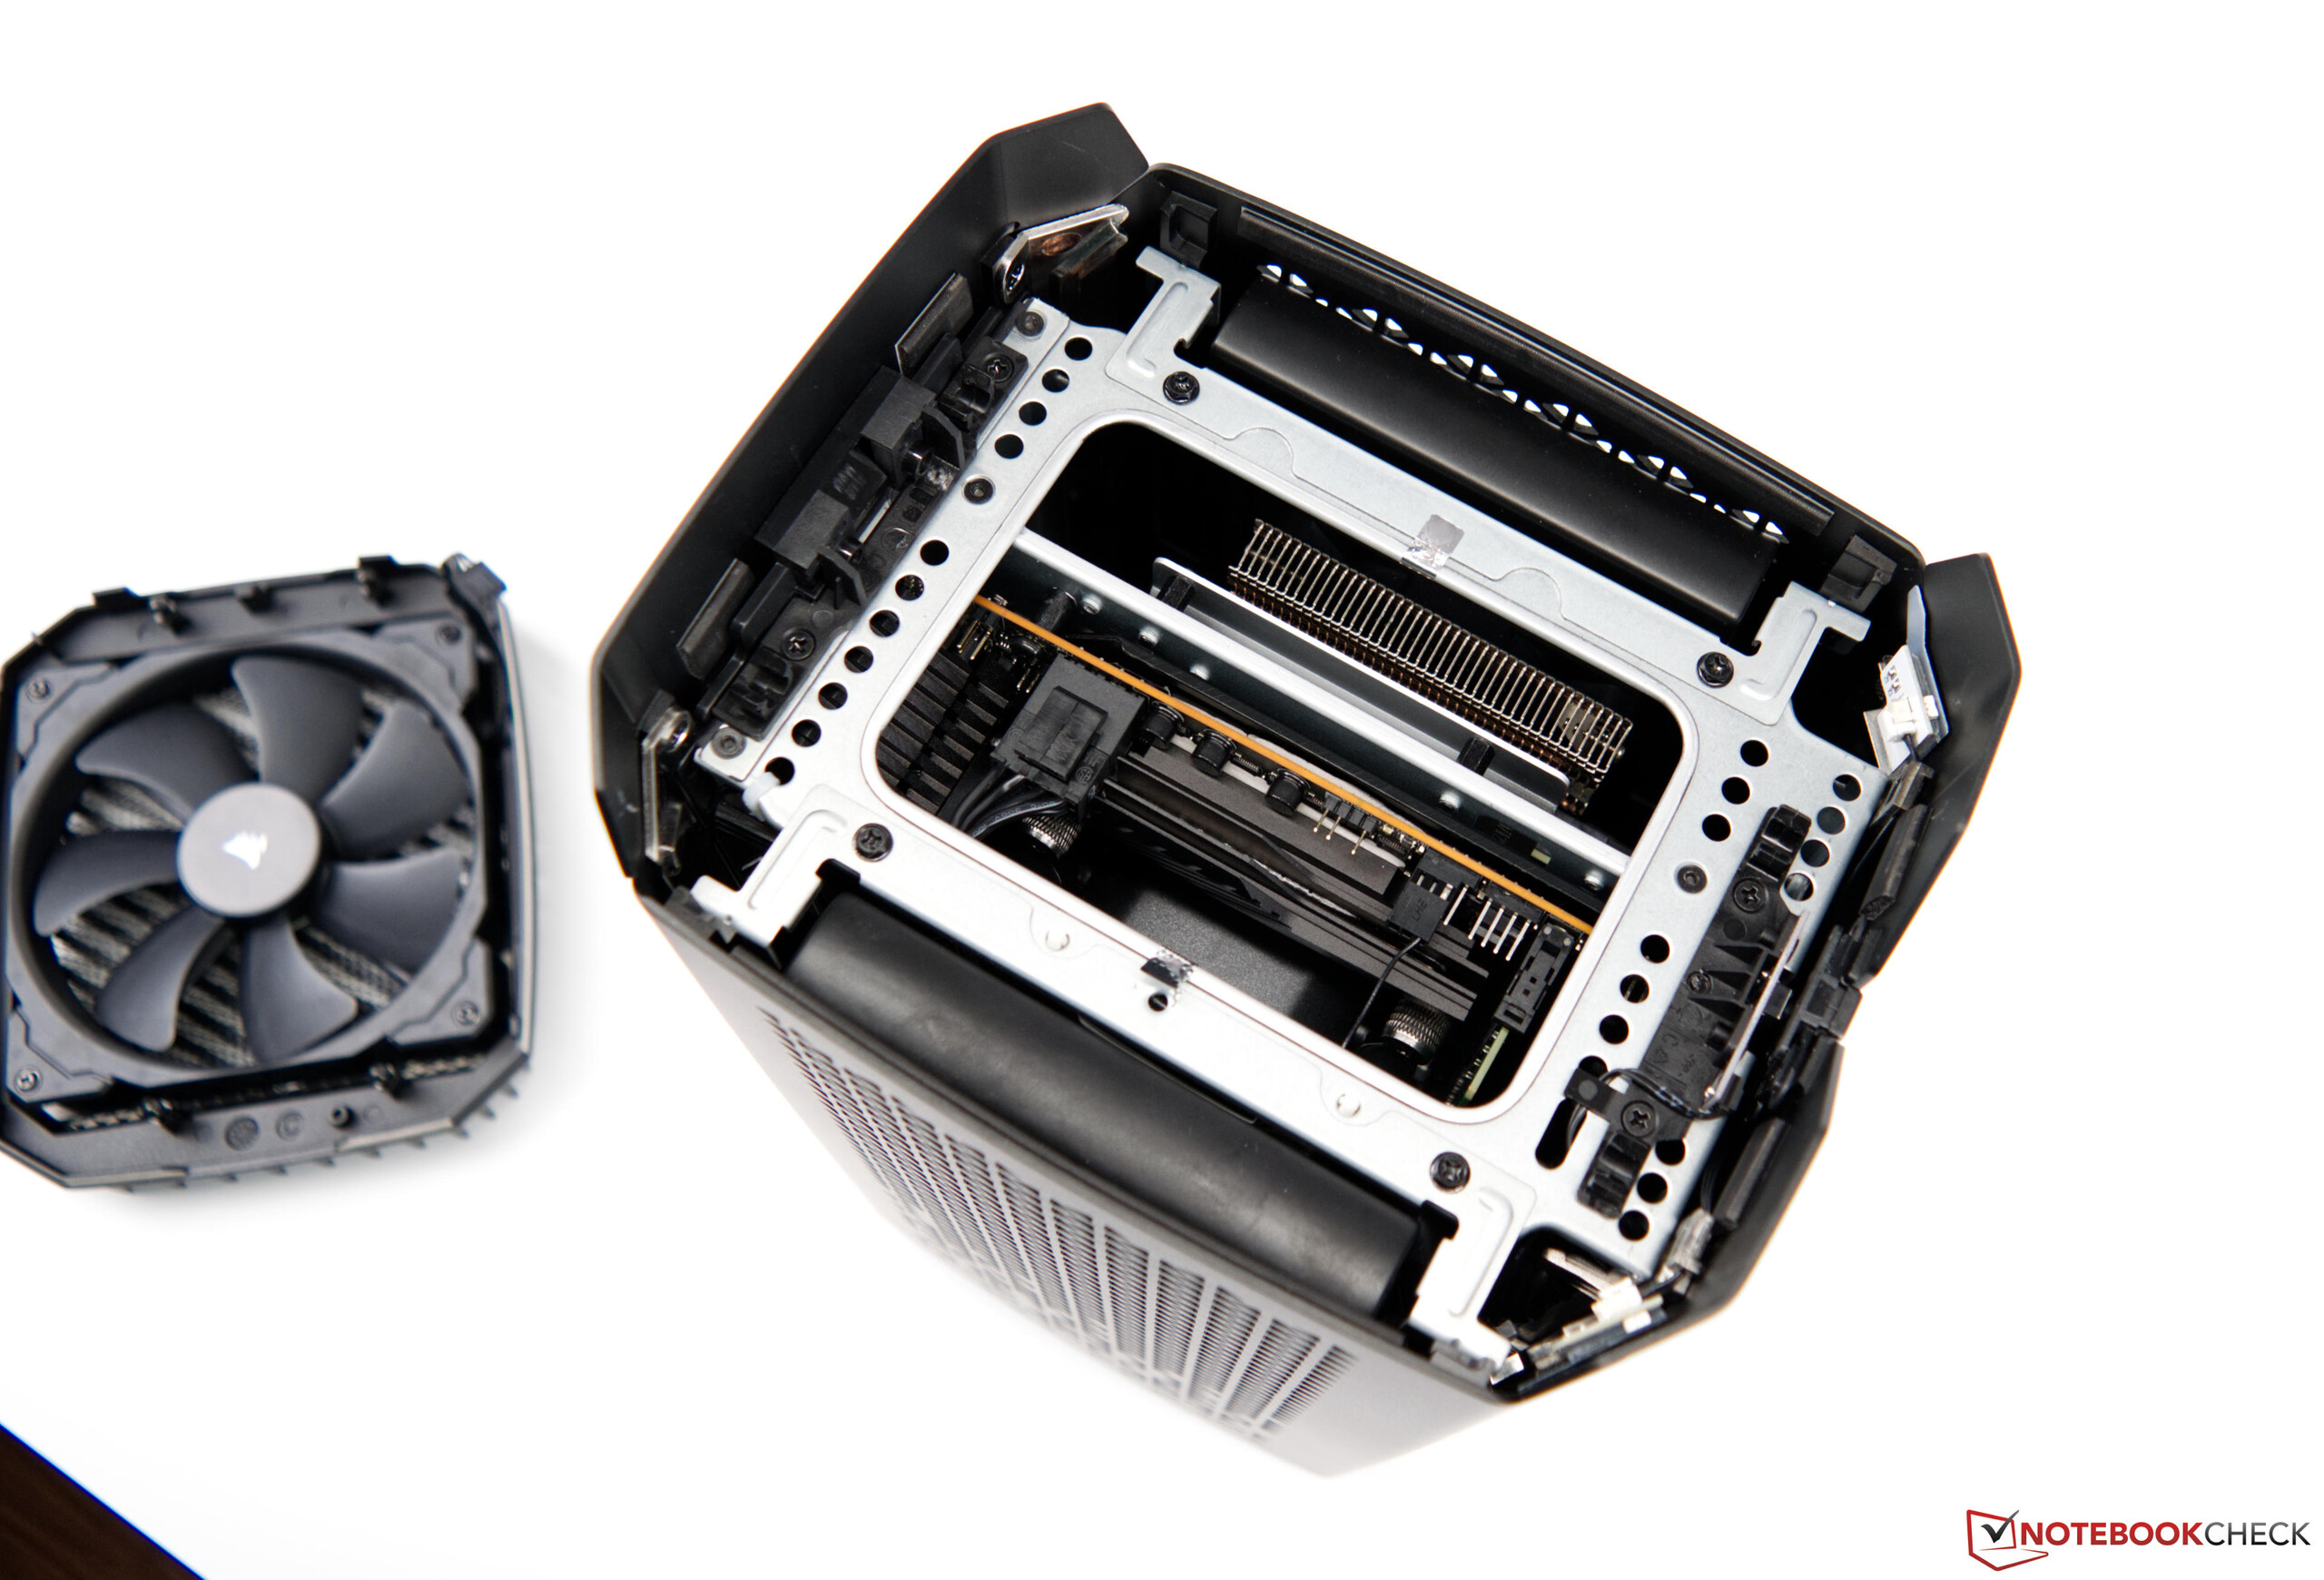
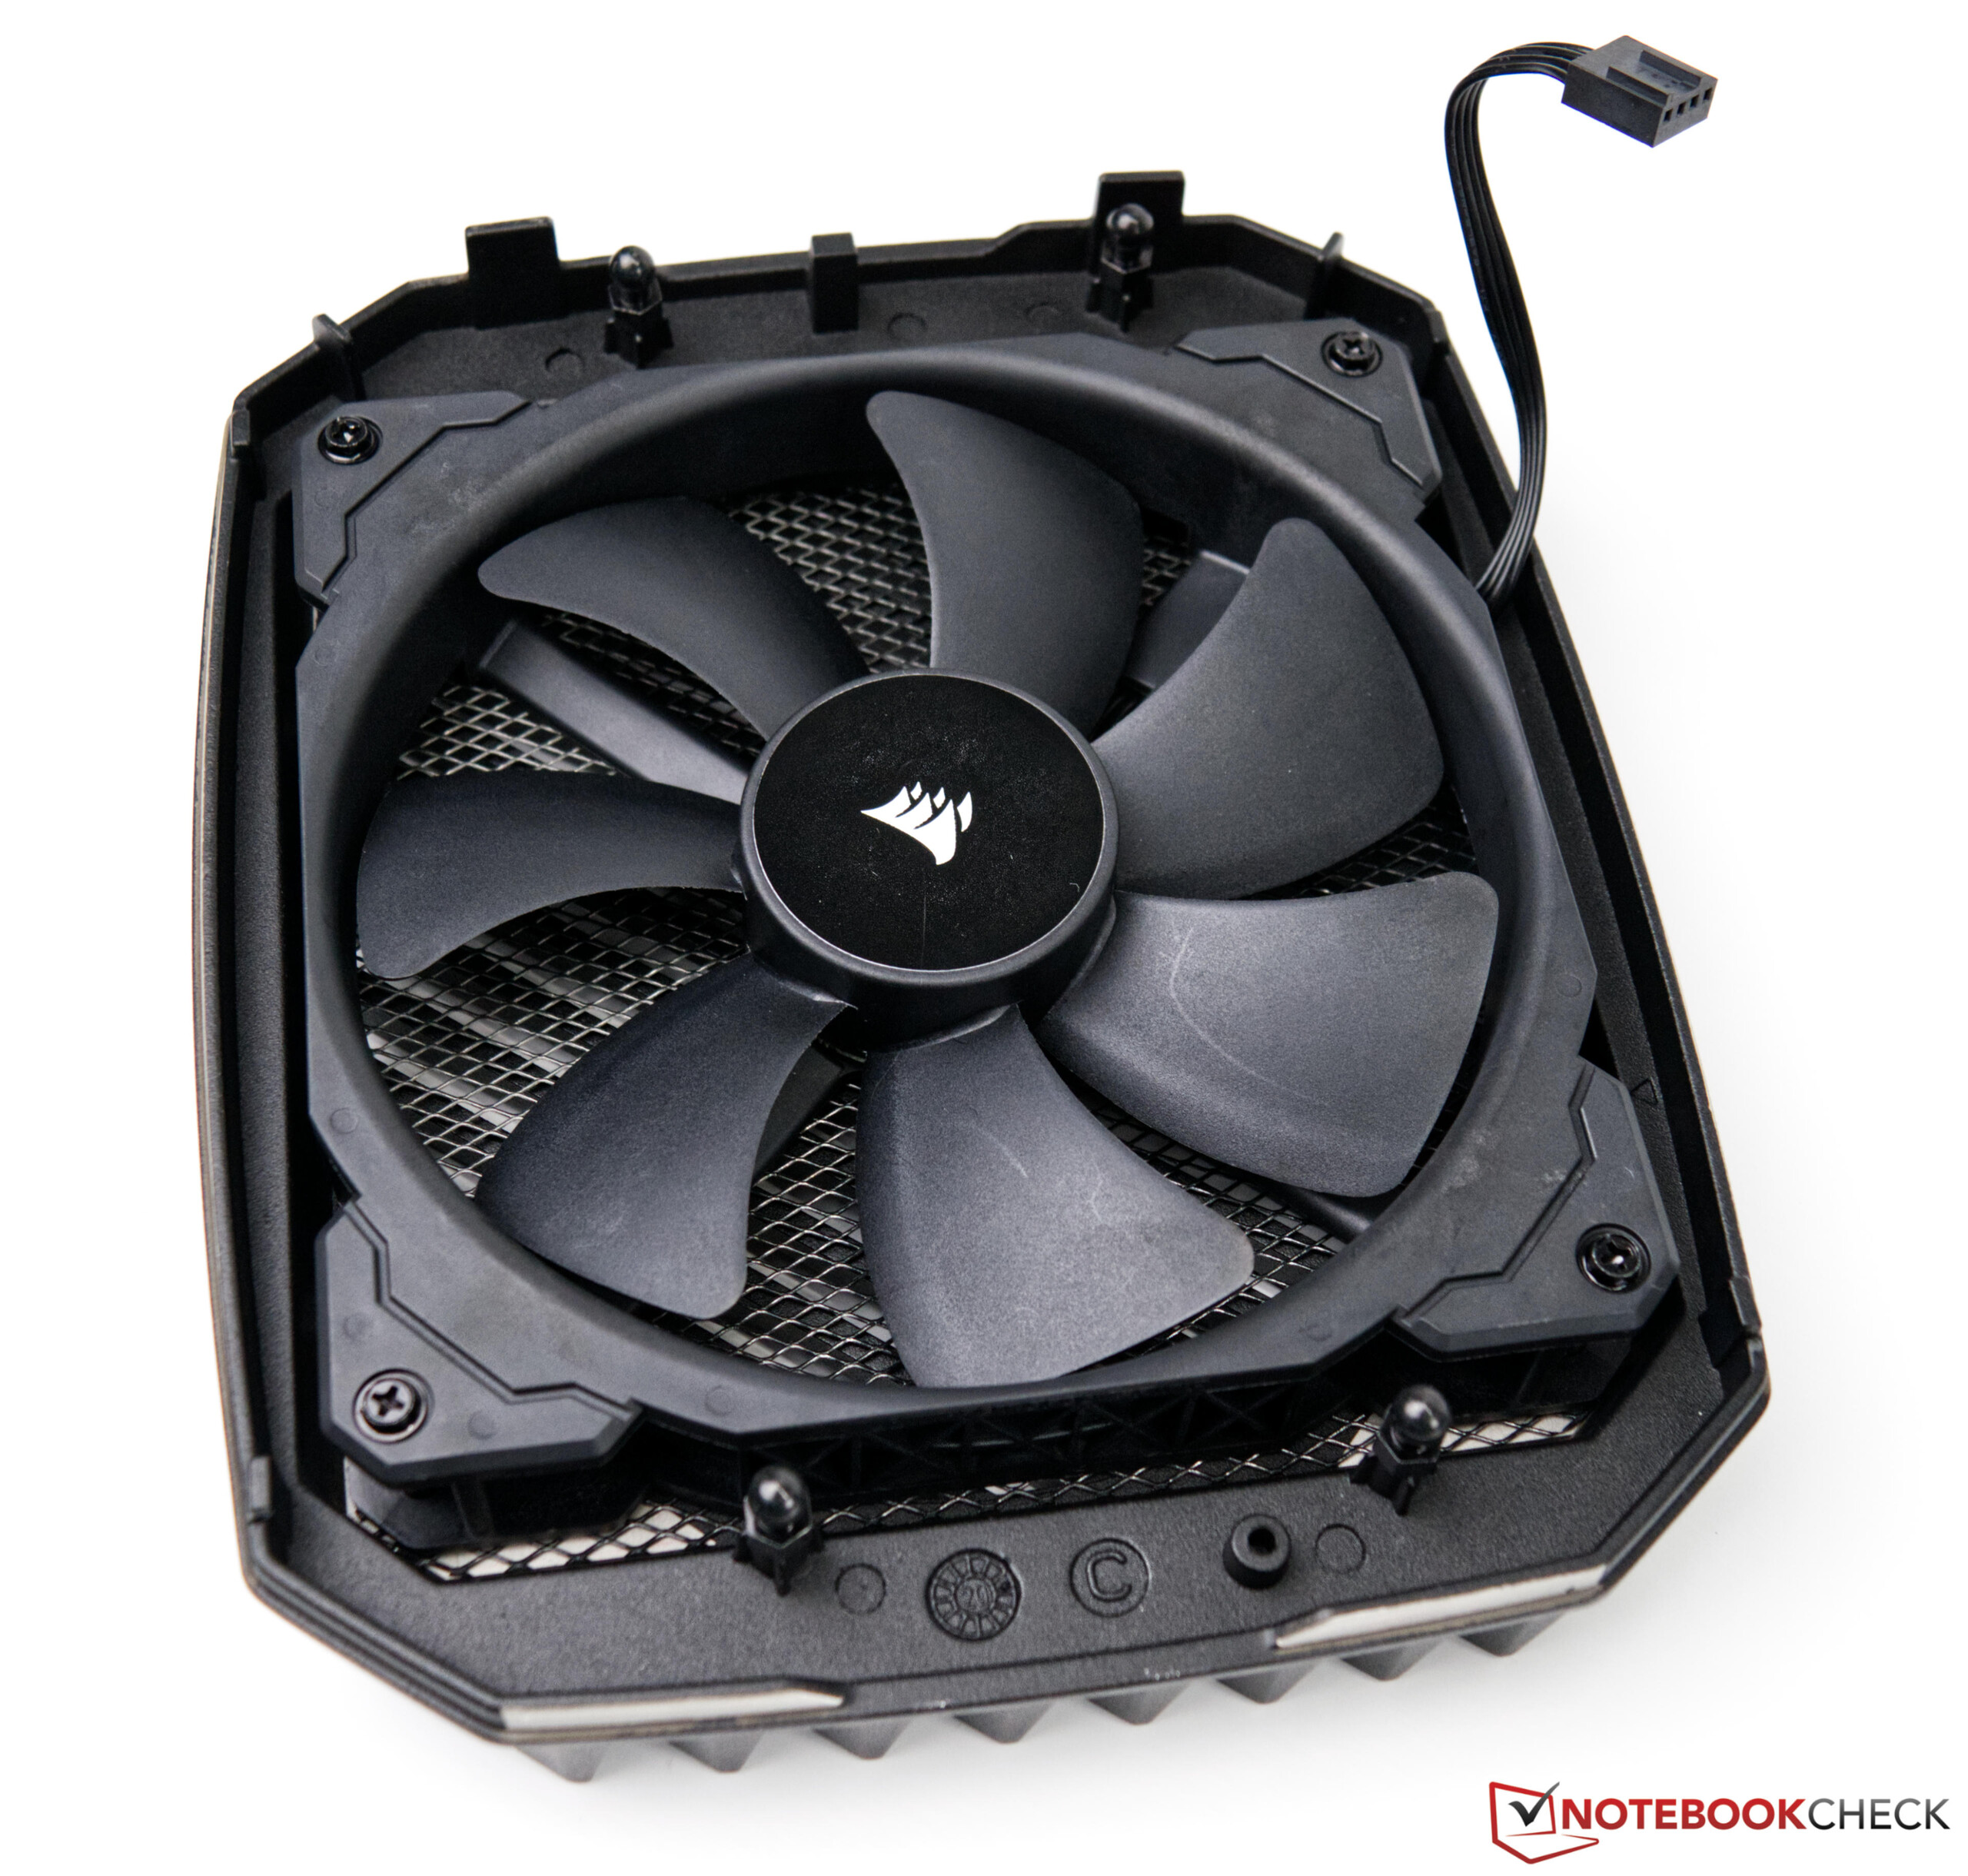
En caso de que el rendimiento del Corsair One i300 sea insuficiente o la solución de almacenamiento resulte demasiado pequeña, también puede actualizar el ordenador. Sin embargo, debe tener cuidado, ya que el espacio interior es muy limitado. El PC de sobremesa se puede abrir fácilmente. La tapa superior de la carcasa con el ventilador de 140 mm se retira rápidamente y las tapas laterales sólo se fijan con dos tornillos. Sin embargo, las mangueras de los AiOs dificultan un rápido reemplazo de los componentes. Aunque puedes acceder a la memoria de trabajo con bastante facilidad, las cosas parecen más difíciles si quieres llegar a la solución de almacenamiento. Por esta razón, nos habría gustado otra opción en las configuraciones disponibles, ya que hay un total de tres ranuras M.2 en la placa base. Sin embargo, el sistema ya está bien equipado con 2 TB de almacenamiento.
Rendimiento
Mirando puramente en términos de los componentes utilizados, el Corsair One i300 ofrece procesadores muy rápidos para los juegos con el Intel Core i9-12900Ky laNvidia GeForce RTX 3080 Ti. Actualmente, la GeForce RTX 3080 Ti es la segunda tarjeta gráfica más rápida de Nvidia, quedándose a pocos puntos porcentuales de la GeForce RTX 3090. Aunque también podría haber encajado en la caja si solo se tiene en cuenta el tamaño físico, la refrigeración de los chips VRAM probablemente llevó a Corsair a utilizar "solo" una GeForce RTX 3080 Ti. El modelo ligeramente más débil del Corsair One i300 está equipado con una GeForce RTX 3080, que podría ser la opción más razonable debido a su menor precio de compra.
Procesador
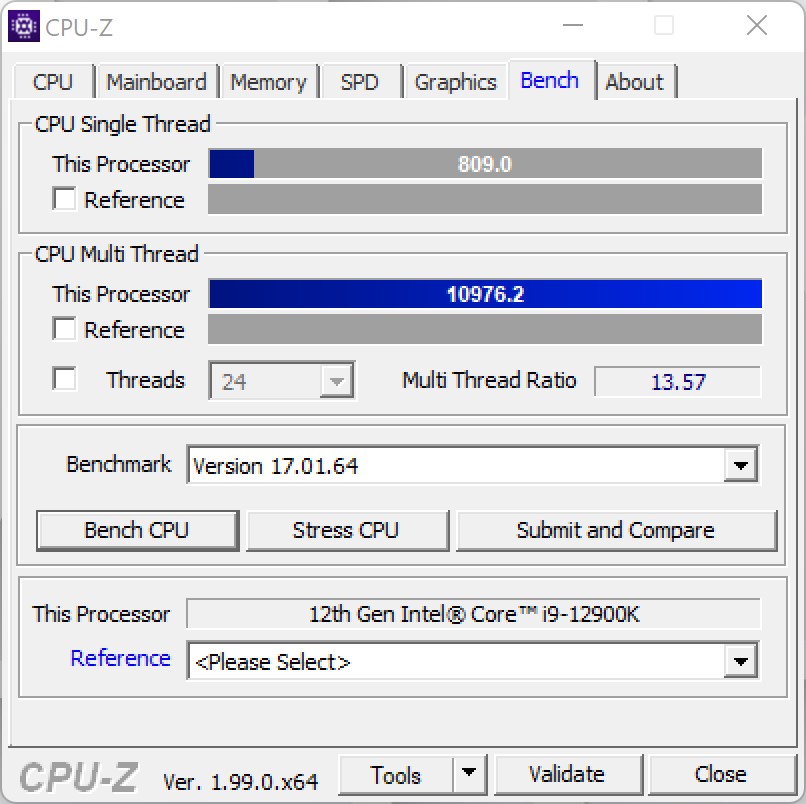
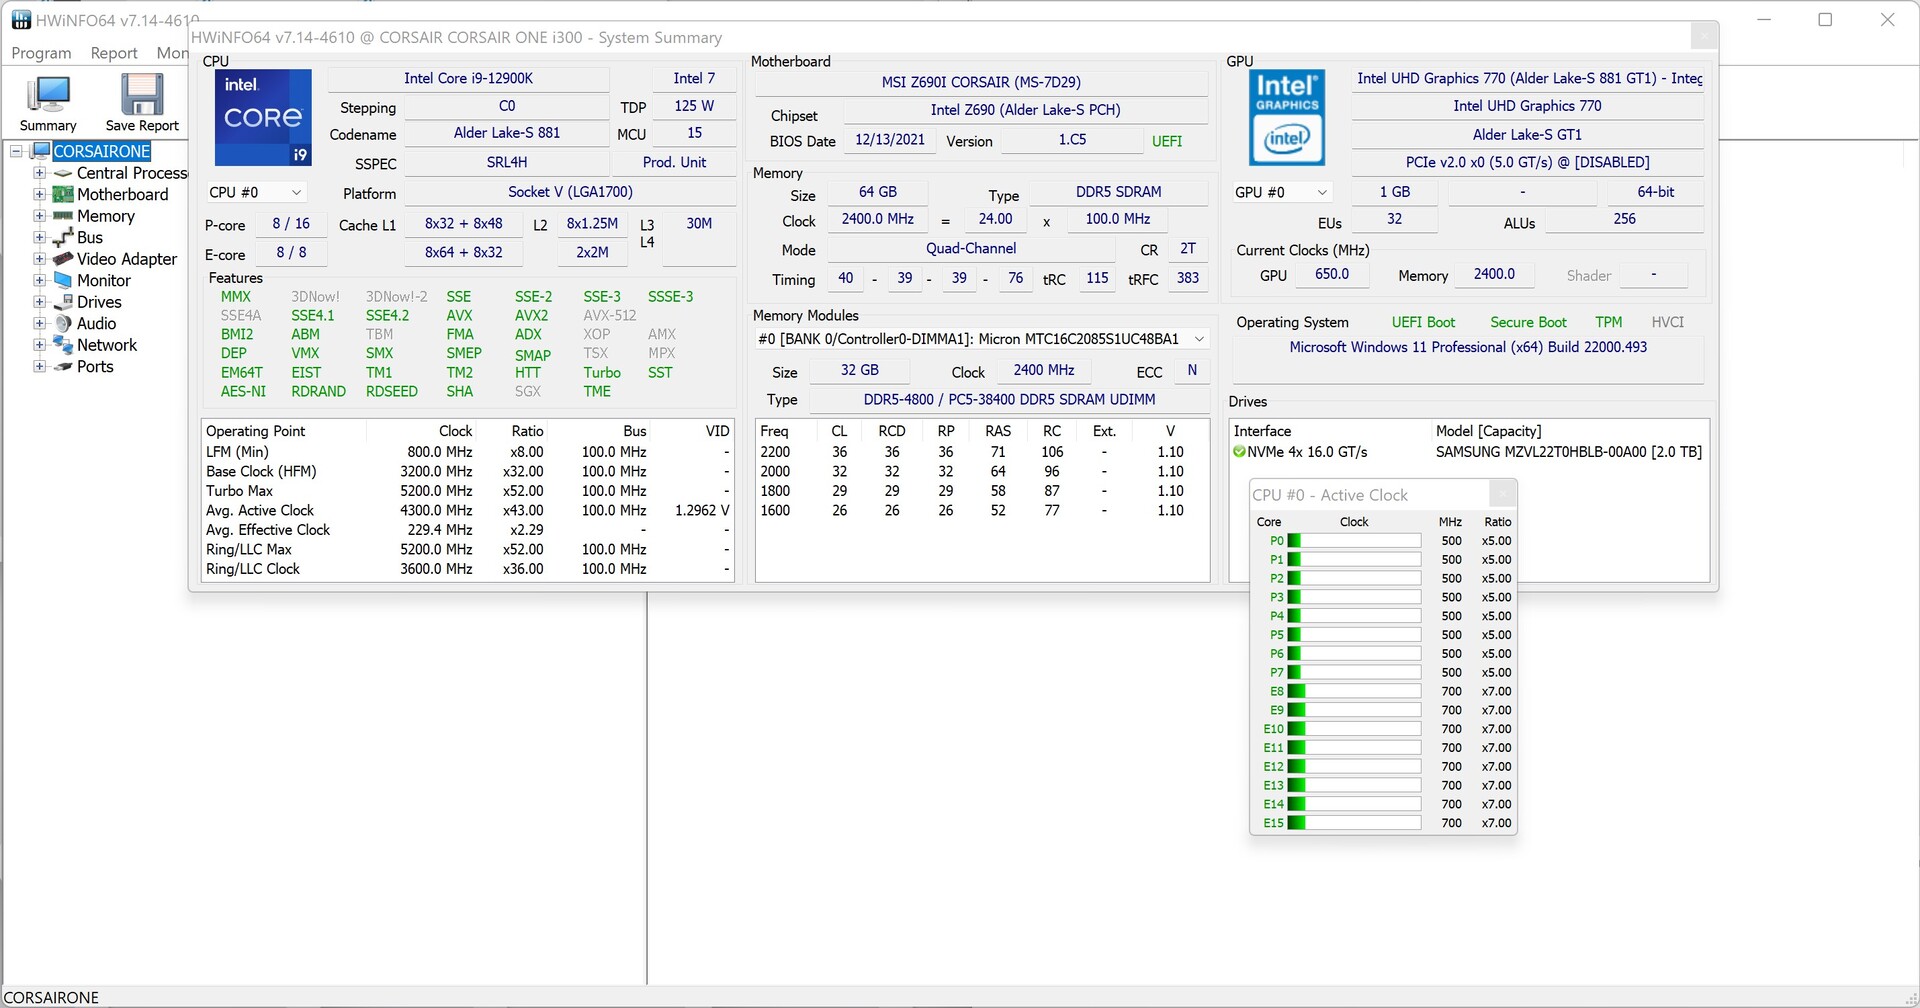
El Corsair One i300 está equipado con el procesador más rápido de Intel disponible actualmente para juegos. Para ser exactos, Corsair utiliza elIntel Core i9-12900Kbasado en una placa Z690 de MSI. Ya pudimos ver de antemano el rendimiento que puede ofrecer el nuevo buque insignia de Intel. Para más detalles sobre el Intel Core i9-12900Knos remitimos a esta página. Sin embargo, hay una pequeña limitación en el Corsair One i300 en cuanto al consumo máximo de energía. PL1 y también PL2 están limitados a los valores de 165 y 175 vatios respectivamente, lo que significa que el procesador está ligeramente estrangulado bajo carga. Sin esta limitación, el Intel Core i9-12900Kdebería ser capaz de consumir hasta 241 vatios. Por otro lado, esta opción se puede modificar en la BIOS. Pero en ese caso también se produciría un mayor volumen de ruido y mayores temperaturas.
En el benchmark que realizamos, el Intel Core i9-12900K lo hace muy bien, aunque no pueda utilizar todo su rendimiento bajo carga. El aumento de rendimiento comparado con el Corsair One i160 es inmenso. En la clasificación general, el sistema actual ofrece un 48% más de rendimiento.
Para más comparaciones y benchmarks, te remitimos a nuestra Tabla de comparación de CPUs.
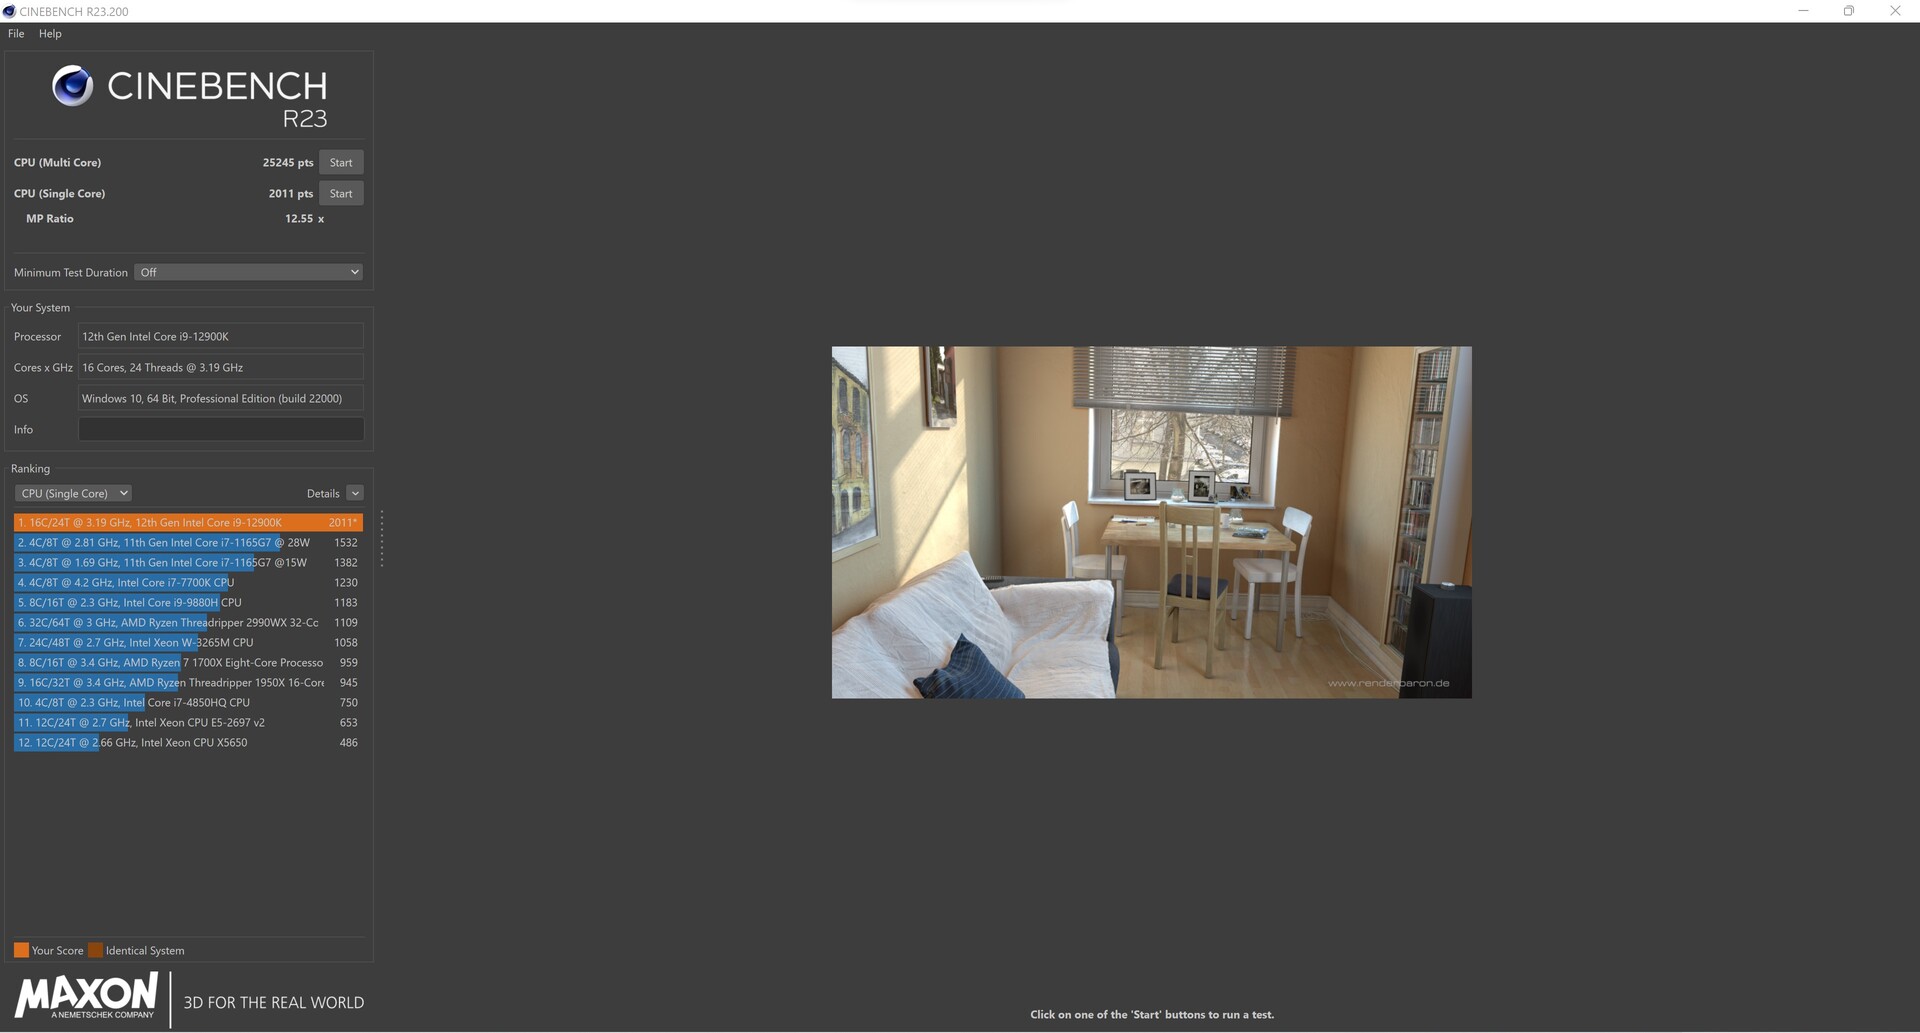
Cinebench R23: Multi Core | Single Core
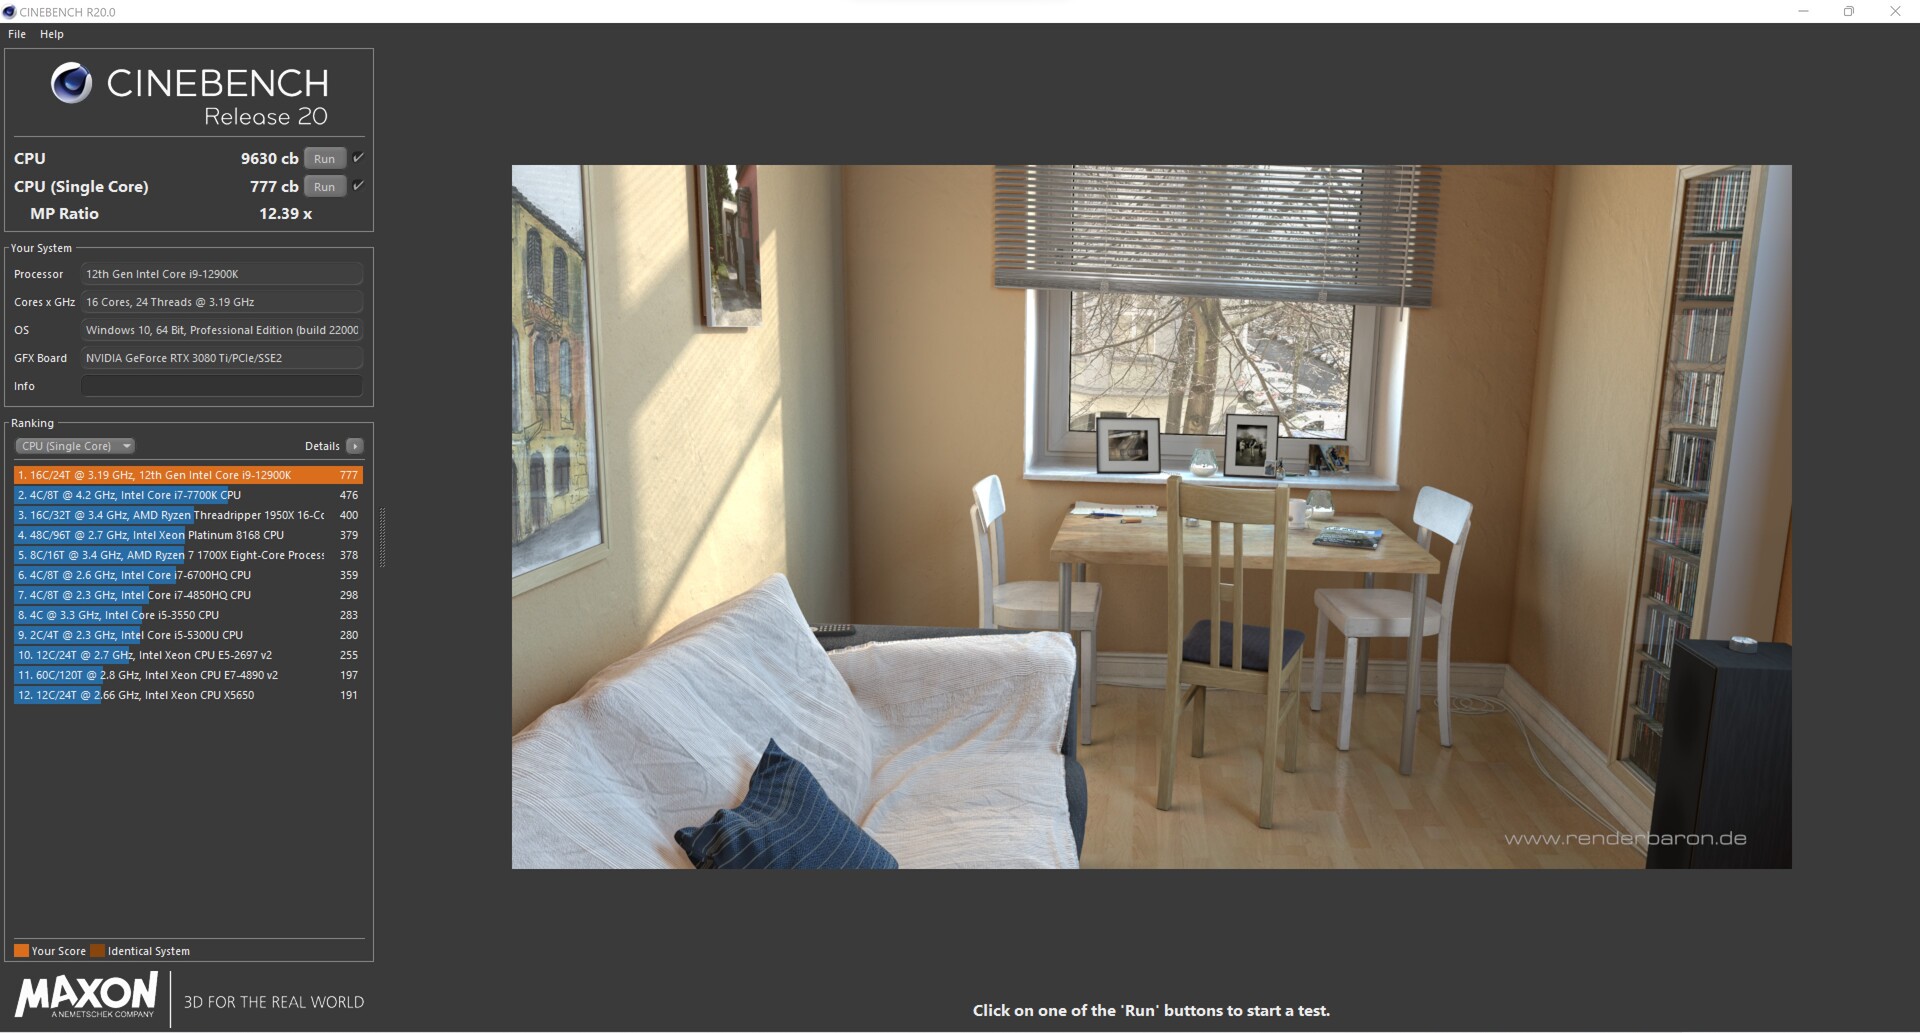
Cinebench R20: CPU (Multi Core) | CPU (Single Core)
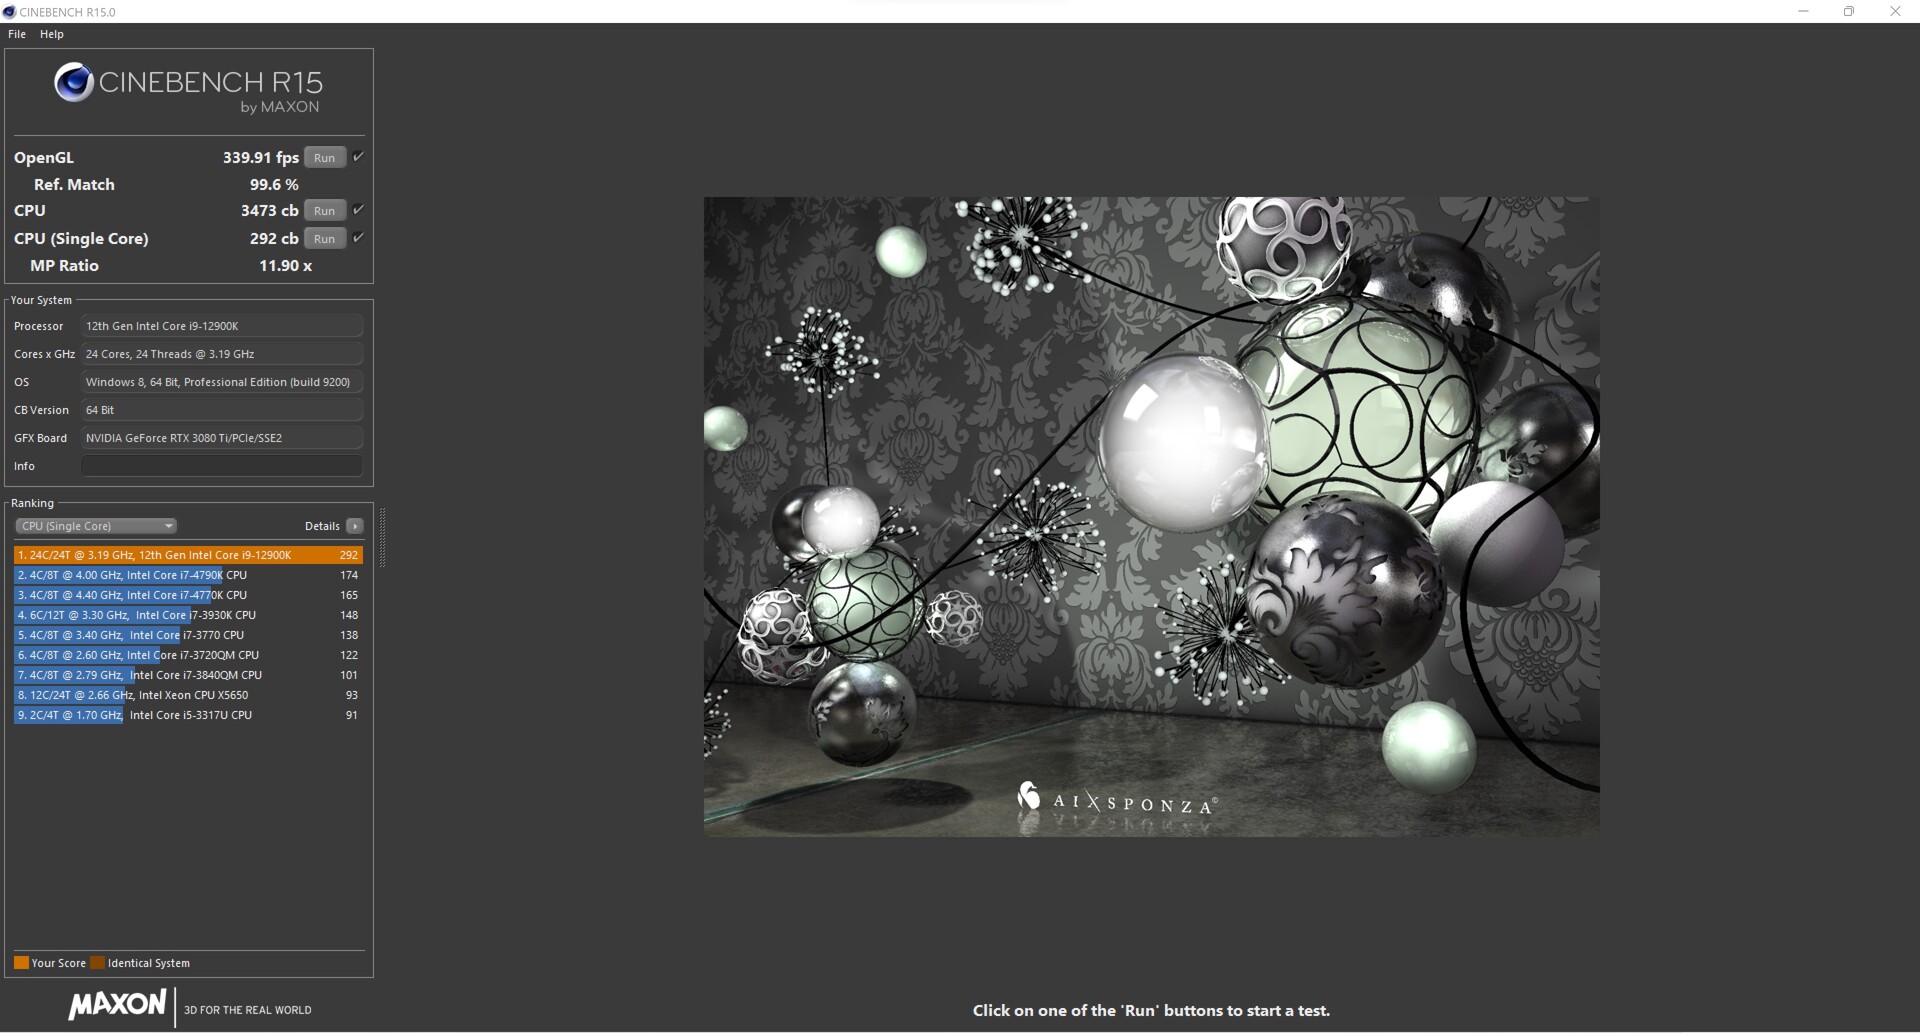
Cinebench R15: CPU Multi 64Bit | CPU Single 64Bit
Blender: v2.79 BMW27 CPU
7-Zip 18.03: 7z b 4 | 7z b 4 -mmt1
Geekbench 5.5: Multi-Core | Single-Core
HWBOT x265 Benchmark v2.2: 4k Preset
LibreOffice : 20 Documents To PDF
R Benchmark 2.5: Overall mean
| CPU Performance rating | |
| Media de la clase Desktop | |
| Intel Core i9-12900K | |
| Medio Intel Core i9-12900K | |
| AMD Ryzen 9 5950X | |
| Intel Core i9-12900K | |
| AMD Ryzen 9 5900X | |
| Intel Core i9-11900K | |
| Intel Core i9-10900K | |
| Intel Core i9-9900K -6! | |
| Cinebench R23 / Multi Core | |
| Media de la clase Desktop (16119 - 44253, n=16, últimos 2 años) | |
| AMD Ryzen 9 5950X | |
| Intel Core i9-12900K | |
| Medio Intel Core i9-12900K (25245 - 27005, n=2) | |
| Intel Core i9-12900K | |
| AMD Ryzen 9 5900X | |
| Intel Core i9-10900K | |
| Intel Core i9-11900K | |
| Cinebench R23 / Single Core | |
| Media de la clase Desktop (1722 - 2439, n=16, últimos 2 años) | |
| Intel Core i9-12900K | |
| Medio Intel Core i9-12900K (1998 - 2011, n=2) | |
| Intel Core i9-12900K | |
| Intel Core i9-11900K | |
| AMD Ryzen 9 5950X | |
| AMD Ryzen 9 5900X | |
| Intel Core i9-10900K | |
| Cinebench R20 / CPU (Multi Core) | |
| Media de la clase Desktop (5710 - 17190, n=15, últimos 2 años) | |
| AMD Ryzen 9 5950X | |
| Intel Core i9-12900K | |
| Medio Intel Core i9-12900K (9630 - 10240, n=2) | |
| Intel Core i9-12900K | |
| AMD Ryzen 9 5900X | |
| Intel Core i9-10900K | |
| Intel Core i9-11900K | |
| Intel Core i9-9900K | |
| Cinebench R20 / CPU (Single Core) | |
| Media de la clase Desktop (674 - 922, n=15, últimos 2 años) | |
| Intel Core i9-12900K | |
| Medio Intel Core i9-12900K (766 - 777, n=2) | |
| Intel Core i9-12900K | |
| Intel Core i9-11900K | |
| AMD Ryzen 9 5950X | |
| AMD Ryzen 9 5900X | |
| Intel Core i9-10900K | |
| Intel Core i9-9900K | |
| Cinebench R15 / CPU Multi 64Bit | |
| Media de la clase Desktop (2652 - 6656, n=16, últimos 2 años) | |
| AMD Ryzen 9 5950X | |
| Intel Core i9-12900K | |
| Medio Intel Core i9-12900K (3473 - 4102, n=3) | |
| AMD Ryzen 9 5900X | |
| Intel Core i9-12900K | |
| Intel Core i9-10900K | |
| Intel Core i9-11900K | |
| Intel Core i9-9900K | |
| Cinebench R15 / CPU Single 64Bit | |
| Media de la clase Desktop (246 - 356, n=16, últimos 2 años) | |
| Intel Core i9-12900K | |
| Medio Intel Core i9-12900K (286 - 292, n=3) | |
| Intel Core i9-12900K | |
| AMD Ryzen 9 5950X | |
| AMD Ryzen 9 5900X | |
| Intel Core i9-11900K | |
| Intel Core i9-10900K | |
| Intel Core i9-9900K | |
| Blender / v2.79 BMW27 CPU | |
| Intel Core i9-9900K | |
| Intel Core i9-11900K | |
| Intel Core i9-10900K | |
| AMD Ryzen 9 5900X | |
| Intel Core i9-12900K | |
| Medio Intel Core i9-12900K (121.1 - 128.3, n=2) | |
| Intel Core i9-12900K | |
| Media de la clase Desktop (75 - 218, n=15, últimos 2 años) | |
| AMD Ryzen 9 5950X | |
| 7-Zip 18.03 / 7z b 4 | |
| AMD Ryzen 9 5950X | |
| Media de la clase Desktop (91898 - 163125, n=17, últimos 2 años) | |
| Intel Core i9-12900K | |
| Medio Intel Core i9-12900K (96960 - 97671, n=2) | |
| Intel Core i9-12900K | |
| AMD Ryzen 9 5900X | |
| Intel Core i9-10900K | |
| Intel Core i9-11900K | |
| Intel Core i9-9900K | |
| 7-Zip 18.03 / 7z b 4 -mmt1 | |
| Media de la clase Desktop (5092 - 8790, n=17, últimos 2 años) | |
| AMD Ryzen 9 5950X | |
| AMD Ryzen 9 5900X | |
| Intel Core i9-11900K | |
| Intel Core i9-12900K | |
| Medio Intel Core i9-12900K (6571 - 6580, n=2) | |
| Intel Core i9-12900K | |
| Intel Core i9-10900K | |
| Intel Core i9-9900K | |
| Geekbench 5.5 / Multi-Core | |
| Media de la clase Desktop (12626 - 28535, n=30, últimos 2 años) | |
| Intel Core i9-12900K | |
| Medio Intel Core i9-12900K (17698 - 17854, n=2) | |
| Intel Core i9-12900K | |
| AMD Ryzen 9 5950X | |
| AMD Ryzen 9 5900X | |
| Intel Core i9-10900K | |
| Intel Core i9-11900K | |
| Geekbench 5.5 / Single-Core | |
| Media de la clase Desktop (1755 - 2597, n=30, últimos 2 años) | |
| Intel Core i9-12900K | |
| Medio Intel Core i9-12900K (1969 - 2042, n=2) | |
| Intel Core i9-12900K | |
| Intel Core i9-11900K | |
| AMD Ryzen 9 5950X | |
| AMD Ryzen 9 5900X | |
| Intel Core i9-10900K | |
| HWBOT x265 Benchmark v2.2 / 4k Preset | |
| Media de la clase Desktop (18.6 - 48.5, n=15, últimos 2 años) | |
| AMD Ryzen 9 5950X | |
| Intel Core i9-12900K | |
| Medio Intel Core i9-12900K (29 - 30, n=2) | |
| Intel Core i9-12900K | |
| AMD Ryzen 9 5900X | |
| Intel Core i9-10900K | |
| Intel Core i9-11900K | |
| Intel Core i9-9900K | |
| LibreOffice / 20 Documents To PDF | |
| Intel Core i9-10900K | |
| Intel Core i9-11900K | |
| AMD Ryzen 9 5900X | |
| AMD Ryzen 9 5950X | |
| Media de la clase Desktop (35.5 - 79.2, n=16, últimos 2 años) | |
| Intel Core i9-12900K | |
| Medio Intel Core i9-12900K (38.1 - 40.6, n=2) | |
| Intel Core i9-12900K | |
| R Benchmark 2.5 / Overall mean | |
| Intel Core i9-10900K | |
| Intel Core i9-11900K | |
| AMD Ryzen 9 5950X | |
| AMD Ryzen 9 5900X | |
| Intel Core i9-12900K | |
| Medio Intel Core i9-12900K (0.3946 - 0.4216, n=2) | |
| Intel Core i9-12900K | |
| Media de la clase Desktop (0.3299 - 0.4909, n=16, últimos 2 años) | |
* ... más pequeño es mejor
AIDA64: FP32 Ray-Trace | FPU Julia | CPU SHA3 | CPU Queen | FPU SinJulia | FPU Mandel | CPU AES | CPU ZLib | FP64 Ray-Trace | CPU PhotoWorxx
| Performance rating | |
| Media de la clase Desktop | |
| AMD Ryzen 9 5950X, NVIDIA Titan RTX | |
| AMD Ryzen 9 5900X, NVIDIA Titan RTX | |
| Intel Core i9-11900K, NVIDIA Titan RTX | |
| Intel Core i9-12900K, NVIDIA GeForce RTX 3080 Ti | |
| Medio Intel Core i9-12900K | |
| Intel Core i9-12900K, NVIDIA Titan RTX | |
| AIDA64 / FP32 Ray-Trace | |
| Media de la clase Desktop (12248 - 84577, n=21, últimos 2 años) | |
| AMD Ryzen 9 5950X, NVIDIA Titan RTX | |
| AMD Ryzen 9 5900X, NVIDIA Titan RTX | |
| Intel Core i9-11900K, NVIDIA Titan RTX | |
| Intel Core i9-12900K, NVIDIA Titan RTX | |
| Medio Intel Core i9-12900K (12739 - 13345, n=3) | |
| Intel Core i9-12900K, NVIDIA GeForce RTX 3080 Ti | |
| AIDA64 / FPU Julia | |
| Media de la clase Desktop (65152 - 246125, n=21, últimos 2 años) | |
| AMD Ryzen 9 5950X, NVIDIA Titan RTX | |
| AMD Ryzen 9 5900X, NVIDIA Titan RTX | |
| Intel Core i9-11900K, NVIDIA Titan RTX | |
| Intel Core i9-12900K, NVIDIA Titan RTX | |
| Medio Intel Core i9-12900K (58406 - 59419, n=3) | |
| Intel Core i9-12900K, NVIDIA GeForce RTX 3080 Ti | |
| AIDA64 / CPU SHA3 | |
| Media de la clase Desktop (2982 - 10804, n=21, últimos 2 años) | |
| Intel Core i9-11900K, NVIDIA Titan RTX | |
| Medio Intel Core i9-12900K (4796 - 5127, n=3) | |
| Intel Core i9-12900K, NVIDIA Titan RTX | |
| Intel Core i9-12900K, NVIDIA GeForce RTX 3080 Ti | |
| AMD Ryzen 9 5950X, NVIDIA Titan RTX | |
| AMD Ryzen 9 5900X, NVIDIA Titan RTX | |
| AIDA64 / CPU Queen | |
| AMD Ryzen 9 5950X, NVIDIA Titan RTX | |
| AMD Ryzen 9 5900X, NVIDIA Titan RTX | |
| Media de la clase Desktop (76512 - 187912, n=18, últimos 2 años) | |
| Intel Core i9-12900K, NVIDIA Titan RTX | |
| Medio Intel Core i9-12900K (112066 - 112694, n=3) | |
| Intel Core i9-12900K, NVIDIA GeForce RTX 3080 Ti | |
| Intel Core i9-11900K, NVIDIA Titan RTX | |
| AIDA64 / FPU SinJulia | |
| AMD Ryzen 9 5950X, NVIDIA Titan RTX | |
| AMD Ryzen 9 5900X, NVIDIA Titan RTX | |
| Media de la clase Desktop (6443 - 35251, n=21, últimos 2 años) | |
| Intel Core i9-12900K, NVIDIA Titan RTX | |
| Medio Intel Core i9-12900K (14590 - 14664, n=3) | |
| Intel Core i9-12900K, NVIDIA GeForce RTX 3080 Ti | |
| Intel Core i9-11900K, NVIDIA Titan RTX | |
| AIDA64 / FPU Mandel | |
| Media de la clase Desktop (31697 - 129745, n=21, últimos 2 años) | |
| AMD Ryzen 9 5950X, NVIDIA Titan RTX | |
| AMD Ryzen 9 5900X, NVIDIA Titan RTX | |
| Intel Core i9-11900K, NVIDIA Titan RTX | |
| Intel Core i9-12900K, NVIDIA Titan RTX | |
| Medio Intel Core i9-12900K (35801 - 39323, n=3) | |
| Intel Core i9-12900K, NVIDIA GeForce RTX 3080 Ti | |
| AIDA64 / CPU AES | |
| Intel Core i9-11900K, NVIDIA Titan RTX | |
| AMD Ryzen 9 5950X, NVIDIA Titan RTX | |
| Media de la clase Desktop (57777 - 513073, n=21, últimos 2 años) | |
| Intel Core i9-12900K, NVIDIA GeForce RTX 3080 Ti | |
| Medio Intel Core i9-12900K (94062 - 140055, n=3) | |
| AMD Ryzen 9 5900X, NVIDIA Titan RTX | |
| Intel Core i9-12900K, NVIDIA Titan RTX | |
| AIDA64 / CPU ZLib | |
| AMD Ryzen 9 5950X, NVIDIA Titan RTX | |
| Media de la clase Desktop (887 - 2674, n=21, últimos 2 años) | |
| Medio Intel Core i9-12900K (1537 - 1608, n=3) | |
| Intel Core i9-12900K, NVIDIA Titan RTX | |
| Intel Core i9-12900K, NVIDIA GeForce RTX 3080 Ti | |
| AMD Ryzen 9 5900X, NVIDIA Titan RTX | |
| Intel Core i9-11900K, NVIDIA Titan RTX | |
| AIDA64 / FP64 Ray-Trace | |
| Media de la clase Desktop (6471 - 44013, n=21, últimos 2 años) | |
| AMD Ryzen 9 5950X, NVIDIA Titan RTX | |
| AMD Ryzen 9 5900X, NVIDIA Titan RTX | |
| Intel Core i9-11900K, NVIDIA Titan RTX | |
| Intel Core i9-12900K, NVIDIA Titan RTX | |
| Medio Intel Core i9-12900K (7586 - 8283, n=3) | |
| Intel Core i9-12900K, NVIDIA GeForce RTX 3080 Ti | |
| AIDA64 / CPU PhotoWorxx | |
| Intel Core i9-12900K, NVIDIA GeForce RTX 3080 Ti | |
| Intel Core i9-12900K, NVIDIA Titan RTX | |
| Media de la clase Desktop (38071 - 63949, n=21, últimos 2 años) | |
| Medio Intel Core i9-12900K (33311 - 49236, n=3) | |
| Intel Core i9-11900K, NVIDIA Titan RTX | |
| AMD Ryzen 9 5950X, NVIDIA Titan RTX | |
| AMD Ryzen 9 5900X, NVIDIA Titan RTX | |
Prueba de carga constante múltiple de Cinebench R15
Echamos un vistazo al sistema bajo carga constante utilizando el bucle Cinebench-R15 Multi. De este modo, podemos determinar si el sistema de refrigeración es lo suficientemente potente como para enfriar el procesador de forma efectiva. En el Corsair One i300, el trabajo del AiO es muy fiable, y el resultado se mantiene constante incluso tras 50 ejecuciones. Sin embargo, el TDP ligeramente inferior delIntel Core i9-12900K se nota claramente aquí. Si dejas que el Core i9-12900K corra libre de las limitaciones, puede lograr casi 500 puntos más.
Rendimiento del sistema
Durante nuestro periodo de pruebas, todo el sistema funcionó muy rápido. Esto también se refleja en las pruebas del sistema. En las pruebas PCMark 10, el Corsair One i300 toma la delantera en todas las pruebas individuales. Sólo en las pruebas de renderizado, el Corsair One i300 no es capaz de mantener el ritmo debido a la tarjeta gráfica. El Nvidia Titan RTXde los sistemas de comparación es la mejor opción aquí, lo que se debe a la cercanía con la serie quad.
| PCMark 10 | |
| Score | |
| Intel Core i9-12900K | |
| AMD Ryzen 9 5950X | |
| Intel Core i9-12900K | |
| AMD Ryzen 9 5900X | |
| Intel Core i9-11900K | |
| Intel Core i9-10900K | |
| Intel Core i9-9900K | |
| Essentials | |
| Intel Core i9-12900K | |
| AMD Ryzen 9 5950X | |
| Intel Core i9-12900K | |
| AMD Ryzen 9 5900X | |
| Intel Core i9-9900K | |
| Intel Core i9-11900K | |
| Intel Core i9-10900K | |
| Productivity | |
| AMD Ryzen 9 5950X | |
| Intel Core i9-12900K | |
| Intel Core i9-12900K | |
| AMD Ryzen 9 5900X | |
| Intel Core i9-11900K | |
| Intel Core i9-10900K | |
| Intel Core i9-9900K | |
| Digital Content Creation | |
| Intel Core i9-12900K | |
| AMD Ryzen 9 5950X | |
| Intel Core i9-12900K | |
| AMD Ryzen 9 5900X | |
| Intel Core i9-10900K | |
| Intel Core i9-9900K | |
| Intel Core i9-11900K | |
| LuxMark v2.0 64Bit | |
| Room GPUs-only | |
| Intel Core i9-12900K | |
| Intel Core i9-9900K | |
| Sala GPUs-only | |
| Intel Core i9-12900K | |
| Intel Core i9-9900K | |
| ComputeMark v2.1 | |
| 1024x600 Normal, Score | |
| Intel Core i9-12900K | |
| Intel Core i9-9900K | |
| 1024x600 Normal, Fluid 3DTex | |
| Intel Core i9-12900K | |
| Intel Core i9-9900K | |
| 1024x600 Normal, Fluid 2DTexArr | |
| Intel Core i9-12900K | |
| Intel Core i9-9900K | |
| 1024x600 Normal, Mandel Vector | |
| Intel Core i9-12900K | |
| Intel Core i9-9900K | |
| 1024x600 Normal, Mandel Scalar | |
| Intel Core i9-12900K | |
| Intel Core i9-9900K | |
| 1024x600 Normal, QJuliaRayTrace | |
| Intel Core i9-12900K | |
| Intel Core i9-9900K | |
| PCMark 10 Score | 8897 puntos | |
ayuda | ||
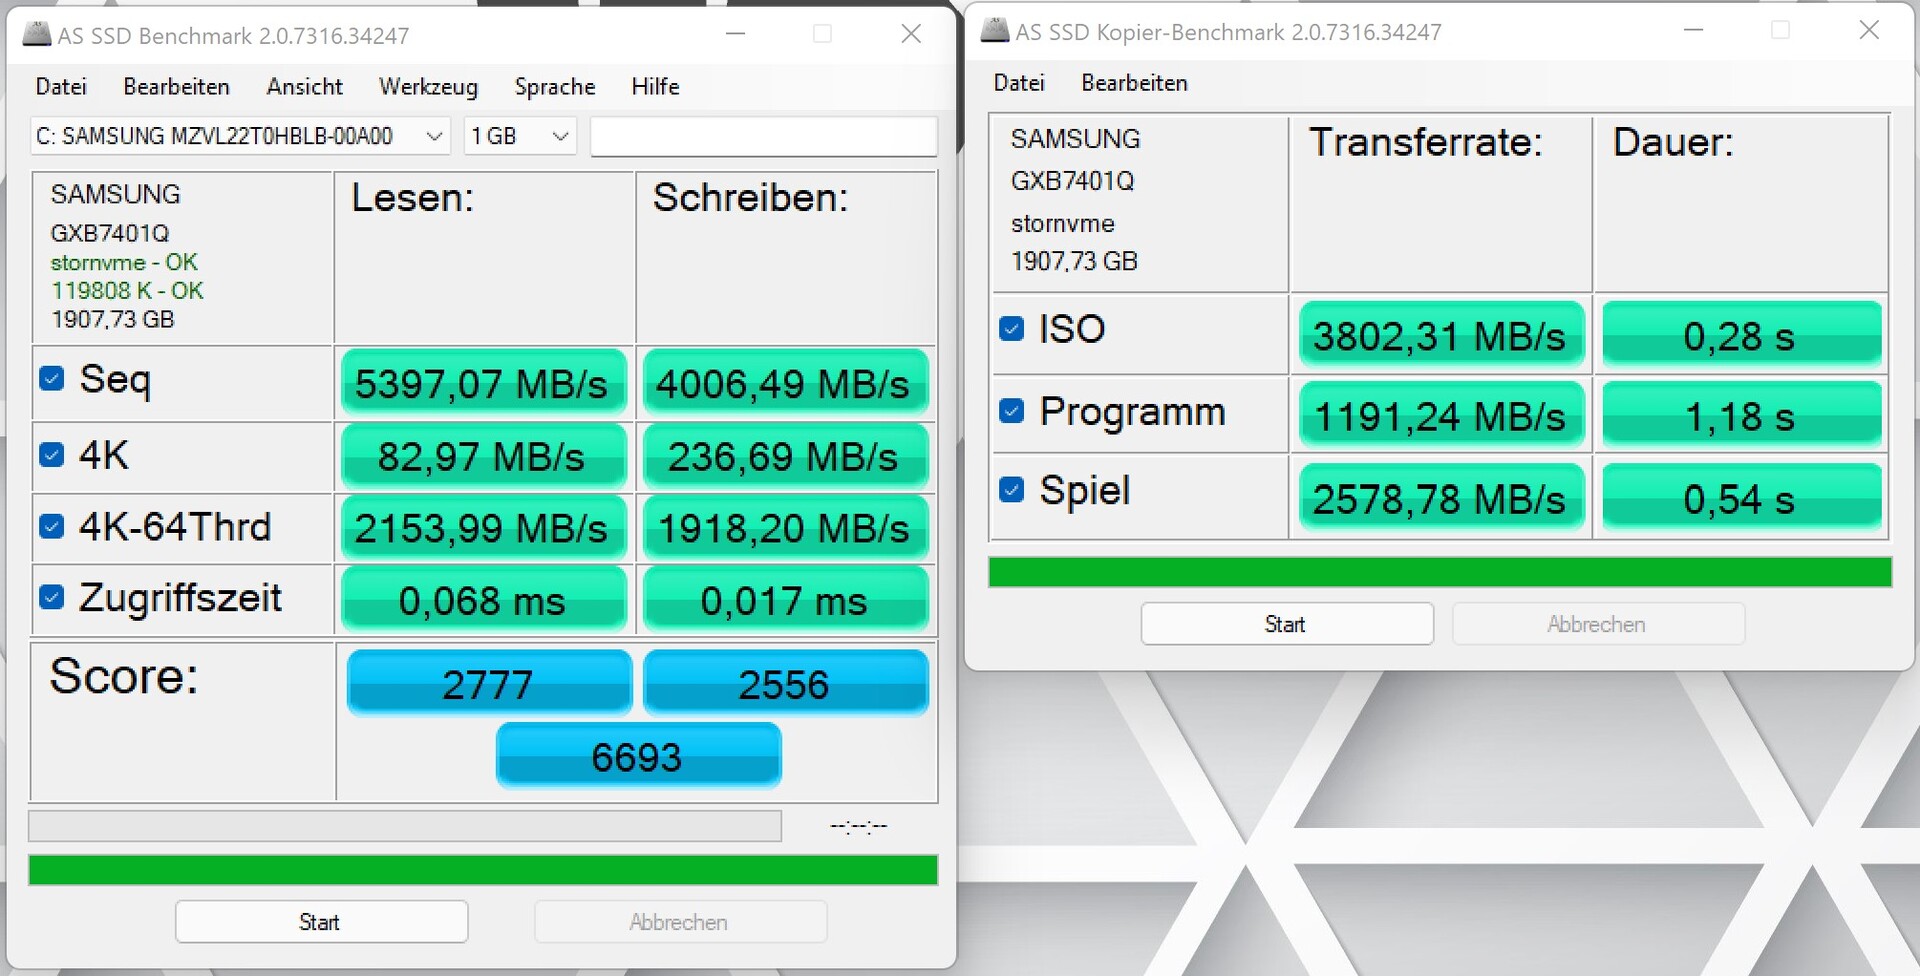
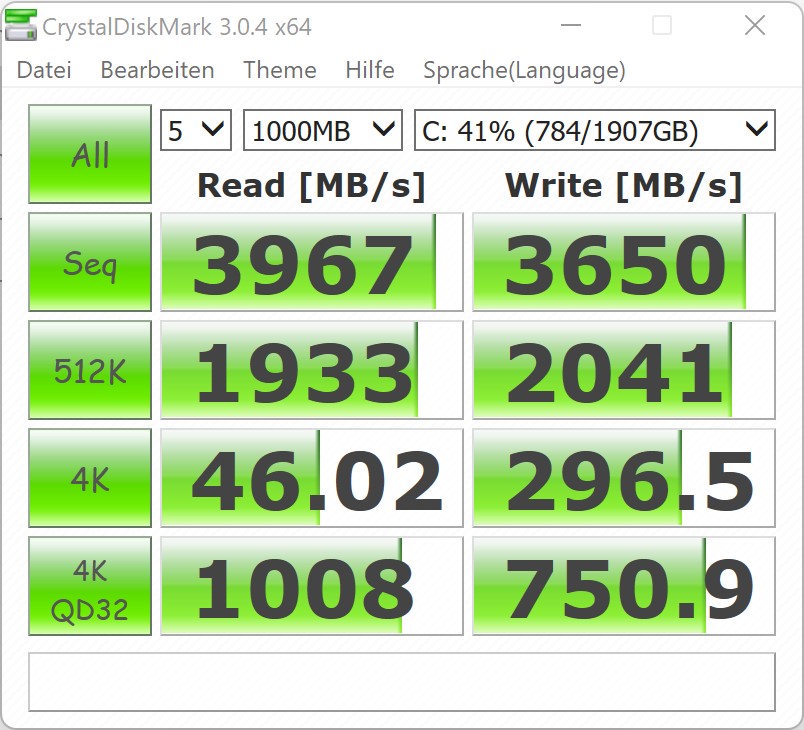
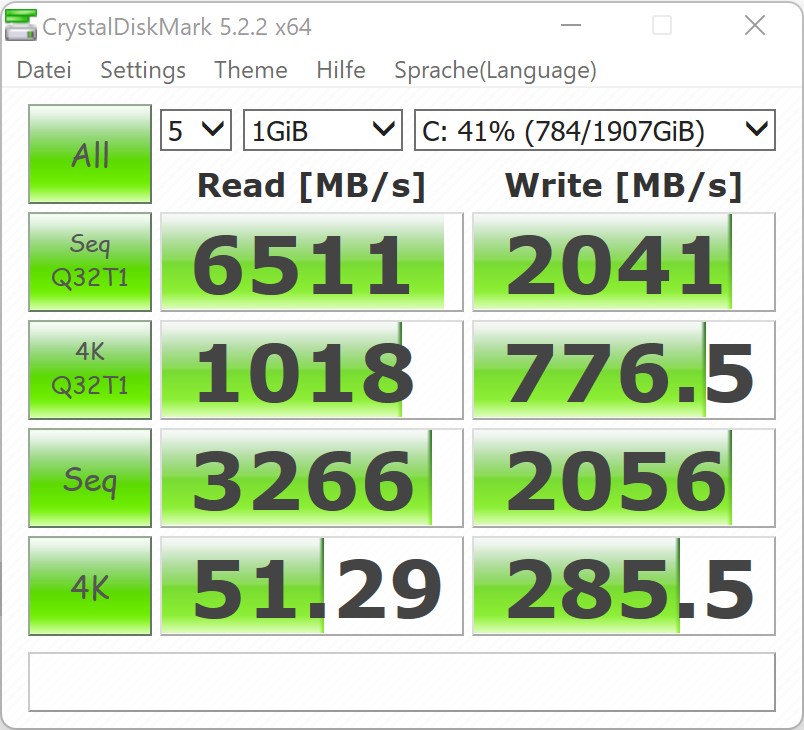
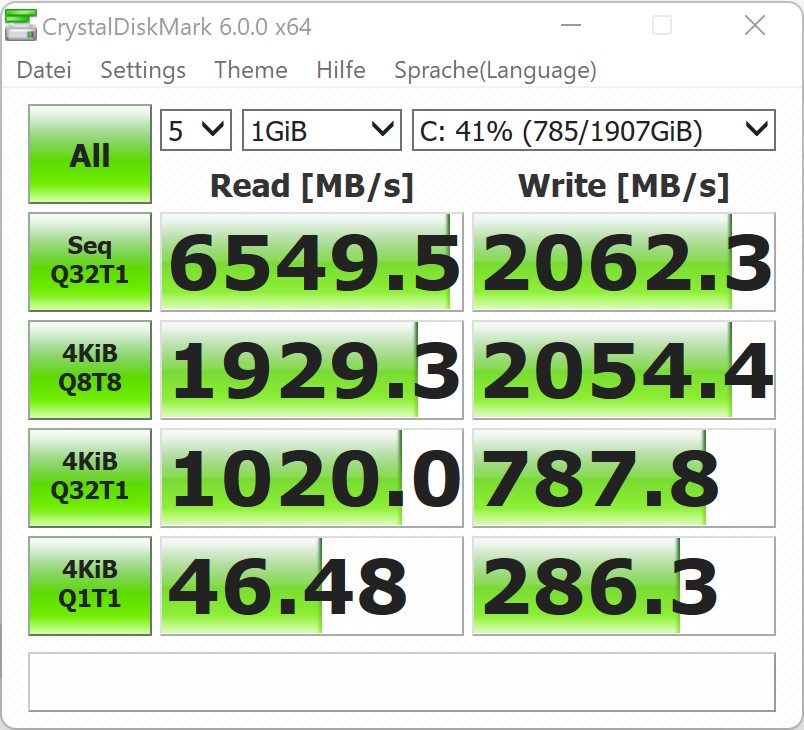
Solución de almacenamiento
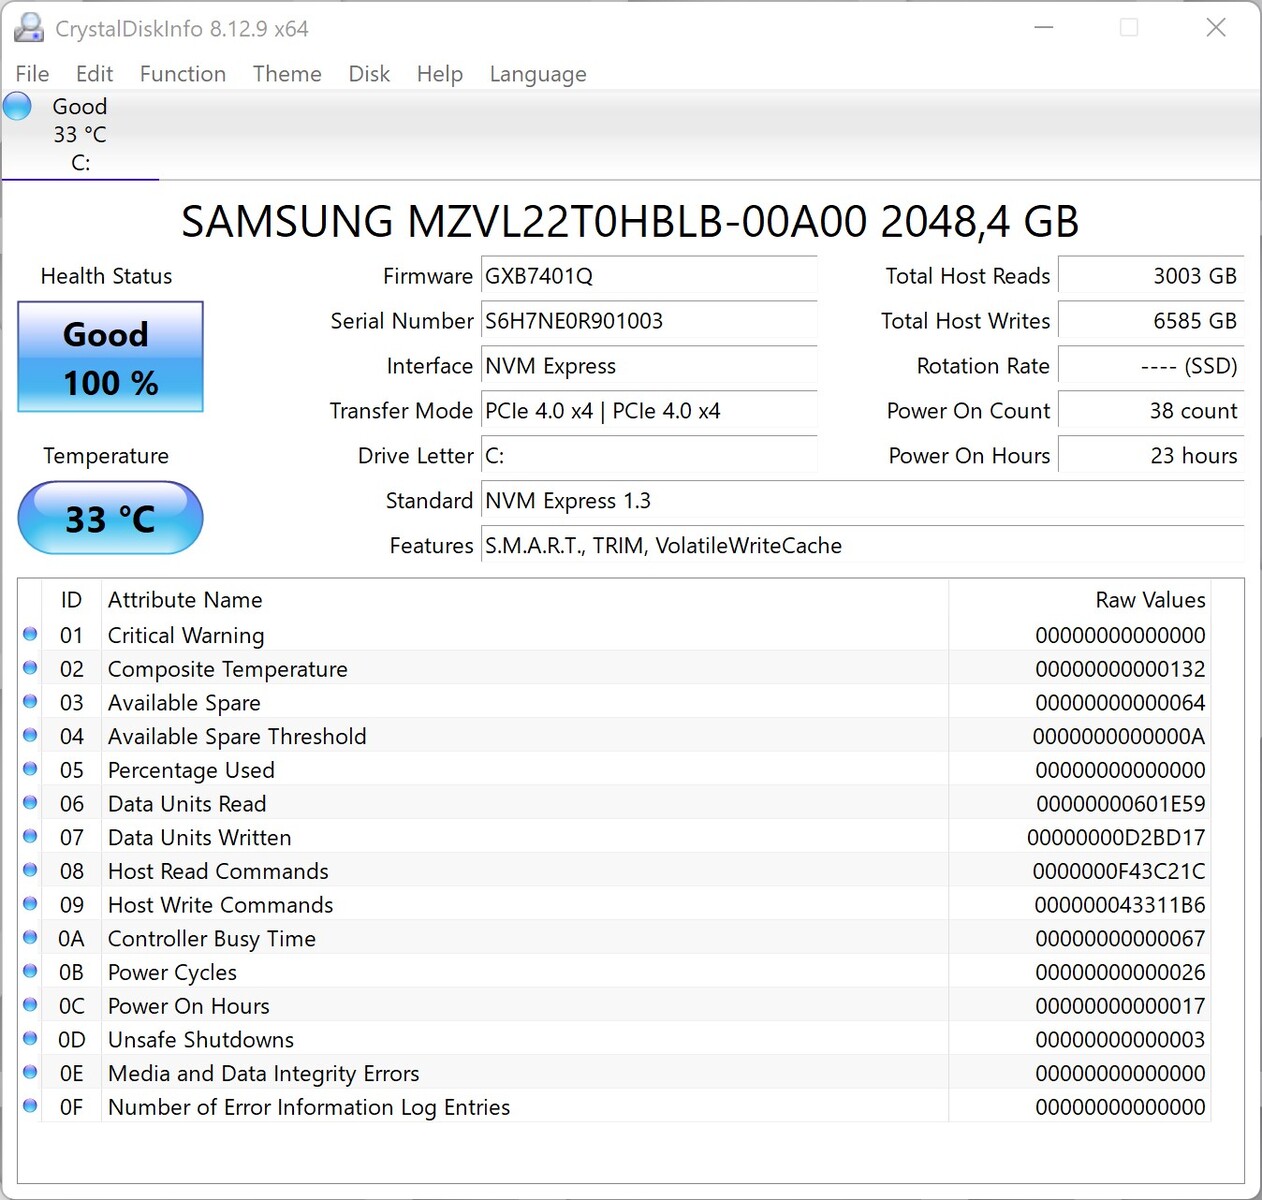
Como ya se ha mencionado, el Corsair One i160 está equipado con dos módulos de almacenamiento. El sistema está instalado en un rápido SSD PCIe de 512 GB de Samsung, y también hay un disco duro convencional que ofrece 2 TB de almacenamiento.
En la prueba, el SSD de Samsung ofreció un rendimiento muy bueno que benefició a todo el sistema. Sin embargo, para un rendimiento general aún mejor, Corsair debería haber equipado el PC únicamente con SSDs. La tasa de transferencia media del disco duro Seagate fue de 107 MB/s. Aunque este valor no es malo, comparado con un SSD, un disco duro tiene desventajas significativas en términos de rendimiento.
Por desgracia, la carcasa compacta no ofrece espacio para módulos de almacenamiento adicionales.

| Drive Performance rating - Percent | |
| Media de la clase Desktop | |
| Corsair One i300 | |
| Medio Samsung PM9A1 MZVL22T0HBLB | |
| AMD Ryzen 9 5950X | |
| Intel Beast Canyon NUC | |
| Corsair One i160 -8! | |
| Zotac Magnus One (ECM73070C) | |
* ... más pequeño es mejor
Tarjeta gráfica
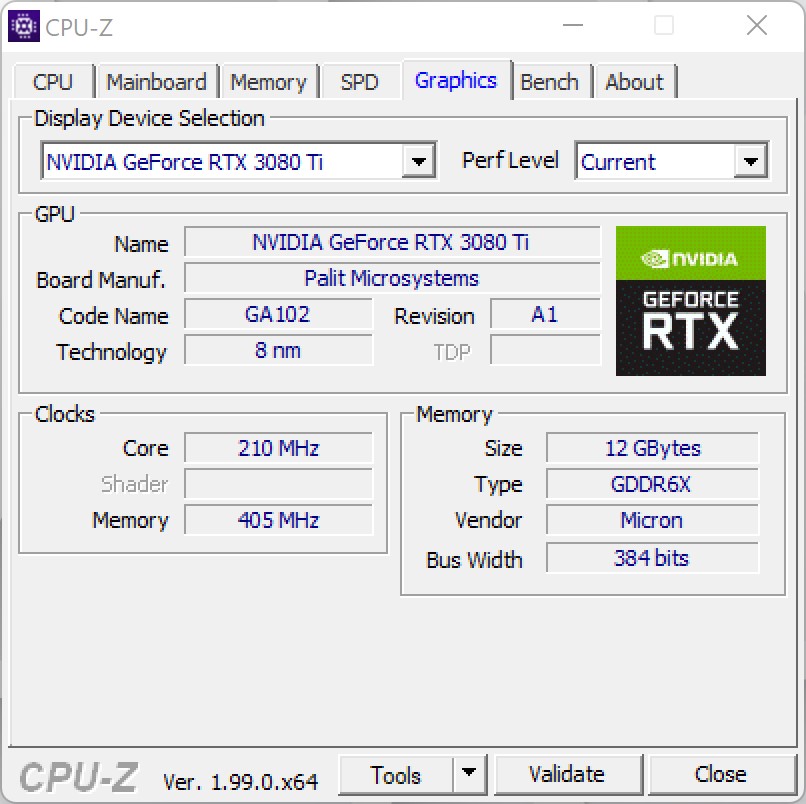
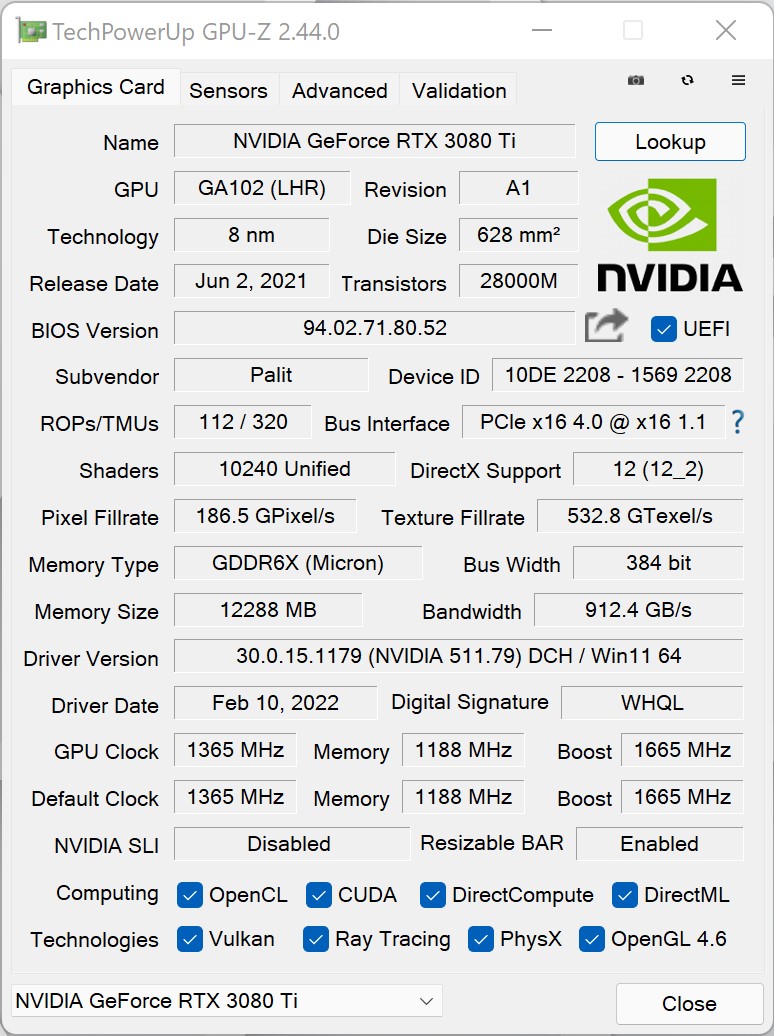
En el sistema de juego compacto, Corsair utiliza unaNvidia GeForce RTX 3080 Tique es casi idéntica a la Nvidia GeForce RTX 3090 en términos de rendimiento. Sin embargo, con 12 GB de VRAM, solo ofrece la mitad de RAM que el modelo superior de Nvidia, pero esto no importa mucho con los juegos actuales. Con esto, el sistema ofrece un rendimiento absoluto en términos de juego. La refrigeración de la tarjeta gráfica está muy bien diseñada, ya que se utiliza un AiO como en la CPU. Además, también hay dos pequeños ventiladores en la tarjeta gráfica, para proporcionar algo de refrigeración activa adicional al transformador y a la VRAM. Puedes ver que este diseño funciona bien, si echas un vistazo a los benchmarks sintéticos. El Corsair One i300 también alcanza los mejores valores gracias al Intel Core i9-12900K.
En comparación con el Corsair One i160puedes esperar un aumento de rendimiento de entre el 20 y el 30%.
| 3DMark 05 Standard | 63621 puntos | |
| 3DMark 06 Standard Score | 66161 puntos | |
| 3DMark Vantage P Result | 120236 puntos | |
| 3DMark 11 Performance | 47170 puntos | |
| 3DMark Ice Storm Standard Score | 336443 puntos | |
| 3DMark Cloud Gate Standard Score | 81921 puntos | |
| 3DMark Fire Strike Score | 40079 puntos | |
| 3DMark Fire Strike Extreme Score | 23109 puntos | |
| 3DMark Time Spy Score | 18985 puntos | |
ayuda | ||
Rendimiento de los juegos
Dado que Corsair utiliza el hardware más actual en el One i300, estaba claro que el rendimiento de juego del sistema también está al máximo nivel. Actualmente, puedes disfrutar de todos los juegos sin ningún compromiso en 2160p. En comparación con las otras GPUs de sobremesa que probamos anteriormente, el rendimiento de nuestra unidad de pruebas resulta significativamente mejor. La ventaja relativamente alta en comparación con la Nvidia GeForce RTX 3090 se debe a la mejor CPU del Corsair One i300. Nuestro sistema de prueba de GPU se basa en un AMD Ryzen 9 5900Xque tiene una desventaja significativa con respecto al Intel Core i9-12900K.
Al igual que en las pruebas de la CPU, también pusimos la tarjeta gráfica bajo carga durante un período de tiempo más largo. Para ello, utilizamos "The Witcher 3" con el preajuste Ultra. Durante la prueba, el rendimiento de la Nvidia GeForce RTX 3080 Tise mantiene estable en todo momento, y no notamos ninguna caída de rendimiento. Con una media de 189 fotogramas por segundo, el juego se ejecuta muy bien, lo que permite utilizar también monitores con 165 Hz.
| The Witcher 3 | |
| 1920x1080 Ultra Graphics & Postprocessing (HBAO+) | |
| Corsair One i300 | |
| Medio NVIDIA GeForce RTX 3090 (160 - 192.6, n=18) | |
| Medio AMD Radeon RX 6800 (152.1 - 156, n=3) | |
| Medio NVIDIA GeForce RTX 3080 (145 - 152, n=2) | |
| Medio NVIDIA Titan RTX (124 - 150, n=28) | |
| Medio AMD Radeon RX 6700 XT (117 - 130.4, n=3) | |
| Medio NVIDIA GeForce RTX 3070 (52.8 - 132.2, n=7) | |
| 3840x2160 High Graphics & Postprocessing (Nvidia HairWorks Off) | |
| Medio NVIDIA GeForce RTX 3090 (128 - 160.2, n=14) | |
| Corsair One i300 | |
| Medio NVIDIA GeForce RTX 3080 (114 - 115, n=2) | |
| Medio NVIDIA Titan RTX (94 - 107.1, n=28) | |
| Medio AMD Radeon RX 6800 (96.8 - 100.7, n=3) | |
| Medio NVIDIA GeForce RTX 3070 (84 - 93.9, n=5) | |
| Medio AMD Radeon RX 6700 XT (63 - 75.7, n=3) | |
| Rise of the Tomb Raider | |
| 1920x1080 Very High Preset AA:FX AF:16x | |
| Medio NVIDIA GeForce RTX 3090 (240 - 254, n=2) | |
| Medio NVIDIA GeForce RTX 3080 (217 - 233, n=2) | |
| Corsair One i300 | |
| Medio NVIDIA Titan RTX (n=1) | |
| Medio AMD Radeon RX 6800 (n=1) | |
| Medio NVIDIA GeForce RTX 3070 (151 - 169, n=3) | |
| Medio AMD Radeon RX 6700 XT (n=1) | |
| 3840x2160 High Preset AA:FX AF:4x | |
| Medio NVIDIA GeForce RTX 3090 (128 - 128.1, n=2) | |
| Corsair One i300 | |
| Medio NVIDIA GeForce RTX 3080 (107 - 114, n=2) | |
| Medio NVIDIA Titan RTX (n=1) | |
| Medio AMD Radeon RX 6800 (n=1) | |
| Medio NVIDIA GeForce RTX 3070 (76.7 - 83.8, n=3) | |
| Medio AMD Radeon RX 6700 XT (n=1) | |
| Far Cry 6 | |
| 1920x1080 Ultra Graphics Quality + HD Textures AA:T | |
| Corsair One i300 | |
| Medio NVIDIA GeForce RTX 3090 (94 - 177.6, n=10) | |
| Medio AMD Radeon RX 6800 (116 - 152.5, n=3) | |
| Medio NVIDIA Titan RTX (94.7 - 138.9, n=6) | |
| Medio AMD Radeon RX 6700 XT (102 - 136.6, n=3) | |
| Medio NVIDIA GeForce RTX 3070 (91 - 114.2, n=2) | |
| Medio NVIDIA GeForce RTX 3080 (n=1) | |
| 3840x2160 Ultra Graphics Quality + HD Textures AA:T | |
| Medio NVIDIA GeForce RTX 3090 (77 - 86.7, n=10) | |
| Corsair One i300 | |
| Medio NVIDIA GeForce RTX 3080 (n=1) | |
| Medio AMD Radeon RX 6800 (68.1 - 69.7, n=3) | |
| Medio NVIDIA Titan RTX (52.8 - 64.2, n=6) | |
| Medio AMD Radeon RX 6700 XT (50 - 52.7, n=3) | |
| Medio NVIDIA GeForce RTX 3070 (26.4 - 57, n=2) | |
| Anno 1800 | |
| 1920x1080 Ultra Graphics Quality (DX11) | |
| Corsair One i300 | |
| Medio NVIDIA GeForce RTX 3090 (51.5 - 85.5, n=4) | |
| Medio NVIDIA GeForce RTX 3070 (46.5 - 74.7, n=3) | |
| Medio NVIDIA GeForce RTX 3080 (54 - 54.1, n=2) | |
| Medio AMD Radeon RX 6800 (n=1) | |
| Medio AMD Radeon RX 6700 XT (n=1) | |
| Medio NVIDIA Titan RTX (33.9 - 54.5, n=2) | |
| 3840x2160 Ultra Graphics Quality (DX11) | |
| Medio NVIDIA GeForce RTX 3090 (51.3 - 87.4, n=4) | |
| Corsair One i300 | |
| Medio NVIDIA GeForce RTX 3080 (43.2 - 46.3, n=2) | |
| Medio AMD Radeon RX 6800 (n=1) | |
| Medio NVIDIA GeForce RTX 3070 (34.3 - 41.8, n=3) | |
| Medio NVIDIA Titan RTX (33 - 40.4, n=2) | |
| Medio AMD Radeon RX 6700 XT (n=1) | |
| F1 2021 | |
| 1920x1080 Ultra High Preset + Raytracing AA:T AF:16x | |
| Corsair One i300 | |
| Medio NVIDIA GeForce RTX 3090 (154 - 244, n=13) | |
| Medio AMD Radeon RX 6800 (167 - 175.5, n=3) | |
| Medio NVIDIA Titan RTX (160 - 172, n=6) | |
| Medio NVIDIA GeForce RTX 3070 (148 - 158, n=2) | |
| Medio NVIDIA GeForce RTX 3080 (n=1) | |
| Medio AMD Radeon RX 6700 XT (143 - 145.2, n=3) | |
| 3840x2160 Ultra High Preset + Raytracing AA:T AF:16x | |
| Medio NVIDIA GeForce RTX 3090 (100.4 - 110, n=13) | |
| Corsair One i300 | |
| Medio NVIDIA GeForce RTX 3080 (n=1) | |
| Medio NVIDIA Titan RTX (71.9 - 74.5, n=6) | |
| Medio AMD Radeon RX 6800 (71.8 - 74, n=3) | |
| Medio NVIDIA GeForce RTX 3070 (64 - 67.3, n=2) | |
| Medio AMD Radeon RX 6700 XT (56.3 - 56.9, n=3) | |
| New World | |
| 1920x1080 Very High Video Quality | |
| Corsair One i300 | |
| Medio NVIDIA Titan RTX (n=1) | |
| Medio AMD Radeon RX 6700 XT (n=1) | |
| Medio NVIDIA GeForce RTX 3070 (68.6 - 117.5, n=2) | |
| Medio NVIDIA GeForce RTX 3090 (70.1 - 126, n=3) | |
| Medio AMD Radeon RX 6800 (n=1) | |
| Medio NVIDIA GeForce RTX 3080 (n=1) | |
| 3840x2160 Very High Video Quality | |
| Corsair One i300 | |
| Medio NVIDIA GeForce RTX 3090 (n=1) | |
| Medio NVIDIA GeForce RTX 3080 (n=1) | |
| Medio NVIDIA Titan RTX (n=1) | |
| Medio NVIDIA GeForce RTX 3070 (48.9 - 52.6, n=2) | |
| Medio AMD Radeon RX 6800 (n=1) | |
| Medio AMD Radeon RX 6700 XT (n=1) | |
The Witcher 3 FPS Chart
| bajo | medio | alto | ultra | QHD | 4K | |
|---|---|---|---|---|---|---|
| GTA V (2015) | 187 | 187 | 187 | 149 | 147 | 180 |
| The Witcher 3 (2015) | 681 | 554 | 365 | 183 | 149 | |
| Dota 2 Reborn (2015) | 240.3 | 214.8 | 207.6 | 196.1 | 191.5 | |
| Rise of the Tomb Raider (2016) | 487 | 340 | 257 | 221 | 114 | |
| Final Fantasy XV Benchmark (2018) | 232 | 227 | 175 | 136 | 84 | |
| X-Plane 11.11 (2018) | 205 | 178 | 135 | 118 | ||
| Far Cry 5 (2018) | 230 | 200 | 190 | 175 | 168 | 108 |
| Strange Brigade (2018) | 667 | 484 | 392 | 345 | 260 | 156 |
| Shadow of the Tomb Raider (2018) | 245 | 226 | 226 | 212 | 164 | 93.7 |
| Far Cry New Dawn (2019) | 190 | 165 | 157 | 141 | 137 | 107 |
| Metro Exodus (2019) | 258 | 212 | 169 | 137 | 113 | 75 |
| Anno 1800 (2019) | 159 | 163 | 124 | 69.4 | 66.1 | 55.9 |
| Control (2019) | 240 | 233 | 187 | 124 | 63.9 | |
| Borderlands 3 (2019) | 208 | 181 | 167 | 152 | 125 | 72 |
| F1 2020 (2020) | 478 | 379 | 397 | 298 | 233 | 143 |
| F1 2021 (2021) | 534 | 498 | 410 | 219 | 170 | 101 |
| New World (2021) | 194 | 165 | 153 | 142 | 133 | 79.2 |
| Far Cry 6 (2021) | 200 | 176 | 155 | 149 | 129 | 81.6 |
| Guardians of the Galaxy (2021) | 194 | 196 | 191 | 191 | 186 | 110 |
| Riders Republic (2021) | 284 | 220 | 188 | 176 | 136 | 80 |
| Forza Horizon 5 (2021) | 292 | 200 | 188 | 126 | 111 | 84 |
| Battlefield 2042 (2021) | 216 | 194 | 169 | 150 | 123 | 83 |
| Farming Simulator 22 (2021) | 349 | 270 | 226 | 203 | 201 | 157 |
| Halo Infinite (2021) | 229 | 198 | 188 | 142 | 83.1 | |
| God of War (2022) | 209 | 181 | 163 | 117 | 98.7 | 64.7 |
| Rainbow Six Extraction (2022) | 365 | 353 | 348 | 282 | 194 | 104 |
| Dying Light 2 (2022) | 189 | 164 | 149 | 109 | 61.5 |
Emisiones
Emisiones acústicas
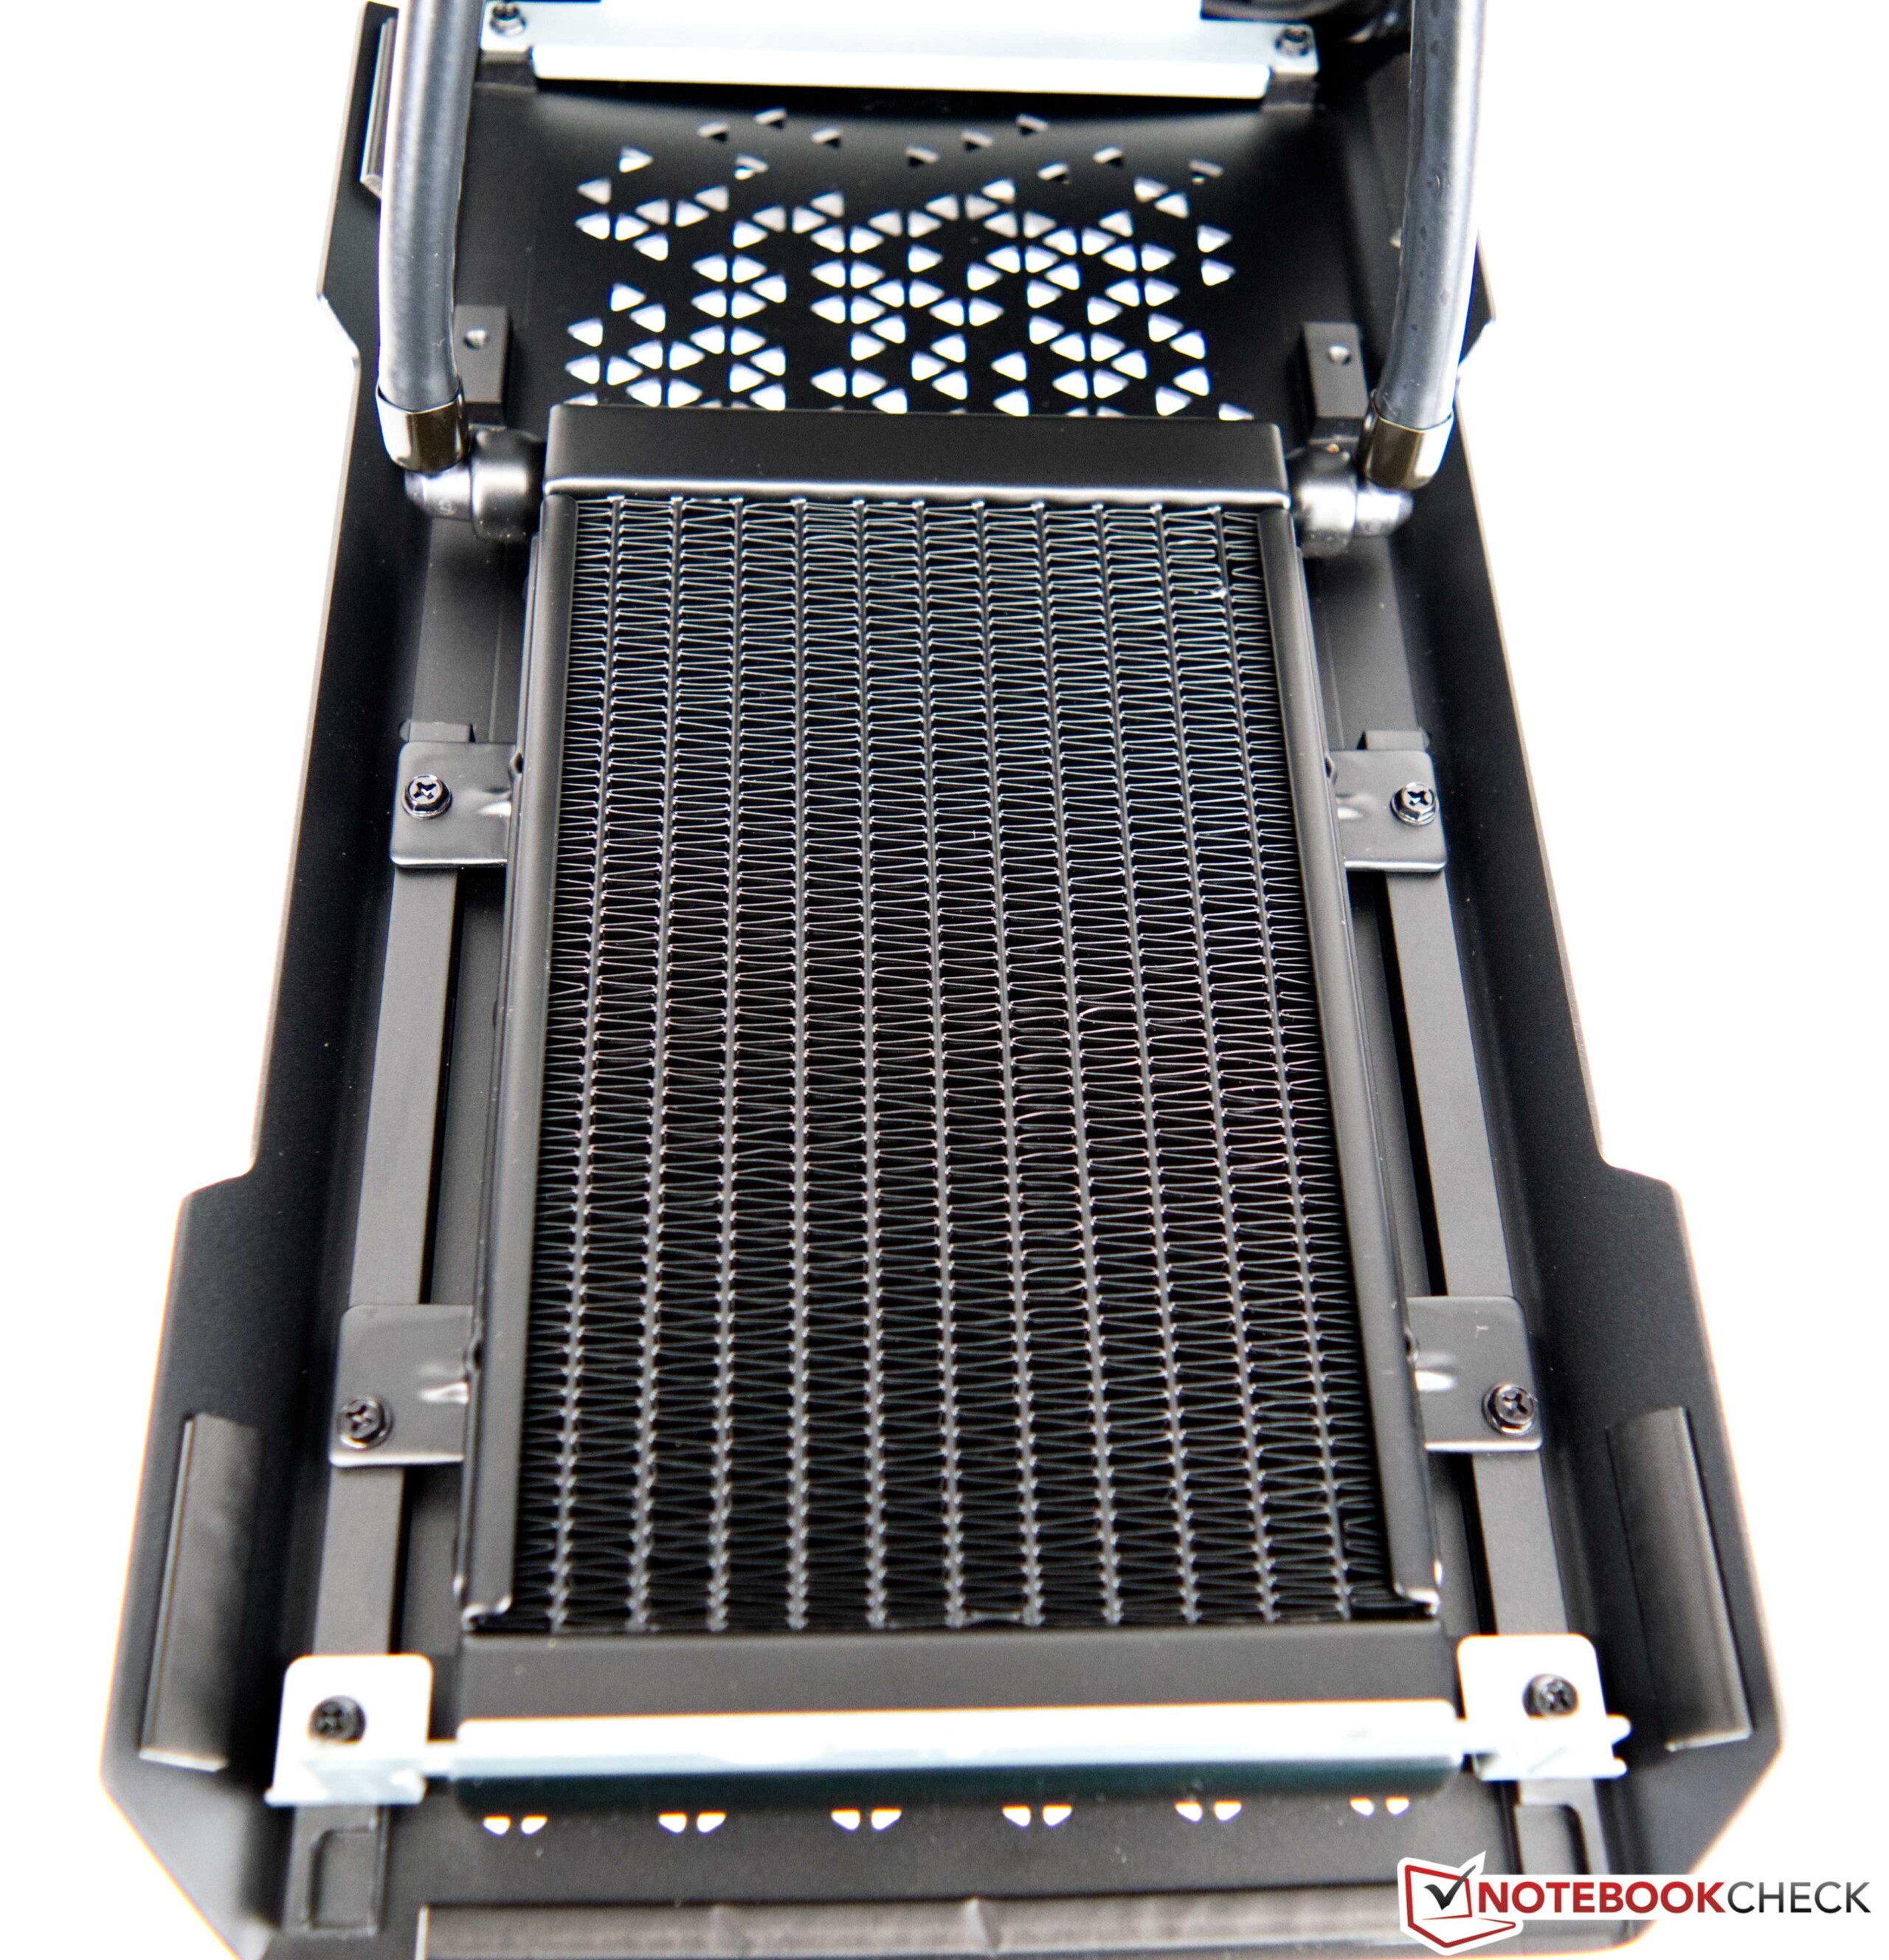
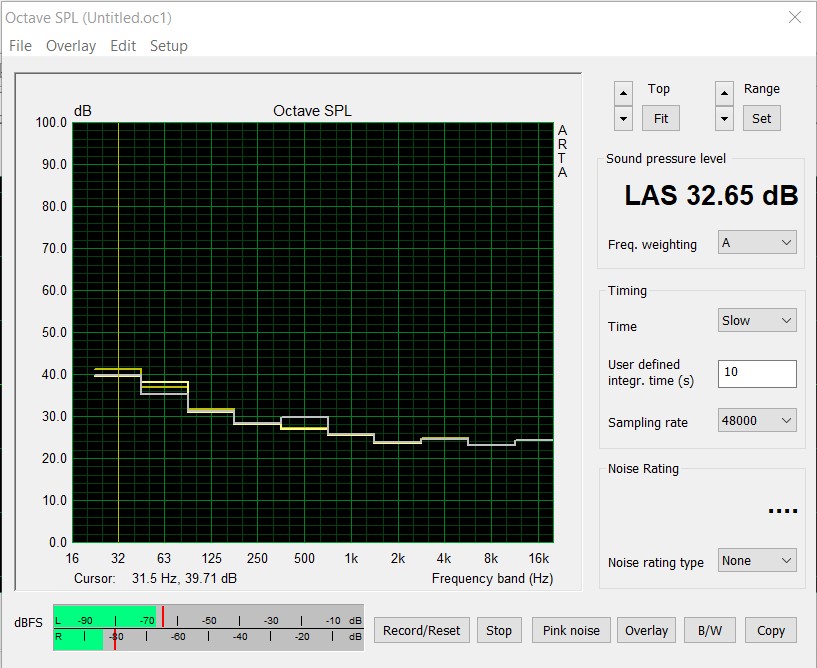
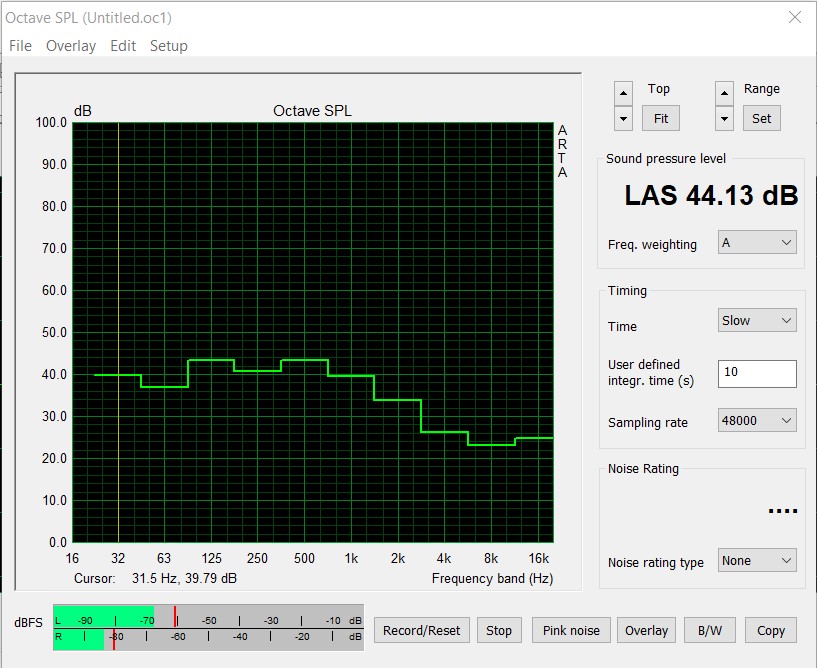
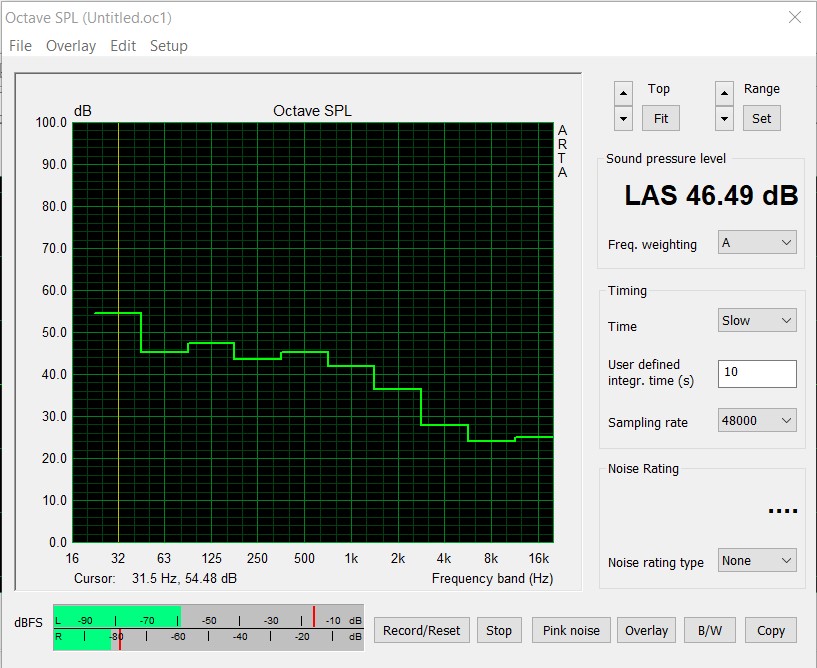
La refrigeración del Corsair One i300 se basa en el mismo método que la del Corsair One i160. En funcionamiento 2D, el sistema funciona de forma relativamente silenciosa con unos 32.6 dB(A). En este punto, el gran ventilador de 140 mm no funciona todavía, pero se pueden oír las dos bombas del AiO y su sonido permanece siempre presente. Desafortunadamente, esto no es muy agradable a la larga. Debe haber algunas bombas que puedan hacer su trabajo permaneciendo significativamente más silenciosas. Bajo carga, el ventilador de 140-mm en la cubierta del chasis también comenzará a funcionar después de un corto tiempo. Con 44 dB(A) durante la prueba de estrés, el sistema entonces puede ser escuchado claramente. Mientras se juega, incluso se vuelve un poco más ruidoso con algo más de 46 dB(A).
Ruido
| Ocioso |
| 32.4 / 32.5 / 32.6 dB(A) |
| Carga |
| / 44.13 dB(A) |
 | ||
30 dB silencioso 40 dB(A) audible 50 dB(A) ruidosamente alto |
||
min: | ||
Temperatura y consumo de energía
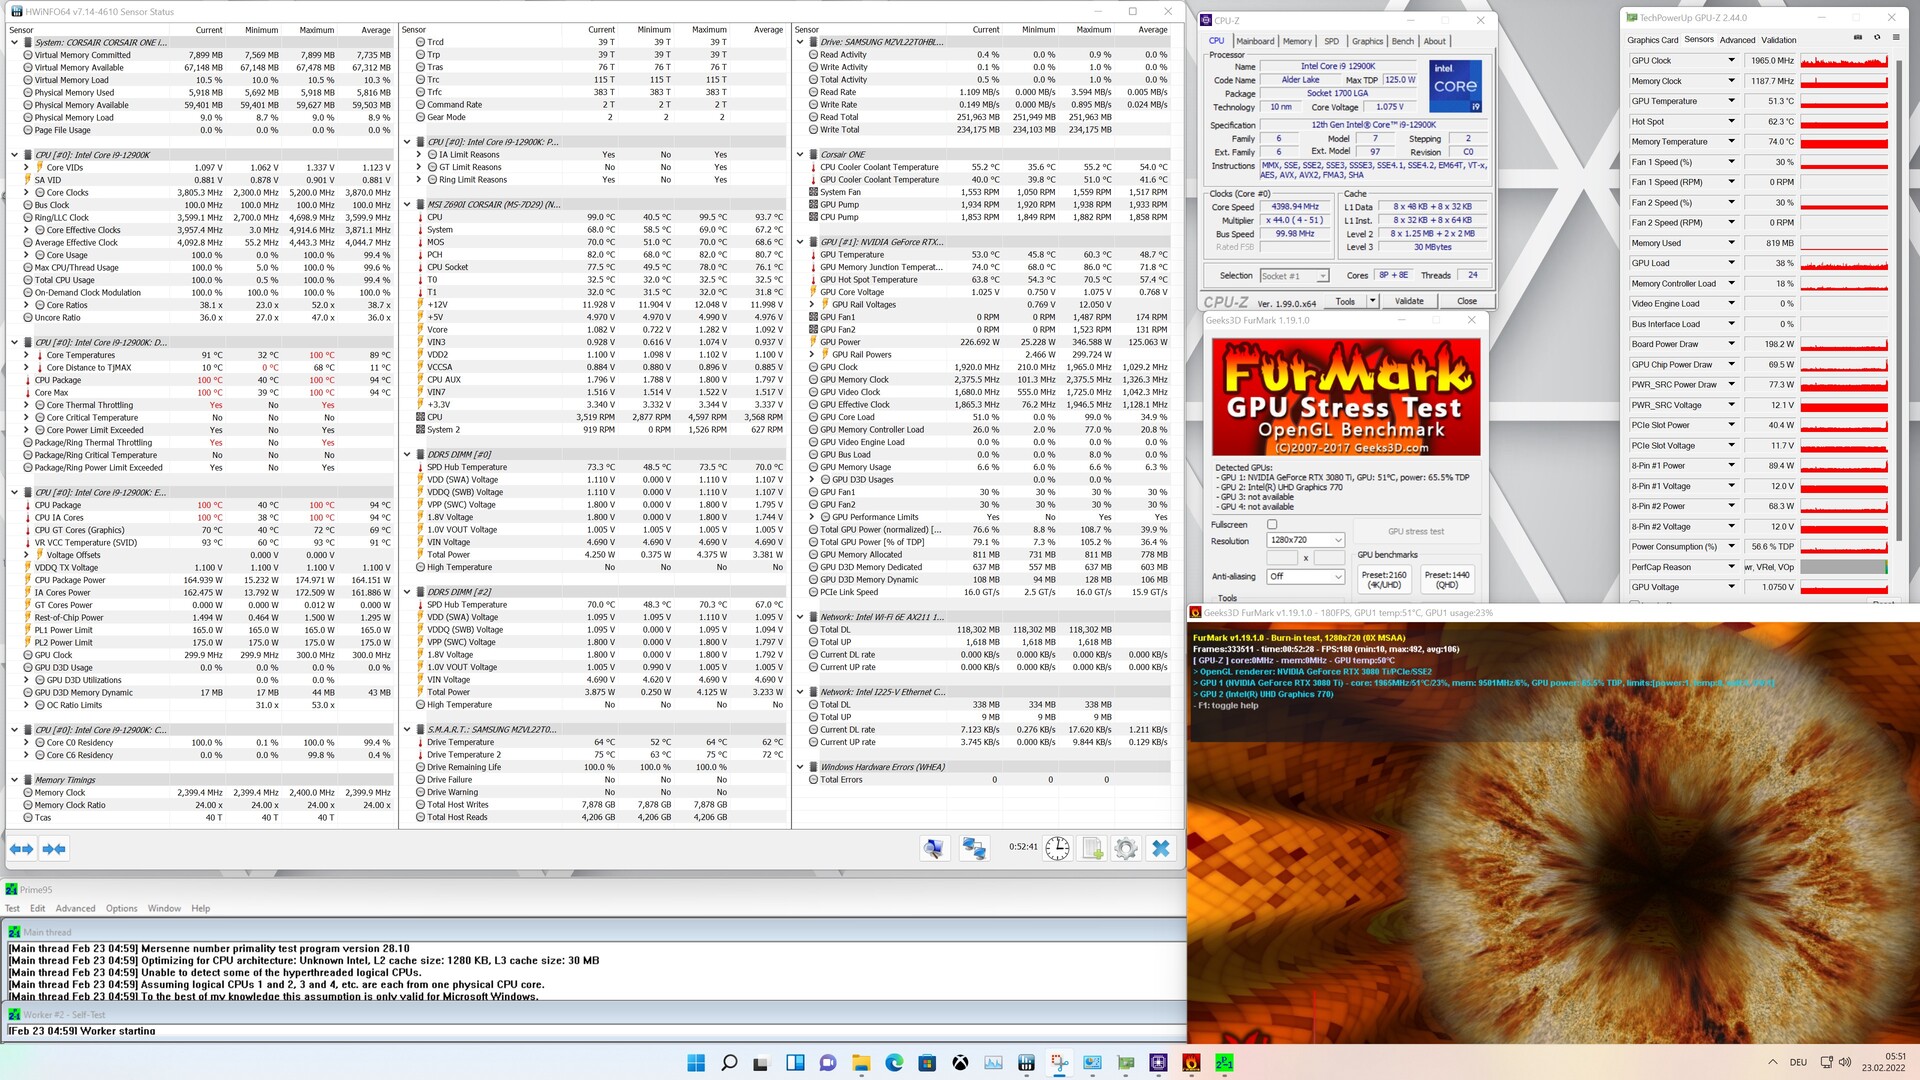
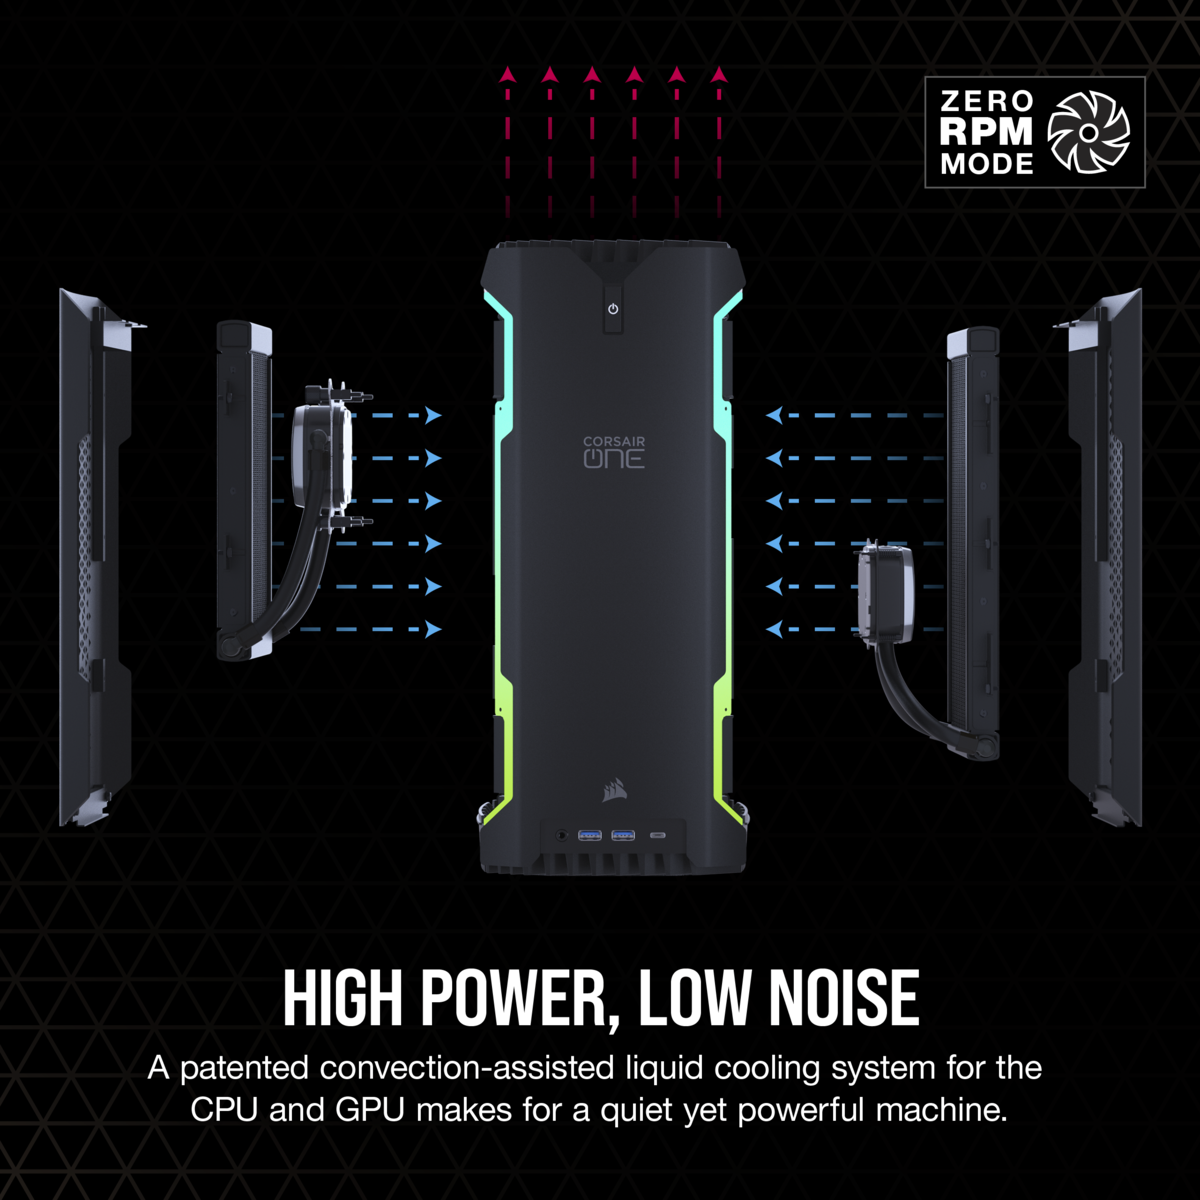
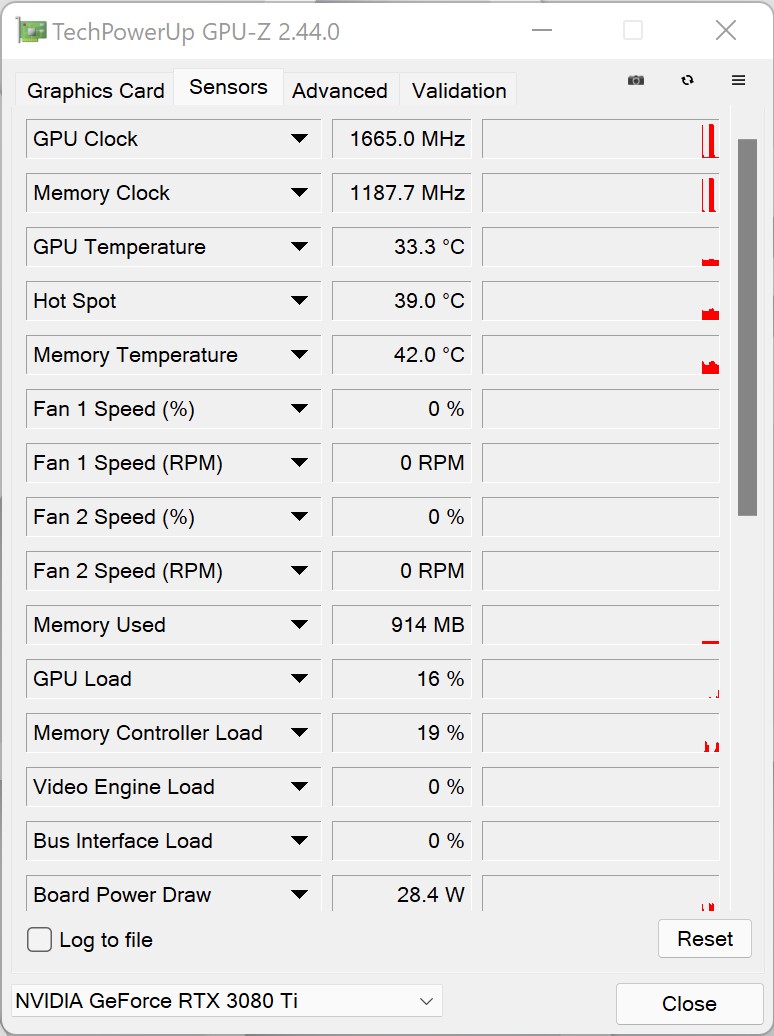
La enorme carcasa ofrece una gran superficie para permitir la transferencia de calor. Bajo carga, ésta se calienta notablemente, y el llamado efecto chimenea asegura que el aire frío es atraído desde los lados y guiado directamente por las aletas de refrigeración de las dos AiO para luego ser empujado fuera de la caja por el gran ventilador de 140 mm de la parte superior. Para una refrigeración eficaz de la tarjeta gráfica, ésta está equipada adicionalmente con dos ventiladores más pequeños para refrigerar el transformador y la VRAM.
Este concepto de refrigeración funciona bien, y todos los componentes se refrigeran eficazmente, sin sobrecalentarse a plena carga. Sin embargo, la CPU alcanzó los 100 °C durante la prueba de estrés. Esto demuestra por qué Corsair limita su rendimiento a un máximo de 175 vatios. Aquellos para los que los 100 °C siguen siendo demasiado calientes también pueden reducir el rendimiento aún más en la BIOS. Sin embargo, las temperaturas del Intel Core i9-12900Ksiguen sin plantear problemas, como ya comprobamos durante el bucle Cinebench R15 Multi. El test de estrés con FurMark y Prime95 ejecutándose al mismo tiempo representa un escenario extremo que difícilmente debería ocurrir en el funcionamiento diario
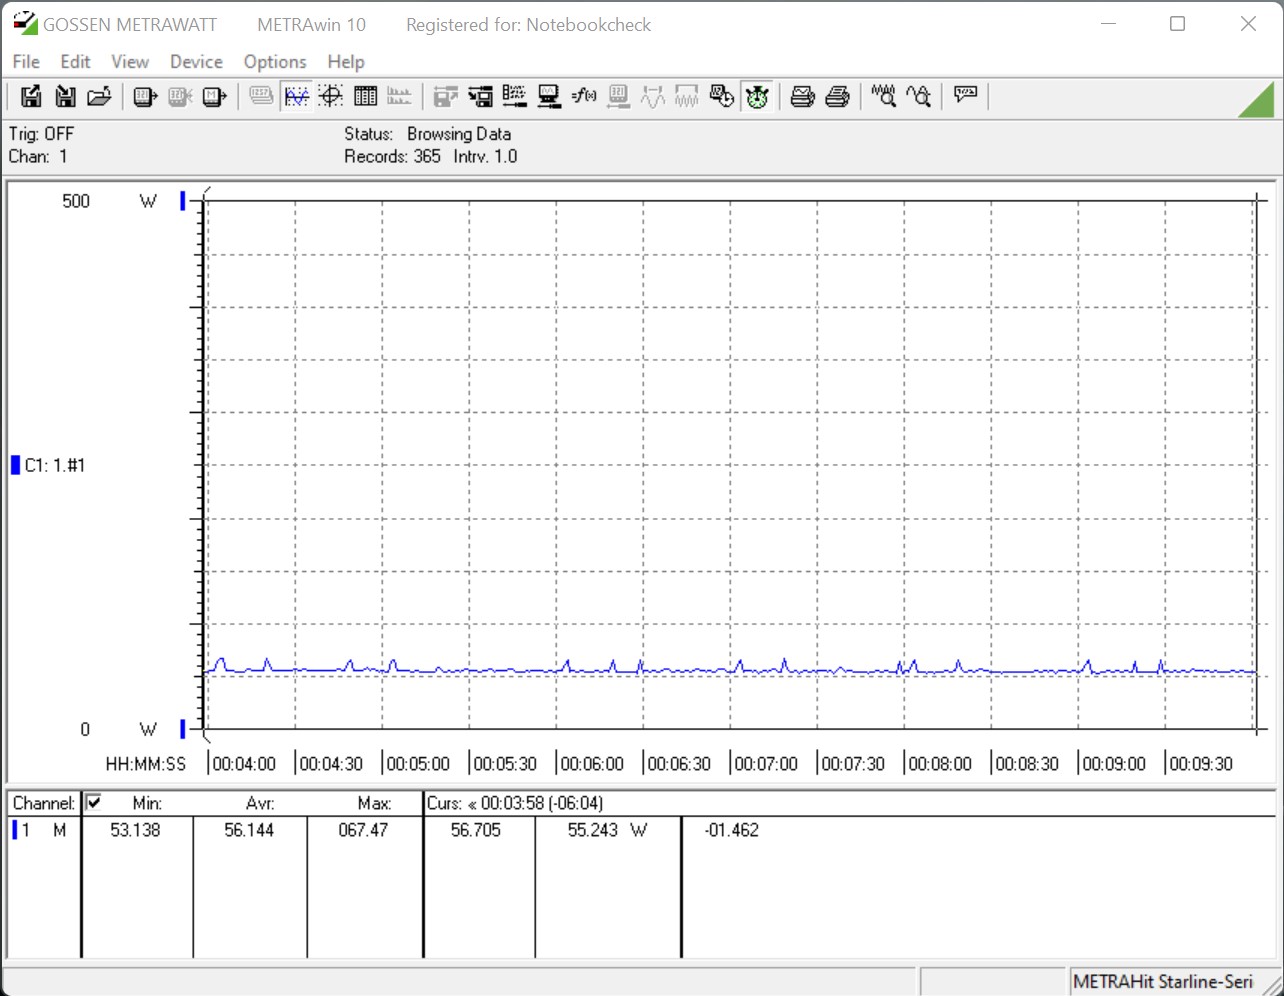
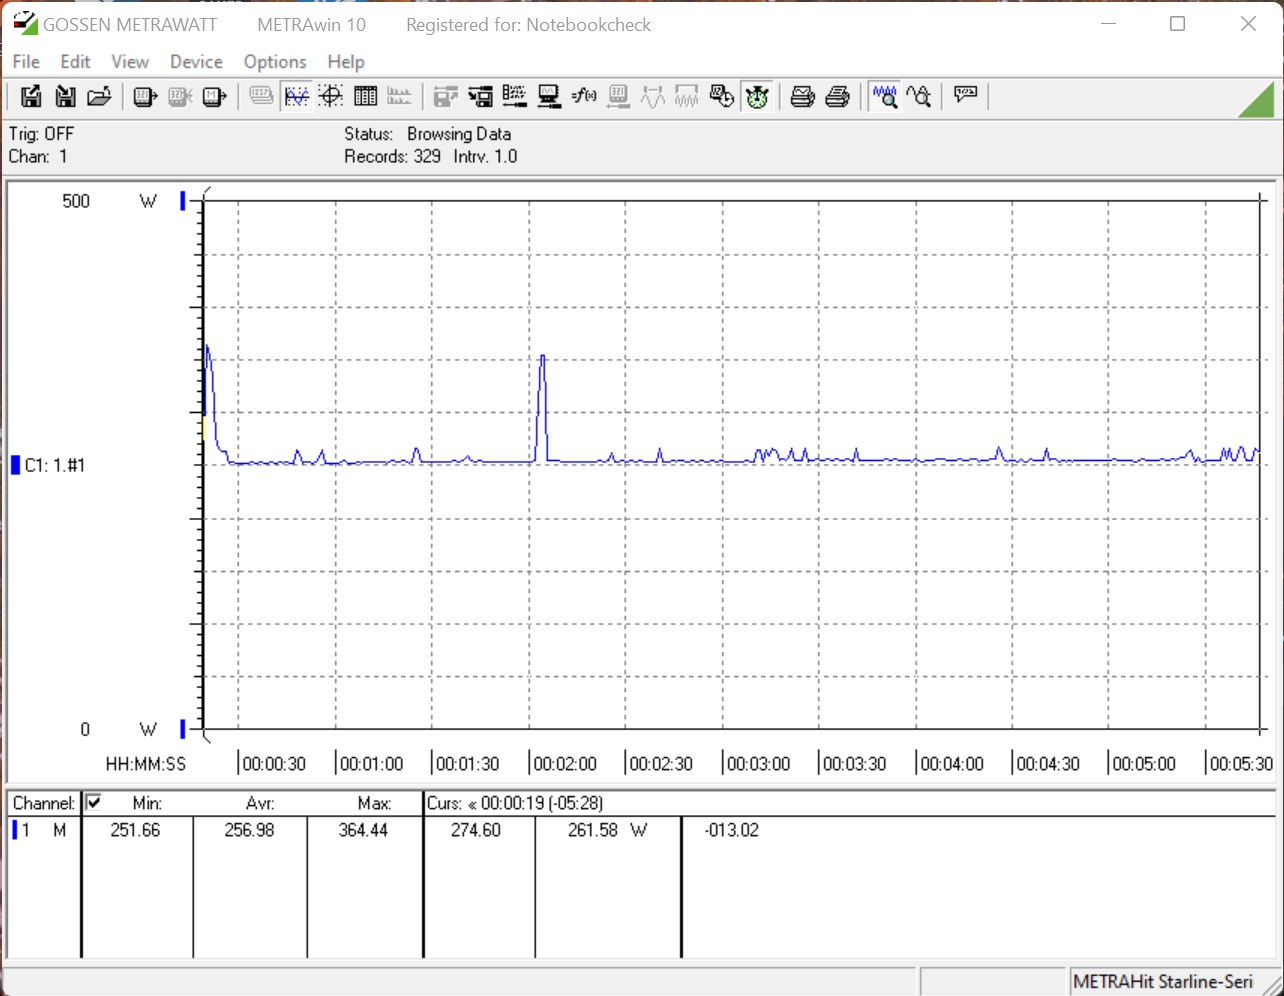
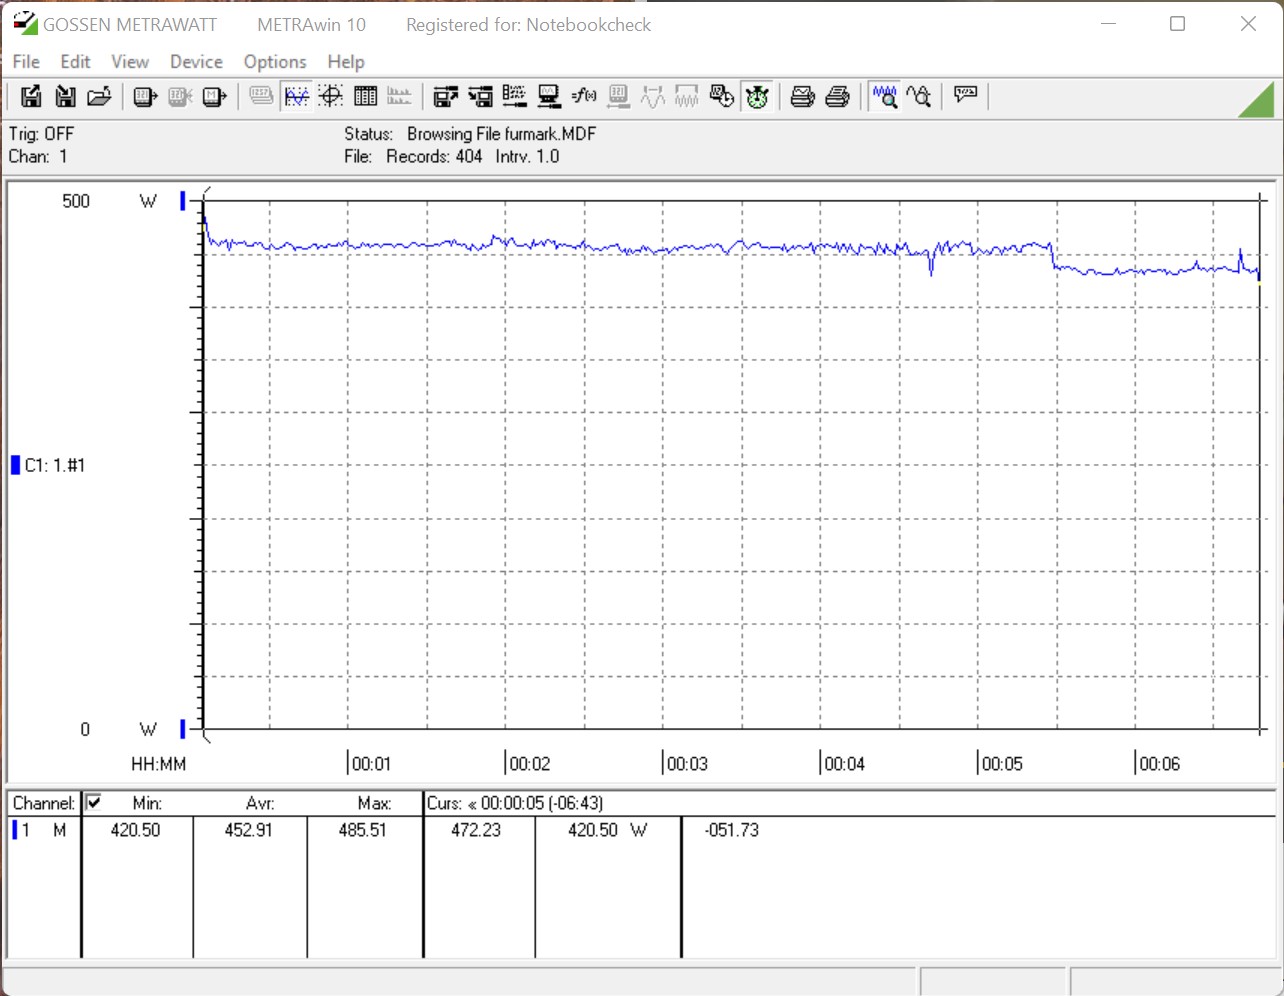
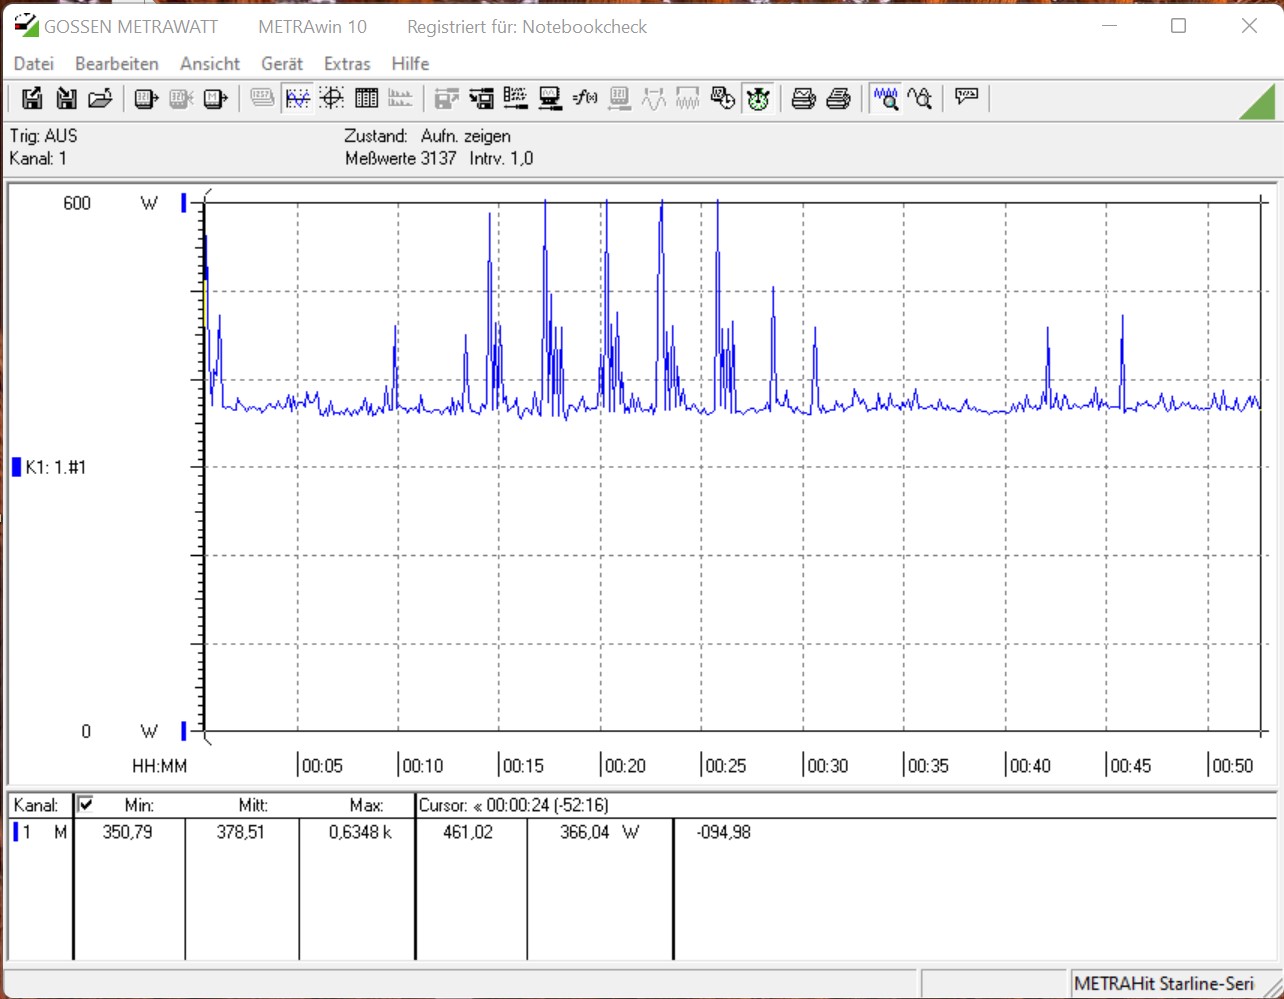
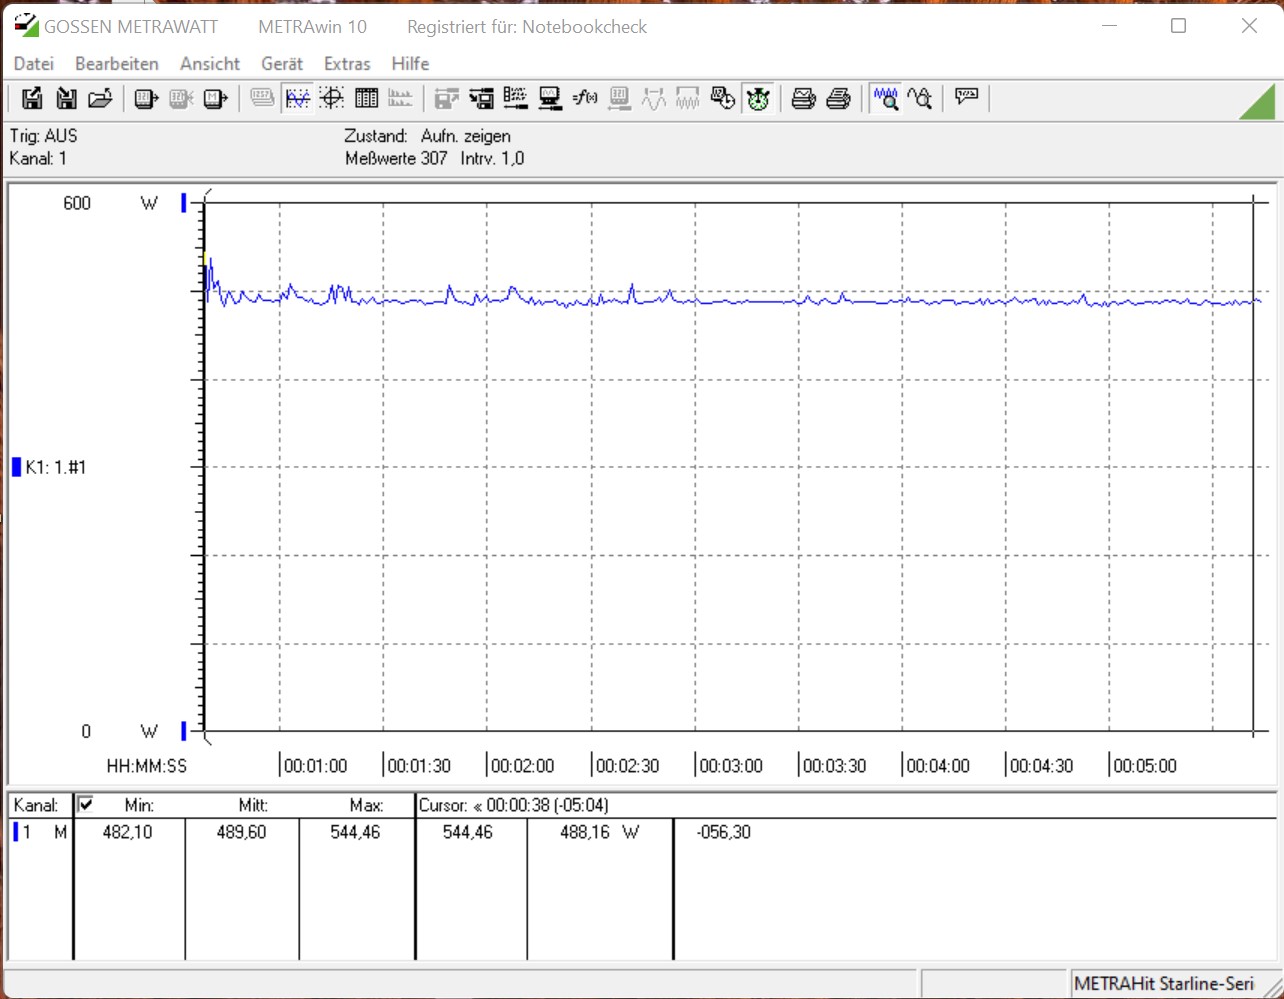
En cuanto al consumo de energía, el sistema destaca con un bajo consumo durante el funcionamiento en vacío. Sólo 56 vatios es un buen valor. Mientras juega, la compacta fuente de alimentación de 750 vatios (construcción SFF) tiene que proporcionar 489 vatios de media, con los picos alcanzando hasta 544 vatios. Durante el test de estrés, incluso medimos brevemente 635 vatios. La fuente de alimentación siempre fue capaz de manejar esto, y no notamos ningún problema.
| Power Consumption - 1920x1080 The Witcher 3 ultra (external Monitor) | |
| Intel Core i9-12900K, NVIDIA GeForce RTX 3080 Ti | |
| Intel Core i9-12900K, NVIDIA Titan RTX (Idle: 70.5 W) | |
| AMD Ryzen 9 5950X, NVIDIA Titan RTX (Idle: 78 W) | |
| AMD Ryzen 9 5900X, NVIDIA Titan RTX (Idle: 78.1 W) | |
| Intel Core i5-11600K, NVIDIA Titan RTX (Idle: 69.49 W) | |
| Intel Core i5-12600K, NVIDIA Titan RTX (Idle: 70.45 W) | |
| Intel Core i9-11900K, NVIDIA Titan RTX (Idle: 57.3 W) | |
* ... más pequeño es mejor
| Power Consumption - 1280x720 FurMark 1.19 GPU Stress Test (external Monitor) | |
| AMD Ryzen 9 5900X, NVIDIA GeForce RTX 3090 (Idle: 105.9 W) | |
| AMD Ryzen 9 5900X, NVIDIA GeForce RTX 3080 (Idle: 88.3 W) | |
| Intel Core i9-12900K, NVIDIA GeForce RTX 3080 Ti | |
| AMD Ryzen 9 5950X, AMD Radeon RX 6800 XT (Idle: 99.5 W) | |
| AMD Ryzen 9 5900X, NVIDIA GeForce RTX 3070 (Idle: 95.1 W) | |
| AMD Ryzen 9 5900X, AMD Radeon RX 6800 (Idle: 81.4 W) | |
| AMD Ryzen 9 5900X, AMD Radeon RX 6700 XT (Idle: 77.1 W) | |
* ... más pequeño es mejor
Power consumption The Witcher 3 / stress test
Power consumption with external monitor
Veredicto - Un PC para juegos 4K perfecto
Pro
Contra
Aunque el Corsair One i300 no es una novedad absoluta, esto no es absolutamente necesario. El aspecto del compacto PC premium es sencillo y moderno. Además, el diseño interno permite utilizar componentes convencionales en cuanto a la placa base y la fuente de alimentación. Sólo el sistema de refrigeración es un diseño propio. En nuestro modelo de prueba, lamentablemente no hace justicia al segmento premium. No obstante, los dos AiOs funcionan bien, refrigerando el sistema de forma fiable. Sin embargo, las dos bombas se hacen notar acústicamente. A la larga, esto es desagradable y considerando el precio de compra de 5099 Euros (~$5722), tampoco es algo que haya que aceptar. Pero el diseño del sistema de refrigeración sigue siendo lo más destacado además de los componentes más actuales. Con el Intel Core i9-12900Kestá la CPU más rápida para juegos, que combinada con una placa base actual que incluye RAM DDR5 y unaNvidia GeForce RTX 3080 Tipermite jugar a 4K sin ningún tipo de compromiso. Además, también hay un SSD de 2 TB con muy buenas tasas de transferencia.
Gracias a un Intel Core i9-12900K y una Nvidia GeForce RTX 3080 Ti, elCorsair One i300 ofrece
un rendimiento de juego 4K utilizando el mínimo espacio.
Un producto premium, naturalmente, también tiene su precio. A 5099 Euros (~5722) para nuestra unidad de pruebas, no es precisamente barato, y aún así no deberíamos hablar mal de los componentes por separado. La carcasa no está disponible y no puede comprarse por separado. Además, la disponibilidad de varias tarjetas gráficas y otros componentes actuales sigue siendo un problema, lo que casi hace que el precio sea justificable en general. El sistema también está equipado con dos AiOs que fueron desarrollados específicamente para la serie Corsair One. Esto hay que tenerlo en cuenta a la hora de considerar el precio. Sin embargo, en nuestra opinión el Corsair One i300 con un Intel Core i9-12900K y Nvidia GeForce RTX 3080 sería el sistema más razonable en términos de precio. Pero entonces la RAM y el SSD sólo serían la mitad, con 32 GB y 1 TB respectivamente. Un sistema con esos componentes está disponible por 4099 euros (4562 dólares). El déficit de rendimiento de la Nvidia GeForce RTX 3080 en comparación con el modelo Ti es limitado y aceptable.
Precio y disponibilidad
En el momento de realizar esta prueba, el dispositivo se puede adquirir directamente en Corsair por 5000 dólares. Como alternativa, el modelo más pequeño también se puede comprar en Amazon por 4000 dólares.

