Análisis del Schenker XMG Pro 17 con RTX 3080 (Clevo PC70HS): Un portátil de juegos ultradelgado y estación de trabajo en uno
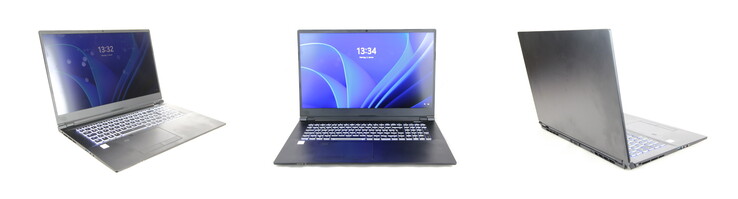
La última vez que probamos la versión de 17 pulgadas del XMG Pro fue a principios de 2020, y desde entonces han pasado muchas cosas. Como vimos en la versión de 15 pulgadasen marzo del año pasado, Schenker ha reelaborado por completo el diseño, convirtiendo una carcasa que solía ser gruesa en un sistema particularmente delgado con hardware de alto rendimiento que está dirigido tanto a los jugadores como a los profesionales creativos. Ahora nos preguntamos si este diseño ultrafino puede ofrecer suficiente potencia para los jugadores y los profesionales al mismo tiempo.
El predecesor con su RTX 2060 y Intel Core i7-9750Hapenas sirve para la comparación. Para las pruebas, por tanto, usamos otros competidores como el Alienware x17 R1y elMedion Erazer Beast X25y el significativamente más caro Asus ROG Zephyrus S17y MSI GS76 Stealth 11UH, así como el de 15 pulgadas XMG Pro 15para comparar
Possible Competitors for Comparison
Valoración | Fecha | Modelo | Peso | Altura | Tamaño | Resolución | Precio |
|---|---|---|---|---|---|---|---|
| 84.7 % v7 (old) | 01/2022 | Schenker XMG Pro 17 (Late 2021, RTX 3080) i7-11800H, GeForce RTX 3080 Laptop GPU | 2.4 kg | 19.9 mm | 17.30" | 3840x2160 | |
| 84.6 % v7 (old) | 01/2022 | Schenker XMG Pro 15 (Late 2021) i7-11800H, GeForce RTX 3080 Laptop GPU | 2 kg | 19.8 mm | 15.60" | 3840x2160 | |
| 89 % v7 (old) | 09/2021 | Alienware x17 RTX 3080 P48E i7-11800H, GeForce RTX 3080 Laptop GPU | 3.2 kg | 21.4 mm | 17.30" | 3840x2160 | |
| 85 % v7 (old) | 07/2021 | Medion Erazer Beast X25 R9 5900HX, GeForce RTX 3080 Laptop GPU | 2.3 kg | 23 mm | 17.30" | 1920x1080 | |
| 86.2 % v7 (old) | 09/2021 | MSI GS76 Stealth 11UH i9-11900H, GeForce RTX 3080 Laptop GPU | 2.4 kg | 20 mm | 17.30" | 3840x2160 | |
| 90.1 % v7 (old) | 07/2021 | Asus ROG Zephyrus S17 GX703HSD i9-11900H, GeForce RTX 3080 Laptop GPU | 2.8 kg | 19.9 mm | 17.30" | 2560x1440 |
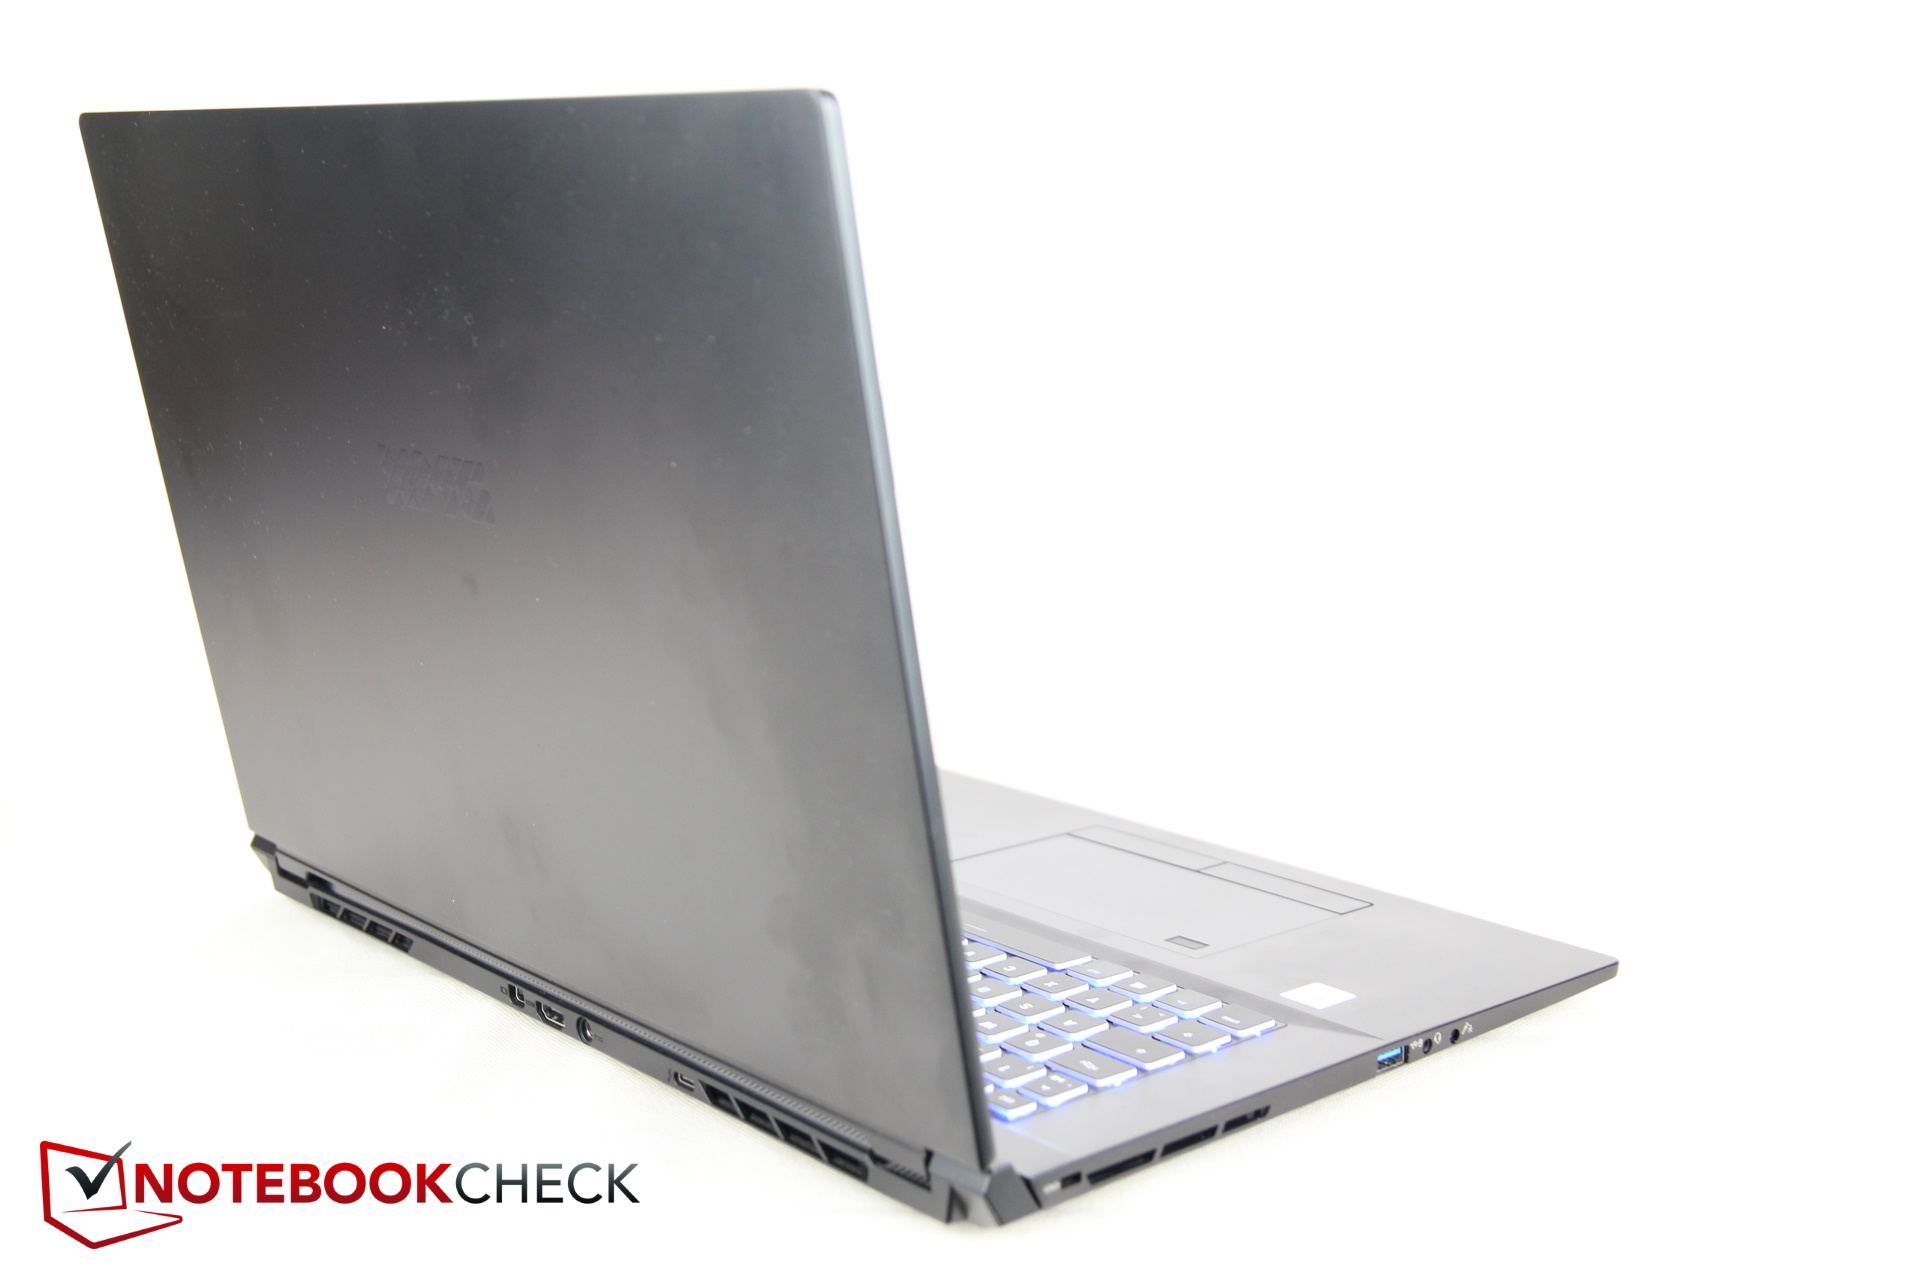
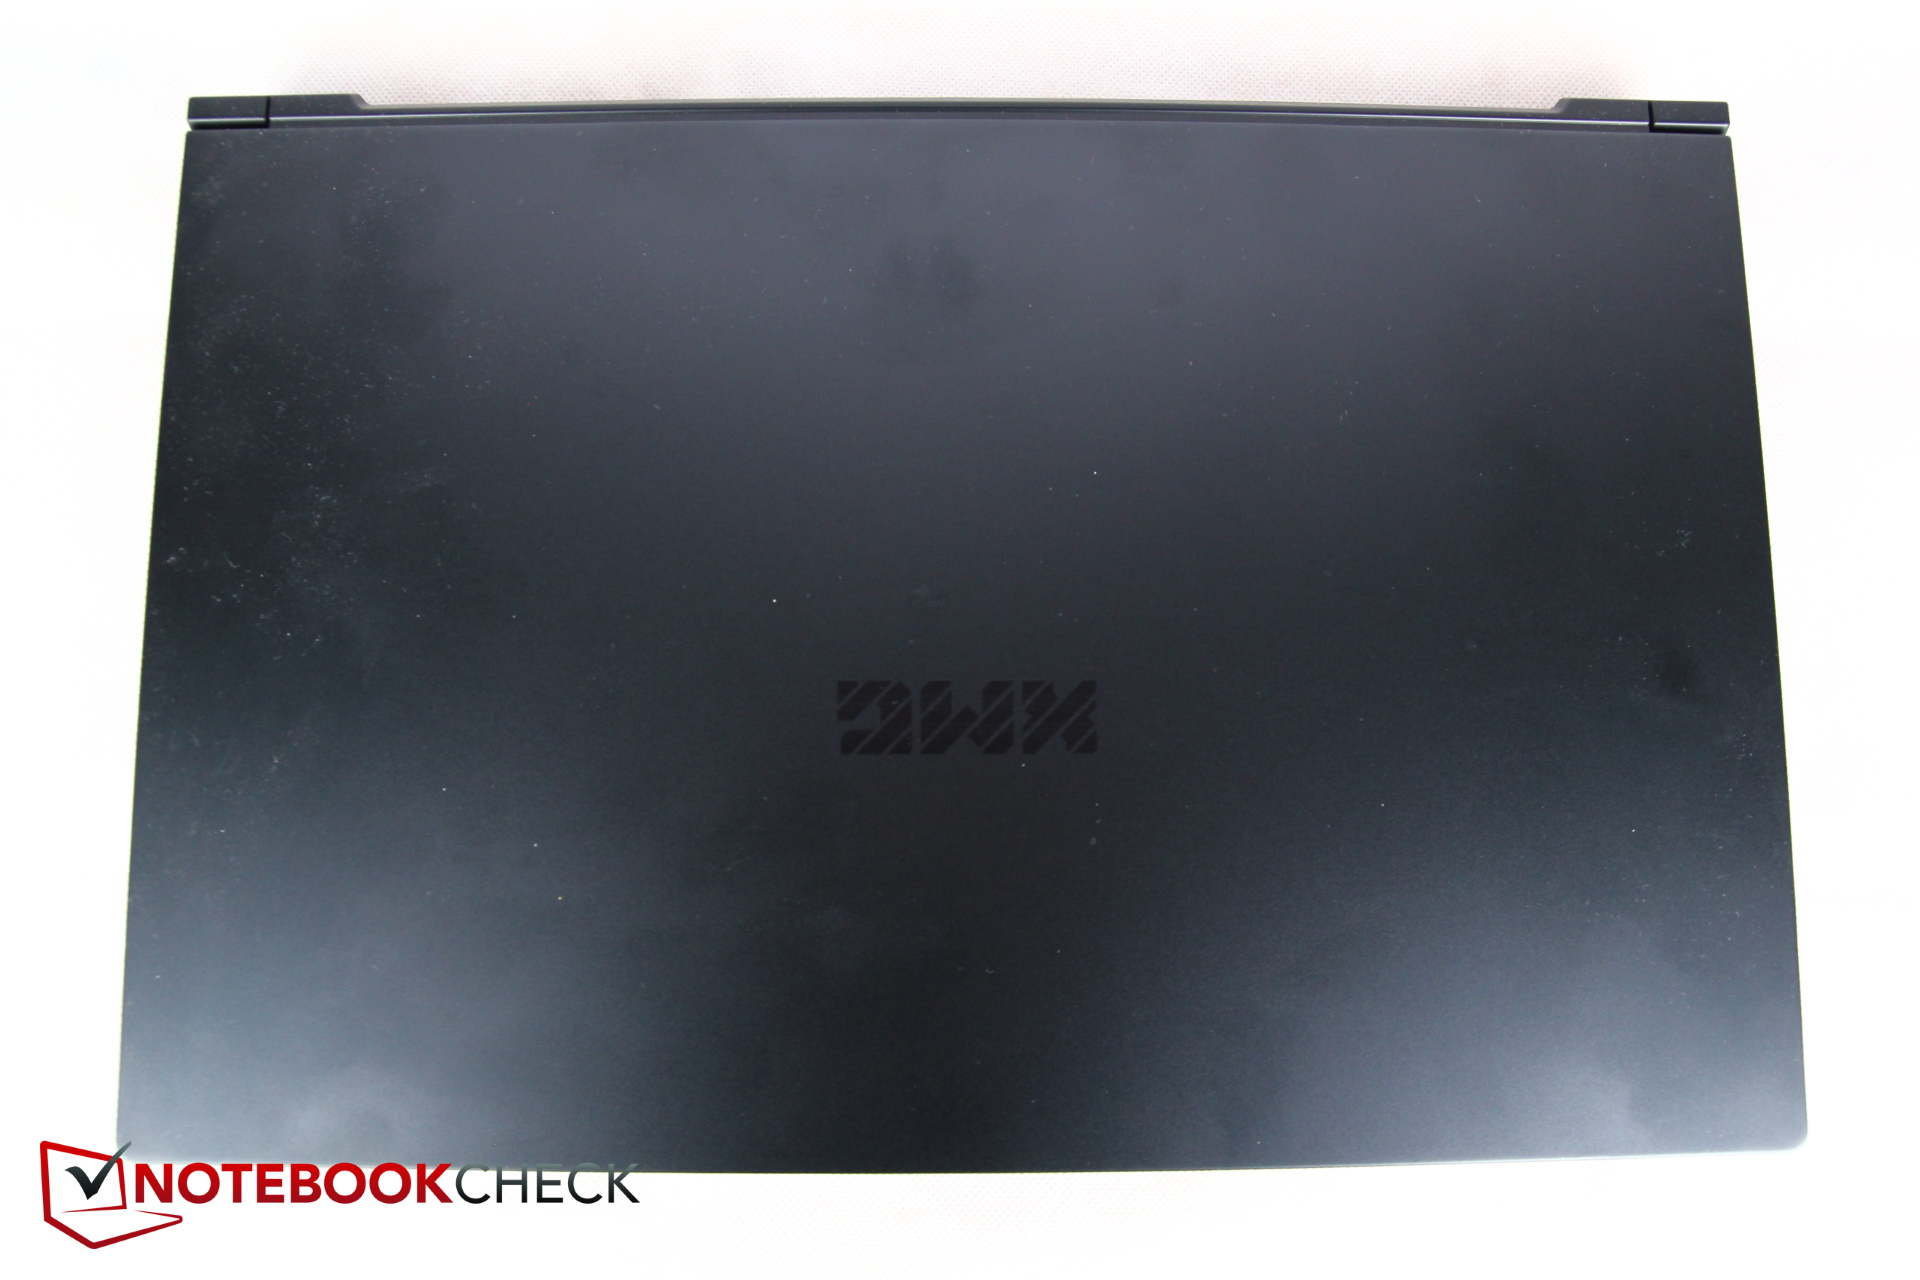
Carcasa - Carcasa metálica ultrafina con teclado de plástico
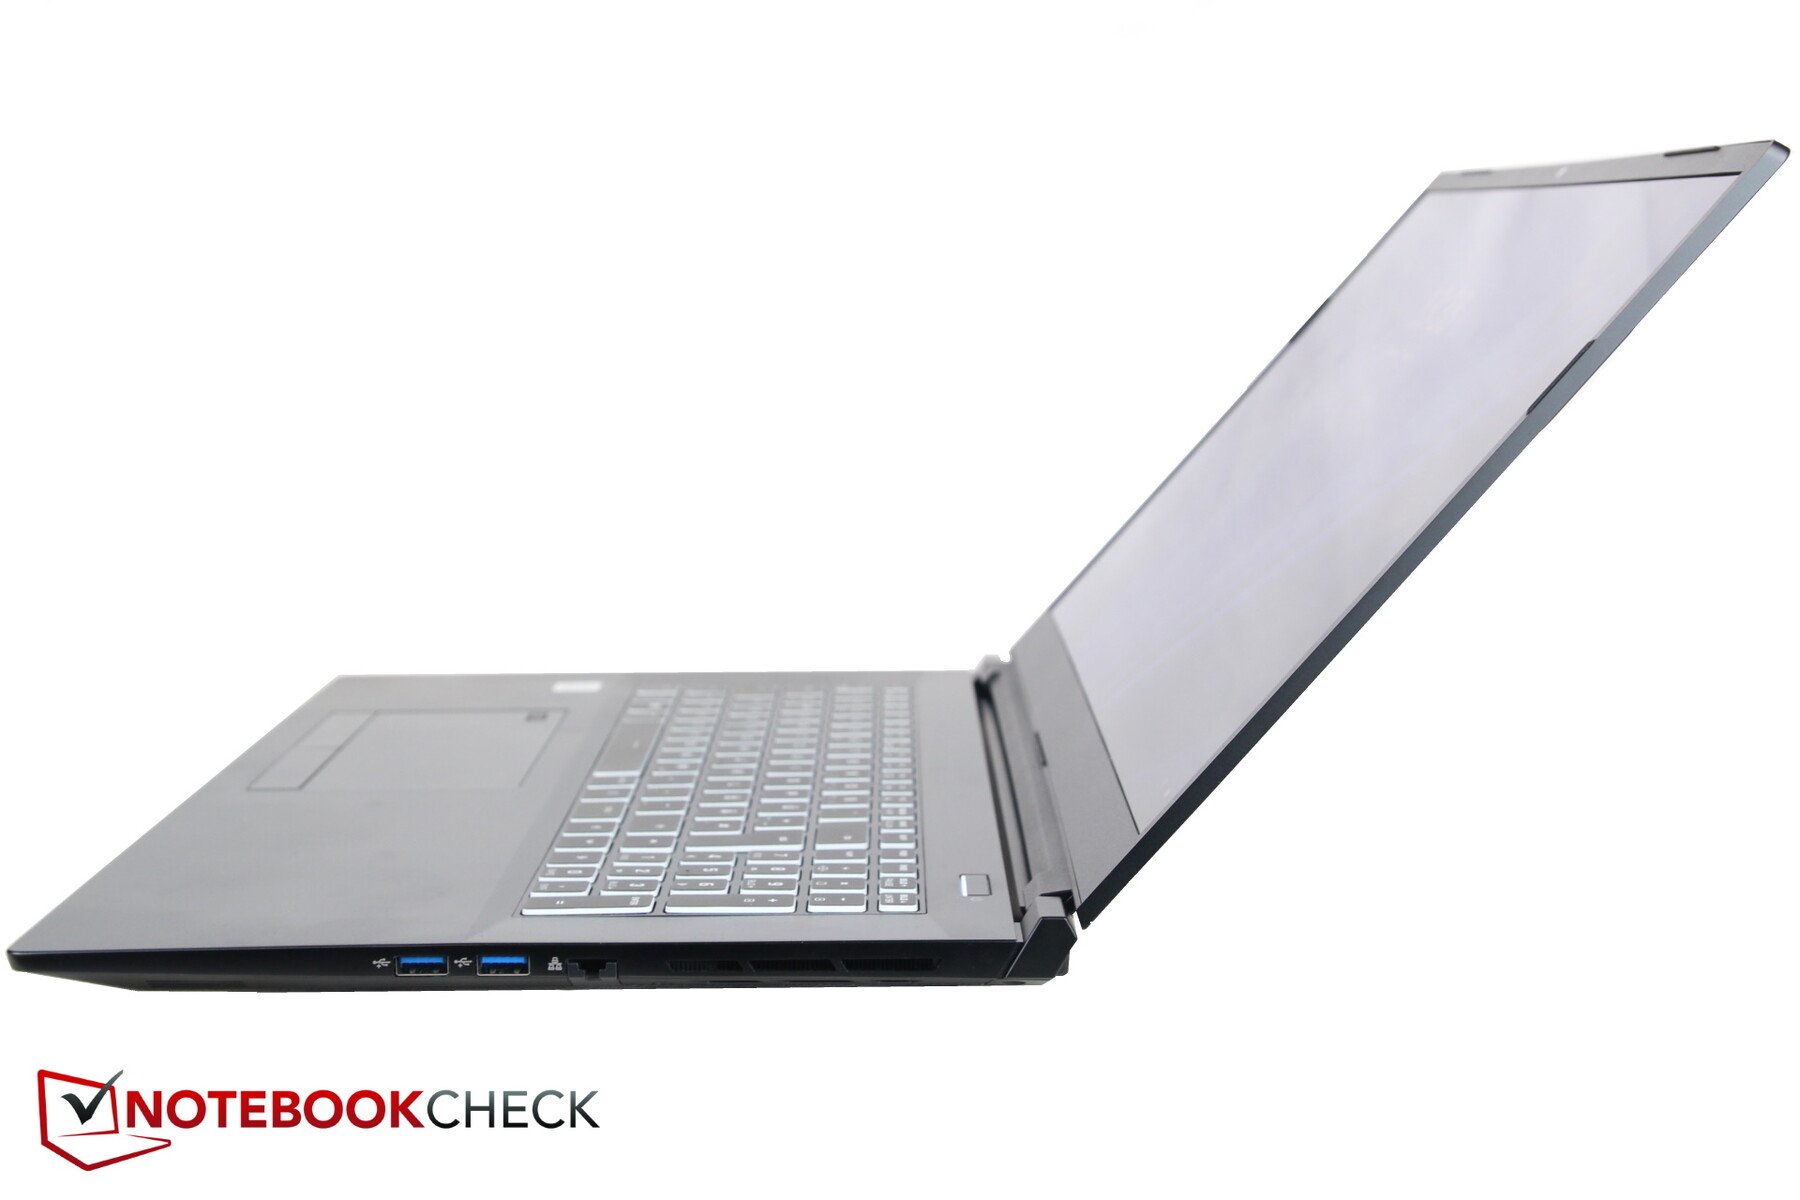
La carcasa negra y delgada es ahora casi completamente de metal, excepto los biseles de la pantalla y el teclado que se encuentra en la base. Para un portátil de juegos, el diseño se mantiene muy modesto, reflejando más sus ambiciones paralelas de ser una estación de trabajo profesional.
La base no es completamente resistente a la deformación, pero sigue siendo bastante robusta, aunque sigue produciendo varios crujidos cuando intentamos doblarla, especialmente en el lado derecho
Aunque la tapa de la pantalla también puede doblarse ligeramente, parece cómodamente robusta gracias al marco metálico. Las bisagras podrían haber estado más ajustadas, sobre todo en los pequeños ángulos de apertura
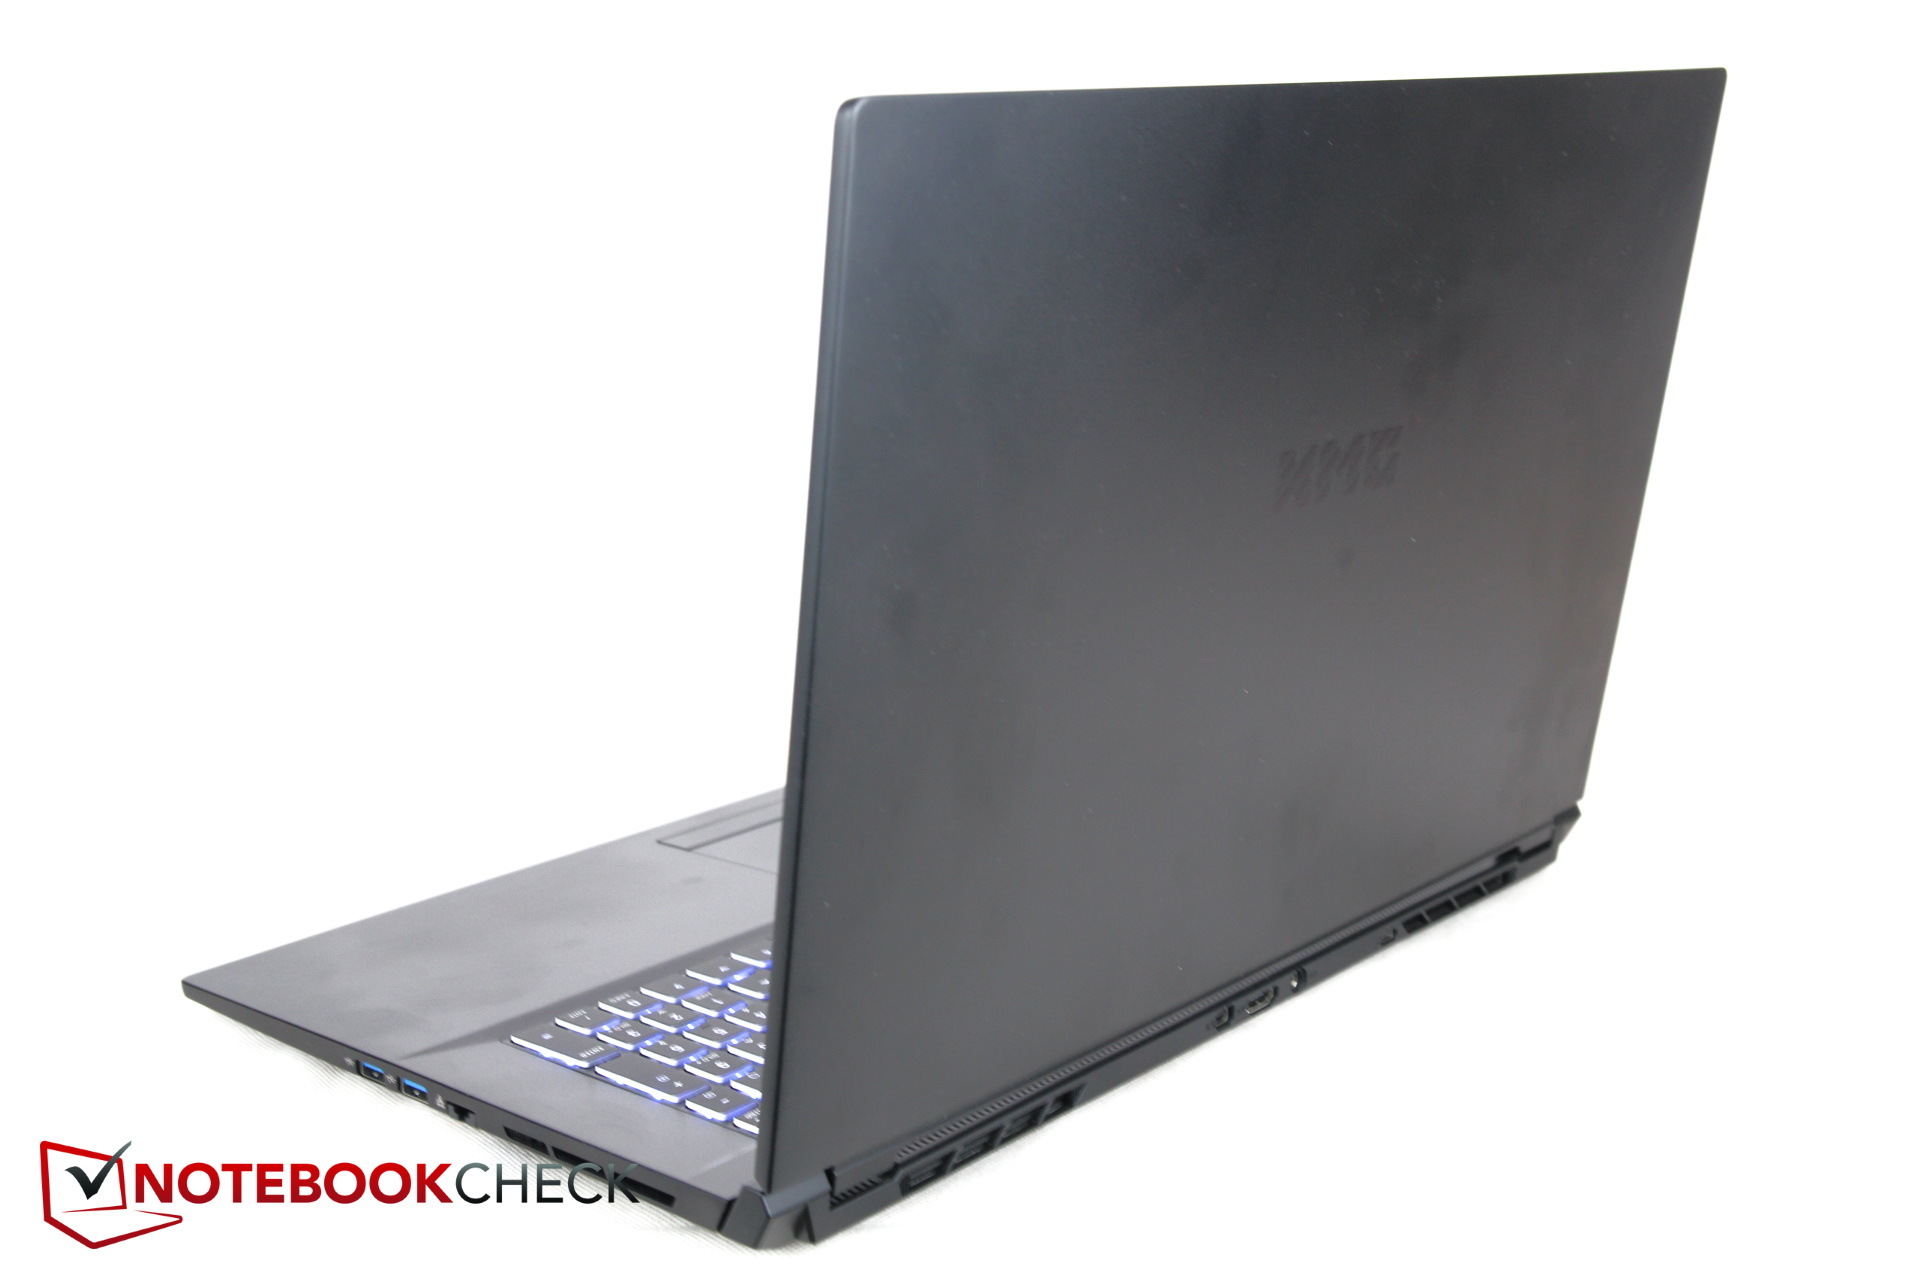
Schenker ofrece varios portátiles de 17 pulgadas, pero el nuevo XMG Pro 17 puede superar fácilmente a los Key, Apex, Core, Ultra, Focus, Neo y al predecesor en términos de diseño delgado. Es un centímetro (~0,4 pulgadas) más delgado, lo que lo convierte en el Schenker de 17 pulgadas más delgado en general
El MSI y el Asus ROG son igualmente delgados, pero cuestan bastante más. El Alienware y el Medion no pueden estar a la altura, aunque al menos el Alienware es todo menos grueso
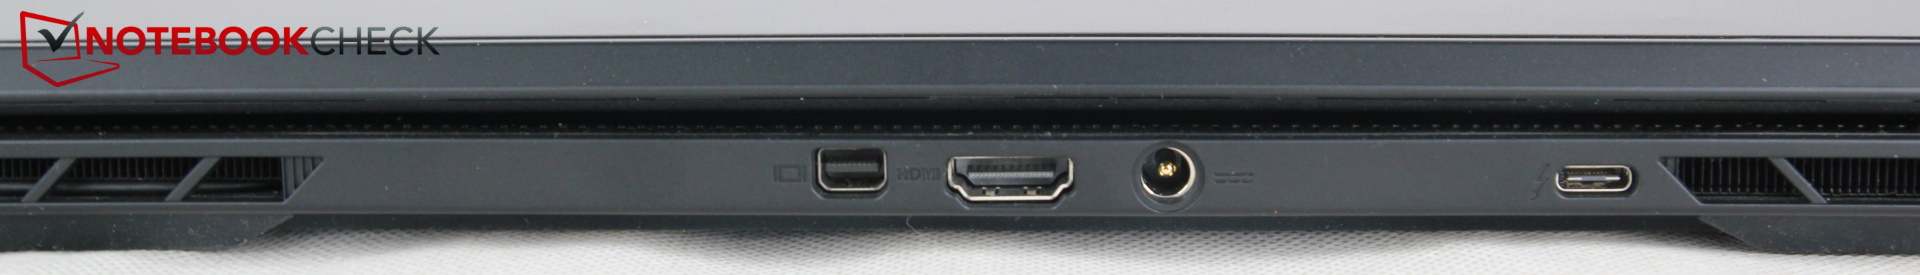
Equipo - 3 monitores externos
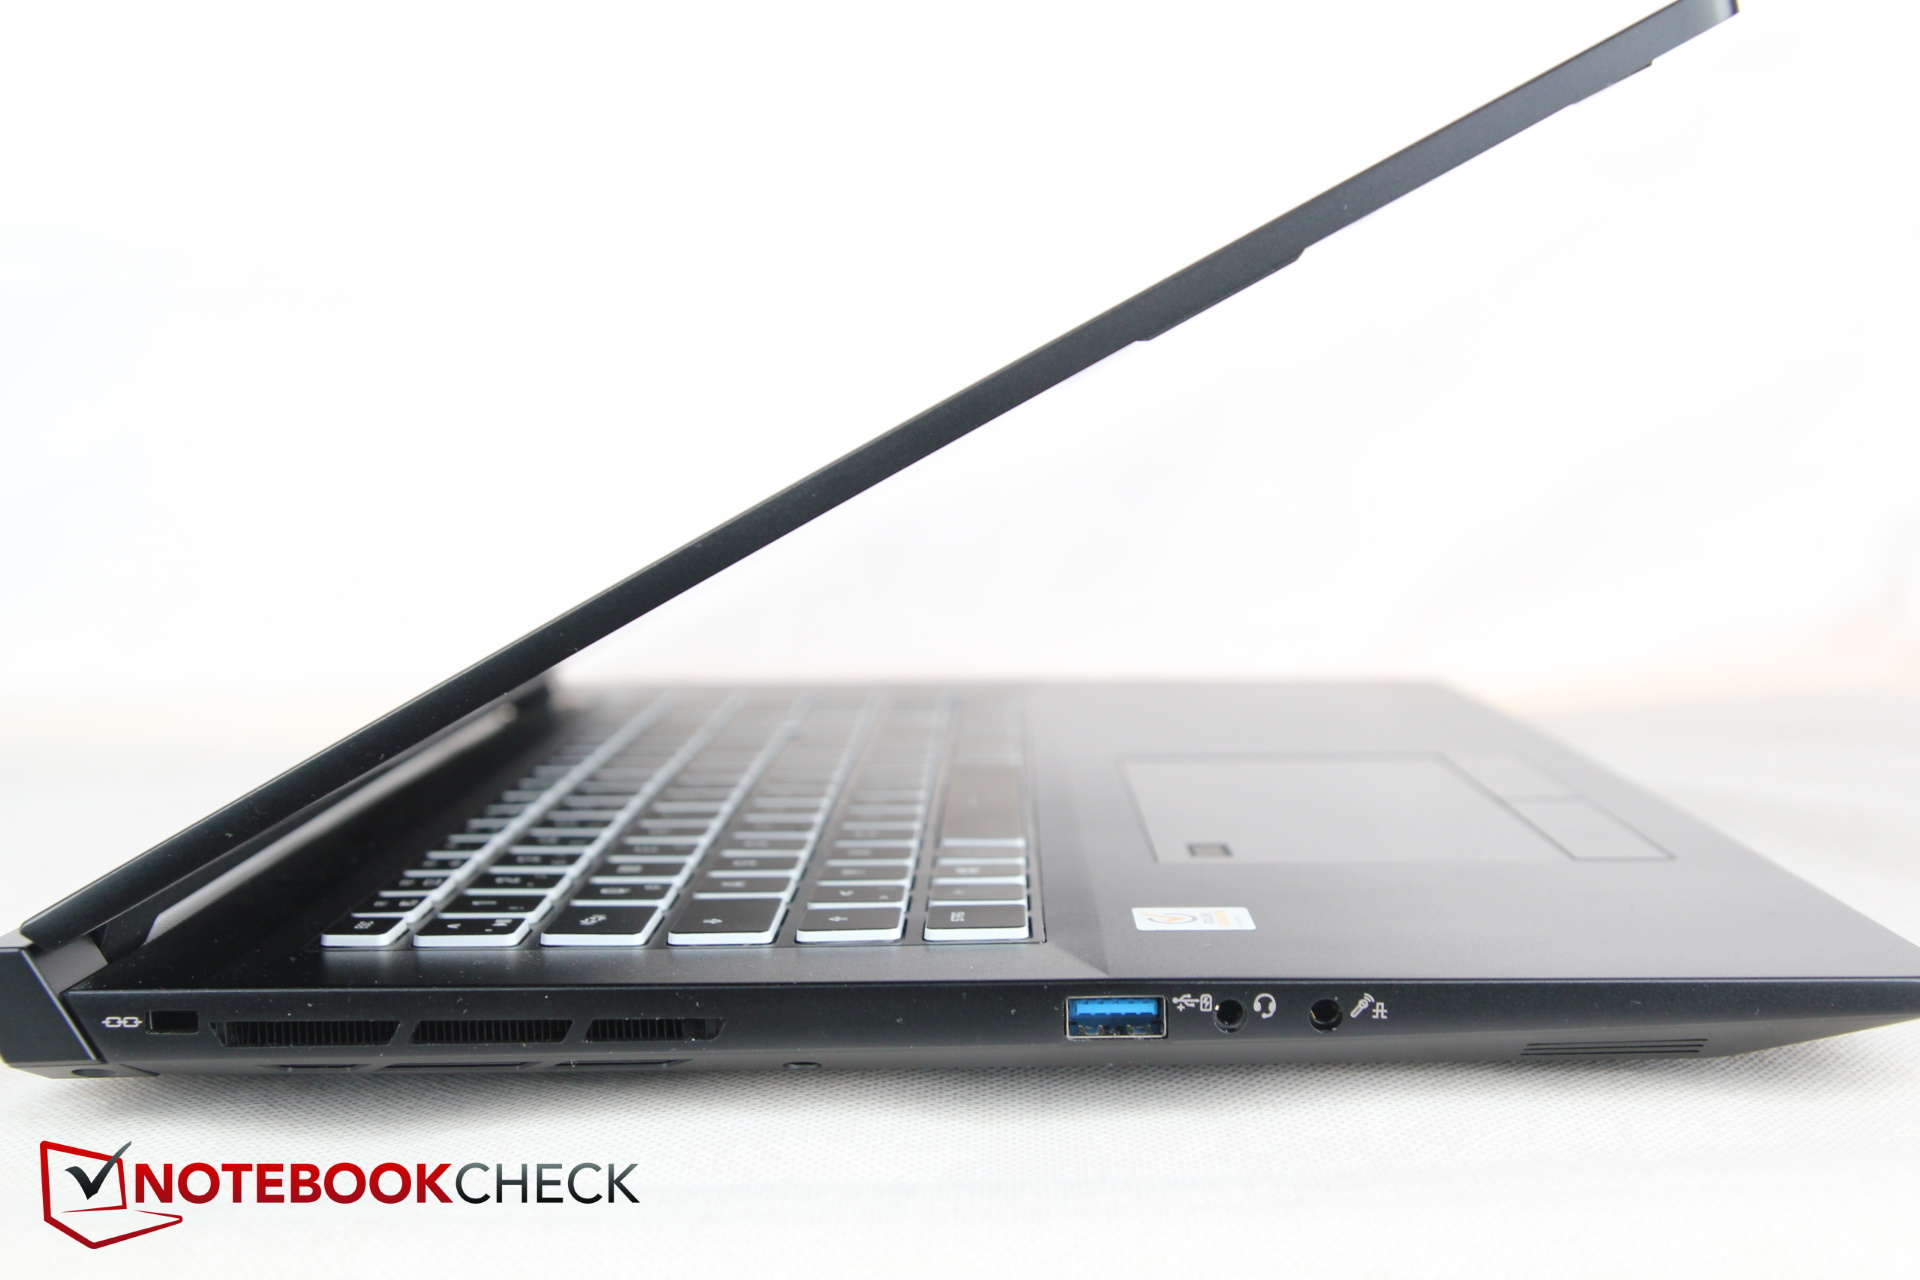
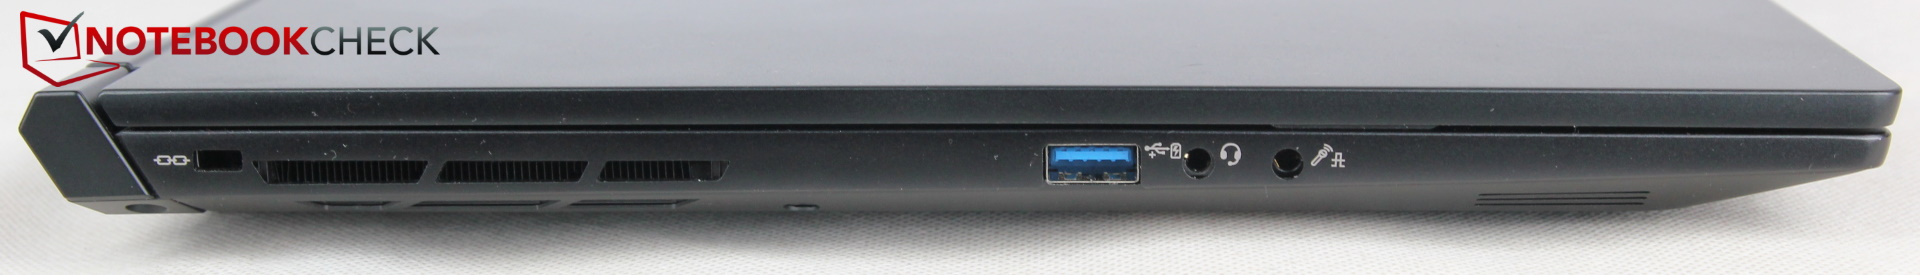
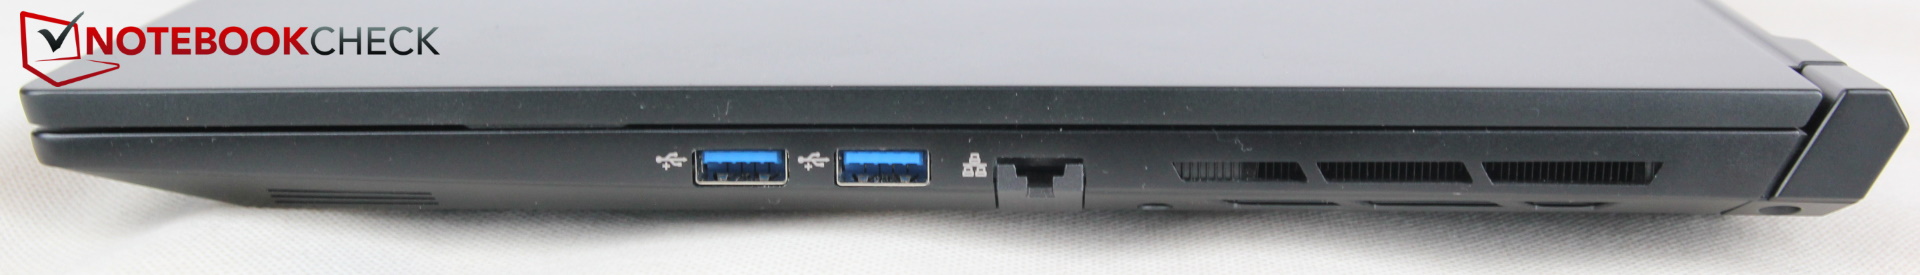
Con Thunderbolt 4 (USB-C sin función de carga), MiniDisplayport y HDMI, puedes conectar tres monitores externos al Pro 17. Todos los puertos de pantalla son compatibles con G-Sync. Los puertos separados para el micrófono y los auriculares también son positivos
Por otro lado, los usuarios profesionales probablemente echarán de menos un lector de tarjetas SD, y la posición de las conexiones también da algún pequeño motivo de queja. Aunque los puertos están distribuidos por la parte trasera, el lado izquierdo y el derecho, por desgracia están colocados muy juntos. En este sentido, todos los fabricantes deberían echar un vistazo al asequible MSI GP66 Leopardcomo un buen ejemplo
Comunicación
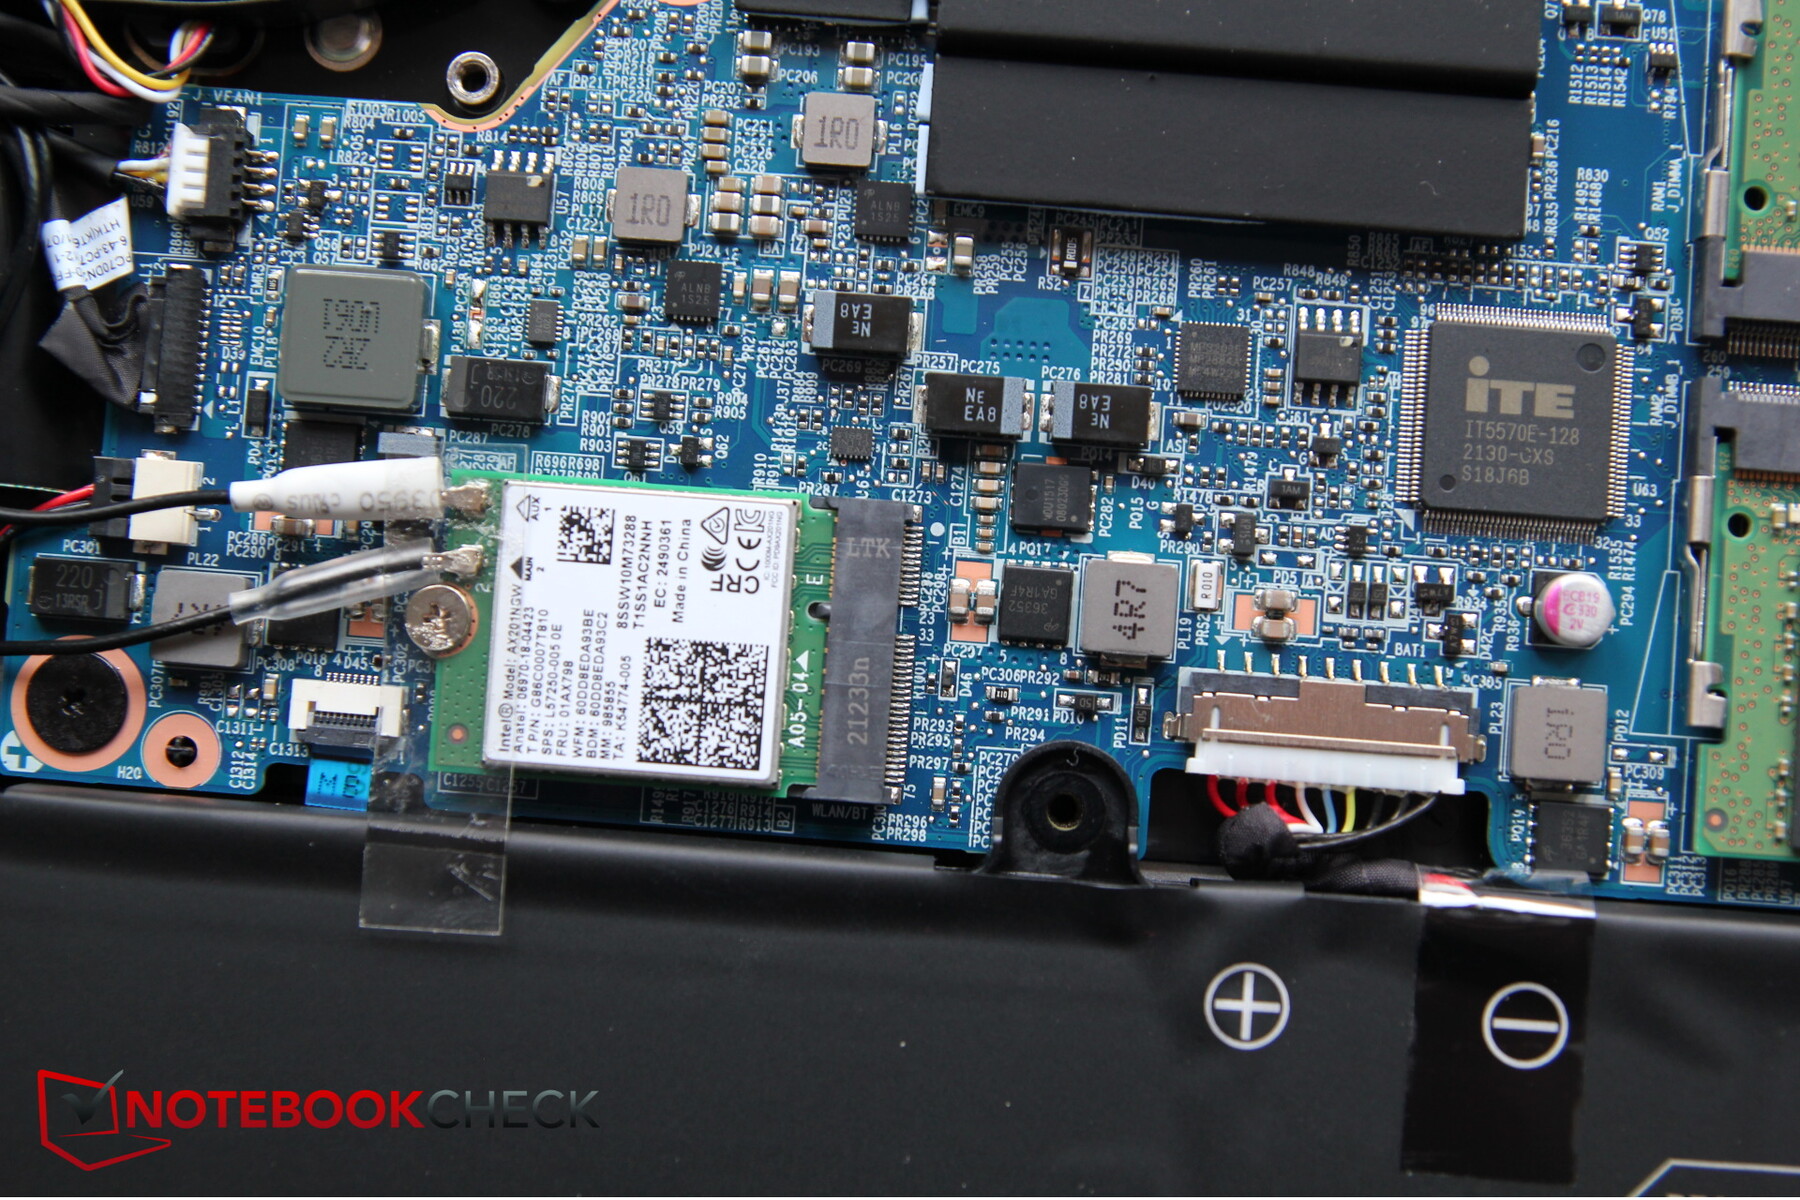
Aunque el módulo WiFi Intel AX201 utilizado aquí alcanza velocidades de Gigabit, sigue rindiendo ligeramente por debajo de sus posibilidades, sobre todo al recibir datos.
Cámara web
A pesar de que el grupo objetivo son los profesionales creativos, hay una cámara web estándar de 720p que lucha con desviaciones de color aún mayores que las de los competidores, que ya no son muy buenas


")
")
 GeForce RTX 3080 Laptop GPU, i7-11800H, Samsung SSD 980 Pro 1TB MZ-V8P1T0BW")
 GeForce RTX 3080 Laptop GPU, i7-11800H, Samsung SSD 980 Pro 1TB MZ-V8P1T0BW")
Seguridad
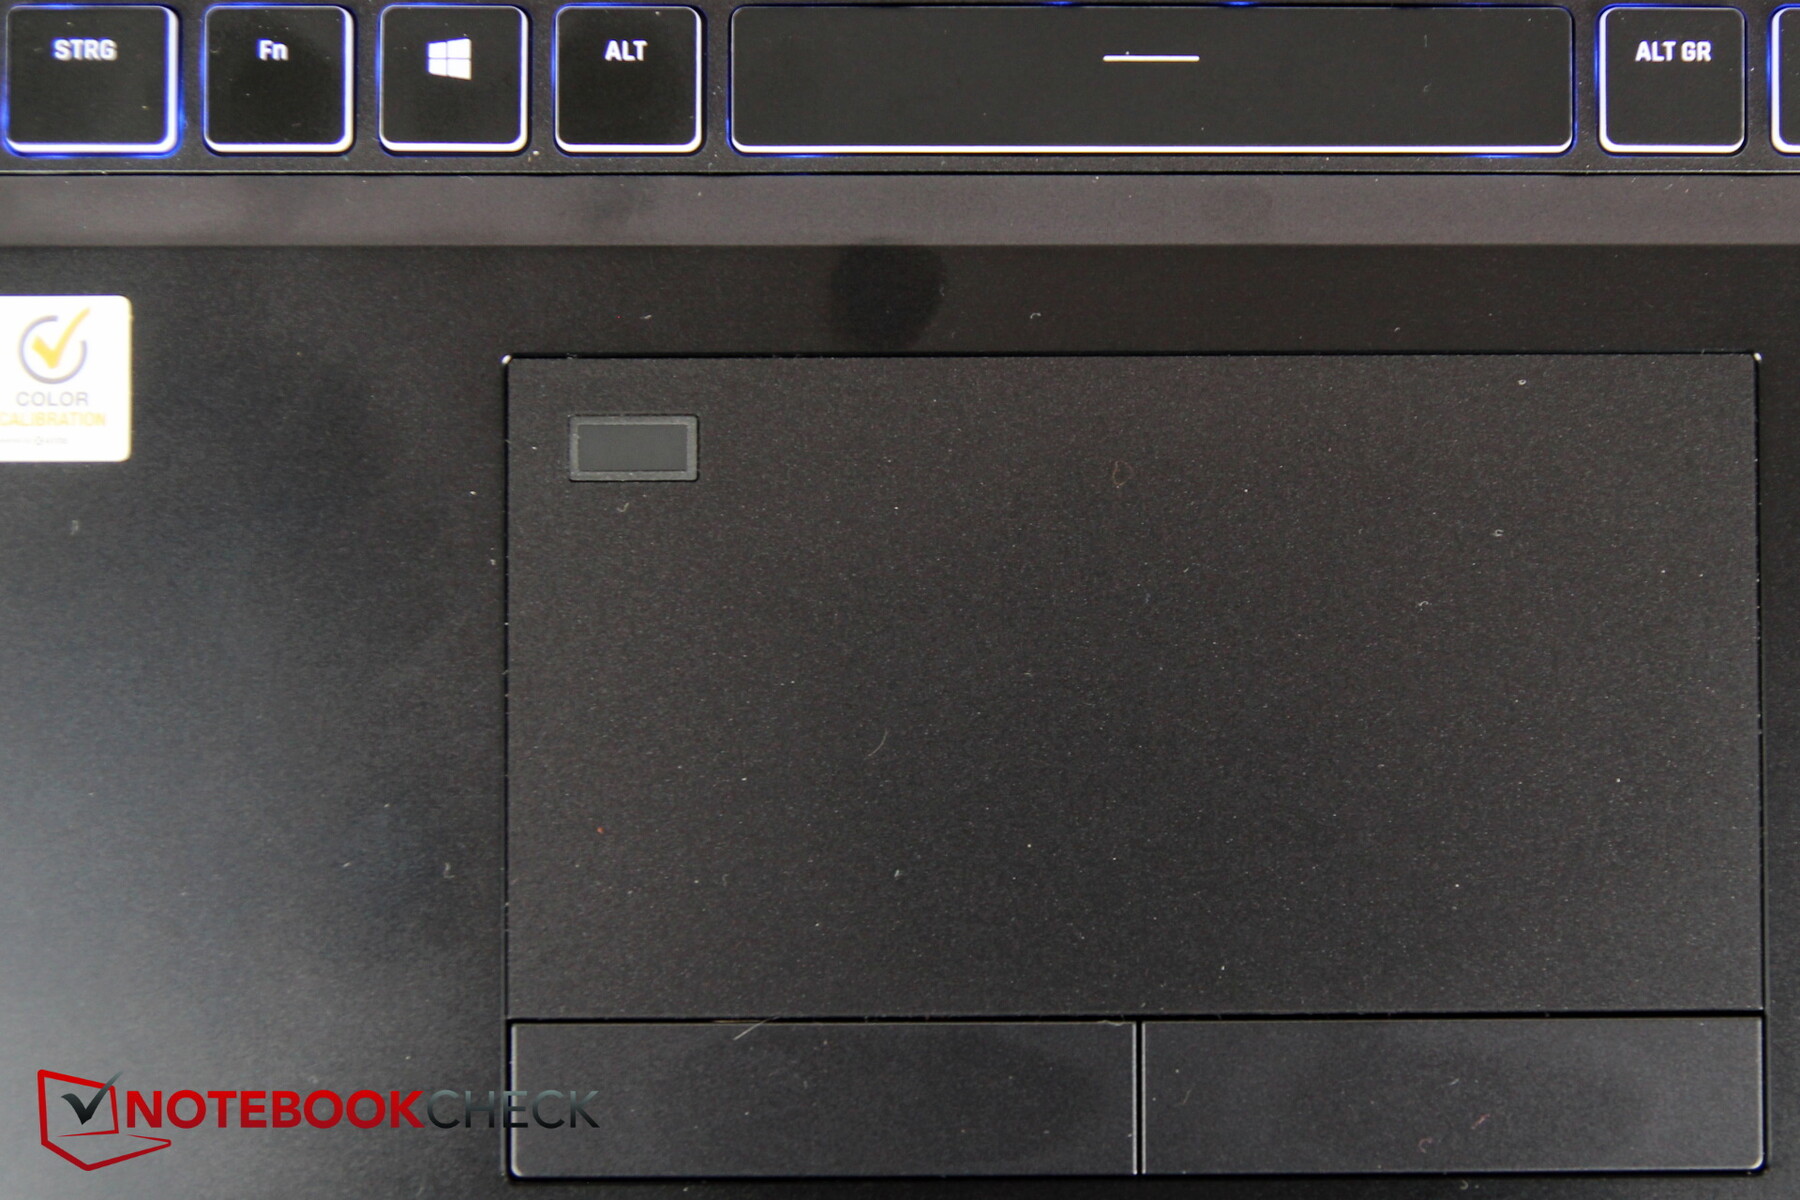
Hay una ranura de bloqueo Kensington y también TPM 2.0. Además, el Pro 17 ofrece un sensor de huellas dactilares, que está integrado en la esquina superior izquierda del touchpad.
El sensor funciona en combinación con Windows Hello y logra desbloquear el portátil muy rápidamente
Accesorios
Además de la documentación habitual, como es típico en Schenker, la caja incluye una memoria USB con los controladores y, alternativamente, también un CD de controladores, así como un paño de limpieza negro. Otros fabricantes sólo incluyen menos accesorios o ninguno
Mantenimiento
La parte inferior de la caja está asegurada con 12 tornillos Philips. Después de quitarlos, no es demasiado difícil hacer palanca para abrir la placa inferior aunque esté hecha de metal sólido. Una vez que tengas acceso al interior, puedes reemplazar los dos módulos de RAM, el módulo WLAN, y el SSD y también limpiar los dos ventiladores. Hay espacio para un segundo SSD, y la batería también es accesible
Garantía
XMG ofrece una garantía de fabricante de dos años. Al pedir el portátil, también se puede ampliar a tres años con un coste adicional. A diferencia de muchos otros fabricantes, el servicio de garantía también incluye una inspección gratuita. Después de enviar el portátil de forma gratuita, se limpia, se renueva la pasta térmica y se actualiza el firmware a la versión más reciente. Si quieres, también se puede reinstalar Windows con todas las actualizaciones actuales.

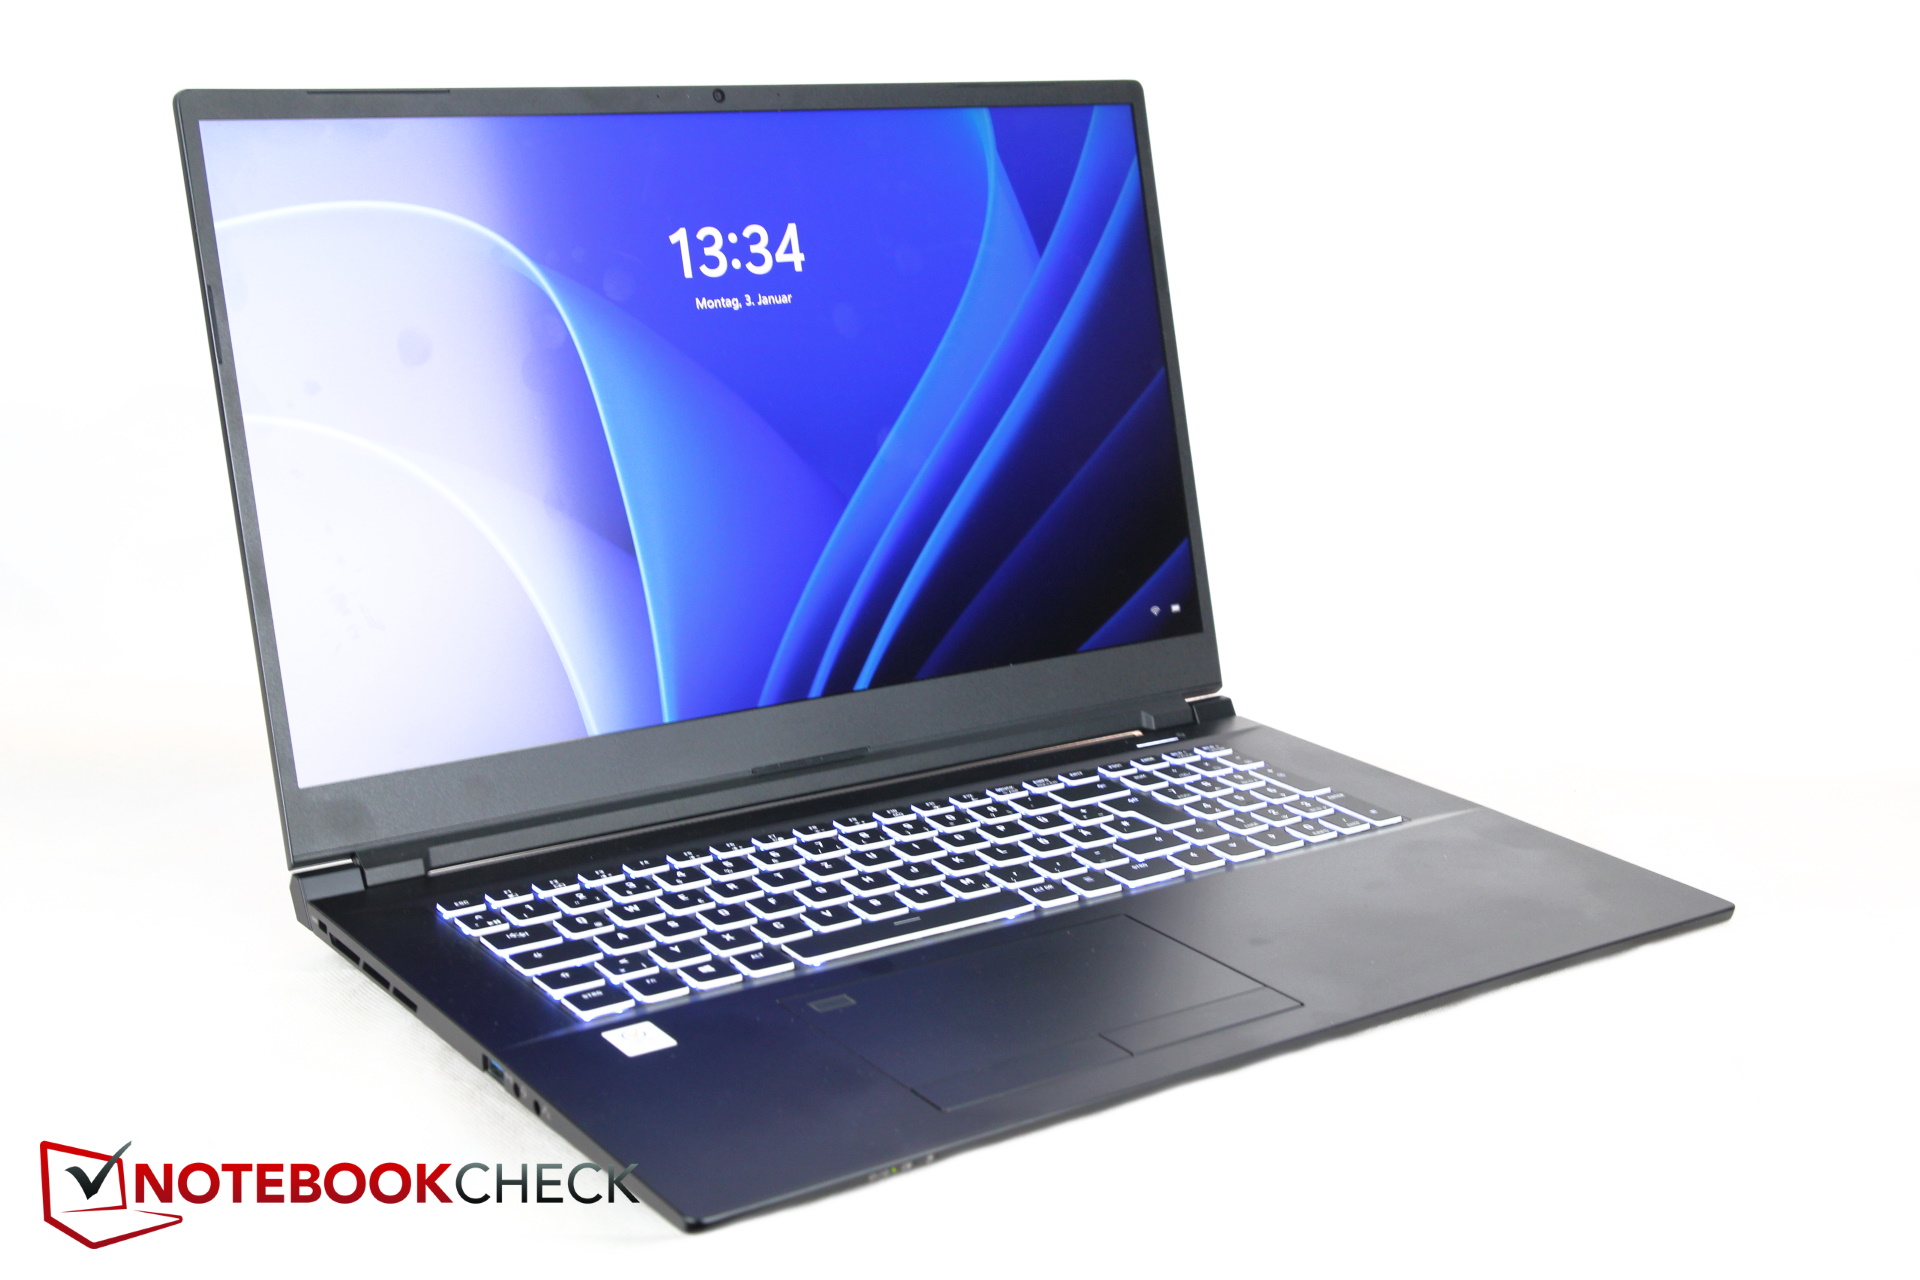
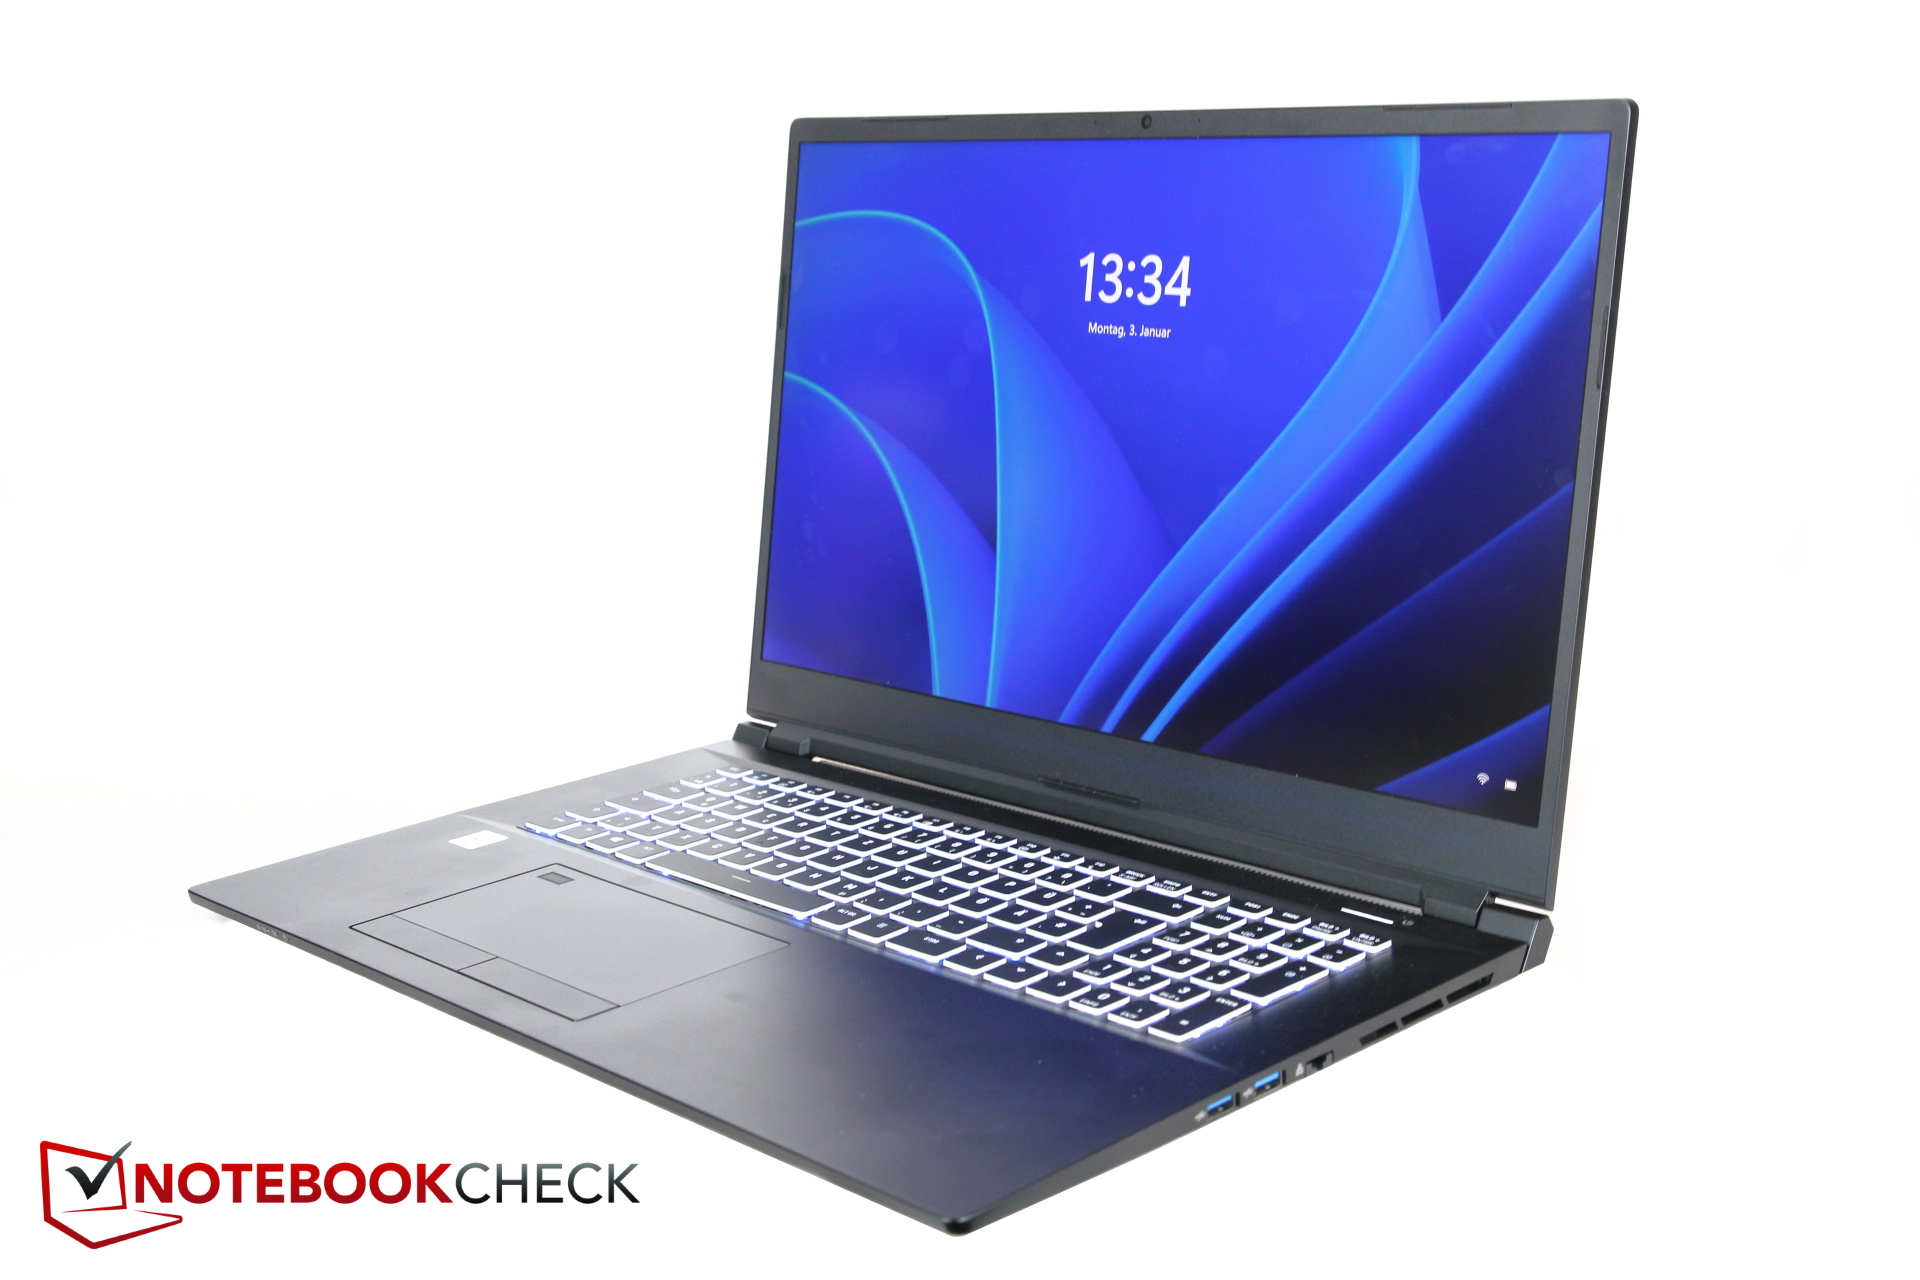
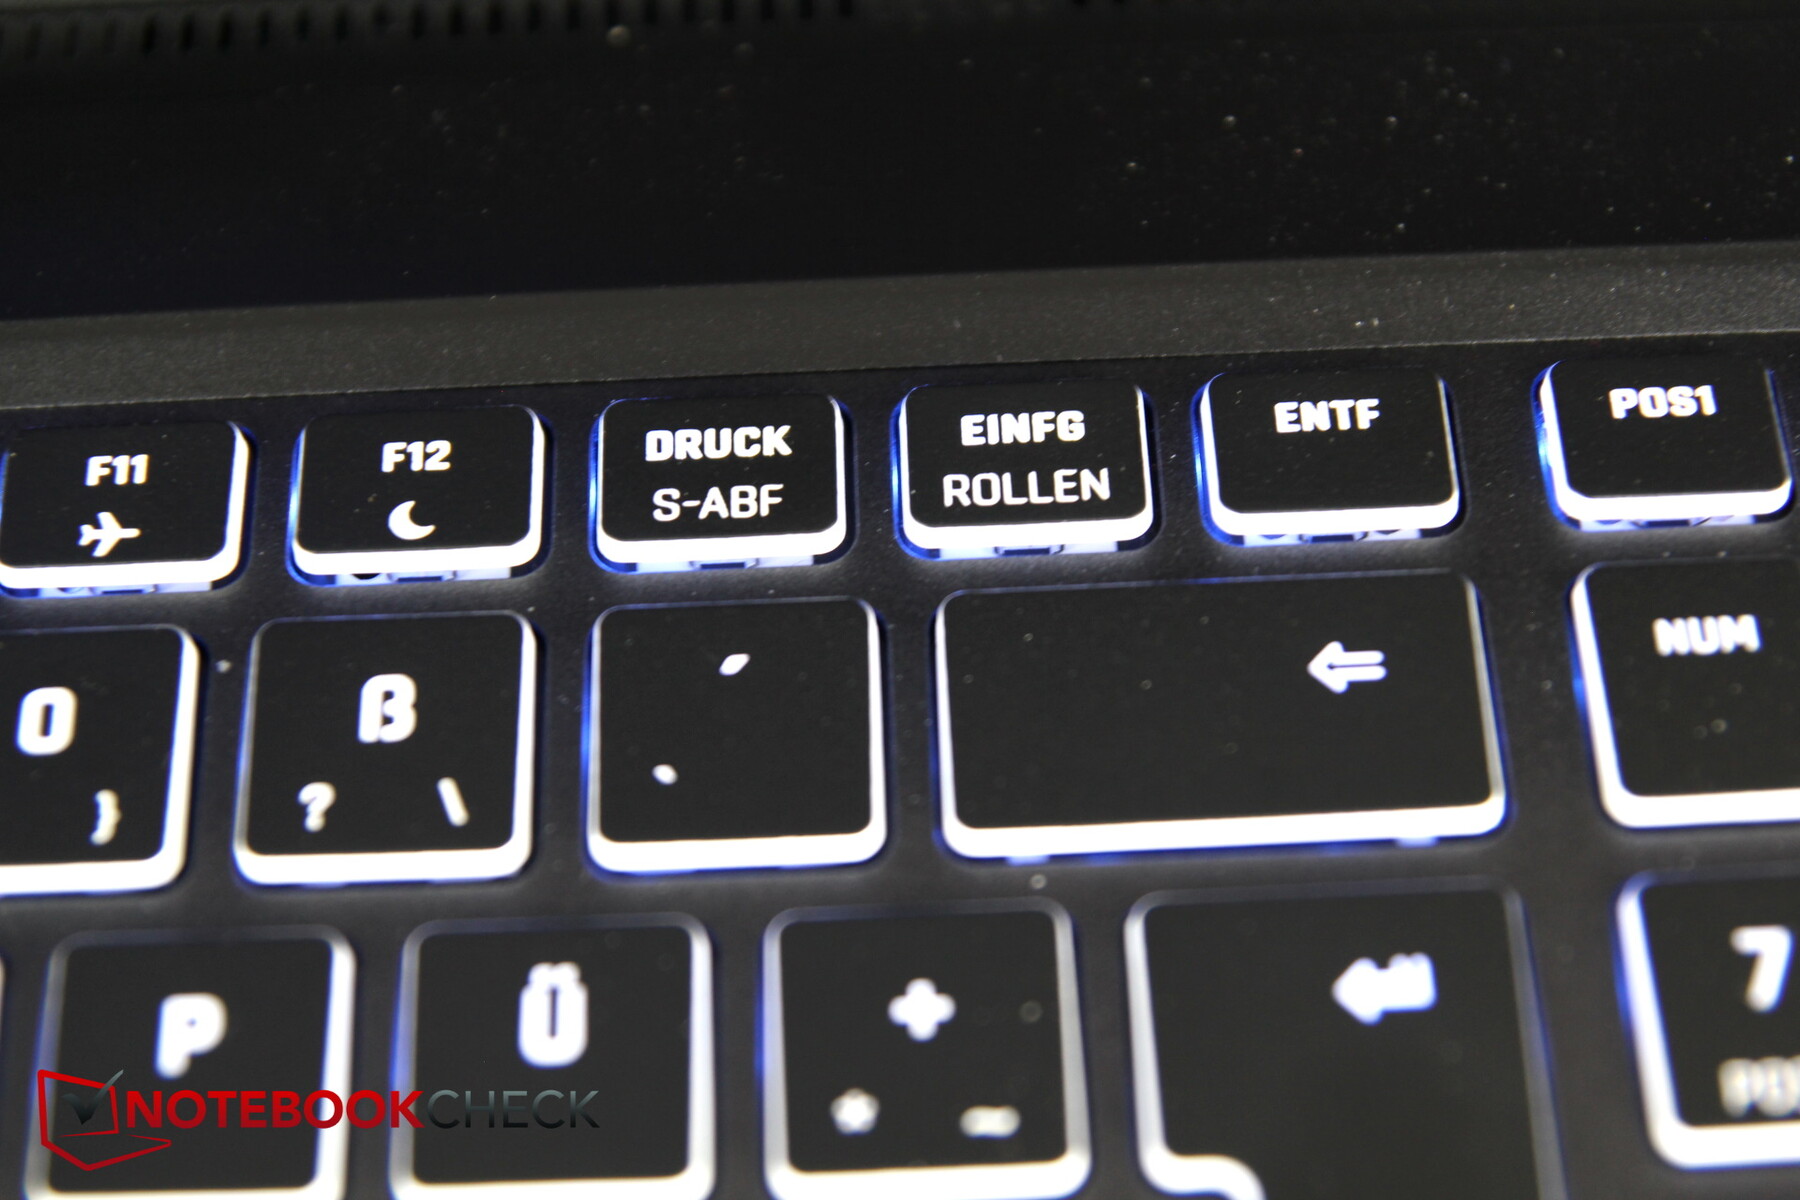
Dispositivos de entrada - Teclas pequeñas en un teclado que se dobla demasiado
Teclado
Las teclas parecen bastante pequeñas, sobre todo para un portátil de 17 pulgadas. Pero la disposición parece muy limpia, y hay un bloque numérico. Lamentablemente, no hay espacio entre el teclado normal y el bloque numérico, por lo que las teclas de flecha de tamaño normal no se colocan por separado, sino que se sitúan entre las dos mitades del teclado.
No es evidente a primera vista, pero el teclado, que se encuentra en la base de metal, sólo está hecho de plástico fino. Esto significa que la delgada placa debajo de las teclas se dobla mucho, moviéndose en ondas visibles mientras se escribe. Esto es un poco excesivo para nosotros y llega a ser molesto.
La altura del trazo resulta mediocre, pero la respuesta es clara y el tecleo es bastante cómodo. Sólo el pequeño tamaño de las teclas es ligeramente molesto. El ruido de tecleo es muy moderado
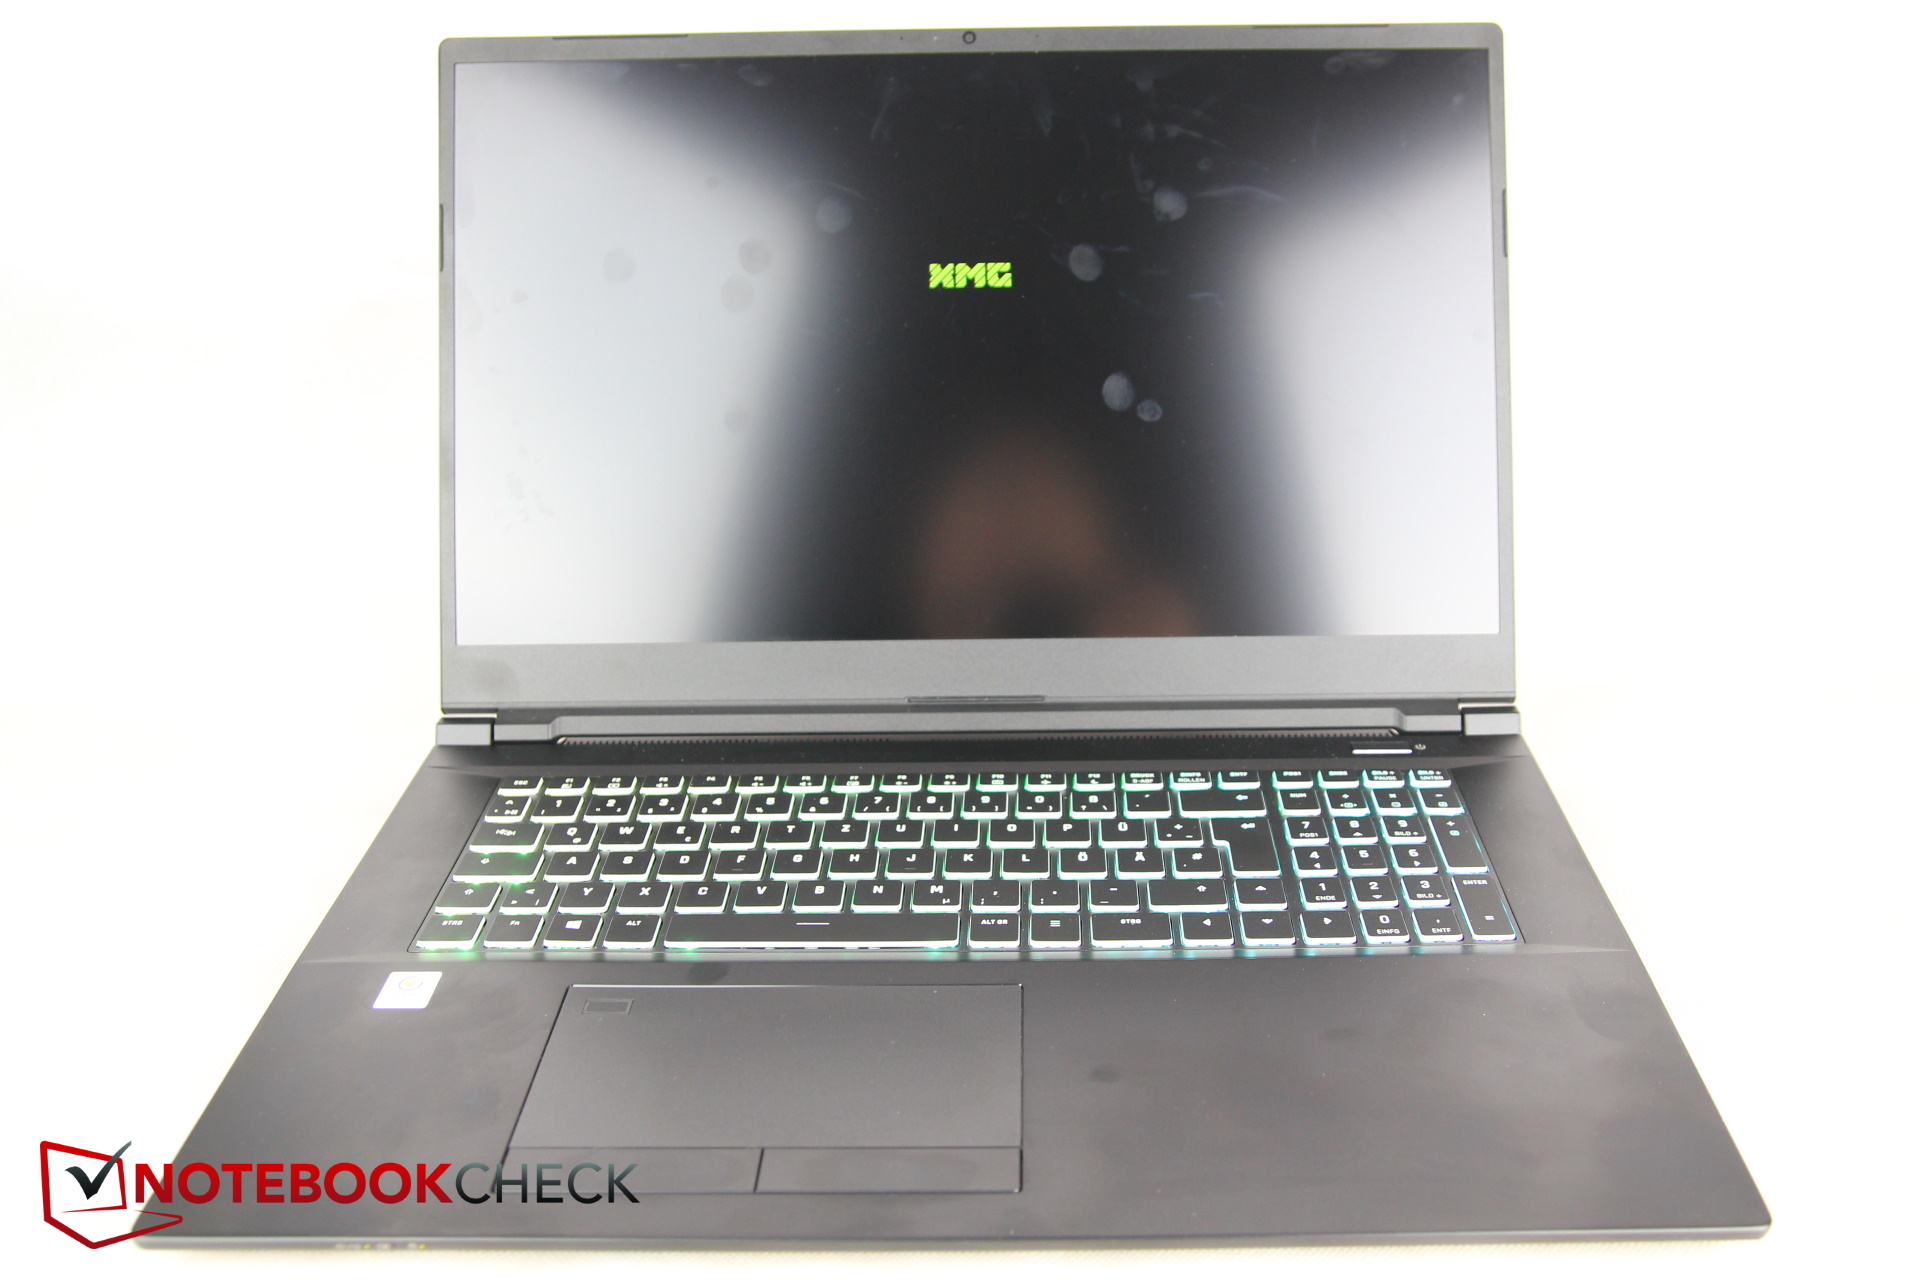
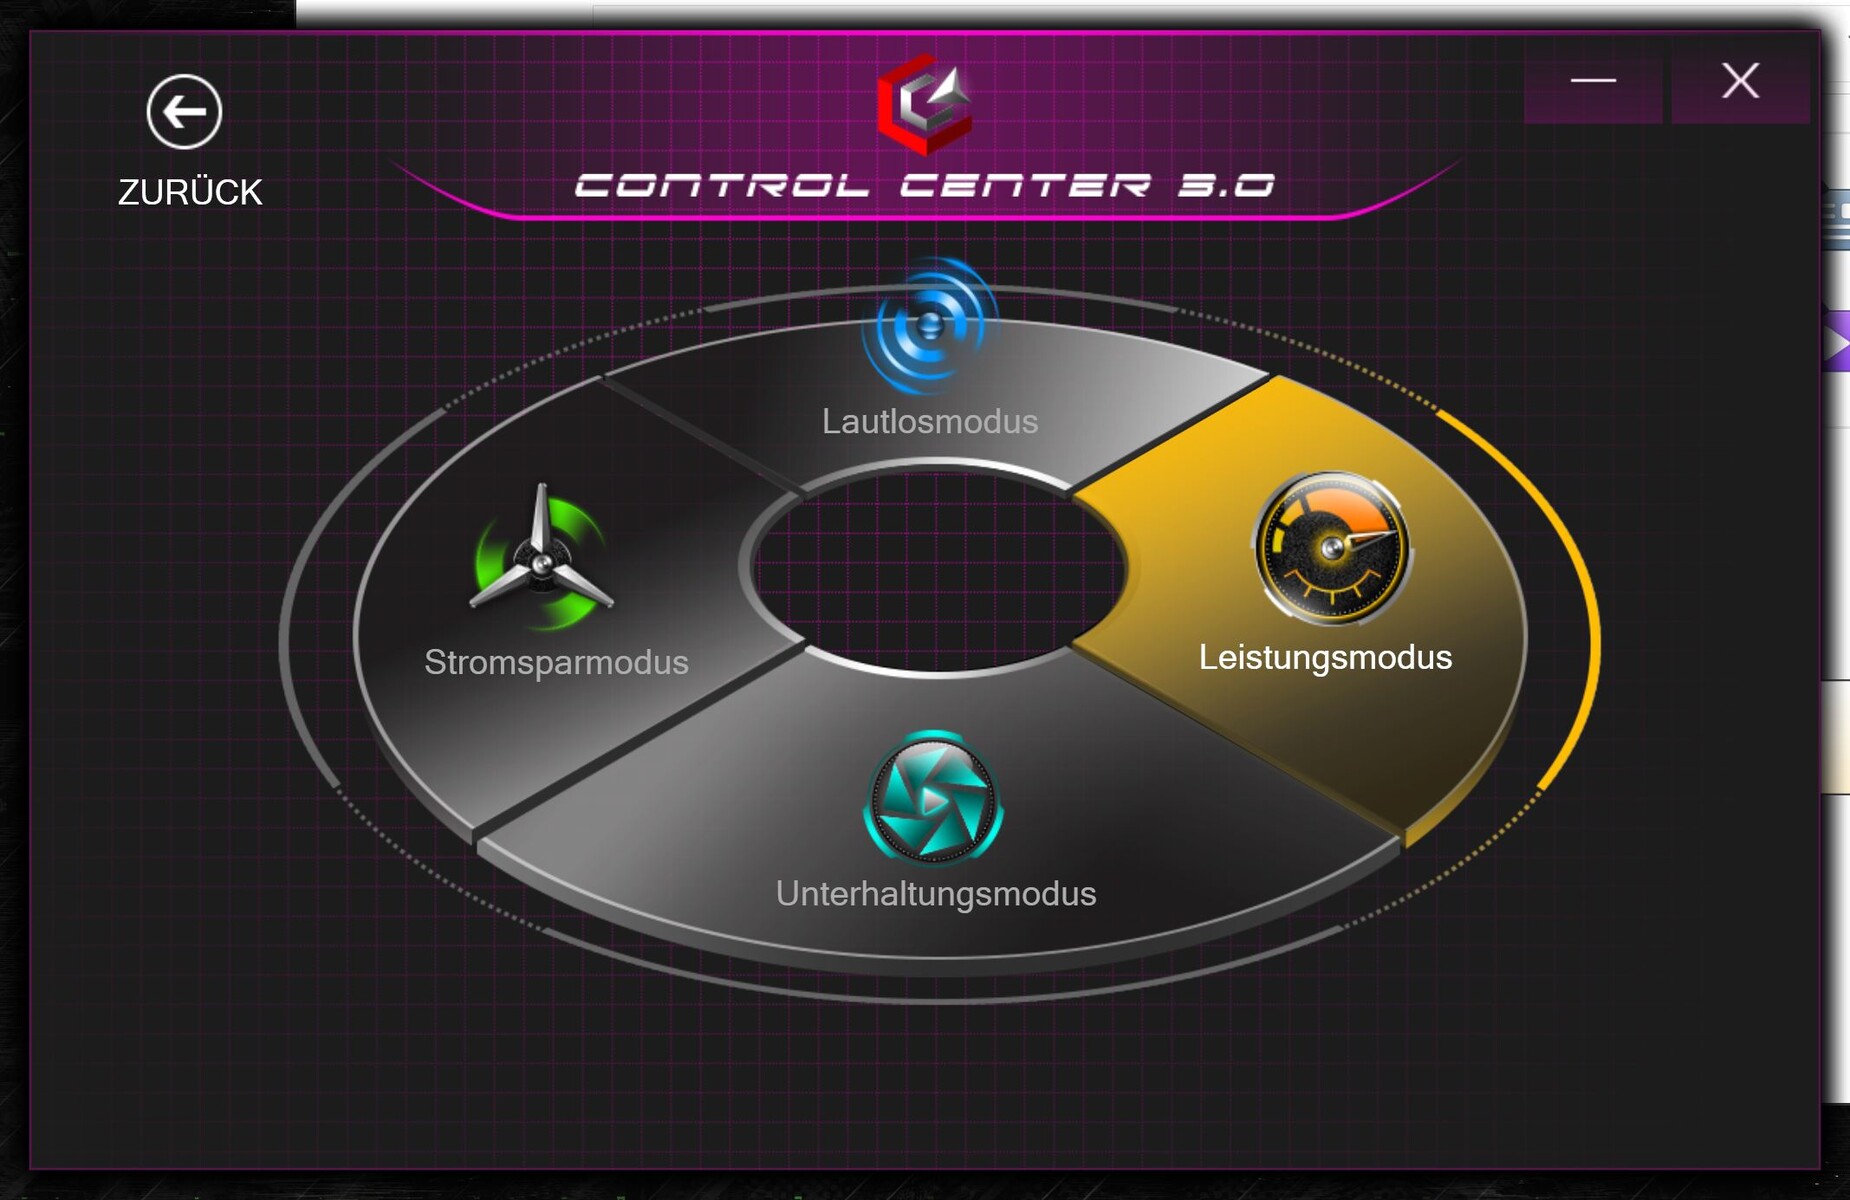
El teclado ofrece una iluminación RGB separada para cada tecla, lo que permite iluminar las teclas WASD en un color diferente, por ejemplo, para que destaquen más de las otras teclas. Los ajustes para ello se encuentran en el Centro de Control
Panel táctil
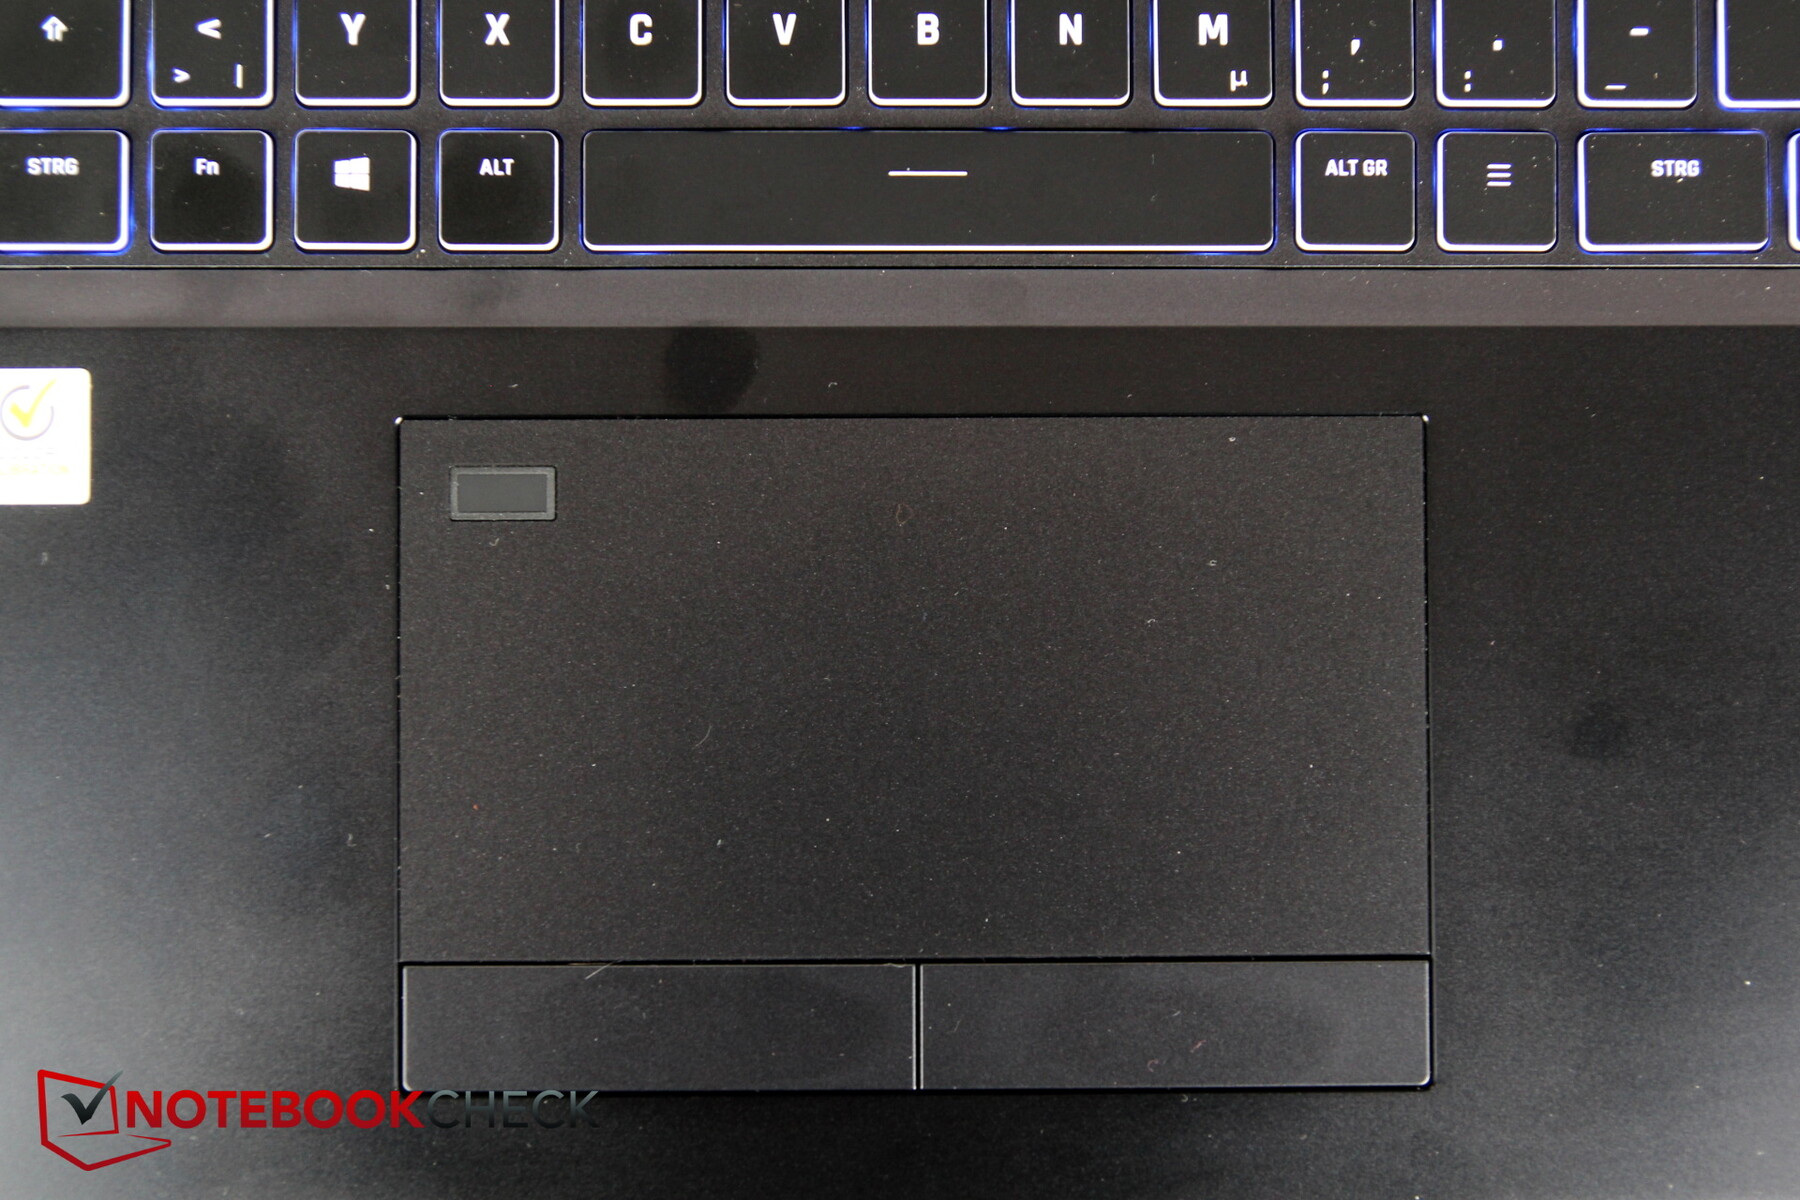
El touchpad es bastante grande (~13 x 6.8 cm, ~5.1 x 2.7 in) con teclas de ratón dedicadas debajo. El sensor de huellas digitales está integrado en la esquina superior izquierda. Los movimientos del dedo por encima y a la izquierda no se registran.
La superficie permite un fácil deslizamiento de los dedos, y apenas hay tartamudeos incluso en movimientos lentos.
Las teclas adicionales del ratón que se encuentran debajo son amplias y causan una buena impresión a primera vista. El volumen de los clics del ratón también está a un nivel moderado. Sin embargo, al escuchar con atención, las teclas producen un ligero chirrido
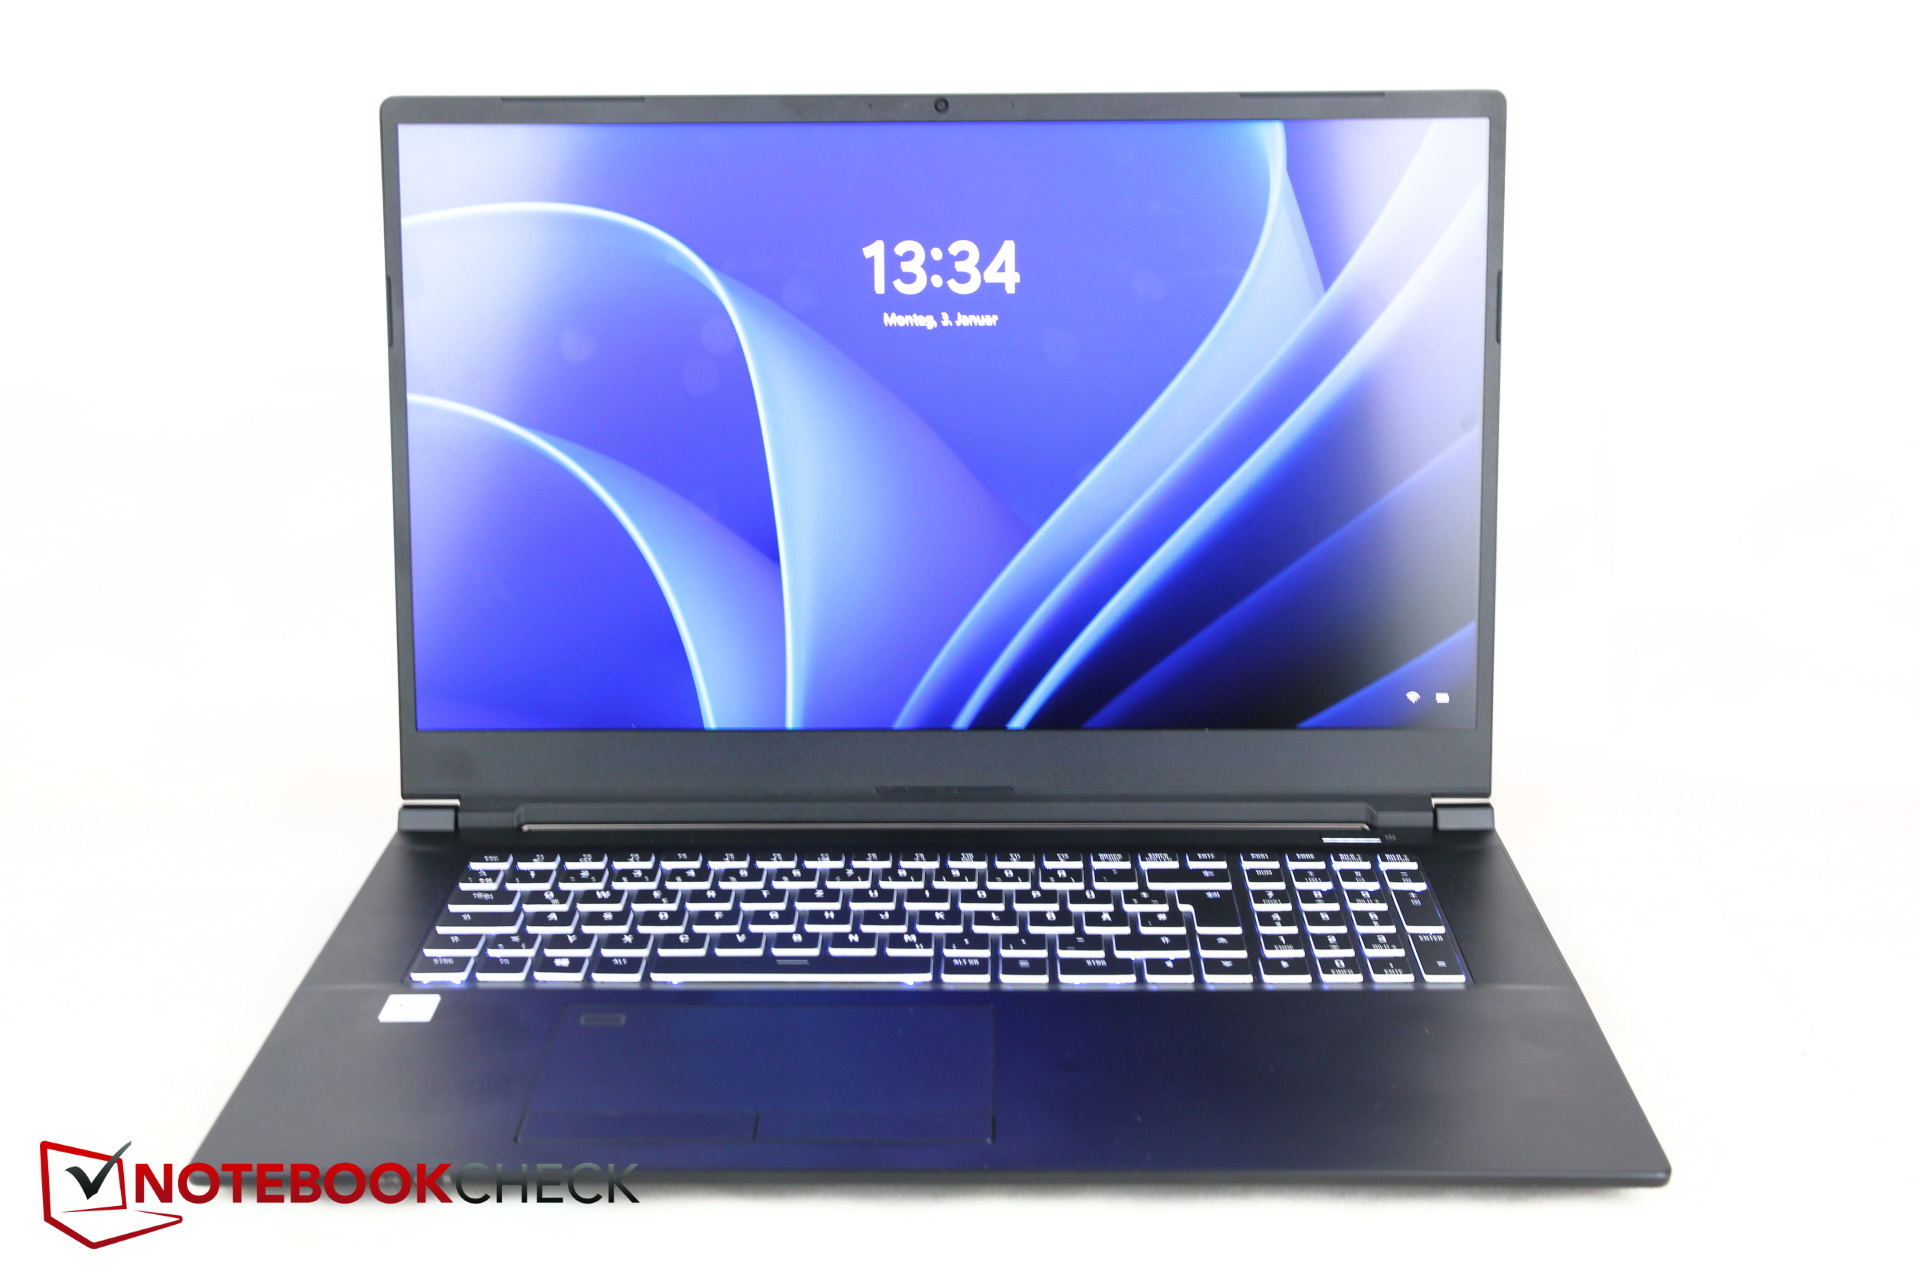
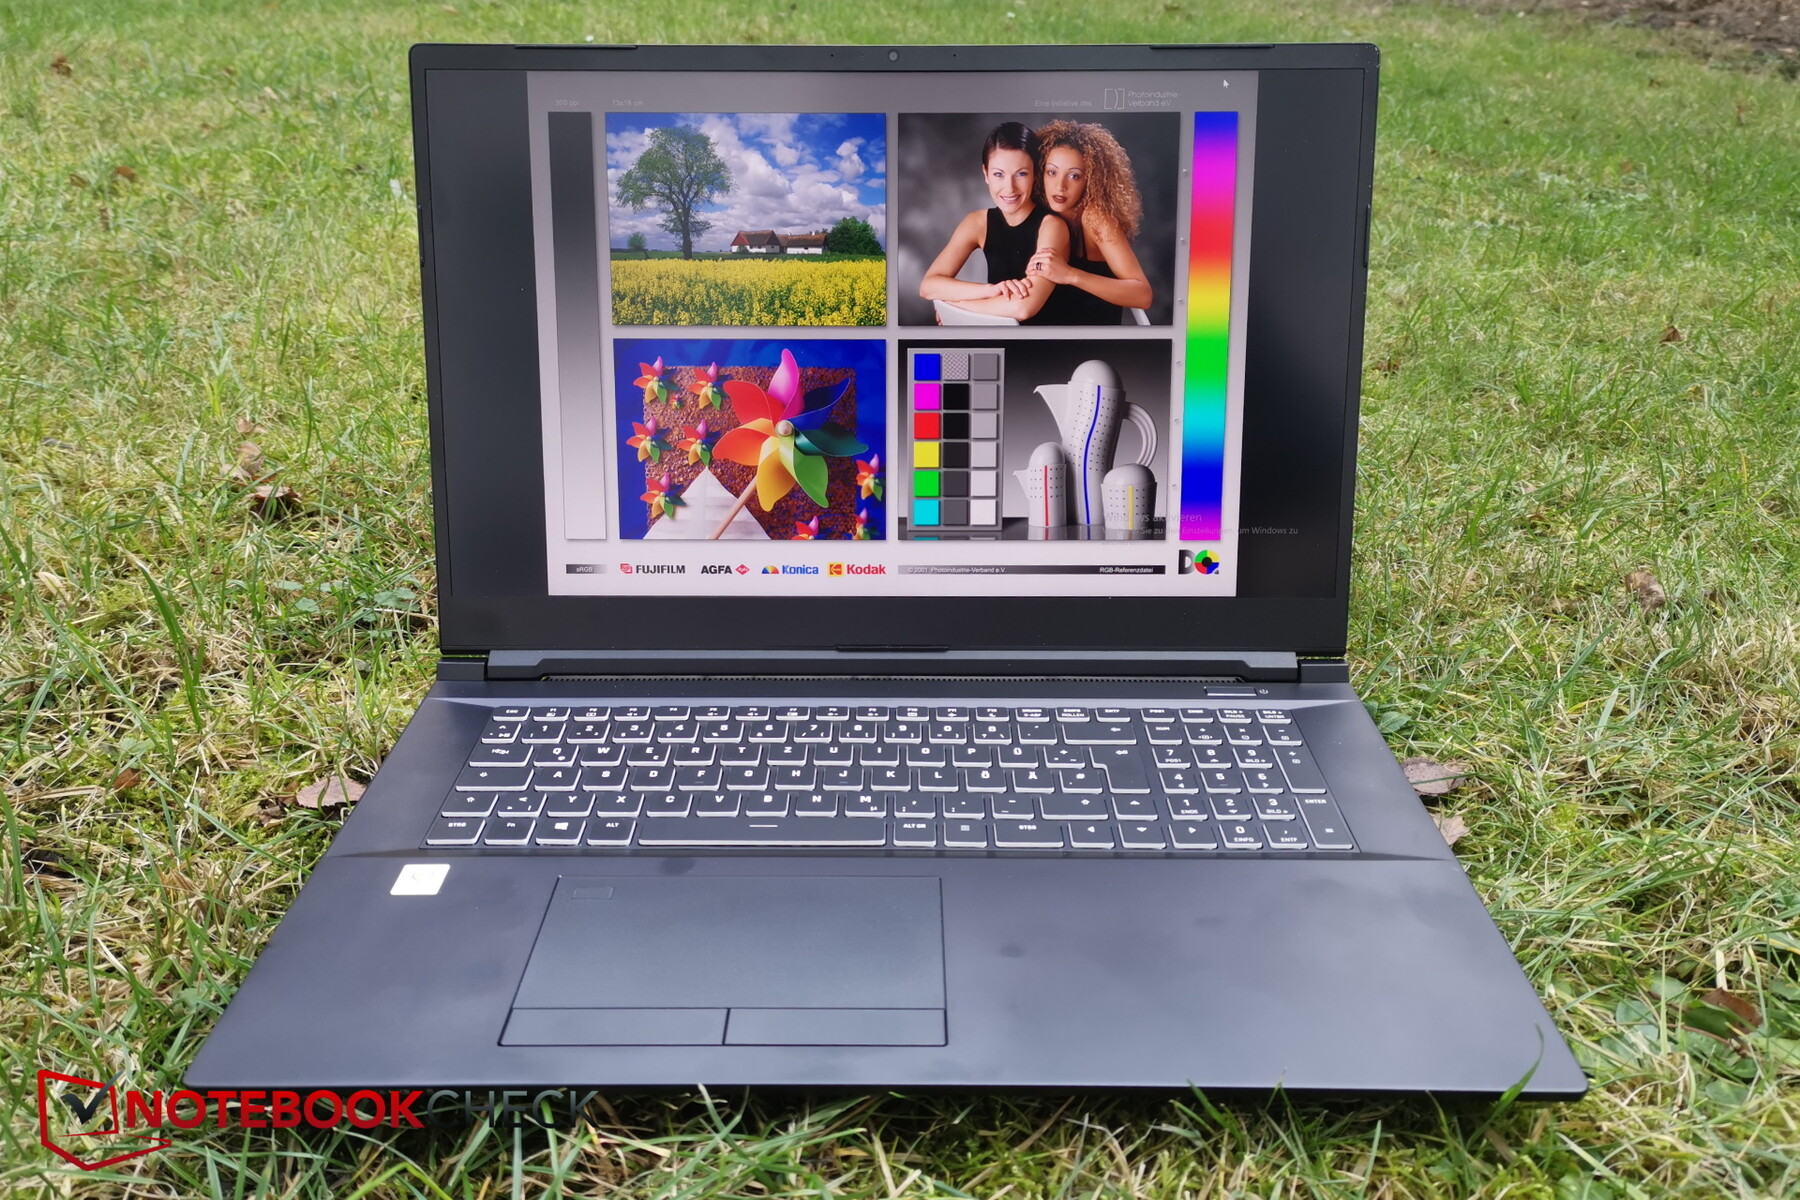
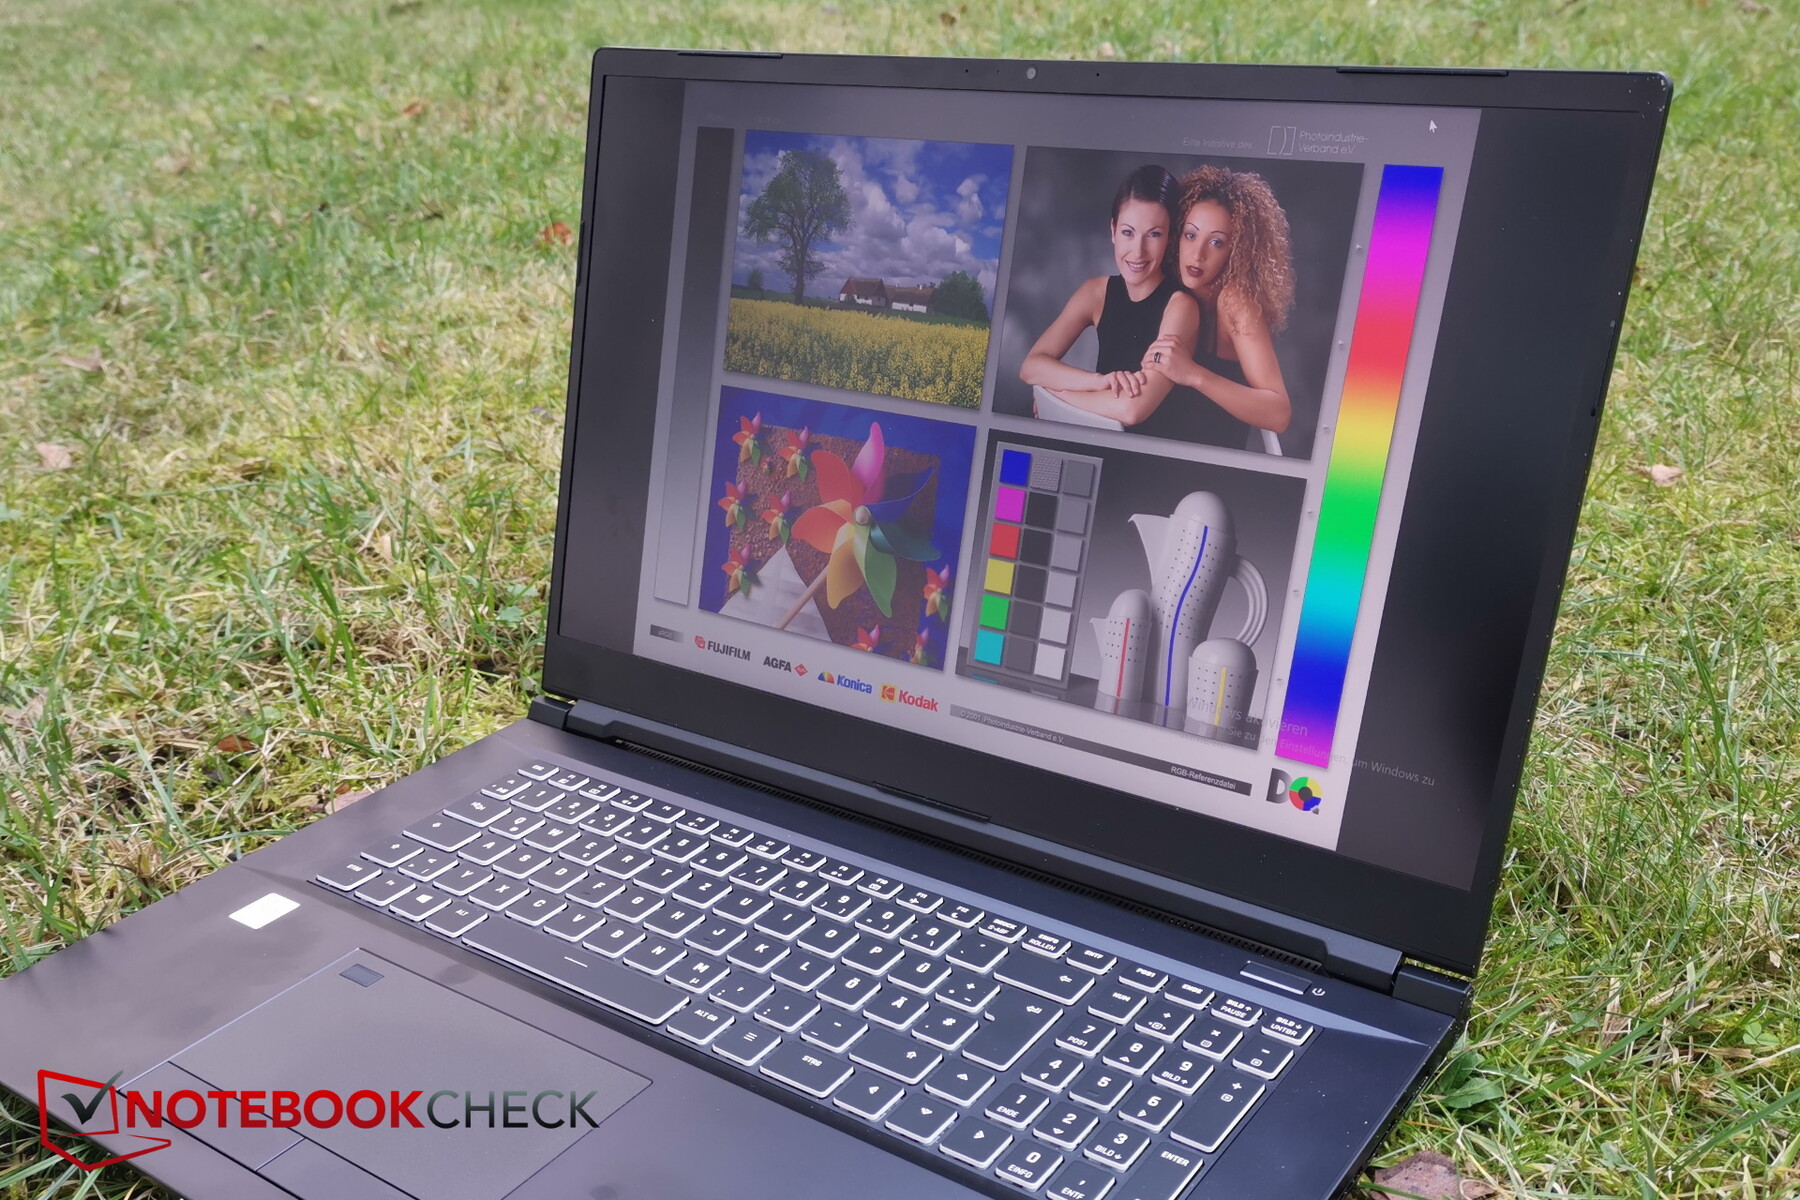
Pantalla - 4K con una alta cobertura del espacio de color
La pantalla IPS 4K mate es la misma que se usa en el Schenker XMG Ultra 17 del año pasado. Por desgracia, tienes que conformarte con una mayor tasa de refresco debido a la resolución 4K. Como alternativa, el portátil también está disponible con una pantalla Full-HD y una velocidad de 300 Hz.
Además, el panel es muy brillante, y la distribución del brillo sigue siendo decente. El valor de negro y el contraste también están a buen nivel, siendo este último incluso ligeramente superior al de los competidores.
Lo que es menos bueno es el tiempo de respuesta, muy flojo. En combinación con la menor tasa de refresco, esto también muestra que el XMG Pro 17 con la pantalla 4K está dirigido más a los profesionales creativos, mientras que los jugadores podrían elegir más bien el modelo Full-HD, según sus preferencias.
No detectamos ningún PWM. Incluso mirando muy de cerca en la oscuridad, sólo podemos ver un mínimo sangrado de pantalla en el borde inferior (pero no es visible en la captura), por lo que no es problemático
| |||||||||||||||||||||||||
iluminación: 84 %
Brillo con batería: 471 cd/m²
Contraste: 1397:1 (Negro: 0.34 cd/m²)
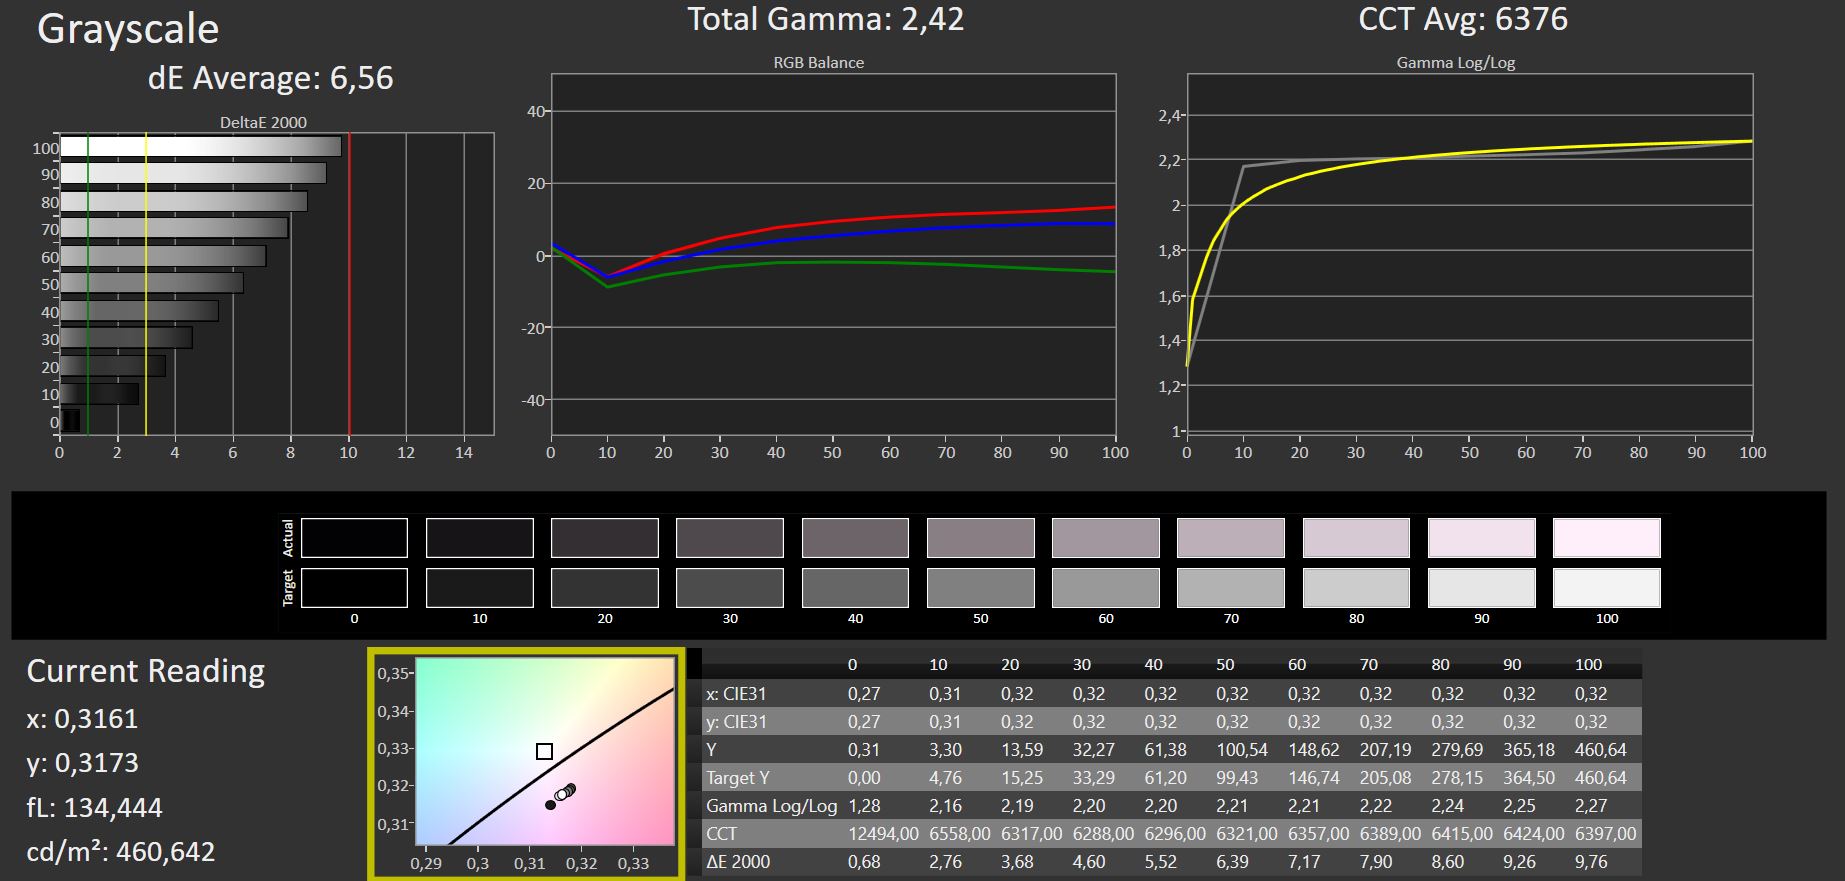
ΔE ColorChecker Calman: 5.84 | ∀{0.5-29.43 Ø4.71}
calibrated: 3.51
ΔE Greyscale Calman: 6.56 | ∀{0.09-98 Ø4.96}
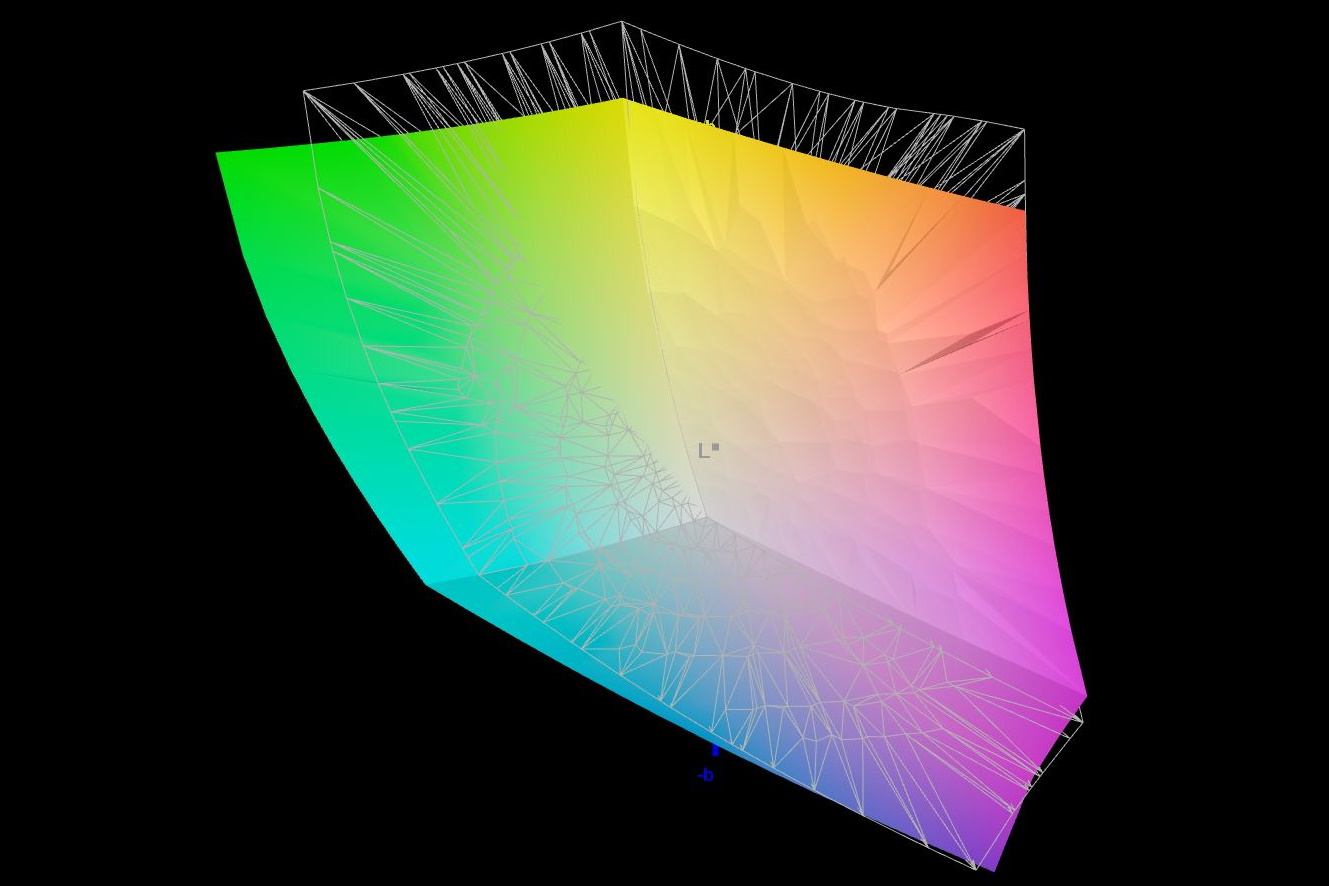
100% AdobeRGB 1998 (Argyll 3D)
100% sRGB (Argyll 3D)
87.1% Display P3 (Argyll 3D)
Gamma: 2.42
CCT: 6376 K
| Schenker XMG Pro 17 (Late 2021, RTX 3080) AUO B173ZAN3.0 (AUO309B), IPS, 3840x2160, 17.3" | Schenker XMG Pro 15 (Late 2021) Samsung ATNA56WR14-0, OLED, 3840x2160, 15.6" | Alienware x17 RTX 3080 P48E AU Optronics B173ZAN, IPS, 3840x2160, 17.3" | Medion Erazer Beast X25 BOE NE173FHM-NZ1 (BOE0884), IPS, 1920x1080, 17.3" | MSI GS76 Stealth 11UH AUO B173ZAN06.1 (AUODE95), IPS, 3840x2160, 17.3" | Asus ROG Zephyrus S17 GX703HSD BOE099D (BOE CQ NE173QHM-NY3), IPS, 2560x1440, 17.3" | |
|---|---|---|---|---|---|---|
| Display | -7% | 0% | -16% | -23% | -3% | |
| Display P3 Coverage (%) | 87.1 | 81.2 -7% | 88.3 1% | 70.4 -19% | 63 -28% | 94.2 8% |
| sRGB Coverage (%) | 100 | 97.7 -2% | 100 0% | 99.8 0% | 94.8 -5% | 98.7 -1% |
| AdobeRGB 1998 Coverage (%) | 100 | 89.1 -11% | 100 0% | 71.6 -28% | 65 -35% | 84.4 -16% |
| Response Times | 94% | 69% | 82% | 81% | 83% | |
| Response Time Grey 50% / Grey 80% * (ms) | 46.8 ? | 3.2 ? 93% | 14.4 ? 69% | 9.2 ? 80% | 8.8 ? 81% | 4.8 90% |
| Response Time Black / White * (ms) | 32.6 ? | 1.6 ? 95% | 10.4 ? 68% | 5.6 ? 83% | 6.4 ? 80% | 8 75% |
| PWM Frequency (Hz) | 60 ? | |||||
| Screen | 212% | 13% | 17% | 22% | 11% | |
| Brightness middle (cd/m²) | 475 | 443 -7% | 438.7 -8% | 329 -31% | 474 0% | 322 -32% |
| Brightness (cd/m²) | 451 | 434 -4% | 435 -4% | 315 -30% | 454 1% | 288 -36% |
| Brightness Distribution (%) | 84 | 94 12% | 91 8% | 88 5% | 88 5% | 72 -14% |
| Black Level * (cd/m²) | 0.34 | 0.02 94% | 0.48 -41% | 0.33 3% | 0.46 -35% | 0.3 12% |
| Contrast (:1) | 1397 | 22150 1486% | 914 -35% | 997 -29% | 1030 -26% | 1073 -23% |
| Colorchecker dE 2000 * | 5.84 | 3.73 36% | 4.34 26% | 2.03 65% | 1.5 74% | 3.05 48% |
| Colorchecker dE 2000 max. * | 9.97 | 8.12 19% | 7.3 27% | 5.5 45% | 5.59 44% | 5.23 48% |
| Colorchecker dE 2000 calibrated * | 3.51 | 0.72 79% | 0.82 77% | 0.86 75% | 1.92 45% | |
| Greyscale dE 2000 * | 6.56 | 2.5 62% | 2.4 63% | 3.5 47% | 2.8 57% | 3.11 53% |
| Gamma | 2.42 91% | 2.001 110% | 2.09 105% | 2.223 99% | 2.158 102% | 2.13 103% |
| CCT | 6376 102% | 6522 100% | 6413 101% | 6526 100% | 6597 99% | 6553 99% |
| Color Space (Percent of AdobeRGB 1998) (%) | 84 | |||||
| Color Space (Percent of sRGB) (%) | 99 | |||||
| Media total (Programa/Opciones) | 100% /
144% | 27% /
18% | 28% /
19% | 27% /
21% | 30% /
18% |
* ... más pequeño es mejor
Schenker anuncia que la pantalla está calibrada en color por X-Rite, pero las desviaciones de color siguen siendo mejorables. Dominan los tonos cálidos y rojos, al menos a pleno brillo. Una calibración manual disminuye aún más el valor Delta-E, y puedes descargar el archivo de perfil ICC correspondiente desde el enlace de más arriba.
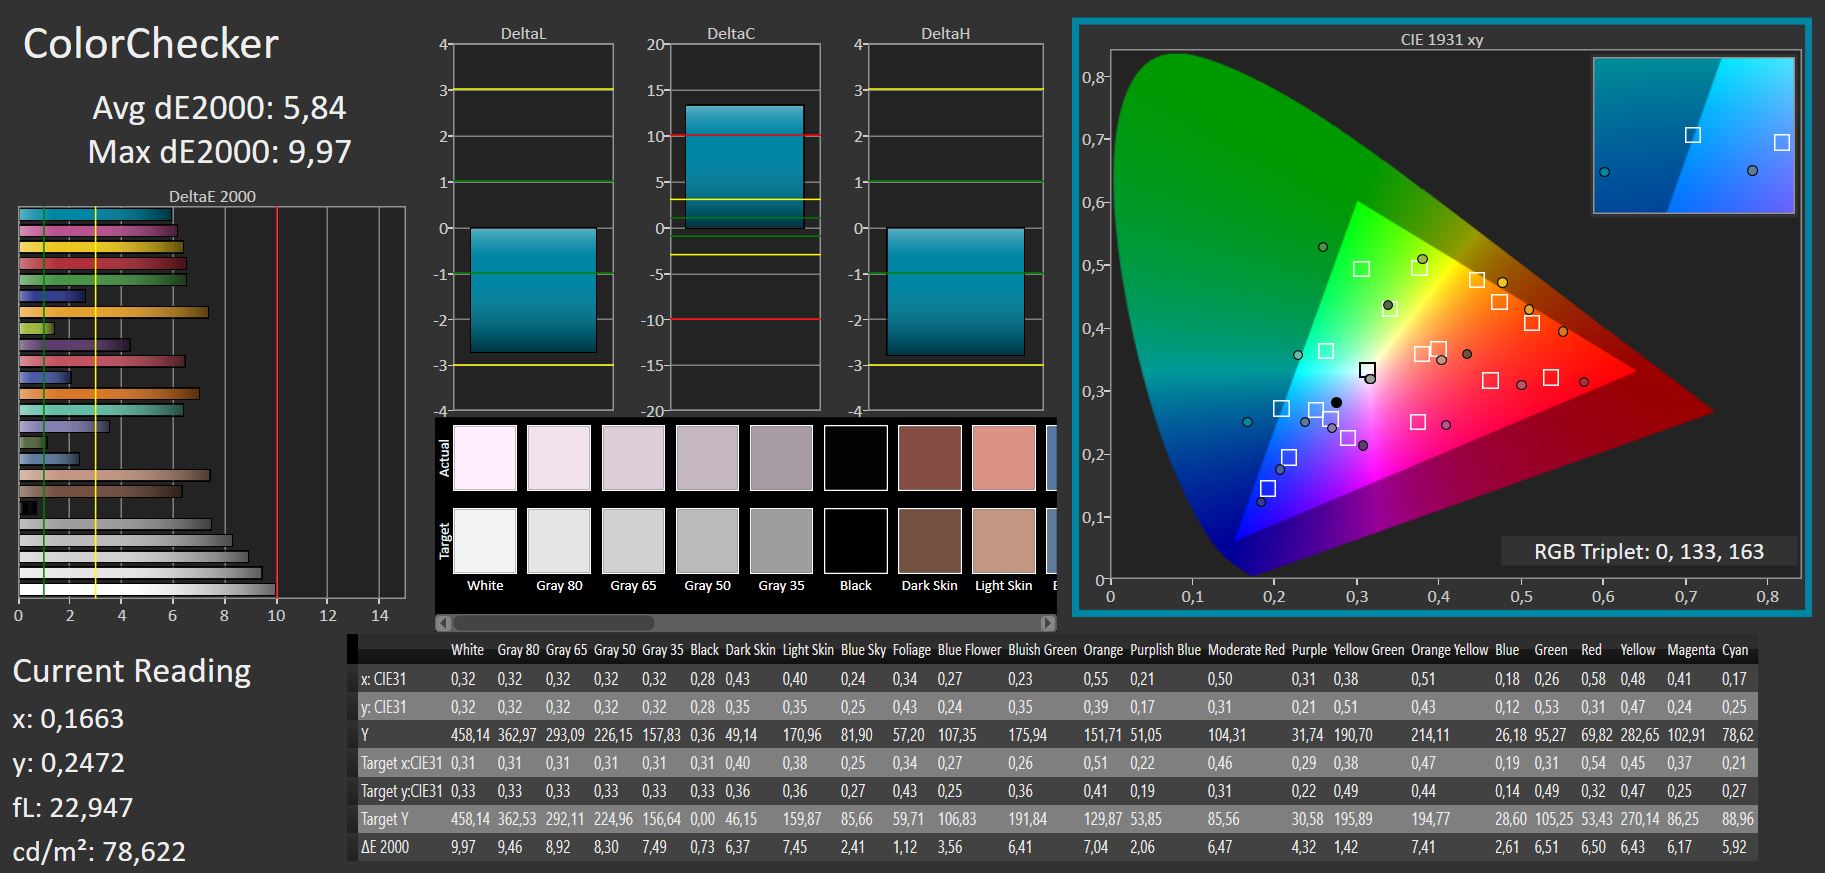
La pantalla es muy adecuada para el procesamiento de imágenes y la edición de vídeo, ya que se cubren bien varios espacios de color. Mientras que sRGB y AdobeRGB se cubren por completo, DCI-P3 aún se cubre al 87%.
El panel 4K del Alienware y el panel 2K del Asus Zephyrus son igualmente buenos, y el Medion Erazer Beast y el MSI GS76 Stealth salen peor parados aquí, pero esto también es una cuestión de precio
Tiempos de respuesta del display
| ↔ Tiempo de respuesta de Negro a Blanco | ||
|---|---|---|
| 32.6 ms ... subida ↗ y bajada ↘ combinada | ↗ 16.6 ms subida | 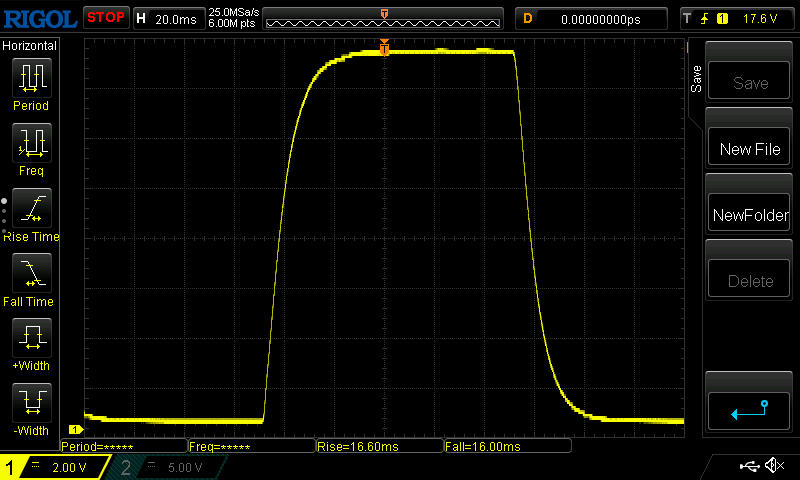 |
| ↘ 16 ms bajada | ||
| La pantalla mostró tiempos de respuesta lentos en nuestros tests y podría ser demasiado lenta para los jugones. En comparación, todos los dispositivos de prueba van de ##min### (mínimo) a 240 (máximo) ms. » 88 % de todos los dispositivos son mejores. Eso quiere decir que el tiempo de respuesta es peor que la media (19.8 ms) de todos los dispositivos testados. | ||
| ↔ Tiempo de respuesta 50% Gris a 80% Gris | ||
| 46.8 ms ... subida ↗ y bajada ↘ combinada | ↗ 23.4 ms subida | 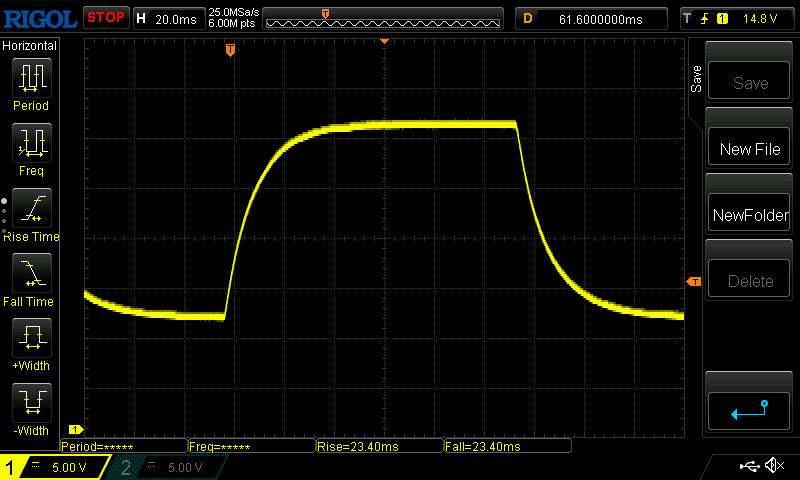 |
| ↘ 23.4 ms bajada | ||
| La pantalla mostró tiempos de respuesta lentos en nuestros tests y podría ser demasiado lenta para los jugones. En comparación, todos los dispositivos de prueba van de ##min### (mínimo) a 636 (máximo) ms. » 81 % de todos los dispositivos son mejores. Eso quiere decir que el tiempo de respuesta es peor que la media (31 ms) de todos los dispositivos testados. | ||
Parpadeo de Pantalla / PWM (Pulse-Width Modulation)
| Parpadeo de Pantalla / PWM no detectado | 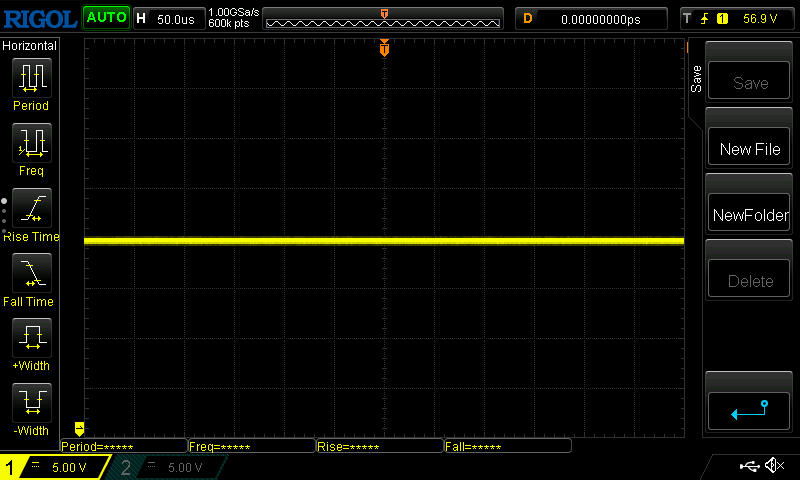 | ||
Comparación: 52 % de todos los dispositivos testados no usaron PWM para atenuar el display. Si se usó, medimos una media de 7757 (mínimo: 5 - máxmo: 343500) Hz. | |||
En exteriores, la superficie mate, el alto brillo de más de 400 Nits, los buenos ángulos de visión y el contraste bastante alto le beneficiarán, permitiéndole leer el contenido de la pantalla en la mayoría de las situaciones sin ser impactado mucho
La estabilidad de los ángulos de visión es decente, aunque el brillo disminuye notablemente a partir de ángulos de visión extremos. Hay paneles IPS con ángulos de visión aún más estables

Rendimiento - Acelerado para el caso delgado
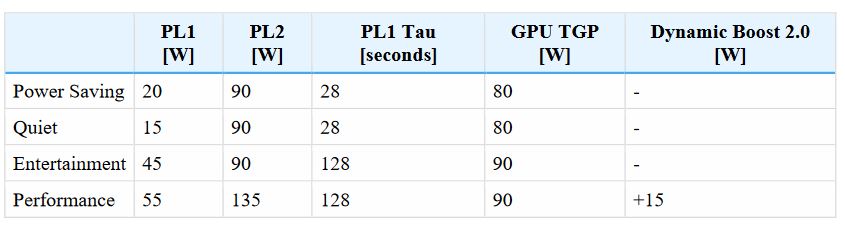
Schenker anuncia el XMG Pro 17 dirigido tanto a los jugadores como a los usuarios profesionales. El Intel Core i7-11800Hy, en particular, la GPU para portátiles NVIDIA GeForce RTX 3080y también los amplios 32 GB de RAM apoyan esta causa. Por otro lado, la pantalla 4K con sólo 60 Hz pero muy buena cobertura del espacio de color muestra que el portátil apunta ligeramente más hacia las necesidades de los usuarios creativos que a las de los jugadores. Además, tampoco se puede esperar el mayor rendimiento de juego de un diseño ultradelgado. Por ejemplo, el TGP de la tarjeta gráfica está limitado a unos relativamente débiles 105 vatios

Condiciones de la prueba
Schenker es bastante transparente en cuanto a los valores de rendimiento de sus distintos perfiles de rendimiento. El fabricante recomienda oficialmente el modo "Entretenimiento" como el mejor compromiso entre volumen de ruido y rendimiento. Sin embargo, como medimos todos los portátiles de juego en el mejor modo de rendimiento (sin overclocking), cambiamos al modo "Rendimiento" en el Centro de Control. Sólo aquí, la GPU también puede usar el Dynamic Boost, y los TDP de la CPU también son ligeramente superiores. La imagen de abajo muestra los valores de rendimiento de todos los modos según la lista de Schenker
Procesador
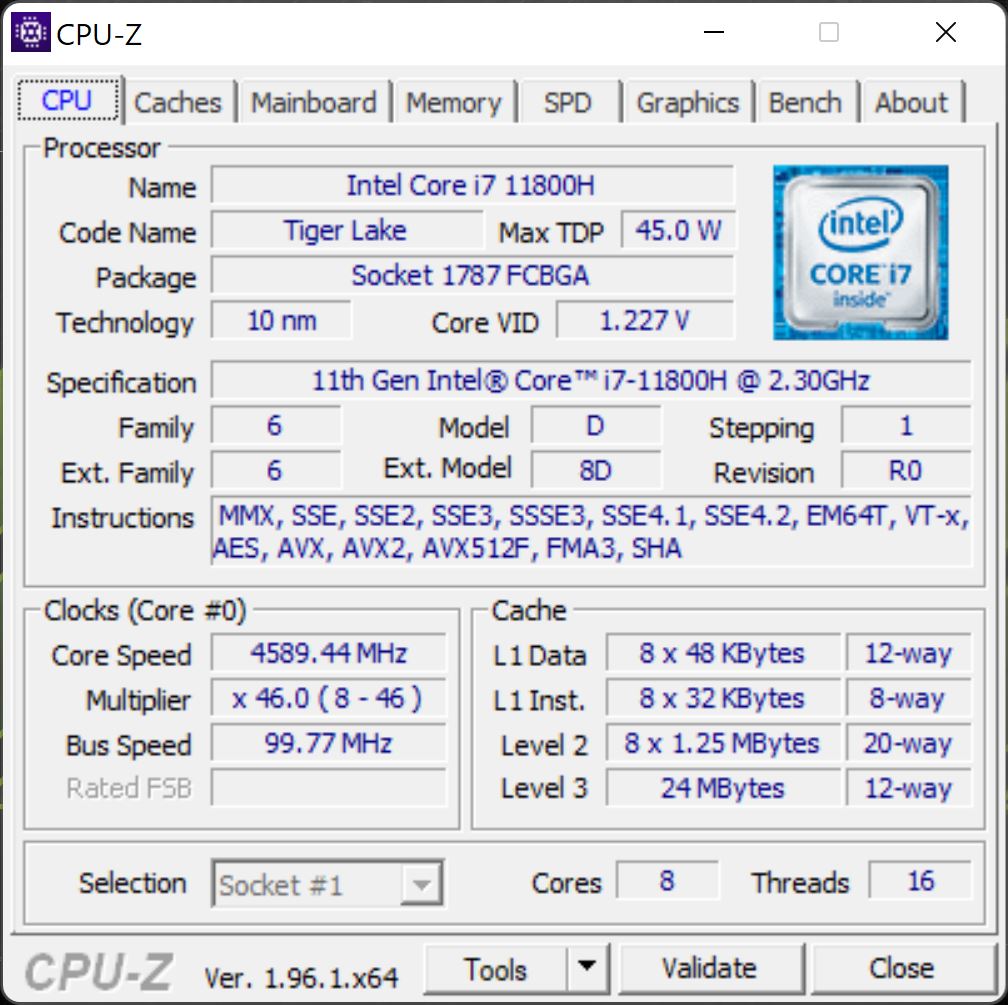
ElIntel Core i7-11800Hofrece un amplio número de ocho núcleos que tienen una velocidad de reloj entre 2,3 y 4,6 GHz
En el bucle de Cinebench, los valores caen alrededor de un 7% en los primeros cuatro o cinco bucles, pero se mantienen estables después.
Aunque usan la misma CPU, el XMG Pro es incapaz de seguir el ritmo del potente Alienware X17 sin estrangulamiento en la prueba multinúcleo, y el resto de competidores lo superan ligeramente. Sin embargo, estas pequeñas diferencias no son relevantes en el funcionamiento diario, y sólo el Alienware es significativamente más rápido en un 10 a 15%.
En las pruebas de un solo núcleo, las diferencias entre los portátiles son significativamente menores
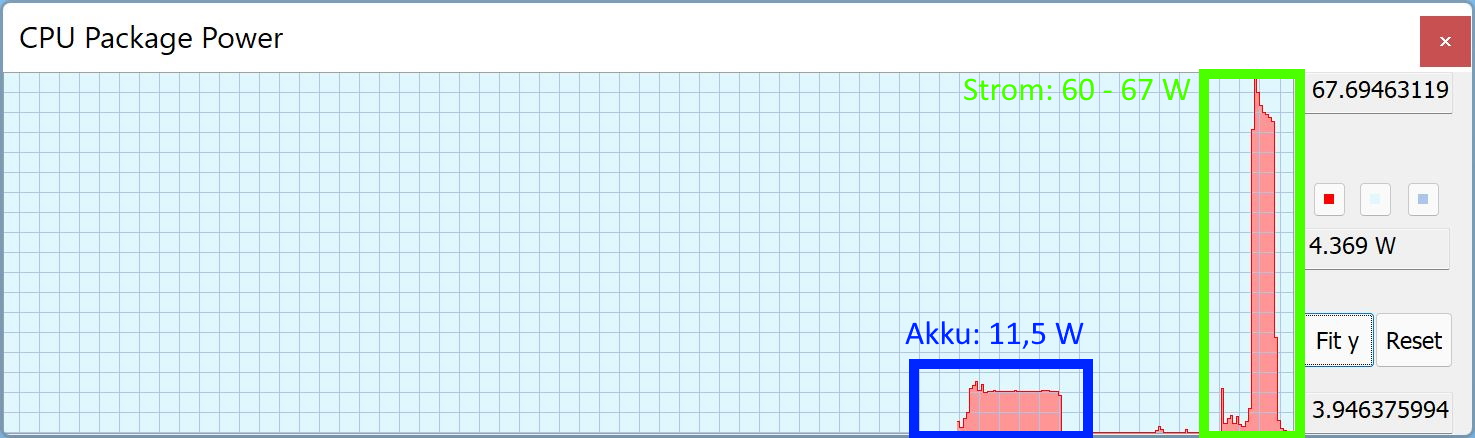
En el modo de batería, el rendimiento de la CPU es considerablemente menor. Tras un valor inicial de 13 vatios, el TDP disminuye a sólo 11,5 vatios. En consecuencia, la puntuación cae de 1.865 - 2.009 a sólo 534 puntos, ¡lo que supone una disminución de al menos el 71%!
Cinebench R15 Multi Constant Load Test
Cinebench R23: Multi Core | Single Core
Cinebench R20: CPU (Multi Core) | CPU (Single Core)
Cinebench R15: CPU Multi 64Bit | CPU Single 64Bit
Blender: v2.79 BMW27 CPU
7-Zip 18.03: 7z b 4 | 7z b 4 -mmt1
Geekbench 5.5: Multi-Core | Single-Core
HWBOT x265 Benchmark v2.2: 4k Preset
LibreOffice : 20 Documents To PDF
R Benchmark 2.5: Overall mean
| CPU Performance rating | |
| Media de la clase Gaming | |
| Asus ROG Zephyrus S17 GX703HSD | |
| MSI GS76 Stealth 11UH | |
| Medion Erazer Beast X25 | |
| Schenker XMG Pro 15 (Late 2021) | |
| Alienware x17 RTX 3080 P48E -2! | |
| Schenker XMG Pro 17 (Late 2021, RTX 3080) | |
| Medio Intel Core i7-11800H | |
| Cinebench R23 / Multi Core | |
| Media de la clase Gaming (10488 - 42661, n=107, últimos 2 años) | |
| Alienware x17 RTX 3080 P48E | |
| MSI GS76 Stealth 11UH | |
| Schenker XMG Pro 15 (Late 2021) | |
| Asus ROG Zephyrus S17 GX703HSD | |
| Medion Erazer Beast X25 | |
| Schenker XMG Pro 17 (Late 2021, RTX 3080) | |
| Medio Intel Core i7-11800H (6508 - 14088, n=48) | |
| Cinebench R23 / Single Core | |
| Media de la clase Gaming (1166 - 2415, n=107, últimos 2 años) | |
| Asus ROG Zephyrus S17 GX703HSD | |
| MSI GS76 Stealth 11UH | |
| Schenker XMG Pro 17 (Late 2021, RTX 3080) | |
| Schenker XMG Pro 15 (Late 2021) | |
| Alienware x17 RTX 3080 P48E | |
| Medio Intel Core i7-11800H (1386 - 1522, n=45) | |
| Medion Erazer Beast X25 | |
| Cinebench R20 / CPU (Multi Core) | |
| Media de la clase Gaming (4029 - 16433, n=106, últimos 2 años) | |
| Alienware x17 RTX 3080 P48E | |
| Asus ROG Zephyrus S17 GX703HSD | |
| MSI GS76 Stealth 11UH | |
| Medion Erazer Beast X25 | |
| Schenker XMG Pro 15 (Late 2021) | |
| Schenker XMG Pro 17 (Late 2021, RTX 3080) | |
| Medio Intel Core i7-11800H (2498 - 5408, n=50) | |
| Cinebench R20 / CPU (Single Core) | |
| Media de la clase Gaming (442 - 913, n=106, últimos 2 años) | |
| MSI GS76 Stealth 11UH | |
| Asus ROG Zephyrus S17 GX703HSD | |
| Schenker XMG Pro 17 (Late 2021, RTX 3080) | |
| Schenker XMG Pro 15 (Late 2021) | |
| Alienware x17 RTX 3080 P48E | |
| Medion Erazer Beast X25 | |
| Medio Intel Core i7-11800H (520 - 586, n=47) | |
| Cinebench R15 / CPU Multi 64Bit | |
| Media de la clase Gaming (1578 - 6330, n=105, últimos 2 años) | |
| Asus ROG Zephyrus S17 GX703HSD | |
| Alienware x17 RTX 3080 P48E | |
| MSI GS76 Stealth 11UH | |
| Schenker XMG Pro 15 (Late 2021) | |
| Medion Erazer Beast X25 | |
| Schenker XMG Pro 17 (Late 2021, RTX 3080) | |
| Medio Intel Core i7-11800H (1342 - 2173, n=50) | |
| Cinebench R15 / CPU Single 64Bit | |
| Media de la clase Gaming (188.8 - 350, n=106, últimos 2 años) | |
| Asus ROG Zephyrus S17 GX703HSD | |
| Medion Erazer Beast X25 | |
| MSI GS76 Stealth 11UH | |
| Schenker XMG Pro 17 (Late 2021, RTX 3080) | |
| Alienware x17 RTX 3080 P48E | |
| Schenker XMG Pro 15 (Late 2021) | |
| Medio Intel Core i7-11800H (201 - 231, n=46) | |
| Blender / v2.79 BMW27 CPU | |
| Medio Intel Core i7-11800H (217 - 454, n=46) | |
| Schenker XMG Pro 17 (Late 2021, RTX 3080) | |
| Medion Erazer Beast X25 | |
| MSI GS76 Stealth 11UH | |
| Schenker XMG Pro 15 (Late 2021) | |
| Asus ROG Zephyrus S17 GX703HSD | |
| Alienware x17 RTX 3080 P48E | |
| Media de la clase Gaming (79 - 330, n=104, últimos 2 años) | |
| 7-Zip 18.03 / 7z b 4 | |
| Media de la clase Gaming (33491 - 148086, n=105, últimos 2 años) | |
| Medion Erazer Beast X25 | |
| Asus ROG Zephyrus S17 GX703HSD | |
| Schenker XMG Pro 15 (Late 2021) | |
| Alienware x17 RTX 3080 P48E | |
| MSI GS76 Stealth 11UH | |
| Schenker XMG Pro 17 (Late 2021, RTX 3080) | |
| Medio Intel Core i7-11800H (33718 - 56758, n=46) | |
| 7-Zip 18.03 / 7z b 4 -mmt1 | |
| Media de la clase Gaming (4199 - 7436, n=105, últimos 2 años) | |
| Asus ROG Zephyrus S17 GX703HSD | |
| Medion Erazer Beast X25 | |
| MSI GS76 Stealth 11UH | |
| Schenker XMG Pro 17 (Late 2021, RTX 3080) | |
| Schenker XMG Pro 15 (Late 2021) | |
| Medio Intel Core i7-11800H (5138 - 5732, n=46) | |
| Alienware x17 RTX 3080 P48E | |
| Geekbench 5.5 / Multi-Core | |
| Media de la clase Gaming (6460 - 28263, n=105, últimos 2 años) | |
| MSI GS76 Stealth 11UH | |
| Asus ROG Zephyrus S17 GX703HSD | |
| Schenker XMG Pro 15 (Late 2021) | |
| Schenker XMG Pro 17 (Late 2021, RTX 3080) | |
| Medion Erazer Beast X25 | |
| Medio Intel Core i7-11800H (4655 - 9851, n=40) | |
| Geekbench 5.5 / Single-Core | |
| Media de la clase Gaming (986 - 2474, n=105, últimos 2 años) | |
| Asus ROG Zephyrus S17 GX703HSD | |
| MSI GS76 Stealth 11UH | |
| Schenker XMG Pro 17 (Late 2021, RTX 3080) | |
| Schenker XMG Pro 15 (Late 2021) | |
| Medio Intel Core i7-11800H (1429 - 1625, n=40) | |
| Medion Erazer Beast X25 | |
| HWBOT x265 Benchmark v2.2 / 4k Preset | |
| Media de la clase Gaming (11.5 - 44.4, n=105, últimos 2 años) | |
| Alienware x17 RTX 3080 P48E | |
| Asus ROG Zephyrus S17 GX703HSD | |
| Medion Erazer Beast X25 | |
| Schenker XMG Pro 15 (Late 2021) | |
| MSI GS76 Stealth 11UH | |
| Schenker XMG Pro 17 (Late 2021, RTX 3080) | |
| Medio Intel Core i7-11800H (7.38 - 17.4, n=46) | |
| LibreOffice / 20 Documents To PDF | |
| Media de la clase Gaming (33.2 - 88.8, n=105, últimos 2 años) | |
| Medion Erazer Beast X25 | |
| MSI GS76 Stealth 11UH | |
| Schenker XMG Pro 15 (Late 2021) | |
| Schenker XMG Pro 17 (Late 2021, RTX 3080) | |
| Alienware x17 RTX 3080 P48E | |
| Medio Intel Core i7-11800H (38.6 - 59.9, n=45) | |
| Asus ROG Zephyrus S17 GX703HSD | |
| R Benchmark 2.5 / Overall mean | |
| Medio Intel Core i7-11800H (0.548 - 0.615, n=46) | |
| Alienware x17 RTX 3080 P48E | |
| Schenker XMG Pro 17 (Late 2021, RTX 3080) | |
| Schenker XMG Pro 15 (Late 2021) | |
| MSI GS76 Stealth 11UH | |
| Asus ROG Zephyrus S17 GX703HSD | |
| Medion Erazer Beast X25 | |
| Media de la clase Gaming (0.3439 - 0.759, n=106, últimos 2 años) | |
* ... más pequeño es mejor
AIDA64: FP32 Ray-Trace | FPU Julia | CPU SHA3 | CPU Queen | FPU SinJulia | FPU Mandel | CPU AES | CPU ZLib | FP64 Ray-Trace | CPU PhotoWorxx
| Performance rating | |
| Media de la clase Gaming | |
| Schenker XMG Pro 17 (Late 2021, RTX 3080) | |
| Medio Intel Core i7-11800H | |
| AIDA64 / FP32 Ray-Trace | |
| Media de la clase Gaming (10227 - 85542, n=105, últimos 2 años) | |
| Schenker XMG Pro 17 (Late 2021, RTX 3080) | |
| Medio Intel Core i7-11800H (8772 - 15961, n=20) | |
| AIDA64 / FPU Julia | |
| Media de la clase Gaming (51376 - 238426, n=105, últimos 2 años) | |
| Schenker XMG Pro 17 (Late 2021, RTX 3080) | |
| Medio Intel Core i7-11800H (39404 - 65636, n=20) | |
| AIDA64 / CPU SHA3 | |
| Media de la clase Gaming (2180 - 10115, n=105, últimos 2 años) | |
| Schenker XMG Pro 17 (Late 2021, RTX 3080) | |
| Medio Intel Core i7-11800H (2599 - 4439, n=20) | |
| AIDA64 / CPU Queen | |
| Media de la clase Gaming (49785 - 173351, n=90, últimos 2 años) | |
| Schenker XMG Pro 17 (Late 2021, RTX 3080) | |
| Medio Intel Core i7-11800H (85233 - 91941, n=20) | |
| AIDA64 / FPU SinJulia | |
| Media de la clase Gaming (4424 - 33636, n=105, últimos 2 años) | |
| Schenker XMG Pro 17 (Late 2021, RTX 3080) | |
| Medio Intel Core i7-11800H (6420 - 9792, n=20) | |
| AIDA64 / FPU Mandel | |
| Media de la clase Gaming (25115 - 128721, n=105, últimos 2 años) | |
| Schenker XMG Pro 17 (Late 2021, RTX 3080) | |
| Medio Intel Core i7-11800H (23365 - 39464, n=20) | |
| AIDA64 / CPU AES | |
| Schenker XMG Pro 17 (Late 2021, RTX 3080) | |
| Medio Intel Core i7-11800H (74617 - 149388, n=20) | |
| Media de la clase Gaming (39258 - 247074, n=105, últimos 2 años) | |
| AIDA64 / CPU ZLib | |
| Media de la clase Gaming (574 - 2531, n=105, últimos 2 años) | |
| Schenker XMG Pro 17 (Late 2021, RTX 3080) | |
| Medio Intel Core i7-11800H (461 - 830, n=43) | |
| AIDA64 / FP64 Ray-Trace | |
| Media de la clase Gaming (5509 - 45446, n=105, últimos 2 años) | |
| Schenker XMG Pro 17 (Late 2021, RTX 3080) | |
| Medio Intel Core i7-11800H (4545 - 8717, n=21) | |
| AIDA64 / CPU PhotoWorxx | |
| Media de la clase Gaming (12271 - 89891, n=105, últimos 2 años) | |
| Schenker XMG Pro 17 (Late 2021, RTX 3080) | |
| Medio Intel Core i7-11800H (11898 - 26757, n=21) | |
Rendimiento del sistema
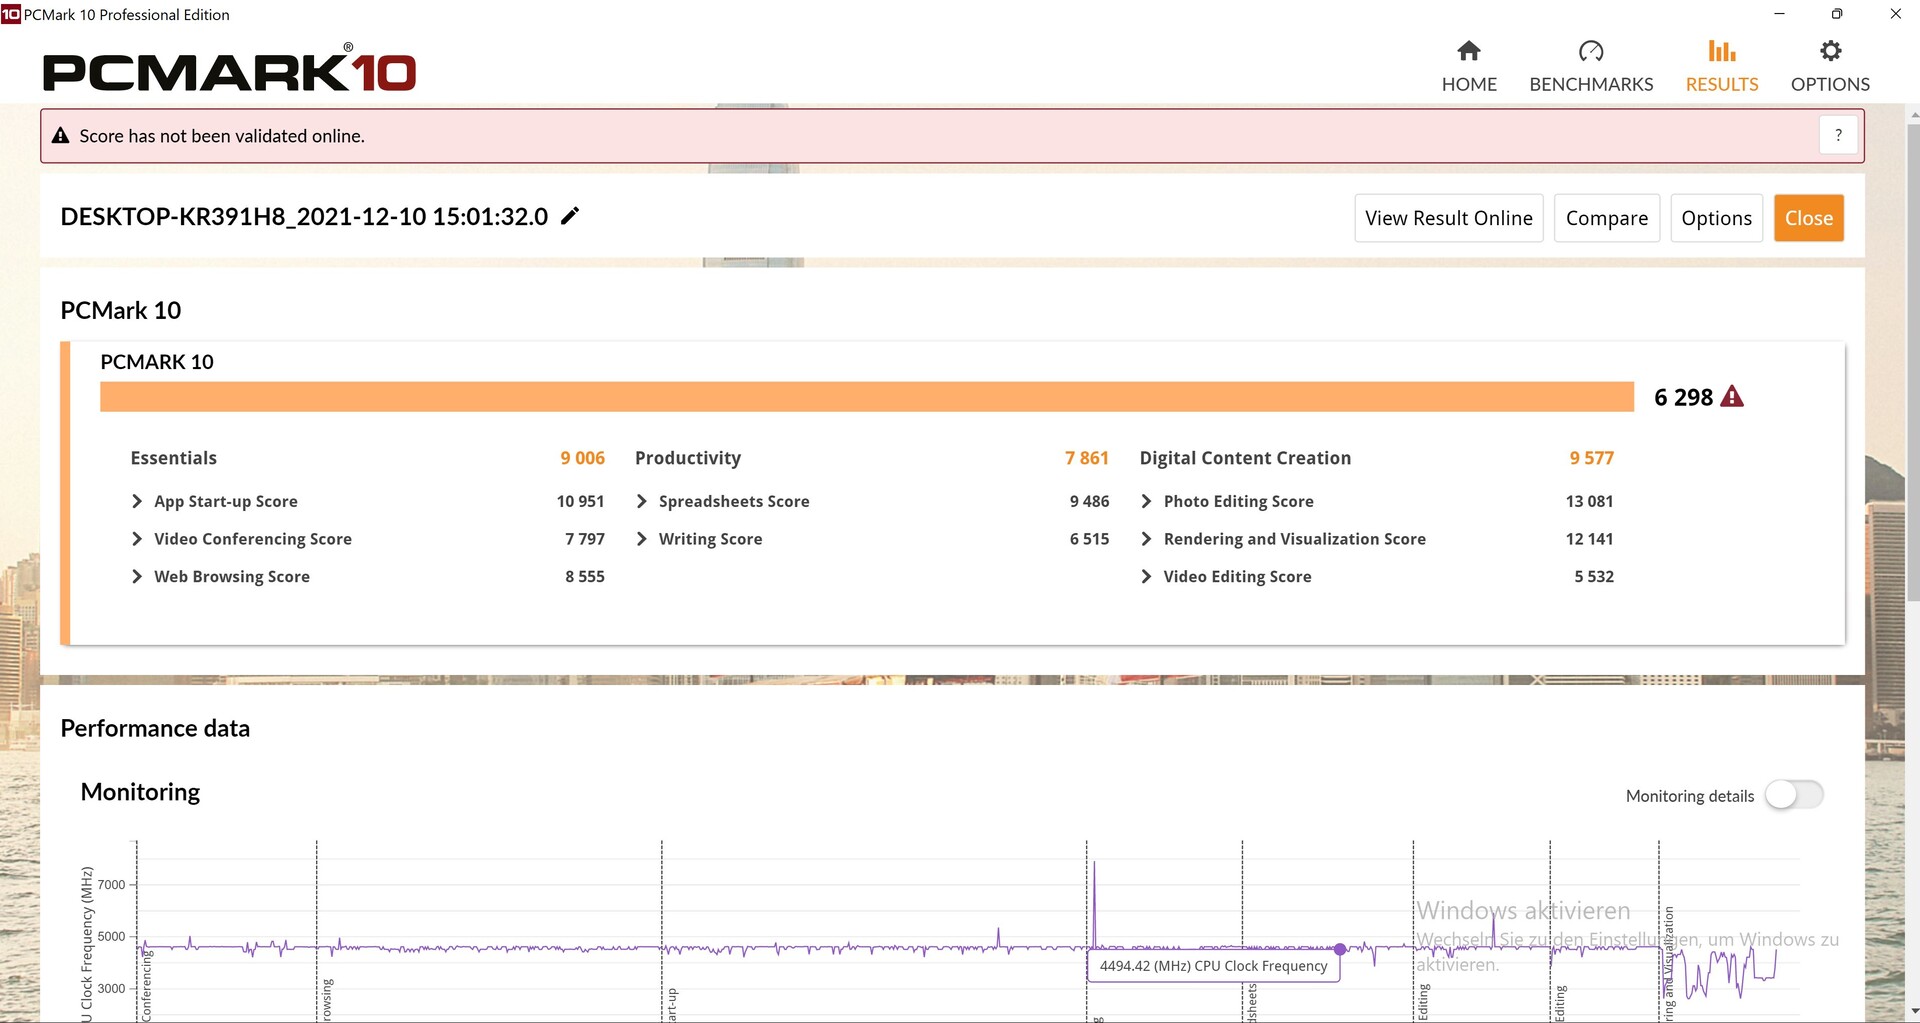
En PCMark 10, el XMG Pro no ofrece necesariamente el rendimiento más potente, por decirlo suavemente. Normalmente, los competidores en la prueba se mantienen bastante cerca, pero nuestra unidad de prueba siempre queda por detrás de los competidores entre un 8% (MSI) y un 18% (Alienware). Mientras que en esta clase de rendimiento, esto no será realmente tan notable en el funcionamiento diario ya que todo funciona sin problemas, para los entusiastas del rendimiento, las puntuaciones PCMark del portátil delgado son una decepción
| PCMark 10 / Score | |
| Media de la clase Gaming (5828 - 12414, n=93, últimos 2 años) | |
| Alienware x17 RTX 3080 P48E | |
| Asus ROG Zephyrus S17 GX703HSD | |
| Medio Intel Core i7-11800H, NVIDIA GeForce RTX 3080 Laptop GPU (6673 - 7470, n=11) | |
| Schenker XMG Pro 17 (Late 2021, RTX 3080) | |
| Medion Erazer Beast X25 | |
| MSI GS76 Stealth 11UH | |
| Schenker XMG Pro 15 (Late 2021) | |
| PCMark 10 / Essentials | |
| Media de la clase Gaming (8810 - 11935, n=97, últimos 2 años) | |
| Asus ROG Zephyrus S17 GX703HSD | |
| Medio Intel Core i7-11800H, NVIDIA GeForce RTX 3080 Laptop GPU (9862 - 11064, n=11) | |
| Alienware x17 RTX 3080 P48E | |
| Schenker XMG Pro 17 (Late 2021, RTX 3080) | |
| Medion Erazer Beast X25 | |
| Schenker XMG Pro 15 (Late 2021) | |
| MSI GS76 Stealth 11UH | |
| PCMark 10 / Productivity | |
| Media de la clase Gaming (6845 - 25323, n=95, últimos 2 años) | |
| Alienware x17 RTX 3080 P48E | |
| Medion Erazer Beast X25 | |
| Asus ROG Zephyrus S17 GX703HSD | |
| Schenker XMG Pro 17 (Late 2021, RTX 3080) | |
| Medio Intel Core i7-11800H, NVIDIA GeForce RTX 3080 Laptop GPU (8278 - 9803, n=11) | |
| MSI GS76 Stealth 11UH | |
| Schenker XMG Pro 15 (Late 2021) | |
| PCMark 10 / Digital Content Creation | |
| Media de la clase Gaming (7602 - 19954, n=95, últimos 2 años) | |
| Alienware x17 RTX 3080 P48E | |
| Asus ROG Zephyrus S17 GX703HSD | |
| Medio Intel Core i7-11800H, NVIDIA GeForce RTX 3080 Laptop GPU (9881 - 11323, n=11) | |
| Schenker XMG Pro 17 (Late 2021, RTX 3080) | |
| MSI GS76 Stealth 11UH | |
| Schenker XMG Pro 15 (Late 2021) | |
| Medion Erazer Beast X25 | |
| PCMark 10 Score | 6996 puntos | |
ayuda | ||
| AIDA64 / Memory Copy | |
| Media de la clase Gaming (21750 - 129946, n=105, últimos 2 años) | |
| Schenker XMG Pro 15 (Late 2021) | |
| Schenker XMG Pro 17 (Late 2021, RTX 3080) | |
| Medion Erazer Beast X25 | |
| Medio Intel Core i7-11800H (24508 - 48144, n=21) | |
| AIDA64 / Memory Read | |
| Media de la clase Gaming (22956 - 118858, n=105, últimos 2 años) | |
| Schenker XMG Pro 15 (Late 2021) | |
| Schenker XMG Pro 17 (Late 2021, RTX 3080) | |
| Medio Intel Core i7-11800H (25882 - 50365, n=20) | |
| Medion Erazer Beast X25 | |
| AIDA64 / Memory Write | |
| Media de la clase Gaming (22297 - 135096, n=105, últimos 2 años) | |
| Medion Erazer Beast X25 | |
| Schenker XMG Pro 15 (Late 2021) | |
| Schenker XMG Pro 17 (Late 2021, RTX 3080) | |
| Medio Intel Core i7-11800H (22240 - 46214, n=20) | |
| AIDA64 / Memory Latency | |
| Media de la clase Gaming (75.3 - 259, n=105, últimos 2 años) | |
| Schenker XMG Pro 15 (Late 2021) | |
| Schenker XMG Pro 17 (Late 2021, RTX 3080) | |
| Medion Erazer Beast X25 | |
| Medio Intel Core i7-11800H (71.9 - 104.1, n=44) | |
| Asus ROG Zephyrus S17 GX703HSD | |
| Alienware x17 RTX 3080 P48E | |
* ... más pequeño es mejor
Latencias del CPD
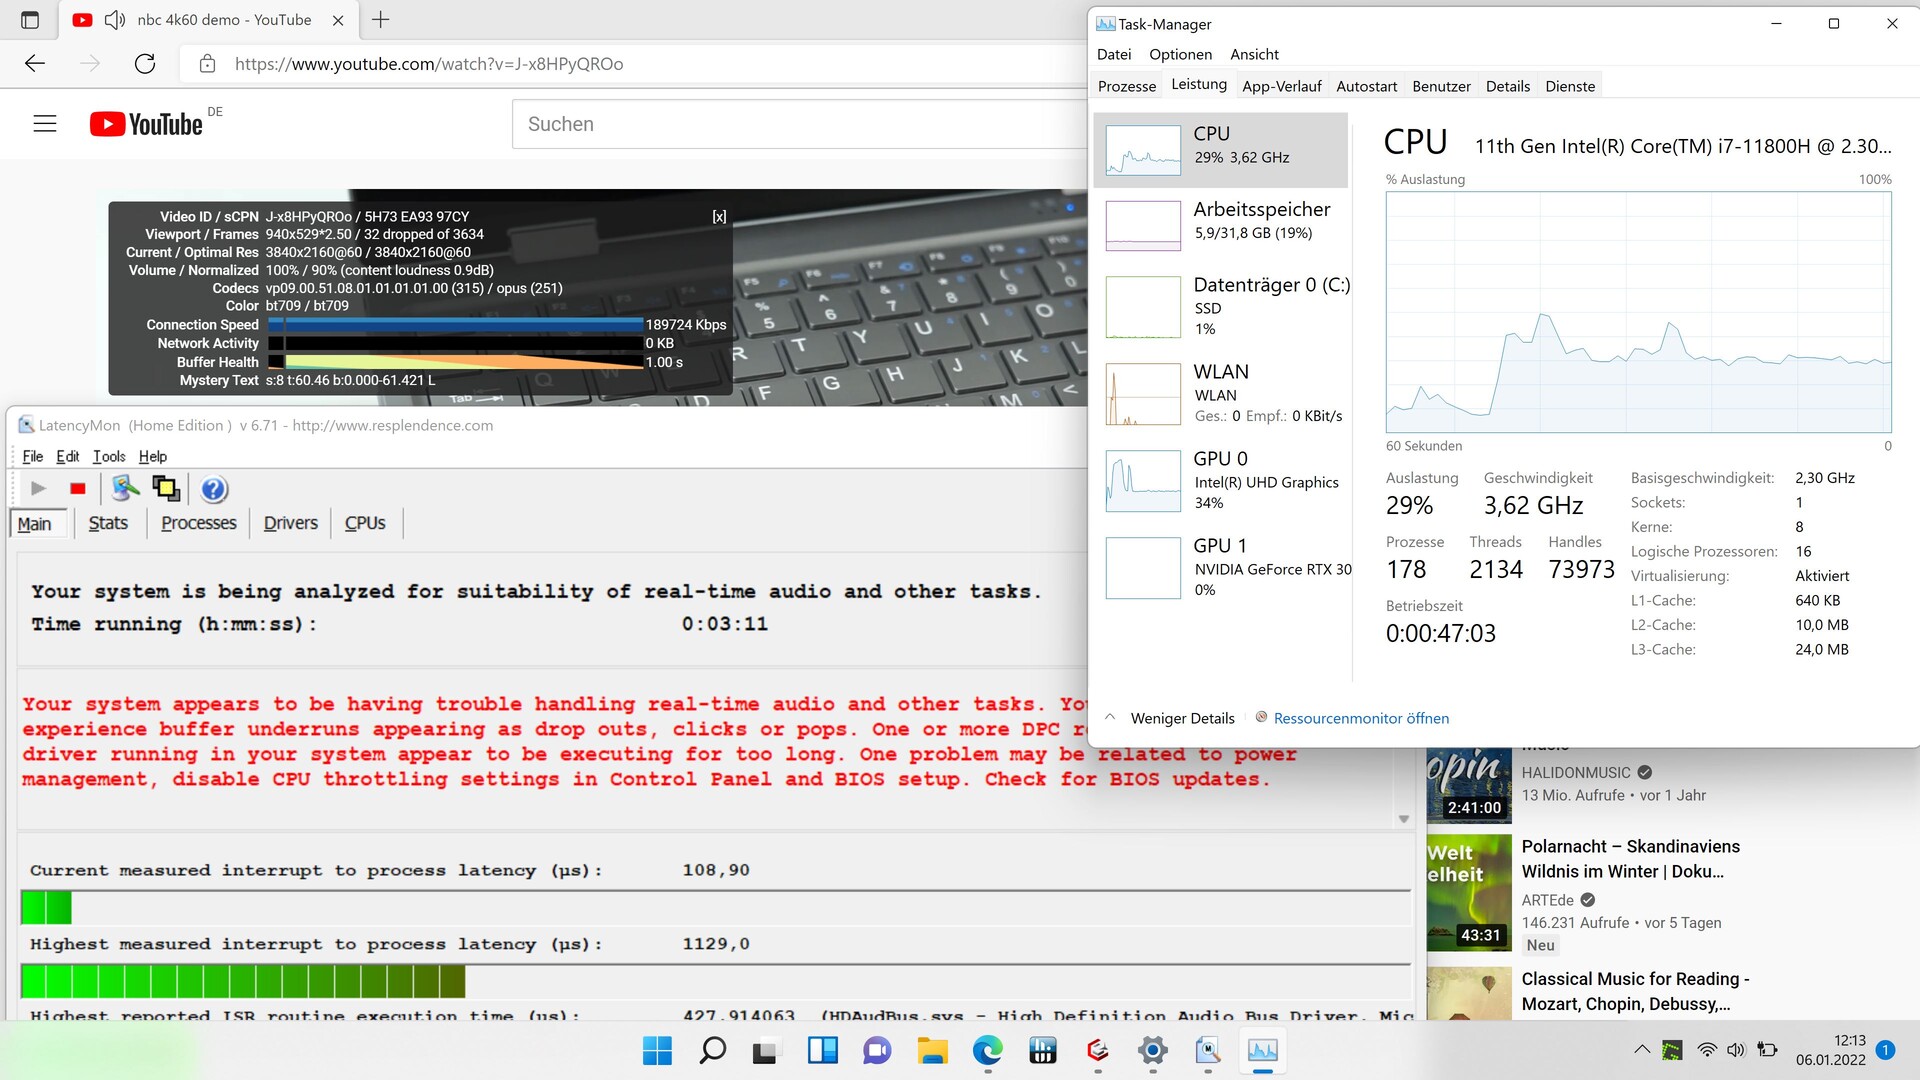
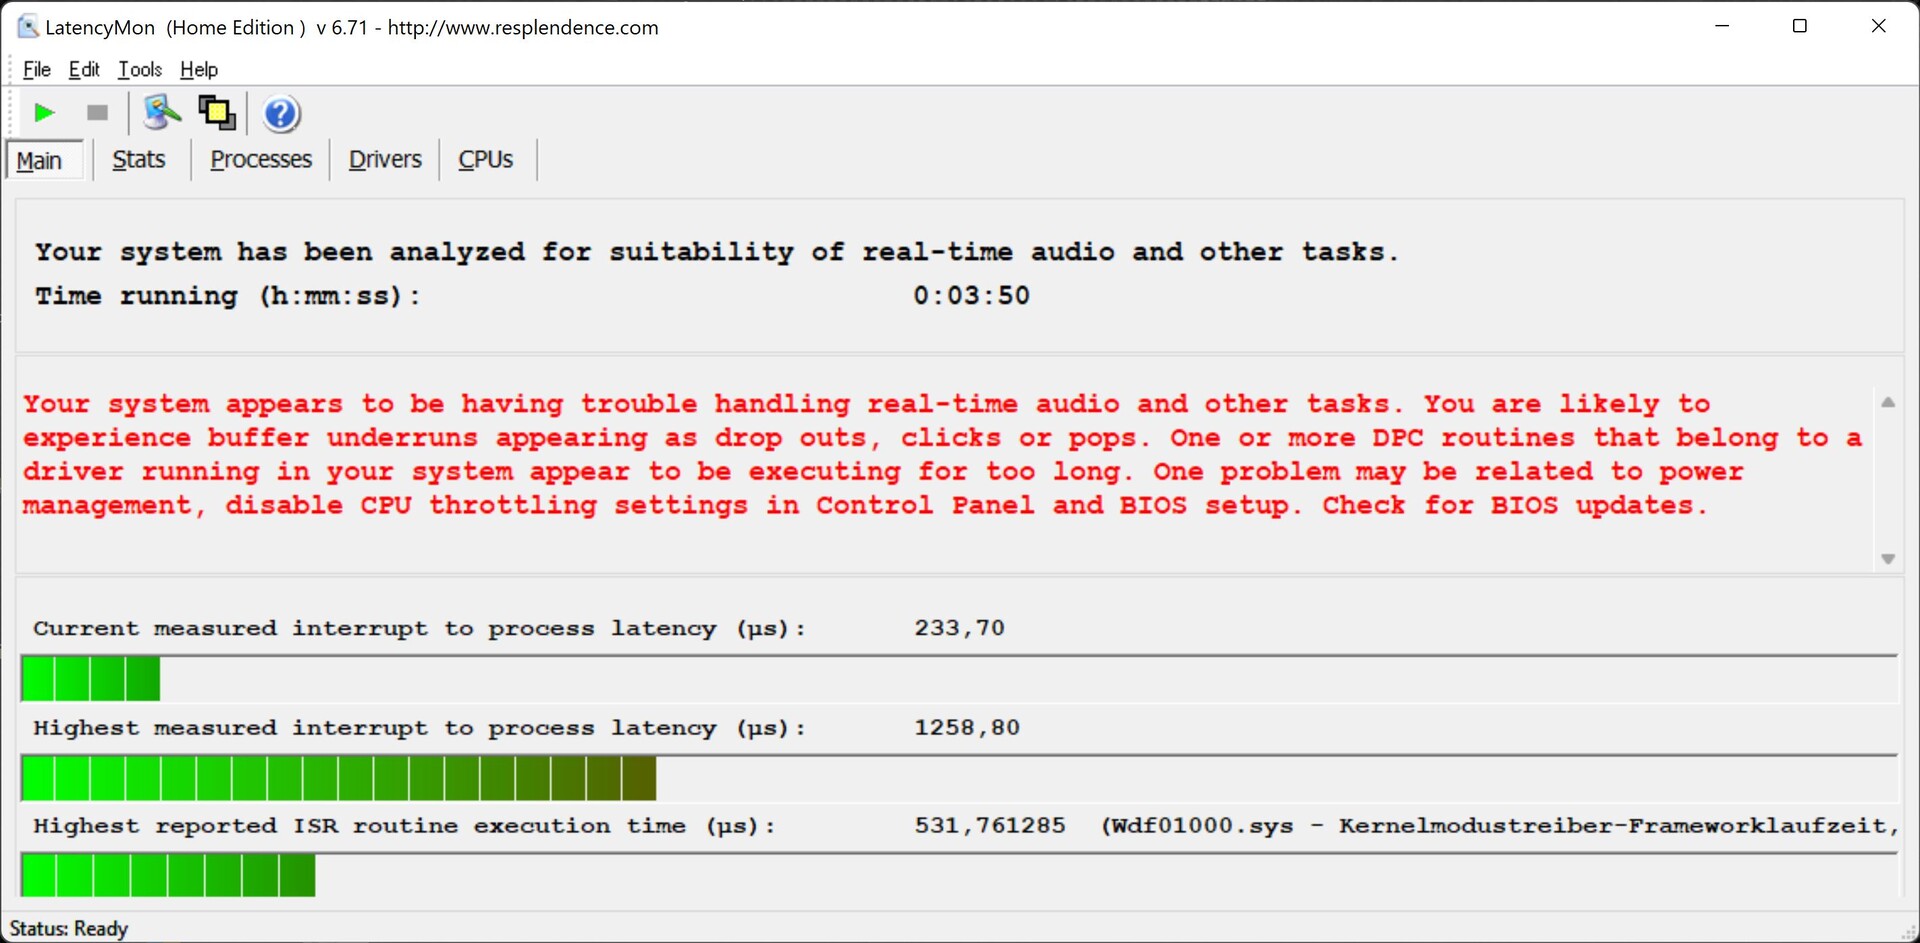
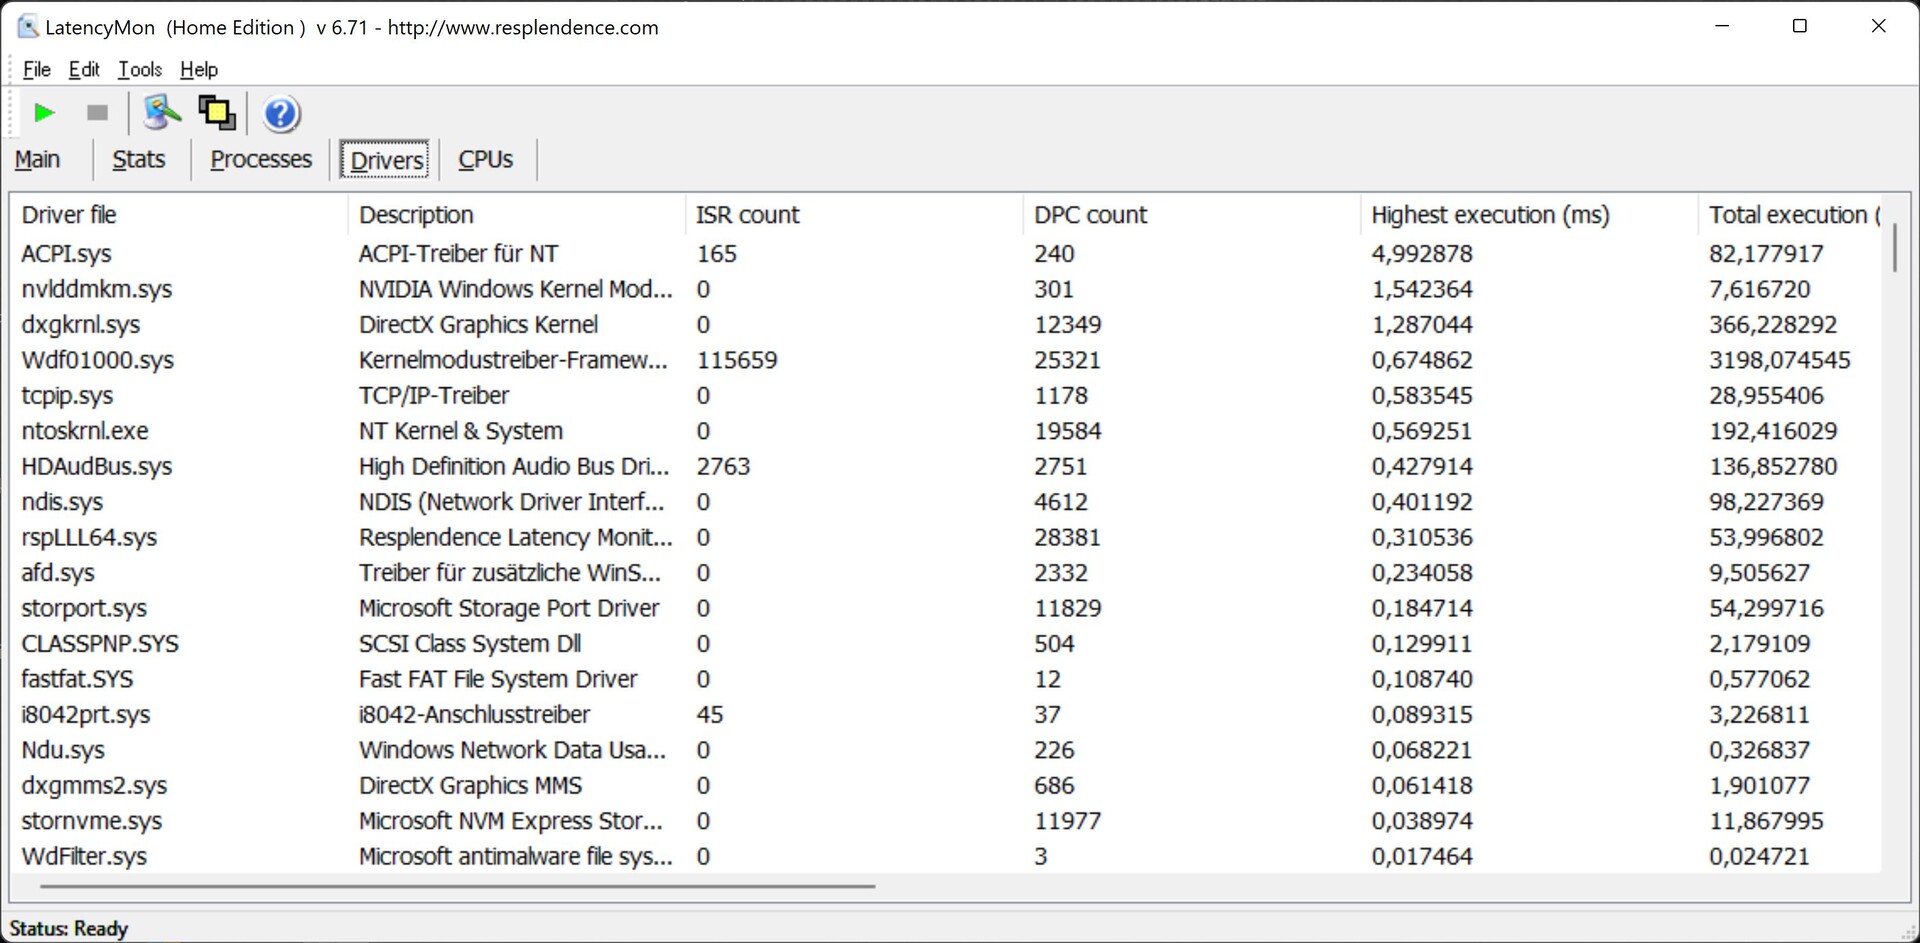
Al abrir el navegador web (Edge), el software LatencyMon ya encuentra algunos problemas de latencia. Estos aumentan al reproducir nuestro vídeo de prueba de YouTube a 4K y 60 fps (32 fotogramas caídos) o al iniciar brevemente la prueba Prime95.
El fallo parece estar principalmente en el controlador ACPI para NT, pero también hay un controlador Nvidia que crea algunos problemas para el sistema.
Sin embargo, en nuestra comparación el tamaño del valor de la latencia está más en el medio del campo, y los portátiles de la comparación tampoco están libres de problemas. Sólo que sus latencias empiezan más tarde y definitivamente no cuando acaban de iniciar el navegador
| DPC Latencies / LatencyMon - interrupt to process latency (max), Web, Youtube, Prime95 | |
| Alienware x17 RTX 3080 P48E | |
| Asus ROG Zephyrus S17 GX703HSD | |
| Schenker XMG Pro 17 (Late 2021, RTX 3080) | |
| Schenker XMG Pro 15 (Late 2021) | |
| Medion Erazer Beast X25 | |
| MSI GS76 Stealth 11UH | |
* ... más pequeño es mejor
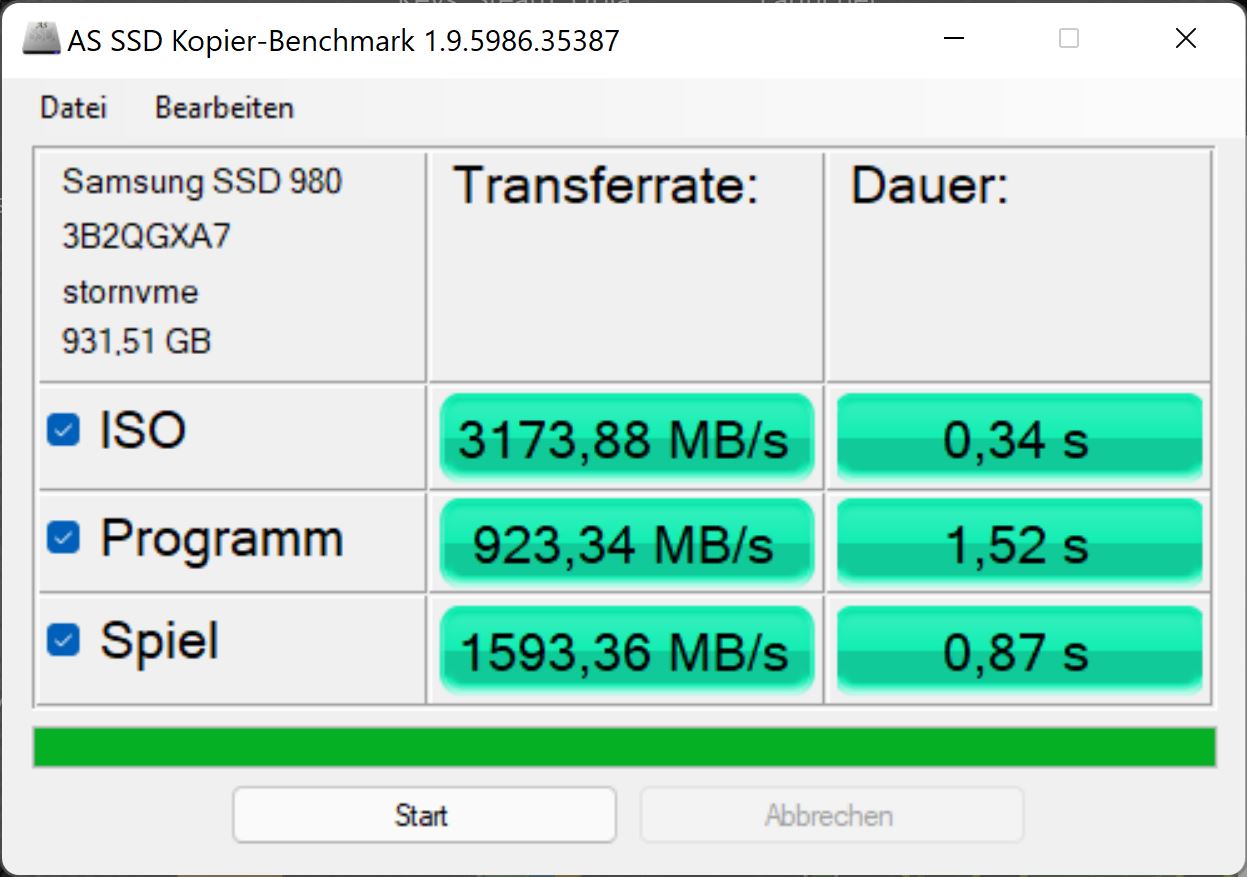
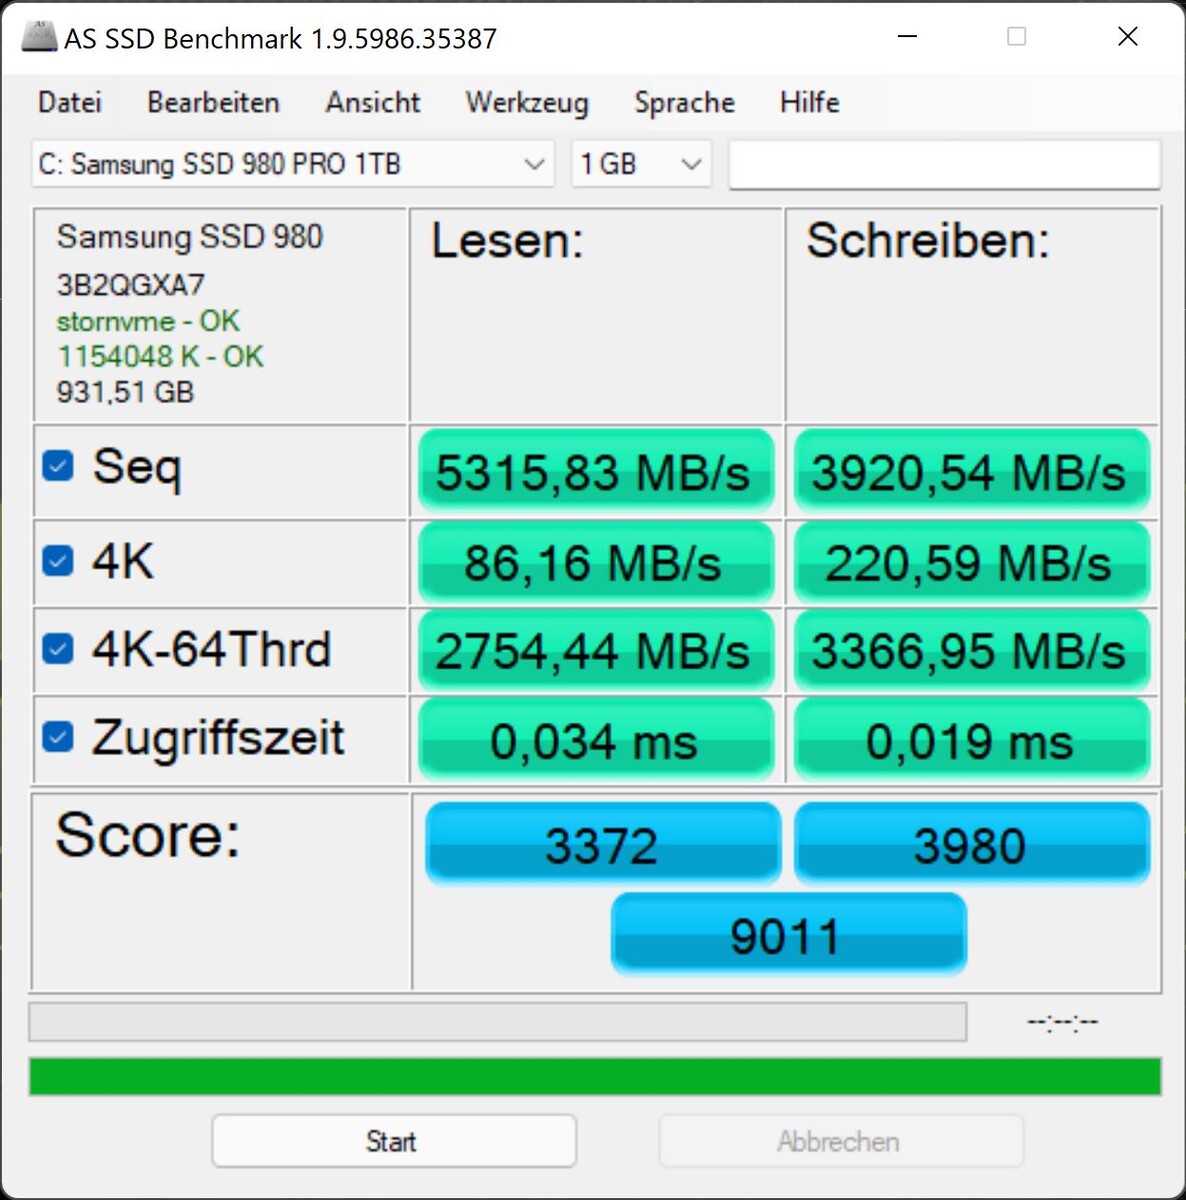
Solución de almacenamiento
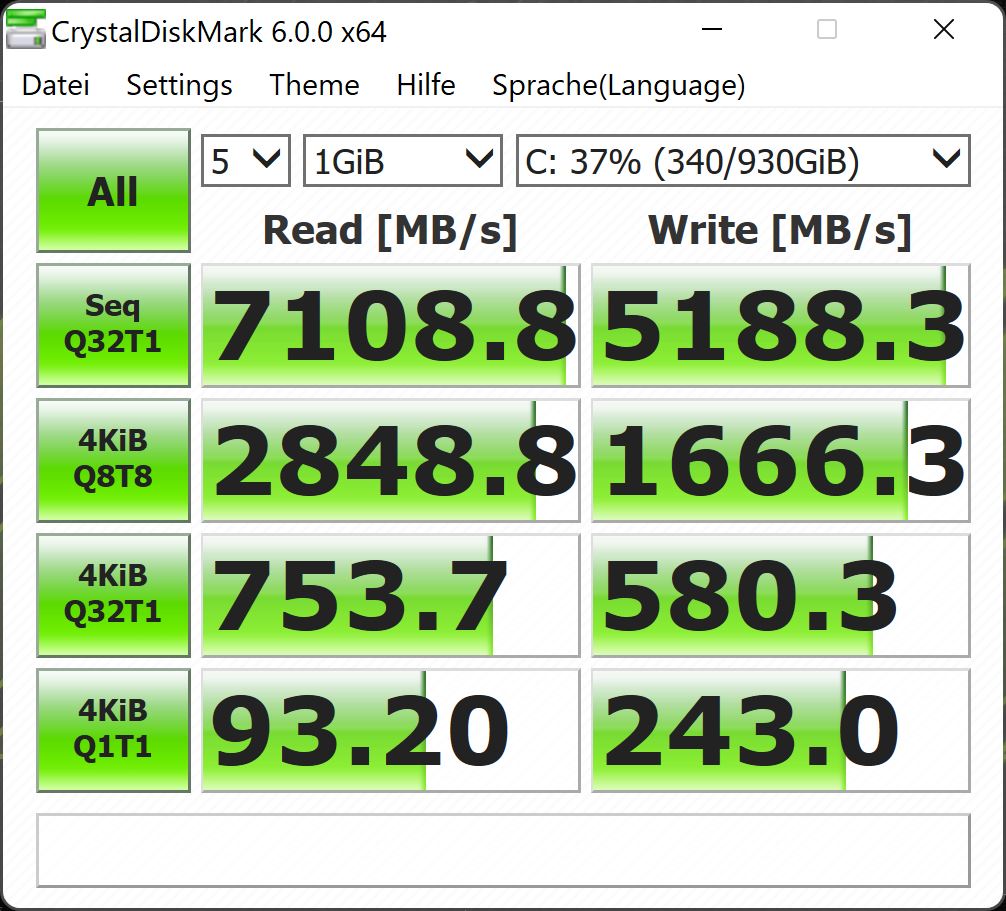
Schenker usa el probado y rápido Samsung SSD 980 Pro con 1 TB de espacio de almacenamiento. Su rendimiento está en el extremo superior, y sólo el PM9A1 (MSI, Asus Zephyrus) del mismo fabricante es ligeramente más rápido en algunas áreas.
Durante la prueba de lectura constante, el altísimo rendimiento cae ligeramente con el tiempo, pero debería seguir siendo superior al de algunos competidores

* ... más pequeño es mejor
Constant Performance Reading: DiskSpd Read Loop, Queue Depth 8
Tarjeta gráfica
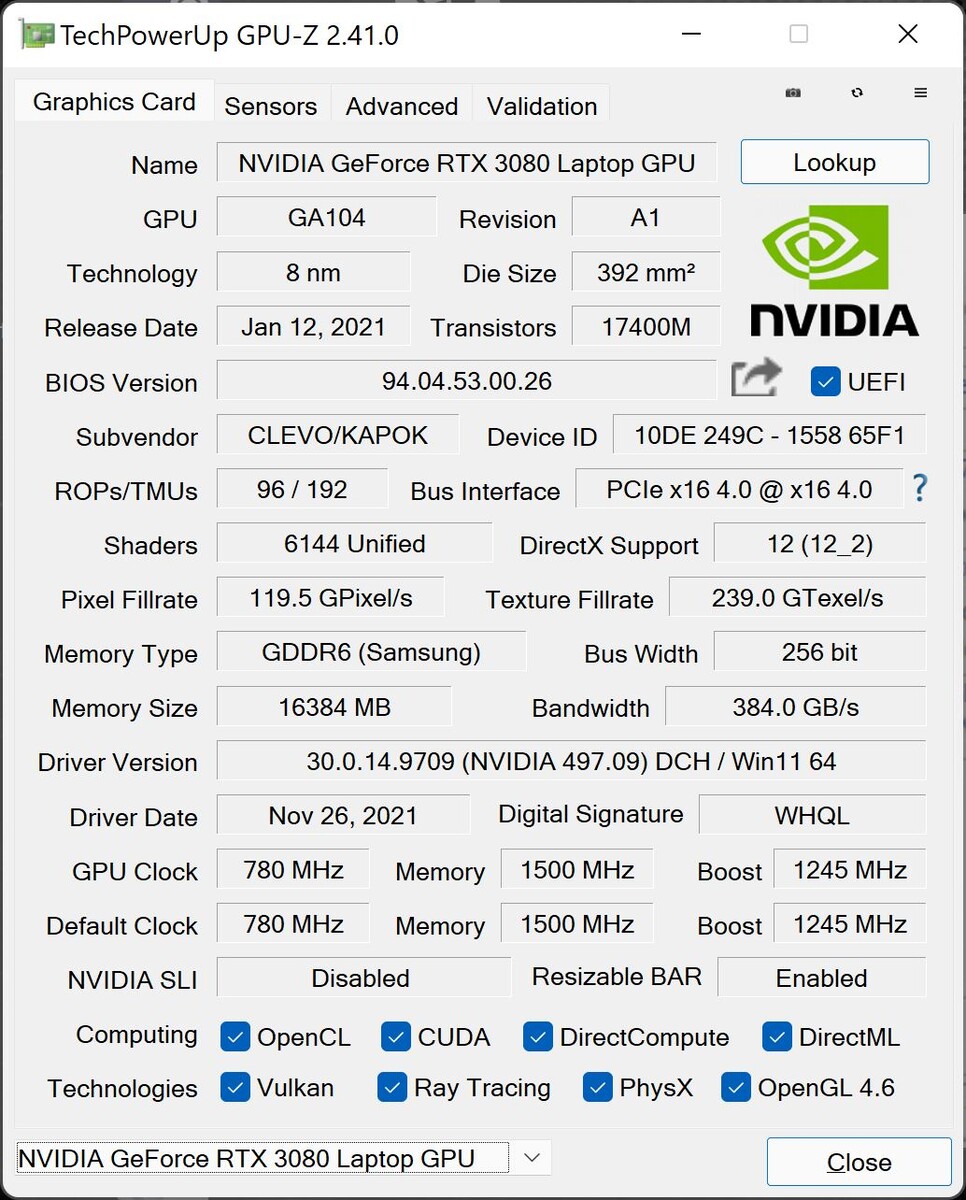
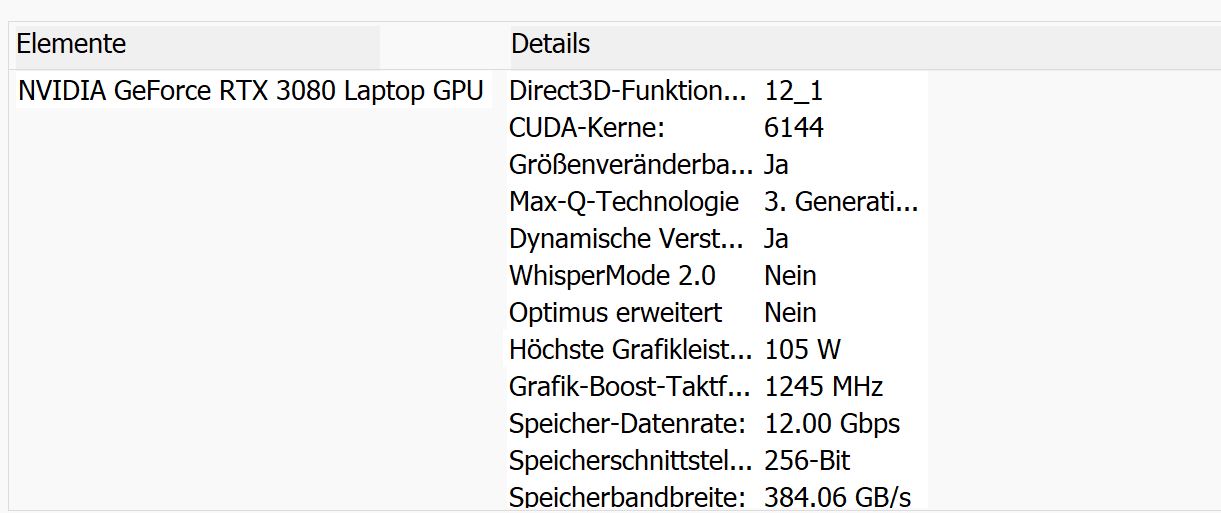
La versión de 16 GB de laGPU NVIDIA GeForce RTX 3080 para portátilesse utiliza, pero solo se le permite consumir 90 vatios más 15 vatios de Dynamic Boost, lo que resulta en un máximo total de 105 vatios. En cambio, el Zephyrus S17 alcanza hasta 140 vatios y el Alienware X17 R1 incluso 165 vatios. Esto muestra que el Schenker tiene que hacer algunos compromisos debido a la delgada carcasa, buscando más la eficiencia que el máximo rendimiento.
Aunque la configuración de nuestra unidad de pruebas no ofrece Optimus avanzado, puedes elegir en la BIOS para el puerto USB-C vía MUX, si debe conectarse vía iGPU o dGPU.
En las pruebas 3DMark, el XMG Pro rinde ligeramente por debajo de la media, pero sigue siendo mejor que el MSI o incluso el portátil Medion en algunas áreas. El Asus ROG Zephyrus y el Alienware son claramente más rápidos.
En modo batería, la mayor parte del rendimiento 3D se pierde. En vez de correr a 90 - 107 fps,"The Witcher 3 Ultra" sólo corre a 8 - 10 fps, lo que lo deja injugable. Así que lejos de la toma de corriente, sólo puedes jugar a juegos casuales o antiguos.
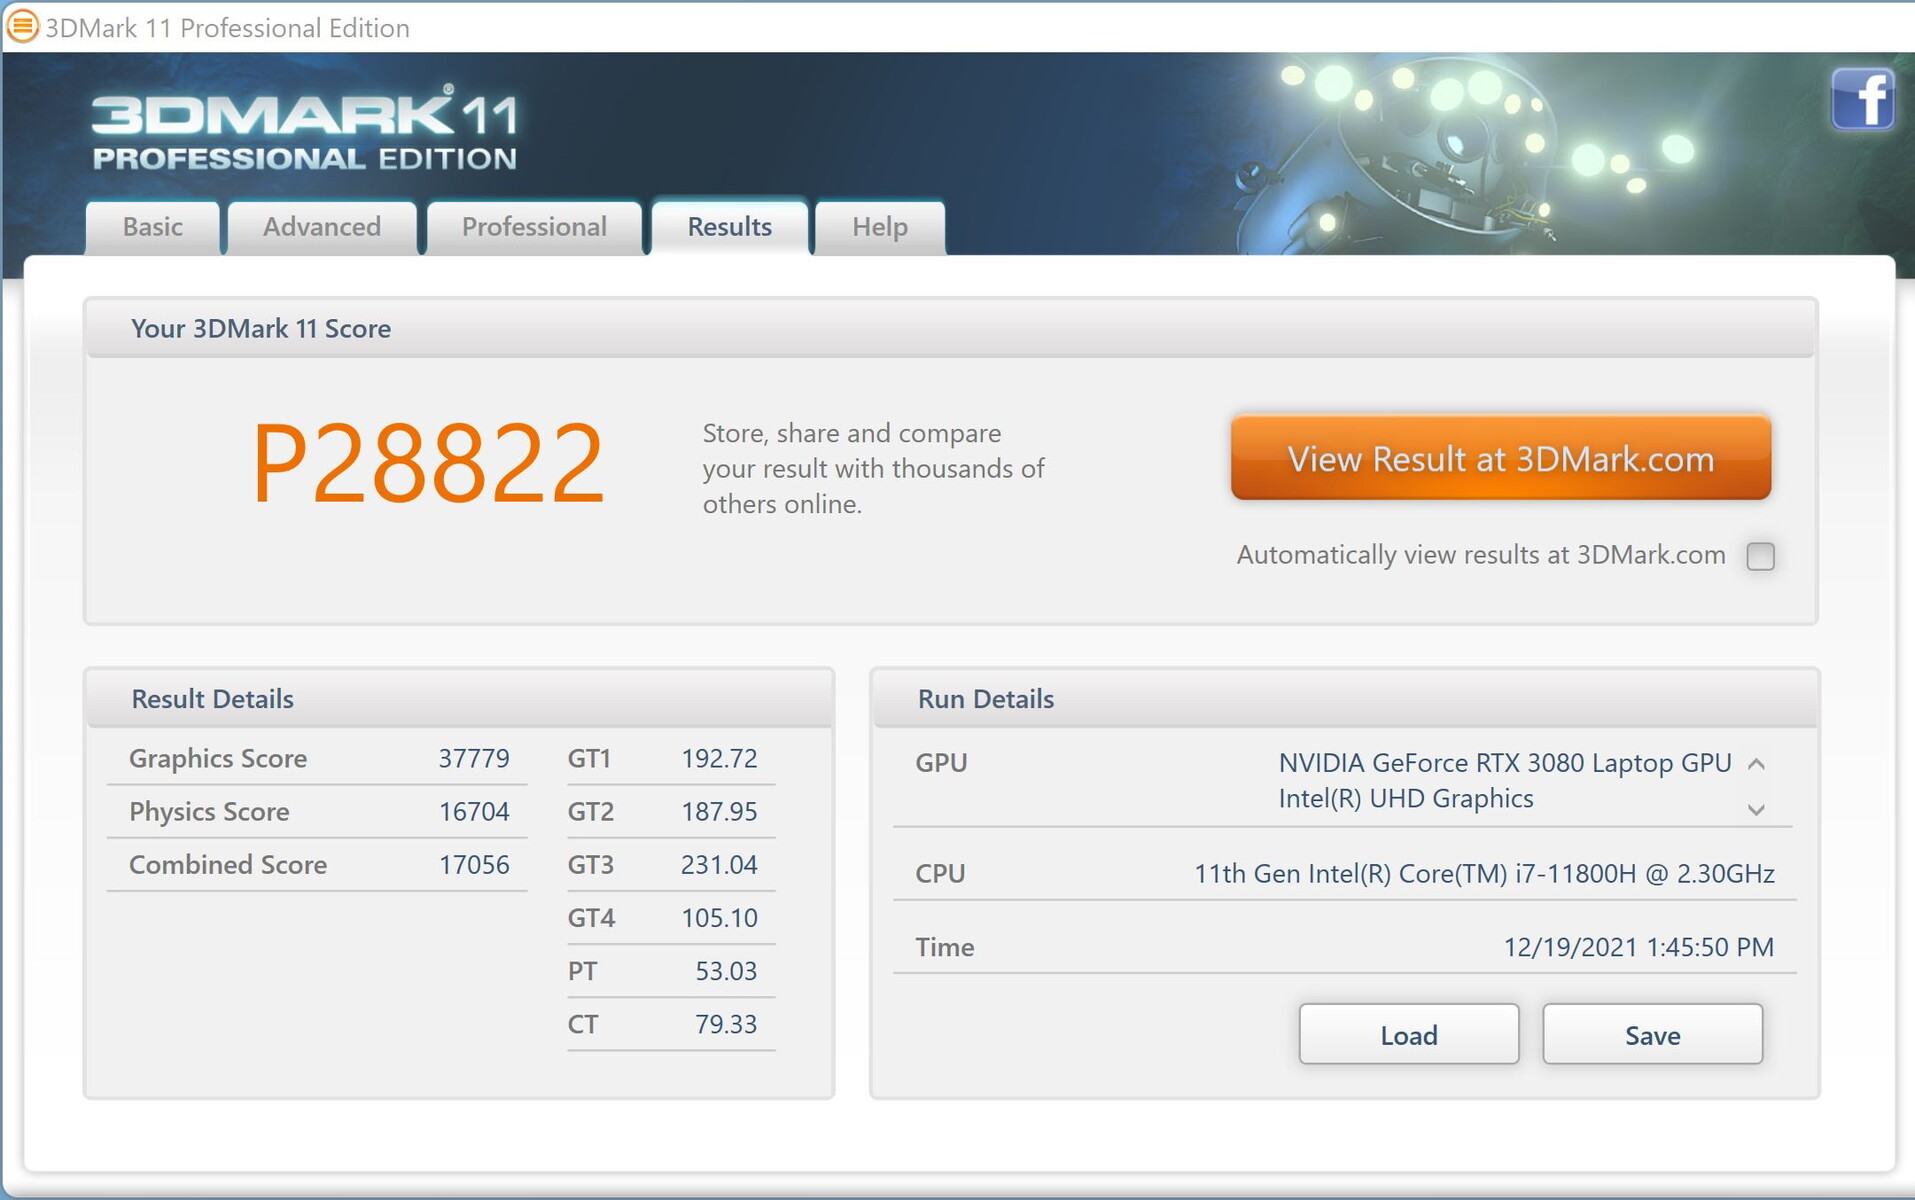
| 3DMark 11 Performance | 28822 puntos | |
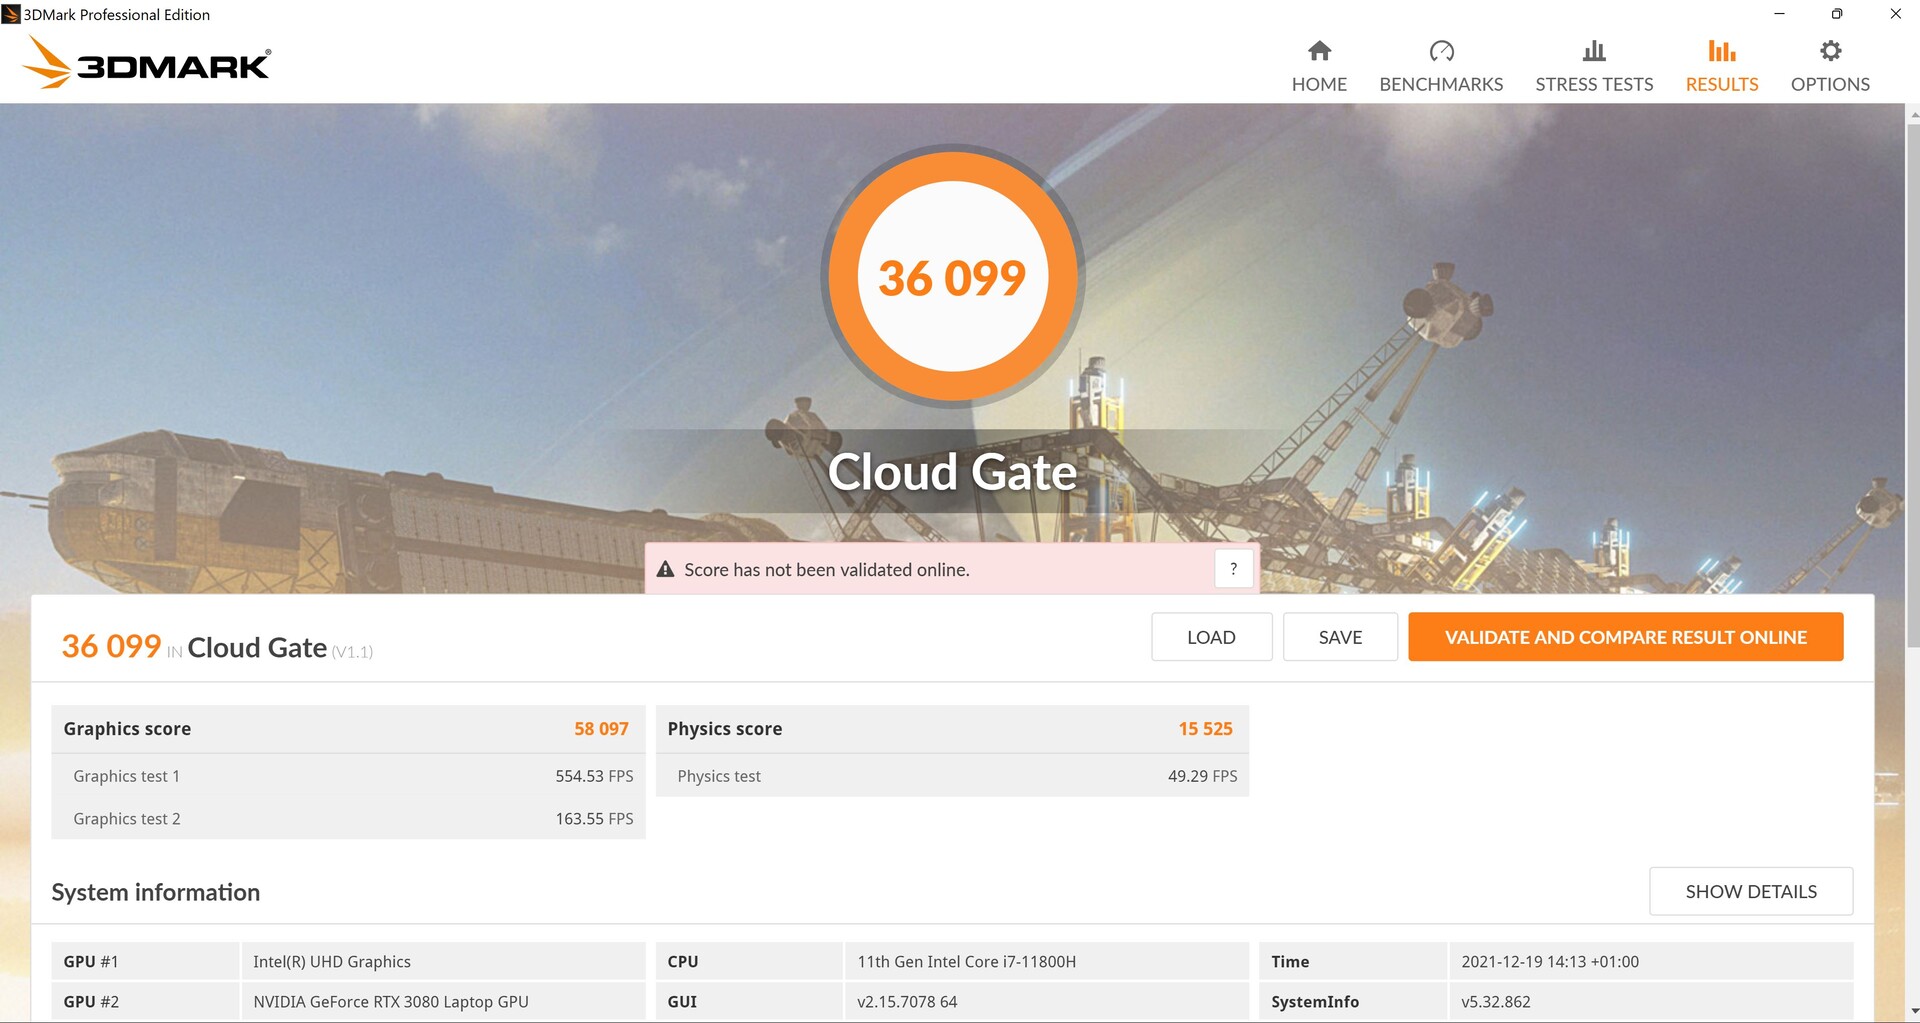
| 3DMark Cloud Gate Standard Score | 36099 puntos | |
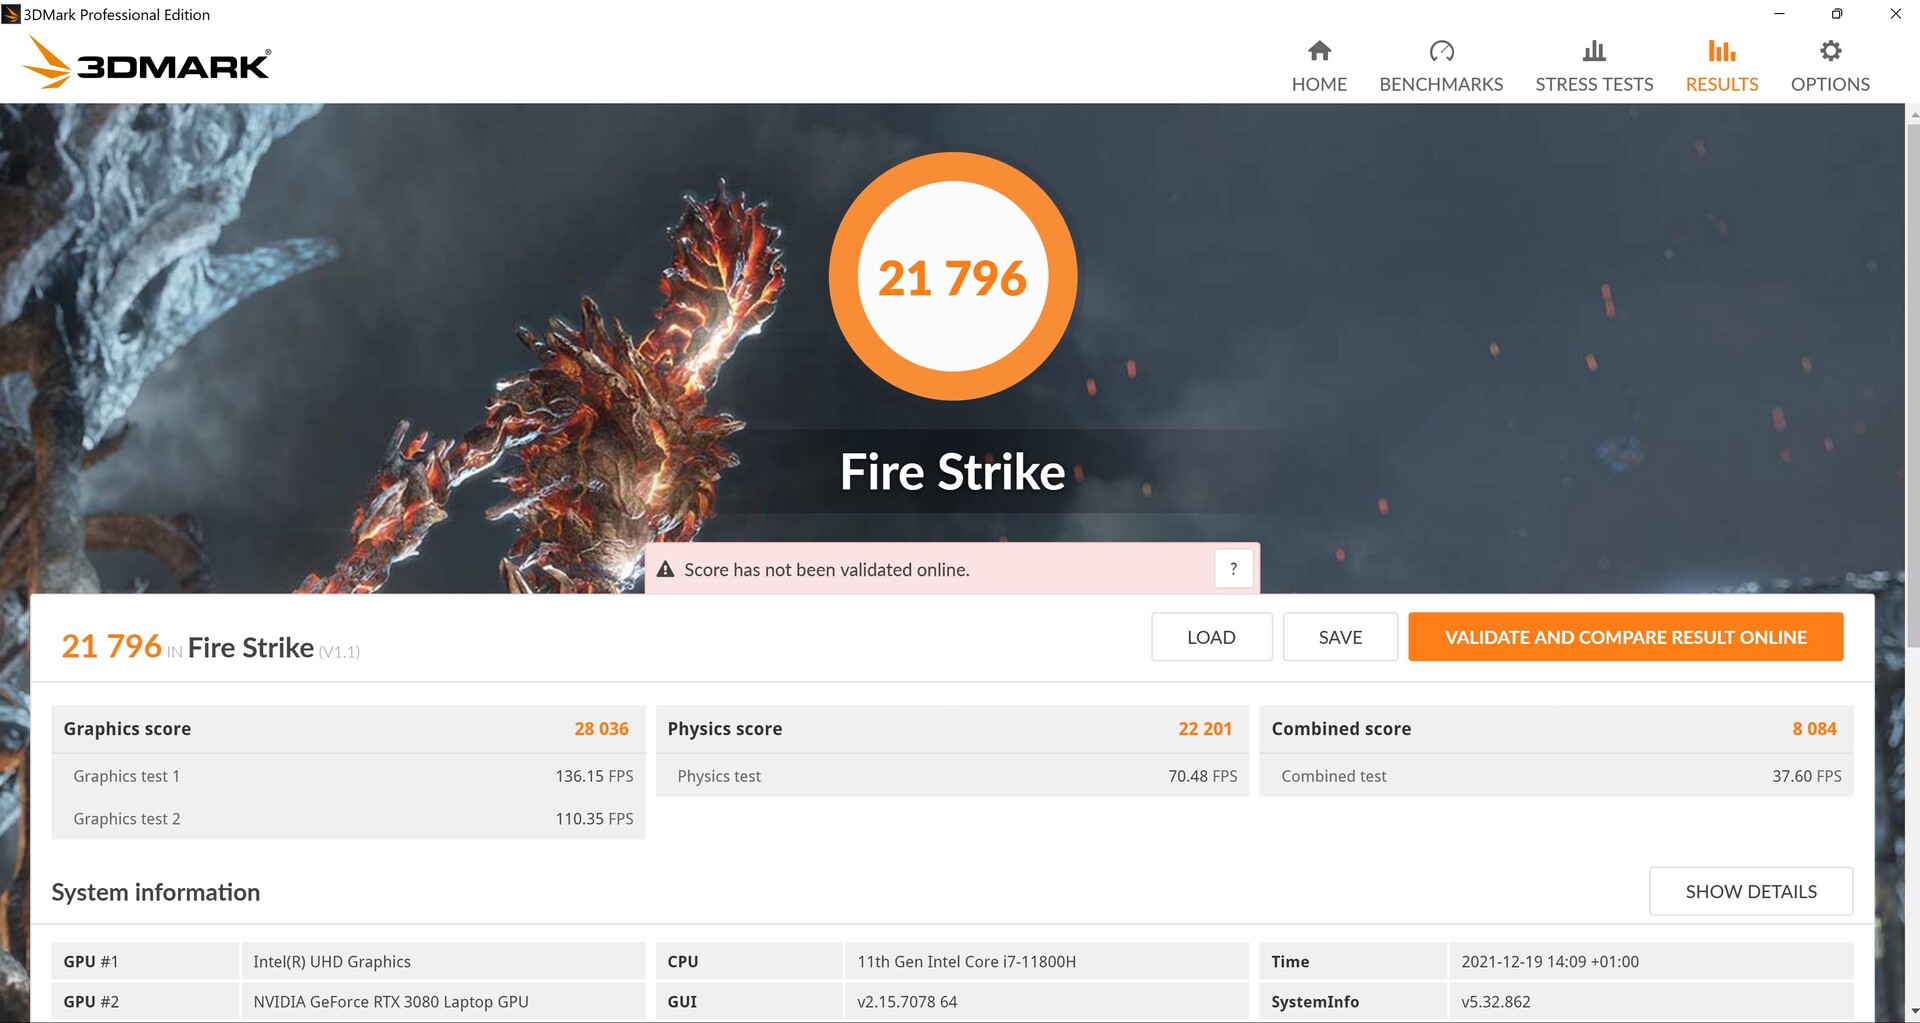
| 3DMark Fire Strike Score | 21796 puntos | |
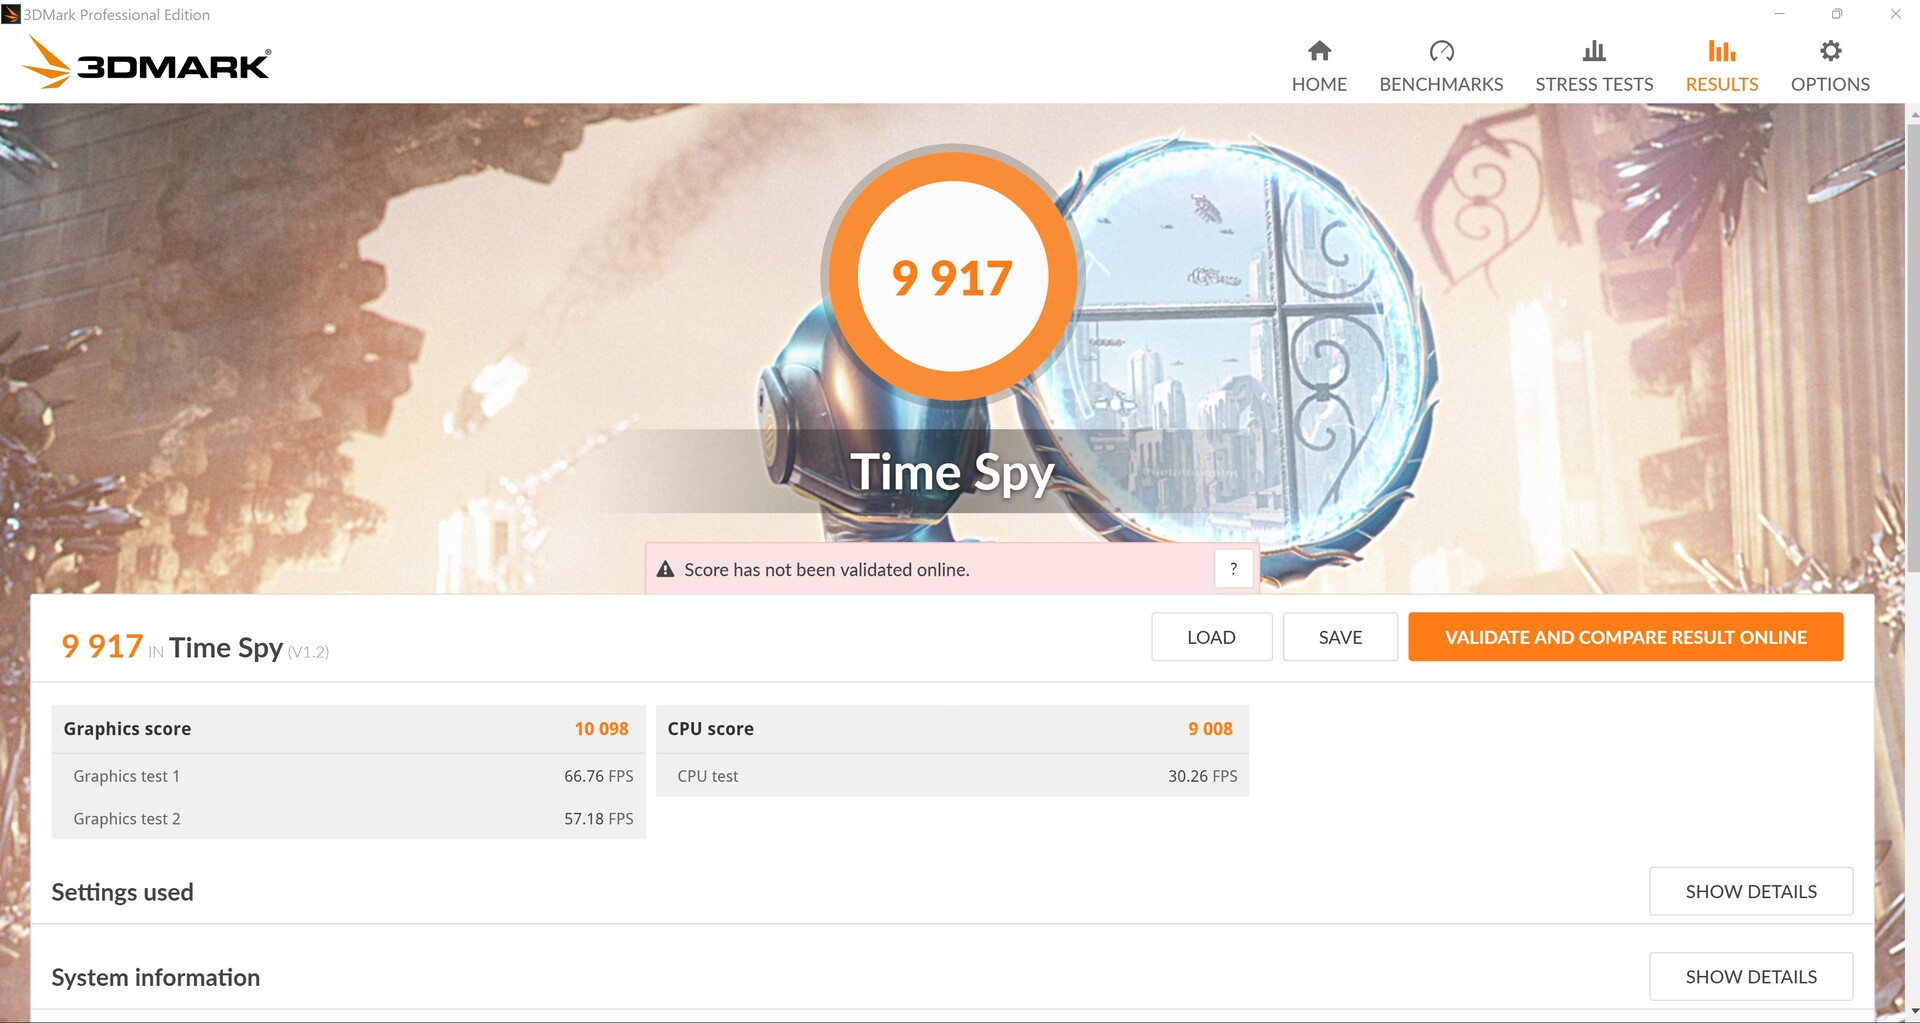
| 3DMark Time Spy Score | 9917 puntos | |
ayuda | ||
Rendimiento de los juegos
El XMG Pro es capaz de jugar a todos los juegos con fluidez en Full HD, pero la RTX 3080 ralentizada puede sudar un poco con juegos muy modernos en la resolución nativa 4K. Por ejemplo,"New World" en 4K y máximos detalles solo corre a 37 fps en las secuencias iniciales, y durante algunos combates complicados ya puede haber algunos tartamudeos. En"Far Cry 5", al menos alcanzará unos buenos 56 fps con los mismos ajustes
Como era de esperar, dependiendo del juego, el rendimiento será ligeramente inferior al de una RTX 3080 media, pero en algunos juegos, la desventaja de TGP es casi imperceptible. En consecuencia, la tarjeta volverá a situarse en el medio, con un orden similar al de las pruebas 3DMark
| New World | |
| 1920x1080 High Video Quality | |
| Medio NVIDIA GeForce RTX 3080 Laptop GPU (75.1 - 96.7, n=4) | |
| Schenker XMG Pro 17 (Late 2021, RTX 3080) | |
| 1920x1080 Very High Video Quality | |
| Medio NVIDIA GeForce RTX 3080 Laptop GPU (71.5 - 90.4, n=4) | |
| Schenker XMG Pro 17 (Late 2021, RTX 3080) | |
| 2560x1440 Very High Video Quality | |
| Medio NVIDIA GeForce RTX 3080 Laptop GPU (63.3 - 67.2, n=2) | |
| Schenker XMG Pro 17 (Late 2021, RTX 3080) | |
| 3840x2160 Very High Video Quality | |
| Medio NVIDIA GeForce RTX 3080 Laptop GPU (37.1 - 42.9, n=2) | |
| Schenker XMG Pro 17 (Late 2021, RTX 3080) | |
En una hora, la velocidad de fotogramas en"The Witcher 3" sólo baja mínimamente al principio, de unos 109 a 100 fps
The Witcher 3 FPS Chart
| bajo | medio | alto | ultra | QHD | 4K | |
|---|---|---|---|---|---|---|
| The Witcher 3 (2015) | 151 | 262 | 189 | 109 | 60 | |
| Dota 2 Reborn (2015) | 178 | 151 | 134 | 136 | 119 | |
| Final Fantasy XV Benchmark (2018) | 187 | 123 | 94.2 | 73.1 | 43.6 | |
| X-Plane 11.11 (2018) | 125 | 110 | 88.8 | 67.9 | ||
| Far Cry 5 (2018) | 170 | 135 | 128 | 120 | 101 | 56 |
| Strange Brigade (2018) | 472 | 254 | 204 | 182 | ||
| New World (2021) | 97.4 | 80.8 | 75.1 | 71.5 | 63.3 | 37.1 |
Emisiones - Bastante ruidosas y calientes
Emisiones acústicas
El factor de forma delgado pasa factura aquí, con la carga de ruido resultando un poco más alta que la de la mayoría de los competidores y sólo la bestia de Medion es similarmente ruidosa. Bajo carga máxima, el XMG es incluso el más ruidoso de nuestro campo de pruebas, a pesar de su limitada RTX TGP. Incluso durante el funcionamiento en vacío, los ventiladores están encendidos la mayor parte del tiempo. El modo "silencioso" sólo hace justicia a su nombre en los ajustes de rendimiento más bajos, incluso en funcionamiento en vacío.
Bajo carga media (primer benchmark en 3DMark 06), los ventiladores pueden llegar a ser bastante ruidosos, y en"The Witcher 3," el nivel de ruido es incluso superior a 51 dB. No notamos ningún ruido electrónico
Ruido
| Ocioso |
| 24 / 31.26 / 38.64 dB(A) |
| Carga |
| 48.11 / 56.74 dB(A) |
 | ||
30 dB silencioso 40 dB(A) audible 50 dB(A) ruidosamente alto |
||
min: | ||
| Schenker XMG Pro 17 (Late 2021, RTX 3080) GeForce RTX 3080 Laptop GPU, i7-11800H, Samsung SSD 980 Pro 1TB MZ-V8P1T0BW | Schenker XMG Pro 15 (Late 2021) GeForce RTX 3080 Laptop GPU, i7-11800H, Samsung SSD 980 Pro 1TB MZ-V8P1T0BW | Alienware x17 RTX 3080 P48E GeForce RTX 3080 Laptop GPU, i7-11800H, 2x WDC PC SN730 SDBPNTY-1T00 (RAID 0) | Medion Erazer Beast X25 GeForce RTX 3080 Laptop GPU, R9 5900HX, Samsung PM9A1 MZVL22T0HBLB | MSI GS76 Stealth 11UH GeForce RTX 3080 Laptop GPU, i9-11900H, Samsung PM9A1 MZVL22T0HBLB | Asus ROG Zephyrus S17 GX703HSD GeForce RTX 3080 Laptop GPU, i9-11900H, Samsung PM9A1 MZVL22T0HBLB | |
|---|---|---|---|---|---|---|
| Noise | -11% | 11% | -4% | 5% | 16% | |
| apagado / medio ambiente * (dB) | 24 | 24 -0% | 24.9 -4% | 25 -4% | 24 -0% | 23 4% |
| Idle Minimum * (dB) | 24 | 31 -29% | 24.9 -4% | 26 -8% | 24 -0% | 23 4% |
| Idle Average * (dB) | 31.26 | 37 -18% | 24.9 20% | 30 4% | 25 20% | 23 26% |
| Idle Maximum * (dB) | 38.64 | 41 -6% | 29.6 23% | 43 -11% | 42 -9% | 23 40% |
| Load Average * (dB) | 48.11 | 56 -16% | 31.1 35% | 54 -12% | 46 4% | 41 15% |
| Witcher 3 ultra * (dB) | 51.5 | 53 -3% | 49.7 3% | 52 -1% | 48 7% | 45 13% |
| Load Maximum * (dB) | 56.74 | 58 -2% | 54.8 3% | 55 3% | 48 15% | 52 8% |
* ... más pequeño es mejor
Temperatura
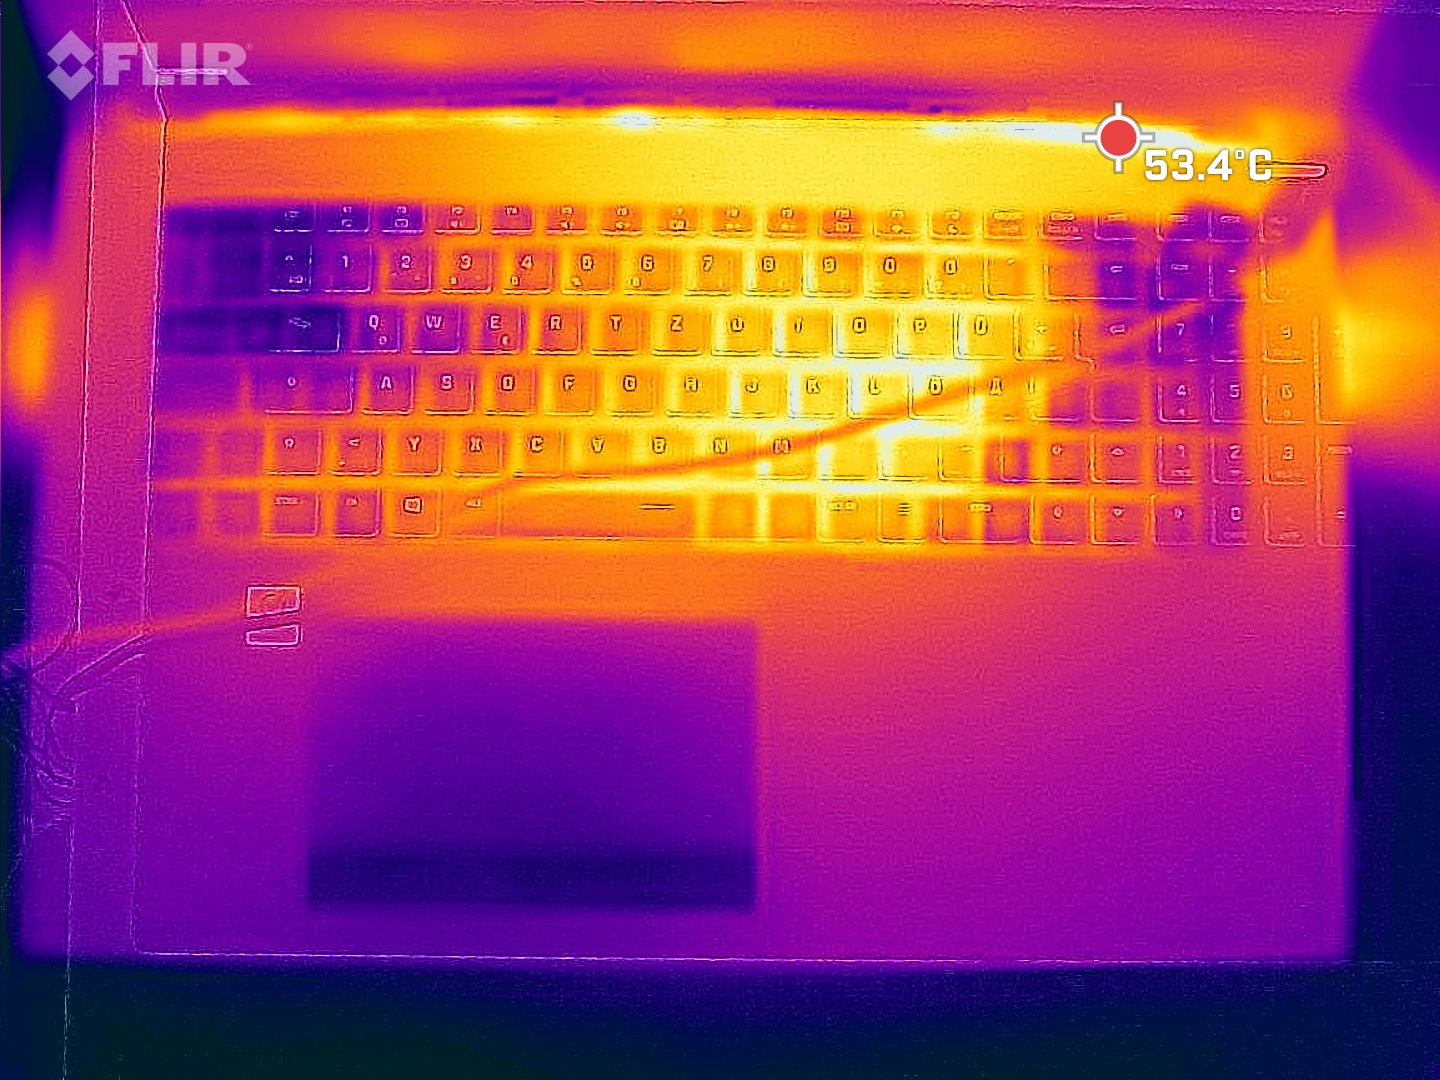
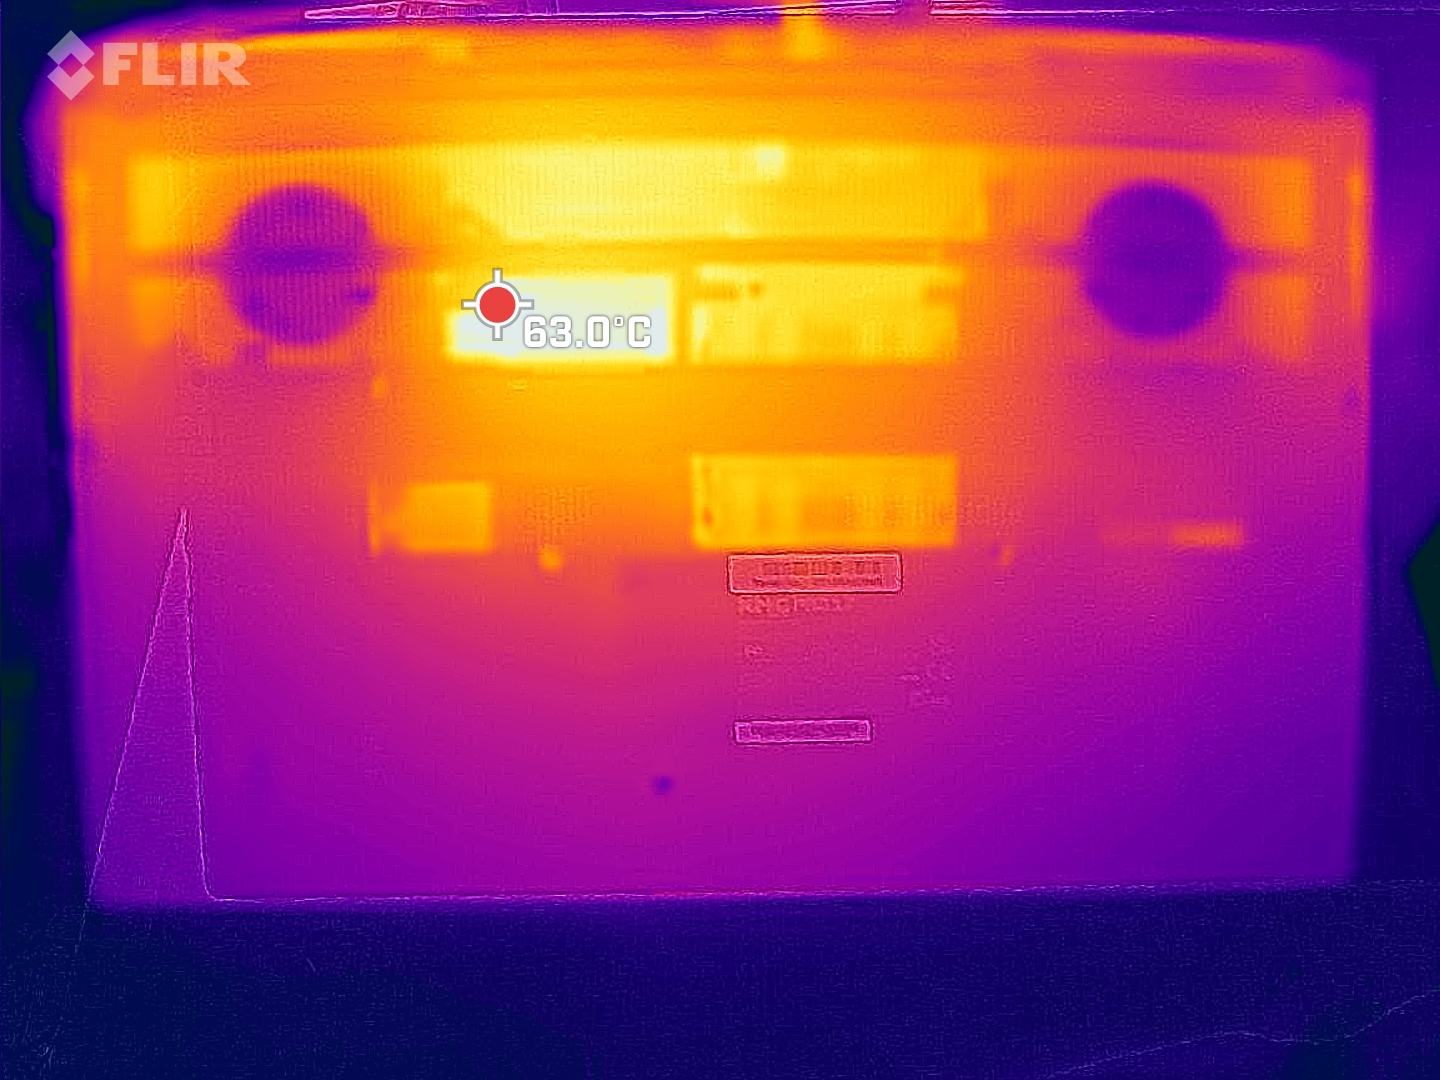
A pesar de que los ventiladores son un poco más ruidosos y el rendimiento es menor, el sistema de refrigeración tiene dificultades para mantener las temperaturas de la superficie dentro de límites moderados. Mientras que con un máximo de 53 °C, la parte superior alcanza temperaturas similares a las de los competidores, medimos hasta 68 °C en la parte inferior, lo que es definitivamente demasiado alto para nuestro gusto. El modelo de 15 pulgadas también se calienta mucho más en la parte inferior que en la superior. Durante la prueba de estrés lo último, deberías sacar el XMG Pro 17 de tu regazo.
Incluso durante el test de estrés, los reposamanos permanecen relativamente frescos, y todo el lado izquierdo, incluyendo las teclas WASD, se ve menos afectado por el desarrollo de calor. Al menos, el portátil de 17 pulgadas se mantiene relativamente fresco durante el funcionamiento en reposo
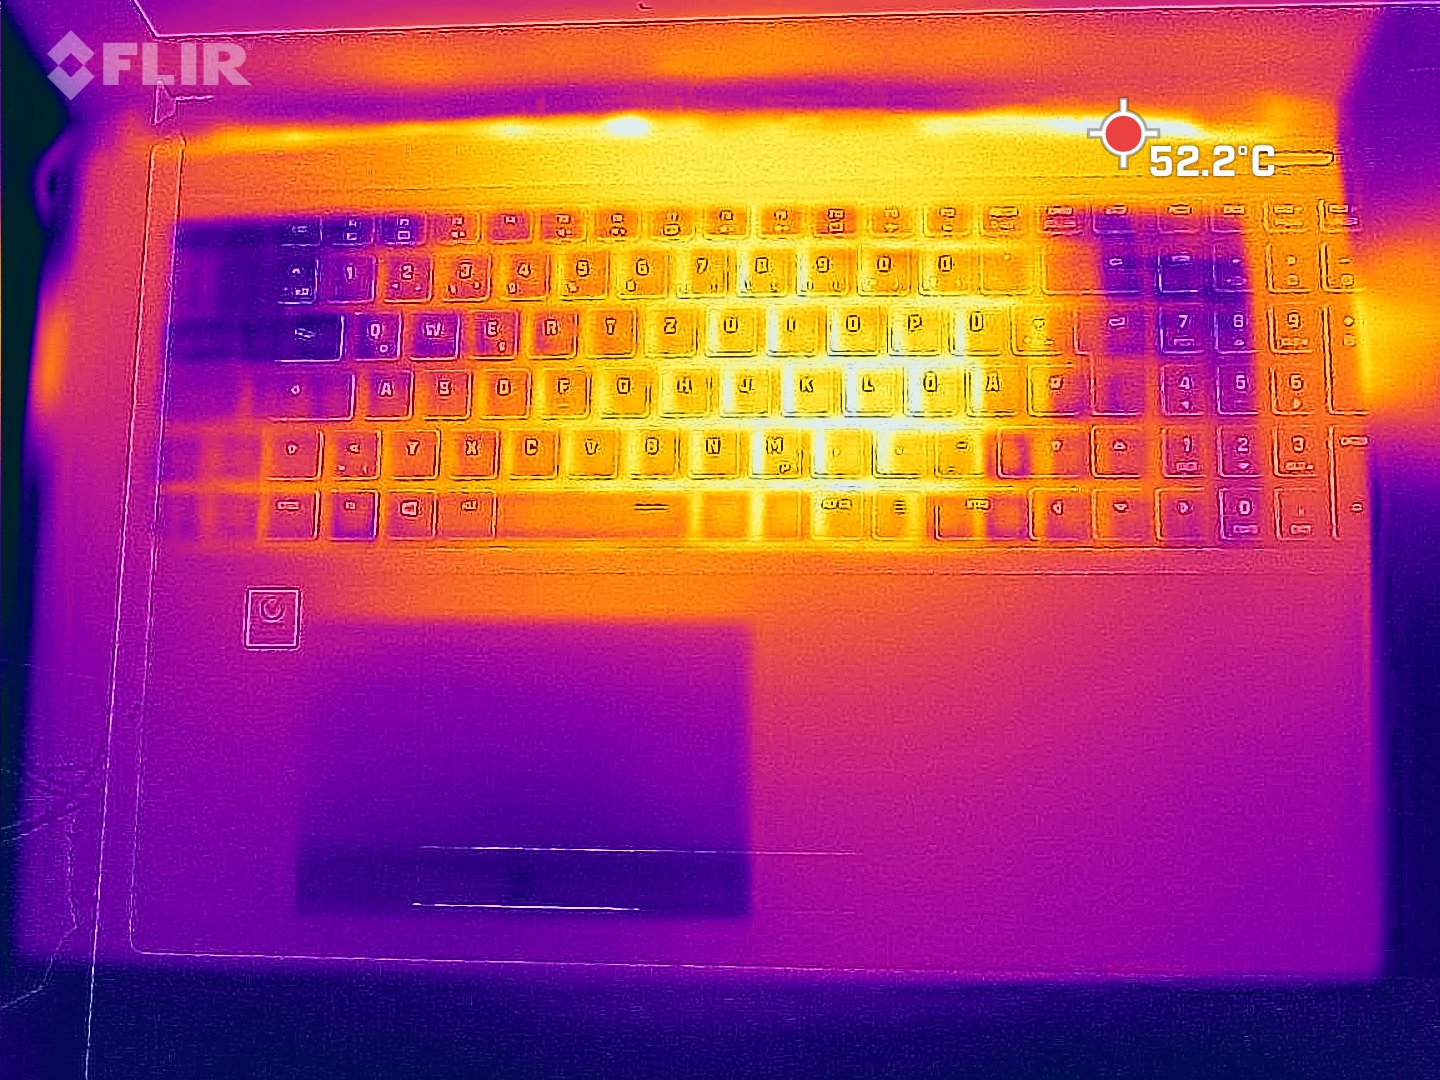
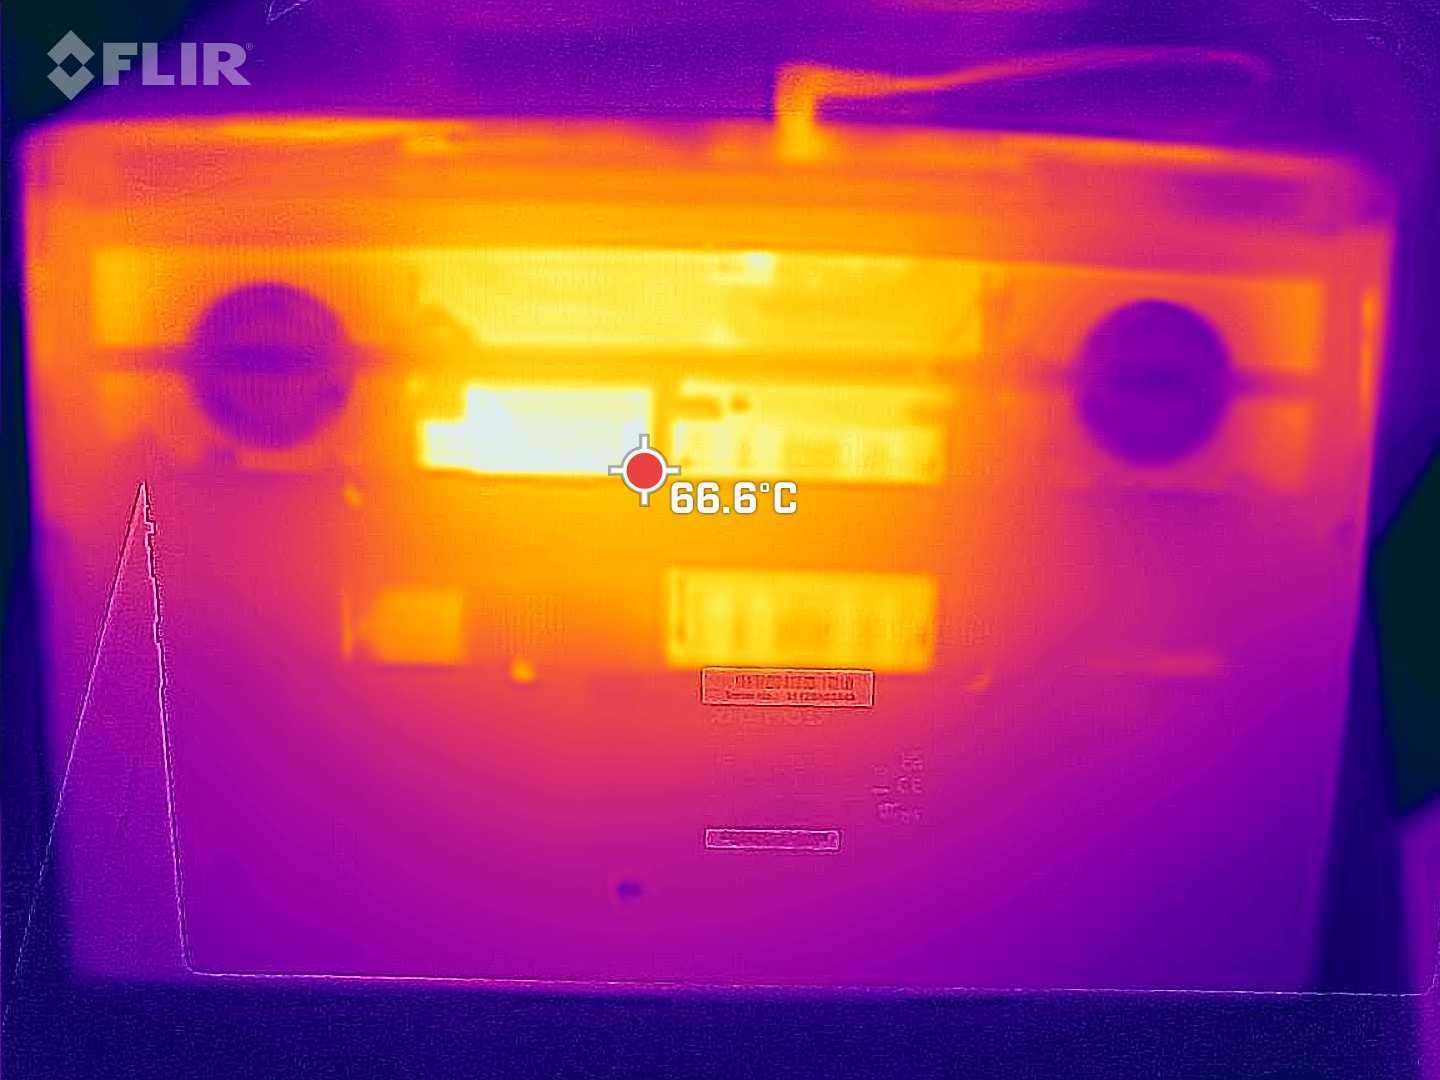
(-) La temperatura máxima en la parte superior es de 53 °C / 127 F, frente a la media de 40.4 °C / 105 F, que oscila entre 21.2 y 68.8 °C para la clase Gaming.
(-) El fondo se calienta hasta un máximo de 68 °C / 154 F, frente a la media de 43.2 °C / 110 F
(+) En reposo, la temperatura media de la parte superior es de 24.2 °C / 76# F, frente a la media del dispositivo de 33.9 °C / 93 F.
(-) Jugando a The Witcher 3, la temperatura media de la parte superior es de 44.9 °C / 113 F, frente a la media del dispositivo de 33.9 °C / 93 F.
(±) El reposamanos y el touchpad pueden calentarse mucho al tacto con un máximo de 37 °C / 98.6 F.
(-) La temperatura media de la zona del reposamanos de dispositivos similares fue de 28.8 °C / 83.8 F (-8.2 °C / -14.8 F).
| Schenker XMG Pro 17 (Late 2021, RTX 3080) Intel Core i7-11800H, NVIDIA GeForce RTX 3080 Laptop GPU | Schenker XMG Pro 15 (Late 2021) Intel Core i7-11800H, NVIDIA GeForce RTX 3080 Laptop GPU | Alienware x17 RTX 3080 P48E Intel Core i7-11800H, NVIDIA GeForce RTX 3080 Laptop GPU | Medion Erazer Beast X25 AMD Ryzen 9 5900HX, NVIDIA GeForce RTX 3080 Laptop GPU | MSI GS76 Stealth 11UH Intel Core i9-11900H, NVIDIA GeForce RTX 3080 Laptop GPU | Asus ROG Zephyrus S17 GX703HSD Intel Core i9-11900H, NVIDIA GeForce RTX 3080 Laptop GPU | |
|---|---|---|---|---|---|---|
| Heat | -1% | -8% | -9% | 3% | -11% | |
| Maximum Upper Side * (°C) | 53 | 44 17% | 58.4 -10% | 54 -2% | 49 8% | 59 -11% |
| Maximum Bottom * (°C) | 68 | 60 12% | 49 28% | 57 16% | 57 16% | 53 22% |
| Idle Upper Side * (°C) | 27 | 30 -11% | 33.6 -24% | 34 -26% | 28 -4% | 35 -30% |
| Idle Bottom * (°C) | 28 | 34 -21% | 34.6 -24% | 35 -25% | 30 -7% | 35 -25% |
* ... más pequeño es mejor
Prueba de esfuerzo
Los núcleos comienzan la prueba de estrés a unos 4,2 GHz. Sin embargo, a los pocos segundos, la CPU alcanza temperaturas de más de 90 °C y se activa el estrangulamiento térmico. Durante todo el transcurso de la prueba, la velocidad del reloj sigue bajando. Después de unos 30 minutos sólo alcanza los 3 GHz, después de una hora, sólo 2,8 GHz, y unos minutos más tarde, sólo 2,7 GHz. Mientras esto sucede, las temperaturas de la CPU suelen ser muy elevadas y siguen alcanzando los 90 °C, con la ralentización dirigida a una temperatura de unos 85 °C.
La GPU comienza a una velocidad de reloj de unos 1,5 GHz. Dependiendo de la carga térmica, la velocidad cae a veces hasta 1,2 GHz, antes de recuperarse de nuevo hasta superar los 1,3 GHz. La temperatura aquí también alcanza unos 85 °C bastante altos, y temporalmente incluso más
Después de la prueba de estrés, el sistema se recupera con bastante rapidez. Una prueba 3DMark 11 realizada inmediatamente después dio como resultado una puntuación aproximadamente un 3 - 4% inferior a la habitual
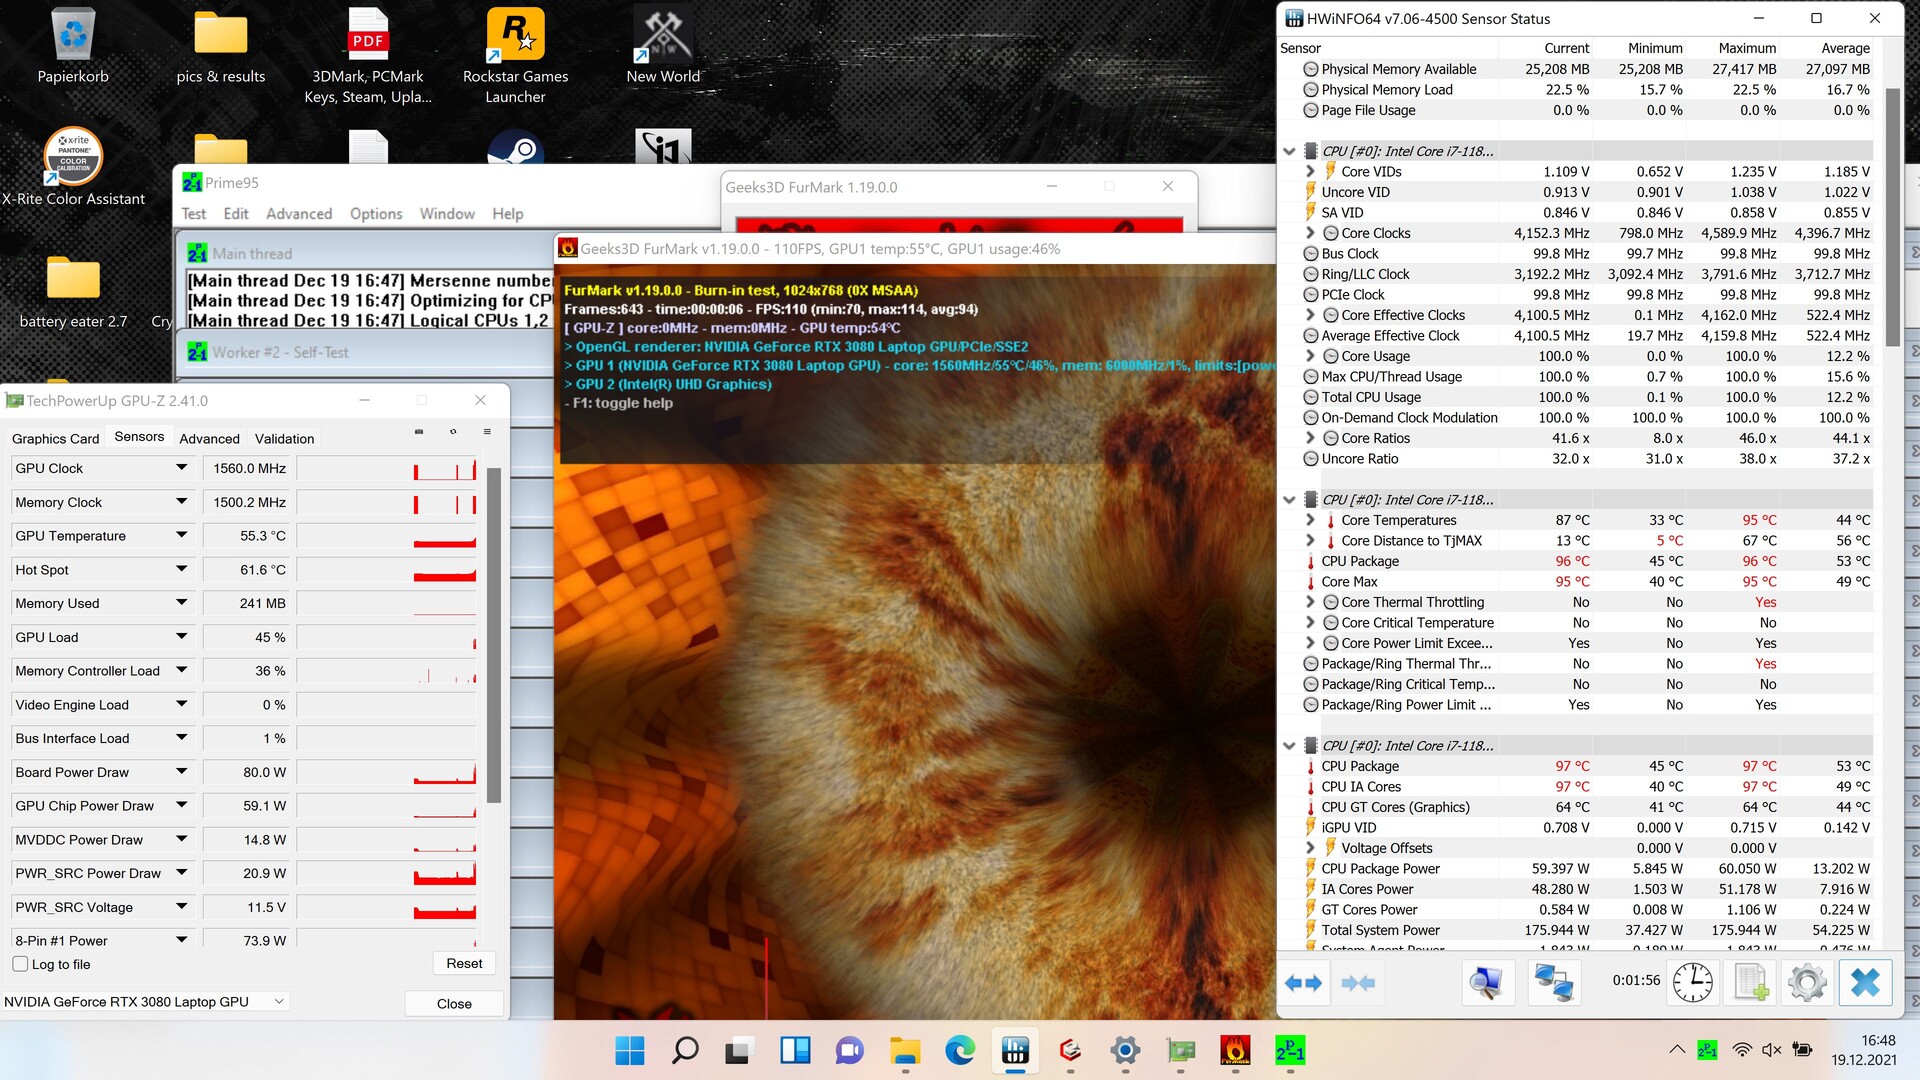
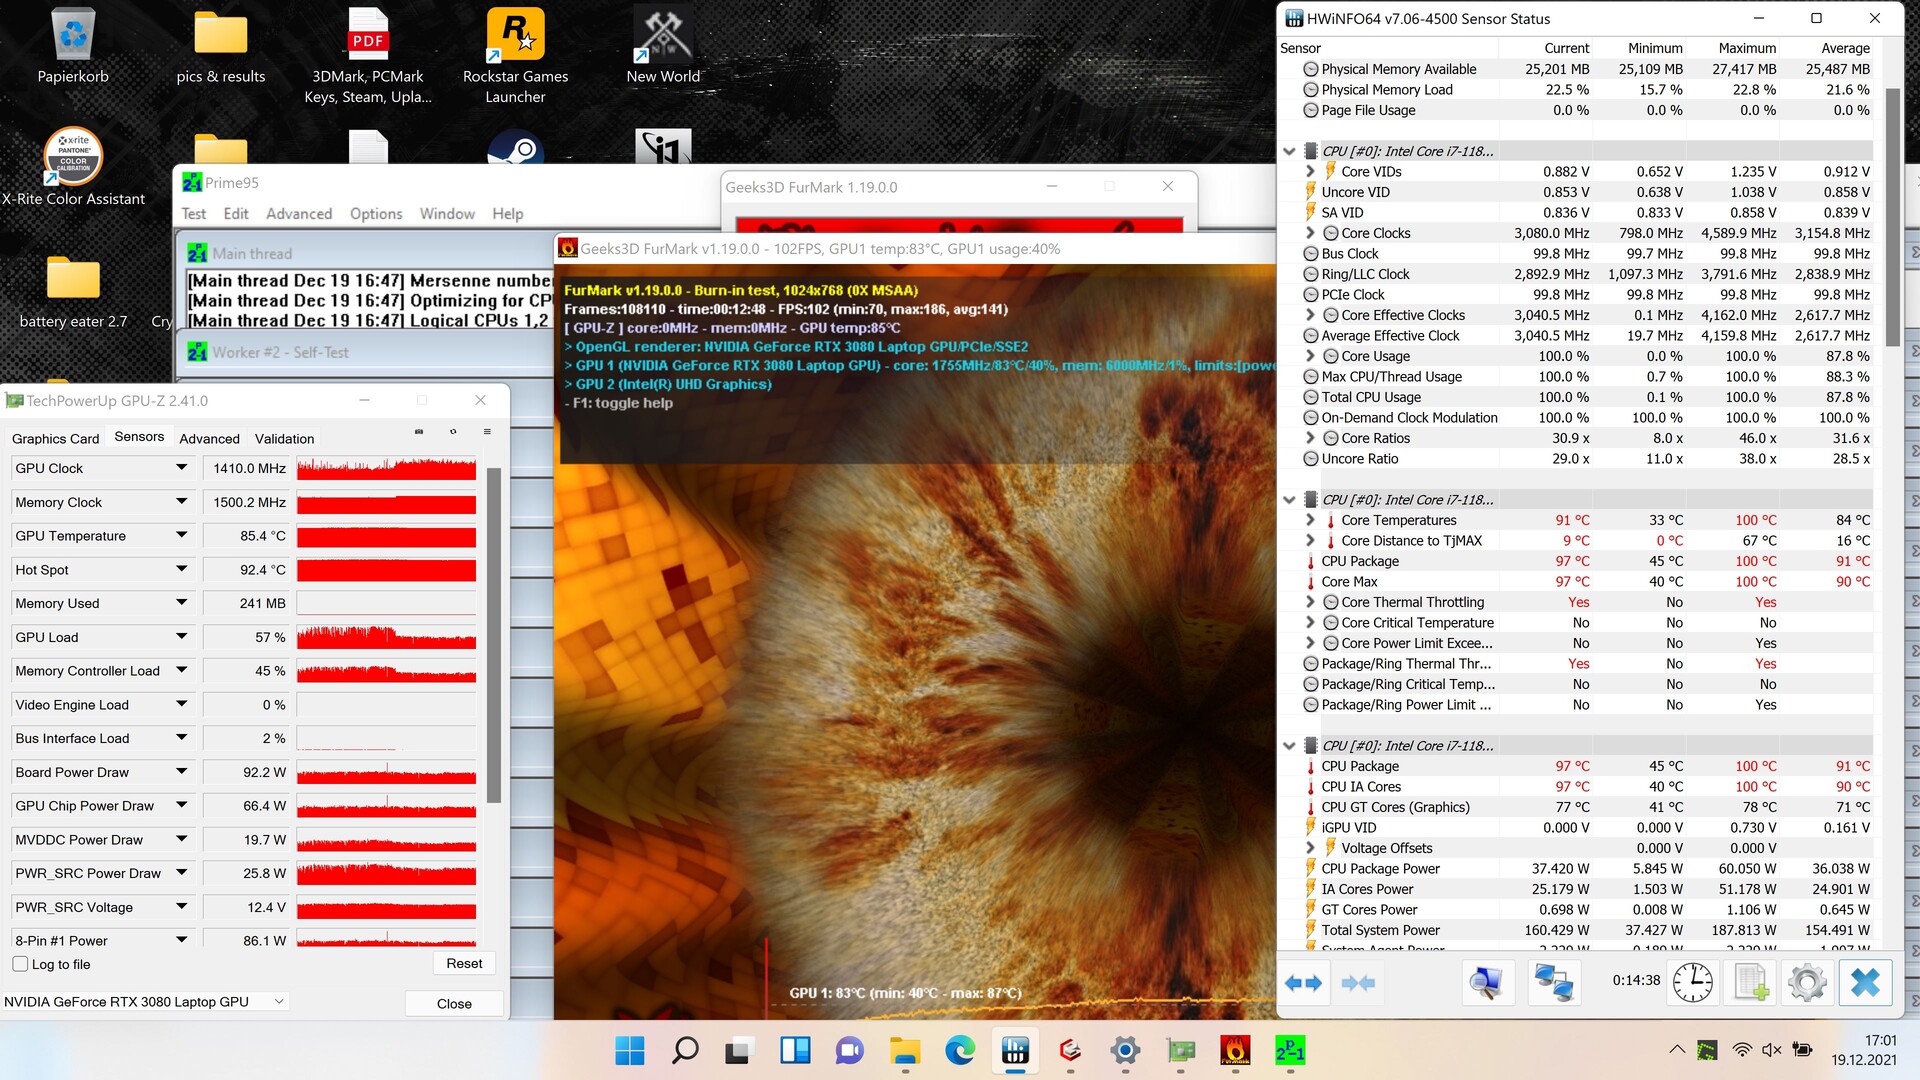
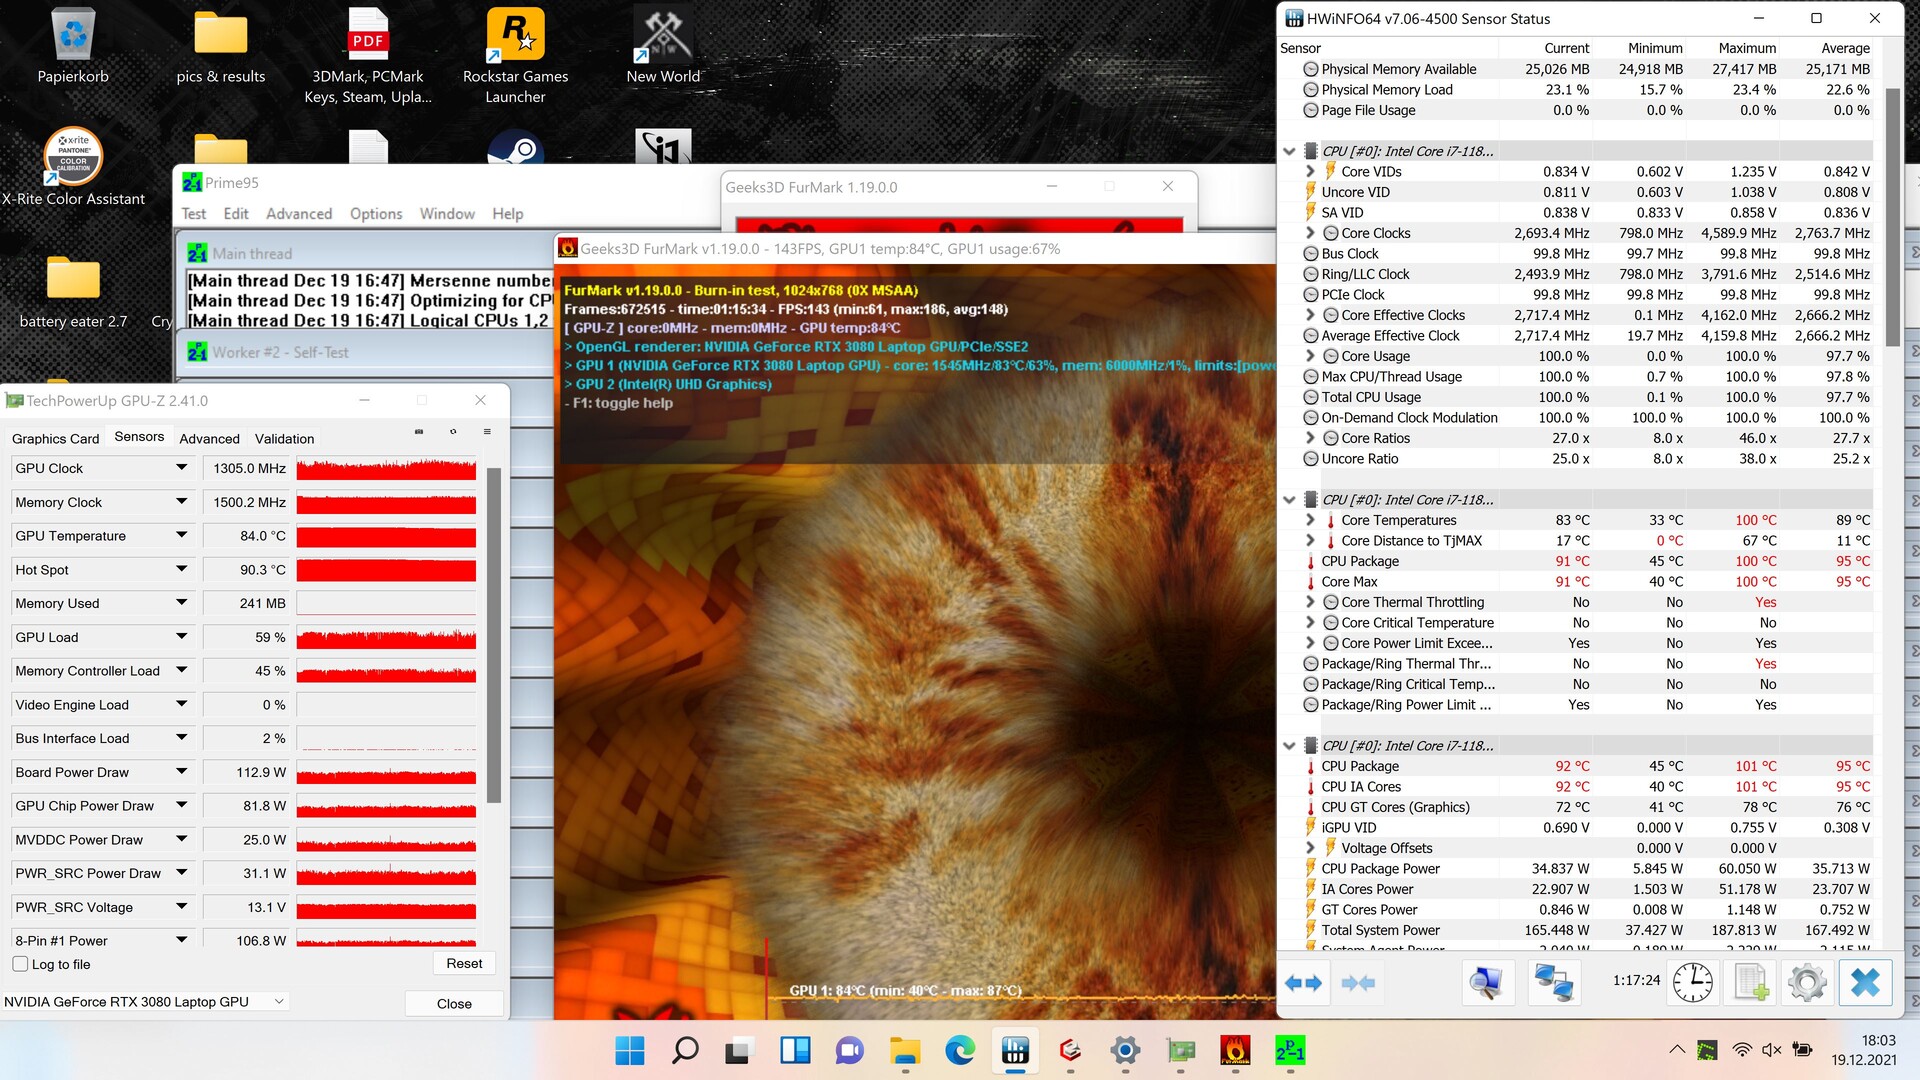
| Relojde la CPU(GHz) | Reloj dela GPU(MHz) | Temperatura media de la CPU (°C) | Temperaturamediade la GPU (°C) | |
| Sistema en reposo | 3,6 | 350 (iGPU) | 35 | 35 |
| Prime95 + FurMark Stress | 2,6 | 1.230 - 1.375 | 88 | 85 |
Altavoces
Los altavoces producen un volumen máximo bastante bueno y unas frecuencias altas equilibradas y lineales. Mientras que los medios están ligeramente infrarrepresentados, los graves apenas están presentes, a pesar del factor de forma de 17 pulgadas.
Se pueden conectar dispositivos de audio externos mediante los auriculares o el puerto de entrada de línea
Schenker XMG Pro 17 (Late 2021, RTX 3080) análisis de audio
(+) | los altavoces pueden reproducir a un volumen relativamente alto (#87.4 dB)
Graves 100 - 315 Hz
(-) | casi sin bajos - de media 24% inferior a la mediana
(±) | la linealidad de los graves es media (8.7% delta a frecuencia anterior)
Medios 400 - 2000 Hz
(±) | medias más altas - de media 10.1% más altas que la mediana
(±) | la linealidad de los medios es media (7.2% delta respecto a la frecuencia anterior)
Altos 2 - 16 kHz
(+) | máximos equilibrados - a sólo 2% de la mediana
(+) | los máximos son lineales (2.6% delta a la frecuencia anterior)
Total 100 - 16.000 Hz
(±) | la linealidad del sonido global es media (18.8% de diferencia con la mediana)
En comparación con la misma clase
» 62% de todos los dispositivos probados de esta clase eran mejores, 8% similares, 30% peores
» El mejor tuvo un delta de 6%, la media fue 18%, el peor fue ###max##%
En comparación con todos los dispositivos probados
» 43% de todos los dispositivos probados eran mejores, 8% similares, 49% peores
» El mejor tuvo un delta de 4%, la media fue 23%, el peor fue ###max##%
Apple MacBook 12 (Early 2016) 1.1 GHz análisis de audio
(+) | los altavoces pueden reproducir a un volumen relativamente alto (#83.6 dB)
Graves 100 - 315 Hz
(±) | lubina reducida - en promedio 11.3% inferior a la mediana
(±) | la linealidad de los graves es media (14.2% delta a frecuencia anterior)
Medios 400 - 2000 Hz
(+) | medios equilibrados - a sólo 2.4% de la mediana
(+) | los medios son lineales (5.5% delta a la frecuencia anterior)
Altos 2 - 16 kHz
(+) | máximos equilibrados - a sólo 2% de la mediana
(+) | los máximos son lineales (4.5% delta a la frecuencia anterior)
Total 100 - 16.000 Hz
(+) | el sonido global es lineal (10.2% de diferencia con la mediana)
En comparación con la misma clase
» 7% de todos los dispositivos probados de esta clase eran mejores, 2% similares, 90% peores
» El mejor tuvo un delta de 5%, la media fue 18%, el peor fue ###max##%
En comparación con todos los dispositivos probados
» 5% de todos los dispositivos probados eran mejores, 1% similares, 94% peores
» El mejor tuvo un delta de 4%, la media fue 23%, el peor fue ###max##%
Gestión de la energía - Eficiente, pero con una fuente de alimentación débil
Consumo de energía
Durante el funcionamiento en reposo, el XMG Pro 17 se presenta como relativamente eficiente. Mientras juega, nuestra unidad de pruebas también consume ligeramente menos energía que el Alienware o el Asus ROG, pero estos ofrecen un rendimiento notablemente superior. En general, los niveles de consumo se corresponden con el rendimiento.
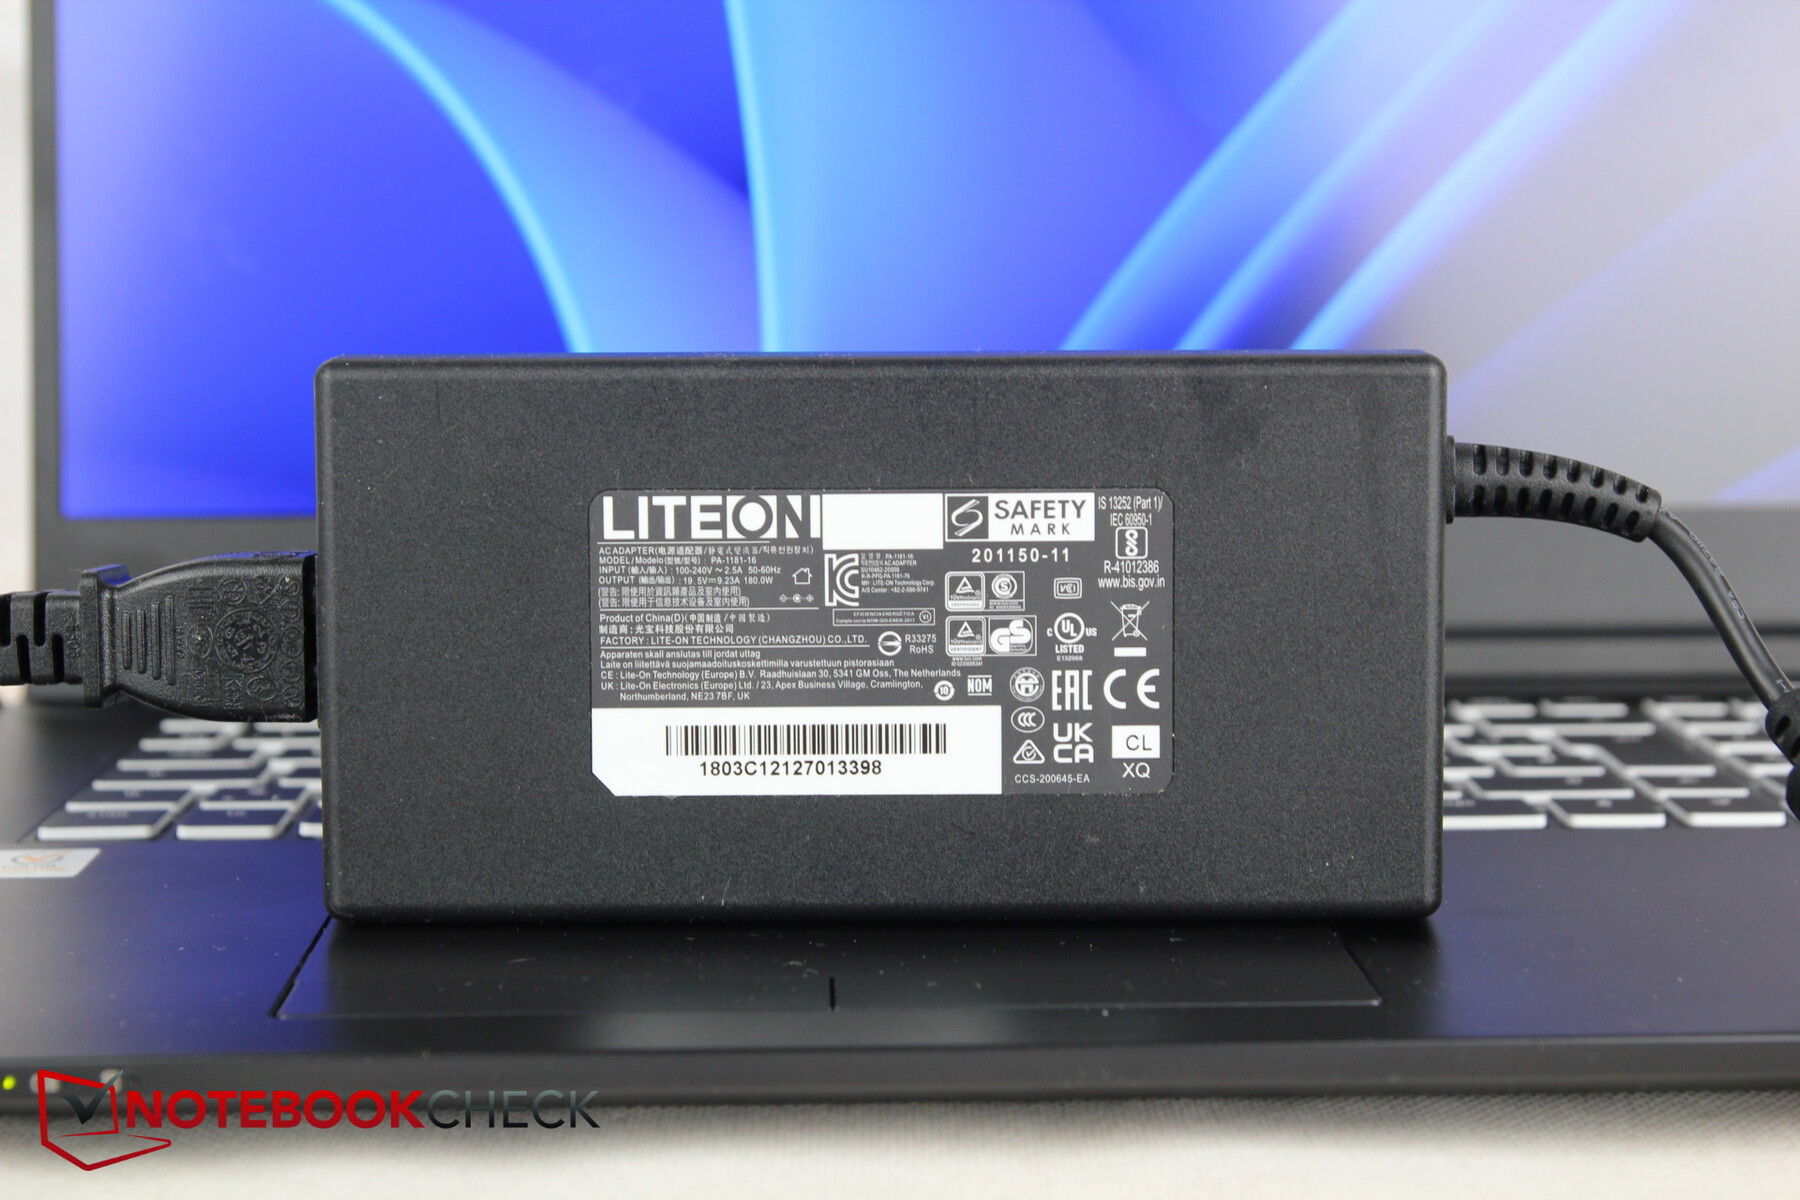
Medimos un consumo máximo de 227 vatios. Sin embargo, la fuente de alimentación LiteOn incluida sólo tiene una capacidad de 180 vatios. Incluso en momentos con un consumo distinto al máximo, esto puede convertirse en un problema. Por ejemplo, utilizó constantemente alrededor de 200 vatios durante la prueba de estrés. En tales escenarios extremos, la fuente de alimentación es incapaz de cargar el portátil de forma fiable
| Ocioso | |
| Carga |
|
Clave:
min: | |
| Schenker XMG Pro 17 (Late 2021, RTX 3080) i7-11800H, GeForce RTX 3080 Laptop GPU, Samsung SSD 980 Pro 1TB MZ-V8P1T0BW, IPS, 3840x2160, 17.3" | Schenker XMG Pro 15 (Late 2021) i7-11800H, GeForce RTX 3080 Laptop GPU, Samsung SSD 980 Pro 1TB MZ-V8P1T0BW, OLED, 3840x2160, 15.6" | Alienware x17 RTX 3080 P48E i7-11800H, GeForce RTX 3080 Laptop GPU, 2x WDC PC SN730 SDBPNTY-1T00 (RAID 0), IPS, 3840x2160, 17.3" | Medion Erazer Beast X25 R9 5900HX, GeForce RTX 3080 Laptop GPU, Samsung PM9A1 MZVL22T0HBLB, IPS, 1920x1080, 17.3" | MSI GS76 Stealth 11UH i9-11900H, GeForce RTX 3080 Laptop GPU, Samsung PM9A1 MZVL22T0HBLB, IPS, 3840x2160, 17.3" | Asus ROG Zephyrus S17 GX703HSD i9-11900H, GeForce RTX 3080 Laptop GPU, Samsung PM9A1 MZVL22T0HBLB, IPS, 2560x1440, 17.3" | Medio NVIDIA GeForce RTX 3080 Laptop GPU | Media de la clase Gaming | |
|---|---|---|---|---|---|---|---|---|
| Power Consumption | -9% | -21% | -24% | 1% | -21% | -18% | 0% | |
| Idle Minimum * (Watt) | 13.6 | 20 -47% | 10.2 25% | 22 -62% | 14 -3% | 21.7 -60% | 19.8 ? -46% | 13 ? 4% |
| Idle Average * (Watt) | 19.4 | 22 -13% | 21.2 -9% | 26 -34% | 19 2% | 27 -39% | 24.3 ? -25% | 19 ? 2% |
| Idle Maximum * (Watt) | 27.7 | 26 6% | 48.4 -75% | 34 -23% | 31 -12% | 33 -19% | 33.3 ? -20% | 24.6 ? 11% |
| Load Average * (Watt) | 110 | 103 6% | 118.7 -8% | 120 -9% | 97 12% | 108 2% | 108.1 ? 2% | 110.7 ? -1% |
| Witcher 3 ultra * (Watt) | 170 | 186 -9% | 249 -46% | 189 -11% | 156 8% | 195 -15% | ||
| Load Maximum * (Watt) | 227 | 218 4% | 262 -15% | 231 -2% | 231 -2% | 210 7% | 230 ? -1% | 259 ? -14% |
* ... más pequeño es mejor
Power Consumption The Witcher 3 / Stress Test
Power Consumption With External Monitor
Duración de la batería
Como en el modelo de 15 pulgadas, Schenker usa una batería de 73 Wh aquí también. Los competidores ofrecen desde 87 (Alienware) hasta casi 100 Wh (MSI), pero esto no resulta necesariamente en una mejor duración de la batería para los modelos de la comparación. Sólo el Asus ROG Zephyrus dura claramente más con su batería de 90 Wh, y el resto de competidores lo hacen incluso peor en partes, incluyendo el MSI.
Puedes planear una tarde de cine de unas 5 horas a brillo reducido, y mientras navegas, el XMG dura unos 40 minutos más
| Schenker XMG Pro 17 (Late 2021, RTX 3080) i7-11800H, GeForce RTX 3080 Laptop GPU, 73 Wh | Schenker XMG Pro 15 (Late 2021) i7-11800H, GeForce RTX 3080 Laptop GPU, 73 Wh | Alienware x17 RTX 3080 P48E i7-11800H, GeForce RTX 3080 Laptop GPU, 87 Wh | Medion Erazer Beast X25 R9 5900HX, GeForce RTX 3080 Laptop GPU, 91 Wh | MSI GS76 Stealth 11UH i9-11900H, GeForce RTX 3080 Laptop GPU, 99.9 Wh | Asus ROG Zephyrus S17 GX703HSD i9-11900H, GeForce RTX 3080 Laptop GPU, 90 Wh | Media de la clase Gaming | |
|---|---|---|---|---|---|---|---|
| Duración de Batería | -4% | -26% | -2% | -8% | 40% | 23% | |
| H.264 (h) | 5.2 | 6.5 25% | 7.2 38% | 8.32 ? 60% | |||
| WiFi v1.3 (h) | 5.7 | 5.2 -9% | 5.9 4% | 6.8 19% | 6.4 12% | 7.5 32% | 7.11 ? 25% |
| Load (h) | 1.8 | 1.3 -28% | 0.8 -56% | 1.4 -22% | 1.3 -28% | 2.7 50% | 1.502 ? -17% |
| Reader / Idle (h) | 10.6 | 7 | 9.9 | 9.9 | 8.27 ? | ||
| Witcher 3 ultra (h) | 1 |
Pro
Contra
Veredicto - Más una estación de trabajo que un portátil para juegos
Aunque el XMG Pro 17 quiere atraer a los jugadores y a los profesionales creativos al mismo tiempo, es poco probable que atraiga a los entusiastas del rendimiento entre los jugadores, ya que hay demasiados compromisos de rendimiento debido al diseño ultrafino. Sin embargo, el modelo Schenker podría ser interesante para algunos jugadores. Al menos, el delgado portátil con una RTX 3080 es más móvil que la mayoría de competidores, y además del tamaño y el peso, la duración de la batería también es correcta. La brillante pantalla 4K con su gran cobertura de espacio de color también es un gran punto a favor para los profesionales, lo que lo hace también adecuado para la edición de vídeo o el procesamiento de imágenes
Con su potente hardware, las desventajas de una carcasa delgada son claras. El portátil se calienta bastante en la parte inferior, no es realmente silencioso, y el rendimiento también es inferior al de muchos competidores. Además, la base tambaleante del teclado es un poco molesta, y Schenker también debería replantearse su fuente de alimentación, que es realmente demasiado débil
Además de su pantalla 4K, la gran ventaja del XMG Pro 17 reside en su carcasa ultrafina y su peso relativamente bajo. Aquellos jugadores y profesionales que prefieran la movilidad a un rendimiento máximo deberían dar una oportunidad a este modelo.
Los portátiles alternativos tampoco lo hacen todo bien, quizá con la excepción del Asus ROG Zephyrus, que es igualmente delgado, pero también 400 g más pesado. Pero ese portátil nos impresiona en casi todas las áreas, y sólo hay que prestar atención a los ruidos molestos de algunas unidades al comprarlo. Por desgracia, el Asus también es un poco más caro, aunque el XMG Pro tampoco es una ganga. Los que quieran ahorrar dinero deberían echar un vistazo al MSI GP66 Leopard por menos de 2000 euros(~$2286).
Precio y disponibilidad
El XMG Pro 17 cuesta 2249€ en la tienda de Schenker con una pantalla Full HD y 278€ más con una pantalla 4K. El Clevo PC70HS, que comparte una construcción similar, parte de 2560€ en la tienda de Clevo
Schenker XMG Pro 17 (Late 2021, RTX 3080)
- 01/13/2022 v7 (old)
Christian Hintze
Price comparison

