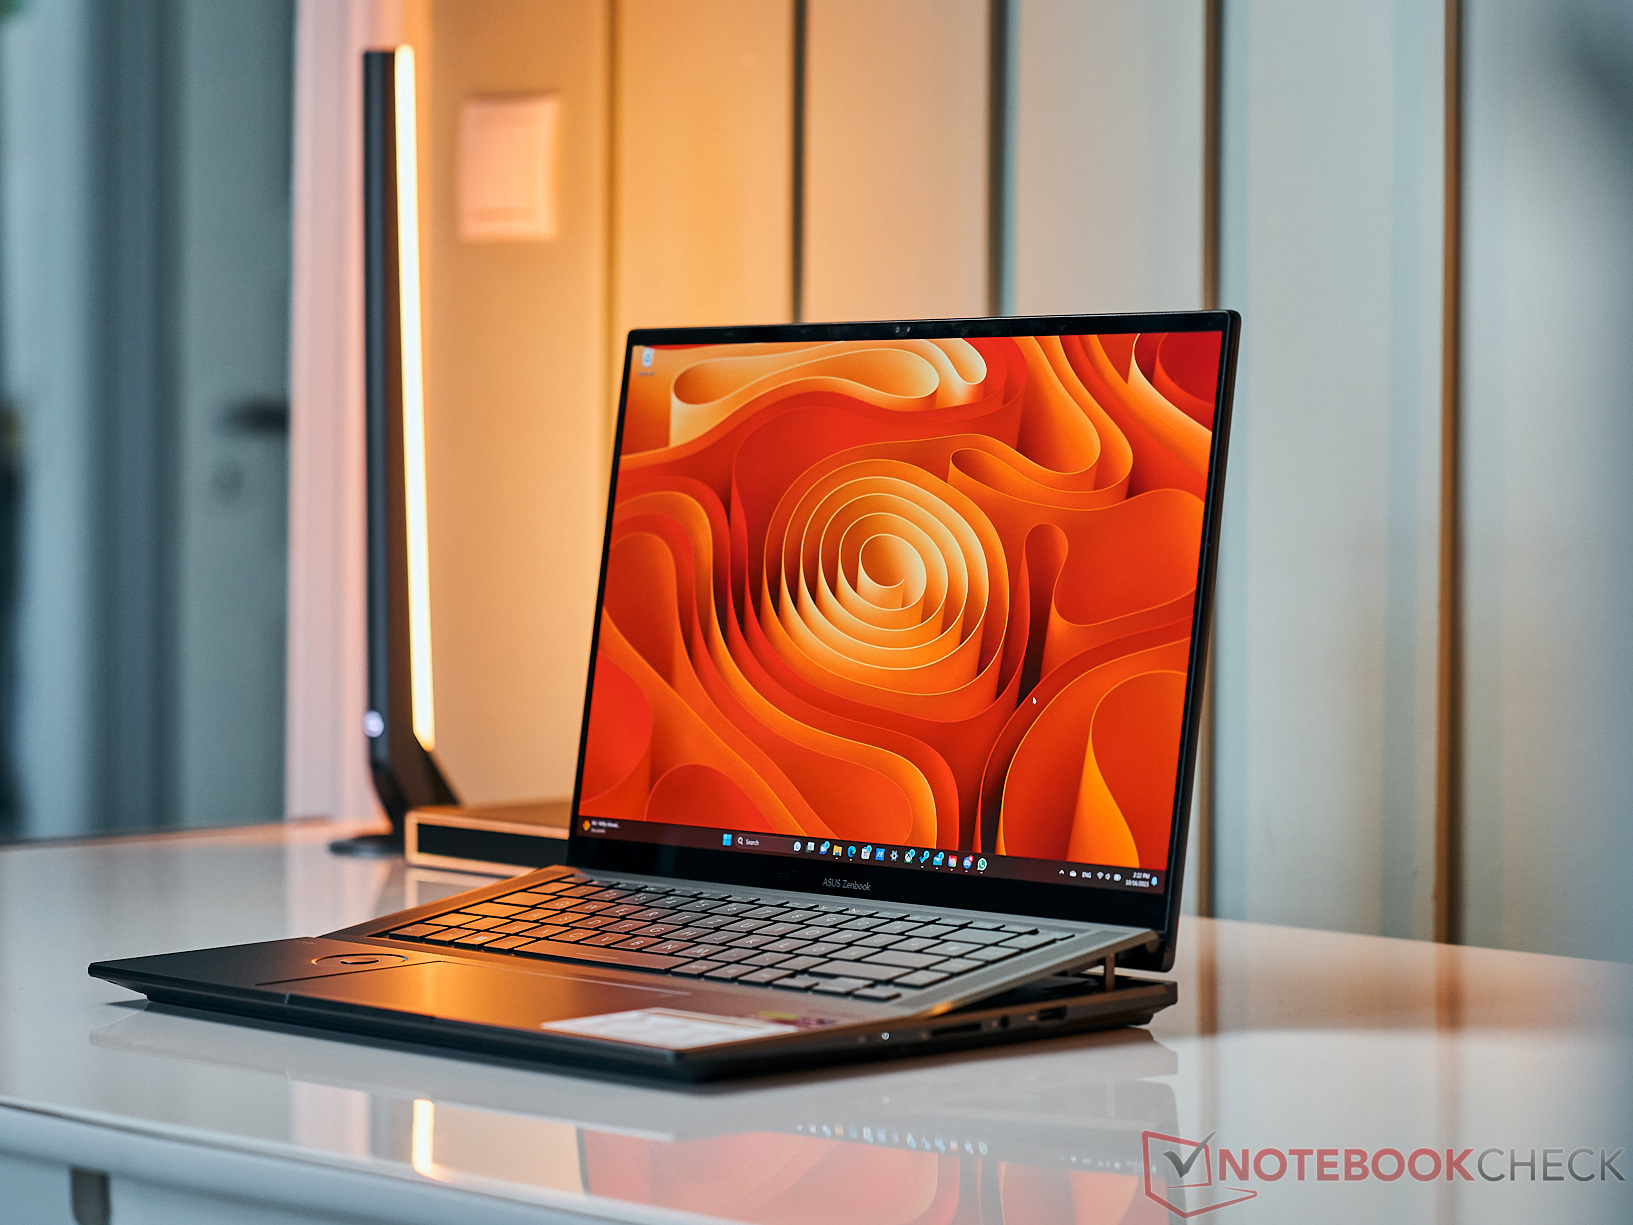
Análisis del Zenbook Pro 16X (2023): Por fin la máxima potencia del buque insignia de Asus

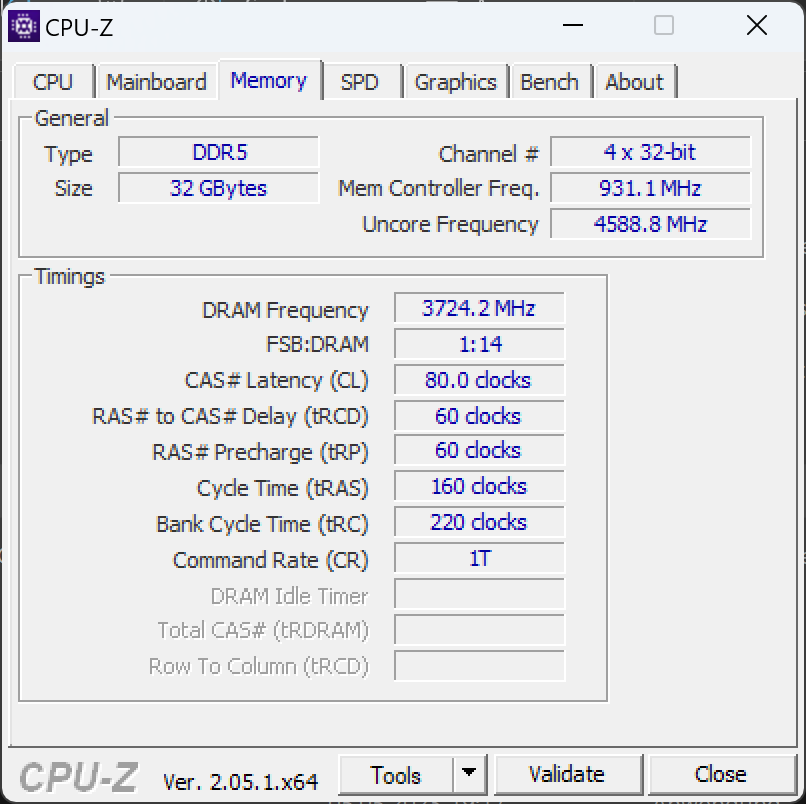
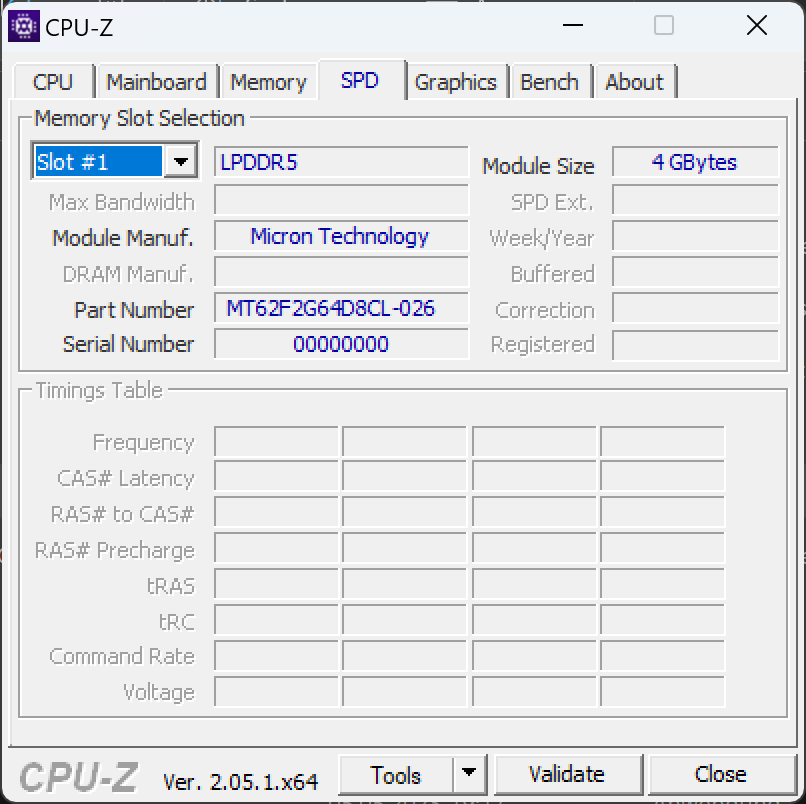
Ópticamente, apenas ha cambiado nada en el Zenbook Pro 16X, cuyo predecesor fue objeto de una extenso análisis el año pasado. En el interior del portátil, en cambio, hay ahora mucha más potencia. Mientras que la algo débil RTX 3060del año pasado fue un punto de crítica, el Zenbook actual brilla con una potente Nvidia GeForce RTX 4080. La nueva CPU y la disposición de la RAM LPDDR5 deberían garantizar un acceso más rápido a la memoria, por lo que el ya potente Intel Core i9-13905Hdebería funcionar aún más rápido.
Por supuesto, un hardware potente también requiere una refrigeración adecuada. De ello se encarga una vez más la refrigeración AAS bajo el teclado abatible de Asus, combinada con cámaras de vapor 3D, metal líquido y ventiladores de 12 V con forma 3D. Esto permite que el sistema consuma hasta 200 vatios sin acumulación de calor. En consecuencia, el nuevo Zenbook Pro 16X es capaz de más que duplicar el rendimiento de su predecesor en algunos benchmarks.
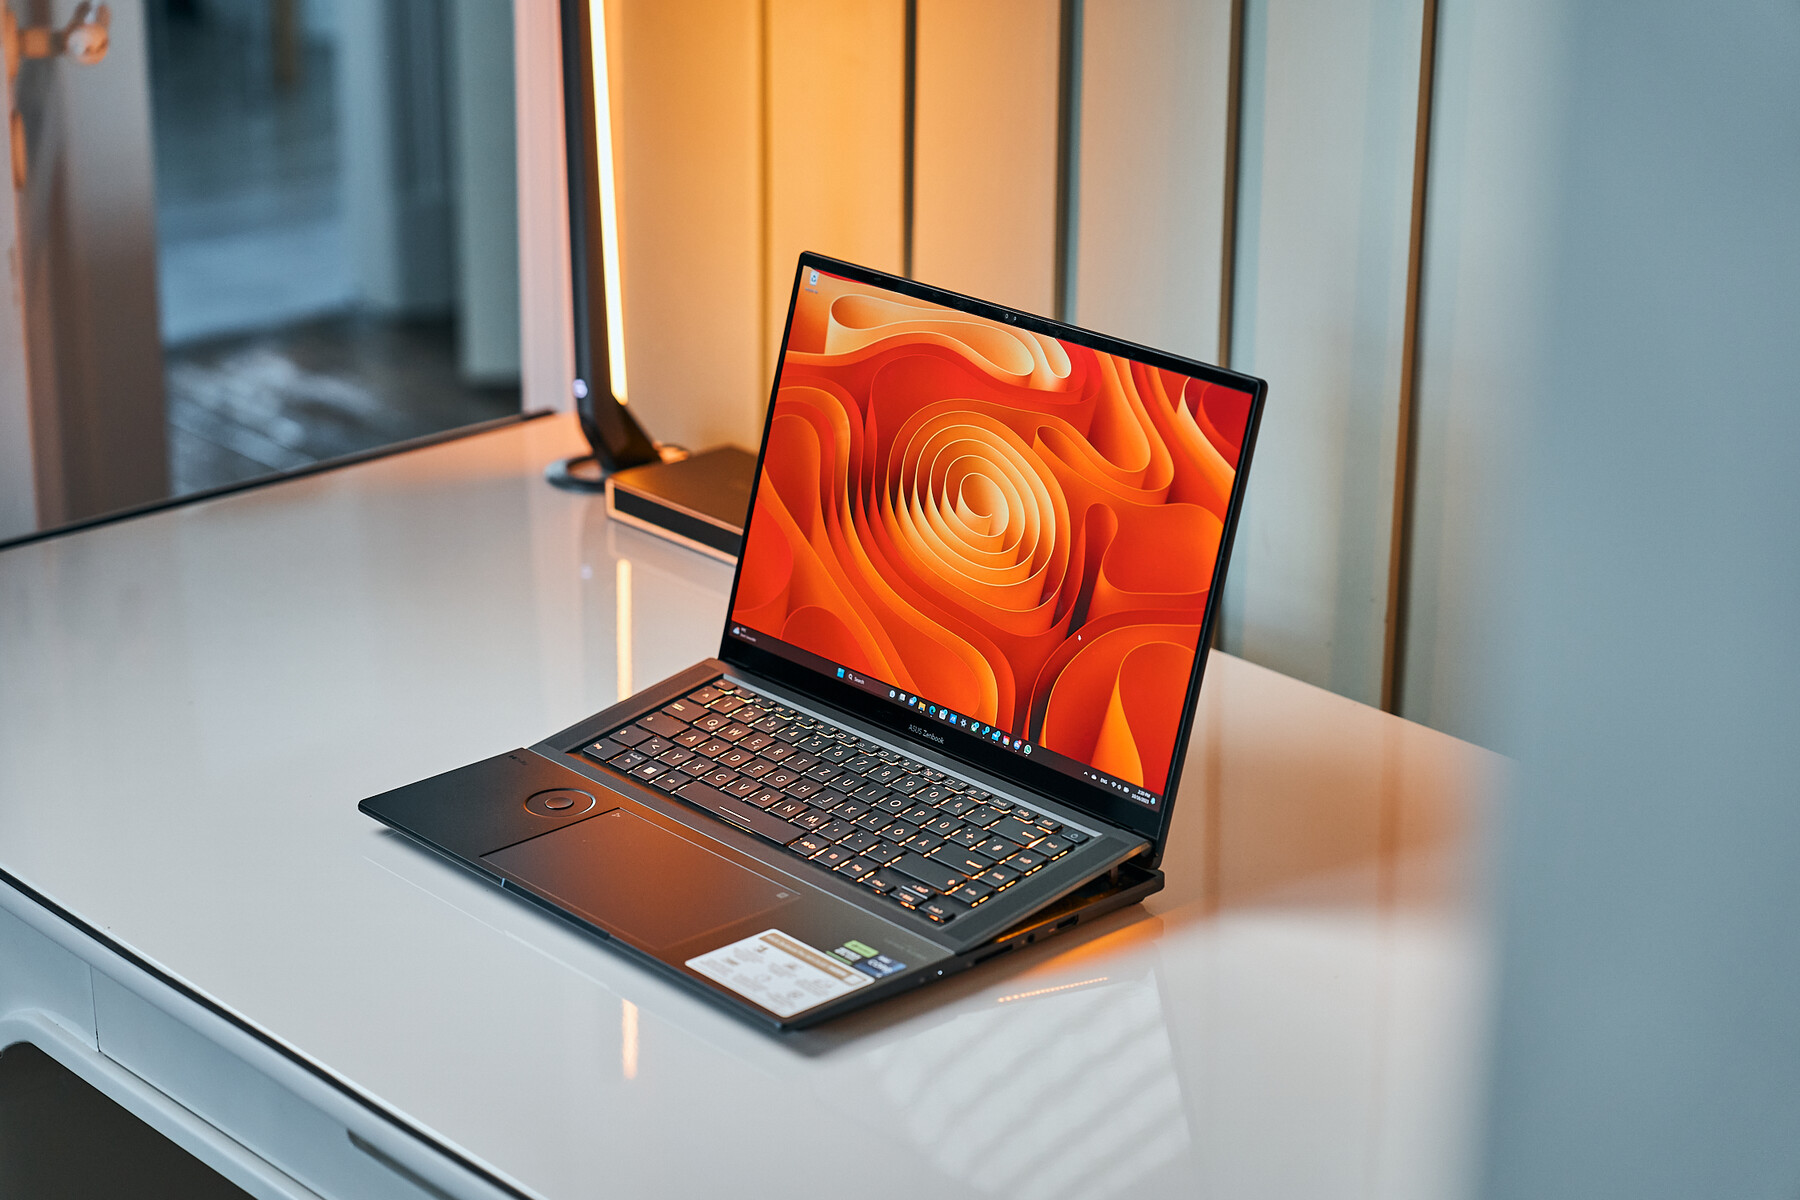
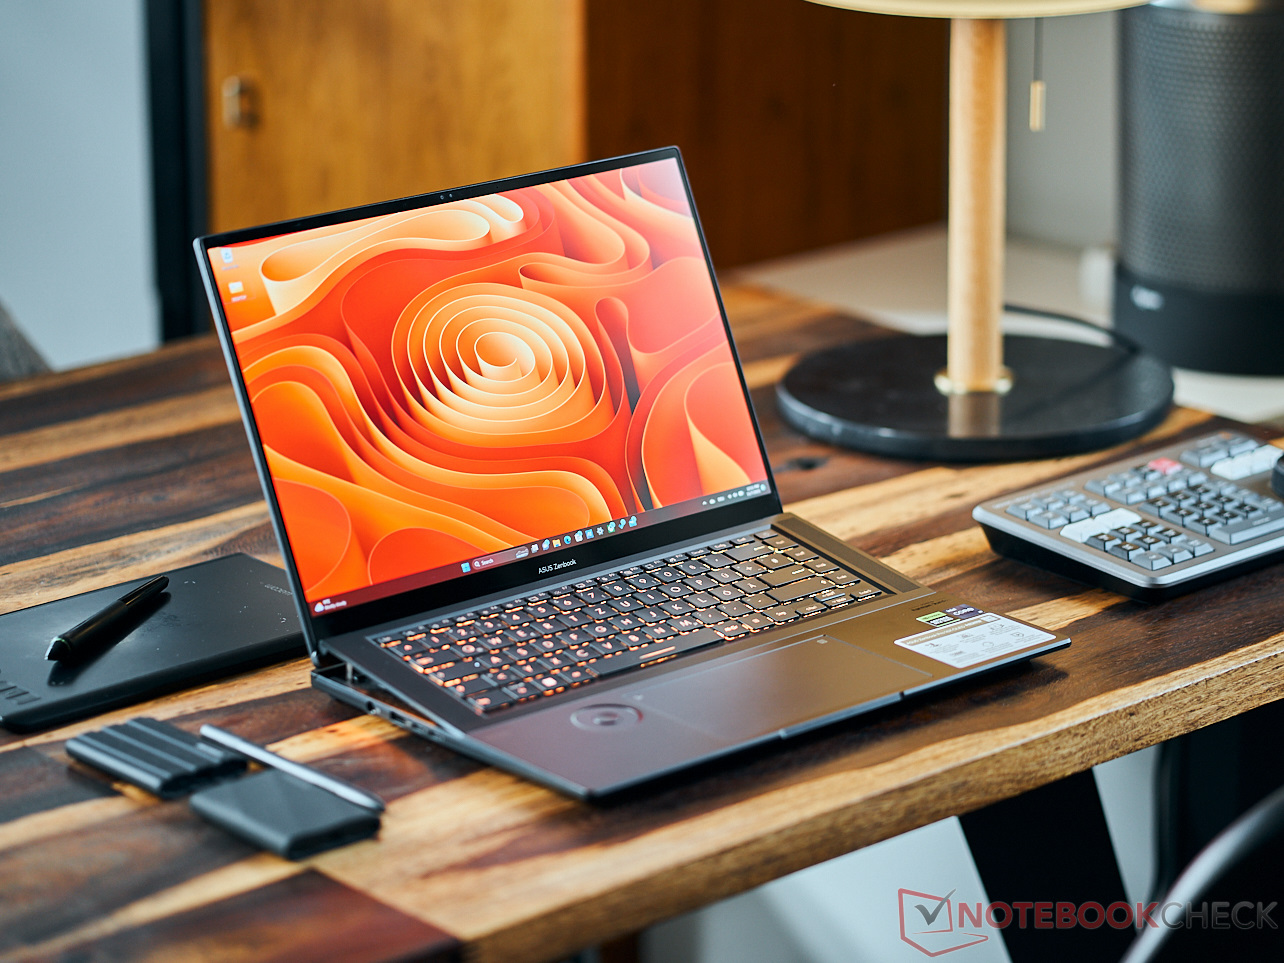
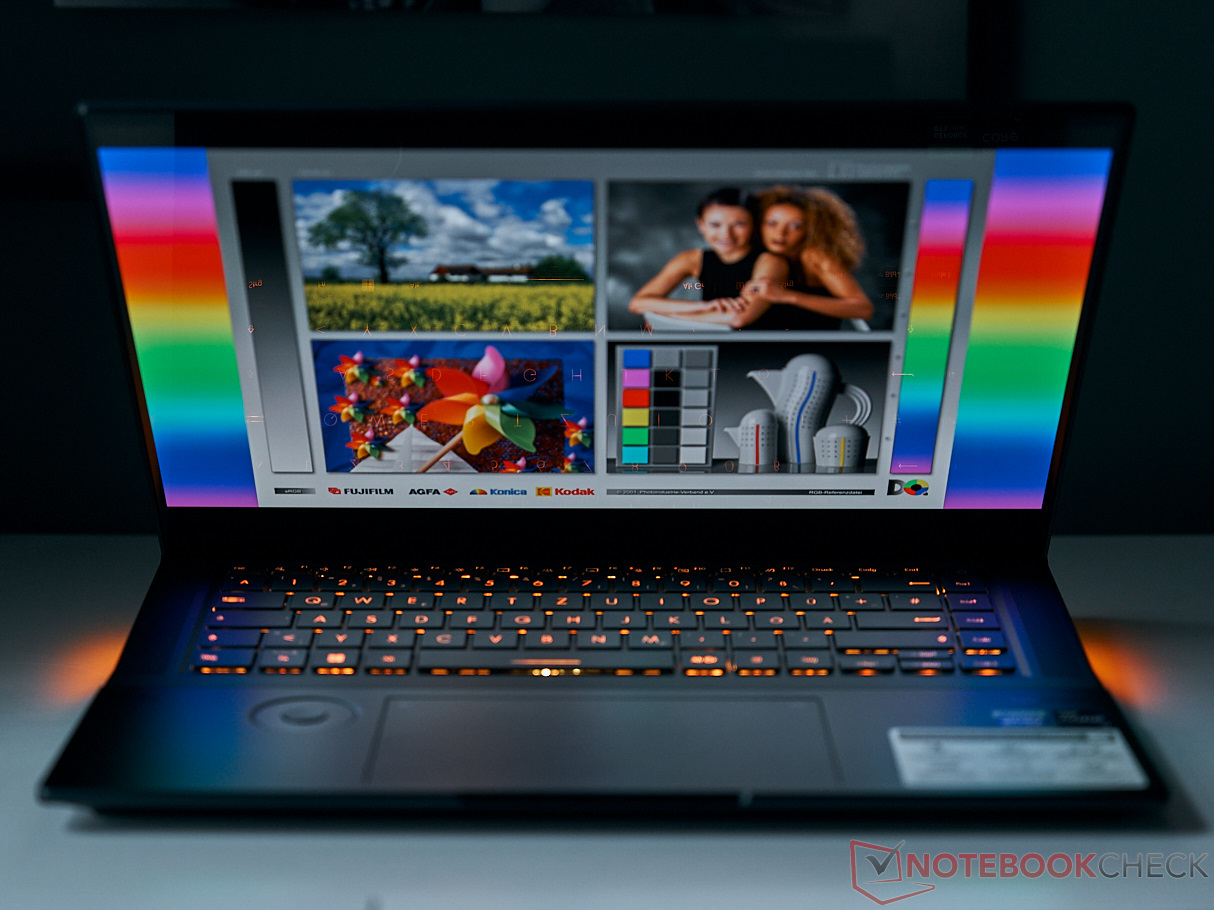
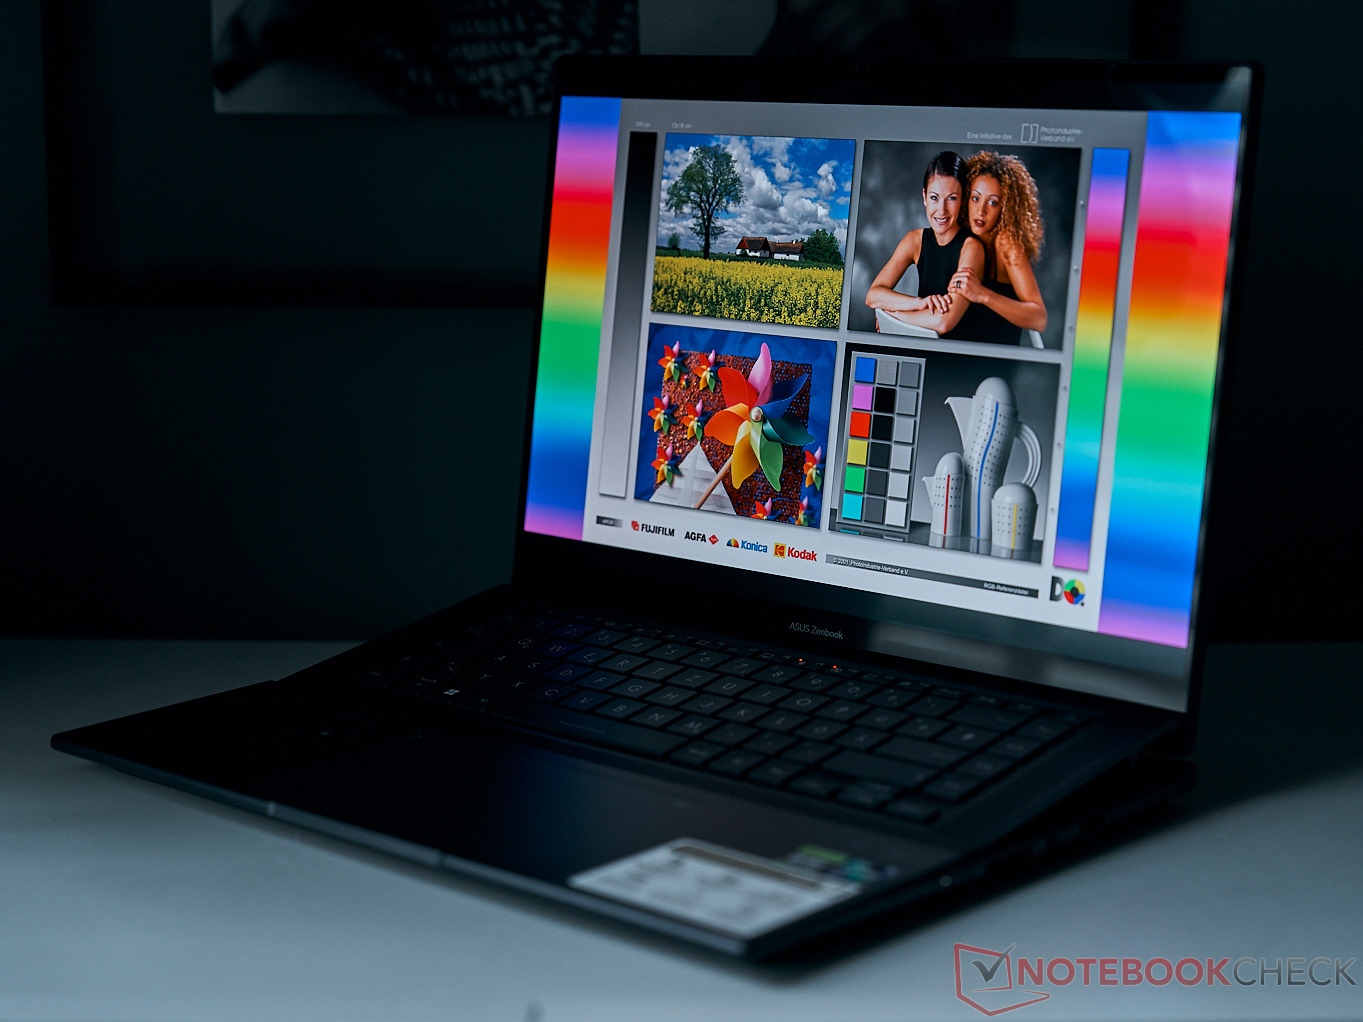
Asus también ha retocado la pantalla y ahora ofrece por fin una pantalla OLED de 120 Hz. Esta viene bien calibrada de fábrica y ofrece una cobertura completa DisplayP3 y DCI P3, lo que significa que esta potencia también puede ser una excelente opción para los diseñadores de medios. La posibilidad de entrada de lápiz también apoya esta noción, así como el Asus Dial, que se puede utilizar para acceder rápidamente a numerosas funciones en software creativo. Por último, las potentes capacidades gráficas del nuevo Zenbook Pro 16X lo hacen interesante para los jugadores que buscan un portátil no tan aparatoso.
Aquí hay bastantes competidores entre los que elegir. En el extremo inferior de la escala de precios está elAsus ROG Strix G16 G614JZque también viene con una RTX 4080y un Intel Core i9, pero no tiene una pantalla OLED. En su lugar, lleva instalado un excelente panel IPS. El MSI Stealth 17 Studio A13VH-014, que también está equipado con una RTX 4080, está algo más orientado al uso creativo. ElLenovo Legion Pro 7 y el Asus ROG Zephyrus M16 están aún mejor equipados, ambos vienen con una RTX 4090.
También comparamos a la baja con elLenovo Legion Slim 7i 16 Gen 8 y el Asus Vivobook Pro 16Xya que están equipados con RTX 4070 y RTX 4060, respectivamente. Por supuesto, el Zenbook Pro 16X del año pasado.
Posibles contendientes en la comparación
Valoración | Fecha | Modelo | Peso | Altura | Tamaño | Resolución | Precio |
|---|---|---|---|---|---|---|---|
| 90.5 % v7 (old) | 11/2023 | Asus Zenbook Pro 16X UX7602BZ-MY005W i9-13905H, GeForce RTX 4080 Laptop GPU | 2.4 kg | 17.8 mm | 16.00" | 3200x2000 | |
| 88.4 % v7 (old) | 12/2022 | Asus ZenBook Pro 16X OLED UX7602ZM-ME115W i9-12900H, GeForce RTX 3060 Laptop GPU | 2.4 kg | 19.5 mm | 16.00" | 3840x2400 | |
| 88.4 % v7 (old) | 03/2023 | Asus ROG Strix G16 G614JZ i9-13980HX, GeForce RTX 4080 Laptop GPU | 2.4 kg | 30.4 mm | 16.00" | 2560x1600 | |
| 89.4 % v7 (old) | 03/2023 | Asus ROG Zephyrus M16 GU604VY-NM042X i9-13900H, GeForce RTX 4090 Laptop GPU | 2.3 kg | 22.9 mm | 16.00" | 2560x1600 | |
| 89.2 % v7 (old) | 04/2023 | MSI Stealth 17 Studio A13VH-014 i9-13900H, GeForce RTX 4080 Laptop GPU | 3 kg | 21.3 mm | 17.30" | 3840x2160 | |
| 88.8 % v7 (old) | 06/2023 | Lenovo Legion Pro 7 RTX4090 i9-13900HX, GeForce RTX 4090 Laptop GPU | 2.7 kg | 26 mm | 16.00" | 2560x1600 | |
| 90 % v7 (old) | 07/2023 | Lenovo Legion Slim 7i 16 Gen 8 i9-13900H, GeForce RTX 4070 Laptop GPU | 2.1 kg | 19.9 mm | 16.00" | 2560x1600 | |
| 86.2 % v7 (old) | 07/2023 | Asus Vivobook Pro 16X K6604JV-MX016W i9-13980HX, GeForce RTX 4060 Laptop GPU | 2.1 kg | 22.8 mm | 16.00" | 3200x2000 |
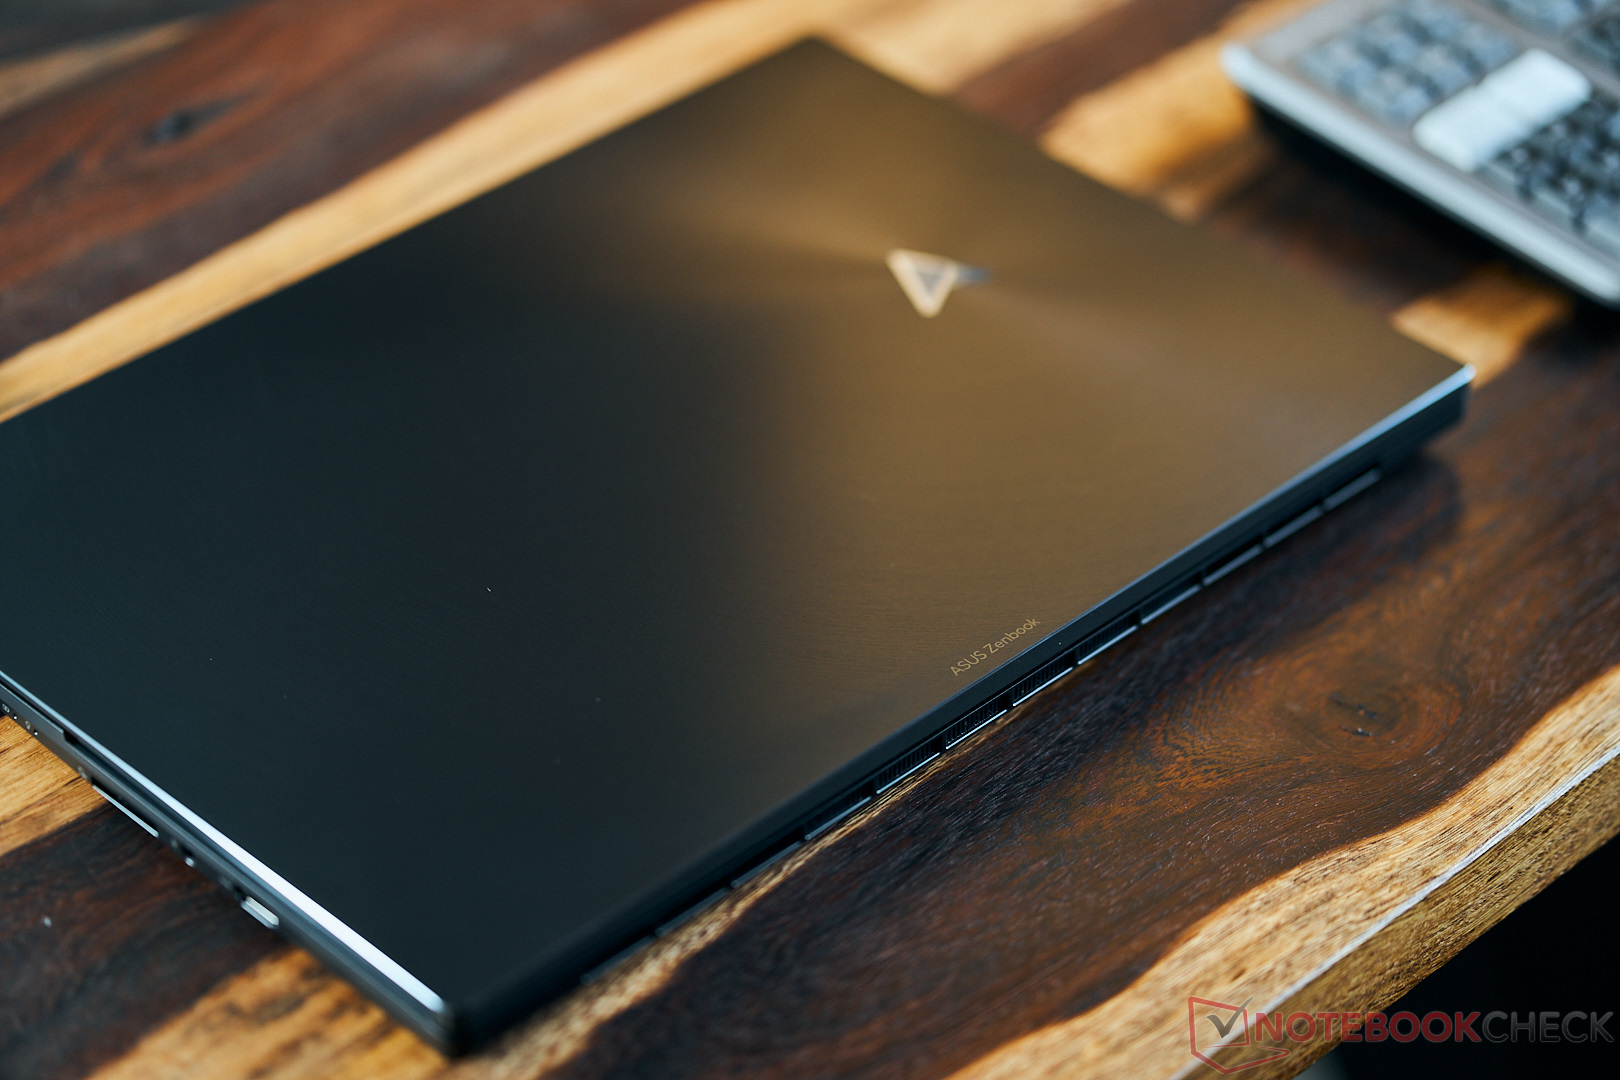
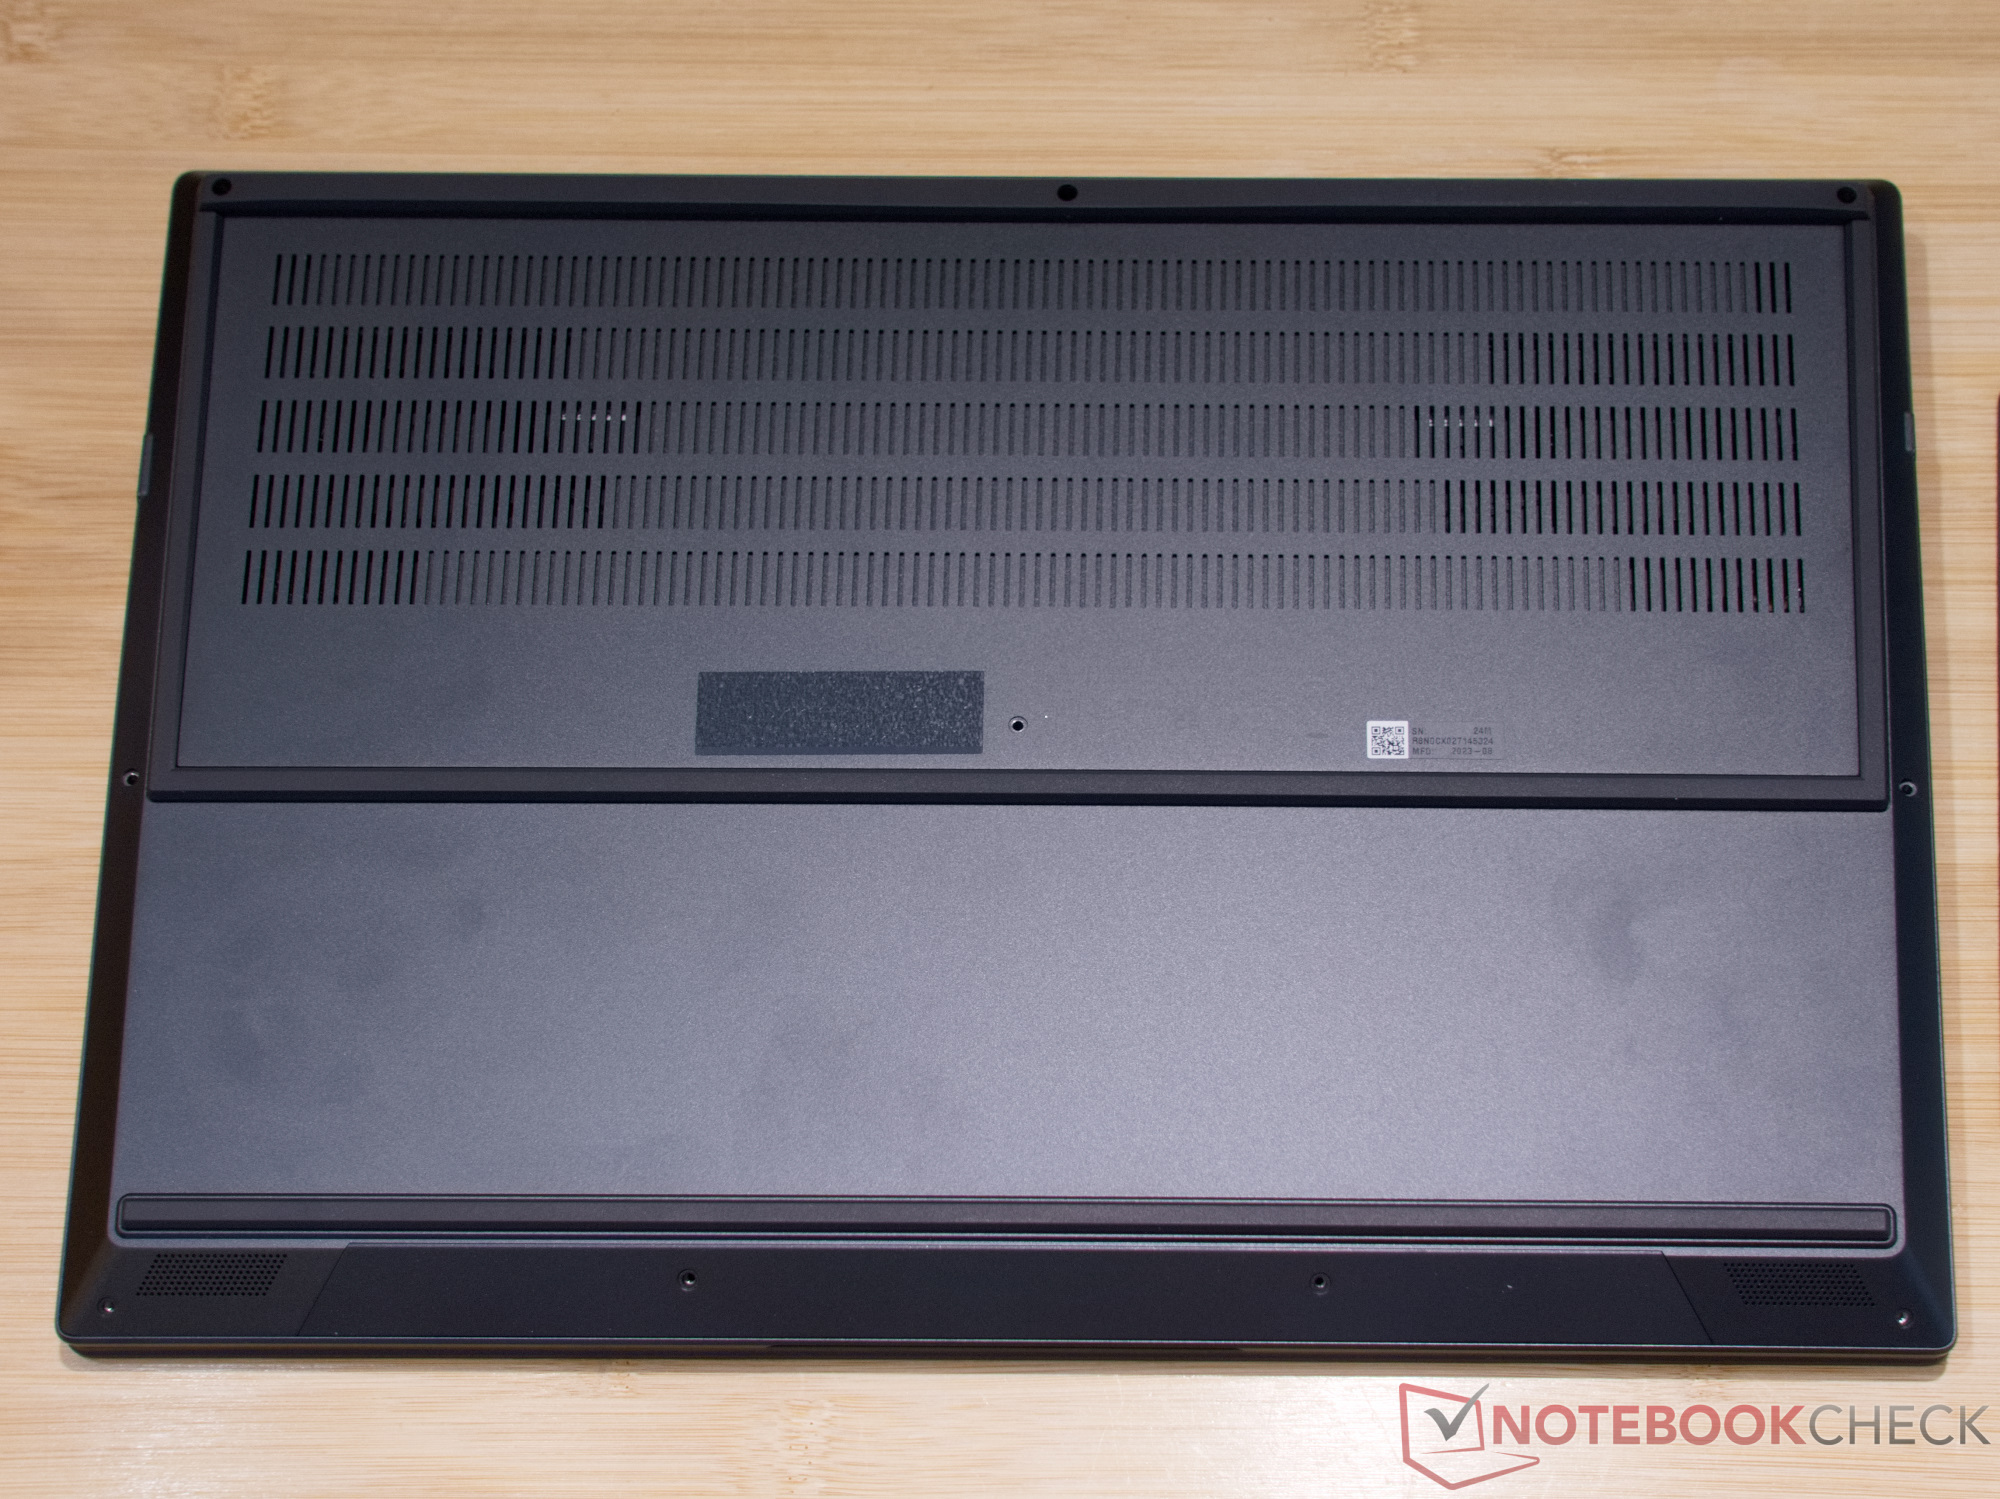
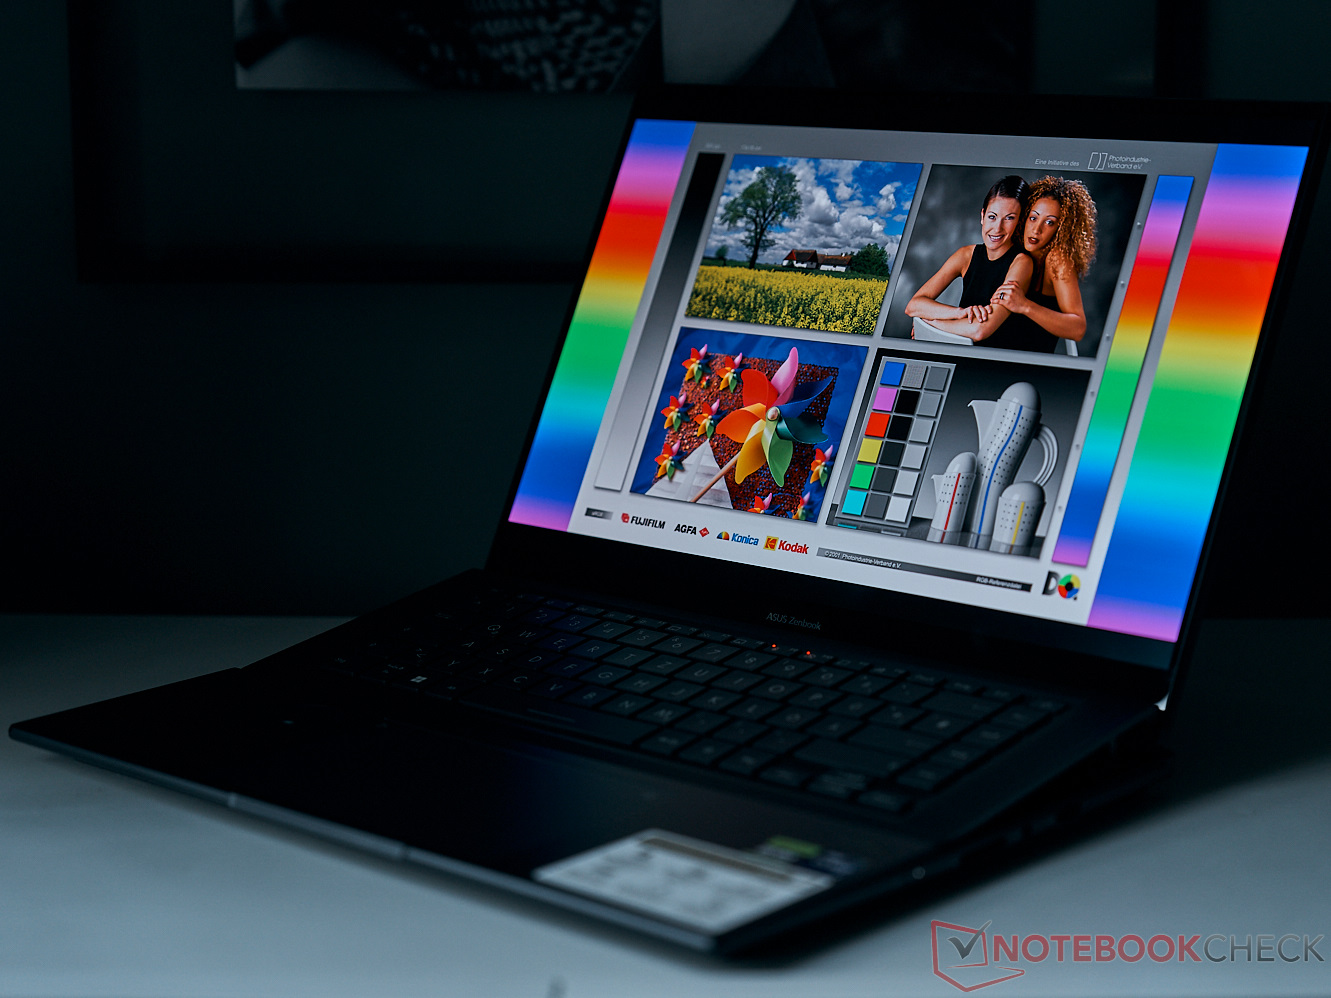
Caja - Una construcción única hecha de metal ligero
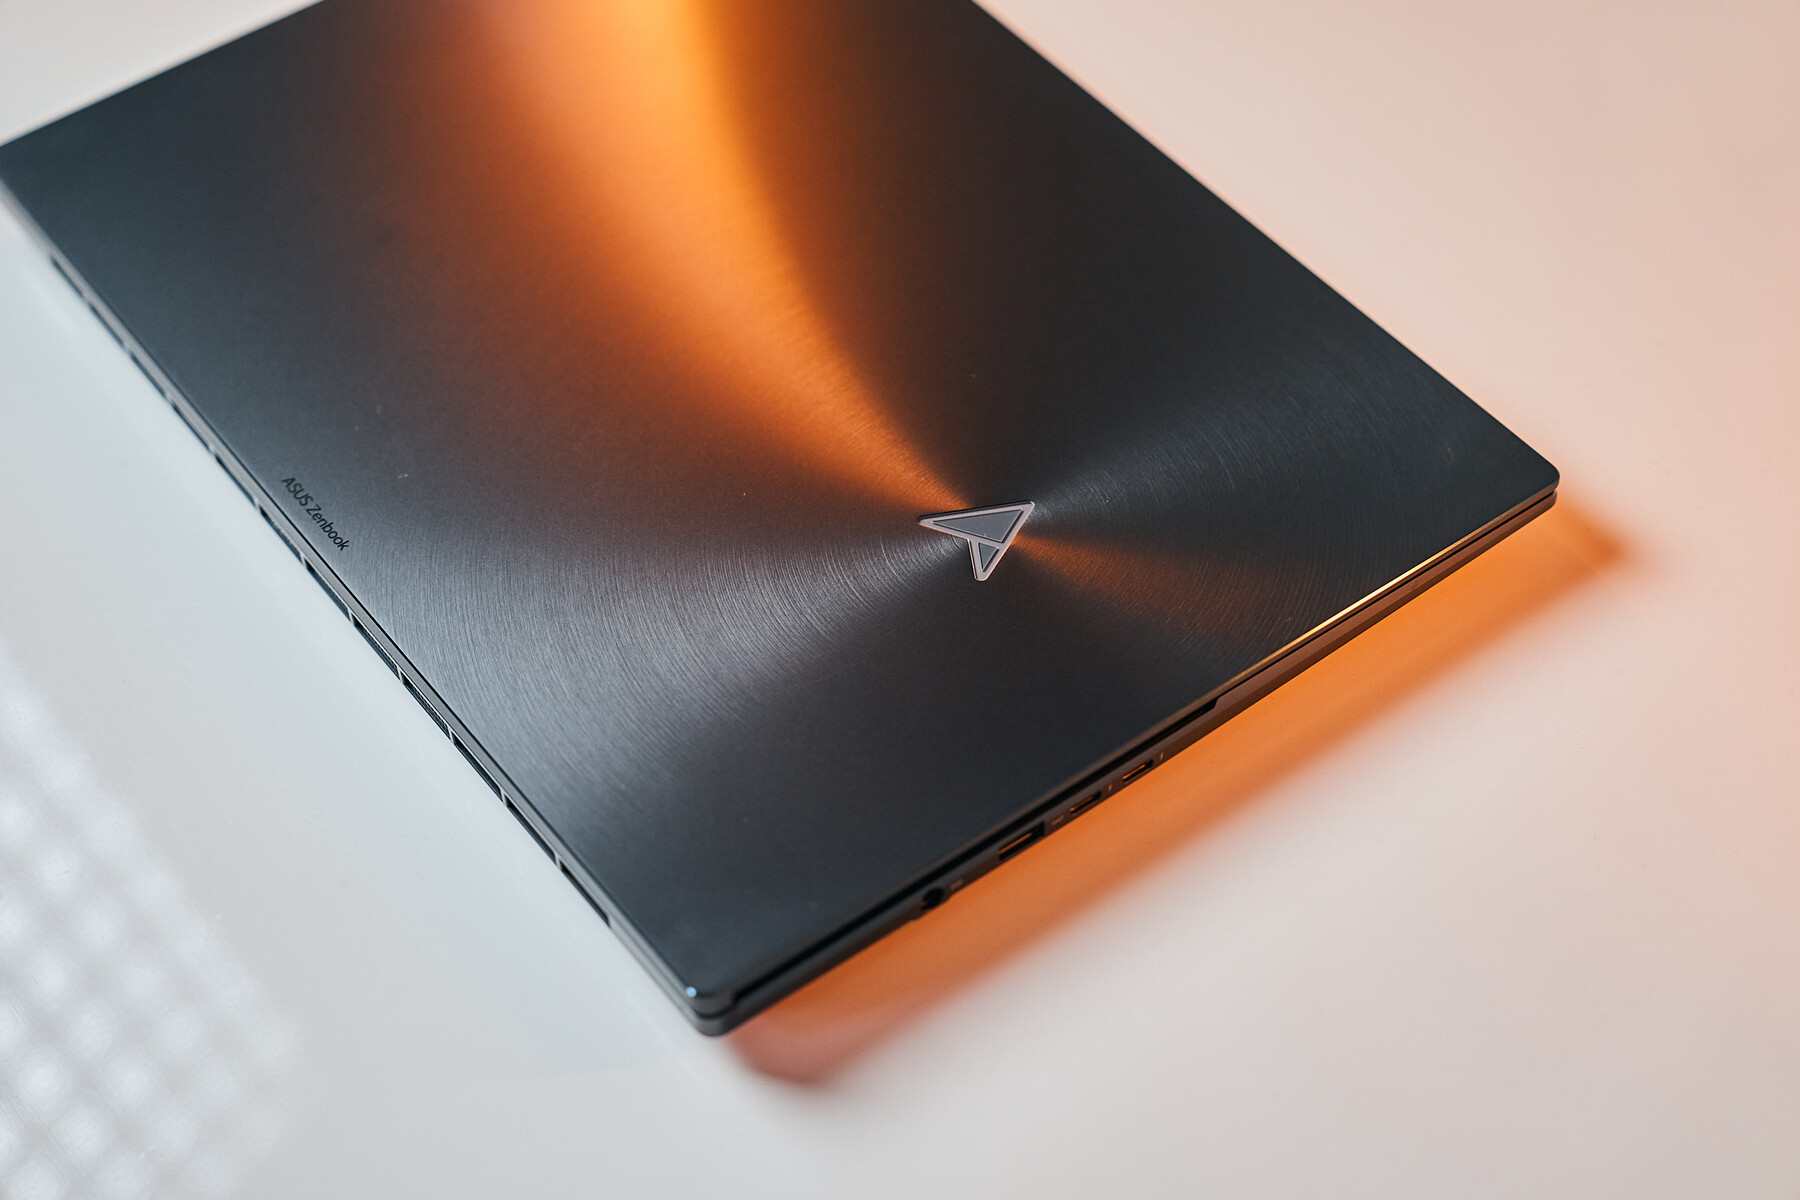
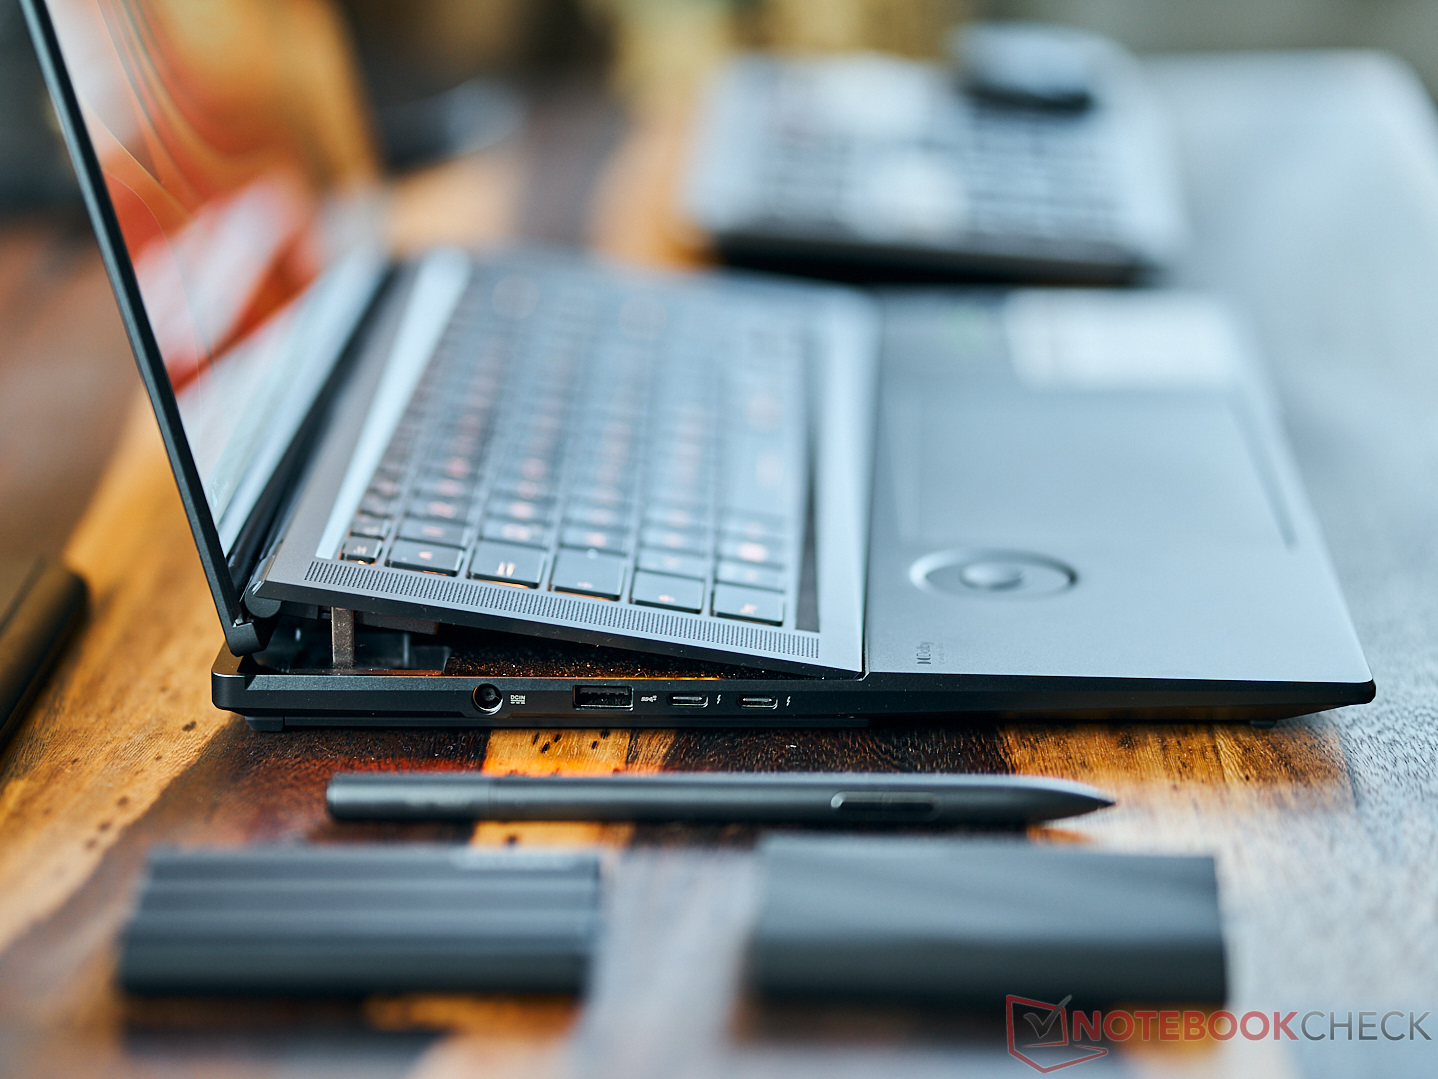
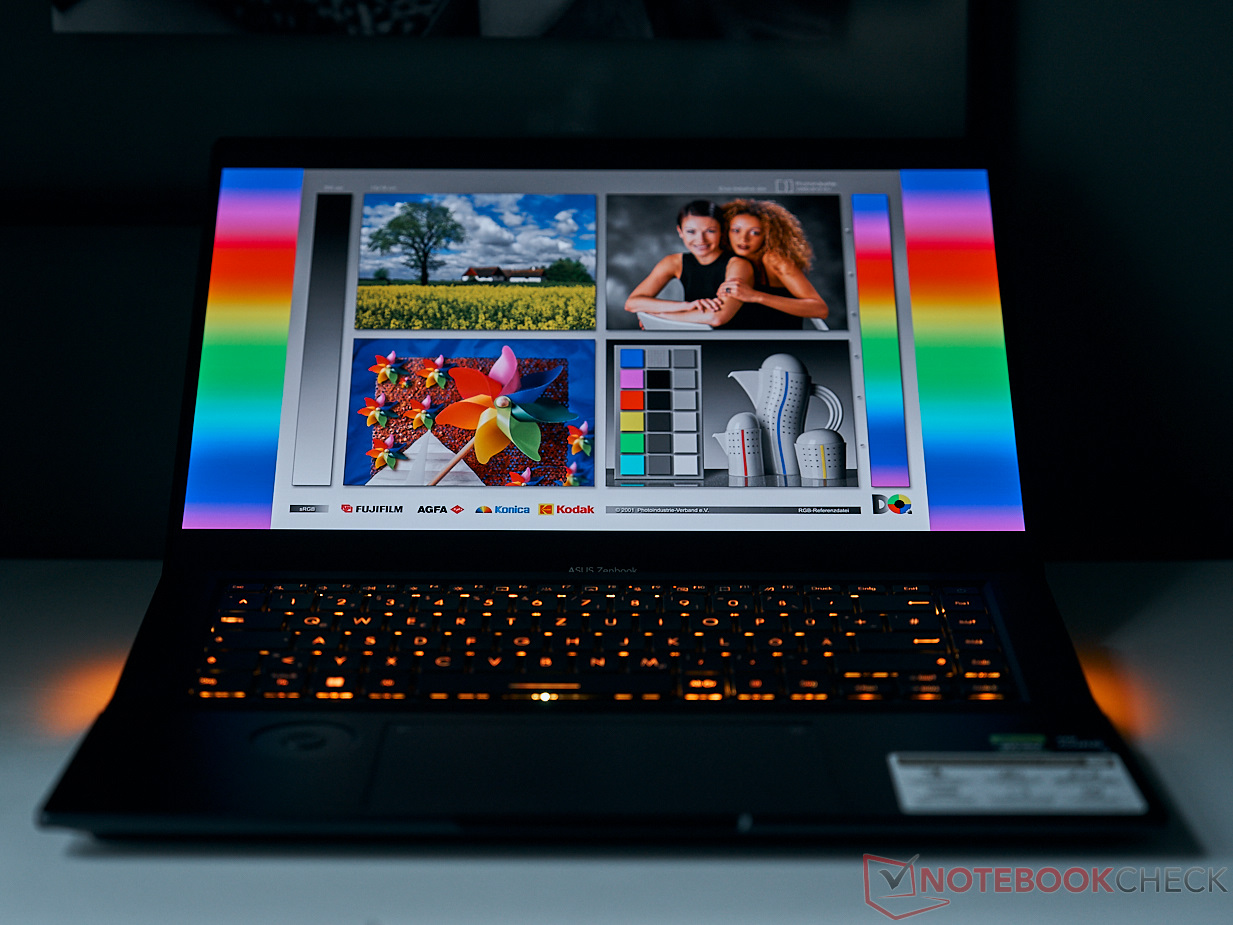
No parece que se hayan realizado cambios significativos en la carcasa del nuevo Zenbook Pro 16x. Como mucho, el teclado tiene un color más distintivo. En nuestra opinión, la estabilidad de las bisagras ha mejorado ligeramente en comparación con el predecesor. En particular, las bisagras tienen un diseño muy elaborado porque, al abrir el portátil, el teclado se eleva 2 cm en la parte trasera. Debajo, dos ventiladores aspiran aire frío, lo que Asus denomina AAS Ultra Cooling. Otra ventaja del teclado elevado es que se mantiene muy fresco, ya que no hay conducción directa de la temperatura entre el hardware caliente y el teclado.
El cristal y el metal distinguen la háptica del Zenbook Pro 16X. Sólo la carcasa de la unidad del teclado es de plástico. En general, el portátil se siente estable, no cruje al girarlo y es de excelente factura.
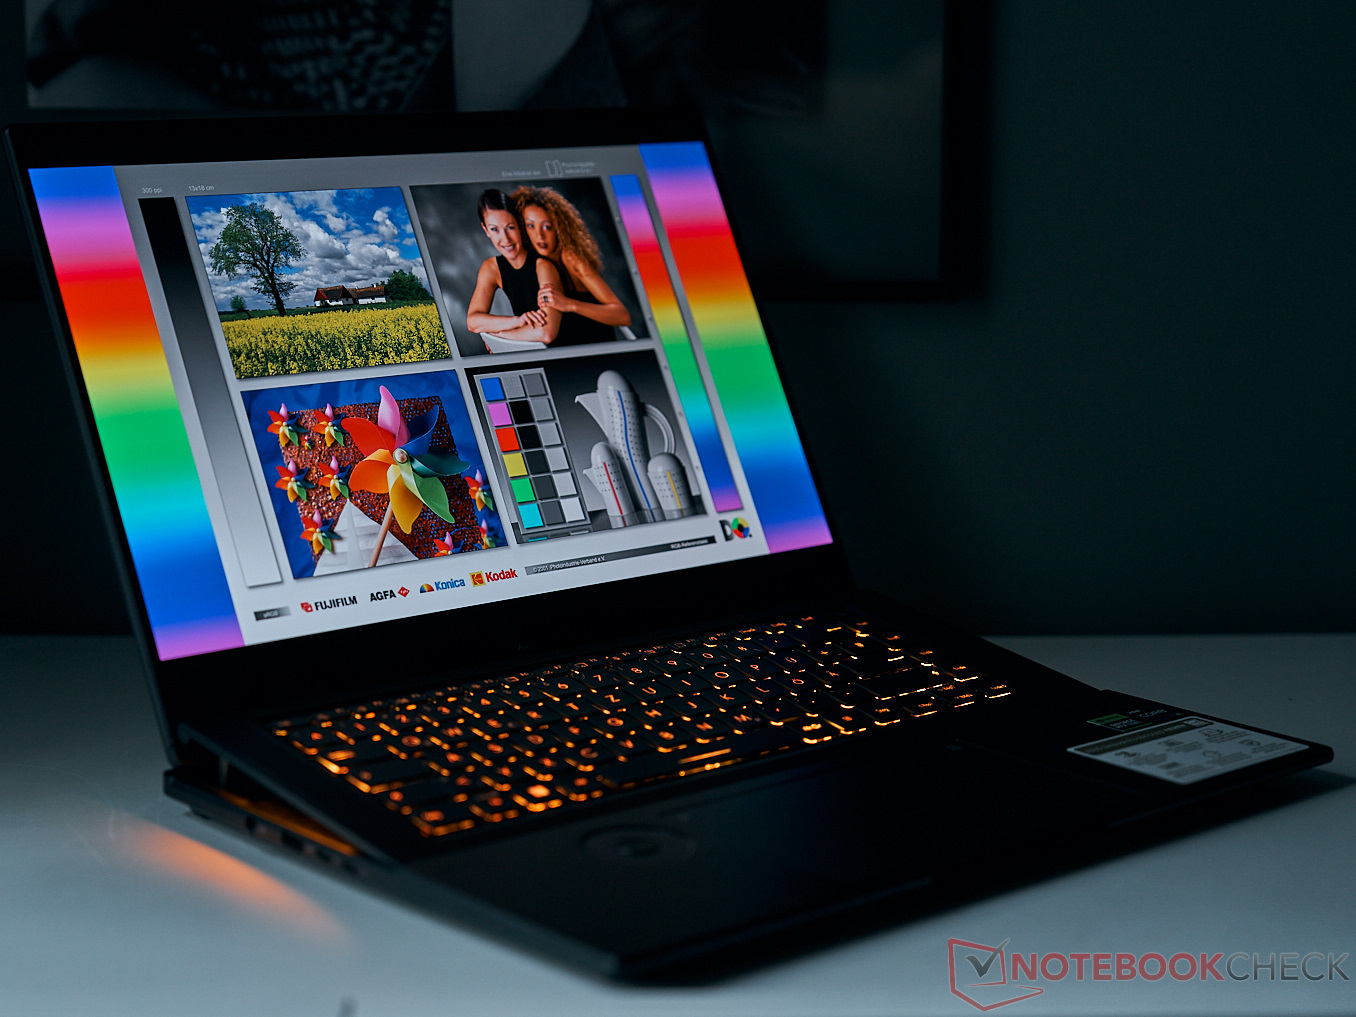
La discreta iluminación RGB también adorna el portátil. Los LED controlables se encuentran bajo el teclado y en el logotipo de la tapa. Las teclas también pueden iluminarse individualmente. Asus consigue un decente equilibrio entre una apariencia discreta y la moderna iluminación RGB, que por otra parte cabría esperar de los llamativos portátiles para juegos.
Con algo más de 2 kg, nuestro dispositivo de prueba se sitúa en el centro del campo de comparación. En términos de tamaño y grosor, sólo el 3 kgMSI Stealth 17 Studiodestaca entre la mayoría de los competidores. Sin embargo, cuando se trata del dispositivo más delgado posible, el Lenovo Legion Slim y nuestro Zenbook no tienen competencia.
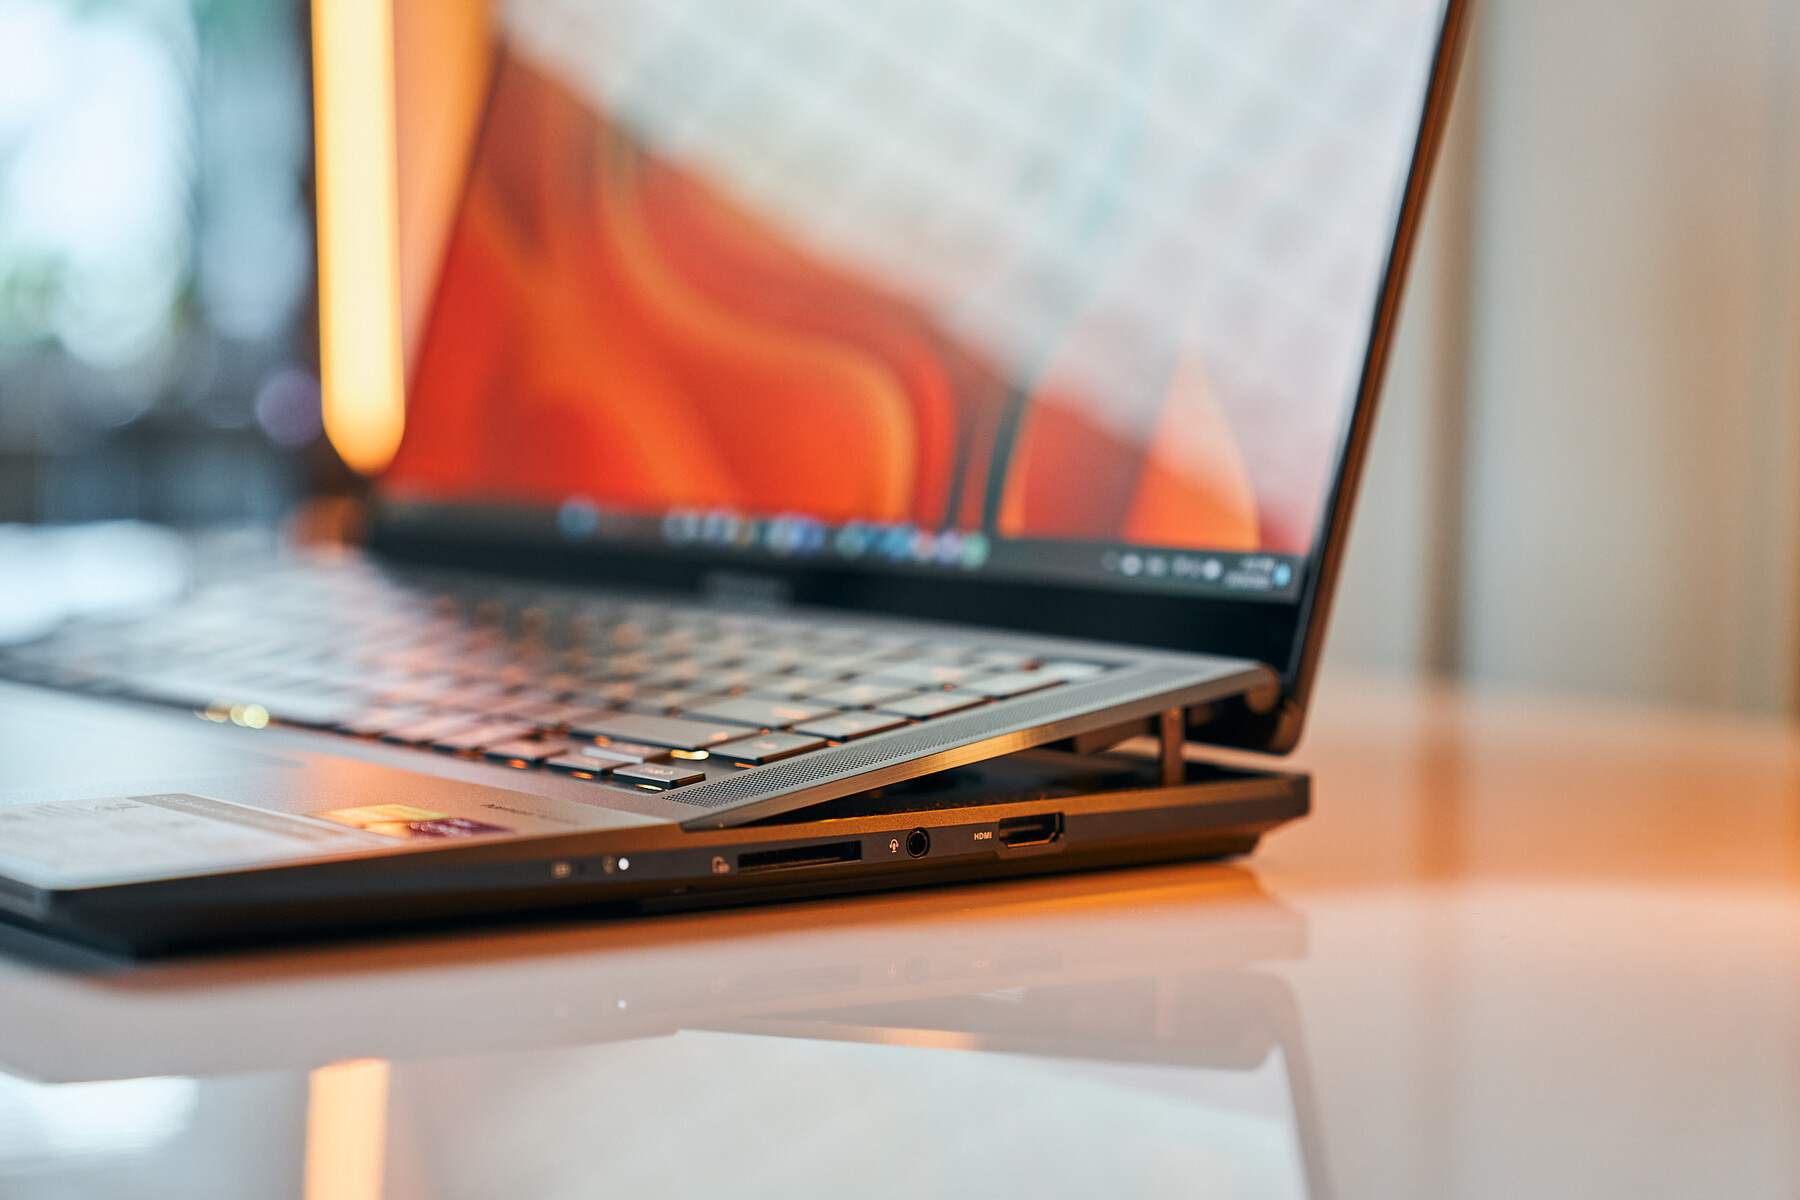
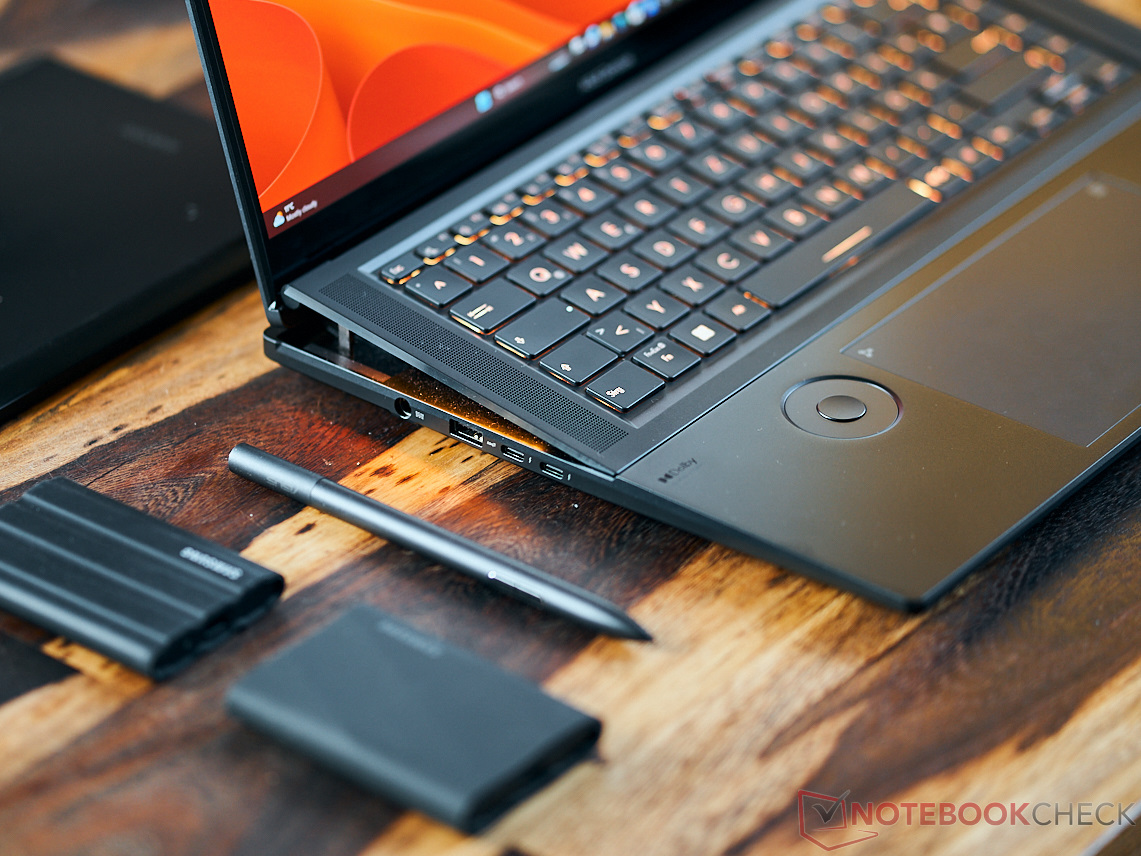
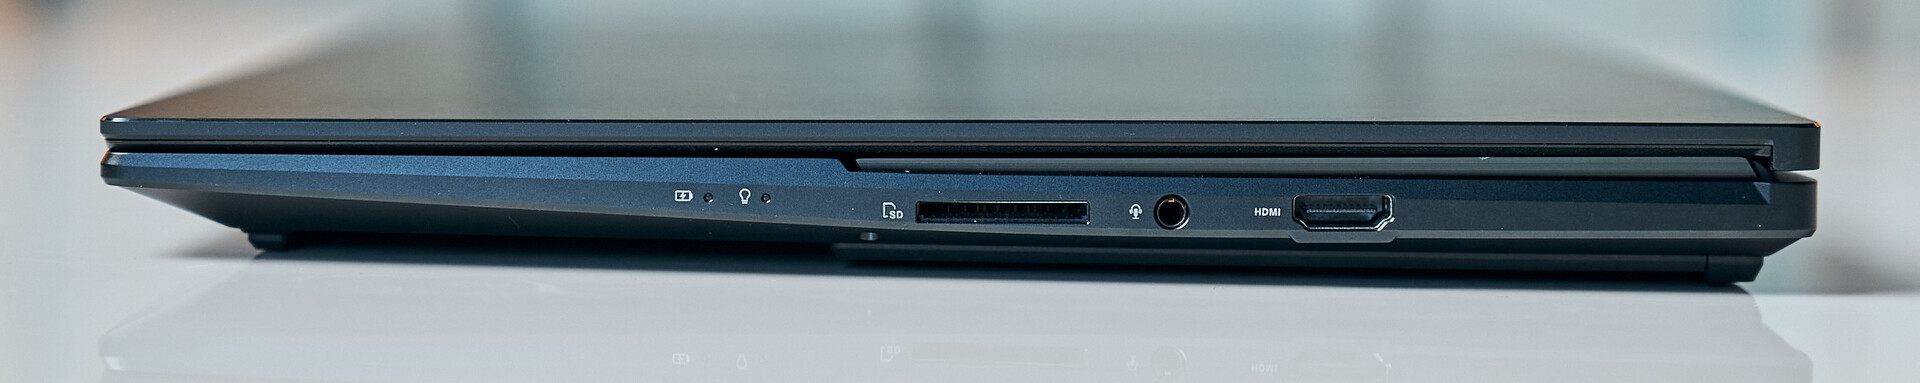
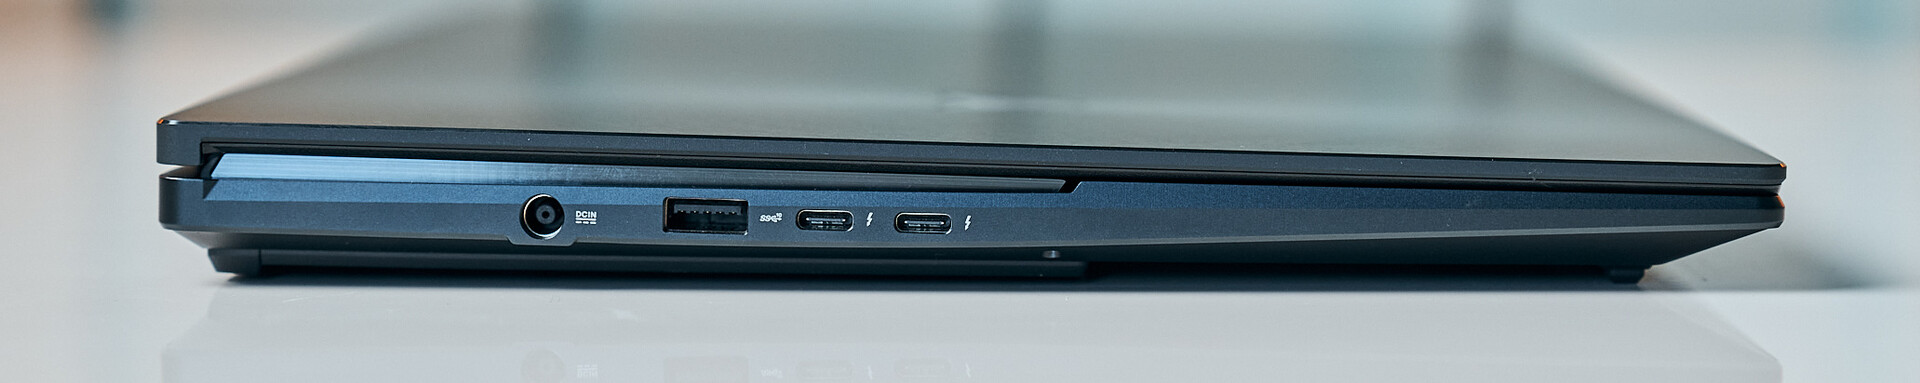
Equipamiento - Tres puertos USB son bastante pocos a pesar de Thunderbolt
Un punto de crítica sobre elpredecesorera la escasa conectividad. Por desgracia, aquí nada ha cambiado: Los puertos USB sólo están disponibles en el lado izquierdo del portátil, mientras que los puertos HDMI y de audio, así como el lector de tarjetas, no especialmente rápido, se encuentran en el lado derecho.
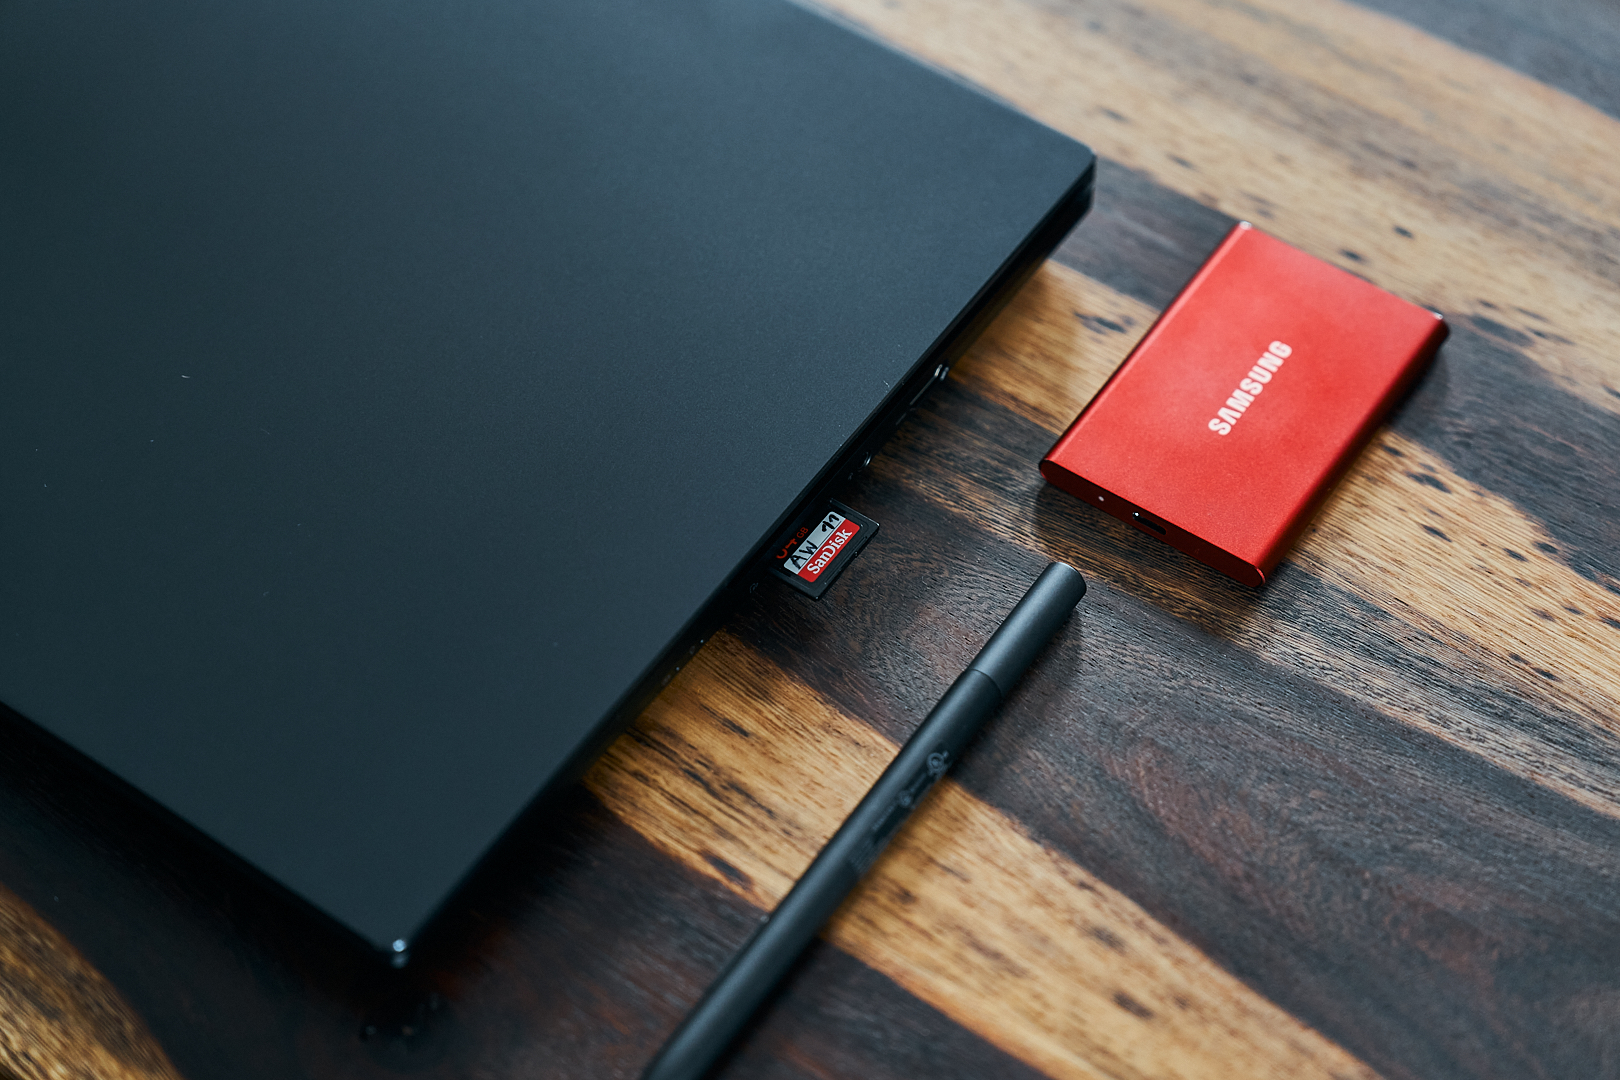
Lector de tarjetas SD
Utilizando nuestra microSD AV PRO, las velocidades de transferencia han aumentado ligeramente en comparación con la predecesora, pero el portátil sigue siendo incapaz de gestionar 100 MB/s en lectura. Si nuestra tarjeta de 128 GB estuviera completamente llena de imágenes, probablemente tendríamos que esperar unos buenos 20 minutos para una transferencia completa.
| SD Card Reader | |
| average JPG Copy Test (av. of 3 runs) | |
| Asus ROG Zephyrus M16 GU604VY-NM042X | |
| Media de la clase Gaming (20.9 - 210, n=54, últimos 2 años) | |
| Asus Vivobook Pro 16X K6604JV-MX016W | |
| Asus Zenbook Pro 16X UX7602BZ-MY005W | |
| Lenovo Legion Slim 7i 16 Gen 8 (Toshiba Exceria Pro SDXC 64 GB UHS-II) | |
| Asus ZenBook Pro 16X OLED UX7602ZM-ME115W (AV Pro SD microSD 128 GB V60) | |
| MSI Stealth 17 Studio A13VH-014 | |
| maximum AS SSD Seq Read Test (1GB) | |
| Asus ROG Zephyrus M16 GU604VY-NM042X | |
| Media de la clase Gaming (25.5 - 261, n=51, últimos 2 años) | |
| Asus Vivobook Pro 16X K6604JV-MX016W | |
| Lenovo Legion Slim 7i 16 Gen 8 (Toshiba Exceria Pro SDXC 64 GB UHS-II) | |
| Asus Zenbook Pro 16X UX7602BZ-MY005W | |
| Asus ZenBook Pro 16X OLED UX7602ZM-ME115W (AV Pro SD microSD 128 GB V60) | |
| MSI Stealth 17 Studio A13VH-014 | |
Comunicación
A pesar de las tres antenas WLAN con un conmutador inteligente, sólo vimos velocidades de transmisión medias cuando lo conectamos a nuestro router de referencia Asus ROG AX11000. Aquellos que necesiten una conexión de red estable también pueden utilizar el adaptador LAN incluido.
Cámara web
La webcam integrada con capacidad Windows Hello del Zenbook es relativamente buena y tiene una resolución de 1920 × 1080. Las desviaciones de color, el contraste y la nitidez están bien, pero no son excepcionales.


Seguridad
El Zenbook Pro 16X está equipado con un escáner de huellas dactilares y reconocimiento facial. Ambos funcionan con rapidez y sin problemas. Las diversas funciones de seguridad habituales de los procesadores modernos también están disponibles. TPM 2.0 y SecureBoot están a bordo.
Accesorios
Además del portátil y una fuente de alimentación de 280 vatios a juego, se incluye una funda protectora y el Asus Pen 2.0. También hay un cable de carga correspondiente y tres puntas de repuesto. También se suministra un adaptador RJ45 USB-C para poder conectar el portátil a la red por cable. Por último, pero no por ello menos importante, no hay que olvidar el embalaje del Zenbook: es especialmente elegante y puede utilizarse como soporte para el portátil.
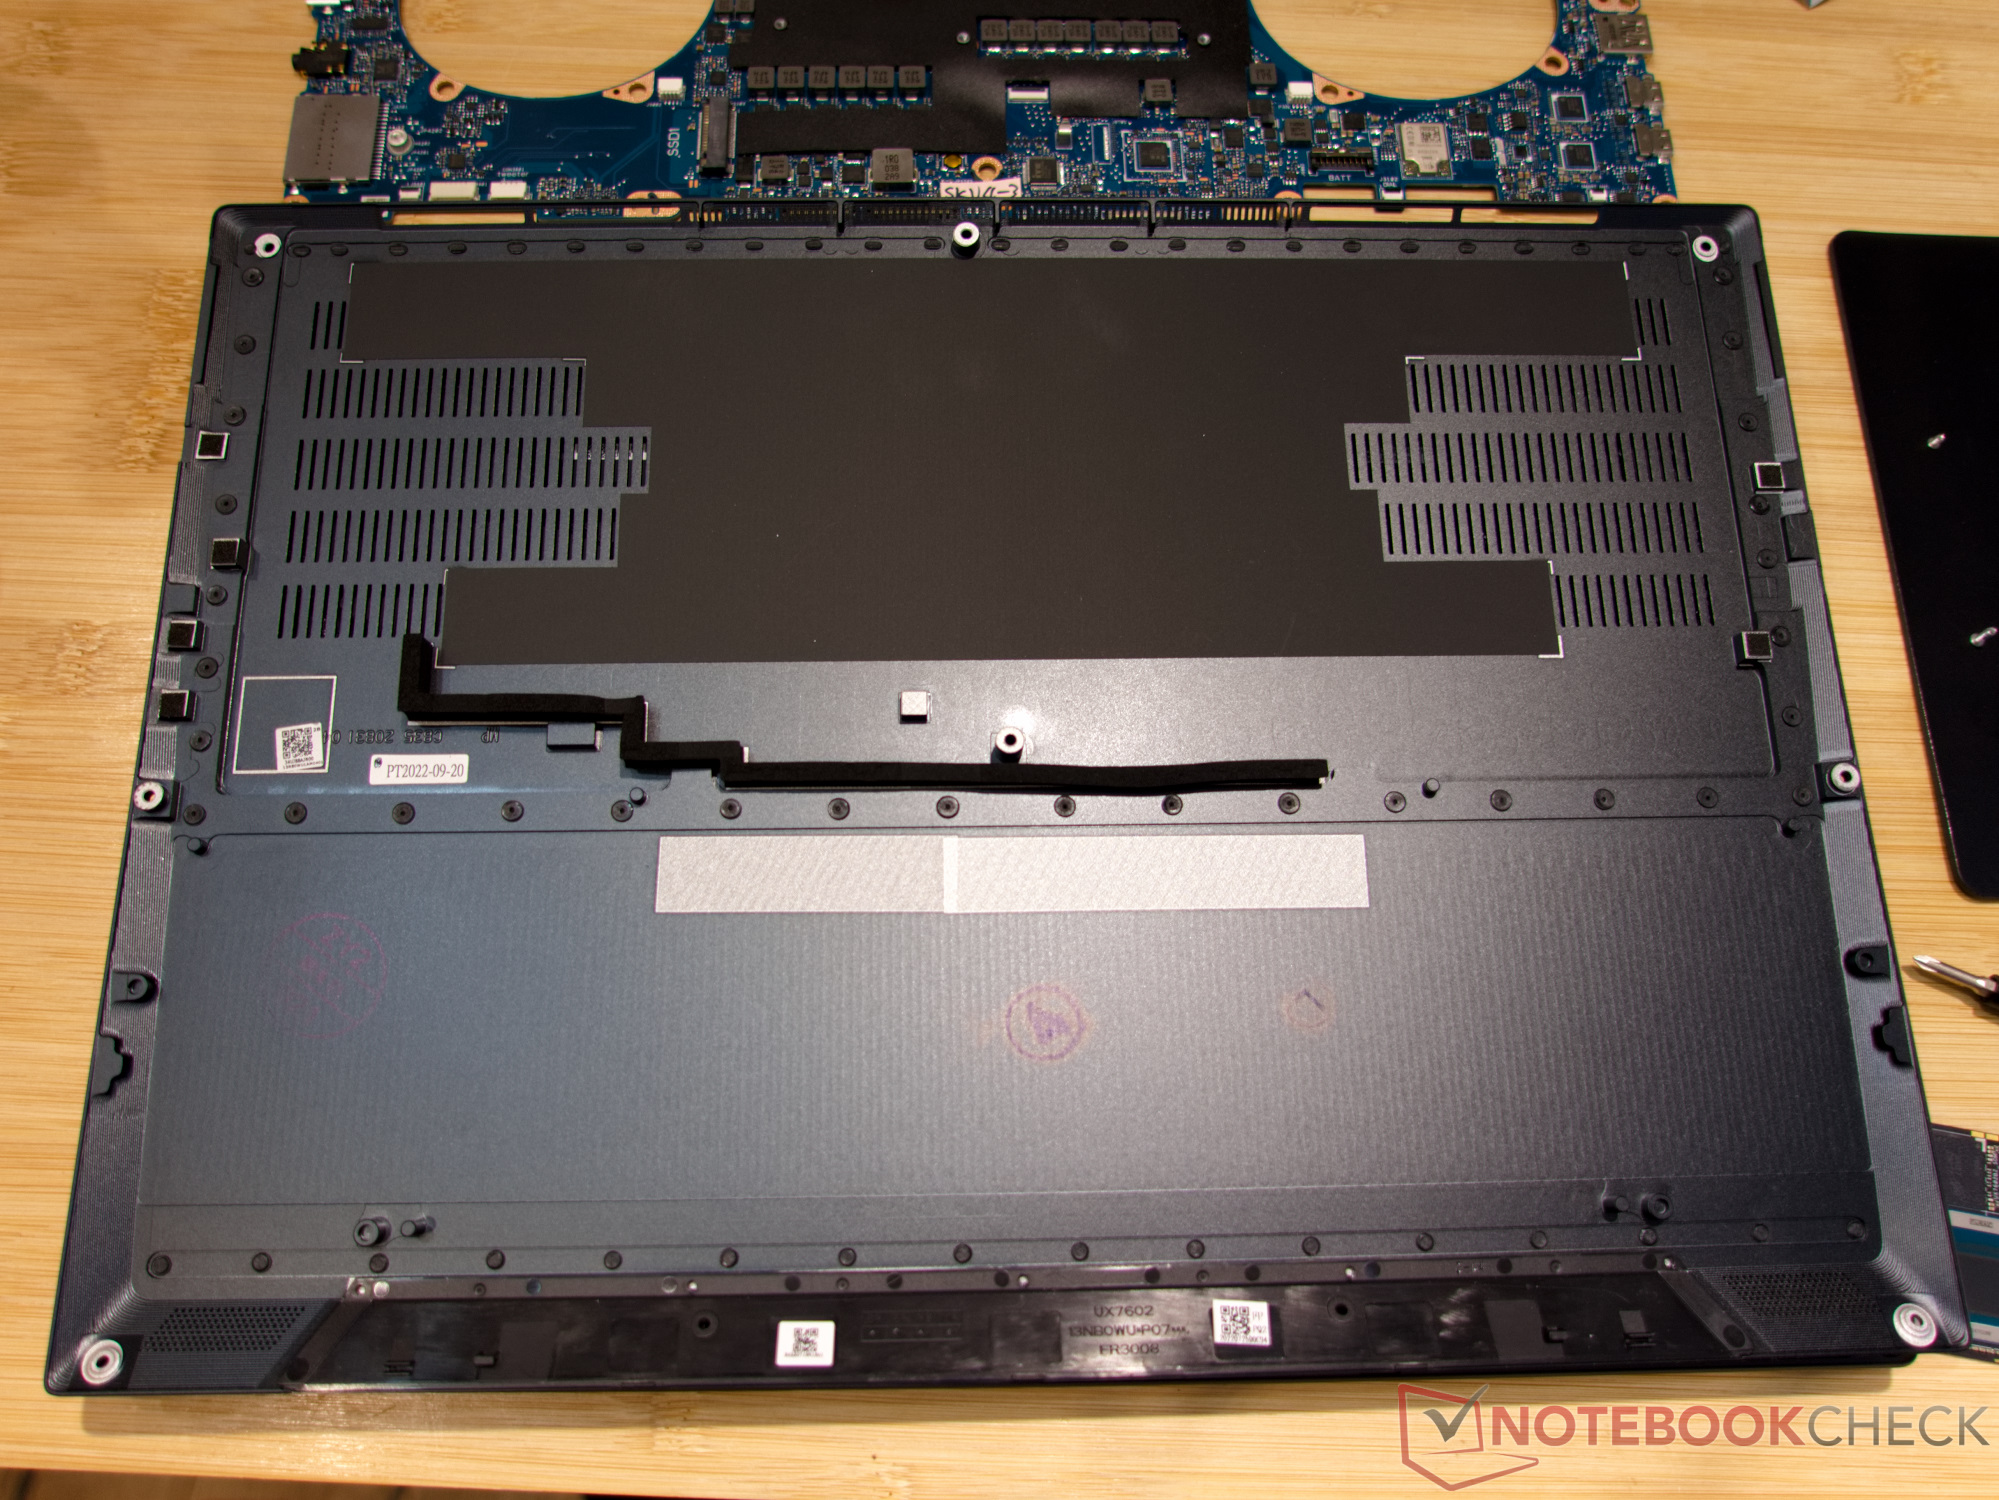
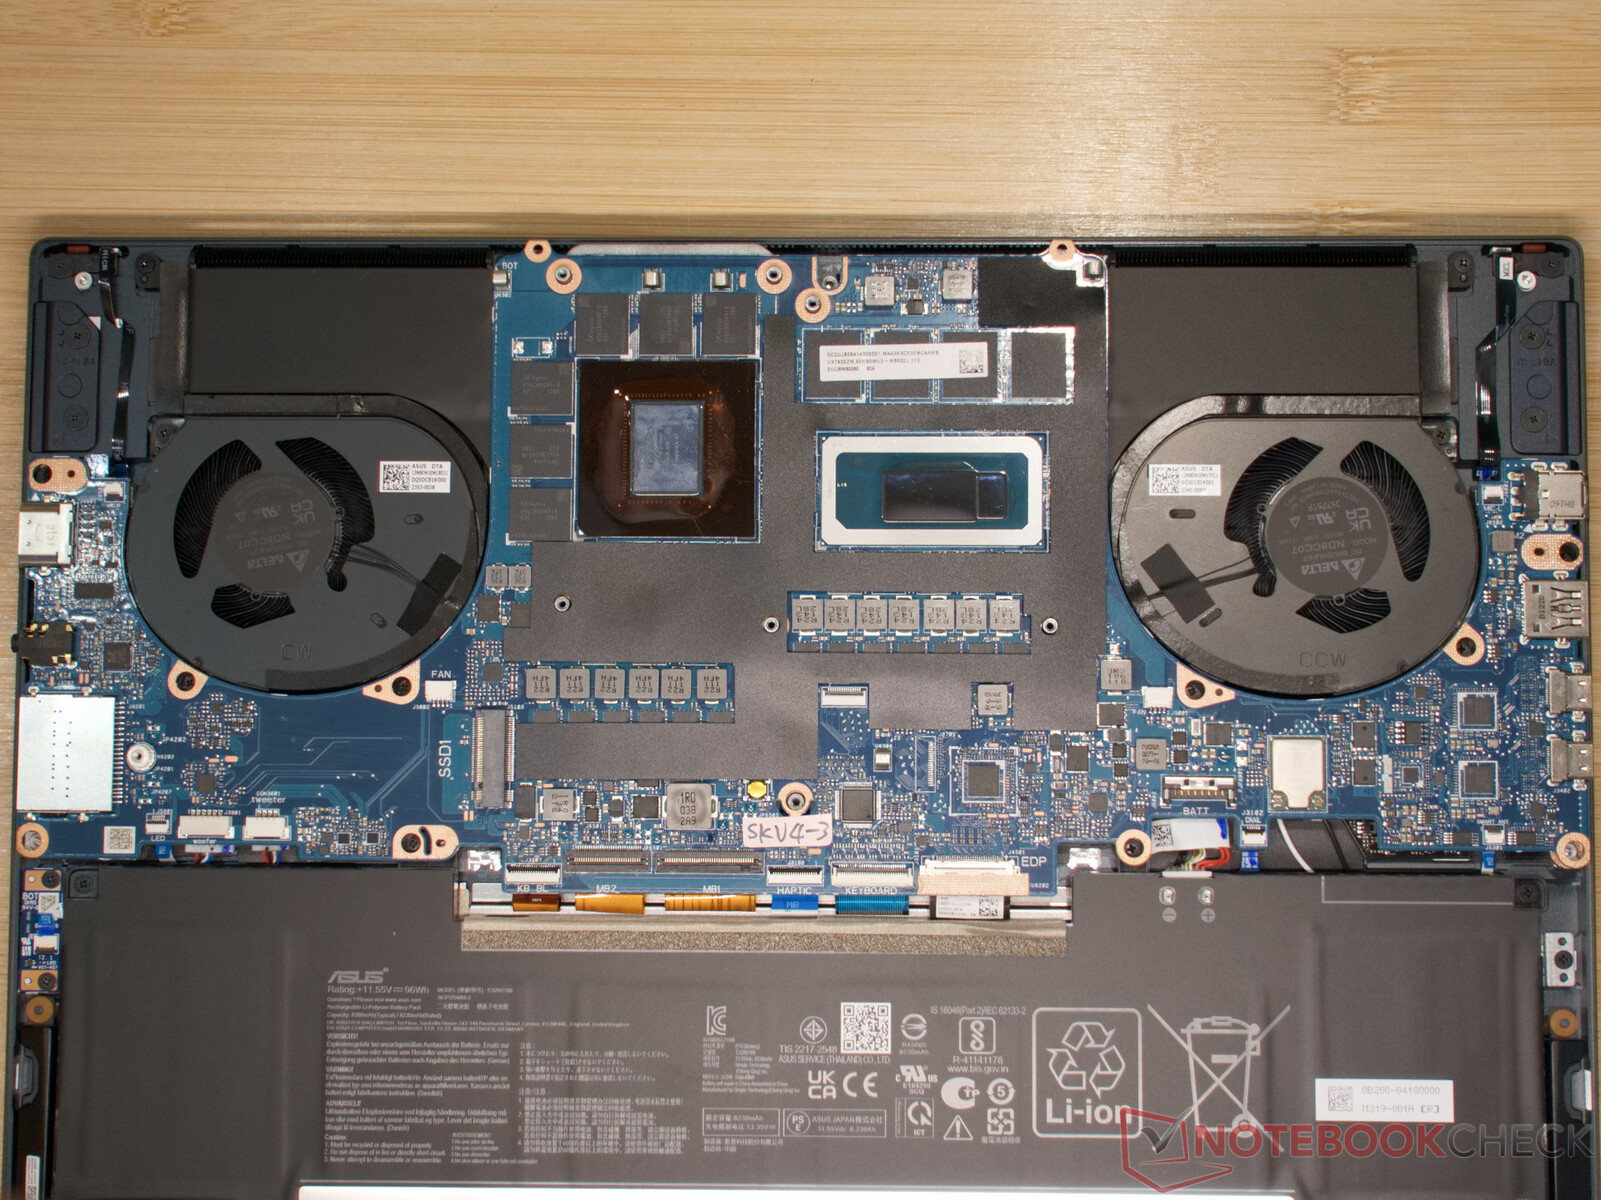
Mantenimiento
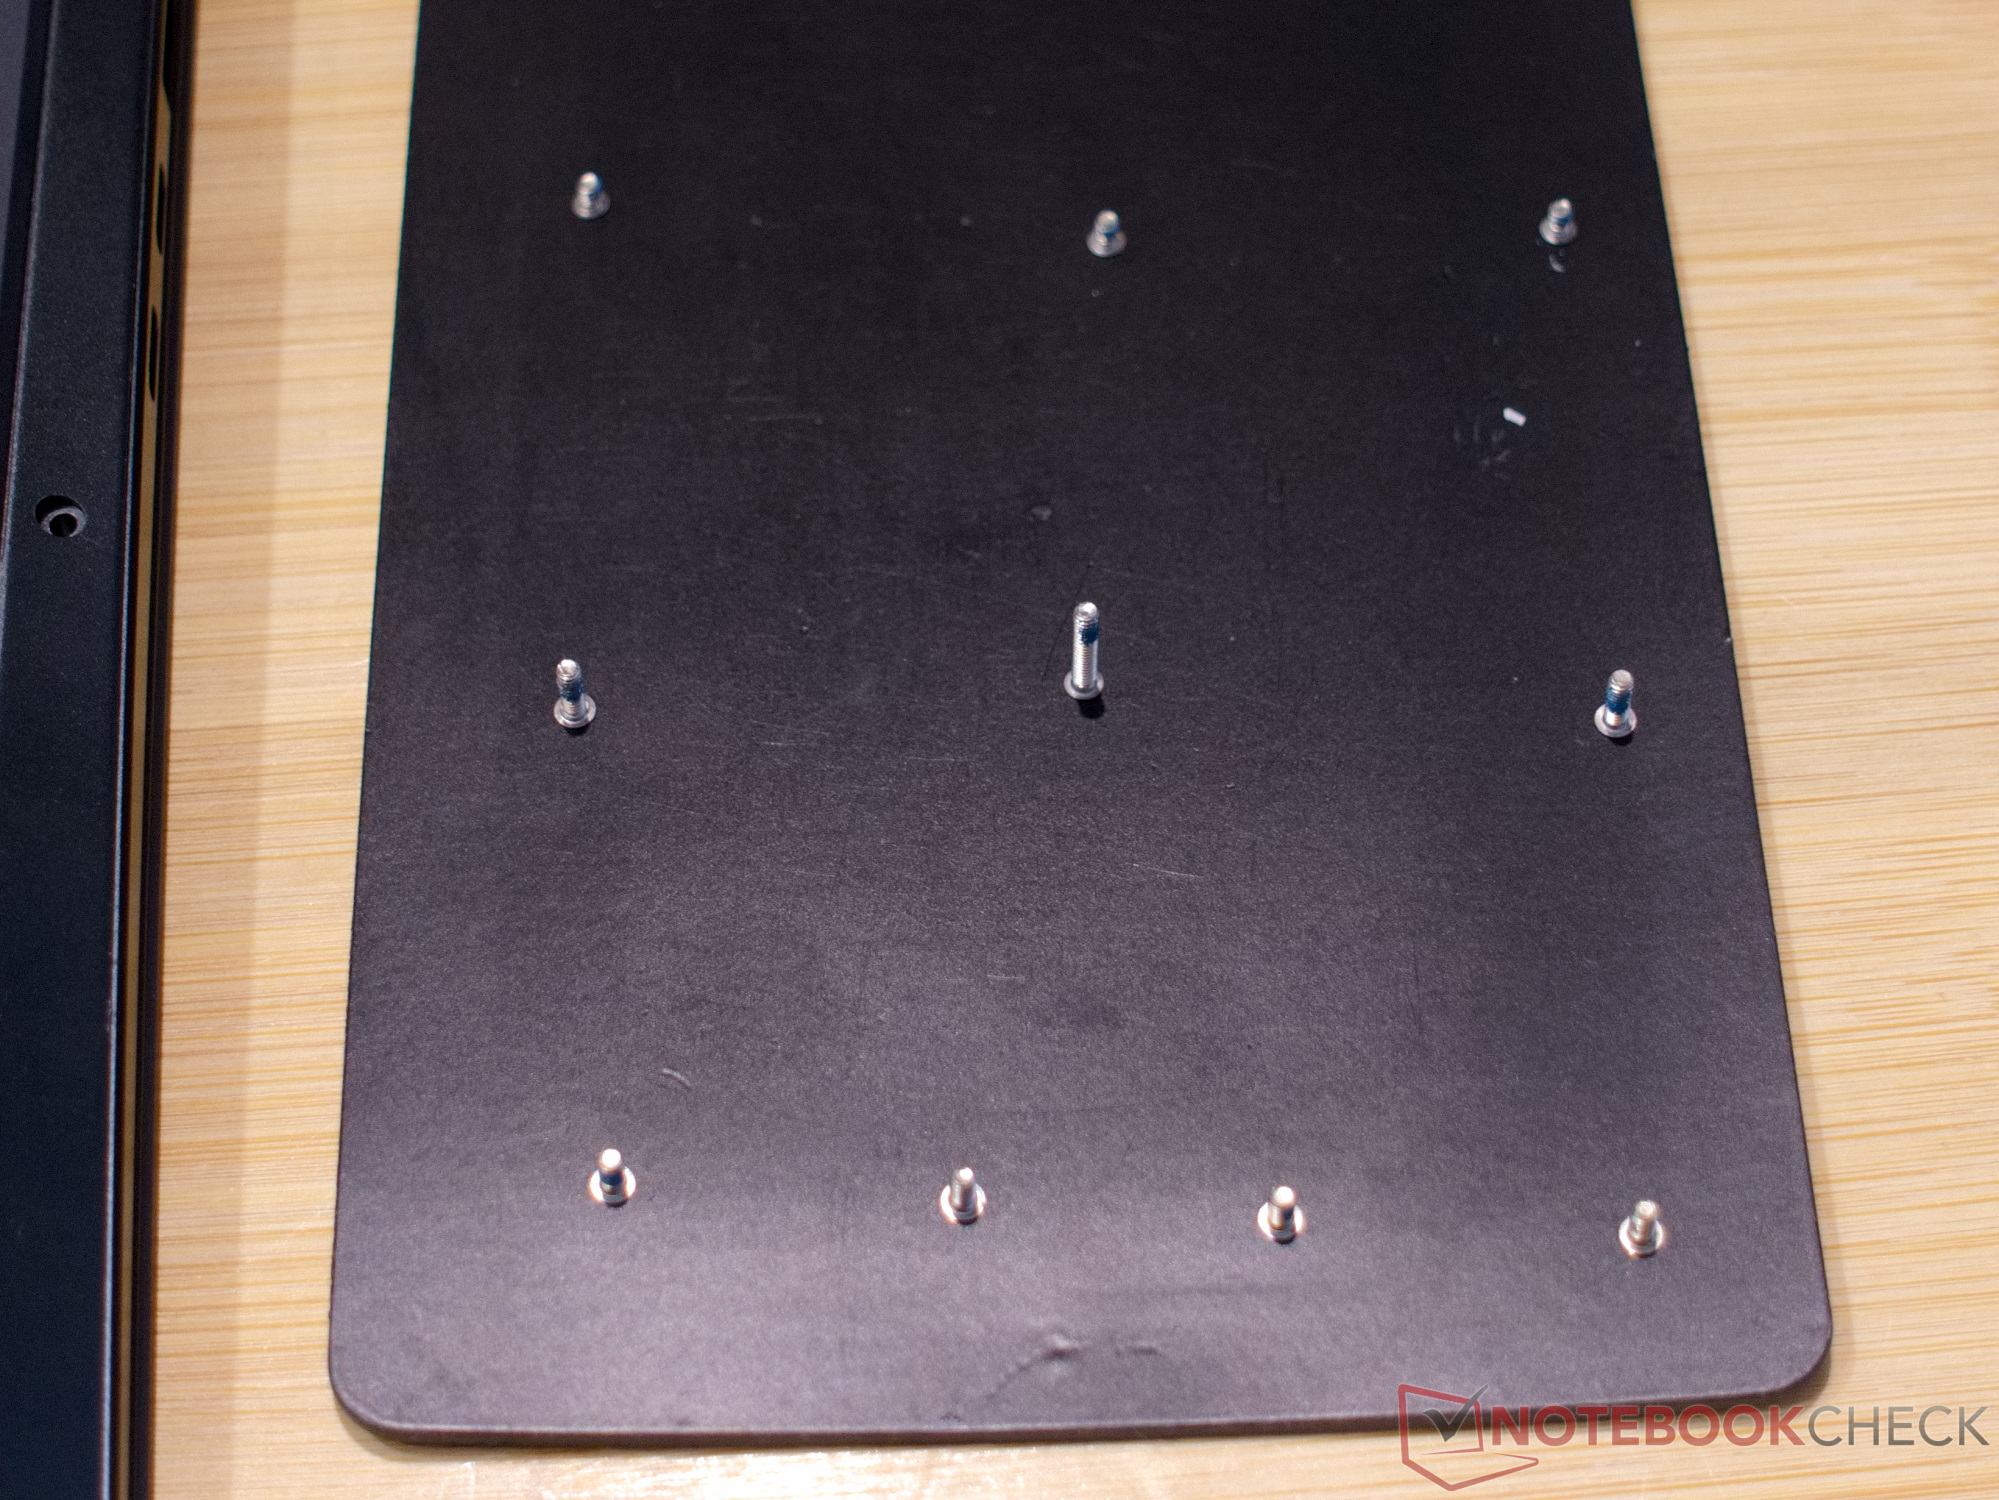
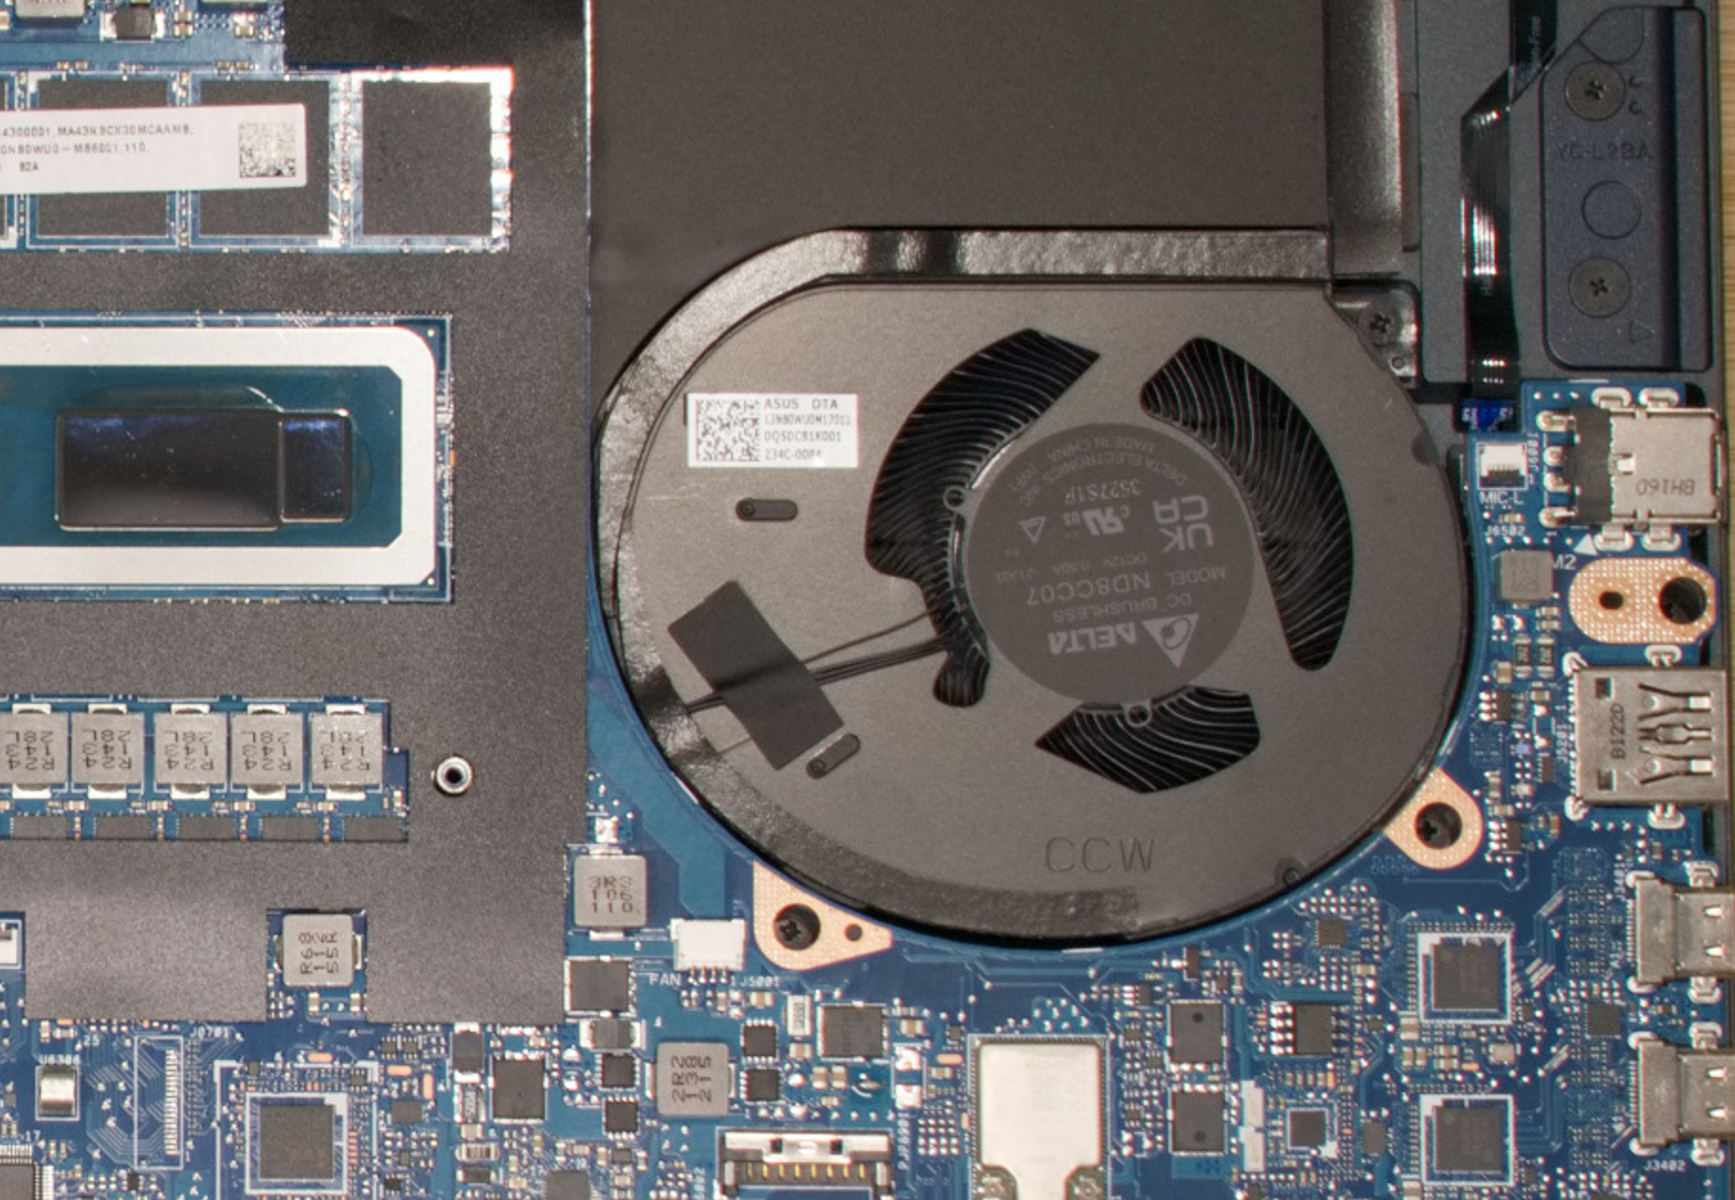
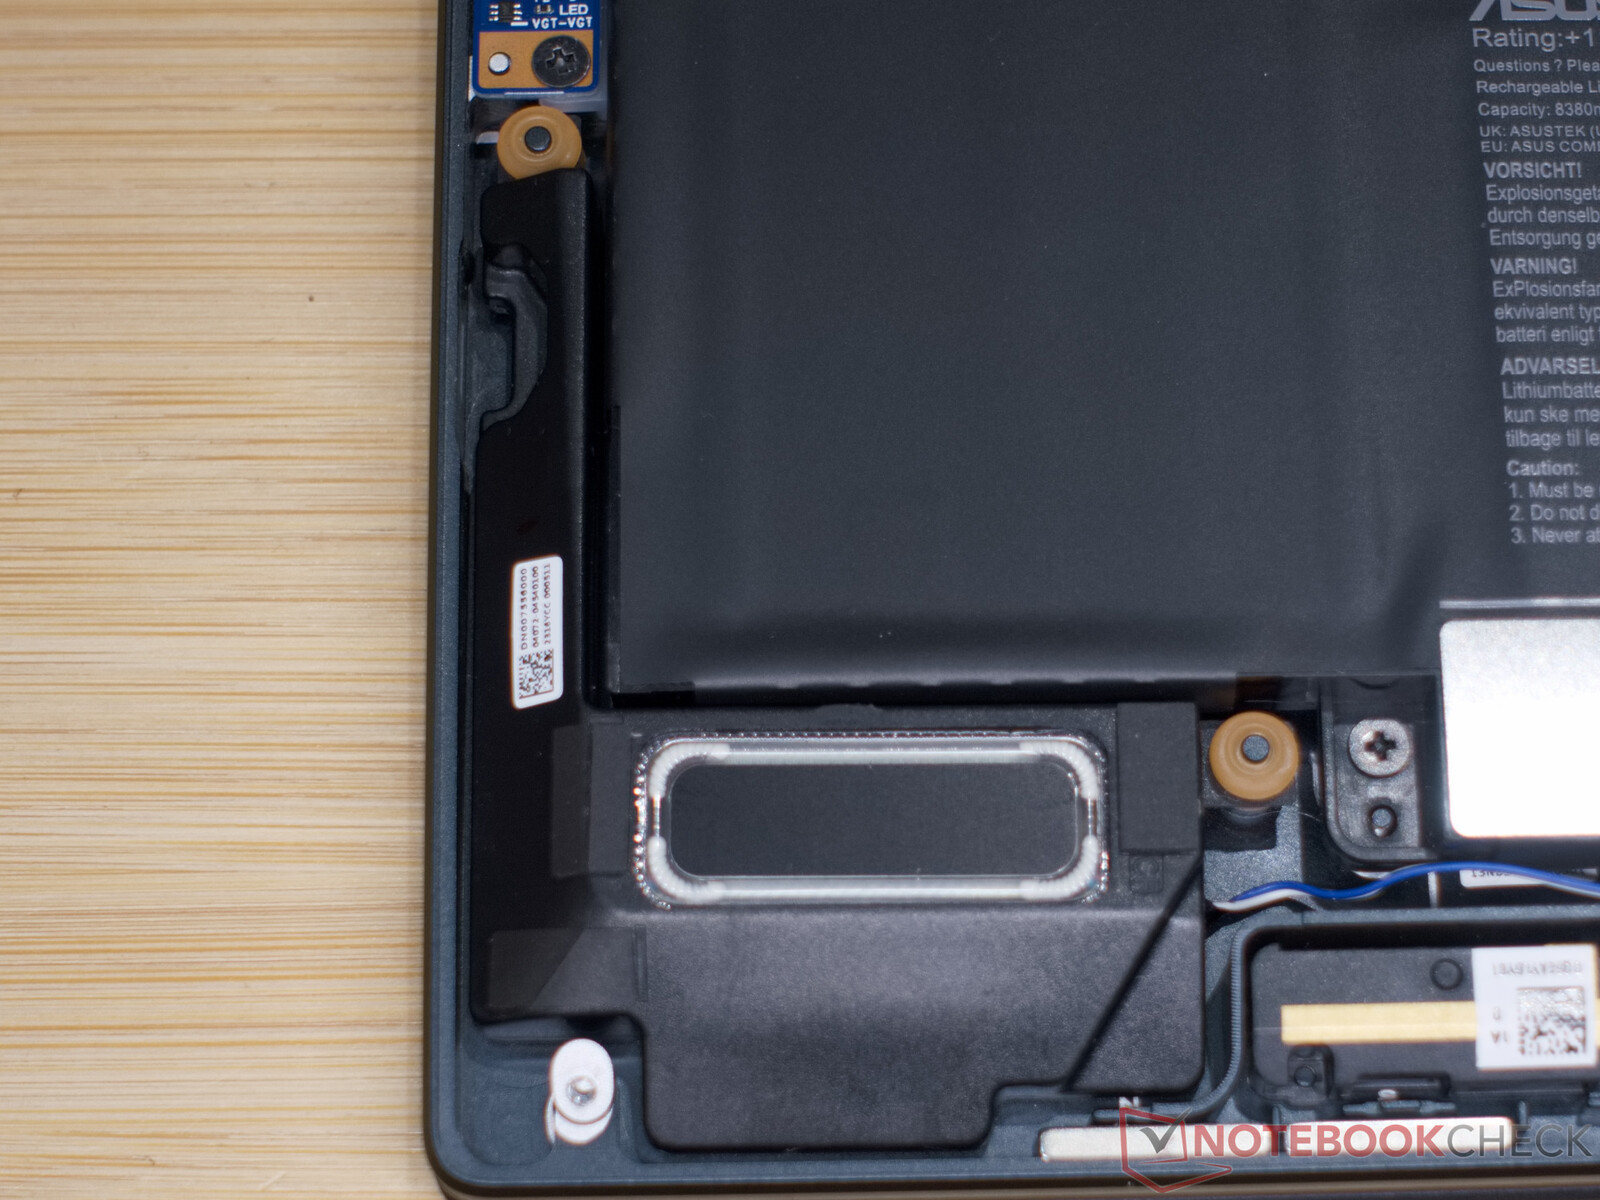
Diez tornillos de cuatro longitudes diferentes mantienen la placa base firmemente fijada en su lugar. Por ello, los propietarios deben fijarse en la ubicación de cada tornillo al desatornillarlos. Por lo demás, no se requiere mucho esfuerzo para acceder al interior del portátil. No hay clips ni abrazaderas y la placa base puede retirarse fácilmente sin los tornillos.
En el interior, hay una unidad SSD reemplazable, mientras que la RAM y el módulo WLAN están soldados. Por lo tanto, el Zenbook no es realmente fácil de usar en términos de reparación o mantenimiento.
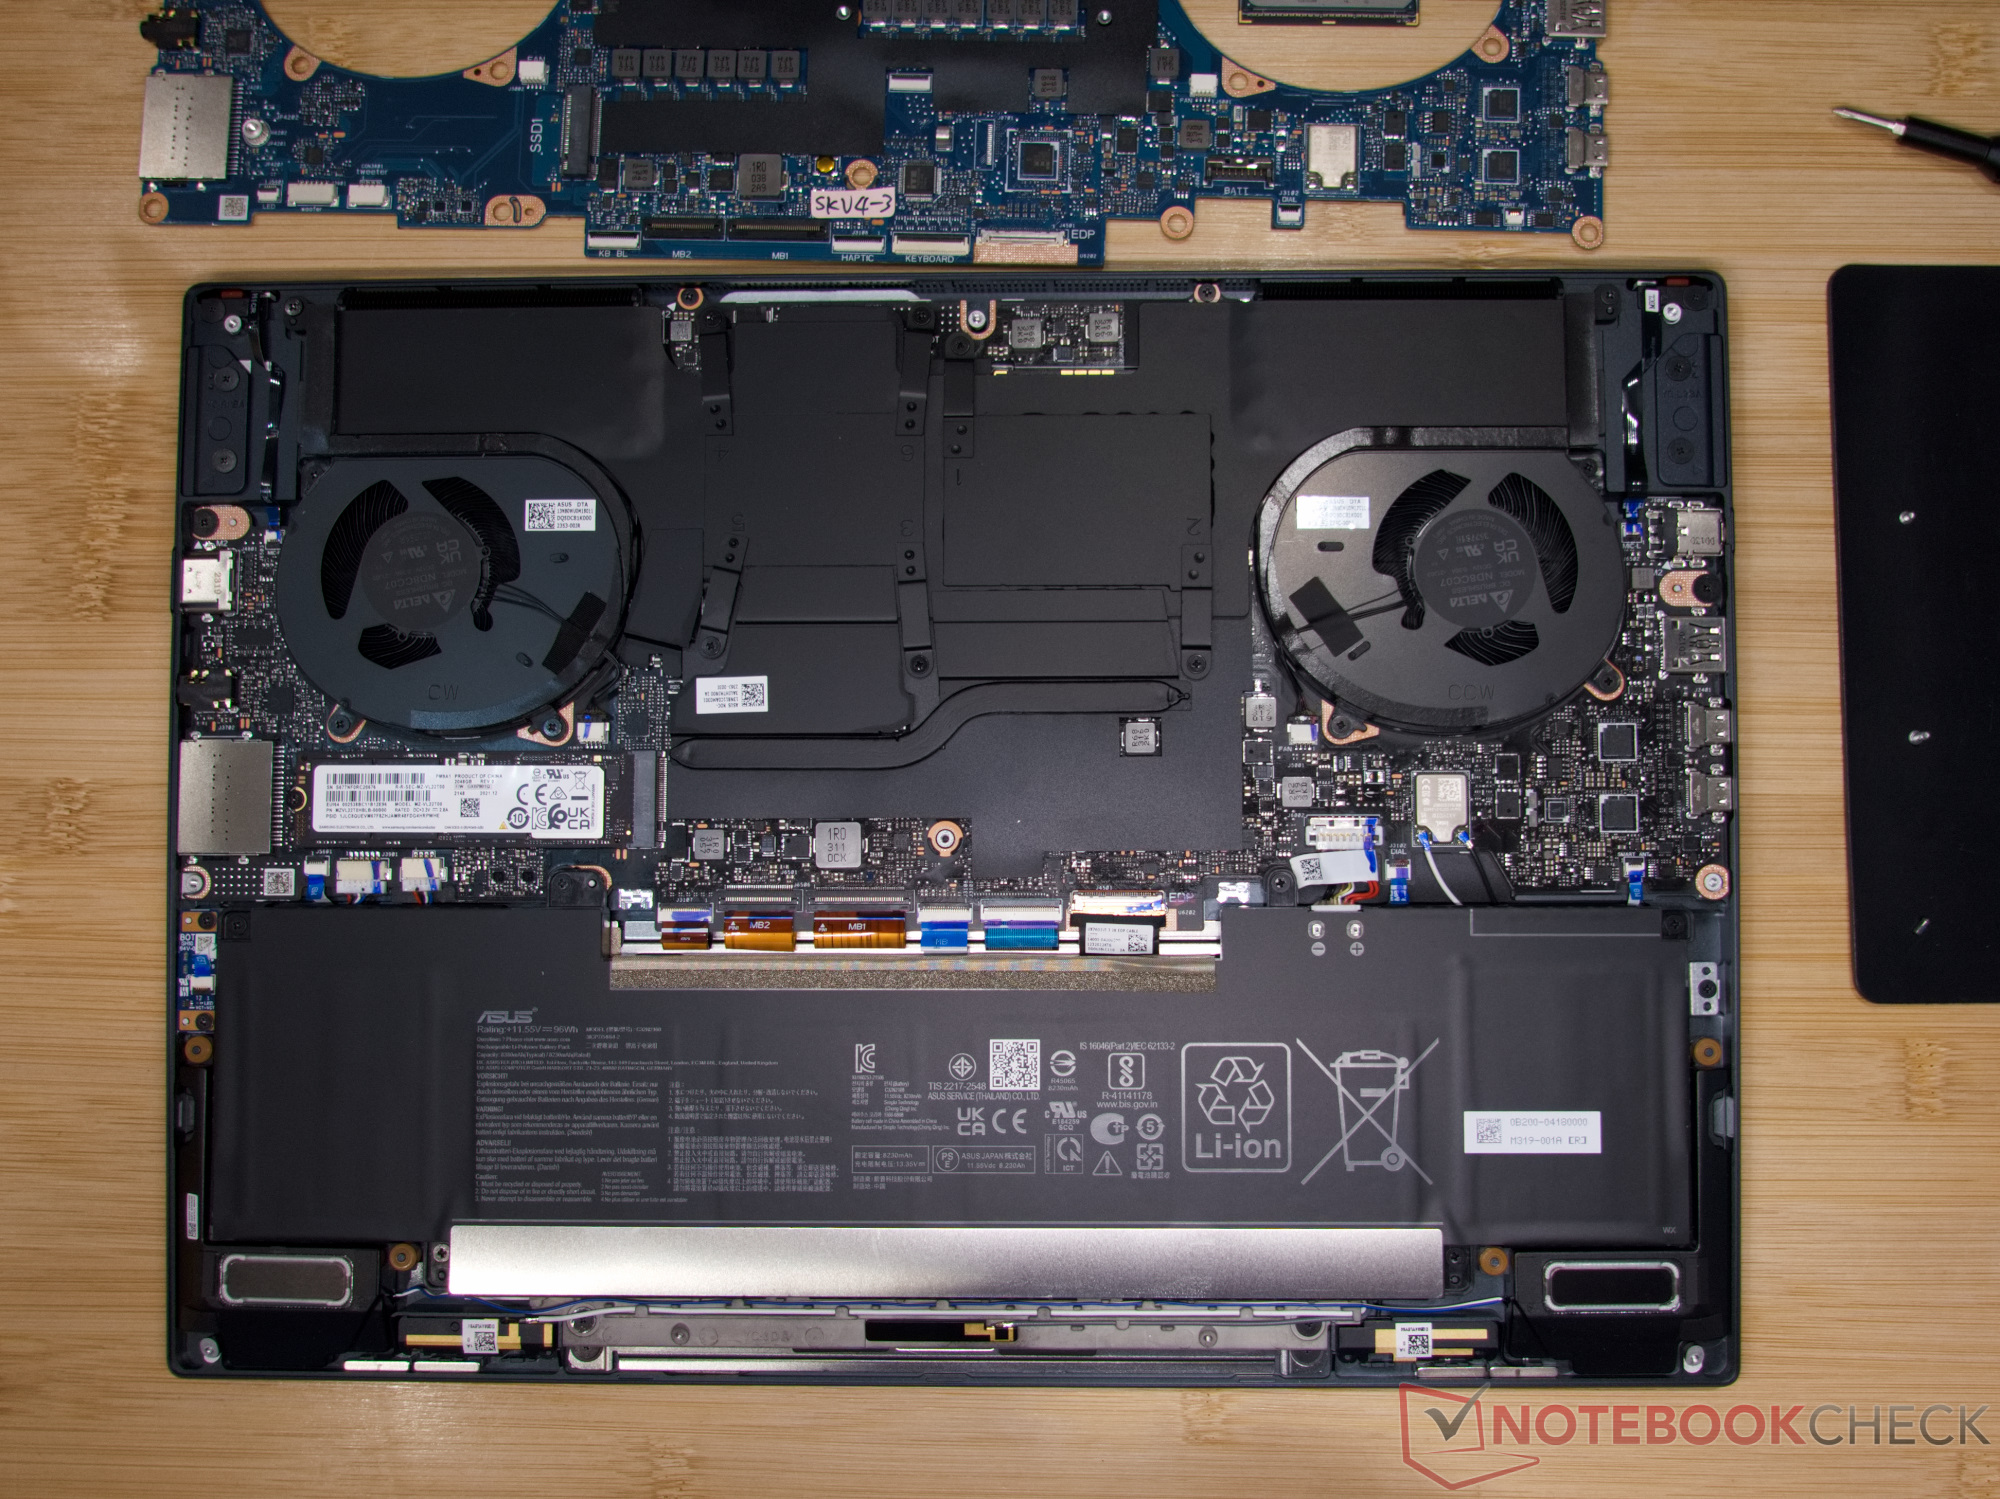
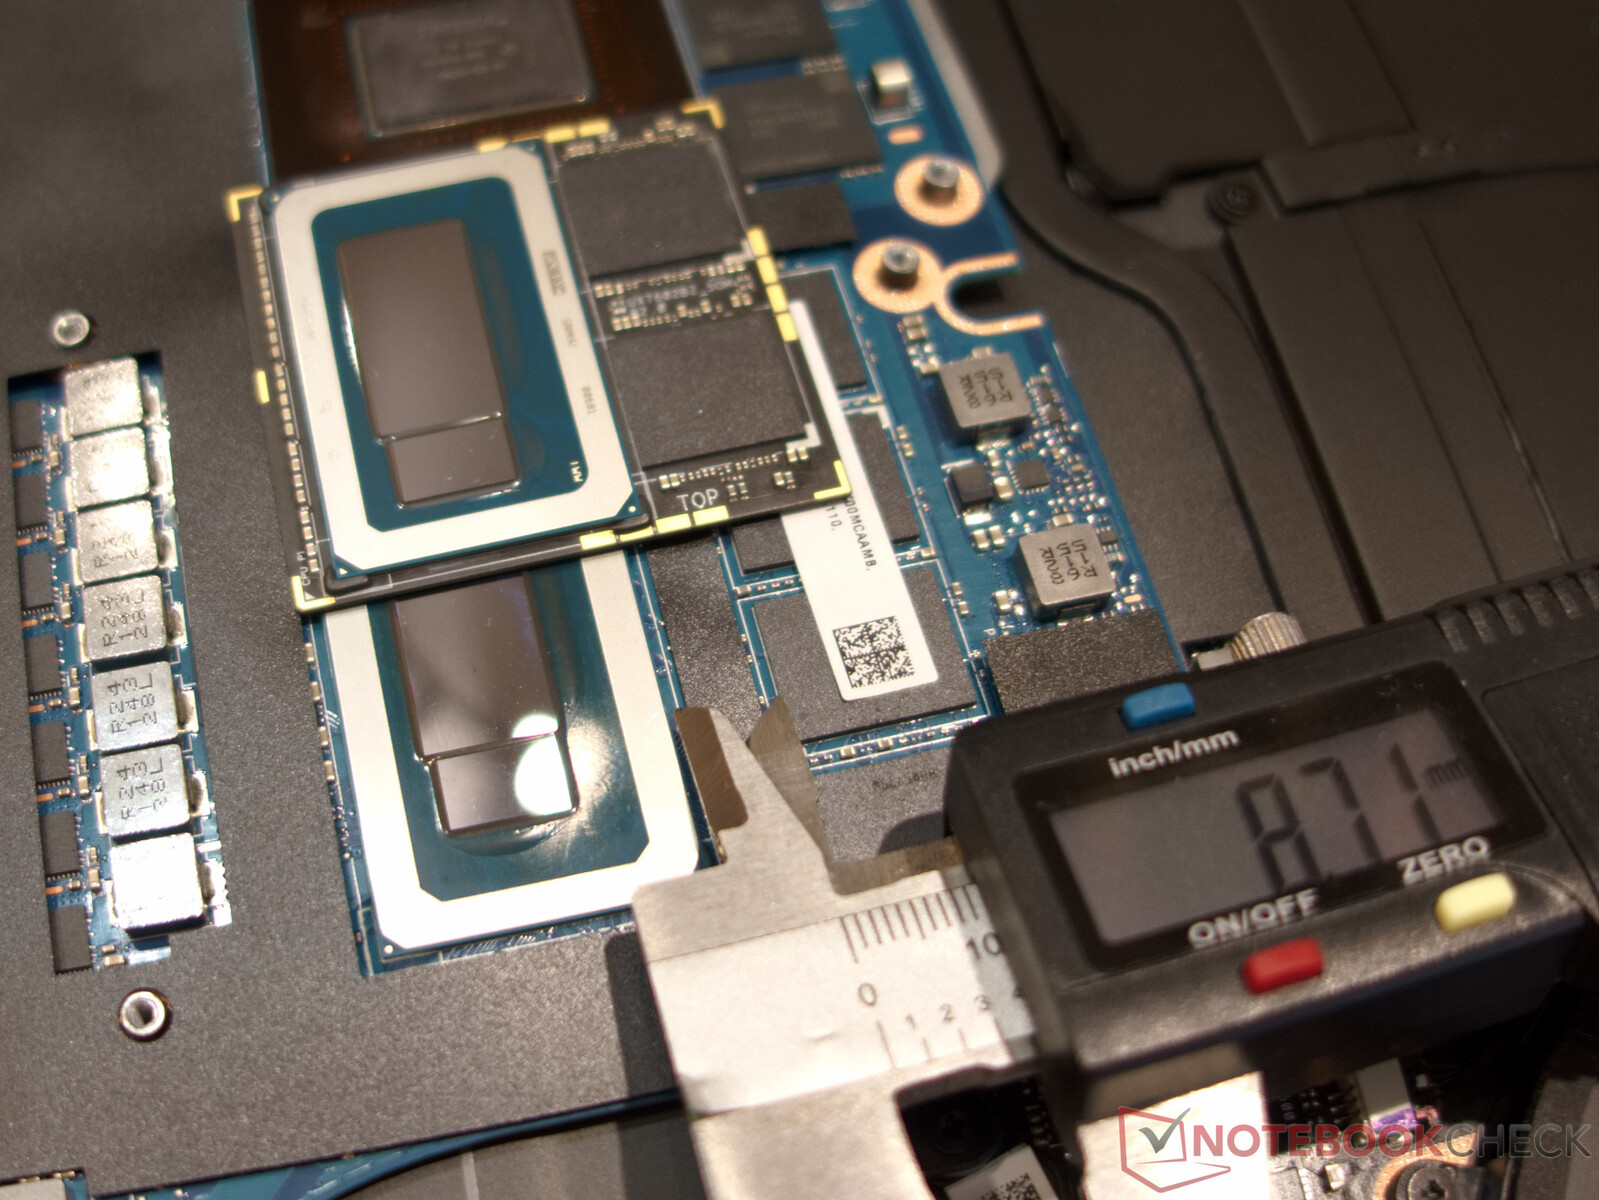
Para comparar el antiguo y el nuevo Zenbook Pro 16X, Asus nos envió una placa base del predecesor y un módulo de procesador en diseño SoM con RAM LPDDR5X integrada. Por tanto, podemos ver que en el nuevo Zenbook Pro 16X la distancia entre la RAM y la CPU se ha reducido en 8 mm enteros. La menor superficie ocupada por los componentes también debería mejorar algo el rendimiento de la refrigeración. En última instancia, sin embargo, podemos decir que la antigua placa también habría encajado en el nuevo Zenbook.
Garantía
Asus ofrece una garantía de 24 meses para las compras en Europa, que por supuesto puede diferir en otras regiones, por lo que se recomienda a los compradores que lo comprueben antes de adquirirlo.
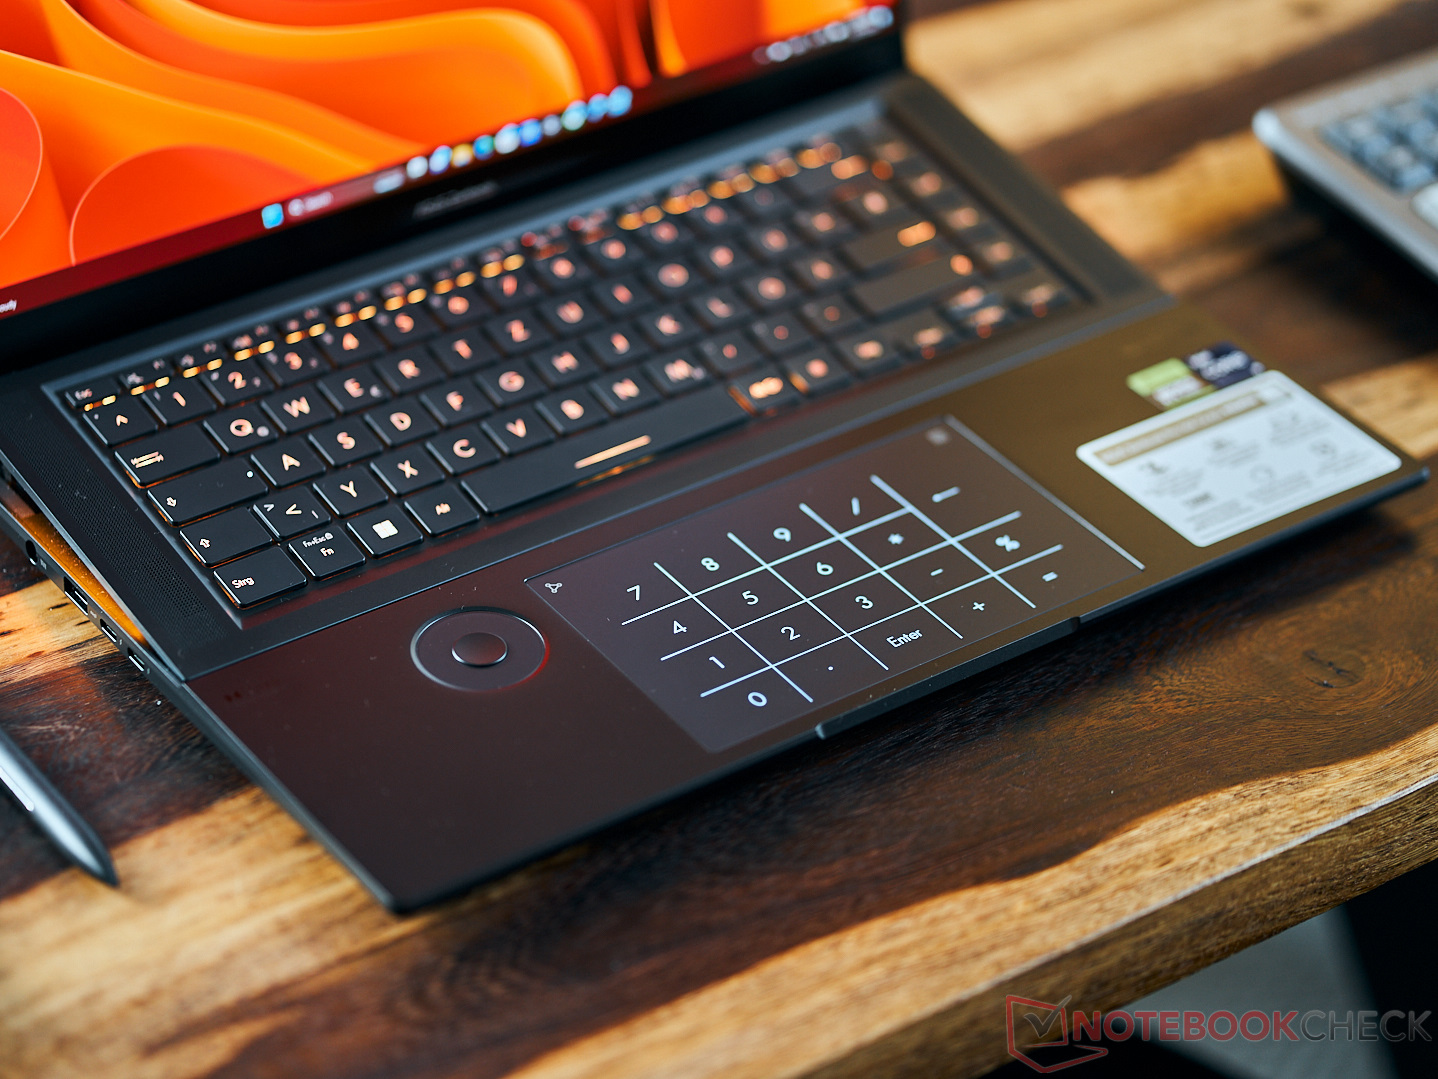
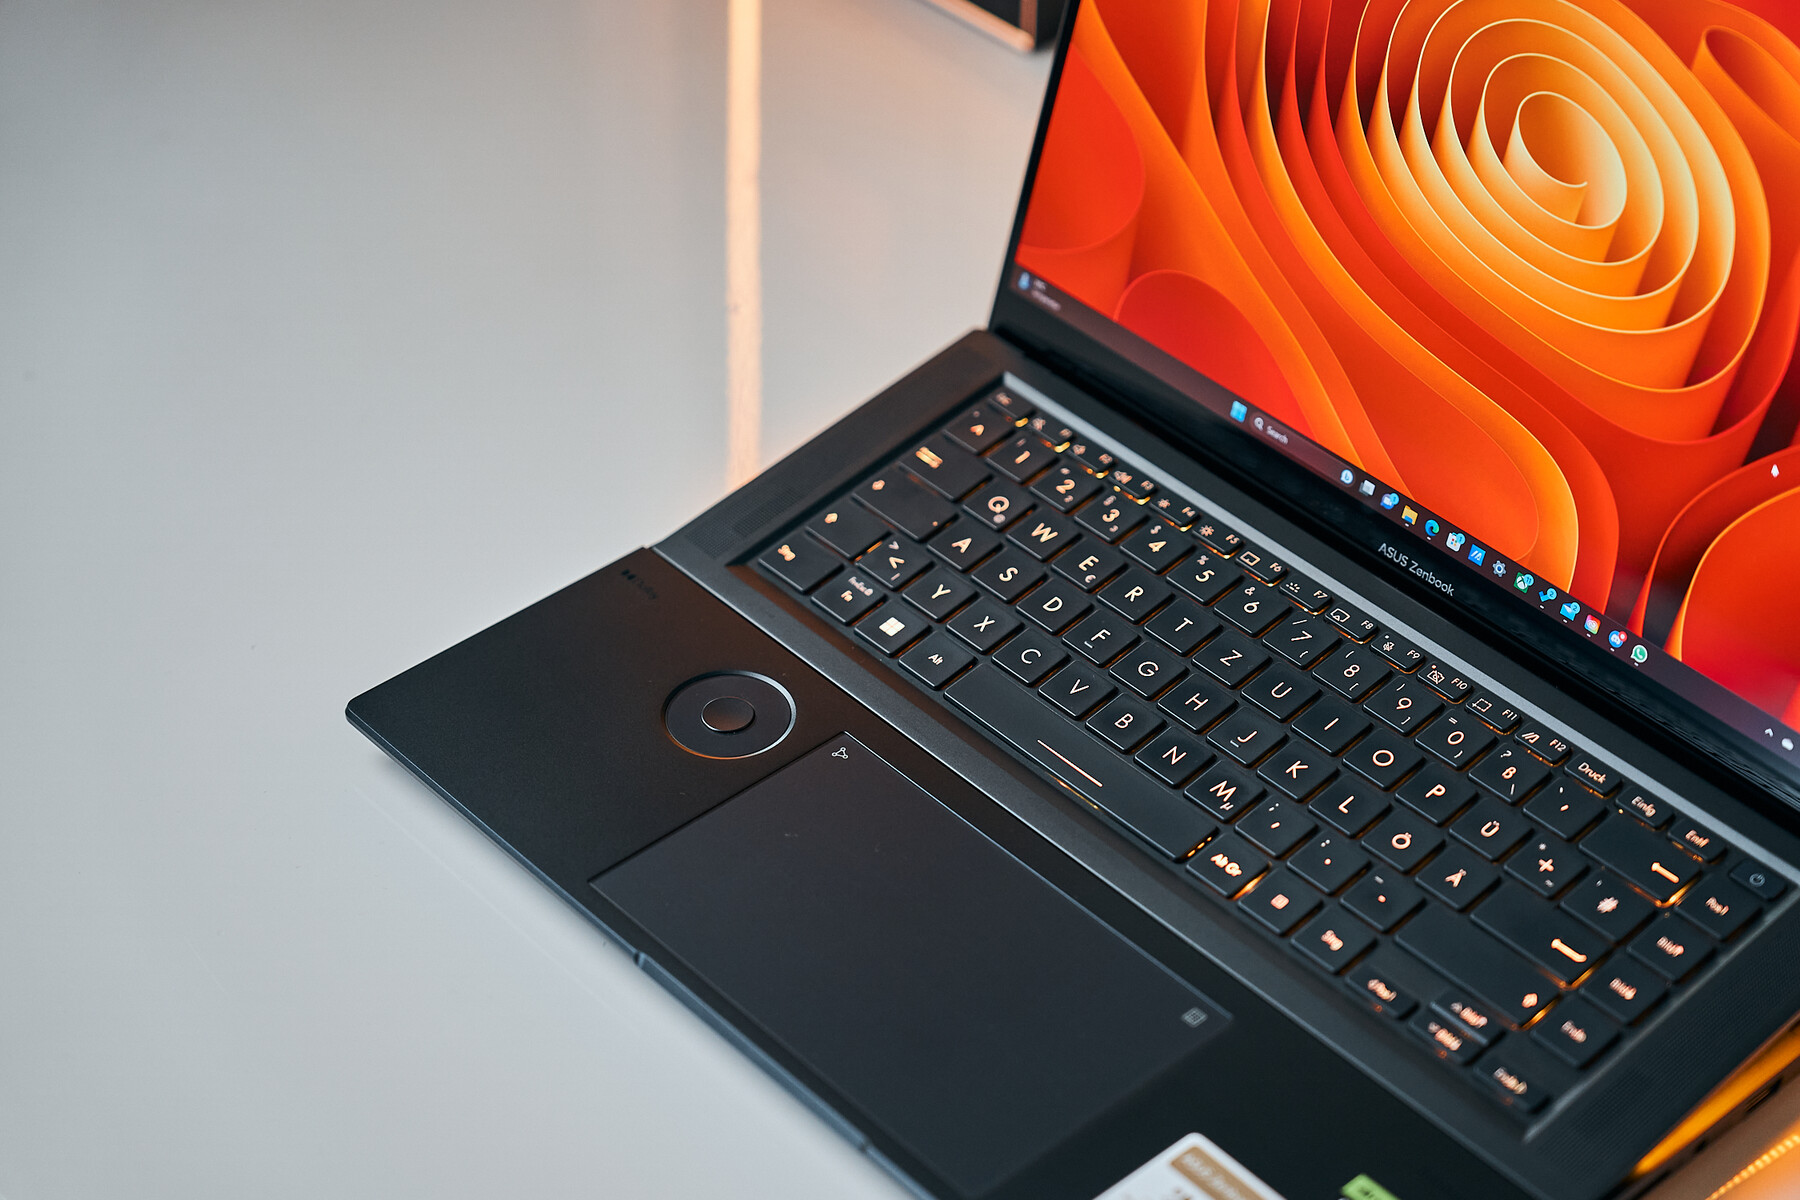
Dispositivos de entrada - Asus pone todo lo que puede en el Zenbook
Como mucho, el Zenbook sigue careciendo de entrada mediante control por gestos. Aparte de eso, la selección de métodos de entrada en nuestro dispositivo de prueba es amplia, y consiste en el teclado, el touchpad, la pantalla táctil, Asus Dial y Asus Pen 2.0. Todos los dispositivos de entrada funcionan sin problemas, pero seguimos encontrando que a veces se estorban unos a otros.
Teclado
Con una caída de alrededor de 1,7 mm, el teclado chiclet del Zenbook ofrece un recorrido de teclas agradable y una respuesta háptica suficiente. En particular, el ángulo ligeramente elevado del teclado hace del Zenbook un dispositivo agradable para escribir textos largos. Los jugadores también deberían disfrutar del teclado: además de las ventajas mencionadas, ofrece iluminación RGB de las teclas individuales y N-key rollover
Panel táctil
El touchpad del Zenbook sigue sin tener teclas o botones físicos. El agradable "clic" lo genera un motor háptico configurable. A pesar de ello, o quizás precisamente por ello, es fácil trabajar con el preciso clickpad. Los dedos se deslizan fácilmente sobre la superficie de cristal mate, pero las huellas dactilares se hacen visibles rápidamente. Si lo desea, el usuario también puede disponer aquí de un teclado numérico. Sin embargo, esto sólo funciona correctamente si se ha activado la distribución de teclado estadounidense en Windows.

Opciones de entrada adicionales
El Asus Pen 2.0 está incluido y el lápiz óptico MPPT 2.0 de Asus funciona a la perfección en la pantalla táctil del Zenbook. El lápiz tiene una batería integrada que se puede cargar a través de un cable USB-C. Reconoce con precisión hasta diez dedos en la pantalla táctil. El Asus Dial también ofrece numerosas funciones. Sin embargo, como ocurría con el predecesor, los dispositivos de entrada individuales a menudo se estorban entre sí. Al teclear, se tiende a colocar la mano sobre el dial, lo que puede dar lugar a entradas incorrectas. Para trabajar en la pantalla con el Asus Pen, se recomienda a los usuarios que apoyen el brazo en el teclado, pero esto tampoco funciona sin problemas. En definitiva, la pantalla es en ocasiones demasiado tambaleante para un lápiz óptico.
Pantalla - Por fin una OLED de 120 Hz

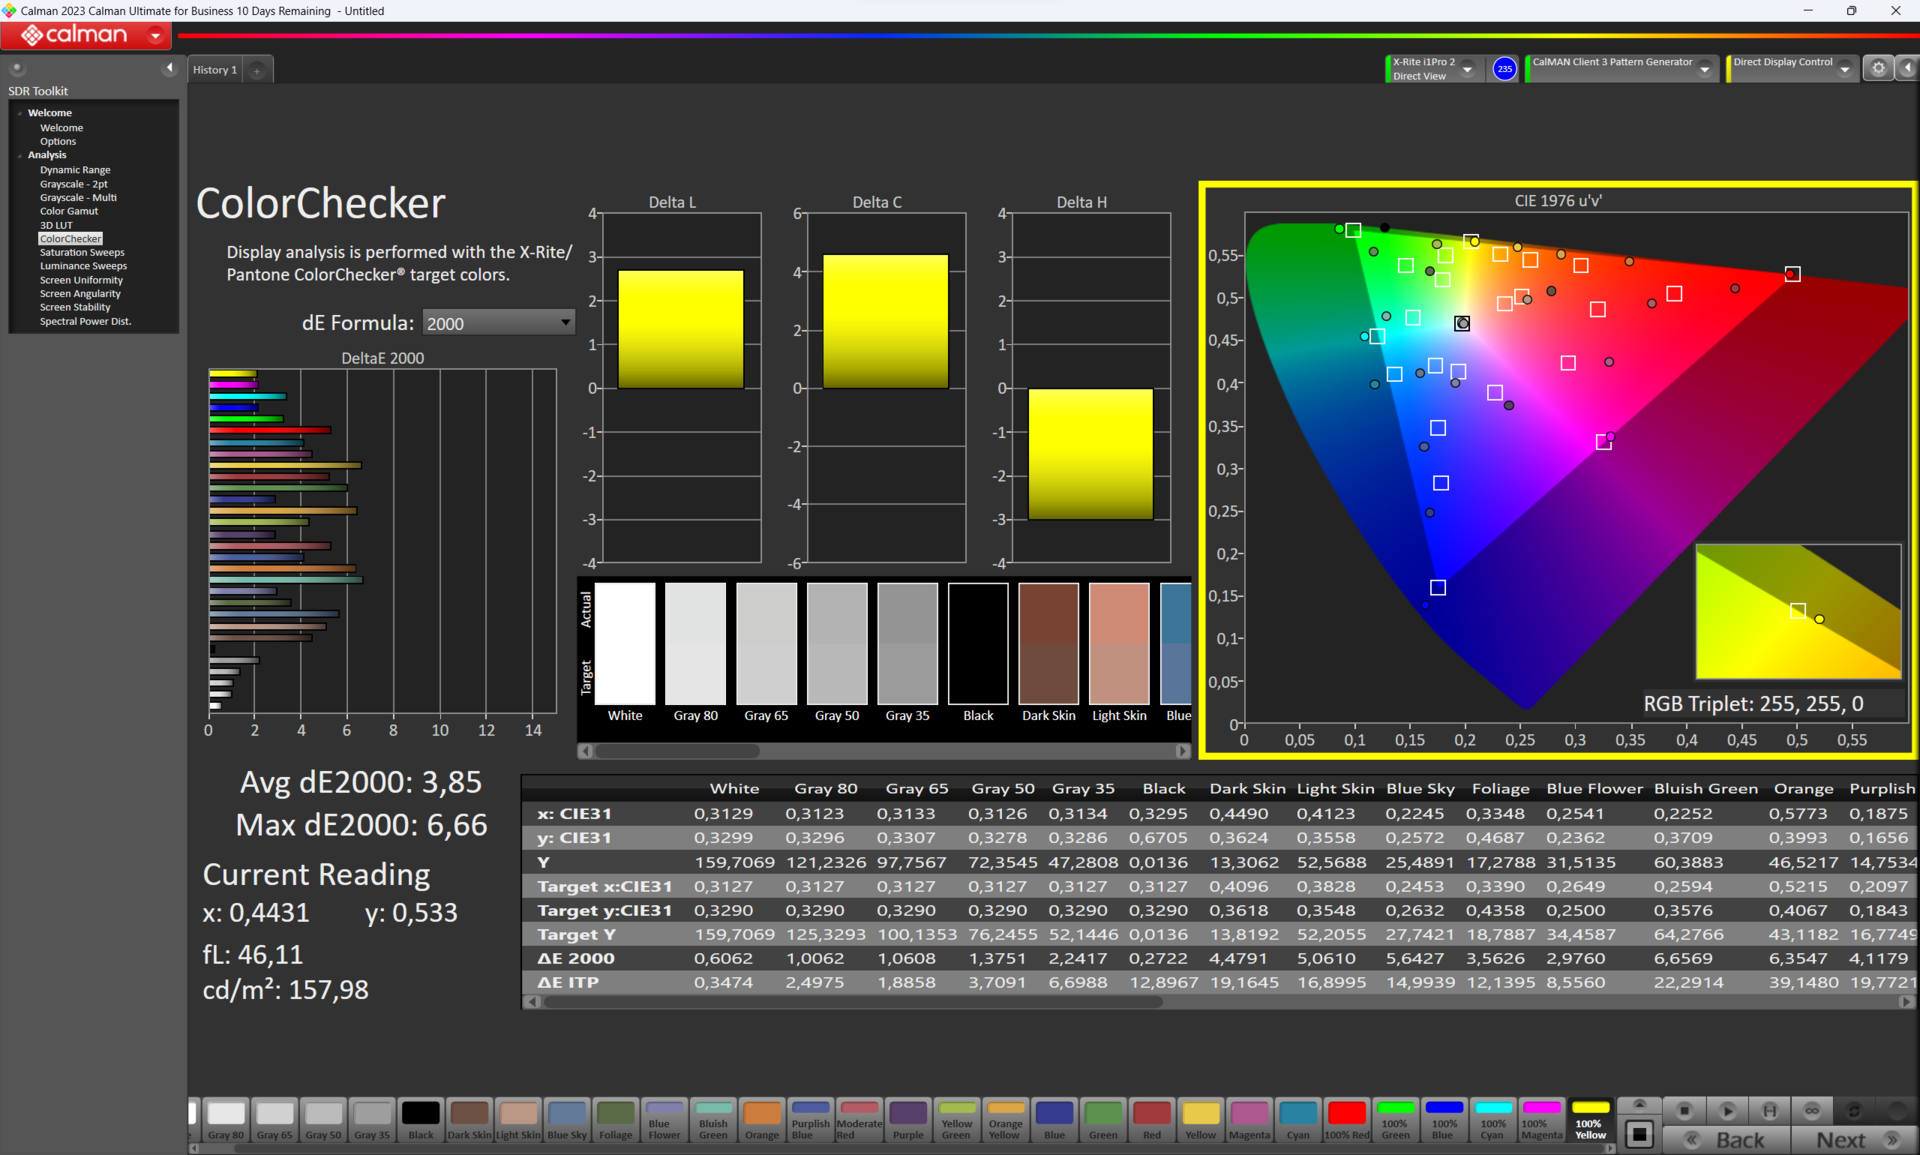
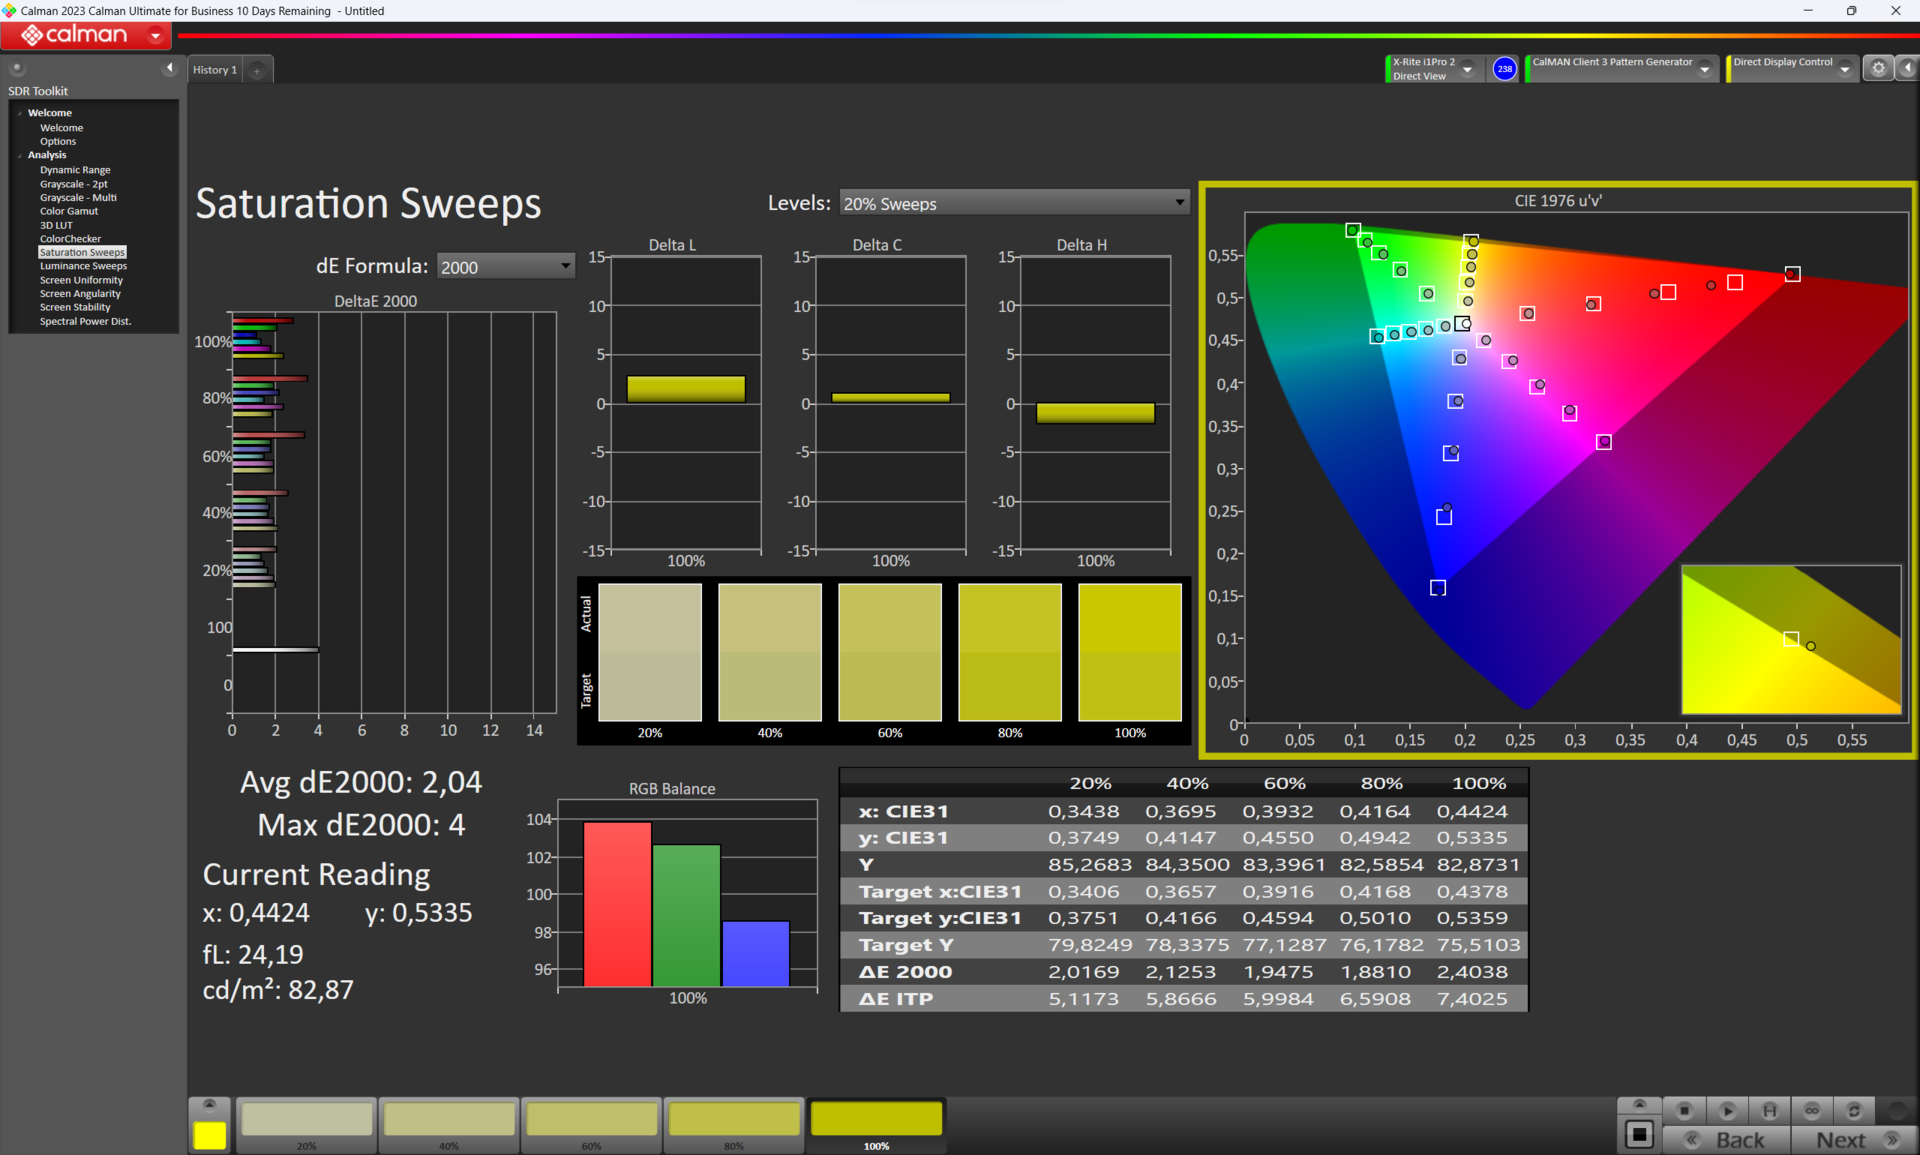
Al igual que el predecesor la pantalla del Zenbook actual cuenta con la certificación Pantone. Tiene un brillo de unos 350 cd/m² y una frecuencia de imagen de 120 Hz. Al estilo típico de Asus, hay varios ajustes opcionales para la pantalla en la aplicación MyAsus. Las pruebas de pantalla se realizaron primero en modo nativo y después en modo DisplayP3.
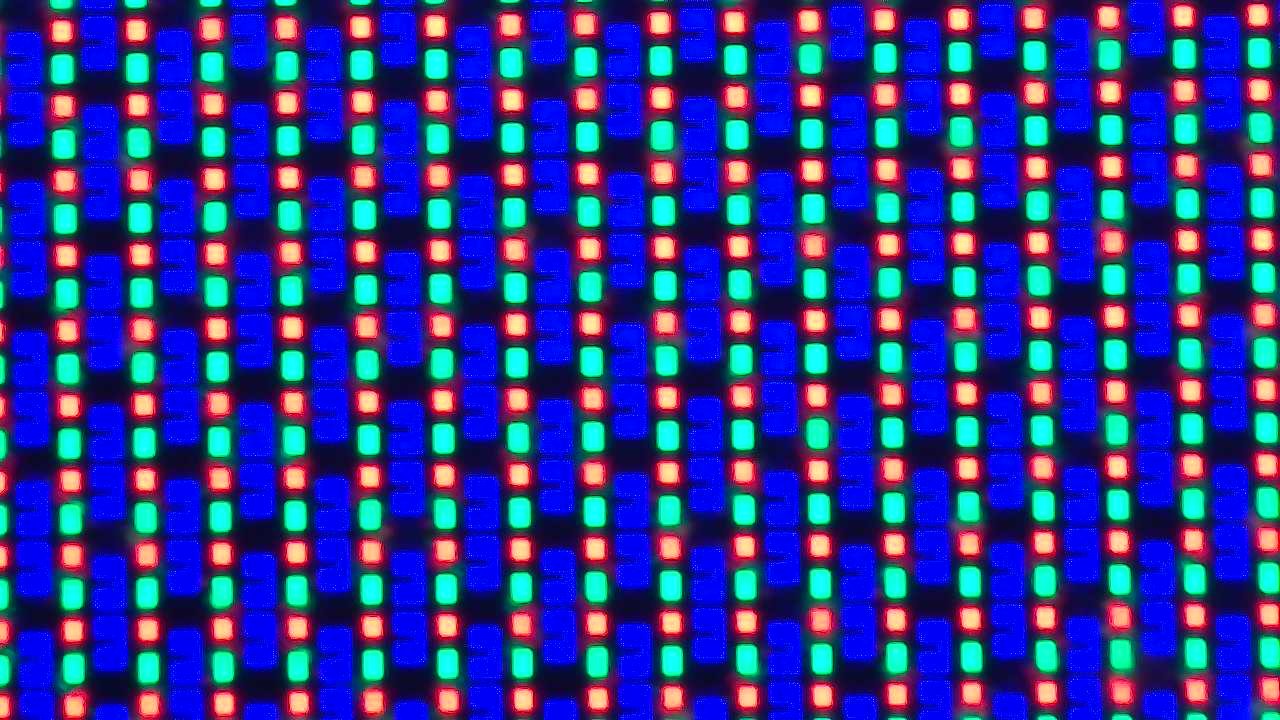
Por desgracia, el nuevo Zenbook ha heredado un aspecto negativo de su predecesor: en la matriz de subpíxeles, los subpíxeles azules están tan separados que las personas con una agudeza visual alta pueden distinguir los huecos.
| |||||||||||||||||||||||||
iluminación: 98 %
Brillo con batería: 329.66 cd/m²
Contraste: 4740:1 (Negro: 0.07 cd/m²)
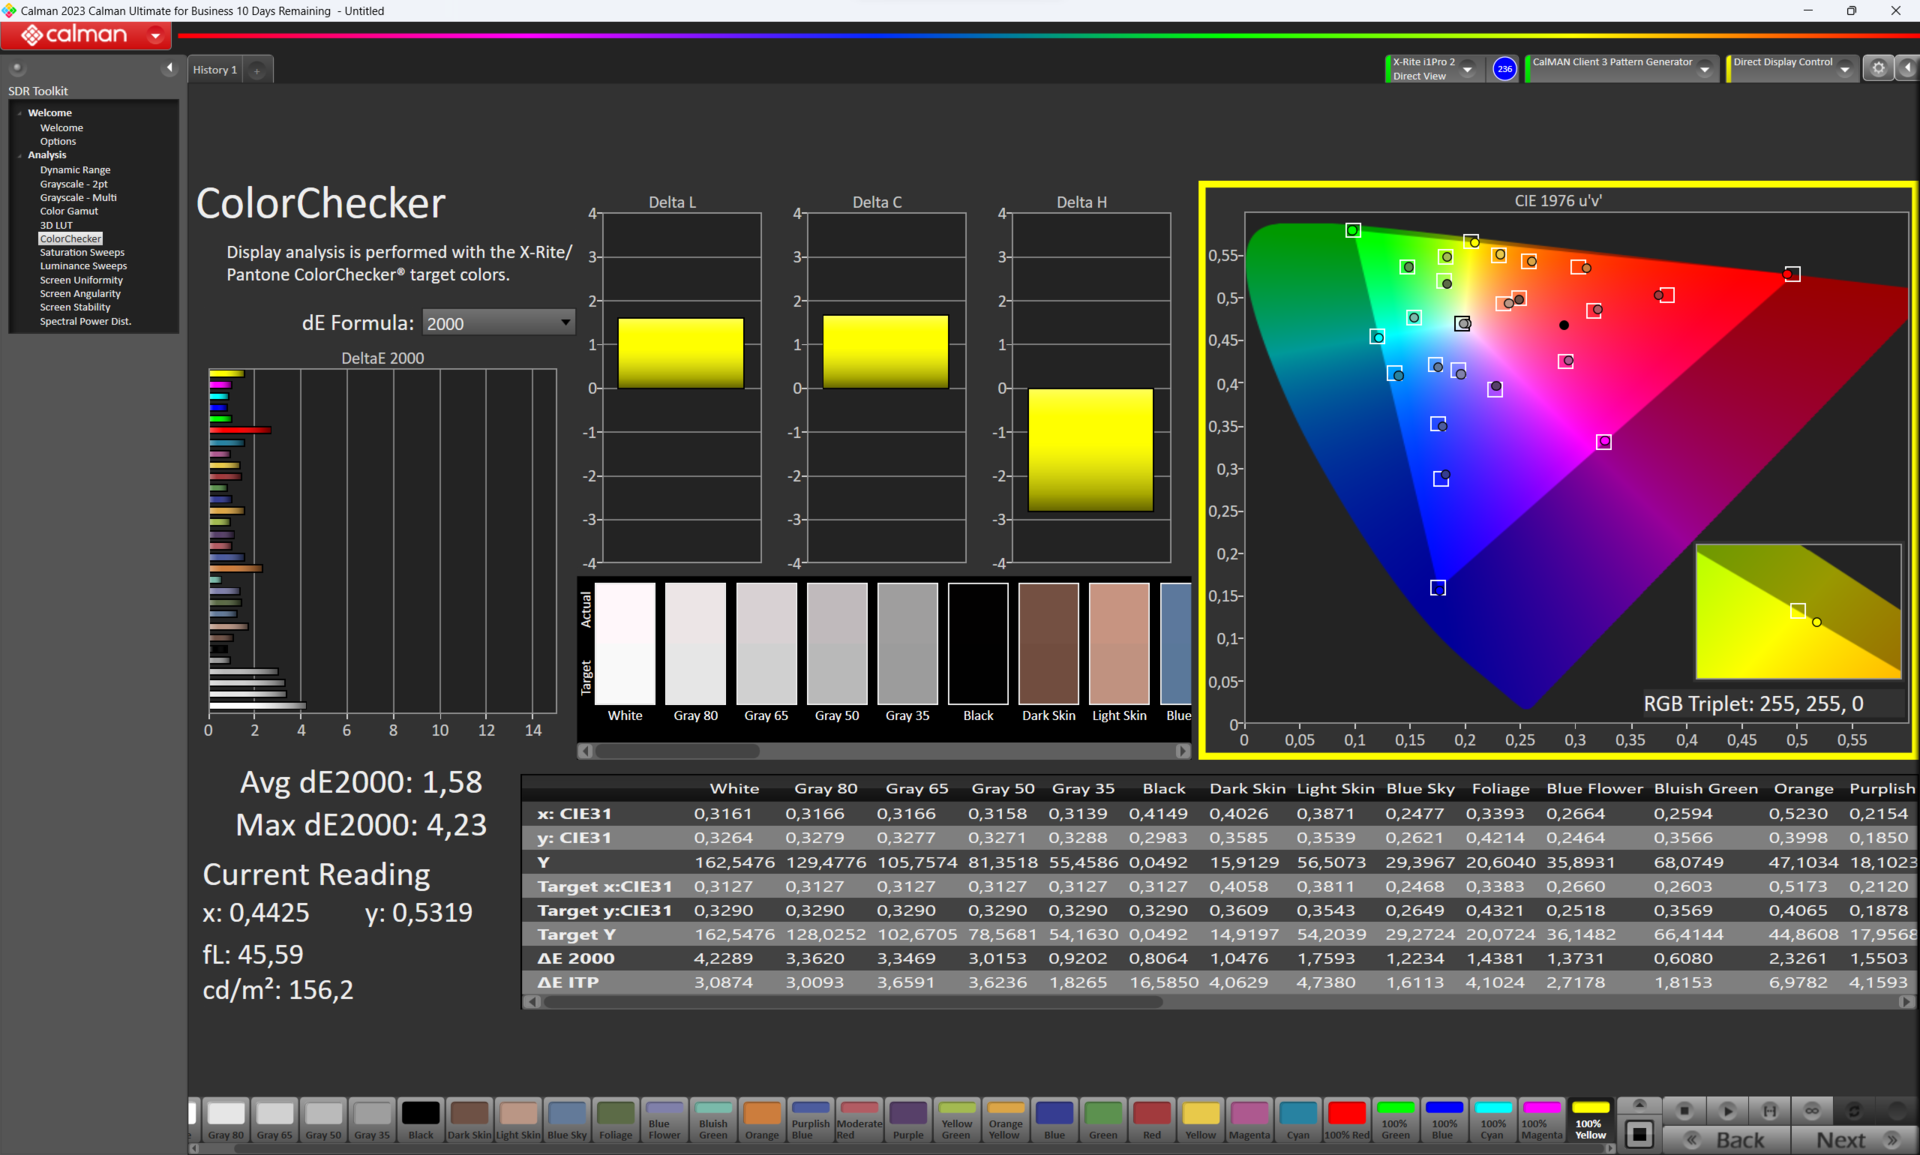
ΔE ColorChecker Calman: 1.58 | ∀{0.5-29.43 Ø4.73}
calibrated: 6.66
ΔE Greyscale Calman: 4.25 | ∀{0.09-98 Ø4.97}
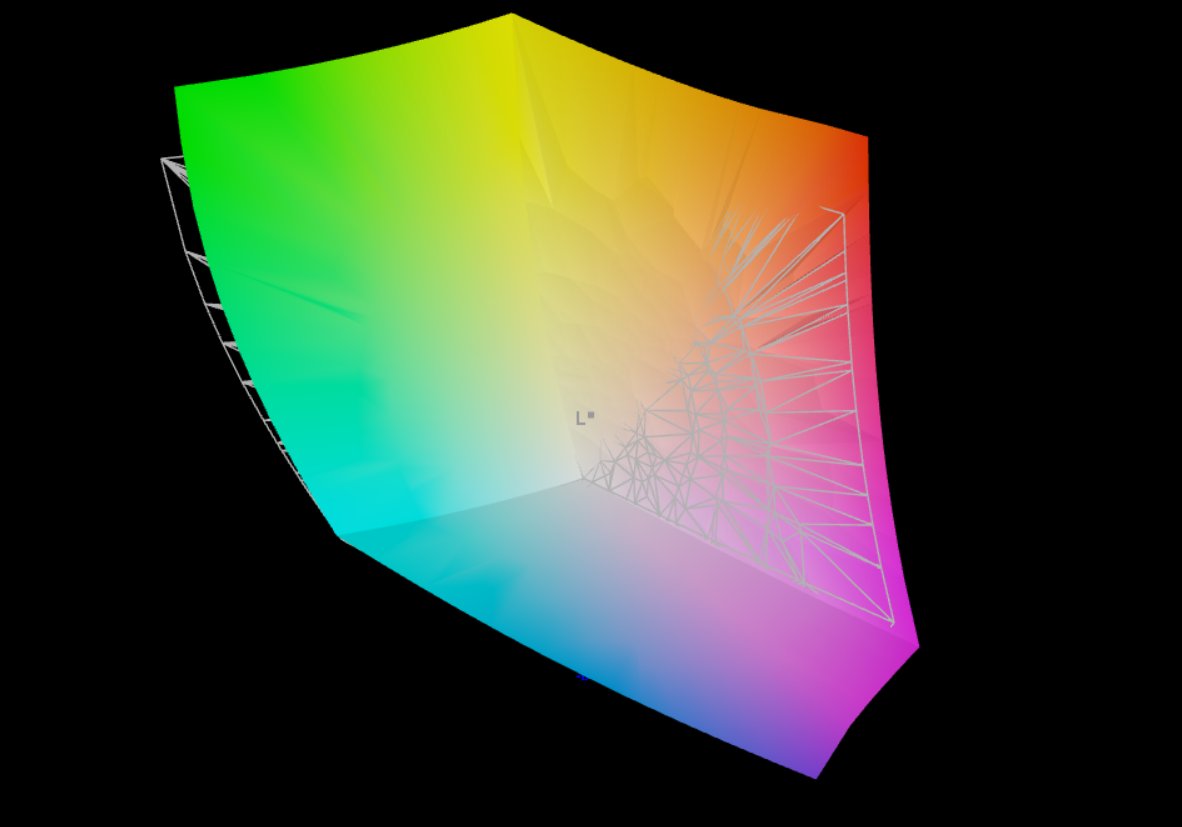
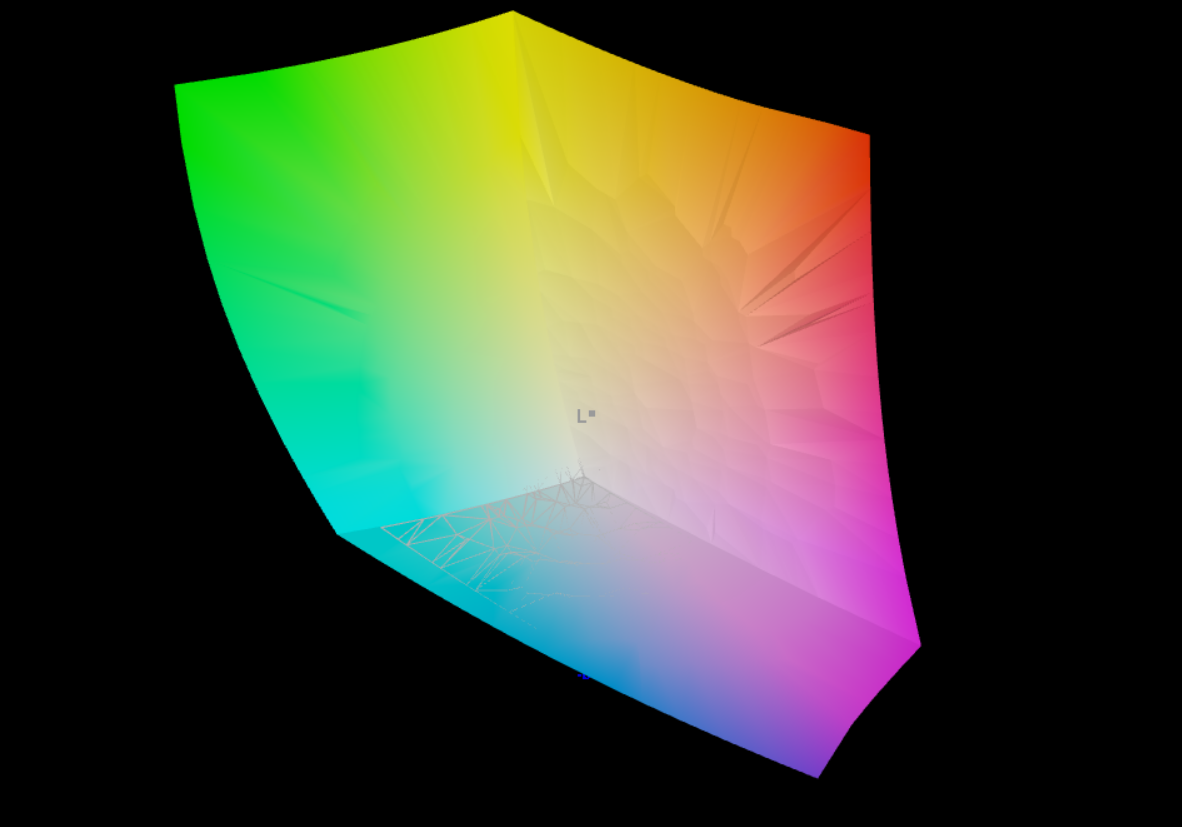
97.48% AdobeRGB 1998 (Argyll 3D)
100% sRGB (Argyll 3D)
99.93% Display P3 (Argyll 3D)
Gamma: 2.206
CCT: 6249 K
| Asus Zenbook Pro 16X UX7602BZ-MY005W ATNA60BX01-1, OLED, 3200x2000, 16" | Asus ZenBook Pro 16X OLED UX7602ZM-ME115W Samsung SDC415D, OLED, 3840x2400, 16" | Asus ROG Strix G16 G614JZ TL160ADMP03-0, IPS, 2560x1600, 16" | Asus ROG Zephyrus M16 GU604VY-NM042X BOE0B74 (NE160QDM-NM4, IPS, 2560x1600, 16" | MSI Stealth 17 Studio A13VH-014 AUO41A2 B173ZAN06.C, Mini LED, 3840x2160, 17.3" | Lenovo Legion Pro 7 RTX4090 MNG007DA2-3 (CSO1628), IPS, 2560x1600, 16" | Lenovo Legion Slim 7i 16 Gen 8 CSOT T3 MNG007DA2-3, IPS, 2560x1600, 16" | Asus Vivobook Pro 16X K6604JV-MX016W Samsung SDC4178 ATNA60BX01-1, OLED, 3200x2000, 16" | |
|---|---|---|---|---|---|---|---|---|
| Display | -3% | -5% | -3% | -4% | -19% | -19% | -1% | |
| Display P3 Coverage (%) | 99.93 | 99.84 0% | 97 -3% | 99.33 -1% | 92 -8% | 69.5 -30% | 70.4 -30% | 98.4 -2% |
| sRGB Coverage (%) | 100 | 99.99 0% | 99.9 0% | 99.9 0% | 99.1 -1% | 99.8 0% | 99.4 -1% | 99.7 0% |
| AdobeRGB 1998 Coverage (%) | 97.48 | 88.9 -9% | 84.9 -13% | 90.01 -8% | 94.07 -3% | 71.6 -27% | 72.5 -26% | 95.8 -2% |
| Response Times | -22% | -247% | -2455% | -1573% | -405% | -551% | 8% | |
| Response Time Grey 50% / Grey 80% * (ms) | 1.4 ? | 2 ? -43% | 5.1 ? -264% | 50.8 ? -3529% | 46.4 ? -3214% | 10.9 ? -679% | 12 ? -757% | 1.6 ? -14% |
| Response Time Black / White * (ms) | 2 ? | 2 ? -0% | 6.6 ? -230% | 29.6 ? -1380% | 0.62 ? 69% | 4.6 ? -130% | 8.9 ? -345% | 1.4 ? 30% |
| PWM Frequency (Hz) | 250 ? | 59 ? | 12000 | 2400 | 120 ? | |||
| Screen | 11% | -43% | 93% | 52% | -41% | -43% | 20% | |
| Brightness middle (cd/m²) | 331.8 | 346 4% | 470 42% | 634 91% | 397.29 20% | 491 48% | 474.6 43% | 347 5% |
| Brightness (cd/m²) | 334 | 354 6% | 459 37% | 627 88% | 392 17% | 472 41% | 445 33% | 346 4% |
| Brightness Distribution (%) | 98 | 96 -2% | 93 -5% | 92 -6% | 93 -5% | 91 -7% | 86 -12% | 97 -1% |
| Black Level * (cd/m²) | 0.07 | 0.42 -500% | 0.03 57% | 0.02 71% | 0.4 -471% | 0.39 -457% | 0.06 14% | |
| Contrast (:1) | 4740 | 1119 -76% | 21133 346% | 19865 319% | 1228 -74% | 1217 -74% | 5783 22% | |
| Colorchecker dE 2000 * | 1.58 | 2.28 -44% | 1.86 -18% | 0.89 44% | 2.52 -59% | 1.6 -1% | 2.12 -34% | 1.89 -20% |
| Colorchecker dE 2000 max. * | 4.23 | 4.94 -17% | 3.87 9% | 1.79 58% | 3.91 8% | 5.15 -22% | 4.73 -12% | 3.26 23% |
| Colorchecker dE 2000 calibrated * | 6.66 | 2.16 68% | 0.93 86% | 0.91 86% | 2.52 62% | 0.97 85% | 0.57 91% | 1.97 70% |
| Greyscale dE 2000 * | 4.25 | 1.64 61% | 2.7 36% | 1.13 73% | 2.78 35% | 3 29% | 2.8 34% | 1.55 64% |
| Gamma | 2.206 100% | 2.37 93% | 2.246 98% | 2.47 89% | 2.63 84% | 2.211 100% | 2.22 99% | 2.39 92% |
| CCT | 6249 104% | 6384 102% | 6711 97% | 6497 100% | 6412 101% | 6979 93% | 6542 99% | 6458 101% |
| Media total (Programa/Opciones) | -5% /
2% | -98% /
-64% | -788% /
-292% | -508% /
-192% | -155% /
-88% | -204% /
-111% | 9% /
14% |
* ... más pequeño es mejor
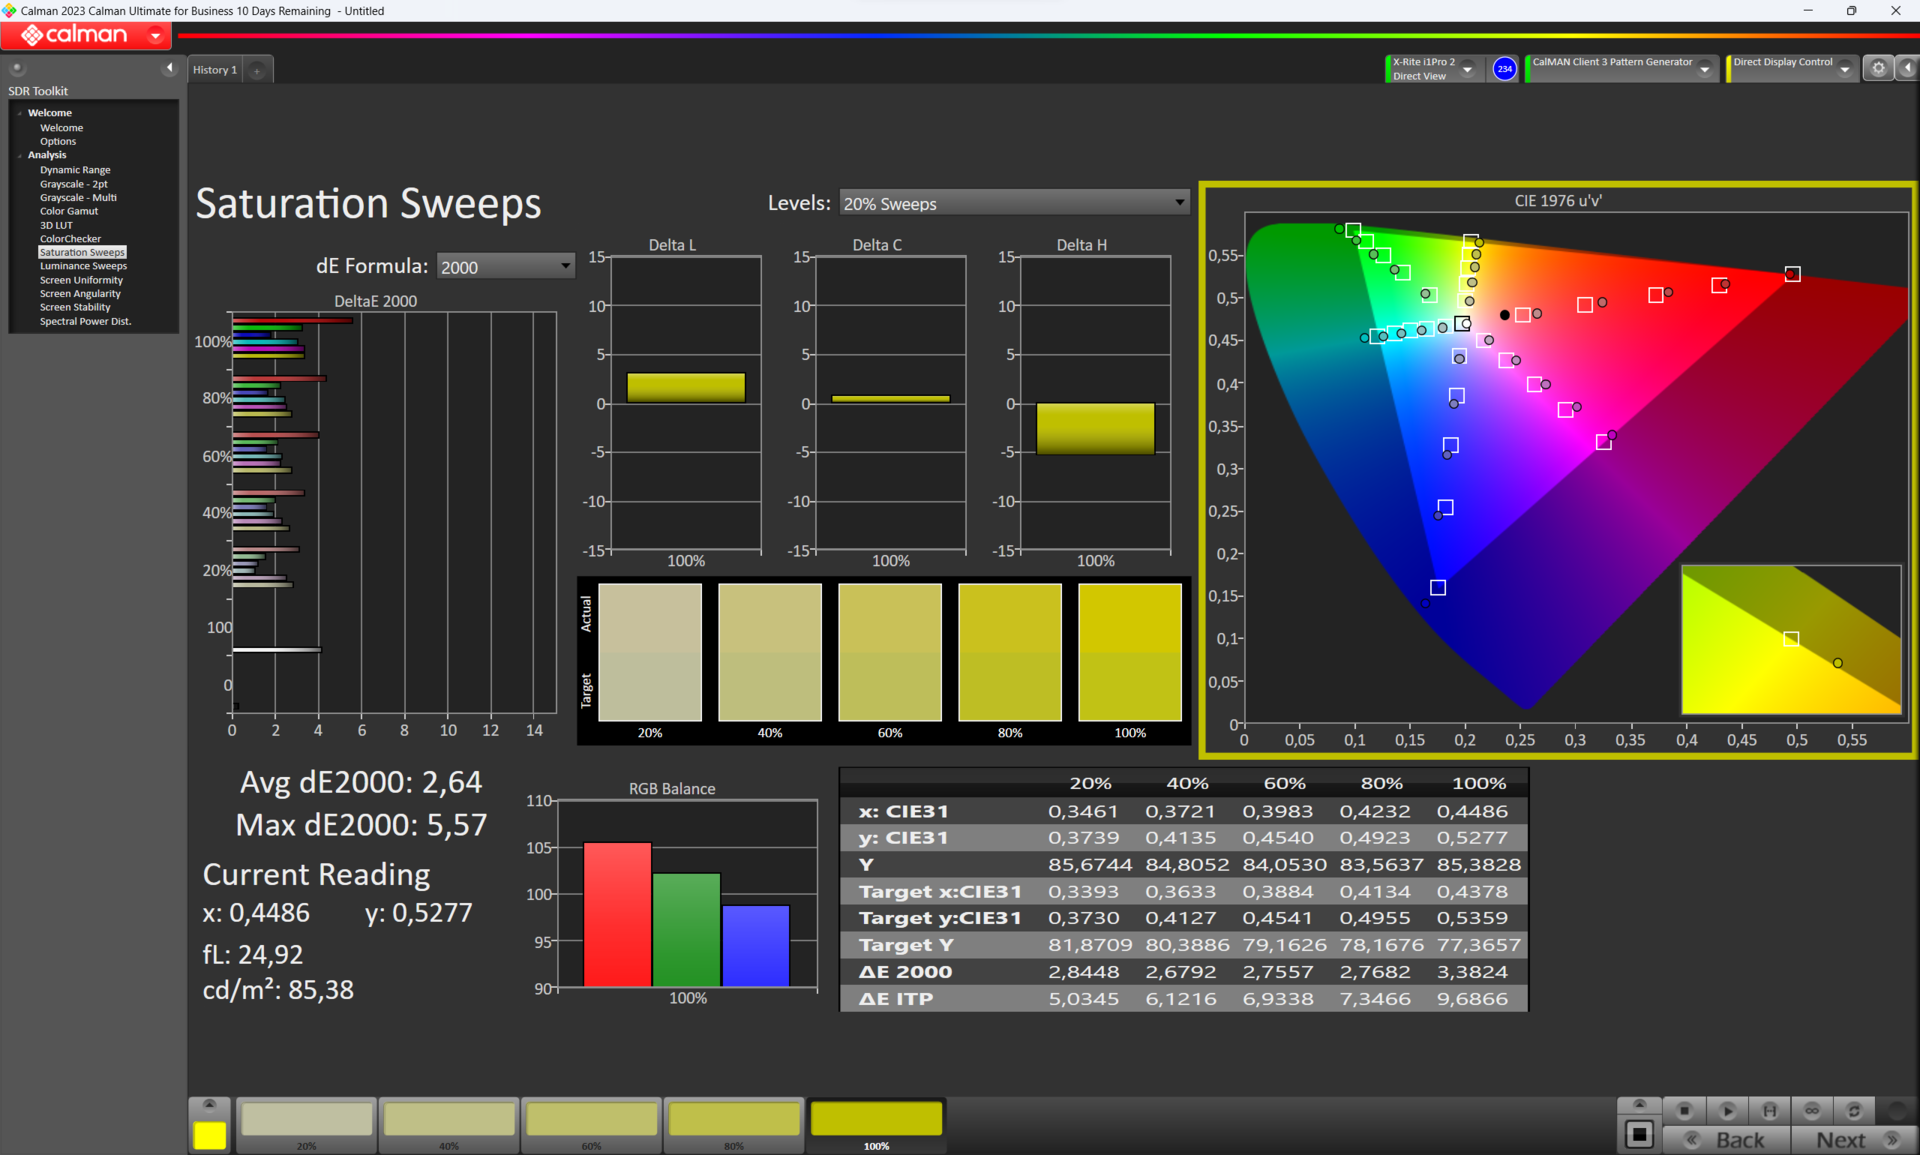
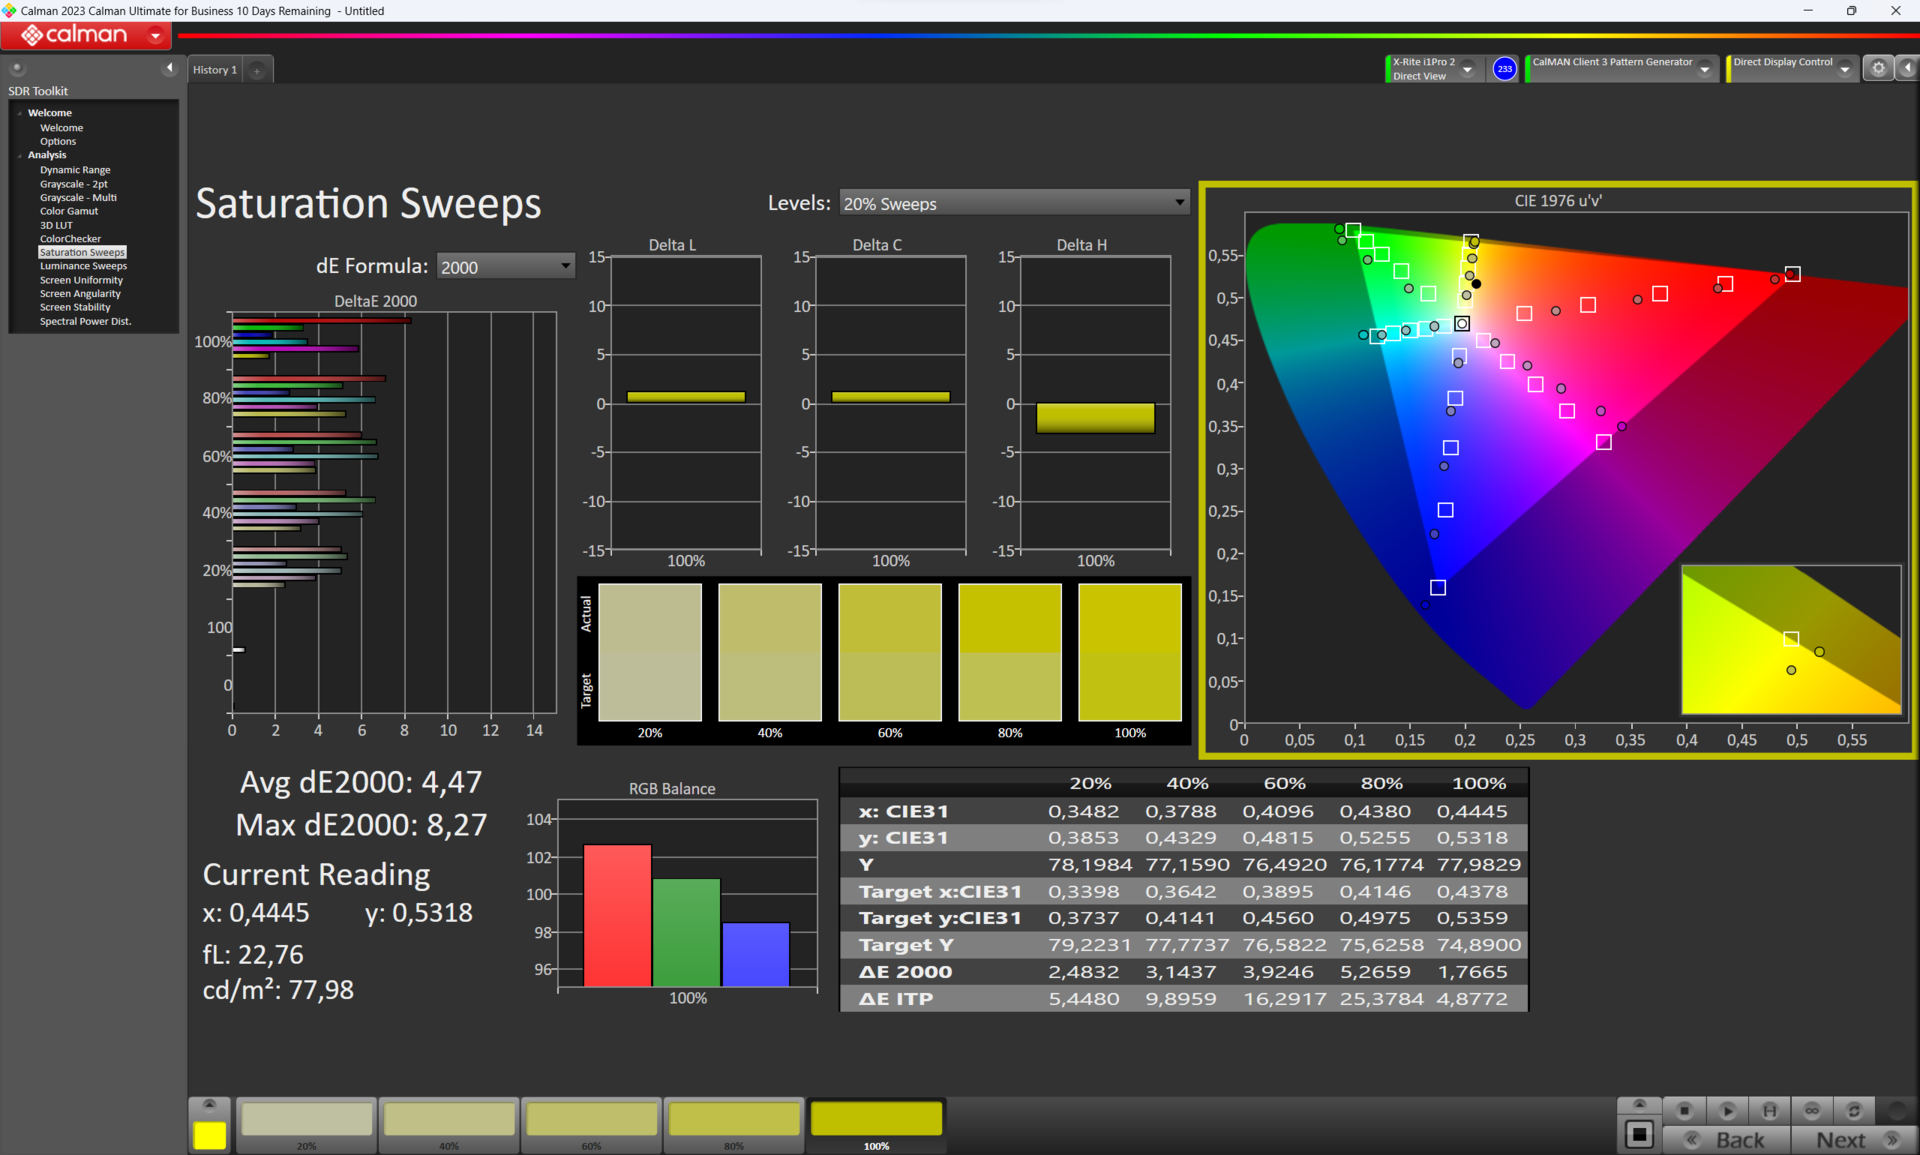
El Zenbook cubre casi el 100% de los tres espacios de color importantes, a saber, AdobeRGB, DisplayP3 y sRGB. Esto debería beneficiar a los profesionales creativos de todos los campos.

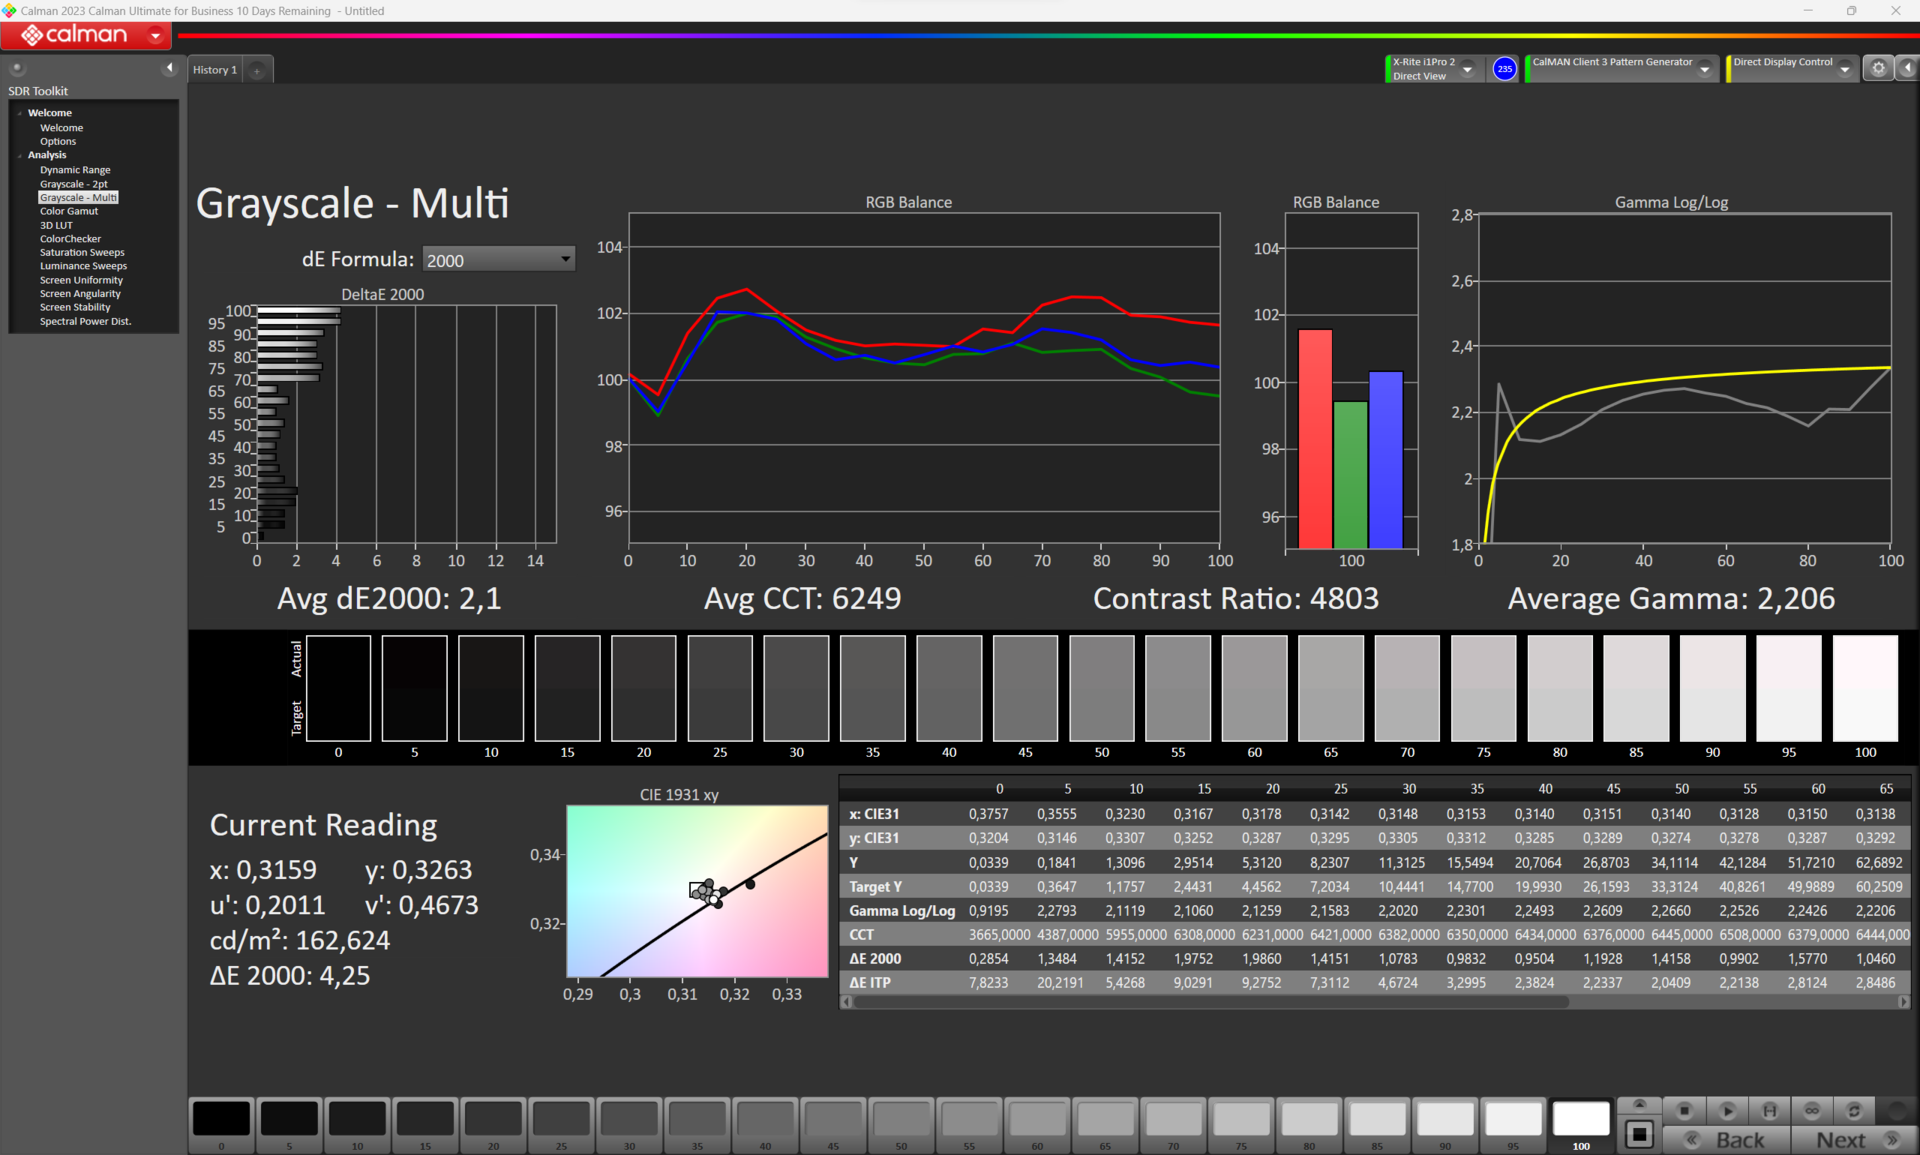
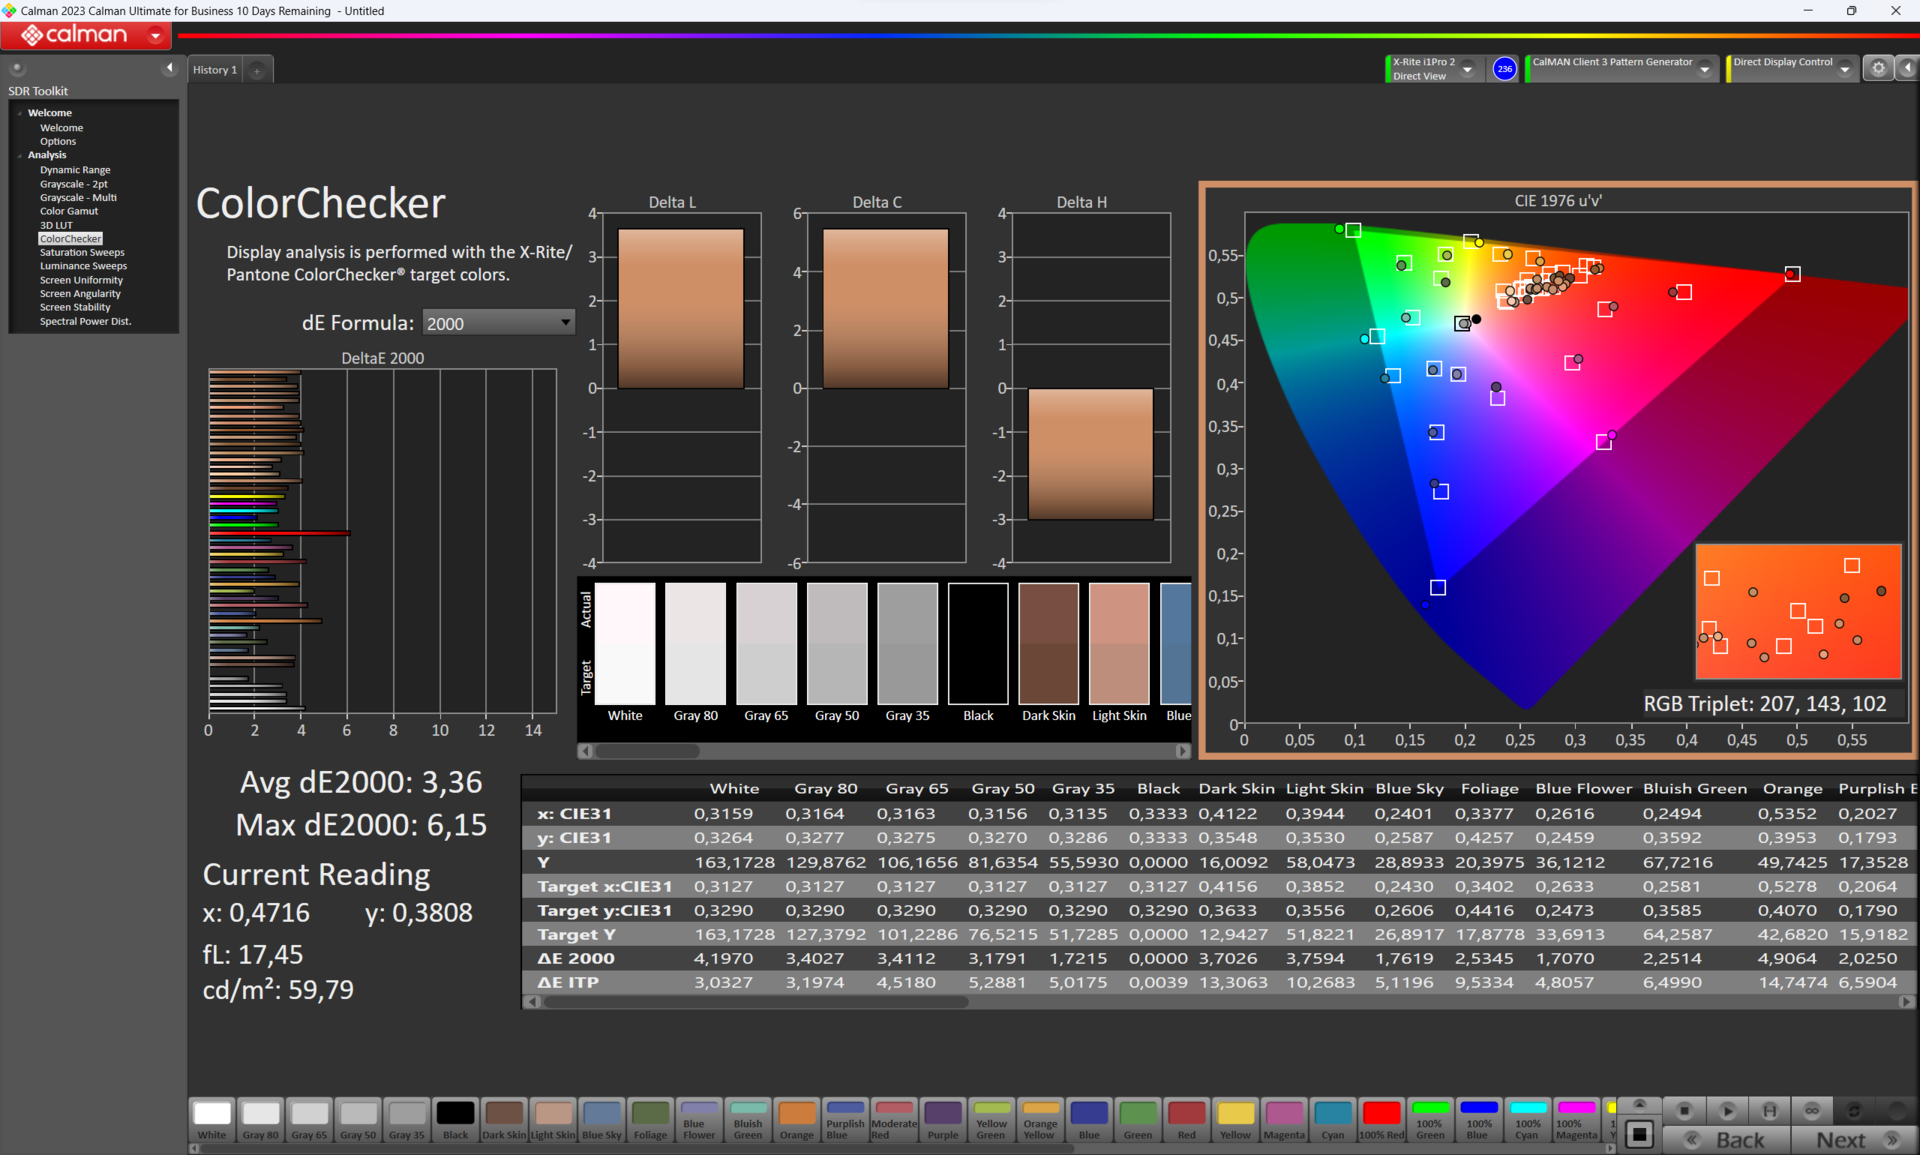
Los diferentes modos de visualización del Asus Zenbook Pro 16X garantizan una representación precisa del color. En modo nativo, la pantalla tiene una desviación media del color de ΔΕ2000 3,36 (espacio de color de destino DisplayP3). El preajuste DisplayP3 de Asus garantiza una desviación de color muy baja de sólo ΔΕ2000 1,58 en el mismo espacio de color. Esto significa que incluso un ojo entrenado es poco probable que note diferencias de color.
Tiempos de respuesta del display
| ↔ Tiempo de respuesta de Negro a Blanco | ||
|---|---|---|
| 2 ms ... subida ↗ y bajada ↘ combinada | ↗ 1 ms subida |  |
| ↘ 1 ms bajada | ||
| La pantalla mostró tiempos de respuesta muy rápidos en nuestros tests y debería ser adecuada para juegos frenéticos. En comparación, todos los dispositivos de prueba van de ##min### (mínimo) a 240 (máximo) ms. » 11 % de todos los dispositivos son mejores. Esto quiere decir que el tiempo de respuesta medido es mejor que la media (19.9 ms) de todos los dispositivos testados. | ||
| ↔ Tiempo de respuesta 50% Gris a 80% Gris | ||
| 1.4 ms ... subida ↗ y bajada ↘ combinada | ↗ 0.6 ms subida |  |
| ↘ 0.8 ms bajada | ||
| La pantalla mostró tiempos de respuesta muy rápidos en nuestros tests y debería ser adecuada para juegos frenéticos. En comparación, todos los dispositivos de prueba van de ##min### (mínimo) a 636 (máximo) ms. » 6 % de todos los dispositivos son mejores. Esto quiere decir que el tiempo de respuesta medido es mejor que la media (31.1 ms) de todos los dispositivos testados. | ||
Parpadeo de Pantalla / PWM (Pulse-Width Modulation)
| Parpadeo de Pantalla / PWM detectado | 250 Hz | ≤ 100 % de brillo |  |
La retroiluminación del display parpadea a 250 Hz (seguramente usa PWM - Pulse-Width Modulation) a un brillo del 100 % e inferior. Sobre este nivel de brillo no debería darse parpadeo / PWM. La frecuencia de 250 Hz es relativamente baja, por lo que la gente sensible debería ver parpadeos y padecer fatiga visual por la pantalla (usado al brillo indicado a continuación). Comparación: 52 % de todos los dispositivos testados no usaron PWM para atenuar el display. Si se usó, medimos una media de 7784 (mínimo: 5 - máxmo: 343500) Hz. | |||


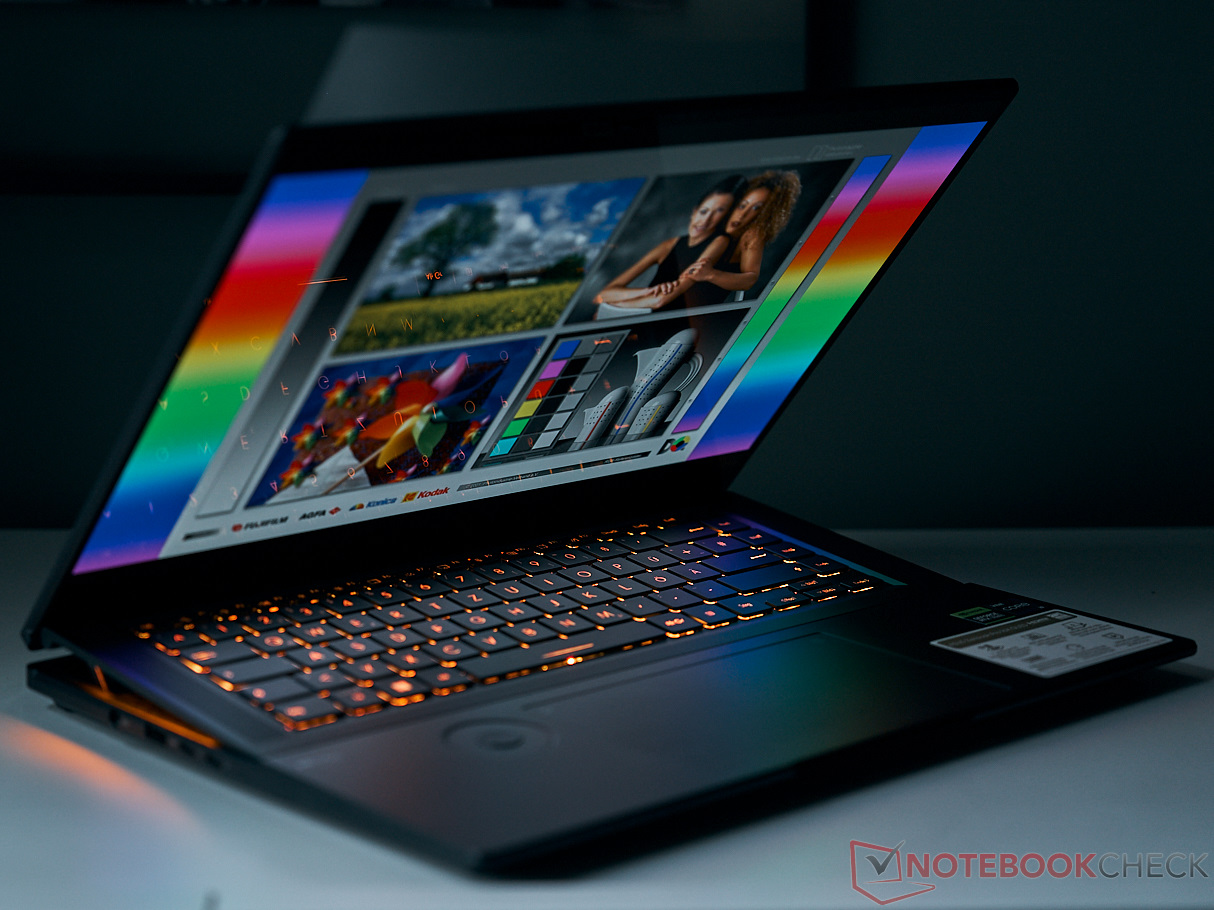
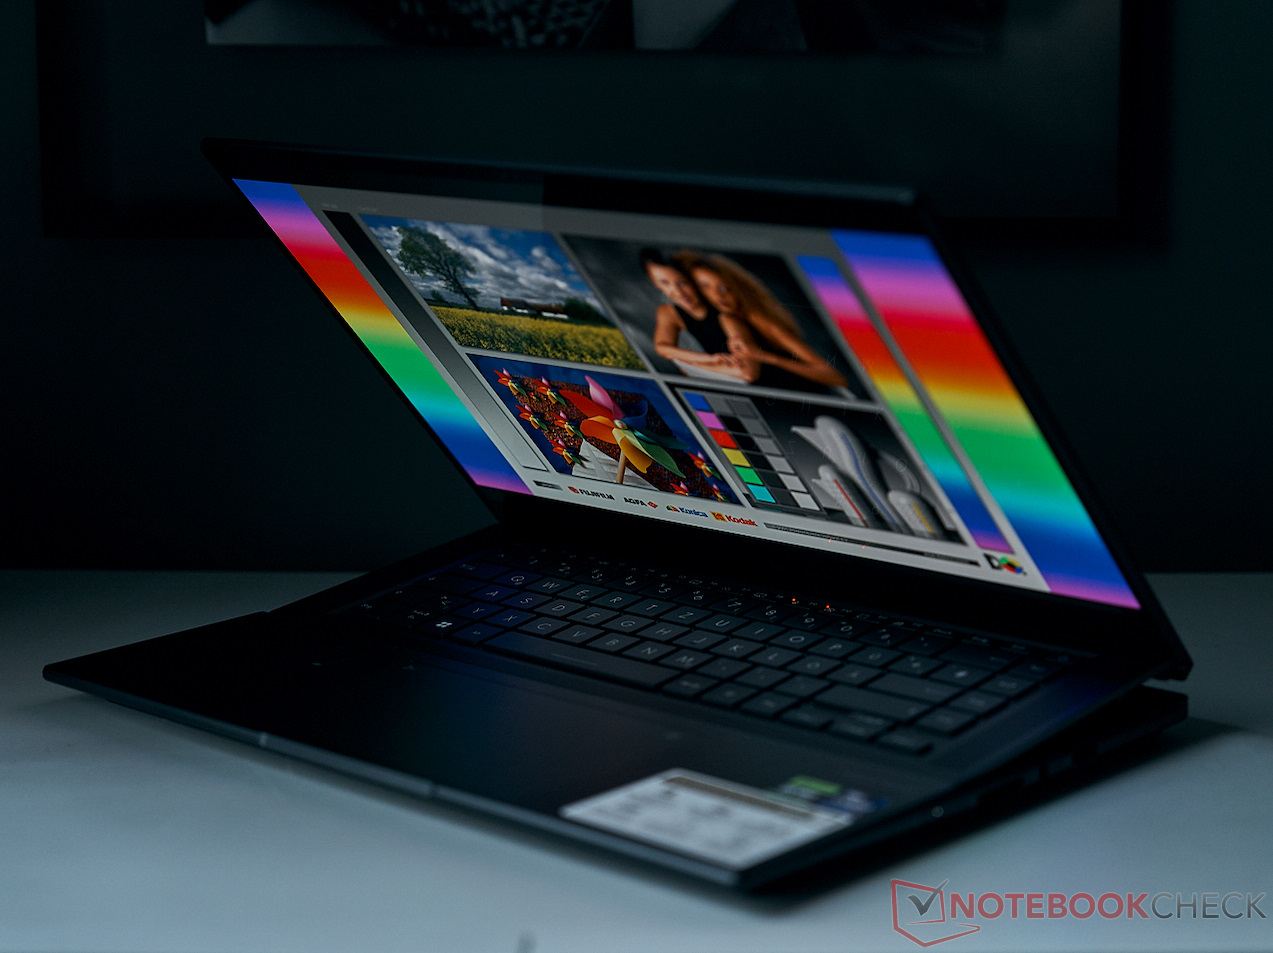
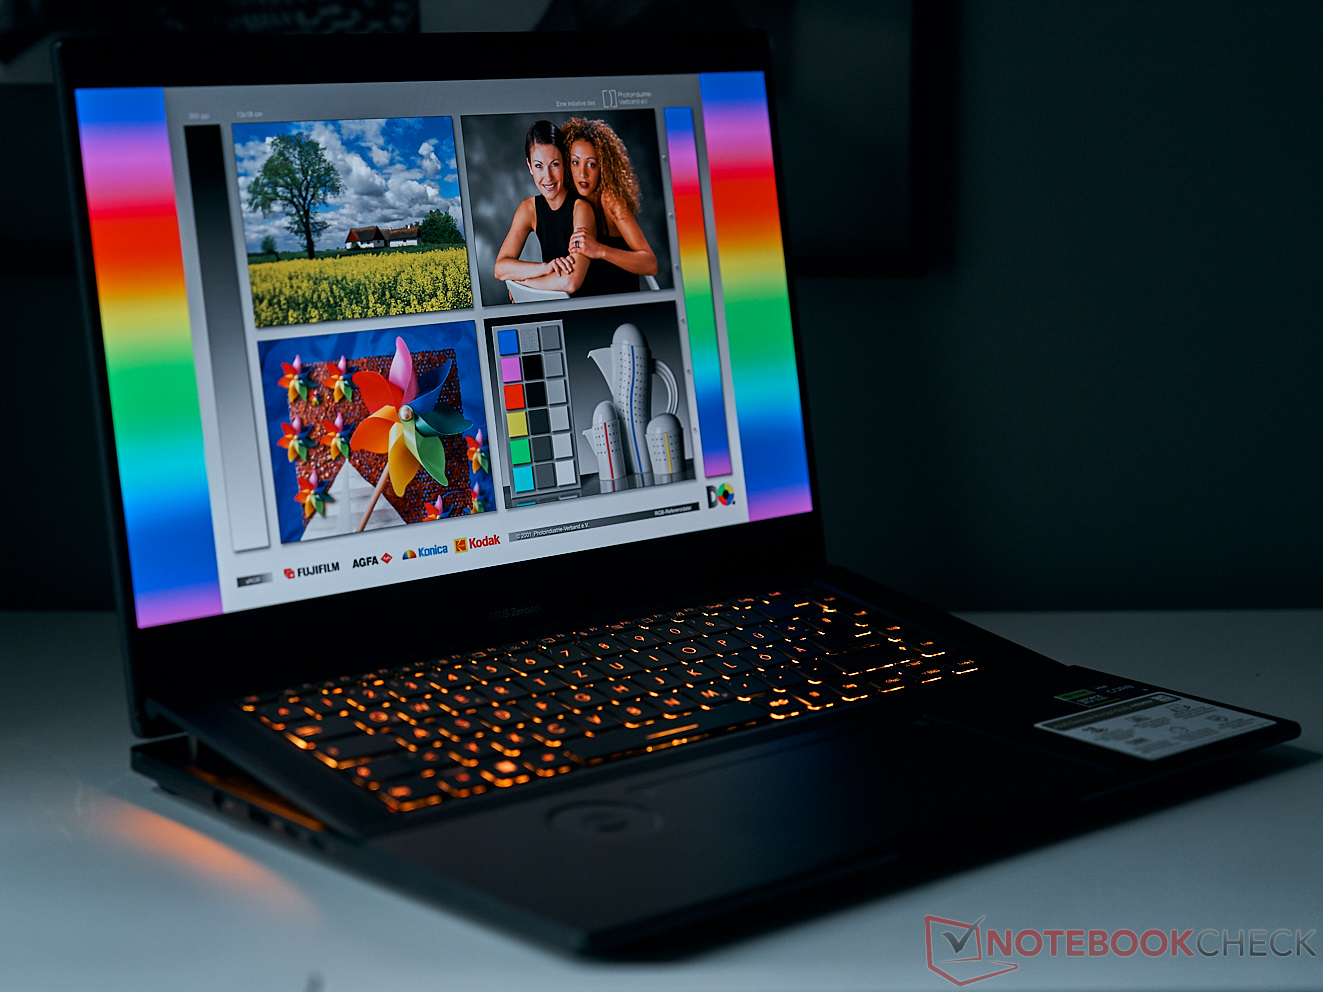
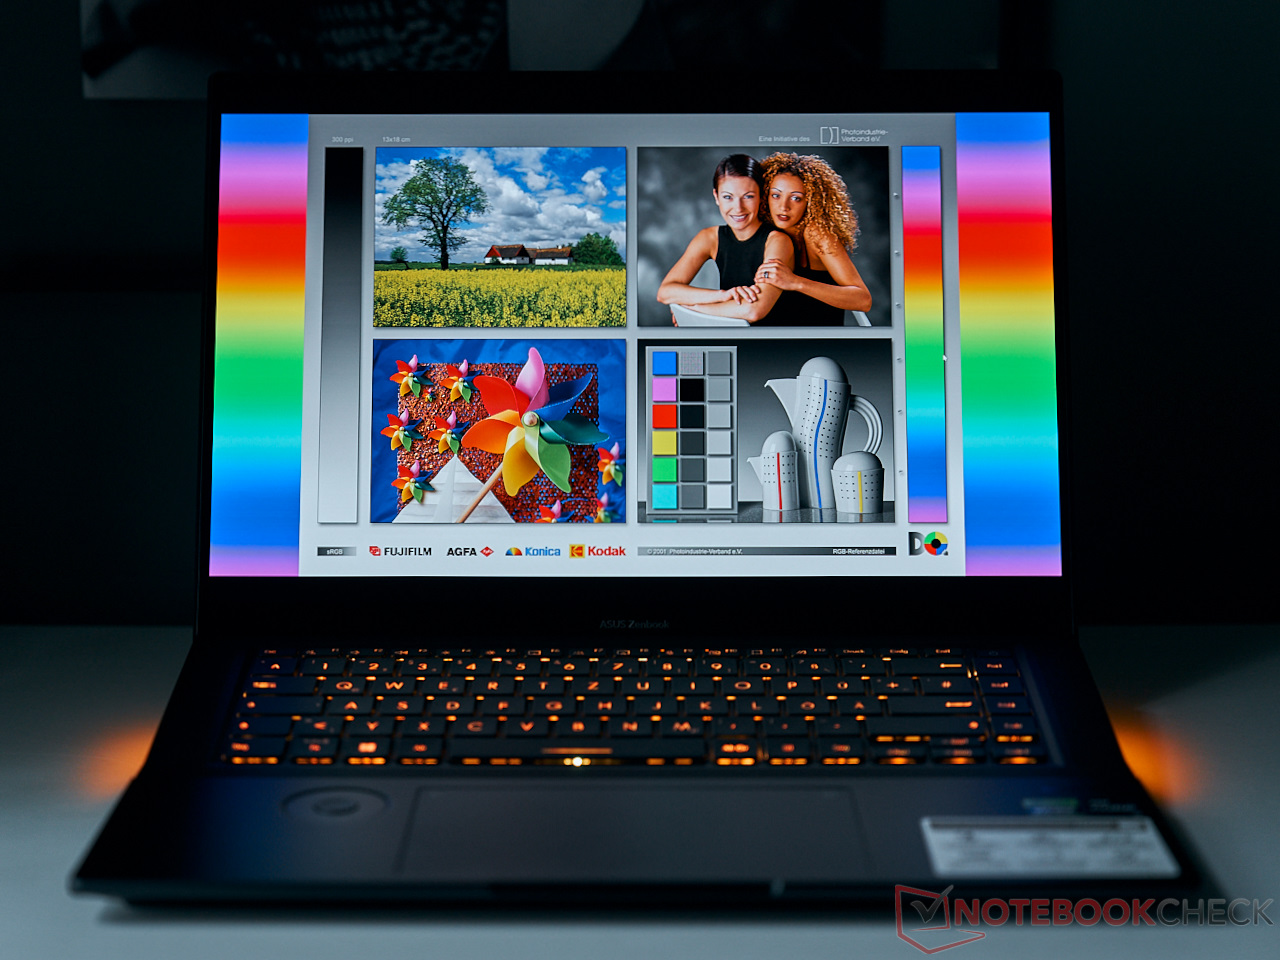
Gracias a la buena estabilidad del ángulo de visión de las pantallas OLED, siempre se puede encontrar un ángulo en el que la pantalla sea razonablemente fácil de leer, incluso al aire libre. Pero la superficie reflectante puede causar problemas, así que es mejor encontrar un lugar a la sombra. Como muestran nuestras fotos del ángulo de visión, incluso la iluminación del teclado es a veces suficiente para producir reflejos claros en la pantalla.
Rendimiento - Al nivel de un portátil para juegos
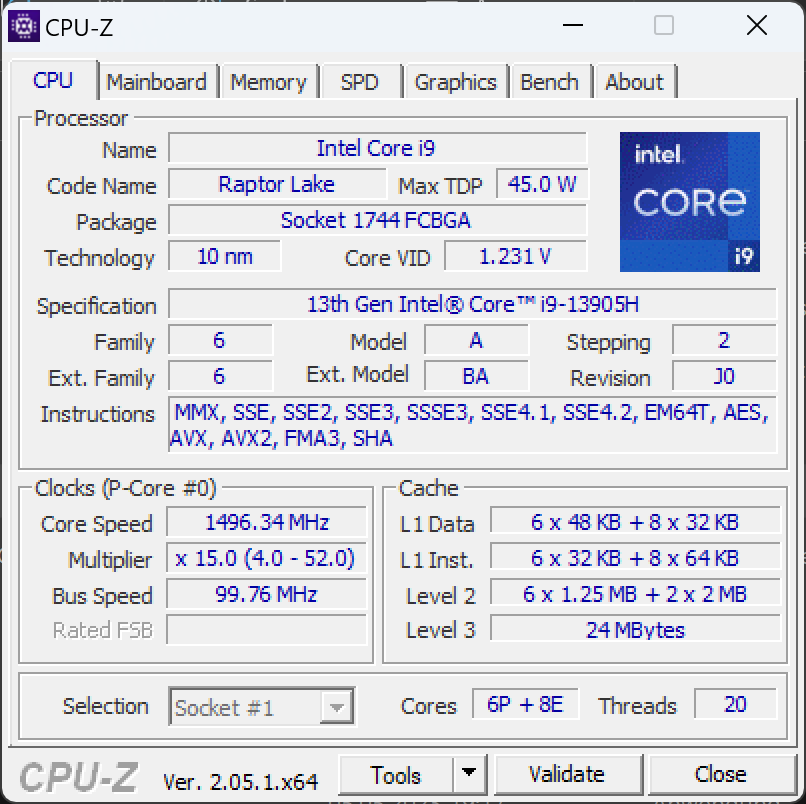
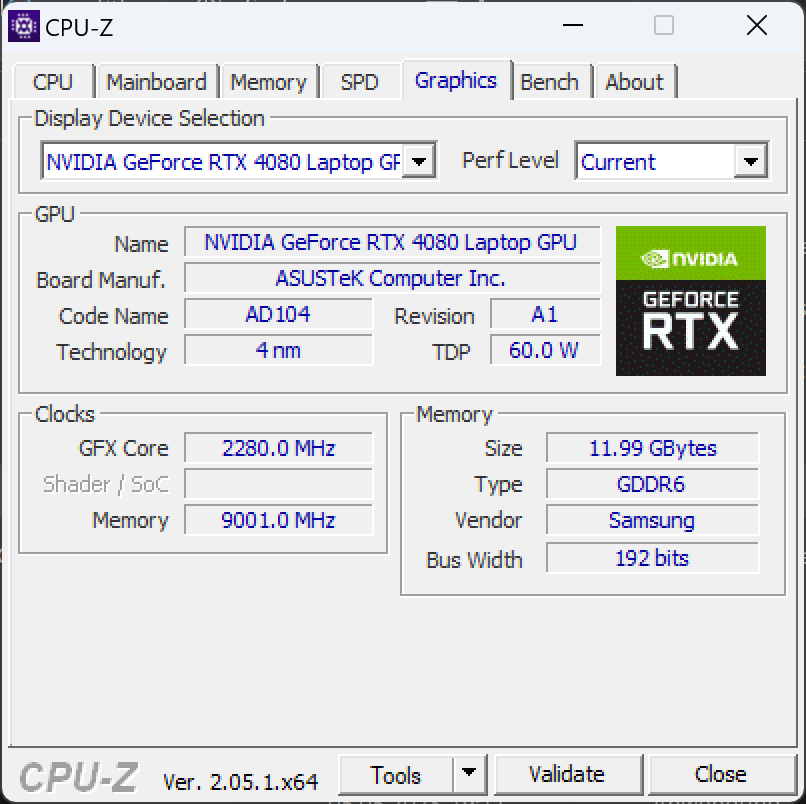
Con una Nvidia GeForce RTX 4080 y el Intel Core i9-13905Hel hardware del Zenbook de este año se ha mejorado significativamente. El portátil está claramente dirigido a creadores de contenidos, jugadores y otros usuarios que confían en un hardware extremadamente potente. Con más de 170 vatios a su disposición, los dos chips de este portátil pueden trabajar bien juntos.
Condiciones de prueba
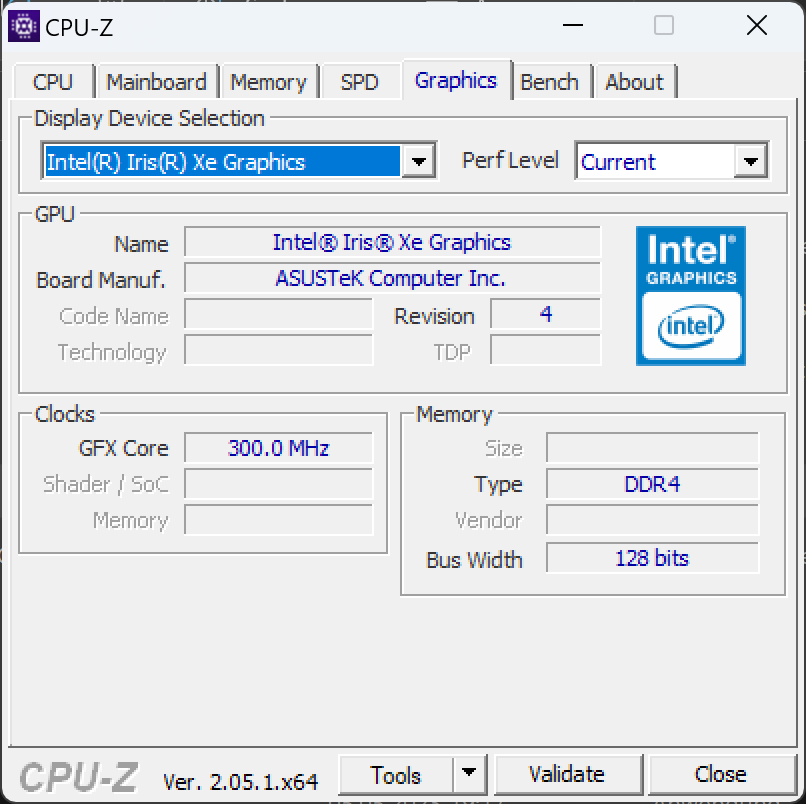
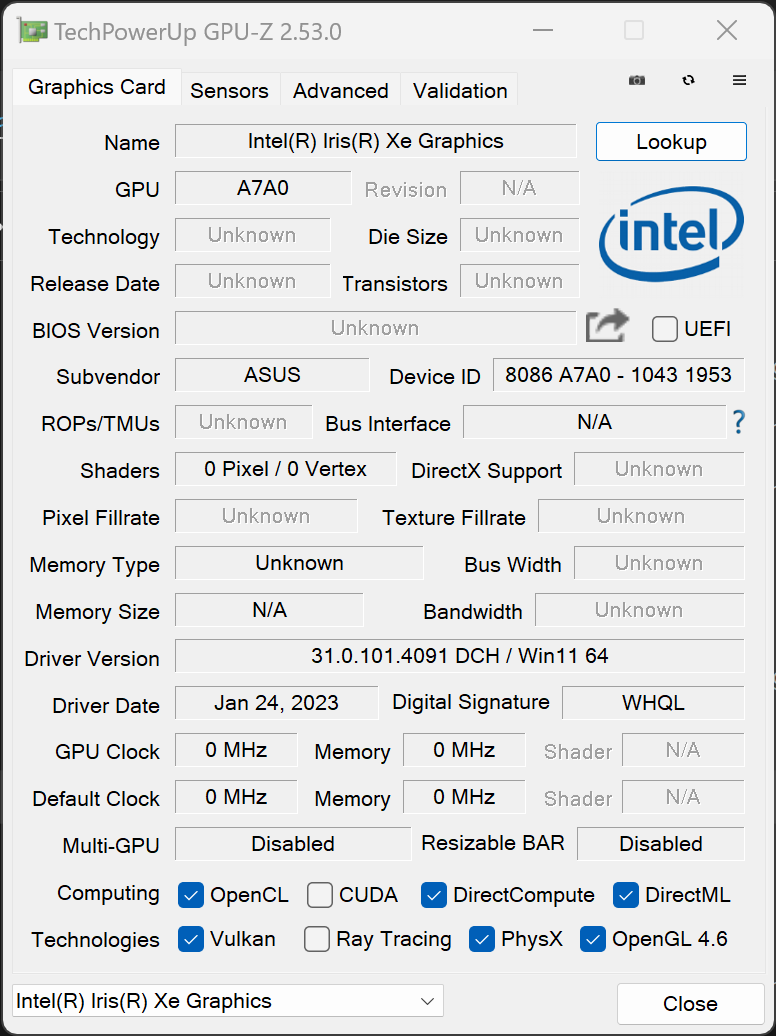
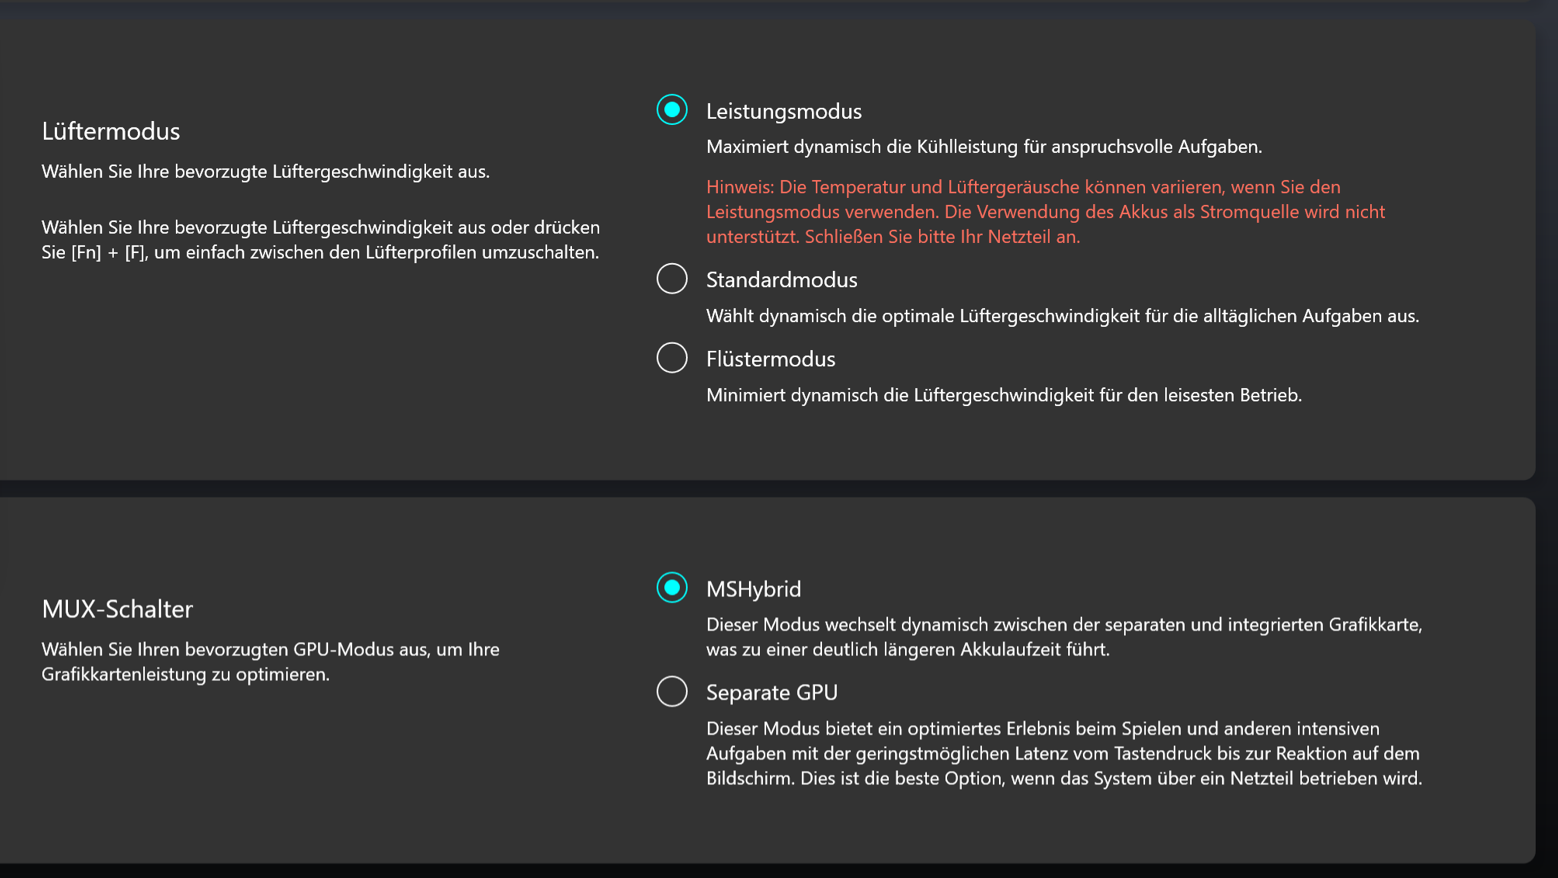
A través de la aplicación MyAsus se pueden alternar tres perfiles de energía diferentes. Decidimos utilizar el modo Rendimiento para poner el hardware a prueba. Sin embargo, para garantizar que el portátil fuera lo más económico posible cuando funcionara con batería, el modo MSHybrid permaneció activo con ambas unidades gráficas. Esto permite al Zenbook deativar laRTX 4080 para tareas poco exigentes. El modo Rendimiento no está disponible en modo batería; el portátil cambia automáticamente al modo Estándar.
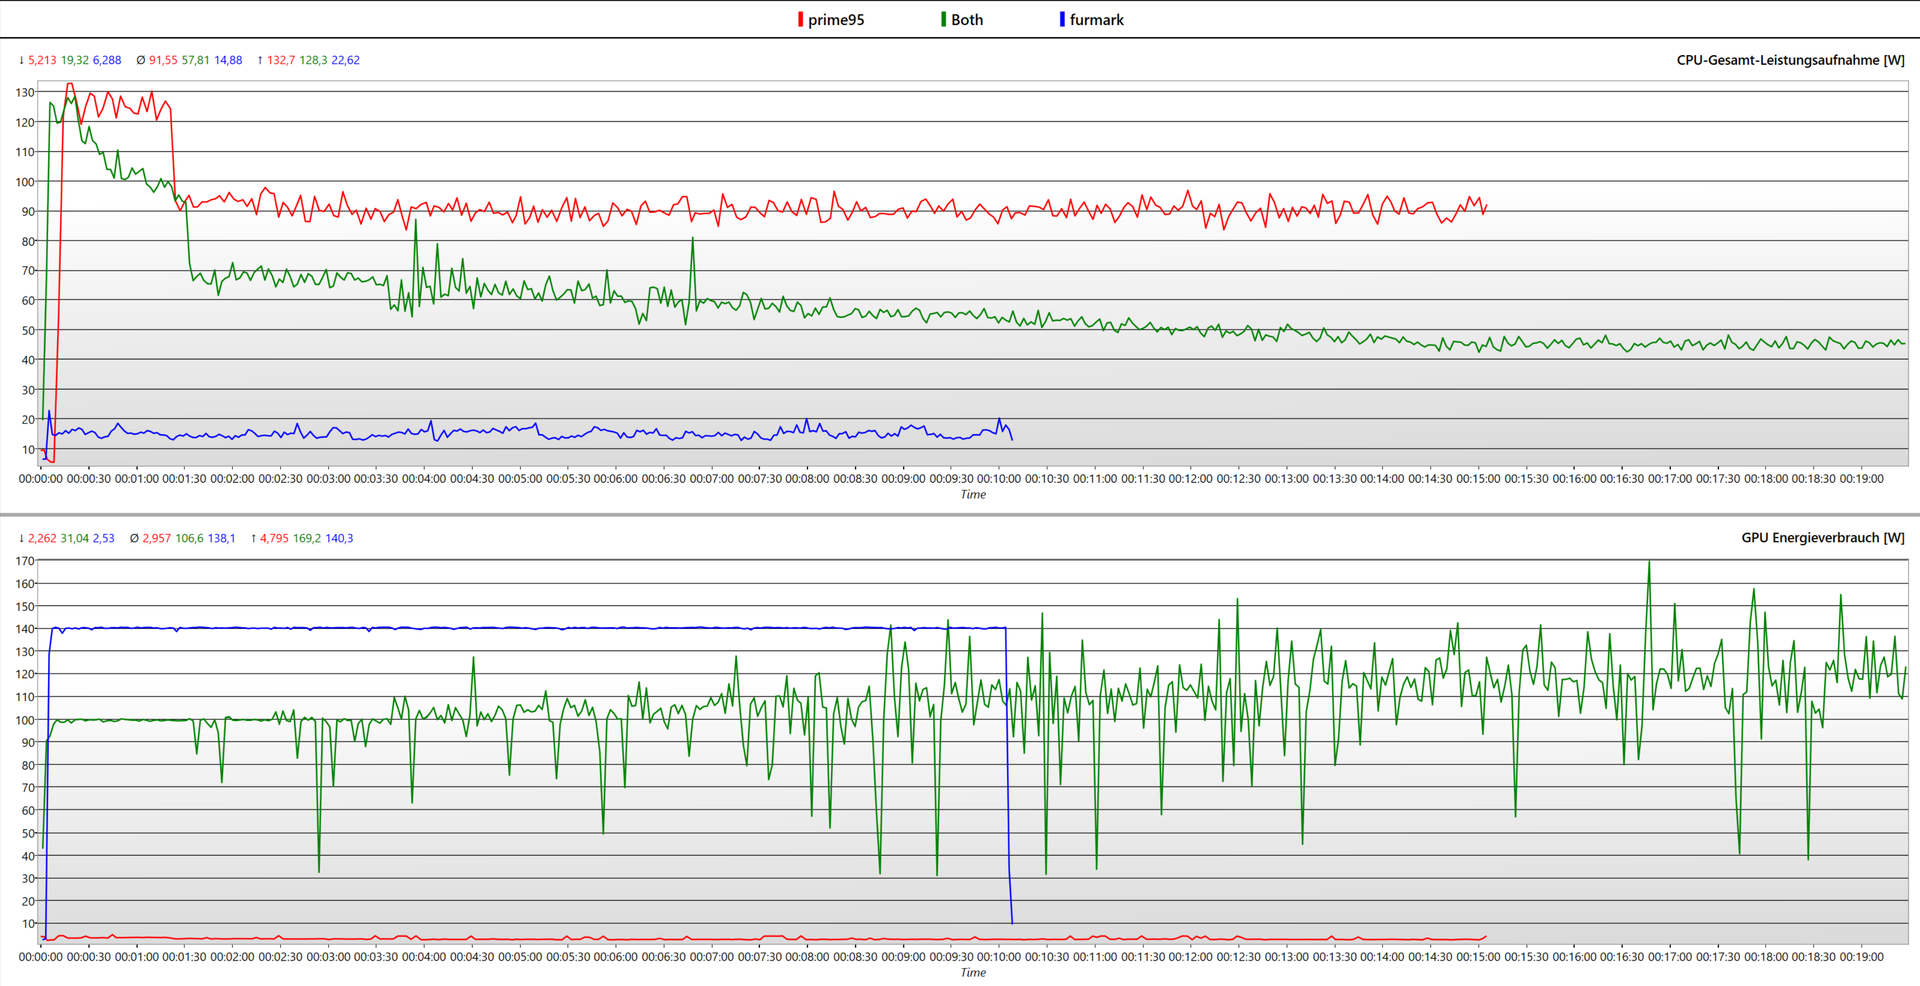
The RTX 4080 operates at a constant maximum of 140 watts. The Intel Core i9 reaches a PL2 of 130 watts and a PL1 of 90 watts. In the Prime95 and Furmark stress tests, we see that the processor runs continuously at 45 watts and the graphics chip at 117 watts.
Procesador
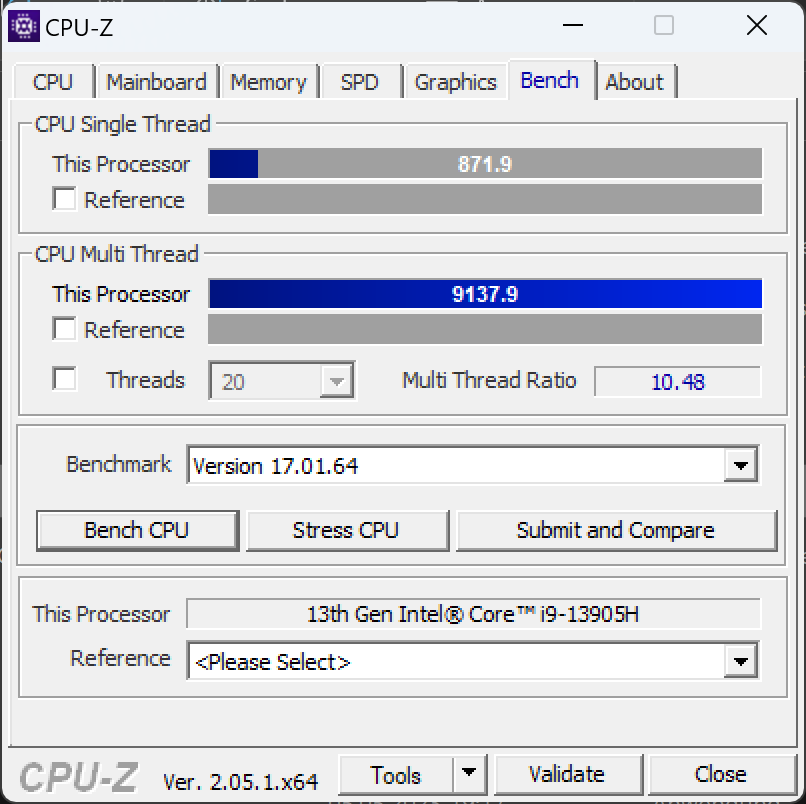
Con 14 núcleos, elIntel Core i9-13905Hdispone de 20 hilos. Esto significa que hay 6 núcleos P y 8 núcleos E trabajando a altos niveles de rendimiento. El Zenbook está en una posición superior en cuanto a rendimiento, pero los dispositivos rivales también son fuertes. Compitiendo por la primera posición está el Lenovo Legion Pro 7y el Asus ROG Strix G16y, sorprendentemente, el más barato Asus Vivobook Pro 16Xel Zenbook Pro 16X actual no tiene una clara ventaja de rendimiento sobre su predecesoren lo que respecta al rendimiento del procesador, ya que los valores de rendimiento bruto del Core i9-13905H y el Core i9-12900Hdel año pasado son demasiado similares. No obstante, Intel ha optimizado un poco, por lo que los puntos de referencia genéricos de Aida64 muestran una imagen diferente. El modelo actual destaca claramente aquí y sólo es superado por los tres dispositivos rivales mencionados anteriormente.
Lo que destaca una y otra vez en nuestros benchmarks es que el Zenbook no utiliza realmente sus ventiladores. Éstos sólo entran en acción mucho más tarde en la ejecución multi-núcleo de Cinebench R23 y las puntuaciones máximas se alcanzan sólo después de varias ejecuciones en el bucle de Cinebench R15. Es posible que se pierda algo de rendimiento en el proceso. Pero durante picos de carga más cortos y en el uso diario, el portátil Asus suele permanecer muy silencioso o completamente silencioso.
Cinebench R15 Multi Sustained Load
Cinebench R23: Multi Core | Single Core
Cinebench R20: CPU (Multi Core) | CPU (Single Core)
Cinebench R15: CPU Multi 64Bit | CPU Single 64Bit
Blender: v2.79 BMW27 CPU
7-Zip 18.03: 7z b 4 | 7z b 4 -mmt1
Geekbench 5.5: Multi-Core | Single-Core
HWBOT x265 Benchmark v2.2: 4k Preset
LibreOffice : 20 Documents To PDF
R Benchmark 2.5: Overall mean
| CPU Performance rating | |
| Lenovo Legion Pro 7 RTX4090 | |
| Asus ROG Strix G16 G614JZ | |
| Asus Vivobook Pro 16X K6604JV-MX016W | |
| Media de la clase Gaming | |
| Lenovo Legion Slim 7i 16 Gen 8 -1! | |
| Asus ROG Zephyrus M16 GU604VY-NM042X | |
| MSI Stealth 17 Studio A13VH-014 | |
| Asus Zenbook Pro 16X UX7602BZ-MY005W | |
| Medio Intel Core i9-13905H | |
| Asus ZenBook Pro 16X OLED UX7602ZM-ME115W | |
| Cinebench R23 / Multi Core | |
| Lenovo Legion Pro 7 RTX4090 | |
| Asus ROG Strix G16 G614JZ | |
| Asus Vivobook Pro 16X K6604JV-MX016W | |
| Media de la clase Gaming (10488 - 40970, n=110, últimos 2 años) | |
| MSI Stealth 17 Studio A13VH-014 | |
| Asus Zenbook Pro 16X UX7602BZ-MY005W | |
| Lenovo Legion Slim 7i 16 Gen 8 | |
| Asus ROG Zephyrus M16 GU604VY-NM042X | |
| Medio Intel Core i9-13905H (17880 - 20237, n=3) | |
| Asus ZenBook Pro 16X OLED UX7602ZM-ME115W | |
| Cinebench R23 / Single Core | |
| Asus ROG Strix G16 G614JZ | |
| Lenovo Legion Pro 7 RTX4090 | |
| Asus Zenbook Pro 16X UX7602BZ-MY005W | |
| Lenovo Legion Slim 7i 16 Gen 8 | |
| Media de la clase Gaming (1166 - 2356, n=110, últimos 2 años) | |
| Asus ROG Zephyrus M16 GU604VY-NM042X | |
| Medio Intel Core i9-13905H (1652 - 2030, n=3) | |
| Asus Vivobook Pro 16X K6604JV-MX016W | |
| Asus ZenBook Pro 16X OLED UX7602ZM-ME115W | |
| MSI Stealth 17 Studio A13VH-014 | |
| Cinebench R20 / CPU (Multi Core) | |
| Lenovo Legion Pro 7 RTX4090 | |
| Asus ROG Strix G16 G614JZ | |
| Asus Vivobook Pro 16X K6604JV-MX016W | |
| Media de la clase Gaming (4029 - 16108, n=109, últimos 2 años) | |
| MSI Stealth 17 Studio A13VH-014 | |
| Lenovo Legion Slim 7i 16 Gen 8 | |
| Asus ROG Zephyrus M16 GU604VY-NM042X | |
| Asus Zenbook Pro 16X UX7602BZ-MY005W | |
| Medio Intel Core i9-13905H (6462 - 7469, n=3) | |
| Asus ZenBook Pro 16X OLED UX7602ZM-ME115W | |
| Cinebench R20 / CPU (Single Core) | |
| Asus ROG Strix G16 G614JZ | |
| Lenovo Legion Pro 7 RTX4090 | |
| Lenovo Legion Slim 7i 16 Gen 8 | |
| Media de la clase Gaming (442 - 895, n=109, últimos 2 años) | |
| Asus ROG Zephyrus M16 GU604VY-NM042X | |
| Asus Vivobook Pro 16X K6604JV-MX016W | |
| Asus ZenBook Pro 16X OLED UX7602ZM-ME115W | |
| Medio Intel Core i9-13905H (622 - 775, n=3) | |
| MSI Stealth 17 Studio A13VH-014 | |
| Asus Zenbook Pro 16X UX7602BZ-MY005W | |
| Cinebench R15 / CPU Multi 64Bit | |
| Asus ROG Strix G16 G614JZ | |
| Asus ROG Strix G16 G614JZ | |
| Asus Vivobook Pro 16X K6604JV-MX016W | |
| Lenovo Legion Pro 7 RTX4090 | |
| Media de la clase Gaming (1578 - 6271, n=109, últimos 2 años) | |
| Asus ROG Zephyrus M16 GU604VY-NM042X | |
| MSI Stealth 17 Studio A13VH-014 | |
| Lenovo Legion Slim 7i 16 Gen 8 | |
| Asus Zenbook Pro 16X UX7602BZ-MY005W | |
| Medio Intel Core i9-13905H (2676 - 2931, n=3) | |
| Asus ZenBook Pro 16X OLED UX7602ZM-ME115W | |
| Blender / v2.79 BMW27 CPU | |
| Asus ZenBook Pro 16X OLED UX7602ZM-ME115W | |
| Medio Intel Core i9-13905H (163 - 178, n=3) | |
| Asus ROG Zephyrus M16 GU604VY-NM042X | |
| MSI Stealth 17 Studio A13VH-014 | |
| Asus Zenbook Pro 16X UX7602BZ-MY005W | |
| Media de la clase Gaming (80 - 330, n=107, últimos 2 años) | |
| Asus Vivobook Pro 16X K6604JV-MX016W | |
| Asus ROG Strix G16 G614JZ | |
| Lenovo Legion Pro 7 RTX4090 | |
| 7-Zip 18.03 / 7z b 4 -mmt1 | |
| Asus Vivobook Pro 16X K6604JV-MX016W | |
| Lenovo Legion Pro 7 RTX4090 | |
| Asus ROG Strix G16 G614JZ | |
| Lenovo Legion Slim 7i 16 Gen 8 | |
| Media de la clase Gaming (4199 - 7436, n=108, últimos 2 años) | |
| Asus ROG Zephyrus M16 GU604VY-NM042X | |
| MSI Stealth 17 Studio A13VH-014 | |
| Asus ZenBook Pro 16X OLED UX7602ZM-ME115W | |
| Asus Zenbook Pro 16X UX7602BZ-MY005W | |
| Medio Intel Core i9-13905H (4871 - 6069, n=3) | |
| Geekbench 5.5 / Multi-Core | |
| Lenovo Legion Pro 7 RTX4090 | |
| Asus ROG Strix G16 G614JZ | |
| Asus Vivobook Pro 16X K6604JV-MX016W | |
| Media de la clase Gaming (6460 - 27010, n=108, últimos 2 años) | |
| Asus ROG Zephyrus M16 GU604VY-NM042X | |
| Medio Intel Core i9-13905H (13661 - 14999, n=3) | |
| MSI Stealth 17 Studio A13VH-014 | |
| Asus Zenbook Pro 16X UX7602BZ-MY005W | |
| Asus ZenBook Pro 16X OLED UX7602ZM-ME115W | |
| Lenovo Legion Slim 7i 16 Gen 8 | |
| Geekbench 5.5 / Single-Core | |
| Media de la clase Gaming (986 - 2474, n=108, últimos 2 años) | |
| Asus ROG Strix G16 G614JZ | |
| MSI Stealth 17 Studio A13VH-014 | |
| Lenovo Legion Pro 7 RTX4090 | |
| Asus Vivobook Pro 16X K6604JV-MX016W | |
| Asus ROG Zephyrus M16 GU604VY-NM042X | |
| Lenovo Legion Slim 7i 16 Gen 8 | |
| Asus ZenBook Pro 16X OLED UX7602ZM-ME115W | |
| Medio Intel Core i9-13905H (1672 - 1966, n=3) | |
| Asus Zenbook Pro 16X UX7602BZ-MY005W | |
| HWBOT x265 Benchmark v2.2 / 4k Preset | |
| Lenovo Legion Pro 7 RTX4090 | |
| Asus ROG Strix G16 G614JZ | |
| Media de la clase Gaming (11.5 - 44.3, n=108, últimos 2 años) | |
| Asus Vivobook Pro 16X K6604JV-MX016W | |
| MSI Stealth 17 Studio A13VH-014 | |
| Asus ROG Zephyrus M16 GU604VY-NM042X | |
| Lenovo Legion Slim 7i 16 Gen 8 | |
| Medio Intel Core i9-13905H (20.5 - 22.9, n=3) | |
| Asus Zenbook Pro 16X UX7602BZ-MY005W | |
| Asus ZenBook Pro 16X OLED UX7602ZM-ME115W | |
| LibreOffice / 20 Documents To PDF | |
| Medio Intel Core i9-13905H (42.8 - 94.8, n=3) | |
| MSI Stealth 17 Studio A13VH-014 | |
| Asus Vivobook Pro 16X K6604JV-MX016W | |
| Asus ROG Zephyrus M16 GU604VY-NM042X | |
| Media de la clase Gaming (19 - 88.8, n=108, últimos 2 años) | |
| Asus ROG Strix G16 G614JZ | |
| Asus Zenbook Pro 16X UX7602BZ-MY005W | |
| Lenovo Legion Pro 7 RTX4090 | |
| Asus ZenBook Pro 16X OLED UX7602ZM-ME115W | |
| Lenovo Legion Slim 7i 16 Gen 8 | |
| R Benchmark 2.5 / Overall mean | |
| Asus Zenbook Pro 16X UX7602BZ-MY005W | |
| Medio Intel Core i9-13905H (0.4178 - 0.4974, n=3) | |
| Asus ZenBook Pro 16X OLED UX7602ZM-ME115W | |
| Media de la clase Gaming (0.3439 - 0.759, n=109, últimos 2 años) | |
| MSI Stealth 17 Studio A13VH-014 | |
| Lenovo Legion Slim 7i 16 Gen 8 | |
| Asus ROG Zephyrus M16 GU604VY-NM042X | |
| Asus Vivobook Pro 16X K6604JV-MX016W | |
| Lenovo Legion Pro 7 RTX4090 | |
| Asus ROG Strix G16 G614JZ | |
* ... más pequeño es mejor
AIDA64: FP32 Ray-Trace | FPU Julia | CPU SHA3 | CPU Queen | FPU SinJulia | FPU Mandel | CPU AES | CPU ZLib | FP64 Ray-Trace | CPU PhotoWorxx
| Performance rating | |
| Lenovo Legion Pro 7 RTX4090 | |
| Asus ROG Strix G16 G614JZ | |
| Media de la clase Gaming | |
| Asus Vivobook Pro 16X K6604JV-MX016W | |
| Asus Zenbook Pro 16X UX7602BZ-MY005W | |
| Asus ROG Zephyrus M16 GU604VY-NM042X | |
| MSI Stealth 17 Studio A13VH-014 | |
| Medio Intel Core i9-13905H | |
| Lenovo Legion Slim 7i 16 Gen 8 | |
| Asus ZenBook Pro 16X OLED UX7602ZM-ME115W | |
| AIDA64 / FP32 Ray-Trace | |
| Media de la clase Gaming (10227 - 85542, n=107, últimos 2 años) | |
| Asus ROG Strix G16 G614JZ | |
| Lenovo Legion Pro 7 RTX4090 | |
| Asus Vivobook Pro 16X K6604JV-MX016W | |
| Asus Zenbook Pro 16X UX7602BZ-MY005W | |
| MSI Stealth 17 Studio A13VH-014 | |
| Asus ROG Zephyrus M16 GU604VY-NM042X | |
| Medio Intel Core i9-13905H (17642 - 19900, n=3) | |
| Lenovo Legion Slim 7i 16 Gen 8 | |
| Asus ZenBook Pro 16X OLED UX7602ZM-ME115W | |
| AIDA64 / FP64 Ray-Trace | |
| Media de la clase Gaming (5509 - 45446, n=107, últimos 2 años) | |
| Asus ROG Strix G16 G614JZ | |
| Lenovo Legion Pro 7 RTX4090 | |
| Asus Vivobook Pro 16X K6604JV-MX016W | |
| Asus Zenbook Pro 16X UX7602BZ-MY005W | |
| MSI Stealth 17 Studio A13VH-014 | |
| Asus ROG Zephyrus M16 GU604VY-NM042X | |
| Medio Intel Core i9-13905H (9483 - 10804, n=3) | |
| Lenovo Legion Slim 7i 16 Gen 8 | |
| Asus ZenBook Pro 16X OLED UX7602ZM-ME115W | |
| AIDA64 / CPU PhotoWorxx | |
| Asus Zenbook Pro 16X UX7602BZ-MY005W | |
| Medio Intel Core i9-13905H (51720 - 60161, n=3) | |
| Lenovo Legion Pro 7 RTX4090 | |
| MSI Stealth 17 Studio A13VH-014 | |
| Asus ROG Zephyrus M16 GU604VY-NM042X | |
| Asus ZenBook Pro 16X OLED UX7602ZM-ME115W | |
| Media de la clase Gaming (12271 - 89891, n=107, últimos 2 años) | |
| Asus Vivobook Pro 16X K6604JV-MX016W | |
| Asus ROG Strix G16 G614JZ | |
| Lenovo Legion Slim 7i 16 Gen 8 | |
Rendimiento del sistema
Con una tarjeta gráfica más potente y un procesador que está al menos a la par, el nuevo Zenbook Pro 16X en realidad debería rendir mucho mejor que su predecesor en los benchmarks PCMark 10 y CrossMark. También esperábamos una clara ventaja en las pruebas comparativas de memoria AIDA64. Pero las latencias de memoria apenas son inferiores a pesar del camino acortado hasta los chips de RAM. Sólo las velocidades de escritura y copia de la RAM se benefician claramente del nuevo diseño SoM.
Los resultados muestran que la RTX 4080 consigue un aumento significativo de puntos en la subárea de creación de contenidos digitales. Las demás subáreas de PCMark10 también experimentaron un pequeño aumento de puntos en comparación con su predecesora. La comparación con elAsus ROG Zephyrus M16 o el Lenovo Legion Pro 7 con sus RTX 4090 revelan que la tarjeta gráfica nominalmente más potente no confiere prácticamente ninguna ventaja en estos benchmarks. La carcasa cerrada de 18 mm de grosor apenas parece influir en el rendimiento extremo del portátil, pero hay otro factor que sí lo hace: los ventiladores y el control de potencia del Zenbook Pro 16X reaccionan muy lentamente a los cambios bajo carga. Este hecho ya fue visible en la prueba Cinebench R15 de larga duración. Un sistema "precalentado" ofrece ocasionalmente más rendimiento que un portátil recién arrancado. En última instancia, sin embargo, esto es discutir porque el Asus Zenbook Pro 16X es un portátil de muy alto rendimiento que puede manejar fácilmente PhotoShop o Premiere Pro.
CrossMark: Overall | Productivity | Creativity | Responsiveness
WebXPRT 4: Overall
| PCMark 10 / Score | |
| Lenovo Legion Slim 7i 16 Gen 8 | |
| Media de la clase Gaming (5828 - 11574, n=94, últimos 2 años) | |
| Asus ROG Zephyrus M16 GU604VY-NM042X | |
| Lenovo Legion Pro 7 RTX4090 | |
| Asus Zenbook Pro 16X UX7602BZ-MY005W | |
| Medio Intel Core i9-13905H, NVIDIA GeForce RTX 4080 Laptop GPU (n=1) | |
| MSI Stealth 17 Studio A13VH-014 | |
| Asus ZenBook Pro 16X OLED UX7602ZM-ME115W | |
| Asus ROG Strix G16 G614JZ | |
| Asus Vivobook Pro 16X K6604JV-MX016W | |
| PCMark 10 / Essentials | |
| Asus ROG Strix G16 G614JZ | |
| Asus ROG Zephyrus M16 GU604VY-NM042X | |
| Asus Zenbook Pro 16X UX7602BZ-MY005W | |
| Medio Intel Core i9-13905H, NVIDIA GeForce RTX 4080 Laptop GPU (n=1) | |
| Lenovo Legion Slim 7i 16 Gen 8 | |
| Lenovo Legion Pro 7 RTX4090 | |
| Asus ZenBook Pro 16X OLED UX7602ZM-ME115W | |
| Media de la clase Gaming (8810 - 12600, n=98, últimos 2 años) | |
| Asus Vivobook Pro 16X K6604JV-MX016W | |
| MSI Stealth 17 Studio A13VH-014 | |
| PCMark 10 / Productivity | |
| Asus ROG Zephyrus M16 GU604VY-NM042X | |
| Lenovo Legion Slim 7i 16 Gen 8 | |
| Media de la clase Gaming (6845 - 18766, n=96, últimos 2 años) | |
| Asus Zenbook Pro 16X UX7602BZ-MY005W | |
| Medio Intel Core i9-13905H, NVIDIA GeForce RTX 4080 Laptop GPU (n=1) | |
| Asus ZenBook Pro 16X OLED UX7602ZM-ME115W | |
| MSI Stealth 17 Studio A13VH-014 | |
| Lenovo Legion Pro 7 RTX4090 | |
| Asus Vivobook Pro 16X K6604JV-MX016W | |
| Asus ROG Strix G16 G614JZ | |
| PCMark 10 / Digital Content Creation | |
| Lenovo Legion Pro 7 RTX4090 | |
| Media de la clase Gaming (7602 - 19657, n=96, últimos 2 años) | |
| Lenovo Legion Slim 7i 16 Gen 8 | |
| Asus Zenbook Pro 16X UX7602BZ-MY005W | |
| Medio Intel Core i9-13905H, NVIDIA GeForce RTX 4080 Laptop GPU (n=1) | |
| Asus ROG Zephyrus M16 GU604VY-NM042X | |
| MSI Stealth 17 Studio A13VH-014 | |
| Asus ROG Strix G16 G614JZ | |
| Asus ZenBook Pro 16X OLED UX7602ZM-ME115W | |
| Asus Vivobook Pro 16X K6604JV-MX016W | |
| CrossMark / Overall | |
| Asus ROG Strix G16 G614JZ | |
| Asus Vivobook Pro 16X K6604JV-MX016W | |
| Asus Zenbook Pro 16X UX7602BZ-MY005W | |
| Medio Intel Core i9-13905H, NVIDIA GeForce RTX 4080 Laptop GPU (n=1) | |
| Media de la clase Gaming (1366 - 2409, n=96, últimos 2 años) | |
| Lenovo Legion Slim 7i 16 Gen 8 | |
| Asus ROG Zephyrus M16 GU604VY-NM042X | |
| Asus ZenBook Pro 16X OLED UX7602ZM-ME115W | |
| MSI Stealth 17 Studio A13VH-014 | |
| CrossMark / Productivity | |
| Asus ROG Strix G16 G614JZ | |
| Asus Vivobook Pro 16X K6604JV-MX016W | |
| Lenovo Legion Slim 7i 16 Gen 8 | |
| Media de la clase Gaming (1386 - 2254, n=96, últimos 2 años) | |
| Asus ROG Zephyrus M16 GU604VY-NM042X | |
| Asus Zenbook Pro 16X UX7602BZ-MY005W | |
| Medio Intel Core i9-13905H, NVIDIA GeForce RTX 4080 Laptop GPU (n=1) | |
| Asus ZenBook Pro 16X OLED UX7602ZM-ME115W | |
| MSI Stealth 17 Studio A13VH-014 | |
| CrossMark / Creativity | |
| Asus ROG Strix G16 G614JZ | |
| Asus Vivobook Pro 16X K6604JV-MX016W | |
| Asus Zenbook Pro 16X UX7602BZ-MY005W | |
| Medio Intel Core i9-13905H, NVIDIA GeForce RTX 4080 Laptop GPU (n=1) | |
| Asus ROG Zephyrus M16 GU604VY-NM042X | |
| Media de la clase Gaming (1343 - 2729, n=96, últimos 2 años) | |
| Lenovo Legion Slim 7i 16 Gen 8 | |
| Asus ZenBook Pro 16X OLED UX7602ZM-ME115W | |
| MSI Stealth 17 Studio A13VH-014 | |
| CrossMark / Responsiveness | |
| Asus ROG Strix G16 G614JZ | |
| Lenovo Legion Slim 7i 16 Gen 8 | |
| Media de la clase Gaming (1226 - 2334, n=96, últimos 2 años) | |
| Asus ROG Zephyrus M16 GU604VY-NM042X | |
| Asus Vivobook Pro 16X K6604JV-MX016W | |
| Asus Zenbook Pro 16X UX7602BZ-MY005W | |
| Medio Intel Core i9-13905H, NVIDIA GeForce RTX 4080 Laptop GPU (n=1) | |
| MSI Stealth 17 Studio A13VH-014 | |
| Asus ZenBook Pro 16X OLED UX7602ZM-ME115W | |
| WebXPRT 4 / Overall | |
| Asus ROG Strix G16 G614JZ | |
| Asus ROG Zephyrus M16 GU604VY-NM042X | |
| Lenovo Legion Slim 7i 16 Gen 8 | |
| Media de la clase Gaming (176.4 - 354, n=99, últimos 2 años) | |
| Lenovo Legion Pro 7 RTX4090 | |
| Asus ZenBook Pro 16X OLED UX7602ZM-ME115W | |
| Asus Vivobook Pro 16X K6604JV-MX016W | |
| Asus Zenbook Pro 16X UX7602BZ-MY005W | |
| Medio Intel Core i9-13905H, NVIDIA GeForce RTX 4080 Laptop GPU (n=1) | |
| MSI Stealth 17 Studio A13VH-014 | |
| PCMark 10 Score | 8033 puntos | |
ayuda | ||
| AIDA64 / Memory Latency | |
| Medio Intel Core i9-13905H (101.4 - 134.8, n=3) | |
| Asus ZenBook Pro 16X OLED UX7602ZM-ME115W | |
| Media de la clase Gaming (75.3 - 259, n=107, últimos 2 años) | |
| Asus Zenbook Pro 16X UX7602BZ-MY005W | |
| MSI Stealth 17 Studio A13VH-014 | |
| Asus Vivobook Pro 16X K6604JV-MX016W | |
| Asus ROG Zephyrus M16 GU604VY-NM042X | |
| Asus ROG Strix G16 G614JZ | |
| Lenovo Legion Pro 7 RTX4090 | |
| Lenovo Legion Slim 7i 16 Gen 8 | |
* ... más pequeño es mejor
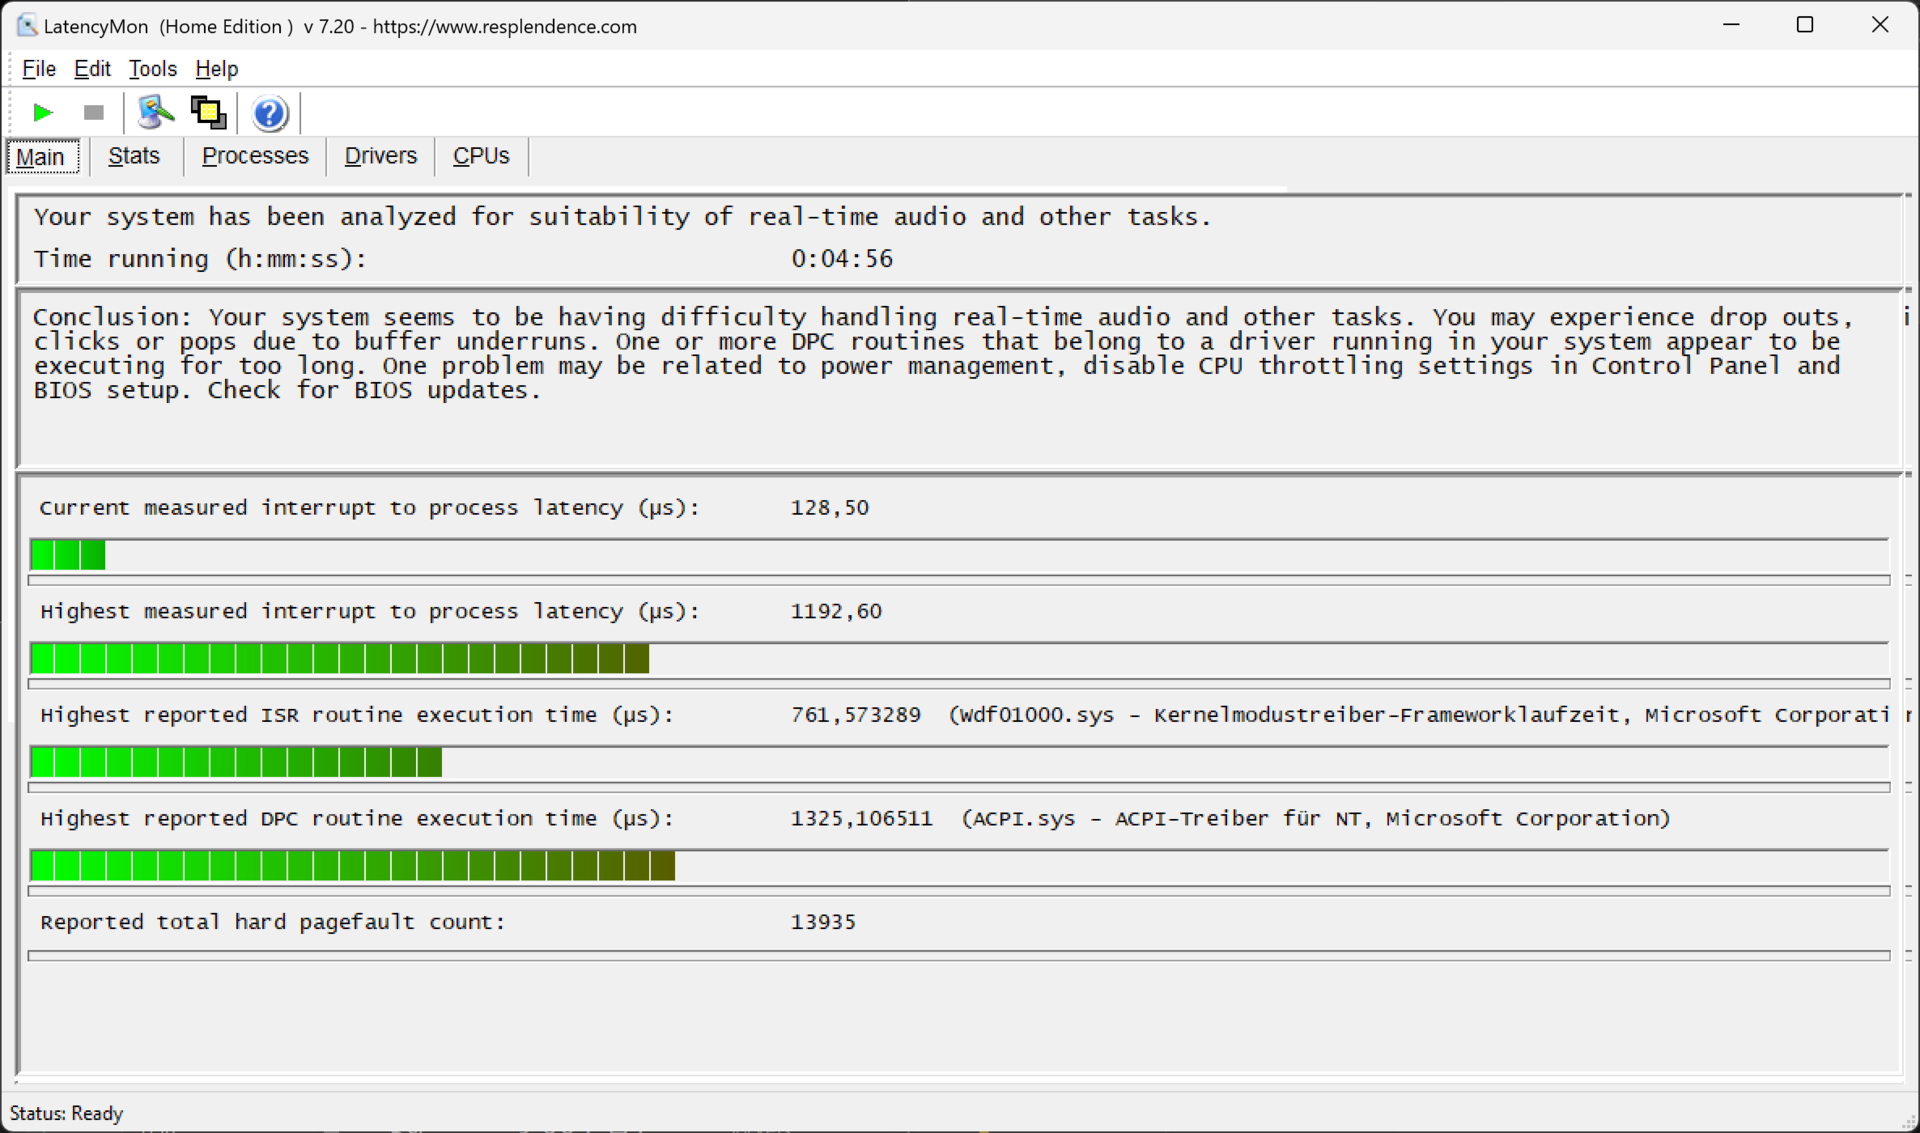
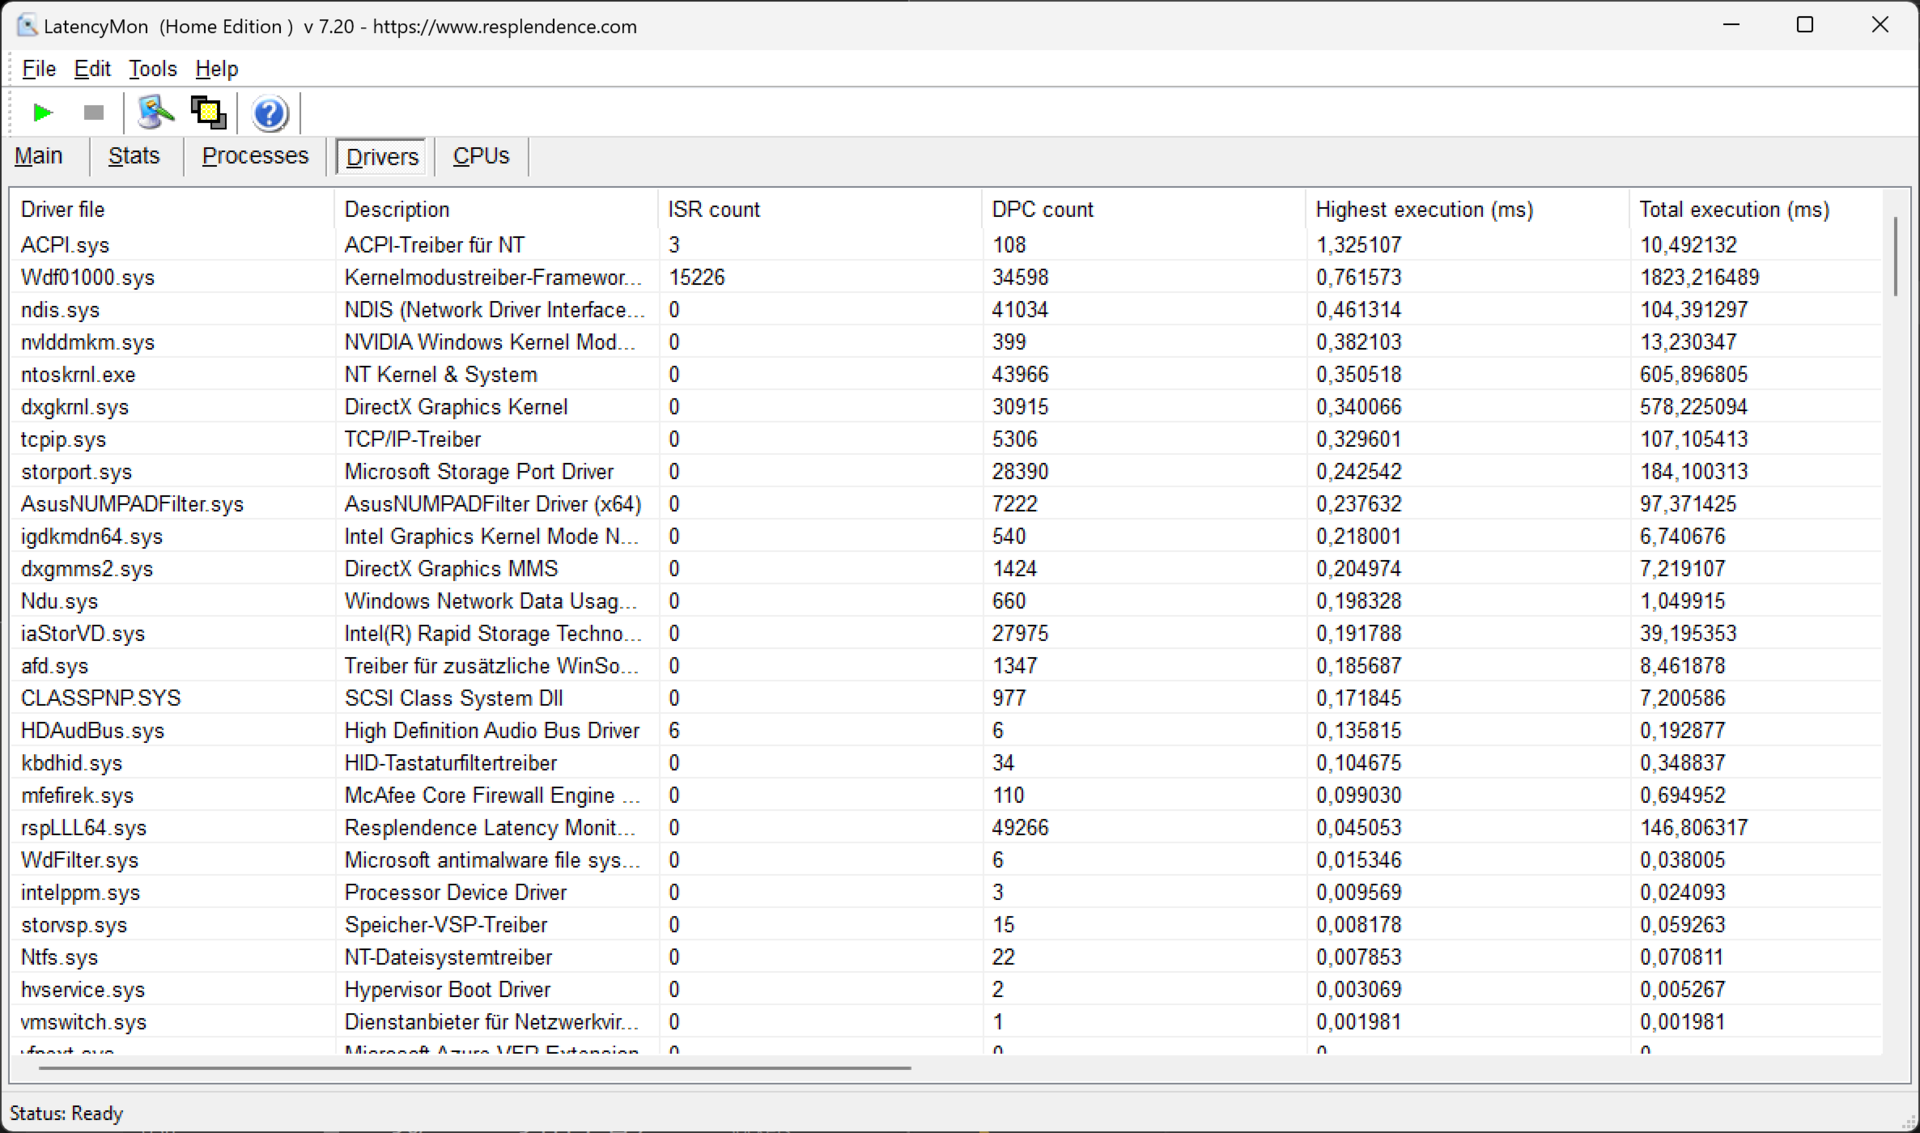
Latencia del CPD
En términos de latencia, el Zenbook Pro 16X rinde realmente bastante bien en comparación con sus competidores. Pero incluso a 1164 µs, LatencyMon sigue afirmando que podría haber problemas con las aplicaciones en tiempo real. En última instancia, la configuración actual de los controladores y el firmware del dispositivo son decisivos para las latencias del CPD. Ambos podrían ver cambios significativos mediante actualizaciones.
| DPC Latencies / LatencyMon - interrupt to process latency (max), Web, Youtube, Prime95 | |
| Lenovo Legion Pro 7 RTX4090 | |
| Lenovo Legion Slim 7i 16 Gen 8 | |
| Asus ROG Zephyrus M16 GU604VY-NM042X | |
| MSI Stealth 17 Studio A13VH-014 | |
| Asus ROG Strix G16 G614JZ | |
| Asus Vivobook Pro 16X K6604JV-MX016W | |
| Asus Zenbook Pro 16X UX7602BZ-MY005W | |
| Asus ZenBook Pro 16X OLED UX7602ZM-ME115W | |
* ... más pequeño es mejor
Dispositivos de almacenamiento
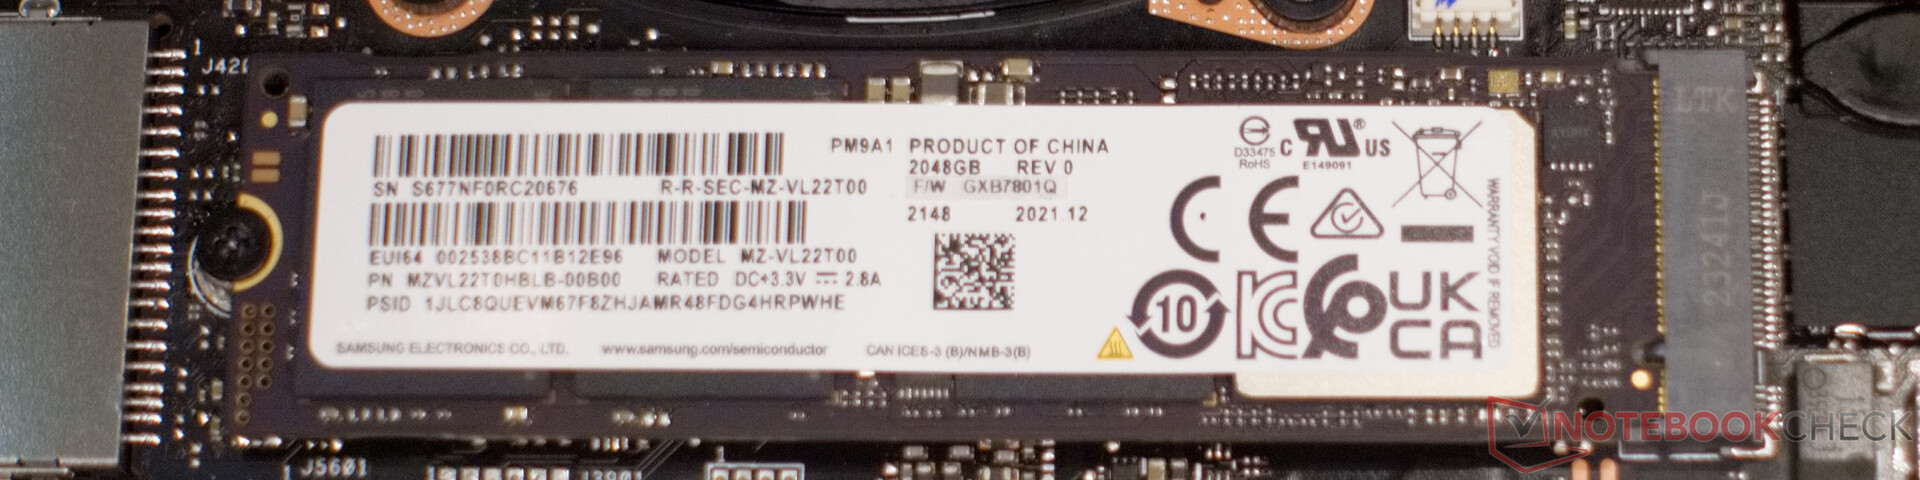
En principio, la Samsung PM9A1 es una potente unidad SSD NVMe. En nuestro dispositivo de pruebas se ha instalado un módulo con una capacidad de 2 TB. Todas las velocidades de lectura y escritura son buenas en nuestras pruebas, aunque notamos un ligero descenso en las velocidades de escritura 4K en comparación con otros portátiles. En lectura y escritura secuencial, la SSD se encuentra en plena forma y sin ninguna caída.

* ... más pequeño es mejor
Sustained read performance: DiskSpd Read Loop, Queue Depth 8
Tarjeta gráfica
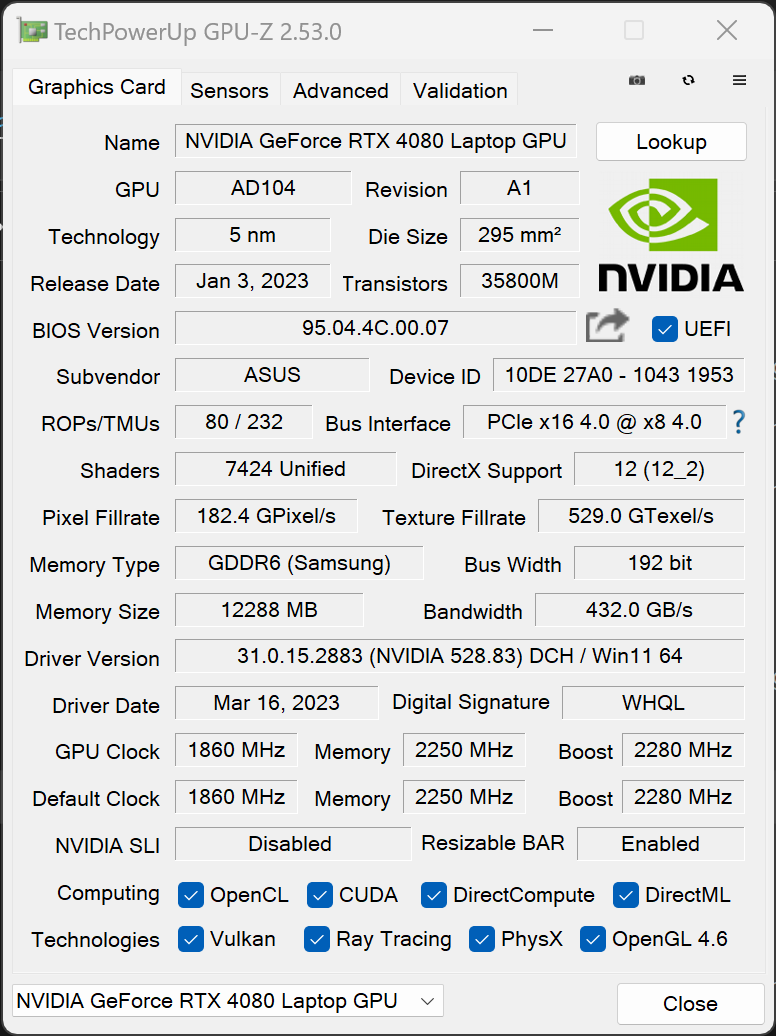
La RTX 4080 en el Asus Zenbook Pro 16X proporciona 12 GB de RAM GDDR6X. Esto significa que la unidad gráfica aquí es mucho más adecuada para la edición de vídeo que la RTX 3060 en el predecesorgracias a una fuente de alimentación de hasta 140 vatios, el chip gráfico está claramente en el rango superior de su espectro de rendimiento. Nvidia ofrece hasta 150 vatios para el chip, lo que también se nota en nuestros benchmarks 3DMark, Blender y PugetBench. El Zenbook consigue puntuaciones altas en todas las aplicaciones. En algunos escenarios, incluso está a una distancia sorprendente de la RTX 4090 del Asus ROG Zephyrus M16sólo el Lenovo Legion Pro 7 y el Asus ROG Strix G16destacan realmente en las pruebas.
Una de nuestras críticas más fuertes al predecesor ha sido eliminada gracias al chip gráfico significativamente más potente. La Nvidia RTX 4080 es una opción sólida en este caso y también es adecuada para jugar a una resolución de pantalla nativa de 3200 × 2000.
| 3DMark 11 Performance | 42771 puntos | |
| 3DMark Cloud Gate Standard Score | 61442 puntos | |
| 3DMark Fire Strike Score | 31314 puntos | |
| 3DMark Time Spy Score | 16666 puntos | |
ayuda | ||
* ... más pequeño es mejor
| Premiere Pro PugetBench - Overall Score 0.98 | |
| Asus Zenbook Pro 16X UX7602BZ-MY005W | |
| Apple MacBook Pro 16 2023 M3 Max | |
| Apple MacBook Pro 14 2023 M3 | |
Rendimiento en juegos
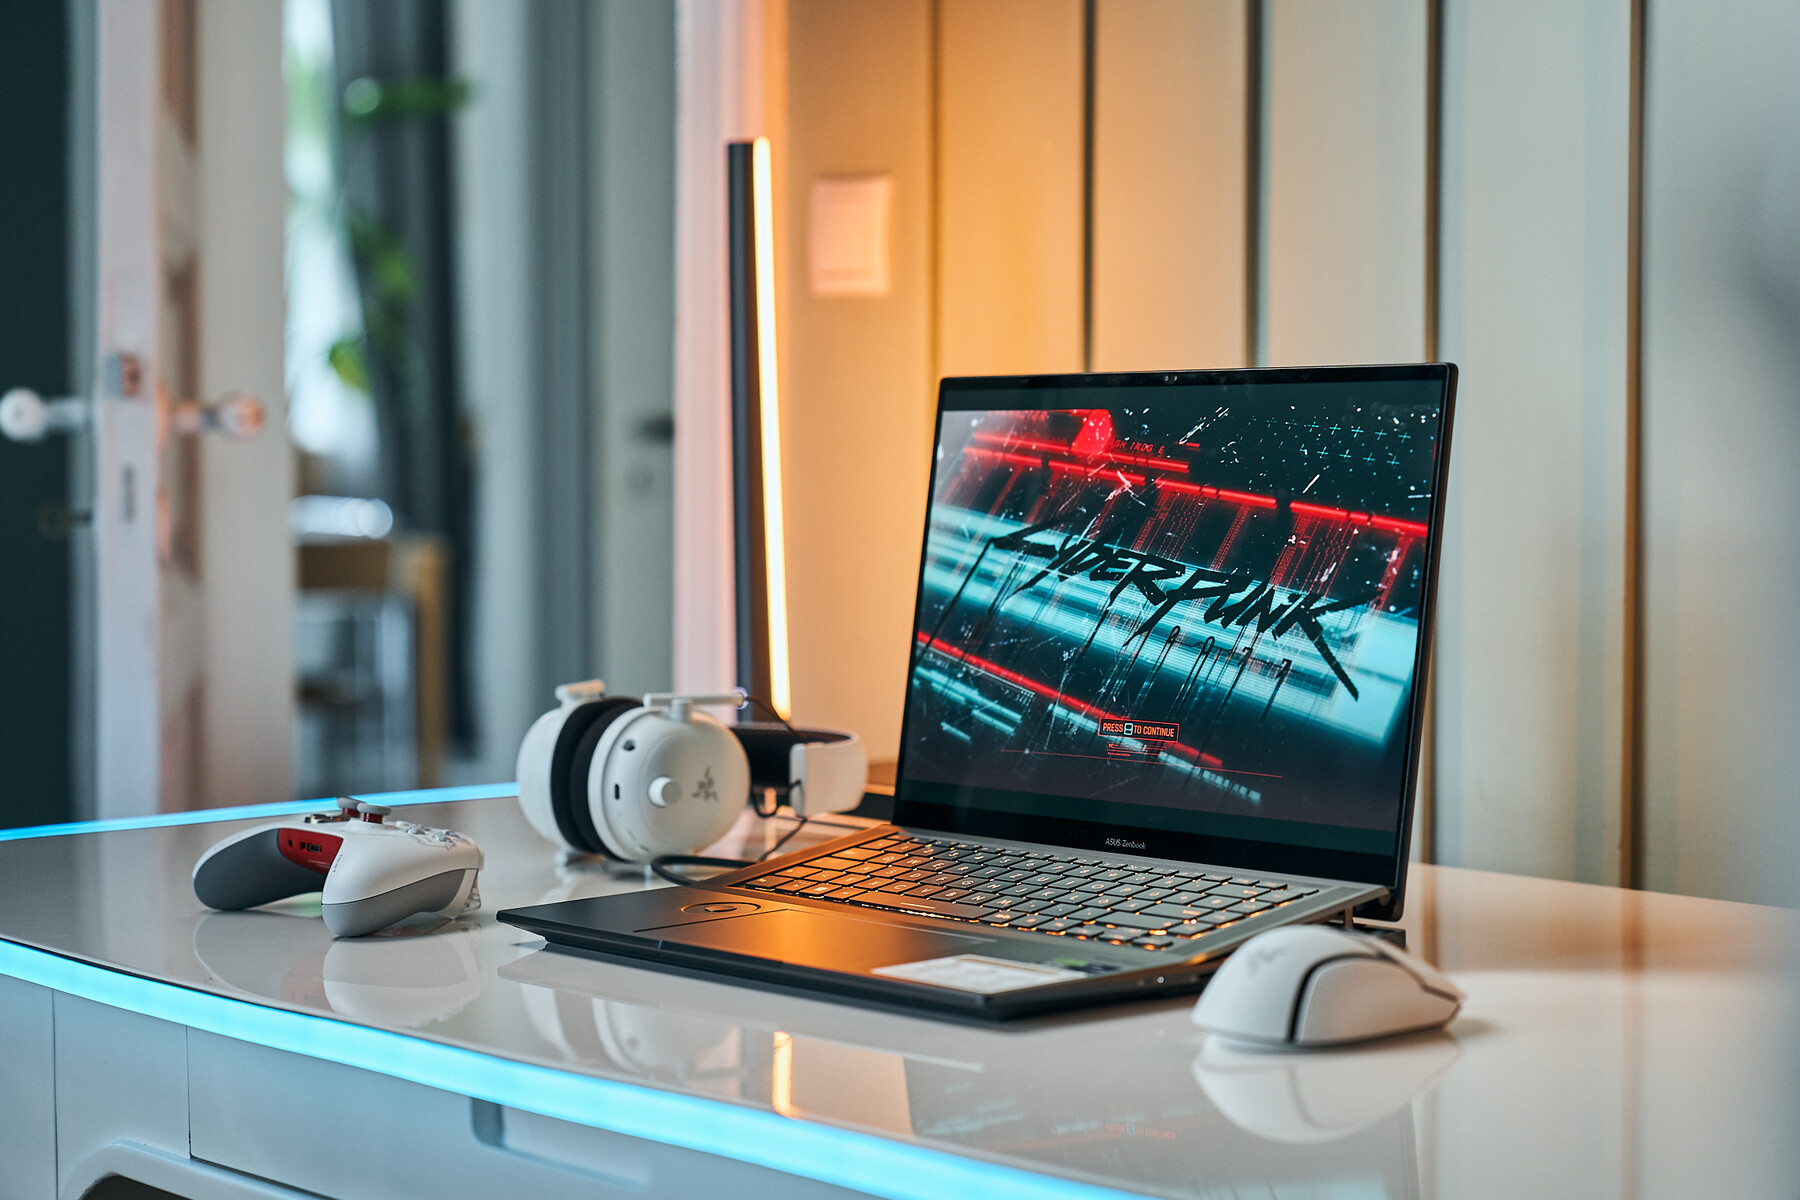
los juegos 4K no presentan ninguna dificultad para el Asus Zenbook Pro 16X. El trazado de rayos también suele ser posible. SóloCyberpunk yAlan Wake 2 ponen un poco de rodillas al portátil, aunque las velocidades de fotogramas se mantienen en unos razonablemente jugables 30 fps. La resolución QHD nativa de la pantalla funciona a 60 fps en todos los juegos y ajustes probados. El delgado portátil demuestra ser un potente portátil para juegos en los puntos de referencia y también en nuestra transmisión en directo en YouTube.
Witcher 3 FPS chart
| bajo | medio | alto | ultra | QHD | 4K DLSS | 4K | |
|---|---|---|---|---|---|---|---|
| GTA V (2015) | 184.4 | 184.2 | 180.2 | 132.1 | 115.3 | 159.7 | |
| The Witcher 3 (2015) | 172.4 | 131.4 | 114.2 | ||||
| Dota 2 Reborn (2015) | 176.2 | 152.4 | 146 | 138.3 | 138.7 | ||
| Final Fantasy XV Benchmark (2018) | 201 | 180.1 | 152.9 | 123.3 | |||
| X-Plane 11.11 (2018) | 138.1 | 122.3 | 95.3 | 82.8 | |||
| Strange Brigade (2018) | 444 | 349 | 324 | 297 | 221 | 144.3 | |
| Shadow of the Tomb Raider (2018) | 176 | 142 | 79 | ||||
| Far Cry 6 (2021) | 130 | 110 | 70 | ||||
| Tiny Tina's Wonderlands (2022) | 144.93 | 105.29 | 55.65 | ||||
| Call of Duty Modern Warfare 2 2022 (2022) | 148 | 108 | 65 | ||||
| F1 23 (2023) | 236 | 238 | 227 | 90.8 | 60 | 65.1 | |
| Cyberpunk 2077 (2023) | 109.17 | 71.31 | 30.89 | ||||
| Alan Wake 2 (2023) | 76.7 | 66.8 | 34.3 | 34.9 |
Emisiones - El Zenbook es silencioso como un susurro a petición
Ruido
El Zenbook se mantiene en un nivel de ruido muy agradable con una carga de ligera a media. A una distancia de 15 cm sólo medimos 38 dB(A). Bajo carga completa en modo Estándar , el portátil es claramente audible con 41 dB(A), pero no es perturbadoramente ruidoso. Sólo en el modo Rendimiento los ventiladores se aceleran al máximo y generan hasta 51 dB(A). Las frecuencias medias y bajas son audibles en todos los rangos de velocidad, por lo que el ruido de fondo es más bien un silbido agradable.
Ruido
| Ocioso |
| 24.9 / 24.9 / 24.9 dB(A) |
| Carga |
| 38 / 51 dB(A) |
 | ||
30 dB silencioso 40 dB(A) audible 50 dB(A) ruidosamente alto |
||
min: | ||
| Asus Zenbook Pro 16X UX7602BZ-MY005W GeForce RTX 4080 Laptop GPU, i9-13905H, Samsung PM9A1 MZVL22T0HBLB | Asus ZenBook Pro 16X OLED UX7602ZM-ME115W GeForce RTX 3060 Laptop GPU, i9-12900H, Samsung PM9A1 MZVL21T0HCLR | Asus ROG Strix G16 G614JZ GeForce RTX 4080 Laptop GPU, i9-13980HX, WD PC SN560 SDDPNQE-1T00 | Asus ROG Zephyrus M16 GU604VY-NM042X GeForce RTX 4090 Laptop GPU, i9-13900H, Samsung PM9A1 MZVL22T0HBLB | MSI Stealth 17 Studio A13VH-014 GeForce RTX 4080 Laptop GPU, i9-13900H, Samsung PM9A1 MZVL22T0HBLB | Lenovo Legion Pro 7 RTX4090 GeForce RTX 4090 Laptop GPU, i9-13900HX, Samsung PM9A1 MZVL21T0HCLR | Lenovo Legion Slim 7i 16 Gen 8 GeForce RTX 4070 Laptop GPU, i9-13900H, Samsung PM9A1 MZVL21T0HCLR | Asus Vivobook Pro 16X K6604JV-MX016W GeForce RTX 4060 Laptop GPU, i9-13980HX, Solidigm P41 Plus SSDPFKNU010TZ | |
|---|---|---|---|---|---|---|---|---|
| Noise | -8% | -11% | -10% | 5% | -20% | 6% | -14% | |
| apagado / medio ambiente * (dB) | 24.9 | 26 -4% | 25 -0% | 24 4% | 24 4% | 25 -0% | 22.8 8% | 25.2 -1% |
| Idle Minimum * (dB) | 24.9 | 26 -4% | 26 -4% | 24 4% | 24 4% | 28 -12% | 23.6 5% | 26.6 -7% |
| Idle Average * (dB) | 24.9 | 26 -4% | 28 -12% | 29.96 -20% | 24 4% | 30 -20% | 23.6 5% | 26.6 -7% |
| Idle Maximum * (dB) | 24.9 | 26 -4% | 30 -20% | 34.27 -38% | 24 4% | 38 -53% | 25.7 -3% | 29.2 -17% |
| Load Average * (dB) | 38 | 48 -26% | 48 -26% | 35.89 6% | 34.49 9% | 48 -26% | 27.6 27% | 53.4 -41% |
| Load Maximum * (dB) | 51 | 54.6 -7% | 52 -2% | 57.54 -13% | 49.66 3% | 55 -8% | 54.4 -7% | 56.9 -12% |
| Witcher 3 ultra * (dB) | 49 | 57.5 | 48.29 | 53 | 54.4 |
* ... más pequeño es mejor
Temperatura
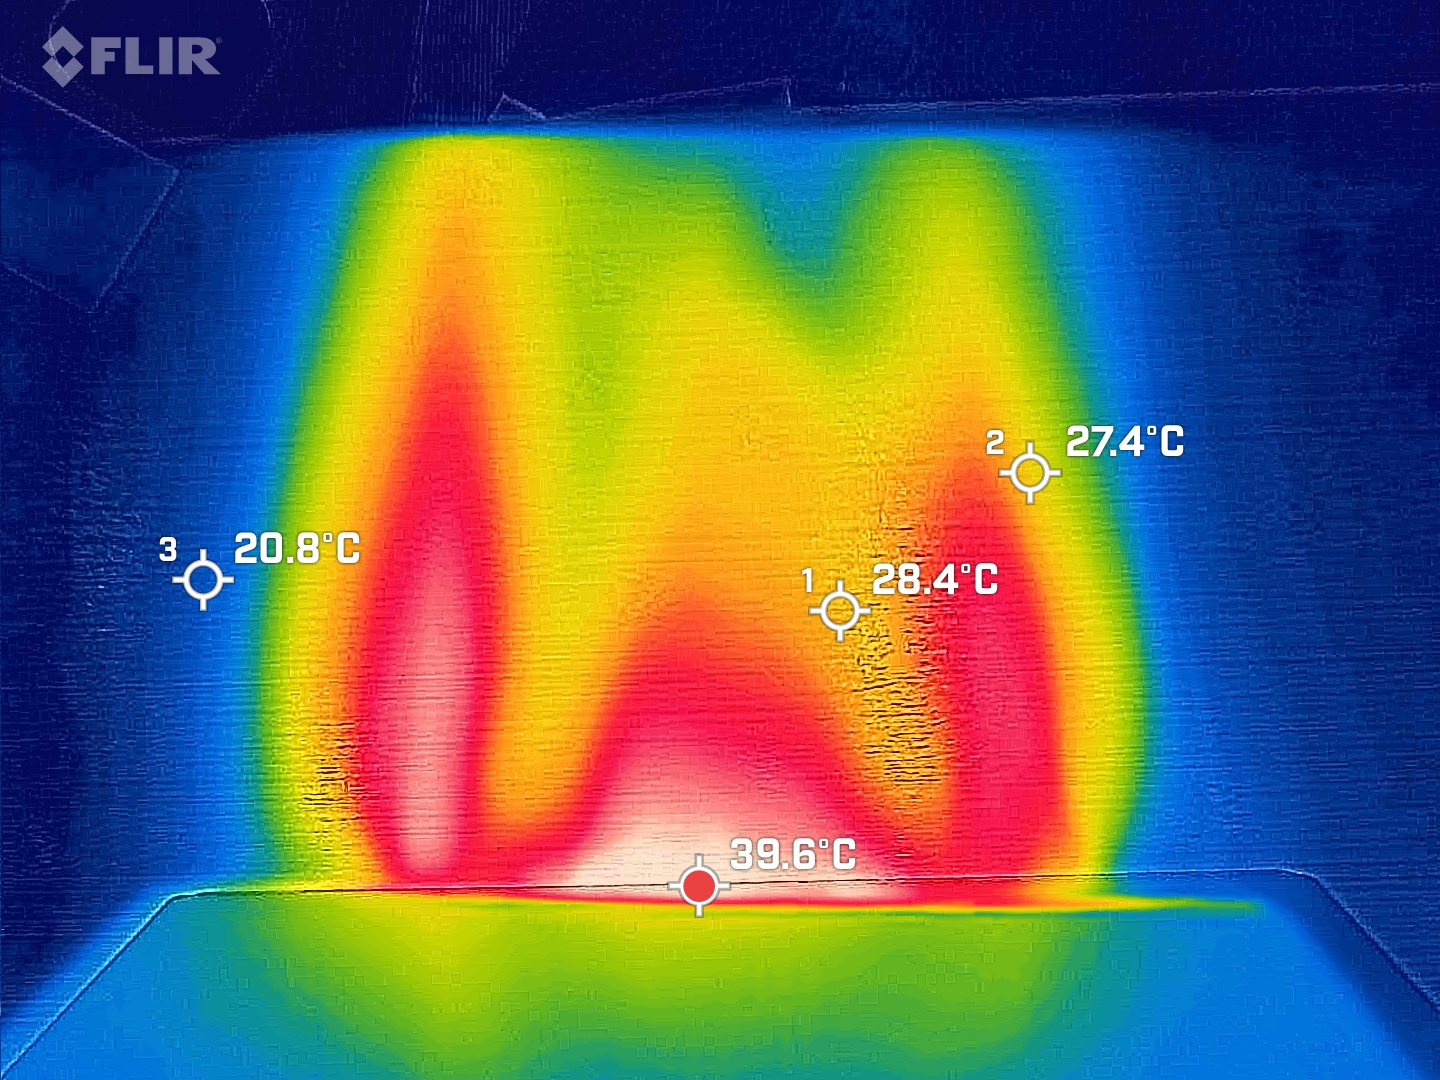
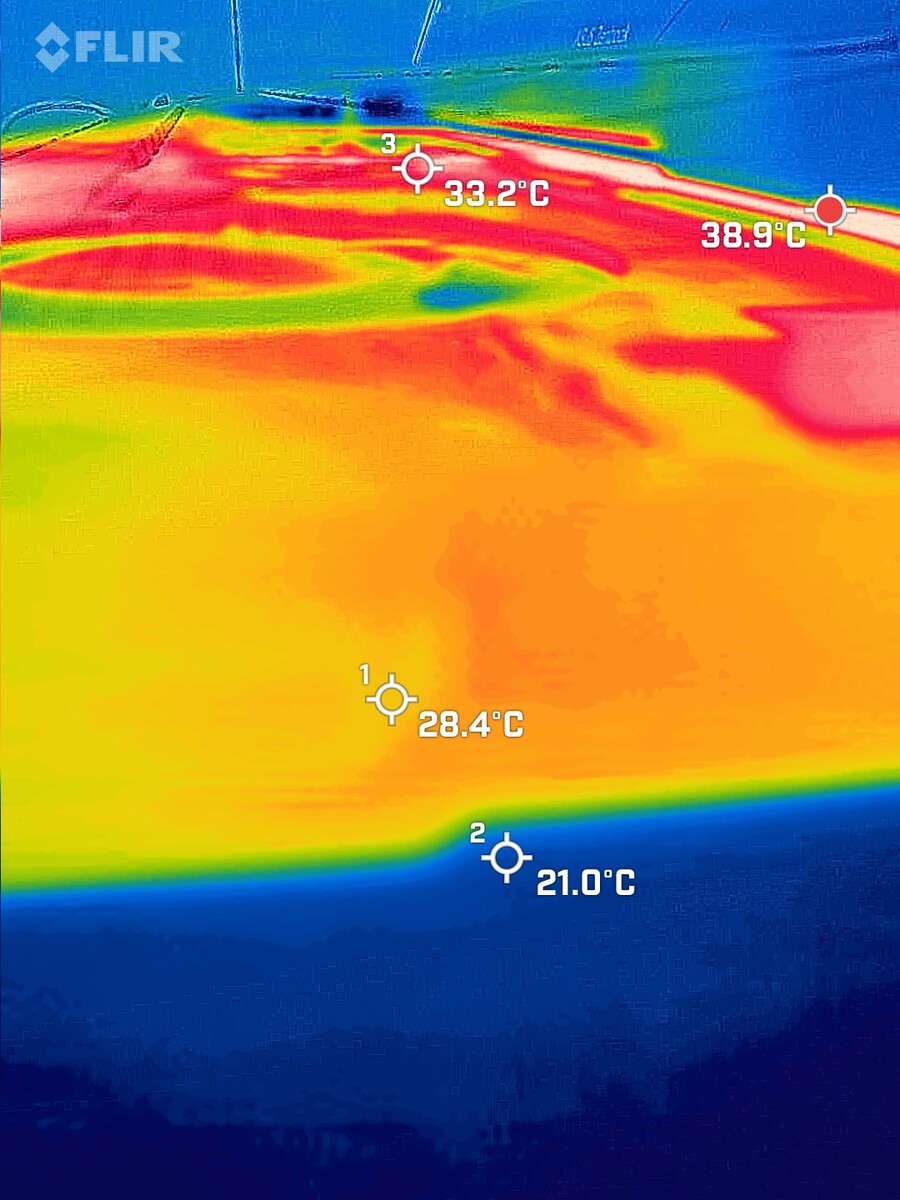
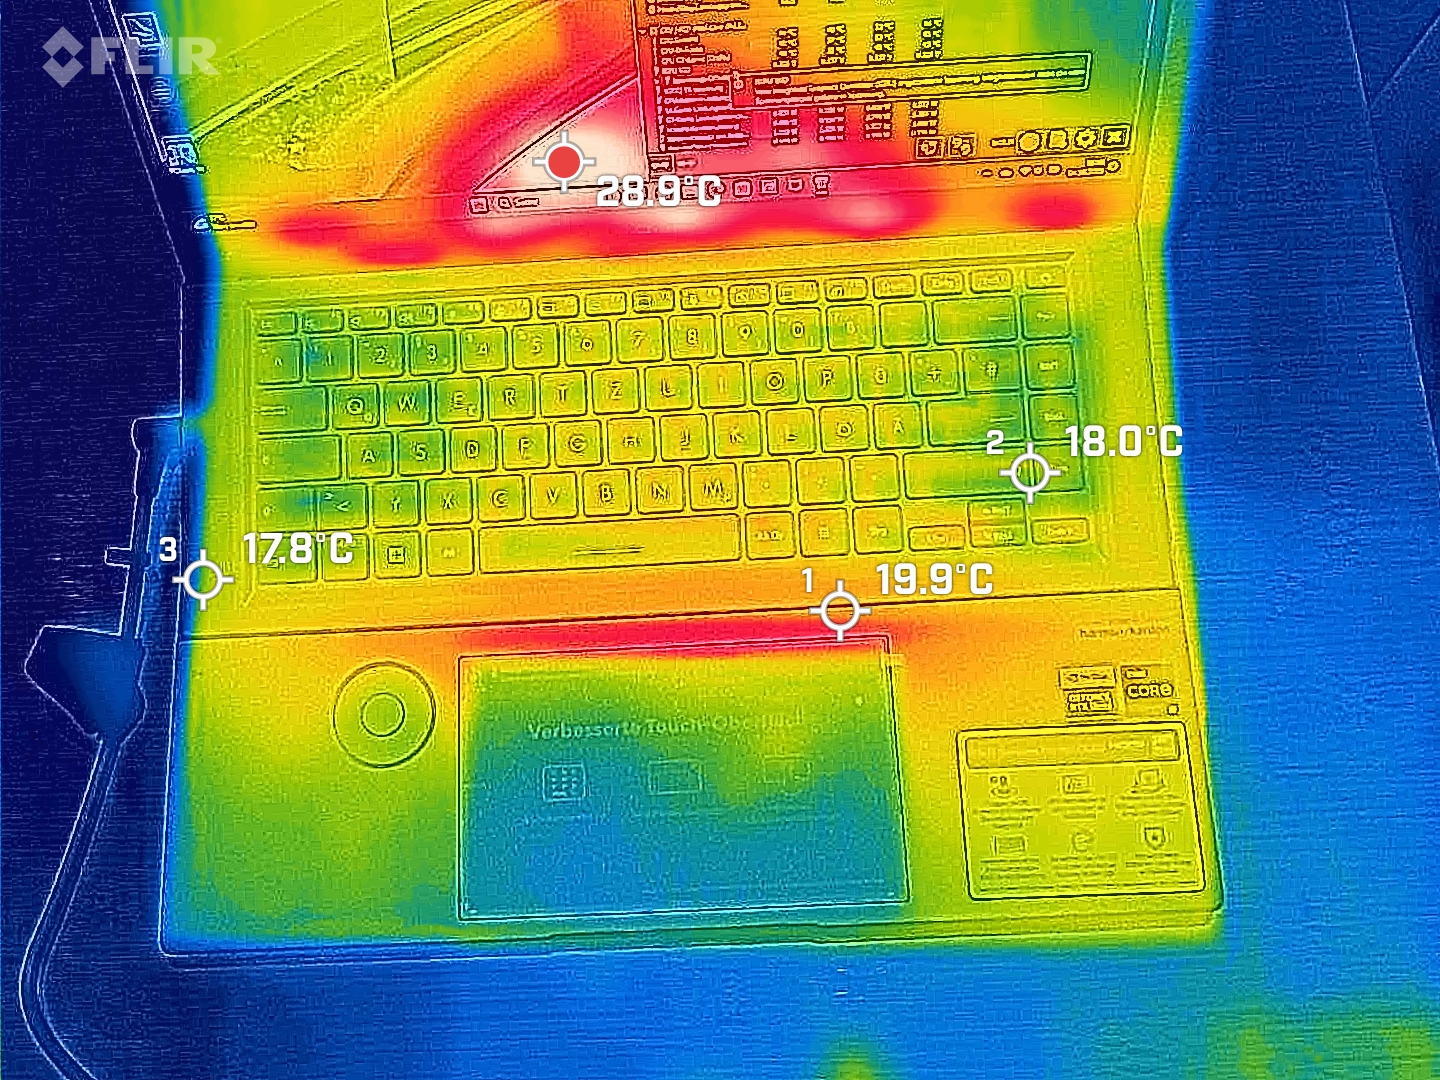
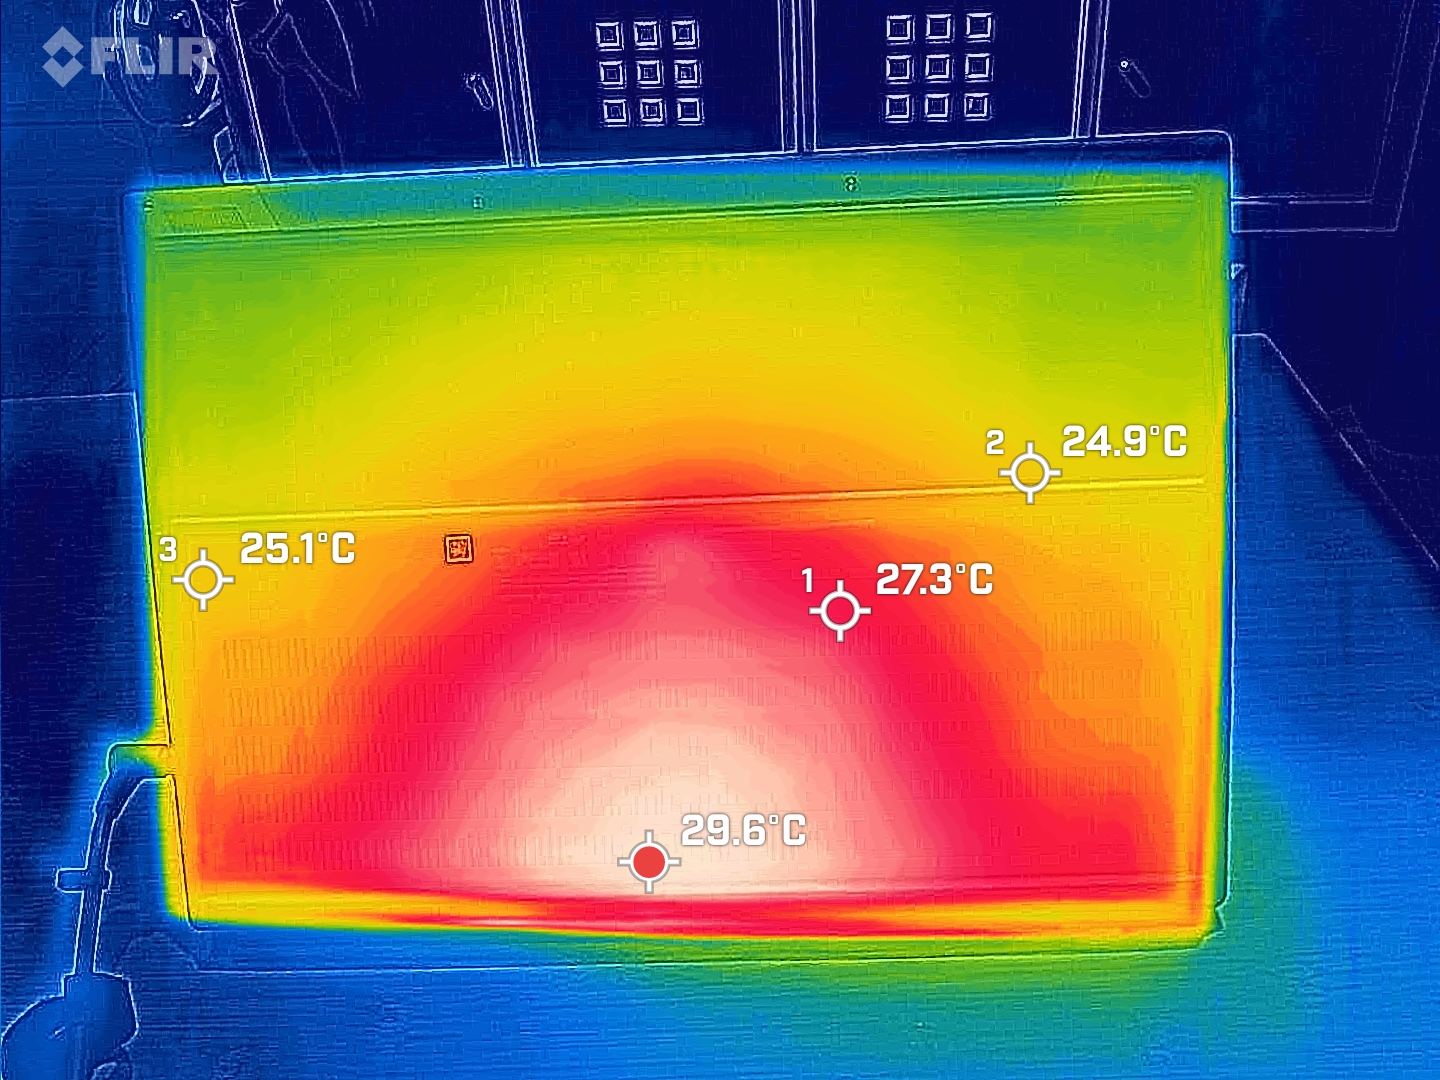
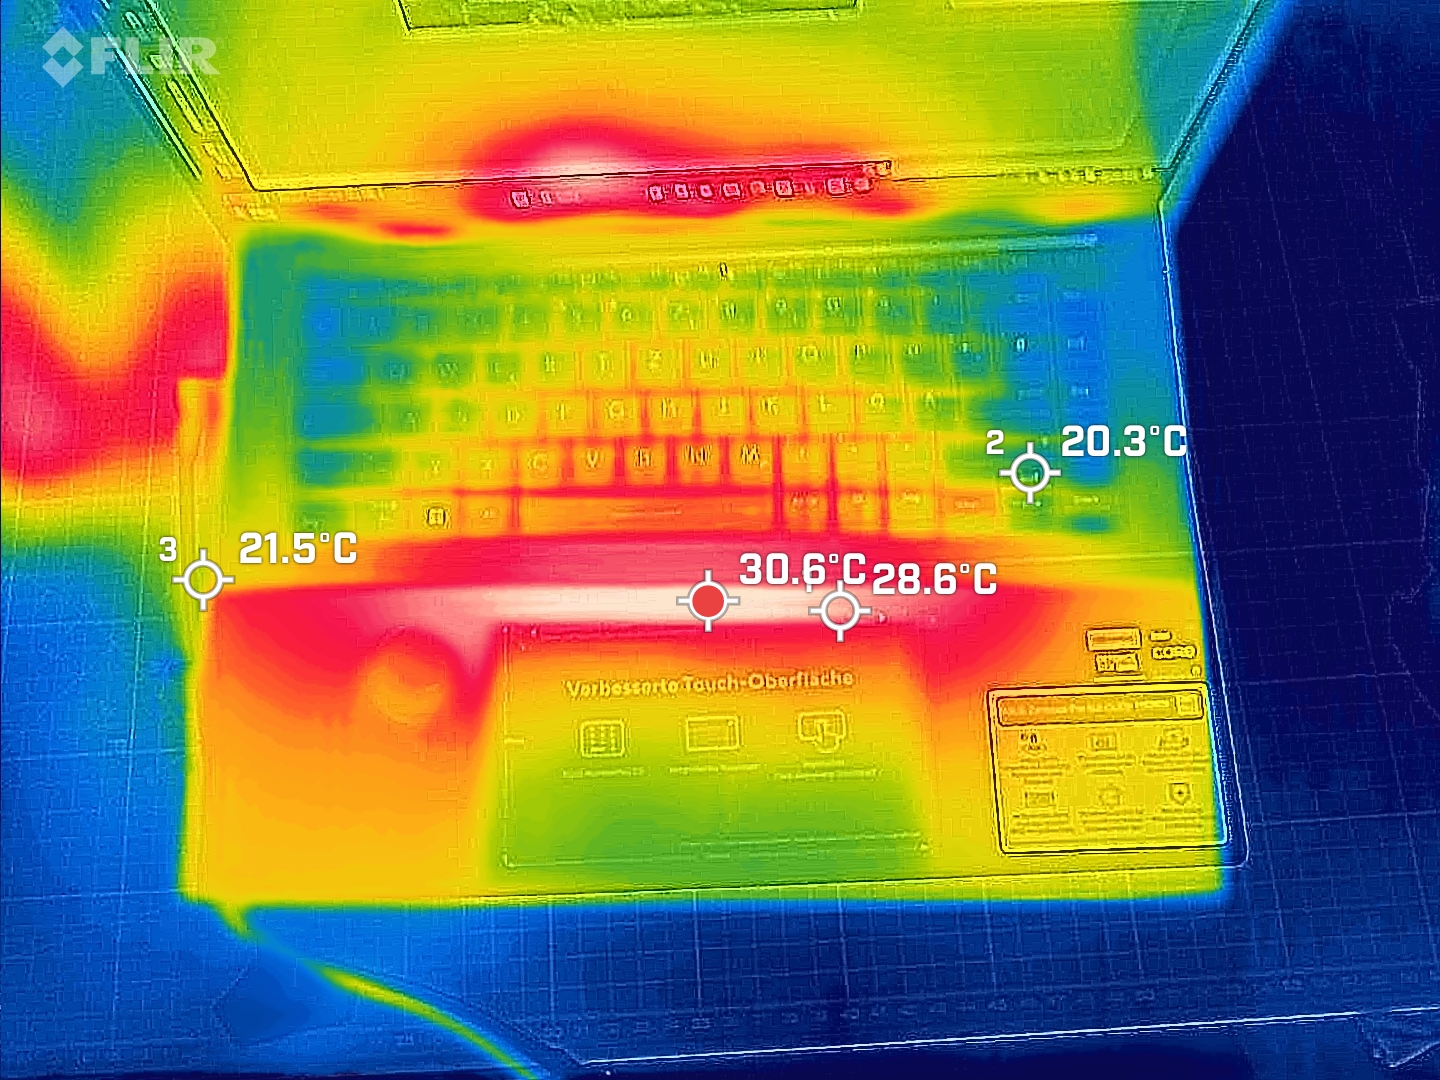
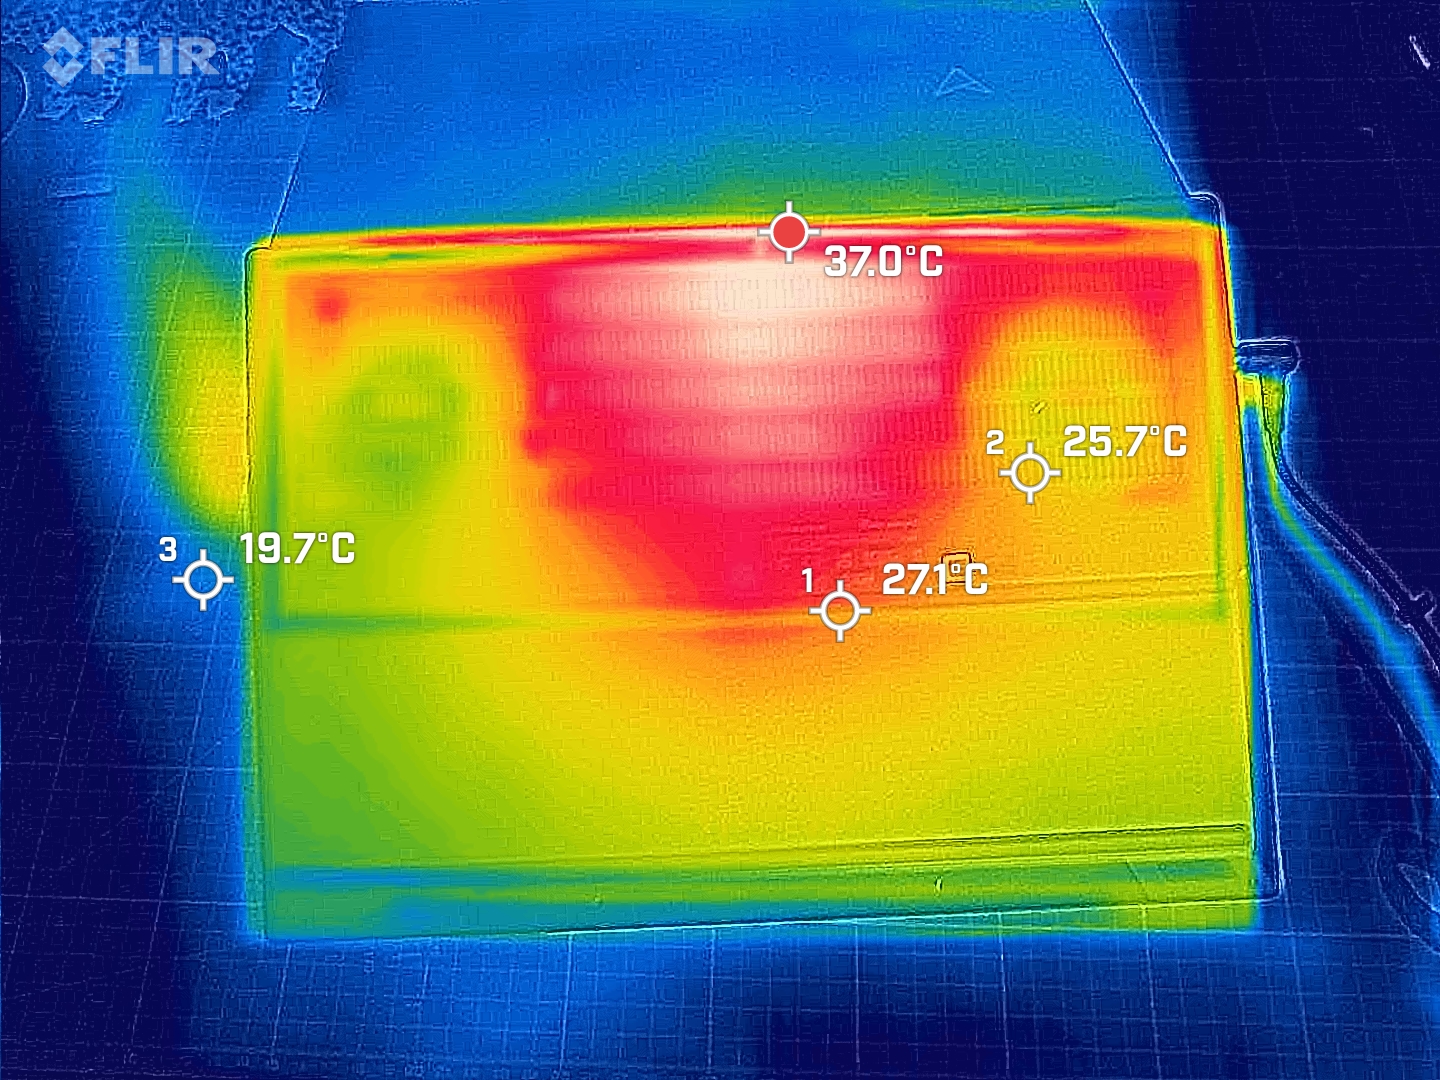
Una cosa particularmente notable del Zenbook Pro 16X es que el portátil calienta su entorno más que a sí mismo. El sistema de refrigeración es tan potente que el chasis del portátil, a un máximo de 36 °C, permanece tres grados más frío que el tablero de la mesa tras las rejillas de ventilación de la parte trasera en nuestra prueba de estrés. La imagen térmica también muestra claramente lo potentes que son los dos ventiladores del Zenbook.
La superficie del portátil también se mantuvo en gran medida fría durante nuestras pruebas. El teclado en particular está casi a temperatura ambiente gracias a la separación con el hardware. Un vistazo bajo el teclado con el Flir One Pro revela zonas más cálidas, pero incluso en el hueco medimos un máximo de 39 °C. Así, el Zenbook se mantiene sorprendentemente fresco a pesar de los 200 vatios de potencia extraídos del zócalo.
(+) La temperatura máxima en la parte superior es de 28.2 °C / 83 F, frente a la media de 40.4 °C / 105 F, que oscila entre 21.2 y 68.8 °C para la clase Gaming.
(+) El fondo se calienta hasta un máximo de 35.1 °C / 95 F, frente a la media de 43.2 °C / 110 F
(+) En reposo, la temperatura media de la parte superior es de 22.8 °C / 73# F, frente a la media del dispositivo de 33.9 °C / 93 F.
(+) El reposamanos y el panel táctil están a una temperatura inferior a la de la piel, con un máximo de 26.1 °C / 79 F y, por tanto, son fríos al tacto.
(+) La temperatura media de la zona del reposamanos de dispositivos similares fue de 28.8 °C / 83.8 F (+2.7 °C / 4.8 F).
| Asus Zenbook Pro 16X UX7602BZ-MY005W Intel Core i9-13905H, NVIDIA GeForce RTX 4080 Laptop GPU | Asus ZenBook Pro 16X OLED UX7602ZM-ME115W Intel Core i9-12900H, NVIDIA GeForce RTX 3060 Laptop GPU | Asus ROG Strix G16 G614JZ Intel Core i9-13980HX, NVIDIA GeForce RTX 4080 Laptop GPU | Asus ROG Zephyrus M16 GU604VY-NM042X Intel Core i9-13900H, NVIDIA GeForce RTX 4090 Laptop GPU | MSI Stealth 17 Studio A13VH-014 Intel Core i9-13900H, NVIDIA GeForce RTX 4080 Laptop GPU | Lenovo Legion Pro 7 RTX4090 Intel Core i9-13900HX, NVIDIA GeForce RTX 4090 Laptop GPU | Lenovo Legion Slim 7i 16 Gen 8 Intel Core i9-13900H, NVIDIA GeForce RTX 4070 Laptop GPU | Asus Vivobook Pro 16X K6604JV-MX016W Intel Core i9-13980HX, NVIDIA GeForce RTX 4060 Laptop GPU | |
|---|---|---|---|---|---|---|---|---|
| Heat | -22% | -45% | -36% | -38% | -51% | -35% | -39% | |
| Maximum Upper Side * (°C) | 28.2 | 32 -13% | 54 -91% | 50 -77% | 47 -67% | 53 -88% | 49.8 -77% | 39.7 -41% |
| Maximum Bottom * (°C) | 35.1 | 41.6 -19% | 55 -57% | 58 -65% | 54 -54% | 59 -68% | 48.8 -39% | 60 -71% |
| Idle Upper Side * (°C) | 24.6 | 32.6 -33% | 29 -18% | 26 -6% | 30 -22% | 34 -38% | 29.4 -20% | 30.9 -26% |
| Idle Bottom * (°C) | 29.4 | 36 -22% | 33 -12% | 28 5% | 32 -9% | 32 -9% | 30 -2% | 34.7 -18% |
* ... más pequeño es mejor
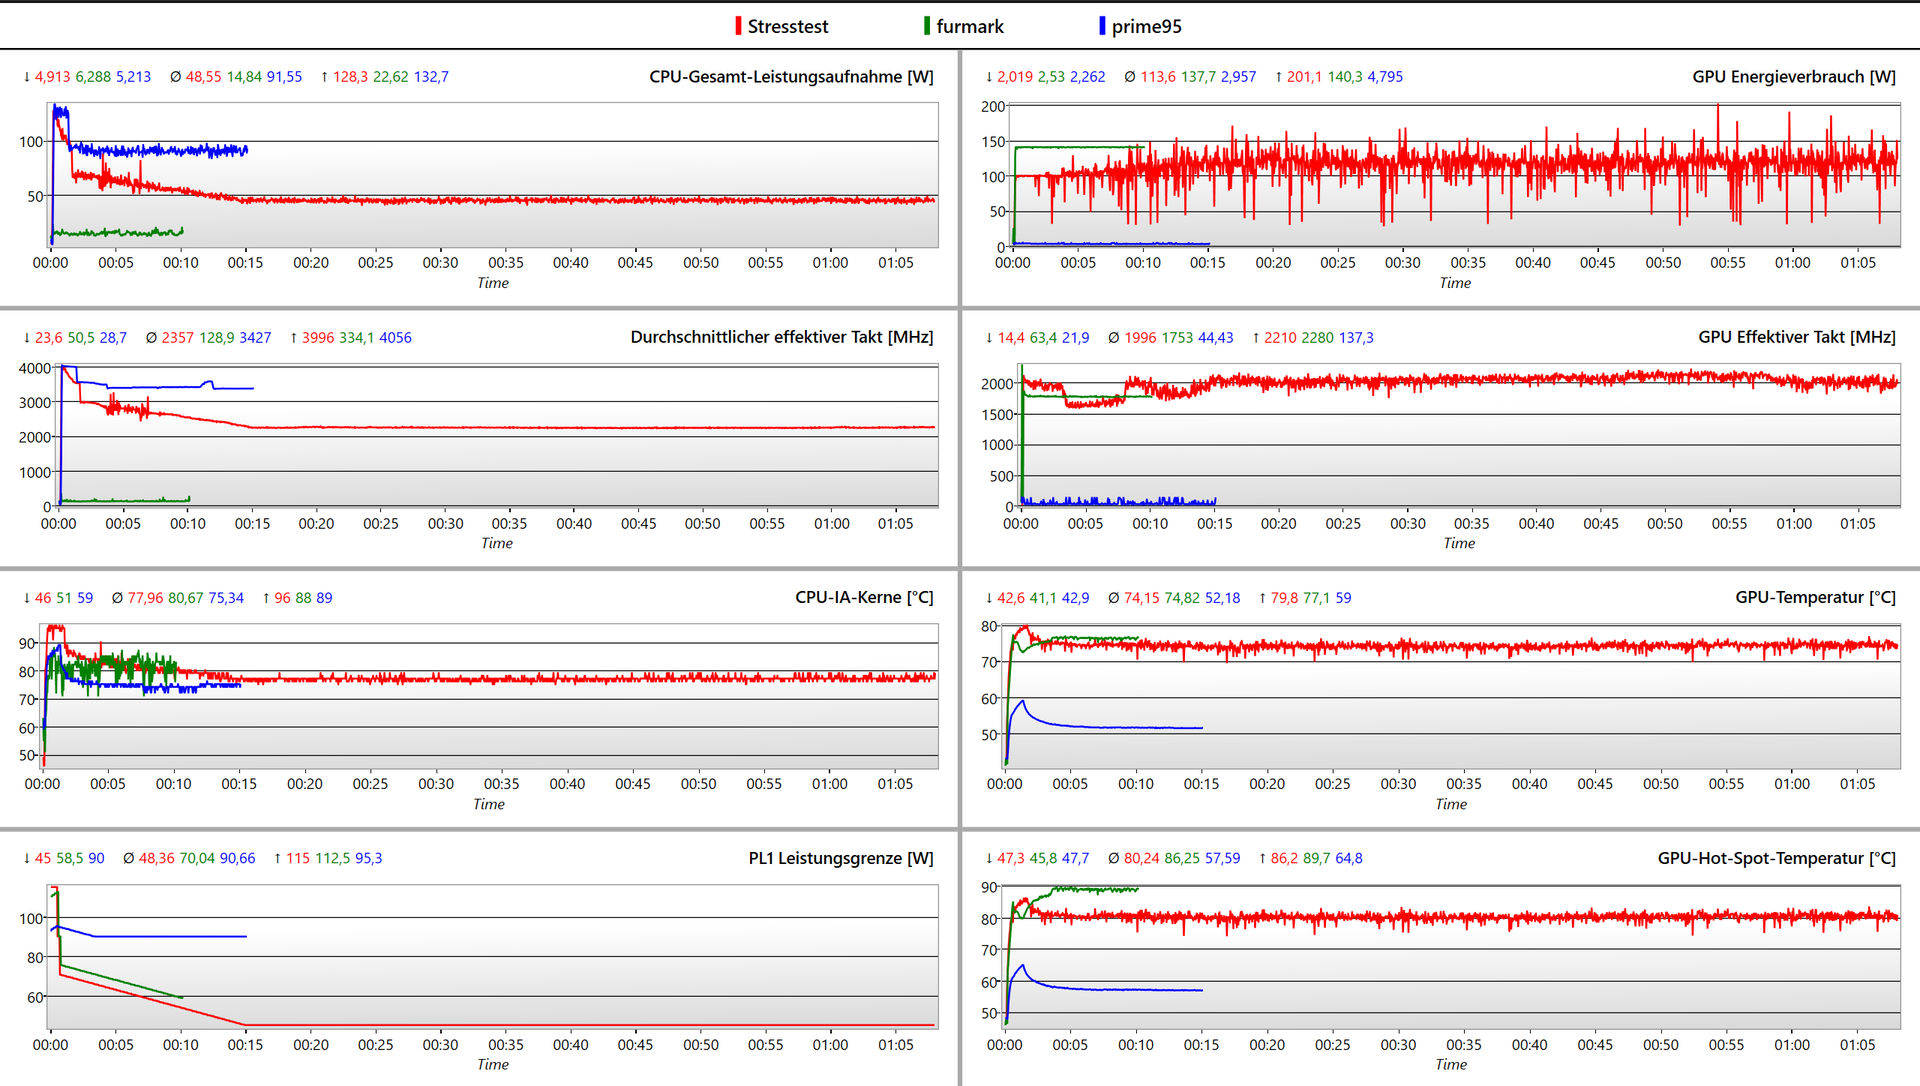
Pruebas de estrés
Aunque se alcanza un equilibrio con relativa rapidez en las pruebas de estrés individuales Prime95 o Furmark, el Zenbook desplaza el rendimiento de la CPU a la GPU con bastante lentitud en ambas pruebas. ElIntel Core i9-13905Hestá en modo boost durante casi dos minutos. Sólo en Prime95 esto supone unos 125 vatios; si Furmark también se está ejecutando, la potencia boost baja de 126 vatios a 100 vatios. En las pruebas de estrés con ambos programas ejecutándose al mismo tiempo, se alcanza un equilibrio inicial al cabo de dos minutos con 70 vatios para el procesador y 100 vatios para la RTX 4080. Sin embargo, el rendimiento sigue cambiando gradualmente durante los 12 minutos siguientes, en los que el rendimiento de la CPU desciende unos 25 vatios mientras que el de la GPU aumenta hasta una media de 120 vatios.
Las temperaturas de la CPU y la GPU se mantienen dentro de los límites en todas las pruebas, en torno a los 75 °C. LaNvidia GeForce RTX 4080's ligeramente más alta temperatura de 90 °C en la prueba de estrés Furmark nos causó algunas molestias. En casos especiales en los que sólo se somete a estrés la tarjeta gráfica durante largos periodos de tiempo, el rendimiento puede verse ligeramente afectado.
Altavoces
Hay cuatro módulos de altavoces con seis controladores en el Zenbook Pro 16X. Los altavoces de agudos están situados a la izquierda y a la derecha del teclado y dos altavoces de rango completo con dos controladores cada uno en la base. El resultado global es una calidad de sonido bien redondeada. Con unos 88 dB(A), el Zenbook también puede llegar a ser bastante ruidoso y no tiene por qué rehuir la comparación con el MacBook Pro 16.
Asus Zenbook Pro 16X UX7602BZ-MY005W análisis de audio
(+) | los altavoces pueden reproducir a un volumen relativamente alto (#88.5 dB)
Graves 100 - 315 Hz
(±) | lubina reducida - en promedio 9.8% inferior a la mediana
(±) | la linealidad de los graves es media (7.7% delta a frecuencia anterior)
Medios 400 - 2000 Hz
(+) | medios equilibrados - a sólo 1.6% de la mediana
(+) | los medios son lineales (4.5% delta a la frecuencia anterior)
Altos 2 - 16 kHz
(+) | máximos equilibrados - a sólo 2.1% de la mediana
(+) | los máximos son lineales (3.3% delta a la frecuencia anterior)
Total 100 - 16.000 Hz
(+) | el sonido global es lineal (8.1% de diferencia con la mediana)
En comparación con la misma clase
» 1% de todos los dispositivos probados de esta clase eran mejores, 1% similares, 98% peores
» El mejor tuvo un delta de 6%, la media fue 18%, el peor fue ###max##%
En comparación con todos los dispositivos probados
» 2% de todos los dispositivos probados eran mejores, 1% similares, 98% peores
» El mejor tuvo un delta de 4%, la media fue 24%, el peor fue ###max##%
Apple MacBook Pro 16 2021 M1 Pro análisis de audio
(+) | los altavoces pueden reproducir a un volumen relativamente alto (#84.7 dB)
Graves 100 - 315 Hz
(+) | buen bajo - sólo 3.8% lejos de la mediana
(+) | el bajo es lineal (5.2% delta a la frecuencia anterior)
Medios 400 - 2000 Hz
(+) | medios equilibrados - a sólo 1.3% de la mediana
(+) | los medios son lineales (2.1% delta a la frecuencia anterior)
Altos 2 - 16 kHz
(+) | máximos equilibrados - a sólo 1.9% de la mediana
(+) | los máximos son lineales (2.7% delta a la frecuencia anterior)
Total 100 - 16.000 Hz
(+) | el sonido global es lineal (4.6% de diferencia con la mediana)
En comparación con la misma clase
» 0% de todos los dispositivos probados de esta clase eran mejores, 0% similares, 100% peores
» El mejor tuvo un delta de 5%, la media fue 17%, el peor fue ###max##%
En comparación con todos los dispositivos probados
» 0% de todos los dispositivos probados eran mejores, 0% similares, 100% peores
» El mejor tuvo un delta de 4%, la media fue 24%, el peor fue ###max##%
Gestión de la energía - Un hardware potente requiere un gran aporte de energía
Consumo de energía
Asus incluye una fuente de alimentación de 280 vatios con el Zenbook Pro 16X. Por una buena razón, como pronto descubrimos en nuestras mediciones de energía. El portátil extrae hasta 262 vatios en las pruebas de estrés. A plena carga, el consumo de energía del portátil se mantiene constante en torno a los 200 vatios. Esto es completamente apropiado a la vista de la potencia de cálculo que ofrece.
El campo de comparación también muestra que el Zenbook puede ser bastante económico en modo inactivo y bajo cargas bajas.
| Off / Standby | |
| Ocioso | |
| Carga |
|
Clave:
min: | |
| Asus Zenbook Pro 16X UX7602BZ-MY005W i9-13905H, GeForce RTX 4080 Laptop GPU, Samsung PM9A1 MZVL22T0HBLB, OLED, 3200x2000, 16" | Asus ZenBook Pro 16X OLED UX7602ZM-ME115W i9-12900H, GeForce RTX 3060 Laptop GPU, Samsung PM9A1 MZVL21T0HCLR, OLED, 3840x2400, 16" | Asus ROG Strix G16 G614JZ i9-13980HX, GeForce RTX 4080 Laptop GPU, WD PC SN560 SDDPNQE-1T00, IPS, 2560x1600, 16" | Asus ROG Zephyrus M16 GU604VY-NM042X i9-13900H, GeForce RTX 4090 Laptop GPU, Samsung PM9A1 MZVL22T0HBLB, IPS, 2560x1600, 16" | MSI Stealth 17 Studio A13VH-014 i9-13900H, GeForce RTX 4080 Laptop GPU, Samsung PM9A1 MZVL22T0HBLB, Mini LED, 3840x2160, 17.3" | Lenovo Legion Pro 7 RTX4090 i9-13900HX, GeForce RTX 4090 Laptop GPU, Samsung PM9A1 MZVL21T0HCLR, IPS, 2560x1600, 16" | Lenovo Legion Slim 7i 16 Gen 8 i9-13900H, GeForce RTX 4070 Laptop GPU, Samsung PM9A1 MZVL21T0HCLR, IPS, 2560x1600, 16" | Asus Vivobook Pro 16X K6604JV-MX016W i9-13980HX, GeForce RTX 4060 Laptop GPU, Solidigm P41 Plus SSDPFKNU010TZ, OLED, 3200x2000, 16" | Medio NVIDIA GeForce RTX 4080 Laptop GPU | Media de la clase Gaming | |
|---|---|---|---|---|---|---|---|---|---|---|
| Power Consumption | 4% | -28% | -44% | -11% | -69% | -59% | -17% | -55% | -27% | |
| Idle Minimum * (Watt) | 9 | 11.1 -23% | 10 -11% | 20 -122% | 13.9 -54% | 20 -122% | 22 -144% | 13.8 -53% | 16.9 ? -88% | 13.2 ? -47% |
| Idle Average * (Watt) | 11.9 | 11.4 4% | 16 -34% | 24 -102% | 20 -68% | 25 -110% | 29 -144% | 16 -34% | 22 ? -85% | 18.9 ? -59% |
| Idle Maximum * (Watt) | 20.5 | 14.4 30% | 27 -32% | 25 -22% | 20.6 -0% | 35 -71% | 39.5 -93% | 19 7% | 34.1 ? -66% | 24.3 ? -19% |
| Load Average * (Watt) | 93.5 | 137.4 -47% | 129 -38% | 107 -14% | 77 18% | 136 -45% | 98.7 -6% | 147 -57% | 117.9 ? -26% | 108.3 ? -16% |
| Witcher 3 ultra * (Watt) | 195.7 | 136 31% | 247 -26% | 208 -6% | 162 17% | 282 -44% | 171.8 12% | 147.8 24% | ||
| Load Maximum * (Watt) | 267 | 197 26% | 342 -28% | 267 -0% | 216 19% | 320 -20% | 213.2 20% | 244 9% | 297 ? -11% | 254 ? 5% |
* ... más pequeño es mejor
Power consumption Witcher 3 / Stress test
Power consumption with an external monitor
Duración de las pilas
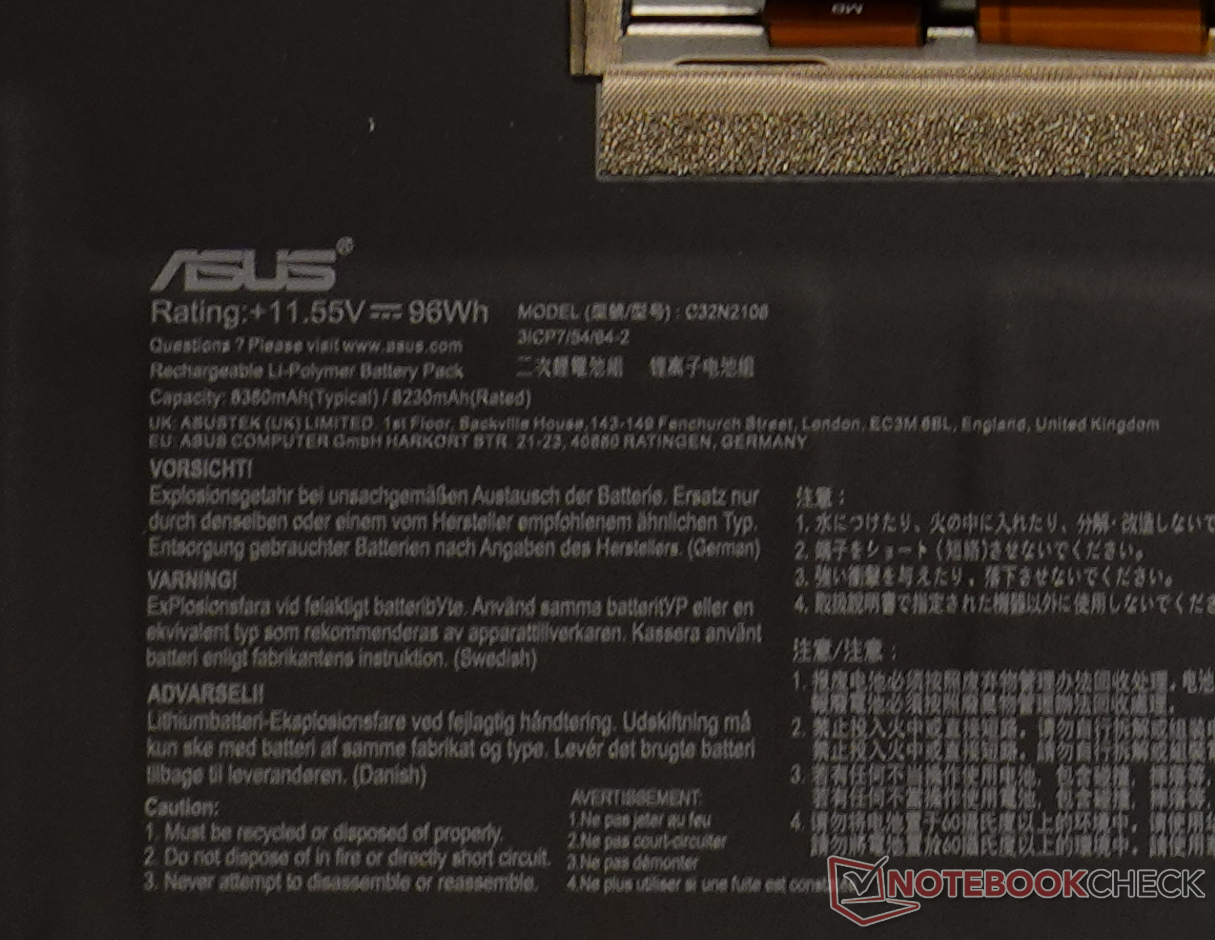
En el Zenbook se ha instalado una batería de 96 Wh, que incluso tiene el mismo número de pieza que su predecesoren nuestra prueba de navegación web por WiFi, el tiempo de autonomía alcanzado se redujo en una buena hora. Sólo en reposo el nuevo Zenbook dura poco más que su predecesor. No podrá aguantar un día entero de trabajo sin alimentación, pero al menos el Zenbook tiene mejor aguante en comparación con sus rivales. Siempre que no necesite extraer toda la energía del portátil sobre la marcha, al menos puede llevar una fuente de alimentación más pequeña o el banco de energía correspondiente gracias al USB-PD.
| Asus Zenbook Pro 16X UX7602BZ-MY005W i9-13905H, GeForce RTX 4080 Laptop GPU, 96 Wh | Asus ZenBook Pro 16X OLED UX7602ZM-ME115W i9-12900H, GeForce RTX 3060 Laptop GPU, 96 Wh | Asus ROG Strix G16 G614JZ i9-13980HX, GeForce RTX 4080 Laptop GPU, 90 Wh | Asus ROG Zephyrus M16 GU604VY-NM042X i9-13900H, GeForce RTX 4090 Laptop GPU, 90 Wh | MSI Stealth 17 Studio A13VH-014 i9-13900H, GeForce RTX 4080 Laptop GPU, 99 Wh | Lenovo Legion Pro 7 RTX4090 i9-13900HX, GeForce RTX 4090 Laptop GPU, 99.9 Wh | Lenovo Legion Slim 7i 16 Gen 8 i9-13900H, GeForce RTX 4070 Laptop GPU, 99.9 Wh | Asus Vivobook Pro 16X K6604JV-MX016W i9-13980HX, GeForce RTX 4060 Laptop GPU, 90 Wh | Media de la clase Gaming | |
|---|---|---|---|---|---|---|---|---|---|
| Duración de Batería | 6% | -16% | -13% | -31% | -35% | -56% | -28% | -28% | |
| Reader / Idle (h) | 13 | 12.7 -2% | 5.1 -61% | 8.71 ? -33% | |||||
| WiFi v1.3 (h) | 7.9 | 8.9 13% | 9.7 23% | 4.3 -46% | 5.6 -29% | 5.1 -35% | 4.4 -44% | 6.5 -18% | 7.04 ? -11% |
| Load (h) | 2.4 | 2.6 8% | 1.1 -54% | 2.9 21% | 1.6 -33% | 0.9 -62% | 1.5 -37% | 1.47 ? -39% | |
| H.264 (h) | 4.8 | 5.6 | 5.3 | 8.26 ? | |||||
| Witcher 3 ultra (h) | 2.6 |
Pro
Contra
Veredicto - Rendimiento casi sin concesiones
En el caso del predecesor, hicimos una afirmación clara: capacidades de alto rendimiento, pero potencial desaprovechado. Asus ha realizado enormes mejoras en este sentido. El nuevo Zenbook Pro 16X es más potente, más silencioso y no tiene por qué rehuir las estaciones de trabajo dedicadas y los jugadores. También es comparativamente compacto, y nuestro dispositivo de prueba es el mejor Zenbook que hemos analizado hasta ahora. Parece igualmente adecuado para creadores de contenidos y jugadores o para cualquiera que busque un portátil muy potente que siga siendo delgado. Sin embargo, se mantienen algunos puntos de crítica del año pasado: Asus ha aflojado considerablemente las riendas del control de potencia, pero los ventiladores siguen entrando en funcionamiento bastante tarde, lo que significa que se pierde un poco de tiempo de impulso. No obstante, el Zenbook se defiende claramente frente a dispositivos para juegos como el Lenovo Legion Slim 7i o el MSI Stealth.
El nuevo Zenbook Pro 16X puede describirse con razón como un buque insignia. Asus demuestra lo que es posible a pesar de un chasis de 18 mm de grosor.
El año pasado criticamos una serie de cosas menores del Zenbook y, por desgracia, se mantienen en el modelo actual. El portátil sigue sobrecargado de métodos de entrada que a veces interfieren entre sí. Los huecos entre los subpíxeles azules también siguen siendo visibles. La conectividad podría ser más amplia y, por último, el elevado precio de compra también merece críticas a ojos de algunos.
OLED, refrigeración AAS y un chasis delgado no pueden ser los únicos criterios de compra, ya que el Asus ROG Strix G16 y el Lenovo Legion Slim 7i 16 tienen características similares y ambos cuestan más de 1.000 dólares menos. Seguro que el Zenbook tiene una mayor selección de entradas y más metal para el chasis, pero la diferencia de precio aquí sigue pareciendo excesiva para todos aquellos que no quieran o necesiten utilizar toda la gama de funciones del Zenbook. Por otro lado, para todos aquellos que necesiten una tarjeta gráfica potente, una muy buena pantalla (táctil) y quizás también entrada de lápiz y el Asus Dial, el Zenbook se queda sin alternativa.
Precio y disponibilidad
El Zenbook Pro 16X está disponible actualmente en dos configuraciones. La configuración más débil con una Nvidia GeForce RTX 4070, 32 LPDDR5X RAM y 1 TB puede adquirirse a través de newgg por 2699,99 dólares. La configuración más potente con una RTX 4080, 32 GB de RAM y 2 TB tiene un precio de US$3.394,00 en Adorama.
Asus Zenbook Pro 16X UX7602BZ-MY005W
- 11/09/2023 v7 (old)
Marc Herter/ Alex Wätzel
Transparencia
La selección de los dispositivos que se van a reseñar corre a cargo de nuestro equipo editorial. La muestra de prueba fue proporcionada al autor en calidad de préstamo por el fabricante o el minorista a los efectos de esta reseña. El prestamista no tuvo ninguna influencia en esta reseña, ni el fabricante recibió una copia de la misma antes de su publicación. No había ninguna obligación de publicar esta reseña. Como empresa de medios independiente, Notebookcheck no está sujeta a la autoridad de fabricantes, minoristas o editores.
Así es como prueba Notebookcheck
Cada año, Notebookcheck revisa de forma independiente cientos de portátiles y smartphones utilizando procedimientos estandarizados para asegurar que todos los resultados son comparables. Hemos desarrollado continuamente nuestros métodos de prueba durante unos 20 años y hemos establecido los estándares de la industria en el proceso. En nuestros laboratorios de pruebas, técnicos y editores experimentados utilizan equipos de medición de alta calidad. Estas pruebas implican un proceso de validación en varias fases. Nuestro complejo sistema de clasificación se basa en cientos de mediciones y puntos de referencia bien fundamentados, lo que mantiene la objetividad.Price comparison

