Análisis del colorido EVOL X15 AT 23: Impresionante gamer QHD con Raptor Lake-HX y algunas peculiaridades imperdibles

Más popular por su gama de placas base y GPU para PC, Colorful empezó a ampliar sus horizontes para incluir portátiles Intel Alder Lake de 12ª generación. Este año, el gigante tecnológico chino ha actualizado su línea para ofrecer varias ofertas Raptor Lake de 13ª generación.
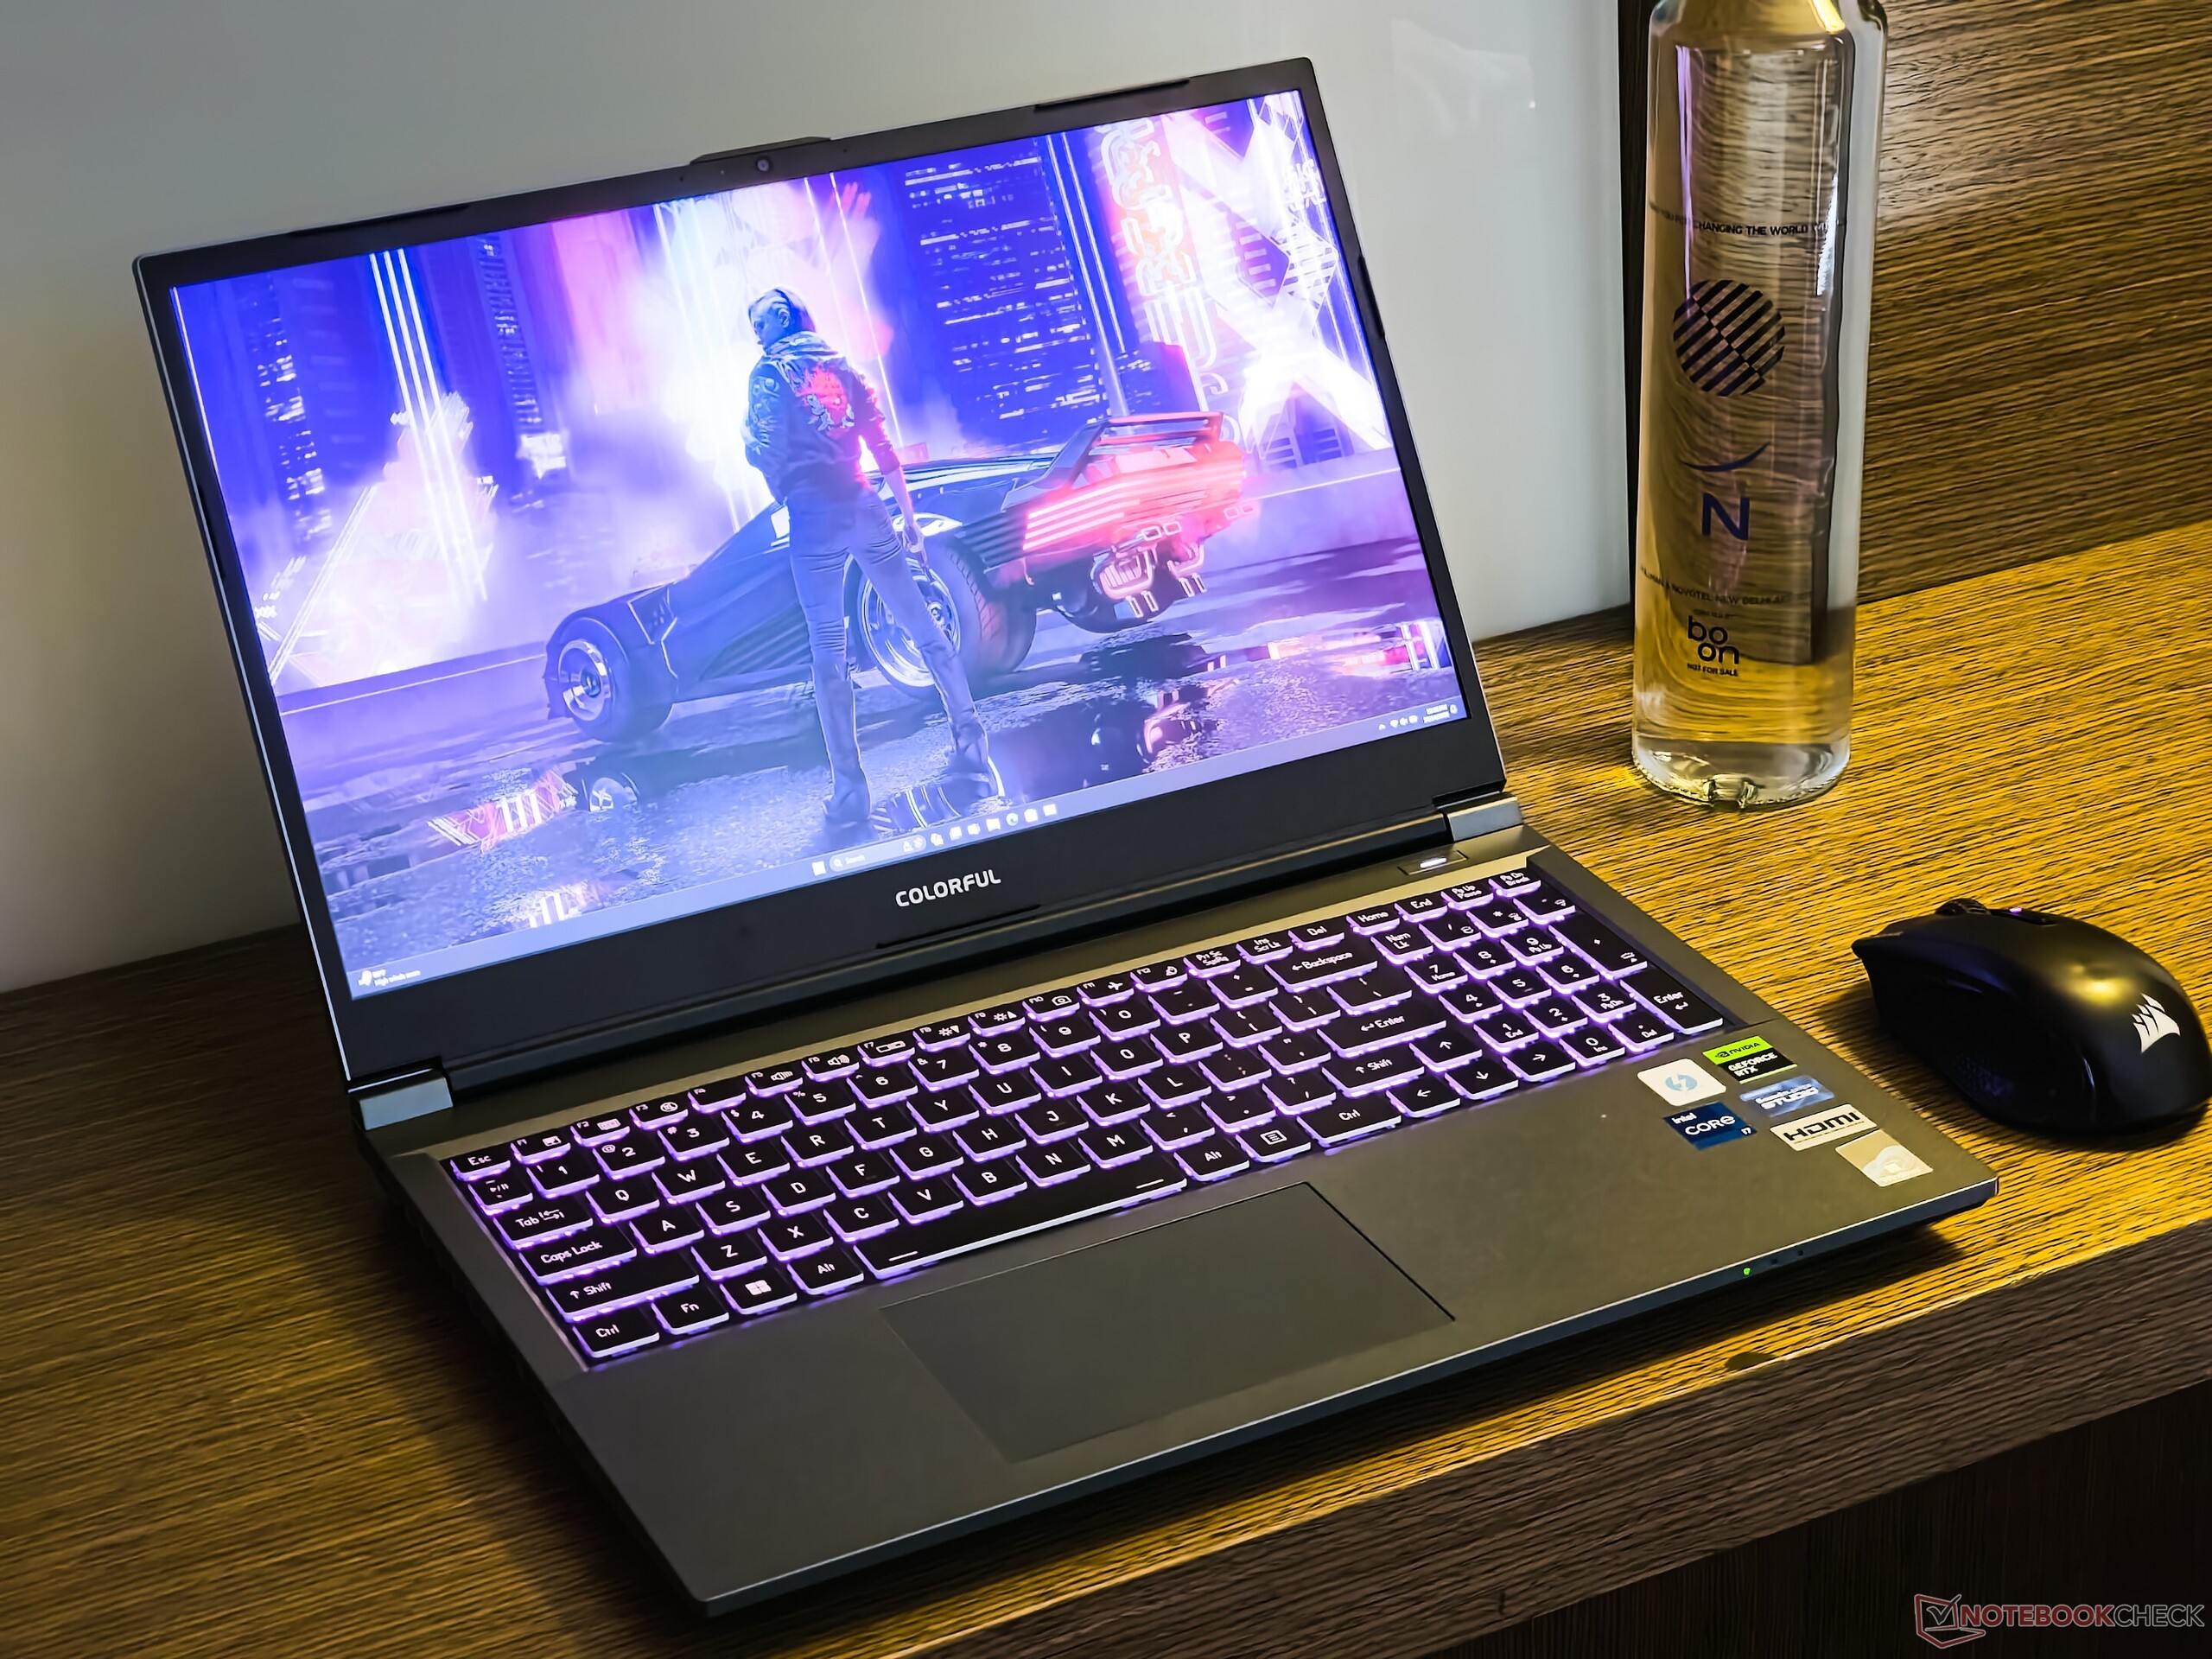
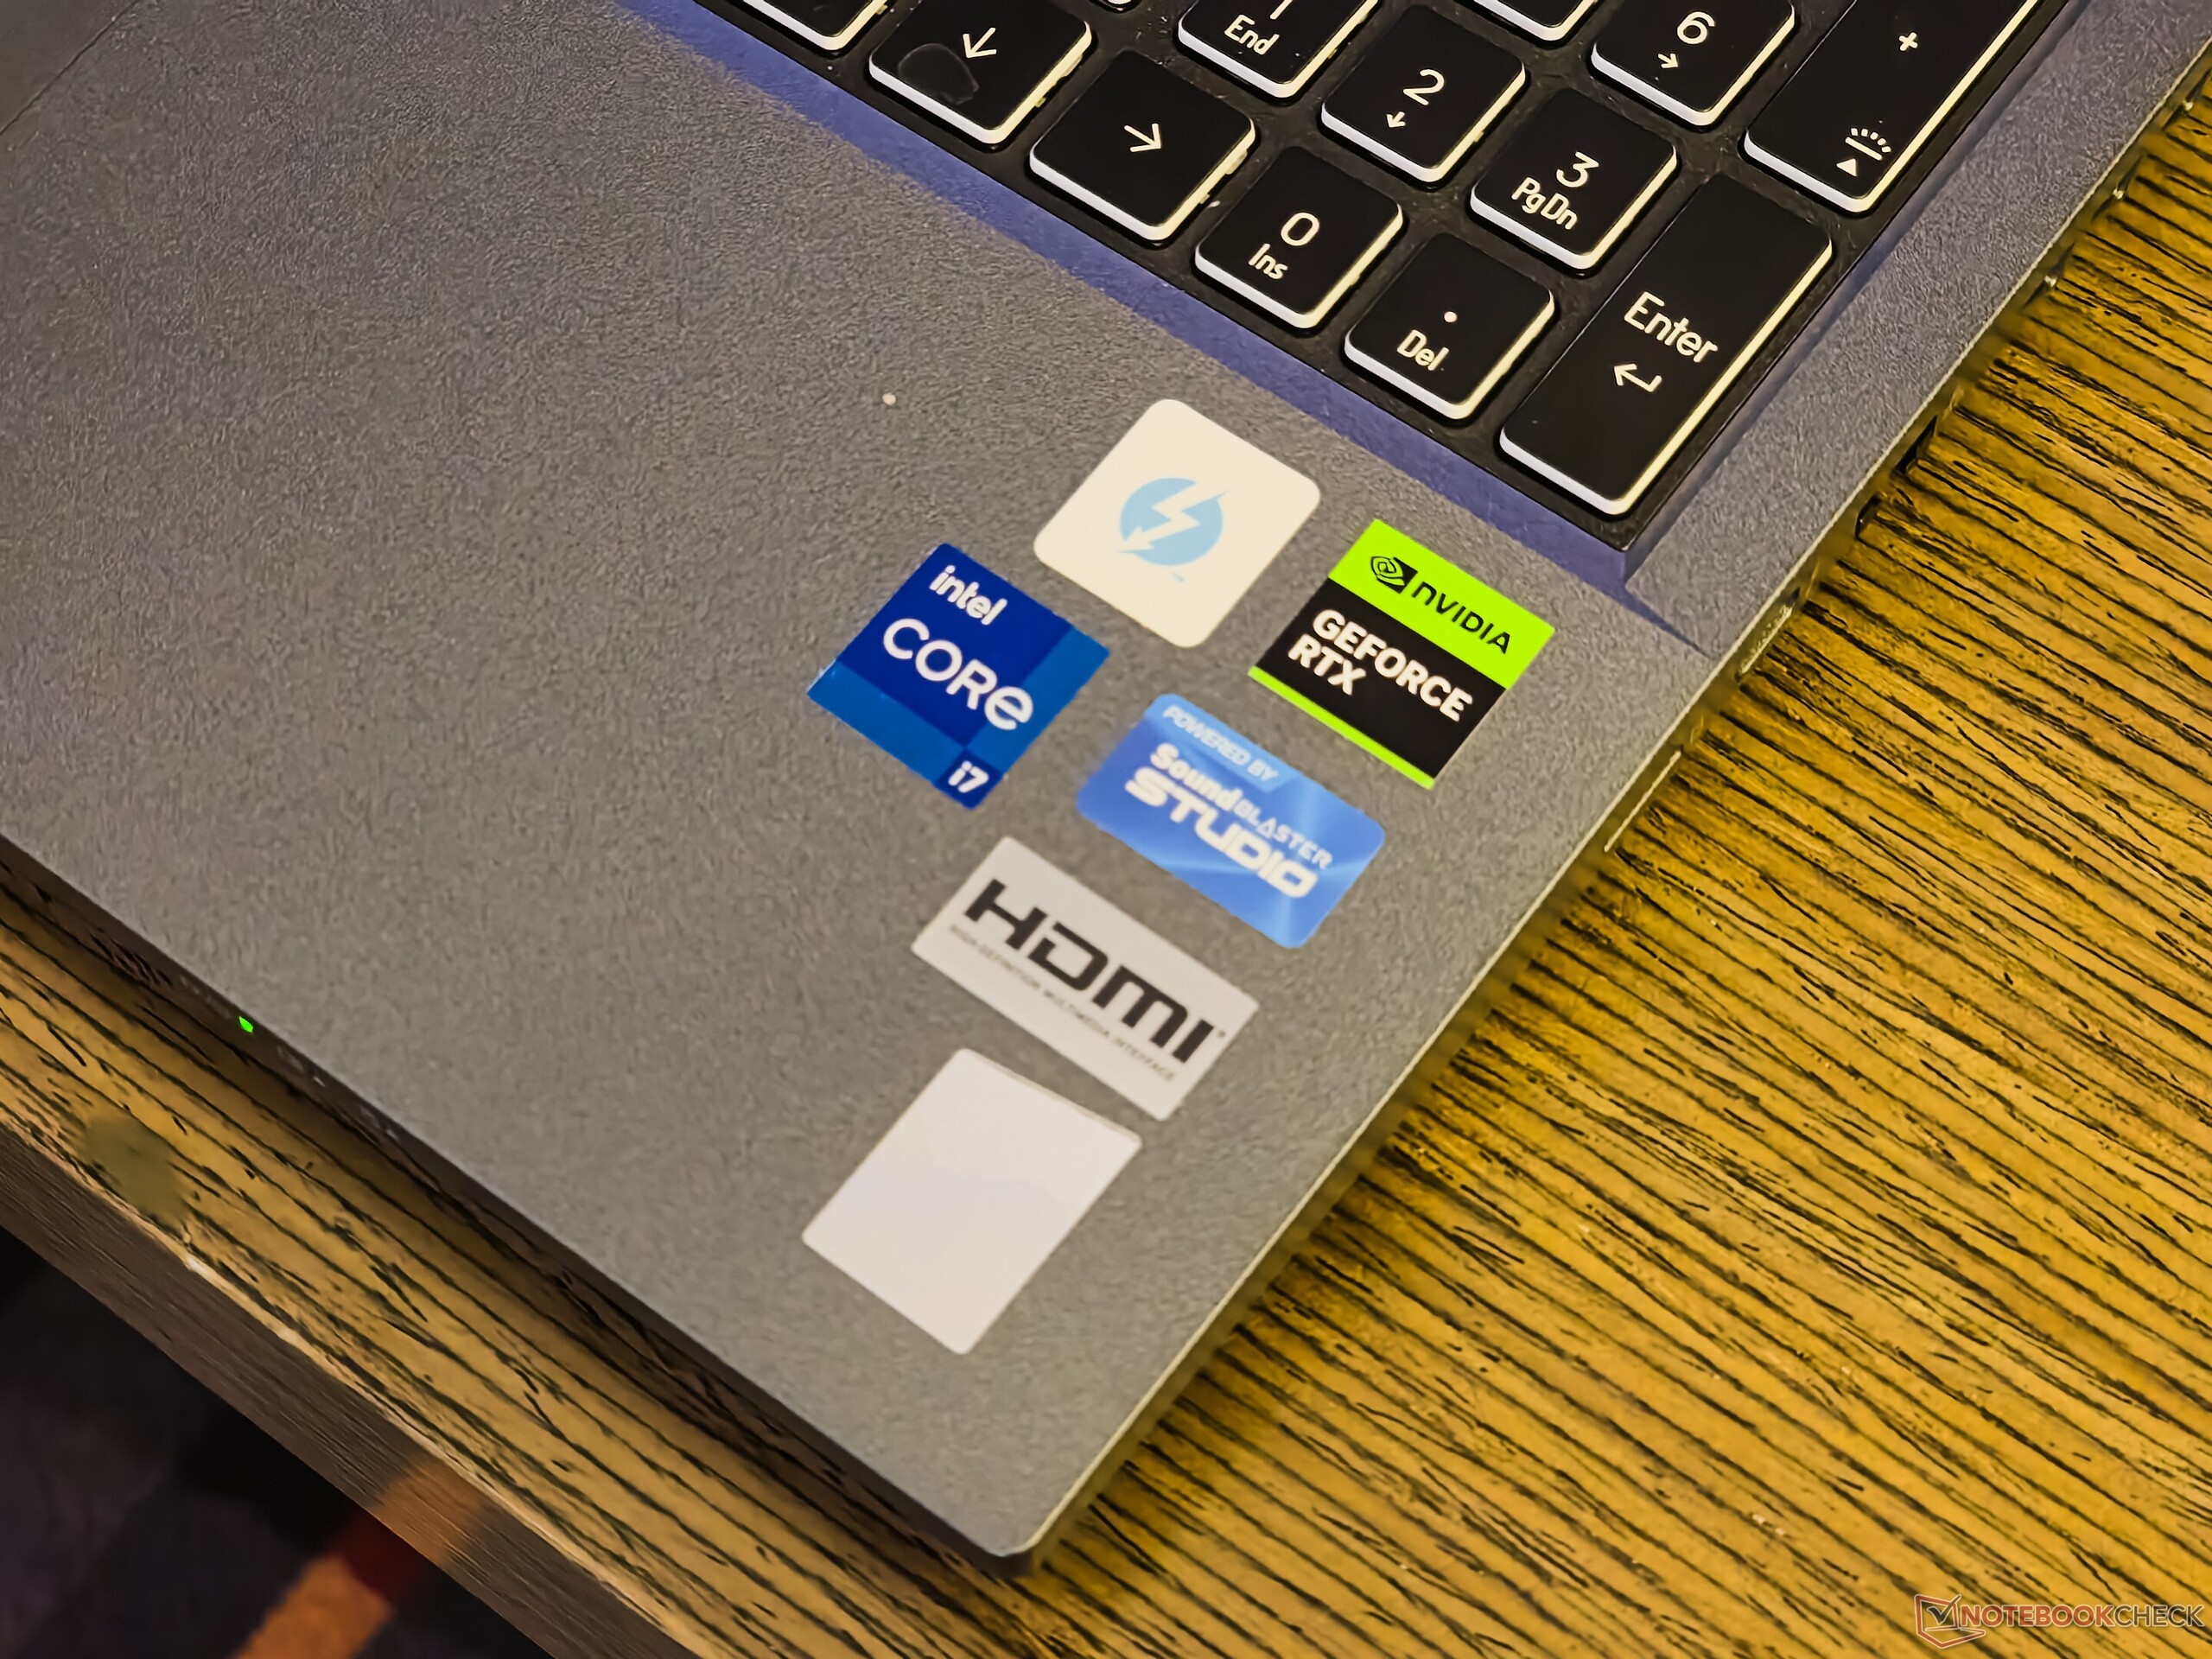
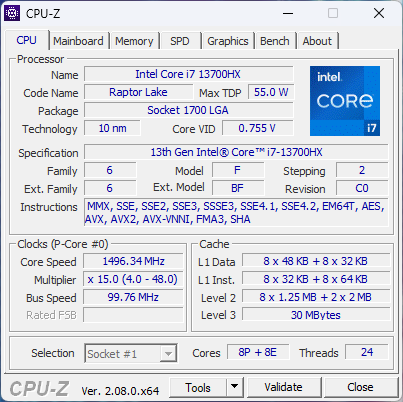
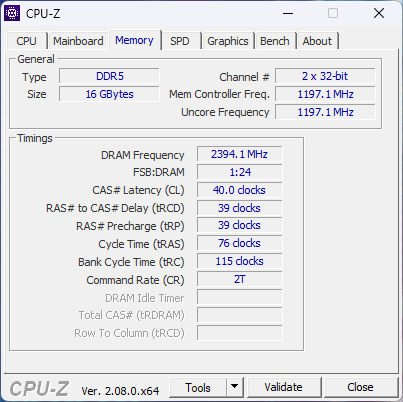
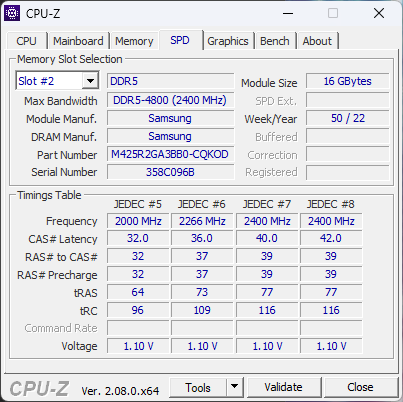
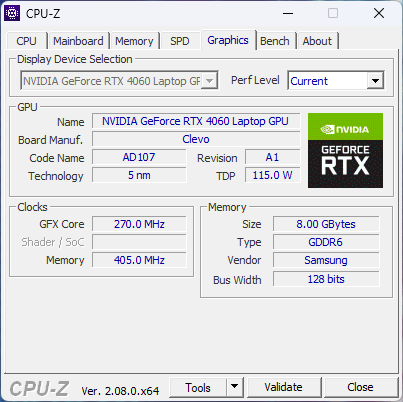
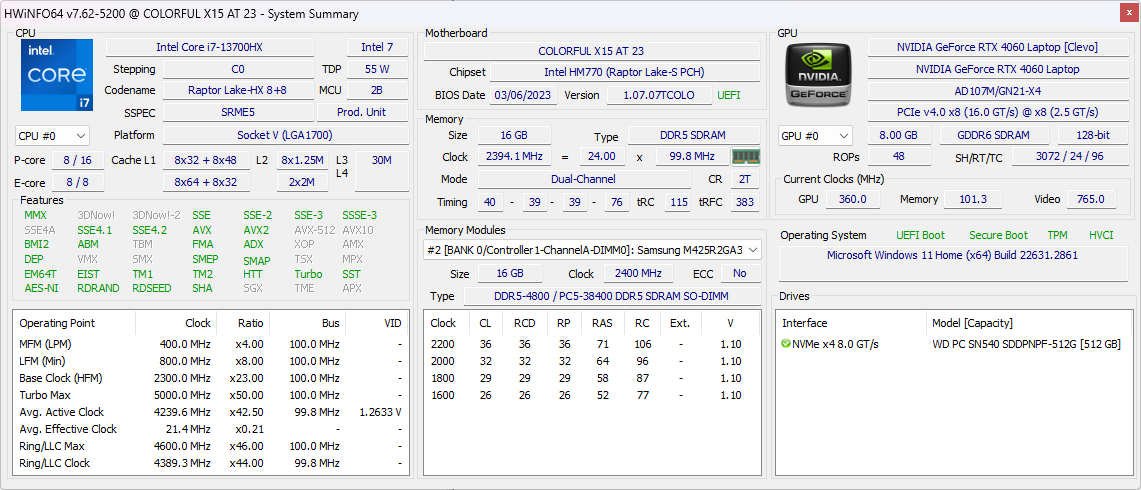
A propósito de esto, el nuevo Colorful EVOL X15 AT 23 ha llegado recientemente a nuestros laboratorios de pruebas. Nuestra muestra del EVOL X15 AT está alimentada por el Intel Core i7-13700HX, GPU Nvidia GeForce RTX 4060 para portátiles, 16 GB de memoria DDR5-4800 (un solo stick) y una SSD NVMe de 512 GB.
El dispositivo ofrece especificaciones impresionantes, incluyendo una pantalla QHD de 165 Hz y una batería de 73 WHr, y está disponible en mercados asiáticos selectos como China, Tailandia, Malasia, Indonesia, Filipinas, y en Rusia en Ozon por unos 969 dólares. Newegg está vendiendo este SKU en los EE.UU. con un sobreprecio de 1.759 dólares.
En este análisis, echamos un vistazo al nuevo Colorful EVOL X15 AT y comprobamos si puede plantar cara a algunos de sus competidores más arraigados.
Posibles contendientes en la comparación
Valoración | Fecha | Modelo | Peso | Altura | Tamaño | Resolución | Precio |
|---|---|---|---|---|---|---|---|
| 84.9 % v7 (old) | 12/2023 | Colorful EVOL X15 AT 23 i7-13700HX, GeForce RTX 4060 Laptop GPU | 2.3 kg | 26.9 mm | 15.60" | 2560x1440 | |
| 88.3 % v7 (old) | 09/2023 | Alienware m16 R1 Intel i7-13700HX, GeForce RTX 4060 Laptop GPU | 3 kg | 25.4 mm | 16.00" | 2560x1600 | |
| 87.4 % v7 (old) | 07/2023 | HP Omen 16-wf000 i7-13700HX, GeForce RTX 4080 Laptop GPU | 2.4 kg | 23.6 mm | 16.10" | 2560x1440 | |
| 89.5 % v7 (old) | 07/2023 | Acer Predator Helios 16 PH16-71-731Q i7-13700HX, GeForce RTX 4060 Laptop GPU | 2.6 kg | 26.9 mm | 16.00" | 2560x1600 | |
| 84.2 % v7 (old) | 06/2023 | Dell G15 5530 i7-13650HX, GeForce RTX 4060 Laptop GPU | 3 kg | 26.95 mm | 15.60" | 1920x1080 | |
| 86.2 % v7 (old) | 07/2023 | Schenker XMG Pro 15 (E23) i9-13900HX, GeForce RTX 4060 Laptop GPU | 2.4 kg | 24.9 mm | 15.60" | 2560x1440 | |
| 89.2 % v7 (old) | 08/2023 | Alienware m16 R1 AMD R9 7845HX, GeForce RTX 4080 Laptop GPU | 3.1 kg | 25.4 mm | 16.00" | 2560x1600 | |
| 88.2 % v7 (old) | 03/2023 | Uniwill GM6PX7X RTX 4070 i7-13700HX, GeForce RTX 4070 Laptop GPU | 2.2 kg | 22 mm | 16.00" | 2560x1600 |
Chasis: La función por encima de la forma en la estética plástica de Clevo
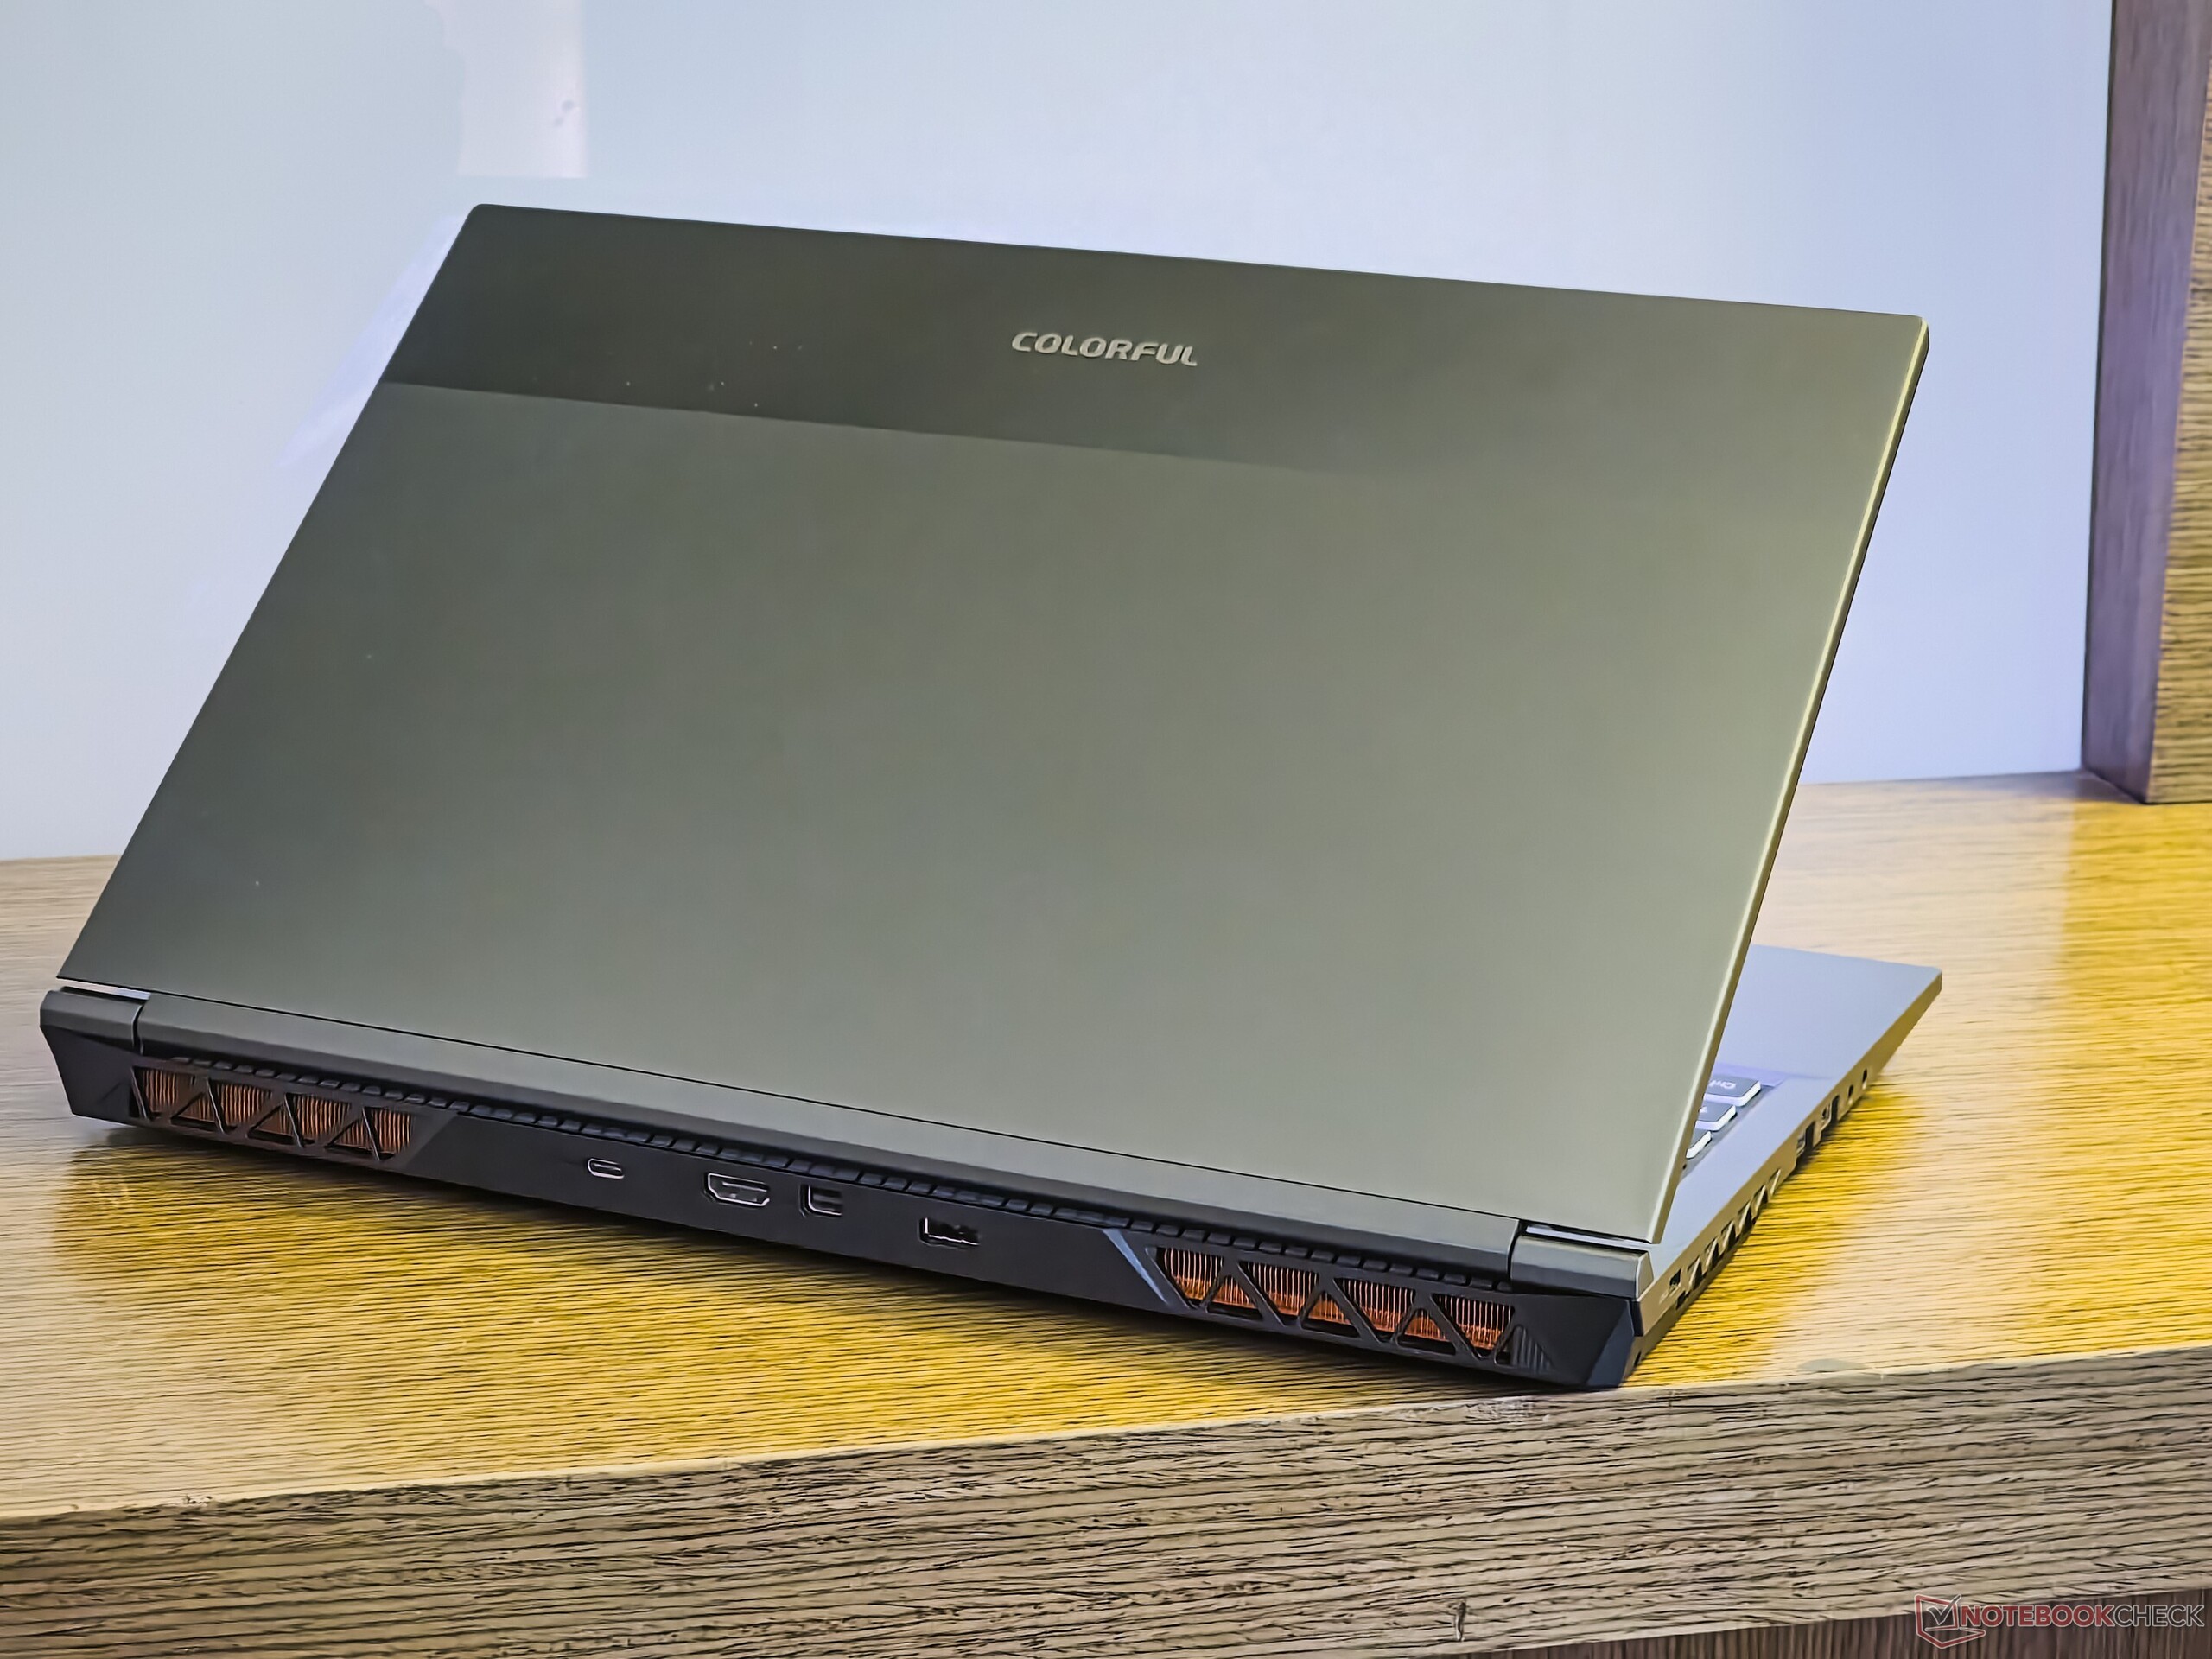
Colorful ofrece el EVOL X15 AT en tres tonalidades: púrpura uva, azul pino y gris niebla (nuestra unidad de revisión). Con un grosor de 27,1 mm y un peso de 2,3 kg, el EVOL XT15 AT no ganará ningún premio a la delgadez. Aún así, es significativamente más portátil que el Dell G15 5530 y el Alienware m16 R1.
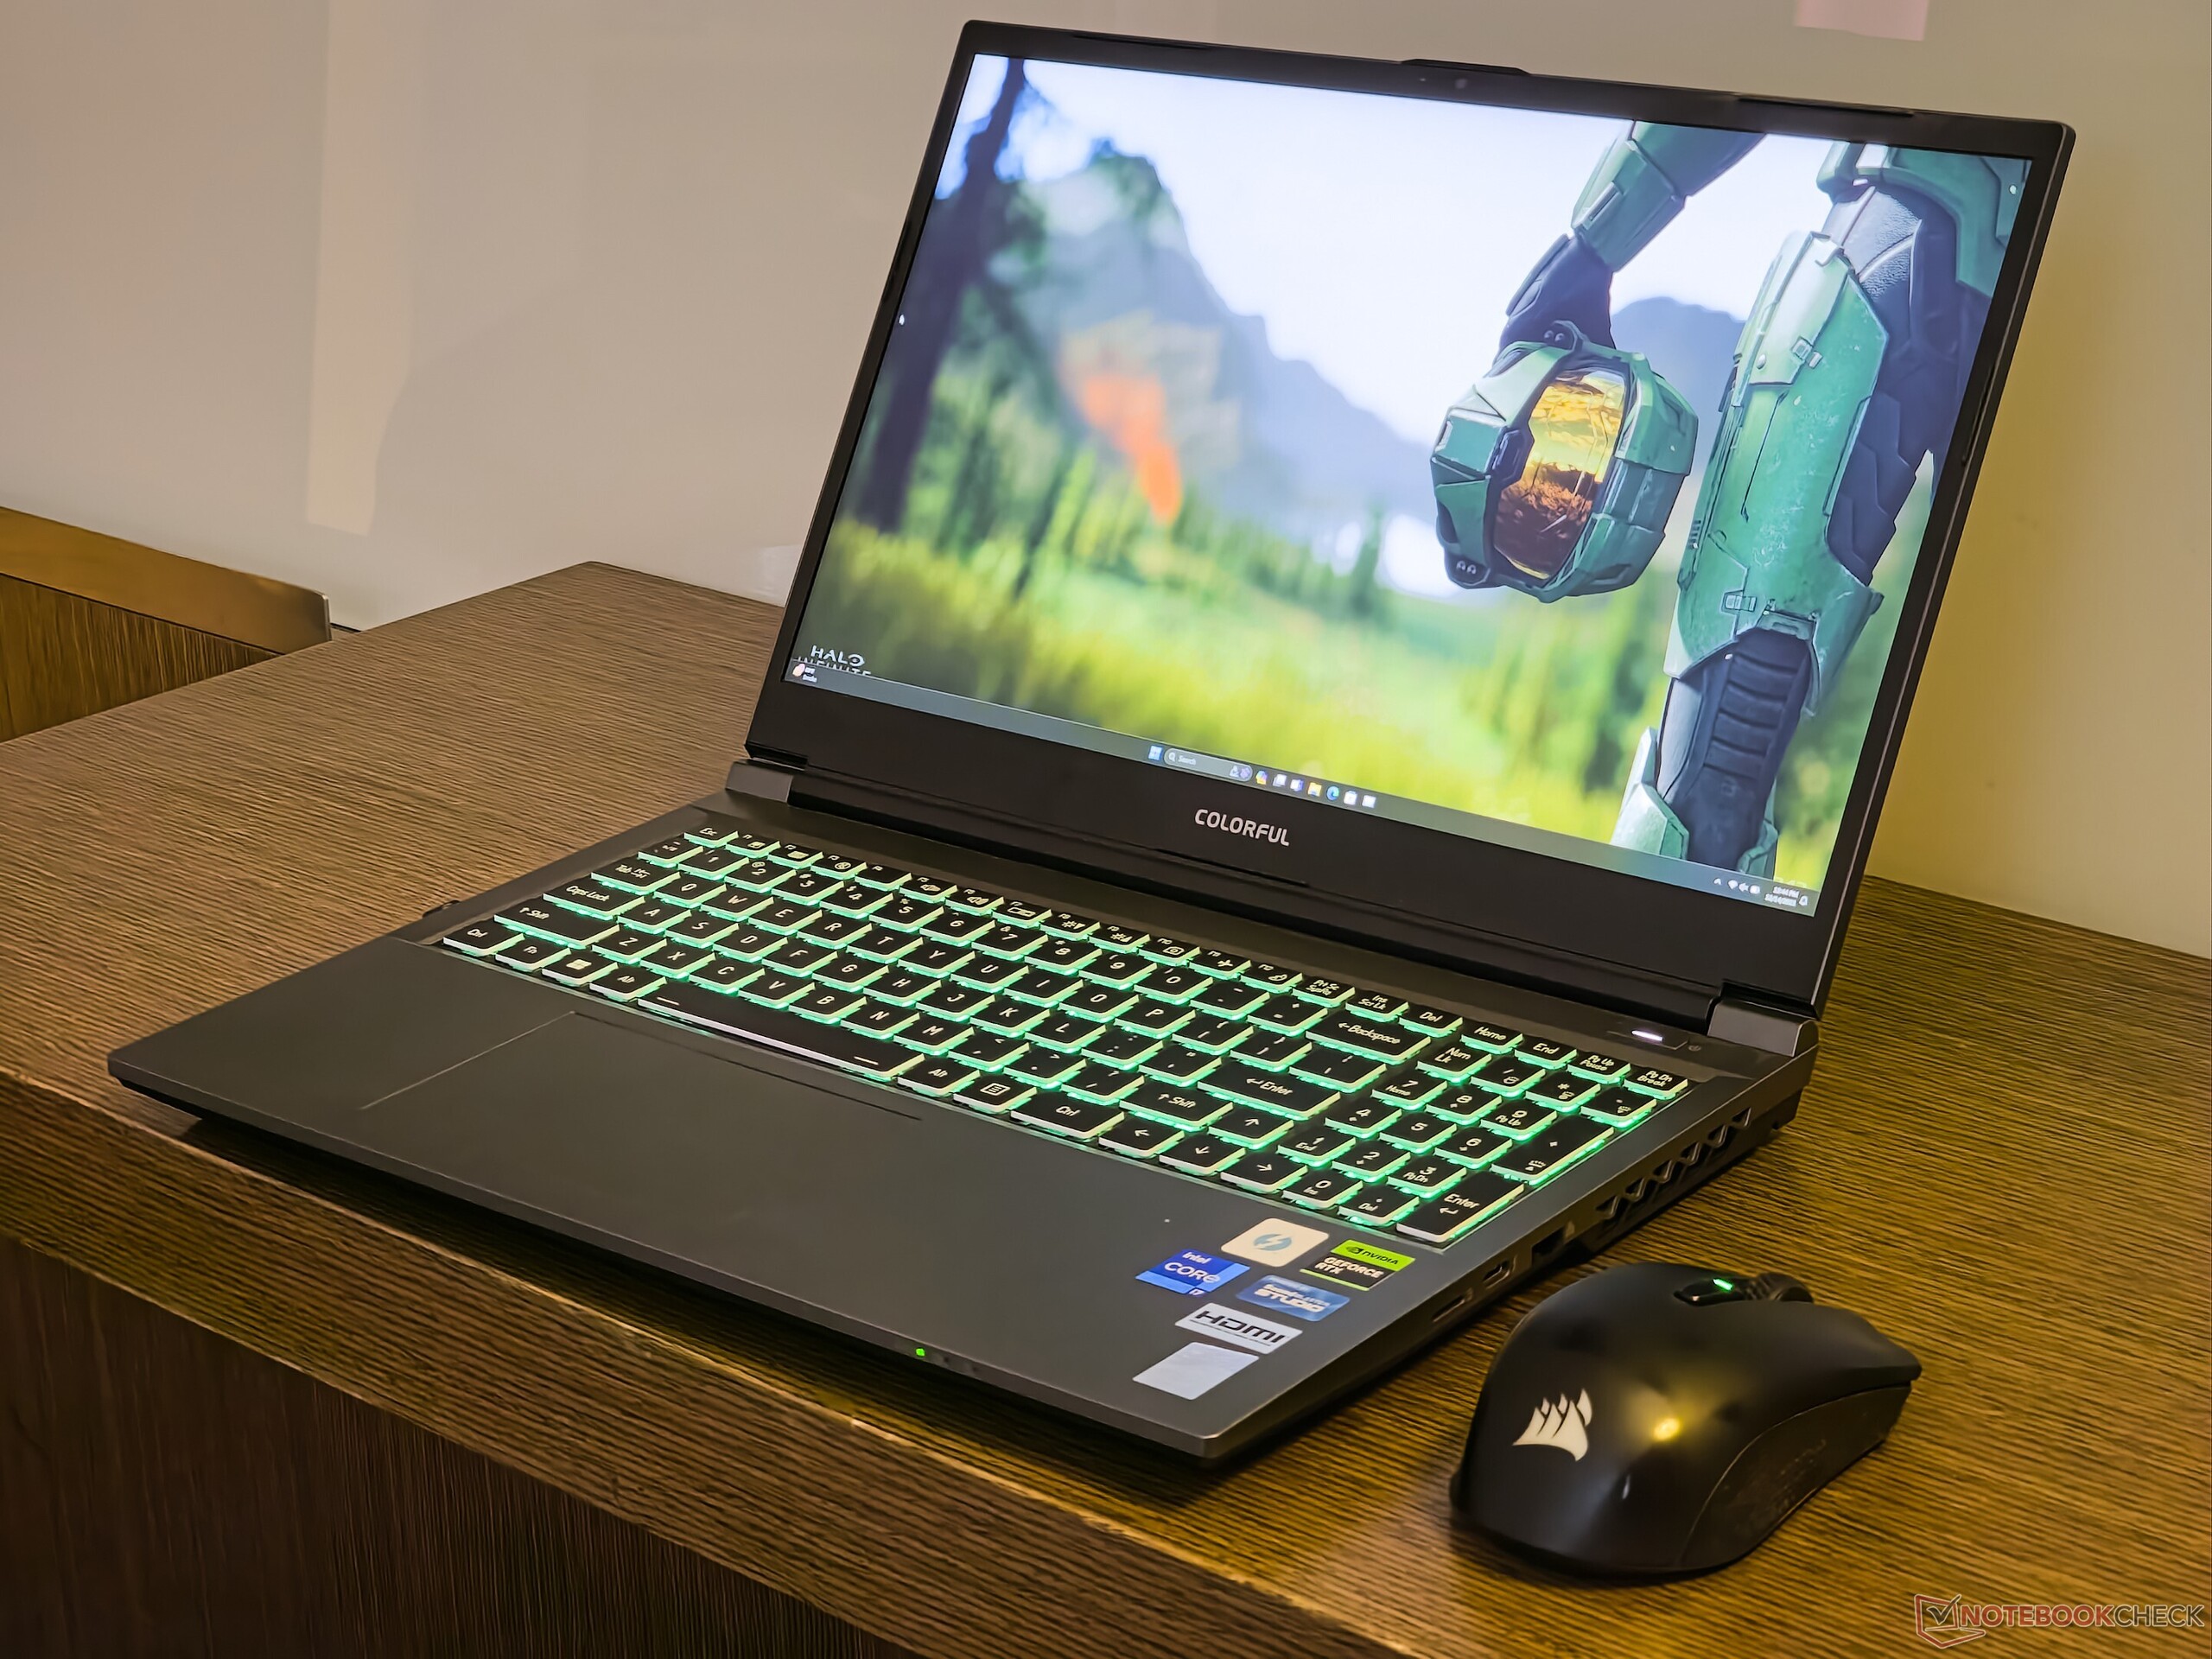
El EVOL X15 AT, al ser un diseño de Clevo, luce principalmente un robusto chasis de plástico. La construcción recuerda en gran medida al Gigabyte G5 KE, que también es un rebranding de Clevo. A pesar de la robustez de la construcción, observamos una flexión considerable en la cubierta del teclado.
La tapa de la pantalla es de metal y no se tambalea demasiado. Las bisagras tienen una tensión ideal, lo que permite abrir la tapa con un solo dedo sin que la base se deslice
En general, el EVOL X15 AT no pretende enamorar con un lenguaje de diseño suave, pero es lo suficientemente utilitario como portátil para juegos.
Conectividad: Puertos Type-C sin entrada de alimentación
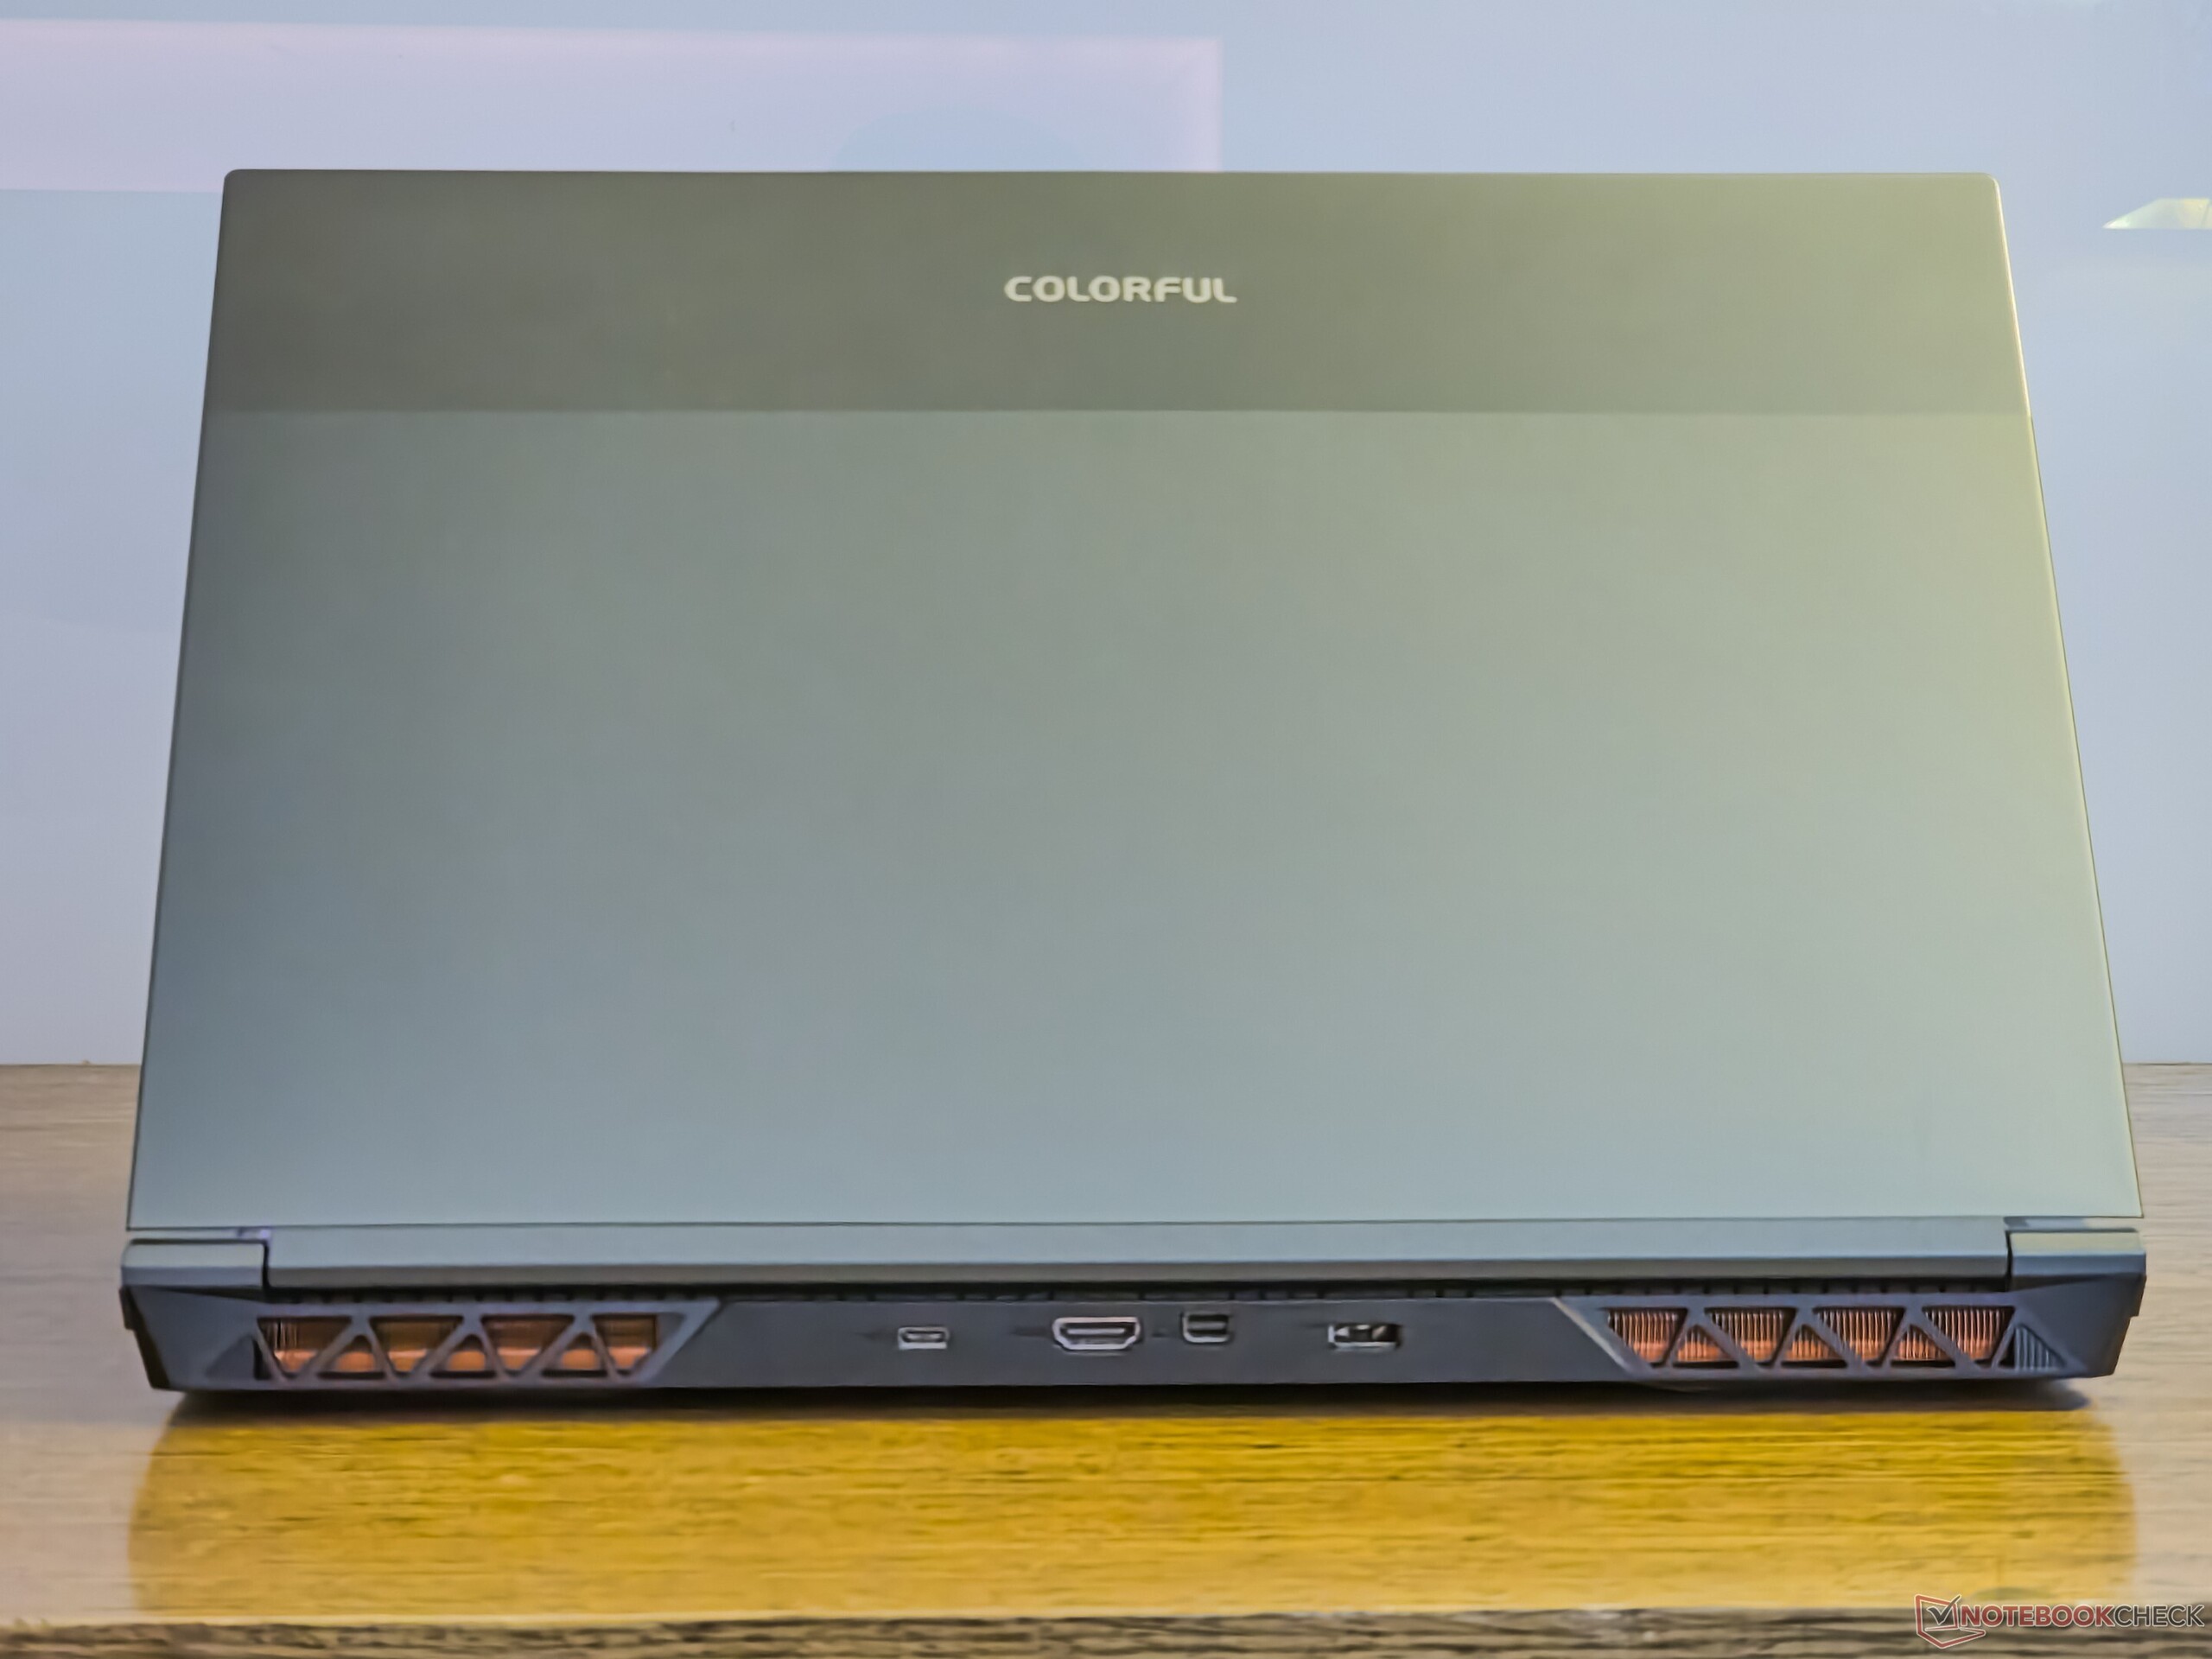
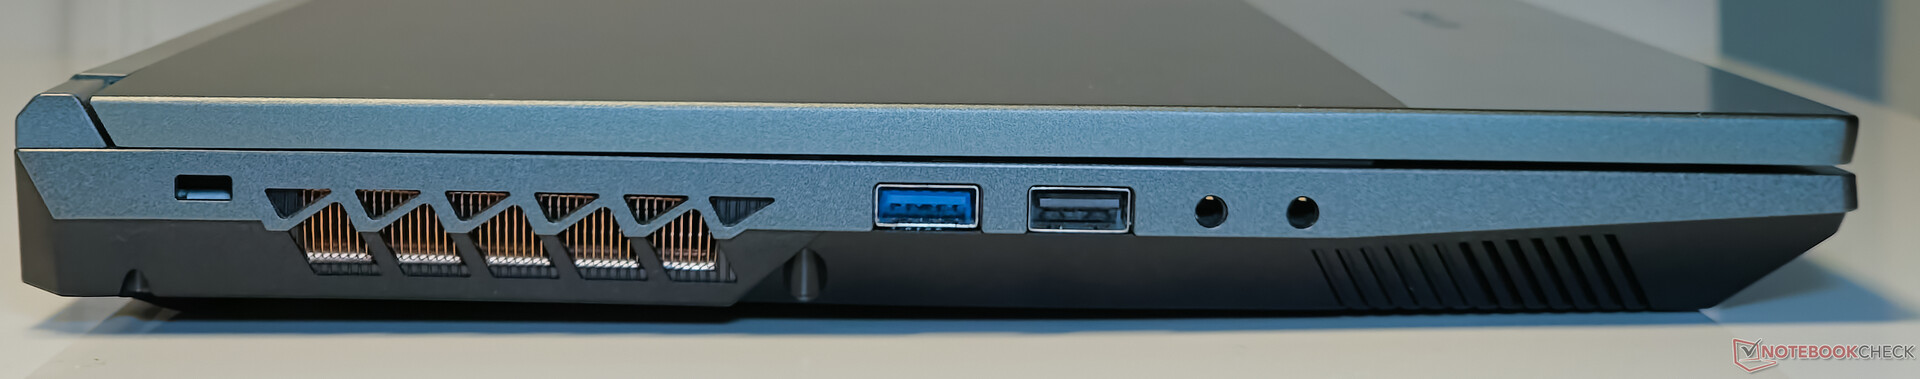
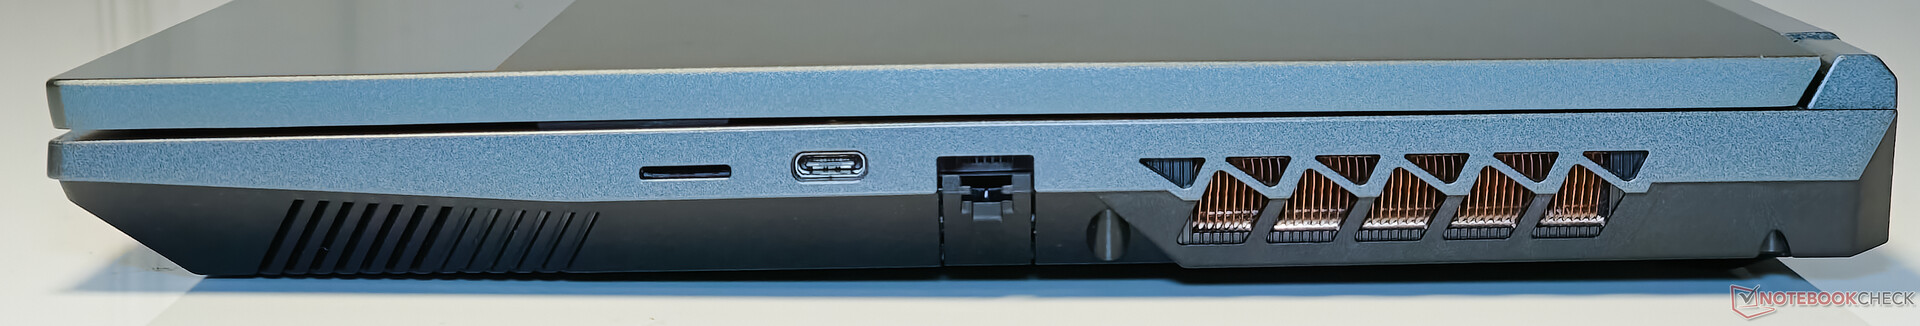
Colorful ha dotado al EVOL X15 AT de una selección de puertos bastante decente. El flanco izquierdo alberga dos opciones USB-A (USB 2.0 y USB 3.2 Gen 1) además de una toma de entrada de línea dedicada para entrada de audio analógico. En el lateral derecho residen una ranura microSD, Thunderbolt 4 y Gigabit LAN.
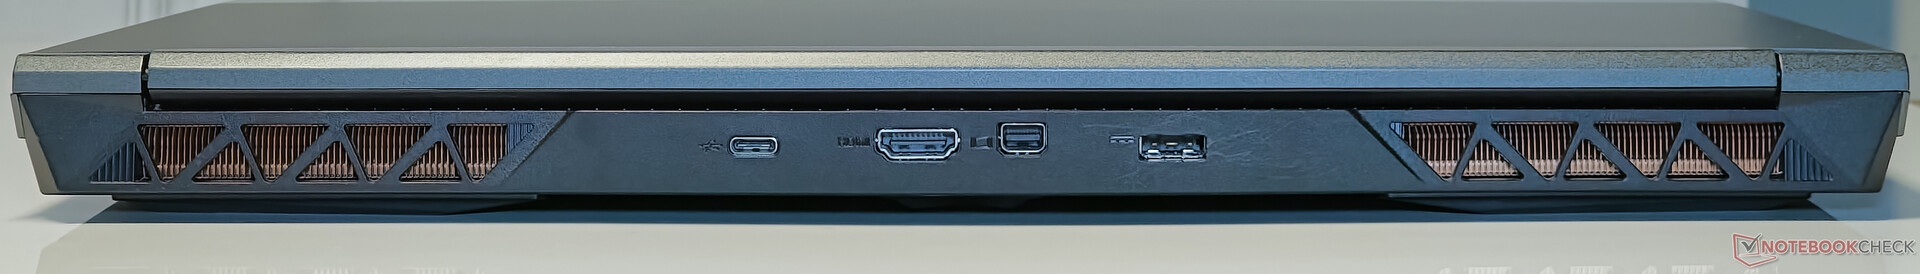
A la derecha, vemos un lector de tarjetas microSD, Thunderbolt 4 y Gigabit LAN. Por último, la parte trasera alberga USB 3.2 Gen2 Tipo-C, salida mini-DisplayPort y salida HDMI.
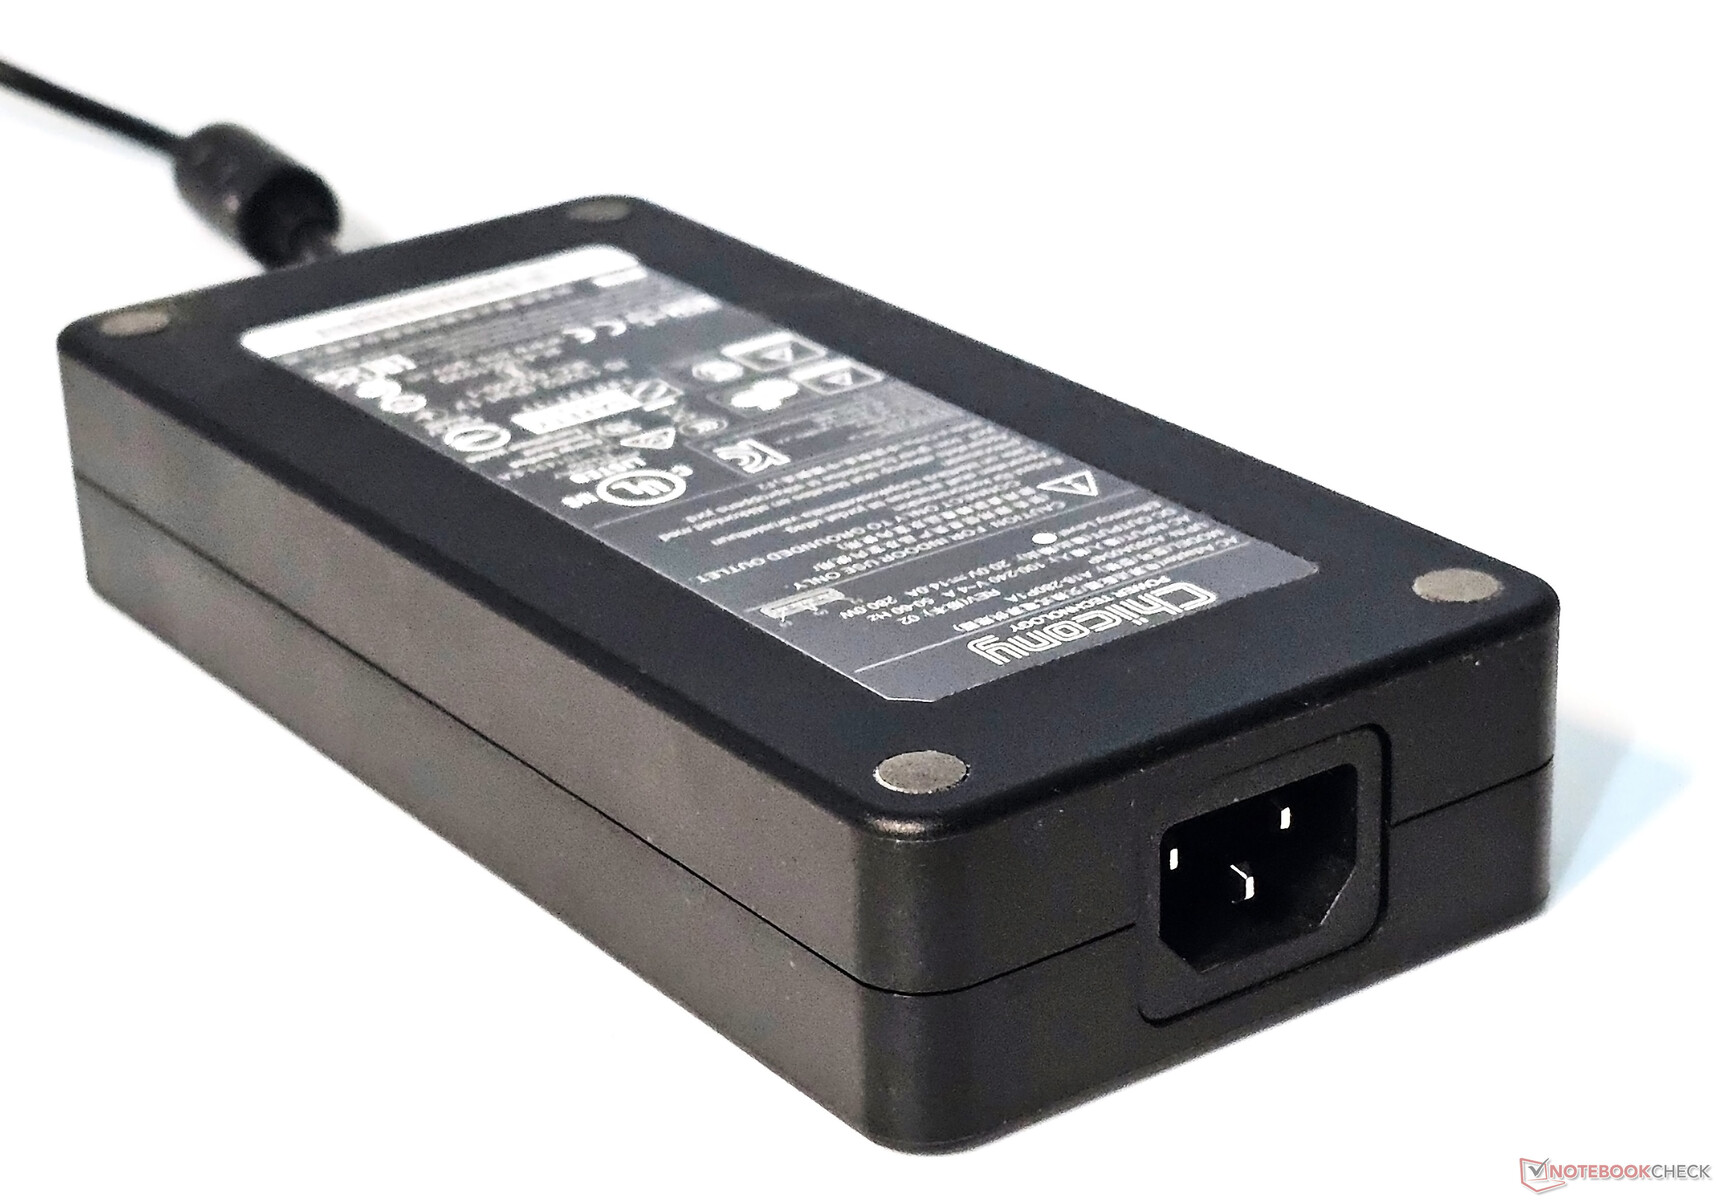
Lamentablemente, los puertos Type-C sólo admiten la salida de alimentación, por lo que tendrá que cargar inevitablemente con el ladrillo de alimentación de casi 1 kg a todas partes para mantener el portátil alimentado.
Lector de tarjetas SD
El lector de tarjetas microSD del EVOL X15 no bate ningún récord de velocidad y es aproximadamente un 28% más lento que la media de su clase en las pruebas de copia JPG y lectura secuencial AS SSD.
| SD Card Reader | |
| average JPG Copy Test (av. of 3 runs) | |
| Alienware m16 R1 AMD (Toshiba Exceria Pro SDXC 64 GB UHS-II) | |
| Alienware m16 R1 Intel (AV PRO microSD 128 GB V60) | |
| Media de la clase Gaming (20.9 - 210, n=54, últimos 2 años) | |
| Schenker XMG Pro 15 (E23) | |
| Colorful EVOL X15 AT 23 (AV PRO microSD 128 GB V60) | |
| Acer Predator Helios 16 PH16-71-731Q | |
| Uniwill GM6PX7X RTX 4070 (AV PRO microSD 128 GB V60) | |
| maximum AS SSD Seq Read Test (1GB) | |
| Alienware m16 R1 AMD (Toshiba Exceria Pro SDXC 64 GB UHS-II) | |
| Alienware m16 R1 Intel (AV PRO microSD 128 GB V60) | |
| Media de la clase Gaming (25.5 - 261, n=51, últimos 2 años) | |
| Schenker XMG Pro 15 (E23) | |
| Colorful EVOL X15 AT 23 (AV PRO microSD 128 GB V60) | |
| Uniwill GM6PX7X RTX 4070 (AV PRO microSD 128 GB V60) | |
| Acer Predator Helios 16 PH16-71-731Q | |
Comunicación
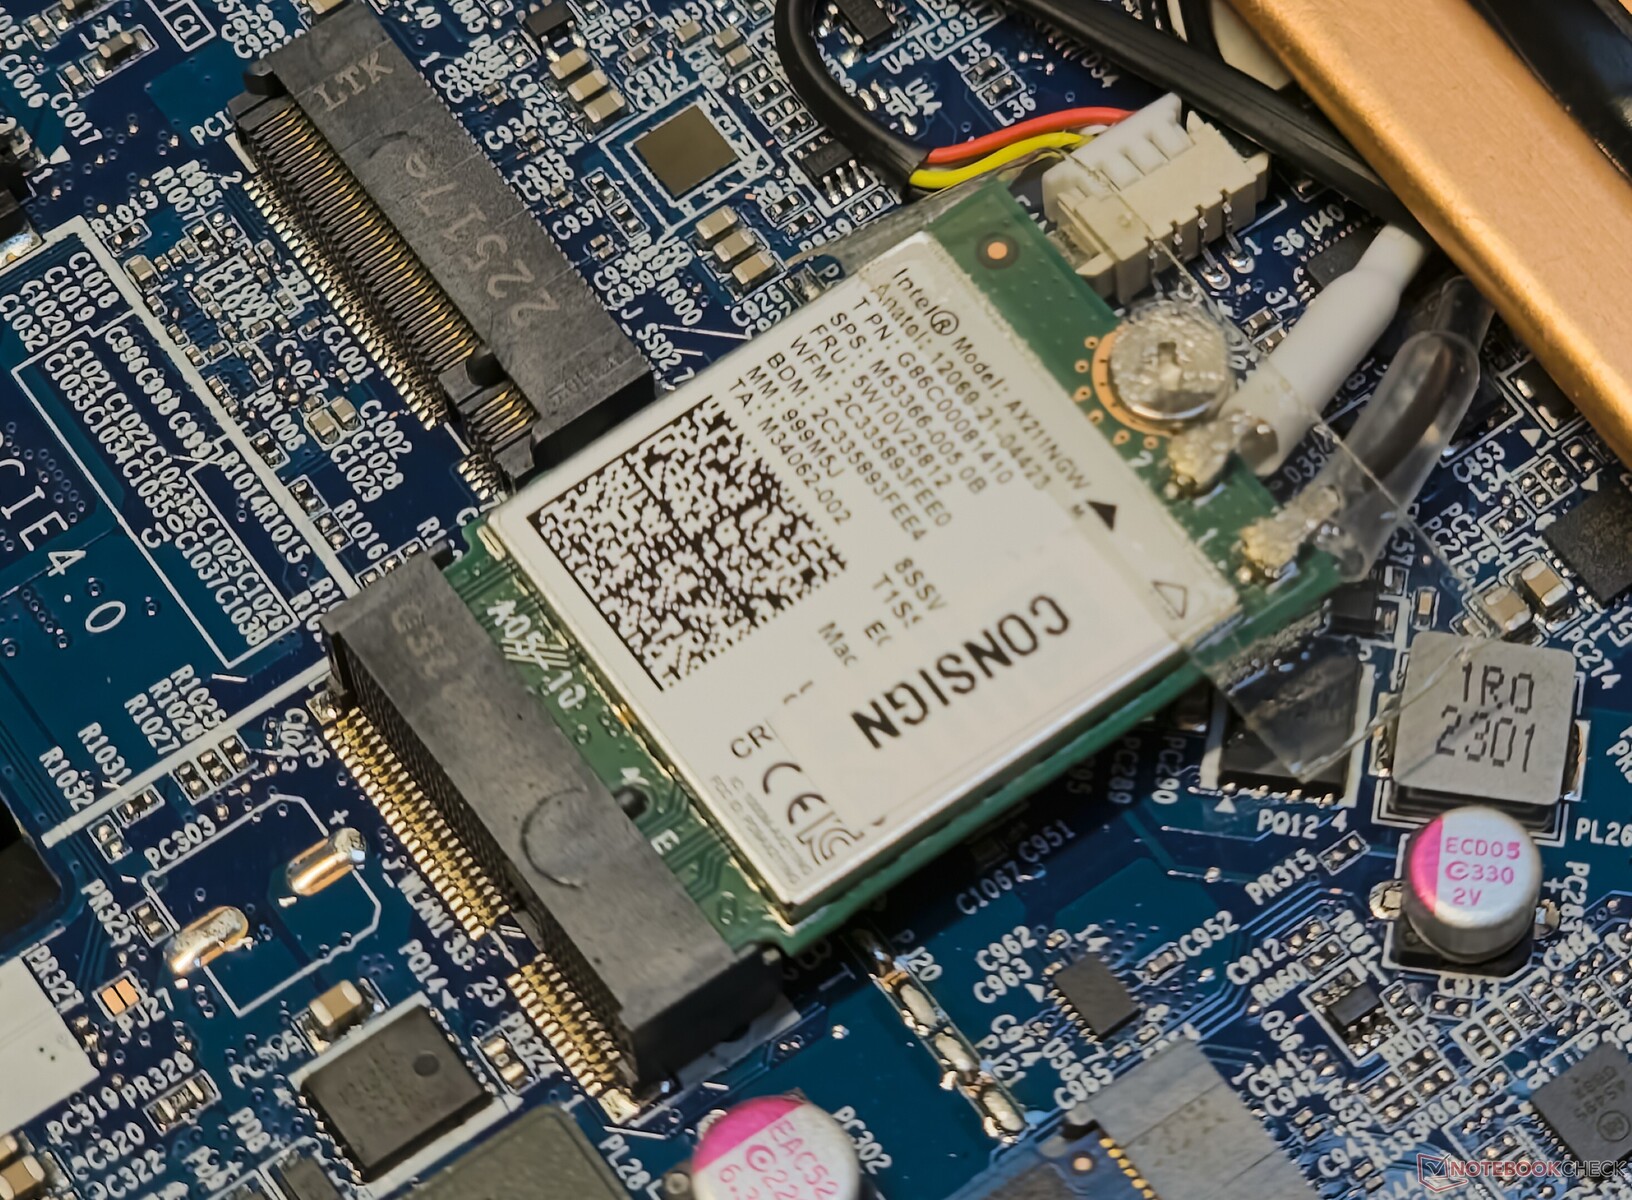
El EVOL X15 AT incorpora un chip WLAN Intel Wi-Fi 6E AX211. Las velocidades de transferencia son bastante consistentes tanto en la banda de 5 GHz como en la de 6 GHz cuando se probó con nuestro router de referencia Asus ROG Rapture GT-AXE11000.
El portátil ofrece un excelente rendimiento de transmisión y recepción en la banda de 5 GHz. En la banda de 6 GHz, el EVOL X15 se queda corto frente al Alienware m16 R1 AMD en las pruebas de transmisión iPerf3 pero compensa la deficiencia en las pruebas de recepción con un rendimiento máximo de 1,7 Gbps.
| Networking / iperf3 transmit AXE11000 | |
| Colorful EVOL X15 AT 23 | |
| Dell G15 5530 | |
| Alienware m16 R1 AMD | |
| Acer Predator Helios 16 PH16-71-731Q | |
| Alienware m16 R1 Intel | |
| Media de la clase Gaming (560 - 1862, n=87, últimos 2 años) | |
| Medio Intel Wi-Fi 6E AX211 (64 - 1921, n=276) | |
| Uniwill GM6PX7X RTX 4070 | |
| HP Omen 16-wf000 | |
| Schenker XMG Pro 15 (E23) | |
| Networking / iperf3 receive AXE11000 | |
| Colorful EVOL X15 AT 23 | |
| Alienware m16 R1 Intel | |
| Dell G15 5530 | |
| Media de la clase Gaming (680 - 1745, n=87, últimos 2 años) | |
| Acer Predator Helios 16 PH16-71-731Q | |
| Alienware m16 R1 AMD | |
| Medio Intel Wi-Fi 6E AX211 (582 - 1890, n=276) | |
| HP Omen 16-wf000 | |
| Uniwill GM6PX7X RTX 4070 | |
| Schenker XMG Pro 15 (E23) | |
| Networking / iperf3 transmit AXE11000 6GHz | |
| Alienware m16 R1 AMD | |
| Acer Predator Helios 16 PH16-71-731Q | |
| Schenker XMG Pro 15 (E23) | |
| Colorful EVOL X15 AT 23 | |
| Media de la clase Gaming (723 - 1868, n=36, últimos 2 años) | |
| Medio Intel Wi-Fi 6E AX211 (385 - 1851, n=226) | |
| HP Omen 16-wf000 | |
| Networking / iperf3 receive AXE11000 6GHz | |
| Colorful EVOL X15 AT 23 | |
| Schenker XMG Pro 15 (E23) | |
| Media de la clase Gaming (975 - 1775, n=35, últimos 2 años) | |
| Alienware m16 R1 AMD | |
| Medio Intel Wi-Fi 6E AX211 (700 - 1857, n=226) | |
| Acer Predator Helios 16 PH16-71-731Q | |
| HP Omen 16-wf000 | |
Cámara web
Dado su enfoque principal en los juegos, el EVOL X15 se conforma con una webcam convencional de 720p. La webcam es adecuada para videochats rápidos, pero carece de precisión de color, reproducción de detalles y nitidez general.


Seguridad
No hay funciones de seguridad dedicadas como los inicios de sesión biométricos incorporados. Un módulo TPM 2.0 está presente para cumplir con los requisitos de seguridad de Windows 11.
Accesorios y garantía
No hay accesorios separados en la caja, aparte del adaptador de 280 W y el papeleo habitual. El Colorful EVOL X15 AT se envía con una garantía estándar de dos años.
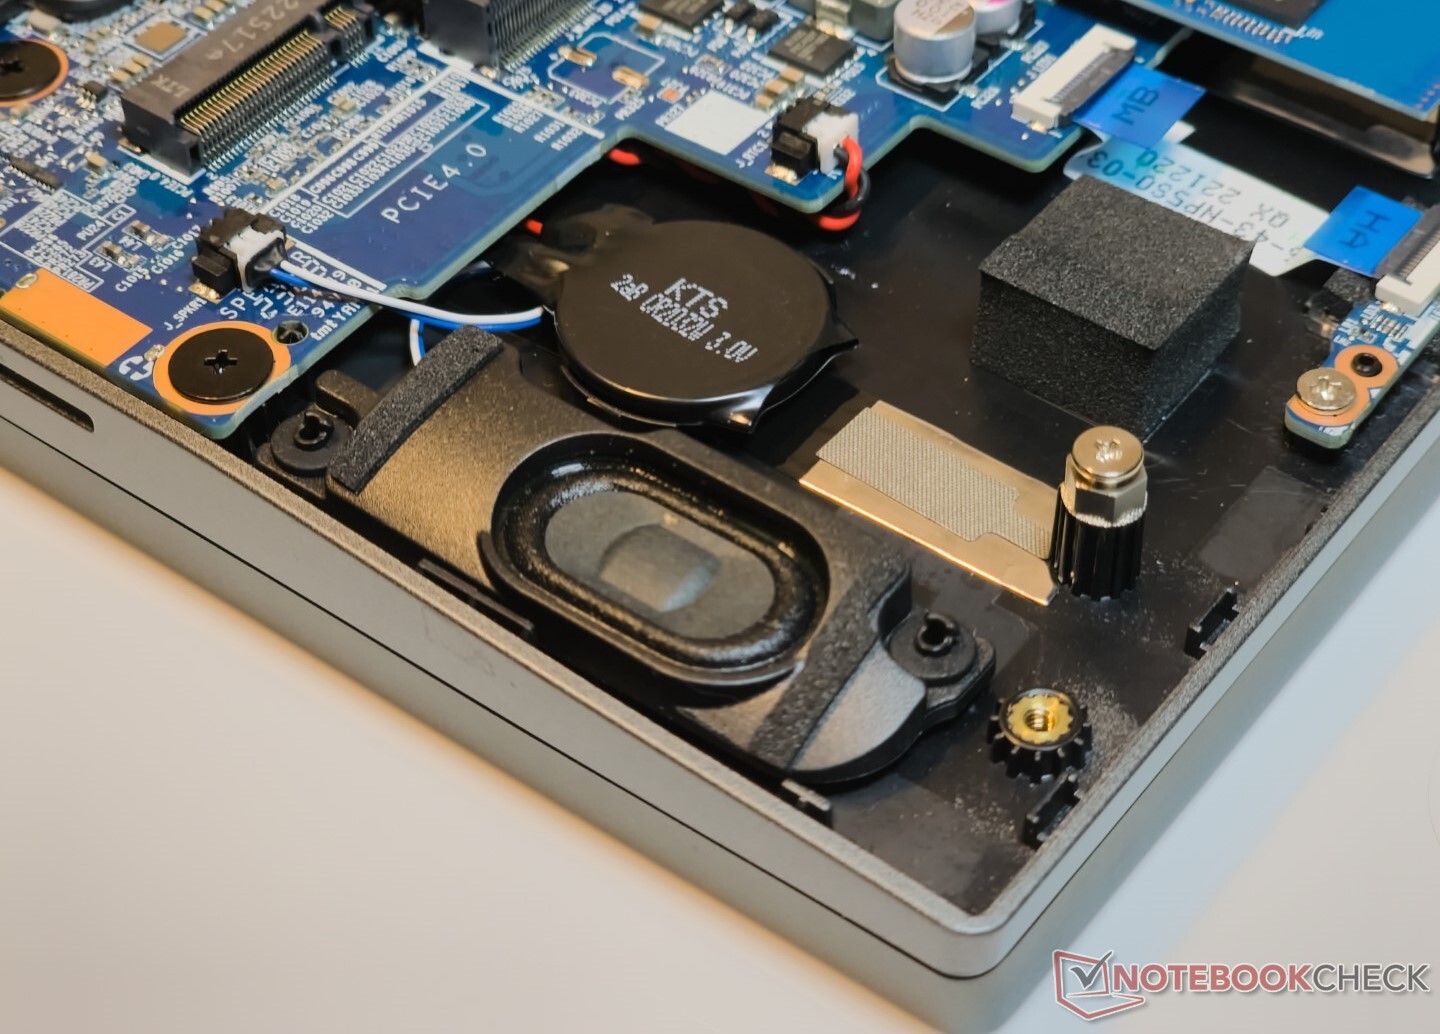
Mantenimiento
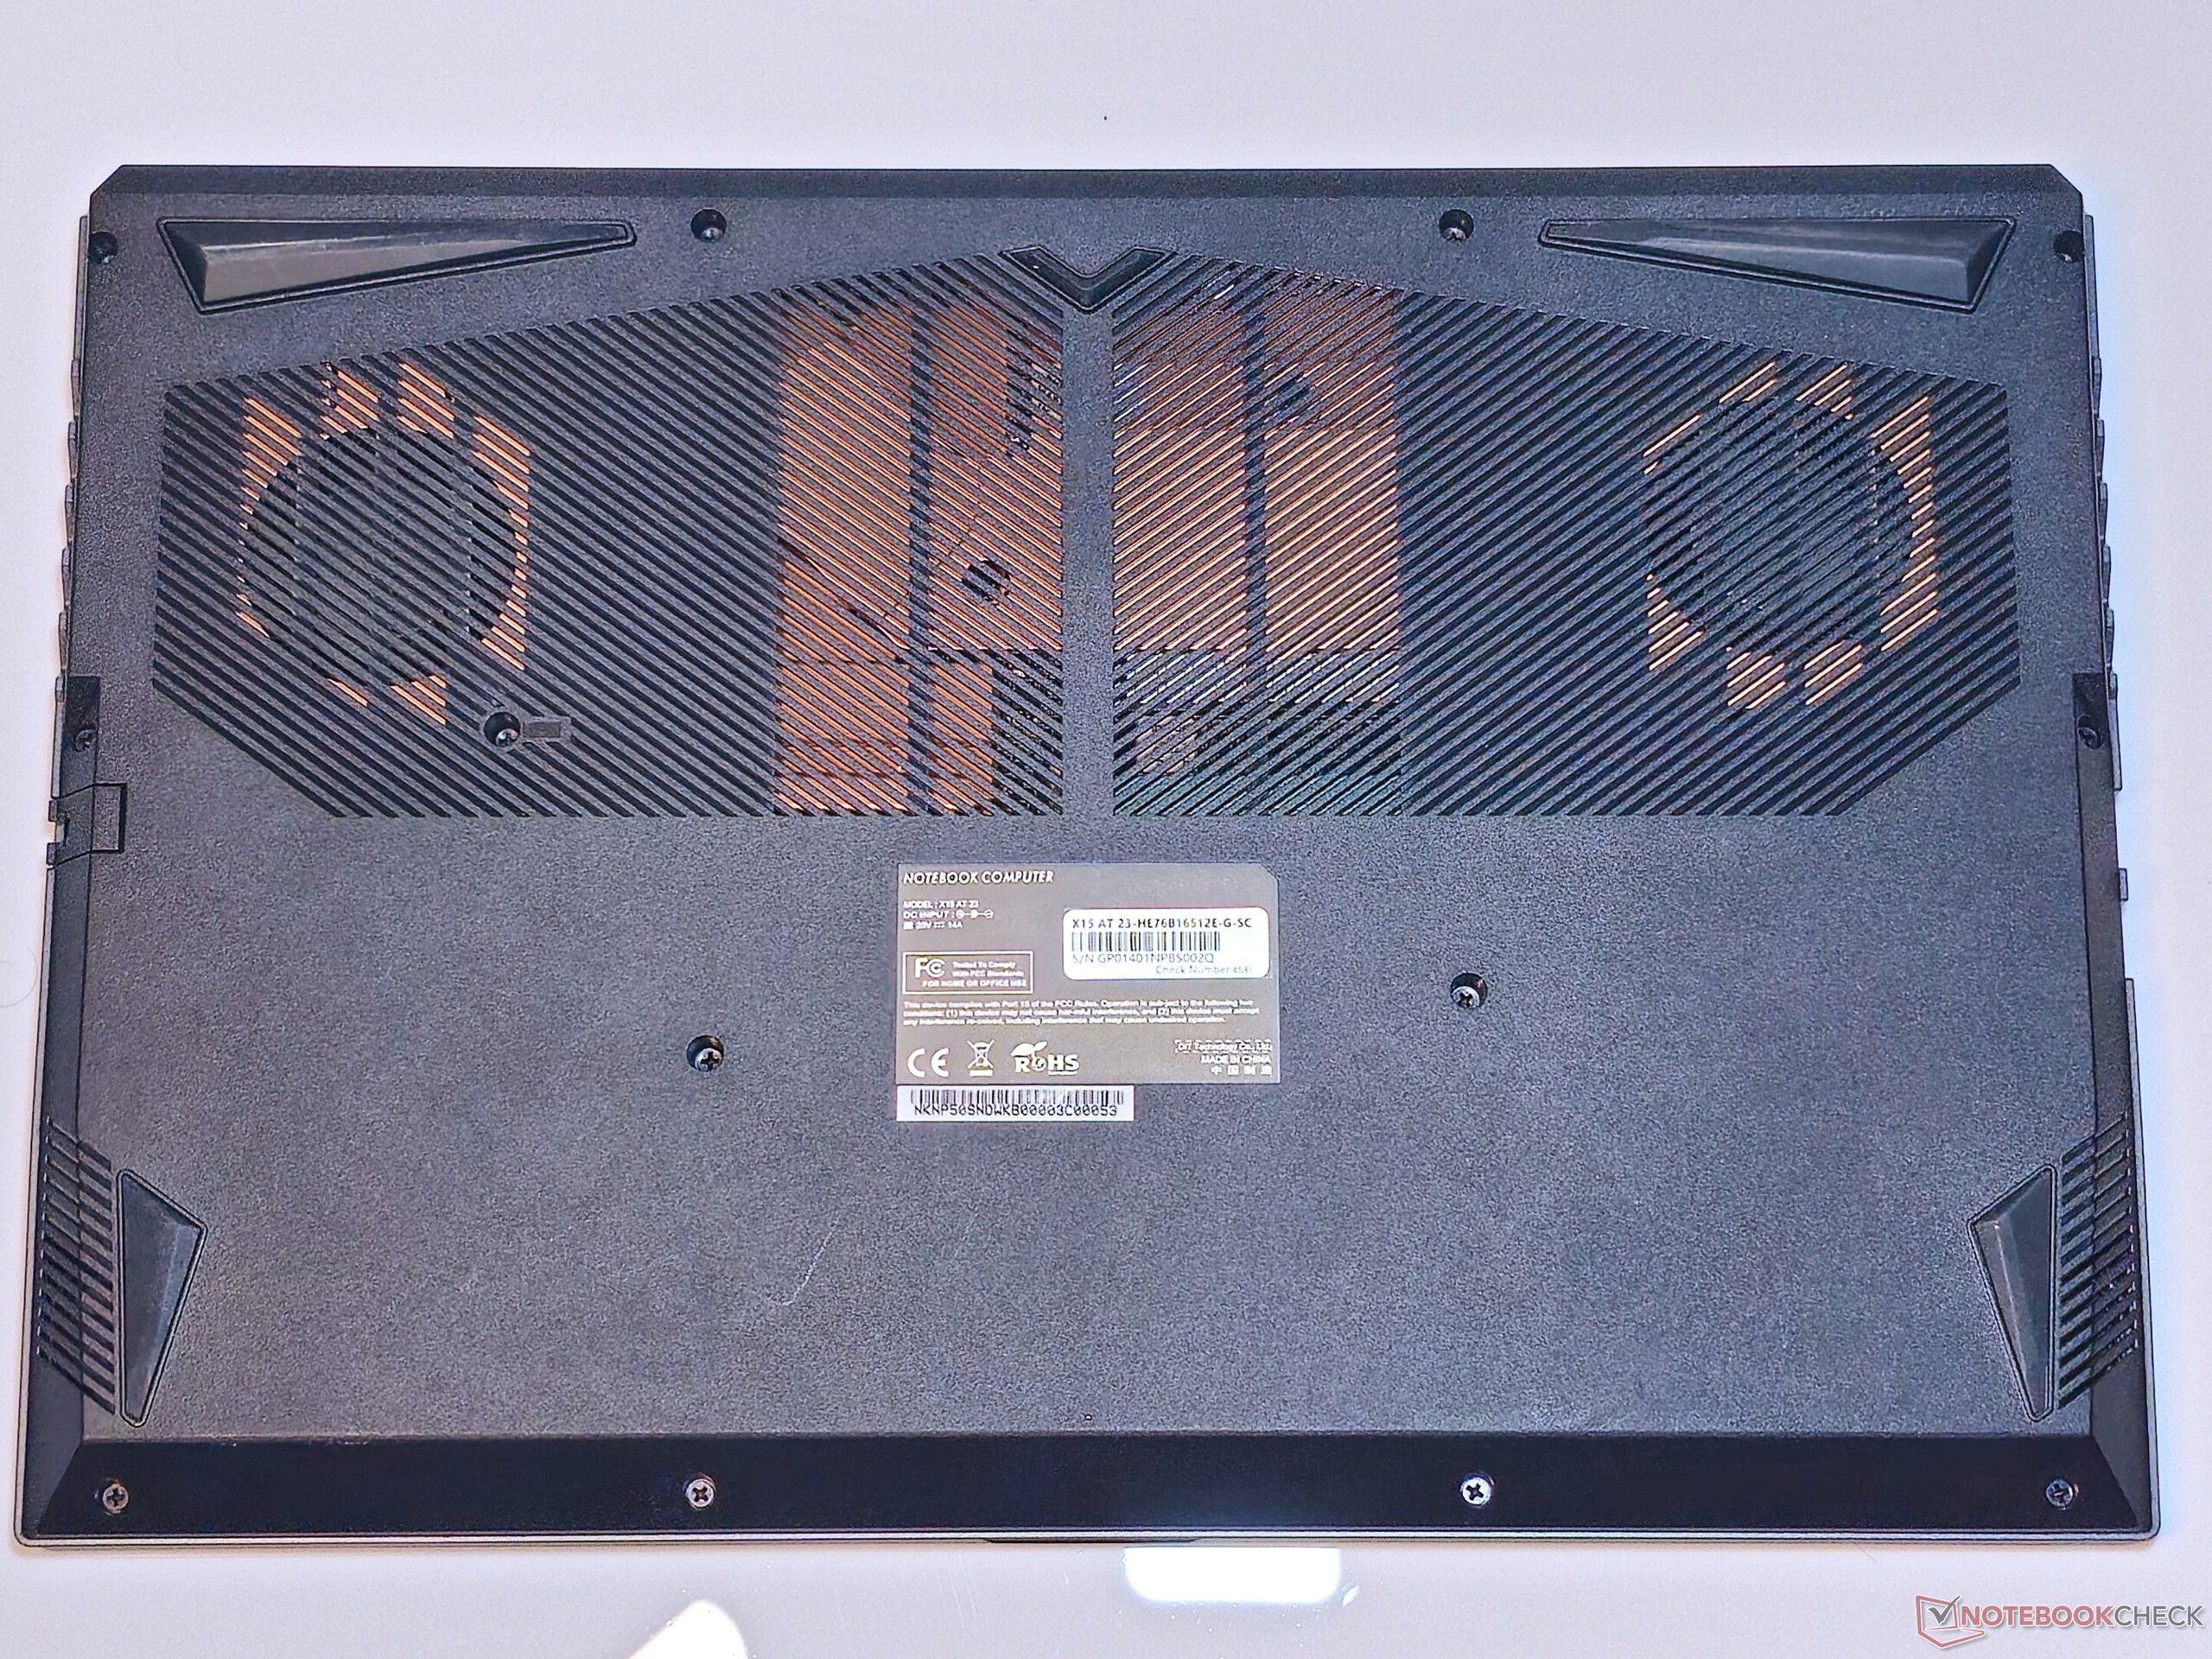
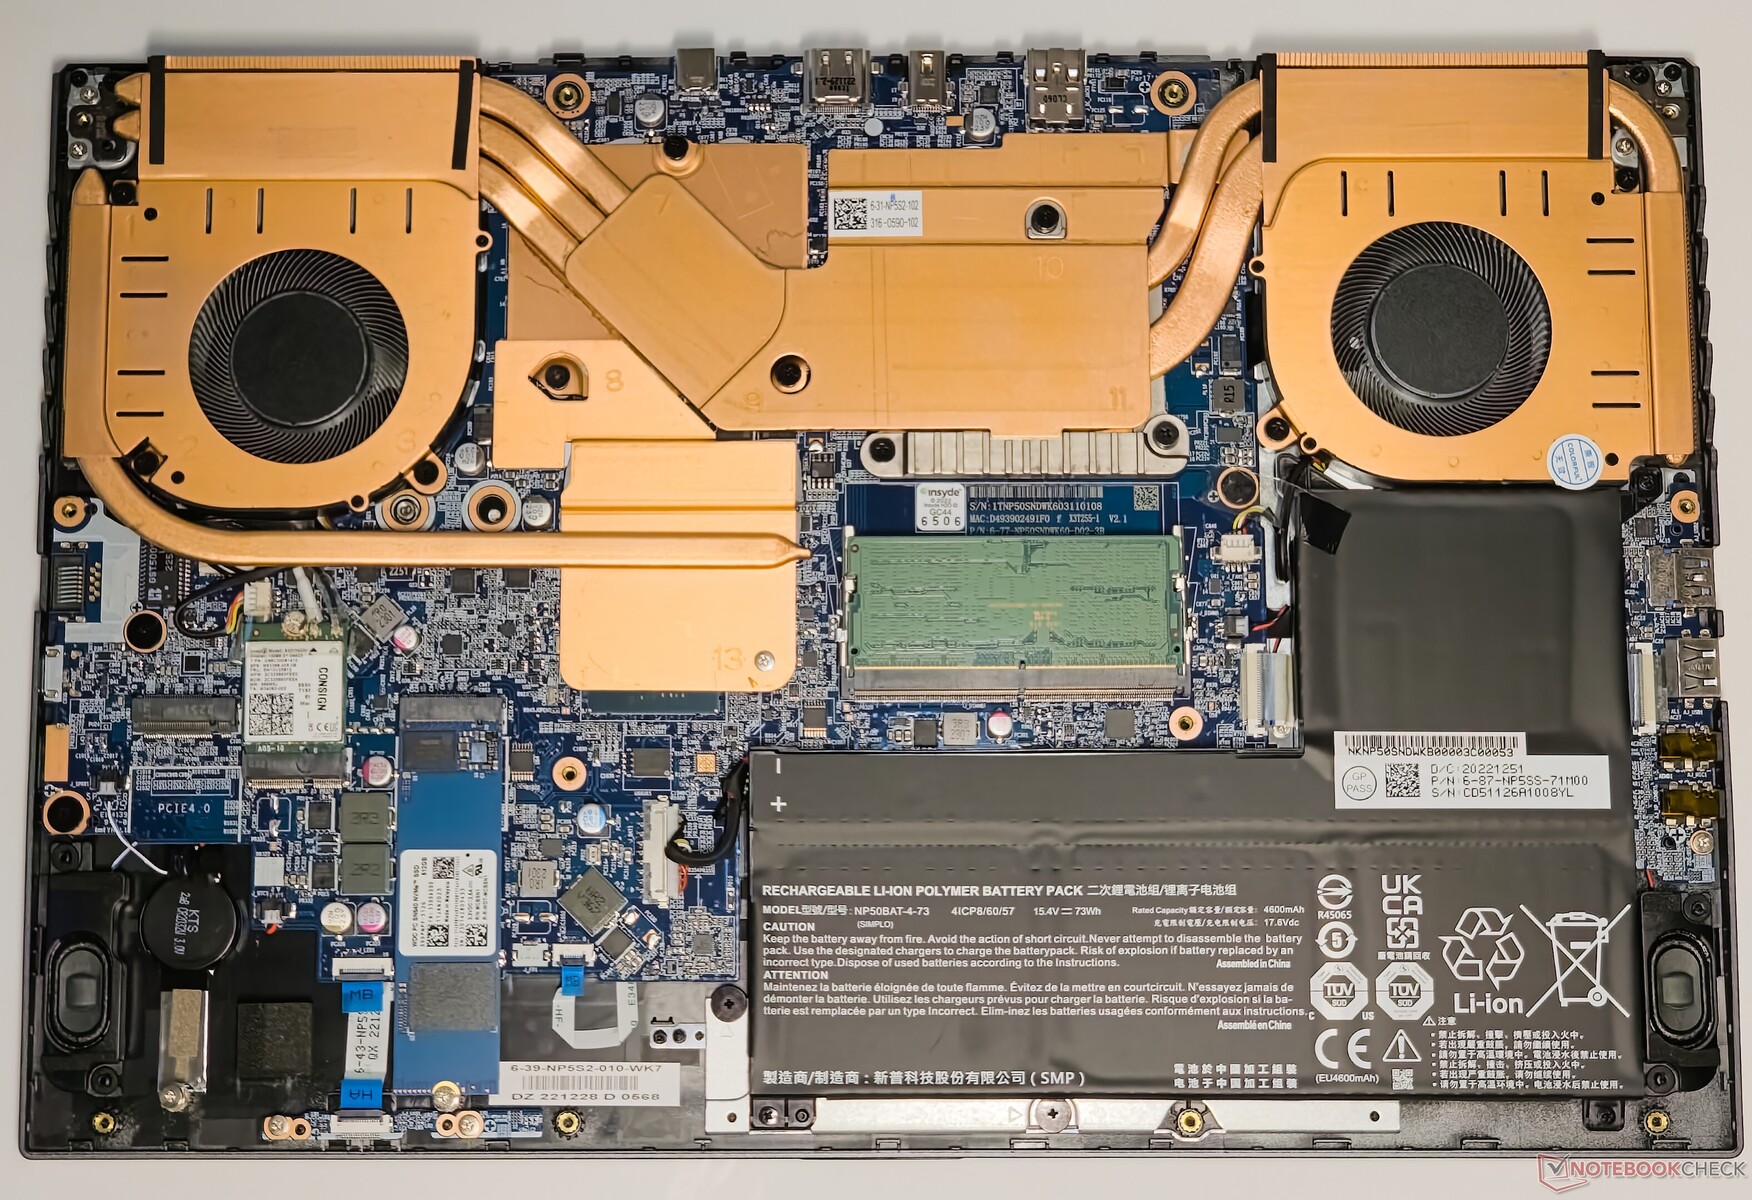
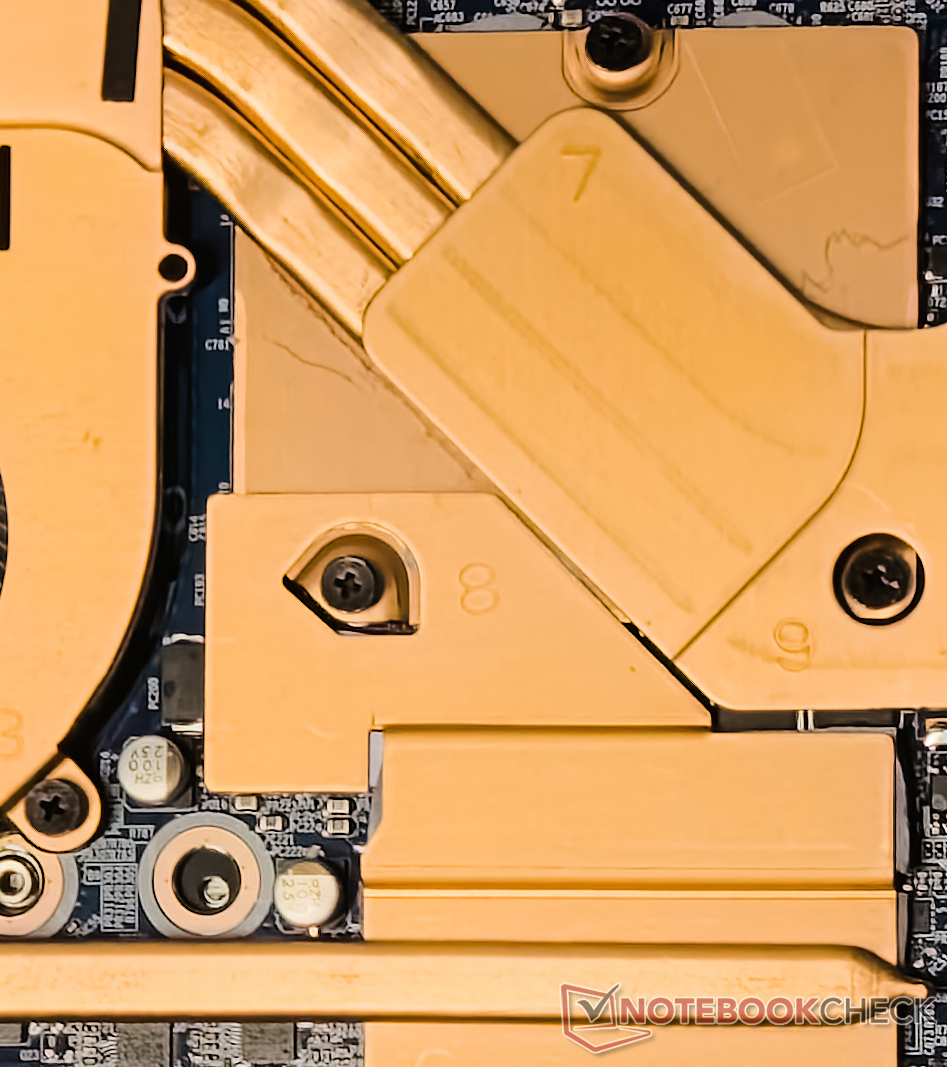
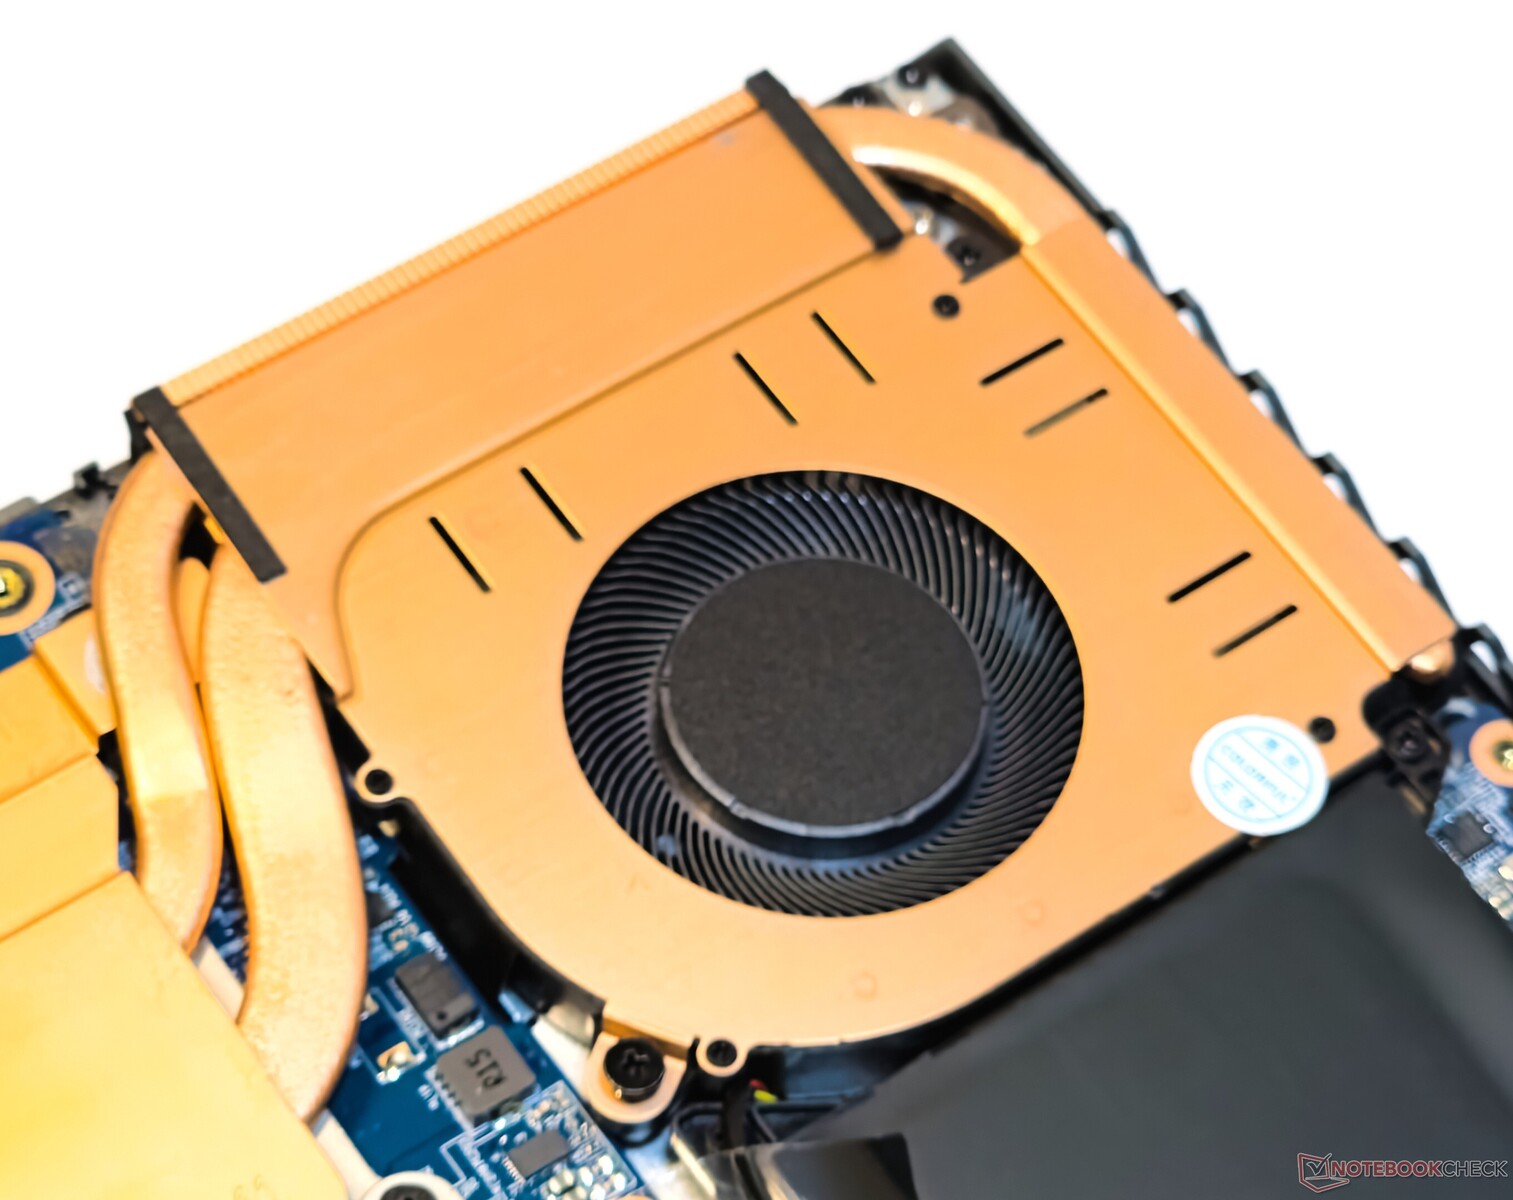
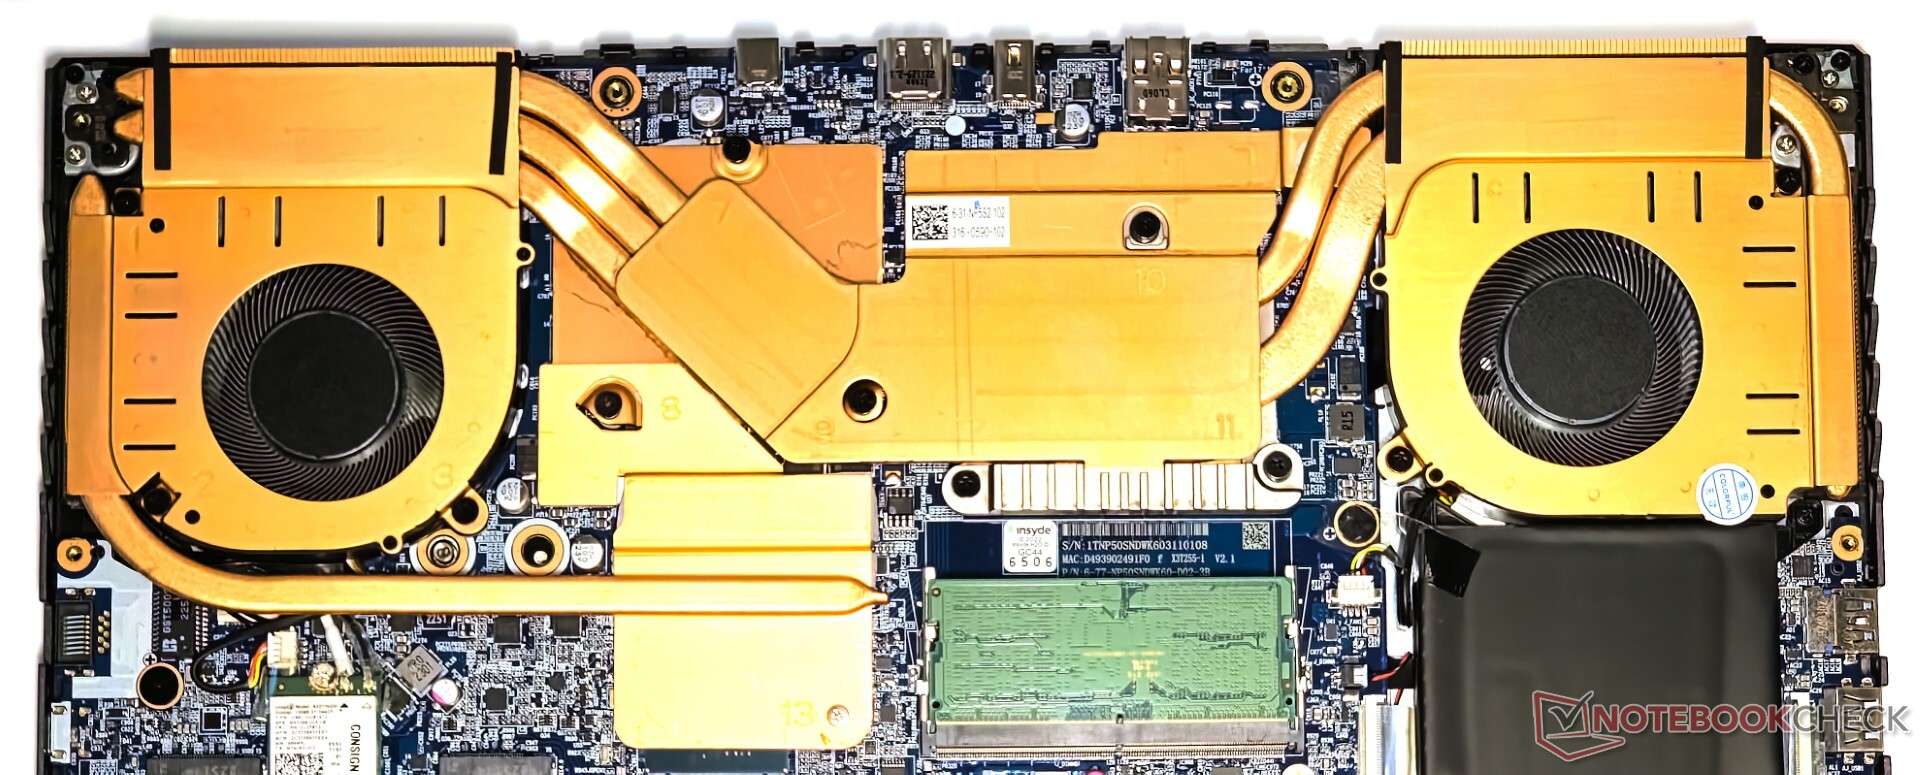
El panel trasero se desprende fácilmente tras retirar los 13 tornillos PH0. La EVOL X15 muestra una distribución interna muy trabajada junto con un amplio sistema de refrigeración totalmente de cobre para la CPU y la GPU.
Nuestra unidad venía con una sola memoria DDR5-4800 de 16 GB configurada en modo de doble canal. La tarjeta WLAN, la RAM y la SSD NVMe pueden sustituirse o actualizarse según sea necesario, y el paquete de baterías en forma de L puede desatornillarse.
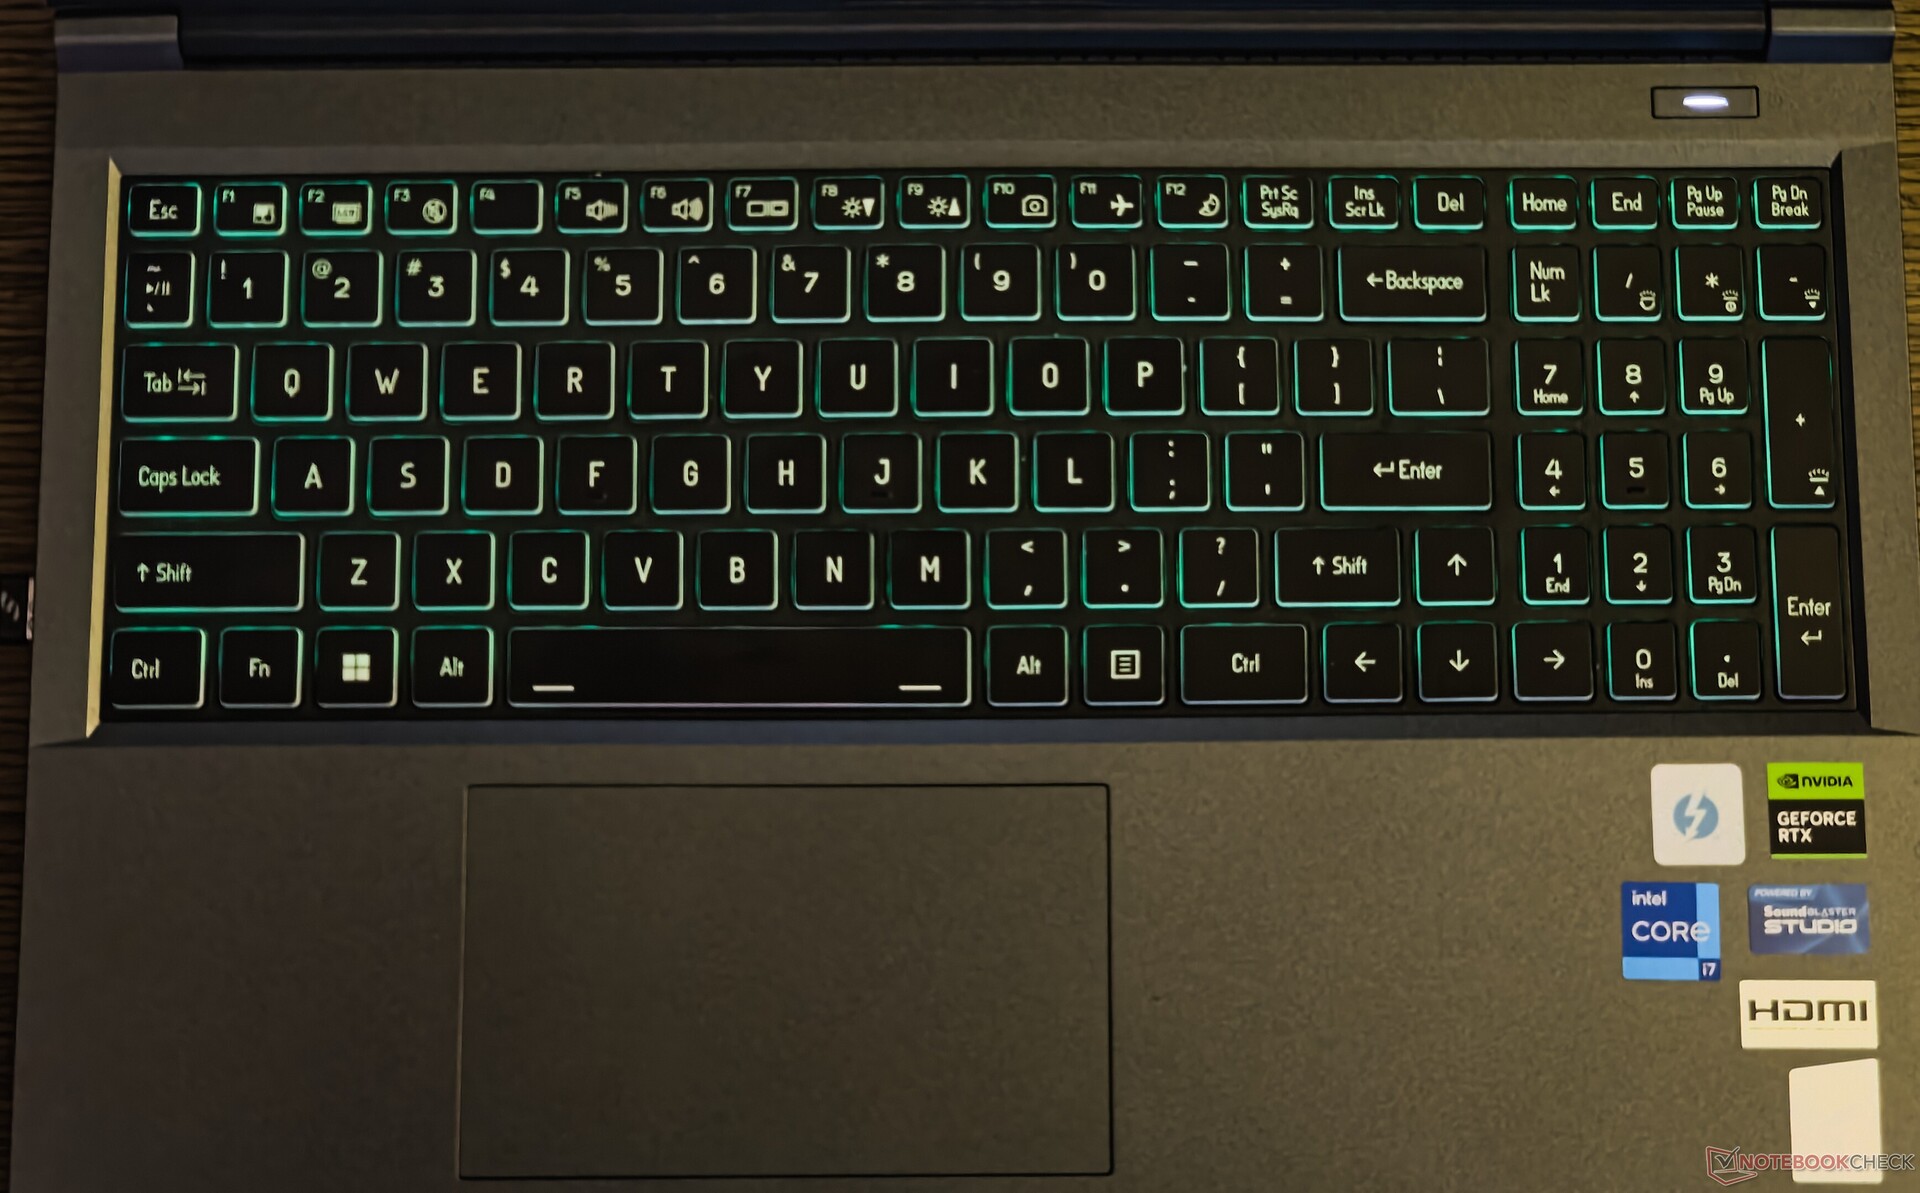
Dispositivos de entrada: Teclas blandas con un tacto decente
Teclado
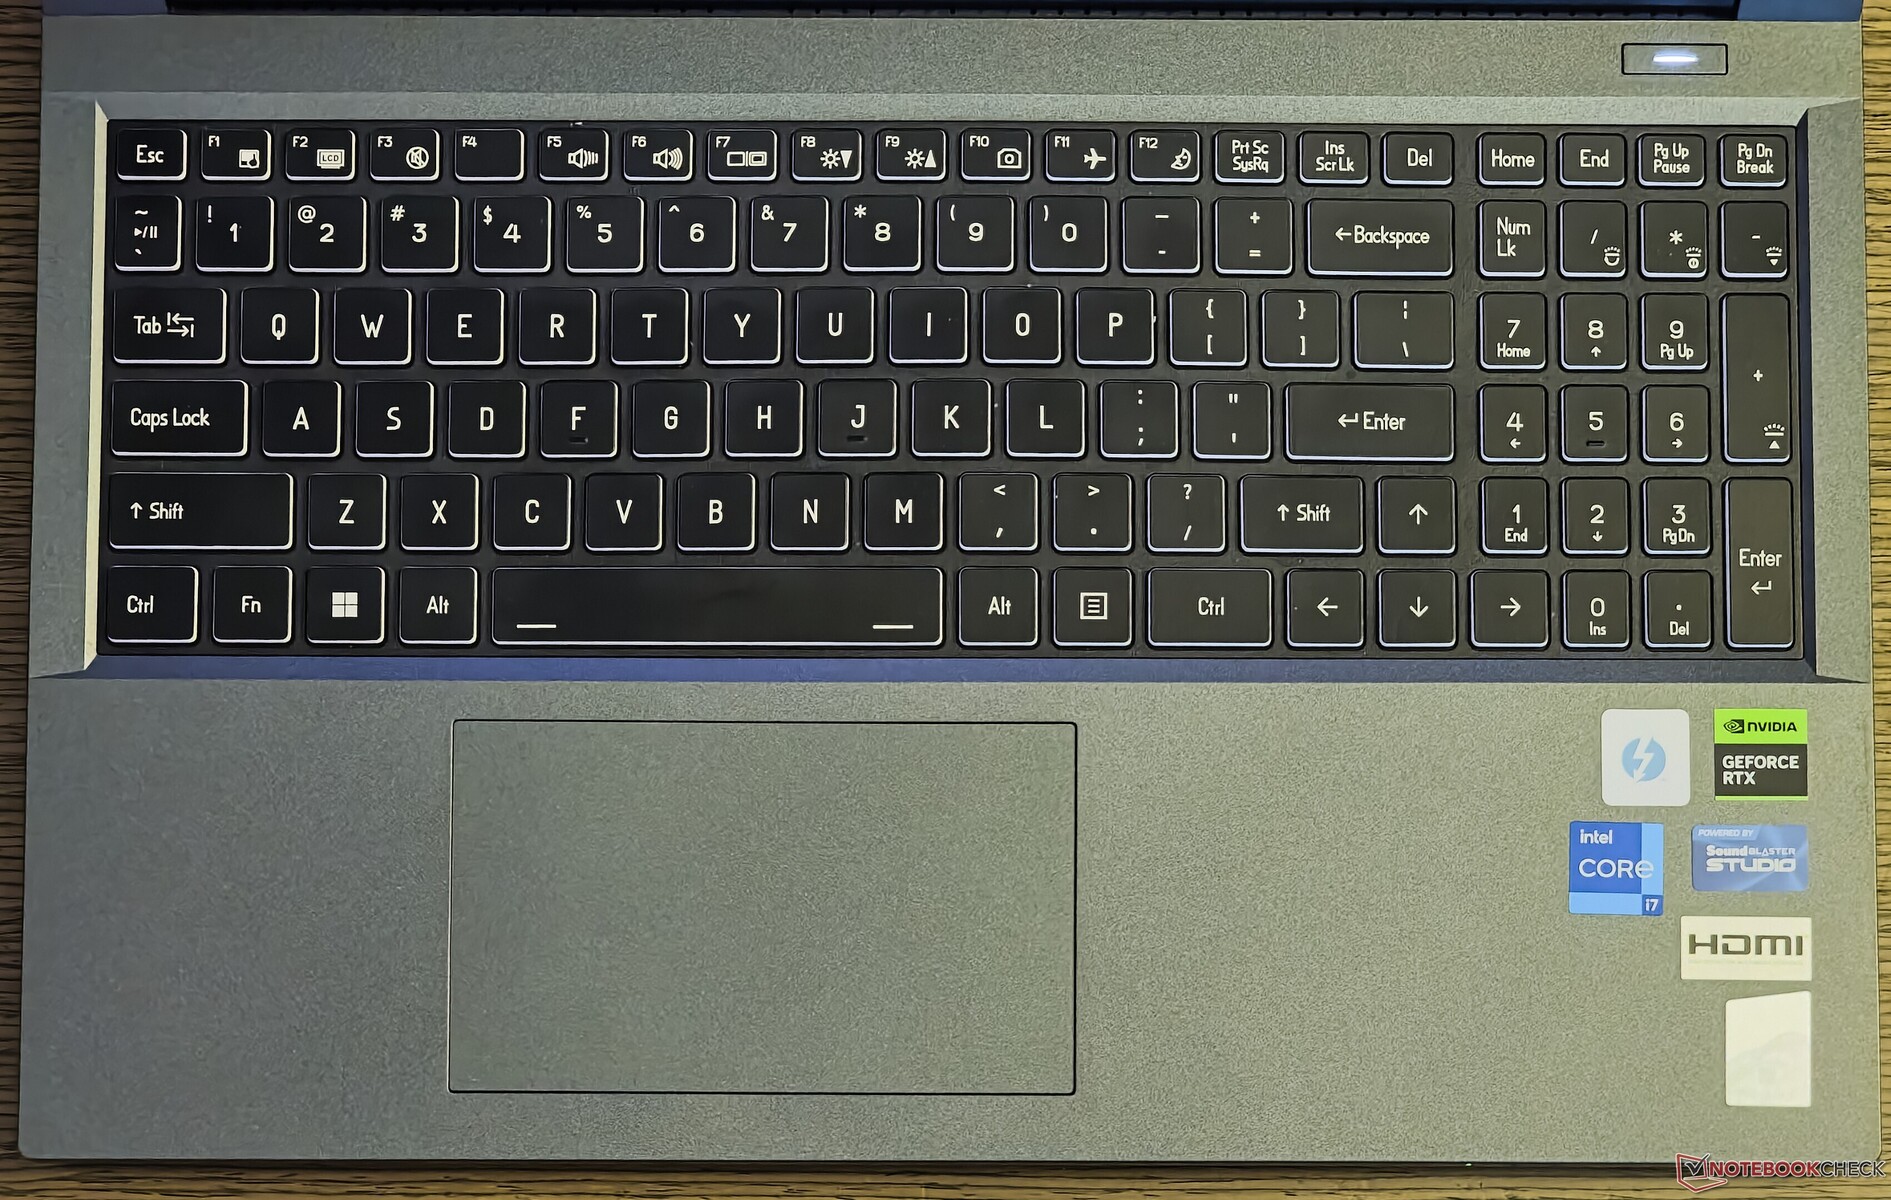
El teclado de tamaño completo del EVOL X15 incluye un teclado numérico y espacio para teclas de flecha de tamaño adecuado, una gran ayuda para los títulos de carreras. Un inconveniente de esta disposición es la tecla Shift derecha acortada, que podría tropezar con los usuarios en transición desde un teclado típico de sobremesa o incluso de portátil.
Al principio, el recorrido de las teclas es un poco blando, pero tiene suficiente tacto para jugar y escribir. La aplicación Control Center de Colorful (léase Clevo) permite grabar macros de teclado y ratón, lo que debería resultar útil para los jugadores de MMORPG y MOBA.
No hay retroiluminación RGB multizona o por tecla, por lo que tendrá que lidiar con una paleta de colores limitada en la app Control Center. La retroiluminación se puede ajustar en cuatro niveles, pero las teclas filtran una buena cantidad de luz para que no pase.
Panel táctil
El touchpad de 12 cm x 7 cm no es el más grande que hemos visto en portátiles para juegos este año, pero ofrece una experiencia de deslizamiento relativamente suave y es totalmente compatible con los gestos de Windows Precision.
Toda la superficie del touchpad sirve como botón izquierdo del ratón. Sin embargo, los clics son más fáciles y menos ruidosos en las regiones central e inferior del touchpad en comparación con las esquinas superiores.
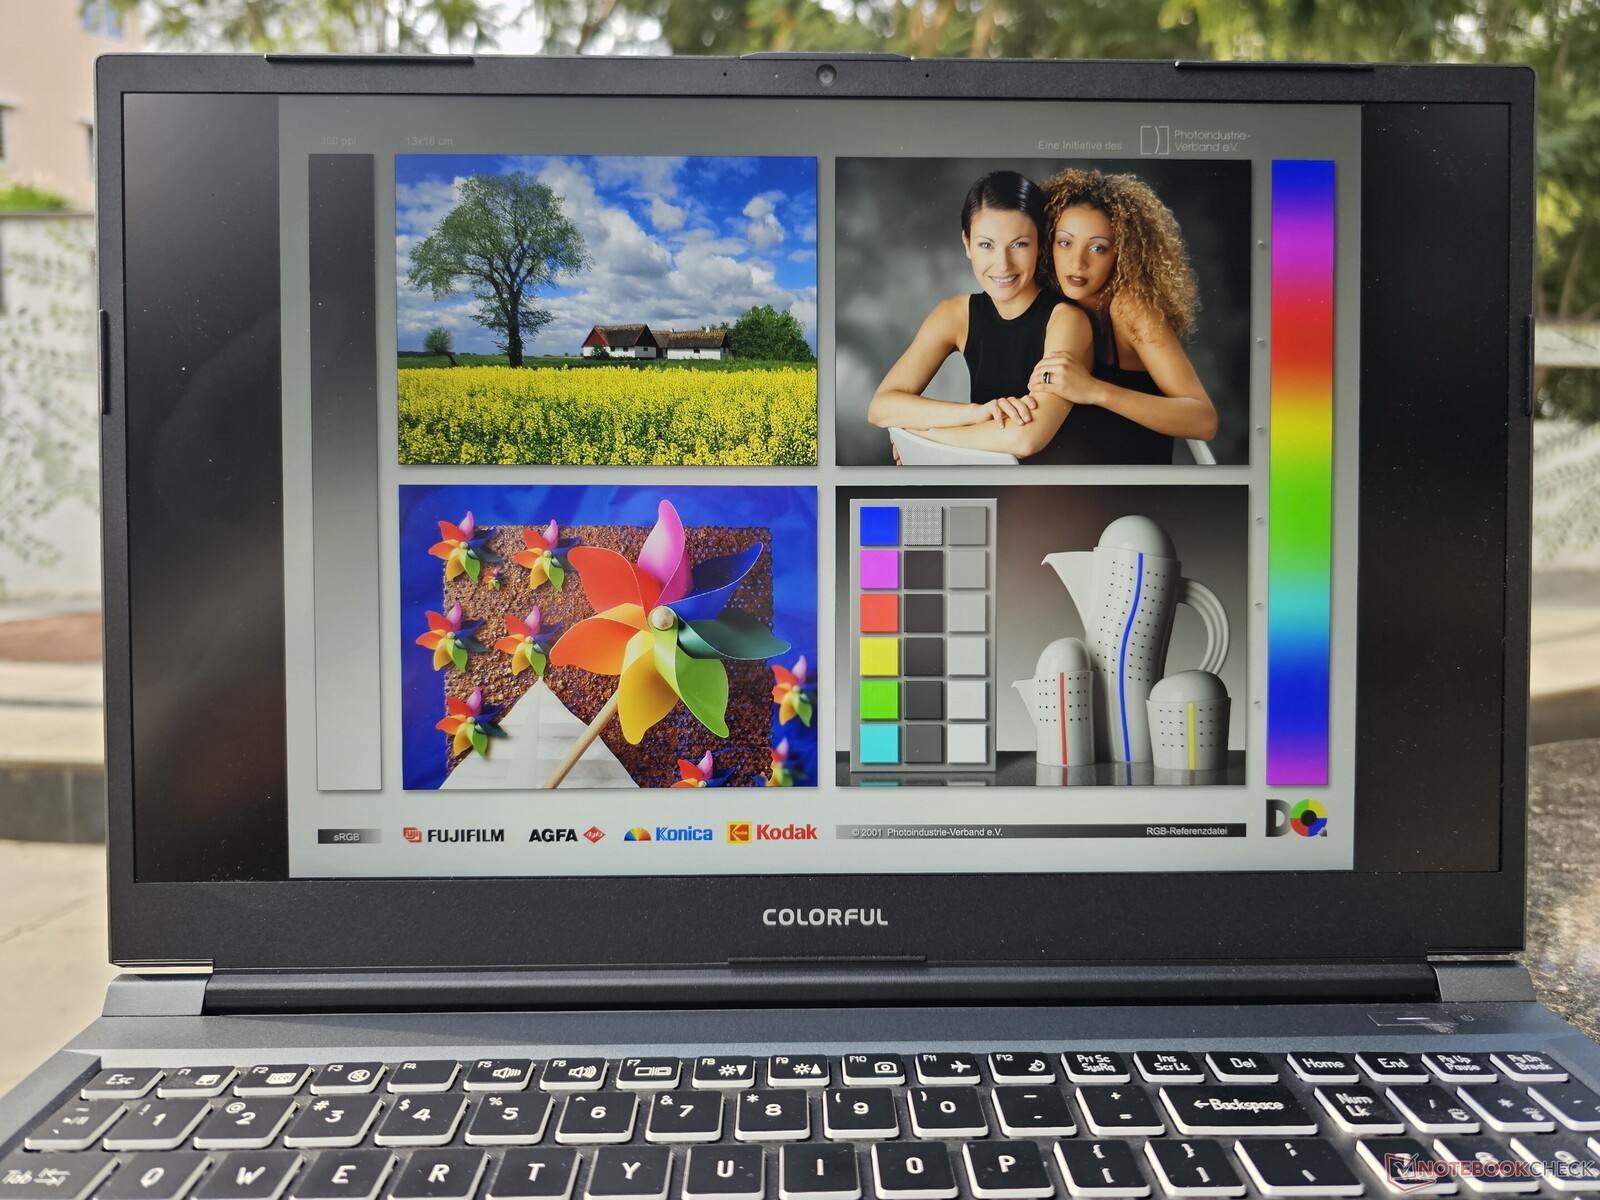
Pantalla: panel QHD de 165 Hz sin PWM
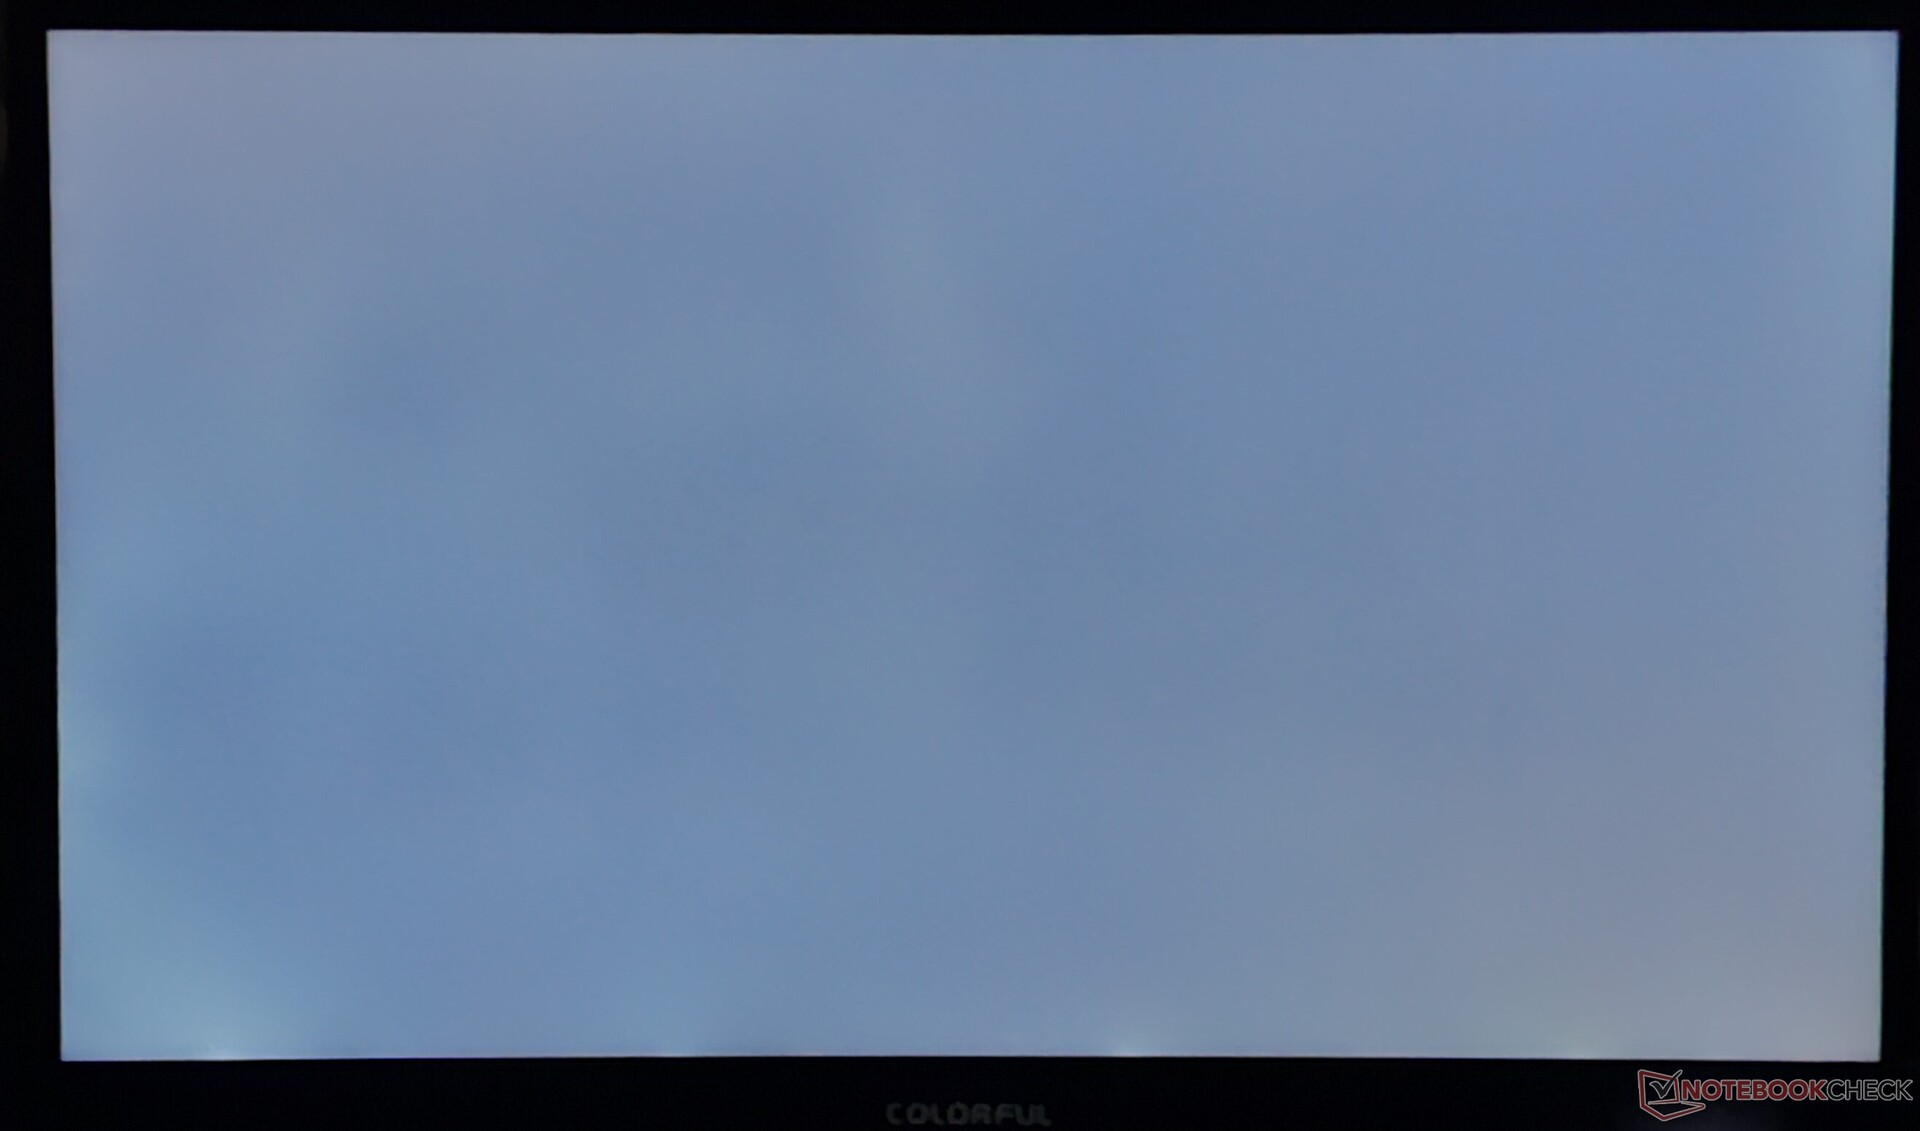
El EVOL X15 AT viene equipado con un panel QHD BOE de 15,6 pulgadas y 165 Hz. La pantalla no sorprende precisamente con sus 345 nits de pico y 318 nits de luminancia media, pero está a la altura de la mayoría de portátiles para juegos de este precio. Se observa un sangrado mínimo de la retroiluminación en las esquinas.
El panel exhibe una decente distribución del brillo del 81%, pero la relación de contraste medida de 607:1 está en el extremo inferior, especialmente si se compara con otros paneles BOE de esta comparativa.

| |||||||||||||||||||||||||
iluminación: 81 %
Brillo con batería: 251 cd/m²
Contraste: 607:1 (Negro: 0.57 cd/m²)
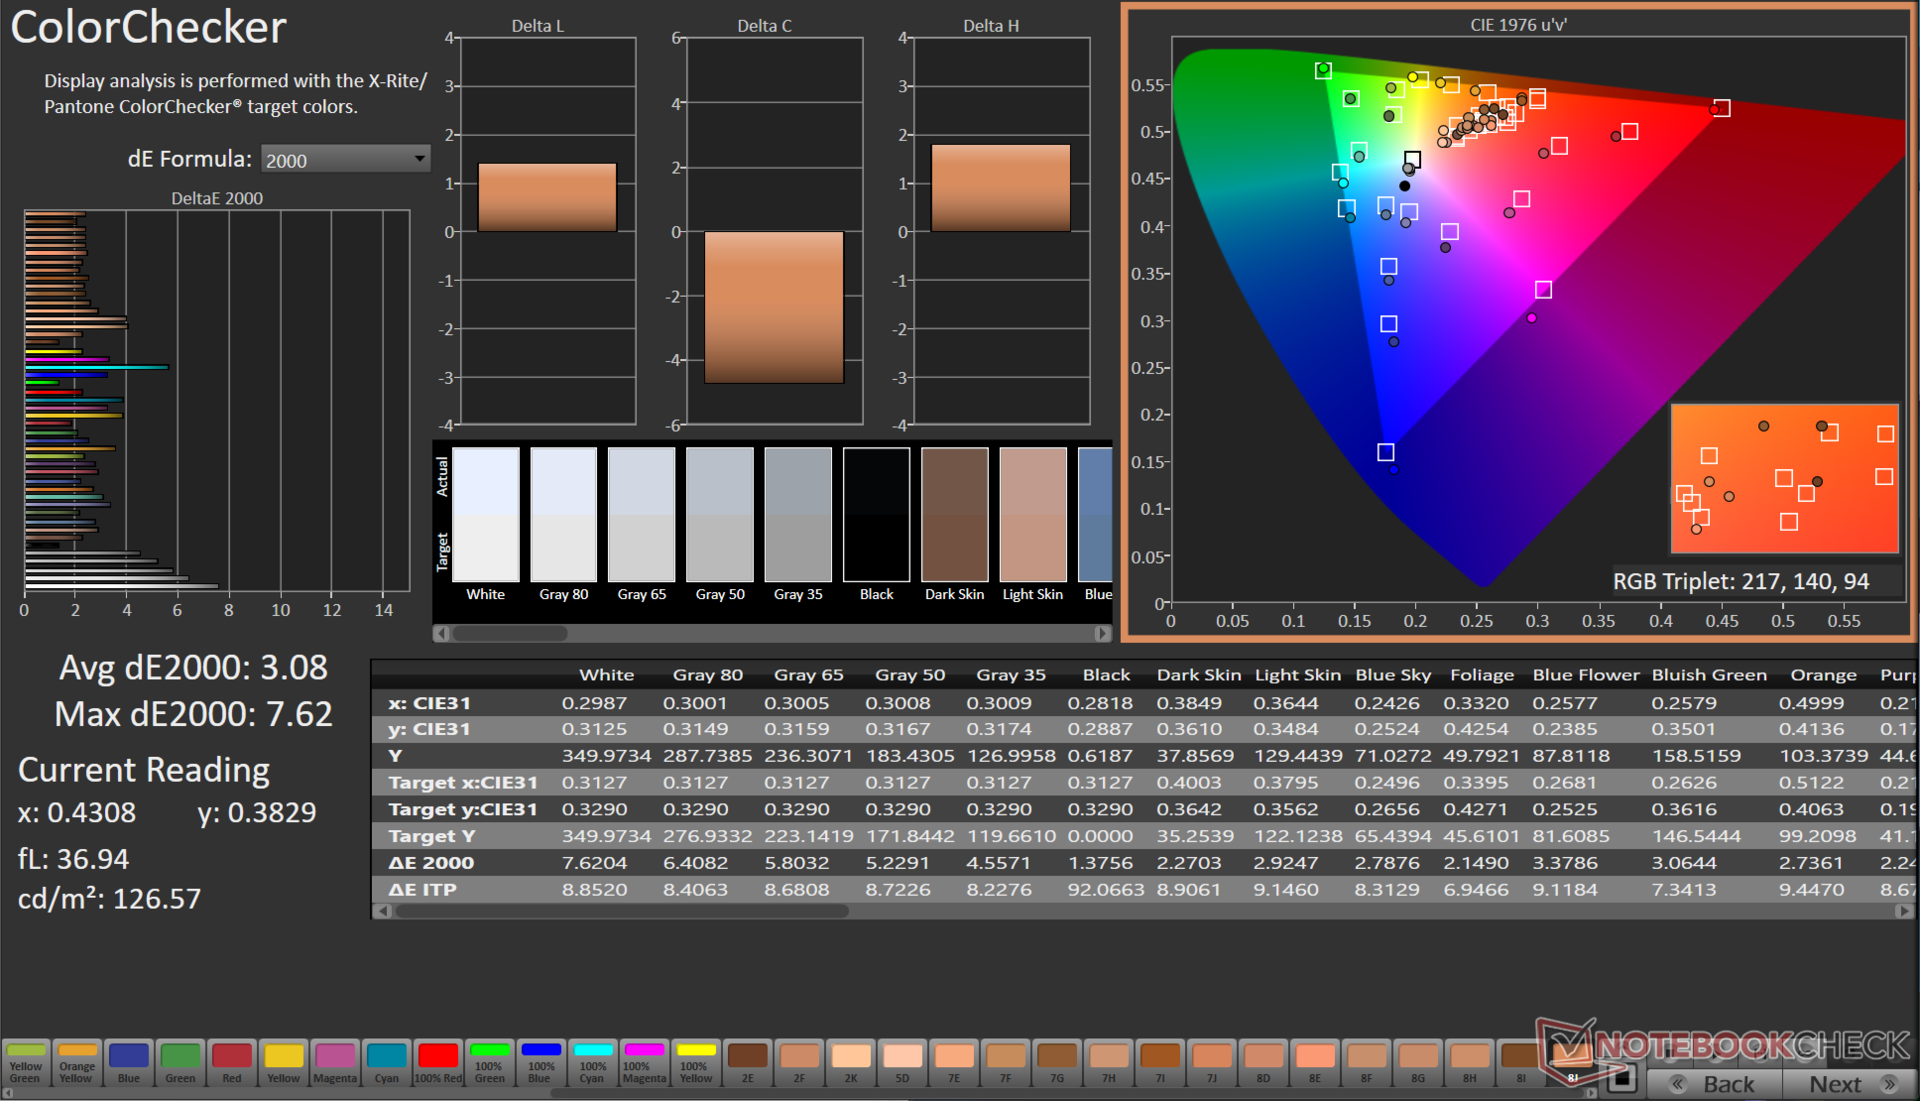
ΔE ColorChecker Calman: 3.08 | ∀{0.5-29.43 Ø4.71}
calibrated: 1.12
ΔE Greyscale Calman: 4.3 | ∀{0.09-98 Ø4.96}
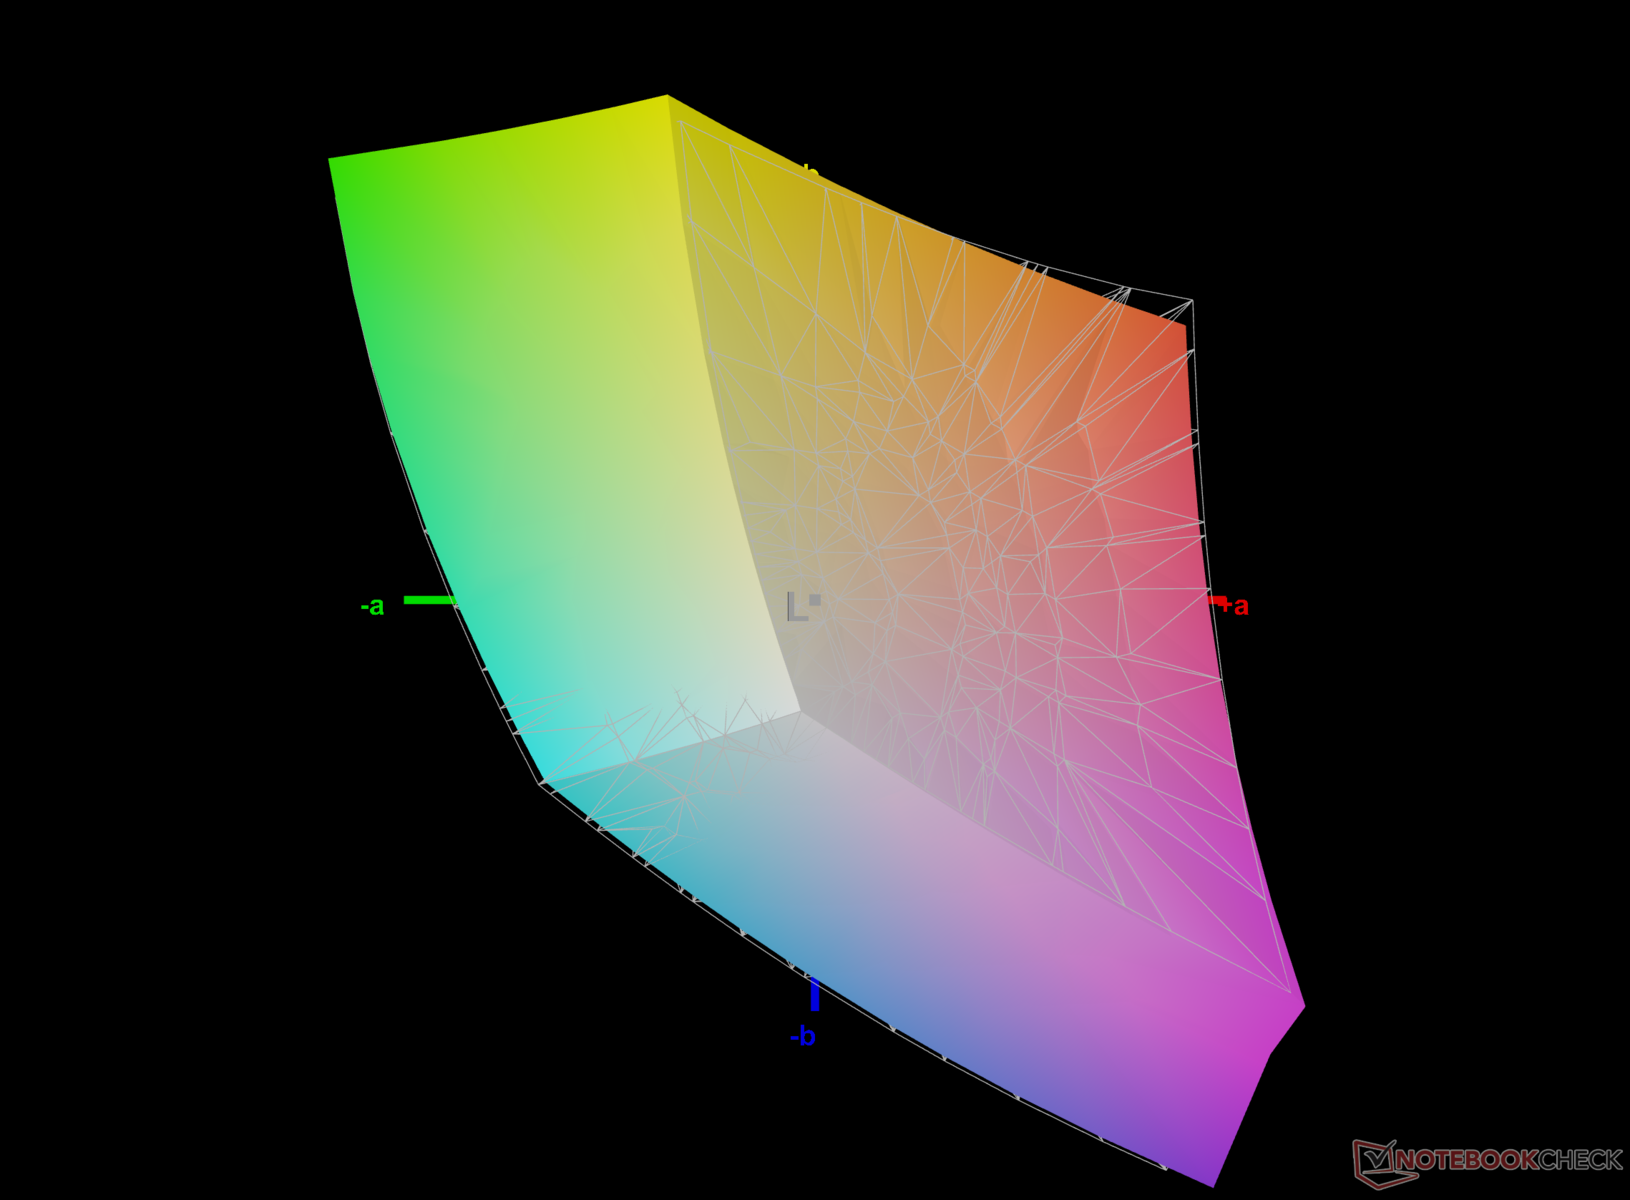
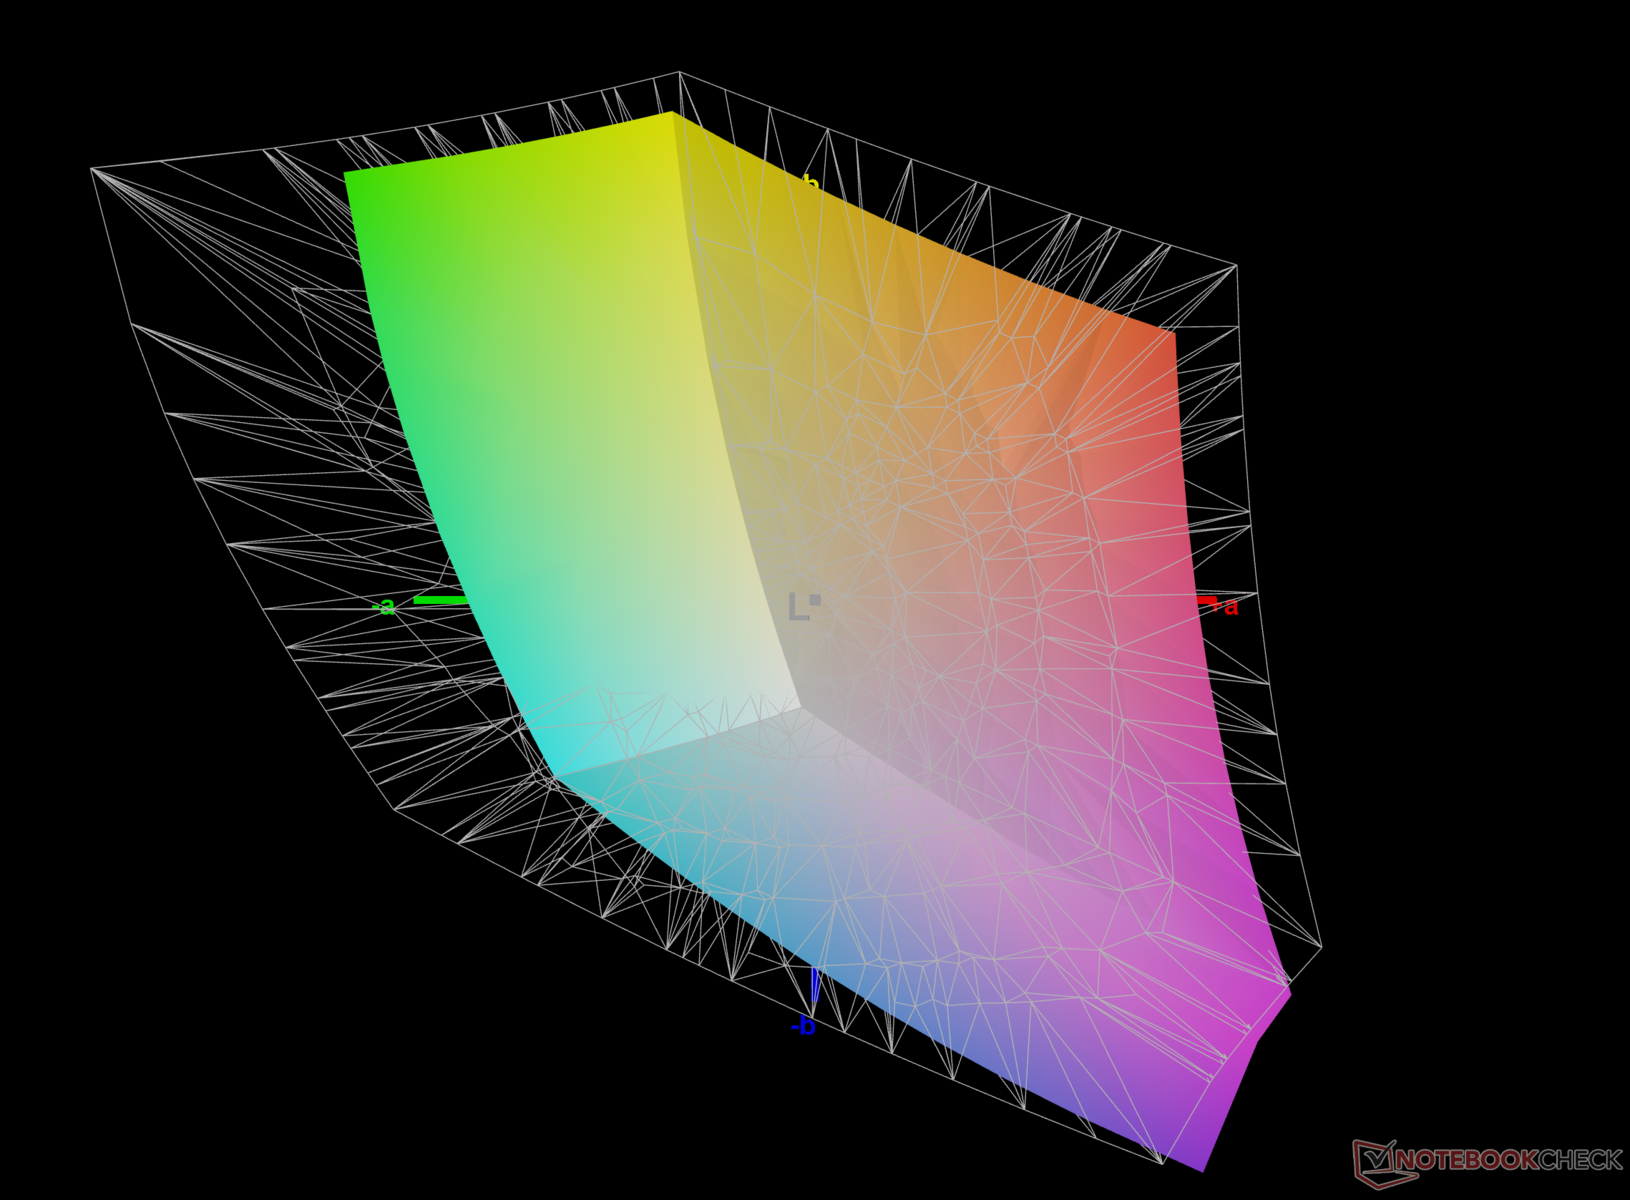
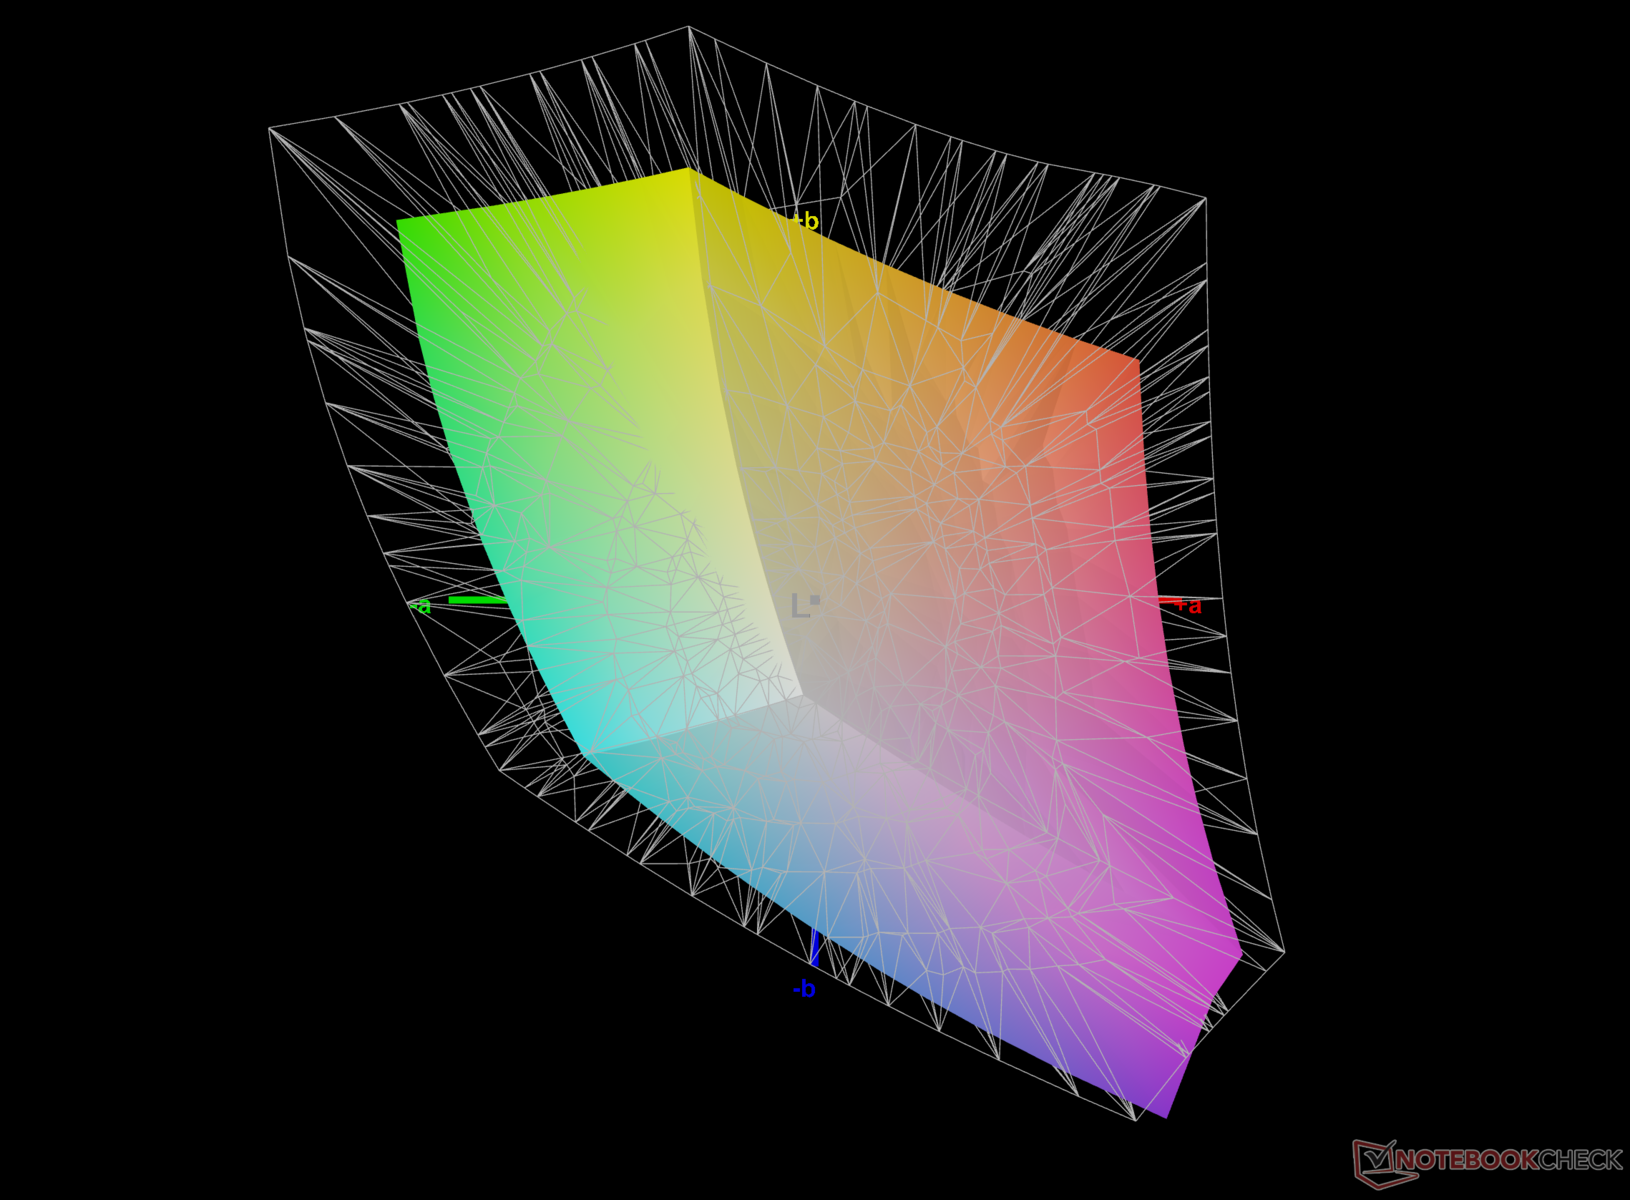
68.2% AdobeRGB 1998 (Argyll 3D)
97.4% sRGB (Argyll 3D)
66.9% Display P3 (Argyll 3D)
Gamma: 2.02
CCT: 7438 K
| Colorful EVOL X15 AT 23 BOE CQ NE156QHM-NY2, IPS, 2560x1440, 15.6" | Alienware m16 R1 Intel BOE NE16NYB, IPS, 2560x1600, 16" | HP Omen 16-wf000 BOE0B7D, IPS, 2560x1440, 16.1" | Acer Predator Helios 16 PH16-71-731Q BOE NE160QDM-NZ2, IPS-LED, 2560x1600, 16" | Dell G15 5530 AUO B156HAN, IPS, 1920x1080, 15.6" | Schenker XMG Pro 15 (E23) BOE0AD1, IPS, 2560x1440, 15.6" | Alienware m16 R1 AMD BOE NE16NZ4, IPS, 2560x1600, 16" | Uniwill GM6PX7X RTX 4070 BOE CQ NE160QDM-NZ1, IPS, 2560x1600, 16" | |
|---|---|---|---|---|---|---|---|---|
| Display | 1% | 3% | 24% | 6% | 25% | 27% | 0% | |
| Display P3 Coverage (%) | 66.9 | 67.7 1% | 69 3% | 97.1 45% | 73.1 9% | 97.8 46% | 98.6 47% | 67.5 1% |
| sRGB Coverage (%) | 97.4 | 97.2 0% | 99.2 2% | 100 3% | 98.4 1% | 99.9 3% | 99.9 3% | 96.4 -1% |
| AdobeRGB 1998 Coverage (%) | 68.2 | 70 3% | 71.2 4% | 84.7 24% | 74.4 9% | 85.4 25% | 88.9 30% | 68.6 1% |
| Response Times | 35% | 16% | -7% | 49% | -29% | 18% | -23% | |
| Response Time Grey 50% / Grey 80% * (ms) | 10.42 ? | 4 ? 62% | 4.6 ? 56% | 13.6 ? -31% | 3.39 ? 67% | 14 ? -34% | 5.1 ? 51% | 12.6 ? -21% |
| Response Time Black / White * (ms) | 7.81 ? | 7.3 ? 7% | 9.7 ? -24% | 6.4 ? 18% | 5.35 ? 31% | 9.6 ? -23% | 9 ? -15% | 9.8 ? -25% |
| PWM Frequency (Hz) | 21620 ? | |||||||
| Screen | 24% | 28% | 42% | 7% | 12% | 0% | 22% | |
| Brightness middle (cd/m²) | 346 | 306 -12% | 310.9 -10% | 511 48% | 320 -8% | 322 -7% | 329 -5% | 338.6 -2% |
| Brightness (cd/m²) | 318 | 302 -5% | 296 -7% | 498 57% | 316 -1% | 301 -5% | 317 0% | 328 3% |
| Brightness Distribution (%) | 81 | 89 10% | 91 12% | 94 16% | 94 16% | 85 5% | 89 10% | 89 10% |
| Black Level * (cd/m²) | 0.57 | 0.3 47% | 0.35 39% | 0.36 37% | 0.21 63% | 0.36 37% | 0.32 44% | 0.32 44% |
| Contrast (:1) | 607 | 1020 68% | 888 46% | 1419 134% | 1524 151% | 894 47% | 1028 69% | 1058 74% |
| Colorchecker dE 2000 * | 3.08 | 2.57 17% | 2.18 29% | 1.76 43% | 4.55 -48% | 1.98 36% | 3.71 -20% | 2.18 29% |
| Colorchecker dE 2000 max. * | 7.62 | 4.26 44% | 3.58 53% | 3.7 51% | 9.83 -29% | 5.24 31% | 7.23 5% | 7.14 6% |
| Colorchecker dE 2000 calibrated * | 1.12 | 0.85 24% | 0.52 54% | 1.56 -39% | 1.51 -35% | 1.98 -77% | 2.82 -152% | 0.93 17% |
| Greyscale dE 2000 * | 4.3 | 3.3 23% | 2.8 35% | 3 30% | 6.2 -44% | 2.44 43% | 2.2 49% | 3.7 14% |
| Gamma | 2.02 109% | 1.997 110% | 2.18 101% | 2.33 94% | 2.07 106% | 2.42 91% | 2.3 96% | 2.18 101% |
| CCT | 7438 87% | 6895 94% | 6002 108% | 6341 103% | 6479 100% | 6984 93% | 6270 104% | 7245 90% |
| Media total (Programa/Opciones) | 20% /
21% | 16% /
21% | 20% /
31% | 21% /
13% | 3% /
9% | 15% /
8% | -0% /
11% |
* ... más pequeño es mejor
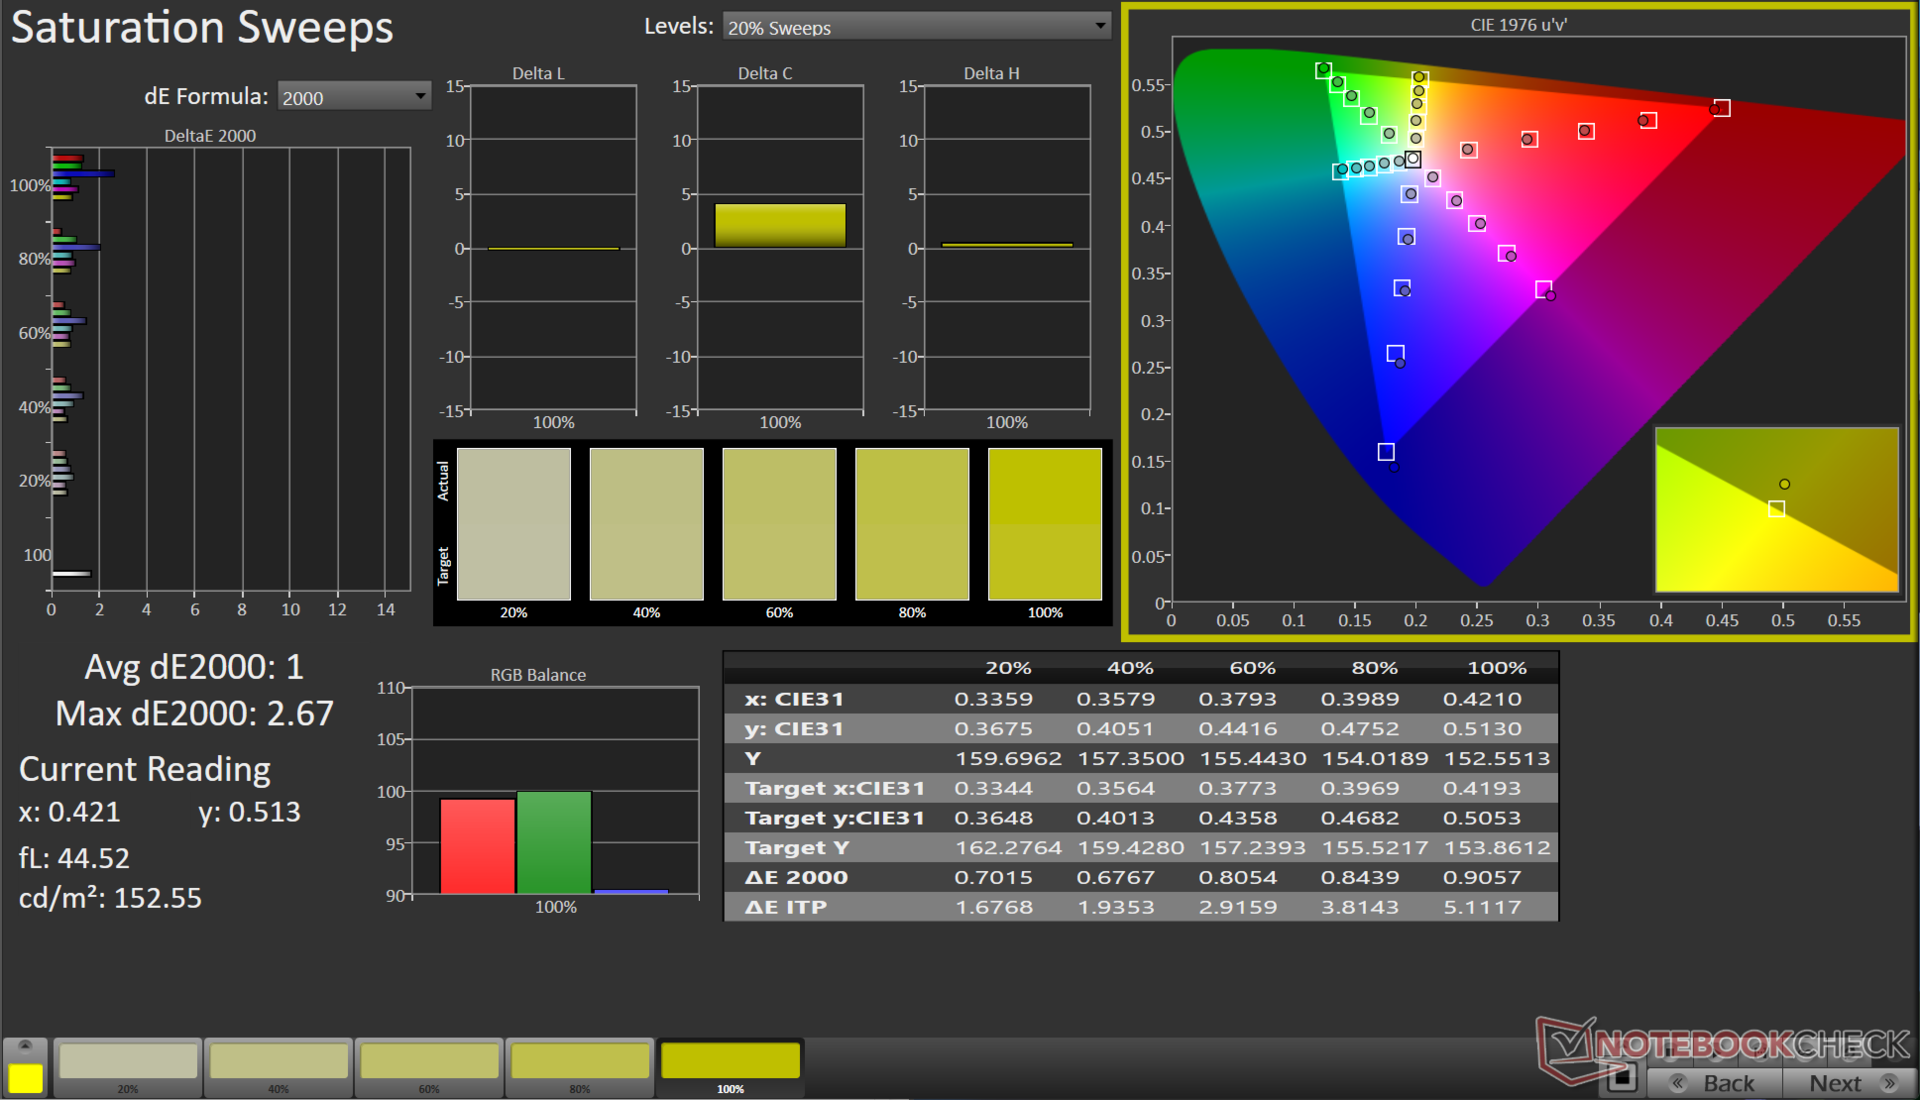
La EVOL X15 no está dirigida a creadores de contenidos, pero la cobertura sRGB del 97% es un buen augurio para juegos, web y ediciones básicas. Los creadores que deseen aprovechar la capacidad del hardware de la EVOL X15 pueden utilizar una pantalla externa para aumentar el rendimiento del color.
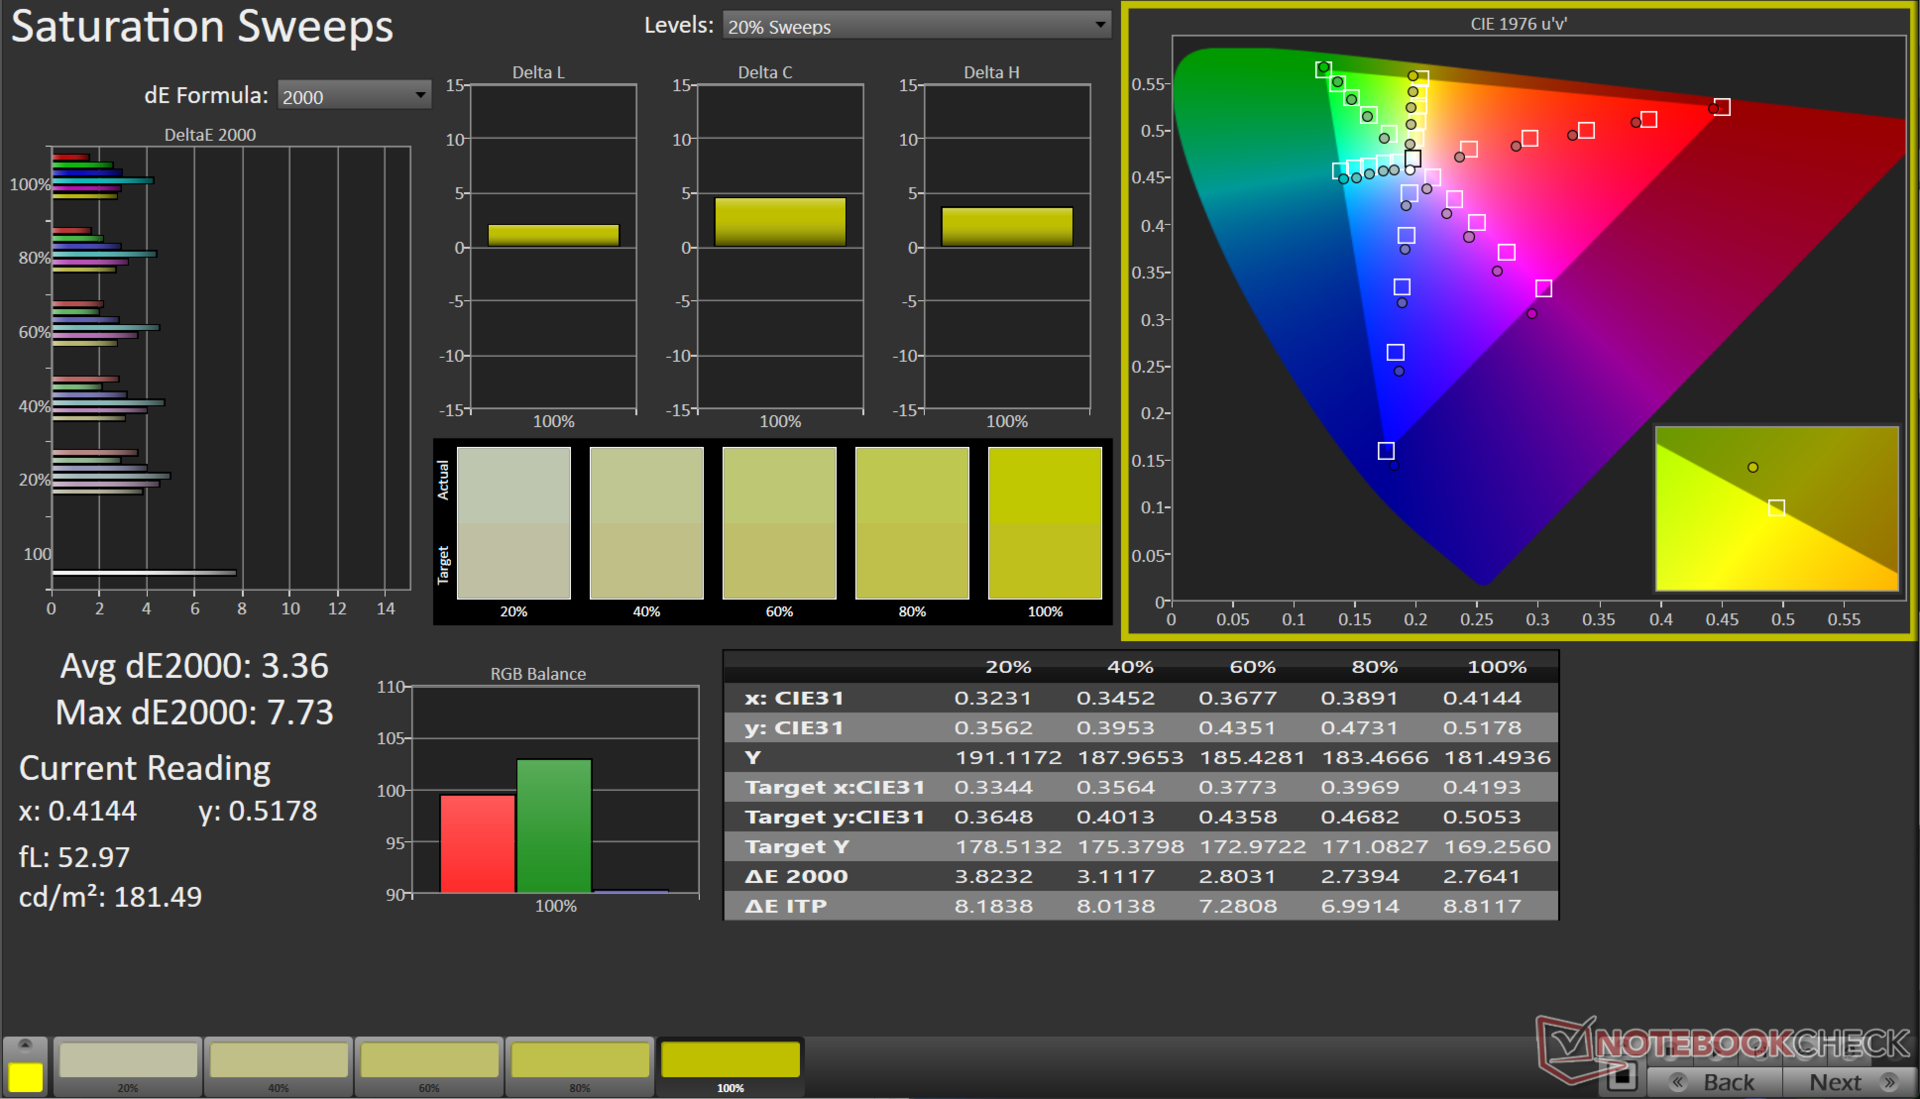
La reproducción del color de la pantalla es aceptable en su mayor parte, con unos valores medios de escala de grises y ColorChecker Delta E 2000 de 4,3 y 3,08, respectivamente.
Nuestra rutina de calibración, utilizando el espectrofotómetro X-Rite i1Basic Pro 3 y el software Calman Ultimate de Portrait Display, mejora considerablemente estos valores correspondientes a 1 y 1,12.
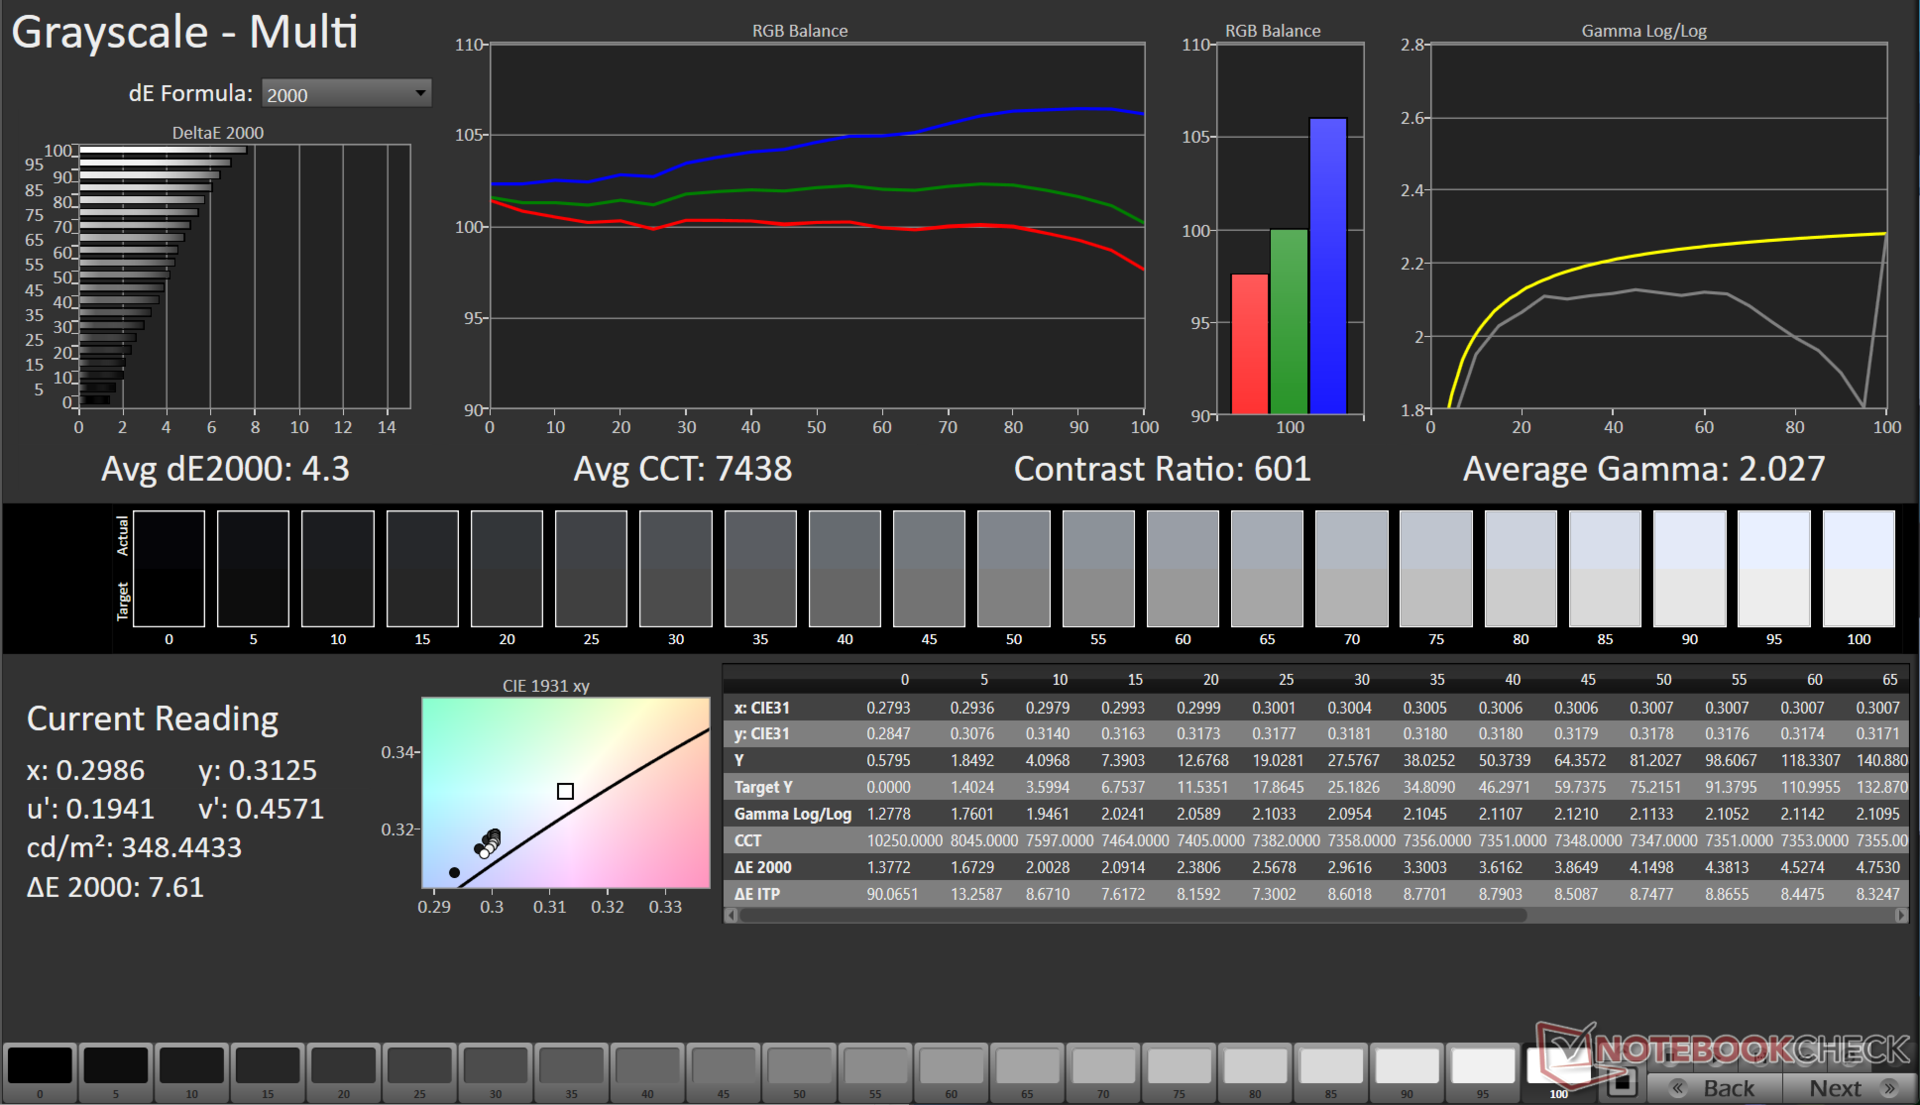
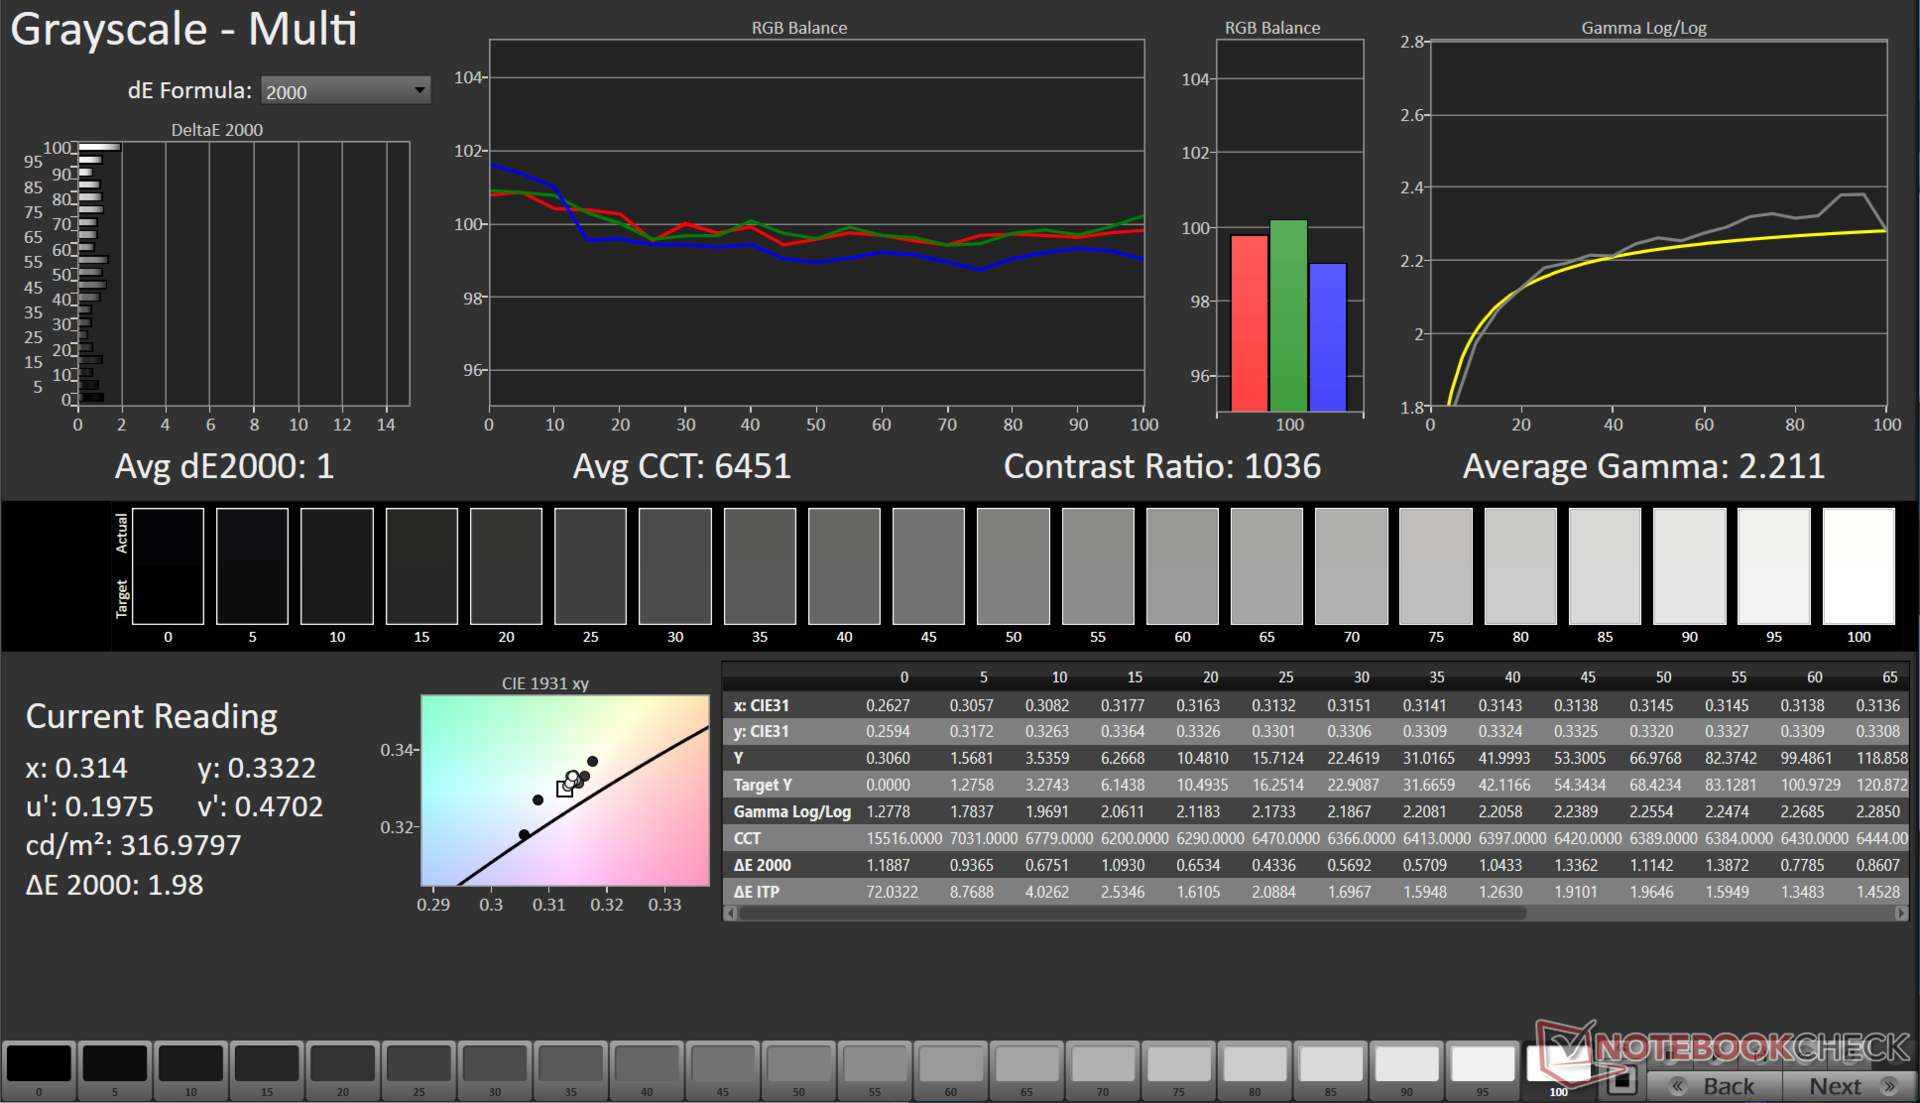
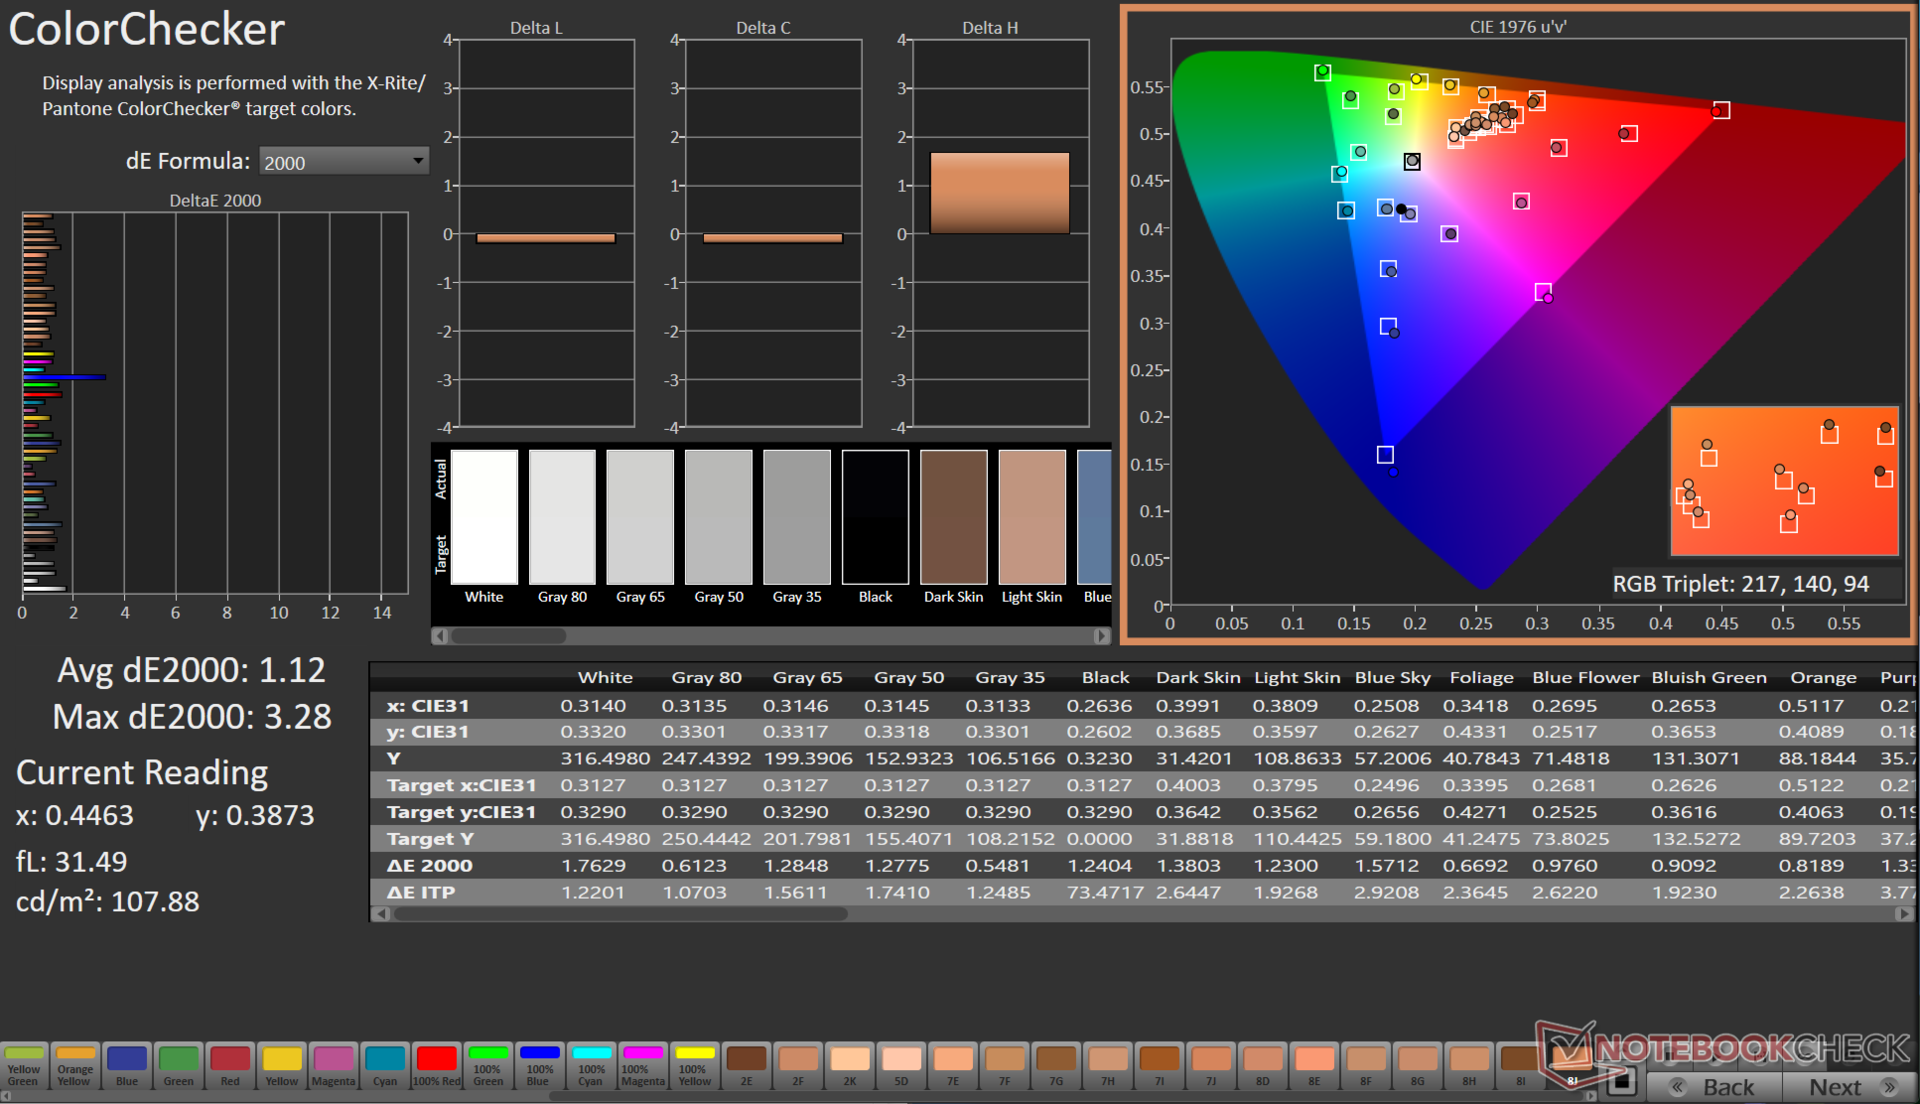
El archivo ICC calibrado puede descargarse desde el enlace anterior.
Tiempos de respuesta del display
| ↔ Tiempo de respuesta de Negro a Blanco | ||
|---|---|---|
| 7.81 ms ... subida ↗ y bajada ↘ combinada | ↗ 4.01 ms subida | 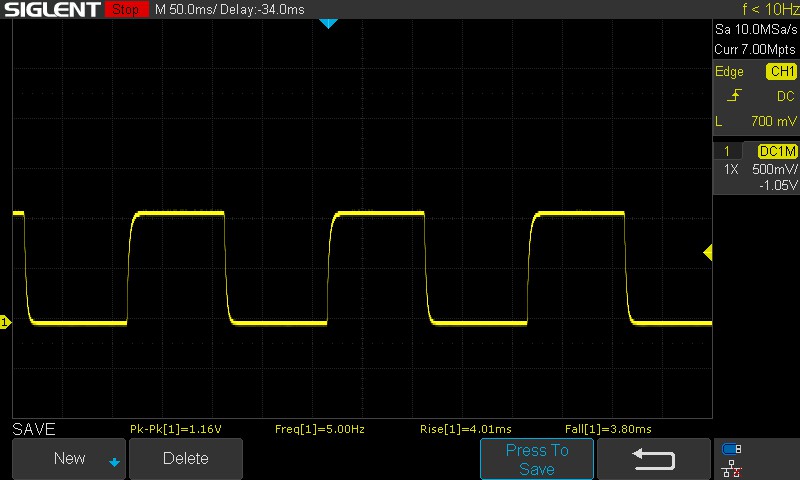 |
| ↘ 3.8 ms bajada | ||
| La pantalla mostró tiempos de respuesta muy rápidos en nuestros tests y debería ser adecuada para juegos frenéticos. En comparación, todos los dispositivos de prueba van de ##min### (mínimo) a 240 (máximo) ms. » 22 % de todos los dispositivos son mejores. Esto quiere decir que el tiempo de respuesta medido es mejor que la media (19.8 ms) de todos los dispositivos testados. | ||
| ↔ Tiempo de respuesta 50% Gris a 80% Gris | ||
| 10.42 ms ... subida ↗ y bajada ↘ combinada | ↗ 4.73 ms subida | 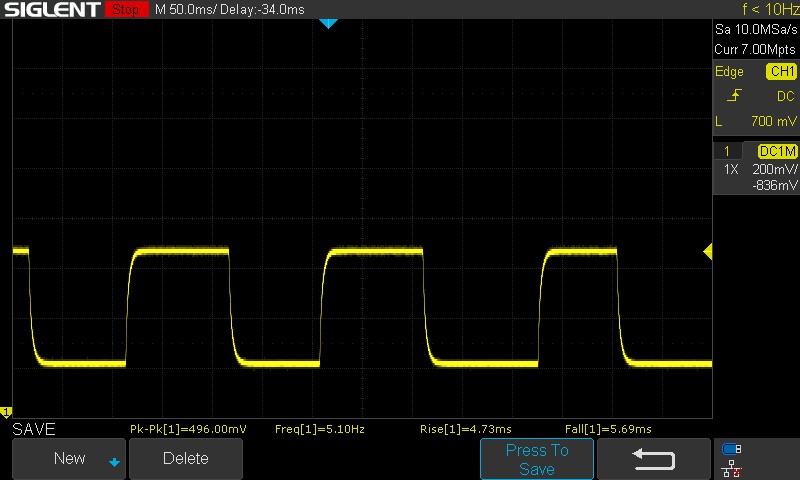 |
| ↘ 5.69 ms bajada | ||
| La pantalla mostró buenos tiempos de respuesta en nuestros tests pero podría ser demasiado lenta para los jugones competitivos. En comparación, todos los dispositivos de prueba van de ##min### (mínimo) a 636 (máximo) ms. » 24 % de todos los dispositivos son mejores. Esto quiere decir que el tiempo de respuesta medido es mejor que la media (30.9 ms) de todos los dispositivos testados. | ||
Los tiempos de respuesta son decentes para la mayoría de las necesidades de juego. El panel del EVOL X15 AT no utiliza overdrive y no hay opción para activarlo, lo que habría ayudado a reducir aún más los tiempos de transición del 50% de gris al 80% de gris.
Parpadeo de Pantalla / PWM (Pulse-Width Modulation)
| Parpadeo de Pantalla / PWM no detectado | ≤ 100 % de brillo | 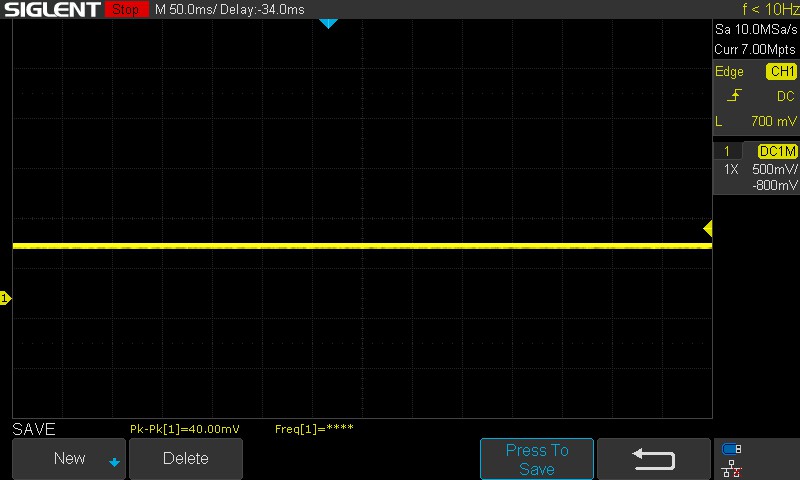 | |
Comparación: 52 % de todos los dispositivos testados no usaron PWM para atenuar el display. Si se usó, medimos una media de 7741 (mínimo: 5 - máxmo: 343500) Hz. | |||
No detectamos PWM ni parpadeos en ninguno de los niveles de brillo probados.
Para más información, consulte nuestro artículo "Por qué el PWM es un dolor de cabeza", y también nuestra Tabla de clasificación PWM.
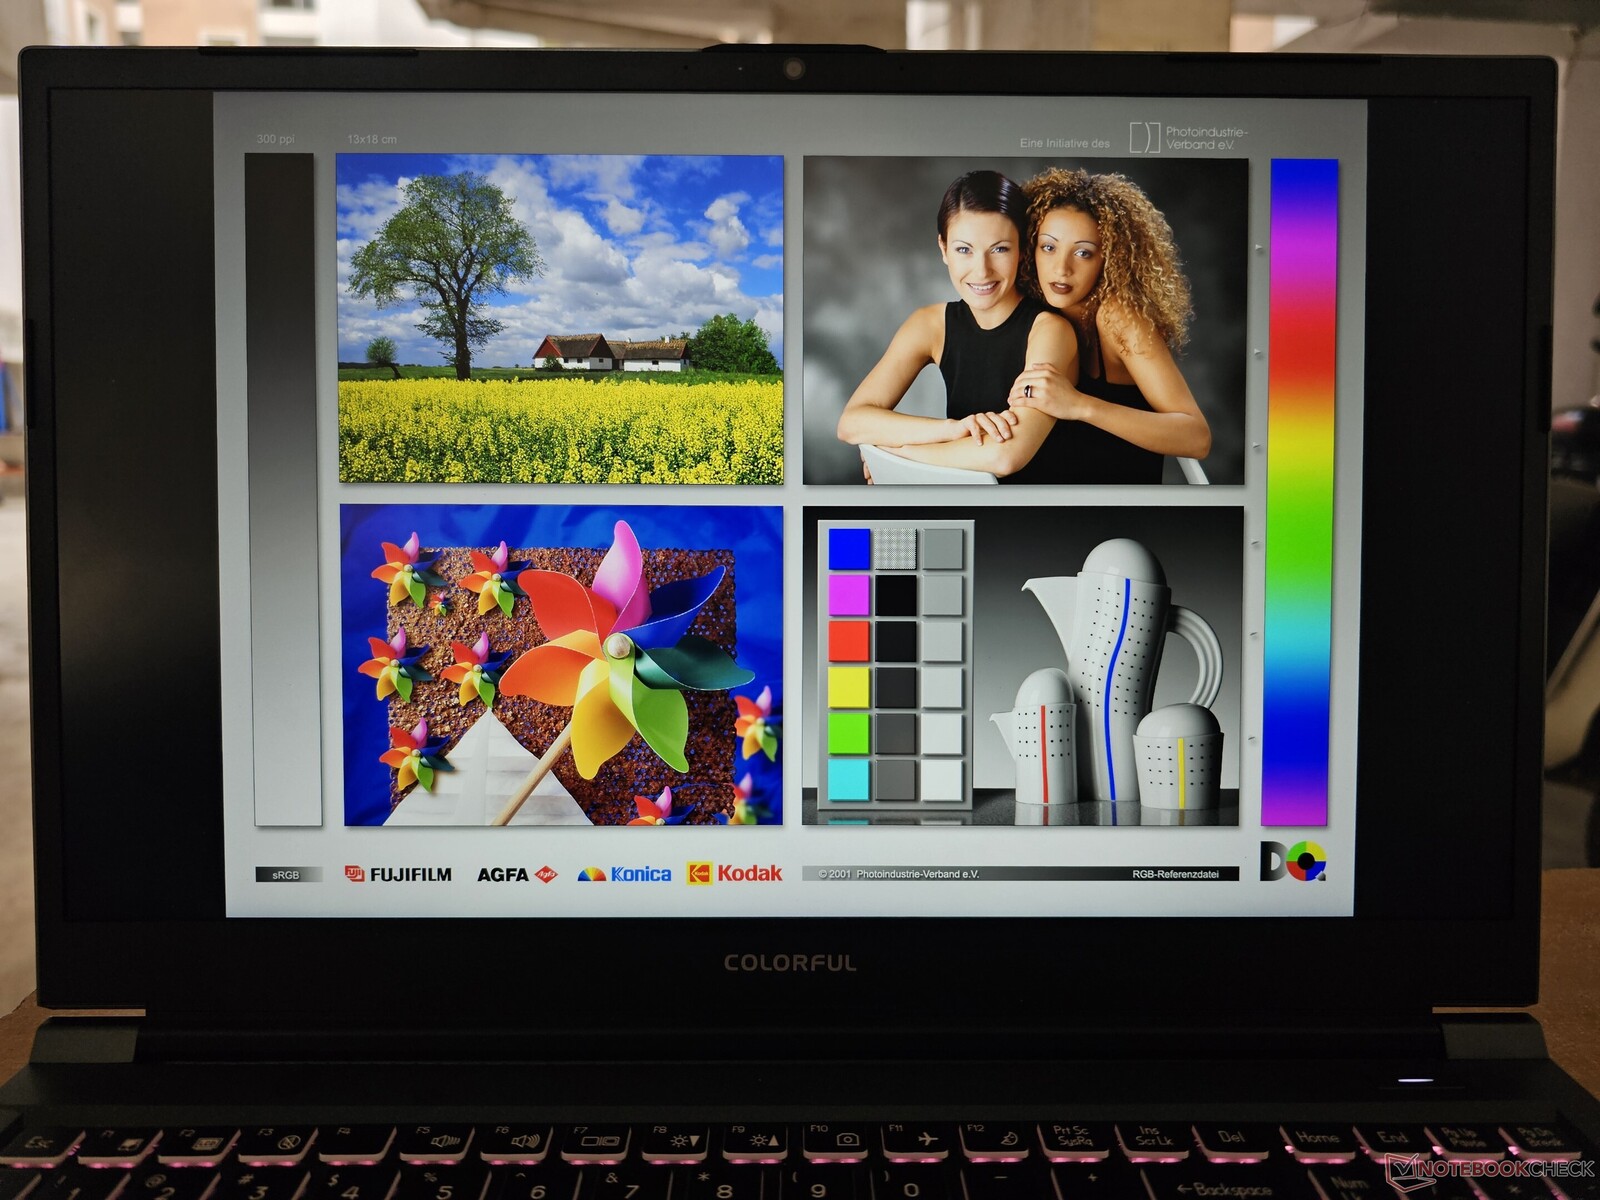
La visualización en exteriores está bien, pero el brillo de la pantalla puede no ser adecuado para su uso bajo la luz solar directa. Los ángulos de visión son relativamente estables, con sólo una pequeña pérdida de brillo en los extremos.

Rendimiento: Core i7-13700HX y RTX 4060 son un buen augurio para los juegos AAA de gama media
El colorido EVOL X15 AT está disponible con Intel Core i5-13500HX y Core i7-13700HX con las opciones de GPU correspondientes siendo la GPU Nvidia GeForce RTX 4050 para portátiles y la GPU RTX 4060 para portátiles.
Condiciones de prueba
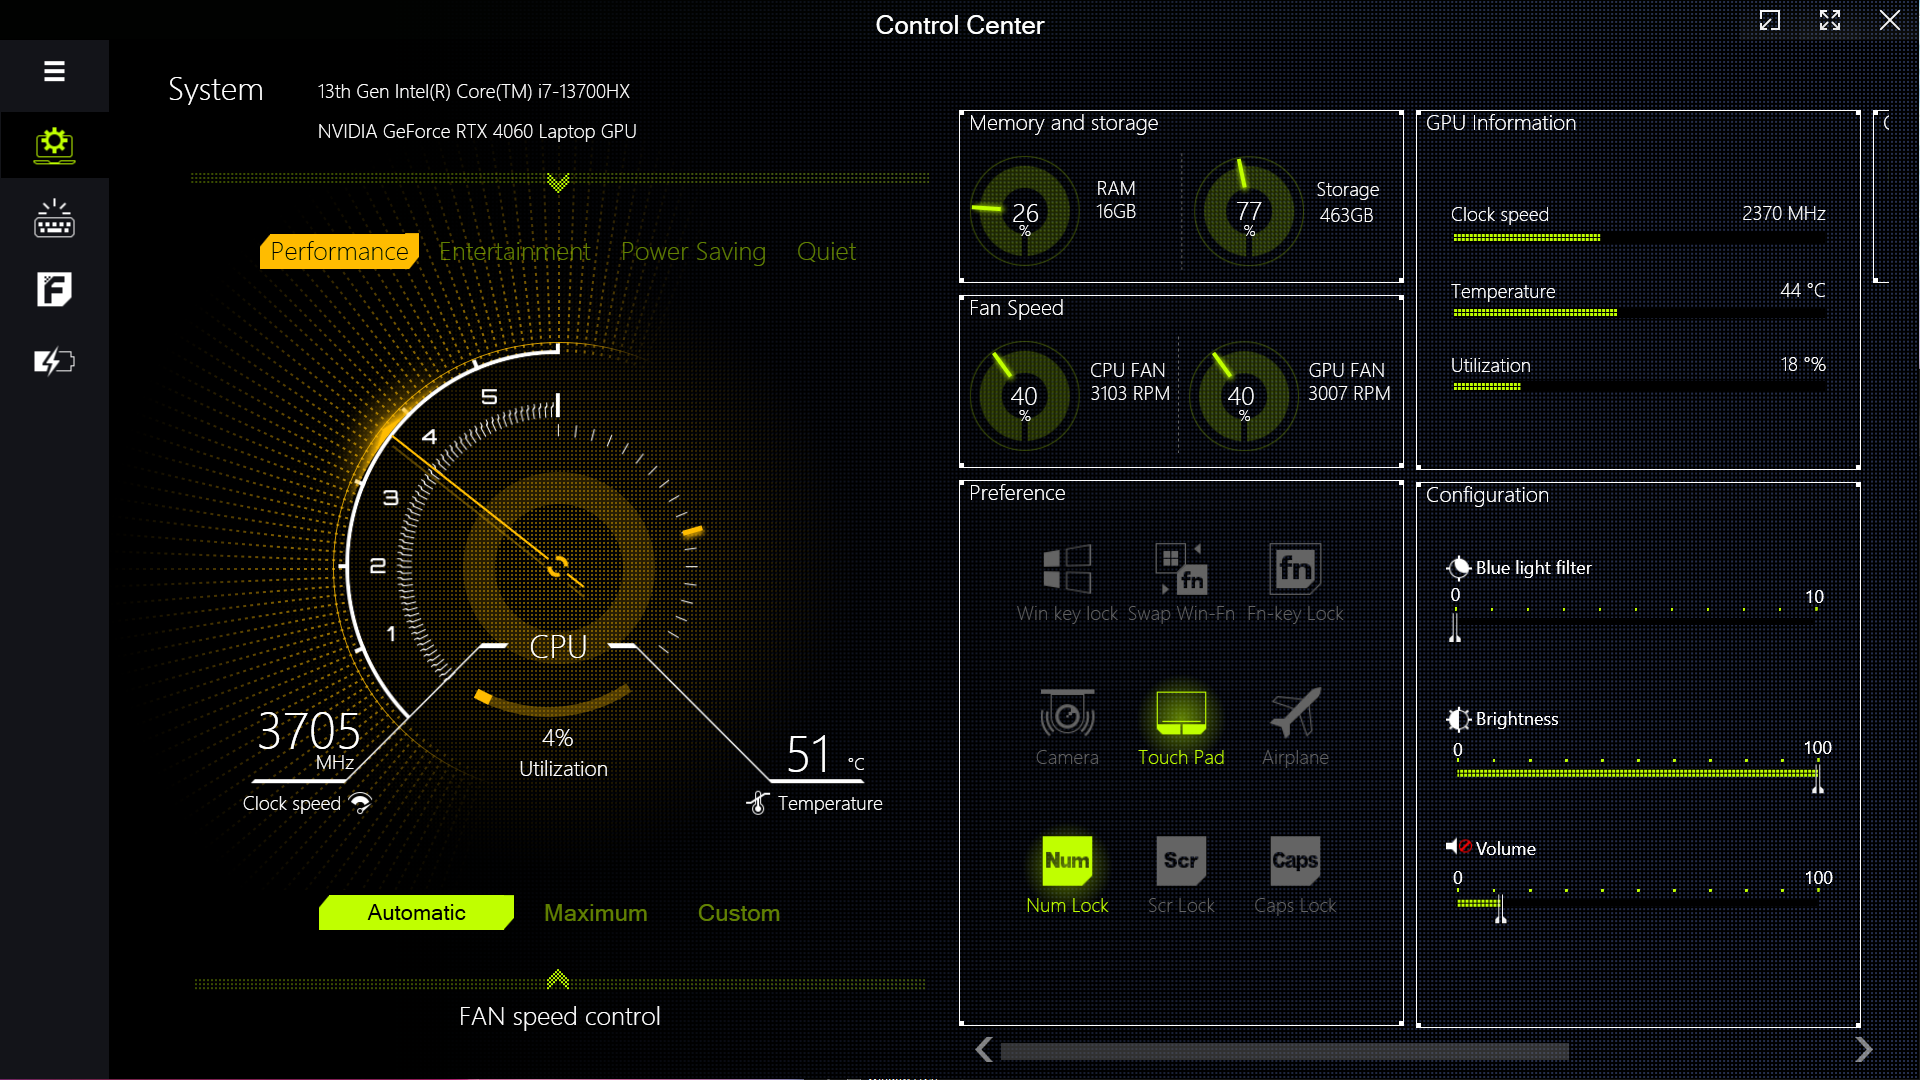
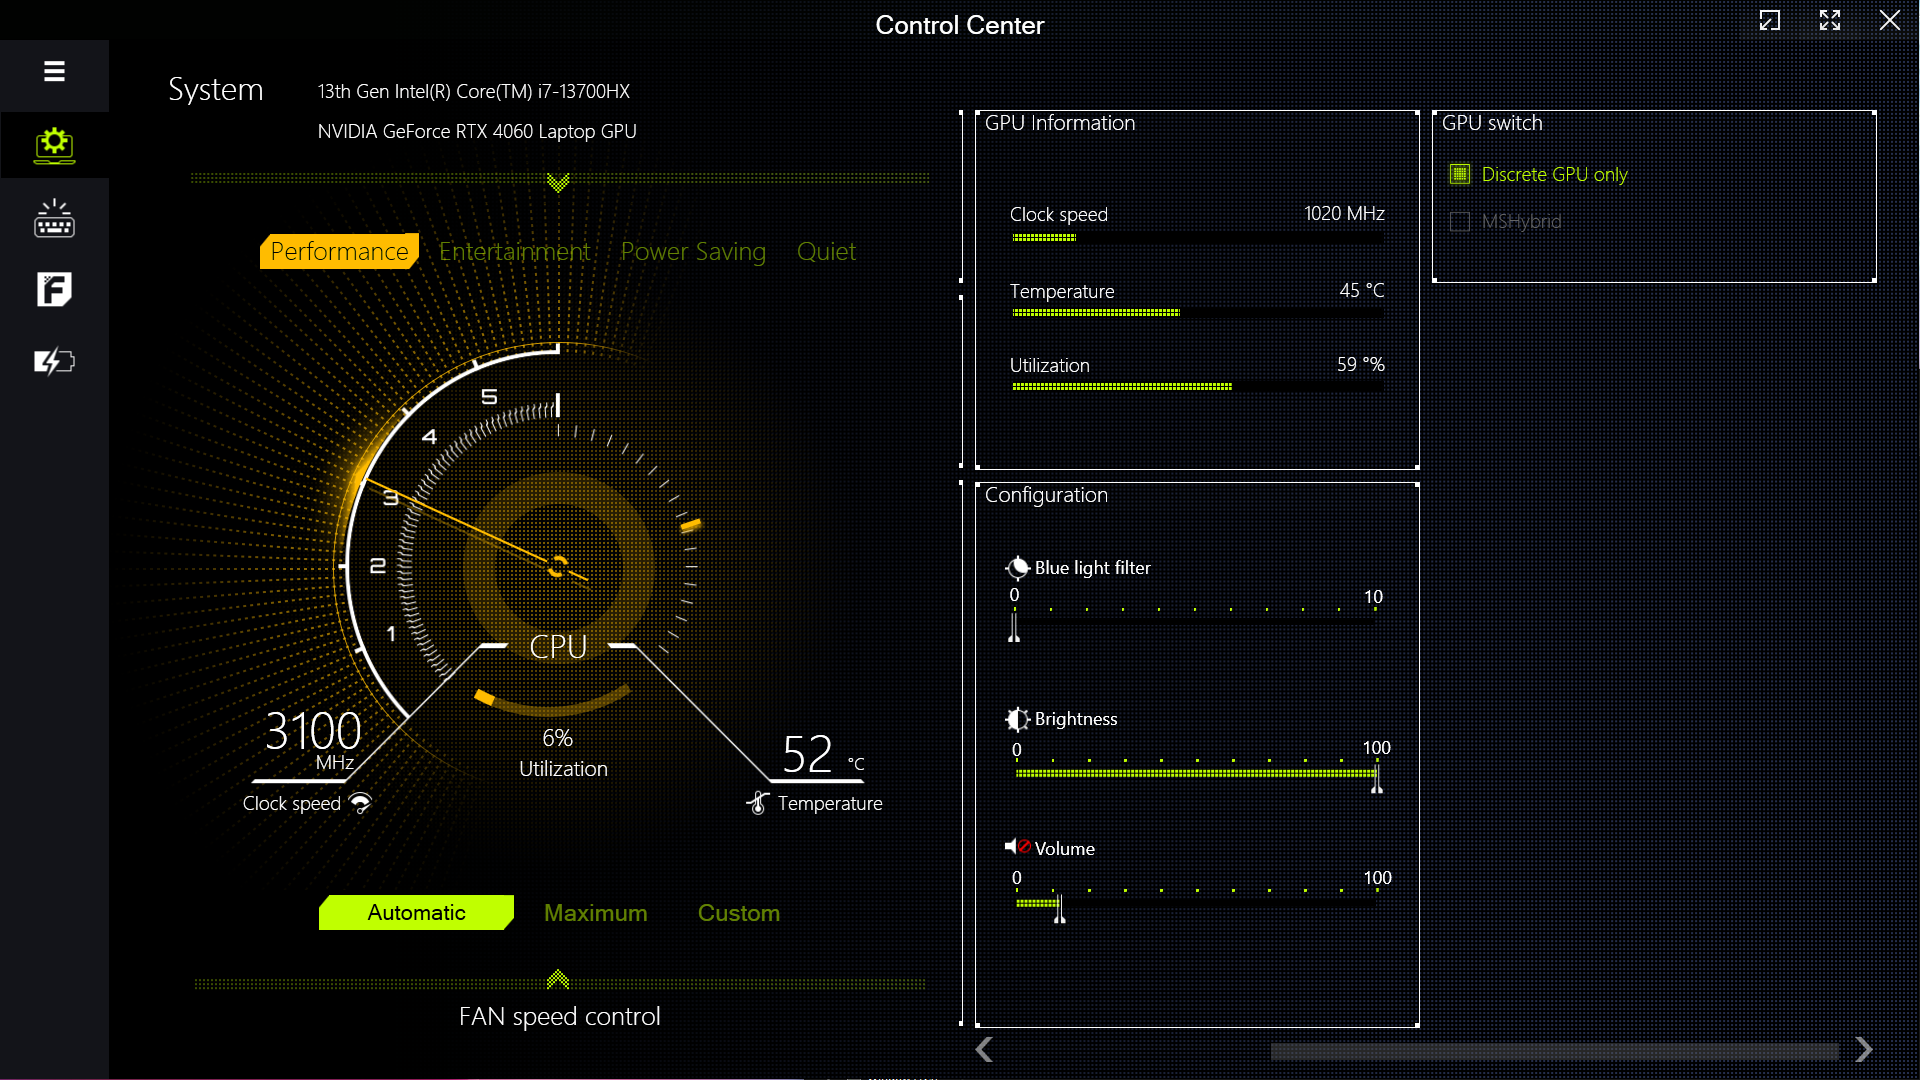
Colorful ofrece la aplicación Centro de control de Clevo para ajustar el rendimiento y diversos efectos RGB. Se ofrece un total de cuatro modos de rendimiento.
Todas las pruebas comparativas se realizaron en el modo Rendimiento que permite al Core i7-13700HX sacar todo su potencial. El modo GPU discreta se utilizó para las pruebas de gráficos y juegos.
Las pruebas de batería se realizaron en el perfil Silencioso con MSHybrid activado.
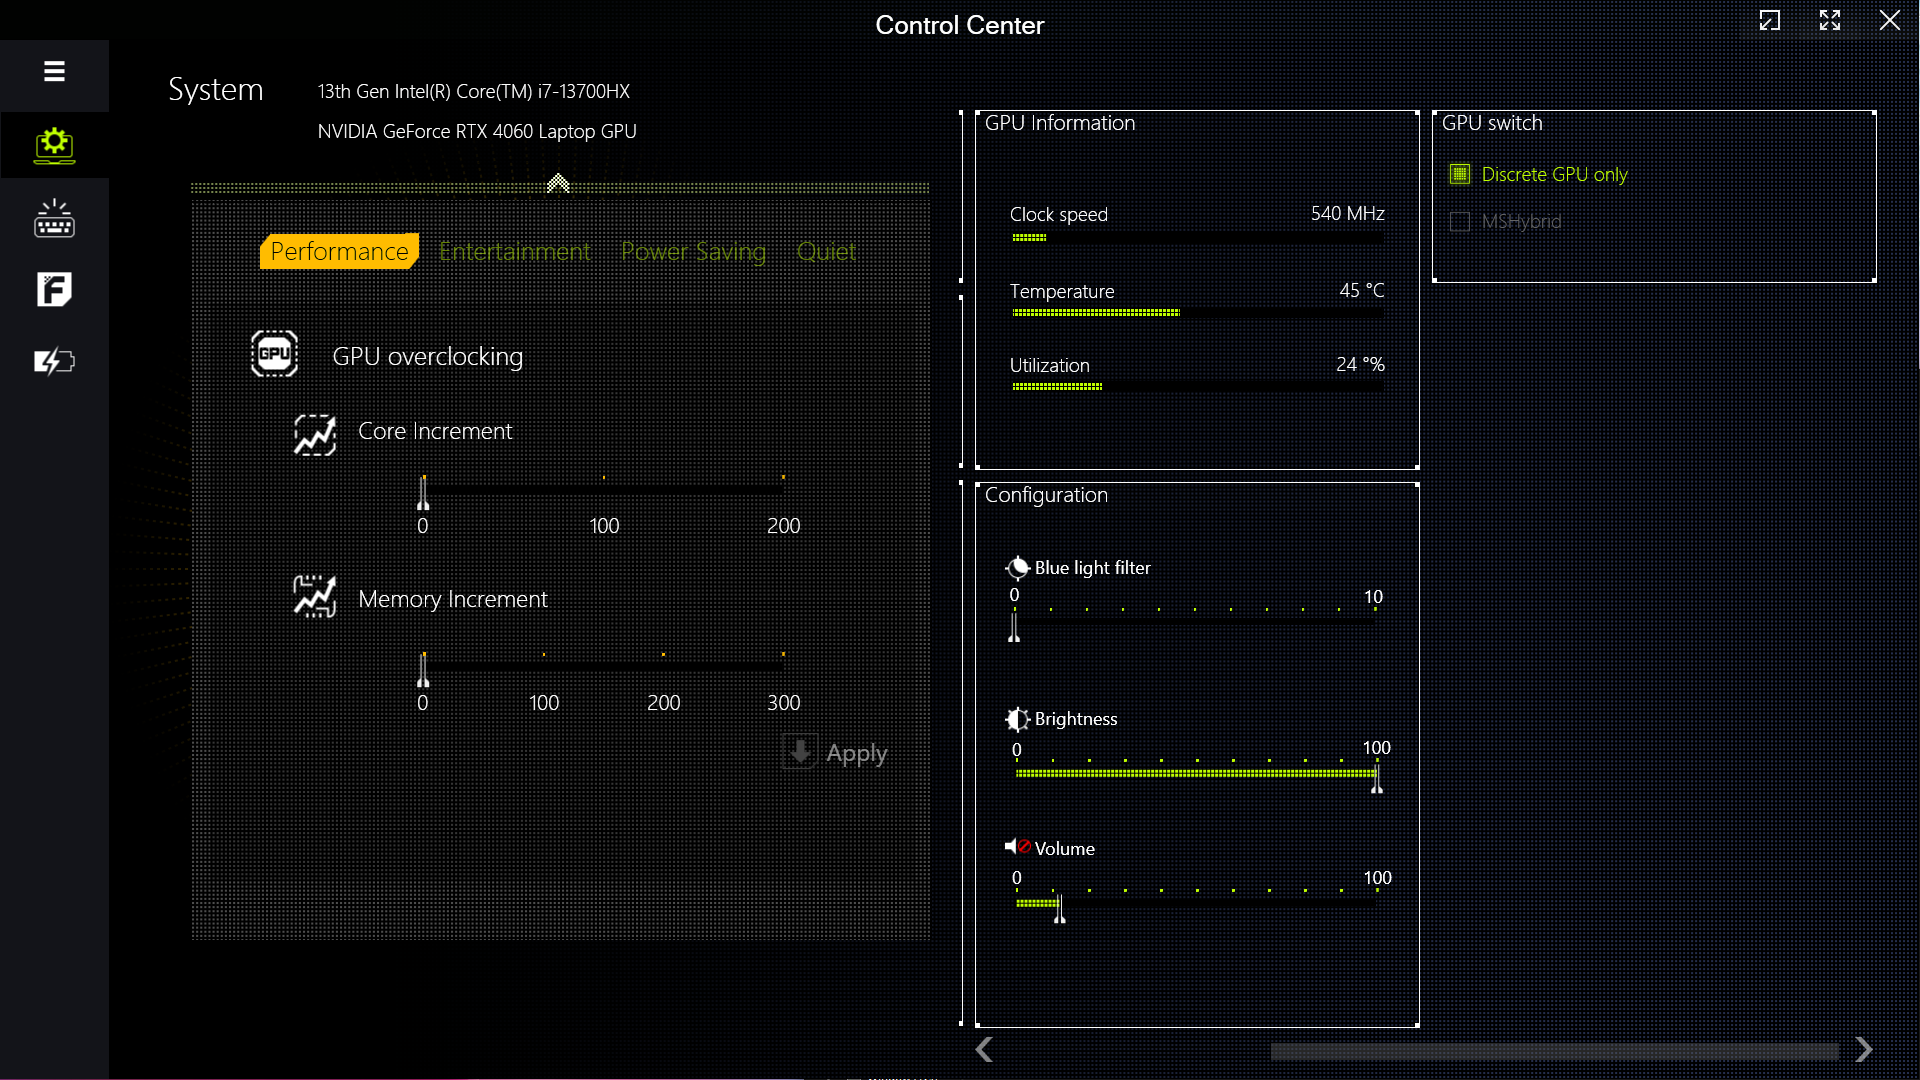
Colorful limita el PL2 a 30 W en los modos Silencioso y Ahorro de energía, lo que supone una importante reducción de potencia en comparación con los otros modos. Esto se refleja en la drástica caída de las puntuaciones de Cinebench R15, como se ilustra en la tabla siguiente.
| Modo de rendimiento | PL1 (PBP) / Tau | PL2 (MTP) / Tau | Cinebench R15 Puntuación múltiple | Cinebench R15 Puntuación múltiple (30 bucles) |
|---|---|---|---|---|
| Silencioso | 15 W / 8 s | 30 W / 2,44 ms | 567 (-83%) | 542 (-82,28%) |
| Ahorro de energía | 45 W / 8 s | 30 W / 2,44 ms | 557 (-84%) | 548 (-82,08%) |
| Entretenimiento | 65 W / 56 s | 130 W / 2,44 ms | 2814 (-19,18%) | 2168 (-29,12%) |
| Rendimiento | 135 W / 96 s | 162 W / 2,44 ms | 3482 (100%) | 3059 (100%) |
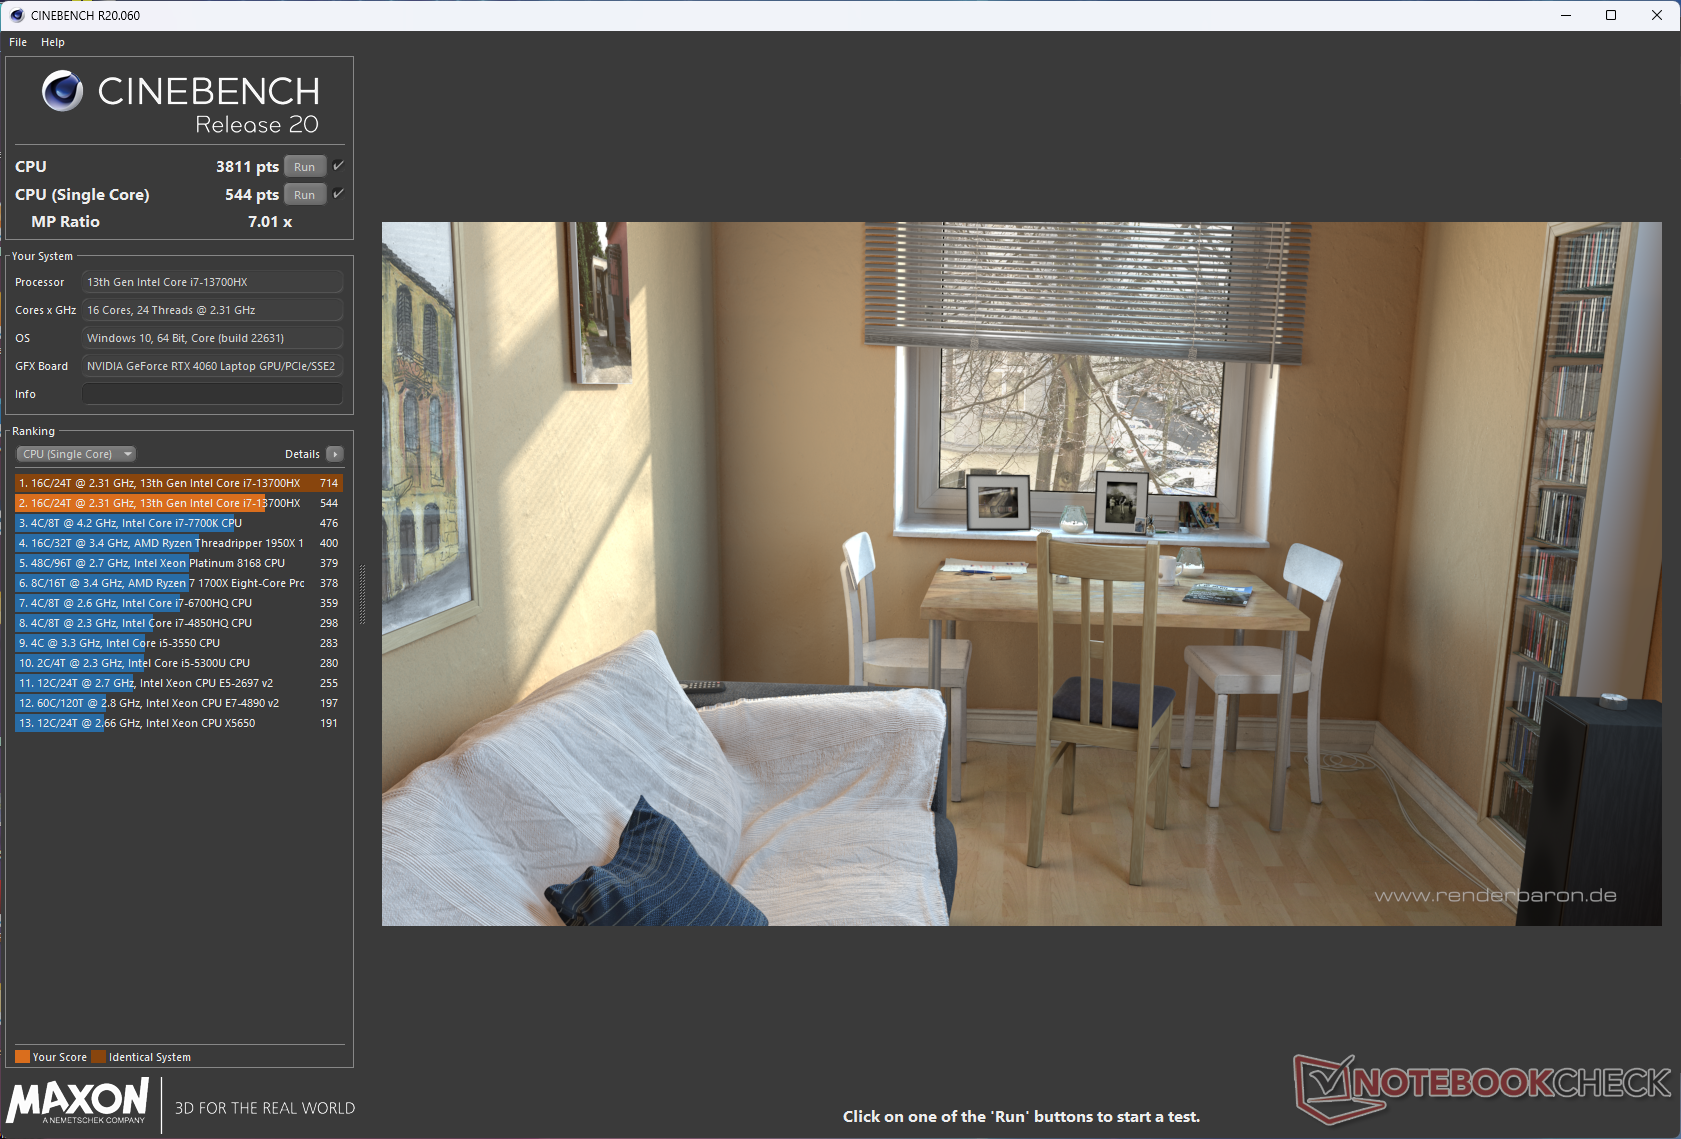
Procesador
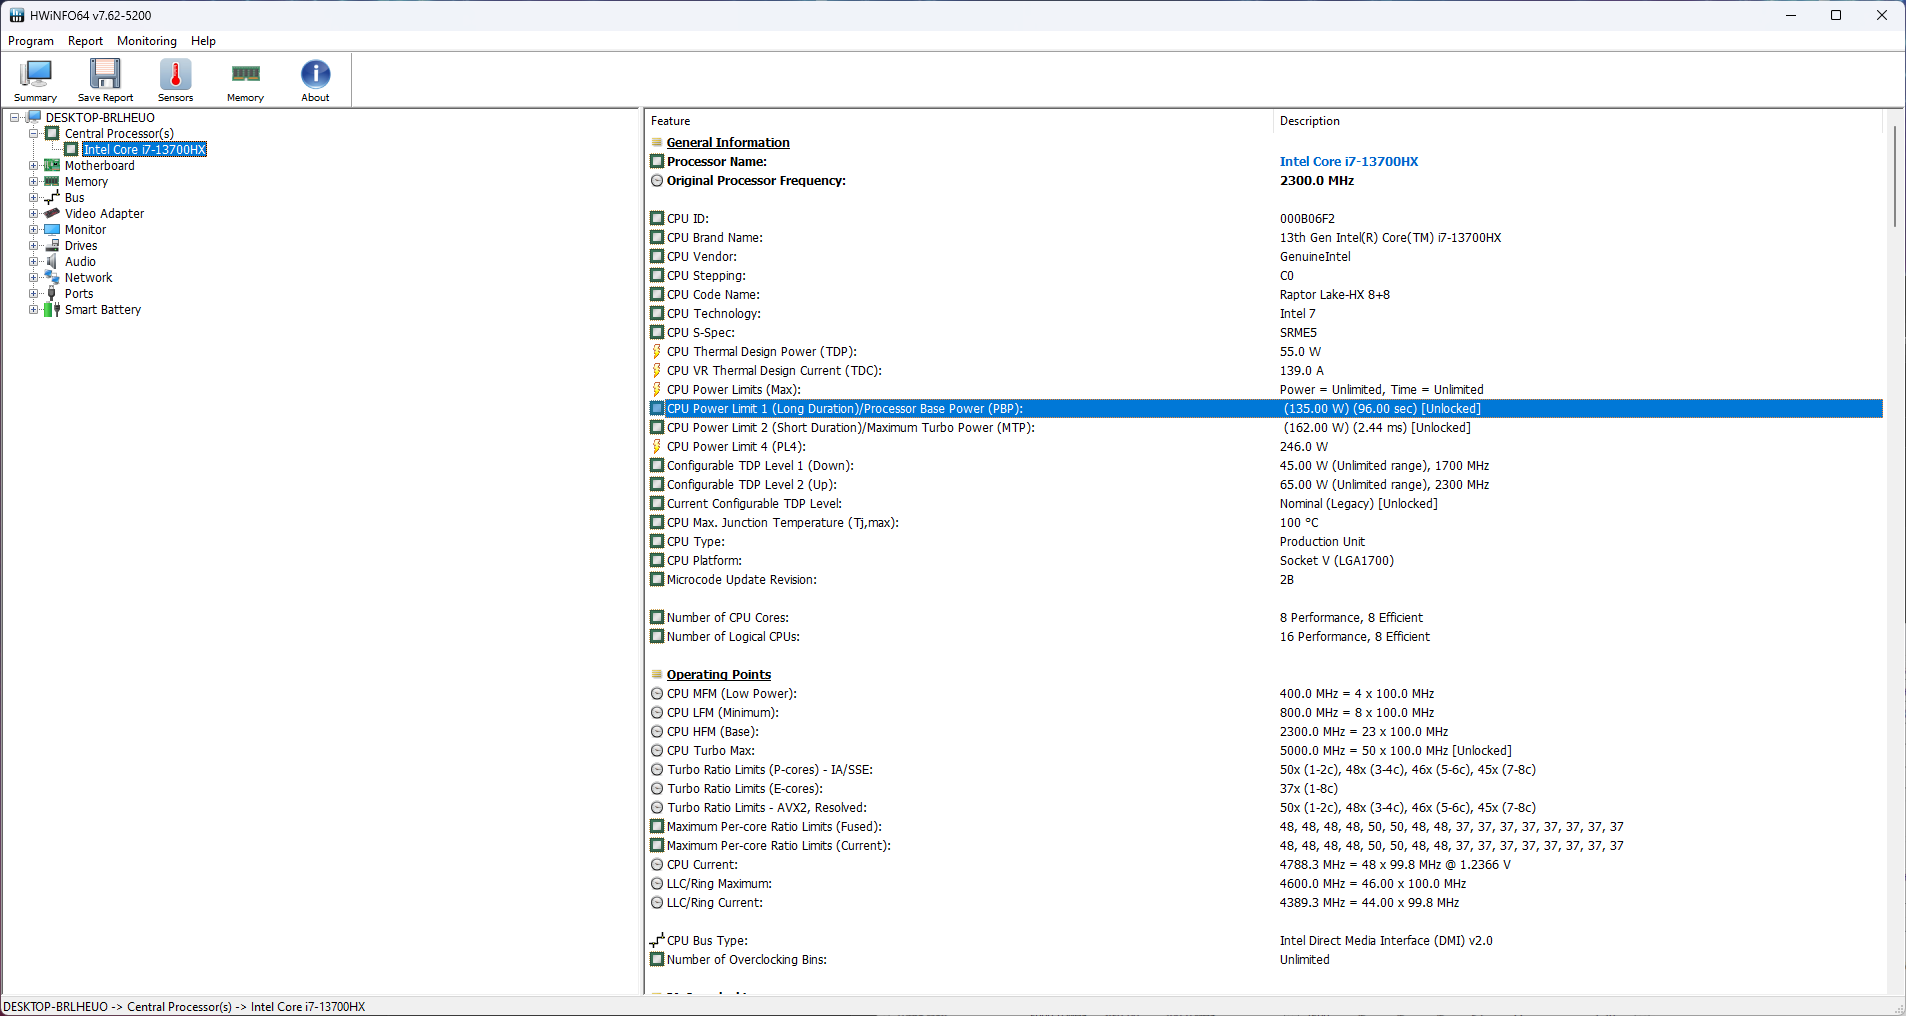
El Core i7-13700HX cuenta con 16 núcleos y 24 hilos con un boost clock de hasta 5 GHz. Esta CPU en el EVOL X15 AT rinde en general a la par que su homóloga en el Alienware m16 R1, y en otros portátiles de este tipo en general. Sin embargo, queda significativamente por detrás del 12-core 24-thread AMD Ryzen 9 7845HX en las pruebas multinúcleo.
Aunque tiene una potencia nominal de 162 W, el Core i7-13700HX puede utilizar hasta 145 W en el modo Rendimiento. No obstante, esto sólo proporciona una ventaja mínima en el rendimiento de un solo núcleo sobre el PL2 de 115 W del HP Omen 16.
Aparte de la disminución gradual inicial en las puntuaciones, no se percibe estrangulamiento durante la prueba de bucle multinúcleo Cinebench R15.
Cinebench R15 Multi Loop
Cinebench R23: Multi Core | Single Core
Cinebench R20: CPU (Multi Core) | CPU (Single Core)
Cinebench R15: CPU Multi 64Bit | CPU Single 64Bit
Blender: v2.79 BMW27 CPU
7-Zip 18.03: 7z b 4 | 7z b 4 -mmt1
Geekbench 5.5: Multi-Core | Single-Core
HWBOT x265 Benchmark v2.2: 4k Preset
LibreOffice : 20 Documents To PDF
R Benchmark 2.5: Overall mean
| CPU Performance rating | |
| Alienware m16 R1 AMD | |
| Media de la clase Gaming | |
| Schenker XMG Pro 15 (E23) | |
| Acer Predator Helios 16 PH16-71-731Q | |
| HP Omen 16-wf000 -1! | |
| Uniwill GM6PX7X RTX 4070 | |
| Alienware m16 R1 Intel | |
| Dell G15 5530 | |
| Colorful EVOL X15 AT 23 | |
| Medio Intel Core i7-13700HX | |
| Cinebench R23 / Multi Core | |
| Alienware m16 R1 AMD | |
| Media de la clase Gaming (10488 - 42661, n=104, últimos 2 años) | |
| Schenker XMG Pro 15 (E23) | |
| Acer Predator Helios 16 PH16-71-731Q | |
| Colorful EVOL X15 AT 23 | |
| Alienware m16 R1 Intel | |
| Uniwill GM6PX7X RTX 4070 | |
| Dell G15 5530 | |
| Medio Intel Core i7-13700HX (15558 - 22598, n=11) | |
| HP Omen 16-wf000 | |
| Cinebench R23 / Single Core | |
| Media de la clase Gaming (1601 - 2415, n=104, últimos 2 años) | |
| Alienware m16 R1 Intel | |
| Colorful EVOL X15 AT 23 | |
| Acer Predator Helios 16 PH16-71-731Q | |
| Schenker XMG Pro 15 (E23) | |
| HP Omen 16-wf000 | |
| Alienware m16 R1 AMD | |
| Dell G15 5530 | |
| Medio Intel Core i7-13700HX (1666 - 1933, n=11) | |
| Uniwill GM6PX7X RTX 4070 | |
| Cinebench R20 / CPU (Multi Core) | |
| Alienware m16 R1 AMD | |
| Media de la clase Gaming (4029 - 16433, n=103, últimos 2 años) | |
| Schenker XMG Pro 15 (E23) | |
| Acer Predator Helios 16 PH16-71-731Q | |
| Colorful EVOL X15 AT 23 | |
| Uniwill GM6PX7X RTX 4070 | |
| Alienware m16 R1 Intel | |
| Dell G15 5530 | |
| Medio Intel Core i7-13700HX (6160 - 8610, n=11) | |
| HP Omen 16-wf000 | |
| Cinebench R20 / CPU (Single Core) | |
| Media de la clase Gaming (622 - 913, n=103, últimos 2 años) | |
| Colorful EVOL X15 AT 23 | |
| Alienware m16 R1 Intel | |
| Acer Predator Helios 16 PH16-71-731Q | |
| Schenker XMG Pro 15 (E23) | |
| HP Omen 16-wf000 | |
| Alienware m16 R1 AMD | |
| Dell G15 5530 | |
| Uniwill GM6PX7X RTX 4070 | |
| Medio Intel Core i7-13700HX (644 - 740, n=11) | |
| Cinebench R15 / CPU Multi 64Bit | |
| Alienware m16 R1 AMD | |
| Media de la clase Gaming (1578 - 6330, n=102, últimos 2 años) | |
| Schenker XMG Pro 15 (E23) | |
| Colorful EVOL X15 AT 23 | |
| Acer Predator Helios 16 PH16-71-731Q | |
| Acer Predator Helios 16 PH16-71-731Q | |
| Uniwill GM6PX7X RTX 4070 | |
| Medio Intel Core i7-13700HX (2548 - 3482, n=12) | |
| Alienware m16 R1 Intel | |
| Dell G15 5530 | |
| HP Omen 16-wf000 | |
| Cinebench R15 / CPU Single 64Bit | |
| Media de la clase Gaming (188.8 - 350, n=103, últimos 2 años) | |
| Alienware m16 R1 AMD | |
| Alienware m16 R1 Intel | |
| Colorful EVOL X15 AT 23 | |
| Dell G15 5530 | |
| Acer Predator Helios 16 PH16-71-731Q | |
| Medio Intel Core i7-13700HX (243 - 279, n=11) | |
| HP Omen 16-wf000 | |
| Uniwill GM6PX7X RTX 4070 | |
| Schenker XMG Pro 15 (E23) | |
| Blender / v2.79 BMW27 CPU | |
| Medio Intel Core i7-13700HX (138 - 207, n=10) | |
| Dell G15 5530 | |
| Acer Predator Helios 16 PH16-71-731Q | |
| Alienware m16 R1 Intel | |
| Colorful EVOL X15 AT 23 | |
| Uniwill GM6PX7X RTX 4070 | |
| Schenker XMG Pro 15 (E23) | |
| Media de la clase Gaming (79 - 330, n=101, últimos 2 años) | |
| Alienware m16 R1 AMD | |
| 7-Zip 18.03 / 7z b 4 | |
| Alienware m16 R1 AMD | |
| Media de la clase Gaming (33491 - 148086, n=102, últimos 2 años) | |
| Schenker XMG Pro 15 (E23) | |
| Uniwill GM6PX7X RTX 4070 | |
| Alienware m16 R1 Intel | |
| Acer Predator Helios 16 PH16-71-731Q | |
| HP Omen 16-wf000 | |
| Dell G15 5530 | |
| Medio Intel Core i7-13700HX (58912 - 89294, n=11) | |
| Colorful EVOL X15 AT 23 | |
| 7-Zip 18.03 / 7z b 4 -mmt1 | |
| Alienware m16 R1 AMD | |
| Media de la clase Gaming (4824 - 7436, n=102, últimos 2 años) | |
| Alienware m16 R1 Intel | |
| Colorful EVOL X15 AT 23 | |
| Schenker XMG Pro 15 (E23) | |
| Acer Predator Helios 16 PH16-71-731Q | |
| Medio Intel Core i7-13700HX (5552 - 6409, n=11) | |
| Uniwill GM6PX7X RTX 4070 | |
| HP Omen 16-wf000 | |
| Dell G15 5530 | |
| Geekbench 5.5 / Multi-Core | |
| Schenker XMG Pro 15 (E23) | |
| Media de la clase Gaming (6460 - 28263, n=102, últimos 2 años) | |
| Acer Predator Helios 16 PH16-71-731Q | |
| Uniwill GM6PX7X RTX 4070 | |
| Alienware m16 R1 AMD | |
| HP Omen 16-wf000 | |
| Alienware m16 R1 Intel | |
| Dell G15 5530 | |
| Medio Intel Core i7-13700HX (10156 - 15850, n=12) | |
| Colorful EVOL X15 AT 23 | |
| Geekbench 5.5 / Single-Core | |
| Media de la clase Gaming (1403 - 2474, n=102, últimos 2 años) | |
| Alienware m16 R1 AMD | |
| Acer Predator Helios 16 PH16-71-731Q | |
| HP Omen 16-wf000 | |
| Dell G15 5530 | |
| Alienware m16 R1 Intel | |
| Colorful EVOL X15 AT 23 | |
| Uniwill GM6PX7X RTX 4070 | |
| Schenker XMG Pro 15 (E23) | |
| Medio Intel Core i7-13700HX (1666 - 1899, n=12) | |
| HWBOT x265 Benchmark v2.2 / 4k Preset | |
| Alienware m16 R1 AMD | |
| Media de la clase Gaming (11.5 - 44.4, n=102, últimos 2 años) | |
| Uniwill GM6PX7X RTX 4070 | |
| Acer Predator Helios 16 PH16-71-731Q | |
| Schenker XMG Pro 15 (E23) | |
| Dell G15 5530 | |
| Alienware m16 R1 Intel | |
| Medio Intel Core i7-13700HX (17.1 - 25.5, n=11) | |
| Colorful EVOL X15 AT 23 | |
| HP Omen 16-wf000 | |
| LibreOffice / 20 Documents To PDF | |
| Colorful EVOL X15 AT 23 | |
| Schenker XMG Pro 15 (E23) | |
| Media de la clase Gaming (33.2 - 88.8, n=102, últimos 2 años) | |
| Dell G15 5530 | |
| HP Omen 16-wf000 | |
| Alienware m16 R1 Intel | |
| Medio Intel Core i7-13700HX (36.5 - 52.9, n=11) | |
| Alienware m16 R1 AMD | |
| Uniwill GM6PX7X RTX 4070 | |
| Acer Predator Helios 16 PH16-71-731Q | |
| R Benchmark 2.5 / Overall mean | |
| Uniwill GM6PX7X RTX 4070 | |
| Medio Intel Core i7-13700HX (0.4274 - 0.513, n=11) | |
| Schenker XMG Pro 15 (E23) | |
| HP Omen 16-wf000 | |
| Colorful EVOL X15 AT 23 | |
| Alienware m16 R1 Intel | |
| Acer Predator Helios 16 PH16-71-731Q | |
| Dell G15 5530 | |
| Alienware m16 R1 AMD | |
| Media de la clase Gaming (0.3439 - 0.59, n=102, últimos 2 años) | |
* ... más pequeño es mejor
El Core i7-13700HX del EVOL X15 puede utilizar un máximo de 145 W con aumentos de hasta 4,2 GHz mientras ejecuta el bucle multinúcleo Cinebench R15 en modo Rendimiento. En modo Entretenimiento, el Core i7-13700HX aún puede alcanzar los 4,2 GHz a 113 W, pero la potencia media desciende a sólo unos 21 W durante la ejecución.
En el modo silencioso, el EVOL X15 alcanza los 4 GHz de pico con un consumo de sólo 30 W. Sin embargo, la media de los relojes desciende a poco menos de 1 GHz y consume 15 W.
Las puntuaciones de Cinebench R20 en batería caen un 26,5% y un 54% en mononúcleo y multinúcleo, respectivamente.
AIDA64: FP32 Ray-Trace | FPU Julia | CPU SHA3 | CPU Queen | FPU SinJulia | FPU Mandel | CPU AES | CPU ZLib | FP64 Ray-Trace | CPU PhotoWorxx
| Performance rating | |
| Alienware m16 R1 AMD | |
| Media de la clase Gaming | |
| Uniwill GM6PX7X RTX 4070 | |
| Alienware m16 R1 Intel | |
| Acer Predator Helios 16 PH16-71-731Q | |
| Schenker XMG Pro 15 (E23) | |
| Medio Intel Core i7-13700HX | |
| HP Omen 16-wf000 | |
| Colorful EVOL X15 AT 23 | |
| Dell G15 5530 | |
| AIDA64 / FP32 Ray-Trace | |
| Alienware m16 R1 AMD | |
| Media de la clase Gaming (10227 - 85542, n=102, últimos 2 años) | |
| Uniwill GM6PX7X RTX 4070 | |
| Alienware m16 R1 Intel | |
| Acer Predator Helios 16 PH16-71-731Q | |
| Colorful EVOL X15 AT 23 | |
| Medio Intel Core i7-13700HX (14261 - 21999, n=11) | |
| HP Omen 16-wf000 | |
| Dell G15 5530 | |
| Schenker XMG Pro 15 (E23) | |
| AIDA64 / FPU Julia | |
| Alienware m16 R1 AMD | |
| Media de la clase Gaming (51376 - 372155, n=102, últimos 2 años) | |
| Uniwill GM6PX7X RTX 4070 | |
| Alienware m16 R1 Intel | |
| Colorful EVOL X15 AT 23 | |
| Acer Predator Helios 16 PH16-71-731Q | |
| HP Omen 16-wf000 | |
| Medio Intel Core i7-13700HX (74636 - 109364, n=11) | |
| Schenker XMG Pro 15 (E23) | |
| Dell G15 5530 | |
| AIDA64 / CPU SHA3 | |
| Alienware m16 R1 AMD | |
| Media de la clase Gaming (2180 - 10115, n=102, últimos 2 años) | |
| Uniwill GM6PX7X RTX 4070 | |
| Alienware m16 R1 Intel | |
| Schenker XMG Pro 15 (E23) | |
| Colorful EVOL X15 AT 23 | |
| Acer Predator Helios 16 PH16-71-731Q | |
| Dell G15 5530 | |
| Medio Intel Core i7-13700HX (3359 - 5053, n=11) | |
| HP Omen 16-wf000 | |
| AIDA64 / CPU Queen | |
| Alienware m16 R1 AMD | |
| Schenker XMG Pro 15 (E23) | |
| Media de la clase Gaming (49785 - 173351, n=86, últimos 2 años) | |
| Alienware m16 R1 Intel | |
| Acer Predator Helios 16 PH16-71-731Q | |
| Colorful EVOL X15 AT 23 | |
| Uniwill GM6PX7X RTX 4070 | |
| Medio Intel Core i7-13700HX (86532 - 114717, n=11) | |
| Dell G15 5530 | |
| HP Omen 16-wf000 | |
| AIDA64 / FPU SinJulia | |
| Alienware m16 R1 AMD | |
| Media de la clase Gaming (4424 - 33636, n=102, últimos 2 años) | |
| Alienware m16 R1 Intel | |
| Uniwill GM6PX7X RTX 4070 | |
| Acer Predator Helios 16 PH16-71-731Q | |
| Colorful EVOL X15 AT 23 | |
| Schenker XMG Pro 15 (E23) | |
| Medio Intel Core i7-13700HX (9290 - 13519, n=11) | |
| HP Omen 16-wf000 | |
| Dell G15 5530 | |
| AIDA64 / FPU Mandel | |
| Alienware m16 R1 AMD | |
| Media de la clase Gaming (25115 - 196829, n=102, últimos 2 años) | |
| Uniwill GM6PX7X RTX 4070 | |
| Alienware m16 R1 Intel | |
| Acer Predator Helios 16 PH16-71-731Q | |
| Colorful EVOL X15 AT 23 | |
| HP Omen 16-wf000 | |
| Medio Intel Core i7-13700HX (35751 - 53484, n=11) | |
| Schenker XMG Pro 15 (E23) | |
| Dell G15 5530 | |
| AIDA64 / CPU AES | |
| Uniwill GM6PX7X RTX 4070 | |
| Alienware m16 R1 Intel | |
| Acer Predator Helios 16 PH16-71-731Q | |
| Medio Intel Core i7-13700HX (67846 - 182575, n=11) | |
| Media de la clase Gaming (39258 - 247074, n=102, últimos 2 años) | |
| Alienware m16 R1 AMD | |
| Colorful EVOL X15 AT 23 | |
| Schenker XMG Pro 15 (E23) | |
| HP Omen 16-wf000 | |
| Dell G15 5530 | |
| AIDA64 / CPU ZLib | |
| Alienware m16 R1 AMD | |
| Media de la clase Gaming (574 - 2531, n=102, últimos 2 años) | |
| Acer Predator Helios 16 PH16-71-731Q | |
| Schenker XMG Pro 15 (E23) | |
| Uniwill GM6PX7X RTX 4070 | |
| Alienware m16 R1 Intel | |
| HP Omen 16-wf000 | |
| Colorful EVOL X15 AT 23 | |
| Dell G15 5530 | |
| Medio Intel Core i7-13700HX (981 - 1451, n=11) | |
| AIDA64 / FP64 Ray-Trace | |
| Alienware m16 R1 AMD | |
| Media de la clase Gaming (5509 - 45446, n=102, últimos 2 años) | |
| Uniwill GM6PX7X RTX 4070 | |
| Alienware m16 R1 Intel | |
| Colorful EVOL X15 AT 23 | |
| Acer Predator Helios 16 PH16-71-731Q | |
| Medio Intel Core i7-13700HX (7728 - 11837, n=11) | |
| HP Omen 16-wf000 | |
| Dell G15 5530 | |
| Schenker XMG Pro 15 (E23) | |
| AIDA64 / CPU PhotoWorxx | |
| Schenker XMG Pro 15 (E23) | |
| Media de la clase Gaming (12271 - 89891, n=102, últimos 2 años) | |
| Uniwill GM6PX7X RTX 4070 | |
| HP Omen 16-wf000 | |
| Dell G15 5530 | |
| Alienware m16 R1 Intel | |
| Acer Predator Helios 16 PH16-71-731Q | |
| Medio Intel Core i7-13700HX (19678 - 42415, n=11) | |
| Alienware m16 R1 AMD | |
| Colorful EVOL X15 AT 23 | |
Encontrará más información en nuestro Intel Core i7-13700HX página.
Rendimiento del sistema
El EVOL X15 AT obtiene mejores resultados en PCMark 10 en comparación con CrossMark. Las puntuaciones de memoria AIDA64 están en el lado inferior debido al único stick DDR5-4800 de doble canal en el EVOL X15 en comparación con la implementación dual de cuatro canales en sus competidores.
Dicho esto, no nos encontramos con ningún contratiempo al utilizar el EVOL X15 para tareas rutinarias de productividad y navegación web.
CrossMark: Overall | Productivity | Creativity | Responsiveness
AIDA64: Memory Copy | Memory Read | Memory Write | Memory Latency
| PCMark 10 / Score | |
| Alienware m16 R1 AMD | |
| Media de la clase Gaming (5828 - 12414, n=93, últimos 2 años) | |
| Uniwill GM6PX7X RTX 4070 | |
| HP Omen 16-wf000 | |
| Acer Predator Helios 16 PH16-71-731Q | |
| Colorful EVOL X15 AT 23 | |
| Schenker XMG Pro 15 (E23) | |
| Medio Intel Core i7-13700HX, NVIDIA GeForce RTX 4060 Laptop GPU (6909 - 7743, n=5) | |
| Alienware m16 R1 Intel | |
| Dell G15 5530 | |
| PCMark 10 / Essentials | |
| Uniwill GM6PX7X RTX 4070 | |
| Alienware m16 R1 AMD | |
| Schenker XMG Pro 15 (E23) | |
| Acer Predator Helios 16 PH16-71-731Q | |
| Dell G15 5530 | |
| Alienware m16 R1 Intel | |
| Media de la clase Gaming (8810 - 11935, n=97, últimos 2 años) | |
| Medio Intel Core i7-13700HX, NVIDIA GeForce RTX 4060 Laptop GPU (9760 - 11313, n=5) | |
| Colorful EVOL X15 AT 23 | |
| HP Omen 16-wf000 | |
| PCMark 10 / Productivity | |
| Media de la clase Gaming (6845 - 25323, n=95, últimos 2 años) | |
| Acer Predator Helios 16 PH16-71-731Q | |
| Uniwill GM6PX7X RTX 4070 | |
| Schenker XMG Pro 15 (E23) | |
| Alienware m16 R1 AMD | |
| Dell G15 5530 | |
| Medio Intel Core i7-13700HX, NVIDIA GeForce RTX 4060 Laptop GPU (9131 - 11018, n=5) | |
| Alienware m16 R1 Intel | |
| Colorful EVOL X15 AT 23 | |
| HP Omen 16-wf000 | |
| PCMark 10 / Digital Content Creation | |
| Alienware m16 R1 AMD | |
| Media de la clase Gaming (7602 - 19954, n=95, últimos 2 años) | |
| Uniwill GM6PX7X RTX 4070 | |
| HP Omen 16-wf000 | |
| Colorful EVOL X15 AT 23 | |
| Medio Intel Core i7-13700HX, NVIDIA GeForce RTX 4060 Laptop GPU (9393 - 12434, n=5) | |
| Acer Predator Helios 16 PH16-71-731Q | |
| Alienware m16 R1 Intel | |
| Schenker XMG Pro 15 (E23) | |
| Dell G15 5530 | |
| CrossMark / Overall | |
| Acer Predator Helios 16 PH16-71-731Q | |
| Alienware m16 R1 Intel | |
| Alienware m16 R1 AMD | |
| Media de la clase Gaming (1366 - 2409, n=94, últimos 2 años) | |
| Uniwill GM6PX7X RTX 4070 | |
| Schenker XMG Pro 15 (E23) | |
| Medio Intel Core i7-13700HX, NVIDIA GeForce RTX 4060 Laptop GPU (1663 - 2105, n=5) | |
| Dell G15 5530 | |
| Colorful EVOL X15 AT 23 | |
| HP Omen 16-wf000 | |
| CrossMark / Productivity | |
| Acer Predator Helios 16 PH16-71-731Q | |
| Alienware m16 R1 Intel | |
| Alienware m16 R1 AMD | |
| Media de la clase Gaming (1386 - 2254, n=94, últimos 2 años) | |
| Uniwill GM6PX7X RTX 4070 | |
| Schenker XMG Pro 15 (E23) | |
| Medio Intel Core i7-13700HX, NVIDIA GeForce RTX 4060 Laptop GPU (1618 - 1989, n=5) | |
| Dell G15 5530 | |
| Colorful EVOL X15 AT 23 | |
| HP Omen 16-wf000 | |
| CrossMark / Creativity | |
| Acer Predator Helios 16 PH16-71-731Q | |
| Media de la clase Gaming (1343 - 2786, n=94, últimos 2 años) | |
| Alienware m16 R1 Intel | |
| Schenker XMG Pro 15 (E23) | |
| Alienware m16 R1 AMD | |
| Uniwill GM6PX7X RTX 4070 | |
| Dell G15 5530 | |
| Medio Intel Core i7-13700HX, NVIDIA GeForce RTX 4060 Laptop GPU (1710 - 2274, n=5) | |
| HP Omen 16-wf000 | |
| Colorful EVOL X15 AT 23 | |
| CrossMark / Responsiveness | |
| Acer Predator Helios 16 PH16-71-731Q | |
| Alienware m16 R1 Intel | |
| Uniwill GM6PX7X RTX 4070 | |
| Schenker XMG Pro 15 (E23) | |
| Alienware m16 R1 AMD | |
| Media de la clase Gaming (1226 - 2334, n=94, últimos 2 años) | |
| Medio Intel Core i7-13700HX, NVIDIA GeForce RTX 4060 Laptop GPU (1269 - 1983, n=5) | |
| Dell G15 5530 | |
| HP Omen 16-wf000 | |
| Colorful EVOL X15 AT 23 | |
| AIDA64 / Memory Copy | |
| Schenker XMG Pro 15 (E23) | |
| Media de la clase Gaming (21750 - 129946, n=102, últimos 2 años) | |
| Uniwill GM6PX7X RTX 4070 | |
| HP Omen 16-wf000 | |
| Dell G15 5530 | |
| Alienware m16 R1 Intel | |
| Acer Predator Helios 16 PH16-71-731Q | |
| Medio Intel Core i7-13700HX, NVIDIA GeForce RTX 4060 Laptop GPU (36504 - 58458, n=5) | |
| Alienware m16 R1 AMD | |
| Colorful EVOL X15 AT 23 | |
| AIDA64 / Memory Read | |
| Schenker XMG Pro 15 (E23) | |
| Media de la clase Gaming (22956 - 118858, n=102, últimos 2 años) | |
| Uniwill GM6PX7X RTX 4070 | |
| Dell G15 5530 | |
| Alienware m16 R1 Intel | |
| HP Omen 16-wf000 | |
| Acer Predator Helios 16 PH16-71-731Q | |
| Medio Intel Core i7-13700HX, NVIDIA GeForce RTX 4060 Laptop GPU (36510 - 67644, n=5) | |
| Alienware m16 R1 AMD | |
| Colorful EVOL X15 AT 23 | |
| AIDA64 / Memory Write | |
| Acer Predator Helios 16 PH16-71-731Q | |
| Media de la clase Gaming (22297 - 135096, n=102, últimos 2 años) | |
| Schenker XMG Pro 15 (E23) | |
| HP Omen 16-wf000 | |
| Uniwill GM6PX7X RTX 4070 | |
| Medio Intel Core i7-13700HX, NVIDIA GeForce RTX 4060 Laptop GPU (33598 - 85675, n=5) | |
| Dell G15 5530 | |
| Alienware m16 R1 Intel | |
| Alienware m16 R1 AMD | |
| Colorful EVOL X15 AT 23 | |
| AIDA64 / Memory Latency | |
| Media de la clase Gaming (75.3 - 165.4, n=102, últimos 2 años) | |
| Alienware m16 R1 AMD | |
| Dell G15 5530 | |
| Alienware m16 R1 Intel | |
| Uniwill GM6PX7X RTX 4070 | |
| HP Omen 16-wf000 | |
| Medio Intel Core i7-13700HX, NVIDIA GeForce RTX 4060 Laptop GPU (81.9 - 93, n=5) | |
| Acer Predator Helios 16 PH16-71-731Q | |
| Schenker XMG Pro 15 (E23) | |
| Colorful EVOL X15 AT 23 | |
* ... más pequeño es mejor
| PCMark 8 Home Score Accelerated v2 | 5769 puntos | |
| PCMark 8 Work Score Accelerated v2 | 5995 puntos | |
| PCMark 10 Score | 7655 puntos | |
ayuda | ||
Latencia del CPD
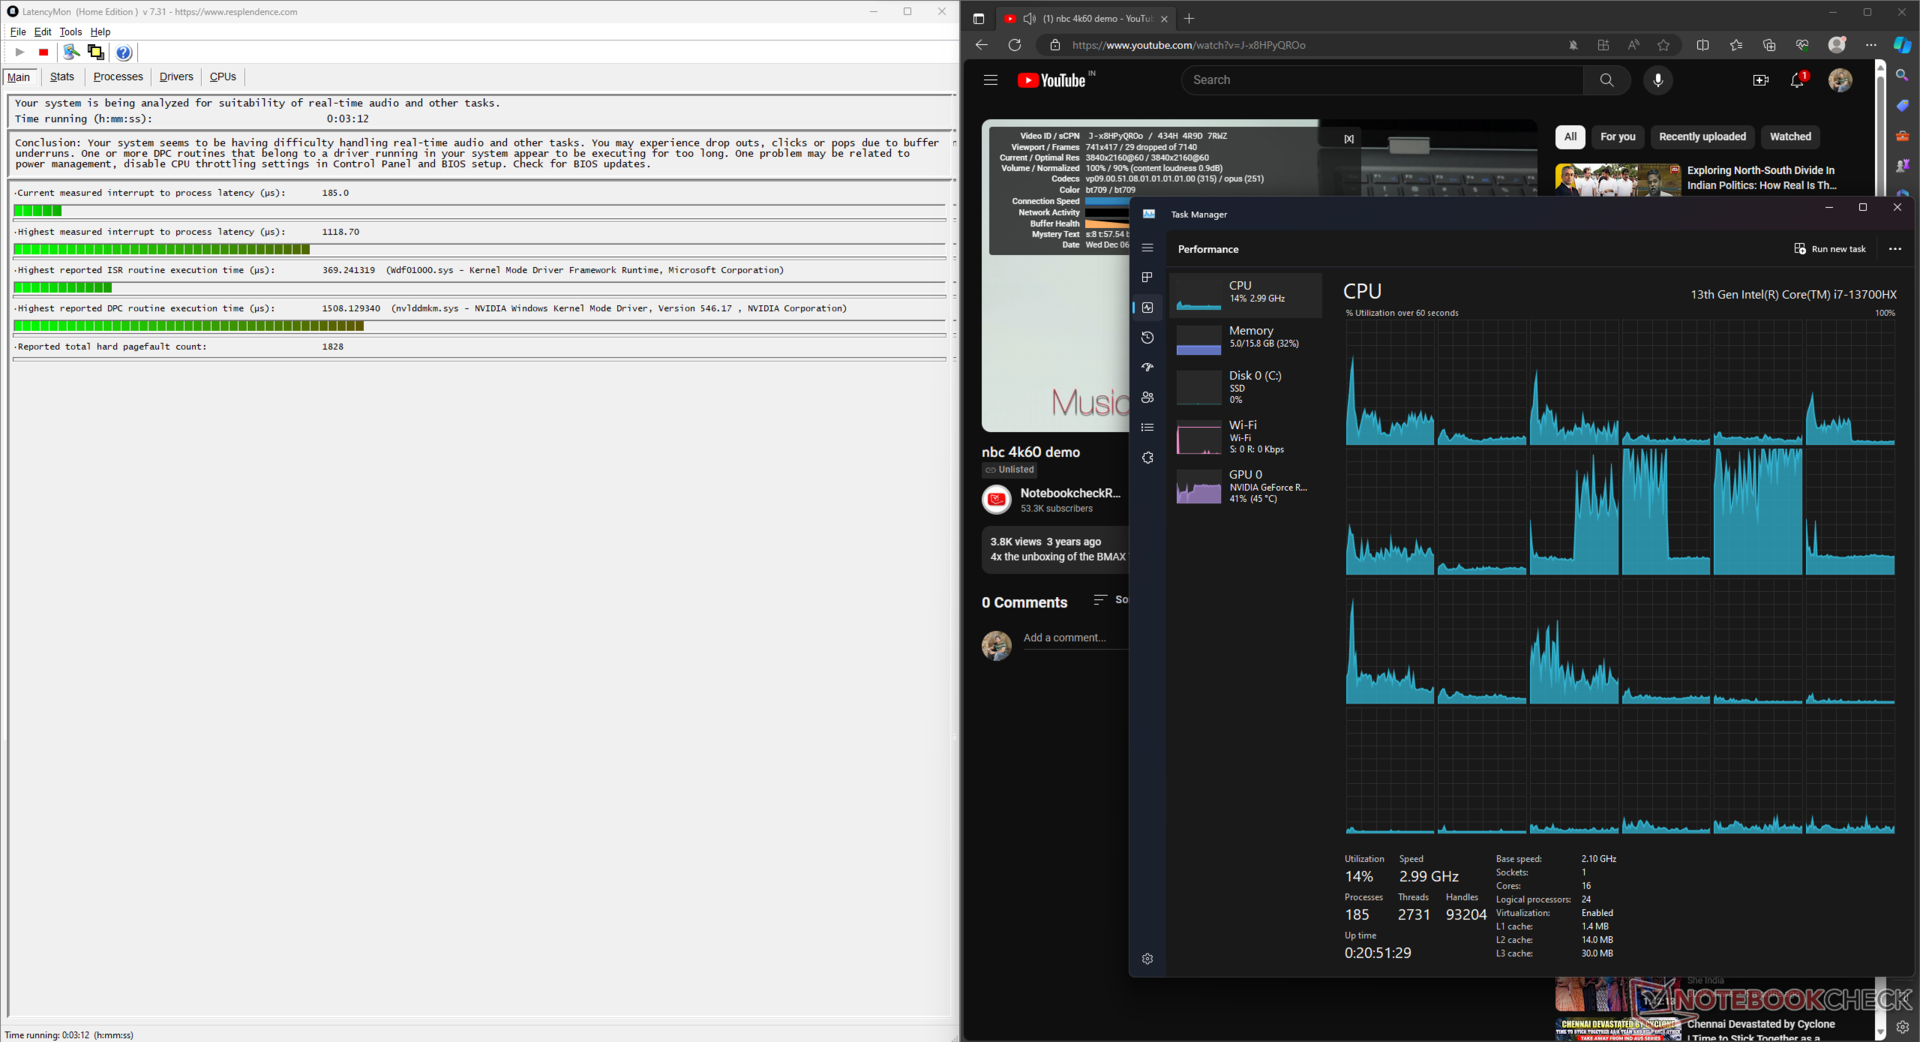
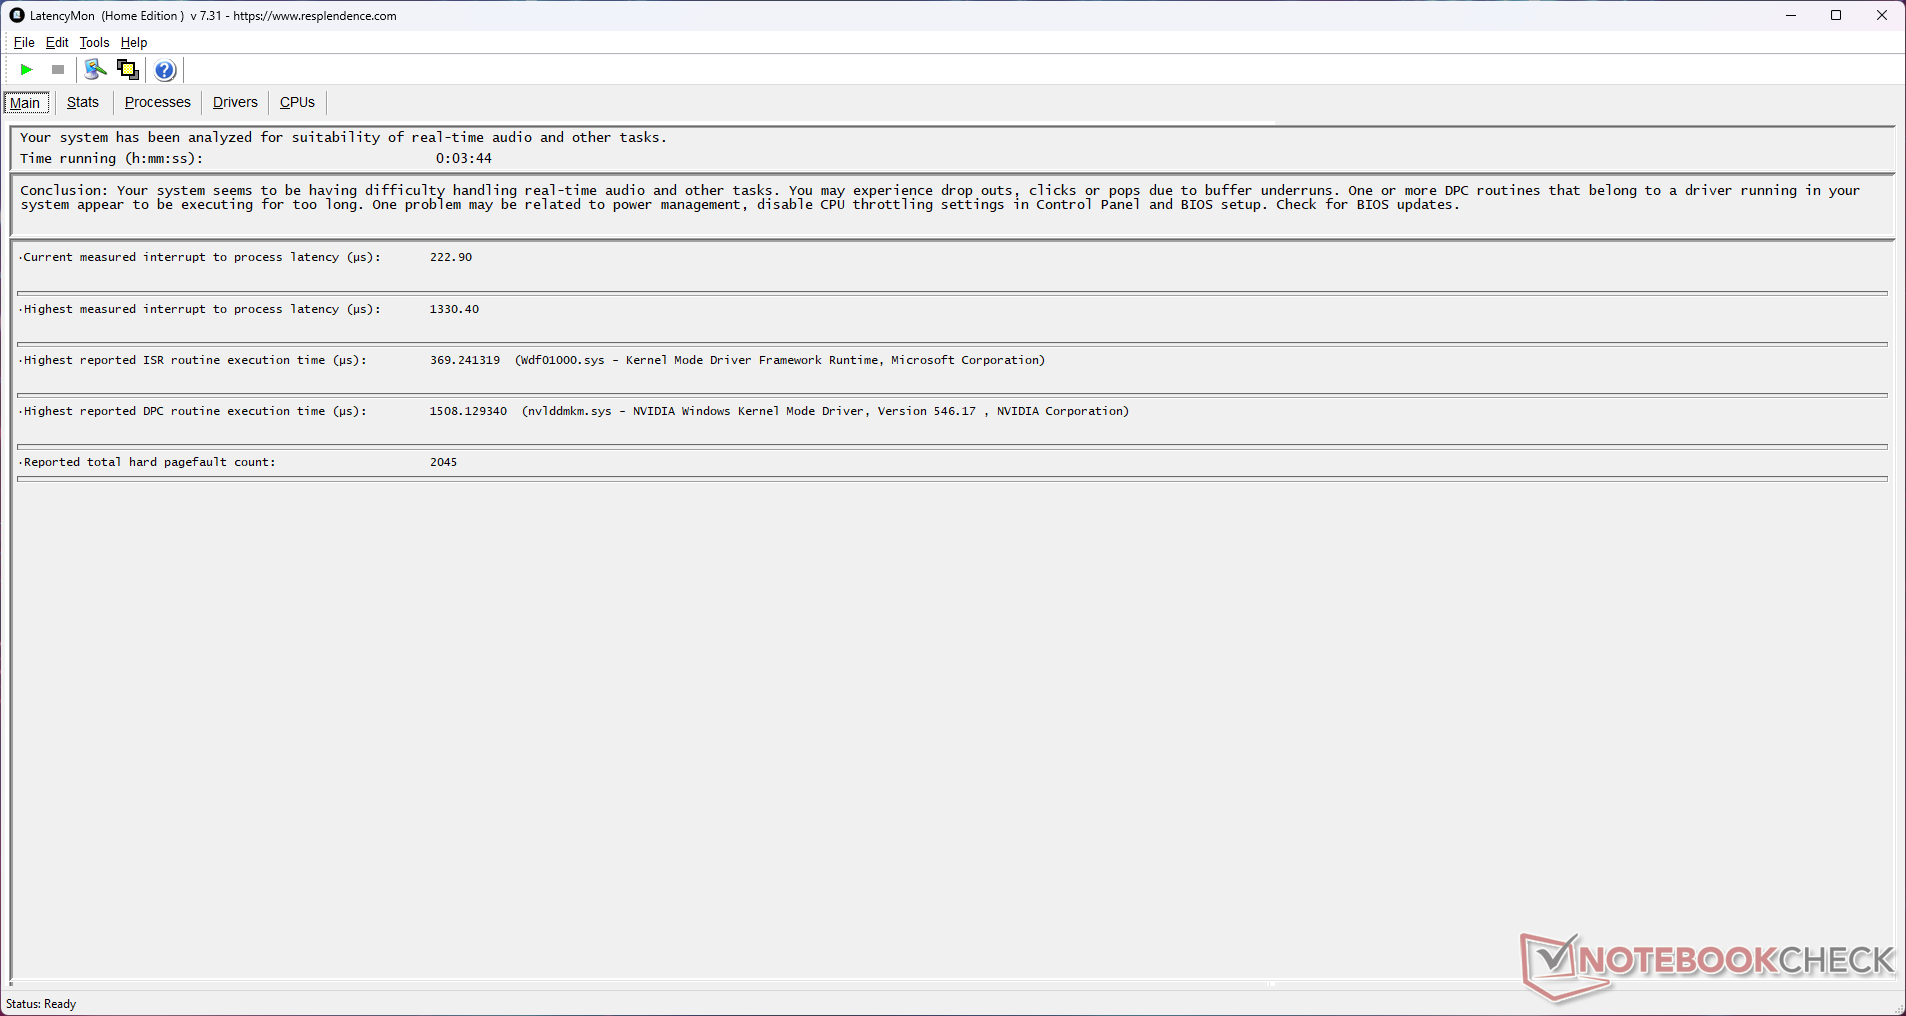
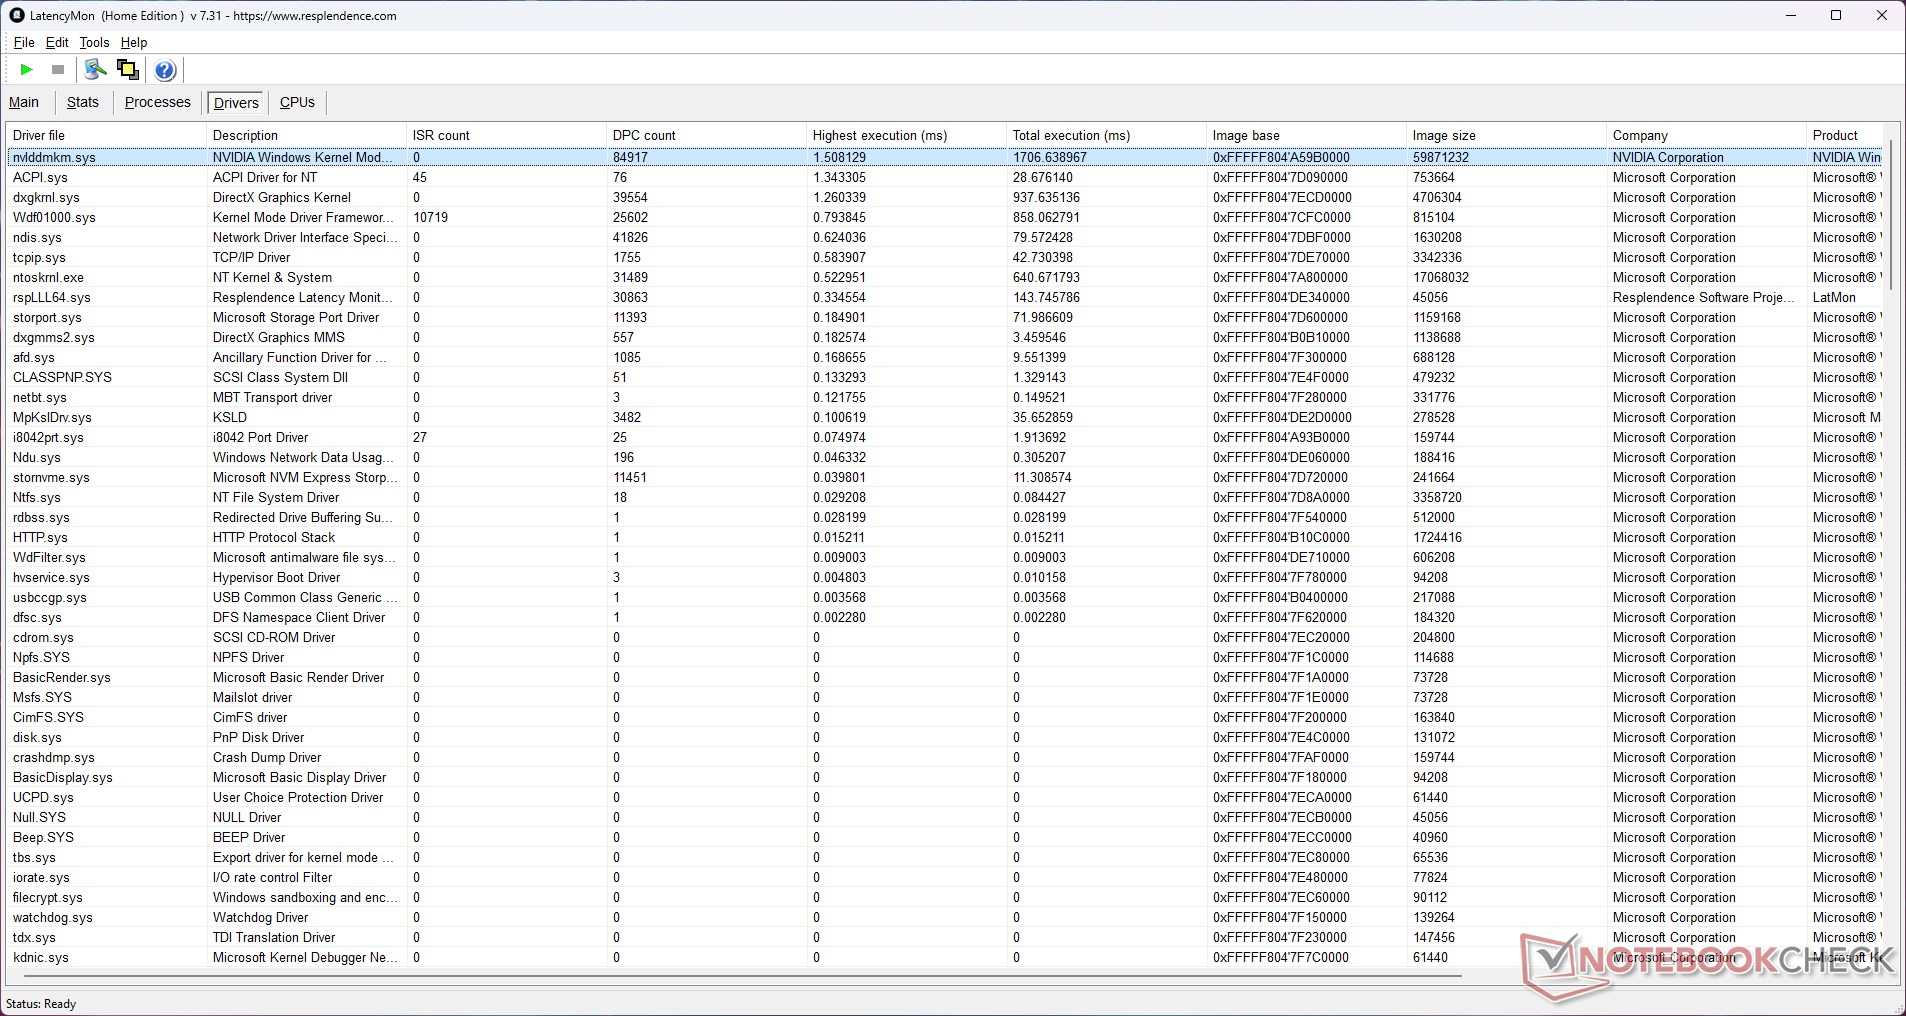
La alta latencia del CPD es un problema conocido en los portátiles con tarjetas Nvidia, y el EVOL X15 no es una excepción, aunque le va mejor que a sus competidores.
Registramos una latencia de interrupción a proceso de 1.330,4 µs utilizando LatencyMon, tras una reproducción de YouTube 4K60 de muestra y un estrés Prime95 de 10 segundos. El Nvidia Windows Kernel Mode Driver Framework (nvlddmkm.sys) contribuye a esta alta latencia.
| DPC Latencies / LatencyMon - interrupt to process latency (max), Web, Youtube, Prime95 | |
| Dell G15 5530 | |
| Alienware m16 R1 Intel | |
| HP Omen 16-wf000 | |
| Alienware m16 R1 AMD | |
| Acer Predator Helios 16 PH16-71-731Q | |
| Colorful EVOL X15 AT 23 | |
| Uniwill GM6PX7X RTX 4070 | |
| Schenker XMG Pro 15 (E23) | |
* ... más pequeño es mejor
Nuestra Clasificación de la latencia del CPD proporciona más comparaciones de LatencyMon entre los dispositivos probados.
Dispositivos de almacenamiento
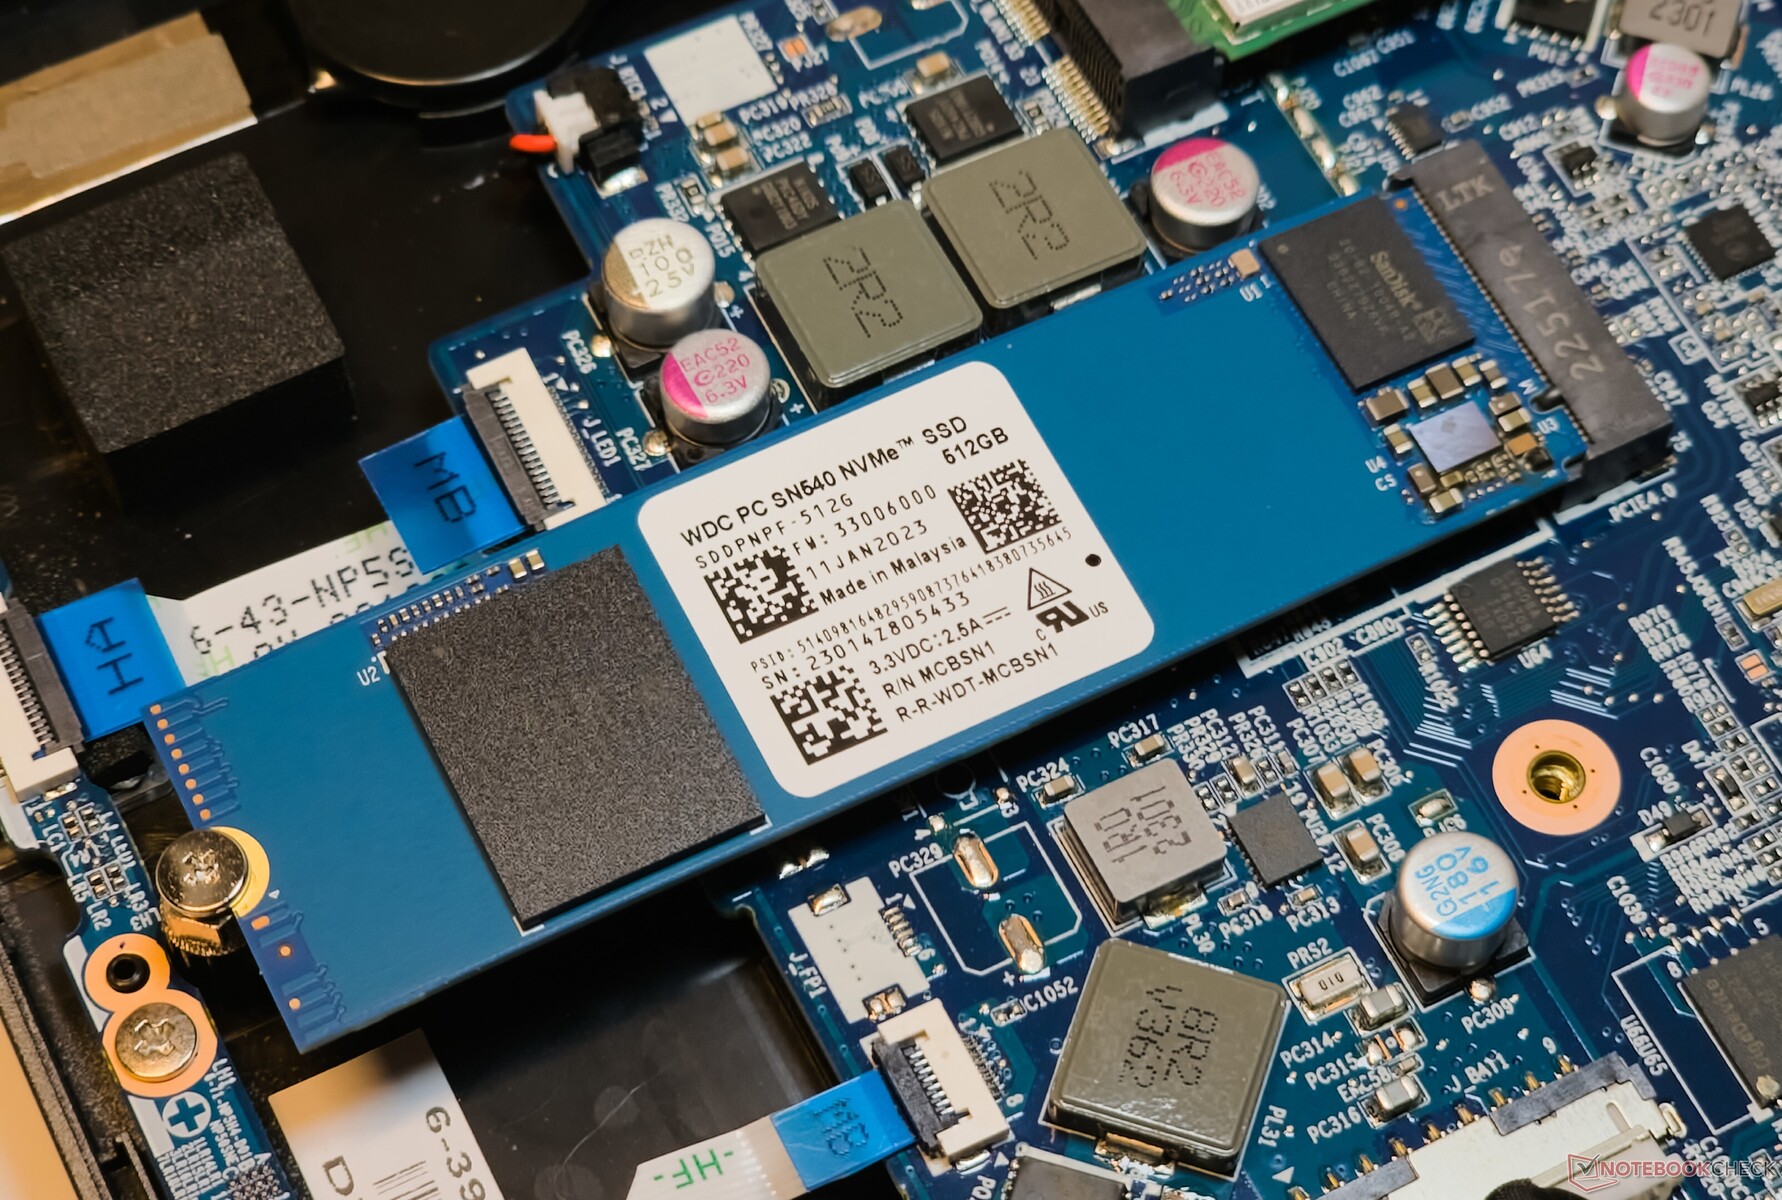
La unidad SSD NVMe Western Digital SN540 de 512 GB del EVOL X15 no está a la altura de las unidades Kioxia y SK Hynix utilizadas por sus competidores. No obstante, las lecturas 4k q1 t1 y las escrituras 4k q1 t1 superan a las del Kioxia XG8 en el Alienware m16 R1 AMD.
Colorful permite añadir otra unidad PCIe Gen4 NVMe. Sin embargo, no hay posibilidad de añadir almacenamiento masivo SATA de 2,5 pulgadas.

* ... más pequeño es mejor
Estrangulamiento de disco: Bucle de lectura DiskSpd, profundidad de cola 8
La unidad empieza a ralentizarse después del 17º bucle durante la prueba de bucle de lectura DiskSpd a una profundidad de cola de 8. No hay cubierta térmica ni acolchado en la unidad.
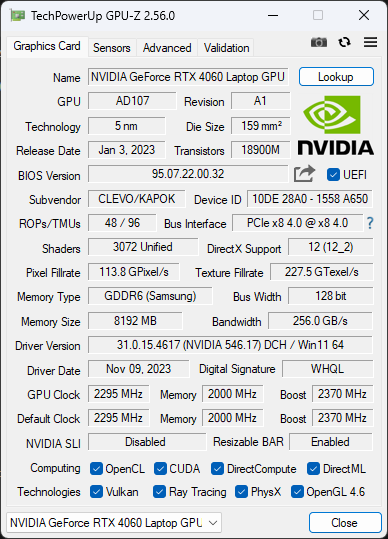
Rendimiento de la GPU
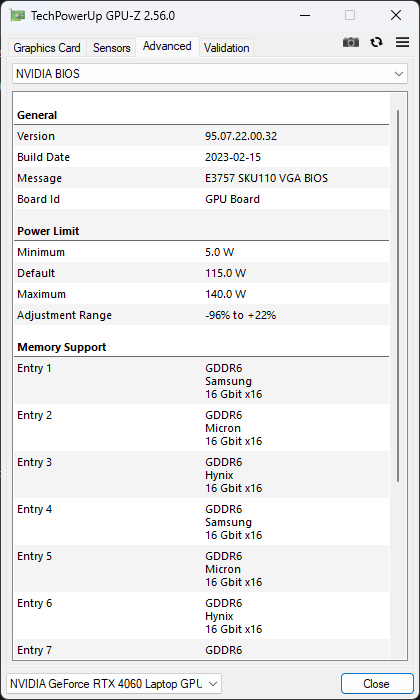
La GPU Nvidia GeForce RTX 4060 para portátiles del EVOL X15 AT funciona a una TGP de 140 W. Su rendimiento general en 3DMark es comparable al de otros portátiles que utilizan la misma GPU.
También vemos que la RTX 4060 está a poca distancia de los 140 W GPU RTX 4070 para portátiles en el Uniwill GM6PX7Xpero se queda corta en un 31% si la comparamos con la GPU de 175 W GPU RTX 4080 para portátiles que impulsa el Alienware m16 R1 AMD.
las puntuaciones gráficas de 3DMark Time Spy pueden caer casi un 54% con batería.
| 3DMark 11 Performance | 30245 puntos | |
| 3DMark Ice Storm Standard Score | 278340 puntos | |
| 3DMark Cloud Gate Standard Score | 63582 puntos | |
| 3DMark Fire Strike Score | 24674 puntos | |
| 3DMark Fire Strike Extreme Score | 12089 puntos | |
| 3DMark Time Spy Score | 10590 puntos | |
ayuda | ||
| Blender / v3.3 Classroom OPTIX/RTX | |
| Schenker XMG Pro 15 (E23) | |
| Colorful EVOL X15 AT 23 | |
| Alienware m16 R1 Intel | |
| Medio NVIDIA GeForce RTX 4060 Laptop GPU (19 - 28, n=53) | |
| Acer Predator Helios 16 PH16-71-731Q | |
| Dell G15 5530 | |
| Uniwill GM6PX7X RTX 4070 | |
| Media de la clase Gaming (9 - 32, n=103, últimos 2 años) | |
| HP Omen 16-wf000 | |
| Alienware m16 R1 AMD | |
| Blender / v3.3 Classroom CUDA | |
| Schenker XMG Pro 15 (E23) | |
| Medio NVIDIA GeForce RTX 4060 Laptop GPU (39 - 53, n=53) | |
| Colorful EVOL X15 AT 23 | |
| Acer Predator Helios 16 PH16-71-731Q | |
| Dell G15 5530 | |
| Alienware m16 R1 Intel | |
| Uniwill GM6PX7X RTX 4070 | |
| Media de la clase Gaming (15 - 228, n=103, últimos 2 años) | |
| Alienware m16 R1 AMD | |
| HP Omen 16-wf000 | |
| Blender / v3.3 Classroom CPU | |
| Medio NVIDIA GeForce RTX 4060 Laptop GPU (189 - 452, n=53) | |
| HP Omen 16-wf000 | |
| Dell G15 5530 | |
| Acer Predator Helios 16 PH16-71-731Q | |
| Colorful EVOL X15 AT 23 | |
| Schenker XMG Pro 15 (E23) | |
| Alienware m16 R1 Intel | |
| Uniwill GM6PX7X RTX 4070 | |
| Media de la clase Gaming (122 - 565, n=99, últimos 2 años) | |
| Alienware m16 R1 AMD | |
* ... más pequeño es mejor
Rendimiento en juegos
El EVOL X15 logra pequeñas ventajas sobre los portátiles de la competencia de especificaciones similares, incluido el Acer Predator Helios 16 y el Alienware m16 R1 Intel en rendimiento general para juegos a 1080p Ultra.
Los juegos a 60 fps QHD son alcanzables en muchos títulos AAA, y hay potencial para conseguir velocidades de fotogramas aún mayores con la ayuda de escaladores como Nvidia DLSS, AMD FSR o Intel XeSS.
| The Witcher 3 - 1920x1080 Ultra Graphics & Postprocessing (HBAO+) | |
| Media de la clase Gaming (104.7 - 240, n=7, últimos 2 años) | |
| Alienware m16 R1 AMD | |
| HP Omen 16-wf000 | |
| Schenker XMG Pro 15 (E23) | |
| Uniwill GM6PX7X RTX 4070 | |
| Alienware m16 R1 Intel | |
| Dell G15 5530 | |
| Colorful EVOL X15 AT 23 | |
| Acer Predator Helios 16 PH16-71-731Q | |
| GTA V - 1920x1080 Highest AA:4xMSAA + FX AF:16x | |
| Media de la clase Gaming (67.1 - 186.9, n=90, últimos 2 años) | |
| Uniwill GM6PX7X RTX 4070 | |
| Colorful EVOL X15 AT 23 | |
| HP Omen 16-wf000 | |
| Acer Predator Helios 16 PH16-71-731Q | |
| Dell G15 5530 | |
| Schenker XMG Pro 15 (E23) | |
| Final Fantasy XV Benchmark - 1920x1080 High Quality | |
| Alienware m16 R1 AMD | |
| HP Omen 16-wf000 | |
| Media de la clase Gaming (64.2 - 215, n=91, últimos 2 años) | |
| Uniwill GM6PX7X RTX 4070 | |
| Alienware m16 R1 Intel | |
| Colorful EVOL X15 AT 23 | |
| Acer Predator Helios 16 PH16-71-731Q | |
| Dell G15 5530 | |
La tabla de FPS de Witcher 3
La refrigeración del subsistema gráfico de la EVOL X15 parece ser bastante eficiente, como demuestran las estables frecuencias de cuadro observadas bajo tensión con The Witcher 3 a 1080p Ultra.
| bajo | medio | alto | ultra | QHD | |
|---|---|---|---|---|---|
| GTA V (2015) | 185.6 | 182.3 | 177.3 | 114.6 | 85.6 |
| The Witcher 3 (2015) | 450 | 333 | 205 | 103.4 | 75.7 |
| Dota 2 Reborn (2015) | 192.2 | 169.7 | 164.6 | 153.1 | |
| Final Fantasy XV Benchmark (2018) | 206 | 143.9 | 101 | 74 | |
| X-Plane 11.11 (2018) | 176.1 | 155.9 | 116.4 | ||
| Far Cry 5 (2018) | 162 | 146 | 141 | 135 | 101 |
| Strange Brigade (2018) | 480 | 288 | 225 | 192 | 127.4 |
| F1 22 (2022) | 253 | 253 | 194.5 | 65.8 | 42.3 |
| F1 23 (2023) | 248 | 250 | 184.1 | 58.3 | 37 |
| Cyberpunk 2077 (2023) | 119.4 | 96.5 | 82.8 | 71.1 | 42.8 |
| Assassin's Creed Mirage (2023) | 137 | 125 | 116 | 89 | 65 |
| Call of Duty Modern Warfare 3 2023 (2023) | 128 | 114 | 86 | 65 | 56 |
| Avatar Frontiers of Pandora (2023) | 77.3 | 71.1 | 60.8 | 45.2 | 29.8 |
Consulte nuestra página dedicada GPU Nvidia GeForce RTX 4060 para portátiles para obtener más información y comparaciones de rendimiento.
Emisiones: Bajas temperaturas superficiales acompañadas de un elevado ruido del ventilador
Ruido del sistema
Colorful limita el ruido del ventilador del EVOL X15 AT a menos de 30 db(A) en el modo silencioso.
Sin embargo, tanto el modo Entretenimiento como el Rendimiento ven niveles de ruido cercanos a la marca de 55 db(A) incluso bajo cargas medias de 3DMark 06.
Los perfiles de potencia proporcionados sí tienen un impacto perceptible en el rendimiento de los juegos. Por ejemplo, vemos que la velocidad media de fotogramas cae un 33% en The Witcher 3 a 1080p Ultra al cambiar del modo Rendimiento al modo Silencio.
Ruido
| Ocioso |
| 33.16 / 33.16 / 33.16 dB(A) |
| Carga |
| 54.62 / 54.53 dB(A) |
 | ||
30 dB silencioso 40 dB(A) audible 50 dB(A) ruidosamente alto |
||
min: | ||
| Modo de rendimiento | Al ralentí dB(A) | Carga media dB(A) | Carga máxima dB(A) | La Witcher 3 1080p Ultra dB(A) |
|---|---|---|---|---|
| Silencio | 24,73 | 26,61 | 26,08 | 26,82 / 67 fps |
| Ahorro de energía | 24,85 | 26,02 | 41,05 | 46,10 / 75 fps |
| Entretenimiento | 25.07 | 54.06 | 54.56 | 53.29 / 97 fps |
| Rendimiento | 33.16 | 54.62 | 54.53 | 54.62 / 100 fps |
| Colorful EVOL X15 AT 23 i7-13700HX, GeForce RTX 4060 Laptop GPU | Alienware m16 R1 Intel i7-13700HX, GeForce RTX 4060 Laptop GPU | HP Omen 16-wf000 i7-13700HX, GeForce RTX 4080 Laptop GPU | Acer Predator Helios 16 PH16-71-731Q i7-13700HX, GeForce RTX 4060 Laptop GPU | Dell G15 5530 i7-13650HX, GeForce RTX 4060 Laptop GPU | Schenker XMG Pro 15 (E23) i9-13900HX, GeForce RTX 4060 Laptop GPU | Alienware m16 R1 AMD R9 7845HX, GeForce RTX 4080 Laptop GPU | Uniwill GM6PX7X RTX 4070 i7-13700HX, GeForce RTX 4070 Laptop GPU | |
|---|---|---|---|---|---|---|---|---|
| Noise | 9% | 7% | 14% | 19% | 11% | 13% | 13% | |
| apagado / medio ambiente * (dB) | 21.32 | 25 -17% | 23 -8% | 24 -13% | 20.41 4% | 24 -13% | 22.9 -7% | 22.4 -5% |
| Idle Minimum * (dB) | 33.16 | 25 25% | 29.6 11% | 24 28% | 26.85 19% | 24 28% | 22.9 31% | 22.9 31% |
| Idle Average * (dB) | 33.16 | 26 22% | 29.8 10% | 24 28% | 26.85 19% | 24 28% | 29.7 10% | 29 13% |
| Idle Maximum * (dB) | 33.16 | 27 19% | 30.4 8% | 32.32 3% | 26.85 19% | 24 28% | 29.7 10% | 29 13% |
| Load Average * (dB) | 54.62 | 52 5% | 33.8 38% | 36.66 33% | 27.65 49% | 53.65 2% | 29.8 45% | 40.2 26% |
| Witcher 3 ultra * (dB) | 54.6 | 51 7% | 57 -4% | 49.06 10% | 47.9 12% | 53.53 2% | 54.7 -0% | 48.7 11% |
| Load Maximum * (dB) | 54.53 | 53 3% | 58.3 -7% | 49.49 9% | 47.86 12% | 53.65 2% | 54.7 -0% | 55 -1% |
* ... más pequeño es mejor
Temperatura
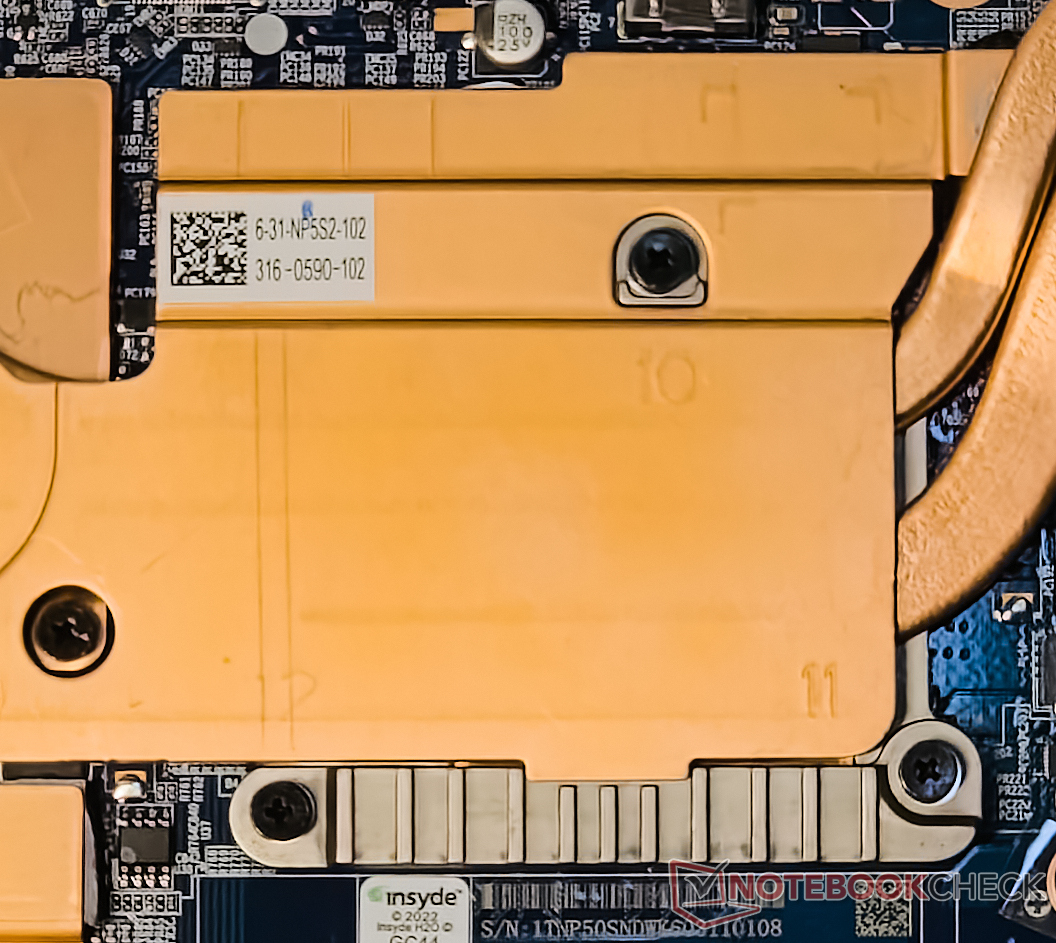
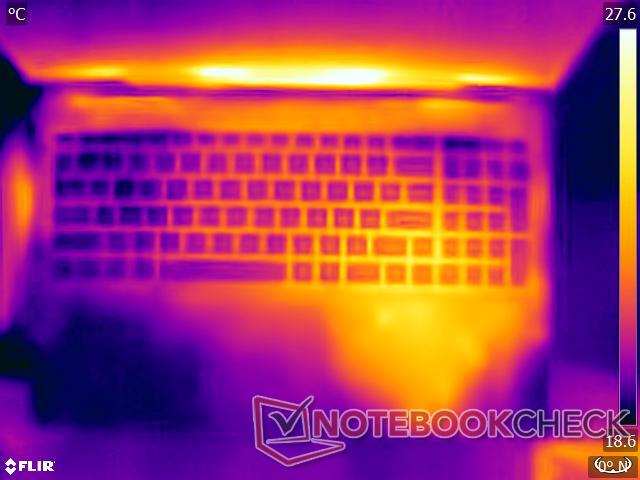
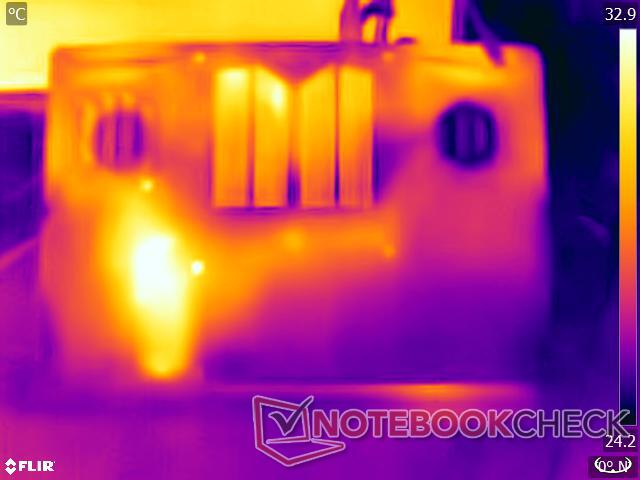
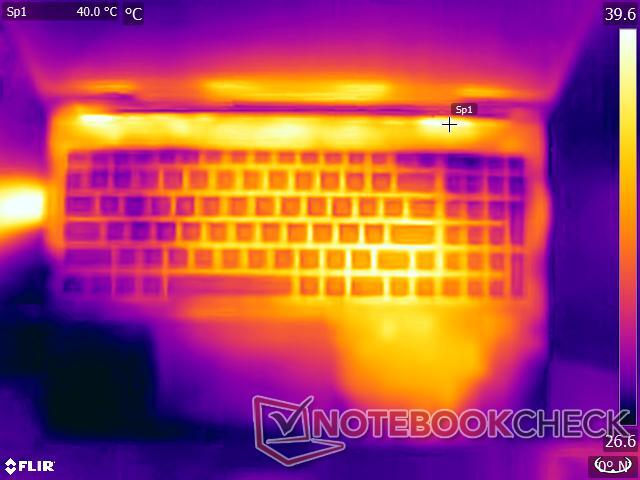
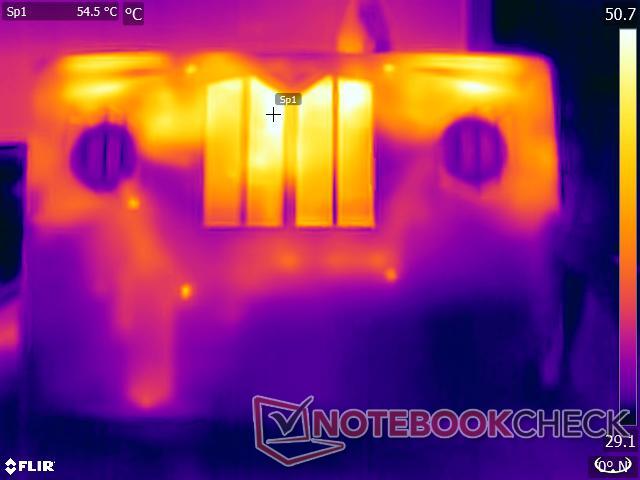
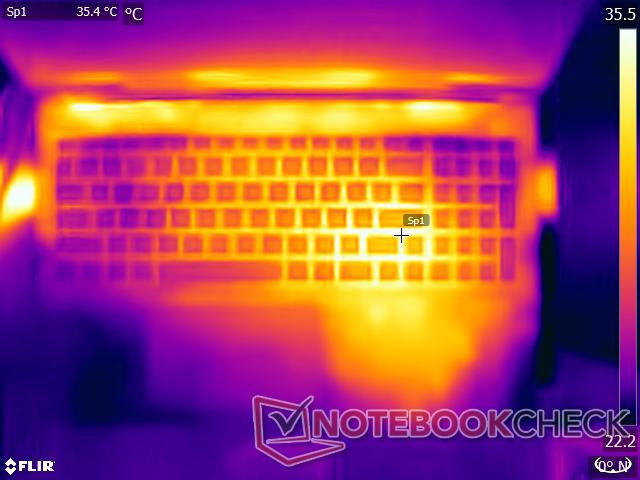
El EVOL X15 incorpora un robusto sistema de refrigeración que cubre por completo la CPU, la GPU y el chipset. Las temperaturas de la superficie son manejables bajo cargas pesadas gracias a la sólida construcción en plástico y a la amplia separación del panel trasero respecto a la placa base. Sólo un punto caliente en la parte inferior alcanza los 51 °C.
A pesar de su peso, el EVOL X15 puede utilizarse sobre el regazo siempre que no se le presione demasiado. Las zonas del panel táctil y del reposamuñecas permanecen relativamente frías, sólo se calientan ligeramente bajo carga extrema.
(+) La temperatura máxima en la parte superior es de 37 °C / 99 F, frente a la media de 40.4 °C / 105 F, que oscila entre 21.2 y 68.8 °C para la clase Gaming.
(-) El fondo se calienta hasta un máximo de 51.2 °C / 124 F, frente a la media de 43.2 °C / 110 F
(+) En reposo, la temperatura media de la parte superior es de 29.3 °C / 85# F, frente a la media del dispositivo de 33.9 °C / 93 F.
(+) Jugando a The Witcher 3, la temperatura media de la parte superior es de 31.7 °C / 89 F, frente a la media del dispositivo de 33.9 °C / 93 F.
(+) Los reposamanos y el panel táctil alcanzan como máximo la temperatura de la piel (34.8 °C / 94.6 F) y, por tanto, no están calientes.
(-) La temperatura media de la zona del reposamanos de dispositivos similares fue de 28.8 °C / 83.8 F (-6 °C / -10.8 F).

| Colorful EVOL X15 AT 23 Intel Core i7-13700HX, NVIDIA GeForce RTX 4060 Laptop GPU | Alienware m16 R1 Intel Intel Core i7-13700HX, NVIDIA GeForce RTX 4060 Laptop GPU | HP Omen 16-wf000 Intel Core i7-13700HX, NVIDIA GeForce RTX 4080 Laptop GPU | Acer Predator Helios 16 PH16-71-731Q Intel Core i7-13700HX, NVIDIA GeForce RTX 4060 Laptop GPU | Dell G15 5530 Intel Core i7-13650HX, NVIDIA GeForce RTX 4060 Laptop GPU | Schenker XMG Pro 15 (E23) Intel Core i9-13900HX, NVIDIA GeForce RTX 4060 Laptop GPU | Alienware m16 R1 AMD AMD Ryzen 9 7845HX, NVIDIA GeForce RTX 4080 Laptop GPU | Uniwill GM6PX7X RTX 4070 Intel Core i7-13700HX, NVIDIA GeForce RTX 4070 Laptop GPU | |
|---|---|---|---|---|---|---|---|---|
| Heat | -18% | 0% | -17% | -19% | -9% | -9% | -5% | |
| Maximum Upper Side * (°C) | 37 | 49 -32% | 45 -22% | 41 -11% | 54 -46% | 50 -35% | 48 -30% | 38.2 -3% |
| Maximum Bottom * (°C) | 51.2 | 48 6% | 48.8 5% | 66 -29% | 62.2 -21% | 50 2% | 39 24% | 45 12% |
| Idle Upper Side * (°C) | 31.2 | 40 -28% | 29.2 6% | 36 -15% | 33.4 -7% | 33 -6% | 37 -19% | 33.6 -8% |
| Idle Bottom * (°C) | 32.8 | 39 -19% | 28.8 12% | 37 -13% | 33.4 -2% | 32 2% | 36.2 -10% | 39.6 -21% |
* ... más pequeño es mejor
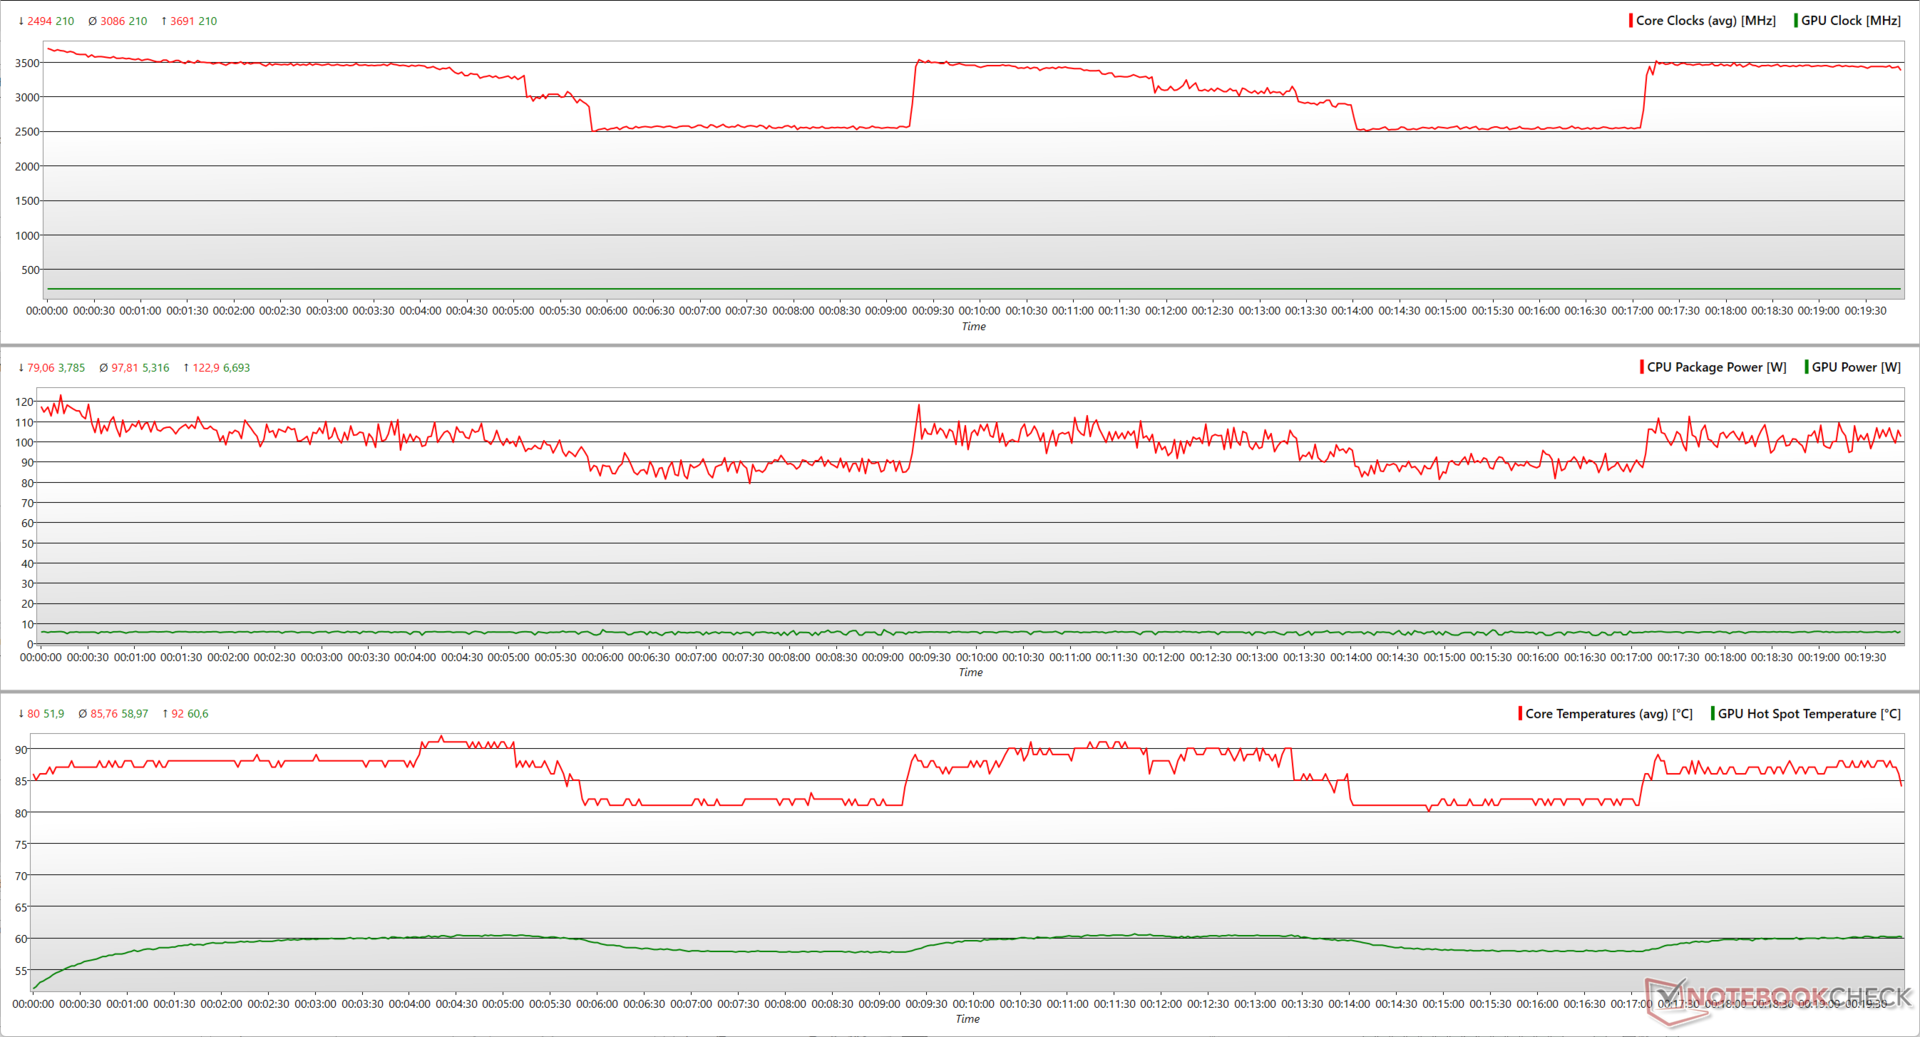
Prueba de estrés
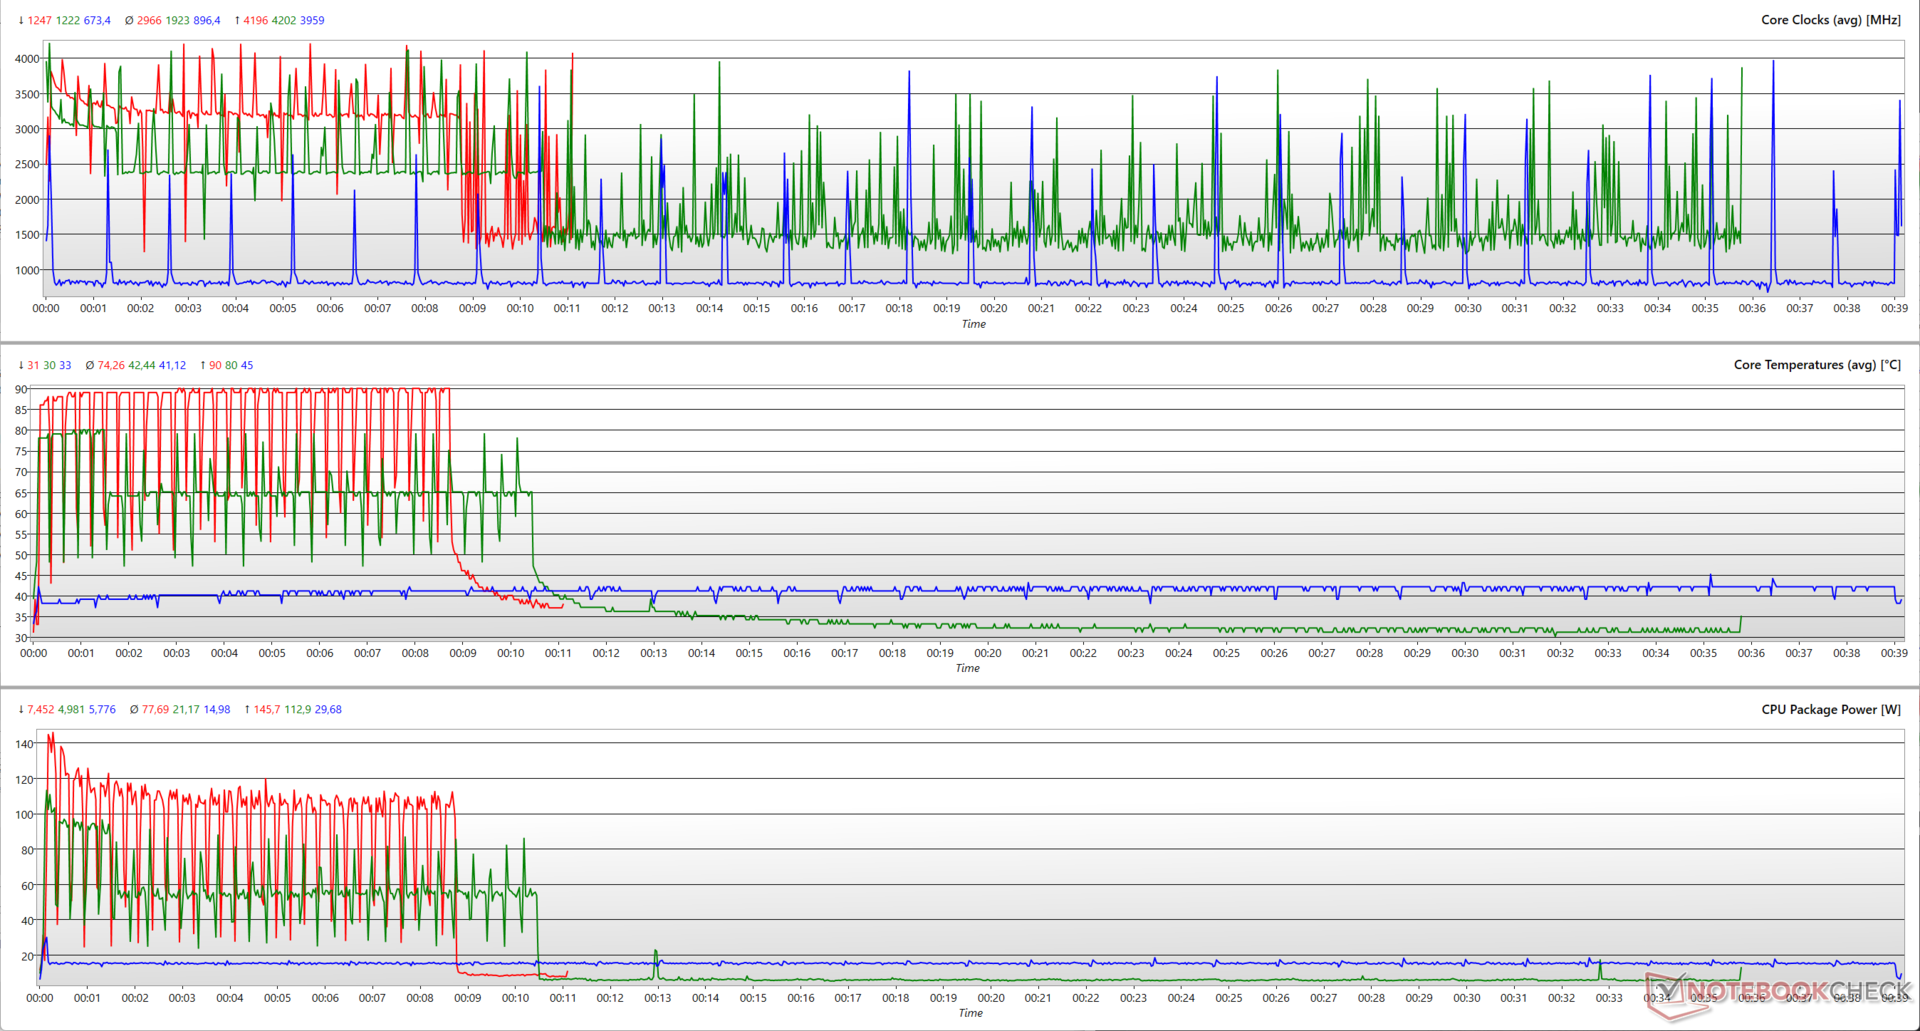
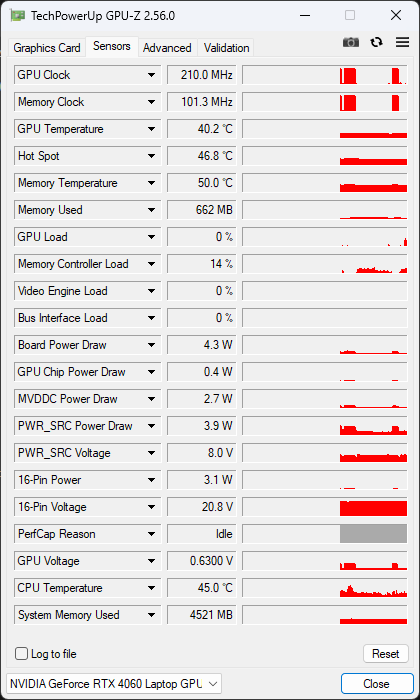
Al estresar el EVOL X15 con grandes FFT en Prime95, el Core i7-13700HX alcanza picos de potencia de hasta 3,7 GHz utilizando 123 W. A pesar de la refrigeración integral, la CPU cae periódicamente a 2,5 GHz a 80 W antes de intentar volver a subir a 3,7 GHz.
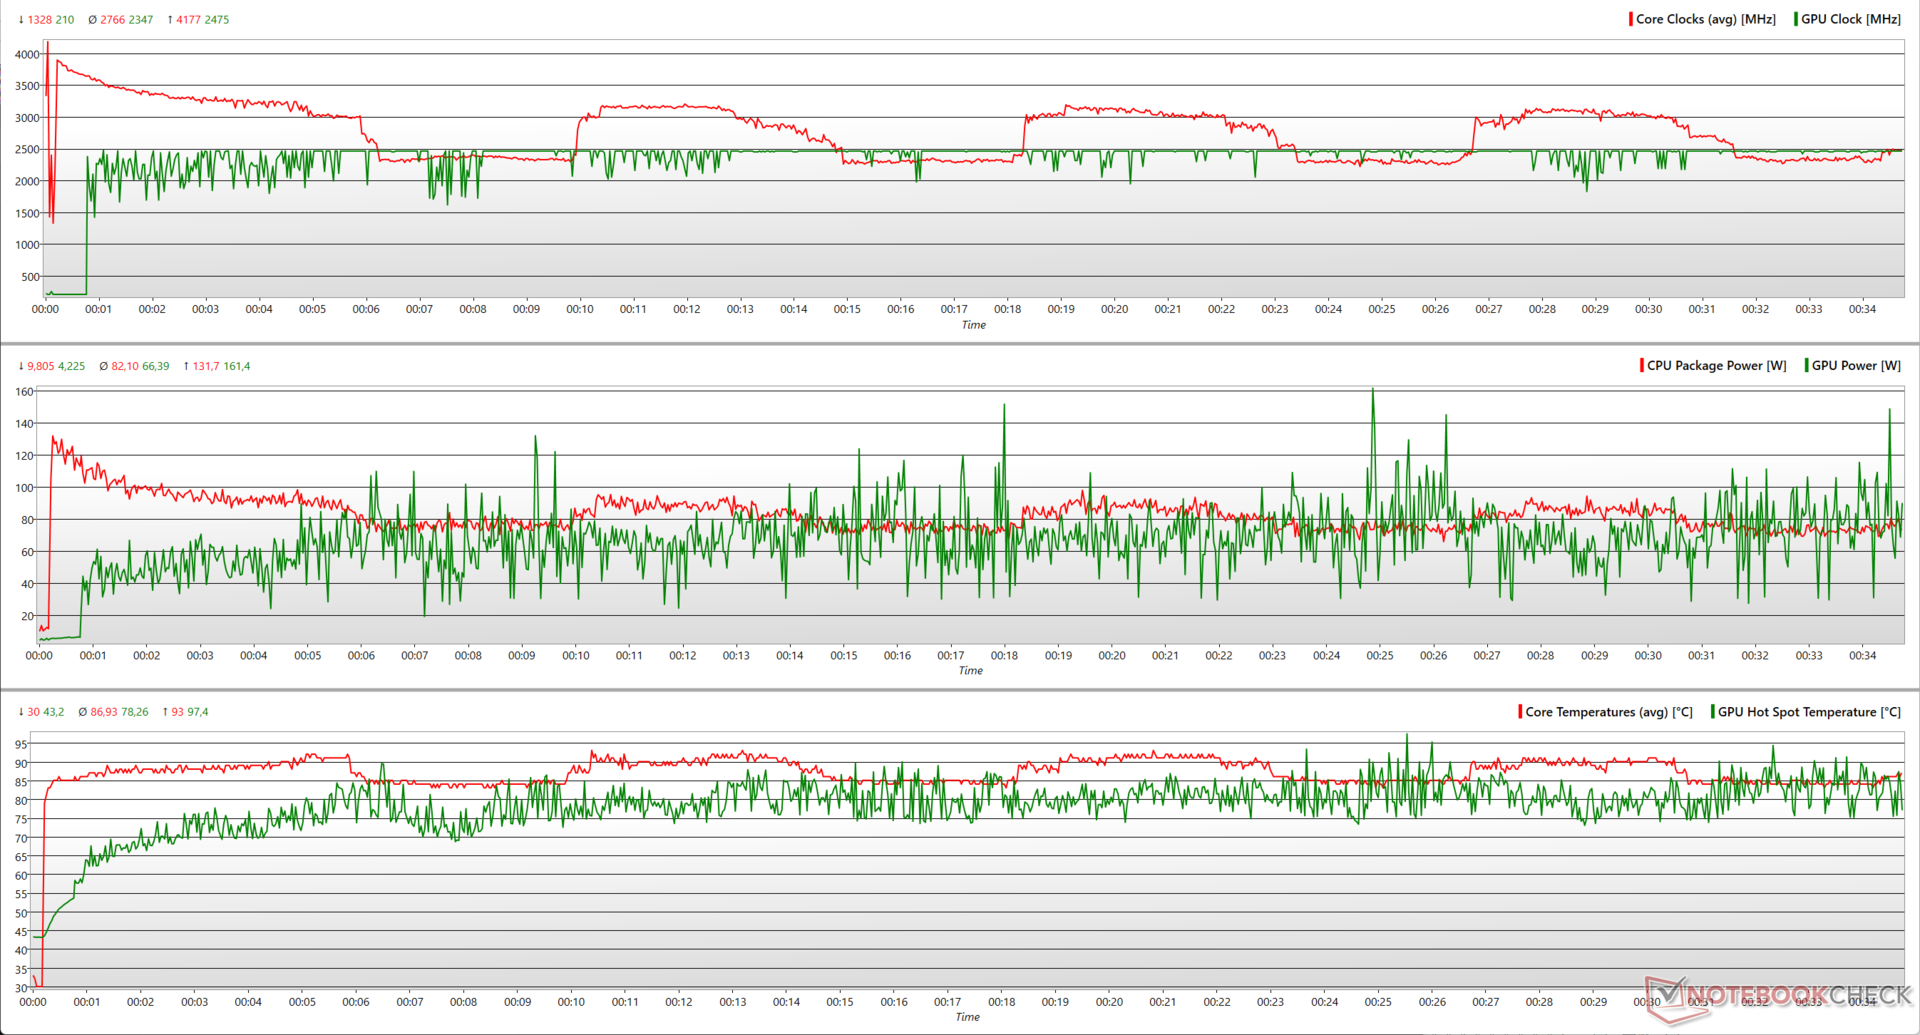
Al añadir FurMark, el Core i7-13700HX puede utilizar ahora hasta 132 W para alcanzar los 4,2 GHz, pero sigue ralentizándose intermitentemente cerca de la marca de los 2,5 GHz. La RTX 4060 puede aprovechar el margen de potencia y alcanzar los 2.475 MHz de pico utilizando 161 W.
| Prueba de estrés | Relojdela CPU (GHz) | Reloj de la GPU (MHz) | Temperatura media dela CPU (°C) | Temperatura media de la GPU (°C) |
| Sistema en reposo | 1,42 | 210 | 31 | 37,1 |
| Prime95 | 3,42 | 210 | 85 | 50,8 |
| Prime95 + FurMark | 2,99 | 2.460 | 86 | 70,8 |
| El Witcher 3 1080p Ultra | 3,12 | 2.460 | 64 | 73,7 |
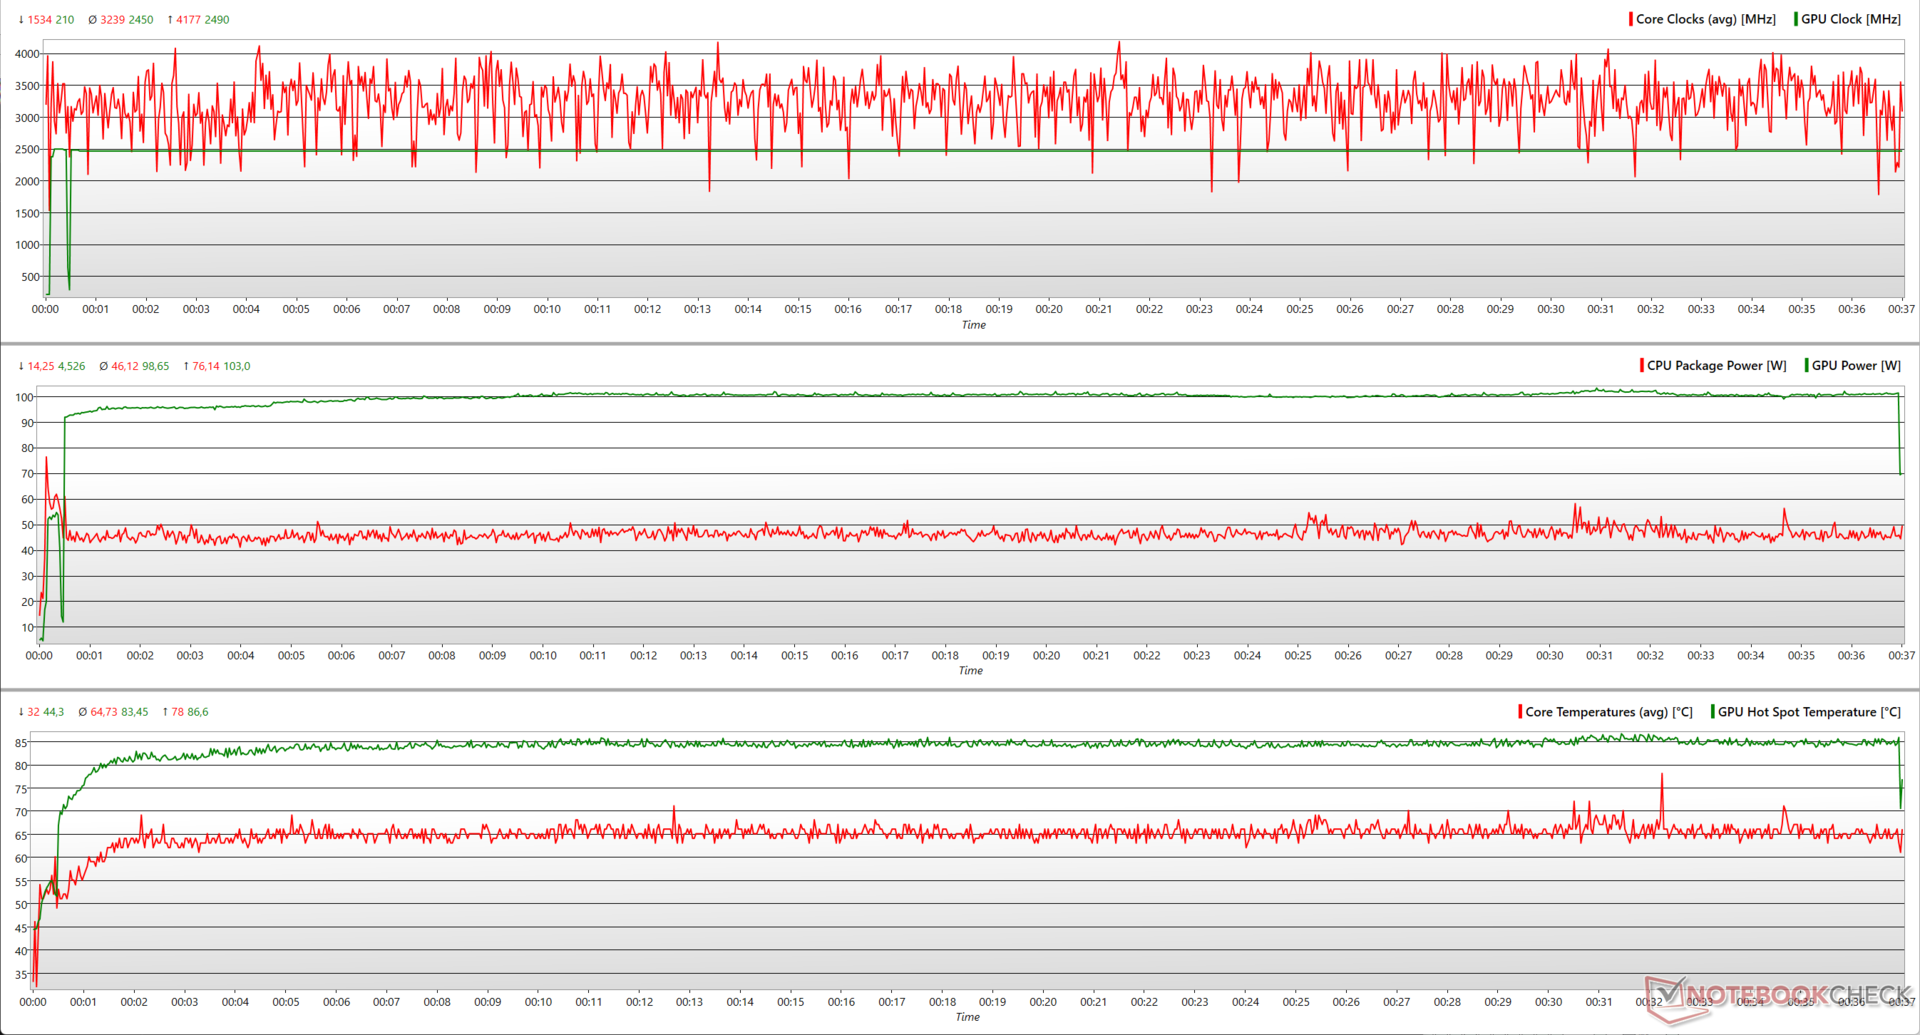
Con The Witcher 3 a 1080p Ultra, el Core i7-13700HX es capaz de alcanzar los 4,2 GHz de pico utilizando sólo 76 W, mientras mantiene un promedio de relojes de 3,2 GHz a 46 W. Esto permite suficiente margen de maniobra para que la RTX 4060 alcance un aumento casi constante de 2.490 MHz a 103 W.
Altavoces
Los altavoces estéreo del EVOL X15 tienen un volumen suficiente para una habitación de tamaño moderado. Anuncian la sintonización Creative SoundBlaster Studio, pero el audio suena metálico debido a la falta de respuesta de los graves y a unos medios medios. Las frecuencias altas, en cambio, se reproducen bastante bien.
Idealmente, Colorful podría haber aprovechado el gran chasis para incluir radiadores pasivos más potentes. No obstante, los usuarios pueden obtener una mejor calidad de audio a través de la toma de audio combo de 3,5 mm o del Bluetooth 5.2.
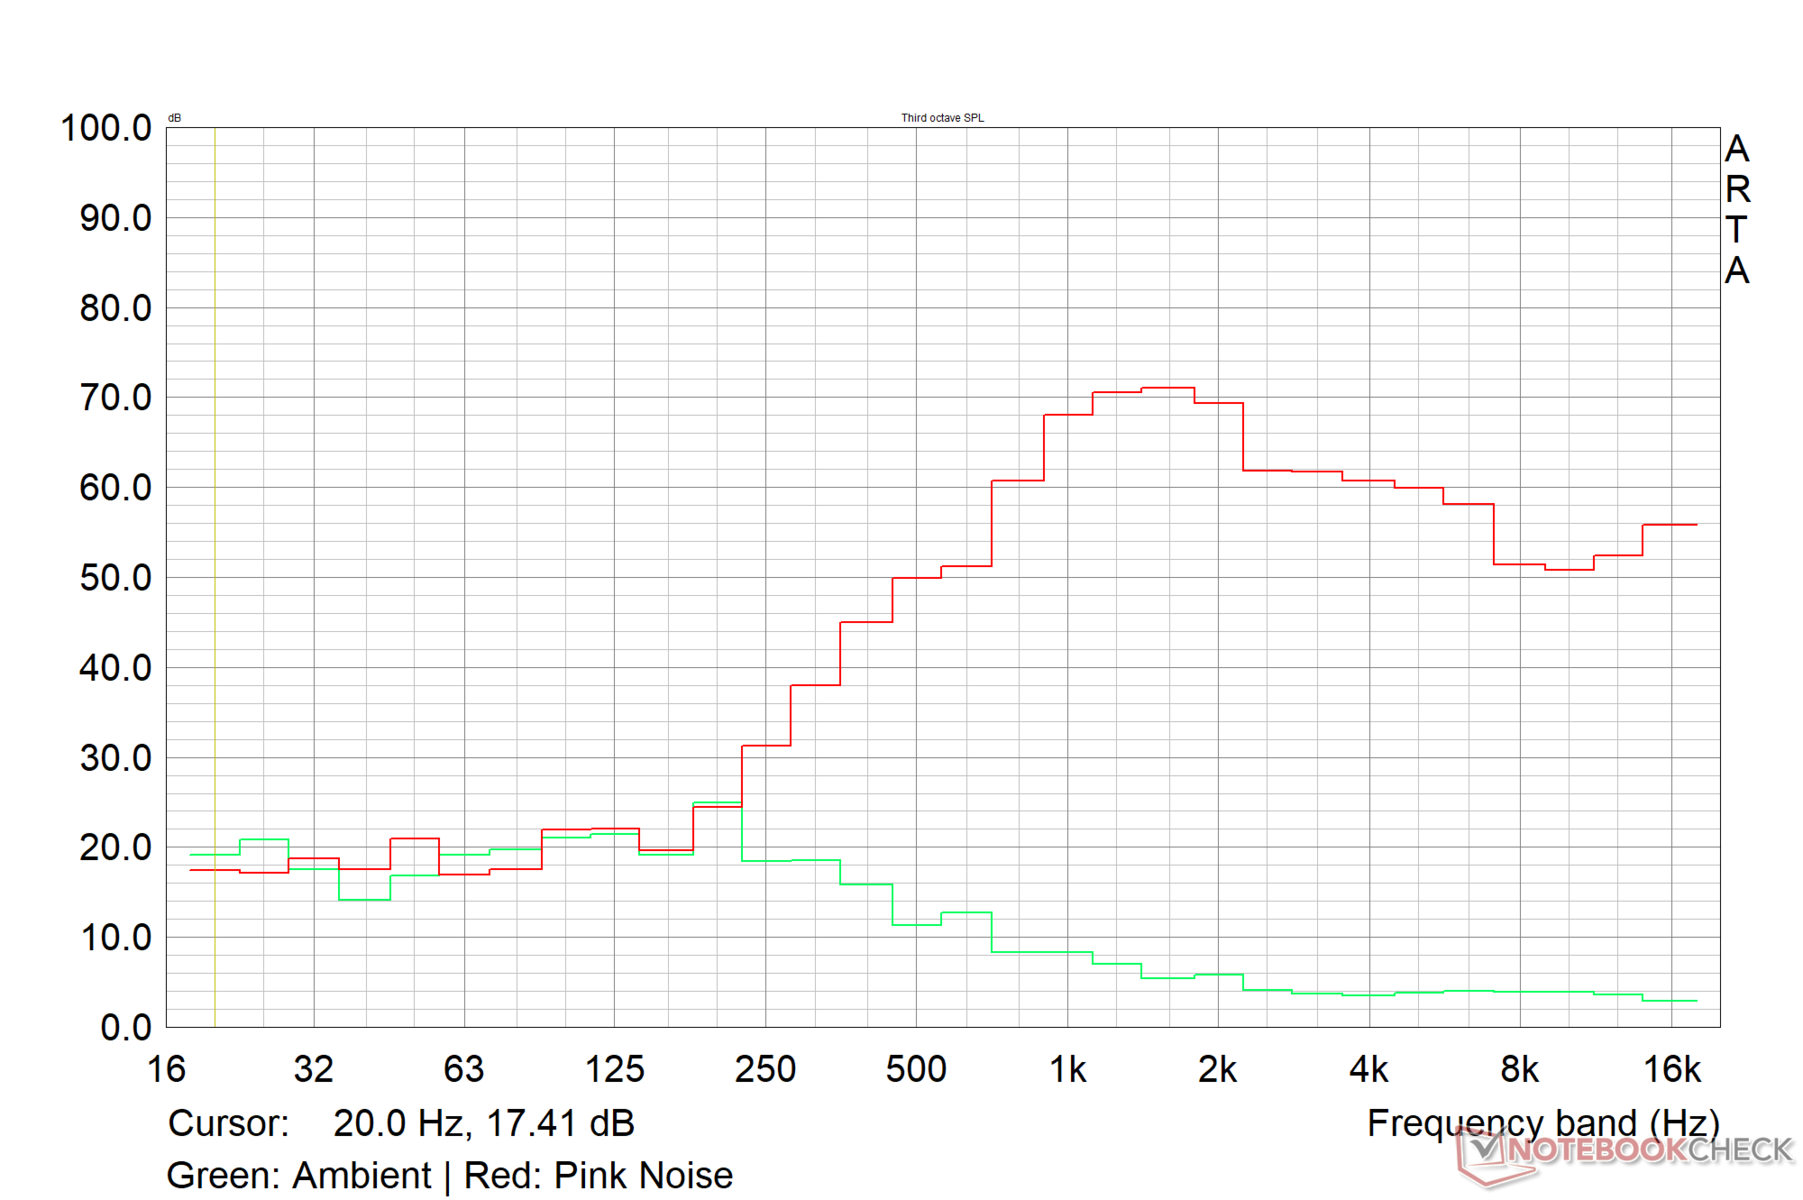
Colorful EVOL X15 AT 23 análisis de audio
(±) | la sonoridad del altavoz es media pero buena (77.5 dB)
Graves 100 - 315 Hz
(-) | casi sin bajos - de media 26.2% inferior a la mediana
(±) | la linealidad de los graves es media (9.2% delta a frecuencia anterior)
Medios 400 - 2000 Hz
(±) | medias más altas - de media 11.1% más altas que la mediana
(±) | la linealidad de los medios es media (9.6% delta respecto a la frecuencia anterior)
Altos 2 - 16 kHz
(±) | máximos más altos - de media 6.1% más altos que la mediana
(+) | los máximos son lineales (5.8% delta a la frecuencia anterior)
Total 100 - 16.000 Hz
(±) | la linealidad del sonido global es media (29.7% de diferencia con la mediana)
En comparación con la misma clase
» 95% de todos los dispositivos probados de esta clase eran mejores, 2% similares, 3% peores
» El mejor tuvo un delta de 6%, la media fue 18%, el peor fue ###max##%
En comparación con todos los dispositivos probados
» 88% de todos los dispositivos probados eran mejores, 3% similares, 10% peores
» El mejor tuvo un delta de 4%, la media fue 23%, el peor fue ###max##%
Apple MacBook Pro 16 2021 M1 Pro análisis de audio
(+) | los altavoces pueden reproducir a un volumen relativamente alto (#84.7 dB)
Graves 100 - 315 Hz
(+) | buen bajo - sólo 3.8% lejos de la mediana
(+) | el bajo es lineal (5.2% delta a la frecuencia anterior)
Medios 400 - 2000 Hz
(+) | medios equilibrados - a sólo 1.3% de la mediana
(+) | los medios son lineales (2.1% delta a la frecuencia anterior)
Altos 2 - 16 kHz
(+) | máximos equilibrados - a sólo 1.9% de la mediana
(+) | los máximos son lineales (2.7% delta a la frecuencia anterior)
Total 100 - 16.000 Hz
(+) | el sonido global es lineal (4.6% de diferencia con la mediana)
En comparación con la misma clase
» 0% de todos los dispositivos probados de esta clase eran mejores, 0% similares, 100% peores
» El mejor tuvo un delta de 5%, la media fue 17%, el peor fue ###max##%
En comparación con todos los dispositivos probados
» 0% de todos los dispositivos probados eran mejores, 0% similares, 100% peores
» El mejor tuvo un delta de 4%, la media fue 23%, el peor fue ###max##%
Gestión de la energía: Económico bajo carga máxima
Consumo de energía
El consumo de energía en reposo del EVOL X15 está en el lado más alto en comparación con la competencia que utiliza el Core i7-13700HX y la RTX 4060. Dicho esto, el consumo bajo carga máxima es relativamente inferior con 224 W.
El Uniwill GM6PX7X con una RTX 4070 muestra un 33% más de consumo de energía bajo carga máxima y aún así consigue ser un 16% más económico en general que el EVOL X15.
El bloque de alimentación de 280 W suministrado puede alimentar adecuadamente el portátil en condiciones de estrés.
| Off / Standby | |
| Ocioso | |
| Carga |
|
Clave:
min: | |
| Colorful EVOL X15 AT 23 i7-13700HX, GeForce RTX 4060 Laptop GPU, IPS, 2560x1440, 15.6" | Alienware m16 R1 Intel i7-13700HX, GeForce RTX 4060 Laptop GPU, IPS, 2560x1600, 16" | HP Omen 16-wf000 i7-13700HX, GeForce RTX 4080 Laptop GPU, IPS, 2560x1440, 16.1" | Acer Predator Helios 16 PH16-71-731Q i7-13700HX, GeForce RTX 4060 Laptop GPU, IPS-LED, 2560x1600, 16" | Dell G15 5530 i7-13650HX, GeForce RTX 4060 Laptop GPU, IPS, 1920x1080, 15.6" | Schenker XMG Pro 15 (E23) i9-13900HX, GeForce RTX 4060 Laptop GPU, IPS, 2560x1440, 15.6" | Alienware m16 R1 AMD R9 7845HX, GeForce RTX 4080 Laptop GPU, IPS, 2560x1600, 16" | Uniwill GM6PX7X RTX 4070 i7-13700HX, GeForce RTX 4070 Laptop GPU, IPS, 2560x1600, 16" | Medio NVIDIA GeForce RTX 4060 Laptop GPU | Media de la clase Gaming | |
|---|---|---|---|---|---|---|---|---|---|---|
| Power Consumption | 20% | 2% | 20% | 30% | -11% | -45% | 16% | 36% | 24% | |
| Idle Minimum * (Watt) | 28.3 | 10 65% | 21.8 23% | 15.9 44% | 8.4 70% | 21.6 24% | 39 -38% | 12.6 55% | 11.5 ? 59% | 13.1 ? 54% |
| Idle Average * (Watt) | 32.2 | 14 57% | 26 19% | 20.5 36% | 14.98 53% | 29 10% | 44.6 -39% | 17.7 45% | 16 ? 50% | 19 ? 41% |
| Idle Maximum * (Watt) | 36.5 | 21 42% | 36 1% | 20.9 43% | 15.56 57% | 42.7 -17% | 68.1 -87% | 31.8 13% | 20.3 ? 44% | 24.6 ? 33% |
| Load Average * (Watt) | 119 | 119 -0% | 115.5 3% | 106 11% | 96.8 19% | 190 -60% | 129.8 -9% | 101.4 15% | 92.9 ? 22% | 111.3 ? 6% |
| Witcher 3 ultra * (Watt) | 189.6 | 186.7 2% | 214 -13% | 175 8% | 186 2% | 189 -0% | 285 -50% | 185.3 2% | ||
| Load Maximum * (Watt) | 224.3 | 323 -44% | 269.7 -20% | 276 -23% | 271.42 -21% | 269 -20% | 327.3 -46% | 298 -33% | 210 ? 6% | 260 ? -16% |
* ... más pequeño es mejor
Power Consumption: The Witcher 3 / Stress test
Power Consumption: External monitor
Duración de las pilas
Dadas las entrañas bastante potentes del EVOL X15, la batería de 73 WHr sólo puede permitirse tiempos de funcionamiento medios. A 150 nits de brillo, el portátil puede durar casi 5,5 horas en nuestra prueba estándar de navegación web Wi-Fi y aproximadamente 6,5 horas durante la reproducción de vídeo H.264 1080p.
| Colorful EVOL X15 AT 23 i7-13700HX, GeForce RTX 4060 Laptop GPU, 73 Wh | Alienware m16 R1 Intel i7-13700HX, GeForce RTX 4060 Laptop GPU, 86 Wh | HP Omen 16-wf000 i7-13700HX, GeForce RTX 4080 Laptop GPU, 83 Wh | Acer Predator Helios 16 PH16-71-731Q i7-13700HX, GeForce RTX 4060 Laptop GPU, 90 Wh | Dell G15 5530 i7-13650HX, GeForce RTX 4060 Laptop GPU, 86 Wh | Schenker XMG Pro 15 (E23) i9-13900HX, GeForce RTX 4060 Laptop GPU, 80 Wh | Alienware m16 R1 AMD R9 7845HX, GeForce RTX 4080 Laptop GPU, 86 Wh | Uniwill GM6PX7X RTX 4070 i7-13700HX, GeForce RTX 4070 Laptop GPU, 62 Wh | Media de la clase Gaming | |
|---|---|---|---|---|---|---|---|---|---|
| Duración de Batería | -15% | -11% | 5% | -11% | 26% | -35% | -26% | 26% | |
| H.264 (h) | 6.3 | 5.6 -11% | 4.8 -24% | 6.8 8% | 8.27 ? 31% | ||||
| WiFi v1.3 (h) | 5.4 | 4.8 -11% | 5.1 -6% | 5.6 4% | 6.5 20% | 5.7 6% | 3.7 -31% | 4 -26% | 7.08 ? 31% |
| Witcher 3 ultra (h) | 1.2 | 1.5 25% | 0.8 -33% | ||||||
| Load (h) | 1.3 | 1 -23% | 1.1 -15% | 1.5 15% | 0.8 -38% | 1.9 46% | 0.8 -38% | 1.496 ? 15% | |
| Reader / Idle (h) | 6.4 | 5.5 | 4 | 7.84 ? |
Pro
Contra
Veredicto: Buena elección si puede conseguirlo por menos de 1.000 dólares

Colorful pretende ofrecer un portátil para juegos QHD capaz por menos de 1.000 dólares y lo consigue en gran medida con el EVOL X15 AT 23. Construido principalmente con plástico Clevo, hay algo de flexión en el teclado; sin embargo, el EVOL X15 sigue siendo estructuralmente sólido en general.
El EVOL X15 AT tiene muchas cosas a su favor. Los posibles compradores apreciarán la decente selección de puertos, las rápidas velocidades Wi-Fi 6E y el fácil acceso a las entrañas.
La combinación de un Intel Core i7-13700HX de clase de escritorio y la CPU GPU Nvidia GeForce RTX 4060 para portátiles permite al EVOL X15 AT competir eficazmente con modelos de mayor precio como el Alienware m16 R1 y el Acer Predator Helios 16.
Puede que el Colorful EVOL X15 AT no ofrezca todas las campanas y silbatos que se encuentran en la bien establecida competencia, pero en gran medida consigue hacer bien lo básico sin limitaciones de rendimiento apreciables."
Dicho esto, también hay varios aspectos criticables. Aspectos como la falta de entrega de potencia con los puertos Tipo-C y los tiempos de respuesta algo más elevados necesitan ser abordados. Colorful también necesita centrarse en afinar las curvas de los ventiladores con los perfiles de rendimiento predeterminados y también trabajar en mejorar el consumo de energía en reposo.
En general, el Colorful EVOL X15 AT es digno de consideración, siempre que pueda hacerse con uno por menos de 1.000 dólares y no tenga que pagar un sobreprecio.
Dicho esto, los portátiles equipados con la GPU RTX 3070 Ti para portátileso incluso la Radeon RX 6800M, pueden ofrecer un mejor paquete global a precios similares si no le importa perder en la generación de fotogramas DLSS 3 y en las ganancias de eficiencia con Ada Lovelace.
Precio y disponibilidad
El Colorful EVOL X15 AT 23 está disponible directamente en los distribuidores locales de productos Colorful. La configuración probada del EVOL X15 AT tiene oficialmente un precio de 969 dólares, pero actualmente se vende en Newegg a un precio considerablemente elevado de 1.759 dólares.
Como alternativa, una variante QHD del Acer Nitro 5 con un procesador AMD Ryzen 7 6800H y una GPU RTX 3070 Ti para portátiles puede adquirirse en Amazon US por menos de 1.200 dólares.
Si el rendimiento bruto de la CPU no es una prioridad, el Asus ROG Strix G15 con un AMD Ryzen 9 5900HX y Radeon RX 6800M es una buena opción por menos de 1.300 dólares en Amazon US y menos de 1.200 dólares en Best Buy US.
Colorful EVOL X15 AT 23
- 12/20/2023 v7 (old)
Vaidyanathan Subramaniam
Transparencia
Nuestro equipo editorial se encarga de seleccionar los dispositivos que se someten a revisión. La muestra de prueba fue entregada al autor por el fabricante de forma gratuita para los fines de la revisión. No hubo influencia de terceros en esta revisión, ni el fabricante recibió una copia de esta revisión antes de su publicación. No había ninguna obligación de publicar esta reseña. Como empresa de medios independiente, Notebookcheck no está sujeta a la autoridad de fabricantes, minoristas o editores.
Así es como prueba Notebookcheck
Cada año, Notebookcheck revisa de forma independiente cientos de portátiles y smartphones utilizando procedimientos estandarizados para asegurar que todos los resultados son comparables. Hemos desarrollado continuamente nuestros métodos de prueba durante unos 20 años y hemos establecido los estándares de la industria en el proceso. En nuestros laboratorios de pruebas, técnicos y editores experimentados utilizan equipos de medición de alta calidad. Estas pruebas implican un proceso de validación en varias fases. Nuestro complejo sistema de clasificación se basa en cientos de mediciones y puntos de referencia bien fundamentados, lo que mantiene la objetividad.Price comparison

