Estreno del rendimiento del Core i7-13700HX: Análisis del portátil Uniwill GM6PX7X IDX
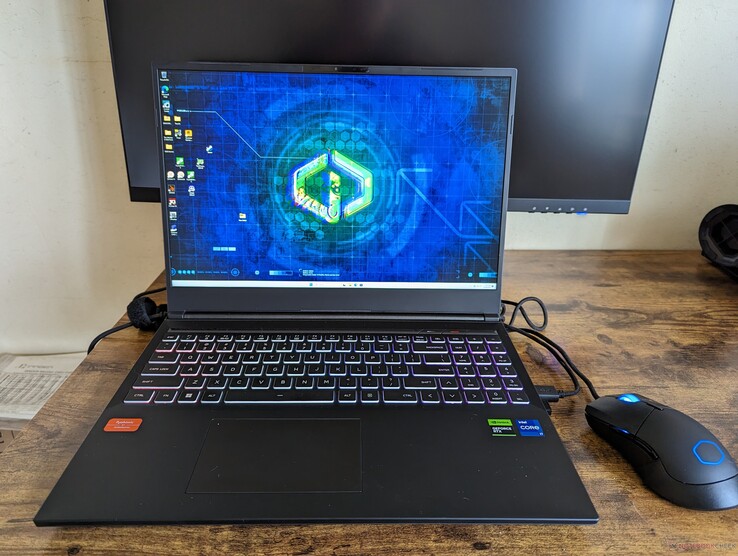
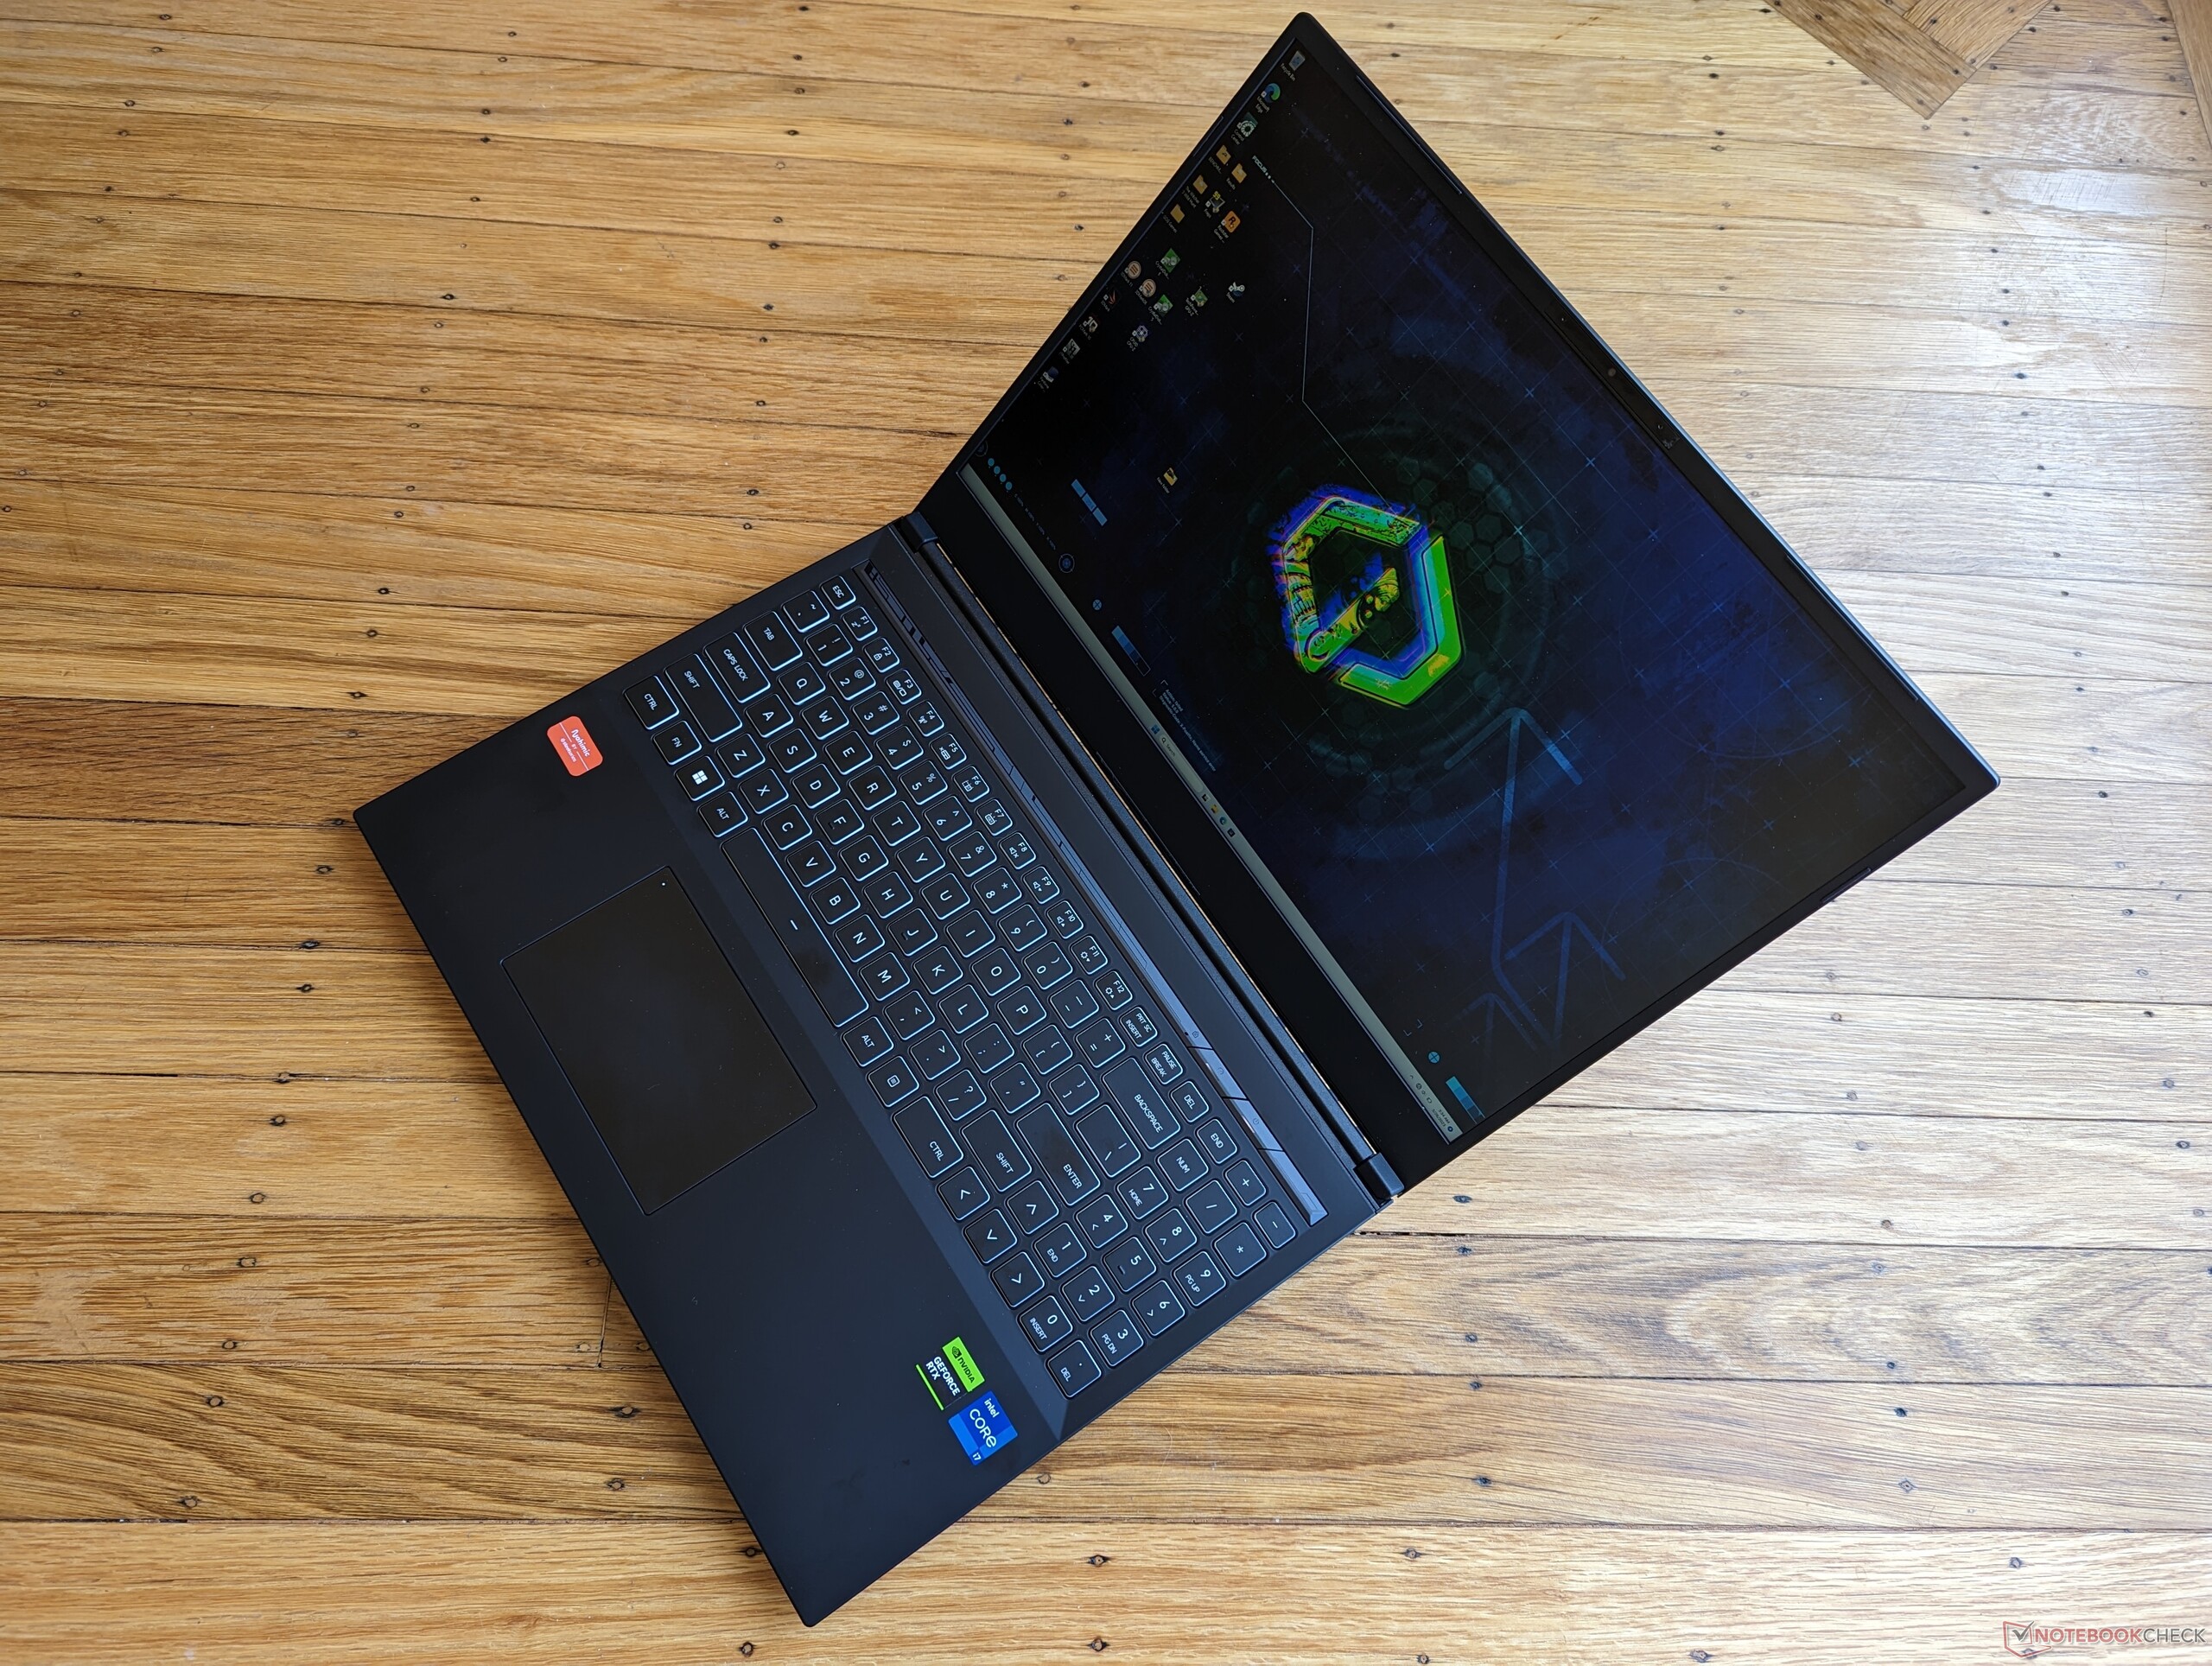
El Uniwill GM6PX7X es un portátil gaming de 16 pulgadas de marca blanca conocido en algunos mercados como el Schenker XMG Neo 16 E23. Se trata de un modelo más reciente presentado en el CES 2023 junto con la serie Raptor Lake-H de 13ª generación para portátiles y la serie Ada Lovelace GeForce RTX 40 para portátiles.
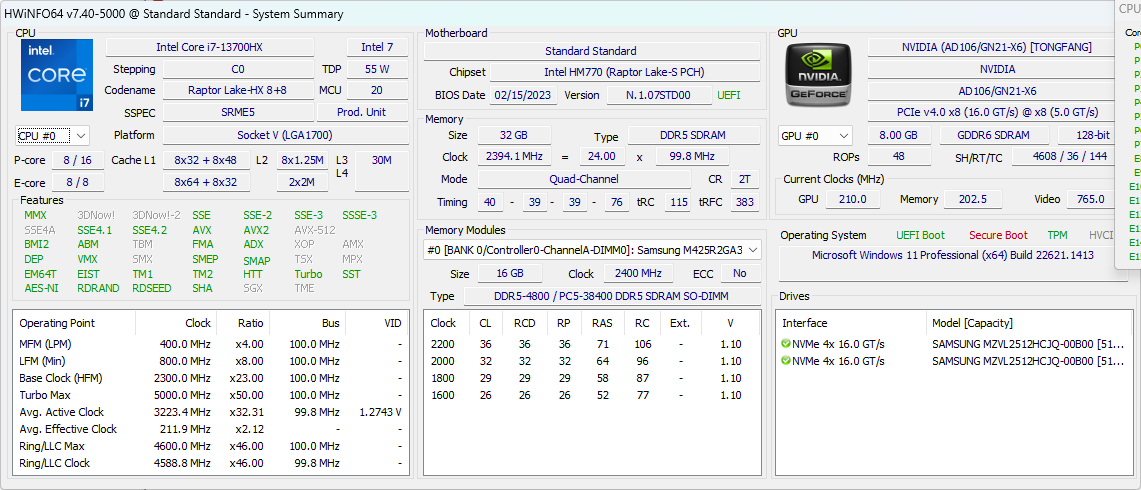
Como la mayoría de los demás modelos de Uniwill o Schenker, el GM6PX7X es altamente configurable con opciones de CPU de hasta Core i9-13900HX y opciones de GPU que van desde la GeForce RTX 4060 móvil hasta la 4090. Nuestra unidad de análisis específica es una configuración de gama media equipada con Core i7-13700HX y RTX 4070.
Consulte nuestro análisis completo sobre el Schenker XMG Neo 16 E23 con RTX 4090 para obtener más información sobre el chasis y como nuestro Uniwill GM6PX7X con RTX 4070 utiliza el mismo diseño. Hay, sin embargo, varias diferencias físicas entre ellos que vamos a señalar a continuación.
Más análisis de Uniwill/Schenker:
Posibles contendientes en la comparación
Valoración | Fecha | Modelo | Peso | Altura | Tamaño | Resolución | Precio |
|---|---|---|---|---|---|---|---|
| 88.2 % v7 (old) | 03/2023 | Uniwill GM6PX7X RTX 4070 i7-13700HX, GeForce RTX 4070 Laptop GPU | 2.2 kg | 22 mm | 16.00" | 2560x1600 | |
| 87.7 % v7 (old) | 04/2023 | Schenker XMG Neo 16 E23 i9-13900HX, GeForce RTX 4090 Laptop GPU | 2.5 kg | 29.9 mm | 16.00" | 2560x1600 | |
| 88.4 % v7 (old) | 03/2023 | Asus ROG Strix G16 G614JZ i9-13980HX, GeForce RTX 4080 Laptop GPU | 2.4 kg | 30.4 mm | 16.00" | 2560x1600 | |
| 89.4 % v7 (old) | 02/2023 | Lenovo Legion Pro 7 16IRX8H i9-13900HX, GeForce RTX 4080 Laptop GPU | 2.7 kg | 26 mm | 16.00" | 2560x1600 | |
| 86.2 % v7 (old) | 03/2023 | Gigabyte AERO 16 OLED BSF i9-13900H, GeForce RTX 4070 Laptop GPU | 2.1 kg | 18 mm | 16.00" | 3840x2400 | |
| 91.2 % v7 (old) | 02/2023 | Razer Blade 16 Early 2023 i9-13950HX, GeForce RTX 4080 Laptop GPU | 2.4 kg | 21.99 mm | 16.00" | 2560x1600 |
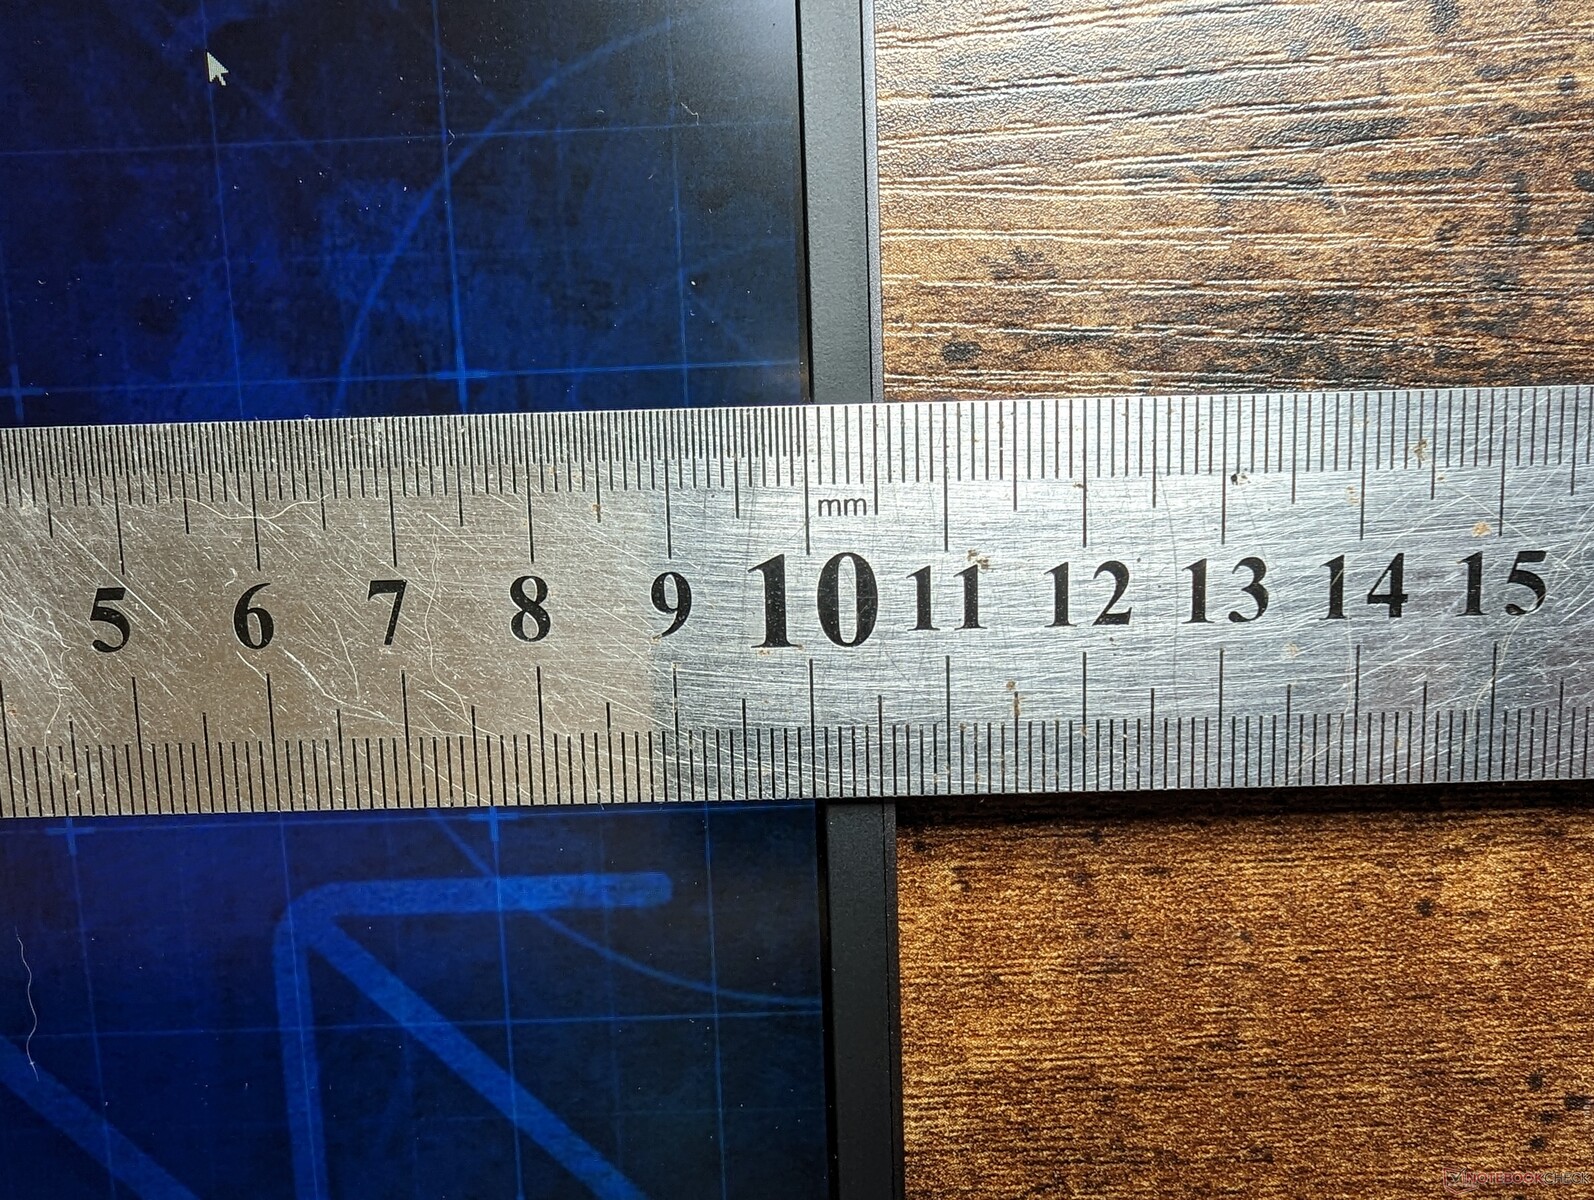
Caso
Hay dos versiones de chasis de la Schenker XMG Neo 16: una más delgada para todas las configuraciones RTX 4060 y 4070 y otra más gruesa para todas las configuraciones RTX 4080 y 4090. Las GPU RTX 4080/4090 móviles consumen más energía que las RTX 4060/4070 móviles, por lo que requieren un chasis de mayor tamaño. Las principales diferencias entre las dos versiones son:
- Grosor: 22 mm frente a 26,1 mm
- Peso: 2,2 kg frente a 2,5 kg
- Capacidad de la batería: 62 Wh frente a 99 Wh
- Cámara web: 1 MP frente a 2 MP
- Adaptador de CA: 280 W frente a 330 W
Por lo demás, ambos modelos comparten las mismas opciones de teclado (de membrana o mecánico Cherry MX), clickpad, puertos, pantalla y materiales del chasis.
Lector de tarjetas SD
| SD Card Reader | |
| average JPG Copy Test (av. of 3 runs) | |
| Gigabyte AERO 16 OLED BSF | |
| Razer Blade 16 Early 2023 (AV PRO microSD 128 GB V60) | |
| Schenker XMG Neo 16 E23 (AV PRO microSD 128 GB V60) | |
| Uniwill GM6PX7X RTX 4070 (AV PRO microSD 128 GB V60) | |
| maximum AS SSD Seq Read Test (1GB) | |
| Razer Blade 16 Early 2023 (AV PRO microSD 128 GB V60) | |
| Gigabyte AERO 16 OLED BSF | |
| Uniwill GM6PX7X RTX 4070 (AV PRO microSD 128 GB V60) | |
| Schenker XMG Neo 16 E23 (AV PRO microSD 128 GB V60) | |
Comunicación
| Networking | |
| iperf3 transmit AXE11000 | |
| Schenker XMG Neo 16 E23 | |
| Lenovo Legion Pro 7 16IRX8H | |
| Asus ROG Strix G16 G614JZ | |
| Razer Blade 16 Early 2023 | |
| Uniwill GM6PX7X RTX 4070 | |
| iperf3 receive AXE11000 | |
| Schenker XMG Neo 16 E23 | |
| Lenovo Legion Pro 7 16IRX8H | |
| Asus ROG Strix G16 G614JZ | |
| Razer Blade 16 Early 2023 | |
| Uniwill GM6PX7X RTX 4070 | |
| iperf3 transmit AXE11000 6GHz | |
| Gigabyte AERO 16 OLED BSF | |
| Razer Blade 16 Early 2023 | |
| iperf3 receive AXE11000 6GHz | |
| Gigabyte AERO 16 OLED BSF | |
| Razer Blade 16 Early 2023 | |
Cámara web


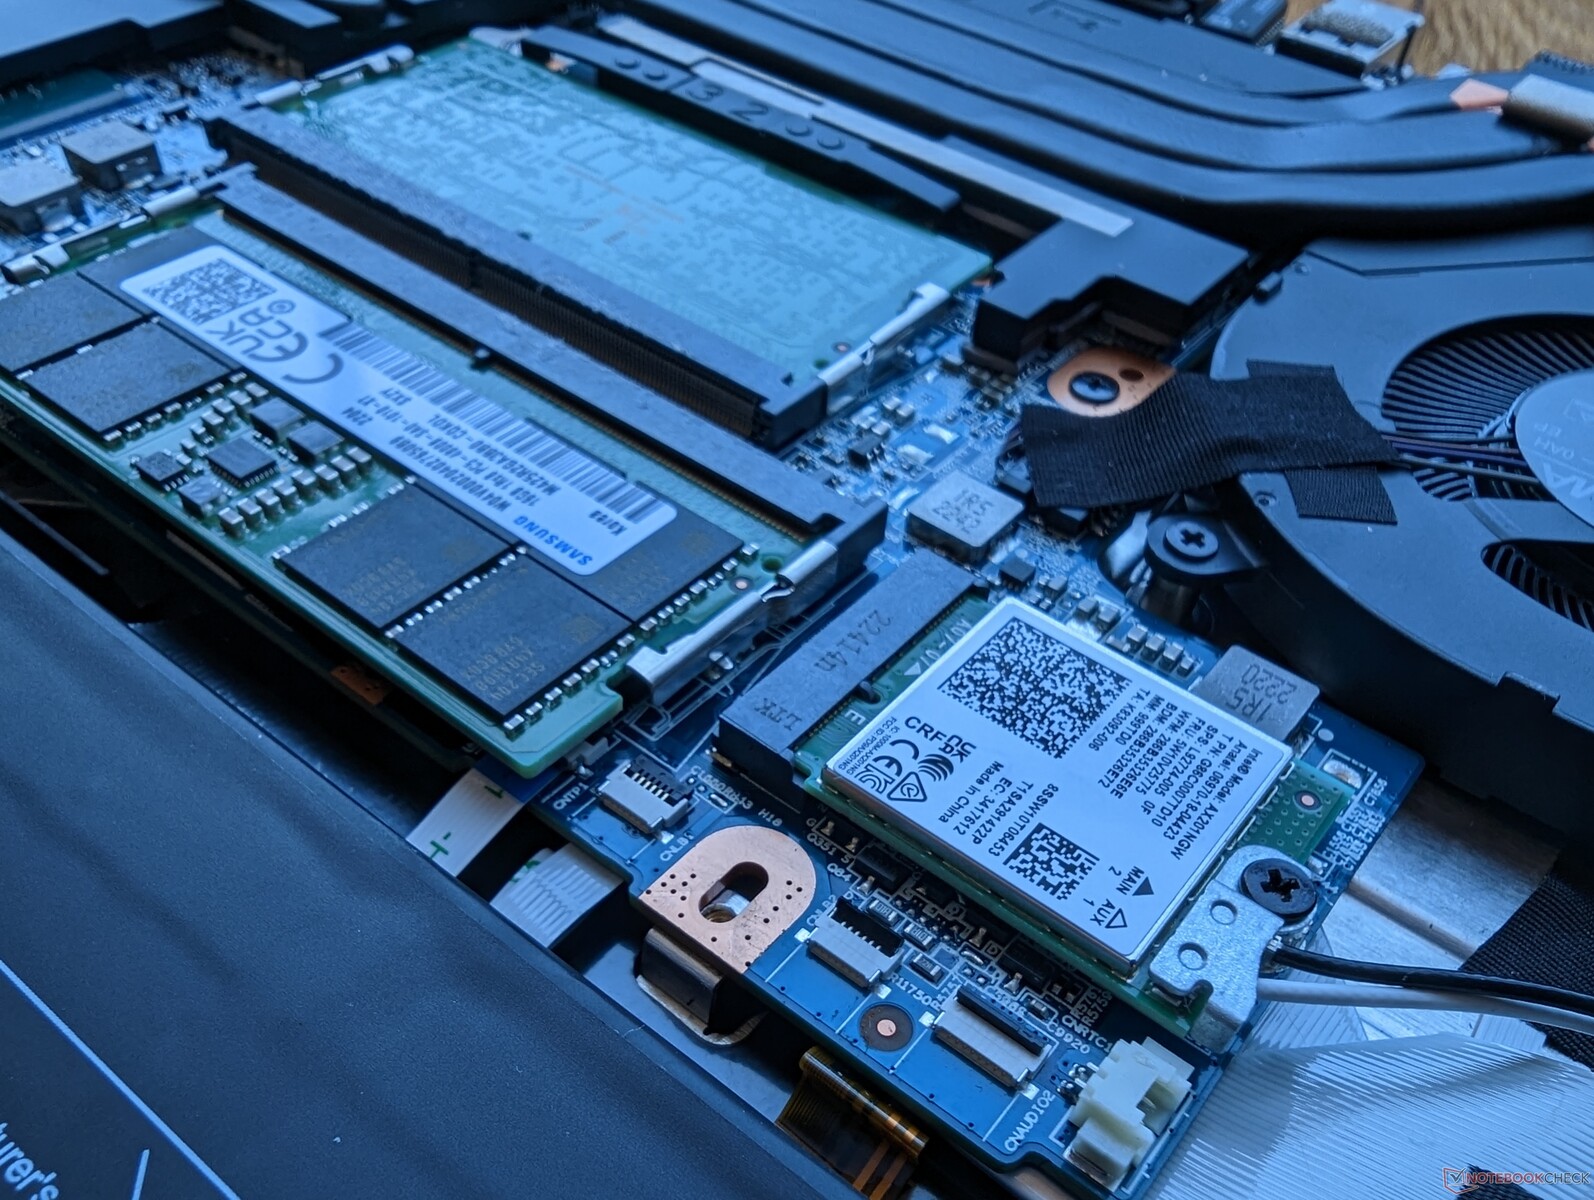
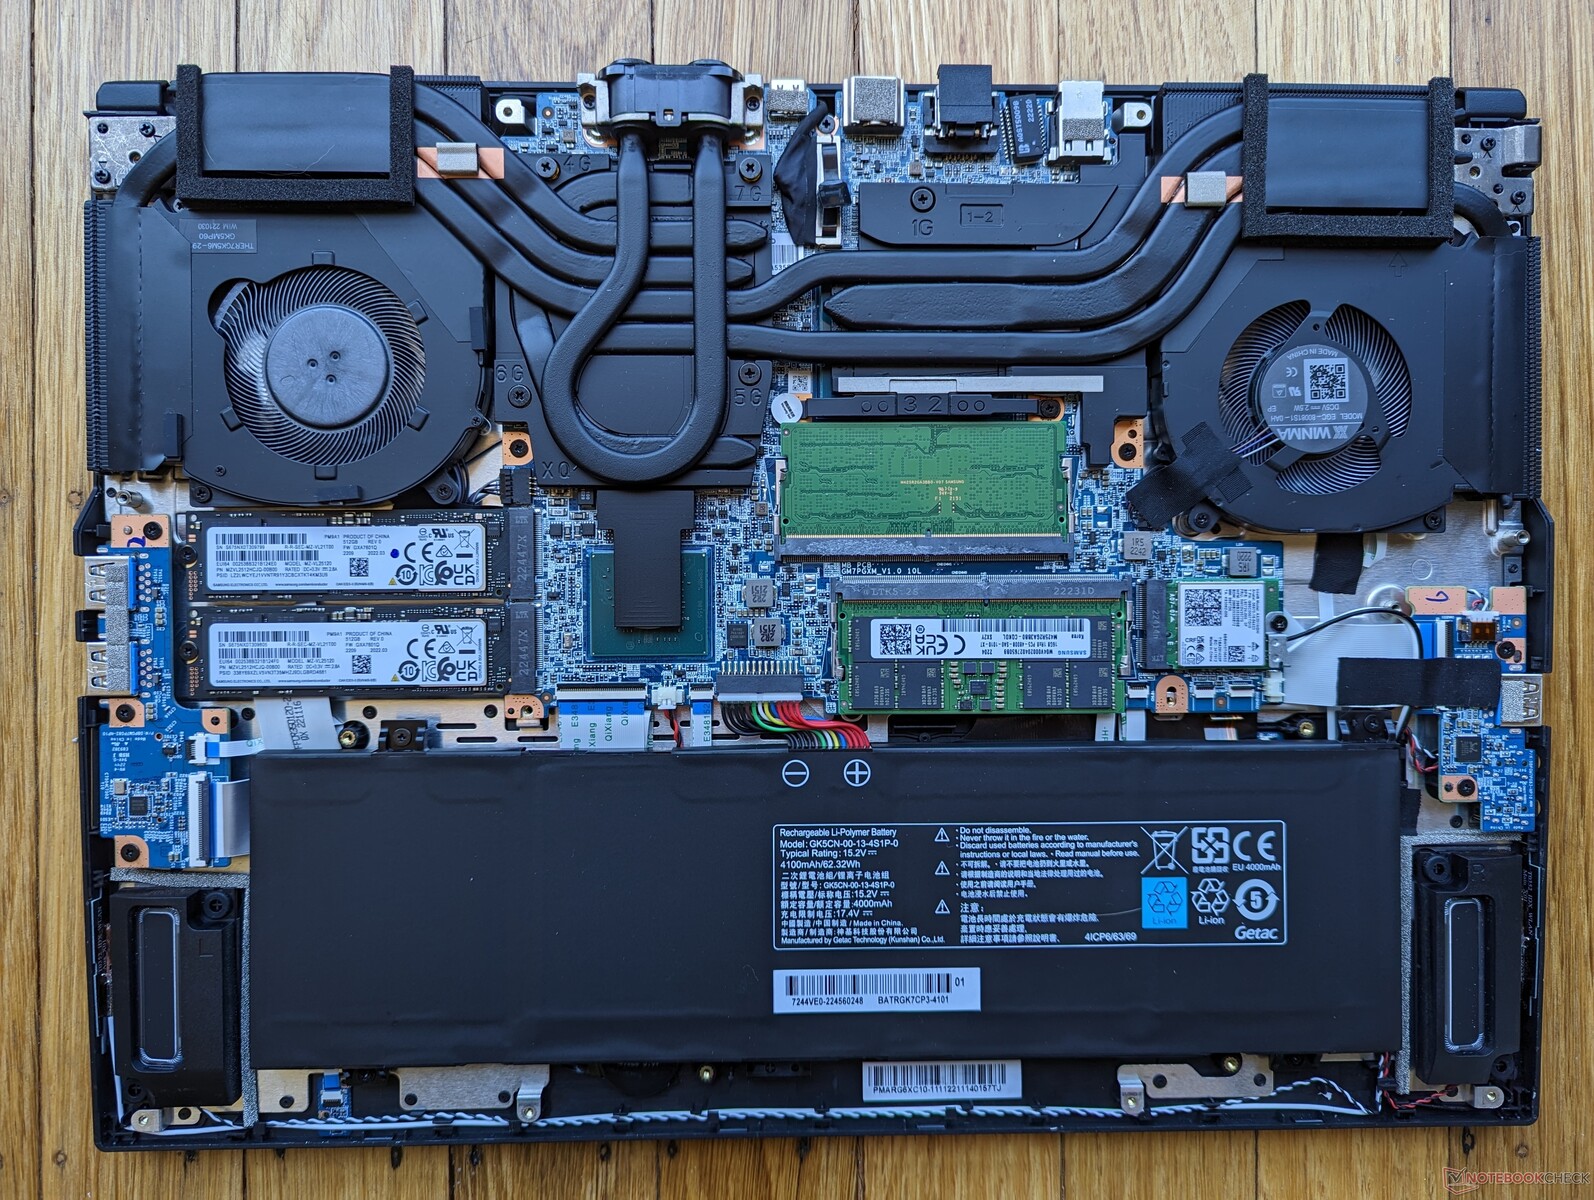
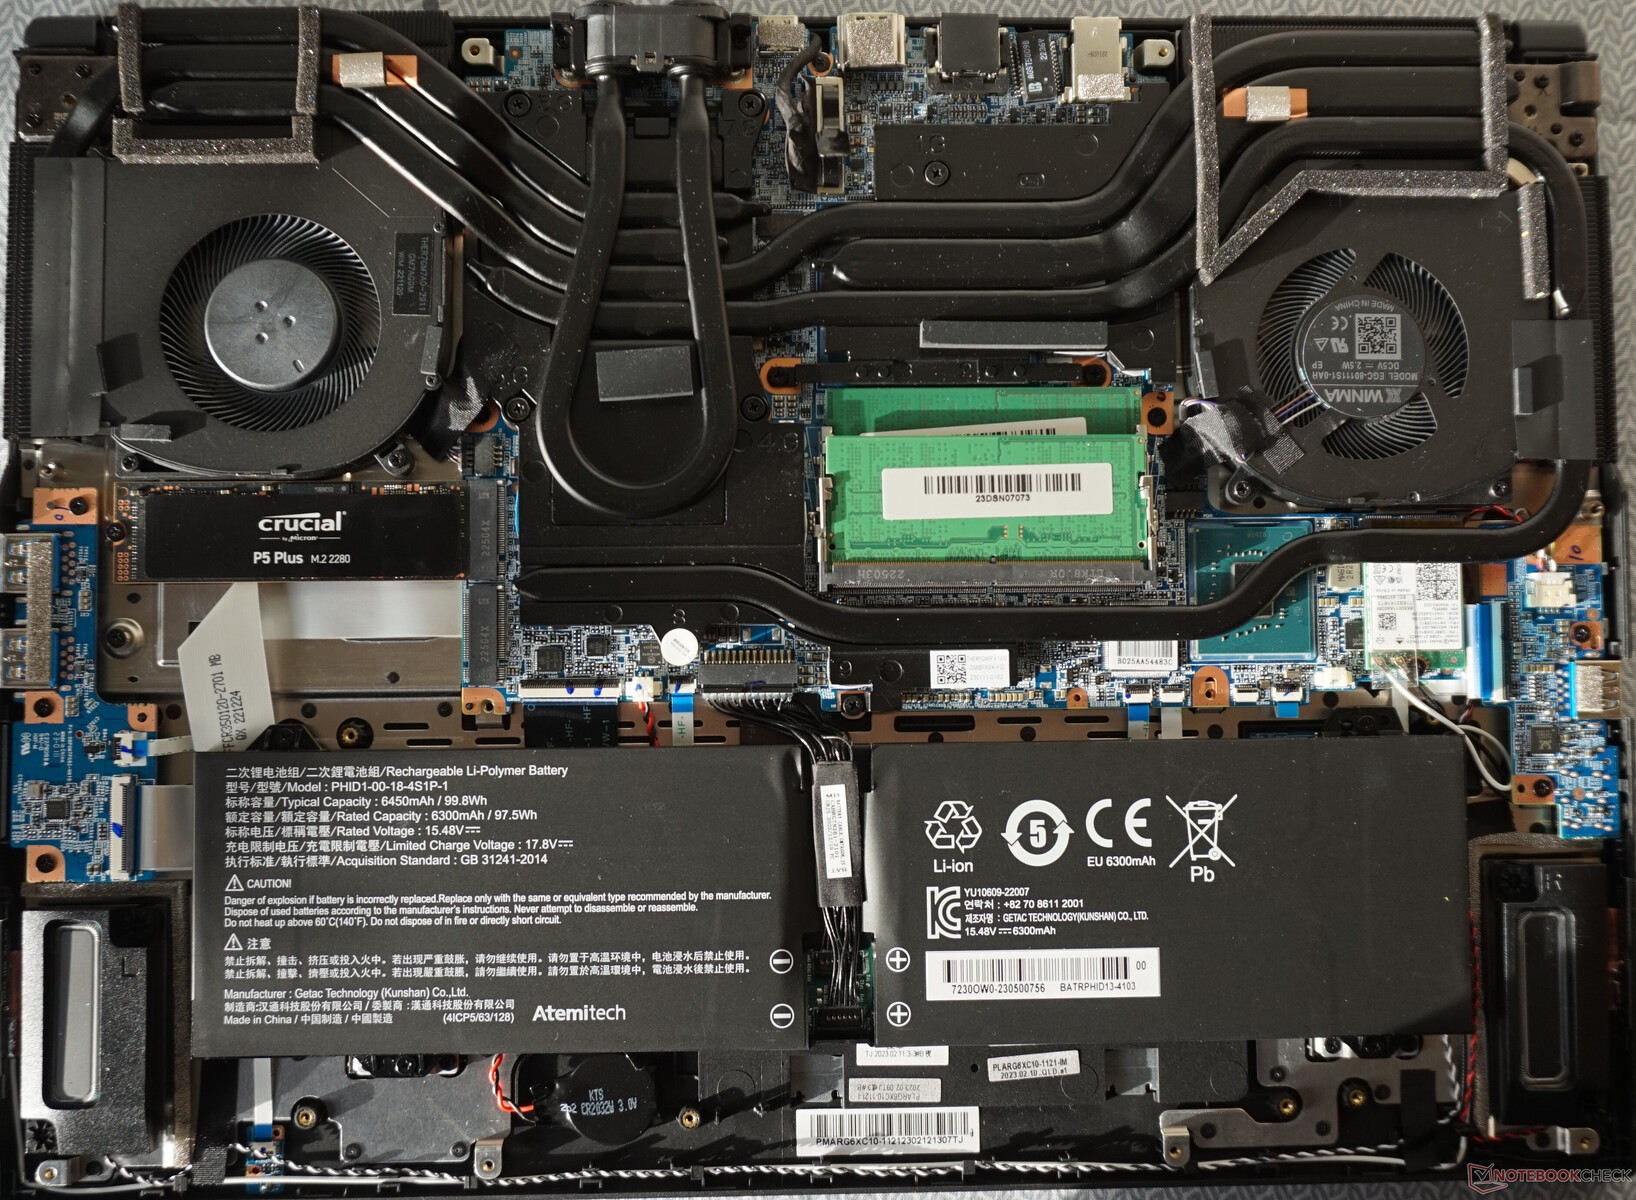
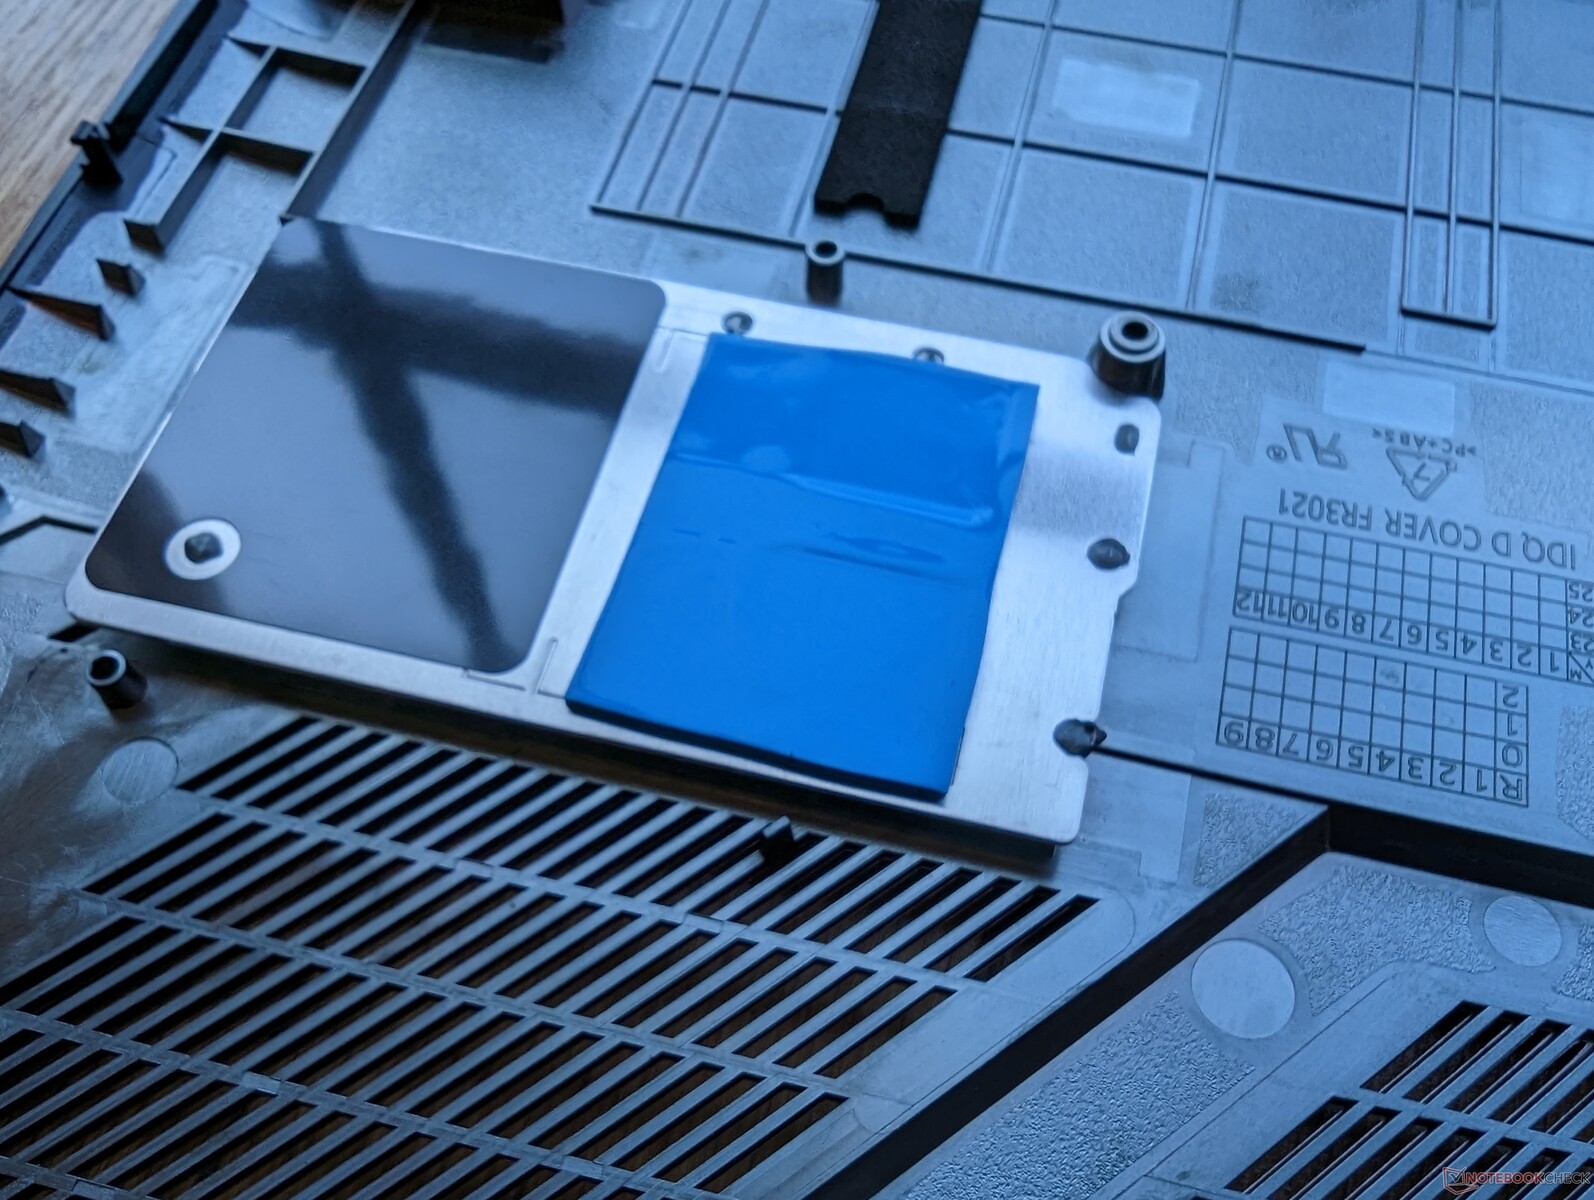
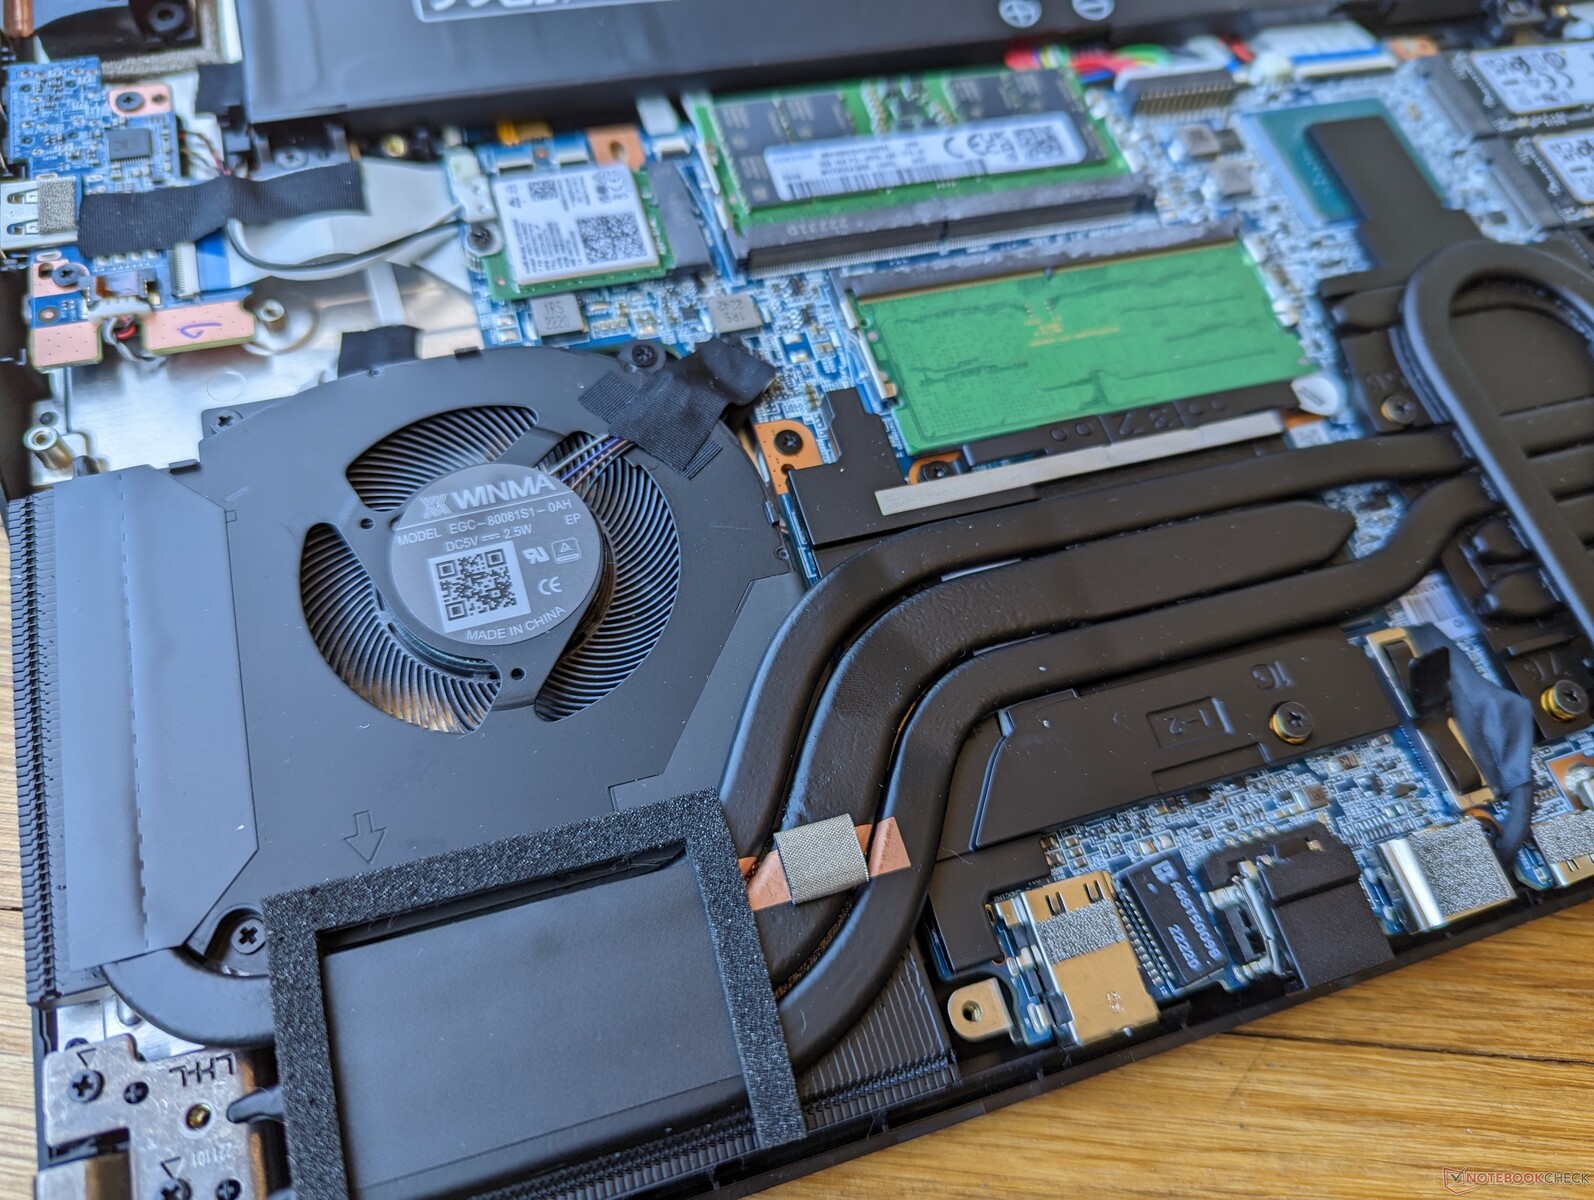
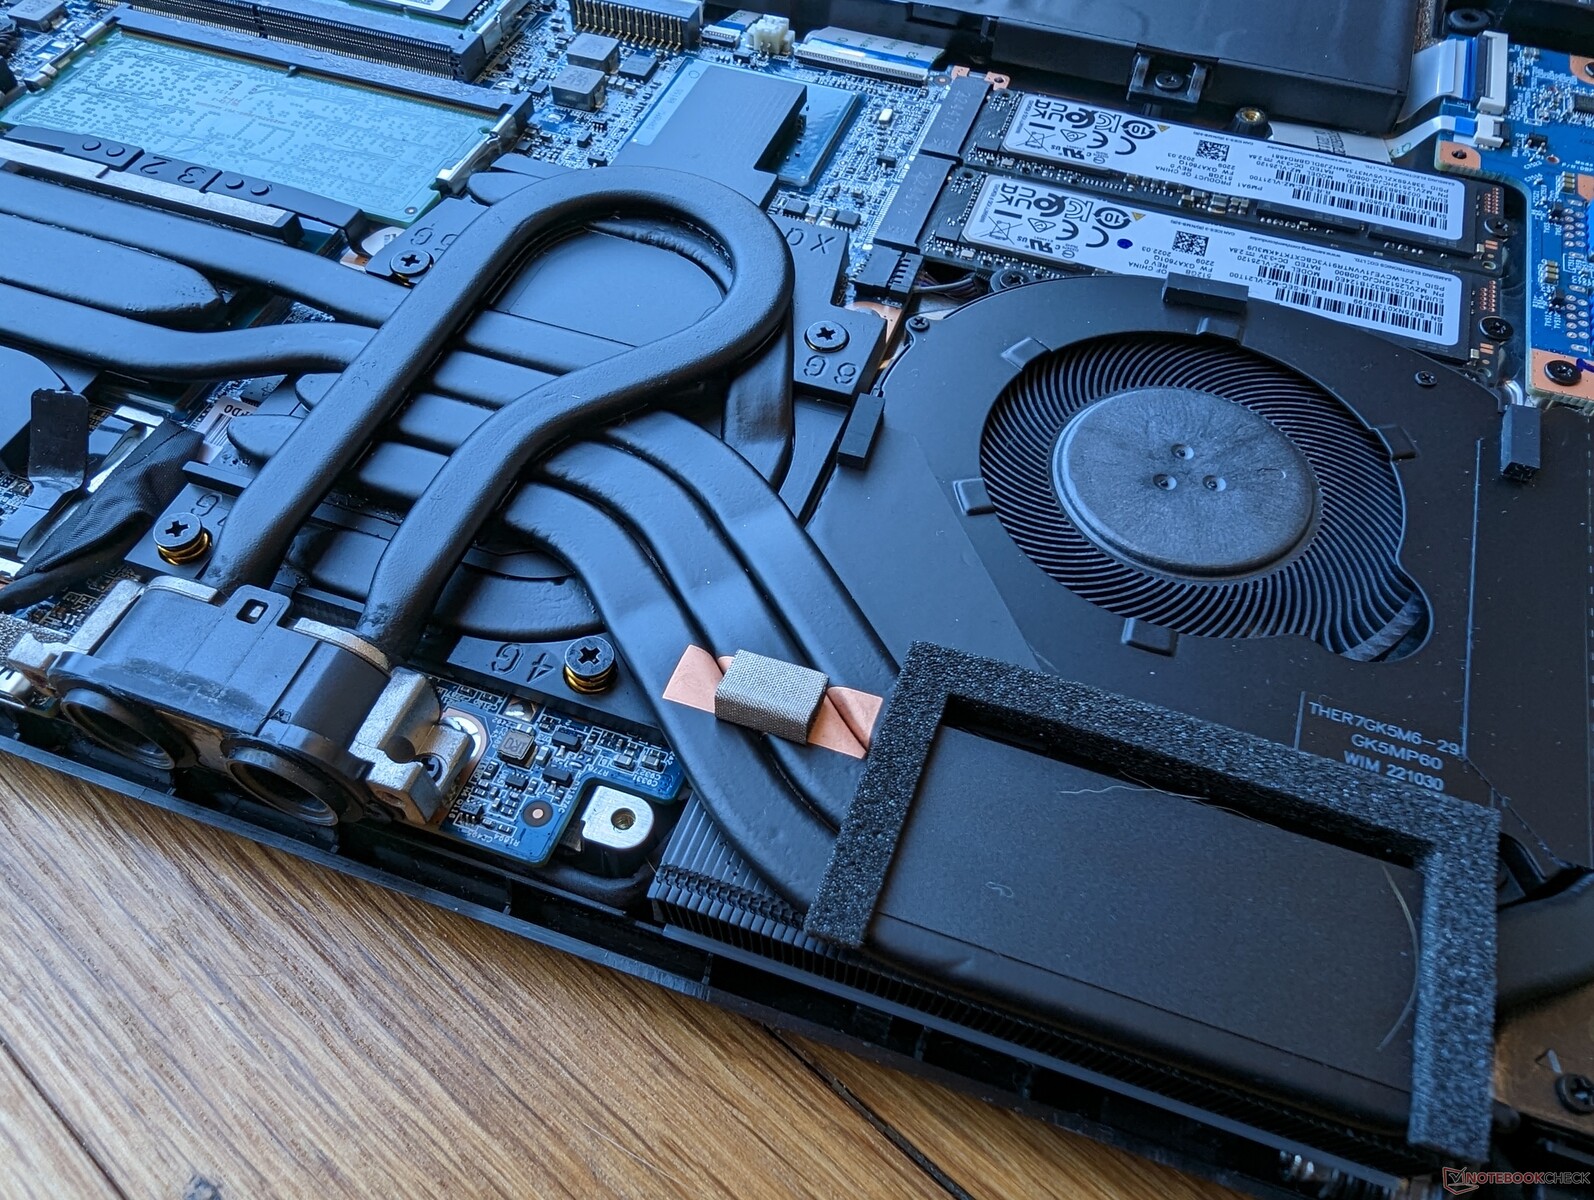
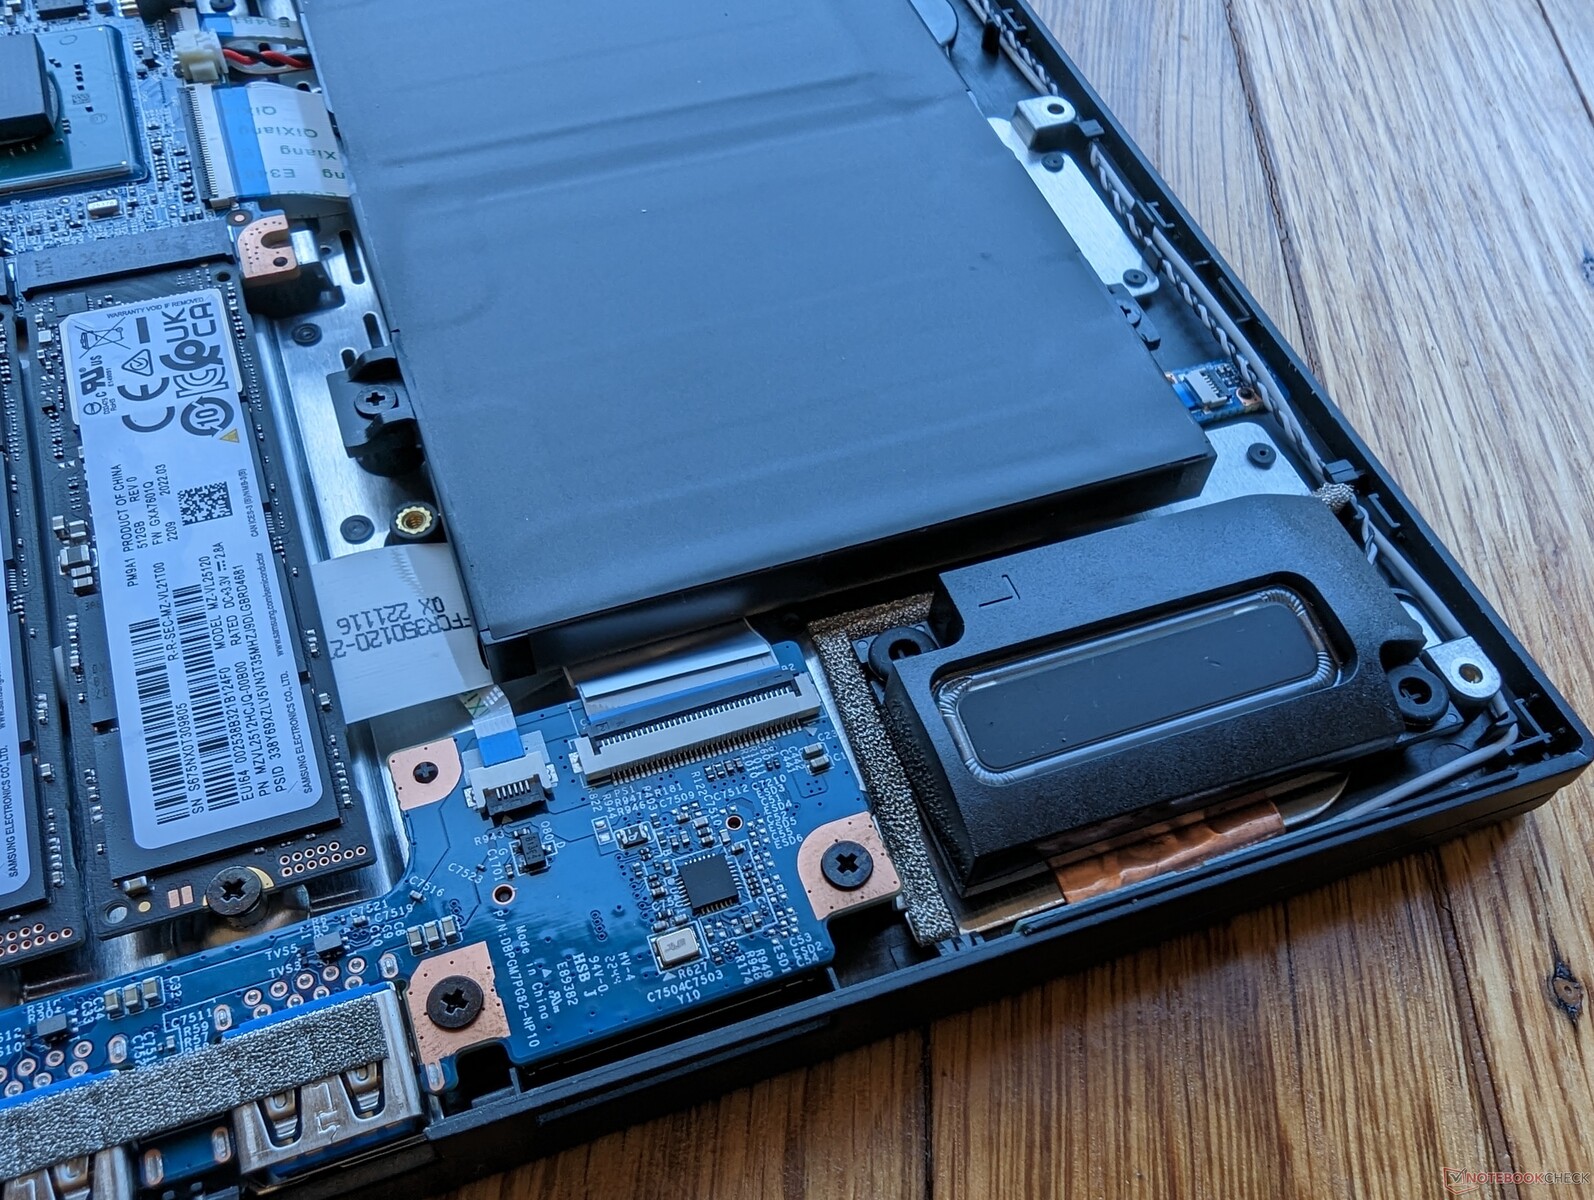
Mantenimiento
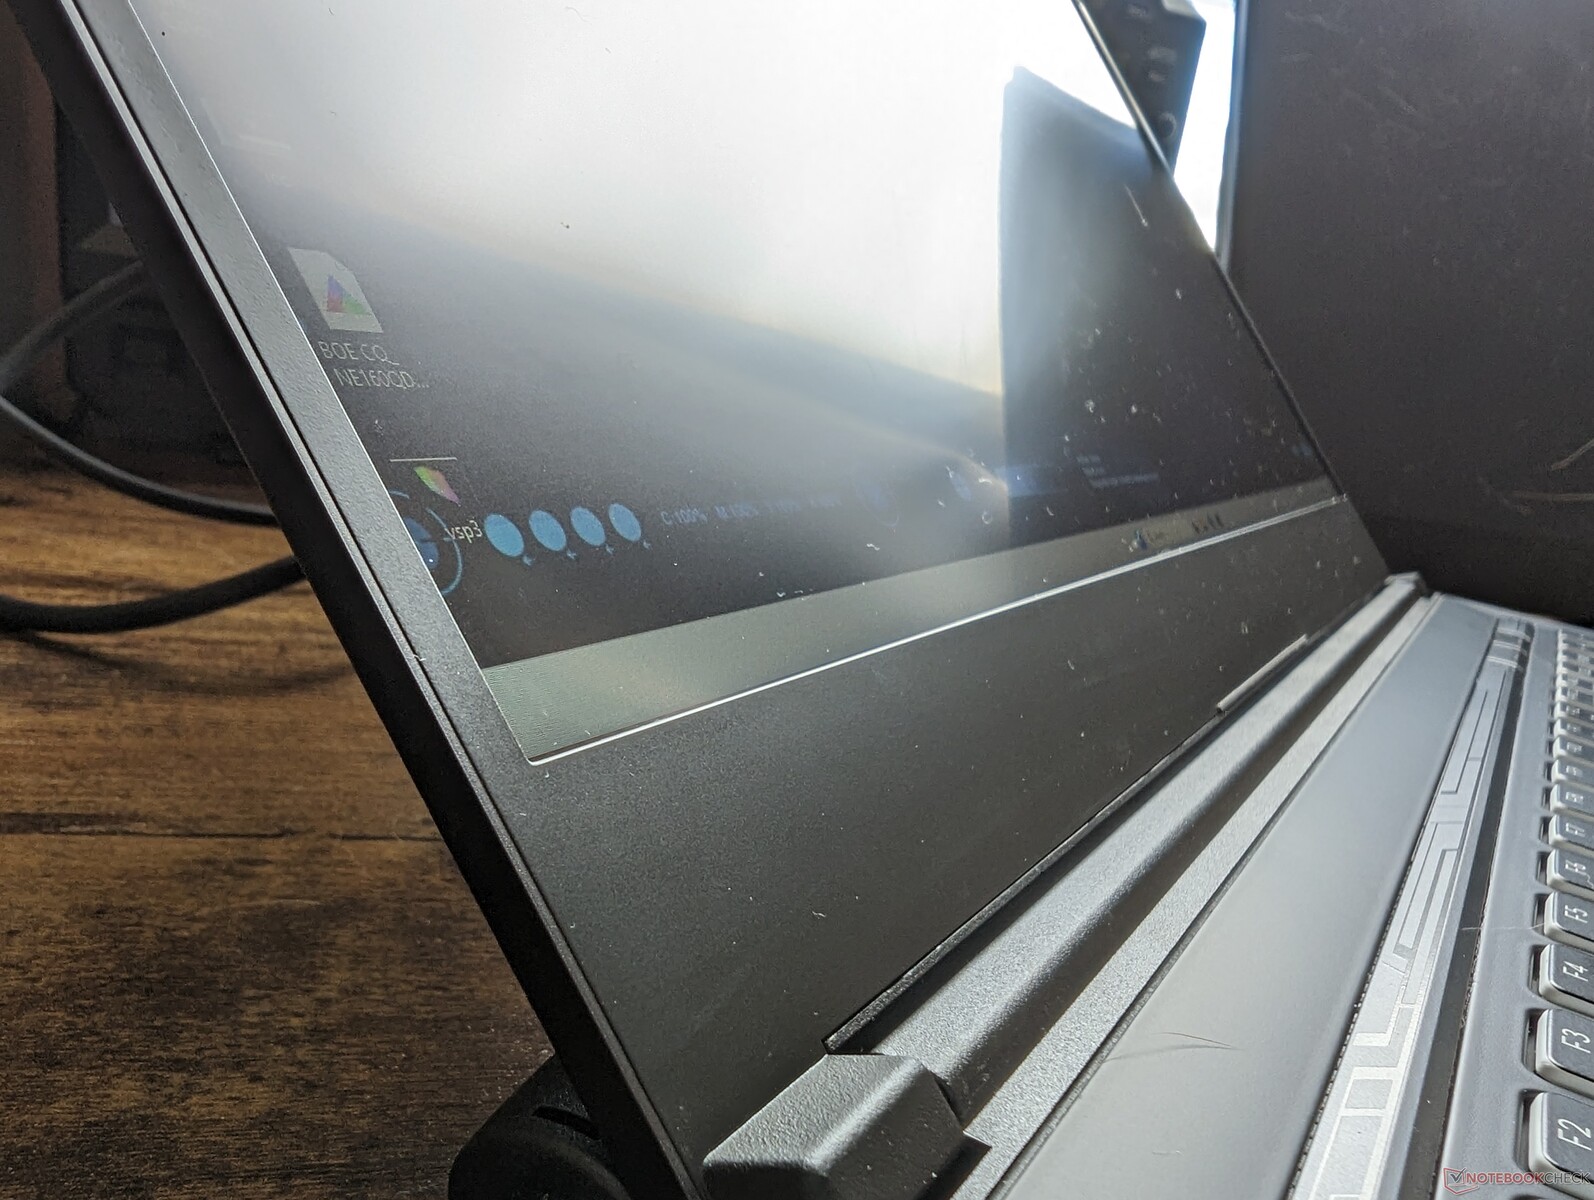
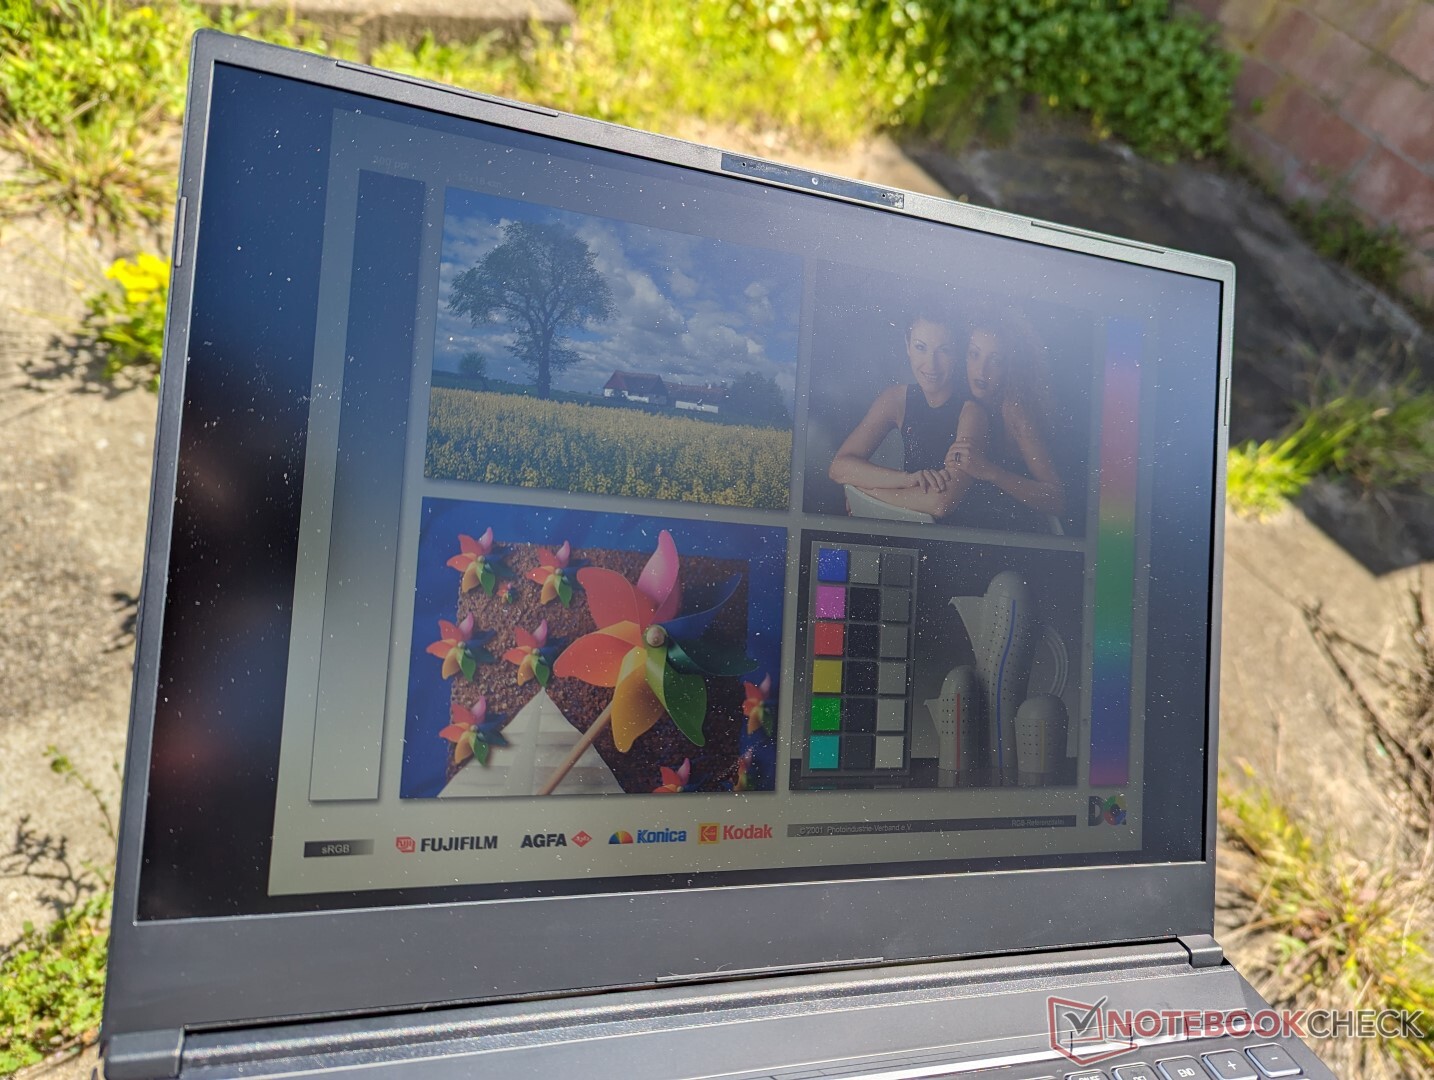
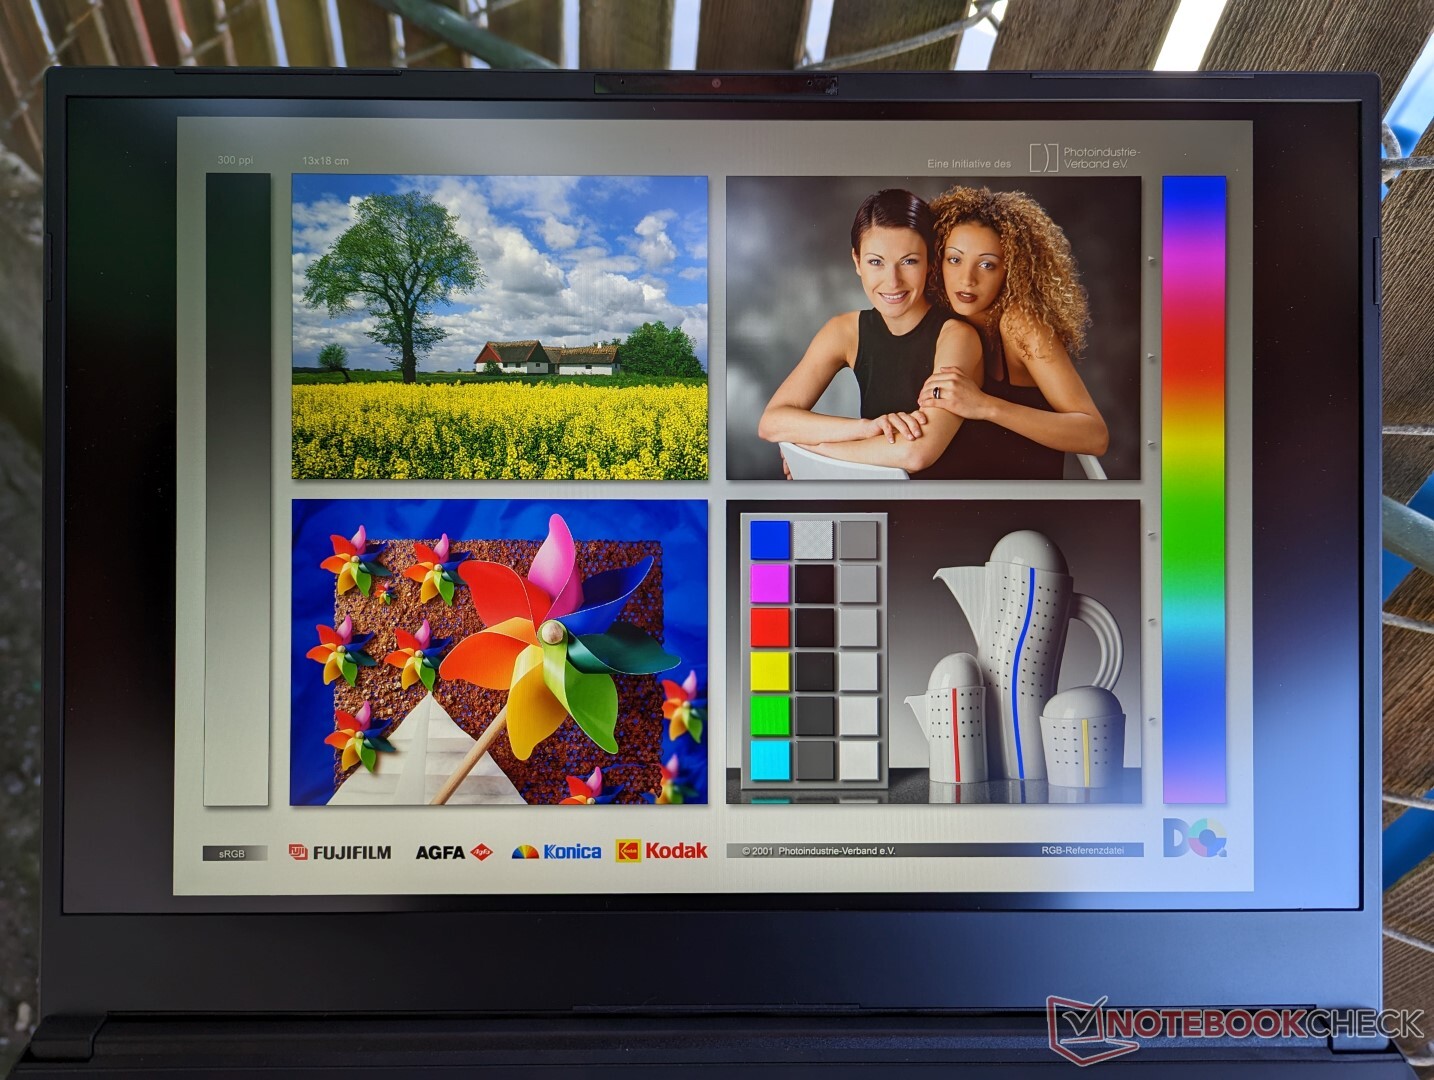
Mostrar
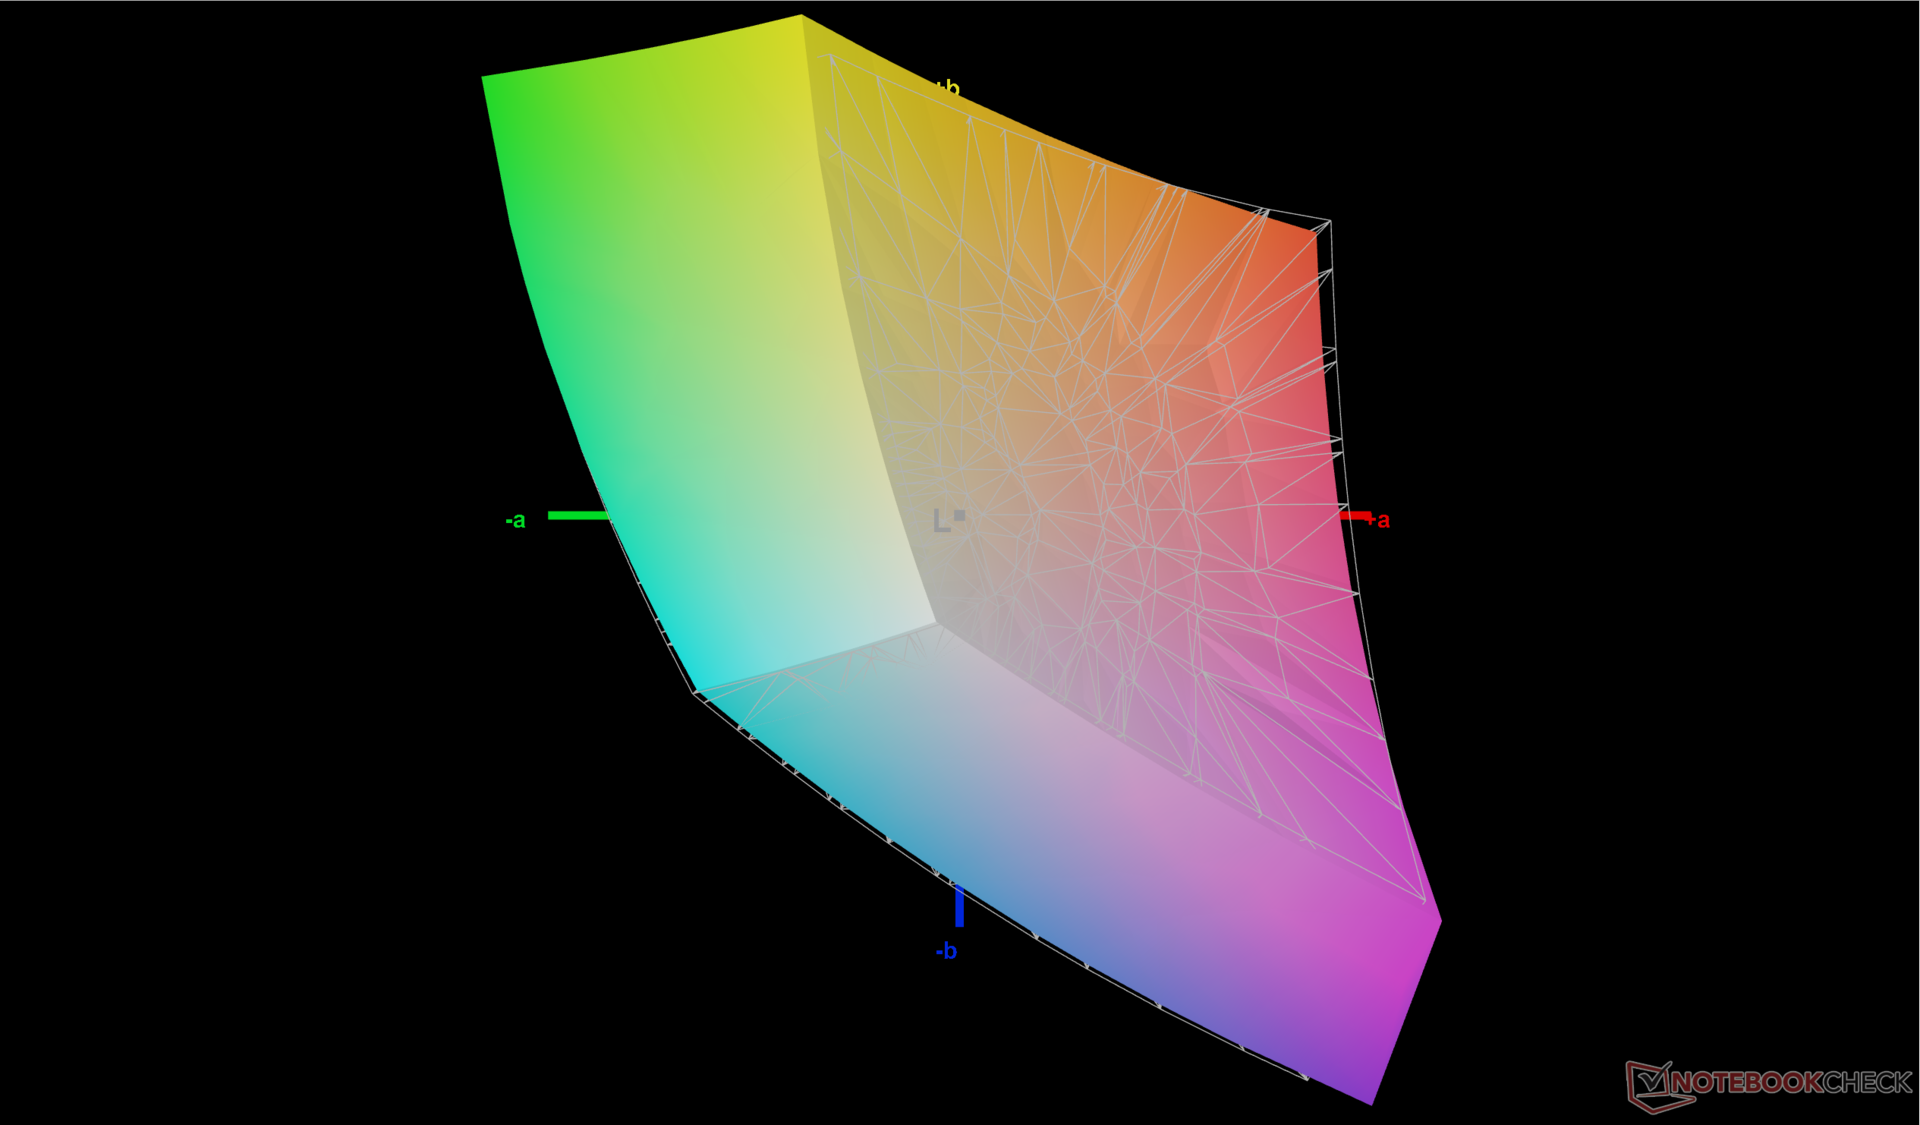
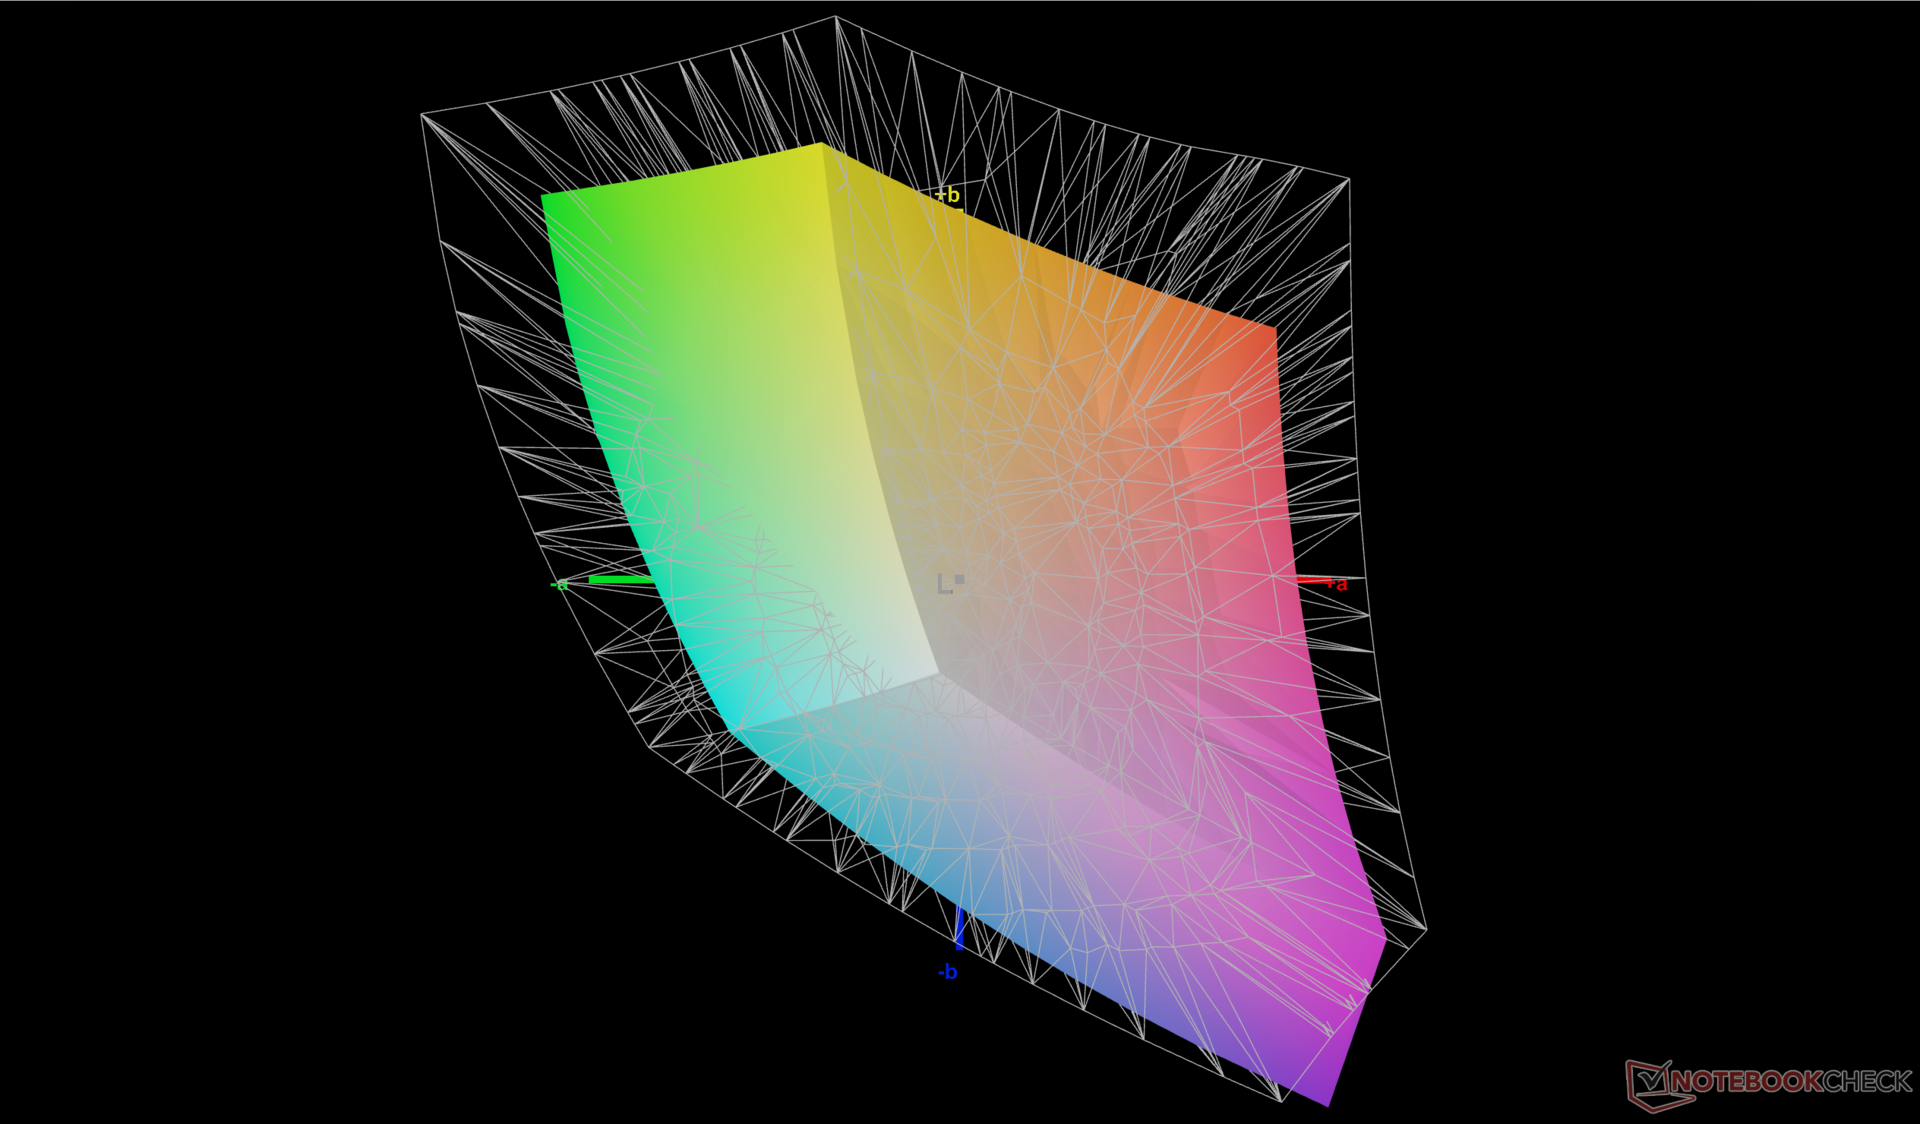
No hay segundas opciones de pantalla para este diseño de chasis en particular, así que nuestro Uniwill utiliza el mismo panel IPS BOE NE160QDM-NZ1 que se encuentra en el Schenker Neo 16 con RTX 4090. El panel destaca por su rápida frecuencia de actualización de 240 Hz y una cobertura sRGB superior al 95%. No obstante, portátiles de la competencia como elAsus ROG Strix G16 oGigabyte AERO 16 OLED ofrecen colores aún más profundos y tiempos de respuesta más rápidos que los jugadores hardcore o los editores gráficos pueden apreciar.

| |||||||||||||||||||||||||
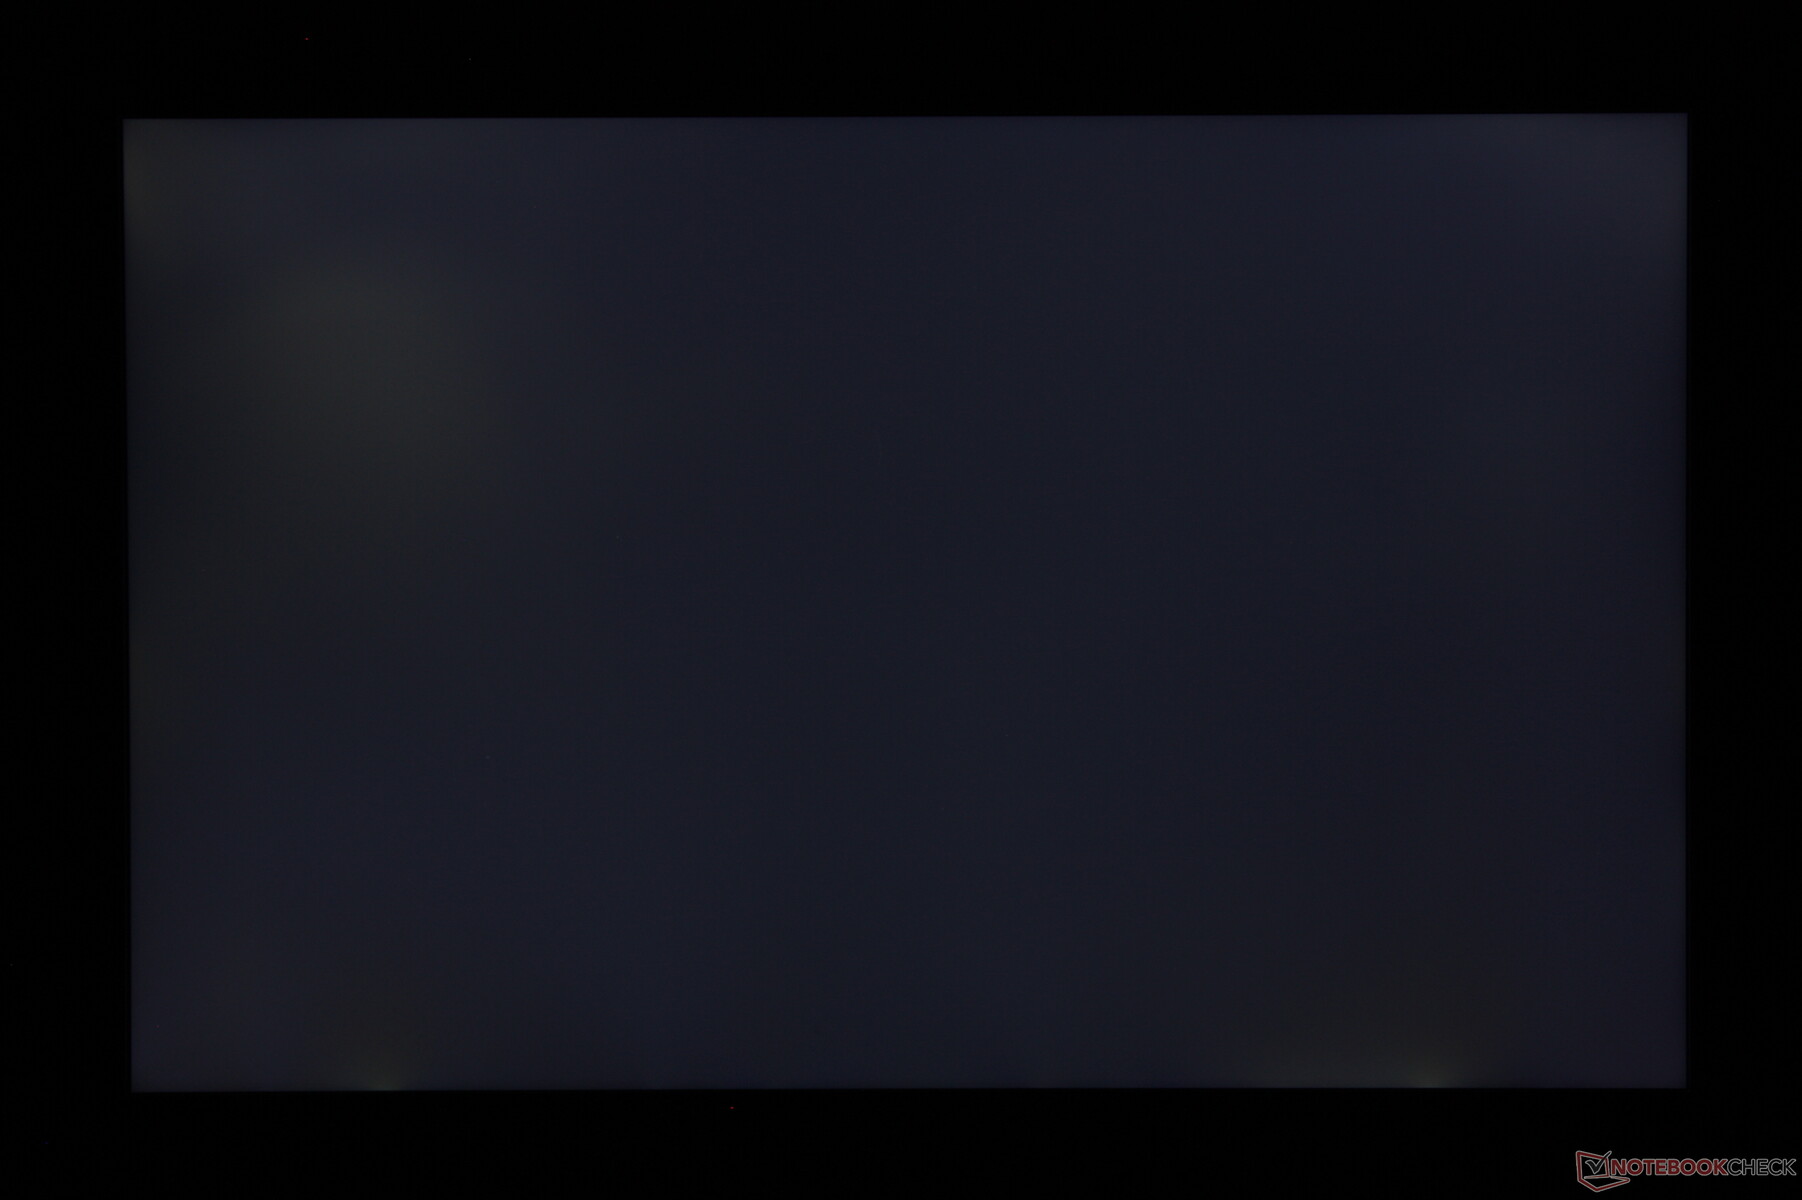
iluminación: 89 %
Brillo con batería: 338.6 cd/m²
Contraste: 1058:1 (Negro: 0.32 cd/m²)
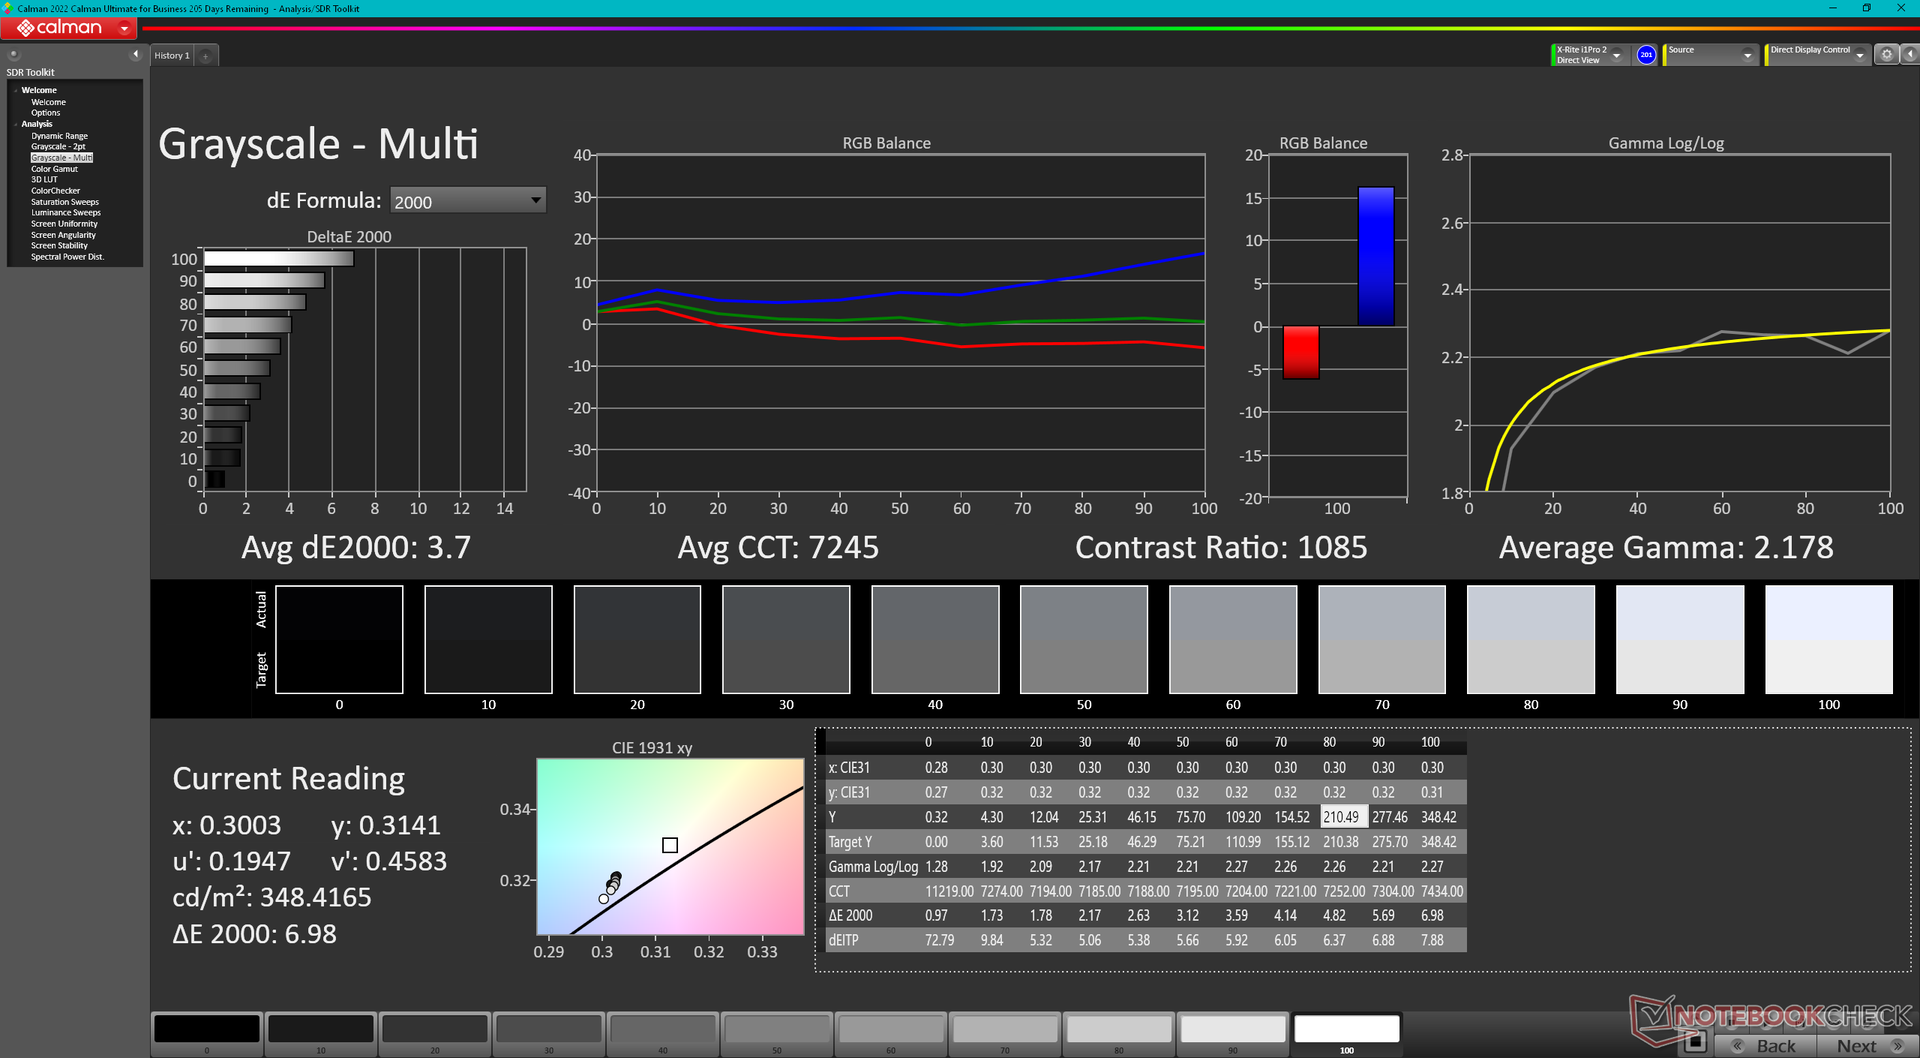
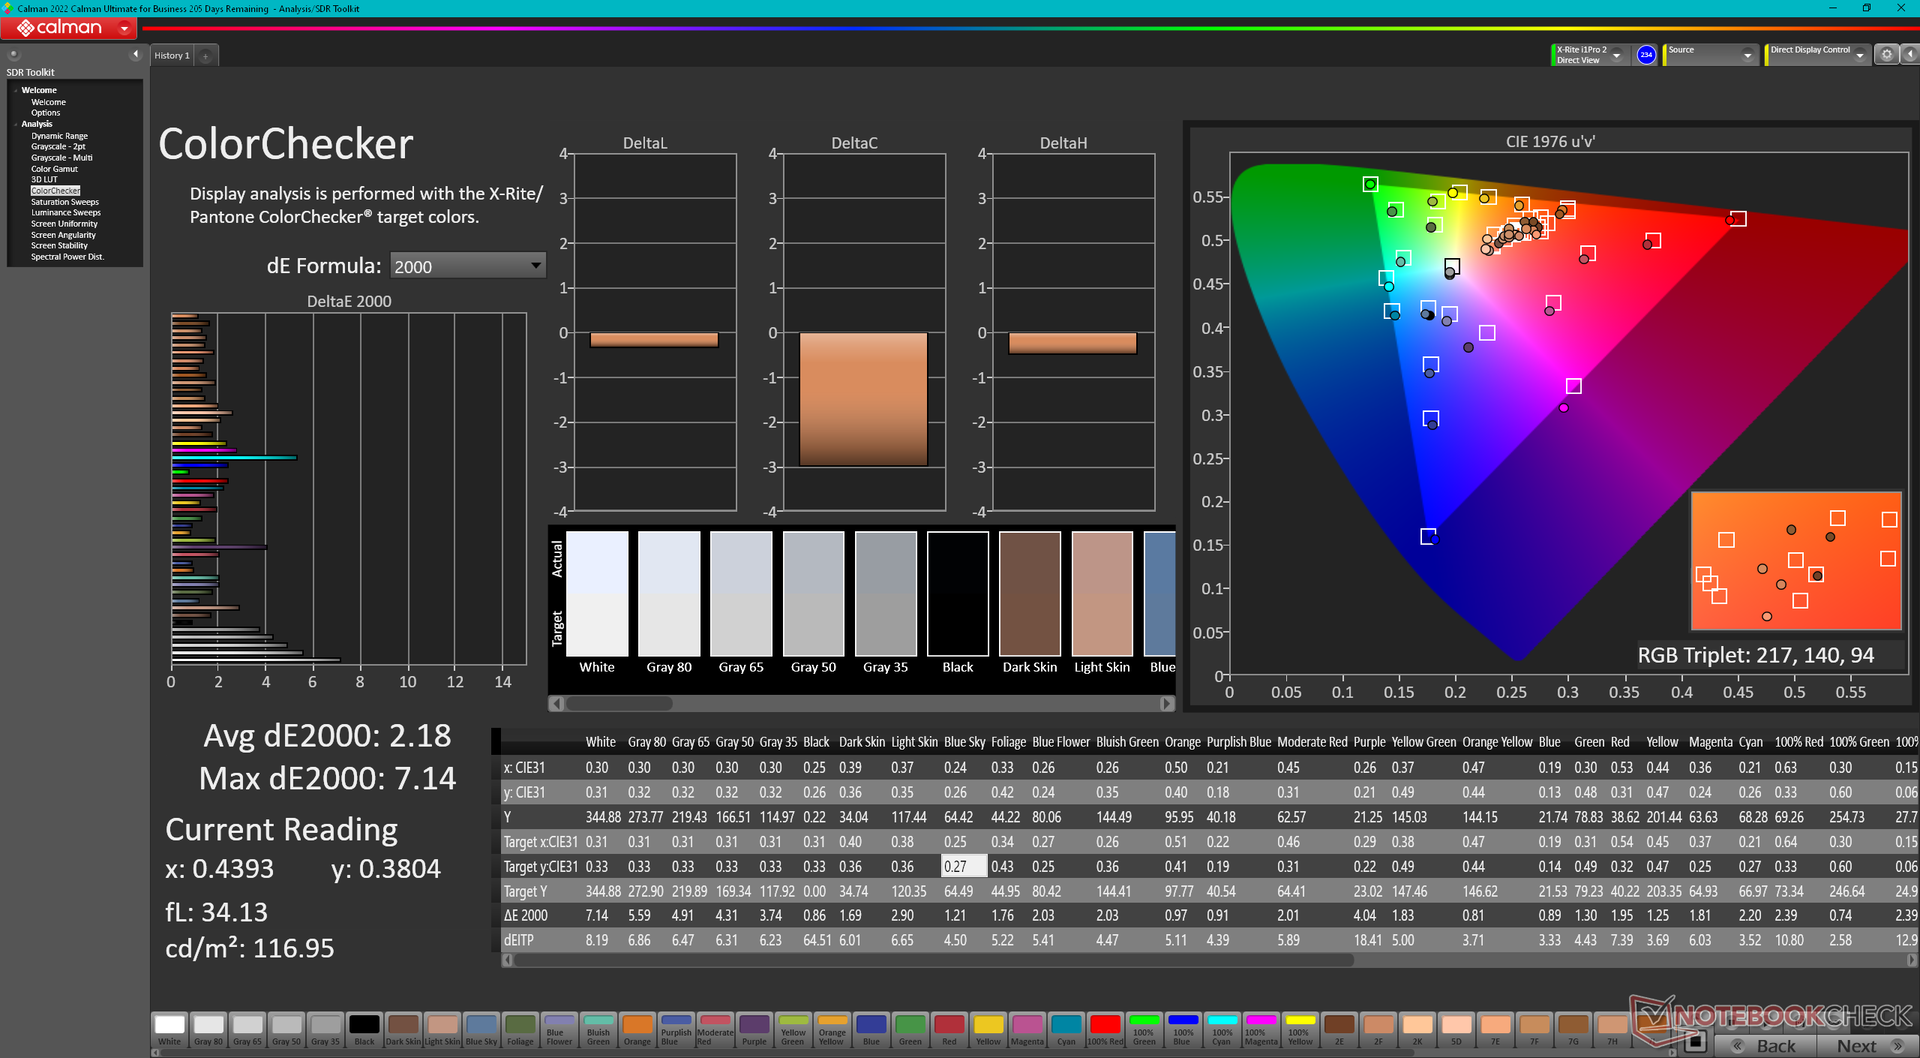
ΔE ColorChecker Calman: 2.18 | ∀{0.5-29.43 Ø4.71}
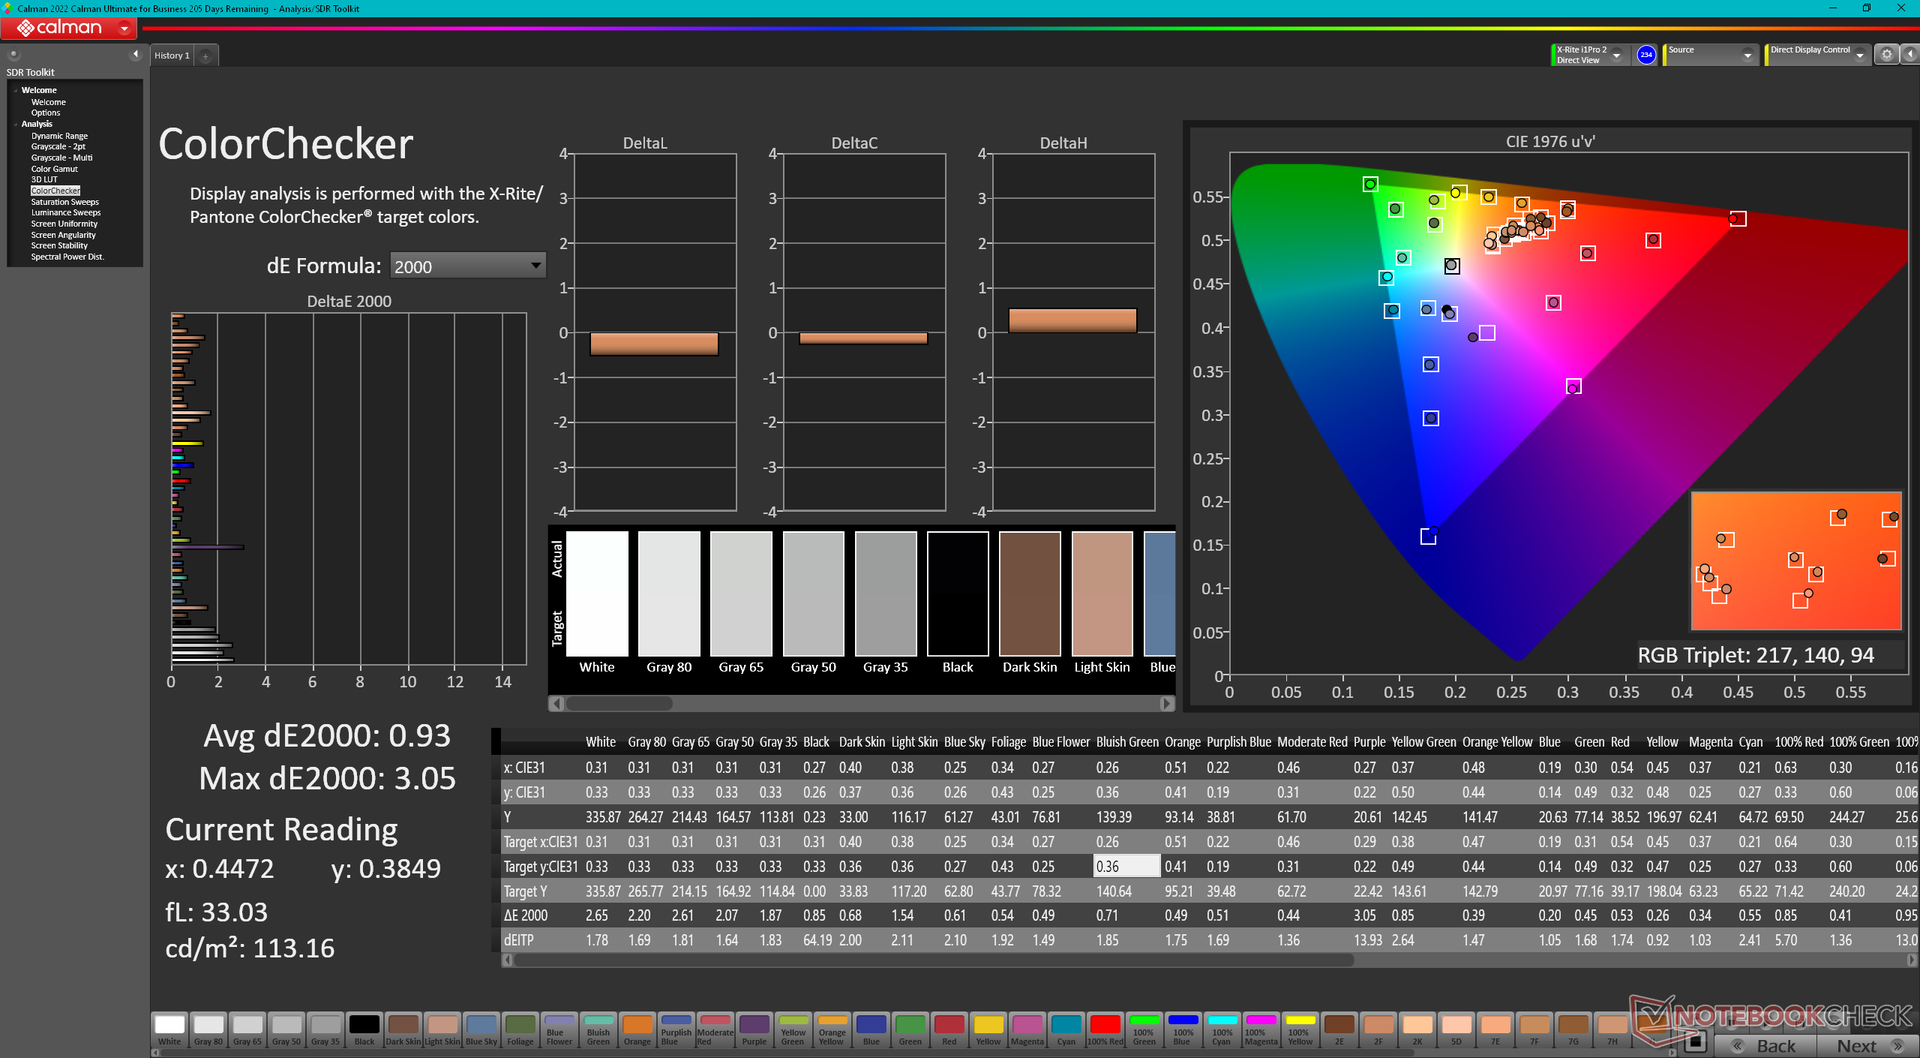
calibrated: 0.93
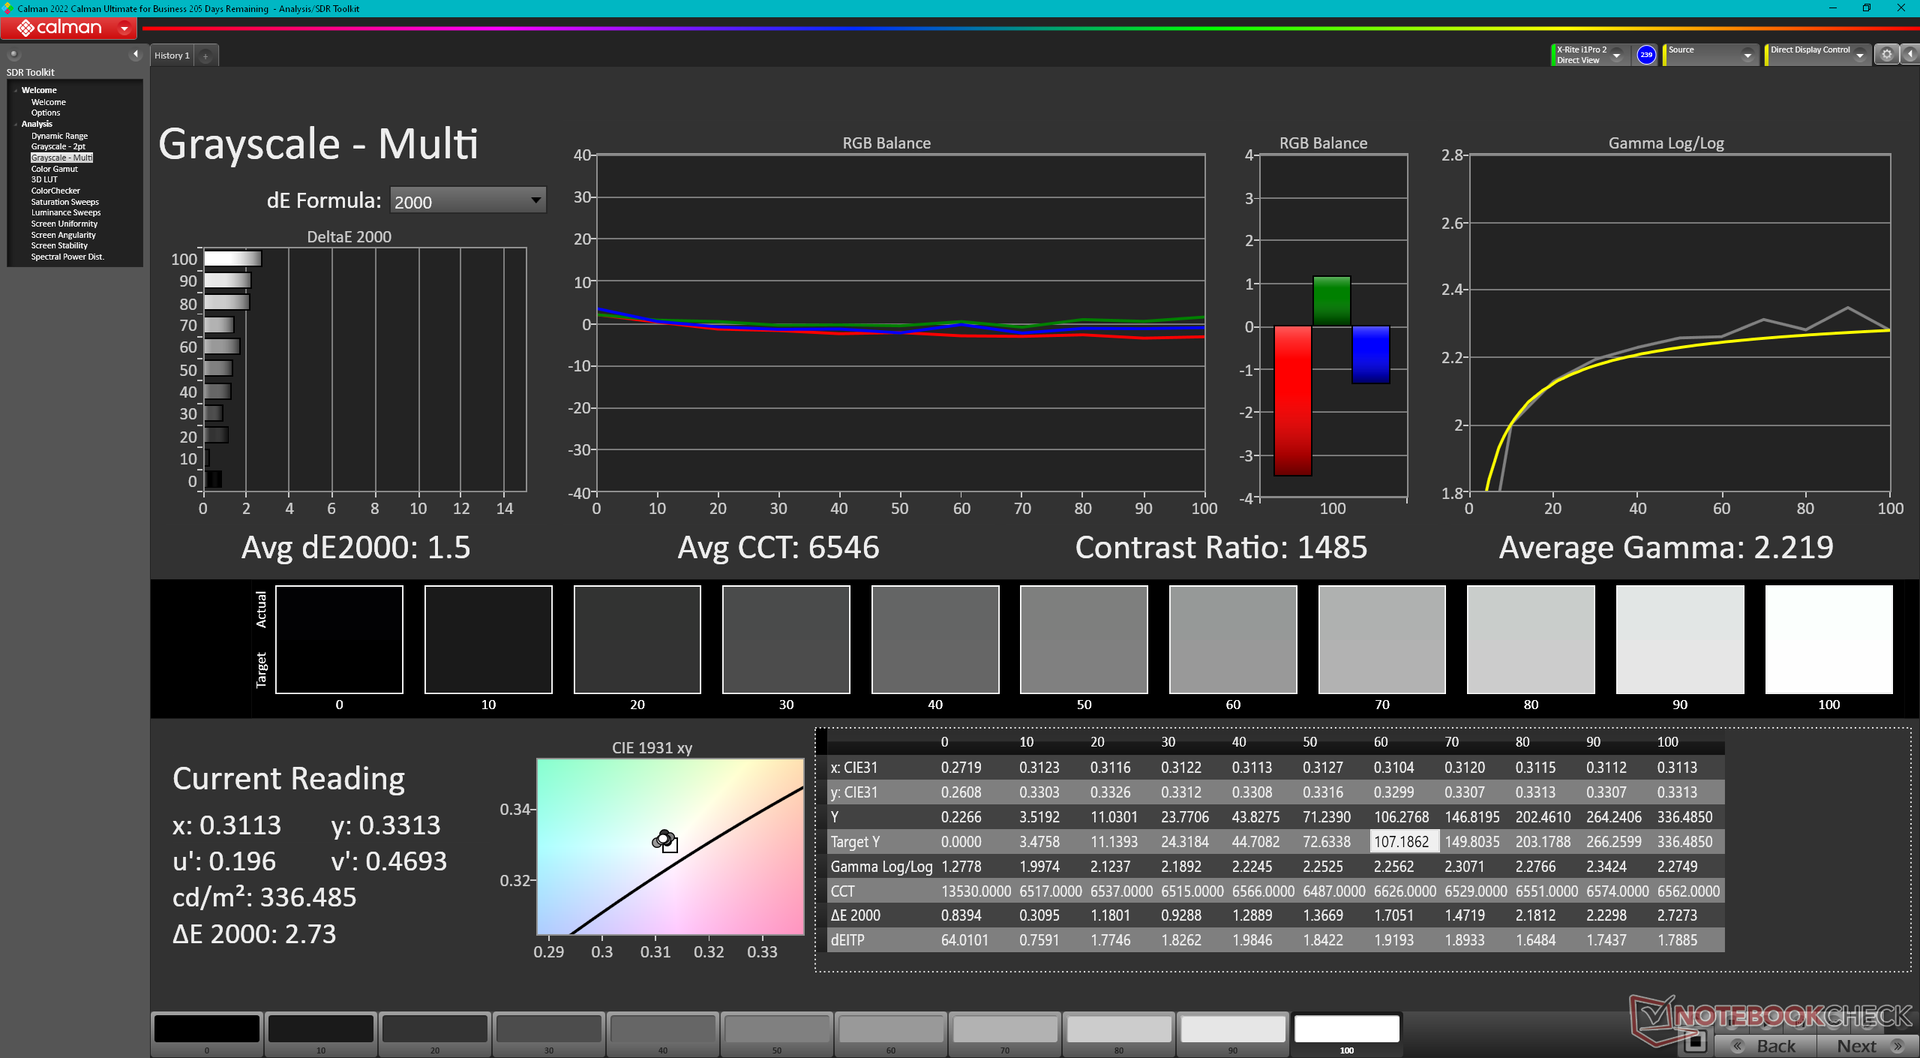
ΔE Greyscale Calman: 3.7 | ∀{0.09-98 Ø4.96}
68.6% AdobeRGB 1998 (Argyll 3D)
96.4% sRGB (Argyll 3D)
67.5% Display P3 (Argyll 3D)
Gamma: 2.18
CCT: 7245 K
| Uniwill GM6PX7X RTX 4070 BOE CQ NE160QDM-NZ1, IPS, 2560x1600, 16" | Schenker XMG Neo 16 E23 BOE0AF0 NE160QDM-NZ1, IPS, 2560x1600, 16" | Asus ROG Strix G16 G614JZ TL160ADMP03-0, IPS, 2560x1600, 16" | Lenovo Legion Pro 7 16IRX8H MNG007DA2-3 (CSO1628), IPS, 2560x1600, 16" | Gigabyte AERO 16 OLED BSF Samsung SDC4191 (ATNA60YV09-0, OLED, 3840x2400, 16" | Razer Blade 16 Early 2023 CSOT T3 MNG007DA4-1, IPS, 2560x1600, 16" | |
|---|---|---|---|---|---|---|
| Display | 0% | 24% | 3% | 31% | 27% | |
| Display P3 Coverage (%) | 67.5 | 67.3 0% | 97 44% | 69.1 2% | 99.9 48% | 98.5 46% |
| sRGB Coverage (%) | 96.4 | 96.7 0% | 99.9 4% | 99.7 3% | 100 4% | 100 4% |
| AdobeRGB 1998 Coverage (%) | 68.6 | 68.9 0% | 84.9 24% | 71.2 4% | 96.4 41% | 89.7 31% |
| Response Times | -2% | 47% | 21% | 82% | 13% | |
| Response Time Grey 50% / Grey 80% * (ms) | 12.6 ? | 14.5 ? -15% | 5.1 ? 60% | 12.3 ? 2% | 2 ? 84% | 6.6 ? 48% |
| Response Time Black / White * (ms) | 9.8 ? | 8.6 ? 12% | 6.6 ? 33% | 5.9 ? 40% | 1.98 ? 80% | 12 ? -22% |
| PWM Frequency (Hz) | 60 | |||||
| Screen | 9% | 16% | 33% | 142% | 8% | |
| Brightness middle (cd/m²) | 338.6 | 372 10% | 470 39% | 511 51% | 389.97 15% | 456.8 35% |
| Brightness (cd/m²) | 328 | 349 6% | 459 40% | 469 43% | 395 20% | 437 33% |
| Brightness Distribution (%) | 89 | 88 -1% | 93 4% | 86 -3% | 97 9% | 83 -7% |
| Black Level * (cd/m²) | 0.32 | 0.32 -0% | 0.42 -31% | 0.4 -25% | 0.03 91% | 0.35 -9% |
| Contrast (:1) | 1058 | 1163 10% | 1119 6% | 1278 21% | 12999 1129% | 1305 23% |
| Colorchecker dE 2000 * | 2.18 | 2.06 6% | 1.86 15% | 0.95 56% | 2 8% | 3.7 -70% |
| Colorchecker dE 2000 max. * | 7.14 | 3 58% | 3.87 46% | 2.07 71% | 4.1 43% | 6.42 10% |
| Colorchecker dE 2000 calibrated * | 0.93 | 1.5 -61% | 0.93 -0% | 0.91 2% | 1.68 -81% | 0.66 29% |
| Greyscale dE 2000 * | 3.7 | 1.9 49% | 2.7 27% | 0.6 84% | 2.23 40% | 2.6 30% |
| Gamma | 2.18 101% | 2.312 95% | 2.246 98% | 2.176 101% | 2.41 91% | 2.3 96% |
| CCT | 7245 90% | 6747 96% | 6711 97% | 6545 99% | 6323 103% | 6108 106% |
| Media total (Programa/Opciones) | 2% /
5% | 29% /
22% | 19% /
25% | 85% /
109% | 16% /
13% |
* ... más pequeño es mejor
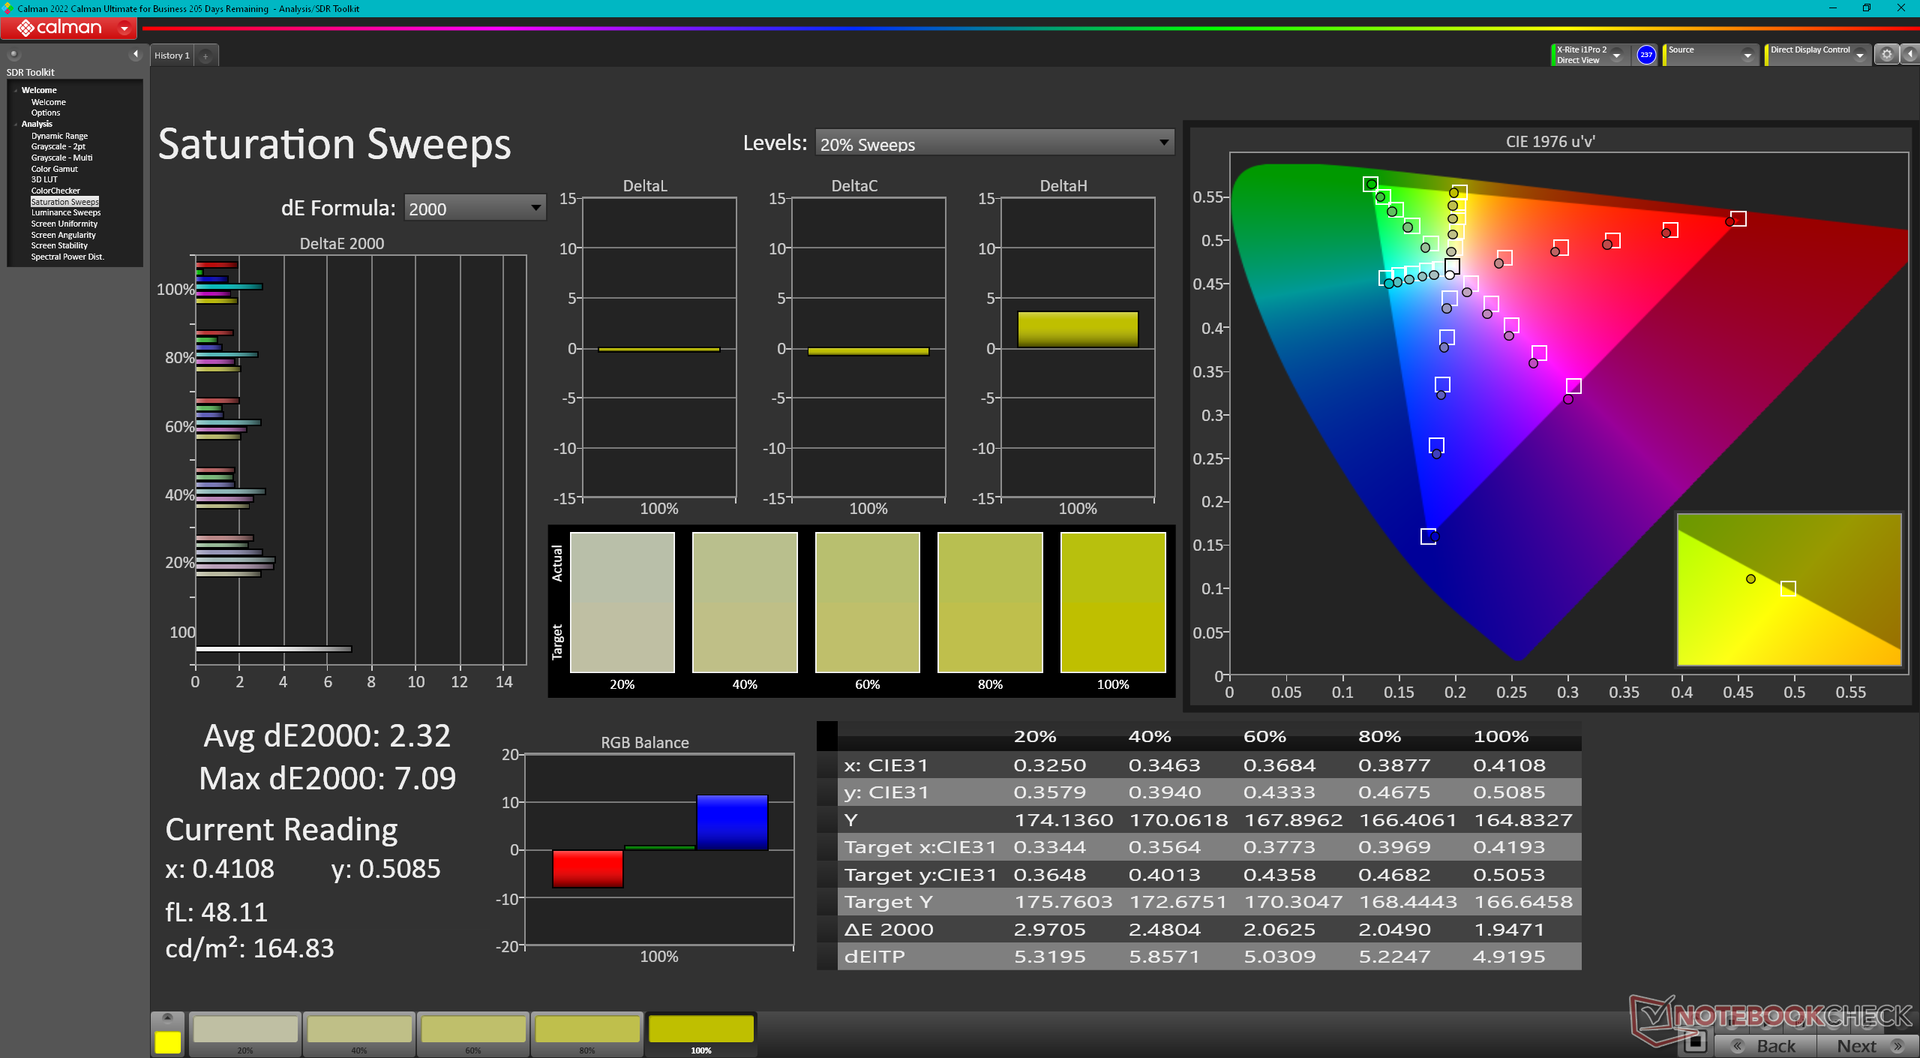
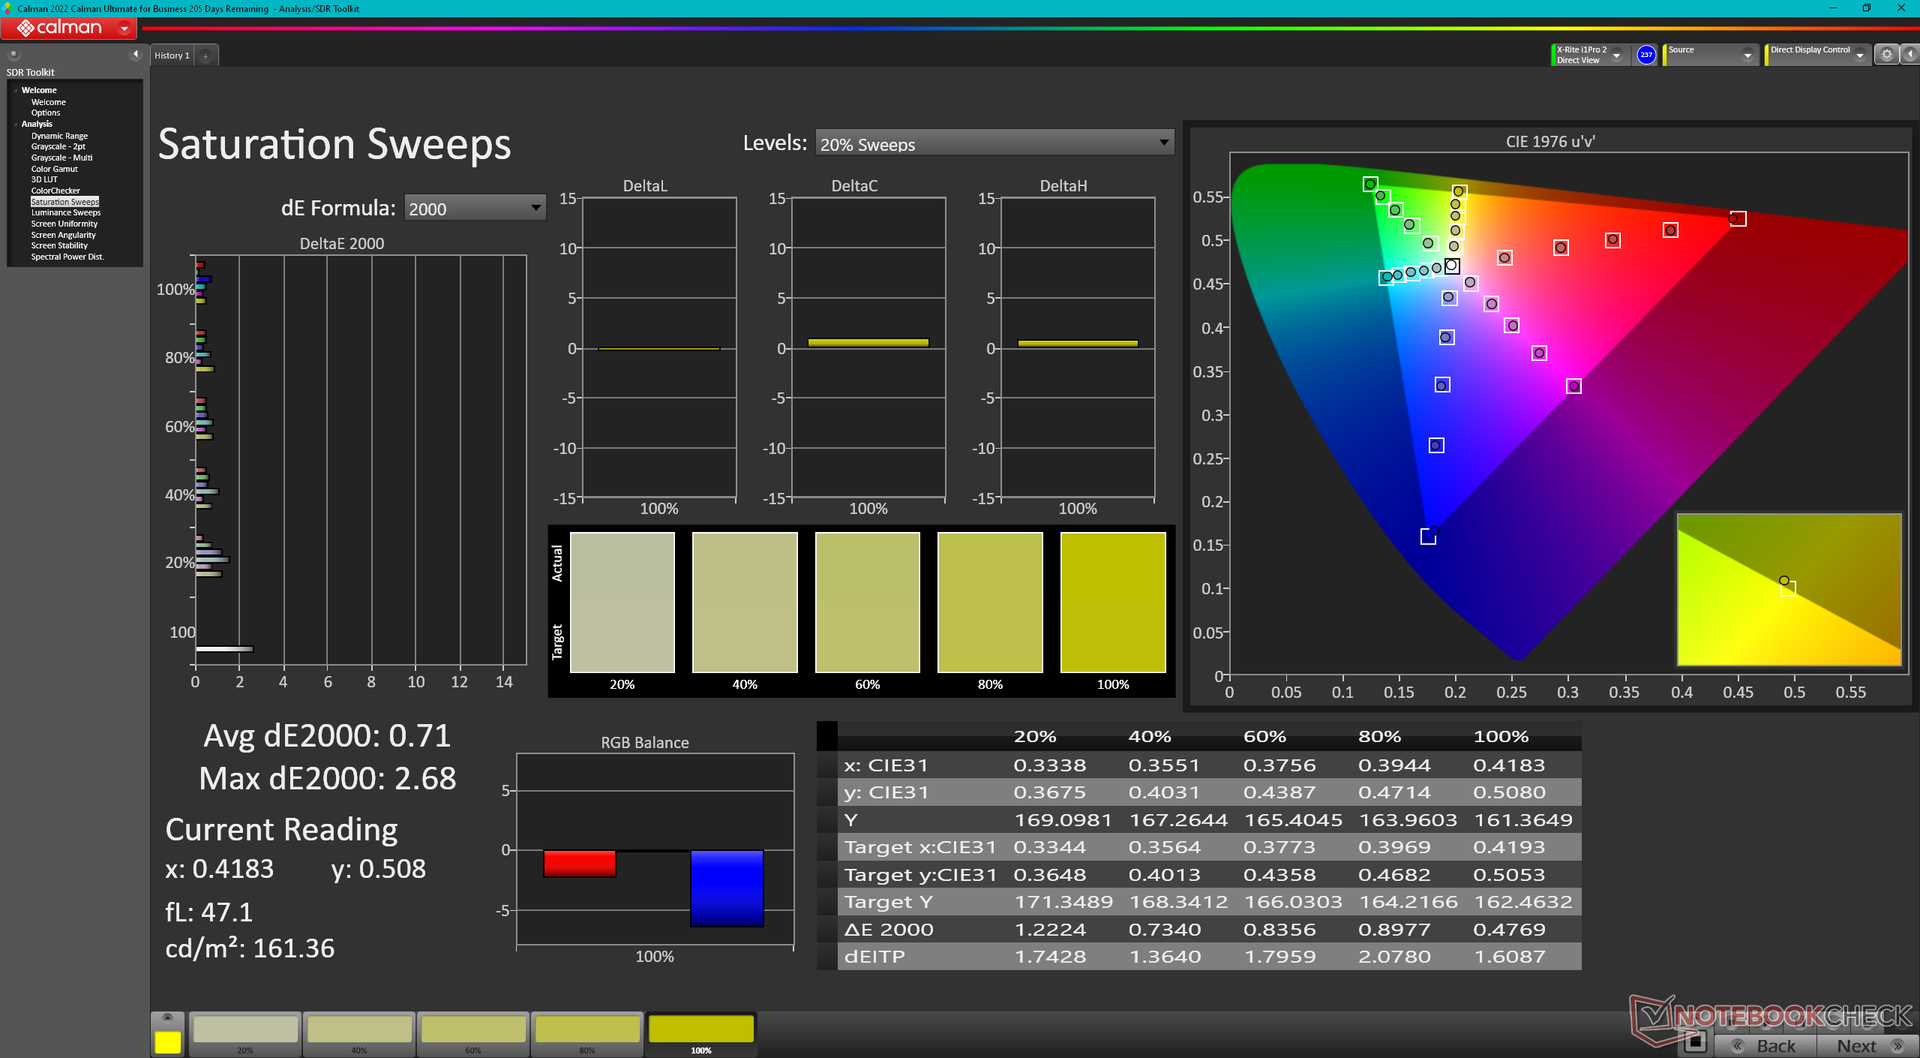
La pantalla está bien calibrada de fábrica, con unos valores medios de escala de grises y deltaE de color de 3,7 y 2,18, respectivamente. Sin embargo, la temperatura del color es ligeramente fría, lo que soluciona nuestra calibración X-Rite. Los usuarios pueden aplicar nuestro perfil ICM calibrado más arriba para obtener colores más precisos de la Uniwill.
Tiempos de respuesta del display
| ↔ Tiempo de respuesta de Negro a Blanco | ||
|---|---|---|
| 9.8 ms ... subida ↗ y bajada ↘ combinada | ↗ 5.1 ms subida | 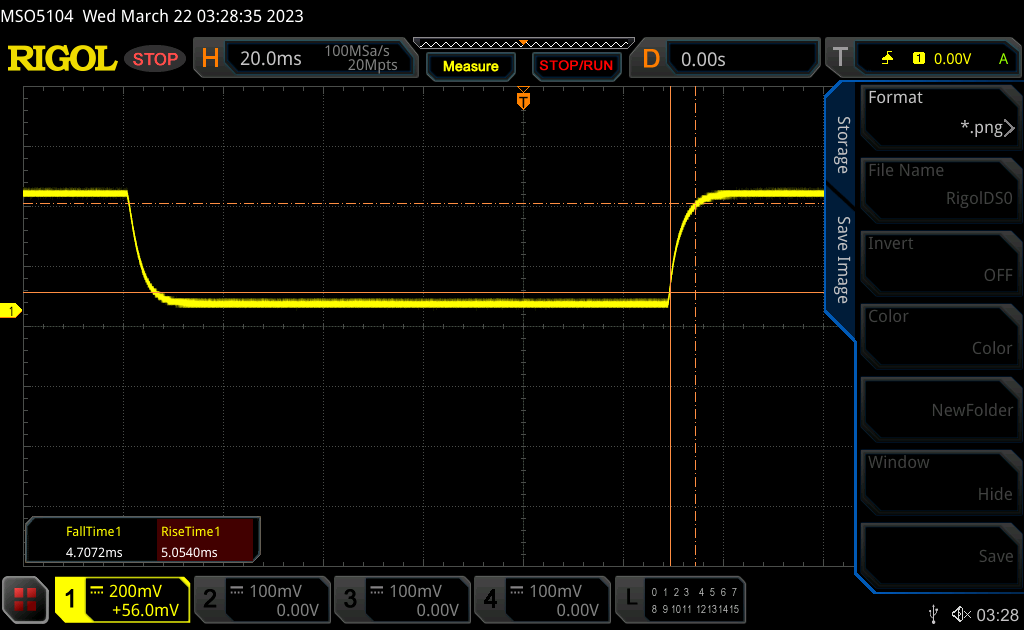 |
| ↘ 4.7 ms bajada | ||
| La pantalla mostró tiempos de respuesta rápidos en nuestros tests y debería ser adecuada para juegos. En comparación, todos los dispositivos de prueba van de ##min### (mínimo) a 240 (máximo) ms. » 27 % de todos los dispositivos son mejores. Esto quiere decir que el tiempo de respuesta medido es mejor que la media (19.8 ms) de todos los dispositivos testados. | ||
| ↔ Tiempo de respuesta 50% Gris a 80% Gris | ||
| 12.6 ms ... subida ↗ y bajada ↘ combinada | ↗ 6.3 ms subida | 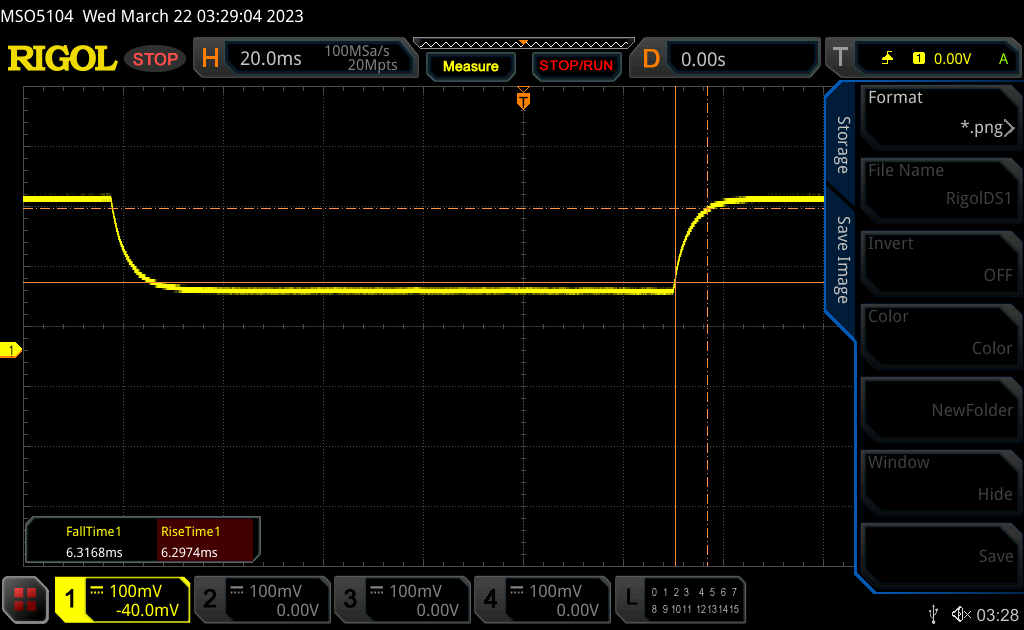 |
| ↘ 6.3 ms bajada | ||
| La pantalla mostró buenos tiempos de respuesta en nuestros tests pero podría ser demasiado lenta para los jugones competitivos. En comparación, todos los dispositivos de prueba van de ##min### (mínimo) a 636 (máximo) ms. » 26 % de todos los dispositivos son mejores. Esto quiere decir que el tiempo de respuesta medido es mejor que la media (31 ms) de todos los dispositivos testados. | ||
Parpadeo de Pantalla / PWM (Pulse-Width Modulation)
| Parpadeo de Pantalla / PWM no detectado | 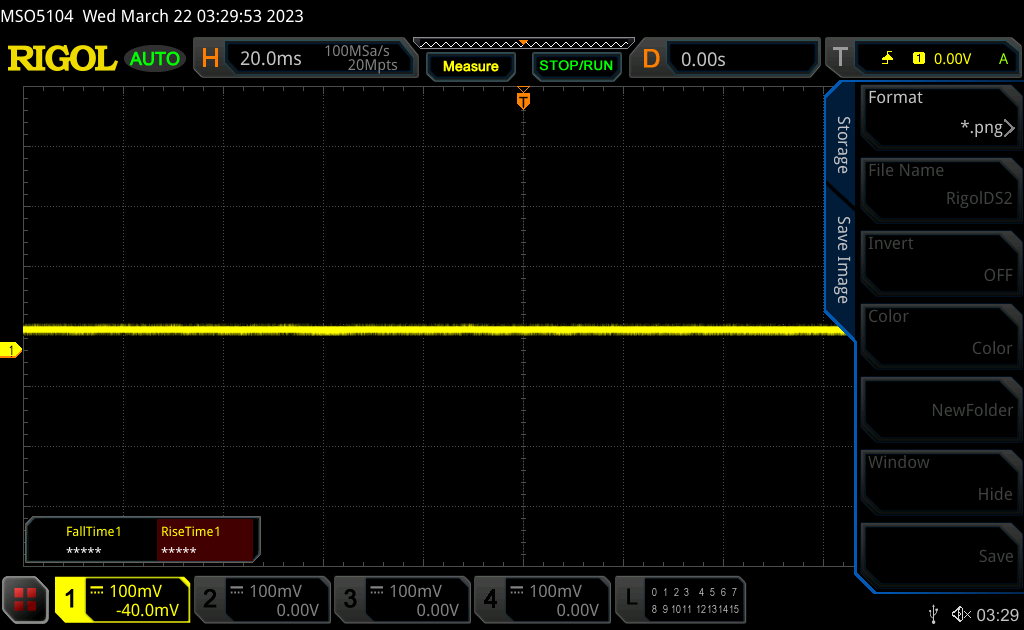 | ||
Comparación: 52 % de todos los dispositivos testados no usaron PWM para atenuar el display. Si se usó, medimos una media de 7754 (mínimo: 5 - máxmo: 343500) Hz. | |||

Rendimiento
Condiciones de ensayo
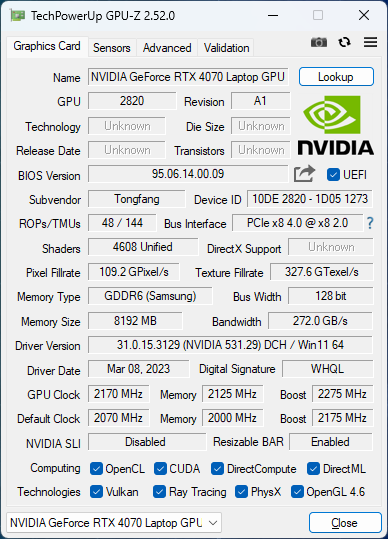
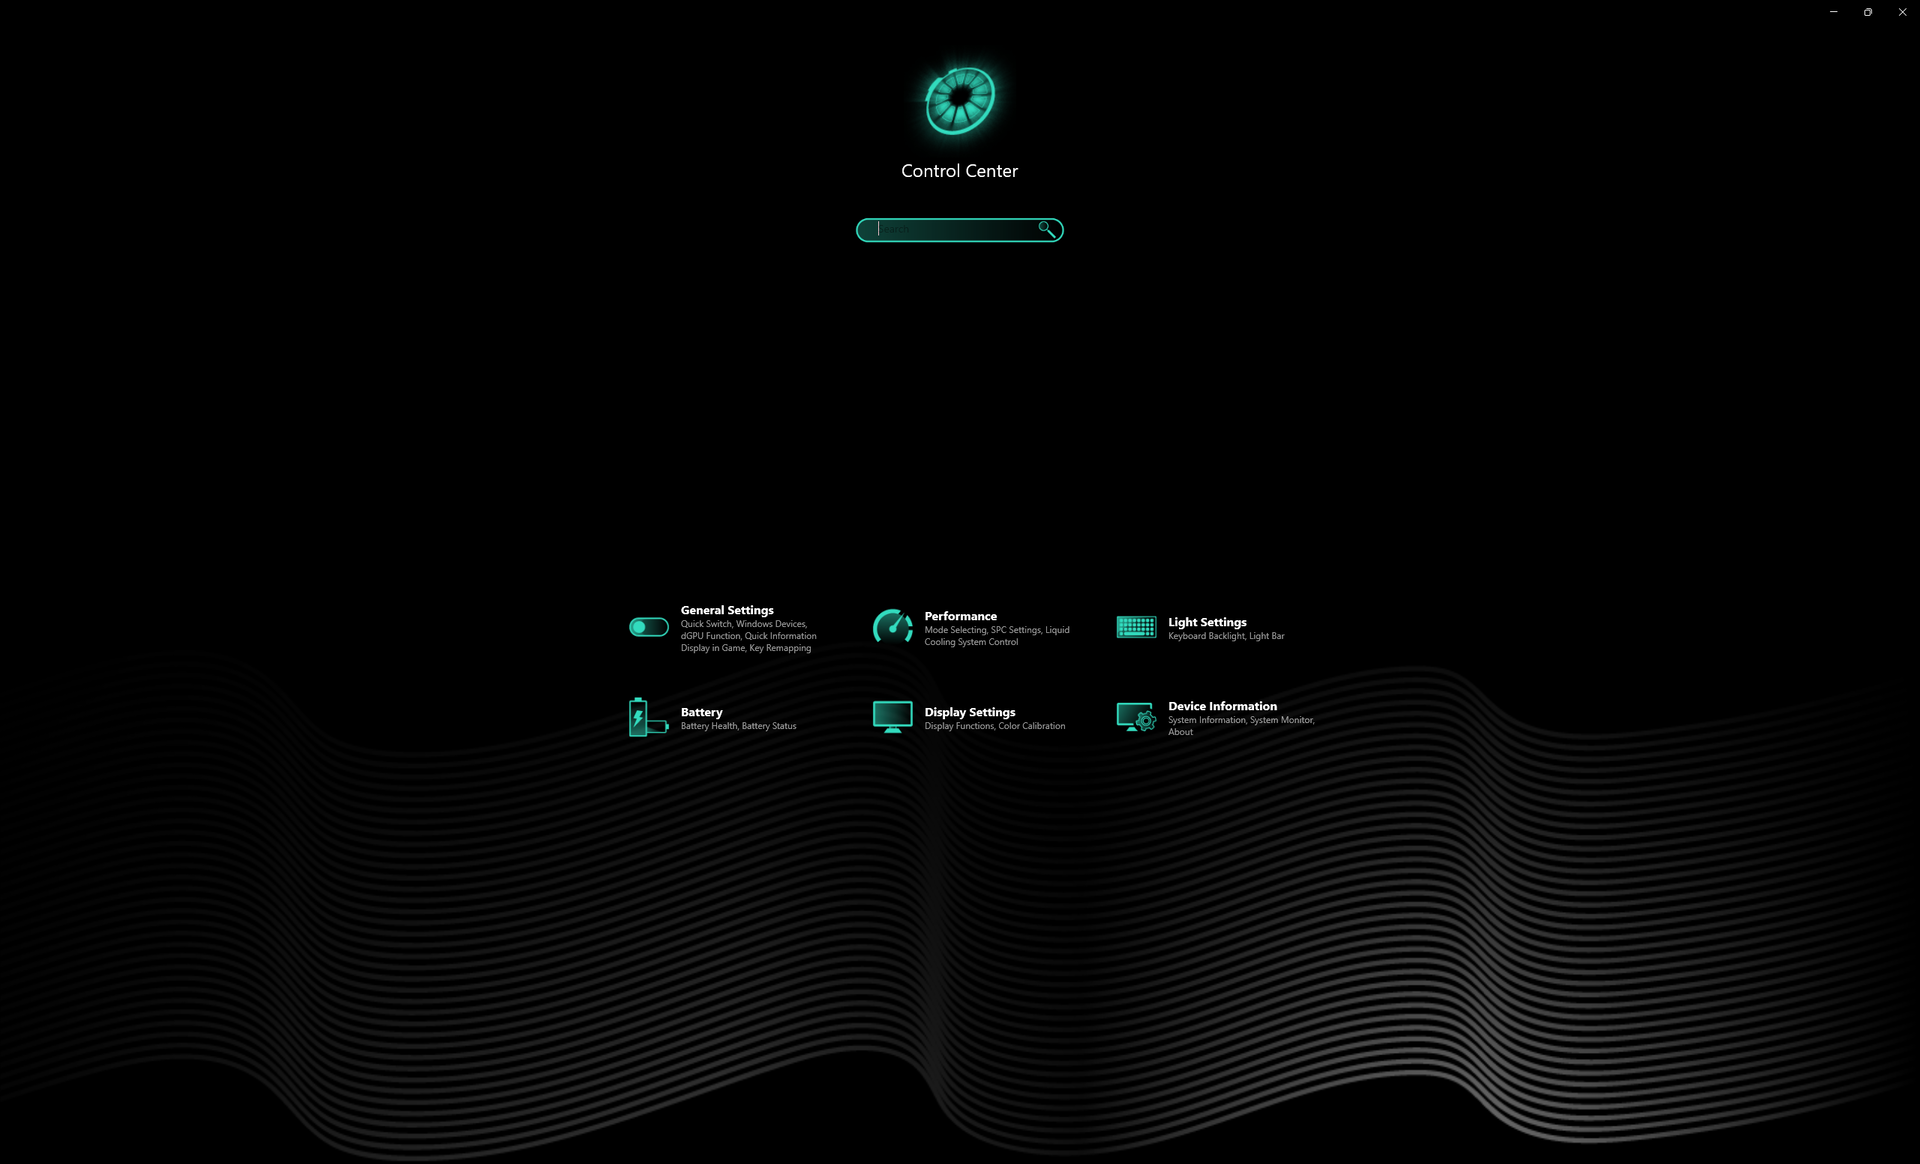
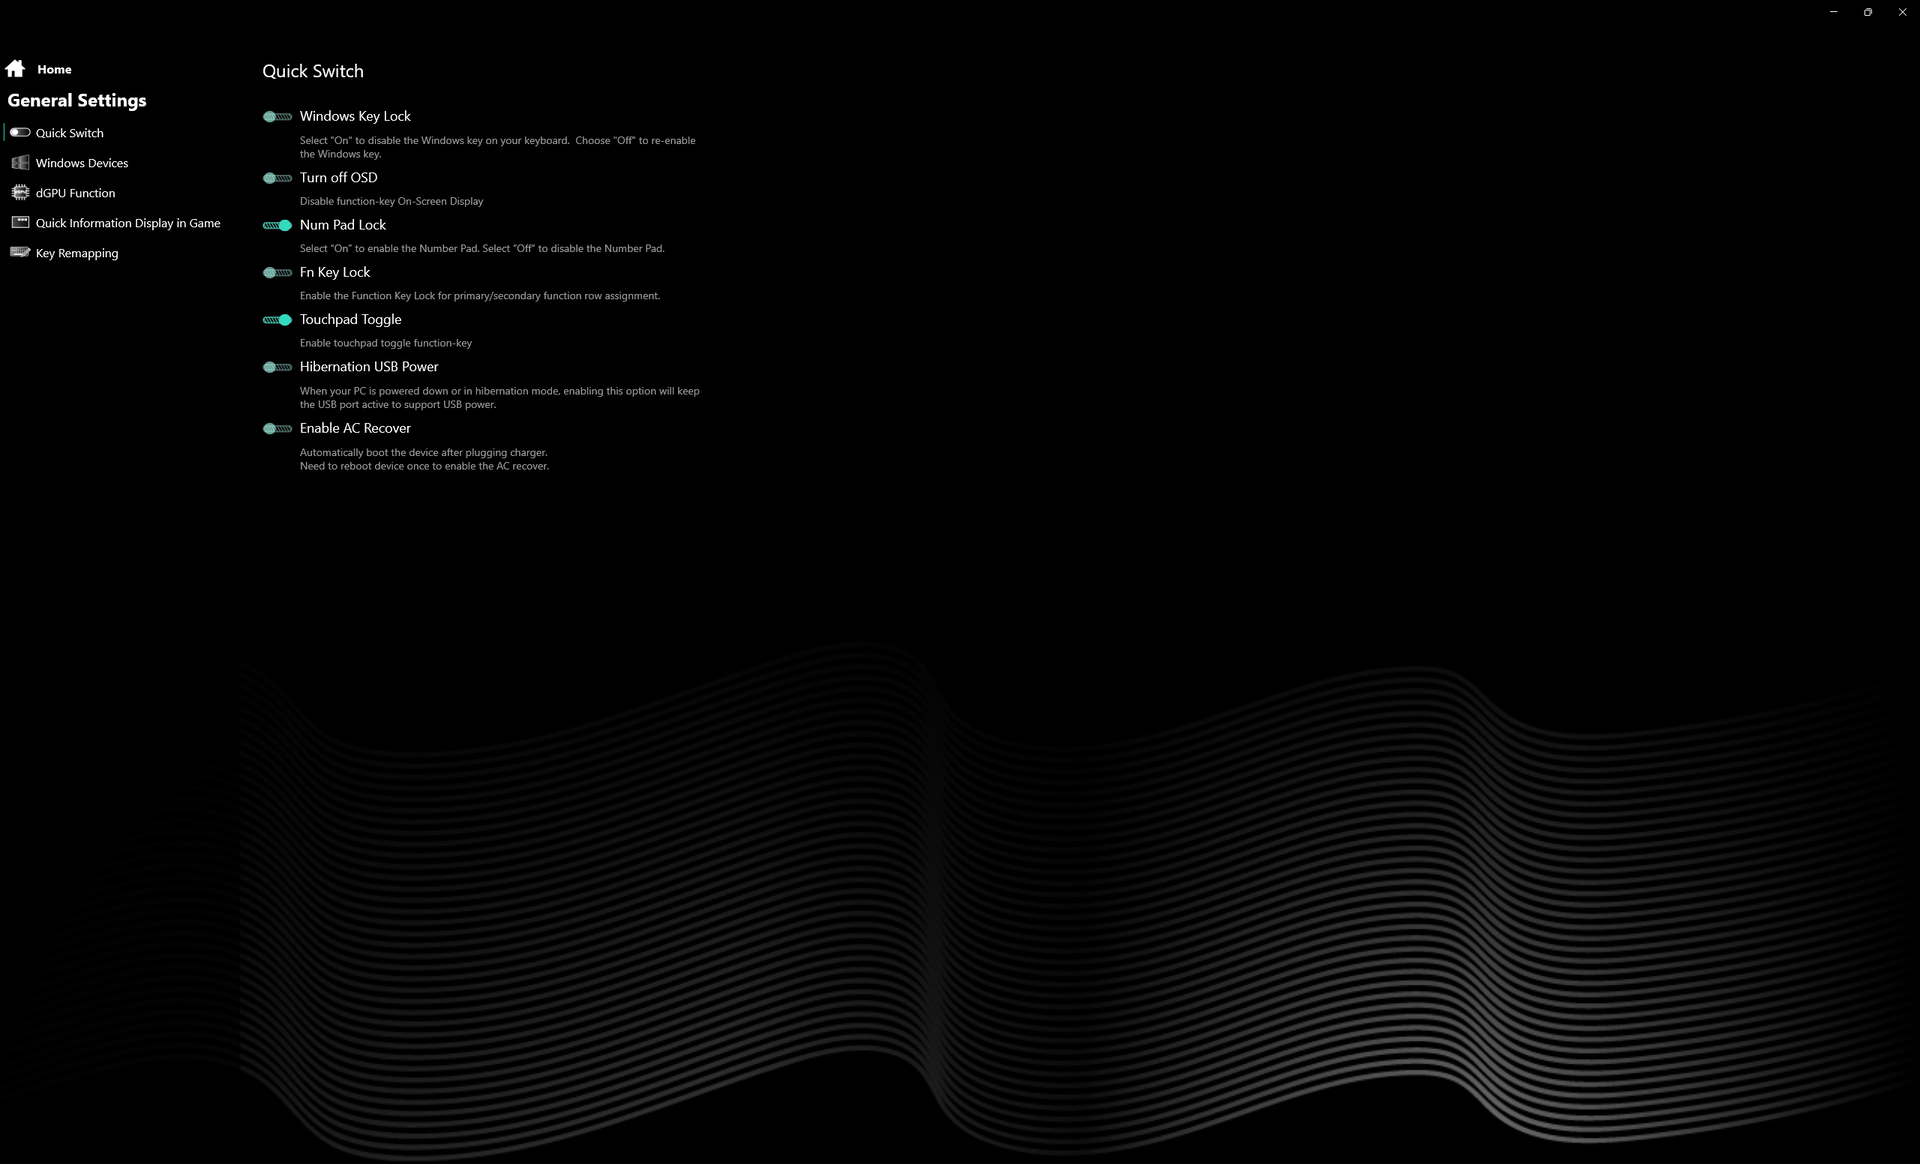
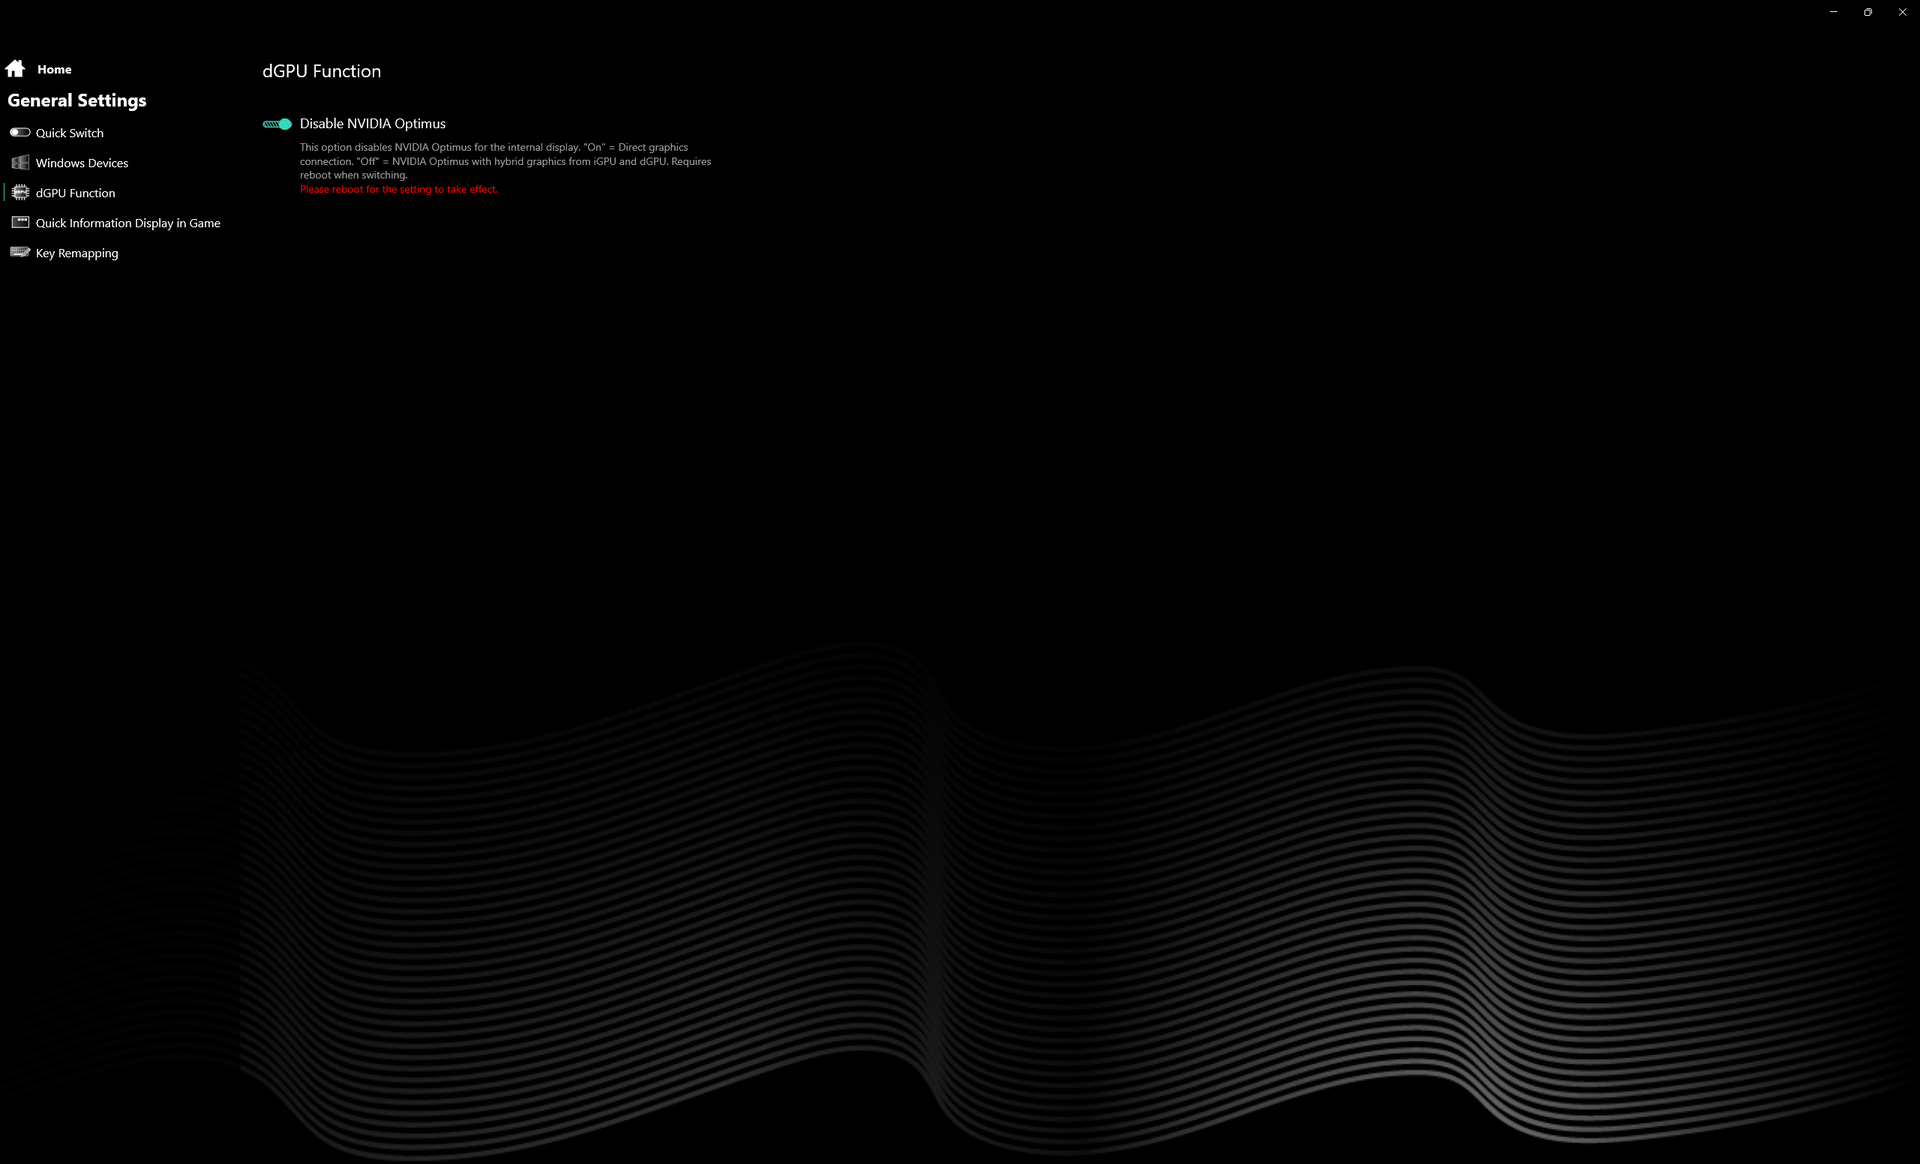
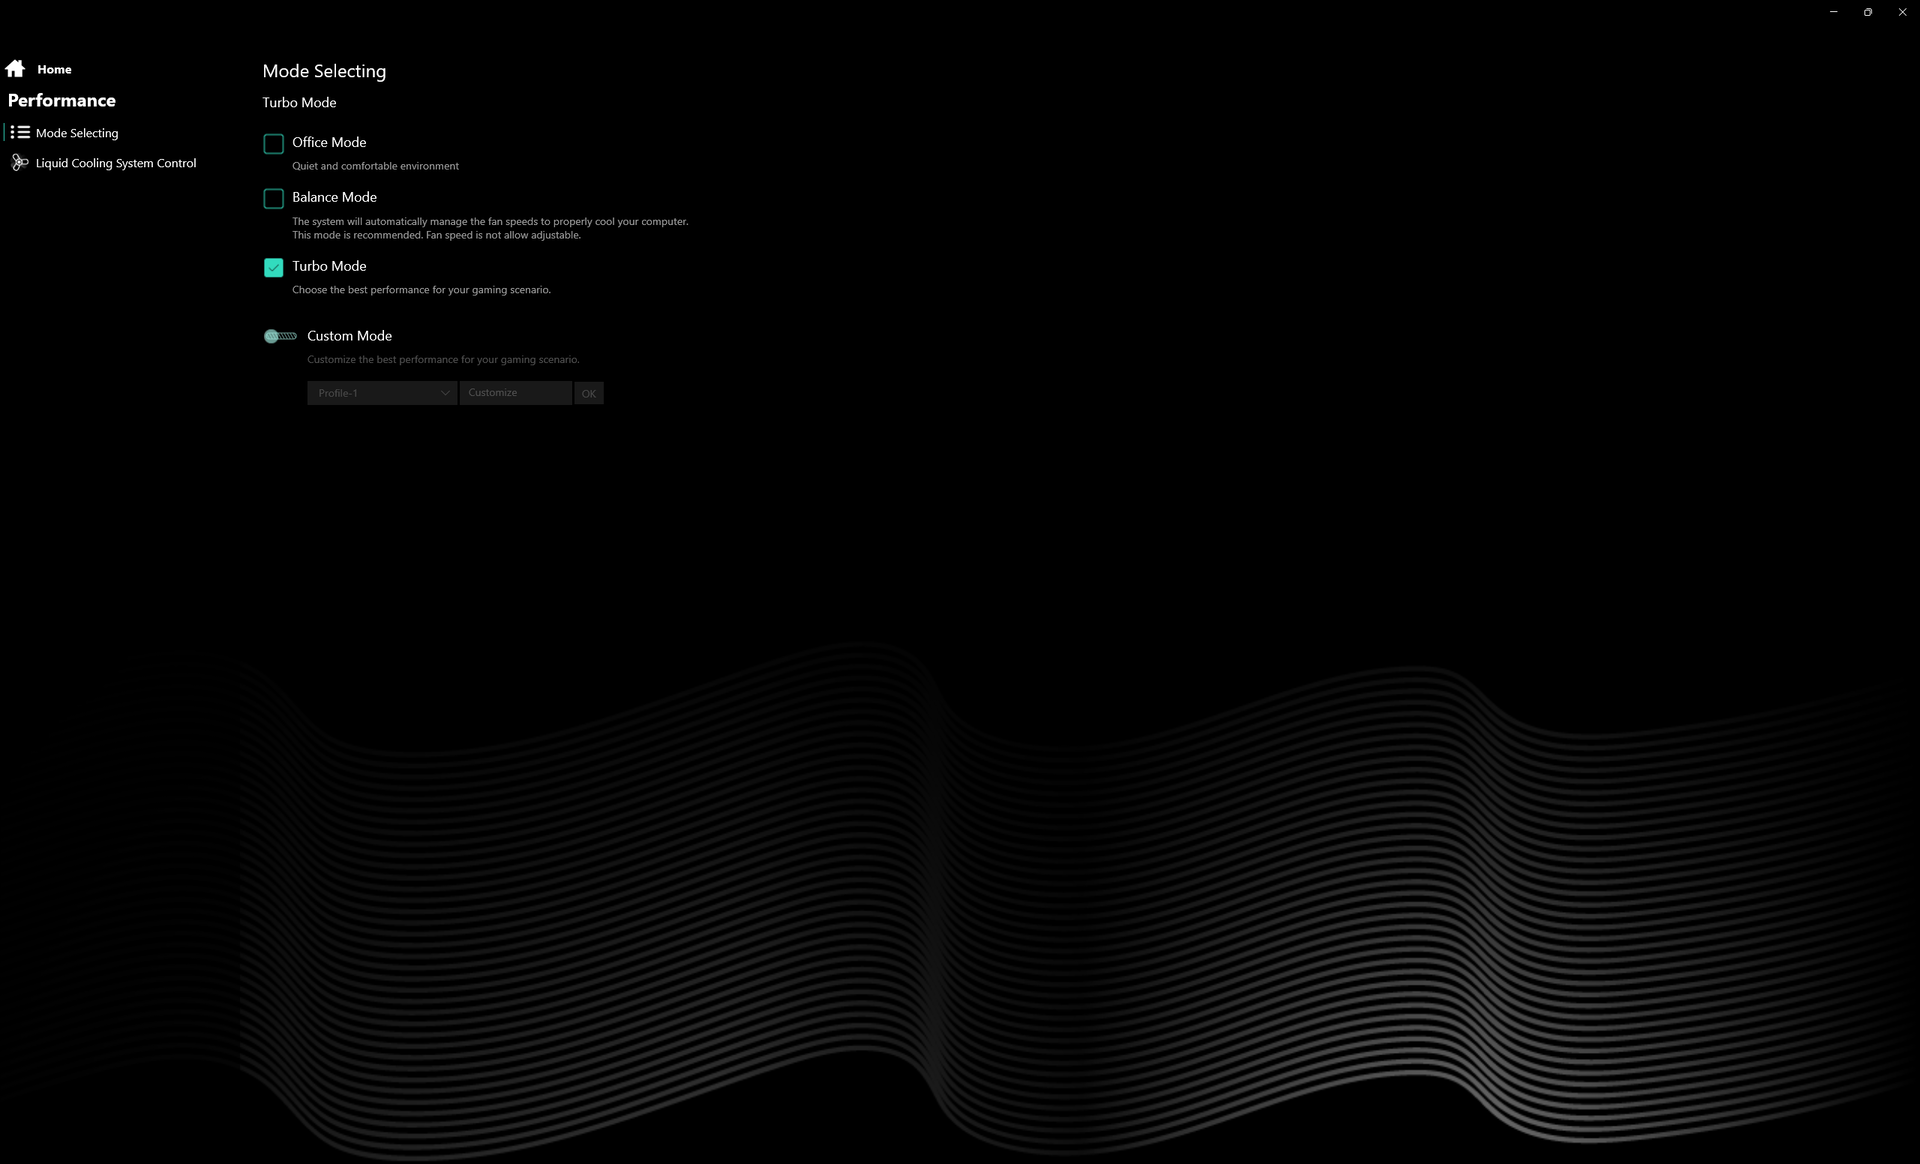
Pusimos la unidad en modo Turbo a través del software Control Center preinstalado con Optimus desactivado antes de ejecutar las pruebas. El sistema no es compatible con Advanced Optimus, lo que significa que es necesario reiniciar cuando se cambia entre la GPU discreta y Optimus. Se recomienda a los usuarios que se familiaricen con el software Control Center preinstalado, ya que es el centro neurálgico para ajustar los perfiles de rendimiento, Optimus y mucho más.
G-Sync no es compatible con la pantalla interna.
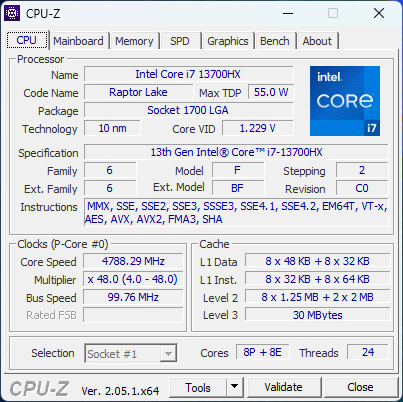
Procesador
Por fin podemos ver cómo se comporta la CPU de gama media-alta Core i7-13700HX después de haber probado varios portátiles de juegos para entusiastas con procesadores Core i9 de 13ª generación. Los bancos de pruebas muestran que es aproximadamente un 25 por ciento más rápida que la anterior generación de procesadores Core i7-13700HX de 12ª generación Core i7-12700H que se suele encontrar en la mayoría de los portátiles para juegos de gama media y alta de 2022. La actualización al Core i9-13900HX se espera que aumente el rendimiento de forma significativa en un 35%.
El rendimiento general está muy por delante de cualquier CPU Zen 3+ móvil, mientras que el último Zen 4 Ryzen 9 7945HX sigue siendo el procesador más rápido en un 20-50 por ciento. La estabilidad del rendimiento es excelente, sin grandes fluctuaciones de la frecuencia de reloj en condiciones de estrés.
Puedes encontrar más detalles técnicos y comparaciones comparativas sobre el Core i7-13700HX en nuestra página dedicada aquí.
Cinebench R15 Multi Loop
Cinebench R23: Multi Core | Single Core
Cinebench R20: CPU (Multi Core) | CPU (Single Core)
Cinebench R15: CPU Multi 64Bit | CPU Single 64Bit
Blender: v2.79 BMW27 CPU
7-Zip 18.03: 7z b 4 | 7z b 4 -mmt1
Geekbench 5.5: Multi-Core | Single-Core
HWBOT x265 Benchmark v2.2: 4k Preset
LibreOffice : 20 Documents To PDF
R Benchmark 2.5: Overall mean
* ... más pequeño es mejor
AIDA64: FP32 Ray-Trace | FPU Julia | CPU SHA3 | CPU Queen | FPU SinJulia | FPU Mandel | CPU AES | CPU ZLib | FP64 Ray-Trace | CPU PhotoWorxx
| Performance rating | |
| Lenovo Legion Pro 7 16IRX8H | |
| Asus ROG Strix G16 G614JZ | |
| Schenker XMG Neo 16 E23 | |
| Razer Blade 16 Early 2023 | |
| Uniwill GM6PX7X RTX 4070 | |
| Gigabyte AERO 16 OLED BSF | |
| Medio Intel Core i7-13700HX | |
| AIDA64 / CPU Queen | |
| Asus ROG Strix G16 G614JZ | |
| Schenker XMG Neo 16 E23 | |
| Razer Blade 16 Early 2023 | |
| Razer Blade 16 Early 2023 | |
| Lenovo Legion Pro 7 16IRX8H | |
| Uniwill GM6PX7X RTX 4070 | |
| Medio Intel Core i7-13700HX (86532 - 114717, n=11) | |
| Gigabyte AERO 16 OLED BSF | |
Rendimiento del sistema
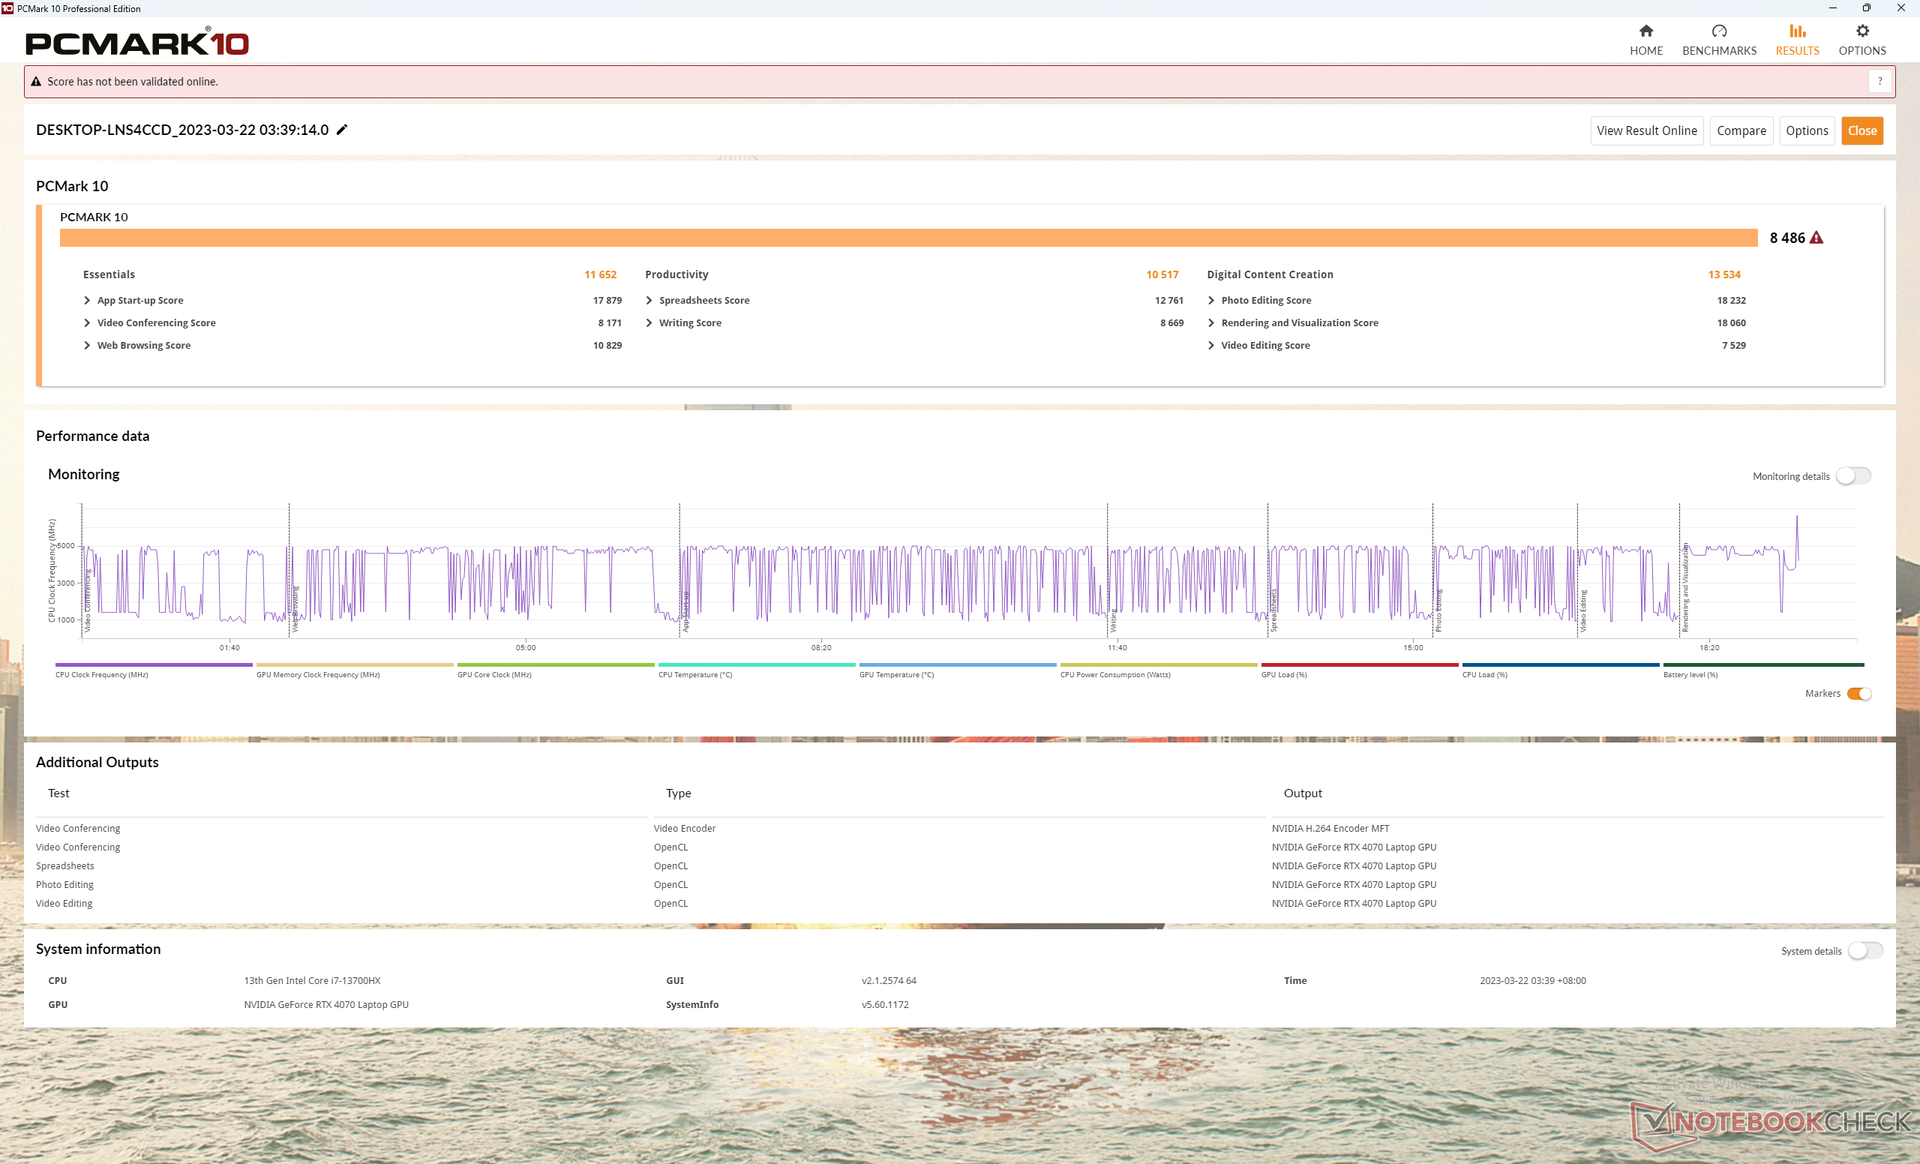
Los resultados de PCMark son comparables a los de otros portátiles para juegos de gama alta con CPU Core de 13ª generación y GPU GeForce 40, como el Gigabyte AERO 16 o el Razer Blade 16. Las puntuaciones son sistemáticamente superiores a las del Schenker XMG Neo 15 que funciona con hardware Zen 3+ y GeForce 30 más antiguo.
CrossMark: Overall | Productivity | Creativity | Responsiveness
| PCMark 10 / Score | |
| Uniwill GM6PX7X RTX 4070 | |
| Schenker XMG Neo 16 E23 | |
| Gigabyte AERO 16 OLED BSF | |
| Razer Blade 16 Early 2023 | |
| Lenovo Legion Pro 7 16IRX8H | |
| Asus ROG Strix G16 G614JZ | |
| PCMark 10 / Essentials | |
| Asus ROG Strix G16 G614JZ | |
| Lenovo Legion Pro 7 16IRX8H | |
| Uniwill GM6PX7X RTX 4070 | |
| Gigabyte AERO 16 OLED BSF | |
| Razer Blade 16 Early 2023 | |
| Schenker XMG Neo 16 E23 | |
| PCMark 10 / Productivity | |
| Lenovo Legion Pro 7 16IRX8H | |
| Uniwill GM6PX7X RTX 4070 | |
| Schenker XMG Neo 16 E23 | |
| Gigabyte AERO 16 OLED BSF | |
| Razer Blade 16 Early 2023 | |
| Asus ROG Strix G16 G614JZ | |
| PCMark 10 / Digital Content Creation | |
| Schenker XMG Neo 16 E23 | |
| Razer Blade 16 Early 2023 | |
| Gigabyte AERO 16 OLED BSF | |
| Uniwill GM6PX7X RTX 4070 | |
| Asus ROG Strix G16 G614JZ | |
| Lenovo Legion Pro 7 16IRX8H | |
| CrossMark / Overall | |
| Asus ROG Strix G16 G614JZ | |
| Schenker XMG Neo 16 E23 | |
| Uniwill GM6PX7X RTX 4070 | |
| Gigabyte AERO 16 OLED BSF | |
| Razer Blade 16 Early 2023 | |
| CrossMark / Productivity | |
| Asus ROG Strix G16 G614JZ | |
| Schenker XMG Neo 16 E23 | |
| Uniwill GM6PX7X RTX 4070 | |
| Gigabyte AERO 16 OLED BSF | |
| Razer Blade 16 Early 2023 | |
| CrossMark / Creativity | |
| Schenker XMG Neo 16 E23 | |
| Asus ROG Strix G16 G614JZ | |
| Uniwill GM6PX7X RTX 4070 | |
| Gigabyte AERO 16 OLED BSF | |
| Razer Blade 16 Early 2023 | |
| CrossMark / Responsiveness | |
| Asus ROG Strix G16 G614JZ | |
| Gigabyte AERO 16 OLED BSF | |
| Uniwill GM6PX7X RTX 4070 | |
| Schenker XMG Neo 16 E23 | |
| Razer Blade 16 Early 2023 | |
| PCMark 10 Score | 8486 puntos | |
ayuda | ||
| AIDA64 / Memory Latency | |
| Razer Blade 16 Early 2023 | |
| Razer Blade 16 Early 2023 | |
| Razer Blade 16 Early 2023 | |
| Gigabyte AERO 16 OLED BSF | |
| Asus ROG Strix G16 G614JZ | |
| Uniwill GM6PX7X RTX 4070 | |
| Medio Intel Core i7-13700HX (81.5 - 97.9, n=11) | |
| Schenker XMG Neo 16 E23 | |
| Lenovo Legion Pro 7 16IRX8H | |
* ... más pequeño es mejor
Latencia del CPD
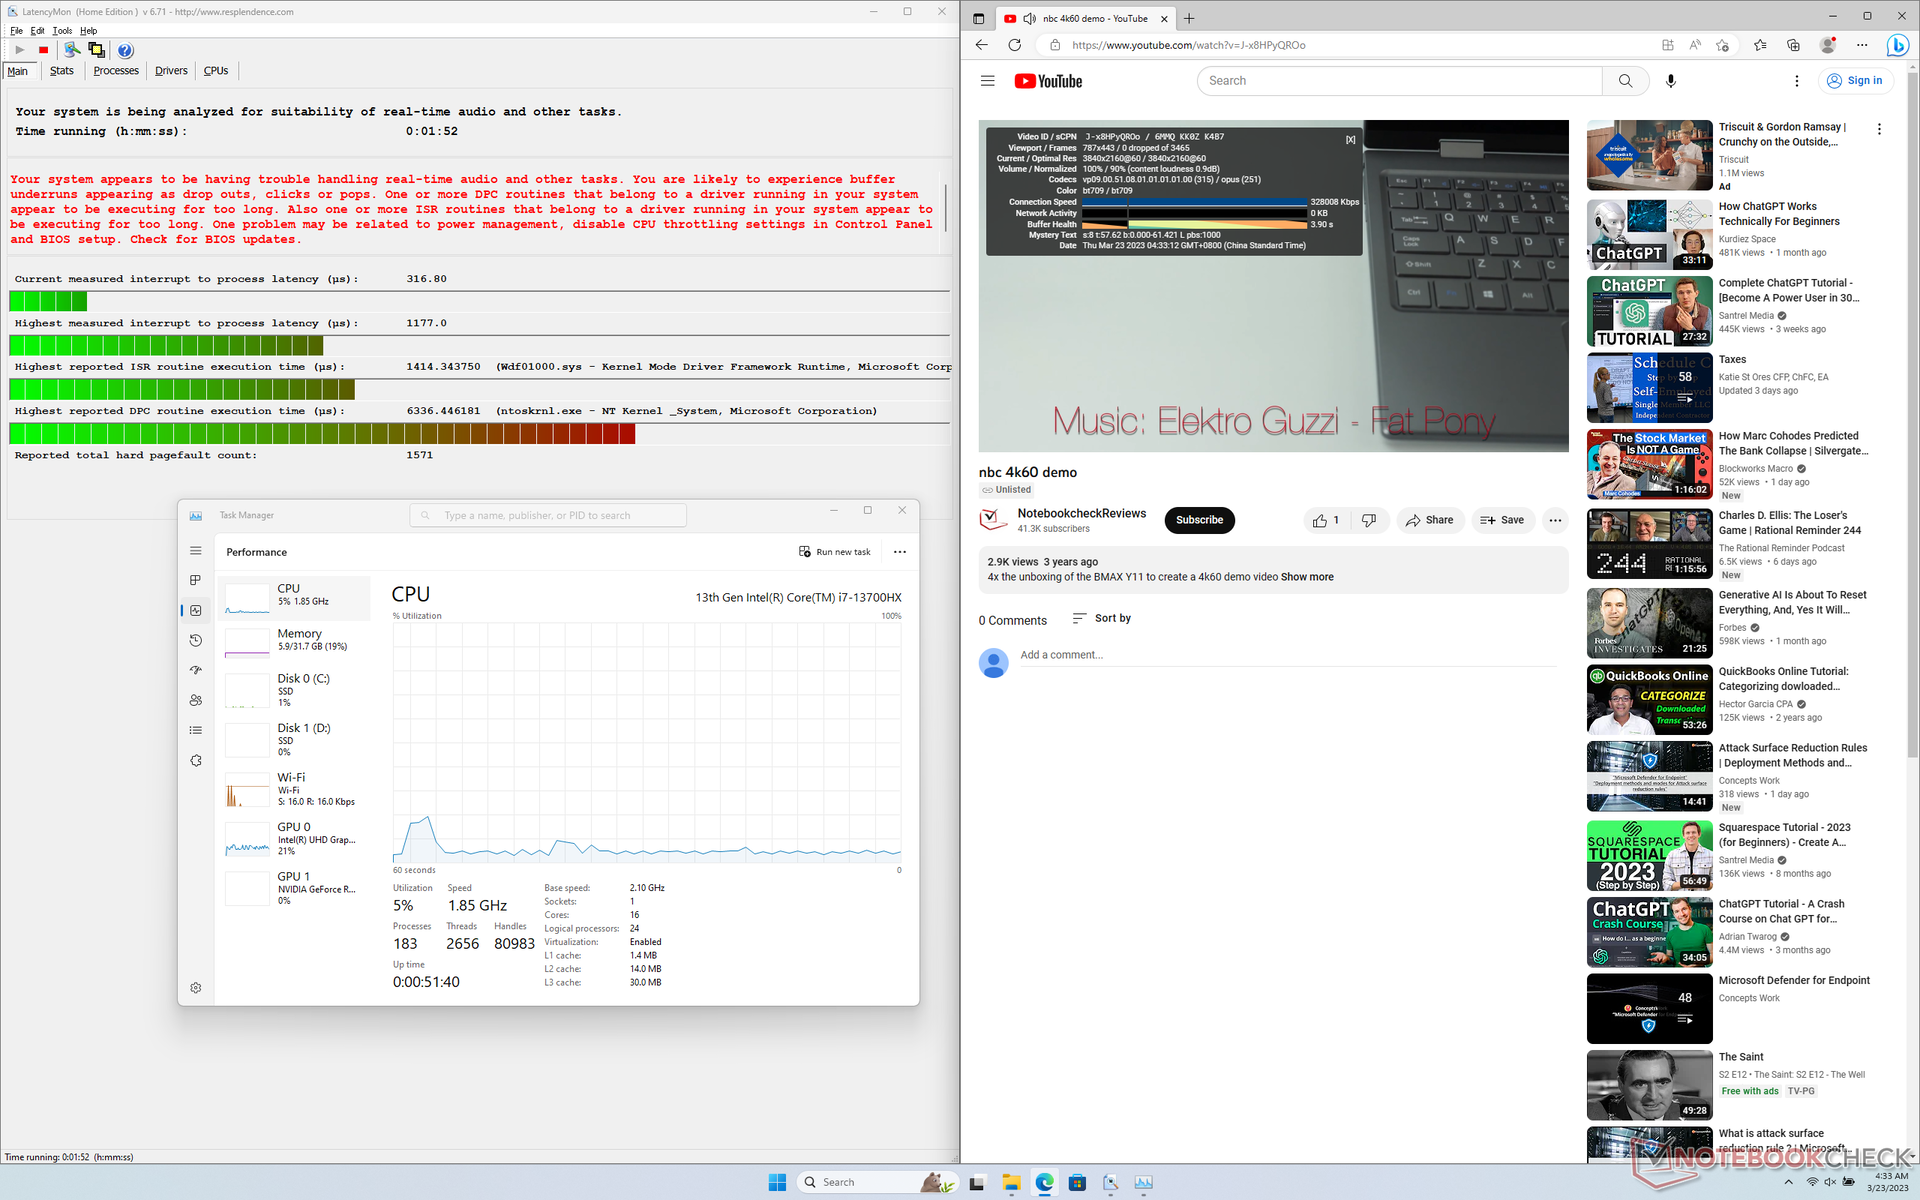
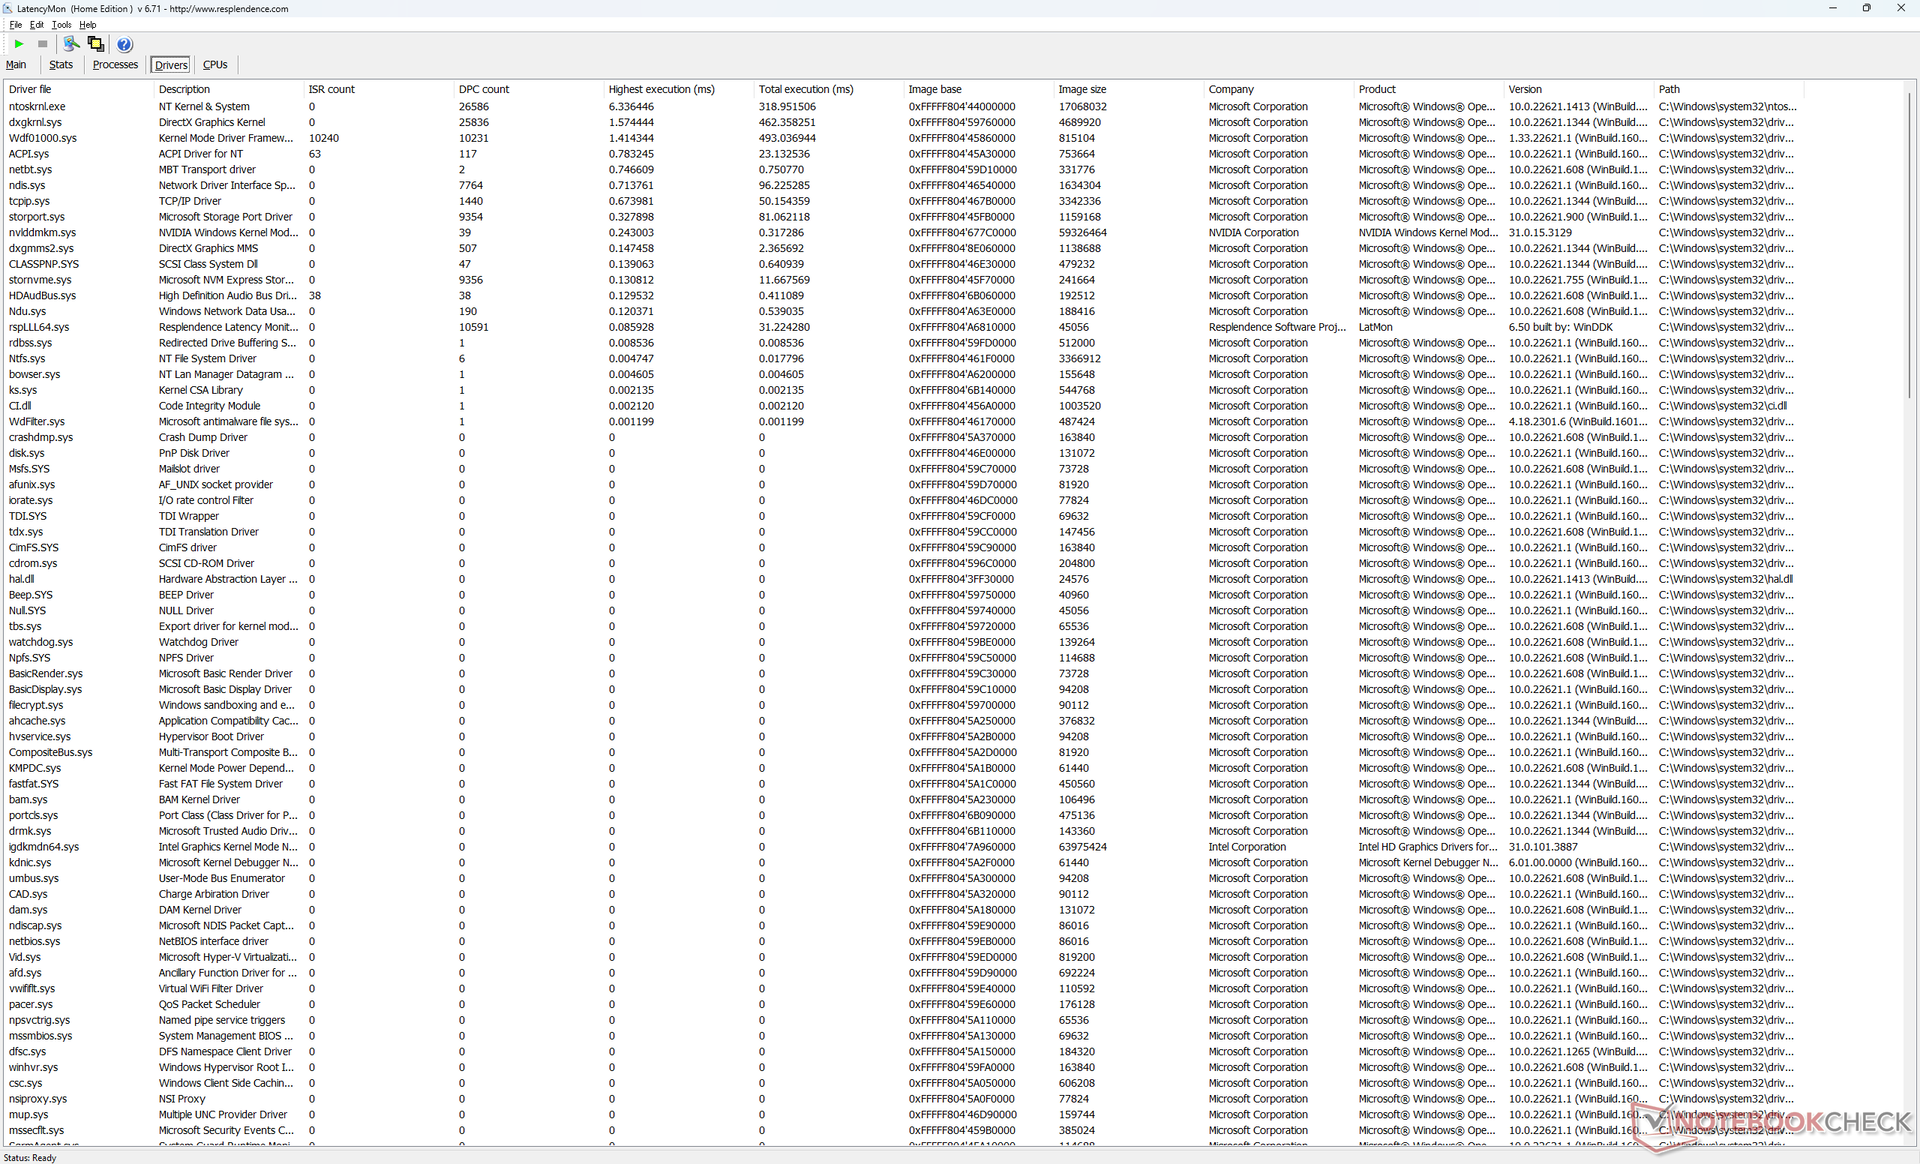
LatencyMon revela problemas de CPD al abrir varias pestañas del navegador en nuestra página de inicio. por lo demás, la reproducción de vídeo 4K a 60 FPS es perfecta, con bajo uso de CPU y GPU y sin caídas de frames.
| DPC Latencies / LatencyMon - interrupt to process latency (max), Web, Youtube, Prime95 | |
| Schenker XMG Neo 16 E23 | |
| Asus ROG Strix G16 G614JZ | |
| Razer Blade 16 Early 2023 | |
| Uniwill GM6PX7X RTX 4070 | |
| Gigabyte AERO 16 OLED BSF | |
| Lenovo Legion Pro 7 16IRX8H | |
* ... más pequeño es mejor
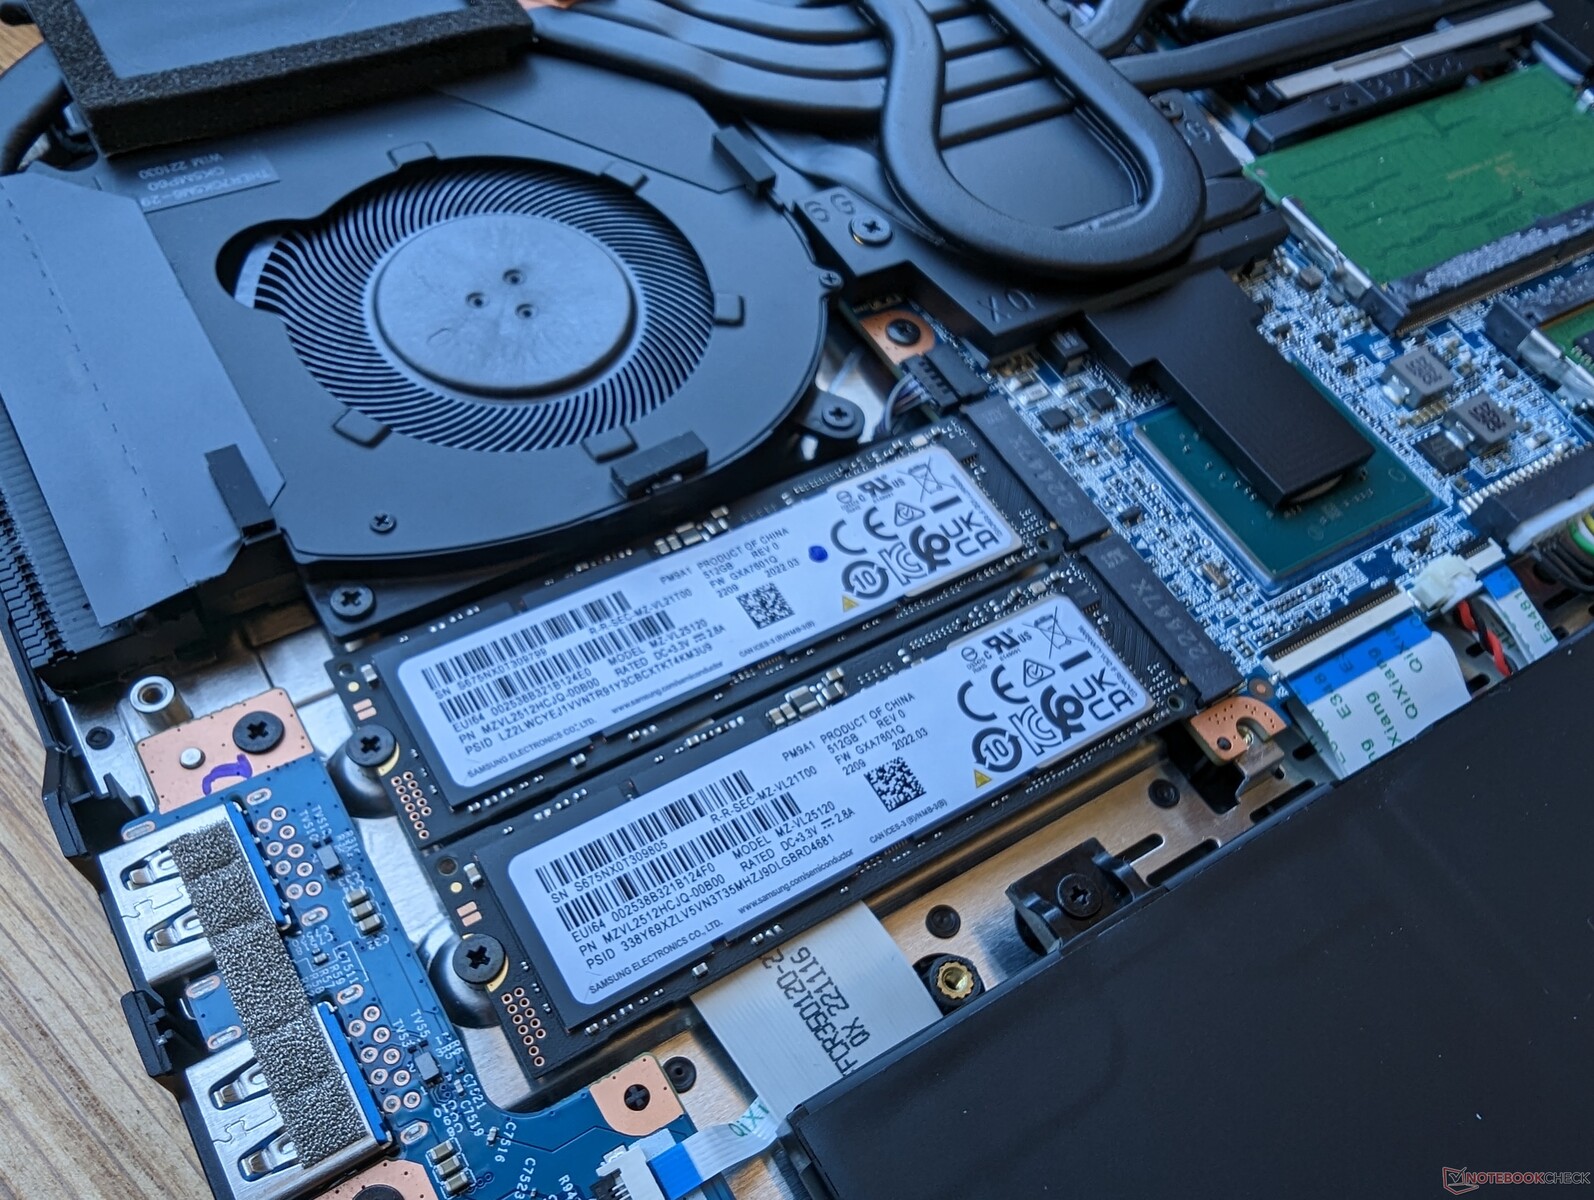
Dispositivos de almacenamiento
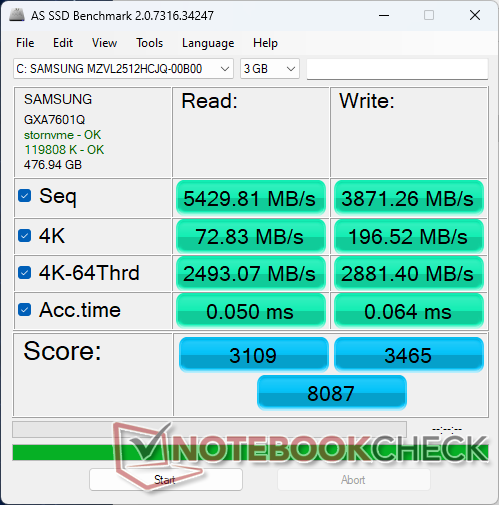
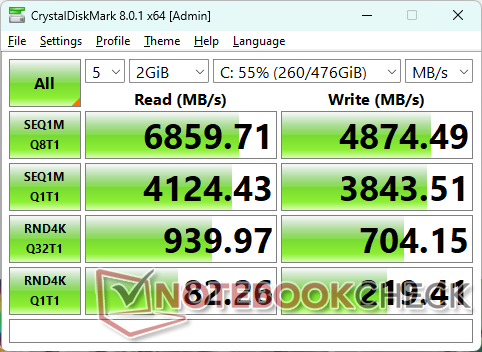
Nuestra unidad de prueba se suministra con un PCIe4 x4 Samsung PM9A1 MZVL2512HCJQ SSD NVMe que admite velocidades de lectura secuencial de 6700 MB/s. Las rápidas tasas también son sostenibles sin caídas de rendimiento bajo estrés.

| Drive Performance rating - Percent | |
| Lenovo Legion Pro 7 16IRX8H | |
| Uniwill GM6PX7X RTX 4070 | |
| Gigabyte AERO 16 OLED BSF | |
| Razer Blade 16 Early 2023 | |
| Asus ROG Strix G16 G614JZ | |
| Schenker XMG Neo 16 E23 | |
* ... más pequeño es mejor
Disk Throttling: DiskSpd Read Loop, Queue Depth 8
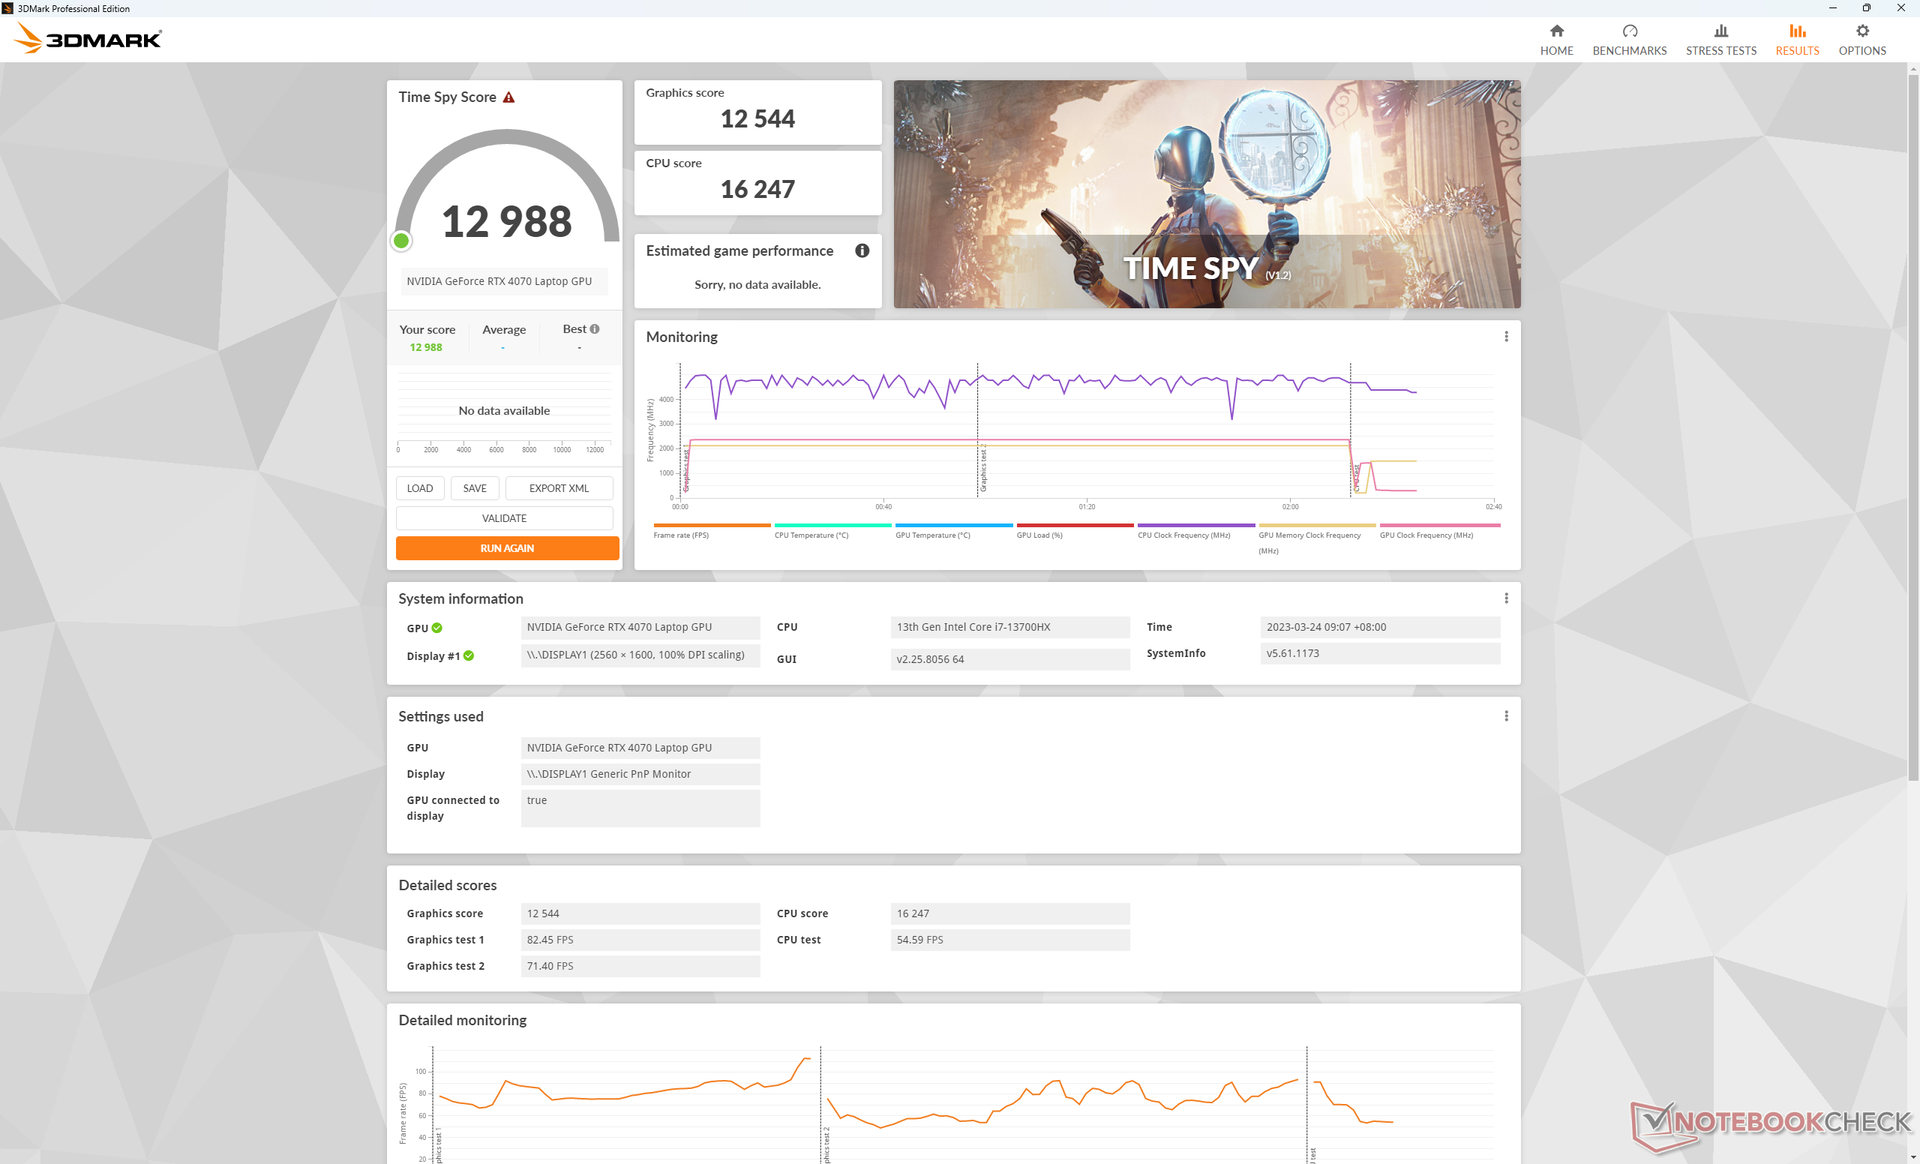
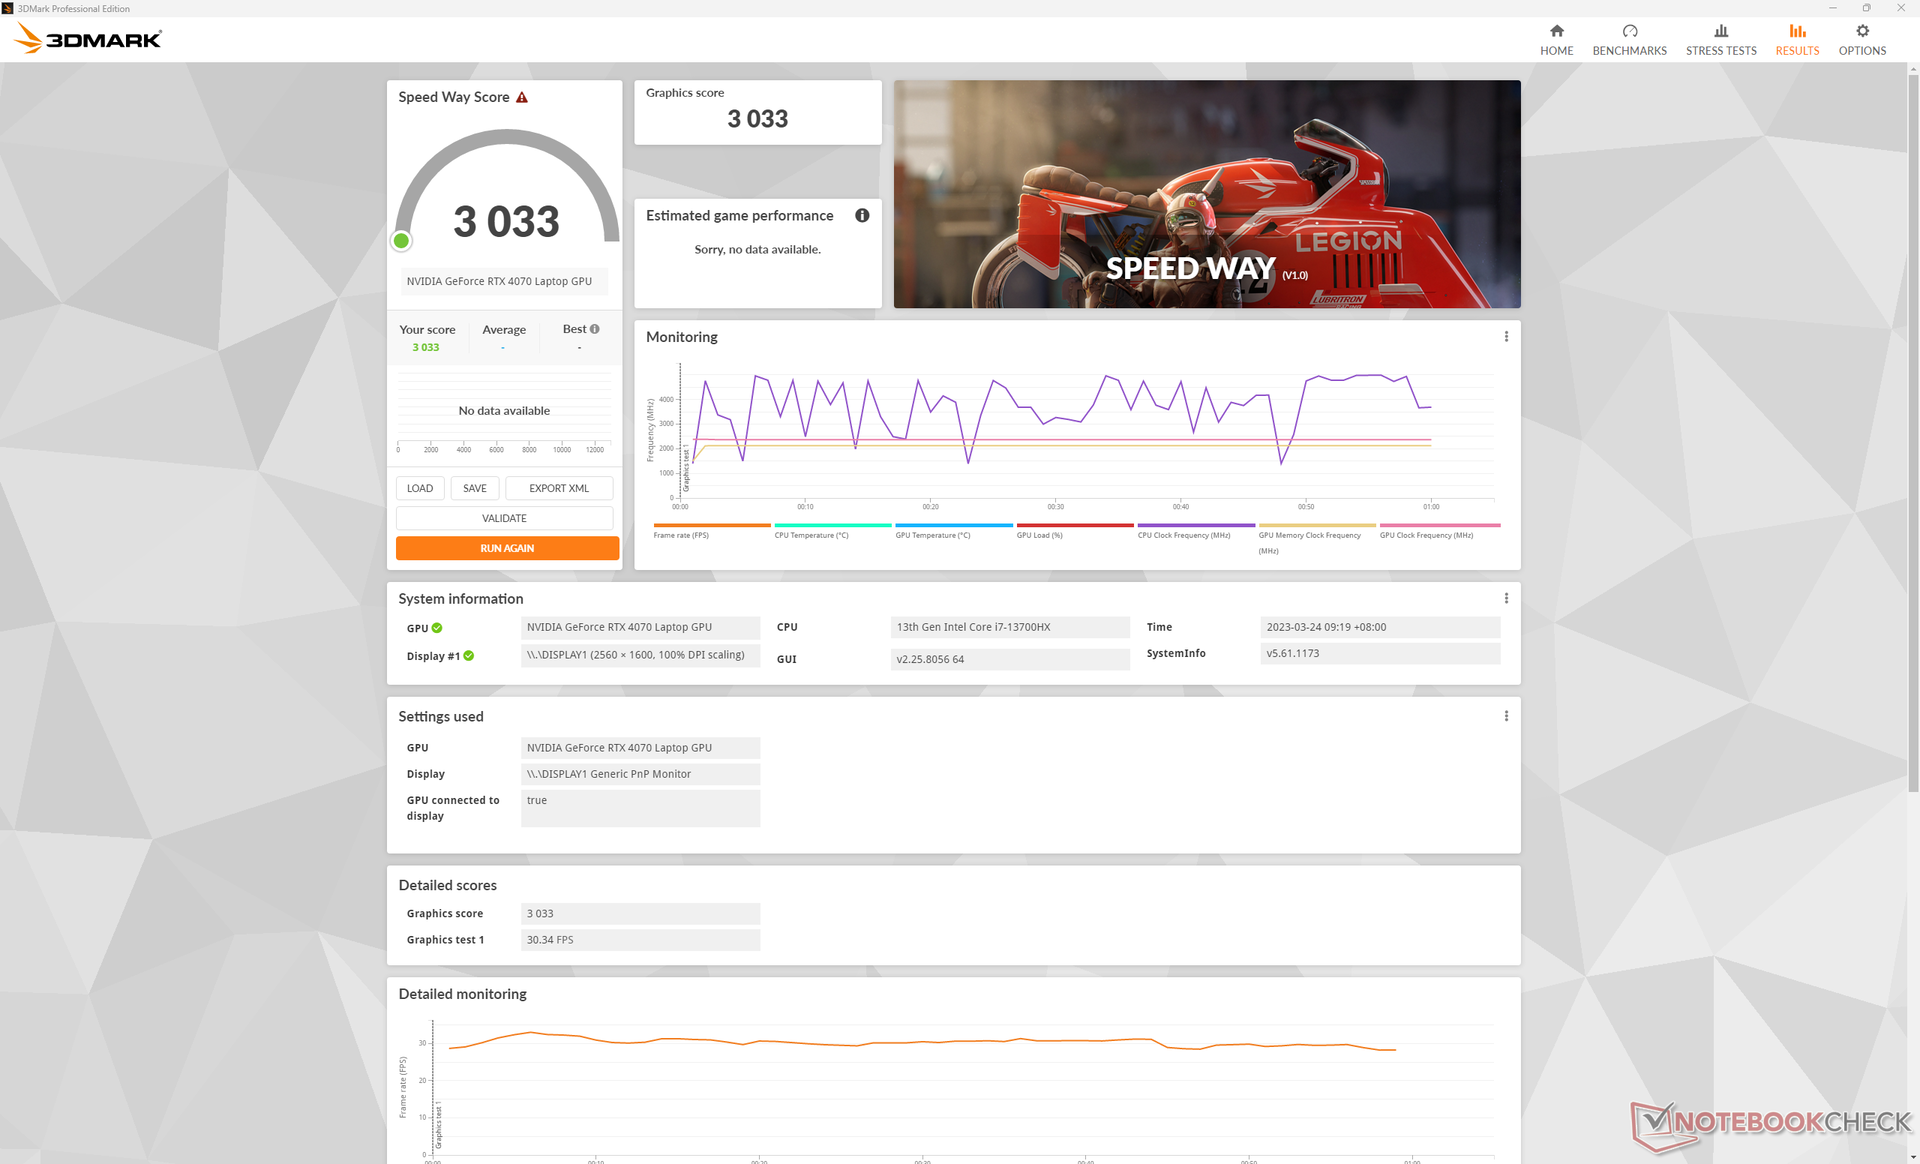
Rendimiento de la GPU
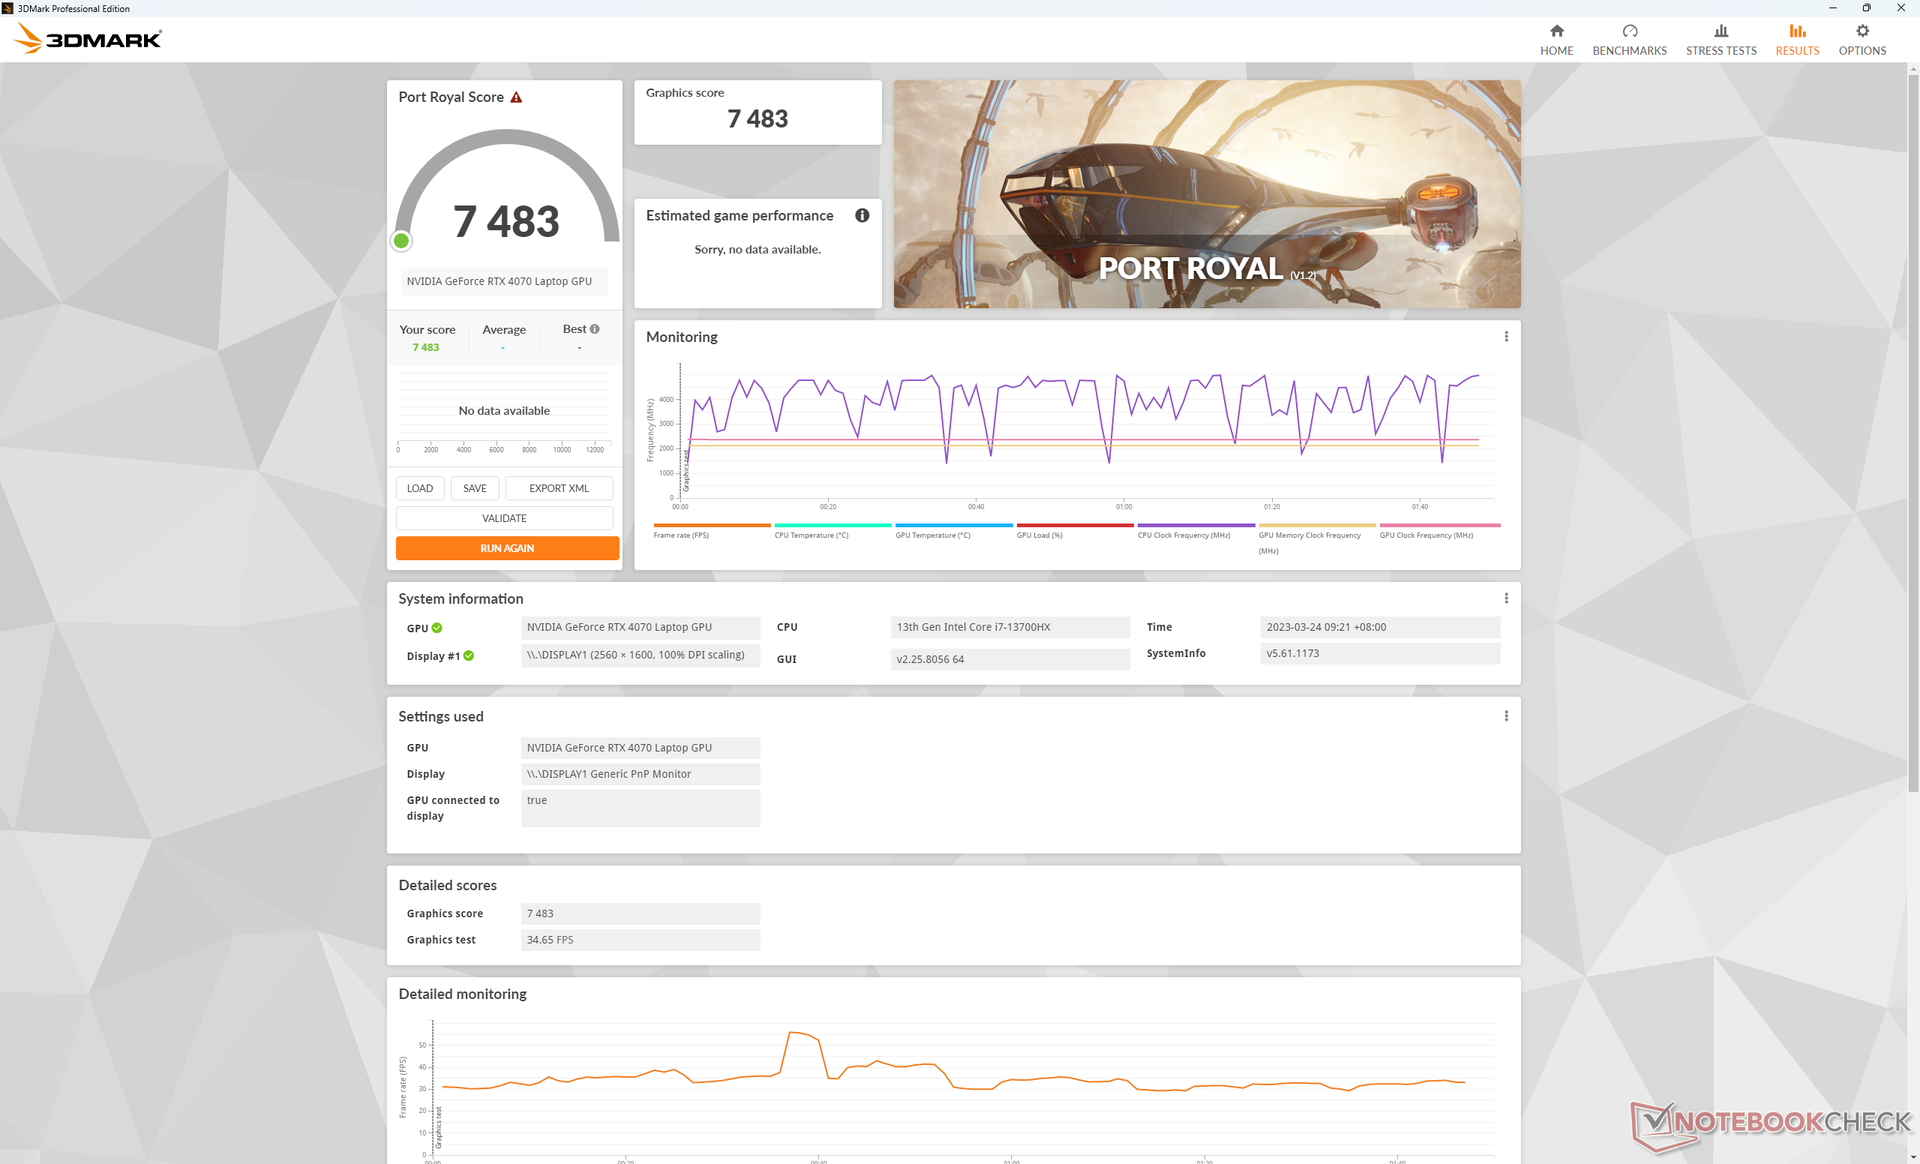
Después de haber probado un puñado de GeForce RTX 4060, 4070, 4080 y 4090 hasta ahora, las diferencias de rendimiento esperadas entre ellos están quedando claras. En cuanto a la RTX 4070 de 140 W para portátiles, los usuarios pueden esperar que sea entre un 15 y un 20 % más rápida que la RTX 4060 para portátiles o entre un 30 y un 35 % más lenta que la RTX 4080 de 175 W para portátiles. Por tanto, la diferencia de rendimiento entre la RTX 4070 y la RTX 4080 es mucho mayor que entre la RTX 4060 y la RTX 4070. Puede que sea la forma que tiene Nvidia de animar a los compradores potenciales a considerar las configuraciones de gama alta 4080 o 4090.
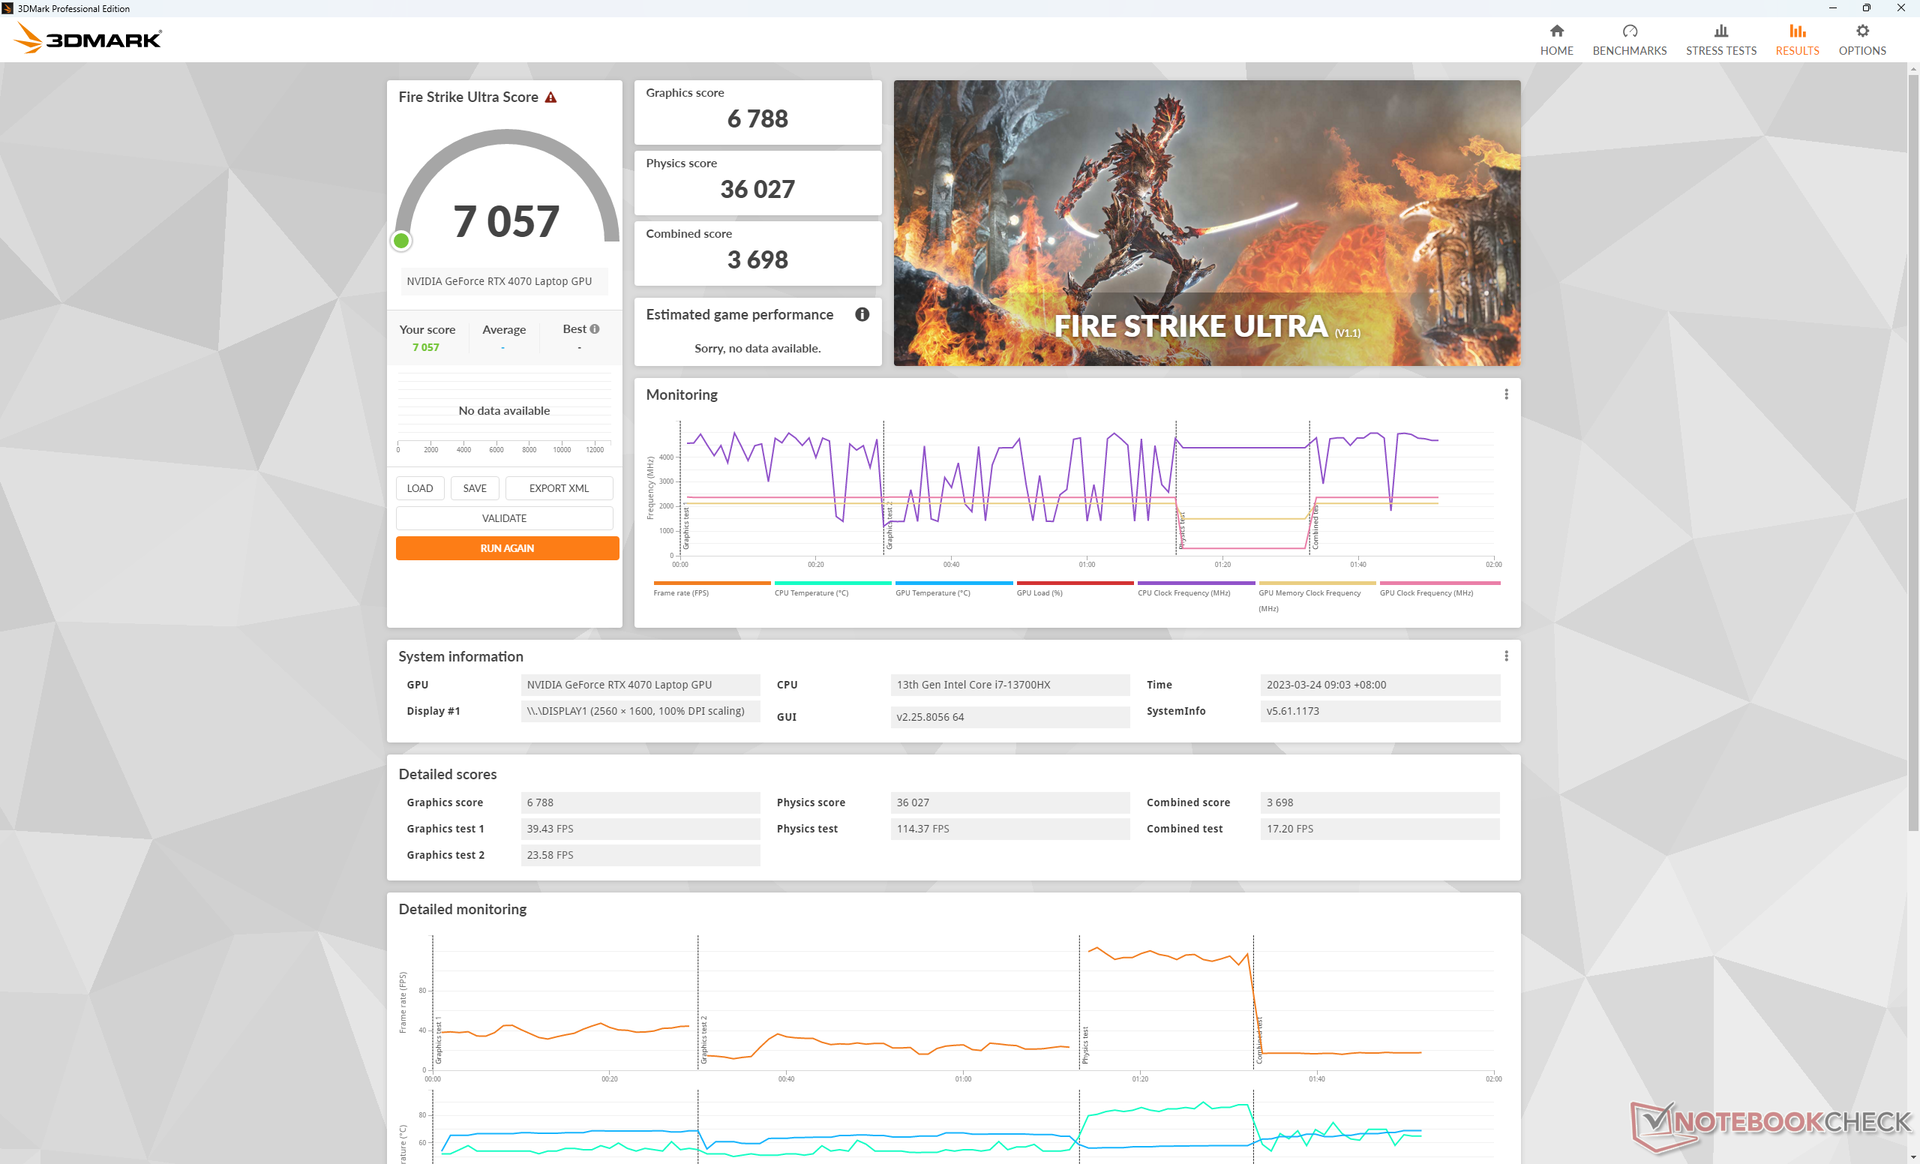
La actualización de la RTX 4070 móvil a la opción RTX 4090 móvil de 175 W aumenta el rendimiento bruto entre un 55 % y un 80 %. Los juegos extremadamente exigentes a 4K como Cyberpunk 2077 o F1 22 no se ejecutan bien en la RTX 4070 móvil a menos que se admita DLSS o la generación de fotogramas.
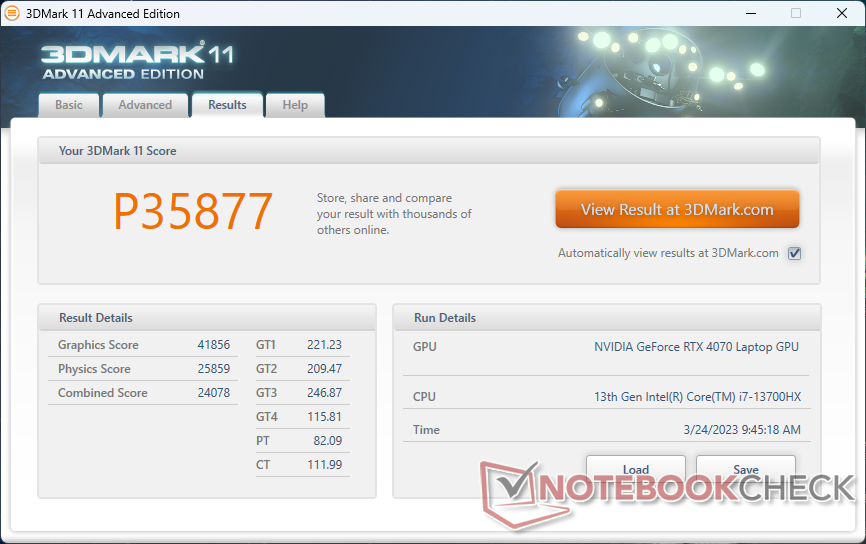
| 3DMark 11 Performance | 35877 puntos | |
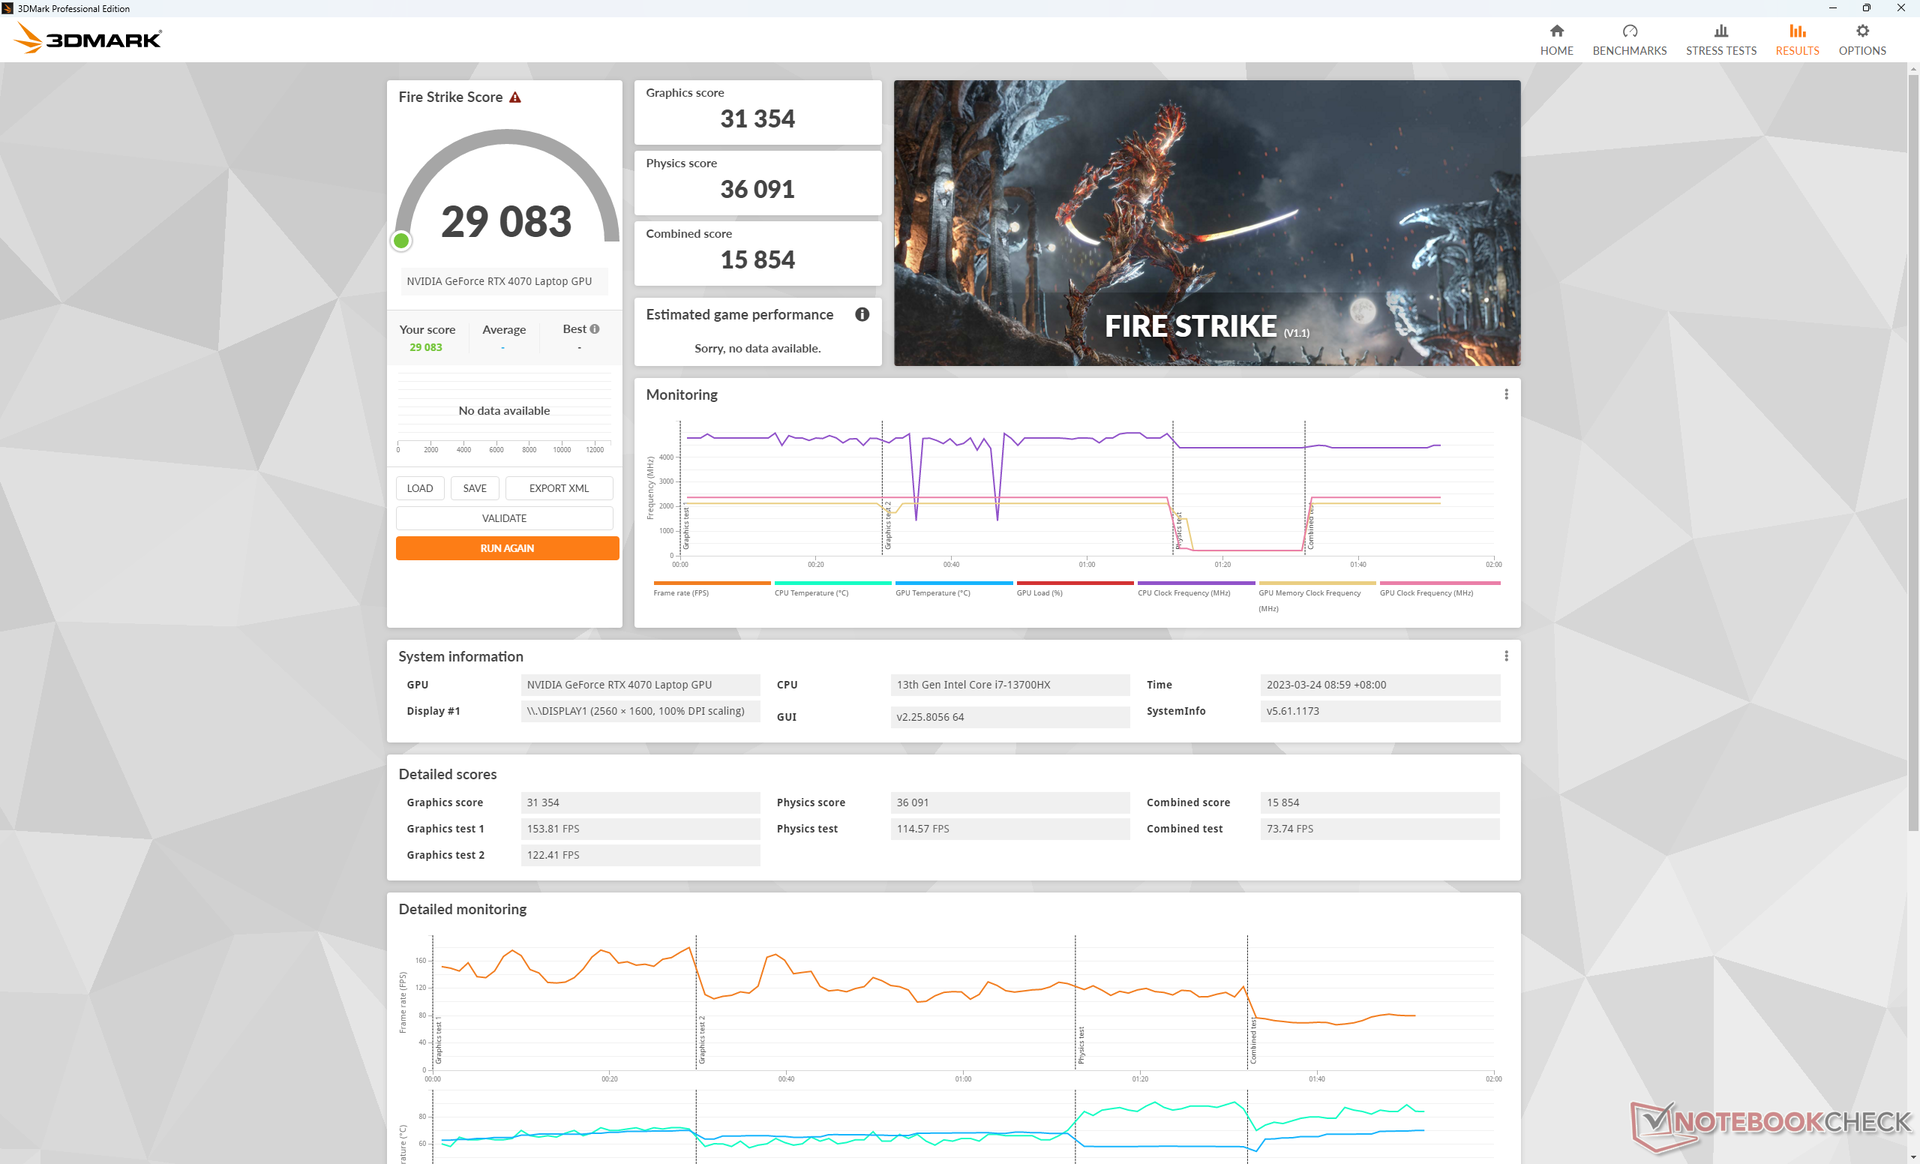
| 3DMark Fire Strike Score | 29083 puntos | |
| 3DMark Time Spy Score | 12988 puntos | |
ayuda | ||
* ... más pequeño es mejor
Witcher 3 FPS Chart
| bajo | medio | alto | ultra | QHD | 4K | |
|---|---|---|---|---|---|---|
| GTA V (2015) | 187 | 186.9 | 183.1 | 124.8 | 93.1 | 93.6 |
| The Witcher 3 (2015) | 606.3 | 430.3 | 260.5 | 123.2 | 78.8 | |
| Dota 2 Reborn (2015) | 213 | 187.9 | 187.2 | 170.2 | 146.6 | |
| Final Fantasy XV Benchmark (2018) | 227 | 177.3 | 121.2 | 88.6 | 48.8 | |
| X-Plane 11.11 (2018) | 189.4 | 165.6 | 129.2 | 109.2 | ||
| Strange Brigade (2018) | 567 | 332 | 255 | 217 | 143.3 | 75.3 |
| Cyberpunk 2077 1.6 (2022) | 182.8 | 152.9 | 115.1 | 93.6 | 55.6 | 24.4 |
| F1 22 (2022) | 310 | 306 | 231 | 83.1 | 53.8 | 26.5 |
Emisiones
Ruido del sistema
El ruido del ventilador depende del perfil de potencia y de la configuración de la GPU. Por ejemplo, si está en modo de GPU discreta, el ruido del ventilador será de 29 dB(A) cuando esté en reposo sobre el escritorio frente a un fondo silencioso de 22,4 dB(A). En comparación, el ruido del ventilador sería mucho más silencioso, con sólo 22,9 dB(A) si está en modo Optimus. Por tanto, querrás mantener el sistema en modo Optimus para tareas poco exigentes como navegación web o streaming de vídeo.
Ejecutando Witcher 3 en modo Rendimiento con la dGPU activa resultaría en un ruido de ventilador de algo menos de 49 dB(A), que es más silencioso que en muchos otros portátiles de juego de 16 pulgadas incluyendo el Neo 16 con RTX 4090 o elLenovo Legion Pro 7 16. No obstante, el ruido del ventilador aún puede alcanzar los 55 dB(A) si el título es mucho más exigente.
Ruido
| Ocioso |
| 22.9 / 29 / 29 dB(A) |
| Carga |
| 40.2 / 55 dB(A) |
 | ||
30 dB silencioso 40 dB(A) audible 50 dB(A) ruidosamente alto |
||
min: | ||
| Uniwill GM6PX7X RTX 4070 GeForce RTX 4070 Laptop GPU, i7-13700HX, Samsung PM9A1 MZVL2512HCJQ | Schenker XMG Neo 16 E23 GeForce RTX 4090 Laptop GPU, i9-13900HX, Crucial P5 Plus 1TB CT1000P5PSSD8 | Asus ROG Strix G16 G614JZ GeForce RTX 4080 Laptop GPU, i9-13980HX, WD PC SN560 SDDPNQE-1T00 | Lenovo Legion Pro 7 16IRX8H GeForce RTX 4080 Laptop GPU, i9-13900HX, Samsung PM9A1 MZVL21T0HCLR | Gigabyte AERO 16 OLED BSF GeForce RTX 4070 Laptop GPU, i9-13900H, Gigabyte AG470S1TB-SI B10 | Razer Blade 16 Early 2023 GeForce RTX 4080 Laptop GPU, i9-13950HX, SSSTC CA6-8D1024 | |
|---|---|---|---|---|---|---|
| Noise | -25% | -6% | -10% | -6% | 6% | |
| apagado / medio ambiente * (dB) | 22.4 | 25 -12% | 25 -12% | 24 -7% | 23 -3% | 23 -3% |
| Idle Minimum * (dB) | 22.9 | 31 -35% | 26 -14% | 26 -14% | 23 -0% | 23 -0% |
| Idle Average * (dB) | 29 | 33 -14% | 28 3% | 28 3% | 23 21% | 23 21% |
| Idle Maximum * (dB) | 29 | 42 -45% | 30 -3% | 34 -17% | 33.64 -16% | 23.6 19% |
| Load Average * (dB) | 40.2 | 58 -44% | 48 -19% | 47 -17% | 51.49 -28% | 39 3% |
| Witcher 3 ultra * (dB) | 48.7 | 57 -17% | 49 -1% | 55 -13% | 55.27 -13% | 51.6 -6% |
| Load Maximum * (dB) | 55 | 59 -7% | 52 5% | 56 -2% | 55.24 -0% | 51.3 7% |
* ... más pequeño es mejor
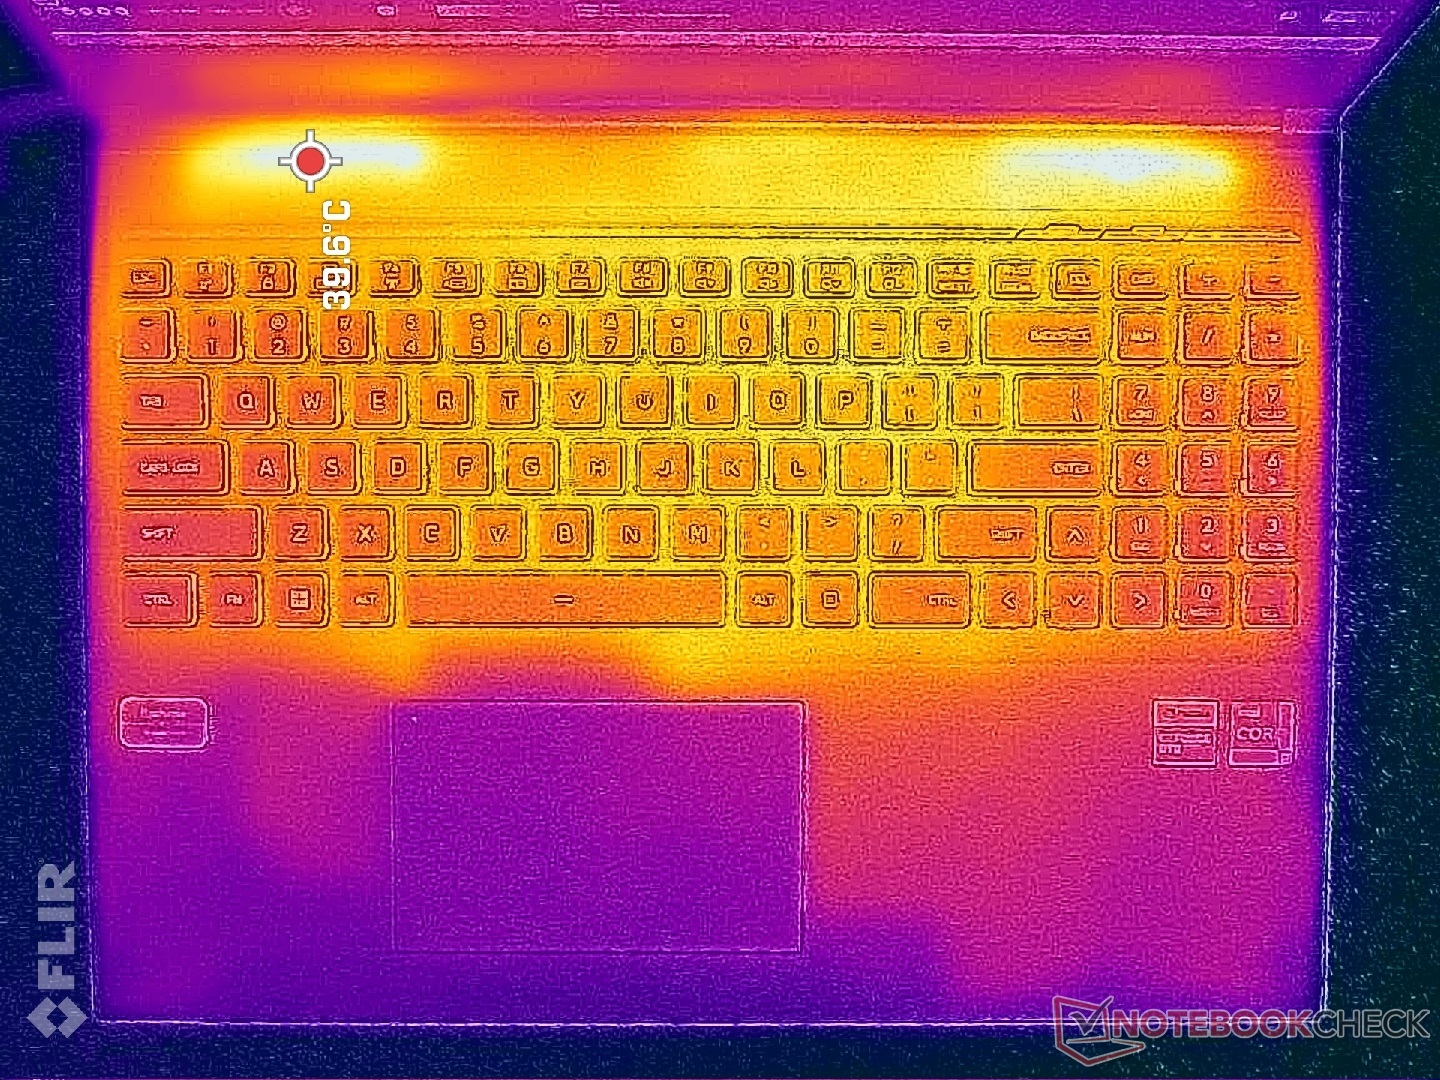
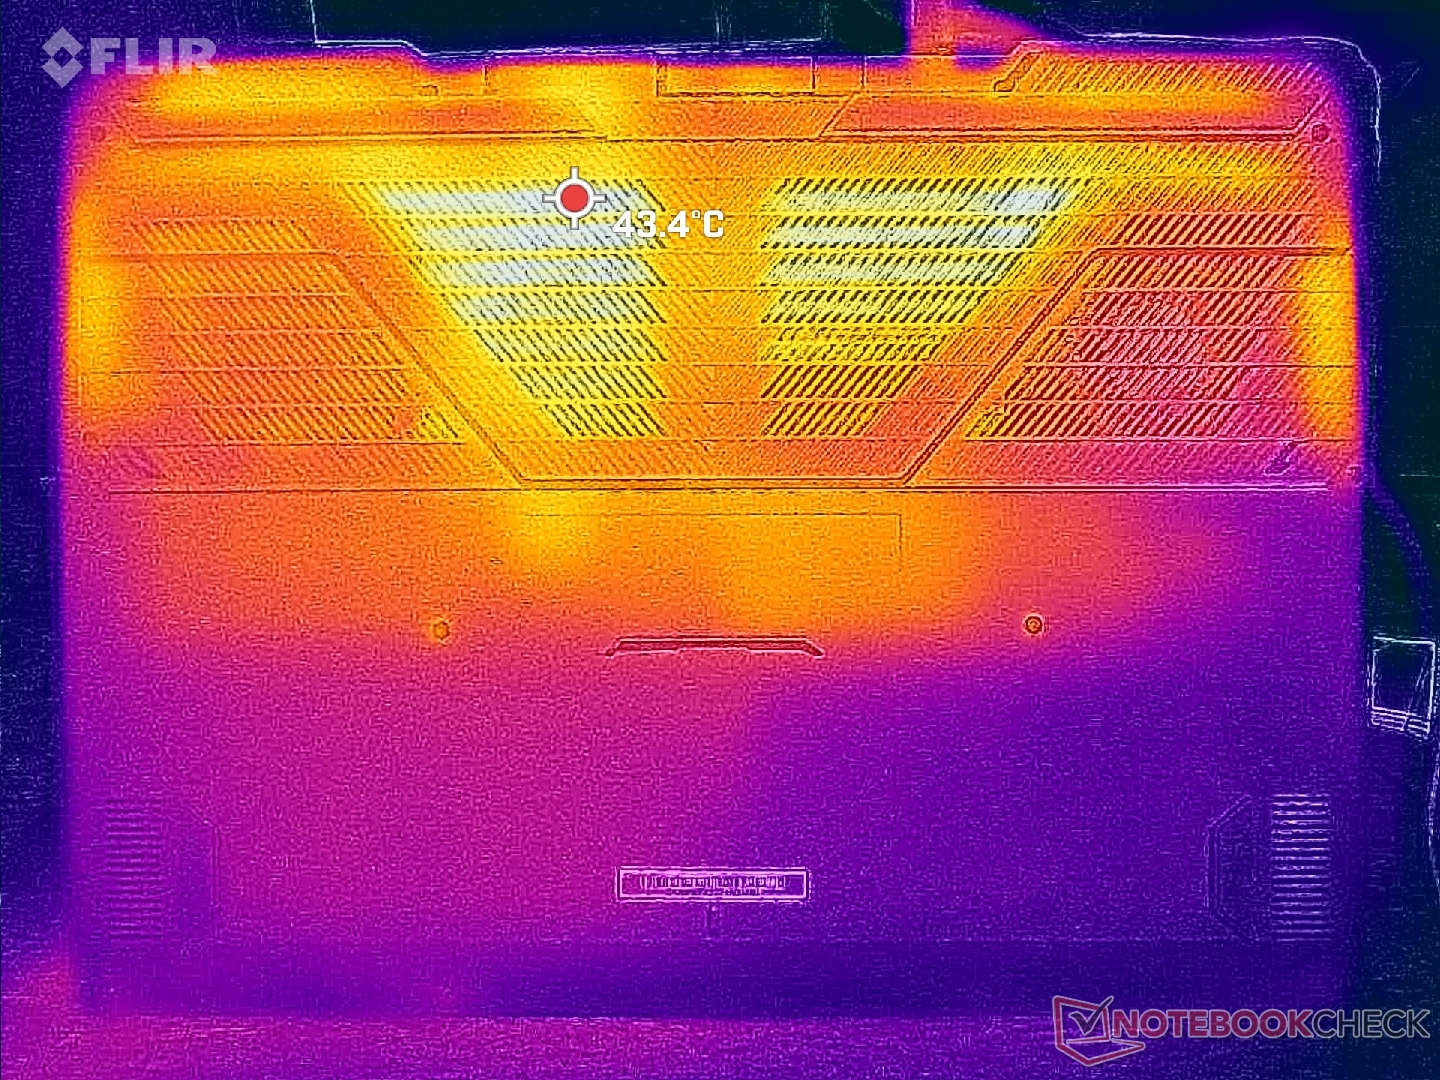
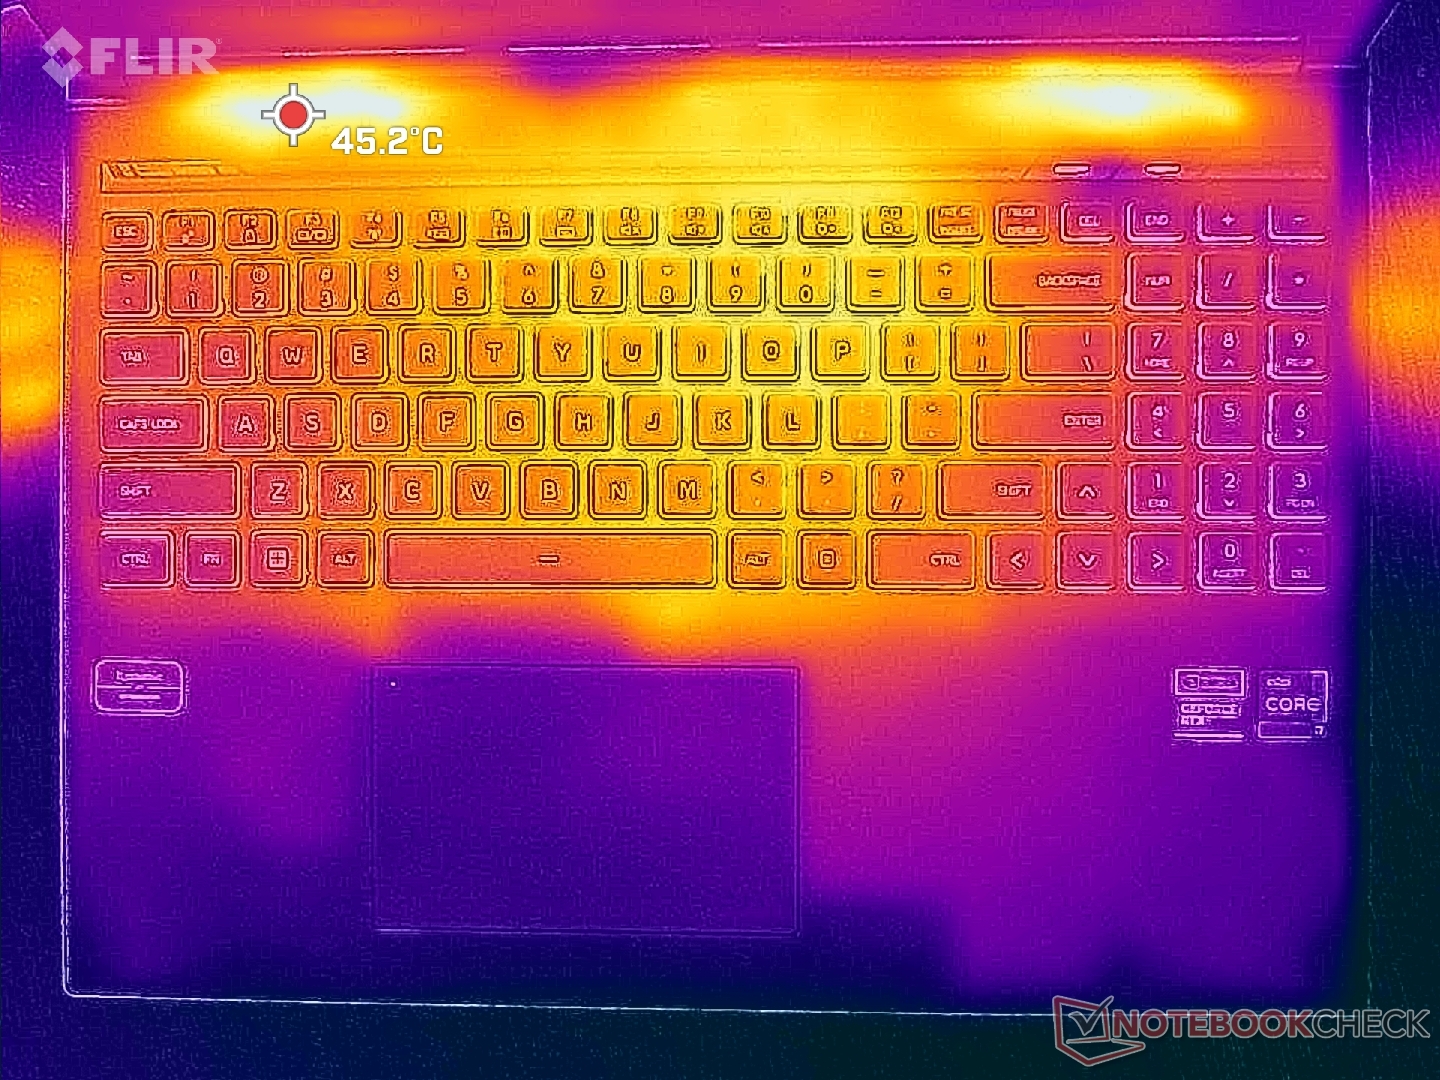
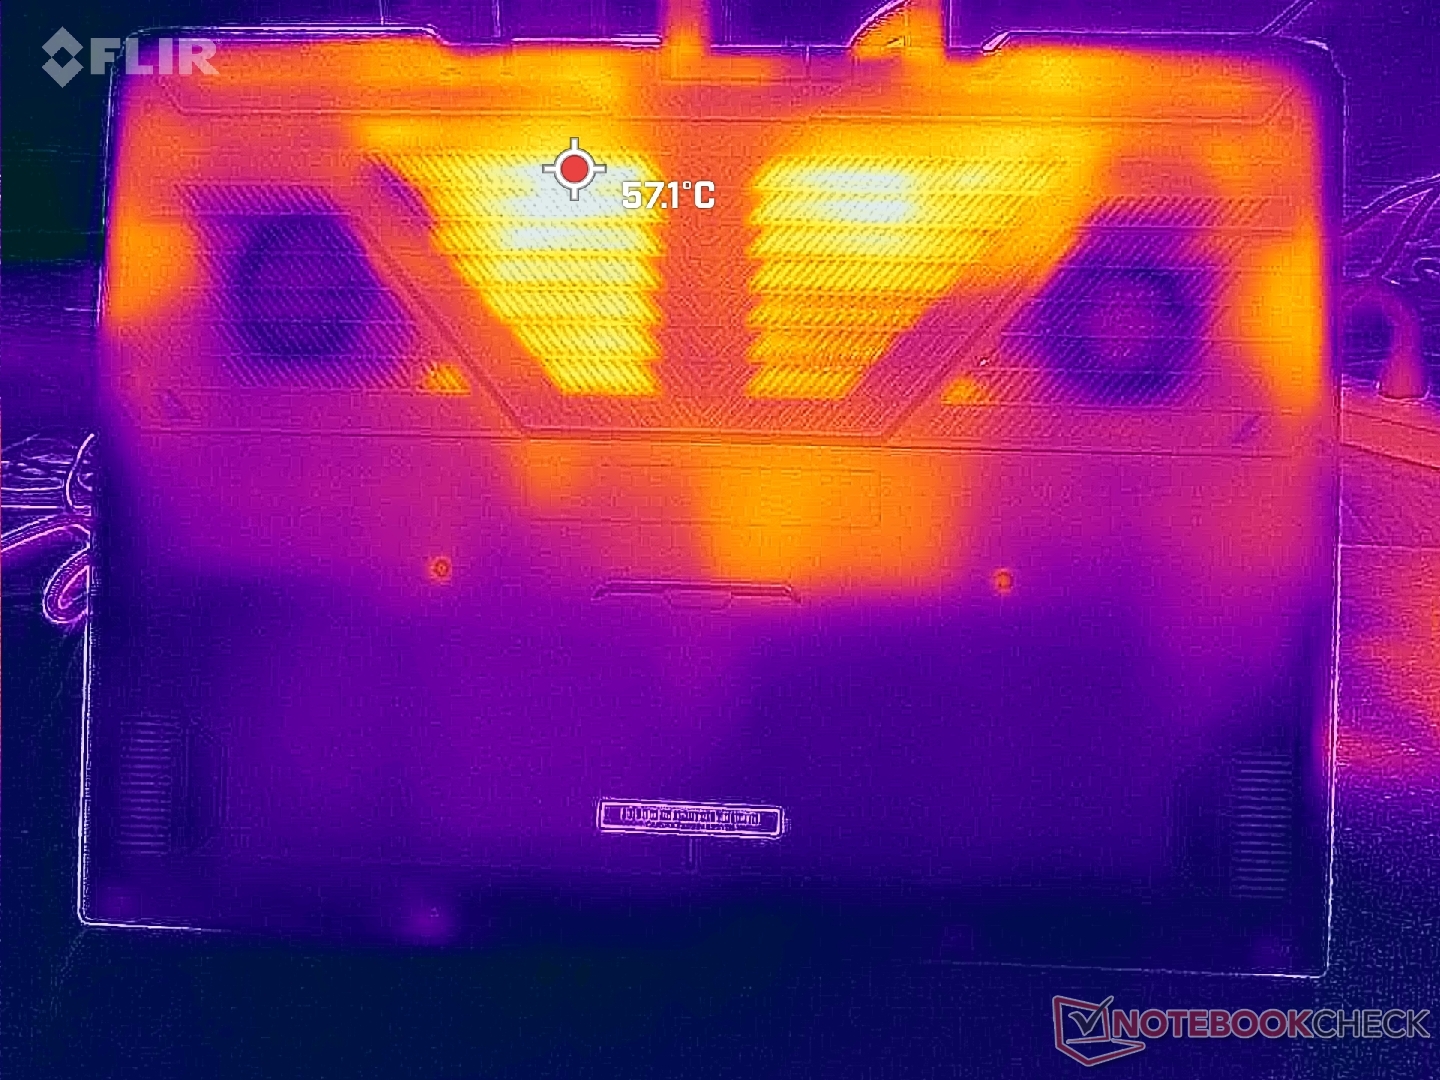
Temperatura
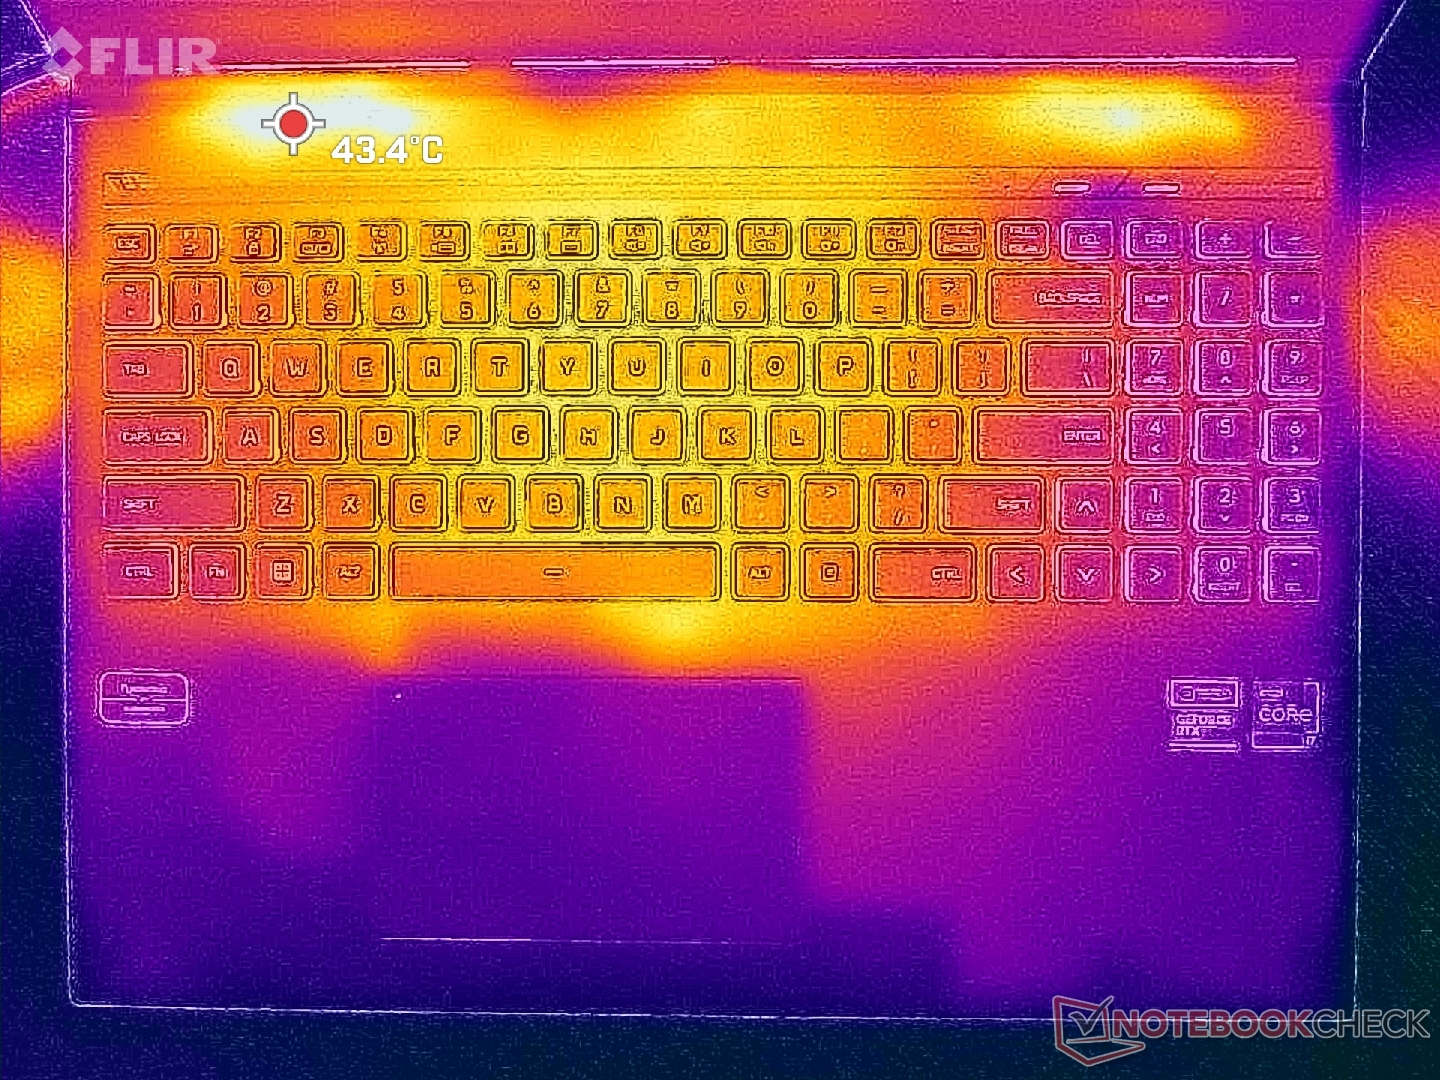
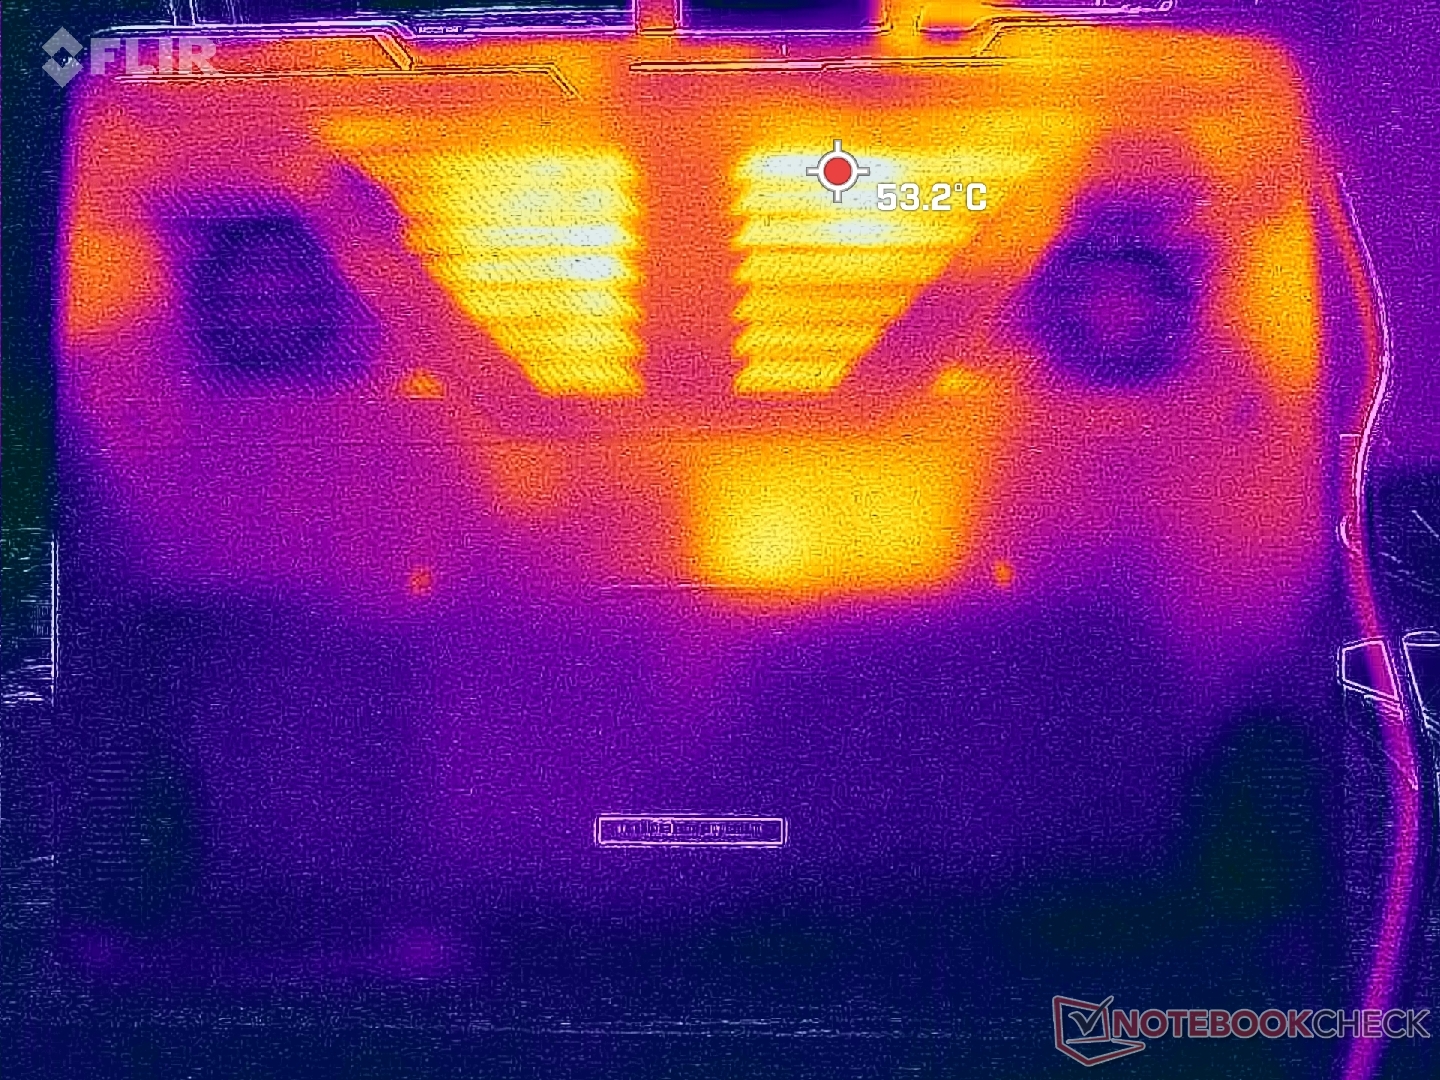
Las temperaturas de la superficie durante los juegos son relativamente bajas en comparación con otros portátiles de 16 pulgadas para juegos. ElAsus ROG Strix G16por ejemplo, puede superar los 54 C, mientras que los puntos calientes del Uniwill alcanzan los 40 C en la parte superior y los 45 C en la inferior. Las temperaturas son más frías que en el Neo 16 con RTX 4090 por unos pocos grados C también bajo cargas de juego similares.
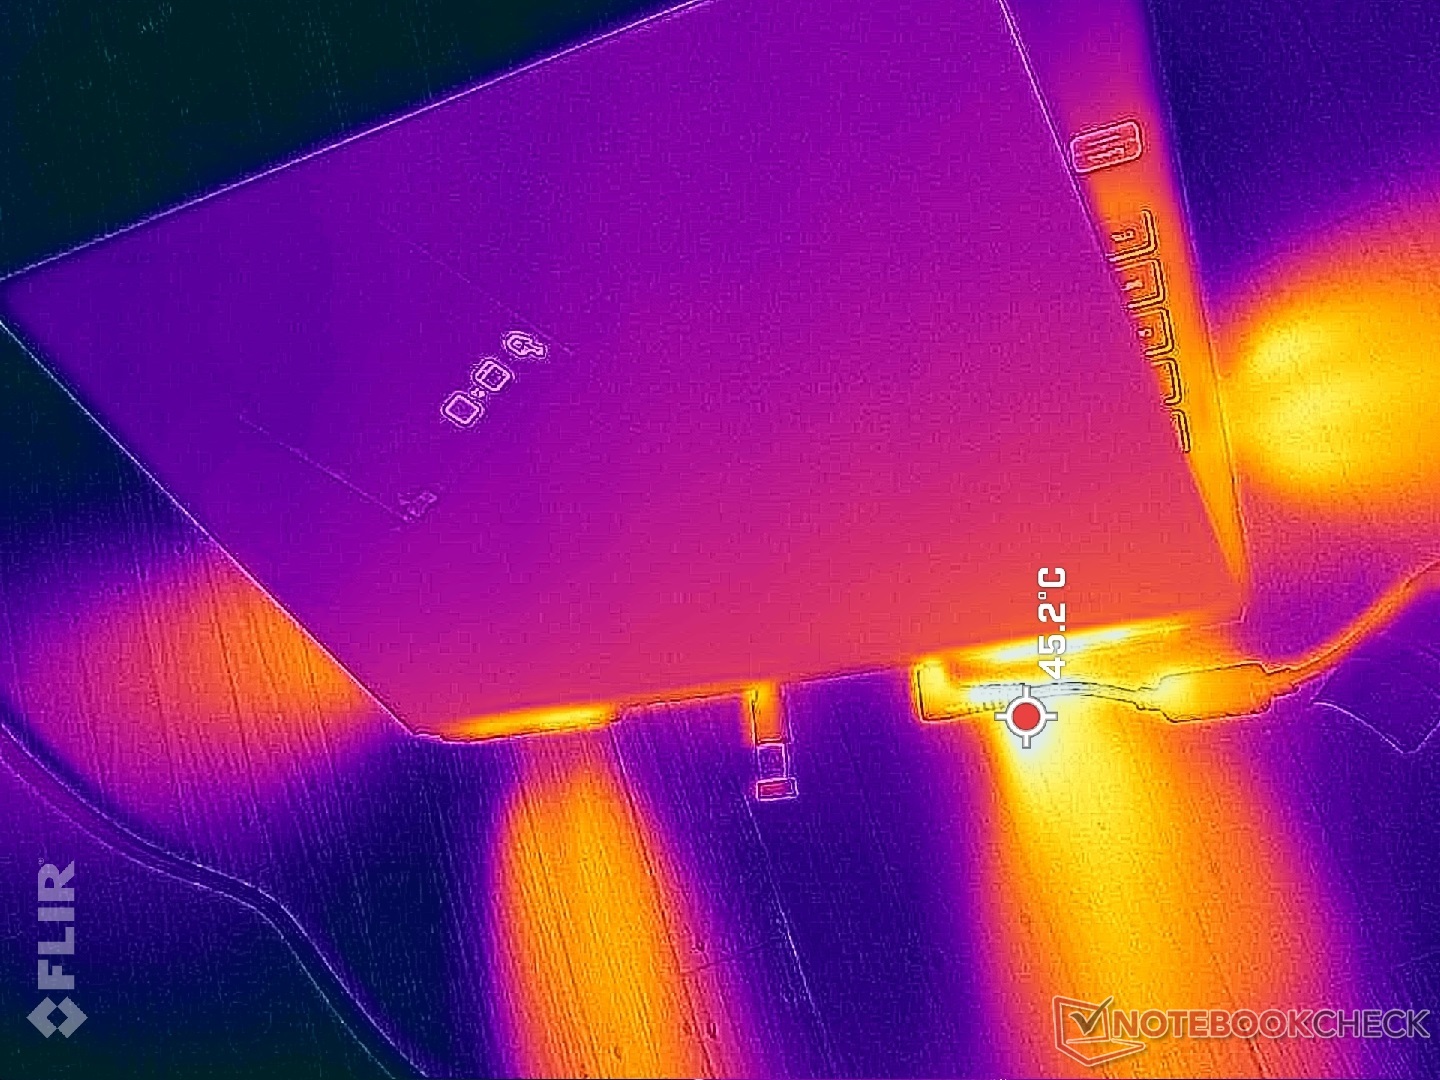
(+) La temperatura máxima en la parte superior es de 38.2 °C / 101 F, frente a la media de 40.4 °C / 105 F, que oscila entre 21.2 y 68.8 °C para la clase Gaming.
(±) El fondo se calienta hasta un máximo de 45 °C / 113 F, frente a la media de 43.2 °C / 110 F
(+) En reposo, la temperatura media de la parte superior es de 28.9 °C / 84# F, frente a la media del dispositivo de 33.9 °C / 93 F.
(±) Jugando a The Witcher 3, la temperatura media de la parte superior es de 32.7 °C / 91 F, frente a la media del dispositivo de 33.9 °C / 93 F.
(+) El reposamanos y el panel táctil están a una temperatura inferior a la de la piel, con un máximo de 26.4 °C / 79.5 F y, por tanto, son fríos al tacto.
(+) La temperatura media de la zona del reposamanos de dispositivos similares fue de 28.8 °C / 83.8 F (+2.4 °C / 4.3 F).
| Uniwill GM6PX7X RTX 4070 Intel Core i7-13700HX, NVIDIA GeForce RTX 4070 Laptop GPU | Schenker XMG Neo 16 E23 Intel Core i9-13900HX, NVIDIA GeForce RTX 4090 Laptop GPU | Asus ROG Strix G16 G614JZ Intel Core i9-13980HX, NVIDIA GeForce RTX 4080 Laptop GPU | Lenovo Legion Pro 7 16IRX8H Intel Core i9-13900HX, NVIDIA GeForce RTX 4080 Laptop GPU | Gigabyte AERO 16 OLED BSF Intel Core i9-13900H, NVIDIA GeForce RTX 4070 Laptop GPU | Razer Blade 16 Early 2023 Intel Core i9-13950HX, NVIDIA GeForce RTX 4080 Laptop GPU | |
|---|---|---|---|---|---|---|
| Heat | 2% | -8% | -9% | 16% | 9% | |
| Maximum Upper Side * (°C) | 38.2 | 50 -31% | 54 -41% | 48 -26% | 41 -7% | 40 -5% |
| Maximum Bottom * (°C) | 45 | 51 -13% | 55 -22% | 49 -9% | 47 -4% | 37.6 16% |
| Idle Upper Side * (°C) | 33.6 | 28 17% | 29 14% | 40 -19% | 23 32% | 32.4 4% |
| Idle Bottom * (°C) | 39.6 | 26 34% | 33 17% | 33 17% | 23 42% | 31.4 21% |
* ... más pequeño es mejor
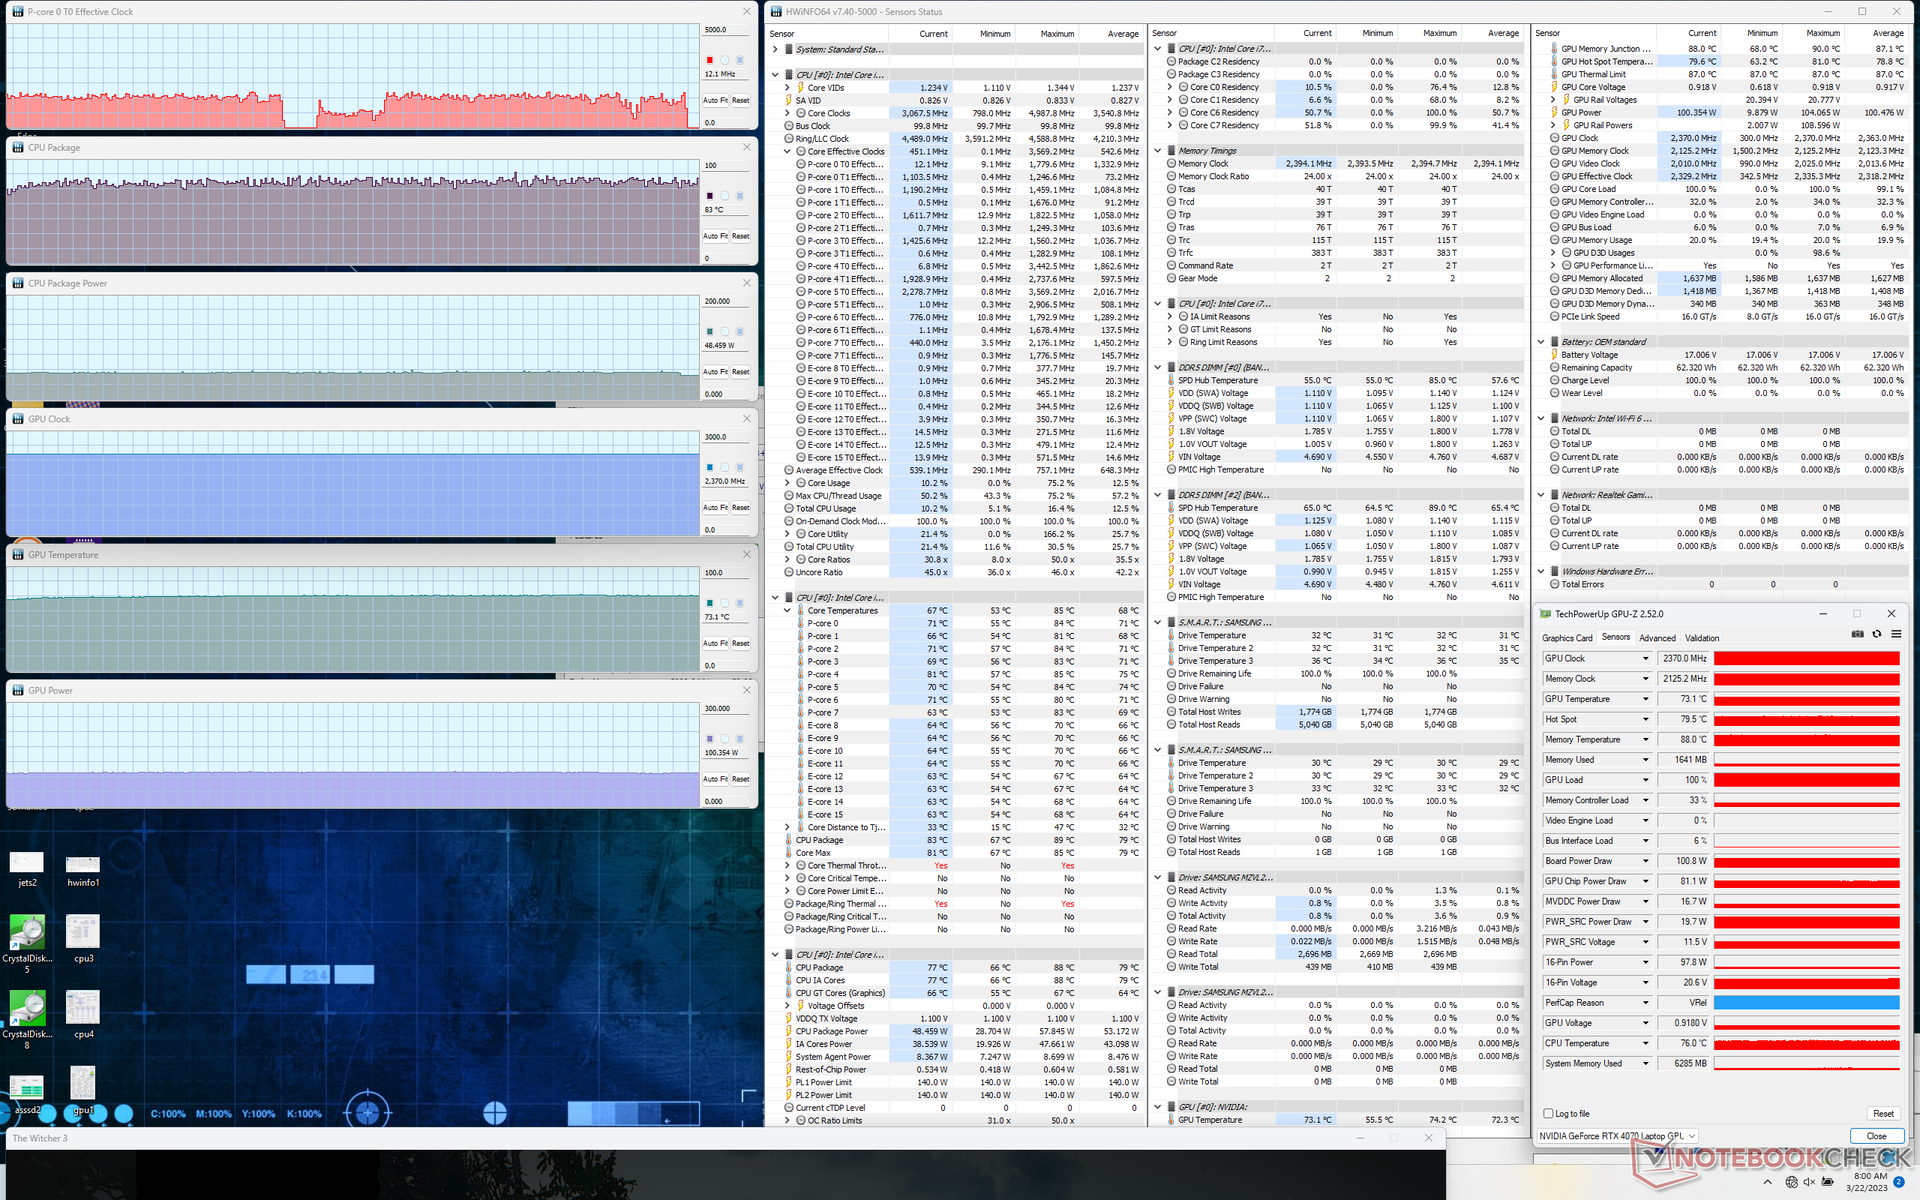
Prueba de resistencia
Cuando se sometió a Prime95, la CPU alcanzó los 4 GHz y 130 W sólo durante los primeros minutos. Después, la velocidad de reloj y el consumo de la placa caen a 3,4 GHz y 122 W, respectivamente. La temperatura del núcleo rondaría los 90 C, una temperatura muy alta incluso para un portátil de juegos. Ejecutar esta misma prueba en el Razer Blade 16, por ejemplo, daría como resultado una temperatura de la CPU mucho más cercana a los 80 C.
La temperatura de la CPU y la GPU en Witcher 3 se estabilizaría en 83 C y 73 C, respectivamente, frente a los 78 C del Blade 16. El consumo de energía de la GPU se estabilizaría en 100 W, frente a los 140 W del TGP.
Funcionar con batería limita el rendimiento como era de esperar. Un test Fire Strike con baterías arrojaría unas puntuaciones de Física y Gráficos de 9314 y 11777 puntos, respectivamente, comparados con los 36091 y 31354 puntos de la red eléctrica.
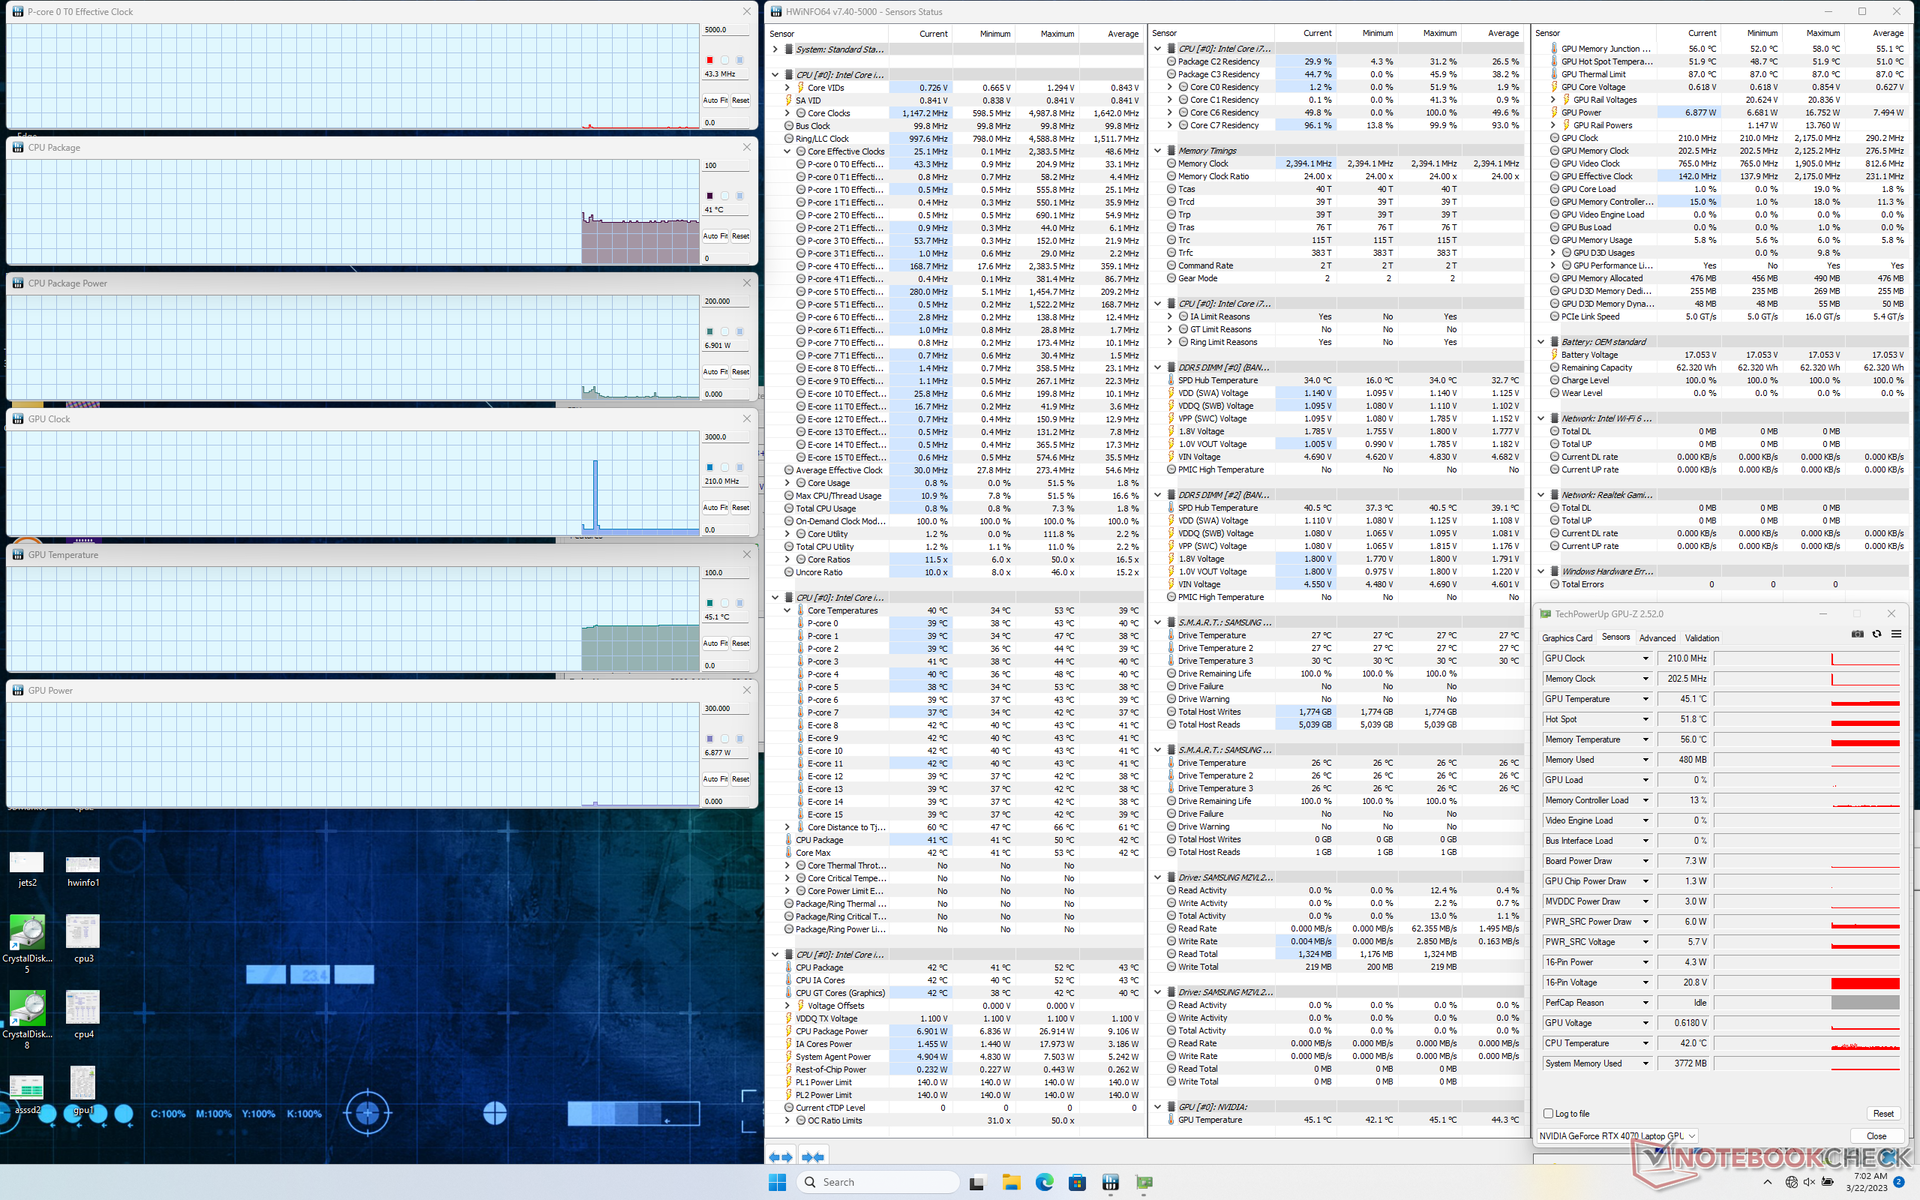
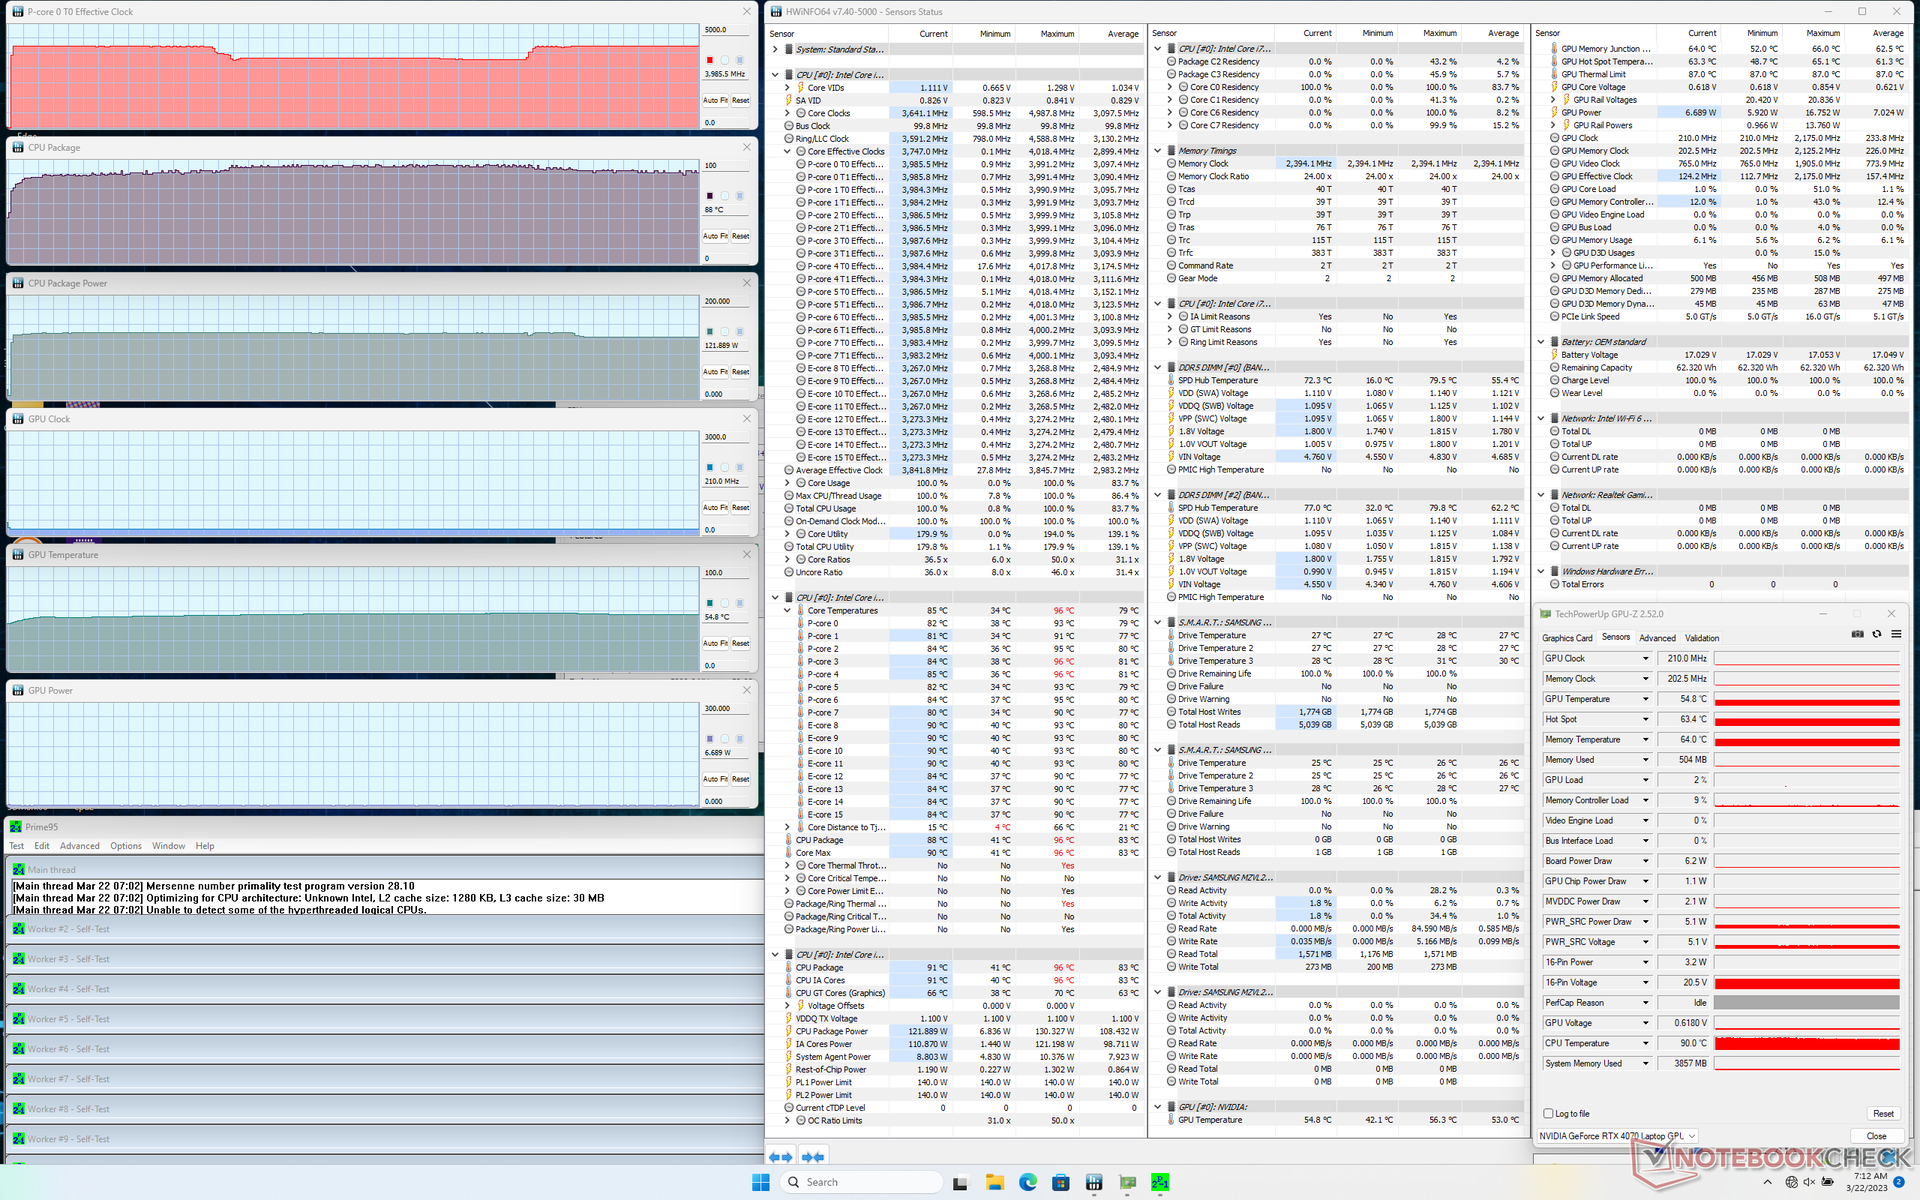
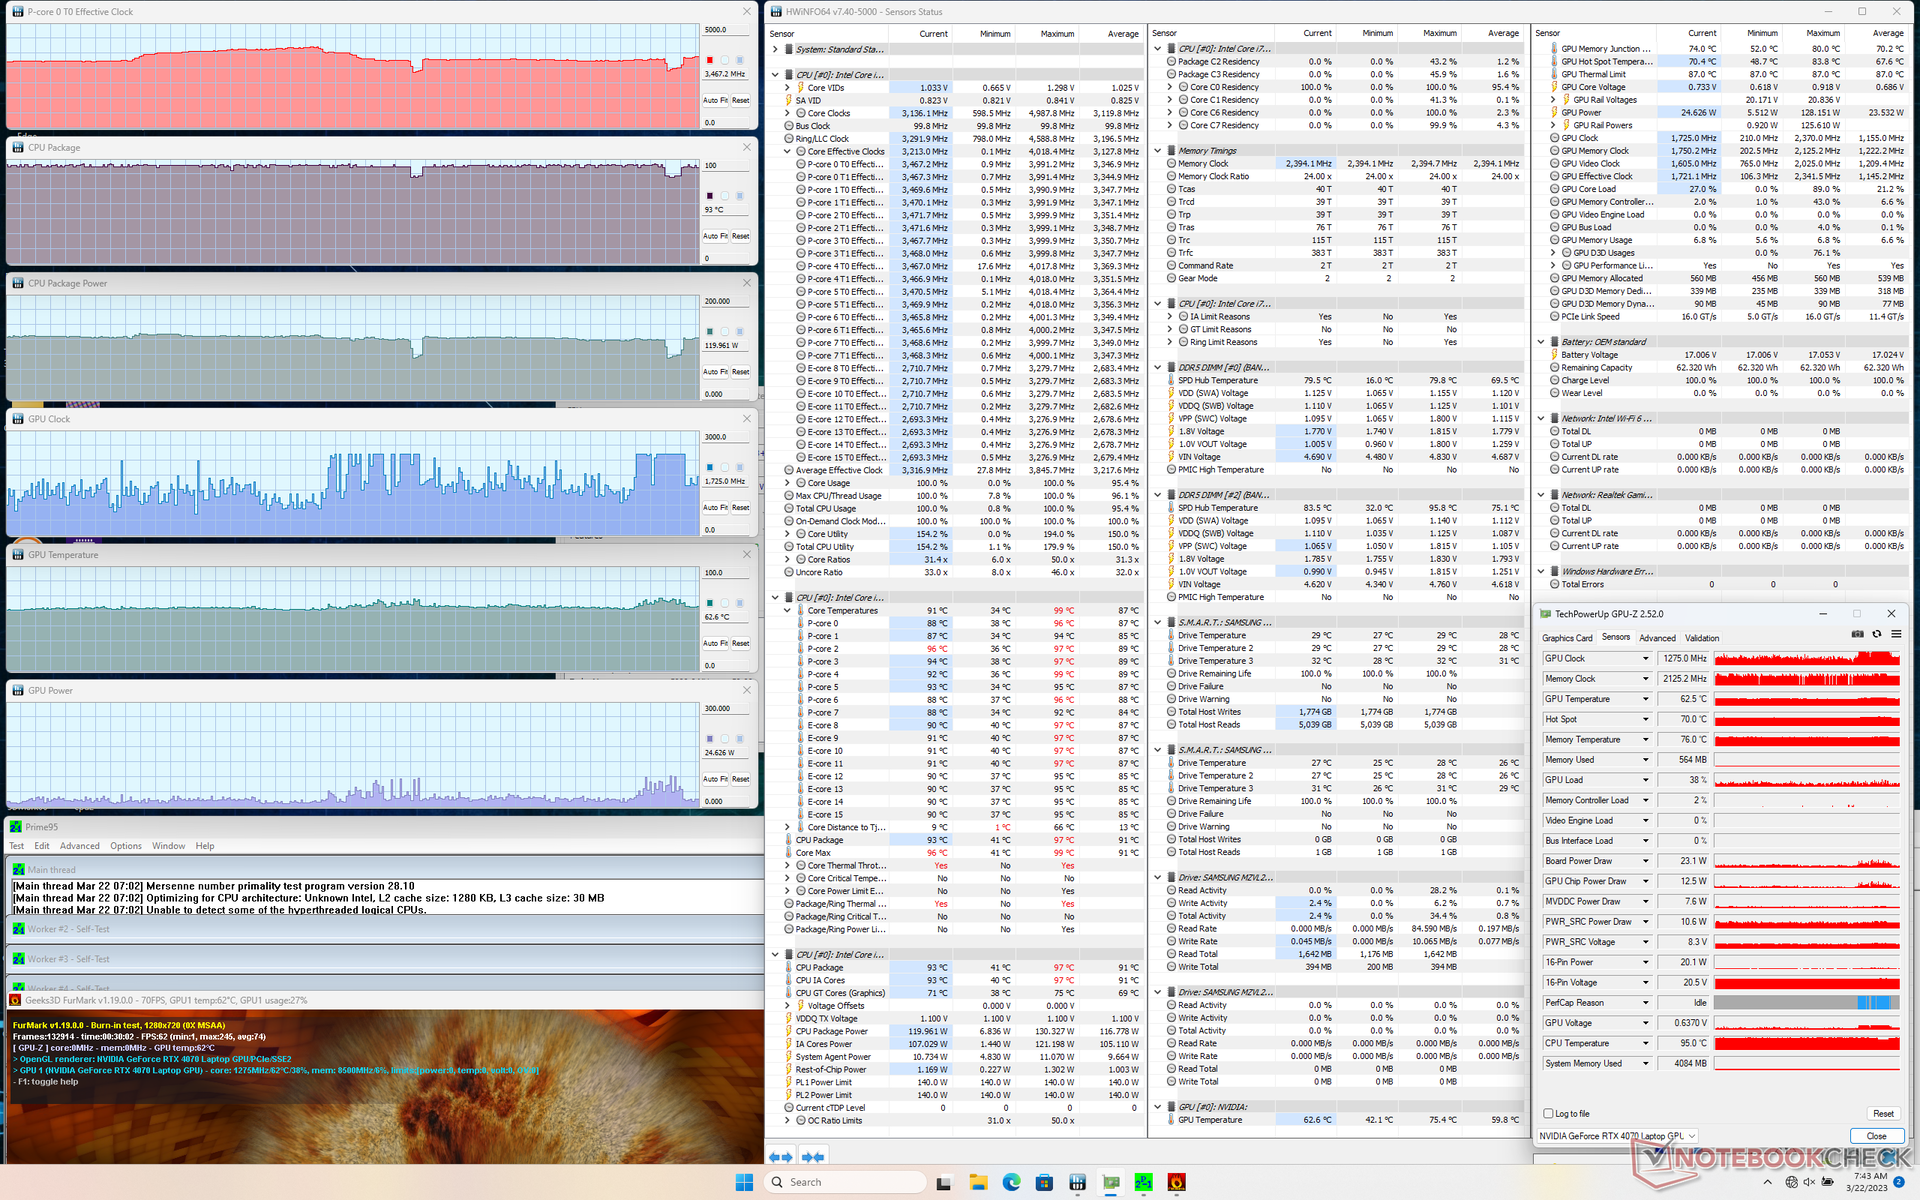
| RelojCPU (GHz) | Reloj GPU (MHz) | Temperatura mediaCPU (°C) | Temperatura media GPU (°C) | |
| Sistema en reposo | -- | -- | 41 | 45 |
| Prime95 Stress | 3.4 - 4.0 | -- | 89 | 55 |
| Prime95+ FurMark Estrés | ~3,5 | 1275 - 2350 | 93 | 63 |
| Witcher 3 Tensión | ~1450 | 2370 | 83 | 73 |
Altavoces
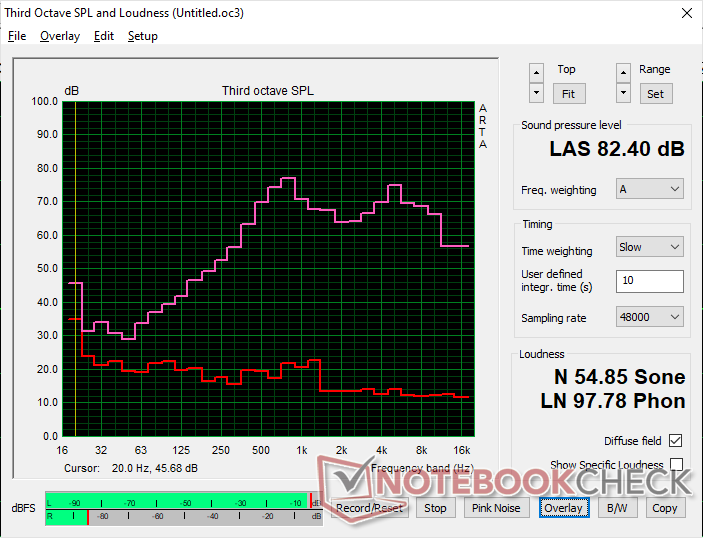
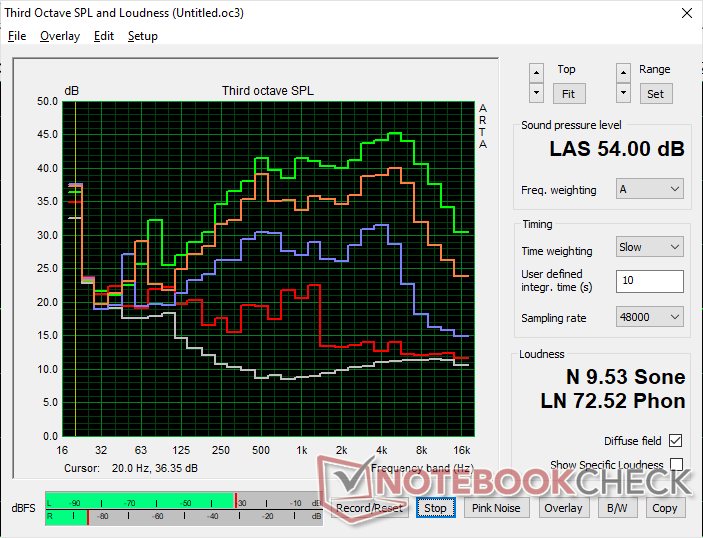
Uniwill GM6PX7X RTX 4070 análisis de audio
(+) | los altavoces pueden reproducir a un volumen relativamente alto (#82.4 dB)
Graves 100 - 315 Hz
(-) | casi sin bajos - de media 18.6% inferior a la mediana
(+) | el bajo es lineal (6.4% delta a la frecuencia anterior)
Medios 400 - 2000 Hz
(+) | medios equilibrados - a sólo 4.4% de la mediana
(±) | la linealidad de los medios es media (8.4% delta respecto a la frecuencia anterior)
Altos 2 - 16 kHz
(+) | máximos equilibrados - a sólo 2.9% de la mediana
(+) | los máximos son lineales (5.5% delta a la frecuencia anterior)
Total 100 - 16.000 Hz
(±) | la linealidad del sonido global es media (16.8% de diferencia con la mediana)
En comparación con la misma clase
» 44% de todos los dispositivos probados de esta clase eran mejores, 11% similares, 45% peores
» El mejor tuvo un delta de 6%, la media fue 18%, el peor fue ###max##%
En comparación con todos los dispositivos probados
» 30% de todos los dispositivos probados eran mejores, 8% similares, 63% peores
» El mejor tuvo un delta de 4%, la media fue 23%, el peor fue ###max##%
Apple MacBook Pro 16 2021 M1 Pro análisis de audio
(+) | los altavoces pueden reproducir a un volumen relativamente alto (#84.7 dB)
Graves 100 - 315 Hz
(+) | buen bajo - sólo 3.8% lejos de la mediana
(+) | el bajo es lineal (5.2% delta a la frecuencia anterior)
Medios 400 - 2000 Hz
(+) | medios equilibrados - a sólo 1.3% de la mediana
(+) | los medios son lineales (2.1% delta a la frecuencia anterior)
Altos 2 - 16 kHz
(+) | máximos equilibrados - a sólo 1.9% de la mediana
(+) | los máximos son lineales (2.7% delta a la frecuencia anterior)
Total 100 - 16.000 Hz
(+) | el sonido global es lineal (4.6% de diferencia con la mediana)
En comparación con la misma clase
» 0% de todos los dispositivos probados de esta clase eran mejores, 0% similares, 100% peores
» El mejor tuvo un delta de 5%, la media fue 17%, el peor fue ###max##%
En comparación con todos los dispositivos probados
» 0% de todos los dispositivos probados eran mejores, 0% similares, 100% peores
» El mejor tuvo un delta de 4%, la media fue 23%, el peor fue ###max##%
Gestión de la energía
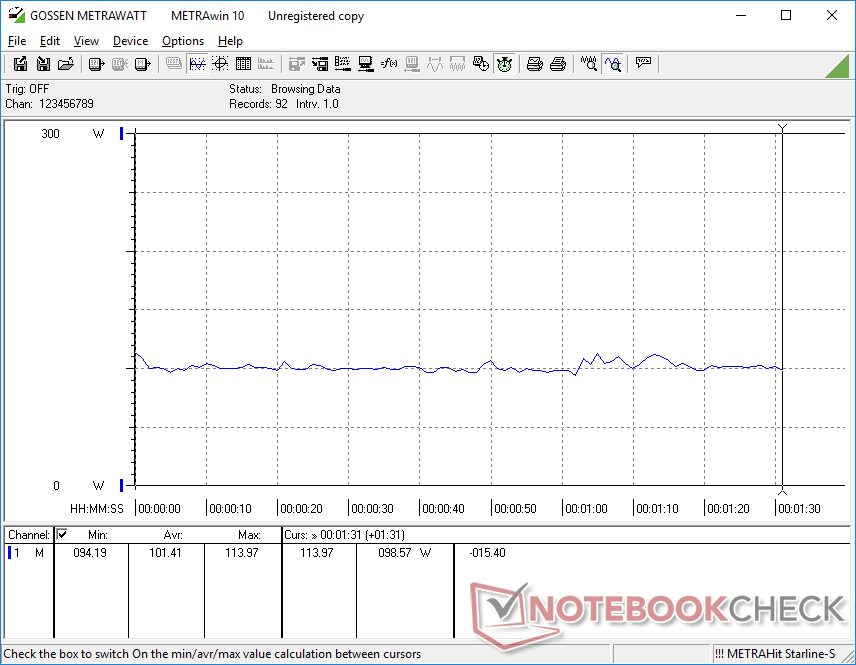
Consumo de energía
El consumo de energía debería ser inferior al del Neo 16 equipado con la RTX 4090 en todos los casos, pero extrañamente no es así. El funcionamiento en ralentí en el escritorio exigiría entre 12 W y 32 W en comparación con sólo 8 W y 28 W en el Neo 16 equipado con RTX 4090. Comprobamos dos veces los perfiles de energía y los ajustes de brillo, pero los resultados no mejoraron.
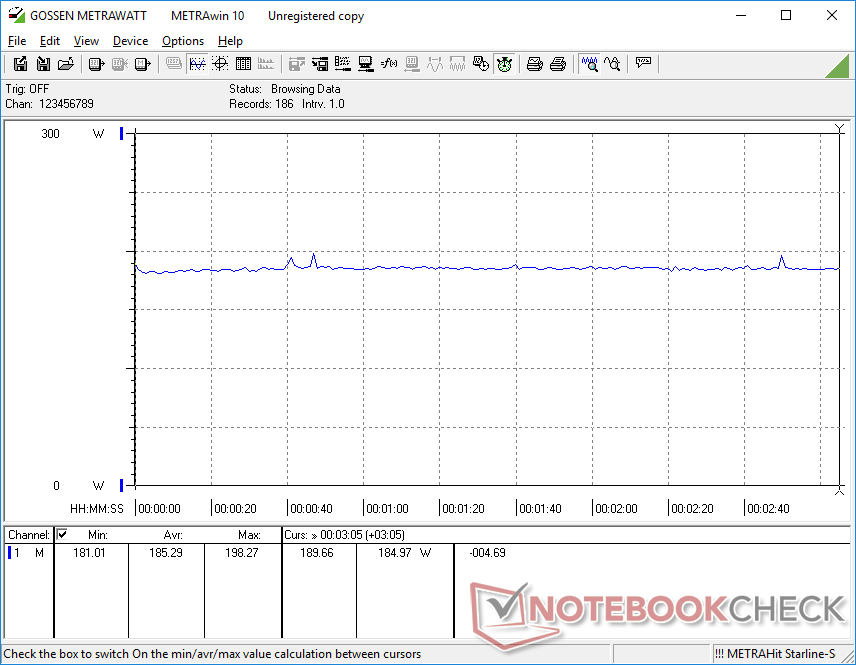
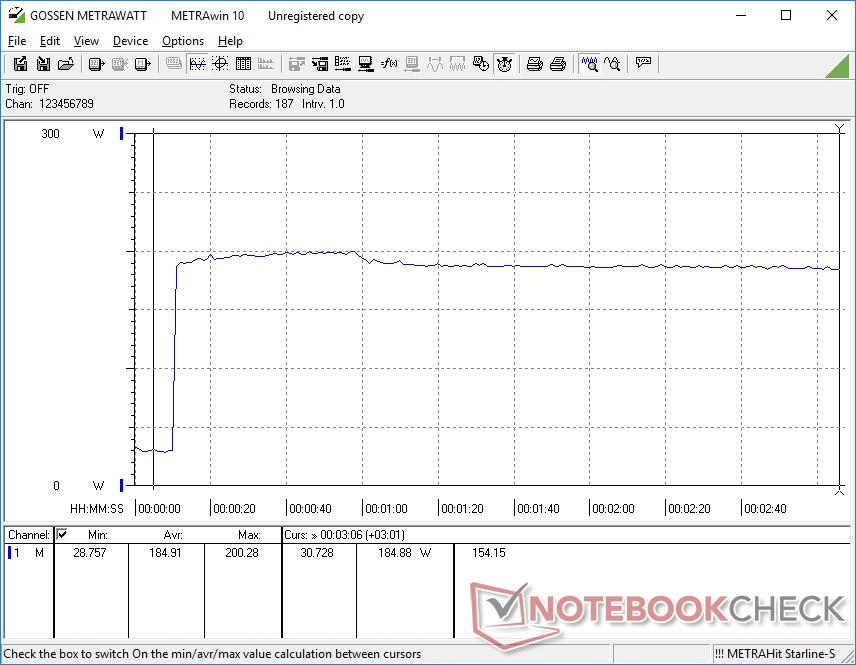
La ejecución de cargas más altas, como juegos, consume entre un 24 y un 37 por ciento menos de energía que el Neo 16. La RTX 4070 móvil es entre un 35 y un 45 por ciento más lenta que la RTX 4090 móvil, por lo que el menor consumo no es inesperado.
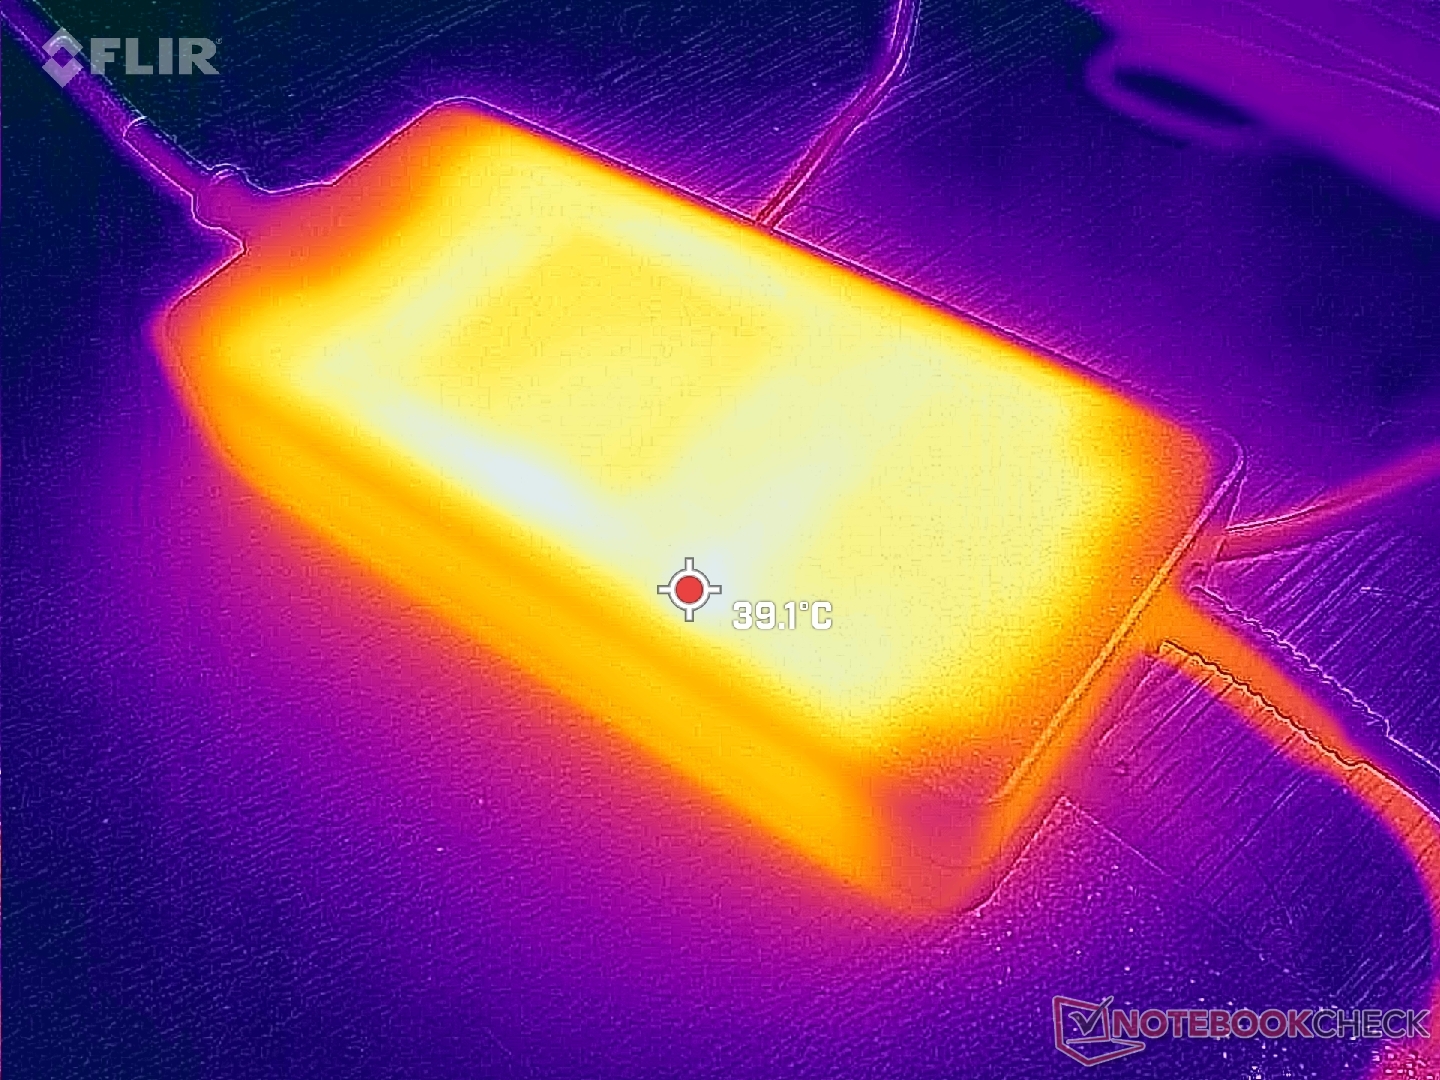
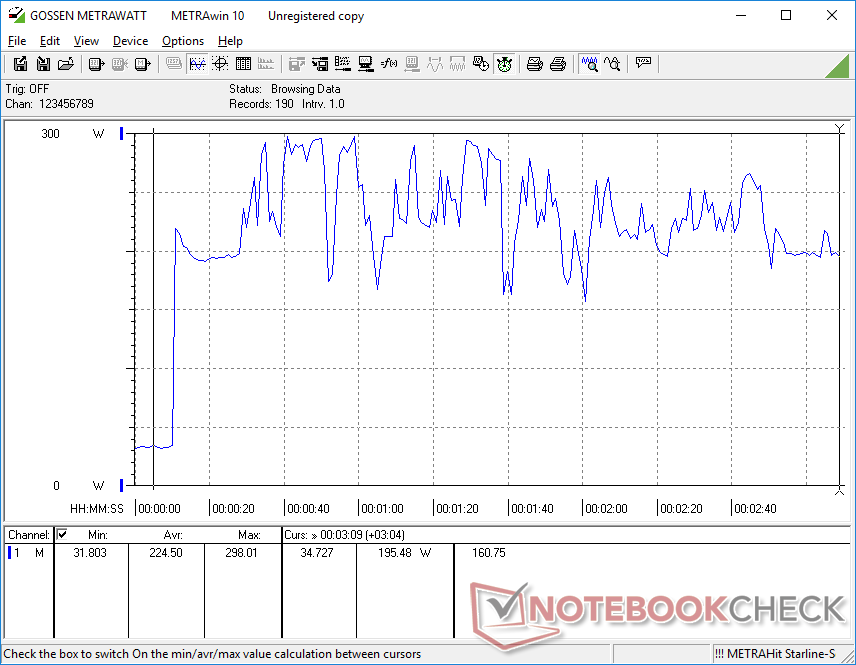
Ejecutar Prime95 y FurMark simultáneamente provocaría que el consumo oscilara fuertemente entre 167 W y 298 W, a pesar de que el adaptador de CA de gran tamaño (~18 x 8,4 x 3,5 cm) tiene una potencia nominal de 280 W. El consumo sería mucho más estable al repetir esta prueba en el Neo 16 equipado con RTX 4090, como se muestra en la tabla comparativa siguiente.
| Off / Standby | |
| Ocioso | |
| Carga |
|
Clave:
min: | |
| Uniwill GM6PX7X RTX 4070 i7-13700HX, GeForce RTX 4070 Laptop GPU, Samsung PM9A1 MZVL2512HCJQ, IPS, 2560x1600, 16" | Schenker XMG Neo 16 E23 i9-13900HX, GeForce RTX 4090 Laptop GPU, Crucial P5 Plus 1TB CT1000P5PSSD8, IPS, 2560x1600, 16" | Asus ROG Strix G16 G614JZ i9-13980HX, GeForce RTX 4080 Laptop GPU, WD PC SN560 SDDPNQE-1T00, IPS, 2560x1600, 16" | Lenovo Legion Pro 7 16IRX8H i9-13900HX, GeForce RTX 4080 Laptop GPU, Samsung PM9A1 MZVL21T0HCLR, IPS, 2560x1600, 16" | Gigabyte AERO 16 OLED BSF i9-13900H, GeForce RTX 4070 Laptop GPU, Gigabyte AG470S1TB-SI B10, OLED, 3840x2400, 16" | Razer Blade 16 Early 2023 i9-13950HX, GeForce RTX 4080 Laptop GPU, SSSTC CA6-8D1024, IPS, 2560x1600, 16" | |
|---|---|---|---|---|---|---|
| Power Consumption | -13% | -5% | -26% | 19% | -25% | |
| Idle Minimum * (Watt) | 12.6 | 8 37% | 10 21% | 18 -43% | 11.8 6% | 15.2 -21% |
| Idle Average * (Watt) | 17.7 | 18 -2% | 16 10% | 24 -36% | 16.1 9% | 22.8 -29% |
| Idle Maximum * (Watt) | 31.8 | 28 12% | 27 15% | 32 -1% | 17 47% | 49.8 -57% |
| Load Average * (Watt) | 101.4 | 133 -31% | 129 -27% | 130 -28% | 100.6 1% | 121.2 -20% |
| Witcher 3 ultra * (Watt) | 185.3 | 294 -59% | 247 -33% | 260 -40% | 158 15% | 242 -31% |
| Load Maximum * (Watt) | 298 | 399 -34% | 342 -15% | 320 -7% | 192 36% | 273.7 8% |
* ... más pequeño es mejor
Power Consumption Witcher 3 / Stresstest
Power Consumption external Monitor
Duración de la batería
La capacidad de la batería es un tercio menor que en el Neo 16 con RTX 4090, lo que reduce la duración de la batería WLAN a unas 4 horas. En comparación, la mayoría de portátiles de juego de 16 pulgadas tienen baterías de mayor capacidad y duración.
Cargarlo de vacío a lleno tarda algo menos de dos horas. Ninguno de nuestros cargadores USB-C puede recargar el portátil.
| Uniwill GM6PX7X RTX 4070 i7-13700HX, GeForce RTX 4070 Laptop GPU, 62 Wh | Schenker XMG Neo 16 E23 i9-13900HX, GeForce RTX 4090 Laptop GPU, 99 Wh | Asus ROG Strix G16 G614JZ i9-13980HX, GeForce RTX 4080 Laptop GPU, 90 Wh | Lenovo Legion Pro 7 16IRX8H i9-13900HX, GeForce RTX 4080 Laptop GPU, 99.9 Wh | Gigabyte AERO 16 OLED BSF i9-13900H, GeForce RTX 4070 Laptop GPU, 88 Wh | Razer Blade 16 Early 2023 i9-13950HX, GeForce RTX 4080 Laptop GPU, 95.2 Wh | |
|---|---|---|---|---|---|---|
| Duración de Batería | 68% | 142% | 27% | 88% | 53% | |
| WiFi v1.3 (h) | 4 | 6.7 68% | 9.7 142% | 5.1 27% | 7.5 88% | 6.1 53% |
| H.264 (h) | 5.8 | 7.4 | ||||
| Witcher 3 ultra (h) | 1.4 | |||||
| Load (h) | 1.1 | 2.1 | 2.1 | 1.4 | ||
| Reader / Idle (h) | 6.4 | 8.9 |
Pro
Contra
Veredicto

El Uniwill GM6PX7X es un sólido portátil de 16 pulgadas para juegos, aunque no destaque en ninguna categoría en particular. El sistema es ligero, por ejemplo, pero el Gigabyte Aero 16 es aún más ligero. La cobertura de color se acerca al 100% sRGB, pero hay colores P3 aún más profundos en elAsus ROG Strix G16 oRazer Blade 16. El rendimiento gráfico es genial para el tamaño, pero la falta de soporte Advanced Optimus o G-Sync en el monitor interno es una espina clavada en la experiencia. Admite retroiluminación RGB por zonas, pero la iluminación RGB por tecla está vinculada a una actualización mecánica opcional de Cherry. Mientras tanto, la configuración con la GeForce RTX 4080 o 4090 más rápida implica un chasis más grueso y pesado que anula una de las ventajas clave del diseño del Uniwill GM6PX7X. No hay debilidades notables o características sobresalientes a la Uniwill que le da una sensación de coherencia que algunos jugadores podrían apreciar.
El Uniwill GM6PX7X es un portátil para juegos sin florituras que está por encima de la media en casi todas las categorías, pero carece de la fuerza o la característica llamativa para ayudar a destacar entre la multitud.
Aún así, podemos elogiar el modelo por su teclado numérico y teclas de flecha de tamaño completo y el raro soporte para un refrigerador de agua externo opcional. Estas mismas teclas suelen ser más pequeñas y estrechas en otros portátiles para juegos. Los entusiastas quizá quieran considerar las versiones RTX 4080 o 4090 para aprovechar mejor la refrigeración por agua opcional.
Precio y disponibilidad
El Uniwill GM6PX7X ya se comercializa con distintos nombres y precios según la región. Schenker, por ejemplo, ofrece el chasis bajo la marca XMG Neo 16.
Uniwill GM6PX7X RTX 4070
- 03/28/2023 v7 (old)
Allen Ngo
Transparencia
La selección de los dispositivos que se van a reseñar corre a cargo de nuestro equipo editorial. La muestra de prueba fue proporcionada al autor en calidad de préstamo por el fabricante o el minorista a los efectos de esta reseña. El prestamista no tuvo ninguna influencia en esta reseña, ni el fabricante recibió una copia de la misma antes de su publicación. No había ninguna obligación de publicar esta reseña. Como empresa de medios independiente, Notebookcheck no está sujeta a la autoridad de fabricantes, minoristas o editores.
Así es como prueba Notebookcheck
Cada año, Notebookcheck revisa de forma independiente cientos de portátiles y smartphones utilizando procedimientos estandarizados para asegurar que todos los resultados son comparables. Hemos desarrollado continuamente nuestros métodos de prueba durante unos 20 años y hemos establecido los estándares de la industria en el proceso. En nuestros laboratorios de pruebas, técnicos y editores experimentados utilizan equipos de medición de alta calidad. Estas pruebas implican un proceso de validación en varias fases. Nuestro complejo sistema de clasificación se basa en cientos de mediciones y puntos de referencia bien fundamentados, lo que mantiene la objetividad.Price comparison

