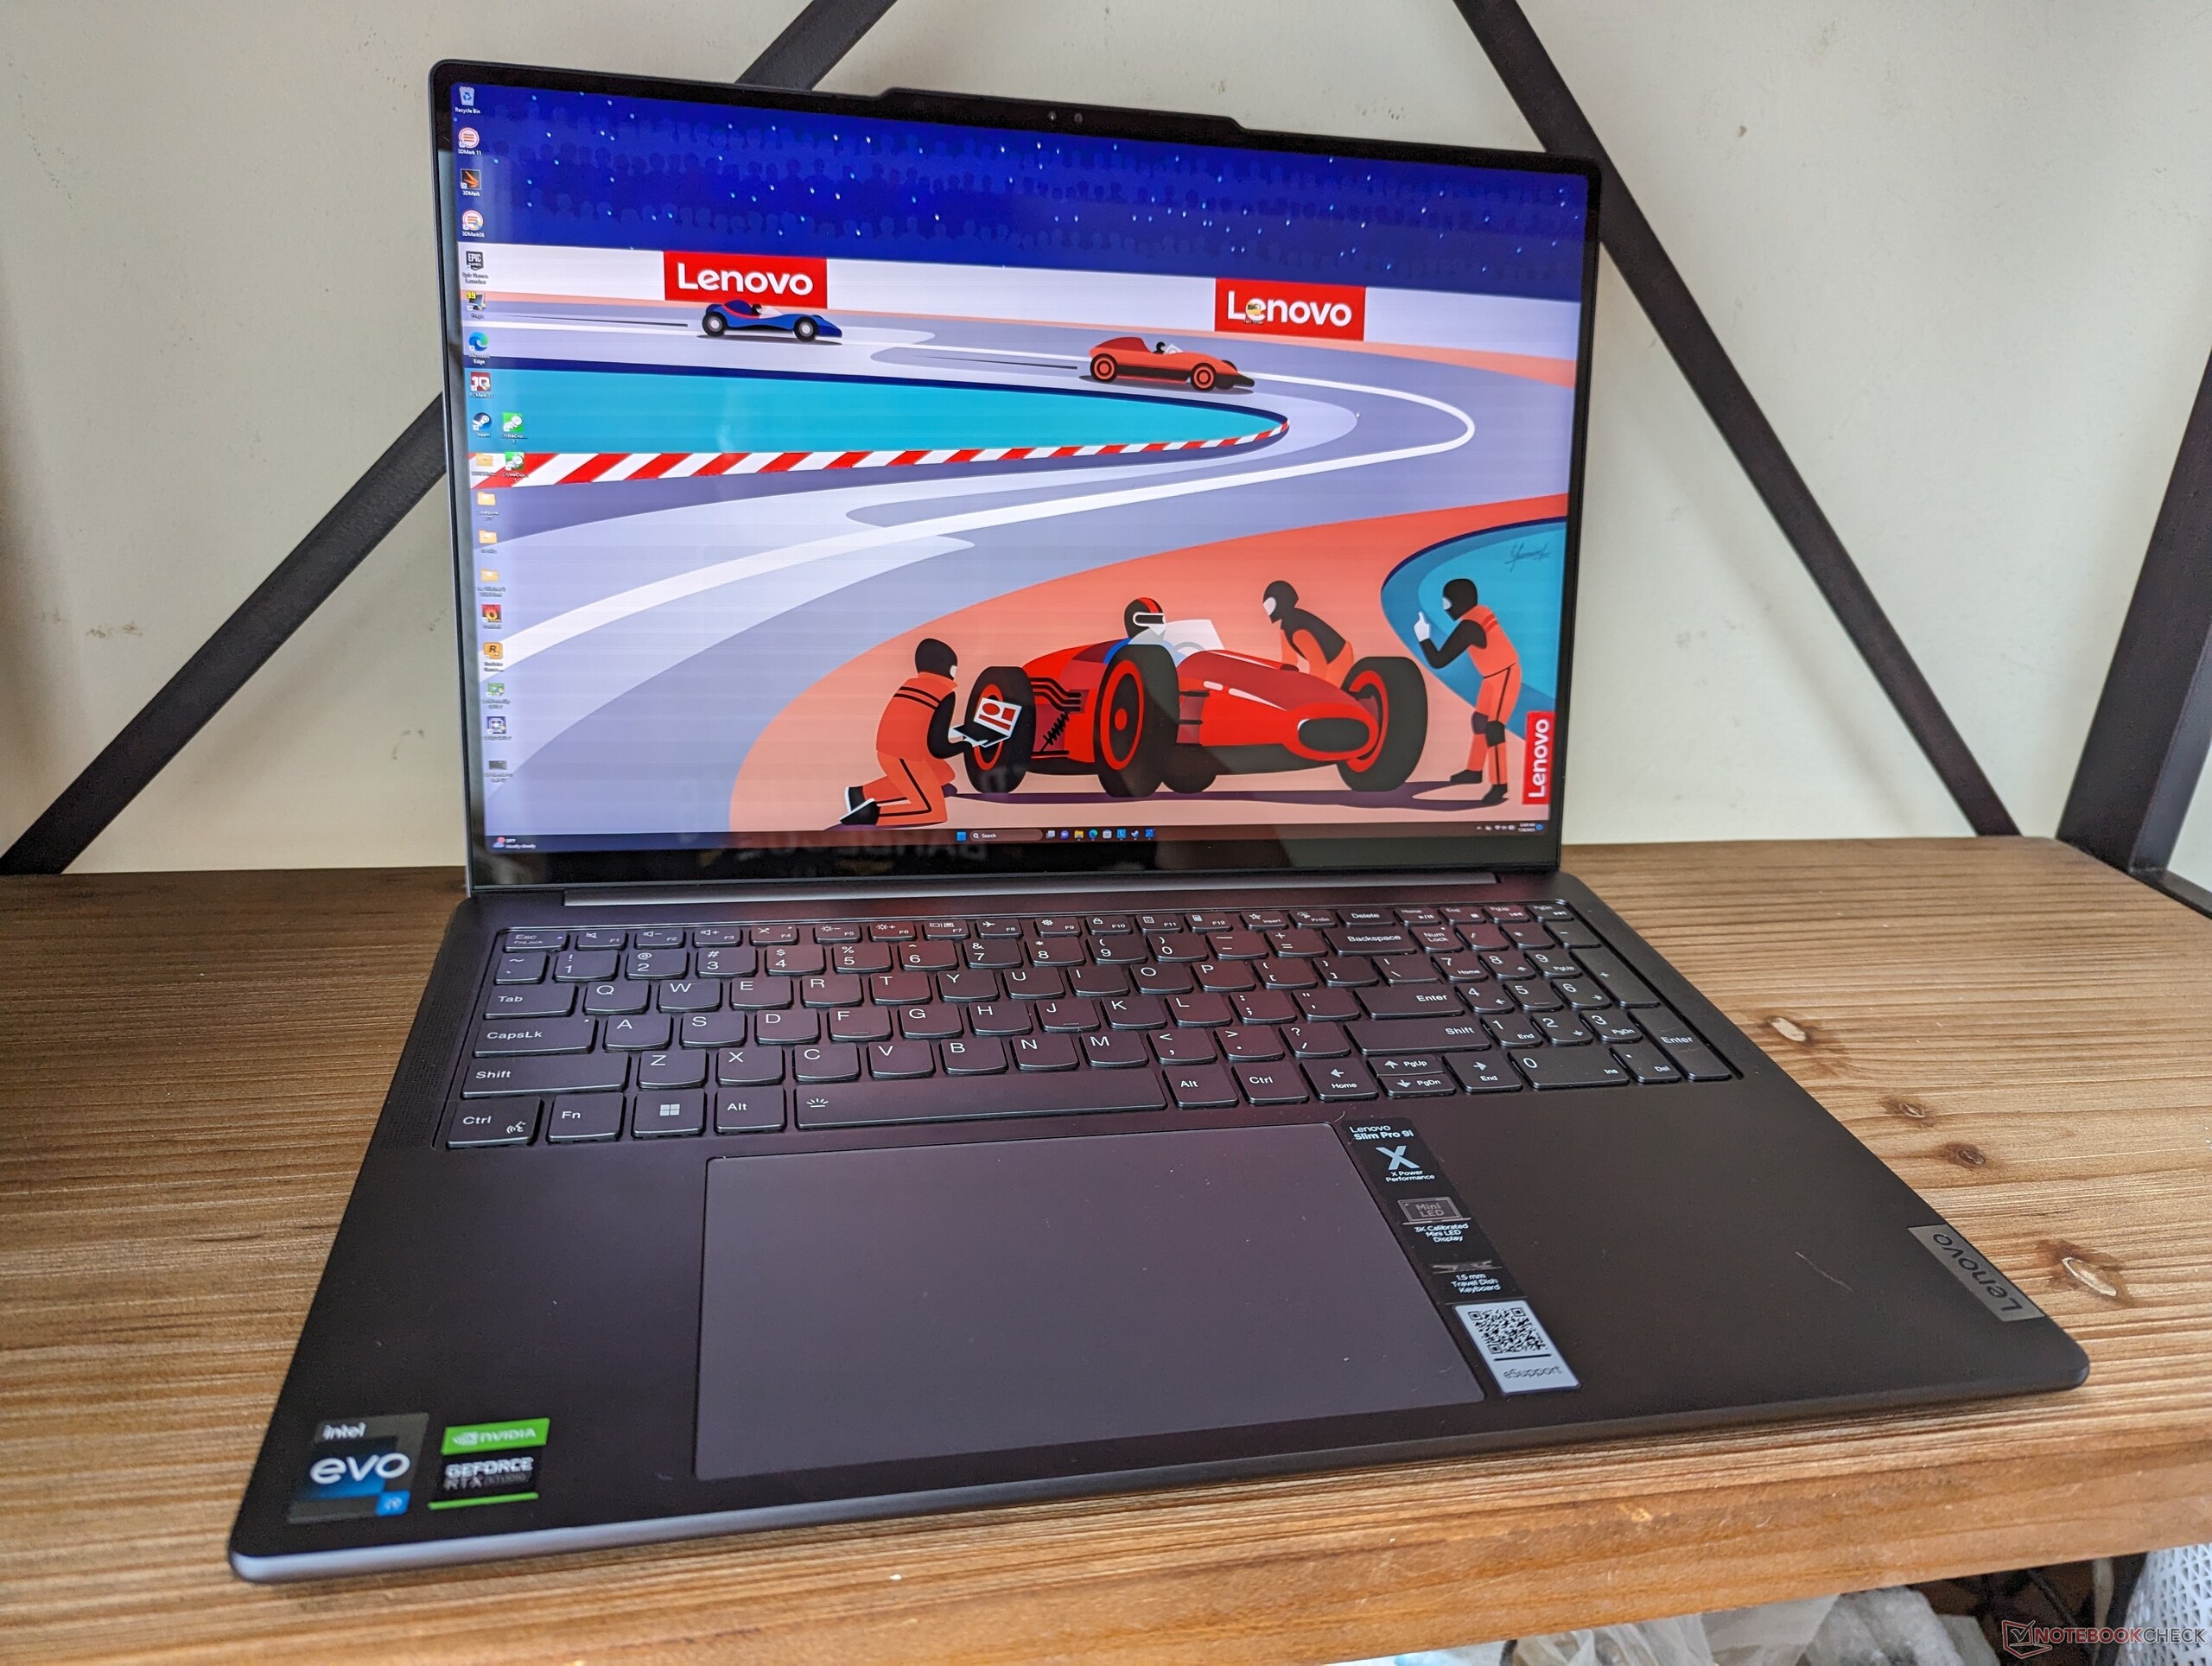
Análisis del portátil Lenovo Slim Pro 9i 16IRP8: La alternativa al MacBook Pro 16 de Apple

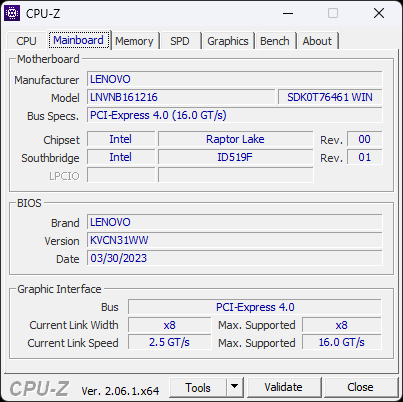
El Lenovo Slim Pro 9i 16 G8 es un portátil de gama alta diseñado para la creación de contenidos y fines multimedia. Compite con modelos de 16 pulgadas centrados en el creador como el MSI CreatorPro Z16P, Apple MacBook Pro 16, HP Envy 16o el Asus ProArt StudioBook 16.
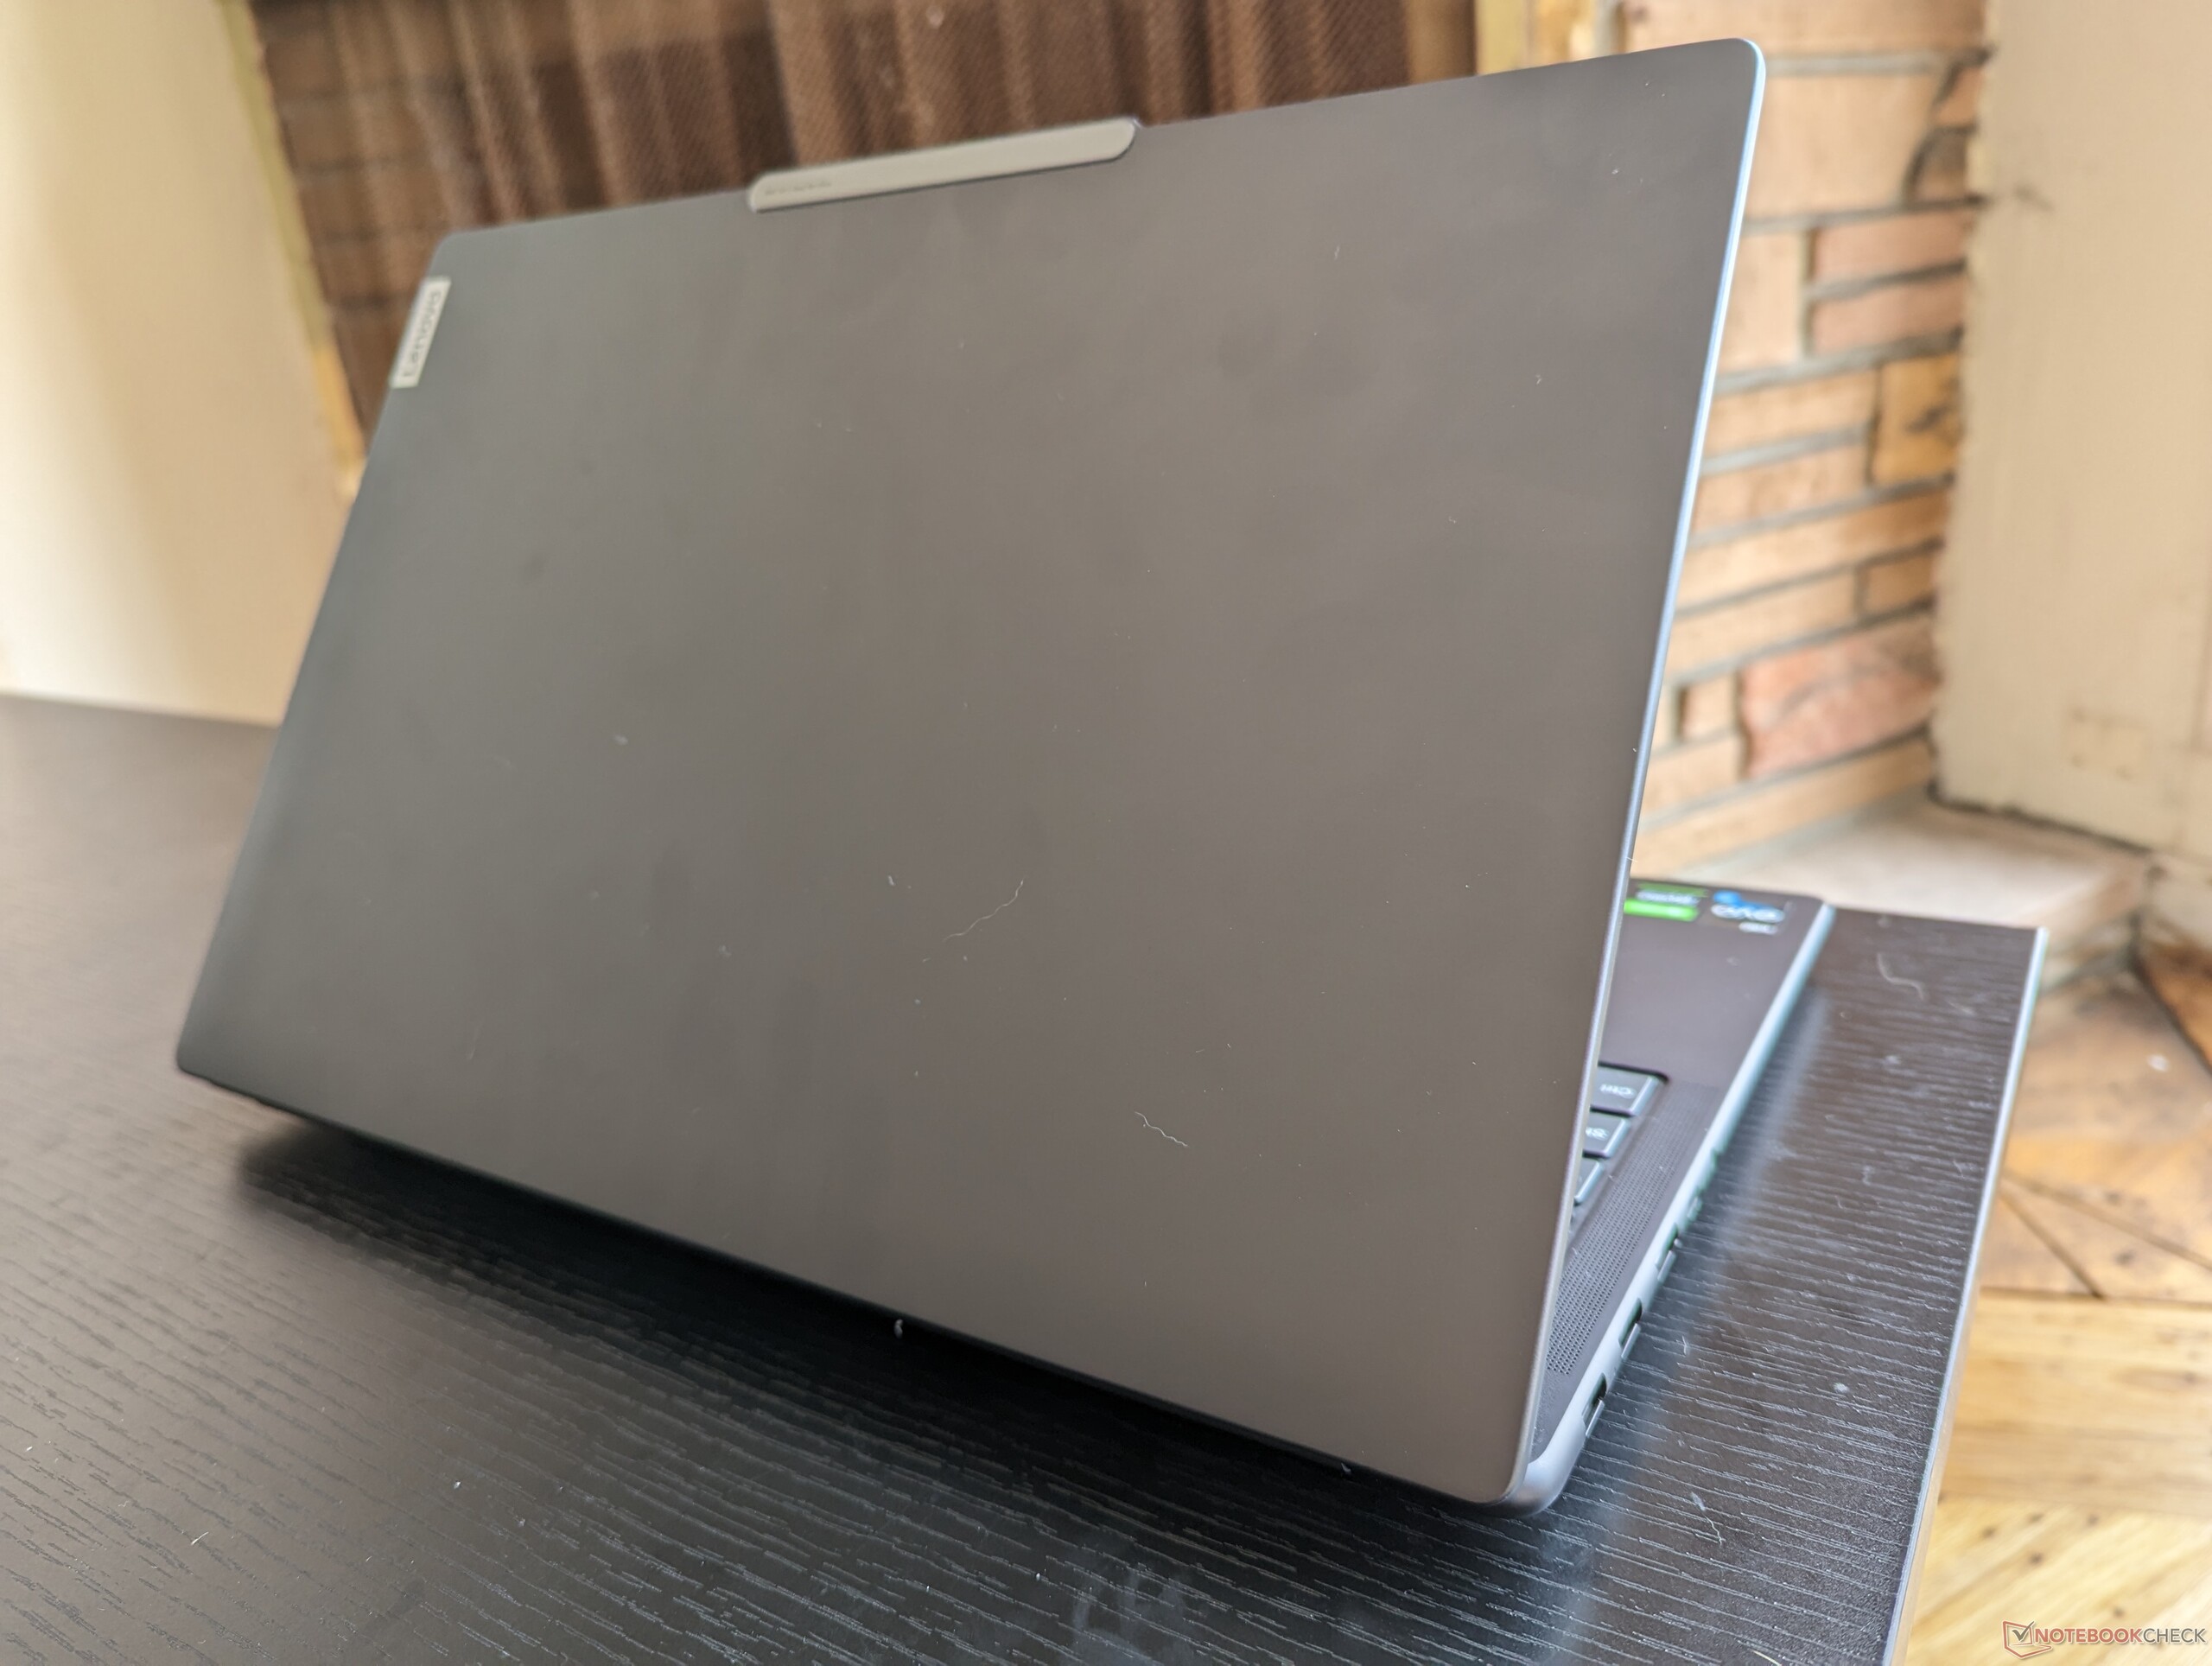
Confusamente, el nombre de este modelo es diferente según la región. En Europa, por ejemplo, este modelo se conoce como Yoga Pro 9i 16 mientras que en Norteamérica es el Slim Pro 9i 16. Recomendamos consultar nuestro análisis del Yoga Pro 9i 16 para saber más sobre las características físicas de este portátil.
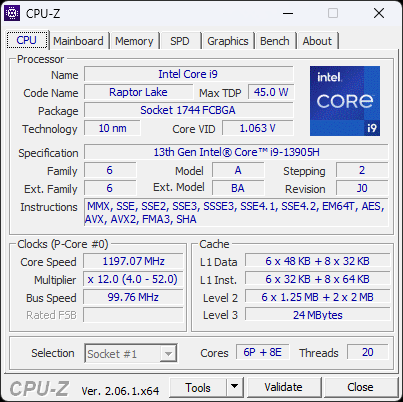
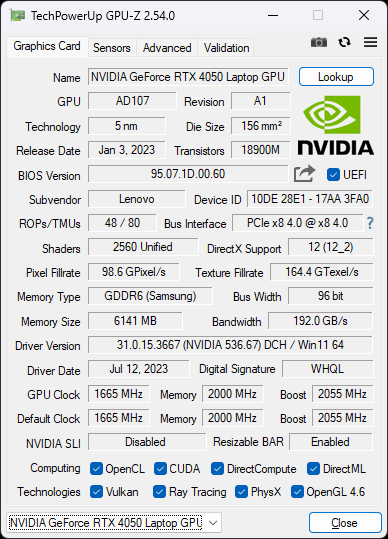
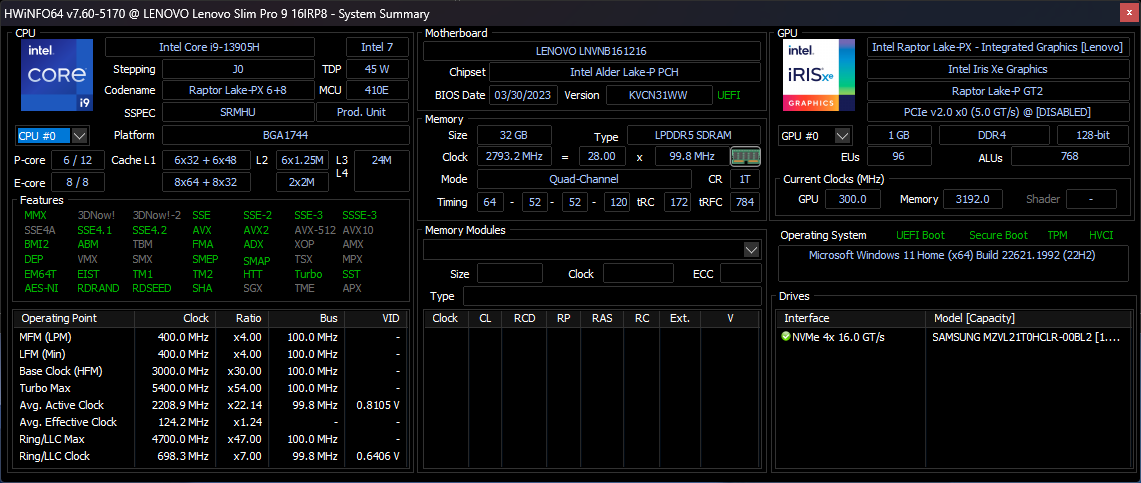
Nuestra configuración de análisis viene con la CPU Raptor Lake Core i9-13905H de 13ª generación y la RTX 4050 de 100 W de GeForce en contraste con el Core i7-13705H y la RTX 4060 de nuestro Yoga Pro 9i 16. Por lo demás, ambas configuraciones vienen con la misma CPU Raptor Lake de 13ª generación y la RTX 4050 de 100 W de . Por lo demás, ambas configuraciones vienen con la misma pantalla táctil mini-LED de 3.2K (3200 x 2000) con colores DCI-P3 completos.
También hay disponible una versión de 14 pulgadas de este modelo llamada Slim Pro 9i 14 o Yoga Pro 9i 14.
Más opiniones sobre Lenovo:
Posibles contendientes en la comparación
Valoración | Fecha | Modelo | Peso | Altura | Tamaño | Resolución | Precio |
|---|---|---|---|---|---|---|---|
| 88 % v7 (old) | 08/2023 | Lenovo Slim Pro 9i 16IRP8 i9-13905H, GeForce RTX 4050 Laptop GPU | 2.2 kg | 18.2 mm | 16.00" | 3200x2000 | |
| 88.4 % v7 (old) | 08/2023 | Lenovo Yoga Pro 9 16-IRP G8 i7-13705H, GeForce RTX 4060 Laptop GPU | 2.2 kg | 18.2 mm | 16.00" | 3200x2000 | |
| 86.3 % v7 (old) | 05/2023 | Asus VivoBook Pro 16 i7-12700H, GeForce RTX 3050 Ti Laptop GPU | 1.9 kg | 20 mm | 16.00" | 2560x1600 | |
| 87.5 % v7 (old) | 06/2023 | Acer Swift Edge SFE16-42-R1GM R7 7735U, Radeon 680M | 1.2 kg | 13.95 mm | 16.00" | 3840x2400 | |
| 87.4 % v7 (old) | 08/2022 | Dell Inspiron 16 Plus 7620 i7-12700H, GeForce RTX 3050 Ti Laptop GPU | 2.1 kg | 18.99 mm | 16.00" | 3072x1920 | |
| 86.9 % v7 (old) | 09/2022 | HP Envy 16 h0112nr i7-12700H, GeForce RTX 3060 Laptop GPU | 2.3 kg | 19.8 mm | 16.00" | 3840x2400 |
Caso
Lector de tarjetas SD
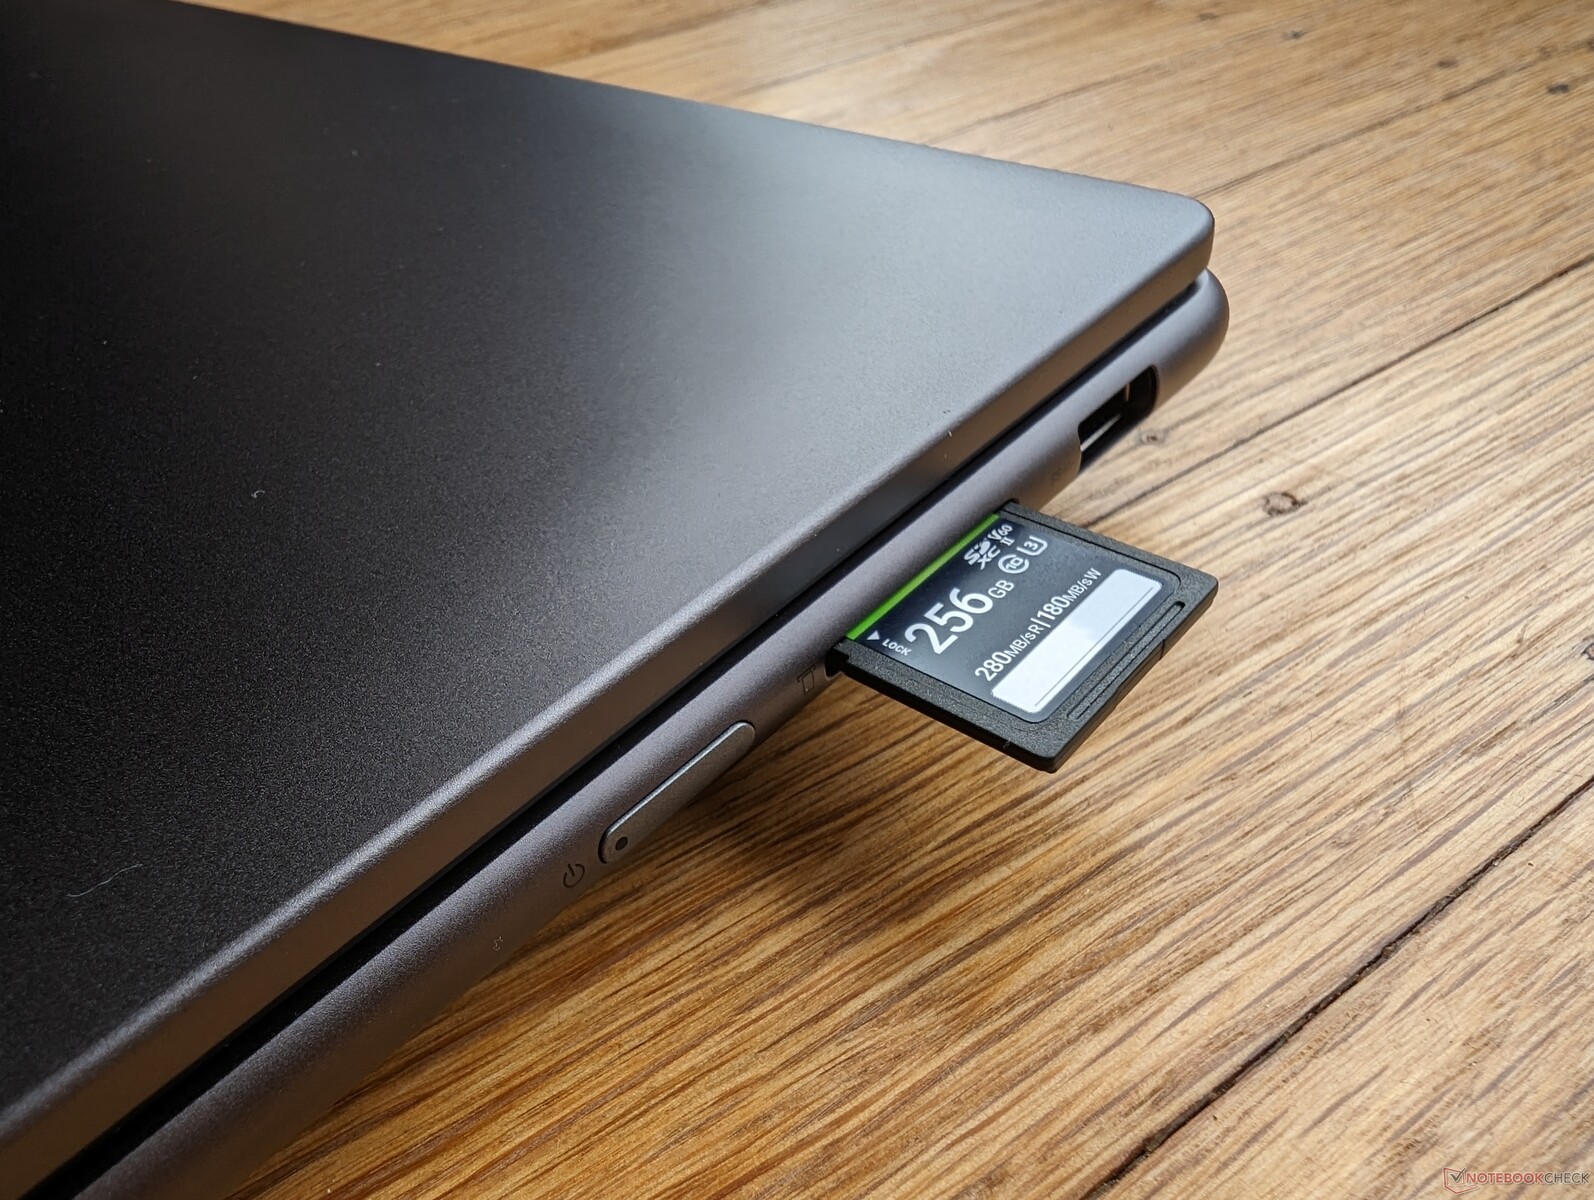
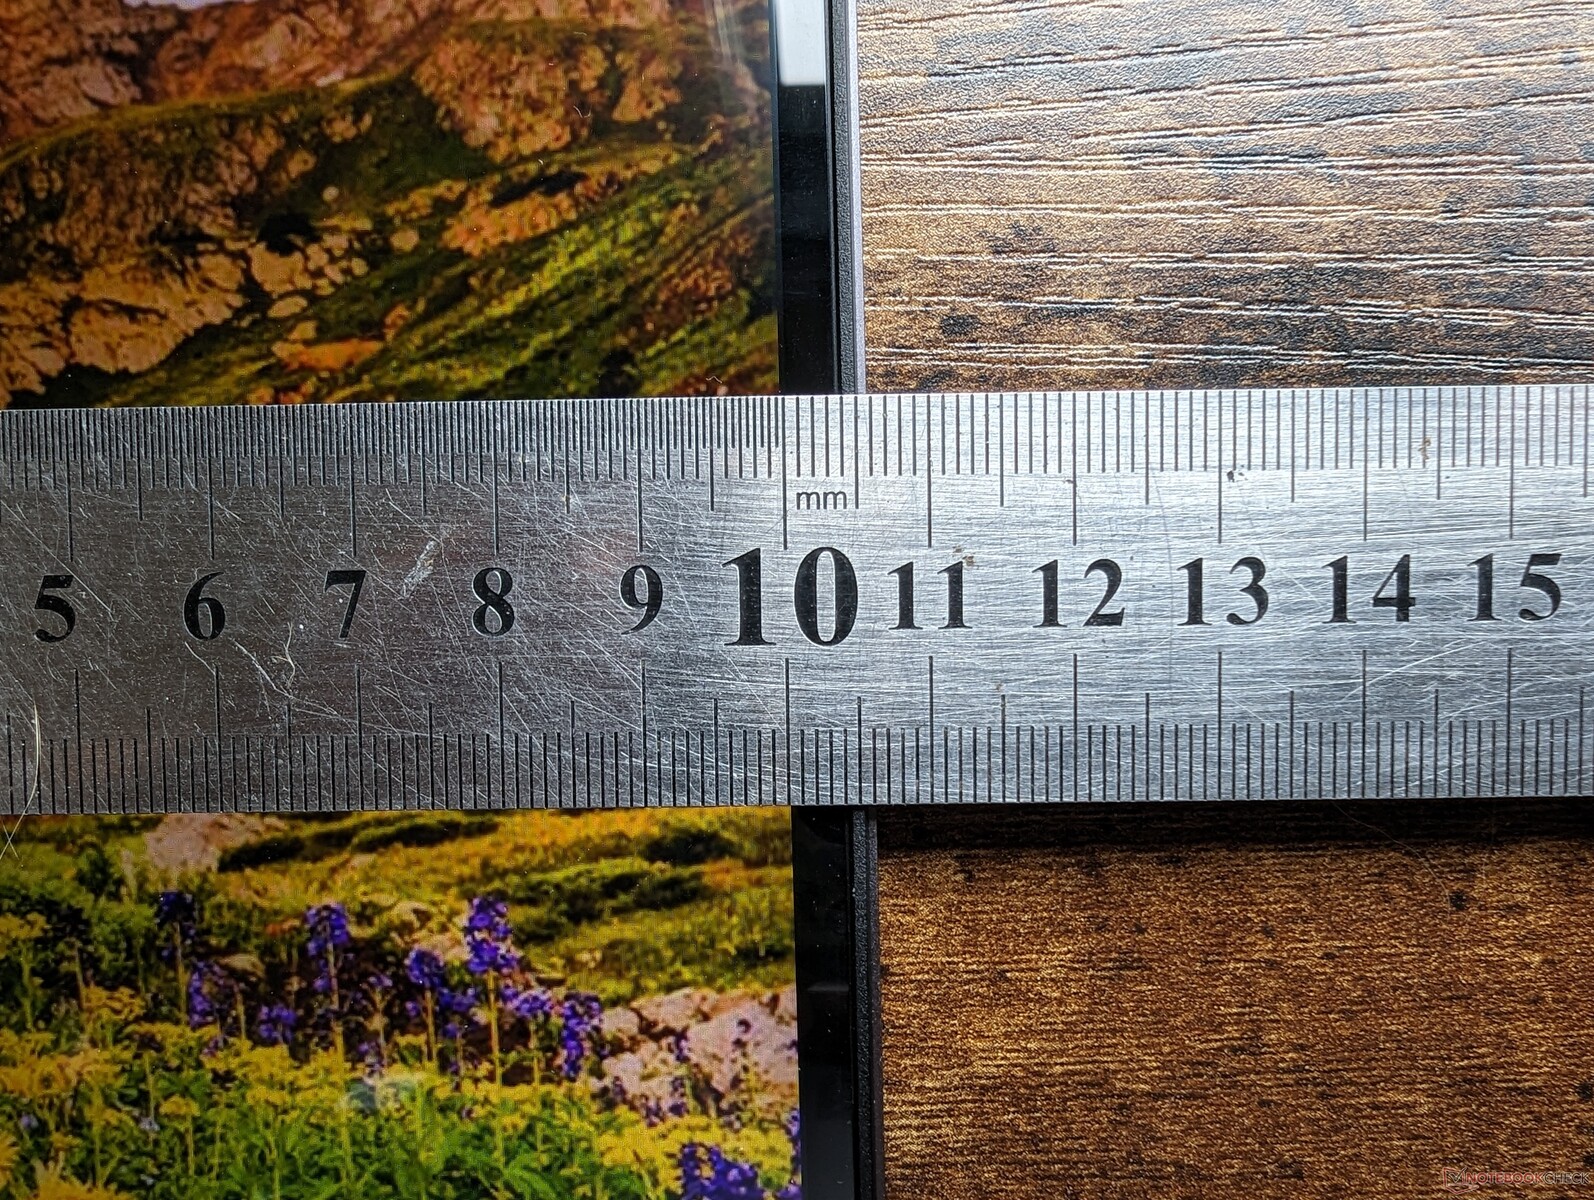
Las velocidades de transferencia son medias para la categoría con nuestra tarjeta de prueba PNY EliteX-Pro60 V60 UHS-II. Por desgracia, el lector de tarjetas del Lenovo es poco profundo, por lo que la tarjeta SD sobresaldría más de la mitad de su longitud para un transporte poco seguro.
| SD Card Reader | |
| average JPG Copy Test (av. of 3 runs) | |
| Lenovo Slim Pro 9i 16IRP8 (PNY EliteX-Pro60 V60 256 GB) | |
| Lenovo Yoga Pro 9 16-IRP G8 (Angelibird AV Pro V60) | |
| Asus VivoBook Pro 16 (AV Pro SD microSD 128 GB V60) | |
| HP Envy 16 h0112nr (AV Pro SD microSD 128 GB V60) | |
| Dell Inspiron 16 Plus 7620 (Toshiba Exceria Pro SDXC 64 GB UHS-II) | |
| maximum AS SSD Seq Read Test (1GB) | |
| Lenovo Slim Pro 9i 16IRP8 (PNY EliteX-Pro60 V60 256 GB) | |
| HP Envy 16 h0112nr (AV Pro SD microSD 128 GB V60) | |
| Lenovo Yoga Pro 9 16-IRP G8 (Angelibird AV Pro V60) | |
| Asus VivoBook Pro 16 (AV Pro SD microSD 128 GB V60) | |
| Dell Inspiron 16 Plus 7620 (Toshiba Exceria Pro SDXC 64 GB UHS-II) | |
Comunicación
| Networking | |
| iperf3 transmit AXE11000 | |
| Lenovo Yoga Pro 9 16-IRP G8 | |
| Asus VivoBook Pro 16 | |
| Lenovo Slim Pro 9i 16IRP8 | |
| Acer Swift Edge SFE16-42-R1GM | |
| iperf3 receive AXE11000 | |
| Lenovo Yoga Pro 9 16-IRP G8 | |
| Lenovo Slim Pro 9i 16IRP8 | |
| Acer Swift Edge SFE16-42-R1GM | |
| iperf3 transmit AXE11000 6GHz | |
| Lenovo Slim Pro 9i 16IRP8 | |
| Acer Swift Edge SFE16-42-R1GM | |
| HP Envy 16 h0112nr | |
| Dell Inspiron 16 Plus 7620 | |
| iperf3 receive AXE11000 6GHz | |
| Asus VivoBook Pro 16 | |
| Acer Swift Edge SFE16-42-R1GM | |
| Lenovo Slim Pro 9i 16IRP8 | |
| HP Envy 16 h0112nr | |
| Dell Inspiron 16 Plus 7620 | |
Cámara web
El sensor de 5 MP es de mayor calidad que las webcams de la mayoría de portátiles, en los que 2 MP o 1 MP siguen siendo habituales. Se incluyen IR y un interruptor de apagado de la cámara.


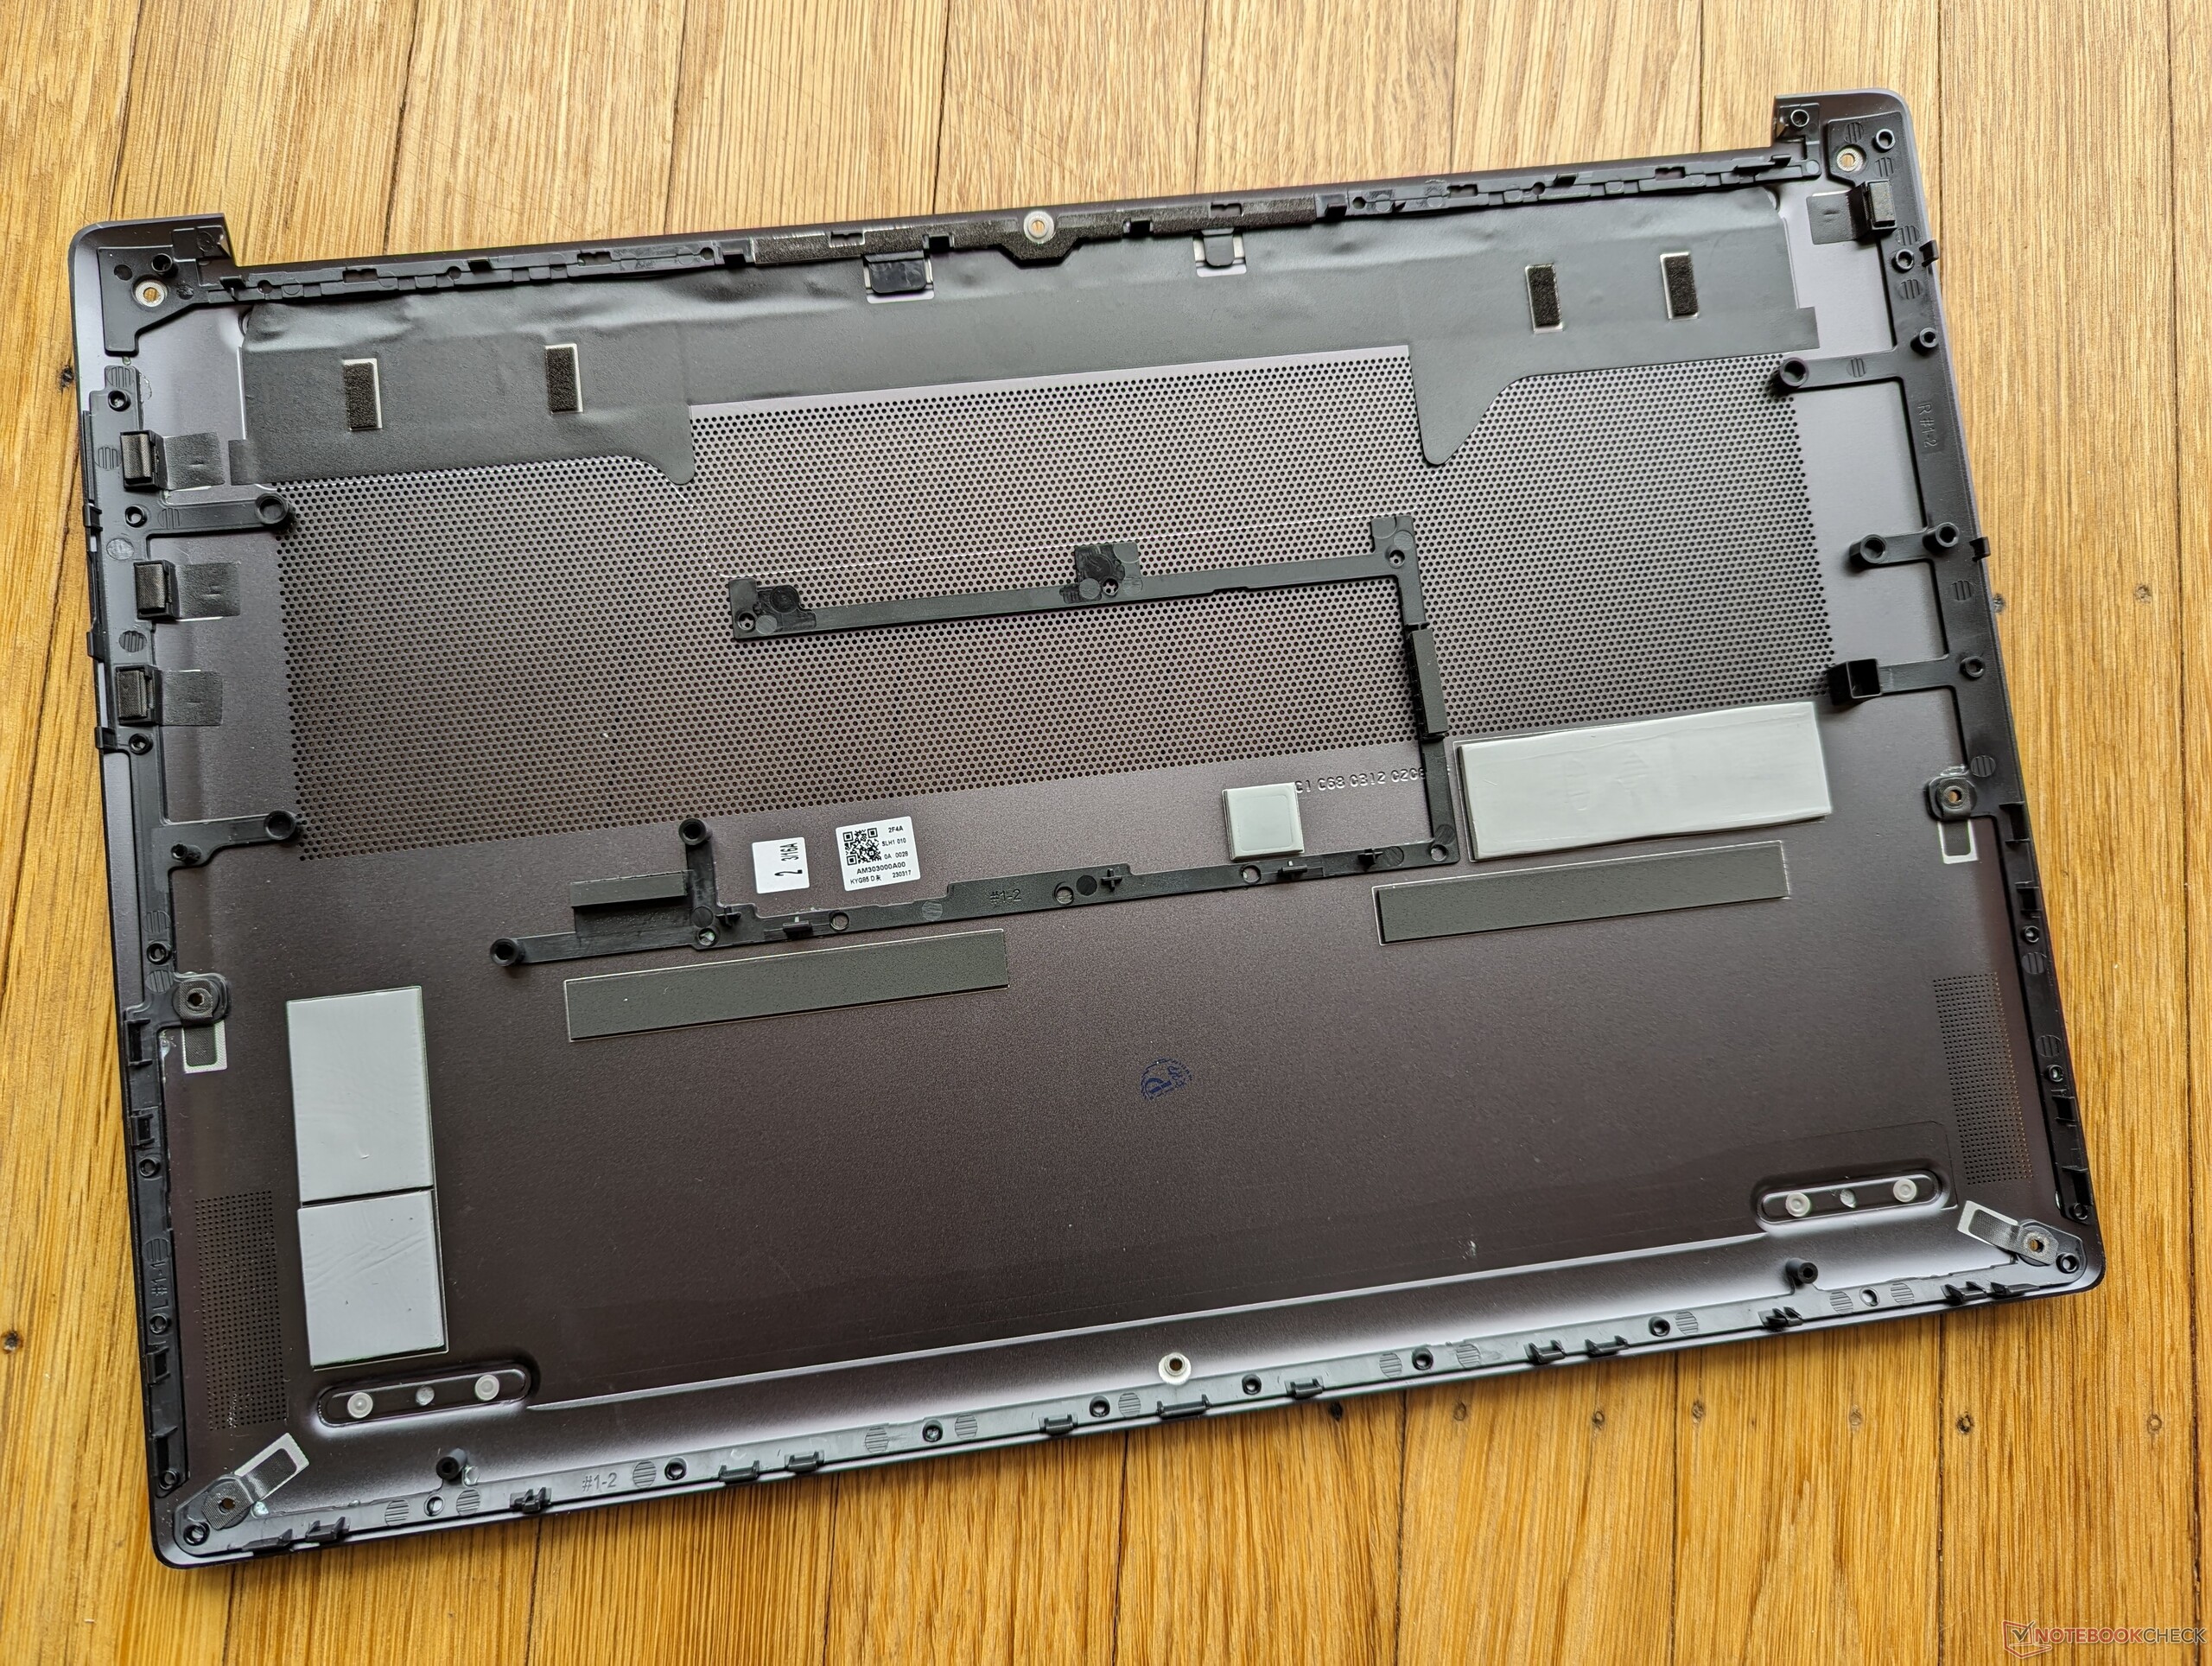
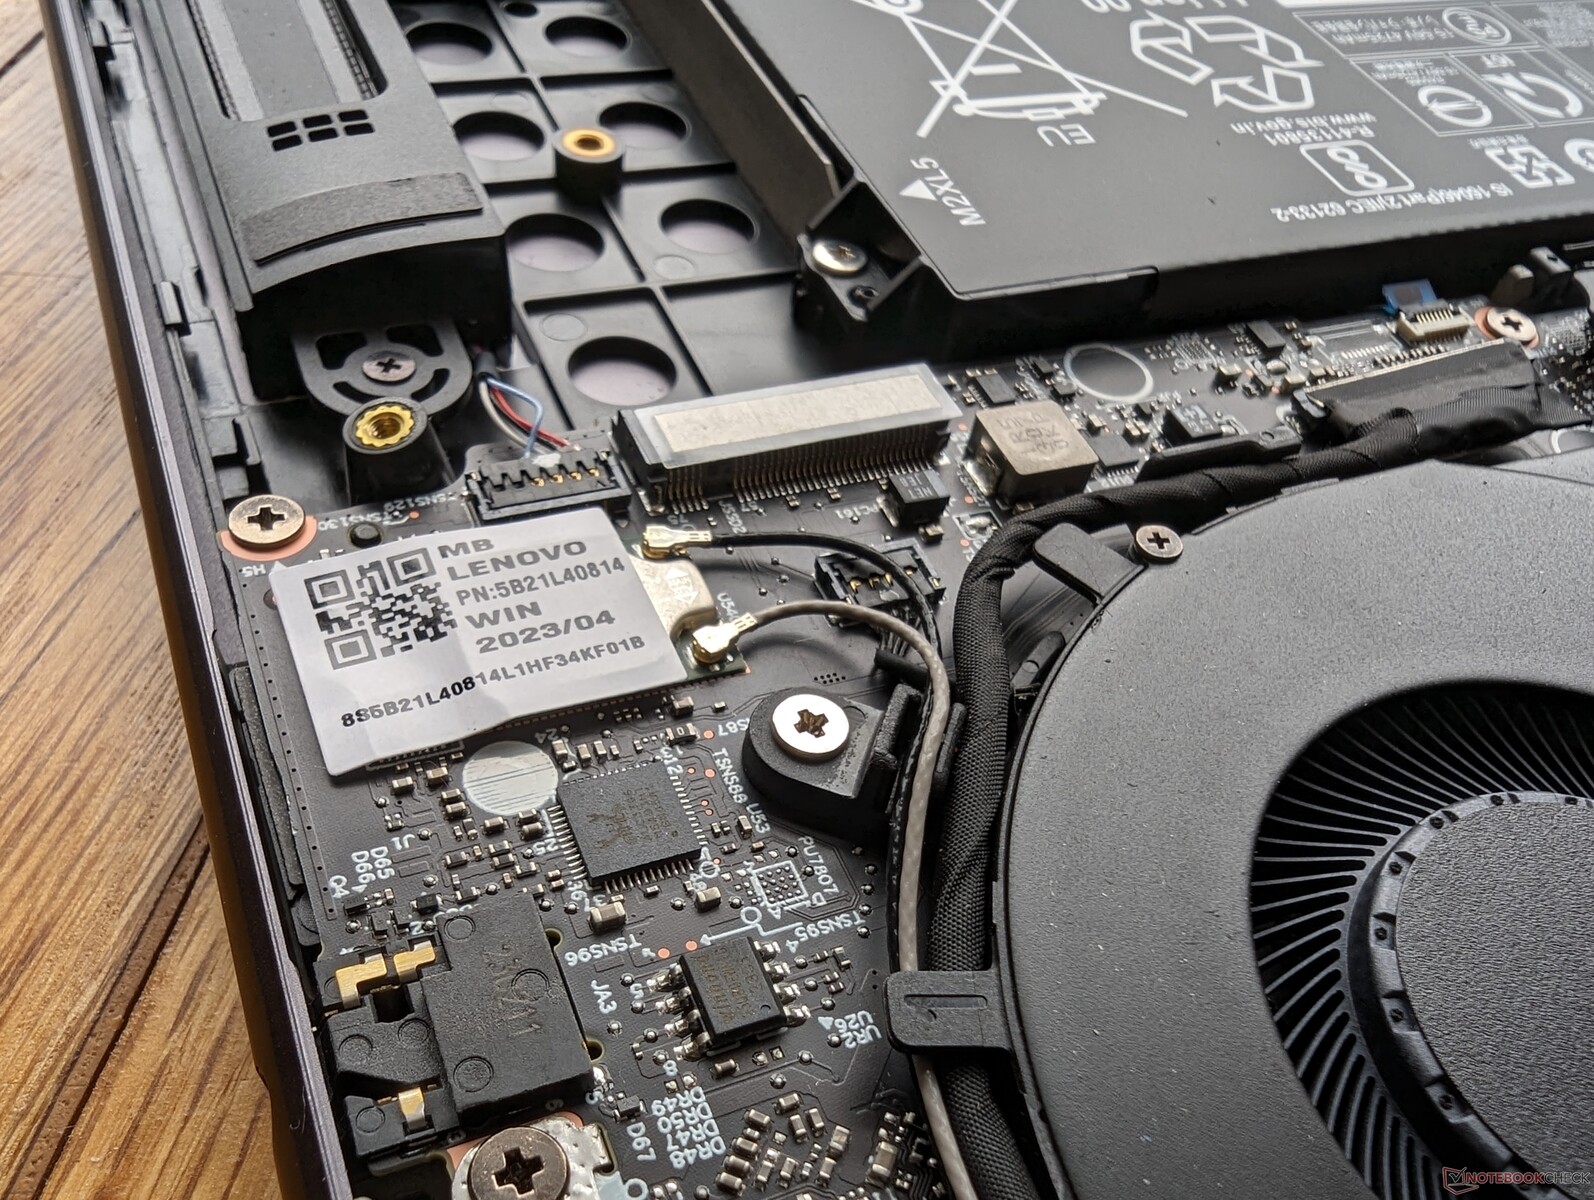
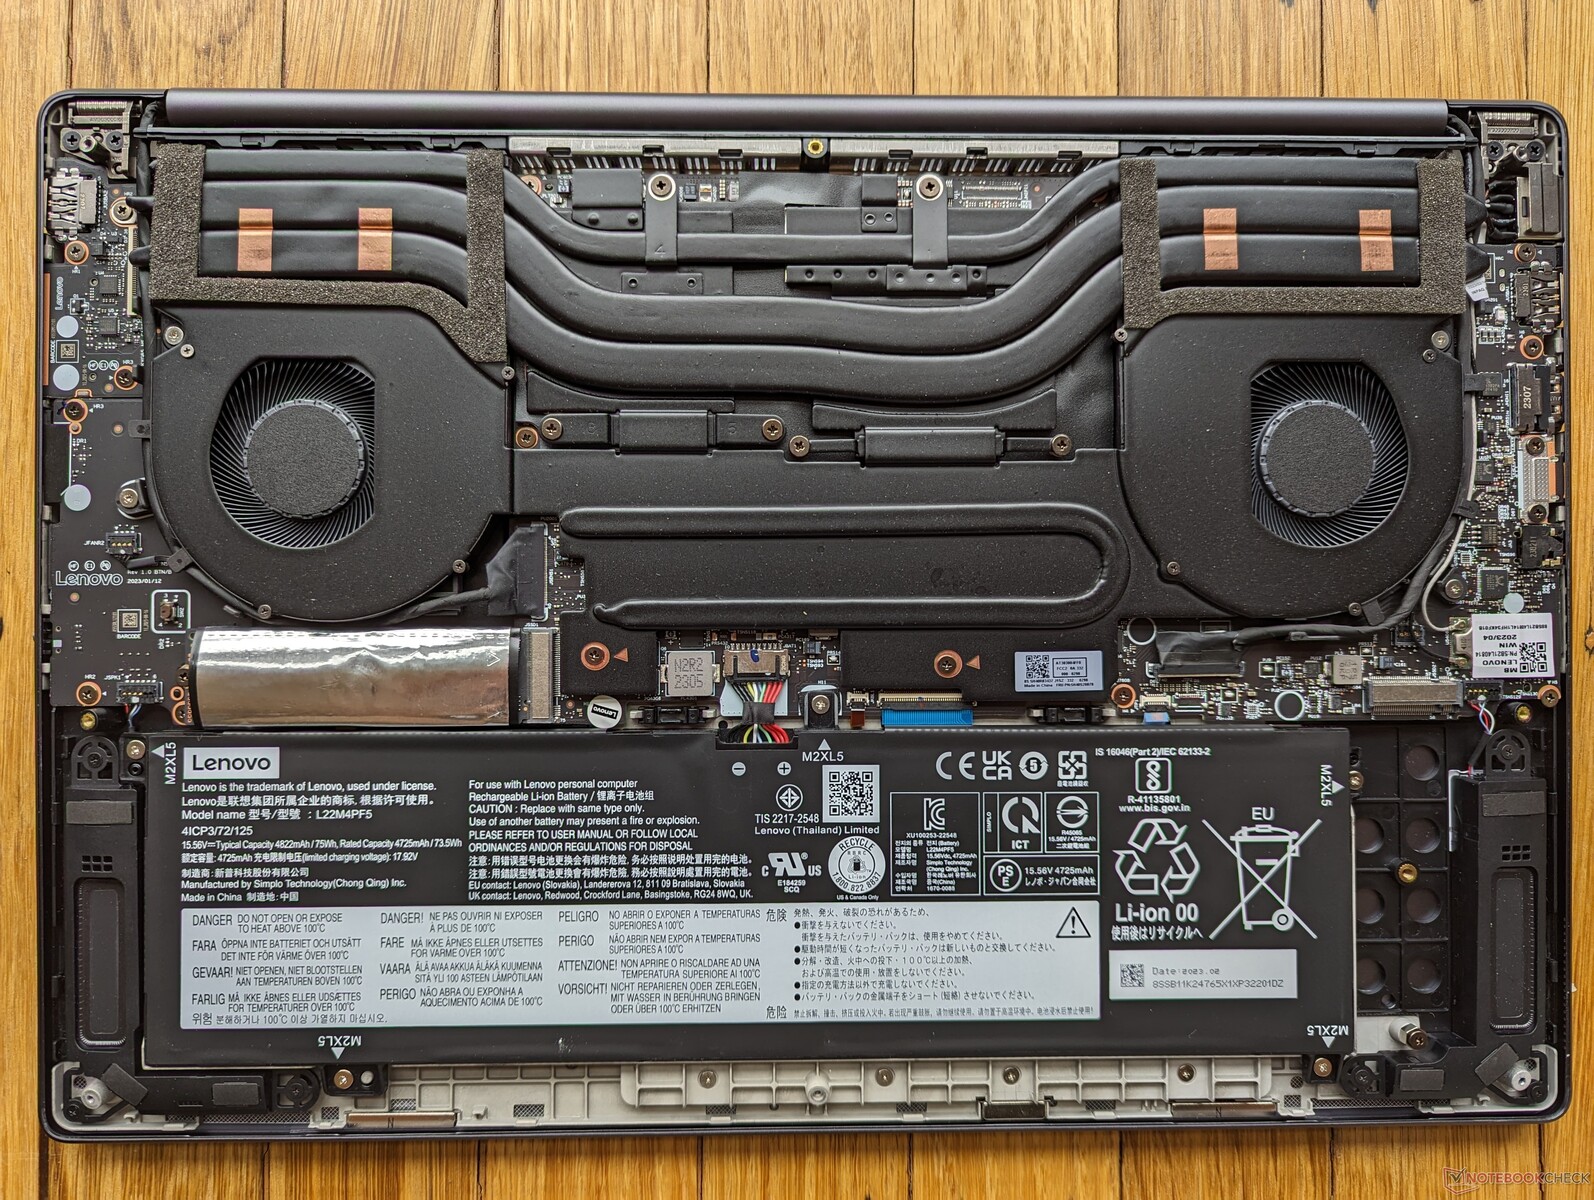
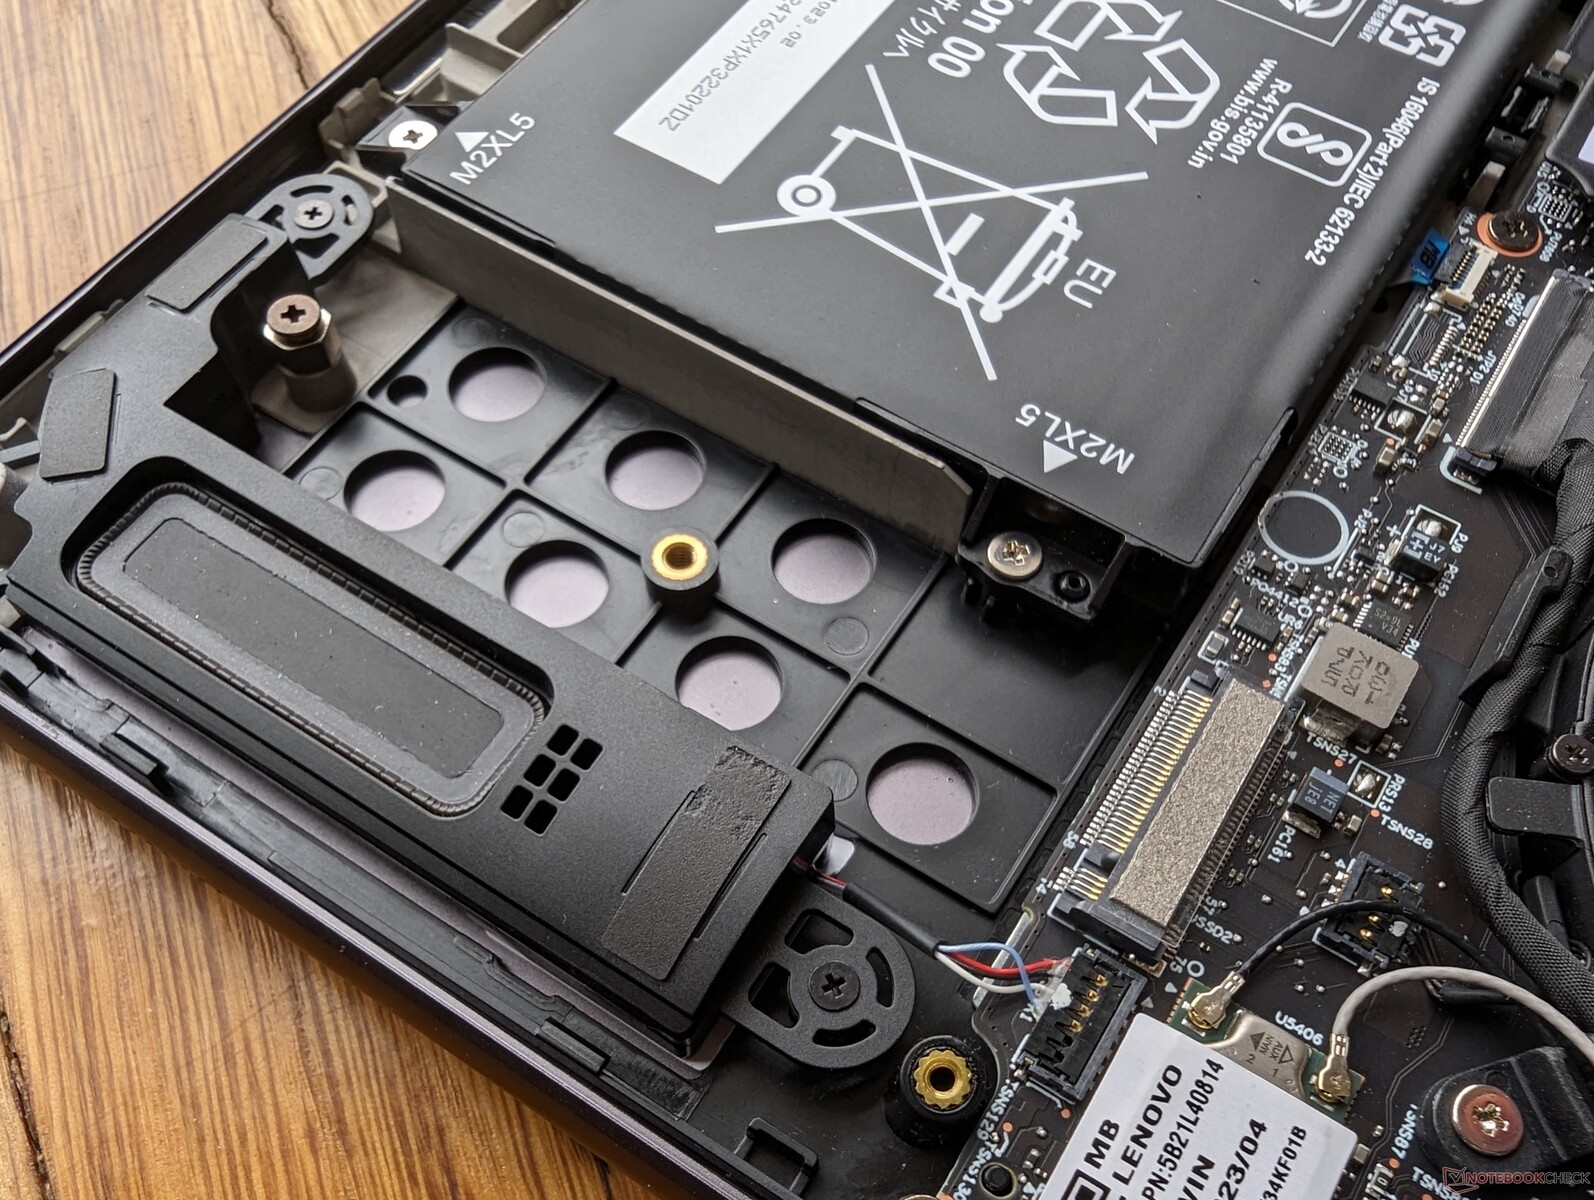
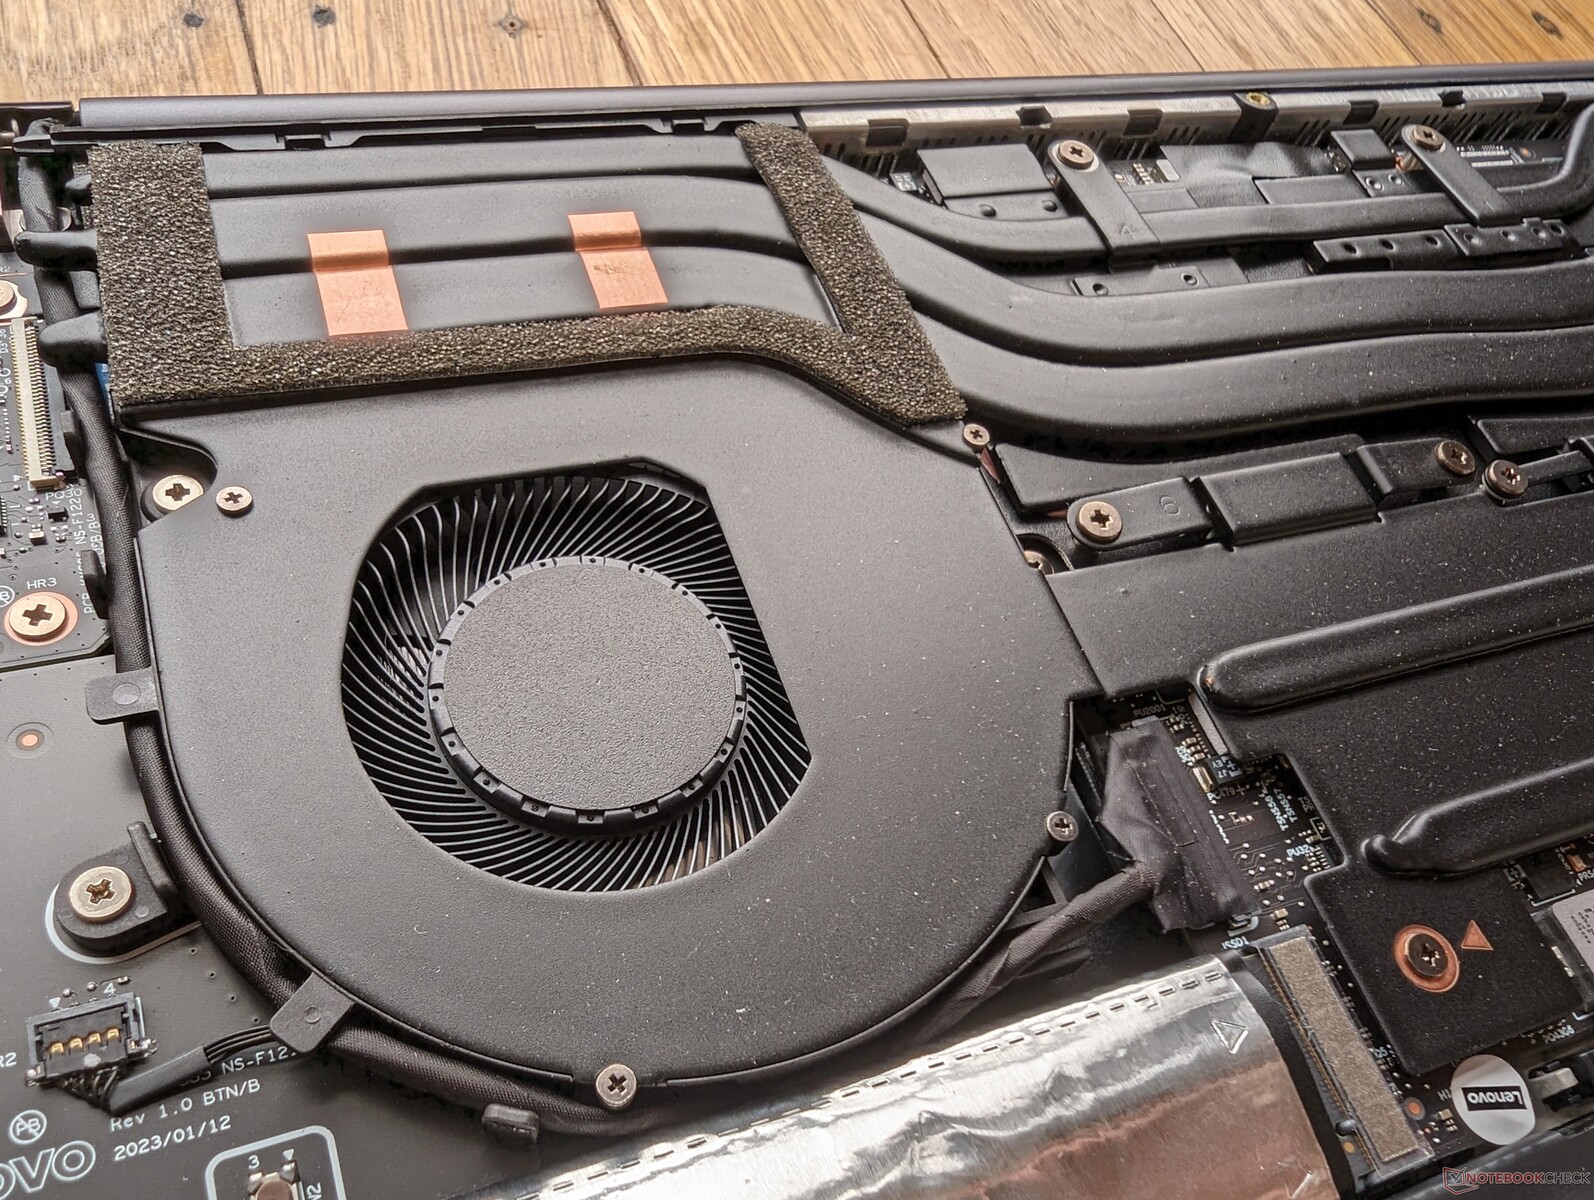
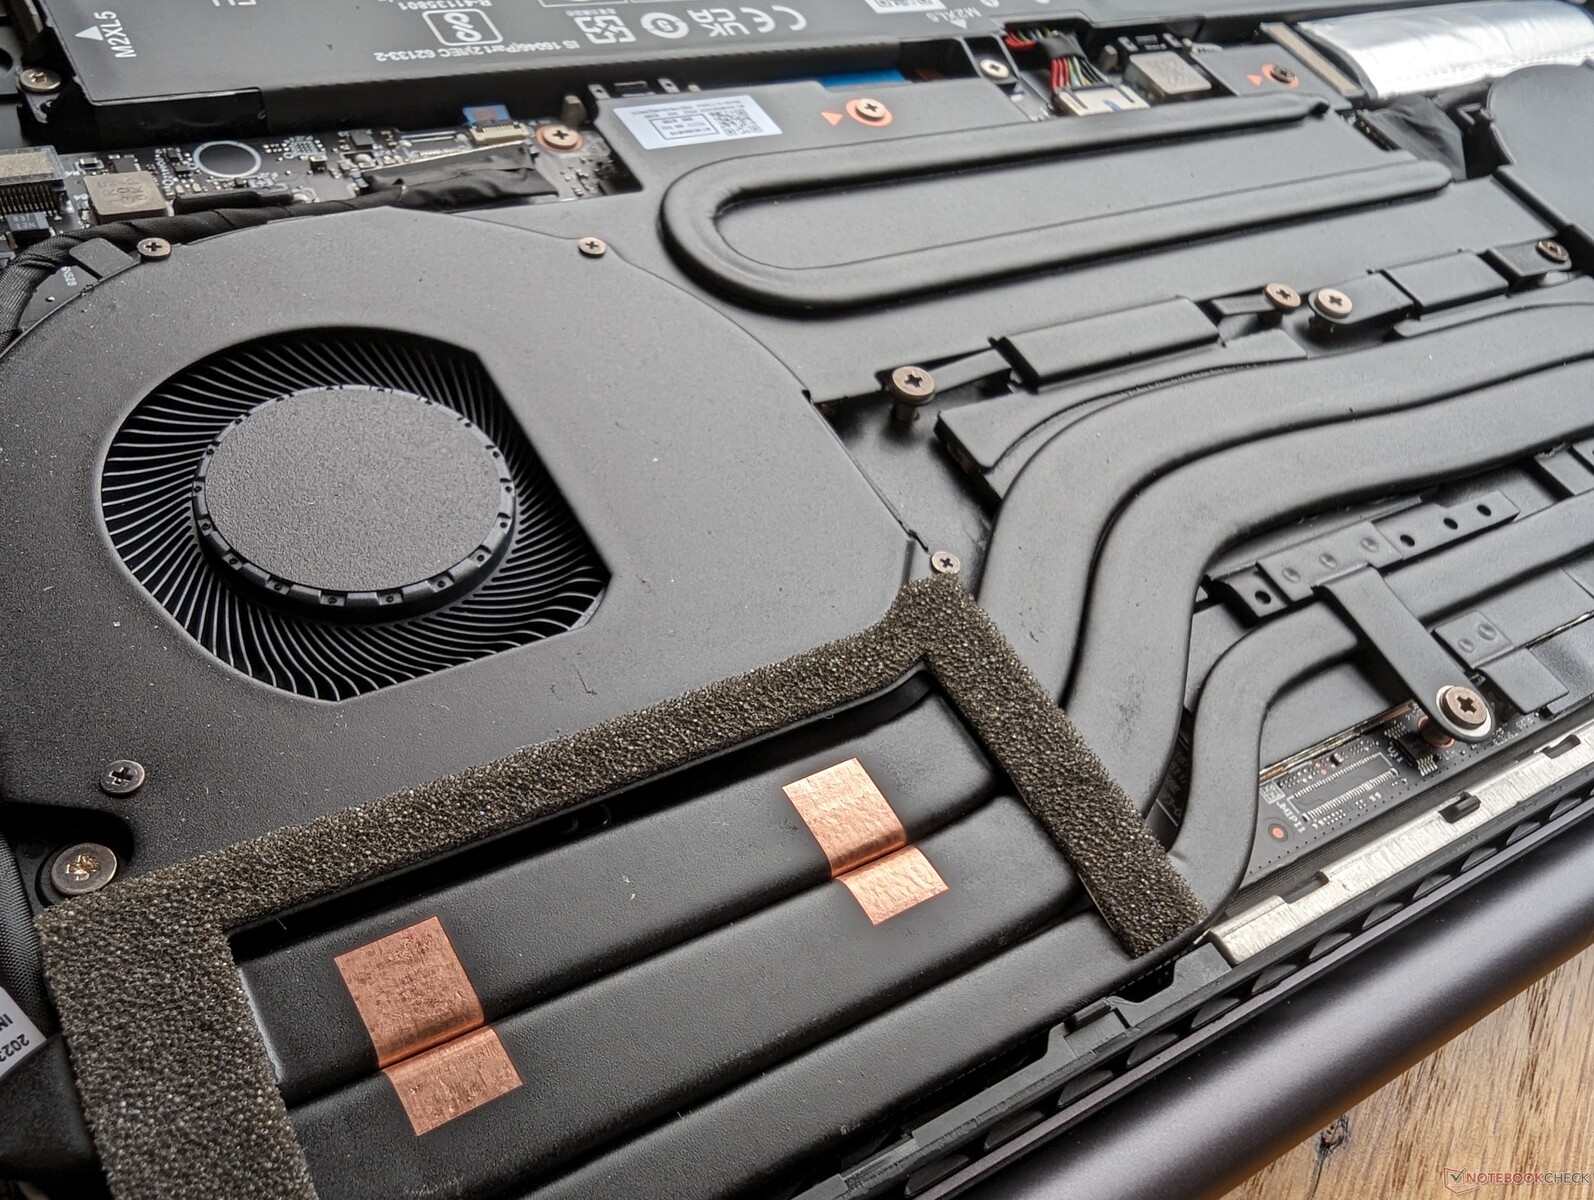
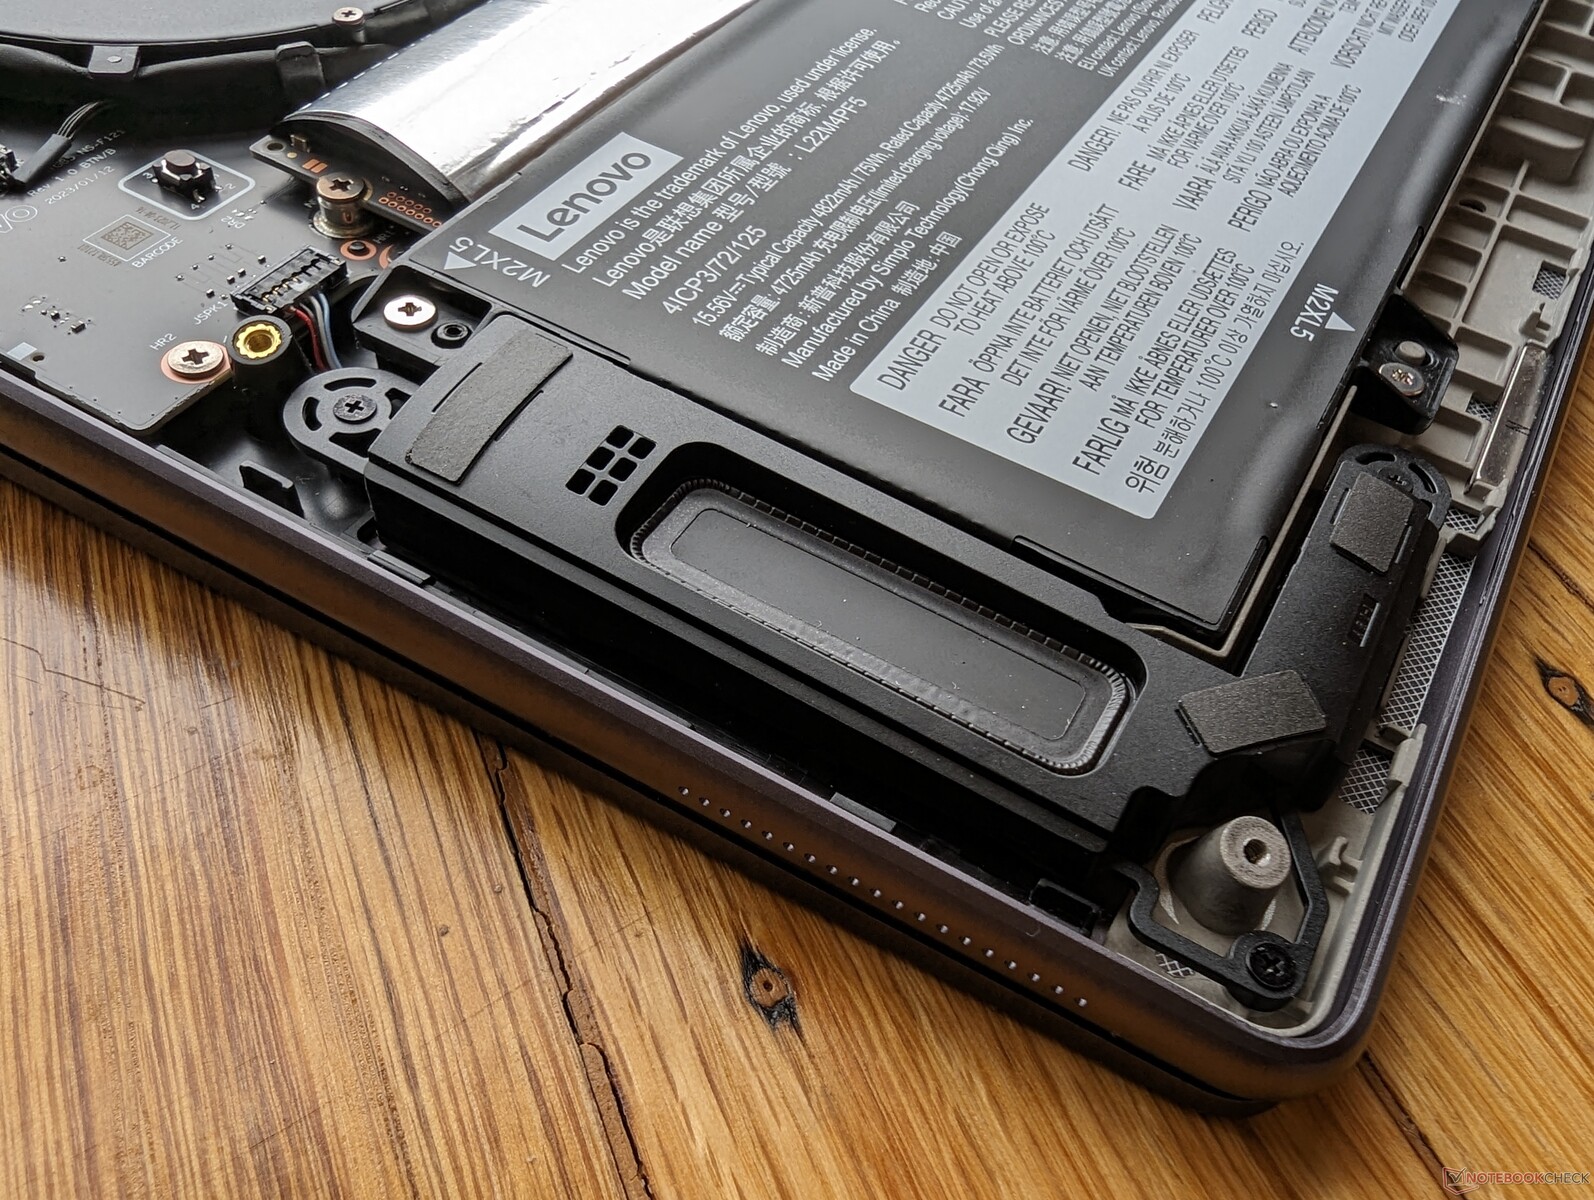
Mantenimiento
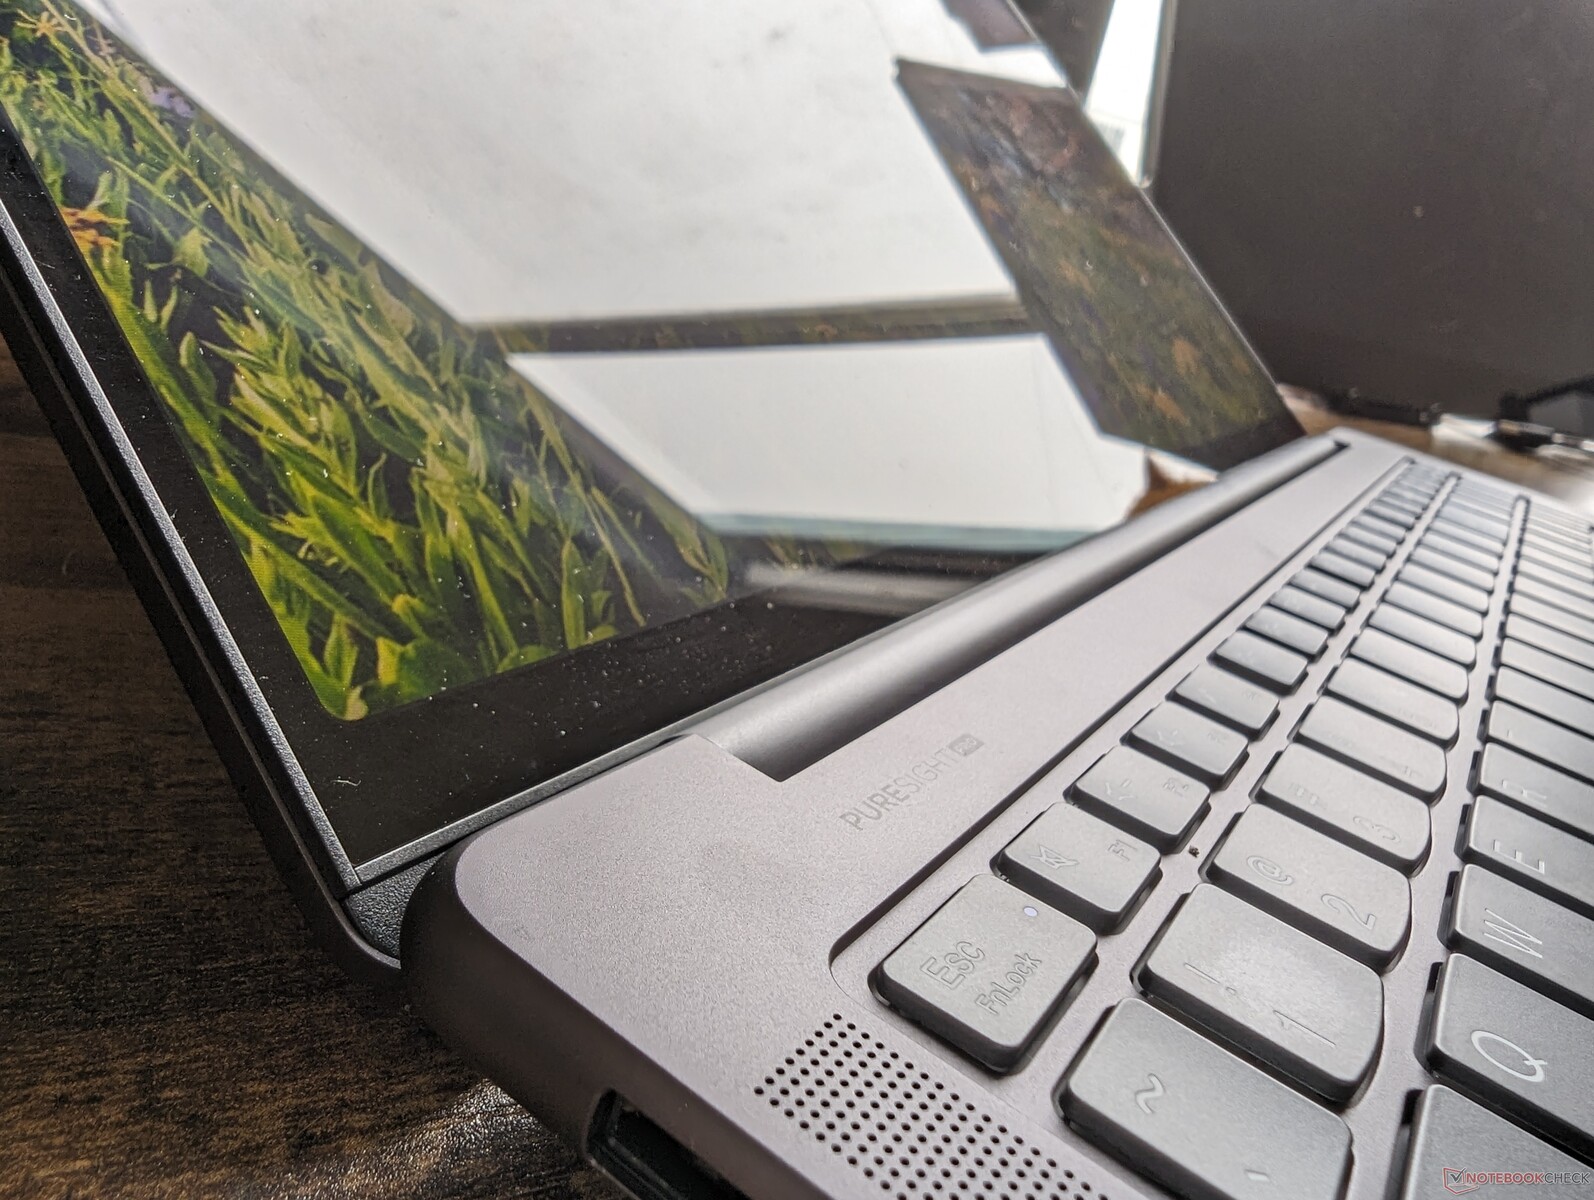
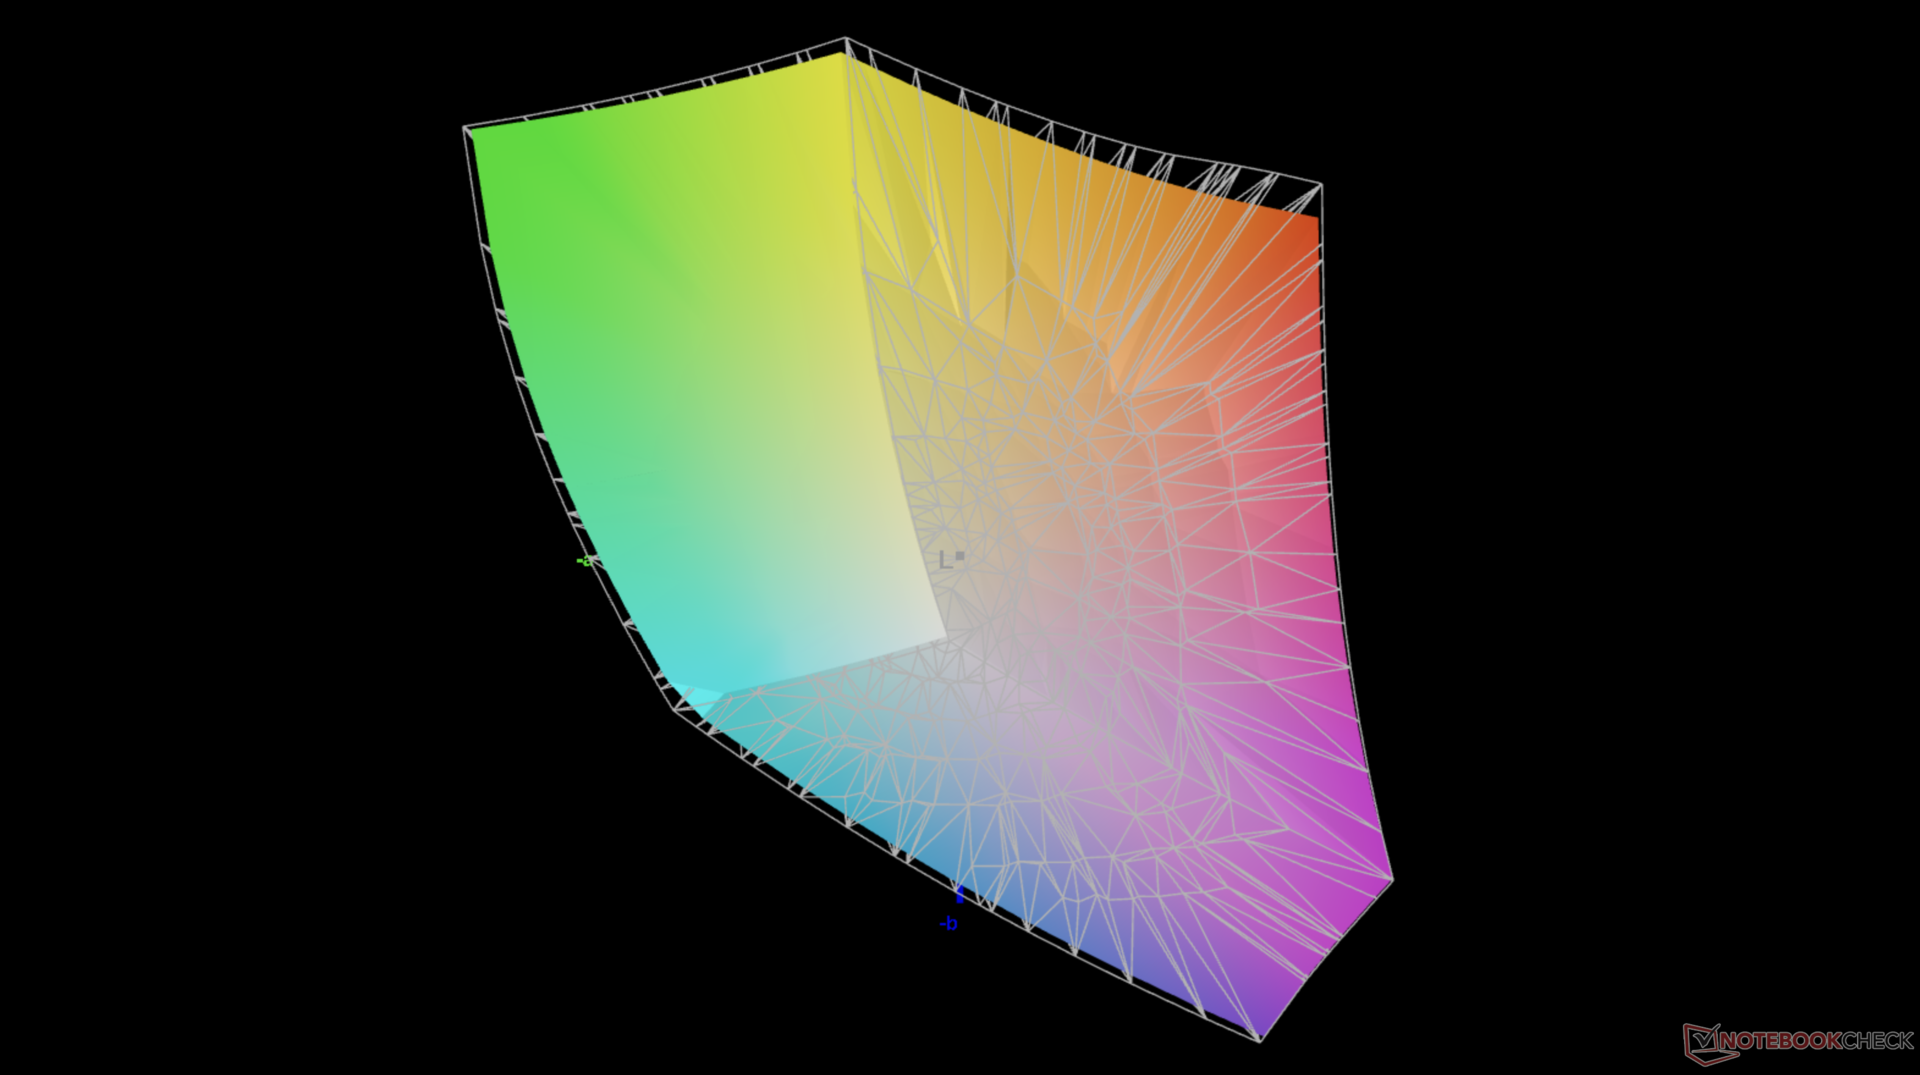
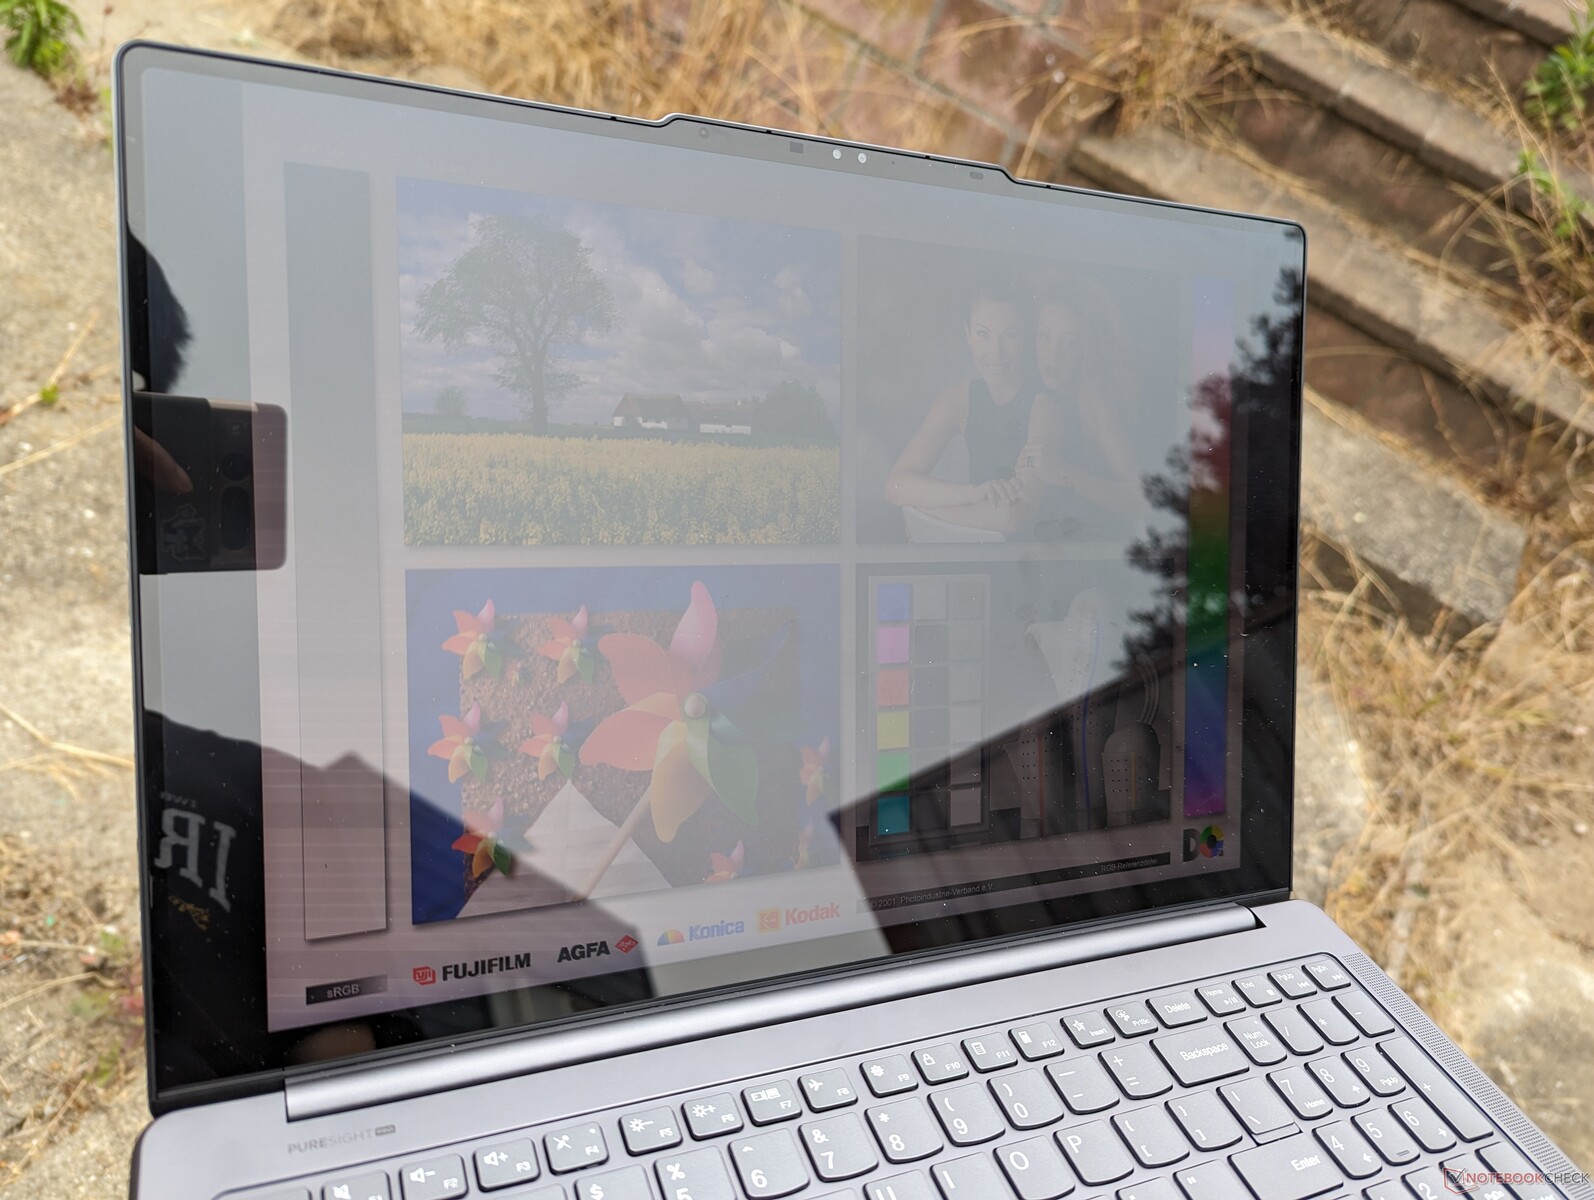
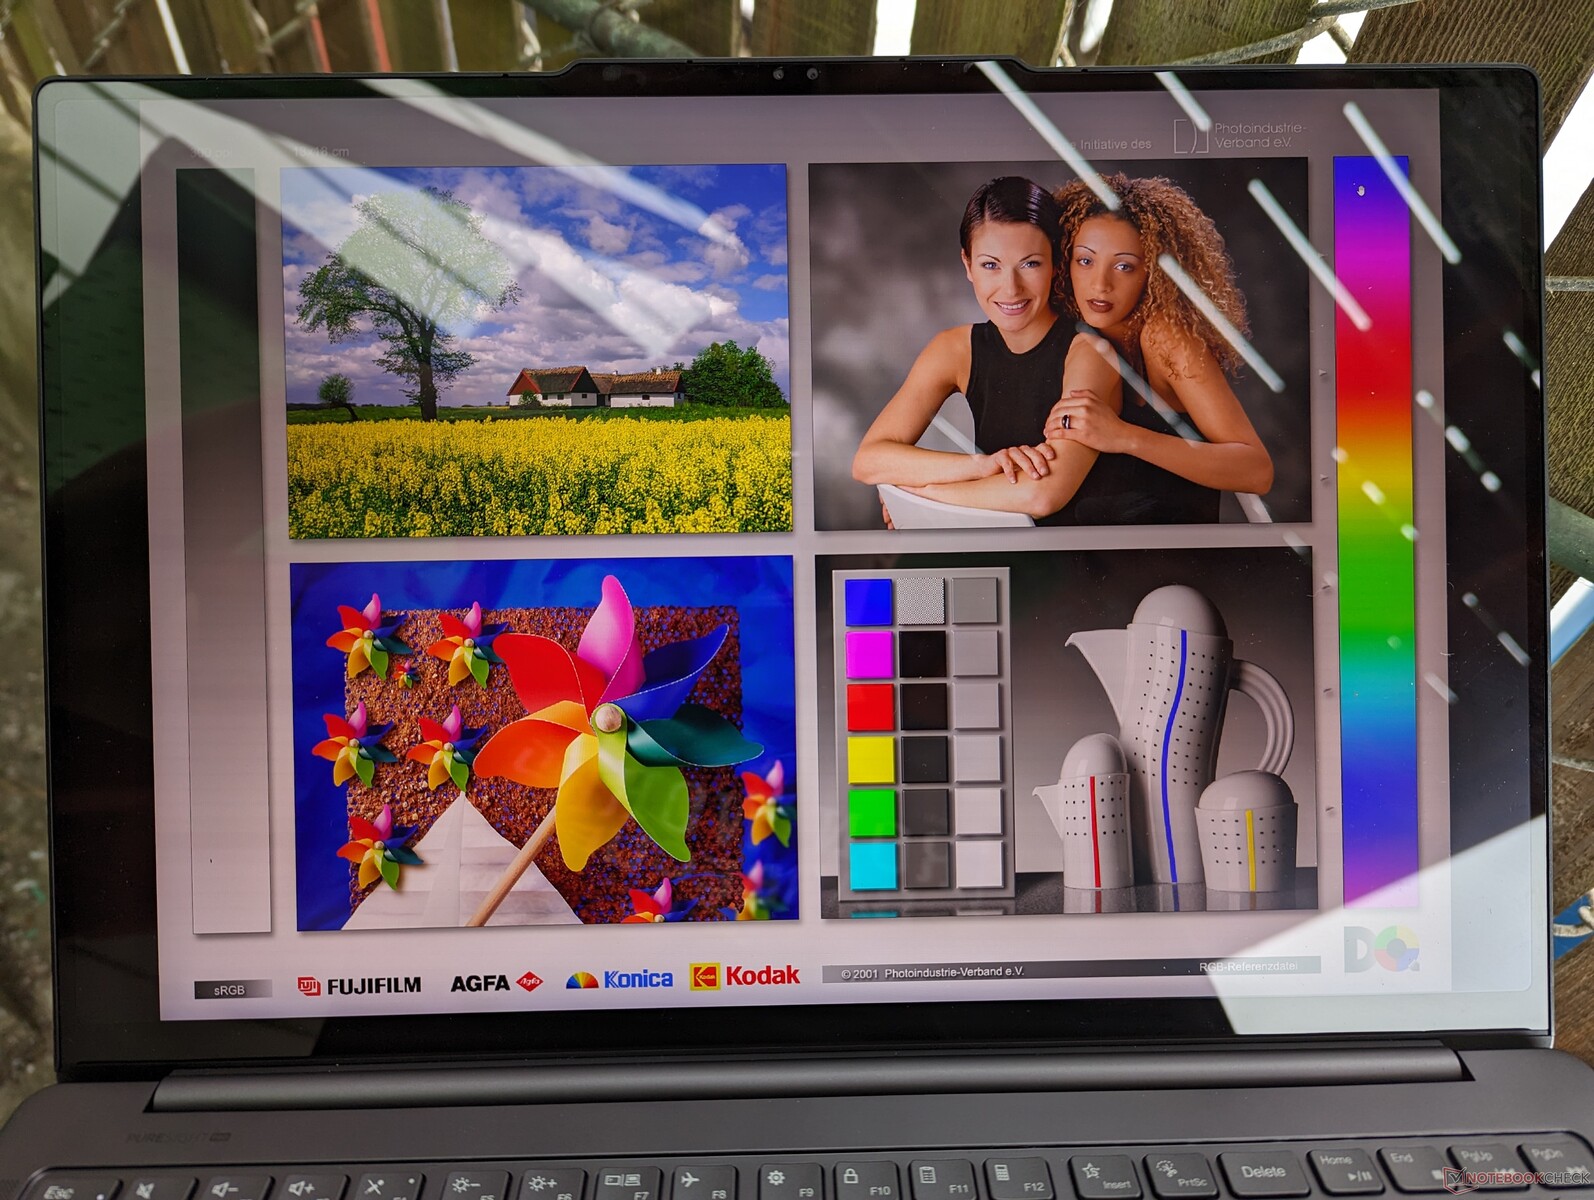
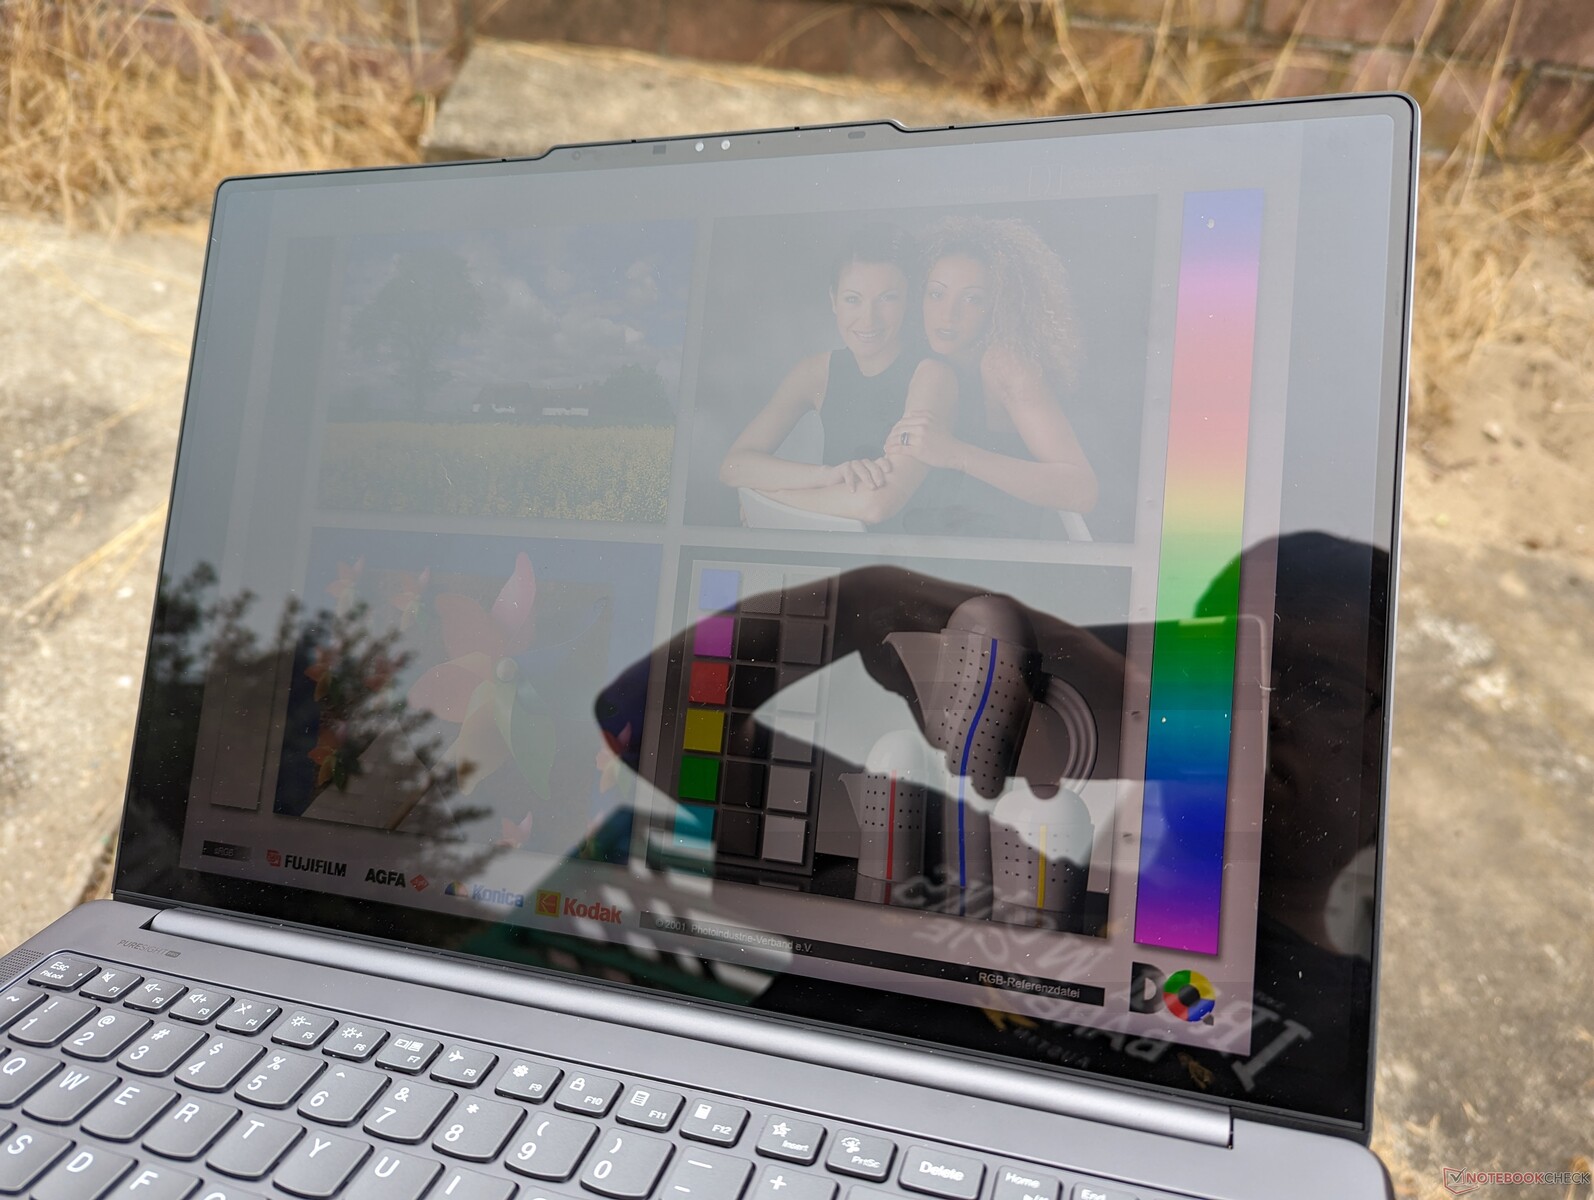
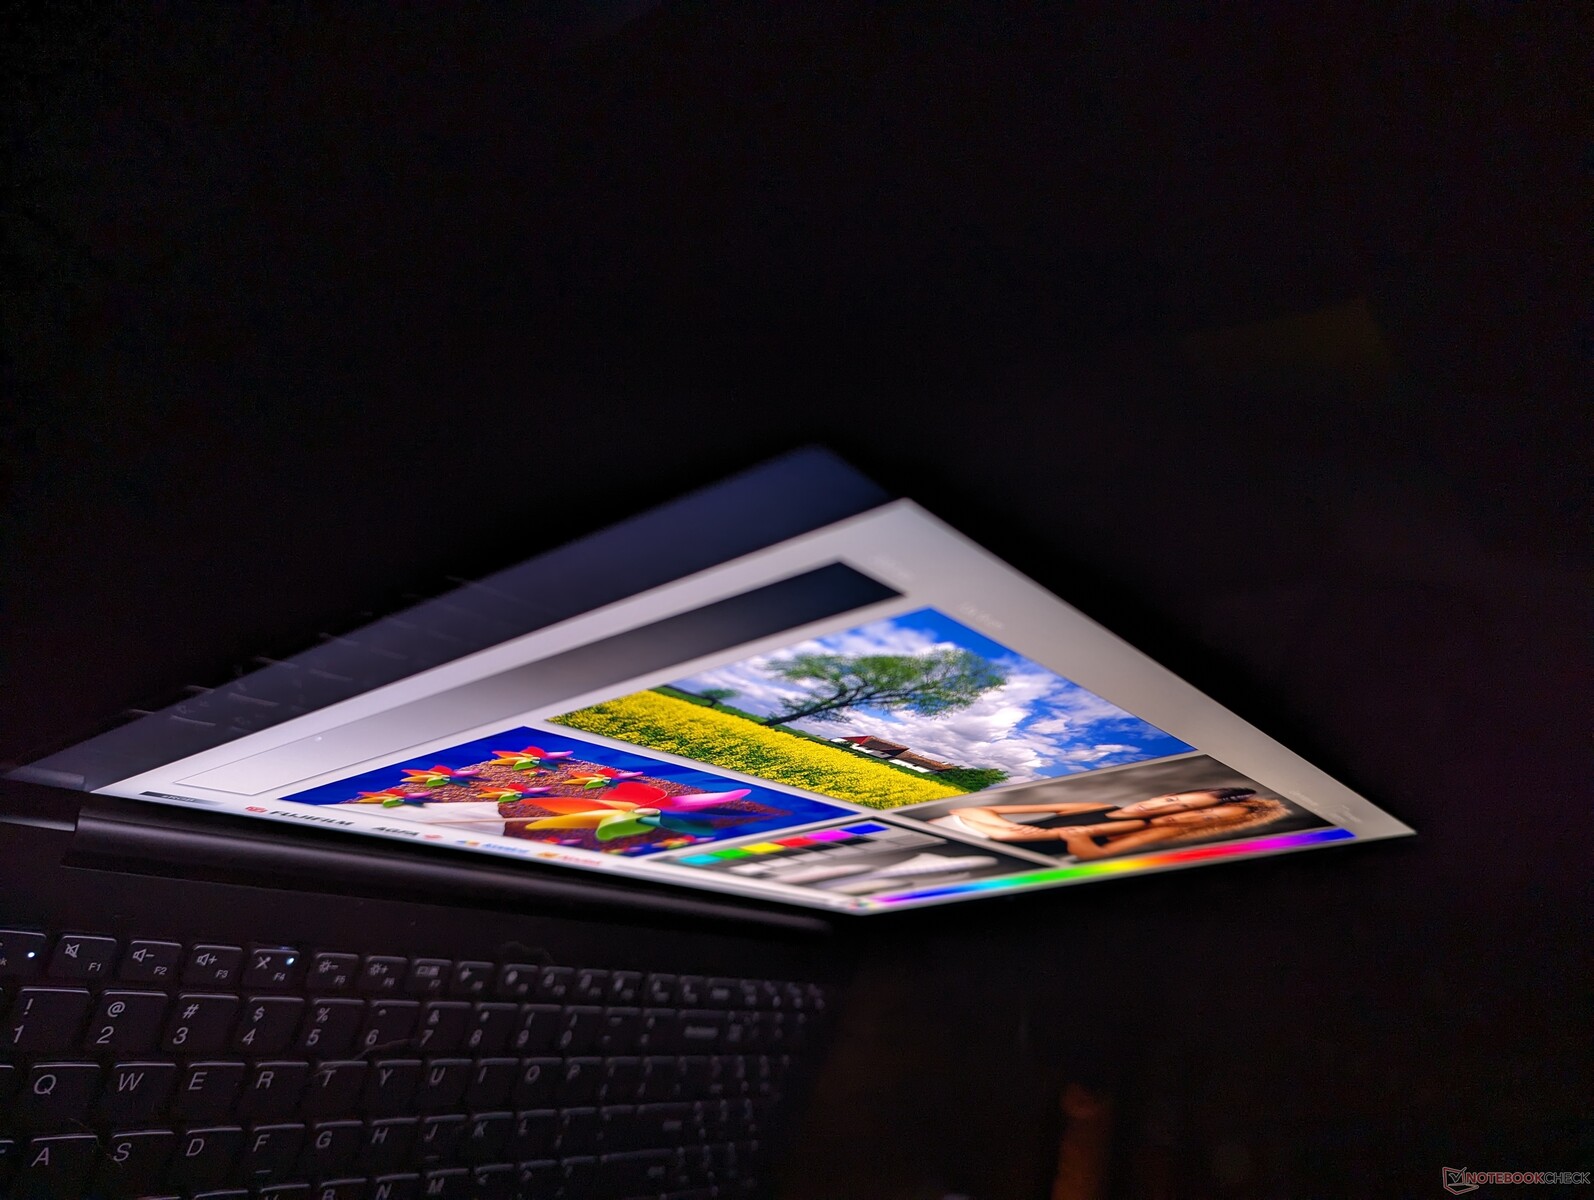
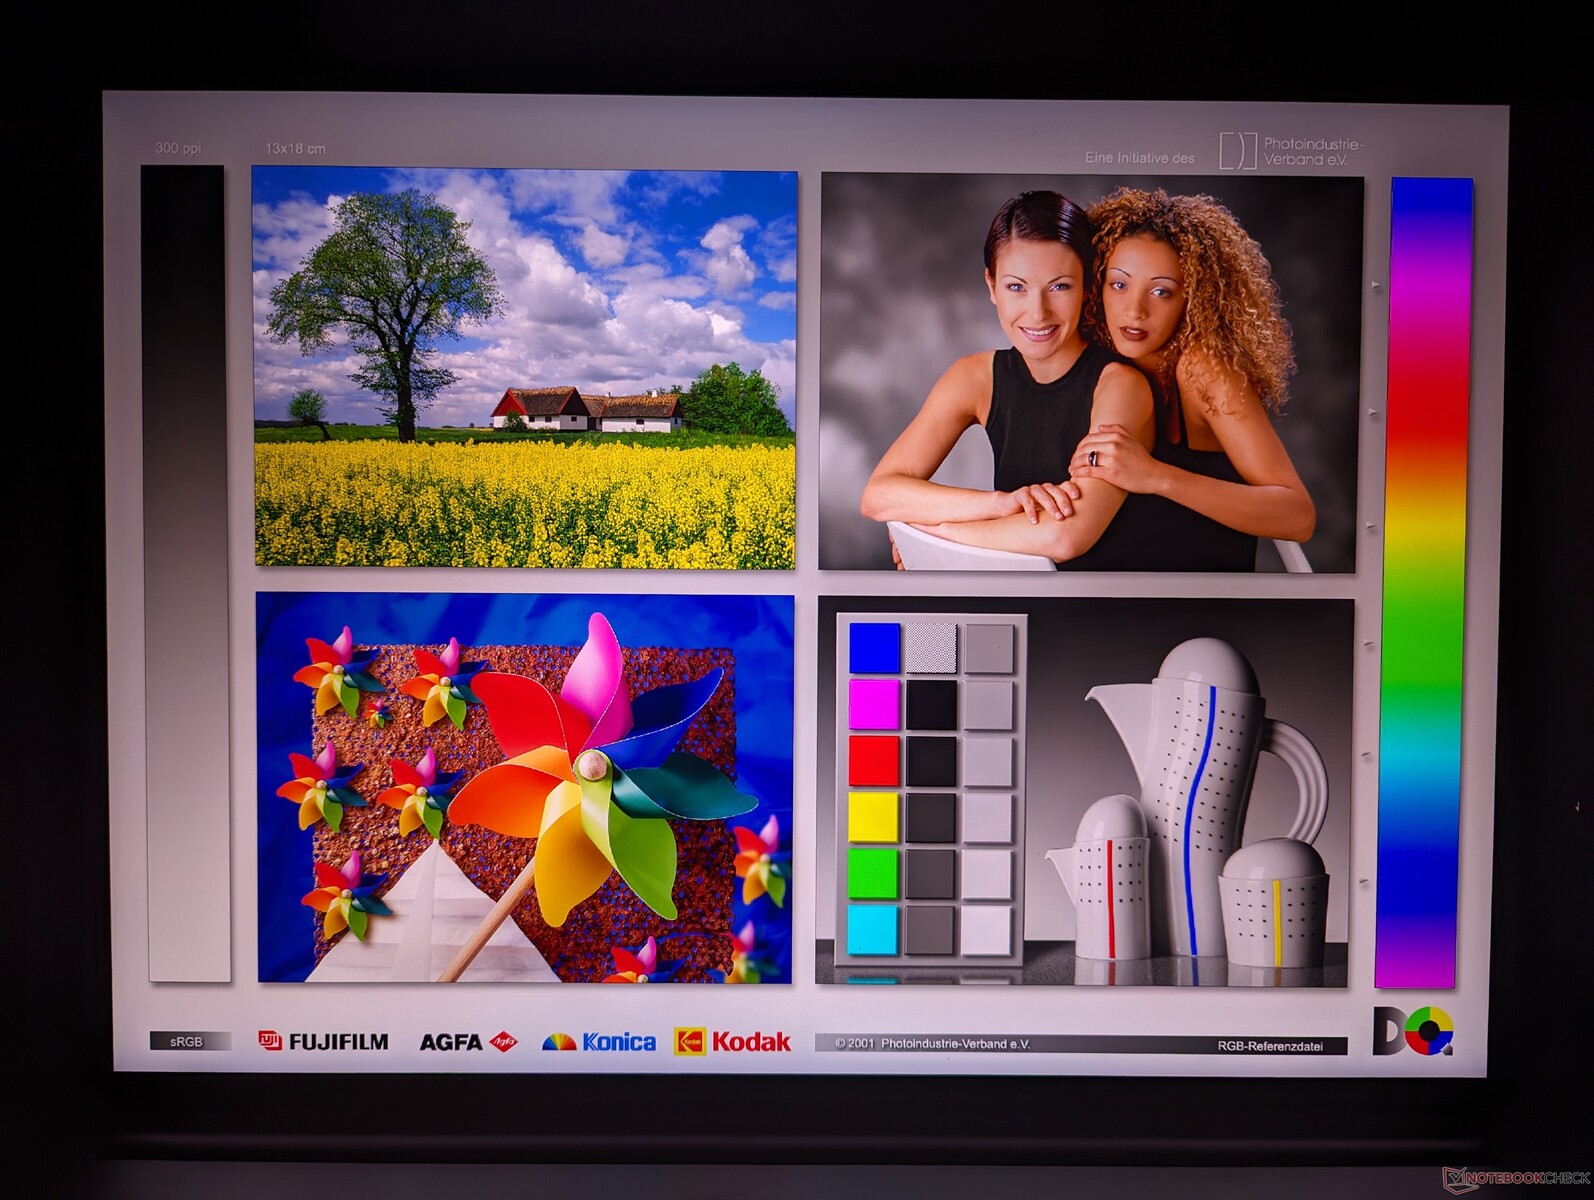
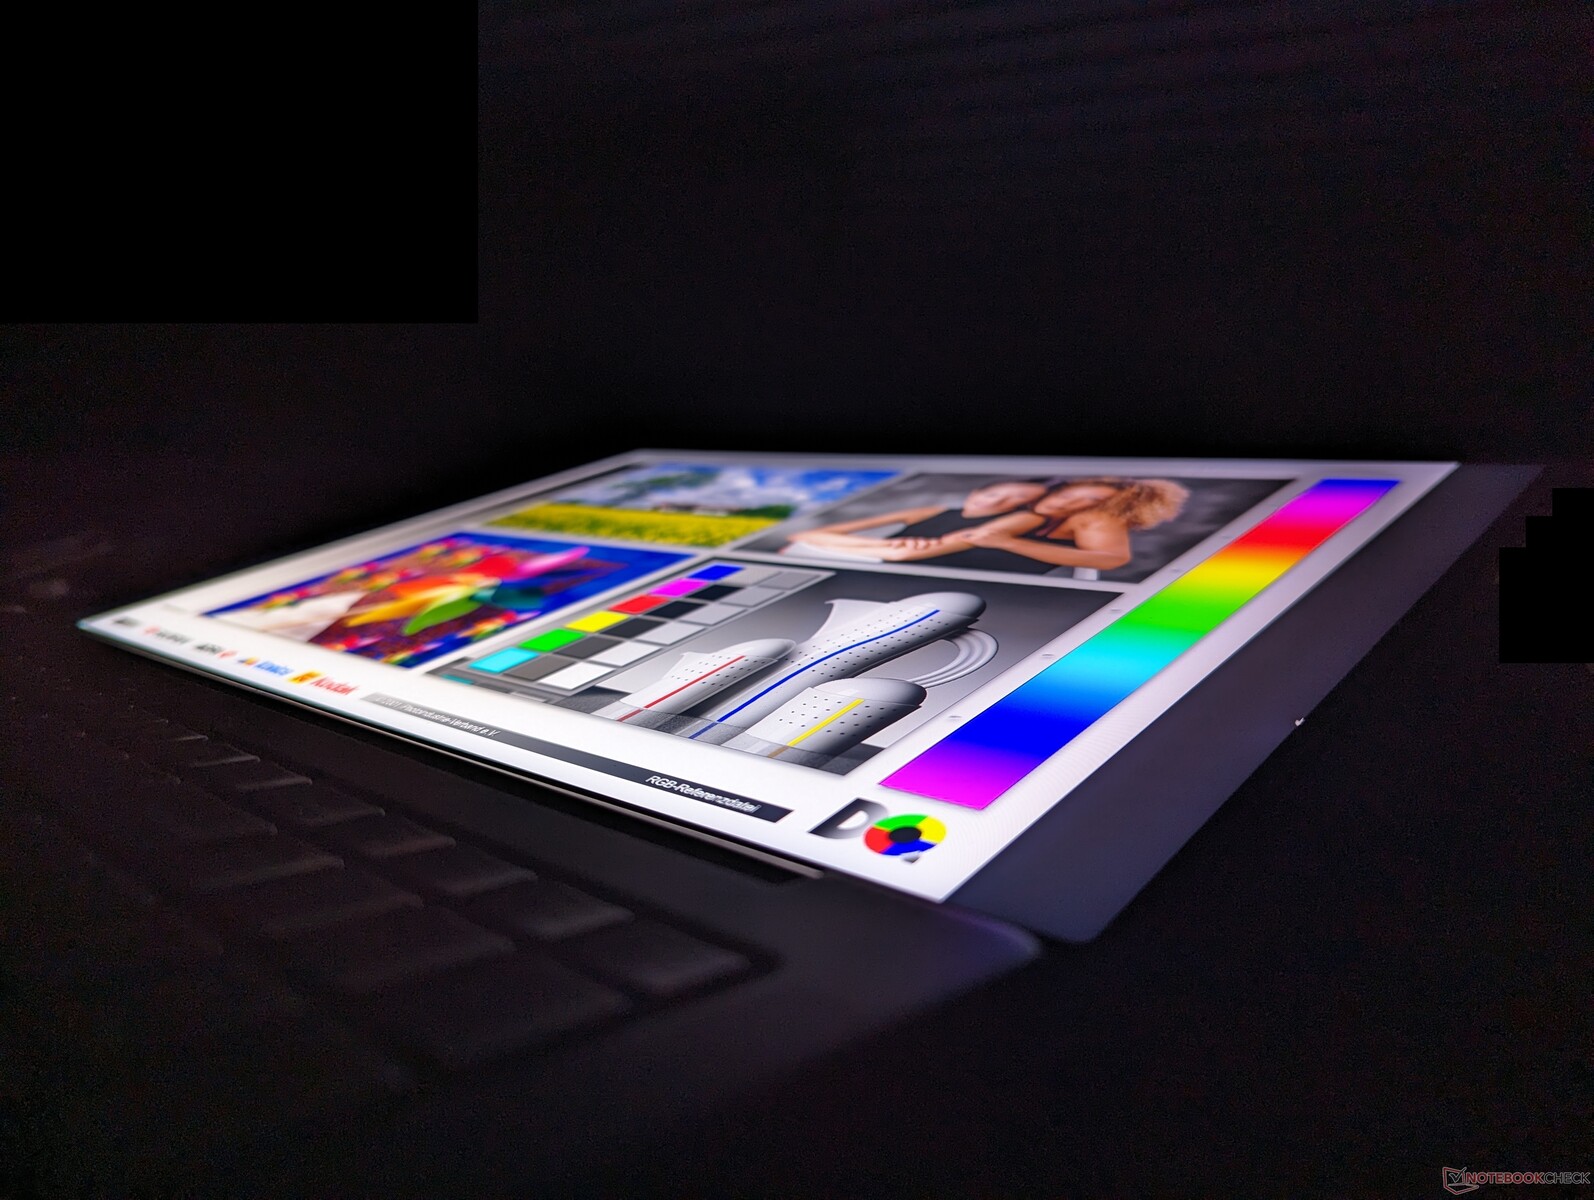
Pantalla - 100% DCI-P3, 165 Hz, Mini-LED, baja luz azul, 3,2K
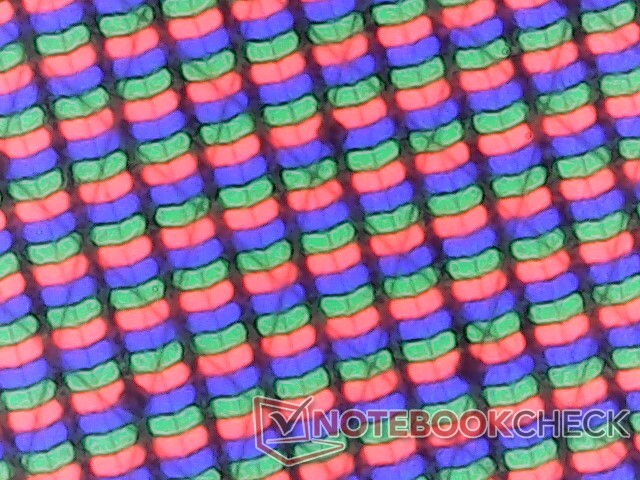
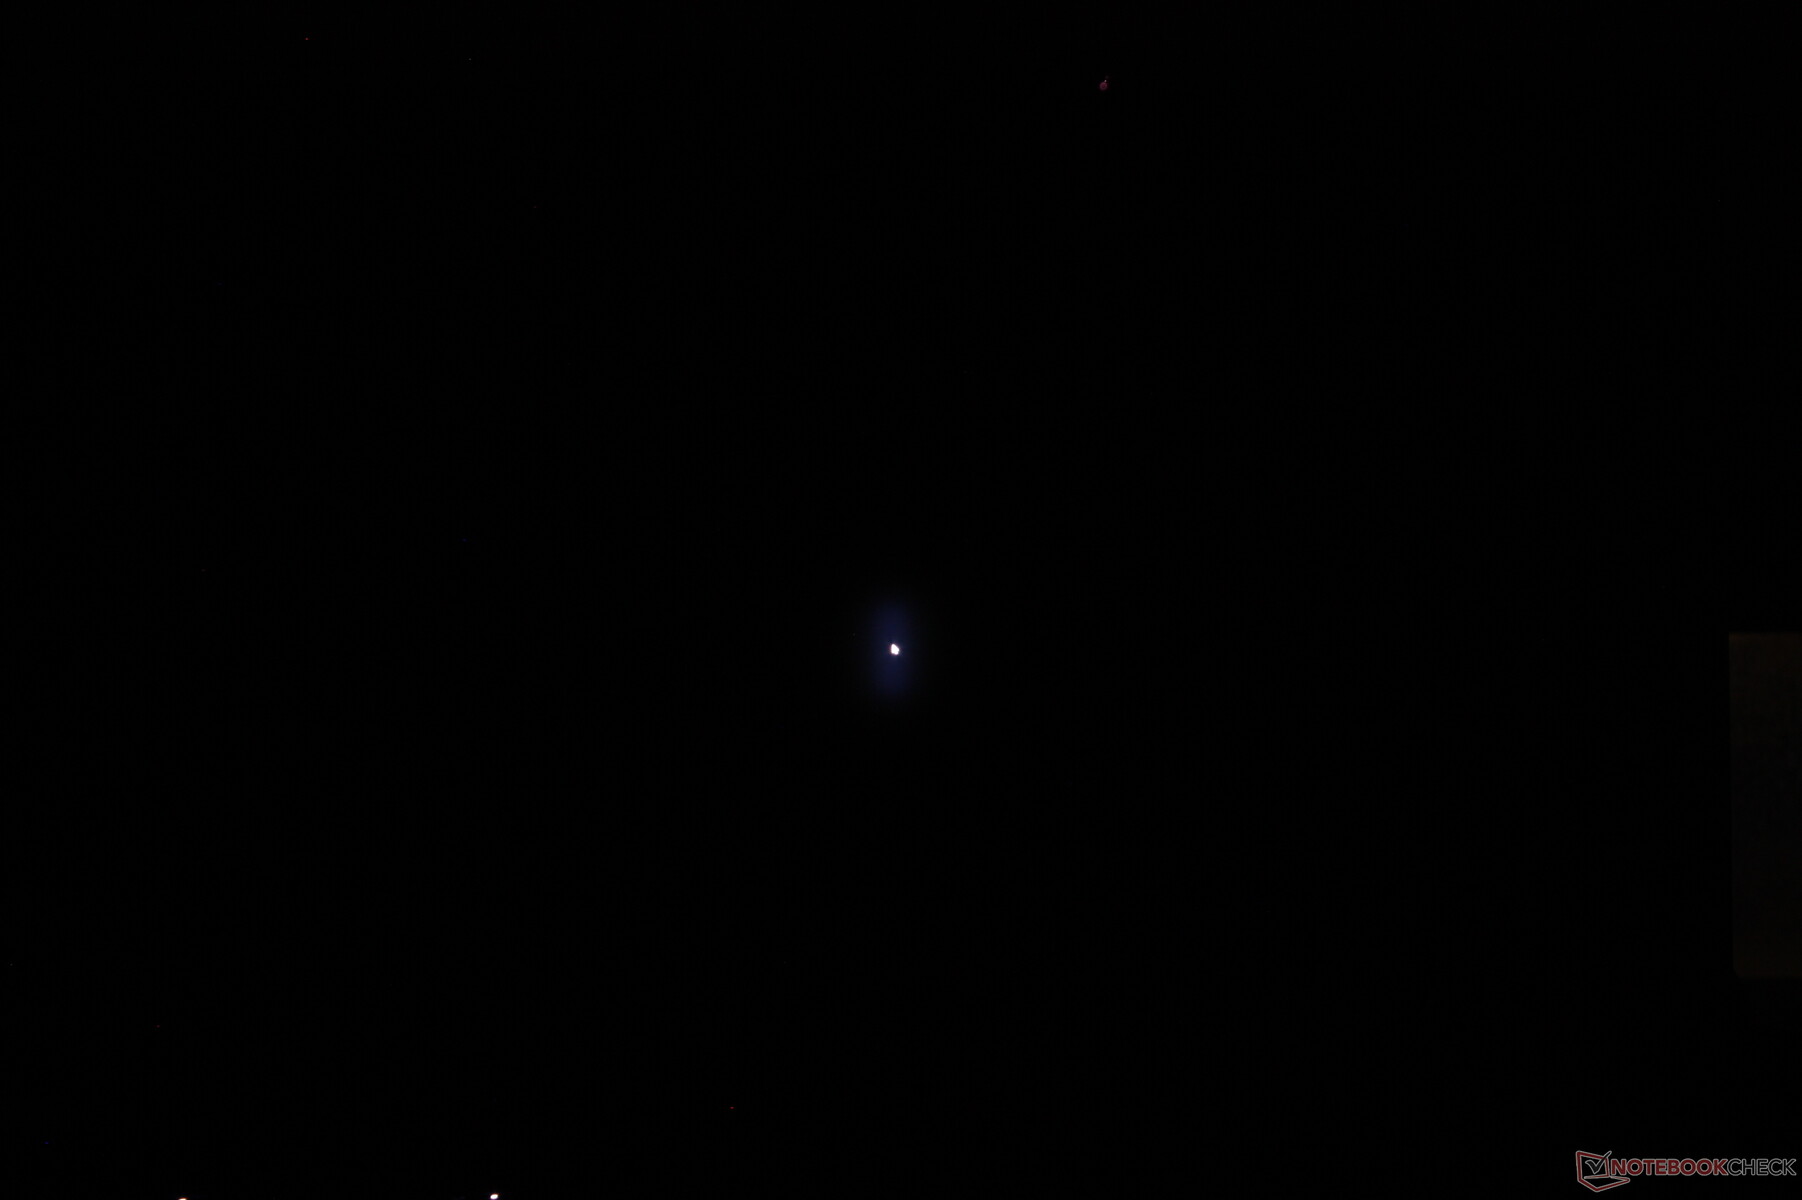
Mini-LED combina las ventajas de IPS, más barata, y OLED, más cara. Ofrece las velocísimas frecuencias de refresco nativas de IPS con el mayor brillo máximo de OLED mediante atenuación local para colores más vivos. El inconveniente, sin embargo, es un notable efecto "halo" cuando se muestra un objeto muy brillante sobre un fondo muy oscuro. Por ejemplo, en la siguiente captura de pantalla se muestra un cursor de ratón blanco sobre un fondo negro. En un panel OLED, el cursor se vería nítido y con bordes definidos, pero en un mini-LED brilla porque la atenuación local no es perfecta.
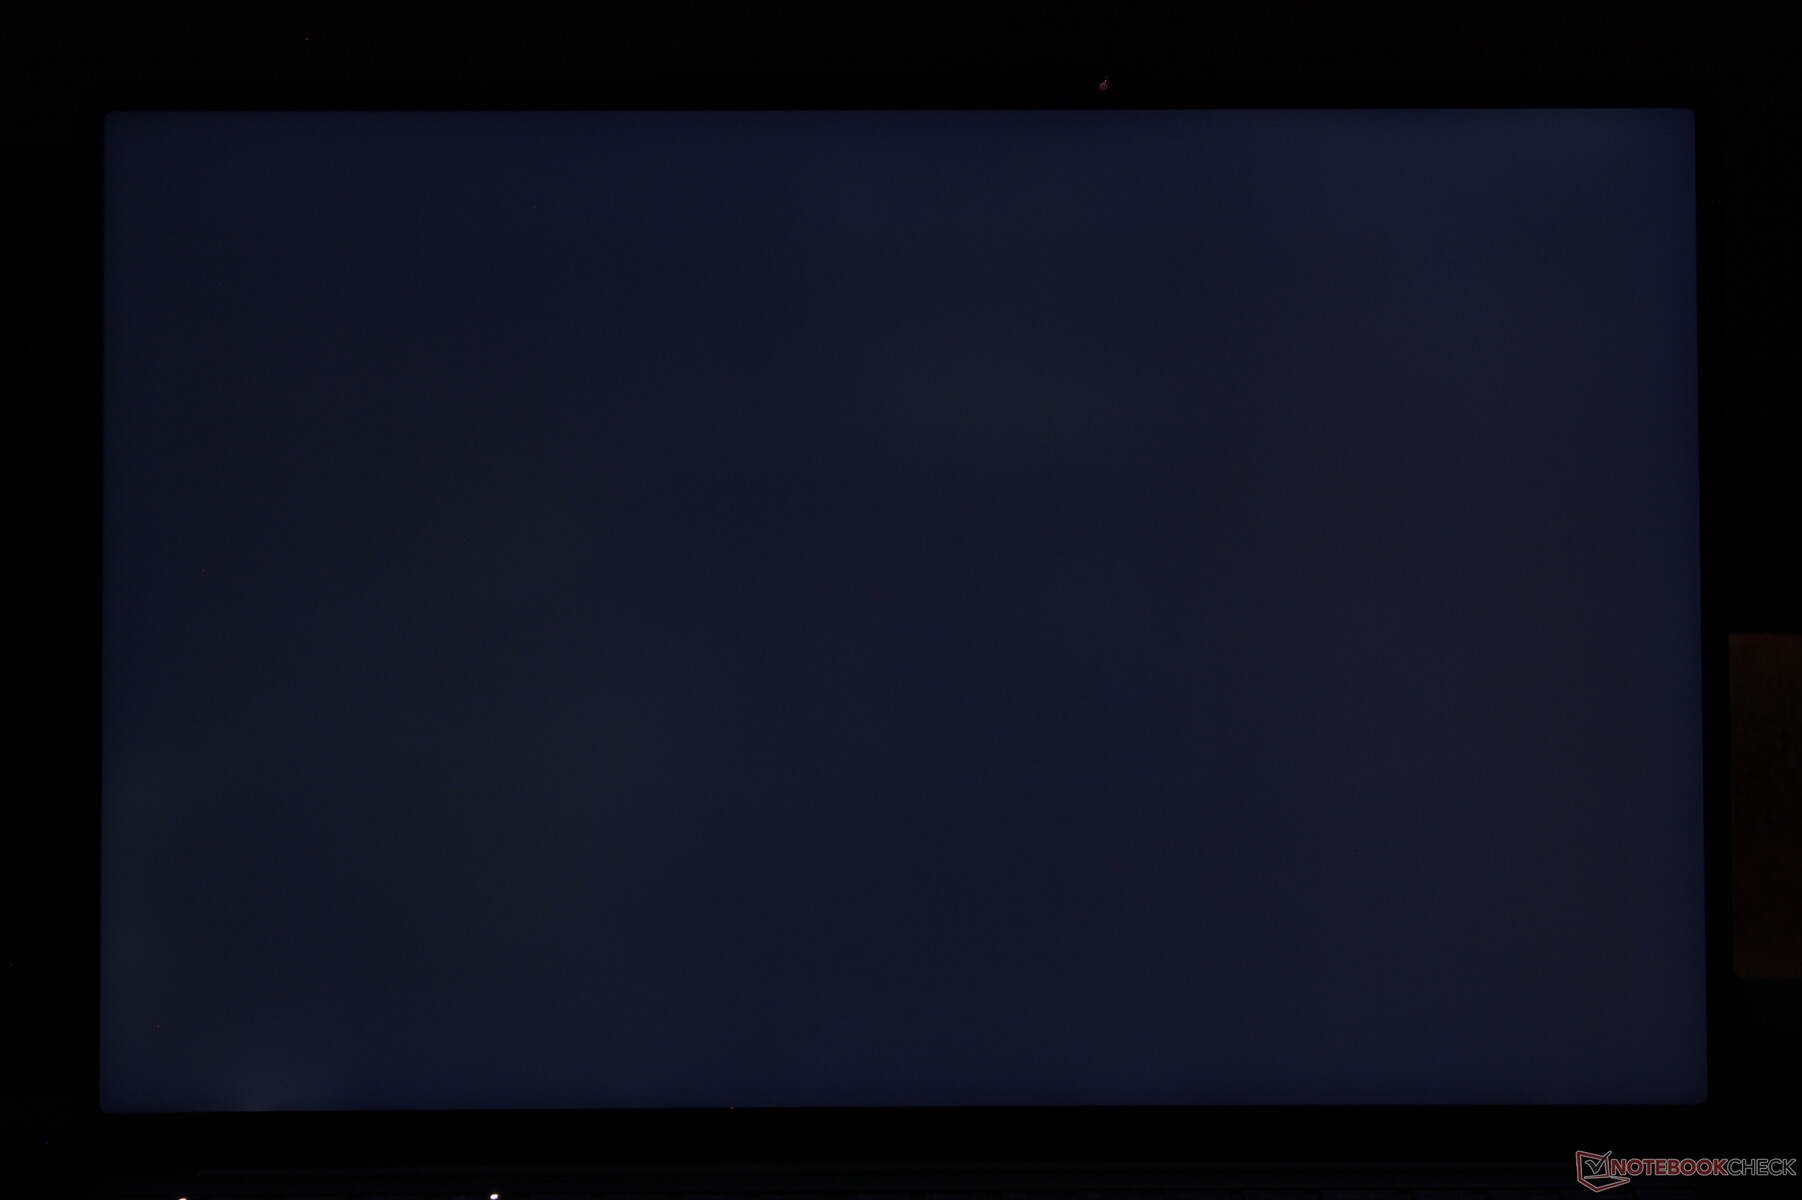
El brillo máximo se limita a unos 600 nits cuando se muestra una imagen totalmente blanca. Al ejecutar esta prueba HDRsin embargo, podemos medir un brillo máximo superior de 1330 nits, que coincide con la afirmación de Lenovo de 1200 nits.
| |||||||||||||||||||||||||
iluminación: 95 %
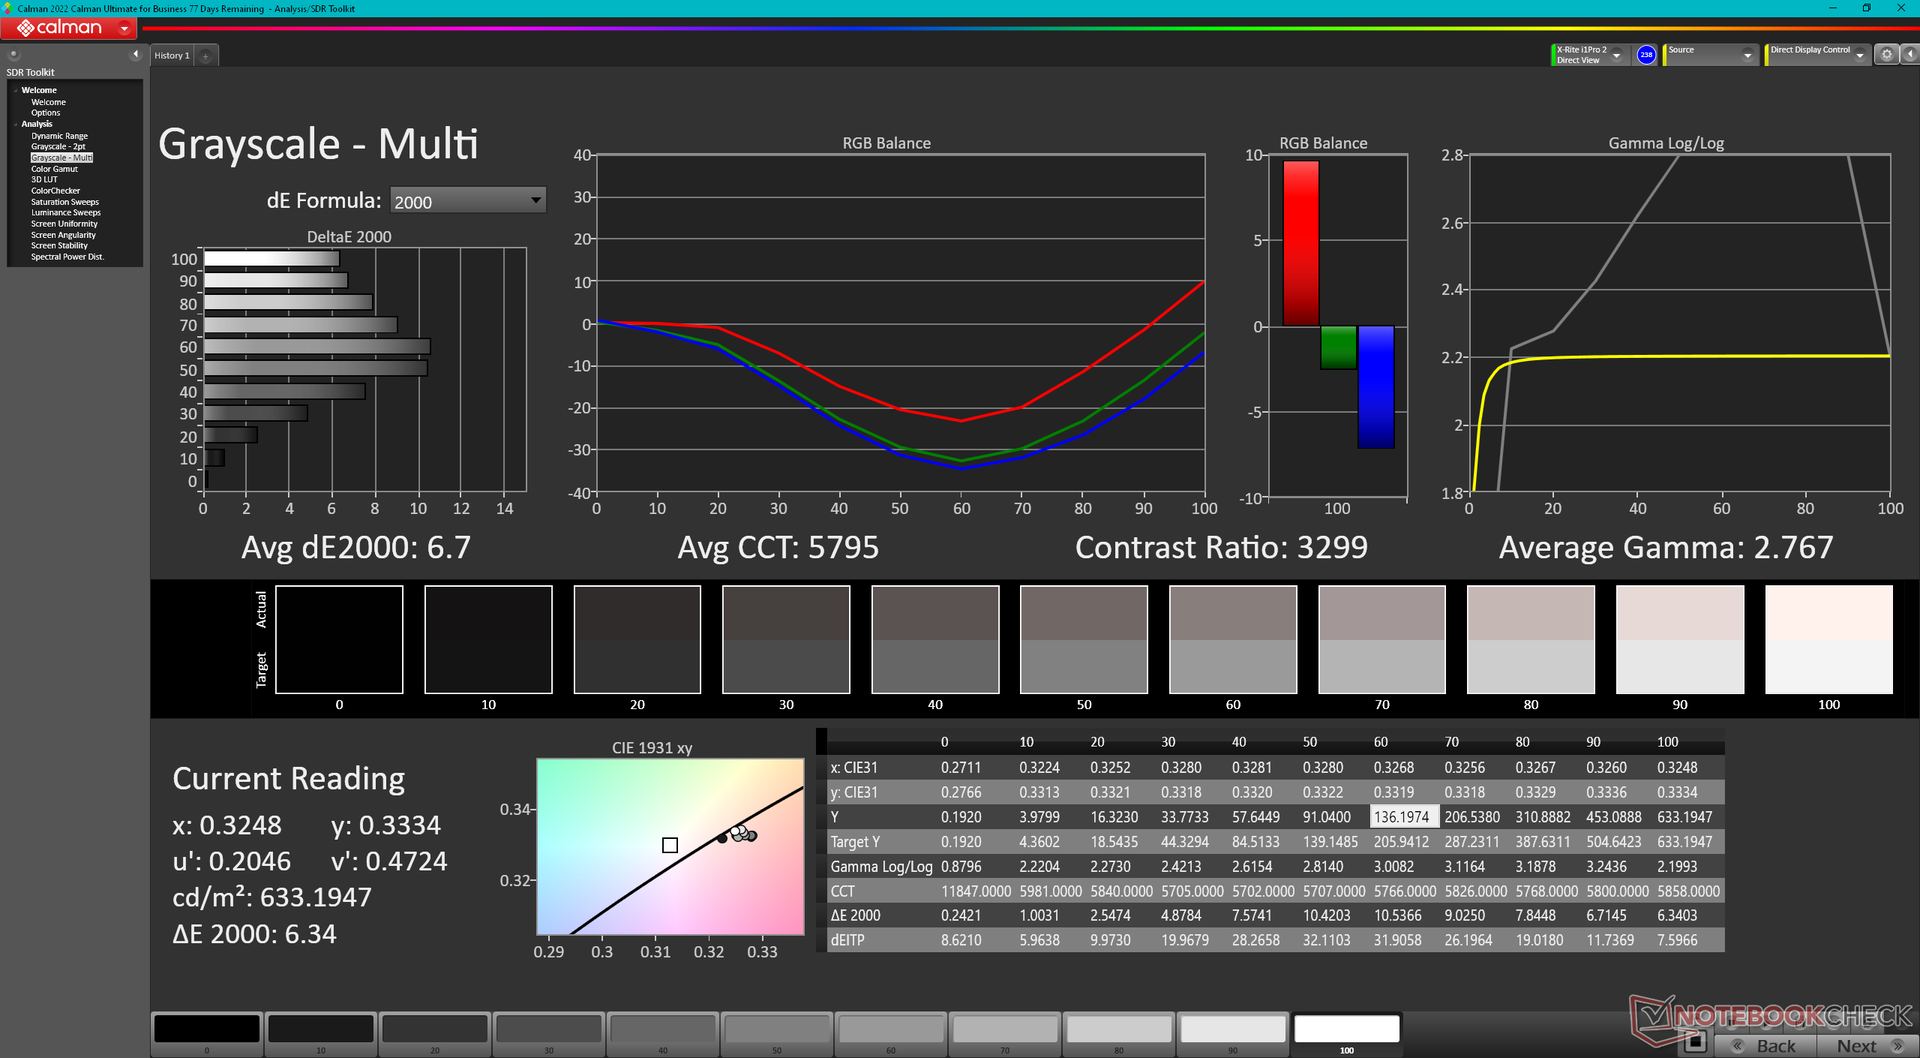
Brillo con batería: 627.4 cd/m²
Contraste: 3302:1 (Negro: 0.19 cd/m²)
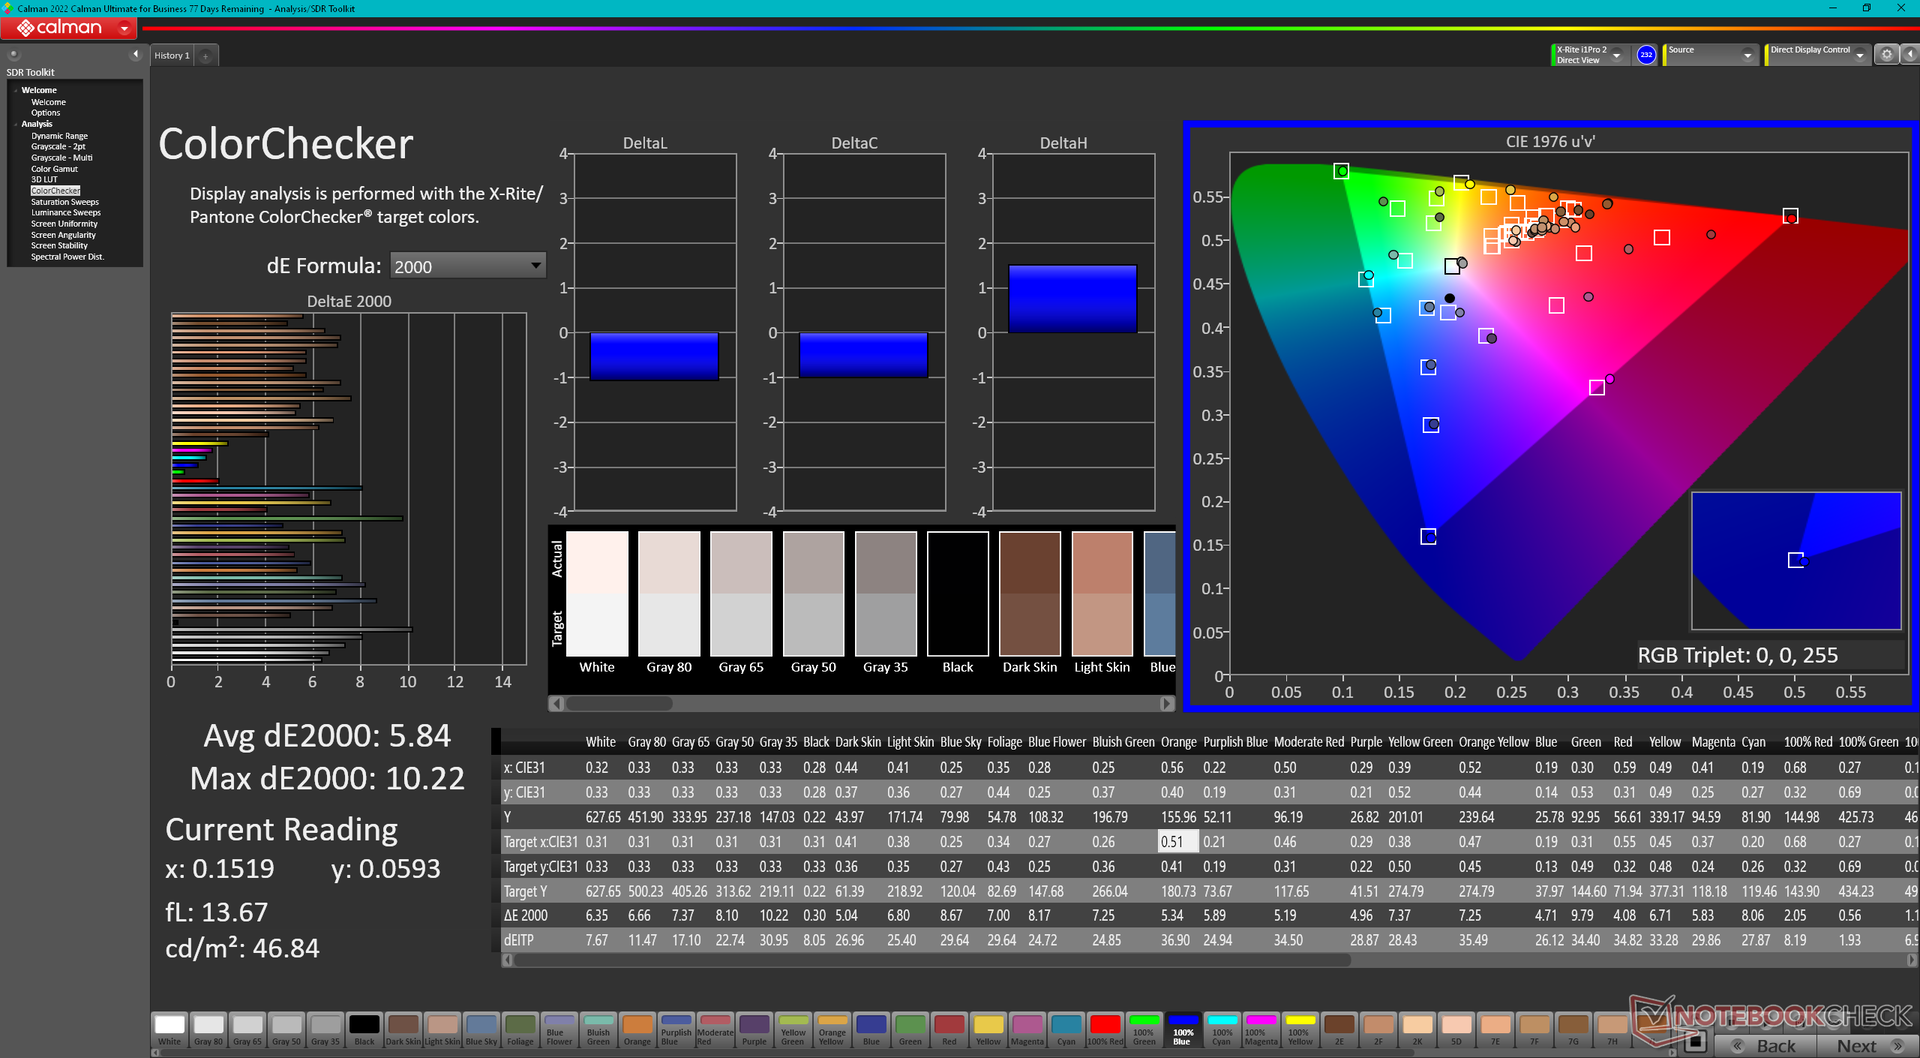
ΔE ColorChecker Calman: 5.84 | ∀{0.5-29.43 Ø4.71}
calibrated: 4.45
ΔE Greyscale Calman: 6.7 | ∀{0.09-98 Ø4.96}
84.6% AdobeRGB 1998 (Argyll 3D)
99.9% sRGB (Argyll 3D)
95.1% Display P3 (Argyll 3D)
Gamma: 2.77
CCT: 5795 K
| Lenovo Slim Pro 9i 16IRP8 LEN160-3.2K, Mini-LED, 3200x2000, 16" | Lenovo Yoga Pro 9 16-IRP G8 LEN160-3.2K, Mini-LED, 3200x2000, 16" | Asus VivoBook Pro 16 Au Optronics B160QAN02.L, IPS, 2560x1600, 16" | Acer Swift Edge SFE16-42-R1GM Samsung SDC4168, OLED, 3840x2400, 16" | Dell Inspiron 16 Plus 7620 BOE NE16N41, IPS, 3072x1920, 16" | HP Envy 16 h0112nr Samsung SDC4174, OLED, 3840x2400, 16" | |
|---|---|---|---|---|---|---|
| Display | 5% | 2% | 7% | -13% | 3% | |
| Display P3 Coverage (%) | 95.1 | 97 2% | 98.5 4% | 99.7 5% | 70.8 -26% | 99.3 4% |
| sRGB Coverage (%) | 99.9 | 99.8 0% | 99.9 0% | 100 0% | 99.5 0% | 100 0% |
| AdobeRGB 1998 Coverage (%) | 84.6 | 95.1 12% | 86.1 2% | 97.2 15% | 73.2 -13% | 88 4% |
| Response Times | 0% | 50% | 77% | -188% | 83% | |
| Response Time Grey 50% / Grey 80% * (ms) | 14 ? | 14 ? -0% | 2 ? 86% | 2 ? 86% | 38 ? -171% | 2 ? 86% |
| Response Time Black / White * (ms) | 9.2 ? | 9.2 ? -0% | 8 ? 13% | 3 ? 67% | 28 ? -204% | 1.9 ? 79% |
| PWM Frequency (Hz) | 5784 ? | 5800 ? | 239 ? | 240.4 ? | ||
| Screen | 24% | 5% | 21% | 9% | 17% | |
| Brightness middle (cd/m²) | 627.4 | 539 -14% | 504 -20% | 369 -41% | 288.9 -54% | 328.8 -48% |
| Brightness (cd/m²) | 618 | 546 -12% | 465 -25% | 371 -40% | 276 -55% | 332 -46% |
| Brightness Distribution (%) | 95 | 96 1% | 87 -8% | 97 2% | 92 -3% | 97 2% |
| Black Level * (cd/m²) | 0.19 | 0.18 5% | 0.35 -84% | 0.26 -37% | ||
| Contrast (:1) | 3302 | 2994 -9% | 1440 -56% | 1111 -66% | ||
| Colorchecker dE 2000 * | 5.84 | 1.4 76% | 1.83 69% | 2.3 61% | 1.88 68% | 1.53 74% |
| Colorchecker dE 2000 max. * | 10.22 | 2.1 79% | 5.51 46% | 4.37 57% | 4.37 57% | 6.04 41% |
| Colorchecker dE 2000 calibrated * | 4.45 | 1.34 70% | 2.87 36% | 0.42 91% | ||
| Greyscale dE 2000 * | 6.7 | 2.2 67% | 3.02 55% | 1.83 73% | 1.4 79% | 1.3 81% |
| Gamma | 2.77 79% | 2.19 100% | 2.39 92% | 2.39 92% | 2.3 96% | 2.18 101% |
| CCT | 5795 112% | 6479 100% | 6688 97% | 6392 102% | 6634 98% | 6362 102% |
| Media total (Programa/Opciones) | 10% /
16% | 19% /
11% | 35% /
27% | -64% /
-24% | 34% /
25% |
* ... más pequeño es mejor
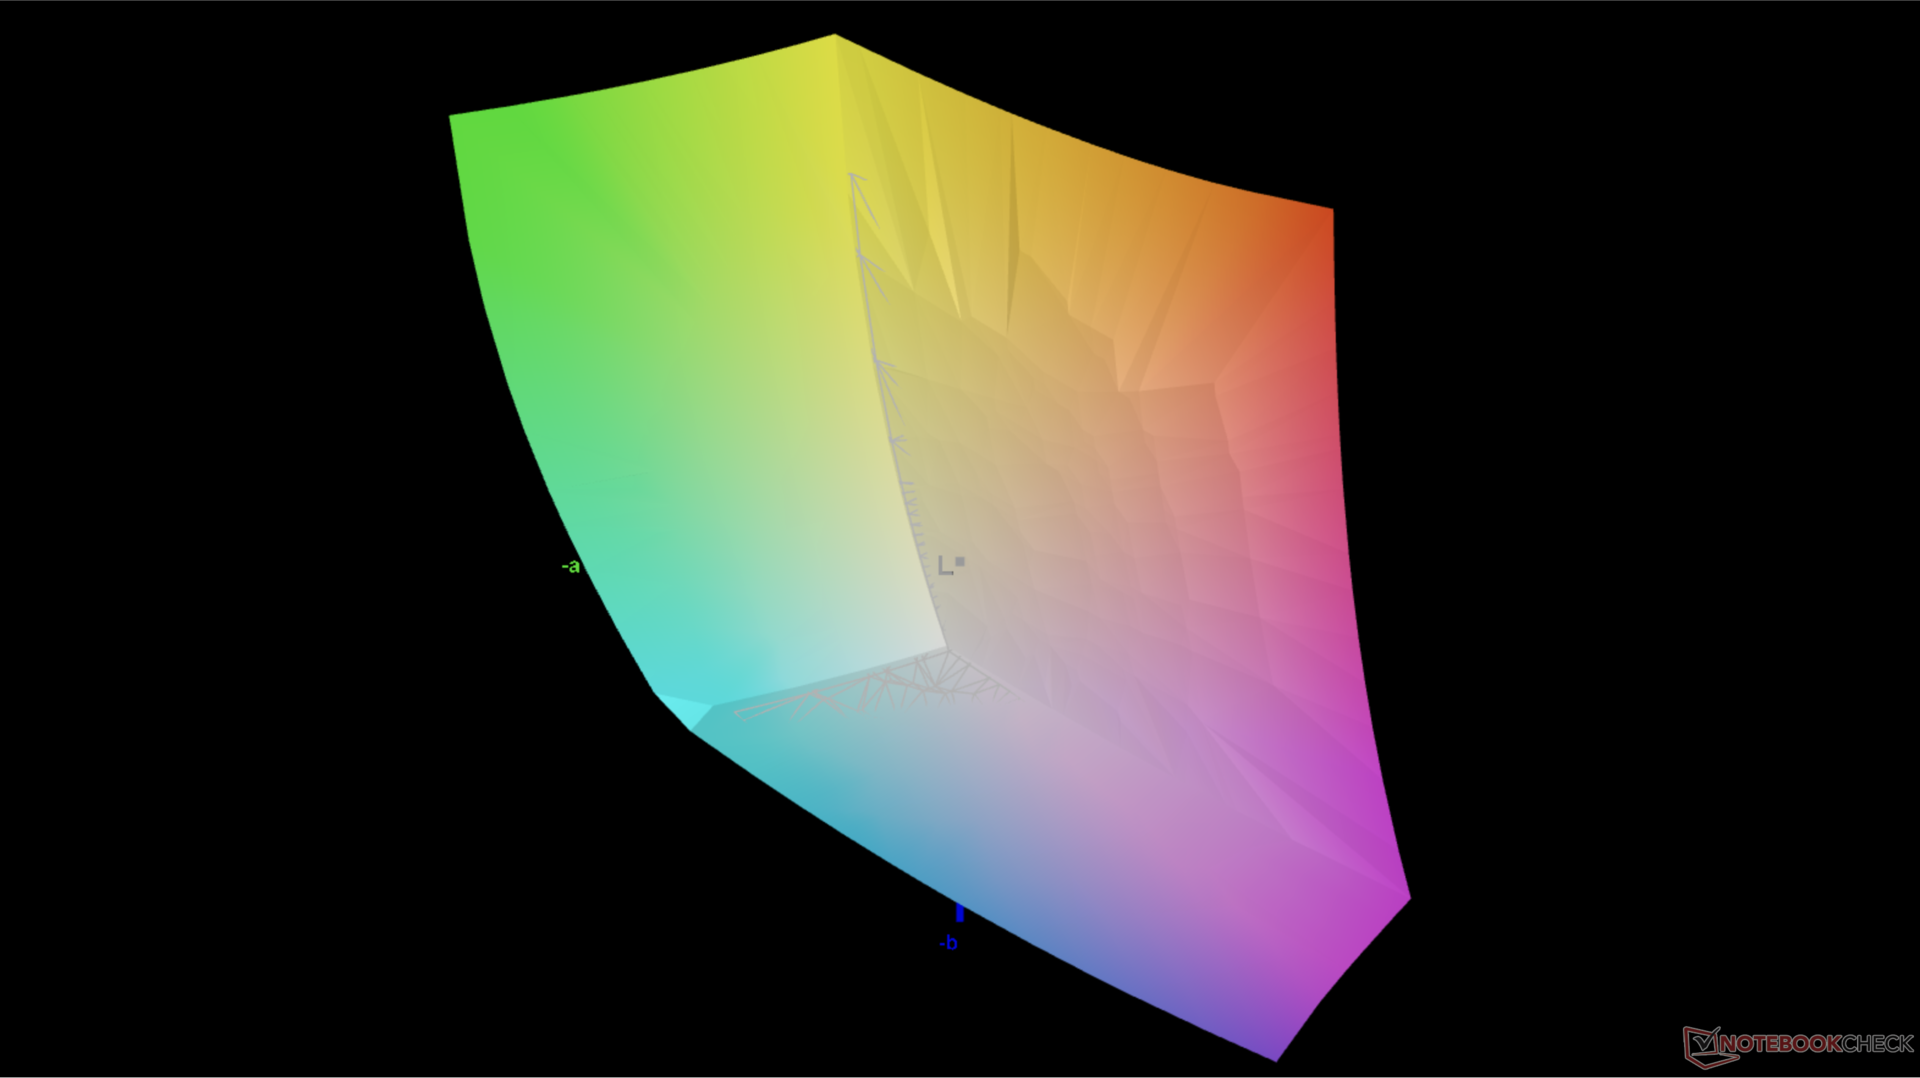
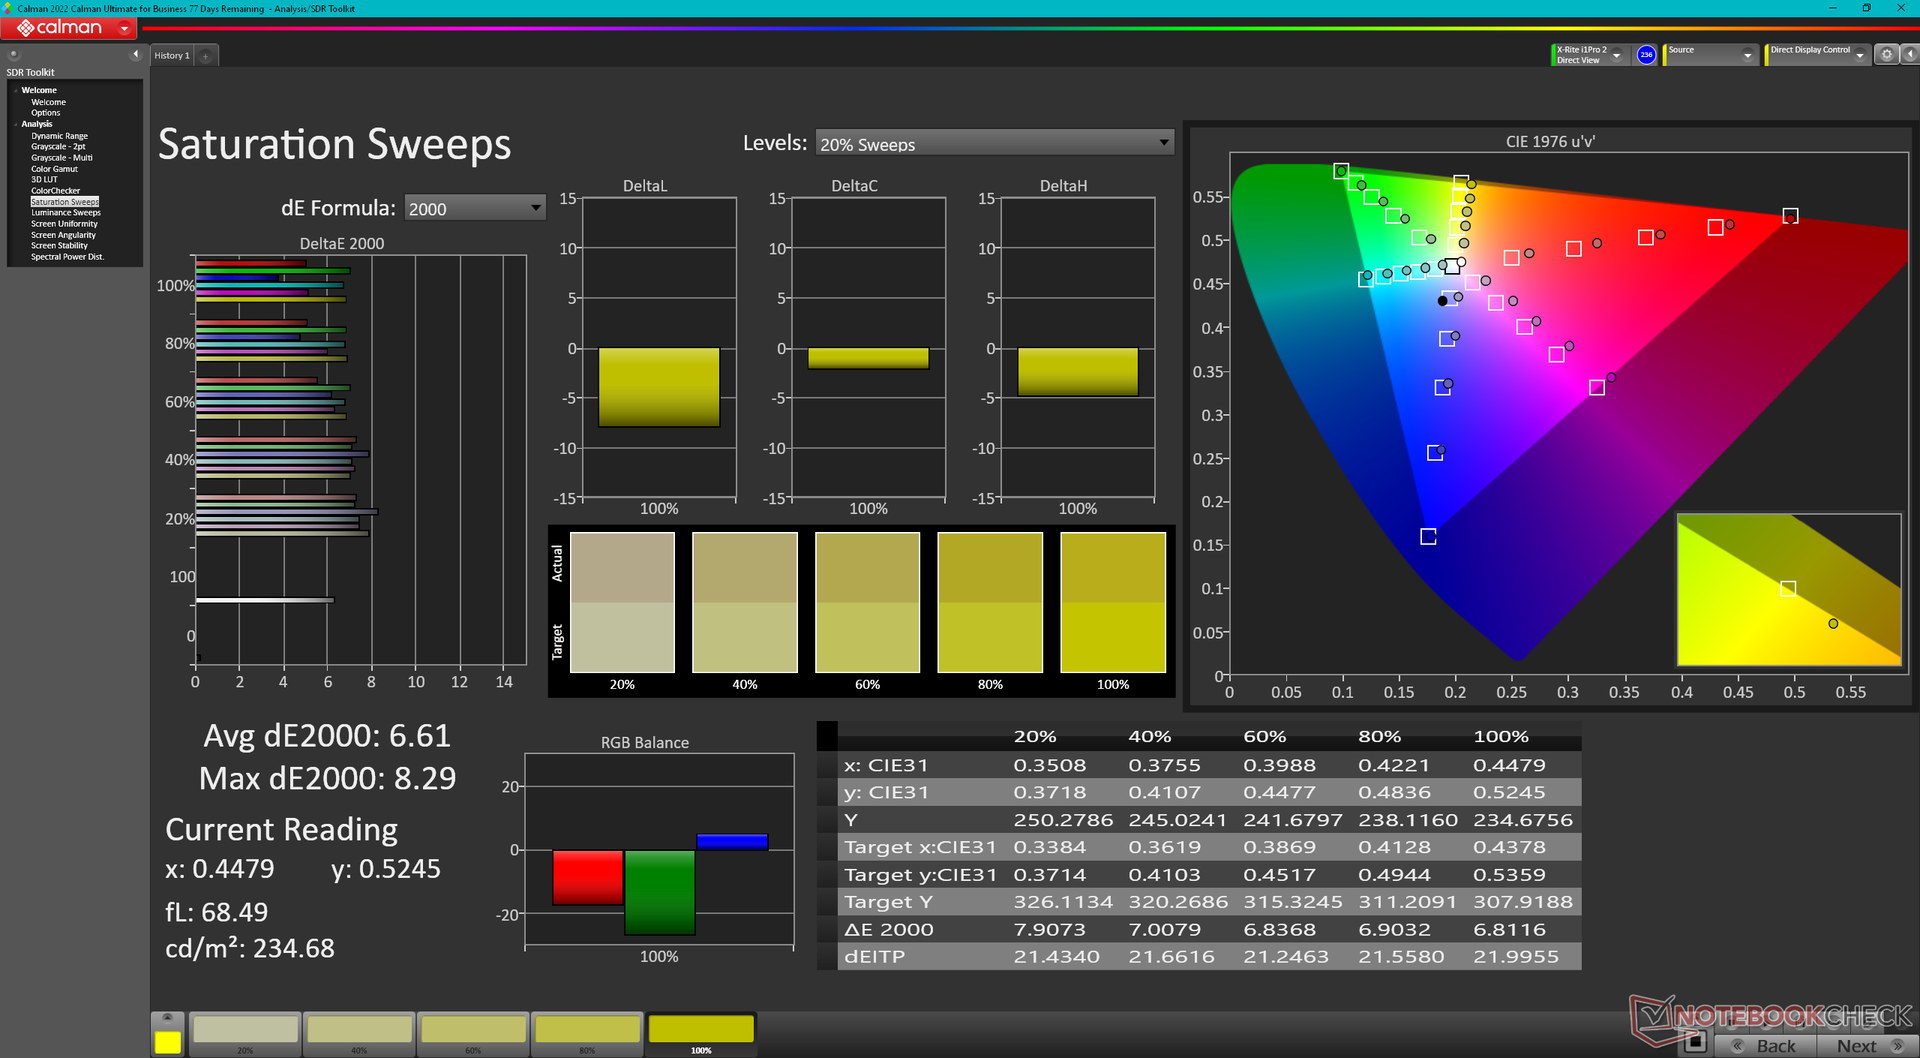
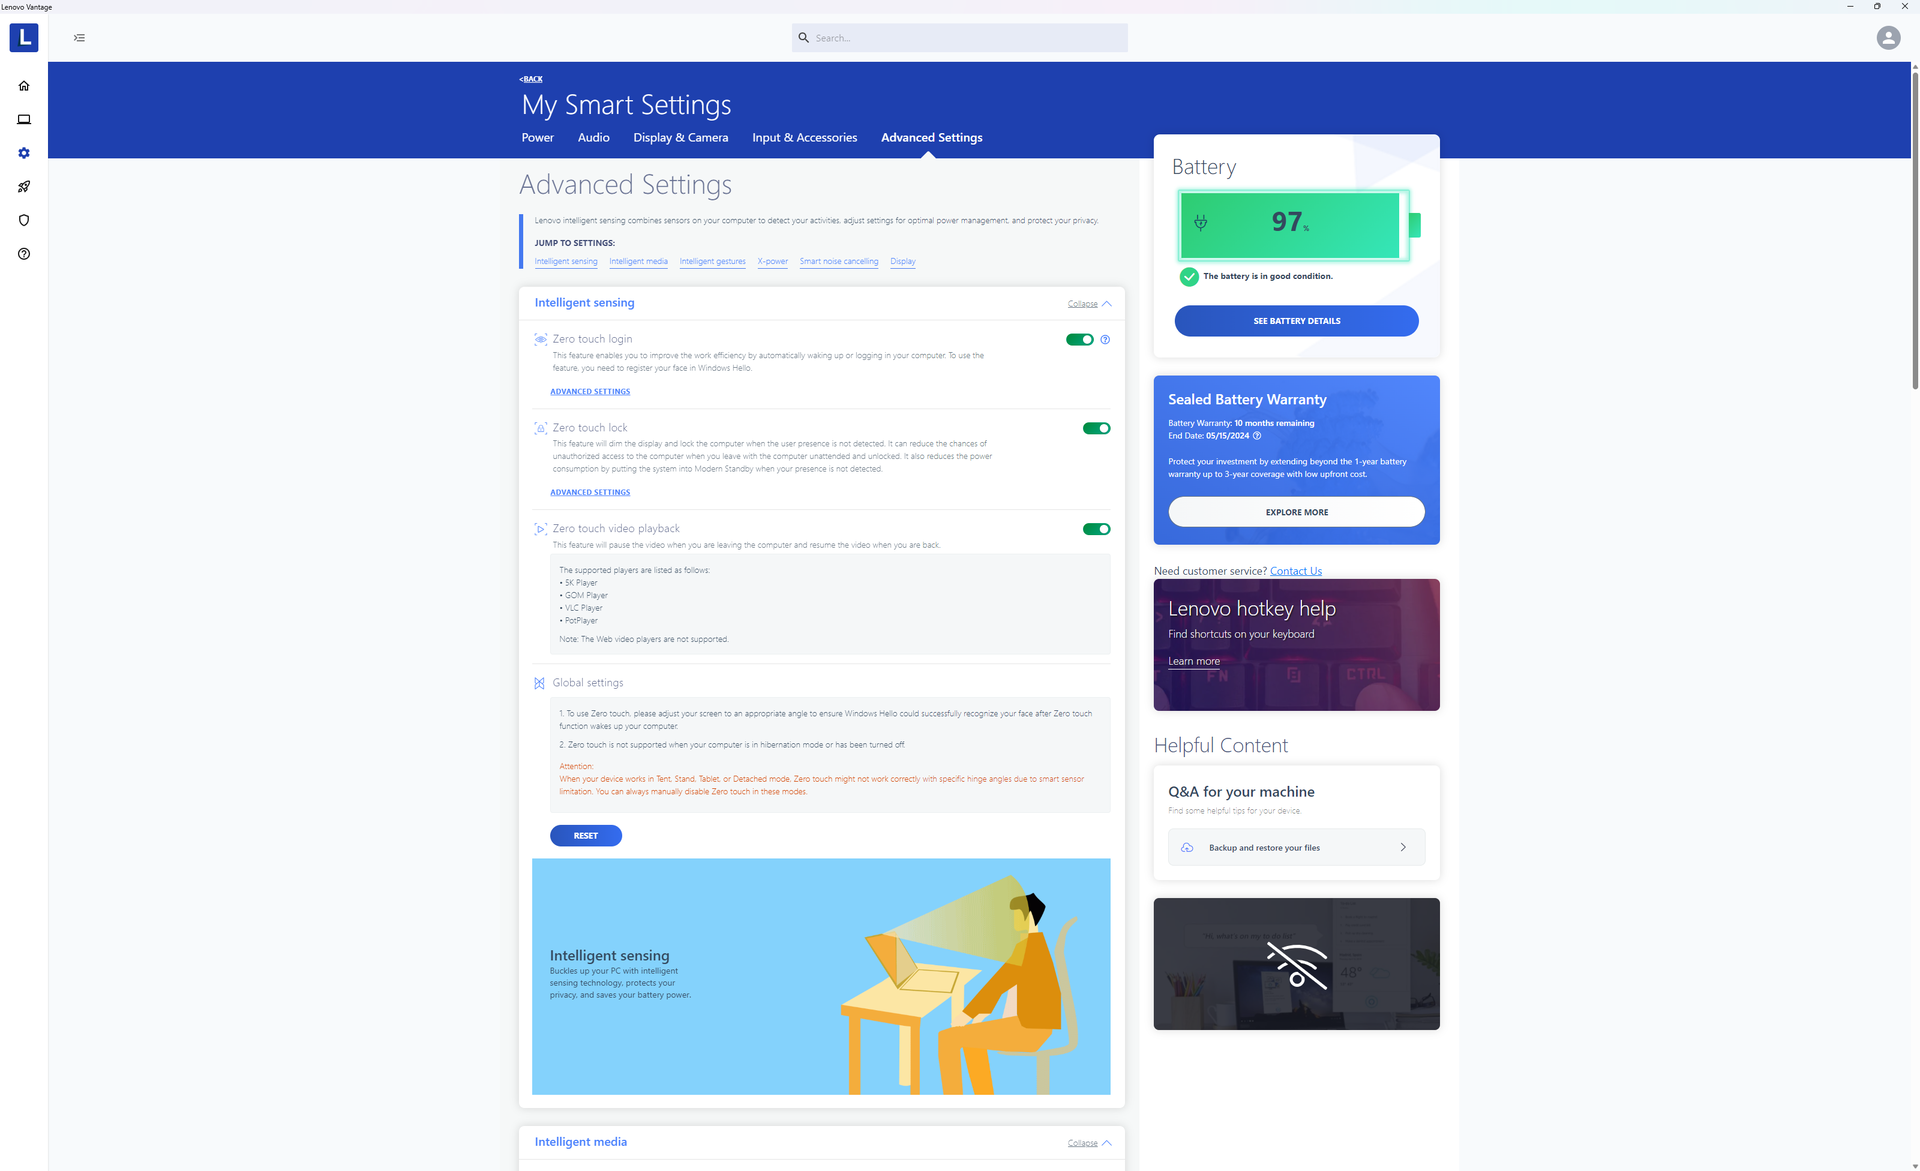
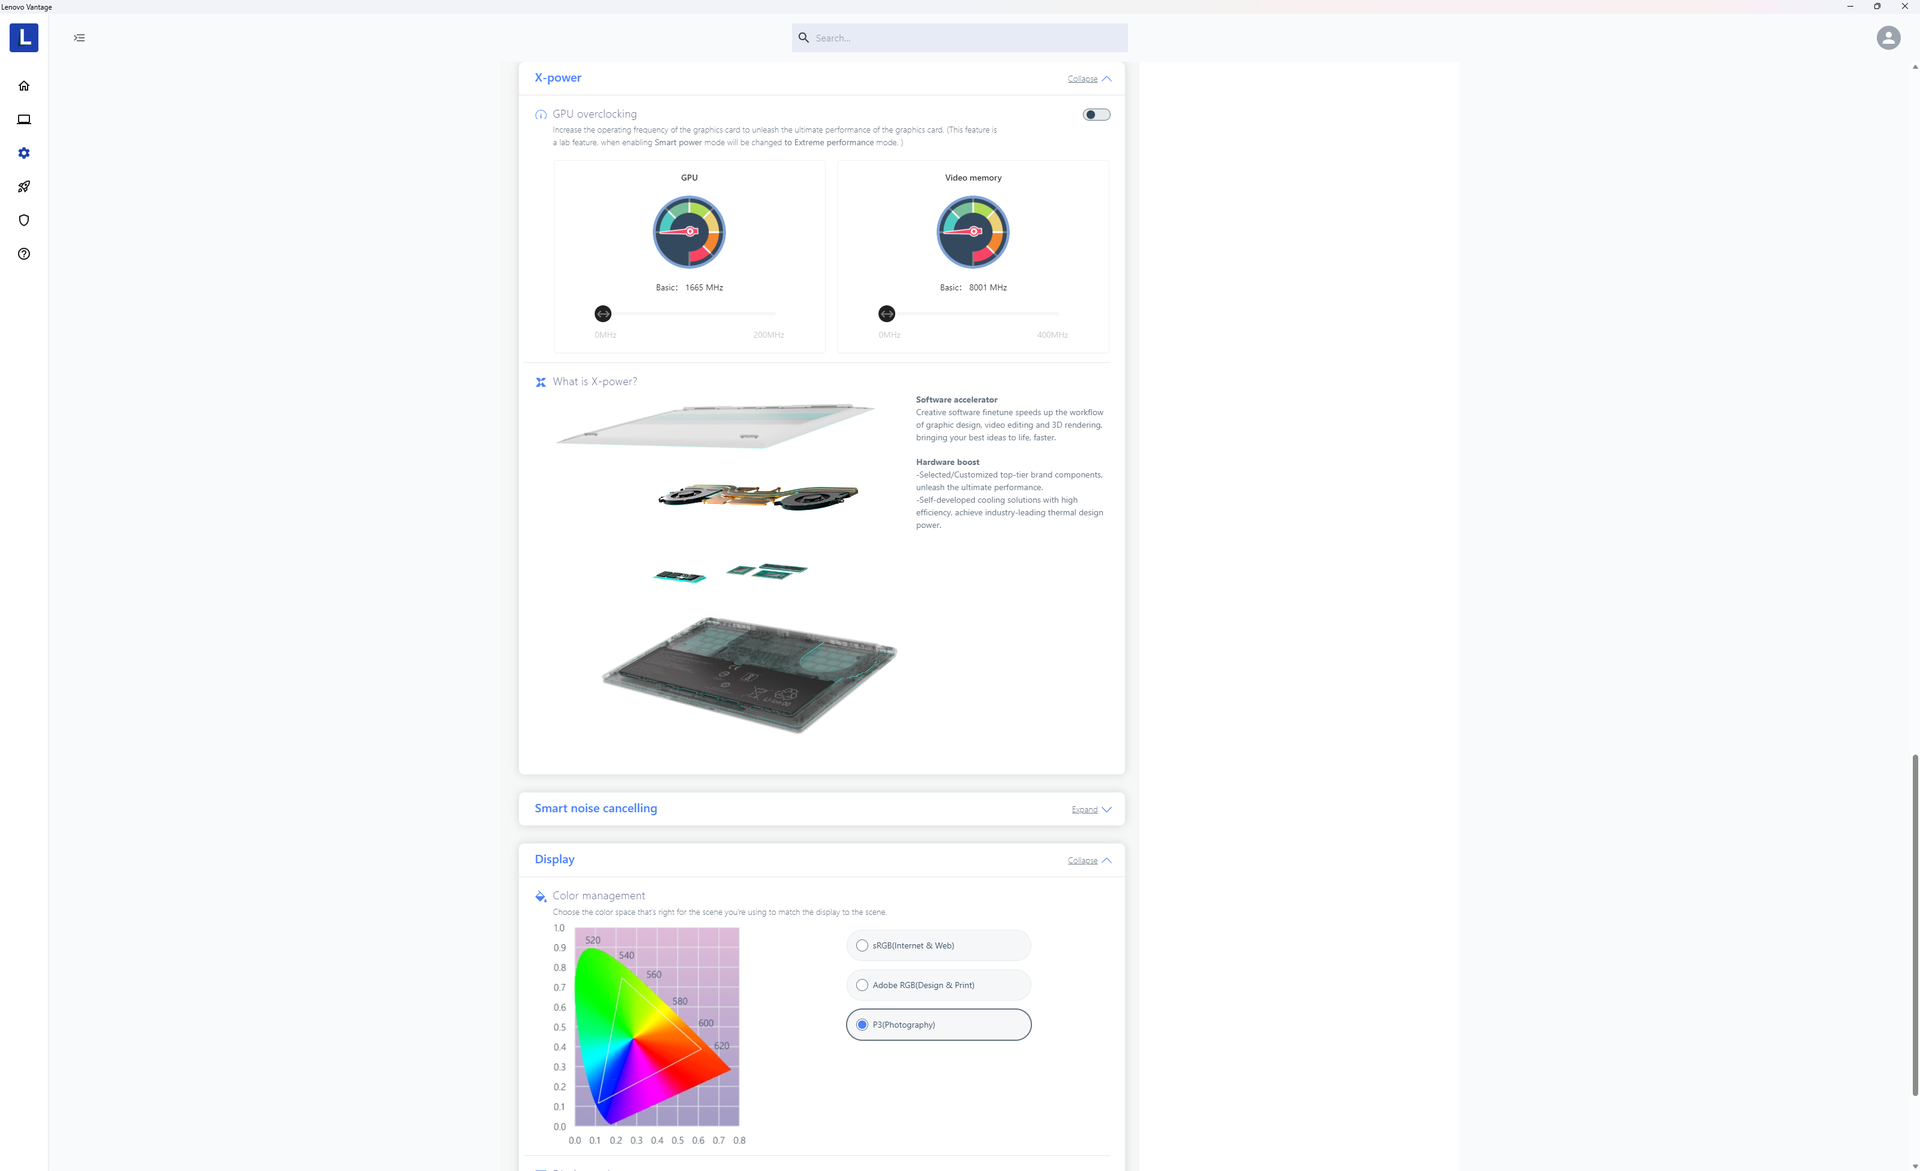
La temperatura del color es más cálida de lo esperado cuando se ajusta al modo P3. A diferencia de muchos modelos MSI, el software Lenovo Vantage no tiene un control deslizante para ajustar la temperatura del color.
Tiempos de respuesta del display
| ↔ Tiempo de respuesta de Negro a Blanco | ||
|---|---|---|
| 9.2 ms ... subida ↗ y bajada ↘ combinada | ↗ 2.2 ms subida | 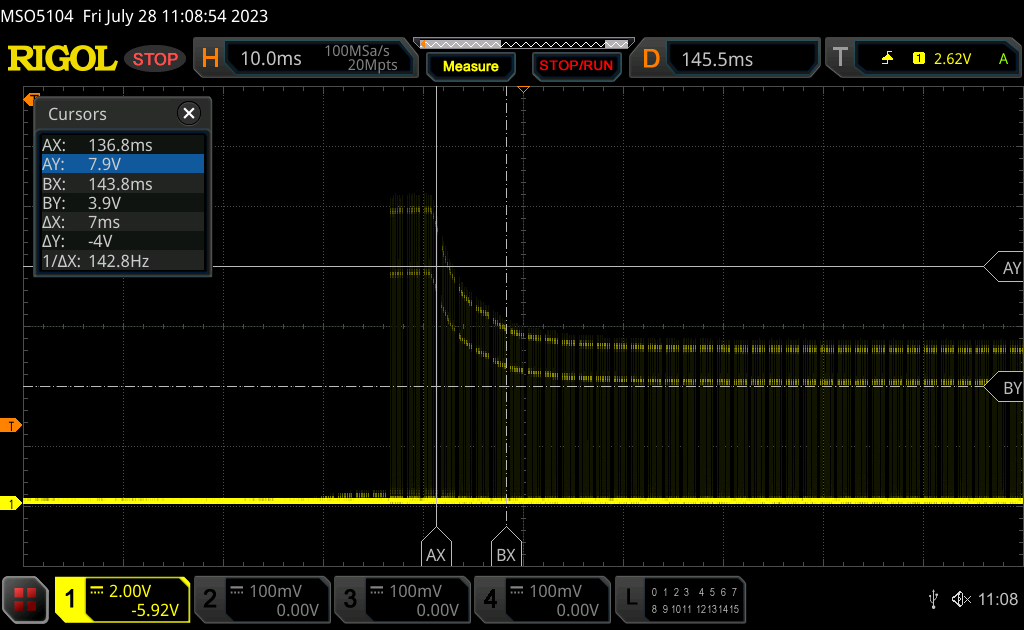 |
| ↘ 7 ms bajada | ||
| La pantalla mostró tiempos de respuesta rápidos en nuestros tests y debería ser adecuada para juegos. En comparación, todos los dispositivos de prueba van de ##min### (mínimo) a 240 (máximo) ms. » 26 % de todos los dispositivos son mejores. Esto quiere decir que el tiempo de respuesta medido es mejor que la media (19.8 ms) de todos los dispositivos testados. | ||
| ↔ Tiempo de respuesta 50% Gris a 80% Gris | ||
| 14 ms ... subida ↗ y bajada ↘ combinada | ↗ 7.4 ms subida | 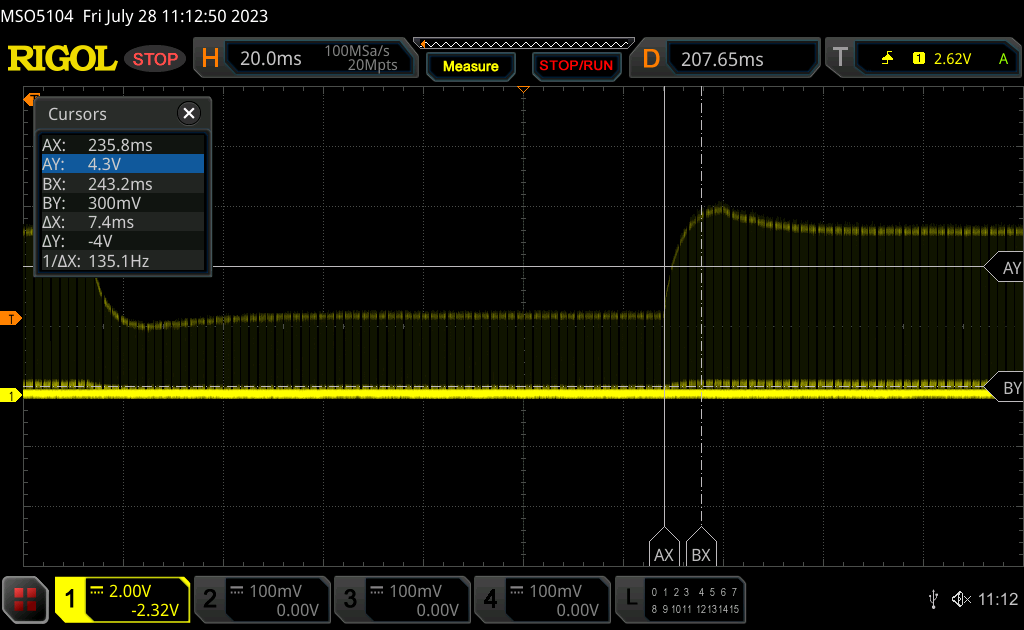 |
| ↘ 6.6 ms bajada | ||
| La pantalla mostró buenos tiempos de respuesta en nuestros tests pero podría ser demasiado lenta para los jugones competitivos. En comparación, todos los dispositivos de prueba van de ##min### (mínimo) a 636 (máximo) ms. » 28 % de todos los dispositivos son mejores. Esto quiere decir que el tiempo de respuesta medido es mejor que la media (31 ms) de todos los dispositivos testados. | ||
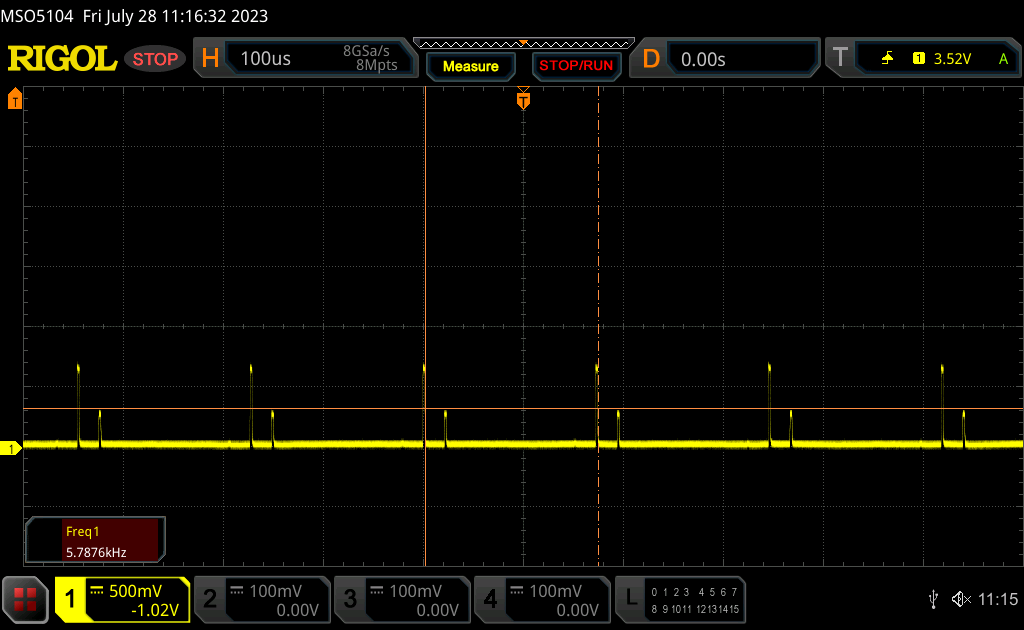
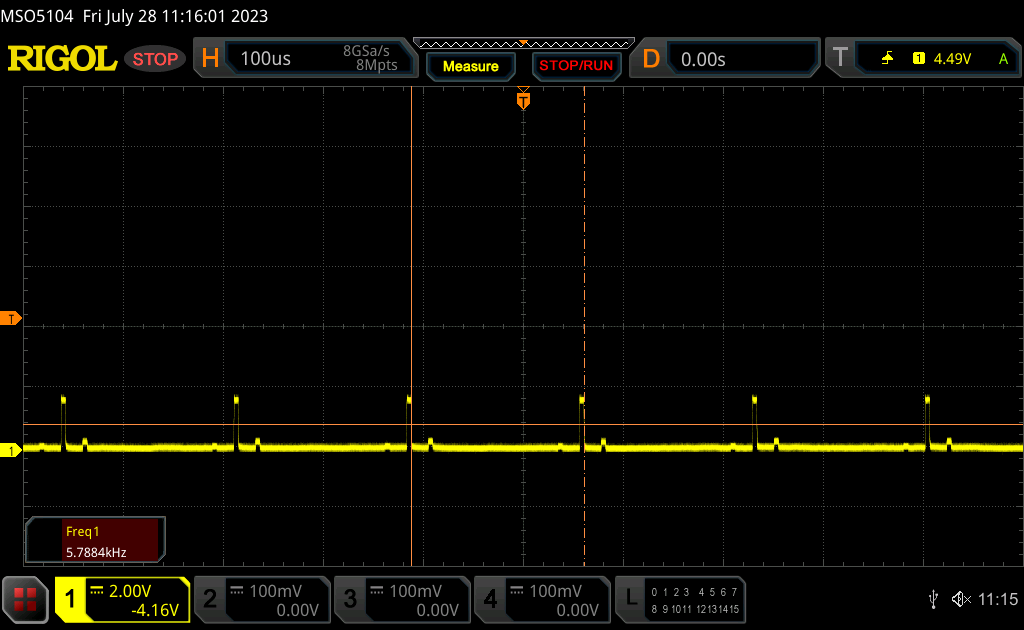
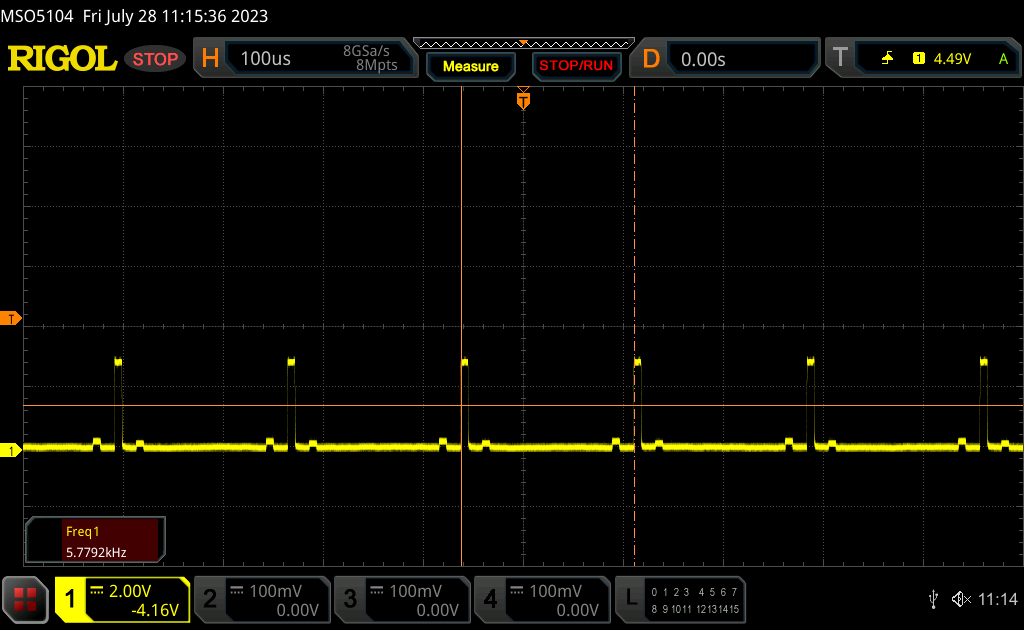
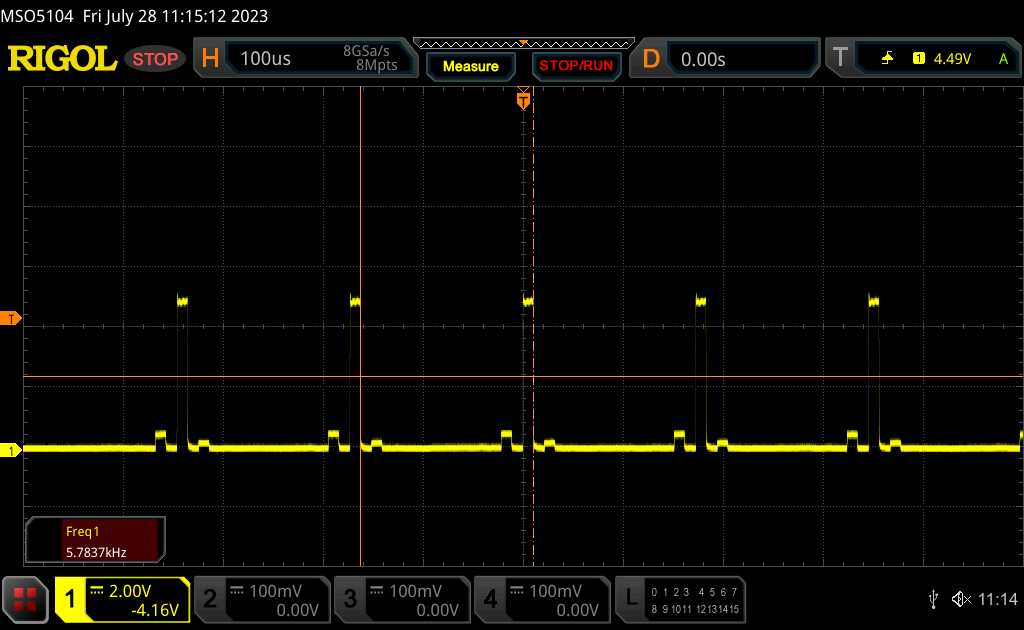
Parpadeo de Pantalla / PWM (Pulse-Width Modulation)
| Parpadeo de Pantalla / PWM detectado | 5784 Hz | ≤ 100 % de brillo | 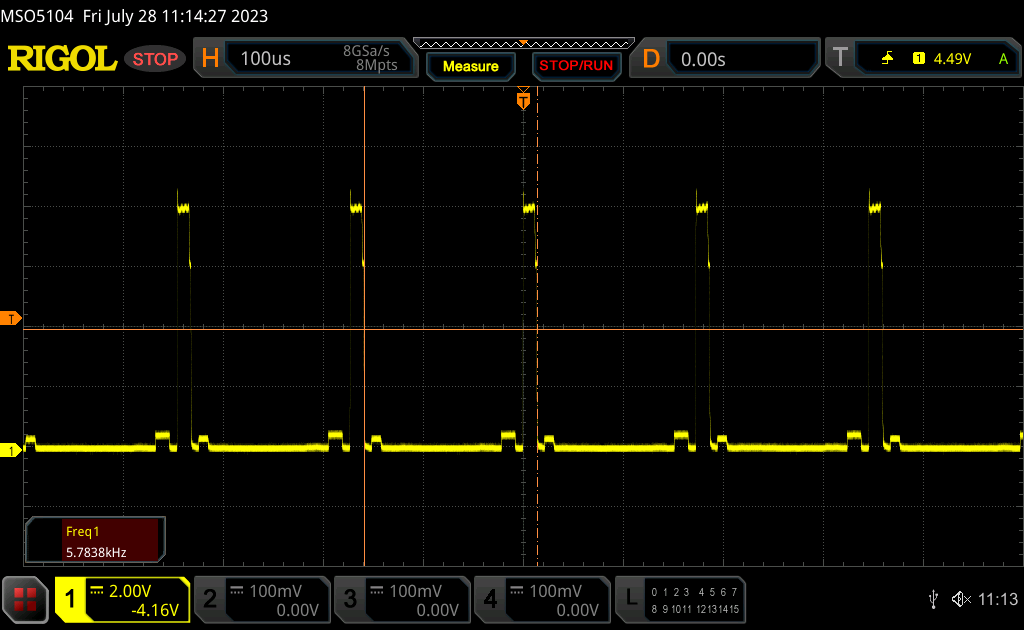 |
La retroiluminación del display parpadea a 5784 Hz (seguramente usa PWM - Pulse-Width Modulation) a un brillo del 100 % e inferior. Sobre este nivel de brillo no debería darse parpadeo / PWM. La frecuencia de 5784 Hz es bastante alta, por lo que la mayoría de gente sensible al parpadeo no debería ver parpadeo o tener fatiga visual. Comparación: 52 % de todos los dispositivos testados no usaron PWM para atenuar el display. Si se usó, medimos una media de 7754 (mínimo: 5 - máxmo: 343500) Hz. | |||
El parpadeo está presente en todos los niveles de brillo cuando está en modo SDR. Sin embargo, su frecuencia es relativamente alta, de 5784 Hz, por lo que no debería ser un problema para la gran mayoría de usuarios.
Rendimiento - 13ª generación Raptor Lake-H
Condiciones de ensayo
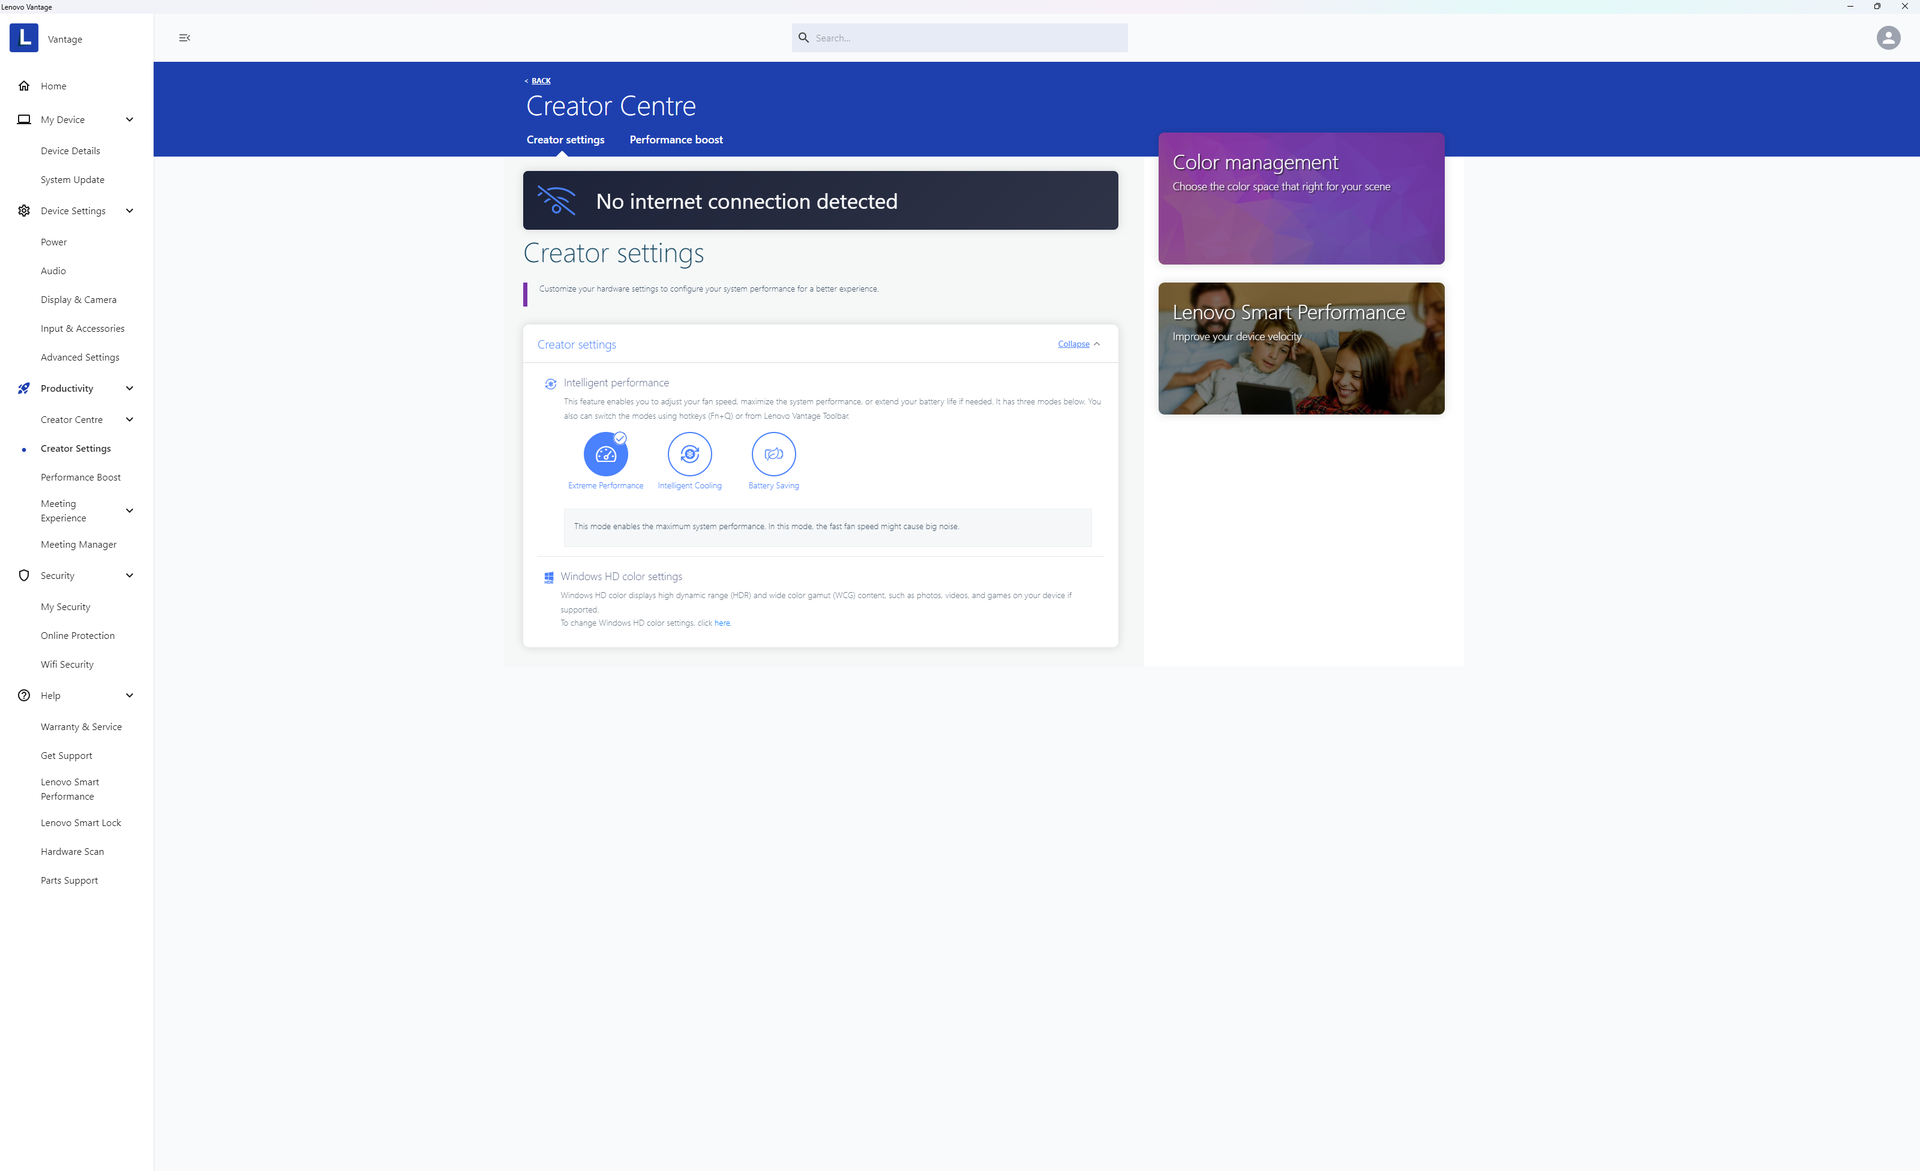
Pusimos nuestra unidad en modo Rendimiento a través de Windows y en modo Rendimiento Extremo a través de Lenovo Vantage antes de ejecutar los benchmarks de abajo. Por desgracia, Lenovo rediseña su interfaz Vantage con bastante frecuencia, por lo que todos los ajustes se encuentran en submenús diferentes en comparación con el mismo software en otros portátiles Lenovo.
Procesador
ElCore i9-13905H puede ser más rápido que elCore i7-13705H sobre el papel, pero las ventajas son mínimas. El rendimiento multihilo es casi idéntico entre ambos, mientras que el rendimiento monohilo es sólo entre un 5 y un 10 por ciento más rápido con nuestro Core i9.
Cinebench R15 Multi Loop
Cinebench R23: Multi Core | Single Core
Cinebench R20: CPU (Multi Core) | CPU (Single Core)
Cinebench R15: CPU Multi 64Bit | CPU Single 64Bit
Blender: v2.79 BMW27 CPU
7-Zip 18.03: 7z b 4 | 7z b 4 -mmt1
Geekbench 5.5: Multi-Core | Single-Core
HWBOT x265 Benchmark v2.2: 4k Preset
LibreOffice : 20 Documents To PDF
R Benchmark 2.5: Overall mean
* ... más pequeño es mejor
AIDA64: FP32 Ray-Trace | FPU Julia | CPU SHA3 | CPU Queen | FPU SinJulia | FPU Mandel | CPU AES | CPU ZLib | FP64 Ray-Trace | CPU PhotoWorxx
| Performance rating | |
| Lenovo Slim Pro 9i 16IRP8 | |
| Medio Intel Core i9-13905H | |
| Lenovo Yoga Pro 9 16-IRP G8 | |
| HP Envy 16 h0112nr | |
| Asus VivoBook Pro 16 | |
| Dell Inspiron 16 Plus 7620 | |
| Acer Swift Edge SFE16-42-R1GM | |
| AIDA64 / FP32 Ray-Trace | |
| Medio Intel Core i9-13905H (17642 - 19900, n=3) | |
| Lenovo Slim Pro 9i 16IRP8 | |
| Lenovo Yoga Pro 9 16-IRP G8 | |
| Asus VivoBook Pro 16 | |
| Dell Inspiron 16 Plus 7620 | |
| HP Envy 16 h0112nr | |
| Acer Swift Edge SFE16-42-R1GM | |
| AIDA64 / FPU Julia | |
| Lenovo Yoga Pro 9 16-IRP G8 | |
| Lenovo Slim Pro 9i 16IRP8 | |
| Medio Intel Core i9-13905H (89198 - 94350, n=3) | |
| Asus VivoBook Pro 16 | |
| Acer Swift Edge SFE16-42-R1GM | |
| Dell Inspiron 16 Plus 7620 | |
| HP Envy 16 h0112nr | |
| AIDA64 / CPU SHA3 | |
| Lenovo Slim Pro 9i 16IRP8 | |
| Lenovo Yoga Pro 9 16-IRP G8 | |
| Medio Intel Core i9-13905H (3945 - 4296, n=3) | |
| Asus VivoBook Pro 16 | |
| Dell Inspiron 16 Plus 7620 | |
| HP Envy 16 h0112nr | |
| Acer Swift Edge SFE16-42-R1GM | |
| AIDA64 / CPU Queen | |
| Lenovo Slim Pro 9i 16IRP8 | |
| Lenovo Yoga Pro 9 16-IRP G8 | |
| Medio Intel Core i9-13905H (94506 - 117697, n=3) | |
| Asus VivoBook Pro 16 | |
| HP Envy 16 h0112nr | |
| Dell Inspiron 16 Plus 7620 | |
| Acer Swift Edge SFE16-42-R1GM | |
| AIDA64 / FPU SinJulia | |
| Lenovo Slim Pro 9i 16IRP8 | |
| Lenovo Yoga Pro 9 16-IRP G8 | |
| Acer Swift Edge SFE16-42-R1GM | |
| Medio Intel Core i9-13905H (10478 - 11328, n=3) | |
| Asus VivoBook Pro 16 | |
| Dell Inspiron 16 Plus 7620 | |
| HP Envy 16 h0112nr | |
| AIDA64 / FPU Mandel | |
| Medio Intel Core i9-13905H (43922 - 48884, n=3) | |
| Lenovo Slim Pro 9i 16IRP8 | |
| Lenovo Yoga Pro 9 16-IRP G8 | |
| Acer Swift Edge SFE16-42-R1GM | |
| Asus VivoBook Pro 16 | |
| Dell Inspiron 16 Plus 7620 | |
| HP Envy 16 h0112nr | |
| AIDA64 / CPU AES | |
| HP Envy 16 h0112nr | |
| Lenovo Slim Pro 9i 16IRP8 | |
| Lenovo Yoga Pro 9 16-IRP G8 | |
| Medio Intel Core i9-13905H (80275 - 86469, n=3) | |
| Asus VivoBook Pro 16 | |
| Dell Inspiron 16 Plus 7620 | |
| Acer Swift Edge SFE16-42-R1GM | |
| AIDA64 / CPU ZLib | |
| Lenovo Slim Pro 9i 16IRP8 | |
| Lenovo Yoga Pro 9 16-IRP G8 | |
| Medio Intel Core i9-13905H (1154 - 1234, n=3) | |
| Dell Inspiron 16 Plus 7620 | |
| Asus VivoBook Pro 16 | |
| HP Envy 16 h0112nr | |
| Acer Swift Edge SFE16-42-R1GM | |
| AIDA64 / FP64 Ray-Trace | |
| Medio Intel Core i9-13905H (9483 - 10804, n=3) | |
| Lenovo Slim Pro 9i 16IRP8 | |
| Lenovo Yoga Pro 9 16-IRP G8 | |
| Asus VivoBook Pro 16 | |
| Dell Inspiron 16 Plus 7620 | |
| HP Envy 16 h0112nr | |
| Acer Swift Edge SFE16-42-R1GM | |
| AIDA64 / CPU PhotoWorxx | |
| Medio Intel Core i9-13905H (51720 - 60161, n=3) | |
| Lenovo Slim Pro 9i 16IRP8 | |
| Lenovo Yoga Pro 9 16-IRP G8 | |
| HP Envy 16 h0112nr | |
| Dell Inspiron 16 Plus 7620 | |
| Acer Swift Edge SFE16-42-R1GM | |
| Asus VivoBook Pro 16 | |
Rendimiento del sistema
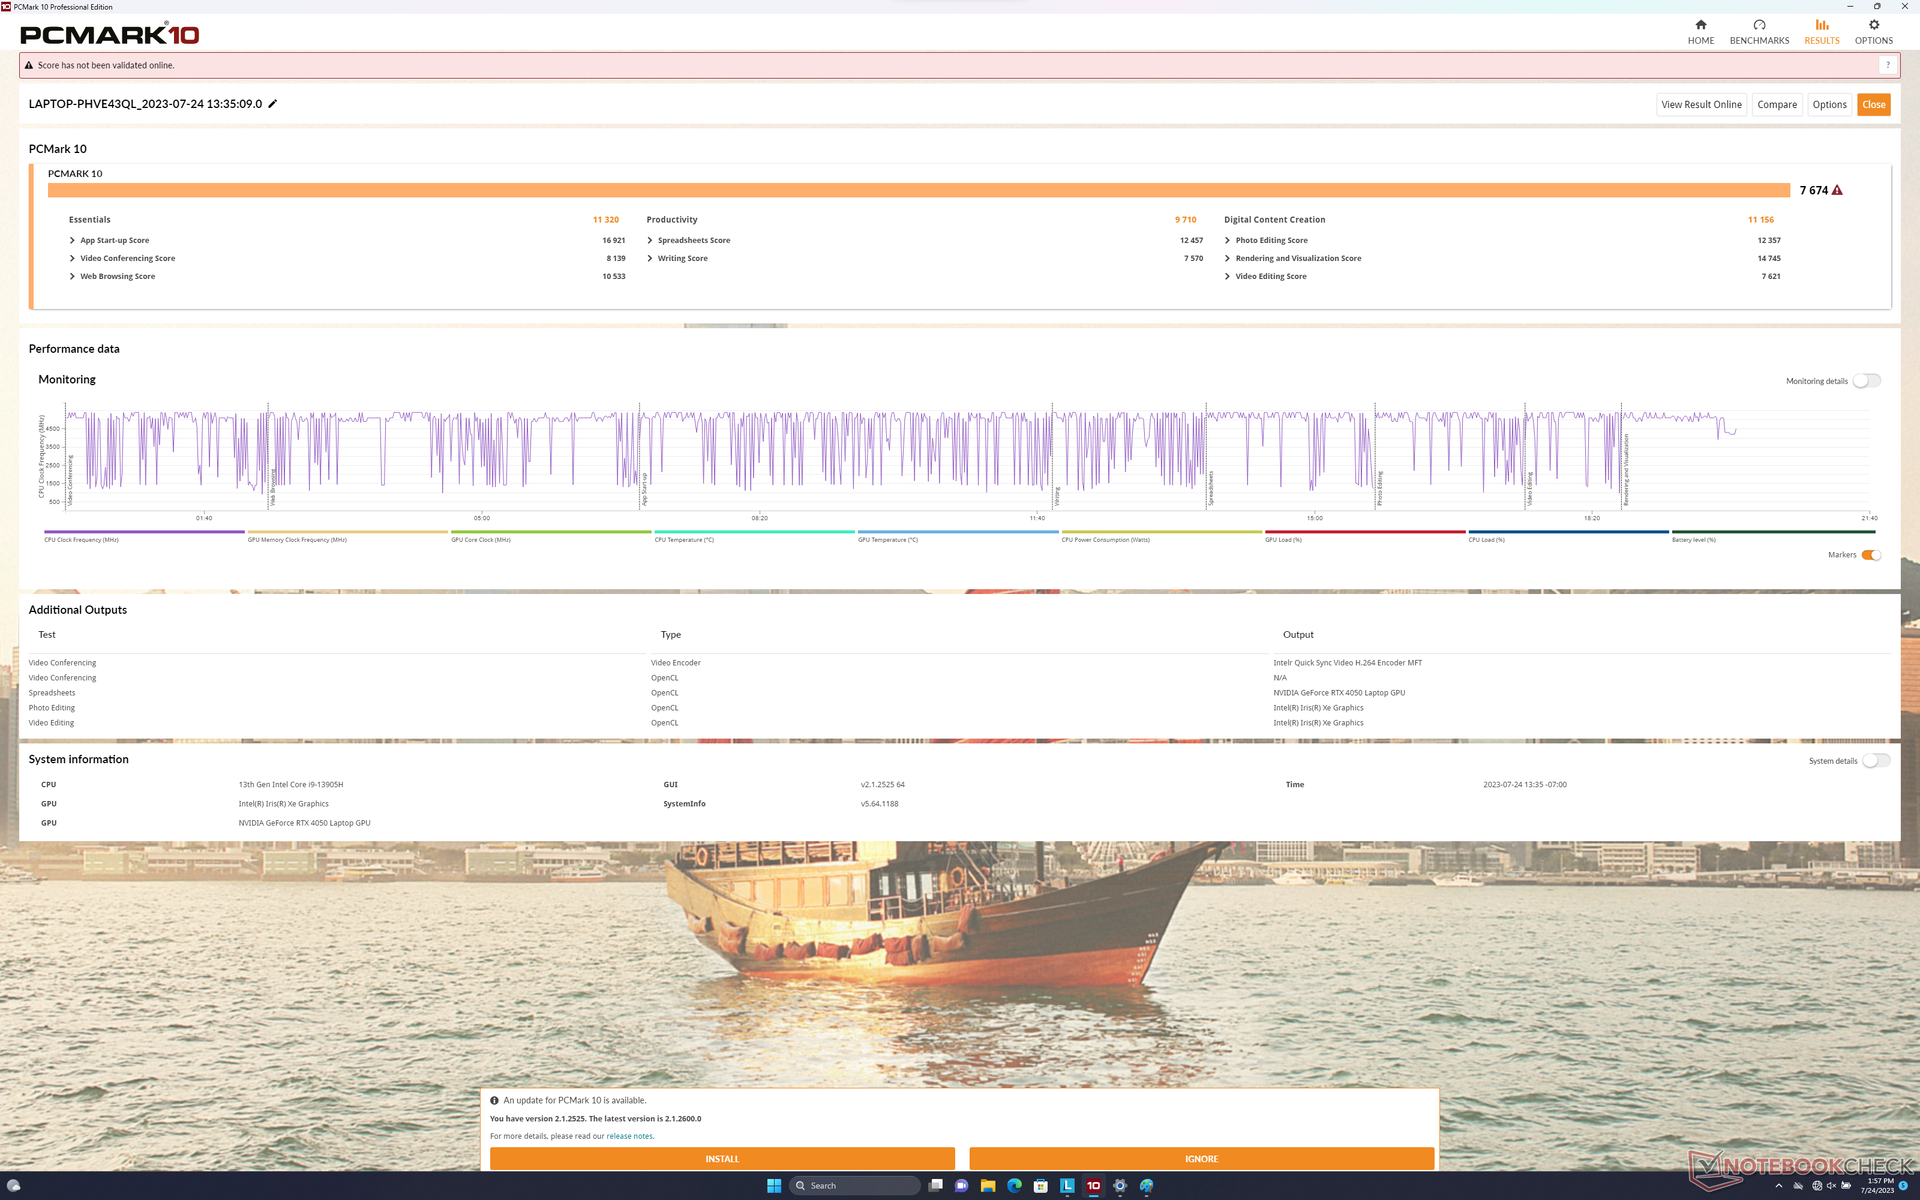
Experimentamos problemas al despertar del sueño e incluso un BSOD durante las pruebas. A veces, la pantalla se quedaba en blanco al intentar despertar de la suspensión y era necesario reiniciar para volver a Windows.
CrossMark: Overall | Productivity | Creativity | Responsiveness
| PCMark 10 / Score | |
| Lenovo Slim Pro 9i 16IRP8 | |
| HP Envy 16 h0112nr | |
| Lenovo Yoga Pro 9 16-IRP G8 | |
| Dell Inspiron 16 Plus 7620 | |
| Asus VivoBook Pro 16 | |
| Acer Swift Edge SFE16-42-R1GM | |
| PCMark 10 / Essentials | |
| HP Envy 16 h0112nr | |
| Lenovo Slim Pro 9i 16IRP8 | |
| Lenovo Yoga Pro 9 16-IRP G8 | |
| Dell Inspiron 16 Plus 7620 | |
| Asus VivoBook Pro 16 | |
| Acer Swift Edge SFE16-42-R1GM | |
| PCMark 10 / Productivity | |
| Lenovo Slim Pro 9i 16IRP8 | |
| HP Envy 16 h0112nr | |
| Acer Swift Edge SFE16-42-R1GM | |
| Dell Inspiron 16 Plus 7620 | |
| Asus VivoBook Pro 16 | |
| Lenovo Yoga Pro 9 16-IRP G8 | |
| PCMark 10 / Digital Content Creation | |
| Lenovo Slim Pro 9i 16IRP8 | |
| Lenovo Yoga Pro 9 16-IRP G8 | |
| HP Envy 16 h0112nr | |
| Dell Inspiron 16 Plus 7620 | |
| Asus VivoBook Pro 16 | |
| Acer Swift Edge SFE16-42-R1GM | |
| CrossMark / Overall | |
| Lenovo Yoga Pro 9 16-IRP G8 | |
| HP Envy 16 h0112nr | |
| Lenovo Slim Pro 9i 16IRP8 | |
| Dell Inspiron 16 Plus 7620 | |
| Asus VivoBook Pro 16 | |
| Acer Swift Edge SFE16-42-R1GM | |
| CrossMark / Productivity | |
| HP Envy 16 h0112nr | |
| Lenovo Yoga Pro 9 16-IRP G8 | |
| Asus VivoBook Pro 16 | |
| Dell Inspiron 16 Plus 7620 | |
| Lenovo Slim Pro 9i 16IRP8 | |
| Acer Swift Edge SFE16-42-R1GM | |
| CrossMark / Creativity | |
| Lenovo Yoga Pro 9 16-IRP G8 | |
| Lenovo Slim Pro 9i 16IRP8 | |
| HP Envy 16 h0112nr | |
| Dell Inspiron 16 Plus 7620 | |
| Asus VivoBook Pro 16 | |
| Acer Swift Edge SFE16-42-R1GM | |
| CrossMark / Responsiveness | |
| Asus VivoBook Pro 16 | |
| HP Envy 16 h0112nr | |
| Lenovo Yoga Pro 9 16-IRP G8 | |
| Dell Inspiron 16 Plus 7620 | |
| Lenovo Slim Pro 9i 16IRP8 | |
| Acer Swift Edge SFE16-42-R1GM | |
| PCMark 10 Score | 7674 puntos | |
ayuda | ||
| AIDA64 / Memory Copy | |
| Medio Intel Core i9-13905H (76905 - 88014, n=3) | |
| Lenovo Slim Pro 9i 16IRP8 | |
| Lenovo Yoga Pro 9 16-IRP G8 | |
| HP Envy 16 h0112nr | |
| Dell Inspiron 16 Plus 7620 | |
| Acer Swift Edge SFE16-42-R1GM | |
| Asus VivoBook Pro 16 | |
| AIDA64 / Memory Read | |
| Lenovo Yoga Pro 9 16-IRP G8 | |
| Medio Intel Core i9-13905H (68837 - 79123, n=3) | |
| Lenovo Slim Pro 9i 16IRP8 | |
| HP Envy 16 h0112nr | |
| Dell Inspiron 16 Plus 7620 | |
| Acer Swift Edge SFE16-42-R1GM | |
| Asus VivoBook Pro 16 | |
| AIDA64 / Memory Write | |
| Lenovo Yoga Pro 9 16-IRP G8 | |
| Medio Intel Core i9-13905H (89545 - 103259, n=3) | |
| Lenovo Slim Pro 9i 16IRP8 | |
| HP Envy 16 h0112nr | |
| Dell Inspiron 16 Plus 7620 | |
| Acer Swift Edge SFE16-42-R1GM | |
| Asus VivoBook Pro 16 | |
| AIDA64 / Memory Latency | |
| Lenovo Yoga Pro 9 16-IRP G8 | |
| Medio Intel Core i9-13905H (101.4 - 134.8, n=3) | |
| Lenovo Slim Pro 9i 16IRP8 | |
| Acer Swift Edge SFE16-42-R1GM | |
| Dell Inspiron 16 Plus 7620 | |
| HP Envy 16 h0112nr | |
| Asus VivoBook Pro 16 | |
* ... más pequeño es mejor
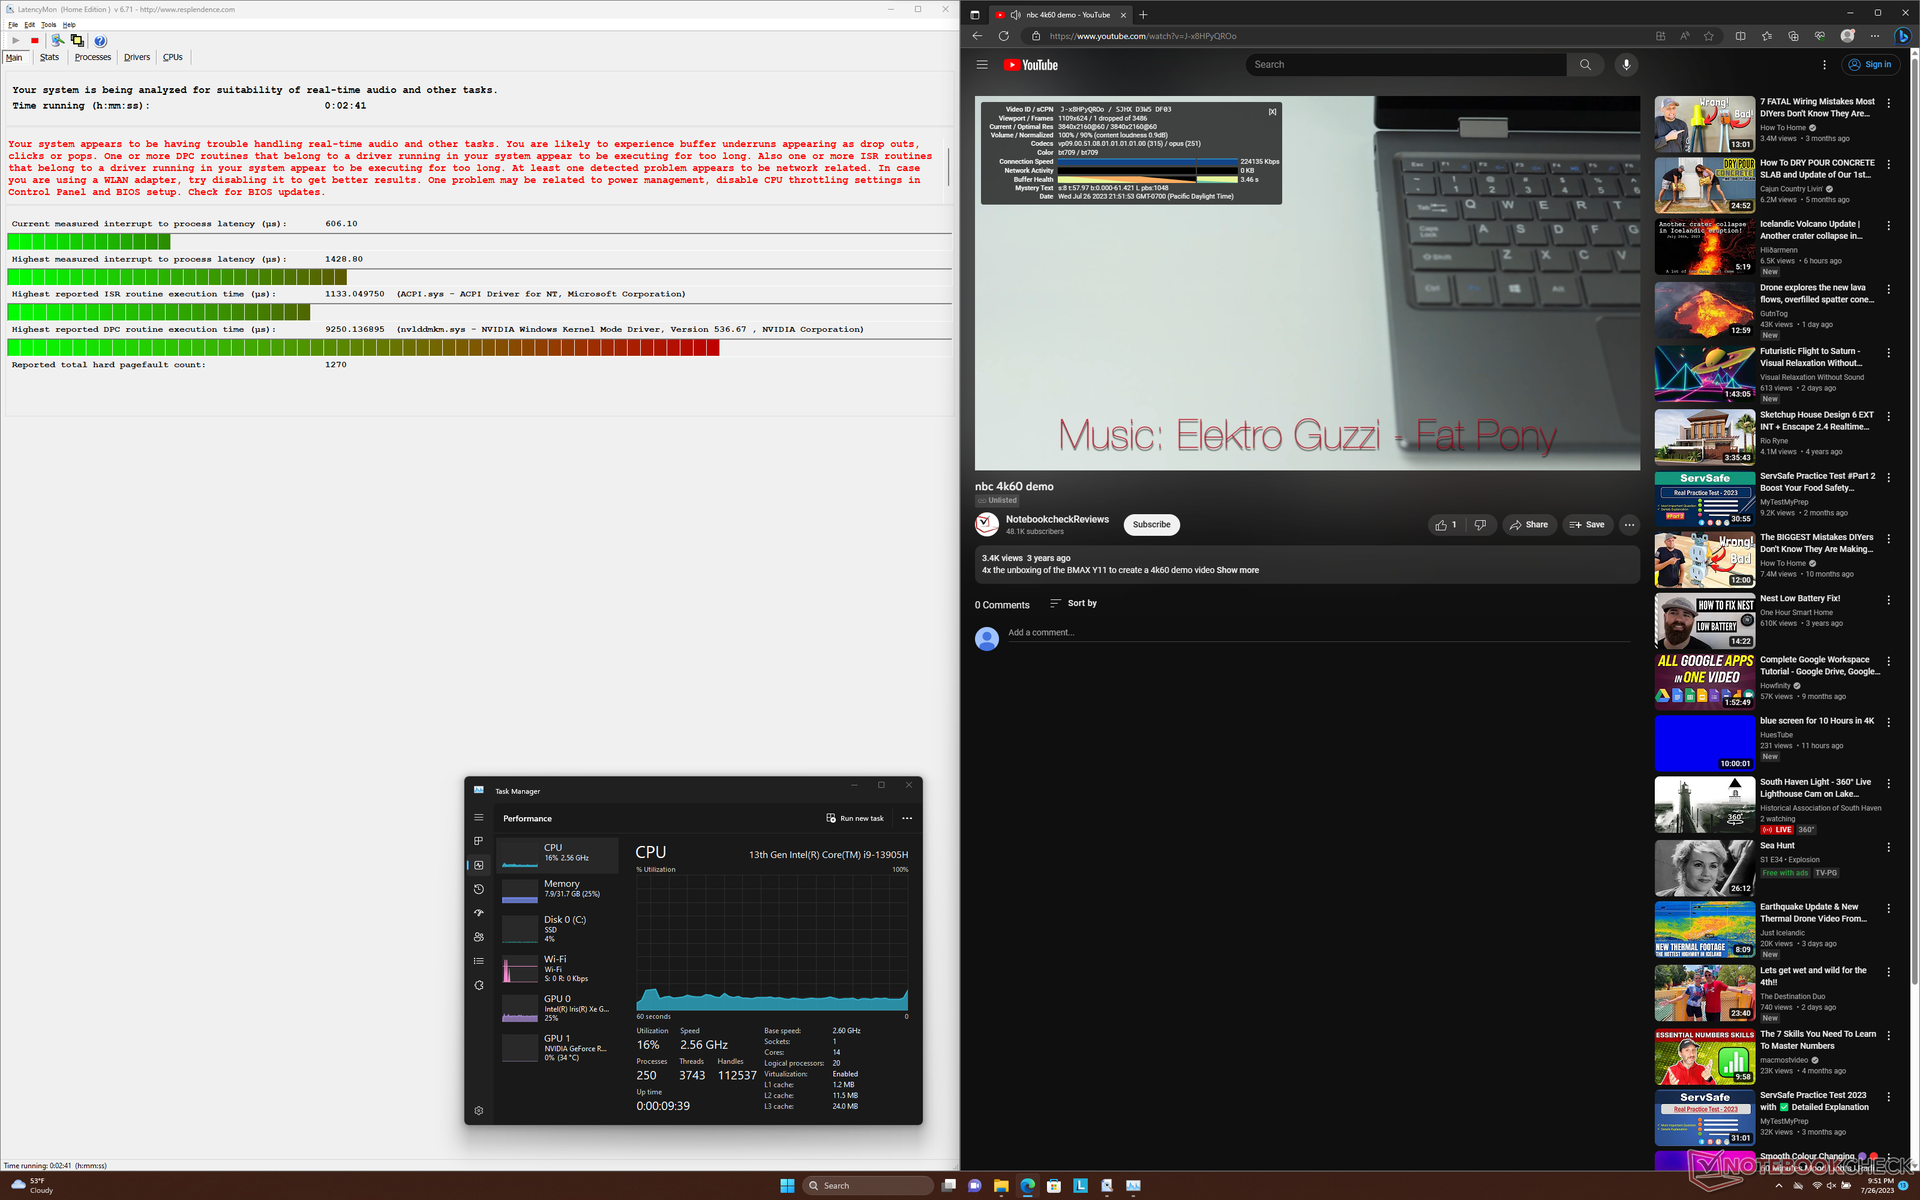
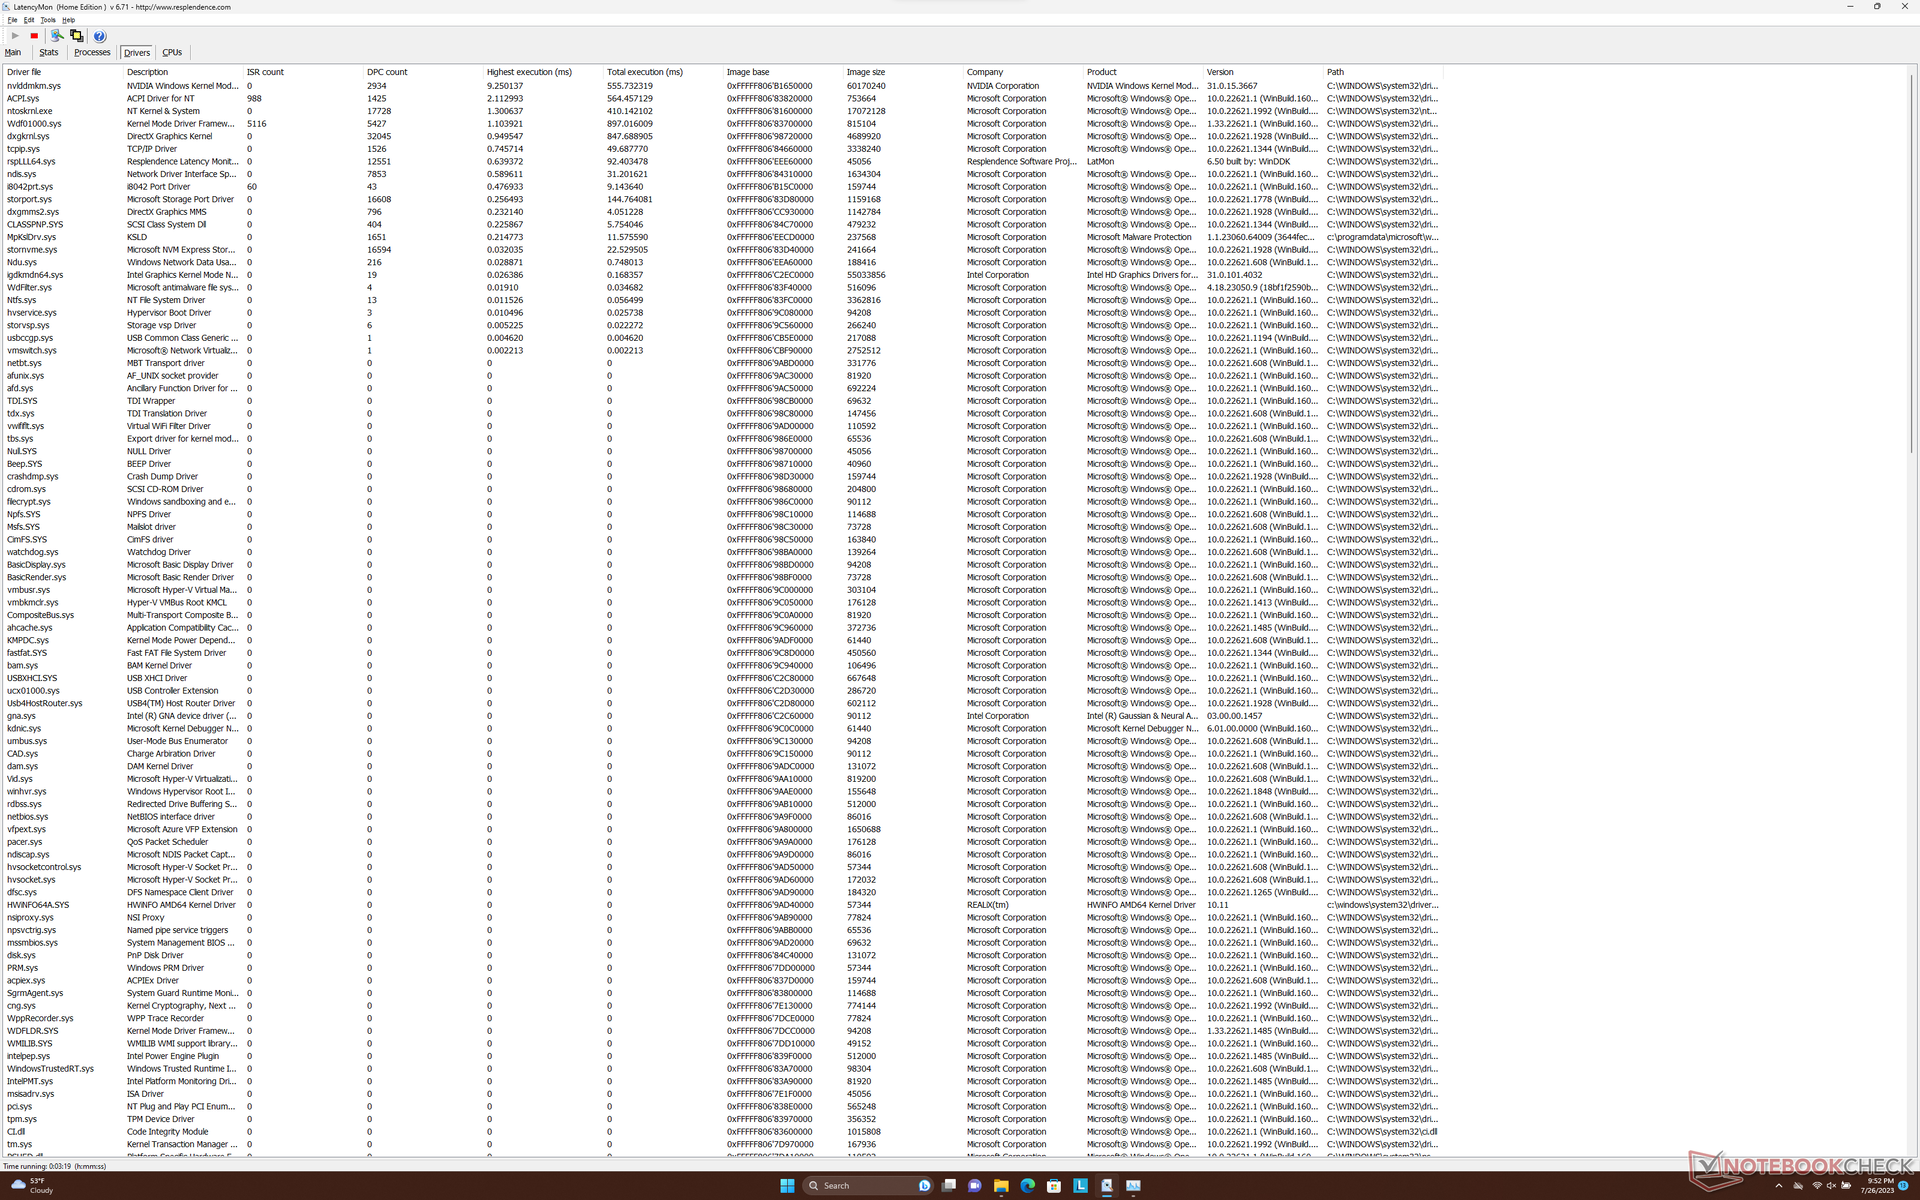
Latencia del CPD
LatencyMon revela problemas de CPD al abrir varias pestañas de nuestra página de inicio. por lo demás, la reproducción de vídeo 4K a 60 FPS es excelente, con una sola pérdida de fotograma en 60 segundos.
| DPC Latencies / LatencyMon - interrupt to process latency (max), Web, Youtube, Prime95 | |
| Lenovo Yoga Pro 9 16-IRP G8 | |
| Acer Swift Edge SFE16-42-R1GM | |
| Asus VivoBook Pro 16 | |
| Lenovo Slim Pro 9i 16IRP8 | |
| Dell Inspiron 16 Plus 7620 | |
| HP Envy 16 h0112nr | |
* ... más pequeño es mejor
Dispositivos de almacenamiento
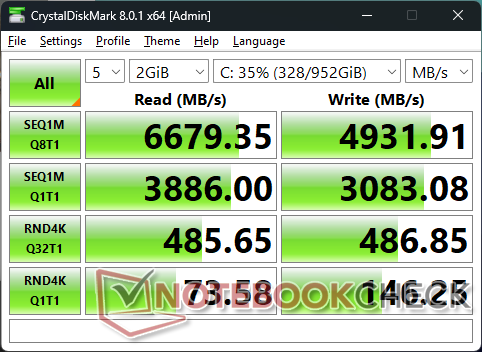
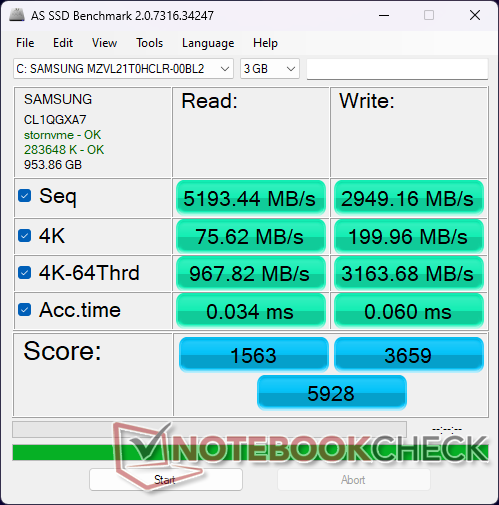

| Drive Performance rating - Percent | |
| Acer Swift Edge SFE16-42-R1GM | |
| Lenovo Yoga Pro 9 16-IRP G8 | |
| Lenovo Slim Pro 9i 16IRP8 | |
| HP Envy 16 h0112nr | |
| Asus VivoBook Pro 16 | |
| Dell Inspiron 16 Plus 7620 | |
* ... más pequeño es mejor
Disk Throttling: DiskSpd Read Loop, Queue Depth 8
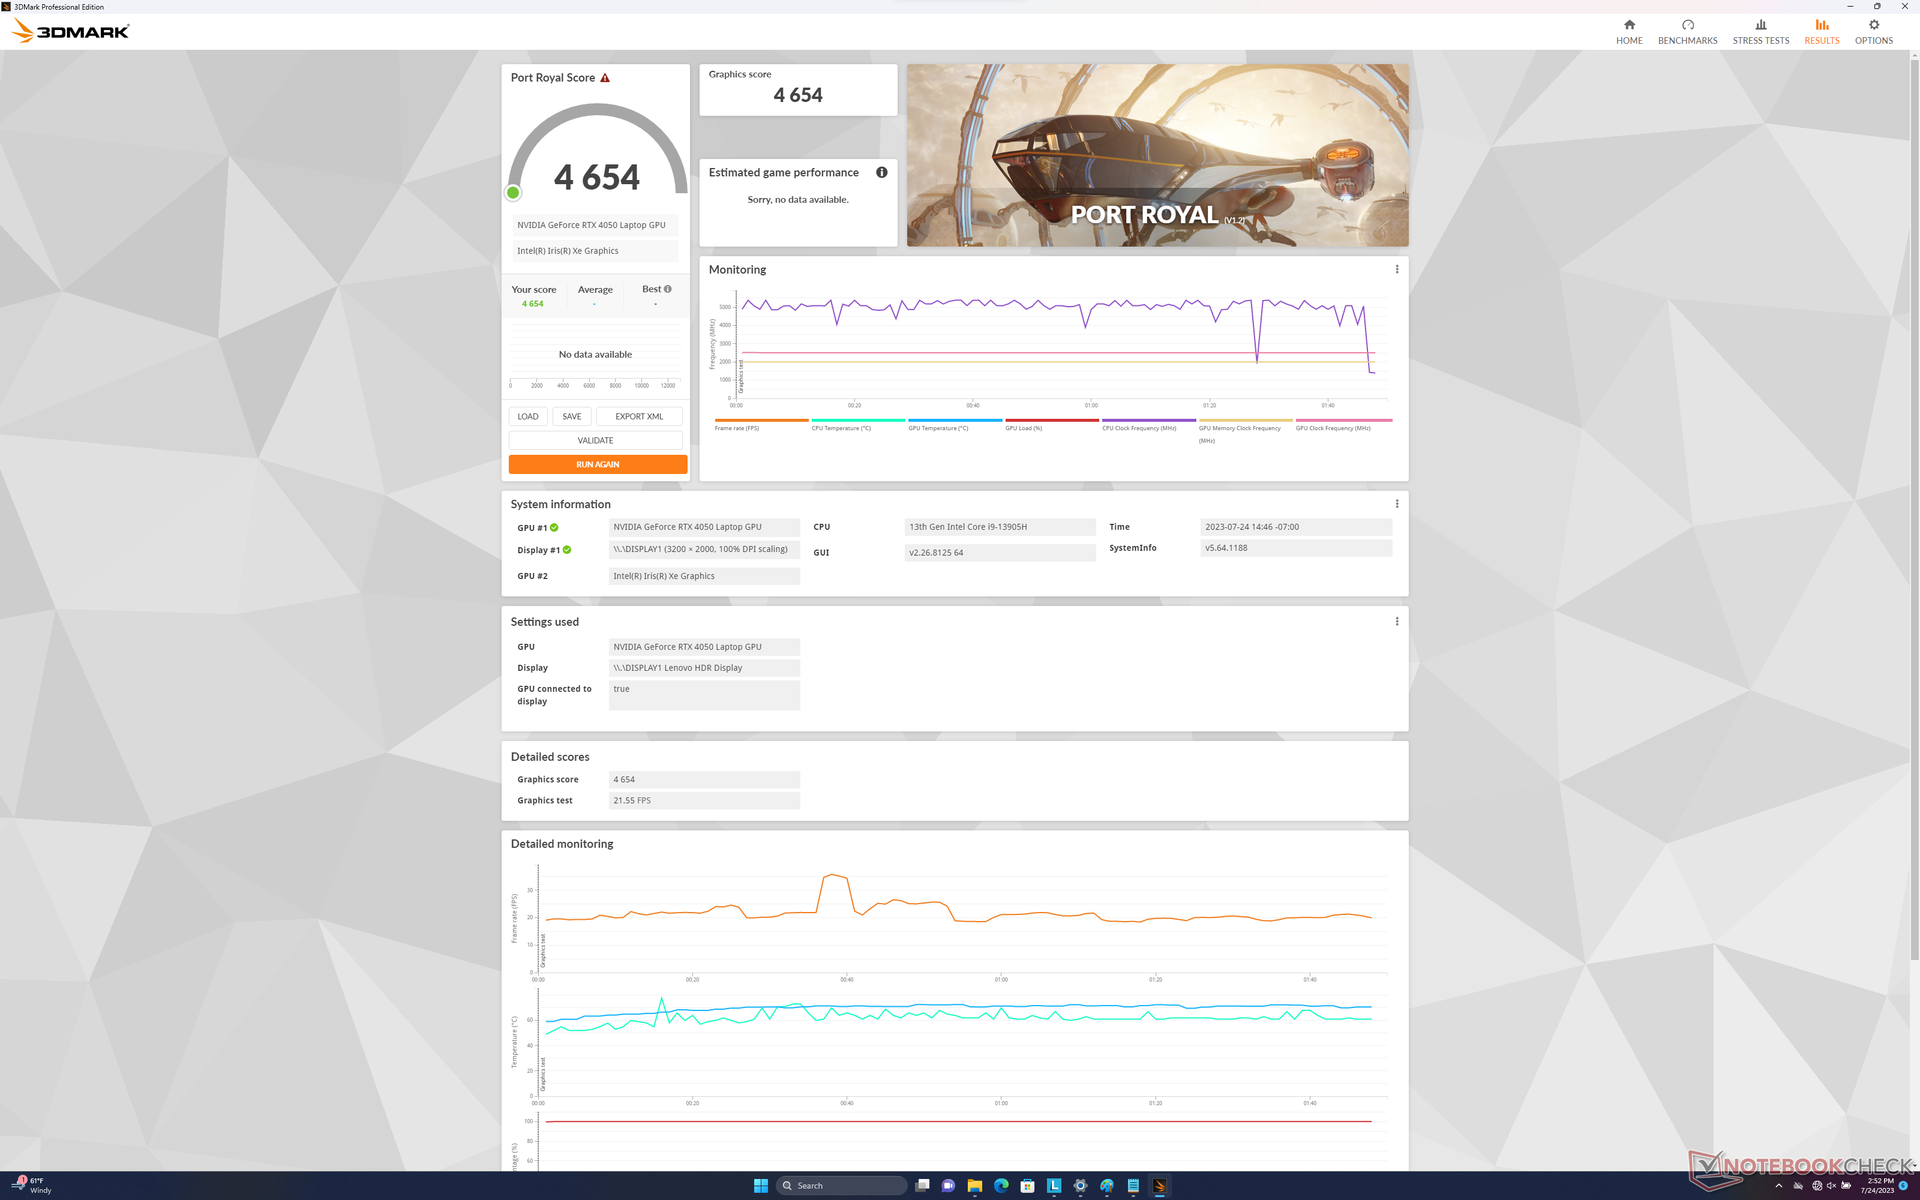
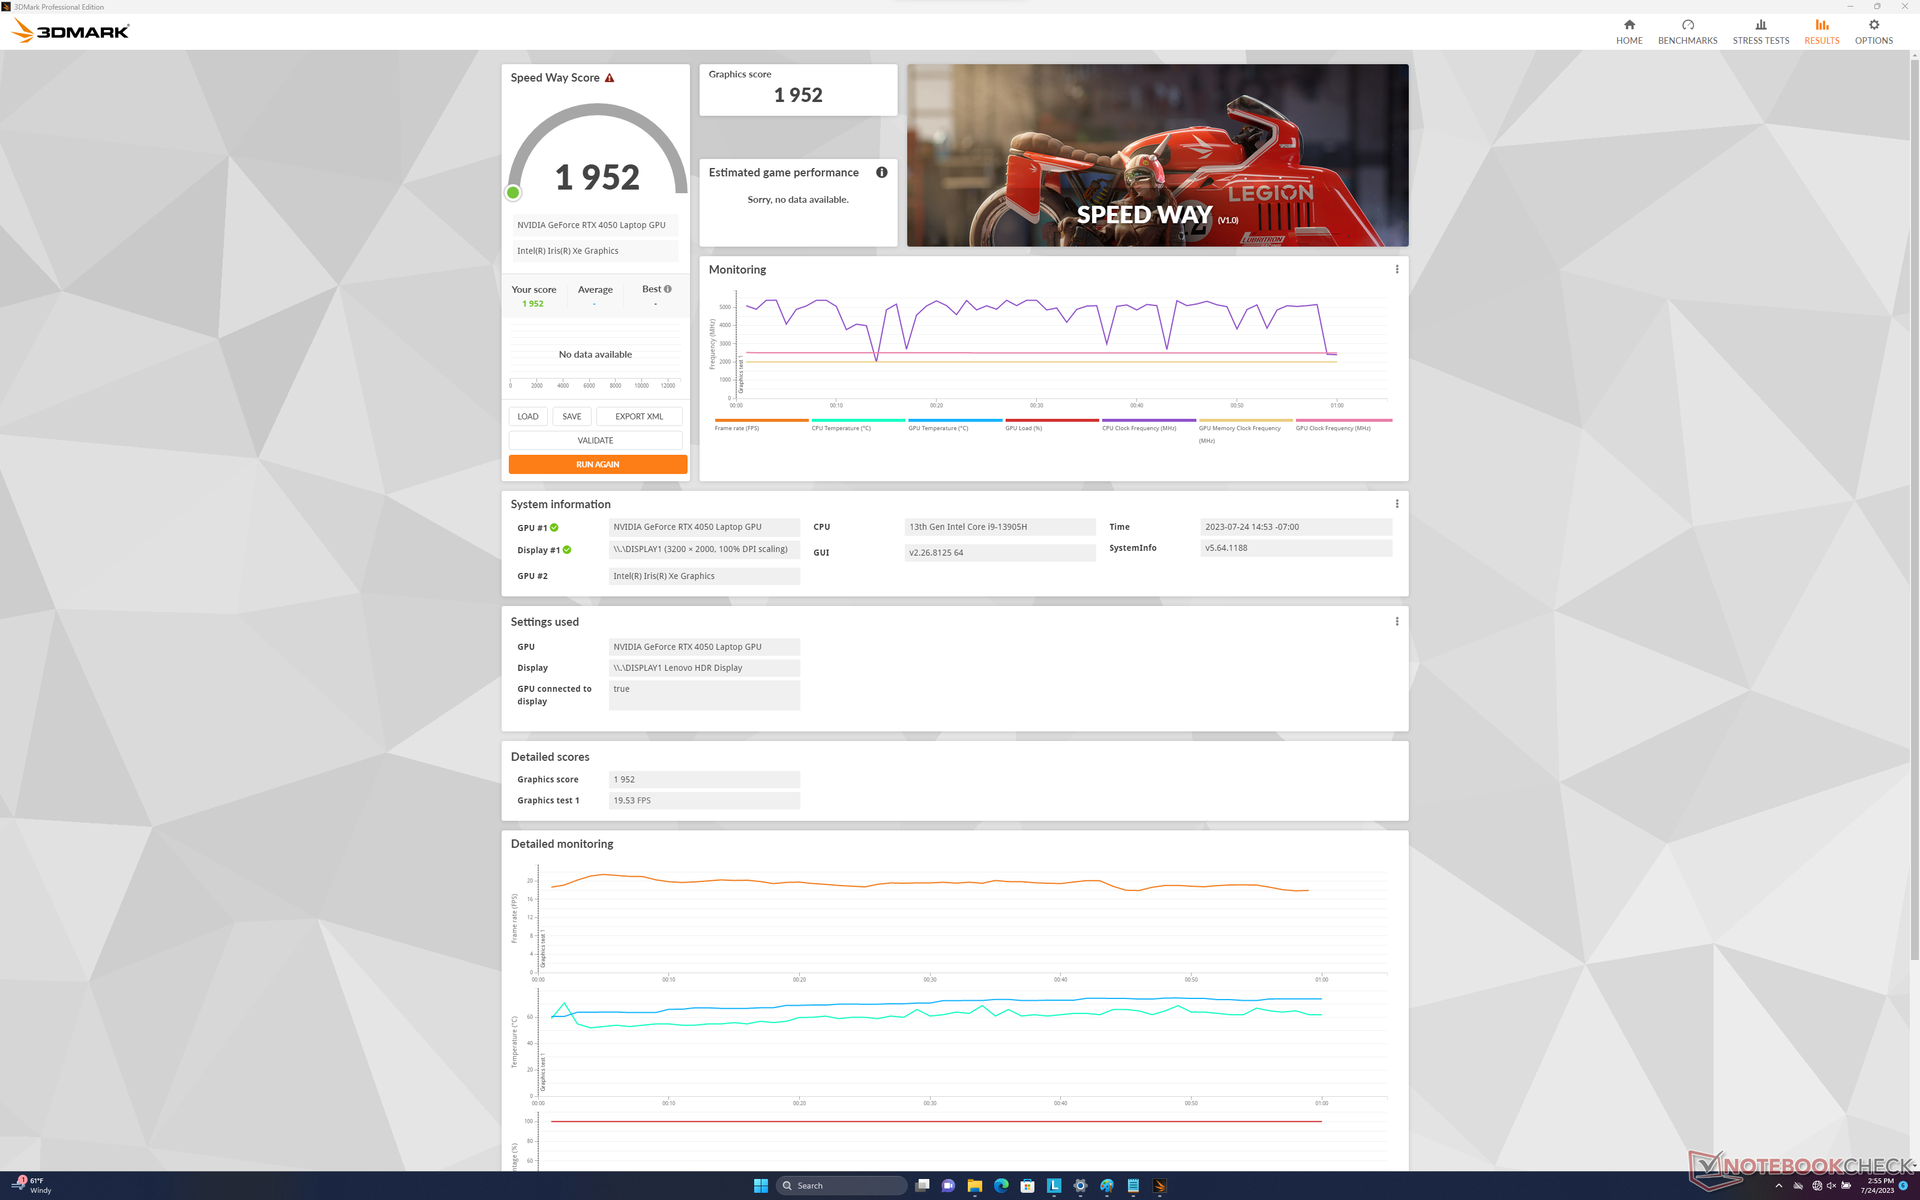
Rendimiento de la GPU
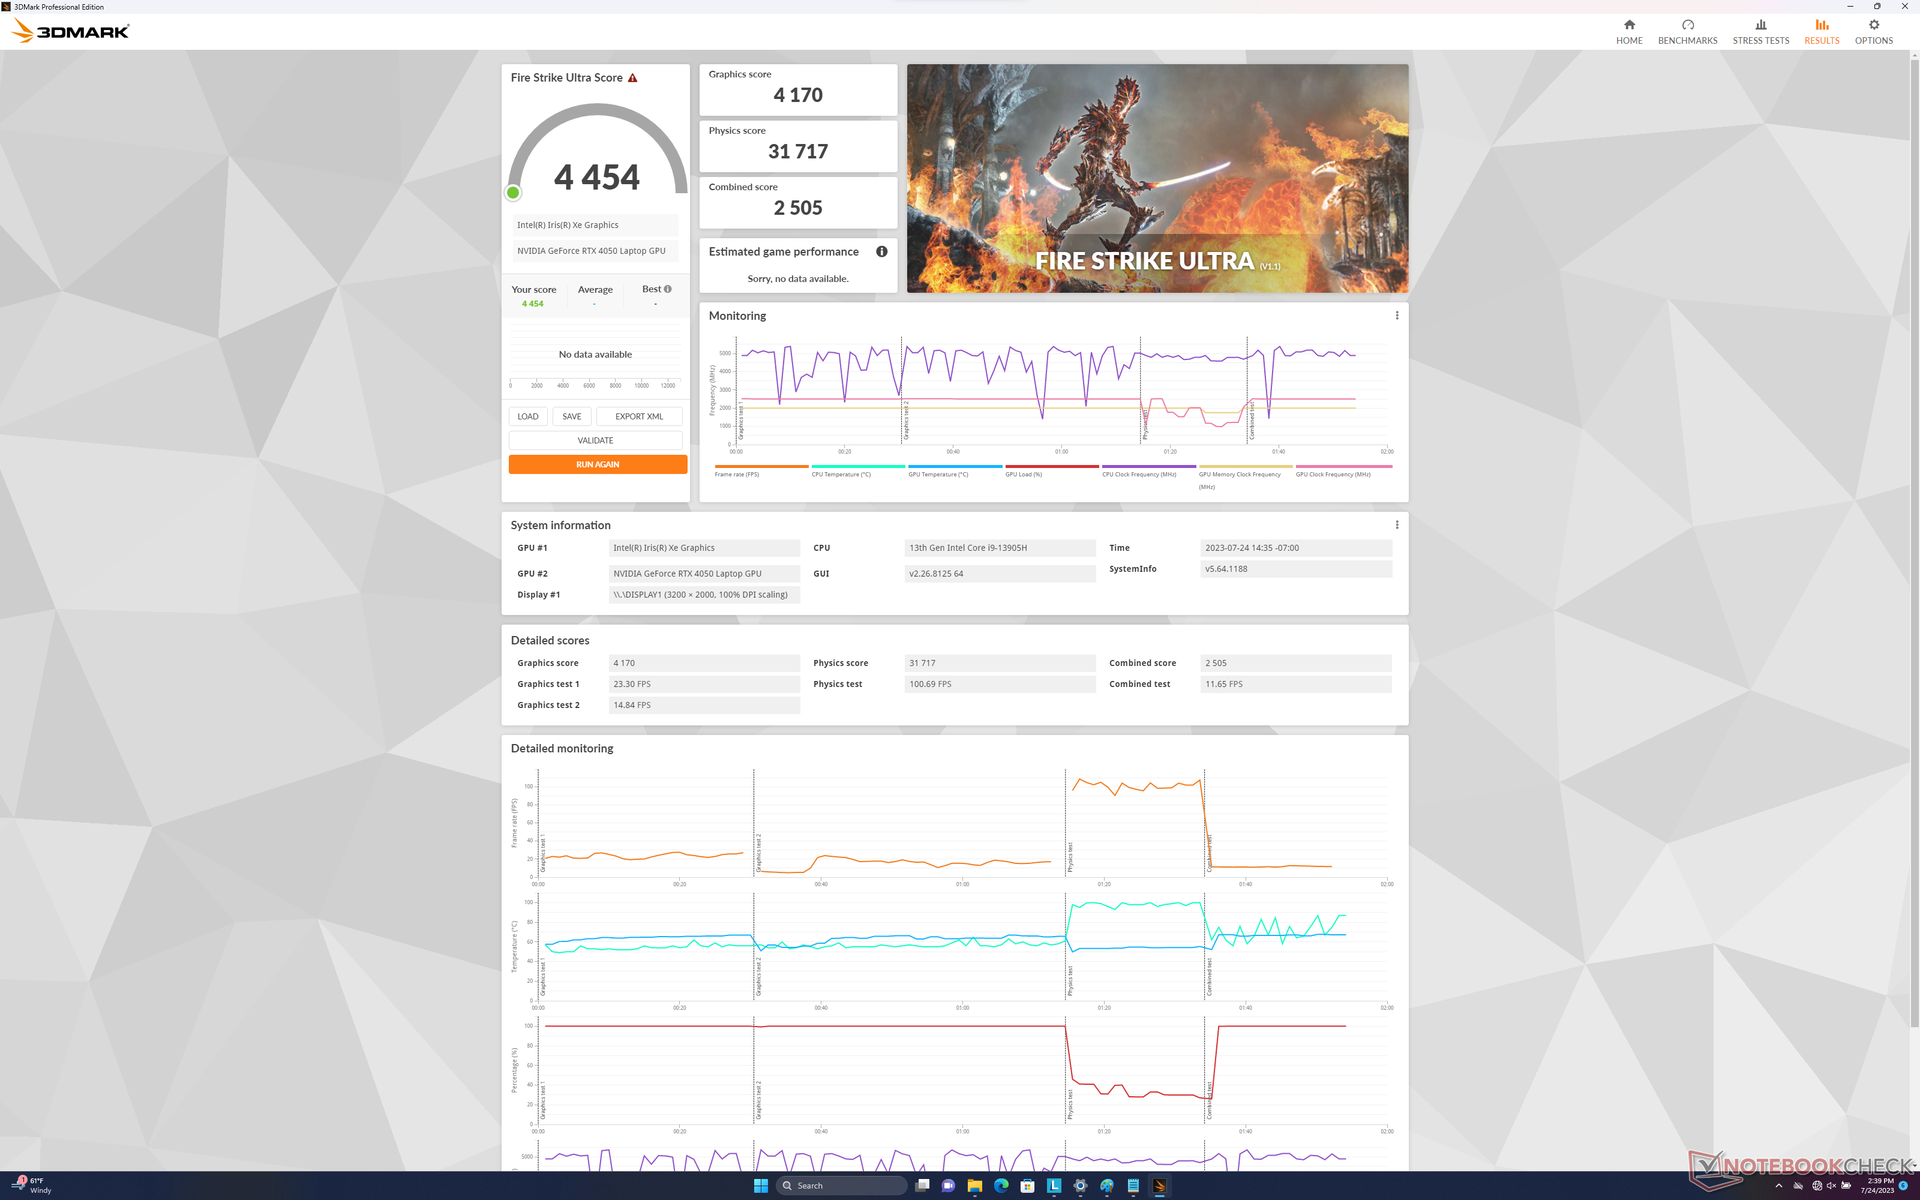
El móvil GeForce RTX 4050 es una mejora significativa con respecto a la decepcionante serie RTX 3050 del año pasado. El rendimiento gráfico bruto es entre un 50 y un 60 por ciento más rápido que el de la RTX 3050 Ti para estar a la par con la rTX 3060 para portátiles.
La actualización a la RTX 4060 se espera que aumente el rendimiento en un 20%.
Ejecutar en modo Equilibrado en lugar de en modo Rendimiento afecta ligeramente al rendimiento, como muestran nuestros resultados de Fire Strike en la tabla siguiente.
| Perfil de potencia | Fire Strike Puntuación física | Puntuación de gráficos | Puntuación combinada |
| Batería | 30199 (-4%) | 12900 (-39%) | 5642 (-43%) |
| Equilibrada | 28925 (-8%) | 20047 (-6%) | 7581 (-24%) |
| Rendimiento | 31606 | 21212 | 9969 |

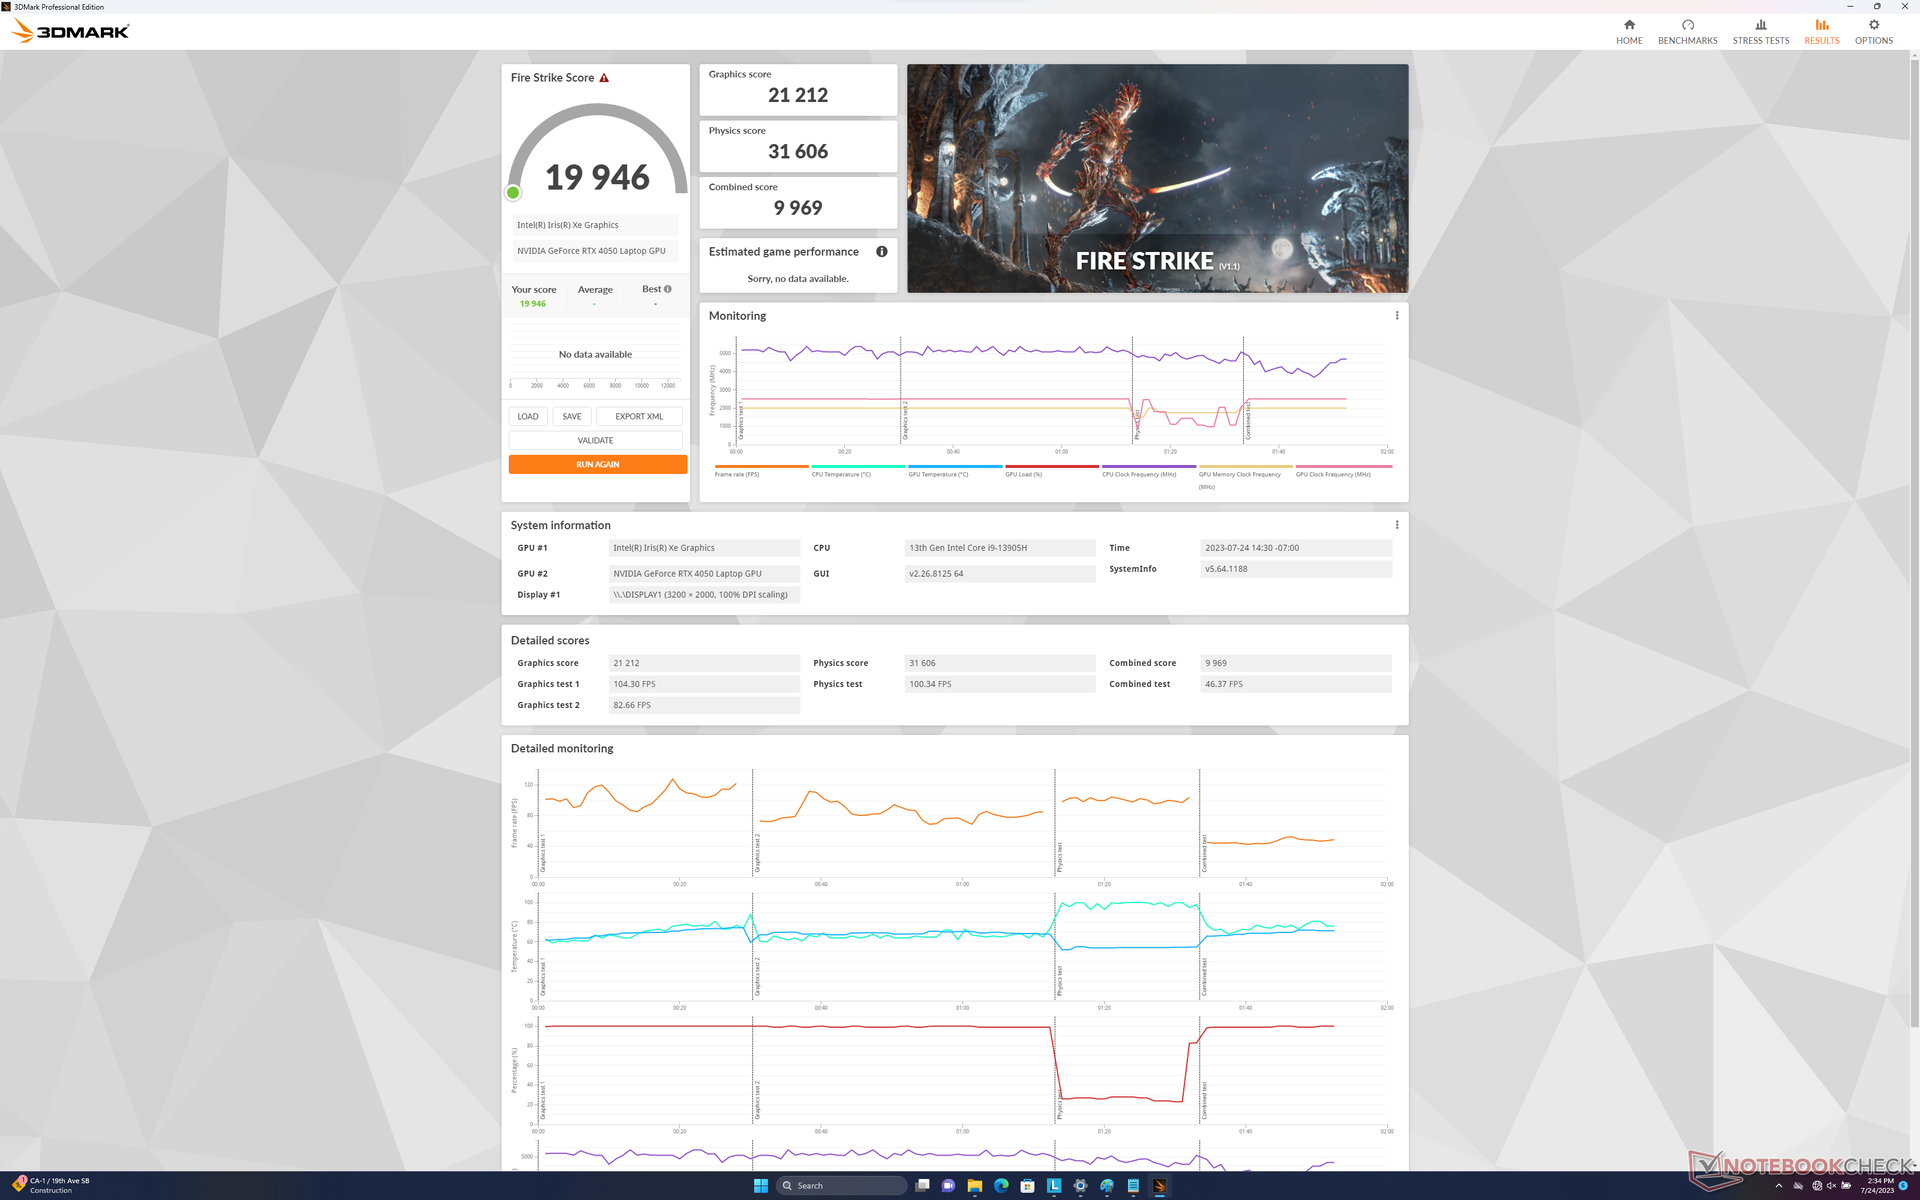
| 3DMark 11 Performance | 28168 puntos | |
| 3DMark Fire Strike Score | 19946 puntos | |
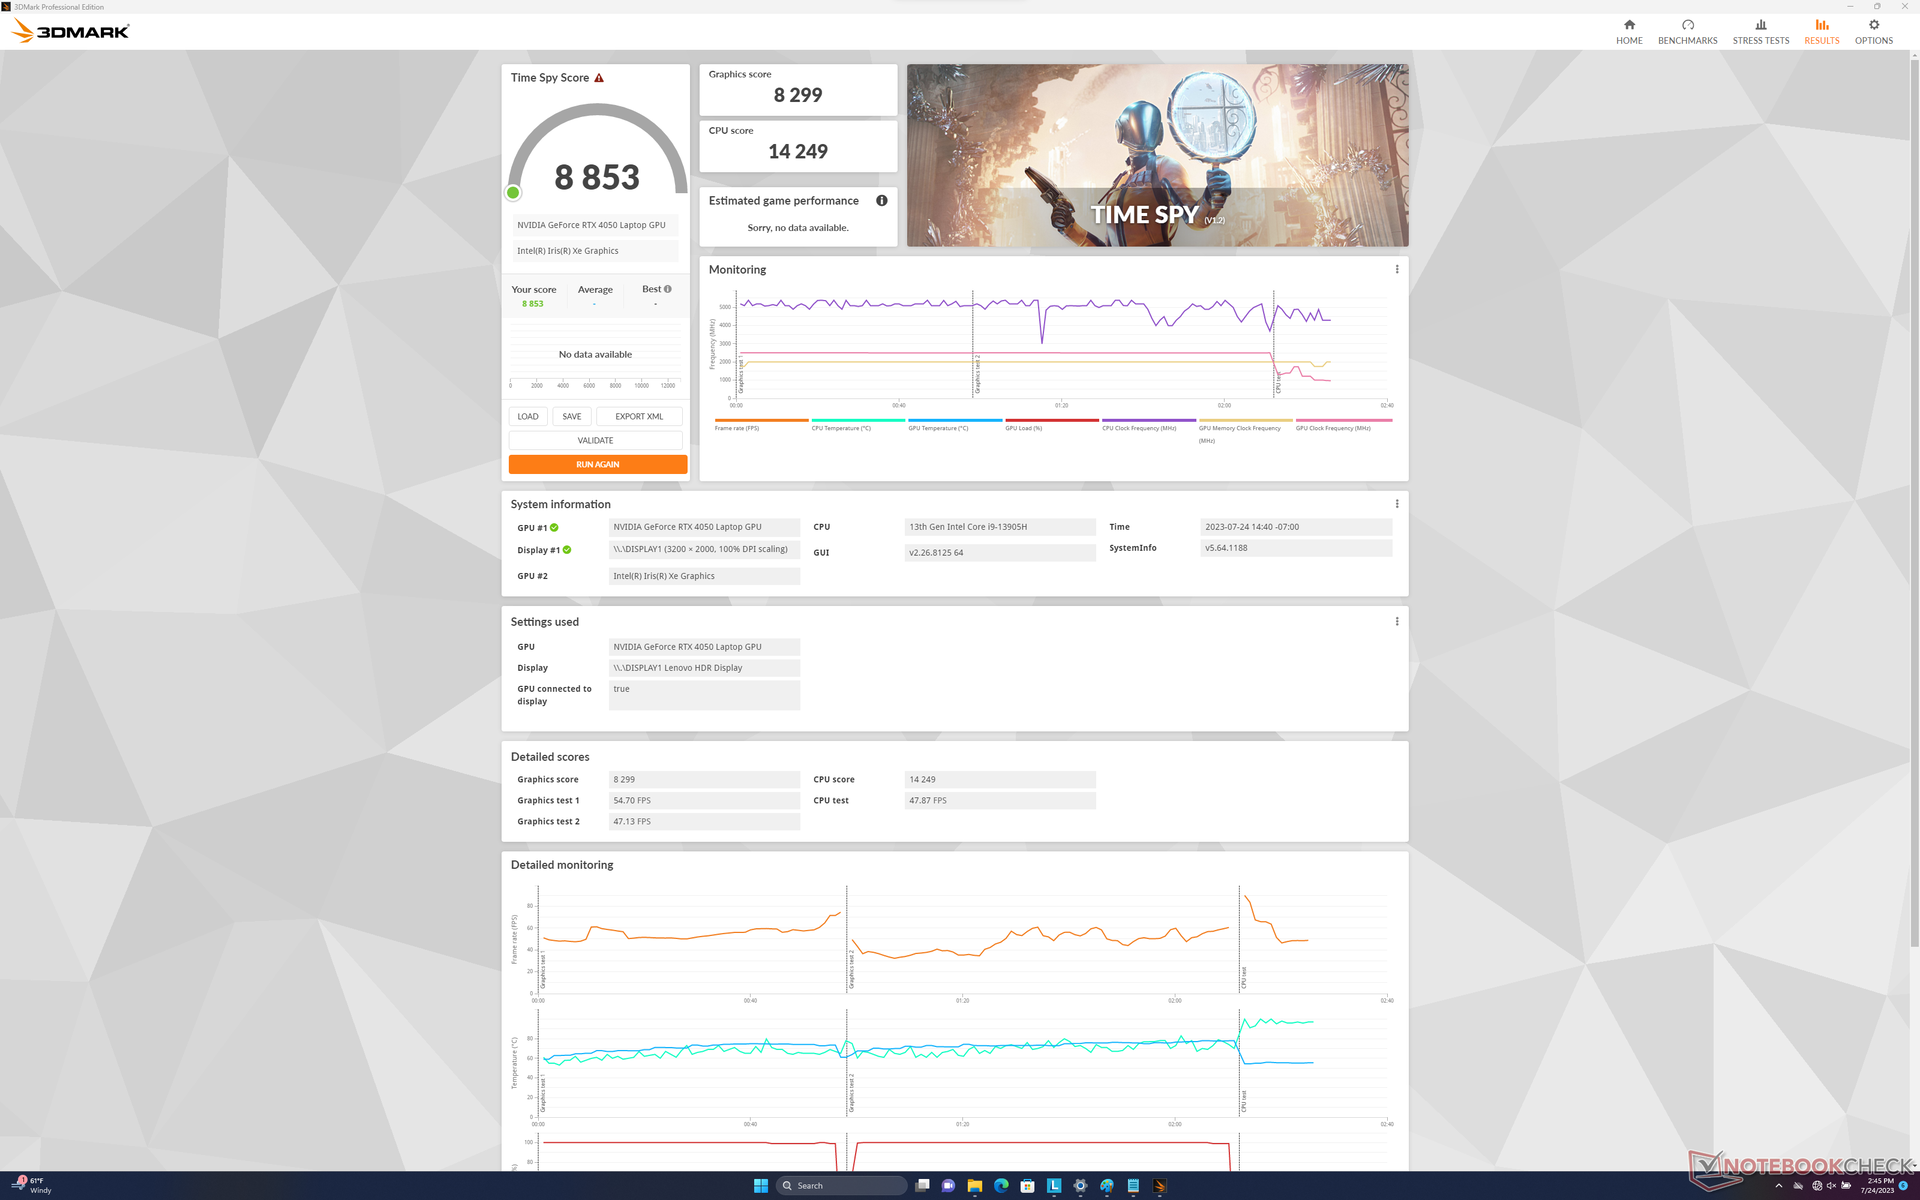
| 3DMark Time Spy Score | 8853 puntos | |
ayuda | ||
* ... más pequeño es mejor
Rendimiento en juegos
Aunque técnicamente no es una máquina de juegos, el sistema es más que capaz de reproducir los títulos más recientes incluso a la resolución QHD+ nativa. Los títulos más nuevos y exigentes, como Returnal, pueden ejecutarse con los ajustes máximos, pero se recomienda DLSS para obtener frecuencias de cuadro más tolerables.
Por desgracia, la pantalla interna no soporta G-Sync.
Witcher 3 FPS Chart
| bajo | medio | alto | ultra | QHD | |
|---|---|---|---|---|---|
| GTA V (2015) | 183.7 | 180.6 | 167.8 | 96.8 | 67.5 |
| The Witcher 3 (2015) | 410.2 | 271.1 | 164.7 | 84.9 | 59.2 |
| Dota 2 Reborn (2015) | 180 | 162.5 | 155 | 138.6 | |
| Final Fantasy XV Benchmark (2018) | 186.9 | 118.6 | 83.5 | 60 | |
| X-Plane 11.11 (2018) | 153 | 130.6 | 103.2 | ||
| Strange Brigade (2018) | 429 | 202 | 164.7 | 144.1 | 96.3 |
| Cyberpunk 2077 1.6 (2022) | 121.3 | 105.9 | 78.7 | 64.1 | 38.5 |
| Tiny Tina's Wonderlands (2022) | 183.3 | 142.8 | 91.5 | 70.2 | 47.7 |
| F1 22 (2022) | 214 | 199.8 | 150.8 | 52.6 | 32.3 |
| Returnal (2023) | 64 | 63 | 59 | 52 | 34 |
Emisiones
Ruido del sistema
El ruido del ventilador tiende a establecerse en el tranquilo rango de 25 a 27 dB(A) contra un fondo silencioso de 22,7 dB(A) cuando se ejecutan cargas poco exigentes como navegadores o flujos de vídeo. Sin embargo, cuando se introducen cargas más altas, como juegos, los ventiladores aumentan de forma constante hasta alcanzar un máximo de 52,6 dB(A), tan ruidosos como muchos portátiles para juegos.
Merece la pena señalar que el ruido del ventilador baja considerablemente a sólo 44,2 dB(A) cuando se ejecutan juegos en modo Equilibrado en vez de en modo Rendimiento. Por tanto, el menor ruido del ventilador puede merecer la pena por la ligera disminución del rendimiento, dependiendo de las preferencias del usuario.
Ruido
| Ocioso |
| 22.7 / 22.7 / 27.5 dB(A) |
| Carga |
| 28.9 / 52.5 dB(A) |
 | ||
30 dB silencioso 40 dB(A) audible 50 dB(A) ruidosamente alto |
||
min: | ||
| Lenovo Slim Pro 9i 16IRP8 GeForce RTX 4050 Laptop GPU, i9-13905H, Samsung PM9A1 MZVL21T0HCLR | Lenovo Yoga Pro 9 16-IRP G8 GeForce RTX 4060 Laptop GPU, i7-13705H, Samsung PM9A1 MZVL21T0HCLR | Asus VivoBook Pro 16 GeForce RTX 3050 Ti Laptop GPU, i7-12700H, Intel SSD 670p SSDPEKNU010TZ | Acer Swift Edge SFE16-42-R1GM Radeon 680M, R7 7735U, Micron 3400 1TB MTFDKBA1T0TFH | Dell Inspiron 16 Plus 7620 GeForce RTX 3050 Ti Laptop GPU, i7-12700H, Kioxia BG5 KBG50ZNS512G | HP Envy 16 h0112nr GeForce RTX 3060 Laptop GPU, i7-12700H, Micron 3400 1TB MTFDKBA1T0TFH | |
|---|---|---|---|---|---|---|
| Noise | -10% | -22% | -13% | -13% | -7% | |
| apagado / medio ambiente * (dB) | 22.7 | 24.7 -9% | 25.2 -11% | 25.7 -13% | 23.3 -3% | 22.8 -0% |
| Idle Minimum * (dB) | 22.7 | 24.7 -9% | 25.2 -11% | 25.7 -13% | 25.7 -13% | 22.9 -1% |
| Idle Average * (dB) | 22.7 | 26.2 -15% | 25.2 -11% | 27 -19% | 26.1 -15% | 22.9 -1% |
| Idle Maximum * (dB) | 27.5 | 26.2 5% | 25.2 8% | 29.3 -7% | 30.6 -11% | 30.5 -11% |
| Load Average * (dB) | 28.9 | 39.7 -37% | 55.1 -91% | 42.3 -46% | 46.2 -60% | 41.4 -43% |
| Witcher 3 ultra * (dB) | 52.6 | 53.2 -1% | 49.2 6% | 51.1 3% | ||
| Load Maximum * (dB) | 52.5 | 53.2 -1% | 61.5 -17% | 42.7 19% | 49.4 6% | 51.4 2% |
* ... más pequeño es mejor
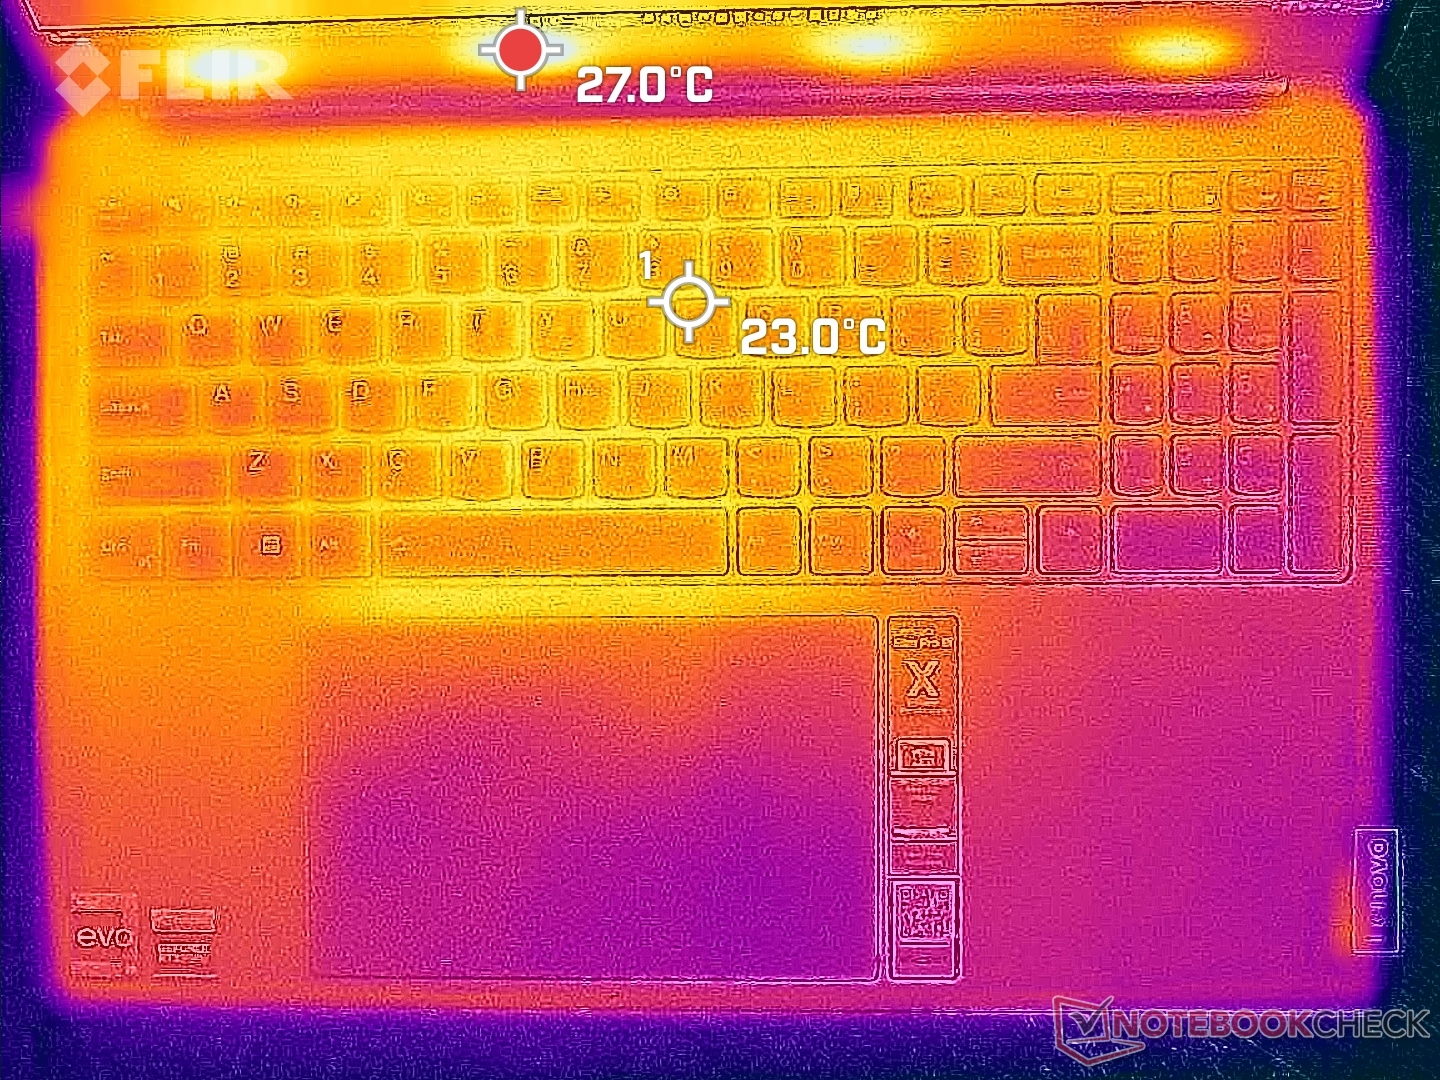
Temperatura
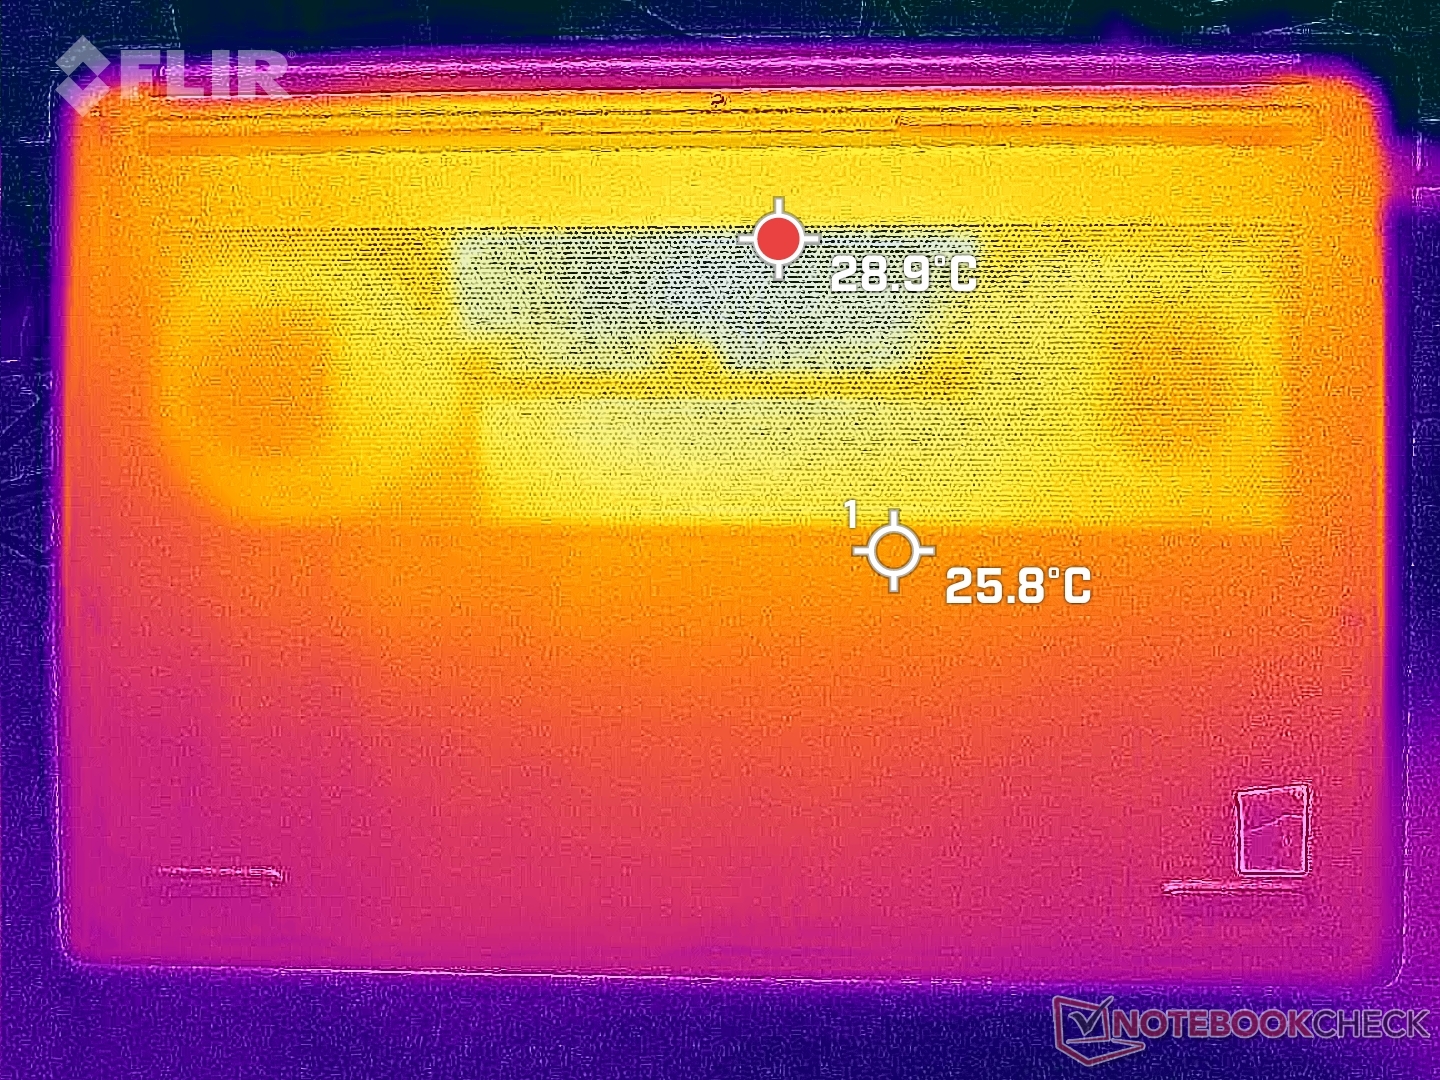
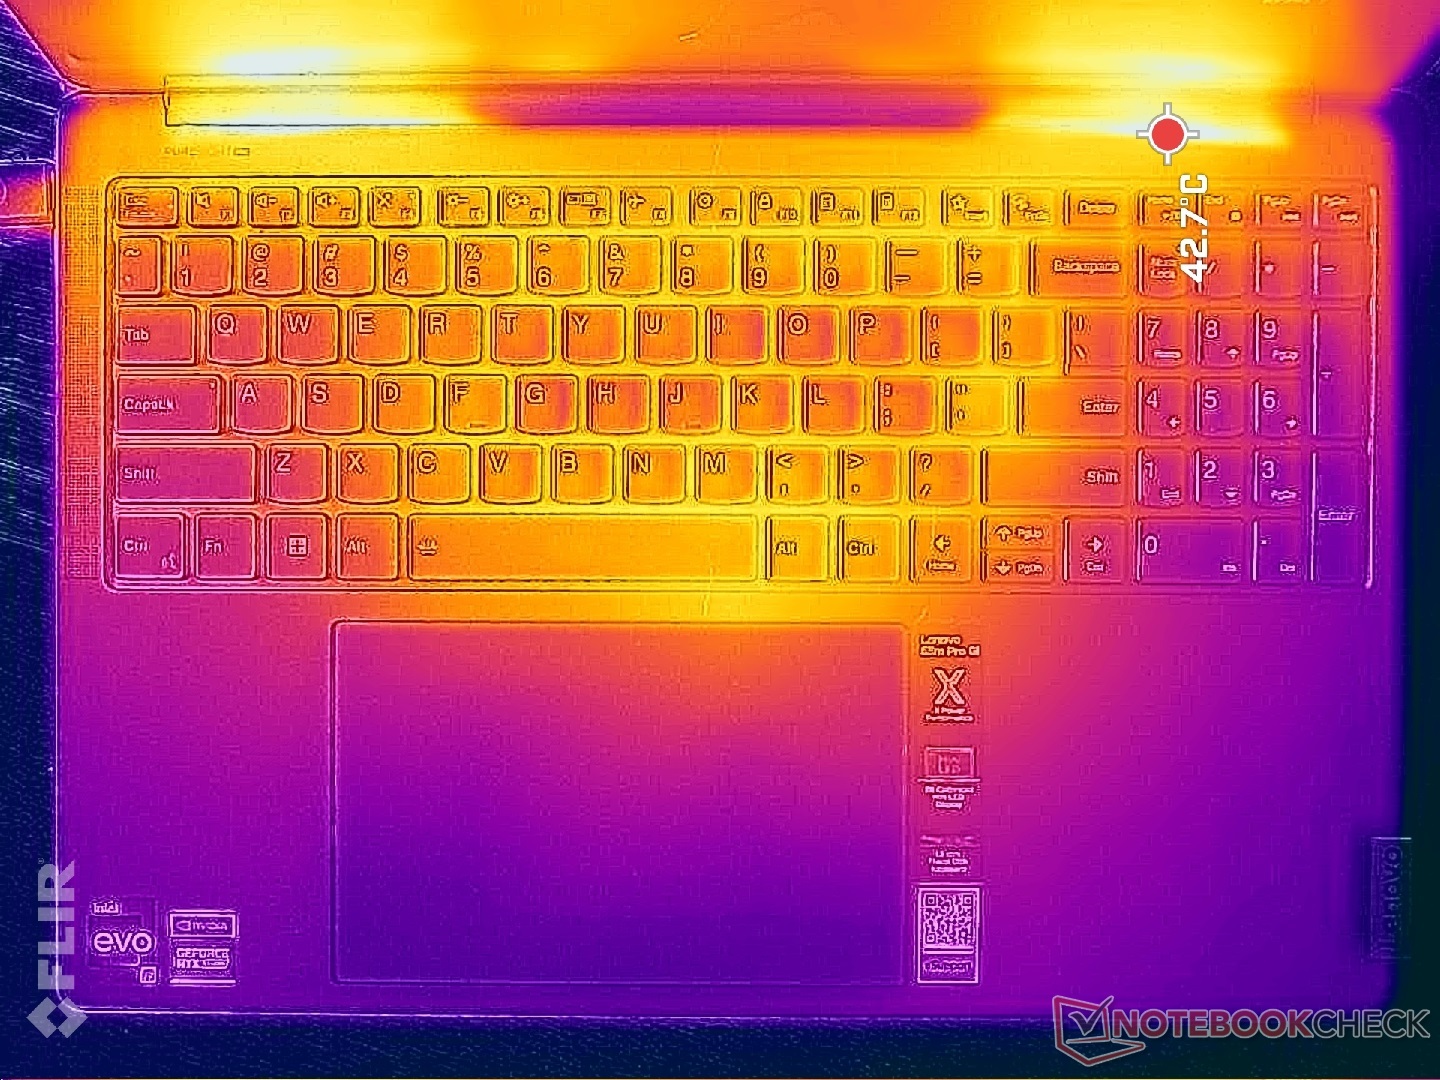
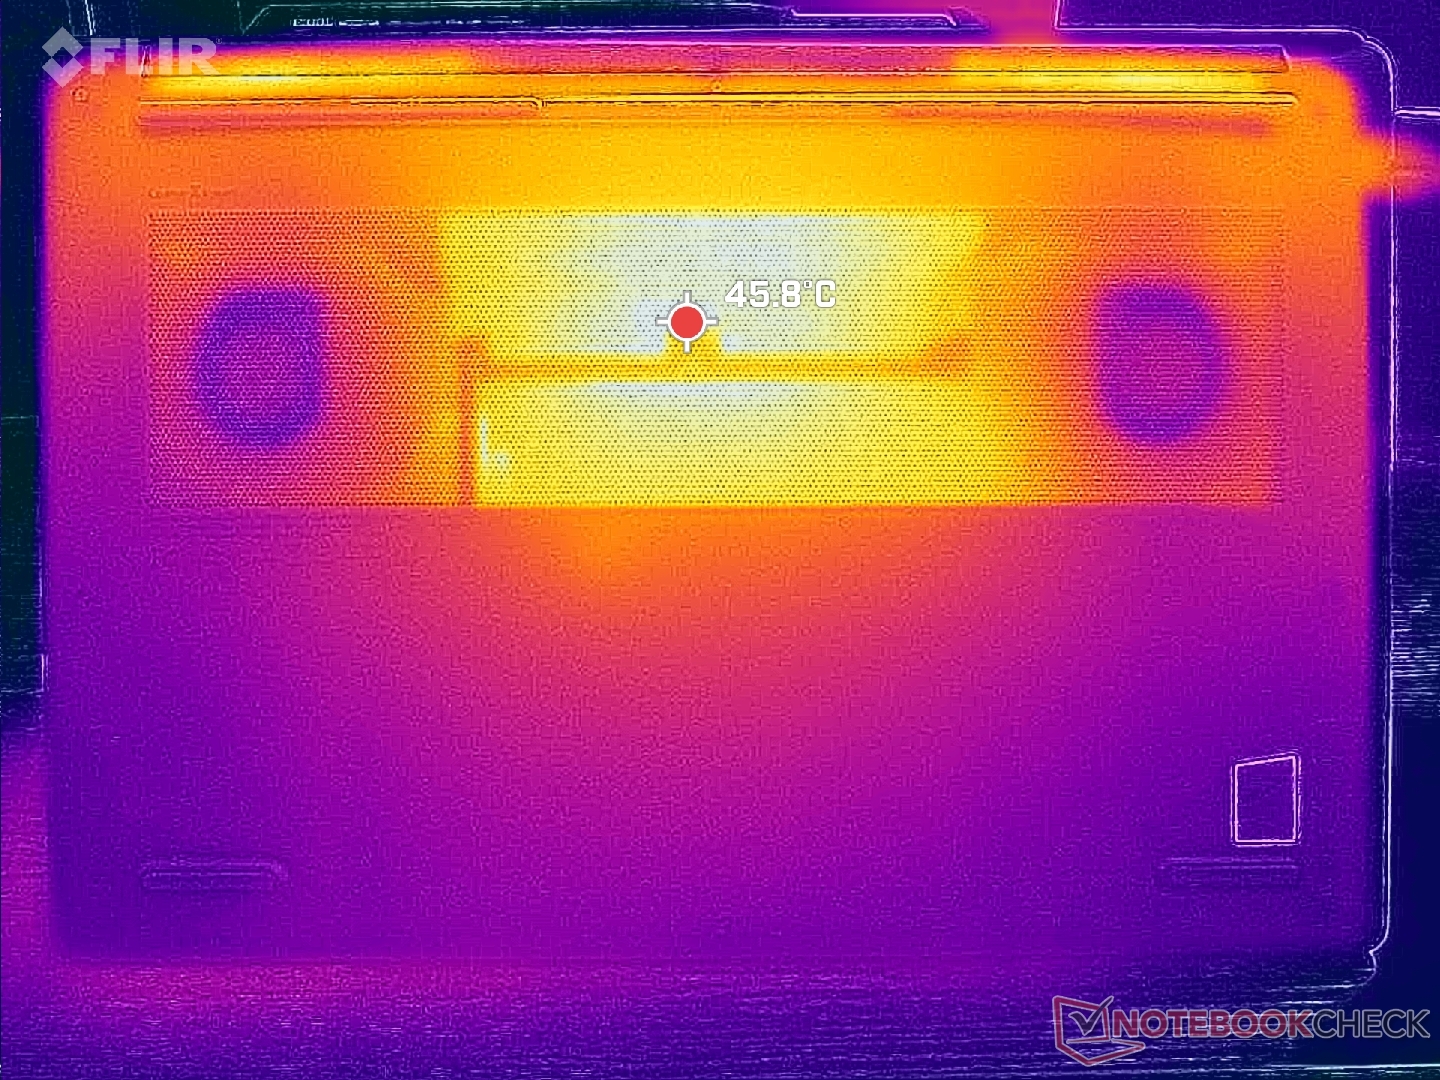
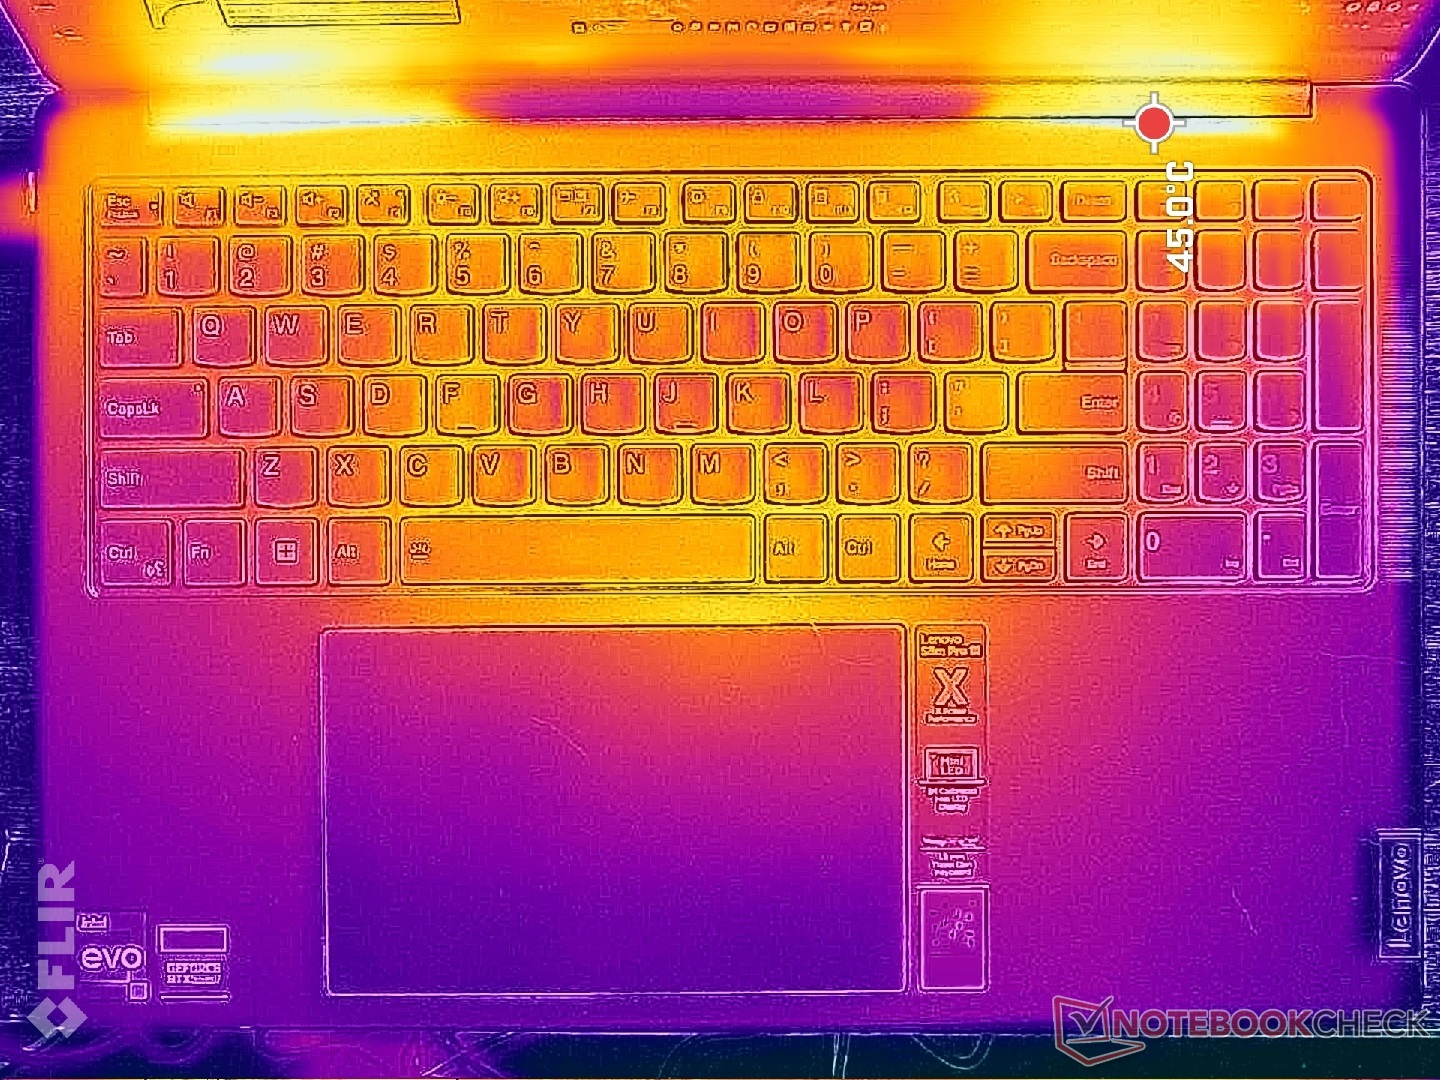
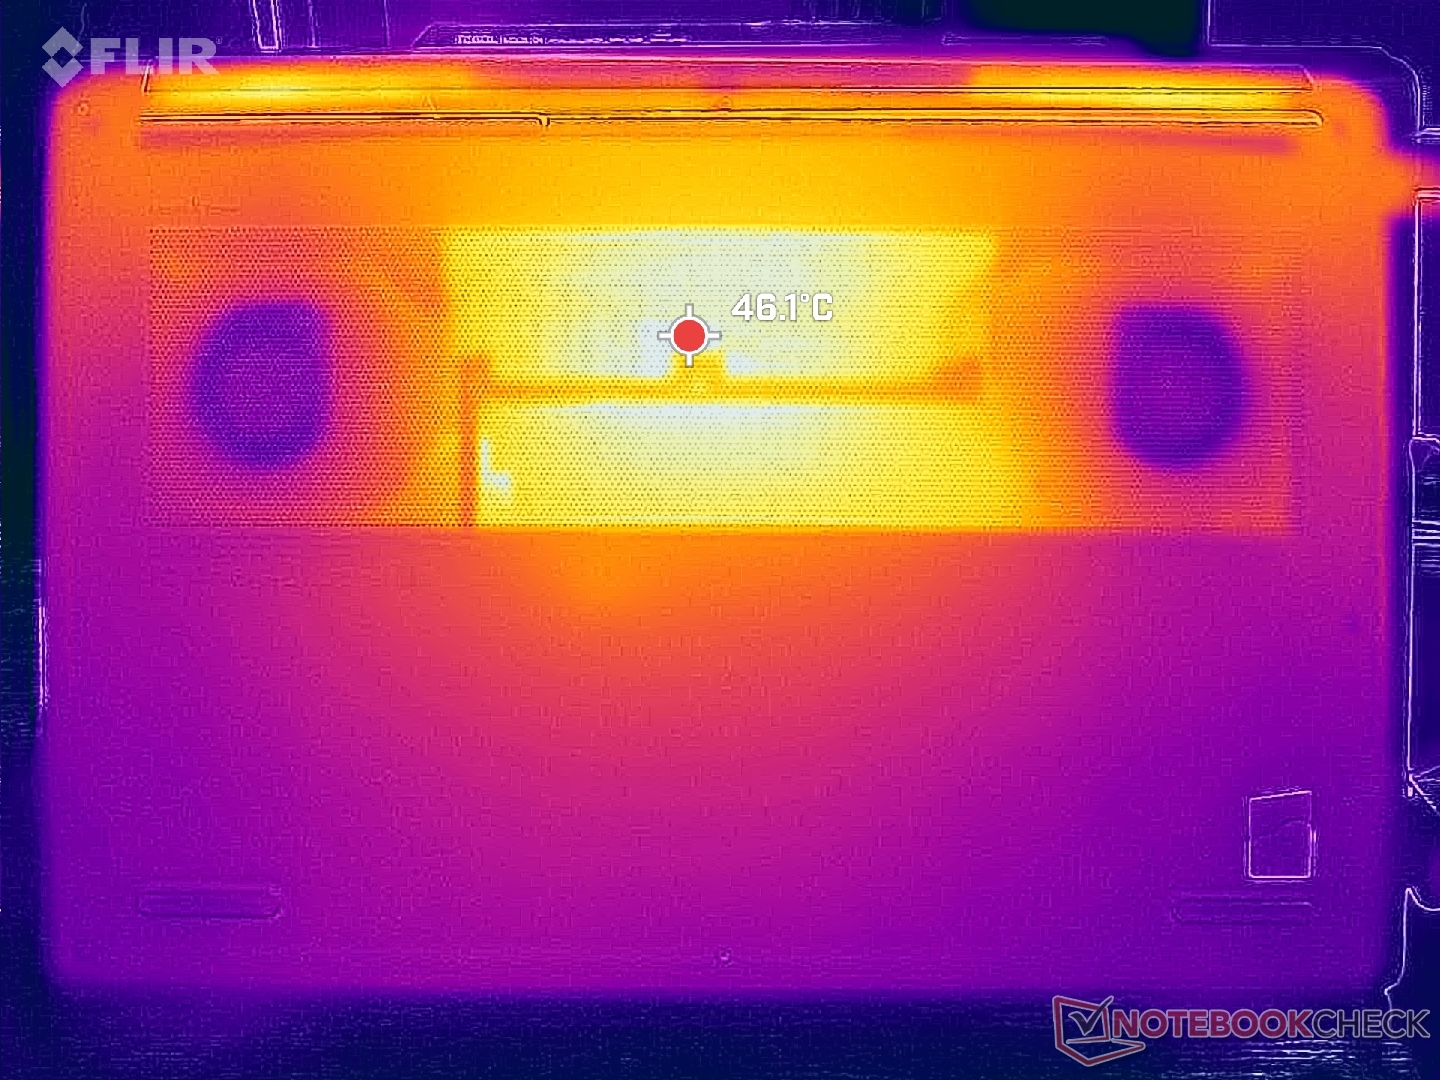
Las temperaturas superficiales son más cálidas cerca de las regiones centrales, donde los puntos calientes pueden alcanzar más de 38 C y 44 C en la parte superior e inferior, respectivamente. El teclado del Lenovo no está tan caliente como el delInspiron 16 Plus 7620 donde el centro puede alcanzar los 50 C bajo carga.
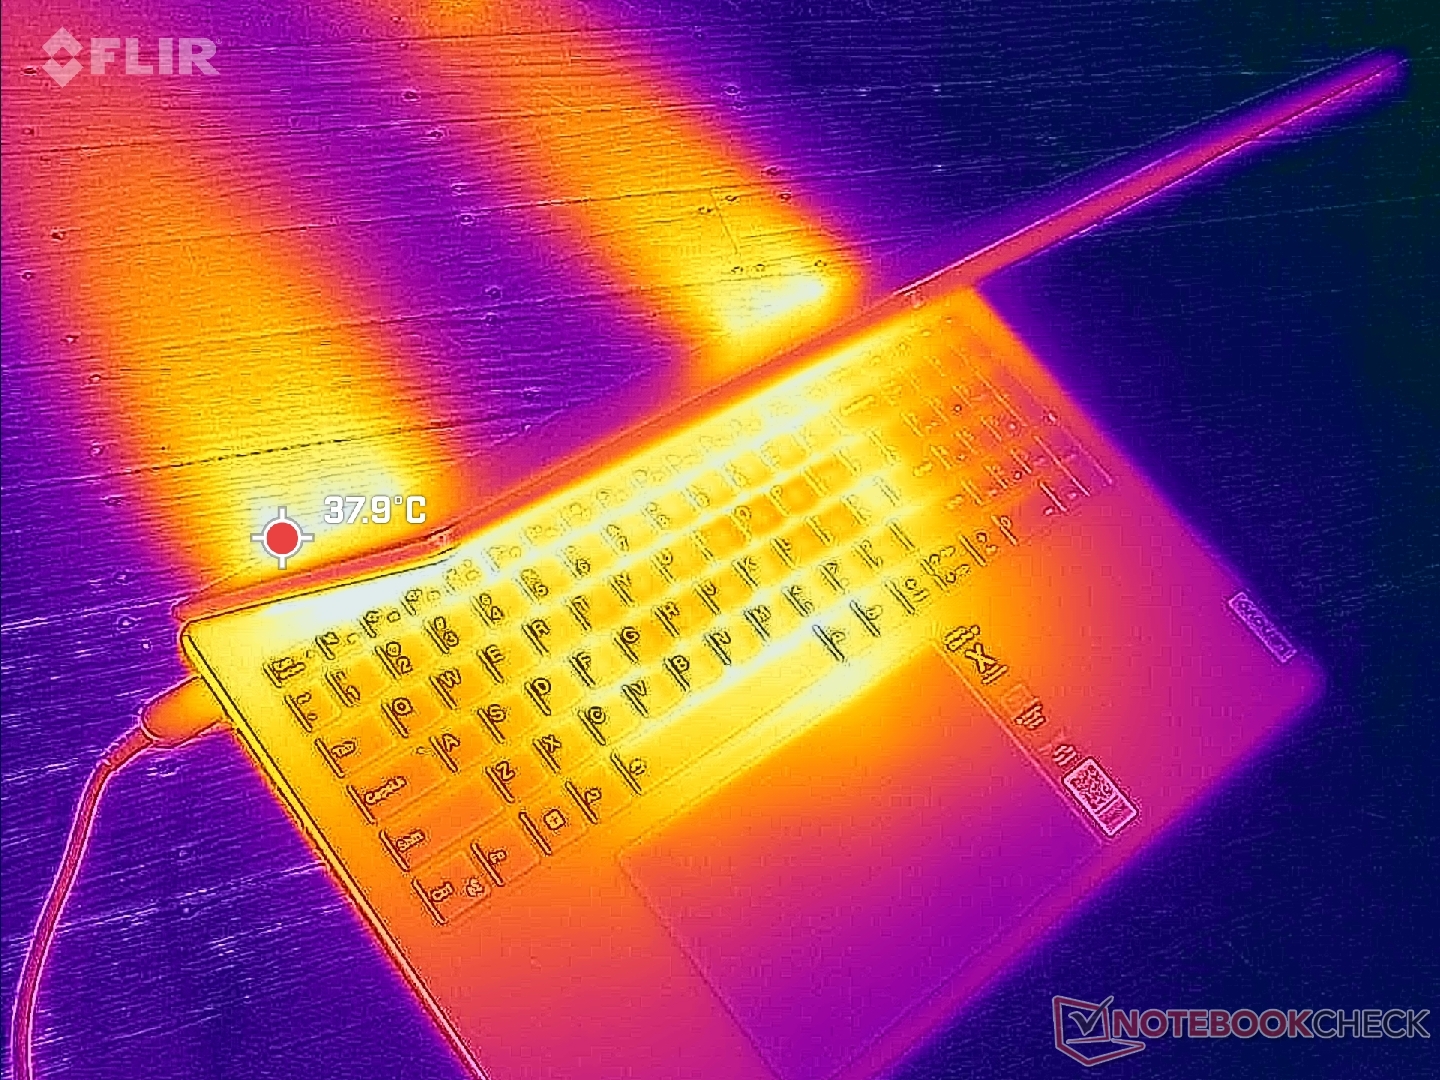
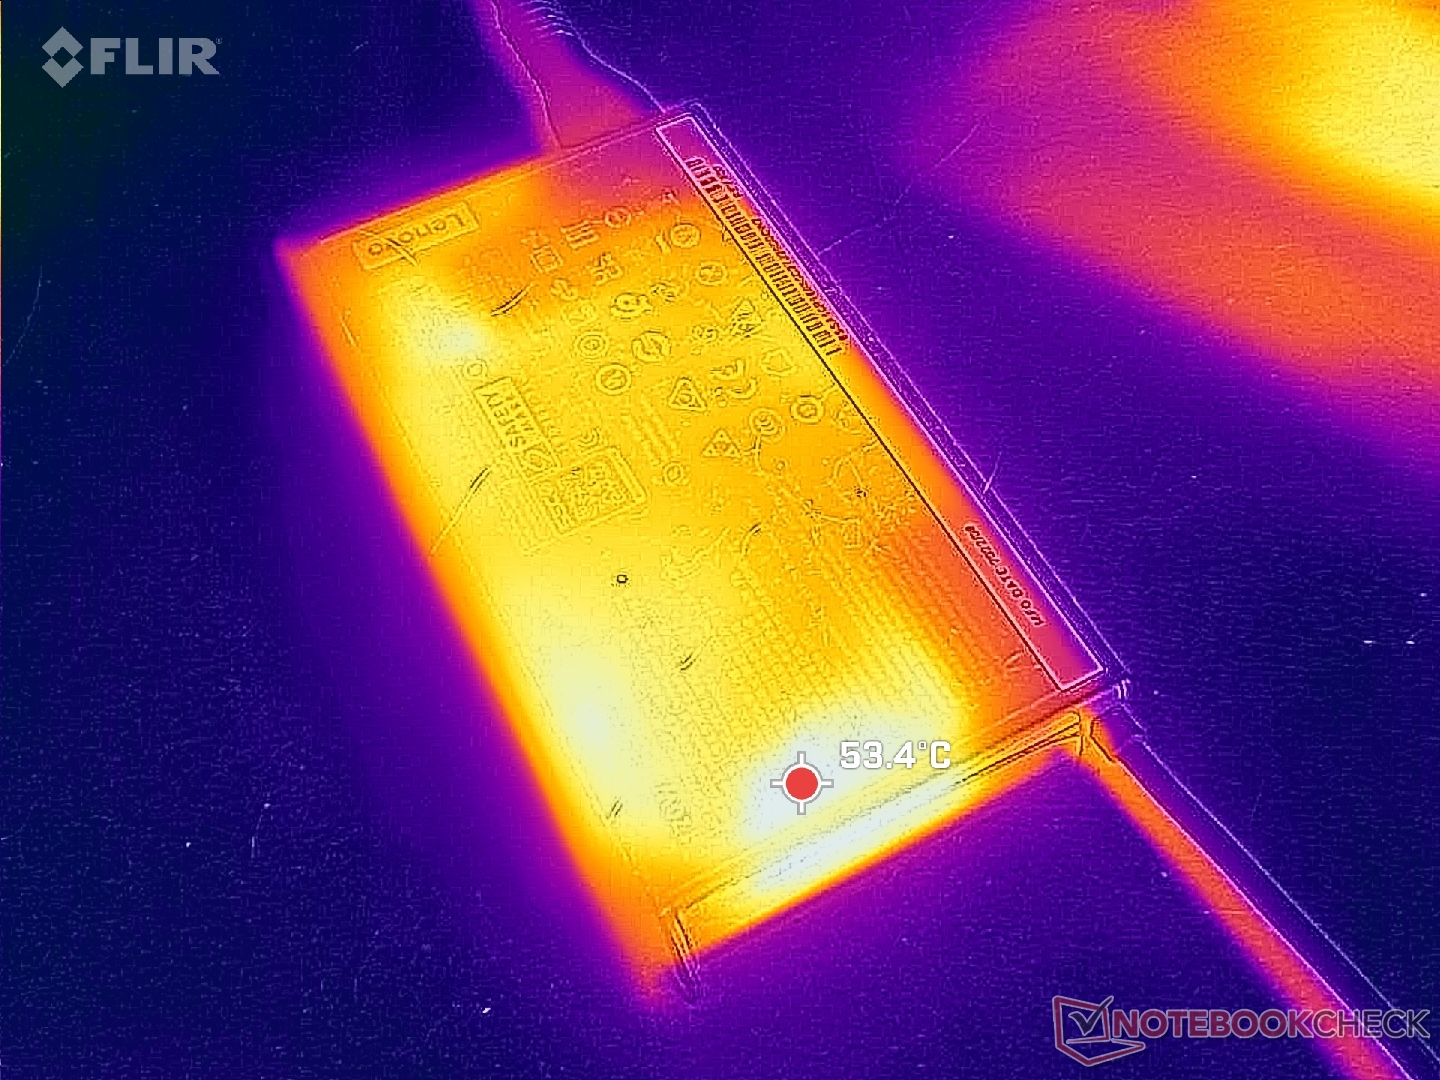
(+) La temperatura máxima en la parte superior es de 37.8 °C / 100 F, frente a la media de 36.8 °C / 98 F, que oscila entre 21 y 71 °C para la clase Multimedia.
(±) El fondo se calienta hasta un máximo de 44.8 °C / 113 F, frente a la media de 39.1 °C / 102 F
(+) En reposo, la temperatura media de la parte superior es de 28.8 °C / 84# F, frente a la media del dispositivo de 31.3 °C / 88 F.
(±) Jugando a The Witcher 3, la temperatura media de la parte superior es de 35.4 °C / 96 F, frente a la media del dispositivo de 31.3 °C / 88 F.
(+) Los reposamanos y el panel táctil alcanzan como máximo la temperatura de la piel (32 °C / 89.6 F) y, por tanto, no están calientes.
(-) La temperatura media de la zona del reposamanos de dispositivos similares fue de 28.7 °C / 83.7 F (-3.3 °C / -5.9 F).
| Lenovo Slim Pro 9i 16IRP8 Intel Core i9-13905H, NVIDIA GeForce RTX 4050 Laptop GPU | Lenovo Yoga Pro 9 16-IRP G8 Intel Core i7-13705H, NVIDIA GeForce RTX 4060 Laptop GPU | Asus VivoBook Pro 16 Intel Core i7-12700H, NVIDIA GeForce RTX 3050 Ti Laptop GPU | Acer Swift Edge SFE16-42-R1GM AMD Ryzen 7 7735U, AMD Radeon 680M | Dell Inspiron 16 Plus 7620 Intel Core i7-12700H, NVIDIA GeForce RTX 3050 Ti Laptop GPU | HP Envy 16 h0112nr Intel Core i7-12700H, NVIDIA GeForce RTX 3060 Laptop GPU | |
|---|---|---|---|---|---|---|
| Heat | 0% | -16% | -11% | -5% | -8% | |
| Maximum Upper Side * (°C) | 37.8 | 41.6 -10% | 44.2 -17% | 49.4 -31% | 46 -22% | 45.2 -20% |
| Maximum Bottom * (°C) | 44.8 | 50 -12% | 53 -18% | 44.7 -0% | 45.8 -2% | 44 2% |
| Idle Upper Side * (°C) | 30.6 | 26.8 12% | 32.1 -5% | 34 -11% | 29.2 5% | 33.6 -10% |
| Idle Bottom * (°C) | 31 | 27.9 10% | 38.4 -24% | 31.6 -2% | 31 -0% | 32.6 -5% |
* ... más pequeño es mejor
Prueba de resistencia
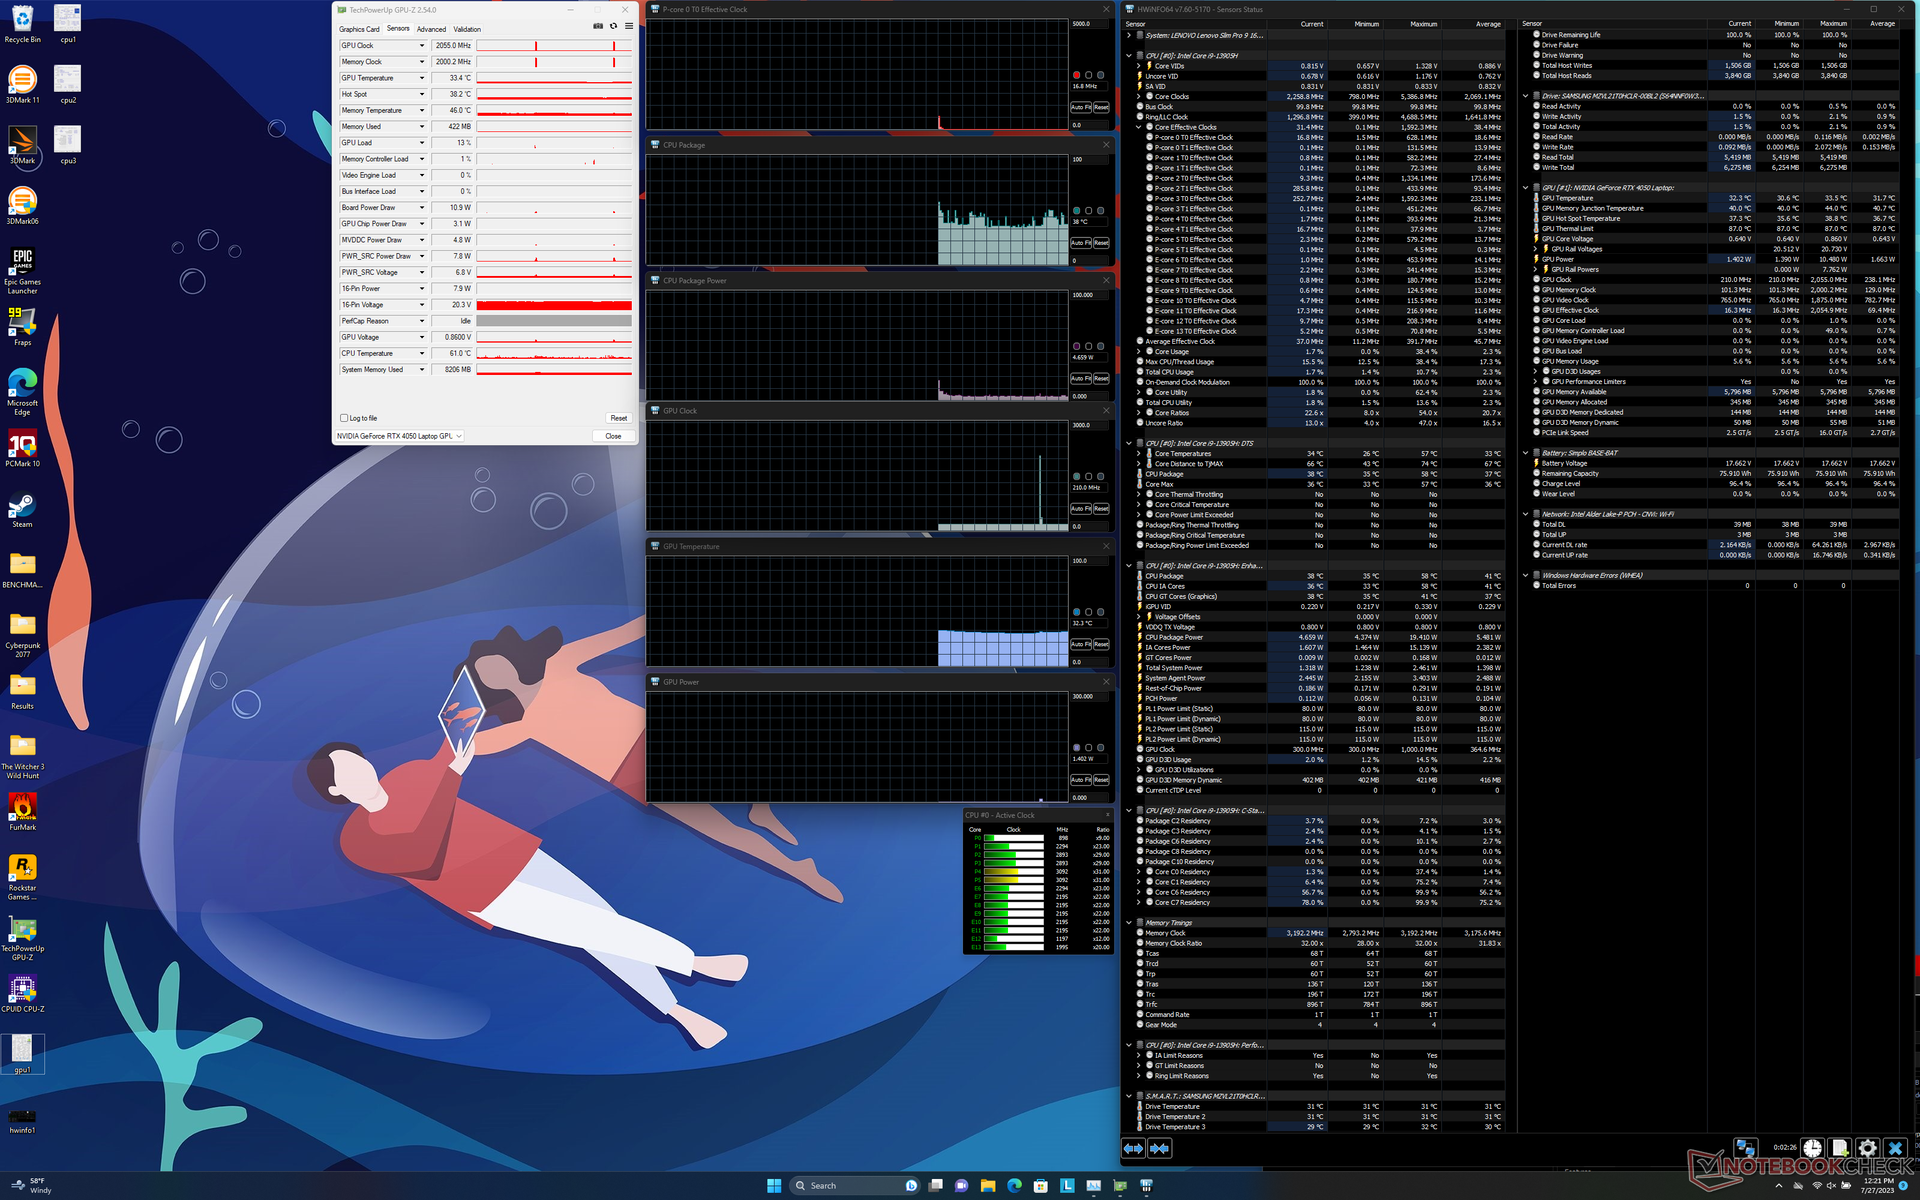
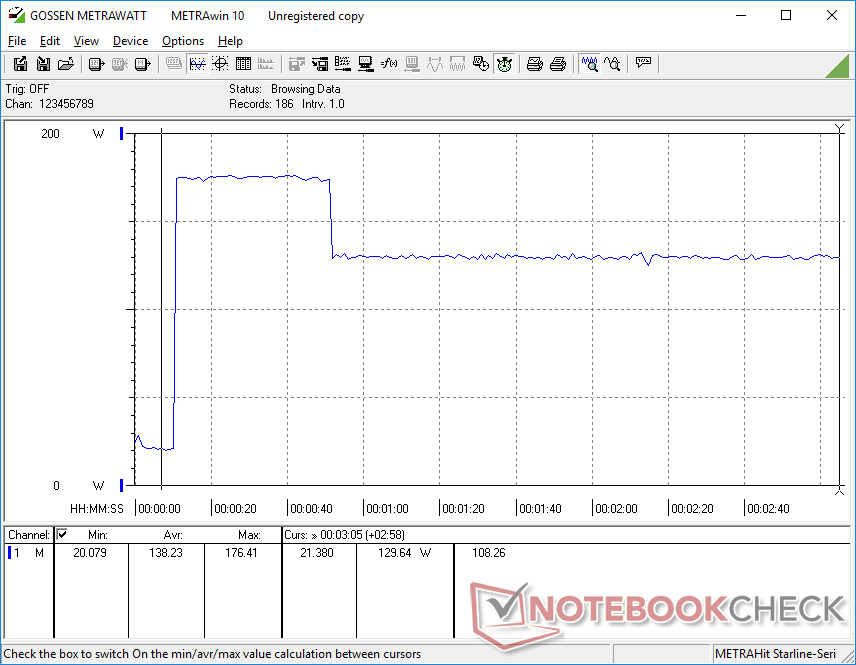
La CPU se aceleraba a 4 GHz, 120 W y 100 C durante los primeros 40 segundos al iniciar el estrés Prime95. Como 100 C no es lo ideal, las frecuencias de reloj y el consumo de la placa caerían rápidamente a sólo 3,0 a 3,2 GHz y 85 W, respectivamente, para mantener una temperatura del núcleo más razonable de 82 C. Las altas frecuencias de reloj Turbo Boost del Core i9-13905H son, por tanto, insostenibles en el Slim Pro 9i debido a las limitaciones de refrigeración.
La GPU Nvidia se estabilizaría a 2505 MHz, 70 C, y 72 W cuando se ejecuta Witcher 3 en modo Rendimiento frente a 2460 MHz, 62 C y 56 W en modo Equilibrado. El consumo de la GPU puede acercarse a los 92 W en su pico máximo, frente a su objetivo TGP de 100 W.
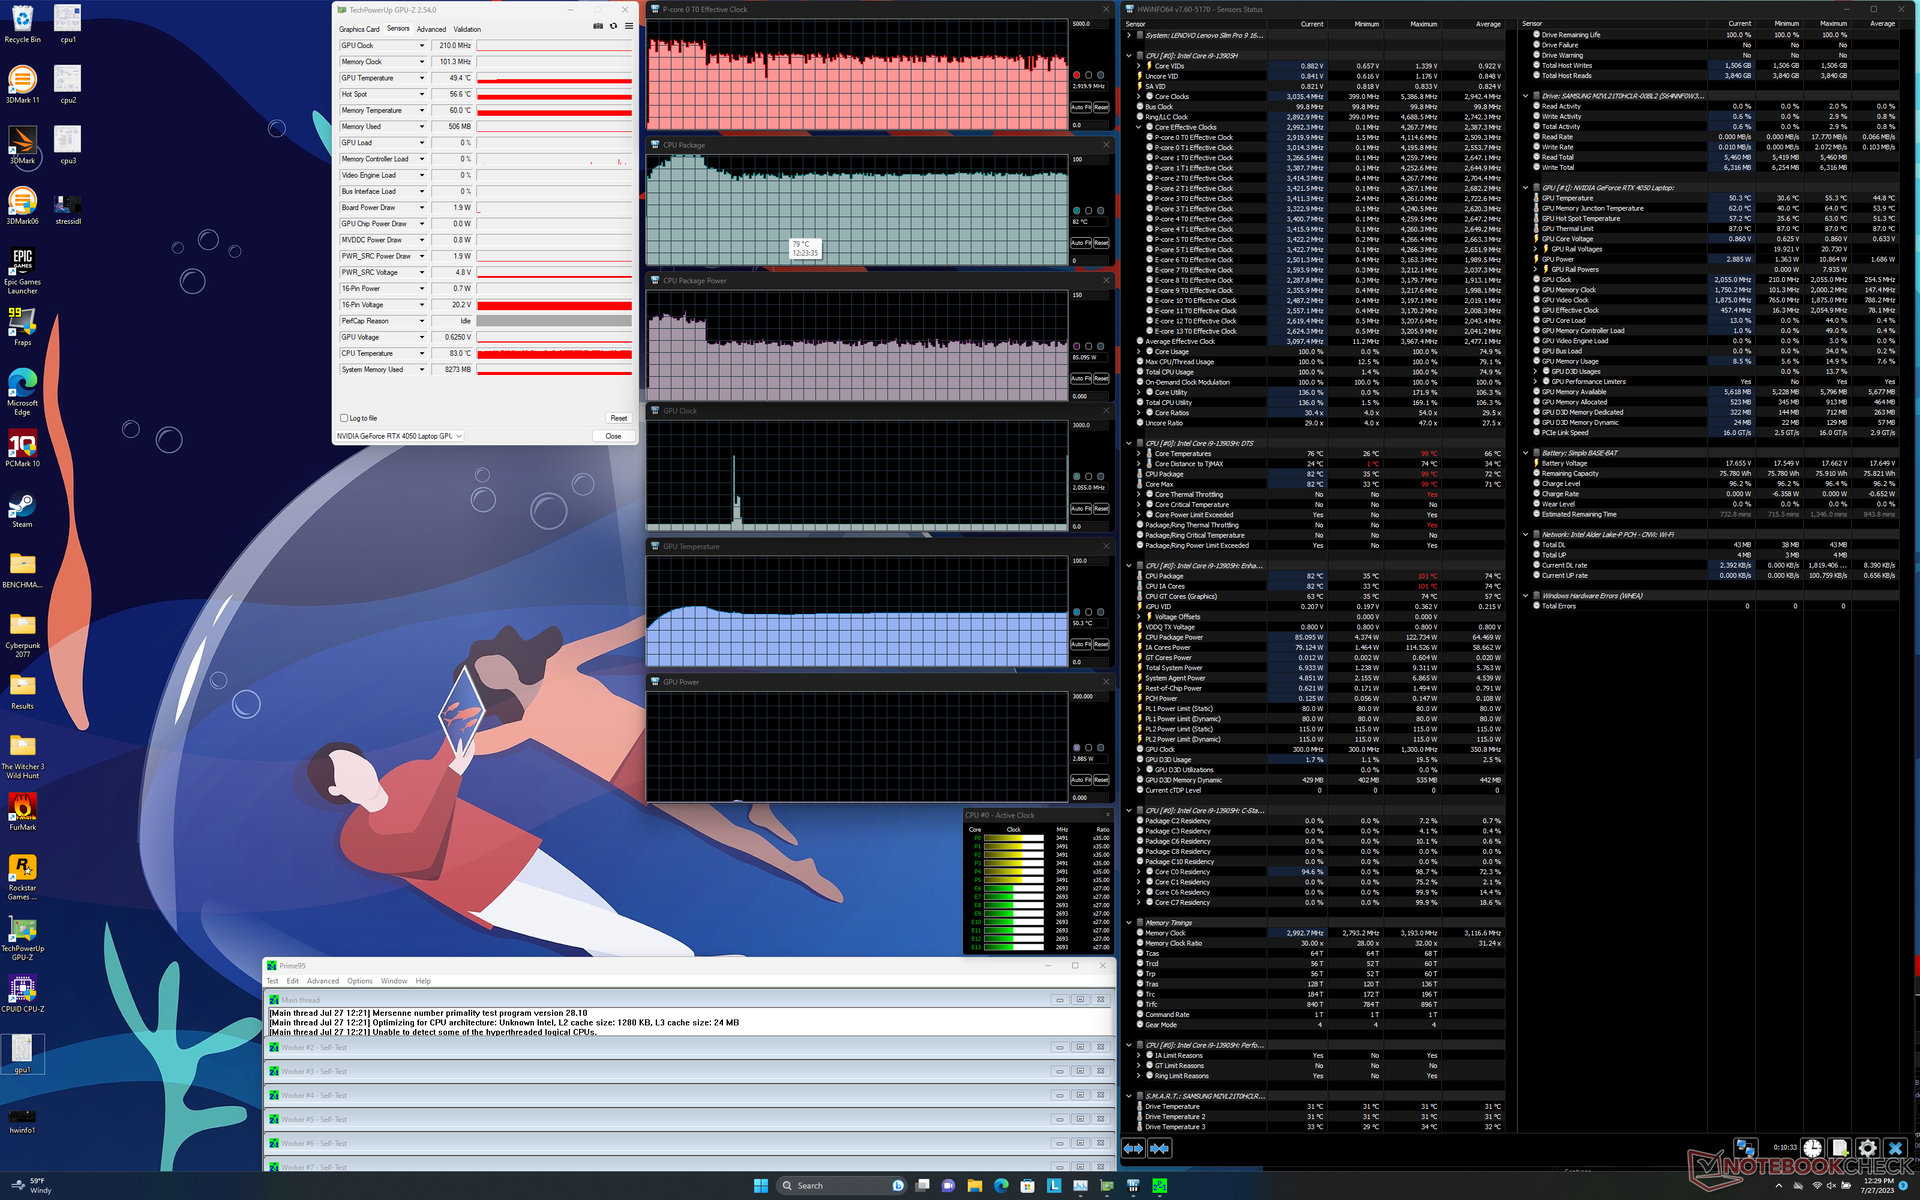
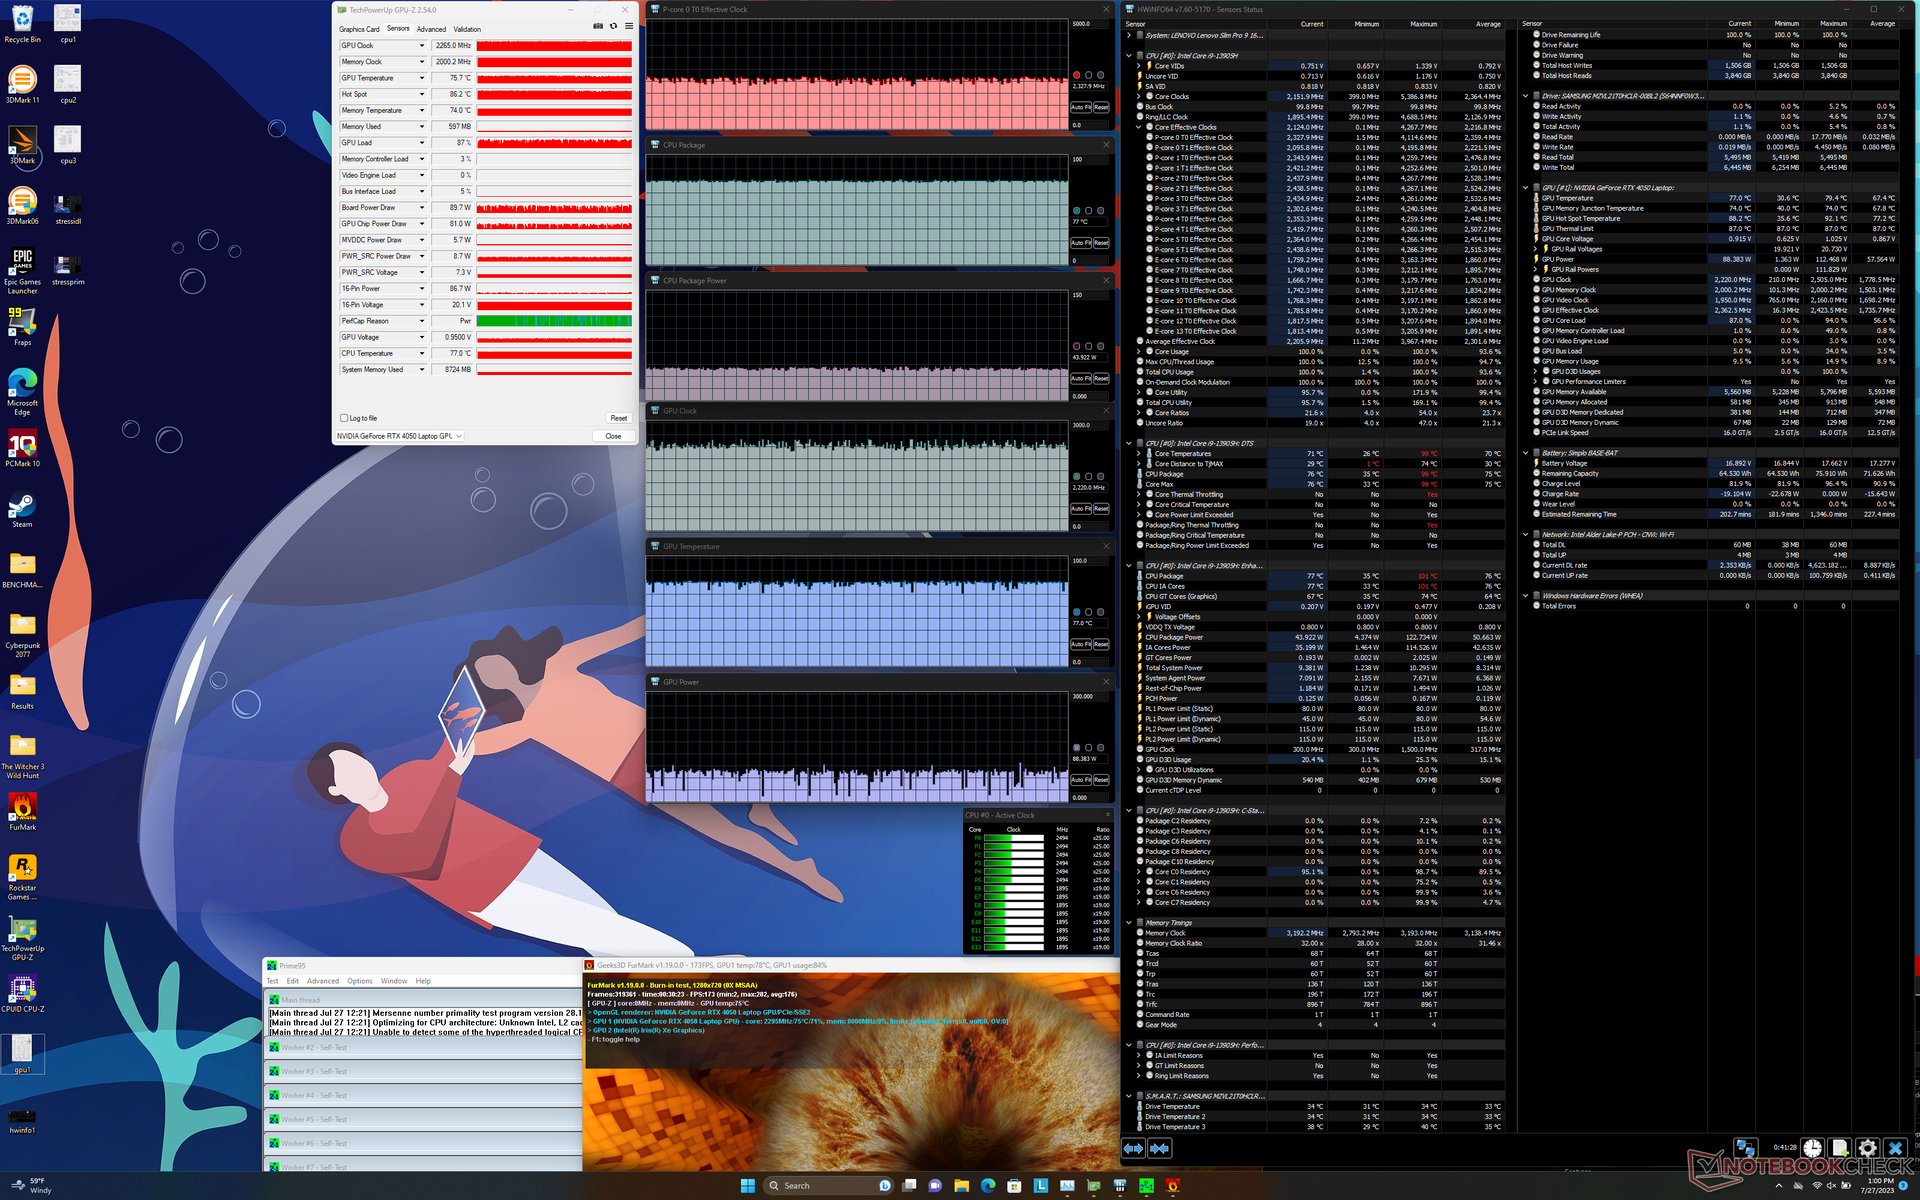
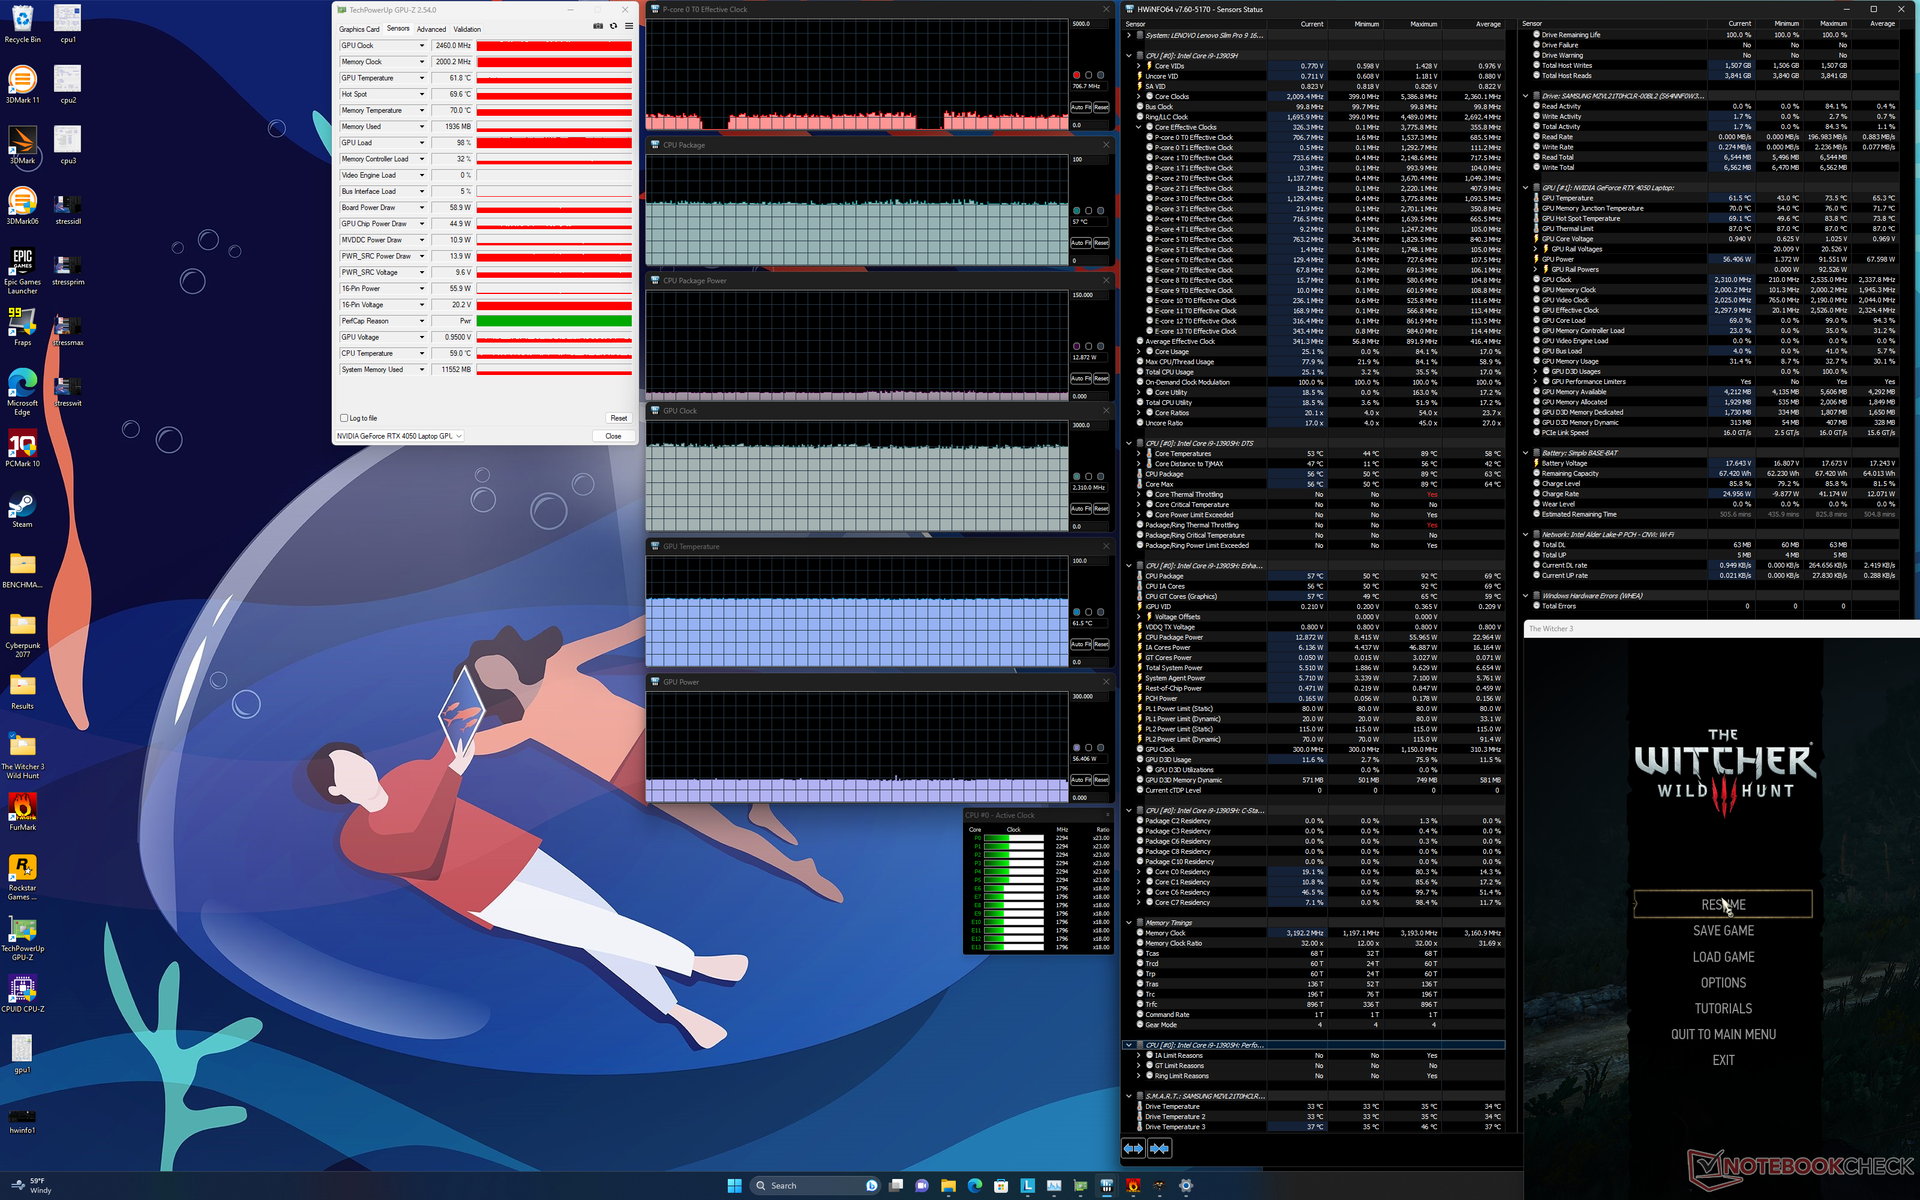
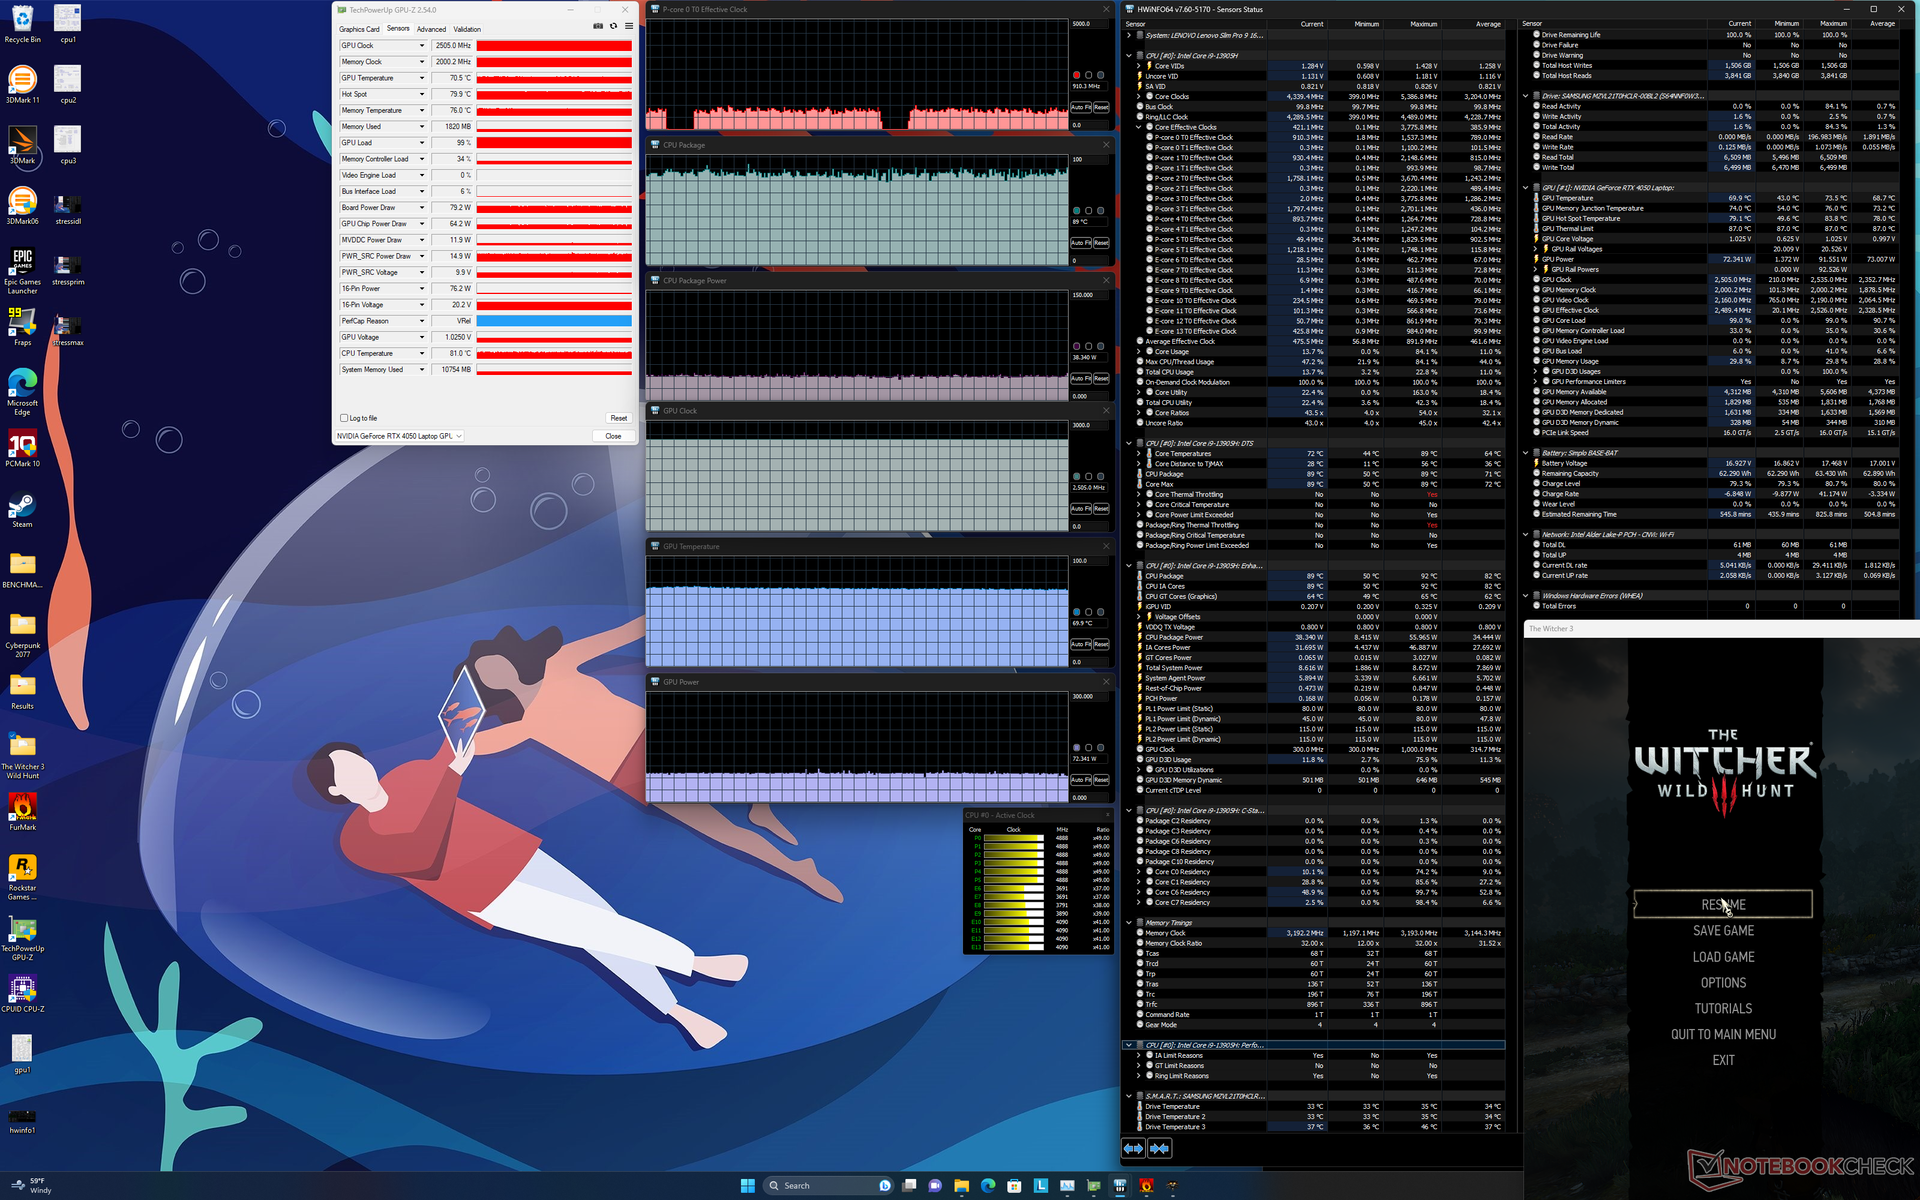
| RelojCPU (GHz) | Reloj GPU (MHz) | Temperatura mediaCPU (°C) | Temperatura media GPU (°C) | |
| Sistema en reposo | -- | -- | 38 | 32 |
| Prime95 Stress | ~3,0 | -- | 82 | 50 |
| Prime95+ FurMark Estrés | ~2,4 | 2265 | 77 | 77 |
| Witcher 3 Estrés (modoRendimiento) | ~0,9 | 2505 | 89 | 70 |
| Witcher 3 Estrés (modoequilibrado) | ~0,7 | 2460 | 57 | 62 |
Altavoces
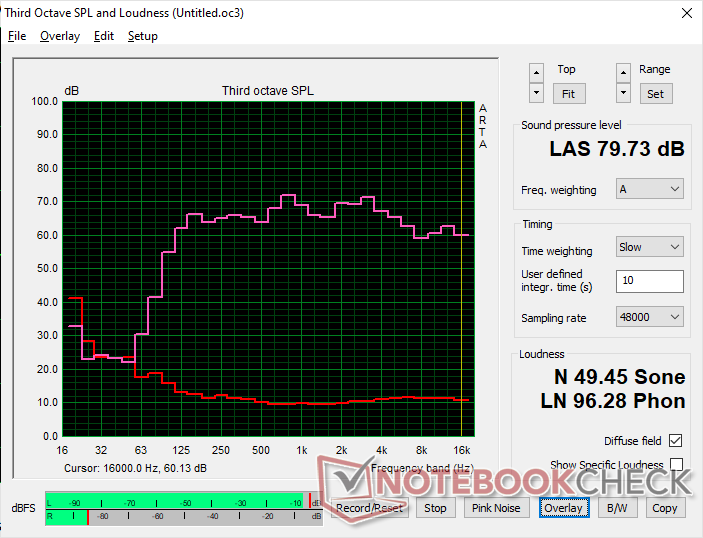
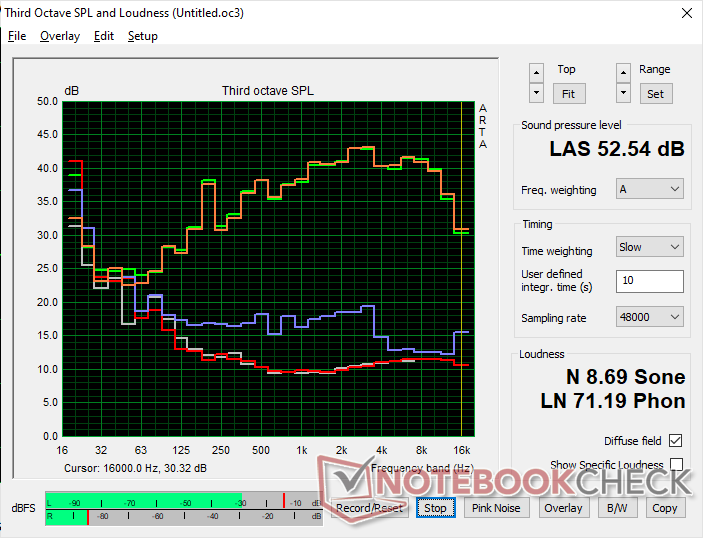
Lenovo Slim Pro 9i 16IRP8 análisis de audio
(±) | la sonoridad del altavoz es media pero buena (79.7 dB)
Graves 100 - 315 Hz
(+) | buen bajo - sólo 2.8% lejos de la mediana
(±) | la linealidad de los graves es media (8.9% delta a frecuencia anterior)
Medios 400 - 2000 Hz
(+) | medios equilibrados - a sólo 2.4% de la mediana
(+) | los medios son lineales (4.9% delta a la frecuencia anterior)
Altos 2 - 16 kHz
(+) | máximos equilibrados - a sólo 3.6% de la mediana
(+) | los máximos son lineales (4.3% delta a la frecuencia anterior)
Total 100 - 16.000 Hz
(+) | el sonido global es lineal (7.3% de diferencia con la mediana)
En comparación con la misma clase
» 6% de todos los dispositivos probados de esta clase eran mejores, 1% similares, 94% peores
» El mejor tuvo un delta de 5%, la media fue 17%, el peor fue ###max##%
En comparación con todos los dispositivos probados
» 1% de todos los dispositivos probados eran mejores, 0% similares, 99% peores
» El mejor tuvo un delta de 4%, la media fue 23%, el peor fue ###max##%
Apple MacBook Pro 16 2021 M1 Pro análisis de audio
(+) | los altavoces pueden reproducir a un volumen relativamente alto (#84.7 dB)
Graves 100 - 315 Hz
(+) | buen bajo - sólo 3.8% lejos de la mediana
(+) | el bajo es lineal (5.2% delta a la frecuencia anterior)
Medios 400 - 2000 Hz
(+) | medios equilibrados - a sólo 1.3% de la mediana
(+) | los medios son lineales (2.1% delta a la frecuencia anterior)
Altos 2 - 16 kHz
(+) | máximos equilibrados - a sólo 1.9% de la mediana
(+) | los máximos son lineales (2.7% delta a la frecuencia anterior)
Total 100 - 16.000 Hz
(+) | el sonido global es lineal (4.6% de diferencia con la mediana)
En comparación con la misma clase
» 0% de todos los dispositivos probados de esta clase eran mejores, 0% similares, 100% peores
» El mejor tuvo un delta de 5%, la media fue 17%, el peor fue ###max##%
En comparación con todos los dispositivos probados
» 0% de todos los dispositivos probados eran mejores, 0% similares, 100% peores
» El mejor tuvo un delta de 4%, la media fue 23%, el peor fue ###max##%
Gestión de la energía
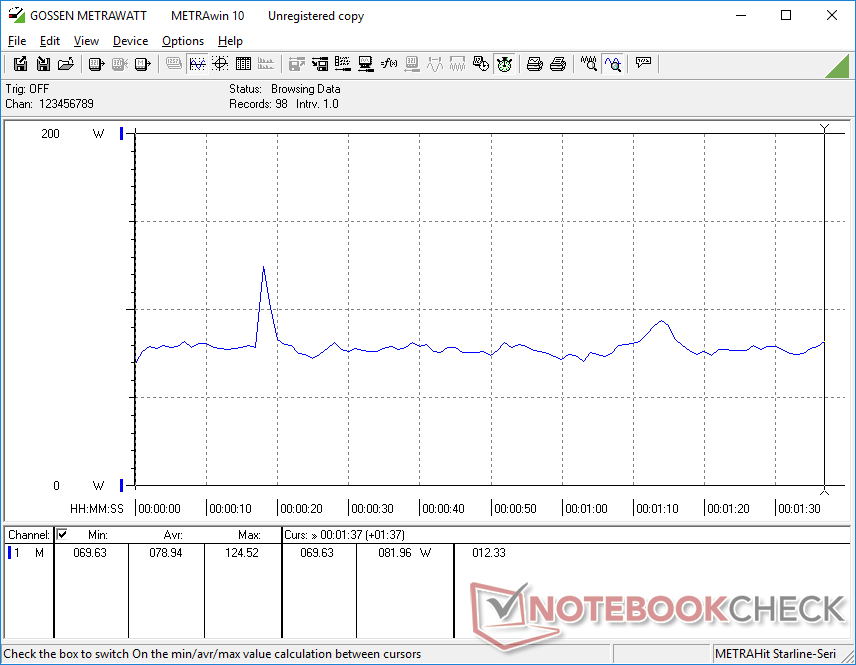
Consumo de energía
El consumo de energía puede oscilar entre 16 W en el ajuste de brillo mínimo con la iGPU activa y 30 W al mostrar una imagen totalmente blanca en el ajuste de brillo máximo con la dGPU activa. Por tanto, se recomienda prestar más atención a la configuración del brillo y los colores si la duración de la batería es una preocupación, al igual que en los paneles OLED.
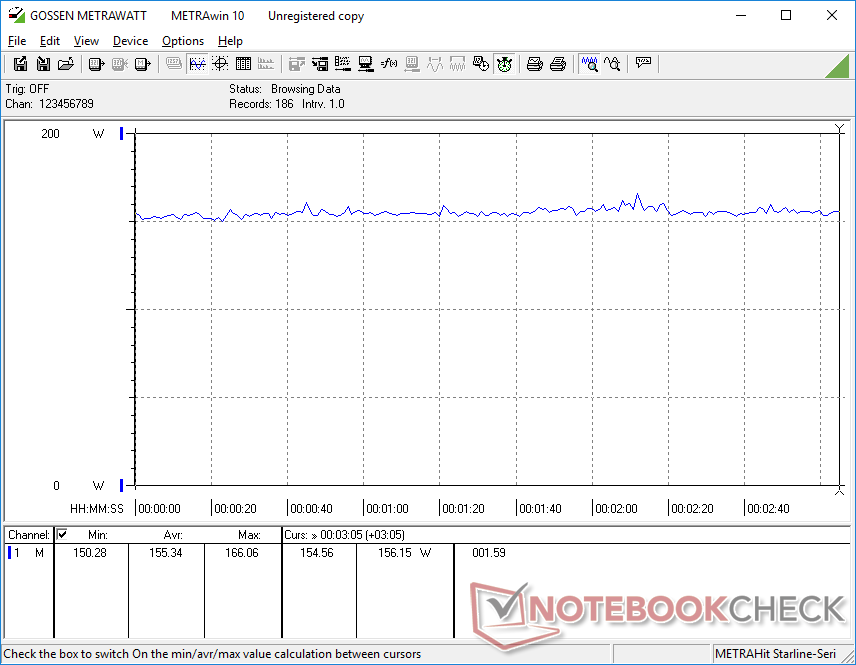
El consumo de energía en juegos es casi idéntico al que registramos en el Yoga Pro 9i, aunque este último ofrece un rendimiento gráfico hasta un 20% más rápido. Tanto la configuración RTX 4050 como la RTX 4060 apuntan a 100 W TGP cada una, lo que explicaría sus similares niveles de consumo cuando la GPU está bajo carga.
Nuestro Core i9-13905H alcanza picos ligeramente superiores al Core i7-13705H al iniciar Prime95 antes de estabilizarse en niveles similares.
| Off / Standby | |
| Ocioso | |
| Carga |
|
Clave:
min: | |
| Lenovo Slim Pro 9i 16IRP8 i9-13905H, GeForce RTX 4050 Laptop GPU, Samsung PM9A1 MZVL21T0HCLR, Mini-LED, 3200x2000, 16" | Lenovo Yoga Pro 9 16-IRP G8 i7-13705H, GeForce RTX 4060 Laptop GPU, Samsung PM9A1 MZVL21T0HCLR, Mini-LED, 3200x2000, 16" | Asus VivoBook Pro 16 i7-12700H, GeForce RTX 3050 Ti Laptop GPU, Intel SSD 670p SSDPEKNU010TZ, IPS, 2560x1600, 16" | Acer Swift Edge SFE16-42-R1GM R7 7735U, Radeon 680M, Micron 3400 1TB MTFDKBA1T0TFH, OLED, 3840x2400, 16" | Dell Inspiron 16 Plus 7620 i7-12700H, GeForce RTX 3050 Ti Laptop GPU, Kioxia BG5 KBG50ZNS512G, IPS, 3072x1920, 16" | HP Envy 16 h0112nr i7-12700H, GeForce RTX 3060 Laptop GPU, Micron 3400 1TB MTFDKBA1T0TFH, OLED, 3840x2400, 16" | |
|---|---|---|---|---|---|---|
| Power Consumption | 12% | 22% | 61% | 29% | 10% | |
| Idle Minimum * (Watt) | 16 | 10.9 32% | 8.7 46% | 8.6 46% | 6.8 57% | 10 37% |
| Idle Average * (Watt) | 30 | 22.6 25% | 13.1 56% | 7.7 74% | 9.6 68% | 10.9 64% |
| Idle Maximum * (Watt) | 30.4 | 23.5 23% | 18.3 40% | 9.3 69% | 17 44% | 27.8 9% |
| Load Average * (Watt) | 78.9 | 84.6 -7% | 116 -47% | 47.9 39% | 117.5 -49% | 116.4 -48% |
| Witcher 3 ultra * (Watt) | 155.3 | 159.5 -3% | 117.6 24% | 46.3 70% | 113.1 27% | 133.7 14% |
| Load Maximum * (Watt) | 180.4 | 177.3 2% | 162 10% | 56 69% | 137.4 24% | 209.8 -16% |
* ... más pequeño es mejor
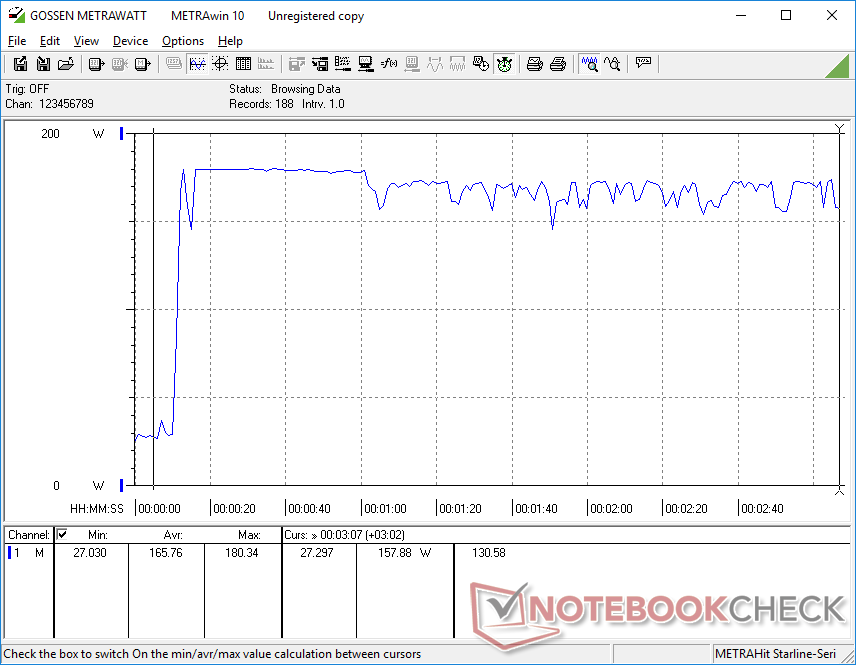
Power Consumption Witcher 3 / Stresstest
Power Consumption external Monitor
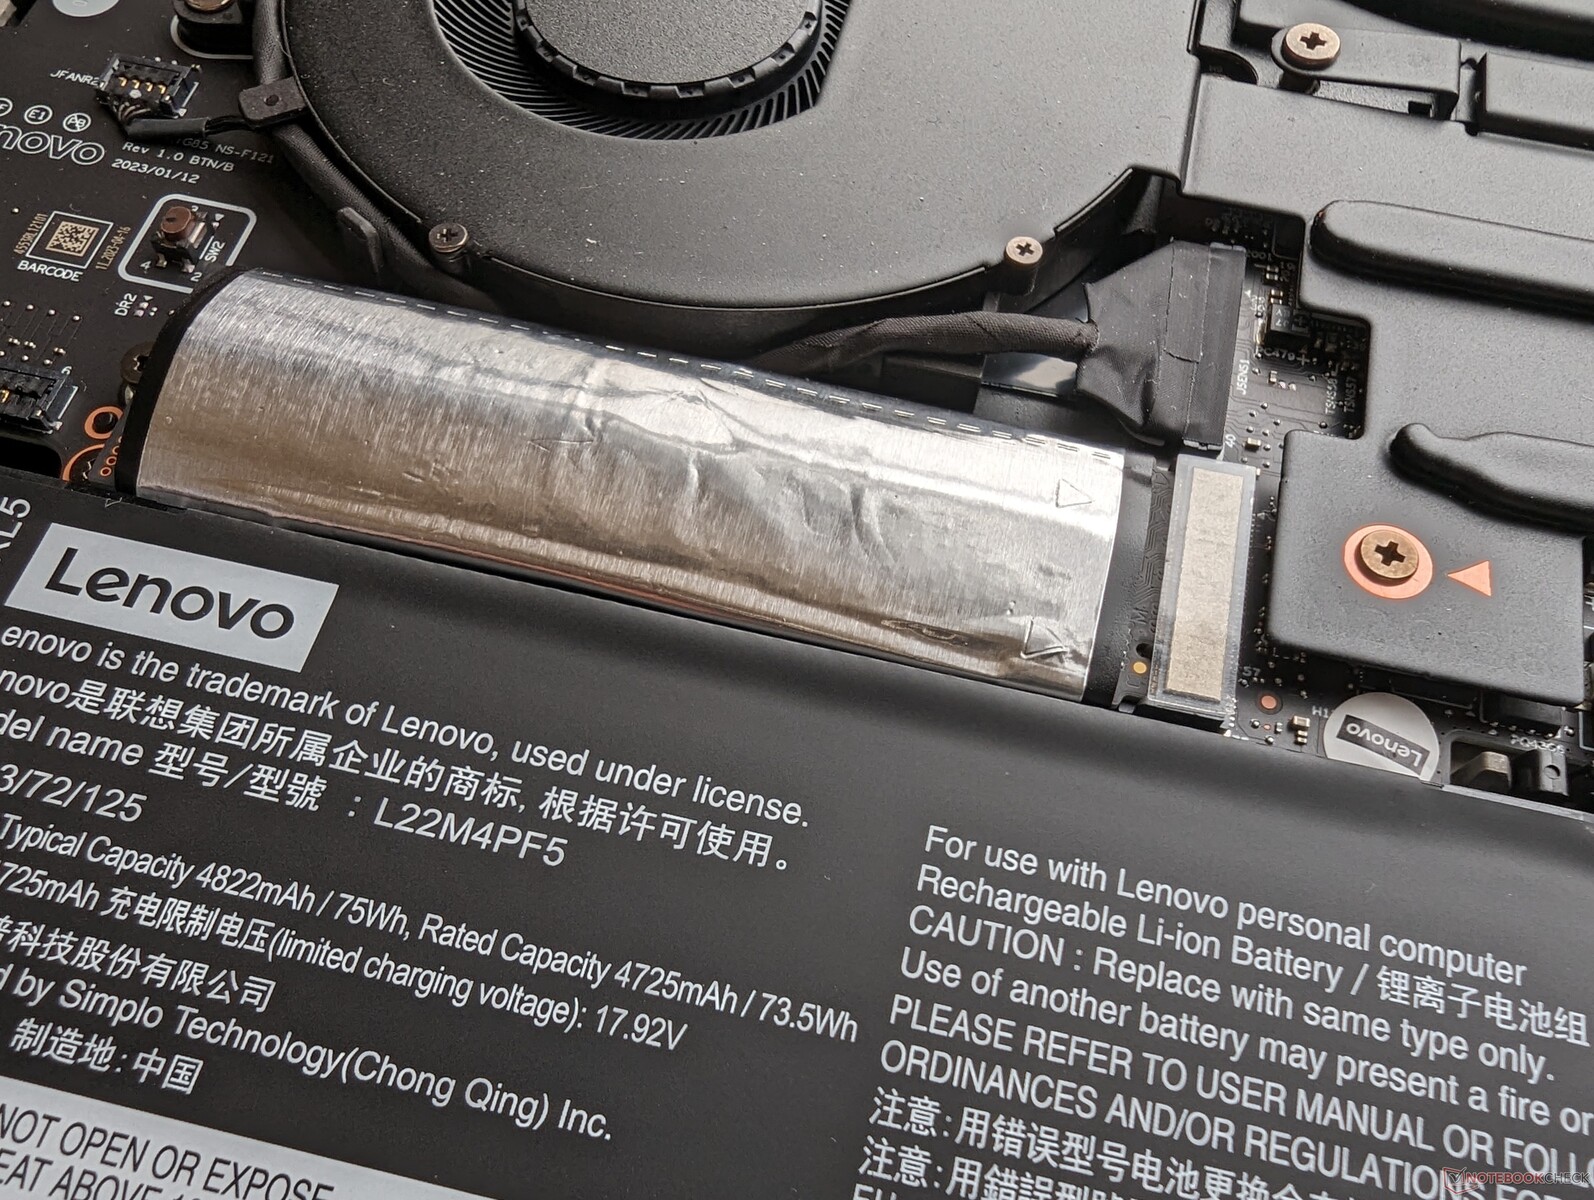
Duración de la batería
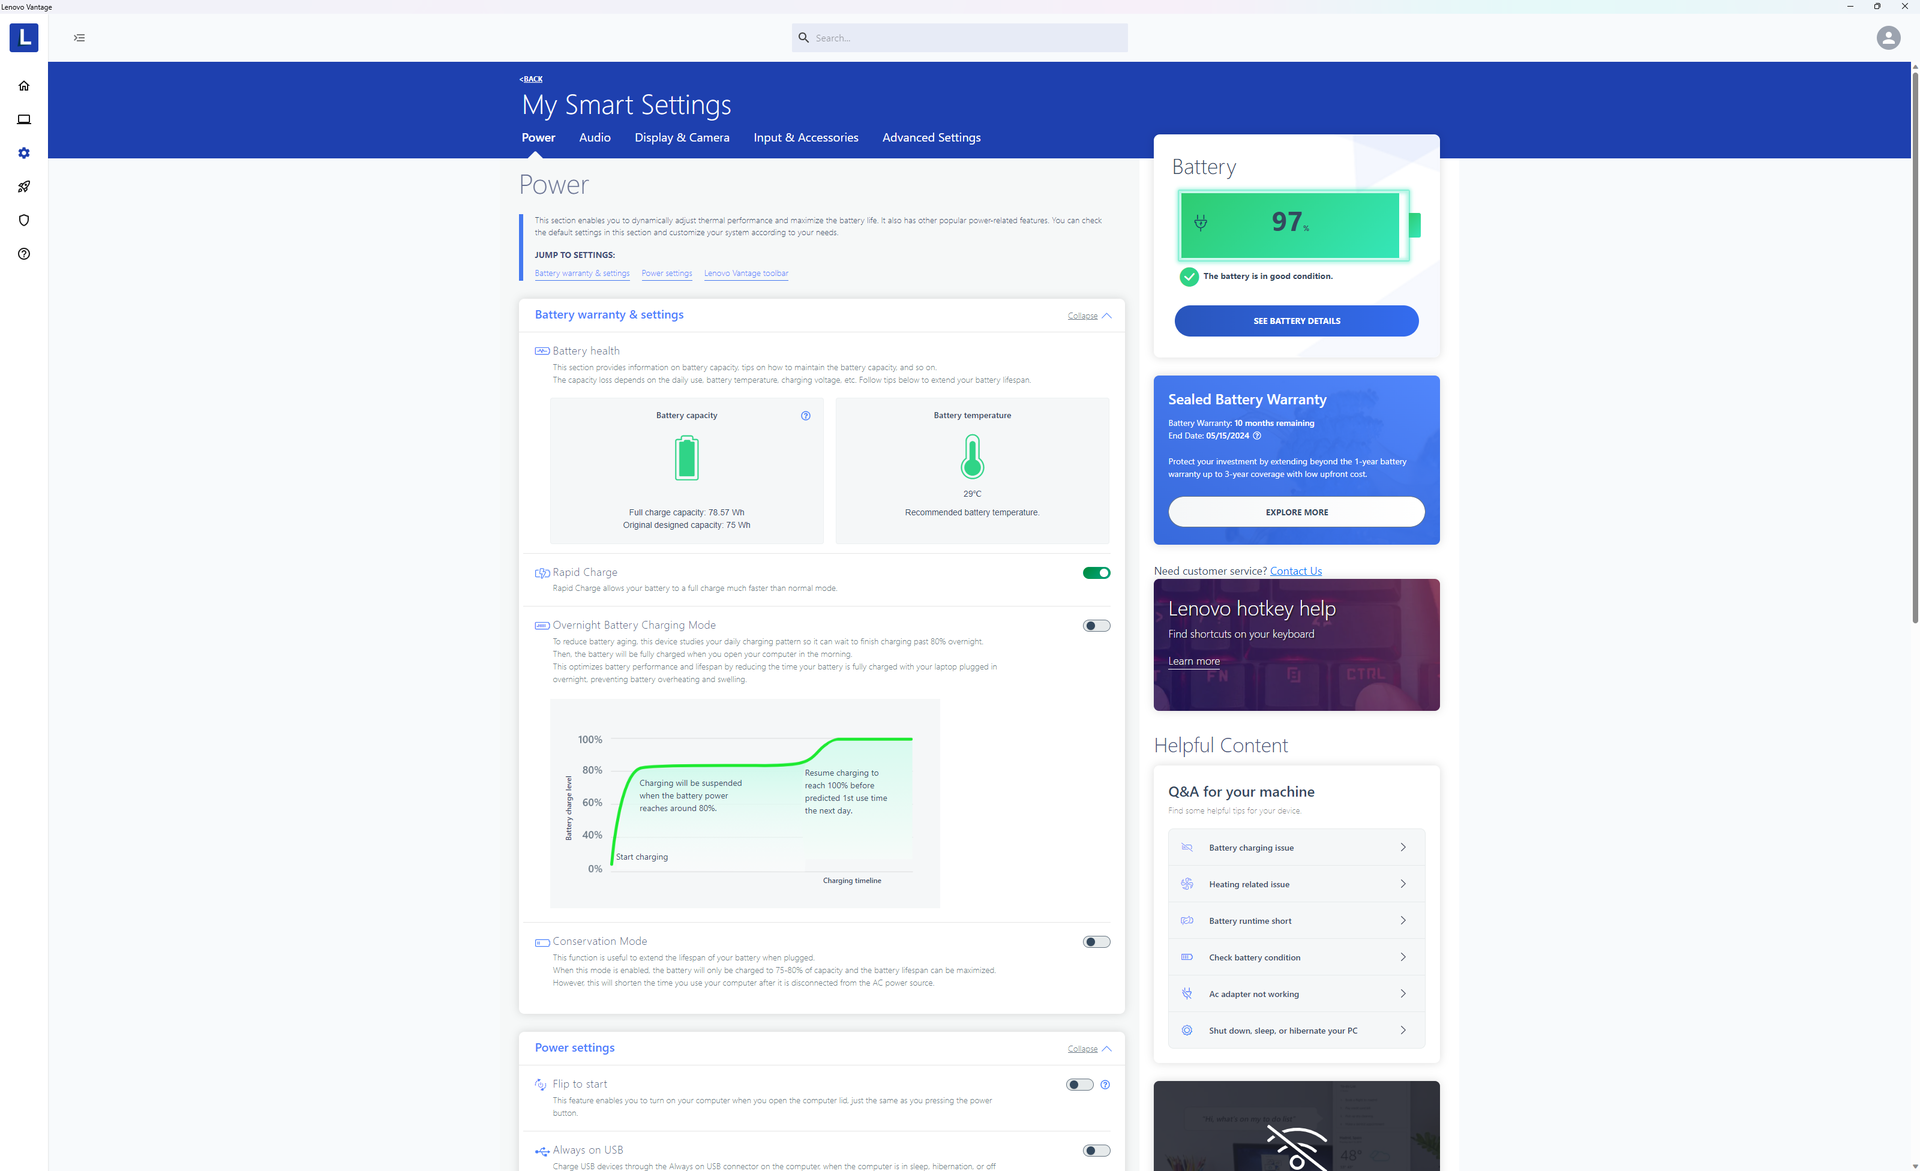
Los tiempos de ejecución son esencialmente idénticos a los que registramos en el Yoga Pro 9 16 con unas 6,5 horas de navegación real. La carga de vacío a lleno tarda unos 90 minutos incluso con la carga rápida activada.
La carga de la batería puede caer si se ejecutan cargas exigentes, incluso cuando está conectado a la red eléctrica. Durante nuestro test Prime95 y FurMark de una hora, por ejemplo, la carga de la batería bajó del 100% al 79%, lo que indica que el modelo podría haberse beneficiado de un adaptador de corriente de mayor capacidad.
Ciertos adaptadores USB-C pueden cargar el sistema. Nuestro adaptador USB-C Dell XPS 15 de 130 W, por ejemplo, parece ser incompatible, mientras que el adaptador USB-C Lenovo de 140 W funcionaría sin problemas.
| Lenovo Slim Pro 9i 16IRP8 i9-13905H, GeForce RTX 4050 Laptop GPU, 75 Wh | Lenovo Yoga Pro 9 16-IRP G8 i7-13705H, GeForce RTX 4060 Laptop GPU, 75 Wh | Asus VivoBook Pro 16 i7-12700H, GeForce RTX 3050 Ti Laptop GPU, 70 Wh | Acer Swift Edge SFE16-42-R1GM R7 7735U, Radeon 680M, 54 Wh | Dell Inspiron 16 Plus 7620 i7-12700H, GeForce RTX 3050 Ti Laptop GPU, 86 Wh | HP Envy 16 h0112nr i7-12700H, GeForce RTX 3060 Laptop GPU, 83 Wh | |
|---|---|---|---|---|---|---|
| Duración de Batería | -3% | 11% | 11% | 45% | 20% | |
| WiFi v1.3 (h) | 6.6 | 6.4 -3% | 7.3 11% | 7.3 11% | 9.6 45% | 7.9 20% |
| H.264 (h) | 7.5 | 8.6 | ||||
| Load (h) | 0.7 | 1.5 | 1.2 | 1.6 | ||
| Reader / Idle (h) | 10.9 | 18.6 | 17.8 |
Pro
Contra
Veredicto - Core i7 con GeForce RTX 4060 es la mejor oferta
Hay al menos dos configuraciones del Slim Pro 9i 16 disponibles en este momento: una con el Core i7-13705H y GeForce RTX 4060 y otra con el Core i9-13905H y GeForce RTX 4050. Dado que los precios de ambos son tan similares, la opción Core i7 con RTX 4060 es muy recomendable frente a la Core i9 con RTX 4050, ya que el Core i7 tiene un rendimiento casi idéntico al Core i9. Por su parte, el salto de la RTX 4050 a la RTX 4060 proporciona un aumento mayor y más notable del rendimiento gráfico.
La configuración Core i7 y GeForce RTX 4060 es el punto dulce para los que estén considerando el Lenovo Slim Pro 9i 16.
Otros aspectos del modelo son comparables a alternativas como elHP Envy 16 o MacBook Pro 16 desde las amplias opciones de puertos hasta el rápido rendimiento general, el peso denso y las dimensiones razonables. Sin embargo, no tendrás la RAM ampliable por el usuario del Envy 16 ni la pantalla precalibrada y la mayor duración de la batería del MacBook Pro.
Precio y disponibilidad
Lenovo ya comercializa su Slim Pro 9i 16 por 2200 USD con la RTX 4060 de gama alta GeForce. El modelo también está disponible en Best Buy.
Lenovo Slim Pro 9i 16IRP8
- 08/10/2023 v7 (old)
Allen Ngo
Transparencia
La selección de los dispositivos que se van a reseñar corre a cargo de nuestro equipo editorial. La muestra de prueba fue proporcionada al autor en calidad de préstamo por el fabricante o el minorista a los efectos de esta reseña. El prestamista no tuvo ninguna influencia en esta reseña, ni el fabricante recibió una copia de la misma antes de su publicación. No había ninguna obligación de publicar esta reseña. Como empresa de medios independiente, Notebookcheck no está sujeta a la autoridad de fabricantes, minoristas o editores.
Así es como prueba Notebookcheck
Cada año, Notebookcheck revisa de forma independiente cientos de portátiles y smartphones utilizando procedimientos estandarizados para asegurar que todos los resultados son comparables. Hemos desarrollado continuamente nuestros métodos de prueba durante unos 20 años y hemos establecido los estándares de la industria en el proceso. En nuestros laboratorios de pruebas, técnicos y editores experimentados utilizan equipos de medición de alta calidad. Estas pruebas implican un proceso de validación en varias fases. Nuestro complejo sistema de clasificación se basa en cientos de mediciones y puntos de referencia bien fundamentados, lo que mantiene la objetividad.Price comparison

