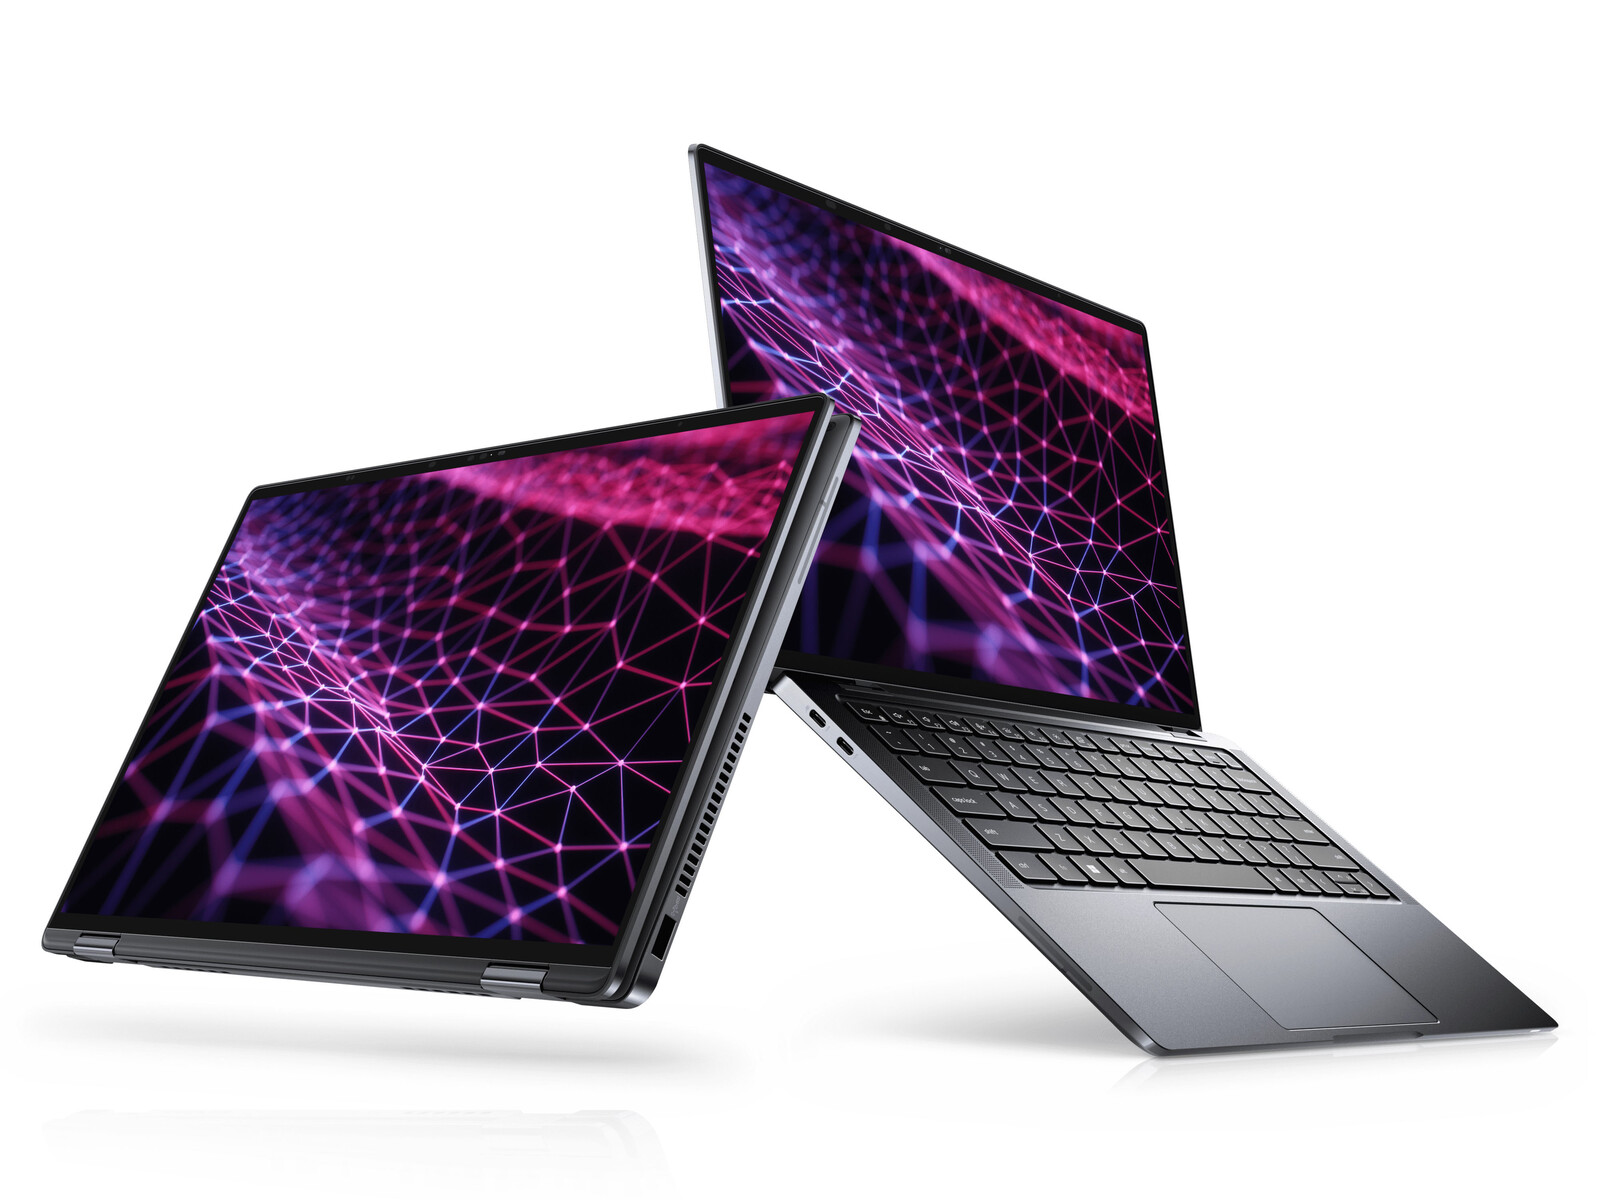
Estreno del Core i7-1260U: Análisis del convertible Dell Latitude 13 9330 2-en-1
La serie Latitude 9000 alberga los portátiles empresariales estrella de Dell para contrastar con la gama media alta Latitude 7000 y la gama media Latitude 5000 y la gama baja Latitude 3000 de gama baja. Nuestro modelo de análisis es el Latitude 9330, que es el primer convertible de 13,3 pulgadas de la familia Latitude 9000
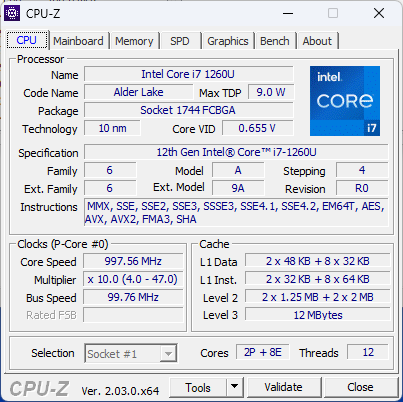
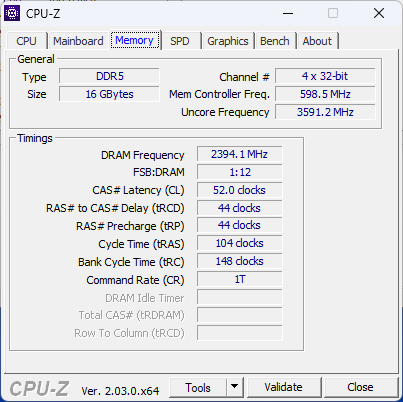
Nuestra configuración específica es el modelo de gama más alta con la CPU Core i7-1260U de 12ª generación, 32 GB de RAM LPDDR5 y 512 GB de SSD NVMe por unos 2.700 dólares. Otros SKU con la CPU Core i5-1240U más lenta y la mitad de la RAM y el almacenamiento también están disponibles a partir de $2000 USD, pero todas las opciones por lo demás vienen con gráficos integrados solamente y la misma pantalla táctil IPS de 2560 x 1600 de resolución
Entre los competidores del Latitude 9330 se encuentran otros convertibles de 13 pulgadas de gama alta centrados en la empresa, como el Lenovo ThinkPad X1 Yoga G1, MSI Summit E13 Flipo el HP Elite Dragonfly Max.
Más opiniones de Dell
Posibles contendientes en la comparación
Valoración | Fecha | Modelo | Peso | Altura | Tamaño | Resolución | Precio |
|---|---|---|---|---|---|---|---|
| 89 % v7 (old) | 11/2022 | Dell Latitude 9330 i7-1260U, Iris Xe G7 96EUs | 1.2 kg | 14.1 mm | 13.30" | 2560x1600 | |
| 88.5 % v7 (old) | Lenovo ThinkPad X1 Titanium Yoga G1 20QB0016GE i5-1140G7, Iris Xe G7 80EUs | 1.2 kg | 11.5 mm | 13.50" | 2256x1504 | ||
| 86.9 % v7 (old) | 04/2021 | MSI Summit E13 Flip Evo A11MT i7-1185G7, Iris Xe G7 96EUs | 1.4 kg | 14.9 mm | 13.40" | 1920x1200 | |
| 90 % v7 (old) | 11/2020 | HP EliteBook x360 1030 G7 i7-10810U, UHD Graphics 620 | 1.2 kg | 16 mm | 13.30" | 1920x1080 | |
| 90.8 % v7 (old) | 06/2021 | HP Elite Dragonfly Max i7-1185G7, Iris Xe G7 96EUs | 1.2 kg | 16 mm | 13.30" | 1920x1080 | |
| 87.2 % v7 (old) | 01/2021 | Dell Latitude 5310-23VP6 i5-10310U, UHD Graphics 620 | 1.3 kg | 19.7 mm | 13.30" | 1920x1080 |
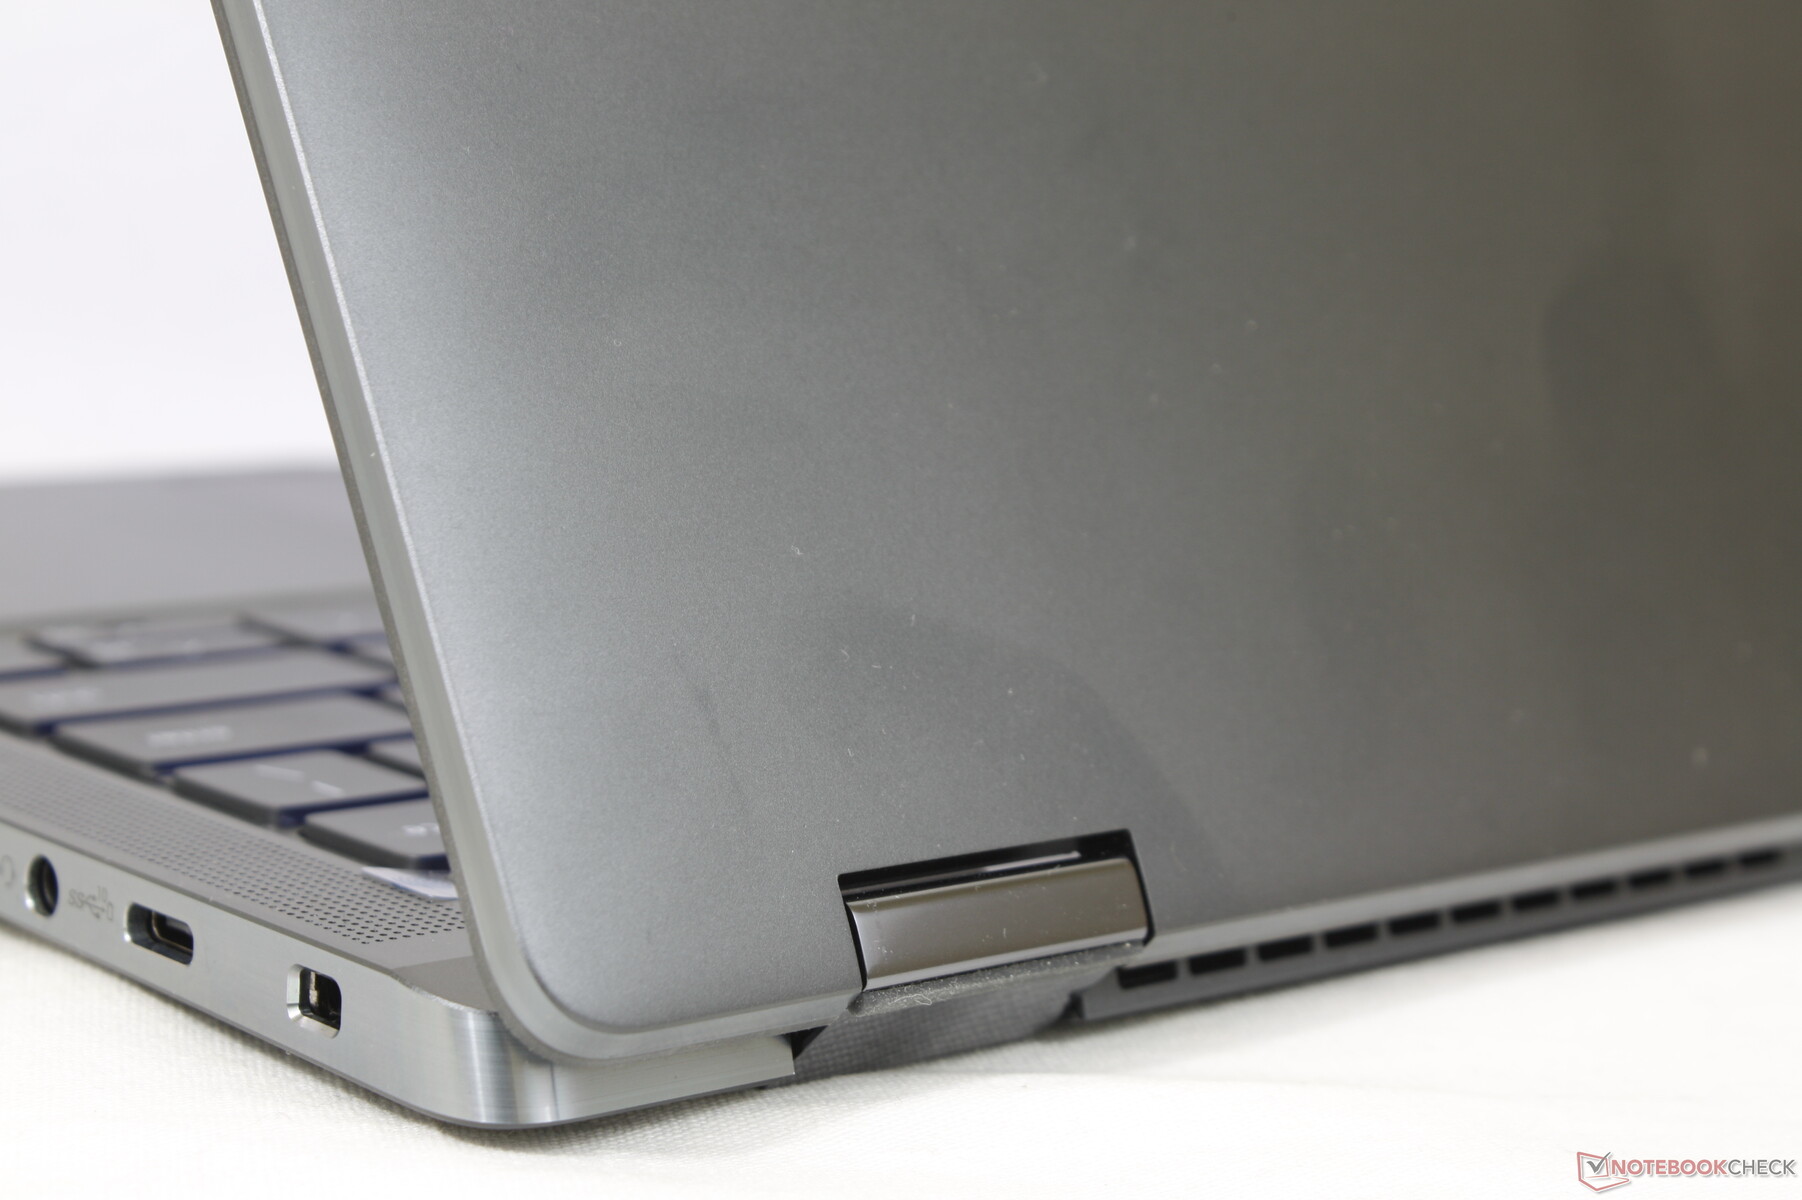
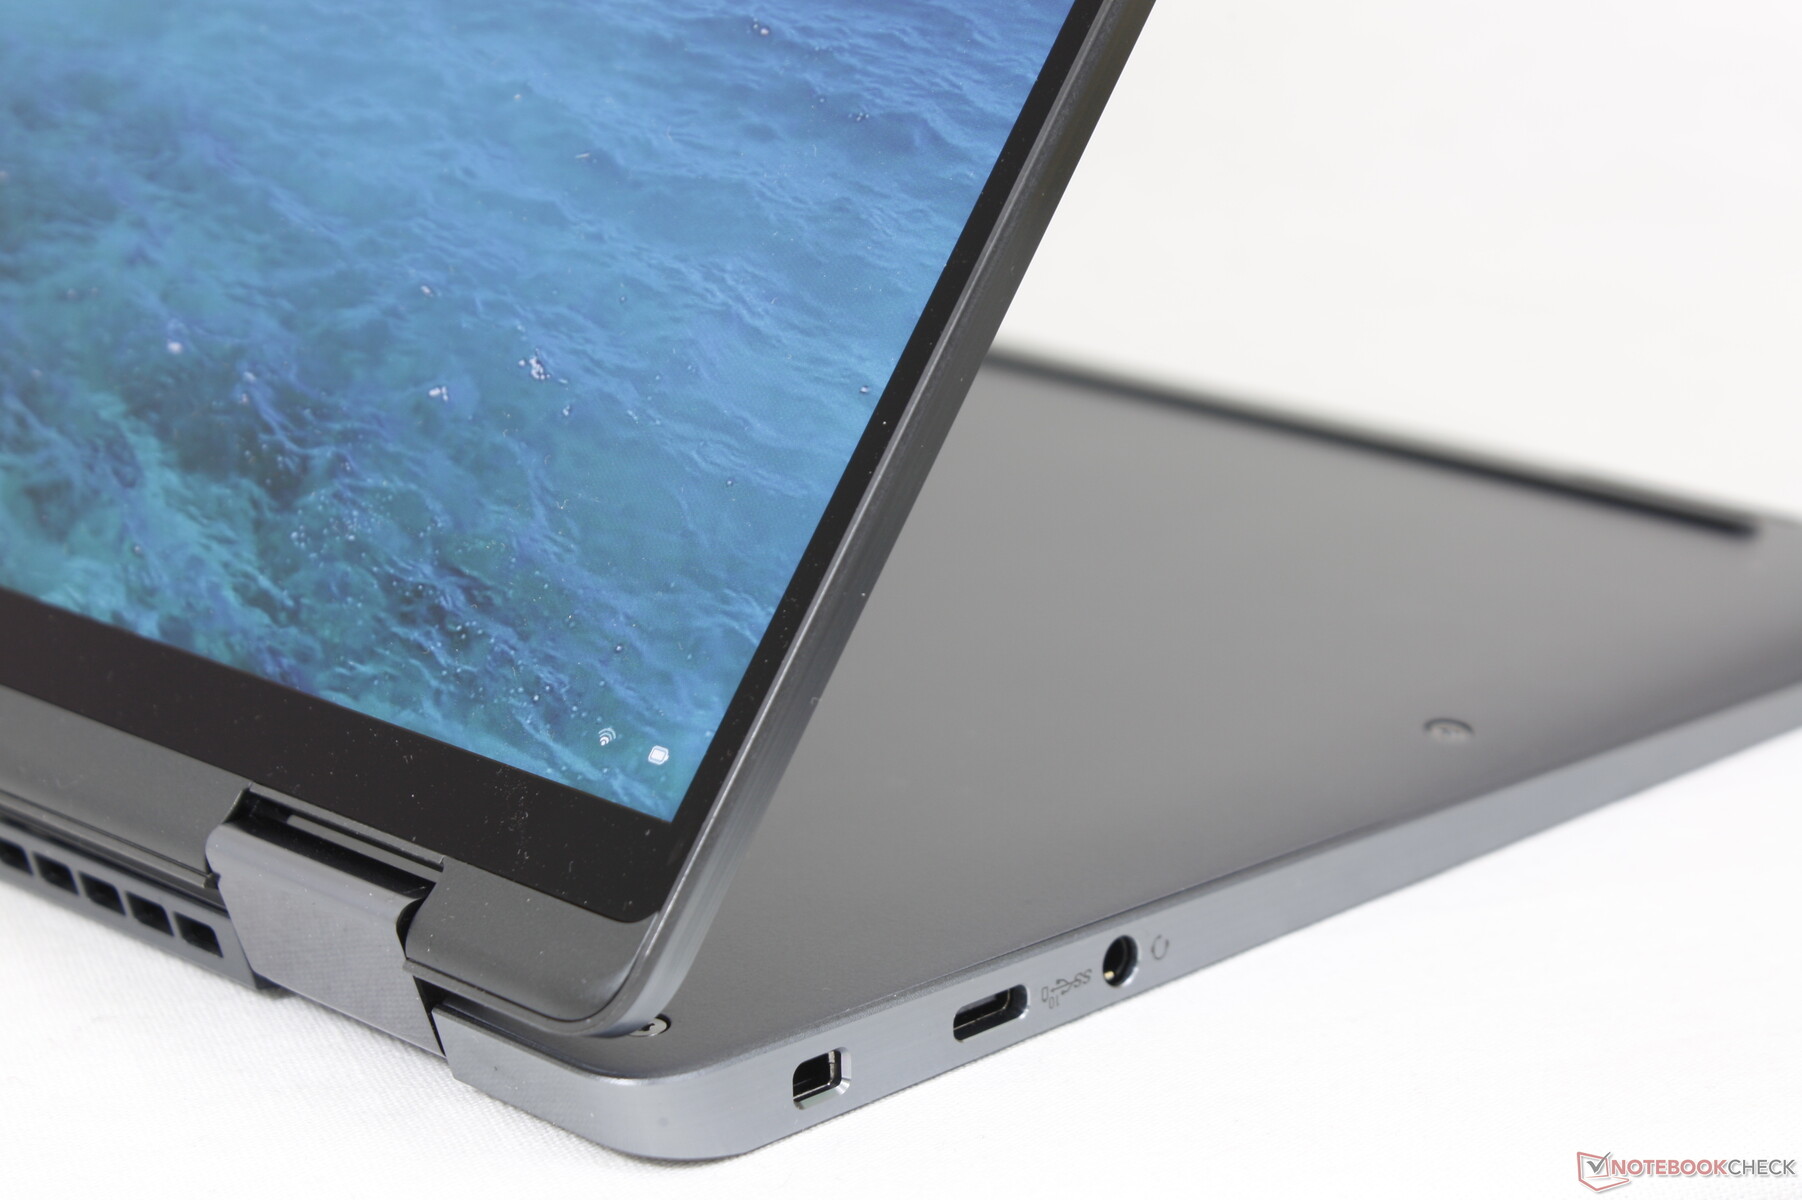
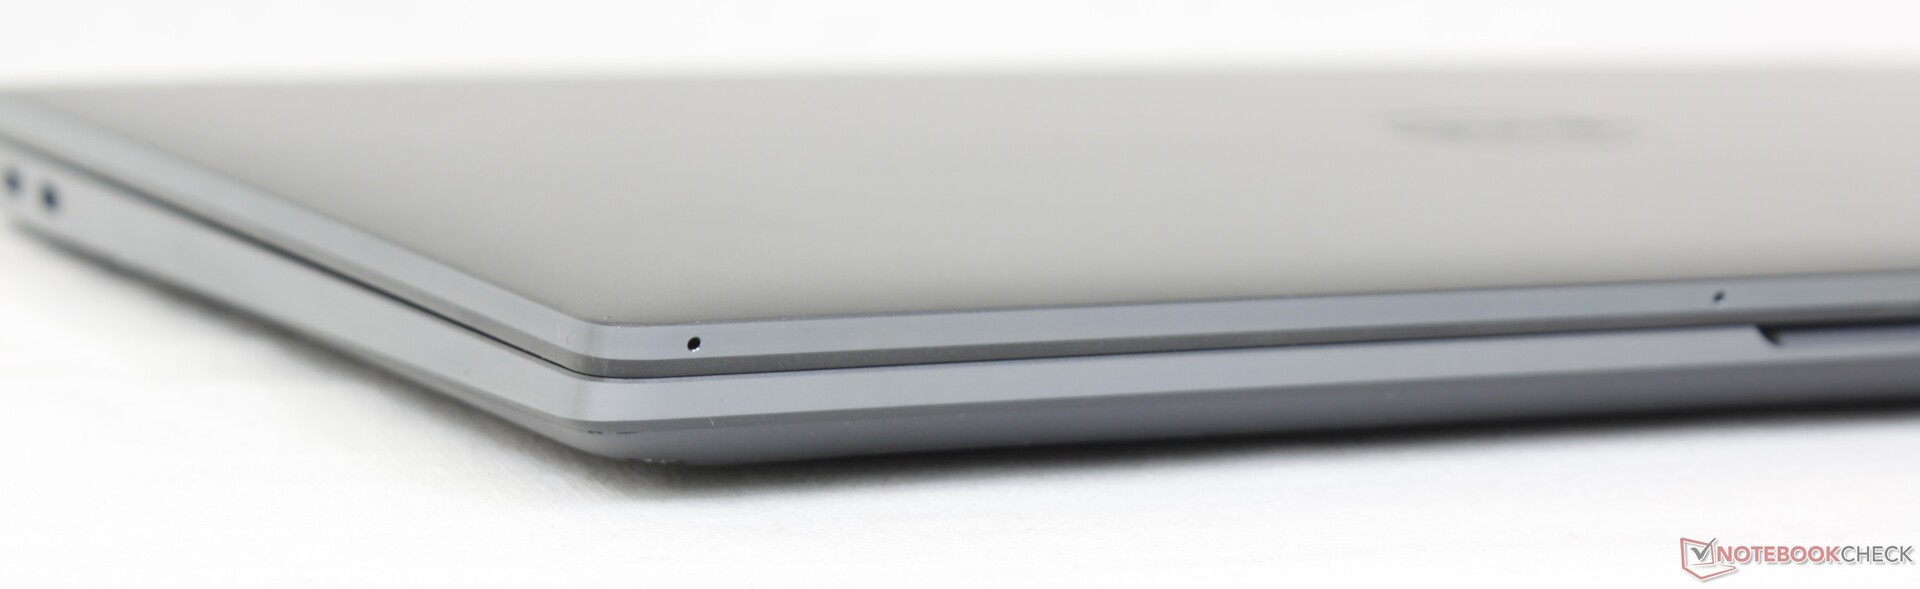
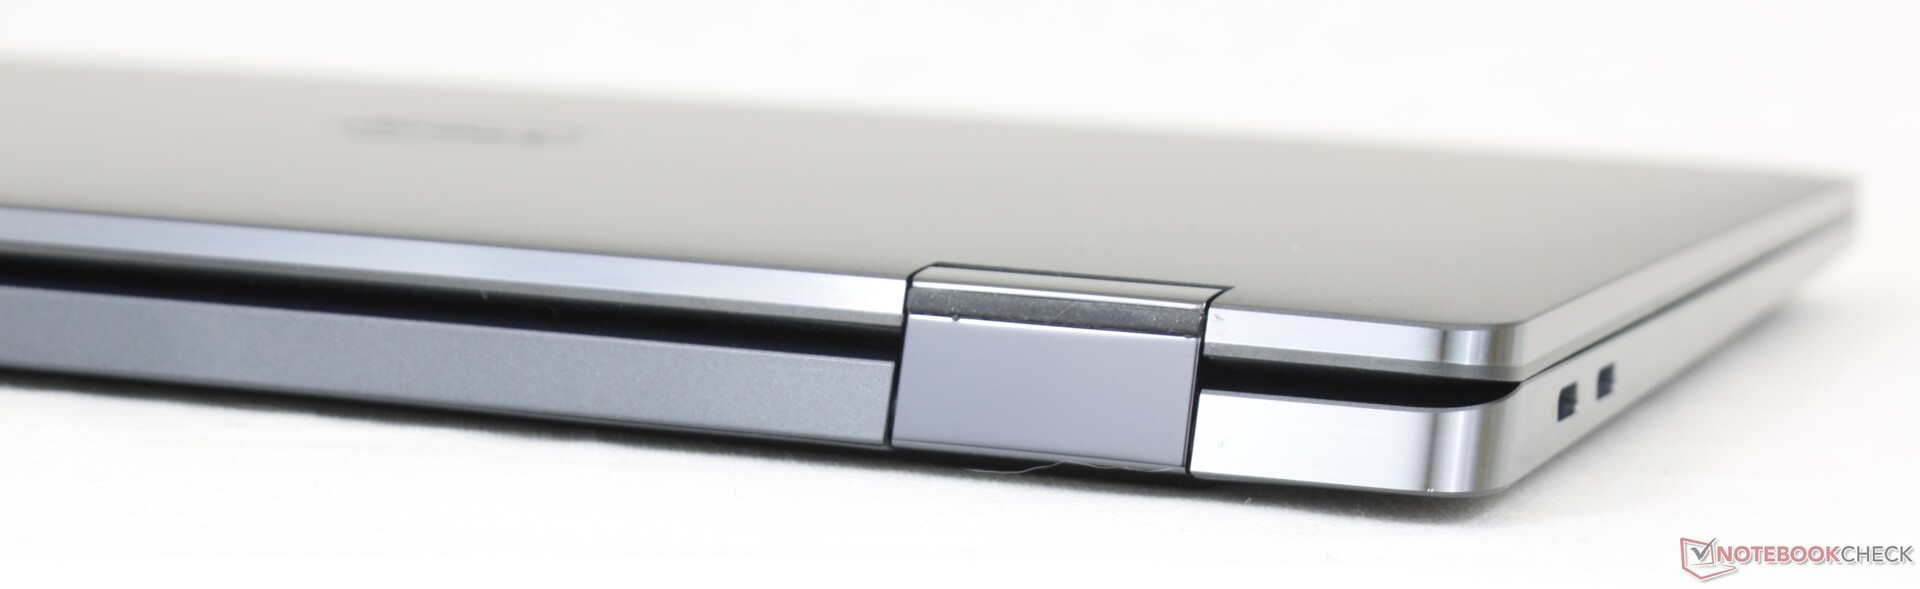
Caja - Apariencia aburrida, diseño fuerte
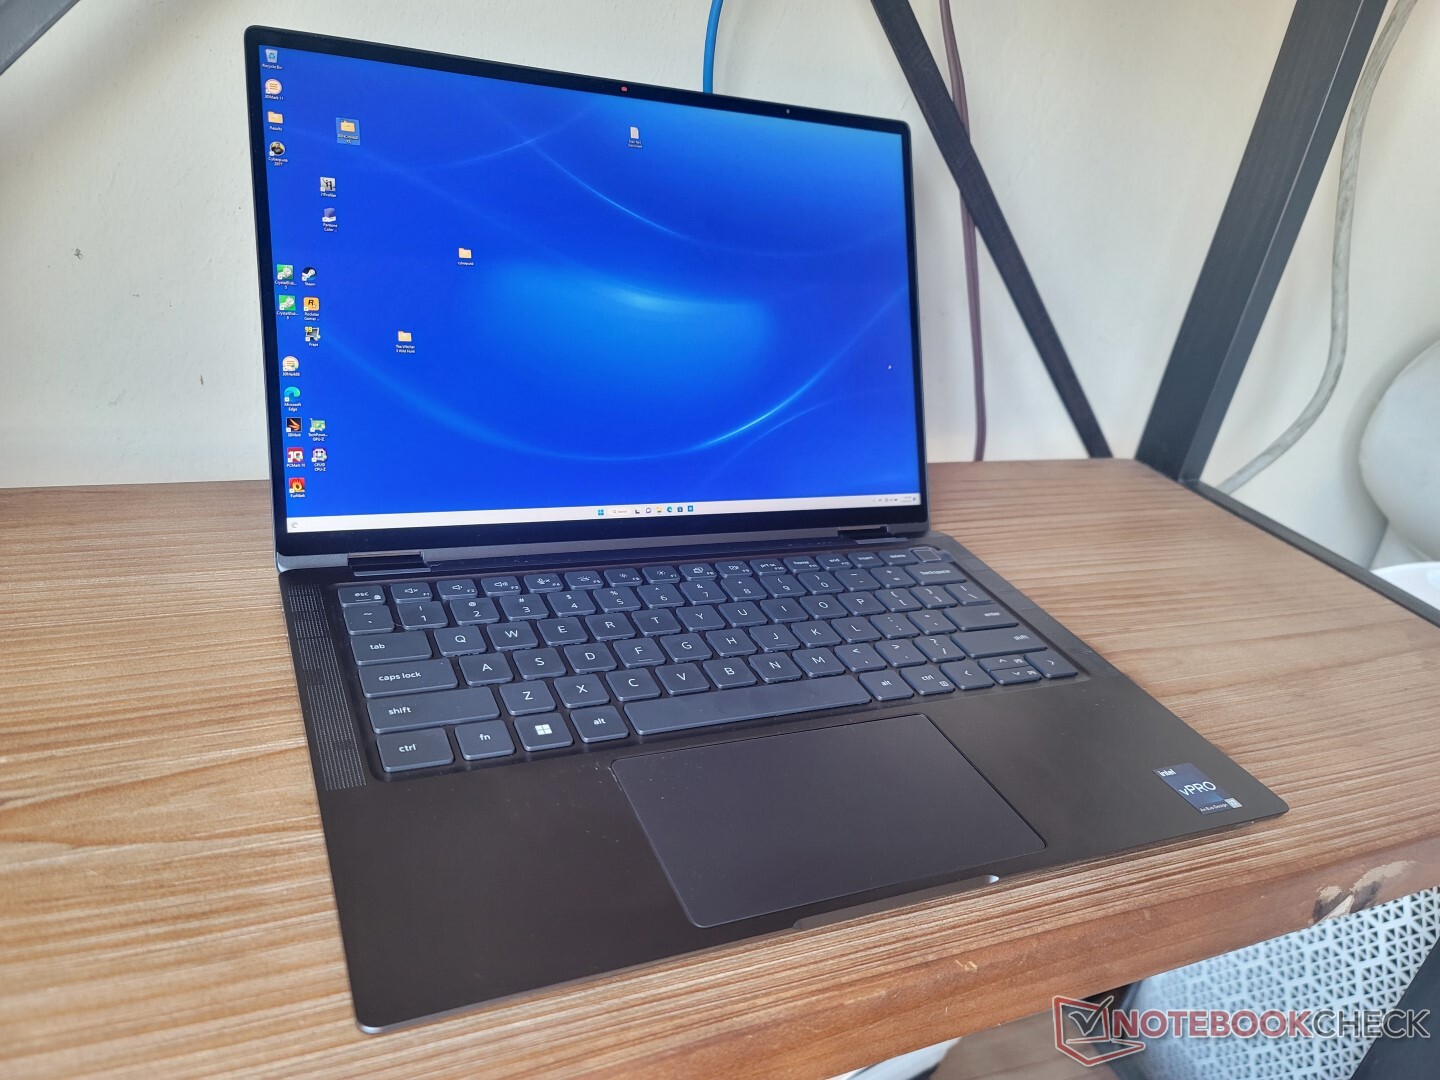
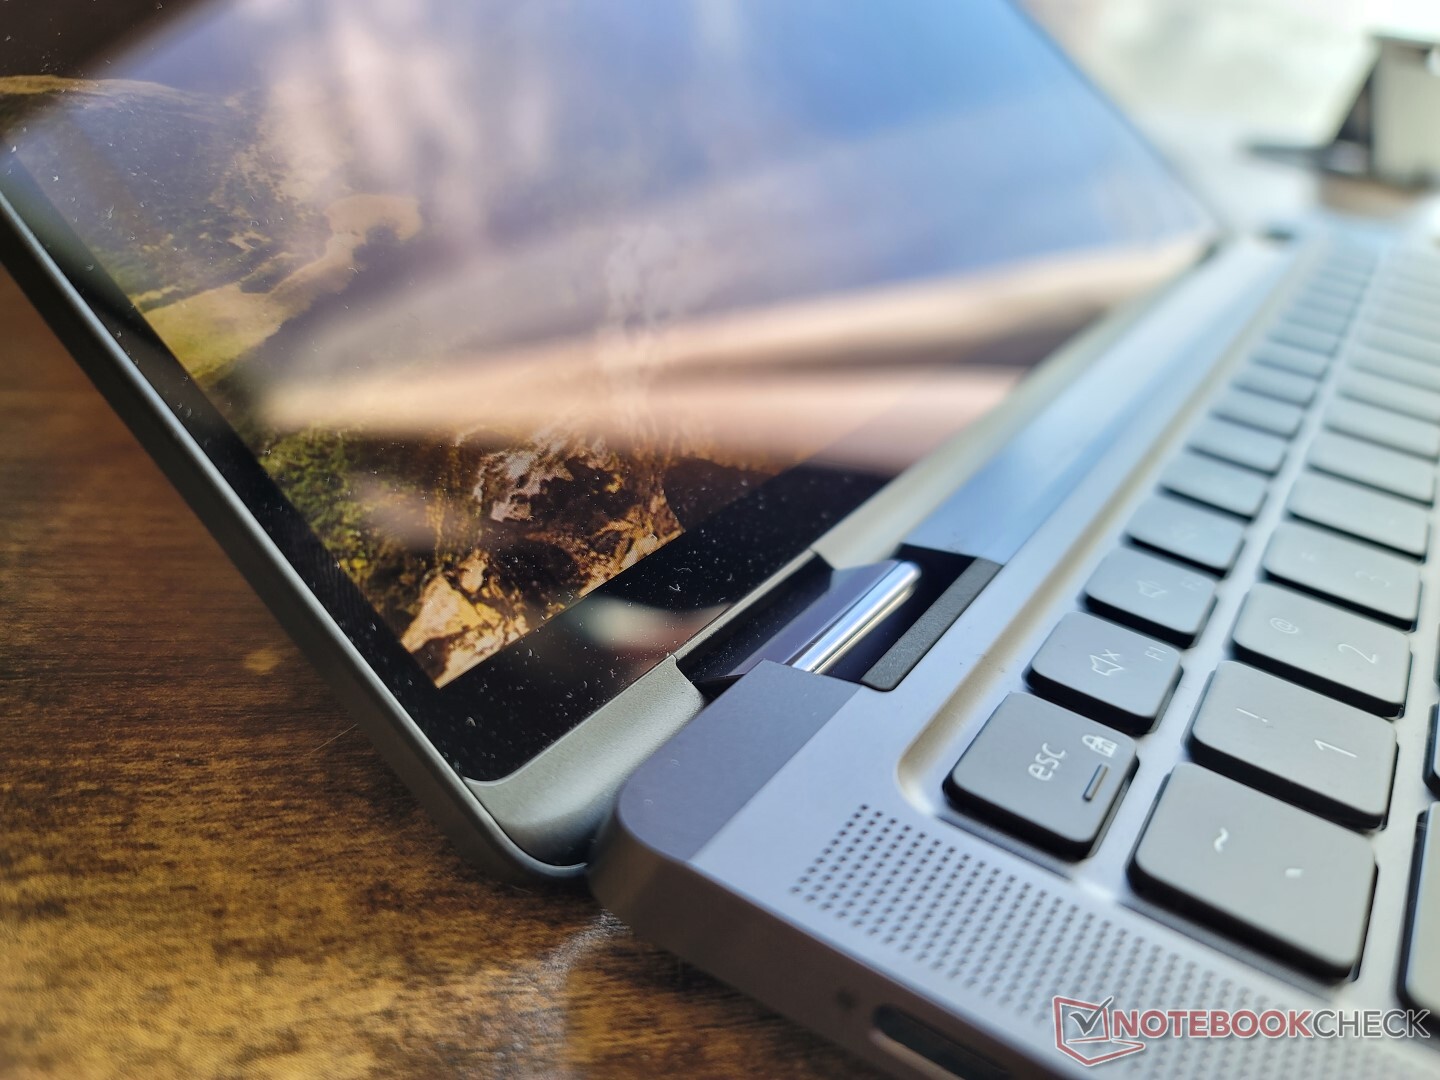
El esqueleto metálico gris puede no parecer gran cosa, especialmente si se compara con los llamativos diseños dorados del MSI Summit E13 Flip o del HP Spectre pero es igual de resistente, si no más. Intentar retorcer la base desde sus lados o por el centro del teclado resultaría en una mínima deformación para una excelente primera impresión. Incluso la pantalla es resistente a la torsión o flexión. La rigidez general es una de las mejores que hemos visto en cualquier subportátil convertible ultradelgado.
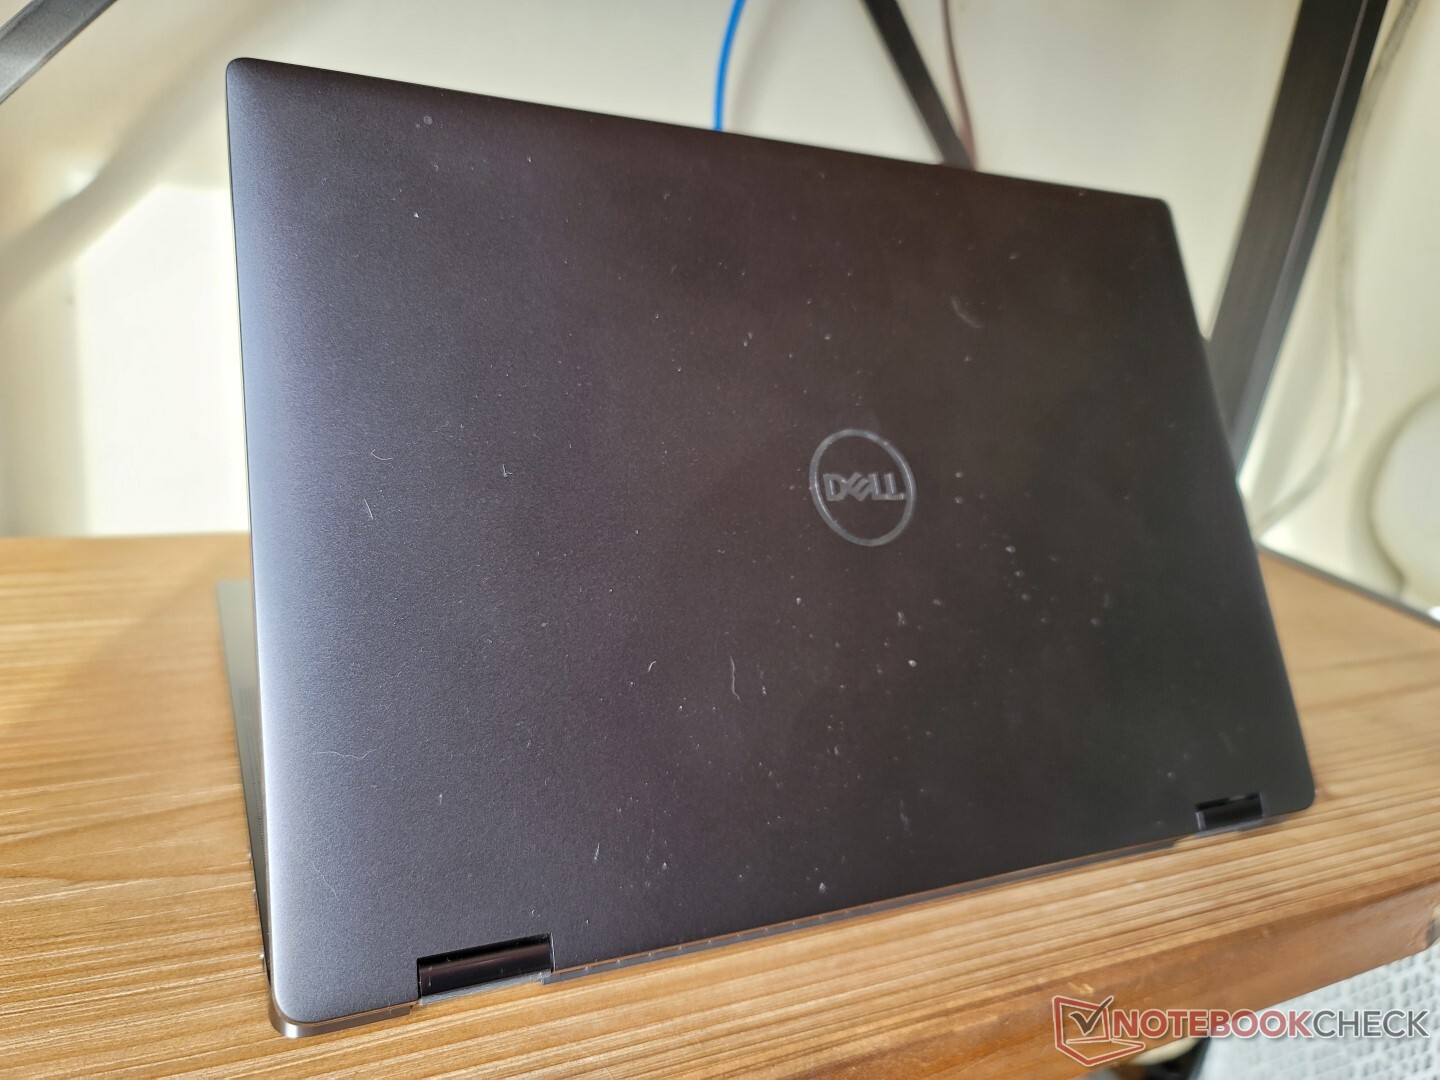
Las dimensiones y el peso son similares a los del Elite Dragonfly Max. El modelo de Dell es ligeramente más largo debido a su relación de aspecto 16:10 más alta frente al 16:9 de HP, pero el diseño de Dell lo compensa con unos biseles laterales más estrechos y un perfil más delgado. Por su parte, el Summit E13 Flip es un convertible de 13 pulgadas aún más grande y pesado.
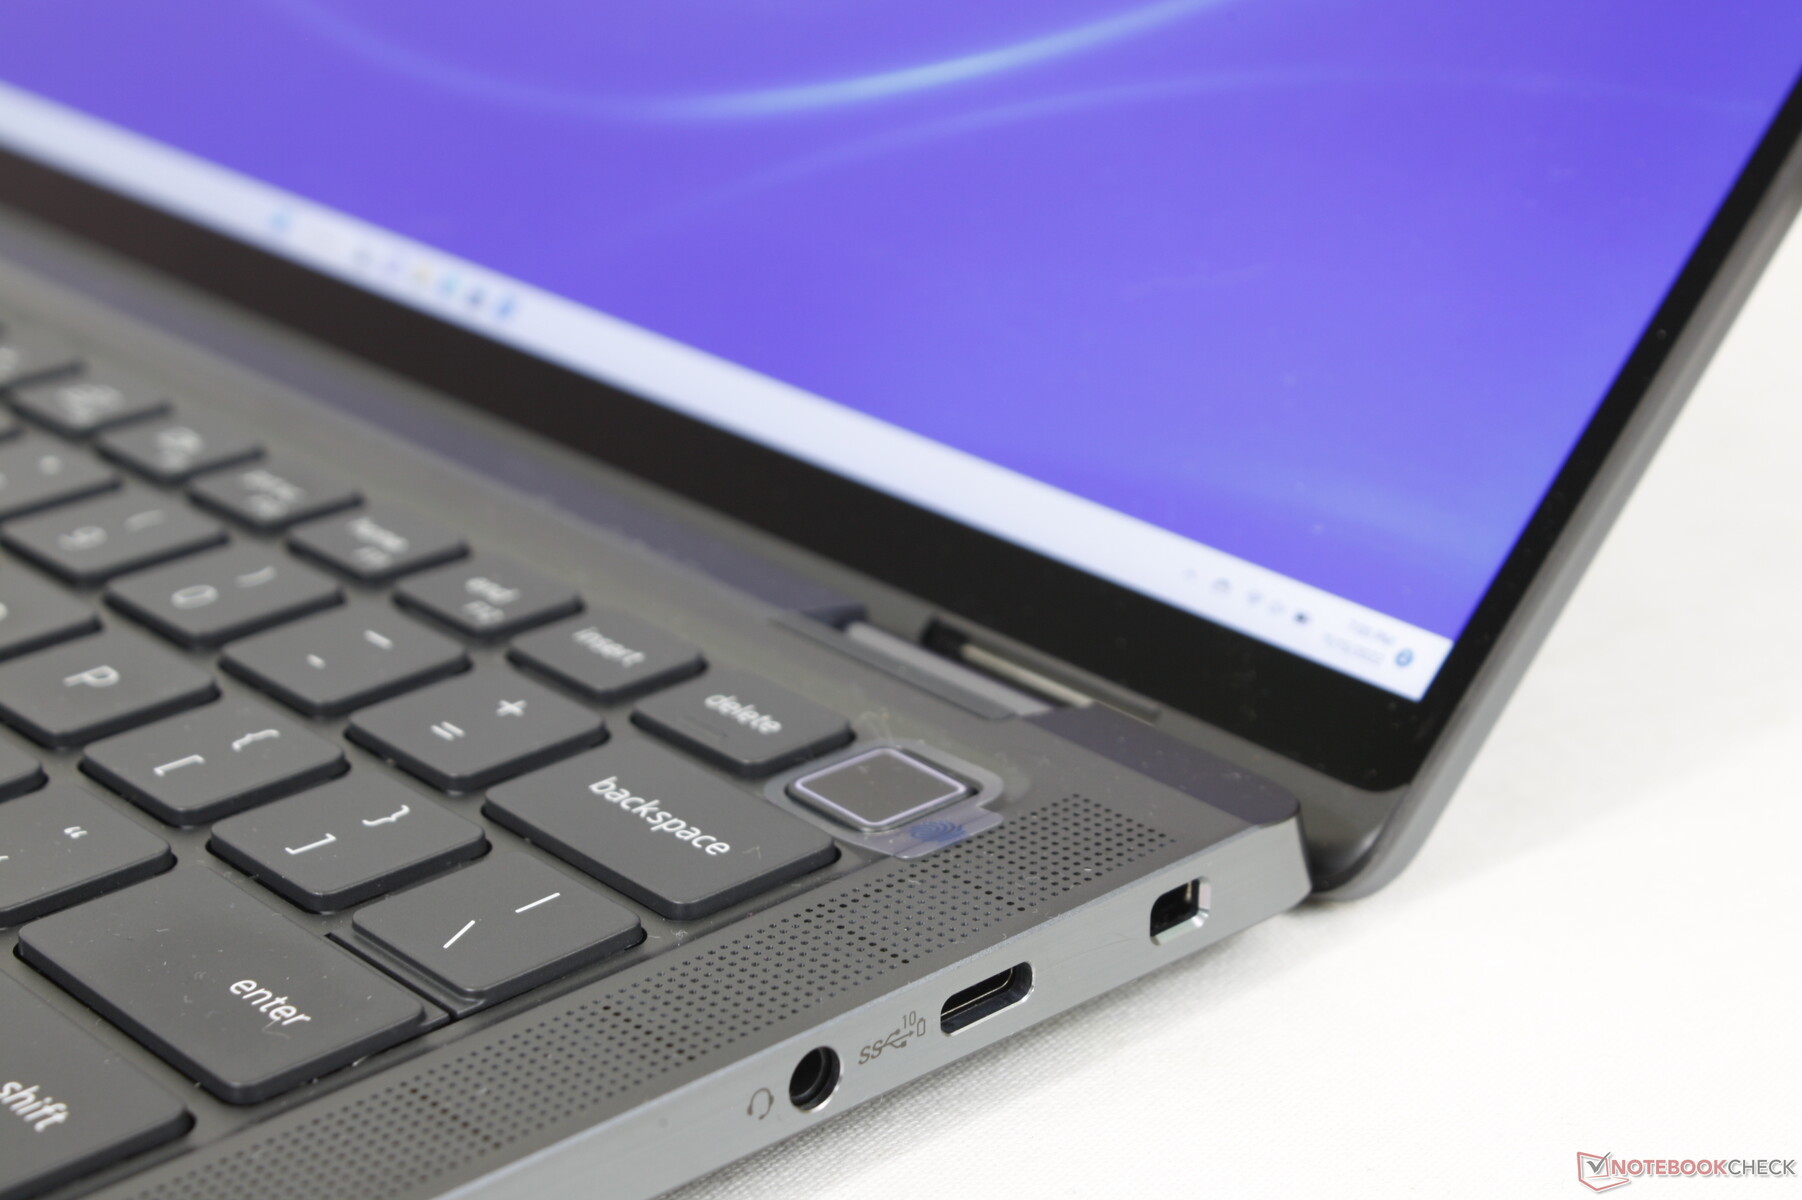
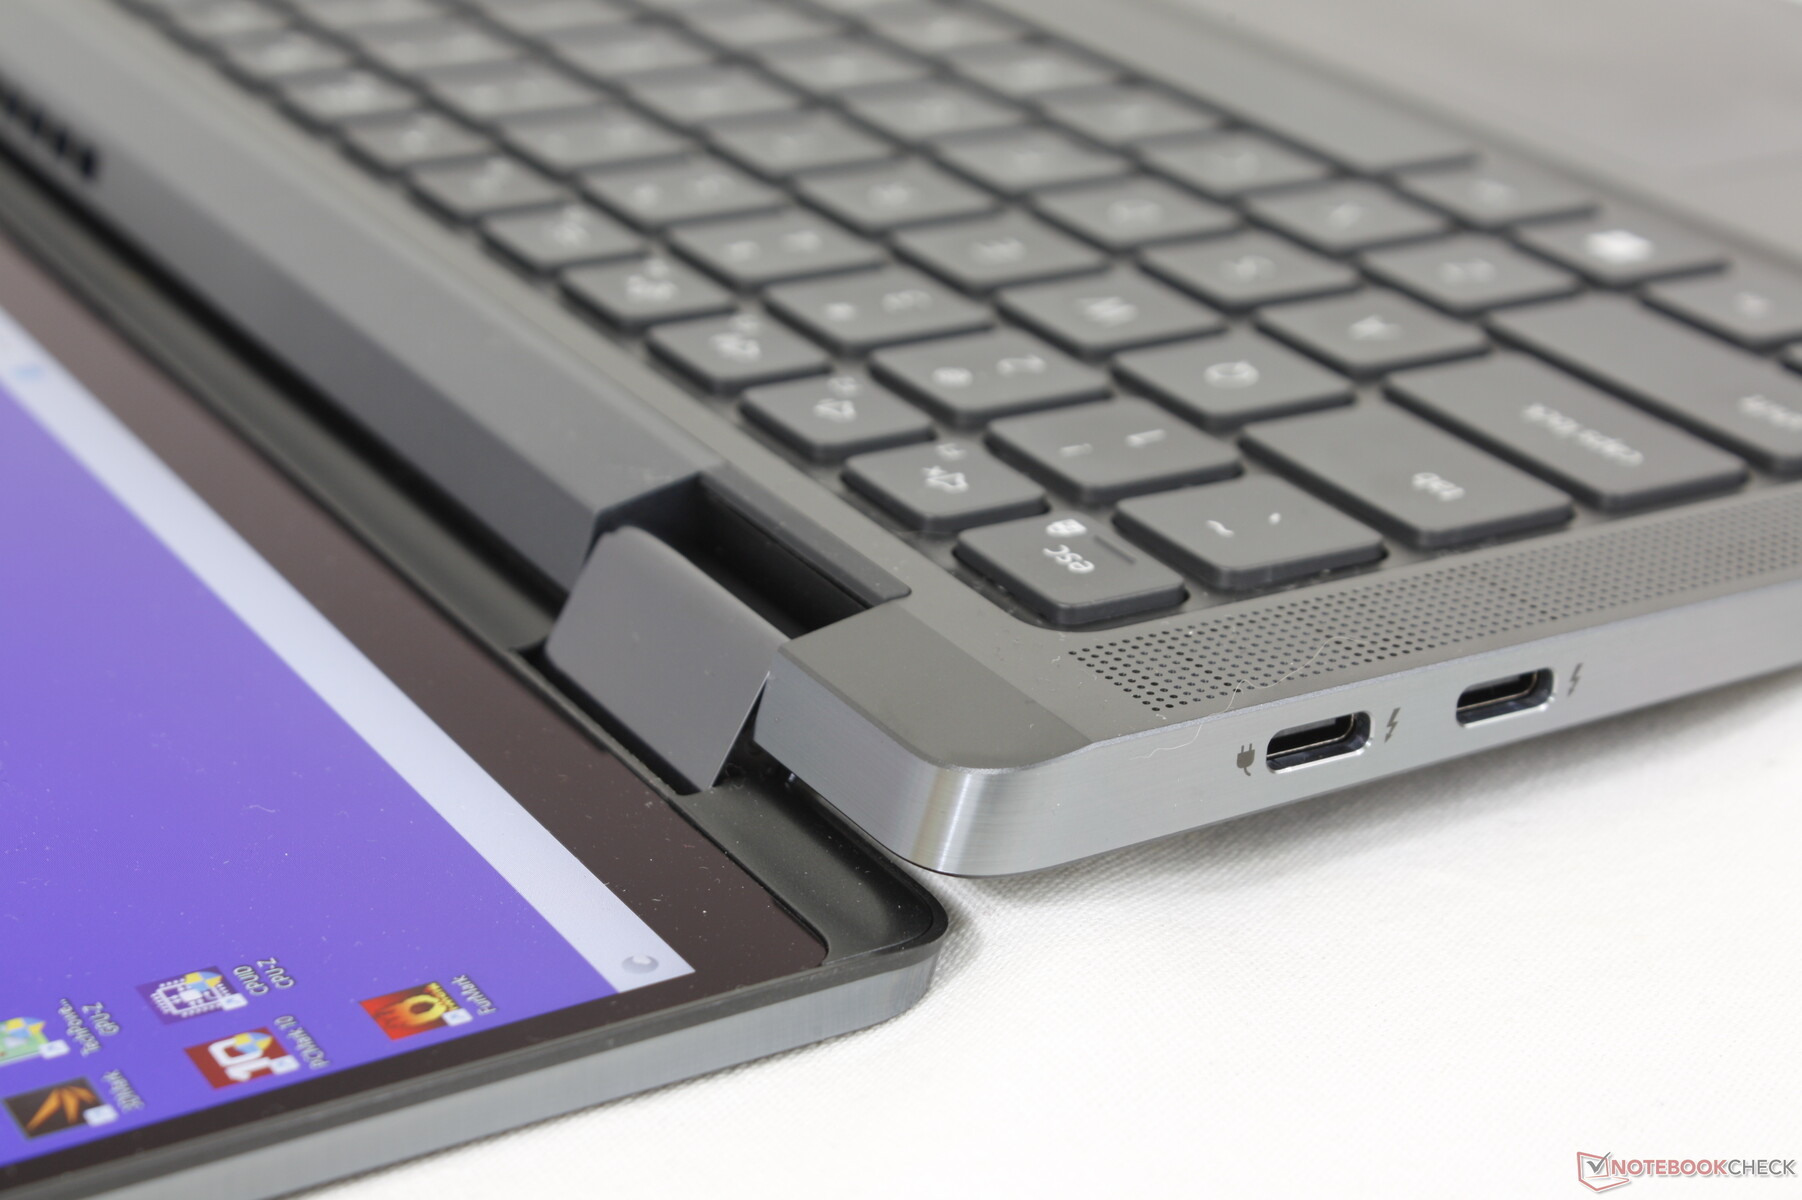
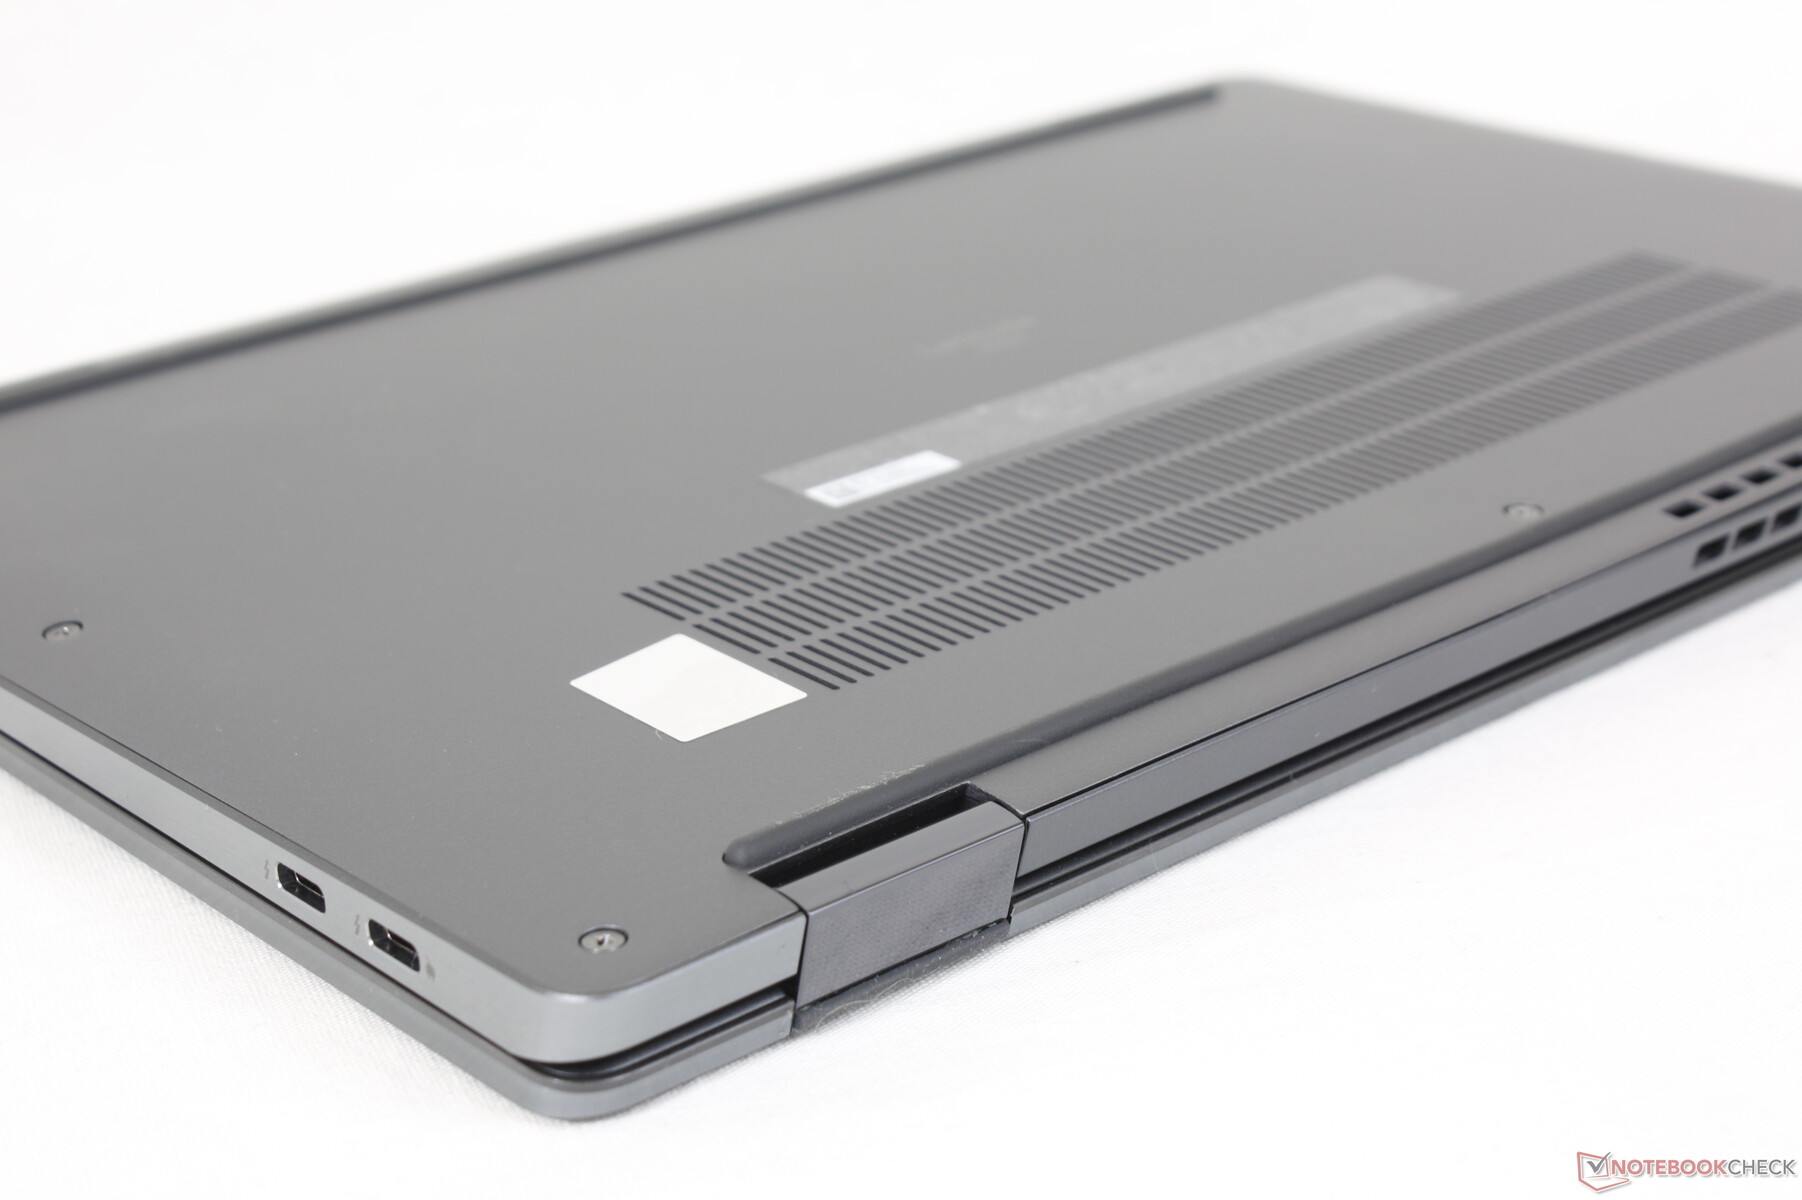
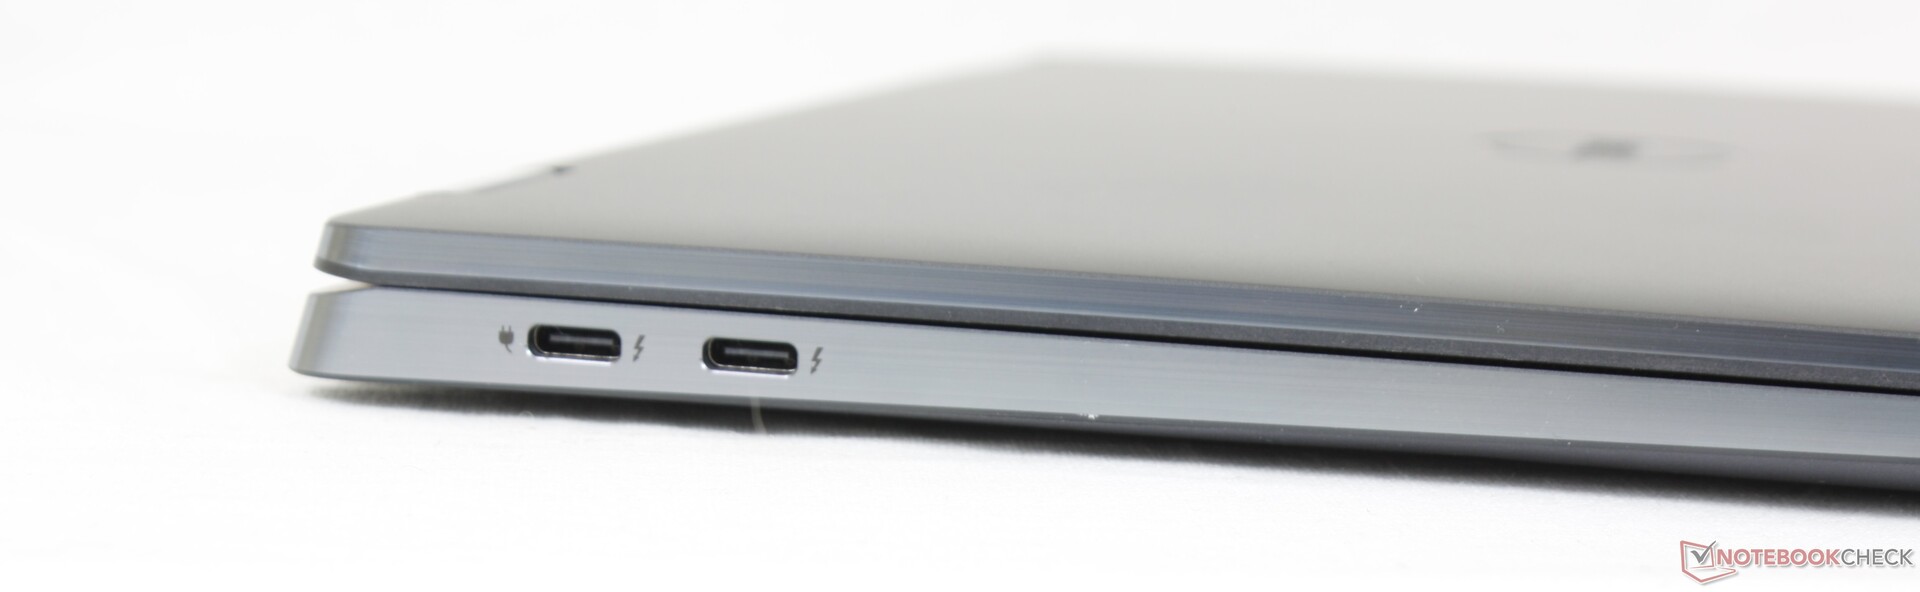
Conectividad - Sólo USB-C
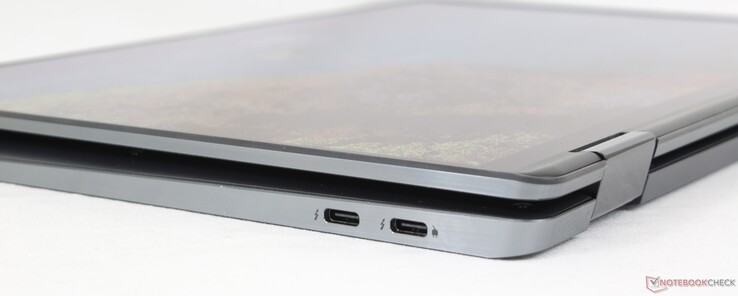
Prepárate para llevar adaptadores USB-C a todas partes, ya que el modelo no integra puertos USB-A ni HDMI. Si esos puertos son necesarios, entonces puede considerar el Dragonfly Max en su lugar o incluso el Summit E13 Flip.
Ten en cuenta que solo los dos puertos USB-C de la izquierda admiten dispositivos Thunderbolt 4. Por lo demás, cualquiera de los tres puertos USB-C puede usarse para monitores externos y propósitos de carga.
Es un poco decepcionante que el modelo no integre ningún lector de tarjetas SD teniendo en cuenta que el más baratoLatitude 5310 2 en 1 incluye uno.

Comunicación
Un Intel AX211 viene de serie para la conectividad Wi-Fi 6E y Bluetooth 5.2. Las tasas de transferencia son ligeramente más rápidas en 6 GHz cuando se comparan con las de 5 GHz, pero la diferencia no es tan amplia como muchos esperarían
El Snapdragon X20 LTE-A o el Intel 5000 5G son opcionales para la conectividad WWAN de la uSIM. Lamentablemente, no se puede comprar un SKU sin WWAN para añadir un módulo WAN más tarde, ya que la antena no está incluida en las configuraciones sin WWAN.
| Networking | |
| iperf3 transmit AX12 | |
| Dell Latitude 5310-23VP6 | |
| HP Elite Dragonfly Max | |
| HP EliteBook x360 1030 G7 | |
| MSI Summit E13 Flip Evo A11MT | |
| iperf3 receive AX12 | |
| HP EliteBook x360 1030 G7 | |
| HP Elite Dragonfly Max | |
| MSI Summit E13 Flip Evo A11MT | |
| Dell Latitude 5310-23VP6 | |
| iperf3 receive AXE11000 6GHz | |
| Dell Latitude 9330 | |
| iperf3 receive AXE11000 | |
| Dell Latitude 9330 | |
| iperf3 transmit AXE11000 | |
| Dell Latitude 9330 | |
| iperf3 transmit AXE11000 6GHz | |
| Dell Latitude 9330 | |
Cámara web
La webcam de 2 MP con IR viene de serie para soportar Windows Hello. En comparación, los portátiles HP Elite y Spectre vienen con sensores de 5 MP para una calidad de imagen más nítida. Todas las cámaras web de los portátiles Dell Latitude y Lenovo ThinkPad siguen estando limitadas a 2 MP.


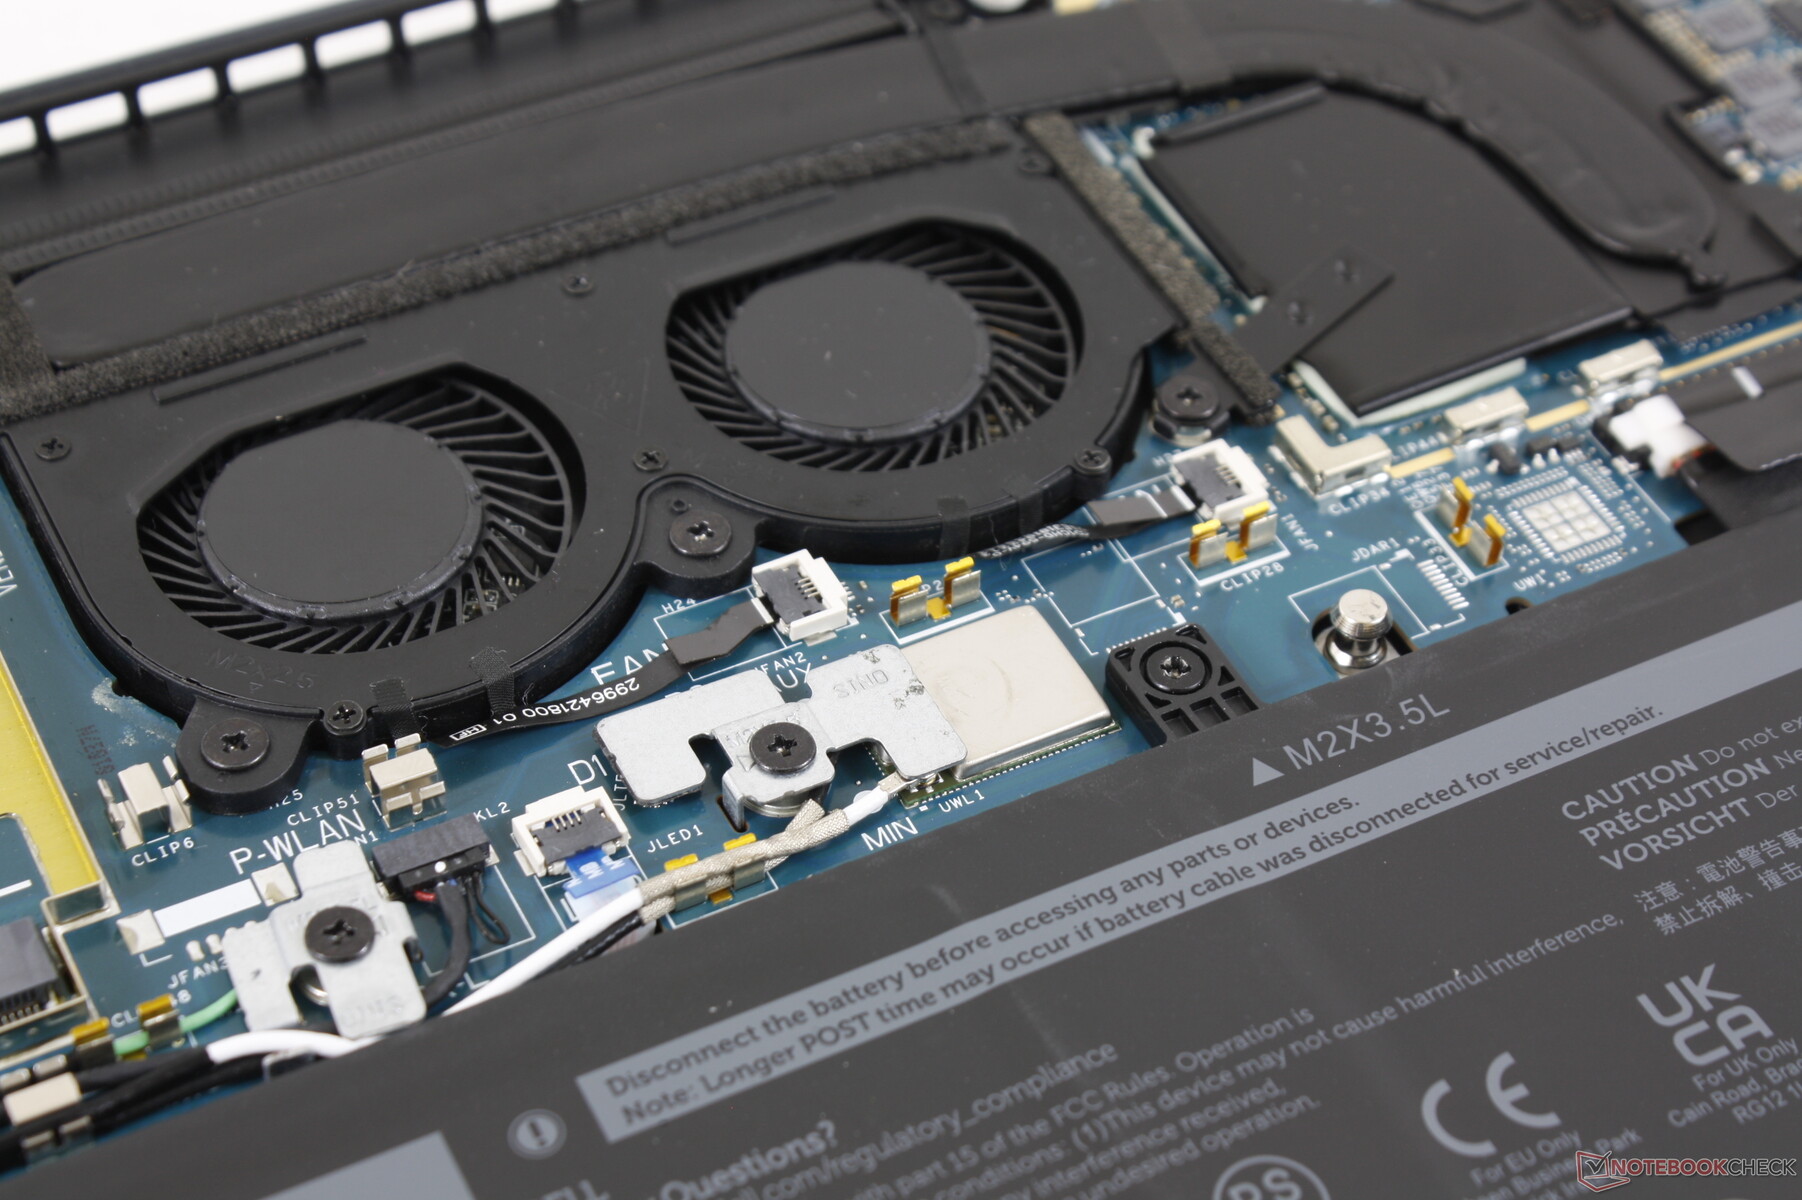
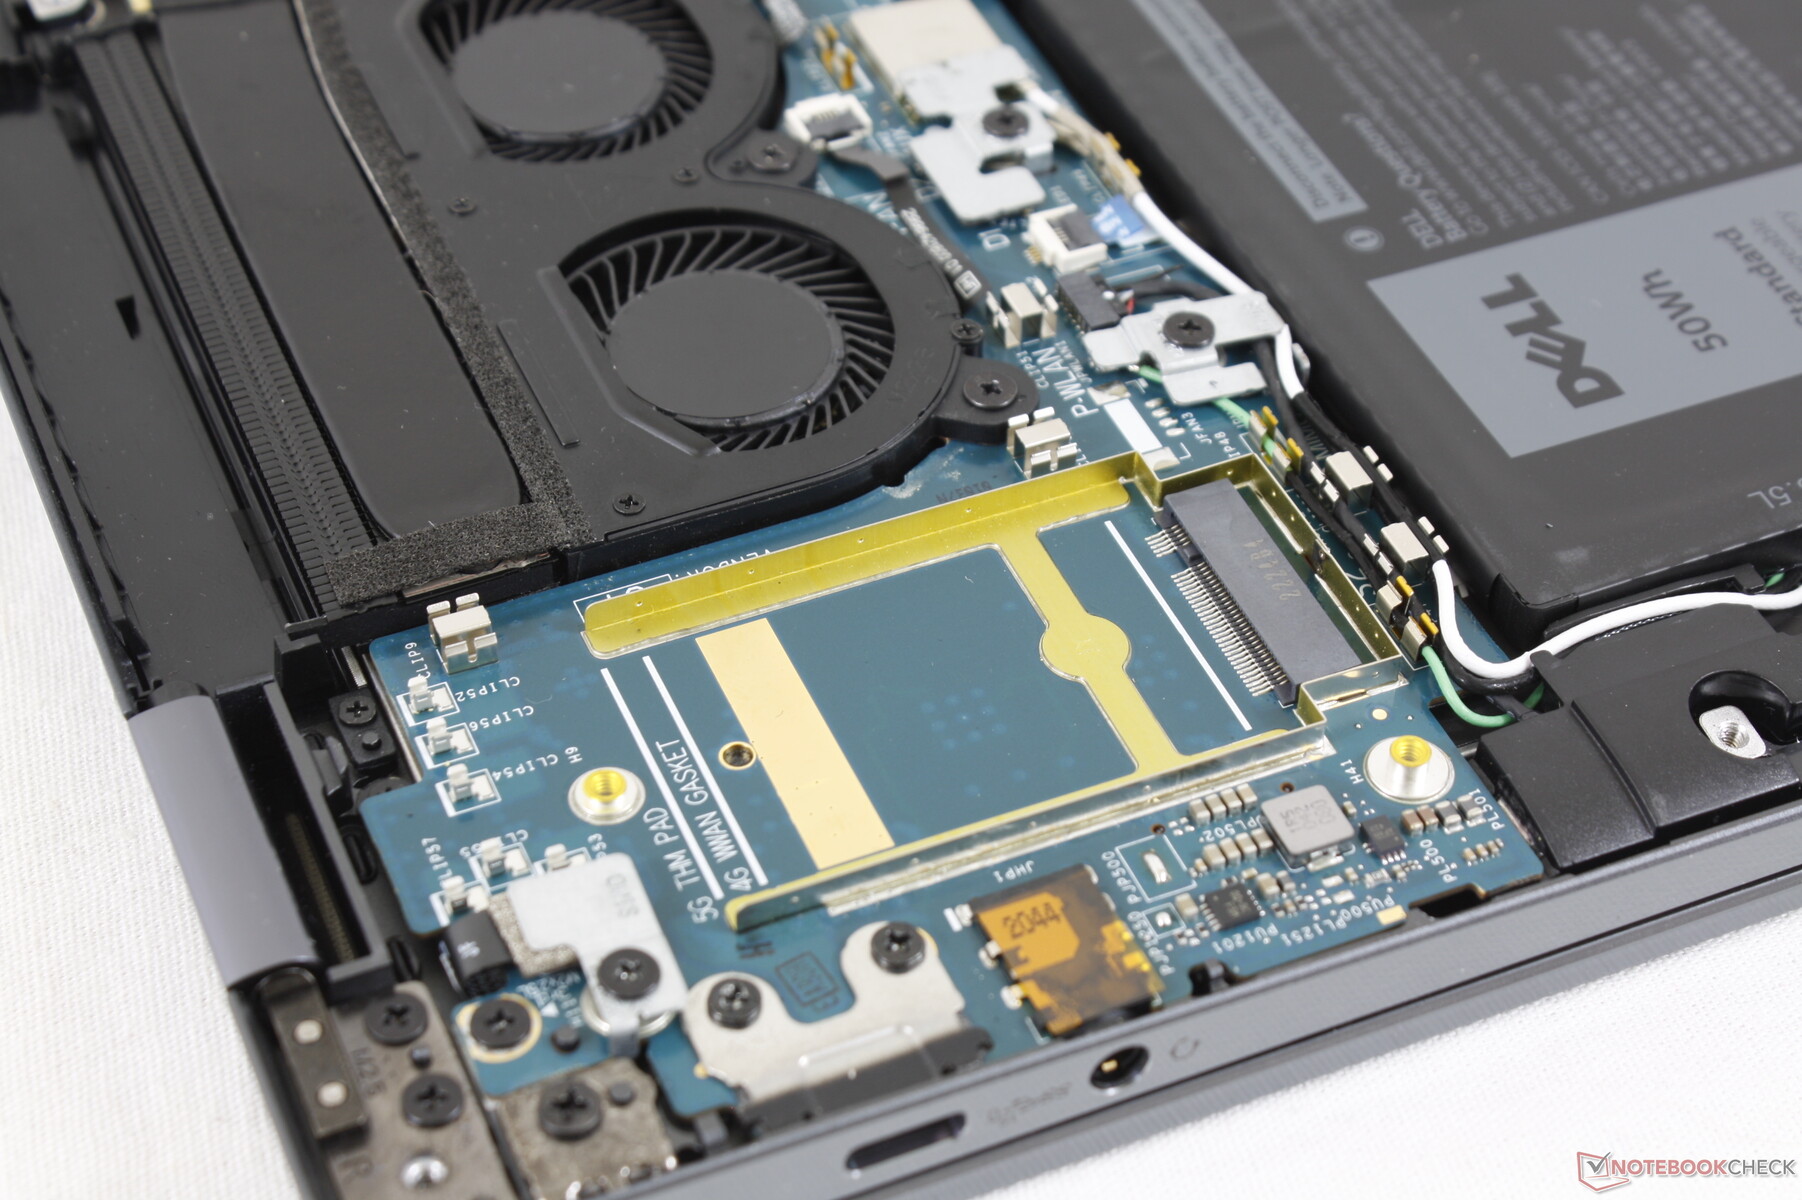
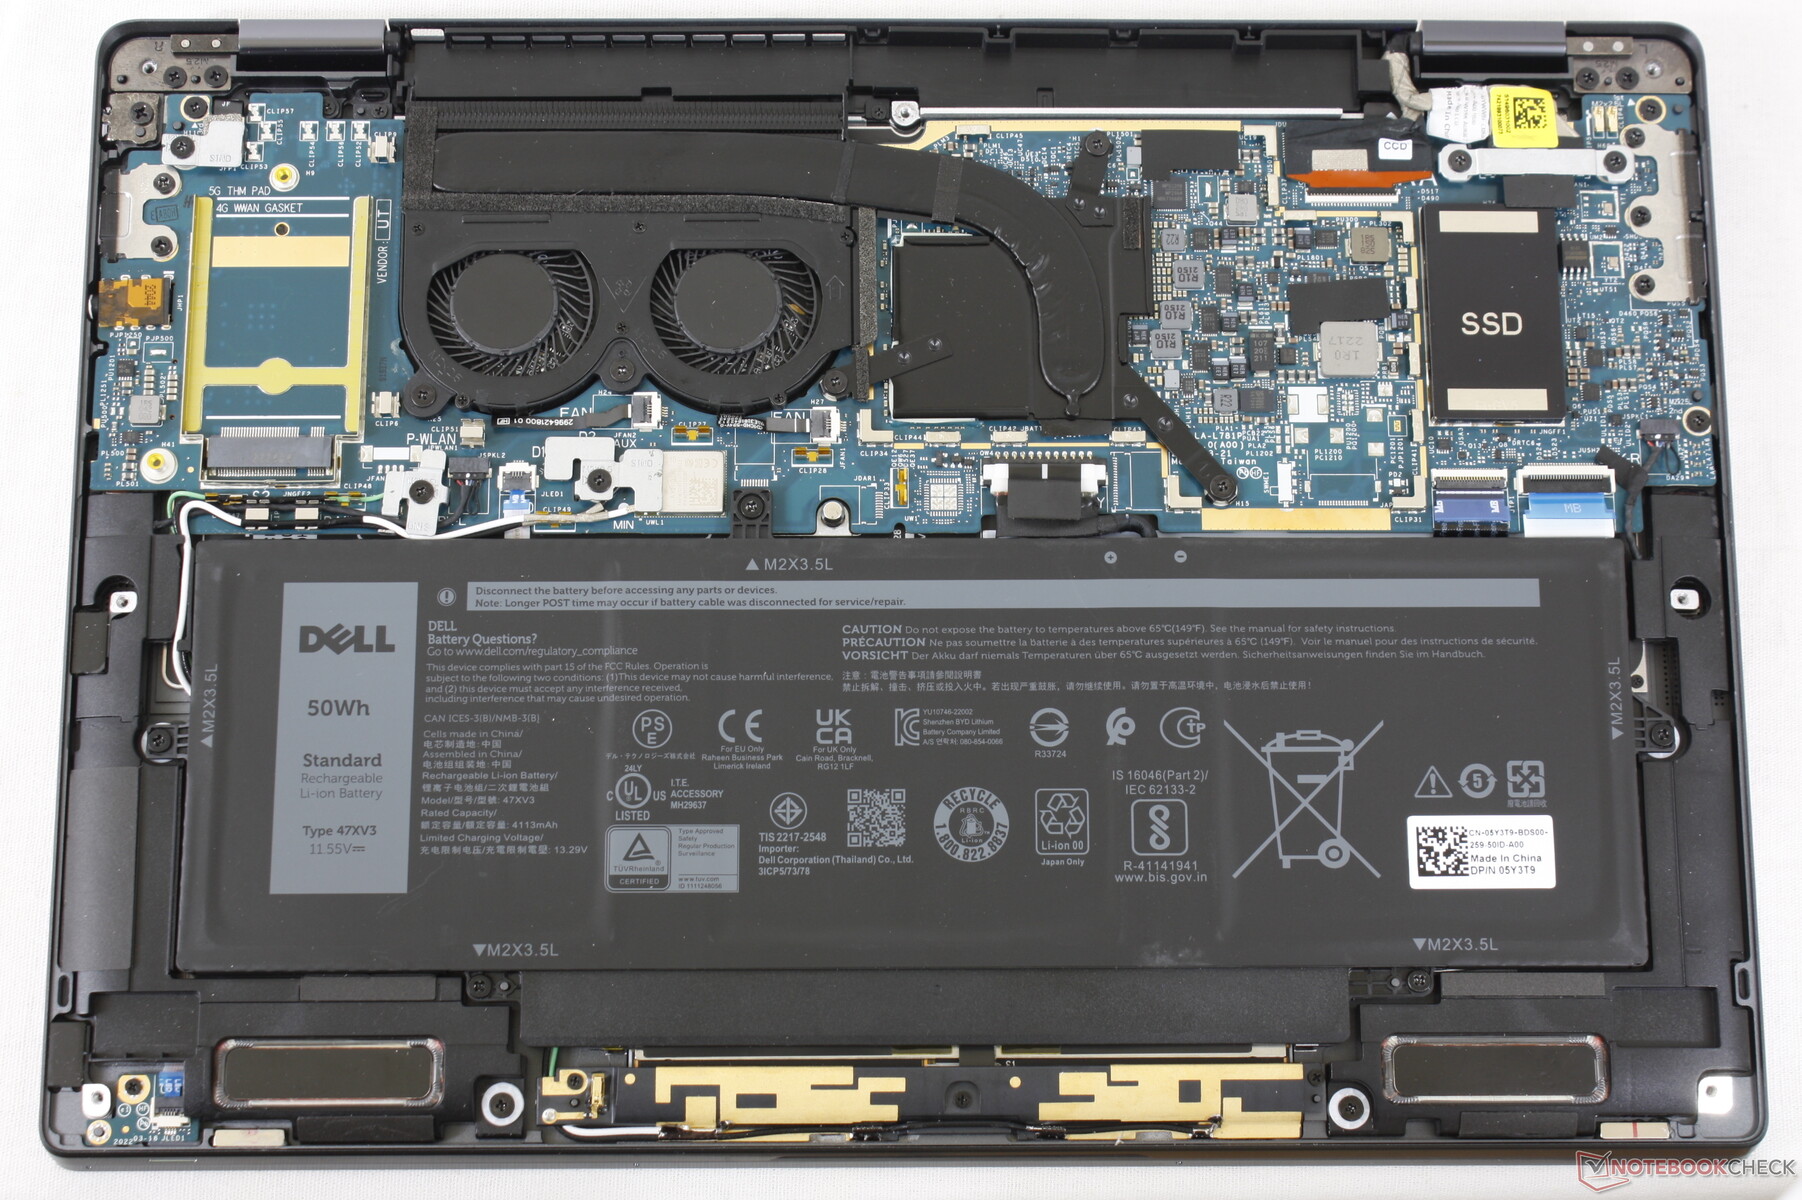
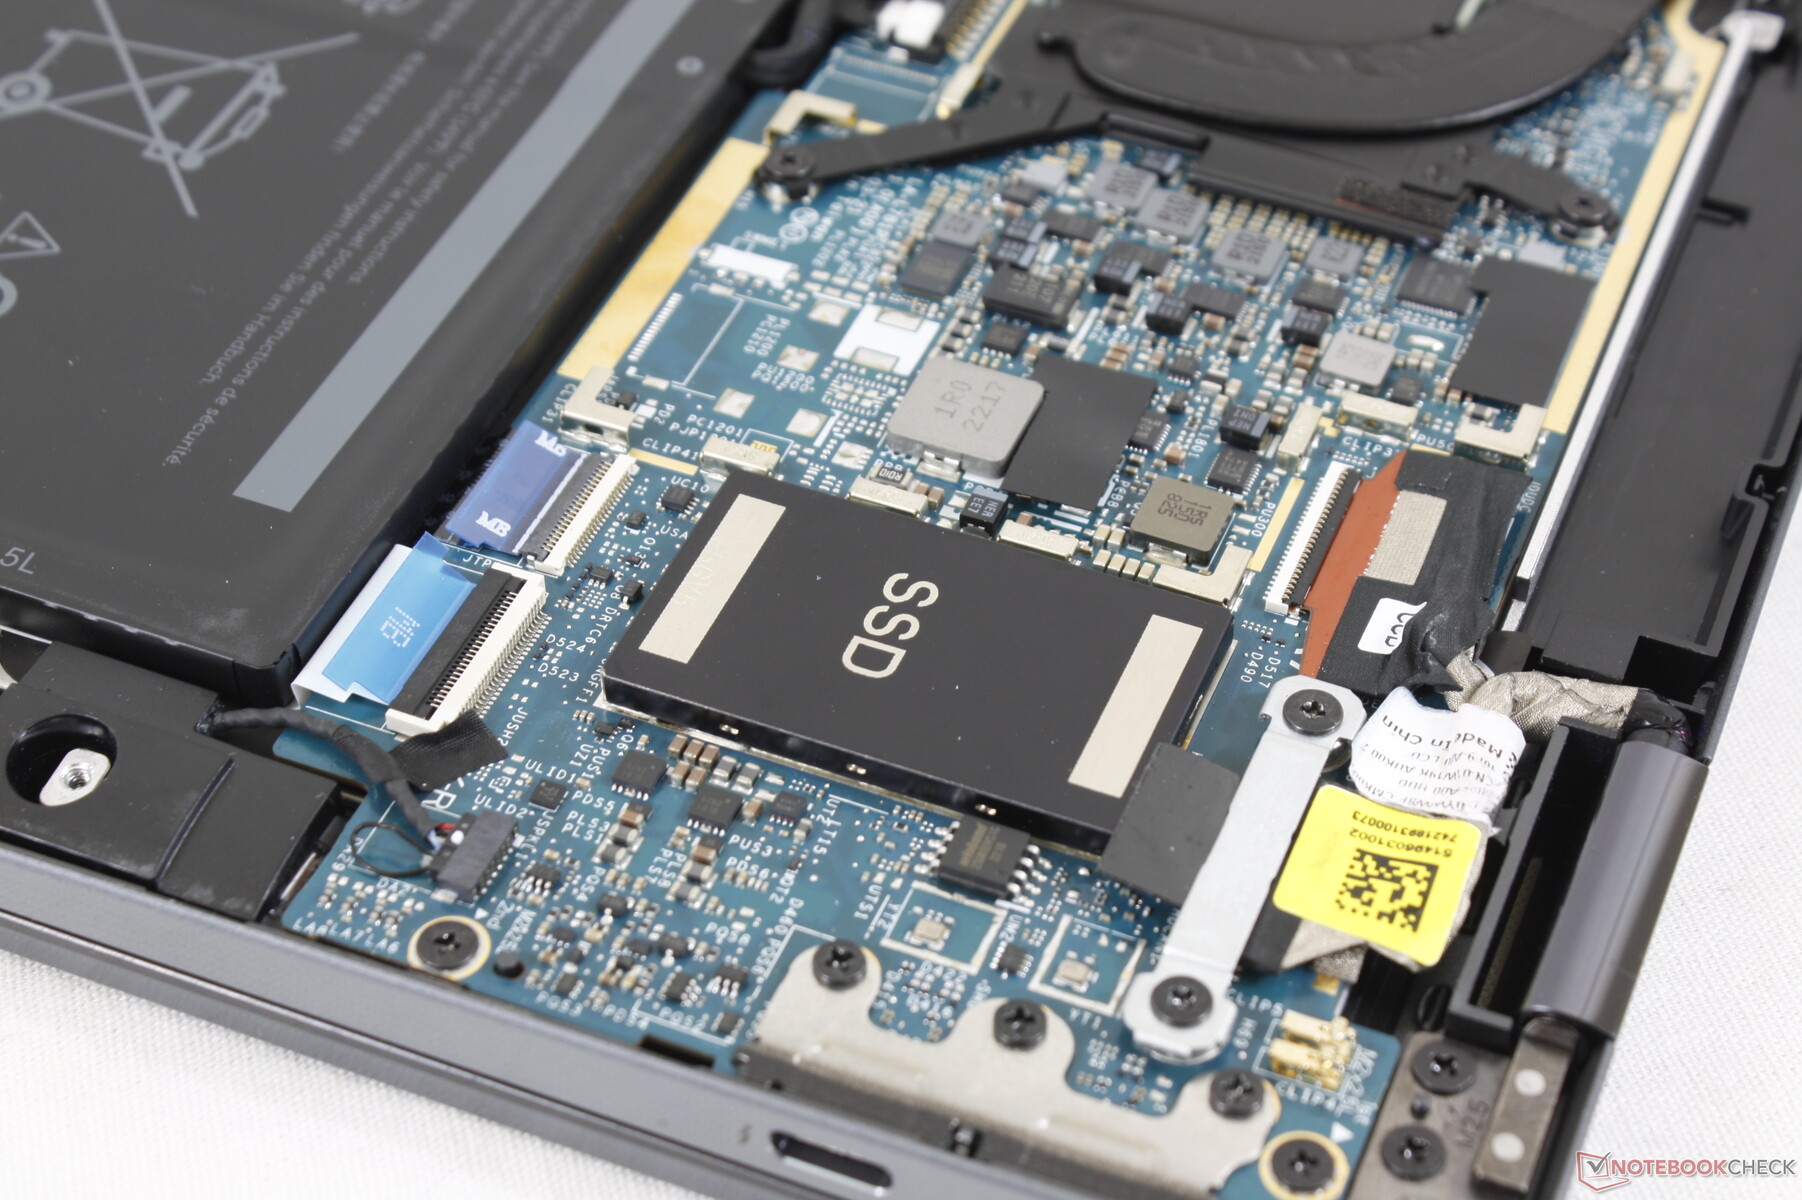
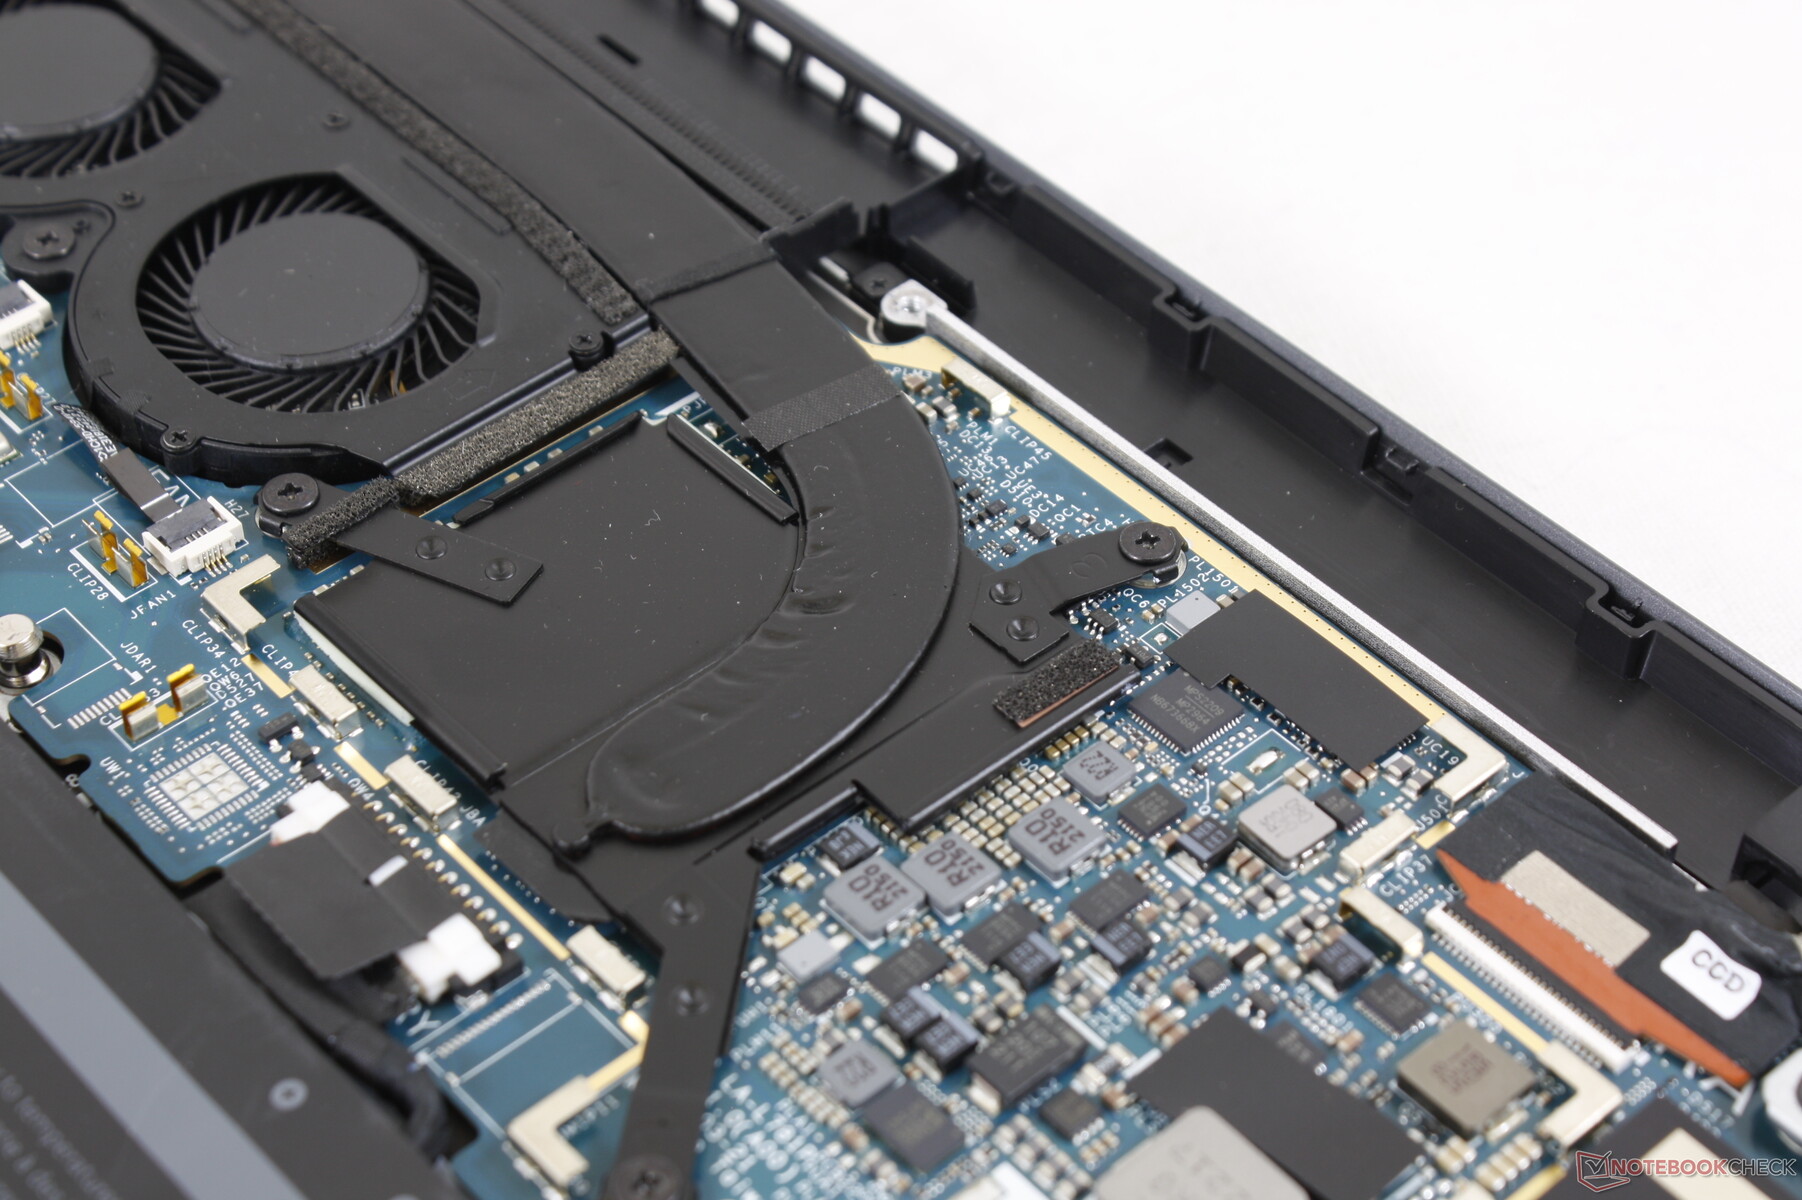
Mantenimiento
El panel inferior se fija con sólo 6 tornillos Philips para facilitar el mantenimiento. Los usuarios pueden retirar la batería, la WAN y los módulos SSD mientras los módulos WLAN y RAM están soldados. La WLAN y la RAM no actualizables son habituales en los subportátiles de 13 pulgadas.
Accesorios y garantía
La caja de venta incluye un adaptador de USB-C a USB-A para mitigar el hecho de que el Latitude 9330 no integra puertos USB-A. La garantía limitada de tres años del fabricante viene de serie, lo que es habitual en los PC empresariales de gama alta de Dell o HP.
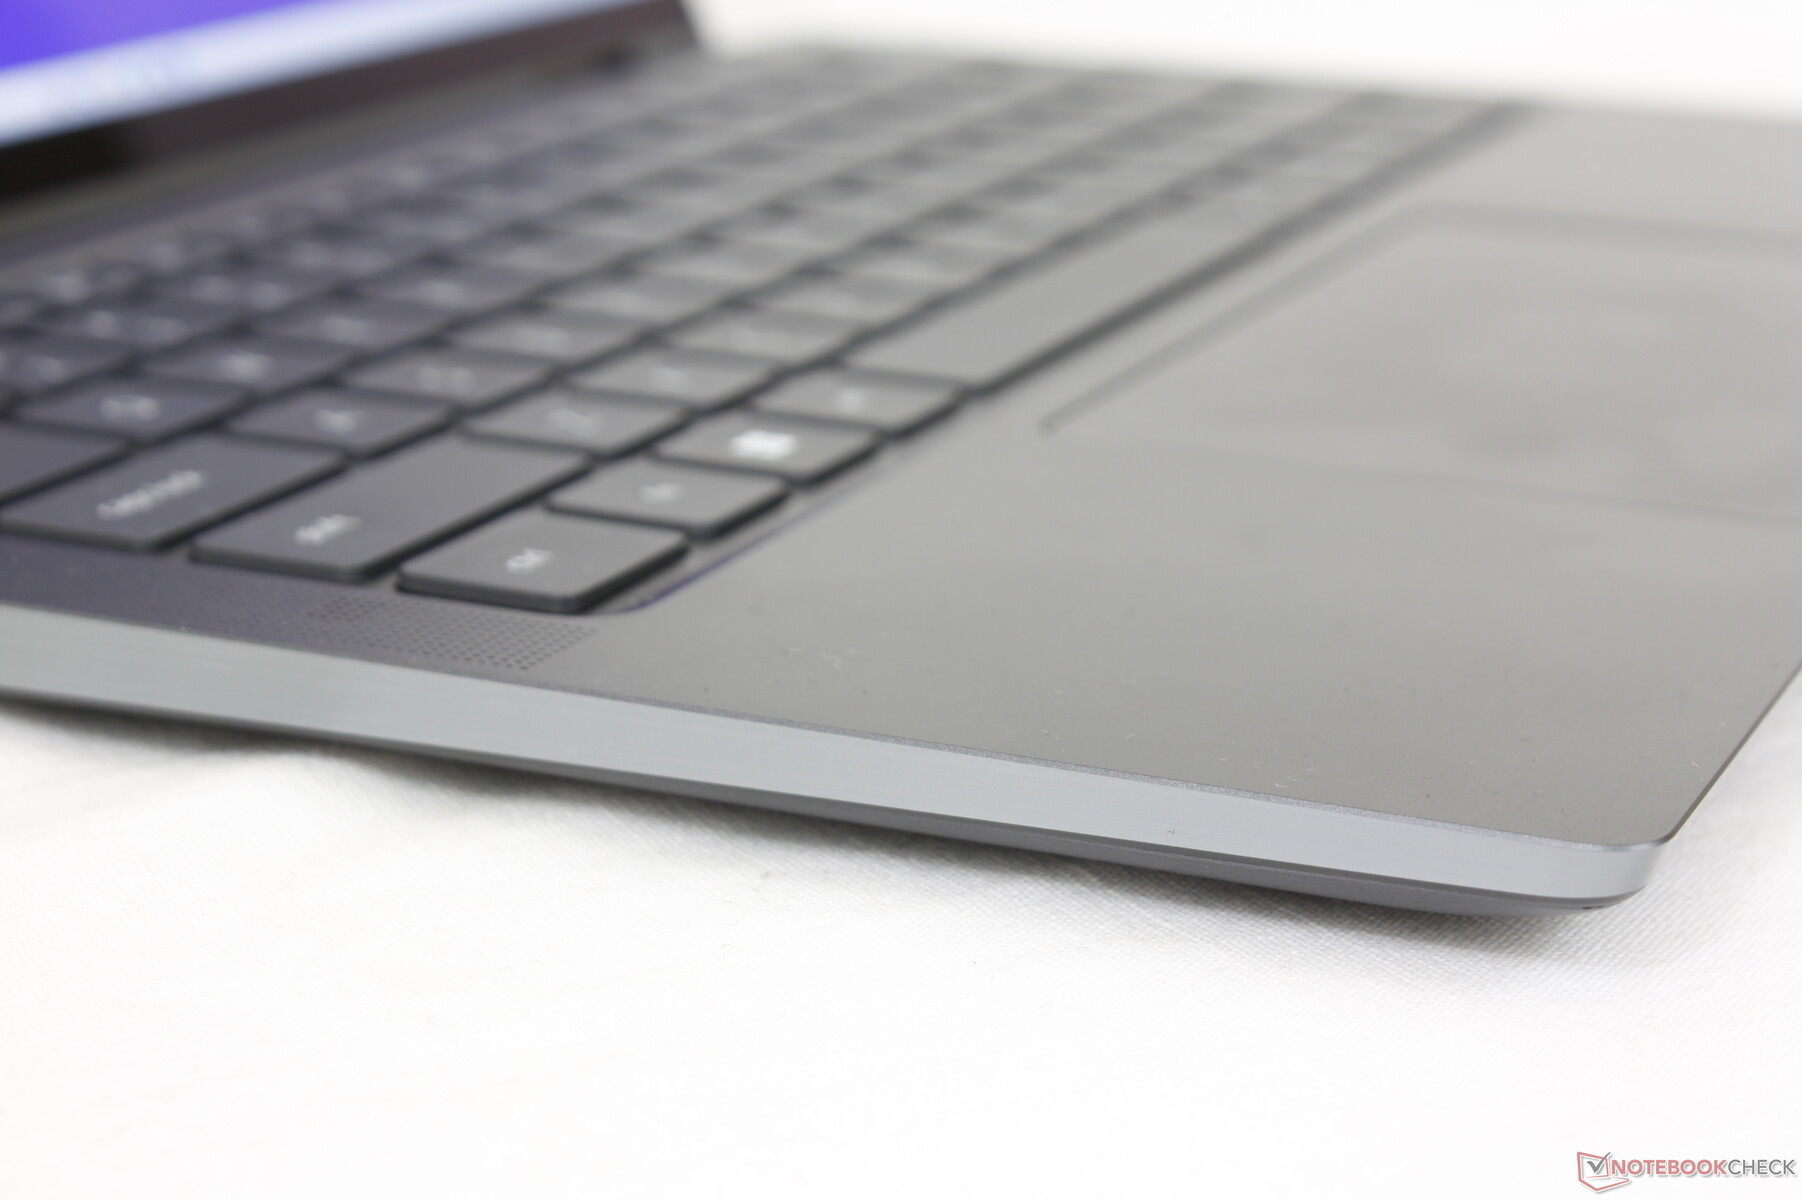
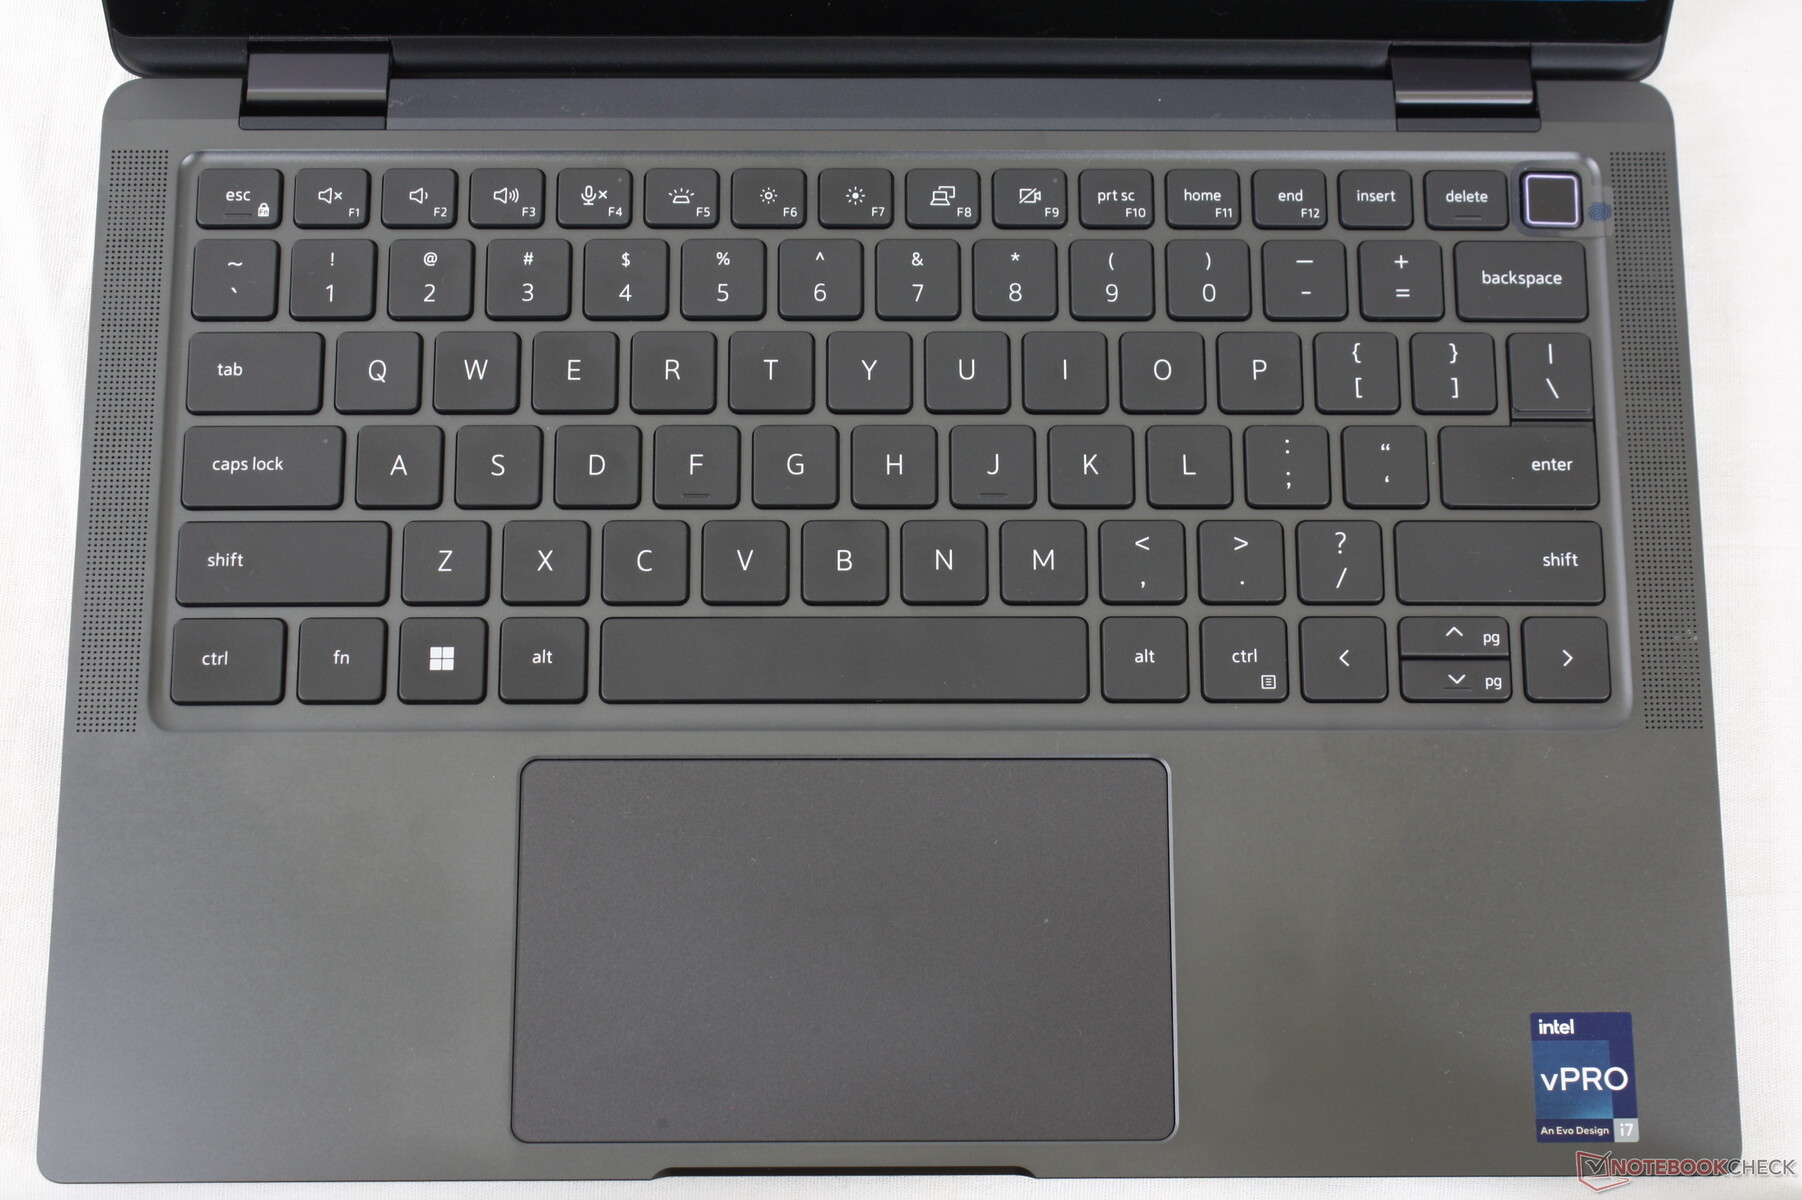
Dispositivos de entrada: un cómodo teclado y un esponjoso clickpad
Teclado
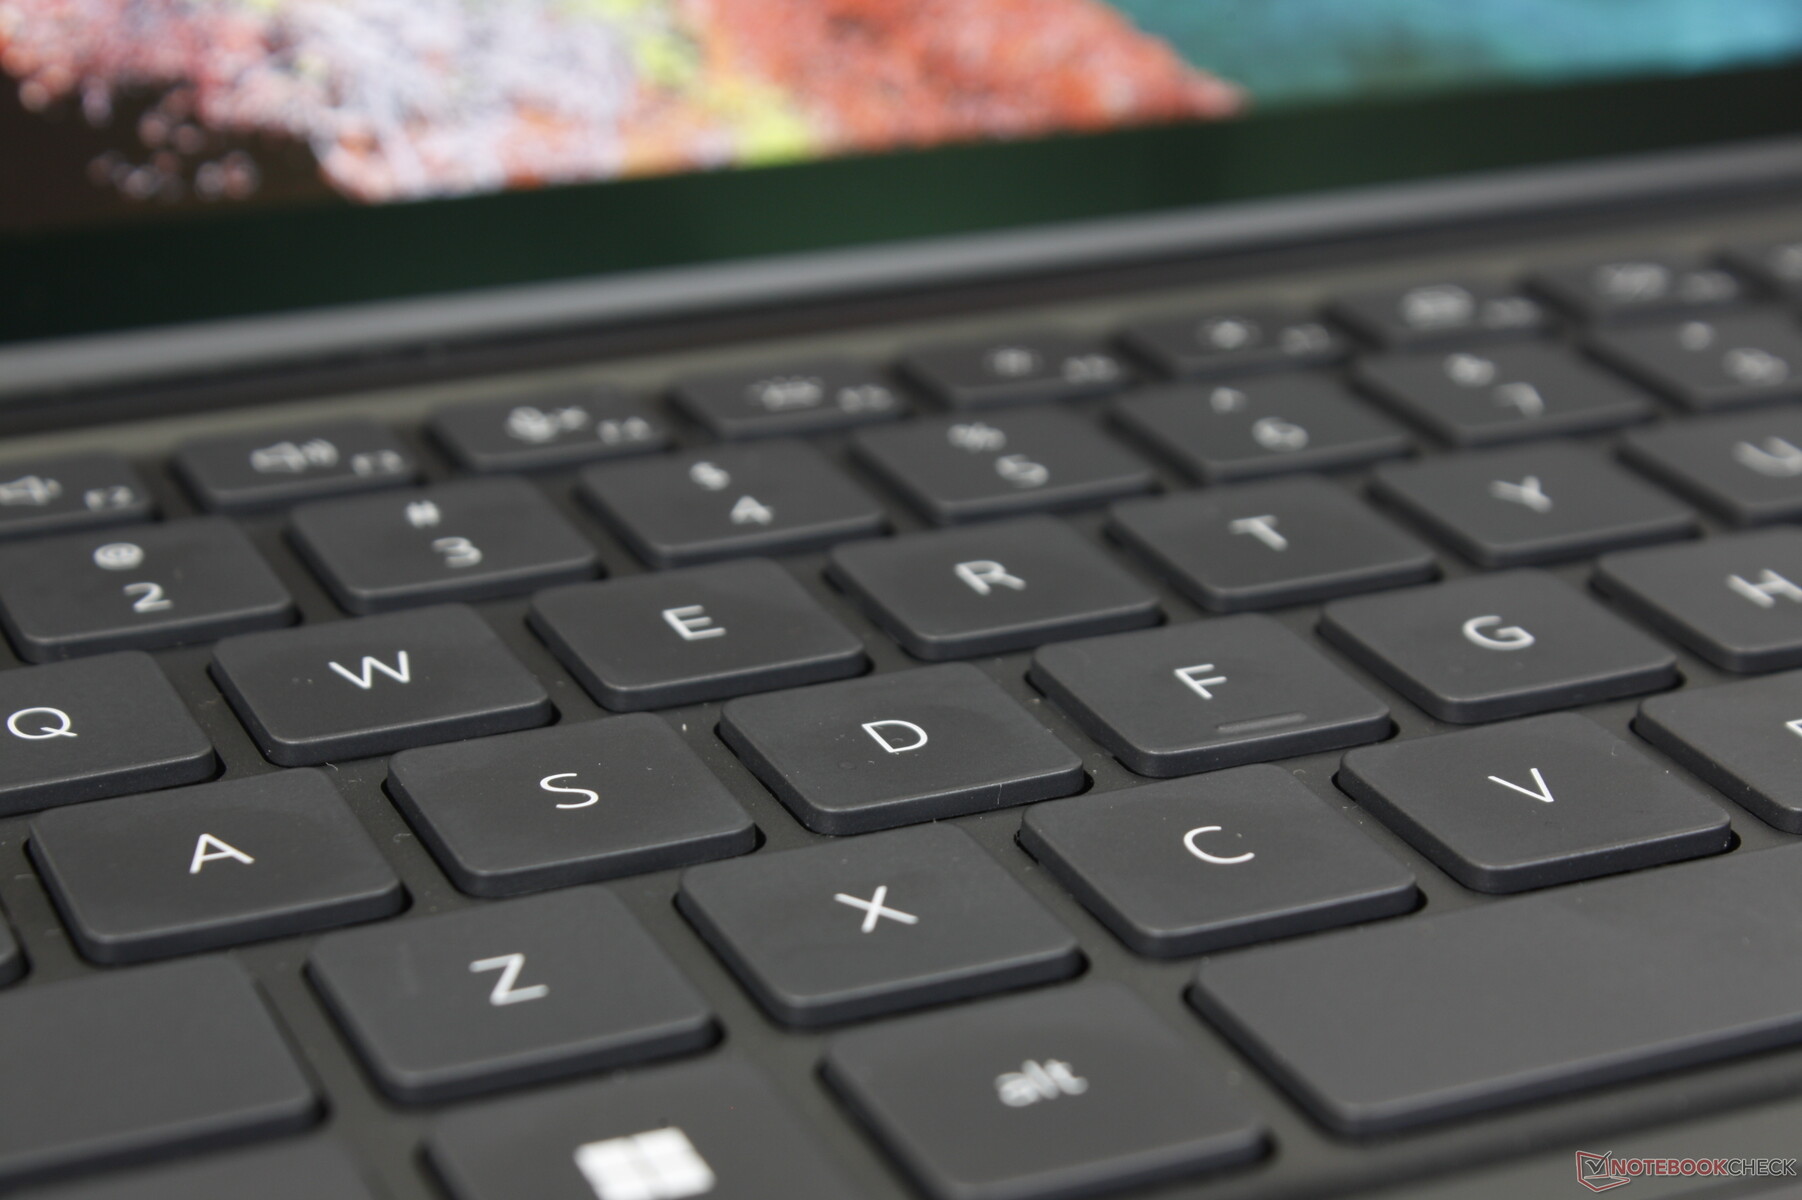
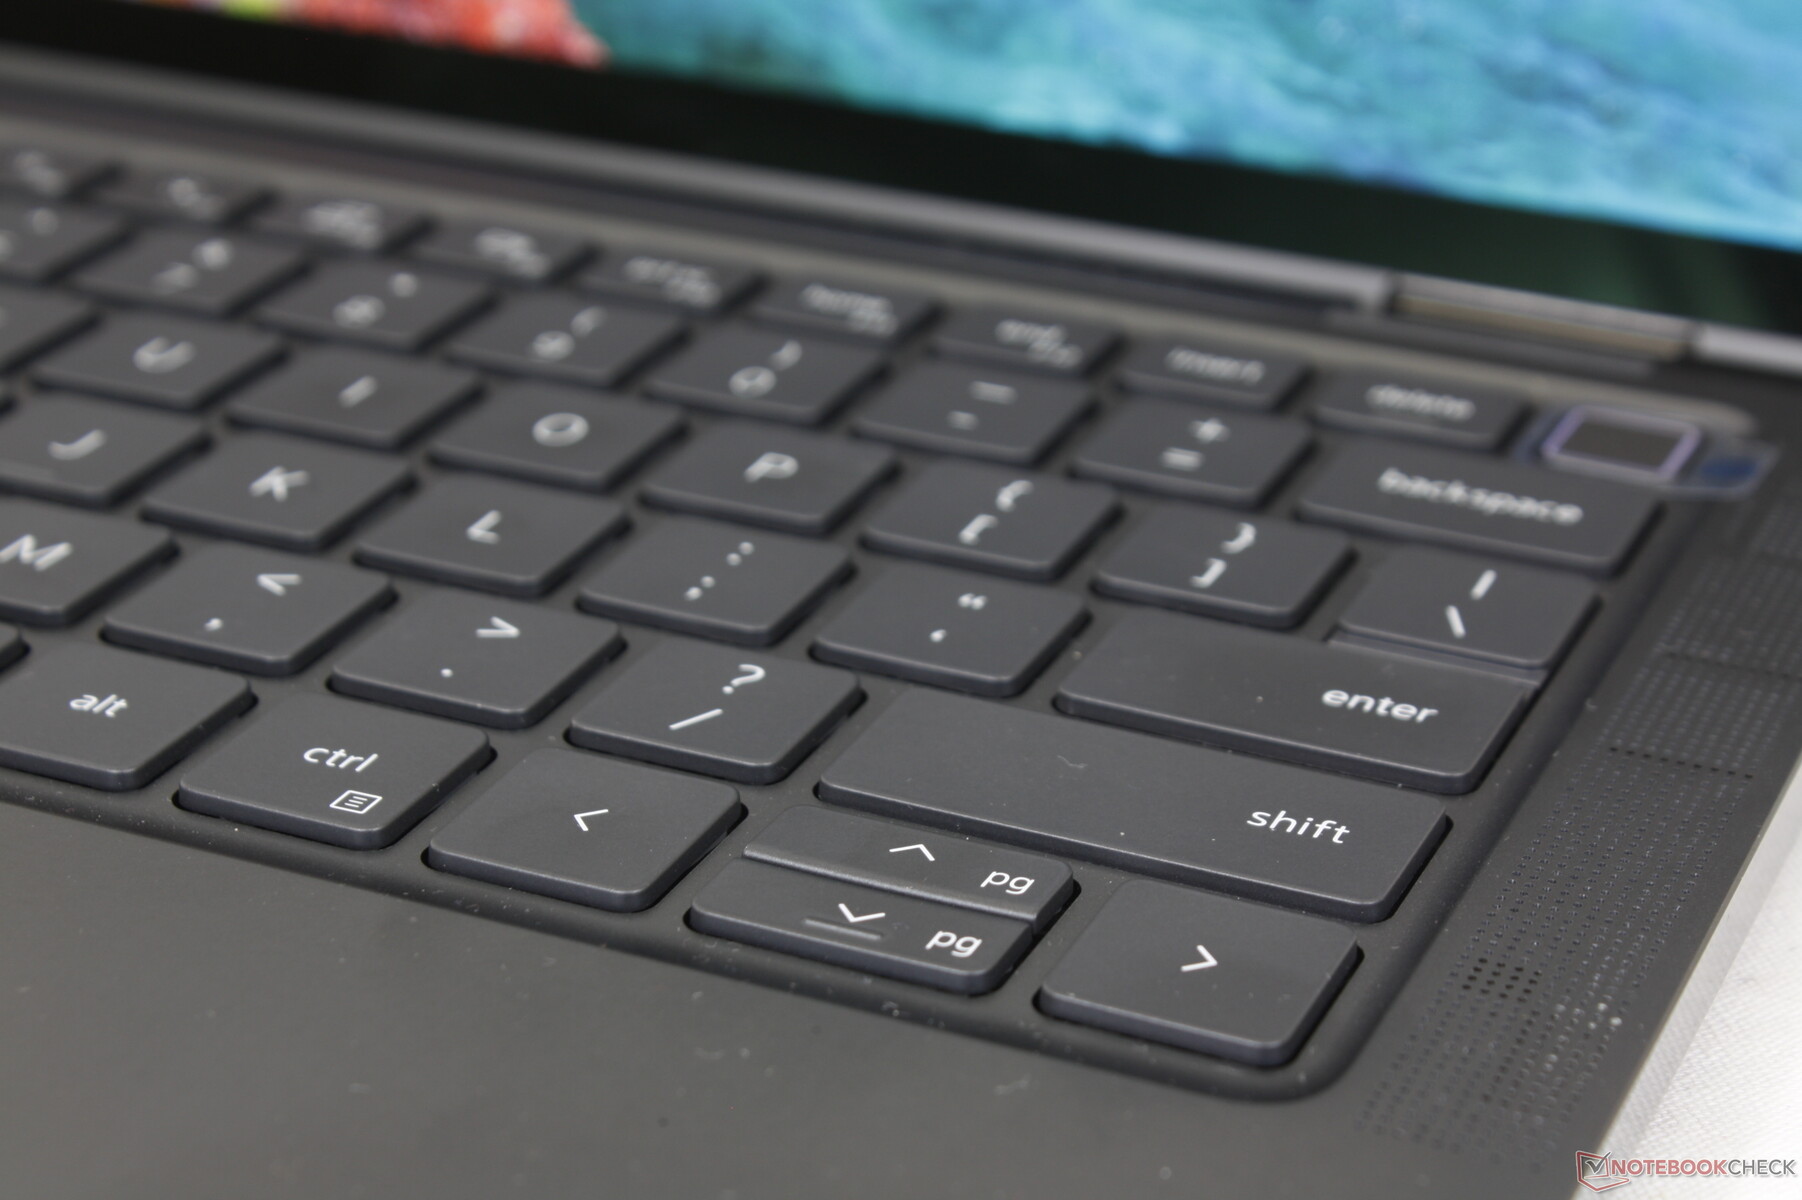
Las teclas del Latitude 9330 son más firmes y con una respuesta más fuerte que las del Serie XPS 13 9315 para una experiencia de tecleo más cómoda. Son más comparables a las teclas de las series Spectre o EliteBook que a las de los subportátiles de consumo más baratos. El ruido es moderadamente fuerte, sin embargo, lo que es una consecuencia de la respuesta más nítida.
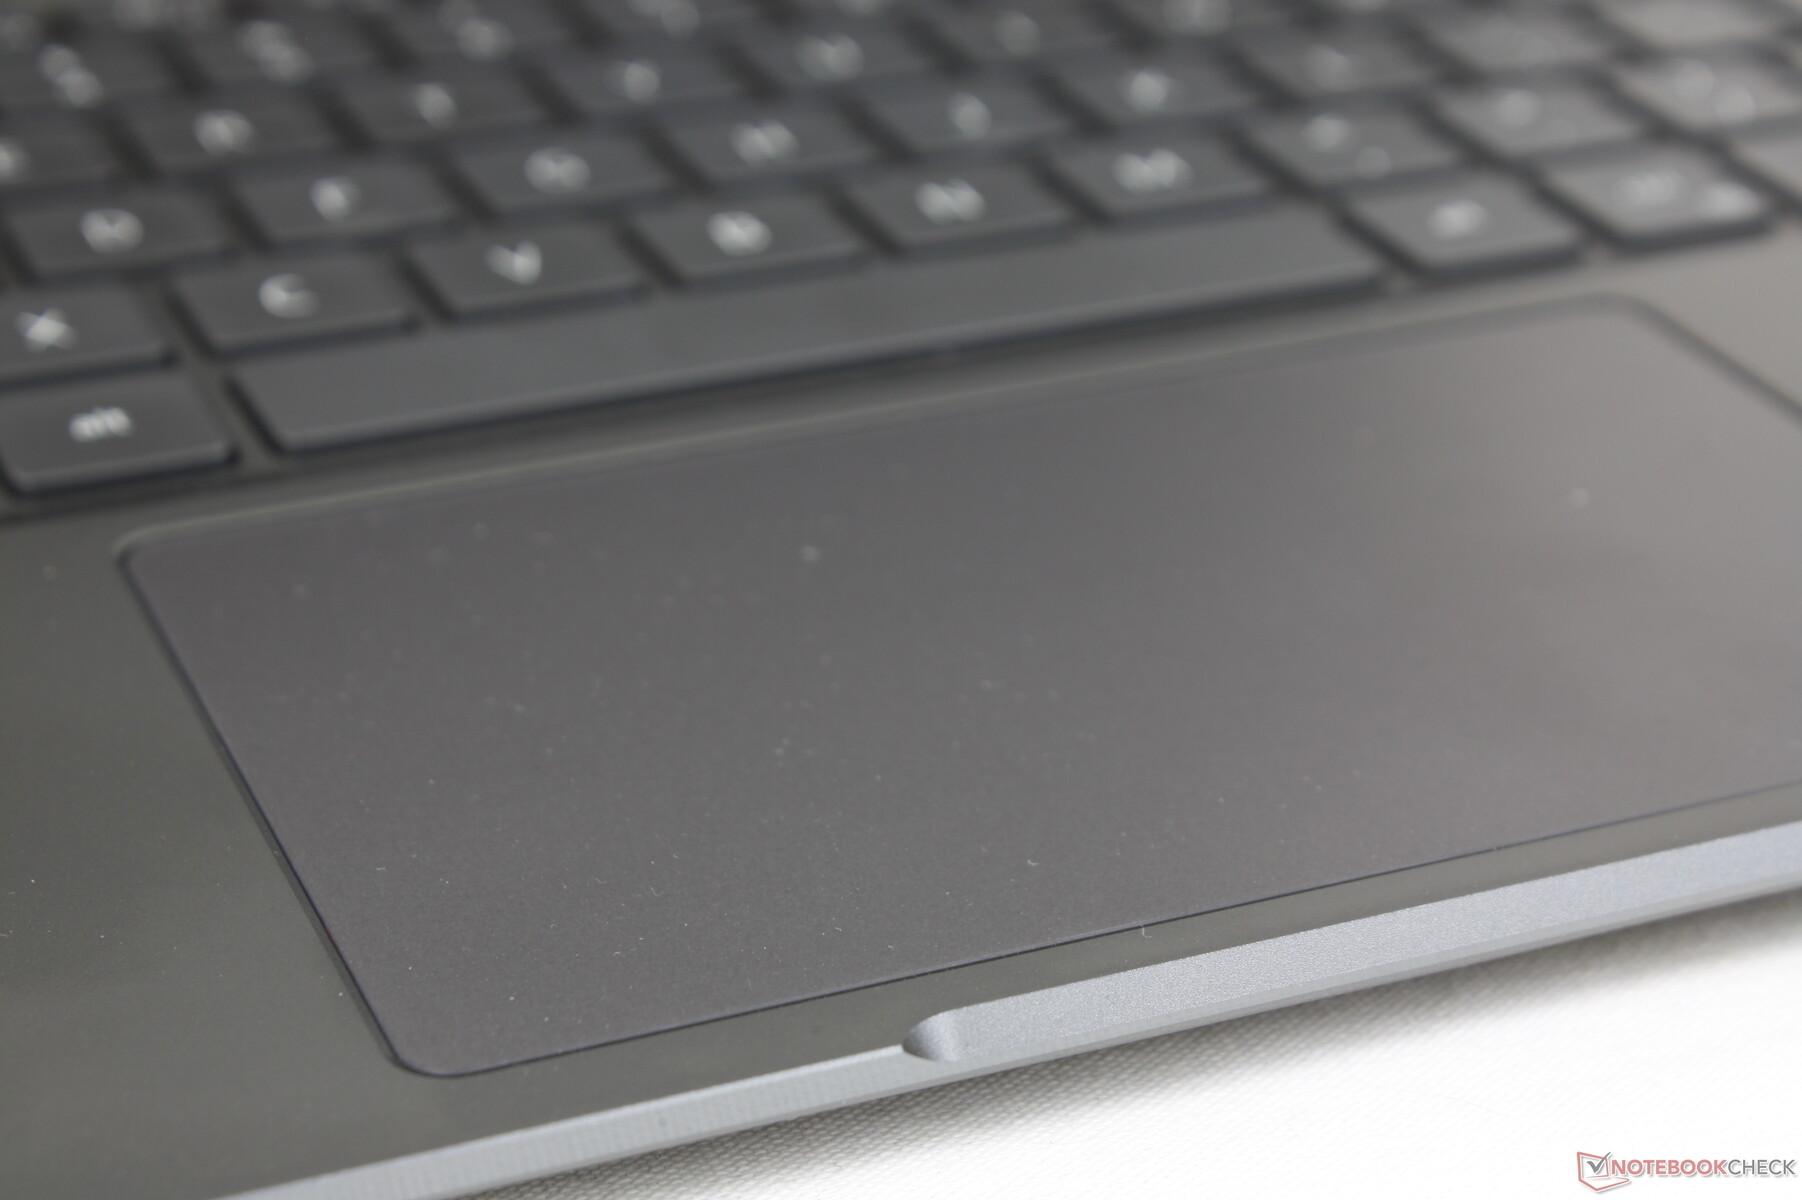
Teclado táctil
El clickpad es más grande que el del ThinkPad X1 Titanium Yoga (11,5 x 6,8 cm frente a 9 x 6,5 cm) para facilitar las entradas multitáctiles a pesar del pequeño factor de forma de 13 pulgadas. En el lado opuesto, no hay botones de ratón dedicados, por lo que las acciones de arrastrar y soltar son más difíciles de realizar. Su superficie es completamente lisa y sólo se pega un poco a velocidades más lentas para que los clics sean más precisos.
La respuesta al hacer clic en el clickpad es más suave y silenciosa que en la mayoría de los otros portátiles. Aunque algunos pueden apreciar la ausencia de un "clic" fuerte cuando se pulsa, la respuesta esponjosa no es muy satisfactoria.
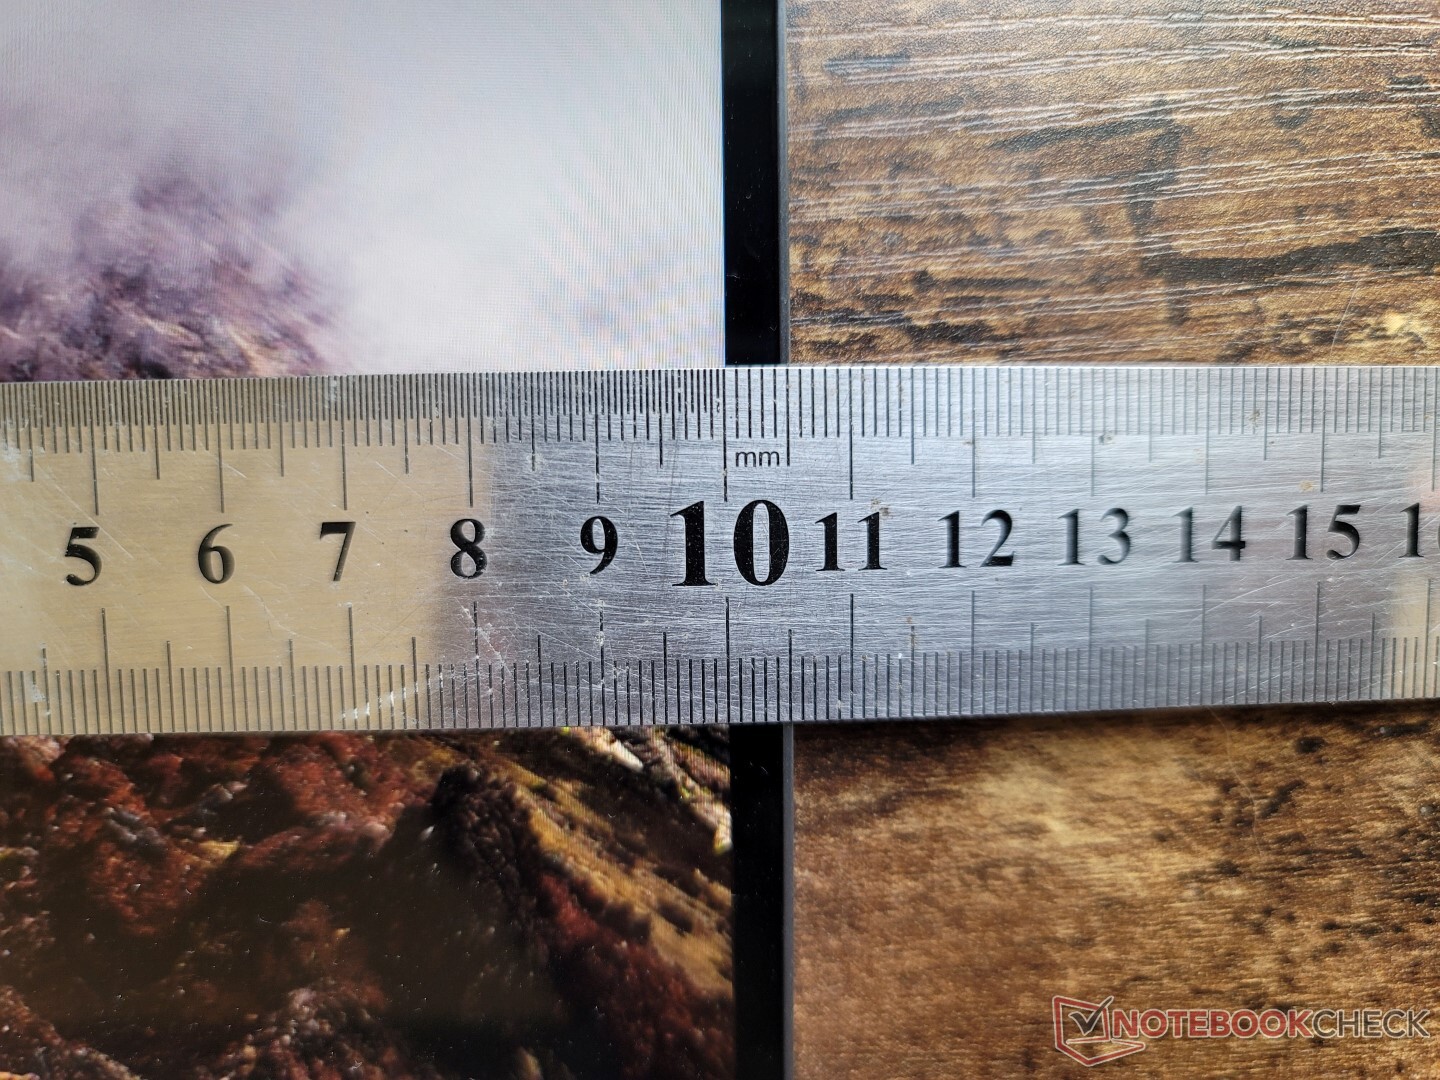
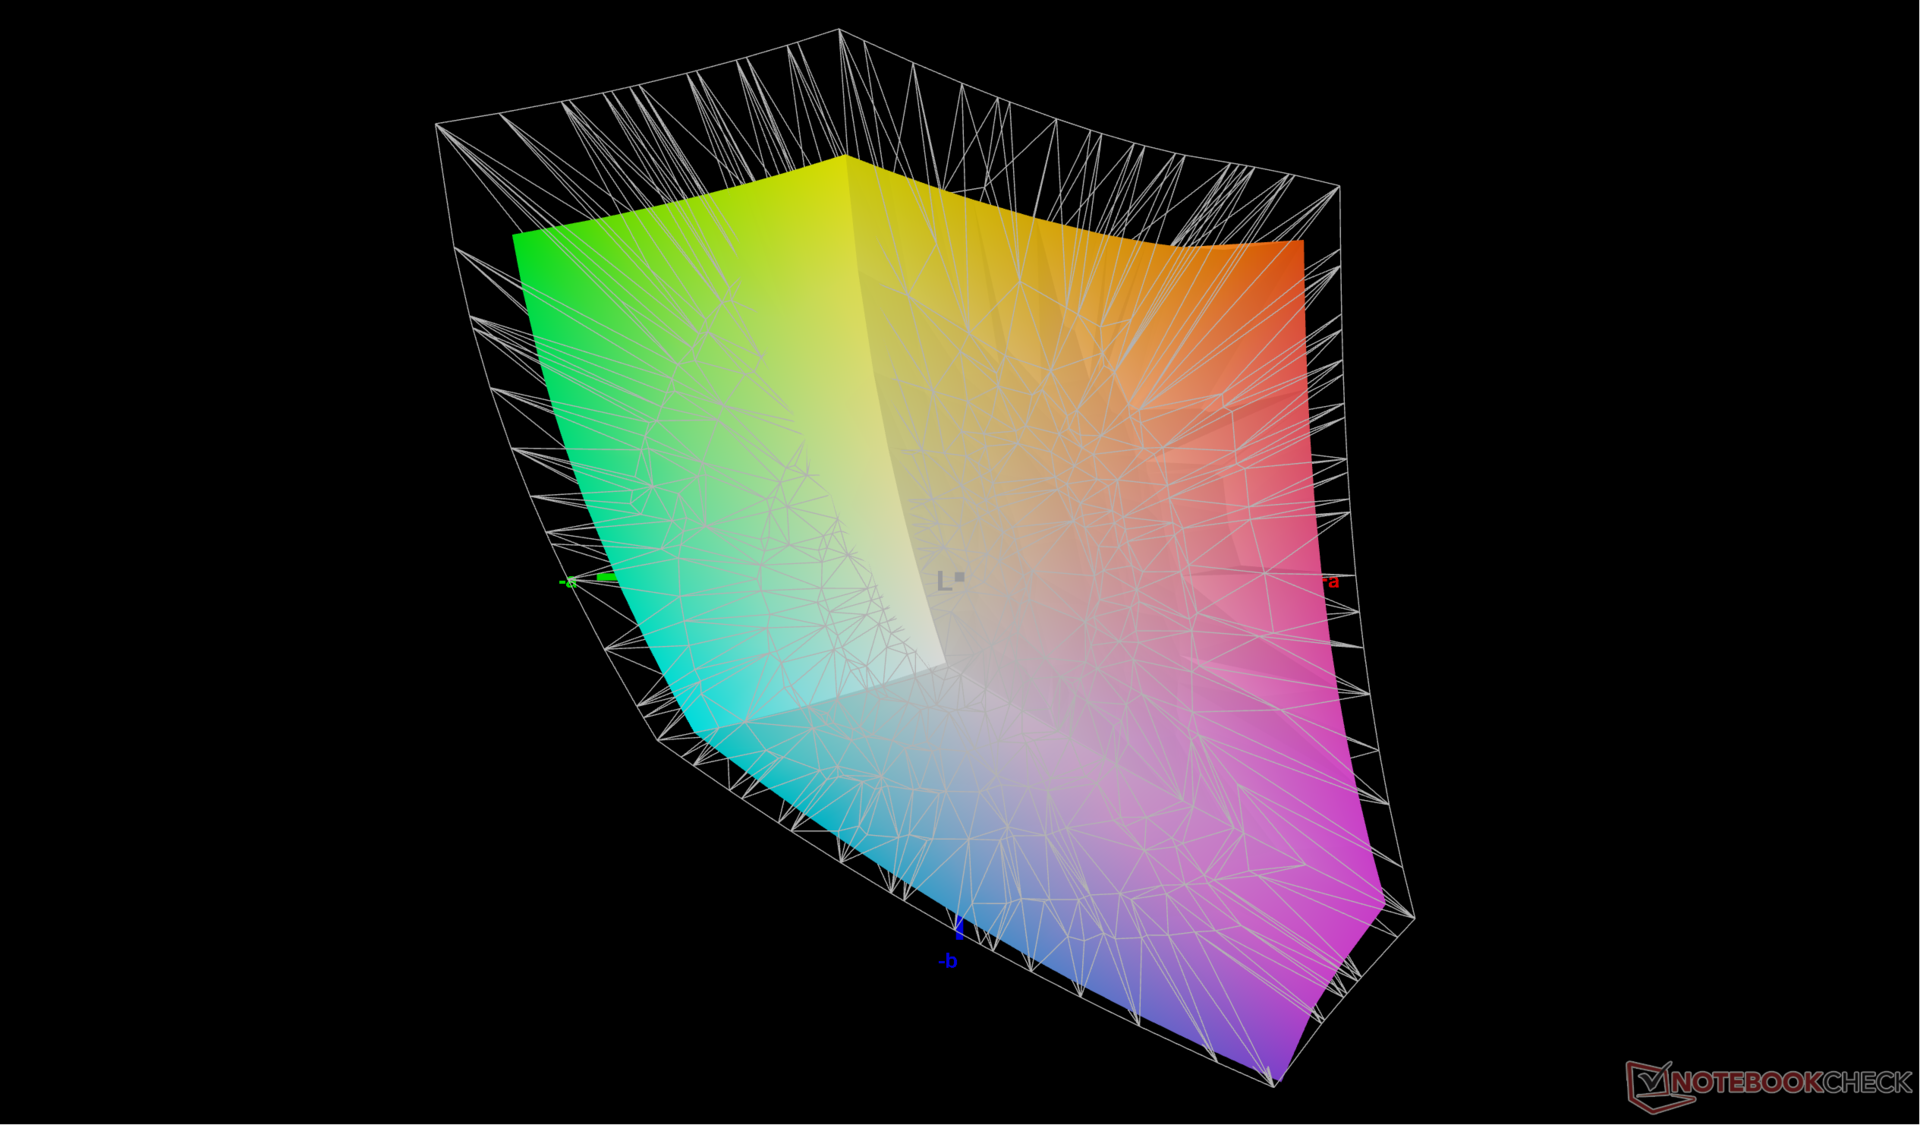
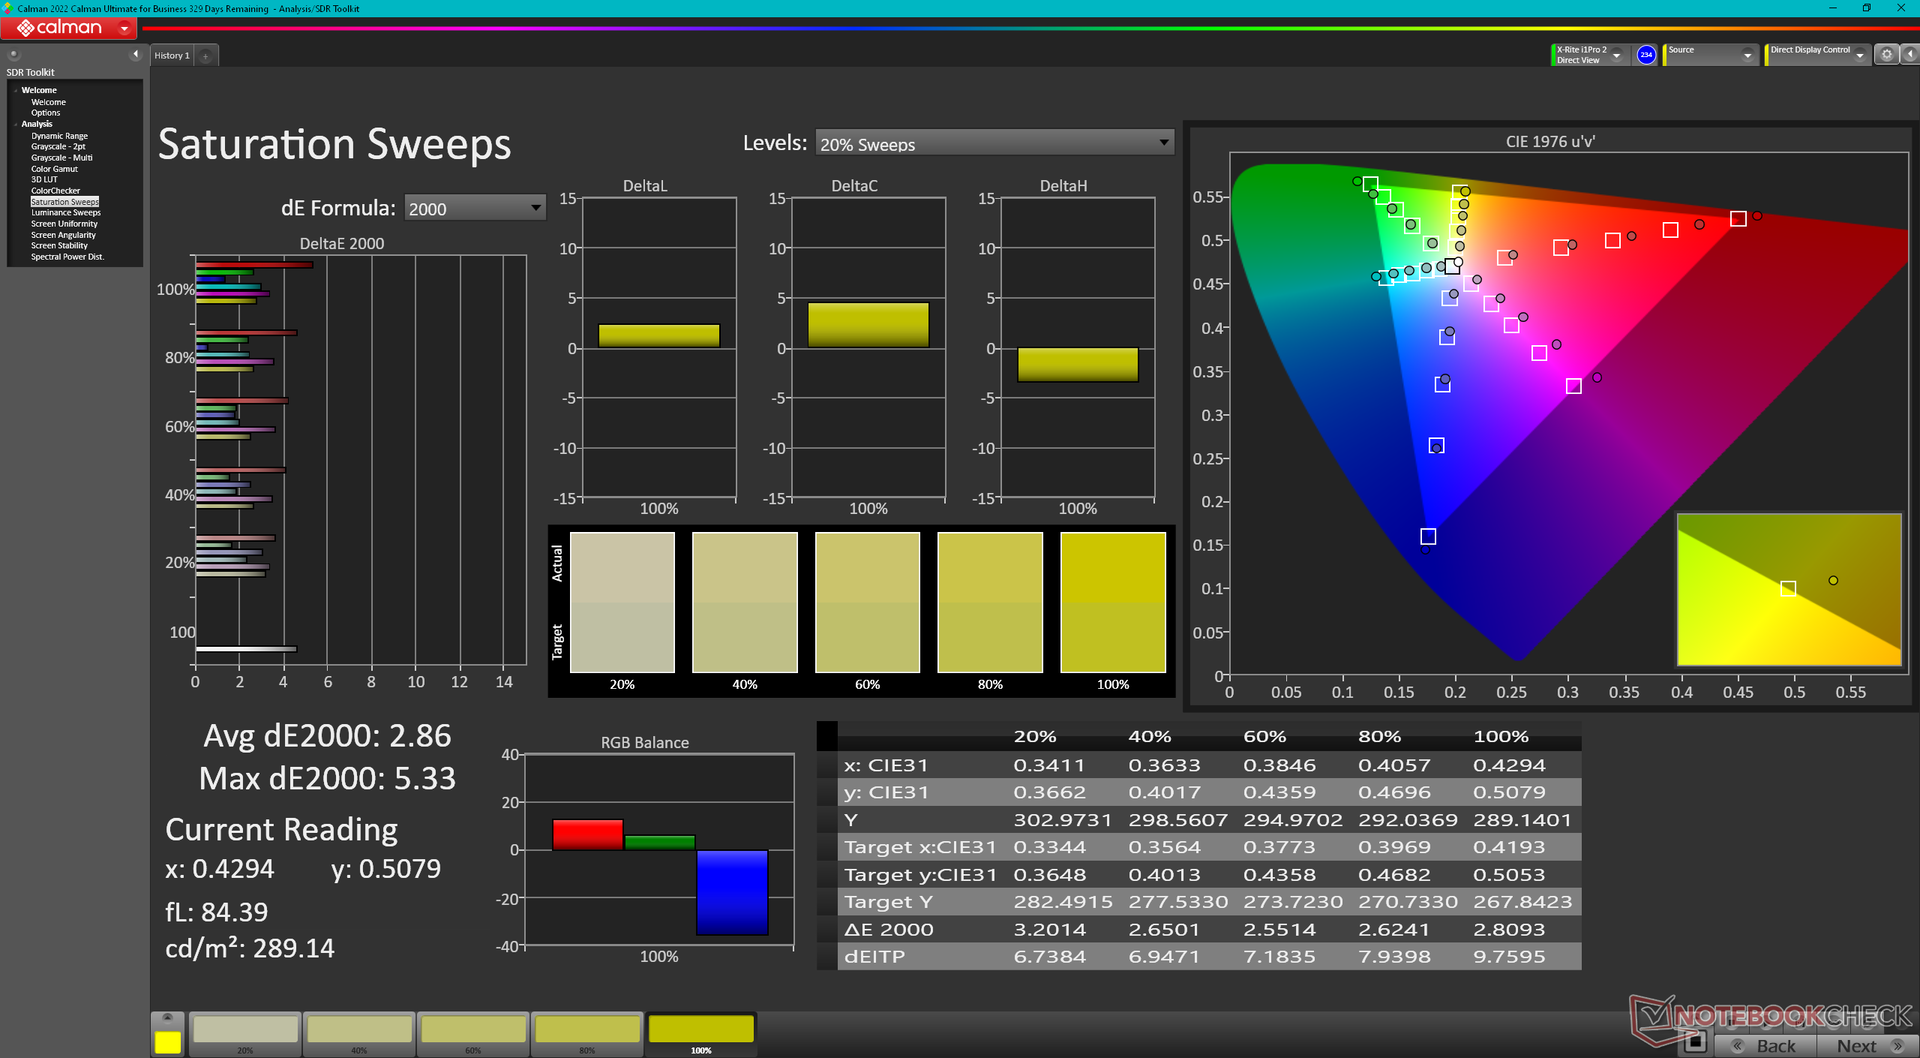
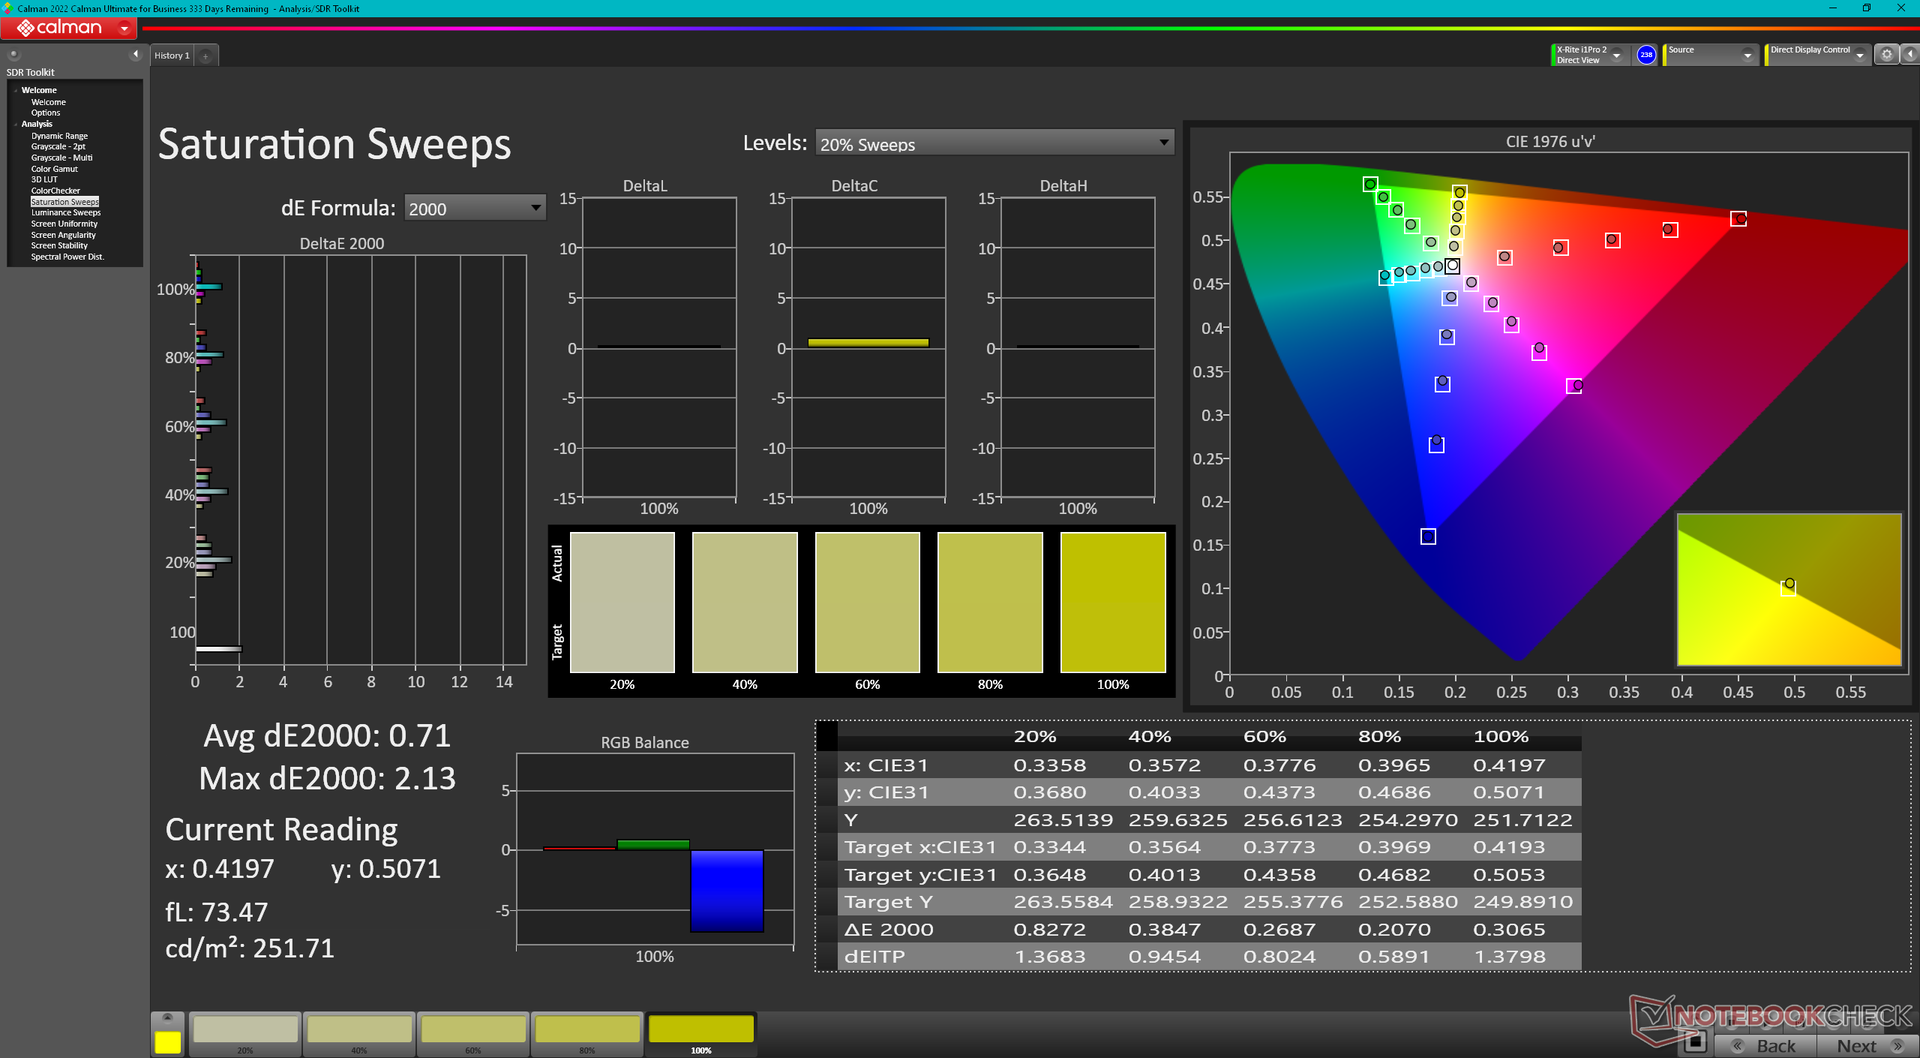
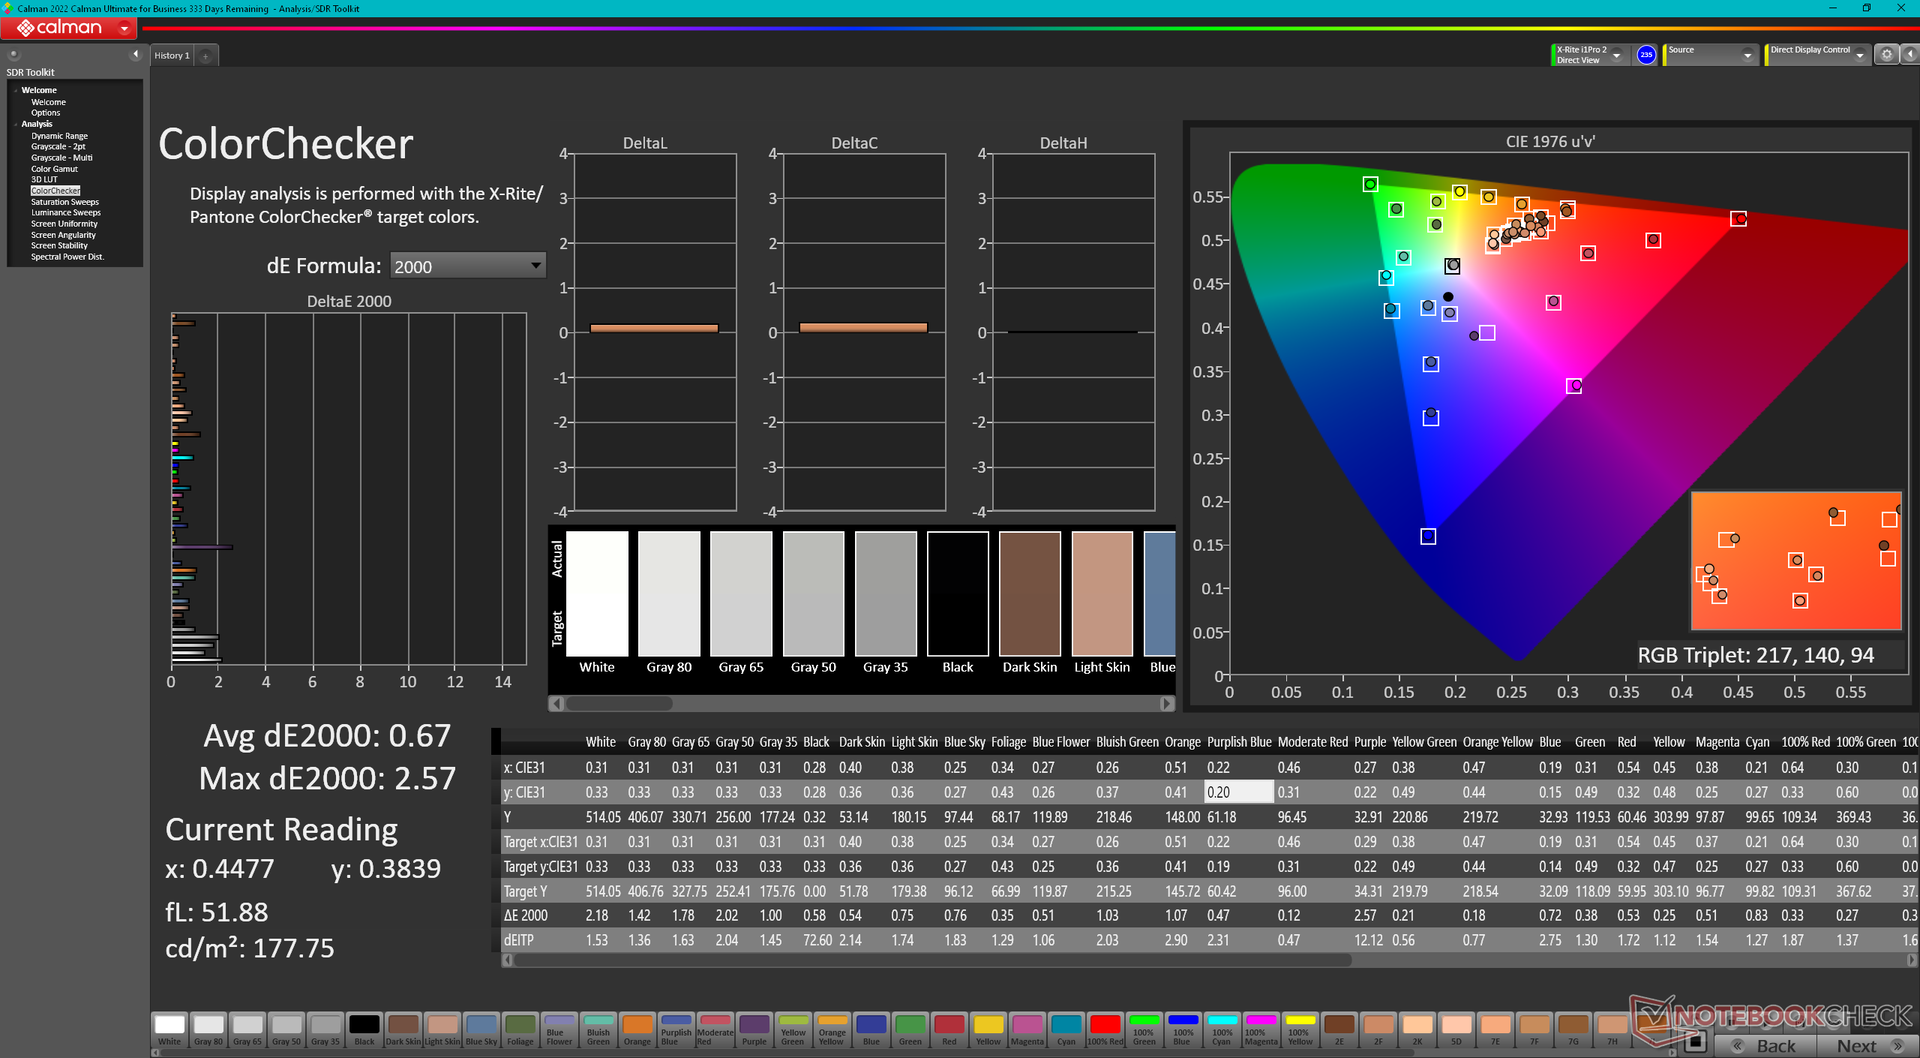
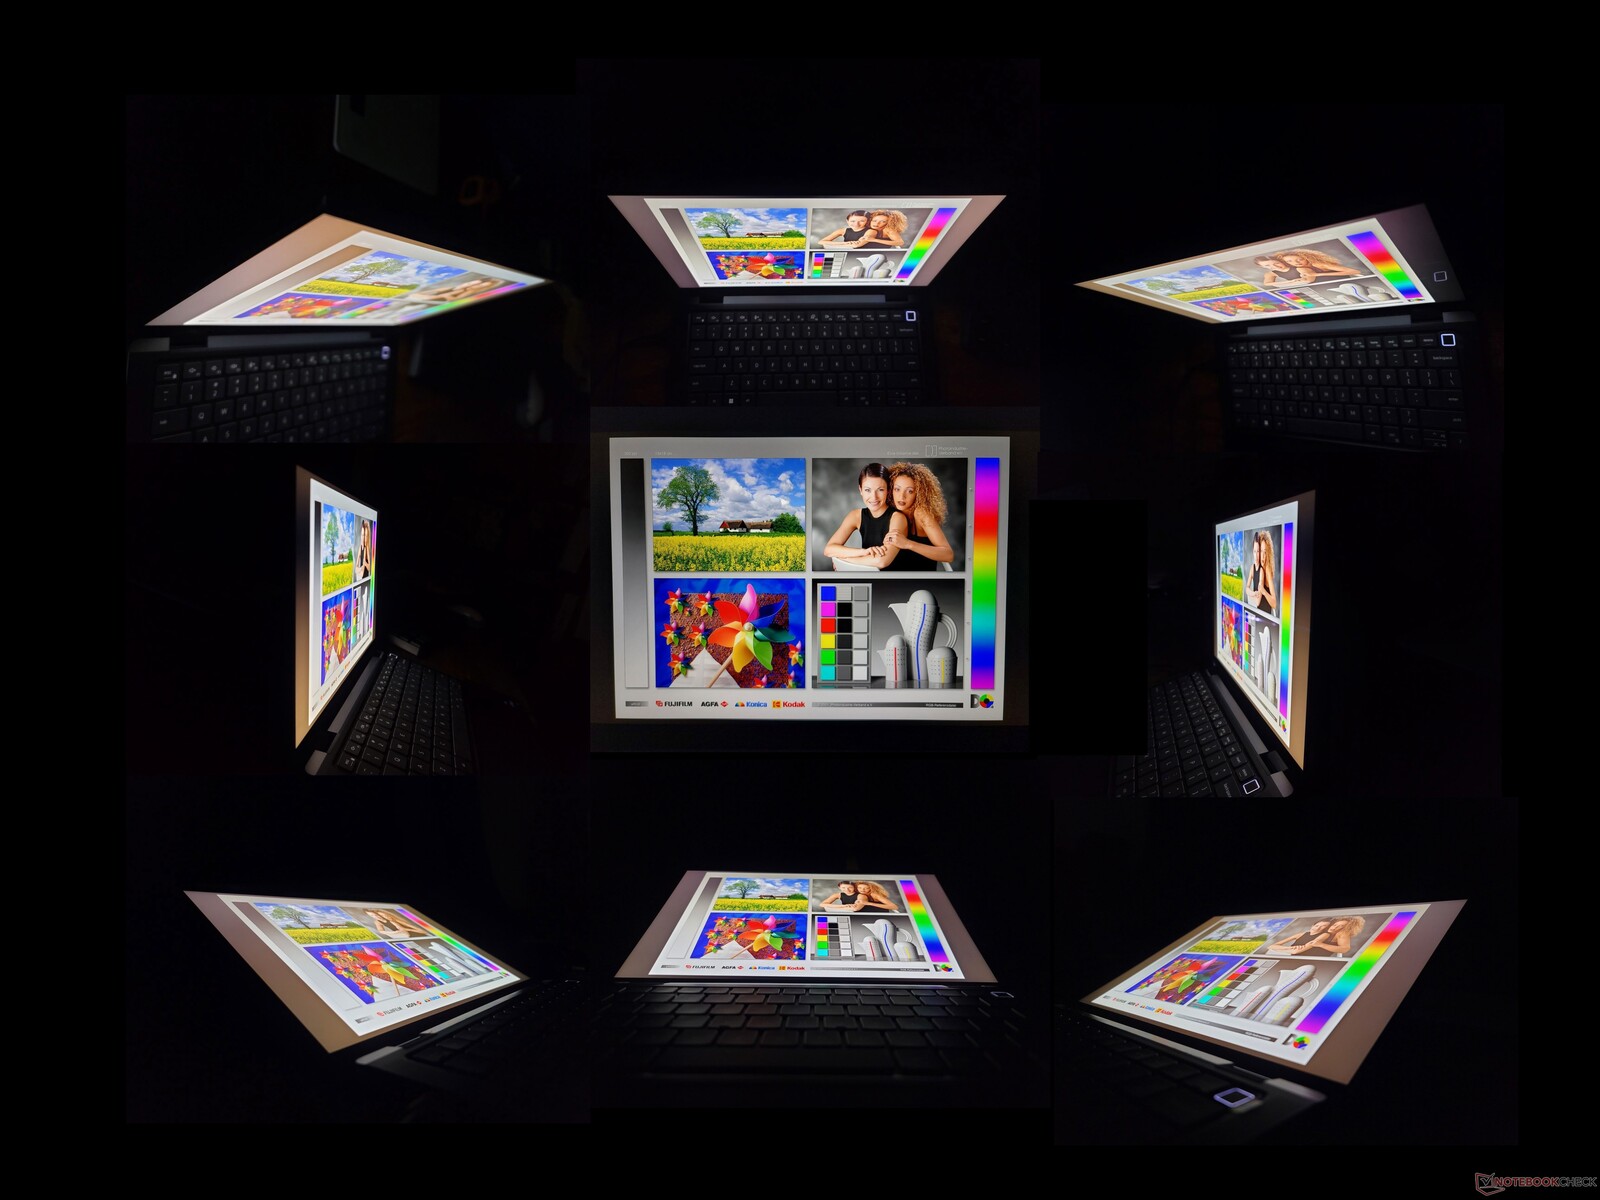
Pantalla - 100% sRGB, pantalla táctil IPS de 500 nits
Dell anuncia una pantalla táctil de 500 nits con cobertura sRGB completa que podemos confirmar con nuestras mediciones independientes. Es una pantalla de gama alta con niveles de brillo y contraste similares a los de la pantalla del MSI Summit E13 Flip.
Los dos mayores inconvenientes de la pantalla son los lentísimos tiempos de respuesta en blanco y negro y la limitada tasa de refresco de 60 Hz. Aunque no es una máquina de juegos, el ghosting es difícil de pasar por alto incluso cuando se navega por la web, mientras que la tasa de refresco de 60 Hz está empezando a mostrar su edad. Una mayor frecuencia de refresco habría mejorado la respuesta de la pantalla táctil también.
No hay opciones para algo más brillante o con colores P3 más amplios ya que todos los SKUs Latitude 9330 vienen con el mismo panel AU Optronics por el momento.
| |||||||||||||||||||||||||
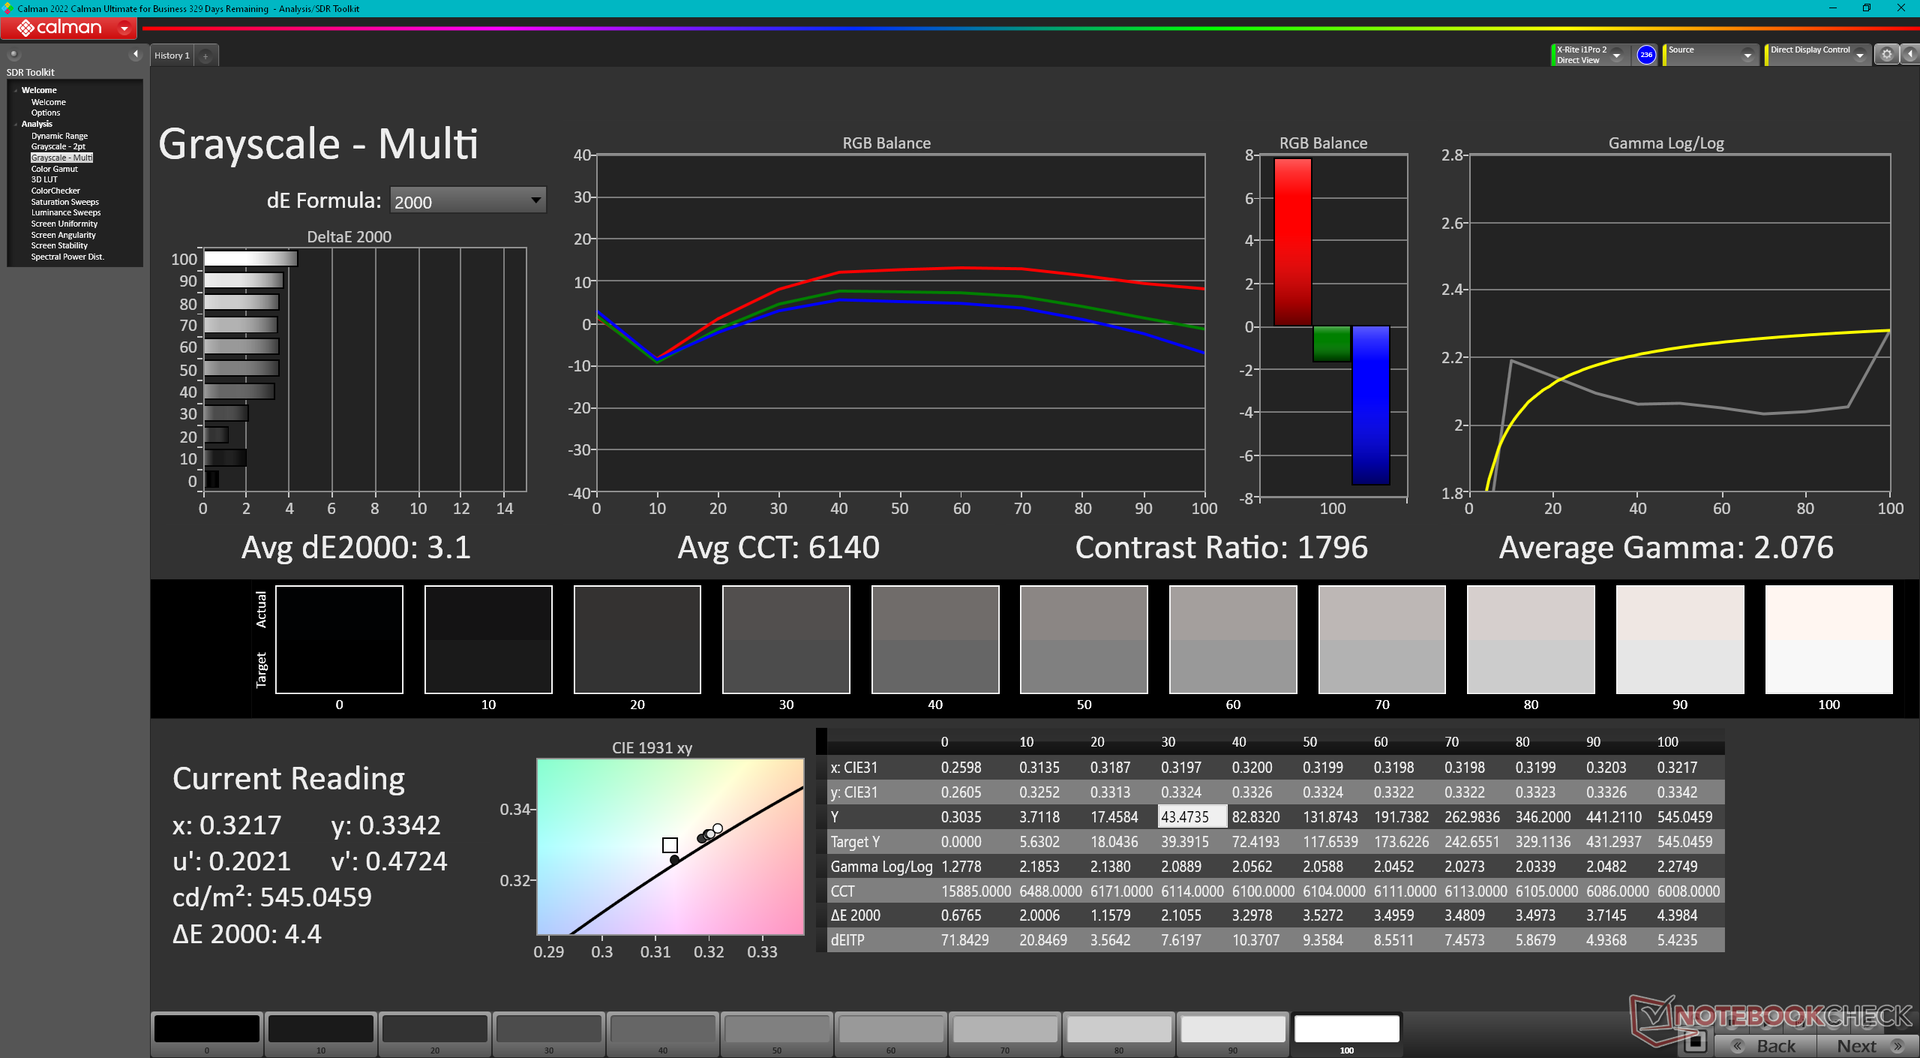
iluminación: 85 %
Brillo con batería: 542.3 cd/m²
Contraste: 1427:1 (Negro: 0.38 cd/m²)
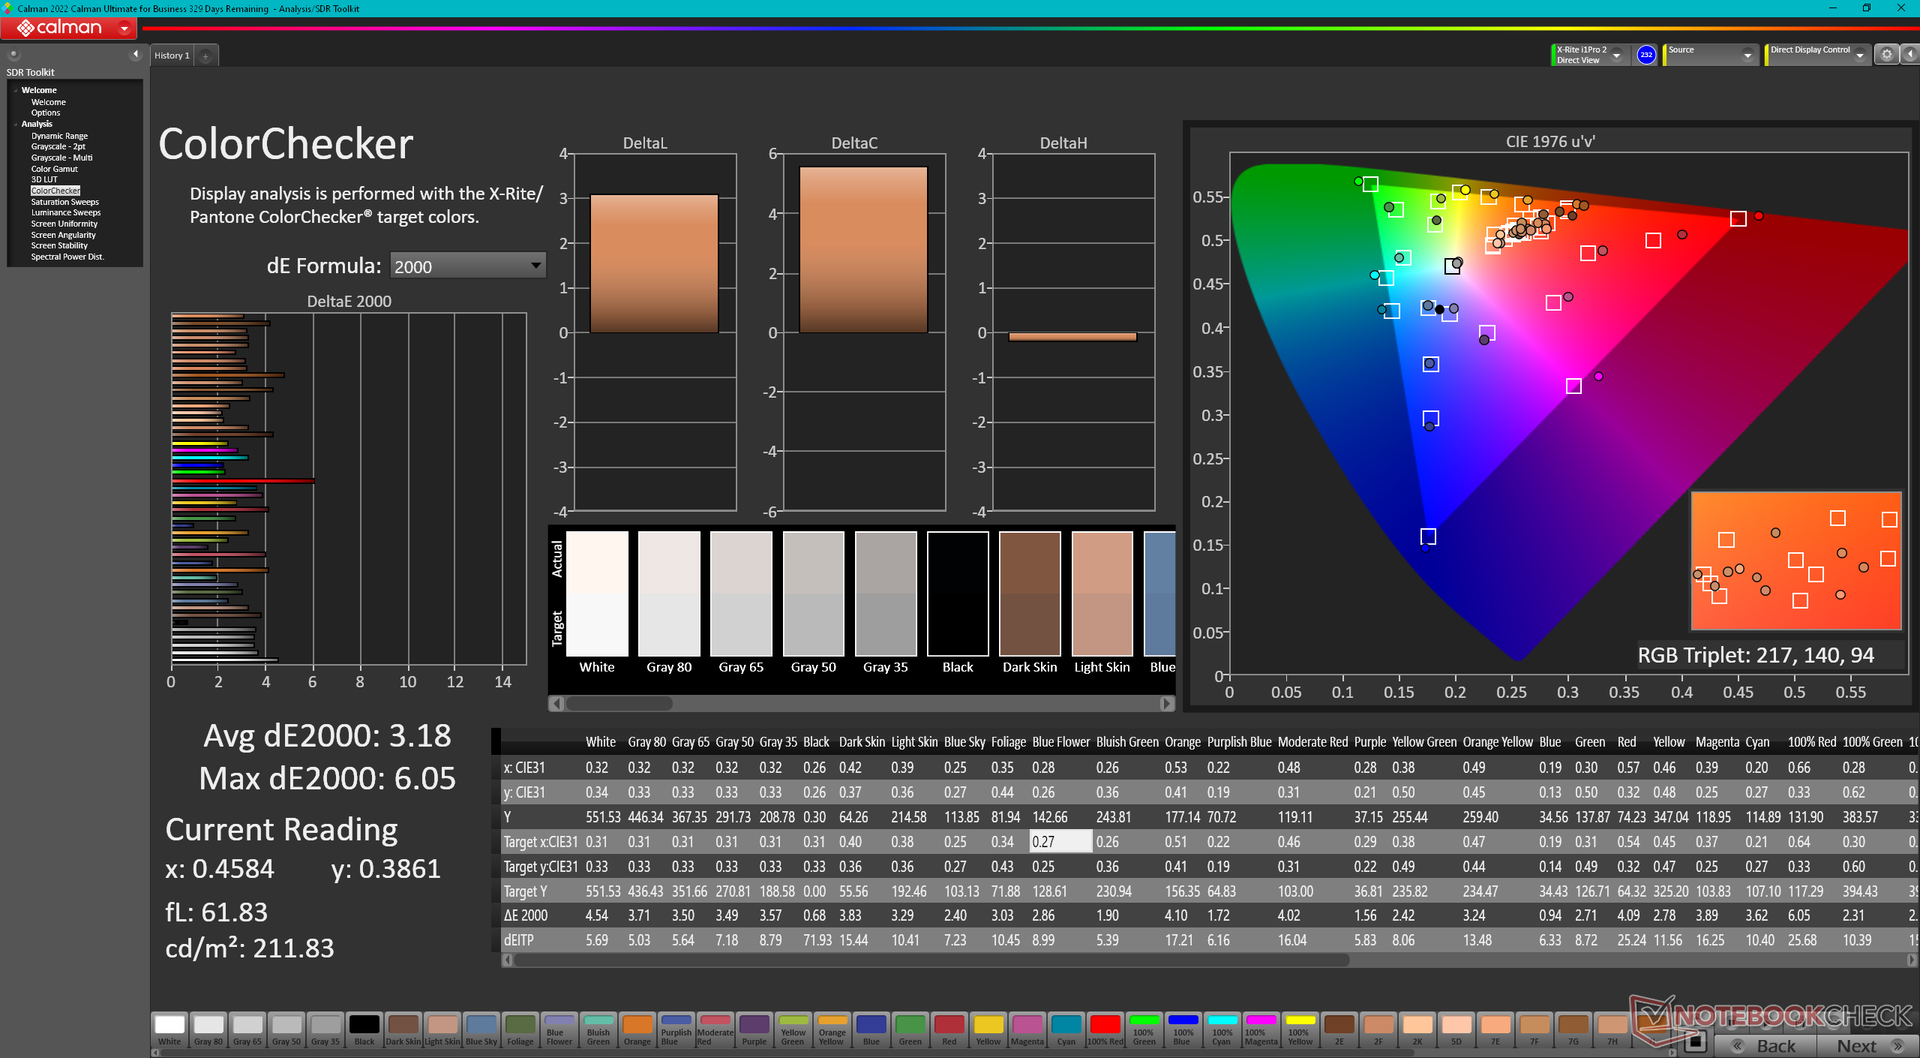
ΔE ColorChecker Calman: 3.18 | ∀{0.5-29.43 Ø4.73}
calibrated: 0.67
ΔE Greyscale Calman: 3.1 | ∀{0.09-98 Ø4.97}
77.5% AdobeRGB 1998 (Argyll 3D)
99.9% sRGB (Argyll 3D)
77.8% Display P3 (Argyll 3D)
Gamma: 2.08
CCT: 6140 K
| Dell Latitude 9330 AU Optronics B133QAA, IPS, 2560x1600, 13.3" | Lenovo ThinkPad X1 Titanium Yoga G1 20QB0016GE LPM135M467, IPS LED, 2256x1504, 13.5" | MSI Summit E13 Flip Evo A11MT Sharp LQ134N1JW53, IPS, 1920x1200, 13.4" | HP EliteBook x360 1030 G7 Chi Mei CMN13A9, IPS, 1920x1080, 13.3" | HP Elite Dragonfly Max InfoVision X133NVFL R0, IPS, 1920x1080, 13.3" | Dell Latitude 5310-23VP6 Chi Mei CMN1382, IPS, 1920x1080, 13.3" | |
|---|---|---|---|---|---|---|
| Display | -9% | -7% | -10% | -8% | ||
| Display P3 Coverage (%) | 77.8 | 66.8 -14% | 69.8 -10% | 66.1 -15% | 67.5 -13% | |
| sRGB Coverage (%) | 99.9 | 98 -2% | 98.8 -1% | 97 -3% | 99 -1% | |
| AdobeRGB 1998 Coverage (%) | 77.5 | 68.6 -11% | 70.6 -9% | 67.7 -13% | 69.2 -11% | |
| Response Times | 9% | 9% | 25% | 36% | 50% | |
| Response Time Grey 50% / Grey 80% * (ms) | 67.6 ? | 64 ? 5% | 64 ? 5% | 56.4 ? 17% | 44.8 ? 34% | 36 ? 47% |
| Response Time Black / White * (ms) | 50.4 ? | 44 ? 13% | 44 ? 13% | 34.4 ? 32% | 32 ? 37% | 24 ? 52% |
| PWM Frequency (Hz) | 26040 ? | 2500 ? | ||||
| Screen | 9% | 3% | -25% | 10% | 2% | |
| Brightness middle (cd/m²) | 542.3 | 465 -14% | 551.3 2% | 425.4 -22% | 777.5 43% | 383 -29% |
| Brightness (cd/m²) | 516 | 451 -13% | 517 0% | 407 -21% | 727 41% | 364 -29% |
| Brightness Distribution (%) | 85 | 92 8% | 91 7% | 89 5% | 75 -12% | 84 -1% |
| Black Level * (cd/m²) | 0.38 | 0.28 26% | 0.37 3% | 0.28 26% | 0.44 -16% | 0.34 11% |
| Contrast (:1) | 1427 | 1661 16% | 1490 4% | 1519 6% | 1767 24% | 1126 -21% |
| Colorchecker dE 2000 * | 3.18 | 2 37% | 1.45 54% | 4.39 -38% | 1.62 49% | 2.24 30% |
| Colorchecker dE 2000 max. * | 6.05 | 4.7 22% | 2.86 53% | 6.73 -11% | 5.26 13% | 3.32 45% |
| Colorchecker dE 2000 calibrated * | 0.67 | 0.7 -4% | 1.7 -154% | 1.65 -146% | 1.32 -97% | 0.72 -7% |
| Greyscale dE 2000 * | 3.1 | 2.9 6% | 1.3 58% | 3.9 -26% | 1.6 48% | 2.42 22% |
| Gamma | 2.08 106% | 2.09 105% | 2.14 103% | 1.87 118% | 2.2 100% | 2.65 83% |
| CCT | 6140 106% | 6181 105% | 6580 99% | 6758 96% | 6538 99% | 6776 96% |
| Color Space (Percent of AdobeRGB 1998) (%) | 65 | 61.7 | 72.3 | 56 | ||
| Color Space (Percent of sRGB) (%) | 99 | 96.6 | 94.8 | 99 | ||
| Media total (Programa/Opciones) | 3% /
5% | 2% /
2% | -3% /
-15% | 23% /
15% | 15% /
7% |
* ... más pequeño es mejor
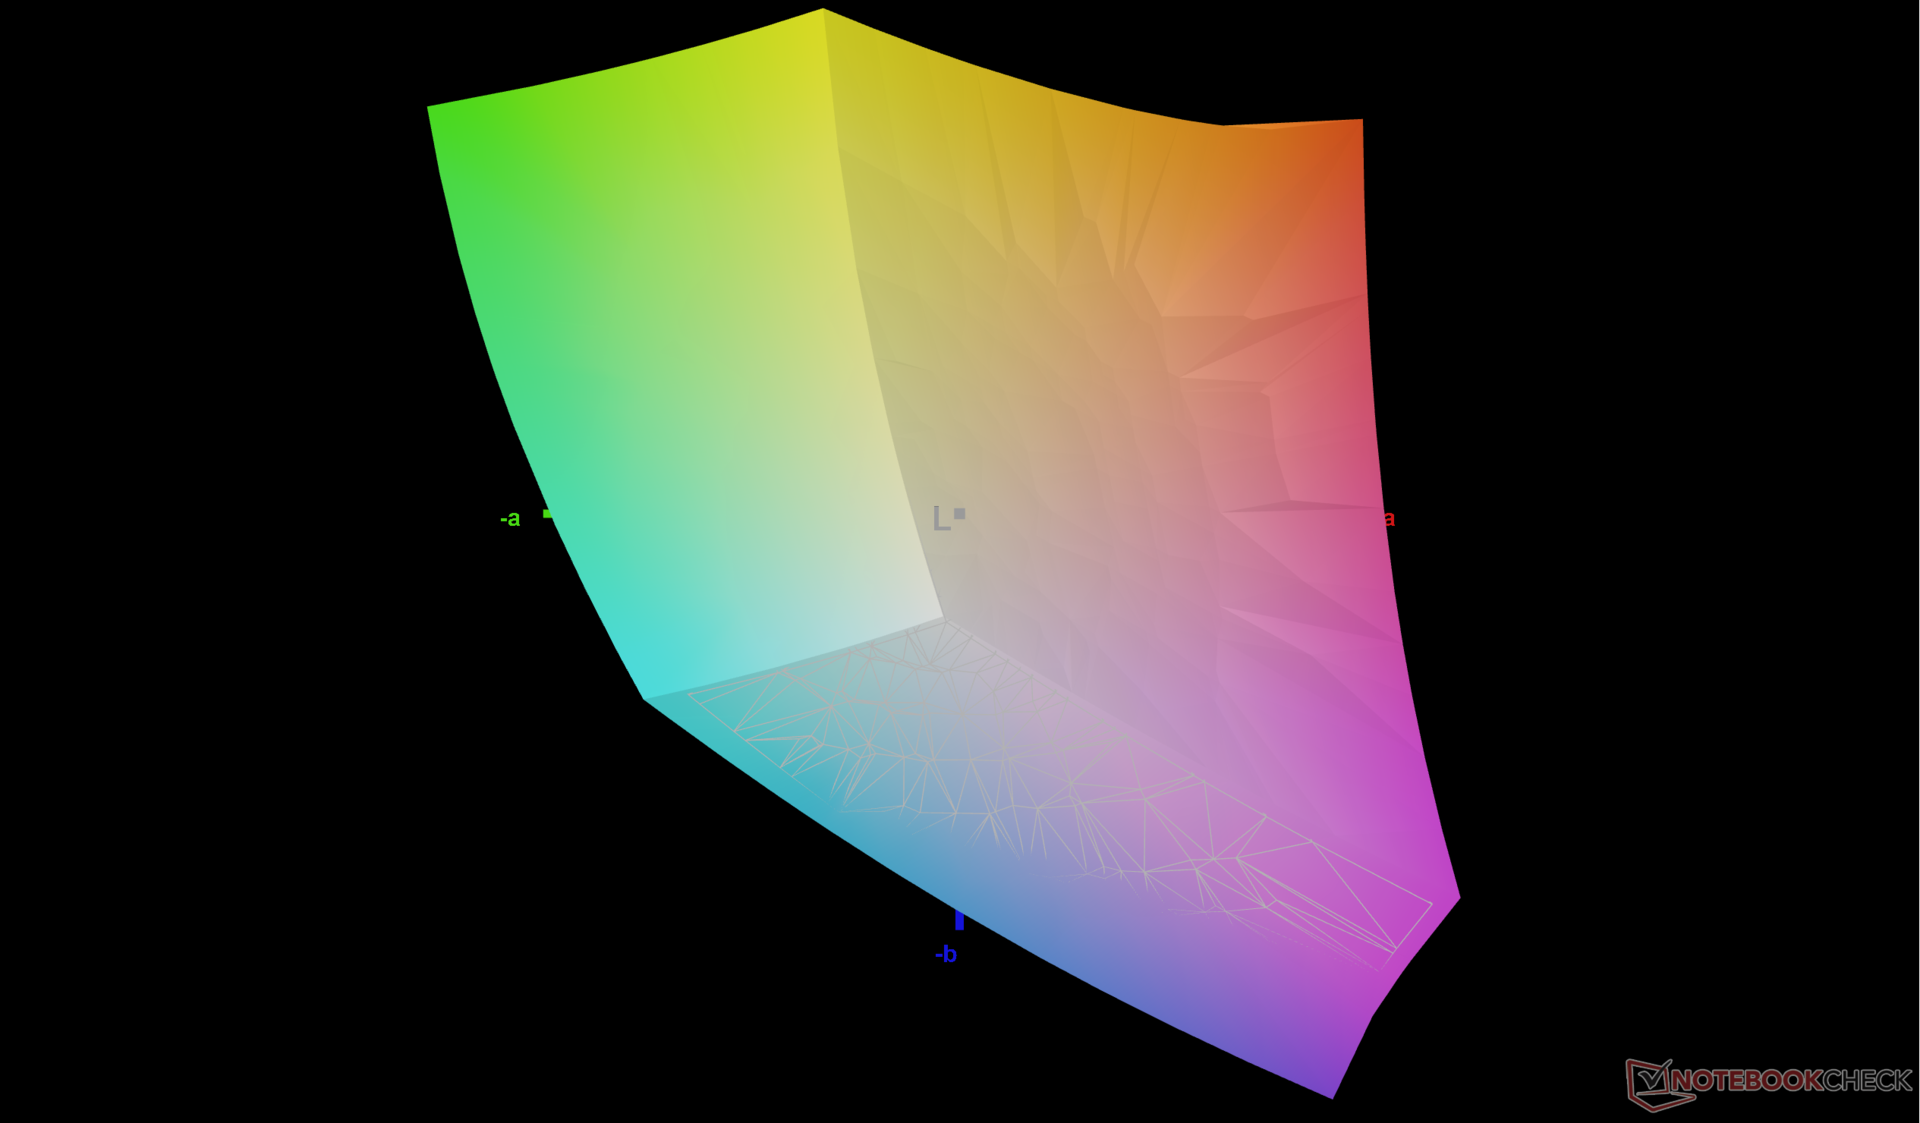
La pantalla no viene precalibrada, lo cual es decepcionante para un portátil que se vende por más de 2000 dólares. Calibrando el panel nosotros mismos con un colorímetro X-Rite mejoraríamos los valores medios de escala de grises y color DeltaE de 3,1 y 3,18 a sólo 1,4 y 0,67, respectivamente. Los usuarios pueden aplicar nuestro perfil ICM anterior para aprovechar mejor todos los colores sRGB de la pantalla.

Tiempos de respuesta del display
| ↔ Tiempo de respuesta de Negro a Blanco | ||
|---|---|---|
| 50.4 ms ... subida ↗ y bajada ↘ combinada | ↗ 26.8 ms subida | 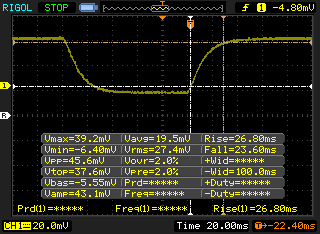 |
| ↘ 23.6 ms bajada | ||
| La pantalla mostró tiempos de respuesta lentos en nuestros tests y podría ser demasiado lenta para los jugones. En comparación, todos los dispositivos de prueba van de ##min### (mínimo) a 240 (máximo) ms. » 99 % de todos los dispositivos son mejores. Eso quiere decir que el tiempo de respuesta es peor que la media (19.9 ms) de todos los dispositivos testados. | ||
| ↔ Tiempo de respuesta 50% Gris a 80% Gris | ||
| 67.6 ms ... subida ↗ y bajada ↘ combinada | ↗ 34.8 ms subida | 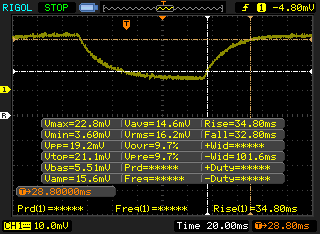 |
| ↘ 32.8 ms bajada | ||
| La pantalla mostró tiempos de respuesta lentos en nuestros tests y podría ser demasiado lenta para los jugones. En comparación, todos los dispositivos de prueba van de ##min### (mínimo) a 636 (máximo) ms. » 98 % de todos los dispositivos son mejores. Eso quiere decir que el tiempo de respuesta es peor que la media (31.1 ms) de todos los dispositivos testados. | ||
Parpadeo de Pantalla / PWM (Pulse-Width Modulation)
| Parpadeo de Pantalla / PWM no detectado |  | ||
Comparación: 52 % de todos los dispositivos testados no usaron PWM para atenuar el display. Si se usó, medimos una media de 7794 (mínimo: 5 - máxmo: 343500) Hz. | |||
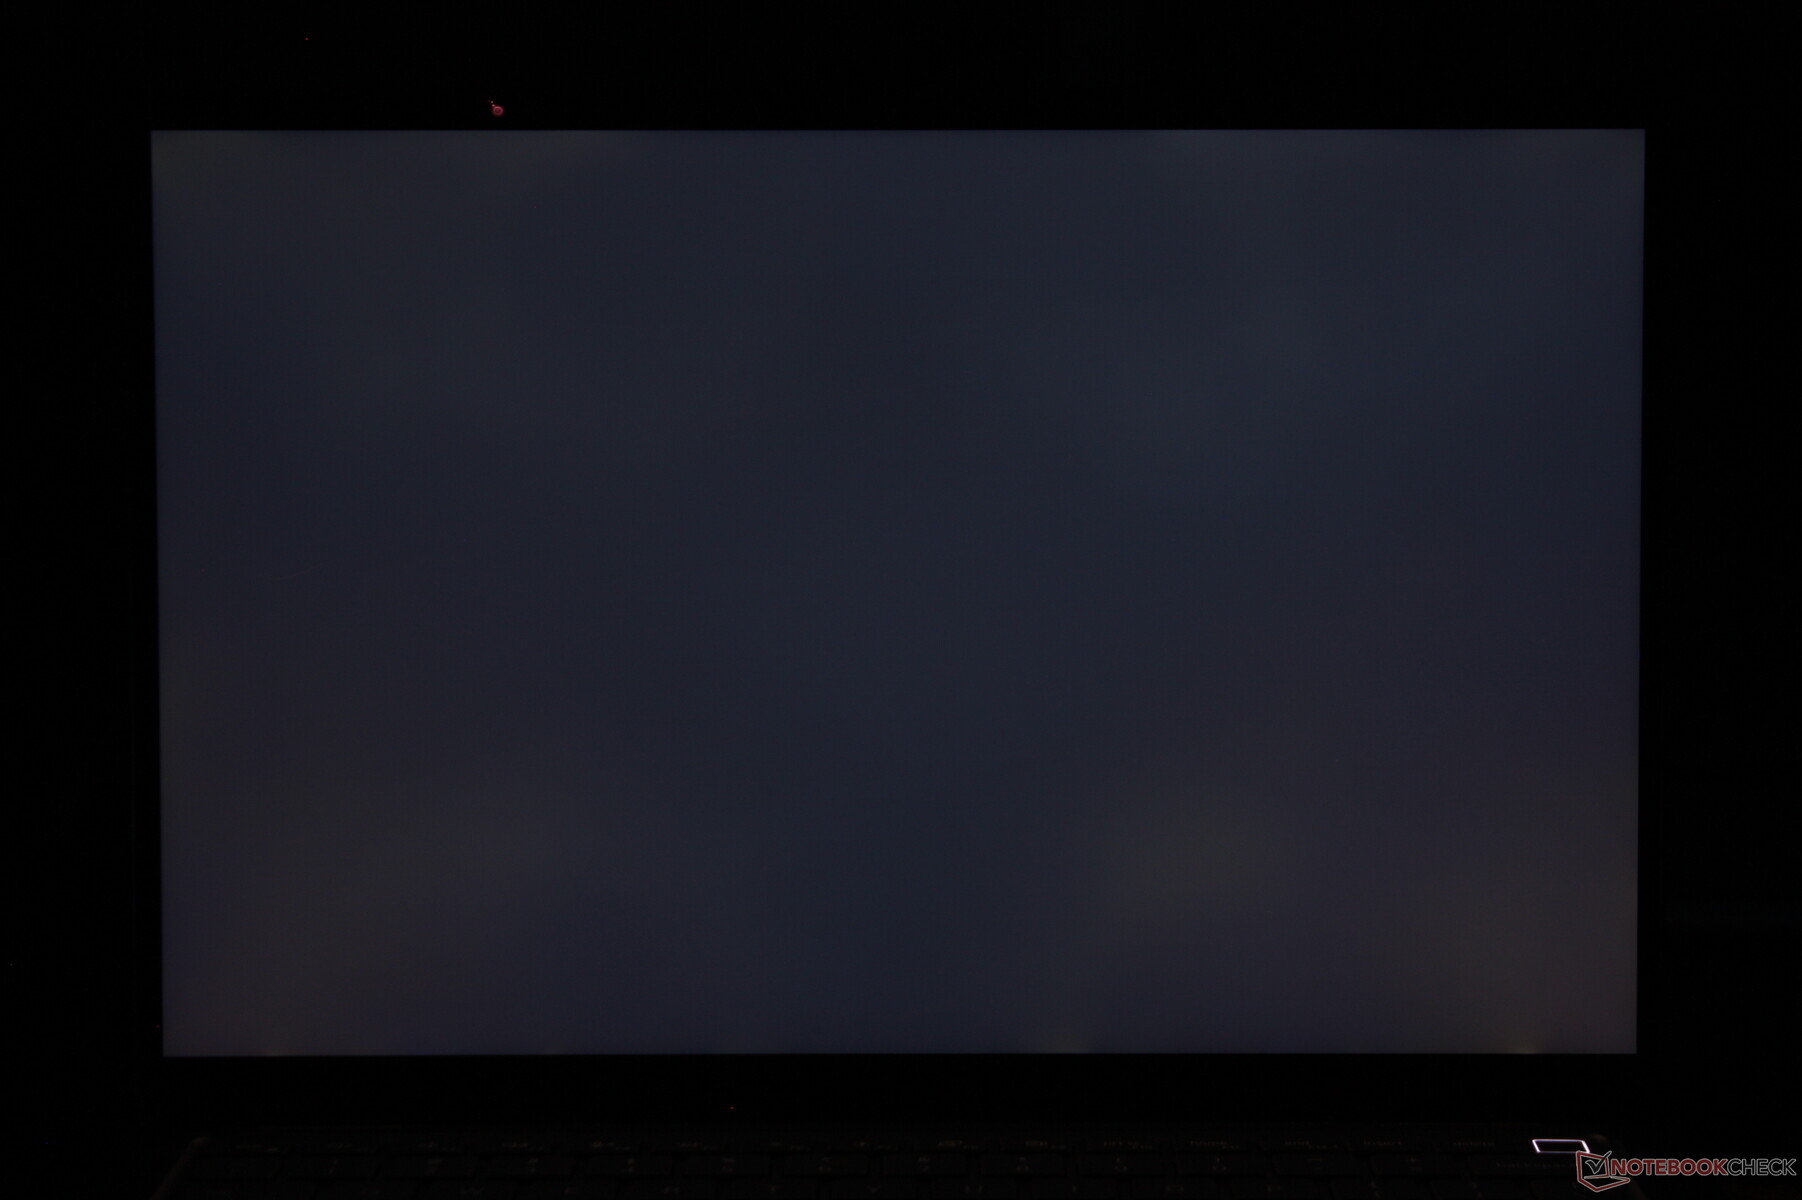
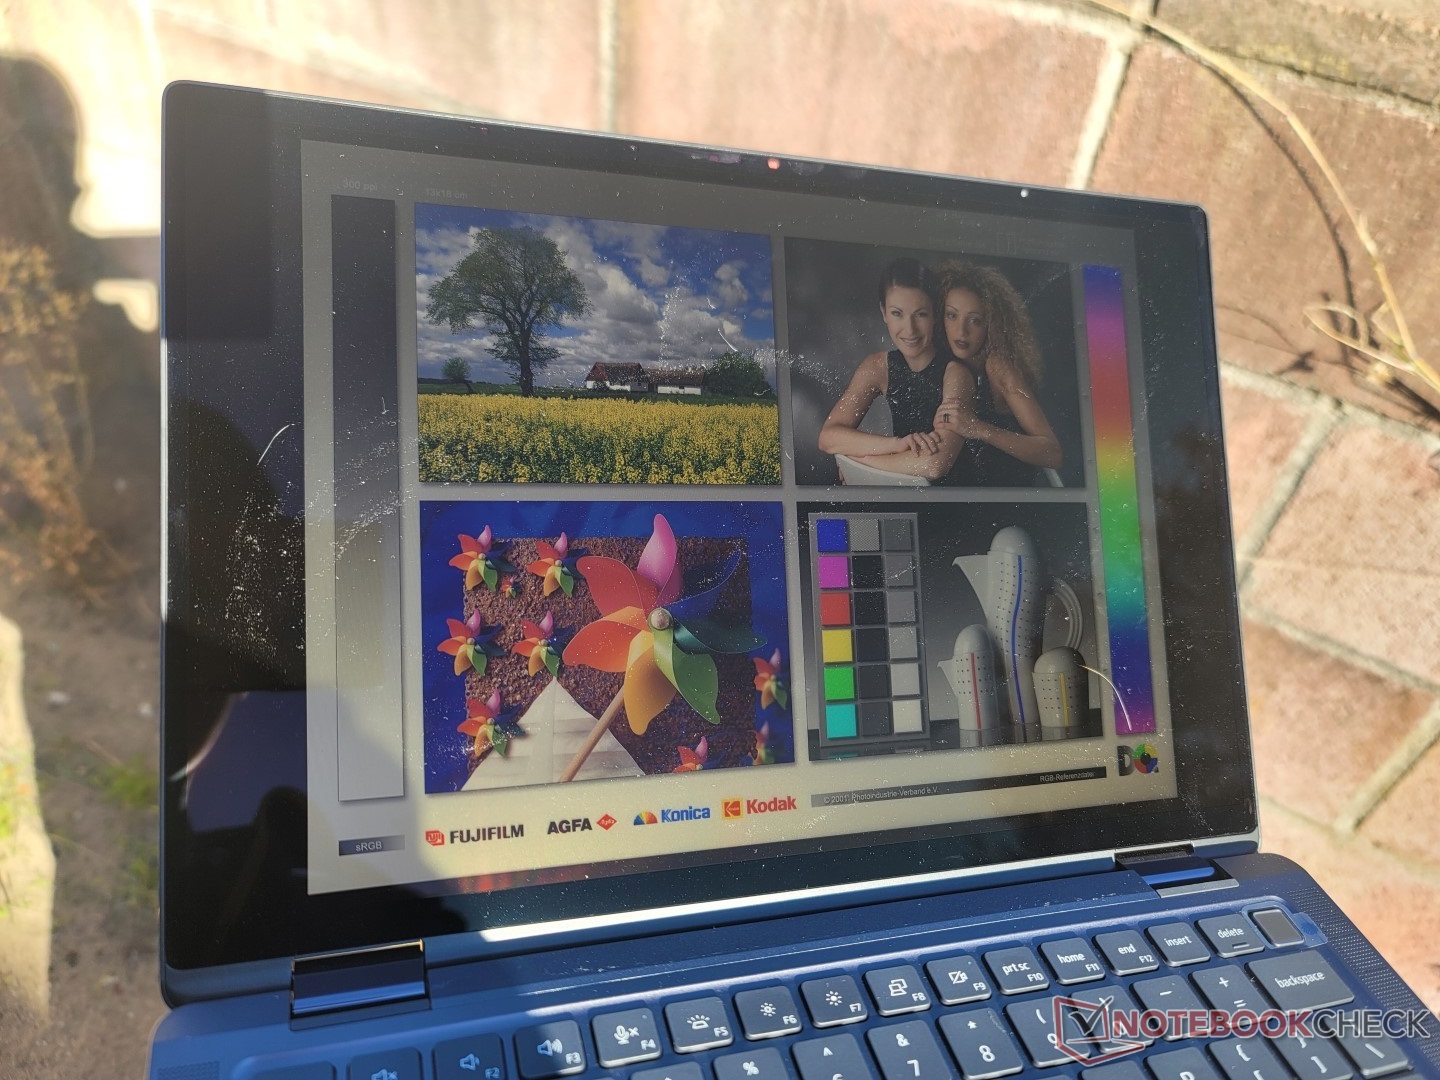
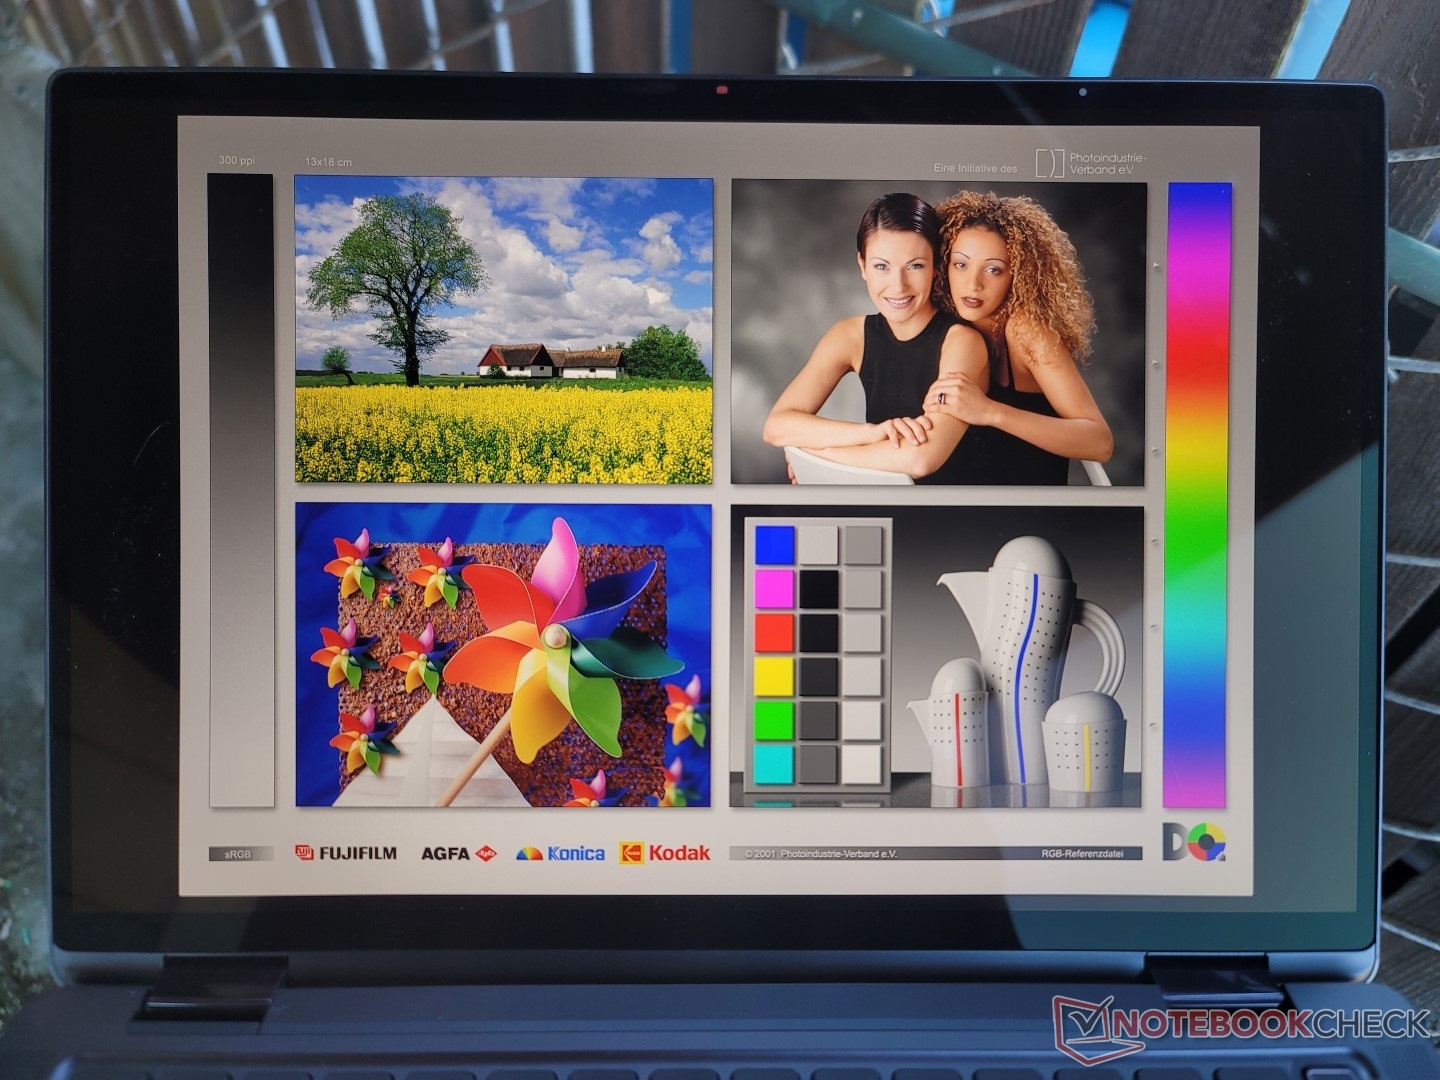
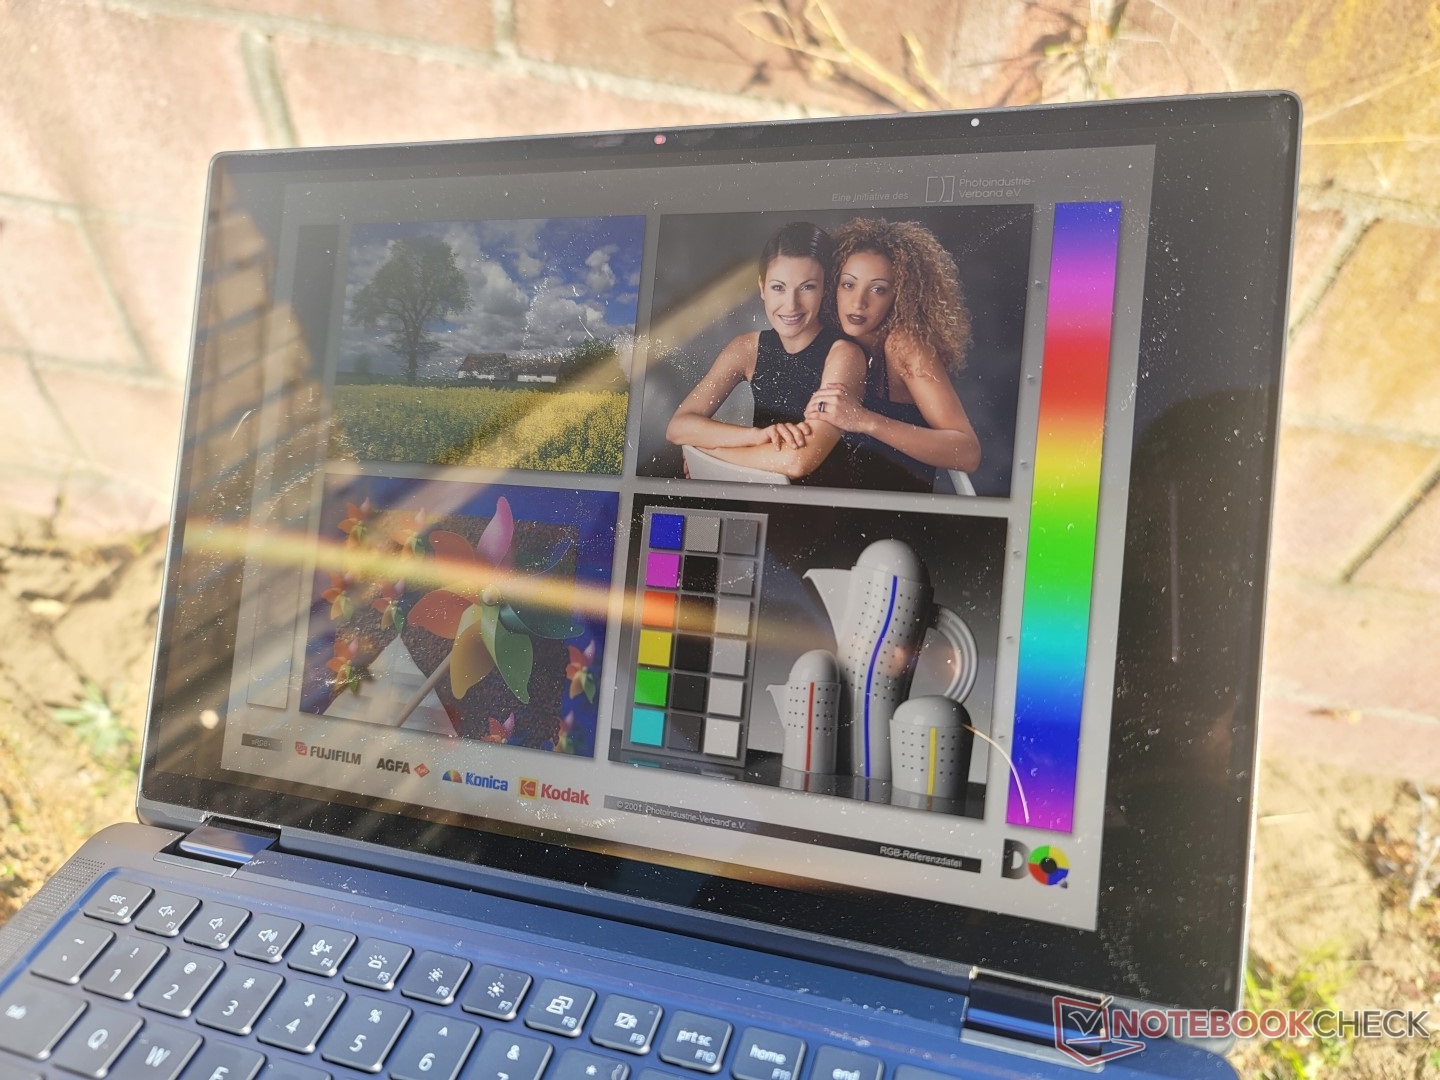
La visibilidad en exteriores es buena cuando está a la sombra, ya que la pantalla es lo suficientemente brillante como para superar el resplandor menor o moderado. Aun así, hay que evitar la luz solar directa siempre que sea posible para optimizar la experiencia de visualización. El competidor Dragonfly Max ofrece opciones de visualización aún más brillantes que el Latitude 9330 para una visión más cómoda en exteriores.
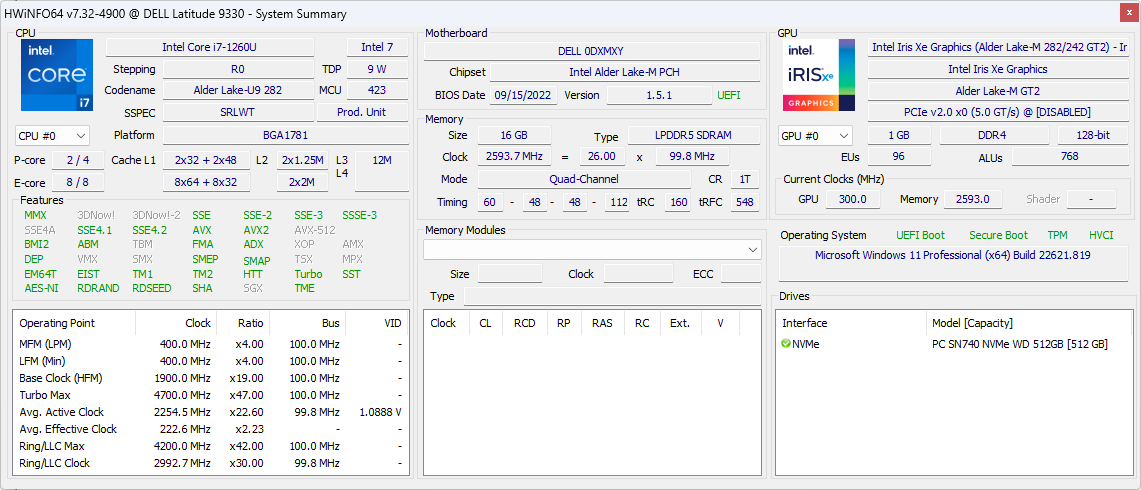
Rendimiento - 12ª generación Alder Lake-U
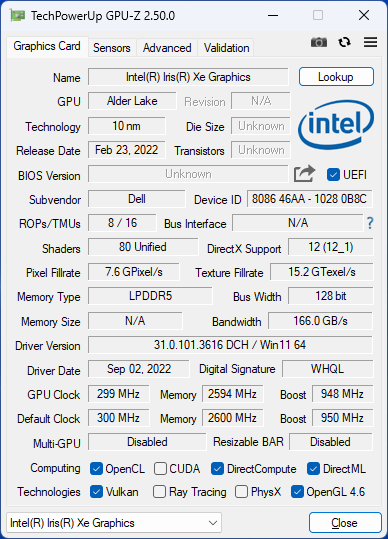
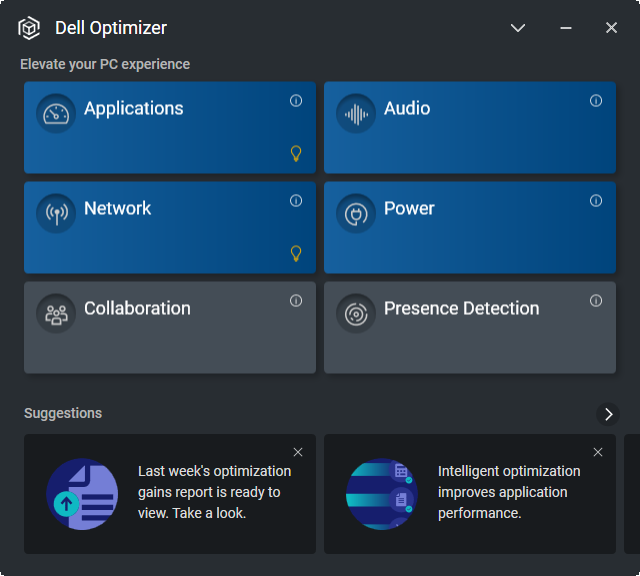
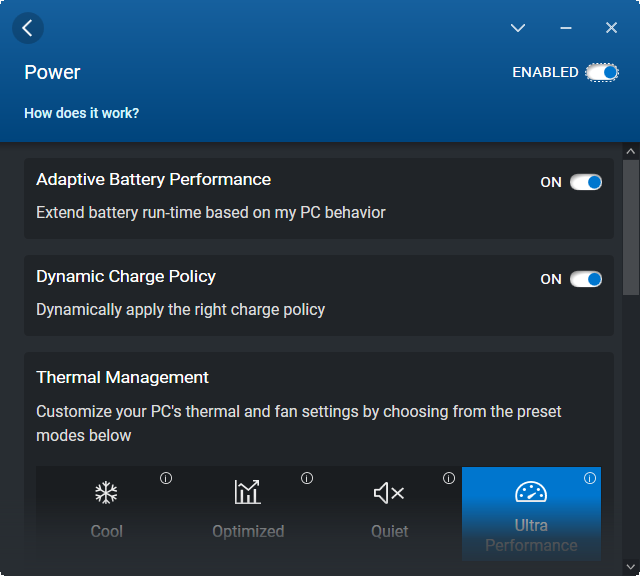
Condiciones de la prueba
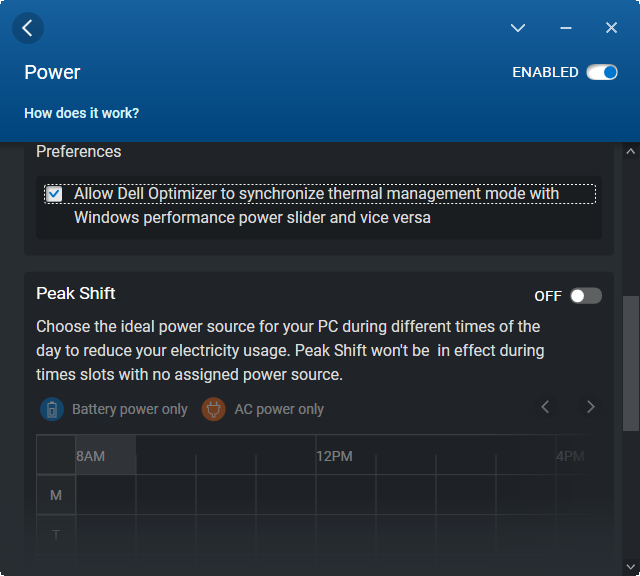
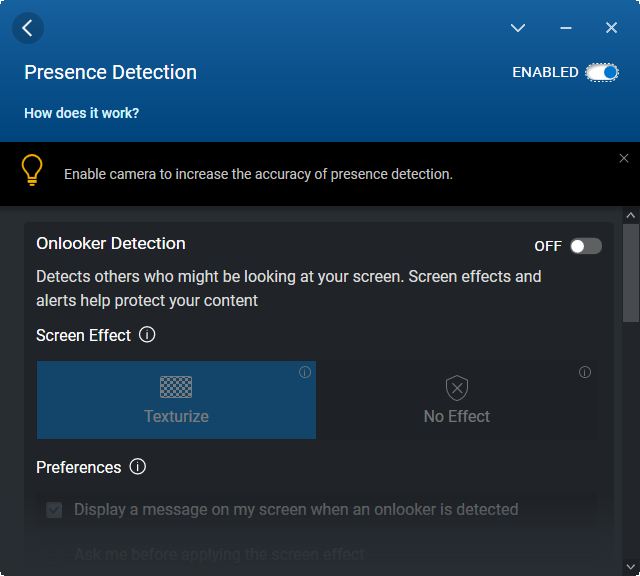
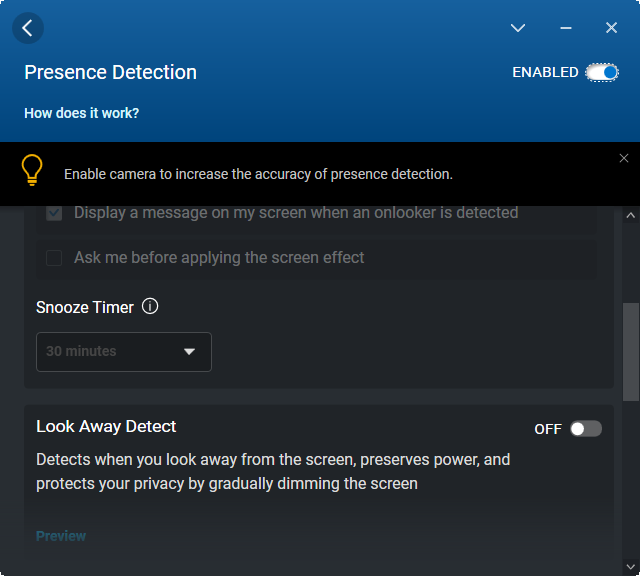
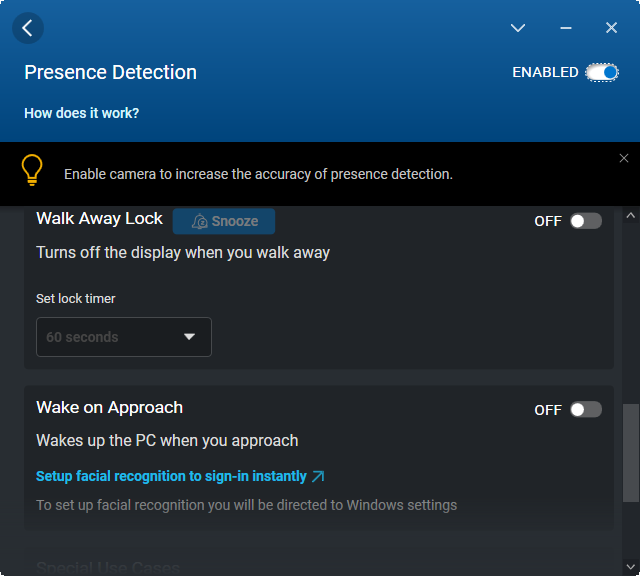
Nuestra unidad se configuró en el modo de ultra rendimiento a través de Windows y del software Dell Optimizer. Se recomienda encarecidamente que los propietarios se familiaricen con Optimizer, ya que es el centro para activar las características específicas de Latitude, como la detección de presencia para el inicio de sesión con manos libres o la activación de botones táctiles adicionales en el teclado. Los perfiles de rendimiento también se encuentran a través del software, como muestran las capturas de pantalla siguientes.
Procesador
El rendimiento de la CPU es excelente en general, pero no hace lo suficiente para diferenciarse del Core i5-1235U. Por ejemplo, los resultados de las pruebas de rendimiento están entre el 5 y el 10 por ciento del Core i5-1235U, más barato, en el IdeaPad Flex 5i. Mientras tanto, el Core i7-1255U es más rápido entre un 10 y un 15 por ciento debido a su mayor TDP respecto a nuestro Core i7-1260U. La ventaja de rendimiento multihilo sobre el 11º gen Core i7-1165G7 sigue siendo significativa, en torno al 35 por ciento, a pesar de las menores diferencias entre el i5-1235U y el i7-1255U de la 12ª generación
La sostenibilidad del rendimiento es buena y mucho mejor que lo que observamos en el competidor ThinkPad X1 Nano Gen 2 como muestra el gráfico comparativo de abajo. El sistema Dell es capaz de lograr esto a través de temperaturas de núcleo muy altas que nuestra sección de Test de Estrés ilustrará.
Cinebench R15 Multi Loop
Cinebench R23: Multi Core | Single Core
Cinebench R15: CPU Multi 64Bit | CPU Single 64Bit
Blender: v2.79 BMW27 CPU
7-Zip 18.03: 7z b 4 | 7z b 4 -mmt1
Geekbench 5.5: Multi-Core | Single-Core
HWBOT x265 Benchmark v2.2: 4k Preset
LibreOffice : 20 Documents To PDF
R Benchmark 2.5: Overall mean
| Cinebench R20 / CPU (Multi Core) | |
| Asus Zenbook S 13 OLED | |
| Lenovo ThinkPad X1 Nano Gen 2 Core i7-1280P | |
| HP Spectre x360 13.5 14t-ef000 | |
| Medio Intel Core i7-1260U (2838 - 3165, n=2) | |
| Lenovo ThinkBook 13s G3 20YA0005GE | |
| Lenovo Yoga 6 13ALC6 | |
| Dell Latitude 9330 | |
| Lenovo IdeaPad Flex 5i 14IAU7 | |
| Samsung Galaxy Book2 Pro 13 NP930XED-KA1DE | |
| Framework Laptop 13.5 | |
| MSI Summit E13 Flip Evo A11MT | |
| HP EliteBook x360 1030 G7 | |
| HP Elite Dragonfly Max | |
| Dell Latitude 5310-23VP6 | |
| Lenovo ThinkPad X1 Titanium Yoga G1 20QB0016GE | |
| Cinebench R20 / CPU (Single Core) | |
| HP Spectre x360 13.5 14t-ef000 | |
| Lenovo IdeaPad Flex 5i 14IAU7 | |
| Lenovo ThinkPad X1 Nano Gen 2 Core i7-1280P | |
| Dell Latitude 9330 | |
| Framework Laptop 13.5 | |
| Medio Intel Core i7-1260U (566 - 588, n=2) | |
| Asus Zenbook S 13 OLED | |
| Lenovo ThinkBook 13s G3 20YA0005GE | |
| MSI Summit E13 Flip Evo A11MT | |
| HP Elite Dragonfly Max | |
| Lenovo Yoga 6 13ALC6 | |
| HP EliteBook x360 1030 G7 | |
| Lenovo ThinkPad X1 Titanium Yoga G1 20QB0016GE | |
| Dell Latitude 5310-23VP6 | |
| Samsung Galaxy Book2 Pro 13 NP930XED-KA1DE | |
| Cinebench R23 / Multi Core | |
| Asus Zenbook S 13 OLED | |
| Lenovo ThinkPad X1 Nano Gen 2 Core i7-1280P | |
| HP Spectre x360 13.5 14t-ef000 | |
| Lenovo IdeaPad Flex 5i 14IAU7 | |
| Lenovo ThinkBook 13s G3 20YA0005GE | |
| Medio Intel Core i7-1260U (7444 - 8381, n=2) | |
| Lenovo Yoga 6 13ALC6 | |
| Dell Latitude 9330 | |
| Samsung Galaxy Book2 Pro 13 NP930XED-KA1DE | |
| MSI Summit E13 Flip Evo A11MT | |
| Framework Laptop 13.5 | |
| HP Elite Dragonfly Max | |
| Lenovo ThinkPad X1 Titanium Yoga G1 20QB0016GE | |
| Cinebench R23 / Single Core | |
| HP Spectre x360 13.5 14t-ef000 | |
| Lenovo ThinkPad X1 Nano Gen 2 Core i7-1280P | |
| Lenovo IdeaPad Flex 5i 14IAU7 | |
| Medio Intel Core i7-1260U (1538 - 1664, n=2) | |
| Dell Latitude 9330 | |
| Framework Laptop 13.5 | |
| Asus Zenbook S 13 OLED | |
| MSI Summit E13 Flip Evo A11MT | |
| Lenovo ThinkBook 13s G3 20YA0005GE | |
| HP Elite Dragonfly Max | |
| Lenovo Yoga 6 13ALC6 | |
| Lenovo ThinkPad X1 Titanium Yoga G1 20QB0016GE | |
| Samsung Galaxy Book2 Pro 13 NP930XED-KA1DE | |
| Cinebench R15 / CPU Multi 64Bit | |
| Lenovo ThinkPad X1 Nano Gen 2 Core i7-1280P | |
| Lenovo ThinkBook 13s G3 20YA0005GE | |
| Lenovo ThinkBook 13s G3 20YA0005GE | |
| Asus Zenbook S 13 OLED | |
| HP Spectre x360 13.5 14t-ef000 | |
| Lenovo IdeaPad Flex 5i 14IAU7 | |
| Medio Intel Core i7-1260U (1117 - 1289, n=2) | |
| Lenovo Yoga 6 13ALC6 | |
| Dell Latitude 9330 | |
| Samsung Galaxy Book2 Pro 13 NP930XED-KA1DE | |
| MSI Summit E13 Flip Evo A11MT | |
| Framework Laptop 13.5 | |
| HP EliteBook x360 1030 G7 | |
| Lenovo ThinkPad X1 Titanium Yoga G1 20QB0016GE | |
| HP Elite Dragonfly Max | |
| Dell Latitude 5310-23VP6 | |
| Cinebench R15 / CPU Single 64Bit | |
| HP Spectre x360 13.5 14t-ef000 | |
| Lenovo IdeaPad Flex 5i 14IAU7 | |
| Lenovo ThinkPad X1 Nano Gen 2 Core i7-1280P | |
| Asus Zenbook S 13 OLED | |
| Lenovo ThinkBook 13s G3 20YA0005GE | |
| Framework Laptop 13.5 | |
| Dell Latitude 9330 | |
| Medio Intel Core i7-1260U (217 - 222, n=2) | |
| MSI Summit E13 Flip Evo A11MT | |
| Lenovo Yoga 6 13ALC6 | |
| HP EliteBook x360 1030 G7 | |
| Lenovo ThinkPad X1 Titanium Yoga G1 20QB0016GE | |
| HP Elite Dragonfly Max | |
| Dell Latitude 5310-23VP6 | |
| Samsung Galaxy Book2 Pro 13 NP930XED-KA1DE | |
| Blender / v2.79 BMW27 CPU | |
| Lenovo ThinkPad X1 Titanium Yoga G1 20QB0016GE | |
| Dell Latitude 5310-23VP6 | |
| HP Elite Dragonfly Max | |
| HP EliteBook x360 1030 G7 | |
| Samsung Galaxy Book2 Pro 13 NP930XED-KA1DE | |
| MSI Summit E13 Flip Evo A11MT | |
| Framework Laptop 13.5 | |
| Dell Latitude 9330 | |
| Medio Intel Core i7-1260U (393 - 431, n=2) | |
| Lenovo IdeaPad Flex 5i 14IAU7 | |
| Lenovo ThinkBook 13s G3 20YA0005GE | |
| HP Spectre x360 13.5 14t-ef000 | |
| Lenovo Yoga 6 13ALC6 | |
| Asus Zenbook S 13 OLED | |
| Lenovo ThinkPad X1 Nano Gen 2 Core i7-1280P | |
| 7-Zip 18.03 / 7z b 4 | |
| Asus Zenbook S 13 OLED | |
| Lenovo ThinkPad X1 Nano Gen 2 Core i7-1280P | |
| Lenovo ThinkBook 13s G3 20YA0005GE | |
| Lenovo Yoga 6 13ALC6 | |
| HP Spectre x360 13.5 14t-ef000 | |
| Medio Intel Core i7-1260U (32008 - 36480, n=2) | |
| Dell Latitude 9330 | |
| Lenovo IdeaPad Flex 5i 14IAU7 | |
| MSI Summit E13 Flip Evo A11MT | |
| Framework Laptop 13.5 | |
| Samsung Galaxy Book2 Pro 13 NP930XED-KA1DE | |
| HP EliteBook x360 1030 G7 | |
| HP Elite Dragonfly Max | |
| Dell Latitude 5310-23VP6 | |
| Lenovo ThinkPad X1 Titanium Yoga G1 20QB0016GE | |
| 7-Zip 18.03 / 7z b 4 -mmt1 | |
| Lenovo ThinkPad X1 Nano Gen 2 Core i7-1280P | |
| HP Spectre x360 13.5 14t-ef000 | |
| Asus Zenbook S 13 OLED | |
| Framework Laptop 13.5 | |
| Lenovo ThinkBook 13s G3 20YA0005GE | |
| MSI Summit E13 Flip Evo A11MT | |
| HP Elite Dragonfly Max | |
| Lenovo IdeaPad Flex 5i 14IAU7 | |
| Medio Intel Core i7-1260U (4746 - 5047, n=2) | |
| Dell Latitude 9330 | |
| Lenovo Yoga 6 13ALC6 | |
| HP EliteBook x360 1030 G7 | |
| Dell Latitude 5310-23VP6 | |
| Lenovo ThinkPad X1 Titanium Yoga G1 20QB0016GE | |
| Samsung Galaxy Book2 Pro 13 NP930XED-KA1DE | |
| Geekbench 5.5 / Multi-Core | |
| Lenovo ThinkPad X1 Nano Gen 2 Core i7-1280P | |
| Lenovo IdeaPad Flex 5i 14IAU7 | |
| HP Spectre x360 13.5 14t-ef000 | |
| Asus Zenbook S 13 OLED | |
| Medio Intel Core i7-1260U (7072 - 7444, n=2) | |
| Dell Latitude 9330 | |
| Lenovo ThinkBook 13s G3 20YA0005GE | |
| MSI Summit E13 Flip Evo A11MT | |
| HP Elite Dragonfly Max | |
| HP EliteBook x360 1030 G7 | |
| Samsung Galaxy Book2 Pro 13 NP930XED-KA1DE | |
| Lenovo ThinkPad X1 Titanium Yoga G1 20QB0016GE | |
| Dell Latitude 5310-23VP6 | |
| Geekbench 5.5 / Single-Core | |
| Lenovo ThinkPad X1 Nano Gen 2 Core i7-1280P | |
| HP Spectre x360 13.5 14t-ef000 | |
| Lenovo IdeaPad Flex 5i 14IAU7 | |
| Medio Intel Core i7-1260U (1560 - 1662, n=2) | |
| Dell Latitude 9330 | |
| HP Elite Dragonfly Max | |
| Asus Zenbook S 13 OLED | |
| MSI Summit E13 Flip Evo A11MT | |
| Lenovo ThinkBook 13s G3 20YA0005GE | |
| Lenovo ThinkPad X1 Titanium Yoga G1 20QB0016GE | |
| HP EliteBook x360 1030 G7 | |
| Dell Latitude 5310-23VP6 | |
| Samsung Galaxy Book2 Pro 13 NP930XED-KA1DE | |
| HWBOT x265 Benchmark v2.2 / 4k Preset | |
| Asus Zenbook S 13 OLED | |
| HP Spectre x360 13.5 14t-ef000 | |
| Lenovo ThinkBook 13s G3 20YA0005GE | |
| Lenovo ThinkPad X1 Nano Gen 2 Core i7-1280P | |
| Lenovo IdeaPad Flex 5i 14IAU7 | |
| Lenovo Yoga 6 13ALC6 | |
| Medio Intel Core i7-1260U (8.54 - 9.58, n=2) | |
| Dell Latitude 9330 | |
| MSI Summit E13 Flip Evo A11MT | |
| Framework Laptop 13.5 | |
| Samsung Galaxy Book2 Pro 13 NP930XED-KA1DE | |
| HP EliteBook x360 1030 G7 | |
| HP Elite Dragonfly Max | |
| Dell Latitude 5310-23VP6 | |
| Lenovo ThinkPad X1 Titanium Yoga G1 20QB0016GE | |
| LibreOffice / 20 Documents To PDF | |
| Samsung Galaxy Book2 Pro 13 NP930XED-KA1DE | |
| HP EliteBook x360 1030 G7 | |
| Dell Latitude 5310-23VP6 | |
| Lenovo Yoga 6 13ALC6 | |
| Asus Zenbook S 13 OLED | |
| Dell Latitude 9330 | |
| Lenovo ThinkPad X1 Titanium Yoga G1 20QB0016GE | |
| Lenovo ThinkBook 13s G3 20YA0005GE | |
| Lenovo IdeaPad Flex 5i 14IAU7 | |
| Medio Intel Core i7-1260U (45.9 - 51.4, n=2) | |
| MSI Summit E13 Flip Evo A11MT | |
| HP Elite Dragonfly Max | |
| Lenovo ThinkPad X1 Nano Gen 2 Core i7-1280P | |
| Framework Laptop 13.5 | |
| HP Spectre x360 13.5 14t-ef000 | |
| R Benchmark 2.5 / Overall mean | |
| Samsung Galaxy Book2 Pro 13 NP930XED-KA1DE | |
| Lenovo ThinkPad X1 Titanium Yoga G1 20QB0016GE | |
| Dell Latitude 5310-23VP6 | |
| HP EliteBook x360 1030 G7 | |
| HP Elite Dragonfly Max | |
| MSI Summit E13 Flip Evo A11MT | |
| Lenovo Yoga 6 13ALC6 | |
| Framework Laptop 13.5 | |
| Lenovo ThinkBook 13s G3 20YA0005GE | |
| Dell Latitude 9330 | |
| Asus Zenbook S 13 OLED | |
| Medio Intel Core i7-1260U (0.494 - 0.53, n=2) | |
| Lenovo IdeaPad Flex 5i 14IAU7 | |
| HP Spectre x360 13.5 14t-ef000 | |
| Lenovo ThinkPad X1 Nano Gen 2 Core i7-1280P | |
Cinebench R23: Multi Core | Single Core
Cinebench R15: CPU Multi 64Bit | CPU Single 64Bit
Blender: v2.79 BMW27 CPU
7-Zip 18.03: 7z b 4 | 7z b 4 -mmt1
Geekbench 5.5: Multi-Core | Single-Core
HWBOT x265 Benchmark v2.2: 4k Preset
LibreOffice : 20 Documents To PDF
R Benchmark 2.5: Overall mean
* ... más pequeño es mejor
AIDA64: FP32 Ray-Trace | FPU Julia | CPU SHA3 | CPU Queen | FPU SinJulia | FPU Mandel | CPU AES | CPU ZLib | FP64 Ray-Trace | CPU PhotoWorxx
| Performance rating | |
| MSI Summit E13 Flip Evo A11MT | |
| Medio Intel Core i7-1260U | |
| Dell Latitude 9330 | |
| HP Elite Dragonfly Max | |
| Lenovo ThinkPad X1 Titanium Yoga G1 20QB0016GE | |
| Dell Latitude 5310-23VP6 | |
| AIDA64 / FP32 Ray-Trace | |
| MSI Summit E13 Flip Evo A11MT | |
| Medio Intel Core i7-1260U (6694 - 7261, n=2) | |
| Dell Latitude 9330 | |
| HP Elite Dragonfly Max | |
| Dell Latitude 5310-23VP6 | |
| Lenovo ThinkPad X1 Titanium Yoga G1 20QB0016GE | |
| AIDA64 / FPU Julia | |
| Medio Intel Core i7-1260U (33823 - 37371, n=2) | |
| Dell Latitude 9330 | |
| MSI Summit E13 Flip Evo A11MT | |
| Dell Latitude 5310-23VP6 | |
| HP Elite Dragonfly Max | |
| Lenovo ThinkPad X1 Titanium Yoga G1 20QB0016GE | |
| AIDA64 / CPU SHA3 | |
| MSI Summit E13 Flip Evo A11MT | |
| Medio Intel Core i7-1260U (1816 - 1949, n=2) | |
| Dell Latitude 9330 | |
| HP Elite Dragonfly Max | |
| Lenovo ThinkPad X1 Titanium Yoga G1 20QB0016GE | |
| Dell Latitude 5310-23VP6 | |
| AIDA64 / CPU Queen | |
| MSI Summit E13 Flip Evo A11MT | |
| Medio Intel Core i7-1260U (50854 - 53090, n=2) | |
| Dell Latitude 9330 | |
| HP Elite Dragonfly Max | |
| Dell Latitude 5310-23VP6 | |
| Lenovo ThinkPad X1 Titanium Yoga G1 20QB0016GE | |
| AIDA64 / FPU SinJulia | |
| MSI Summit E13 Flip Evo A11MT | |
| Dell Latitude 5310-23VP6 | |
| Medio Intel Core i7-1260U (4067 - 4155, n=2) | |
| Dell Latitude 9330 | |
| HP Elite Dragonfly Max | |
| Lenovo ThinkPad X1 Titanium Yoga G1 20QB0016GE | |
| AIDA64 / FPU Mandel | |
| MSI Summit E13 Flip Evo A11MT | |
| Medio Intel Core i7-1260U (16988 - 17918, n=2) | |
| Dell Latitude 9330 | |
| HP Elite Dragonfly Max | |
| Dell Latitude 5310-23VP6 | |
| Lenovo ThinkPad X1 Titanium Yoga G1 20QB0016GE | |
| AIDA64 / CPU AES | |
| MSI Summit E13 Flip Evo A11MT | |
| HP Elite Dragonfly Max | |
| Lenovo ThinkPad X1 Titanium Yoga G1 20QB0016GE | |
| Medio Intel Core i7-1260U (33289 - 35061, n=2) | |
| Dell Latitude 9330 | |
| Dell Latitude 5310-23VP6 | |
| AIDA64 / CPU ZLib | |
| Medio Intel Core i7-1260U (506 - 586, n=2) | |
| Dell Latitude 9330 | |
| MSI Summit E13 Flip Evo A11MT | |
| Dell Latitude 5310-23VP6 | |
| HP Elite Dragonfly Max | |
| Lenovo ThinkPad X1 Titanium Yoga G1 20QB0016GE | |
| AIDA64 / FP64 Ray-Trace | |
| MSI Summit E13 Flip Evo A11MT | |
| Medio Intel Core i7-1260U (3666 - 3854, n=2) | |
| Dell Latitude 9330 | |
| HP Elite Dragonfly Max | |
| Dell Latitude 5310-23VP6 | |
| Lenovo ThinkPad X1 Titanium Yoga G1 20QB0016GE | |
| AIDA64 / CPU PhotoWorxx | |
| MSI Summit E13 Flip Evo A11MT | |
| HP Elite Dragonfly Max | |
| Medio Intel Core i7-1260U (37448 - 37790, n=2) | |
| Dell Latitude 9330 | |
| Lenovo ThinkPad X1 Titanium Yoga G1 20QB0016GE | |
| Dell Latitude 5310-23VP6 | |
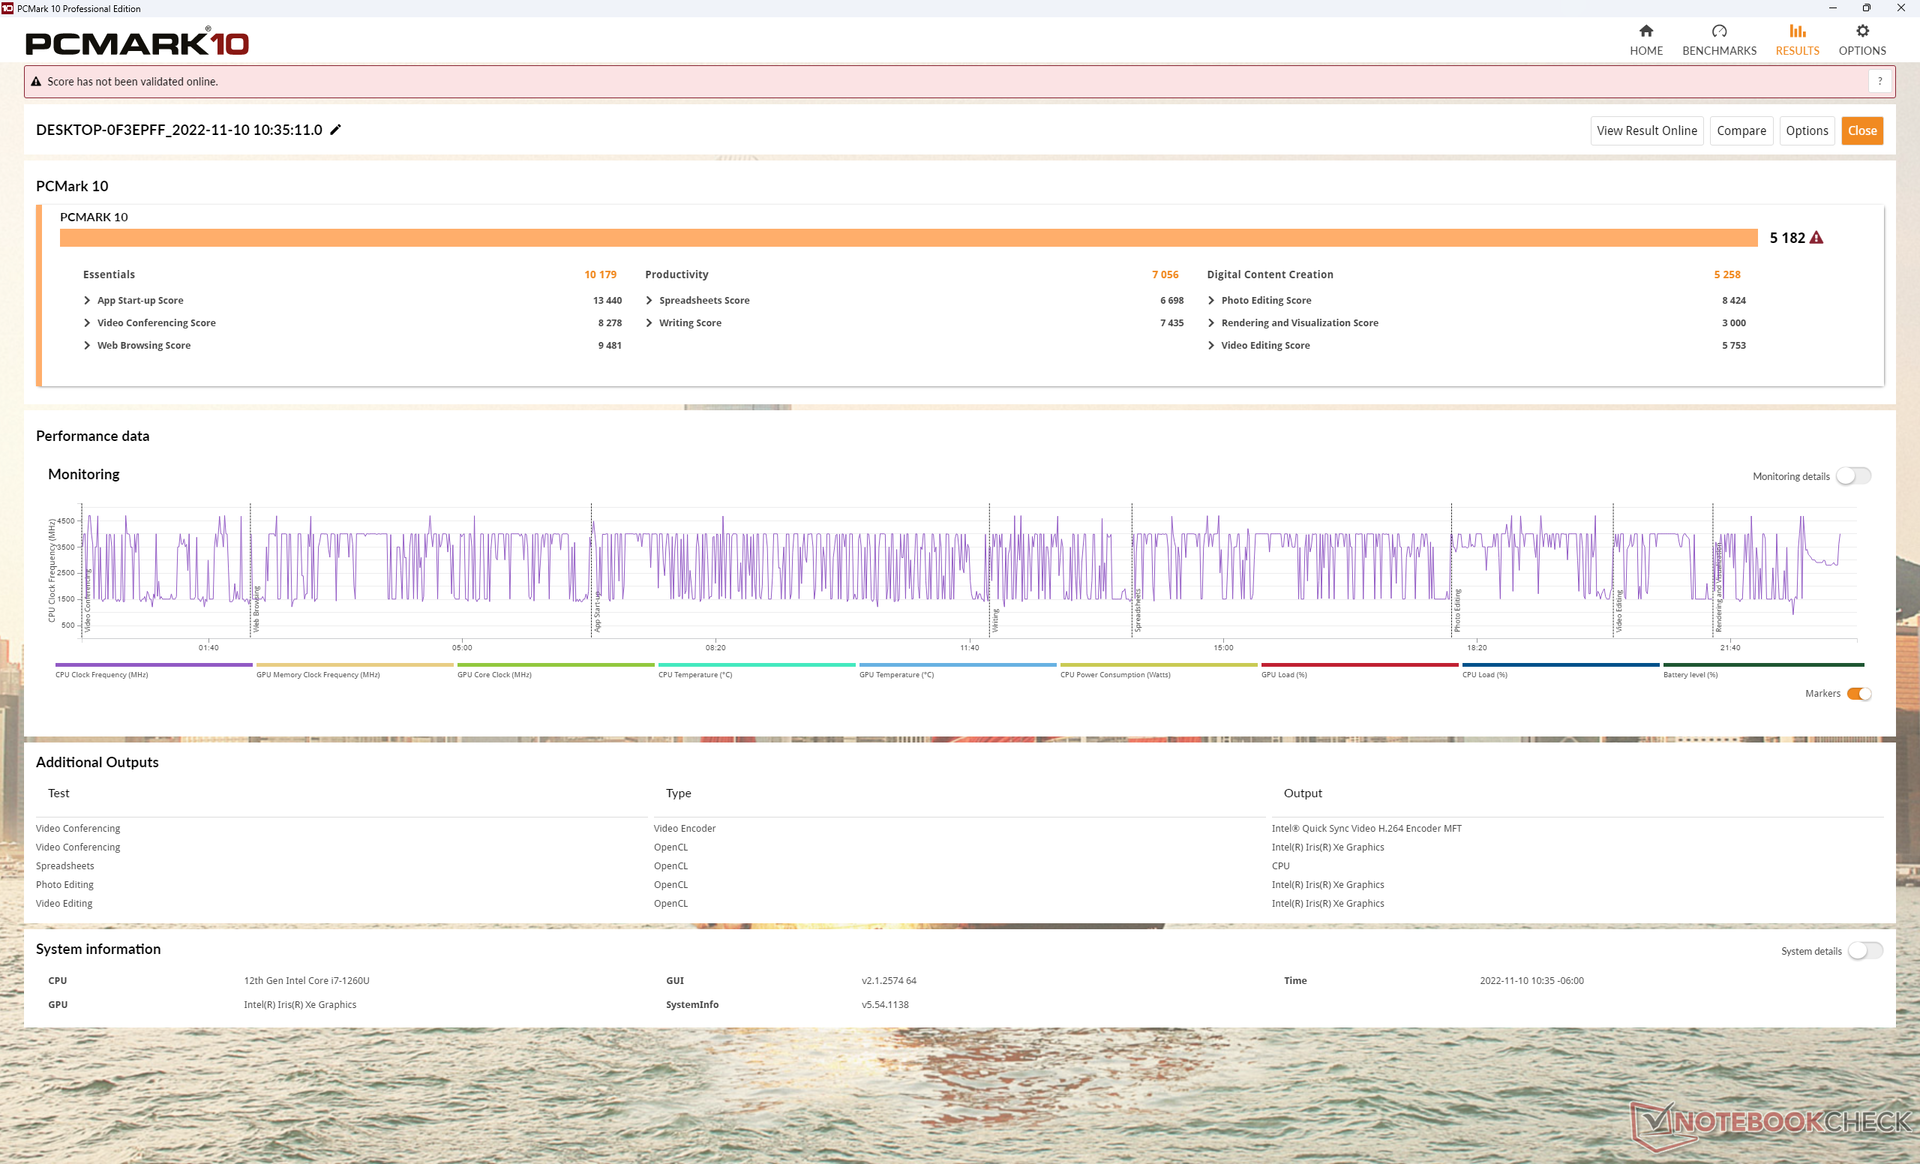
Rendimiento del sistema
Los resultados de PCMark 10 son superiores a los de la mayoría de subportátiles de 13 pulgadas, siendo uno de los más rápidos de la categoría. Muchos modelos de esta clase de tamaño tienden a funcionar con CPUs con objetivos de TDP más bajos, como el ThinkPad X1 Yoga G1 para un rendimiento finalmente más lento.
| PCMark 10 / Score | |
| Medio Intel Core i7-1260U, Intel Iris Xe Graphics G7 96EUs (5182 - 5300, n=2) | |
| Dell Latitude 9330 | |
| HP Elite Dragonfly Max | |
| MSI Summit E13 Flip Evo A11MT | |
| Lenovo ThinkPad X1 Titanium Yoga G1 20QB0016GE | |
| HP EliteBook x360 1030 G7 | |
| Dell Latitude 5310-23VP6 | |
| PCMark 10 / Essentials | |
| HP Elite Dragonfly Max | |
| Dell Latitude 9330 | |
| Medio Intel Core i7-1260U, Intel Iris Xe Graphics G7 96EUs (9929 - 10179, n=2) | |
| Lenovo ThinkPad X1 Titanium Yoga G1 20QB0016GE | |
| HP EliteBook x360 1030 G7 | |
| Dell Latitude 5310-23VP6 | |
| MSI Summit E13 Flip Evo A11MT | |
| PCMark 10 / Productivity | |
| Medio Intel Core i7-1260U, Intel Iris Xe Graphics G7 96EUs (7056 - 7287, n=2) | |
| Dell Latitude 9330 | |
| MSI Summit E13 Flip Evo A11MT | |
| HP Elite Dragonfly Max | |
| Dell Latitude 5310-23VP6 | |
| HP EliteBook x360 1030 G7 | |
| Lenovo ThinkPad X1 Titanium Yoga G1 20QB0016GE | |
| PCMark 10 / Digital Content Creation | |
| Medio Intel Core i7-1260U, Intel Iris Xe Graphics G7 96EUs (5258 - 5584, n=2) | |
| Dell Latitude 9330 | |
| MSI Summit E13 Flip Evo A11MT | |
| HP Elite Dragonfly Max | |
| Lenovo ThinkPad X1 Titanium Yoga G1 20QB0016GE | |
| HP EliteBook x360 1030 G7 | |
| Dell Latitude 5310-23VP6 | |
| PCMark 10 Score | 5182 puntos | |
ayuda | ||
| AIDA64 / Memory Copy | |
| Dell Latitude 9330 | |
| Medio Intel Core i7-1260U (68849 - 69994, n=2) | |
| HP Elite Dragonfly Max | |
| MSI Summit E13 Flip Evo A11MT | |
| Lenovo ThinkPad X1 Titanium Yoga G1 20QB0016GE | |
| Dell Latitude 5310-23VP6 | |
| AIDA64 / Memory Read | |
| HP Elite Dragonfly Max | |
| Dell Latitude 9330 | |
| Medio Intel Core i7-1260U (59219 - 60804, n=2) | |
| MSI Summit E13 Flip Evo A11MT | |
| Lenovo ThinkPad X1 Titanium Yoga G1 20QB0016GE | |
| Dell Latitude 5310-23VP6 | |
| AIDA64 / Memory Write | |
| HP Elite Dragonfly Max | |
| Dell Latitude 9330 | |
| Medio Intel Core i7-1260U (62367 - 63786, n=2) | |
| Lenovo ThinkPad X1 Titanium Yoga G1 20QB0016GE | |
| MSI Summit E13 Flip Evo A11MT | |
| Dell Latitude 5310-23VP6 | |
| AIDA64 / Memory Latency | |
| Dell Latitude 9330 | |
| Medio Intel Core i7-1260U (107.2 - 107.7, n=2) | |
| HP Elite Dragonfly Max | |
| Dell Latitude 5310-23VP6 | |
| MSI Summit E13 Flip Evo A11MT | |
| Lenovo ThinkPad X1 Titanium Yoga G1 20QB0016GE | |
* ... más pequeño es mejor
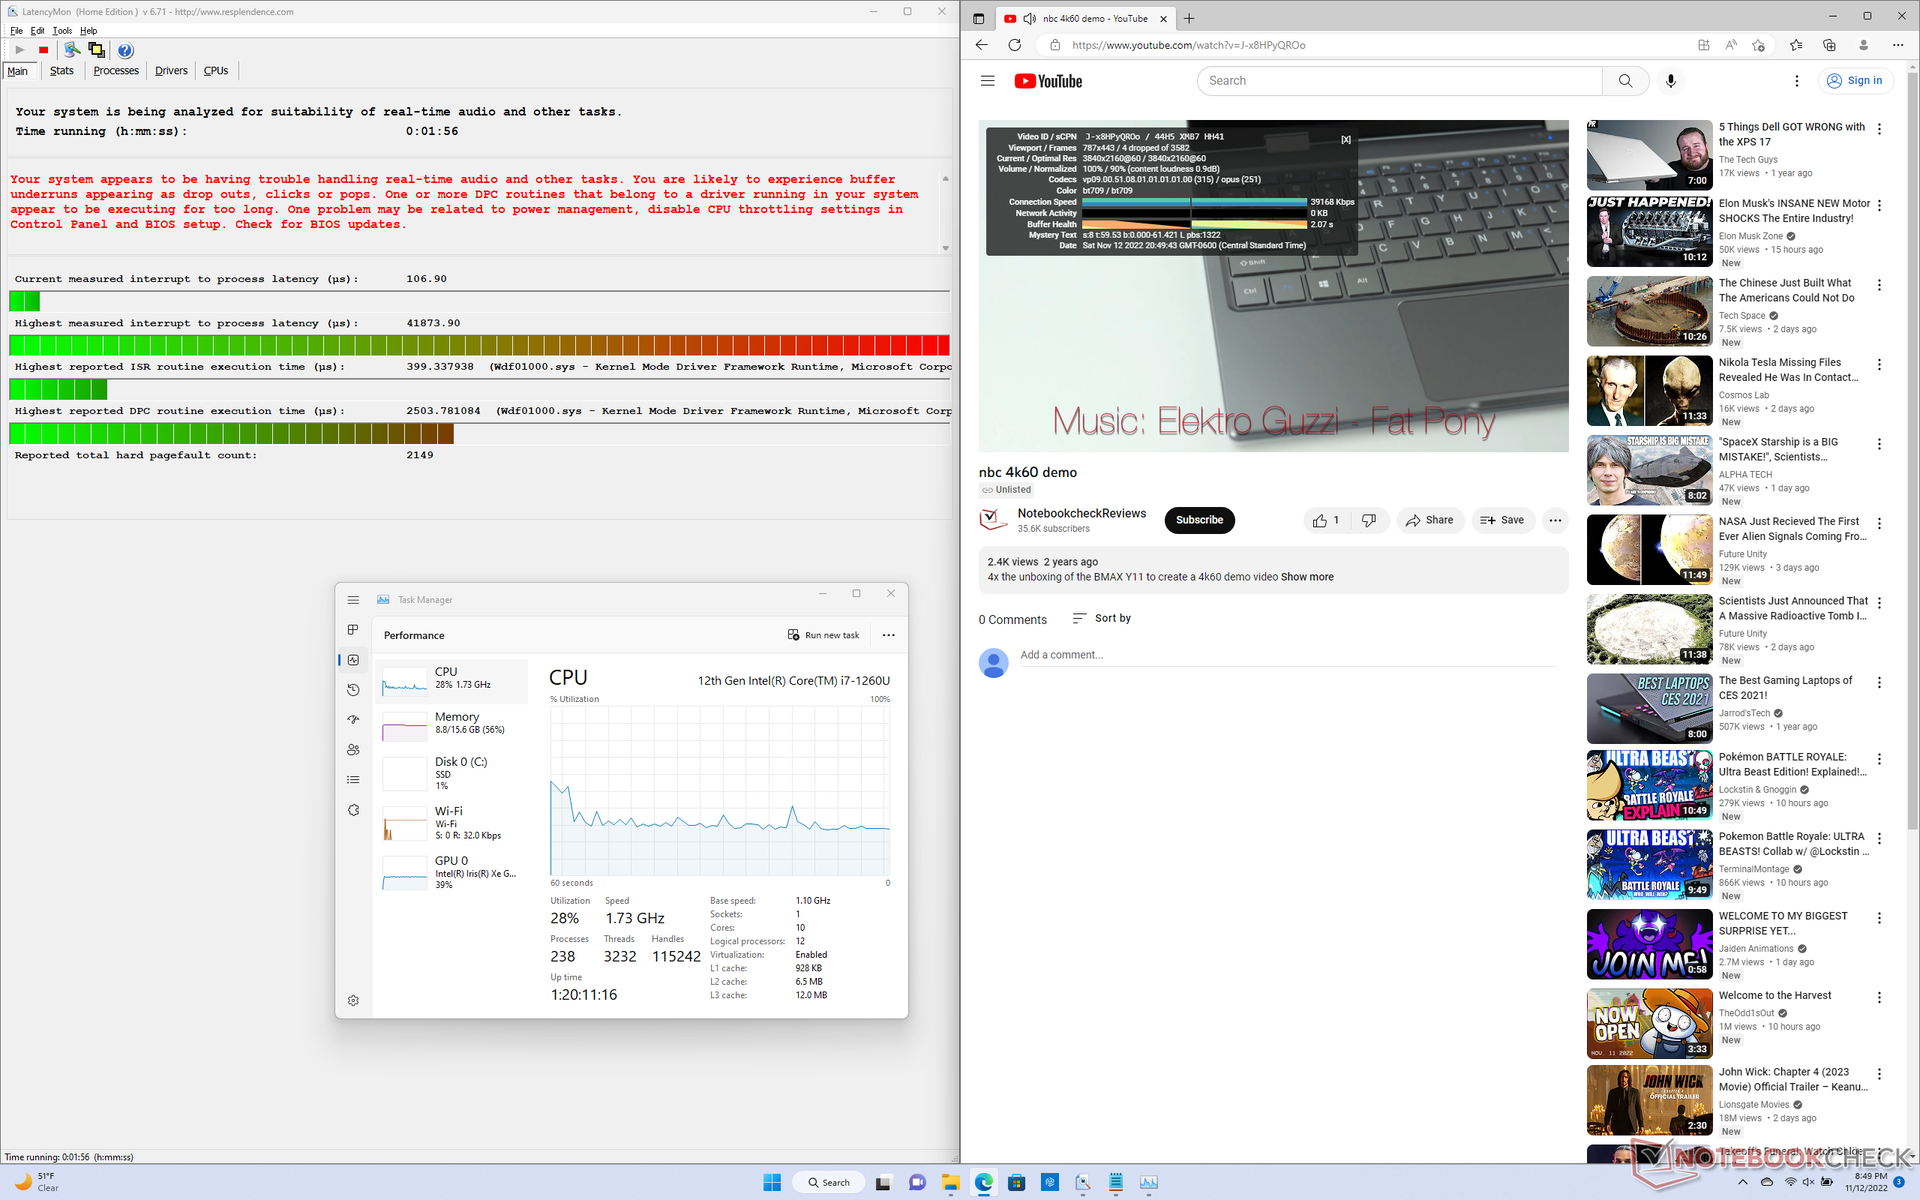
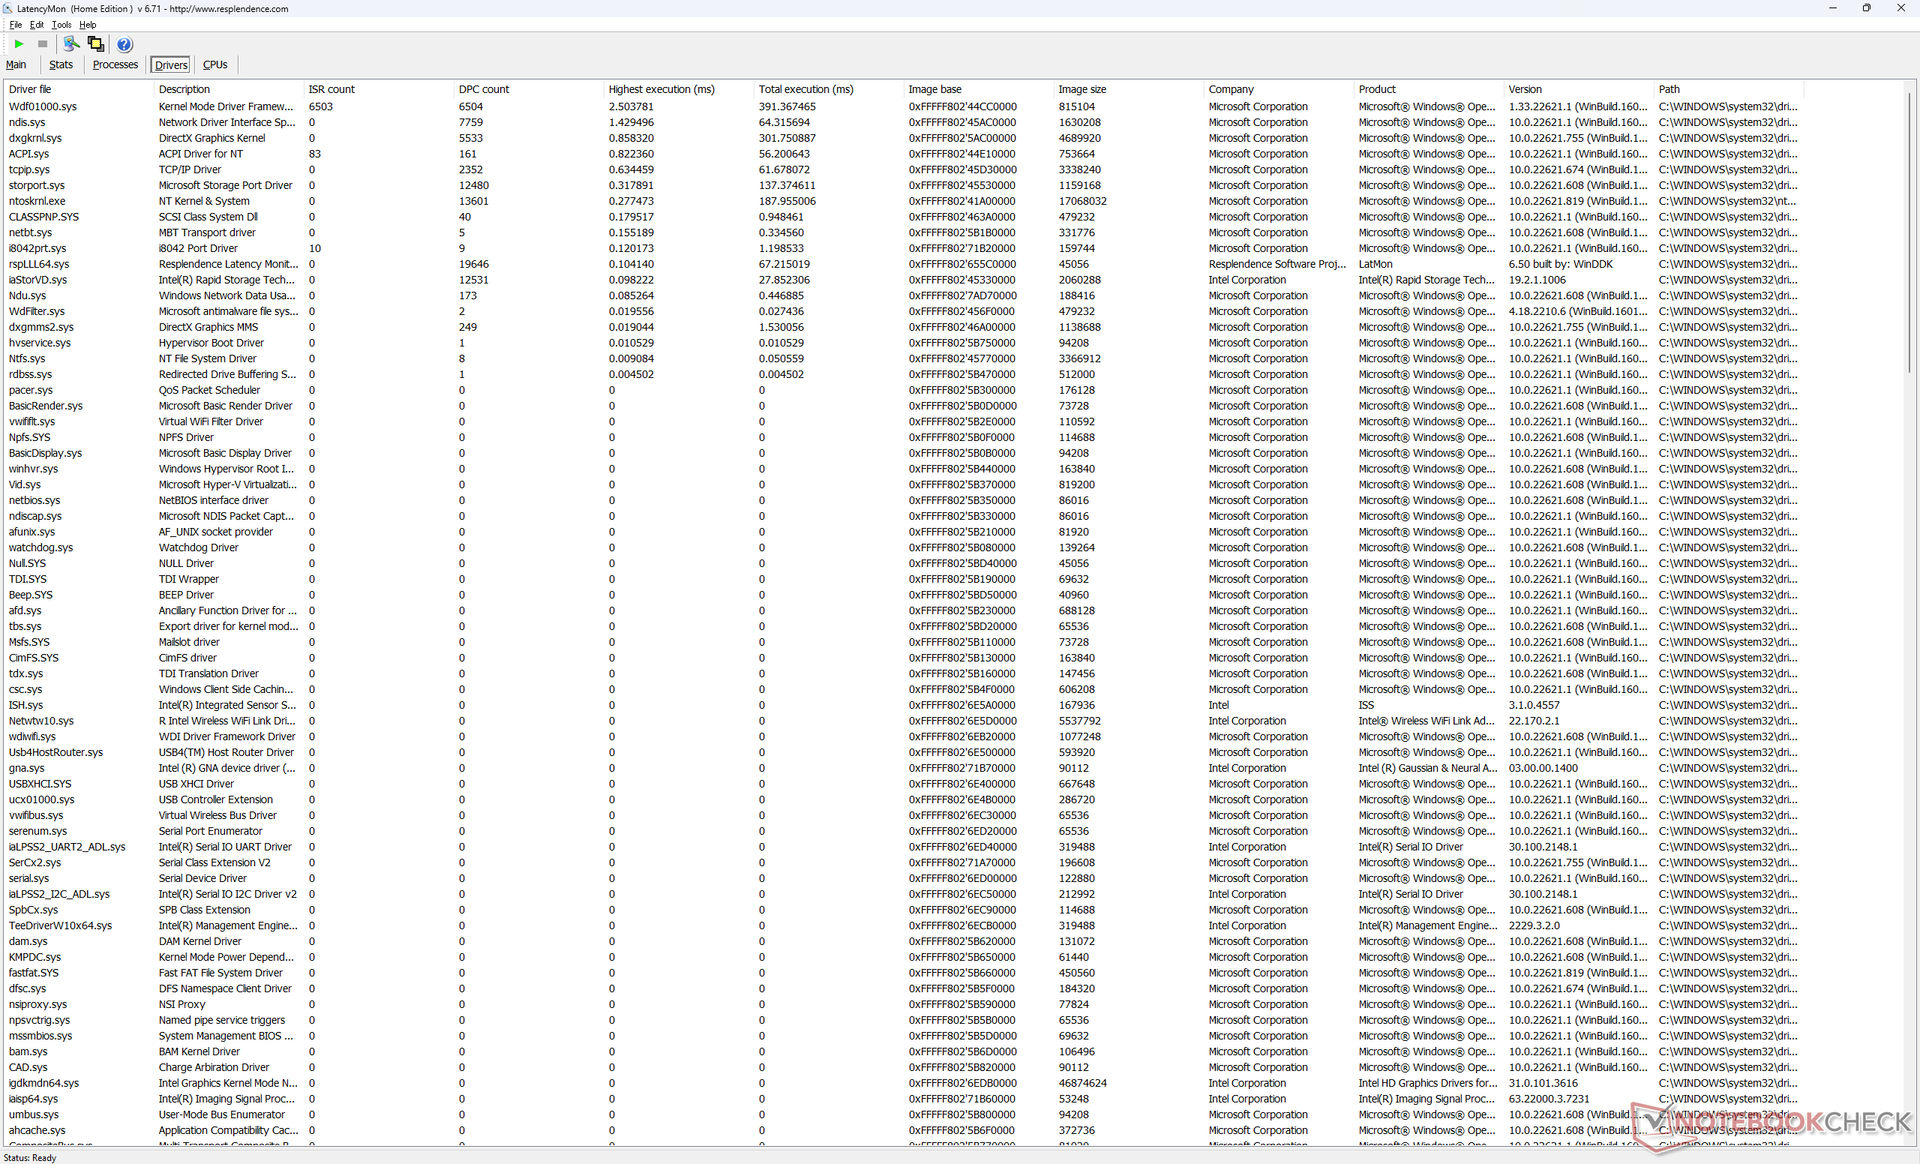
Latencia del CPD
Nuestra unidad mostraba importantes problemas de CPD al abrir varias pestañas del navegador de nuestra página web, incluso después de múltiples pruebas. la reproducción de vídeo 4K a 60 FPS también es imperfecta con 4 fotogramas perdidos durante el minuto de vídeo de prueba. Los resultados son decepcionantes en un portátil empresarial de gama alta en el que el rendimiento constante es importante.
| DPC Latencies / LatencyMon - interrupt to process latency (max), Web, Youtube, Prime95 | |
| Dell Latitude 9330 | |
| HP EliteBook x360 1030 G7 | |
| HP Elite Dragonfly Max | |
| MSI Summit E13 Flip Evo A11MT | |
| Lenovo ThinkPad X1 Titanium Yoga G1 20QB0016GE | |
| Dell Latitude 5310-23VP6 | |
* ... más pequeño es mejor
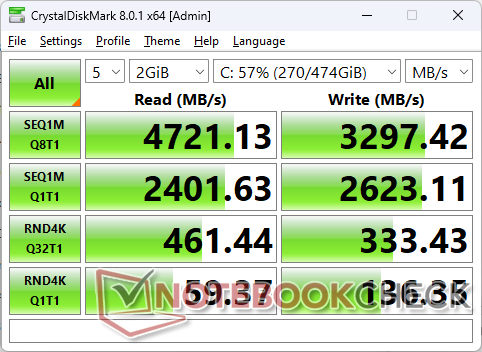
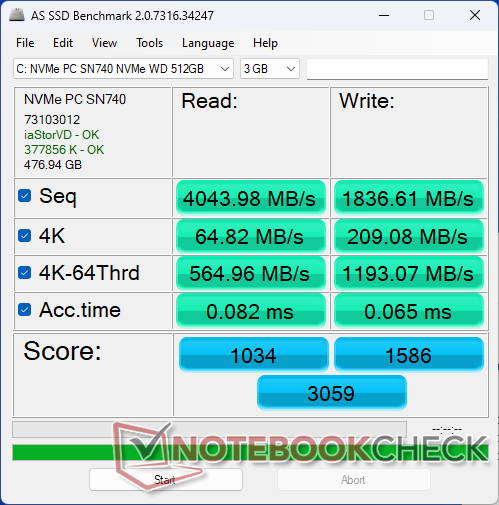
Dispositivos de almacenamiento - Sólo PCIe4 x4 2230
Nuestra unidad de prueba se entrega con una unidad de 512 GB WD SN740 PCIe4 x4 NVMe SSD que ofrece velocidades de lectura y escritura secuenciales constantes de hasta 4700 MB/s y 3300 MB/s, respectivamente. Se trata de una unidad de gama media teniendo en cuenta que las últimas unidades PCIe4 x4 de Samsung pueden alcanzar más de 7000 MB/s. El sistema sólo admite una unidad interna sin opciones secundarias.

| Drive Performance rating - Percent | |
| MSI Summit E13 Flip Evo A11MT | |
| Dell Latitude 9330 | |
| HP EliteBook x360 1030 G7 | |
| HP Elite Dragonfly Max | |
| Lenovo ThinkPad X1 Titanium Yoga G1 20QB0016GE | |
| Dell Latitude 5310-23VP6 | |
* ... más pequeño es mejor
Disk Throttling: DiskSpd Read Loop, Queue Depth 8
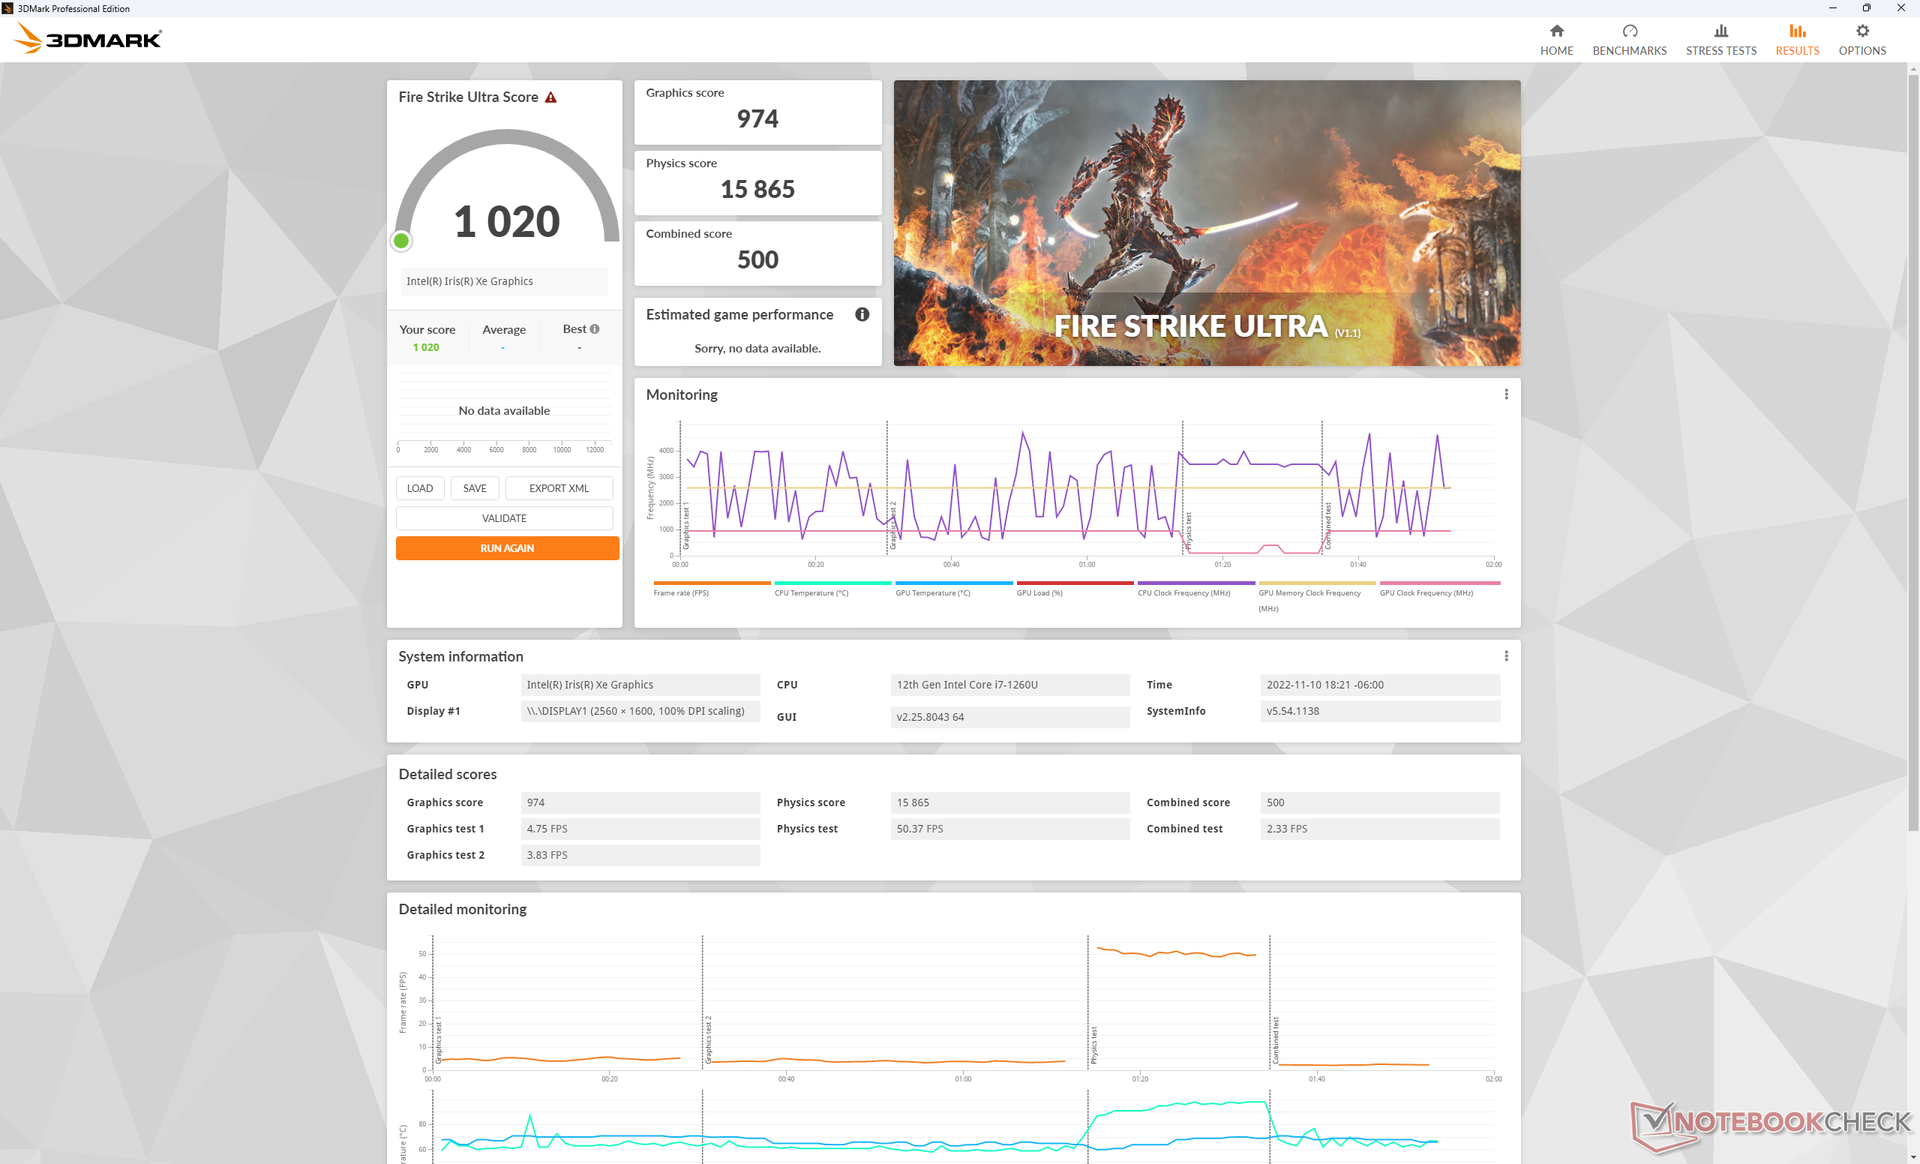
Rendimiento de la GPU: bueno pero no genial
El rendimiento gráfico es un 15 por ciento más lento que el de la media de portátiles de nuestra base de datos con la misma integración Iris Xe 96 EUs A pesar de los amplios 32 GB de RAM LPDDR5-5200. La serie Latitude no está diseñada para juegos, por lo que este déficit no es un gran problema. El rendimiento general está más cerca del Iris Xe 80 UE que se encuentran en muchas CPUs Core i5
La mayoría de los juegos se pueden jugar en el Latitude 9330, aunque sólo con ajustes bajos.
| 3DMark 11 - 1280x720 Performance GPU | |
| Asus Zenbook S 13 OLED | |
| MSI Summit E13 Flip Evo A11MT | |
| Lenovo ThinkPad X1 Nano Gen 2 Core i7-1280P | |
| Medio Intel Iris Xe Graphics G7 96EUs (2867 - 7676, n=209) | |
| HP Spectre x360 13.5 14t-ef000 | |
| Lenovo ThinkBook 13s G3 20YA0005GE | |
| Lenovo Yoga 6 13ALC6 | |
| Lenovo IdeaPad Flex 5i 14IAU7 | |
| Samsung Galaxy Book2 Pro 13 NP930XED-KA1DE | |
| HP Elite Dragonfly Max | |
| Dell Latitude 9330 | |
| Lenovo ThinkPad X1 Titanium Yoga G1 20QB0016GE | |
| HP EliteBook x360 1030 G7 | |
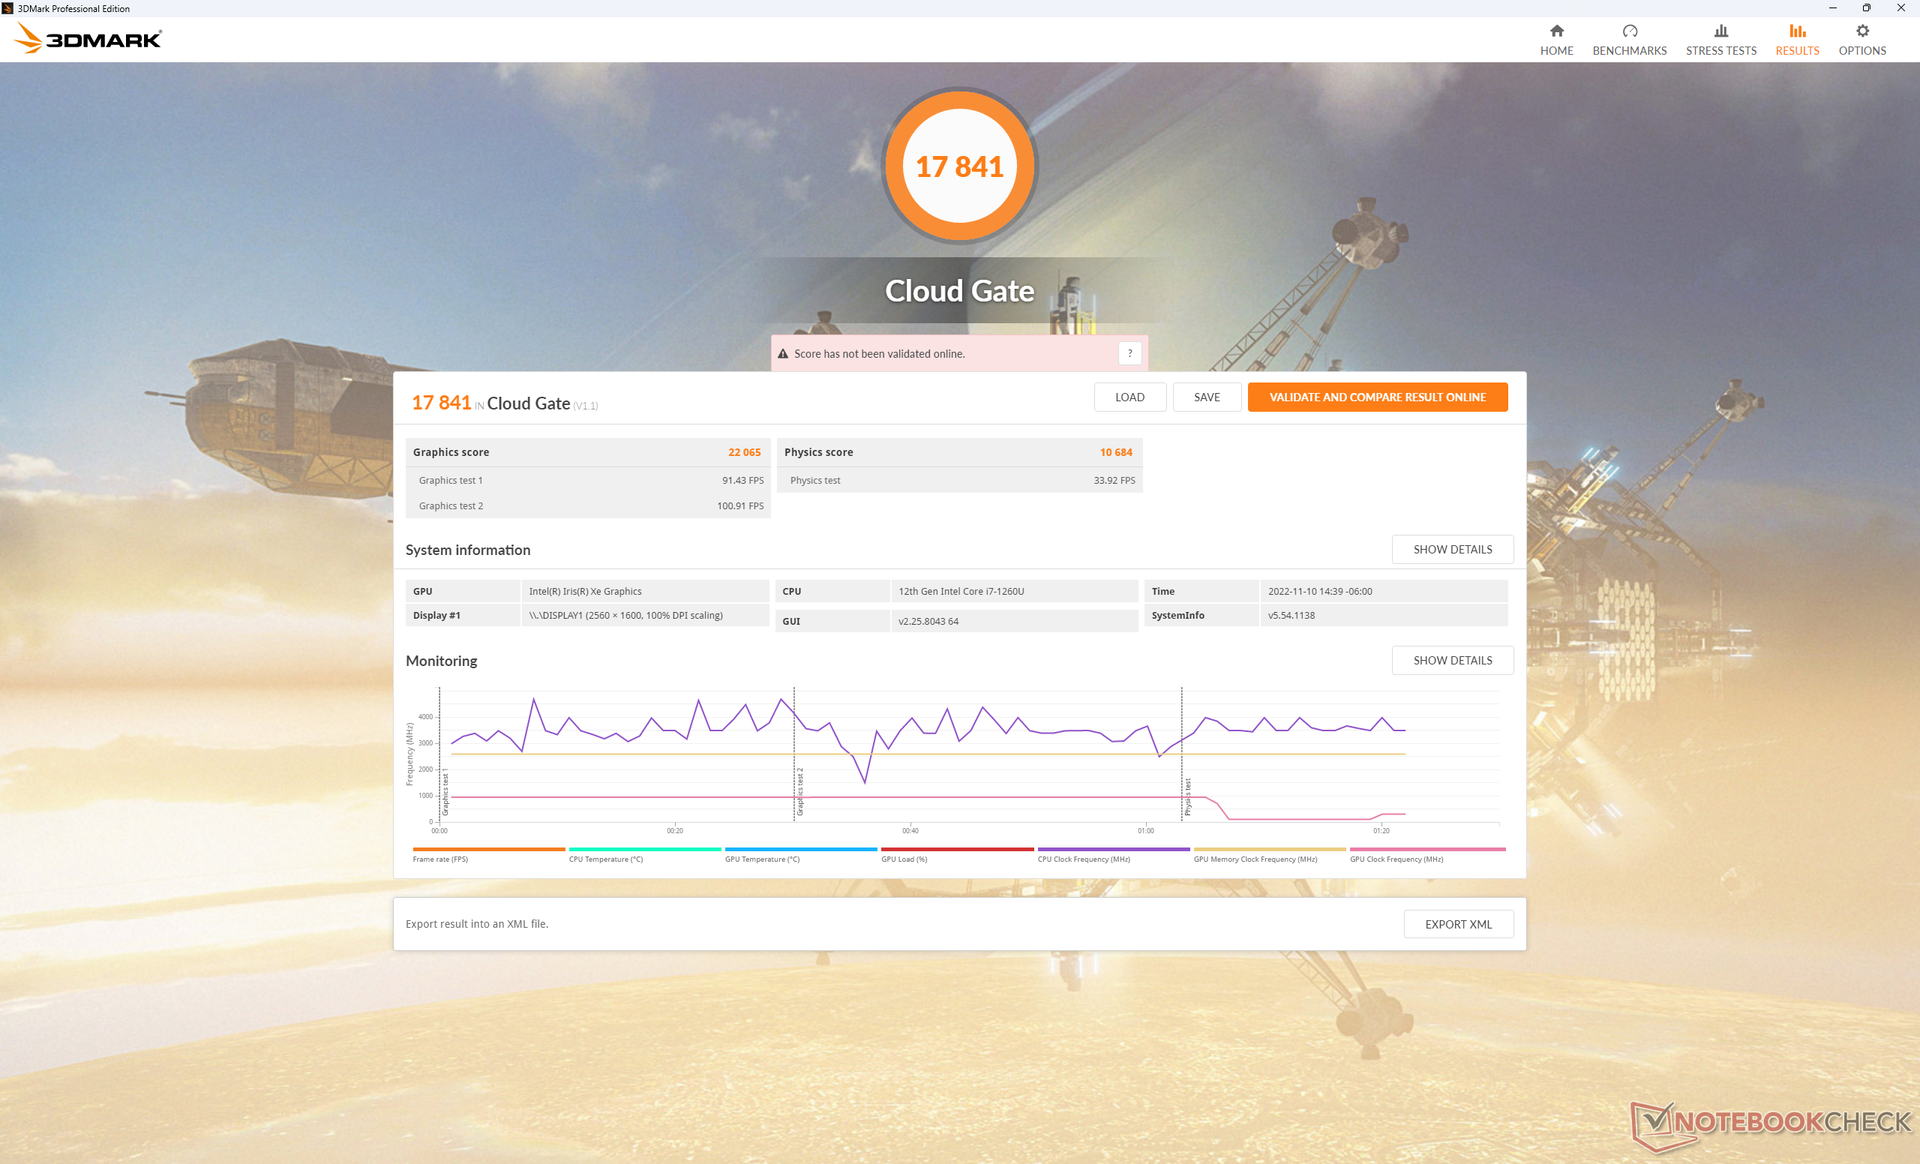
| 3DMark 11 Performance | 5349 puntos | |
| 3DMark Cloud Gate Standard Score | 17841 puntos | |
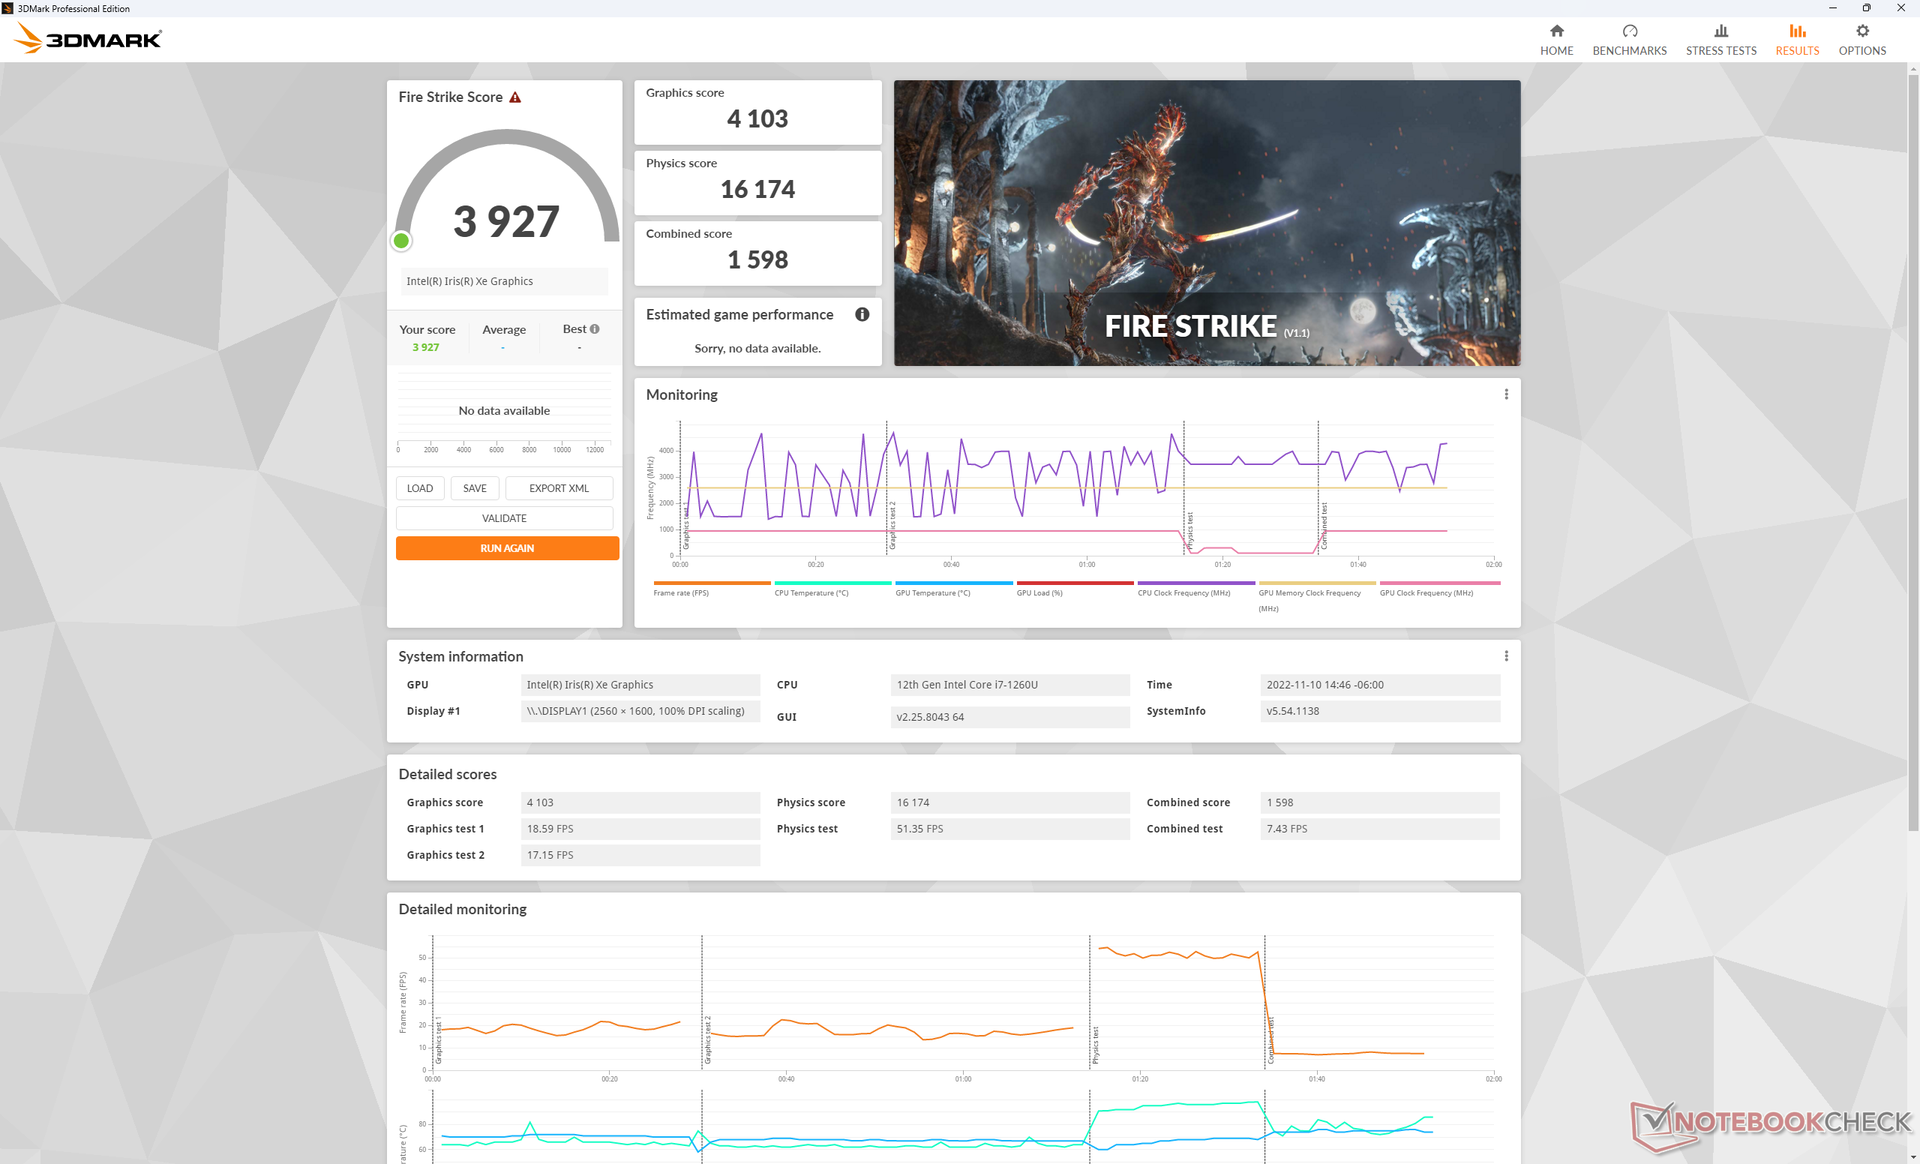
| 3DMark Fire Strike Score | 3927 puntos | |
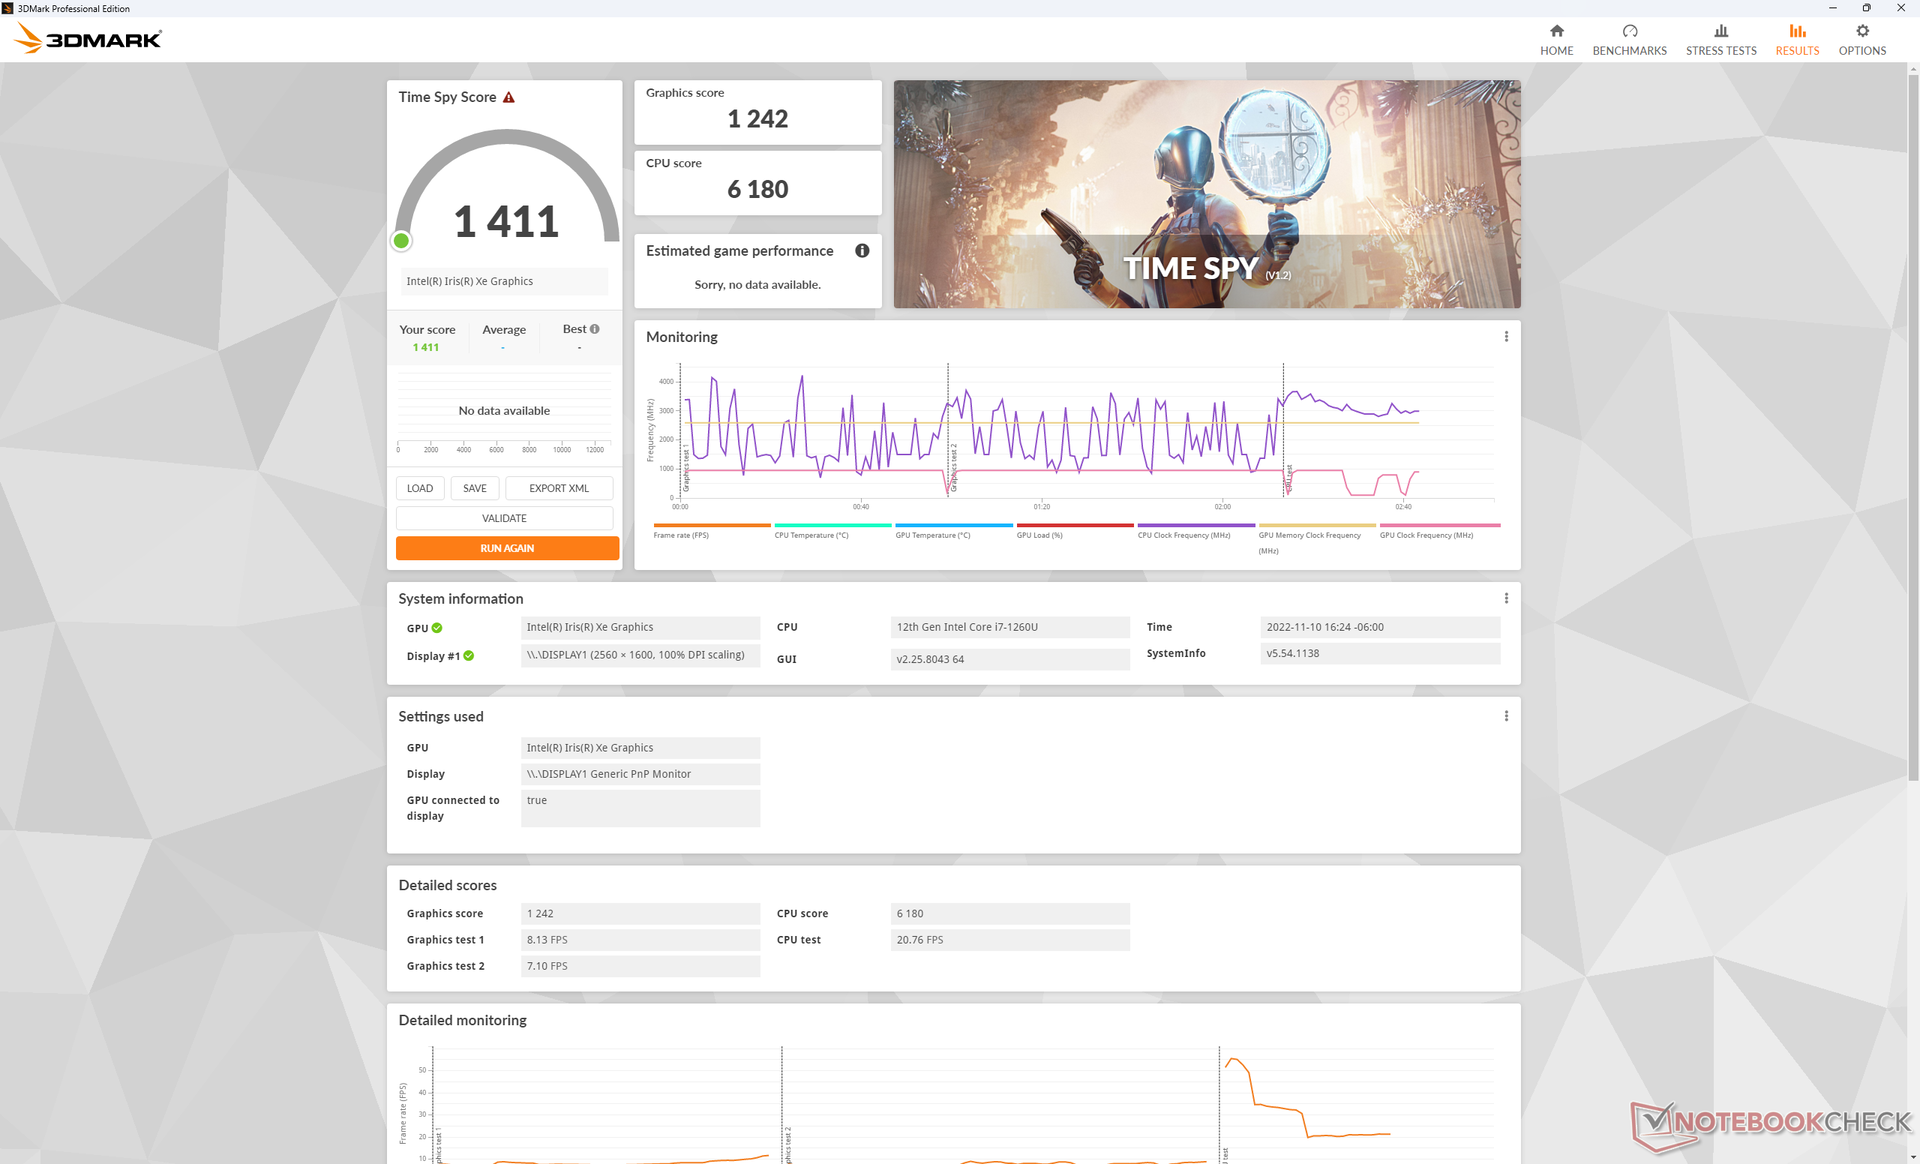
| 3DMark Time Spy Score | 1411 puntos | |
ayuda | ||
| Blender - v3.3 Classroom CPU | |
| Dell Latitude 9330 | |
| Medio Intel Iris Xe Graphics G7 96EUs (336 - 1259, n=109) | |
* ... más pequeño es mejor
| Performance rating - Percent | |
| MSI Summit E13 Flip Evo A11MT | |
| Dell Latitude 9330 | |
| HP Elite Dragonfly Max -1! | |
| Lenovo ThinkPad X1 Titanium Yoga G1 20QB0016GE -3! | |
| HP EliteBook x360 1030 G7 -3! | |
| Dell Latitude 5310-23VP6 -4! | |
| The Witcher 3 - 1920x1080 Ultra Graphics & Postprocessing (HBAO+) | |
| MSI Summit E13 Flip Evo A11MT | |
| HP Elite Dragonfly Max | |
| Dell Latitude 9330 | |
| Lenovo ThinkPad X1 Titanium Yoga G1 20QB0016GE | |
| GTA V - 1920x1080 Highest AA:4xMSAA + FX AF:16x | |
| MSI Summit E13 Flip Evo A11MT | |
| Dell Latitude 9330 | |
| Final Fantasy XV Benchmark - 1920x1080 High Quality | |
| MSI Summit E13 Flip Evo A11MT | |
| Dell Latitude 9330 | |
| HP Elite Dragonfly Max | |
| HP EliteBook x360 1030 G7 | |
| Strange Brigade - 1920x1080 ultra AA:ultra AF:16 | |
| MSI Summit E13 Flip Evo A11MT | |
| Dell Latitude 9330 | |
| HP Elite Dragonfly Max | |
| Dota 2 Reborn - 1920x1080 ultra (3/3) best looking | |
| Dell Latitude 9330 | |
| MSI Summit E13 Flip Evo A11MT | |
| Lenovo ThinkPad X1 Titanium Yoga G1 20QB0016GE | |
| HP Elite Dragonfly Max | |
| HP EliteBook x360 1030 G7 | |
| Dell Latitude 5310-23VP6 | |
| X-Plane 11.11 - 1920x1080 high (fps_test=3) | |
| MSI Summit E13 Flip Evo A11MT | |
| Dell Latitude 9330 | |
| HP Elite Dragonfly Max | |
| Lenovo ThinkPad X1 Titanium Yoga G1 20QB0016GE | |
| HP EliteBook x360 1030 G7 | |
| Dell Latitude 5310-23VP6 | |
Witcher 3 FPS Chart
| bajo | medio | alto | ultra | |
|---|---|---|---|---|
| GTA V (2015) | 102.1 | 91.1 | 21.7 | 8.94 |
| The Witcher 3 (2015) | 75.8 | 47.2 | 25.9 | 11.4 |
| Dota 2 Reborn (2015) | 100.3 | 80.1 | 58.6 | 53.4 |
| Final Fantasy XV Benchmark (2018) | 37.3 | 21 | 14.6 | |
| X-Plane 11.11 (2018) | 37.1 | 34.4 | 30.8 | |
| Strange Brigade (2018) | 69.1 | 32.4 | 25 | 20.4 |
| Cyberpunk 2077 1.6 (2022) | 17.5 | 14.5 | 11.2 | 8.9 |
Emisiones
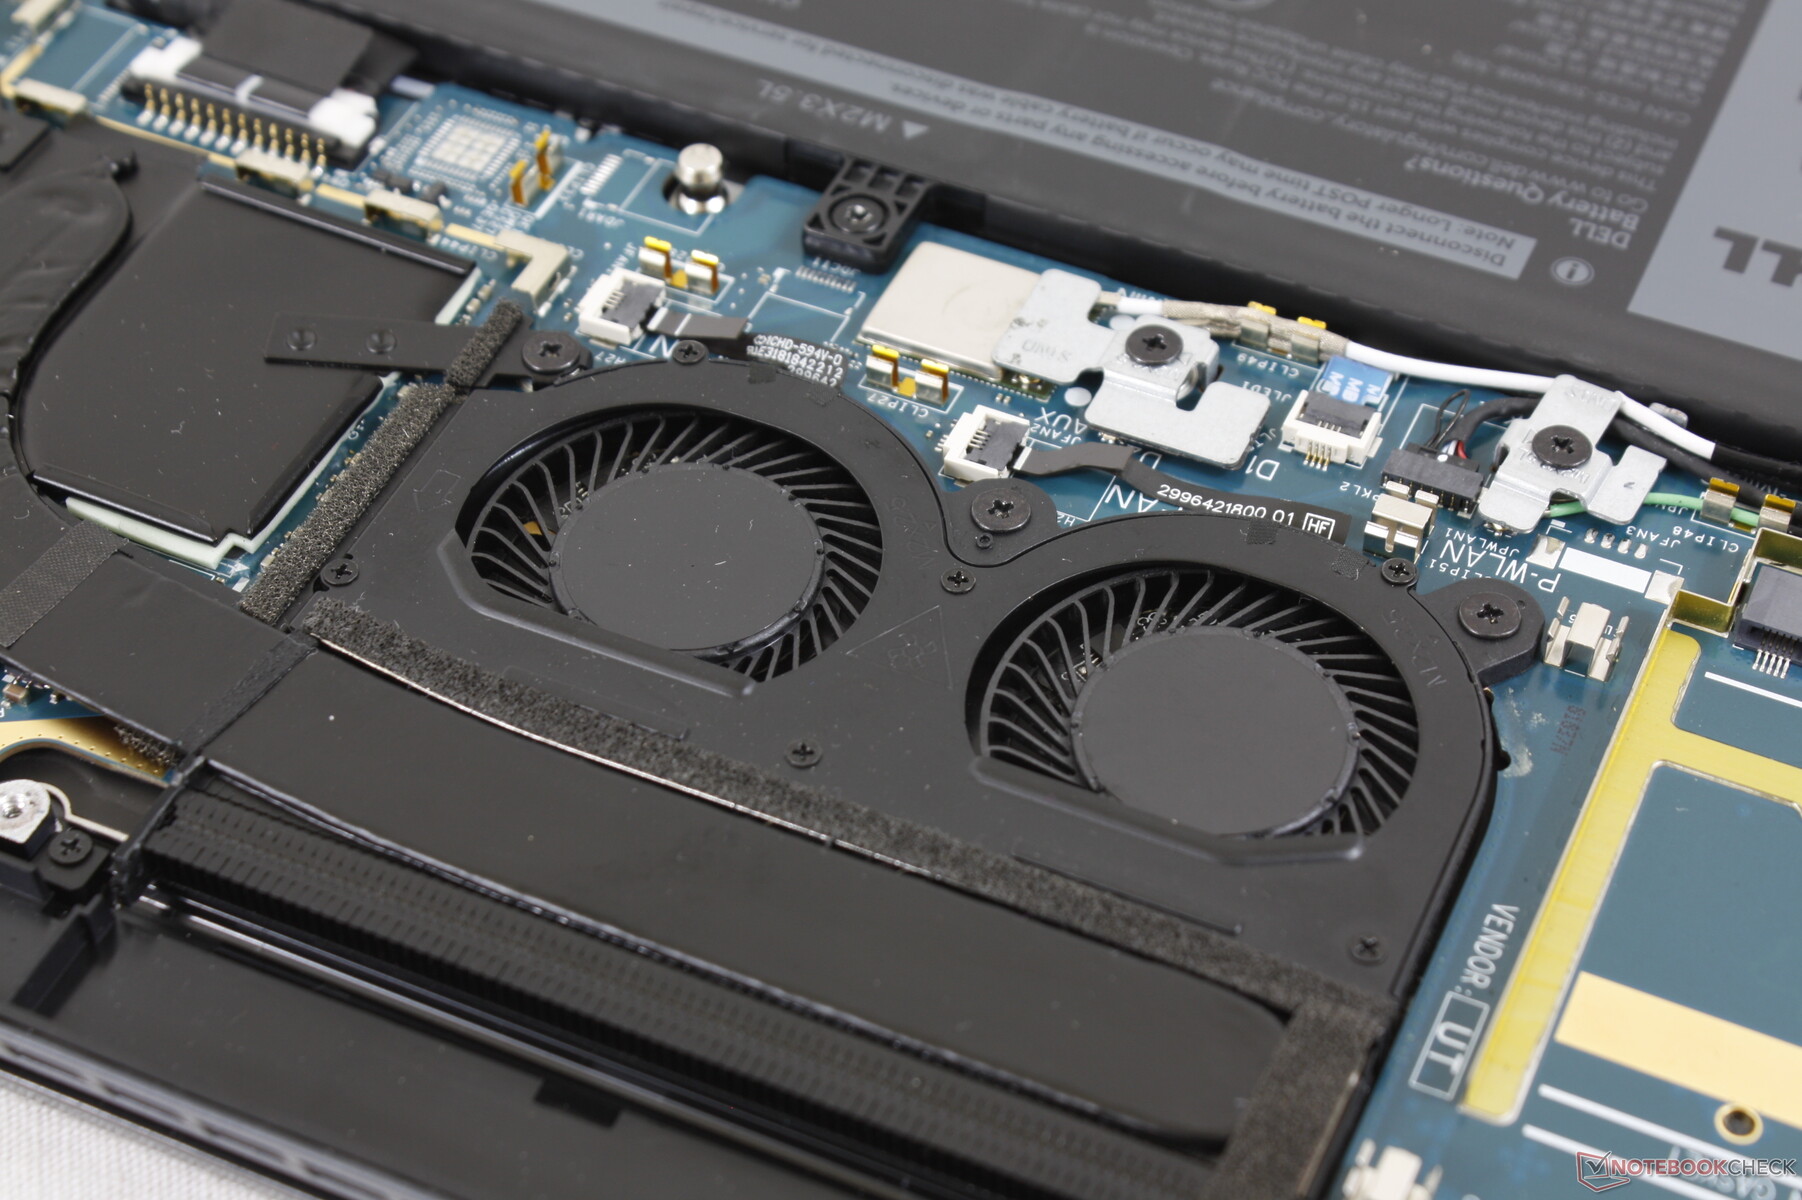
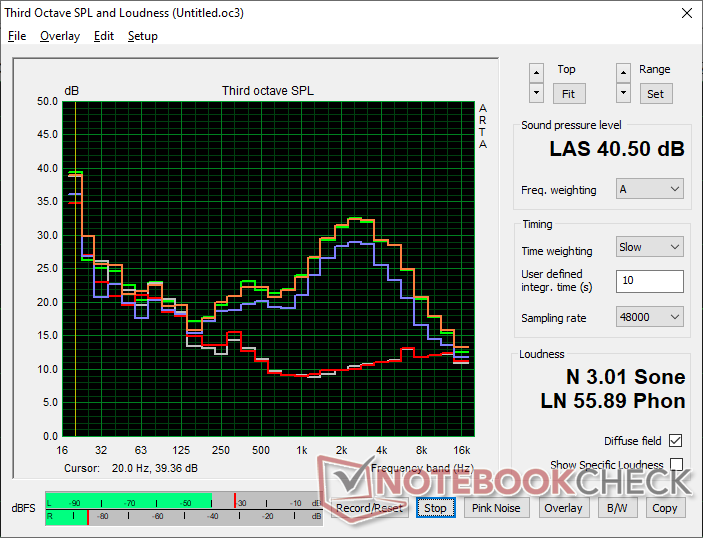
Ruido del sistema - Ventiladores de tono alto
Los dos ventiladores internos son bastante pequeños, con sólo 30 mm de diámetro cada uno, en comparación con los 40 mm o más de la mayoría de los otros portátiles. La principal desventaja de los ventiladores más pequeños es que suelen ser más agudos que los más grandes, por lo que son más perceptibles cuando están activos. Nuestras mediciones con el micrófono confirman el ruido más alto con un pico relativamente agudo de unos 3k Hz comparado con los picos más amplios de otros subportátiles de 13 pulgadas como el XPS 13 Plus 9320. En otras palabras, los ventiladores del Latitude 9330 son más propensos a distraer cuando se navega por la web o se transmite vídeo.
Cuando se ejecuta 3DMark 06, el ruido del ventilador aumenta bruscamente desde el silencio hasta los 37 dB(A) aproximadamente a la mitad de la primera escena del benchmark. El Dell es mucho más ruidoso que lo que registramos en elHP Dragonfly Max mientras que está a la par con el Summit E13 Flip. Recomendamos ejecutar el sistema en modo silencioso o equilibrado para mantener las pulsaciones del ventilador al mínimo.
Ruido
| Ocioso |
| 23 / 23.1 / 23.1 dB(A) |
| Carga |
| 37.1 / 40.5 dB(A) |
 | ||
30 dB silencioso 40 dB(A) audible 50 dB(A) ruidosamente alto |
||
min: | ||
| Dell Latitude 9330 Iris Xe G7 96EUs, i7-1260U | Lenovo ThinkPad X1 Titanium Yoga G1 20QB0016GE Iris Xe G7 80EUs, i5-1140G7, Lenovo UMIS RPJTJ256MEE1OWX | MSI Summit E13 Flip Evo A11MT Iris Xe G7 96EUs, i7-1185G7, Phison 1TB SM2801T24GKBB4S-E162 | HP EliteBook x360 1030 G7 UHD Graphics 620, i7-10810U, Samsung SSD PM981a MZVLB512HBJQ | HP Elite Dragonfly Max Iris Xe G7 96EUs, i7-1185G7, Toshiba XG6 KXG60ZNV512G | Dell Latitude 5310-23VP6 UHD Graphics 620, i5-10310U, SK hynix BC511 HFM512GDHTNI-87A0B | |
|---|---|---|---|---|---|---|
| Noise | -9% | -8% | -13% | 5% | 1% | |
| apagado / medio ambiente * (dB) | 23 | 25.61 -11% | 24.5 -7% | 28.1 -22% | 24.9 -8% | 24.9 -8% |
| Idle Minimum * (dB) | 23 | 25.61 -11% | 24.7 -7% | 28.1 -22% | 24.9 -8% | 24.9 -8% |
| Idle Average * (dB) | 23.1 | 25.61 -11% | 24.7 -7% | 28.1 -22% | 24.9 -8% | 24.9 -8% |
| Idle Maximum * (dB) | 23.1 | 25.61 -11% | 26.4 -14% | 28.1 -22% | 24.9 -8% | 24.9 -8% |
| Load Average * (dB) | 37.1 | 40.14 -8% | 37.8 -2% | 35.1 5% | 29.7 20% | 30 19% |
| Witcher 3 ultra * (dB) | 40.6 | 41.4 -2% | 31.3 23% | 36 11% | ||
| Load Maximum * (dB) | 40.5 | 40.14 1% | 48.8 -20% | 37.6 7% | 31.3 23% | 36.3 10% |
* ... más pequeño es mejor
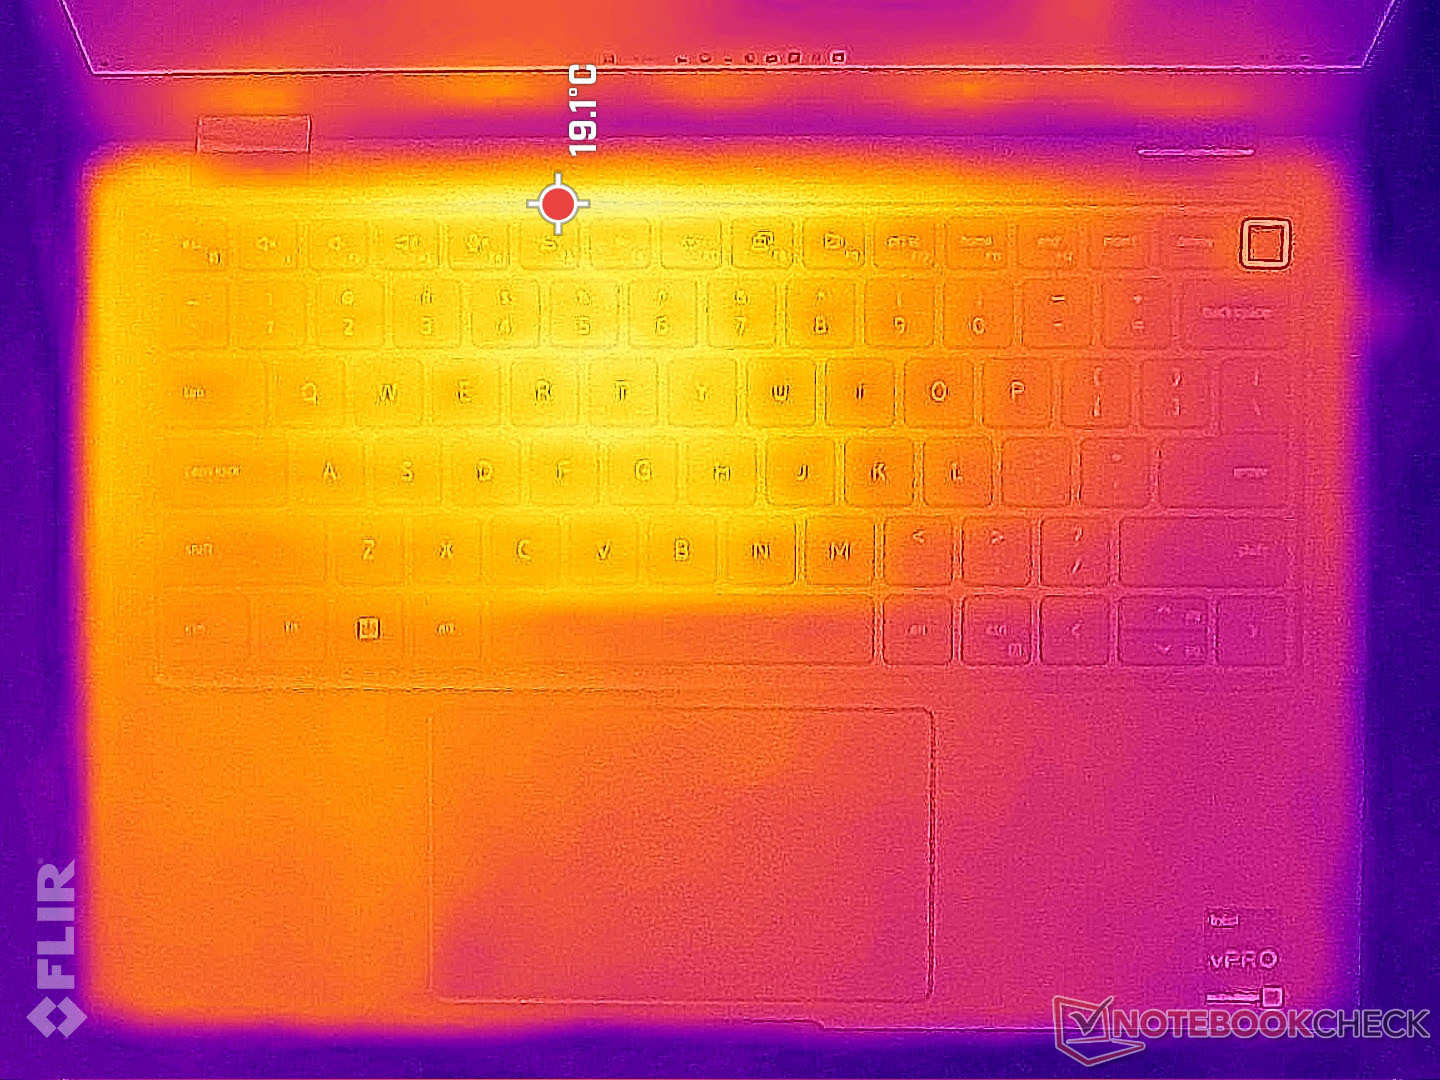
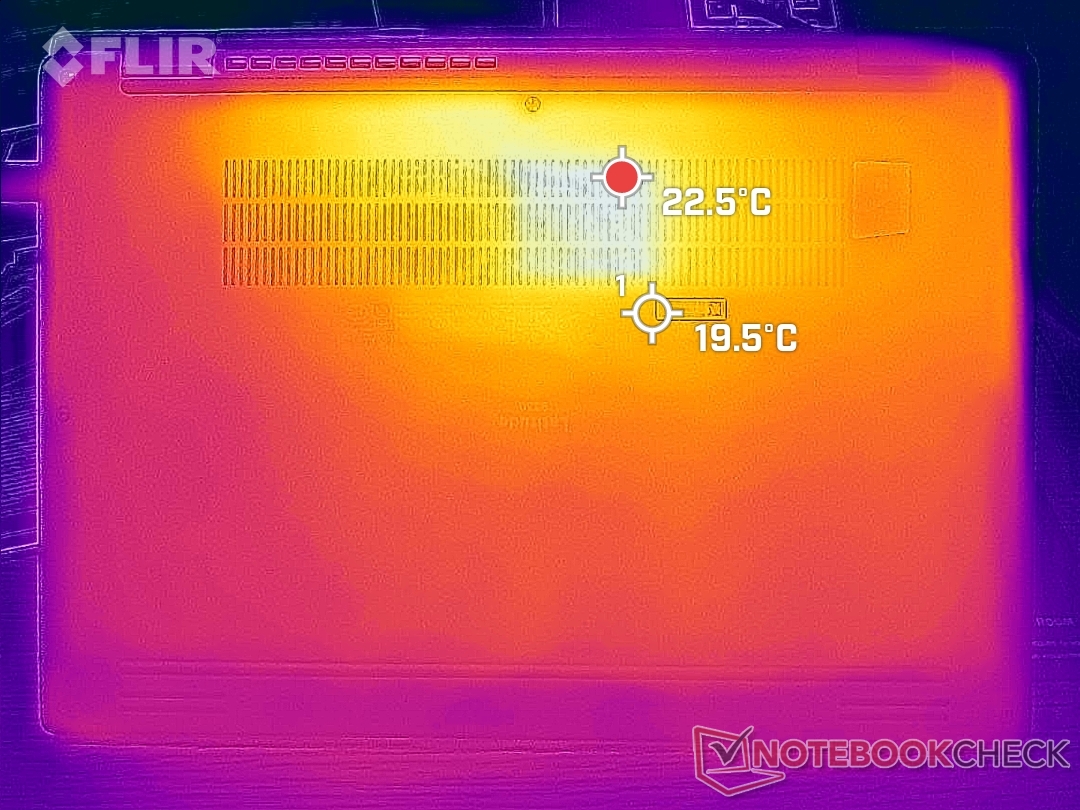
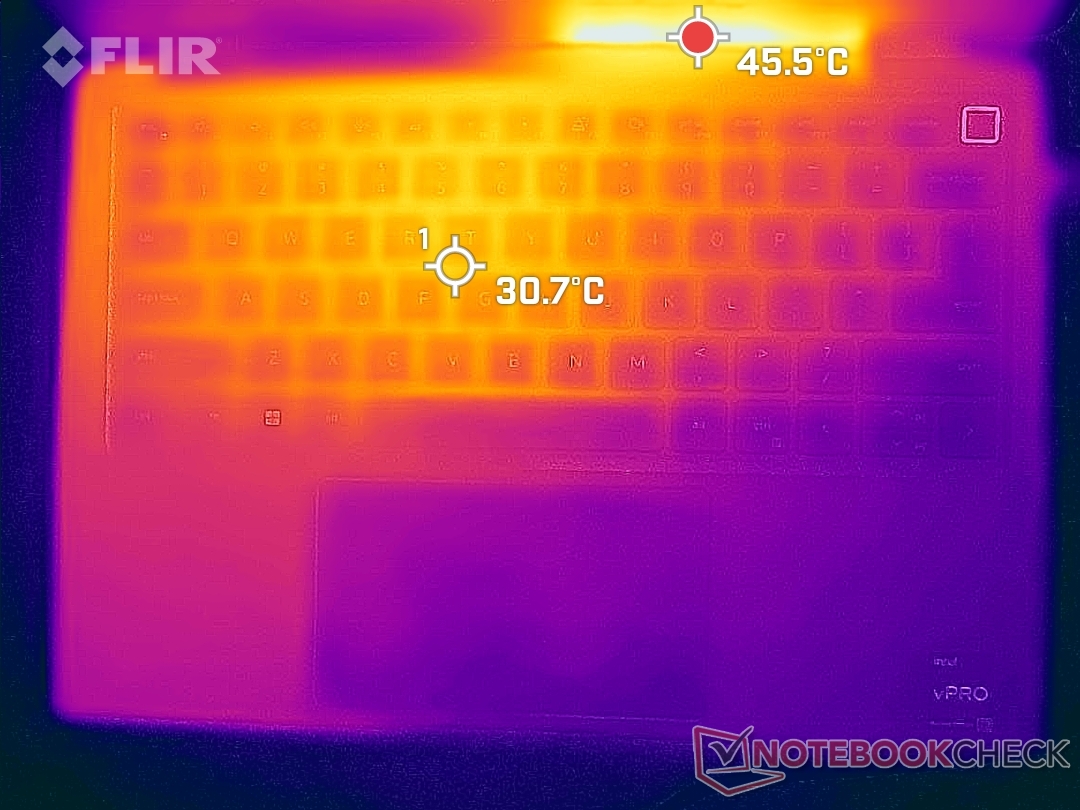
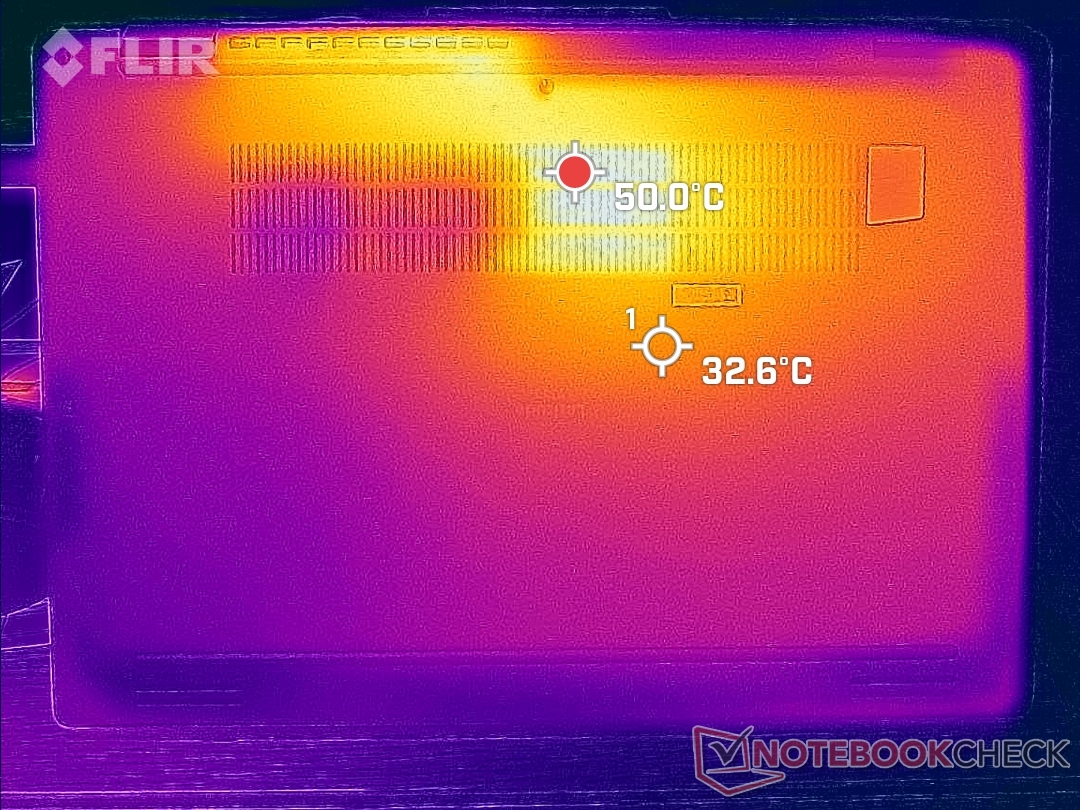
Temperatura
Las temperaturas de la superficie son muy frías durante las cargas bajas, ya que la mayor parte del chasis es metálica. Sin embargo, cuando se somete a cargas más altas, los puntos calientes pueden alcanzar hasta 41 C y 50 C en la parte superior e inferior, respectivamente. Los puntos calientes se encuentran hacia la parte trasera del chasis, por lo que el teclado y los reposamanos permanecen más frescos para escribir cómodamente. El competidor Dragonfly Max alcanza máximos similares, mientras que el Summit E13 Flip puede llegar a calentarse aún más, hasta 57 C.
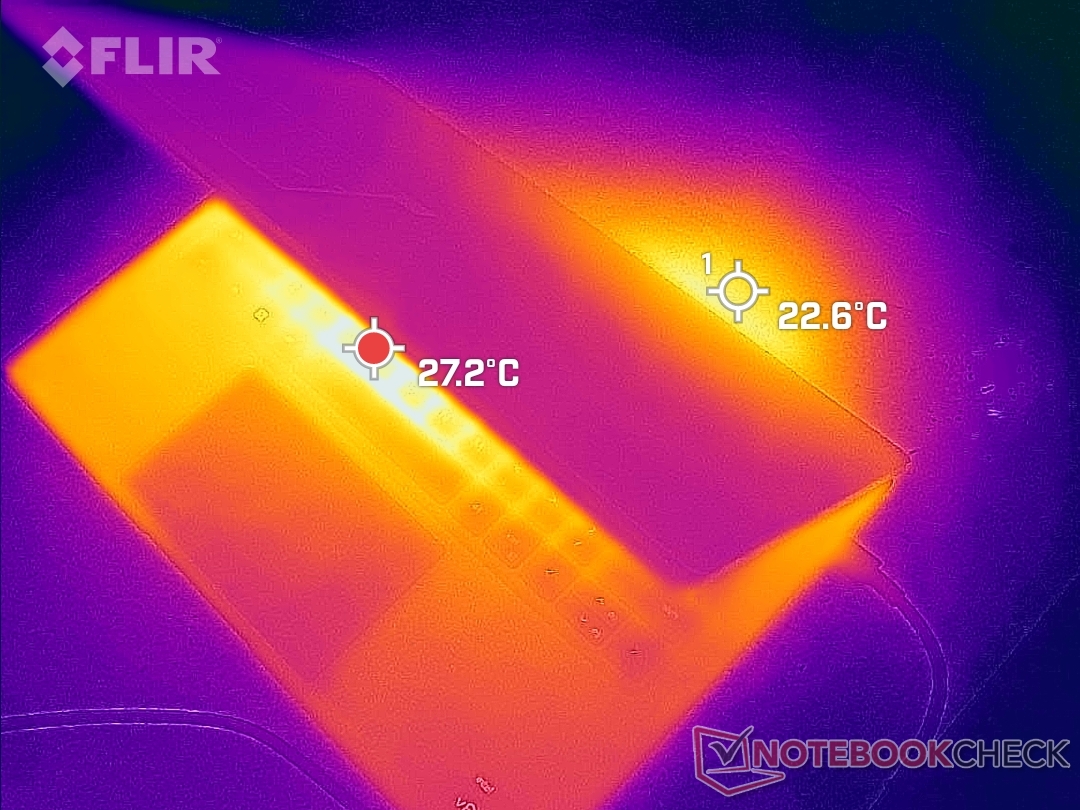
(±) La temperatura máxima en la parte superior es de 40.6 °C / 105 F, frente a la media de 35.4 °C / 96 F, que oscila entre 19.6 y 60 °C para la clase Convertible.
(-) El fondo se calienta hasta un máximo de 50.2 °C / 122 F, frente a la media de 36.9 °C / 98 F
(+) En reposo, la temperatura media de la parte superior es de 23.5 °C / 74# F, frente a la media del dispositivo de 30.3 °C / 87 F.
(+) El reposamanos y el panel táctil están a una temperatura inferior a la de la piel, con un máximo de 28 °C / 82.4 F y, por tanto, son fríos al tacto.
(±) La temperatura media de la zona del reposamanos de dispositivos similares fue de 28 °C / 82.4 F (0 °C / 0 F).
| Dell Latitude 9330 Intel Core i7-1260U, Intel Iris Xe Graphics G7 96EUs | Lenovo ThinkPad X1 Titanium Yoga G1 20QB0016GE Intel Core i5-1140G7, Intel Iris Xe Graphics G7 80EUs | MSI Summit E13 Flip Evo A11MT Intel Core i7-1185G7, Intel Iris Xe Graphics G7 96EUs | HP EliteBook x360 1030 G7 Intel Core i7-10810U, Intel UHD Graphics 620 | HP Elite Dragonfly Max Intel Core i7-1185G7, Intel Iris Xe Graphics G7 96EUs | Dell Latitude 5310-23VP6 Intel Core i5-10310U, Intel UHD Graphics 620 | |
|---|---|---|---|---|---|---|
| Heat | -3% | -22% | -2% | -11% | 6% | |
| Maximum Upper Side * (°C) | 40.6 | 46.3 -14% | 52 -28% | 37 9% | 39.4 3% | 39 4% |
| Maximum Bottom * (°C) | 50.2 | 43.3 14% | 57.4 -14% | 47.2 6% | 50 -0% | 44.8 11% |
| Idle Upper Side * (°C) | 25 | 26.8 -7% | 30.4 -22% | 25.8 -3% | 31.6 -26% | 24.3 3% |
| Idle Bottom * (°C) | 27.6 | 28.3 -3% | 34.2 -24% | 32.6 -18% | 33.4 -21% | 25.6 7% |
* ... más pequeño es mejor
Prueba de esfuerzo
La temperatura de la CPU alcanza regularmente los 90 C o más cuando se ejecutan cargas exigentes. Cuando se ejecuta Prime95, por ejemplo, la CPU se dispara casi instantáneamente a 99 C, 2.8 GHz, y 29 W, respectivamente, antes de caer rápidamente y estabilizarse en 2.4 GHz y 25 W para mantener una temperatura de núcleo de ~98 C. Ejecutar esta misma prueba en el Dragonfly Max con el Core i7-1185G7 resultaría en velocidades de reloj mucho más lentas y una temperatura de núcleo más fría de sólo 1.5 GHz y 71 C, respectivamente. Dell no teme hacer funcionar el procesador a mayor temperatura que en la mayoría de los otros modelos para ofrecer un rendimiento más rápido.
La velocidad de reloj de la GPU y la temperatura cuando se ejecuta Witcher 3 para representar una carga gráfica exigente se estabilizarían en 948 MHz y 91 C, respectivamente, en comparación con sólo 700 MHz y 61 C en el mencionado HP.
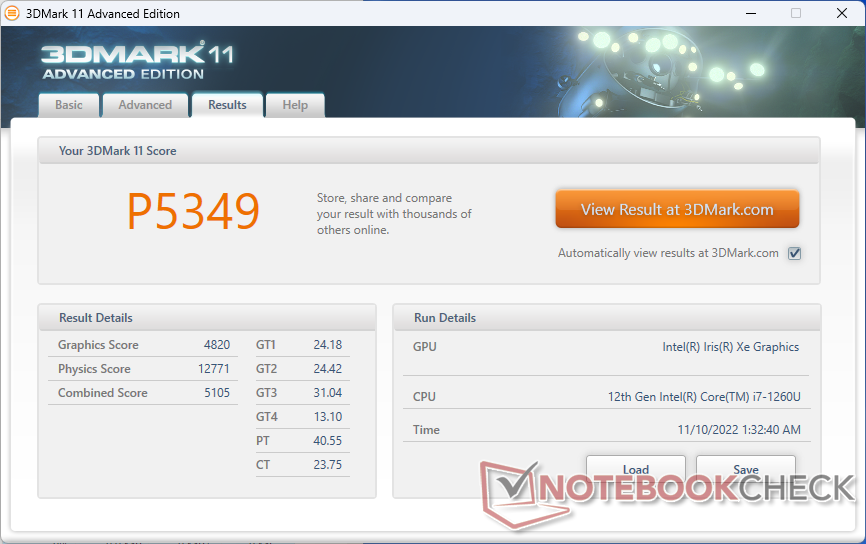
Funcionar con batería limita el rendimiento. Un test 3DMark 11 en batería devolvería unas puntuaciones de Física y Gráficos de 7531 y 4193 puntos, respectivamente, comparado con 12771 y 4820 puntos cuando está conectado a la red.
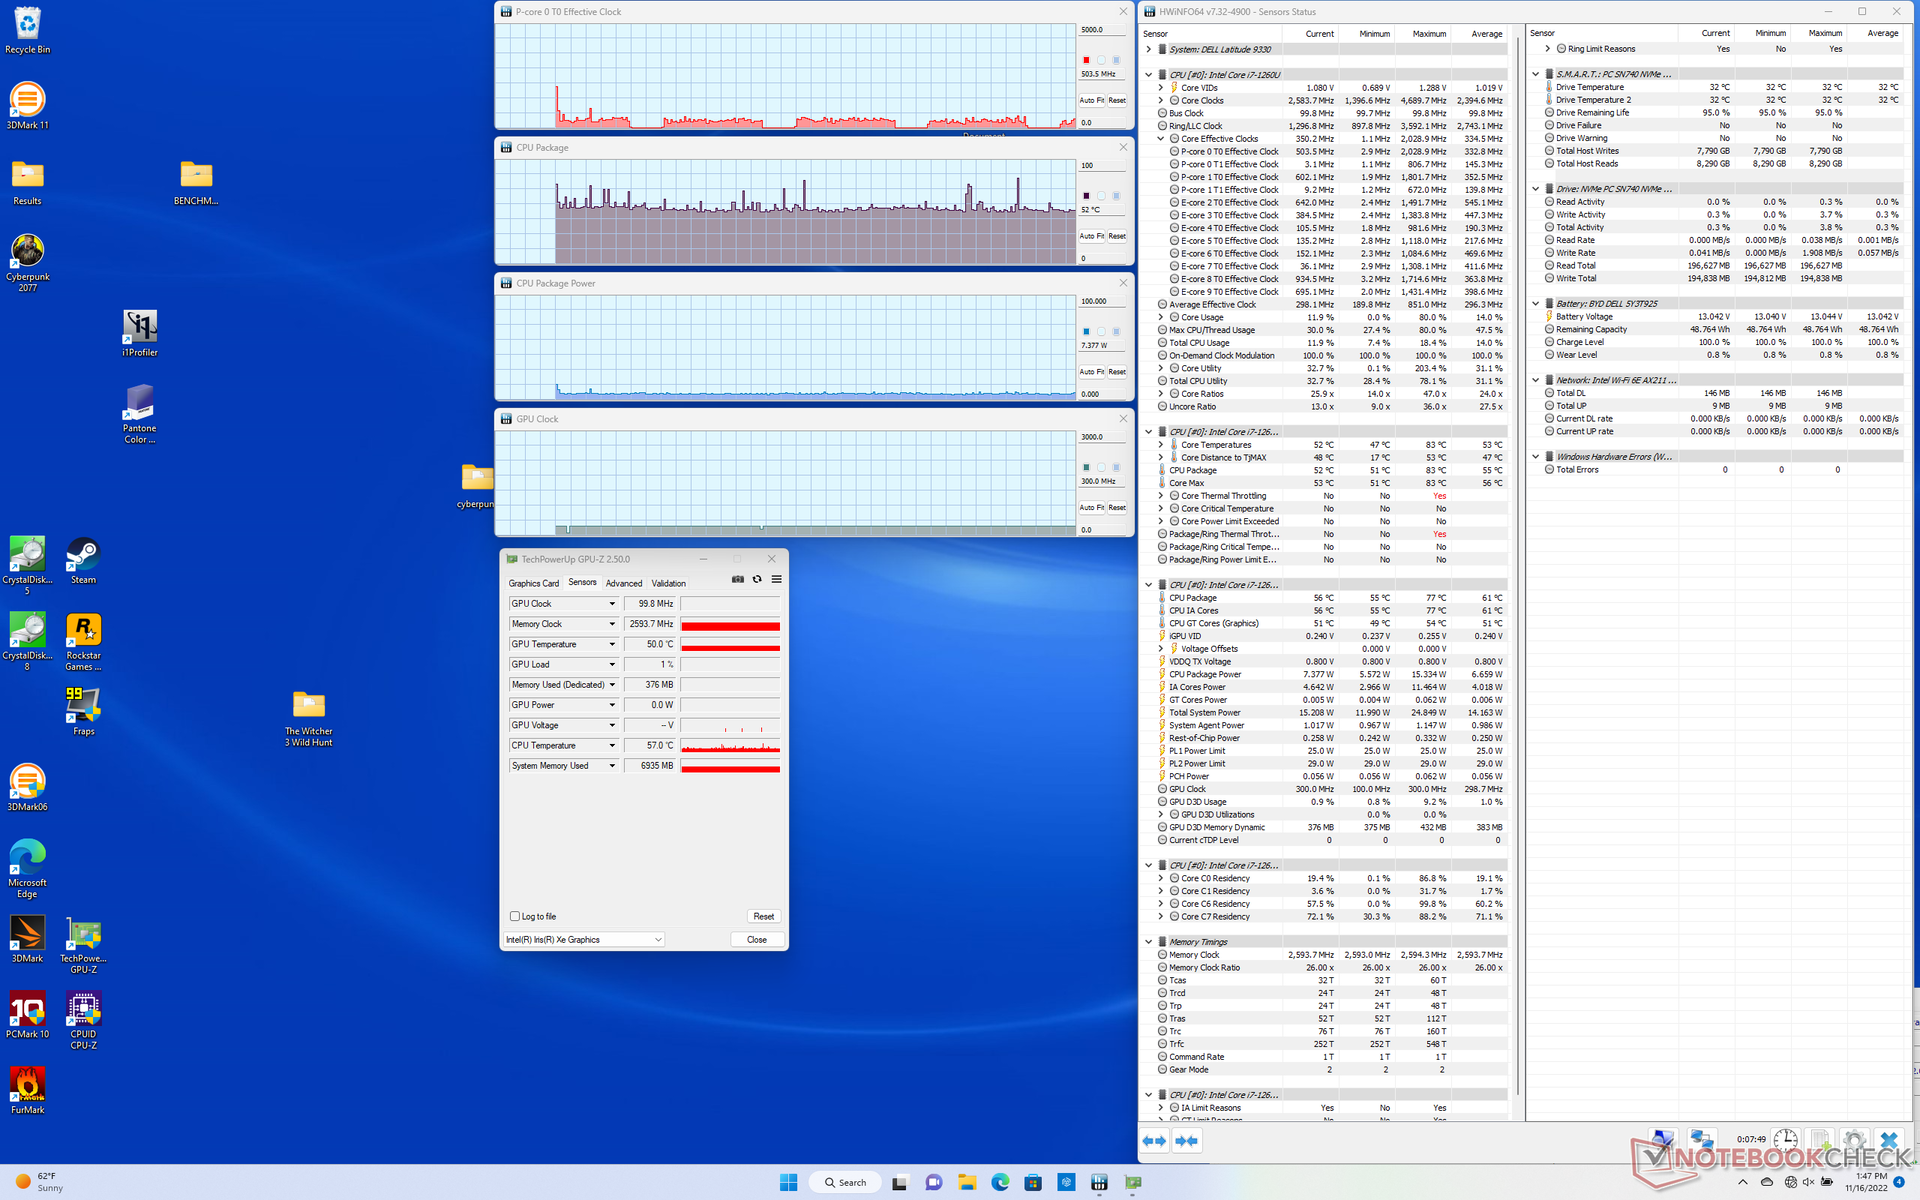
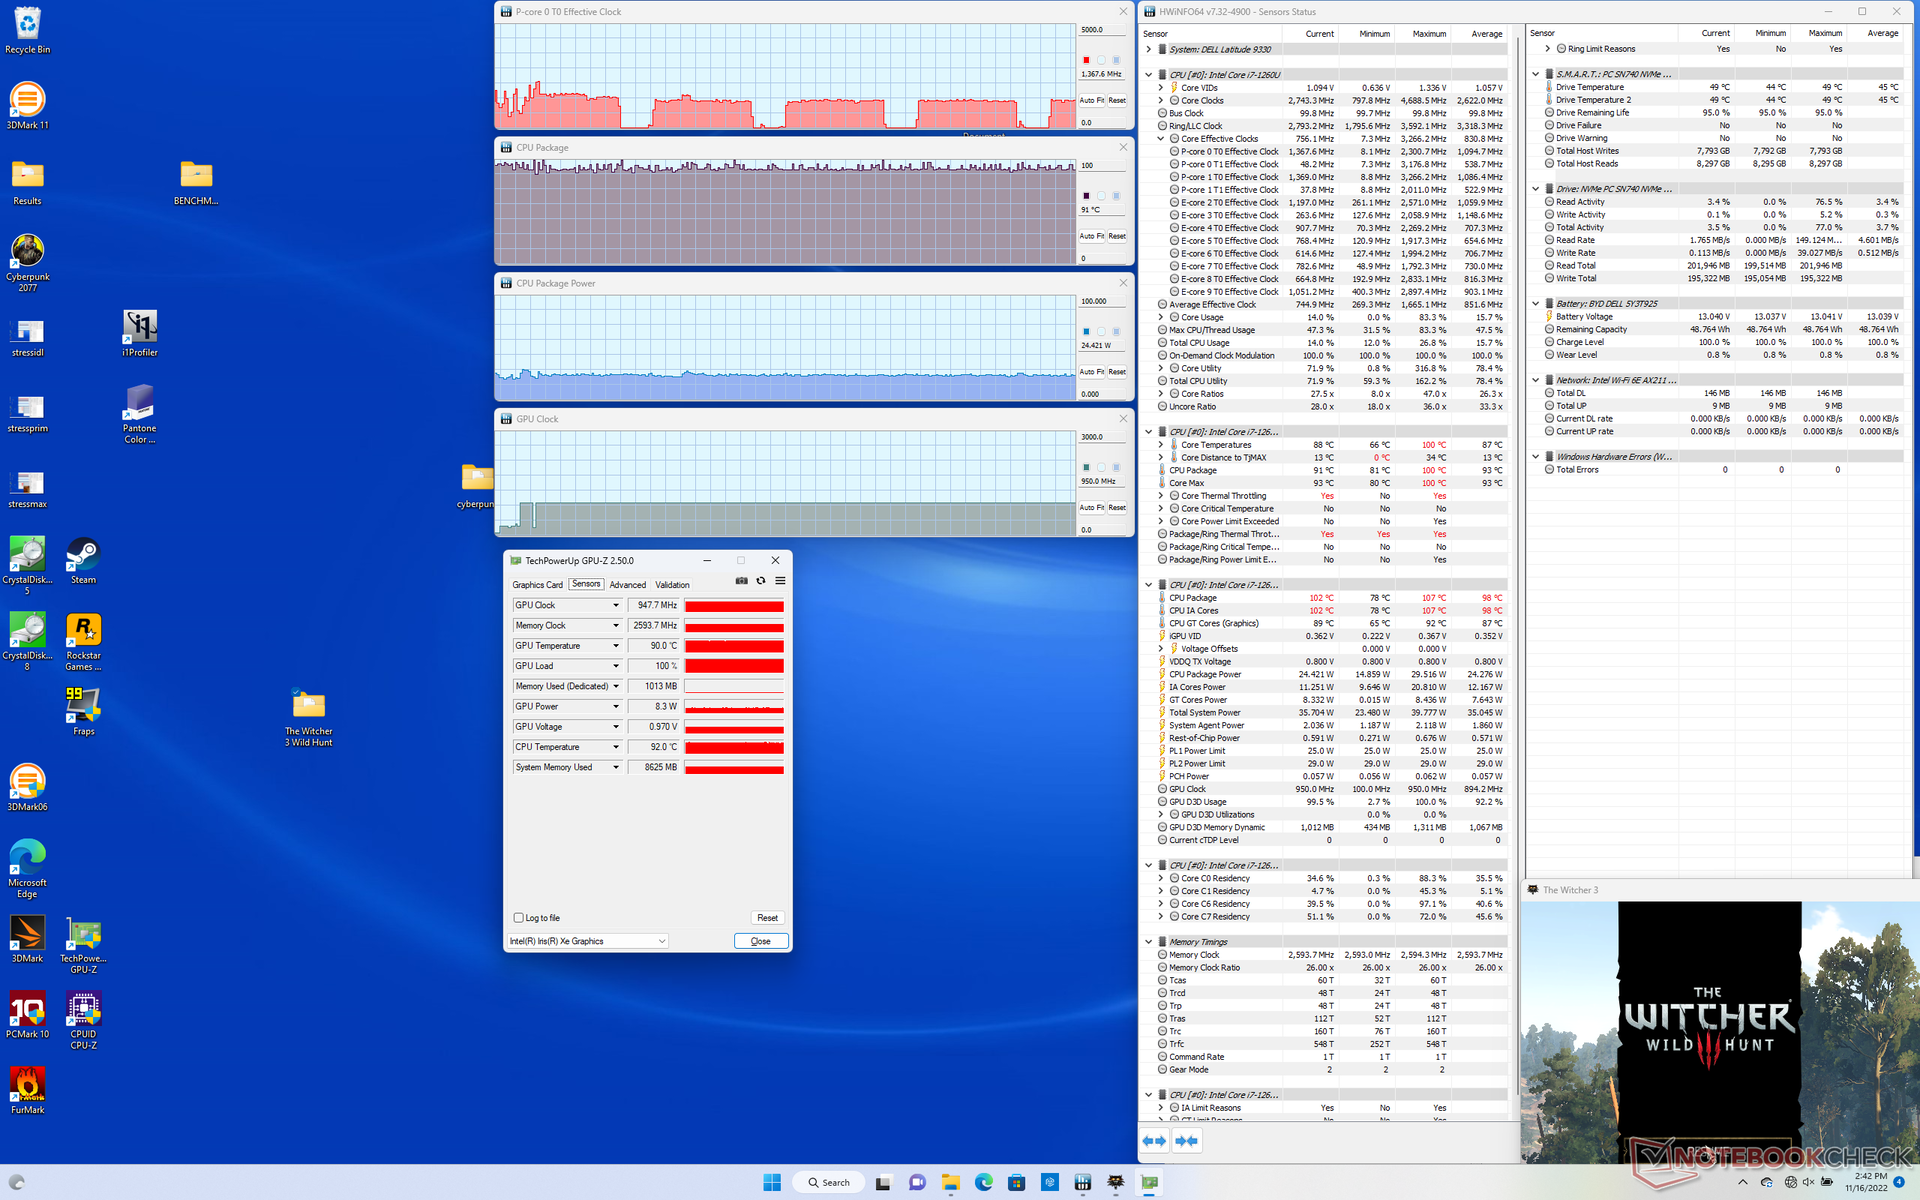
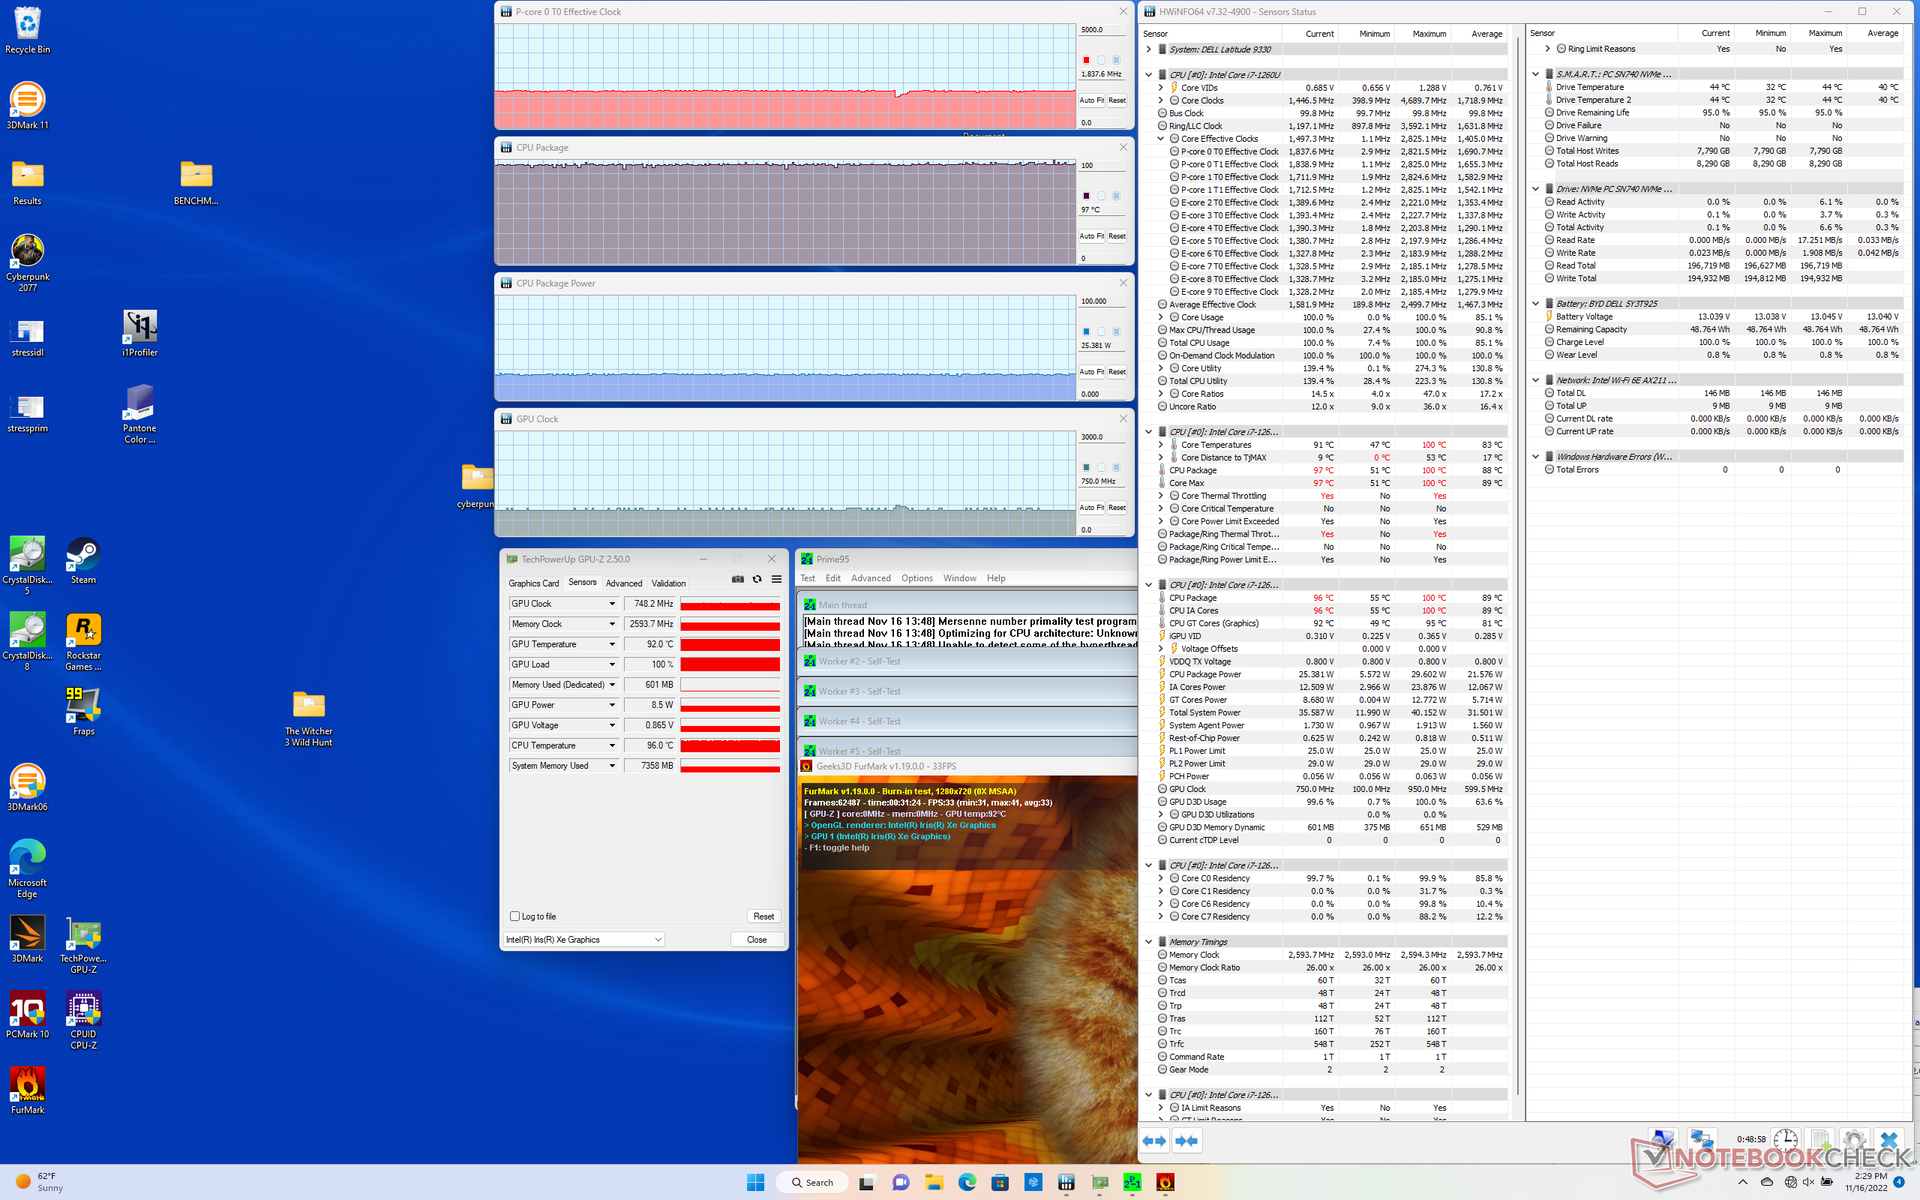
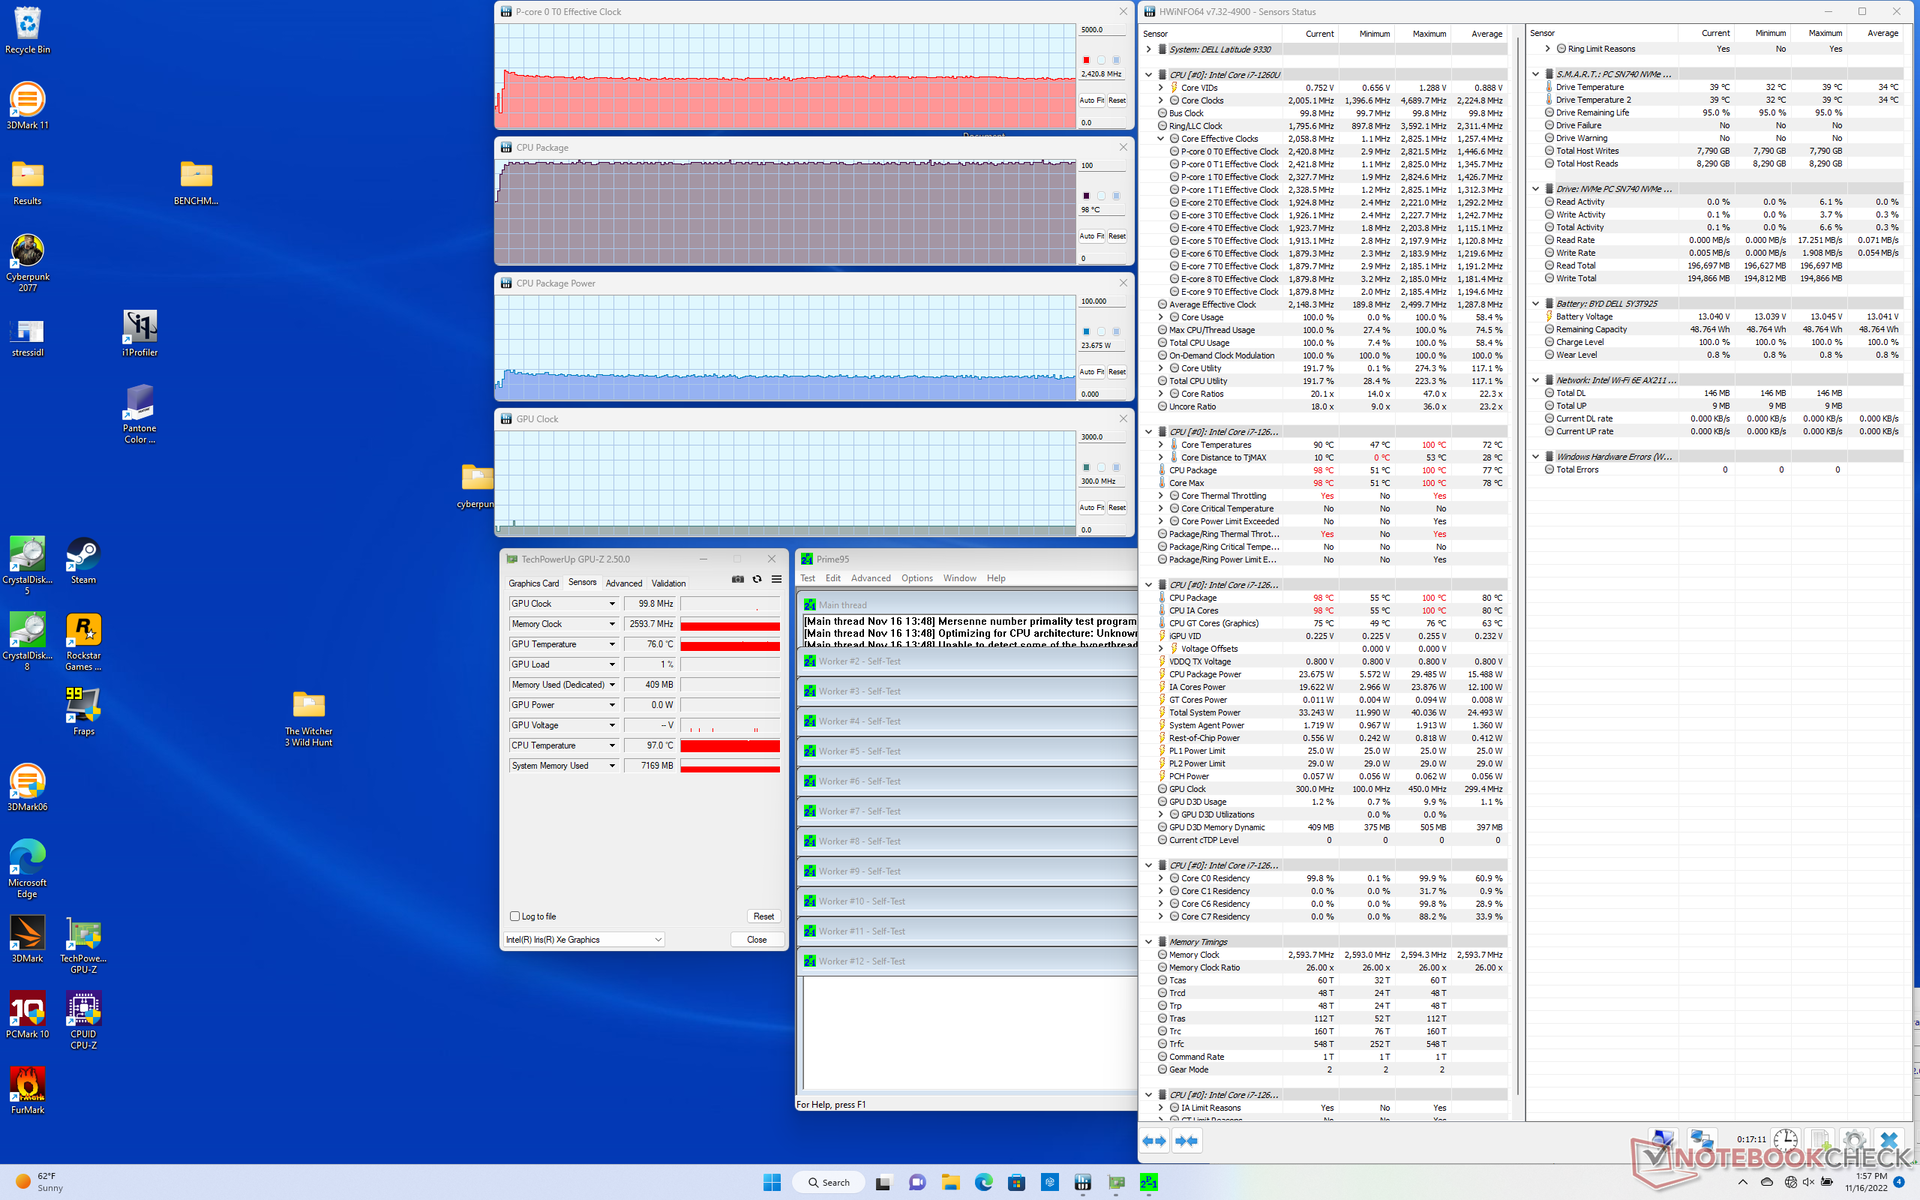
| Reloj dela CPU (GHz) | Reloj de la GPU (MHz) | Temperatura media de la CPU (°C) | |
| Sistema en reposo | -- | -- | 52 |
| Prime95 Stress | 2.4 | -- | 98 |
| Prime95+ FurMark Stress | 1,8 | 748 | 97 |
| Witcher 3 Estrés | 1,4 | 948 | 91 |
Altavoces
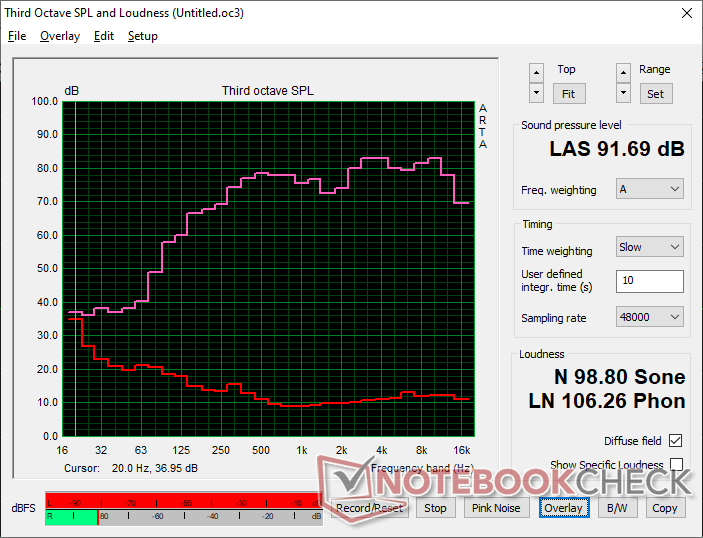
Dell se las ha arreglado para meter cuatro altavoces individuales con una excelente reproducción de audio a pesar del pequeño factor de forma. El volumen máximo es alto y claro, sin estática perceptible. Es obvio que los altavoces internos han sido optimizados para conferencias de audio o vídeo.
Dell Latitude 9330 análisis de audio
(+) | los altavoces pueden reproducir a un volumen relativamente alto (#91.7 dB)
Graves 100 - 315 Hz
(±) | lubina reducida - en promedio 11.9% inferior a la mediana
(+) | el bajo es lineal (6.3% delta a la frecuencia anterior)
Medios 400 - 2000 Hz
(+) | medios equilibrados - a sólo 1.9% de la mediana
(+) | los medios son lineales (2.7% delta a la frecuencia anterior)
Altos 2 - 16 kHz
(+) | máximos equilibrados - a sólo 3.4% de la mediana
(+) | los máximos son lineales (3.5% delta a la frecuencia anterior)
Total 100 - 16.000 Hz
(+) | el sonido global es lineal (9.2% de diferencia con la mediana)
En comparación con la misma clase
» 4% de todos los dispositivos probados de esta clase eran mejores, 1% similares, 95% peores
» El mejor tuvo un delta de 6%, la media fue 20%, el peor fue ###max##%
En comparación con todos los dispositivos probados
» 3% de todos los dispositivos probados eran mejores, 1% similares, 96% peores
» El mejor tuvo un delta de 4%, la media fue 24%, el peor fue ###max##%
Apple MacBook Pro 16 2021 M1 Pro análisis de audio
(+) | los altavoces pueden reproducir a un volumen relativamente alto (#84.7 dB)
Graves 100 - 315 Hz
(+) | buen bajo - sólo 3.8% lejos de la mediana
(+) | el bajo es lineal (5.2% delta a la frecuencia anterior)
Medios 400 - 2000 Hz
(+) | medios equilibrados - a sólo 1.3% de la mediana
(+) | los medios son lineales (2.1% delta a la frecuencia anterior)
Altos 2 - 16 kHz
(+) | máximos equilibrados - a sólo 1.9% de la mediana
(+) | los máximos son lineales (2.7% delta a la frecuencia anterior)
Total 100 - 16.000 Hz
(+) | el sonido global es lineal (4.6% de diferencia con la mediana)
En comparación con la misma clase
» 0% de todos los dispositivos probados de esta clase eran mejores, 0% similares, 100% peores
» El mejor tuvo un delta de 5%, la media fue 17%, el peor fue ###max##%
En comparación con todos los dispositivos probados
» 0% de todos los dispositivos probados eran mejores, 0% similares, 100% peores
» El mejor tuvo un delta de 4%, la media fue 24%, el peor fue ###max##%
Gestión de la energía
Consumo de energía - Alto rendimiento por vatio
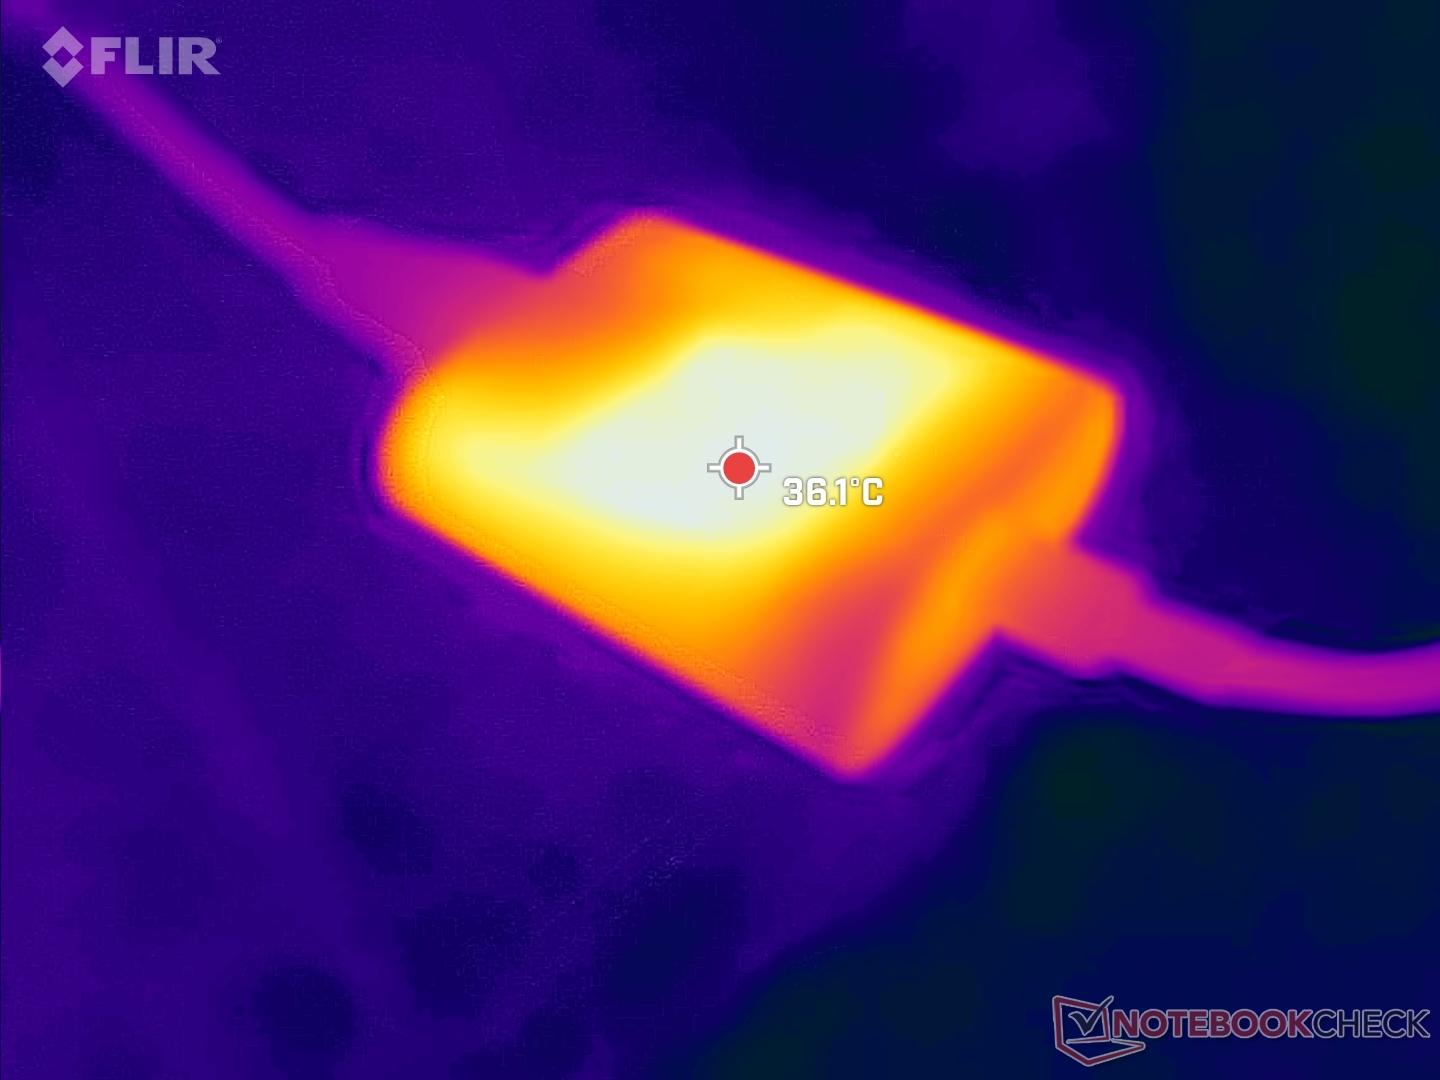
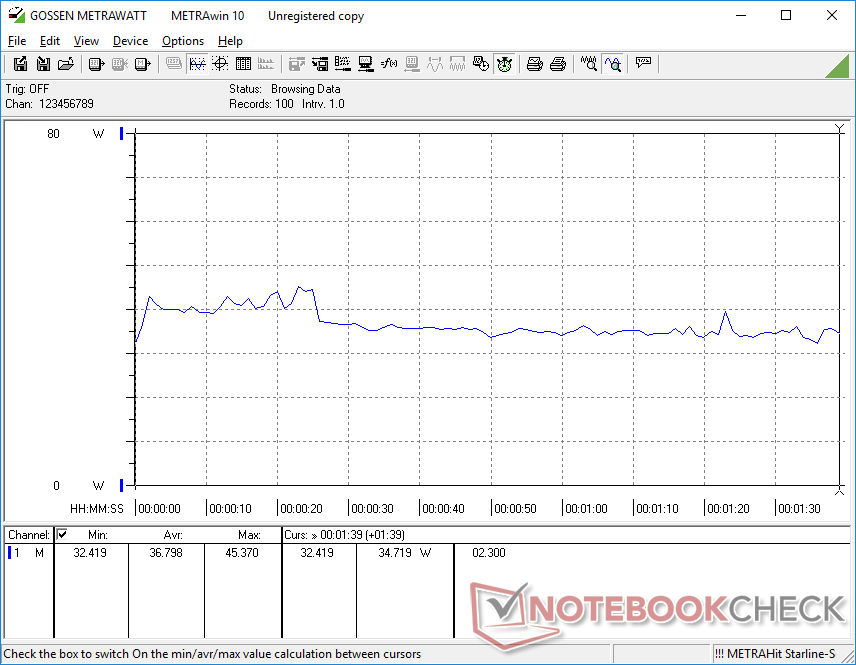
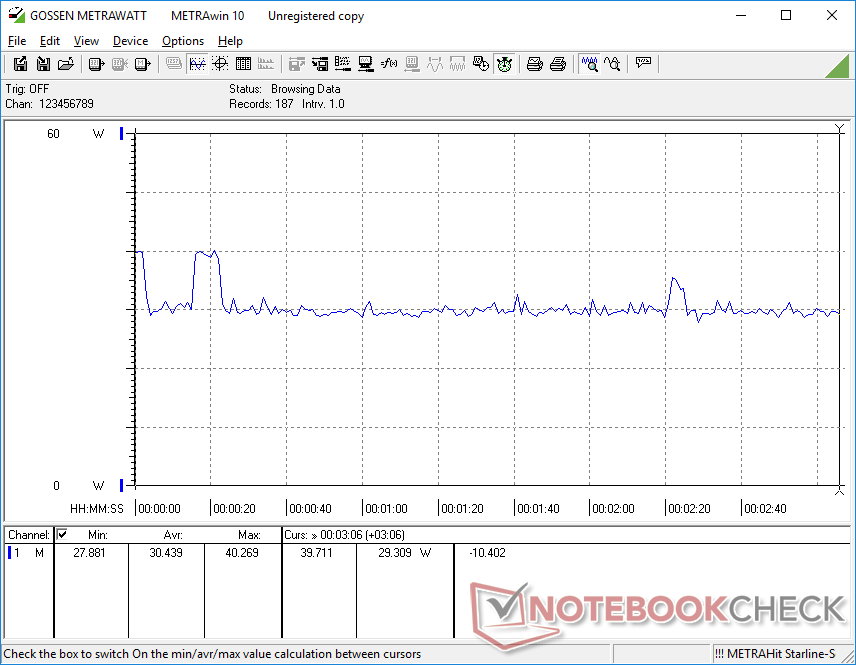
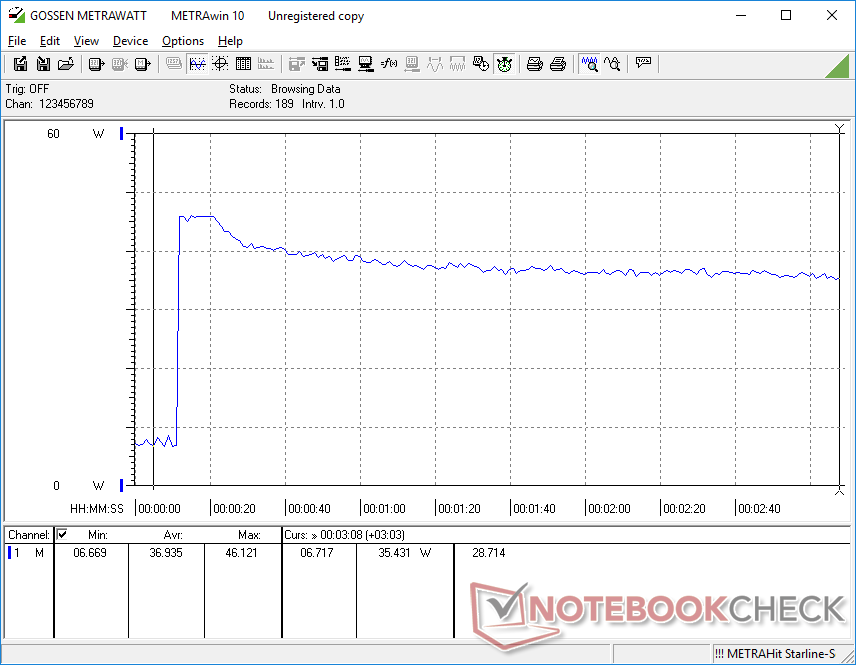
El sistema es muy eficiente desde el punto de vista energético, como cabría esperar de un portátil con una CPU Core de la serie U. Lo más notable es el hecho de que nuestro Latitude 9330 consume alrededor de un 23 por ciento menos de energía que el antiguoLatitude 5310 cuando se ejecutan aplicaciones de uso intensivo de la GPU, al tiempo que ofrece entre 2 y 3 veces el rendimiento gráfico. Los usuarios que se actualicen a partir de CPUs Intel de 10ª generación o anteriores verán un aumento significativo del rendimiento por vatio como resultado.
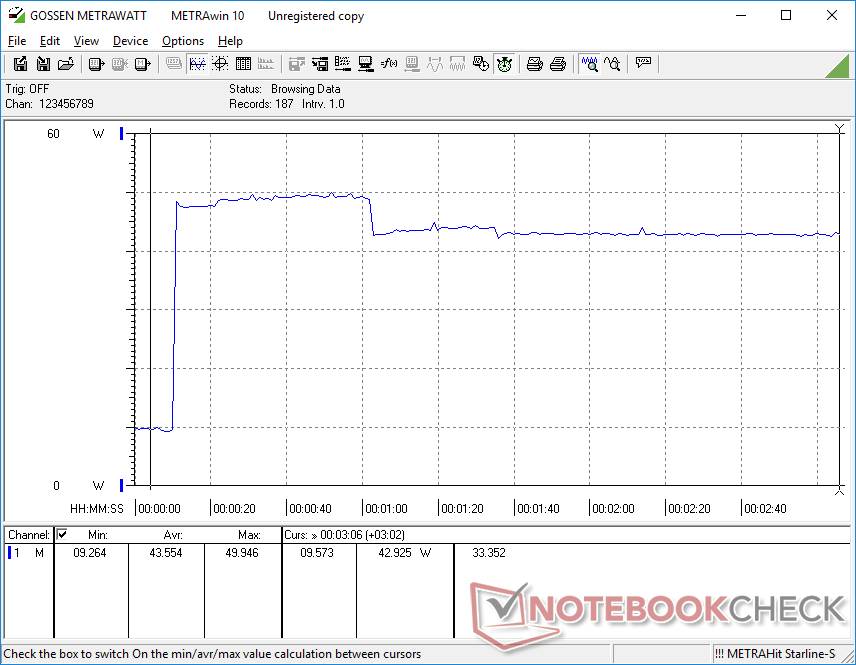
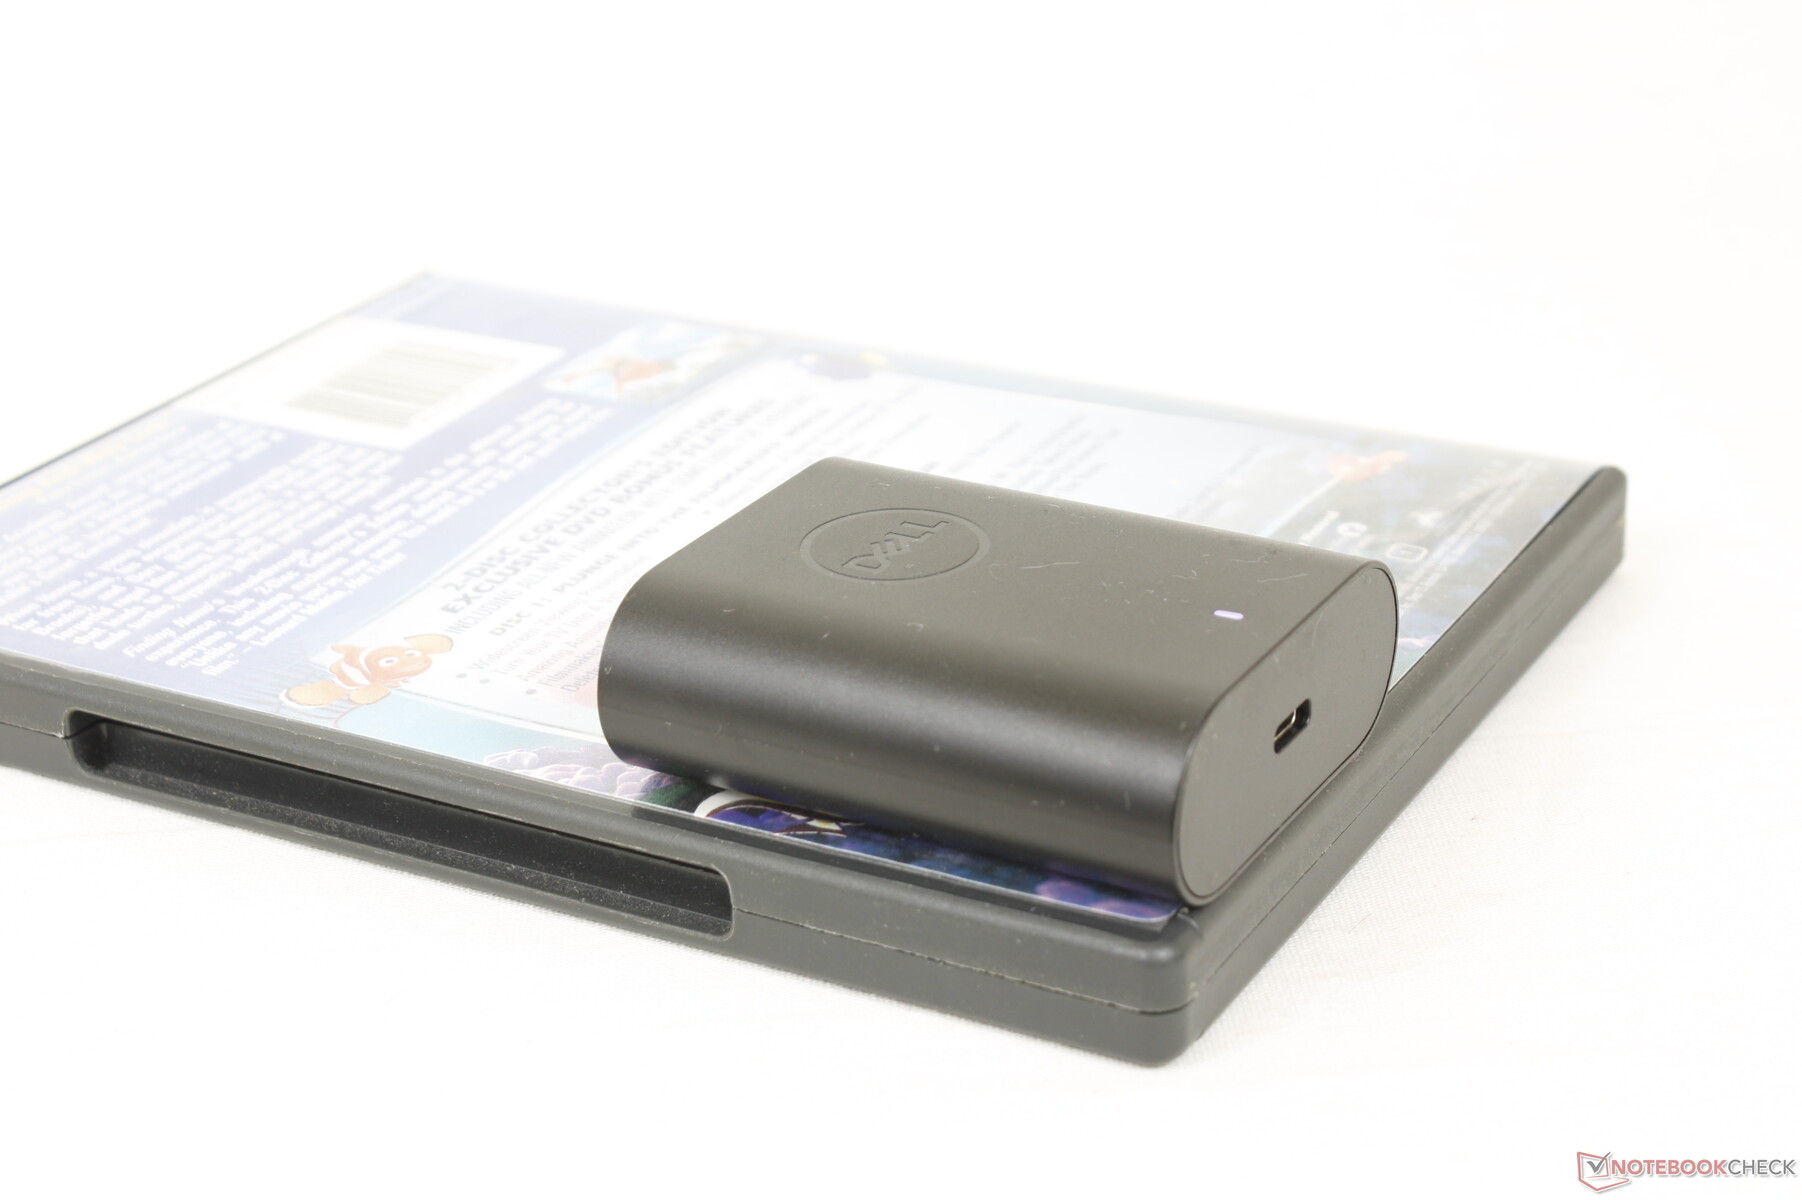
El consumo de energía es aproximadamente un 27 por ciento menor que el del Core i7-1255U Spectre x360 13.5 cuando se ejecuta el estrés Prime95. Pudimos medir un consumo máximo temporal de 50 W del pequeño (~6.7 x 5.3 x 2.3 cm) adaptador USB-C AC de 60 W cuando la CPU está al 100% de uso. El consumo de energía cae con el tiempo, como muestran nuestros gráficos a continuación, ya que el rendimiento máximo del Turbo Boost no es indefinido.
| Off / Standby | |
| Ocioso | |
| Carga |
|
Clave:
min: | |
| Dell Latitude 9330 i7-1260U, Iris Xe G7 96EUs, , IPS, 2560x1600, 13.3" | Lenovo ThinkPad X1 Titanium Yoga G1 20QB0016GE i5-1140G7, Iris Xe G7 80EUs, Lenovo UMIS RPJTJ256MEE1OWX, IPS LED, 2256x1504, 13.5" | MSI Summit E13 Flip Evo A11MT i7-1185G7, Iris Xe G7 96EUs, Phison 1TB SM2801T24GKBB4S-E162, IPS, 1920x1200, 13.4" | HP Elite Dragonfly Max i7-1185G7, Iris Xe G7 96EUs, Toshiba XG6 KXG60ZNV512G, IPS, 1920x1080, 13.3" | Dell Latitude 5310-23VP6 i5-10310U, UHD Graphics 620, SK hynix BC511 HFM512GDHTNI-87A0B, IPS, 1920x1080, 13.3" | Lenovo Yoga Slim 9 14IAP7 i7-1280P, Iris Xe G7 96EUs, Samsung PM9B1 1024GB MZAL41T0HBLB, OLED, 2880x1800, 14" | |
|---|---|---|---|---|---|---|
| Power Consumption | 11% | -23% | -5% | 5% | -98% | |
| Idle Minimum * (Watt) | 4.7 | 3.75 20% | 4.8 -2% | 2.9 38% | 2.9 38% | 11.8 -151% |
| Idle Average * (Watt) | 8.2 | 7.75 5% | 8.4 -2% | 9.9 -21% | 5.9 28% | 17.4 -112% |
| Idle Maximum * (Watt) | 8.4 | 8.69 -3% | 8.6 -2% | 10.4 -24% | 6.7 20% | 22.4 -167% |
| Load Average * (Watt) | 36.8 | 33.12 10% | 47.1 -28% | 37.1 -1% | 42 -14% | 53 -44% |
| Witcher 3 ultra * (Watt) | 30.4 | 28.7 6% | 51.6 -70% | 31.5 -4% | 43 -41% | 52.6 -73% |
| Load Maximum * (Watt) | 49.9 | 35.19 29% | 65.9 -32% | 58.8 -18% | 50 -0% | 71 -42% |
* ... más pequeño es mejor
Power Consumption Witcher 3 / Stresstest
Power Consumption external Monitor
Duración de la batería: buena para un día de trabajo
La capacidad de la batería está en la media para un subportátil con 50 Wh. La duración es buena, no obstante, con casi 9,5 horas de uso real de la WLAN para ser sólo un poco más corta que en el HP Dragonfly Max o el MSI Summit E13 Flip.
La carga de vacío a plena capacidad tarda unos 90 minutos.
| Dell Latitude 9330 i7-1260U, Iris Xe G7 96EUs, 50 Wh | Lenovo ThinkPad X1 Titanium Yoga G1 20QA001RGE i7-1160G7, Iris Xe G7 96EUs, 44.5 Wh | MSI Summit E13 Flip Evo A11MT i7-1185G7, Iris Xe G7 96EUs, 70 Wh | HP EliteBook x360 1030 G7 i7-10810U, UHD Graphics 620, 54 Wh | HP Elite Dragonfly Max i7-1185G7, Iris Xe G7 96EUs, 56 Wh | Dell Latitude 5310-23VP6 i5-10310U, UHD Graphics 620, 60 Wh | |
|---|---|---|---|---|---|---|
| Duración de Batería | -14% | 11% | 37% | 43% | 18% | |
| Reader / Idle (h) | 15.4 | 21.1 37% | 30.9 101% | 28.7 86% | ||
| WiFi v1.3 (h) | 9.4 | 8.4 -11% | 11.2 19% | 10.3 10% | 11 17% | 11.1 18% |
| Load (h) | 2.3 | 1.9 -17% | 1.8 -22% | 2.3 0% | 2.9 26% | |
| H.264 (h) | 11.4 |
Pro
Contra
Veredicto - Sobresaliendo donde es importante
El Latitude 9330 2-en-1 está altamente optimizado para entornos de oficina con características que no están disponibles en la mayoría de los modelos centrados en el consumidor, incluyendo el XPS 13. La calidad de construcción y la rigidez son de las mejores que hemos visto para un convertible de 13 pulgadas ultradelgado, lo que nos da más confianza en la longevidad y fiabilidad del modelo. Si decides invertir en el Latitude 9330, es más que probable que te dure varios años.
Aunque el sistema de Dell es de bueno a excelente en la mayoría de las áreas, está empezando a quedarse atrás en algunas otras Los modelos de la competencia de HP ofrecen opciones de pantalla de 1000 nits y cámaras web de 5 MP, mientras que el Latitude 9330 se queda en 500 nits y 2 MP. La falta de puertos USB-A y HDMI también molestará a muchos usuarios. Prepárate para un ruido de ventilador notablemente más alto si pretendes ejecutar cargas exigentes en el Dell también.
Aparte de algunas especificaciones medias, el Dell Latitude 9330 2-en-1 es nuestro convertible empresarial más recomendado si quieres algo que dure varios años.
Otros inconvenientes como el menor rendimiento gráfico, las temperaturas más altas del núcleo y la falta de soporte para SSDs M.2 2280 son relativamente menores teniendo en cuenta el público objetivo de los usuarios empresariales o de negocios. Nos encantaría ver opciones de pantalla de mayor frecuencia de refresco con tiempos de respuesta en blanco y negro más rápidos en el futuro, ya que la tasa de fotogramas más suave mejoraría significativamente la experiencia de usuario de la pantalla táctil.
Precio y disponibilidad
Dellya está a la venta el Latitude 9330 2-en-1 a partir de 2065 USD hasta más de 2700 USD si está totalmente configurado.
Dell Latitude 9330
- 11/18/2022 v7 (old)
Allen Ngo
Price comparison

