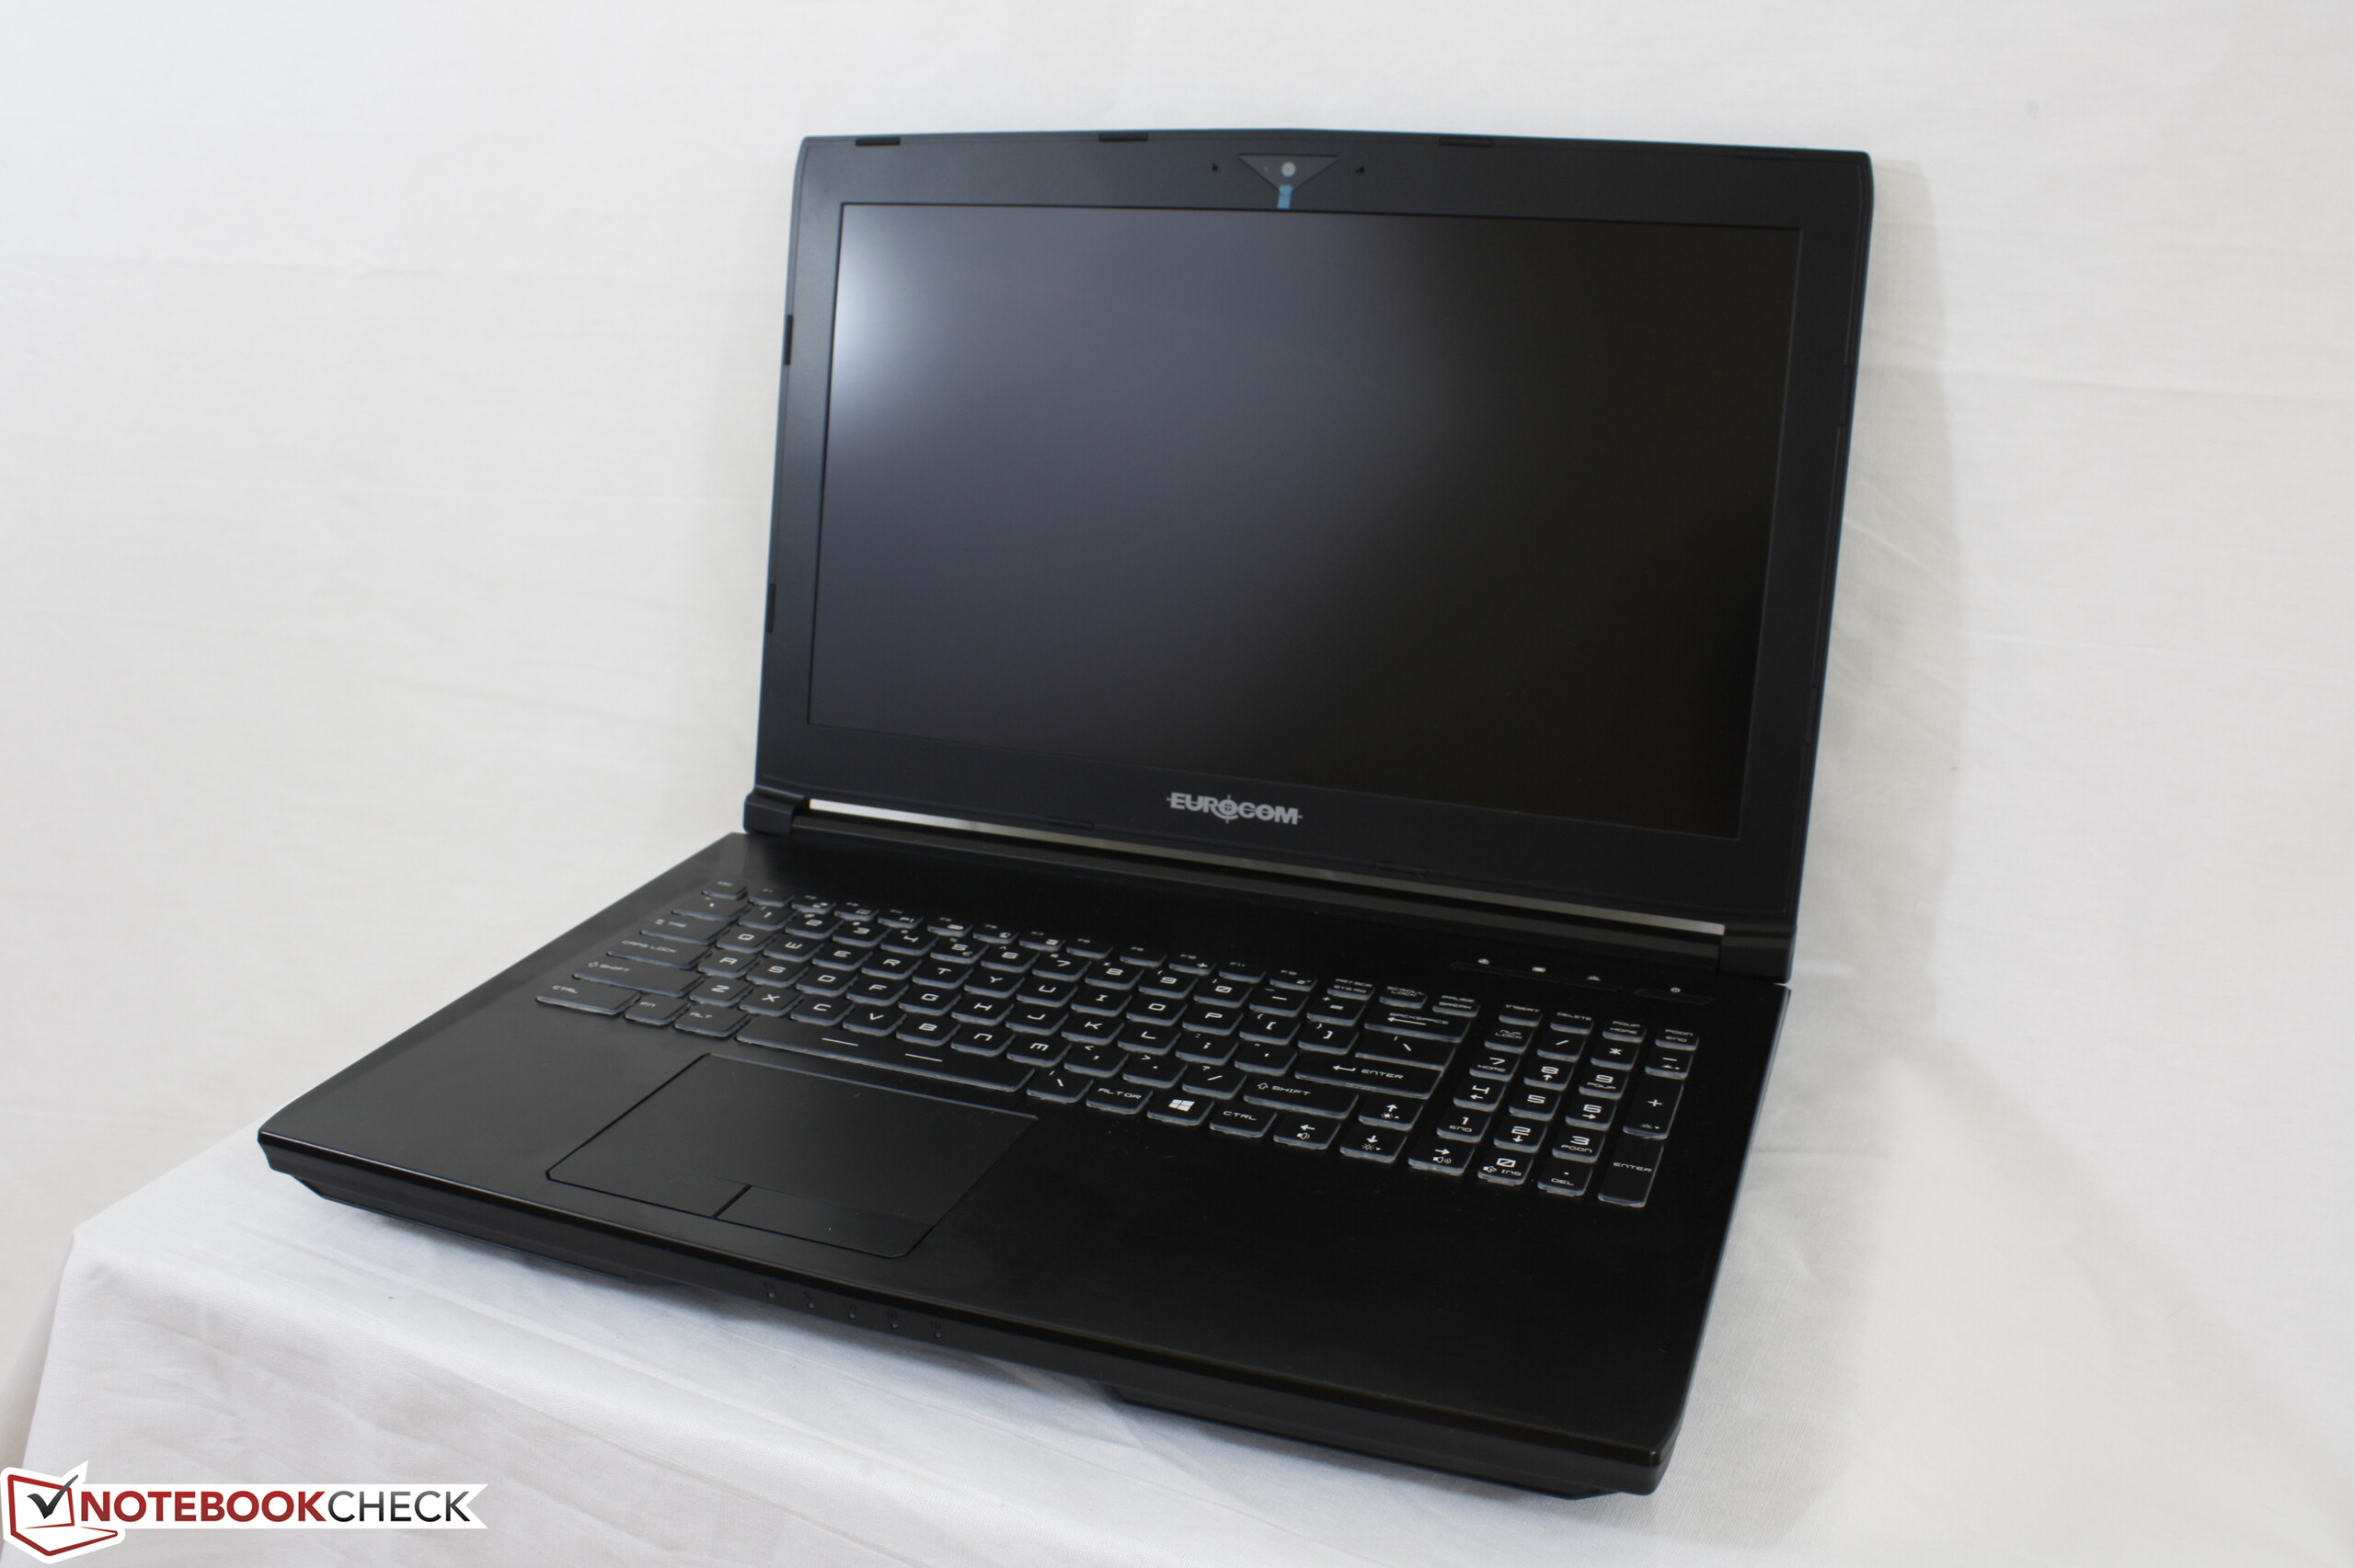
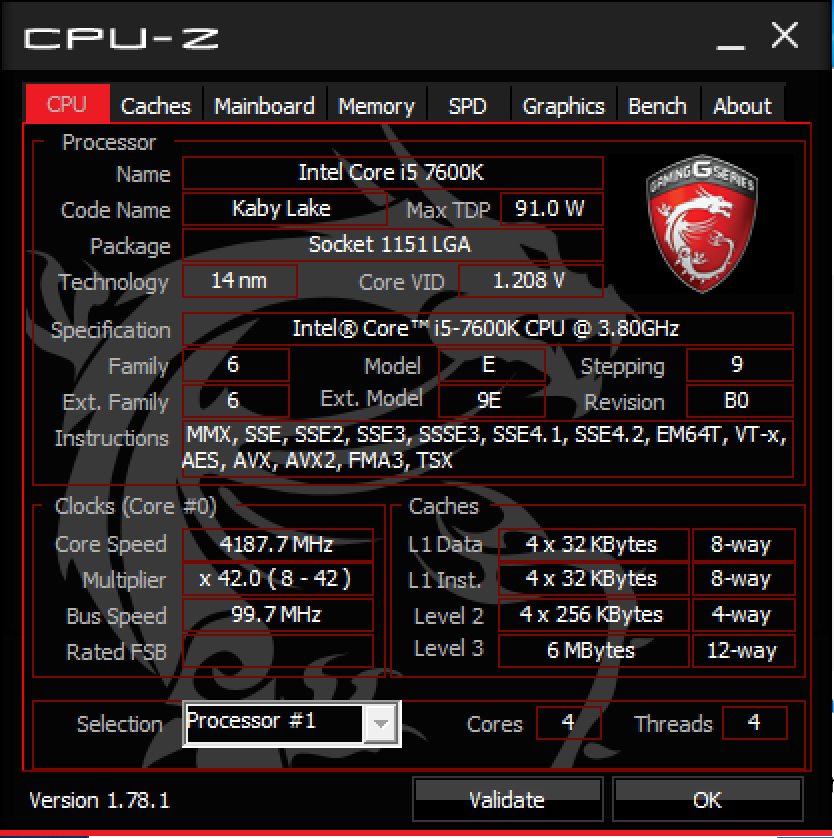
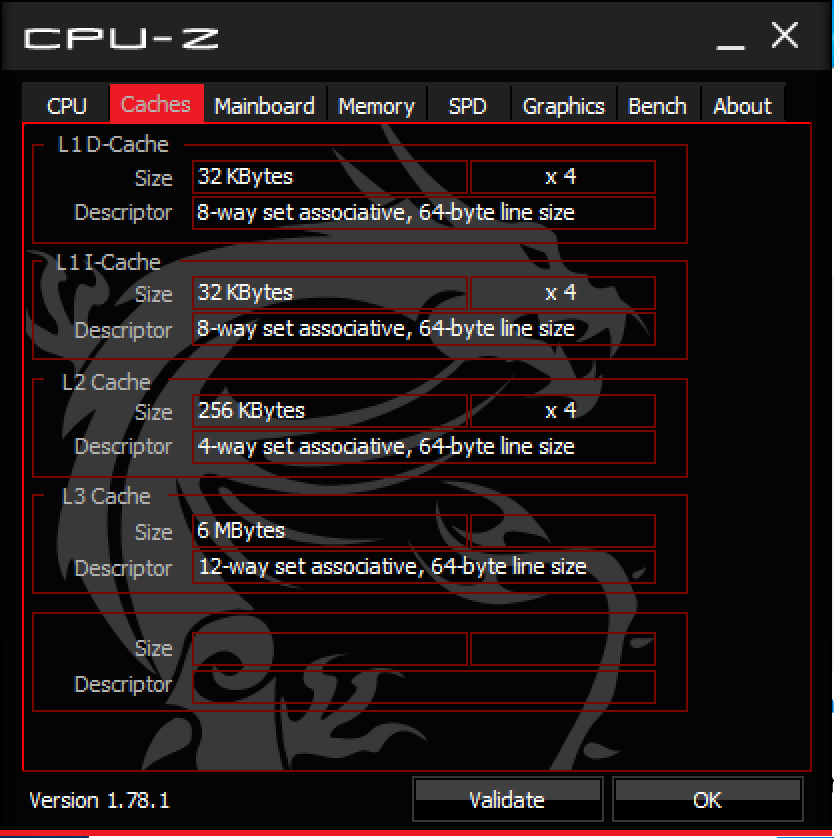
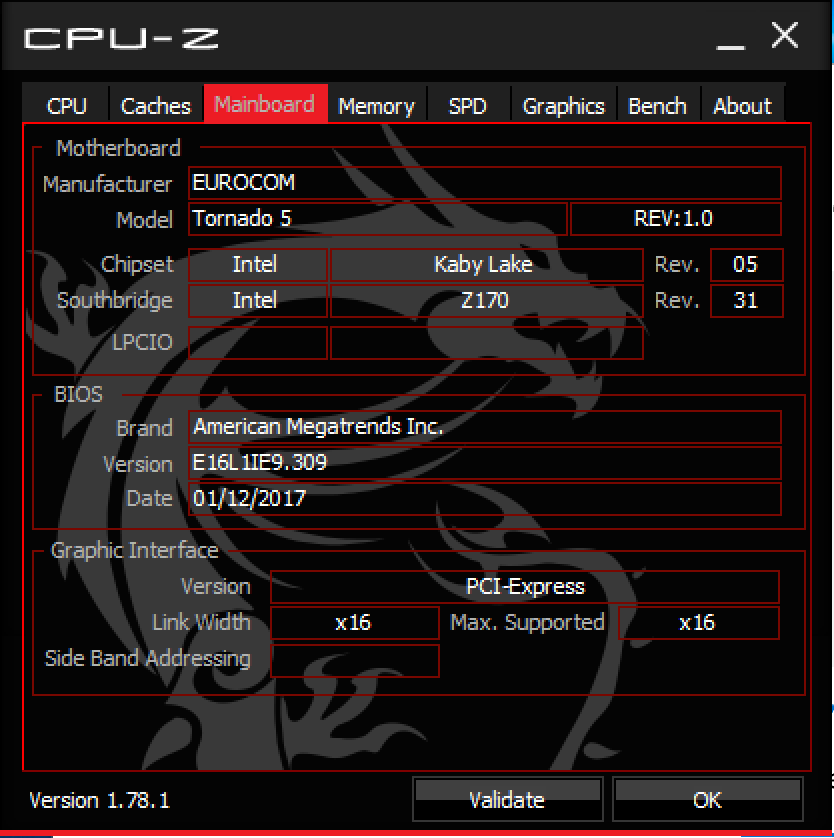
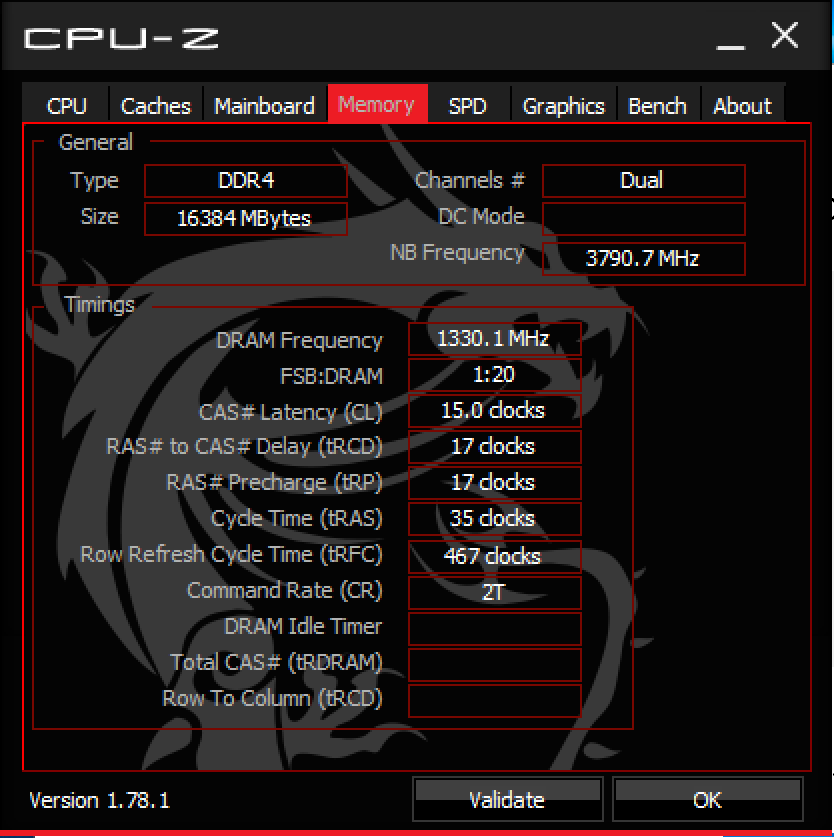
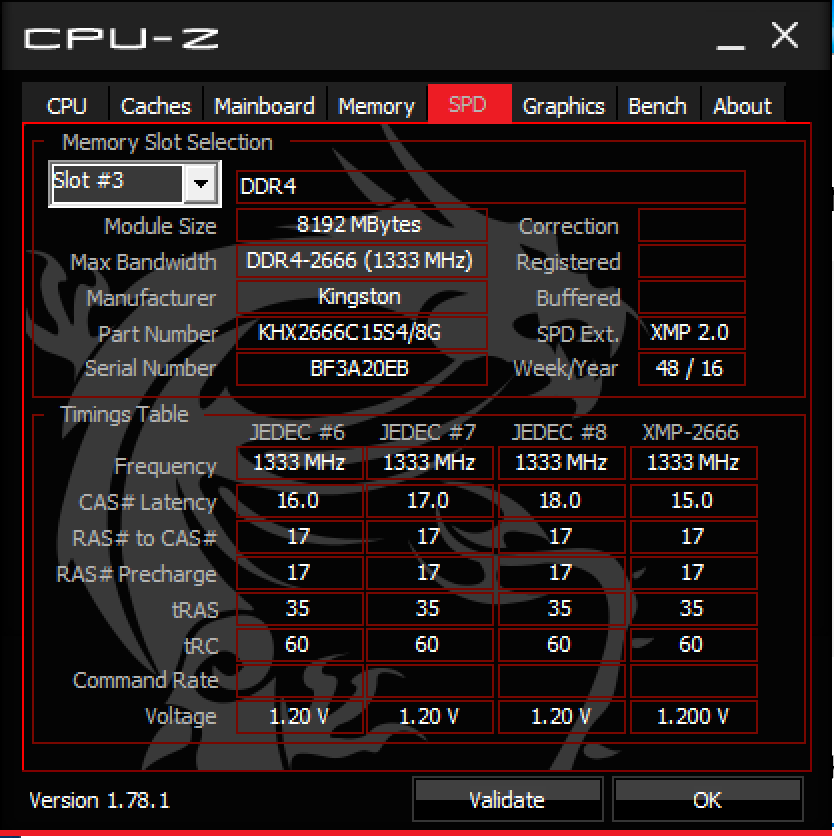
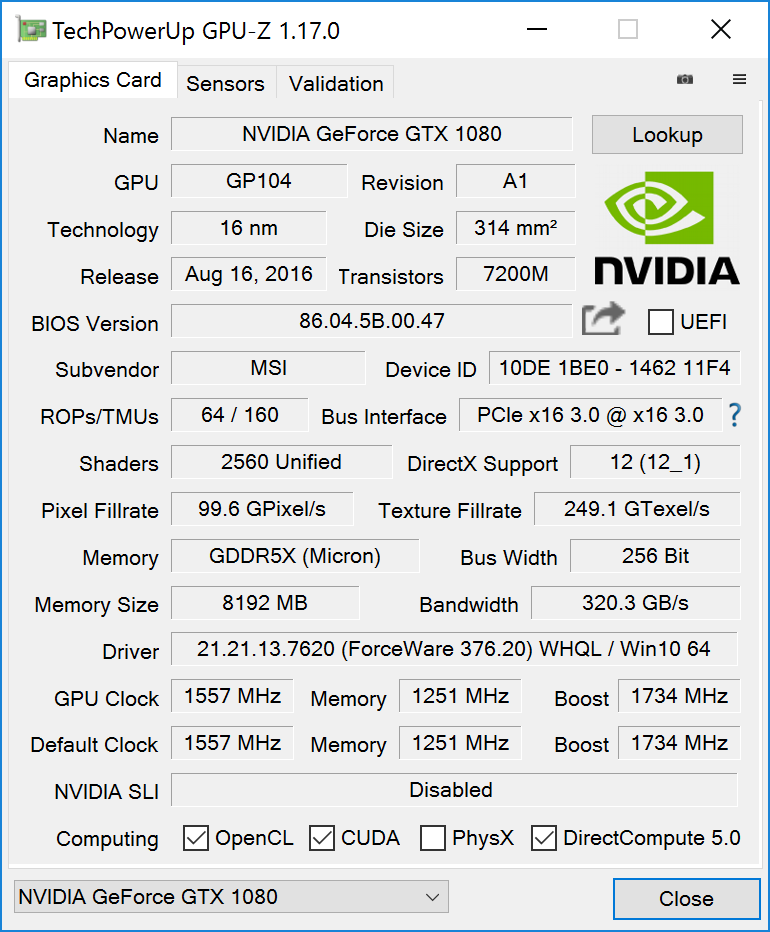
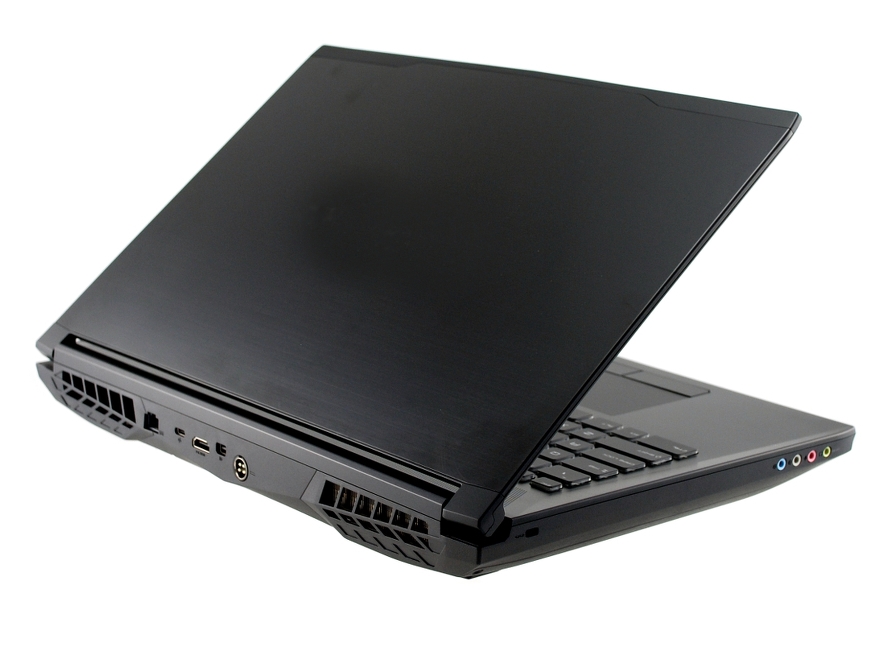
Breve análisis del Eurocom Tornado F5 Killer Edition (i5-7600K, 4K UHD, GTX 1080, MSI 16L13)


| SD Card Reader | |
| average JPG Copy Test (av. of 3 runs) | |
| Eurocom Tornado F5 Killer Edition | |
| MSI GT72VR 7RE-433 | |
| Alienware 17 R3 (A17-9935) | |
| maximum AS SSD Seq Read Test (1GB) | |
| Eurocom Tornado F5 Killer Edition | |
| MSI GT72VR 7RE-433 | |
| Alienware 17 R3 (A17-9935) | |
| Networking | |
| iperf3 transmit AX12 | |
| Dell XPS 15 9560 (i7-7700HQ, UHD) | |
| Eurocom Tornado F5 Killer Edition | |
| HP Spectre x360 15-bl002xx | |
| iperf3 receive AX12 | |
| Dell XPS 15 9560 (i7-7700HQ, UHD) | |
| HP Spectre x360 15-bl002xx | |
| Eurocom Tornado F5 Killer Edition | |
| |||||||||||||||||||||||||
iluminación: 84 %
Brillo con batería: 305.8 cd/m²
Contraste: 665:1 (Negro: 0.46 cd/m²)
ΔE ColorChecker Calman: 5.2 | ∀{0.5-29.43 Ø4.71}
ΔE Greyscale Calman: 1.1 | ∀{0.09-98 Ø4.96}
75.5% sRGB (Argyll 1.6.3 3D)
47.3% AdobeRGB 1998 (Argyll 1.6.3 3D)
51.5% AdobeRGB 1998 (Argyll 3D)
75% sRGB (Argyll 3D)
49.9% Display P3 (Argyll 3D)
Gamma: 2.23
CCT: 6732 K
| Eurocom Tornado F5 Killer Edition IPS, 15.6", 3840x2160 | Dell XPS 15 9560 (i7-7700HQ, UHD) IGZO IPS, 15.6", 3840x2160 | Alienware 15 R3 HPJGK_B156HTN (AUO51ED), TN, 15.6", 1920x1080 | Acer Predator 15 G9-593-765Q LG Philips LP156WF6-SPP1 (LGD04D5), IPS, 15.6", 1920x1080 | Eurocom Tornado F5 IPS, 15.6", 1920x1080 | |
|---|---|---|---|---|---|
| Display | 69% | 27% | 19% | 19% | |
| Display P3 Coverage (%) | 49.9 | 89.7 80% | 66 32% | 63.6 27% | 64.5 29% |
| sRGB Coverage (%) | 75 | 100 33% | 90.5 21% | 83.9 12% | 83 11% |
| AdobeRGB 1998 Coverage (%) | 51.5 | 100 94% | 66.2 29% | 61.3 19% | 60.7 18% |
| Response Times | -40% | 48% | 13% | 4% | |
| Response Time Grey 50% / Grey 80% * (ms) | 38.8 ? | 57.2 ? -47% | 25 ? 36% | 35 ? 10% | 33.6 ? 13% |
| Response Time Black / White * (ms) | 29.6 ? | 39.2 ? -32% | 12 ? 59% | 25 ? 16% | 31.2 ? -5% |
| PWM Frequency (Hz) | 1351 ? | 962 | |||
| Screen | -6% | -87% | 2% | -15% | |
| Brightness middle (cd/m²) | 305.8 | 370.1 21% | 386 26% | 273 -11% | 315.8 3% |
| Brightness (cd/m²) | 282 | 356 26% | 382 35% | 267 -5% | 310 10% |
| Brightness Distribution (%) | 84 | 87 4% | 93 11% | 83 -1% | 90 7% |
| Black Level * (cd/m²) | 0.46 | 0.37 20% | 0.39 15% | 0.27 41% | 0.33 28% |
| Contrast (:1) | 665 | 1000 50% | 990 49% | 1011 52% | 957 44% |
| Colorchecker dE 2000 * | 5.2 | 5.3 -2% | 10.2 -96% | 3.77 27% | 5 4% |
| Colorchecker dE 2000 max. * | 11.9 | 9.9 17% | 15.81 -33% | 10.64 11% | 10.1 15% |
| Greyscale dE 2000 * | 1.1 | 4.6 -318% | 11.28 -925% | 2.48 -125% | 4.2 -282% |
| Gamma | 2.23 99% | 2.31 95% | 2.23 99% | 2.37 93% | 2.12 104% |
| CCT | 6732 97% | 6284 103% | 11383 57% | 6854 95% | 6107 106% |
| Color Space (Percent of AdobeRGB 1998) (%) | 47.3 | 88.3 87% | 59 25% | 55 16% | 54.5 15% |
| Color Space (Percent of sRGB) (%) | 75.5 | 100 32% | 90 19% | 84 11% | 83 10% |
| Media total (Programa/Opciones) | 8% /
4% | -4% /
-46% | 11% /
7% | 3% /
-5% |
* ... más pequeño es mejor
Tiempos de respuesta del display
| ↔ Tiempo de respuesta de Negro a Blanco | ||
|---|---|---|
| 29.6 ms ... subida ↗ y bajada ↘ combinada | ↗ 19.6 ms subida | 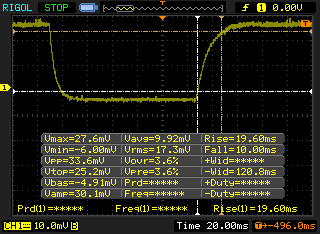 |
| ↘ 10 ms bajada | ||
| La pantalla mostró tiempos de respuesta relativamente lentos en nuestros tests pero podría ser demasiado lenta para los jugones. En comparación, todos los dispositivos de prueba van de ##min### (mínimo) a 240 (máximo) ms. » 79 % de todos los dispositivos son mejores. Eso quiere decir que el tiempo de respuesta es peor que la media (19.8 ms) de todos los dispositivos testados. | ||
| ↔ Tiempo de respuesta 50% Gris a 80% Gris | ||
| 38.8 ms ... subida ↗ y bajada ↘ combinada | ↗ 17.2 ms subida | 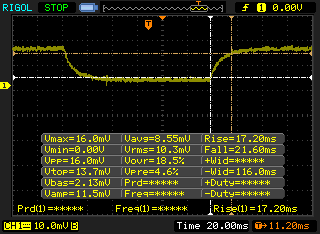 |
| ↘ 21.6 ms bajada | ||
| La pantalla mostró tiempos de respuesta lentos en nuestros tests y podría ser demasiado lenta para los jugones. En comparación, todos los dispositivos de prueba van de ##min### (mínimo) a 636 (máximo) ms. » 58 % de todos los dispositivos son mejores. Eso quiere decir que el tiempo de respuesta es peor que la media (30.9 ms) de todos los dispositivos testados. | ||
Parpadeo de Pantalla / PWM (Pulse-Width Modulation)
| Parpadeo de Pantalla / PWM detectado | 1351 Hz | ≤ 19 % de brillo | 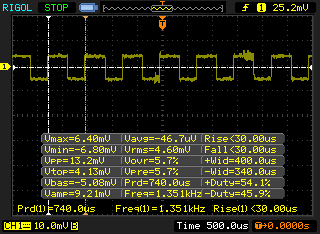 |
La retroiluminación del display parpadea a 1351 Hz (seguramente usa PWM - Pulse-Width Modulation) a un brillo del 19 % e inferior. Sobre este nivel de brillo no debería darse parpadeo / PWM. La frecuencia de 1351 Hz es bastante alta, por lo que la mayoría de gente sensible al parpadeo no debería ver parpadeo o tener fatiga visual. Comparación: 52 % de todos los dispositivos testados no usaron PWM para atenuar el display. Si se usó, medimos una media de 7748 (mínimo: 5 - máxmo: 343500) Hz. | |||
| Cinebench R15 | |
| CPU Single 64Bit | |
| i5-7600K Gigabyte Z270-Gaming K3 | |
| Eurocom Tornado F5 | |
| Asus G701VIK-BA049T | |
| Eurocom Tornado F5 Killer Edition | |
| Eurocom Sky X7E2 | |
| Dell XPS 15 9560 (i7-7700HQ, UHD) | |
| MSI GT80 Titan SLI | |
| Asus GL702VM-GC102D | |
| Lenovo IdeaPad Y50 | |
| CPU Multi 64Bit | |
| Asus G701VIK-BA049T | |
| Eurocom Tornado F5 | |
| Eurocom Sky X7E2 | |
| Dell XPS 15 9560 (i7-7700HQ, UHD) | |
| MSI GT80 Titan SLI | |
| i5-7600K Gigabyte Z270-Gaming K3 | |
| Asus GL702VM-GC102D | |
| Eurocom Tornado F5 Killer Edition | |
| Lenovo IdeaPad Y50 | |
| Cinebench R11.5 | |
| CPU Single 64Bit | |
| Eurocom Tornado F5 | |
| Asus G701VIK-BA049T | |
| i5-7600K Gigabyte Z270-Gaming K3 | |
| Eurocom Tornado F5 Killer Edition | |
| Dell XPS 15 9560 (i7-7700HQ, UHD) | |
| Eurocom Sky X7E2 | |
| MSI GT80 Titan SLI | |
| Asus GL702VM-GC102D | |
| Lenovo IdeaPad Y50 | |
| CPU Multi 64Bit | |
| Asus G701VIK-BA049T | |
| Eurocom Tornado F5 | |
| Eurocom Sky X7E2 | |
| Dell XPS 15 9560 (i7-7700HQ, UHD) | |
| i5-7600K Gigabyte Z270-Gaming K3 | |
| MSI GT80 Titan SLI | |
| Eurocom Tornado F5 Killer Edition | |
| Asus GL702VM-GC102D | |
| Lenovo IdeaPad Y50 | |
| Cinebench R10 | |
| Rendering Multiple CPUs 32Bit | |
| Eurocom Tornado F5 | |
| i5-7600K Gigabyte Z270-Gaming K3 | |
| Eurocom Sky X7E2 | |
| Eurocom Tornado F5 Killer Edition | |
| MSI GT80 Titan SLI | |
| Dell XPS 15 9560 (i7-7700HQ, UHD) | |
| Asus GL702VM-GC102D | |
| Lenovo IdeaPad Y50 | |
| Rendering Single 32Bit | |
| Eurocom Tornado F5 | |
| i5-7600K Gigabyte Z270-Gaming K3 | |
| Eurocom Tornado F5 Killer Edition | |
| Eurocom Sky X7E2 | |
| Dell XPS 15 9560 (i7-7700HQ, UHD) | |
| MSI GT80 Titan SLI | |
| Asus GL702VM-GC102D | |
| Lenovo IdeaPad Y50 | |
| wPrime 2.10 - 1024m | |
| Lenovo IdeaPad Y50 | |
| i5-7600K Gigabyte Z270-Gaming K3 | |
| Eurocom Tornado F5 Killer Edition | |
| Dell XPS 15 9560 (i7-7700HQ, UHD) | |
| Eurocom Sky X7E2 | |
| Eurocom Tornado F5 | |
| 3DMark | |
| 3840x2160 Fire Strike Ultra Physics | |
| Eurocom Tornado F5 | |
| Eurocom Sky X7E2 | |
| Dell XPS 15 9560 (i7-7700HQ, UHD) | |
| Asus GL702VM-GC102D | |
| Eurocom Tornado F5 Killer Edition | |
| Fire Strike Extreme Physics | |
| Eurocom Tornado F5 | |
| Eurocom Sky X7E2 | |
| MSI GT80 Titan SLI | |
| Dell XPS 15 9560 (i7-7700HQ, UHD) | |
| Asus GL702VM-GC102D | |
| Eurocom Tornado F5 Killer Edition | |
| Lenovo IdeaPad Y50 | |
| 1920x1080 Fire Strike Physics | |
| Eurocom Tornado F5 | |
| Eurocom Sky X7E2 | |
| Asus G701VIK-BA049T | |
| MSI GT80 Titan SLI | |
| Dell XPS 15 9560 (i7-7700HQ, UHD) | |
| i5-7600K Gigabyte Z270-Gaming K3 | |
| Asus GL702VM-GC102D | |
| Eurocom Tornado F5 Killer Edition | |
| Lenovo IdeaPad Y50 | |
* ... más pequeño es mejor
| PCMark 8 | |
| Home Score Accelerated v2 | |
| Asus G701VIK-BA049T | |
| Eurocom Tornado F5 | |
| Alienware 15 R3 | |
| Eurocom Tornado F5 Killer Edition | |
| Dell XPS 15 9560 (i7-7700HQ, UHD) | |
| Work Score Accelerated v2 | |
| Eurocom Tornado F5 | |
| Asus G701VIK-BA049T | |
| Alienware 15 R3 | |
| Eurocom Tornado F5 Killer Edition | |
| Dell XPS 15 9560 (i7-7700HQ, UHD) | |
| Creative Score Accelerated v2 | |
| Eurocom Tornado F5 | |
| Eurocom Tornado F5 Killer Edition | |
| Alienware 15 R3 | |
| Dell XPS 15 9560 (i7-7700HQ, UHD) | |
| PCMark 8 Home Score Accelerated v2 | 4821 puntos | |
| PCMark 8 Creative Score Accelerated v2 | 8420 puntos | |
| PCMark 8 Work Score Accelerated v2 | 4831 puntos | |
ayuda | ||
| Eurocom Tornado F5 Killer Edition Samsung SSD 960 Evo 250GB m.2 NVMe | Dell XPS 15 9560 (i7-7700HQ, UHD) Lite-On CX2-8B512-Q11 | Alienware 15 R3 | Eurocom Tornado F5 Samsung SSD 960 Pro 512 GB m.2 | MSI GT62VR 7RE-223 Samsung SSD PM871a MZNLN256HMHQ | |
|---|---|---|---|---|---|
| CrystalDiskMark 3.0 | -7% | -31% | 10% | -50% | |
| Read Seq (MB/s) | 1546 | 1684 9% | 1123 -27% | 2145 39% | 521 -66% |
| Write Seq (MB/s) | 1456 | 1106 -24% | 429.2 -71% | 1724 18% | 422.8 -71% |
| Read 512 (MB/s) | 710 | 977 38% | 833 17% | 715 1% | 462 -35% |
| Write 512 (MB/s) | 860 | 1119 30% | 428.1 -50% | 967 12% | 286.9 -67% |
| Read 4k (MB/s) | 58.8 | 45.14 -23% | 37.8 -36% | 55.9 -5% | 38.55 -34% |
| Write 4k (MB/s) | 174.1 | 134.1 -23% | 122.9 -29% | 180.6 4% | 122.8 -29% |
| Read 4k QD32 (MB/s) | 711 | 509 -28% | 542 -24% | 744 5% | 388.4 -45% |
| Write 4k QD32 (MB/s) | 579 | 398.1 -31% | 429.8 -26% | 634 9% | 257.9 -55% |

| 3DMark | |
| 1920x1080 Fire Strike Graphics | |
| i7-6950X Asus X99-E | |
| Schenker XMG U727 2017 | |
| MSI GT73VR 6RF | |
| Eurocom Tornado F5 Killer Edition | |
| Nvidia GeForce GTX 1080 Founders Edition | |
| Eurocom X8 | |
| Eurocom Tornado F5 | |
| Asus FX502VM-AS73 | |
| Asus Strix GL502VY-DS71 | |
| 3840x2160 Fire Strike Ultra Graphics | |
| i7-6950X Asus X99-E | |
| MSI GT73VR 6RF | |
| Eurocom Tornado F5 Killer Edition | |
| Nvidia GeForce GTX 1080 Founders Edition | |
| Eurocom Tornado F5 | |
| Asus FX502VM-AS73 | |
| Asus Strix GL502VY-DS71 | |
| Fire Strike Extreme Graphics | |
| i7-6950X Asus X99-E | |
| MSI GT73VR 6RF | |
| Nvidia GeForce GTX 1080 Founders Edition | |
| Eurocom Tornado F5 Killer Edition | |
| Eurocom X8 | |
| Eurocom Tornado F5 | |
| Asus FX502VM-AS73 | |
| Asus Strix GL502VY-DS71 | |
| 3DMark 11 | |
| 1280x720 Performance GPU | |
| i7-6950X Asus X99-E | |
| Nvidia GeForce GTX 1080 Founders Edition | |
| Schenker XMG U727 2017 | |
| MSI GT73VR 6RF | |
| Eurocom Tornado F5 Killer Edition | |
| Eurocom Tornado F5 | |
| Eurocom X8 | |
| Asus FX502VM-AS73 | |
| Asus Strix GL502VY-DS71 | |
| 1280x720 Performance Combined | |
| i7-6950X Asus X99-E | |
| Nvidia GeForce GTX 1080 Founders Edition | |
| Schenker XMG U727 2017 | |
| Eurocom Tornado F5 | |
| Asus FX502VM-AS73 | |
| MSI GT73VR 6RF | |
| Eurocom X8 | |
| Eurocom Tornado F5 Killer Edition | |
| Asus Strix GL502VY-DS71 | |
| 3DMark 11 Performance | 17375 puntos | |
| 3DMark Ice Storm Standard Score | 153604 puntos | |
| 3DMark Cloud Gate Standard Score | 22675 puntos | |
| 3DMark Fire Strike Score | 15116 puntos | |
| 3DMark Fire Strike Extreme Score | 8680 puntos | |
ayuda | ||
| The Witcher 3 - 3840x2160 High Graphics & Postprocessing (Nvidia HairWorks Off) | |
| Nvidia GeForce GTX 1080 Ti Founders Edition | |
| Eurocom Tornado F5 Killer Edition | |
| Nvidia GeForce GTX 1080 Founders Edition | |
| Schenker XMG U727 2017 | |
| Metal Gear Solid V - 3840x2160 High / On | |
| Nvidia GeForce GTX 1080 Founders Edition | |
| Eurocom Sky X7E2 | |
| Eurocom Tornado F5 Killer Edition | |
| Fallout 4 - 3840x2160 High Preset AA:T AF:16x | |
| Nvidia GeForce GTX 1080 Ti Founders Edition | |
| Eurocom Sky X7E2 | |
| Nvidia GeForce GTX 1080 Founders Edition | |
| Eurocom Tornado F5 Killer Edition | |
| Gigabyte P57X v7 | |
| Rise of the Tomb Raider - 3840x2160 High Preset AA:FX AF:4x | |
| Nvidia GeForce GTX 1080 Ti Founders Edition | |
| Nvidia GeForce GTX 1080 Ti Founders Edition | |
| Eurocom Sky X7E2 | |
| Eurocom Tornado F5 Killer Edition | |
| Nvidia GeForce GTX 1080 Founders Edition | |
| Nvidia GeForce GTX 1080 Founders Edition | |
| Gigabyte P57X v7 | |
| Ashes of the Singularity - 3840x2160 crazy | |
| Nvidia GeForce GTX 1080 Ti Founders Edition | |
| Eurocom Tornado F5 Killer Edition | |
| Nvidia GeForce GTX 1080 Founders Edition | |
| Doom - 3840x2160 High Preset AA:FX | |
| Nvidia GeForce GTX 1080 Ti Founders Edition | |
| Nvidia GeForce GTX 1080 Ti Founders Edition | |
| Eurocom Tornado F5 Killer Edition | |
| Eurocom Sky X7E2 | |
| Nvidia GeForce GTX 1080 Founders Edition | |
| Overwatch - 3840x2160 High (Render Scale 100 %) AA:SM AF:4x | |
| Nvidia GeForce GTX 1080 Ti Founders Edition | |
| Eurocom Sky X7E2 | |
| Eurocom Tornado F5 Killer Edition | |
| Nvidia GeForce GTX 1080 Founders Edition | |
| Mafia 3 - 3840x2160 High Preset | |
| Nvidia GeForce GTX 1080 Ti Founders Edition | |
| Eurocom Tornado F5 Killer Edition | |
| Asus G701VIK-BA049T | |
| Schenker XMG U727 2017 | |
| Nvidia GeForce GTX 1080 Founders Edition | |
| bajo | medio | alto | ultra | 4K | |
|---|---|---|---|---|---|
| Guild Wars 2 (2012) | 90.5 | ||||
| BioShock Infinite (2013) | 152.3 | ||||
| Metro: Last Light (2013) | 110.2 | ||||
| Thief (2014) | 115 | ||||
| The Witcher 3 (2015) | 74.2 | 55.8 | |||
| Batman: Arkham Knight (2015) | 92 | 56 | |||
| Metal Gear Solid V (2015) | 60 | ||||
| Fallout 4 (2015) | 52.6 | ||||
| Rise of the Tomb Raider (2016) | 112.2 | 50.2 | |||
| Ashes of the Singularity (2016) | 65.9 | 44.2 | |||
| Doom (2016) | 66.9 | ||||
| Overwatch (2016) | 104.9 | ||||
| Mafia 3 (2016) | 95.1 | 29.1 |
Ruido
| Ocioso |
| 36.1 / 36.1 / 36.1 dB(A) |
| Carga |
| 44.3 / 51.7 dB(A) |
 | ||
30 dB silencioso 40 dB(A) audible 50 dB(A) ruidosamente alto |
||
min: | ||
| Eurocom Tornado F5 Killer Edition GeForce GTX 1080 Mobile, i5-7600K, Samsung SSD 960 Evo 250GB m.2 NVMe | Dell XPS 15 9560 (i7-7700HQ, UHD) GeForce GTX 1050 Mobile, i7-7700HQ, Lite-On CX2-8B512-Q11 | Alienware 15 R3 GeForce GTX 1070 Mobile, i7-7700HQ | Eurocom Tornado F5 GeForce GTX 1070 Mobile, i7-7700K, Samsung SSD 960 Pro 512 GB m.2 | MSI GT62VR 7RE-223 GeForce GTX 1070 Mobile, i7-7700HQ, Samsung SSD PM871a MZNLN256HMHQ | |
|---|---|---|---|---|---|
| Noise | 9% | -1% | 3% | 4% | |
| apagado / medio ambiente * (dB) | 28.8 | 28.4 1% | 30 -4% | 29.4 -2% | 30 -4% |
| Idle Minimum * (dB) | 36.1 | 29 20% | 31 14% | 33.3 8% | 34 6% |
| Idle Average * (dB) | 36.1 | 29 20% | 32 11% | 33.5 7% | 35 3% |
| Idle Maximum * (dB) | 36.1 | 32.2 11% | 42 -16% | 33.5 7% | 36 -0% |
| Load Average * (dB) | 44.3 | 47.1 -6% | 49 -11% | 44.2 -0% | 40 10% |
| Load Maximum * (dB) | 51.7 | 47.1 9% | 50 3% | 52.5 -2% | 46 11% |
| Witcher 3 ultra * (dB) | 52 |
* ... más pequeño es mejor
(+) La temperatura máxima en la parte superior es de 39.4 °C / 103 F, frente a la media de 40.4 °C / 105 F, que oscila entre 21.2 y 68.8 °C para la clase Gaming.
(-) El fondo se calienta hasta un máximo de 48.6 °C / 119 F, frente a la media de 43.2 °C / 110 F
(+) En reposo, la temperatura media de la parte superior es de 24.1 °C / 75# F, frente a la media del dispositivo de 33.9 °C / 93 F.
(+) Los reposamanos y el panel táctil alcanzan como máximo la temperatura de la piel (32.2 °C / 90 F) y, por tanto, no están calientes.
(-) La temperatura media de la zona del reposamanos de dispositivos similares fue de 28.8 °C / 83.8 F (-3.4 °C / -6.2 F).
Eurocom Tornado F5 Killer Edition análisis de audio
(-) | altavoces no muy altos (#64.8 dB)
Graves 100 - 315 Hz
(±) | lubina reducida - en promedio 11.8% inferior a la mediana
(±) | la linealidad de los graves es media (11.6% delta a frecuencia anterior)
Medios 400 - 2000 Hz
(±) | medias más altas - de media 5.5% más altas que la mediana
(±) | la linealidad de los medios es media (13.5% delta respecto a la frecuencia anterior)
Altos 2 - 16 kHz
(+) | máximos equilibrados - a sólo 3.2% de la mediana
(±) | la linealidad de los máximos es media (9.8% delta a frecuencia anterior)
Total 100 - 16.000 Hz
(±) | la linealidad del sonido global es media (26.1% de diferencia con la mediana)
En comparación con la misma clase
» 92% de todos los dispositivos probados de esta clase eran mejores, 1% similares, 7% peores
» El mejor tuvo un delta de 6%, la media fue 18%, el peor fue ###max##%
En comparación con todos los dispositivos probados
» 80% de todos los dispositivos probados eran mejores, 4% similares, 16% peores
» El mejor tuvo un delta de 4%, la media fue 23%, el peor fue ###max##%
Apple MacBook 12 (Early 2016) 1.1 GHz análisis de audio
(+) | los altavoces pueden reproducir a un volumen relativamente alto (#83.6 dB)
Graves 100 - 315 Hz
(±) | lubina reducida - en promedio 11.3% inferior a la mediana
(±) | la linealidad de los graves es media (14.2% delta a frecuencia anterior)
Medios 400 - 2000 Hz
(+) | medios equilibrados - a sólo 2.4% de la mediana
(+) | los medios son lineales (5.5% delta a la frecuencia anterior)
Altos 2 - 16 kHz
(+) | máximos equilibrados - a sólo 2% de la mediana
(+) | los máximos son lineales (4.5% delta a la frecuencia anterior)
Total 100 - 16.000 Hz
(+) | el sonido global es lineal (10.2% de diferencia con la mediana)
En comparación con la misma clase
» 7% de todos los dispositivos probados de esta clase eran mejores, 2% similares, 90% peores
» El mejor tuvo un delta de 5%, la media fue 18%, el peor fue ###max##%
En comparación con todos los dispositivos probados
» 5% de todos los dispositivos probados eran mejores, 1% similares, 94% peores
» El mejor tuvo un delta de 4%, la media fue 23%, el peor fue ###max##%
| Off / Standby | |
| Ocioso | |
| Carga |
|
Clave:
min: | |
| Eurocom Tornado F5 Killer Edition i5-7600K, GeForce GTX 1080 Mobile, Samsung SSD 960 Evo 250GB m.2 NVMe, IPS, 3840x2160, 15.6" | Dell XPS 15 9560 (i7-7700HQ, UHD) i7-7700HQ, GeForce GTX 1050 Mobile, Lite-On CX2-8B512-Q11, IGZO IPS, 3840x2160, 15.6" | Alienware 15 R3 i7-7700HQ, GeForce GTX 1070 Mobile, , TN, 1920x1080, 15.6" | Eurocom Tornado F5 i7-7700K, GeForce GTX 1070 Mobile, Samsung SSD 960 Pro 512 GB m.2, IPS, 1920x1080, 15.6" | Asus G701VIK-BA049T i7-7820HK, GeForce GTX 1080 Mobile, 2x Samsung SM961 MZVPW256HEGL NVMe (RAID 0), IPS, 1920x1080, 17.3" | |
|---|---|---|---|---|---|
| Power Consumption | 51% | 31% | 20% | 6% | |
| Idle Minimum * (Watt) | 28.4 | 11.9 58% | 19 33% | 21.2 25% | 24 15% |
| Idle Average * (Watt) | 32 | 17.1 47% | 23 28% | 25.1 22% | 31 3% |
| Idle Maximum * (Watt) | 33.5 | 17.3 48% | 29 13% | 26.3 21% | 38 -13% |
| Load Average * (Watt) | 190.9 | 94.7 50% | 85 55% | 169.4 11% | 98 49% |
| Load Maximum * (Watt) | 259.4 | 122 53% | 192 26% | 202.4 22% | 320 -23% |
| Witcher 3 ultra * (Watt) | 104.8 |
* ... más pequeño es mejor
| Eurocom Tornado F5 Killer Edition i5-7600K, GeForce GTX 1080 Mobile, 75.24 Wh | Dell XPS 15 9560 (i7-7700HQ, UHD) i7-7700HQ, GeForce GTX 1050 Mobile, 97 Wh | Alienware 15 R3 i7-7700HQ, GeForce GTX 1070 Mobile, 99 Wh | Eurocom Tornado F5 i7-7700K, GeForce GTX 1070 Mobile, 75.24 Wh | MSI GT62VR 7RE-223 i7-7700HQ, GeForce GTX 1070 Mobile, 75 Wh | |
|---|---|---|---|---|---|
| Duración de Batería | 115% | 29% | -3% | 24% | |
| Reader / Idle (h) | 4.2 | 13.9 231% | 6.4 52% | 4.9 17% | 6.3 50% |
| WiFi v1.3 (h) | 3.6 | 7.2 100% | 4.4 22% | 3.6 0% | 4.1 14% |
| Load (h) | 1.5 | 1.7 13% | 1.7 13% | 1.1 -27% | 1.6 7% |
Pro
Contra
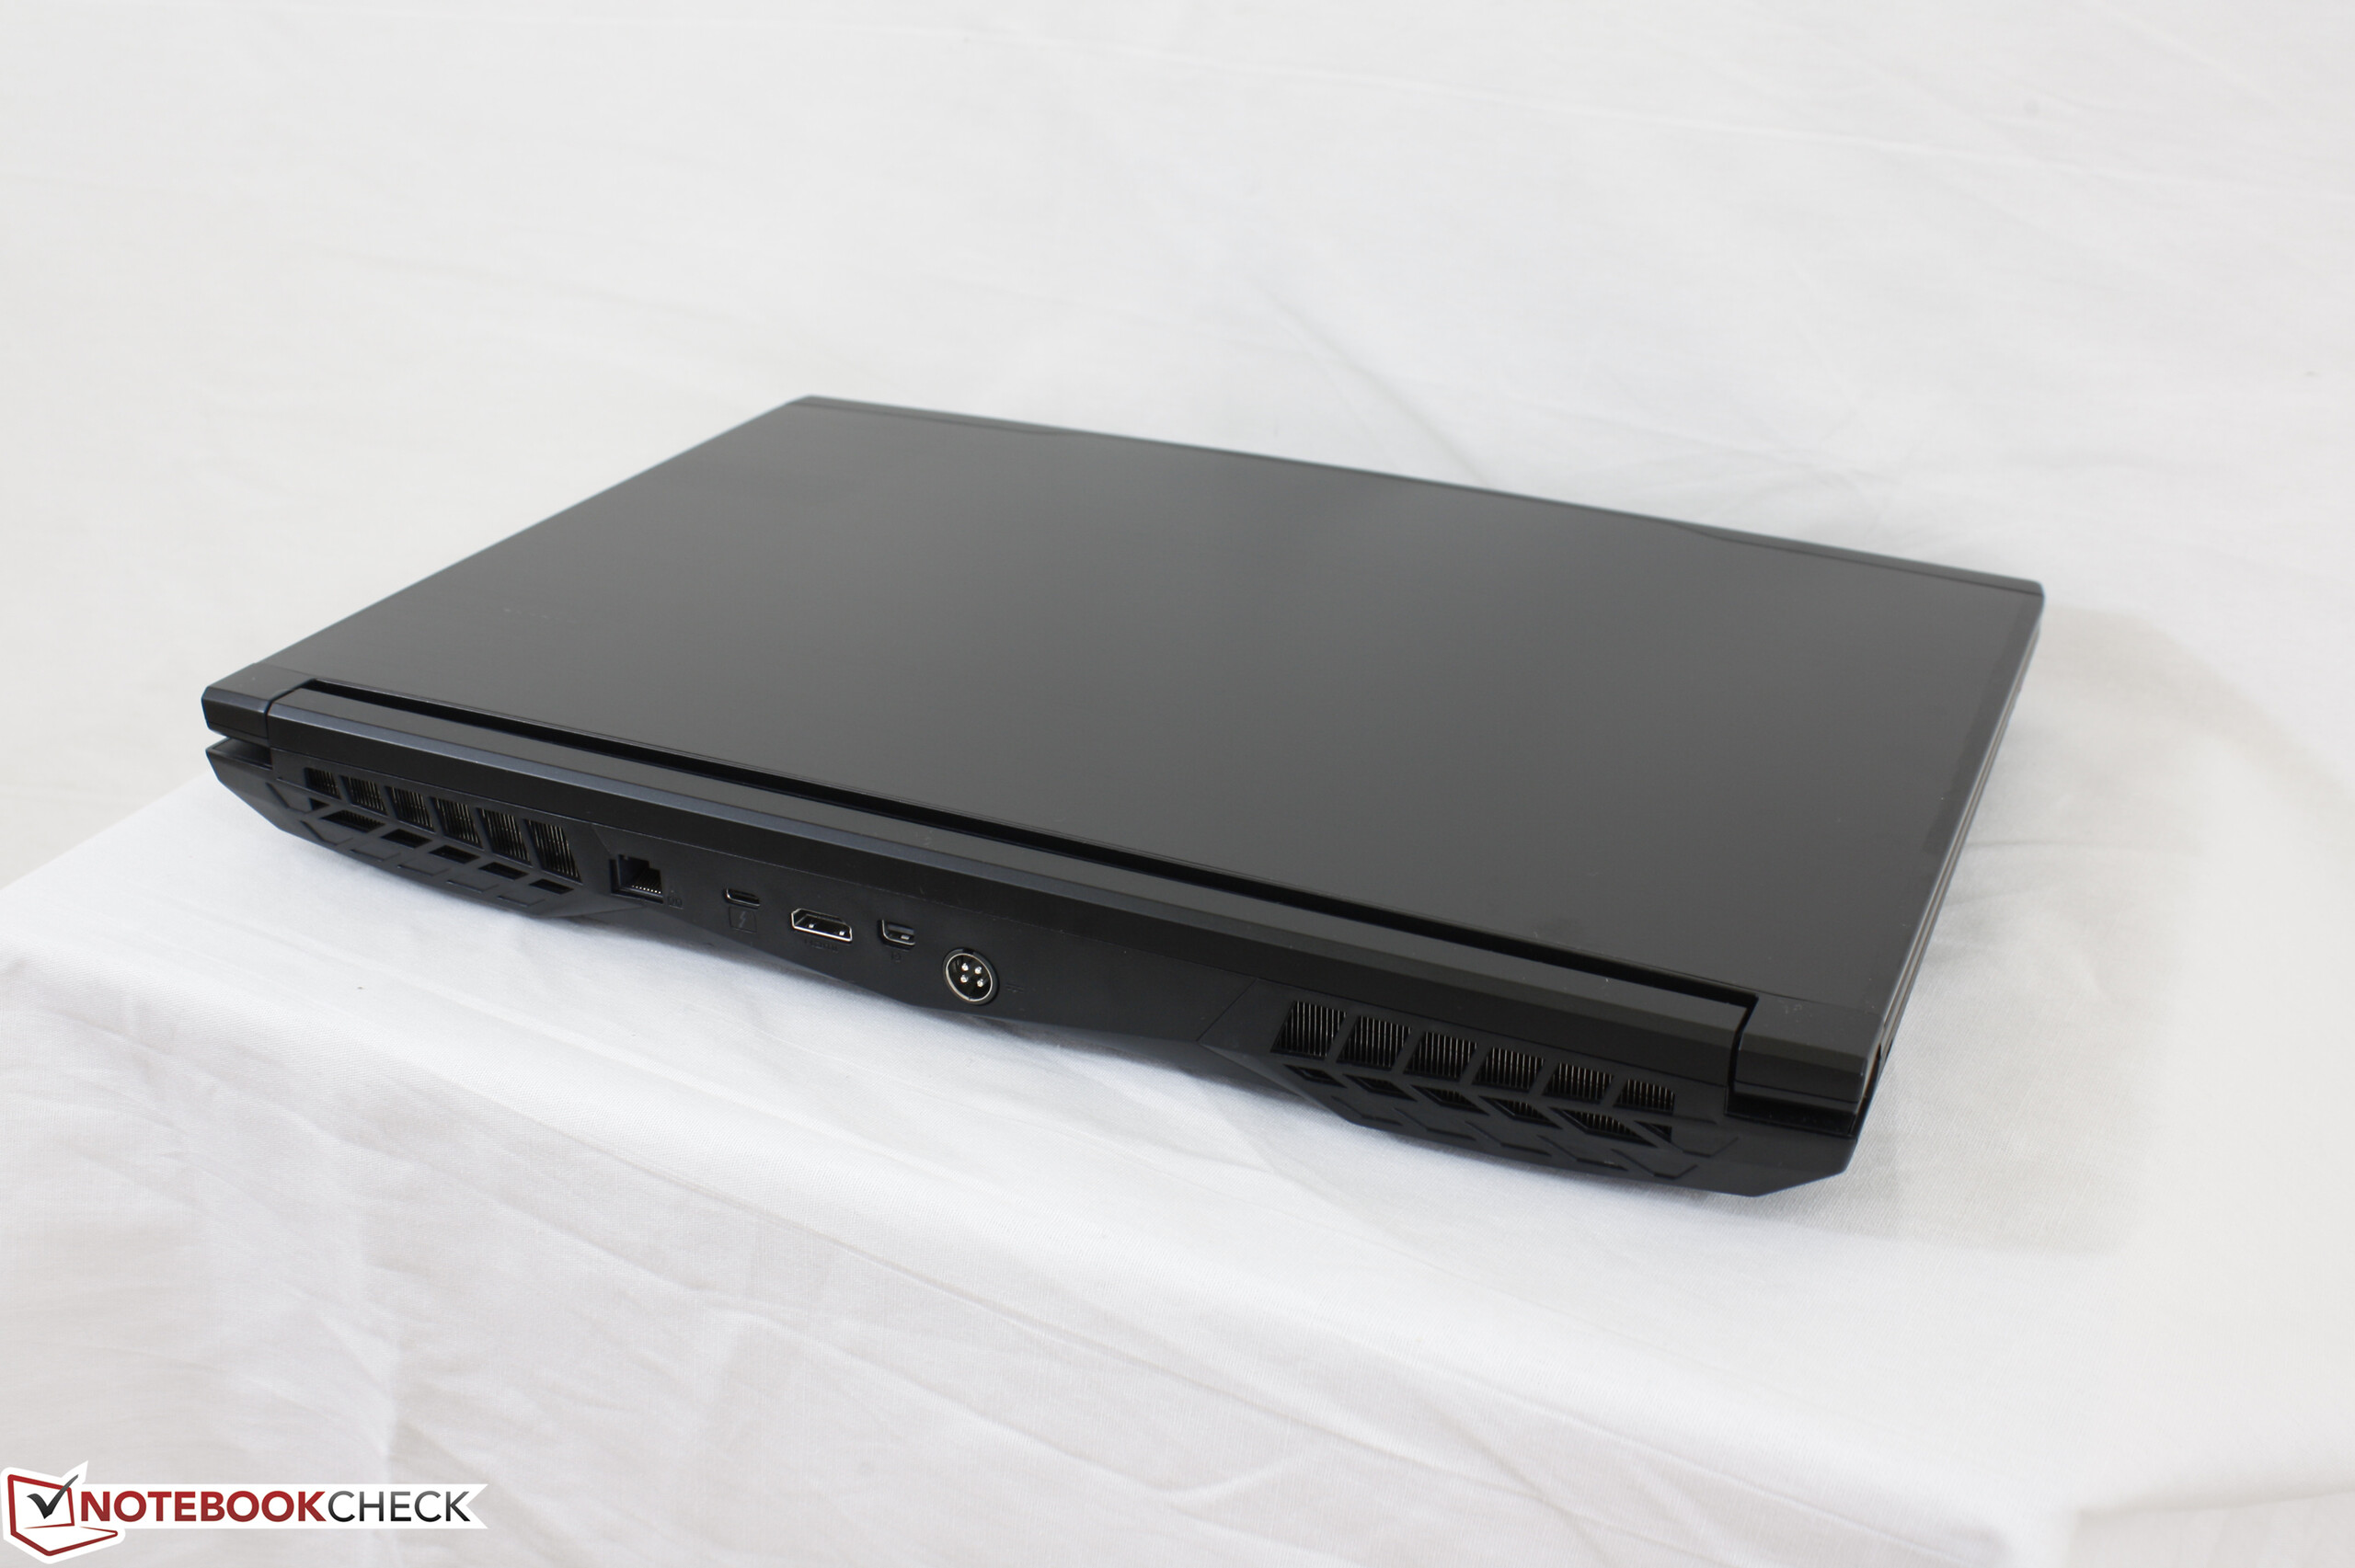
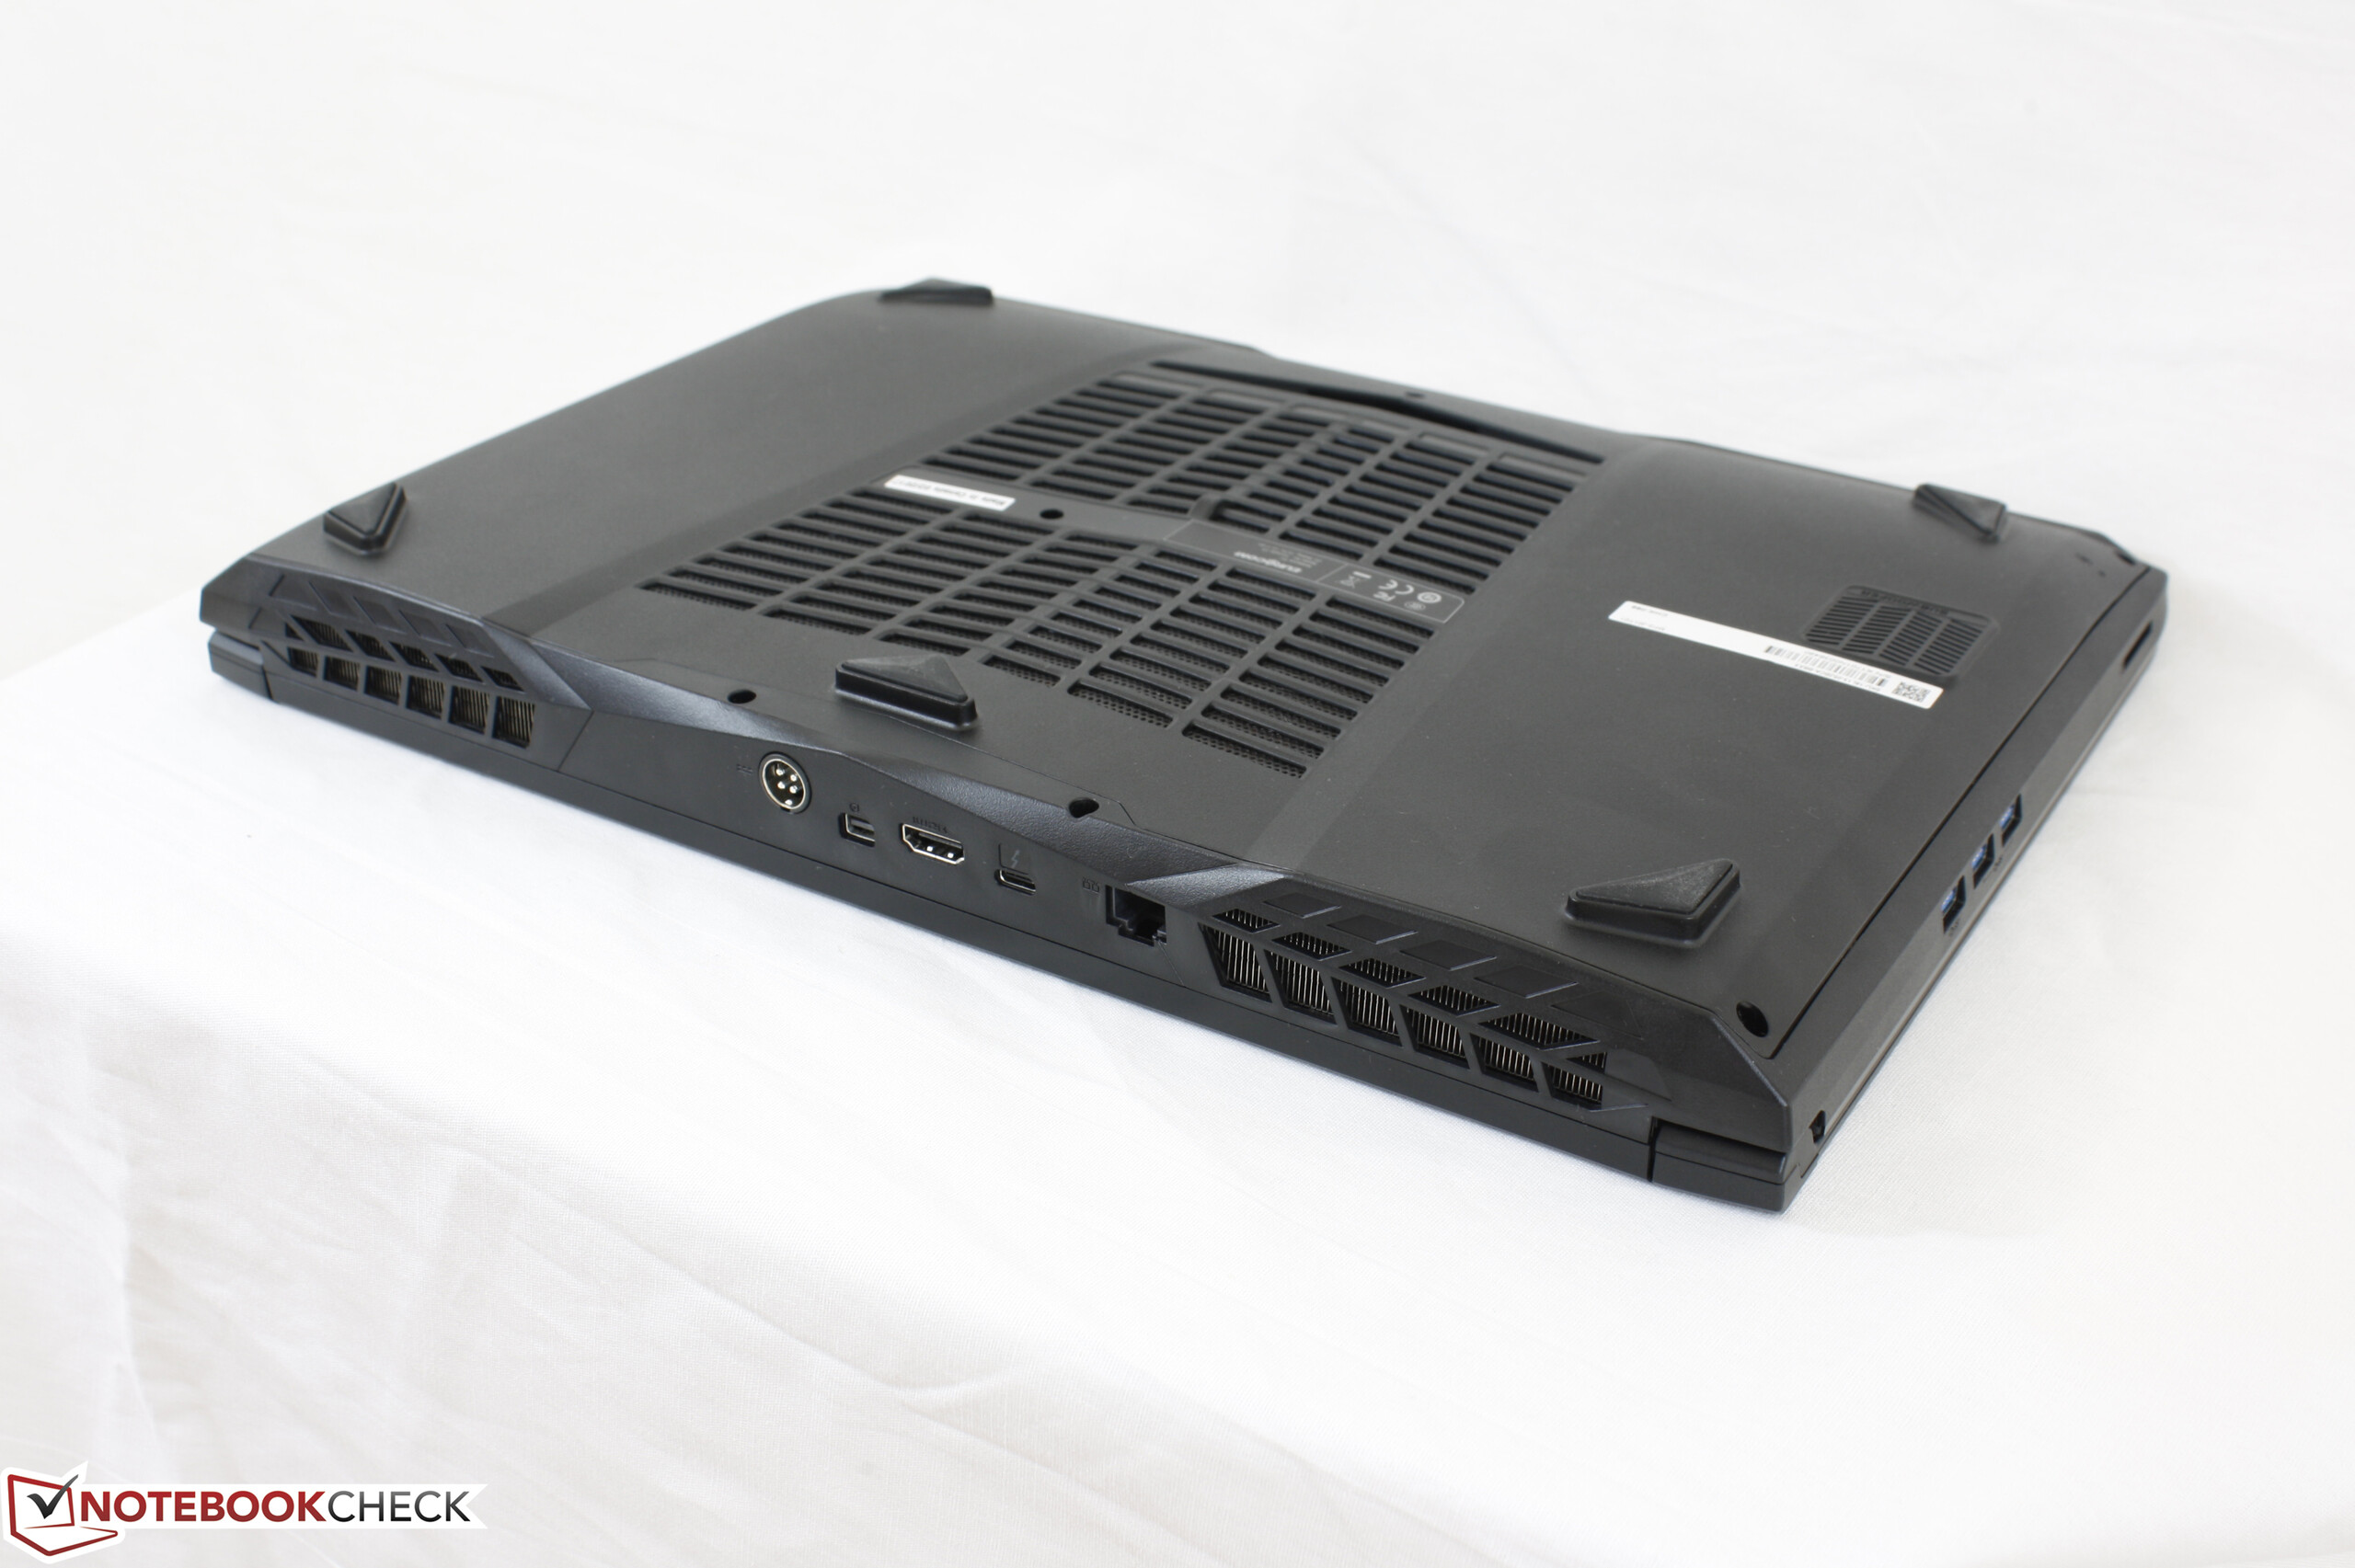
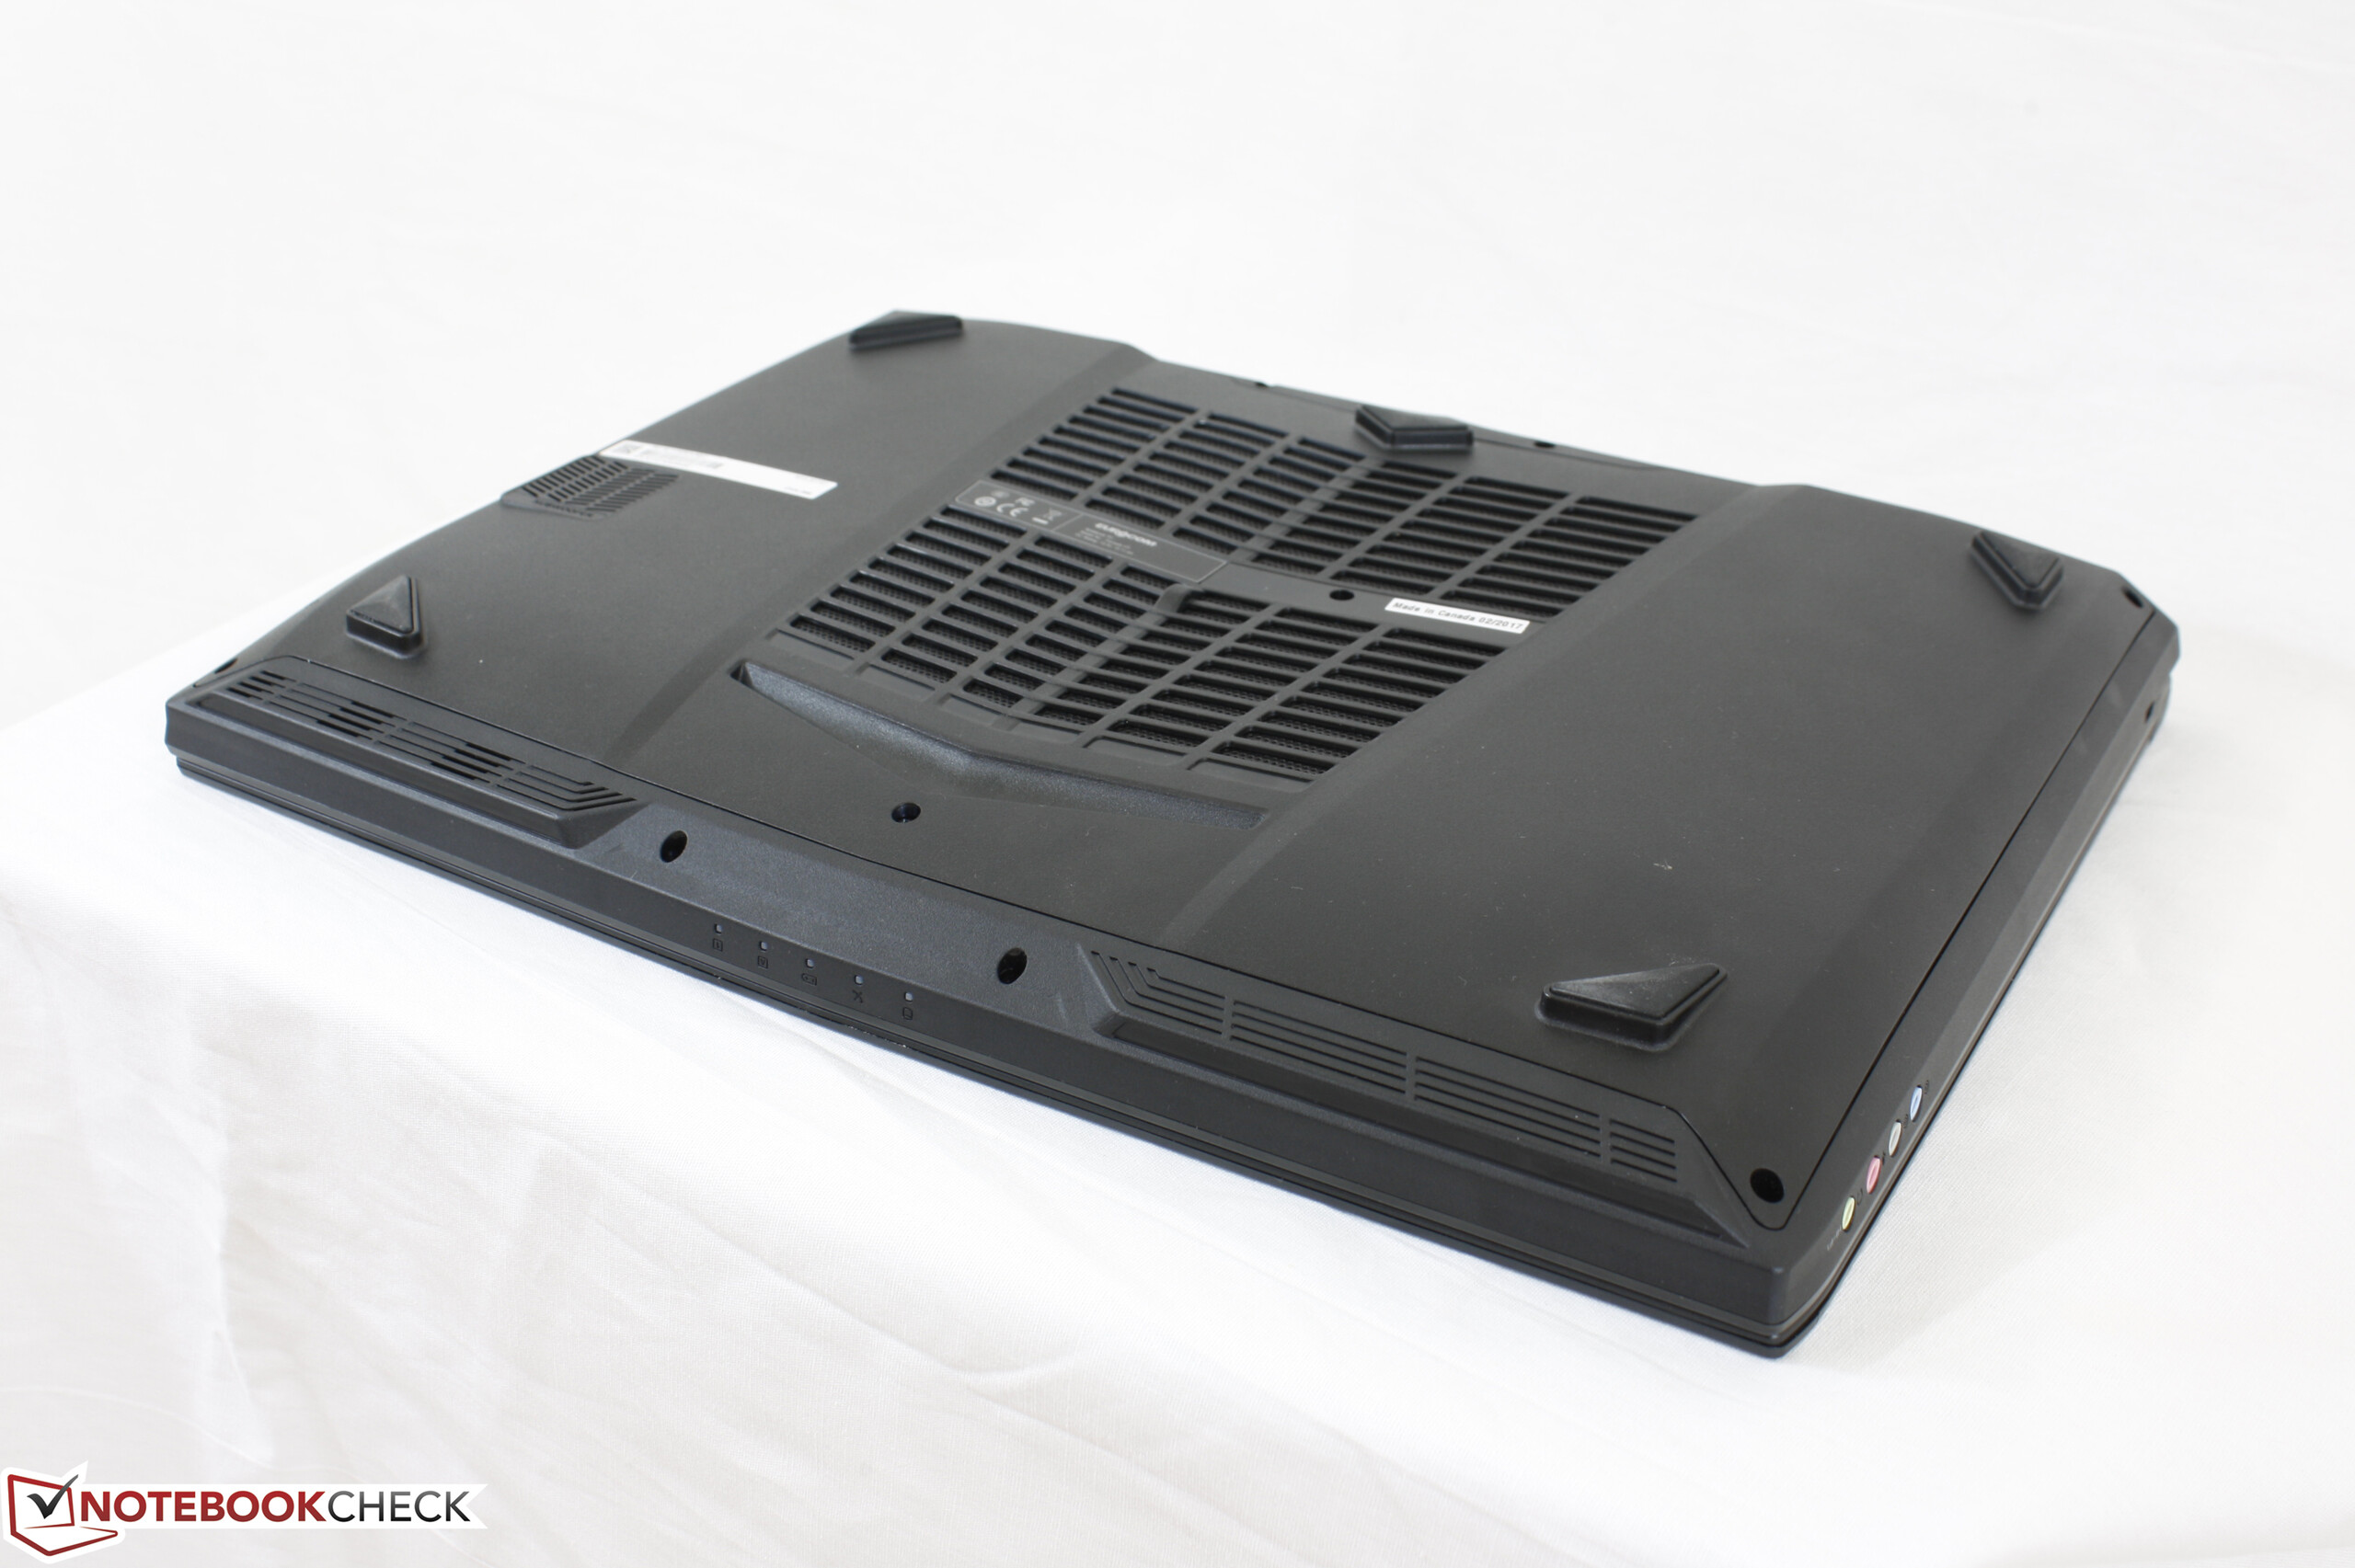
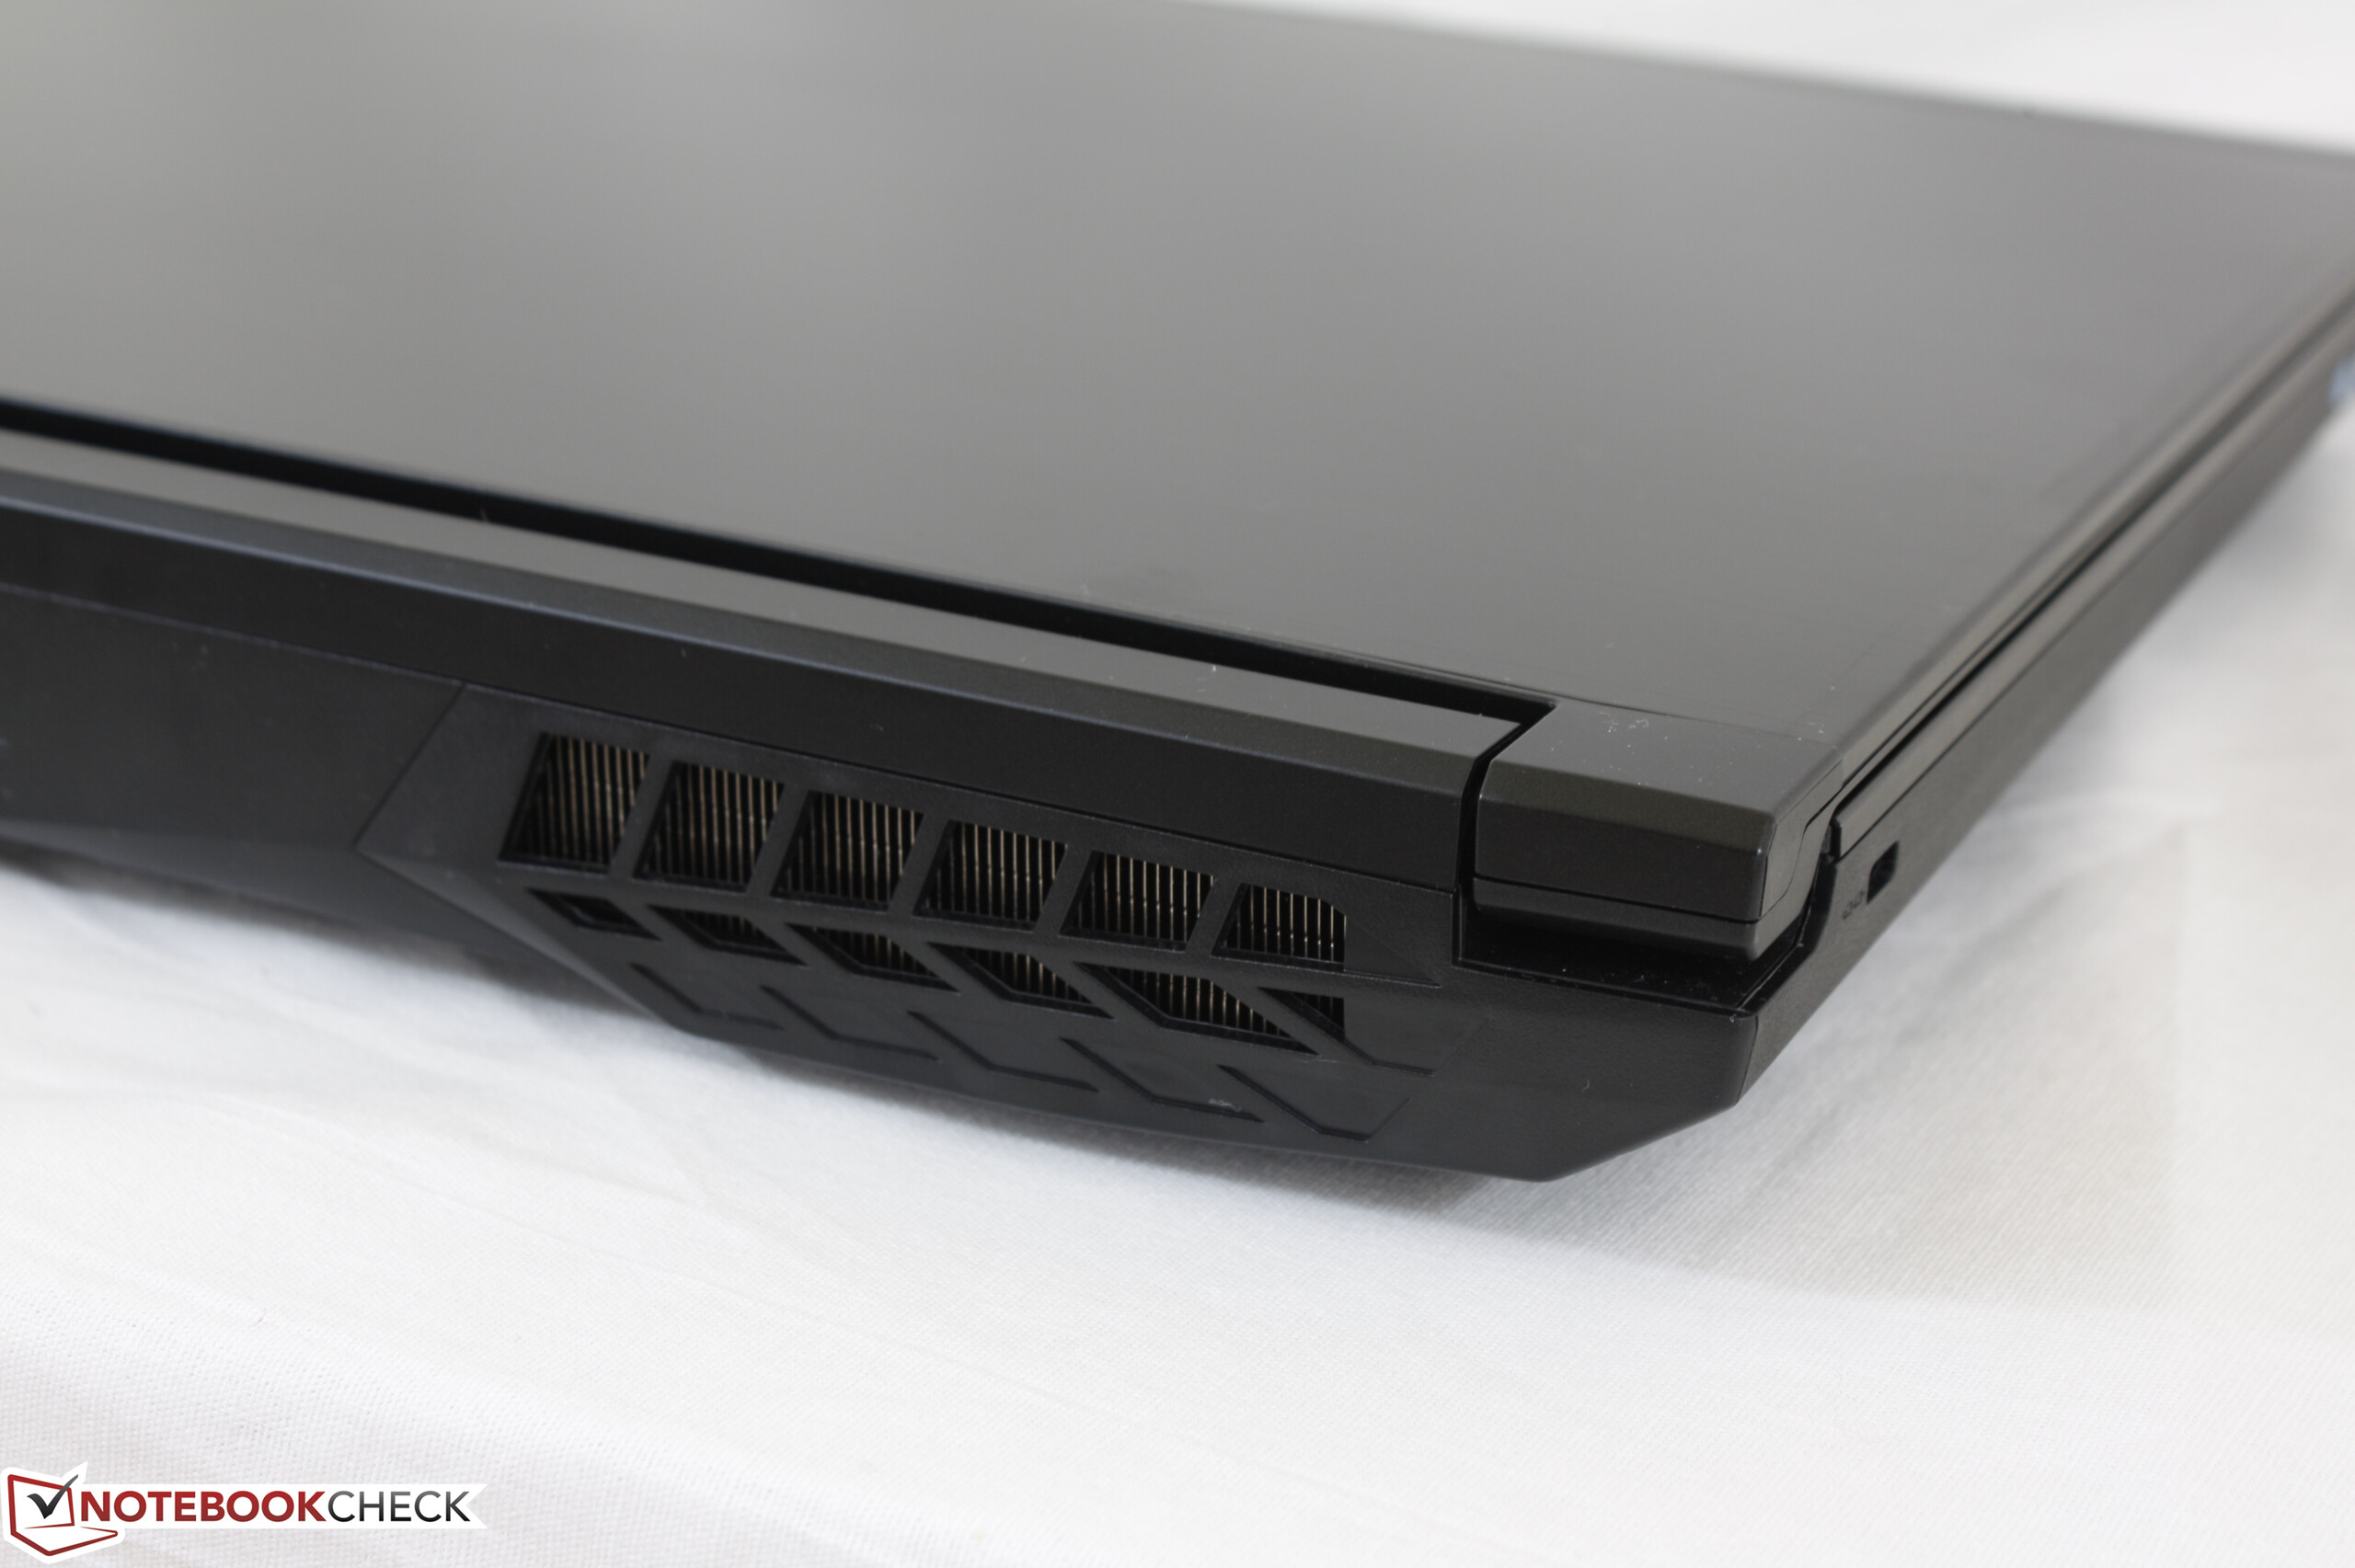
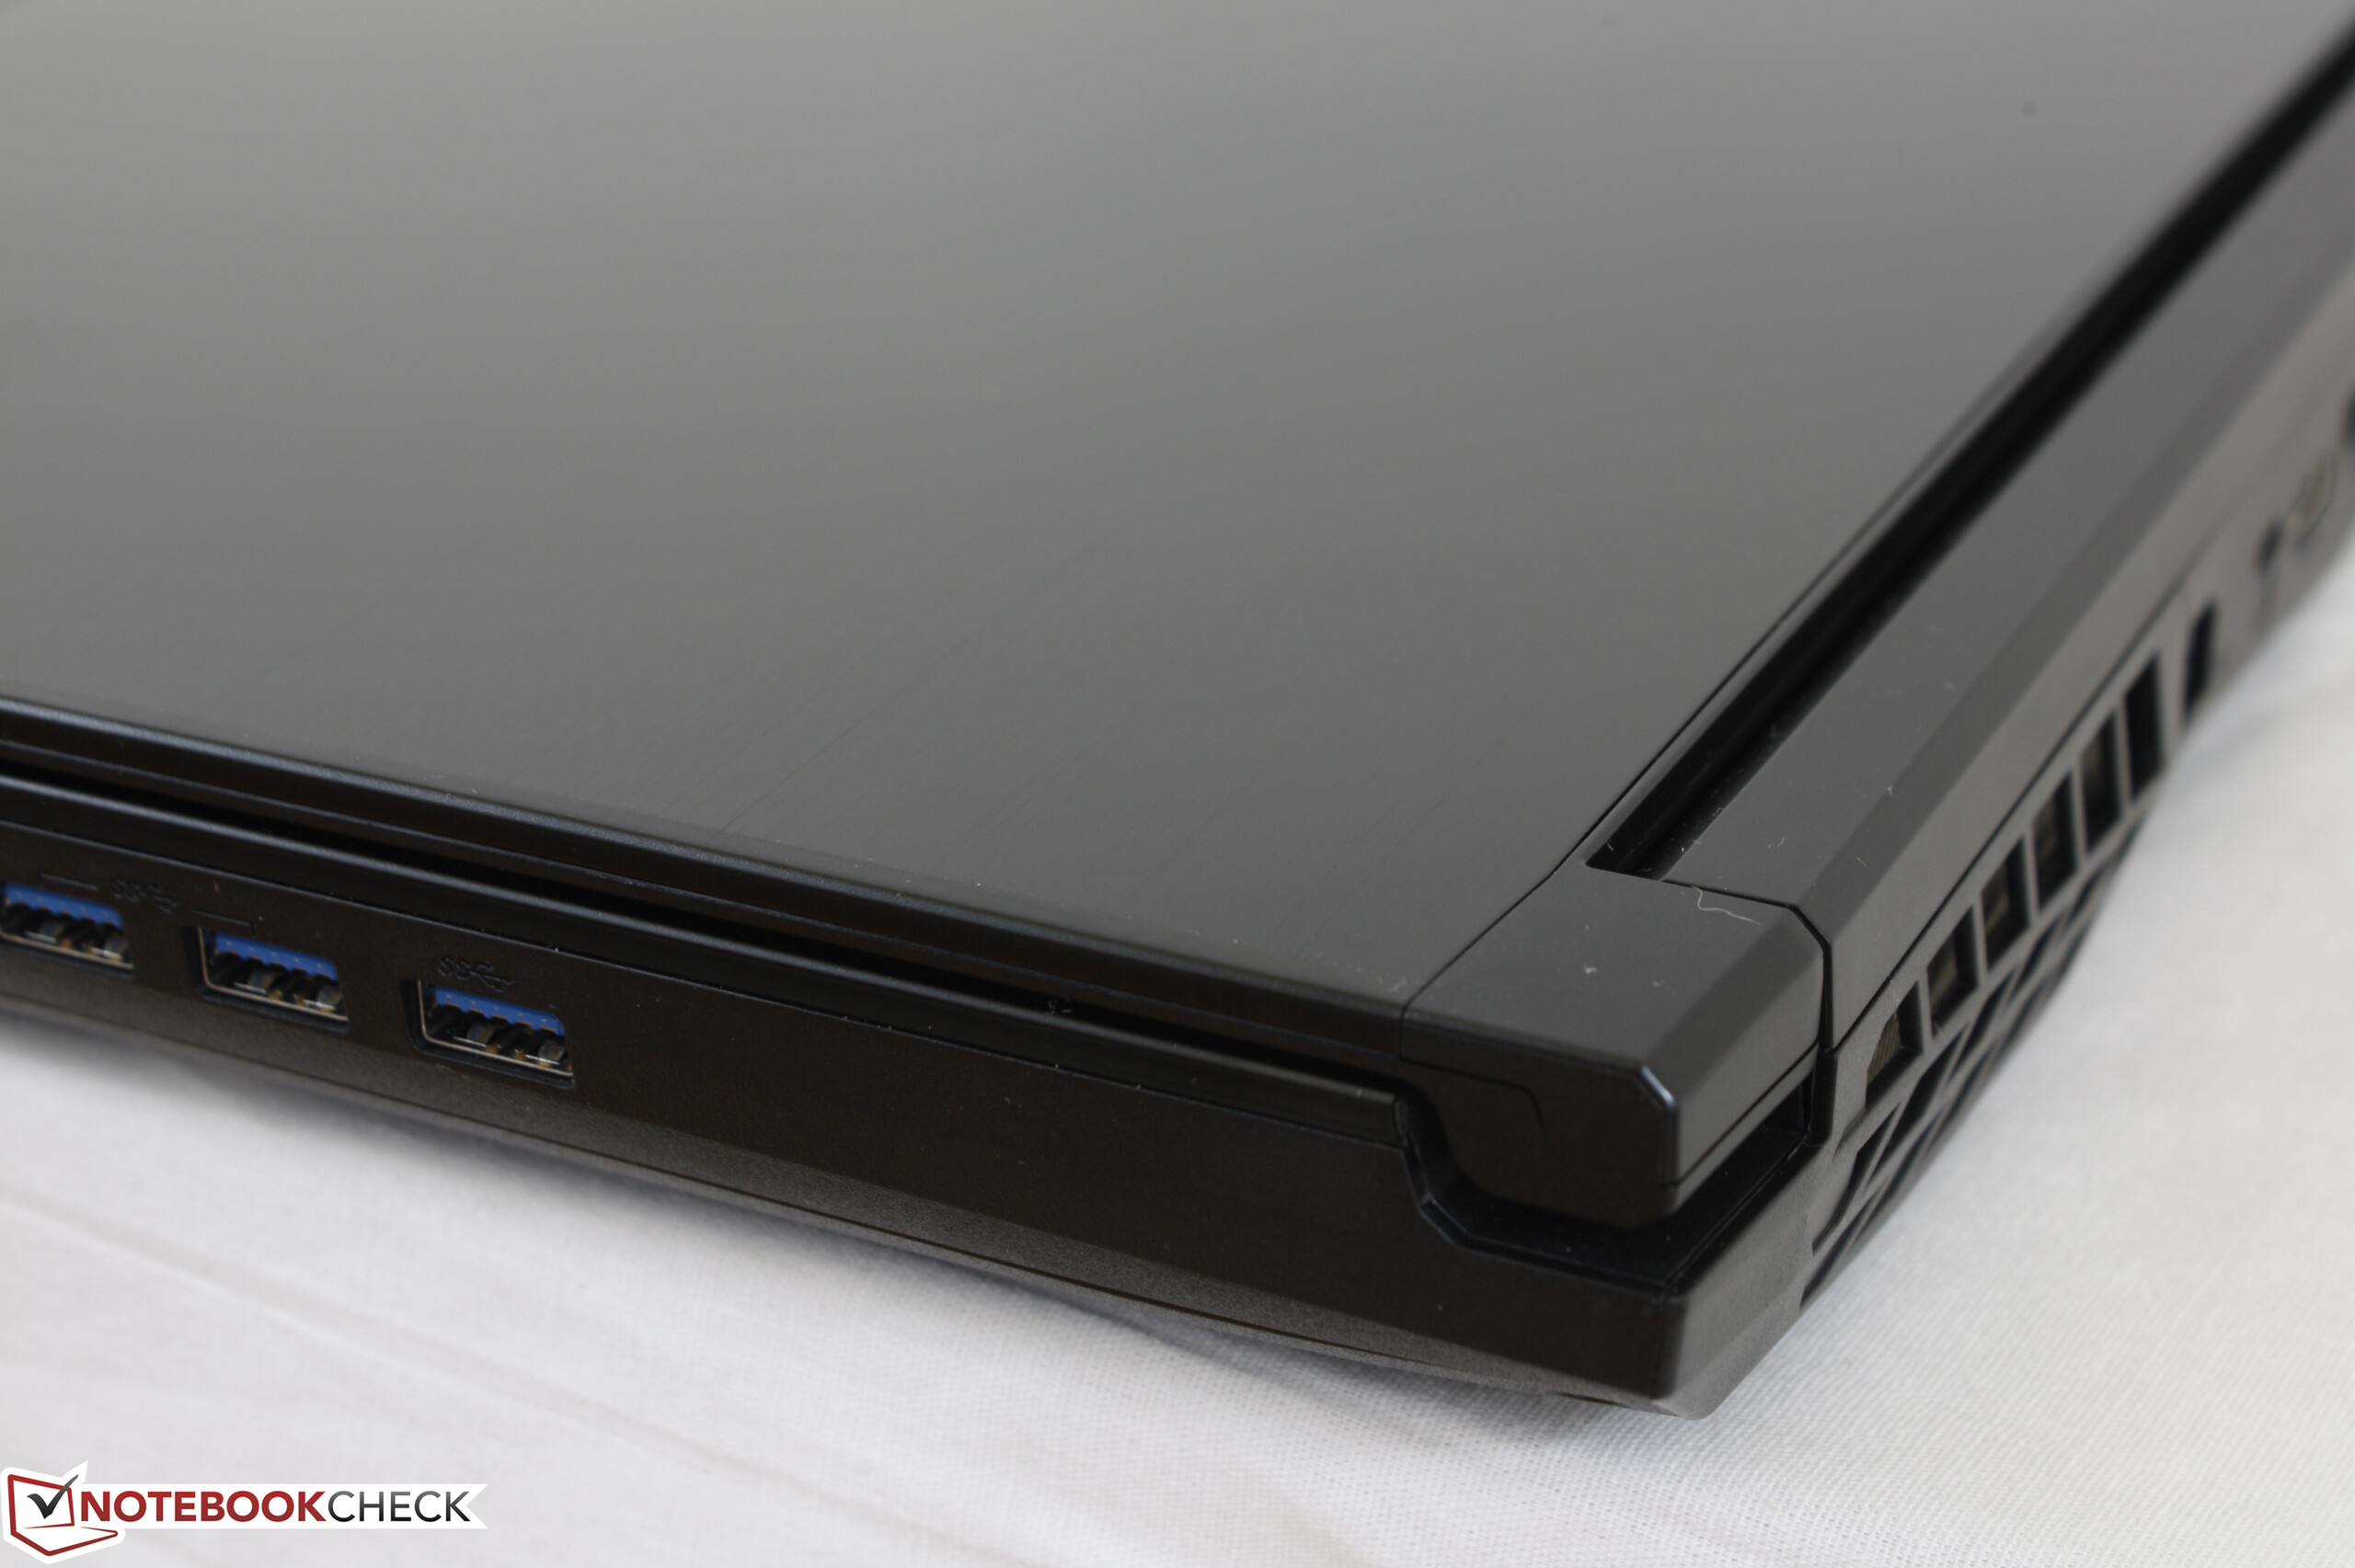
El Tornado F5 merece alabanzas por incorporar un socket LGA 1151 y una ranura MXM 3.0 accesibles en un chasis de 15" que es más pequeño y ligero que muchas alternativas populares y menos potentes. DEsde esta perspectiva, el sistema es como el Razer Blade Pro - se puede meter un hardware exhuberante en un chasis compacto. El hecho de que no podamos registrar problemas de ralentización importantes o recortes ocultos que afecten directamente al rendimiento es otro logro notable.
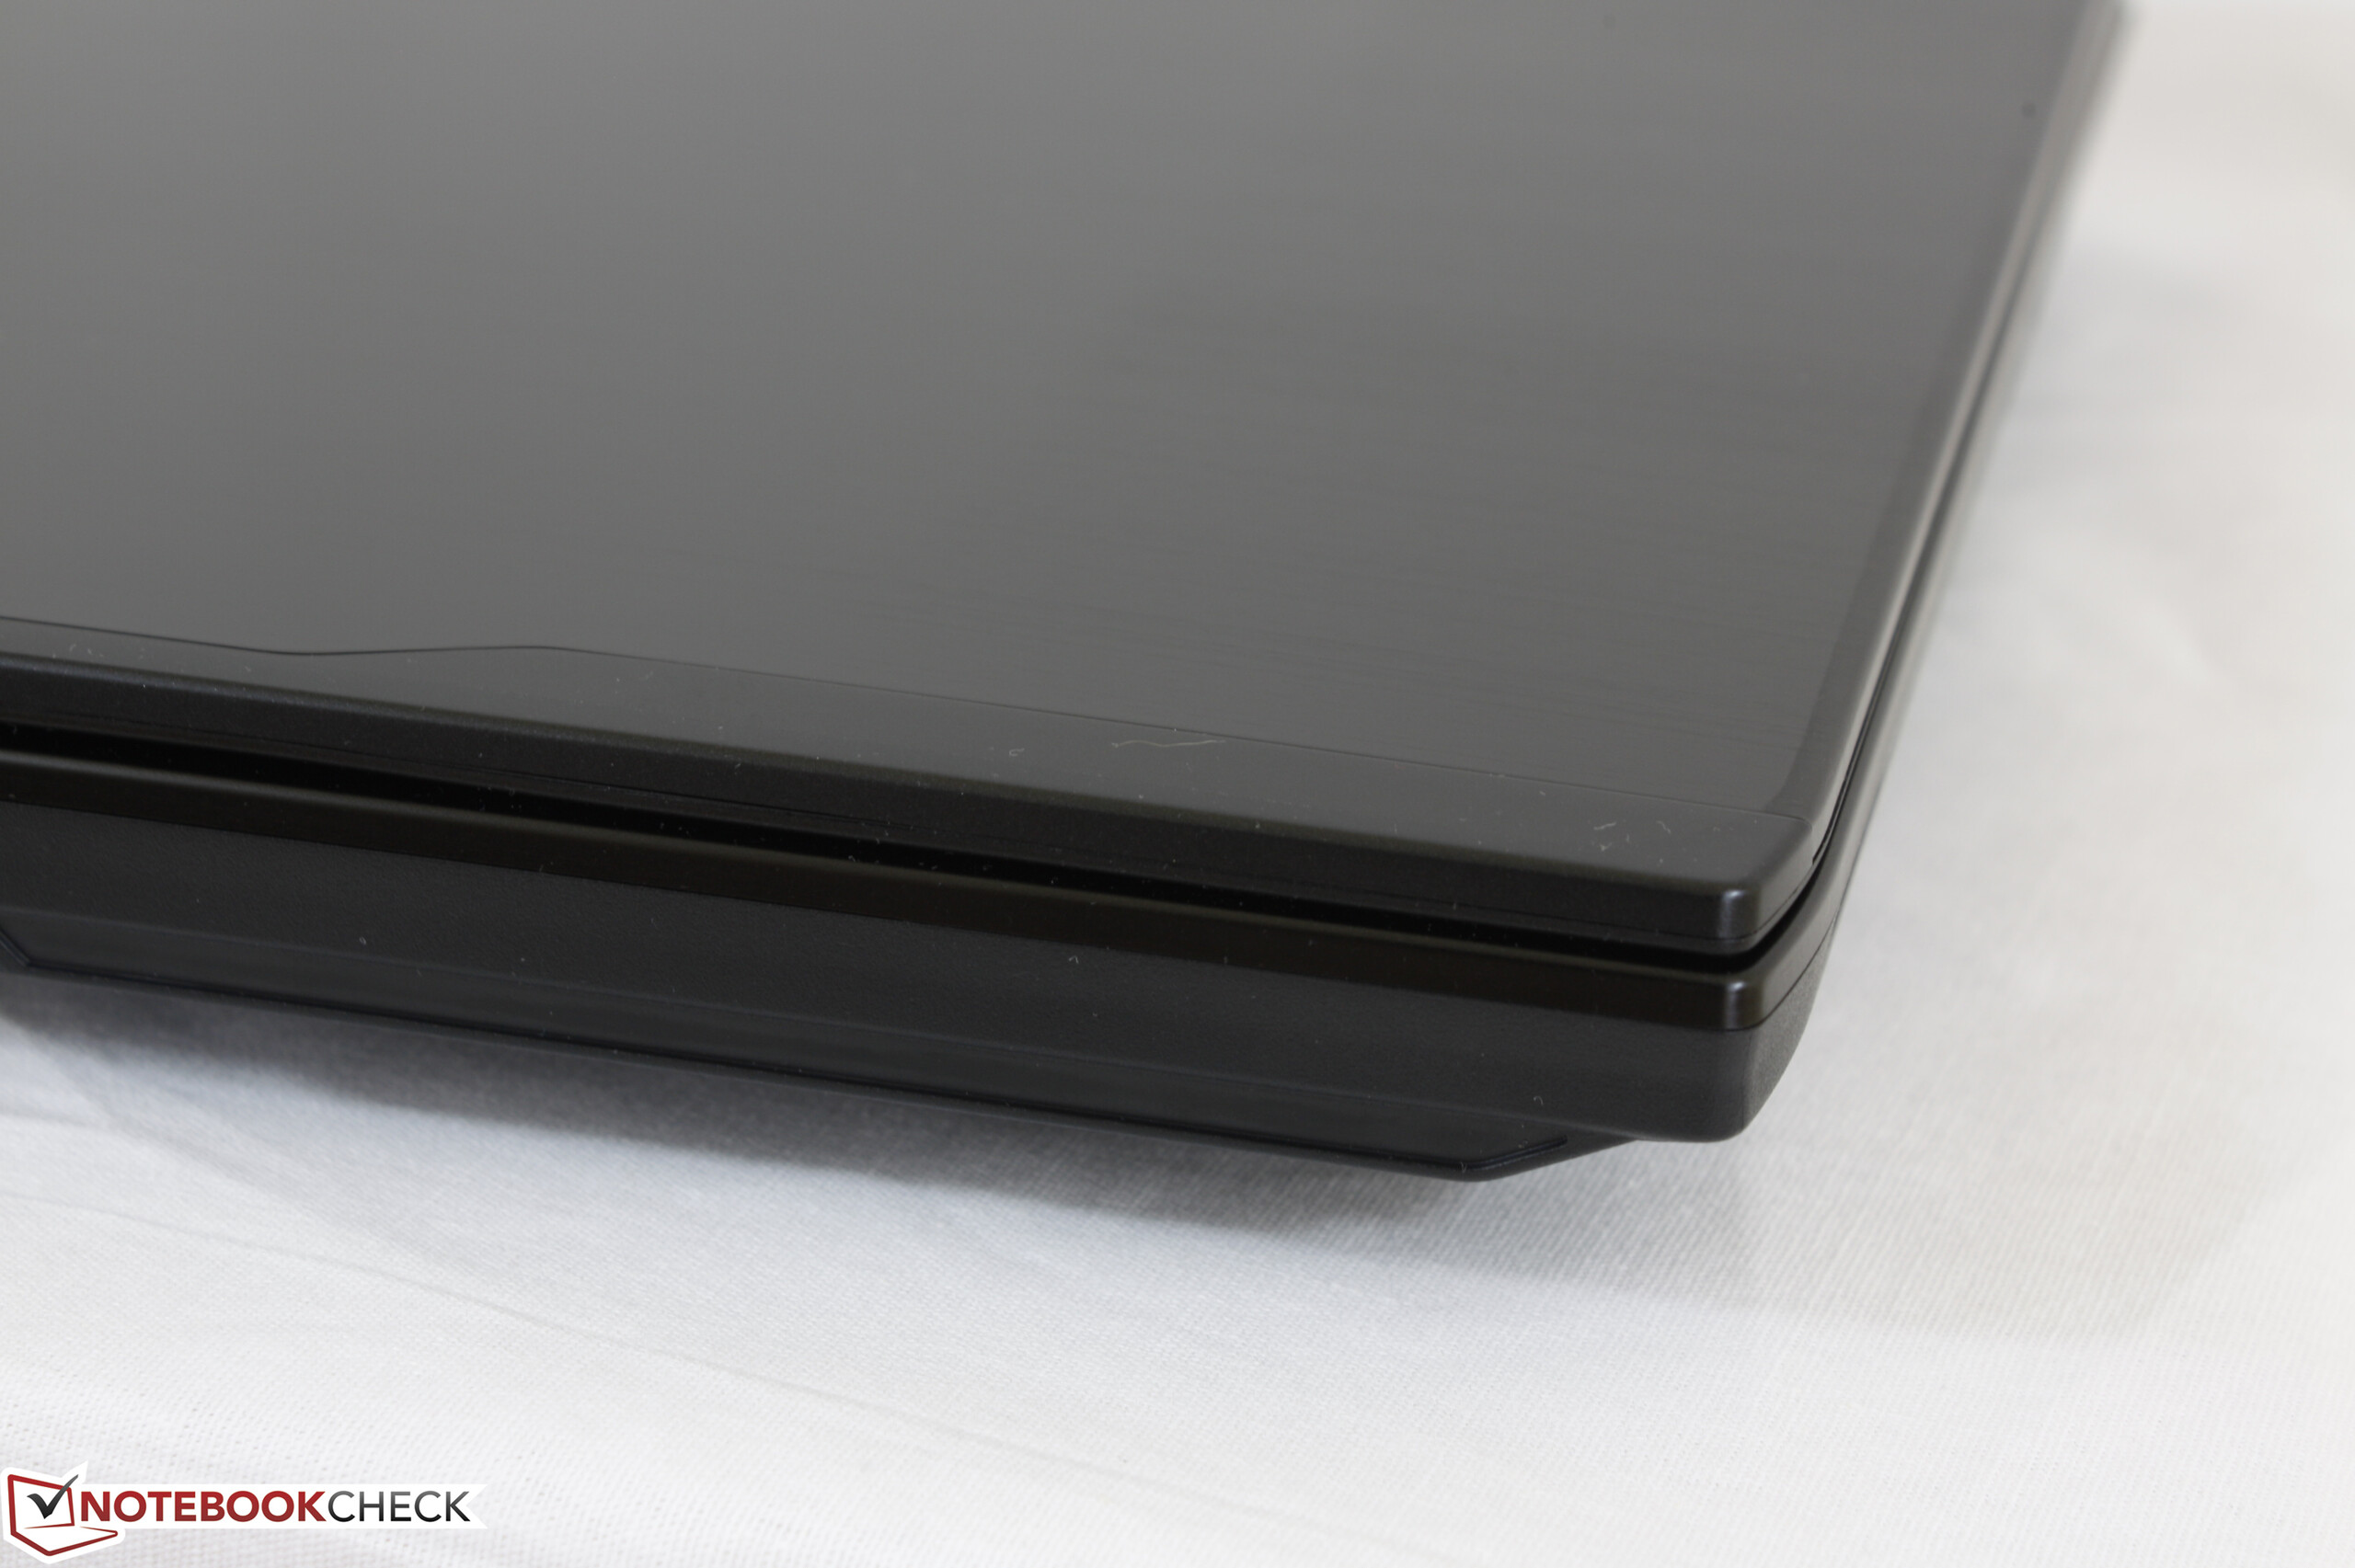
Se aplican los defectos habituales, incluyendo ventiladores ruidosos y poco aguante de batería. Si bien ninguno sorprende, creemos que el ruido del ventilador se podría mejorar bajo cargas leves para hacer que el portátil no distraiga tanto en ambientes más silenciosos. La tapa flexiona más fácilmente de lo que nos gustaría, y el control de calidad en el sangrado de pantalla es mejorable.
Respecto al display 4K UHD, definitivamente hay pros y contras que no lo hacen absolutamente recomendable. La cobertura de color es menor y el contraste es ḿás bajo incluso que la opción 1080p. Además, los usuarios pueden incluso tener en cuenta la tercera opción 1080p 120 Hz/5 ms ya que los veloces tiempos de respuesta y la doble tasa de refresco marcan una enorme diferencia en el juego, bastante más que un panel 4K UHD 60 Hz.
Quizá la mayor razón por la que un entusiasta pueda preferir el Eurocom respecto a un Asus, MSI, o Alienware sean sus componentes modulares y el soporte de procesadores sobremesa. La capacidad de mejorar y testar fácilmente tanto CPU como GPU sin duda es un prospecto atractivo, pero su impacto en el rendimiento gaming es marginal ya que la mayoría de títulos modernos están ligados a la GPU. Cuando un i7-7700HQ móvil puede ejecutar los juegos tan bien como un i5-7600K o i7-7700K con casi la mitad de TDP, cuesta ver los beneficios prácticos de tener una CPU sobremesa en un portátil desde una perspectiva puramente gamer.
El Tornado F5 es el portátil gaming de 15" más versátil que hay si el socket LGA 1151 accesible y la ranura MXM 3.0 son de máxima importancia. Por lo demás, un portátil gaming más tradicional con GPU soldada equivalente puede ofrecer los mismos resultados seguramente a precios más bajos.
Ésta es una versión acortada del análisis original. Puedes leer el análisis completo en inglés aquí.
Eurocom Tornado F5 Killer Edition
- 03/18/2017 v6 (old)
Allen Ngo
Price comparison
