Breve análisis del smartphone Huawei Mate 10 Lite

| Networking | |
| iperf3 transmit AX12 | |
| ZTE Axon 7 | |
| HTC U Ultra | |
| Samsung Galaxy A5 2017 | |
| BQ Aquaris X Pro | |
| Honor 9 | |
| Huawei Mate 10 Lite | |
| iperf3 receive AX12 | |
| ZTE Axon 7 | |
| Honor 9 | |
| HTC U Ultra | |
| BQ Aquaris X Pro | |
| Samsung Galaxy A5 2017 | |
| Huawei Mate 10 Lite | |


| |||||||||||||||||||||||||
iluminación: 89 %
Brillo con batería: 467 cd/m²
Contraste: 1557:1 (Negro: 0.3 cd/m²)
ΔE ColorChecker Calman: 5 | ∀{0.5-29.43 Ø4.71}
ΔE Greyscale Calman: 6.1 | ∀{0.09-98 Ø4.96}
Gamma: 2.15
CCT: 7961 K
| Huawei Mate 10 Lite IPS, 2160x1080, 5.9" | Samsung Galaxy A5 2017 Super AMOLED, 1920x1080, 5.2" | HTC U Ultra SLCD 5, 2560x1440, 5.7" | BQ Aquaris X Pro IPS, 1920x1080, 5.2" | ZTE Axon 7 AMOLED, 2560x1440, 5.5" | Honor 9 IPS/LTPS, 1920x1080, 5.2" | |
|---|---|---|---|---|---|---|
| Screen | 42% | -2% | -38% | -13% | 13% | |
| Brightness middle (cd/m²) | 467 | 539 15% | 470 1% | 458 -2% | 328 -30% | 550 18% |
| Brightness (cd/m²) | 457 | 542 19% | 445 -3% | 473 4% | 334 -27% | 535 17% |
| Brightness Distribution (%) | 89 | 93 4% | 88 -1% | 88 -1% | 88 -1% | 92 3% |
| Black Level * (cd/m²) | 0.3 | 0.22 27% | 0.51 -70% | 0.42 -40% | ||
| Contrast (:1) | 1557 | 2136 37% | 898 -42% | 1310 -16% | ||
| Colorchecker dE 2000 * | 5 | 1.6 68% | 5.5 -10% | 7.1 -42% | 4.6 8% | 3.3 34% |
| Colorchecker dE 2000 max. * | 8.2 | 2.6 68% | 11.9 -45% | 14.5 -77% | 14.7 -79% | 4.5 45% |
| Greyscale dE 2000 * | 6.1 | 1.5 75% | 7.6 -25% | 10.5 -72% | 2.8 54% | 3.6 41% |
| Gamma | 2.15 102% | 2.28 96% | 2.2 100% | 2.28 96% | 2.29 96% | 2.38 92% |
| CCT | 7961 82% | 6422 101% | 7454 87% | 8951 73% | 6612 98% | 7226 90% |
* ... más pequeño es mejor
Parpadeo de Pantalla / PWM (Pulse-Width Modulation)
| Parpadeo de Pantalla / PWM no detectado | 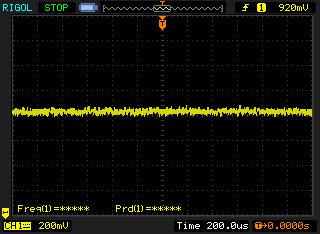 | ||
Comparación: 52 % de todos los dispositivos testados no usaron PWM para atenuar el display. Si se usó, medimos una media de 7754 (mínimo: 5 - máxmo: 343500) Hz. | |||
Tiempos de respuesta del display
| ↔ Tiempo de respuesta de Negro a Blanco | ||
|---|---|---|
| 28 ms ... subida ↗ y bajada ↘ combinada | ↗ 12.4 ms subida | 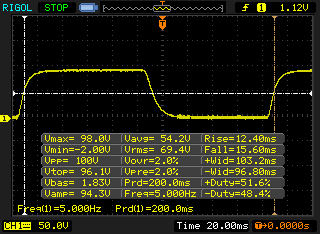 |
| ↘ 15.6 ms bajada | ||
| La pantalla mostró tiempos de respuesta relativamente lentos en nuestros tests pero podría ser demasiado lenta para los jugones. En comparación, todos los dispositivos de prueba van de ##min### (mínimo) a 240 (máximo) ms. » 71 % de todos los dispositivos son mejores. Eso quiere decir que el tiempo de respuesta es peor que la media (19.8 ms) de todos los dispositivos testados. | ||
| ↔ Tiempo de respuesta 50% Gris a 80% Gris | ||
| 43.2 ms ... subida ↗ y bajada ↘ combinada | ↗ 19.6 ms subida | 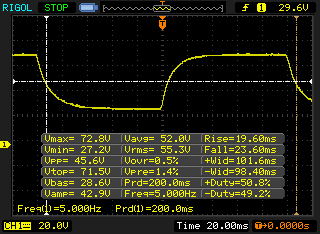 |
| ↘ 23.6 ms bajada | ||
| La pantalla mostró tiempos de respuesta lentos en nuestros tests y podría ser demasiado lenta para los jugones. En comparación, todos los dispositivos de prueba van de ##min### (mínimo) a 636 (máximo) ms. » 72 % de todos los dispositivos son mejores. Eso quiere decir que el tiempo de respuesta es peor que la media (31 ms) de todos los dispositivos testados. | ||
| AnTuTu v6 - Total Score (ordenar por valor) | |
| Huawei Mate 10 Lite | |
| Huawei Nova 2 | |
| HTC U Ultra | |
| BQ Aquaris X Pro | |
| Honor 9 | |
| ZTE Axon 7 | |
| Samsung Galaxy A5 2017 | |
| PCMark for Android | |
| Work performance score (ordenar por valor) | |
| Huawei Mate 10 Lite | |
| Huawei Nova 2 | |
| HTC U Ultra | |
| BQ Aquaris X Pro | |
| Honor 9 | |
| ZTE Axon 7 | |
| Samsung Galaxy A5 2017 | |
| Work 2.0 performance score (ordenar por valor) | |
| Huawei Mate 10 Lite | |
| Huawei Nova 2 | |
| HTC U Ultra | |
| BQ Aquaris X Pro | |
| Honor 9 | |
| Samsung Galaxy A5 2017 | |
| Geekbench 4.4 | |
| 64 Bit Single-Core Score (ordenar por valor) | |
| Huawei Mate 10 Lite | |
| Huawei Nova 2 | |
| BQ Aquaris X Pro | |
| Honor 9 | |
| Samsung Galaxy A5 2017 | |
| 64 Bit Multi-Core Score (ordenar por valor) | |
| Huawei Mate 10 Lite | |
| Huawei Nova 2 | |
| BQ Aquaris X Pro | |
| Honor 9 | |
| Samsung Galaxy A5 2017 | |
| Geekbench 4.0 | |
| 64 Bit Single-Core Score (ordenar por valor) | |
| Huawei Mate 10 Lite | |
| Huawei Nova 2 | |
| HTC U Ultra | |
| BQ Aquaris X Pro | |
| ZTE Axon 7 | |
| Samsung Galaxy A5 2017 | |
| 64 Bit Multi-Core Score (ordenar por valor) | |
| Huawei Mate 10 Lite | |
| Huawei Nova 2 | |
| HTC U Ultra | |
| BQ Aquaris X Pro | |
| ZTE Axon 7 | |
| Samsung Galaxy A5 2017 | |
| GFXBench (DX / GLBenchmark) 2.7 | |
| T-Rex Onscreen (ordenar por valor) | |
| Huawei Mate 10 Lite | |
| Huawei Nova 2 | |
| HTC U Ultra | |
| BQ Aquaris X Pro | |
| Honor 9 | |
| ZTE Axon 7 | |
| Samsung Galaxy A5 2017 | |
| 1920x1080 T-Rex Offscreen (ordenar por valor) | |
| Huawei Mate 10 Lite | |
| Huawei Nova 2 | |
| HTC U Ultra | |
| BQ Aquaris X Pro | |
| Honor 9 | |
| ZTE Axon 7 | |
| Samsung Galaxy A5 2017 | |
| GFXBench 3.0 | |
| on screen Manhattan Onscreen OGL (ordenar por valor) | |
| Huawei Mate 10 Lite | |
| Huawei Nova 2 | |
| HTC U Ultra | |
| BQ Aquaris X Pro | |
| Honor 9 | |
| ZTE Axon 7 | |
| Samsung Galaxy A5 2017 | |
| 1920x1080 1080p Manhattan Offscreen (ordenar por valor) | |
| Huawei Mate 10 Lite | |
| Huawei Nova 2 | |
| HTC U Ultra | |
| BQ Aquaris X Pro | |
| Honor 9 | |
| ZTE Axon 7 | |
| Samsung Galaxy A5 2017 | |
| GFXBench 3.1 | |
| on screen Manhattan ES 3.1 Onscreen (ordenar por valor) | |
| Huawei Mate 10 Lite | |
| Huawei Nova 2 | |
| HTC U Ultra | |
| BQ Aquaris X Pro | |
| Honor 9 | |
| ZTE Axon 7 | |
| Samsung Galaxy A5 2017 | |
| 1920x1080 Manhattan ES 3.1 Offscreen (ordenar por valor) | |
| Huawei Mate 10 Lite | |
| Huawei Nova 2 | |
| HTC U Ultra | |
| BQ Aquaris X Pro | |
| Honor 9 | |
| ZTE Axon 7 | |
| Samsung Galaxy A5 2017 | |
| GFXBench | |
| on screen Car Chase Onscreen (ordenar por valor) | |
| Huawei Mate 10 Lite | |
| Huawei Nova 2 | |
| HTC U Ultra | |
| BQ Aquaris X Pro | |
| Honor 9 | |
| ZTE Axon 7 | |
| Samsung Galaxy A5 2017 | |
| 1920x1080 Car Chase Offscreen (ordenar por valor) | |
| Huawei Mate 10 Lite | |
| Huawei Nova 2 | |
| HTC U Ultra | |
| BQ Aquaris X Pro | |
| Honor 9 | |
| ZTE Axon 7 | |
| Samsung Galaxy A5 2017 | |
| Lightmark - 1920x1080 1080p (ordenar por valor) | |
| Huawei Nova 2 | |
| Basemark X 1.1 | |
| Medium Quality (ordenar por valor) | |
| Huawei Nova 2 | |
| High Quality (ordenar por valor) | |
| Huawei Nova 2 | |
| Basemark ES 3.1 / Metal - offscreen Overall Score (ordenar por valor) | |
| Huawei Nova 2 | |
| Samsung Galaxy A5 2017 | |
| Epic Citadel - Ultra High Quality (ordenar por valor) | |
| Huawei Nova 2 | |
| JetStream 1.1 - 1.1 Total | |
| Honor 9 (Chrome 59) | |
| HTC U Ultra (Chrome 56) | |
| ZTE Axon 7 (Chrome 53.0.2785.124) | |
| Samsung Galaxy A5 2017 (Samsung Browser (Chrome 44)) | |
| Huawei Mate 10 Lite (Chrome 62) | |
| Huawei Nova 2 (Chrome 60.0.3112.116) | |
| BQ Aquaris X Pro (Chrome 59.0.3071.125) | |
| Octane V2 - Total Score | |
| Honor 9 (Chrome 59) | |
| ZTE Axon 7 (Chrome 53.0.2785.124) | |
| HTC U Ultra (Chrome 56) | |
| Samsung Galaxy A5 2017 (Samsung Browser (Chrome 44)) | |
| Huawei Mate 10 Lite (Chrome 62) | |
| Huawei Nova 2 (Chrome 60.0.3112.116) | |
| BQ Aquaris X Pro (Chrome 59.0.3071.125) | |
| Mozilla Kraken 1.1 - Total | |
| Huawei Nova 2 (Chrome 60.0.3112.116) | |
| BQ Aquaris X Pro (Chrome 59.0.3071.125) | |
| Huawei Mate 10 Lite (Chrome 62) | |
| Samsung Galaxy A5 2017 (Samsung Browser (Chrome 44)) | |
| HTC U Ultra (Chrome 56) | |
| Honor 9 (Chrome 59) | |
| ZTE Axon 7 (Chrome 53.0.2785.124) | |
| WebXPRT 2015 - Overall | |
| ZTE Axon 7 (Chrome 53.0.2785.124) | |
| Honor 9 (Chrome 59) | |
| Huawei Mate 10 Lite (Chrome 62) | |
| Huawei Nova 2 (Chrome 60.0.3112.116) | |
| Samsung Galaxy A5 2017 (Samsung Browser (Chrome 44)) | |
| BQ Aquaris X Pro (Chrome 59.0.3071.125) | |
* ... más pequeño es mejor
| Huawei Mate 10 Lite | Samsung Galaxy A5 2017 | HTC U Ultra | BQ Aquaris X Pro | ZTE Axon 7 | Honor 9 | |
|---|---|---|---|---|---|---|
| AndroBench 3-5 | -8% | 64% | 15% | 74% | 49% | |
| Sequential Read 256KB (MB/s) | 286.8 | 182 -37% | 423.9 48% | 270.5 -6% | 406.5 42% | 293 2% |
| Sequential Write 256KB (MB/s) | 99.8 | 77.1 -23% | 164.7 65% | 139.6 40% | 150.9 51% | 204 104% |
| Random Read 4KB (MB/s) | 31.5 | 22.41 -29% | 84.2 167% | 37.97 21% | 121.1 284% | 55.7 77% |
| Random Write 4KB (MB/s) | 15.26 | 12.13 -21% | 13.7 -10% | 12.07 -21% | 16.22 6% | 32.7 114% |
| Sequential Read 256KB SDCard (MB/s) | 69.1 ? | 73.7 ? 7% | 82.8 ? 20% | 78.7 ? 14% | 78.4 ? 13% | 68 ? -2% |
| Sequential Write 256KB SDCard (MB/s) | 35.35 ? | 56 ? 58% | 67.6 ? 91% | 49.77 ? 41% | 51.3 ? 45% | 34.64 ? -2% |
| Real Racing 3 | |||
| Configuraciones | Valor | ||
| high | 26 fps | ||
| Asphalt 8: Airborne | |||
| Configuraciones | Valor | ||
| high | 22 fps | ||
| very low | 30 fps | ||
| Dead Trigger 2 | |||
| Configuraciones | Valor | ||
| high | 30 fps | ||
(+) La temperatura máxima en la parte superior es de 35.5 °C / 96 F, frente a la media de 35.3 °C / 96 F, que oscila entre 21.9 y 247 °C para la clase Smartphone.
(+) El fondo se calienta hasta un máximo de 31.3 °C / 88 F, frente a la media de 34 °C / 93 F
(+) En reposo, la temperatura media de la parte superior es de 28.8 °C / 84# F, frente a la media del dispositivo de 33 °C / 91 F.
Huawei Mate 10 Lite análisis de audio
(+) | los altavoces pueden reproducir a un volumen relativamente alto (#86.5 dB)
Graves 100 - 315 Hz
(-) | casi sin bajos - de media 28% inferior a la mediana
(±) | la linealidad de los graves es media (7.3% delta a frecuencia anterior)
Medios 400 - 2000 Hz
(±) | medios reducidos - de media 5% inferior a la mediana
(+) | los medios son lineales (5.7% delta a la frecuencia anterior)
Altos 2 - 16 kHz
(±) | máximos más altos - de media 10.5% más altos que la mediana
(+) | los máximos son lineales (4.2% delta a la frecuencia anterior)
Total 100 - 16.000 Hz
(±) | la linealidad del sonido global es media (25.5% de diferencia con la mediana)
En comparación con la misma clase
» 64% de todos los dispositivos probados de esta clase eran mejores, 6% similares, 30% peores
» El mejor tuvo un delta de 11%, la media fue 34%, el peor fue ###max##%
En comparación con todos los dispositivos probados
» 78% de todos los dispositivos probados eran mejores, 4% similares, 17% peores
» El mejor tuvo un delta de 4%, la media fue 23%, el peor fue ###max##%
HTC U Ultra análisis de audio
(+) | los altavoces pueden reproducir a un volumen relativamente alto (#86 dB)
Graves 100 - 315 Hz
(-) | casi sin bajos - de media 27.3% inferior a la mediana
(±) | la linealidad de los graves es media (10.1% delta a frecuencia anterior)
Medios 400 - 2000 Hz
(+) | medios equilibrados - a sólo 4.4% de la mediana
(+) | los medios son lineales (6.6% delta a la frecuencia anterior)
Altos 2 - 16 kHz
(±) | máximos más altos - de media 12.1% más altos que la mediana
(+) | los máximos son lineales (6.3% delta a la frecuencia anterior)
Total 100 - 16.000 Hz
(±) | la linealidad del sonido global es media (29% de diferencia con la mediana)
En comparación con la misma clase
» 76% de todos los dispositivos probados de esta clase eran mejores, 3% similares, 20% peores
» El mejor tuvo un delta de 11%, la media fue 34%, el peor fue ###max##%
En comparación con todos los dispositivos probados
» 87% de todos los dispositivos probados eran mejores, 2% similares, 11% peores
» El mejor tuvo un delta de 4%, la media fue 23%, el peor fue ###max##%
Samsung Galaxy A5 2017 análisis de audio
(+) | los altavoces pueden reproducir a un volumen relativamente alto (#83 dB)
Graves 100 - 315 Hz
(-) | casi sin bajos - de media 15.5% inferior a la mediana
(±) | la linealidad de los graves es media (9.1% delta a frecuencia anterior)
Medios 400 - 2000 Hz
(±) | medias más altas - de media 9.4% más altas que la mediana
(±) | la linealidad de los medios es media (7.6% delta respecto a la frecuencia anterior)
Altos 2 - 16 kHz
(±) | máximos más altos - de media 5% más altos que la mediana
(±) | la linealidad de los máximos es media (7.6% delta a frecuencia anterior)
Total 100 - 16.000 Hz
(±) | la linealidad del sonido global es media (23.6% de diferencia con la mediana)
En comparación con la misma clase
» 54% de todos los dispositivos probados de esta clase eran mejores, 8% similares, 38% peores
» El mejor tuvo un delta de 11%, la media fue 34%, el peor fue ###max##%
En comparación con todos los dispositivos probados
» 71% de todos los dispositivos probados eran mejores, 6% similares, 23% peores
» El mejor tuvo un delta de 4%, la media fue 23%, el peor fue ###max##%
| Off / Standby | |
| Ocioso | |
| Carga |
|
Clave:
min: | |
| Huawei Mate 10 Lite 3340 mAh | Samsung Galaxy S8 3000 mAh | HTC U Ultra 3000 mAh | BQ Aquaris X Pro 3100 mAh | Honor 9 3200 mAh | ZTE Axon 7 3250 mAh | Samsung Galaxy A5 2017 3000 mAh | |
|---|---|---|---|---|---|---|---|
| Power Consumption | 20% | -38% | 6% | -24% | -1% | 33% | |
| Idle Minimum * (Watt) | 0.87 | 0.78 10% | 1 -15% | 0.67 23% | 1.13 -30% | 0.64 26% | 0.64 26% |
| Idle Average * (Watt) | 2.14 | 1.1 49% | 2.41 -13% | 1.7 21% | 2.25 -5% | 0.84 61% | 1.36 36% |
| Idle Maximum * (Watt) | 2.16 | 1.16 46% | 2.46 -14% | 1.78 18% | 2.3 -6% | 0.87 60% | 1.4 35% |
| Load Average * (Watt) | 3.7 | 4.15 -12% | 6.8 -84% | 4.42 -19% | 4.89 -32% | 6.02 -63% | 2.53 32% |
| Load Maximum * (Watt) | 5.48 | 5.12 7% | 8.9 -62% | 6.3 -15% | 7.99 -46% | 10.45 -91% | 3.63 34% |
* ... más pequeño es mejor
| Huawei Mate 10 Lite 3340 mAh | Samsung Galaxy A5 2017 3000 mAh | HTC U Ultra 3000 mAh | BQ Aquaris X Pro 3100 mAh | ZTE Axon 7 3250 mAh | Honor 9 3200 mAh | |
|---|---|---|---|---|---|---|
| Duración de Batería | 95% | 15% | 35% | 20% | 14% | |
| Reader / Idle (h) | 19.2 | 40.3 110% | 26.1 36% | 30.7 60% | 28.9 51% | 23.3 21% |
| H.264 (h) | 8.4 | 16.4 95% | 10.1 20% | 10.7 27% | 11.7 39% | 9.4 12% |
| WiFi v1.3 (h) | 8.7 | 14.1 62% | 9.1 5% | 12.2 40% | 6.9 -21% | 8.6 -1% |
| Load (h) | 3.7 | 7.8 111% | 3.6 -3% | 4.2 14% | 4.1 11% | 4.6 24% |
Pro
Contra
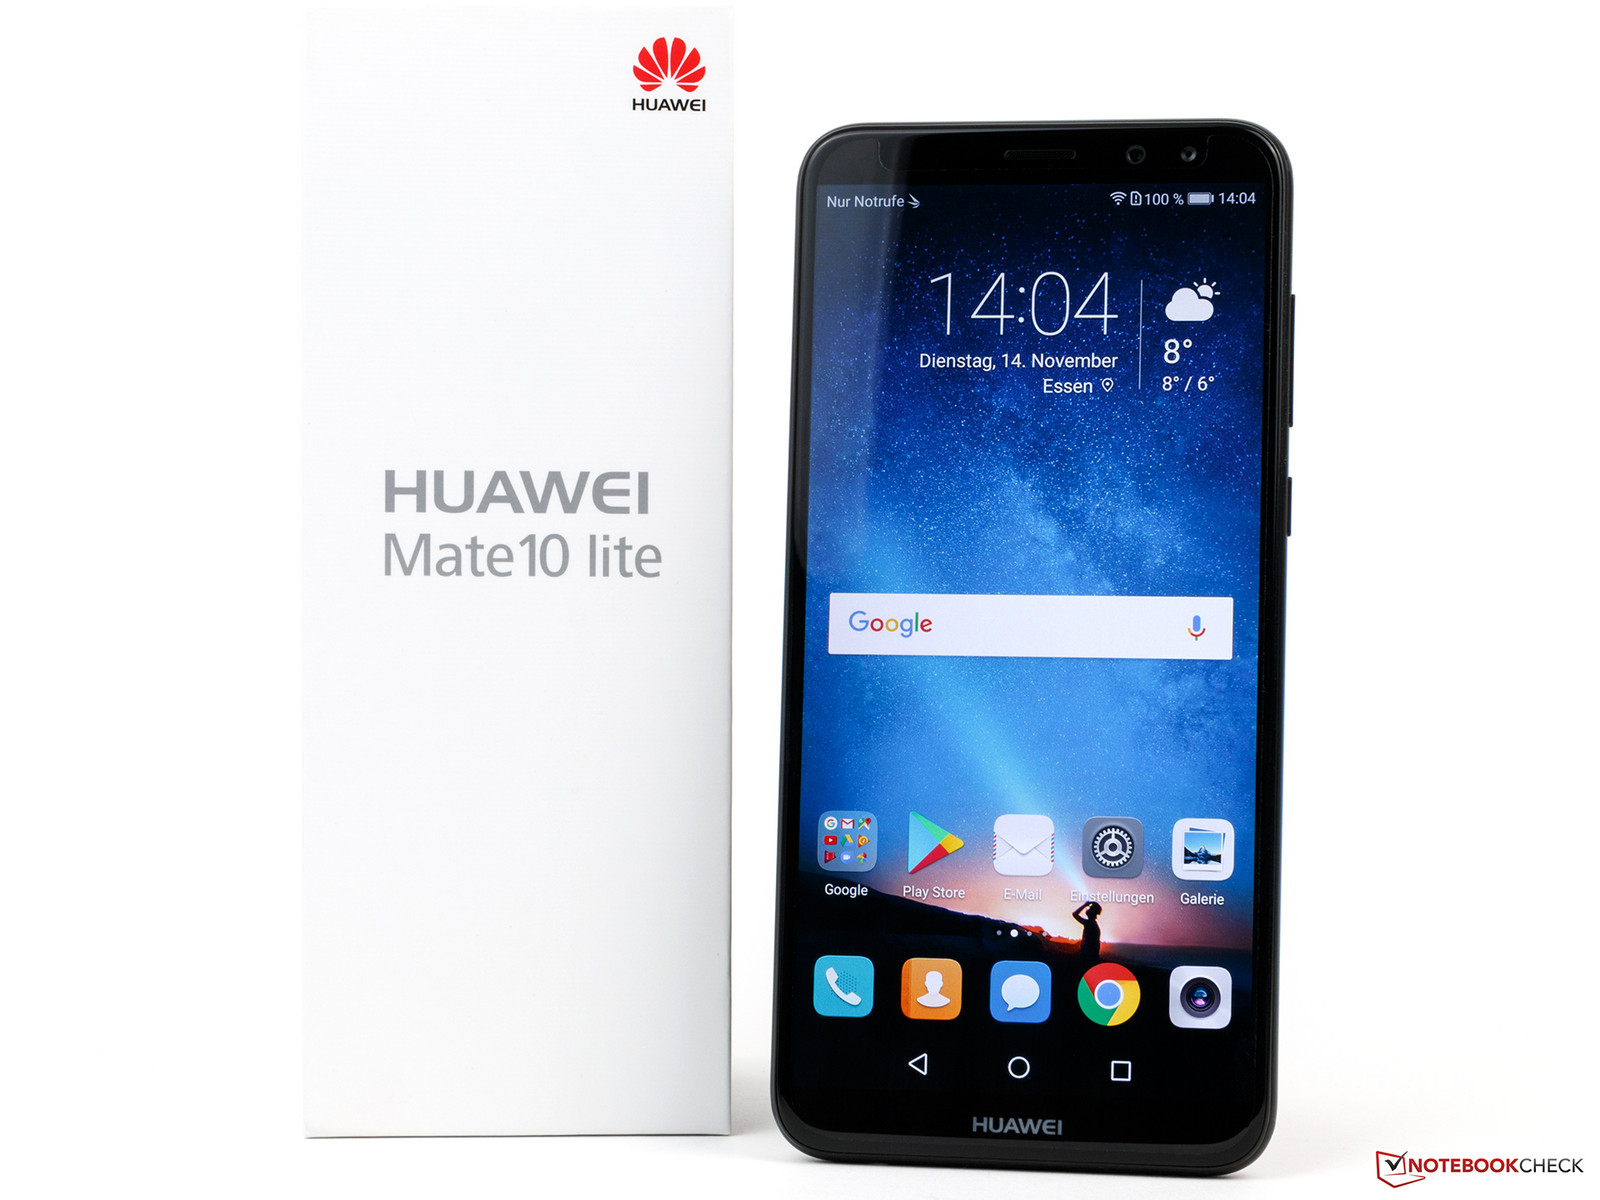
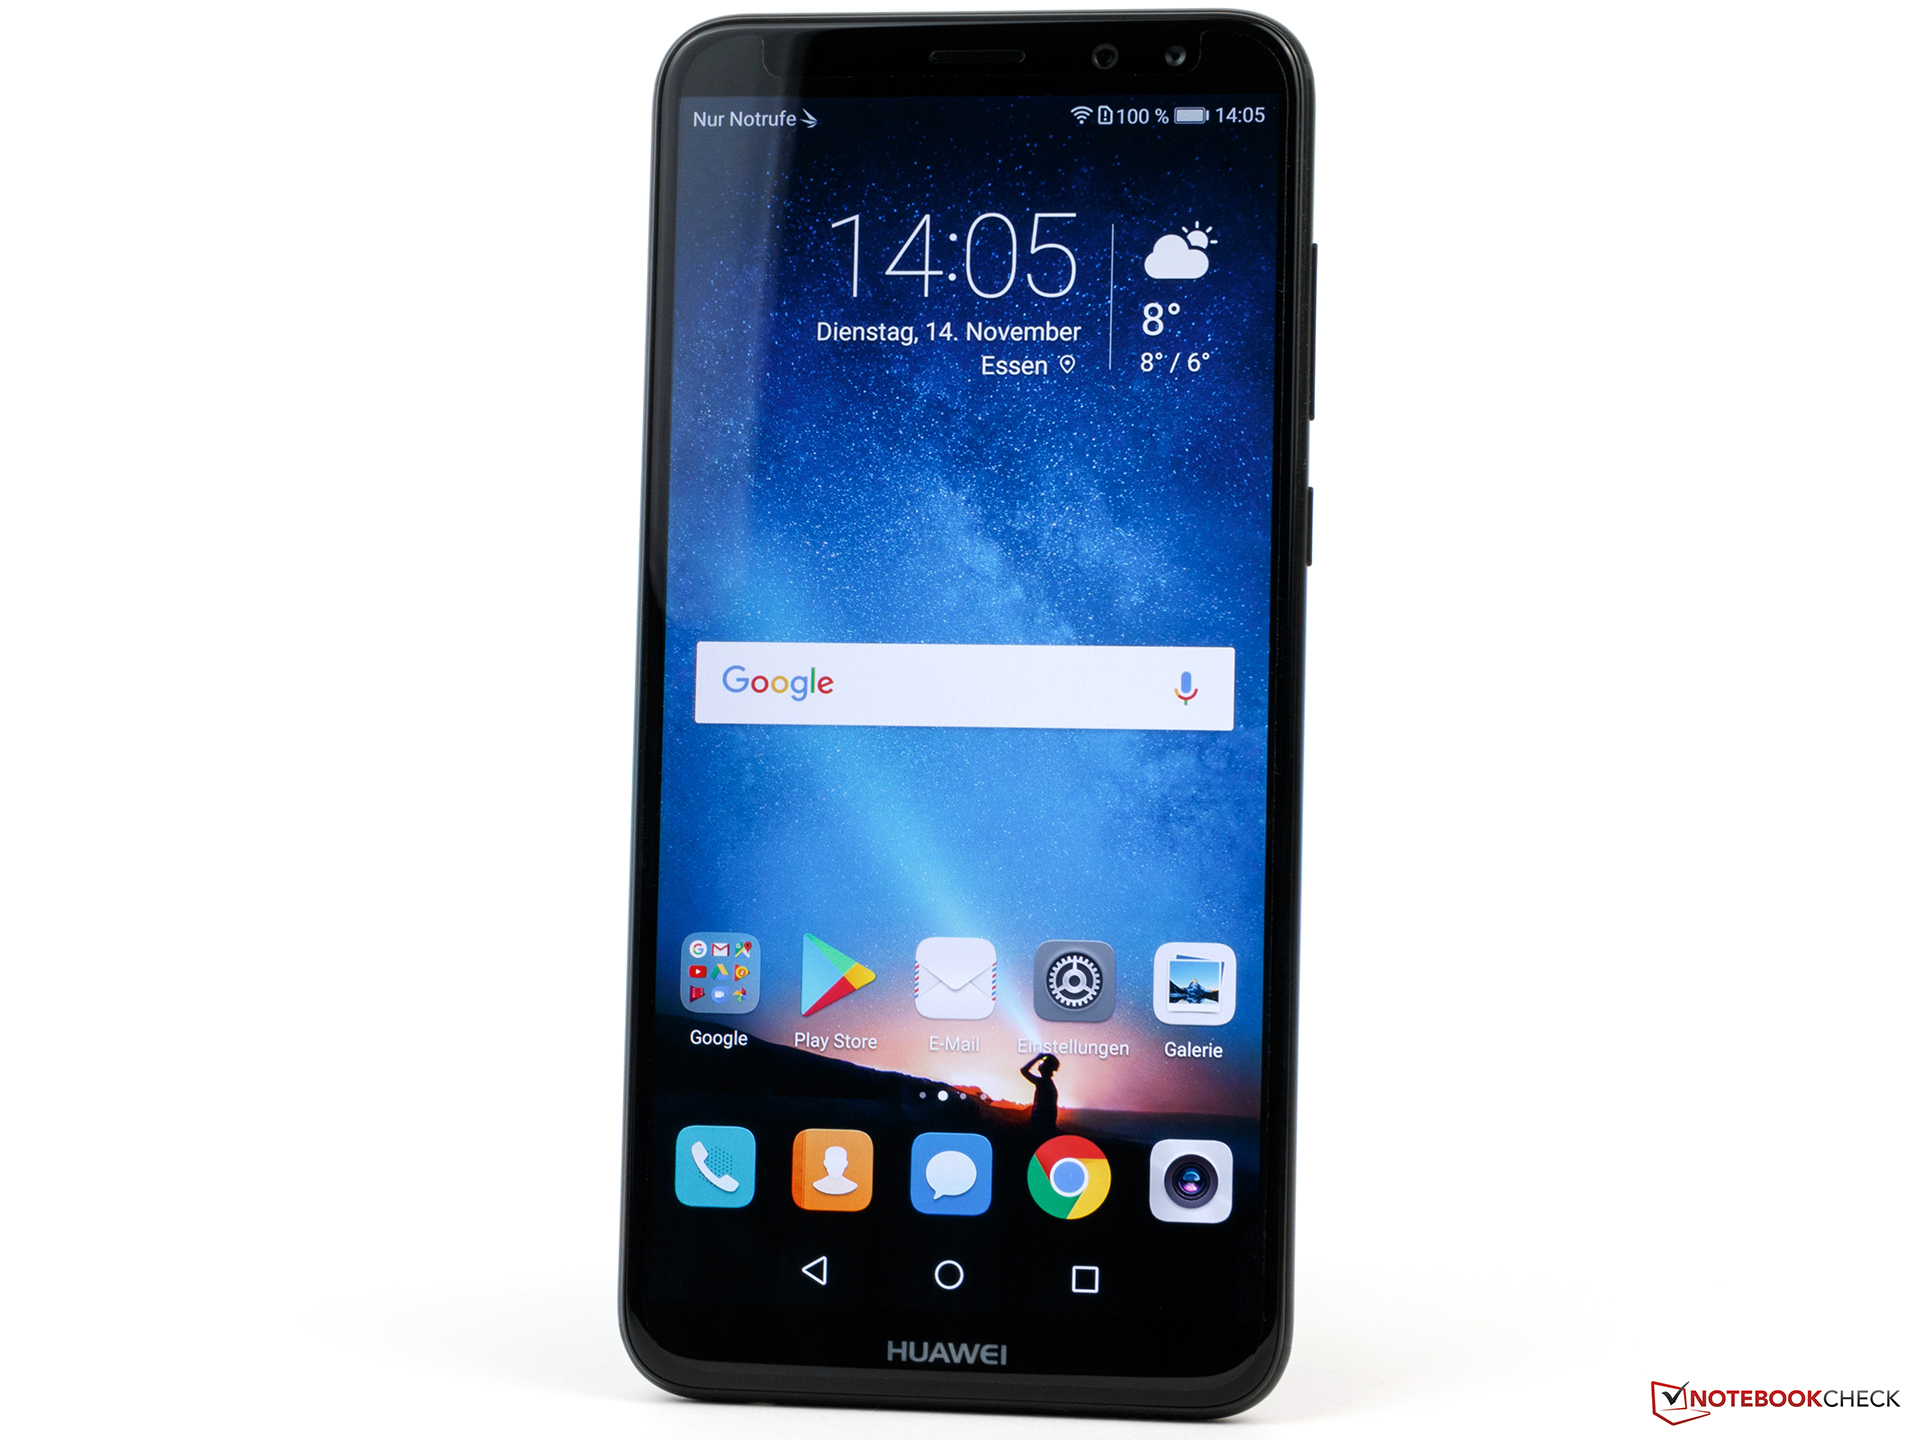
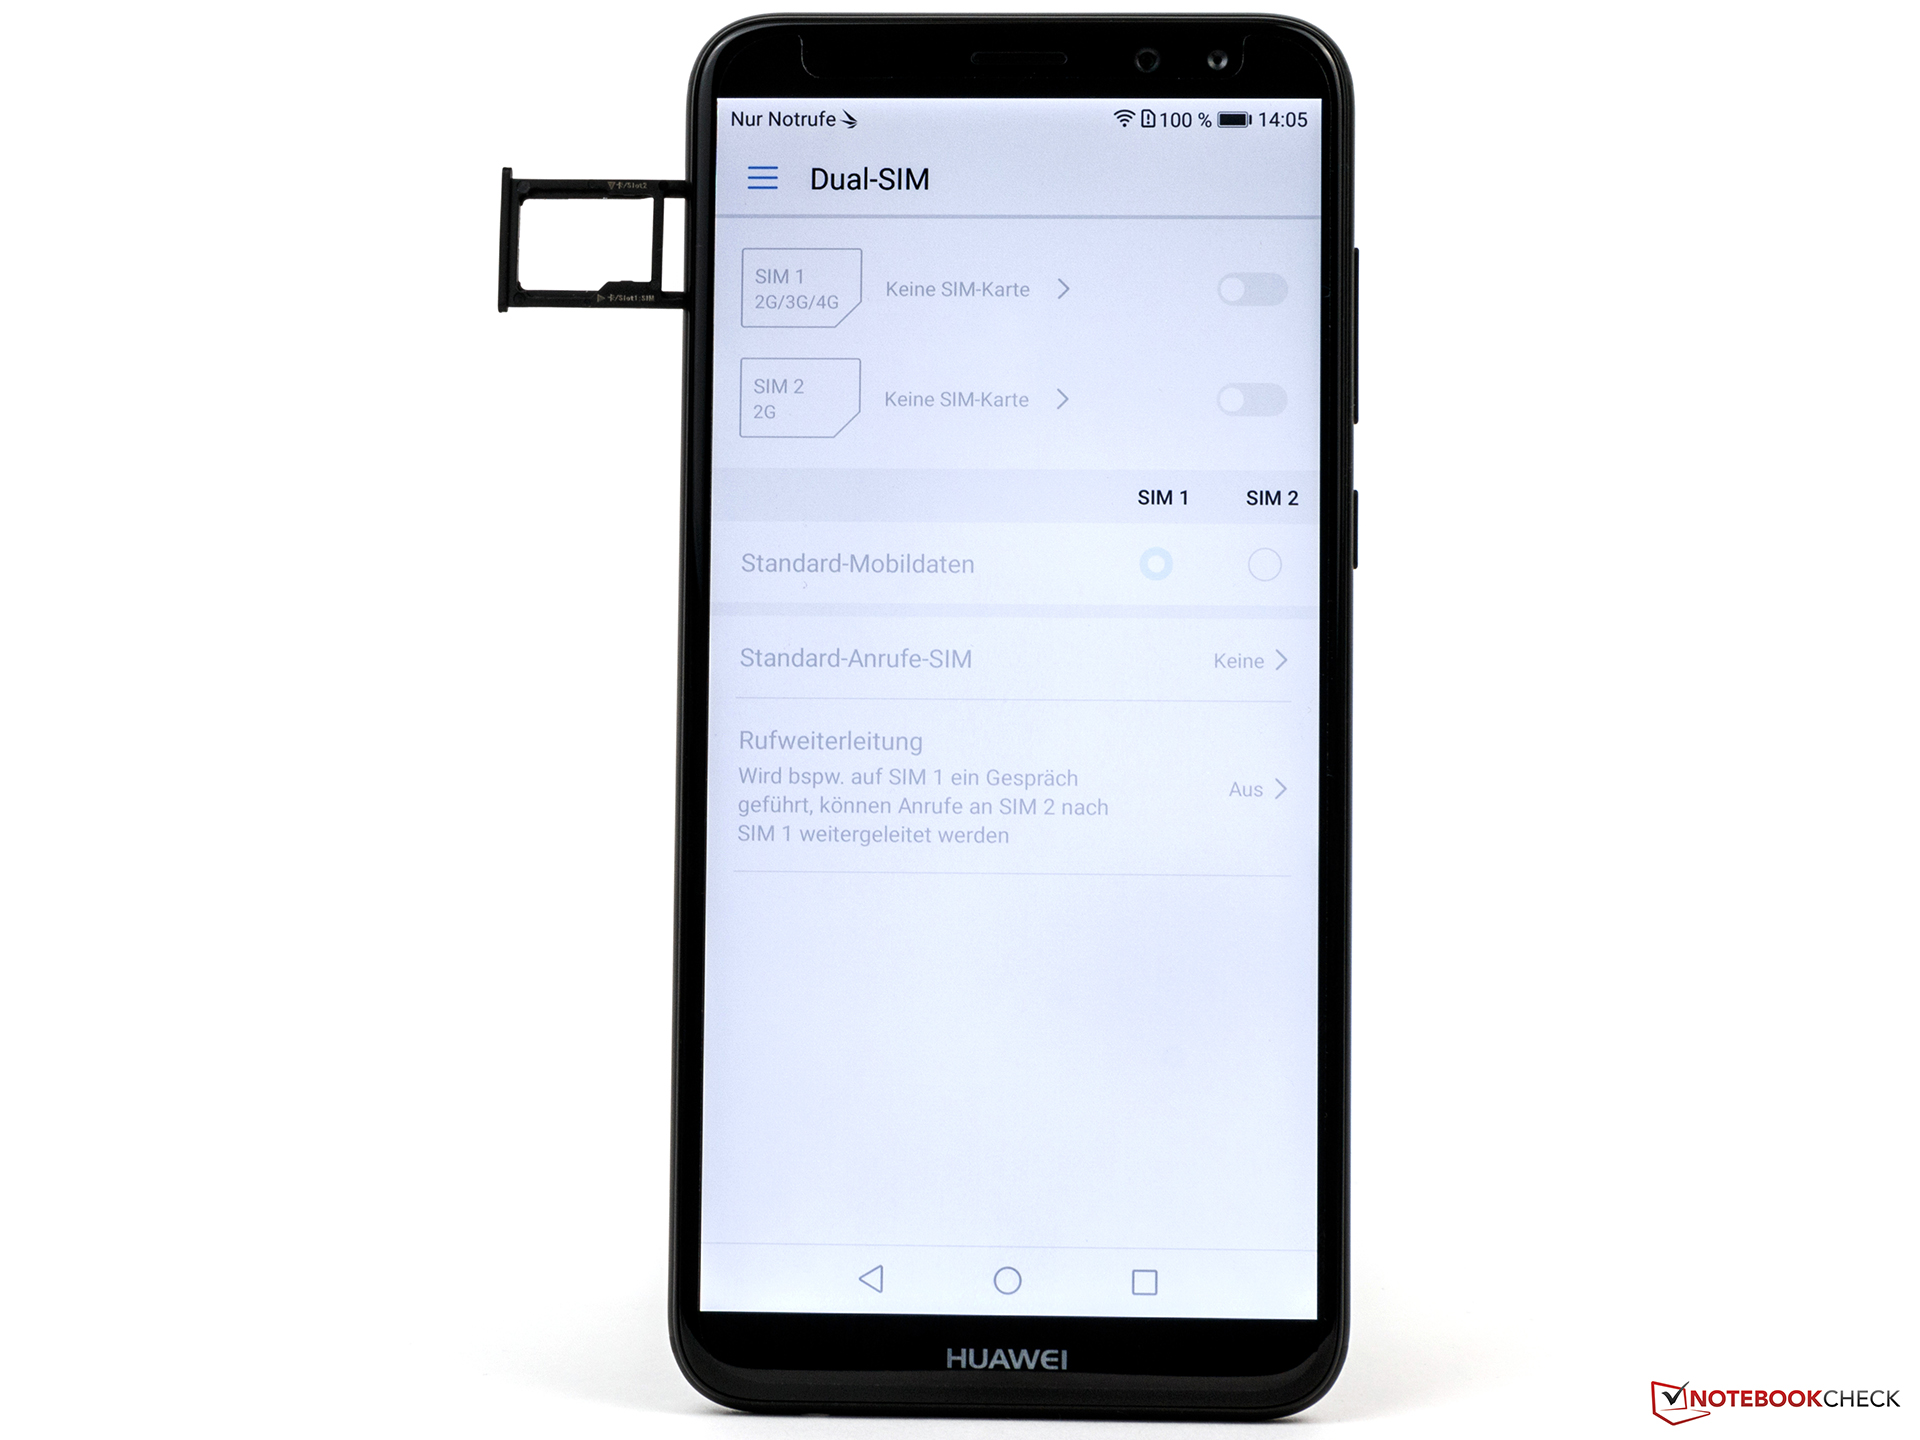
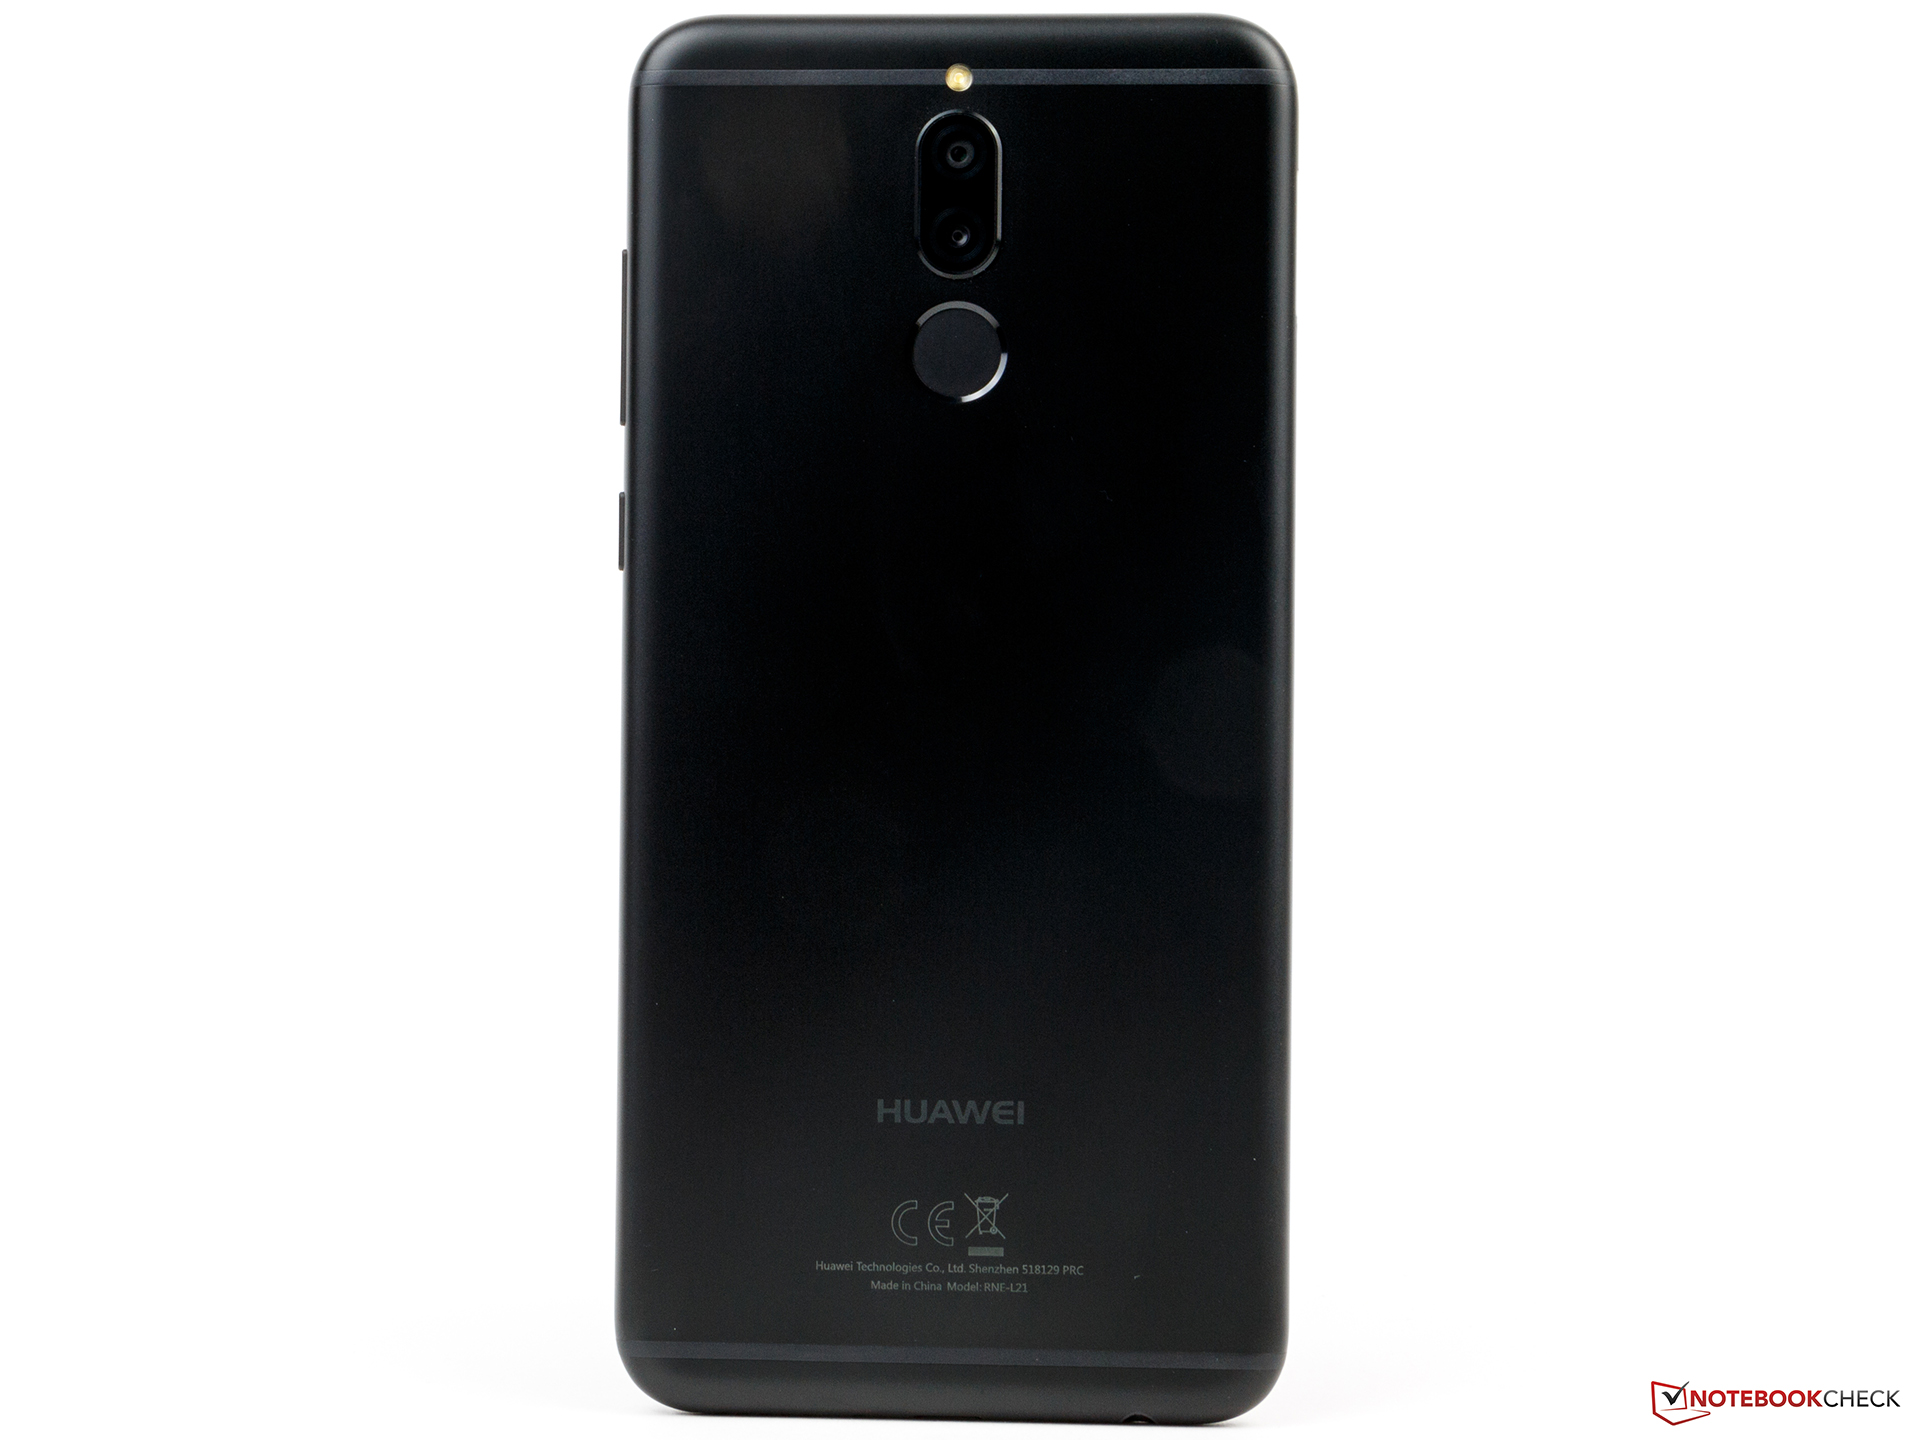
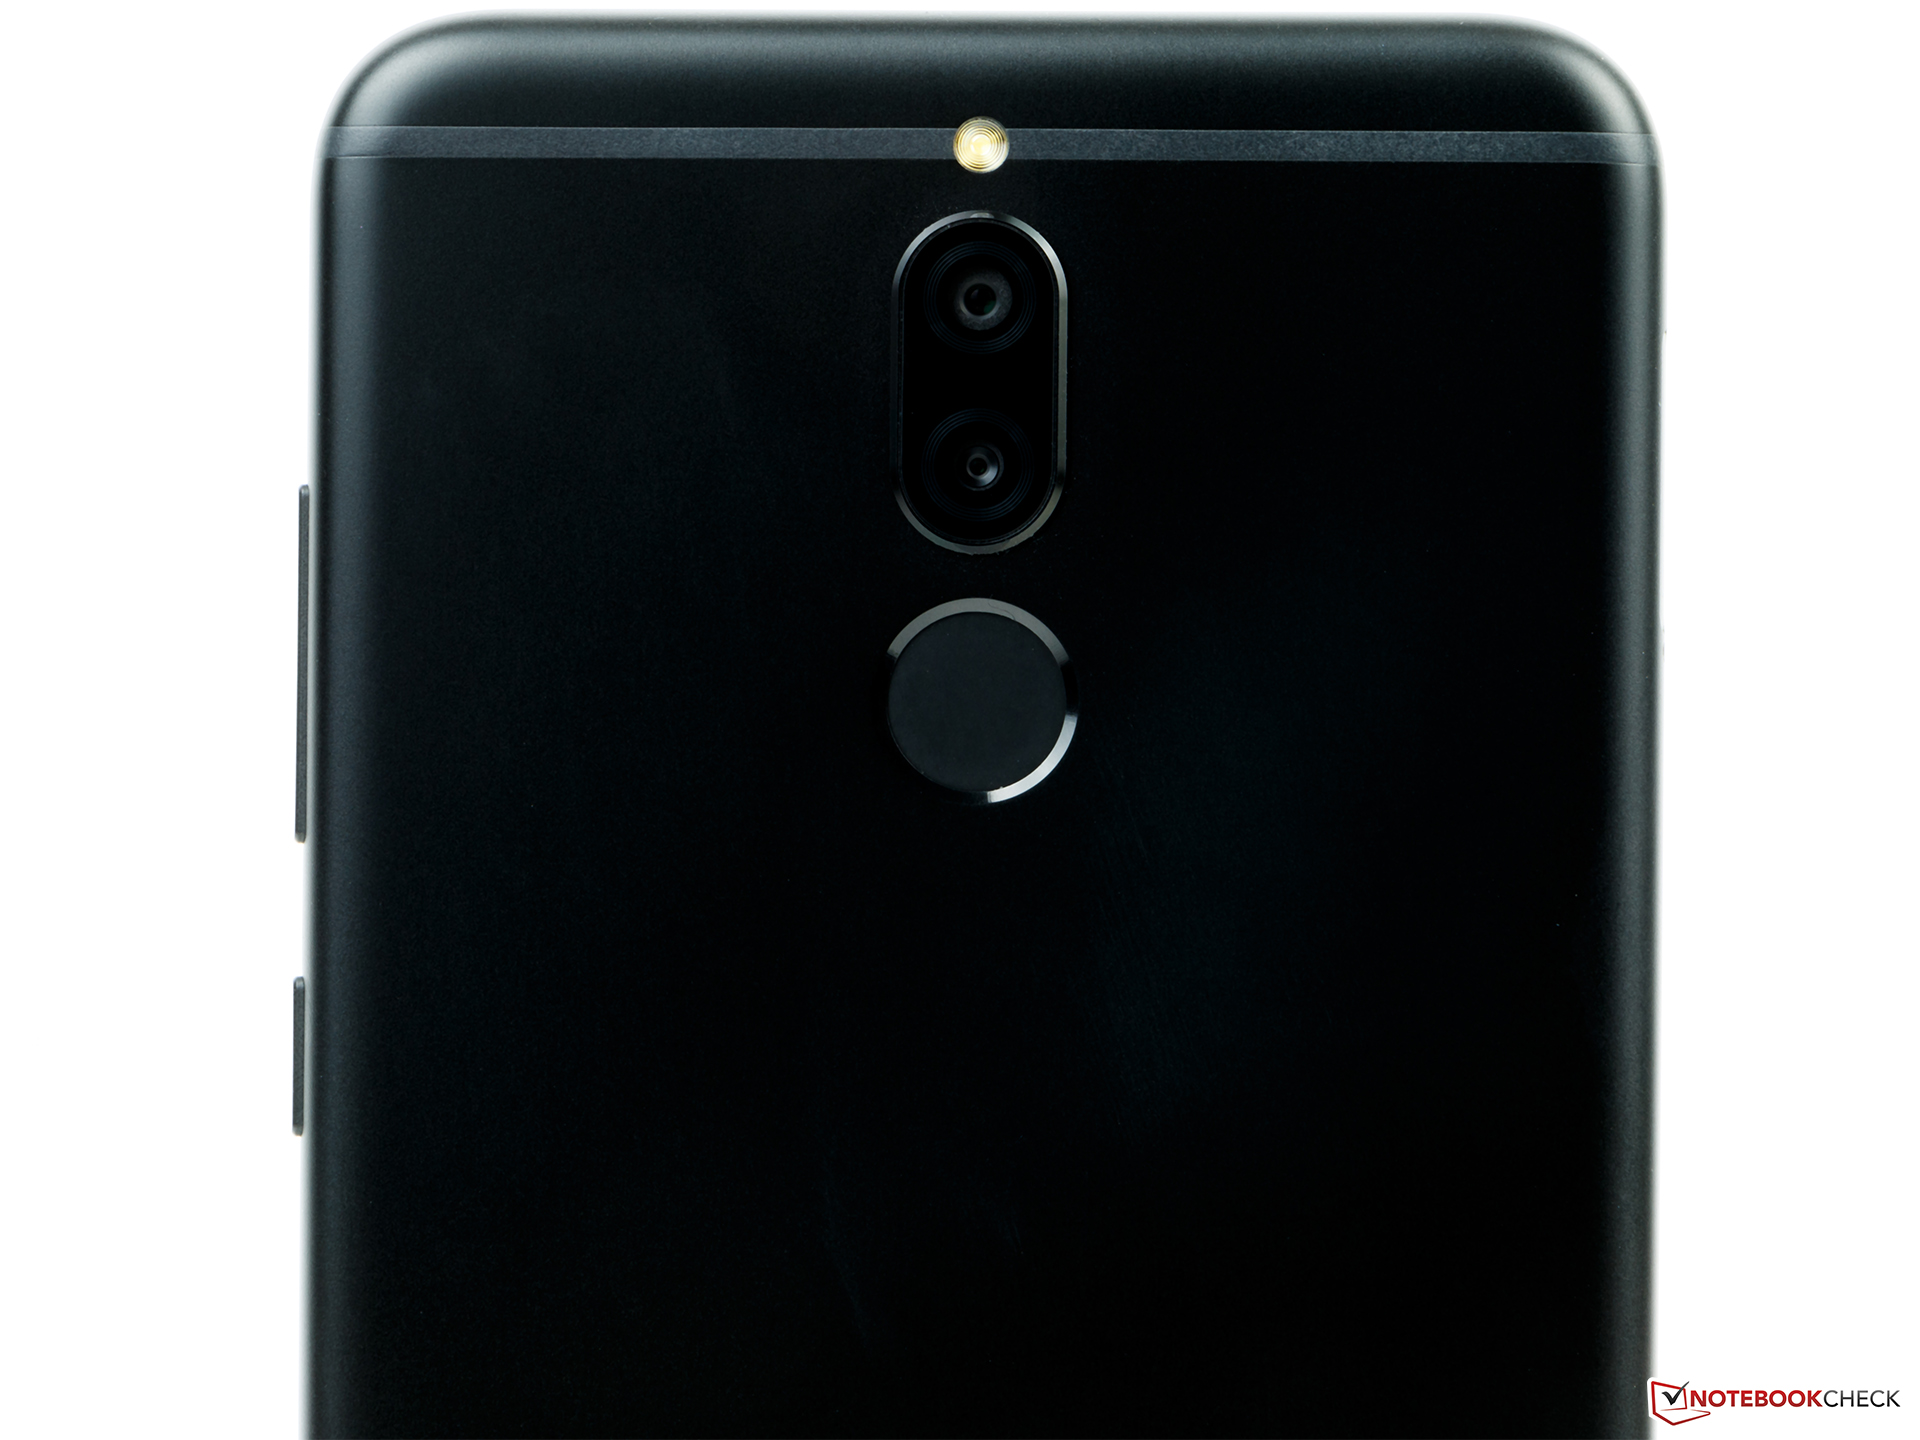
El miembro más pequeño y asequible de la familia Mate 10 resultó ser muy interesante. Desafortunadamente, la competencia en su campo elegido es inmensa, y la única característica diferente del Mate 10 Lite es su pantalla 18:9 de 5,9" con una excelente relación pantalla a cuerpo. Otras características incluyen la tarjeta SIM híbrida, 4 GB de RAM, 64 GB de almacenamiento interno que se puede ampliar a través de microSD y cámaras duales en ambos lados del teléfono. En general, el paquete se siente como una versión más grande de la Nova 2, y nos gustó la cámara frontal Mate 10 Lite mejor que la enorme bestia megapíxel de la anterior.
Aparte de su nombre, el Mate 10 Lite tiene poco en común con la serie Mate en general. Sin embargo, es un smartphone bastante decente.
El tamaño del panel aparte, el Huawei Mate 10 Lite tiene poco en común con los otros dos miembros de la familia Mate. Carece de NFC, la batería es más pequeña, el SoC es mucho más lento, la configuración de cámara dual de Leica no se ve, aptX para audio de alta resolución no es compatible y en lugar de Super Charge solo admite QuickCharge.
Considerando todo, aun resulta ser un smartphone bastante decente, particularmente para aquellos que prefieren que las pantallas de sus smartphones sean grandes y masivas. Sin embargo, hubiéramos deseado menos compromisos en comparación con sus dos hermanos mayores, y el aguante de la batería podría haber sido un poco mejor.
Ésta es una versión acortada del análisis original. Puedes leer el análisis completo en inglés aquí.
Huawei Mate 10 Lite
- 11/27/2017 v6 (old)
Daniel Schmidt
Price comparison
