Reseña de la BD770i de Minisforum: La placa base mini-ITX con AMD Ryzen 7 7745HX como base para pequeños PCs de juegos
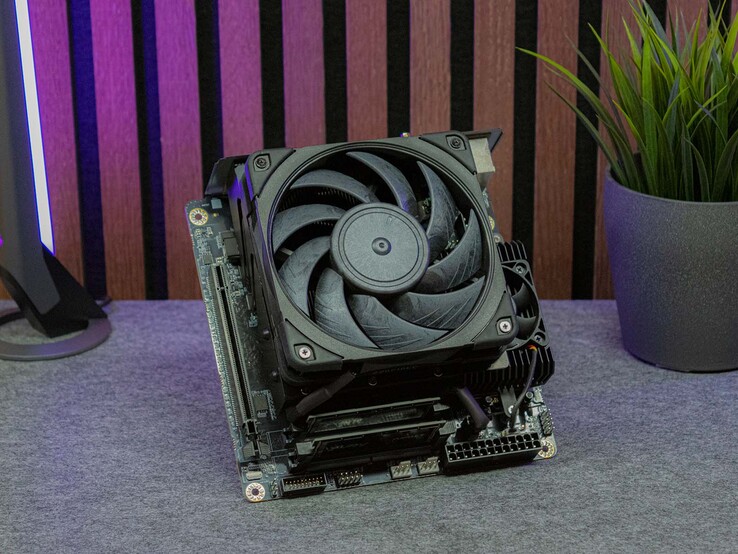
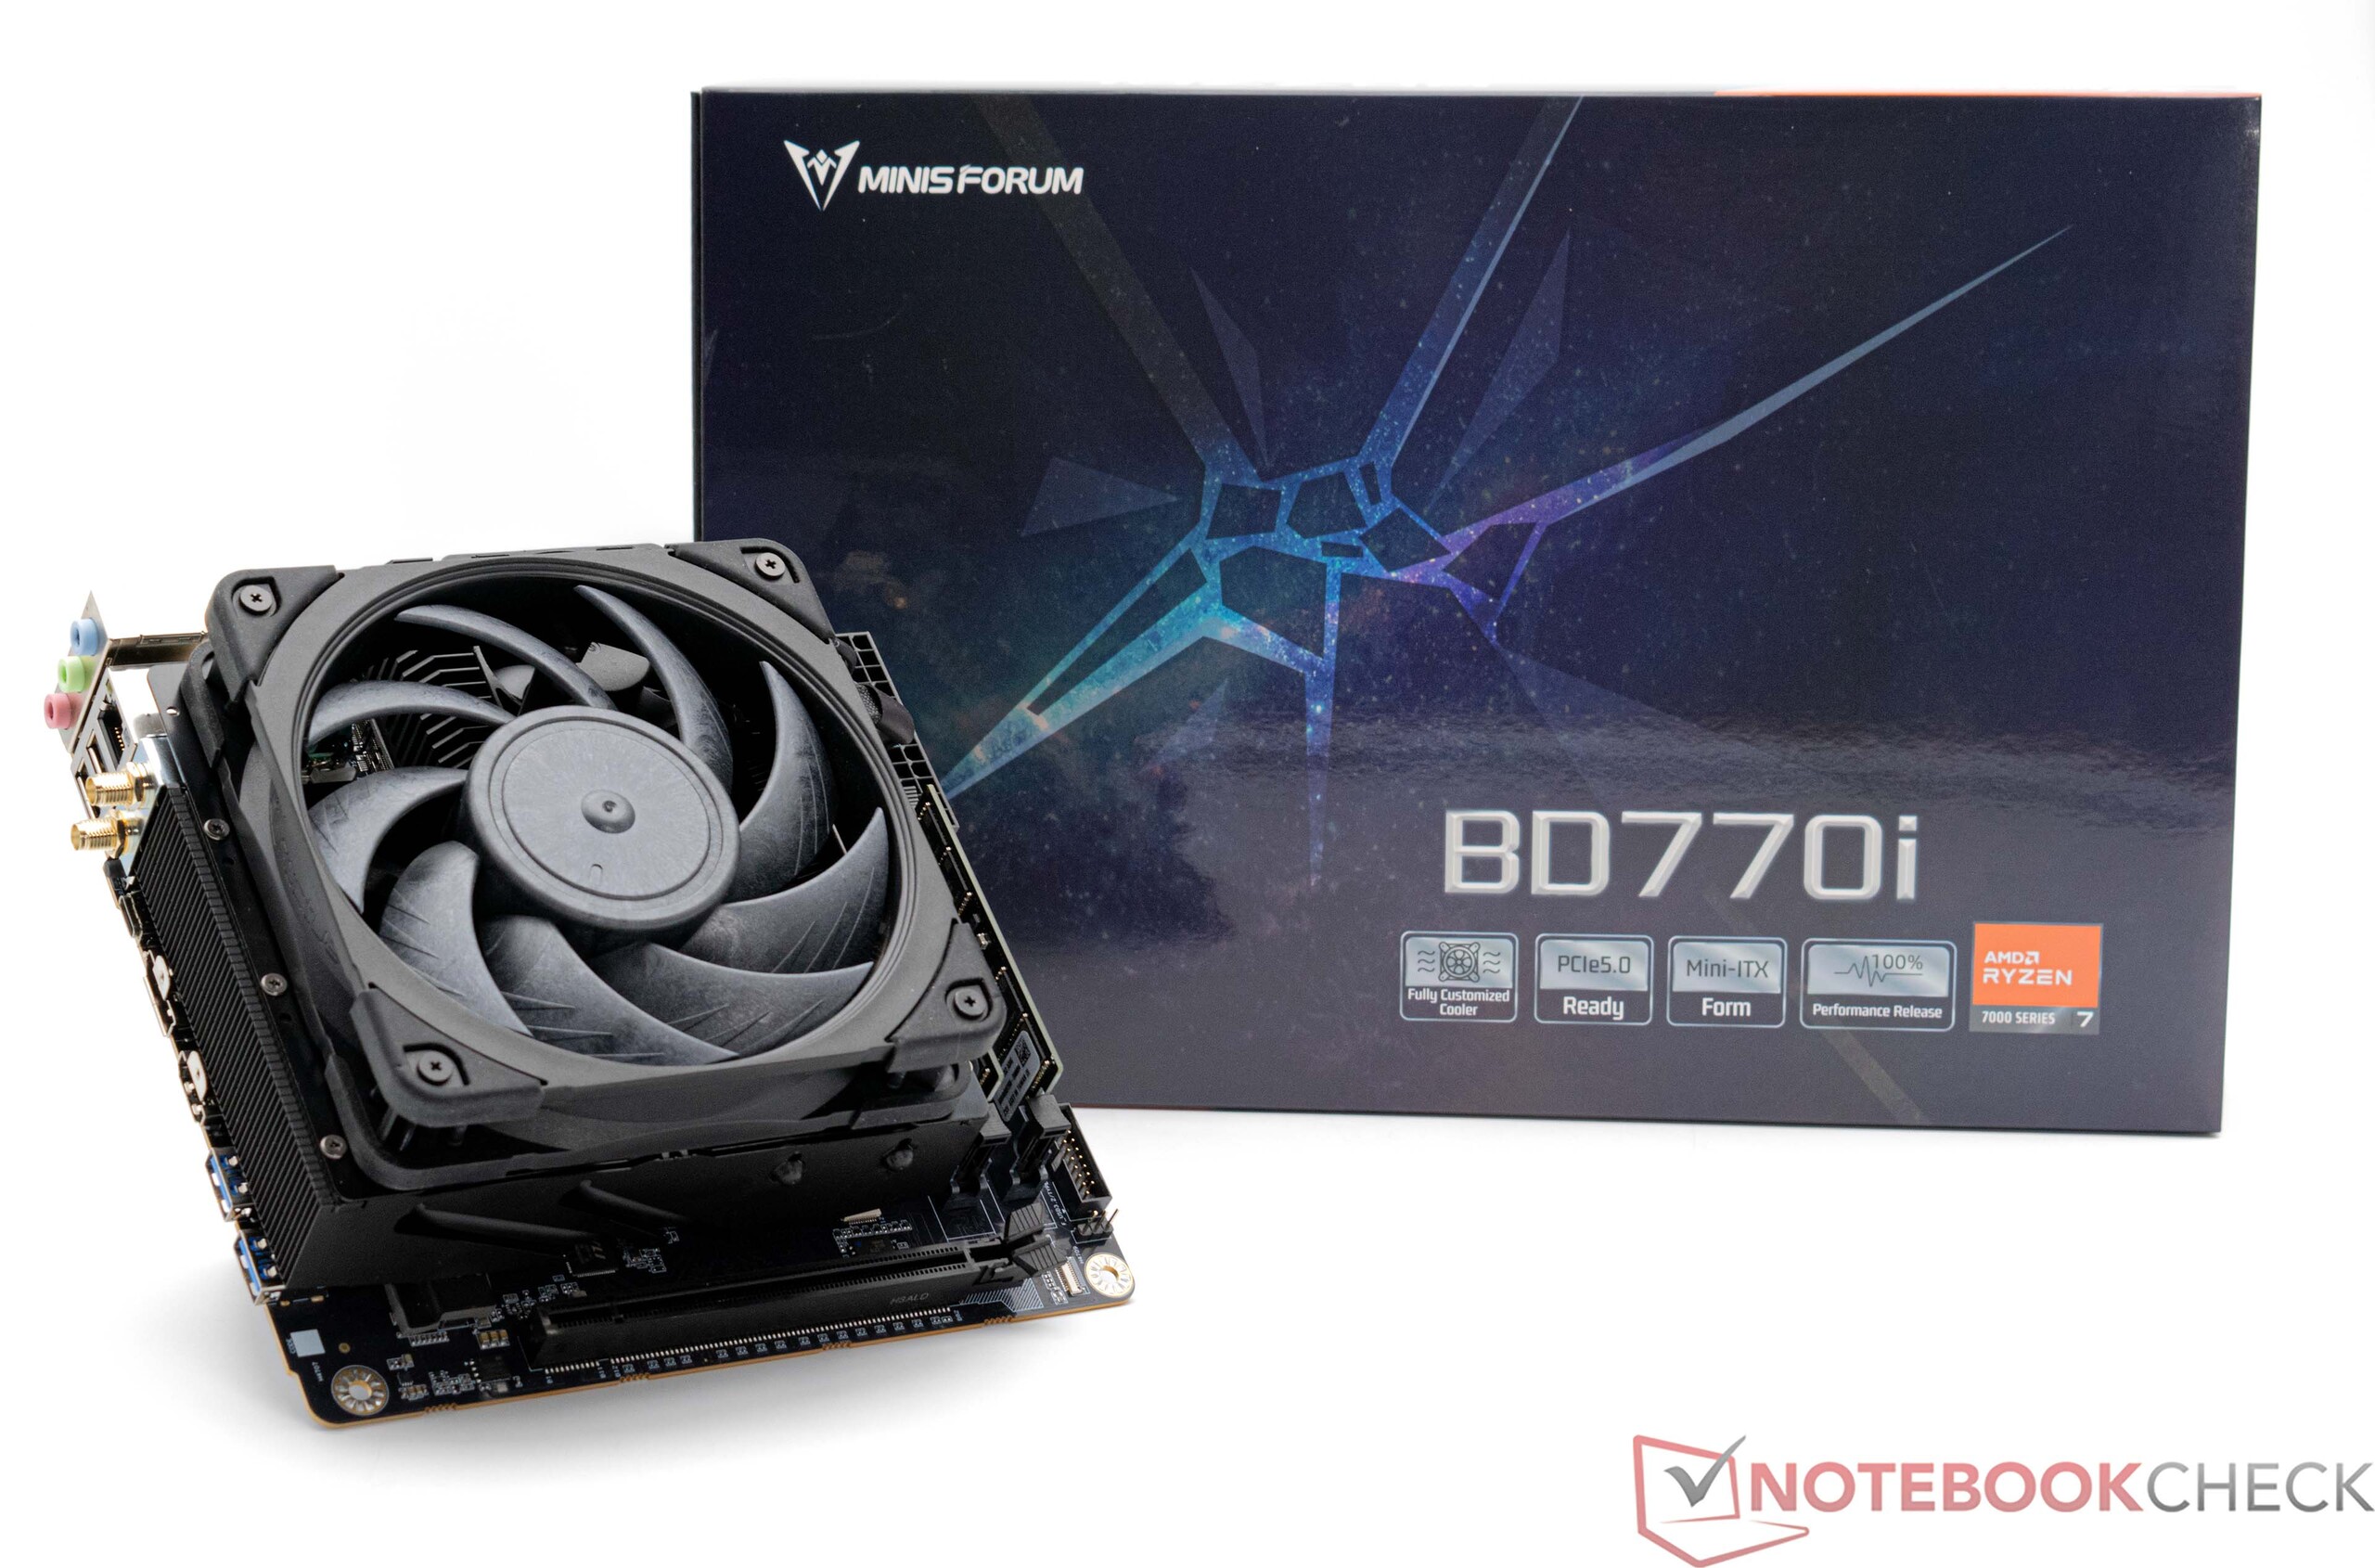
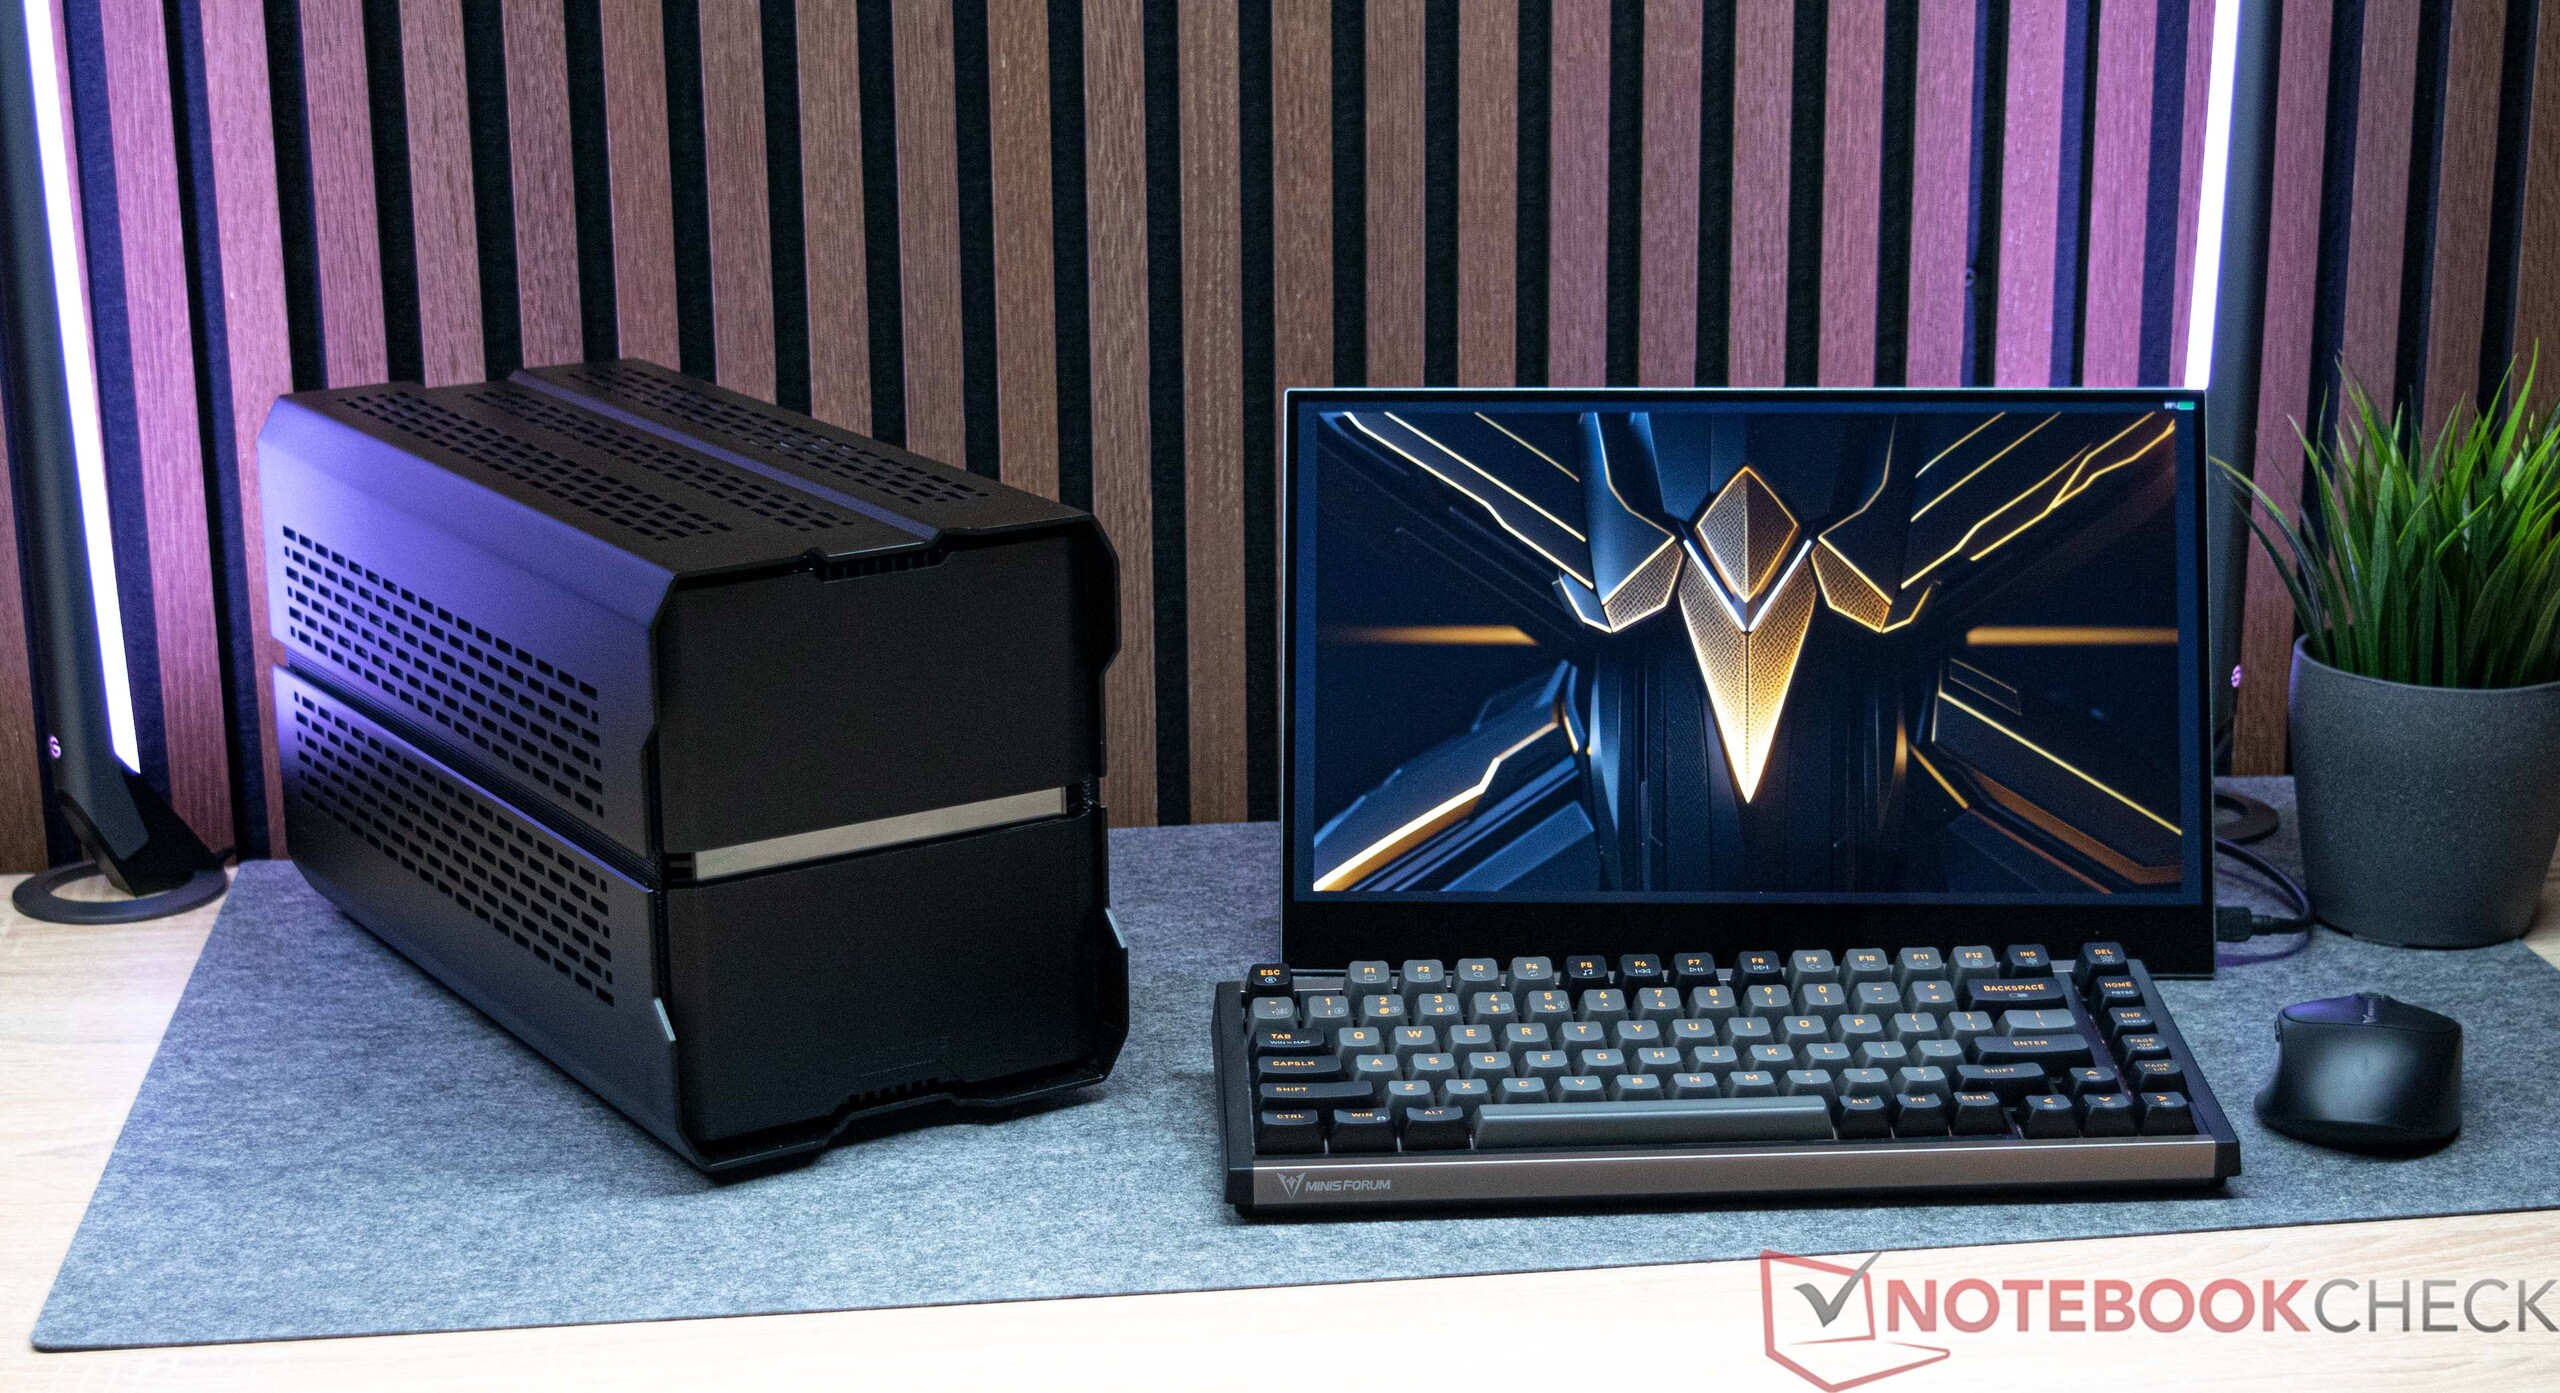
Minisforum, conocido por sus mini PC, se adentra en un nuevo territorio con la Minisforum BD770i al ofrecer una placa base con CPU soldada. Al adherirse al estándar ITX como factor de forma, esta placa base es compatible con la mayoría de las carcasas de PC. Dada su compacidad, es probable que encuentre aplicaciones en carcasas Mini-ITX muy pequeñas.
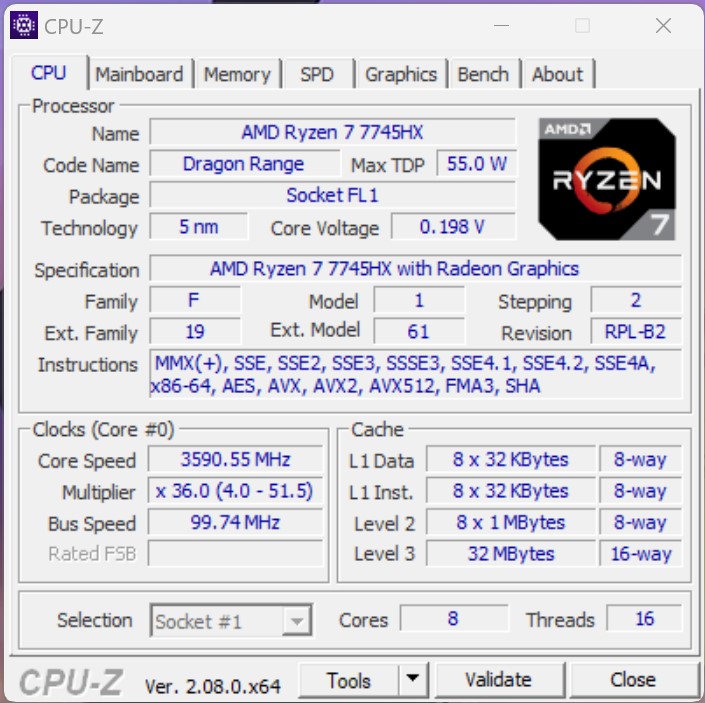
La BD770i está alimentada por un
AMD Ryzen 7 7745HX que incorpora ocho núcleos Zen4. Se espera que este SoC ofrezca un amplio rendimiento para manejar tareas complejas. Profundizamos en el rendimiento para juegos junto con una Nvidia GeForce RTX 4090ya que la tarjeta gráfica puede funcionar al máximo rendimiento gracias a la ranura PCIe x16 completa. Minisforum ofrece actualmente cinco placas base diferentes, cada una equipada con un procesador del sector de los portátiles. En el siguiente resumen, hemos recopilado información sobre estos dispositivos, destacando sus especificaciones clave.Placas base Minisforum en comparación
| Nombre | BD790i | BD770i | AR900i | AR650i | AD650i |
| CPU | AMD Ryzen 9 7945HX | AMD Ryzen 7 7745HX | Procesador Intel Core i9-13900HX | Procesador Intel Core i7-13650HX | Procesador Intel Core i7-13650HX |
| Núcleos / Hilos | 16 / 32 | 8/ 16 | 24 / 32 | 14 / 20 | 14 / 20 |
| GPU | AMD Radeon610M | AMD Radeon 610M | Intel UHD Graphics | Intel UHD Graphics | Intel UHD Graphics |
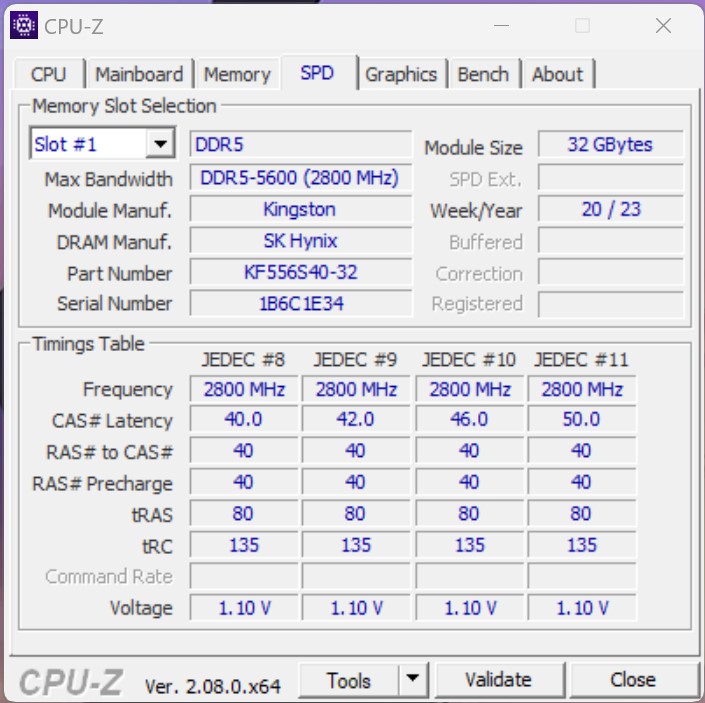
| Tipos de memoria | DDR5-5200 SODIMM | DDR5-5200SODIMM | DDR5-5600 SODIMM | DDR5-5600 SODIMM | DDR5-5600 SODIMM |
| Tamaño máximo de memoria | 96 GB | 64 GB | 64 GB | 64 GB | 64 GB |
Minisforo BD770i y el sistema de prueba en detalle

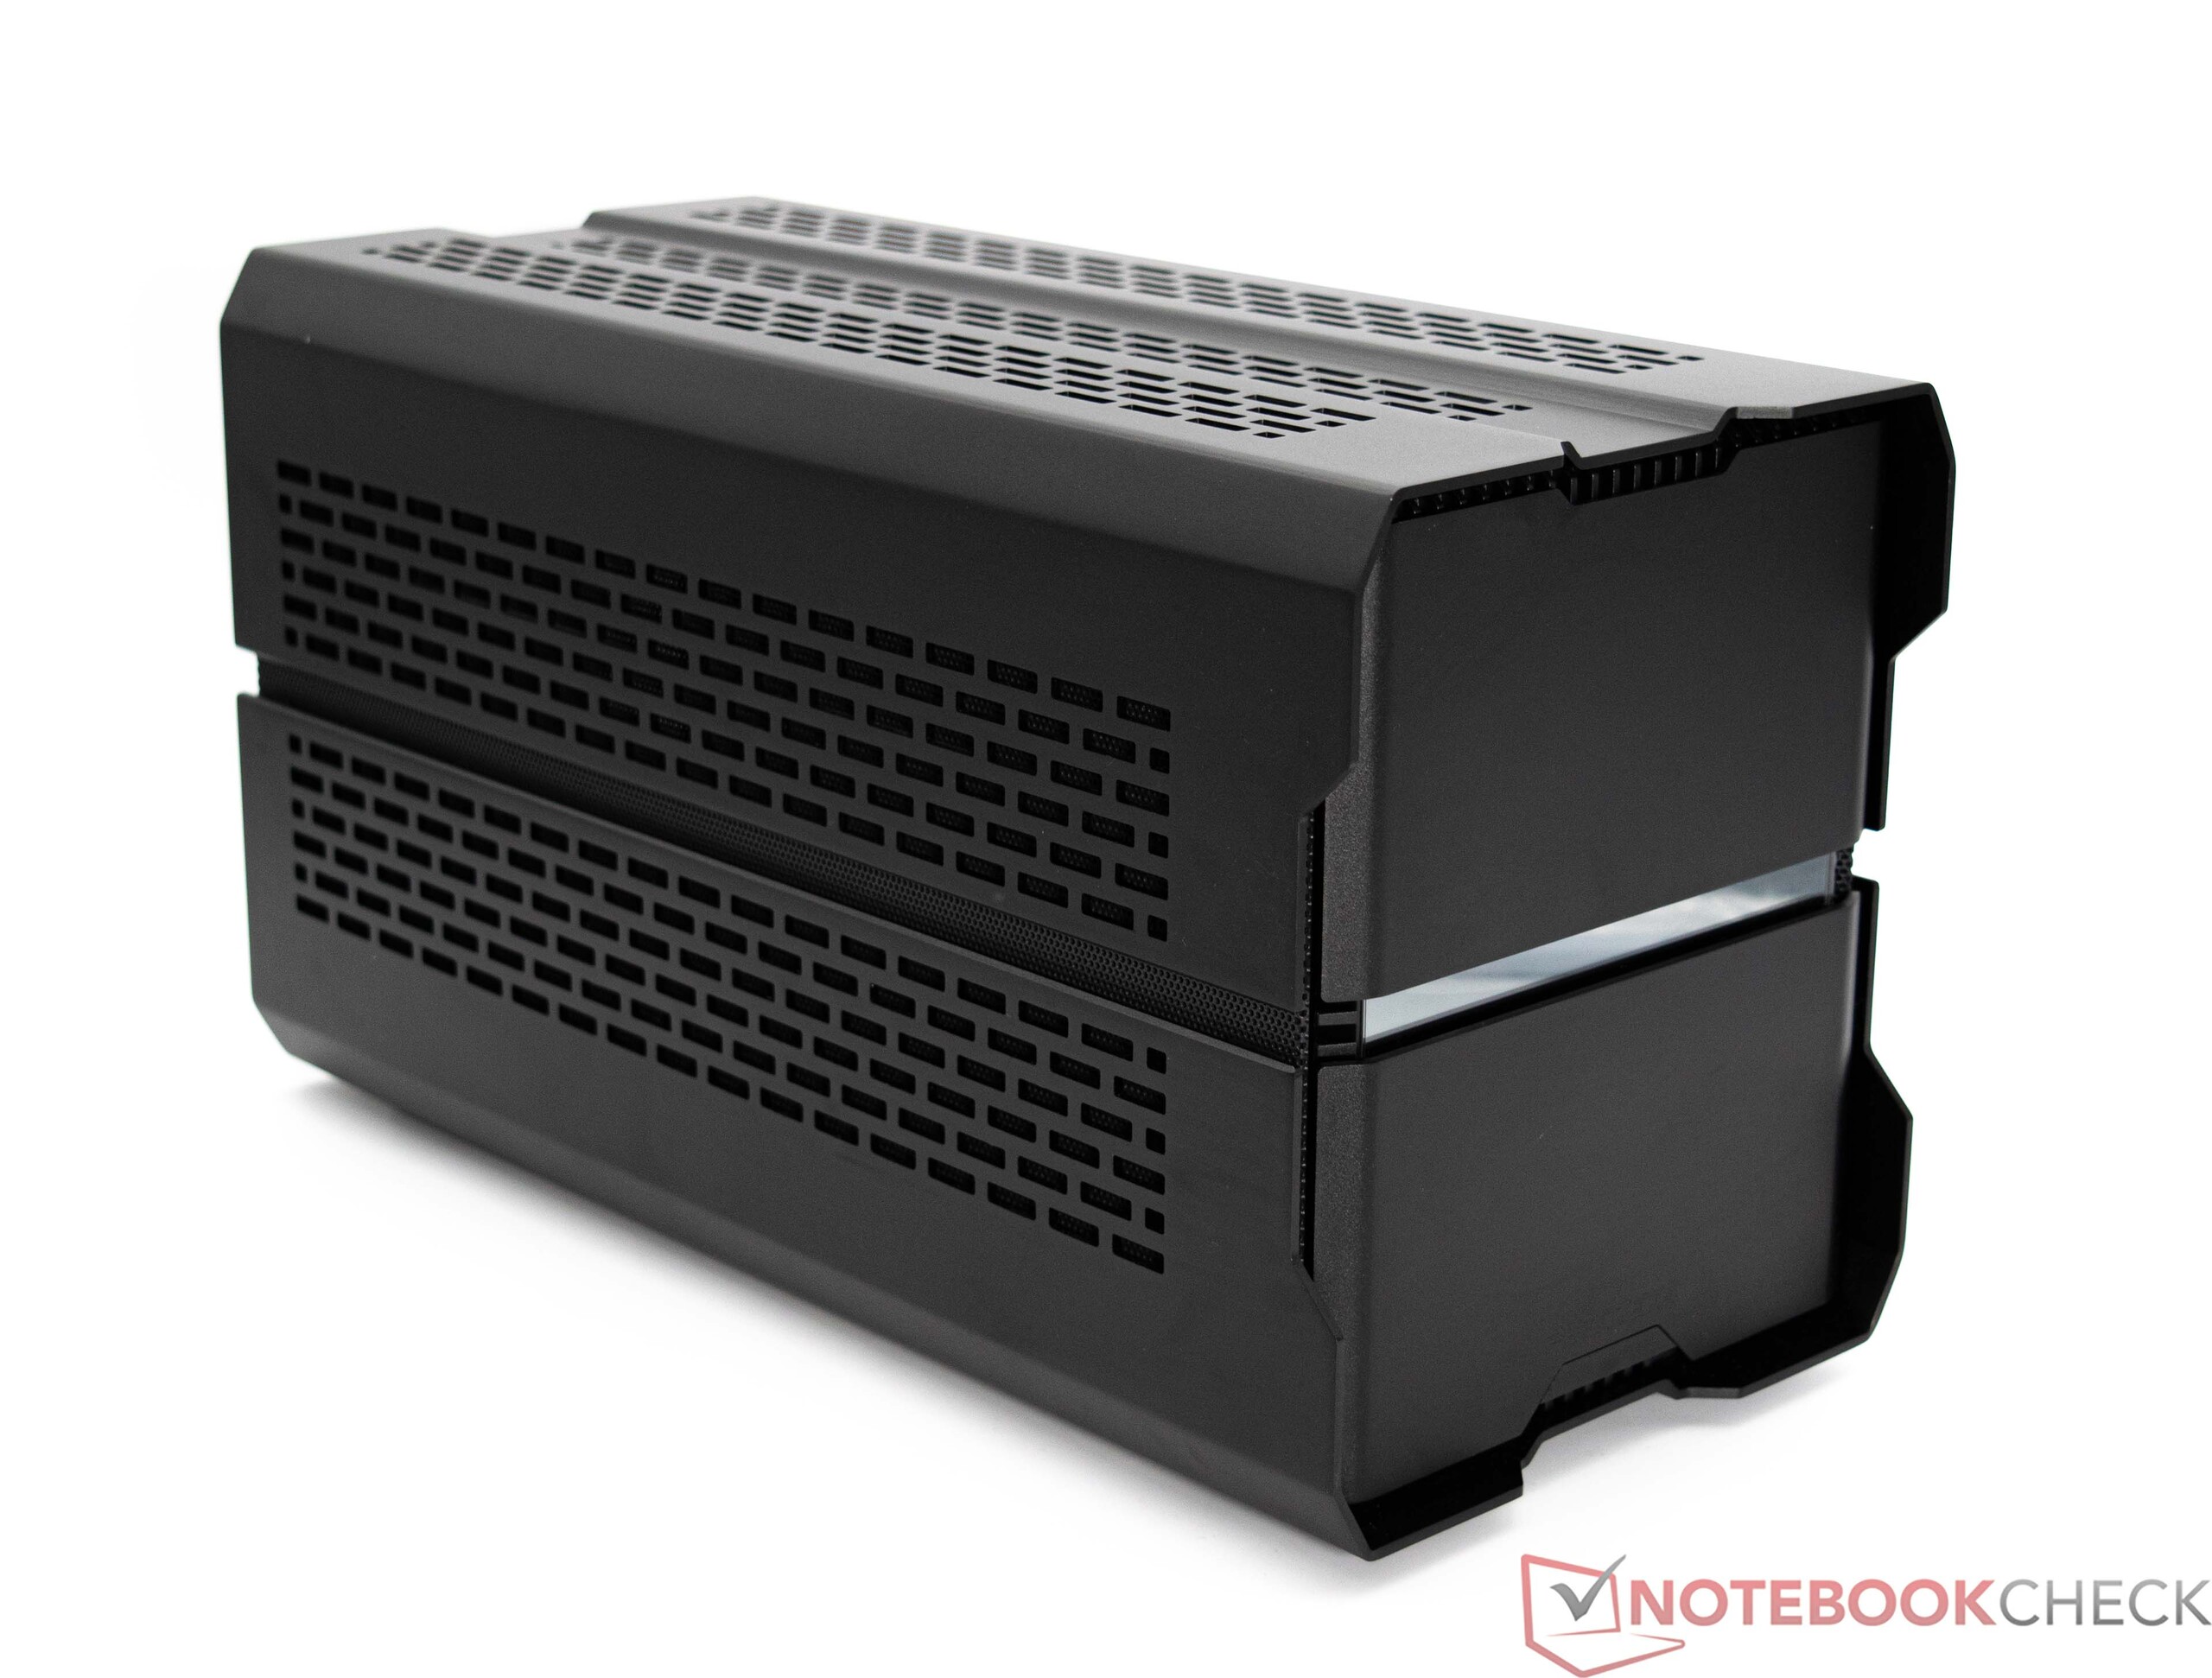
Caso y configuración de la prueba
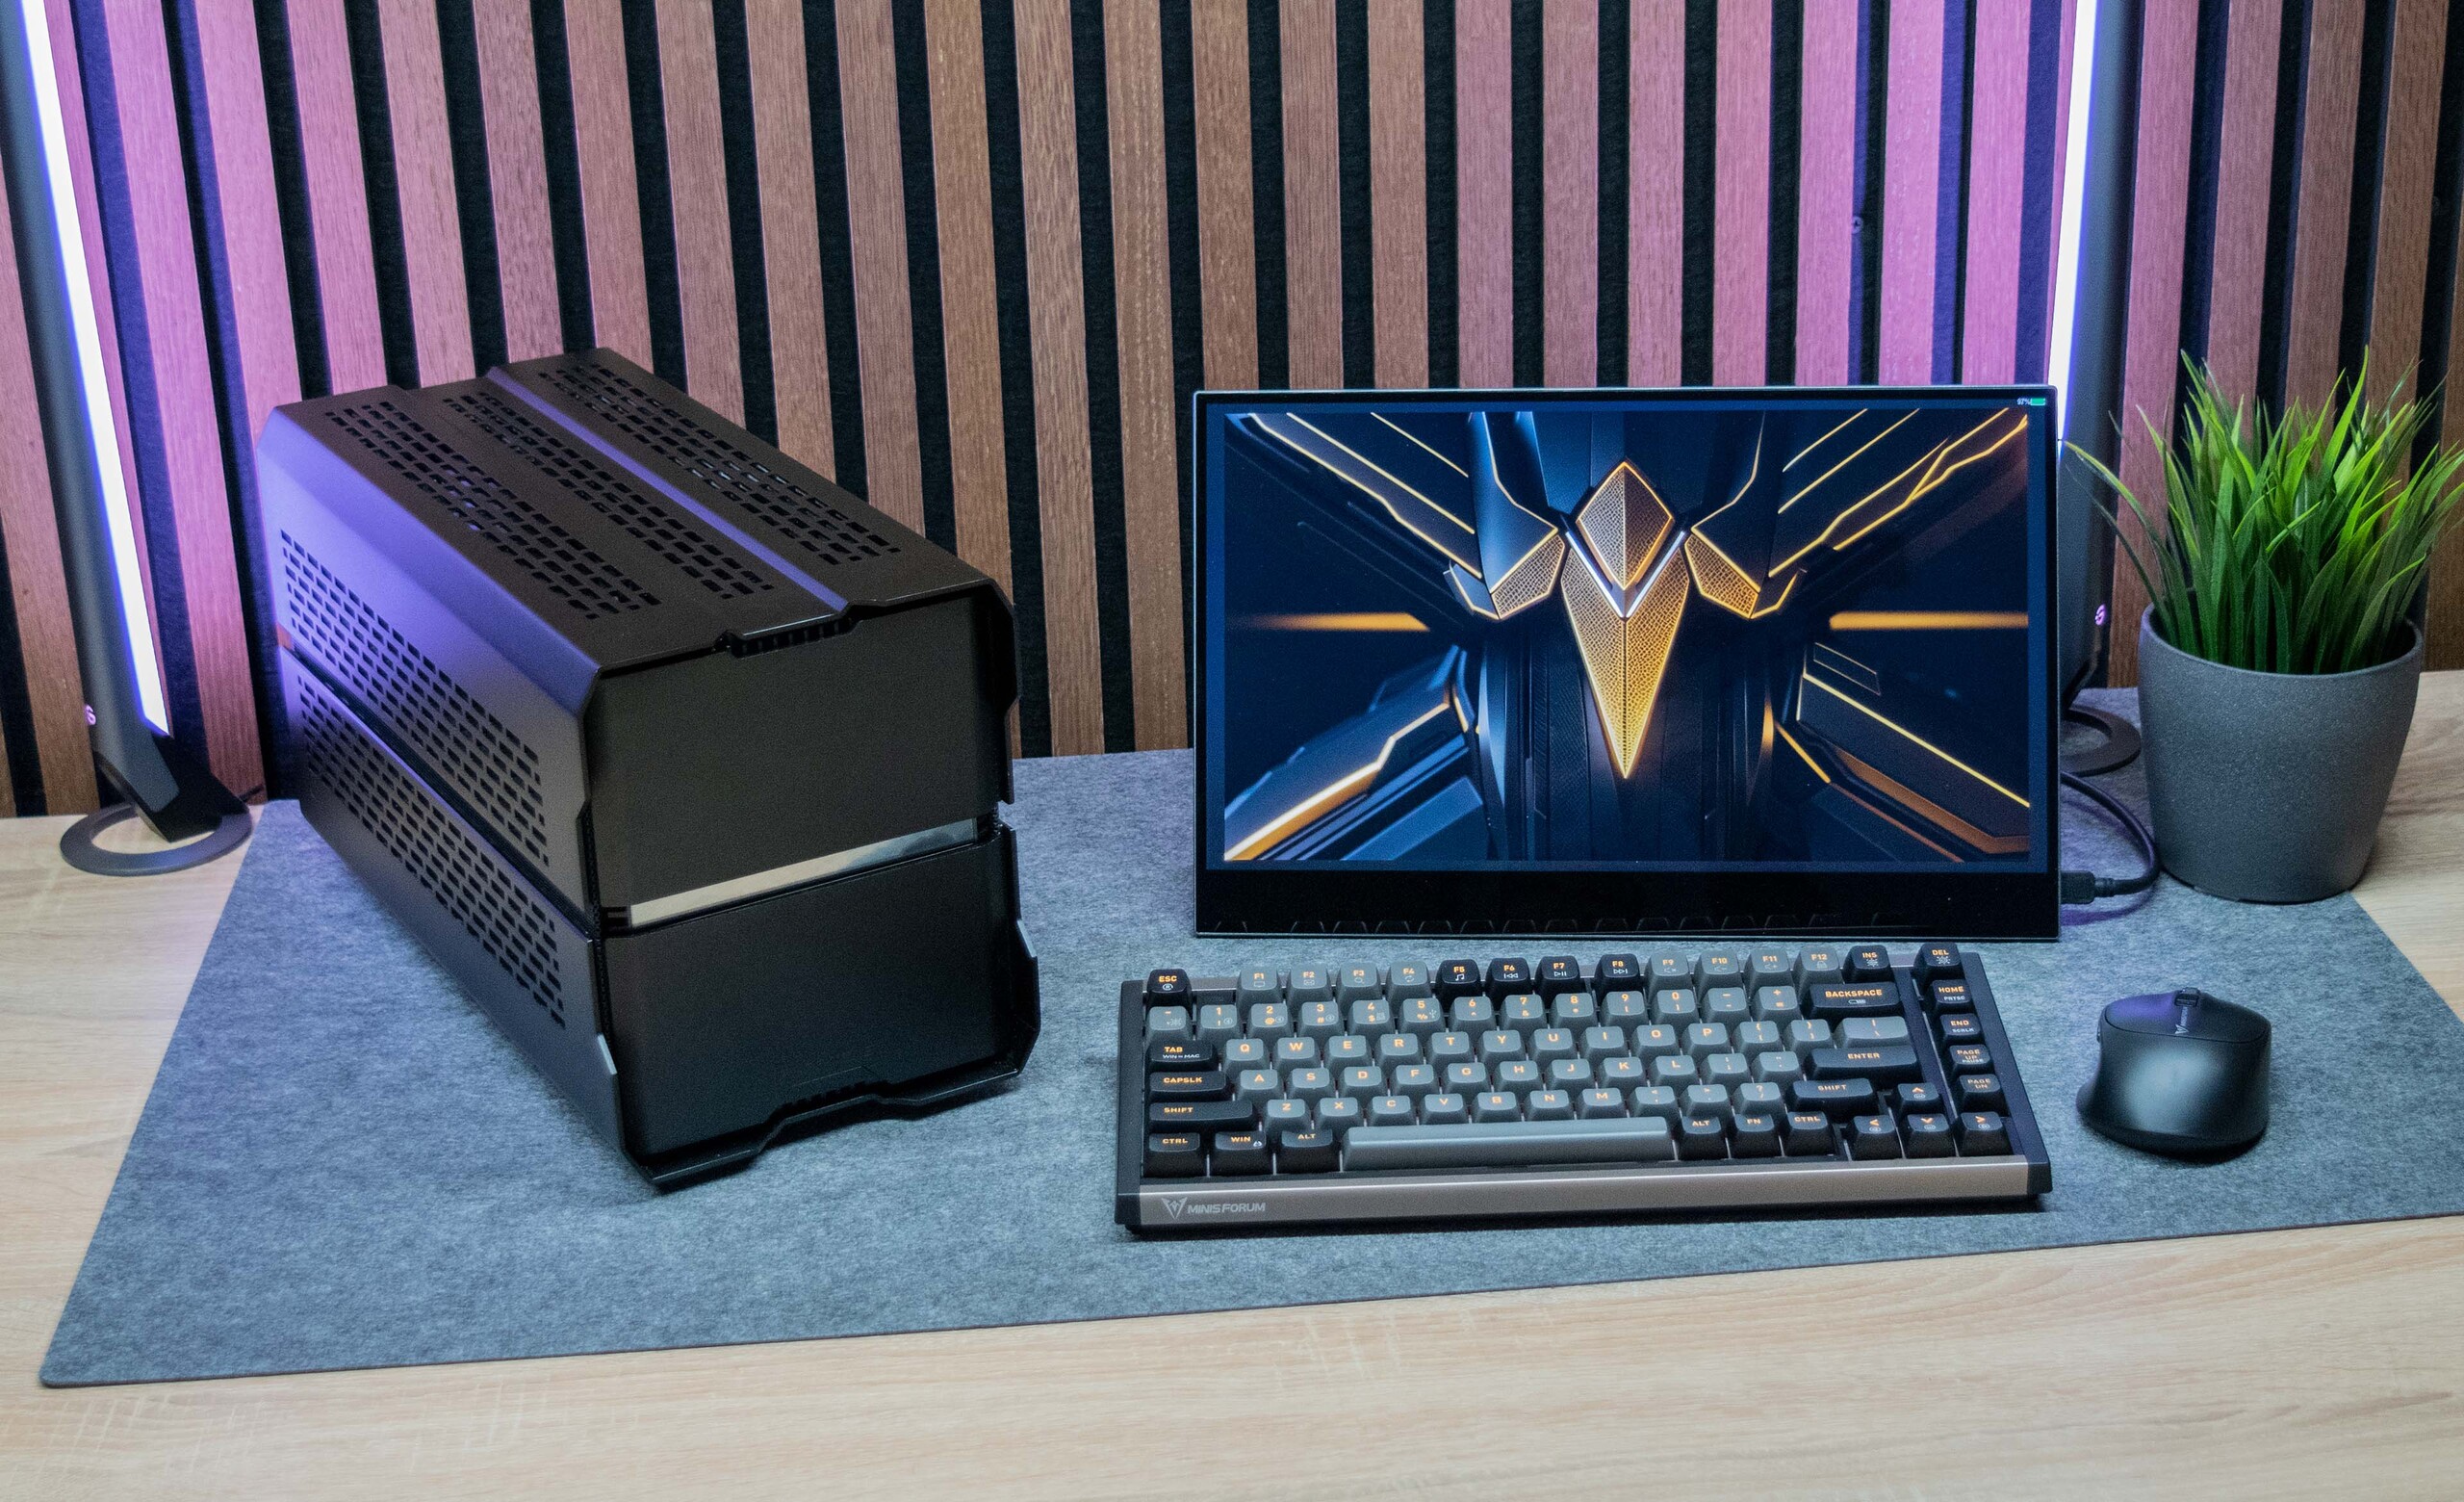
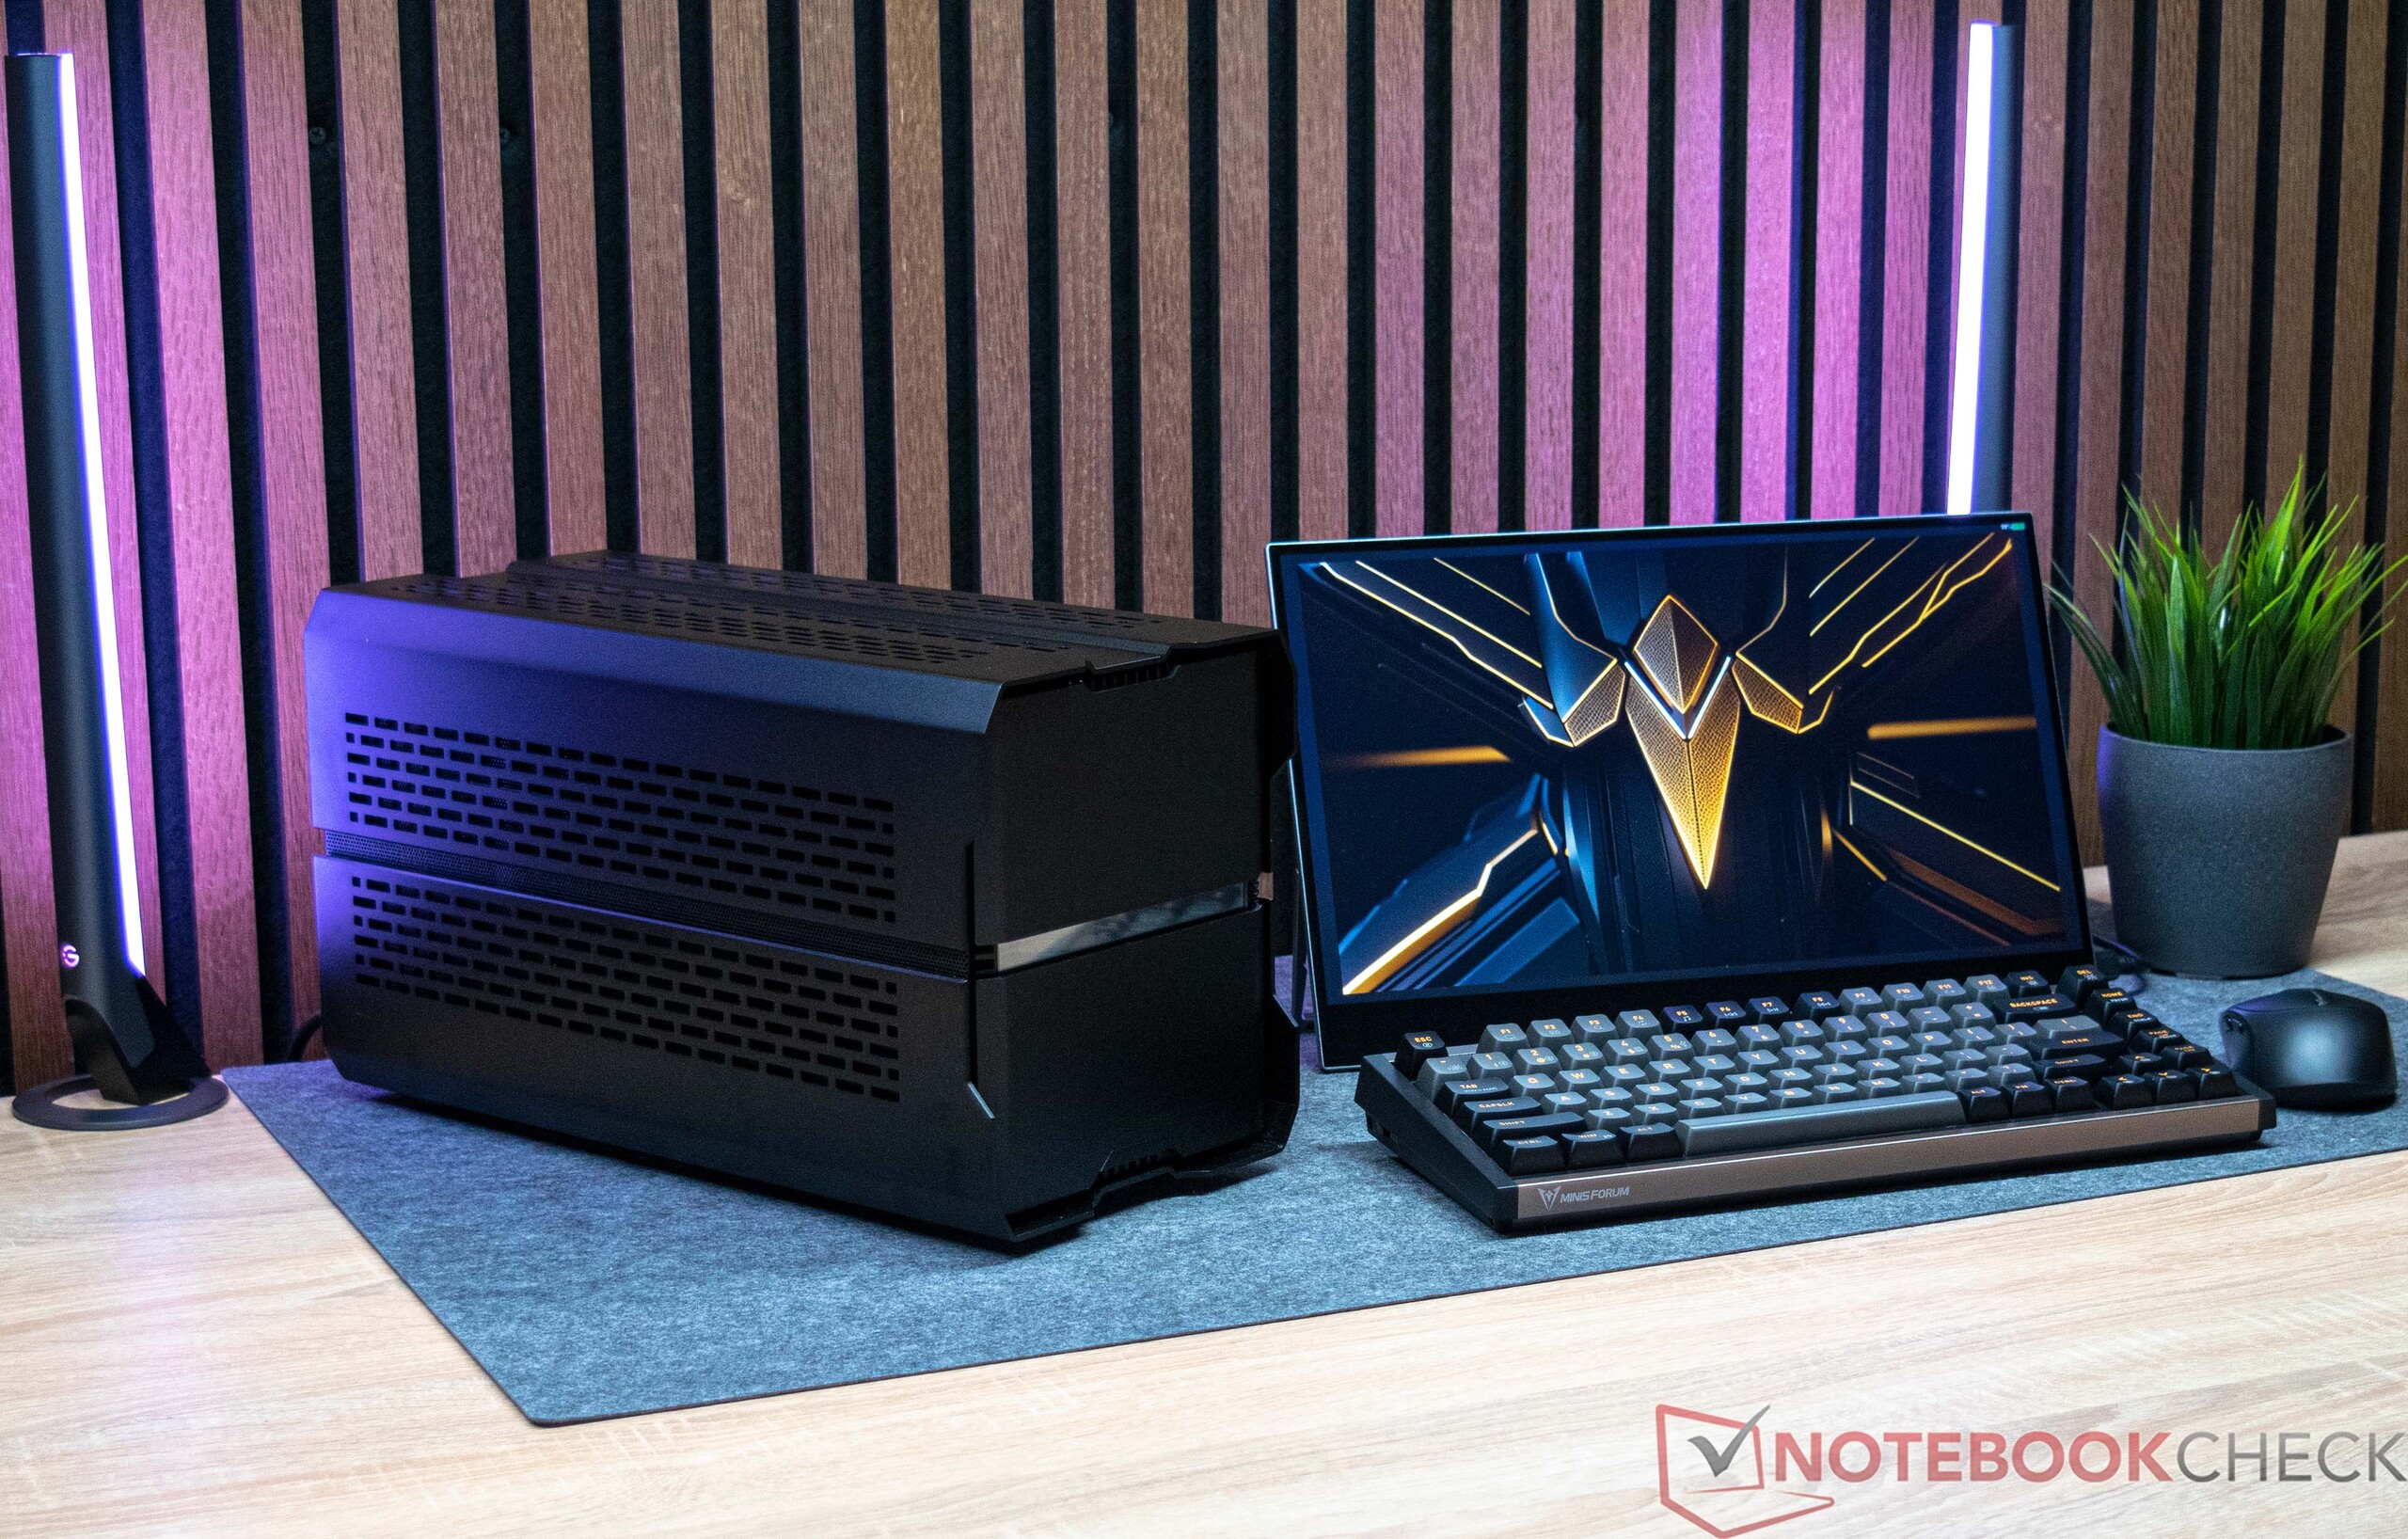
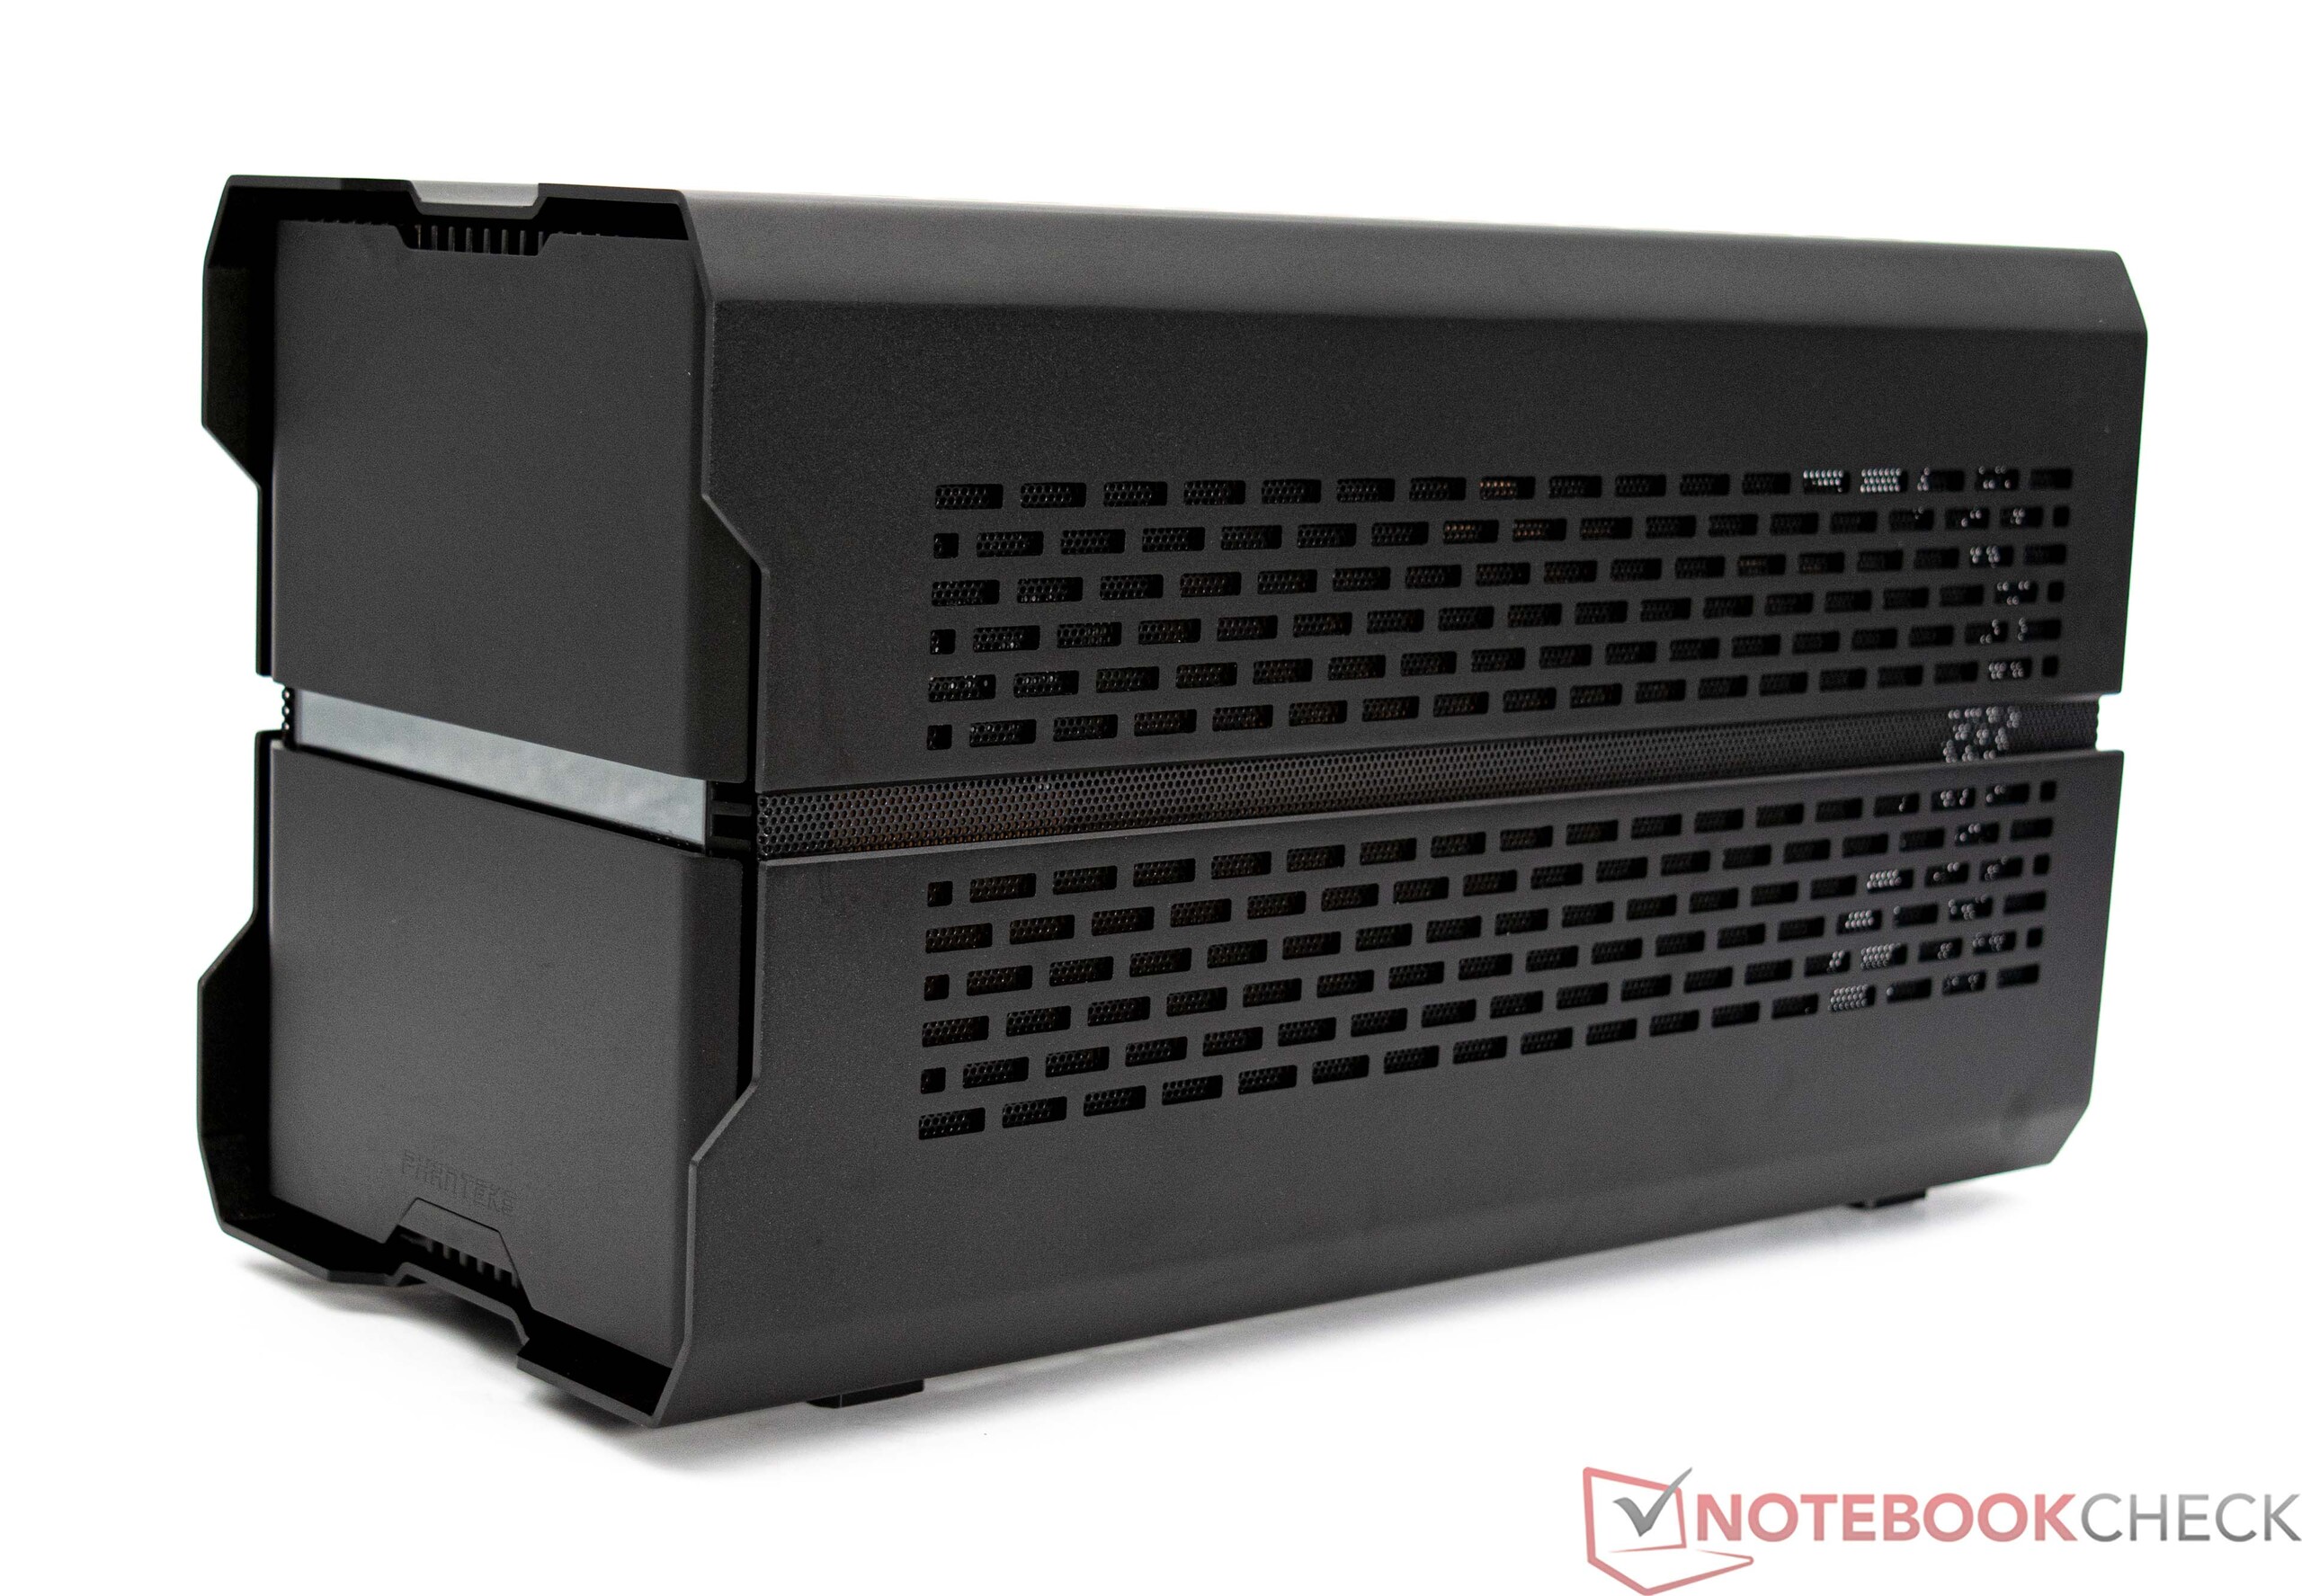
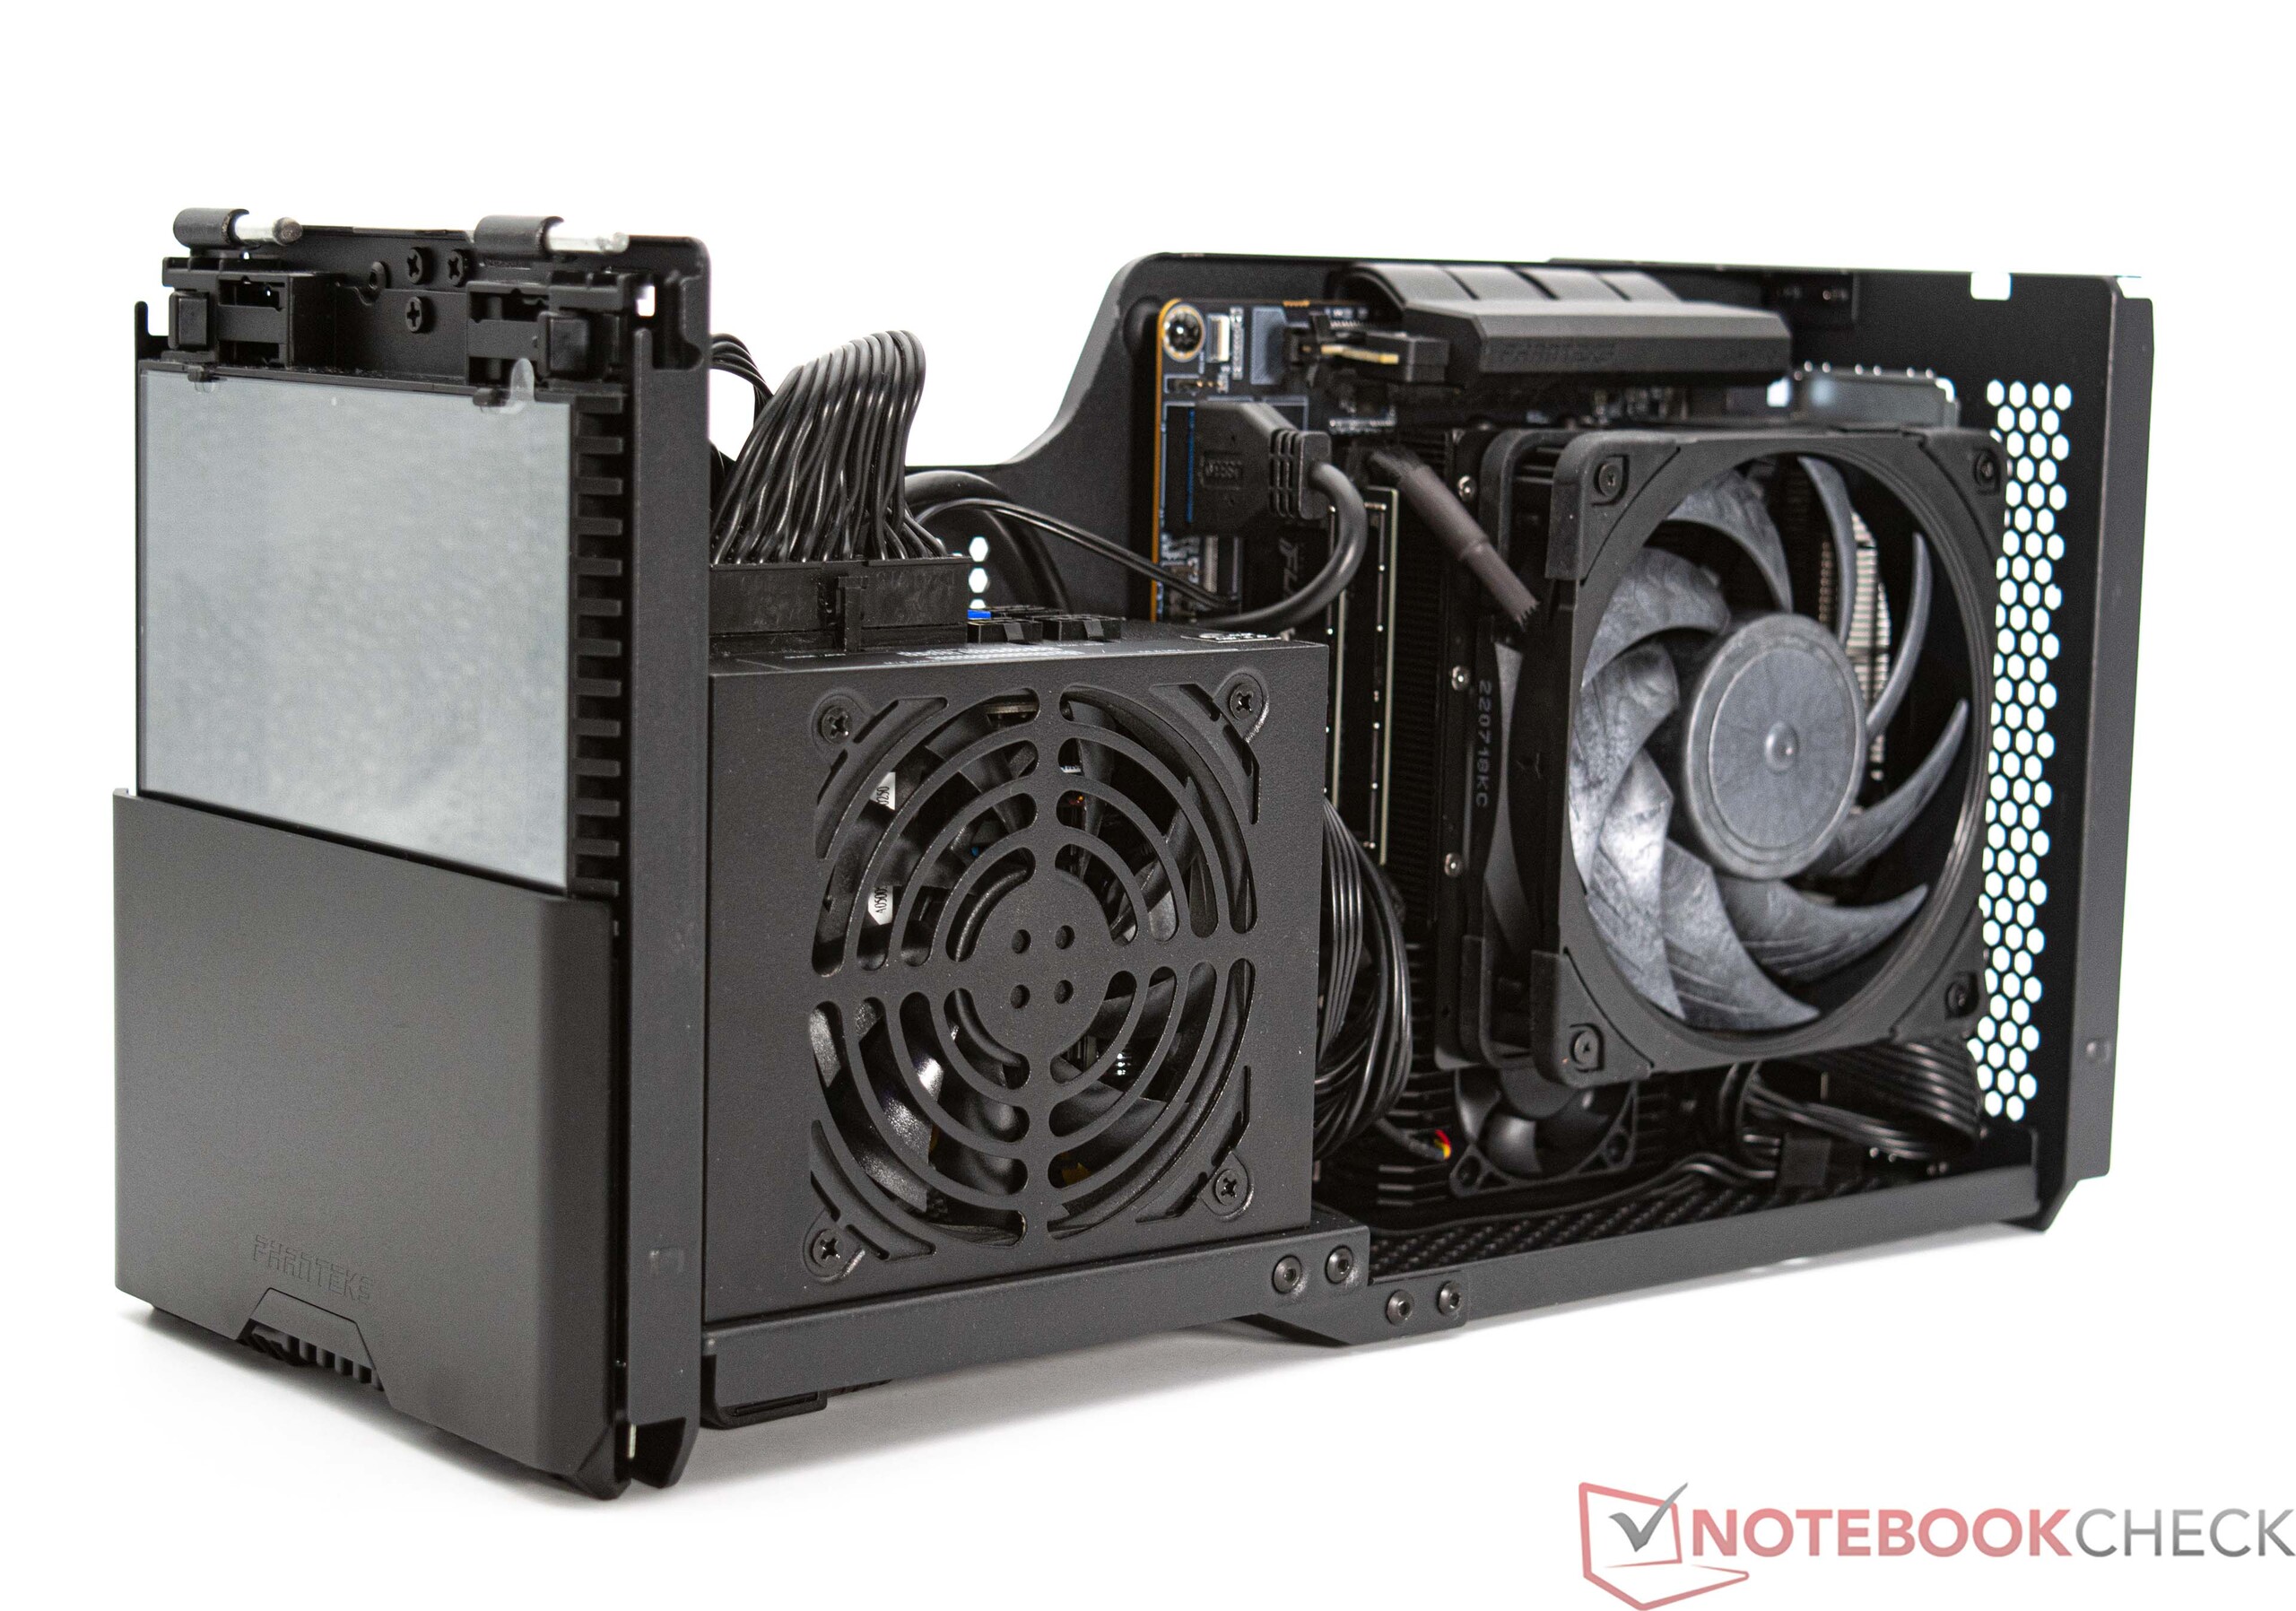
Para garantizar la autenticidad de la prueba, optamos por ejecutar todas las pruebas sin una tarjeta gráfica dedicada. Utilizamos la caja Phanteks Enthoo Evolv Shift XT, elegida por su diseño compacto, para proporcionar una base sólida.
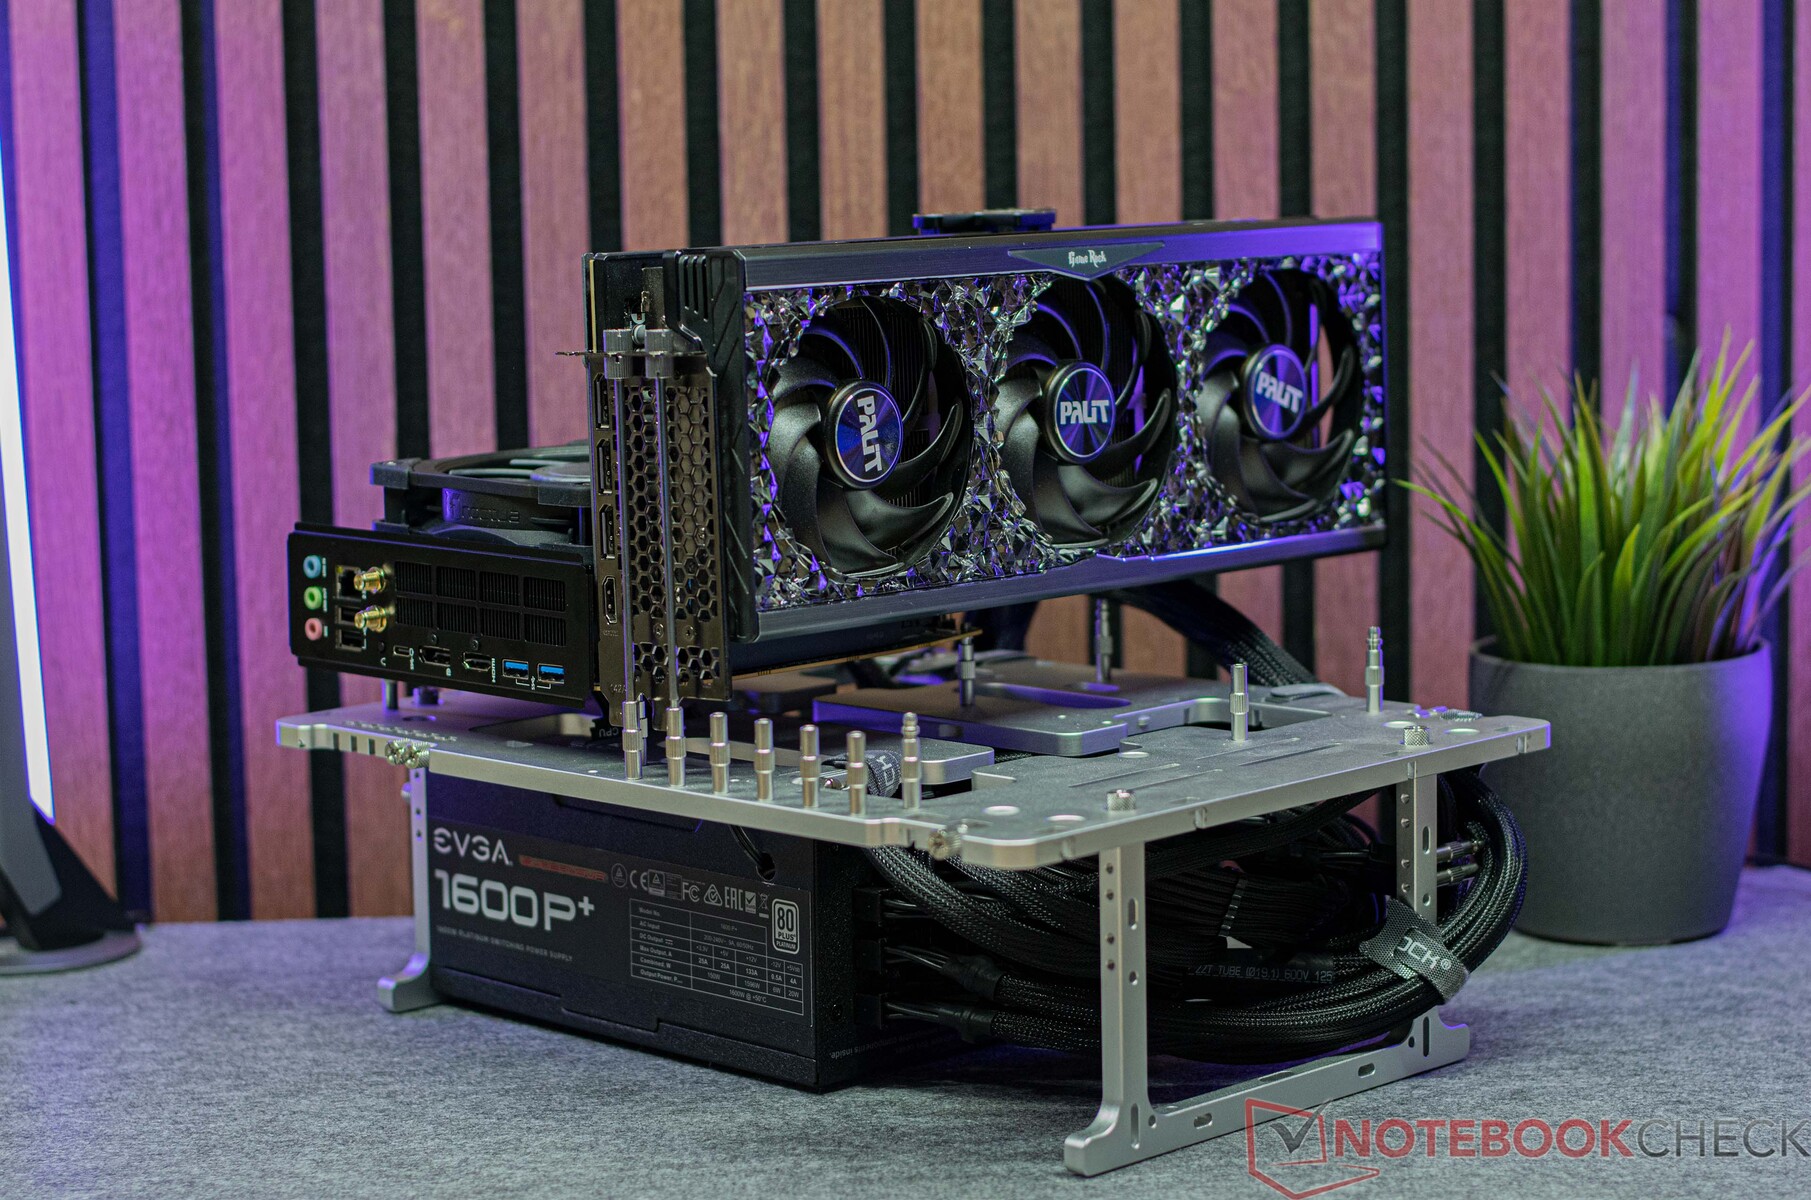
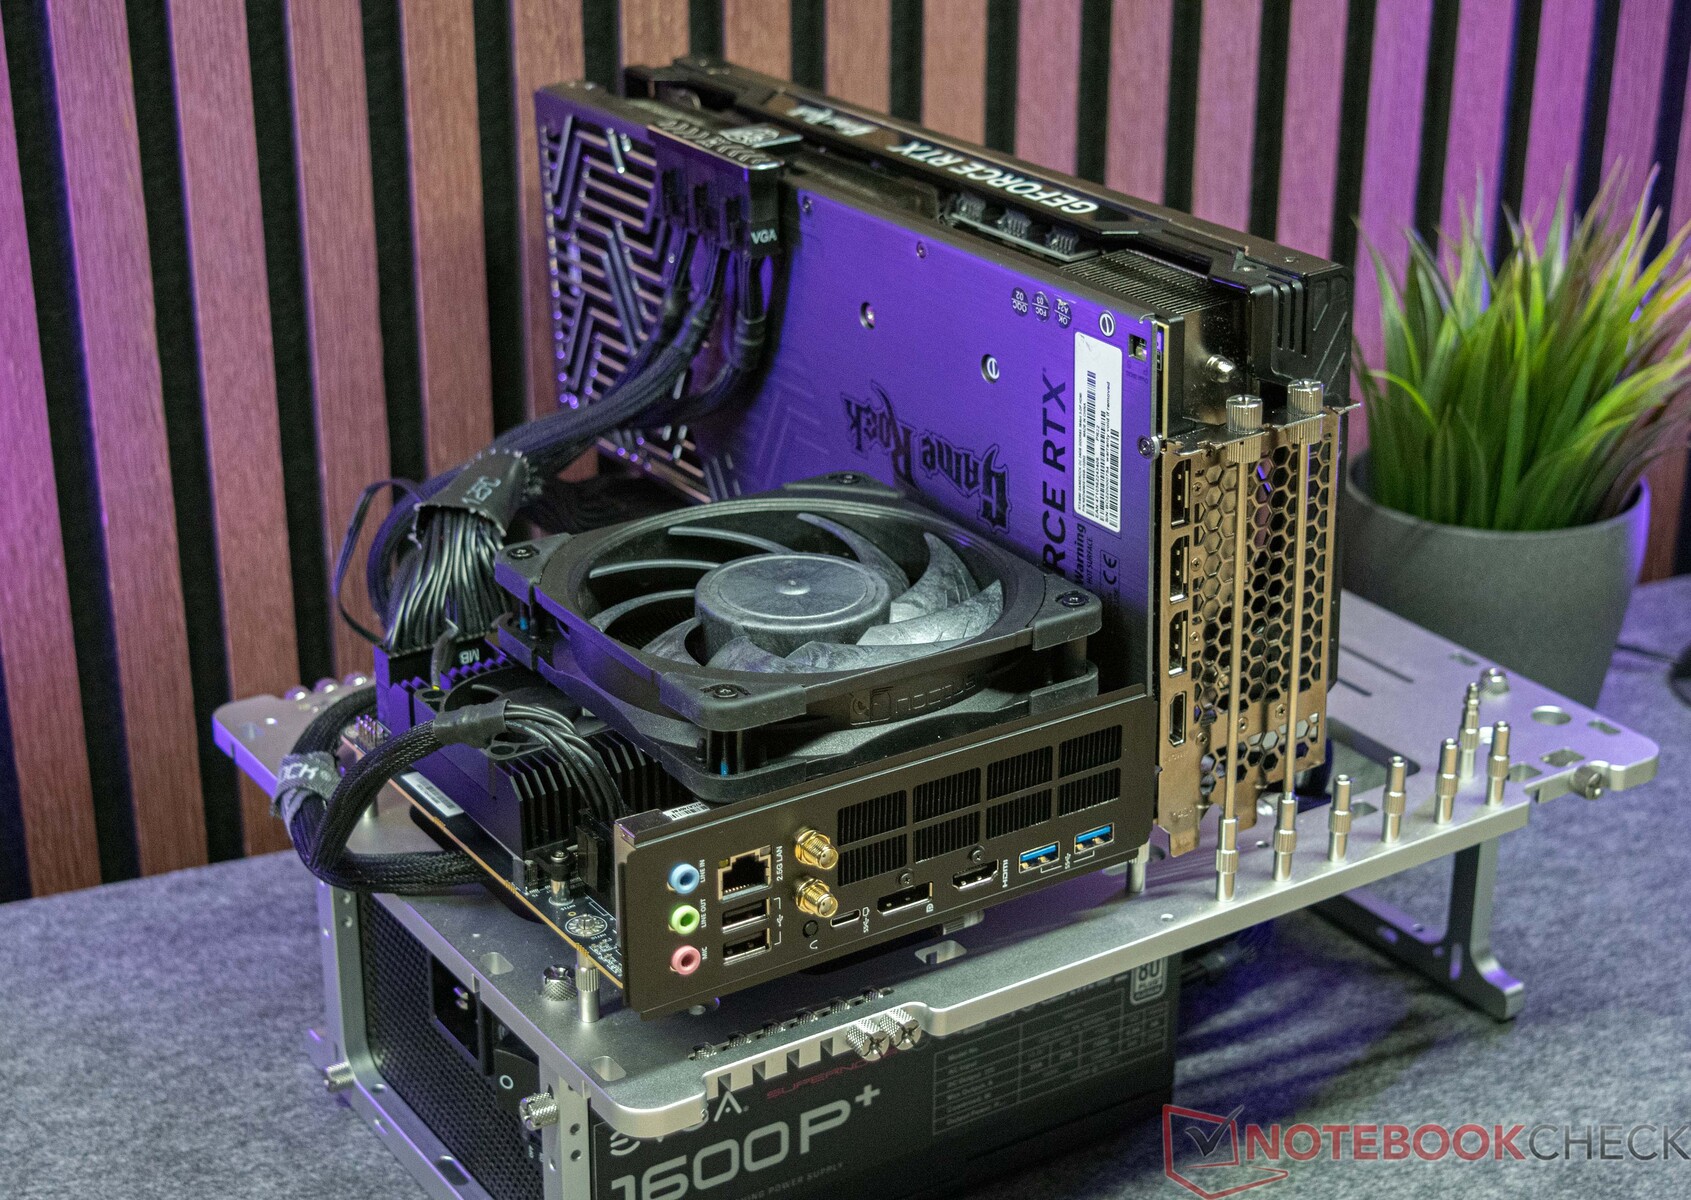
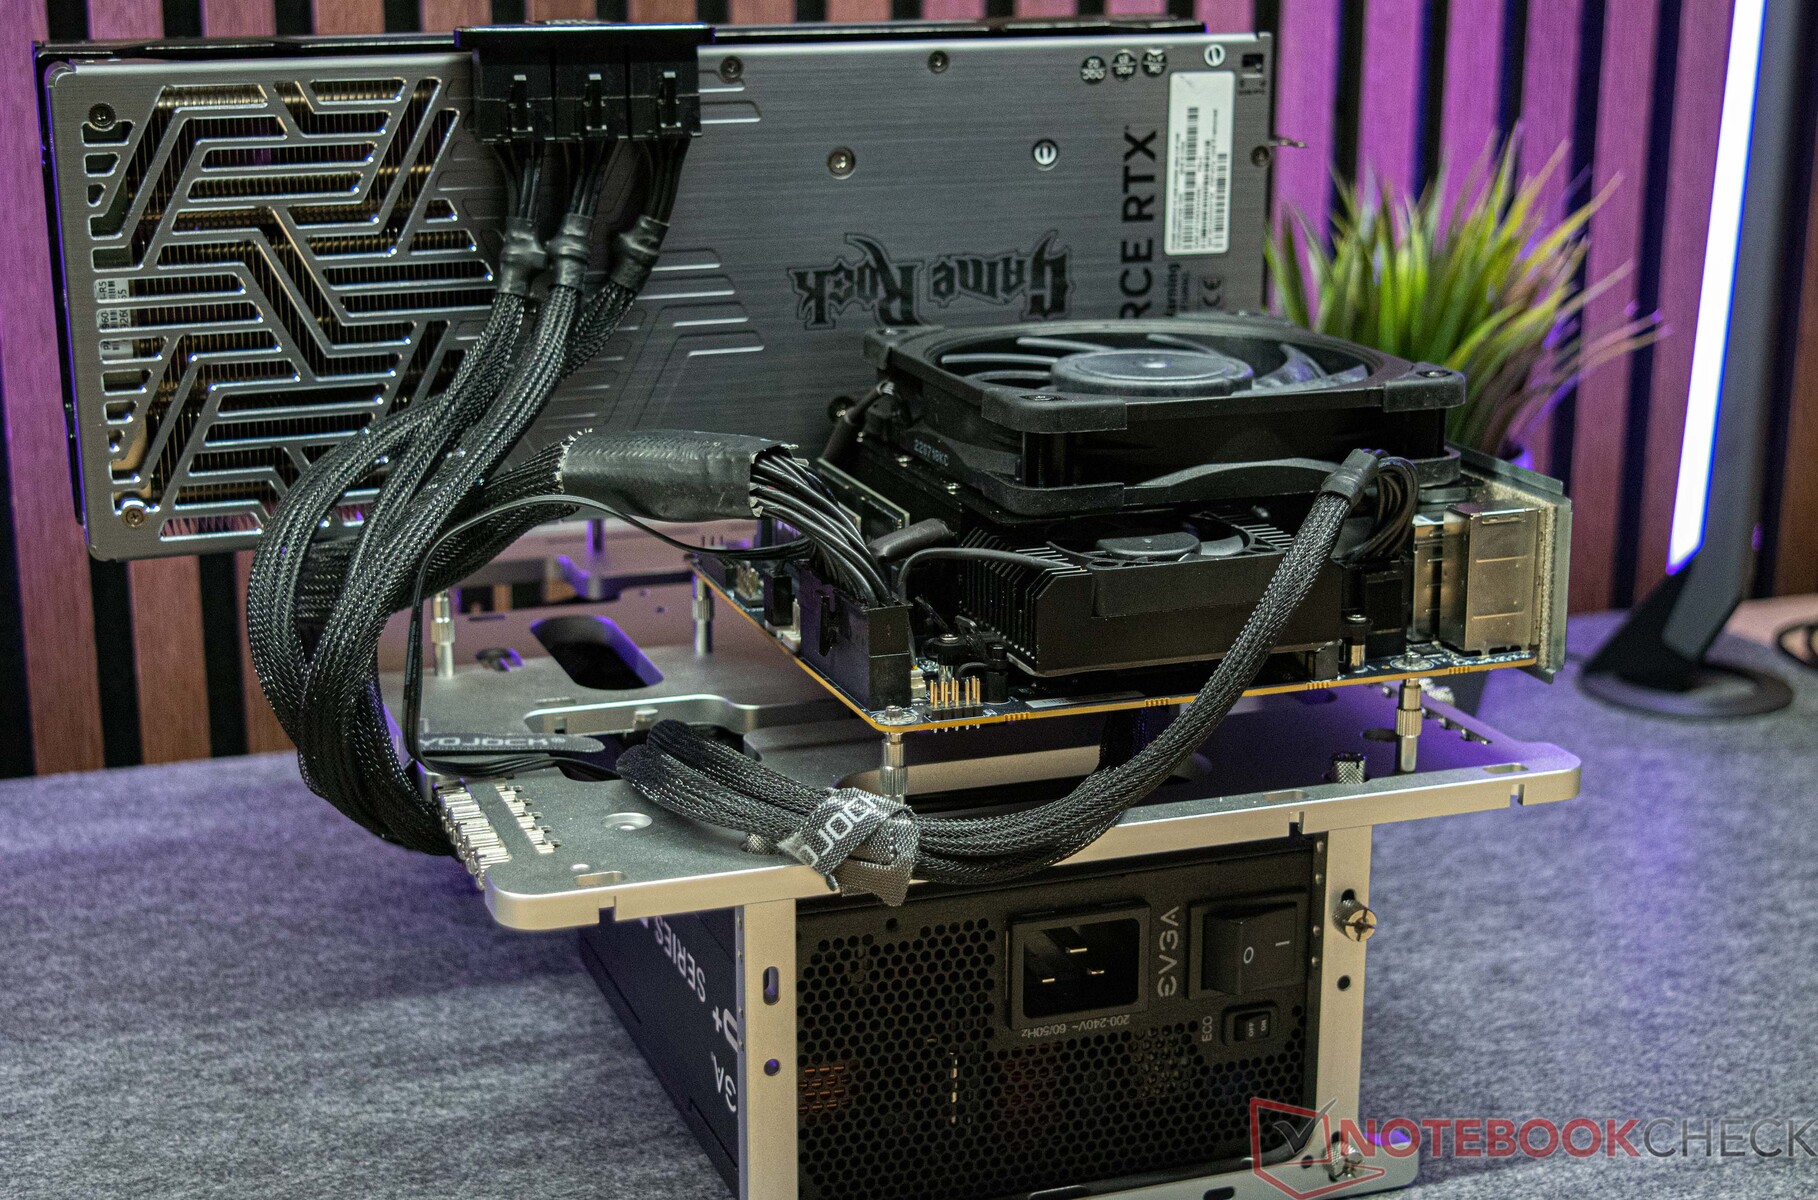
Además, para la comparación de rendimiento que implicaba una tarjeta gráfica dedicada, evaluamos la Minisforum BD770i junto con la Palit GeForce RTX 4090 GameRock OC en una configuración abierta. El tamaño de la tarjeta gráfica impidió su instalación en la Phanteks Enthoo Evolv Shift XT. La caja admite tarjetas gráficas cuya longitud no supere los 32,4 centímetros.
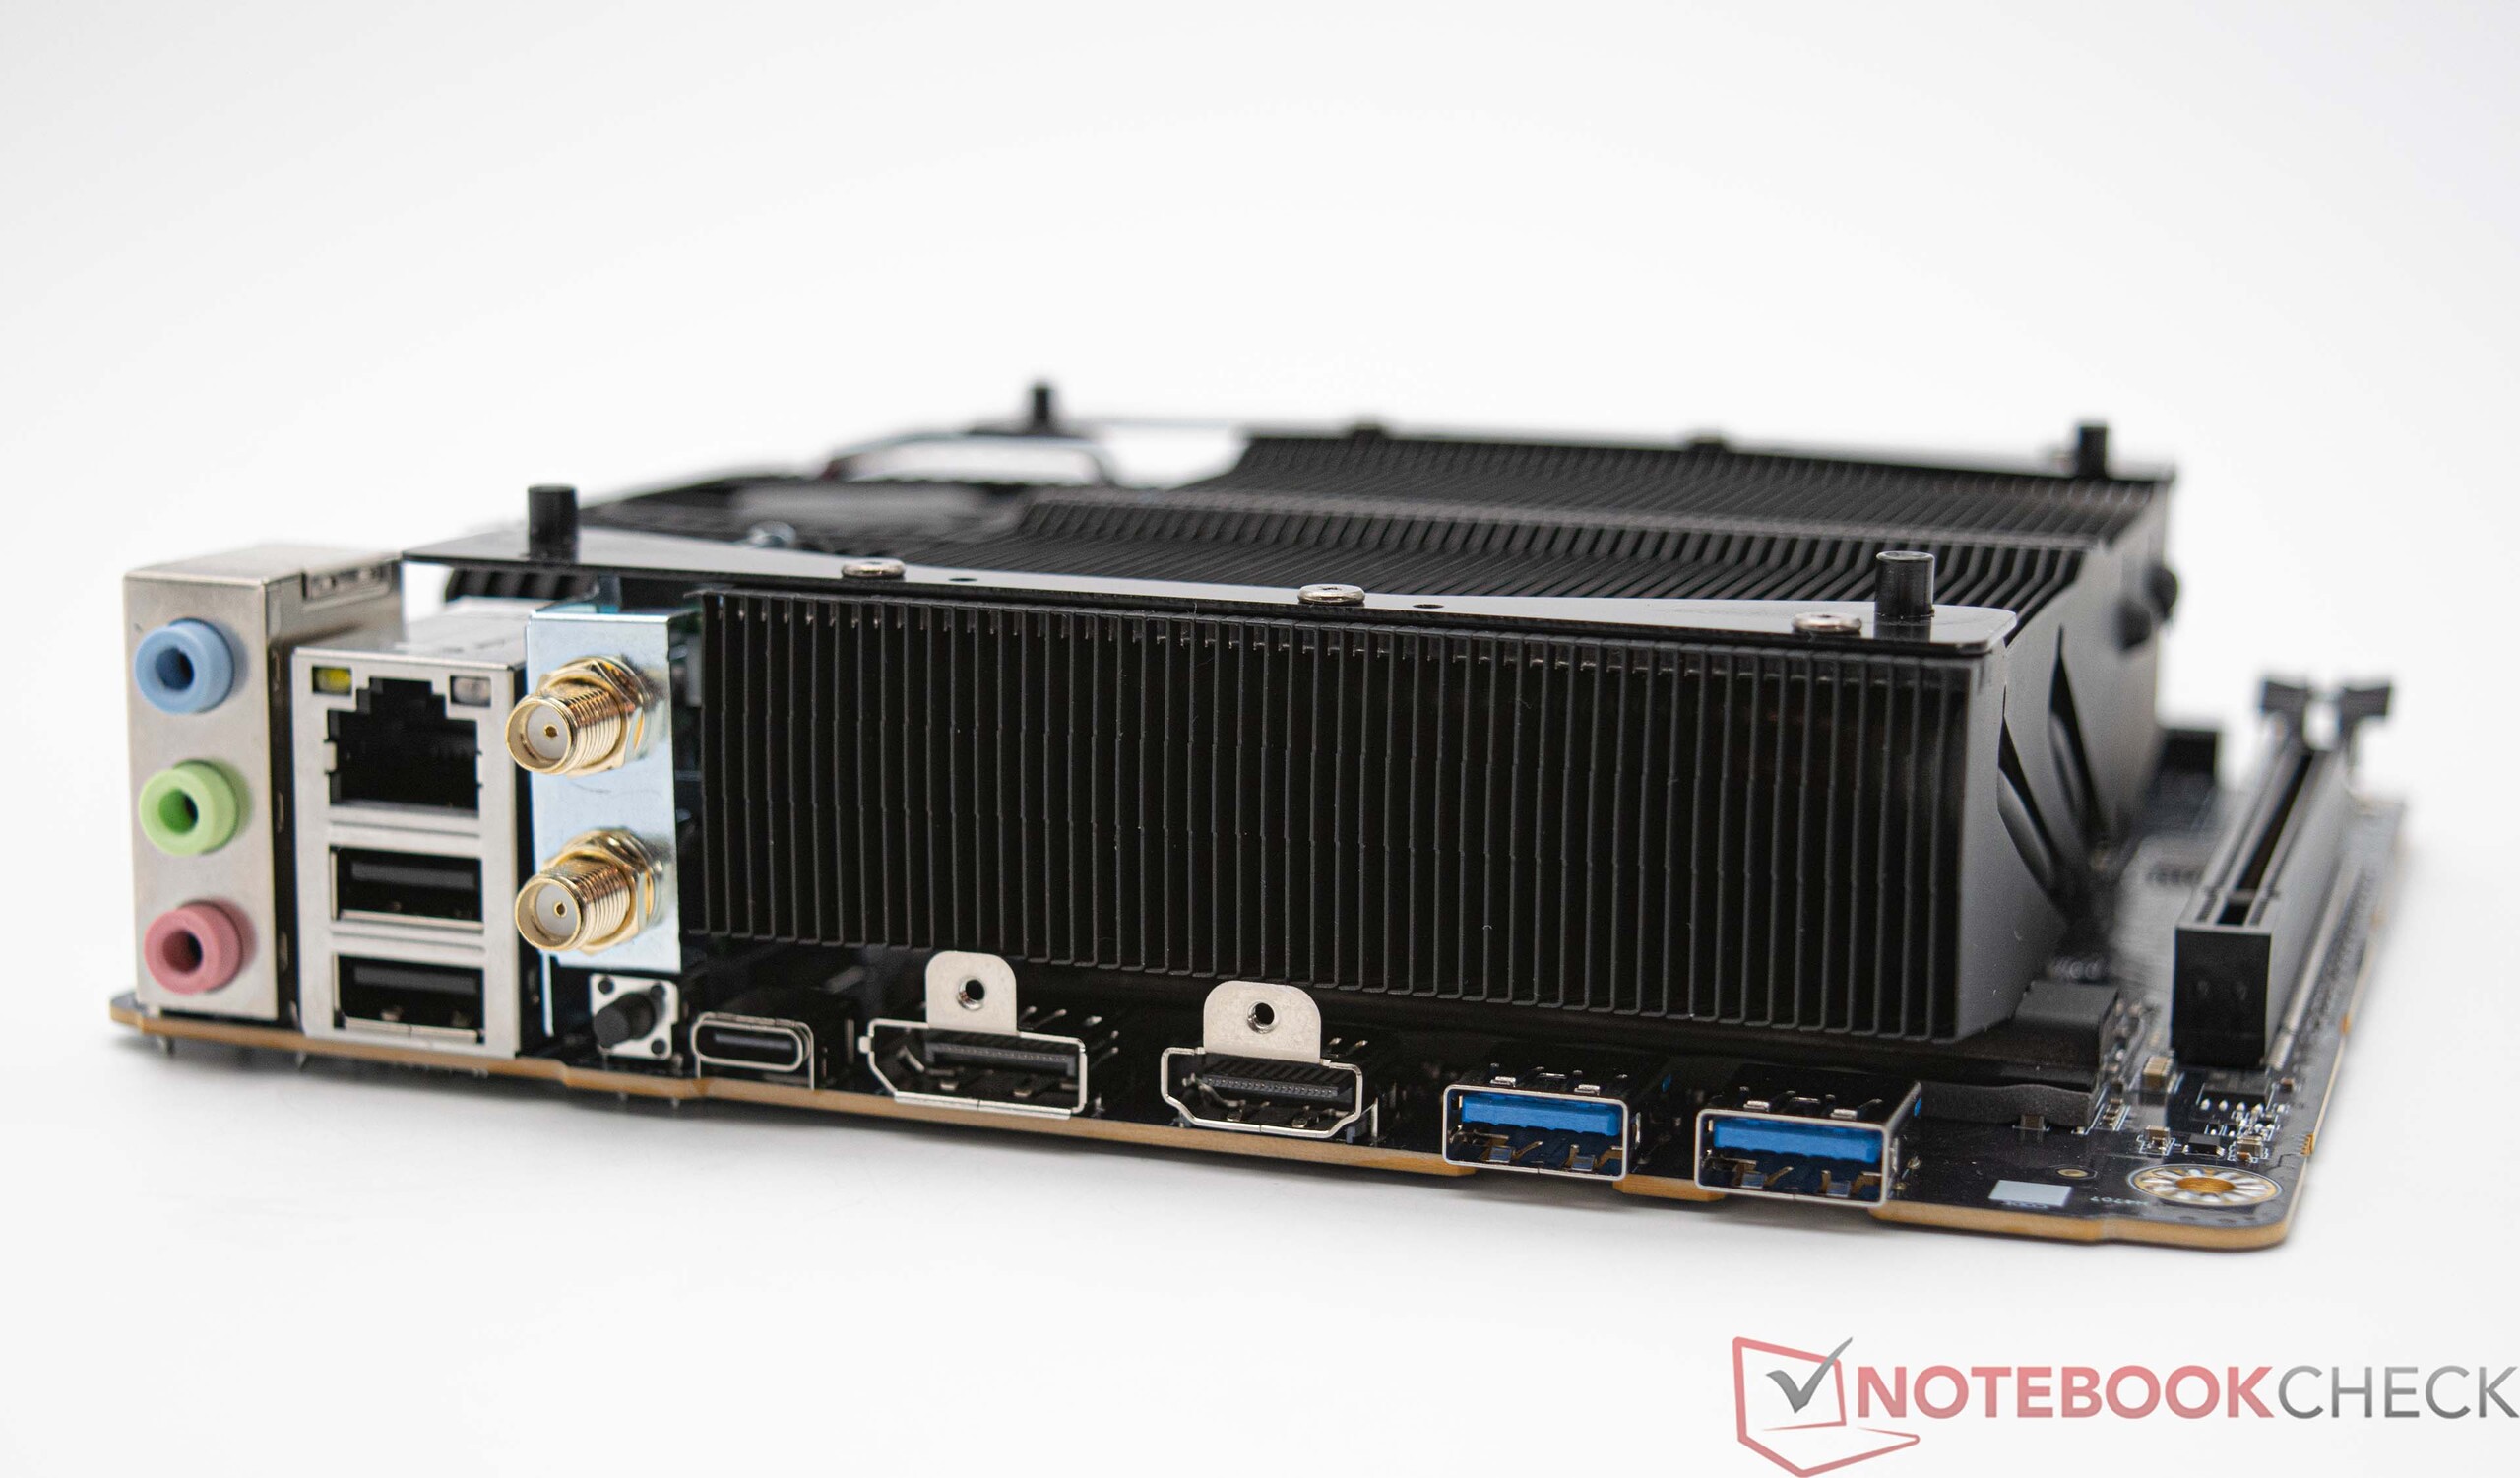
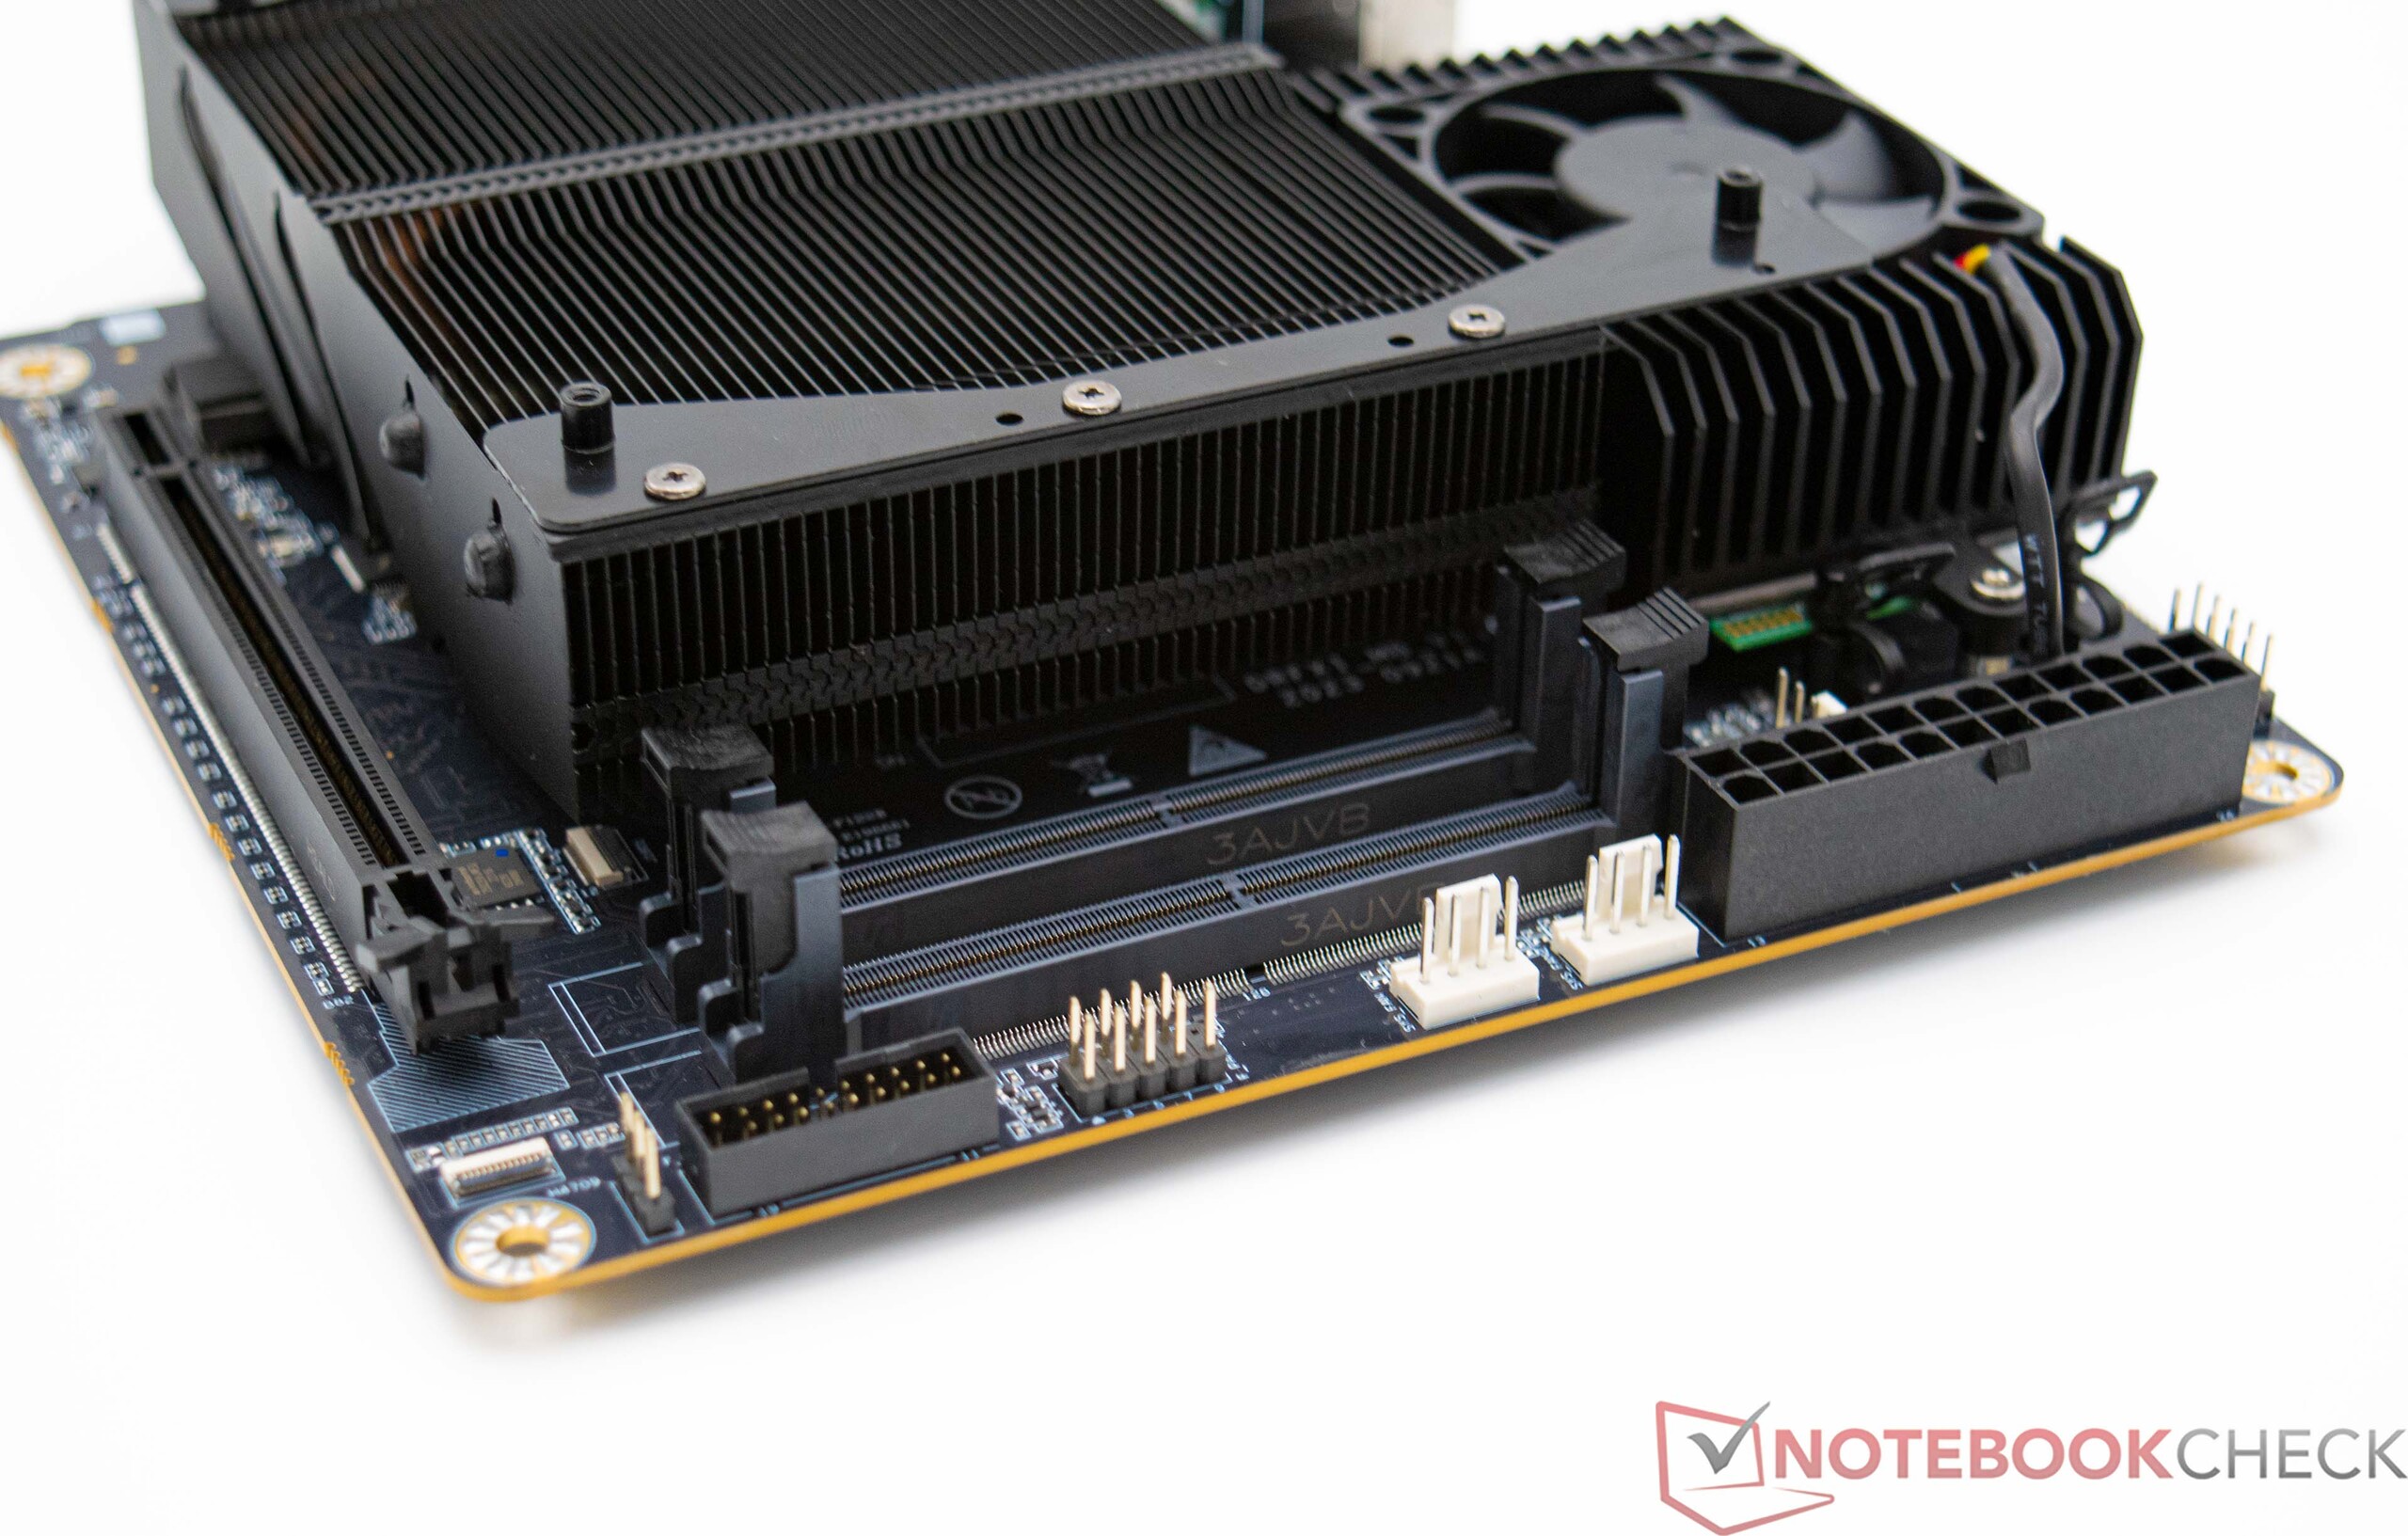
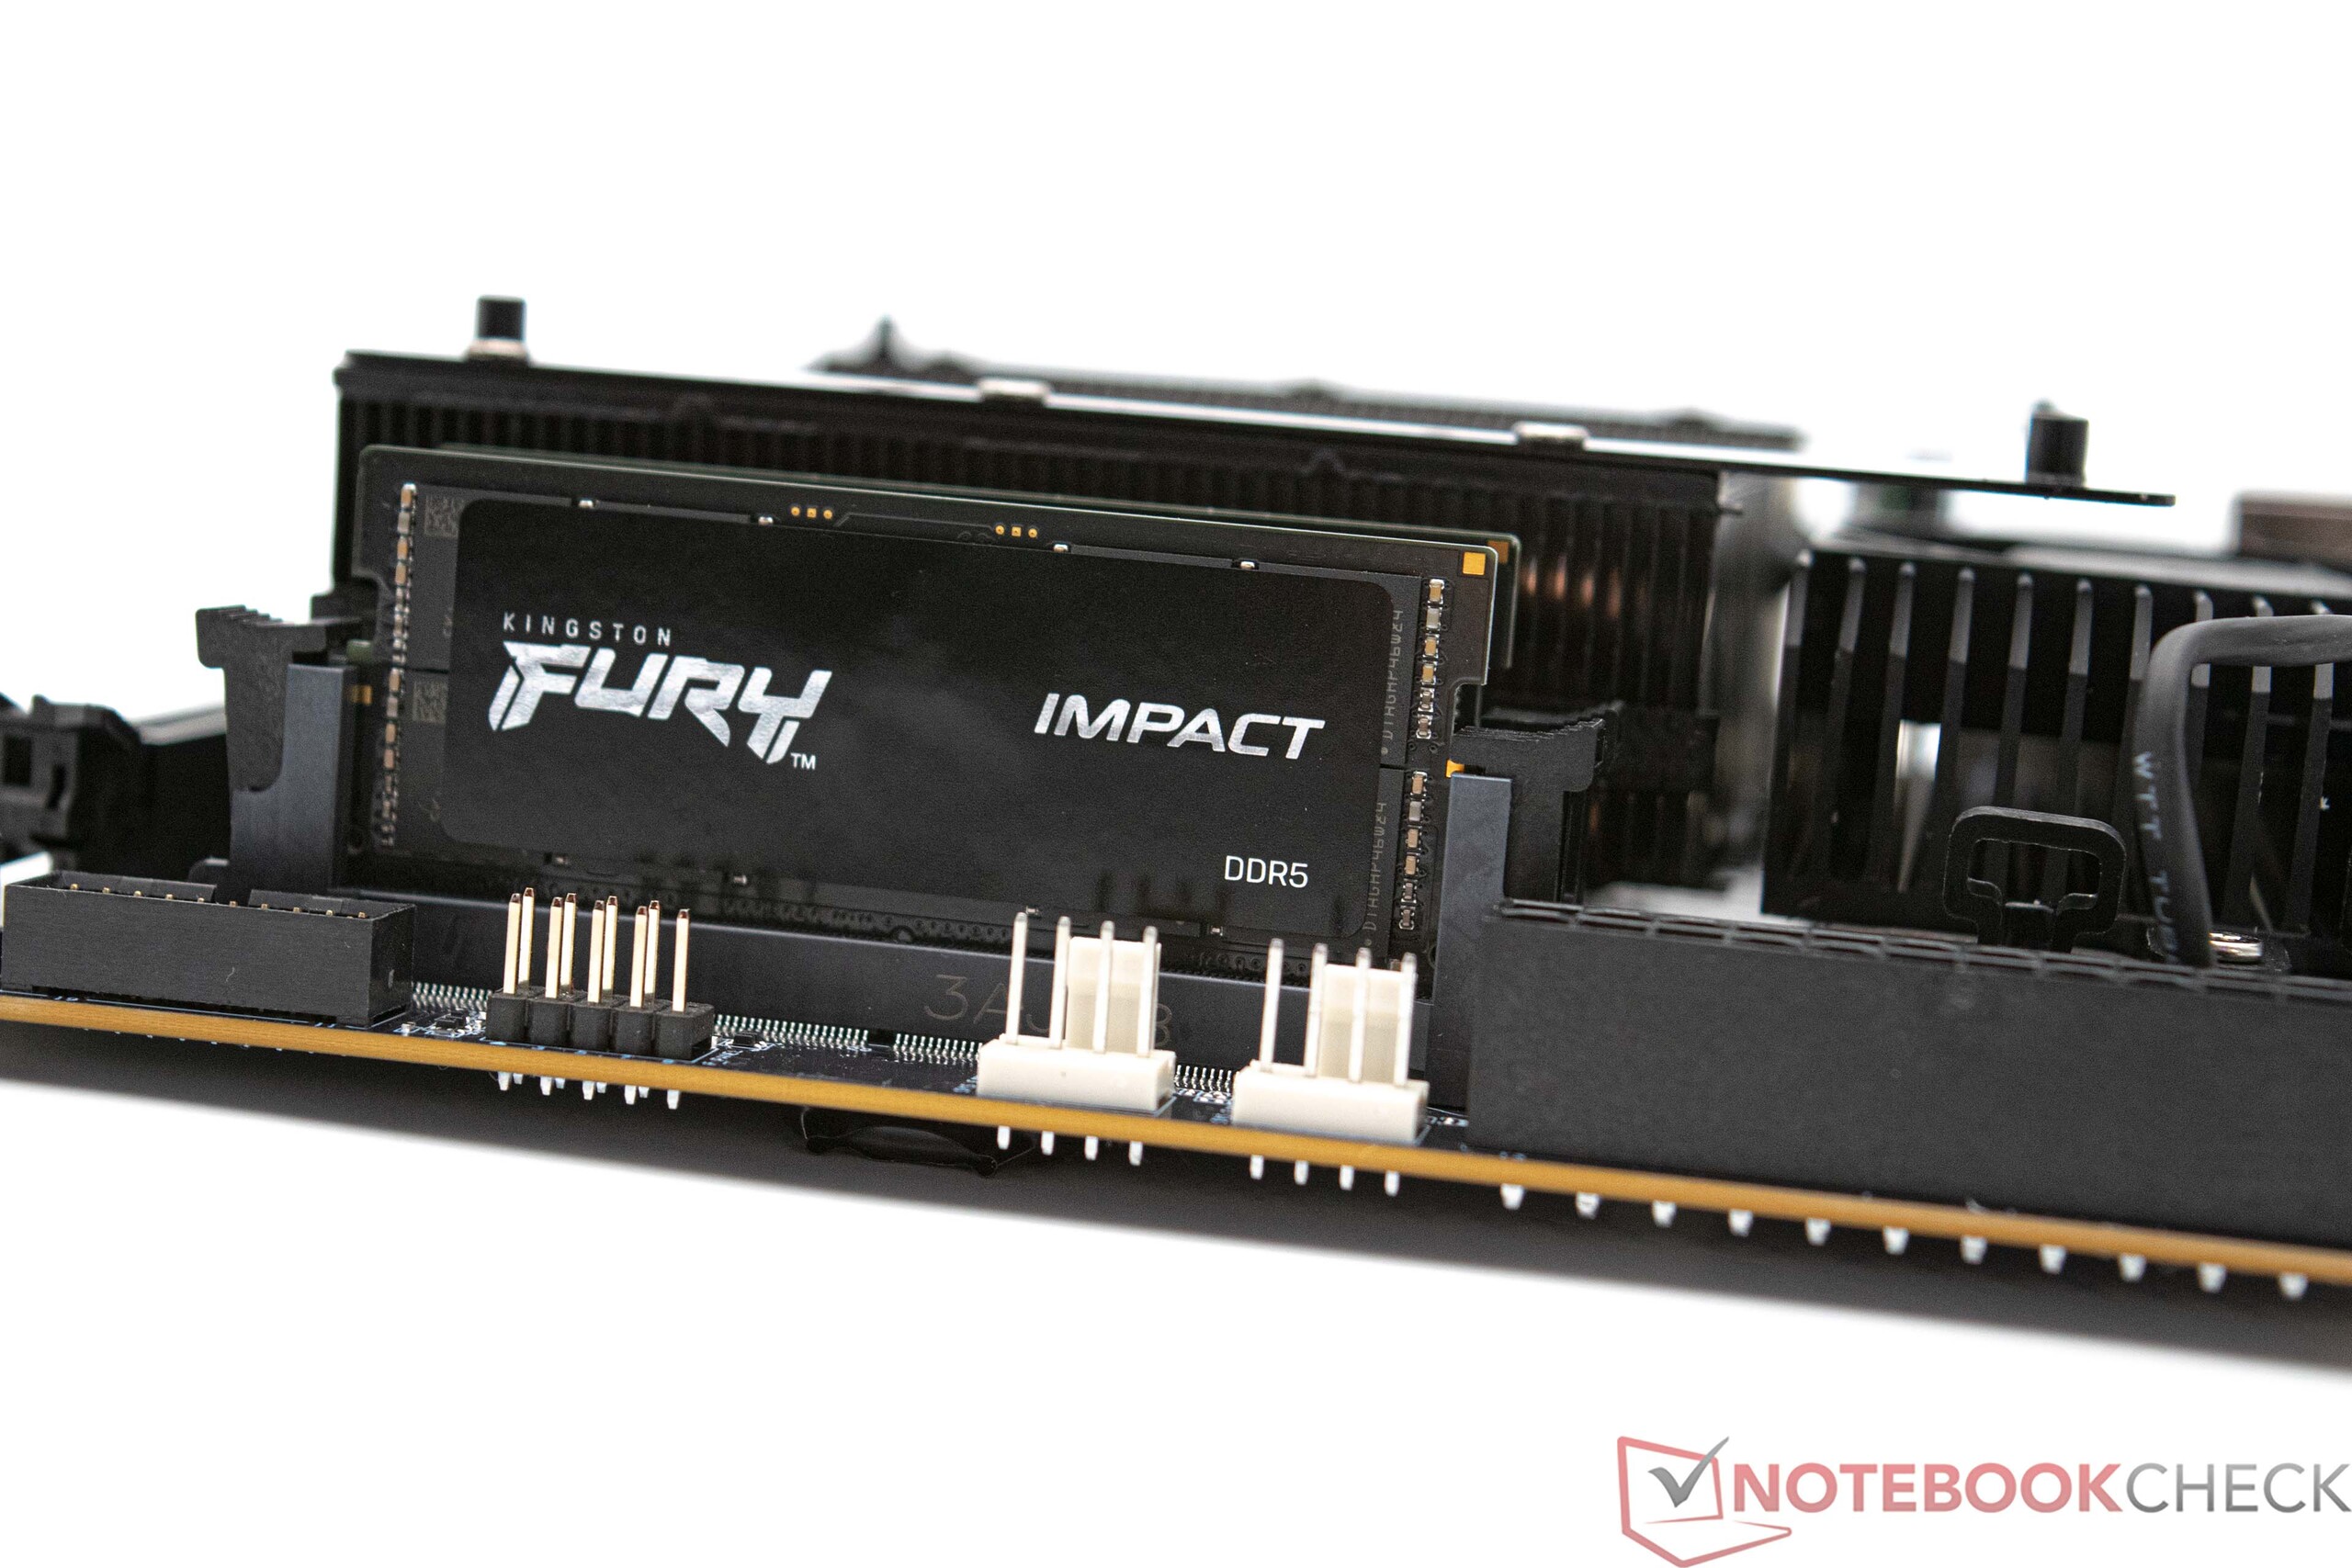
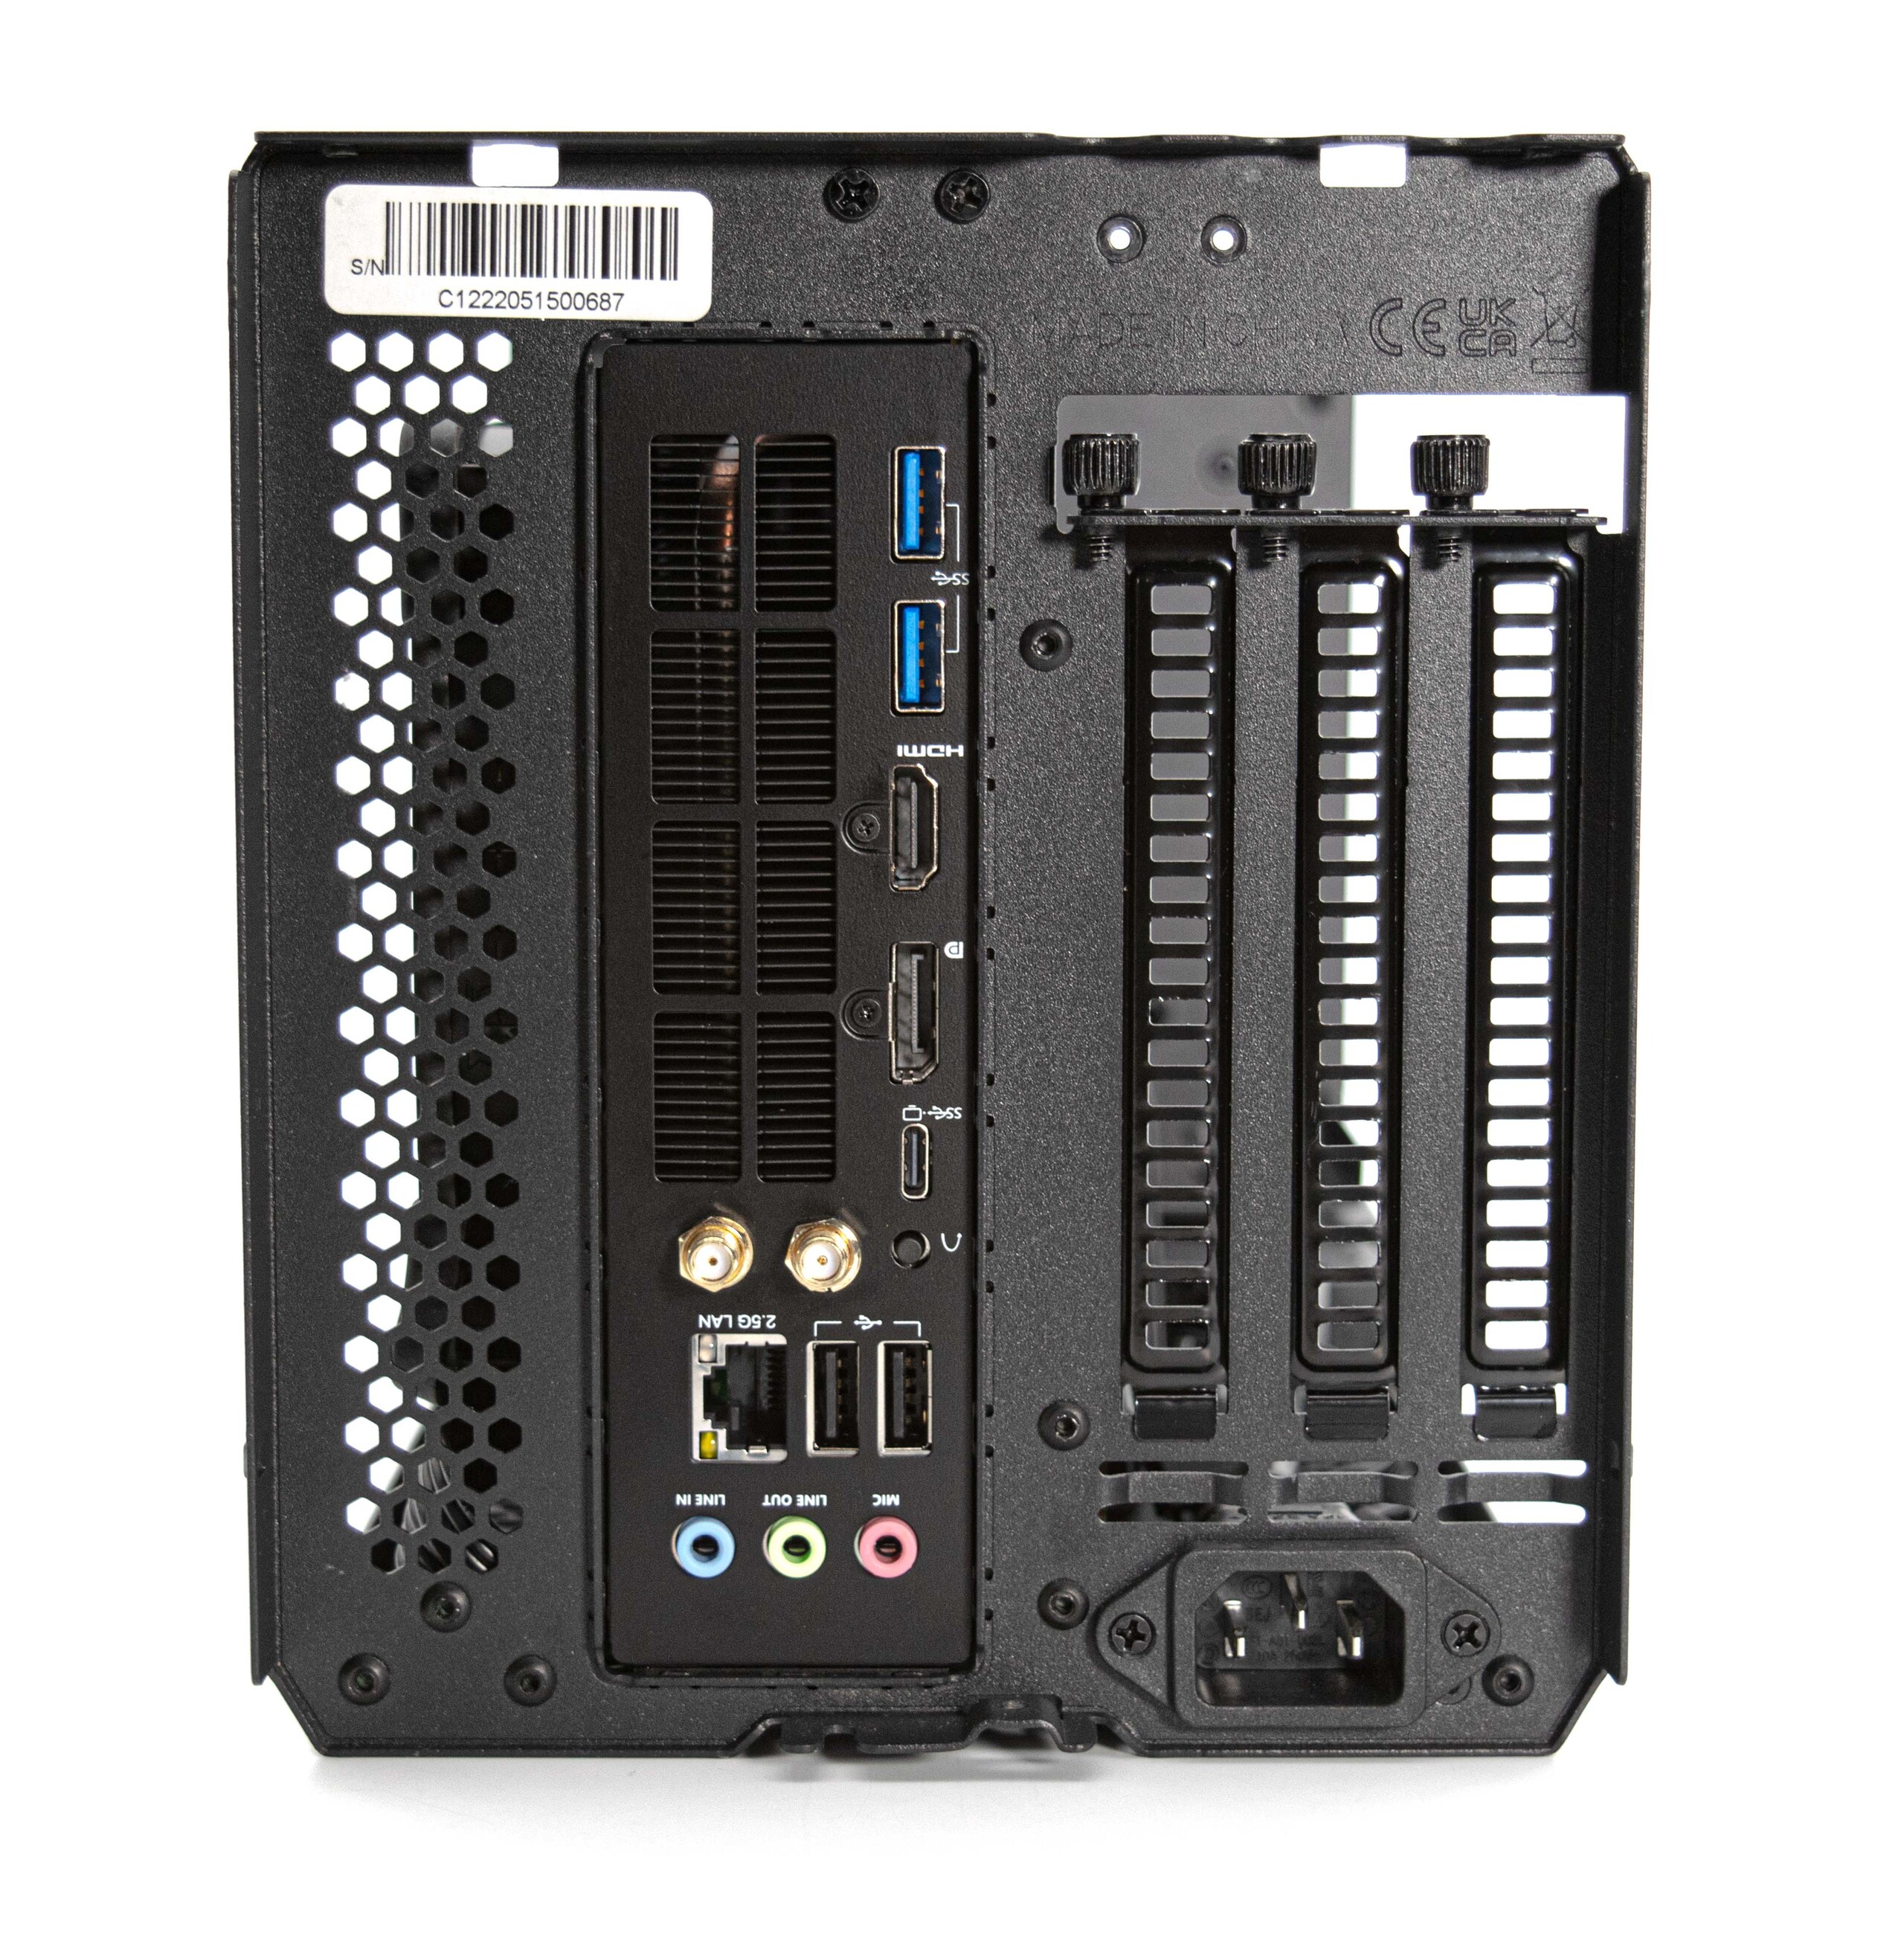
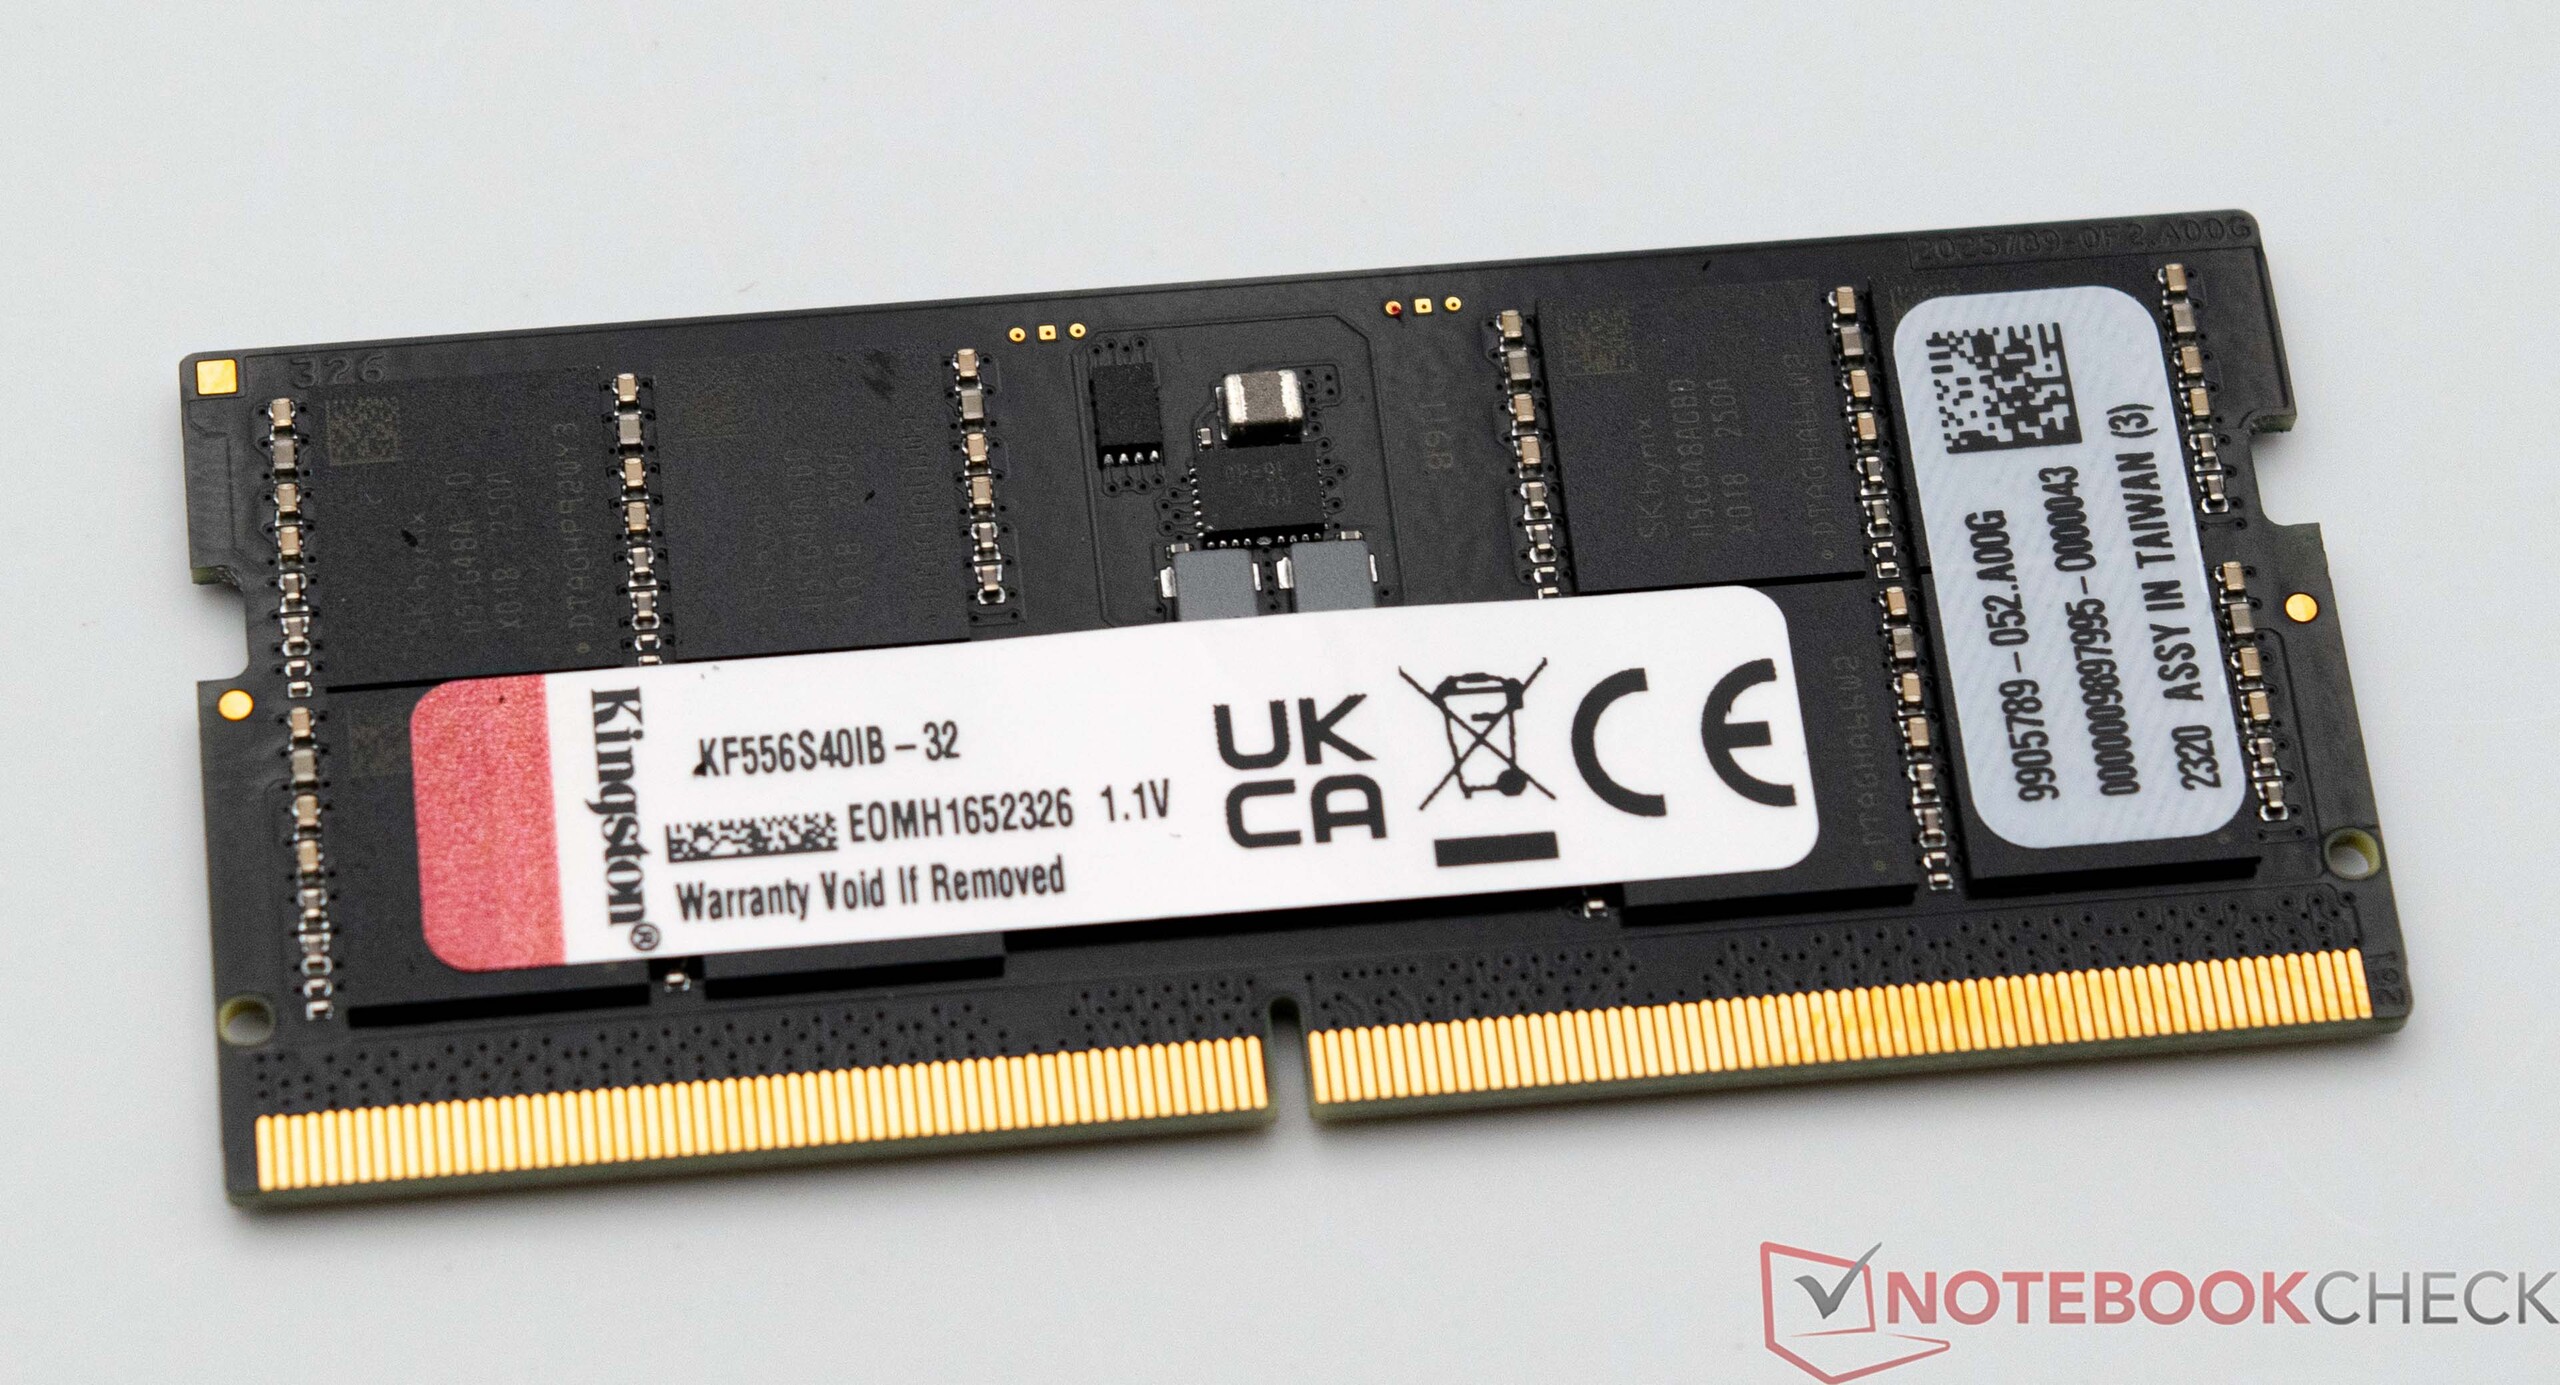
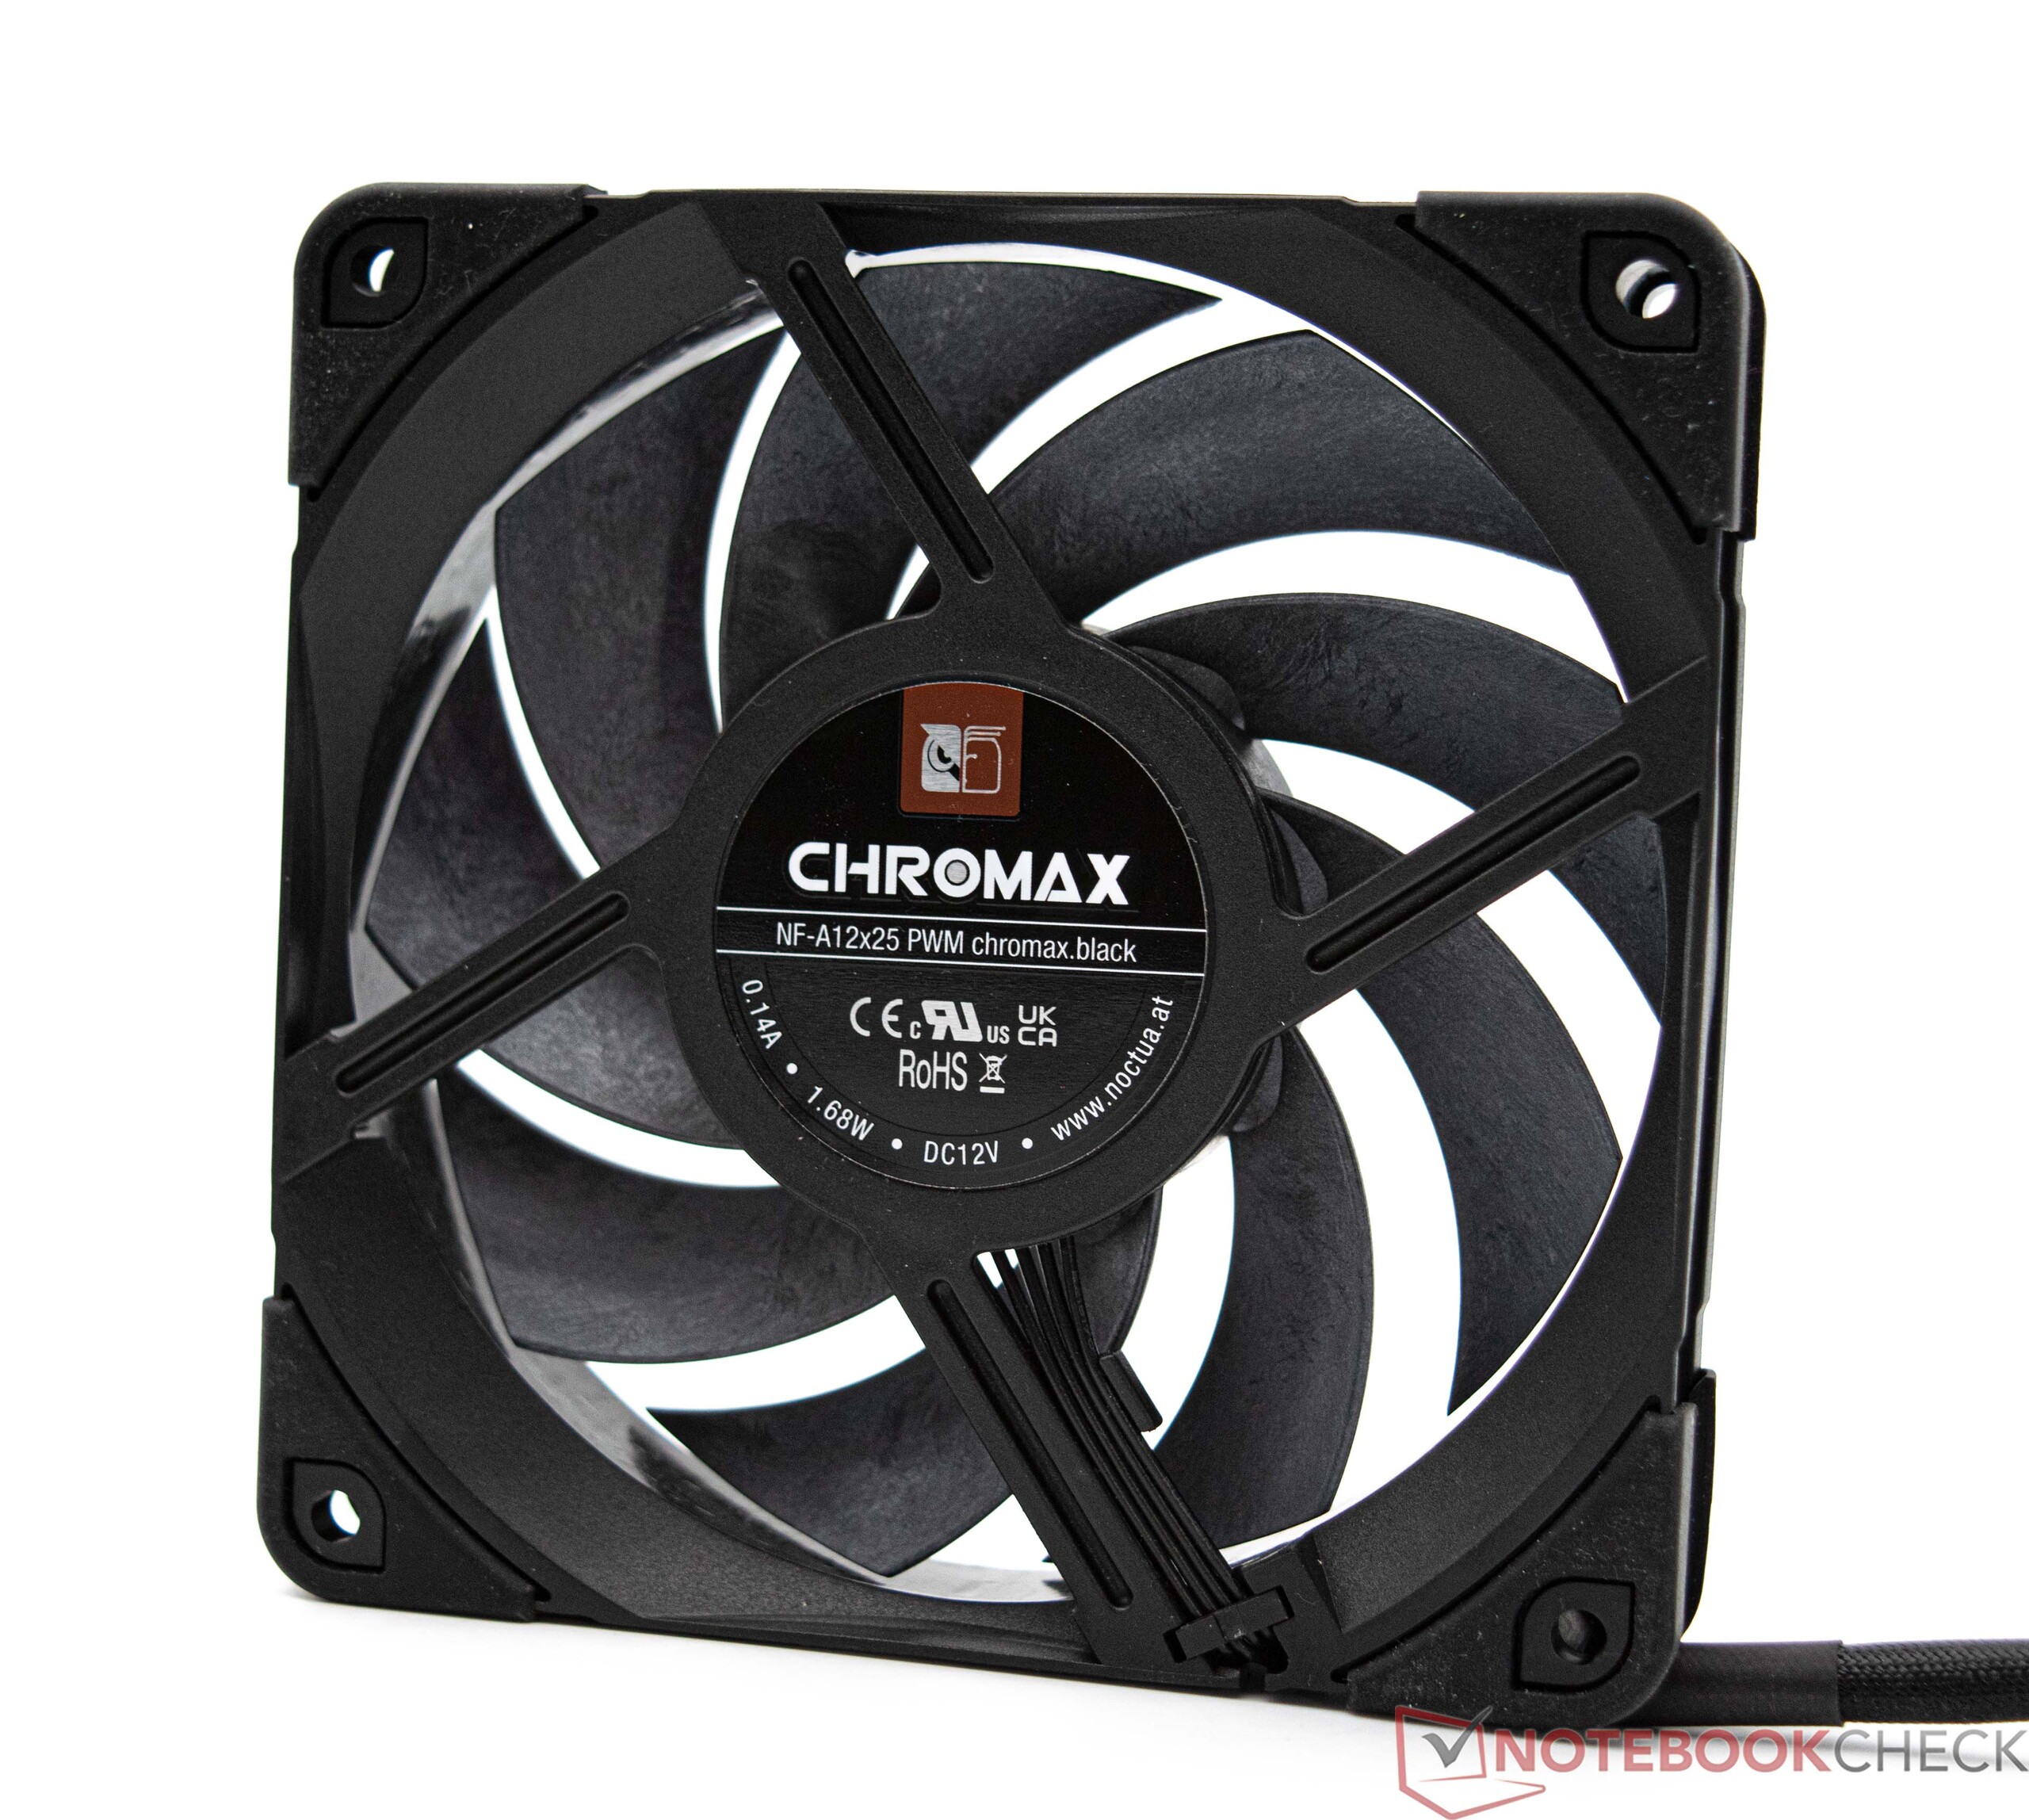
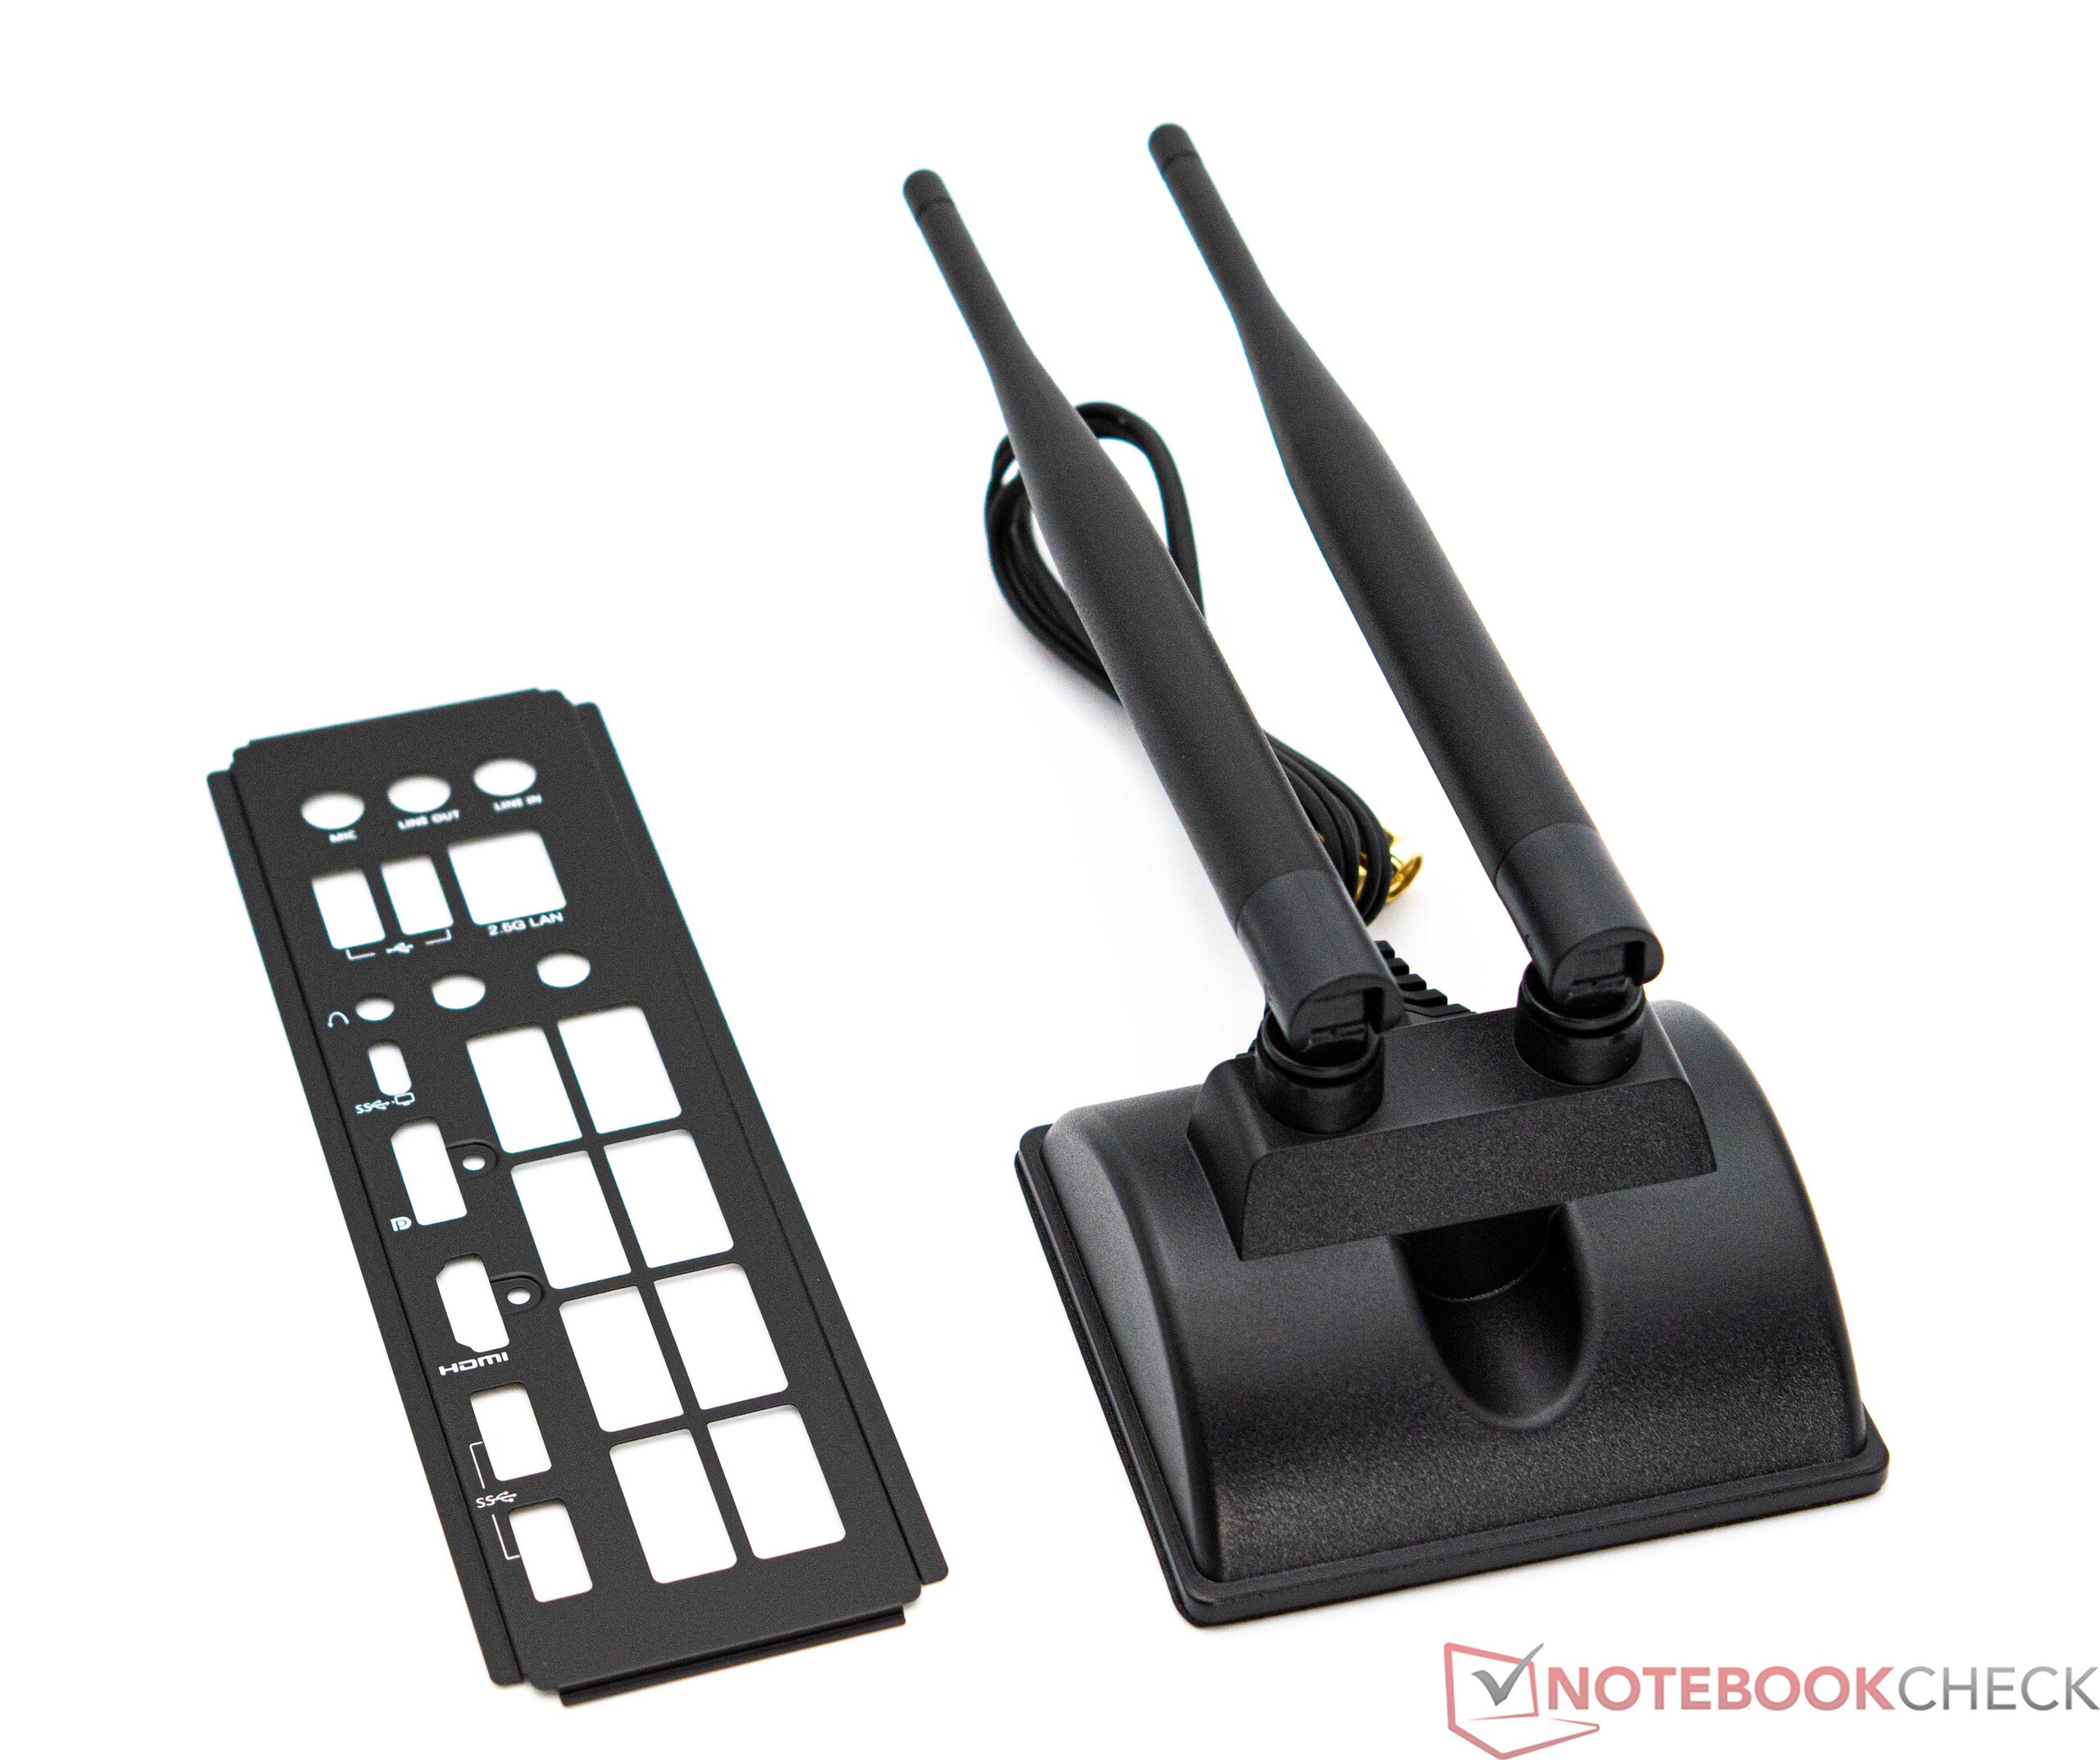
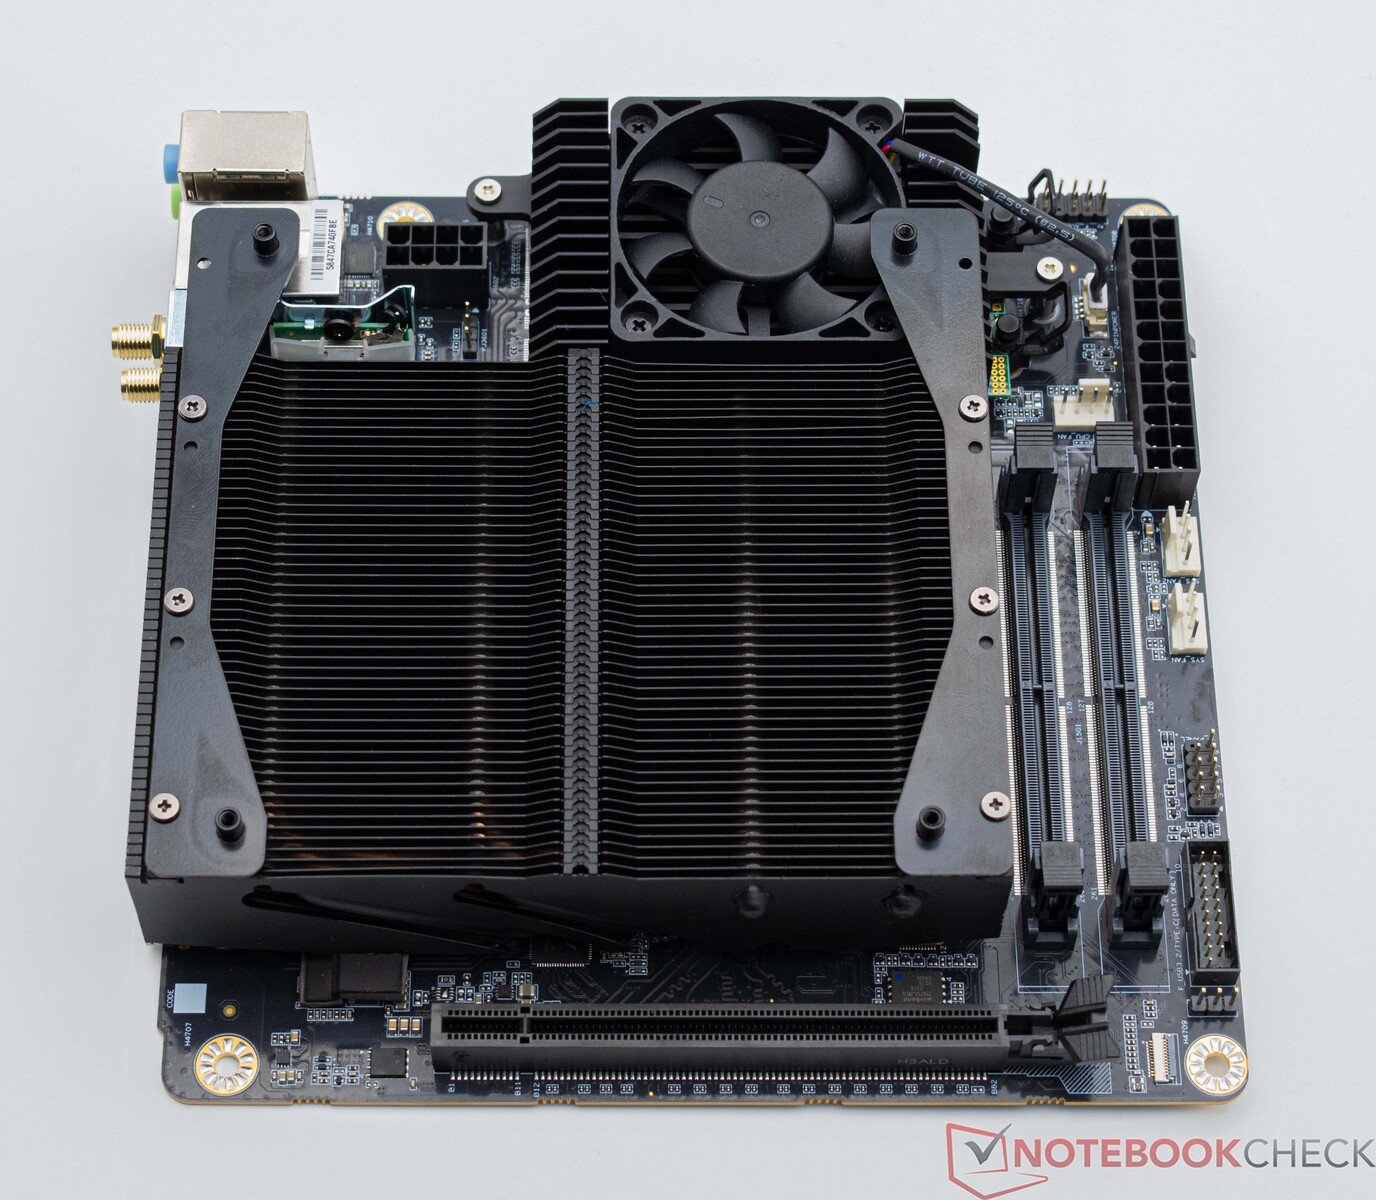
Volumen de suministro
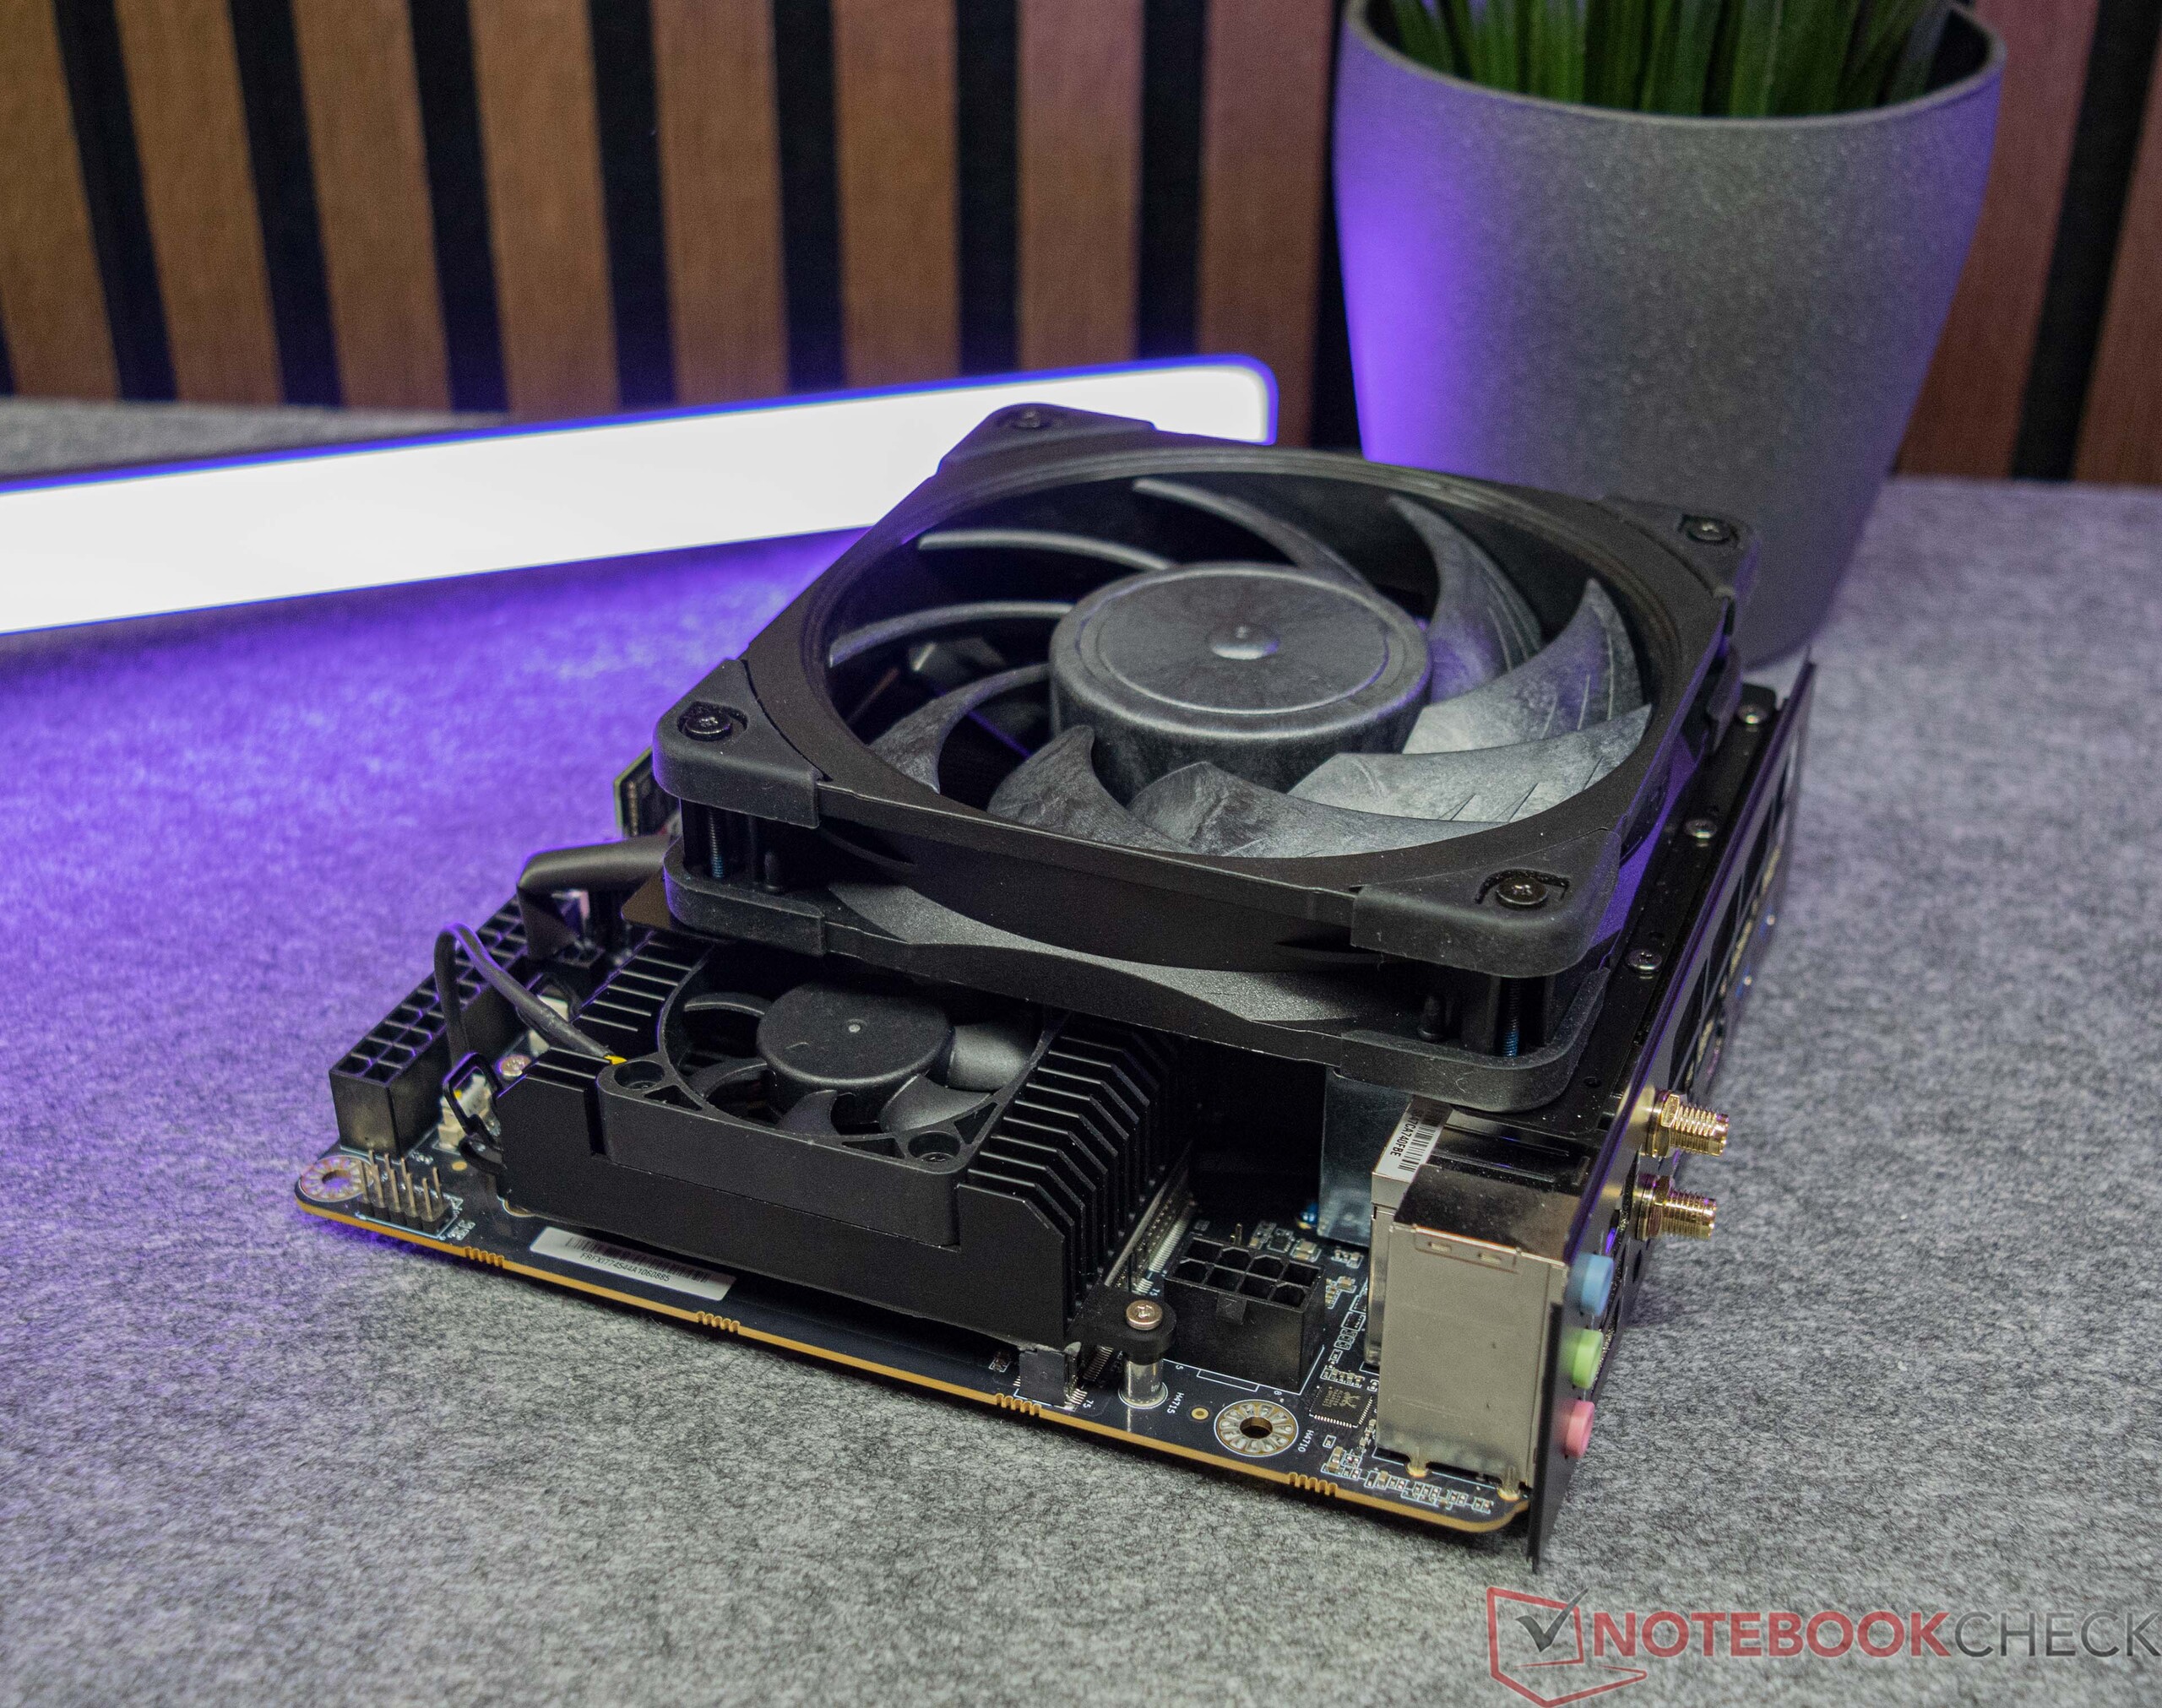
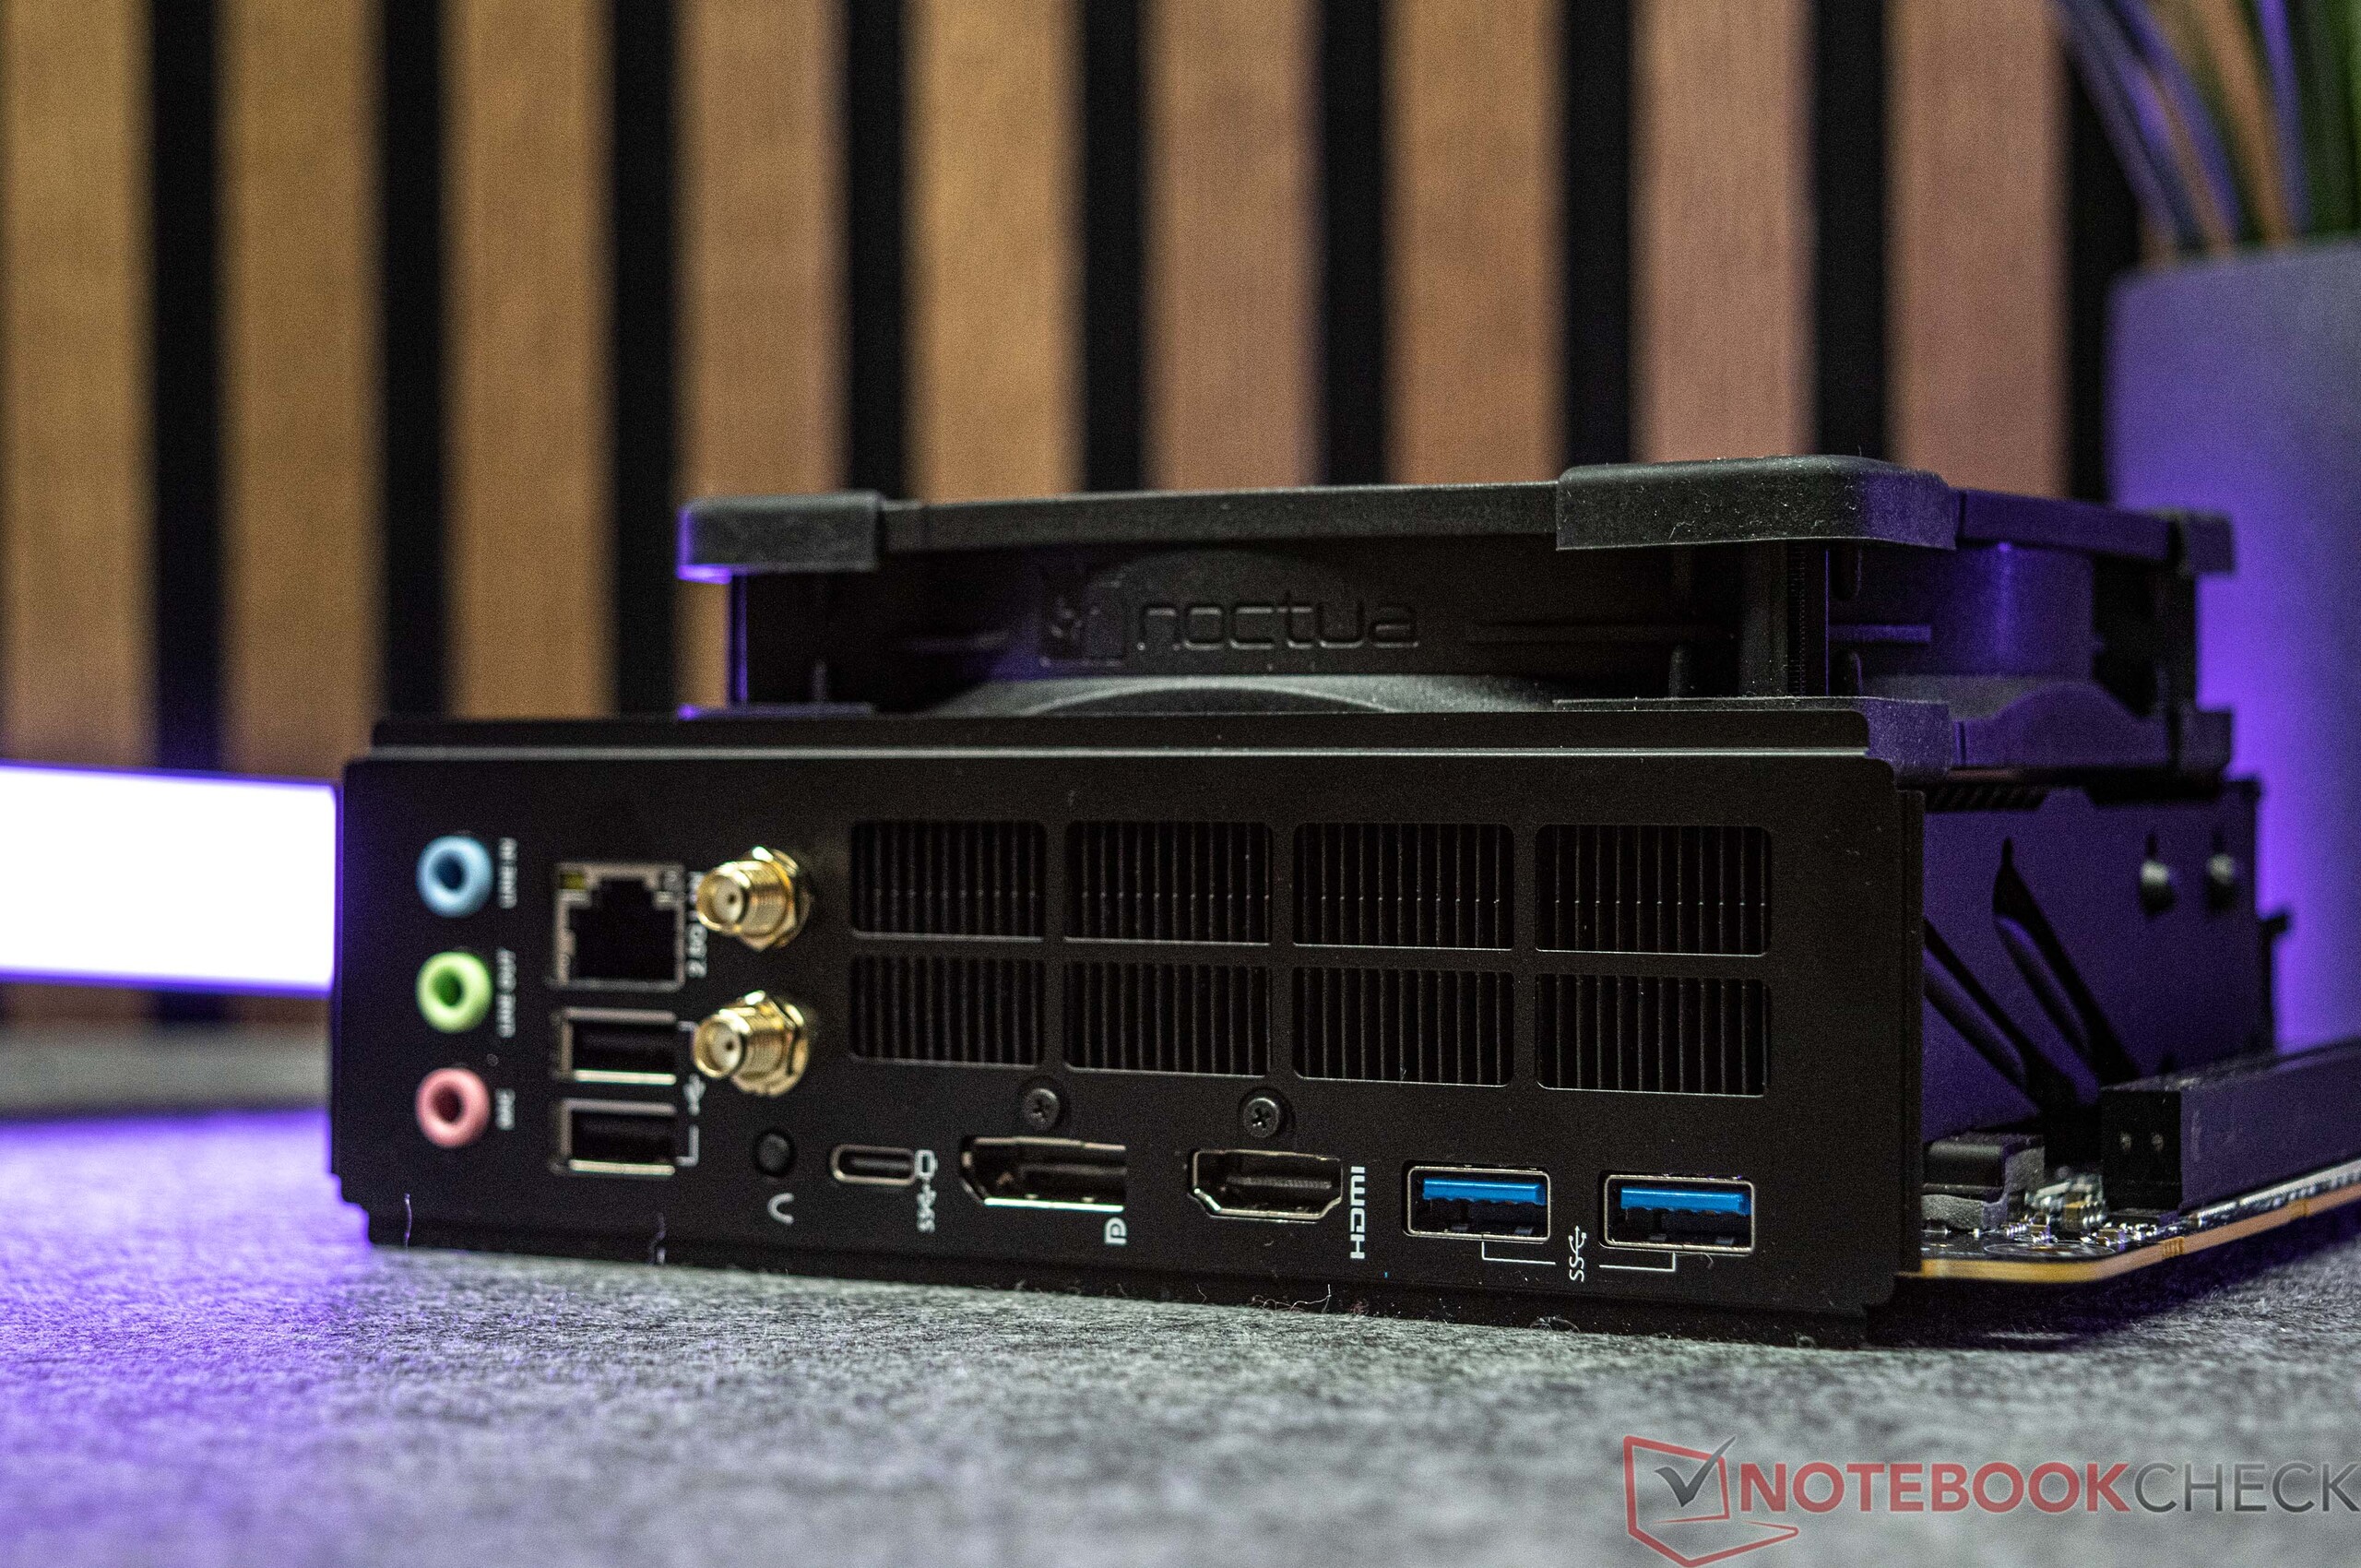
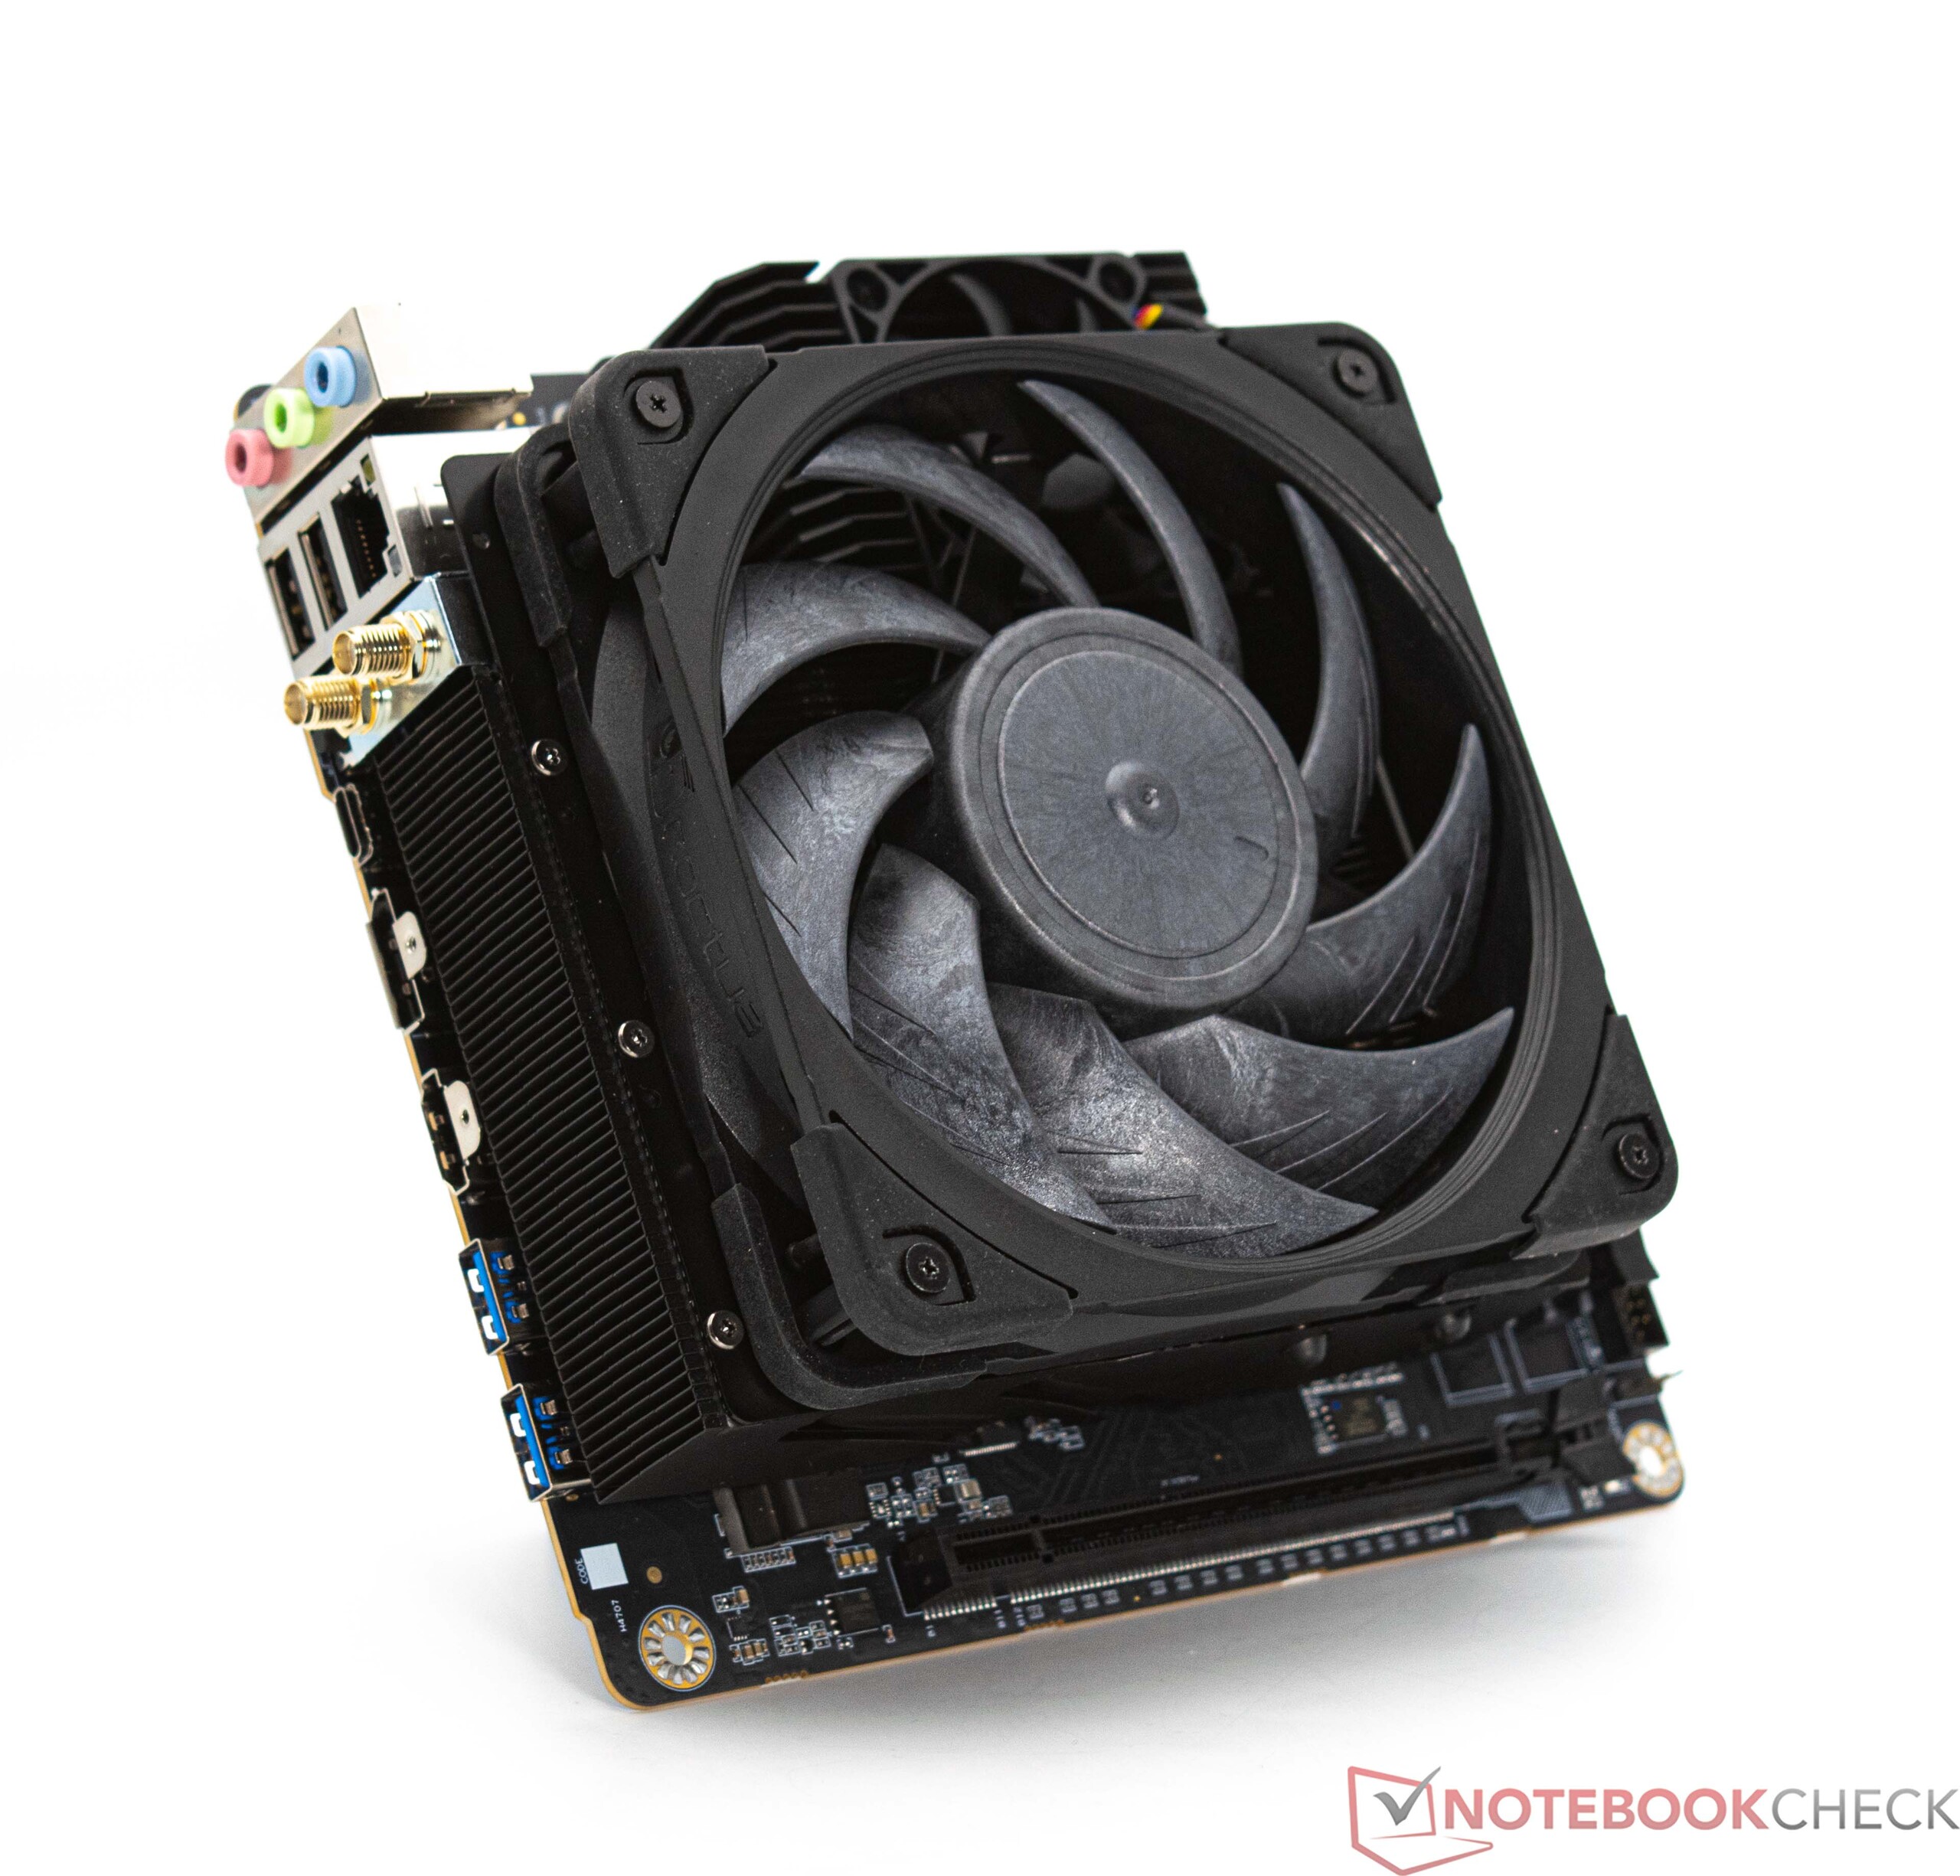
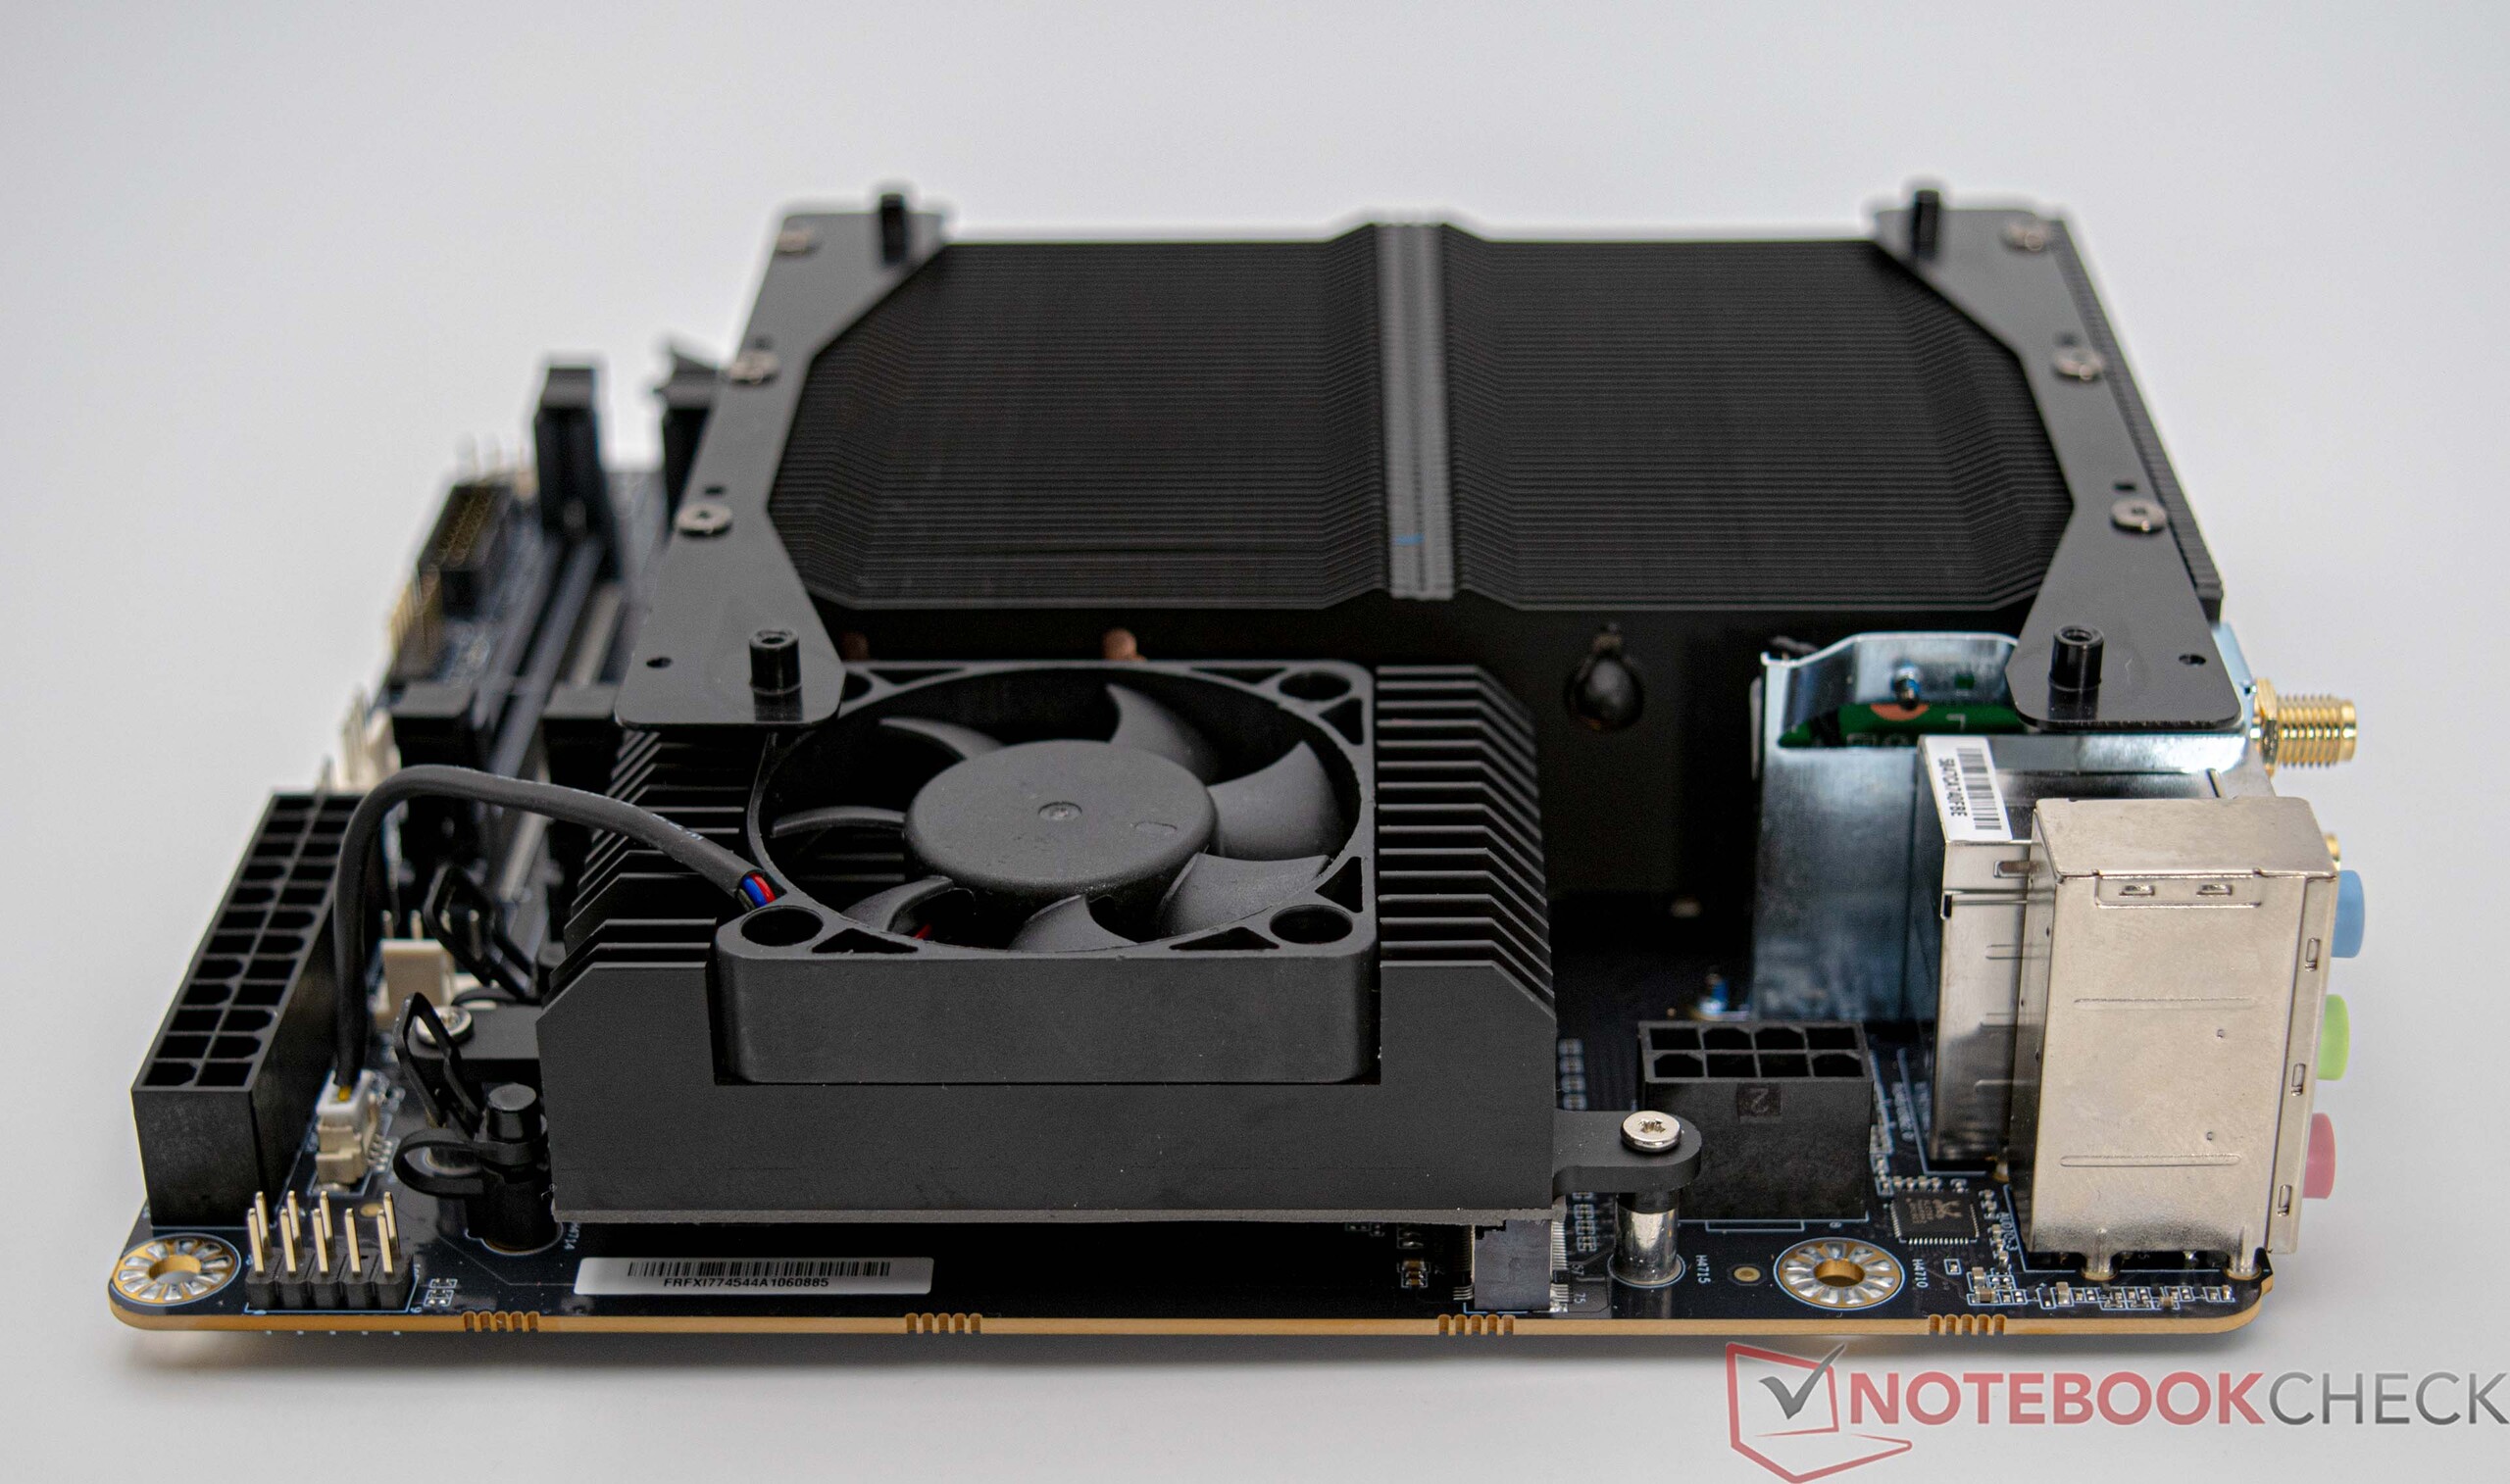
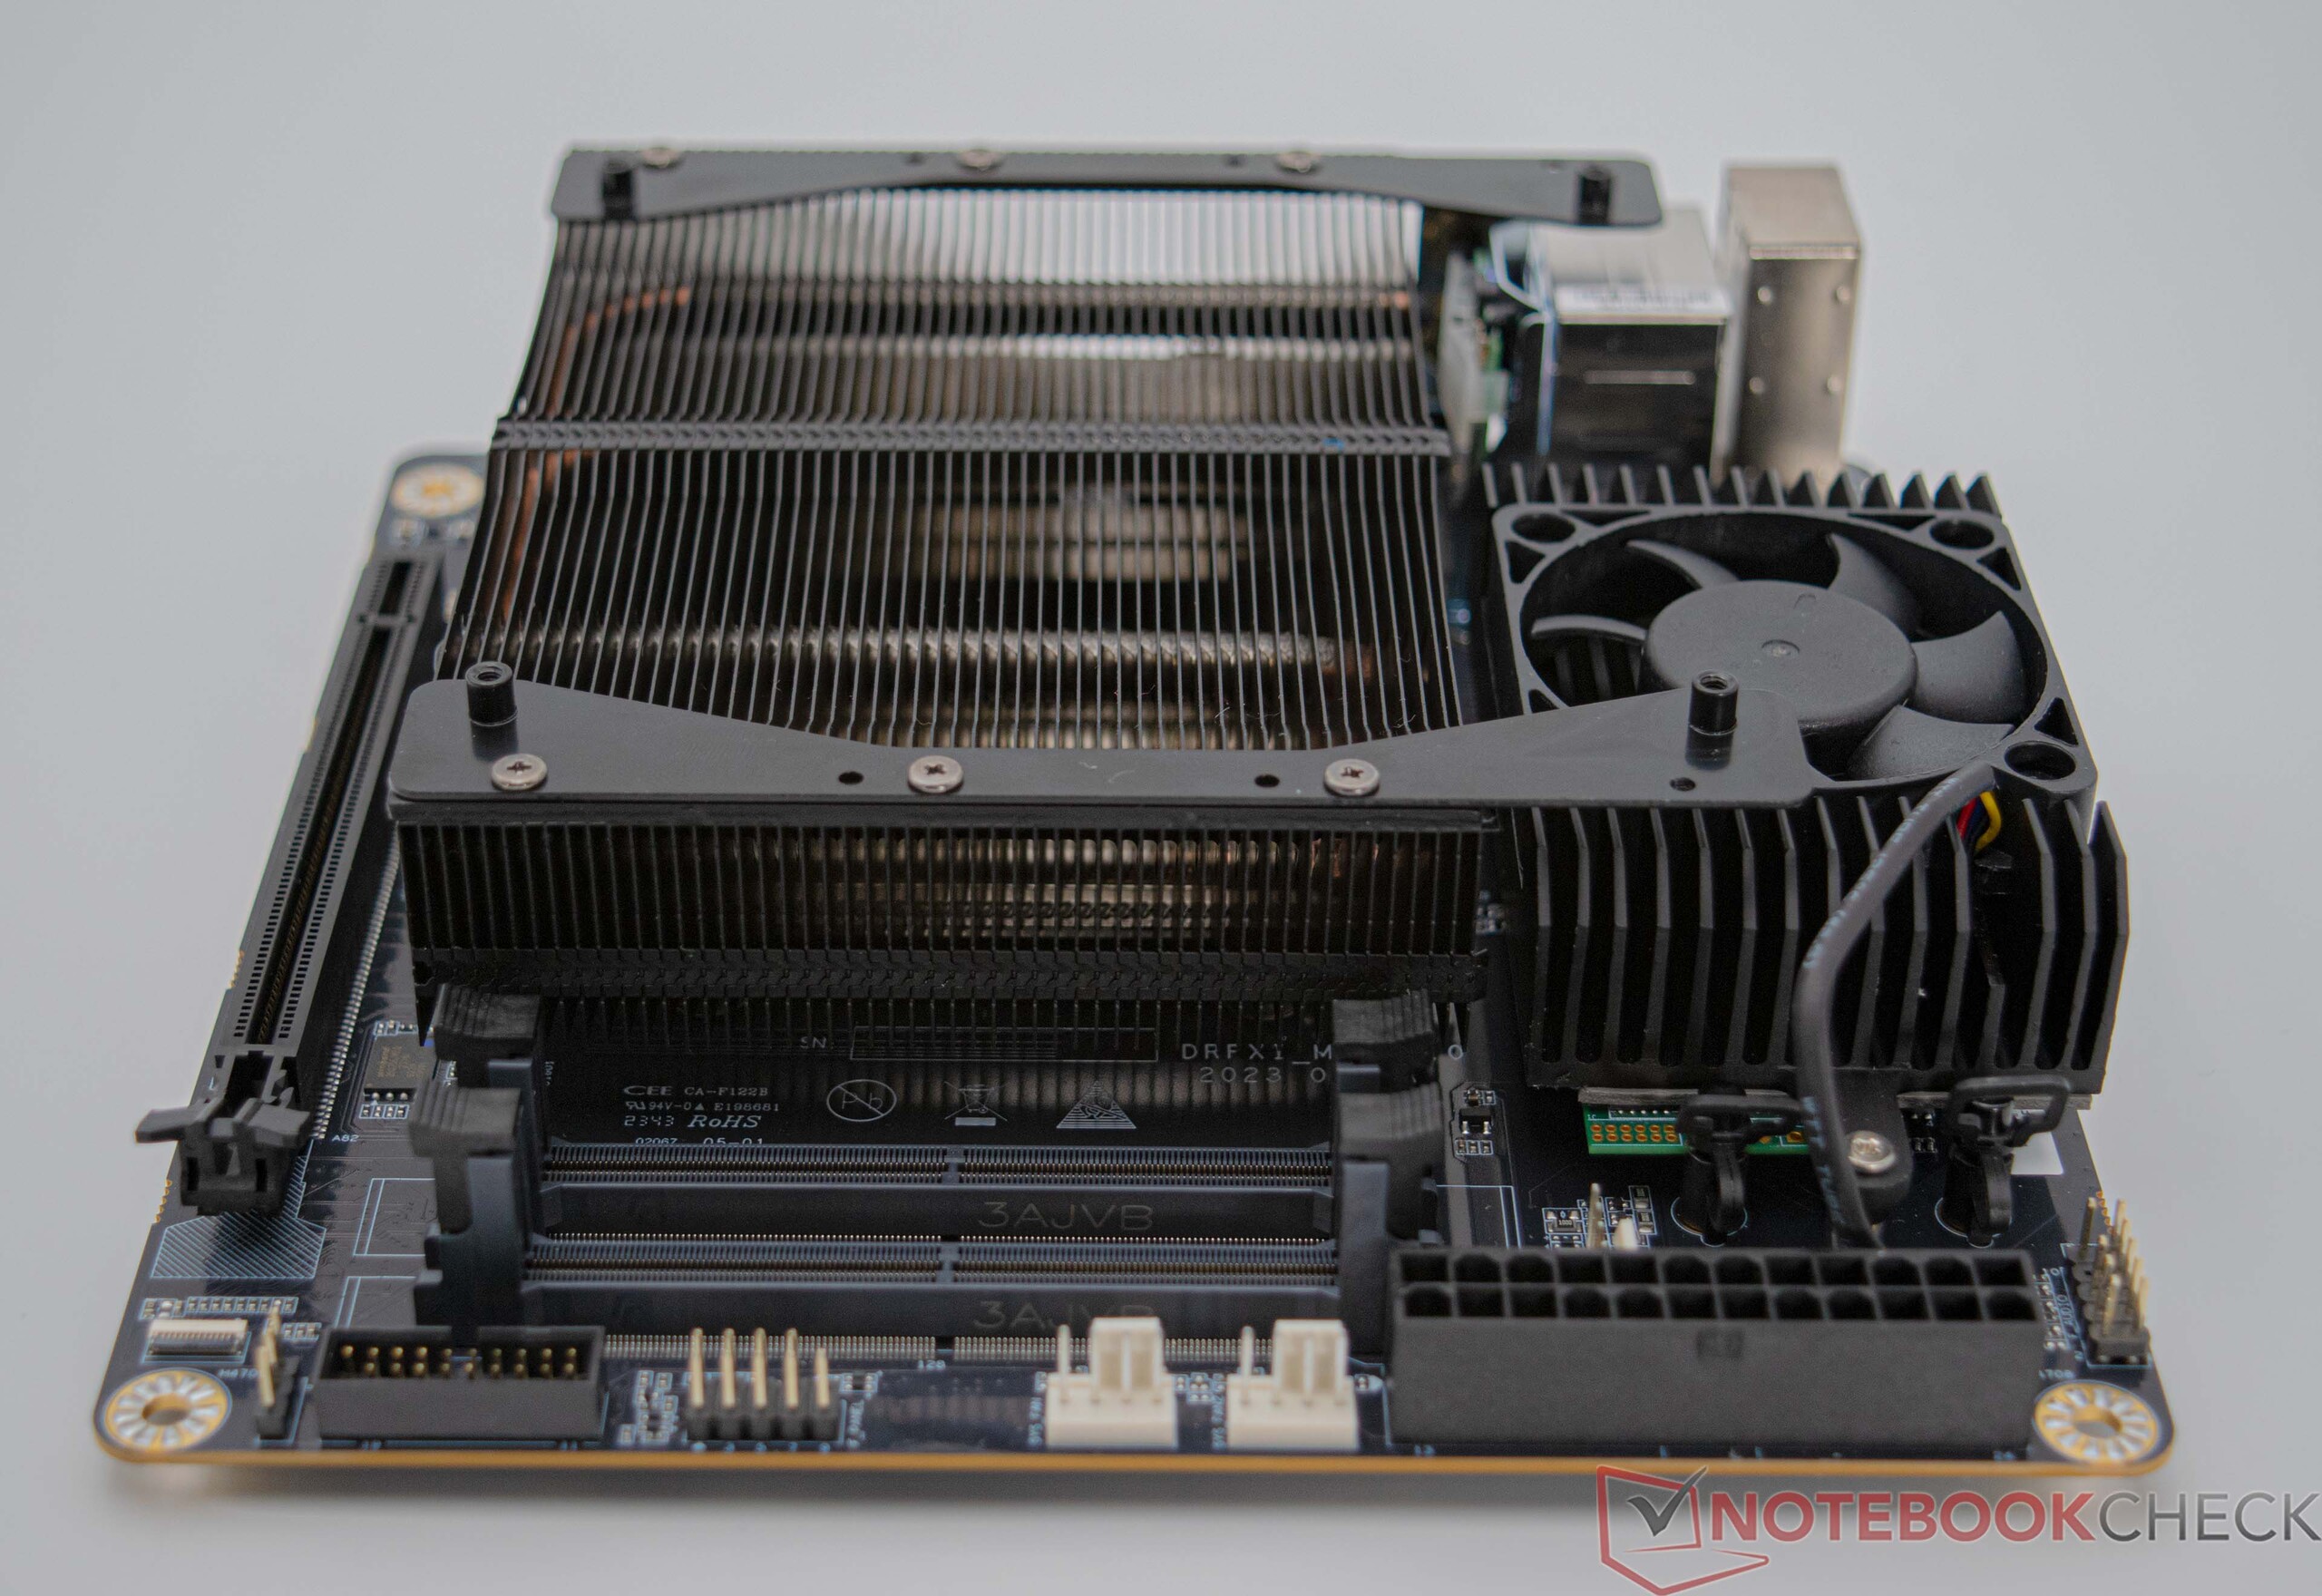
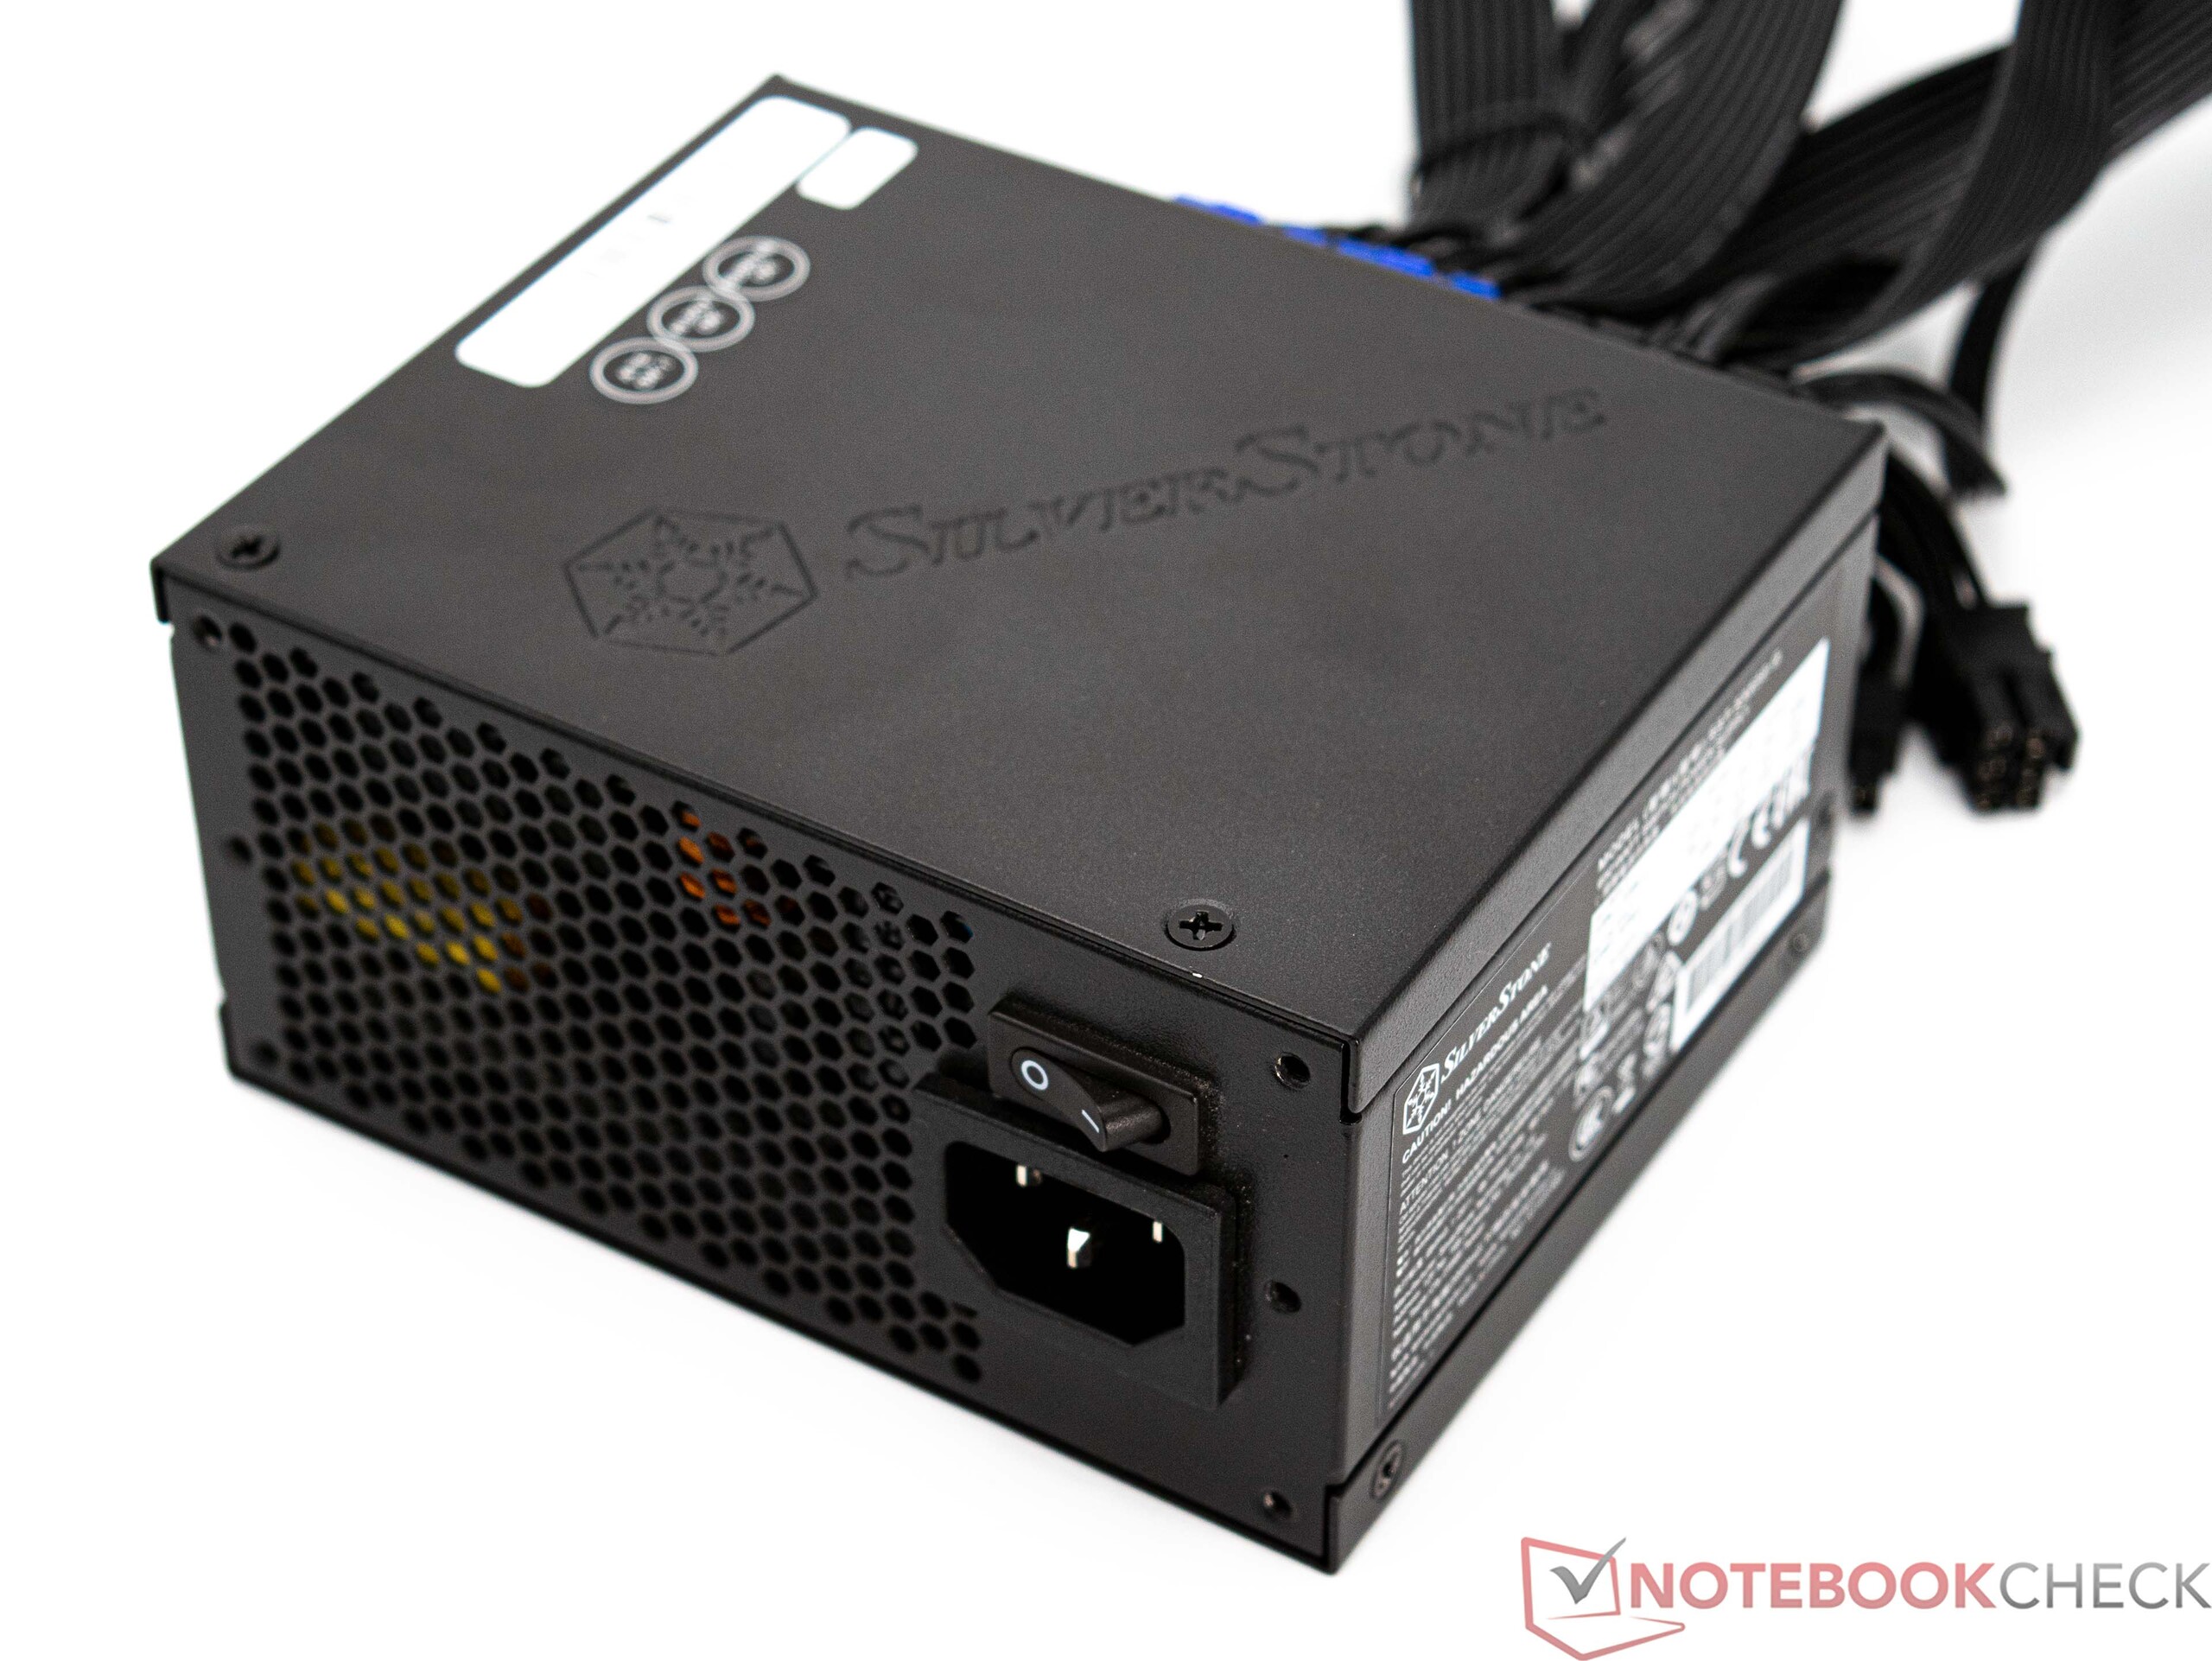
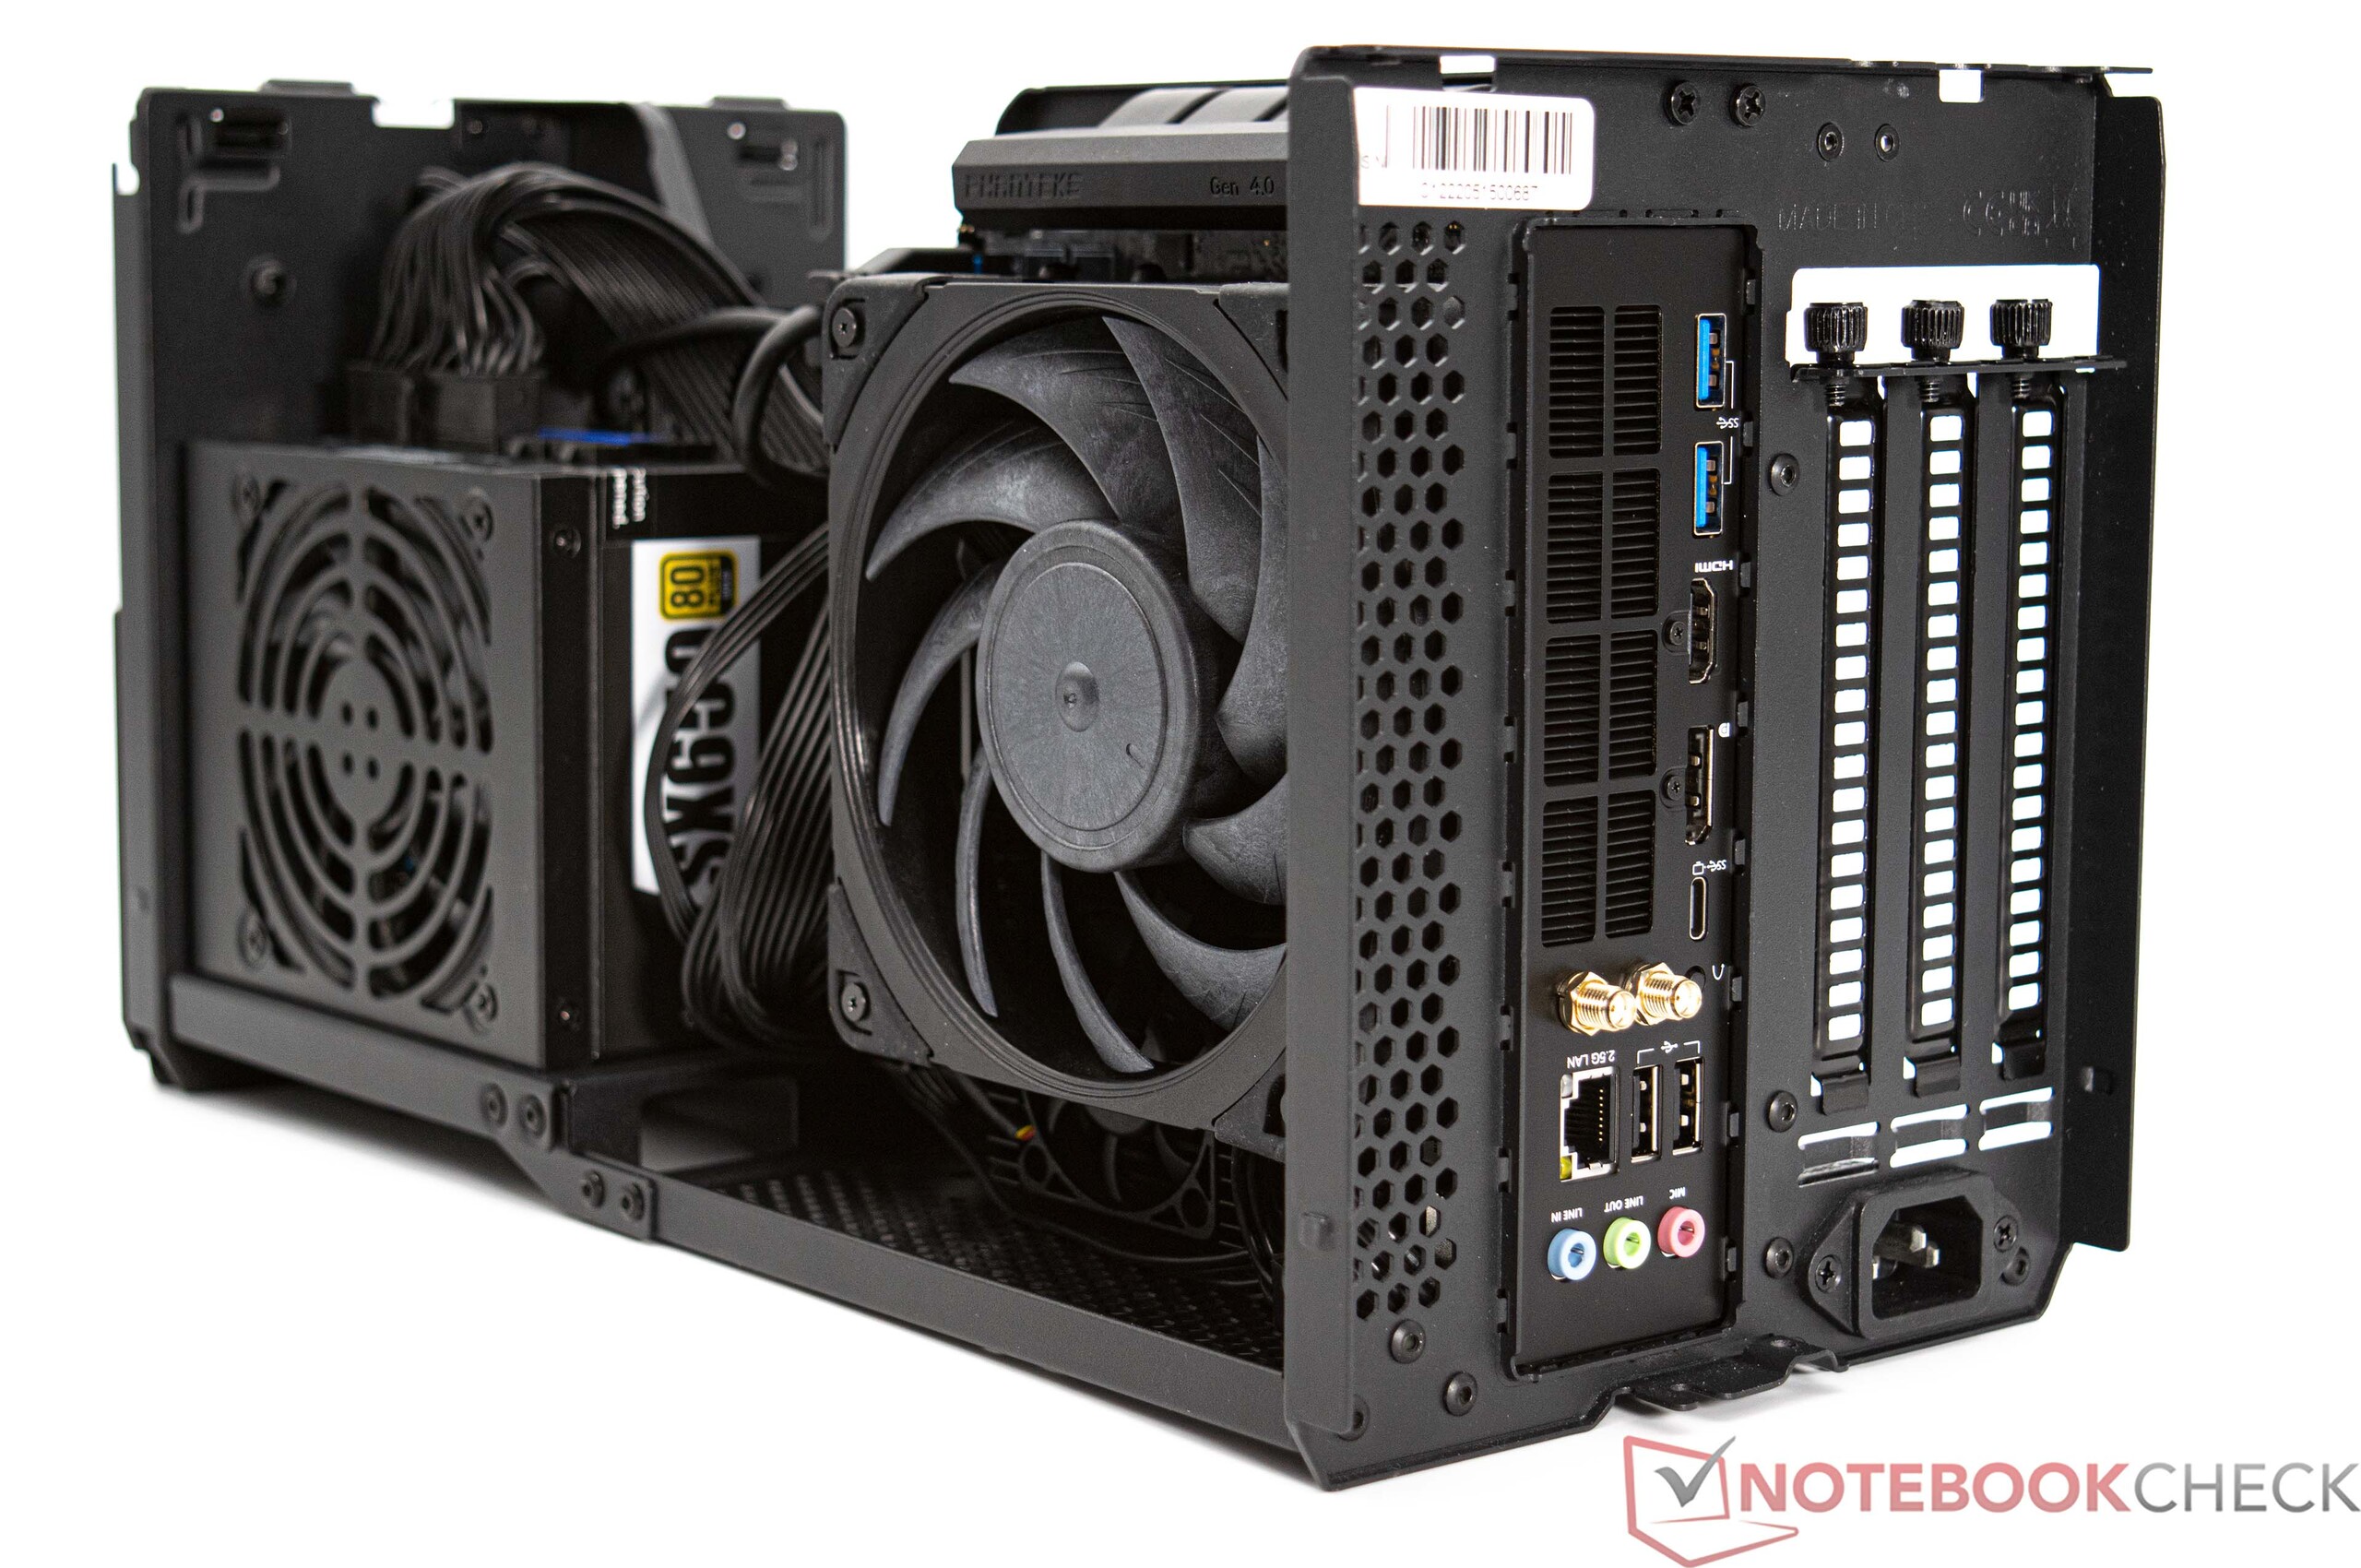
La entrega incluye la placa base Minisforum BD770i con un disipador de calor SoC ya montado. Además, también se incluye una antena WLAN relativamente grande con un soporte magnético y el blindaje IO correspondiente. Para el funcionamiento del Minisforum BD770i se necesitan otras piezas. El fabricante no ofrece ni un ventilador de 120 milímetros ni RAM o SSD preinstalados. Además, se necesita una fuente de alimentación de PC adecuada; debe ser pequeña y en formato SFX para que quepa en la caja Phanteks Enthoo Evolv Shift XT. En consecuencia, el Minisforum BD770i sirve como base sólida para un PC DIY compacto en formato miniatura.

Puntos de referencia del procesador
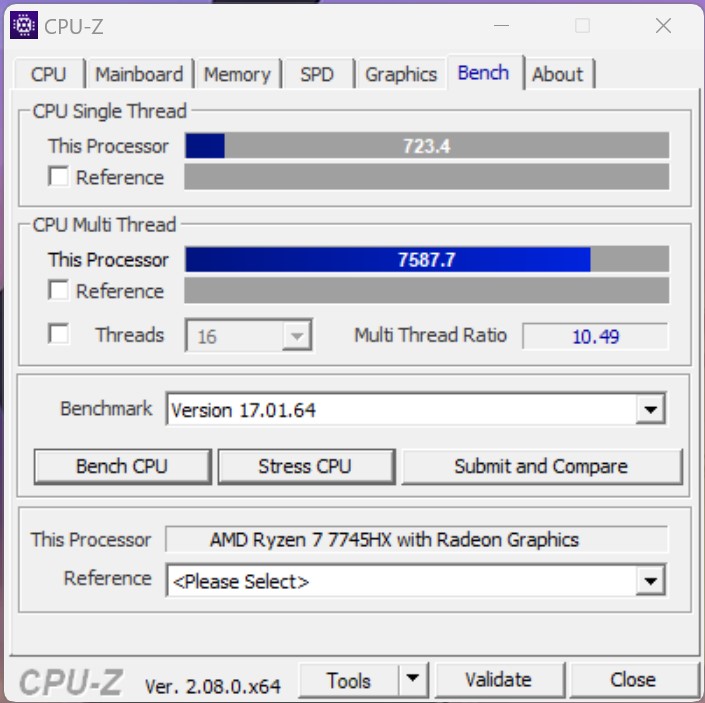
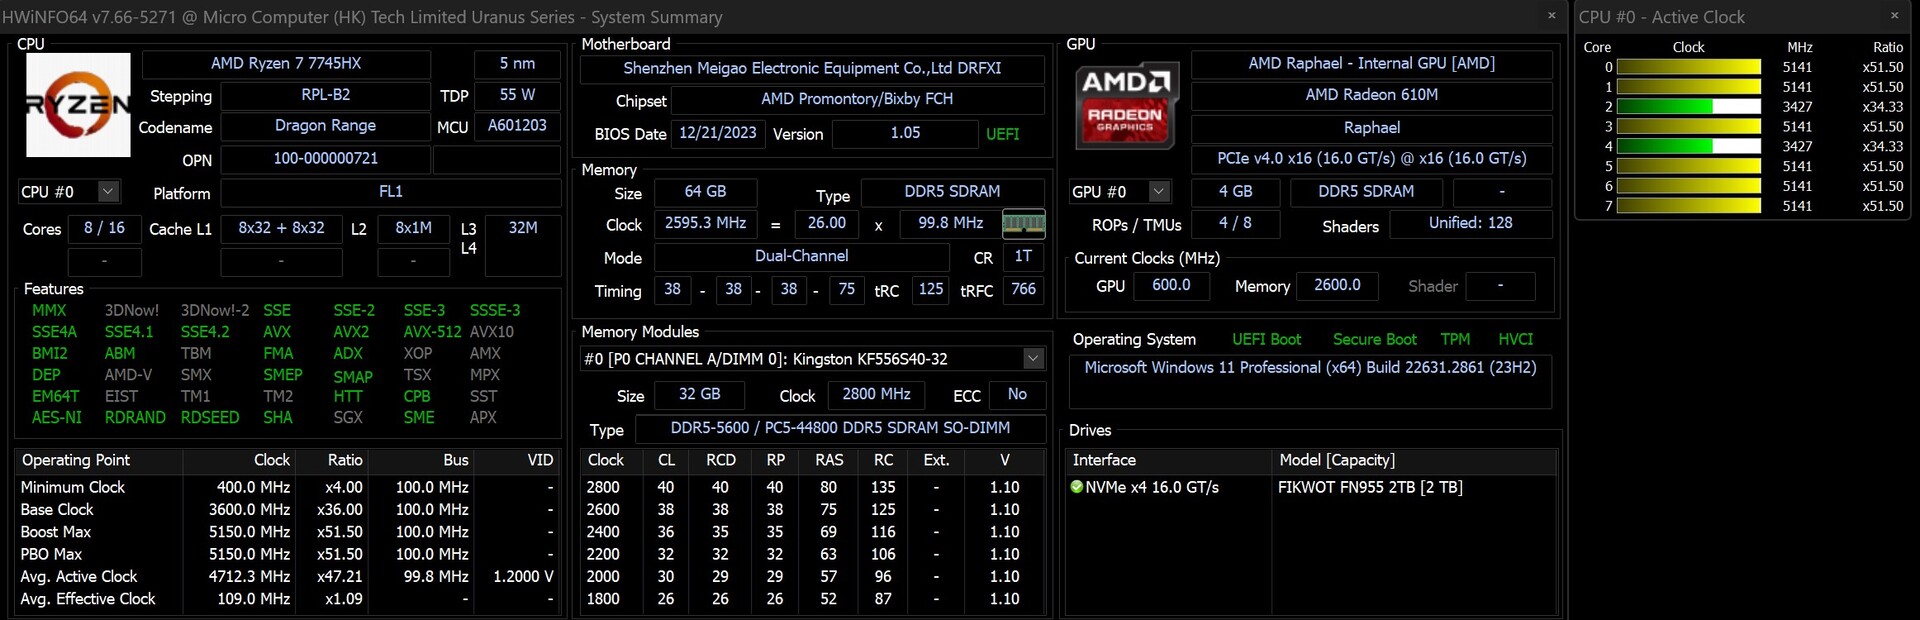
Equipado con el AMD Ryzen 7 7745HX, la placa base Minisforum BD770i incorpora un SoC moderno, aunque no los últimos procesadores AMD. No obstante, el SoC instalado destaca con sus ocho núcleos Zen4 capaces de procesar 16 hilos. La excelente refrigeración garantiza un alto rendimiento constante, y las limitaciones térmicas no son tan graves como en los portátiles o mini PC. En nuestra evaluación de rendimiento, el AMD Ryzen 7 7745HX siguió de cerca a un AMD Ryzen 7 7800X3D. En comparación con Intel, superó a un Core i5-12600K, aunque un Intel Core i5-13600K rindió ligeramente mejor. Apreciamos la estrategia de integrar un procesador móvil en un PC de sobremesa tradicional, ya que estas CPU suelen ser más fáciles de refrigerar sin dejar de ofrecer un rendimiento encomiable. Incluso un Intel Core i5-14600K sólo alcanza un diez por ciento de ventaja en la clasificación de rendimiento. Esto puso de manifiesto la evolución positiva del rendimiento de los SoC móviles con una refrigeración eficaz. Durante las pruebas individuales, es posible que el AMD Ryzen 7 7745HX no iguale el rendimiento de los conocidos modelos insignia debido a su menor número de núcleos.
Cabe destacar la comparación del AMD Ryzen 7 7840HS y el AMD Ryzen 9 7940HSque fueron ambos evaluados en mini PC de Minisforum (Minisforum EliteMini UM780 XTX y Minisforum Serie Venus UM790 Pro). No hay que pasar por alto el hecho de que los dos modelos HS consumen marginalmente menos energía. No obstante, resulta evidente que los SoC móviles pueden ofrecer un rendimiento significativamente mayor con una refrigeración eficaz. Para ello se requieren unos ajustes UEFI adecuados que permitan al procesador recibir una potencia más sostenida, siempre que las condiciones térmicas lo permitan. El BD770i de Minisforum no limita artificialmente los valores, y el límite de potencia puede ajustarse manualmente. En el estado predeterminado, documentamos un consumo de energía estable de 75 vatios para el AMD Ryzen 7 7745HX.
Para más comparaciones y puntos de referencia, consulte nuestra tabla comparativa de CPUs Procesadores mobiles - lista de benchmarks (nueva) .
| Performance rating - Percent | |
| Intel Core i9-14900K | |
| Intel Core i9-13900K | |
| AMD Ryzen 9 7950X | |
| AMD Ryzen 9 7950X3D | |
| AMD Ryzen 9 7900X | |
| Intel Core i5-14600K | |
| Intel Core i9-12900K | |
| AMD Ryzen 9 5950X | |
| Intel Core i5-13600K | |
| AMD Ryzen 7 7800X3D | |
| AMD Ryzen 7 7745HX | |
| AMD Ryzen 5 7600X | |
| Intel Core i5-12600K | |
| AMD Ryzen 7 7840HS | |
| AMD Ryzen 9 7940HS | |
| Intel Core i5-13400 | |
| Intel Core i5-12400F | |
| Cinebench R15 | |
| CPU Single 64Bit | |
| Intel Core i9-14900K | |
| AMD Ryzen 9 7950X | |
| Intel Core i9-13900K | |
| AMD Ryzen 9 7950X3D | |
| AMD Ryzen 9 7900X | |
| AMD Ryzen 5 7600X | |
| Intel Core i5-14600K | |
| AMD Ryzen 7 7745HX | |
| AMD Ryzen 7 7800X3D | |
| Intel Core i5-13600K | |
| Intel Core i9-12900K | |
| AMD Ryzen 9 7940HS | |
| AMD Ryzen 7 7840HS | |
| Intel Core i5-12600K | |
| AMD Ryzen 9 5950X | |
| Intel Core i5-13400 | |
| Intel Core i5-12400F | |
| CPU Multi 64Bit | |
| Intel Core i9-14900K | |
| AMD Ryzen 9 7950X | |
| Intel Core i9-13900K | |
| AMD Ryzen 9 7950X3D | |
| AMD Ryzen 9 7900X | |
| AMD Ryzen 9 5950X | |
| Intel Core i9-12900K | |
| Intel Core i5-13600K | |
| Intel Core i5-14600K | |
| AMD Ryzen 7 7745HX | |
| AMD Ryzen 7 7800X3D | |
| AMD Ryzen 9 7940HS | |
| AMD Ryzen 7 7840HS | |
| Intel Core i5-12600K | |
| AMD Ryzen 5 7600X | |
| Intel Core i5-13400 | |
| Intel Core i5-12400F | |
| Cinebench R20 | |
| CPU (Single Core) | |
| Intel Core i9-14900K | |
| Intel Core i9-13900K | |
| AMD Ryzen 9 7950X | |
| AMD Ryzen 9 7950X3D | |
| Intel Core i5-14600K | |
| AMD Ryzen 9 7900X | |
| Intel Core i5-13600K | |
| Intel Core i9-12900K | |
| AMD Ryzen 5 7600X | |
| Intel Core i5-12600K | |
| AMD Ryzen 7 7745HX | |
| AMD Ryzen 9 7940HS | |
| AMD Ryzen 7 7800X3D | |
| AMD Ryzen 7 7840HS | |
| Intel Core i5-13400 | |
| Intel Core i5-12400F | |
| AMD Ryzen 9 5950X | |
| CPU (Multi Core) | |
| Intel Core i9-14900K | |
| Intel Core i9-13900K | |
| AMD Ryzen 9 7950X | |
| AMD Ryzen 9 7950X3D | |
| AMD Ryzen 9 7900X | |
| AMD Ryzen 9 5950X | |
| Intel Core i9-12900K | |
| Intel Core i5-14600K | |
| Intel Core i5-13600K | |
| AMD Ryzen 7 7745HX | |
| AMD Ryzen 7 7800X3D | |
| Intel Core i5-12600K | |
| AMD Ryzen 9 7940HS | |
| AMD Ryzen 7 7840HS | |
| Intel Core i5-13400 | |
| AMD Ryzen 5 7600X | |
| Intel Core i5-12400F | |
| Cinebench R23 | |
| Single Core | |
| Intel Core i9-14900K | |
| Intel Core i9-13900K | |
| Intel Core i5-14600K | |
| AMD Ryzen 9 7950X3D | |
| AMD Ryzen 9 7950X | |
| AMD Ryzen 9 7900X | |
| Intel Core i5-13600K | |
| Intel Core i9-12900K | |
| AMD Ryzen 5 7600X | |
| Intel Core i5-12600K | |
| AMD Ryzen 7 7745HX | |
| AMD Ryzen 7 7800X3D | |
| AMD Ryzen 9 7940HS | |
| Intel Core i5-13400 | |
| AMD Ryzen 7 7840HS | |
| Intel Core i5-12400F | |
| AMD Ryzen 9 5950X | |
| Multi Core | |
| Intel Core i9-14900K | |
| Intel Core i9-13900K | |
| AMD Ryzen 9 7950X | |
| AMD Ryzen 9 7950X3D | |
| AMD Ryzen 9 7900X | |
| AMD Ryzen 9 5950X | |
| Intel Core i9-12900K | |
| Intel Core i5-14600K | |
| Intel Core i5-13600K | |
| AMD Ryzen 7 7745HX | |
| AMD Ryzen 7 7800X3D | |
| Intel Core i5-12600K | |
| AMD Ryzen 9 7940HS | |
| AMD Ryzen 7 7840HS | |
| Intel Core i5-13400 | |
| AMD Ryzen 5 7600X | |
| Intel Core i5-12400F | |
| Cinebench R11.5 | |
| CPU Single 64Bit | |
| Intel Core i9-14900K | |
| Intel Core i9-13900K | |
| AMD Ryzen 9 7950X | |
| AMD Ryzen 9 7950X3D | |
| AMD Ryzen 9 7900X | |
| AMD Ryzen 5 7600X | |
| Intel Core i5-14600K | |
| AMD Ryzen 7 7745HX | |
| Intel Core i9-12900K | |
| Intel Core i5-13600K | |
| AMD Ryzen 9 7940HS | |
| AMD Ryzen 7 7800X3D | |
| AMD Ryzen 7 7840HS | |
| Intel Core i5-12600K | |
| AMD Ryzen 9 5950X | |
| Intel Core i5-13400 | |
| Intel Core i5-12400F | |
| CPU Multi 64Bit | |
| Intel Core i9-14900K | |
| Intel Core i9-13900K | |
| AMD Ryzen 9 7950X | |
| AMD Ryzen 9 7950X3D | |
| AMD Ryzen 9 7900X | |
| AMD Ryzen 9 5950X | |
| Intel Core i9-12900K | |
| Intel Core i5-13600K | |
| Intel Core i5-14600K | |
| AMD Ryzen 7 7745HX | |
| AMD Ryzen 7 7800X3D | |
| AMD Ryzen 9 7940HS | |
| AMD Ryzen 7 7840HS | |
| Intel Core i5-12600K | |
| AMD Ryzen 5 7600X | |
| Intel Core i5-13400 | |
| Intel Core i5-12400F | |
| Cinebench R10 | |
| Rendering Single CPUs 64Bit | |
| Intel Core i9-14900K | |
| Intel Core i9-13900K | |
| Intel Core i5-14600K | |
| AMD Ryzen 9 7900X | |
| AMD Ryzen 9 7950X | |
| Intel Core i5-13600K | |
| Intel Core i9-12900K | |
| AMD Ryzen 5 7600X | |
| Intel Core i5-12600K | |
| AMD Ryzen 7 7745HX | |
| AMD Ryzen 9 7940HS | |
| AMD Ryzen 7 7800X3D | |
| AMD Ryzen 7 7840HS | |
| Intel Core i5-13400 | |
| Intel Core i5-12400F | |
| AMD Ryzen 9 5950X | |
| AMD Ryzen 9 7950X3D | |
| Rendering Multiple CPUs 64Bit | |
| Intel Core i9-14900K | |
| Intel Core i9-13900K | |
| AMD Ryzen 9 7950X | |
| AMD Ryzen 9 7900X | |
| Intel Core i5-14600K | |
| Intel Core i9-12900K | |
| Intel Core i5-13600K | |
| AMD Ryzen 9 5950X | |
| AMD Ryzen 7 7745HX | |
| AMD Ryzen 7 7800X3D | |
| AMD Ryzen 5 7600X | |
| Intel Core i5-12600K | |
| AMD Ryzen 9 7940HS | |
| AMD Ryzen 7 7840HS | |
| Intel Core i5-13400 | |
| AMD Ryzen 9 7950X3D | |
| Intel Core i5-12400F | |
| Blender - v2.79 BMW27 CPU | |
| Intel Core i5-12400F | |
| Intel Core i5-13400 | |
| AMD Ryzen 5 7600X | |
| AMD Ryzen 7 7840HS | |
| Intel Core i5-12600K | |
| AMD Ryzen 9 7940HS | |
| AMD Ryzen 7 7800X3D | |
| AMD Ryzen 7 7745HX | |
| Intel Core i5-13600K | |
| Intel Core i5-14600K | |
| Intel Core i9-12900K | |
| AMD Ryzen 9 5950X | |
| AMD Ryzen 9 7900X | |
| AMD Ryzen 9 7950X3D | |
| AMD Ryzen 9 7950X | |
| Intel Core i9-13900K | |
| Intel Core i9-14900K | |
| wPrime 2.10 | |
| 32m | |
| Intel Core i9-12900K | |
| Intel Core i5-12600K | |
| Intel Core i5-12400F | |
| Intel Core i5-13400 | |
| AMD Ryzen 5 7600X | |
| AMD Ryzen 9 7940HS | |
| AMD Ryzen 7 7840HS | |
| AMD Ryzen 9 5950X | |
| Intel Core i5-13600K | |
| AMD Ryzen 7 7800X3D | |
| Intel Core i5-14600K | |
| AMD Ryzen 7 7745HX | |
| Intel Core i9-14900K | |
| AMD Ryzen 9 7950X3D | |
| Intel Core i9-13900K | |
| AMD Ryzen 9 7900X | |
| AMD Ryzen 9 7950X | |
| 1024m | |
| Intel Core i5-13400 | |
| Intel Core i5-12600K | |
| Intel Core i9-12900K | |
| Intel Core i5-13600K | |
| Intel Core i5-14600K | |
| Intel Core i5-12400F | |
| Intel Core i9-13900K | |
| AMD Ryzen 5 7600X | |
| Intel Core i9-14900K | |
| AMD Ryzen 7 7840HS | |
| AMD Ryzen 9 7940HS | |
| AMD Ryzen 9 5950X | |
| AMD Ryzen 7 7800X3D | |
| AMD Ryzen 7 7745HX | |
| AMD Ryzen 9 7900X | |
| AMD Ryzen 9 7950X3D | |
| AMD Ryzen 9 7950X | |
| X264 HD Benchmark 4.0 | |
| Pass 1 | |
| Intel Core i9-14900K | |
| Intel Core i9-13900K | |
| Intel Core i5-14600K | |
| AMD Ryzen 9 7950X3D | |
| Intel Core i5-13600K | |
| AMD Ryzen 9 7950X | |
| AMD Ryzen 9 7900X | |
| Intel Core i9-12900K | |
| AMD Ryzen 5 7600X | |
| AMD Ryzen 7 7745HX | |
| AMD Ryzen 7 7800X3D | |
| AMD Ryzen 9 5950X | |
| Intel Core i5-12600K | |
| Intel Core i5-13400 | |
| AMD Ryzen 9 7940HS | |
| AMD Ryzen 7 7840HS | |
| Intel Core i5-12400F | |
| Pass 2 | |
| Intel Core i9-14900K | |
| Intel Core i9-13900K | |
| AMD Ryzen 9 7950X | |
| AMD Ryzen 9 7950X3D | |
| AMD Ryzen 9 7900X | |
| AMD Ryzen 9 5950X | |
| Intel Core i5-14600K | |
| Intel Core i9-12900K | |
| Intel Core i5-13600K | |
| AMD Ryzen 7 7745HX | |
| AMD Ryzen 7 7800X3D | |
| AMD Ryzen 9 7940HS | |
| AMD Ryzen 7 7840HS | |
| Intel Core i5-12600K | |
| AMD Ryzen 5 7600X | |
| Intel Core i5-13400 | |
| Intel Core i5-12400F | |
| WinRAR - Result | |
| AMD Ryzen 9 7900X | |
| AMD Ryzen 7 7800X3D | |
| AMD Ryzen 9 7950X | |
| AMD Ryzen 5 7600X | |
| Intel Core i9-14900K | |
| AMD Ryzen 9 7950X3D | |
| Intel Core i9-13900K | |
| AMD Ryzen 7 7745HX | |
| AMD Ryzen 9 5950X | |
| Intel Core i5-14600K | |
| Intel Core i5-13600K | |
| Intel Core i9-12900K | |
| Intel Core i5-13400 | |
| Intel Core i5-12400F | |
| AMD Ryzen 7 7840HS | |
| AMD Ryzen 9 7940HS | |
| Intel Core i5-12600K | |
| Geekbench 5.5 | |
| Multi-Core | |
| Intel Core i9-14900K | |
| AMD Ryzen 9 7950X | |
| AMD Ryzen 9 7950X3D | |
| Intel Core i9-13900K | |
| AMD Ryzen 9 7900X | |
| Intel Core i9-12900K | |
| Intel Core i5-14600K | |
| AMD Ryzen 9 5950X | |
| Intel Core i5-13600K | |
| AMD Ryzen 7 7800X3D | |
| AMD Ryzen 7 7745HX | |
| Intel Core i5-12600K | |
| AMD Ryzen 7 7840HS | |
| Intel Core i5-13400 | |
| AMD Ryzen 5 7600X | |
| AMD Ryzen 9 7940HS | |
| Intel Core i5-12400F | |
| Single-Core | |
| AMD Ryzen 9 7950X | |
| AMD Ryzen 9 7950X3D | |
| Intel Core i9-13900K | |
| AMD Ryzen 9 7900X | |
| Intel Core i9-14900K | |
| AMD Ryzen 5 7600X | |
| AMD Ryzen 7 7745HX | |
| Intel Core i9-12900K | |
| AMD Ryzen 7 7800X3D | |
| Intel Core i5-14600K | |
| AMD Ryzen 9 7940HS | |
| Intel Core i5-13600K | |
| AMD Ryzen 7 7840HS | |
| Intel Core i5-12600K | |
| Intel Core i5-13400 | |
| Intel Core i5-12400F | |
| AMD Ryzen 9 5950X | |
| Geekbench 5.0 | |
| 5.0 Multi-Core | |
| Intel Core i9-14900K | |
| AMD Ryzen 9 7950X | |
| Intel Core i9-13900K | |
| AMD Ryzen 9 7950X3D | |
| AMD Ryzen 9 7900X | |
| Intel Core i9-12900K | |
| Intel Core i5-14600K | |
| Intel Core i5-13600K | |
| AMD Ryzen 9 5950X | |
| AMD Ryzen 7 7800X3D | |
| AMD Ryzen 7 7745HX | |
| Intel Core i5-12600K | |
| AMD Ryzen 7 7840HS | |
| AMD Ryzen 5 7600X | |
| Intel Core i5-13400 | |
| AMD Ryzen 9 7940HS | |
| Intel Core i5-12400F | |
| 5.0 Single-Core | |
| Intel Core i9-14900K | |
| AMD Ryzen 9 7950X | |
| Intel Core i9-13900K | |
| AMD Ryzen 9 7900X | |
| AMD Ryzen 9 7950X3D | |
| AMD Ryzen 5 7600X | |
| Intel Core i5-14600K | |
| AMD Ryzen 7 7745HX | |
| Intel Core i9-12900K | |
| AMD Ryzen 7 7800X3D | |
| Intel Core i5-13600K | |
| AMD Ryzen 7 7840HS | |
| AMD Ryzen 9 7940HS | |
| Intel Core i5-12600K | |
| Intel Core i5-13400 | |
| AMD Ryzen 9 5950X | |
| Intel Core i5-12400F | |
| Geekbench 4.4 | |
| 64 Bit Single-Core Score | |
| Intel Core i9-14900K | |
| Intel Core i9-13900K | |
| AMD Ryzen 9 7950X | |
| AMD Ryzen 9 7950X3D | |
| AMD Ryzen 9 7900X | |
| AMD Ryzen 7 7800X3D | |
| AMD Ryzen 5 7600X | |
| Intel Core i5-14600K | |
| Intel Core i9-12900K | |
| Intel Core i5-13600K | |
| AMD Ryzen 7 7745HX | |
| Intel Core i5-12600K | |
| AMD Ryzen 7 7840HS | |
| AMD Ryzen 9 7940HS | |
| Intel Core i5-13400 | |
| Intel Core i5-12400F | |
| AMD Ryzen 9 5950X | |
| 64 Bit Multi-Core Score | |
| AMD Ryzen 9 7950X | |
| Intel Core i9-14900K | |
| AMD Ryzen 9 7950X3D | |
| Intel Core i9-13900K | |
| AMD Ryzen 9 7900X | |
| Intel Core i5-14600K | |
| Intel Core i9-12900K | |
| AMD Ryzen 9 5950X | |
| Intel Core i5-13600K | |
| AMD Ryzen 7 7800X3D | |
| AMD Ryzen 7 7745HX | |
| AMD Ryzen 7 7840HS | |
| AMD Ryzen 5 7600X | |
| Intel Core i5-12600K | |
| AMD Ryzen 9 7940HS | |
| Intel Core i5-13400 | |
| Intel Core i5-12400F | |
| 3DMark 11 - 1280x720 Performance Physics | |
| AMD Ryzen 9 7950X3D | |
| AMD Ryzen 7 7800X3D | |
| Intel Core i9-13900K | |
| Intel Core i9-14900K | |
| Intel Core i5-14600K | |
| Intel Core i5-13600K | |
| AMD Ryzen 9 7900X | |
| AMD Ryzen 9 7950X | |
| Intel Core i9-12900K | |
| AMD Ryzen 7 7745HX | |
| AMD Ryzen 5 7600X | |
| AMD Ryzen 9 5950X | |
| Intel Core i5-12600K | |
| Intel Core i5-13400 | |
| AMD Ryzen 7 7840HS | |
| AMD Ryzen 9 7940HS | |
| Intel Core i5-12400F | |
| 7-Zip 18.03 | |
| 7z b 4 | |
| AMD Ryzen 9 7950X | |
| AMD Ryzen 9 7950X3D | |
| Intel Core i9-14900K | |
| Intel Core i9-13900K | |
| AMD Ryzen 9 5950X | |
| AMD Ryzen 9 7900X | |
| Intel Core i9-12900K | |
| Intel Core i5-14600K | |
| Intel Core i5-13600K | |
| AMD Ryzen 7 7800X3D | |
| AMD Ryzen 7 7745HX | |
| AMD Ryzen 7 7840HS | |
| AMD Ryzen 9 7940HS | |
| AMD Ryzen 5 7600X | |
| Intel Core i5-12600K | |
| Intel Core i5-13400 | |
| Intel Core i5-12400F | |
| 7z b 4 -mmt1 | |
| AMD Ryzen 9 7950X | |
| AMD Ryzen 9 7950X3D | |
| AMD Ryzen 9 7900X | |
| AMD Ryzen 7 7800X3D | |
| AMD Ryzen 5 7600X | |
| Intel Core i9-14900K | |
| AMD Ryzen 7 7745HX | |
| Intel Core i9-13900K | |
| AMD Ryzen 9 5950X | |
| Intel Core i5-14600K | |
| AMD Ryzen 9 7940HS | |
| Intel Core i9-12900K | |
| AMD Ryzen 7 7840HS | |
| Intel Core i5-13600K | |
| Intel Core i5-12600K | |
| Intel Core i5-13400 | |
| Intel Core i5-12400F | |
| HWBOT x265 Benchmark v2.2 - 4k Preset | |
| AMD Ryzen 9 7950X | |
| Intel Core i9-14900K | |
| Intel Core i9-13900K | |
| AMD Ryzen 9 7950X3D | |
| AMD Ryzen 9 7900X | |
| AMD Ryzen 9 5950X | |
| Intel Core i5-12600K | |
| Intel Core i9-12900K | |
| Intel Core i5-14600K | |
| Intel Core i5-13600K | |
| AMD Ryzen 7 7800X3D | |
| AMD Ryzen 7 7745HX | |
| AMD Ryzen 5 7600X | |
| AMD Ryzen 7 7840HS | |
| AMD Ryzen 9 7940HS | |
| Intel Core i5-13400 | |
| Intel Core i5-12400F | |
| R Benchmark 2.5 - Overall mean | |
| Intel Core i5-12400F | |
| Intel Core i5-13400 | |
| AMD Ryzen 9 5950X | |
| Intel Core i5-12600K | |
| AMD Ryzen 7 7840HS | |
| Intel Core i9-12900K | |
| AMD Ryzen 9 7940HS | |
| AMD Ryzen 7 7800X3D | |
| AMD Ryzen 7 7745HX | |
| Intel Core i5-13600K | |
| Intel Core i5-14600K | |
| AMD Ryzen 5 7600X | |
| AMD Ryzen 9 7900X | |
| AMD Ryzen 9 7950X3D | |
| AMD Ryzen 9 7950X | |
| Intel Core i9-13900K | |
| Intel Core i9-14900K | |
| LibreOffice - 20 Documents To PDF | |
| Intel Core i5-12600K | |
| AMD Ryzen 7 7840HS | |
| Intel Core i5-12400F | |
| AMD Ryzen 9 7940HS | |
| AMD Ryzen 9 5950X | |
| AMD Ryzen 7 7745HX | |
| AMD Ryzen 7 7800X3D | |
| Intel Core i9-12900K | |
| Intel Core i5-13400 | |
| AMD Ryzen 9 7950X3D | |
| AMD Ryzen 5 7600X | |
| Intel Core i9-13900K | |
| AMD Ryzen 9 7950X | |
| Intel Core i5-13600K | |
| AMD Ryzen 9 7900X | |
| Intel Core i9-14900K | |
| Intel Core i5-14600K | |
| WebXPRT 3 - Overall | |
| AMD Ryzen 9 7950X3D | |
| Intel Core i9-14900K | |
| AMD Ryzen 9 7900X | |
| AMD Ryzen 9 7950X | |
| AMD Ryzen 5 7600X | |
| Intel Core i9-13900K | |
| Intel Core i5-14600K | |
| AMD Ryzen 7 7800X3D | |
| AMD Ryzen 7 7745HX | |
| Intel Core i5-13600K | |
| AMD Ryzen 7 7840HS | |
| Intel Core i9-12900K | |
| Intel Core i5-13400 | |
| AMD Ryzen 9 7940HS | |
| Intel Core i5-12600K | |
| AMD Ryzen 9 5950X | |
| Intel Core i5-12400F | |
| Mozilla Kraken 1.1 - Total | |
| Intel Core i5-12400F | |
| AMD Ryzen 9 5950X | |
| Intel Core i5-13400 | |
| AMD Ryzen 7 7840HS | |
| Intel Core i5-12600K | |
| AMD Ryzen 7 7800X3D | |
| AMD Ryzen 9 7940HS | |
| Intel Core i9-12900K | |
| AMD Ryzen 7 7745HX | |
| Intel Core i5-13600K | |
| Intel Core i5-14600K | |
| AMD Ryzen 5 7600X | |
| AMD Ryzen 9 7950X3D | |
| AMD Ryzen 9 7950X | |
| Intel Core i9-13900K | |
| AMD Ryzen 9 7900X | |
| Intel Core i9-14900K | |
| 3DMark | |
| 1920x1080 Fire Strike Physics | |
| Intel Core i9-14900K | |
| Intel Core i9-13900K | |
| AMD Ryzen 9 7950X3D | |
| AMD Ryzen 9 7900X | |
| AMD Ryzen 9 7950X | |
| Intel Core i5-14600K | |
| AMD Ryzen 9 5950X | |
| Intel Core i9-12900K | |
| Intel Core i5-13600K | |
| AMD Ryzen 7 7800X3D | |
| AMD Ryzen 5 7600X | |
| Intel Core i5-12600K | |
| AMD Ryzen 7 7840HS | |
| AMD Ryzen 9 7940HS | |
| Intel Core i5-13400 | |
| Intel Core i5-12400F | |
| AMD Ryzen 7 7745HX | |
| 2560x1440 Time Spy CPU | |
| Intel Core i9-14900K | |
| Intel Core i9-13900K | |
| Intel Core i5-14600K | |
| Intel Core i9-12900K | |
| AMD Ryzen 9 7950X3D | |
| Intel Core i5-13600K | |
| AMD Ryzen 9 7900X | |
| AMD Ryzen 9 7950X | |
| AMD Ryzen 7 7800X3D | |
| Intel Core i5-12600K | |
| AMD Ryzen 9 5950X | |
| Intel Core i5-13400 | |
| AMD Ryzen 7 7840HS | |
| AMD Ryzen 7 7745HX | |
| AMD Ryzen 9 7940HS | |
| AMD Ryzen 5 7600X | |
| Intel Core i5-12400F | |
* ... más pequeño es mejor
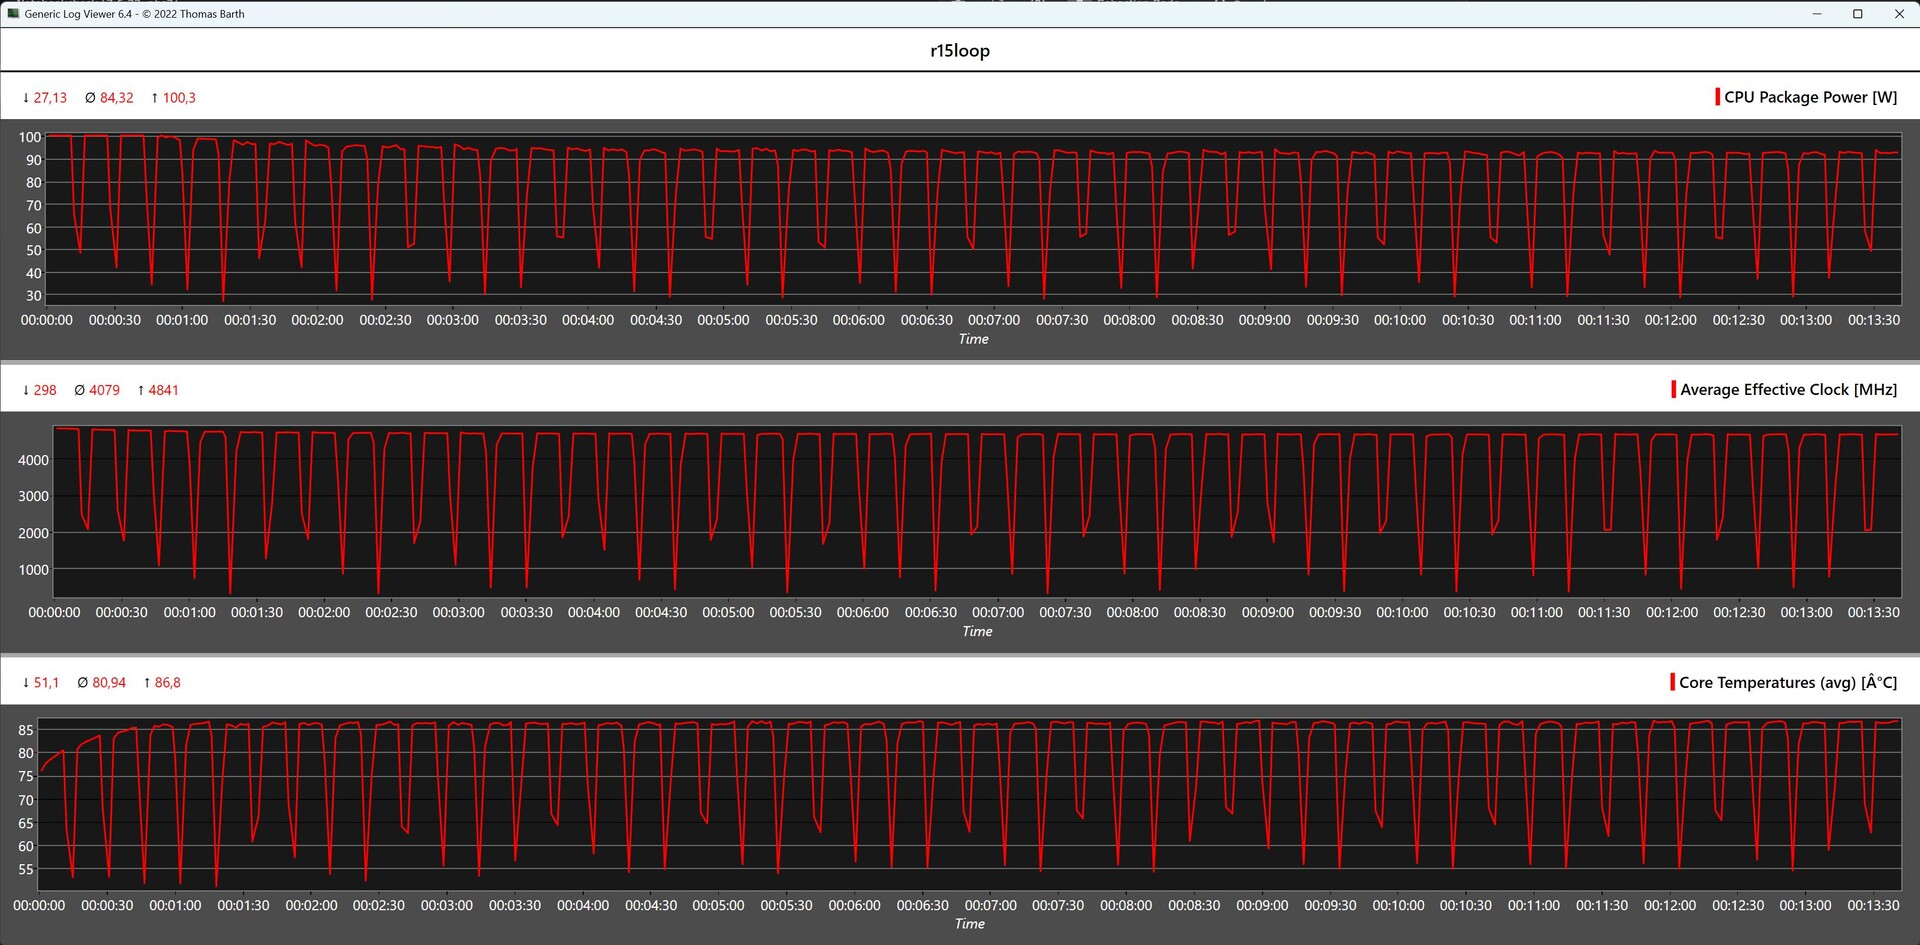
Resultados de Cinebench AMD Ryzen 7 7745HX
La prueba Cinebench R15 Multi continua proporciona una primera visión del rendimiento de la solución de refrigeración instalada. En general, el AMD Ryzen 7 7745HX demuestra un rendimiento relativamente estable. Con una puntuación media de 2.867 puntos, nuestra muestra de prueba ofreció un resultado sobresaliente en este escenario. En particular, supera el resultado obtenido por un AMD Ryzen 7 7840HS en esta medición.
Rendimiento del sistema
En cuanto al rendimiento del sistema, resumimos brevemente nuestra experiencia subjetiva con el sistema de pruebas Minisforum BD770i: El rendimiento del sistema fue consistentemente alto, con los 8 núcleos nativos manejando aplicaciones exigentes con eficacia. Emparejado con la rápida SSD NVMe y la RAM DDR5, garantizó una rápida velocidad operativa. Esta observación fue válida para todos los sistemas de comparación mencionados aquí. Ninguna combinación mostró deficiencias significativas, y las diferencias fueron principalmente medibles. El sistema Minisforum BD770i se situó en la zona media inferior, una posición compartida con los dos mini PC de Minisforum. Aunque estos dispositivos no hayan igualado en potencia a un sistema de sobremesa de gama alta, es esencial señalar que esta comparación fue un tanto injusta. Sin embargo, la inclusión de estos dispositivos en el resumen proporcionó un mejor contexto para evaluar el rendimiento del Minisforum BD770i con el AMD Ryzen 7 7745HX.
| Performance rating - Percent | |
| AMD Ryzen 9 7950X3D, AMD Ryzen 9 7950X3D -1! | |
| NVIDIA GeForce RTX 3090 Founders Edition, AMD Ryzen 9 7950X | |
| AMD Ryzen 9 7900X, AMD Ryzen 9 7900X | |
| Palit GeForce RTX 4090 GameRock OC, Intel Core i9-14900K | |
| AMD Ryzen 5 7600X, AMD Ryzen 5 7600X | |
| Intel Core i9-13900K, Intel Core i9-13900K | |
| Intel Core i5-13600K, Intel Core i5-13600K | |
| Intel Core i5-14600K, Intel Core i5-14600K | |
| AMD Ryzen 7 7800X3D, AMD Ryzen 7 7800X3D | |
| AMD Ryzen 9 5950X, AMD Ryzen 9 5950X | |
| Intel Core i9-12900K, Intel Core i9-12900K | |
| Intel Core i5-13400, Intel Core i5-13400 | |
| Intel Core i5-12600K, Intel Core i5-12600K | |
| Minisforum BD770i, AMD Ryzen 7 7745HX | |
| Minisforum EliteMini UM780 XTX, AMD Ryzen 7 7840HS | |
| Minisforum Venus Series UM790 Pro, AMD Ryzen 9 7940HS | |
| Intel Core i5-12400F, Intel Core i5-12400F | |
| CrossMark / Overall | |
| Palit GeForce RTX 4090 GameRock OC, Palit GeForce RTX 4090 GameRock OC, Intel Core i9-14900K | |
| Intel Core i9-13900K, Intel Core i9-13900K, Intel Core i9-13900K | |
| NVIDIA GeForce RTX 3090 Founders Edition, NVIDIA GeForce RTX 3090 Founders Edition, AMD Ryzen 9 7950X | |
| AMD Ryzen 9 7900X, AMD Ryzen 9 7900X, AMD Ryzen 9 7900X | |
| Intel Core i5-14600K, Intel Core i5-14600K, Intel Core i5-14600K | |
| Intel Core i5-13600K, Intel Core i5-13600K, Intel Core i5-13600K | |
| AMD Ryzen 5 7600X, AMD Ryzen 5 7600X, AMD Ryzen 5 7600X | |
| AMD Ryzen 7 7800X3D, AMD Ryzen 7 7800X3D, AMD Ryzen 7 7800X3D | |
| AMD Ryzen 9 7950X3D, AMD Ryzen 9 7950X3D, AMD Ryzen 9 7950X3D | |
| Minisforum BD770i, AMD Ryzen 7 7745HX | |
| Intel Core i5-13400, Intel Core i5-13400, Intel Core i5-13400 | |
| Intel Core i5-12400F, Intel Core i5-12400F, Intel Core i5-12400F | |
| Minisforum EliteMini UM780 XTX, AMD Ryzen 7 7840HS | |
| Minisforum Venus Series UM790 Pro, AMD Ryzen 9 7940HS | |
| AMD Ryzen 9 5950X, AMD Ryzen 9 5950X, AMD Ryzen 9 5950X | |
| CrossMark / Productivity | |
| Palit GeForce RTX 4090 GameRock OC, Palit GeForce RTX 4090 GameRock OC, Intel Core i9-14900K | |
| Intel Core i9-13900K, Intel Core i9-13900K, Intel Core i9-13900K | |
| NVIDIA GeForce RTX 3090 Founders Edition, NVIDIA GeForce RTX 3090 Founders Edition, AMD Ryzen 9 7950X | |
| AMD Ryzen 9 7900X, AMD Ryzen 9 7900X, AMD Ryzen 9 7900X | |
| Intel Core i5-14600K, Intel Core i5-14600K, Intel Core i5-14600K | |
| Intel Core i5-13600K, Intel Core i5-13600K, Intel Core i5-13600K | |
| AMD Ryzen 5 7600X, AMD Ryzen 5 7600X, AMD Ryzen 5 7600X | |
| AMD Ryzen 7 7800X3D, AMD Ryzen 7 7800X3D, AMD Ryzen 7 7800X3D | |
| Minisforum BD770i, AMD Ryzen 7 7745HX | |
| AMD Ryzen 9 7950X3D, AMD Ryzen 9 7950X3D, AMD Ryzen 9 7950X3D | |
| Intel Core i5-13400, Intel Core i5-13400, Intel Core i5-13400 | |
| Minisforum Venus Series UM790 Pro, AMD Ryzen 9 7940HS | |
| Intel Core i5-12400F, Intel Core i5-12400F, Intel Core i5-12400F | |
| Minisforum EliteMini UM780 XTX, AMD Ryzen 7 7840HS | |
| AMD Ryzen 9 5950X, AMD Ryzen 9 5950X, AMD Ryzen 9 5950X | |
| CrossMark / Creativity | |
| Palit GeForce RTX 4090 GameRock OC, Palit GeForce RTX 4090 GameRock OC, Intel Core i9-14900K | |
| NVIDIA GeForce RTX 3090 Founders Edition, NVIDIA GeForce RTX 3090 Founders Edition, AMD Ryzen 9 7950X | |
| Intel Core i9-13900K, Intel Core i9-13900K, Intel Core i9-13900K | |
| AMD Ryzen 9 7900X, AMD Ryzen 9 7900X, AMD Ryzen 9 7900X | |
| Intel Core i5-14600K, Intel Core i5-14600K, Intel Core i5-14600K | |
| AMD Ryzen 9 7950X3D, AMD Ryzen 9 7950X3D, AMD Ryzen 9 7950X3D | |
| AMD Ryzen 7 7800X3D, AMD Ryzen 7 7800X3D, AMD Ryzen 7 7800X3D | |
| AMD Ryzen 5 7600X, AMD Ryzen 5 7600X, AMD Ryzen 5 7600X | |
| Intel Core i5-13600K, Intel Core i5-13600K, Intel Core i5-13600K | |
| Minisforum BD770i, AMD Ryzen 7 7745HX | |
| Minisforum EliteMini UM780 XTX, AMD Ryzen 7 7840HS | |
| Intel Core i5-13400, Intel Core i5-13400, Intel Core i5-13400 | |
| Minisforum Venus Series UM790 Pro, AMD Ryzen 9 7940HS | |
| Intel Core i5-12400F, Intel Core i5-12400F, Intel Core i5-12400F | |
| AMD Ryzen 9 5950X, AMD Ryzen 9 5950X, AMD Ryzen 9 5950X | |
| CrossMark / Responsiveness | |
| Intel Core i9-13900K, Intel Core i9-13900K, Intel Core i9-13900K | |
| Palit GeForce RTX 4090 GameRock OC, Palit GeForce RTX 4090 GameRock OC, Intel Core i9-14900K | |
| Intel Core i5-13600K, Intel Core i5-13600K, Intel Core i5-13600K | |
| NVIDIA GeForce RTX 3090 Founders Edition, NVIDIA GeForce RTX 3090 Founders Edition, AMD Ryzen 9 7950X | |
| AMD Ryzen 9 7900X, AMD Ryzen 9 7900X, AMD Ryzen 9 7900X | |
| AMD Ryzen 5 7600X, AMD Ryzen 5 7600X, AMD Ryzen 5 7600X | |
| Intel Core i5-14600K, Intel Core i5-14600K, Intel Core i5-14600K | |
| AMD Ryzen 7 7800X3D, AMD Ryzen 7 7800X3D, AMD Ryzen 7 7800X3D | |
| Minisforum BD770i, AMD Ryzen 7 7745HX | |
| Intel Core i5-13400, Intel Core i5-13400, Intel Core i5-13400 | |
| Intel Core i5-12400F, Intel Core i5-12400F, Intel Core i5-12400F | |
| AMD Ryzen 9 7950X3D, AMD Ryzen 9 7950X3D, AMD Ryzen 9 7950X3D | |
| Minisforum Venus Series UM790 Pro, AMD Ryzen 9 7940HS | |
| Minisforum EliteMini UM780 XTX, AMD Ryzen 7 7840HS | |
| AMD Ryzen 9 5950X, AMD Ryzen 9 5950X, AMD Ryzen 9 5950X | |
| AIDA64 / Memory Copy | |
| Palit GeForce RTX 4090 GameRock OC | |
| Palit GeForce RTX 4090 GameRock OC | |
| Intel Core i5-14600K | |
| Intel Core i9-13900K | |
| AMD Ryzen 9 7950X3D | |
| Intel Core i9-12900K | |
| NVIDIA GeForce RTX 3090 Founders Edition | |
| Intel Core i5-13400 | |
| Intel Core i5-13600K | |
| Intel Core i5-12400F | |
| Intel Core i5-12600K | |
| Media de la clase Desktop (54743 - 98416, n=21, últimos 2 años) | |
| AMD Ryzen 9 7900X | |
| Minisforum EliteMini UM780 XTX | |
| AMD Ryzen 7 7800X3D | |
| Minisforum Venus Series UM790 Pro | |
| AMD Ryzen 5 7600X | |
| AMD Ryzen 9 5950X | |
| Minisforum BD770i | |
| Medio AMD Ryzen 7 7745HX (50007 - 53867, n=2) | |
| AIDA64 / Memory Read | |
| Palit GeForce RTX 4090 GameRock OC | |
| Palit GeForce RTX 4090 GameRock OC | |
| Intel Core i5-14600K | |
| Intel Core i9-13900K | |
| Intel Core i9-12900K | |
| AMD Ryzen 9 7950X3D | |
| NVIDIA GeForce RTX 3090 Founders Edition | |
| Intel Core i5-13400 | |
| Intel Core i5-12600K | |
| Intel Core i5-13600K | |
| Media de la clase Desktop (58375 - 110448, n=21, últimos 2 años) | |
| AMD Ryzen 9 7900X | |
| Intel Core i5-12400F | |
| AMD Ryzen 9 5950X | |
| AMD Ryzen 7 7800X3D | |
| Minisforum EliteMini UM780 XTX | |
| Minisforum Venus Series UM790 Pro | |
| AMD Ryzen 5 7600X | |
| Minisforum BD770i | |
| Medio AMD Ryzen 7 7745HX (50703 - 54278, n=2) | |
| AIDA64 / Memory Write | |
| AMD Ryzen 7 7800X3D | |
| Minisforum EliteMini UM780 XTX | |
| AMD Ryzen 9 7950X3D | |
| Intel Core i5-14600K | |
| Palit GeForce RTX 4090 GameRock OC | |
| Palit GeForce RTX 4090 GameRock OC | |
| AMD Ryzen 5 7600X | |
| NVIDIA GeForce RTX 3090 Founders Edition | |
| Minisforum Venus Series UM790 Pro | |
| Media de la clase Desktop (60635 - 93889, n=21, últimos 2 años) | |
| AMD Ryzen 9 7900X | |
| Intel Core i9-13900K | |
| Intel Core i5-13400 | |
| Intel Core i5-12600K | |
| Intel Core i5-12400F | |
| Intel Core i9-12900K | |
| Intel Core i5-13600K | |
| Minisforum BD770i | |
| Medio AMD Ryzen 7 7745HX (54587 - 70803, n=2) | |
| AMD Ryzen 9 5950X | |
| AIDA64 / Memory Latency | |
| Minisforum EliteMini UM780 XTX | |
| Media de la clase Desktop (68.5 - 168, n=21, últimos 2 años) | |
| Minisforum Venus Series UM790 Pro | |
| Medio AMD Ryzen 7 7745HX (80.7 - 86.5, n=2) | |
| Intel Core i5-13600K | |
| Minisforum BD770i | |
| Intel Core i5-12400F | |
| Intel Core i5-13400 | |
| Intel Core i9-13900K | |
| Palit GeForce RTX 4090 GameRock OC | |
| Palit GeForce RTX 4090 GameRock OC | |
| Intel Core i5-14600K | |
| AMD Ryzen 7 7800X3D | |
| AMD Ryzen 9 5950X | |
| AMD Ryzen 9 7950X3D | |
| AMD Ryzen 5 7600X | |
| AMD Ryzen 9 7900X | |
| NVIDIA GeForce RTX 3090 Founders Edition | |
* ... más pequeño es mejor
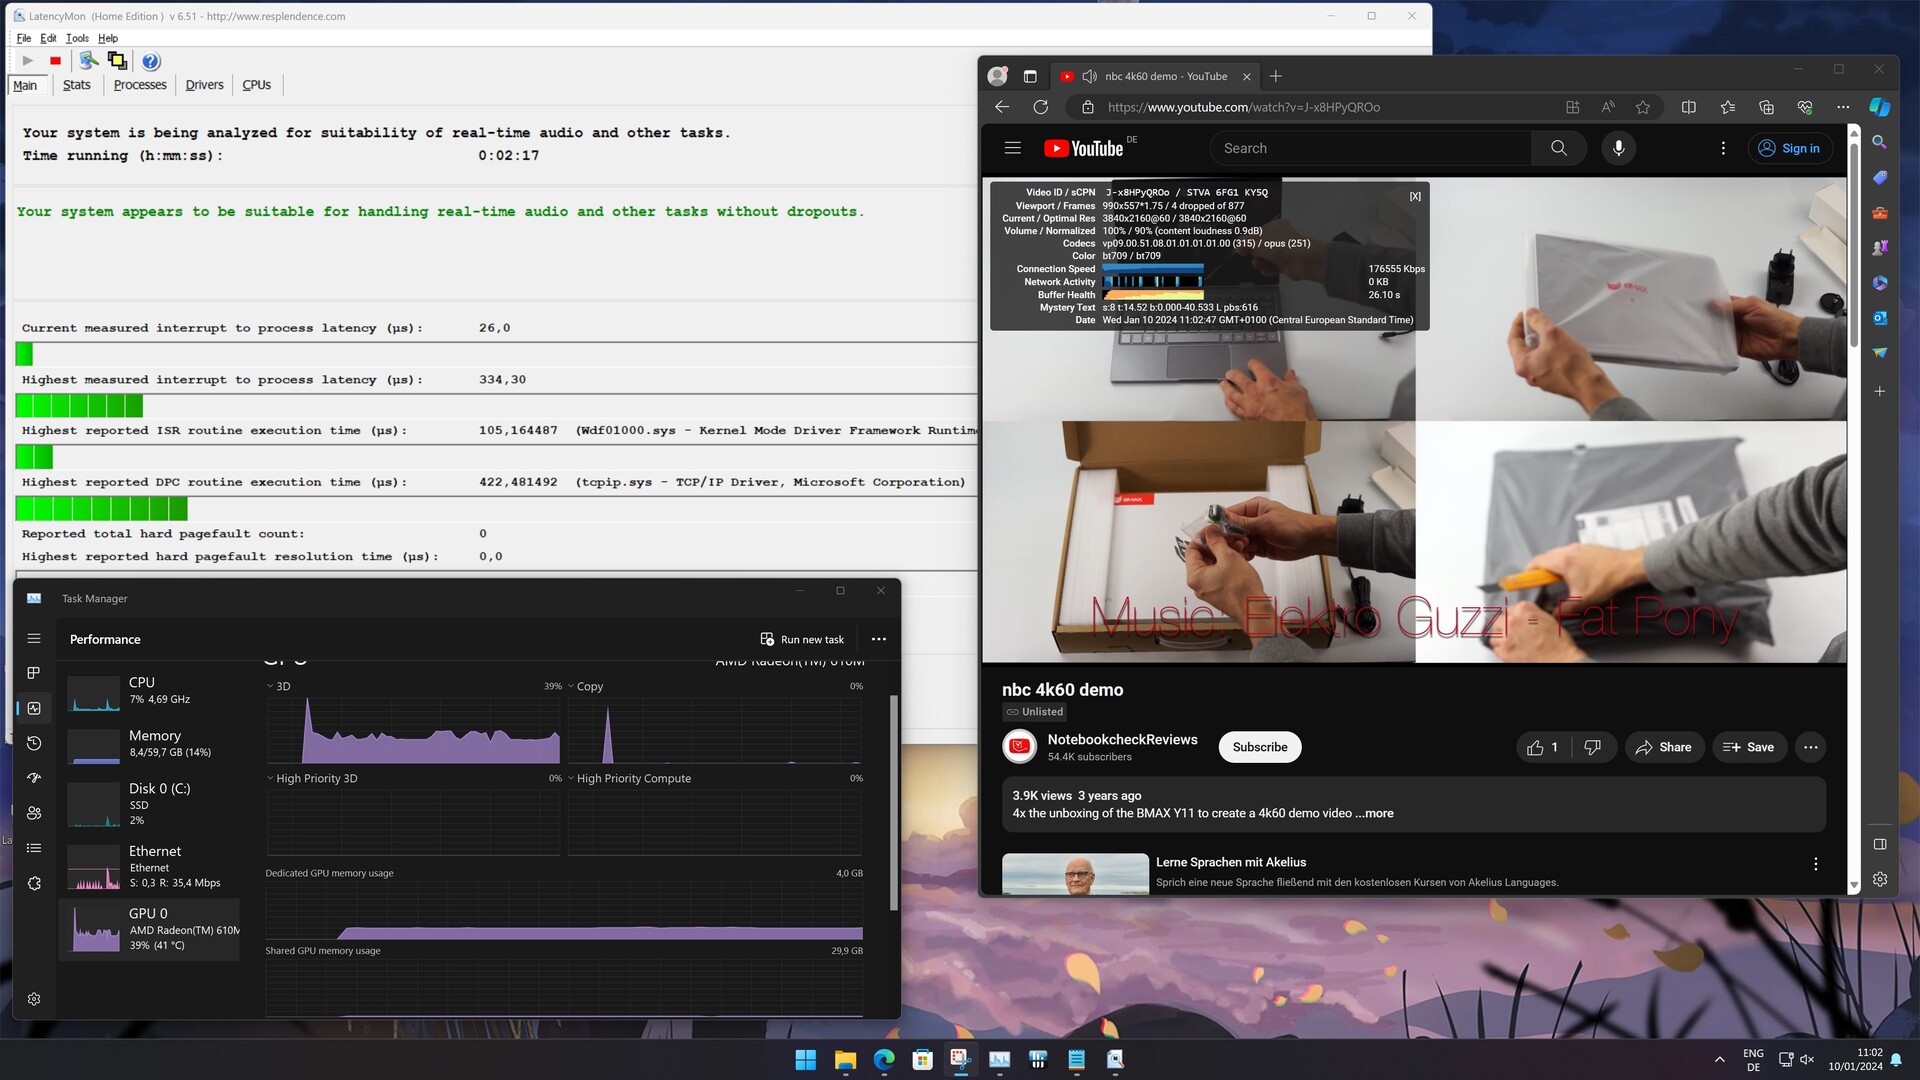
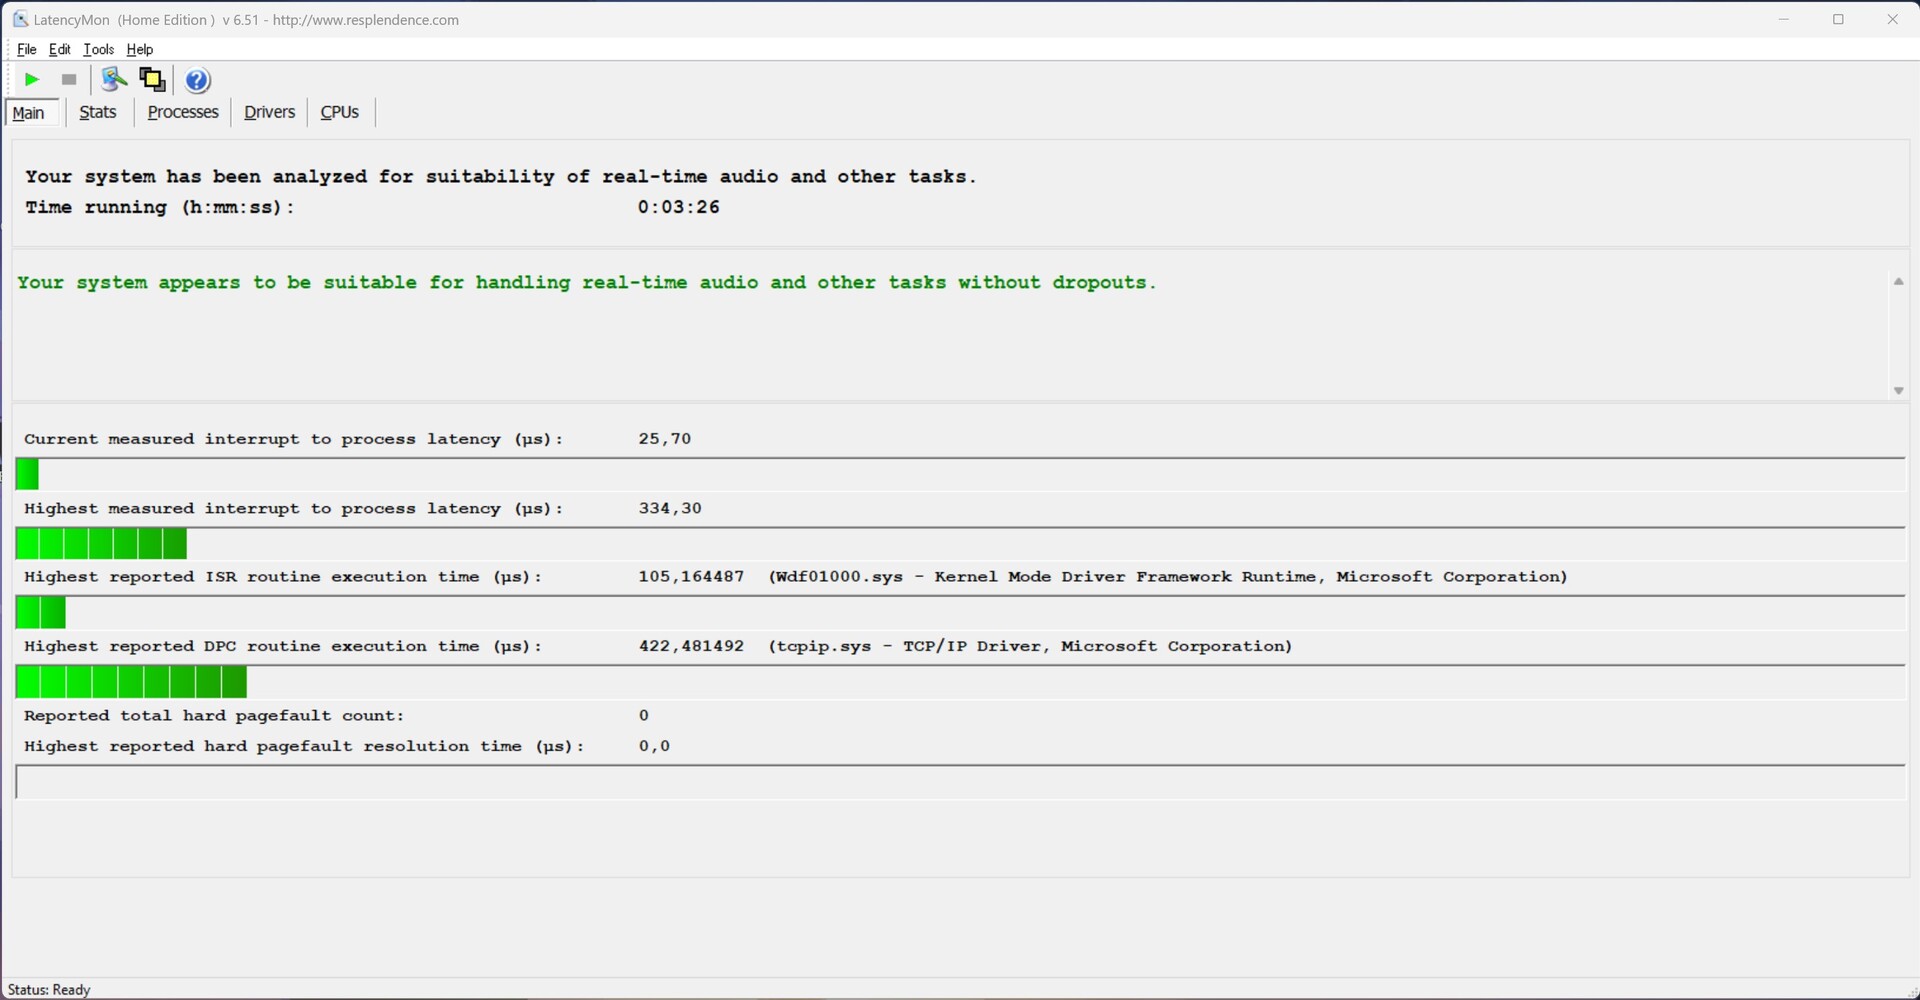
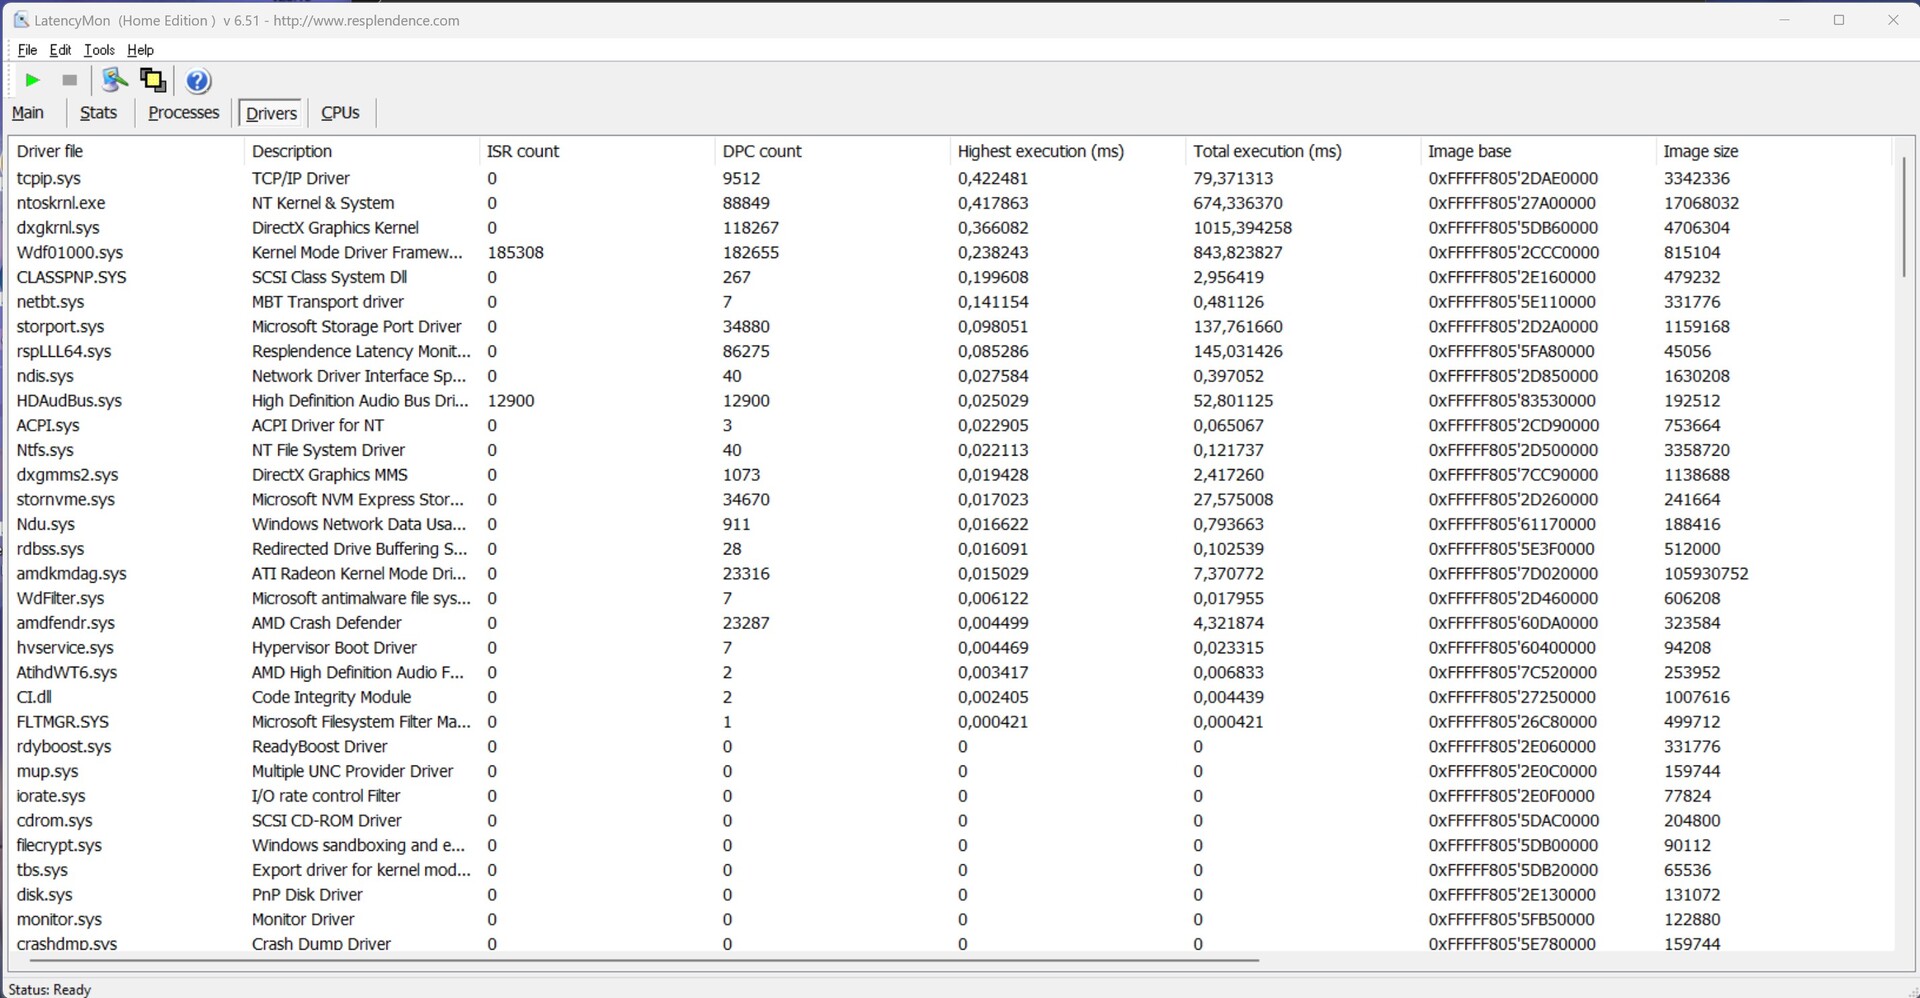
Latencia del CPD
En nuestro sistema de pruebas construido en torno al Minisforum BD770i, observamos latencias muy bajas. Tanto en una simple navegación por Internet como en la reproducción de un vídeo de prueba 4K, ni siquiera la prueba de estrés Prime95 produjo latencias elevadas. Como resultado, la placa base Minisforum BD770i es muy adecuada para crear sistemas de streaming compactos y silenciosos para el salón.
| DPC Latencies / LatencyMon - interrupt to process latency (max), Web, Youtube, Prime95 | |
| Minisforum EliteMini UM780 XTX | |
| Minisforum Venus Series UM790 Pro | |
| Minisforum BD770i | |
* ... más pequeño es mejor
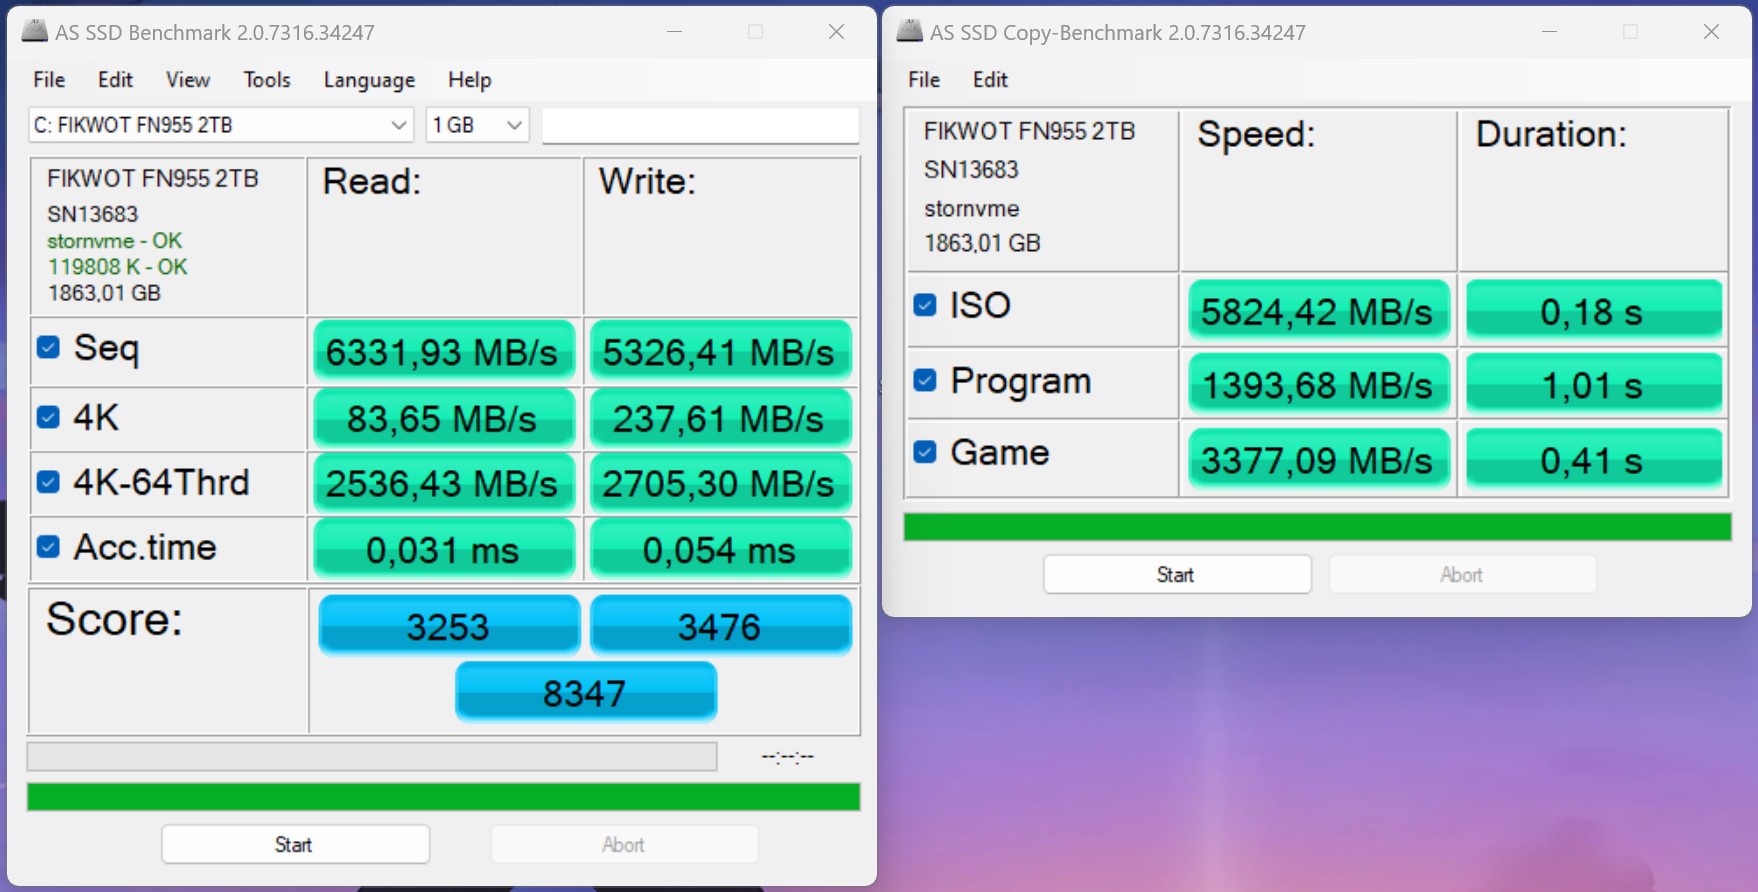
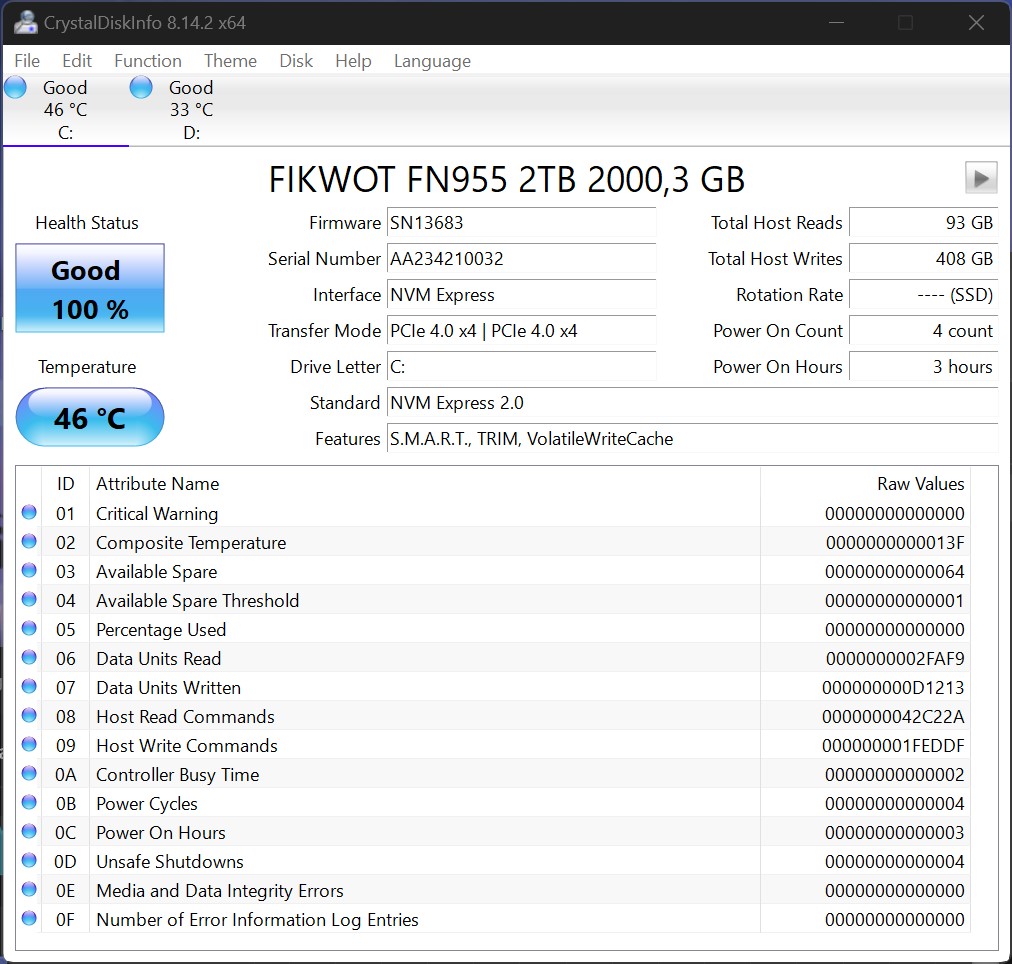
Dispositivos de almacenamiento
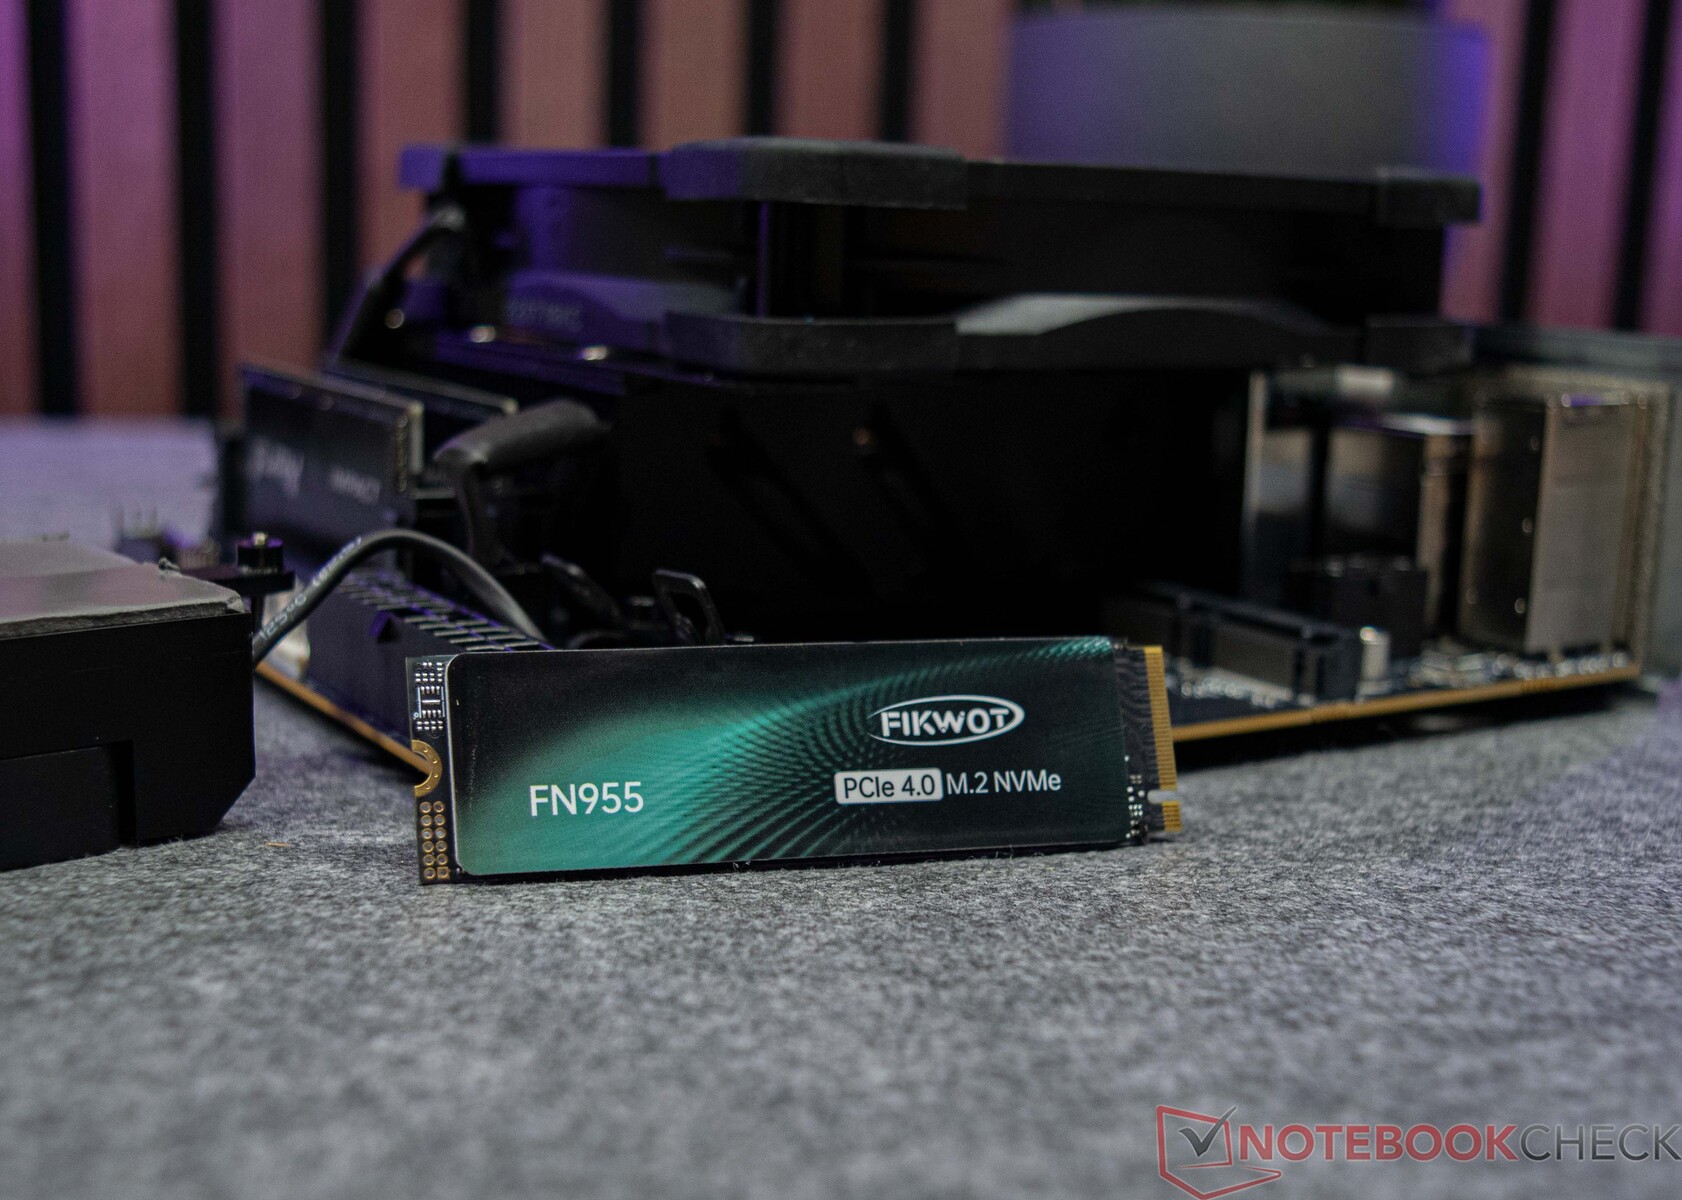
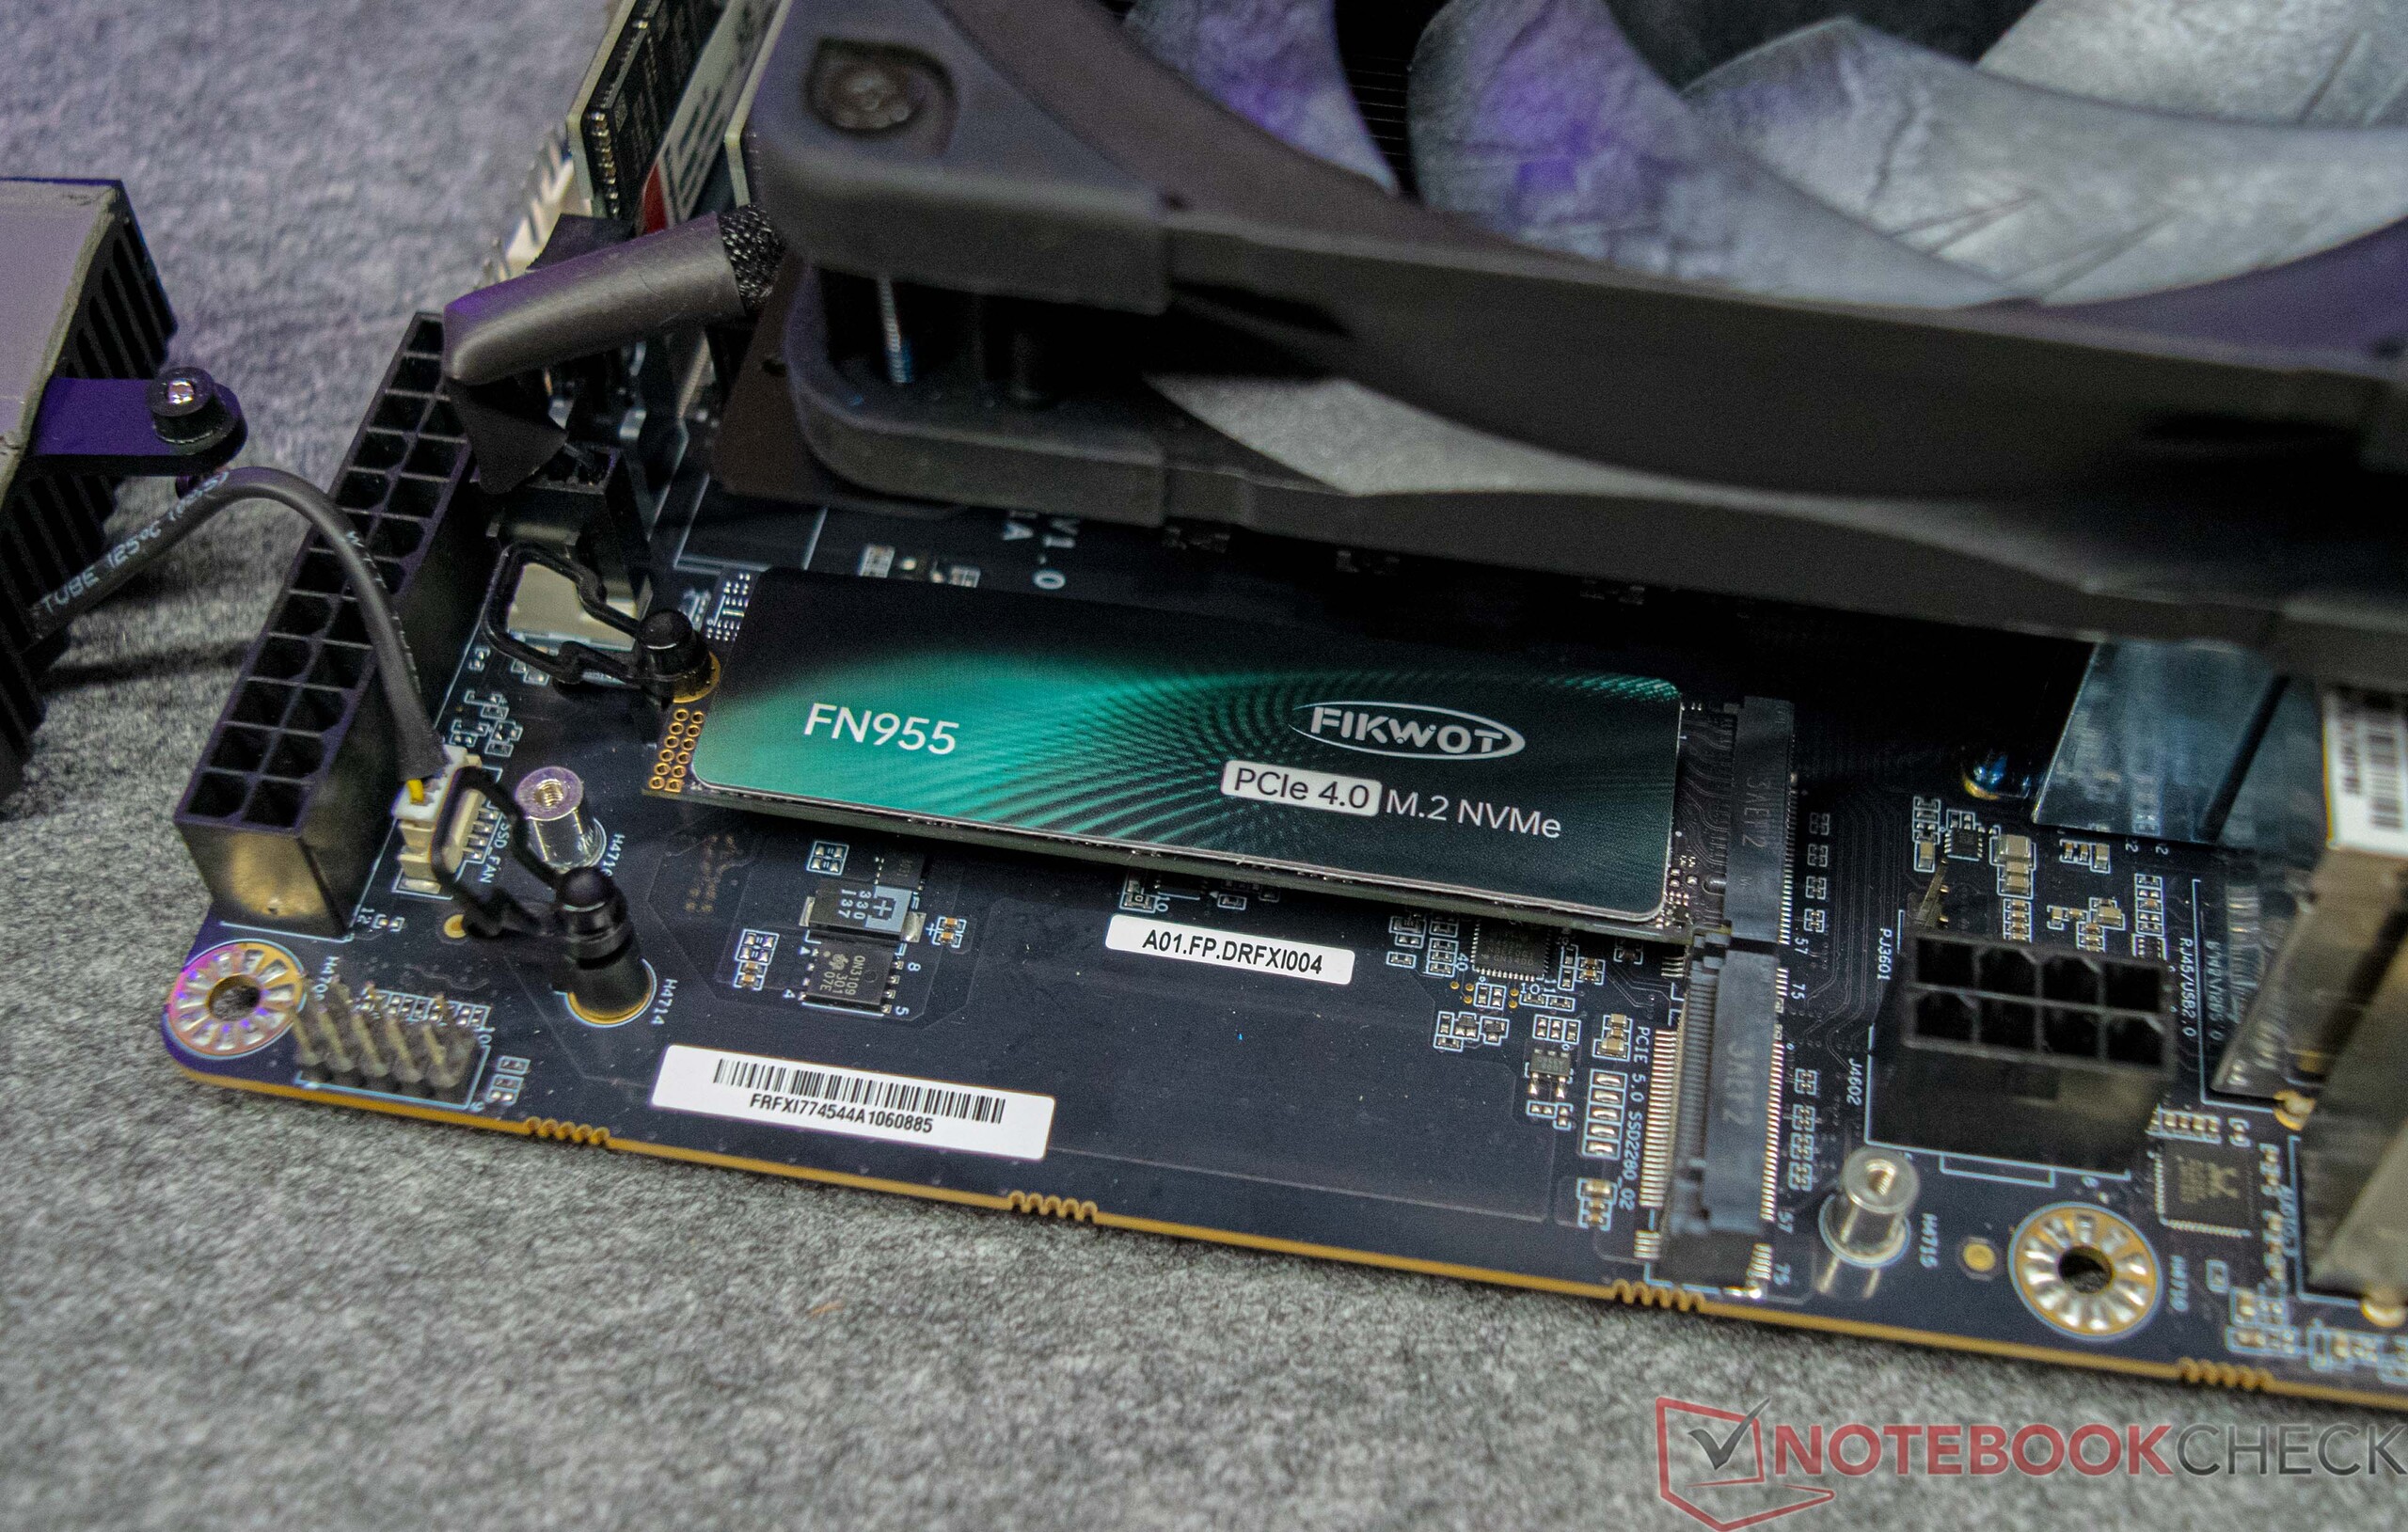
Como se ha mencionado anteriormente, Minisforum proporciona la placa base BD770i sin almacenamiento masivo integrado. Para nuestras pruebas, utilizamos una unidad SSD de 2 TB relativamente asequible del fabricante Fikwot. Este modelo emplea la interfaz M.2 y se conecta a través de PCIe 4.0 x4, lo que se traduce en excelentes velocidades de transferencia. La placa base admite hasta dos dispositivos de almacenamiento masivo y es compatible con el último estándar PCI 5.0. También puede equiparse con refrigeración activa, especialmente beneficiosa para las SSD PCIe 5.0. A lo largo de nuestras pruebas, nuestras SSD no mostraron problemas térmicos bajo carga, manteniendo un rendimiento constante.
Para más comparaciones y puntos de referencia, consulte nuestra tabla comparativa.
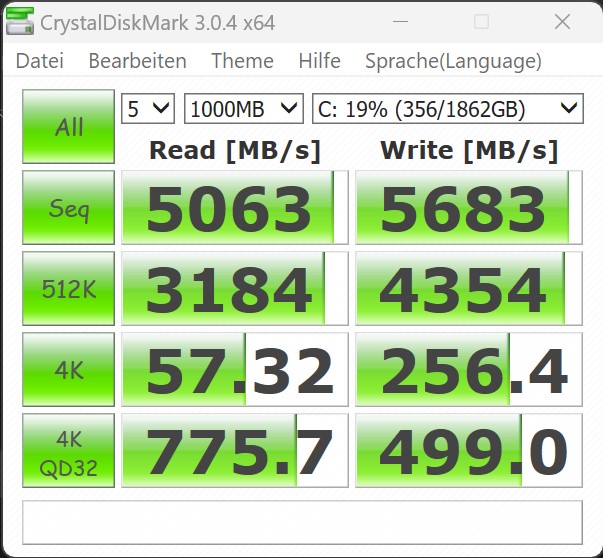
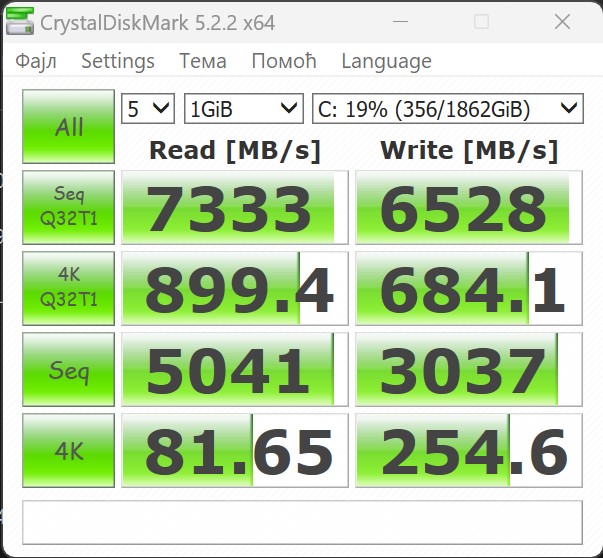
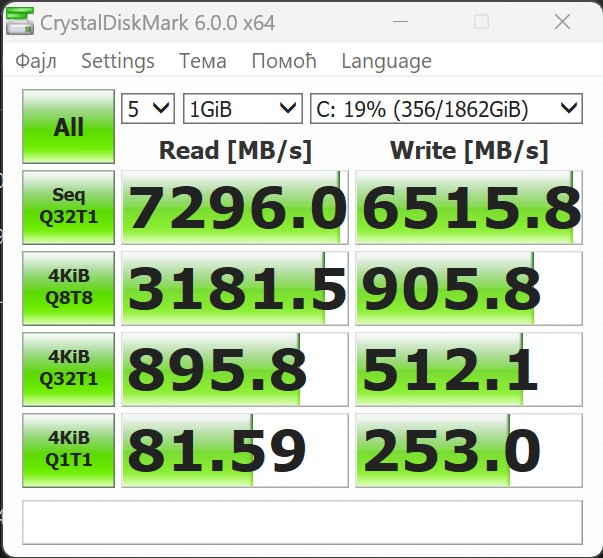

"Reading continuous performance: DiskSpd Read Loop, Queue Depth 8 "
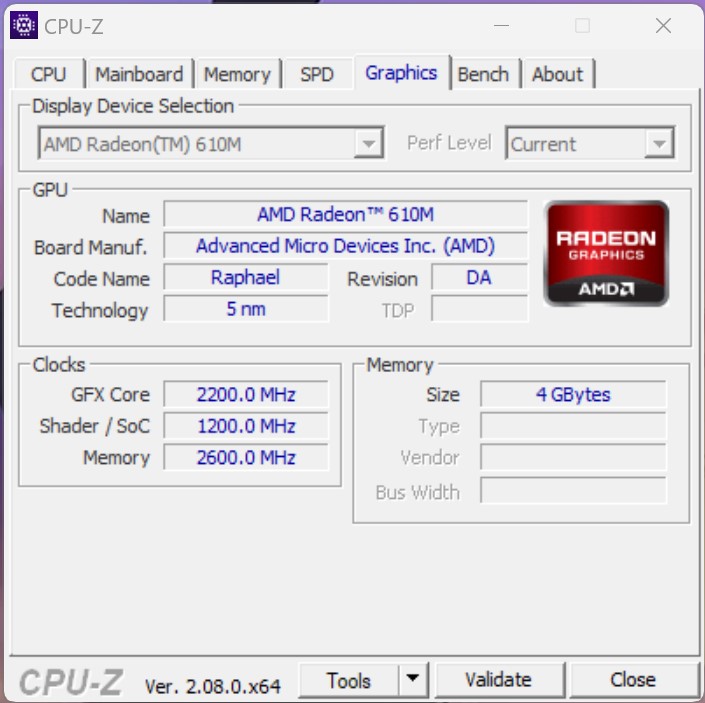
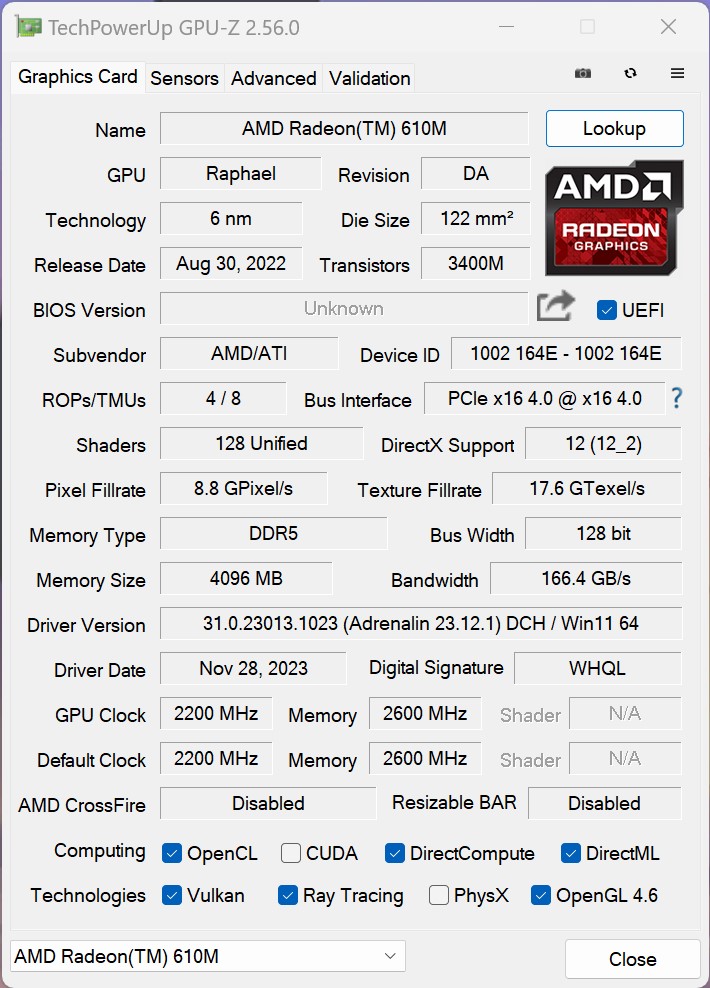
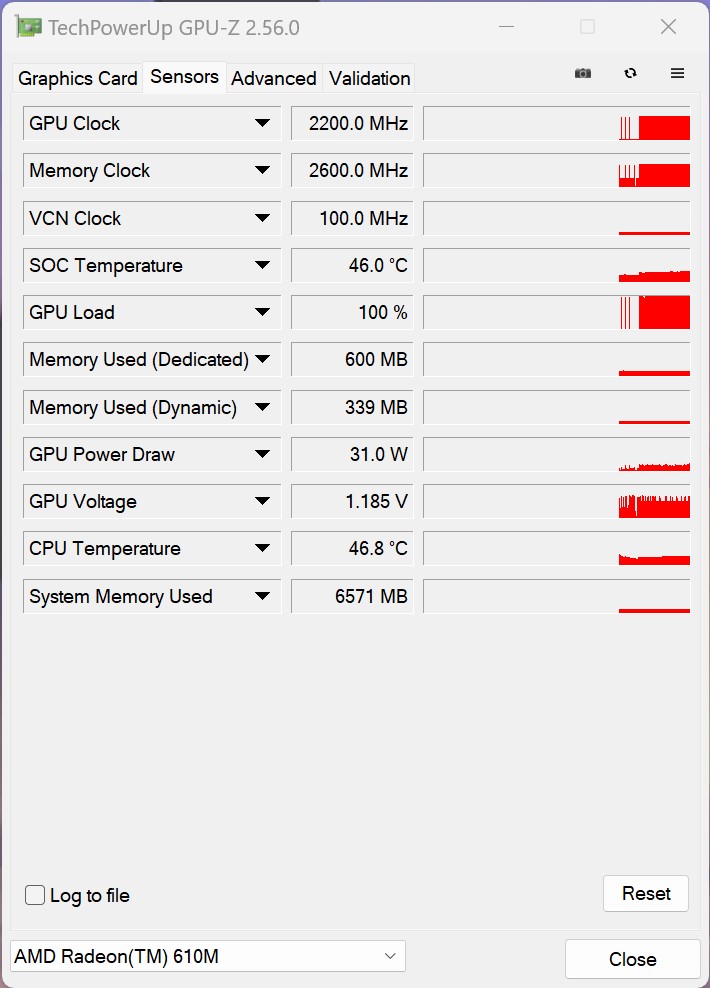
Tarjeta gráfica - AMD Radeon 610M como iGPU
El AMD Ryzen 7 7745HX está equipado con una AMD Radeon 610M iGPU. Sin embargo, esta iGPU se basa en la arquitectura RDNA2 y ofrece sólo 2 Compute Units (CUs), lo que resulta en un total de 128 unidades shader que manejan los cálculos 3D. En consecuencia, el rendimiento de la AMD Radeon 610M es relativamente modesto.En nuestra comparación media, la iGPU del Minisforum BD770i superó a la de un portátil convencional, pero se limitó a tareas gráficas sencillas. Las expectativas más allá de la simple salida de imágenes deben mantenerse bajo control dadas las limitaciones de esta solución gráfica de nivel básico.
Para más comparaciones y pruebas comparativas, consulte nuestra Tabla comparativa de GPU.
| Performance rating - Percent | |
| Minisforum EliteMini UM780 XTX | |
| Minisforum Venus Series UM790 Pro | |
| Minisforum Mars Series MC560 | |
| NiPoGi AD08 | |
| Acemagic AD15 | |
| Minisforum BD770i | |
| Medio AMD Radeon 610M | |
| Performance rating - Percent | |
| NiPoGi AD08 | |
| Minisforum EliteMini UM780 XTX | |
| Minisforum Venus Series UM790 Pro | |
| Medio AMD Radeon 610M | |
| Acemagic AD15 | |
| Minisforum Mars Series MC560 | |
| Minisforum BD770i | |
| Unigine Valley 1.0 | |
| 1920x1080 Extreme HD DirectX AA:x8 | |
| Minisforum EliteMini UM780 XTX | |
| Minisforum Venus Series UM790 Pro | |
| Minisforum Mars Series MC560 | |
| NiPoGi AD08 | |
| Minisforum BD770i | |
| Medio AMD Radeon 610M (9.8 - 10, n=4) | |
| Acemagic AD15 | |
| 1920x1080 Extreme HD Preset OpenGL AA:x8 | |
| Minisforum EliteMini UM780 XTX | |
| Minisforum Venus Series UM790 Pro | |
| NiPoGi AD08 | |
| Minisforum Mars Series MC560 | |
| Acemagic AD15 | |
| Minisforum BD770i | |
| Medio AMD Radeon 610M (9.1 - 9.6, n=4) | |
| Affinity Photo 2 - Combined (Single / Multi GPU) | |
| NiPoGi AD08 | |
| Medio AMD Radeon 610M (889 - 5750, n=4) | |
| Acemagic AD15 | |
| Minisforum EliteMini UM780 XTX | |
| Minisforum Mars Series MC560 | |
| Minisforum Venus Series UM790 Pro | |
| Minisforum BD770i | |
| 3DMark 06 Standard Score | 20555 puntos | |
| 3DMark Vantage P Result | 12092 puntos | |
| 3DMark 11 Performance | 3873 puntos | |
| 3DMark Ice Storm Standard Score | 41556 puntos | |
| 3DMark Cloud Gate Standard Score | 14629 puntos | |
| 3DMark Fire Strike Score | 2156 puntos | |
| 3DMark Fire Strike Extreme Score | 530 puntos | |
| 3DMark Time Spy Score | 740 puntos | |
ayuda | ||
Rendimiento en juegos - AMD Radeon 610M
Sólo una cantidad limitada de aplicaciones 3D pueden beneficiarse del rendimiento de la AMD Radeon 610M, como demuestran las pruebas comparativas sintéticas. Esto también es evidente en las pruebas de juegos. La GPU integrada (iGPU) sólo puede generar velocidades de fotogramas decentes con los ajustes gráficos más bajos y una resolución de sólo 1.280 x 720 píxeles. Los dos mini PC equipados con la AMD Radeon 780m iGPU ofrecen un rendimiento notablemente mejor, pero incluso en estos casos, el sistema alcanza rápidamente sus límites cuando se intenta jugar a juegos modernos. Todas las tarjetas gráficas actuales pueden conectarse fácilmente a través de la interfaz PCI Express.
Para obtener una visión general del rendimiento de la iGPU en comparación con otras tarjetas gráficas, consulte nuestra Lista de juegos GPU.
| The Witcher 3 | |
| 1024x768 Low Graphics & Postprocessing (ordenar por valor) | |
| Minisforum EliteMini UM780 XTX | |
| Minisforum Venus Series UM790 Pro | |
| Minisforum BD770i | |
| NiPoGi AD08 | |
| Acemagic AD15 | |
| Minisforum Mars Series MC560 | |
| 1920x1080 High Graphics & Postprocessing (Nvidia HairWorks Off) (ordenar por valor) | |
| Minisforum EliteMini UM780 XTX | |
| Minisforum Venus Series UM790 Pro | |
| Minisforum BD770i | |
| NiPoGi AD08 | |
| Acemagic AD15 | |
| Minisforum Mars Series MC560 | |
| Borderlands 3 | |
| 1280x720 Very Low Overall Quality (DX11) (ordenar por valor) | |
| Minisforum EliteMini UM780 XTX | |
| Minisforum Venus Series UM790 Pro | |
| Minisforum BD770i | |
| NiPoGi AD08 | |
| Acemagic AD15 | |
| Minisforum Mars Series MC560 | |
| 1920x1080 High Overall Quality (DX11) (ordenar por valor) | |
| Minisforum EliteMini UM780 XTX | |
| Minisforum Venus Series UM790 Pro | |
| Minisforum BD770i | |
| NiPoGi AD08 | |
| Acemagic AD15 | |
| Minisforum Mars Series MC560 | |
| GTA V | |
| 1024x768 Lowest Settings possible (ordenar por valor) | |
| Minisforum EliteMini UM780 XTX | |
| Minisforum Venus Series UM790 Pro | |
| Minisforum BD770i | |
| NiPoGi AD08 | |
| Acemagic AD15 | |
| Minisforum Mars Series MC560 | |
| 1920x1080 High/On (Advanced Graphics Off) AA:2xMSAA + FX AF:8x (ordenar por valor) | |
| Minisforum EliteMini UM780 XTX | |
| Minisforum Venus Series UM790 Pro | |
| Minisforum BD770i | |
| NiPoGi AD08 | |
| Acemagic AD15 | |
| Minisforum Mars Series MC560 | |
| Tiny Tina's Wonderlands | |
| 1280x720 Lowest Preset (DX12) (ordenar por valor) | |
| Minisforum EliteMini UM780 XTX | |
| Minisforum Venus Series UM790 Pro | |
| Minisforum BD770i | |
| Acemagic AD15 | |
| Minisforum Mars Series MC560 | |
| 1920x1080 High Preset (DX12) (ordenar por valor) | |
| Minisforum EliteMini UM780 XTX | |
| Minisforum Venus Series UM790 Pro | |
| Minisforum BD770i | |
| Acemagic AD15 | |
| Minisforum Mars Series MC560 | |
| Metro Exodus | |
| 1280x720 Low Quality AF:4x (ordenar por valor) | |
| Minisforum EliteMini UM780 XTX | |
| Minisforum Venus Series UM790 Pro | |
| Minisforum BD770i | |
| NiPoGi AD08 | |
| 1920x1080 High Quality AF:16x (ordenar por valor) | |
| Minisforum EliteMini UM780 XTX | |
| Minisforum Venus Series UM790 Pro | |
| Minisforum BD770i | |
| NiPoGi AD08 | |
| Shadow of the Tomb Raider | |
| 1280x720 Lowest Preset (ordenar por valor) | |
| Minisforum EliteMini UM780 XTX | |
| Minisforum Venus Series UM790 Pro | |
| Minisforum BD770i | |
| NiPoGi AD08 | |
| Acemagic AD15 | |
| 1920x1080 High Preset AA:SM (ordenar por valor) | |
| Minisforum EliteMini UM780 XTX | |
| Minisforum Venus Series UM790 Pro | |
| Minisforum BD770i | |
| NiPoGi AD08 | |
| Acemagic AD15 | |
| bajo | medio | alto | ultra | |
|---|---|---|---|---|
| GTA V (2015) | 134.5 | 101.9 | 23.1 | 10.5 |
| The Witcher 3 (2015) | 44 | 26.2 | 13.5 | 8.49 |
| Final Fantasy XV Benchmark (2018) | 26.8 | 12.3 | 8.79 | |
| X-Plane 11.11 (2018) | 44.7 | 26.2 | 22.9 | |
| Far Cry 5 (2018) | 34 | 15 | 14 | 13 |
| Strange Brigade (2018) | 67.7 | 21.4 | 17 | |
| Shadow of the Tomb Raider (2018) | 40 | 14 | 12.6 | 10.5 |
| Far Cry New Dawn (2019) | 35 | 17 | 16 | 14 |
| Metro Exodus (2019) | 28.4 | 11.8 | 8.4 | 6.95 |
| Borderlands 3 (2019) | 40.3 | 14.9 | 9.04 | 6.48 |
| Tiny Tina's Wonderlands (2022) | 18.1 | 14.5 | 9.24 | 6.92 |
Minisforum BD770i con Nvidia GeForce RTX 4090
Si tiene intención de utilizar la placa base Minisforum BD770i como base para un sistema de juego, puede proceder sin dudarlo. El AMD Ryzen 7 7745HX cuenta con amplias reservas de rendimiento para estar a la altura de los sistemas actuales. En las pruebas comparativas sintéticas, nuestro sistema de pruebas logró incluso asegurarse la tercera posición. Sin embargo, debido al tamaño de la tarjeta gráfica, tuvimos que utilizar la Minisforum BD770i en una configuración abierta para estas pruebas, ya que la Pait GeForce RTX 4090 Gamerock OC es demasiado grande para la caja Phanteks Enthoo Evolv Shift XT.
En cuanto a los puntos de referencia de juegos, es crucial hacer una distinción: cuando se determina el rendimiento puro de la CPU, es esencial mantenerse dentro del límite de la CPU. En este escenario, el AMD Ryzen 7 7745HX está a la par con un Intel Core i7-13700, e incluso el Intel Core i7-13700K no puede superarlo. La clasificación de nuestra muestra de prueba se mantiene constante en los niveles de detalle más altos y en los ajustes máximos. La placa base Minisforum BD770i sigue compitiendo con el Intel Core i7-13700, y al examinar las pruebas individuales por separado, el AMD Ryzen 7 7745HX, emparejado con el Palit GeForce RTX 4090 Gamerock OC, puede competir con los modelos superiores en ciertos casos. Todos los títulos actuales pueden jugarse con fluidez en 2.160p sin pérdida de detalle en esta configuración.
Todos los sistemas que figuran en esta comparación se probaron con la misma tarjeta gráfica, a saber, la Pait GeForce RTX 4090 Gamerock OC.
Una nota importante cuando se utiliza una Nvidia GeForce RTX 4090:
Nuestra muestra de prueba del Minisforum BD770i no estaba equipada con la última BIOS durante las pruebas. En consecuencia, la tarjeta gráfica sólo estaba conectada con PCIe 4.0 x1. La versión 1.05 es la única que permite que la tarjeta gráfica funcione con el máximo ancho de banda; se puede encontrar en el sitio web de soporte. El proceso de actualización de la BIOS puede iniciarse directamente desde Windows.
| Performance rating - Percent | |
| NVIDIA GeForce RTX 4090, Intel Core i9-14900K | |
| NVIDIA GeForce RTX 4090, Intel Core i5-14600K | |
| NVIDIA GeForce RTX 4090, AMD Ryzen 7 7745HX | |
| NVIDIA GeForce RTX 4090, AMD Ryzen 9 7950X | |
| NVIDIA GeForce RTX 4090, AMD Ryzen 7 7800X3D | |
| NVIDIA GeForce RTX 4090, Intel Core i7-13700 | |
| NVIDIA GeForce RTX 4090, Intel Core i7-12700 | |
| NVIDIA GeForce RTX 4090, Intel Core i5-13400 | |
| NVIDIA GeForce RTX 4090, Intel Core i5-12400F -6! | |
| 3DMark 11 - 1280x720 Performance GPU | |
| NVIDIA GeForce RTX 4090, AMD Ryzen 7 7745HX | |
| NVIDIA GeForce RTX 4090, AMD Ryzen 7 7800X3D | |
| NVIDIA GeForce RTX 4090, Intel Core i5-14600K | |
| NVIDIA GeForce RTX 4090, AMD Ryzen 9 7950X | |
| NVIDIA GeForce RTX 4090, Intel Core i7-13700 | |
| NVIDIA GeForce RTX 4090, Intel Core i7-12700 | |
| NVIDIA GeForce RTX 4090, Intel Core i5-13400 | |
| NVIDIA GeForce RTX 4090, Intel Core i9-14900K | |
| NVIDIA GeForce RTX 4090, Intel Core i5-12400F | |
| 3DMark | |
| 2560x1440 Time Spy Graphics | |
| NVIDIA GeForce RTX 4090, AMD Ryzen 7 7745HX | |
| NVIDIA GeForce RTX 4090, Intel Core i5-14600K | |
| NVIDIA GeForce RTX 4090, Intel Core i9-14900K | |
| NVIDIA GeForce RTX 4090, AMD Ryzen 7 7800X3D | |
| NVIDIA GeForce RTX 4090, Intel Core i7-13700 | |
| NVIDIA GeForce RTX 4090, AMD Ryzen 9 7950X | |
| NVIDIA GeForce RTX 4090, Intel Core i7-12700 | |
| NVIDIA GeForce RTX 4090, Intel Core i5-13400 | |
| NVIDIA GeForce RTX 4090, Intel Core i5-12400F | |
| 1920x1080 Fire Strike Graphics | |
| NVIDIA GeForce RTX 4090, AMD Ryzen 7 7745HX | |
| NVIDIA GeForce RTX 4090, Intel Core i5-14600K | |
| NVIDIA GeForce RTX 4090, Intel Core i5-12400F | |
| NVIDIA GeForce RTX 4090, Intel Core i7-12700 | |
| NVIDIA GeForce RTX 4090, Intel Core i7-13700 | |
| NVIDIA GeForce RTX 4090, Intel Core i5-13400 | |
| NVIDIA GeForce RTX 4090, AMD Ryzen 7 7800X3D | |
| NVIDIA GeForce RTX 4090, AMD Ryzen 9 7950X | |
| NVIDIA GeForce RTX 4090, Intel Core i9-14900K | |
| 3840x2160 Fire Strike Ultra Graphics | |
| NVIDIA GeForce RTX 4090, AMD Ryzen 7 7800X3D | |
| NVIDIA GeForce RTX 4090, AMD Ryzen 7 7745HX | |
| NVIDIA GeForce RTX 4090, Intel Core i5-14600K | |
| NVIDIA GeForce RTX 4090, Intel Core i7-13700 | |
| NVIDIA GeForce RTX 4090, Intel Core i5-13400 | |
| NVIDIA GeForce RTX 4090, AMD Ryzen 9 7950X | |
| NVIDIA GeForce RTX 4090, Intel Core i9-14900K | |
| NVIDIA GeForce RTX 4090, Intel Core i7-12700 | |
| NVIDIA GeForce RTX 4090, Intel Core i5-12400F | |
| Unigine Superposition | |
| 1280x720 720p Low | |
| NVIDIA GeForce RTX 4090, Intel Core i9-14900K | |
| NVIDIA GeForce RTX 4090, AMD Ryzen 7 7800X3D | |
| NVIDIA GeForce RTX 4090, AMD Ryzen 9 7950X | |
| NVIDIA GeForce RTX 4090, AMD Ryzen 7 7745HX | |
| NVIDIA GeForce RTX 4090, Intel Core i7-13700 | |
| NVIDIA GeForce RTX 4090, Intel Core i5-14600K | |
| NVIDIA GeForce RTX 4090, Intel Core i7-12700 | |
| NVIDIA GeForce RTX 4090, Intel Core i5-13400 | |
| NVIDIA GeForce RTX 4090, Intel Core i5-12400F | |
| 1920x1080 1080p High | |
| NVIDIA GeForce RTX 4090, Intel Core i9-14900K | |
| NVIDIA GeForce RTX 4090, AMD Ryzen 7 7800X3D | |
| NVIDIA GeForce RTX 4090, AMD Ryzen 9 7950X | |
| NVIDIA GeForce RTX 4090, AMD Ryzen 7 7745HX | |
| NVIDIA GeForce RTX 4090, Intel Core i7-13700 | |
| NVIDIA GeForce RTX 4090, Intel Core i5-14600K | |
| NVIDIA GeForce RTX 4090, Intel Core i7-12700 | |
| NVIDIA GeForce RTX 4090, Intel Core i5-13400 | |
| NVIDIA GeForce RTX 4090, Intel Core i5-12400F | |
| 1920x1080 1080p Extreme | |
| NVIDIA GeForce RTX 4090, AMD Ryzen 7 7800X3D | |
| NVIDIA GeForce RTX 4090, AMD Ryzen 7 7745HX | |
| NVIDIA GeForce RTX 4090, Intel Core i5-14600K | |
| NVIDIA GeForce RTX 4090, Intel Core i9-14900K | |
| NVIDIA GeForce RTX 4090, AMD Ryzen 9 7950X | |
| NVIDIA GeForce RTX 4090, Intel Core i7-13700 | |
| NVIDIA GeForce RTX 4090, Intel Core i5-13400 | |
| NVIDIA GeForce RTX 4090, Intel Core i7-12700 | |
| NVIDIA GeForce RTX 4090, Intel Core i5-12400F | |
| 3840x2160 4k Optimized | |
| NVIDIA GeForce RTX 4090, AMD Ryzen 9 7950X | |
| NVIDIA GeForce RTX 4090, Intel Core i7-13700 | |
| NVIDIA GeForce RTX 4090, Intel Core i9-14900K | |
| NVIDIA GeForce RTX 4090, Intel Core i5-14600K | |
| NVIDIA GeForce RTX 4090, AMD Ryzen 7 7800X3D | |
| NVIDIA GeForce RTX 4090, AMD Ryzen 7 7745HX | |
| NVIDIA GeForce RTX 4090, Intel Core i7-12700 | |
| NVIDIA GeForce RTX 4090, Intel Core i5-13400 | |
| NVIDIA GeForce RTX 4090, Intel Core i5-12400F | |
| 7680x4320 8k Optimized | |
| NVIDIA GeForce RTX 4090, AMD Ryzen 9 7950X | |
| NVIDIA GeForce RTX 4090, Intel Core i7-13700 | |
| NVIDIA GeForce RTX 4090, Intel Core i7-12700 | |
| NVIDIA GeForce RTX 4090, Intel Core i5-13400 | |
| NVIDIA GeForce RTX 4090, Intel Core i5-12400F | |
| NVIDIA GeForce RTX 4090, Intel Core i9-14900K | |
| NVIDIA GeForce RTX 4090, Intel Core i5-14600K | |
| NVIDIA GeForce RTX 4090, AMD Ryzen 7 7800X3D | |
| NVIDIA GeForce RTX 4090, AMD Ryzen 7 7745HX | |
| Unigine Valley 1.0 | |
| 1920x1080 Extreme HD DirectX AA:x8 | |
| NVIDIA GeForce RTX 4090, Intel Core i9-14900K | |
| NVIDIA GeForce RTX 4090, Intel Core i5-14600K | |
| NVIDIA GeForce RTX 4090, AMD Ryzen 9 7950X | |
| NVIDIA GeForce RTX 4090, Intel Core i7-13700 | |
| NVIDIA GeForce RTX 4090, AMD Ryzen 7 7745HX | |
| NVIDIA GeForce RTX 4090, AMD Ryzen 7 7800X3D | |
| NVIDIA GeForce RTX 4090, Intel Core i7-12700 | |
| NVIDIA GeForce RTX 4090, Intel Core i5-13400 | |
| NVIDIA GeForce RTX 4090, Intel Core i5-12400F | |
| 1920x1080 Extreme HD Preset OpenGL AA:x8 | |
| NVIDIA GeForce RTX 4090, Intel Core i9-14900K | |
| NVIDIA GeForce RTX 4090, Intel Core i5-14600K | |
| NVIDIA GeForce RTX 4090, Intel Core i7-13700 | |
| NVIDIA GeForce RTX 4090, AMD Ryzen 9 7950X | |
| NVIDIA GeForce RTX 4090, AMD Ryzen 7 7745HX | |
| NVIDIA GeForce RTX 4090, AMD Ryzen 7 7800X3D | |
| NVIDIA GeForce RTX 4090, Intel Core i7-12700 | |
| NVIDIA GeForce RTX 4090, Intel Core i5-13400 | |
| NVIDIA GeForce RTX 4090, Intel Core i5-12400F | |
| Unigine Heaven 4.0 | |
| Extreme Preset OpenGL | |
| NVIDIA GeForce RTX 4090, Intel Core i9-14900K | |
| NVIDIA GeForce RTX 4090, AMD Ryzen 7 7745HX | |
| NVIDIA GeForce RTX 4090, Intel Core i5-14600K | |
| NVIDIA GeForce RTX 4090, AMD Ryzen 9 7950X | |
| NVIDIA GeForce RTX 4090, Intel Core i7-13700 | |
| NVIDIA GeForce RTX 4090, AMD Ryzen 7 7800X3D | |
| NVIDIA GeForce RTX 4090, Intel Core i7-12700 | |
| NVIDIA GeForce RTX 4090, Intel Core i5-13400 | |
| NVIDIA GeForce RTX 4090, Intel Core i5-12400F | |
| Extreme Preset DX11 | |
| NVIDIA GeForce RTX 4090, AMD Ryzen 9 7950X | |
| NVIDIA GeForce RTX 4090, Intel Core i9-14900K | |
| NVIDIA GeForce RTX 4090, AMD Ryzen 7 7745HX | |
| NVIDIA GeForce RTX 4090, Intel Core i5-14600K | |
| NVIDIA GeForce RTX 4090, AMD Ryzen 7 7800X3D | |
| NVIDIA GeForce RTX 4090, Intel Core i7-13700 | |
| NVIDIA GeForce RTX 4090, Intel Core i7-12700 | |
| NVIDIA GeForce RTX 4090, Intel Core i5-13400 | |
| NVIDIA GeForce RTX 4090, Intel Core i5-12400F | |
| ComputeMark v2.1 | |
| 1024x600 Normal, Score | |
| NVIDIA GeForce RTX 4090, AMD Ryzen 7 7745HX | |
| NVIDIA GeForce RTX 4090, Intel Core i5-14600K | |
| NVIDIA GeForce RTX 4090, AMD Ryzen 9 7950X | |
| NVIDIA GeForce RTX 4090, Intel Core i9-14900K | |
| NVIDIA GeForce RTX 4090, Intel Core i7-12700 | |
| NVIDIA GeForce RTX 4090, AMD Ryzen 7 7800X3D | |
| NVIDIA GeForce RTX 4090, Intel Core i5-13400 | |
| NVIDIA GeForce RTX 4090, Intel Core i7-13700 | |
| 1024x600 Normal, Fluid 3DTex | |
| NVIDIA GeForce RTX 4090, AMD Ryzen 7 7800X3D | |
| NVIDIA GeForce RTX 4090, Intel Core i5-14600K | |
| NVIDIA GeForce RTX 4090, Intel Core i7-13700 | |
| NVIDIA GeForce RTX 4090, Intel Core i5-13400 | |
| NVIDIA GeForce RTX 4090, Intel Core i7-12700 | |
| NVIDIA GeForce RTX 4090, AMD Ryzen 9 7950X | |
| NVIDIA GeForce RTX 4090, AMD Ryzen 7 7745HX | |
| NVIDIA GeForce RTX 4090, Intel Core i9-14900K | |
| 1024x600 Normal, Fluid 2DTexArr | |
| NVIDIA GeForce RTX 4090, AMD Ryzen 7 7745HX | |
| NVIDIA GeForce RTX 4090, Intel Core i5-14600K | |
| NVIDIA GeForce RTX 4090, Intel Core i9-14900K | |
| NVIDIA GeForce RTX 4090, AMD Ryzen 9 7950X | |
| NVIDIA GeForce RTX 4090, Intel Core i7-12700 | |
| NVIDIA GeForce RTX 4090, Intel Core i7-13700 | |
| NVIDIA GeForce RTX 4090, AMD Ryzen 7 7800X3D | |
| NVIDIA GeForce RTX 4090, Intel Core i5-13400 | |
| 1024x600 Normal, Mandel Vector | |
| NVIDIA GeForce RTX 4090, AMD Ryzen 7 7745HX | |
| NVIDIA GeForce RTX 4090, Intel Core i5-14600K | |
| NVIDIA GeForce RTX 4090, AMD Ryzen 9 7950X | |
| NVIDIA GeForce RTX 4090, Intel Core i9-14900K | |
| NVIDIA GeForce RTX 4090, Intel Core i7-13700 | |
| NVIDIA GeForce RTX 4090, Intel Core i7-12700 | |
| NVIDIA GeForce RTX 4090, AMD Ryzen 7 7800X3D | |
| NVIDIA GeForce RTX 4090, Intel Core i5-13400 | |
| 1024x600 Normal, Mandel Scalar | |
| NVIDIA GeForce RTX 4090, AMD Ryzen 7 7745HX | |
| NVIDIA GeForce RTX 4090, Intel Core i5-14600K | |
| NVIDIA GeForce RTX 4090, Intel Core i9-14900K | |
| NVIDIA GeForce RTX 4090, AMD Ryzen 7 7800X3D | |
| NVIDIA GeForce RTX 4090, AMD Ryzen 9 7950X | |
| NVIDIA GeForce RTX 4090, Intel Core i7-12700 | |
| NVIDIA GeForce RTX 4090, Intel Core i7-13700 | |
| NVIDIA GeForce RTX 4090, Intel Core i5-13400 | |
| 1024x600 Normal, QJuliaRayTrace | |
| NVIDIA GeForce RTX 4090, AMD Ryzen 7 7745HX | |
| NVIDIA GeForce RTX 4090, Intel Core i5-14600K | |
| NVIDIA GeForce RTX 4090, AMD Ryzen 9 7950X | |
| NVIDIA GeForce RTX 4090, Intel Core i9-14900K | |
| NVIDIA GeForce RTX 4090, Intel Core i5-13400 | |
| NVIDIA GeForce RTX 4090, Intel Core i7-12700 | |
| NVIDIA GeForce RTX 4090, Intel Core i7-13700 | |
| NVIDIA GeForce RTX 4090, AMD Ryzen 7 7800X3D | |
| Performance rating - Percent | |
| AMD Ryzen 7 7800X3D | |
| AMD Ryzen 9 7950X3D | |
| Intel Core i9-14900K | |
| AMD Ryzen 9 7950X | |
| AMD Ryzen 5 7600X | |
| Intel Core i9-13900K | |
| Intel Core i7-13700K | |
| Intel Core i7-13700 | |
| AMD Ryzen 7 7745HX | |
| Intel Core i7-12700 | |
| Intel Core i5-13400 | |
| F1 22 - 1280x720 Ultra Low Preset AA:T AF:16x | |
| AMD Ryzen 7 7800X3D | |
| Intel Core i9-14900K | |
| AMD Ryzen 9 7950X3D | |
| AMD Ryzen 9 7950X | |
| AMD Ryzen 5 7600X | |
| Intel Core i9-13900K | |
| AMD Ryzen 7 7745HX | |
| Intel Core i7-13700K | |
| Intel Core i7-13700 | |
| Intel Core i7-12700 | |
| Intel Core i5-13400 | |
| Far Cry 5 - 1280x720 Low Preset AA:T | |
| AMD Ryzen 7 7800X3D | |
| AMD Ryzen 9 7950X3D | |
| Intel Core i9-14900K | |
| Intel Core i9-13900K | |
| Intel Core i7-13700K | |
| AMD Ryzen 5 7600X | |
| AMD Ryzen 9 7950X | |
| Intel Core i7-13700 | |
| AMD Ryzen 7 7745HX | |
| Intel Core i7-12700 | |
| Intel Core i5-13400 | |
| X-Plane 11.11 - 1280x720 low (fps_test=1) | |
| Intel Core i9-13900K | |
| Intel Core i9-14900K | |
| AMD Ryzen 9 7950X3D | |
| Intel Core i7-13700K | |
| AMD Ryzen 9 7950X | |
| AMD Ryzen 7 7800X3D | |
| Intel Core i7-13700 | |
| AMD Ryzen 5 7600X | |
| AMD Ryzen 7 7745HX | |
| Intel Core i7-12700 | |
| Intel Core i5-13400 | |
| Final Fantasy XV Benchmark - 1280x720 Lite Quality | |
| AMD Ryzen 7 7745HX | |
| Intel Core i9-13900K | |
| AMD Ryzen 9 7950X | |
| AMD Ryzen 5 7600X | |
| Intel Core i7-13700 | |
| Intel Core i7-13700K | |
| AMD Ryzen 7 7800X3D | |
| Intel Core i9-14900K | |
| AMD Ryzen 9 7950X3D | |
| Intel Core i7-12700 | |
| Intel Core i5-13400 | |
| Dota 2 Reborn - 1280x720 min (0/3) fastest | |
| AMD Ryzen 7 7800X3D | |
| AMD Ryzen 9 7950X3D | |
| AMD Ryzen 9 7950X | |
| Intel Core i9-14900K | |
| Intel Core i9-13900K | |
| AMD Ryzen 5 7600X | |
| AMD Ryzen 7 7745HX | |
| Intel Core i7-13700K | |
| Intel Core i7-13700 | |
| Intel Core i7-12700 | |
| Intel Core i5-13400 | |
| The Witcher 3 - 1024x768 Low Graphics & Postprocessing | |
| AMD Ryzen 9 7950X3D | |
| AMD Ryzen 7 7800X3D | |
| Intel Core i9-14900K | |
| AMD Ryzen 9 7950X | |
| Intel Core i9-13900K | |
| AMD Ryzen 5 7600X | |
| AMD Ryzen 7 7745HX | |
| Intel Core i7-13700K | |
| Intel Core i7-13700 | |
| Intel Core i7-12700 | |
| Intel Core i5-13400 | |
| GTA V - 1024x768 Lowest Settings possible | |
| AMD Ryzen 7 7800X3D | |
| AMD Ryzen 9 7950X | |
| AMD Ryzen 9 7950X3D | |
| AMD Ryzen 5 7600X | |
| Intel Core i9-14900K | |
| Intel Core i9-13900K | |
| Intel Core i7-13700 | |
| Intel Core i7-13700K | |
| AMD Ryzen 7 7745HX | |
| Intel Core i7-12700 | |
| Intel Core i5-13400 | |
| Borderlands 3 - 1280x720 Very Low Overall Quality (DX11) | |
| AMD Ryzen 7 7800X3D | |
| AMD Ryzen 9 7950X3D | |
| Intel Core i9-14900K | |
| Intel Core i9-13900K | |
| AMD Ryzen 9 7950X | |
| AMD Ryzen 5 7600X | |
| Intel Core i7-13700 | |
| Intel Core i7-13700K | |
| AMD Ryzen 7 7745HX | |
| Intel Core i7-12700 | |
| Intel Core i5-13400 | |
| Far Cry New Dawn - 1280x720 Low Preset | |
| AMD Ryzen 7 7800X3D | |
| AMD Ryzen 9 7950X3D | |
| Intel Core i9-14900K | |
| Intel Core i9-13900K | |
| Intel Core i7-13700 | |
| Intel Core i7-13700K | |
| AMD Ryzen 9 7950X | |
| AMD Ryzen 5 7600X | |
| Intel Core i7-12700 | |
| AMD Ryzen 7 7745HX | |
| Intel Core i5-13400 | |
| Shadow of the Tomb Raider - 1280x720 Lowest Preset | |
| AMD Ryzen 7 7800X3D | |
| AMD Ryzen 9 7950X3D | |
| AMD Ryzen 9 7950X | |
| Intel Core i9-14900K | |
| AMD Ryzen 5 7600X | |
| Intel Core i9-13900K | |
| AMD Ryzen 7 7745HX | |
| Intel Core i7-13700 | |
| Intel Core i7-13700K | |
| Intel Core i7-12700 | |
| Intel Core i5-13400 | |
| Tiny Tina's Wonderlands - 1280x720 Lowest Preset (DX12) | |
| AMD Ryzen 7 7800X3D | |
| Intel Core i9-14900K | |
| AMD Ryzen 9 7950X3D | |
| AMD Ryzen 9 7950X | |
| AMD Ryzen 5 7600X | |
| Intel Core i9-13900K | |
| AMD Ryzen 7 7745HX | |
| Intel Core i7-13700 | |
| Intel Core i7-13700K | |
| Intel Core i7-12700 | |
| Intel Core i5-13400 | |
| Strange Brigade - 1280x720 lowest AF:1 | |
| AMD Ryzen 5 7600X | |
| Intel Core i9-14900K | |
| AMD Ryzen 7 7800X3D | |
| AMD Ryzen 9 7950X | |
| Intel Core i9-13900K | |
| AMD Ryzen 7 7745HX | |
| AMD Ryzen 9 7950X3D | |
| Intel Core i7-13700K | |
| Intel Core i7-13700 | |
| Intel Core i7-12700 | |
| Intel Core i5-13400 | |
| Metro Exodus - 1280x720 Low Quality AF:4x | |
| AMD Ryzen 7 7800X3D | |
| Intel Core i9-14900K | |
| AMD Ryzen 5 7600X | |
| AMD Ryzen 9 7950X | |
| AMD Ryzen 9 7950X3D | |
| AMD Ryzen 7 7745HX | |
| Intel Core i7-13700 | |
| Intel Core i9-13900K | |
| Intel Core i7-13700K | |
| Intel Core i7-12700 | |
| Intel Core i5-13400 | |
| F1 2020 - 1280x720 Ultra Low Preset | |
| AMD Ryzen 7 7800X3D | |
| Intel Core i9-14900K | |
| AMD Ryzen 9 7950X3D | |
| AMD Ryzen 9 7950X | |
| AMD Ryzen 5 7600X | |
| AMD Ryzen 7 7745HX | |
| Intel Core i9-13900K | |
| Intel Core i7-13700K | |
| Intel Core i7-13700 | |
| Intel Core i7-12700 | |
| Intel Core i5-13400 | |
| F1 2021 - 1280x720 Ultra Low Preset | |
| AMD Ryzen 7 7800X3D | |
| Intel Core i9-14900K | |
| AMD Ryzen 5 7600X | |
| AMD Ryzen 9 7950X3D | |
| AMD Ryzen 9 7950X | |
| Intel Core i9-13900K | |
| AMD Ryzen 7 7745HX | |
| Intel Core i7-13700K | |
| Intel Core i7-13700 | |
| Intel Core i7-12700 | |
| Intel Core i5-13400 | |
| Performance rating - Percent | |
| AMD Ryzen 7 7800X3D | |
| AMD Ryzen 9 7950X3D | |
| Intel Core i9-14900K | |
| AMD Ryzen 9 7950X | |
| AMD Ryzen 5 7600X | |
| Intel Core i9-13900K | |
| Intel Core i7-13700K | |
| Intel Core i7-13700 | |
| AMD Ryzen 7 7745HX | |
| Intel Core i7-12700 | |
| Intel Core i5-13400 | |
| F1 22 | |
| 3840x2160 Ultra High Preset AA:T AF:16x | |
| AMD Ryzen 7 7745HX | |
| AMD Ryzen 7 7800X3D | |
| Intel Core i9-14900K | |
| AMD Ryzen 5 7600X | |
| AMD Ryzen 9 7950X | |
| Intel Core i7-13700K | |
| AMD Ryzen 9 7950X3D | |
| Intel Core i7-13700 | |
| Intel Core i7-12700 | |
| Intel Core i5-13400 | |
| Intel Core i9-13900K | |
| 2560x1440 Ultra High Preset AA:T AF:16x | |
| AMD Ryzen 7 7800X3D | |
| Intel Core i9-14900K | |
| AMD Ryzen 7 7745HX | |
| AMD Ryzen 9 7950X3D | |
| AMD Ryzen 5 7600X | |
| AMD Ryzen 9 7950X | |
| Intel Core i9-13900K | |
| Intel Core i7-13700K | |
| Intel Core i7-13700 | |
| Intel Core i7-12700 | |
| Intel Core i5-13400 | |
| 1920x1080 Ultra High Preset AA:T AF:16x | |
| AMD Ryzen 7 7800X3D | |
| Intel Core i9-14900K | |
| AMD Ryzen 5 7600X | |
| AMD Ryzen 9 7950X3D | |
| AMD Ryzen 9 7950X | |
| Intel Core i9-13900K | |
| AMD Ryzen 7 7745HX | |
| Intel Core i7-13700K | |
| Intel Core i7-13700 | |
| Intel Core i7-12700 | |
| Intel Core i5-13400 | |
| Far Cry 5 | |
| 3840x2160 Ultra Preset AA:T | |
| AMD Ryzen 7 7800X3D | |
| Intel Core i9-14900K | |
| Intel Core i9-13900K | |
| AMD Ryzen 9 7950X3D | |
| AMD Ryzen 9 7950X | |
| AMD Ryzen 5 7600X | |
| Intel Core i7-13700K | |
| Intel Core i7-13700 | |
| Intel Core i7-12700 | |
| AMD Ryzen 7 7745HX | |
| Intel Core i5-13400 | |
| 2560x1440 Ultra Preset AA:T | |
| AMD Ryzen 7 7800X3D | |
| AMD Ryzen 9 7950X3D | |
| Intel Core i9-14900K | |
| Intel Core i9-13900K | |
| AMD Ryzen 5 7600X | |
| AMD Ryzen 9 7950X | |
| Intel Core i7-13700K | |
| Intel Core i7-13700 | |
| AMD Ryzen 7 7745HX | |
| Intel Core i7-12700 | |
| Intel Core i5-13400 | |
| 1920x1080 Ultra Preset AA:T | |
| AMD Ryzen 7 7800X3D | |
| AMD Ryzen 9 7950X3D | |
| Intel Core i9-14900K | |
| Intel Core i9-13900K | |
| AMD Ryzen 9 7950X | |
| AMD Ryzen 5 7600X | |
| Intel Core i7-13700 | |
| Intel Core i7-13700K | |
| Intel Core i7-12700 | |
| AMD Ryzen 7 7745HX | |
| Intel Core i5-13400 | |
| Final Fantasy XV Benchmark | |
| 3840x2160 High Quality | |
| Intel Core i9-14900K | |
| Intel Core i9-13900K | |
| AMD Ryzen 9 7950X | |
| AMD Ryzen 7 7745HX | |
| AMD Ryzen 5 7600X | |
| AMD Ryzen 7 7800X3D | |
| Intel Core i7-13700 | |
| AMD Ryzen 9 7950X3D | |
| Intel Core i7-13700K | |
| Intel Core i7-12700 | |
| Intel Core i5-13400 | |
| 2560x1440 High Quality | |
| AMD Ryzen 7 7800X3D | |
| Intel Core i9-14900K | |
| Intel Core i9-13900K | |
| AMD Ryzen 9 7950X | |
| AMD Ryzen 9 7950X3D | |
| AMD Ryzen 5 7600X | |
| Intel Core i7-13700K | |
| Intel Core i7-13700 | |
| AMD Ryzen 7 7745HX | |
| Intel Core i7-12700 | |
| Intel Core i5-13400 | |
| 1920x1080 High Quality | |
| Intel Core i9-14900K | |
| AMD Ryzen 9 7950X | |
| AMD Ryzen 7 7800X3D | |
| Intel Core i9-13900K | |
| AMD Ryzen 9 7950X3D | |
| Intel Core i7-13700K | |
| AMD Ryzen 5 7600X | |
| Intel Core i7-13700 | |
| AMD Ryzen 7 7745HX | |
| Intel Core i7-12700 | |
| Intel Core i5-13400 | |
| Dota 2 Reborn | |
| 3840x2160 ultra (3/3) best looking | |
| AMD Ryzen 7 7800X3D | |
| AMD Ryzen 9 7950X3D | |
| AMD Ryzen 9 7950X | |
| Intel Core i9-13900K | |
| Intel Core i9-14900K | |
| AMD Ryzen 5 7600X | |
| Intel Core i7-13700K | |
| Intel Core i7-13700 | |
| AMD Ryzen 7 7745HX | |
| Intel Core i7-12700 | |
| Intel Core i5-13400 | |
| 1920x1080 ultra (3/3) best looking | |
| AMD Ryzen 7 7800X3D | |
| AMD Ryzen 9 7950X3D | |
| AMD Ryzen 9 7950X | |
| Intel Core i9-13900K | |
| Intel Core i9-14900K | |
| AMD Ryzen 5 7600X | |
| Intel Core i7-13700K | |
| Intel Core i7-13700 | |
| AMD Ryzen 7 7745HX | |
| Intel Core i7-12700 | |
| Intel Core i5-13400 | |
| The Witcher 3 | |
| 3840x2160 High Graphics & Postprocessing (Nvidia HairWorks Off) | |
| AMD Ryzen 5 7600X | |
| Intel Core i9-14900K | |
| AMD Ryzen 9 7950X | |
| Intel Core i5-13400 | |
| Intel Core i7-13700 | |
| Intel Core i7-12700 | |
| AMD Ryzen 7 7800X3D | |
| Intel Core i7-13700K | |
| AMD Ryzen 7 7745HX | |
| AMD Ryzen 9 7950X3D | |
| Intel Core i9-13900K | |
| 1920x1080 Ultra Graphics & Postprocessing (HBAO+) | |
| Intel Core i9-13900K | |
| AMD Ryzen 9 7950X | |
| AMD Ryzen 7 7800X3D | |
| Intel Core i9-14900K | |
| AMD Ryzen 5 7600X | |
| Intel Core i7-13700K | |
| Intel Core i7-13700 | |
| AMD Ryzen 9 7950X3D | |
| Intel Core i7-12700 | |
| AMD Ryzen 7 7745HX | |
| Intel Core i5-13400 | |
| GTA V | |
| 3840x2160 Highest AA:4xMSAA + FX AF:16x | |
| AMD Ryzen 7 7800X3D | |
| Intel Core i9-14900K | |
| Intel Core i9-13900K | |
| AMD Ryzen 9 7950X | |
| AMD Ryzen 9 7950X3D | |
| Intel Core i7-13700K | |
| AMD Ryzen 5 7600X | |
| Intel Core i7-13700 | |
| AMD Ryzen 7 7745HX | |
| Intel Core i7-12700 | |
| Intel Core i5-13400 | |
| 2560x1440 Highest AA:4xMSAA + FX AF:16x | |
| AMD Ryzen 7 7800X3D | |
| Intel Core i9-14900K | |
| Intel Core i9-13900K | |
| AMD Ryzen 9 7950X | |
| AMD Ryzen 9 7950X3D | |
| Intel Core i7-13700K | |
| Intel Core i7-13700 | |
| AMD Ryzen 5 7600X | |
| AMD Ryzen 7 7745HX | |
| Intel Core i7-12700 | |
| Intel Core i5-13400 | |
| 1920x1080 Highest AA:4xMSAA + FX AF:16x | |
| AMD Ryzen 7 7800X3D | |
| Intel Core i9-14900K | |
| Intel Core i9-13900K | |
| AMD Ryzen 9 7950X | |
| AMD Ryzen 9 7950X3D | |
| Intel Core i7-13700K | |
| AMD Ryzen 5 7600X | |
| Intel Core i7-13700 | |
| AMD Ryzen 7 7745HX | |
| Intel Core i7-12700 | |
| Intel Core i5-13400 | |
| Borderlands 3 | |
| 3840x2160 Badass Overall Quality (DX11) | |
| Intel Core i7-13700K | |
| Intel Core i9-14900K | |
| AMD Ryzen 7 7800X3D | |
| AMD Ryzen 9 7950X3D | |
| Intel Core i9-13900K | |
| AMD Ryzen 9 7950X | |
| AMD Ryzen 5 7600X | |
| Intel Core i7-13700 | |
| AMD Ryzen 7 7745HX | |
| Intel Core i7-12700 | |
| Intel Core i5-13400 | |
| 2560x1440 Badass Overall Quality (DX11) | |
| AMD Ryzen 7 7800X3D | |
| AMD Ryzen 9 7950X3D | |
| Intel Core i9-14900K | |
| AMD Ryzen 9 7950X | |
| Intel Core i9-13900K | |
| AMD Ryzen 5 7600X | |
| Intel Core i7-13700K | |
| Intel Core i7-13700 | |
| AMD Ryzen 7 7745HX | |
| Intel Core i7-12700 | |
| Intel Core i5-13400 | |
| 1920x1080 Badass Overall Quality (DX11) | |
| AMD Ryzen 9 7950X3D | |
| AMD Ryzen 7 7800X3D | |
| Intel Core i9-14900K | |
| AMD Ryzen 9 7950X | |
| Intel Core i9-13900K | |
| AMD Ryzen 5 7600X | |
| Intel Core i7-13700K | |
| Intel Core i7-13700 | |
| AMD Ryzen 7 7745HX | |
| Intel Core i7-12700 | |
| Intel Core i5-13400 | |
| Far Cry New Dawn | |
| 3840x2160 Ultra Preset | |
| AMD Ryzen 7 7800X3D | |
| AMD Ryzen 9 7950X3D | |
| Intel Core i9-14900K | |
| Intel Core i9-13900K | |
| AMD Ryzen 9 7950X | |
| Intel Core i7-13700 | |
| Intel Core i7-13700K | |
| AMD Ryzen 5 7600X | |
| Intel Core i7-12700 | |
| AMD Ryzen 7 7745HX | |
| Intel Core i5-13400 | |
| 2560x1440 Ultra Preset | |
| AMD Ryzen 7 7800X3D | |
| AMD Ryzen 9 7950X3D | |
| Intel Core i9-14900K | |
| Intel Core i9-13900K | |
| AMD Ryzen 9 7950X | |
| Intel Core i7-13700K | |
| AMD Ryzen 5 7600X | |
| Intel Core i7-13700 | |
| Intel Core i7-12700 | |
| AMD Ryzen 7 7745HX | |
| Intel Core i5-13400 | |
| 1920x1080 Ultra Preset | |
| AMD Ryzen 7 7800X3D | |
| AMD Ryzen 9 7950X3D | |
| Intel Core i9-14900K | |
| Intel Core i9-13900K | |
| AMD Ryzen 9 7950X | |
| Intel Core i7-13700K | |
| AMD Ryzen 5 7600X | |
| Intel Core i7-13700 | |
| Intel Core i7-12700 | |
| AMD Ryzen 7 7745HX | |
| Intel Core i5-13400 | |
| Shadow of the Tomb Raider | |
| 3840x2160 Highest Preset AA:T | |
| Intel Core i9-14900K | |
| Intel Core i7-13700K | |
| AMD Ryzen 7 7800X3D | |
| Intel Core i7-13700 | |
| AMD Ryzen 9 7950X3D | |
| AMD Ryzen 5 7600X | |
| AMD Ryzen 7 7745HX | |
| AMD Ryzen 9 7950X | |
| Intel Core i9-13900K | |
| Intel Core i7-12700 | |
| Intel Core i5-13400 | |
| 2560x1440 Highest Preset AA:T | |
| AMD Ryzen 7 7800X3D | |
| AMD Ryzen 9 7950X3D | |
| Intel Core i9-14900K | |
| Intel Core i9-13900K | |
| AMD Ryzen 9 7950X | |
| AMD Ryzen 5 7600X | |
| Intel Core i7-13700K | |
| Intel Core i7-13700 | |
| AMD Ryzen 7 7745HX | |
| Intel Core i7-12700 | |
| Intel Core i5-13400 | |
| 1920x1080 Highest Preset AA:T | |
| AMD Ryzen 7 7800X3D | |
| AMD Ryzen 9 7950X3D | |
| Intel Core i9-14900K | |
| AMD Ryzen 9 7950X | |
| Intel Core i9-13900K | |
| AMD Ryzen 5 7600X | |
| Intel Core i7-13700K | |
| Intel Core i7-13700 | |
| AMD Ryzen 7 7745HX | |
| Intel Core i7-12700 | |
| Intel Core i5-13400 | |
| Tiny Tina's Wonderlands | |
| 3840x2160 Badass Preset (DX12) | |
| Intel Core i9-14900K | |
| AMD Ryzen 9 7950X3D | |
| AMD Ryzen 7 7745HX | |
| AMD Ryzen 5 7600X | |
| AMD Ryzen 9 7950X | |
| Intel Core i7-13700 | |
| Intel Core i9-13900K | |
| AMD Ryzen 7 7800X3D | |
| Intel Core i7-12700 | |
| Intel Core i5-13400 | |
| Intel Core i7-13700K | |
| 2560x1440 Badass Preset (DX12) | |
| AMD Ryzen 9 7950X3D | |
| Intel Core i9-14900K | |
| AMD Ryzen 7 7800X3D | |
| AMD Ryzen 9 7950X | |
| AMD Ryzen 7 7745HX | |
| AMD Ryzen 5 7600X | |
| Intel Core i7-13700K | |
| Intel Core i9-13900K | |
| Intel Core i7-13700 | |
| Intel Core i7-12700 | |
| Intel Core i5-13400 | |
| 1920x1080 Badass Preset (DX12) | |
| AMD Ryzen 7 7800X3D | |
| Intel Core i9-14900K | |
| AMD Ryzen 9 7950X3D | |
| AMD Ryzen 9 7950X | |
| AMD Ryzen 5 7600X | |
| AMD Ryzen 7 7745HX | |
| Intel Core i9-13900K | |
| Intel Core i7-13700 | |
| Intel Core i7-13700K | |
| Intel Core i7-12700 | |
| Intel Core i5-13400 | |
| Strange Brigade | |
| 3840x2160 ultra AA:ultra AF:16 | |
| Intel Core i9-14900K | |
| AMD Ryzen 7 7800X3D | |
| AMD Ryzen 7 7745HX | |
| Intel Core i7-13700K | |
| AMD Ryzen 9 7950X3D | |
| Intel Core i7-12700 | |
| AMD Ryzen 5 7600X | |
| Intel Core i7-13700 | |
| AMD Ryzen 9 7950X | |
| Intel Core i9-13900K | |
| Intel Core i5-13400 | |
| 2560x1440 ultra AA:ultra AF:16 | |
| Intel Core i9-14900K | |
| AMD Ryzen 7 7800X3D | |
| AMD Ryzen 5 7600X | |
| AMD Ryzen 7 7745HX | |
| AMD Ryzen 9 7950X | |
| Intel Core i9-13900K | |
| AMD Ryzen 9 7950X3D | |
| Intel Core i7-13700K | |
| Intel Core i7-13700 | |
| Intel Core i7-12700 | |
| Intel Core i5-13400 | |
| 1920x1080 ultra AA:ultra AF:16 | |
| Intel Core i9-14900K | |
| AMD Ryzen 5 7600X | |
| AMD Ryzen 7 7800X3D | |
| AMD Ryzen 9 7950X | |
| Intel Core i9-13900K | |
| AMD Ryzen 7 7745HX | |
| AMD Ryzen 9 7950X3D | |
| Intel Core i7-13700K | |
| Intel Core i7-13700 | |
| Intel Core i7-12700 | |
| Intel Core i5-13400 | |
| Metro Exodus | |
| 3840x2160 Ultra Quality AF:16x | |
| Intel Core i9-14900K | |
| AMD Ryzen 7 7800X3D | |
| AMD Ryzen 9 7950X | |
| AMD Ryzen 9 7950X3D | |
| Intel Core i9-13900K | |
| AMD Ryzen 5 7600X | |
| Intel Core i7-13700 | |
| Intel Core i7-13700K | |
| AMD Ryzen 7 7745HX | |
| Intel Core i7-12700 | |
| Intel Core i5-13400 | |
| 2560x1440 Ultra Quality AF:16x | |
| AMD Ryzen 7 7800X3D | |
| Intel Core i9-14900K | |
| AMD Ryzen 9 7950X | |
| AMD Ryzen 5 7600X | |
| AMD Ryzen 7 7745HX | |
| AMD Ryzen 9 7950X3D | |
| Intel Core i9-13900K | |
| Intel Core i7-13700 | |
| Intel Core i7-13700K | |
| Intel Core i7-12700 | |
| Intel Core i5-13400 | |
| 1920x1080 Ultra Quality AF:16x | |
| AMD Ryzen 7 7800X3D | |
| Intel Core i9-14900K | |
| AMD Ryzen 9 7950X | |
| AMD Ryzen 7 7745HX | |
| AMD Ryzen 5 7600X | |
| AMD Ryzen 9 7950X3D | |
| Intel Core i9-13900K | |
| Intel Core i7-13700 | |
| Intel Core i7-13700K | |
| Intel Core i7-12700 | |
| Intel Core i5-13400 | |
| F1 2020 | |
| 3840x2160 Ultra High Preset AA:T AF:16x | |
| Intel Core i9-14900K | |
| AMD Ryzen 9 7950X3D | |
| AMD Ryzen 7 7800X3D | |
| AMD Ryzen 7 7745HX | |
| AMD Ryzen 9 7950X | |
| Intel Core i9-13900K | |
| AMD Ryzen 5 7600X | |
| Intel Core i7-13700K | |
| Intel Core i7-13700 | |
| Intel Core i7-12700 | |
| Intel Core i5-13400 | |
| 2560x1440 Ultra High Preset AA:T AF:16x | |
| AMD Ryzen 7 7800X3D | |
| Intel Core i9-14900K | |
| AMD Ryzen 9 7950X3D | |
| AMD Ryzen 9 7950X | |
| Intel Core i9-13900K | |
| AMD Ryzen 5 7600X | |
| AMD Ryzen 7 7745HX | |
| Intel Core i7-13700K | |
| Intel Core i7-13700 | |
| Intel Core i7-12700 | |
| Intel Core i5-13400 | |
| 1920x1080 Ultra High Preset AA:T AF:16x | |
| AMD Ryzen 7 7800X3D | |
| AMD Ryzen 9 7950X3D | |
| Intel Core i9-14900K | |
| AMD Ryzen 5 7600X | |
| AMD Ryzen 9 7950X | |
| AMD Ryzen 7 7745HX | |
| Intel Core i9-13900K | |
| Intel Core i7-13700K | |
| Intel Core i7-13700 | |
| Intel Core i7-12700 | |
| Intel Core i5-13400 | |
| F1 2021 | |
| 3840x2160 Ultra High Preset + Raytracing AA:T AF:16x | |
| AMD Ryzen 7 7800X3D | |
| AMD Ryzen 7 7745HX | |
| AMD Ryzen 5 7600X | |
| AMD Ryzen 9 7950X3D | |
| Intel Core i9-14900K | |
| AMD Ryzen 9 7950X | |
| Intel Core i7-13700K | |
| Intel Core i7-13700 | |
| Intel Core i9-13900K | |
| Intel Core i7-12700 | |
| Intel Core i5-13400 | |
| 2560x1440 Ultra High Preset + Raytracing AA:T AF:16x | |
| AMD Ryzen 7 7800X3D | |
| Intel Core i9-14900K | |
| AMD Ryzen 5 7600X | |
| AMD Ryzen 9 7950X3D | |
| AMD Ryzen 9 7950X | |
| Intel Core i7-13700K | |
| Intel Core i7-13700 | |
| AMD Ryzen 7 7745HX | |
| Intel Core i7-12700 | |
| Intel Core i5-13400 | |
| Intel Core i9-13900K | |
| 1920x1080 Ultra High Preset + Raytracing AA:T AF:16x | |
| AMD Ryzen 7 7800X3D | |
| Intel Core i9-14900K | |
| AMD Ryzen 5 7600X | |
| Intel Core i9-13900K | |
| AMD Ryzen 9 7950X | |
| AMD Ryzen 9 7950X3D | |
| Intel Core i7-13700K | |
| Intel Core i7-13700 | |
| AMD Ryzen 7 7745HX | |
| Intel Core i7-12700 | |
| Intel Core i5-13400 | |
Power consumption with external monitor
| bajo | medio | alto | ultra | QHD | 4K DLSS | 4K | |
|---|---|---|---|---|---|---|---|
| GTA V (2015) | 187.6 | 186.9 | 183.7 | 142.9 | 142.6 | 183.6 | |
| The Witcher 3 (2015) | 692 | 608 | 566 | 291 | 255 | 277 | |
| Dota 2 Reborn (2015) | 252 | 222 | 218 | 195.2 | 192.8 | ||
| Final Fantasy XV Benchmark (2018) | 237 | 236 | 217 | 212 | 160.2 | ||
| X-Plane 11.11 (2018) | 195.9 | 164.5 | 127.3 | 106.7 | |||
| Far Cry 5 (2018) | 205 | 176 | 168 | 155 | 157 | 152 | |
| Strange Brigade (2018) | 676 | 553 | 548 | 541 | 517 | 287 | |
| Shadow of the Tomb Raider (2018) | 275 | 253 | 246 | 254 | 242 | 186.4 | |
| Far Cry New Dawn (2019) | 170 | 148 | 143 | 128 | 128 | 124 | |
| Metro Exodus (2019) | 287 | 271 | 239 | 199.4 | 182.8 | 135.8 | |
| Borderlands 3 (2019) | 203 | 179.9 | 162.4 | 154.7 | 153.2 | 127.9 | |
| F1 2020 (2020) | 529 | 408 | 431 | 392 | 383 | 287 | |
| Death Stranding (2020) | 238 | 237 | 234 | 230 | 227 | 197.7 | |
| Horizon Zero Dawn (2020) | 290 | 268 | 250 | 237 | 230 | 208 | 165 |
| F1 2021 (2021) | 589 | 567 | 483 | 253 | 252 | 207 | |
| Forza Horizon 5 (2021) | 359 | 281 | 278 | 201 | 187 | 161 | |
| God of War (2022) | 230 | 233 | 229 | 205 | 179.7 | 127.1 | |
| GRID Legends (2022) | 229 | 205 | 190.1 | 184.2 | 181.8 | 173.9 | |
| Tiny Tina's Wonderlands (2022) | 393 | 333 | 295 | 279 | 229 | 130.8 | |
| F1 22 (2022) | 375 | 391 | 363 | 191.4 | 159.5 | 84.9 | |
| The Callisto Protocol (2022) | 211.1 | 199.9 | 196.8 | 185.5 | 179.2 | 149.6 | |
| High On Life (2023) | 343 | 325 | 292 | 278 | 224 | 109.9 | |
| The Witcher 3 v4 (2023) | 259 | 219 | 191.6 | 180.1 | 176.9 | 160.4 | |
| Dead Space Remake (2023) | 194.3 | 194.1 | 186.1 | 184.9 | 170.6 | 97.9 | |
| Returnal (2023) | 199 | 199 | 196 | 193 | 170 | 113 | |
| Atomic Heart (2023) | 258 | 214 | 190 | 177.9 | 164.6 | 105.6 | |
| Company of Heroes 3 (2023) | 312.3 | 284.6 | 268.8 | 267.4 | 236.3 | 195.4 | |
| The Last of Us (2023) | 182.3 | 171.4 | 170.3 | 166.5 | 142.5 | 123.9 | 82.2 |
| F1 23 (2023) | 384 | 401 | 379 | 174.6 | 153.2 | 133.2 | 80.7 |
| Starfield (2023) | 164 | 162.7 | 152.6 | 144.5 | 122.7 | 82.1 | |
| Lies of P (2023) | 315 | 296 | 276 | 257 | 245 | 224 | 165.8 |
| Cyberpunk 2077 (2023) | 203 | 201 | 185.5 | 170.7 | 152 | 75.9 | |
| Assassin's Creed Mirage (2023) | 253 | 244 | 232 | 166 | 160 | 144 | 130 |
| Total War Pharaoh (2023) | 544.4 | 319.5 | 211.7 | 163.1 | 162.8 | 150 | |
| Lords of the Fallen (2023) | 160.8 | 154.8 | 147.8 | 122.1 | 93.9 | 93.2 | 55.4 |
| EA Sports WRC (2023) | 224 | 147.3 | 138.3 | 134.7 | 131.7 | 123.2 | 120.7 |
| Call of Duty Modern Warfare 3 2023 (2023) | 246 | 245 | 244 | 243 | 230 | 164 | |
| Avatar Frontiers of Pandora (2023) | 236 | 224 | 201 | 169 | 126 | 113 | 68 |
| The Finals (2023) | 302 | 268 | 261 | 270 | 257 | 223 | 140.4 |
Consumo de energía y temperaturas
Minisforum proporciona la placa base BD770i con un sistema de refrigeración por tubo de calor preinstalado. Sin embargo, los usuarios tienen la flexibilidad de elegir el ventilador de 120 milímetros para su instalación. Cabe señalar que pueden producirse variaciones de temperatura con ventiladores diferentes en comparación con nuestro ventilador Noctua NF-A12x25. En general, tenemos pocas críticas sobre la unidad de refrigeración. El SoC y los convertidores de voltaje de la placa base reciben refrigeración directa, destacando que no se pueden instalar refrigeradores alternativos. Las temperaturas del AMD Ryzen 7 7745HX rondan justo por encima de los 90 °C tanto en sistemas cerrados como abiertos. Esto está dentro del rango aceptable para una CPU del sector móvil, ya que las especificaciones de AMD permiten que el procesador alcance temperaturas de hasta 100 °C antes de experimentar una reducción del rendimiento. Incluso durante pruebas de estrés prolongadas, no alcanzamos los 100 °C.
Una de las características más destacadas del Minisforum BD770i es su consumo de energía. Registramos sólo 127,5 vatios en la prueba Cinebench R15 Multi, lo que resulta en una eficiencia excepcional, superando a otros sistemas de sobremesa en comparación. En los escenarios de juego, donde se utiliza una parte importante de la energía para el rendimiento de la tarjeta gráfica, documentamos un resultado comparativamente bueno con una media de 495 vatios. La eficiencia del AMD Ryzen 7 7745HX está a la par con el AMD Ryzen 7 7800X3D. Sin embargo, en términos de eficiencia en el modo de juego, el AMD Ryzen 7 7745HX superó al AMD Ryzen 7 7800X3D. Sin el uso de una tarjeta gráfica dedicada, el sistema de prueba funcionó de forma significativamente más económica, requiriendo una media de sólo 60 vatios en modo de juego.
En cuanto al funcionamiento general y los niveles de ruido, observamos que la fuente de alimentación instalada es audible en nuestra configuración de prueba. Tanto en condiciones de reposo como de carga, no detectamos ninguna medición influida por el adaptador instalado. El pequeño ventilador preinstalado para la refrigeración activa de la unidad SSD funciona de forma muy silenciosa y permanece inaudible desde una carcasa cerrada. La configuración de la BIOS de la placa base Minisforum BD770i ofrece opciones de ajuste limitadas. Los usuarios pueden fijar la potencia de la CPU en pasos predefinidos (45, 55 y 75 vatios) y ajustar la temperatura máxima de la CPU a cualquier valor. En comparación con otros fabricantes de placas base conocidos, la placa base Minisforum BD770i tiene unas opciones de ajuste más limitadas. La posibilidad de ajustar la curva del ventilador podría ser un añadido valioso para los usuarios que prefieren la flexibilidad a experimentar con los límites de potencia y temperatura del SoC.
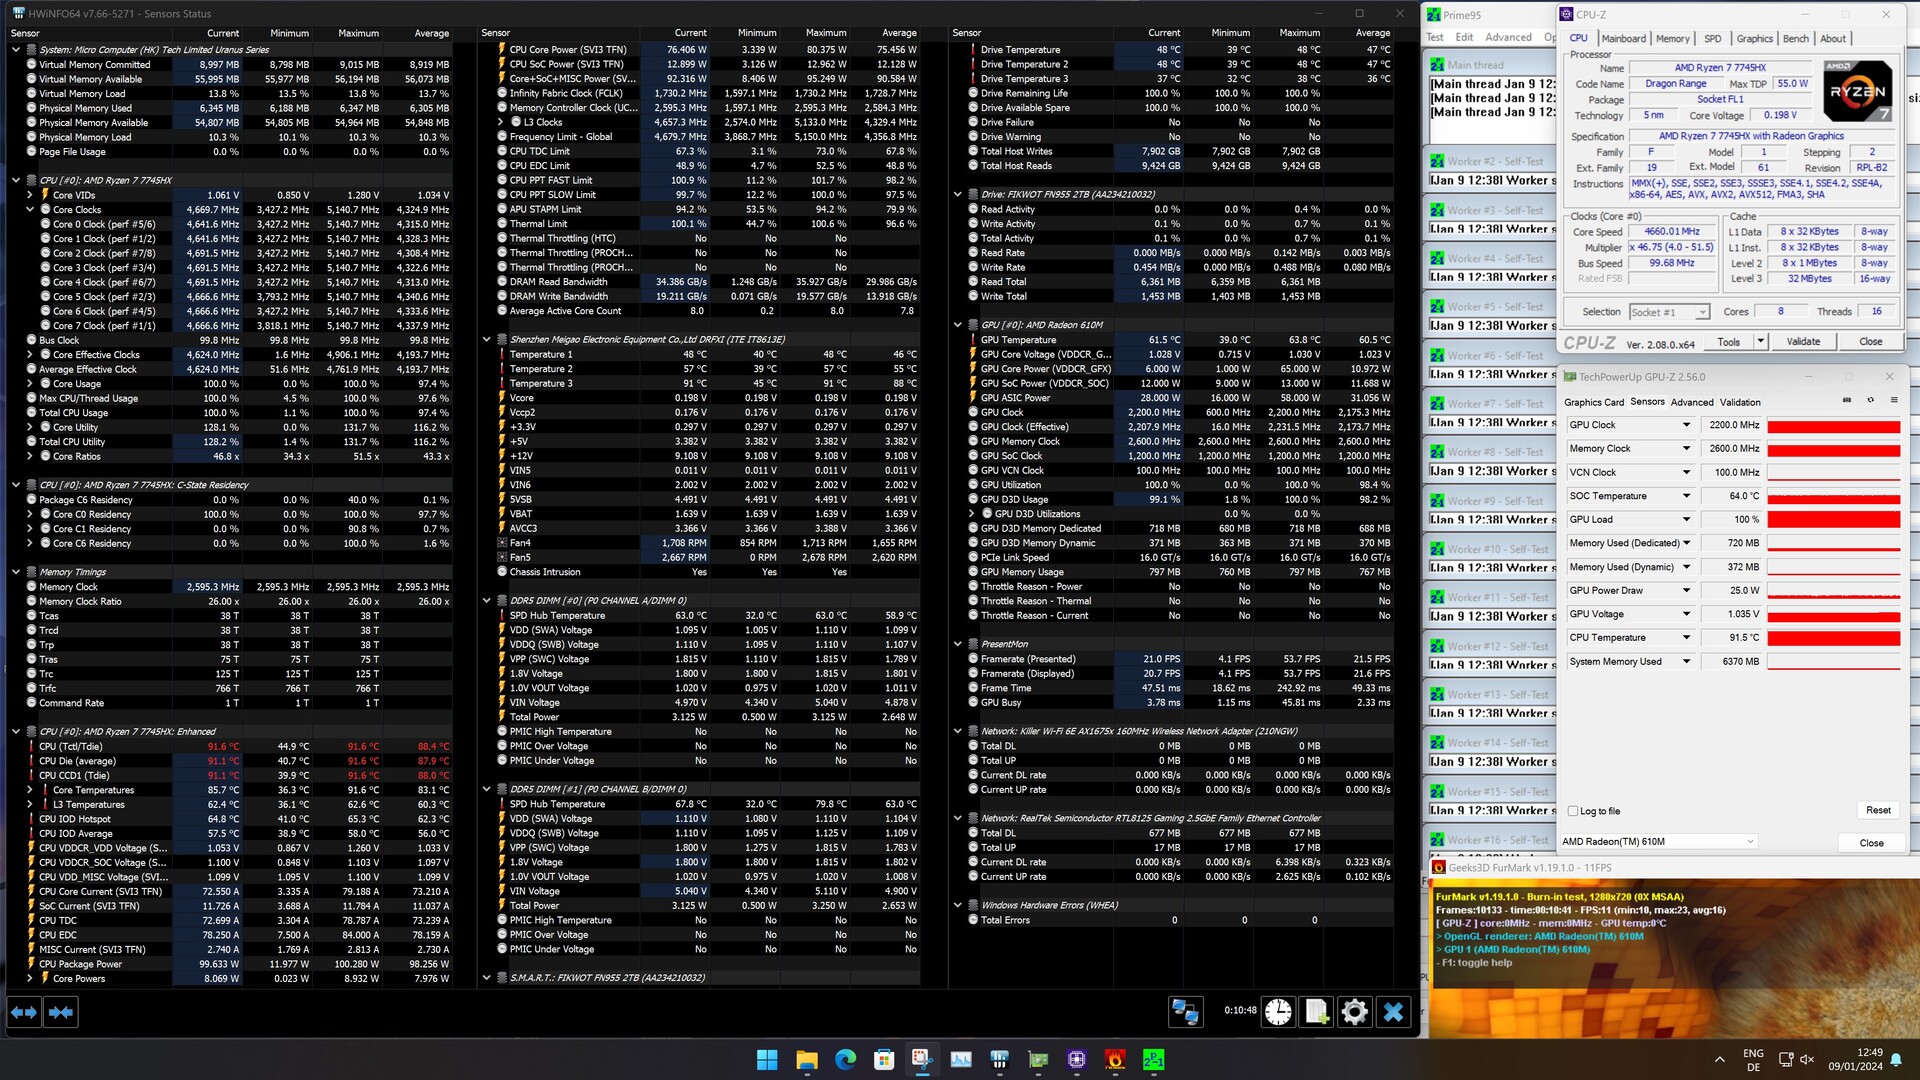
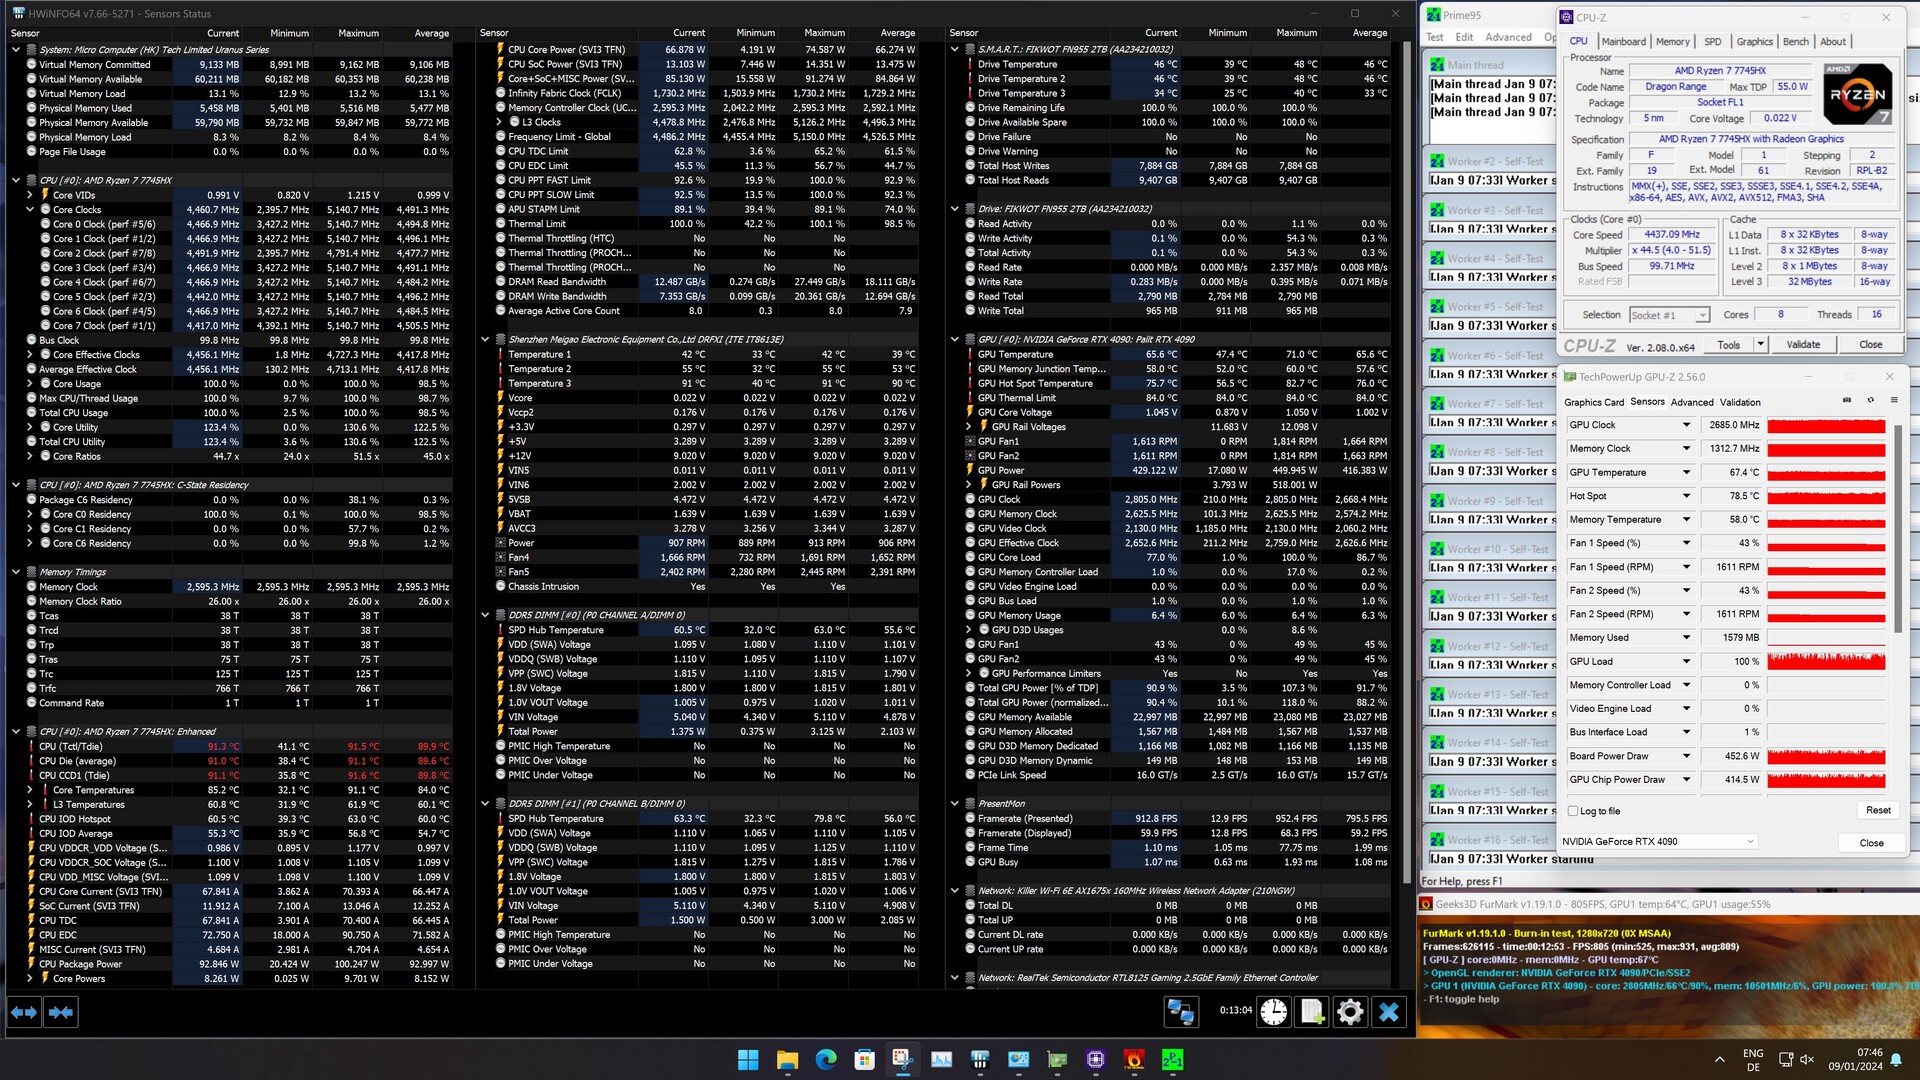
| Power Consumption / Cinebench R15 Multi (external Monitor) | |
| Intel Core i9-14900K | |
| Intel Core i9-13900K | |
| AMD Ryzen 9 7950X (Idle: 95.2 W) | |
| Intel Core i7-13700K | |
| Intel Core i5-14600K | |
| Intel Core i5-13600K | |
| Intel Core i7-12700 | |
| AMD Ryzen 9 7950X3D | |
| AMD Ryzen 7 7800X3D | |
| Intel Core i5-13400 | |
| Intel Core i5-12400F | |
| AMD Ryzen 7 7745HX | |
| Power Consumption / Prime95 V2810 Stress (external Monitor) | |
| Intel Core i9-14900K | |
| Intel Core i9-13900K | |
| Intel Core i5-14600K | |
| Intel Core i7-13700K | |
| Intel Core i5-13600K | |
| AMD Ryzen 9 7950X (Idle: 95.2 W) | |
| Intel Core i7-12700 | |
| AMD Ryzen 9 7950X3D | |
| Intel Core i5-12400F | |
| Intel Core i5-13400 | |
| AMD Ryzen 7 7800X3D | |
| AMD Ryzen 7 7745HX | |
| Power Consumption / Cinebench R23 Multi (external Monitor) | |
| Intel Core i9-14900K | |
| AMD Ryzen 9 7950X (95.2) | |
| Intel Core i5-14600K | |
| AMD Ryzen 9 7950X3D | |
| AMD Ryzen 7 7800X3D | |
| AMD Ryzen 7 7745HX | |
| Power Consumption / Cinebench R23 Single (external Monitor) | |
| AMD Ryzen 7 7800X3D | |
| AMD Ryzen 9 7950X (95.2) | |
| Intel Core i9-14900K | |
| Intel Core i5-14600K | |
| AMD Ryzen 7 7745HX | |
| Power Consumption / Cinebench R15 Multi Efficiency (external Monitor) | |
| AMD Ryzen 7 7745HX | |
| AMD Ryzen 9 7950X3D | |
| AMD Ryzen 9 7950X | |
| AMD Ryzen 7 7800X3D | |
| Intel Core i9-13900K | |
| Intel Core i5-13600K | |
| Intel Core i9-14900K | |
| Intel Core i5-14600K | |
* ... más pequeño es mejor
| Power Consumption / The Witcher 3 ultra (external Monitor) | |
| Intel Core i5-14600K | |
| Intel Core i9-14900K | |
| Intel Core i7-13700 | |
| Intel Core i7-13700K | |
| AMD Ryzen 9 7950X | |
| AMD Ryzen 9 7950X3D | |
| Intel Core i9-13900K | |
| Intel Core i7-12700 | |
| Intel Core i5-13400 | |
| AMD Ryzen 7 7800X3D | |
| AMD Ryzen 7 7745HX | |
| Intel Core i5-12400F | |
| AMD Ryzen 7 7745HX | |
| Power Consumption / Witcher 3 ultra Efficiency (external Monitor) | |
| AMD Ryzen 7 7800X3D | |
| Intel Core i5-12400F | |
| Intel Core i9-13900K | |
| AMD Ryzen 9 7950X | |
| Intel Core i7-12700 | |
| AMD Ryzen 9 7950X3D | |
| AMD Ryzen 7 7745HX | |
| Intel Core i7-13700K | |
| Intel Core i7-13700 | |
| Intel Core i9-14900K | |
| Intel Core i5-14600K | |
| Intel Core i5-13400 | |
| AMD Ryzen 7 7745HX | |
* ... más pequeño es mejor
Power consumption with external monitor
Pro
Contra
Veredicto - Potente AMD Ryzen 7 7745HX

El Minisforum BD770i del fabricante de sistemas chino, conocido por sus PC compactos, proporciona una base excelente para construir dispositivos altamente eficientes. Con el BD770i, Minisforum atiende a los clientes interesados en autoensamblar sus sistemas, ya que el paquete incluye únicamente la placa base con una CPU instalada de forma permanente y un disipador de tubo de calor premontado. Esto ofrece la flexibilidad de crear sistemas económicos para el uso diario en la oficina o potentes configuraciones para juegos incorporando una tarjeta gráfica dedicada.
Con el AMD Ryzen 7 7745HX, el Minisforum BD770i ofrece un sólido rendimiento y es compatible con futuras tarjetas gráficas gracias a su conexión PCIe 5.0.
La estrategia de integrar una CPU móvil en un sobremesa ha demostrado ser un éxito. La eficaz entrega de potencia, libre de estrangulamiento térmico, garantiza una eficiencia notable gracias al bajo consumo. Incluso en comparación con los actuales procesadores X3D de AMD, famosos por su extraordinaria eficiencia, la placa base Minisforum BD770i se mantiene firme.
Aunque el precio inicial de ~399 dólares puede parecer elevado, teniendo en cuenta su clase de rendimiento en relación con un sistema de sobremesa convencional, la Minisforum BD770i podría ser una opción convincente. Es especialmente adecuado para los usuarios que no tengan previsto actualizar su CPU más adelante. Aun así, es importante tener en cuenta que se trata de una especie de sistema barebone, que conlleva costes adicionales para que el dispositivo sea totalmente operativo.
Precio y disponibilidad
Minisforum vende el BD770i a través de Amazon, donde también se puede comprar la placa base por 399 dólares.
Transparencia
Nuestro equipo editorial se encarga de seleccionar los dispositivos que se someten a revisión. La muestra de prueba fue entregada al autor por el fabricante de forma gratuita para los fines de la revisión. No hubo influencia de terceros en esta revisión, ni el fabricante recibió una copia de esta revisión antes de su publicación. No había ninguna obligación de publicar esta reseña. Como empresa de medios independiente, Notebookcheck no está sujeta a la autoridad de fabricantes, minoristas o editores.
Así es como prueba Notebookcheck
Cada año, Notebookcheck revisa de forma independiente cientos de portátiles y smartphones utilizando procedimientos estandarizados para asegurar que todos los resultados son comparables. Hemos desarrollado continuamente nuestros métodos de prueba durante unos 20 años y hemos establecido los estándares de la industria en el proceso. En nuestros laboratorios de pruebas, técnicos y editores experimentados utilizan equipos de medición de alta calidad. Estas pruebas implican un proceso de validación en varias fases. Nuestro complejo sistema de clasificación se basa en cientos de mediciones y puntos de referencia bien fundamentados, lo que mantiene la objetividad.
